UNITED STATES
SECURITIES AND EXCHANGE COMMISSION
Washington, D.C. 20549
FORM N-CSR
CERTIFIED SHAREHOLDER REPORT OF REGISTERED MANAGEMENT INVESTMENT COMPANIES
Investment Company Act file number: 811-07332 and 811-08162
Name of Fund: BlackRock Funds III
BlackRock Cash Funds: Institutional
BlackRock Cash Funds: Prime
BlackRock Cash Funds: Treasury
BlackRock CoreAlpha Bond Fund
BlackRock Disciplined International Fund
BlackRock Large Cap Index Fund
BlackRock LifePath® Retirement Fund
BlackRock LifePath® 2020 Fund
BlackRock LifePath® 2025 Fund
BlackRock LifePath® 2030 Fund
BlackRock LifePath® 2035 Fund
BlackRock LifePath® 2040 Fund
BlackRock LifePath® 2045 Fund
BlackRock LifePath® 2050 Fund
BlackRock LifePath® 2055 Fund
BlackRock LifePath® Index Retirement Fund
BlackRock LifePath® Index 2020 Fund
BlackRock LifePath® Index 2025 Fund
BlackRock LifePath® Index 2030 Fund
BlackRock LifePath® Index 2035 Fund
BlackRock LifePath® Index 2040 Fund
BlackRock LifePath® Index 2045 Fund
BlackRock LifePath® Index 2050 Fund
BlackRock LifePath® Index 2055 Fund
BlackRock S&P 500 Index Fund
BlackRock Total International ex U.S. Index Fund
BlackRock U.S. Total Bond Index Fund
Master Investment Portfolio
Active Stock Master Portfolio
CoreAlpha Bond Master Portfolio
International Tilts Master Portfolio
Large Cap Index Master Portfolio
LifePath® Retirement Master Portfolio
LifePath® 2020 Master Portfolio
LifePath® 2025 Master Portfolio
LifePath® 2030 Master Portfolio
LifePath® 2035 Master Portfolio
LifePath® 2040 Master Portfolio
LifePath® 2045 Master Portfolio
LifePath® 2050 Master Portfolio
LifePath® 2055 Master Portfolio
LifePath® Index Retirement Master Portfolio
LifePath® Index 2020 Master Portfolio
LifePath® Index 2025 Master Portfolio
LifePath® Index 2030 Master Portfolio
LifePath® Index 2035 Master Portfolio
LifePath® Index 2040 Master Portfolio
LifePath® Index 2045 Master Portfolio
LifePath® Index 2050 Master Portfolio
LifePath® Index 2055 Master Portfolio
Money Market Master Portfolio
Prime Money Market Master Portfolio
S&P 500 Index Master Portfolio
Total International ex U.S. Index Master Portfolio
Treasury Money Market Master Portfolio
U.S. Total Bond Index Master Portfolio
Fund Address: 100 Bellevue Parkway, Wilmington, DE 19809
Name and address of agent for service: John M. Perlowski, Chief Executive Officer, BlackRock Funds III and
Master Investment Portfolio, 55 East 52nd Street, New York, NY 10055
Registrants’ telephone number, including area code: (800) 537-4942
Date of fiscal year end: 12/31/2015
Date of reporting period: 12/31/2015
Item 1 – Report to Stockholders
2
DECEMBER 31, 2015
| | | | |
ANNUAL REPORT | | | |  |
BlackRock Funds III
| Ø | BlackRock Cash Funds: Institutional |
| Ø | BlackRock Cash Funds: Prime |
| Ø | BlackRock Cash Funds: Treasury |
|
| Not FDIC Insured • May Lose Value • No Bank Guarantee |
| | | | | | |
| | | | | | | |
| 2 | | BLACKROCK FUNDS III | | DECEMBER 31, 2015 | | |
Dear Shareholder,
Diverging monetary policies and shifting economic outlooks across regions have been the overarching themes driving financial markets over the past couple of years. With U.S. growth outpacing the global economic recovery in 2015 while inflationary pressures remained low, investors spent most of the year anticipating a short-term rate hike from the Federal Reserve (the “Fed”), which ultimately came to fruition in December. In contrast, the European Central Bank (“ECB”) and the Bank of Japan moved to a more accommodative stance during the year. In this environment, the U.S. dollar strengthened considerably, causing profit challenges for U.S. exporters and high levels of volatility in emerging market currencies and commodities. Oil prices were particularly volatile and below the historical norm due to an ongoing imbalance in global supply and demand.
Market volatility broadly increased in the middle of 2015, beginning with a sharp, but temporary, selloff in June as Greece’s long-brewing debt troubles came to an impasse. Just as these concerns abated, Chinese equities tumbled amid weakness in the country’s economy. This, combined with a depreciation of the yuan and declining confidence in China’s policymakers, stoked worries about the potential impact to the broader world economy, causing heightened volatility to spread throughout markets globally. Given a dearth of meaningful growth across most of the world, financial markets became more reliant on central bank policies to drive performance. In that vein, risk assets (such as equities and high yield bonds) rallied in October when China’s central bank provided more stimulus, the ECB hinted at further easing, and soft U.S. data pushed back expectations for a Fed rate hike. As the period came to a close, however, the ECB disappointed investors with its subdued policy changes. The Fed’s December rate hike had a positive impact on the markets as it removed a source of uncertainty, but this was counteracted by the dampening effect of a stronger U.S. dollar, falling oil prices and tighter credit conditions.
At BlackRock, we believe investors need to think globally, extend their scope across a broad array of asset classes and be prepared to move freely as market conditions change over time. We encourage you to talk with your financial advisor and visit blackrock.com for further insight about investing in today’s markets.
Sincerely,

Rob Kapito
President, BlackRock Advisors, LLC

Rob Kapito
President, BlackRock Advisors, LLC
| | | | | | | | |
| Total Returns as of December 31, 2015 | |
| | | 6-month | | | 12-month | |
U.S. large cap equities
(S&P 500® Index) | | | 0.15 | % | | | 1.38 | % |
U.S. small cap equities
(Russell 2000® Index) | | | (8.75 | ) | | | (4.41 | ) |
International equities
(MSCI Europe, Australasia,
Far East Index) | | | (6.01 | ) | | | (0.81 | ) |
Emerging market equities
(MSCI Emerging Markets Index) | | | (17.35 | ) | | | (14.92 | ) |
3-month Treasury bills
(BofA Merrill Lynch 3-Month
U.S. Treasury Bill Index) | | | 0.04 | | | | 0.05 | |
U.S. Treasury securities
(BofA Merrill Lynch
10-Year U.S. Treasury
Index) | | | 1.43 | | | | 0.91 | |
U.S. investment-grade bonds
(Barclays U.S.
Aggregate Bond Index) | | | 0.65 | | | | 0.55 | |
Tax-exempt municipal
bonds (S&P Municipal
Bond Index) | | | 3.31 | | | | 3.32 | |
U.S. high yield bonds
(Barclays U.S. Corporate
High Yield 2% Issuer
Capped Index) | | | (6.79 | ) | | | (4.43 | ) |
| Past performance is no guarantee of future results. Index performance is shown for illustrative purposes only. You cannot invest directly in an index. | |
| | | | | | |
| | | | | | | |
| | THIS PAGE NOT PART OF YOUR FUND REPORT | | | | 3 |
|
| For the 12-Month Period Ended December 31, 2015 |
While the U.S. labor market continued to improve, U.S. economic growth slowed in the fourth quarter due to a strong dollar and global headwinds. Lower oil prices continued to undermine investments by energy firms while unseasonably mild weather cut into consumer spending on utilities and apparel. For the first time since 2006, on December 16, 2015, the Federal Open Market Committee (“FOMC”) voted unanimously to raise its target range for the Federal Funds Rate by 25 basis points to 0.25% to 0.50%. The move was widely expected as in the 2 months leading up to the meeting several Fed speakers commented on economic growth, specifically the gradual improvement and sustainability experienced throughout 2015. Over the same time period, Fed Fund Futures projected a 55% to 76% probability of a 25 basis point rate hike at the December meeting. As a result of the well telegraphed move, the market experienced minimal volatility throughout the remainder of the year. To note, effective December 17, the overnight level of the N.Y. Federal Reserve Reverse Repo Program (“RRP”) moved up to 0.25% from 0.05% and Interest on Reserves (“IOR”) up to 0.50% from 0.25%.
Also at the December meeting, the Federal Reserve released an updated forecast of the Summary of Economic Projection (“SEP”); the data projected 4 additional rate increases by the end of 2016 (ending the year with a 1.25% Fed Funds rate). While Chairwoman Yellen did not comment on the “dots,” she and several Fed officials did state that the future path of policy would remain dependent on the data and if the positive momentum continues, the pace of additional increases would be gradual as to not disrupt or shock the market.
The short-term tax-exempt market was relatively stable for the duration of the twelve months ended December 31, 2015. While municipal money fund industry assets have been stable, holdings of highly liquid variable rate demand note (“VRDN”) securities generally increased over the period. Rates on VRDN securities as measured by the benchmark Securities Industry and Financial Markets Association (“SIFMA”) Index, which represents the average rate on seven-day terms, ranged between a high of 0.03% to a historical low of 0.01%, and ended the period at 0.01%. With the exception of seasonal weakness resulting from tax-related redemptions in April and May, when inventory of VRDN securities reached a high not seen in over three years of near $13 billion, inventory remained at or near historical lows around and sometimes below $1 billion for the majority of the period.
Posturing around the FOMC meetings and the need to replace maturing municipal notes combined to keep demand for VRDN securities elevated over the majority of the period. In addition, improvement in the fiscal health of state and local municipal issuers contributed to a reduced need to borrow in the short-term municipal market to meet fiscal year 2016 operational budget needs. The reduced borrowing need has resulted in a reduction in one-year fixed-rate note issuance by roughly 25% from the previous year’s levels. While a federal funds rate hike was widely expected before year end, a reduction in note issuance had contributed to only a moderate amount of upward pressure on one-year rates. As the year came to a close, rates on one-year notes continued to rise as investors prepared for the anticipated Fed rate hike and reached an all-time high for the period when the Fed ultimately commenced its rate hiking cycle in mid-December. The Municipal Market Advisors AAA General Obligation One-Year Index yield increased from 0.18% on December 31, 2014 to 0.50% on December 31, 2015. In addition, the reduced supply of fixed-rate notes and defensive positioning have combined to elevate demand for VRDN securities as an investment alternative, which resulted in the SIFMA Index dropping to the historical low of 0.01% by December 31, 2015.
Past performance is no guarantee of future results. Index performance is shown for illustrative purposes only. You cannot invest directly in an index.
| | | | | | |
| | | | | | | |
| 4 | | BLACKROCK FUNDS III | | DECEMBER 31, 2015 | | |
| | |
| Fund Information as of December 31, 2015 | | |
| | |
| BlackRock Cash Funds: Institutional |
BlackRock Cash Funds: Institutional’s (the “Fund”) investment objective is to seek a high level of income consistent with liquidity and the preservation of capital.
| | | | | | | | |
| | | 7-Day
SEC Yield | | | 7-Day
Yield | |
Aon Captives | | | 0.25 | % | | | 0.26 | % |
Institutional | | | 0.35 | % | | | 0.36 | % |
Select | | | 0.27 | % | | | 0.27 | % |
SL Agency | | | 0.38 | % | | | 0.39 | % |
| | |
| BlackRock Cash Funds: Prime |
BlackRock Cash Funds: Prime’s (the “Fund”) investment objective is to seek a high level of income consistent with liquidity and the preservation of capital.
| | | | | | | | |
| | | 7-Day
SEC Yield | | | 7-Day
Yield | |
Capital | | | 0.31 | % | | | 0.31 | % |
Institutional | | | 0.33 | % | | | 0.33 | % |
Premium | | | 0.28 | % | | | 0.28 | % |
SL Agency | | | 0.36 | % | | | 0.36 | % |
| | |
| BlackRock Cash Funds: Treasury |
BlackRock Cash Funds: Treasury’s (the “Fund”) investment objective is to seek current income consistent with liquidity and stability of principal.
| | | | | | | | |
| | | 7-Day
SEC Yield | | | 7-Day
Yield | |
SL Agency | | | 0.18 | % | | | 0.19 | % |
The 7-Day SEC Yields may differ from the 7-Day Yields shown due to the fact that the 7-Day SEC Yields exclude distributed capital gains.
Past performance is not indicative of future results.
| | | | | | |
| | | | | | | |
| | BLACKROCK FUNDS III | | DECEMBER 31, 2015 | | 5 |
Shareholders of these Funds may incur the following charges: (a) transactional expenses, such as sales charges; and (b) operating expenses, including administration fees, service and distribution fees, including 12b-1 fees, acquired fund fees and expenses, and other Fund expenses. The expense examples shown below (which are based on a hypothetical investment of $1,000 invested on July 1, 2015 and held through December 31, 2015) are intended to assist shareholders both in calculating expenses based on an investment in each Fund and in comparing these expenses with similar costs of investing in other mutual funds.
The expense examples provide information about actual account values and actual expenses. In order to estimate the expenses a shareholder paid during the period covered by this report, shareholders can divide their account value by $1,000 and then multiply the result by the number corresponding to their Fund and share class under the heading entitled “Expenses Paid During the Period.”
The expense examples also provide information about hypothetical account values and hypothetical expenses based on a Fund’s actual expense ratio and an assumed rate of return of 5% per year before expenses. In order to assist shareholders in comparing the ongoing expenses of investing in these Funds and other funds, compare the 5% hypothetical example with the 5% hypothetical examples that appear in other funds’ shareholder reports.
The expenses shown in the expense examples are intended to highlight shareholders’ ongoing costs only and do not reflect any transactional expenses, such as sales charges, if any. Therefore, the hypothetical examples are useful in comparing ongoing expenses only, and will not help shareholders determine the relative total expenses of owning different funds. If these transactional expenses were included, shareholder expenses would have been higher.
| | | | | | | | | | | | | | | | | | | | | | | | | | | | |
| | | Actual | | | Hypothetical2 | | | | |
| BlackRock Cash Funds: Institutional | | Beginning
Account Value
July 1, 2015 | | | Ending
Account Value
December 31, 2015 | | | Expenses Paid
During the Period1 | | | Beginning
Account Value
July 1, 2015 | | | Ending
Account Value
December 31, 2015 | | | Expenses Paid
During the Period1 | | | Annualized
Expense
Ratio | |
Aon Captives | | $ | 1,000.00 | | | $ | 1,000.40 | | | $ | 1.11 | | | $ | 1,000.00 | | | $ | 1,024.10 | | | $ | 1.12 | | | | 0.22 | % |
Institutional | | $ | 1,000.00 | | | $ | 1,000.30 | | | $ | 0.61 | | | $ | 1,000.00 | | | $ | 1,024.60 | | | $ | 0.61 | | | | 0.12 | % |
Select | | $ | 1,000.00 | | | $ | 1,000.50 | | | $ | 0.96 | | | $ | 1,000.00 | | | $ | 1,024.25 | | | $ | 0.97 | | | | 0.19 | % |
SL Agency | | $ | 1,000.00 | | | $ | 1,001.10 | | | $ | 0.45 | | | $ | 1,000.00 | | | $ | 1,024.75 | | | $ | 0.46 | | | | 0.09 | % |
| BlackRock Cash Funds: Prime | | | | | | | | | | | | | | | | | | | | | |
Capital | | $ | 1,000.00 | | | $ | 1,000.80 | | | $ | 0.71 | | | $ | 1,000.00 | | | $ | 1,024.50 | | | $ | 0.71 | | | | 0.14 | % |
Institutional | | $ | 1,000.00 | | | $ | 1,000.90 | | | $ | 0.61 | | | $ | 1,000.00 | | | $ | 1,024.60 | | | $ | 0.61 | | | | 0.12 | % |
Premium | | $ | 1,000.00 | | | $ | 1,000.60 | | | $ | 0.86 | | | $ | 1,000.00 | | | $ | 1,024.35 | | | $ | 0.87 | | | | 0.17 | % |
SL Agency | | $ | 1,000.00 | | | $ | 1,001.00 | | | $ | 0.45 | | | $ | 1,000.00 | | | $ | 1,024.75 | | | $ | 0.46 | | | | 0.09 | % |
| BlackRock Cash Funds: Treasury | | | | | | | | | | | | | | | | | | | | | |
SL Agency | | $ | 1,000.00 | | | $ | 1,000.30 | | | $ | 0.45 | | | $ | 1,000.00 | | | $ | 1,024.75 | | | $ | 0.46 | | | | 0.09 | % |
| | 1 | | For each class of a Fund, expenses are equal to the annualized net expense ratio for the class, multiplied by the average account value over the period, multiplied by 184/365 (to reflect the one-half year period shown). Because each Fund invests significantly in its corresponding Master Portfolio, the expense examples reflect the net expenses of both the Fund and the Master Portfolio in which it invests. |
| | 2 | | Hypothetical 5% annual return before expenses is calculated by prorating the number of days in the most recent fiscal half year divided by 365. |
| | | | | | |
| | | | | | | |
| 6 | | BLACKROCK FUNDS III | | DECEMBER 31, 2015 | | |
| | |
| Statements of Assets and Liabilities | | |
| | | | | | | | | | | | |
| December 31, 2015 | | BlackRock Cash Funds:
Institutional | | | BlackRock Cash Funds: Prime | | | BlackRock Cash Funds: Treasury | |
| | | | | | | | | | | | |
| Assets | | | | | | | | | | | | |
Investments at value — from the applicable Master Portfolio1,2 | | $ | 42,518,321,189 | | | $ | 25,455,493,138 | | | $ | 2,154,951,136 | |
Capital shares sold receivable | | | 1,030 | | | | — | | | | — | |
| | | | |
Total assets | | | 42,518,322,219 | | | | 25,455,493,138 | | | | 2,154,951,136 | |
| | | | |
| | | | | | | | | | | | |
| Liabilities | | | | | | | | | | | | |
| Payables: | | | | | | | | | | | | |
Income dividends | | | 8,771,009 | | | | 3,752,886 | | | | 324,302 | |
Administration fees | | | 786,404 | | | | 848,238 | | | | 41,178 | |
Distribution fees | | | 726 | | | | — | | | | — | |
Professional fees | | | 12,105 | | | | 12,128 | | | | 12,121 | |
| | | | |
Total liabilities | | | 9,570,244 | | | | 4,613,252 | | | | 377,601 | |
| | | | |
Net Assets | | $ | 42,508,751,975 | | | $ | 25,450,879,886 | | | $ | 2,154,573,535 | |
| | | | |
| | | | | | | | | | | | |
| Net Assets Consist of | | | | | | | | | | | | |
Paid-in capital | | $ | 42,507,513,041 | | | $ | 25,450,294,314 | | | $ | 2,154,557,914 | |
Undistributed net investment income | | | — | | | | 15,057 | | | | — | |
Accumulated net realized gain | | | 1,238,934 | | | | 570,515 | | | | 15,621 | |
| | | | |
Net Assets | | $ | 42,508,751,975 | | | $ | 25,450,879,886 | | | $ | 2,154,573,535 | |
| | | | |
| | | | | | | | | | | | |
| Net Asset Value | | | | | | | | | | | | |
| Aon Captives: | | | | | | | | | | | | |
Net assets | | $ | 8,558,218 | | | | — | | | | — | |
| | | | |
Shares outstanding3 | | | 8,558,237 | | | | — | | | | — | |
| | | | |
Net asset value | | $ | 1.00 | | | | — | | | | — | |
| | | | |
| Capital: | | | | | | | | | | | | |
Net assets | | | — | | | $ | 2,125,858,370 | | | | — | |
| | | | |
Shares outstanding3 | | | — | | | | 2,125,818,522 | | | | — | |
| | | | |
Net asset value | | | — | | | $ | 1.00 | | | | — | |
| | | | |
| Institutional: | | | | | | | | | | | | |
Net assets | | $ | 2,056,593,835 | | | $ | 13,516,544,543 | | | | — | |
| | | | |
Shares outstanding3 | | | 2,056,598,279 | | | | 13,516,291,088 | | | | — | |
| | | | |
Net asset value | | $ | 1.00 | | | $ | 1.00 | | | | — | |
| | | | |
| Premium: | | | | | | | | | | | | |
Net assets | | | — | | | $ | 1,132,613,946 | | | | — | |
| | | | |
Shares outstanding3 | | | — | | | | 1,132,592,713 | | | | — | |
| | | | |
Net asset value | | | — | | | $ | 1.00 | | | | — | |
| | | | |
| Select: | | | | | | | | | | | | |
Net assets | | $ | 5,392 | | | | — | | | | — | |
| | | | |
Shares outstanding3 | | | 5,392 | | | | — | | | | — | |
| | | | |
Net asset value | | $ | 1.00 | | | | — | | | | — | |
| | | | |
| SL Agency: | | | | | | | | | | | | |
Net assets | | $ | 40,443,594,530 | | | $ | 8,675,863,027 | | | $ | 2,154,573,535 | |
| | | | |
Shares outstanding3 | | | 40,443,681,919 | | | | 8,675,700,368 | | | | 2,154,557,916 | |
| | | | |
Net asset value | | $ | 1.00 | | | $ | 1.00 | | | $ | 1.00 | |
| | | | |
1 Investments at cost — affiliated | | | | | | | | | | | | |
2 Money Market Master Portfolio, Prime Money Market Master Portfolio, and Treasury Money Market Master Portfolio (each, a “Master Portfolio”), respectively. | |
3 Unlimited number of shares authorized, no par value. | | | | | | | | | | | | |
| | | | | | |
| See Notes to Financial Statements. | | | | |
| | | | | | | |
| | BLACKROCK FUNDS III | | DECEMBER 31, 2015 | | 7 |
| | | | | | | | | | | | |
| Year Ended December 31, 2015 | | BlackRock Cash Funds: Institutional | | | BlackRock Cash Funds:
Prime | | | BlackRock Cash Funds:
Treasury | |
| | | | | | | | | | | | |
| Investment Income | | | | | | | | | | | | |
| Net investment income allocated from the applicable Master Portfolio: | | | | | | | | | | | | |
Interest | | $ | 117,133,081 | | | $ | 61,995,030 | | | $ | 2,361,947 | |
Expenses | | | (42,795,786 | ) | | | (23,286,798 | ) | | | (2,181,133 | ) |
Fees waived | | | 13,208,966 | | | | 7,221,193 | | | | 700,916 | |
| | | | |
Total income | | | 87,546,261 | | | | 45,929,425 | | | | 881,730 | |
| | | | |
| | | | | | | | | | | | |
| Fund Expenses | | | | | | | | | | | | |
Administration — class specific | | | 9,414,494 | | | | 9,471,702 | | | | 426,247 | |
Professional | | | 20,650 | | | | 17,432 | | | | 14,210 | |
Distribution — Aon Captives | | | 8,195 | | | | — | | | | — | |
Miscellaneous | | | 325 | | | | 325 | | | | 325 | |
| | | | |
Total expenses | | | 9,443,664 | | | | 9,489,459 | | | | 440,782 | |
| Less: | | | | | | | | | | | | |
Administration fees waived — class specific | | | (4 | ) | | | (265 | ) | | | (91,775 | ) |
Fees reimbursed by the administrator | | | (20,650 | ) | | | (17,432 | ) | | | (14,210 | ) |
| | | | |
Total expenses after fees waived and/or reimbursed | | | 9,423,010 | | | | 9,471,762 | | | | 334,797 | |
| | | | |
Net investment income | | | 78,123,251 | | | | 36,457,663 | | | | 546,933 | |
| | | | |
| | | | | | | | | | | | |
| Realized Gain Allocated from the Master Portfolios | | | | | | | | | | | | |
Net realized gain from investments | | | 1,366,640 | | | | 570,515 | | | | 98,963 | |
| | | | |
Net Increase in Net Assets Resulting from Operations | | $ | 79,489,891 | | | $ | 37,028,178 | | | $ | 645,896 | |
| | | | |
| | | | | | |
| See Notes to Financial Statements. | | | | |
| | | | | | | |
| 8 | | BLACKROCK FUNDS III | | DECEMBER 31, 2015 | | |
| | |
| Statements of Changes in Net Assets | | |
| | | | | | | | |
| | | BlackRock Cash Funds: Institutional | |
| | | Year Ended December 31, | |
| Increase (Decrease) in Net Assets: | | 2015 | | | 2014 | |
| | | | | | | | |
| Operations | |
Net investment income | | $ | 78,123,251 | | | $ | 56,132,730 | |
Net realized gain | | | 1,366,640 | | | | 3,084,717 | |
| | | | |
Net increase in net assets resulting from operations | | | 79,489,891 | | | | 59,217,447 | |
| | | | |
| | | | | | | | |
| Distributions to Shareholders1 | | | | | | | | |
| From net investment income: | | | | | | | | |
Aon Captives | | | (4,715 | ) | | | (479 | ) |
Institutional | | | (4,942,131 | ) | | | (2,429,848 | ) |
Select | | | (13 | ) | | | (62 | ) |
SL Agency | | | (73,176,392 | ) | | | (53,702,341 | ) |
| Net realized gain: | | | | | | | | |
Aon Captives | | | (270 | ) | | | (667 | ) |
Institutional | | | (72,604 | ) | | | (179,314 | ) |
Select | | | — | | | | (9 | ) |
SL Agency | | | (1,333,902 | ) | | | (3,240,008 | ) |
| | | | |
Decrease in net assets resulting from distributions to shareholders | | | (79,530,027 | ) | | | (59,552,728 | ) |
| | | | |
| | | | | | | | |
| Capital Share Transactions | | | | | | | | |
Net increase (decrease) in net assets derived from capital share transactions | | | 2,500,790,392 | | | | (675,694,893 | ) |
| | | | |
| | | | | | | | |
| Net Assets | | | | | | | | |
Total increase (decrease) in net assets | | | 2,500,750,256 | | | | (676,030,174 | ) |
Beginning of year | | | 40,008,001,719 | | | | 40,684,031,893 | |
| | | | |
End of year | | $ | 42,508,751,975 | | | $ | 40,008,001,719 | |
| | | | |
1 Distributions for annual periods determined in accordance with federal income tax regulations. | | | | |
| | | | | | |
| See Notes to Financial Statements. | | | | |
| | | | | | | |
| | BLACKROCK FUNDS III | | DECEMBER 31, 2015 | | 9 |
| | |
| Statements of Changes in Net Assets | | |
| | | | | | | | |
| | | BlackRock Cash Funds: Prime | |
| | | Year Ended December 31, | |
| Increase (Decrease) in Net Assets: | | 2015 | | | 2014 | |
| | | | | | | | |
| Operations | |
Net investment income | | $ | 36,457,663 | | | $ | 15,551,904 | |
Net realized gain | | | 570,515 | | | | 728,334 | |
| | | | |
Net increase in net assets resulting from operations | | | 37,028,178 | | | | 16,280,238 | |
| | | | |
| | | | | | | | |
| Distributions to Shareholders1 | | | | | | | | |
| From net investment income: | | | | | | | | |
Capital | | | (2,423,327 | ) | | | (875,180 | ) |
Institutional | | | (15,039,119 | ) | | | (5,326,684 | ) |
Premium | | | (1,252,061 | ) | | | (588,278 | ) |
Select | | | (1,082 | ) | | | (74 | ) |
SL Agency | | | (17,730,967 | ) | | | (8,761,688 | ) |
| From net realized gain: | | | | | | | | |
Capital | | | (28,402 | ) | | | (66,763 | ) |
Institutional | | | (170,670 | ) | | | (221,109 | ) |
Premium | | | (17,796 | ) | | | (49,476 | ) |
Select | | | (19 | ) | | | (42 | ) |
SL Agency | | | (131,220 | ) | | | (312,573 | ) |
Trust | | | — | | | | (37 | ) |
| | | | |
Decrease in net assets resulting from distributions to shareholders | | | (36,794,663 | ) | | | (16,201,904 | ) |
| | | | |
| | | | | | | | |
| Capital Share Transactions | | | | | | | | |
Net increase in net assets derived from capital share transactions | | | 2,758,323,754 | | | | 5,582,620,700 | |
| | | | |
| | | | | | | | |
| Net Assets | | | | | | | | |
Total increase in net assets | | | 2,758,557,269 | | | | 5,582,699,034 | |
Beginning of year | | | 22,692,322,617 | | | | 17,109,623,583 | |
| | | | |
End of year | | $ | 25,450,879,886 | | | $ | 22,692,322,617 | |
| | | | |
Undistributed net investment income, end of year | | $ | 3,950 | | | $ | 3,950 | |
| | | | |
1 Distributions for annual periods determined in accordance with federal income tax regulations. | | | | |
| | | | | | |
| See Notes to Financial Statements. | | | | |
| | | | | | | |
| 10 | | BLACKROCK FUNDS III | | DECEMBER 31, 2015 | | |
| | |
| Statements of Changes in Net Assets | | |
| | | | | | | | |
| | | BlackRock Cash Funds: Treasury | |
| | | Year Ended December 31, | |
| Increase (Decrease) in Net Assets: | | 2015 | | | 2014 | |
| | | | | | | | |
| Operations | |
Net investment income | | $ | 546,933 | | | $ | — | |
Net realized gain | | | 98,963 | | | | 59,659 | |
| | | | |
Net increase in net assets resulting from operations | | | 645,896 | | | | 59,659 | |
| | | | |
| | | | | | | | |
| Distributions to Shareholders1 | | | | | | | | |
| From net investment income: | | | | | | | | |
Institutional | | | (279 | ) | | | — | |
Select | | | (1 | ) | | | — | |
SL Agency | | | (546,653 | ) | | | — | |
| From net realized gain: | | | | | | | | |
Capital | | | — | | | | (12 | ) |
Institutional | | | (51 | ) | | | — | |
Select | | | — | | | | (97 | ) |
SL Agency | | | (90,949 | ) | | | (58,648 | ) |
Trust | | | — | | | | (257 | ) |
| | | | |
Decrease in net assets resulting from distributions to shareholders | | | (637,933 | ) | | | (59,014 | ) |
| | | | |
| | | | | | | | |
| Capital Share Transactions | | | | | | | | |
Net increase (decrease) in net assets derived from capital share transactions | | | (231,225,048 | ) | | | 800,572,506 | |
| | | | |
| | | | | | | | |
| Net Assets | | | | | | | | |
Total increase (decrease) in net assets | | | (231,217,085 | ) | | | 800,573,151 | |
Beginning of year | | | 2,385,790,620 | | | | 1,585,217,469 | |
| | | | |
End of year | | $ | 2,154,573,535 | | | $ | 2,385,790,620 | |
| | | | |
1 Distributions for annual periods determined in accordance with federal income tax regulations. | | | | |
| | | | | | |
| See Notes to Financial Statements. | | | | |
| | | | | | | |
| | BLACKROCK FUNDS III | | DECEMBER 31, 2015 | | 11 |
| | |
| Financial Highlights | | BlackRock Cash Funds: Institutional |
| | | | | | | | | | | | | | | | | | | | |
| | | Aon Captives | |
| | | Year Ended December 31, | |
| | | 2015 | | | 2014 | | | 2013 | | | 2012 | | | 2011 | |
| | | | | | | | | | | | | | | | | | | | |
| Per Share Operating Performance | | | | | | | | | | | | | | | | | | | | |
Net asset value, beginning of year | | $ | 1.00 | | | $ | 1.00 | | | $ | 1.00 | | | $ | 1.00 | | | $ | 1.00 | |
| | | | |
Net investment income | | | 0.0006 | | | | 0.0000 | 1 | | | 0.0005 | | | | 0.0012 | | | | 0.0008 | |
Net realized and unrealized gain | | | 0.0000 | 1 | | | 0.0001 | | | | 0.0000 | 1 | | | — | | | | — | |
| | | | |
Net increase from investment operations | | | 0.0006 | | | | 0.0001 | | | | 0.0005 | | | | 0.0012 | | | | 0.0008 | |
| | | | |
| Distributions from:2 | | | | | | | | | | | | | | | | | | | | |
Net investment income | | | (0.0006 | ) | | | (0.0000 | )3 | | | (0.0005 | ) | | | (0.0012 | ) | | | (0.0008 | ) |
Net realized gain | | | (0.0000 | )3 | | | (0.0001 | ) | | | (0.0000 | )3 | | | — | | | | — | |
| | | | |
Total distributions | | | (0.0006 | ) | | | (0.0001 | ) | | | (0.0005 | ) | | | (0.0012 | ) | | | (0.0008 | ) |
| | | | |
Net asset value, end of year | | $ | 1.00 | | | $ | 1.00 | | | $ | 1.00 | | | $ | 1.00 | | | $ | 1.00 | |
| | | | |
| | | | | | | | | | | | | | | | | | | | |
| Total Return4 | | | | | | | | | | | | | | | | | | | | |
Based on net asset value | | | 0.06% | | | | 0.01% | | | | 0.05% | | | | 0.12% | | | | 0.08% | |
| | | | |
| | | | | | | | | | | | | | | | | | | | |
| Ratios to Average Net Assets5,6 | | | | | | | | | | | | | | | | | | | | |
Total expenses | | | 0.22% | | | | 0.22% | | | | 0.22% | | | | 0.22% | | | | 0.22% | |
| | | | |
Total expenses after fees waived and/or reimbursed | | | 0.22% | | | | 0.22% | | | | 0.22% | | | | 0.22% | | | | 0.22% | |
| | | | |
Net investment income | | | 0.06% | | | | 0.01% | | | | 0.04% | | | | 0.12% | | | | 0.07% | |
| | | | |
| | | | | | | | | | | | | | | | | | | | |
| Supplemental Data | | | | | | | | | | | | | | | | | | | | |
Net assets, end of year (000) | | $ | 8,558 | | | $ | 7,999 | | | $ | 9,166 | | | $ | 11,003 | | | $ | 9,167 | |
| | | | |
| | 1 | | Amount is less than $0.00005 per share. |
| | 2 | | Distributions for annual periods determined in accordance with federal income tax regulations. |
| | 3 | | Amount is greater than $(0.00005) per share. |
| | 4 | | Where applicable, assumes the reinvestment of distributions. |
| | 5 | | Includes the Fund’s share of the Master Portfolio’s allocated net expenses and/or net investment income. |
| | 6 | | Includes the Fund’s share of the Master Portfolio’s allocated fees waived of 0.03%. |
| | | | | | |
| See Notes to Financial Statements. | | | | |
| | | | | | | |
| 12 | | BLACKROCK FUNDS III | | DECEMBER 31, 2015 | | |
| | |
| Financial Highlights (continued) | | BlackRock Cash Funds: Institutional |
| | | | | | | | | | | | | | | | | | | | |
| | | Institutional | |
| | | Year Ended December 31, | |
| | | 2015 | | | 2014 | | | 2013 | | | 2012 | | | 2011 | |
| | | | | | | | | | | | | | | | | | | | |
| Per Share Operating Performance | | | | | | | | | | | | | | | | | | | | |
Net asset value, beginning of year | | $ | 1.00 | | | $ | 1.00 | | | $ | 1.00 | | | $ | 1.00 | | | $ | 1.00 | |
| | | | |
Net investment income | | | 0.0016 | | | | 0.0010 | | | | 0.0015 | | | | 0.0022 | | | | 0.0018 | |
Net realized and unrealized gain | | | 0.0000 | 1 | | | 0.0001 | | | | 0.0000 | 1 | | | — | | | | — | |
| | | | |
Net increase from investment operations | | | 0.0016 | | | | 0.0011 | | | | 0.0015 | | | | 0.0022 | | | | 0.0018 | |
| | | | |
| Distributions from:2 | | | | | | | | | | | | | | | | | | | | |
Net investment income | | | (0.0016 | ) | | | (0.0010 | ) | | | (0.0015 | ) | | | (0.0022 | ) | | | (0.0018 | ) |
Net realized gain | | | (0.0000 | )3 | | | (0.0001 | ) | | | (0.0000 | )3 | | | — | | | | — | |
| | | | |
Total distributions | | | (0.0016 | ) | | | (0.0011 | ) | | | (0.0015 | ) | | | (0.0022 | ) | | | (0.0018 | ) |
| | | | |
Net asset value, end of year | | $ | 1.00 | | | $ | 1.00 | | | $ | 1.00 | | | $ | 1.00 | | | $ | 1.00 | |
| | | | |
| | | | | | | | | | | | | | | | | | | | |
| Total Return4 | | | | | | | | | | | | | | | | | | | | |
Based on net asset value | | | 0.16% | | | | 0.11% | | | | 0.15% | | | | 0.22% | | | | 0.18% | |
| | | | |
| | | | | | | | | | | | | | | | | | | | |
| Ratios to Average Net Assets5,6 | | | | | | | | | | | | | | | | | | | | |
Total expenses | | | 0.12% | | | | 0.12% | | | | 0.12% | | | | 0.12% | | | | 0.12% | |
| | | | |
Total expenses after fees waived and/or reimbursed | | | 0.12% | | | | 0.12% | | | | 0.12% | | | | 0.12% | | | | 0.12% | |
| | | | |
Net investment income | | | 0.15% | | | | 0.11% | | | | 0.14% | | | | 0.22% | | | | 0.17% | |
| | | | |
| | | | | | | | | | | | | | | | | | | | |
| Supplemental Data | | | | | | | | | | | | | | | | | | | | |
Net assets, end of year (000) | | $ | 2,056,594 | | | $ | 2,251,121 | | | $ | 2,802,911 | | | $ | 1,211,912 | | | $ | 1,089,872 | |
| | | | |
| | 1 | | Amount is less than $0.00005 per share. |
| | 2 | | Distributions for annual periods determined in accordance with federal income tax regulations. |
| | 3 | | Amount is greater than $(0.00005) per share. |
| | 4 | | Where applicable, assumes the reinvestment of distributions. |
| | 5 | | Includes the Fund’s share of the Master Portfolio’s allocated net expenses and/or net investment income. |
| | 6 | | Includes the Fund’s share of the Master Portfolio’s allocated fees waived of 0.03%. |
| | | | | | |
| See Notes to Financial Statements. | | | | |
| | | | | | | |
| | BLACKROCK FUNDS III | | DECEMBER 31, 2015 | | 13 |
| | |
| Financial Highlights (continued) | | BlackRock Cash Funds: Institutional |
| | | | | | | | | | | | | | | | | | | | |
| | | Select | |
| | | Year Ended December 31, | |
| | | 2015 | | | 2014 | | | 2013 | | | 2012 | | | 2011 | |
| | | | | | | | | | | | | | | | | | | | |
| Per Share Operating Performance | | | | | | | | | | | | | | | | | | | | |
Net asset value, beginning of year | | $ | 1.00 | | | $ | 1.00 | | | $ | 1.00 | | | $ | 1.00 | | | $ | 1.00 | |
| | | | |
Net investment income | | | 0.0008 | | | | 0.0002 | | | | 0.0007 | | | | 0.0014 | | | | 0.0010 | |
Net realized and unrealized gain | | | 0.0000 | 1 | | | 0.0001 | | | | 0.0000 | 1 | | | — | | | | — | |
| | | | |
Net increase from investment operations | | | 0.0008 | | | | 0.0003 | | | | 0.0007 | | | | 0.0014 | | | | 0.0010 | |
| | | | |
| Distributions from:2 | | | | | | | | | | | | | | | | | | | | |
Net investment income | | | (0.0008 | ) | | | (0.0002 | ) | | | (0.0007 | ) | | | (0.0014 | ) | | | (0.0010 | ) |
Net realized gain | | | (0.0000 | )3 | | | (0.0001 | ) | | | (0.0000 | )3 | | | — | | | | — | |
| | | | |
Total distributions | | | (0.0008 | ) | | | (0.0003 | ) | | | (0.0007 | ) | | | (0.0014 | ) | | | (0.0010 | ) |
| | | | |
Net asset value, end of year | | $ | 1.00 | | | $ | 1.00 | | | $ | 1.00 | | | $ | 1.00 | | | $ | 1.00 | |
| | | | |
| | | | | | | | | | | | | | | | | | | | |
| Total Return4 | | | | | | | | | | | | | | | | | | | | |
Based on net asset value | | | 0.08% | | | | 0.03% | | | | 0.07% | | | | 0.14% | | | | 0.10% | |
| | | | |
| | | | | | | | | | | | | | | | | | | | |
| Ratios to Average Net Assets5,6 | | | | | | | | | | | | | | | | | | | | |
Total expenses | | | 0.22% | | | | 0.22% | | | | 0.22% | | | | 0.22% | | | | 0.22% | |
| | | | |
Total expenses after fees waived and/or reimbursed | | | 0.20% | | | | 0.20% | | | | 0.20% | | | | 0.20% | | | | 0.20% | |
| | | | |
Net investment income | | | 0.07% | | | | 0.03% | | | | 0.06% | | | | 0.14% | | | | 0.09% | |
| | | | |
| | | | | | | | | | | | | | | | | | | | |
| Supplemental Data | | | | | | | | | | | | | | | | | | | | |
Net assets, end of year (000) | | $ | 5 | | | $ | 109 | | | $ | 4,324 | | | $ | 11,459 | | | $ | 44,788 | |
| | | | |
| | 1 | | Amount is less than $0.00005 per share. |
| | 2 | | Distributions for annual periods determined in accordance with federal income tax regulations. |
| | 3 | | Amount is greater than $(0.00005) per share. |
| | 4 | | Where applicable, assumes the reinvestment of distributions. |
| | 5 | | Includes the Fund’s share of the Master Portfolio’s allocated net expenses and/or net investment income. |
| | 6 | | Includes the Fund’s share of the Master Portfolio’s allocated fees waived of 0.03%. |
| | | | | | |
| See Notes to Financial Statements. | | | | |
| | | | | | | |
| 14 | | BLACKROCK FUNDS III | | DECEMBER 31, 2015 | | |
| | |
| Financial Highlights (continued) | | BlackRock Cash Funds: Institutional |
| | | | | | | | | | | | | | | | | | | | |
| | | SL Agency | |
| | | Year Ended December 31, | |
| | | 2015 | | | 2014 | | | 2013 | | | 2012 | | | 2011 | |
| | | | | | | | | | | | | | | | | | | | |
| Per Share Operating Performance | | | | | | | | | | | | | | | | | | | | |
Net asset value, beginning of year | | $ | 1.00 | | | $ | 1.00 | | | $ | 1.00 | | | $ | 1.00 | | | $ | 1.00 | |
| | | | |
Net investment income | | | 0.0019 | | | | 0.0013 | | | | 0.0018 | | | | 0.0025 | | | | 0.0021 | |
Net realized and unrealized gain | | | 0.0000 | 1 | | | 0.0001 | | | | 0.0000 | 1 | | | — | | | | — | |
| | | | |
Net increase from investment operations | | | 0.0019 | | | | 0.0014 | | | | 0.0018 | | | | 0.0025 | | | | 0.0021 | |
| | | | |
| Distributions from:2 | | | | | | | | | | | | | | | | | | | | |
Net investment income | | | (0.0019 | ) | | | (0.0013 | ) | | | (0.0018 | ) | | | (0.0025 | ) | | | (0.0021 | ) |
Net realized gain | | | (0.0000 | )3 | | | (0.0001 | ) | | | (0.0000 | )3 | | | — | | | | — | |
| | | | |
Total distributions | | | (0.0019 | ) | | | (0.0014 | ) | | | (0.0018 | ) | | | (0.0025 | ) | | | (0.0021 | ) |
| | | | |
Net asset value, end of year | | $ | 1.00 | | | $ | 1.00 | | | $ | 1.00 | | | $ | 1.00 | | | $ | 1.00 | |
| | | | |
| | | | | | | | | | | | | | | | | | | | |
| Total Return4 | | | | | | | | | | | | | | | | | | | | |
Based on net asset value | | | 0.19% | | | | 0.14% | | | | 0.18% | | | | 0.25% | | | | 0.21% | |
| | | | |
| | | | | | | | | | | | | | | | | | | | |
| Ratios to Average Net Assets5,6 | | | | | | | | | | | | | | | | | | | | |
Total expenses | | | 0.09% | | | | 0.09% | | | | 0.09% | | | | 0.09% | | | | 0.09% | |
| | | | |
Total expenses after fees waived and/or reimbursed | | | 0.09% | | | | 0.09% | | | | 0.09% | | | | 0.09% | | | | 0.09% | |
| | | | |
Net investment income | | | 0.19% | | | | 0.14% | | | | 0.17% | | | | 0.25% | | | | 0.20% | |
| | | | |
| | | | | | | | | | | | | | | | | | | | |
| Supplemental Data | | | | | | | | | | | | | | | | | | | | |
Net assets, end of year (000) | | $ | 40,443,595 | | | $ | 37,748,773 | | | $ | 37,867,084 | | | $ | 33,350,562 | | | $ | 26,815,279 | |
| | | | |
| | 1 | | Amount is less than $0.00005 per share. |
| | 2 | | Distributions for annual periods determined in accordance with federal income tax regulations. |
| | 3 | | Amount is greater than $(0.00005) per share. |
| | 4 | | Where applicable, assumes the reinvestment of distributions. |
| | 5 | | Includes the Fund’s share of the Master Portfolio’s allocated net expenses and/or net investment income. |
| | 6 | | Includes the Fund’s share of the Master Portfolio’s allocated fees waived of 0.03%. |
| | | | | | |
| See Notes to Financial Statements. | | | | |
| | | | | | | |
| | BLACKROCK FUNDS III | | DECEMBER 31, 2015 | | 15 |
| | |
| Financial Highlights (concluded) | | BlackRock Cash Funds: Institutional |
| | | | | | | | | | | | | | | | |
| | | Trust | |
| | | Period
January 1, 2014
to November 10,
20141 | | | Year Ended December 31 | |
| | | | 2013 | | | 2012 | | | 2011 | |
| | | | | | | | | | | | | | | | |
| Per Share Operating Performance | | | | | | | | | | | | | | | | |
Net asset value, beginning of period | | $ | 1.00 | | | $ | 1.00 | | | $ | 1.00 | | | $ | 1.00 | |
| | | | |
Net investment income | | | 0.0000 | 2 | | | 0.0001 | | | | 0.0000 | 2 | | | 0.0001 | |
Net realized gain | | | 0.0000 | 2 | | | 0.0000 | 2 | | | — | | | | — | |
| | | | |
Net increase from investment operations | | | 0.0000 | | | | 0.0001 | | | | 0.0000 | | | | 0.0001 | |
| | | | |
| Distributions from:3 | | | | | | | | | | | | | | | | |
Net investment income | | | (0.0000 | )4 | | | (0.0001 | ) | | | (0.0000 | )4 | | | (0.0001 | ) |
Net realized gain | | | (0.0000 | )4 | | | (0.0000 | )4 | | | — | | | | — | |
| | | | |
Total distributions | | | (0.0000 | ) | | | (0.0001 | ) | | | (0.0000 | ) | | | (0.0001 | ) |
| | | | |
Net asset value, end of period | | $ | 1.00 | | | $ | 1.00 | | | $ | 1.00 | | | $ | 1.00 | |
| | | | |
| | | | | | | | | | | | | | | | |
| Total Return5 | | | | | | | | | | | | | | | | |
Based on net asset value | | | 0.00% | 6 | | | 0.01% | | | | —% | | | | 0.01% | |
| | | | |
| | | | | | | | | | | | | | | | |
| Ratios to Average Net Assets7 | | | | | | | | | | | | | | | | |
Total expenses | | | 0.45% | 8.9 | | | 0.45% | 9 | | | 0.45% | 9 | | | 0.45% | 9 |
| | | | |
Total expenses after fees waived and/or reimbursed | | | 0.22% | 8,9 | | | 0.28% | 9 | | | 0.34% | 9 | | | 0.29% | 9 |
| | | | |
Net investment income | | | 0.00% | 8,9 | | | 0.00% | 9 | | | 0.00% | 9 | | | 0.00% | 9 |
| | | | |
| | | | | | | | | | | | | | | | |
| Supplemental Data | | | | | | | | | | | | | | | | |
Net assets, end of period (000) | | | — | 1 | | $ | 547 | | | $ | 8,215 | | | $ | 10,640 | |
| | | | |
| | 1 | | There were no Trust Shares outstanding from November 11, 2014 through December 31, 2014 and the year ended December 31, 2015. |
| | 2 | | Amount is less than $0.00005 per share. |
| | 3 | | Distributions for annual periods determined in accordance with federal income tax regulations. |
| | 4 | | Amount is greater than $(0.00005) per share. |
| | 5 | | Where applicable, assumes the reinvestment of distributions. |
| | 6 | | Aggregate total return. |
| | 7 | | Includes the Fund’s share of the Master Portfolio’s allocated net expenses and/or net investment income. |
| | 9 | | Includes the Fund’s share of the Master Portfolio’s allocated fees waived of 0.03%. |
| | | | | | |
| See Notes to Financial Statements. | | | | |
| | | | | | | |
| 16 | | BLACKROCK FUNDS III | | DECEMBER 31, 2015 | | |
| | |
| Financial Highlights | | BlackRock Cash Funds: Prime |
| | | | | | | | | | | | | | | | | | | | |
| | | Capital | |
| | | Year Ended December 31, | |
| | | 2015 | | | 2014 | | | 2013 | | | 2012 | | | 2011 | |
| | | | | | | | | | | | | | | | | | | | |
| Per Share Operating Performance | | | | | | | | | | | | | | | | | | | | |
Net asset value, beginning of year | | $ | 1.00 | | | $ | 1.00 | | | $ | 1.00 | | | $ | 1.00 | | | $ | 1.00 | |
| | | | |
Net investment income | | | 0.0013 | | | | 0.0007 | | | | 0.0011 | | | | 0.0018 | | | | 0.0014 | |
Net realized gain | | | 0.0000 | 1 | | | 0.0000 | 1 | | | 0.0000 | 1 | | | — | | | | — | |
| | | | |
Net increase from investment operations | | | 0.0013 | | | | 0.0007 | | | | 0.0011 | | | | 0.0018 | | | | 0.0014 | |
| | | | |
| Distributions from:2 | | | | | | | | | | | | | | | | | | | | |
Net investment income | | | (0.0013 | ) | | | (0.0007 | ) | | | (0.0011 | ) | | | (0.0018 | ) | | | (0.0014 | ) |
Net realized gain | | | (0.0000 | )3 | | | (0.0000 | )3 | | | (0.0000 | )3 | | | — | | | | — | |
| | | | |
Total distributions | | | (0.0013 | ) | | | (0.0007 | ) | | | (0.0011 | ) | | | (0.0018 | ) | | | (0.0014 | ) |
| | | | |
Net asset value, end of year | | $ | 1.00 | | | $ | 1.00 | | | $ | 1.00 | | | $ | 1.00 | | | $ | 1.00 | |
| | | | |
| | | | | | | | | | | | | | | | | | | | |
| Total Return4 | | | | | | | | | | | | | | | | | | | | |
Based on net asset value | | | 0.13% | | | | 0.07% | | | | 0.11% | | | | 0.18% | | | | 0.14% | |
| | | | |
| | | | | | | | | | | | | | | | | | | | |
| Ratios to Average Net Assets5 | | | | | | | | | | | | | | | | | | | | |
Total expenses | | | 0.14% | 6 | | | 0.14% | 6 | | | 0.14% | 6 | | | 0.14% | 6 | | | 0.14% | 6 |
| | | | |
Total expenses after fees waived and/or reimbursed | | | 0.14% | 6 | | | 0.14% | 6 | | | 0.14% | 6 | | | 0.14% | 6 | | | 0.14% | 6 |
| | | | |
Net investment income | | | 0.13% | 6 | | | 0.07% | 6 | | | 0.10% | 6 | | | 0.18% | 6 | | | 0.15% | 6 |
| | | | |
| | | | | | | | | | | | | | | | | | | | |
| Supplemental Data | | | | | | | | | | | | | | | | | | | | |
Net assets, end of year (000) | | $ | 2,125,858 | | | $ | 1,747,725 | | | $ | 1,472,926 | | | $ | 1,394,794 | | | $ | 456,657 | |
| | | | |
| | 1 | | Amount is less than $0.00005 per share. |
| | 2 | | Distributions for annual periods determined in accordance with federal income tax regulations. |
| | 3 | | Amount is greater than $(0.00005) per share. |
| | 4 | | Where applicable, assumes the reinvestment of distributions. |
| | 5 | | Includes the Fund’s share of the Master Portfolio’s allocated net expenses and/or net investment income. |
| | 6 | | Includes the Fund’s share of the Master Portfolio’s allocated fees waived of 0.03%. |
| | | | | | |
| See Notes to Financial Statements. | | | | |
| | | | | | | |
| | BLACKROCK FUNDS III | | DECEMBER 31, 2015 | | 17 |
| | |
| Financial Highlights (continued) | | BlackRock Cash Funds: Prime |
| | | | | | | | | | | | | | | | | | | | |
| | | Institutional | |
| | | Year Ended December 31, | |
| | | 2015 | | | 2014 | | | 2013 | | | 2012 | | | 2011 | |
| | | | | | | | | | | | | | | | | | | | |
| Per Share Operating Performance | | | | | | | | | | | | | | | | | | | | |
Net asset value, beginning of year | | $ | 1.00 | | | $ | 1.00 | | | $ | 1.00 | | | $ | 1.00 | | | $ | 1.00 | |
| | | | |
Net investment income | | | 0.0015 | | | | 0.0009 | | | | 0.0013 | | | | 0.0020 | | | | 0.0016 | |
Net realized gain | | | 0.0000 | 1 | | | 0.0000 | 1 | | | 0.0000 | 1 | | | — | | | | — | |
| | | | |
Net increase from investment operations | | | 0.0015 | | | | 0.0009 | | | | 0.0013 | | | | 0.0020 | | | | 0.0016 | |
| | | | |
| Distributions from:2 | | | | | | | | | | | | | | | | | | | | |
Net investment income | | | (0.0015 | ) | | | (0.0009 | ) | | | (0.0013 | ) | | | (0.0020 | ) | | | (0.0016 | ) |
Net realized gain | | | (0.0000 | )3 | | | (0.0000 | )3 | | | (0.0000 | )3 | | | — | | | | — | |
| | | | |
Total distributions | | | (0.0015 | ) | | | (0.0009 | ) | | | (0.0013 | ) | | | (0.0020 | ) | | | (0.0016 | ) |
| | | | |
Net asset value, end of year | | $ | 1.00 | | | $ | 1.00 | | | $ | 1.00 | | | $ | 1.00 | | | $ | 1.00 | |
| | | | |
| | | | | | | | | | | | | | | | | | | | |
| Total Return4 | | | | | | | | | | | | | | | | | | | | |
Based on net asset value | | | 0.15% | | | | 0.09% | | | | 0.13% | | | | 0.20% | | | | 0.16% | |
| | | | |
| | | | | | | | | | | | | | | | | | | | |
| Ratios to Average Net Assets5 | | | | | | | | | | | | | | | | | | | | |
Total expenses | | | 0.12% | 6 | | | 0.12% | 6 | | | 0.12% | 6 | | | 0.12% | 6 | | | 0.12% | 6 |
| | | | |
Total expenses after fees waived and/or reimbursed | | | 0.12% | 6 | | | 0.12% | 6 | | | 0.12% | 6 | | | 0.12% | 6 | | | 0.12% | 6 |
| | | | |
Net investment income | | | 0.15% | 6 | | | 0.09% | 6 | | | 0.12% | 6 | | | 0.20% | 6 | | | 0.16% | 6 |
| | | | |
| | | | | | | | | | | | | | | | | | | | |
| Supplemental Data | | | | | | | | | | | | | | | | | | | | |
Net assets, end of year (000) | | $ | 13,516,545 | | | $ | 9,074,064 | | | $ | 5,269,961 | | | $ | 3,236,082 | | | $ | 2,282,923 | |
| | | | |
| | 1 | | Amount is less than $0.00005 per share. |
| | 2 | | Distributions for annual periods determined in accordance with federal income tax regulations. |
| | 3 | | Amount is greater than $(0.00005) per share. |
| | 4 | | Where applicable, assumes the reinvestment of distributions. |
| | 5 | | Includes the Fund’s share of the Master Portfolio’s allocated net expenses and/or net investment income. |
| | 6 | | Includes the Fund’s share of the Master Portfolio’s allocated fees waived of 0.03%. |
| | | | | | |
| See Notes to Financial Statements. | | | | |
| | | | | | | |
| 18 | | BLACKROCK FUNDS III | | DECEMBER 31, 2015 | | |
| | |
| Financial Highlights (continued) | | BlackRock Cash Funds: Prime |
| | | | | | | | | | | | | | | | | | | | |
| | | Premium | |
| | | Year Ended December 31, | |
| | | 2015 | | | 2014 | | | 2013 | | | 2012 | | | 2011 | |
| | | | | | | | | | | | | | | | | | | | |
| Per Share Operating Performance | | | | | | | | | | | | | | | | | | | | |
Net asset value, beginning of year | | $ | 1.00 | | | $ | 1.00 | | | $ | 1.00 | | | $ | 1.00 | | | $ | 1.00 | |
| | | | |
Net investment income | | | 0.0010 | | | | 0.0004 | | | | 0.0008 | | | | 0.0015 | | | | 0.0011 | |
Net realized gain | | | 0.0000 | 1 | | | 0.0000 | 1 | | | 0.0000 | 1 | | | — | | | | — | |
| | | | |
Net increase from investment operations | | | 0.0010 | | | | 0.0004 | | | | 0.0008 | | | | 0.0015 | | | | 0.0011 | |
| | | | |
| Distributions from:2 | | | | | | | | | | | | | | | | | | | | |
Net investment income | | | (0.0010 | ) | | | (0.0004 | ) | | | (0.0008 | ) | | | (0.0015 | ) | | | (0.0011 | ) |
Net realized gain | | | (0.0000 | )3 | | | (0.0000 | )3 | | | (0.0000 | )3 | | | — | | | | — | |
| | | | |
Total distributions | | | (0.0010 | ) | | | (0.0004 | ) | | | (0.0008 | ) | | | (0.0015 | ) | | | (0.0011 | ) |
| | | | |
Net asset value, end of year | | $ | 1.00 | | | $ | 1.00 | | | $ | 1.00 | | | $ | 1.00 | | | $ | 1.00 | |
| | | | |
| | | | | | | | | | | | | | | | | | | | |
| Total Return4 | | | | | | | | | | | | | | | | | | | | |
Based on net asset value | | | 0.10% | | | | 0.04% | | | | 0.08% | | | | 0.15% | | | | 0.11% | |
| | | | |
| | | | | | | | | | | | | | | | | | | | |
| Ratios to Average Net Assets5 | | | | | | | | | | | | | | | | | | | | |
Total expenses | | | 0.17% | 6 | | | 0.17% | 6 | | | 0.17% | 6 | | | 0.17% | 6 | | | 0.17% | 6 |
| | | | |
Total expenses after fees waived and/or reimbursed | | | 0.17% | 6 | | | 0.17% | 6 | | | 0.17% | 6 | | | 0.17% | 6 | | | 0.17% | 6 |
| | | | |
Net investment income | | | 0.10% | 6 | | | 0.04% | 6 | | | 0.07% | 6 | | | 0.16% | 6 | | | 0.11% | 6 |
| | | | |
| | | | | | | | | | | | | | | | | | | | |
| Supplemental Data | | | | | | | | | | | | | | | | | | | | |
Net assets, end of year (000) | | $ | 1,132,614 | | | $ | 1,254,768 | | | $ | 4,669,369 | | | $ | 3,481,506 | | | $ | 1,460,178 | |
| | | | |
| | 1 | | Amount is less than $0.00005 per share. |
| | 2 | | Distributions for annual periods determined in accordance with federal income tax regulations. |
| | 3 | | Amount is greater than $(0.00005) per share. |
| | 4 | | Where applicable, assumes the reinvestment of distributions. |
| | 5 | | Includes the Fund’s share of the Master Portfolio’s allocated net expenses and/or net investment income. |
| | 6 | | Includes the Fund’s share of the Master Portfolio’s allocated fees waived of 0.03%. |
| | | | | | |
| See Notes to Financial Statements. | | | | |
| | | | | | | |
| | BLACKROCK FUNDS III | | DECEMBER 31, 2015 | | 19 |
| | |
| Financial Highlights (continued) | | BlackRock Cash Funds: Prime |
| | | | | | | | | | | | | | | | | | | | |
| | | Select | |
| | | Period January 1, 2015 to December 31,
20151 | | | Period January 1, 2014 to December 21,
20142 | | | Year Ended December 31, | |
| | | | | 2013 | | | 2012 | | | 2011 | |
| | | | | | | | | | | | | | | | | | | | |
| Per Share Operating Performance | | | | | | | | | | | | | | | | | | | | |
Net asset value, beginning of period | | $ | 1.00 | | | $ | 1.00 | | | $ | 1.00 | | | $ | 1.00 | | | $ | 1.00 | |
| | | | |
Net investment income | | | 0.0000 | 3 | | | 0.0000 | 3 | | | 0.0005 | | | | 0.0012 | | | | 0.0008 | |
Net realized gain | | | 0.0000 | 3 | | | 0.0000 | 3 | | | 0.0000 | 3 | | | — | | | | — | |
| | | | |
Net increase from investment operations | | | 0.0000 | | | | 0.0000 | | | | 0.0005 | | | | 0.0012 | | | | 0.0008 | |
| | | | |
| Distributions from:4 | | | | | | | | | | | | | | | | | | | | |
Net investment income | | | (0.0000 | )5 | | | (0.0000 | )5 | | | (0.0005 | ) | | | (0.0012 | ) | | | (0.0008 | ) |
Net realized gain | | | — | | | | (0.0000 | )5 | | | (0.0000 | )5 | | | — | | | | — | |
| | | | |
Total distributions | | | (0.0000 | ) | | | (0.0000 | ) | | | (0.0005 | ) | | | (0.0012 | ) | | | (0.0008 | ) |
| | | | |
Net asset value, end of period | | $ | 1.00 | | | $ | 1.00 | | | $ | 1.00 | | | $ | 1.00 | | | $ | 1.00 | |
| | | | |
| | | | | | | | | | | | | | | | | | | | |
| Total Return6 | | | | | | | | | | | | | | | | | | | | |
Based on net asset value | | | 0.00%7 | | | | 0.00% | 7 | | | 0.05% | | | | 0.12% | | | | 0.09% | |
| | | | |
| | | | | | | | | | | | | | | | | | | | |
| Ratios to Average Net Assets8 | | | | | | | | | | | | | | | | | | | | |
Total expenses | | | 0.22% | 9,10 | | | 0.22% | 9,10 | | | 0.22% | 9 | | | 0.22% | 9 | | | 0.22% | 9 |
| | | | |
Total expenses after fees waived and/or reimbursed | | | 0.20% | 9,10 | | | 0.20% | 9,10 | | | 0.20% | 9 | | | 0.20% | 9 | | | 0.20% | 9 |
| | | | |
Net investment income | | | 0.08% | 9,10 | | | 0.00% | 9,10 | | | 0.04% | 9 | | | 0.12% | 9 | | | 0.08% | 9 |
| | | | |
| | | | | | | | | | | | | | | | | | | | |
| Supplemental Data | | | | | | | | | | | | | | | | | | | | |
Net assets, end of period (000) | | | — | 1 | | | — | 2 | | $ | 90 | | | $ | 10,454 | | | $ | 69,779 | |
| | | | |
| | 1 | | There were no Select Shares outstanding from January 1, 2015 through January 19, 2015, January 21, 2015 through February 17, 2015, February 20, 2015 through March 17, 2015, March 20, 2015 through April 19, 2015, April 22, 2015 through May 17, 2015, May 20, 2015 through June 18, 2015 and June 22, 2015 through December 31, 2015. |
| | 2 | | There were no Select Shares outstanding from November 11, 2014 through November 17, 2014, November 18, 2014 through December 18, 2014, December 22, 2014 through December 31, 2014 |
| | 3 | | Amount is less than $0.00005 per share. |
| | 4 | | Distributions for annual periods determined in accordance with federal income tax regulations. |
| | 5 | | Amount is greater than $(0.00005) per share. |
| | 6 | | Where applicable, assumes the reinvestment of distributions. |
| | 7 | | Aggregate total return. |
| | 8 | | Includes the Fund’s share of the Master Portfolio’s allocated net expenses and/or net investment income. |
| | 9 | | Includes the Fund’s share of the Master Portfolio’s annualized allocated fees waived of 0.03%. |
| | | | | | |
| See Notes to Financial Statements. | | | | |
| | | | | | | |
| 20 | | BLACKROCK FUNDS III | | DECEMBER 31, 2015 | | |
| | |
| Financial Highlights (continued) | | BlackRock Cash Funds: Prime |
| | | | | | | | | | | | | | | | | | | | |
| | | SL Agency | |
| | | Year Ended December 31, | |
| | | 2015 | | | 2014 | | | 2013 | | | 2012 | | | 2011 | |
| | | | | | | | | | | | | | | | | | | | |
| Per Share Operating Performance | | | | | | | | | | | | | | | | | | | | |
Net asset value, beginning of year | | $ | 1.00 | | | $ | 1.00 | | | $ | 1.00 | | | $ | 1.00 | | | $ | 1.00 | |
| | | | |
Net investment income | | | 0.0018 | | | | 0.0012 | | | | 0.0016 | | | | 0.0023 | | | | 0.0019 | |
Net realized gain | | | 0.0000 | 1 | | | 0.0000 | 1 | | | 0.0000 | 1 | | | — | | | | — | |
| | | | |
Net increase from investment operations | | | 0.0018 | | | | 0.0012 | | | | 0.0016 | | | | 0.0023 | | | | 0.0019 | |
| | | | |
| Distributions from:2 | | | | | | | | | | | | | | | | | | | | |
Net investment income | | | (0.0018 | ) | | | (0.0012 | ) | | | (0.0016 | ) | | | (0.0023 | ) | | | (0.0019 | ) |
Net realized gain | | | (0.0000 | )3 | | | (0.0000 | )3 | | | (0.0000 | )3 | | | — | | | | — | |
| | | | |
Total distributions | | | (0.0018 | ) | | | (0.0012 | ) | | | (0.0016 | ) | | | (0.0023 | ) | | | (0.0019 | ) |
| | | | |
Net asset value, end of year | | $ | 1.00 | | | $ | 1.00 | | | $ | 1.00 | | | $ | 1.00 | | | $ | 1.00 | |
| | | | |
| | | | | | | | | | | | | | | | | | | | |
| Total Return4 | | | | | | | | | | | | | | | | | | | | |
Based on net asset value | | | 0.18% | | | | 0.12% | | | | 0.16% | | | | 0.23% | | | | 0.19% | |
| | | | |
| | | | | | | | | | | | | | | | | | | | |
| Ratios to Average Net Assets5 | | | | | | | | | | | | | | | | | | | | |
Total expenses | | | 0.09% | 6 | | | 0.09% | 6 | | | 0.09% | 6 | | | 0.09% | 6 | | | 0.09% | 6 |
| | | | |
Total expenses after fees waived | | | 0.09% | 6 | | | 0.09% | 6 | | | 0.09% | 6 | | | 0.09% | 6 | | | 0.09% | 6 |
| | | | |
Net investment income | | | 0.18% | 6 | | | 0.12% | 6 | | | 0.15% | 6 | | | 0.23% | 6 | | | 0.19% | 6 |
| | | | |
| | | | | | | | | | | | | | | | | | | | |
| Supplemental Data | | | | | | | | | | | | | | | | | | | | |
Net assets, end of year (000) | | $ | 8,675,863 | | | $ | 10,615,765 | | | $ | 5,689,192 | | | $ | 5,877,464 | | | $ | 4,830,517 | |
| | | | |
| | 1 | | Amount is less than $0.00005 per share. |
| | 2 | | Distributions for annual periods determined in accordance with federal income tax regulations. |
| | 3 | | Amount is greater than $(0.00005) per share. |
| | 4 | | Where applicable, assumes the reinvestment of distributions. |
| | 5 | | Includes the Fund’s share of the Master Portfolio’s allocated net expenses and/or net investment income. |
| | 6 | | Includes the Fund’s share of the Master Portfolio’s allocated fees waived of 0.03%. |
| | | | | | |
| See Notes to Financial Statements. | | | | |
| | | | | | | |
| | BLACKROCK FUNDS III | | DECEMBER 31, 2015 | | 21 |
| | |
| Financial Highlights (concluded) | | BlackRock Cash Funds: Prime |
| | | | | | | | | | | | | | | | |
| | | Trust | |
| | | Period January 1, 2014 to November 10,
20141 | | | Year Ended December 31, | |
| | | | 2013 | | | 2012 | | | 2011 | |
| | | | | | | | | | | | | | | | |
| Per Share Operating Performance | | | | | | | | | | | | | | | | |
Net asset value, beginning of period | | $ | 1.00 | | | $ | 1.00 | | | $ | 1.00 | | | $ | 1.00 | |
| | | | |
Net investment income | | | 0.0000 | 2 | | | 0.0001 | | | | 0.0000 | 2 | | | 0.0000 | 2 |
Net realized gain | | | 0.0000 | 2 | | | 0.0000 | 2 | | | — | | | | — | |
| | | | |
Net increase from investment operations | | | 0.0000 | | | | 0.0001 | | | | 0.0000 | | | | 0.0000 | |
| | | | |
| Distributions from:3 | | | | | | | | | | | | | | | | |
Net investment income | | | (0.0000 | )4 | | | (0.0001 | ) | | | (0.0000 | )4 | | | (0.0000 | )4 |
Net realized gain | | | (0.0000 | )4 | | | (0.0000 | )4 | | | — | | | | — | |
| | | | |
Total distributions | | | (0.0000 | ) | | | (0.0001 | ) | | | (0.0000 | ) | | | (0.0000 | ) |
| | | | |
Net asset value, end of period | | $ | 1.00 | | | $ | 1.00 | | | $ | 1.00 | | | $ | 1.00 | |
| | | | |
| | | | | | | | | | | | | | | | |
| Total Return5 | | | | | | | | | | | | | | | | |
Based on net asset value | | | 0.00% | 6 | | | 0.01% | | | | 0.00% | | | | 0.00% | |
| | | | |
| | | | | | | | | | | | | | | | |
| Ratios to Average Net Assets7 | | | | | | | | | | | | | | | | |
Total expenses | | | 0.45% | 8,9 | | | 0.45% | 9 | | | 0.45% | 9 | | | 0.45% | 9 |
| | | | |
Total expenses after fees waived and/or reimbursed | | | 0.20% | 8,9 | | | 0.24% | 9 | | | 0.32% | 9 | | | 0.28% | 9 |
| | | | |
Net investment income | | | 0.00% | 8,9 | | | 0.00% | 9 | | | 0.00% | 9 | | | 0.01% | 9 |
| | | | |
| | | | | | | | | | | | | | | | |
| Supplemental Data | | | | | | | | | | | | | | | | |
Net assets, end of period (000) | | | — | 1 | | $ | 8,086 | | | $ | 21,702 | | | $ | 29,657 | |
| | | | |
| | 1 | | There were no Trust Shares outstanding from November 11, 2014 through December 31, 2014 and the year ended December 31, 2015. |
| | 2 | | Amount is less than $0.00005 per share. |
| | 3 | | Distributions for annual periods determined in accordance with federal income tax regulations. |
| | 4 | | Amount is greater than $(0.00005) per share. |
| | 5 | | Where applicable, assumes the reinvestment of distributions. |
| | 6 | | Aggregate total return. |
| | 7 | | Includes the Fund’s share of the Master Portfolio’s allocated net expenses and/or net investment income. |
| | 9 | | Includes the Fund’s share of the Master Portfolio’s annualized allocated fees waived of 0.03%. |
| | | | | | |
| See Notes to Financial Statements. | | | | |
| | | | | | | |
| 22 | | BLACKROCK FUNDS III | | DECEMBER 31, 2015 | | |
| | |
| Financial Highlights | | BlackRock Cash Funds: Treasury |
| | | | | | | | | | | | | | | | |
| | | Capital | |
| | | Period
January 1, 2014
to November 10, 20141 | | | Year Ended December 31, | |
| | | | 2013 | | | 2012 | | | 2011 | |
| | | | | | | | | | | | | | | | |
| Per Share Operating Performance | | | | | | | | | | | | | | | | |
Net asset value, beginning of period | | $ | 1.00 | | | $ | 1.00 | | | $ | 1.00 | | | $ | 1.00 | |
| | | | |
Net investment income | | | — | | | | 0.0001 | | | | 0.0002 | | | | 0.0004 | |
Net realized gain | | | 0.0000 | 2 | | | 0.0000 | 2 | | | — | | | | — | |
| | | | |
Net increase from investment operations | | | 0.0000 | | | | 0.0001 | | | | 0.0002 | | | | 0.0004 | |
| | | | |
| Distributions from:3 | | | | | | | | | | | | | | | | |
Net investment income | | | — | | | | (0.0001 | ) | | | (0.0002 | ) | | | (0.0004 | ) |
Net realized gain | | | (0.0000 | )4 | | | (0.0000 | )4 | | | — | | | | — | |
| | | | |
Total distributions | | | (0.0000 | ) | | | (0.0001 | ) | | | (0.0002 | ) | | | (0.0004 | ) |
| | | | |
Net asset value, end of period | | $ | 1.00 | | | $ | 1.00 | | | $ | 1.00 | | | $ | 1.00 | |
| | | | |
| | | | | | | | | | | | | | | | |
| Total Return5 | | | | | | | | | | | | | | | | |
Based on net asset value | | | 0.00% | 6 | | | 0.01% | | | | 0.02% | | | | 0.04% | |
| | | | |
| | | | | | | | | | | | | | | | |
| Ratios to Average Net Assets7 | | | | | | | | | | | | | | | | |
Total expenses | | | 0.13% | 8,9 | | | 0.14% | 10 | | | 0.14% | 10 | | | 0.14% | 9 |
| | | | |
Total expenses after fees waived and/or reimbursed | | | 0.06% | 8,9 | | | 0.12% | 10 | | | 0.13% | 10 | | | 0.10% | 9 |
| | | | |
Net investment income | | | 0.00% | 8,9 | | | 0.00% | 10 | | | 0.02% | 10 | | | 0.01% | 9 |
| | | | |
| | | | | | | | | | | | | | | | |
| Supplemental Data | | | | | | | | | | | | | | | | |
Net assets, end of period (000) | | | — | 1 | | $ | 715 | | | $ | 273,121 | | | $ | 18,370 | |
| | | | |
| | 1 | | There were no Capital shares outstanding from November 11, 2014 through December 31, 2014 and the year ended December 31, 2015. |
| | 2 | | Amount is less than $0.00005 per share. |
| | 3 | | Distributions for annual periods determined in accordance with federal income tax regulations. |
| | 4 | | Amount is greater than $(0.00005) per share. |
| | 5 | | Where applicable, assumes the reinvestment of distributions. |
| | 6 | | Aggregate total return. |
| | 7 | | Includes the Fund’s share of the Master Portfolio’s allocated net expenses and/or net investment income. |
| | 9 | | Includes the Fund’s share of the Master’s Portfolio allocated fees waived of 0.04%. |
| | 10 | | Includes the Fund’s share of the Master’s Portfolio allocated fees waived of 0.03%. |
| | | | | | |
| See Notes to Financial Statements. | | | | |
| | | | | | | |
| | BLACKROCK FUNDS III | | DECEMBER 31, 2015 | | 23 |
| | |
| Financial Highlights (continued) | | BlackRock Cash Funds: Treasury |
| | | | | | | | | | | | | | | | | | | | |
| | | Institutional | |
| | | Period
January 1, 2015
to December 31
20151 | | | Year Ended December 31, | |
| | | | 2014 | | | 2013 | | | 2012 | | | 2011 | |
| | | | | | | | | | | | | | | | | | | | |
| Per Share Operating Performance | | | | | | | | | | | | | | | | | | | | |
Net asset value, beginning of period | | $ | 1.00 | | | $ | 1.00 | | | $ | 1.00 | | | $ | 1.00 | | | $ | 1.00 | |
| | | | |
Net investment income | | | 0.0000 | 2 | | | — | | | | 0.0001 | | | | 0.0002 | | | | 0.0004 | |
Net realized gain | | | 0.0000 | 2 | | | 0.0000 | 1 | | | 0.0000 | 1 | | | — | | | | — | |
| | | | |
Net increase from investment operations | | | 0.0000 | | | | 0.0000 | | | | 0.0000 | 1 | | | 0.0002 | | | | 0.0004 | |
| | | | |
| Distributions from:3 | | | | | | | | | | | | | | | | | | | | |
Net investment income | | | (0.0000 | )4 | | | — | | | | (0.0001 | ) | | | (0.0002 | ) | | | (0.0004 | ) |
Net realized gain. | | | (0.0000 | )4 | | | (0.0000 | )3 | | | (0.0000 | )3 | | | — | | | | — | |
| | | | |
Total distributions | | | (0.0000 | ) | | | (0.0000 | ) | | | (0.0001 | ) | | | (0.0002 | ) | | | (0.0004 | ) |
| | | | |
Net asset value, end of period | | $ | 1.00 | | | $ | 1.00 | | | $ | 1.00 | | | $ | 1.00 | | | $ | 1.00 | |
| | | | |
| | | | | | | | | | | | | | | | | | | | |
| Total Return5 | | | | | | | | | | | | | | | | | | | | |
Based on net asset value | | | 0.00% | | | | 0.00% | | | | 0.01% | | | | 0.02% | | | | 0.04% | |
| | | | |
| | | | | | | | | | | | | | | | | | | | |
| Ratios to Average Net Assets6 | | | | | | | | | | | | | | | | | | | | |
Total expenses | | | 0.12% | 7 | | | 0.17% | 8 | | | 0.12% | 7 | | | 0.12% | 7 | | | 0.12% | 8 |
| | | | |
Total expenses after fees waived and/or reimbursed | | | 0.11% | 7 | | | 0.06% | 8 | | | 0.10% | 7 | | | 0.11% | 7 | | | 0.11% | 8 |
| | | | |
Net investment income | | | 0.01% | 7 | | | 0.00% | 8 | | | 0.01% | 7 | | | 0.02% | 7 | | | 0.03% | 8 |
| | | | |
| | | | | | | | | | | | | | | | | | | | |
| Supplemental Data | | | | | | | | | | | | | | | | | | | | |
Net assets, end of period (000) | | | — | 1 | | $ | 4 | | | $ | 4 | | | $ | 4 | | | $ | 8,941 | |
| | | | |
| | 1 | | There were no Institutional shares outstanding as of the year ended December 31, 2015. |
| | 2 | | Amount is less than $0.00005 per share. |
| | 3 | | Distributions for annual periods determined in accordance with federal income tax regulations. |
| | 4 | | Amount is greater than $(0.00005) per share. |
| | 5 | | Where applicable, assumes the reinvestment of distributions |
| | 6 | | Includes the Fund’s share of the Master Portfolio’s allocated net expenses and/or net investment income. |
| | 7 | | Includes the Fund’s share of the Master Portfolio’s allocated fees waived of 0.03%. |
| | 8 | | Includes the Fund’s share of the Master Portfolio’s allocated fees waived of 0.04%. |
| | | | | | |
| See Notes to Financial Statements. | | | | |
| | | | | | | |
| 24 | | BLACKROCK FUNDS III | | DECEMBER 31, 2015 | | |
| | |
| Financial Highlights (continued) | | BlackRock Cash Funds: Treasury |
| | | | | | | | |
| | | Premium | |
| | | Period December 20,
20121 | | | Period January 1, 2010
to July 26,
20102 | |
| | | | | | | | |
| Per Share Operating Performance | | | | | | | | |
Net asset value, beginning of period | | $ | 1.00 | | | $ | 1.00 | |
| | | | |
Net investment income | | | 0.0000 | 3 | | | 0.0003 | |
Net realized gain | | | 0.0000 | 3 | | | — | |
| | | | |
Net increase from investment operations | | | 0.0000 | | | | 0.0003 | |
| | | | |
| Distributions from:4 | | | | |
Net investment income | | | (0.0000 | )5 | | | (0.0003 | ) |
Net realized gain | | | (0.0000 | )5 | | | — | |
| | | | |
Total distributions | | | (0.0000 | ) | | | (0.0003 | ) |
| | | | |
Net asset value, end of period | | $ | 1.00 | | | $ | 1.00 | |
| | | | |
| | | | | | | | |
| Total Return6 | | | | | | | | |
Based on net asset value | | | 0.00% | 7 | | | 0.03% | 7 |
| | | | |
| | | | | | | | |
| Ratios to Average Net Assets8 | | | | | | | | |
Total expenses | | | 0.00% | 9,10 | | | 0.20% | 9,10 |
| | | | |
Total expenses after fees waived | | | 0.00% | 9,10 | | | 0.11% | 9,10 |
| | | | |
Net investment income | | | 0.00% | 9,10 | | | 0.05% | 9,10 |
| | | | |
| | | | | | | | |
| Supplemental Data | | | | | | | | |
Net assets, end of period (000) | | | — | 1 | | | — | 2 |
| | | | |
| | 1 | | There were no Premium Shares outstanding during the fiscal years ended December 31, 2012, December 31, 2013, December 31, 2014, and December 31, 2015, except for December 20, 2012. |
| | 2 | | There were no Premium Shares outstanding from July 27, 2010 through December 31, 2010 and during the fiscal year ended December 31, 2011. |
| | 3 | | Amount is less than $0.00005 per share. |
| | 4 | | Distributions for annual periods determined in accordance with federal income tax regulations. |
| | 5 | | Amount is greater than $(0.00005) per share. |
| | 6 | | Where applicable, assumes the reinvestment of distributions. |
| | 7 | | Aggregate total return. |
| | 8 | | Includes the Fund’s share of the Master Portfolio’s allocated net expenses and/or net investment income, except the total expenses for the period ended July 26, 2010, which includes gross expenses. |
| | 9 | | Includes the Fund’s share of the Master Portfolio’s allocated fees waived of 0.03%. |
| | | | | | |
| See Notes to Financial Statements. | | | | |
| | | | | | | |
| | BLACKROCK FUNDS III | | DECEMBER 31, 2015 | | 25 |
| | |
| Financial Highlights (continued) | | BlackRock Cash Funds: Treasury |
| | | | | | | | | | | | | | | | |
| | | Select | |
| | | Period January 1, 2014
to December 22,
20141 | | | Year Ended December 31, | |
| | | | 2013 | | | 2012 | | | 2011 | |
| | | | | | | | | | | | | | | | |
| Per Share Operating Performance | | | | | | | | | | | | | | | | |
Net asset value, beginning of period | | $ | 1.00 | | | $ | 1.00 | | | $ | 1.00 | | | $ | 1.00 | |
| | | | |
Net investment income | | | — | | | | 0.0001 | | | | 0.0000 | 2 | | | 0.0003 | |
Net realized gain | | | 0.0000 | 2 | | | 0.0000 | 2 | | | — | | | | — | |
| | | | |
Net increase from investment operations | | | 0.0000 | | | | 0.0001 | | | | 0.0000 | | | | 0.0003 | |
| | | | |
| Distributions from:3 | | | | | | | | | | | | | | | | |
Net investment income | | | — | | | | (0.0001 | )1 | | | (0.0000 | )4 | | | (0.0003 | ) |
Net realized gain | | | (0.0000 | )4 | | | (0.0000 | )4 | | | — | | | | — | |
| | | | |
Total Distributions | | | (0.0000 | ) | | | (0.0001 | ) | | | (0.0000 | ) | | | (0.0003 | ) |
| | | | |
Net asset value, end of period | | $ | 1.00 | | | $ | 1.00 | | | $ | 1.00 | | | $ | 1.00 | |
| | | | |
| | | | | | | | | | | | | | | | |
| Total Return5 | | | | | | | | | | | | | | | | |
Based on net asset value | | | 0.00% | 6 | | | 0.01% | | | | 0.00% | | | | 0.03% | |
| | | | |
| | | | | | | | | | | | | | | | |
| Ratios to Average Net Assets7 | | | | | | | | | | | | | | | | |
Total expenses | | | 0.21% | 8,9 | | | 0.21% | 9 | | | 0.22% | 10 | | | 0.21% | 9 |
| | | | |
Total expenses after fees waived and/or reimbursed | | | 0.06% | 8,9 | | | 0.09% | 9 | | | 0.15% | 10 | | | 0.08% | 9 |
| | | | |
Net investment income | | | 0.00% | 8,9 | | | 0.00% | 9 | | | 0.00% | 10 | | | 0.00% | 9 |
| | | | |
| | | | | | | | | | | | | | | | |
| Supplemental Data | | | | | | | | | | | | | | | | |
Net assets, end of period (000) | | | — | 1 | | $ | 10,398 | | | $ | 10,543 | | | $ | 13,119 | |
| | | | |
| | 1 | | There were no Select shares outstanding from December 22, 2014 through December 31, 2014, and the year ended December 31, 2015. |
| | 2 | | Amount is less than $0.00005 per share. |
| | 3 | | Distributions for annual periods determined in accordance with federal income tax regulations. |
| | 4 | | Amount is greater than $(0.00005) per share. |
| | 5 | | Where applicable, assumes the reinvestment of distributions. |
| | 6 | | Aggregate total return. |
| | 7 | | Includes the Fund’s share of the Master Portfolio’s allocated net expenses and/or net investment income. |
| | 9 | | Includes the Fund’s share of the Master’s Portfolio allocated fees waived of 0.04%. |
| | 10 | | Includes the Fund’s share of the Master’s Portfolio allocated fees waived of 0.03%. |
| | | | | | |
| See Notes to Financial Statements. | | | | |
| | | | | | | |
| 26 | | BLACKROCK FUNDS III | | DECEMBER 31, 2015 | | |
| | |
| Financial Highlights (continued) | | BlackRock Cash Funds: Treasury |
| | | | | | | | | | | | | | | | | | | | |
| | | SL Agency | |
| | | Year Ended December 31, | |
| | | 2015 | | | 2014 | | | 2013 | | | 2012 | | | 2011 | |
| | | | | | | | | | | | | | | | | | | | |
| Per Share Operating Performance | | | | | | | | | | | | | | | | | | | | |
Net asset value, beginning of year | | $ | 1.00 | | | $ | 1.00 | | | $ | 1.00 | | | $ | 1.00 | | | $ | 1.00 | |
| | | | |
Net investment income | | | 0.0003 | | | | — | | | | 0.0002 | | | | 0.0006 | | | | 0.0005 | |
Net realized gain | | | 0.0000 | 1 | | | 0.0000 | 1 | | | 0.0000 | 1 | | | — | | | | — | |
| | | | |
Net increase from investment operations | | | 0.0003 | | | | 0.0000 | | | | 0.0002 | | | | 0.0006 | | | | 0.0005 | |
| | | | |
| Distributions from:2 | | | | | | | | | | | | | | | | | | | | |
Net investment income | | | (0.0003 | ) | | | — | | | | (0.0002 | ) | | | (0.0006 | ) | | | (0.0005 | ) |
Net realized gain | | | (0.0000 | )3 | | | (0.0000 | )3 | | | (0.0000 | )3 | | | — | | | | — | |
| | | | |
Total distributions | | | (0.0003 | ) | | | (0.0000 | ) | | | (0.0002 | ) | | | (0.0006 | ) | | | (0.0005 | ) |
| | | | |
Net asset value, end of year | | $ | 1.00 | | | $ | 1.00 | | | $ | 1.00 | | | $ | 1.00 | | | $ | 1.00 | |
| | | | |
| | | | | | | | | | | | | | | | | | | | |
| Total Return4 | | | | | | | | | | | | | | | | | | | | |
Based on net asset value | | | 0.03% | | | | 0.00% | | | | 0.02% | | | | 0.06% | | | | 0.05% | |
| | | | |
| | | | | | | | | | | | | | | | | | | | |
| Ratios to Average Net Assets5 | | | | | | | | | | | | | | | | | | | | |
Total expenses | | | 0.09% | 6 | | | 0.08% | 7 | | | 0.08% | 7 | | | 0.09% | 6 | | | 0.09% | 7 |
| | | | |
Total expenses after fees waived and/or reimbursed | | | 0.09% | 6 | | | 0.06% | 7 | | | 0.07% | 7 | | | 0.09% | 6 | | | 0.08% | 7 |
| | | | |
Net investment income | | | 0.03% | 6 | | | 0.00% | 7 | | | 0.01% | 7 | | | 0.06% | 6 | | | 0.03% | 7 |
| | | | |
| | | | | | | | | | | | | | | | | | | | |
| Supplemental Data | | | | | | | | | | | | | | | | | | | | |
Net assets, end of year (000) | | $ | 2,154,574 | | | $ | 2,385,787 | | | $ | 1,548,187 | | | $ | 1,525,904 | | | $ | 682,865 | |
| | | | |
| | 1 | | Amount is less than $0.00005 per share. |
| | 2 | | Distributions for annual periods determined in accordance with federal income tax regulations. |
| | 3 | | Amount is greater than $(0.00005) per share. |
| | 4 | | Where applicable, assumes the reinvestment of distributions. |
| | 5 | | Includes the Fund’s share of the Master Portfolio’s allocated net expenses and/or net investment income. |
| | 6 | | Includes the Fund’s share of the Master Portfolio’s allocated fees waived of 0.03%. |
| | 7 | | Includes the Fund’s share of the Master Portfolio’s allocated fees waived of 0.04%. |
| | | | | | |
| See Notes to Financial Statements. | | | | |
| | | | | | | |
| | BLACKROCK FUNDS III | | DECEMBER 31, 2015 | | 27 |
| | |
| Financial Highlights (concluded) | | BlackRock Cash Funds: Treasury |
| | | | | | | | | | | | | | | | |
| | | Trust | |
| | | Period January 1, 2014 to November 10, 20141 | | | Year Ended December 31, | |
| | | | 2013 | | | 2012 | | | 2011 | |
| | | | | | | | | | | | | | | | |
| Per Share Operating Performance | | | | | | | | | | | | | | | | |
Net asset value, beginning of period | | $ | 1.00 | | | $ | 1.00 | | | $ | 1.00 | | | $ | 1.00 | |
| | | | |
Net investment income | | | — | | | | 0.0001 | | | | 0.0000 | 2 | | | 0.0003 | |
Net realized gain | | | 0.0000 | 2 | | | 0.0000 | 2 | | | — | | | | — | |
| | | | |
Net increase from investment operations | | | 0.0000 | | | | 0.0001 | | | | 0.0000 | | | | 0.0003 | |
| | | | |
| Distributions from:3 | | | | | | | | | | | | | | | | |
Net investment income | | | — | | | | (0.0001 | ) | | | (0.0000 | )4 | | | (0.0003 | ) |
Net realized gain | | | (0.0000 | )4 | | | (0.0000 | )4 | | | — | | | | — | |
| | | | |
Total Distributions | | | (0.0000 | ) | | | (0.0001 | ) | | | (0.0000 | ) | | | (0.0003 | ) |
| | | | |
Net asset value, end of period | | $ | 1.00 | | | $ | 1.00 | | | $ | 1.00 | | | $ | 1.00 | |
| | | | |
| | | | | | | | | | | | | | | | |
| Total Return5 | | | | | | | | | | | | | | | | |
Based on net asset value | | | 0.00% | 6 | | | 0.01% | | | | 0.00% | | | | 0.03% | |
| | | | |
| | | | | | | | | | | | | | | | |
| Ratios to Average Net Assets7 | | | | | | | | | | | | | | | | |
Total expenses | | | 0.44% | 8,9 | | | 0.44% | 9 | | | 0.45% | 10 | | | 0.45% | 9 |
| | | | |
Total expenses after fees waived and/or reimbursed | | | 0.06% | 8,9 | | | 0.09% | 9 | | | 0.15% | 10 | | | 0.10% | 9 |
| | | | |
Net investment income | | | 0.00% | 8,9 | | | 0.00% | 9 | | | 0.00% | 10 | | | 0.00% | 9 |
| | | | |
| | | | | | | | | | | | | | | | |
| Supplemental Data | | | | | | | | | | | | | | | | |
Net assets, end of period (000) | | | — | 1 | | $ | 25,914 | | | $ | 15,407 | | | $ | 23,597 | |
| | | | |
| | 1 | | There were no Trust shares outstanding from November 11, 2014 through December 31, 2014, and the year ended December 31, 2015. |
| | 2 | | Amount is less than $0.00005 per share. |
| | 3 | | Distributions for annual periods determined in accordance with federal income tax regulations. |
| | 4 | | Amount is greater than $(0.00005) per share. |
| | 5 | | Where applicable, assumes the reinvestment of distributions. |
| | 6 | | Aggregate total return. |
| | 7 | | Includes the Fund’s share of the Master Portfolio’s allocated net expenses and/or net investment income. |
| | 9 | | Includes the Fund’s share of the Master’s Portfolio allocated fees waived of 0.04%. |
| | 10 | | Includes the Fund’s share of the Master’s Portfolio allocated fees waived of 0.03%. |
| | | | | | |
| See Notes to Financial Statements. | | | | |
| | | | | | | |
| 28 | | BLACKROCK FUNDS III | | DECEMBER 31, 2015 | | |
| | | | |
| Notes to Financial Statements | | BlackRock Funds III |
1. Organization:
BlackRock Funds III (the “Trust”) is registered under the Investment Company Act of 1940, as amended (the “1940 Act”), as an open-end management investment company. The Trust is organized as a Delaware statutory trust. The following are referred to herein collectively as the “Funds” or individually, a “Fund”:
| | | | |
| Fund Name | | Herein Referred To As | | Diversification Classification |
BlackRock Cash Funds: Institutional | | Institutional | | Diversified |
BlackRock Cash Funds: Prime | | Prime | | Diversified |
| BlackRock Cash Funds: Treasury | | Treasury | | Diversified |
Each Fund seeks to achieve its investment objective by investing all of its assets in a corresponding series of the Master Investment Portfolio (“MIP”): Money Market Master Portfolio, Prime Money Market Master Portfolio and Treasury Money Market Master Portfolio (each, a “Master Portfolio”) and together (the “Master Portfolios”). MIP is an affiliate of the Trust. Each Master Portfolio has the same investment objective and strategies as its corresponding Fund. The value of each Fund’s investment in the its corresponding Master Portfolio reflects the Fund’s proportionate interest in the net assets of the Master Portfolio. The performance of the Funds is directly affected by the performance of the Master Portfolios. At December 31, 2015, the percentage of the Master Portfolio owned by the corresponding Fund was 98.2% for Institutional, 95.3% for Prime and 62.5% for Treasury. The financial statements of the Master Portfolios, including the Schedules of Investments, are included elsewhere in this report and should be read in conjunction with the Funds’ financial statements.
Each Fund offers multiple classes of shares. All classes of shares have identical voting, dividend, liquidation and other rights and are subject to the same terms and conditions. The Aon Captives Shares also bear certain expenses related to the distribution of such shares. The Aon Captives Shares have exclusive voting rights with respect to matters relating to their distribution expenditures. The Boards of Trustees of the Funds and Boards of Directors of the Master Portfolios are referred to throughout this report as the “Board of Directors” or the “Board” and the members are referred to as “Directors.”
2. Significant Accounting Policies:
The financial statements are prepared in conformity with accounting principles generally accepted in the United States of America (“U.S. GAAP”), which may require management to make estimates and assumptions that affect the reported amounts of assets and liabilities in the financial statements, disclosure of contingent assets and liabilities at the date of the financial statements and the reported amounts of increases and decreases in net assets from operations during the reporting period. Actual results could differ from those estimates. Each Fund is considered an investment company under U.S. GAAP and follows the accounting and reporting guidance applicable to investment companies. Below is a summary of significant accounting policies:
Investment Transactions and Investment Income: For financial reporting purposes, contributions to and withdrawals from the Master Portfolio are accounted on a trade date basis. The Funds record daily their proportionate share of the Master Portfolio’s income, expenses and realized and unrealized gains and losses. In addition, the Funds accrue their own expenses. Income, expenses and realized and unrealized gains and losses are allocated daily to each class based on its relative net assets.
Distributions: Distributions from net investment income are declared daily and paid monthly. Distributions of capital gains are recorded on the ex-dividend date. The character and timing of distributions are determined in accordance with federal income tax regulations, which may differ from U.S. GAAP.
Indemnifications: In the normal course of business, the Funds enter into contracts that contain a variety of representations that provide general indemnification. The Funds’ maximum exposure under these arrangements is unknown because it involves future potential claims against the Funds, which cannot be predicted with any certainty.
Other: Expenses directly related to a Fund or its classes are charged to that Fund or the applicable class. Other operating expenses shared by several funds, including other funds managed by BlackRock Fund Advisors (the “Manager” or “BFA”), the investment advisor to the Master Portfolios, are prorated among those funds on the basis of relative net assets or other appropriate methods. Expenses directly related to the Funds and other shared expenses prorated to the Funds are allocated daily to each class based on its relative net assets or other appropriate methods.
The Funds have an arrangement with their custodian whereby fees may be reduced by credits earned on uninvested cash balances, which, if applicable, are shown as fees paid indirectly in the Statements of Operations. The custodian imposes fees on overdrawn cash balances, which can be offset by accumulated credits earned or may result in additional custody charges. Effective September 2015, the arrangement with their custodian for earning credits on uninvested cash balances has ceased and the custodian will be imposing fees on certain uninvested cash balances.
3. Investment Valuation and Fair Value Measurements:
The Funds’ policy is to fair value its financial instruments at market value. Each Fund records its investment in the corresponding Master Portfolio at fair value based on the Fund’s proportionate interest in the net assets of the Master Portfolio. Valuation of securities held by the Master Portfolio is discussed in Note 3 of the Master Portfolios’ Notes to Financial Statements, which are included elsewhere in this report.
| | | | | | |
| | | | | | | |
| | BLACKROCK FUNDS III | | DECEMBER 31, 2015 | | 29 |
| | |
| Notes to Financial Statements (continued) | | BlackRock Funds III |
4. Administration Agreement and Other Transactions with Affiliates:
The PNC Financial Services Group, Inc. is the largest stockholder and an affiliate of BlackRock, Inc. (“BlackRock”) for 1940 Act purposes.
The Trust, on behalf of the Funds entered into an Administration Agreement with BlackRock Advisors, LLC (“BAL”), which has agreed to provide general administration services (other than investment advice and related portfolio activities). BAL, in consideration thereof, has agreed to bear all of the Funds’ ordinary operating expenses, excluding, generally, investment advisory fees, distribution fees, brokerage and other expenses related to the execution of portfolio transactions, extraordinary expenses and certain other expenses which are borne by the Funds. BAL is entitled to receive for these administration services an annual fee based on the average daily net assets of each Fund as follows:
| | | | | | | | | | | | |
| | | Institutional | | | Prime | | | Treasury | |
Aon Captives | | | 0.05% | | | | N/A | | | | N/A | |
Capital | | | 0.07% | 1 | | | 0.07% | | | | 0.07% | 1 |
Institutional | | | 0.05% | | | | 0.05% | | | | 0.05% | 1 |
Premium | | | 0.10% | 1 | | | 0.10% | | | | 0.10% | 1 |
Select | | | 0.15% | | | | 0.15% | 1 | | | 0.15% | 1 |
SL Agency | | | 0.02% | | | | 0.02% | | | | 0.02% | |
Trust | | | 0.38% | 1 | | | 0.38% | 1 | | | 0.38% | 1 |
| | 1 | | With no shares outstanding as of December 31, 2015 |
For the year ended December 31, 2015, the administration fees, which are included in administration — class specific in the Statements of Operations, for each class of each Fund are as follows:
| | | | | | | | | | | | |
| | | Institutional | | | Prime | | | Treasury | |
Aon Captives | | $ | 4,098 | | | | N/A | | | | N/A | |
Capital | | | — | 1 | | $ | 1,304,195 | | | | — | 1 |
Institutional | | $ | 1,602,721 | | | $ | 4,893,500 | | | $ | 1,684 | 1 |
Premium | | | — | 1 | | $ | 1,265,661 | | | | — | 1 |
Select | | $ | 37 | | | $ | 1,985 | 1 | | | — | 1 |
SL Agency | | $ | 7,807,638 | | | $ | 2,006,361 | | | $ | 424,559 | |
Trust | | | — | 1 | | | — | 1 | | $ | 4 | 1 |
| | 1 | | With no shares outstanding as of December 31, 2015 |
From time to time, BAL may waive such fees in whole or in part. Any such waiver will reduce the expenses of the Fund and, accordingly, have a favorable impact on its performance. BAL may delegate certain of its administration duties to sub-administrators.
BAL contractually agreed to waive a portion of its administration fees for the Select Shares through April 30, 2016. After giving effect to such contractual expense limitation, the administration fees for the Select Shares will be 0.13%. These amounts are included in administration fees waived — class specific in the Statements of Operations.
The fees and expenses of the Funds’ trustees who are not “interested persons” of the Trust, as defined in the 1940 Act (“Independent Trustees”), counsel to the Independent Trustees and the Trust’s independent registered public accounting firm (together, the “independent expenses”) are paid directly by the Funds. BAL has contractually agreed to provide an offsetting credit against the administration fees paid by the Funds in an amount equal to the independent expenses through April 30, 2016. These amounts are included in fees reimbursed by the administrator in the Statements of Operations.
BAL voluntarily agreed to waive administration fees and/or reimburse operating expenses to enable the Funds to maintain minimum levels of daily net investment income. These amounts are reported in the Statements of Operations as administration fees waived — class specific. BAL may discontinue the waiver or reimbursement at any time.
For the year ended December 31, 2015, BAL waived the administration fees, for the funds as follows:
| | | | | | | | | | | | |
| | | Institutional | | | Prime | | | Treasury | |
Aon Captives | | | N/A | | | | N/A | | | | N/A | |
Capital | | | — | | | | — | | | | N/A | |
Institutional | | | — | | | | — | | | $ | 319 | |
Premium | | | — | | | | — | | | | — | |
Select | | $ | 4 | | | $ | 265 | | | | N/A | |
SL Agency | | | — | | | | — | | | $ | 91,453 | |
Trust | | | N/A | | | | N/A | | | $ | 3 | |
As of December 31, 2015, the only investors for the SL Agency Shares of the Funds are investment companies for which (i) BFA, BAL, or an affiliate provides investment advisory or administration services, or (ii) BlackRock Institutional Trust Company, N.A. (“BTC”) acts as securities lending agent and which have directed BTC on their behalf to invest securities lending cash collateral in the Funds. Affiliated shareholders in the SL Agency Shares of the Funds represent a significant portion of the outstanding shares and net assets of Institutional, Prime and Treasury.
| | | | | | |
| | | | | | | |
| 30 | | BLACKROCK FUNDS III | | DECEMBER 31, 2015 | | |
| | | | |
| Notes to Financial Statements (continued) | | BlackRock Funds III |
The Trust, on behalf of the Funds, entered into a Distribution Agreement with BlackRock Investments, LLC (“BRIL”), an affiliate of the Administrator, and has adopted a Distribution Plan in accordance with Rule 12b-1 with respect to the Aon Captives Shares. Pursuant to the Distribution Plan and in accordance with Rule 12b-1 under the 1940 Act, Institutional pays BRIL ongoing distribution fees with respect to Aon Captives Shares. The fees are accrued daily and paid monthly at an annual rate of 0.10% based upon the average daily net assets of the Aon Captives Shares. The Capital Shares, Institutional Shares, Premium Shares, Select Shares, SL Agency Shares and Trust Shares of Institutional do not pay any fees for distribution services. The fees paid to BRIL by Institutional are shown as Distribution – Aon Captives in the Statements of Operations.
Certain officers and/or directors of the Trust are officers and/or directors of BlackRock or its affiliates.
5. Income Tax Information:
It is the Funds’ policy to comply with the requirements of the Internal Revenue Code of 1986, as amended, applicable to regulated investment companies, and to distribute substantially all of their taxable income to their shareholders. Therefore, no federal income tax provision is required.
Each Fund files U.S. federal and various state and local tax returns. No income tax returns are currently under examination. The statute of limitations on each Fund’s U.S. federal tax returns remains open for each of the four years ended December 31, 2015. The statutes of limitations on each Fund’s state and local tax returns may remain open for an additional year depending upon the jurisdiction.
Management has analyzed tax laws and regulations and their application to the Funds as of December 31, 2015, inclusive of the open tax return years, and does not believe there are any uncertain tax positions that require recognition of a tax liability in the Funds’ financial statements.
The tax character of distributions paid was as follows:
| | | | | | | | | | | | | | | | |
| | | | | | Institutional | | | Prime | | | Treasury | |
Ordinary income | | | 12/31/15 | | | $ | 79,488,252 | | | $ | 36,794,663 | | | $ | 637,933 | |
| | | 12/31/14 | | | $ | 59,552,727 | | | $ | 16,201,904 | | | $ | 59,014 | |
Long-term capital gains | | | 12/31/15 | | | $ | 41,775 | | | | — | | | | — | |
| | | 12/31/14 | | | $ | 1 | | | | — | | | | — | |
| | | | |
Total | | | 12/31/15 | | | $ | 79,530,027 | | | $ | 36,794,663 | | | $ | 637,933 | |
| | | | |
| | | 12/31/14 | | | $ | 59,552,728 | | | $ | 16,201,904 | | | $ | 59,014 | |
| | | | |
As of December 31, 2015, the tax components of accumulated net earnings (losses) were as follows:
| | | | | | | | | | | | |
| | | Institutional | | | Prime | | | Treasury | |
Undistributed ordinary income | | $ | 1,238,934 | | | $ | 585,572 | | | $ | 11,194 | |
Undistributed long-term capital gains | | | — | | | | — | | | | 4,427 | |
| | | | | | | | | | | | |
Total | | $ | 1,238,934 | | | $ | 585,572 | | | $ | 15,621 | |
| | | | | | | | | | | | |
6. Principal Risks:
On July 23, 2014, the U.S. Securities and Exchange Commission adopted amendments to money market fund regulations, which structurally change the way that certain money market funds will be required to operate. The compliance period for amendments range between July 2015 and October 2016. When implemented, the changes may affect the Funds’ investment strategies, fees and expenses, portfolio and share liquidity and return potential. The Funds continue to evaluate their strategy to implement the new regulations.
7. Capital Share Transactions:
The number of shares sold, reinvested, and redeemed corresponds to the net proceeds from the sale of shares, reinvestment of all distributions and cost of shares redeemed, respectively, since shares are sold and redeemed at $1.00 per share.
Transactions in capital shares for each class were as follows:
| | | | | | | | |
| | | Year Ended
December 31, | |
| Institutional | | 2015 | | | 2014 | |
| Aon Captives | | | | | | |
Shares sold | | | 559,341 | | | | 863 | |
Shares issued in reinvestment of distributions | | | 7 | | | | 9 | |
Shares redeemed | | | — | | | | (1,168,184 | ) |
| | | | |
Net increase (decrease) | | | 559,348 | | | | (1,167,312 | ) |
| | | | |
| | | | | | | | |
| | | | | | |
| | | | | | | |
| | BLACKROCK FUNDS III | | DECEMBER 31, 2015 | | 31 |
| | |
| Notes to Financial Statements (continued) | | BlackRock Funds III |
| | | | | | | | |
| | | Year Ended
December 31, | |
| Institutional (concluded) | | 2015 | | | 2014 | |
| Institutional | | | | | | | | |
Shares sold | | | 26,330,768,077 | | | | 24,174,318,747 | |
Shares issued in reinvestment of distributions | | | 2,755,963 | | | | 1,530,102 | |
Shares redeemed | | | (26,528,049,293 | ) | | | (24,727,616,848 | ) |
| | | | |
Net decrease | | | (194,525,253 | ) | | | (551,767,999 | ) |
| | | | |
| | | | | | | | |
| Select | | | | | | | | |
Shares sold | | | — | | | | 59,051 | |
Shares issued in reinvestment of distributions | | | 13 | | | | 69 | |
Shares redeemed | | | (103,187 | ) | | | (4,274,228 | ) |
| | | | |
Net decrease | | | (103,174 | ) | | | (4,215,108 | ) |
| | | | |
| | | | | | | | |
| SL Agency | | | | | | | | |
Shares sold | | | 98,921,406,773 | | | | 75,649,211,014 | |
Shares issued in reinvestment of distributions | | | 20,513 | | | | 5,745 | |
Shares redeemed and automatic conversion of shares | | | (96,226,567,815 | ) | | | (75,767,214,636 | ) |
| | | | |
Net increase (decrease) | | | 2,694,859,471 | | | | (117,997,877 | ) |
| | | | |
| | | | | | | | |
| Trust | | | | | | | | |
Shares sold | | | — | | | | 491,932 | |
Shares issued in reinvestment of distributions | | | — | | | | — | |
Shares redeemed and automatic conversion of shares | | | — | | | | (1,038,529 | ) |
| | | | |
Net decrease | | | — | | | | (546,597 | ) |
| | | | |
Total Net Increase (Decrease) | | | 2,500,790,392 | | | | (675,694,893 | ) |
| | | | |
| | | | | | | | |
| Prime | | | | | | |
| Capital | | | | | | |
Shares sold | | | 30,021,242,764 | | | | 19,558,369,648 | |
Shares issued in reinvestment of distributions | | | 1,851,980 | | | | 747,799 | |
Shares redeemed | | | (29,644,982,520 | ) | | | (19,284,321,993 | ) |
| | | | |
Net increase | | | 378,112,224 | | | | 274,795,454 | |
| | | | |
| | | | | | | | |
| Institutional | | | | | | |
Shares sold | | | 146,093,605,195 | | | | 90,953,147,912 | |
Shares issued in reinvestment of distributions | | | 6,541,052 | | | | 2,041,048 | |
Shares redeemed | | | (141,657,821,784 | ) | | | (87,151,135,023 | ) |
| | | | |
Net increase | | | 4,442,324,463 | | | | 3,804,053,937 | |
| | | | | | | | |
| | | | | | | | |
| Premium | | | | | | | | |
Shares sold | | | 168,198,834,483 | | | | 91,004,079,422 | |
Shares issued in reinvestment of distributions | | | 82,926 | | | | 289,235 | |
Shares redeemed | | | (168,321,079,404 | ) | | | (94,418,933,588 | ) |
| | | | |
Net decrease | | | (122,161,995 | ) | | | (3,414,564,931 | ) |
| | | | | | | | |
| | | | | | | | |
| Select | | | | | | | | |
Shares sold | | | 221,615,435 | | | | 185,549,826 | |
Shares issued in reinvestment of distributions | | | 1,100 | | | | 117 | |
Shares redeemed | | | (221,616,535 | ) | | | (185,639,776 | ) |
| | | | |
Net decrease | | | — | | | | (89,833 | ) |
| | | | |
| | | | | | | | |
| | | | | | |
| | | | | | | |
| 32 | | BLACKROCK FUNDS III | | DECEMBER 31, 2015 | | |
| | | | |
| Notes to Financial Statements (concluded) | | BlackRock Funds III |
| | | | | | | | |
| | | Year Ended
December 31, | |
| Prime (concluded) | | 2015 | | | 2014 | |
| SL Agency | | | | | | | | |
Shares sold | | | 10,735,695,202 | | | | 9,947,000,412 | |
Shares issued in reinvestment of distributions | | | 87 | | | | 79 | |
Shares redeemed and automatic conversion of shares | | | (12,675,646,227 | ) | | | (5,020,488,361 | ) |
| | | | |
Net increase (decrease) | | | (1,939,950,938 | ) | | | 4,926,512,130 | |
| | | | |
| | | | | | | | |
| Trust | | | | | | | | |
Shares sold | | | — | | | | 1,137,434 | |
Shares issued in reinvestment of distributions | | | — | | | | 37 | |
Shares redeemed and automatic conversion of shares | | | — | | | | (9,223,528 | ) |
| | | | |
Net decrease | | | — | | | | (8,086,057 | ) |
| | | | |
Total Net Increase | | | 2,758,323,754 | | | | 5,582,620,700 | |
| | | | |
| | | | | | | | |
| Treasury | | | | | | |
| Capital | | | | | | |
Shares sold | | | — | | | | 20,717,143 | |
Shares issued in reinvestment of distributions | | | — | | | | 12 | |
Shares redeemed | | | — | | | | (21,432,458 | ) |
| | | | |
Net decrease | | | — | | | | (715,303 | ) |
| | | | |
| | | | | | | | |
| Institutional | | | | | | | | |
Shares sold | | | 211,800,000 | | | | — | |
Shares issued in reinvestment of distributions | | | 330 | | | | — | |
Shares redeemed | | | (211,804,234 | ) | | | — | |
| | | | |
Net decrease | | | (3,904 | ) | | | — | |
| | | | |
| | | | | | | | |
| Select | | | | | | | | |
Shares sold | | | — | | | | 143,550,647 | |
Shares issued in reinvestment of distributions | | | — | | | | 97 | |
Shares redeemed | | | — | | | | (153,948,584 | ) |
| | | | | | | | |
Net decrease | | | — | | | | (10,397,840 | ) |
| | | | |
| | | | | | | | |
| SL Agency | | | | | | | | |
Shares sold | | | 61,854,753,309 | | | | 52,795,170,781 | |
Shares issued in reinvestment of distributions | | | 23,792 | | | | 2,784 | |
Shares redeemed and automatic conversion of shares | | | (62,085,998,245 | ) | | | (51,957,574,256 | ) |
| | | | | | | | |
Net increase (decrease) | | | (231,221,144 | ) | | | 837,599,309 | |
| | | | |
| | | | | | | | |
| Trust | | | | | | | | |
Shares sold | | | — | | | | 25,872,237 | |
Shares issued in reinvestment of distributions | | | — | | | | 256 | |
Shares redeemed and automatic conversion of shares | | | — | | | | (51,786,153 | ) |
| | | | |
Net decrease | | | — | | | | (25,913,660 | ) |
| | | | |
Total Net Increase (Decrease) | | | (231,225,048 | ) | | | 800,572,506 | |
| | | | |
8. Subsequent Events:
Management has evaluated the impact of all subsequent events on the Funds through the date the financial statements were issued and has determined that there were no subsequent events requiring adjustment or additional disclosure in the financial statements.
| | | | | | |
| | | | | | | |
| | BLACKROCK FUNDS III | | DECEMBER 31, 2015 | | 33 |
| | |
| Report of Independent Registered Public Accounting Firm | | BlackRock Funds III |
To the Board of Trustees of BlackRock Funds III and the Shareholders of BlackRock Cash Funds: Institutional, BlackRock Cash Funds: Prime and BlackRock Cash Funds: Treasury:
In our opinion, the accompanying statements of assets and liabilities and the related statements of operations and of changes in net assets and the financial highlights present fairly, in all material respects, the financial position of BlackRock Cash Funds: Institutional, BlackRock Cash Funds: Prime and BlackRock Cash Funds: Treasury (the “Funds”), each a series of BlackRock Funds III, at December 31, 2015, the results of each of their operations for the year then ended, the changes in each of their net assets for each of the two years in the period then ended and the financial highlights for each of the periods presented, in conformity with accounting principles generally accepted in the United States of America. These financial statements and financial highlights (hereafter referred to as “financial statements”) are the responsibility of the Funds’ management. Our responsibility is to express an opinion on these financial statements based on our audits. We conducted our audits of these financial statements in accordance with the standards of the Public Company Accounting Oversight Board (United States). Those standards require that we plan and perform the audit to obtain reasonable assurance about whether the financial statements are free of material misstatement. An audit includes examining, on a test basis, evidence supporting the amounts and disclosures in the financial statements, assessing the accounting principles used and significant estimates made by management, and evaluating the overall financial statement presentation. We believe that our audits provide a reasonable basis for our opinion.
/s/ PricewaterhouseCoopers LLP
Philadelphia, Pennsylvania
February 18, 2016
|
| Important Tax Information (Unaudited) |
The following information is provided with respect to the ordinary income distributions paid by Institutional, Prime and Treasury for the taxable year ended December 31, 2015.
| | |
| Interest Related Dividends and Qualified Short-Term Capital Gains for Non-US Residents1 |
| | | Months Paid |
| | | January — December 2015 |
Institutional | | 83.89% |
Prime | | 78.79% |
Treasury | | 100.00% |
| Federal Obligation Interest2 |
Institutional | | 2.85% |
Prime | | 0.59% |
Treasury | | 54.76% |
| 1 | | Represents the portion of the taxable ordinary dividends eligible for exemption from U.S. withholding tax for nonresident aliens and foreign corporations. |
| 2 | | The law varies in each state as to whether and what percentage of dividend income attributable to Federal obligations is exempt from state income tax. We recommend that you consult your tax advisor to determine if any of the dividends you received is exempt from state income taxes. |
Additionally, Institutional distributed long-term capital gains of $0.0000010020 per share to shareholders of record on December 15, 2015.
| | | | | | |
| | | | | | | |
| 34 | | BLACKROCK FUNDS III | | DECEMBER 31, 2015 | | |
| | |
| Master Portfolio Information as of December 31, 2015 | | Master Investment Portfolio |
|
| Money Market Master Portfolio |
| | | | |
| Portfolio Composition | | Percent of
Net Assets | |
Repurchase Agreements | | | 40 | % |
Commercial Paper | | | 29 | |
Certificates of Deposit | | | 26 | |
U.S. Government Sponsored Agency Obligations | | | 4 | |
Time Deposits | | | 1 | |
Corporate Notes | | | — | |
U.S. Treasury Obligations | | | — | |
Liabilities in Excess of Other Assets | | | (— | ) |
| | | | |
Total | | | 100 | % |
| | | | |
|
| Prime Money Market Master Portfolio |
| | | | |
| Portfolio Composition | | Percent of
Net Assets | |
Repurchase Agreements | | | 45 | % |
Commercial Paper | | | 30 | |
Certificates of Deposit | | | 21 | |
Time Deposits | | | 2 | |
Corporate Notes | | | 1 | |
U.S. Government Sponsored Agency Obligation | | | 1 | |
U.S. Treasury Obligations | | | — | |
Other Assets Less Liabilities | | | — | |
| | | | |
Total | | | 100 | % |
| | | | |
|
| Treasury Money Market Master Portfolio |
| | | | |
| Portfolio Composition | | Percent of
Net Assets | |
Repurchase Agreements | | | 58 | % |
U.S. Treasury Obligations | | | 42 | |
Other Assets Less Liabilities | | | — | |
| | | | |
Total | | | 100 | % |
| | | | |
| | | | | | |
| | | | | | | |
| | BLACKROCK FUNDS III | | DECEMBER 31, 2015 | | 35 |
| | |
Schedule of Investments December 31, 2015 | | Money Market Master Portfolio (Percentages shown are based on Net Assets) |
| | | | | | | | |
| Certificates of Deposit | | Par (000) | | | Value | |
Domestic | | | | | | | | |
Bank of America N.A.: | | | | | | | | |
0.37%, 1/04/16 | | $ | 183,000 | | | $ | 183,000,000 | |
0.42%, 1/07/16 (a) | | | 200,000 | | | | 200,000,000 | |
0.44%, 4/05/16 (a) | | | 497,400 | | | | 497,400,000 | |
0.48%, 4/18/16 | | | 100,000 | | | | 100,000,000 | |
0.57%, 4/20/16 (a) | | | 150,000 | | | | 150,000,000 | |
State Street Bank & Trust, 0.59%, 3/29/16 (a) | | | 149,000 | | | | 149,000,000 | |
Wells Fargo Bank NA (a): | | | | | | | | |
0.55%, 1/06/16 | | | 135,000 | | | | 135,000,000 | |
0.55%, 1/21/16 | | | 150,000 | | | | 150,000,000 | |
0.54%, 2/12/16 | | | 100,000 | | | | 100,000,000 | |
0.57%, 2/12/16 | | | 35,000 | | | | 35,000,000 | |
0.54%, 2/18/16 | | | 150,000 | | | | 150,000,000 | |
0.32%, 4/01/16 | | | 177,500 | | | | 177,500,000 | |
| | | | | | | | |
| | | | | | | | 2,026,900,000 | |
Yankee (b) | | | | | | | | |
Bank of Montreal, Chicago (a): | | | | | | | | |
0.39%, 1/07/16 | | | 140,000 | | | | 140,000,000 | |
0.59%, 1/25/16 | | | 200,000 | | | | 200,000,000 | |
0.60%, 4/21/16 | | | 400,000 | | | | 400,000,000 | |
0.56%, 6/01/16 | | | 130,000 | | | | 130,000,000 | |
0.65%, 7/21/16 | | | 125,000 | | | | 125,000,000 | |
Bank of Nova Scotia, Houston (a): | | | | | | | | |
0.56%, 3/18/16 | | | 75,000 | | | | 75,000,000 | |
0.58%, 4/08/16 | | | 185,000 | | | | 185,000,000 | |
0.55%, 4/15/16 | | | 92,000 | | | | 92,000,000 | |
0.59%, 5/09/16 | | | 150,000 | | | | 150,000,000 | |
0.56%, 6/06/16 | | | 100,000 | | | | 100,000,000 | |
Bank of Tokyo-Mitsubishi UFJ Ltd., New York: | | | | | | | | |
0.28%, 1/05/16 | | | 100,000 | | | | 100,000,000 | |
0.28%, 1/06/16 | | | 75,000 | | | | 75,000,000 | |
0.48%, 1/07/16 (a) | | | 246,000 | | | | 246,000,000 | |
Canadian Imperial Bank of Commerce, New York (a): | | | | | | | | |
0.53%, 1/26/16 | | | 97,100 | | | | 97,100,000 | |
0.57%, 4/18/16 | | | 200,000 | | | | 200,000,000 | |
0.59%, 5/19/16 | | | 400,000 | | | | 400,000,000 | |
0.55%, 5/23/16 | | | 400,000 | | | | 400,000,000 | |
0.55%, 6/01/16 | | | 250,000 | | | | 250,000,000 | |
0.62%, 6/01/16 | | | 200,000 | | | | 200,000,000 | |
0.65%, 6/30/16 | | | 150,000 | | | | 150,000,000 | |
Credit Industriel et Commercial, New York, 0.53%, 2/11/16 (a) | | | 225,000 | | | | 225,000,000 | |
Mitsubishi UFJ Trust & Banking Corp., New York, 0.45%, 2/04/16 (a) | | | 100,000 | | | | 100,000,000 | |
Mizuho Bank Ltd., New York: | | | | | | | | |
0.37%, 1/19/16 | | | 150,000 | | | | 150,000,000 | |
0.30%, 1/26/16 | | | 298,550 | | | | 298,550,000 | |
0.51%, 4/01/16 | | | 50,000 | | | | 50,000,000 | |
Nordea Bank AB, 0.49%, 5/13/16 (a) | | | 180,000 | | | | 180,000,000 | |
Norinchukin Bank, New York: | | | | | | | | |
0.33%, 1/06/16 | | | 122,500 | | | | 122,500,000 | |
0.33%, 1/07/16 | | | 300,000 | | | | 300,000,000 | |
0.31%, 1/08/16 | | | 125,000 | | | | 125,000,000 | |
0.30%, 1/27/16 | | | 88,500 | | | | 88,500,000 | |
Rabobank Nederland, New York (a): | | | | | | | | |
0.41%, 1/11/16 | | | 280,000 | | | | 280,000,000 | |
0.46%, 4/11/16 | | | 200,000 | | | | 200,000,000 | |
Royal Bank of Canada, New York (a): | | | | | | | | |
0.45%, 3/16/16 | | | 200,000 | | | | 200,000,000 | |
0.46%, 5/03/16 | | | 310,000 | | | | 310,000,000 | |
0.57%, 10/14/16 | | | 180,000 | | | | 180,000,000 | |
Skandinaviska Enskilda Banken AB, New York: | | | | | | | | |
0.50%, 3/01/16 | | | 10,000 | | | | 10,002,491 | |
0.50%, 3/14/16 (a) | | | 150,000 | | | | 150,000,000 | |
0.39%, 4/05/16 (a) | | | 200,000 | | | | 200,000,000 | |
| | | | | | | | |
| Certificates of Deposit | | Par (000) | | | Value | |
Yankee (b) (continued) | | | | | | | | |
Standard Chartered Bank, New York, 0.37%, 1/04/16 (a) | | $ | 200,000 | | | $ | 200,000,000 | |
Sumitomo Mitsui Banking Corp., New York (a): | | | | | | | | |
0.48%, 1/08/16 (a) | | | 100,000 | | | | 100,000,000 | |
0.64%, 2/25/16 | | | 175,000 | | | | 175,000,000 | |
0.55%, 3/15/16 | | | 250,000 | | | | 250,000,000 | |
0.49%, 4/07/16 | | | 130,000 | | | | 130,000,000 | |
Sumitomo Mitsui Trust Bank Ltd.: | | | | | | | | |
0.38%, 1/08/16 | | | 220,000 | | | | 220,000,000 | |
0.77%, 6/21/16 (a) | | | 100,000 | | | | 100,000,000 | |
Toronto-Dominion Bank, New York: | | | | | | | | |
0.52%, 1/26/16 (a) | | | 150,000 | | | | 150,000,000 | |
0.53%, 2/25/16 (a) | | | 100,000 | | | | 100,000,000 | |
0.57%, 5/19/16 (a) | | | 75,000 | | | | 75,000,000 | |
0.75%, 6/06/16 | | | 130,000 | | | | 130,000,000 | |
0.57%, 10/17/16 (a) | | | 137,000 | | | | 137,000,000 | |
UBS AG, Stamford (a): | | | | | | | | |
0.56%, 2/17/16 | | | 300,000 | | | | 300,000,000 | |
0.67%, 4/29/16 | | | 295,000 | | | | 295,000,000 | |
Westpac Banking Corp., New York, 0.57%, 10/21/16 (a) | | | 25,000 | | | | 25,000,000 | |
| | | | | | | | |
| | | | | | | | 9,271,652,491 | |
Total Certificates of Deposit — 26.1% | | | | 11,298,552,491 | |
| | | | | | | | |
| | |
| | |
| Commercial Paper | | | | | | |
ABN Amro Funding USA LLC (c): | | | | | | | | |
0.32%, 1/19/16 | | | 100,000 | | | | 99,984,000 | |
0.43%, 3/02/16 | | | 170,000 | | | | 169,876,136 | |
0.63%, 3/28/16 | | | 296,500 | | | | 296,048,579 | |
ANZ New Zealand International Ltd. (a): | | | | | | | | |
0.45%, 5/03/16 | | | 100,000 | | | | 100,000,000 | |
0.39%, 6/03/16 (d) | | | 50,000 | | | | 50,000,000 | |
ASB Finance Ltd. (a): | | | | | | | | |
0.50%, 5/09/16 | | | 100,000 | | | | 100,000,000 | |
0.49%, 7/01/16 | | | 150,000 | | | | 150,000,000 | |
Atlantic Asset Securitization LLC (c): | | | | | | | | |
0.30%, 1/06/16 | | | 200,000 | | | | 199,991,667 | |
0.30%, 1/07/16 | | | 100,000 | | | | 99,995,000 | |
Australia & New Zealand Banking Group Ltd. (a): | | | | | | | | |
0.63%, 5/23/16 | | | 250,000 | | | | 250,000,000 | |
0.64%, 5/26/16 | | | 250,000 | | | | 250,000,000 | |
0.60%, 6/03/16 | | | 180,000 | | | | 180,000,000 | |
Bank of Nova Scotia: | | | | | | | | |
0.55%, 4/21/16 (a) | | | 75,000 | | | | 74,990,576 | |
0.50%, 5/04/16 (c)(d) | | | 190,000 | | | | 189,672,778 | |
Bennington Stark Capital Co. (c): | | | | | | | | |
0.30%, 1/05/16 | | | 45,000 | | | | 44,998,500 | |
0.60%, 2/02/16 | | | 130,000 | | | | 129,930,667 | |
0.55%, 2/16/16 | | | 100,000 | | | | 99,929,722 | |
Bedford Row Funding Corp. (a): | | | | | | | | |
0.41%, 2/05/16 | | | 100,000 | | | | 100,000,000 | |
0.56%, 2/26/16 | | | 65,000 | | | | 65,000,000 | |
0.41%, 3/07/16 (d) | | | 50,000 | | | | 50,000,000 | |
0.47%, 4/07/16 | | | 75,000 | | | | 75,000,000 | |
0.60%, 4/20/16 | | | 100,000 | | | | 100,000,000 | |
0.44%, 5/10/16 | | | 100,000 | | | | 100,000,000 | |
0.70%, 6/13/16 | | | 100,000 | | | | 100,000,000 | |
BPCE SA, 0.65%, 3/31/16 (c) | | | 600,000 | | | | 599,025,000 | |
Cafco LLC, 0.50%, 3/07/16 (c) | | | 25,000 | | | | 24,977,083 | |
Cancara Asset Securitisation LLC (c): | | | | | | | | |
0.33%, 1/07/16 | | | 300,000 | | | | 299,983,500 | |
0.31%, 1/14/16 | | | 41,000 | | | | 40,995,410 | |
Chariot Funding LLC, 0.52%, 5/04/16 (c) | | | 48,000 | | | | 47,914,027 | |
See Notes to Financial Statements.
| | | | | | |
| | | | | | | |
| 36 | | BLACKROCK FUNDS III | | DECEMBER 31, 2015 | | |
| | |
Schedule of Investments (continued) | | Money Market Master Portfolio |
| | | | | | | | |
| Commercial Paper | | Par (000) | | | Value | |
Collateralized Commercial Paper Co. LLC (a): | | | | | | | | |
0.45%, 1/07/16 | | $ | 200,000 | | | $ | 200,000,000 | |
0.60%, 2/22/16 | | | 125,000 | | | | 125,000,000 | |
0.61%, 4/19/16 | | | 110,000 | | | | 110,000,000 | |
Collateralized Commercial Paper II Co.: | | | | | | | | |
0.53%, 5/13/16 (c) | | | 100,000 | | | | 99,804,194 | |
0.67%, 6/08/16 (a) | | | 100,000 | | | | 100,000,000 | |
Commonwealth Bank of Australia (a): | | | | | | | | |
0.37%, 2/19/16 | | | 100,000 | | | | 100,000,000 | |
0.52%, 2/26/16 | | | 150,000 | | | | 150,000,000 | |
0.53%, 3/29/16 (d) | | | 100,000 | | | | 100,000,000 | |
0.53%, 3/30/16 | | | 100,000 | | | | 100,000,000 | |
0.40%, 4/29/16 | | | 48,000 | | | | 48,000,000 | |
0.55%, 5/20/16 | | | 100,000 | | | | 99,992,153 | |
0.42%, 6/02/16 | | | 100,000 | | | | 100,000,000 | |
0.50%, 6/14/16 | | | 150,000 | | | | 150,000,000 | |
0.63%, 6/24/16 | | | 340,000 | | | | 340,000,000 | |
0.65%, 6/28/16 | | | 200,000 | | | | 200,000,000 | |
0.49%, 7/05/16 | | | 49,000 | | | | 49,000,000 | |
0.62%, 7/15/16 | | | 75,000 | | | | 75,000,000 | |
Crown Point Capital LLC, 0.23%, 1/04/16 (c) | | | 30,000 | | | | 29,999,425 | |
DBS Bank Ltd., | | | | | | | | |
0.65%, 3/30/16 (c)(d) | | | 50,000 | | | | 49,922,361 | |
Deutsche Telekom AG (c): | | | | | | | | |
0.67%, 1/08/16 | | | 36,500 | | | | 36,495,245 | |
0.66%, 1/11/16 | | | 46,000 | | | | 45,991,567 | |
Duke Energy Corp. (c): | | | | | | | | |
0.63%, 1/04/16 | | | 49,750 | | | | 49,747,388 | |
0.80%, 1/15/16 | | | 47,500 | | | | 47,485,222 | |
HSBC Bank PLC (a): | | | | | | | | |
0.40%, 2/05/16 | | | 200,000 | | | | 200,000,000 | |
0.50%, 7/06/16 | | | 160,000 | | | | 160,000,000 | |
Hyundai Capital America (c): | | | | | | | | |
0.55%, 1/08/16 | | | 50,000 | | | | 49,994,653 | |
0.55%, 1/14/16 | | | 25,000 | | | | 24,995,035 | |
Kellogg Co. (c): | | | | | | | | |
0.40%, 1/07/16 (d) | | | 35,000 | | | | 34,997,667 | |
0.72%, 1/13/16 | | | 13,000 | | | | 12,996,880 | |
Kells Funding LLC (c): | | | | | | | | |
0.34%, 2/03/16 | | | 150,000 | | | | 149,953,250 | |
0.34%, 2/08/16 | | | 150,000 | | | | 149,946,167 | |
0.37%, 3/02/16 | | | 115,000 | | | | 114,927,901 | |
LMA Americas LLC (c): | | | | | | | | |
0.33%, 2/04/16 | | | 44,400 | | | | 44,386,162 | |
0.40%, 2/12/16 | | | 30,000 | | | | 29,986,000 | |
Lyondellbasell Investment LLC, 0.78%, 1/19/16 (c) | | | 98,000 | | | | 97,961,780 | |
Matchpoint Finance PLC, 0.52%, 3/24/16 (c) | | | 4,625 | | | | 4,619,455 | |
Medtronic, Inc., 0.70%, 1/21/16 (c)(d) | | | 23,000 | | | | 22,991,056 | |
Mitsubishi UFJ Trust & Banking Corp., New York, 0.70%, 4/04/16 (c) | | | 40,000 | | | | 39,926,889 | |
Mizuho Bank Ltd., 0.49%, 4/18/16 (c)(d) | | | 262,000 | | | | 261,614,860 | |
Motiva Enterprises LLC, 0.69%, 1/14/16 (c) | | | 46,000 | | | | 45,988,538 | |
National Australia Bank Ltd. (a): | | | | | | | | |
0.59%, 2/26/16 | | | 374,000 | | | | 374,000,000 | |
0.62%, 6/08/16 | | | 140,000 | | | | 140,000,000 | |
National Bank of Canada, 0.62%, 3/23/16 (a) | | | 400,000 | | | | 400,000,000 | |
Natixis, New York, 0.40%, 2/11/16 (c) | | | 40,000 | | | | 39,981,778 | |
Nissan Motor Acceptance Corp. (c): | | | | | | | | |
0.45%, 1/04/16 | | | 50,000 | | | | 49,998,125 | |
0.45%, 1/05/16 | | | 25,000 | | | | 24,998,750 | |
0.45%, 1/06/16 (d) | | | 15,000 | | | | 14,999,062 | |
0.73%, 1/19/16 | | | 60,000 | | | | 59,978,100 | |
Nordea Bank AB (c): | | | | | | | | |
0.48%, 2/26/16 | | | 150,000 | | | | 149,889,167 | |
0.40%, 4/01/16 | | | 150,000 | | | | 149,848,333 | |
0.50%, 4/18/16 | | | 9,500 | | | | 9,485,892 | |
| | | | | | | | |
| Commercial Paper | | Par (000) | | | Value | |
Old Line Funding LLC (c): | | | | | | | | |
0.51%, 5/16/16 | | $ | 80,000 | | | $ | 79,845,867 | |
0.63%, 5/23/16 | | | 50,000 | | | | 49,874,875 | |
Oversea Chinese Banking Corp. Ltd., 0.55%, 5/19/16 (a) | | | 40,000 | | | | 40,000,000 | |
Sheffield Receivable Corp. (c): | | | | | | | | |
0.27%, 1/04/16 | | | 500 | | | | 499,989 | |
0.37%, 1/19/16 | | | 200,000 | | | | 199,963,000 | |
0.40%, 1/27/16 | | | 300,000 | | | | 299,913,333 | |
0.80%, 3/18/16 | | | 250,000 | | | | 249,572,222 | |
Societe Generale SA, 0.50%, 2/01/16 (c) | | | 23,850 | | | | 23,839,731 | |
Standard Chartered Bank, 0.37%, 3/03/16 (c) | | | 5,000 | | | | 4,996,814 | |
Sumitomo Mitsui Banking Corp. (c): | | | | | | | | |
0.70%, 3/22/16 (d) | | | 150,000 | | | | 149,763,750 | |
0.50%, 4/01/16 | | | 75,000 | | | | 74,905,208 | |
Sumitomo Mitsui Trust Bank Ltd., 0.38%, 2/05/16 (c)(d) | | | 200,000 | | | | 199,926,111 | |
Thunder Bay Funding LLC (c): | | | | | | | | |
0.50%, 3/11/16 (d) | | | 50,000 | | | | 49,951,389 | |
0.83%, 6/15/16 | | | 86,000 | | | | 85,670,859 | |
Versailles Commercial Paper LLC (c): | | | | | | | | |
0.33%, 1/04/16 | | | 150,000 | | | | 149,995,875 | |
0.30%, 1/15/16 | | | 99,120 | | | | 99,108,436 | |
0.50%, 3/03/16 | | | 75,000 | | | | 74,935,417 | |
0.66%, 4/01/16 | | | 200,000 | | | | 199,666,333 | |
Virginia Electric & Power Co., 0.55%, 1/08/16 (c) | | | 50,000 | | | | 49,994,653 | |
Westpac Banking Corp. (a): | | | | | | | | |
0.40%, 3/02/16 | | | 40,000 | | | | 40,000,000 | |
0.47%, 3/18/16 | | | 25,000 | | | | 25,000,000 | |
0.50%, 3/18/16 | | | 112,000 | | | | 112,000,000 | |
0.22%, 4/01/16 | | | 150,000 | | | | 150,000,000 | |
0.63%, 6/23/16 | | | 485,000 | | | | 485,000,000 | |
Westpac Securities NZ Ltd., London (a): | | | | | | | | |
0.41%, 5/06/16 (d) | | | 50,000 | | | | 50,000,000 | |
0.63%, 5/23/16 | | | 198,500 | | | | 198,500,000 | |
| Total Commercial Paper — 28.9% | | | | 12,496,139,562 | |
| | | | | | | | |
| | |
| | |
| Corporate Notes | | | | | | |
Commonwealth Bank of Australia, 3.25%, 3/17/16 (d) | | | 50,000 | | | | 50,279,626 | |
GE Capital International Funding Co., 0.96%, 4/15/16 (d) | | | 177,476 | | | | 177,696,486 | |
| Total Corporate Notes — 0.5% | | | | 227,976,112 | |
| | | | | | | | |
| | |
| | |
| Time Deposits — 0.7% | | | | | | |
Credit Agricole SA, 0.25%, 1/04/16 | | | 326,000 | | | | 326,000,000 | |
| | | | | | | | |
| | |
|
| U.S. Government Sponsored Agency Obligations | |
Fannie Mae, 0.35%, 8/16/17 (a) | | | 80,000 | | | | 79,986,860 | |
Federal Farm Credit Bank (a): | | | | | | | | |
0.47%, 2/24/16 | | | 79,750 | | | | 79,754,838 | |
0.24%, 3/29/16 | | | 100,000 | | | | 99,997,562 | |
0.43%, 8/01/16 | | | 75,000 | | | | 74,995,576 | |
0.22%, 10/03/16 | | | 74,500 | | | | 74,489,004 | |
0.50%, 11/21/16 | | | 32,000 | | | | 32,024,573 | |
0.43%, 1/30/17 | | | 150,000 | | | | 149,967,076 | |
0.46%, 3/24/17 | | | 50,000 | | | | 50,003,296 | |
0.44%, 3/29/17 | | | 100,000 | | | | 99,988,168 | |
0.35%, 7/13/17 | | | 100,000 | | | | 99,968,892 | |
0.22%, 7/20/17 | | | 50,000 | | | | 49,986,753 | |
0.37%, 9/13/17 | | | 115,000 | | | | 115,000,000 | |
0.26%, 10/27/17 | | | 145,000 | | | | 144,944,845 | |
0.38%, 12/04/17 | | | 125,000 | | | | 125,000,000 | |
See Notes to Financial Statements.
| | | | | | |
| | | | | | | |
| | BLACKROCK FUNDS III | | DECEMBER 31, 2015 | | 37 |
| | |
Schedule of Investments (continued) | | Money Market Master Portfolio |
| | | | | | | | |
| U.S. Government Sponsored Agency Obligations | | Par (000) | | | Value | |
Federal Farm Credit Bank (a) (continued): | | | | | | | | |
0.29%, 1/26/18 | | $ | 90,000 | | | $ | 89,980,934 | |
0.39%, 3/02/18 | | | 68,000 | | | | 67,999,196 | |
Federal Home Loan Bank (a): | | | | | | | | |
0.31%, 5/27/16 | | | 35,000 | | | | 34,997,861 | |
0.18%, 2/07/17 | | | 68,000 | | | | 67,967,495 | |
| Total U.S. Government Sponsored Agency Obligations — 3.5% | | | | 1,537,052,929 | |
| | | | | | | | |
| | |
| | |
| U.S. Treasury Obligations — 0.1% | | | | | | |
U.S. Treasury Note, 0.43%, 10/31/17 (a) | | | 62,500 | | | | 62,312,973 | |
| | | | | | | | |
| | |
| | |
| Repurchase Agreements | | | | | | |
BNP Paribas Securities Corp., 0.22%, 1/04/16 (Purchased on 12/31/15 to be repurchased at $166,004,058, collateralized by various Corporate Debt/Obligations, 0.83% to 3.62%, due 10/20/23 to 8/23/36, original par and fair values of $181,765,820 and $177,620,001, respectively) | | | 166,000 | | | | 166,000,000 | |
Total Value of BNP Paribas Securities Corp. (collateral value of $177,620,001) | | | | | | | 166,000,000 | |
Citigroup Global Markets, Inc., 0.17%, 1/04/16 (Purchased on 12/31/15 to be repurchased at $100,001,889, collateralized by a U.S. Government Sponsored Agency Obligation, 2.00%, due 8/15/25, original par and fair value of $104,098,300 and $102,000,095, respectively) | | | 100,000 | | | | 100,000,000 | |
Citigroup Global Markets, Inc., 0.32%, 1/04/16 (Purchased on 12/31/15 to be repurchased at $1,210,043, collateralized by various U.S. Treasury Obligations, 1.88% to 2.50%, due 8/31/22 to 8/15/23, original par and fair values of $1,241,443 and $1,234,201, respectively) (e) | | | 1,210 | | | | 1,210,000 | |
Citigroup Global Markets, Inc., 0.96%, 3/05/16 (Purchased on 12/31/15 to be repurchased at $150,261,354, collateralized by various Corporate Debt/Obligations, 0.53% to 5.19%, due 2/25/37 to 11/23/46, original par and fair values of $381,135,477 and $160,500,000, respectively) (f) | | | 150,000 | | | | 150,000,000 | |
Total Value of Citigroup Global Markets, Inc. (collateral value of $263,734,296) | | | | | | | 251,210,000 | |
Credit Suisse Securities (USA) LLC, 0.47%, 1/04/16 (Purchased on 12/31/15 to be repurchased at $324,016,920, collateralized by various Corporate Debt/Obligations, 0.00%, due 11/27/45 to 4/25/55, original par and fair values of $432,265,000 and $388,803,435, respectively) | | | 324,000 | | | | 324,000,000 | |
Credit Suisse Securities (USA) LLC, 0.47%, 1/04/16 (Purchased on 12/31/15 to be repurchased at $163,508,538, collateralized by various Corporate Debt/Obligations, 5.00% to 9.89%, due 5/15/21 to 5/25/55, original par and fair values of $200,724,242 and $196,200,571, respectively) | | | 163,500 | | | | 163,500,000 | |
| | | | | | | | |
| Repurchase Agreements | | Par (000) | | | Value | |
Credit Suisse Securities (USA) LLC, 0.70%, 1/05/16 (Purchased on 12/29/15 to be repurchased at $244,023,722, collateralized by various U.S. Government Sponsored Agency Obligations, 0.00% to 7.50%, due 11/15/17 to 4/25/54, original par and fair values of $459,420,606 and $292,804,539, respectively) | | $ | 244,000 | | | $ | 244,000,000 | |
Credit Suisse Securities (USA) LLC, 0.88%, 2/04/16 (Purchased on 12/31/15 to be repurchased at $400,342,222, collateralized by a Corporate Debt/Obligation, 5.00%, due 11/27/45, original par and fair value of $545,120,000 and $480,000,232, respectively) (f) | | | 400,000 | | | | 400,000,000 | |
Total Value of Credit Suisse Securities (USA) LLC (collateral value of $1,357,808,777) | | | | | | | 1,131,500,000 | |
Federal Reserve Bank of New York, 0.25%, 1/04/16 (Purchased on 12/31/15 to be repurchased at $12,550,348,611, collateralized by various U.S. Treasury Obligations, 2.38% to 6.13%, due 5/31/18 to 11/15/27, original par and fair values of $11,928,523,600 and $12,550,348,671, respectively) | | | 12,550,000 | | | | 12,550,000,000 | |
Total Value of Federal Reserve Bank of New York (collateral value of $12,550,348,671) | | | | | | | 12,550,000,000 | |
Goldman Sachs & Co., 0.34%, 1/05/16 (Purchased on 12/29/15 to be repurchased at $563,026,586, collateralized by various U.S. Government Sponsored Agency Obligations, 0.00% to 8.89%, due 6/25/19 to 10/15/49, original par and fair values of $13,632,455,938 and $606,302,169, respectively) | | | 563,000 | | | | 563,000,000 | |
Goldman Sachs & Co., 0.38%, 1/07/16 (Purchased on 12/31/15 to be repurchased at $24,001,773, collateralized by various U.S. Government Sponsored Agency Obligations, 3.50% to 5.17%, due 3/25/33 to 11/20/45, original par and fair values of $23,013,915 and $24,483,982, respectively) | | | 24,000 | | | | 24,000,000 | |
Total Value of Goldman Sachs & Co. (collateral value of $630,786,151) | | | | | | | 587,000,000 | |
HSBC Securities (USA), Inc., 0.24%, 1/04/16 (Purchased on 12/31/15 to be repurchased at $50,001,333, collateralized by various Corporate Debt/Obligations, 2.46% to 10.00%, due 4/15/16 to 11/01/35, original par and fair values of $53,121,000 and $52,427,893, respectively) | | | 50,000 | | | | 50,000,000 | |
HSBC Securities (USA), Inc., 0.32%, 1/04/16 (Purchased on 12/31/15 to be repurchased at $185,006,578, collateralized by various Corporate Debt/Obligations, 2.46% to 11.00%, due 7/08/16 to 1/15/26, original par and fair values of $212,096,000 and $194,250,533, respectively) | | | 185,000 | | | | 185,000,000 | |
Total Value of HSBC Securities (USA), Inc. (collateral value of $246,678,426) | | | | | | | 235,000,000 | |
See Notes to Financial Statements.
| | | | | | |
| | | | | | | |
| 38 | | BLACKROCK FUNDS III | | DECEMBER 31, 2015 | | |
| | |
Schedule of Investments (continued) | | Money Market Master Portfolio |
| | | | | | | | |
| Repurchase Agreements | | Par (000) | | | Value | |
J.P. Morgan Securities LLC, 0.47%, 1/04/16 (Purchased on 12/31/15 to be repurchased at $60,003,133, collateralized by various Corporate Debt/Obligations, 0.70% to 7.21%, due 1/15/29 to 6/25/36, original par and fair values of $116,509,938 and $75,003,783, respectively) | | $ | 60,000 | | | $ | 60,000,000 | |
J.P. Morgan Securities LLC, 0.71%, 2/04/16 (Purchased on 12/31/15 to be repurchased at $150,103,542, collateralized by various Corporate Debt/Obligations, 0.03% to 1.75%, due 11/05/30 to 7/15/56, original par and fair values of $23,130,633,154 and $160,500,171, respectively) (f) | | | 150,000 | | | | 150,000,000 | |
J.P. Morgan Securities LLC, 0.79%, 2/04/16 (Purchased on 12/31/15 to be repurchased at $150,115,208, collateralized by various Corporate Debt/Obligations, 0.00% to 5.08%, due 4/15/26 to 2/25/37, original par and fair values of $219,123,453 and $187,500,416, respectively) (f) | | | 150,000 | | | | 150,000,000 | |
J.P. Morgan Securities LLC, 0.99%, 3/31/16 (Purchased on 12/31/15 to be repurchased at $150,376,513, collateralized by various Corporate Debt/Obligations, 0.00% to 6.90%, due 3/20/16 to 4/17/52, original par and fair values of $230,201,571 and $187,500,489, respectively) (f) | | | 150,000 | | | | 150,000,000 | |
J.P. Morgan Securities LLC, 1.11%, 3/31/16 (Purchased on 12/31/15 to be repurchased at $200,562,683, collateralized by various Corporate Debt/Obligations, 0.47% to 7.08%, due 6/25/21 to 3/25/54, original par and fair values of $2,016,825,155 and $243,199,697, respectively) (f) | | | 200,000 | | | | 200,000,000 | |
J.P. Morgan Securities LLC, 0.67%, 2/16/16 (Purchased on 11/17/15 to be repurchased at $142,124,211, collateralized by various Corporate Debt/Obligations, 0.00% to 7.92%, due 3/20/16 to 5/25/47, original par and fair values of $614,633,034 and $177,500,608, respectively) | | | 142,000 | | | | 142,000,000 | |
Total Value of J.P. Morgan Securities LLC (collateral value of $1,031,205,164) | | | | | | | 852,000,000 | |
Merrill Lynch, Pierce, Fenner & Smith, Inc., 0.29%, 1/04/16 (Purchased on 12/31/15 to be repurchased at $25,000,806, collateralized by a U.S. Treasury Obligation, 1.38%, due 2/29/20, original par and fair value of $25,705,000 and $25,500,093, respectively) | | | 25,000 | | | | 25,000,000 | |
Merrill Lynch, Pierce, Fenner & Smith, Inc., 0.35%, 1/07/16 (Purchased on 12/31/15 to be repurchased at $262,017,831, collateralized by various U.S. Government Sponsored Agency Obligations, 0.00% to 8.42%, due 4/15/20 to 10/20/65, original par and fair values of $16,928,845,510 and $284,391,929, respectively) | | | 262,000 | | | | 262,000,000 | |
Merrill Lynch, Pierce, Fenner & Smith, Inc., 0.72%, 2/14/16, (Purchased on 12/31/15 to be repurchased at $42,037,800, collateralized by various Corporate Debt/Obligations, 0.00% to 1.01%, due 8/26/23 to 6/26/47, original par and fair values of $86,875,618 and $52,500,001, respectively) (f) | �� | | 42,000 | | | | 42,000,000 | |
Total Value of Merrill Lynch, Pierce, Fenner & Smith, Inc. (collateral value of $362,392,023) | | | | 329,000,000 | |
| | | | | | | | |
| Repurchase Agreements | | Par (000) | | | Value | |
Mizuho Securities USA, Inc., 0.35%, 1/04/16 (Purchased on 12/31/15 to be repurchased at $75,002,917, collateralized by various U.S. Government Sponsored Agency Obligations, 3.00% to 6.33%, due 4/15/32 to 2/25/45, original par and fair values of $786,690,823 and $81,250,559, respectively) | | $ | 75,000 | | | $ | 75,000,000 | |
Mizuho Securities USA, Inc., 1.44%, 2/01/16 (Purchased on 12/31/15 to be repurchased at $44,807,439, collateralized by various U.S. Government Sponsored Agency Obligations, 3.00% to 6.32%, due 9/25/32 to 4/15/44, original par and fair values of $415,776,602 and $48,462,004, respectively) (f) | | | 44,750 | | | | 44,750,000 | |
Total Value of Mizuho Security USA, Inc. (collateral value of $129,712,563) | | | | | | | 119,750,000 | |
RBC Capital Markets LLC, 0.19%, 1/04/16 (Purchased on 12/31/15 to be repurchased at $209,004,412, collateralized by various Corporate Debt/Obligations, 0.00% to 9.38%, due 3/22/16 to 12/31/99, original par and fair values of $251,654,767 and $219,493,233, respectively) | | | 209,000 | | | | 209,000,000 | |
RBC Capital Markets LLC, 0.20%, 1/04/16 (Purchased on 12/31/15 to be repurchased at $51,001,133, collateralized by various Corporate Debt/Obligations, 0.00% to 10.20%, due 3/22/16 to 11/15/67, original par and fair values of $56,479,011 and $53,551,007, respectively) | | | 51,000 | | | | 51,000,000 | |
RBC Capital Markets LLC, 0.20%, 1/04/16 (Purchased on 12/31/15 to be repurchased at $90,002,000, collateralized by various U.S. Government Sponsored Agency Obligations, 0.00% to 0.32%, due 1/7/16 to 6/14/16, original par and fair values of $94,668,389 and $94,500,001, respectively) | | | 90,000 | | | | 90,000,000 | |
Total Value of RBC Capital Markets LLC (collateral value of $367,544,241) | | | | | | | 350,000,000 | |
Wells Fargo Securities LLC, 0.27%, 1/04/16 (Purchased on 12/31/15 to be repurchased at $320,009,600, collateralized by various Corporate Debt/Obligations, 0.71% to 4.95%, due 5/20/17 to 10/15/48, original par and fair values of $345,035,080 and $342,400,001, respectively) | | | 320,000 | | | | 320,000,000 | |
Wells Fargo Securities LLC, 0.55%, 1/11/16 (Purchased on 10/13/15 to be repurchased at $93,030,632, collateralized by various Corporate Debt/Obligations, 1.05% to 6.88%, due 5/27/16 to 4/01/45, original par and fair values of $100,348,000 and $97,666,622, respectively) | | | 93,015 | | | | 93,015,000 | |
Wells Fargo Securities LLC, 0.49%, 2/01/16 (Purchased on 11/02/15 to be repurchased at $150,065,333, collateralized by various Corporate/Debt Obligations, 1.90% to 6.55%, due 1/25/16 to 10/15/44, par and fair value of $154,473,000 and $157,500,345, respectively) | | | 150,000 | | | | 150,000,000 | |
Wells Fargo Securities LLC, 0.49%, 2/02/16 (Purchased on 11/03/15 to be repurchased at $140,062,883, collateralized by various Corporate Debt/Obligations, 0.49% to 6.35%, due 1/25/16 to 5/01/46, original par and fair values of $146,882,000 and $147,000,757, respectively) | | | 140,000 | | | | 140,000,000 | |
See Notes to Financial Statements.
| | | | | | |
| | | | | | | |
| | BLACKROCK FUNDS III | | DECEMBER 31, 2015 | | 39 |
| | |
Schedule of Investments (concluded) | | Money Market Master Portfolio |
| | | | | | | | |
| Repurchase Agreements | | Par (000) | | | Value | |
Wells Fargo Securities, LLC, 0.97%, 3/17/16 (Purchased on 12/17/15 to be repurchased at $110,228,219, collateralized by various Corporate Debt/Obligations, 0.00% to 5.64%, due 6/17/31 to 5/25/55, original par and fair values of $142,111,559 and $137,500,000, respectively) | | $ | 110,000 | | | $ | 110,000,000 | |
Total Value of Wells Fargo Securities, LLC (collateral value of $882,067,725) | | | | | | | 813,015,000 | |
| Total Repurchase Agreements — 40.2% | | | | | | | 17,384,475,000 | |
| Total Investments (Cost — $43,332,509,067*) — 100.1% | | | | 43,332,509,067 | |
| Liabilities in Excess of Other Assets — (0.1)% | | | | (43,355,075 | ) |
| | | | | | | | |
| Net Assets — 100.0% | | | | | | $ | 43,289,153,992 | |
| | | | | | | | |
|
| Notes to Schedule of Investments |
| * | | Cost for federal income tax purposes. |
| (a) | | Variable rate security. Rate as of period end. |
| (b) | | Issuer is a U.S. branch of foreign domiciled bank. |
| (c) | | Rates are discount rates or a range of discount rates at the time of purchase. |
| (d) | | Security exempt from registration pursuant to Rule 144A under the Securities Act of 1933, as amended. These securities may be resold in transactions exempt from registration to qualified institutional investors. |
| (e) | | Traded in a joint account. |
| (f) | | Variable rate security. Rate as of period end and maturity is the date the principal owed can be recovered through demand. |
|
| Fair Value Hierarchy as of Period End |
Various inputs are used in determining the fair value of investments. For information about the Master Portfolio’s policy regarding valuation of investments, refer to the Notes to Financial Statements.
The following tables summarize the Master Portfolio’s investments categorized in the disclosure hierarchy:
| | | | | | | | | | | | | | | | |
| | | Level 1 | | | Level 2 | | | Level 3 | | | Total | |
Assets: | | | | | | | | | | | | | | | | |
| Investments: | | | | | | | | | | | | | | | | |
Short-Term Securities 1 | | | — | | | $ | 43,332,509,067 | | | | — | | | $ | 43,332,509,067 | |
1 See above Schedule of Investments for values in each security type. | |
The Master Portfolio may hold assets in which the fair value approximates the carrying amount for financial statement purposes. As of period end, cash of $807,820 is categorized as Level 1 within the disclosure hierarchy.
During the year ended December 31, 2015, there were no transfers between levels.
See Notes to Financial Statements.
| | | | | | |
| | | | | | | |
| 40 | | BLACKROCK FUNDS III | | DECEMBER 31, 2015 | | |
| | |
Schedule of Investments December 31, 2015 | | Prime Money Market Master Portfolio (Percentages shown are based on Net Assets) |
| | | | | | | | |
| Certificates of Deposit | | Par (000) | | | Value | |
Domestic — 1.8% | | | | | | | | |
State Street Bank & Trust, 0.59%, 3/29/16 (a) | | $ | 64,500 | | | $ | 64,500,000 | |
Wells Fargo Bank NA (a): | | | | | | | | |
0.55%, 1/06/16 | | | 100,000 | | | | 100,000,000 | |
0.55%, 1/21/16 | | | 100,000 | | | | 100,000,000 | |
0.54%, 2/12/16 | | | 100,000 | | | | 100,000,000 | |
0.57%, 2/12/16 | | | 25,000 | | | | 25,000,000 | |
0.32%, 4/01/16 | | | 80,000 | | | | 80,000,000 | |
| | | | | | | | |
| | | | | | | | 469,500,000 | |
Yankee (b) — 19.4% | | | | | | | | |
Bank of Montreal, Chicago (a): | | | | | | | | |
0.39%, 1/07/16 | | | 75,000 | | | | 75,000,000 | |
0.59%, 1/25/16 | | | 100,000 | | | | 100,000,000 | |
0.60%, 4/21/16 | | | 100,000 | | | | 100,000,000 | |
0.56%, 6/01/16 | | | 150,000 | | | | 150,000,000 | |
0.65%, 7/21/16 | | | 75,000 | | | | 75,000,000 | |
Bank of Nova Scotia, Houston (a): | | | | | | | | |
0.55%, 2/05/16 | | | 25,000 | | | | 25,005,187 | |
0.64%, 2/29/16 | | | 75,000 | | | | 75,009,860 | |
Bank of Tokyo-Mitsubishi UFJ, Ltd., New York: | | | | | | | | |
0.28%, 1/05/16 | | | 200,000 | | | | 200,000,000 | |
0.62%, 3/24/16 (a) | | | 100,000 | | | | 100,000,000 | |
BNP Paribas SA, New York,
0.65%, 2/29/16 (a) | | | 95,000 | | | | 95,000,000 | |
Canadian Imperial Bank of Commerce, New York (a): | | | | | | | | |
0.53%, 1/26/16 | | | 125,000 | | | | 125,000,000 | |
0.40%, 2/10/16 | | | 150,000 | | | | 150,000,000 | |
0.57%, 4/18/16 | | | 100,000 | | | | 100,000,000 | |
0.59%, 5/19/16 | | | 99,200 | | | | 99,200,000 | |
0.55%, 6/01/16 | | | 200,000 | | | | 200,000,000 | |
0.62%, 6/01/16 | | | 100,000 | | | | 100,000,000 | |
0.65%, 6/30/16 | | | 150,000 | | | | 150,000,000 | |
Mitsubishi UFJ Trust & Banking Corp., New York (a): | | | | | | | | |
0.45%, 1/05/16 | | | 150,000 | | | | 150,000,000 | |
0.45%, 2/04/16 | | | 199,250 | | | | 199,250,000 | |
Mizuho Bank Ltd., New York: | | | | | | | | |
0.29%, 1/06/16 | | | 25,000 | | | | 25,000,000 | |
0.37%, 1/19/16 | | | 100,000 | | | | 100,000,000 | |
0.45%, 2/04/16 (a) | | | 149,200 | | | | 149,200,000 | |
0.51%, 4/01/16 | | | 50,000 | | | | 50,000,000 | |
National Bank of Canada, New York (a): | | | | | | | | |
0.46%, 5/03/16 | | | 88,300 | | | | 88,300,000 | |
0.49%, 5/05/16 | | | 250,000 | | | | 250,000,000 | |
Nordea Bank AB, New York
0.49%, 5/13/16 (a) | | | 95,000 | | | | 95,000,000 | |
Norinchukin Bank, New York: | | | | | | | | |
0.33%, 1/07/16 | | | 200,000 | | | | 200,000,000 | |
0.31%, 1/08/16 | | | 115,000 | | | | 115,000,000 | |
Rabobank Nederland, New York: | | | | | | | | |
0.39%, 1/11/16 (a) | | | 100,000 | | | | 100,000,000 | |
0.41%, 1/11/16 (a) | | | 110,000 | | | | 110,000,000 | |
0.52%, 2/22/16 (a) | | | 75,000 | | | | 75,000,000 | |
0.46%, 4/11/16 (a) | | | 100,000 | | | | 100,000,000 | |
0.53%, 5/10/16 | | | 86,000 | | | | 86,000,000 | |
Royal Bank of Canada, New York,
0.45%, 3/16/16 (a) | | | 50,000 | | | | 50,000,000 | |
Skandinaviska Enskilda Banken AB, New York,
0.50%, 3/14/16 (a) | | | 150,000 | | | | 150,000,000 | |
Sumitomo Mitsui Banking Corp., New York (a): | | | | | | | | |
0.64%, 2/25/16 | | | 125,000 | | | | 125,000,000 | |
0.49%, 4/07/16 | | | 100,000 | | | | 100,000,000 | |
Sumitomo Mitsui Trust Bank Ltd., New York: | | | | | | | | |
0.48%, 1/08/16 (a) | | | 100,000 | | | | 100,000,000 | |
0.38%, 2/05/16 | | | 150,000 | | | | 150,000,000 | |
| | | | | | | | |
| Certificates of Deposit | | Par (000) | | | Value | |
Yankee (b) — (continued) | |
Toronto-Dominion Bank, New York: | | | | | | | | |
0.53%, 2/25/16 (a) | | $ | 50,000 | | | $ | 50,000,000 | |
0.50%, 5/06/16 | | | 75,000 | | | | 75,000,000 | |
0.57%, 5/19/16 (a) | | | 25,000 | | | | 25,000,000 | |
0.49%, 6/06/16 (a) | | | 100,000 | | | | 100,000,000 | |
0.75%, 6/06/16 | | | 70,000 | | | | 70,000,000 | |
0.57%, 10/17/16 (a) | | | 42,500 | | | | 42,500,000 | |
UBS AG, Stamford, 0.67%, 4/29/16 (a) | | | 185,000 | | | | 185,000,000 | |
Westpac Banking Corp., New York, 0.49%, 6/03/16 (a) | | | 150,000 | | | | 150,000,000 | |
| | | | | | | | |
| | | | | | | | 5,184,465,047 | |
| Total Certificates of Deposit — 21.2% | | | | | | | 5,653,965,047 | |
| | | | | | | | |
| | | | | | | | | |
| | |
| Commercial Paper | | | | | | |
ANZ New Zealand International Ltd., London (a): | | | | | | | | |
0.45%, 5/03/16 | | | 50,000 | | | | 50,000,000 | |
0.42%, 5/04/16 | | | 45,000 | | | | 45,000,095 | |
0.39%, 5/05/16 | | | 150,000 | | | | 150,000,000 | |
0.39%, 6/03/16 (c) | | | 100,000 | | | | 100,000,000 | |
ASB Finance Ltd., 0.55%, 5/16/16 (a)(c) | | | 150,000 | | | | 150,000,000 | |
Australia & New Zealand Banking International Group Ltd., 0.64%, 5/26/16 (a) | | | 250,000 | | | | 250,000,000 | |
Bank of Nova Scotia, 0.50%, 5/04/16 (c)(d) | | | 98,000 | | | | 97,831,222 | |
Barton Capital Corp., 0.65%, 3/30/16 (d) | | | 50,000 | | | | 49,919,653 | |
Bedford Row Funding Corp. (a): | | | | | | | | |
0.50%, 2/18/16 | | | 100,000 | | | | 100,000,000 | |
0.56%, 2/26/16 | | | 35,000 | | | | 35,000,000 | |
0.38%, 3/02/16 | | | 80,000 | | | | 80,000,000 | |
0.41%, 3/07/16 (c) | | | 50,000 | | | | 50,000,000 | |
0.62%, 3/24/16 | | | 100,000 | | | | 100,000,000 | |
0.47%, 4/07/16 | | | 75,000 | | | | 75,000,000 | |
0.60%, 4/20/16 | | | 25,750 | | | | 25,750,000 | |
0.70%, 6/13/16 | | | 100,000 | | | | 100,000,000 | |
Bennington Stark Capital Co., 0.45%, 1/05/16 (d) | | | 200,000 | | | | 199,990,000 | |
Caisse des Depots et Consignations: | | | | | | | | |
0.39%, 2/08/16 (d) | | | 4,325 | | | | 4,323,220 | |
0.58%, 4/22/16 (a) | | | 250,000 | | | | 250,000,000 | |
Cancara Asset Securitisation LLC, 0.30%, 1/20/16 (d) | | | 100,000 | | | | 99,984,167 | |
Chariot Funding LLC (d): | | | | | | | | |
0.42%, 1/05/16 | | | 100,000 | | | | 99,995,333 | |
0.42%, 1/06/16 | | | 50,000 | | | | 49,997,083 | |
0.43%, 1/11/16 | | | 50,000 | | | | 49,994,028 | |
0.52%, 5/04/16 | | | 25,500 | | | | 25,454,327 | |
Collateralized Commercial Paper Co. (a): | | | | | | | | |
0.45%, 1/07/16 | | | 100,000 | | | | 100,000,000 | |
0.60%, 2/22/16 | | | 75,000 | | | | 75,000,000 | |
Collateralized Commercial Paper II Co.: | | | | | | | | |
0.53%, 5/13/16 (d) | | | 99,650 | | | | 99,454,880 | |
0.67%, 6/08/16 (a) | | | 100,000 | | | | 100,000,000 | |
Commonwealth Bank of Australia (a): | | | | | | | | |
0.37%, 2/19/16 | | | 50,000 | | | | 50,000,000 | |
0.52%, 2/26/16 | | | 50,000 | | | | 50,000,000 | |
0.40%, 4/29/16 | | | 27,000 | | | | 27,000,000 | |
0.42%, 6/02/16 | | | 100,000 | | | | 100,000,000 | |
0.50%, 6/14/16 | | | 50,000 | | | | 50,000,000 | |
0.49%, 7/05/16 | | | 185,000 | | | | 185,000,000 | |
0.62%, 7/15/16 | | | 25,000 | | | | 25,000,000 | |
CRC Funding LLC (d): | | | | | | | | |
0.50%, 2/08/16 | | | 199,500 | | | | 199,394,708 | |
0.50%, 3/07/16 | | | 50,000 | | | | 49,954,167 | |
DBS Bank, Ltd., 0.65%, 4/01/16 (d) | | | 100,000 | | | | 99,841,111 | |
Fairway Finance Co. LLC (a): | | | | | | | | |
0.39%, 1/06/16 | | | 50,000 | | | | 49,999,874 | |
0.51%, 4/18/16 | | | 50,000 | | | | 50,000,000 | |
See Notes to Financial Statements.
| | | | | | |
| | | | | | | |
| | BLACKROCK FUNDS III | | DECEMBER 31, 2015 | | 41 |
| | |
Schedule of Investments (continued) | | Prime Money Market Master Portfolio |
| | | | | | | | |
| Commercial Paper | | Par (000) | | | Value | |
Gotham Funding Corp., 0.42%, 1/20/16 (d) | | $ | 100,000 | | | $ | 99,977,833 | |
HSBC Bank PLC (a): | | | | | | | | |
0.38%, 1/13/16 | | | 100,000 | | | | 100,000,000 | |
0.40%, 2/05/16 | | | 116,500 | | | | 116,500,000 | |
0.65%, 6/20/16 | | | 127,000 | | | | 127,000,000 | |
0.50%, 7/06/16 | | | 70,000 | | | | 70,000,000 | |
Jupiter Securitization Co. LLC (d): | | | | | | | | |
0.42%, 1/04/16 | | | 100,000 | | | | 99,996,500 | |
0.43%, 1/12/16 | | | 50,000 | | | | 49,993,431 | |
Kells Funding LLC: | | | | | | | | |
0.34%, 1/13/16 (a) | | | 100,000 | | | | 100,000,000 | |
0.41%, 1/20/16 (d) | | | 200,000 | | | | 199,956,722 | |
0.34%, 2/10/16 (d) | | | 100,000 | | | | 99,962,222 | |
Mitsubishi UFJ Trust & Banking Corp., New York, 0.70%, 4/04/16 (d) | | | 35,000 | | | | 34,936,028 | |
Mizuho Bank Ltd., New York, 0.35%, 2/16/16 (d) | | | 175,000 | | | | 174,921,736 | |
National Australia Bank Ltd. (a): | | | | | | | | |
0.43%, 1/09/16 (c) | | | 200,000 | | | | 200,000,000 | |
0.59%, 2/26/16 | | | 100,000 | | | | 100,000,000 | |
0.62%, 6/08/16 | | | 94,000 | | | | 94,000,000 | |
Nieuw Amsterdam Receivables Corp., 0.38%, 2/01/16 (d) | | | 2,000 | | | | 1,999,346 | |
Nordea Bank AB (d): | | | | | | | | |
0.48%, 2/26/16 | | | 100,000 | | | | 99,926,111 | |
0.40%, 4/01/16 | | | 100,000 | | | | 99,898,889 | |
Old Line Funding LLC: | | | | | | | | |
0.44%, 1/06/16 (a) | | | 92,000 | | | | 92,000,000 | |
0.45%, 2/09/16 (a)(c) | | | 100,000 | | | | 100,002,155 | |
0.51%, 3/03/16 (d) | | | 46,311 | | | | 46,270,323 | |
0.50%, 3/07/16 (d) | | | 80,000 | | | | 79,926,667 | |
0.50%, 3/11/16 (d) | | | 50,000 | | | | 49,951,389 | |
0.75%, 4/26/16 (d) | | | 50,000 | | | | 49,879,167 | |
0.51%, 5/16/16 (d) | | | 45,000 | | | | 44,913,300 | |
0.63%, 5/23/16 (d) | | | 50,000 | | | | 49,874,875 | |
Oversea-Chinese Banking Corp. Ltd., New York, 0.55%, 5/19/16 (a) | | | 10,000 | | | | 10,000,000 | |
Province of Quebec, 0.40%, 1/28/16 (d) | | | 3,775 | | | | 3,773,882 | |
PSP Capital, Inc. (d): | | | | | | | | |
0.24%, 1/28/16 | | | 100,000 | | | | 99,982,000 | |
0.47%, 2/09/16 | | | 25,000 | | | | 24,987,271 | |
Sumitomo Mitsui Banking Corp., 0.70%, 3/22/16 (c)(d) | | | 150,000 | | | | 149,763,750 | |
Sumitomo Trust & Banking Co., 0.38%, 2/05/16 (c)(d) | | | 200,000 | | | | 199,926,111 | |
Thunder Bay Funding LLC: | | | | | | | | |
0.44%, 1/06/16 (a) | | | 50,000 | | | | 50,000,000 | |
0.75%, 4/26/16 (d) | | | 98,700 | | | | 98,461,475 | |
0.83%, 6/06/16 (d) | | | 80,000 | | | | 79,710,422 | |
0.83%, 6/15/16 (d) | | | 30,000 | | | | 29,885,183 | |
Toyota Credit Canada, Inc. (d): | | | | | | | | |
0.33%, 2/16/16 | | | 50,000 | | | | 49,978,917 | |
0.38%, 3/14/16 | | | 50,000 | | | | 49,961,472 | |
0.38%, 3/15/16 | | | 50,000 | | | | 49,960,944 | |
Toyota Motor Credit Corp., 0.39%, 1/08/16 (a) | | | 200,000 | | | | 200,000,000 | |
United Overseas Bank Ltd. (d): | | | | | | | | |
0.30%, 1/06/16 | | | 89,200 | | | | 89,196,283 | |
0.39%, 1/11/16 | | | 200,000 | | | | 199,978,333 | |
0.39%, 1/14/16 | | | 100,000 | | | | 99,985,917 | |
Victory Receivables Corp. (d): | | | | | | | | |
0.30%, 1/11/16 | | | 50,000 | | | | 49,995,833 | |
0.63%, 3/28/16 | | | 80,000 | | | | 79,878,200 | |
Westpac Banking Corp. (a): | | | | | | | | |
0.40%, 3/02/16 | | | 250,000 | | | | 250,000,000 | |
0.28%, 3/18/16 | | | 75,000 | | | | 75,000,000 | |
0.44%, 4/14/16 | | | 90,000 | | | | 90,000,000 | |
0.46%, 5/09/16 | | | 100,000 | | | | 100,000,000 | |
| | | | | | | | |
| Commercial Paper | | Par (000) | | | Value | |
Westpac Securities NZ Ltd., 0.41%, 5/06/16 (a)(c) | | $ | 25,000 | | | $ | 25,000,000 | |
| Total Commercial Paper — 30.3% | | | | | | | 8,086,196,555 | |
| | | | | | | | |
| | | | | | | | | |
|
| Corporate Notes | |
Commonwealth Bank of Australia (c): | | | | | | | | |
3.25%, 3/17/16 | | | 65,000 | | | | 65,363,514 | |
1.07%, 9/20/16 (a) | | | 20,000 | | | | 20,042,210 | |
GE Capital International Funding Co., 0.96%, 4/15/16 (c) | | | 183,409 | | | | 183,644,601 | |
| Total Corporate Notes — 1.0% | | | | | | | 269,050,325 | |
| | | | | | | | |
| | | | | | | | | |
|
| Time Deposits | |
BNP Paribas SA, New York, 0.20%, 1/04/16 | | | 100,000 | | | | 100,000,000 | |
Credit Agricole Corporate & Investment Bank, 0.25%, 1/04/16 | | | 503,000 | | | | 503,000,000 | |
| Total Time Deposits — 2.2% | | | | | | | 603,000,000 | |
| | | | | | | | |
| | | | | | | | | |
|
| U.S. Government Sponsored Agency Obligations | |
Federal Farm Credit Banks, 0.38%, 12/04/17 (a) | | | 125,000 | | | | 125,000,000 | |
Federal Home Loan Bank: | | | | | | | | |
0.22%, 1/25/16 (d) | | | 1,710 | | | | 1,709,749 | |
0.23%, 2/14/17 (a) | | | 50,000 | | | | 49,975,958 | |
| Total U.S. Government Sponsored Agency Obligations — 0.7% | | | | 176,685,707 | |
| | | | | | | | |
| | | | | | | | | |
| | |
| U.S. Treasury Obligations — 0.1% | | | | | | |
U.S. Treasury Notes, 0.43%, 10/31/17 (a) | | | 34,415 | | | | 34,311,717 | |
| | | | | | | | |
| | | | | | | | | |
|
| Repurchase Agreements | |
BNP Paribas Securities Corp., 0.22%, 1/04/16 (Purchased on 12/31/15 to be repurchased at $84,002,054, collateralized by various Corporate Debt Obligations, 1.47% to 3.90%, due 10/19/24 to 11/25/44, original par and fair values of $100,647,248 and $89,880,001, respectively) | | | 84,000 | | | | 84,000,000 | |
Total Value of BNP Paribas Securities Corp.
(collateral value of $89,880,001) | | | | 84,000,000 | |
Citigroup Global Markets, Inc., 0.32%, 1/04/16 (Purchased on 12/31/15 to be repurchased at $123,510,391, collateralized by various U.S. Treasury Obligations, 1.88% to 2.50%, due 8/31/22 to 8/15/23, original par and fair values of $126,715,392 and $125,976,161, respectively) (e) | | | 123,506 | | | | 123,506,000 | |
Total Value of Citigroup Global Markets, Inc. (collateral value of $125,976,161) | | | | | | | 123,506,000 | |
Credit Suisse Securities (USA) LLC, 0.70%, 1/05/16 (Purchased on 12/29/15 to be repurchased at $136,013,222, collateralized by various Corporate Debt Obligations, 0.00% to 9.89%, due 7/01/20 to 9/25/55, original par and fair values of $168,334,390 and $163,201,709, respectively) | | | 136,000 | | | | 136,000,000 | |
See Notes to Financial Statements.
| | | | | | |
| | | | | | | |
| 42 | | BLACKROCK FUNDS III | | DECEMBER 31, 2015 | | |
| | |
Schedule of Investments (continued) | | Prime Money Market Master Portfolio |
| | | | | | | | |
| Repurchase Agreements | | Par (000) | | | Value | |
Credit Suisse Securities (USA) LLC, 0.47%, 1/04/16 (Purchased on 12/31/15 to be repurchased at $185,125,667, collateralized by various Corporate Debt Obligations, 0.00% to 5.75%, due 7/25/45 to 6/25/55, original par and fair values of $283,742,406 and $222,142,907, respectively) | | $ | 185,116 | | | $ | 185,116,000 | |
Credit Suisse Securities (USA) LLC, 0.47%, 1/04/16 (Purchased on 12/31/15 to be repurchased at $86,504,517, collateralized by various Corporate Debt Obligations, 0.00% to 5.00%, due 10/25/29 to 4/25/55, original par and fair values of $514,498,210 and $103,804,220, respectively) | | | 86,500 | | | | 86,500,000 | |
Credit Suisse Securities (USA) LLC, 0.88%, 2/04/16 (Purchased on 12/31/15 to be repurchased at $133,113,724, collateralized by various Corporate Debt Obligations, 0.00% to 5.00%, due 7/25/54 to 9/25/55, original par and fair values of $171,597,875 and $159,601,970, respectively) (f) | | | 133,000 | | | | 133,000,000 | |
Total Value of Credit Suisse Securities (USA) LLC (collateral value of $648,750,806) | | | | | | | 540,616,000 | |
Federal Reserve Bank of New York, 0.25%, 1/04/16 (Purchased on 12/31/15 to be repurchased at $9,775,271,528, collateralized by various U.S. Treasury Obligations, 2.50% to 3.63%, due 2/15/21 to 8/15/23, original par and fair values of $9,437,634,800 and $9,775,271,605, respectively) | | | 9,775,000 | | | | 9,775,000,000 | |
Total Value of Federal Reserve Bank of New York (collateral value of $9,775,271,605) | | | | | | | 9,775,000,000 | |
HSBC Securities (USA), Inc., 0.29%, 1/04/16 (Purchased on 12/31/15 to be repurchased at $15,000,483, collateralized by a U.S. Treasury Obligation, 2.38%, due 8/15/24, original par and fair value of $15,045,000 and $15,301,311, respectively) | | | 15,000 | | | | 15,000,000 | |
Total Value of HSBC Securities (USA), Inc.
(collateral value of $15,301,311) | | | | 15,000,000 | |
J.P. Morgan Securities LLC, 0.27%, 1/04/16 (Purchased on 12/31/15 to be repurchased at $50,001,500, collateralized by various Corporate Debt Obligations, 0.38% to 5.70%, due 8/25/16 to 9/12/49, original par and fair values of $3,600,176,069 and $53,502,352, respectively) | | | 50,000 | | | | 50,000,000 | |
J.P. Morgan Securities LLC, 0.47%, 1/04/16 (Purchased on 12/31/15 to be repurchased at $30,001,567, collateralized by various Corporate Debt Obligations, 0.48% to 4.79%, due 5/25/36 to 5/15/37, original par and fair values of $83,228,000 and $37,501,185, respectively) | | | 30,000 | | | | 30,000,000 | |
J.P. Morgan Securities LLC, 0.62%, 1/05/16 (Purchased on 10/05/15 to be repurchased at $100,008,611, collateralized by various Corporate Debt Obligations, 0.38% to 7.54%, due 6/15/28 to 4/25/46, original par and fair values of $329,536,158 and $125,001,996, respectively) | | | 100,000 | | | | 100,000,000 | |
| | | | | | | | |
| Repurchase Agreements | | Par (000) | | | Value | |
J.P. Morgan Securities LLC, 0.71%, 2/04/16 (Purchased on 12/31/15 to be repurchased at $125,086,224, collateralized by various Corporate Debt Obligations, 0.00% to 1.53%, due 12/15/39 to 8/10/55, original par and fair values of $7,257,902,286 and $133,750,006, respectively) (f) | | $ | 125,000 | | | $ | 125,000,000 | |
J.P. Morgan Securities LLC, 0.79%, 2/04/16 (Purchased on 12/31/15 to be repurchased at $45,034,541, collateralized by a Corporate Debt Obligation, 0.39%, due 2/25/37, original par and fair values of $99,635,000 and $56,250,493, respectively) (f) | | | 45,000 | | | | 45,000,000 | |
J.P. Morgan Securities LLC, 0.67%, 2/16/16 (Purchased on 11/17/15 to be repurchased at $75,065,604, collateralized by various Corporate Debt Obligations, 0.36% to 7.86%, due 3/01/30 to 1/25/46, original par and fair values of $198,336,592 and $93,751,158, respectively) | | | 75,000 | | | | 75,000,000 | |
J.P. Morgan Securities LLC, 0.99%, 3/31/16 (Purchased on 12/31/15 to be repurchased at $45,112,920, collateralized by various Corporate Debt Obligations, 0.00% to 7.24%, due 7/11/20 to 4/22/46, original par and fair values of $91,007,000 and $56,254,819, respectively) (f) | | | 45,000 | | | | 45,000,000 | |
J.P. Morgan Securities LLC, 1.11%, 3/31/16 (Purchased on 12/31/15 to be repurchased at $80,225,013, collateralized by various Corporate Debt Obligations, 0.13% to 7.50%, due 1/25/19 to 3/12/51, original par and fair values of $2,904,489,168 and $93,236,768, respectively) (f) | | | 80,000 | | | | 80,000,000 | |
Total Value of J.P. Morgan Securities LLC (collateral value of $649,248,777) | | | | | | | 550,000,000 | |
Merrill Lynch, Pierce, Fenner & Smith, Inc., 0.72%, 2/16/16 (Purchased on 12/31/15 to be repurchased at $140,126,000, collateralized by various Corporate Debt Obligations, 0.31% to 5.07%, due 1/28/30 to 3/04/39, original par and fair values of $208,583,860 and $175,000,001, respectively) (f) | | | 140,000 | | | | 140,000,000 | |
Total Value of Merrill Lynch, Pierce, Fenner & Smith, Inc. (collateral value of $175,000,001) | | | | | | | 140,000,000 | |
RBC Capital Markets LLC, 0.19%, 1/04/16 (Purchased on 12/31/15 to be repurchased at $63,001,330, collateralized by various Corporate Debt Obligations, 0.00% to 10.20%, due 3/22/16 to 11/15/67, original par and fair values of $77,461,272 and $66,150,952, respectively) | | | 63,000 | | | | 63,000,000 | |
RBC Capital Markets LLC, 0.20%, 1/04/16 (Purchased on 12/31/15 to be repurchased at $25,000,556, collateralized by various Corporate Debt Obligations, 0.00% to 0.45%, due 1/07/16 to 6/14/16, original par and fair values of $26,304,828 and $26,250,001, respectively) | | | 25,000 | | | | 25,000,000 | |
RBC Capital Markets LLC, 0.20%, 1/04/16 (Purchased on 12/31/15 to be repurchased at $16,000,356, collateralized by various Corporate Debt Obligations, 0.00% to 8.10%, due 3/22/16 to 11/01/64, original par and fair values of $19,002,091 and $16,800,373, respectively) | | | 16,000 | | | | 16,000,000 | |
See Notes to Financial Statements.
| | | | | | |
| | | | | | | |
| | BLACKROCK FUNDS III | | DECEMBER 31, 2015 | | 43 |
| | |
Schedule of Investments (concluded) | | Prime Money Market Master Portfolio |
| | | | | | | | |
| Repurchase Agreements | | Par (000) | | | Value | |
RBC Capital Markets LLC, 0.44%, 1/05/16 (Purchased on 12/29/15 to be repurchased at $100,006,111, collateralized by various Corporate Debt Obligations, 0.00% to 10.20%, due 5/18/16 to 11/15/67, original par and fair values of $104,394,486 and $105,000,069, respectively) | | $ | 100,000 | | | $ | 100,000,000 | |
Total Value of RBC Capital Markets LLC (collateral value of $214,201,395) | | | | | | | 204,000,000 | |
Wells Fargo Securities LLC, 0.27%, 1/04/16 (Purchased on 12/31/15 to be repurchased at $180,005,400, collateralized by various Corporate Debt Obligations, 0.78% to 7.15%, due 10/16/17 to 11/15/46, original par and fair values of $192,074,840 and $192,600,001, respectively) | | | 180,000 | | | | 180,000,000 | |
Wells Fargo Securities LLC, 0.55%, 1/08/16 (Purchased on 10/08/15 to be repurchased at $50,006,111, collateralized by various Corporate Debt Obligations, 0.00%, due 2/01/16 to 2/02/16, original par and fair values of $51,023,140 and $51,000,000, respectively) | | | 50,000 | | | | 50,000,000 | |
Wells Fargo Securities LLC, 0.55%, 1/11/16 (Purchased on 10/13/15 to be repurchased at $36,711,168, collateralized by various Corporate Debt Obligations, 0.00%, due 2/02/16 to 2/08/16, original par and fair values of $37,458,567 and $37,439,100, respectively) | | | 36,705 | | | | 36,705,000 | |
| | | | | | | | |
| Repurchase Agreements | | Par (000) | | | Value | |
Wells Fargo Securities LLC, 0.49%, 2/01/16 (Purchased on 11/02/15 to be repurchased at $100,043,556, collateralized by various Corporate Debt Obligations, 0.00%, due 1/06/16 to 7/25/16, original par and fair values of $102,234,077 and $102,000,000, respectively) | | $ | 100,000 | | | $ | 100,000,000 | |
Wells Fargo Securities LLC, 0.49%, 2/02/16 (Purchased on 11/03/15 to be repurchased at $59,026,501, collateralized by various Corporate Debt Obligations, 0.00%, due 2/08/16 to 3/01/16, original par and fair values of $60,222,076 and $60,180,001, respectively) | | | 59,000 | | | | 59,000,000 | |
Wells Fargo Securities LLC, 0.97%, 3/17/16 (Purchased on 12/17/15 to be repurchased at $55,114,110, collateralized by various Corporate Debt Obligations, 0.00% to 4.84%, due 1/17/20 to 5/25/55, original par and fair values of $74,083,857 and $68,750,001, respectively) | | | 55,000 | | | | 55,000,000 | |
Total Value of Wells Fargo Securities LLC (collateral value of $511,969,103) | | | | | | | 480,705,000 | |
| Total Repurchase Agreements — 44.6% | | | | | | | 11,912,827,000 | |
| Total Investments (Cost — $26,736,036,351*) — 100.1% | | | | 26,736,036,351 | |
| Liabilities in Excess of Other Assets — (0.1)% | | | | | | | (34,365,599 | ) |
| | | | | | | | |
Net Assets — 100.0% | | | | | | $ | 26,701,670,752 | |
| | | | | | | | |
| | |
| Notes to Schedule of Investments | | |
| * | | Cost for federal income tax purposes. |
| (a) | | Variable rate security. Rate as of period end. |
| (b) | | Issuer is a U.S. branch of foreign domiciled bank. |
| (c) | | Security exempt from registration pursuant to Rule 144A under the Securities Act of 1933, as amended. These securities may be resold in transactions exempt from registration to qualified institutional investors. |
| (d) | | Rates are discount rates or a range of discount rates at the time of purchase. |
| (e) | | Traded in a joint account. |
| (f) | | Variable rate security. Rate as of period end and maturity is the date the principal owed can be recovered through demand. |
| | |
| Fair Value Hierarchy as of Period End | | |
Various inputs are used in determining the fair value of investments and derivative financial instruments. For information about the Master Portfolio’s policy regarding valuation of investments, refer to the Notes to Financial Statements.
The following table summarizes the Master Portfolio’s investments categorized in the disclosure hierarchy:
| | | | | | | | | | | | | | | | |
| | | Level 1 | | | Level 2 | | | Level 3 | | | Total | |
Assets: | | | | | | | | | | | | | | | | |
| Investments: | | | | | | | | | | | | | | | | |
Short-Term Securities1 | | | — | | | $ | 26,736,036,351 | | | | — | | | $ | 26,736,036,351 | |
1 See above Schedule of Investments for values in each security type. | |
The Master Portfolio may hold assets in which the fair value approximates the carrying amount for financial statement purposes. As of period end, cash of $62,070,850 is categorized as Level 1 within the disclosure hierarchy.
During the year ended December 31, 2015, there were no transfers between levels.
See Notes to Financial Statements.
| | | | | | |
| | | | | | | |
| 44 | | BLACKROCK FUNDS III | | DECEMBER 31, 2015 | | |
| | |
Schedule of Investments December 31, 2015 | | Treasury Money Market Master Portfolio (Percentages shown are based on Net Assets) |
| | | | | | | | |
| U.S. Treasury Obligations | | Par (000) | | | Value | |
U.S. Treasury Bills (a): | | | | | | | | |
0.20%, 1/21/16 | | $ | 145,000 | | | $ | 144,984,292 | |
0.20%, 2/25/16 | | | 54,190 | | | | 54,173,576 | |
0.11%, 3/31/16 | | | 25,000 | | | | 24,993,438 | |
0.34%, 5/19/16 | | | 100,000 | | | | 99,870,653 | |
0.36%, 5/26/16 | | | 50,000 | | | | 49,929,028 | |
0.54%, 6/09/16 | | | 90,000 | | | | 89,787,778 | |
0.58%, 6/16/16 | | | 75,000 | | | | 74,796,469 | |
0.52%, 6/23/16 | | | 50,000 | | | | 49,875,542 | |
U.S. Treasury Notes: | | | | | | | | |
0.38%, 1/15/16 | | | 32,150 | | | | 32,152,615 | |
0.38% — 4.50%, 2/15/16 | | | 171,000 | | | | 171,759,502 | |
0.25% — 2.63%, 2/29/16 | | | 62,540 | | | | 62,695,917 | |
2.38%, 3/31/16 | | | 34,175 | | | | 34,355,580 | |
0.25%, 4/15/16 | | | 115,000 | | | | 114,967,638 | |
3.25%, 5/31/16 | | | 19,500 | | | | 19,741,490 | |
0.63%, 7/15/16 | | | 18,940 | | | | 18,938,653 | |
0.50%, 7/31/16 | | | 31,265 | | | | 31,238,766 | |
0.34%, 1/31/17 (b) | | | 97,504 | | | | 97,504,698 | |
0.33%, 4/30/17 (b) | | | 108,291 | | | | 108,287,918 | |
0.34%, 7/31/17 (b) | | | 84,160 | �� | | | 84,127,328 | |
0.43%, 10/31/17 (b) | | | 73,036 | | | | 73,001,437 | |
| Total U.S. Treasury Obligations — 41.7% | | | | | | | 1,437,182,318 | |
| | | | | | | | |
| | | | | | | | | |
| | |
| Repurchase Agreements — 58.1 % | | | | | | |
BNP Paribas Securities Corp., 0.29%, 1/04/16 (Purchased on 12/31/15 to be repurchased at $74,002,384, collateralized by various U.S. Treasury Obligations, 0.00% to 3.75%, due 11/15/16 to 11/15/43, original par and fair values of $71,236,905 and $75,480,000, respectively) | | | 74,000 | | | | 74,000,000 | |
Total Value of BNP Paribas Securities Corp. (collateral value of $75,480,000) | | | | | | | 74,000,000 | |
Citigroup Global Markets, Inc., 0.32%, 1/04/16 (Purchased on 12/31/15 to be repurchased at $50,285,788, collateralized by various U.S. Treasury Obligations, 1.88% to 2.50%, due 8/31/22 to 8/15/23, original par and fair values of $51,590,665 and $51,289,696, respectively) (c) | | | 50,284 | | | | 50,284,000 | |
Total Value of Citigroup Global Markets, Inc. (collateral value of $51,289,696) | | | | | | | 50,284,000 | |
HSBC Securities (USA), Inc., 0.27%, 1/04/16 (Purchased on 12/31/15 to be repurchased at $522,015,660, collateralized by various U.S. Treasury Obligations, 0.25% to 9.25%, due 1/15/16 to 11/15/45, original par and fair values of $515,129,331 and $532,443,445, respectively) | | | 522,000 | | | | 522,000,000 | |
HSBC Securities (USA), Inc., 0.27%, 1/04/16 (Purchased on 12/31/15 to be repurchased at $200,006,000, collateralized by various U.S. Treasury Obligations, 0.50% to 8.13%, due 7/31/16 to 5/15/41, original par and fair values of $194,518,973 and $204,001,440, respectively) (d) | | | 200,000 | | | | 200,000,000 | |
Total Value of HSBC Securities (USA), Inc. (collateral value of $736,444,885) | | | | | | | 722,000,000 | |
| | | | | | | | |
| Repurchase Agreements | | Par (000) | | | Value | |
Merrill Lynch, Pierce, Fenner & Smith, Inc., 0.29%, 1/04/16 (Purchased on 12/31/15 to be repurchased at $513,578,548, collateralized by various U.S. Government Sponsored Agency Obligations, 1.63% to 3.00%, due 6/30/20 to 5/15/45, original par and fair values of $526,777,000 and $523,833,335, respectively) | | $ | 513,562 | | | $ | 513,562,000 | |
Total Value of Merrill Lynch, Pierce, Fenner & Smith, Inc. (collateral value of $523,833,335) | | | | 513,562,000 | |
Morgan Stanley & Co. LLC, 0.27%, 1/04/16 (Purchased on 12/31/15 to be repurchased at $146,579,397, collateralized by various U.S. Treasury Obligations, 0.88% to 1.38%, due 11/30/16 to 11/30/18, original par and fair values of $149,408,200 and $149,506,514, respectively) | | | 146,575 | | | | 146,575,000 | |
Morgan Stanley & Co. LLC, 0.27%, 1/04/16 (Purchased on 12/31/15 to be repurchased at $24,000,720, collateralized by various U.S. Treasury Obligations, 1.63% to 2.75%, due 04/30/19 to 02/15/45, original par and fair values of $23,941,500 and $24,480,005, respectively) | | | 24,000 | | | | 24,000,000 | |
Total Value of Morgan Stanley & Co. LLC (collateral value of $173,986,519) | | | | | | | 170,575,000 | |
RBC Capital Markets LLC, 0.26%, 1/04/16 (Purchased on 12/31/15 to be repurchased at $24,000,693, collateralized by a U.S. Treasury Obligation, 2.63%, due 8/15/20, original par and fair value of $23,371,700 and $24,480,074, respectively) | | | 24,000 | | | | 24,000,000 | |
Total Value of RBC Capital Markets LLC (collateral value of $24,480,074) | | | | | | | 24,000,000 | |
TD Securities (USA) LLC, 0.32%, 1/04/16 (Purchased on 12/31/15 to be repurchased at $451,016,036 collateralized by various U.S. Treasury Obligations, 0.00% to 4.50%, due 1/07/16 to 2/15/45, original par and fair values of $445,274,693 and $460,020,001, respectively) | | | 451,000 | | | | 451,000,000 | |
Total Value of TD Securities (USA) LLC (collateral value of $460,020,001) | | | | | | | 451,000,000 | |
| Total Repurchase Agreements — 58.1% | | | | | | | 2,005,421,000 | |
| Total Investments (Cost — $3,442,603,318*) — 99.8% | | | | 3,442,603,318 | |
| Other Assets Less Liabilities — 0.2% | | | | | | | 7,577,961 | |
| | | | | | | | |
Net Assets — 100.0% | | | | | | $ | 3,450,181,279 | |
| | | | | | | | |
See Notes to Financial Statements.
| | | | | | |
| | | | | | | |
| | BLACKROCK FUNDS III | | DECEMBER 31, 2015 | | 45 |
| | |
Schedule of Investments (concluded) | | Treasury Money Market Master Portfolio |
| | |
| Notes to Schedule of Investments | | |
| * | | Cost for federal income tax purposes. |
| (a) | | Rates are discount rates or a range of discount rates at the time of purchase. |
| (b) | | Variable rate security. Rate as of period end. |
| (c) | | Traded in a joint account. |
| (d) | | Variable rate security. Rate as of period end and maturity is the date the principal owed can be recovered through demand. |
| | |
| Fair Value Hierarchy as of Period End | | |
Various inputs are used in determining the fair value of investments and derivative financial instruments. For information about the Master Portfolio’s policy regarding valuation of investments, refer to the Notes to Financial Statements.
The following table summarizes the Master Portfolio’s investments categorized in the disclosure hierarchy:
| | | | | | | | | | | | | | | | |
| | | Level 1 | | | Level 2 | | | Level 3 | | | Total | |
Assets: | | | | | | | | | | | | | | | | |
| Investments: | | | | | | | | | | | | | | | | |
Short-Term Securities1 | | | — | | | $ | 3,442,603,318 | | | | — | | | $ | 3,442,603,318 | |
1 See above Schedule of Investments for values in each security type. | |
The Master Portfolio may hold assets in which the fair value approximates the carrying amount for financial statement purposes. As of period end, cash of $4,309,710 is categorized as Level 1 within the disclosure hierarchy.
During the year ended December 31, 2015, there were no transfers between levels.
See Notes to Financial Statements.
| | | | | | |
| | | | | | | |
| 46 | | BLACKROCK FUNDS III | | DECEMBER 31, 2015 | | |
| | |
| Statements of Assets and Liabilities | | |
| | | | | | | | | | | | |
| December 31, 2015 | | Money Market
Master Portfolio | | | Prime Money
Market Master
Portfolio | | | Treasury
Money Market
Master Portfolio | |
| | | | | | | | | | | | |
| Assets | | | | | | | | | | | | |
Investments at value — unaffiliated1 | | $ | 25,948,034,067 | | | $ | 14,823,209,351 | | | $ | 1,437,182,318 | |
Repurchase agreements, at value2 | | | 17,384,475,000 | | | | 11,912,827,000 | | | | 2,005,421,000 | |
Cash | | | 807,820 | | | | 62,070,850 | | | | 4,309,710 | |
Interest receivable | | | 8,523,001 | | | | 4,914,803 | | | | 3,517,666 | |
| | | | |
Total assets | | | 43,341,839,888 | | | | 26,803,022,004 | | | | 3,450,430,694 | |
| | | | |
| | | | | | | | | | | | |
| Liabilities | | | | | | | | | | | | |
| Payables: | | | | | | | | | | | | |
Investments purchased | | | 49,922,361 | | | | 99,841,111 | | | | — | |
Investment advisory fees | | | 2,614,406 | | | | 1,431,471 | | | | 218,276 | |
Trustees’ fees | | | 118,296 | | | | 68,672 | | | | 15,697 | |
Professional fees | | | 30,833 | | | | 9,998 | | | | 15,442 | |
| | | | |
Total liabilities | | | 52,685,896 | | | | 101,351,252 | | | | 249,415 | |
| | | | |
Net Assets | | $ | 43,289,153,992 | | | $ | 26,701,670,752 | | | $ | 3,450,181,279 | |
| | | | |
| | | | | | | | | | | | |
| Net Assets Consist of | | | | | | | | | | | | |
Investors’ capital | | $ | 43,289,153,992 | | | $ | 26,701,670,752 | | | $ | 3,450,181,279 | |
| | | | |
1 Investments at cost — unaffiliated | | $ | 25,948,034,067 | | | $ | 14,823,209,351 | | | $ | 1,437,182,318 | |
2 Repurchase agreements at cost — unaffiliated | | $ | 17,384,475,000 | | | $ | 11,912,827,000 | | | $ | 2,005,421,000 | |
| | | | | | |
| See Notes to Financial Statements. | | | | |
| | | | | | | |
| | BLACKROCK FUNDS III | | DECEMBER 31, 2015 | | 47 |
| | | | | | | | | | | | |
| Year Ended December 31, 2015 | | Money Market
Master Portfolio | | | Prime
Money Market
Master Portfolio | | | Treasury
Money Market
Master Portfolio | |
| | | | | | | | | | | | |
| Investment Income | | | | | | | | | | | | |
Interest | | $ | 119,502,024 | | | $ | 65,009,673 | | | $ | 3,614,908 | |
| | | | |
| | | | | | | | | | | | |
| Expenses | | | | | | | | | | | | |
Investment advisory | | | 43,123,047 | | | | 24,069,560 | | | | 3,267,656 | |
Independent Trustees | | | 471,506 | | | | 296,412 | | | | 62,680 | |
Professional | | | 68,211 | | | | 55,784 | | | | 22,330 | |
| | | | |
Total expenses | | | 43,662,764 | | | | 24,421,756 | | | | 3,352,666 | |
Less fees waived by the Manager | | | (13,476,631 | ) | | | (7,573,064 | ) | | | (1,078,789 | ) |
| | | | |
Total expenses after fees waived | | | 30,186,133 | | | | 16,848,692 | | | | 2,273,877 | |
| | | | |
Net investment income | | | 89,315,891 | | | | 48,160,981 | | | | 1,341,031 | |
| | | | |
| | | | | | | | | | | | |
| Realized Gain | | | | | | | | | | | | |
Net realized gain from investments | | | 1,394,458 | | | | 597,937 | | | | 169,786 | |
| | | | |
Net Increase in Net Assets Resulting from Operations | | $ | 90,710,349 | | | $ | 48,758,918 | | | $ | 1,510,817 | |
| | | | |
| | | | | | |
| See Notes to Financial Statements. | | | | |
| | | | | | | |
| 48 | | BLACKROCK FUNDS III | | DECEMBER 31, 2015 | | |
| | |
| Statements of Changes in Net Assets | | Master Investment Portfolio |
| | | | | | | | |
| | | Money Market Master Portfolio | |
| | | Year Ended December 31, | |
| Increase (Decrease) in Net Assets: | | 2015 | | | 2014 | |
| | | | | | | | |
| Operations | | | | | | | | |
Net investment income | | $ | 89,315,891 | | | $ | 66,517,792 | |
Net realized gain | | | 1,394,458 | | | | 3,145,559 | |
| | | | |
Net increase in net assets resulting from operations | | | 90,710,349 | | | | 69,663,351 | |
| | | | |
| | | | | | | | |
| Capital Share Transactions | | | | | | | | |
Proceeds from contributions | | | 125,579,520,075 | | | | 53,841,747,303 | |
Value of withdrawals | | | (123,227,762,969 | ) | | | (54,589,158,809 | ) |
| | | | |
Net increase (decrease) in net assets derived from capital transactions | | | 2,351,757,106 | | | | (747,411,506 | ) |
| | | | |
| | | | | | | | |
| Net Assets | | | | | | | | |
Total increase (decrease) in net assets | | | 2,442,467,455 | | | | (677,748,155 | ) |
Beginning of year | | | 40,846,686,537 | | | | 41,524,434,692 | |
| | | | |
End of year | | $ | 43,289,153,992 | | | $ | 40,846,686,537 | |
| | | | |
| | | | | | |
| See Notes to Financial Statements. | | | | |
| | | | | | | |
| | BLACKROCK FUNDS III | | DECEMBER 31, 2015 | | 49 |
| | |
| Statements of Changes in Net Assets | | Master Investment Portfolio |
| | | | | | | | |
| | | Prime Money Market Master Portfolio | |
| | | Year Ended December 31, | |
| Increase (Decrease) in Net Assets: | | 2015 | | | 2014 | |
| | | | | | | | |
| Operations | | | | | | | | |
Net investment income | | $ | 48,160,981 | | | $ | 24,529,317 | |
Net realized gain | | | 597,937 | | | | 794,518 | |
| | | | |
Net increase in net assets resulting from operations | | | 48,758,918 | | | | 25,323,835 | |
| | | | |
| | | | | | | | |
| Capital Transactions | | | | | | | | |
Proceeds from contributions | | | 367,806,236,981 | | | | 128,913,398,407 | |
Value of withdrawals | | | (364,947,666,929 | ) | | | (124,057,023,599 | ) |
| | | | |
Net increase in net assets derived from capital transactions | | | 2,858,570,052 | | | | 4,856,374,808 | |
| | | | |
| | | | | | | | |
| Net Assets | | | | | | | | |
Total increase in net assets | | | 2,907,328,970 | | | | 4,881,698,643 | |
Beginning of year | | | 23,794,341,782 | | | | 18,912,643,139 | |
| | | | |
End of year | | $ | 26,701,670,752 | | | $ | 23,794,341,782 | |
| | | | |
| | | | | | |
| See Notes to Financial Statements. | | | | |
| | | | | | | |
| 50 | | BLACKROCK FUNDS III | | DECEMBER 31, 2015 | | |
| | |
| Statements of Changes in Net Assets | | Master Investment Portfolio |
| | | | | | | | |
| | | Treasury Money Market Master Portfolio, | |
| | | Year Ended December 31, | |
| Increase (Decrease) in Net Assets: | | 2015 | | | 2014 | |
| | | | | | | | |
| Operations | | | | | | | | |
Net investment income | | $ | 1,341,031 | | | $ | 40,546 | |
Net realized gain | | | 169,786 | | | | 110,422 | |
| | | | |
Net increase in net assets resulting from operations | | | 1,510,817 | | | | 150,968 | |
| | | | |
| | | | | | | | |
| Capital Transactions | | | | | | | | |
Proceeds from contributions | | | 63,745,962,994 | | | | 27,585,996,303 | |
Value of withdrawals | | | (64,154,846,234 | ) | | | (26,466,792,303 | ) |
| | | | |
Net increase in net assets derived from capital transactions | | | (408,883,240 | ) | | | 1,119,204,000 | |
| | | | |
| | | | | | | | |
| Net Assets | | | | | | | | |
Total increase (decrease) in net assets | | | (407,372,423 | ) | | | 1,119,354,968 | |
Beginning of year | | | 3,857,553,702 | | | | 2,738,198,734 | |
| | | | |
End of year | | $ | 3,450,181,279 | | | $ | 3,857,553,702 | |
| | | | |
| | | | | | |
| See Notes to Financial Statements. | | | | |
| | | | | | | |
| | BLACKROCK FUNDS III | | DECEMBER 31, 2015 | | 51 |
| | |
| Financial Highlights | | Master Investment Portfolio |
| | | | | | | | | | | | | | | | | | | | |
| | | Money Market Master Portfolio | |
| | | Year Ended December 31, | |
| | | 2015 | | | 2014 | | | 2013 | | | 2012 | | | 2011 | |
| | | | | | | | | | | | | | | | | | | | |
| Total Return | | | | | | | | | | | | | | | | | | | | |
Based on net asset value | | | 0.21% | | | | 0.16% | | | | 0.20% | | | | 0.27% | | | | 0.23% | |
| | | | |
| | | | | | | | | | | | | | | | | | | | |
| Ratio to Average Net Assets | | | | | | | | | | | | | | | | | | | | |
Total expenses | | | 0.10% | | | | 0.10% | | | | 0.10% | | | | 0.10% | | | | 0.10% | |
| | | | |
Total expenses after fees waived | | | 0.07% | | | | 0.07% | | | | 0.07% | | | | 0.07% | | | | 0.07% | |
| | | | |
Net investment income | | | 0.21% | | | | 0.16% | | | | 0.19% | | | | 0.27% | | | | 0.22% | |
| | | | |
| | | | | | | | | | | | | | | | | | | | |
| Supplemental Data | | | | | | | | | | | | | | | | | | | | |
Net assets, end of year (000) | | $ | 43,289,154 | | | $ | 40,846,687 | | | $ | 41,524,435 | | | $ | 35,289,099 | | | $ | 28,528,047 | |
| | | | |
| | | | | | |
| See Notes to Financial Statements. | | | | |
| | | | | | | |
| 52 | | BLACKROCK FUNDS III | | DECEMBER 31, 2015 | | |
| | |
| Financial Highlights | | Master Investment Portfolio |
| | | | | | | | | | | | | | | | | | | | |
| | | Prime Money Market Master Portfolio | |
| | | Year Ended December 31, | |
| | | 2015 | | | 2014 | | | 2013 | | | 2012 | | | 2011 | |
| | | | | | | | | | | | | | | | | | | | |
| Total Return | | | | | | | | | | | | | | | | | | | | |
Total Return | | | 0.19% | | | | 0.13% | | | | 0.17% | | | | 0.25% | | | | 0.21% | |
| | | | |
| | | | | | | | | | | | | | | | | | | | |
| Ratios to Average Net Assets | | | | | | | | | | | | | | | | | | | | |
Total expenses | | | 0.10% | | | | 0.10% | | | | 0.10% | | | | 0.10% | | | | 0.10% | |
| | | | |
Total expenses after fees waived | | | 0.07% | | | | 0.07% | | | | 0.07% | | | | 0.07% | | | | 0.07% | |
| | | | |
Net investment income | | | 0.20% | | | | 0.14% | | | | 0.17% | | | | 0.25% | | | | 0.21% | |
| | | | |
| | | | | | | | | | | | | | | | | | | | |
| Supplemental Data | | | | | | | | | | | | | | | | | | | | |
Net assets, end of year (000) | | $ | 26,701,671 | | | $ | 23,794,342 | | | $ | 18,912,643 | | | $ | 15,934,441 | | | $ | 10,732,297 | |
| | | | |
| | | | | | |
| See Notes to Financial Statements. | | | | |
| | | | | | | |
| | BLACKROCK FUNDS III | | DECEMBER 31, 2015 | | 53 |
| | |
| Financial Highlights | | Master Investment Portfolio |
| | | | | | | | | | | | | | | | | | | | |
| | | Treasury Money Market Master Portfolio | |
| | | Year Ended December 31, | |
| | | 2015 | | | 2014 | | | 2013 | | | 2012 | | | 2011 | |
| | | | | | | | | | | | | | | | | | | | |
| Total Return | | | | | | | | | | | | | | | | | | | | |
Total Return | | | 0.03% | | | | 0.00% | | | | 0.02% | | | | 0.06% | | | | 0.09% | |
| | | | |
| | | | | | | | | | | | | | | | | | | | |
| Ratio to Average Net Assets | | | | | | | | | | | | | | | | | | | | |
Total expenses | | | 0.10% | | | | 0.10% | | | | 0.10% | | | | 0.10% | | | | 0.10% | |
| | | | |
Total expenses after fees waived | | | 0.07% | | | | 0.06% | | | | 0.06% | | | | 0.07% | | | | 0.06% | |
| | | | |
Net investment income | | | 0.04% | | | | 0.00% | | | | 0.02% | | | | 0.08% | | | | 0.03% | |
| | | | |
| | | | | | | | | | | | | | | | | | | | |
| Supplemental Data | | | | | | | | | | | | | | | | | | | | |
Net assets, end of year (000) | | $ | 3,450,181 | | | $ | 3,857,554 | | | $ | 2,738,199 | | | $ | 2,613,824 | | | $ | 1,602,468 | |
| | | | |
| | | | | | |
| See Notes to Financial Statements. | | | | |
| | | | | | | |
| 54 | | BLACKROCK FUNDS III | | DECEMBER 31, 2015 | | |
| | |
| Notes to Financial Statements | | Master Investment Portfolio |
1. Organization:
Master Investment Portfolio (“MIP”) is registered under the Investment Company Act of 1940, as amended (the “1940 Act”), as a diversified, open-end management investment company. MIP is organized as a Delaware statutory trust. The financial statements and these accompanying notes relate to three series of MIP: Money Market Master Portfolio, Prime Money Market Master Portfolio and Treasury Money Market Master Portfolio (each, a “Master Portfolio” and together, the “Master Portfolios”).
The Master Portfolios, together with certain other registered investment companies advised by BlackRock Advisors, LLC (the “Manager”) or its affiliates, are included in a complex of open-end funds referred to as the Equity-Liquidity Complex.
2. Significant Accounting Policies:
The financial statements are prepared in conformity with accounting principles generally accepted in the United States of America (“U.S. GAAP”), which may require management to make estimates and assumptions that affect the reported amounts of assets and liabilities in the financial statements, disclosure of contingent assets and liabilities at the date of the financial statements and the reported amounts of increases and decreases in net assets from operations during the reporting period. Actual results could differ from those estimates. Each Master Portfolio is considered an investment company under U.S. GAAP and follows the accounting and reporting guidance applicable to investment companies. Below is a summary of significant accounting policies:
Investment Transactions and Investment Income: For financial reporting purposes, investment transactions are recorded on the dates the transactions are entered into (the trade dates). Realized gains and losses on investment transactions are determined on the identified cost basis. Interest income, including amortization and accretion of premiums and discounts on debt securities, is recognized on the accrual basis.
Indemnifications: In the normal course of business, a Master Portfolio enters into contracts that contain a variety of representations that provide general indemnification. A Master Portfolio’s maximum exposure under these arrangements is unknown because it involves future potential claims against a Master Portfolio, which cannot be predicted with any certainty.
Other: Expenses directly related to a Master Portfolio are charged to that Master Portfolio. Other operating expenses shared by several funds, including other funds managed by the Manager, are prorated among those funds on the basis of relative net assets or other appropriate methods.
The Master Portfolios have an arrangement with their custodian whereby fees may be reduced by credits earned on uninvested cash balances, which, if applicable, are shown as fees paid indirectly in the Statements of Operations. The custodian imposes fees on overdrawn cash balances, which can be offset by accumulated credits earned or may result in additional custody charges. Effective September 2015, the arrangement with their custodian for earning credits on uninvested cash balances has ceased and the custodian will be imposing fees on certain uninvested cash balances.
3. Investment Valuation and Fair Value Measurements:
Investment Valuation Policies: U.S. GAAP defines fair value as the price the Master Portfolios would receive to sell an asset or pay to transfer a liability in an orderly transaction between market participants at the measurement date. The Master Portfolios’ investments are valued under the amortized cost method which approximates current market value in accordance with Rule 2a-7 under the 1940 Act. Under this method, investments are valued at cost when purchased and, thereafter, a constant proportionate accretion of discounts and amortization of premiums are recorded until the maturity of the security. Each Master Portfolio seeks to maintain its net asset value per share at $1.00, although there is no assurance that it will be able to do so on a continuing basis.
Fair Value Hierarchy: Various inputs are used in determining the fair value of investments. These inputs to valuation techniques are categorized into a fair value hierarchy consisting of three broad levels for financial statement purposes as follows:
| • | | Level 1 — unadjusted price quotations in active markets/exchanges for identical assets or liabilities that each Master Portfolio has the ability to access |
| • | | Level 2 — other observable inputs (including, but not limited to, quoted prices for similar assets or liabilities in markets that are active, quoted prices for identical or similar assets or liabilities in markets that are not active, inputs other than quoted prices that are observable for the assets or liabilities (such as interest rates, yield curves, volatilities, prepayment speeds, loss severities, credit risks and default rates) or other market–corroborated inputs) |
| • | | Level 3 — unobservable inputs based on the best information available in the circumstances, to the extent observable inputs are not available (including each Master Portfolio’s own assumptions used in determining the fair value of investments) |
The hierarchy gives the highest priority to unadjusted quoted prices in active markets for identical assets or liabilities (Level 1 measurements) and the lowest priority to unobservable inputs (Level 3 measurements). Accordingly, the degree of judgment exercised in determining fair value is greatest for instruments categorized in Level 3. The inputs used to measure fair value may fall into different levels of the fair value hierarchy. In such cases, for disclosure purposes, the fair value hierarchy classification is determined based on the lowest level input that is significant to the fair value measurement in its entirety. The fair value hierarchy for each Master Portfolio’s investments has been included in the Schedules of Investments.
| | | | | | |
| | | | | | | |
| | BLACKROCK FUNDS III | | DECEMBER 31, 2015 | | 55 |
| | | | |
| Notes to Financial Statements (continued) | | Master Investment Portfolio |
Changes in valuation techniques may result in transfers into or out of an assigned level within the hierarchy. In accordance with each Master Portfolio’s policy, transfers between different levels of the fair value hierarchy are deemed to have occurred as of the beginning of the reporting period. The categorization of a value determined for investments is based on the pricing transparency of the investments and is not necessarily an indication of the risks associated with investing in those securities.
4. Securities and Other Investments:
Repurchase Agreements: Repurchase agreements are commitments to purchase a security from a counterparty who agrees to repurchase the same security at a mutually agreed upon date and price. On a daily basis, the counterparty is required to maintain eligible collateral subject to the agreement and in value no less than the agreed repurchase amount. Pursuant to the custodial undertaking associated with a tri-party repo arrangement, an unaffiliated third party custodian maintains accounts to hold collateral for a Master Portfolio and its counterparties. Typically, a Master Portfolio and counterparty are not permitted to sell, re-pledge or use the collateral absent a default by the counterparty or a Master Portfolio, respectively. A Master Portfolio, along with other registered investment companies advised by the Manager, may transfer uninvested cash into a single joint trading account which is then invested in one or more repurchase agreements.
In the event the counterparty defaults and the fair value of the collateral declines, a Master Portfolio could experience losses, delays and costs in liquidating the collateral.
Repurchase agreements are entered into by a Master Portfolio under Master Repurchase Agreements (each, an “MRA”). The MRA permits a Master Portfolio, under certain circumstances including an event of default (such as bankruptcy or insolvency), to offset payables and/or receivables with collateral held by and/or posted to the counterparty. As a result, one single net payment is created. Bankruptcy or insolvency laws of a particular jurisdiction may impose restrictions on or prohibitions against such a right of offset in the event of the MRA counterparty’s bankruptcy or insolvency. Based on the terms of the MRA, a Master Portfolio receives securities as collateral with a market value in excess of the repurchase price at maturity. Upon a bankruptcy or insolvency of the MRA counterparty, a Master Portfolio would recognize a liability with respect to such excess collateral. The liability reflects a Master Portfolio’s obligation under bankruptcy law to return the excess to the counterparty.
5. Investment Advisory Agreement and Other Transactions with Affiliates:
The PNC Financial Services Group, Inc. is the largest stockholder and an affiliate of BlackRock, Inc. (“BlackRock”) for 1940 Act purposes.
MIP, on behalf of each Master Portfolio, entered into an Investment Advisory Agreement with the Manager, the Master Portfolios’ investment advisor, an indirect, wholly owned subsidiary of BlackRock, to provide investment advisory and administration services. The Manager is responsible for the management of each Master Portfolio’s portfolio and provides the personnel, facilities, equipment and certain other services necessary to the operations of each Master Portfolio. For such services, each Master Portfolio pays the Manager a monthly fee based on a percentage of each Master Portfolio’s average daily net assets at the following annual rates:
| | | | |
Money Market Master Portfolio | | | 0.10% | |
Prime Money Market Master Portfolio | | | 0.10% | |
Treasury Money Market Master Portfolio | | | 0.10% | |
The Manager has contractually agreed to waive 0.03% its investment advisory fees through April 30, 2016. The Manager has also voluntarily agreed to waive investment advisory fees to enable the feeders that invest in the Master Portfolios to maintain minimum levels of daily net investment income. The Manager may discontinue the voluntary waiver at any time. For the year ended December 31, 2015, the amounts included in fees waived by the Manager in the Statements of Operations are as follows:
| | | | |
Money Market Master Portfolio | | $ | 12,936,914 | |
Prime Money Market Master Portfolio | | $ | 7,220,868 | |
Treasury Money Market Master Portfolio | | $ | 993,779 | |
The fees and expenses of MIP’s trustees who are not “interested persons” of MIP, as defined in the 1940 Act (“Independent Trustees”), counsel to the Independent Trustees and the Master Portfolios’ independent registered public accounting firm (together, the “independent expenses”) are paid directly by the Master Portfolios. The Manager has contractually agreed to provide an offsetting credit against the Management fees paid by the Master Portfolios in an amount equal to these independent expenses through April 30, 2016. The amounts waived are included in fees waived by the Manager in the Statements of Operations. For the year ended December 31, 2015, such waiver amounts are as follows:
| | | | |
Money Market Master Portfolio | | $ | 539,717 | |
Prime Money Market Master Portfolio | | $ | 352,196 | |
Treasury Money Market Master Portfolio | | $ | 85,010 | |
| | | | | | |
| | | | | | | |
| 56 | | BLACKROCK FUNDS III | | DECEMBER 31, 2015 | | |
| | | | |
| Notes to Financial Statements (concluded) | | Master Investment Portfolio |
MIP entered into an Administration Agreement with BlackRock Advisors, LLC (“BAL”), which has agreed to provide general administration services (other than investment advice and related portfolio activities). BAL, in consideration thereof, has agreed to bear all of the Master Portfolios’ ordinary operating expenses, excluding, generally, investment advisory fees, distribution fees, brokerage and other expenses related to the execution of portfolio transactions, extraordinary expenses and certain other expenses which are borne by the Master Portfolios. BAL is not entitled to compensation for providing administration service to the Master Portfolios, for so long as BAL is entitled to compensation for providing administration service to corresponding feeder funds that invest substantially all of their assets in the Master Portfolios, or BAL (or an affiliate) receives investment advisory fees from the Master Portfolios.
Certain officers and/or trustees of the MIP are officers and/or directors of BlackRock or its affiliates.
6. Income Tax Information:
The Master Portfolios are classified as a partnership for federal income tax purposes. As such, each investor in the Master Portfolios is treated as the owner of its proportionate share of net assets, income, expenses and realized and unrealized gains and losses of the Master Portfolios. Therefore, no federal income tax provision is required. It is intended that the Master Portfolios’ assets will be managed so an investor in the Master Portfolios can satisfy the requirements of Subchapter M of the Internal Revenue Code of 1986, as amended.
The Master Portfolios file U.S. federal and various state and local tax returns. No income tax returns are currently under examination. The statute of limitations on each Master Portfolio’s U.S. federal tax returns remains open for each of the four years ended December 31, 2015. The statutes of limitations on the Master Portfolios state and local tax returns may remain open for an additional year depending upon the jurisdiction.
Management has analyzed tax laws and regulations and their application to the Master Portfolios as of December 31, 2015, inclusive of the open tax return years, and does not believe there are any uncertain tax positions that require recognition of a tax liability in the Master Portfolios’ financial statements.
7. Principal Risks:
In the normal course of business, certain Master Portfolios invest in securities and enter into transactions where risks exist due to fluctuations in the market (market risk) or failure of the issuer to meet all its obligations, including the ability to pay principal and interest when due (issuer credit risk). The value of securities held by the Master Portfolios may decline in response to certain events, including those directly involving the issuers of securities owned by the Master Portfolios. Changes arising from the general economy, the overall market and local, regional or global political or/and social instability, as well as currency, interest rate and price fluctuations, may also affect the securities’ value.
Counterparty Credit Risk: Similar to issuer credit risk, the Master Portfolios may be exposed to counterparty credit risk, or the risk that an entity may fail to or be unable to perform on its commitments related to unsettled or open transactions. The Master Portfolios manage counterparty credit risk by entering into transactions only with counterparties that the Manager believes have the financial resources to honor their obligations and by monitoring the financial stability of those counterparties. Financial assets, which potentially expose the Master Portfolios to market, issuer and counterparty credit risks, consist principally of financial instruments and receivables due from counterparties. The extent of the Master Portfolios’ exposure to market, issuer and counterparty credit risks with respect to these financial assets is approximately their value recorded in the Statements of Assets and Liabilities, less any collateral held by the Master Portfolios.
On July 23, 2014, the U.S. Securities and Exchange Commission adopted amendments to money market fund regulations, which structurally change the way that certain money market funds will be required to operate. The compliance period for amendments range between July 2015 and October 2016. When implemented, the changes may affect the Master Portfolios’ investment strategies, fees and expenses, portfolio and share liquidity and return potential. The Master Portfolios continue to evaluate their strategy to implement the new regulations.
8. Subsequent Events:
Management has evaluated the impact of all subsequent events on the Master Portfolios through the date the financial statements were issued and has determined that there were no subsequent events requiring adjustment or additional disclosure in the financial statements.
| | | | | | |
| | | | | | | |
| | BLACKROCK FUNDS III | | DECEMBER 31, 2015 | | 57 |
| | |
| Report of Independent Registered Public Accounting Firm | | Master Investment Portfolio |
To the Board of Trustees of Master Investment Portfolio and the Interestholders of Money Market Master Portfolio, Prime Money Market Master Portfolio and Treasury Money Market Master Portfolio:
In our opinion, the accompanying statements of assets and liabilities, including the schedules of investments, and the related statements of operations and of changes in net assets and the financial highlights present fairly, in all material respects, the financial position of Money Market Master Portfolio, Prime Money Market Master Portfolio and Treasury Money Market Master Portfolio (the “Master Portfolios”), each a series of Master Investment Portfolio, at December 31, 2015, the results of each of their operations for the year then ended, the changes in each of their net assets for each of the two years in the period then ended and the financial highlights for each of the five years in the period then ended, in conformity with accounting principles generally accepted in the United States of America. These financial statements and financial highlights (hereafter referred to as “financial statements”) are the responsibility of the Master Portfolios’ management. Our responsibility is to express an opinion on these financial statements based on our audits. We conducted our audits of these financial statements in accordance with the standards of the Public Company Accounting Oversight Board (United States). Those standards require that we plan and perform the audit to obtain reasonable assurance about whether the financial statements are free of material misstatement. An audit includes examining, on a test basis, evidence supporting the amounts and disclosures in the financial statements, assessing the accounting principles used and significant estimates made by management, and evaluating the overall financial statement presentation. We believe that our audits, which included confirmation of securities at December 31, 2015 by correspondence with the custodian and brokers, provide a reasonable basis for our opinion.
/s/PricewaterhouseCoopers LLP
Philadelphia, Pennsylvania
February 18, 2016
| | | | | | |
| | | | | | | |
| 58 | | BLACKROCK FUNDS III | | DECEMBER 31, 2015 | | |
| | | | | | | | | | |
Name, Address1
and Year of Birth | | Position(s)
Held with
the Trust/MIP | | Length
of Time
Served as
a Trustee3 | | Principal Occupation(s) During Past Five Years | | Number of BlackRock-
Advised Registered
Investment Companies
(“RICs”) Consisting of
Investment Portfolios
(“Portfolios”) Overseen | | Public
Directorships |
| Independent Trustees2 |
Rodney D. Johnson 1941 | | Chair of the Board and Trustee | | Since 2009 | | President, Fairmount Capital Advisors, Inc. from 1987 to 2013; Member of the Archdiocesan Investment Committee of the Archdiocese of Philadelphia from 2004 to 2012; Director, The Committee of Seventy (civic) from 2006 to 2012; Director, Fox Chase Cancer Center from 2004 to 2011. | | 33 RICs consisting of
155 Portfolios | | None |
David O. Beim 1940 | | Trustee | | Since 2009 | | Professor of Professional Practice at the Columbia University Graduate School of Business since 1991; Trustee, Phillips Exeter Academy from 2002 to 2012; Chairman, Wave Hill, Inc. (public garden and cultural center) from 1990 to 2006. | | 33 RICs consisting of
155 Portfolios | | None |
Collette Chilton 1958 | | Trustee | | Since 2015 | | Chief Investment Officer, Williams College since 2006; Chief Investment Officer, Lucent Asset Management Corporation from 1998 to 2006. | | 33 RICs consisting of
155 Portfolios | | None |
Frank J. Fabozzi 1948 | | Trustee | | Since 2014 | | Editor of and Consultant for The Journal of Portfolio Management since 2006; Professor of Finance, EDHEC Business School since 2011; Visiting Professor, Princeton University from 2013 to 2014; Professor in the Practice of Finance and Becton Fellow, Yale University School of Management from 2006 to 2011. | | 108 RICs consisting of
230 Portfolios | | None |
Dr. Matina S. Horner 1939 | | Trustee | | Since 2009 | | Executive Vice President, Teachers Insurance and Annuity Association and College Retirement Equities Fund from 1989 to 2003. | | 33 RICs consisting of
155 Portfolios | | NSTAR (electric and gas utility) |
Herbert I. London 1939 | | Trustee | | Since 2009 | | Professor Emeritus, New York University since 2005; President, London Center for Policy Research since 2012; John M. Olin Professor of Humanities, New York University from 1993 to 2005 and Professor thereof from 1980 to 2005; President Emeritus, Hudson Institute (policy research organization) from 2011 to 2012, President thereof from 1997 to 2011 and Trustee from 1980 to 2012; Chairman of the Board of Trustees for Grantham University since 2006; Director, InnoCentive, Inc. (global internet service) since 2005; Director, Cerego, LLC (educational software) since 2005; Director, Cybersettle (online adjudication) since 2009; Director, AIMS Worldwide, Inc. (marketing) from 2007 to 2012. | | 33 RICs consisting of
155 Portfolios | | None |
Cynthia A. Montgomery 1952 | | Trustee | | Since 2009 | | Professor, Harvard Business School since 1989; Director, McLean Hospital from 2005 to 2012; Director, Harvard Business School Publishing from 2005 to 2010. | | 33 RICs consisting of
155 Portfolios | | Newell Rubbermaid, Inc. (manufacturing) |
Joseph P. Platt 1947 | | Trustee | | Since 2009 | | Director, Jones and Brown (Canadian insurance broker) since 1998; General Partner, Thorn Partners, LP (private investments) since 1998; Director, WQED Multi-Media (public broadcasting not-for-profit) since 2001; Director, The West Penn Allegheny Health System (a not-for-profit health system) from 2008 to 2013; Partner, Amarna Corporation, LLC (private investment company) from 2002 to 2008. | | 33 RICs consisting of
155 Portfolios | | Greenlight Capital Re, Ltd. (reinsurance company) |
Robert C. Robb, Jr. 1945 | | Trustee | | Since 2009 | | Partner, Lewis, Eckert, Robb and Company (management and financial consulting firm) since 1981. | | 33 RICs consisting of
155 Portfolios | | None |
Toby Rosenblatt 1938 | | Trustee | | Since 2009 | | President, Founders Investments Ltd. (private investments) since 1999; Director, Forward Management, LLC since 2007; Director, College Futures Foundation (philanthropic foundation) since 2009; Director, The James Irvine Foundation (philanthropic foundation) from 1998 to 2008. | | 33 RICs consisting of
155 Portfolios | | None |
| | | | | | |
| | | | | | | |
| | BLACKROCK FUNDS III | | DECEMBER 31, 2015 | | 59 |
| | | | |
| Officers and Trustees (continued) | | |
| | | | | | | | | | |
Name, Address1
and Year of Birth | | Position(s)
Held with
the Trust/MIP | | Length
of Time
Served as
a Trustee3 | | Principal Occupation(s) During Past Five Years | | Number of BlackRock-
Advised Registered
Investment Companies
(“RICs”) Consisting of
Investment Portfolios
(“Portfolios”) Overseen | | Public
Directorships |
| Independent Trustees2 (concluded) |
Mark Stalnecker 1951 | | Trustee | | Since 2015 | | Chief Investment Officer, University of Delaware from 1999 to 2013; Trustee, Winterthur Museum and Country Estate since 2001; Member of the Investment Committee, Delaware Public Employees’ Retirement System since 2002; Member of the Investment Committee, Christiana Care Health System since 2009; Member of the Investment Committee, Delaware Community Foundation from 2013 to 2014. | | 33 RICs consisting of
155 Portfolios | | None |
Kenneth L. Urish 1951 | | Trustee | | Since 2009 | | Managing Partner, Urish Popeck & Co., LLC (certified public accountants and consultants) since 1976; Immediate past- Chairman of the Professional Ethics Committee of the Pennsylvania Institute of Certified Public Accountants and Committee Member thereof since 2007; Member of External Advisory Board, The Pennsylvania State University Accounting Department since 2001; Principal, UP Strategic Wealth Investment Advisors, LLC since 2013; Trustee, The Holy Family Institute from 2001 to 2010; President and Trustee, Pittsburgh Catholic Publishing Associates from 2003 to 2008; Director, Inter-Tel from 2006 to 2007. | | 33 RICs consisting of
155 Portfolios | | None |
Frederick W. Winter 1945 | | Trustee | | Since 2009 | | Director, Alkon Corporation (pneumatics) since 1992; Professor and Dean Emeritus of the Joseph M. Katz School of Business, University of Pittsburgh from 2005 to 2013 and Dean thereof from 1997 to 2005; Director, Tippman Sports (recreation) from 2005 to 2013; Director, Indotronix International (IT services) from 2004 to 2008. | | 33 RICs consisting of
155 Portfolios | | None |
| | 1 The address of each Trustee is c/o BlackRock, Inc., 55 East 52nd Street, New York, NY 10055. |
| | 2 Independent Trustees serve until their resignation, retirement, removal or death, or until December 31 of the year in which they turn 75. The Board has determined to extend the terms of Independent Trustees on a case-by-case basis, as appropriate. The Board has unanimously approved extending the mandatory retirement age for David O. Beim and Dr. Matina S. Horner until December 31, 2016, which the Board believes is in the best interests of shareholders of the Fund. |
| | 3 Date shown is the earliest date a person has served for the Trust/MIP. In connection with the acquisition of Barclays Global Investors by BlackRock, Inc. in December 2009, certain Independent Trustees were elected to the Trust’s/MIP’s Board. As a result, although the chart shows certain Independent Trustees as joining the Trust’s/MIP’s board in 2009, those Independent Trustees first became members of the boards of other funds advised by BlackRock Advisors, LLC or its affiliates as follows: David O. Beim, 1998; Dr. Matina S. Horner, 2004; Rodney D. Johnson, 1995; Herbert I. London, 1987; Cynthia A. Montgomery, 1994; Joseph P. Platt, 1999; Robert C. Robb, Jr., 1999; Toby Rosenblatt, 2005; Kenneth L. Urish, 1999; and Frederick W. Winter, 1999. Frank J. Fabozzi first became a member of the board of other funds advised by BlackRock Advisors, LLC or its affiliates in 1988. |
| Interested Trustees4 | | | | | | | | | | |
Barbara G. Novick 1960 | | Trustee | | Since 2015 | | Vice Chairman of BlackRock since 2006; Chair of BlackRock’s Government Relations Steering Committee since 2009; Head of the Global Client Group of BlackRock from 1988 to 2008. | | 108 RICs consisting of
230 Portfolios | | None |
John M. Perlowski 1964 | | Trustee, President, and Chief Executive Officer | | Since 2015 (Trustee);
Since 2010 (President and Chief Executive Officer) | | Managing Director of BlackRock since 2009; Head of BlackRock Global Fund Services since 2009; Managing Director and Chief Operating Officer of the Global Product Group at Goldman Sachs Asset Management, L.P. from 2003 to 2009; Treasurer of Goldman Sachs Mutual Funds from 2003 to 2009 and Senior Vice President thereof from 2007 to 2009; Director of Goldman Sachs Offshore Funds from 2002 to 2009; Director of Family Resource Network (charitable foundation) since 2009. | | 136 RICs consisting of
328 Portfolios | | None |
| | 4 Mr. Perlowski and Ms. Novick are both “interested persons,” as defined in the 1940 Act, of the Funds based on their positions with BlackRock and its affiliates. Mr. Perlowski and Ms. Novick are also board members of a complex of BlackRock registered open-end funds. Mr. Perlowski is also a board member of the BlackRock Equity-Bond Complex and the BlackRock Equity-Liquidity Complex, and Ms. Novick is also a board member of the BlackRock Equity-Liquidity Complex. Interested Trustees serve until their resignation, retirement, removal or death, or until December 31 of the year in which they turn 75. The maximum age limitation may be waived as to any Trustee by action of a majority of the Trustees upon a finding of good cause therefor. |
| | | | | | |
| | | | | | | |
| 60 | | BLACKROCK FUNDS III | | DECEMBER 31, 2015 | | |
| | |
| Officers and Trustees (concluded) | | |
| | | | | | |
Name, Address1
and Year of Birth | | Position(s)
Held with
the Trust/MIP | | Length of
Time Served
as an Officer | | Principal Occupation(s) During Past Five Years |
| Officers2 |
John M. Perlowski 1964 | | Trustee, President and Chief Executive Officer | | Since 2015 (Trustee);
Since 2010 (President and Chief Executive Officer) | | Managing Director of BlackRock since 2009; Head of BlackRock Global Fund Services since 2009; Managing Director and Chief Operating Officer of the Global Product Group at Goldman Sachs Asset Management, L.P. from 2003 to 2009; Treasurer of Goldman Sachs Mutual Funds from 2003 to 2009 and Senior Vice President thereof from 2007 to 2009; Director of Goldman Sachs Offshore Funds from 2002 to 2009; Director of Family Resource Network (charitable foundation) since 2009. |
Jennifer McGovern 1977 | | Vice President | | Since 2014 | | Director of BlackRock since 2011; Head of Product Structure and Oversight for BlackRock’s U.S. Wealth Advisory Group since 2013; Vice President of BlackRock from 2008 to 2010. |
Neal Andrews 1966 | | Chief Financial Officer | | Since 2007 | | Managing Director of BlackRock since 2006; Senior Vice President and Line of Business Head of Fund Accounting and Administration at PNC Global Investment Servicing (U.S.) Inc. from 1992 to 2006. |
Jay Fife 1970 | | Treasurer | | Since 2007 | | Managing Director of BlackRock since 2007; Director of BlackRock in 2006; Assistant Treasurer of the MLIM and Fund Asset Management, L.P. advised funds from 2005 to 2006; Director of MLIM Fund Services Group from 2001 to 2006. |
Charles Park 1967 | | Chief Compliance Officer | | Since 2014 | | Anti-Money Laundering Compliance Officer for the BlackRock-advised Funds in the Equity-Bond Complex, the Equity-Liquidity Complex and the Closed-End Complex from 2014 to 2015; Chief Compliance Officer of BlackRock Advisors, LLC and the BlackRock-advised Funds in the Equity-Bond Complex, the Equity-Liquidity Complex and the Closed-End Complex since 2014; Principal of and Chief Compliance Officer for iShares® Delaware Trust Sponsor LLC since 2012 and BlackRock Fund Advisors (“BFA”) since 2006; Chief Compliance Officer for the BFA-advised iShares exchange traded funds since 2006; Chief Compliance Officer for BlackRock Asset Management International Inc. since 2012. |
Fernanda Piedra 1969 | | Anti-Money Laundering Compliance Officer | | Since 2015 | | Director of BlackRock since 2014; Anti-Money Laundering Compliance Officer and Regional Head of Financial Crime for the Americas at BlackRock since 2014; Head of Regulatory Changes and Remediation for the Asset Wealth Management Division of Deutsche Bank from 2010 to 2014; Vice President of Goldman Sachs (Anti-Money Laundering/Suspicious Activities Group) from 2004 to 2010. |
Benjamin Archibald 1975 | | Secretary | | Since 2012 | | Managing Director of BlackRock since 2014; Director of BlackRock from 2010 to 2013; Secretary of the iShares exchange traded funds since 2015; Secretary of the BlackRock-advised mutual funds since 2012. |
| | 1 The address of each Officer is c/o BlackRock, Inc., 55 East 52nd Street, New York, NY 10055. |
| | | 2 Officers of the Trust serve at the pleasure of the Board. |
| | Further information about the Officers and Trustees is available in the Trust’s Statement of Additional Information, which can be obtained without charge by calling (800) 626-1960 |
Effective September 25, 2015, John M. Perlowski was appointed to serve as a Trustee of the Trusts.
Effective December 31, 2015, Herbert I. London and Toby Rosenblatt retired as Trustee of the Trust.
| | | | | | |
| | | | |
Investment Advisor BlackRock Fund Advisors San Francisco, CA 94105 | | Custodian, Transfer Agent
and Accounting Agent State Street Bank and Trust Company Boston, MA 02110 | | Distributor BlackRock Investments, LLC New York, NY 10022 | | Address of the Trust 100 Bellevue Parkway Wilmington, DE 19809 |
| | | |
Administrator BlackRock Advisors LLC Wilmington, DE 19809 | | Independent Registered
Public Accounting Firm PricewaterhouseCoopers LLP Philadelphia, PA 19103 | | Legal Counsel Sidley Austin LLP New York, NY 10019 | | |
| | | | | | |
| | | | | | | |
| | BLACKROCK FUNDS III | | DECEMBER 31, 2015 | | 61 |
Householding
The Funds will mail only one copy of shareholder documents, including prospectuses, annual and semi-annual reports and proxy statements, to shareholders with multiple accounts at the same address. This practice is commonly called “householding” and is intended to reduce expenses and eliminate duplicate mailings of shareholder documents. Mailings of your shareholder documents may be householded indefinitely unless you instruct us otherwise. If you do not want the mailing of these documents to be combined with those for other members of your household, please call the Transfer Agent at (888) 204-3956.
Availability of Quarterly Schedule of Investments
The Funds/Master Portfolios file their complete schedules of portfolio holdings with the SEC for the first and third quarters of each fiscal year on Form N-Q. Each Fund’s/Master Portfolio’s Forms N-Q are available on the SEC’s website at http://www.sec.gov and may also be reviewed and copied at the SEC’s Public Reference Room in Washington, D.C. Information on how to access documents on the SEC’s website without charge may be obtained by calling (800) SEC-0330. Each Fund’s/Master Portfolio’s Forms N-Q may also be obtained upon request and without charge by calling (800) 626-1960.
Availability of Proxy Voting Policies and Procedures
A description of the policies and procedures that the Funds/Master Portfolios use to determine how to vote proxies relating to portfolio securities is available upon request and without charge (1) by calling (800) 626-1960; (2) at http://www.blackrock.com; and (3) on the SEC’s website at http://www.sec.gov.
Availability of Proxy Voting Record
Information about how the Funds/Master Portfolios voted proxies relating to securities held in the Funds’/Master Portfolios’ portfolios during the most recent 12-month period ended June 30 is available upon request and without charge (1) at http://www.blackrock.com or by calling (800) 626-1960 and (2) on the SEC’s website at http://www.sec.gov.
|
| BlackRock Privacy Principles |
BlackRock is committed to maintaining the privacy of its current and former fund investors and individual clients (collectively, “Clients”) and to safeguarding their non-public personal information. The following information is provided to help you understand what personal information BlackRock collects, how we protect that information and why in certain cases we share such information with select parties.
If you are located in a jurisdiction where specific laws, rules or regulations require BlackRock to provide you with additional or different privacy-related rights beyond what is set forth below, then BlackRock will comply with those specific laws, rules or regulations.
BlackRock obtains or verifies personal non-public information from and about you from different sources, including the following: (i) information we receive from you or, if applicable, your financial intermediary, on applications, forms or other documents; (ii) information about your transactions with us, our affiliates, or others; (iii) information we receive from a consumer reporting agency; and (iv) from visits to our websites.
BlackRock does not sell or disclose to non-affiliated third parties any non-public personal information about its Clients, except as permitted by law or as is necessary to respond to regulatory requests or to service Client accounts. These non-affiliated third parties are required to protect the confidentiality and security of this information and to use it only for its intended purpose.
We may share information with our affiliates to service your account or to provide you with information about other BlackRock products or services that may be of interest to you. In addition, BlackRock restricts access to non-public personal information about its Clients to those BlackRock employees with a legitimate business need for the information. BlackRock maintains physical, electronic and procedural safeguards that are designed to protect the non-public personal information of its Clients, including procedures relating to the proper storage and disposal of such information.
| | | | | | |
| | | | | | | |
| 62 | | BLACKROCK FUNDS III | | DECEMBER 31, 2015 | | |
This report is intended for current holders. It is not authorized for use as an offer of sale or a solicitation of an offer to buy shares of the Funds unless preceded or accompanied by the Funds’ current prospectus. An investment in a Fund is not insured or guaranteed by the Federal Deposit Insurance Corporation or any other government agency. Although the Funds seek to preserve the value of your investment at $1.00 per share, it is possible to lose money by investing in a Fund. Performance data quoted represents past performance and does not guarantee future results. Total return information assumes reinvestment of all distributions. Current performance may be higher or lower than the performance data quoted. For current month-end performance information, call 800-626-1960. Each Fund’s current 7-day yield more closely reflects the current earnings of a Fund than the total returns quoted. Statements and other information herein are as dated and are subject to change.
| | |
| MMF12/15-AR | |  |
DECEMBER 31, 2015
| | | | |
ANNUAL REPORT | | | |  |
BlackRock CoreAlpha Bond Fund | of BlackRock Funds III
|
| Not FDIC Insured • May Lose Value • No Bank Guarantee |

| | | | | | |
| | | | | | | |
| 2 | | BLACKROCK COREALPHA BOND FUND | | DECEMBER 31, 2015 | | |
Dear Shareholder,
Diverging monetary policies and shifting economic outlooks across regions have been the overarching themes driving financial markets over the past couple of years. With U.S. growth outpacing the global economic recovery in 2015 while inflationary pressures remained low, investors spent most of the year anticipating a short-term rate hike from the Federal Reserve (the “Fed”), which ultimately came to fruition in December. In contrast, the European Central Bank (“ECB”) and the Bank of Japan moved to a more accommodative stance during the year. In this environment, the U.S. dollar strengthened considerably, causing profit challenges for U.S. exporters and high levels of volatility in emerging market currencies and commodities. Oil prices were particularly volatile and below the historical norm due to an ongoing imbalance in global supply and demand.
Market volatility broadly increased in the middle of 2015, beginning with a sharp, but temporary, selloff in June as Greece’s long-brewing debt troubles came to an impasse. Just as these concerns abated, Chinese equities tumbled amid weakness in the country’s economy. This, combined with a depreciation of the yuan and declining confidence in China’s policymakers, stoked worries about the potential impact to the broader world economy, causing heightened volatility to spread throughout markets globally. Given a dearth of meaningful growth across most of the world, financial markets became more reliant on central bank policies to drive performance. In that vein, risk assets (such as equities and high yield bonds) rallied in October when China’s central bank provided more stimulus, the ECB hinted at further easing, and soft U.S. data pushed back expectations for a Fed rate hike. As the period came to a close, however, the ECB disappointed investors with its subdued policy changes. The Fed’s December rate hike had a positive impact on the markets as it removed a source of uncertainty, but this was counteracted by the dampening effect of a stronger U.S. dollar, falling oil prices and tighter credit conditions.
At BlackRock, we believe investors need to think globally, extend their scope across a broad array of asset classes and be prepared to move freely as market conditions change over time. We encourage you to talk with your financial advisor and visit blackrock.com for further insight about investing in today’s markets.
Sincerely,
Rob Kapito
President, BlackRock Advisors, LLC
Rob Kapito
President, BlackRock Advisors, LLC
| | | | | | | | |
| Total Returns as of December 31, 2015 | |
| | | 6-month | | | 12-month | |
U.S. large cap equities
(S&P 500® Index) | | | 0.15 | % | | | 1.38 | % |
U.S. small cap equities
(Russell 2000® Index) | | | (8.75 | ) | | | (4.41 | ) |
International equities
(MSCI Europe, Australasia,
Far East Index) | | | (6.01 | ) | | | (0.81 | ) |
Emerging market equities
(MSCI Emerging Markets Index) | | | (17.35 | ) | | | (14.92 | ) |
3-month Treasury bills
(BofA Merrill Lynch 3-Month
U.S. Treasury Bill Index) | | | 0.04 | | | | 0.05 | |
U.S. Treasury securities
(BofA Merrill Lynch
10-Year U.S. Treasury
Index) | | | 1.43 | | | | 0.91 | |
U.S. investment-grade bonds
(Barclays U.S.
Aggregate Bond Index) | | | 0.65 | | | | 0.55 | |
Tax-exempt municipal
bonds (S&P Municipal
Bond Index) | | | 3.31 | | | | 3.32 | |
U.S. high yield bonds
(Barclays U.S. Corporate
High Yield 2% Issuer
Capped Index) | | | (6.79 | ) | | | (4.43 | ) |
| Past performance is no guarantee of future results. Index performance is shown for illustrative purposes only. You cannot invest directly in an index. | |
| | | | | | |
| | | | | | | |
| | THIS PAGE NOT PART OF YOUR FUND REPORT | | | | 3 |
| | |
| Fund Summary as of December 31, 2015 | | |
BlackRock CoreAlpha Bond Fund’s (the “Fund”) investment objective is to seek to provide a combination of income and capital growth.
|
| Portfolio Management Commentary |
How did the Fund perform?
| • | | For the 12-month period ended December 31, 2015, the Fund’s Institutional Shares returned 0.48%, Investor A Shares returned 0.04% and Investor C Shares returned (0.61)%. The Fund’s Institutional, Investor A and Investor C Shares underperformed the benchmark, the Barclays U.S. Aggregate Bond Index (the “Index”), which returned 0.55% for the same period. |
| • | | The Fund invests all of its assets in the CoreAlpha Bond Master Portfolio (the “Master Portfolio”), a series of Master Investment Portfolio. |
What factors influenced performance?
| • | | Security selection within corporate credits was strong for the full year 2015. In particular, an underweight position to energy was beneficial as low oil prices and global growth concerns put pressure on credit spreads for the sector. An underweight position to metals & mining issuers was also positive due to weakness in commodities. With respect to asset allocation, an overweighting of risk-based assets contributed positively for the full year, despite a drastic widening of credit spreads during the third quarter on macro uncertainties surrounding China, commodities weakness and the timing of the initial rate hike by the U.S. Federal Reserve (the “Fed”). The Master Portfolio’s global interest rate strategies contributed as well, in particular being overweight duration (and corresponding interest rate sensivity) in Australia and Canada. |
| • | | Currency strategies were the primary detractor during the period, driven by the Master Portfolio’s long U.S. dollar position during the second quarter in an environment of weak economic data and a Fed hesitant to raise rates prematurely. In addition, the Master Portfolio’s move from a short to |
| | | a long Canadian dollar position in the fourth quarter detracted from performance. Lastly, the Master Portfolio’s U.S. interest rate strategies hindered returns, in particular positioning along the nominal Treasury yield curve in the first quarter of 2015 and exposure to Treasury Inflation Protected Securities in the third quarter as commodity price declines and China growth concerns undermined the inflation outlook. |
| • | | The Master Portfolio held derivatives (i.e. financial future contracts, swaps, options and forward foreign currency exchange contracts) during the period, which had a modest negative impact on performance, on a net basis. |
Describe recent portfolio activity.
| • | | During the 12-month period, the Master Portfolio increased its energy and basic materials underweights. Within basic materials, the underweight was focused primarily on metals & mining names. The Master Portfolio also moved to an underweight in media, as that segment is experiencing increased competition and facing longer-term industry challenges surrounding the consumer shift to mobile devices. |
Describe portfolio positioning at period end.
| • | | At period end, the Master Portfolio remained overweight relative to the Index in non-government spread sectors and generally underweight U.S. Treasury securities. Within spread sectors, the Master Portfolio was overweight in investment grade corporate credit, agency mortgage-backed securities and asset-backed securities, and underweight in select non-corporate sectors including emerging markets. The Master Portfolio also held a non-benchmark allocation to high yield debt. |
The views expressed reflect the opinions of BlackRock as of the date of this report and are subject to change based on changes in market, economic or other conditions.
These views are not intended to be a forecast of future events and are no guarantee of future results.
| | | | | | |
| | | | | | | |
| 4 | | BLACKROCK COREALPHA BOND FUND | | DECEMBER 31, 2015 | | |
|
| Total Return Based on a $10,000 Investment |
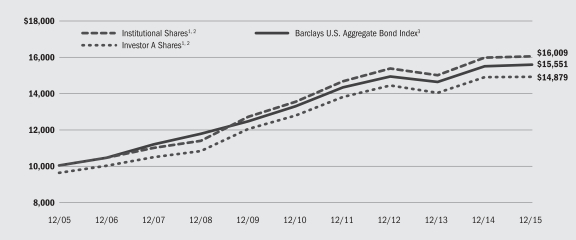
| | 1 | | Assuming maximum sales charges, transaction costs and other operating expenses, including administration fees, if any. Institutional Shares do not have a sales charge. |
| | 2 | | The Fund invests all of its assets in the Master Portfolio. The Master Portfolio invests, under normal circumstances, at least 80% of its assets in bonds, including obligations issued or guaranteed by the U.S. Government, its agencies or instrumentalities; mortgage-backed securities issued or guaranteed by the U.S. Government or its agencies or instrumentalities, including U.S. agency mortgage pass-through securities; commercial mortgage-backed securities; debt obligations of U.S. issuers; municipal securities; asset-backed securities; and U.S.-registered dollar-denominated debt obligations of foreign issuers. The Master Portfolio may invest in bonds of any maturity or duration. |
| | 3 | | A widely recognized unmanaged market-weighted index, comprised of investment-grade corporate bonds rated BBB or better, mortgages and U.S. Treasury and U.S. Government agency issues with at least one year to maturity. |
|
| Performance Summary for the Period Ended December 31, 2015 |
| | | | | | | | | | | | | | | | | | | | | | | | | | | | | | | | | | | | |
| | | | | | | | | | | | Average Annual Total Returns4 | |
| | | | | | | | | | | | 1 Year | | | 5 Years | | | 10 Years | |
| | | Standardized 30-Day Yields | | | Unsubsidized 30-Day Yields | | | 6-Month
Total Returns | | | w/o sales
charge | | | w/sales
charge | | | w/o sales
charge | | | w/sales
charge | | | w/o sales
charge | | | w/sales
charge | |
Institutional | | | 2.29 | % | | | 2.27 | % | | | 0.50 | % | | | 0.48 | % | | | N/A | | | | 3.45 | % | | | N/A | | | | 4.82 | % | | | N/A | |
Investor A | | | 1.94 | | | | 1.93 | | | | 0.32 | | | | 0.04 | | | | (3.96 | )% | | | 3.13 | | | | 2.29 | % | | | 4.48 | | | | 4.06 | % |
Investor C | | | 1.19 | | | | 1.18 | | | | (0.06 | ) | | | (0.61 | ) | | | (1.59 | ) | | | 2.35 | | | | 2.35 | | | | 3.70 | | | | 3.70 | |
Barclays U.S. Aggregate Bond Index | | | — | | | | — | | | | 0.65 | | | | 0.55 | | | | N/A | | | | 3.25 | | | | N/A | | | | 4.51 | | | | N/A | |
| | 4 | | Assuming maximum sales charges, if any. Average annual total returns with and without sales charges reflect reductions for distribution and service fees. See “About Fund Performance” on page 6 for a detailed description of share classes, including any related sales charges and fees. |
| | | | N/A — Not applicable as share class and index do not have a sales charge. |
| | | | Past performance is not indicative of future results. |
| | | | | | | | | | | | | | | | | | | | | | | | | | | | |
| | | Actual | | | Hypothetical6 | | | | |
| | | Beginning
Account Value
July 1, 2015 | | | Ending
Account Value
December 31, 2015 | | | Expenses Paid
During the
Period5 | | | Beginning
Account Value
July 1, 2015 | | | Ending
Account Value
December 31, 2015 | | | Expenses Paid
During the
Period5 | | | Annualized
Expense Ratio | |
Institutional | | $ | 1,000.00 | | | $ | 1,005.00 | | | $ | 1.77 | | | $ | 1,000.00 | | | $ | 1,023.44 | | | $ | 1.79 | | | | 0.35 | % |
Investor A | | $ | 1,000.00 | | | $ | 1,003.20 | | | $ | 3.53 | | | $ | 1,000.00 | | | $ | 1,021.68 | | | $ | 3.57 | | | | 0.70 | % |
Investor C | | $ | 1,000.00 | | | $ | 999.40 | | | $ | 7.31 | | | $ | 1,000.00 | | | $ | 1,017.90 | | | $ | 7.37 | | | | 1.45 | % |
| | 5 | | For each class of the Fund, expenses are equal to the annualized net expense ratio for the class, multiplied by the average account value over the period, multiplied by 184/365 (to reflect the one-half year period shown). Because the Fund invests all of its assets in the Master Portfolio, the expense example reflects the net expenses of both the Fund and the Master Portfolio in which it invests. |
| | 6 | | Hypothetical 5% annual return before expenses is calculated by prorating the number of days in the most recent fiscal half year divided by 365. |
| | | | See “Disclosure of Expenses” on page 6 for further information on how expenses are calculated. |
| | | | | | |
| | | | | | | |
| | BLACKROCK COREALPHA BOND FUND | | DECEMBER 31, 2015 | | 5 |
| • | | Institutional Shares are not subject to any sales charge. These shares bear no ongoing distribution or service fees and are available only to certain eligible investors. |
| • | | Investor A Shares are subject to a maximum initial sales charge (front-end load) of 4.00% and a service fee of 0.25% per year (but no distribution fee). Certain redemptions of these shares may be subject to a contingent deferred sales charge (“CDSC”) where no initial sales charge was paid at the time of purchase. These shares are generally available through financial intermediaries. |
| • | | Investor C Shares are subject to a 1.00% CDSC if redeemed within one year of purchase. In addition, these shares are subject to a distribution fee of 0.75% per year and a service fee of 0.25% per year. These shares are generally available through financial intermediaries. |
Prior to February 28, 2011 for Institutional Shares and prior to April 30, 2012 for Investor A and Investor C Shares, the performance of the classes is based on the returns of the Master Portfolio in which the Fund invests all of its assets adjusted to reflect the estimated annual fund fees and operating expenses of each respective share class of the Fund.
Performance information reflects past performance and does not guarantee future results. Current performance may be lower or higher than the performance data quoted. Refer to www.blackrock.com/funds to obtain performance data current to the most recent month end. Performance results do not reflect the deduction of taxes that a shareholder would pay on fund distributions or the redemption of fund shares. Figures shown in the performance tables on the previous page assume reinvestment of all distributions, if any, at net asset value (“NAV”) on the payable date. Investment return and principal value of shares will fluctuate so that shares, when redeemed, may be worth more or less than their original cost. Distributions paid to each class of shares will vary because of the different levels of service, distribution and transfer agency fees applicable to each class, which are deducted from the income available to be paid to shareholders. BlackRock Advisors, LLC (“BAL” or the “Administrator”), the Fund’s administrator, voluntarily waived a portion of the Fund’s expenses. Without such waiver, the Fund’s performance would have been lower. The Administrator is under no obligation to waive or to continue waiving its fees and such voluntary waiver may be reduced or discontinued at any time. See Note 4 of the Notes to Financial Statements for additional information on waivers. The standardized 30-day yield includes the effects of any waivers and/or reimbursements. The unsubsidized 30-day yield excludes the effects of any waivers and/or reimbursements.
Shareholders of the Fund may incur the following charges: (a) transactional expenses, such as sales charges; and (b) operating expenses, including administration fees, service and distribution fees, including 12b-1 fees, acquired fund fees and expenses and other Fund expenses. The expense example on the previous page (which is based on a hypothetical investment of $1,000 invested on July 1, 2015 and held through December 31, 2015) is intended to assist shareholders both in calculating expenses based on an investment in the Fund and in comparing these expenses with similar costs of investing in other mutual funds.
The expense example provides information about actual account values and actual expenses. In order to estimate the expenses a shareholder paid during the period covered by this report, shareholders can divide their account value by $1,000 and then multiply the result by the number corresponding to their share class under the heading entitled “Expenses Paid During the Period.”
The expense example also provides information about hypothetical account values and hypothetical expenses based on the Fund’s actual expense ratio and an assumed rate of return of 5% per year before expenses. In order to assist shareholders in comparing the ongoing expenses of investing in the Fund and other funds, compare the 5% hypothetical example with the 5% hypothetical examples that appear in shareholder reports of other funds.
The expenses shown in the expense example are intended to highlight shareholders’ ongoing costs only and do not reflect any transactional expenses, such as sales charges, if any. Therefore, the hypothetical example is useful in comparing ongoing expenses only, and will not help shareholders determine the relative total expenses of owning different funds. If these transactional expenses were included, shareholder expenses would have been higher.
| | | | | | |
| | | | | | | |
| 6 | | BLACKROCK COREALPHA BOND FUND | | DECEMBER 31, 2015 | | |
| | |
| Derivative Financial Instruments | | |
The Master Portfolio may invest in various derivative financial instruments. Derivative financial instruments are used to obtain exposure to a security, index and/or market without owning or taking physical custody of securities or to manage market, equity, credit, interest rate, foreign currency exchange rate, commodity and/or other risks. Derivative financial instruments may give rise to a form of economic leverage. Derivative financial instruments also involve risks, including the imperfect correlation between the value of a derivative financial instrument and the underlying asset, possible default of the counterparty to the transaction or illiquidity of the derivative financial instrument. The Master Portfolio’s ability to use a derivative financial instrument successfully depends on the investment advisor’s ability to predict pertinent market movements accurately, which cannot be assured. The use of derivative financial instruments may result in losses greater than if they had not been used, may limit the amount of appreciation the Master Portfolio can realize on an investment and/or may result in lower distributions paid to shareholders. The Master Portfolio’s investments in these instruments, if any, are discussed in detail in the Master Portfolio’s Notes to Financial Statements.
| | | | | | |
| | | | | | | |
| | BLACKROCK COREALPHA BOND FUND | | DECEMBER 31, 2015 | | 7 |
| | |
| Statement of Assets and Liabilities | | BlackRock CoreAlpha Bond Fund |
| | | | |
| December 31, 2015 | | | |
| | | | |
| Assets | |
Investments at value — Master Portfolio (cost — $242,421,759) | | $ | 239,068,861 | |
| Receivables: | | | | |
Capital shares sold | | | 2,621,440 | |
Withdrawals from the Master Portfolio | | | 70,069 | |
| | | | |
Total assets | | | 241,760,370 | |
| | | | |
| | | | |
| Liabilities | | | | |
| Payables: | | | | |
Capital shares redeemed | | | 2,691,509 | |
Income dividends | | | 36,341 | |
Administration fees | | | 18,407 | |
Professional fees | | | 12,008 | |
Service and distribution fees | | | 762 | |
| | | | |
Total liabilities | | | 2,759,027 | |
| | | | |
Net Assets | | $ | 239,001,343 | |
| | | | |
| | | | |
| Net Assets Consist of | | | | |
Paid-in capital | | $ | 241,224,677 | |
Distributions in excess of net investment income | | | (6,006 | ) |
Accumulated net realized gain allocated from the Master Portfolio | | | 1,135,570 | |
Net unrealized appreciation (depreciation) allocated from the Master Portfolio | | | (3,352,898 | ) |
| | | | |
Net Assets | | $ | 239,001,343 | |
| | | | |
| | | | |
| Net Asset Value | | | | |
Institutional — Based on net assets of $236,267,184 and 22,899,792 shares outstanding, unlimited number of shares authorized, no par value | | $ | 10.32 | |
| | | | |
Investor A — Based on net assets of $2,462,561 and 238,563 shares outstanding, unlimited number of shares authorized, no par value | | $ | 10.32 | |
| | | | |
Investor C — Based on net assets of $271,598 and 26,321 shares outstanding, unlimited number of shares authorized, no par value | | $ | 10.32 | |
| | | | |
| | | | | | |
| See Notes to Financial Statements. | | | | |
| | | | | | | |
| 8 | | BLACKROCK COREALPHA BOND FUND | | DECEMBER 31, 2015 | | |
| | |
| Statement of Operations | | BlackRock CoreAlpha Bond Fund |
| | | | |
| Year Ended December 31, 2015 | | | |
| | | | |
| Investment Income | | | | |
| Net investment income allocated from the Master Portfolio: | | | | |
Interest — unaffiliated | | $ | 6,319,128 | |
Dividends — unaffiliated | | | 29,805 | |
Dividends — affiliated | | | 53,557 | |
Securities lending — affiliated — net | | | 1,347 | |
Expenses | | | (571,852 | ) |
Fees waived | | | 16,261 | |
| | | | |
Total income | | | 5,848,246 | |
| | | | |
| | | | |
| Fund Expenses | | | | |
Administration — Institutional | | | 224,307 | |
Administration — Investor A | | | 3,509 | |
Administration — Investor C | | | 529 | |
Service and distribution — Investor A | | | 4,391 | |
Service and distribution — Investor C | | | 2,646 | |
Professional | | | 19,442 | |
Miscellaneous | | | 325 | |
| | | | |
Total expenses | | | 255,149 | |
Less administration fees waived | | | (19,442 | ) |
| | | | |
Total expenses after fees waived | | | 235,707 | |
| | | | |
Net investment income | | | 5,612,539 | |
| | | | |
| | | | |
| Realized and Unrealized Gain (Loss) Allocated from the Master Portfolio | | | | |
Net realized gain from investments, in-kind redemptions1, financial futures contracts, options written, swaps and foreign currency transactions | | | 464,898 | |
Net change in unrealized appreciation (depreciation) on investments, financial futures contracts, option written, swaps and foreign currency translations | | | (5,654,572 | ) |
| | | | |
Net realized and unrealized loss | | | (5,189,674 | ) |
| | | | |
Net Increase in Net Assets Resulting from Operations | | $ | 422,865 | |
| | | | |
1 See Note 2 of the Notes to Financial Statements. | | | | |
| | | | | | |
| See Notes to Financial Statements. | | | | |
| | | | | | | |
| | BLACKROCK COREALPHA BOND FUND | | DECEMBER 31, 2015 | | 9 |
| | |
| Statements of Changes in Net Assets | | BlackRock CoreAlpha Bond Fund |
| | | | | | | | |
| | | Year Ended December 31, | |
| Increase (Decrease) in Net Assets: | | 2015 | | | 2014 | |
| | | | | | | | |
| Operations | |
Net investment income | | $ | 5,612,539 | | | $ | 3,562,127 | |
Net realized gain | | | 464,898 | | | | 1,664,284 | |
Net change in unrealized appreciation (depreciation) | | | (5,654,572 | ) | | | 3,593,170 | |
| | | | |
Net increase in net assets resulting from operations | | | 422,865 | | | | 8,819,581 | |
| | | | |
| | | | | | | | |
| Distributions to Shareholders1 | | | | | | | | |
| From net investment income: | | | | | | | | |
Institutional | | | (5,292,050 | ) | | | (3,475,349 | ) |
Investor A | | | (34,988 | ) | | | (16,428 | ) |
Investor C | | | (3,325 | ) | | | (4,036 | ) |
From net realized gain: | | | | | | | | |
Institutional | | | (1,185,065 | ) | | | (151,873 | ) |
Investor A | | | (8,426 | ) | | | (718 | ) |
Investor C | | | (1,358 | ) | | | (176 | ) |
| | | | |
Decrease in net assets resulting from distributions to shareholders | | | (6,525,212 | ) | | | (3,648,580 | ) |
| | | | |
| | | | | | | | |
| Capital Share Transactions | | | | | | | | |
Net increase in net assets derived from capital share transactions | | | 59,195,073 | | | | 80,653,276 | |
| | | | |
| | | | | | | | |
| Net Assets | | | | | | | | |
Total increase in net assets | | | 53,092,726 | | | | 85,824,277 | |
Beginning of year | | | 185,908,617 | | | | 100,084,340 | |
| | | | |
End of year | | $ | 239,001,343 | | | $ | 185,908,617 | |
| | | | |
Distributions in excess of net investment income, end of year | | $ | (6,006 | ) | | $ | (288,182 | ) |
| | | | |
1 Distributions for annual periods determined in accordance with federal income tax regulations. | |
| | | | | | |
| See Notes to Financial Statements. | | | | |
| | | | | | | |
| 10 | | BLACKROCK COREALPHA BOND FUND | | DECEMBER 31, 2015 | | |
| | | | | | | | | | | | | | | | | | | | |
| | | Institutional | |
| | | Year Ended December 31, | | | Period
February 28, 20111
to December 31,
2011 | |
| | | 2015 | | | 2014 | | | 2013 | | | 2012 | | |
| | | | | | | | | | | | | | | | | | | | |
| Per Share Operating Performance | | | | | | | | | | | | | | | | | | | | |
Net asset value, beginning of period | | $ | 10.57 | | | $ | 10.19 | | | $ | 10.72 | | | $ | 10.50 | | | $ | 10.00 | |
| | | | |
Net investment income2 | | | 0.26 | | | | 0.26 | | | | 0.22 | | | | 0.24 | | | | 0.25 | |
Net realized and unrealized gain (loss) | | | (0.20 | ) | | | 0.39 | | | | (0.48 | ) | | | 0.26 | | | | 0.52 | |
| | | | |
Net increase (decrease) from investment operations | | | 0.06 | | | | 0.65 | | | | (0.26 | ) | | | 0.50 | | | | 0.77 | |
| | | | |
| Distributions from:3 | | | | | | | | | | | | | | | | | | | | |
Net investment income | | | (0.25 | ) | | | (0.26 | ) | | | (0.25 | ) | | | (0.25 | ) | | | (0.26 | ) |
Net realized gain | | | (0.06 | ) | | | (0.01 | ) | | | (0.00 | )4 | | | — | | | | — | |
Return of capital | | | — | | | | — | | | | (0.02 | ) | | | (0.03 | ) | | | (0.01 | ) |
| | | | |
Total distributions | | | (0.31 | ) | | | (0.27 | ) | | | (0.27 | ) | | | (0.28 | ) | | | (0.27 | ) |
| | | | |
Net asset value, end of period | | $ | 10.32 | | | $ | 10.57 | | | $ | 10.19 | | | $ | 10.72 | | | $ | 10.50 | |
| | | | |
| | | | | | | | | | | | | | | | | | | | |
| Total Return5 | | | | | | | | | | | | | | | | | | | | |
Based on net asset value | | | 0.48% | | | | 6.45% | | | | (2.44)% | | | | 4.82% | | | | 7.80% | 6 |
| | | | |
| | | | | | | | | | | | | | | | | | | | |
| Ratios to Average Net Assets7 | | | | | | | | | | | | | | | | | | | | |
Total expenses | | | 0.35% | 8 | | | 0.35% | 8 | | | 0.36% | 8 | | | 0.37% | 9 | | | 0.44% | 8,10 |
| | | | |
Total expenses after fees waived | | | 0.35% | 8 | | | 0.34% | 8 | | | 0.34% | 8 | | | 0.34% | 9 | | | 0.35% | 8,10 |
| | | | |
Net investment income | | | 2.48% | 8 | | | 2.53% | 8 | | | 2.16% | 8 | | | 2.22% | 9 | | | 2.93% | 8,10 |
| | | | |
| | | | | | | | | | | | | | | | | | | | |
| Supplemental Data | | | | | | | | | | | | | | | | | | | | |
Net assets, end of period (000) | | $ | 236,267 | | | $ | 183,880 | | | $ | 99,630 | | | $ | 110,020 | | | $ | 59,250 | |
| | | | |
Portfolio turnover of the Master Portfolio11 | | | 612% | | | | 686% | | | | 986% | | | | 2,128% | | | | 1,646% | |
| | | | |
| | 1 | | Commencement of operations. |
| | 2 | | Based on average shares outstanding. |
| | 3 | | Distributions for annual periods determined in accordance with federal income tax regulations. |
| | 4 | | Amount is greater than $(0.005) per share. |
| | 5 | | Where applicable, assumes the reinvestment of distributions. |
| | 6 | | Aggregate total return. |
| | 7 | | Includes the Fund’s share of the Master Portfolio’s allocated expenses and/or net investment income. |
| | 8 | | Includes the Fund’s share of the Master Portfolio’s allocated fees waived of 0.01%. |
| | 9 | | Includes the Fund’s share of the Master Portfolio’s allocated fees waived of less than 0.01%. |
| | 11 | | Includes mortgage dollar roll transactions (“MDRs”). Additional information regarding portfolio turnover rate is as follows: |
| | | | | | | | | | | | | | | | | | | | |
| | | Year Ended December 31, | | | Period
February 28, 20111
to December 31, 2011 | |
| | | 2015 | | | 2014 | | | 2013 | | | 2012 | | |
| | | | | | | | | | | | | | | | | | | | |
Portfolio turnover rate (excluding MDRs) | | | 540% | | | | 470% | | | | 736% | | | | 1,774% | | | | 1,510% | |
| | | | | | | | | | | | | | | | | | | | |
| | | | | | |
| See Notes to Financial Statements. | | | | |
| | | | | | | |
| | BLACKROCK COREALPHA BOND FUND | | DECEMBER 31, 2015 | | 11 |
| | |
| Financial Highlights (continued) | | |
| | | | | | | | | | | | | | | | |
| | | Investor A | |
| | | Year Ended December 31, | | | Period
April 30, 20121
to December 31, 2012 | |
| | | 2015 | | | 2014 | | | 2013 | | |
| | | | | | | | | | | | | | | | |
| Per Share Operating Performance | | | | | | | | | | | | | | | | |
Net asset value, beginning of period | | $ | 10.58 | | | $ | 10.19 | | | $ | 10.72 | | | $ | 10.55 | |
| | | | |
Net investment income2 | | | 0.22 | | | | 0.23 | | | | 0.18 | | | | 0.12 | |
Net realized and unrealized gain (loss) | | | (0.21 | ) | | | 0.39 | | | | (0.48 | ) | | | 0.22 | |
| | | | |
Net increase (decrease) from investment operations | | | 0.01 | | | | 0.62 | | | | (0.30 | ) | | | 0.34 | |
| | | | |
| Distributions from:3 | | | | | | | | | | | | | | | | |
Net investment income | | | (0.21 | ) | | | (0.22 | ) | | | (0.21 | ) | | | (0.15 | ) |
Net realized gain | | | (0.06 | ) | | | (0.01 | ) | | | (0.00 | )4 | | | — | |
Return of capital | | | — | | | | — | | | | (0.02 | ) | | | (0.02 | ) |
| | | | |
Total distributions | | | (0.27 | ) | | | (0.23 | ) | | | (0.23 | ) | | | (0.17 | ) |
| | | | |
Net asset value, end of period | | $ | 10.32 | | | $ | 10.58 | | | $ | 10.19 | | | $ | 10.72 | |
| | | | |
| | | | | | | | | | | | | | | | |
| Total Return5 | | | | | | | | | | | | | | | | |
Based on net asset value | | | 0.04% | | | | 6.18% | | | | (2.78)% | | | | 3.25% | 6 |
| | | | |
| | | | | | | | | | | | | | | | |
| Ratios to Average Net Assets7 | | | | | | | | | | | | | | | | |
Total expenses | | | 0.70% | 8 | | | 0.71% | 8 | | | 0.71% | 8 | | | 0.72% | 8,9 |
| | | | |
Total expenses after fees waived | | | 0.70% | 8 | | | 0.69% | 8 | | | 0.69% | 8 | | | 0.70% | 8,9 |
| | | | |
Net investment income | | | 2.13% | 8 | | | 2.19% | 8 | | | 1.78% | 8 | | | 1.80% | 8,9 |
| | | | |
| | | | | | | | | | | | | | | | |
| Supplemental Data | | | | | | | | | | | | | | | | |
Net assets, end of period (000) | | $ | 2,463 | | | $ | 1,776 | | | $ | 166 | | | $ | 168 | |
| | | | |
Portfolio turnover of the Master Portfolio10 | | | 612% | | | | 686% | | | | 986% | | | | 2,128% | |
| | | | |
| | 1 | | Commencement of operations. |
| | 2 | | Based on average shares outstanding. |
| | 3 | | Distributions for annual periods determined in accordance with federal income tax regulations. |
| | 4 | | Amount is greater than $(0.005) per share. |
| | 5 | | Where applicable, excludes the effects of any sales charges and assumes the reinvestment of distributions. |
| | 6 | | Aggregate total return. |
| | 7 | | Includes the Fund’s share of the Master Portfolio’s allocated expenses and/or net investment income. |
| | 8 | | Includes the Fund’s share of the Master Portfolio’s allocated fees waived of 0.01%. |
| | 10 | | Includes MDRs. Additional information regarding portfolio turnover rate is as follows: |
| | | | | | | | | | | | | | | | |
| | | Year Ended December 31, | | | Period
April 30, 20121
to December 31,
2012 | |
| | | 2015 | | | 2014 | | | 2013 | | |
| | | | | | | | | | | | | | | | |
Portfolio turnover rate (excluding MDRs) | | | 540% | | | | 470% | | | | 736% | | | | 1,774% | |
| | | | |
| | | | | | |
| See Notes to Financial Statements. | | | | |
| | | | | | | |
| 12 | | BLACKROCK COREALPHA BOND FUND | | DECEMBER 31, 2015 | | |
| | |
| Financial Highlights (concluded) | | |
| | | | | | | | | | | | | | | | |
| | | Investor C | |
| | | Year Ended December 31, | | | Period April 30, 20121
to December 31, 2012 | |
| | | 2015 | | | 2014 | | | 2013 | | |
| | | | | | | | | | | | | | | | |
| Per Share Operating Performance | | | | | | | | | | | | | | | | |
Net asset value, beginning of period | | $ | 10.57 | | | $ | 10.18 | | | $ | 10.71 | | | $ | 10.55 | |
| | | | |
Net investment income2 | | | 0.15 | | | | 0.15 | | | | 0.11 | | | | 0.06 | |
Net realized and unrealized gain (loss) | | | (0.21 | ) | | | 0.40 | | | | (0.48 | ) | | | 0.21 | |
| | | | |
Net increase (decrease) from investment operations | | | (0.06 | ) | | | 0.55 | | | | (0.37 | ) | | | 0.27 | |
| | | | |
| Distributions from:3 | | | | | | | | | | | | | | | | |
Net investment income | | | (0.13 | ) | | | (0.15 | ) | | | (0.14 | ) | | | (0.10 | ) |
Net realized gain | | | (0.06 | ) | | | (0.01 | ) | | | (0.00 | )4 | | | — | |
Return of capital | | | — | | | | — | | | | (0.02 | ) | | | (0.01 | ) |
| | | | |
Total distributions | | | (0.19 | ) | | | (0.16 | ) | | | (0.16 | ) | | | (0.11 | ) |
| | | | |
Net asset value, end of period | | $ | 10.32 | | | $ | 10.57 | | | $ | 10.18 | | | $ | 10.71 | |
| | | | |
| | | | | | | | | | | | | | | | |
| Total Return5 | | | | | | | | | | | | | | | | |
Based on net asset value | | | (0.61)% | | | | 5.40% | | | | (3.51)% | | | | 2.61% | 6 |
| | | | |
| | | | | | | | | | | | | | | | |
| Ratios to Average Net Assets7 | | | | | | | | | | | | | | | | |
Total expenses | | | 1.46% | 8 | | | 1.45% | 8 | | | 1.46% | 8 | | | 1.46% | 8,9 |
| | | | |
Total expenses after fees waived | | | 1.45% | 8 | | | 1.44% | 8 | | | 1.44% | 8 | | | 1.44% | 8,9 |
| | | | |
Net investment income | | | 1.39% | 8 | | | 1.44% | 8 | | | 1.04% | 8 | | | 1.04% | 8,9 |
| | | | |
| | | | | | | | | | | | | | | | |
| Supplemental Data | | | | | | | | | | | | | | | | |
Net assets, end of period (000) | | $ | 272 | | | $ | 253 | | | $ | 288 | | | $ | 273 | |
| | | | |
Portfolio turnover of the Master Portfolio10 | | | 612% | | | | 686% | | | | 986% | | | | 2,128% | |
| | | | |
| | 1 | | Commencement of operations. |
| | 2 | | Based on average shares outstanding. |
| | 3 | | Distributions for annual periods determined in accordance with federal income tax regulations. |
| | 4 | | Amount is greater than $(0.005) per share. |
| | 5 | | Where applicable, excludes the effects of any sales charges and assumes the reinvestment of distributions. |
| | 6 | | Aggregate total return. |
| | 7 | | Includes the Fund’s share of the Master Portfolio’s allocated expenses and/or net investment income. |
| | 8 | | Includes the Fund’s share of the Master Portfolio’s allocated fees waived of 0.01%. |
| | 10 | | Includes MDRs. Additional information regarding portfolio turnover rate is as follows: |
| | | | | | | | | | | | | | | | |
| | | Year Ended December 31, | | | Period
April 30, 20121 to December 31,
2012 | |
| | | 2015 | | | 2014 | | | 2013 | | |
| | | | | | | | | | | | | | | | |
Portfolio turnover rate (excluding MDRs) | | | 540% | | | | 470% | | | | 736% | | | | 1,774% | |
| | | | |
| | | | | | |
| See Notes to Financial Statements. | | | | |
| | | | | | | |
| | BLACKROCK COREALPHA BOND FUND | | DECEMBER 31, 2015 | | 13 |
| | | | |
| Notes to Financial Statements | | BlackRock CoreAlpha Bond Fund |
1. Organization:
BlackRock CoreAlpha Bond Fund (the “Fund”), a series of BlackRock Funds III (the “Trust”), is registered under the Investment Company Act of 1940, as amended (the “1940 Act”), as a diversified, open-end management investment company. The Trust is organized as a Delaware statutory trust. The Fund seeks to achieve its investment objective by investing all of its assets in CoreAlpha Bond Master Portfolio (the “Master Portfolio”), a series of Master Investment Portfolio (“MIP”), an affiliate of the Fund, which has the same investment objective and strategies as the Fund. The value of the Fund’s investment in the Master Portfolio reflects the Fund’s proportionate interest in the net assets of the Master Portfolio. The performance of the Fund is directly affected by the performance of the Master Portfolio. At December 31, 2015, the percentage of the Master Portfolio owned by the Fund was 29.3%. The financial statements of the Master Portfolio, including the Schedule of Investments, are included elsewhere in this report and should be read in conjunction with the Fund’s financial statements.
The Fund offers multiple classes of shares. All classes of shares have identical voting, dividend, liquidation and other rights and are subject to the same terms and conditions, except that Investor A and Investor C Shares bear certain expenses related to shareholder servicing of such shares, and Investor C Shares also bears certain expenses related to distribution of such shares. Institutional Shares are sold only to certain eligible investors. Investor A and Investor C Shares are generally available through financial intermediaries. Each class has exclusive voting rights with respect to matters relating to its shareholder servicing and distribution expenditures. The Board of Trustees of the Trust and Boards of Trustees of MIP are referred to throughout this report as the “Board of Trustees” or the “Board” and the members are referred to as “Trustees.”
| | | | | | | | | | | | |
| Share Class | | Initial Sales Charge | | | CDSC | | | Conversion | |
Institutional Shares | | | No | | | | No | | | | None | |
Investor A Shares | | | Yes | | | | No | 1 | | | None | |
Investor C Shares | | | No | | | | Yes | | | | None | |
| | 1 | | Investor A Shares may be subject to a CDSC for certain redemptions where no initial sales charge was paid at the time of purchase. |
The Fund, together with certain other registered investment companies advised by BAL or its affiliates, is included in a complex of open-end funds referred to as the Equity-Liquidity Complex.
2. Significant Accounting Policies:
The financial statements are prepared in conformity with accounting principles generally accepted in the United States of America (“U.S. GAAP”), which may require management to make estimates and assumptions that affect the reported amounts of assets and liabilities in the financial statements, disclosure of contingent assets and liabilities at the date of the financial statements and the reported amounts of increases and decreases in net assets from operations during the reporting period. Actual results could differ from those estimates. The Fund is considered an investment company under U.S. GAAP and follows the accounting and reporting guidance applicable to investment companies. Below is a summary of significant accounting policies:
Investment Transactions and Investment Income: For financial reporting purposes, contributions to and withdrawals from the Master Portfolio are accounted on a trade date basis. The Fund records daily its proportionate share of the Master Portfolio’s income, expenses and realized and unrealized gains and losses. Realized and unrealized gains and losses are adjusted utilizing partnership tax allocation rules. In addition, the Fund accrues its own expenses. Income, expenses and realized and unrealized gains and losses are allocated daily to each class based on its relative net assets.
Distributions: Distributions from net investment income are declared daily and paid monthly. Distributions of capital gains are recorded on the ex-dividend date. The character and timing of distributions are determined in accordance with federal income tax regulations, which may differ from U.S. GAAP.
In-Kind Redemptions: The Master Portfolio satisfied certain redemptions of investors’ capital through an in-kind redemption of securities and cash. For financial reporting purposes, these transactions were treated as a sale of securities and the resulting gains and losses were recognized at the Master Portfolio based on the market value of the securities on the date of the redemption. For the year ended December 31, 2015, the Fund was allocated realized gain from the in-kind redemption of $915,865. For tax purposes, no gains or losses were recognized.
Indemnifications: In the normal course of business, the Fund enters into contracts that contain a variety of representations that provide general indemnification. The Fund’s maximum exposure under these arrangements is unknown because it involves future potential claims against the Fund, which cannot be predicted with any certainty.
Other: Expenses directly related to the Fund or its classes are charged to the Fund or the applicable class. Other operating expenses shared by several funds, including other funds managed by the Manager, are prorated among those funds on the basis of relative net assets or other appropriate methods. Expenses directly related to the Fund and other shared expenses prorated to the Fund are allocated daily to each class based on its relative net assets or other appropriate methods.
| | | | | | |
| | | | | | | |
| 14 | | BLACKROCK COREALPHA BOND FUND | | DECEMBER 31, 2015 | | |
| | | | |
| Notes to Financial Statements (continued) | | BlackRock CoreAlpha Bond Fund |
3. Investment Valuation and Fair Value Measurements:
Investment Valuation Policies: The Fund’s policy is to value its financial instruments at fair value. The Fund records its investment in the Master Portfolio at fair value based on the Fund’s proportionate interest in the net assets of the Master Portfolio. Valuation of securities held by the Master Portfolio is discussed in Note 3 of the Master Portfolio’s Notes to Financial Statements, which are included elsewhere in this report.
4. Administration Agreement and Other Transactions with Affiliates:
The PNC Financial Services Group, Inc. is the largest stockholder and an affiliate of BlackRock, Inc. (“BlackRock”) for 1940 Act purposes.
The Trust, on behalf of the Fund, entered into an Administration Agreement with BAL, an indirect, wholly owned subsidiary of BlackRock, to provide administrative services (other than investment advice and related portfolio activities). For such services, the Fund pays BAL a monthly fee at an annual rate of 0.10% of the average daily value of the Institutional Share’s net assets and 0.20% of the Investor A and Investor C Shares’ net assets. The Fund does not pay an investment advisory fee or investment management fee.
From time to time, BAL may waive such fees in whole or in part. Any such waiver will reduce the expenses of the Fund and, accordingly, have a favorable impact on its performance. BAL may delegate certain of its administration duties to sub-administrators.
The fees and expenses of the Fund’s trustees who are not “interested persons” of the Trust, as defined in the 1940 Act (“Independent Trustees”), counsel to the Independent Trustees and the Trust’s independent registered public accounting firm (together, the “independent expenses”) are paid directly by the Fund. BAL has contractually agreed to reimburse the Fund or provide an offsetting credit against the administration fees paid by the Fund in an amount equal to the independent expenses through April 30, 2016.
The Trust, on behalf of the Fund, entered into a Distribution Agreement and a Distribution and Service Plan with BlackRock Investments, LLC (“BRIL”), an affiliate of BAL. Pursuant to the Distribution and Service Plan and in accordance with Rule 12b-1 under the 1940 Act, the Fund pays BRIL ongoing service and distribution fees. The fees are accrued daily and paid monthly at annual rates based upon the average daily net assets of the relevant share class of the Fund as follows:
| | | | | | | | |
| | | Service
Fees | | | Distribution
Fees | |
Investor A | | | 0.25% | | | | — | |
Investor C | | | 0.25% | | | | 0.75% | |
Pursuant to sub-agreements with BRIL, broker-dealers and BRIL provide shareholder servicing and distribution services to the Fund. The ongoing service and/or distribution fee compensates BRIL and each broker-dealer for providing shareholder servicing and/or distribution related services to the shareholders.
For the year ended December 31, 2015, affiliates earned underwriting discounts, direct commissions and dealer concessions on sales of the Fund’s Investor A which totaled $930.
For the year ended December 31, 2015, affiliates received CDSCs of $445 and $248 for Investor A and Investor C Shares, respectively.
Certain officers and/or trustees of the Trust are officers and/or directors of BlackRock or its affiliates.
5. Income Tax Information:
It is the Fund’s policy to comply with the requirements of the Internal Revenue Code of 1986, as amended, applicable to regulated investment companies, and to distribute substantially all of its taxable income to its shareholders. Therefore, no federal income tax provision is required.
The Fund files U.S. federal and various state and local tax returns. No income tax returns are currently under examination. The statute of limitations on the Fund’s U.S. federal tax returns remains open for each of the four years ended December 31, 2015. The statutes of limitations on the Fund’s state and local tax returns may remain open for an additional year depending upon the jurisdiction.
Management has analyzed tax laws and regulations and their application to the Fund as December 31, 2015, inclusive of the open tax return years, and does not believe there are any uncertain tax positions that require recognition of a tax liability in the Fund’s financial statements.
The tax character of distributions paid was as follows:
| | | | | | | | |
| | | 12/31/15 | | | 12/31/14 | |
Ordinary income | | $ | 6,146,395 | | | $ | 3,648,580 | |
Long-term capital gains | | | 378,817 | | | | — | |
| | | | | | | | |
Total | | $ | 6,525,212 | | | $ | 3,648,580 | |
| | | | | | | | |
| | | | | | |
| | | | | | | |
| | BLACKROCK COREALPHA BOND FUND | | DECEMBER 31, 2015 | | 15 |
| | |
| Notes to Financial Statements (concluded) | | BlackRock CoreAlpha Bond Fund |
As of period end, the tax components of accumulated net losses were as follows:
| | | | |
Undistributed ordinary income | | $ | 794,586 | |
Capital loss carryforwards | | | (1,587,249 | ) |
Net unrealized losses1 | | | (1,430,671 | ) |
| | | | |
Total | | $ | (2,223,334 | ) |
| | | | |
| | 1 | | The difference between book-basis and tax-basis net unrealized gains (losses) was attributable primarily to the timing and recognition of partnership income. |
As of period end, the Fund had a capital loss carryforward, with no expiration dates, available to offset future realized capital gains of $1,587,249.
6. Capital Share Transactions:
Transactions in capital shares for each class were as follows:
| | | | | | | | | | | | | | | | | | |
| | | Year Ended
December 31, 2015 | | | | | Year Ended
December 31, 2014 | |
| | | Shares | | | Amount | | | | | Shares | | | Amount | |
| Institutional | | | | | | | | | | | | | | | | | | |
Shares sold | | | 9,352,784 | | | $ | 98,811,293 | | | | | | 13,880,886 | | | $ | 144,664,033 | |
Shares issued to shareholders in reinvestment of distributions | | | 568,522 | | | | 5,968,027 | | | | | | 305,732 | | | | 3,201,545 | |
Shares redeemed | | | (4,416,226 | ) | | | (46,330,882 | ) | | | | | (6,572,695 | ) | | | (68,757,052 | ) |
| | | | | | | | | | |
Net increase | | | 5,505,080 | | | $ | 58,448,438 | | | | | | 7,613,923 | | | $ | 79,108,526 | |
| | | | | | | | | | |
| | | | | | | | | | | | | | | | | | |
| Investor A | | | | | | | | | | | | | | | | | | |
Shares sold | | | 206,461 | | | $ | 2,163,091 | | | | | | 171,264 | | | $ | 1,793,894 | |
Shares issued to shareholders in reinvestment of distributions | | | 4,095 | | | | 43,073 | | | | | | 1,582 | | | | 16,615 | |
Shares redeemed | | | (139,923 | ) | | | (1,485,387 | ) | | | | | (21,204 | ) | | | (219,796 | ) |
| | | | | | | | | | |
Net increase | | | 70,633 | | | $ | 720,777 | | | | | | 151,642 | | | $ | 1,590,713 | |
| | | | | | | | | | |
| | | | | | | | | | | | | | | | | | |
| Investor C | | | | | | | | | | | | | | | | | | |
Shares sold | | | 8,280 | | | $ | 86,812 | | | | | | 2 | | | $ | 22 | |
Shares issued to shareholders in reinvestment of distributions | | | 407 | | | | 4,273 | | | | | | 374 | | | | 3,904 | |
Shares redeemed | | | (6,261 | ) | | | (65,227 | ) | | | | | (4,777 | ) | | | (49,889 | ) |
| | | | | | | | | | |
Net increase (decrease) | | | 2,426 | | | $ | 25,858 | | | | | | (4,401 | ) | | $ | (45,963 | ) |
| | | | | | | | | | |
Total Net Increase | | | 5,578,139 | | | $ | 59,195,073 | | | | | | 7,761,164 | | | $ | 80,653,276 | |
| | | | | | | | | | |
At period end, shares owned by BlackRock HoldCo 2, Inc., an affiliate of the Fund, were as follows:
7. Subsequent Events:
Management has evaluated the impact of all subsequent events on the Fund through the date the financial statements were issued and has determined that there were no subsequent events requiring adjustment or additional disclosure in the financial statements.
| | | | | | |
| | | | | | | |
| 16 | | BLACKROCK COREALPHA BOND FUND | | DECEMBER 31, 2015 | | |
| | | | |
| Report of Independent Registered Public Accounting Firm | | |
To the Board of Trustees of BlackRock Funds III and the Shareholders of BlackRock CoreAlpha Bond Fund:
In our opinion, the accompanying statement of assets and liabilities and the related statements of operations and of changes in net assets and the financial highlights present fairly, in all material respects, the financial position of BlackRock CoreAlpha Bond Fund (the “Fund”), a series of BlackRock Funds III, at December 31, 2015, the results of its operations for the year then ended, the changes in its net assets for each of the two years in the period then ended and the financial highlights for each of the periods presented, in conformity with accounting principles generally accepted in the United States of America. These financial statements and financial highlights (hereafter referred to as “financial statements”) are the responsibility of the Fund’s management. Our responsibility is to express an opinion on these financial statements based on our audits. We conducted our audits of these financial statements in accordance with the standards of the Public Company Accounting Oversight Board (United States). Those standards require that we plan and perform the audit to obtain reasonable assurance about whether the financial statements are free of material misstatement. An audit includes examining, on a test basis, evidence supporting the amounts and disclosures in the financial statements, assessing the accounting principles used and significant estimates made by management, and evaluating the overall financial statement presentation. We believe that our audits provide a reasonable basis for our opinion.
/s/PricewaterhouseCoopers LLP
Philadelphia, Pennsylvania
February 24, 2016
| | |
| Important Tax Information (Unaudited) | | |
For the fiscal year ended December 31, 2015, the following information is provided with respect to the ordinary income distributions paid by the Fund.
| | | | |
Interest-Related Dividends and Qualified Short Term Capital Gains for Non-U.S. Residents1 | | | 77.89% | |
Federal Obligation Interest2 | | | 4.97% | |
| | 1 | | Represents the portion of the taxable ordinary income dividends eligible for exemption from U.S. withholding tax for nonresident aliens and foreign corporations. |
| | 2 | | The law varies in each state as to whether and what percentage of dividend income attributable to federal obligations is exempt from state income tax. We recommend that you consult your tax advisor to determine if any portion of the dividends you received is exempt from state income taxes. |
Additionally, the Fund distributed long-term capital gains of $0.016915 per share to shareholders on record June 29, 2015.
| | | | | | |
| | | | | | | |
| | BLACKROCK COREALPHA BOND FUND | | DECEMBER 31, 2015 | | 17 |
| | |
| Master Portfolio Information | | CoreAlpha Bond Master Portfolio |
| | |
| Portfolio Composition | | Percent of Total Investments4 |
| | | | |
U.S. Government Sponsored Agency Securities | | | 45 | % |
Corporate Bonds | | | 35 | |
Non-Agency Mortgage-Backed Securities | | | 12 | |
Asset-Backed Securities | | | 9 | |
Foreign Agency Obligations | | | 1 | |
U.S. Treasury Obligations | | | 1 | |
Investment Companies | | | 1 | |
Municipal Bonds | | | 1 | |
Short-Term Securities | | | 2 | |
TBA Sole Commitments | | | (7 | ) |
| | |
| Credit Quality Allocation1 | | Percent of
Total Investments4 |
| | | | |
AAA/Aaa2 | | | 57 | % |
AA/Aa | | | 7 | |
A | | | 15 | |
BBB/Baa | | | 18 | |
BB/Ba | | | 2 | |
B | | | — | 3 |
CCC | | | — | 3 |
N/R | | | 1 | |
| | 1 | | For financial reporting purposes, credit quality ratings shown above reflect the highest rating assigned by either Standard & Poor’s (“S&P”) or Moody’s Investors Service (“Moody’s”) if ratings differ. These rating agencies are independent, nationally recognized statistical rating organizations and are widely used. Investment grade ratings are credit ratings of BBB/Baa or higher. Below investment grade ratings are credit ratings of BB/Ba or lower. Investments designated N/R are not rated by either rating agency. Unrated investments do not necessarily indicate low credit quality. Credit quality ratings are subject to change. |
| | 2 | | The investment advisor evaluates the credit quality of not-rated investments based upon certain factors including, but not limited to, credit ratings for similar investments and financial analysis of sectors, individual investments and/or issuer. Using this approach, the investment advisor has deemed U.S. Government Sponsored Agency Securities and U.S. Treasury Obligations as AAA/Aaa. |
| | 3 | | Represents less than 1%. |
| | 4 | | Excludes short-term securities. |
| | | | | | |
| | | | | | | |
| 18 | | BLACKROCK COREALPHA BOND FUND | | DECEMBER 31, 2015 | | |
| | |
Schedule of Investments December 31, 2015 | | CoreAlpha Bond Master Portfolio (Percentages shown are based on Net Assets) |
| | | | | | | | |
| Asset-Backed Securities | | Par (000) | | | Value | |
Access Group, Inc., Series 2004-A, Class A2, 0.58%, 4/25/29 (a) | | $ | 946 | | | $ | 933,547 | |
ACE Securities Corp. Home Equity Loan Trust (a): | | | | | | | | |
Series 2005-AG1, Class A2D, 0.78%, 8/25/35 | | | 126 | | | | 124,666 | |
Series 2005-HE2, Class M3, 1.14%, 4/25/35 | | | 325 | | | | 324,565 | |
Series 2005-HE4, Class M2, 1.20%, 7/25/35 | | | 524 | | | | 515,335 | |
American Credit Acceptance Receivables Trust, Series 2014-3, Class A, 0.99%, 8/10/18 (b) | | | 103 | | | | 102,417 | |
AmeriCredit Automobile Receivables Trust: | | | | | | | | |
Series 2012-3, Class D, 3.03%, 7/09/18 | | | 641 | | | | 647,072 | |
Series 2012-4, Class D, 2.68%, 10/09/18 | | | 1,140 | | | | 1,148,645 | |
Series 2012-5, Class B, 1.12%, 11/08/17 | | | 252 | | | | 251,589 | |
Bear Stearns Asset-Backed Securities I Trust, Series 2006-HE1, Class 1A3, 0.75%, 12/25/35 (a) | | | 195 | | | | 194,653 | |
Carfinance Capital Auto Trust, Class A (b): | | | | | | | | |
Series 2013-2A, 1.75%, 11/15/17 | | | 19 | | | | 19,160 | |
Series 2014-1A, 1.46%, 12/17/18 | | | 323 | | | | 322,237 | |
Centex Home Equity Loan Trust, Series 2006-A, Class AV3, 0.58%, 6/25/36 (a) | | | 250 | | | | 249,689 | |
Chase Issuance Trust, Series 2012-A7, Class A7, 2.16%, 9/16/24 | | | 1,190 | | | | 1,155,856 | |
Citibank Credit Card Issuance Trust,
Series 2014-A6, Class A6, 2.15%, 7/15/21 | | | 2,940 | | | | 2,954,067 | |
College Loan Corp. Trust I, Series 2004-1, Class A4, 0.51%, 4/25/24 (a) | | | 3,000 | | | | 2,986,451 | |
Countrywide Asset-Backed Certificates, Series 2005-8, Class M1, 0.89%, 12/25/35 (a) | | | 223 | | | | 223,138 | |
CPS Auto Receivables Trust, Series 2011-B, Class B, 5.68%, 9/17/18 (b) | | | 109 | | | | 109,028 | |
Credit Suisse Mortgage Capital Certificates, Series 2006-CF3, Class A1, 0.96%, 10/25/36 (a)(b) | | | 351 | | | | 346,278 | |
Discover Card Execution Note Trust,
Series 2015-A2, Class A, 1.90%, 10/17/22 | | | 1,160 | | | | 1,144,088 | |
DT Auto Owner Trust, Series 2012-2A, Class D, 4.35%, 3/15/19 (b) | | | 804 | | | | 803,962 | |
Exeter Automobile Receivables Trust (b): | | | | | | | | |
Series 2012-2A, Class B, 2.22%, 12/15/17 | | | 159 | | | | 159,144 | |
Series 2013-1A, Class B, 2.41%, 5/15/18 | | | 521 | | | | 521,381 | |
Series 2014-1A, Class A, 1.29%, 5/15/18 | | | 495 | | | | 494,910 | |
Series 2014-2A, Class A, 1.06%, 8/15/18 | | | 137 | | | | 136,583 | |
First Franklin Mortgage Loan Trust (a): | | | | | | | | |
Series 2005-FF04, Class M1, 1.07%, 5/25/35 | | | 324 | | | | 322,784 | |
Series 2005-FF10, Class A4, 0.74%, 11/25/35 | | | 177 | | | | 172,414 | |
| | | | | | | | |
| Asset-Backed Securities | | Par (000) | | | Value | |
First Investors Auto Owner Trust, Class A2 (b): | | | | | | | | |
Series 2013-1A, 0.90%, 10/15/18 | | $ | 66 | | | $ | 66,034 | |
Series 2014-1A, 0.80%, 2/15/18 | | | 12 | | | | 11,850 | |
Flagship Credit Auto Trust, Series 2014-1, Class A, 1.21%, 4/15/19 (b) | | | 504 | | | | 501,714 | |
HSI Asset Securitization Corp. Trust,
Series 2006-OPT4, Class 2A5, 0.00%, 3/25/36 (c) | | | 1,308 | | | | 1,268,435 | |
JPMorgan Mortgage Acquisition Corp. (a): | | | | | | | | |
Series 2005-OPT2, Class A1B, 0.71%, 12/25/35 | | | 202 | | | | 200,354 | |
Series 2007-CH1, Class AV4, 0.55%, 11/25/36 | | | 49 | | | | 48,542 | |
KeyCorp Student Loan Trust, Series 2006-A, Class 2A4, 0.91%, 9/27/35 (a) | | | 1,079 | | | | 1,040,899 | |
Morgan Stanley ABS Capital I, Inc. Trust (a): | | | | | | | | |
Series 2005-HE3, Class M2, 1.20%, 7/25/35 | | | 56 | | | | 55,735 | |
Series 2005-WMC4, Class M4, 1.37%, 4/25/35 | | | 893 | | | | 894,455 | |
National Collegiate Student Loan Trust (a): | | | | | | | | |
Series 2004-1, Class A2, 0.86%, 6/25/27 | | | 176 | | | | 174,691 | |
Series 2004-2, Class A4, 0.73%, 11/27/28 | | | 1,773 | | | | 1,740,816 | |
Series 2005-1, Class A4, 0.66%, 11/27/28 | | | 105 | | | | 102,683 | |
Series 2005-3, Class A4, 0.70%, 4/25/29 | | | 1,630 | | | | 1,605,218 | |
Series 2006-1, Class A4, 0.67%, 3/27/28 | | | 718 | | | | 691,677 | |
Park Place Securities, Inc. Asset-Backed Pass-Through Certificates (a): | | | | | | | | |
Series 2004-WHQ2, Class M2, 1.37%, 2/25/35 | | | 1,135 | | | | 1,131,699 | |
Series 2004-WWF1, Class M2, 1.44%, 12/25/34 | | | 51 | | | | 50,714 | |
Series 2005-WCW3, Class A2C, 0.80%, 8/25/35 | | | 320 | | | | 317,388 | |
RAMP Trust (a): | | | | | | | | |
Series 2004-RS11, Class M1, 1.35%, 11/25/34 | | | 226 | | | | 223,453 | |
Series 2005-EFC1, Class M2, 0.87%, 5/25/35 | | | 293 | | | | 292,507 | |
Series 2005-RS6, Class M1, 0.92%, 6/25/35 | | | 203 | | | | 202,772 | |
Series 2006-NC2, Class A2, 0.61%, 2/25/36 | | | 892 | | | | 870,776 | |
Series 2006-RZ3, Class A2, 0.58%, 8/25/36 | | | 928 | | | | 919,634 | |
RASC Trust, Series 2005-AHL3, Class A2, 0.66%, 11/25/35 (a) | | | 436 | | | | 429,162 | |
Santander Drive Auto Receivables Trust: | | | | | | | | |
Series 2011-3, Class D, 4.23%, 5/15/17 | | | 785 | | | | 785,180 | |
| | |
| ABS | | Asset-Backed Security |
| AUD | | Australian Dollar |
| BRL | | Brazilian Real |
| CAD | | Canadian Dollar |
| CLP | | Chilean Peso |
| COP | | Certificates of Participation |
| ETF | | Exchange-Traded Fund |
| EUR | | Euro |
| EURIBOR | | Euro Interbank Offered Rate |
| GBP | | British Pound |
| GO | | General Obligation Bonds |
| HSI | | Hong Kong Stock Exchange |
| HUF | | Hungarian Forint |
| | |
| IDR | | Indonesian Rupiah |
| ILS | | Israeli New Shekel |
| INR | | Indian Rupee |
| JPY | | Japanese Yen |
| KRW | | South Korean Won |
| LIBOR | | London Interbank Offered Rate |
| MXN | | Mexican Peso |
| MYR | | Malaysian Ringgit |
| NOK | | Norwegian Krone |
| NYSE | | New York Stock Exchange |
| NZD | | New Zealand Dollar |
| OTC | | Over-the-Counter |
| PHP | | Philippine Peso |
| | |
| PLN | | Polish Zloty |
| RB | | Revenue Bonds |
| RON | | Romanian New Leu |
| RUB | | Russian Ruble |
| SEK | | Swedish Krona |
| SGD | | Singapore Dollar |
| STRIPS | | Separate Trading of Registered Interest and Principal Securities |
| THB | | Thai Baht |
| TRY | | Turkish Lira |
| TWD | | Taiwan Dollar |
| USD | | U.S. Dollar |
See Notes to Financial Statements.
| | | | | | |
| | | | | | | |
| | BLACKROCK COREALPHA BOND FUND | | DECEMBER 31, 2015 | | 19 |
| | |
Schedule of Investments (continued) | | CoreAlpha Bond Master Portfolio |
| | | | | | | | |
| Asset-Backed Securities | | Par (000) | | | Value | |
Santander Drive Auto Receivables Trust (continued): | | | | | | | | |
Series 2011-4, Class D, 4.74%, 9/15/17 | | $ | 349 | | | $ | 351,519 | |
Series 2012-1, Class C, 3.78%, 11/15/17 | | | 2 | | | | 2,250 | |
Series 2012-2, Class C, 3.20%, 2/15/18 | | | 143 | | | | 143,311 | |
Series 2012-2, Class D, 3.87%, 2/15/18 | | | 600 | | | | 606,506 | |
Series 2012-3, Class D, 3.64%, 5/15/18 | | | 1,610 | | | | 1,635,044 | |
Series 2012-4, Class D, 3.50%, 6/15/18 | | | 2,560 | | | | 2,595,835 | |
Series 2012-AA, Class C, 1.78%, 11/15/18 (b) | | | 3,108 | | | | 3,108,140 | |
Series 2012-AA, Class D, 2.46%, 12/17/18 (b) | | | 820 | | | | 824,402 | |
Series 2013-1, Class C, 1.76%, 1/15/19 | | | 1,325 | | | | 1,326,477 | |
Series 2013-2, Class B, 1.33%, 3/15/18 | | | 428 | | | | 427,613 | |
Series 2013-2, Class C, 1.95%, 3/15/19 | | | 2,720 | | | | 2,725,261 | |
Series 2013-3, Class C, 1.81%, 4/15/19 | | | 1,420 | | | | 1,418,486 | |
Series 2013-3, Class D, 2.42%, 4/15/19 | | | 960 | | | | 957,724 | |
Series 2013-4, Class C, 3.25%, 1/15/20 | | | 310 | | | | 313,877 | |
Series 2013-A, Class B,
1.89%, 10/15/19 (b) | | | 678 | | | | 678,576 | |
Series 2013-A, Class C,
3.12%, 10/15/19 (b) | | | 2,165 | | | | 2,188,507 | |
Series 2014-1, Class B, 1.59%, 10/15/18 | | | 1,270 | | | | 1,269,477 | |
Series 2014-1, Class C, 2.36%, 4/15/20 | | | 910 | | | | 911,422 | |
Series 2014-2, Class C, 2.33%, 11/15/19 | | | 3,445 | | | | 3,450,169 | |
Series 2014-4, Class B, 1.82%, 5/15/19 | | | 570 | | | | 570,511 | |
Series 2014-4, Class C, 2.60%, 11/16/20 | | | 540 | | | | 540,908 | |
Series 2014-5, Class C, 2.46%, 6/15/20 | | | 600 | | | | 601,688 | |
Series 2015-1, Class C, 2.57%, 4/15/21 | | | 760 | | | | 755,498 | |
Series 2015-2, Class C, 2.44%, 4/15/21 | | | 700 | | | | 692,319 | |
Series 2015-3, Class C, 2.74%, 1/15/21 | | | 630 | | | | 626,878 | |
SLC Private Student Loan Trust, Series 2006-A, Class A5, 0.49%, 7/15/36 (a) | | | 2,952 | | | | 2,925,574 | |
SLM Private Credit Student Loan Trust (a): | | | | | | | | |
Series 2003-A, Class A2, 0.95%, 9/15/20 | | | 1,403 | | | | 1,388,284 | |
Series 2003-B, Class A2, 0.91%, 3/15/22 | | | 450 | | | | 442,009 | |
Series 2003-C, Class A2, 0.90%, 9/15/20 | | | 396 | | | | 388,081 | |
Series 2004-B, Class A2, 0.71%, 6/15/21 | | | 1,102 | | | | 1,092,277 | |
Series 2005-B, Class A2, 0.69%, 3/15/23 | | | 962 | | | | 951,318 | |
Series 2006-A, Class A4, 0.70%, 12/15/23 | | | 3,192 | | | | 3,140,699 | |
Series 2006-B, Class A4, 0.69%, 3/15/24 | | | 798 | | | | 787,147 | |
Series 2006-C, Class A4, 0.68%, 3/15/23 | | | 769 | | | | 755,323 | |
SLM Private Education Loan Trust (a)(b): | | | | | | | | |
Series 2010-A, Class 1A, 3.20%, 5/16/44 | | | 891 | | | | 912,148 | |
Series 2011-A, Class A1, 1.33%, 10/15/24 | | | 773 | | | | 773,484 | |
Series 2011-B, Class A1, 1.18%, 12/16/24 | | | 111 | | | | 110,482 | |
Series 2011-C, Class A1, 1.73%, 12/15/23 | | | 11 | | | | 11,401 | |
Series 2012-A, Class A1, 1.73%, 8/15/25 | | | 321 | | | | 322,092 | |
Series 2012-C, Class A1, 1.43%, 8/15/23 | | | 229 | | | | 228,746 | |
Series 2012-D, Class A1, 1.38%, 6/15/23 | | | 148 | | | | 147,812 | |
Series 2012-E, Class A1, 1.08%, 10/16/23 | | | 710 | | | | 708,945 | |
Series 2013-A, Class A1, 0.93%, 8/15/22 | | | 1,000 | | | | 996,761 | |
Series 2013-B, Class A1, 0.98%, 7/15/22 | | | 1,595 | | | | 1,591,619 | |
Series 2013-C, Class A1, 1.18%, 2/15/22 | | | 696 | | | | 695,725 | |
SoFi Professional Loan Program LLC, Series 2015-B, Class A2,
2.51%, 9/27/32 (b) | | | 288 | | | | 282,358 | |
Soundview Home Loan Trust, Series 2005-OPT4, Class 2A3, 0.68%, 12/25/35 (a) | | | 786 | | | | 773,091 | |
Terwin Mortgage Trust, Series 2006-5, Class 2A2, 0.63%, 6/25/37 (a)(b) | | | 785 | | | | 741,607 | |
| | | | | | | | |
| Asset-Backed Securities | | Par (000) | | | Value | |
Trade MAPS 1 Ltd., Series 2013-1A (a)(b): | | | | | | | | |
Class A, 0.99%, 12/10/18 | | $ | 2,850 | | | $ | 2,831,894 | |
Class B, 1.54%, 12/10/18 | | | 1,030 | | | | 1,015,260 | |
| Total Asset-Backed Securities — 10.1% | | | | | | | 82,726,582 | |
| | | | | | | | |
| | | | | | | | | |
| | |
| Corporate Bonds | | | | | | |
Aerospace & Defense — 0.7% | | | | | | | | |
Harris Corp., 2.00%, 4/27/18 | | | 395 | | | | 390,562 | |
L-3 Communications Corp.: | | | | | | | | |
3.95%, 11/15/16 | | | 380 | | | | 385,716 | |
1.50%, 5/28/17 | | | 170 | | | | 167,894 | |
4.75%, 7/15/20 | | | 720 | | | | 749,032 | |
4.95%, 2/15/21 | | | 1,618 | | | | 1,667,255 | |
Lockheed Martin Corp.: | | | | | | | | |
1.85%, 11/23/18 | | | 370 | | | | 369,346 | |
2.50%, 11/23/20 | | | 650 | | | | 646,145 | |
3.55%, 1/15/26 | | | 235 | | | | 235,827 | |
4.85%, 9/15/41 | | | 600 | | | | 617,777 | |
3.80%, 3/01/45 | | | 655 | | | | 580,573 | |
| | | | | | | | |
| | | | | | | | 5,810,127 | |
Auto Components — 0.6% | | | | | | | | |
Delphi Corp.: | | | | | | | | |
5.00%, 2/15/23 | | | 270 | | | | 285,660 | |
4.15%, 3/15/24 | | | 945 | | | | 952,227 | |
Icahn Enterprises LP/Icahn Enterprises Finance Corp.: | | | | | | | | |
4.88%, 3/15/19 | | | 465 | | | | 460,815 | |
6.00%, 8/01/20 | | | 525 | | | | 529,410 | |
Johnson Controls, Inc., 1.40%, 11/02/17 | | | 1,000 | | | | 989,607 | |
Lear Corp.: | | | | | | | | |
4.75%, 1/15/23 | | | 310 | | | | 311,550 | |
5.38%, 3/15/24 | | | 1,115 | | | | 1,145,663 | |
ZF North America Capital, Inc.,
4.50%, 4/29/22 (b) | | | 350 | | | | 342,125 | |
| | | | | | | | |
| | | | | | | | 5,017,057 | |
Automobiles — 0.1% | | | | | | | | |
General Motors Co., 5.00%, 4/01/35 | | | 500 | | | | 466,611 | |
Banks — 4.1% | | | | | | | | |
ANZ New Zealand International Ltd., 1.13%, 3/24/16 (b) | | | 840 | | | | 840,513 | |
Bank of Nova Scotia, 1.70%, 6/11/18 | | | 1,055 | | | | 1,050,998 | |
Barclays Bank PLC: | | | | | | | | |
2.00%, 3/16/18 | | | 1,520 | | | | 1,510,929 | |
2.75%, 11/08/19 | | | 1,275 | | | | 1,270,342 | |
Cooperatieve Centrale Raiffeisen-Boerenleenbank BA: | | | | | | | | |
2.25%, 1/14/19 | | | 1,160 | | | | 1,163,737 | |
3.38%, 5/21/25 | | | 930 | | | | 920,800 | |
Credit Suisse, 3.63%, 9/09/24 | | | 1,760 | | | | 1,773,841 | |
Credit Suisse Group Funding Guernsey Ltd. (b) | | | | | | | | |
3.75%, 3/26/25 | | | 1,000 | | | | 967,284 | |
3.80%, 9/15/22 | | | 1,210 | | | | 1,209,045 | |
Discover Bank/Greenwood Delaware, 2.00%, 2/21/18 | | | 870 | | | | 864,118 | |
Fifth Third Bancorp, 0.90%, 2/26/16 | | | 960 | | | | 959,998 | |
HSBC Bank USA NA, 5.88%, 11/01/34 | | | 590 | | | | 683,665 | |
HSBC Holdings PLC: | | | | | | | | |
4.25%, 8/18/25 | | | 700 | | | | 694,685 | |
6.50%, 9/15/37 | | | 400 | | | | 479,887 | |
HSBC USA, Inc., 1.50%, 11/13/17 | | | 1,875 | | | | 1,866,561 | |
Lloyds Bank PLC, 1.75%, 5/14/18 | | | 1,660 | | | | 1,656,416 | |
Rabobank Nederland, 3.88%, 2/08/22 | | | 1,140 | | | | 1,203,138 | |
See Notes to Financial Statements.
| | | | | | |
| | | | | | | |
| 20 | | BLACKROCK COREALPHA BOND FUND | | DECEMBER 31, 2015 | | |
| | |
Schedule of Investments (continued) | | CoreAlpha Bond Master Portfolio |
| | | | | | | | |
| Corporate Bonds | | Par (000) | | | Value | |
Banks (continued) | | | | | | | | |
Royal Bank of Canada: | | | | | | | | |
0.85%, 3/08/16 | | $ | 1,360 | | | $ | 1,360,101 | |
1.20%, 9/19/17 | | | 2,960 | | | | 2,946,008 | |
Toronto-Dominion Bank, 1.50%, 3/13/17 (b) | | | 1,558 | | | | 1,560,508 | |
Wachovia Bank NA, 6.00%, 11/15/17 | | | 1,790 | | | | 1,930,562 | |
Wells Fargo & Co.: | | | | | | | | |
1.15%, 6/02/17 | | | 1,000 | | | | 996,232 | |
2.13%, 4/22/19 | | | 2,370 | | | | 2,372,868 | |
3.00%, 1/22/21 | | | 1,390 | | | | 1,405,232 | |
3.30%, 9/09/24 | | | 190 | | | | 189,016 | |
4.10%, 6/03/26 | | | 580 | | | | 585,449 | |
4.65%, 11/04/44 | | | 580 | | | | 564,269 | |
4.90%, 11/17/45 | | | 355 | | | | 358,166 | |
| | | | | | | | |
| | | | | | | | 33,384,368 | |
Beverages — 0.6% | | | | | | | | |
Anheuser-Busch InBev Worldwide, Inc., 3.75%, 7/15/42 | | | 460 | | | | 395,236 | |
Ball Corp., 4.38%, 12/15/20 | | | 195 | | | | 198,047 | |
Bottling Group LLC, 5.13%, 1/15/19 | | | 340 | | | | 372,390 | |
Diageo Capital PLC, 0.63%, 4/29/16 | | | 830 | | | | 829,527 | |
Dr Pepper Snapple Group, Inc., 2.90%, 1/15/16 | | | 380 | | | | 380,140 | |
PepsiCo, Inc.: | | | | | | | | |
7.90%, 11/01/18 | | | 600 | | | | 703,055 | |
2.75%, 3/01/23 | | | 1,000 | | | | 995,993 | |
4.88%, 11/01/40 | | | 310 | | | | 331,232 | |
3.60%, 8/13/42 | | | 600 | | | | 543,225 | |
| | | | | | | | |
| | | | | | | | 4,748,845 | |
Biotechnology — 0.5% | | | | | | | | |
Biogen, Inc., 2.90%, 9/15/20 | | | 265 | | | | 264,303 | |
Celgene Corp., 2.30%, 8/15/18 | | | 600 | | | | 604,178 | |
Gilead Sciences, Inc.: | | | | | | | | |
2.05%, 4/01/19 | | | 1,480 | | | | 1,482,734 | |
2.55%, 9/01/20 | | | 1,290 | | | | 1,289,510 | |
4.50%, 2/01/45 | | | 680 | | | | 665,151 | |
4.75%, 3/01/46 | | | 140 | | | | 141,684 | |
| | | | | | | | |
| | | | | | | | 4,447,560 | |
Capital Markets — 3.0% | | | | | | | | |
Bank of New York Mellon Corp., 0.70%, 3/04/16 | | | 1,360 | | | | 1,359,759 | |
Bear Stearns Cos. LLC, 6.40%, 10/02/17 | | | 760 | | | | 818,465 | |
FMS Wertmanagement AoeR, 1.13%, 9/05/17 | | | 3,664 | | | | 3,656,811 | |
Goldman Sachs Group, Inc.: | | | | | | | | |
6.15%, 4/01/18 | | | 460 | | | | 499,521 | |
2.90%, 7/19/18 | | | 820 | | | | 836,028 | |
2.63%, 1/31/19 | | | 820 | | | | 825,863 | |
7.50%, 2/15/19 | | | 360 | | | | 411,934 | |
2.55%, 10/23/19 | | | 460 | | | | 459,820 | |
6.00%, 6/15/20 | | | 1,040 | | | | 1,175,314 | |
5.75%, 1/24/22 | | | 430 | | | | 489,005 | |
3.63%, 1/22/23 | | | 240 | | | | 242,725 | |
3.75%, 5/22/25 | | | 1,245 | | | | 1,253,302 | |
6.75%, 10/01/37 | | | 1,300 | | | | 1,519,617 | |
6.25%, 2/01/41 | | | 990 | | | | 1,180,874 | |
Invesco Finance PLC, 5.38%, 11/30/43 | | | 720 | | | | 788,735 | |
Legg Mason, Inc., 2.70%, 7/15/19 | | | 1,285 | | | | 1,281,405 | |
Morgan Stanley: | | | | | | | | |
4.75%, 3/22/17 | | | 980 | | | | 1,015,103 | |
6.25%, 8/28/17 | | | 510 | | | | 546,069 | |
2.50%, 1/24/19 | | | 1,140 | | | | 1,146,223 | |
5.63%, 9/23/19 | | | 2,940 | | | | 3,244,581 | |
3.95%, 4/23/27 | | | 760 | | | | 737,640 | |
6.38%, 7/24/42 | | | 660 | | | | 816,122 | |
| | | | | | | | |
| | | | | | | | 24,304,916 | |
| | | | | | | | |
| Corporate Bonds | | Par (000) | | | Value | |
Chemicals — 0.7% | | | | | | | | |
LYB International Finance BV, 4.88%, 3/15/44 | | $ | 280 | | | $ | 255,694 | |
LyondellBasell Industries NV: | | | | | | | | |
5.00%, 4/15/19 | | | 1,760 | | | | 1,872,286 | |
5.75%, 4/15/24 | | | 670 | | | | 738,129 | |
Monsanto Co.: | | | | | | | | |
2.13%, 7/15/19 | | | 775 | | | | 773,993 | |
2.75%, 7/15/21 | | | 360 | | | | 352,554 | |
4.40%, 7/15/44 | | | 505 | | | | 418,106 | |
3.95%, 4/15/45 | | | 680 | | | | 527,618 | |
RPM International, Inc., 6.13%, 10/15/19 | | | 743 | | | | 812,721 | |
| | | | | | | | |
| | | | | | | | 5,751,101 | |
Communications Equipment — 0.5% | | | | | | | | |
Cisco Systems, Inc.: | | | | | | | | |
2.13%, 3/01/19 | | | 1,480 | | | | 1,492,703 | |
2.45%, 6/15/20 | | | 1,770 | | | | 1,786,802 | |
Juniper Networks, Inc., 4.35%, 6/15/25 | | | 720 | | | | 706,812 | |
| | | | | | | | |
| | | | | | | | 3,986,317 | |
Consumer Finance — 1.5% | | | | | | | | |
Capital One Bank USA NA, 2.15%, 11/21/18 | | | 730 | | | | 723,710 | |
Capital One NA, 1.50%, 9/05/17 | | | 1,650 | | | | 1,636,851 | |
Caterpillar Financial Services Corp., 0.70%, 2/26/16 | | | 1,070 | | | | 1,069,941 | |
MasterCard, Inc.: | | | | | | | | |
2.00%, 4/01/19 | | | 585 | | | | 587,290 | |
3.38%, 4/01/24 | | | 900 | | | | 919,747 | |
Navient Solutions, Inc., 0.00%, 10/03/22 (c) | | | 1,680 | | | | 1,406,928 | |
Synchrony Financial: | | | | | | | | |
3.00%, 8/15/19 | | | 1,540 | | | | 1,537,862 | |
3.75%, 8/15/21 | | | 615 | | | | 614,327 | |
Visa, Inc.: | | | | | | | | |
2.20%, 12/14/20 | | | 990 | | | | 988,158 | |
2.80%, 12/14/22 | | | 895 | | | | 898,699 | |
3.15%, 12/14/25 | | | 1,550 | | | | 1,551,916 | |
4.30%, 12/14/45 | | | 435 | | | | 441,333 | |
| | | | | | | | |
| | | | | | | | 12,376,762 | |
Diversified Financial Services — 3.9% | | | | | | | | |
American Express Credit Corp.: | | | | | | | | |
2.38%, 3/24/17 | | | 900 | | | | 909,774 | |
1.55%, 9/22/17 | | | 855 | | | | 854,656 | |
Bank of America Corp.: | | | | | | | | |
6.88%, 4/25/18 | | | 1,060 | | | | 1,169,452 | |
5.49%, 3/15/19 | | | 600 | | | | 646,978 | |
5.63%, 7/01/20 | | | 760 | | | | 844,184 | |
5.70%, 1/24/22 | | | 2,350 | | | | 2,650,081 | |
6.11%, 1/29/37 | | | 280 | | | | 317,716 | |
Bank of America NA, 1.65%, 3/26/18 | | | 1,035 | | | | 1,027,215 | |
BNP Paribas SA: | | | | | | | | |
1.38%, 3/17/17 | | | 1,480 | | | | 1,478,567 | |
2.40%, 12/12/18 | | | 600 | | | | 604,718 | |
Citigroup, Inc.: | | | | | | | | |
1.80%, 2/05/18 | | | 1,710 | | | | 1,703,454 | |
2.50%, 9/26/18 | | | 900 | | | | 907,817 | |
2.50%, 7/29/19 | | | 1,620 | | | | 1,617,559 | |
5.88%, 1/30/42 | | | 310 | | | | 355,699 | |
5.30%, 5/06/44 | | | 340 | | | | 353,660 | |
Ford Motor Credit Co. LLC: | | | | | | | | |
1.70%, 5/09/16 | | | 930 | | | | 930,911 | |
3.00%, 6/12/17 | | | 1,790 | | | | 1,807,402 | |
1.72%, 12/06/17 | | | 1,690 | | | | 1,663,969 | |
GE Capital International Funding Co., 4.42%, 11/15/35 (b) | | | 492 | | | | 502,077 | |
General Electric Capital Corp., 6.75%, 3/15/32 | | | 54 | | | | 70,557 | |
See Notes to Financial Statements.
| | | | | | |
| | | | | | | |
| | BLACKROCK COREALPHA BOND FUND | | DECEMBER 31, 2015 | | 21 |
| | |
Schedule of Investments (continued) | | CoreAlpha Bond Master Portfolio |
| | | | | | | | |
| Corporate Bonds | | Par (000) | | | Value | |
Diversified Financial Services (continued) | | | | | | | | |
General Motors Financial Co., Inc.: | | | | | | | | |
3.45%, 4/10/22 | | $ | 780 | | | $ | 748,222 | |
4.00%, 1/15/25 | | | 680 | | | | 645,155 | |
4.30%, 7/13/25 | | | 280 | | | | 271,513 | |
Intercontinental Exchange, Inc.: | | | | | | | | |
2.50%, 10/15/18 | | | 900 | | | | 907,883 | |
3.75%, 12/01/25 | | | 415 | | | | 416,141 | |
JPMorgan Chase & Co.: | | | | | | | | |
1.13%, 2/26/16 | | | 1,330 | | | | 1,330,607 | |
2.00%, 8/15/17 | | | 1,220 | | | | 1,224,136 | |
4.25%, 10/15/20 | | | 1,770 | | | | 1,877,694 | |
3.25%, 9/23/22 | | | 780 | | | | 784,502 | |
3.20%, 1/25/23 | | | 580 | | | | 578,106 | |
3.38%, 5/01/23 | | | 540 | | | | 530,721 | |
5.60%, 7/15/41 | | | 310 | | | | 357,824 | |
4.95%, 6/01/45 | | | 340 | | | | 339,935 | |
JPMorgan Chase Bank NA, 6.00%, 10/01/17 | | | 800 | | | | 855,328 | |
Morgan Stanley, 2.20%, 12/07/18 | | | 450 | | | | 450,233 | |
| | | | | | | | |
| | | | | | | | 31,734,446 | |
Diversified Telecommunication Services — 1.8% | | | | | |
AT&T, Inc.: | | | | | | | | |
2.40%, 8/15/16 | | | 380 | | | | 382,511 | |
2.38%, 11/27/18 | | | 1,645 | | | | 1,656,207 | |
2.45%, 6/30/20 | | | 350 | | | | 344,688 | |
3.40%, 5/15/25 | | | 1,140 | | | | 1,095,643 | |
5.55%, 8/15/41 | | | 980 | | | | 984,774 | |
4.80%, 6/15/44 | | | 540 | | | | 494,714 | |
British Telecommunications PLC, 1.25%, 2/14/17 | | | 520 | | | | 517,545 | |
CC Holdings GS V LLC/Crown Castle GS III Corp., 3.85%, 4/15/23 | | | 1,270 | | | | 1,246,397 | |
Frontier Communications Corp., 8.88%, 9/15/20 (b) | | | 260 | | | | 263,250 | |
Verizon Communications, Inc.: | | | | | | | | |
2.00%, 11/01/16 | | | 1,620 | | | | 1,630,089 | |
1.35%, 6/09/17 | | | 1,540 | | | | 1,535,554 | |
3.65%, 9/14/18 | | | 1,330 | | | | 1,390,769 | |
5.05%, 3/15/34 | | | 960 | | | | 956,465 | |
6.90%, 4/15/38 | | | 280 | | | | 334,717 | |
7.35%, 4/01/39 | | | 510 | | | | 632,140 | |
4.75%, 11/01/41 | | | 630 | | | | 581,019 | |
6.55%, 9/15/43 | | | 445 | | | | 528,309 | |
5.01%, 8/21/54 | | | 260 | | | | 238,054 | |
| | | | | | | | |
| | | | | | | | 14,812,845 | |
Electric Utilities — 1.8% | | | | | | | | |
Berkshire Hathaway Energy Co., 6.50%, 9/15/37 | | | 460 | | | | 559,832 | |
Commonwealth Edison Co.: | | | | | | | | |
5.88%, 2/01/33 | | | 600 | | | | 714,878 | |
4.70%, 1/15/44 | | | 191 | | | | 200,904 | |
Duke Energy Corp.: | | | | | | | | |
2.15%, 11/15/16 | | | 630 | | | | 633,778 | |
5.05%, 9/15/19 | | | 600 | | | | 652,678 | |
Duke Energy Florida, Inc., 3.85%, 11/15/42 | | | 460 | | | | 430,383 | |
Exelon Corp., 5.10%, 6/15/45 (b) | | | 720 | | | | 725,252 | |
MidAmerican Energy Holdings Co., 5.75%, 4/01/18 | | | 1,920 | | | | 2,074,237 | |
Mississippi Power Co., 4.25%, 3/15/42 | | | 510 | | | | 389,862 | |
NextEra Energy Capital Holdings, Inc., 2.70%, 9/15/19 | | | 1,040 | | | | 1,035,388 | |
Northern States Power Co., 5.25%, 7/15/35 | | | 760 | | | | 867,777 | |
Pacific Gas & Electric Co.: | | | | | | | | |
5.63%, 11/30/17 | | | 460 | | | | 491,704 | |
3.25%, 9/15/21 | | | 430 | | | | 439,975 | |
3.75%, 8/15/42 | | | 460 | | | | 409,763 | |
| | | | | | | | |
| Corporate Bonds | | Par (000) | | | Value | |
Electric Utilities (continued) | | | | | | | | |
PacifiCorp: | | | | | | | | |
5.50%, 1/15/19 | | $ | 400 | | | $ | 438,992 | |
6.25%, 10/15/37 | | | 310 | | | | 383,459 | |
Progress Energy, Inc.: | | | | | | | | |
4.88%, 12/01/19 | | | 920 | | | | 986,396 | |
4.40%, 1/15/21 | | | 1,110 | | | | 1,174,067 | |
Southern Power Co., 5.15%, 9/15/41 | | | 310 | | | | 286,821 | |
Tampa Electric Co., 2.60%, 9/15/22 | | | 600 | | | | 577,349 | |
Xcel Energy, Inc., 0.75%, 5/09/16 | | | 960 | | | | 959,147 | |
| | | | | | | | |
| | | | | | | | 14,432,642 | |
Electrical Equipment — 0.4% | | | | | | | | |
Amphenol Corp.: | | | | | | | | |
1.55%, 9/15/17 | | | 995 | | | | 989,924 | |
2.55%, 1/30/19 | | | 600 | | | | 600,104 | |
Roper Industries, Inc., 2.05%, 10/01/18 | | | 1,040 | | | | 1,033,260 | |
Roper Technologies, Inc., 3.85%, 12/15/25 | | | 410 | | | | 408,163 | |
| | | | | | | | |
| | | | | | | | 3,031,451 | |
Electronic Equipment, Instruments & Components — 0.2% | |
Flextronics International Ltd.,
4.75%, 6/15/25 (b) | | | 540 | | | | 525,825 | |
Tyco Electronics Group SA, 6.55%, 10/01/17 | | | 860 | | | | 926,808 | |
| | | | | | | | |
| | | | | | | | 1,452,633 | |
Energy Equipment & Services — 0.2% | | | | | | | | |
Ensco PLC, 5.20%, 3/15/25 | | | 400 | | | | 284,668 | |
Halliburton Co.: | | | | | | | | |
3.38%, 11/15/22 | | | 335 | | | | 329,685 | |
3.80%, 11/15/25 | | | 255 | | | | 248,299 | |
5.00%, 11/15/45 | | | 900 | | | | 889,689 | |
| | | | | | | | |
| | | | | | | | 1,752,341 | |
Food & Staples Retailing — 0.5% | | | | | | | | |
CVS Caremark Corp.: | | | | | | | | |
6.13%, 8/15/16 | | | 680 | | | | 699,424 | |
2.25%, 12/05/18 | | | 925 | | | | 929,463 | |
Walgreens Boots Alliance, Inc.: | | | | | | | | |
1.75%, 11/17/17 | | | 1,520 | | | | 1,517,035 | |
2.70%, 11/18/19 | | | 720 | | | | 718,646 | |
4.80%, 11/18/44 | | | 460 | | | | 416,109 | |
| | | | | | | | |
| | | | | | | | 4,280,677 | |
Food Products — 1.0% | | | | | | | | |
ConAgra Foods, Inc., 3.20%, 1/25/23 | | | 900 | | | | 865,826 | |
JM Smucker Co., 2.50%, 3/15/20 | | | 475 | | | | 471,617 | |
Kellogg Co.: | | | | | | | | |
4.45%, 5/30/16 | | | 50 | | | | 50,657 | |
3.25%, 5/21/18 | | | 470 | | | | 481,772 | |
Kraft Heinz Food Co. (b): | | | | | | | | |
3.95%, 7/15/25 | | | 980 | | | | 989,124 | |
5.20%, 7/15/45 | | | 1,190 | | | | 1,243,440 | |
Mondelez International, Inc.: | | | | | | | | |
4.13%, 2/09/16 | | | 600 | | | | 601,547 | |
2.25%, 2/01/19 | | | 600 | | | | 599,779 | |
Pilgrim’s Pride Corp., 5.75%, 3/15/25 (b) | | | 860 | | | | 836,350 | |
Sysco Corp., 3.75%, 10/01/25 | | | 1,605 | | | | 1,627,014 | |
| | | | | | | | |
| | | | | | | | 7,767,126 | |
Gas Utilities — 0.1% | | | | | | | | |
Southern California Gas Co., 3.75%, 9/15/42 | | | 540 | | | | 503,487 | |
Health Care Equipment & Supplies — 1.4% | |
Baxter International, Inc., 1.85%, 6/15/18 | | | 500 | | | | 497,012 | |
Becton Dickinson & Co.: | | | | | | | | |
1.45%, 5/15/17 | | | 210 | | | | 209,113 | |
2.68%, 12/15/19 | | | 335 | | | | 336,824 | |
See Notes to Financial Statements.
| | | | | | |
| | | | | | | |
| 22 | | BLACKROCK COREALPHA BOND FUND | | DECEMBER 31, 2015 | | |
| | |
Schedule of Investments (continued) | | CoreAlpha Bond��Master Portfolio |
| | | | | | | | |
| Corporate Bonds | | Par (000) | | | Value | |
Health Care Equipment & Supplies (continued) | |
Boston Scientific Corp.: | | | | | | | | |
2.65%, 10/01/18 | | $ | 600 | | | $ | 603,154 | |
2.85%, 5/15/20 | | | 225 | | | | 223,828 | |
3.85%, 5/15/25 | | | 1,300 | | | | 1,279,132 | |
Covidien International Finance SA: | | | | | | | | |
4.20%, 6/15/20 | | | 1,485 | | | | 1,589,943 | |
6.55%, 10/15/37 | | | 575 | | | | 720,821 | |
Mallinckrodt International Finance SA/Mallinckrodt CB LLC, 4.88%, 4/15/20 (b) | | | 235 | | | | 226,188 | |
Medtronic, Inc.: | | | | | | | | |
2.50%, 3/15/20 | | | 755 | | | | 760,357 | |
3.15%, 3/15/22 | | | 895 | | | | 904,771 | |
St Jude Medical, Inc., 2.00%, 9/15/18 | | | 575 | | | | 573,933 | |
Stryker Corp.: | | | | | | | | |
3.38%, 11/01/25 | | | 400 | | | | 394,807 | |
4.38%, 5/15/44 | | | 900 | | | | 890,180 | |
Thermo Fisher Scientific, Inc., 2.15%, 12/14/18 | | | 340 | | | | 339,744 | |
Zimmer Holdings, Inc.: | | | | | | | | |
2.00%, 4/01/18 | | | 530 | | | | 526,735 | |
2.70%, 4/01/20 | | | 1,340 | | | | 1,323,159 | |
| | | | | | | | |
| | | | | | | | 11,399,701 | |
Health Care Providers & Services — 1.2% | | | | | | | | |
AmerisourceBergen Corp.: | | | | | | | | |
1.15%, 5/15/17 | | | 1,770 | | | | 1,757,336 | |
3.25%, 3/01/25 | | | 900 | | | | 871,373 | |
Cardinal Health, Inc., 1.70%, 3/15/18 | | | 660 | | | | 658,208 | |
Express Scripts Holding Co., 3.13%, 5/15/16 | | | 900 | | | | 906,006 | |
HCA, Inc., 3.75%, 3/15/19 | | | 935 | | | | 942,013 | |
Humana, Inc.: | | | | | | | | |
2.63%, 10/01/19 | | | 665 | | | | 666,682 | |
4.95%, 10/01/44 | | | 540 | | | | 536,441 | |
McKesson Corp., 1.40%, 3/15/18 | | | 1,330 | | | | 1,312,909 | |
Quest Diagnostics, Inc., 2.50%, 3/30/20 | | | 705 | | | | 695,412 | |
UnitedHealth Group, Inc.: | | | | | | | | |
2.70%, 7/15/20 | | | 270 | | | | 272,829 | |
4.70%, 2/15/21 | | | 920 | | | | 1,006,798 | |
| | | | | | | | |
| | | | | | | | 9,626,007 | |
Hotels, Restaurants & Leisure — 0.3% | | | | | | | | |
McDonald’s Corp.: | | | | | | | | |
2.10%, 12/07/18 | | | 275 | | | | 275,177 | |
2.75%, 12/09/20 | | | 150 | | | | 149,897 | |
3.70%, 1/30/26 | | | 690 | | | | 689,433 | |
6.30%, 10/15/37 | | | 310 | | | | 363,646 | |
Wyndham Worldwide Corp.: | | | | | | | | |
3.90%, 3/01/23 | | | 470 | | | | 457,301 | |
5.10%, 10/01/25 | | | 635 | | | | 641,380 | |
| | | | | | | | |
| | | | | | | | 2,576,834 | |
Household Products — 0.1% | | | | | | | | |
Whirlpool Corp., 1.35%, 3/01/17 | | | 755 | | | | 750,578 | |
Independent Power and Renewable Electricity Producers — 0.1% | |
Constellation Energy Group, Inc., 5.15%, 12/01/20 | | | 360 | | | | 390,868 | |
Exelon Generation Co. LLC, 5.75%, 10/01/41 | | | 170 | | | | 164,348 | |
PSEG Power LLC: | | | | | | | | |
2.45%, 11/15/18 | | | 140 | | | | 140,842 | |
4.15%, 9/15/21 | | | 350 | | | | 356,054 | |
| | | | | | | | |
| | | | | | | | 1,052,112 | |
Insurance — 1.1% | | | | | | | | |
ACE INA Holdings, Inc., 3.35%, 5/15/24 | | | 935 | | | | 943,845 | |
Aflac, Inc.: | | | | | | | | |
3.63%, 11/15/24 | | | 1,480 | | | | 1,506,223 | |
3.25%, 3/17/25 | | | 900 | | | | 888,172 | |
| | | | | | | | |
| Corporate Bonds | | Par (000) | | | Value | |
Insurance (continued) | | | | | | | | |
Aon PLC, 2.80%, 3/15/21 | | $ | 1,640 | | | $ | 1,633,806 | |
Chubb Corp., 6.00%, 5/11/37 | | | 260 | | | | 318,725 | |
Fidelity National Financial, Inc., 5.50%, 9/01/22 | | | 385 | | | | 408,608 | |
Markel Corp.: | | | | | | | | |
5.35%, 6/01/21 | | | 400 | | | | 439,274 | |
3.63%, 3/30/23 | | | 400 | | | | 394,445 | |
Marsh & McLennan Cos., Inc., 2.35%, 9/10/19 | | | 880 | | | | 877,944 | |
Protective Life Corp., 8.45%, 10/15/39 | | | 122 | | | | 160,913 | |
Willis Group Holdings PLC: | | | | | | | | |
4.13%, 3/15/16 | | | 780 | | | | 784,228 | |
5.75%, 3/15/21 | | | 350 | | | | 386,790 | |
XLIT Ltd., 5.75%, 10/01/21 | | | 430 | | | | 479,168 | |
| | | | | | | | |
| | | | | | | | 9,222,141 | |
Internet Software & Services — 0.9% | | | | | | | | |
Baidu, Inc.: | | | | | | | | |
3.25%, 8/06/18 | | | 2,060 | | | | 2,086,386 | |
2.75%, 6/09/19 | | | 532 | | | | 527,371 | |
eBay, Inc.: | | | | | | | | |
2.20%, 8/01/19 | | | 1,600 | | | | 1,581,821 | |
3.45%, 8/01/24 | | | 660 | | | | 630,939 | |
Equinix, Inc.: | | | | | | | | |
5.38%, 1/01/22 | | | 555 | | | | 568,875 | |
5.75%, 1/01/25 | | | 430 | | | | 439,675 | |
Expedia, Inc., 5.00%, 2/15/26 (b) | | | 800 | | | | 780,750 | |
VeriSign, Inc., 4.63%, 5/01/23 | | | 415 | | | | 401,824 | |
| | | | | | | | |
| | | | | | | | 7,017,641 | |
IT Services — 0.9% | | | | | | | | |
Alibaba Group Holding Ltd.: | | | | | | | | |
2.50%, 11/28/19 | | | 1,795 | | | | 1,753,640 | |
3.60%, 11/28/24 | | | 445 | | | | 425,083 | |
Fidelity National Information Services, Inc.: | | | | | | | | |
3.63%, 10/15/20 | | | 1,280 | | | | 1,296,674 | |
4.50%, 10/15/22 | | | 1,280 | | | | 1,302,890 | |
5.00%, 10/15/25 | | | 800 | | | | 821,992 | |
International Business Machines Corp., 7.63%, 10/15/18 | | | 690 | | | | 795,364 | |
Verisk Analytics, Inc., 4.00%, 6/15/25 | | | 1,380 | | | | 1,340,397 | |
| | | | | | | | |
| | | | | | | | 7,736,040 | |
Leisure Products — 0.1% | | | | | | | | |
Royal Caribbean Cruises Ltd., 5.25%, 11/15/22 | | | 1,084 | | | | 1,111,100 | |
Machinery — 0.2% | | | | | | | | |
Illinois Tool Works, Inc., 1.95%, 3/01/19 | | | 1,190 | | | | 1,191,251 | |
Ingersoll-Rand Global Holding Co. Ltd., 2.88%, 1/15/19 | | | 140 | | | | 141,403 | |
Trinity Acquisition PLC, 6.13%, 8/15/43 | | | 210 | | | | 224,418 | |
| | | | | | | | |
| | | | | | | | 1,557,072 | |
Media — 1.2% | | | | | | | | |
Altice Financing SA, 6.63%, 2/15/23 (b) | | | 480 | | | | 474,000 | |
CCO Safari II LLC (b): | | | | | | | | |
3.58%, 7/23/20 | | | 395 | | | | 392,634 | |
6.48%, 10/23/45 | | | 550 | | | | 550,901 | |
Comcast Corp., 5.70%, 5/15/18 | | | 740 | | | | 808,879 | |
DIRECTV Holdings LLC/DIRECTV Financing Co., Inc., 5.15%, 3/15/42 | | | 1,120 | | | | 1,044,217 | |
DISH DBS Corp.: | | | | | | | | |
7.88%, 9/01/19 | | | 780 | | | | 848,250 | |
6.75%, 6/01/21 | | | 360 | | | | 362,700 | |
NBCUniversal Enterprise, Inc.,
1.66%, 4/15/18 (b) | | | 340 | | | | 340,091 | |
Outfront Media Capital LLC/Outfront Media Capital Corp., 5.25%, 2/15/22 | | | 260 | | | | 265,850 | |
See Notes to Financial Statements.
| | | | | | |
| | | | | | | |
| | BLACKROCK COREALPHA BOND FUND | | DECEMBER 31, 2015 | | 23 |
| | |
Schedule of Investments (continued) | | CoreAlpha Bond Master Portfolio |
| | | | | | | | |
| Corporate Bonds | | Par (000) | | | Value | |
Media (continued) | | | | | | | | |
Scripps Networks Interactive, Inc., 2.70%, 12/15/16 | | $ | 680 | | | $ | 684,830 | |
Thomson Reuters Corp., 0.88%, 5/23/16 | | | 500 | | | | 499,610 | |
Time Warner Cable, Inc.: | | | | | | | | |
5.00%, 2/01/20 | | | 680 | | | | 719,822 | |
4.50%, 9/15/42 | | | 510 | | | | 400,239 | |
Time Warner, Inc., 2.10%, 6/01/19 | | | 1,220 | | | | 1,213,284 | |
Viacom, Inc., 2.50%, 9/01/18 | | | 1,280 | | | | 1,276,803 | |
| | | | | | | | |
| | | | | | | | 9,882,110 | |
Metals & Mining — 0.1% | | | | | | | | |
Southern Copper Corp., 5.88%, 4/23/45 | | | 450 | | | | 344,755 | |
Vale Overseas Ltd., 4.38%, 1/11/22 (d) | | | 148 | | | | 112,011 | |
| | | | | | | | |
| | | | | | | | 456,766 | |
Multi-Utilities — 0.3% | | | | | | | | |
Consolidated Edison Co. of New York, Inc., 4.20%, 3/15/42 | | | 720 | | | | 690,493 | |
Dominion Resources, Inc.: | | | | | | | | |
6.40%, 6/15/18 | | | 330 | | | | 361,314 | |
4.45%, 3/15/21 | | | 630 | | | | 666,661 | |
4.05%, 9/15/42 | | | 510 | | | | 449,993 | |
SCANA Corp., 4.13%, 2/01/22 | | | 170 | | | | 166,547 | |
| | | | | | | | |
| | | | | | | | 2,335,008 | |
Oil, Gas & Consumable Fuels — 3.4% | | | | | | | | |
BP Capital Markets PLC: | | | | | | | | |
3.20%, 3/11/16 | | | 460 | | | | 462,225 | |
2.24%, 5/10/19 | | | 900 | | | | 901,194 | |
Buckeye Partners LP: | | | | | | | | |
2.65%, 11/15/18 | | | 1,460 | | | | 1,404,583 | |
4.35%, 10/15/24 | | | 580 | | | | 487,777 | |
CNOOC Finance 2013 Ltd., 1.75%, 5/09/18 | | | 625 | | | | 614,986 | |
CNOOC Finance 2015 Australia Pty Ltd., 2.63%, 5/05/20 | | | 1,160 | | | | 1,133,964 | |
CNOOC Nexen Finance 2014 ULC, 1.63%, 4/30/17 | | | 2,000 | | | | 1,988,430 | |
ConocoPhillips Canada Funding Co. I, 5.63%, 10/15/16 | | | 170 | | | | 175,587 | |
ConocoPhillips Co., 6.50%, 2/01/39 | | | 600 | | | | 632,284 | |
Ecopetrol SA, 5.88%, 5/28/45 | | | 270 | | | | 191,700 | |
Energy Transfer Equity LP, 7.50%, 10/15/20 | | | 1,778 | | | | 1,644,650 | |
Energy Transfer Partners LP: | | | | | | | | |
9.70%, 3/15/19 | | | 262 | | | | 288,548 | |
9.00%, 4/15/19 | | | 123 | | | | 135,331 | |
4.15%, 10/01/20 | | | 1,160 | | | | 1,070,092 | |
Enterprise Products Operating LLC, 3.20%, 2/01/16 | | | 900 | | | | 900,287 | |
Hess Corp., 1.30%, 6/15/17 | | | 350 | | | | 342,474 | |
Kinder Morgan Energy Partners LP, 5.63%, 9/01/41 | | | 275 | | | | 208,385 | |
Kinder Morgan, Inc., 3.05%, 12/01/19 | | | 265 | | | | 245,261 | |
Magellan Midstream Partners LP, 5.15%, 10/15/43 | | | 420 | | | | 360,142 | |
Marathon Petroleum Corp.: | | | | | | | | |
2.70%, 12/14/18 | | | 1,600 | | | | 1,582,149 | |
3.40%, 12/15/20 | | | 1,465 | | | | 1,438,753 | |
4.75%, 9/15/44 | | | 425 | | | | 347,393 | |
Occidental Petroleum Corp., 3.50%, 6/15/25 | | | 305 | | | | 297,893 | |
ONEOK Partners LP, 6.13%, 2/01/41 | | | 500 | | | | 382,079 | |
Petroleos Mexicanos: | | | | | | | | |
4.88%, 1/24/22 | | | 400 | | | | 385,000 | |
4.50%, 1/23/26 (b) | | | 600 | | | | 527,100 | |
6.50%, 6/02/41 | | | 170 | | | | 146,965 | |
6.38%, 1/23/45 | | | 1,860 | | | | 1,574,269 | |
Pioneer Natural Resources Co., 3.45%, 1/15/21 | | | 340 | | | | 313,940 | |
| | | | | | | | |
| Corporate Bonds | | Par (000) | | | Value | |
Oil, Gas & Consumable Fuels (continued) | | | | | | | | |
Shell International Finance BV: | | | | | | | | |
2.13%, 5/11/20 | | $ | 525 | | | $ | 516,476 | |
4.38%, 5/11/45 | | | 820 | | | | 774,135 | |
Statoil ASA: | | | | | | | | |
1.95%, 11/08/18 | | | 850 | | | | 849,386 | |
2.75%, 11/10/21 | | | 1,680 | | | | 1,669,366 | |
Total Capital International SA, 2.10%, 6/19/19 | | | 980 | | | | 972,663 | |
Valero Energy Corp.: | | | | | | | | |
3.65%, 3/15/25 | | | 360 | | | | 339,560 | |
6.63%, 6/15/37 | | | 900 | | | | 904,877 | |
Williams Partners LP: | | | | | | | | |
3.35%, 8/15/22 | | | 1,600 | | | | 1,214,493 | |
4.30%, 3/04/24 | | | 460 | | | | 364,523 | |
| | | | | | | | |
| | | | | | | | 27,788,920 | |
Pharmaceuticals — 1.4% | | | | | | | | |
AbbVie, Inc., 2.50%, 5/14/20 | | | 490 | | | | 485,074 | |
Actavis Funding SCS: | | | | | | | | |
2.35%, 3/12/18 | | | 1,320 | | | | 1,321,375 | |
3.45%, 3/15/22 | | | 1,075 | | | | 1,076,173 | |
AstraZeneca PLC, 6.45%, 9/15/37 | | | 720 | | | | 910,511 | |
Baxalta, Inc., 2.88%, 6/23/20 (b) | | | 775 | | | | 765,382 | |
Bayer US Finance LLC, 1.50%, 10/06/17 (b) | | | 1,000 | | | | 999,588 | |
Eli Lilly & Co., 3.70%, 3/01/45 | | | 155 | | | | 144,990 | |
GlaxoSmithKline Capital, Inc., 5.65%, 5/15/18 | | | 360 | | | | 392,355 | |
Laboratory Corp. of America Holdings, 4.70%, 2/01/45 | | | 507 | | | | 463,224 | |
Novartis Capital Corp.: | | | | | | | | |
3.40%, 5/06/24 | | | 630 | | | | 650,404 | |
4.40%, 5/06/44 | | | 1,280 | | | | 1,334,995 | |
Pfizer, Inc.: | | | | | | | | |
6.20%, 3/15/19 | | | 460 | | | | 517,498 | |
4.30%, 6/15/43 | | | 760 | | | | 760,582 | |
Zoetis, Inc.: | | | | | | | | |
1.15%, 2/01/16 | | | 900 | | | | 899,840 | |
3.45%, 11/13/20 | | | 355 | | | | 355,414 | |
4.50%, 11/13/25 | | | 605 | | | | 613,139 | |
| | | | | | | | |
| | | | | | | | 11,690,544 | |
Real Estate Investment Trusts (REITs) — 1.2% | | | | | | | | |
Alexandria Real Estate Equities, Inc., 2.75%, 1/15/20 | | | 1,190 | | | | 1,169,881 | |
American Tower Corp.: | | | | | | | | |
4.50%, 1/15/18 | | | 630 | | | | 657,023 | |
3.40%, 2/15/19 | | | 538 | | | | 551,874 | |
2.80%, 6/01/20 | | | 1,190 | | | | 1,176,304 | |
5.05%, 9/01/20 | | | 400 | | | | 431,827 | |
3.45%, 9/15/21 | | | 740 | | | | 743,628 | |
4.70%, 3/15/22 | | | 860 | | | | 903,882 | |
5.00%, 2/15/24 | | | 600 | | | | 635,111 | |
Corrections Corp. of America: | | | | | | | | |
4.13%, 4/01/20 | | | 760 | | | | 752,400 | |
4.63%, 5/01/23 | | | 735 | | | | 709,275 | |
HCP, Inc., 6.70%, 1/30/18 | | | 1,190 | | | | 1,293,969 | |
WEA Finance LLC/Westfield UK & Europe Finance PLC, 2.70%, 9/17/19 (b) | | | 655 | | | | 649,604 | |
| | | | | | | | |
| | | | | | | | 9,674,778 | |
Road & Rail — 0.3% | | | | | | | | |
Burlington Northern Santa Fe LLC: | | | | | | | | |
5.40%, 6/01/41 | | | 820 | | | | 891,478 | |
4.55%, 9/01/44 | | | 630 | | | | 608,175 | |
Norfolk Southern Corp., 5.75%, 1/15/16 | | | 735 | | | | 735,889 | |
| | | | | | | | |
| | | | | | | | 2,235,542 | |
Semiconductors & Semiconductor Equipment — 0.7% | | | | | |
Applied Materials, Inc., 2.63%, 10/01/20 | | | 480 | | | | 479,448 | |
See Notes to Financial Statements.
| | | | | | |
| | | | | | | |
| 24 | | BLACKROCK COREALPHA BOND FUND | | DECEMBER 31, 2015 | | |
| | |
Schedule of Investments (continued) | | CoreAlpha Bond Master Portfolio |
| | | | | | | | |
| Corporate Bonds | | Par (000) | | | Value | |
Semiconductors & Semiconductor Equipment (continued) | | | | | |
Intel Corp.: | | | | | | | | |
2.45%, 7/29/20 | | $ | 780 | | | $ | 788,922 | |
3.30%, 10/01/21 | | | 630 | | | | 652,566 | |
4.80%, 10/01/41 | | | 120 | | | | 125,097 | |
4.25%, 12/15/42 | | | 340 | | | | 327,753 | |
4.90%, 7/29/45 | | | 200 | | | | 211,392 | |
KLA-Tencor Corp., 3.38%, 11/01/19 | | | 280 | | | | 282,878 | |
QUALCOMM, Inc., 1.40%, 5/18/18 | | | 935 | | | | 927,004 | |
Seagate HDD Cayman: | | | | | | | | |
3.75%, 11/15/18 | | | 2,210 | | | | 2,193,425 | |
4.75%, 1/01/25 | | | 170 | | | | 141,559 | |
| | | | | | | | |
| | | | | | | | 6,130,044 | |
Software — 0.2% | | | | | | | | |
Microsoft Corp., 4.45%, 11/03/45 | | | 1,100 | | | | 1,134,345 | |
Oracle Corp.: | | | | | | | | |
5.25%, 1/15/16 | | | 460 | | | | 460,675 | |
5.75%, 4/15/18 | | | 180 | | | | 196,404 | |
| | | | | | | | |
| | | | | | | | 1,791,424 | |
Specialty Retail — 0.9% | | | | | | | | |
Advance Auto Parts, Inc., 4.50%, 1/15/22 | | | 920 | | | | 946,934 | |
AutoZone, Inc., 1.30%, 1/13/17 | | | 1,140 | | | | 1,138,487 | |
Home Depot, Inc.: | | | | | | | | |
5.88%, 12/16/36 | | | 600 | | | | 731,304 | |
5.40%, 9/15/40 | | | 600 | | | | 699,175 | |
5.95%, 4/01/41 | | | 260 | | | | 323,548 | |
L Brands, Inc.: | | | | | | | | |
6.90%, 7/15/17 | | | 647 | | | | 692,290 | |
8.50%, 6/15/19 | | | 1,190 | | | | 1,383,375 | |
Lowe’s Cos, Inc., 4.38%, 9/15/45 | | | 95 | | | | 97,639 | |
O’Reilly Automotive, Inc., 4.63%, 9/15/21 | | | 1,580 | | | | 1,683,245 | |
| | | | | | | | |
| | | | | | | | 7,695,997 | |
Technology Hardware, Storage & Peripherals — 0.3% | |
Apple, Inc.: | | | | | | | | |
2.85%, 5/06/21 | | | 1,620 | | | | 1,659,042 | |
3.85%, 5/04/43 | | | 980 | | | | 902,887 | |
| | | | | | | | |
| | | | | | | | 2,561,929 | |
Tobacco — 1.4% | | | | | | | | |
Altria Group, Inc., 5.38%, 1/31/44 | | | 2,110 | | | | 2,269,601 | |
Philip Morris International, Inc.: | | | | | | | | |
5.65%, 5/16/18 | | | 1,280 | | | | 1,396,513 | |
1.88%, 1/15/19 | | | 1,060 | | | | 1,057,012 | |
2.90%, 11/15/21 | | | 430 | | | | 435,140 | |
6.38%, 5/16/38 | | | 760 | | | | 958,587 | |
4.13%, 3/04/43 | | | 600 | | | | 567,153 | |
4.25%, 11/10/44 | | | 190 | | | | 183,489 | |
Reynolds American, Inc.: | | | | | | | | |
3.50%, 8/04/16 | | | 210 | | | | 212,242 | |
2.30%, 6/12/18 | | | 520 | | | | 523,266 | |
3.25%, 6/12/20 | | | 235 | | | | 238,831 | |
4.00%, 6/12/22 | | | 305 | | | | 317,073 | |
3.25%, 11/01/22 | | | 680 | | | | 672,364 | |
4.85%, 9/15/23 | | | 280 | | | | 299,318 | |
4.45%, 6/12/25 | | | 400 | | | | 418,332 | |
4.75%, 11/01/42 | | | 510 | | | | 486,785 | |
6.15%, 9/15/43 | | | 240 | | | | 272,257 | |
5.85%, 8/15/45 | | | 665 | | | | 739,307 | |
| | | | | | | | |
| | | | | | | | 11,047,270 | |
Wireless Telecommunication Services — 0.2% | | | | | | | | |
Crown Castle International Corp., 4.88%, 4/15/22 | | | 830 | | | | 861,125 | |
| | | | | | | | |
| Corporate Bonds | | Par (000) | | | Value | |
Wireless Telecommunication Services (continued) | |
Vodafone Group PLC: | | | | | | | | |
5.63%, 2/27/17 | | $ | 300 | | | $ | 313,212 | |
4.38%, 2/19/43 | | | 435 | | | | 358,576 | |
| | | | | | | | |
| | | | | | | | 1,532,913 | |
| Total Corporate Bonds — 40.1% | | | | | | | 326,933,783 | |
| | | | | | | | |
| | | | | | | | | |
| | |
| Foreign Agency Obligations | | | | | | |
Canada Government International Bond, 1.13%, 3/19/18 | | | 1,880 | | | | 1,874,180 | |
Colombia Government International Bond: | | | | | | | | |
4.00%, 2/26/24 | | | 740 | | | | 704,850 | |
4.50%, 1/28/26 | | | 1,330 | | | | 1,270,150 | |
Export-Import Bank of Korea: | | | | | | | | |
2.38%, 8/12/19 | | | 1,650 | | | | 1,650,254 | |
4.00%, 1/29/21 | | | 486 | | | | 517,609 | |
Mexico Government International Bond: | | | | | | | | |
3.50%, 1/21/21 | | | 865 | | | | 877,975 | |
6.75%, 9/27/34 | | | 720 | | | | 864,000 | |
4.75%, 3/08/44 | | | 420 | | | | 382,620 | |
4.60%, 1/23/46 | | | 613 | | | | 542,505 | |
Peruvian Government International Bond, 4.13%, 8/25/27 | | | 745 | | | | 730,100 | |
Tunisia Government AID Bonds, 2.45%, 7/24/21 | | | 327 | | | | 327,200 | |
| Total Foreign Agency Obligations — 1.2% | | | | | | | 9,741,443 | |
| | | | | | | | |
| | | | | | | | | |
| | |
| Municipal Bonds | | | | | | |
Bay Area Toll Authority, RB, Build America Bonds, San Francisco Toll Bridge, Series S-1, 7.04%, 4/01/50 | | | 260 | | | | 357,807 | |
Chicago Transit Authority, RB, Series B, 6.90%, 12/01/40 | | | 150 | | | | 173,108 | |
City & County of San Francisco California Public Utilities Commission Water Revenue, RB, Build America Bonds, Sub-Series G, 6.95%, 11/01/50 | | | 140 | | | | 195,870 | |
City of Los Angeles California Department of Water & Power, RB, Build America Bonds, Series D, 6.57%, 7/01/45 | | | 110 | | | | 149,307 | |
City of New York New York Transitional Finance Authority, RB, Build America Bonds, Future Tax Secured, Sub-Series B-1, 5.57%, 11/01/38 | | | 150 | | | | 180,834 | |
City of New York New York Water & Sewer System, Refunding RB, 2nd General Resolution, Build America Bonds, Fiscal 2010, Series EE, 6.01%, 6/15/42 | | | 310 | | | | 402,907 | |
County of Orange California Local Transportation Authority, Refunding RB, Build America Bonds, Series A, 6.91%, 2/15/41 | | | 150 | | | | 202,116 | |
County of San Diego California Regional Transportation Commission, RB, Build America Bonds, Series A, 5.91%, 4/01/48 | | | 190 | | | | 239,240 | |
Metropolitan Water District of Southern California, RB, Build America Bonds, Series A, 6.95%, 7/01/40 | | | 360 | | | | 418,975 | |
New Jersey State Turnpike Authority, RB, Build America Bonds, Series A, 7.10%, 1/01/41 | | | 220 | | | | 303,013 | |
Port Authority of New York & New Jersey, RB, 164th Series, 5.65%, 11/01/40 | | | 260 | | | | 307,655 | |
Port Authority of New York & New Jersey, Refunding RB, 174th Series, 4.46%, 10/01/62 | | | 220 | | | | 209,475 | |
See Notes to Financial Statements.
| | | | | | |
| | | | | | | |
| | BLACKROCK COREALPHA BOND FUND | | DECEMBER 31, 2015 | | 25 |
| | |
Schedule of Investments (continued) | | CoreAlpha Bond Master Portfolio |
| | | | | | | | |
| Municipal Bonds | | Par (000) | | | Value | |
State of California, GO, Build America Bonds, Various Purpose: | | | | | | | | |
7.55%, 4/01/39 | | $ | 350 | | | $ | 508,785 | |
7.63%, 3/01/40 | | | 350 | | | | 508,995 | |
7.60%, 11/01/40 | | | 90 | | | | 133,776 | |
State of Illinois, GO: | | | | | | | | |
Build America Bonds, 7.35%, 7/01/35 | | | 210 | | | | 227,816 | |
Pension, 5.10%, 6/01/33 | | | 310 | | | | 293,276 | |
State of Mississippi, GO, Refunding, Build America Bonds, Series F, 5.25%, 11/01/34 | | | 190 | | | | 215,798 | |
State of New York Dormitory Authority, RB, Build America Bonds, General Purpose, Series H, 5.39%, 3/15/40 | | | 225 | | | | 267,406 | |
State of Oregon Department of Transportation, RB, Sub-Lien, Series A, 5.83%, 11/15/34 | | | 140 | | | | 175,893 | |
University of California, Refunding RB, Series AJ, 4.60%, 5/15/31 | | | 310 | | | | 330,376 | |
University of Missouri, RB, Build America Bonds, Series A, 5.79%, 11/01/41 | | | 110 | | | | 140,029 | |
| Total Municipal Bonds — 0.7% | | | | | | | 5,942,457 | |
| | | | | | | | |
| | | | | | | | | |
| | |
| Non-Agency Mortgage-Backed Securities | | | | | | |
Collateralized Mortgage Obligations — 2.2% | | | | | | | | |
Citicorp Mortgage Securities Trust,
Series 2006-1, Class 2A1, 5.00%, 2/25/21 | | | 34 | | | | 35,313 | |
Citigroup Mortgage Loan Trust, Series 2014-A, Class A, 4.00%, 1/25/35 (a)(b) | | | 294 | | | | 303,759 | |
Credit Suisse First Boston Mortgage Securities Corp., Series 2005-7, Class 1A6, 5.25%, 8/25/35 | | | 59 | | | | 60,210 | |
CSMC Trust (a)(b): | | | | | | | | |
Series 2009-13R, Class 5A1, 1.00%, 1/26/35 | | | 140 | | | | 139,701 | |
Series 2011-4R, Class 4A6, 4.00%, 8/27/37 | | | 74 | | | | 73,935 | |
Series 2013-8R, Class 7A1, 0.38%, 4/27/37 | | | 228 | | | | 224,306 | |
Series 2013-8R, Class 8A1, 0.46%, 5/27/37 | | | 793 | | | | 785,549 | |
Fannie Mae Connecticut Avenue Securities (a): | | | | | | | | |
Series 2014-C01, Class M1, 2.02%, 1/25/24 | | | 923 | | | | 924,801 | |
Series 2014-C02, Class 2M1, 1.37%, 5/25/24 | | | 2,415 | | | | 2,400,570 | |
Series 2014-C04, Class 1M1, 2.37%, 11/25/24 | | | 495 | | | | 497,105 | |
Series 2014-C04, Class 2M1, 2.52%, 11/25/24 | | | 784 | | | | 789,117 | |
Series 2015-C01, Class 1M1, 1.92%, 2/25/25 | | | 2,115 | | | | 2,118,390 | |
Series 2015-C03, Class 2M1, 1.92%, 7/25/25 | | | 489 | | | | 488,596 | |
Freddie Mac, Class M1 (a): | | | | | | | | |
Series 2014-HQ2, 1.87%, 9/25/24 | | | 506 | | | | 508,164 | |
Series 2015-DNA3, 1.77%, 4/25/28 | | | 2,950 | | | | 2,951,804 | |
GreenPoint Mortgage Funding Trust,
Series 2006-AR4, Class A1A,
0.52%, 9/25/46 (a) | | | — | (e) | | | 5 | |
Nomura Resecuritization Trust, Series 2014-1R, Class 5A1, 0.37%, 10/26/36 (a)(b) | | | 973 | | | | 940,241 | |
RALI Trust: | | | | | | | | |
Series 2004-QS4, Class A7, 4.00%, 3/25/34 | | | — | (e) | | | 104 | |
Series 2004-QS5, Class A5, 4.75%, 4/25/34 | | | 98 | | | | 100,131 | |
| | | | | | | | |
| Non-Agency Mortgage-Backed Securities | | Par (000) | | | Value | |
Collateralized Mortgage Obligations (continued) | | | | | |
RALI Trust (continued): | | | | | | | | |
Series 2004-QS9, Class A1, 5.00%, 6/25/19 | | $ | 47 | | | $ | 47,144 | |
RBSSP Resecuritization Trust, Series 2009-6, Class 13A4, 2.54%, 8/26/35 (a)(b) | | | 355 | | | | 355,609 | |
Structured Agency Credit Risk Debt Notes, Class M1 (a): | | | | | | | | |
Series 2013-DN1, 3.82%, 7/25/23 | | | 772 | | | | 791,846 | |
Series 2013-DN2, 1.87%, 11/25/23 | | | 3,146 | | | | 3,145,925 | |
| | | | | | | | |
| | | | | | | | 17,682,325 | |
Commercial Mortgage-Backed Securities — 11.2% | | | | | |
Banc of America Commercial Mortgage Trust: | | | | | | | | |
Series 2006-1, Class AM, 5.42%, 9/10/45 (a) | | | 265 | | | | 265,099 | |
Series 2006-4, Class A4, 5.63%, 7/10/46 | | | 1,408 | | | | 1,419,534 | |
Series 2006-6, Class A4, 5.36%, 10/10/45 | | | 1,060 | | | | 1,073,199 | |
Series 2007-3, Class A4,
5.56%, 6/10/49 (a) | | | 1,355 | | | | 1,392,168 | |
Series 2007-3, Class AMF, 5.32%, 6/10/49 | | | 660 | | | | 682,859 | |
Series 2007-4, Class A4, 5.74%, 2/10/51 (a) | | | 776 | | | | 807,809 | |
Series 2007-5, Class A4, 5.49%, 2/10/51 | | | 1,373 | | | | 1,422,402 | |
Bear Stearns Commercial Mortgage Securities Trust, Series 2005-PW10, Class AM, 5.45%, 12/11/40 (a) | | | 55 | | | | 55,266 | |
CD Commercial Mortgage Trust,
Series 2007-CD4, Class AMFX, 5.37%, 12/11/49 (a) | | | 170 | | | | 173,513 | |
Citigroup Commercial Mortgage Trust (a): | | | | | | | | |
Series 2007-C6, Class A4, 5.71%, 12/10/49 | | | 3,260 | | | | 3,368,776 | |
Series 2008-C7, Class A4, 6.14%, 12/10/49 | | | 1,566 | | | | 1,646,139 | |
Series 2010-RR2, Class CA3A, 5.31%, 12/19/39 (b) | | | 211 | | | | 212,889 | |
Citigroup/Deutsche Bank Commercial Mortgage Trust, Series 2007-CD4, Class A4, 5.32%, 12/11/49 | | | 2,906 | | | | 2,955,339 | |
Commercial Mortgage Trust: | | | | | | | | |
Series 2006-C7, Class AM, 5.79%, 6/10/46 (a) | | | 1,025 | | | | 1,035,759 | |
Series 2007-C9, Class A4, 5.80%, 12/10/49 (a) | | | 973 | | | | 1,009,598 | |
Series 2007-C9, Class AJ, 5.65%, 12/10/49 (a) | | | 920 | | | | 931,937 | |
Series 2007-GG9, Class A1A, 5.43%, 3/10/39 | | | 2,648 | | | | 2,718,157 | |
Series 2007-GG9, Class AM, 5.48%, 3/10/39 | | | 590 | | | | 603,592 | |
Series 2013-CR13, Class A4, 4.19%, 11/10/23 (a) | | | 990 | | | | 1,054,050 | |
Series 2013-LC6, Class AM, 3.28%, 1/10/46 | | | 400 | | | | 399,245 | |
Series 2014-CR17, Class A5, 3.98%, 5/10/47 | | | 670 | | | | 699,725 | |
Series 2014-CR21, Class A3, 3.53%, 12/10/47 | | | 950 | | | | 957,588 | |
Credit Suisse Commercial Mortgage Trust: | | | | | | | | |
Series 2006-C2, Class A3, 5.66%, 3/15/39 (a) | | | 113 | | | | 112,486 | |
Series 2006-C3, Class A3, 5.82%, 6/15/38 (a) | | | 2,497 | | | | 2,501,619 | |
See Notes to Financial Statements.
| | | | | | |
| | | | | | | |
| 26 | | BLACKROCK COREALPHA BOND FUND | | DECEMBER 31, 2015 | | |
| | |
Schedule of Investments (continued) | | CoreAlpha Bond Master Portfolio |
| | | | | | | | |
| Non-Agency Mortgage-Backed Securities | | Par (000) | | | Value | |
Commercial Mortgage-Backed Securities (continued) | | | | | |
Credit Suisse Commercial Mortgage Trust (continued): | | | | | | | | |
Series 2006-C3, Class AM, 5.82%, 6/15/38 (a) | | $ | 998 | | | $ | 1,009,119 | |
Series 2006-C5, Class A3, 5.31%, 12/15/39 | | | 1,256 | | | | 1,269,008 | |
Series 2007-C1, Class A3, 5.38%, 2/15/40 | | | 2,001 | | | | 2,039,579 | |
Series 2007-C2, Class A3, 5.54%, 1/15/49 (a) | | | 670 | | | | 685,035 | |
Series 2007-C2, Class AM, 5.60%, 1/15/49 (a) | | | 300 | | | | 309,624 | |
Csail Commercial Mortgage Trust,
Series 2015-C2, Class A4, 3.50%, 6/15/57 | | | 750 | | | | 756,737 | |
GS Mortgage Securities Corp. II,
Series 2015-GC30: | | | | | | | | |
Class A4, 3.38%, 5/10/50 | | | 645 | | | | 641,640 | |
Class B, 4.02%, 5/10/50 (a) | | | 300 | | | | 291,709 | |
GS Mortgage Securities Trust: | | | | | | | | |
Series 2006-GG6, Class AM, 5.62%, 4/10/38 (a) | | | 14 | | | | 14,259 | |
Series 2007-GG10, Class A4, 5.79%, 8/10/45 (a) | | | 2,464 | | | | 2,531,564 | |
Series 2009-RR1, Class GGA, 5.80%, 7/12/38 (a)(b) | | | 340 | | | | 339,601 | |
Series 2012-GCJ7, Class AS, 4.09%, 5/10/45 | | | 280 | | | | 291,898 | |
Series 2013-GC13, Class A5, 4.04%, 7/10/46 (a) | | | 170 | | | | 181,180 | |
Series 2013-GC14, Class A5, 4.24%, 8/10/46 | | | 490 | | | | 524,047 | |
Series 2013-GC16, Class A3, 4.24%, 11/10/46 | | | 480 | | | | 516,945 | |
Series 2014-GC18, Class A4, 4.07%, 1/10/47 | | | 540 | | | | 568,552 | |
Series 2015-GC28, Class A5, 3.40%, 2/10/48 | | | 510 | | | | 507,492 | |
JPMBB Commercial Mortgage Securities Trust: | | | | | | | | |
Series 2013-C14, Class A4, 4.13%, 8/15/46 (a) | | | 430 | | | | 454,727 | |
Series 2013-C14, Class AS, 4.41%, 8/15/46 (a) | | | 240 | | | | 253,971 | |
Series 2013-C15, Class B, 4.93%, 11/15/45 | | | 520 | | | | 560,212 | |
Series 2013-C17, Class A4, 4.20%, 1/15/47 | | | 510 | | | | 541,083 | |
Series 2014-C22, Class A4, 3.80%, 9/15/47 | | | 1,200 | | | | 1,228,566 | |
JPMorgan Chase Commercial Mortgage Securities Trust: | | | | | | | | |
Series 2005-LDP5, Class AJ, 5.48%, 12/15/44 (a) | | | 161 | | | | 160,429 | |
Series 2006-CB14, Class AM, 5.49%, 12/12/44 (a) | | | 1,118 | | | | 1,116,903 | |
Series 2006-CB16, Class A4, 5.55%, 5/12/45 | | | 195 | | | | 197,194 | |
Series 2006-CB17, Class A4, 5.43%, 12/12/43 | | | 2,849 | | | | 2,896,923 | |
Series 2006-LDP8, Class A1A, 5.40%, 5/15/45 | | | 89 | | | | 89,930 | |
Series 2006-LDP8, Class AM, 5.44%, 5/15/45 | | | 1,811 | | | | 1,842,575 | |
Series 2007-CB20, Class A4, 5.79%, 2/12/51 (a) | | | 2,563 | | | | 2,663,772 | |
Series 2011-C5, Class A3, 4.17%, 8/15/46 | | | 340 | | | | 362,064 | |
| | | | | | | | |
| Non-Agency Mortgage-Backed Securities | | Par (000) | | | Value | |
Commercial Mortgage-Backed Securities (continued) | | | | | |
JPMorgan Chase Commercial Mortgage Securities Trust (continued): | | | | | | | | |
Series 2012-CBX, Class AS, 4.27%, 6/15/45 | | $ | 350 | | | $ | 369,262 | |
LB Commercial Mortgage Trust, Series 2007-C3, Class A4, 5.90%, 7/15/44 (a) | | | 604 | | | | 626,909 | |
LB-UBS Commercial Mortgage Trust: | | | | | | | | |
Series 2006-C1, Class AM, 5.22%, 2/15/31 (a) | | | 138 | | | | 137,989 | |
Series 2006-C3, Class A1A, 5.64%, 3/15/39 (a) | | | 694 | | | | 693,815 | |
Series 2006-C4, Class AM, 5.84%, 6/15/38 (a) | | | 1,006 | | | | 1,023,493 | |
Series 2006-C7, Class A2, 5.30%, 11/15/38 | | | 282 | | | | 284,740 | |
Series 2006-C7, Class AM, 5.38%, 11/15/38 | | | 310 | | | | 316,930 | |
Series 2007-C1, Class A4, 5.42%, 2/15/40 | | | 1,204 | | | | 1,231,125 | |
Series 2007-C2, Class A3, 5.43%, 2/15/40 | | | 2,129 | | | | 2,185,192 | |
Series 2007-C2, Class AM, 5.49%, 2/15/40 (a) | | | 540 | | | | 552,735 | |
Series 2007-C7, Class A3, 5.87%, 9/15/45 (a) | | | 865 | | | | 908,206 | |
Merrill Lynch Mortgage Trust, Series 2006-C2 (a): | | | | | | | | |
Class A4, 5.74%, 8/12/43 | | | 631 | | | | 637,817 | |
Class AM, 5.78%, 8/12/43 | | | 460 | | | | 468,040 | |
ML-CFC Commercial Mortgage Trust (a): | | | | | | | | |
Series 2006-2, Class A4, 5.88%, 6/12/46 | | | 423 | | | | 423,459 | |
Series 2006-3, Class AM, 5.46%, 7/12/46 | | | 600 | | | | 609,843 | |
Series 2007-7, Class A4, 5.74%, 6/12/50 | | | 1,438 | | | | 1,492,276 | |
Series 2007-8, Class A3, 5.88%, 8/12/49 | | | 3,142 | | | | 3,274,649 | |
Monty Parent Issuer 1 LLC, Series 2013-LTR1, Class B, 4.25%, 11/20/28 (b) | | | 104 | | | | 104,440 | |
Morgan Stanley Bank of America Merrill Lynch Trust: | | | | | | | | |
Series 2013-C10, Class A4, 4.08%, 7/15/46 (a) | | | 470 | | | | 499,622 | |
Series 2014-C15, Class C, 4.90%, 4/15/47 (a) | | | 510 | | | | 512,764 | |
Series 2015-C21, Class A4, 3.34%, 3/15/48 | | | 300 | | | | 297,206 | |
Morgan Stanley Capital I Trust: | | | | | | | | |
Series 2006-HQ8, Class AM, 5.48%, 3/12/44 (a) | | | 223 | | | | 222,638 | |
Series 2006-T23, Class AJ, 5.85%, 8/12/41 (a) | | | 120 | | | | 121,542 | |
Series 2007-HQ11, Class A1A, 5.42%, 2/12/44 (a) | | | 905 | | | | 928,868 | |
Series 2007-HQ11, Class A4, 5.45%, 2/12/44 (a) | | | 881 | | | | 901,009 | |
Series 2007-IQ13, Class AM, 5.41%, 3/15/44 | | | 812 | | | | 833,076 | |
Series 2007-IQ15, Class A4, 5.92%, 6/11/49 (a) | | | 63 | | | | 65,070 | |
Series 2007-IQ16, Class A4, 5.81%, 12/12/49 | | | 1,573 | | | | 1,642,638 | |
Series 2007-T25, Class A3, 5.51%, 11/12/49 (a) | | | 861 | | | | 879,528 | |
Series 2007-T27, Class A4, 5.64%, 6/11/42 (a) | | | 1,593 | | | | 1,664,854 | |
Series 2007-T27, Class AM, 5.64%, 6/11/42 (a) | | | 630 | | | | 659,039 | |
See Notes to Financial Statements.
| | | | | | |
| | | | | | | |
| | BLACKROCK COREALPHA BOND FUND | | DECEMBER 31, 2015 | | 27 |
| | |
Schedule of Investments (continued) | | CoreAlpha Bond Master Portfolio |
| | | | | | | | |
| Non-Agency Mortgage-Backed Securities | | Par (000) | | | Value | |
Commercial Mortgage-Backed Securities (continued) | | | | | |
Morgan Stanley Capital I Trust (continued): | | | | | | | | |
Series 2012-C4, Class A4, 3.24%, 3/15/45 | | $ | 680 | | | $ | 693,865 | |
Series 2015-MS1, Class A4, 3.78%, 5/15/48 | | | 550 | | | | 564,526 | |
ORES NPL LLC, Series 2014-LV3, Class A, 3.00%, 3/27/24 (b) | | | 333 | | | | 332,382 | |
UBS-Barclays Commercial Mortgage Trust: | | | | | | | | |
Series 2012-C4, Class A5, 2.85%, 12/10/45 | | | 505 | | | | 495,613 | |
Series 2013-C6, Class A4, 3.24%, 4/10/46 | | | 1,181 | | | | 1,183,723 | |
VFC LLC, Series 2014-2, Class A, 2.75%, 7/20/30 (b) | | | 275 | | | | 275,111 | |
Wachovia Bank Commercial Mortgage Trust: | | | | | | | | |
Series 2006-C27, Class A3, 5.77%, 7/15/45 (a) | | | 1,222 | | | | 1,220,740 | |
Series 2006-C28, Class AM, 5.60%, 10/15/48 (a) | | | 1,080 | | | | 1,103,402 | |
Series 2007-C34, Class A3, 5.68%, 5/15/46 | | | 1,142 | | | | 1,182,665 | |
Wells Fargo Commercial Mortgage Trust: | | | | | | | | |
Series 2014-LC18, Class A5, 3.41%, 12/15/47 | | | 1,000 | | | | 996,486 | |
Series 2014-LC18, Class AS, 3.81%, 12/15/47 | | | 510 | | | | 514,609 | |
Series 2015-C27, Class A5, 3.45%, 2/15/48 | | | 820 | | | | 819,300 | |
Series 2015-C28, Class A4, 3.54%, 5/15/48 | | | 310 | | | | 311,392 | |
Series 2015-C28, Class AS, 3.87%, 5/15/48 | | | 195 | | | | 196,844 | |
WF-RBS Commercial Mortgage Trust: | | | | | | | | |
Series 2012-C08, Class AS, 3.66%, 8/15/45 | | | 640 | | | | 658,172 | |
Series 2012-C10, Class A3, 2.88%, 12/15/45 | | | 1,240 | | | | 1,224,633 | |
Series 2012-C10, Class AS, 3.24%, 12/15/45 | | | 460 | | | | 457,597 | |
Series 2013-C18, Class A5, 4.16%, 12/15/46 (a) | | | 570 | | | | 604,928 | |
Series 2014-C20, Class B, 4.38%, 5/15/47 | | | 470 | | | | 481,714 | |
Series 2014-C23, Class A4, 3.65%, 10/15/57 | | | 330 | | | | 336,530 | |
Series 2014-C24, Class A5, 3.61%, 11/15/47 | | | 910 | | | | 923,092 | |
| | | | | | | | |
| | | | | | | | 91,491,184 | |
| Total Non-Agency Mortgage-Backed Securities — 13.4% | | | | 109,173,509 | |
| | | | | | | | |
| | | | | | | | | |
| | |
| U.S. Government Sponsored Agency Securities | | | | | | |
Agency Obligations — 3.8% | | | | | | | | |
Fannie Mae: | | | | | | | | |
0.00%, 10/09/19 - 5/15/30 (c) | | | 11,680 | | | | 9,822,197 | |
1.63%, 1/21/20 | | | 900 | | | | 896,606 | |
6.00%, 4/18/36 | | | 1,500 | | | | 1,522,984 | |
6.32%, 12/20/27 | | | 290 | | | | 382,393 | |
Fannie Mae STRIPS,
0.00%, 3/23/28 - 5/15/29 (c) | | | 1,855 | | | | 1,181,716 | |
Federal Farm Credit Banks: | | | | | | | | |
1.69%, 4/09/20 | | | 2,350 | | | | 2,316,364 | |
2.00%, 4/04/22 | | | 897 | | | | 892,953 | |
Federal Home Loan Bank: | | | | | | | | |
4.00%, 9/01/28 - 9/01/45 | | | 4,109 | | | | 4,360,169 | |
| | | | | | | | |
| U.S. Government Sponsored Agency Securities | | Par (000) | | | Value | |
Agency Obligations (continued) | | | | | | | | |
Federal Home Loan Bank (continued): | | | | | | | | |
5.38%, 8/15/24 | | $ | 1,330 | | | $ | 1,615,516 | |
Federal Home Loan Mortgage Corp., 0.85%, 5/18/17 | | | 900 | | | | 898,005 | |
Financing Corp. (c): | | | | | | | | |
0.00%, 12/06/16 | | | 900 | | | | 891,711 | |
0.00%, 11/02/18 | | | 2,930 | | | | 2,805,739 | |
Freddie Mac, 6.75%, 3/15/31 | | | 900 | | | | 1,290,203 | |
Resolution Funding Corp., 8.13%, 10/15/19 | | | 1,040 | | | | 1,281,545 | |
Tennessee Valley Authority: | | | | | | | | |
3.50%, 12/15/42 | | | 90 | | | | 83,112 | |
4.25%, 9/15/65 | | | 460 | | | | 449,405 | |
5.88%, 4/01/36 | | | 345 | | | | 443,272 | |
| | | | | | | | |
| | | | | | | | 31,133,890 | |
Collateralized Mortgage Obligations — 3.0% | |
Fannie Mae (a): | | | | | | | | |
Series 2013-C01, Class M1, 2.42%, 10/25/23 | | | 3,008 | | | | 3,030,154 | |
Series 2014-92, Class FB, 0.51%, 1/25/45 | | | 2,377 | | | | 2,370,534 | |
Series 2014-C02, Class 1M1, 1.37%, 5/25/24 | | | 2,244 | | | | 2,219,632 | |
Series 2015-C02, Class 2M1, 1.62%, 7/25/24 - 5/25/25 | | | 5,498 | | | | 5,479,397 | |
Fannie Mae REMICS (a): | | | | | | | | |
Series 2007-54, Class PF, 0.64%, 6/25/37 | | | 602 | | | | 598,498 | |
Series 2010-89, Class CF, 0.87%, 2/25/38 | | | 385 | | | | 385,618 | |
Series 2010-35, Class EF, 0.97%, 4/25/40 | | | 342 | | | | 343,293 | |
Freddie Mac, 2.82%, 8/25/24 - 1/25/25 (a) | | | 4,830 | | | | 4,885,953 | |
Freddie Mac REMICS (a): | | | | | | | | |
Series 3807, Class FN, 0.83%, 2/15/41 | | | 222 | | | | 222,257 | |
Series 3667, Class FW, 0.88%, 2/15/38 | | | 215 | | | | 216,159 | |
Ginnie Mae (a): | | | | | | | | |
Series 2014-90, Class FA, 0.64%, 10/20/38 | | | 3,525 | | | | 3,522,275 | |
Series 2012-H23, Class WA, 0.71%, 10/20/62 | | | 773 | | | | 768,469 | |
| | | | | | | | |
| | | | | | | | 24,042,239 | |
Commercial Mortgage-Backed Securities — 0.8% | |
Freddie Mac, Class A2: | | | | | | | | |
Series K025, 2.68%, 10/25/22 | | | 2,590 | | | | 2,598,449 | |
Series K040, 3.24%, 9/25/24 | | | 2,590 | | | | 2,649,210 | |
Series K031, 3.30%, 4/25/23 (a) | | | 281 | | | | 291,311 | |
Series K038, 3.39%, 3/25/24 | | | 1,040 | | | | 1,077,372 | |
| | | | | | | | |
| | | | | | | | 6,616,342 | |
Mortgage-Backed Securities — 44.6% | | | | | | | | |
Fannie Mae Mortgage-Backed Securities: | | | | | | | | |
1.89%, 4/01/43 (a) | | | 168 | | | | 171,571 | |
1.93%, 5/01/43 (a) | | | 234 | | | | 239,873 | |
2.06%, 6/01/43 (a) | | | 326 | | | | 330,370 | |
2.15%, 1/01/36 (a) | | | 225 | | | | 236,911 | |
2.34%, 4/01/40 (a) | | | 46 | | | | 48,766 | |
2.39%, 1/01/35 (a) | | | 260 | | | | 273,018 | |
2.42%, 2/01/42 (a) | | | 21 | | | | 21,885 | |
2.45%, 8/01/33 (a) | | | 372 | | | | 392,952 | |
2.46%, 5/01/33 (a) | | | 500 | | | | 528,937 | |
2.50%, 9/01/28 - 4/01/45 (f) | | | 9,152 | | | | 9,186,607 | |
2.75%, 1/01/42 (a) | | | 164 | | | | 171,067 | |
2.84%, 8/01/41 (a) | | | 304 | | | | 321,599 | |
3.00%, 1/01/27 - 1/01/46 (f) | | | 33,580 | | | | 33,903,984 | |
3.30%, 9/01/41 (a) | | | 204 | | | | 214,173 | |
See Notes to Financial Statements.
| | | | | | |
| | | | | | | |
| 28 | | BLACKROCK COREALPHA BOND FUND | | DECEMBER 31, 2015 | | |
| | |
Schedule of Investments (continued) | | CoreAlpha Bond Master Portfolio |
| | | | | | | | |
| U.S. Government Sponsored Agency Securities | | Par (000) | | | Value | |
Mortgage-Backed Securities (continued) | | | | | | | | |
Fannie Mae Mortgage-Backed Securities (continued): | | | | | | | | |
3.50%, 2/01/26 - 1/01/46 (f) | | $ | 65,860 | | | $ | 68,036,669 | |
4.00%, 8/01/25 - 1/01/46 (f) | | | 68,302 | | | | 72,310,299 | |
4.50%, 10/01/24 - 1/01/46 (f) | | | 37,994 | | | | 41,029,697 | |
5.00%, 1/01/18 - 1/01/46 (f) | | | 15,085 | | | | 16,617,809 | |
5.50%, 9/01/19 - 8/01/37 | | | 2,685 | | | | 2,995,623 | |
6.00%, 11/01/22 - 8/01/38 | | | 1,590 | | | | 1,800,613 | |
6.50%, 12/01/30 - 12/01/32 | | | 1,823 | | | | 2,097,885 | |
Freddie Mac Mortgage-Backed Securities: | | | | | | | | |
1.76%, 6/01/43 (a) | | | 98 | | | | 99,476 | |
2.37%, 2/01/40 (a) | | | 239 | | | | 253,704 | |
2.38%, 4/01/38 (a) | | | 328 | | | | 348,997 | |
2.39%, 10/01/33 (a) | | | 266 | | | | 280,746 | |
2.47%, 5/01/43 (a) | | | 243 | | | | 245,335 | |
2.50%, 1/01/31 - 4/01/43 (f) | | | 5,147 | | | | 5,181,445 | |
2.51%, 8/01/43 (a) | | | 93 | | | | 94,495 | |
2.55%, 1/01/42 (a) | | | 11 | | | | 11,708 | |
2.63%, 11/01/36 (a) | | | 275 | | | | 286,715 | |
2.95%, 8/01/41 (a) | | | 194 | | | | 203,945 | |
3.00%, 3/01/27 - 6/01/43 (f) | | | 14,281 | | | | 14,427,482 | |
3.33%, 7/01/41 (a) | | | 159 | | | | 167,273 | |
3.50%, 12/01/25 - 1/01/46 (f) | | | 15,728 | | | | 16,250,050 | |
4.00%, 3/01/26 - 1/01/46 (f) | | | 12,251 | | | | 12,938,382 | |
4.50%, 8/01/20 - 1/01/46 (f) | | | 5,692 | | | | 6,175,172 | |
5.00%, 10/01/20 - 8/01/40 | | | 1,842 | | | | 2,013,401 | |
5.50%, 5/01/34 - 8/01/38 | | | 1,415 | | | | 1,574,418 | |
6.00%, 9/01/36 - 1/01/38 | | | 638 | | | | 719,467 | |
6.50%, 5/01/21 - 7/01/32 | | | 632 | | | | 746,278 | |
Ginnie Mae Mortgage-Backed Securities: | | | | | | | | |
3.00%, 5/15/43 - 1/01/46 (f) | | | 11,795 | | | | 11,969,704 | |
3.50%, 1/15/41 - 1/01/46 (f) | | | 17,256 | | | | 18,027,652 | |
4.00%, 9/15/40 - 1/01/46 (f) | | | 6,294 | | | | 6,734,845 | |
4.50%, 3/15/39 - 1/01/46 (f) | | | 7,754 | | | | 8,394,521 | |
5.00%, 10/20/39 - 5/20/41 | | | 3,224 | | | | 3,585,424 | |
5.50%, 6/15/34 - 7/20/40 | | | 1,767 | | | | 1,969,497 | |
6.00%, 9/20/38 - 10/20/38 | | | 538 | | | | 602,410 | |
| | | | | | | | |
| | | | | | | | 364,232,850 | |
| Total U.S. Government Sponsored Agency Securities — 52.2% | | | | 426,025,321 | |
| | | | | | | | |
| | | | | | | | | |
| | |
| U.S. Treasury Obligations | | | | | | |
U.S. Treasury Bonds: | | | | | | | | |
6.13%, 11/15/27 | | | 351 | | | | 485,902 | |
6.25%, 5/15/30 | | | 50 | | | | 72,498 | |
U.S. Treasury Inflation Indexed Bonds, 0.13%, 4/15/16 | | | 6,480 | | | | 6,455,092 | |
U.S. Treasury Notes: | | | | | | | | |
0.88%, 4/15/17 | | | 90 | | | | 89,979 | |
0.88%, 10/15/17 | | | 780 | | | | 777,654 | |
0.88%, 10/15/18 | | | 755 | | | | 746,683 | |
2.13%, 6/30/22 | | | 173 | | | | 174,194 | |
| Total U.S. Treasury Obligations — 1.1% | | | | | | | 8,802,002 | |
| | | | | | | | |
| | | | | | | | | |
| | |
| Investment Companies (g) | | Shares | | | | |
iShares 0-5 Year TIPS Bond ETF | | | 1 | | | | 99 | |
iShares 1-3 Year Treasury Bond ETF | | | 1 | | | | 84 | |
iShares 10-20 Year Treasury Bond ETF | | | 1 | | | | 134 | |
iShares 20+ Year Treasury Bond ETF | | | 52,602 | | | | 6,344,853 | |
iShares 3-7 Year Treasury Bond ETF | | | 1 | | | | 123 | |
iShares 7-10 Year Treasury Bond ETF | | | 1 | | | | 106 | |
iShares Agency Bond ETF | | | 1 | | | | 113 | |
iShares Core U.S. Treasury Bond ETF | | | 1 | | | | 25 | |
| | | | | | | | |
| Investment Companies (g) | | Shares | | | Value | |
iShares Short Treasury Bond ETF | | | 1 | | | $ | 110 | |
iShares TIPS Bond ETF | | | 1 | | | | 110 | |
| Total Investment Companies — 0.8% | | | | | | | 6,345,757 | |
| | | | | | | | |
| | | | | | | | | |
| | |
| Preferred Securities | | | | | | |
| | |
| Capital Trusts | | Par (000) | | | | |
Diversified Financial Services — 0.1% | | | | | | | | |
Bank of New York Mellon Corp., Series D, 4.50% (a)(h) | | $ | 394 | | | | 360,510 | |
JPMorgan Chase & Co., Series Q, 5.15% (a)(h) | | | 415 | | | | 392,175 | |
| | | | | | | | |
| | | | | | | | 752,685 | |
Insurance — 0.1% | | | | | | | | |
Chubb Corp., 6.38%, 4/15/37 (a) | | | 760 | | | | 729,851 | |
| Total Capital Trusts — 0.2% | | | | | | | 1,482,536 | |
| | | | | | | | |
| | | | | | | | | |
| | |
| Preferred Stock | | Shares | | | | |
Diversified Telecommunication Services — 0.2% | | | | | |
Qwest Corp., 7.38%, 6/01/51 | | | 76,000 | | | | 1,932,680 | |
| Total Preferred Securities — 0.4% | | | | | | | 3,415,216 | |
Total Long-Term Investments
(Cost — $981,009,663) — 120.0% | | | | | | | 979,106,070 | |
| | | | | | | | |
| | | | | | | | | |
| | |
| Short-Term Securities — 2.4% | | | | | | |
BlackRock Cash Funds: Institutional, SL Agency Shares, 0.35% (g)(i)(j) | | | 19,480,003 | | | | 19,480,003 | |
BlackRock Cash Funds: Prime, SL Agency Shares, 0.31% (g)(i)(j) | | | 50,944 | | | | 50,944 | |
Total Short-Term Securities
(Cost — $19,530,947) — 2.4% | | | | | | | 19,530,947 | |
Total Investments Before TBA Sale Commitments
(Cost — $1,000,540,610) — 122.4% | | | | 998,637,017 | |
| | | | | | | | |
| | | | | | | | | |
| | |
| TBA Sale Commitments | | Par (000) | | | | |
Fannie Mae Mortgage-Backed Securities (f): | | | | | | | | |
2.50%, 1/20/31 | | USD | 800 | | | | (806,375 | ) |
3.00%, 1/20/31 - 1/14/46 | | | 16,300 | | | | (16,318,094 | ) |
3.50%, 1/20/31 - 1/14/46 | | | 12,000 | | | | (12,389,907 | ) |
4.00%, 1/14/46 | | | 22,600 | | | | (23,917,156 | ) |
4.50%, 1/14/46 | | | 500 | | | | (539,844 | ) |
5.00%, 1/14/46 | | | 200 | | | | (220,062 | ) |
Freddie Mac Mortgage-Backed Securities (f): | | | | | | | | |
3.00%, 1/14/46 | | | 300 | | | | (299,578 | ) |
3.50%, 1/20/31 | | | 375 | | | | (391,992 | ) |
4.00%, 1/20/31 - 1/14/46 | | | 2,300 | | | | (2,416,172 | ) |
4.50%, 1/14/46 | | | 1,000 | | | | (1,077,188 | ) |
Ginnie Mae Mortgage-Backed Securities (f): | | | | | | | | |
3.50%, 1/21/46 | | | 1,850 | | | | (1,928,914 | ) |
4.50%, 1/21/46 | | | 500 | | | | (539,062 | ) |
Total TBA Sale Commitments
(Proceeds — $60,853,202) — (7.5)% | | | | | | | (60,844,344 | ) |
Total Investments, Net of TBA Sale Commitments
(Cost — $939,687,408) — 114.9% | | | | 937,792,673 | |
| Liabilities in Excess of Other Assets — (14.9)% | | | | (121,795,234 | ) |
| | | | | | | | |
| Net Assets — 100.0% | | | | | | $ | 815,997,439 | |
| | | | | | | | |
See Notes to Financial Statements.
| | | | | | |
| | | | | | | |
| | BLACKROCK COREALPHA BOND FUND | | DECEMBER 31, 2015 | | 29 |
| | |
Schedule of Investments (continued) | | CoreAlpha Bond Master Portfolio |
|
| Notes to Schedule of Investments |
| (a) | | Variable rate security. Rate as of period end. |
| (b) | | Security exempt from registration pursuant to Rule 144A under the Securities Act of 1933, as amended. These securities may be resold in transactions exempt from registration to qualified institutional investors. |
| (d) | | Security, or a portion of security, is on loan. |
| (e) | | Amount is less than $500. |
| (f) | | Represents or includes a TBA transaction. As of period end, unsettled TBA transactions were as follows: |
| | | | | | | | |
| Counterparty | | Value | | | Unrealized
Appreciation
(Depreciation) | |
J.P. Morgan Securities LLC | | $ | 16,274,625 | | | $ | 13,196 | |
Nomura Securities International, Inc. | | $ | 7,580,047 | | | $ | 4,938 | |
Morgan Stanley & Co. LLC | | $ | 17,014,920 | | | $ | 19,076 | |
Credit Suisse Securities (USA) LLC | | $ | 36,571,466 | | | $ | 60,925 | |
Wells Fargo Securities LLC | | $ | 18,669,239 | | | $ | 68,173 | |
Deutsche Bank Securities, Inc | | $ | (1,000,000 | ) | | $ | 859 | |
Goldman Sachs & Co. | | $ | 11,995,070 | | | $ | 29,567 | |
S.G. America | | $ | 733,031 | | | $ | (191 | ) |
RBC Capital Markets, LLC | | $ | (2,055,703 | ) | | $ | 3,458 | |
Barclays Capital, Inc. | | $ | 11,606,156 | | | $ | 25,359 | |
Bank of America N.A. | | $ | 8,288,000 | | | $ | 11,324 | |
Citigroup Global Markets, Inc. | | $ | 17,560,953 | | | $ | 27,283 | |
| (g) | | During the year ended December 31, 2015, investments in issuers considered to be affiliates of the Master Portfolio for purposes of Section 2(a)(3) of the Investment Company Act of 1940, as amended, were as follows: |
| | | | | | | | | | | | | | | | | | | | | | | | | | | | |
| Affiliate | | Shares Held
at December 31,
2014 | | | Shares
Purchased | | | Shares
Sold | | | Shares Held
at December 31,
2015 | | | Value
at December 31,
2015 | | | Income | | | Realized
Gain | |
BlackRock Cash Funds: Institutional, SL Agency Shares | | | 39,979,776 | | | | — | | | | (20,499,773 | )1 | | | 19,480,003 | | | $ | 19,480,003 | | | $ | 85,524 | 3 | | | — | |
BlackRock Cash Funds: Prime, SL Agency Shares | | | — | | | | 50,944 | 2 | | | — | | | | 50,944 | | | $ | 50,944 | | | $ | 4,215 | 3 | | | — | |
iShares 0-5 Year TIPS Bond ETF | | | 1 | | | | — | | | | — | | | | 1 | | | $ | 99 | | | | — | | | | — | |
iShares 1-3 Year Treasury Bond ETF | | | 1 | | | | — | | | | — | | | | 1 | | | $ | 84 | | | | — | | | | — | |
iShares 10-20 Year Treasury Bond ETF | | | 1 | | | | — | | | | — | | | | 1 | | | $ | 134 | | | $ | 3 | | | | — | |
iShares 20+ Year Treasury Bond ETF | | | 181,108 | | | | — | | | | (128,506 | ) | | | 52,602 | | | $ | 6,344,853 | | | $ | 470,317 | | | $ | 225,108 | 4 |
iShares 3-7 Year Treasury Bond ETF | | | 1 | | | | — | | | | — | | | | 1 | | | $ | 123 | | | $ | 2 | | | | — | |
iShares 7-10 Year Treasury Bond ETF | | | 1 | | | | — | | | | — | | | | 1 | | | $ | 106 | | | $ | 2 | | | | — | |
iShares Agency Bond ETF | | | 1 | | | | — | | | | — | | | | 1 | | | $ | 113 | | | $ | 1 | | | | — | |
iShares Core U.S. Treasury Bond ETF | | | 1 | | | | — | | | | — | | | | 1 | | | $ | 25 | | | | — | | | | — | |
iShares Short Treasury Bond ETF | | | 1 | | | | — | | | | — | | | | 1 | | | $ | 110 | | | | — | | | | — | |
iShares TIPS Bond ETF | | | 1 | | | | — | | | | — | | | | 1 | | | $ | 110 | | | | — | | | | — | |
1 Represents net shares sold. | | | | | | | | | | | | | |
2 Represents net shares purchased. | | | | | | | | | | | | | |
3 Represents all or a portion of securities lending income earned from the reinvestment of cash collateral from loaned securities, net of fees and collateral investment expenses, and other payments to and from borrowers of securities. | |
4 Includes $225,108 of gains and losses from in-kind redemptions. See Note 2 of the Notes to Financial Statements. | | | | | | | | | | | | | |
| (h) | | Perpetual security with no stated maturity date. |
| (i) | | Current yield as of period end. |
| (j) | | All or a portion of security was purchased with the cash collateral from loaned securities. |
|
| Derivative Financial Instruments Outstanding as of Period End |
Financial Futures Contracts
| | | | | | | | | | | | | | | | | | |
Contracts
Long (Short) | | | Issue | | Expiration | | Notional Value | | | Unrealized
Appreciation
(Depreciation) | | | |
| | 41 | | | 2-Year U.S. Treasury Note | | March 2016 | | $ | | | 8,906,609 | | | $ | (5,324 | ) | | |
| | 144 | | | 5-Year U.S. Treasury Note | | March 2016 | | $ | | | 17,038,125 | | | | (1,256 | ) | | |
| | 128 | | | 10-Year Australian T-Bond | | March 2016 | | $ | | | 11,835,704 | | | | 14,024 | | | |
| | (81 | ) | | 10-Year Canada Bond Future | | March 2016 | | $ | | | 8,253,371 | | | | (30,749 | ) | | |
| | 222 | | | 10-Year U.S. Treasury Note | | March 2016 | | $ | | | 27,951,188 | | | | (49,282 | ) | | |
| | 325 | | | 90-Day Euro Dollar Future | | March 2016 | | $ | | | 80,652,812 | | | | (34,447 | ) | | |
See Notes to Financial Statements.
| | | | | | |
| | | | | | | |
| 30 | | BLACKROCK COREALPHA BOND FUND | | DECEMBER 31, 2015 | | |
| | |
Schedule of Investments (continued) | | CoreAlpha Bond Master Portfolio |
Financial Futures Contracts (concluded)
| | | | | | | | | | | | | | | | | | |
Contracts
Long (Short) | | | Issue | | Expiration | | Notional Value | | | Unrealized
Appreciation
(Depreciation) | | | |
| | (325 | ) | | 90-Day Euro Dollar Future | | March 2017 | | $ | | | 80,128,750 | | | $ | 73,567 | | | |
| | (169 | ) | | Euro-Bund Futures | | March 2016 | | $ | | | 29,003,700 | | | | 428,016 | | | |
| | 26 | | | Long U.S. Treasury Bond | | March 2016 | | $ | | | 3,997,500 | | | | (60,620 | ) | | |
| | 223 | | | Ultra Long U.S. Treasury Bond | | March 2016 | | $ | | | 35,387,312 | | | | 20,343 | | | |
| | 71 | | | UK Long Gilt Bond | | March 2016 | | $ | | | 12,222,106 | | | | (23,271 | ) | | |
| | Total | | | | | | | | | | | | | $ | 331,001 | | | |
| | | | | | | | | | | | | | | |
Forward Foreign Currency Exchange Contracts
| | | | | | | | | | | | | | | | | | | | |
Currency
Purchased | | | Currency
Sold | | | Counterparty | | Settlement
Date | | | Unrealized
Appreciation
(Depreciation) | |
| BRL | | | 510,000 | | | USD | | | 131,706 | | | BNP Paribas S.A. | | | 1/05/16 | | | $ | (2,796 | ) |
| BRL | | | 540,000 | | | USD | | | 142,234 | | | BNP Paribas S.A. | | | 1/05/16 | | | | (5,742 | ) |
| BRL | | | 490,000 | | | USD | | | 127,739 | | | BNP Paribas S.A. | | | 1/05/16 | | | | (3,884 | ) |
| BRL | | | 920,000 | | | USD | | | 235,607 | | | BNP Paribas S.A. | | | 1/05/16 | | | | (3,064 | ) |
| BRL | | | 760,000 | | | USD | | | 194,632 | | | HSBC Bank PLC | | | 1/05/16 | | | | (2,531 | ) |
| BRL | | | 940,000 | | | USD | | | 249,271 | | | JPMorgan Chase Bank N.A. | | | 1/05/16 | | | | (11,672 | ) |
| BRL | | | 1,310,000 | | | USD | | | 335,485 | | | JPMorgan Chase Bank N.A. | | | 1/05/16 | | | | (4,363 | ) |
| BRL | | | 770,000 | | | USD | | | 193,225 | | | Morgan Stanley & Co. International PLC | | | 1/05/16 | | | | 1,404 | |
| BRL | | | 260,000 | | | USD | | | 66,585 | | | Morgan Stanley & Co. International PLC | | | 1/05/16 | | | | (866 | ) |
| USD | | | 234,456 | | | BRL | | | 920,000 | | | BNP Paribas S.A. | | | 1/05/16 | | | | 1,913 | |
| USD | | | 125,487 | | | BRL | | | 490,000 | | | BNP Paribas S.A. | | | 1/05/16 | | | | 1,632 | |
| USD | | | 130,608 | | | BRL | | | 510,000 | | | BNP Paribas S.A. | | | 1/05/16 | | | | 1,699 | |
| USD | | | 138,291 | | | BRL | | | 540,000 | | | BNP Paribas S.A. | | | 1/05/16 | | | | 1,798 | |
| USD | | | 195,017 | | | BRL | | | 760,000 | | | HSBC Bank PLC | | | 1/05/16 | | | | 2,916 | |
| USD | | | 344,103 | | | BRL | | | 1,310,000 | | | JPMorgan Chase Bank N.A. | | | 1/05/16 | | | | 12,981 | |
| USD | | | 240,729 | | | BRL | | | 940,000 | | | JPMorgan Chase Bank N.A. | | | 1/05/16 | | | | 3,131 | |
| USD | | | 68,511 | | | BRL | | | 260,000 | | | Morgan Stanley & Co. International PLC | | | 1/05/16 | | | | 2,792 | |
| USD | | | 197,193 | | | BRL | | | 770,000 | | | Morgan Stanley & Co. International PLC | | | 1/05/16 | | | | 2,564 | |
| USD | | | 139,044 | | | BRL | | | 560,000 | | | Citibank N.A. | | | 2/02/16 | | | | (1,112 | ) |
| USD | | | 3,728 | | | BRL | | | 14,551 | | | JPMorgan Chase Bank N.A. | | | 2/02/16 | | | | 86 | |
| USD | | | 185,836 | | | BRL | | | 725,449 | | | Morgan Stanley & Co. International PLC | | | 2/02/16 | | | | 4,271 | |
| USD | | | 191,276 | | | BRL | | | 770,000 | | | Morgan Stanley & Co. International PLC | | | 2/02/16 | | | | (1,439 | ) |
| AUD | | | 250,000 | | | USD | | | 181,871 | | | Barclays Bank PLC | | | 3/10/16 | | | | (568 | ) |
| AUD | | | 234,684 | | | USD | | | 168,657 | | | Citibank N.A. | | | 3/10/16 | | | | 1,539 | |
| AUD | | | 700,000 | | | USD | | | 501,367 | | | Citibank N.A. | | | 3/10/16 | | | | 6,283 | |
| AUD | | | 380,000 | | | USD | | | 271,864 | | | Citibank N.A. | | | 3/10/16 | | | | 3,717 | |
| AUD | | | 280,000 | | | USD | | | 200,321 | | | Citibank N.A. | | | 3/10/16 | | | | 2,739 | |
| AUD | | | 220,382 | | | USD | | | 159,007 | | | Citibank N.A. | | | 3/10/16 | | | | 818 | |
| AUD | | | 585,587 | | | USD | | | 422,504 | | | Citibank N.A. | | | 3/10/16 | | | | 2,173 | |
| AUD | | | 241,371 | | | USD | | | 174,150 | | | Citibank N.A. | | | 3/10/16 | | | | 896 | |
| AUD | | | 375,494 | | | USD | | | 269,573 | | | Citibank N.A. | | | 3/10/16 | | | | 2,741 | |
| AUD | | | 330,000 | | | USD | | | 237,590 | | | Citibank N.A. | | | 3/10/16 | | | | 1,730 | |
| AUD | | | 600,000 | | | USD | | | 431,982 | | | Citibank N.A. | | | 3/10/16 | | | | 3,146 | |
| AUD | | | 240,000 | | | USD | | | 174,607 | | | Credit Suisse International | | | 3/10/16 | | | | (556 | ) |
| AUD | | | 1,323,040 | | | USD | | | 954,033 | | | Credit Suisse International | | | 3/10/16 | | | | 5,454 | |
| AUD | | | 497,918 | | | USD | | | 359,045 | | | Credit Suisse International | | | 3/10/16 | | | | 2,053 | |
| AUD | | | 545,339 | | | USD | | | 393,240 | | | Credit Suisse International | | | 3/10/16 | | | | 2,248 | |
| AUD | | | 150,000 | | | USD | | | 109,373 | | | HSBC Bank PLC | | | 3/10/16 | | | | (590 | ) |
| AUD | | | 135,000 | | | USD | | | 98,435 | | | HSBC Bank PLC | | | 3/10/16 | | | | (531 | ) |
| AUD | | | 115,000 | | | USD | | | 83,852 | | | HSBC Bank PLC | | | 3/10/16 | | | | (453 | ) |
| AUD | | | 270,000 | | | USD | | | 196,821 | | | HSBC Bank PLC | | | 3/10/16 | | | | (1,013 | ) |
| AUD | | | 370,000 | | | USD | | | 264,446 | | | Morgan Stanley & Co. International PLC | | | 3/10/16 | | | | 3,883 | |
| AUD | | | 710,000 | | | USD | | | 504,668 | | | Morgan Stanley & Co. International PLC | | | 3/10/16 | | | | 10,234 | |
| AUD | | | 400,000 | | | USD | | | 284,320 | | | Morgan Stanley & Co. International PLC | | | 3/10/16 | | | | 5,766 | |
| AUD | | | 220,000 | | | USD | | | 156,979 | | | Morgan Stanley & Co. International PLC | | | 3/10/16 | | | | 2,568 | |
| AUD | | | 420,000 | | | USD | | | 302,830 | | | Morgan Stanley & Co. International PLC | | | 3/10/16 | | | | 1,760 | |
| AUD | | | 360,000 | | | USD | | | 261,363 | | | Morgan Stanley & Co. International PLC | | | 3/10/16 | | | | (286 | ) |
| AUD | | | 318,937 | | | USD | | | 230,062 | | | Morgan Stanley & Co. International PLC | | | 3/10/16 | | | | 1,235 | |
| AUD | | | 291,203 | | | USD | | | 210,057 | | | Morgan Stanley & Co. International PLC | | | 3/10/16 | | | | 1,127 | |
See Notes to Financial Statements.
| | | | | | |
| | | | | | | |
| | BLACKROCK COREALPHA BOND FUND | | DECEMBER 31, 2015 | | 31 |
| | |
Schedule of Investments (continued) | | CoreAlpha Bond Master Portfolio |
Forward Foreign Currency Exchange Contracts (continued)
| | | | | | | | | | | | | | | | | | | | |
Currency
Purchased | | | Currency
Sold | | | Counterparty | | Settlement
Date | | | Unrealized
Appreciation
(Depreciation) | |
| AUD | | | 773,768 | | | USD | | | 558,152 | | | Morgan Stanley & Co. International PLC | | | 3/10/16 | | | $ | 2,996 | |
| AUD | | | 339,822 | | | USD | | | 244,254 | | | Morgan Stanley & Co. International PLC | | | 3/10/16 | | | | 2,190 | |
| AUD | | | 510,000 | | | USD | | | 371,617 | | | Westpac Banking Corp. | | | 3/10/16 | | | | (1,758 | ) |
| AUD | | | 250,000 | | | USD | | | 182,165 | | | Westpac Banking Corp. | | | 3/10/16 | | | | (862 | ) |
| AUD | | | 170,000 | | | USD | | | 123,988 | | | Westpac Banking Corp. | | | 3/10/16 | | | | (701 | ) |
| AUD | | | 155,000 | | | USD | | | 113,048 | | | Westpac Banking Corp. | | | 3/10/16 | | | | (639 | ) |
| AUD | | | 125,000 | | | USD | | | 91,168 | | | Westpac Banking Corp. | | | 3/10/16 | | | | (516 | ) |
| AUD | | | 107,605 | | | USD | | | 77,676 | | | Westpac Banking Corp. | | | 3/10/16 | | | | 361 | |
| AUD | | | 44,353 | | | USD | | | 32,017 | | | Westpac Banking Corp. | | | 3/10/16 | | | | 149 | |
| AUD | | | 40,497 | | | USD | | | 29,233 | | | Westpac Banking Corp. | | | 3/10/16 | | | | 136 | |
| CAD | | | 400,160 | | | USD | | | 287,607 | | | Barclays Bank PLC | | | 3/10/16 | | | | 512 | |
| CAD | | | 1,200,481 | | | USD | | | 862,821 | | | Barclays Bank PLC | | | 3/10/16 | | | | 1,536 | |
| CAD | | | 135,700 | | | USD | | | 98,270 | | | BNP Paribas S.A. | | | 3/10/16 | | | | (564 | ) |
| CAD | | | 400,000 | | | USD | | | 291,490 | | | Citibank N.A. | | | 3/10/16 | | | | (3,486 | ) |
| CAD | | | 1,390,000 | | | USD | | | 1,024,378 | | | Citibank N.A. | | | 3/10/16 | | | | (23,566 | ) |
| CAD | | | 1,670,000 | | | USD | | | 1,227,550 | | | Citibank N.A. | | | 3/10/16 | | | | (25,137 | ) |
| CAD | | | 743,236 | | | USD | | | 547,601 | | | Citibank N.A. | | | 3/10/16 | | | | (12,465 | ) |
| CAD | | | 1,343,198 | | | USD | | | 989,641 | | | Citibank N.A. | | | 3/10/16 | | | | (22,527 | ) |
| CAD | | | 304,458 | | | USD | | | 224,319 | | | Citibank N.A. | | | 3/10/16 | | | | (5,106 | ) |
| CAD | | | 2,077,943 | | | USD | | | 1,492,315 | | | Citibank N.A. | | | 3/10/16 | | | | 3,821 | |
| CAD | | | 1,120,000 | | | USD | | | 836,479 | | | Citibank N.A. | | | 3/10/16 | | | | (30,070 | ) |
| CAD | | | 310,000 | | | USD | | | 228,458 | | | Citibank N.A. | | | 3/10/16 | | | | (5,256 | ) |
| CAD | | | 120,000 | | | USD | | | 88,436 | | | Citibank N.A. | | | 3/10/16 | | | | (2,035 | ) |
| CAD | | | 358,223 | | | USD | | | 257,645 | | | Deutsche Bank AG | | | 3/10/16 | | | | 278 | |
| CAD | | | 2,450,000 | | | USD | | | 1,824,847 | | | Goldman Sachs International | | | 3/10/16 | | | | (60,827 | ) |
| CAD | | | 2,490,000 | | | USD | | | 1,866,556 | | | Goldman Sachs International | | | 3/10/16 | | | | (73,735 | ) |
| CAD | | | 409,263 | | | USD | | | 296,323 | | | HSBC Bank PLC | | | 3/10/16 | | | | (1,650 | ) |
| CAD | | | 760,000 | | | USD | | | 553,740 | | | JPMorgan Chase Bank N.A. | | | 3/10/16 | | | | (6,534 | ) |
| CAD | | | 240,000 | | | USD | | | 174,865 | | | JPMorgan Chase Bank N.A. | | | 3/10/16 | | | | (2,063 | ) |
| CAD | | | 35,542 | | | USD | | | 26,188 | | | Morgan Stanley & Co. International PLC | | | 3/10/16 | | | | (598 | ) |
| CAD | | | 156,802 | | | USD | | | 115,537 | | | Morgan Stanley & Co. International PLC | | | 3/10/16 | | | | (2,639 | ) |
| CAD | | | 86,764 | | | USD | | | 63,931 | | | Morgan Stanley & Co. International PLC | | | 3/10/16 | | | | (1,460 | ) |
| CAD | | | 155,036 | | | USD | | | 112,241 | | | Morgan Stanley & Co. International PLC | | | 3/10/16 | | | | (614 | ) |
| CAD | | | 712,057 | | | USD | | | 511,721 | | | Morgan Stanley & Co. International PLC | | | 3/10/16 | | | | 966 | |
| CAD | | | 740,000 | | | USD | | | 530,904 | | | Morgan Stanley & Co. International PLC | | | 3/10/16 | | | | 1,903 | |
| CAD | | | 1,240,000 | | | USD | | | 889,622 | | | Morgan Stanley & Co. International PLC | | | 3/10/16 | | | | 3,188 | |
| CAD | | | 531,777 | | | USD | | | 382,298 | | | Morgan Stanley & Co. International PLC | | | 3/10/16 | | | | 586 | |
| CAD | | | 509,840 | | | USD | | | 366,348 | | | Morgan Stanley & Co. International PLC | | | 3/10/16 | | | | 740 | |
| CAD | | | 1,529,519 | | | USD | | | 1,099,045 | | | Morgan Stanley & Co. International PLC | | | 3/10/16 | | | | 2,221 | |
| CAD | | | 310,000 | | | USD | | | 226,415 | | | UBS AG | | | 3/10/16 | | | | (3,213 | ) |
| CAD | | | 1,660,000 | | | USD | | | 1,239,130 | | | UBS AG | | | 3/10/16 | | | | (43,916 | ) |
| CAD | | | 1,660,000 | | | USD | | | 1,239,685 | | | Westpac Banking Corp. | | | 3/10/16 | | | | (44,471 | ) |
| CLP | | | 60,500,000 | | | USD | | | 84,829 | | | Bank of America N.A. | | | 3/10/16 | | | | (81 | ) |
| CLP | | | 46,500,000 | | | USD | | | 65,199 | | | Bank of America N.A. | | | 3/10/16 | | | | (62 | ) |
| CLP | | | 268,000,000 | | | USD | | | 375,771 | | | Bank of America N.A. | | | 3/10/16 | | | | (357 | ) |
| CLP | | | 283,000,000 | | | USD | | | 395,472 | | | Bank of America N.A. | | | 3/10/16 | | | | 954 | |
| CLP | | | 169,000,000 | | | USD | | | 236,927 | | | Bank of America N.A. | | | 3/10/16 | | | | (192 | ) |
| CLP | | | 1,560,000,000 | | | USD | | | 2,193,476 | | | BNP Paribas S.A. | | | 3/10/16 | | | | (8,227 | ) |
| CLP | | | 1,052,000,000 | | | USD | | | 1,479,190 | | | BNP Paribas S.A. | | | 3/10/16 | | | | (5,548 | ) |
| CLP | | | 263,000,000 | | | USD | | | 368,554 | | | BNP Paribas S.A. | | | 3/10/16 | | | | (143 | ) |
| CLP | | | 143,000,000 | | | USD | | | 200,392 | | | BNP Paribas S.A. | | | 3/10/16 | | | | (78 | ) |
| CLP | | | 268,000,000 | | | USD | | | 375,271 | | | BNP Paribas S.A. | | | 3/10/16 | | | | 143 | |
| CLP | | | 46,500,000 | | | USD | | | 65,112 | | | BNP Paribas S.A. | | | 3/10/16 | | | | 25 | |
| CLP | | | 60,500,000 | | | USD | | | 84,716 | | | BNP Paribas S.A. | | | 3/10/16 | | | | 32 | |
| CLP | | | 413,000,000 | | | USD | | | 583,498 | | | Credit Suisse International | | | 3/10/16 | | | | (4,968 | ) |
| CLP | | | 203,000,000 | | | USD | | | 286,804 | | | Credit Suisse International | | | 3/10/16 | | | | (2,442 | ) |
| CLP | | | 122,000,000 | | | USD | | | 172,365 | | | Credit Suisse International | | | 3/10/16 | | | | (1,467 | ) |
| CLP | | | 311,000,000 | | | USD | | | 445,431 | | | Goldman Sachs International | | | 3/10/16 | | | | (9,782 | ) |
| CLP | | | 237,000,000 | | | USD | | | 333,615 | | | Standard Chartered Bank | | | 3/10/16 | | | | (1,625 | ) |
| CLP | | | 107,000,000 | | | USD | | | 150,619 | | | Standard Chartered Bank | | | 3/10/16 | | | | (734 | ) |
| COP | | | 740,000,000 | | | USD | | | 233,660 | | | Citibank N.A. | | | 3/10/16 | | | | (2,171 | ) |
| COP | | | 930,000,000 | | | USD | | | 293,190 | | | Citibank N.A. | | | 3/10/16 | | | | (2,265 | ) |
| COP | | | 450,000,000 | | | USD | | | 134,128 | | | Credit Suisse International | | | 3/10/16 | | | | 6,642 | |
| COP | | | 390,000,000 | | | USD | | | 123,849 | | | Credit Suisse International | | | 3/10/16 | | | | (1,848 | ) |
See Notes to Financial Statements.
| | | | | | |
| | | | | | | |
| 32 | | BLACKROCK COREALPHA BOND FUND | | DECEMBER 31, 2015 | | |
| | |
Schedule of Investments (continued) | | CoreAlpha Bond Master Portfolio |
Forward Foreign Currency Exchange Contracts (continued)
| | | | | | | | | | | | | | | | | | | | |
Currency
Purchased | | | Currency
Sold | | | Counterparty | | Settlement
Date | | | Unrealized
Appreciation
(Depreciation) | |
| COP | | | 900,000,000 | | | USD | | | 271,739 | | | Goldman Sachs International | | | 3/10/16 | | | $ | 9,802 | |
| COP | | | 450,000,000 | | | USD | | | 134,610 | | | Goldman Sachs International | | | 3/10/16 | | | | 6,161 | |
| COP | | | 820,000,000 | | | USD | | | 245,289 | | | Goldman Sachs International | | | 3/10/16 | | | | 11,226 | |
| COP | | | 450,000,000 | | | USD | | | 133,333 | | | Goldman Sachs International | | | 3/10/16 | | | | 7,437 | |
| COP | | | 300,000,000 | | | USD | | | 88,889 | | | Goldman Sachs International | | | 3/10/16 | | | | 4,958 | |
| COP | | | 320,000,000 | | | USD | | | 96,232 | | | HSBC Bank PLC | | | 3/10/16 | | | | 3,871 | |
| COP | | | 430,000,000 | | | USD | | | 129,312 | | | HSBC Bank PLC | | | 3/10/16 | | | | 5,202 | |
| COP | | | 330,000,000 | | | USD | | | 100,008 | | | HSBC Bank PLC | | | 3/10/16 | | | | 3,223 | |
| COP | | | 450,000,000 | | | USD | | | 133,452 | | | JPMorgan Chase Bank N.A. | | | 3/10/16 | | | | 7,318 | |
| COP | | | 400,000,000 | | | USD | | | 121,692 | | | Morgan Stanley & Co. International PLC | | | 3/10/16 | | | | 3,438 | |
| COP | | | 840,000,000 | | | USD | | | 256,020 | | | Morgan Stanley & Co. International PLC | | | 3/10/16 | | | | 6,752 | |
| COP | | | 1,580,000,000 | | | USD | | | 498,187 | | | Morgan Stanley & Co. International PLC | | | 3/10/16 | | | | (3,926 | ) |
| EUR | | | 248,652 | | | HUF | | | 78,000,000 | | | Barclays Bank PLC | | | 3/10/16 | | | | 2,708 | |
| EUR | | | 626,106 | | | HUF | | | 196,000,000 | | | Barclays Bank PLC | | | 3/10/16 | | | | 8,205 | |
| EUR | | | 373,426 | | | HUF | | | 119,000,000 | | | BNP Paribas S.A. | | | 3/10/16 | | | | (2,319 | ) |
| EUR | | | 208,414 | | | HUF | | | 65,940,000 | | | BNP Paribas S.A. | | | 3/10/16 | | | | 338 | |
| EUR | | | 186,326 | | | HUF | | | 59,000,000 | | | BNP Paribas S.A. | | | 3/10/16 | | | | 136 | |
| EUR | | | 956,758 | | | HUF | | | 300,196,927 | | | Credit Suisse International | | | 3/10/16 | | | | 10,177 | |
| EUR | | | 122,810 | | | HUF | | | 38,749,515 | | | Credit Suisse International | | | 3/10/16 | | | | 565 | |
| EUR | | | 509,462 | | | HUF | | | 159,803,073 | | | Deutsche Bank AG | | | 3/10/16 | | | | 5,585 | |
| EUR | | | 493,548 | | | HUF | | | 155,250,485 | | | Deutsche Bank AG | | | 3/10/16 | | | | 3,902 | |
| EUR | | | 313,176 | | | HUF | | | 98,000,000 | | | Société Générale | | | 3/10/16 | | | | 4,237 | |
| EUR | | | 214,518 | | | HUF | | | 67,510,000 | | | Société Générale | | | 3/10/16 | | | | 1,589 | |
| EUR | | | 313,244 | | | HUF | | | 98,000,000 | | | Société Générale | | | 3/10/16 | | | | 4,310 | |
| EUR | | | 74,331 | | | HUF | | | 23,550,000 | | | UBS AG | | | 3/10/16 | | | | 9 | |
| EUR | | | 125,445 | | | PLN | | | 550,000 | | | Barclays Bank PLC | | | 3/10/16 | | | | (2,610 | ) |
| EUR | | | 323,464 | | | PLN | | | 1,400,000 | | | Credit Suisse International | | | 3/10/16 | | | | (2,127 | ) |
| EUR | | | 3,554,820 | | | PLN | | | 15,250,000 | | | Morgan Stanley & Co. International PLC | | | 3/10/16 | | | | 10,960 | |
| EUR | | | 2,325,000 | | | USD | | | 2,468,162 | | | Barclays Bank PLC | | | 3/10/16 | | | | 61,585 | |
| EUR | | | 75,000 | | | USD | | | 82,230 | | | BNP Paribas S.A. | | | 3/10/16 | | | | (625 | ) |
| EUR | | | 370,000 | | | USD | | | 405,854 | | | BNP Paribas S.A. | | | 3/10/16 | | | | (3,270 | ) |
| EUR | | | 85,000 | | | USD | | | 93,069 | | | Citibank N.A. | | | 3/10/16 | | | | (584 | ) |
| EUR | | | 940,000 | | | USD | | | 1,032,087 | | | Citibank N.A. | | | 3/10/16 | | | | (9,308 | ) |
| EUR | | | 170,000 | | | USD | | | 187,016 | | | Goldman Sachs International | | | 3/10/16 | | | | (2,045 | ) |
| EUR | | | 490,000 | | | USD | | | 539,046 | | | Goldman Sachs International | | | 3/10/16 | | | | (5,895 | ) |
| EUR | | | 2,260,000 | | | USD | | | 2,489,955 | | | Goldman Sachs International | | | 3/10/16 | | | | (30,932 | ) |
| EUR | | | 90,000 | | | USD | | | 98,576 | | | HSBC Bank PLC | | | 3/10/16 | | | | (650 | ) |
| EUR | | | 250,000 | | | USD | | | 272,880 | | | HSBC Bank PLC | | | 3/10/16 | | | | (864 | ) |
| EUR | | | 440,000 | | | USD | | | 481,925 | | | HSBC Bank PLC | | | 3/10/16 | | | | (3,177 | ) |
| EUR | | | 750,000 | | | USD | | | 827,866 | | | HSBC Bank PLC | | | 3/10/16 | | | | (11,818 | ) |
| EUR | | | 90,000 | | | USD | | | 98,643 | | | JPMorgan Chase Bank N.A. | | | 3/10/16 | | | | (717 | ) |
| EUR | | | 270,000 | | | USD | | | 294,101 | | | Morgan Stanley & Co. International PLC | | | 3/10/16 | | | | (324 | ) |
| EUR | | | 3,490,000 | | | USD | | | 3,719,382 | | | Morgan Stanley & Co. International PLC | | | 3/10/16 | | | | 77,958 | |
| EUR | | | 210,000 | | | USD | | | 229,738 | | | Morgan Stanley & Co. International PLC | | | 3/10/16 | | | | (1,245 | ) |
| EUR | | | 2,329,102 | | | USD | | | 2,473,716 | | | UBS AG | | | 3/10/16 | | | | 60,494 | |
| GBP | | | 66,195 | | | USD | | | 100,360 | | | Barclays Bank PLC | | | 3/10/16 | | | | (2,785 | ) |
| GBP | | | 63,116 | | | USD | | | 95,692 | | | Barclays Bank PLC | | | 3/10/16 | | | | (2,655 | ) |
| GBP | | | 73,892 | | | USD | | | 112,029 | | | Barclays Bank PLC | | | 3/10/16 | | | | (3,109 | ) |
| GBP | | | 76,589 | | | USD | | | 114,239 | | | Barclays Bank PLC | | | 3/10/16 | | | | (1,342 | ) |
| GBP | | | 619,096 | | | USD | | | 923,432 | | | Barclays Bank PLC | | | 3/10/16 | | | | (10,848 | ) |
| GBP | | | 217,003 | | | USD | | | 323,677 | | | Barclays Bank PLC | | | 3/10/16 | | | | (3,802 | ) |
| GBP | | | 500,000 | | | USD | | | 744,580 | | | Barclays Bank PLC | | | 3/10/16 | | | | (7,551 | ) |
| GBP | | | 110,326 | | | USD | | | 167,144 | | | BNP Paribas S.A. | | | 3/10/16 | | | | (4,517 | ) |
| GBP | | | 115,708 | | | USD | | | 175,298 | | | BNP Paribas S.A. | | | 3/10/16 | | | | (4,737 | ) |
| GBP | | | 129,163 | | | USD | | | 195,681 | | | BNP Paribas S.A. | | | 3/10/16 | | | | (5,288 | ) |
| GBP | | | 43,411 | | | USD | | | 64,698 | | | Citibank N.A. | | | 3/10/16 | | | | (708 | ) |
| GBP | | | 122,997 | | | USD | | | 183,312 | | | Citibank N.A. | | | 3/10/16 | | | | (2,007 | ) |
| GBP | | | 350,904 | | | USD | | | 522,978 | | | Citibank N.A. | | | 3/10/16 | | | | (5,725 | ) |
| GBP | | | 33,097 | | | USD | | | 50,180 | | | Credit Suisse International | | | 3/10/16 | | | | (1,392 | ) |
| GBP | | | 36,946 | | | USD | | | 56,014 | | | Credit Suisse International | | | 3/10/16 | | | | (1,554 | ) |
| GBP | | | 31,558 | | | USD | | | 47,846 | | | Credit Suisse International | | | 3/10/16 | | | | (1,327 | ) |
| GBP | | | 540,000 | | | USD | | | 813,938 | | | Credit Suisse International | | | 3/10/16 | | | | (17,946 | ) |
| GBP | | | 150,000 | | | USD | | | 226,094 | | | Credit Suisse International | | | 3/10/16 | | | | (4,985 | ) |
| GBP | | | 300,783 | | | USD | | | 451,395 | | | Credit Suisse International | | | 3/10/16 | | | | (8,023 | ) |
See Notes to Financial Statements.
| | | | | | |
| | | | | | | |
| | BLACKROCK COREALPHA BOND FUND | | DECEMBER 31, 2015 | | 33 |
| | |
Schedule of Investments (continued) | | CoreAlpha Bond Master Portfolio |
Forward Foreign Currency Exchange Contracts (continued)
| | | | | | | | | | | | | | | | | | | | |
Currency
Purchased | | | Currency
Sold | | | Counterparty | | Settlement
Date | | | Unrealized
Appreciation
(Depreciation) | |
| GBP | | | 186,199 | | | USD | | | 279,435 | | | Credit Suisse International | | | 3/10/16 | | | $ | (4,967 | ) |
| GBP | | | 120,000 | | | USD | | | 178,159 | | | Credit Suisse International | | | 3/10/16 | | | | (1,272 | ) |
| GBP | | | 145,000 | | | USD | | | 219,534 | | | Credit Suisse International | | | 3/10/16 | | | | (5,795 | ) |
| GBP | | | 160,000 | | | USD | | | 242,244 | | | Credit Suisse International | | | 3/10/16 | | | | (6,395 | ) |
| GBP | | | 135,000 | | | USD | | | 204,393 | | | Credit Suisse International | | | 3/10/16 | | | | (5,395 | ) |
| GBP | | | 190,000 | | | USD | | | 286,372 | | | Deutsche Bank AG | | | 3/10/16 | | | | (6,301 | ) |
| GBP | | | 89,072 | | | USD | | | 135,006 | | | Goldman Sachs International | | | 3/10/16 | | | | (3,709 | ) |
| GBP | | | 497,317 | | | USD | | | 753,782 | | | Goldman Sachs International | | | 3/10/16 | | | | (20,708 | ) |
| GBP | | | 2,580,000 | | | USD | | | 3,877,908 | | | Goldman Sachs International | | | 3/10/16 | | | | (74,837 | ) |
| GBP | | | 460,000 | | | USD | | | 691,410 | | | Goldman Sachs International | | | 3/10/16 | | | | (13,343 | ) |
| GBP | | | 330,000 | | | USD | | | 495,616 | | | HSBC Bank PLC | | | 3/10/16 | | | | (9,176 | ) |
| GBP | | | 790,000 | | | USD | | | 1,185,071 | | | HSBC Bank PLC | | | 3/10/16 | | | | (20,565 | ) |
| GBP | | | 1,350,000 | | | USD | | | 2,045,732 | | | HSBC Bank PLC | | | 3/10/16 | | | | (55,753 | ) |
| GBP | | | 172,683 | | | USD | | | 261,915 | | | Morgan Stanley & Co. International PLC | | | 3/10/16 | | | | (7,370 | ) |
| GBP | | | 30,928 | | | USD | | | 46,910 | | | Morgan Stanley & Co. International PLC | | | 3/10/16 | | | | (1,320 | ) |
| GBP | | | 73,801 | | | USD | | | 110,766 | | | Morgan Stanley & Co. International PLC | | | 3/10/16 | | | | (1,980 | ) |
| GBP | | | 119,217 | | | USD | | | 178,930 | | | Morgan Stanley & Co. International PLC | | | 3/10/16 | | | | (3,198 | ) |
| GBP | | | 410,000 | | | USD | | | 612,431 | | | Morgan Stanley & Co. International PLC | | | 3/10/16 | | | | (8,067 | ) |
| HUF | | | 39,000,000 | | | EUR | | | 122,507 | | | Barclays Bank PLC | | | 3/10/16 | | | | 626 | |
| HUF | | | 96,000,000 | | | EUR | | | 305,680 | | | Barclays Bank PLC | | | 3/10/16 | | | | (2,948 | ) |
| HUF | | | 300,000,000 | | | EUR | | | 953,198 | | | Barclays Bank PLC | | | 3/10/16 | | | | (6,980 | ) |
| HUF | | | 191,000,000 | | | EUR | | | 608,652 | | | Barclays Bank PLC | | | 3/10/16 | | | | (6,384 | ) |
| HUF | | | 41,000,000 | | | EUR | | | 129,409 | | | Credit Suisse International | | | 3/10/16 | | | | (17 | ) |
| HUF | | | 81,000,000 | | | EUR | | | 259,541 | | | Credit Suisse International | | | 3/10/16 | | | | (4,254 | ) |
| HUF | | | 255,000,000 | | | EUR | | | 814,202 | | | JPMorgan Chase Bank N.A. | | | 3/10/16 | | | | (10,268 | ) |
| HUF | | | 947,000,000 | | | EUR | | | 3,037,807 | | | Morgan Stanley & Co. International PLC | | | 3/10/16 | | | | (53,456 | ) |
| HUF | | | 38,000,000 | | | EUR | | | 119,780 | | | UBS AG | | | 3/10/16 | | | | 158 | |
| HUF | | | 31,000,000 | | | USD | | | 107,159 | | | Barclays Bank PLC | | | 3/10/16 | | | | (709 | ) |
| HUF | | | 40,000,000 | | | USD | | | 138,820 | | | Barclays Bank PLC | | | 3/10/16 | | | | (1,465 | ) |
| HUF | | | 44,500,000 | | | USD | | | 154,437 | | | Barclays Bank PLC | | | 3/10/16 | | | | (1,630 | ) |
| HUF | | | 85,410,634 | | | USD | | | 296,493 | | | Barclays Bank PLC | | | 3/10/16 | | | | (3,204 | ) |
| HUF | | | 50,469,920 | | | USD | | | 175,200 | | | Barclays Bank PLC | | | 3/10/16 | | | | (1,893 | ) |
| HUF | | | 101,910,415 | | | USD | | | 353,770 | | | Barclays Bank PLC | | | 3/10/16 | | | | (3,823 | ) |
| HUF | | | 43,000,000 | | | USD | | | 150,098 | | | Barclays Bank PLC | | | 3/10/16 | | | | (2,442 | ) |
| HUF | | | 40,000,000 | | | USD | | | 139,626 | | | Barclays Bank PLC | | | 3/10/16 | | | | (2,271 | ) |
| HUF | | | 33,769,448 | | | USD | | | 116,846 | | | Barclays Bank PLC | | | 3/10/16 | | | | (886 | ) |
| HUF | | | 40,000,000 | | | USD | | | 138,509 | | | BNP Paribas S.A. | | | 3/10/16 | | | | (1,154 | ) |
| HUF | | | 44,500,000 | | | USD | | | 154,091 | | | BNP Paribas S.A. | | | 3/10/16 | | | | (1,284 | ) |
| HUF | | | 179,000,000 | | | USD | | | 622,555 | | | BNP Paribas S.A. | | | 3/10/16 | | | | (7,893 | ) |
| HUF | | | 75,180,000 | | | USD | | | 258,995 | | | BNP Paribas S.A. | | | 3/10/16 | | | | (837 | ) |
| HUF | | | 69,255,878 | | | USD | | | 235,493 | | | Credit Suisse International | | | 3/10/16 | | | | 2,323 | |
| HUF | | | 77,805,986 | | | USD | | | 264,566 | | | Credit Suisse International | | | 3/10/16 | | | | 2,609 | |
| HUF | | | 30,000,000 | | | USD | | | 104,441 | | | Credit Suisse International | | | 3/10/16 | | | | (1,425 | ) |
| HUF | | | 10,171,838 | | | USD | | | 35,202 | | | Credit Suisse International | | | 3/10/16 | | | | (274 | ) |
| HUF | | | 7,749,972 | | | USD | | | 26,821 | | | Credit Suisse International | | | 3/10/16 | | | | (209 | ) |
| HUF | | | 46,170,585 | | | USD | | | 156,995 | | | Credit Suisse International | | | 3/10/16 | | | | 1,548 | |
| HUF | | | 1,530,080 | | | USD | | | 5,312 | | | Credit Suisse International | | | 3/10/16 | | | | (58 | ) |
| HUF | | | 3,089,585 | | | USD | | | 10,726 | | | Credit Suisse International | | | 3/10/16 | | | | (117 | ) |
| HUF | | | 2,589,366 | | | USD | | | 8,990 | | | Credit Suisse International | | | 3/10/16 | | | | (98 | ) |
| HUF | | | 29,682,861 | | | USD | | | 102,469 | | | Credit Suisse International | | | 3/10/16 | | | | (542 | ) |
| HUF | | | 7,829,415 | | | USD | | | 26,619 | | | Deutsche Bank AG | | | 3/10/16 | | | | 266 | |
| HUF | | | 13,194,014 | | | USD | | | 44,858 | | | Deutsche Bank AG | | | 3/10/16 | | | | 448 | |
| HUF | | | 11,744,122 | | | USD | | | 39,929 | | | Deutsche Bank AG | | | 3/10/16 | | | | 399 | |
| HUF | | | 88,000,000 | | | USD | | | 303,135 | | | JPMorgan Chase Bank N.A. | | | 3/10/16 | | | | (955 | ) |
| HUF | | | 282,000,000 | | | USD | | | 959,655 | | | JPMorgan Chase Bank N.A. | | | 3/10/16 | | | | 8,695 | |
| HUF | | | 27,000,000 | | | USD | | | 91,882 | | | JPMorgan Chase Bank N.A. | | | 3/10/16 | | | | 832 | |
| HUF | | | 151,000,000 | | | USD | | | 513,858 | | | JPMorgan Chase Bank N.A. | | | 3/10/16 | | | | 4,656 | |
| HUF | | | 72,000,000 | | | USD | | | 250,227 | | | JPMorgan Chase Bank N.A. | | | 3/10/16 | | | | (2,988 | ) |
| HUF | | | 40,367,691 | | | USD | | | 139,622 | | | JPMorgan Chase Bank N.A. | | | 3/10/16 | | | | (1,005 | ) |
| HUF | | | 31,828,162 | | | USD | | | 110,006 | | | Morgan Stanley & Co. International PLC | | | 3/10/16 | | | | (713 | ) |
| HUF | | | 24,250,028 | | | USD | | | 83,814 | | | Morgan Stanley & Co. International PLC | | | 3/10/16 | | | | (543 | ) |
| IDR | | | 1,300,000,000 | | | USD | | | 92,284 | | | HSBC Bank PLC | | | 3/10/16 | | | | 535 | |
| IDR | | | 2,290,000,000 | | | USD | | | 162,354 | | | HSBC Bank PLC | | | 3/10/16 | | | | 1,149 | |
| IDR | | | 3,990,000,000 | | | USD | | | 285,919 | | | HSBC Bank PLC | | | 3/10/16 | | | | (1,038 | ) |
See Notes to Financial Statements.
| | | | | | |
| | | | | | | |
| 34 | | BLACKROCK COREALPHA BOND FUND | | DECEMBER 31, 2015 | | |
| | |
Schedule of Investments (continued) | | CoreAlpha Bond Master Portfolio |
Forward Foreign Currency Exchange Contracts (continued)
| | | | | | | | | | | | | | | | | | | | |
Currency
Purchased | | | Currency
Sold | | | Counterparty | | Settlement
Date | | | Unrealized
Appreciation
(Depreciation) | |
| IDR | | | 5,940,000,000 | | | USD | | | 425,410 | | | Morgan Stanley & Co. International PLC | | | 3/10/16 | | | $ | (1,302 | ) |
| IDR | | | 7,610,000,000 | | | USD | | | 528,839 | | | Morgan Stanley & Co. International PLC | | | 3/10/16 | | | | 14,504 | |
| IDR | | | 1,890,000,000 | | | USD | | | 133,853 | | | UBS AG | | | 3/10/16 | | | | 1,091 | |
| ILS | | | 365,754 | | | USD | | | 94,467 | | | Barclays Bank PLC | | | 3/10/16 | | | | (349 | ) |
| ILS | | | 27,006 | | | USD | | | 6,928 | | | Barclays Bank PLC | | | 3/10/16 | | | | 21 | |
| ILS | | | 33,303 | | | USD | | | 8,642 | | | Citibank N.A. | | | 3/10/16 | | | | (72 | ) |
| ILS | | | 64,525 | | | USD | | | 16,743 | | | Citibank N.A. | | | 3/10/16 | | | | (139 | ) |
| ILS | | | 8,174 | | | USD | | | 2,122 | | | Citibank N.A. | | | 3/10/16 | | | | (18 | ) |
| ILS | | | 20,947 | | | USD | | | 5,437 | | | Citibank N.A. | | | 3/10/16 | | | | (47 | ) |
| ILS | | | 3,550,000 | | | USD | | | 917,253 | | | Citibank N.A. | | | 3/10/16 | | | | (3,747 | ) |
| ILS | | | 10,100,000 | | | USD | | | 2,609,651 | | | Citibank N.A. | | | 3/10/16 | | | | (10,660 | ) |
| ILS | | | 766,697 | | | USD | | | 199,043 | | | Credit Suisse International | | | 3/10/16 | | | | (1,752 | ) |
| ILS | | | 1,485,476 | | | USD | | | 385,646 | | | Credit Suisse International | | | 3/10/16 | | | | (3,395 | ) |
| ILS | | | 1,200,000 | | | USD | | | 311,013 | | | Credit Suisse International | | | 3/10/16 | | | | (2,222 | ) |
| ILS | | | 450,000 | | | USD | | | 116,630 | | | Credit Suisse International | | | 3/10/16 | | | | (833 | ) |
| ILS | | | 3,000,000 | | | USD | | | 781,402 | | | Credit Suisse International | | | 3/10/16 | | | | (9,425 | ) |
| ILS | | | 1,950,000 | | | USD | | | 502,379 | | | Credit Suisse International | | | 3/10/16 | | | | (594 | ) |
| ILS | | | 772,994 | | | USD | | | 198,597 | | | Credit Suisse International | | | 3/10/16 | | | | 315 | |
| ILS | | | 3,350,000 | | | USD | | | 863,691 | | | Credit Suisse International | | | 3/10/16 | | | | (1,649 | ) |
| ILS | | | 791,826 | | | USD | | | 205,498 | | | Credit Suisse International | | | 3/10/16 | | | | (1,741 | ) |
| ILS | | | 2,029,053 | | | USD | | | 526,588 | | | Credit Suisse International | | | 3/10/16 | | | | (4,460 | ) |
| ILS | | | 1,184,246 | | | USD | | | 306,062 | | | Credit Suisse International | | | 3/10/16 | | | | (1,325 | ) |
| ILS | | | 750,000 | | | USD | | | 194,901 | | | Credit Suisse International | | | 3/10/16 | | | | (1,907 | ) |
| ILS | | | 350,000 | | | USD | | | 89,932 | | | Deutsche Bank AG | | | 3/10/16 | | | | 132 | |
| ILS | | | 1,900,000 | | | USD | | | 493,790 | | | HSBC Bank PLC | | | 3/10/16 | | | | (4,871 | ) |
| ILS | | | 500,000 | | | USD | | | 129,945 | | | HSBC Bank PLC | | | 3/10/16 | | | | (1,282 | ) |
| ILS | | | 1,600,000 | | | USD | | | 411,153 | | | UBS AG | | | 3/10/16 | | | | 569 | |
| INR | | | 23,984,083 | | | USD | | | 354,689 | | | Barclays Bank PLC | | | 3/10/16 | | | | 4,071 | |
| INR | | | 4,125,806 | | | USD | | | 61,015 | | | Barclays Bank PLC | | | 3/10/16 | | | | 700 | |
| INR | | | 22,600,000 | | | USD | | | 337,313 | | | Barclays Bank PLC | | | 3/10/16 | | | | 743 | |
| INR | | | 20,450,000 | | | USD | | | 305,224 | | | Barclays Bank PLC | | | 3/10/16 | | | | 672 | |
| INR | | | 13,200,000 | | | USD | | | 194,346 | | | Citibank N.A. | | | 3/10/16 | | | | 3,103 | |
| INR | | | 7,000,000 | | | USD | | | 103,443 | | | Citibank N.A. | | | 3/10/16 | | | | 1,265 | |
| INR | | | 12,800,000 | | | USD | | | 189,153 | | | Citibank N.A. | | | 3/10/16 | | | | 2,312 | |
| INR | | | 21,700,000 | | | USD | | | 320,059 | | | Citibank N.A. | | | 3/10/16 | | | | 4,535 | |
| INR | | | 15,306,271 | | | USD | | | 226,257 | | | Citibank N.A. | | | 3/10/16 | | | | 2,698 | |
| INR | | | 9,110,876 | | | USD | | | 134,677 | | | Citibank N.A. | | | 3/10/16 | | | | 1,606 | |
| INR | | | 3,665,000 | | | USD | | | 54,216 | | | Citibank N.A. | | | 3/10/16 | | | | 606 | |
| INR | | | 6,160,000 | | | USD | | | 91,124 | | | Citibank N.A. | | | 3/10/16 | | | | 1,019 | |
| INR | | | 6,300,000 | | | USD | | | 94,044 | | | Citibank N.A. | | | 3/10/16 | | | | 193 | |
| INR | | | 36,750,000 | | | USD | | | 548,589 | | | Citibank N.A. | | | 3/10/16 | | | | 1,127 | |
| INR | | | 50,000,000 | | | USD | | | 736,160 | | | Citibank N.A. | | | 3/10/16 | | | | 11,753 | |
| INR | | | 31,100,000 | | | USD | | | 459,447 | | | HSBC Bank PLC | | | 3/10/16 | | | | 5,754 | |
| INR | | | 27,100,000 | | | USD | | | 400,355 | | | HSBC Bank PLC | | | 3/10/16 | | | | 5,014 | |
| INR | | | 18,650,000 | | | USD | | | 277,323 | | | HSBC Bank PLC | | | 3/10/16 | | | | 1,648 | |
| INR | | | 34,400,000 | | | USD | | | 512,633 | | | HSBC Bank PLC | | | 3/10/16 | | | | 1,931 | |
| INR | | | 10,000,000 | | | USD | | | 149,021 | | | HSBC Bank PLC | | | 3/10/16 | | | | 561 | |
| INR | | | 41,600,000 | | | USD | | | 619,928 | | | HSBC Bank PLC | | | 3/10/16 | | | | 2,336 | |
| INR | | | 137,500,000 | | | USD | | | 2,033,723 | | | HSBC Bank PLC | | | 3/10/16 | | | | 23,037 | |
| INR | | | 42,500,000 | | | USD | | | 628,605 | | | HSBC Bank PLC | | | 3/10/16 | | | | 7,121 | |
| INR | | | 150,400,000 | | | USD | | | 2,224,523 | | | HSBC Bank PLC | | | 3/10/16 | | | | 25,199 | |
| INR | | | 21,700,000 | | | USD | | | 320,215 | | | HSBC Bank PLC | | | 3/10/16 | | | | 4,379 | |
| INR | | | 24,733,729 | | | USD | | | 365,884 | | | HSBC Bank PLC | | | 3/10/16 | | | | 4,090 | |
| INR | | | 14,724,124 | | | USD | | | 217,812 | | | HSBC Bank PLC | | | 3/10/16 | | | | 2,435 | |
| INR | | | 17,700,000 | | | USD | | | 264,970 | | | HSBC Bank PLC | | | 3/10/16 | | | | (209 | ) |
| INR | | | 13,300,000 | | | USD | | | 198,371 | | | HSBC Bank PLC | | | 3/10/16 | | | | 574 | |
| INR | | | 10,000,000 | | | USD | | | 147,332 | | | HSBC Bank PLC | | | 3/10/16 | | | | 2,251 | |
| INR | | | 71,700,000 | | | USD | | | 1,056,369 | | | HSBC Bank PLC | | | 3/10/16 | | | | 16,138 | |
| INR | | | 18,700,000 | | | USD | | | 276,219 | | | JPMorgan Chase Bank N.A. | | | 3/10/16 | | | | 3,501 | |
| INR | | | 17,900,000 | | | USD | | | 264,402 | | | JPMorgan Chase Bank N.A. | | | 3/10/16 | | | | 3,351 | |
| INR | | | 26,700,000 | | | USD | | | 393,689 | | | JPMorgan Chase Bank N.A. | | | 3/10/16 | | | | 5,696 | |
| INR | | | 18,200,000 | | | USD | | | 268,357 | | | JPMorgan Chase Bank N.A. | | | 3/10/16 | | | | 3,883 | |
| INR | | | 30,100,000 | | | USD | | | 448,050 | | | Morgan Stanley & Co. International PLC | | | 3/10/16 | | | | 2,193 | |
| INR | | | 41,000,000 | | | USD | | | 610,301 | | | Morgan Stanley & Co. International PLC | | | 3/10/16 | | | | 2,988 | |
See Notes to Financial Statements.
| | | | | | |
| | | | | | | |
| | BLACKROCK COREALPHA BOND FUND | | DECEMBER 31, 2015 | | 35 |
| | |
Schedule of Investments (continued) | | CoreAlpha Bond Master Portfolio |
Forward Foreign Currency Exchange Contracts (continued)
| | | | | | | | | | | | | | | | | | | | |
Currency
Purchased | | | Currency
Sold | | | Counterparty | | Settlement
Date | | | Unrealized
Appreciation
(Depreciation) | |
| INR | | | 26,900,000 | | | USD | | | 400,417 | | | Morgan Stanley & Co. International PLC | | | 3/10/16 | | | $ | 1,960 | |
| INR | | | 4,974,194 | | | USD | | | 73,559 | | | UBS AG | | | 3/10/16 | | | | 846 | |
| INR | | | 28,915,917 | | | USD | | | 427,612 | | | UBS AG | | | 3/10/16 | | | | 4,920 | |
| INR | | | 18,650,000 | | | USD | | | 277,076 | | | UBS AG | | | 3/10/16 | | | | 1,895 | |
| INR | | | 22,600,000 | | | USD | | | 337,263 | | | UBS AG | | | 3/10/16 | | | | 793 | |
| INR | | | 20,450,000 | | | USD | | | 305,178 | | | UBS AG | | | 3/10/16 | | | | 718 | |
| INR | | | 29,100,000 | | | USD | | | 434,718 | | | UBS AG | | | 3/10/16 | | | | 568 | |
| INR | | | 17,900,000 | | | USD | | | 267,404 | | | UBS AG | | | 3/10/16 | | | | 349 | |
| INR | | | 36,750,000 | | | USD | | | 548,507 | | | UBS AG | | | 3/10/16 | | | | 1,208 | |
| INR | | | 6,300,000 | | | USD | | | 94,030 | | | UBS AG | | | 3/10/16 | | | | 207 | |
| JPY | | | 50,000,000 | | | USD | | | 409,286 | | | Barclays Bank PLC | | | 3/10/16 | | | | 6,945 | |
| JPY | | | 25,000,000 | | | USD | | | 205,751 | | | BNP Paribas S.A. | | | 3/10/16 | | | | 2,365 | |
| JPY | | | 50,000,000 | | | USD | | | 406,818 | | | Goldman Sachs International | | | 3/10/16 | | | | 9,413 | |
| JPY | | | 43,000,000 | | | USD | | | 357,622 | | | HSBC Bank PLC | | | 3/10/16 | | | | 336 | |
| JPY | | | 48,937,976 | | | USD | | | 397,536 | | | JPMorgan Chase Bank N.A. | | | 3/10/16 | | | | 9,854 | |
| JPY | | | 1,062,024 | | | USD | | | 8,627 | | | Morgan Stanley & Co. International PLC | | | 3/10/16 | | | | 214 | |
| JPY | | | 76,000,000 | | | USD | | | 617,796 | | | UBS AG | | | 3/10/16 | | | | 14,876 | |
| JPY | | | 73,000,000 | | | USD | | | 600,028 | | | UBS AG | | | 3/10/16 | | | | 7,669 | |
| KRW | | | 90,000,000 | | | USD | | | 76,329 | | | Barclays Bank PLC | | | 3/10/16 | | | | 312 | |
| KRW | | | 105,000,000 | | | USD | | | 89,051 | | | Barclays Bank PLC | | | 3/10/16 | | | | 364 | |
| KRW | | | 70,000,000 | | | USD | | | 59,367 | | | Barclays Bank PLC | | | 3/10/16 | | | | 243 | |
| KRW | | | 275,000,000 | | | USD | | | 235,546 | | | Citibank N.A. | | | 3/10/16 | | | | (1,364 | ) |
| KRW | | | 102,570,833 | | | USD | | | 86,597 | | | Goldman Sachs International | | | 3/10/16 | | | | 749 | |
| KRW | | | 240,000,000 | | | USD | | | 203,373 | | | HSBC Bank PLC | | | 3/10/16 | | | | 1,004 | |
| KRW | | | 180,000,000 | | | USD | | | 151,451 | | | HSBC Bank PLC | | | 3/10/16 | | | | 1,831 | |
| KRW | | | 205,000,000 | | | USD | | | 172,486 | | | HSBC Bank PLC | | | 3/10/16 | | | | 2,086 | |
| KRW | | | 330,000,000 | | | USD | | | 281,378 | | | HSBC Bank PLC | | | 3/10/16 | | | | (360 | ) |
| KRW | | | 245,000,000 | | | USD | | | 208,902 | | | HSBC Bank PLC | | | 3/10/16 | | | | (267 | ) |
| KRW | | | 165,000,000 | | | USD | | | 139,358 | | | HSBC Bank PLC | | | 3/10/16 | | | | 1,151 | |
| KRW | | | 360,000,000 | | | USD | | | 304,054 | | | HSBC Bank PLC | | | 3/10/16 | | | | 2,511 | |
| KRW | | | 340,000,000 | | | USD | | | 287,162 | | | HSBC Bank PLC | | | 3/10/16 | | | | 2,372 | |
| KRW | | | 90,000,000 | | | USD | | | 76,271 | | | JPMorgan Chase Bank N.A. | | | 3/10/16 | | | | 370 | |
| KRW | | | 70,000,000 | | | USD | | | 59,322 | | | JPMorgan Chase Bank N.A. | | | 3/10/16 | | | | 288 | |
| KRW | | | 105,000,000 | | | USD | | | 88,983 | | | JPMorgan Chase Bank N.A. | | | 3/10/16 | | | | 432 | |
| KRW | | | 120,000,000 | | | USD | | | 102,951 | | | Morgan Stanley & Co. International PLC | | | 3/10/16 | | | | (763 | ) |
| KRW | | | 635,000,000 | | | USD | | | 544,784 | | | Morgan Stanley & Co. International PLC | | | 3/10/16 | | | | (4,037 | ) |
| KRW | | | 150,000,000 | | | USD | | | 127,242 | | | Morgan Stanley & Co. International PLC | | | 3/10/16 | | | | 494 | |
| KRW | | | 102,553,253 | | | USD | | | 86,597 | | | Morgan Stanley & Co. International PLC | | | 3/10/16 | | | | 734 | |
| KRW | | | 120,000,000 | | | USD | | | 101,480 | | | Morgan Stanley & Co. International PLC | | | 3/10/16 | | | | 708 | |
| KRW | | | 320,000,000 | | | USD | | | 270,613 | | | Morgan Stanley & Co. International PLC | | | 3/10/16 | | | | 1,889 | |
| KRW | | | 215,000,000 | | | USD | | | 181,818 | | | Morgan Stanley & Co. International PLC | | | 3/10/16 | | | | 1,269 | |
| KRW | | | 190,000,000 | | | USD | | | 163,223 | | | Morgan Stanley & Co. International PLC | | | 3/10/16 | | | | (1,425 | ) |
| KRW | | | 635,000,000 | | | USD | | | 545,509 | | | Morgan Stanley & Co. International PLC | | | 3/10/16 | | | | (4,762 | ) |
| KRW | | | 320,000,000 | | | USD | | | 271,324 | | | Morgan Stanley & Co. International PLC | | | 3/10/16 | | | | 1,178 | |
| KRW | | | 125,000,000 | | | USD | | | 105,986 | | | Morgan Stanley & Co. International PLC | | | 3/10/16 | | | | 460 | |
| KRW | | | 1,170,000,000 | | | USD | | | 998,379 | | | Morgan Stanley & Co. International PLC | | | 3/10/16 | | | | (2,042 | ) |
| KRW | | | 175,000,000 | | | USD | | | 147,854 | | | Morgan Stanley & Co. International PLC | | | 3/10/16 | | | | 1,171 | |
| KRW | | | 125,000,000 | | | USD | | | 105,610 | | | Morgan Stanley & Co. International PLC | | | 3/10/16 | | | | 836 | |
| KRW | | | 635,000,000 | | | USD | | | 536,499 | | | Morgan Stanley & Co. International PLC | | | 3/10/16 | | | | 4,248 | |
| KRW | | | 235,000,000 | | | USD | | | 198,245 | | | Morgan Stanley & Co. International PLC | | | 3/10/16 | | | | 1,874 | |
| KRW | | | 130,000,000 | | | USD | | | 109,668 | | | Morgan Stanley & Co. International PLC | | | 3/10/16 | | | | 1,036 | |
| KRW | | | 14,875,914 | | | USD | | | 12,560 | | | UBS AG | | | 3/10/16 | | | | 108 | |
| MXN | | | 2,400,000 | | | USD | | | 140,841 | | | Bank of America N.A. | | | 3/10/16 | | | | (2,518 | ) |
| MXN | | | 7,300,000 | | | USD | | | 427,695 | | | Citibank N.A. | | | 3/10/16 | | | | (6,965 | ) |
| MXN | | | 5,300,000 | | | USD | | | 310,519 | | | Citibank N.A. | | | 3/10/16 | | | | (5,057 | ) |
| MXN | | | 2,900,000 | | | USD | | | 168,629 | | | Citibank N.A. | | | 3/10/16 | | | | (1,489 | ) |
| MXN | | | 1,839,700 | | | USD | | | 107,229 | | | Citibank N.A. | | | 3/10/16 | | | | (1,199 | ) |
| MXN | | | 1,166,639 | | | USD | | | 67,999 | | | Citibank N.A. | | | 3/10/16 | | | | (760 | ) |
| MXN | | | 13,000,000 | | | USD | | | 751,081 | | | Citibank N.A. | | | 3/10/16 | | | | (1,836 | ) |
| MXN | | | 20,500,000 | | | USD | | | 1,184,398 | | | Citibank N.A. | | | 3/10/16 | | | | (2,895 | ) |
| MXN | | | 7,400,000 | | | USD | | | 425,920 | | | Citibank N.A. | | | 3/10/16 | | | | 573 | |
| MXN | | | 8,400,000 | | | USD | | | 483,477 | | | Citibank N.A. | | | 3/10/16 | | | | 651 | |
| MXN | | | 5,100,000 | | | USD | | | 306,695 | | | Credit Suisse International | | | 3/10/16 | | | | (12,760 | ) |
| MXN | | | 3,500,000 | | | USD | | | 207,117 | | | Credit Suisse International | | | 3/10/16 | | | | (5,397 | ) |
See Notes to Financial Statements.
| | | | | | |
| | | | | | | |
| 36 | | BLACKROCK COREALPHA BOND FUND | | DECEMBER 31, 2015 | | |
| | |
Schedule of Investments (continued) | | CoreAlpha Bond Master Portfolio |
Forward Foreign Currency Exchange Contracts (continued)
| | | | | | | | | | | | | | | | | | | | |
Currency
Purchased | | | Currency
Sold | | | Counterparty | | Settlement
Date | | | Unrealized
Appreciation
(Depreciation) | |
| MXN | | | 8,800,000 | | | USD | | | 513,599 | | | Deutsche Bank AG | | | 3/10/16 | | | $ | (6,417 | ) |
| MXN | | | 15,800,000 | | | USD | | | 949,976 | | | Deutsche Bank AG | | | 3/10/16 | | | | (39,354 | ) |
| MXN | | | 50,000,000 | | | USD | | | 3,006,253 | | | Deutsche Bank AG | | | 3/10/16 | | | | (124,539 | ) |
| MXN | | | 5,300,000 | | | USD | | | 310,036 | | | Goldman Sachs International | | | 3/10/16 | | | | (4,574 | ) |
| MXN | | | 4,700,000 | | | USD | | | 274,937 | | | Goldman Sachs International | | | 3/10/16 | | | | (4,056 | ) |
| MXN | | | 5,800,000 | | | USD | | | 332,430 | | | Goldman Sachs International | | | 3/10/16 | | | | 1,849 | |
| MXN | | | 2,200,000 | | | USD | | | 127,373 | | | HSBC Bank PLC | | | 3/10/16 | | | | (578 | ) |
| MXN | | | 5,900,000 | | | USD | | | 338,525 | | | JPMorgan Chase Bank N.A. | | | 3/10/16 | | | | 1,517 | |
| MXN | | | 3,500,000 | | | USD | | | 203,674 | | | JPMorgan Chase Bank N.A. | | | 3/10/16 | | | | (1,954 | ) |
| MXN | | | 1,433,361 | | | USD | | | 83,349 | | | JPMorgan Chase Bank N.A. | | | 3/10/16 | | | | (738 | ) |
| MXN | | | 2,260,300 | | | USD | | | 131,435 | | | JPMorgan Chase Bank N.A. | | | 3/10/16 | | | | (1,165 | ) |
| MXN | | | 10,200,000 | | | USD | | | 606,381 | | | JPMorgan Chase Bank N.A. | | | 3/10/16 | | | | (18,511 | ) |
| MXN | | | 3,400,000 | | | USD | | | 197,216 | | | Morgan Stanley & Co. International PLC | | | 3/10/16 | | | | (1,259 | ) |
| MXN | | | 7,300,000 | | | USD | | | 423,434 | | | Morgan Stanley & Co. International PLC | | | 3/10/16 | | | | (2,704 | ) |
| MYR | | | 1,075,000 | | | USD | | | 250,466 | | | Bank of America N.A. | | | 3/10/16 | | | | (1,230 | ) |
| MYR | | | 130,000 | | | USD | | | 30,289 | | | Bank of America N.A. | | | 3/10/16 | | | | (149 | ) |
| MYR | | | 140,000 | | | USD | | | 32,684 | | | Barclays Bank PLC | | | 3/10/16 | | | | (225 | ) |
| MYR | | | 1,075,000 | | | USD | | | 250,963 | | | Barclays Bank PLC | | | 3/10/16 | | | | (1,727 | ) |
| MYR | | | 650,000 | | | USD | | | 152,033 | | | HSBC Bank PLC | | | 3/10/16 | | | | (1,332 | ) |
| MYR | | | 140,000 | | | USD | | | 32,695 | | | HSBC Bank PLC | | | 3/10/16 | | | | (236 | ) |
| MYR | | | 1,075,000 | | | USD | | | 251,051 | | | HSBC Bank PLC | | | 3/10/16 | | | | (1,815 | ) |
| MYR | | | 2,000,000 | | | USD | | | 465,224 | | | HSBC Bank PLC | | | 3/10/16 | | | | (1,530 | ) |
| MYR | | | 1,300,000 | | | USD | | | 301,834 | | | HSBC Bank PLC | | | 3/10/16 | | | | (433 | ) |
| MYR | | | 2,820,000 | | | USD | | | 656,195 | | | HSBC Bank PLC | | | 3/10/16 | | | | (2,386 | ) |
| MYR | | | 550,000 | | | USD | | | 127,241 | | | Morgan Stanley & Co. International PLC | | | 3/10/16 | | | | 275 | |
| MYR | | | 1,075,000 | | | USD | | | 250,583 | | | Morgan Stanley & Co. International PLC | | | 3/10/16 | | | | (1,347 | ) |
| MYR | | | 140,000 | | | USD | | | 32,634 | | | Morgan Stanley & Co. International PLC | | | 3/10/16 | | | | (175 | ) |
| MYR | | | 2,000,000 | | | USD | | | 463,822 | | | Morgan Stanley & Co. International PLC | | | 3/10/16 | | | | (128 | ) |
| MYR | | | 600,000 | | | USD | | | 142,535 | | | Morgan Stanley & Co. International PLC | | | 3/10/16 | | | | (3,426 | ) |
| MYR | | | 2,650,000 | | | USD | | | 629,528 | | | Morgan Stanley & Co. International PLC | | | 3/10/16 | | | | (15,133 | ) |
| MYR | | | 400,000 | | | USD | | | 94,731 | | | Morgan Stanley & Co. International PLC | | | 3/10/16 | | | | (1,992 | ) |
| MYR | | | 500,000 | | | USD | | | 118,413 | | | Morgan Stanley & Co. International PLC | | | 3/10/16 | | | | (2,490 | ) |
| MYR | | | 600,000 | | | USD | | | 139,002 | | | Morgan Stanley & Co. International PLC | | | 3/10/16 | | | | 107 | |
| MYR | | | 2,150,000 | | | USD | | | 498,089 | | | Morgan Stanley & Co. International PLC | | | 3/10/16 | | | | 383 | |
| MYR | | | 1,645,000 | | | USD | | | 382,558 | | | Morgan Stanley & Co. International PLC | | | 3/10/16 | | | | (1,170 | ) |
| MYR | | | 235,000 | | | USD | | | 54,651 | | | Morgan Stanley & Co. International PLC | | | 3/10/16 | | | | (167 | ) |
| MYR | | | 1,400,000 | | | USD | | | 325,619 | | | Morgan Stanley & Co. International PLC | | | 3/10/16 | | | | (1,033 | ) |
| MYR | | | 2,200,000 | | | USD | | | 510,441 | | | Morgan Stanley & Co. International PLC | | | 3/10/16 | | | | (377 | ) |
| MYR | | | 650,000 | | | USD | | | 153,447 | | | UBS AG | | | 3/10/16 | | | | (2,746 | ) |
| MYR | | | 7,550,000 | | | USD | | | 1,783,605 | | | Westpac Banking Corp. | | | 3/10/16 | | | | (33,159 | ) |
| MYR | | | 2,350,000 | | | USD | | | 555,162 | | | Westpac Banking Corp. | | | 3/10/16 | | | | (10,321 | ) |
| NOK | | | 8,900,000 | | | USD | | | 1,022,840 | | | BNP Paribas S.A. | | | 3/10/16 | | | | (18,005 | ) |
| NOK | | | 2,400,000 | | | USD | | | 277,703 | | | Citibank N.A. | | | 3/10/16 | | | | (6,736 | ) |
| NOK | | | 1,300,000 | | | USD | | | 150,422 | | | Citibank N.A. | | | 3/10/16 | | | | (3,649 | ) |
| NOK | | | 2,200,000 | | | USD | | | 254,561 | | | Citibank N.A. | | | 3/10/16 | | | | (6,175 | ) |
| NOK | | | 1,300,000 | | | USD | | | 150,443 | | | Citibank N.A. | | | 3/10/16 | | | | (3,670 | ) |
| NOK | | | 2,200,000 | | | USD | | | 254,596 | | | Citibank N.A. | | | 3/10/16 | | | | (6,210 | ) |
| NOK | | | 2,400,000 | | | USD | | | 277,741 | | | Citibank N.A. | | | 3/10/16 | | | | (6,775 | ) |
| NOK | | | 3,400,000 | | | USD | | | 390,646 | | | Citibank N.A. | | | 3/10/16 | | | | (6,777 | ) |
| NOK | | | 10,700,000 | | | USD | | | 1,225,199 | | | Citibank N.A. | | | 3/10/16 | | | | (17,139 | ) |
| NOK | | | 3,900,000 | | | USD | | | 458,358 | | | Citibank N.A. | | | 3/10/16 | | | | (18,037 | ) |
| NOK | | | 3,200,000 | | | USD | | | 376,088 | | | Citibank N.A. | | | 3/10/16 | | | | (14,799 | ) |
| NOK | | | 7,085,937 | | | USD | | | 821,003 | | | Citibank N.A. | | | 3/10/16 | | | | (20,981 | ) |
| NOK | | | 377,421 | | | USD | | | 43,683 | | | Citibank N.A. | | | 3/10/16 | | | | (1,071 | ) |
| NOK | | | 1,209,462 | | | USD | | | 139,983 | | | Citibank N.A. | | | 3/10/16 | | | | (3,431 | ) |
| NOK | | | 2,211,214 | | | USD | | | 256,200 | | | Citibank N.A. | | | 3/10/16 | | | | (6,547 | ) |
| NOK | | | 6,000,000 | | | USD | | | 691,721 | | | Credit Suisse International | | | 3/10/16 | | | | (14,304 | ) |
| NOK | | | 7,200,000 | | | USD | | | 830,065 | | | Credit Suisse International | | | 3/10/16 | | | | (17,165 | ) |
| NOK | | | 700,000 | | | USD | | | 79,507 | | | Credit Suisse International | | | 3/10/16 | | | | (475 | ) |
| NOK | | | 9,000,000 | | | USD | | | 1,042,625 | | | JPMorgan Chase Bank N.A. | | | 3/10/16 | | | | (26,500 | ) |
| NOK | | | 3,500,000 | | | USD | | | 405,465 | | | JPMorgan Chase Bank N.A. | | | 3/10/16 | | | | (10,305 | ) |
| NOK | | | 14,300,000 | | | USD | | | 1,654,499 | | | JPMorgan Chase Bank N.A. | | | 3/10/16 | | | | (39,989 | ) |
| NOK | | | 3,200,000 | | | USD | | | 366,208 | | | JPMorgan Chase Bank N.A. | | | 3/10/16 | | | | (4,919 | ) |
| NOK | | | 1,085,045 | | | USD | | | 125,933 | | | Morgan Stanley & Co. International PLC | | | 3/10/16 | | | | (3,428 | ) |
See Notes to Financial Statements.
| | | | | | |
| | | | | | | |
| | BLACKROCK COREALPHA BOND FUND | | DECEMBER 31, 2015 | | 37 |
| | |
Schedule of Investments (continued) | | CoreAlpha Bond Master Portfolio |
Forward Foreign Currency Exchange Contracts (continued)
| | | | | | | | | | | | | | | | | | | | |
Currency
Purchased | | | Currency
Sold | | | Counterparty | | Settlement
Date | | | Unrealized
Appreciation
(Depreciation) | |
| NOK | | | 1,600,000 | | | USD | | | 183,407 | | | Morgan Stanley & Co. International PLC | | | 3/10/16 | | | $ | (2,762 | ) |
| NOK | | | 5,804,601 | | | USD | | | 671,966 | | | Morgan Stanley & Co. International PLC | | | 3/10/16 | | | | (16,610 | ) |
| NOK | | | 1,811,365 | | | USD | | | 209,691 | | | Morgan Stanley & Co. International PLC | | | 3/10/16 | | | | (5,183 | ) |
| NOK | | | 514,955 | | | USD | | | 59,681 | | | UBS AG | | | 3/10/16 | | | | (1,541 | ) |
| NZD | | | 50,291 | | | USD | | | 33,619 | | | Bank of America N.A. | | | 3/10/16 | | | | 676 | |
| NZD | | | 650,000 | | | USD | | | 428,122 | | | Citibank N.A. | | | 3/10/16 | | | | 15,126 | |
| NZD | | | 930,000 | | | USD | | | 612,544 | | | Citibank N.A. | | | 3/10/16 | | | | 21,641 | |
| NZD | | | 560,000 | | | USD | | | 375,635 | | | Citibank N.A. | | | 3/10/16 | | | | 6,240 | |
| NZD | | | 179,418 | | | USD | | | 119,992 | | | Credit Suisse International | | | 3/10/16 | | | | 2,356 | |
| NZD | | | 900,000 | | | USD | | | 603,283 | | | HSBC Bank PLC | | | 3/10/16 | | | | 10,445 | |
| NZD | | | 250,000 | | | USD | | | 167,258 | | | JPMorgan Chase Bank N.A. | | | 3/10/16 | | | | 3,222 | |
| NZD | | | 420,000 | | | USD | | | 278,751 | | | Morgan Stanley & Co. International PLC | | | 3/10/16 | | | | 7,656 | |
| NZD | | | 280,000 | | | USD | | | 187,328 | | | Morgan Stanley & Co. International PLC | | | 3/10/16 | | | | 3,610 | |
| NZD | | | 280,000 | | | USD | | | 186,754 | | | Morgan Stanley & Co. International PLC | | | 3/10/16 | | | | 4,183 | |
| NZD | | | 620,000 | | | USD | | | 413,528 | | | Morgan Stanley & Co. International PLC | | | 3/10/16 | | | | 9,263 | |
| NZD | | | 270,000 | | | USD | | | 180,085 | | | Morgan Stanley & Co. International PLC | | | 3/10/16 | | | | 4,034 | |
| NZD | | | 230,000 | | | USD | | | 156,274 | | | Morgan Stanley & Co. International PLC | | | 3/10/16 | | | | 568 | |
| NZD | | | 150,000 | | | USD | | | 102,468 | | | Morgan Stanley & Co. International PLC | | | 3/10/16 | | | | (180 | ) |
| NZD | | | 520,000 | | | USD | | | 355,223 | | | Morgan Stanley & Co. International PLC | | | 3/10/16 | | | | (625 | ) |
| NZD | | | 50,291 | | | USD | | | 33,613 | | | Morgan Stanley & Co. International PLC | | | 3/10/16 | | | | 681 | |
| NZD | | | 2,810,000 | | | USD | | | 1,858,394 | | | UBS AG | | | 3/10/16 | | | | 57,801 | |
| NZD | | | 1,400,000 | | | USD | | | 925,890 | | | UBS AG | | | 3/10/16 | | | | 28,798 | |
| NZD | | | 250,000 | | | USD | | | 169,395 | | | UBS AG | | | 3/10/16 | | | | 1,085 | |
| NZD | | | 550,000 | | | USD | | | 361,471 | | | Westpac Banking Corp. | | | 3/10/16 | | | | 13,585 | |
| NZD | | | 300,000 | | | USD | | | 197,166 | | | Westpac Banking Corp. | | | 3/10/16 | | | | 7,410 | |
| NZD | | | 575,000 | | | USD | | | 393,727 | | | Westpac Banking Corp. | | | 3/10/16 | | | | (1,623 | ) |
| NZD | | | 445,000 | | | USD | | | 304,201 | | | Westpac Banking Corp. | | | 3/10/16 | | | | (747 | ) |
| PHP | | | 38,800,000 | | | USD | | | 816,369 | | | Deutsche Bank AG | | | 3/10/16 | | | | 5,082 | |
| PHP | | | 6,300,000 | | | USD | | | 131,937 | | | Deutsche Bank AG | | | 3/10/16 | | | | 1,443 | |
| PHP | | | 8,400,000 | | | USD | | | 175,916 | | | Deutsche Bank AG | | | 3/10/16 | | | | 1,924 | |
| PHP | | | 19,200,000 | | | USD | | | 401,157 | | | Goldman Sachs International | | | 3/10/16 | | | | 5,335 | |
| PHP | | | 9,000,000 | | | USD | | | 188,324 | | | HSBC Bank PLC | | | 3/10/16 | | | | 2,219 | |
| PHP | | | 6,300,000 | | | USD | | | 131,910 | | | HSBC Bank PLC | | | 3/10/16 | | | | 1,470 | |
| PHP | | | 13,100,000 | | | USD | | | 276,546 | | | HSBC Bank PLC | | | 3/10/16 | | | | 799 | |
| PHP | | | 28,300,000 | | | USD | | | 597,425 | | | HSBC Bank PLC | | | 3/10/16 | | | | 1,727 | |
| PHP | | | 24,400,000 | | | USD | | | 515,094 | | | HSBC Bank PLC | | | 3/10/16 | | | | 1,489 | |
| PHP | | | 3,900,000 | | | USD | | | 82,418 | | | HSBC Bank PLC | | | 3/10/16 | | | | 151 | |
| PHP | | | 37,100,000 | | | USD | | | 784,024 | | | HSBC Bank PLC | | | 3/10/16 | | | | 1,436 | |
| PHP | | | 17,100,000 | | | USD | | | 357,890 | | | JPMorgan Chase Bank N.A. | | | 3/10/16 | | | | 4,141 | |
| PHP | | | 12,900,000 | | | USD | | | 271,985 | | | Morgan Stanley & Co. International PLC | | | 3/10/16 | | | | 1,126 | |
| PHP | | | 17,200,000 | | | USD | | | 361,877 | | | Morgan Stanley & Co. International PLC | | | 3/10/16 | | | | 2,272 | |
| PHP | | | 19,500,000 | | | USD | | | 410,267 | | | Morgan Stanley & Co. International PLC | | | 3/10/16 | | | | 2,576 | |
| PHP | | | 9,700,000 | | | USD | | | 204,512 | | | Morgan Stanley & Co. International PLC | | | 3/10/16 | | | | 851 | |
| PHP | | | 6,500,000 | | | USD | | | 137,044 | | | Morgan Stanley & Co. International PLC | | | 3/10/16 | | | | 570 | |
| PHP | | | 8,600,000 | | | USD | | | 181,320 | | | Morgan Stanley & Co. International PLC | | | 3/10/16 | | | | 754 | |
| PHP | | | 8,600,000 | | | USD | | | 181,324 | | | Morgan Stanley & Co. International PLC | | | 3/10/16 | | | | 751 | |
| PHP | | | 25,800,000 | | | USD | | | 542,131 | | | Standard Chartered Bank | | | 3/10/16 | | | | 4,092 | |
| PHP | | | 17,200,000 | | | USD | | | 361,420 | | | Standard Chartered Bank | | | 3/10/16 | | | | 2,728 | |
| PLN | | | 1,450,000 | | | EUR | | | 337,750 | | | Barclays Bank PLC | | | 3/10/16 | | | | (771 | ) |
| PLN | | | 204,033 | | | EUR | | | 47,934 | | | Barclays Bank PLC | | | 3/10/16 | | | | (553 | ) |
| PLN | | | 770,000 | | | EUR | | | 176,330 | | | Barclays Bank PLC | | | 3/10/16 | | | | 2,884 | |
| PLN | | | 1,645,000 | | | EUR | | | 376,542 | | | BNP Paribas S.A. | | | 3/10/16 | | | | 6,339 | |
| PLN | | | 900,000 | | | EUR | | | 206,394 | | | BNP Paribas S.A. | | | 3/10/16 | | | | 3,052 | |
| PLN | | | 900,000 | | | EUR | | | 206,488 | | | BNP Paribas S.A. | | | 3/10/16 | | | | 2,949 | |
| PLN | | | 1,400,000 | | | EUR | | | 319,773 | | | BNP Paribas S.A. | | | 3/10/16 | | | | 6,143 | |
| PLN | | | 1,900,000 | | | EUR | | | 443,526 | | | Citibank N.A. | | | 3/10/16 | | | | (2,052 | ) |
| PLN | | | 85,155 | | | EUR | | | 20,000 | | | Citibank N.A. | | | 3/10/16 | | | | (224 | ) |
| PLN | | | 800,000 | | | EUR | | | 184,394 | | | Credit Suisse International | | | 3/10/16 | | | | 1,697 | |
| PLN | | | 900,000 | | | EUR | | | 209,187 | | | Credit Suisse International | | | 3/10/16 | | | | 12 | |
| PLN | | | 550,000 | | | EUR | | | 129,303 | | | Credit Suisse International | | | 3/10/16 | | | | (1,588 | ) |
| PLN | | | 170,271 | | | EUR | | | 40,005 | | | Credit Suisse International | | | 3/10/16 | | | | (465 | ) |
| PLN | | | 2,408,031 | | | EUR | | | 565,430 | | | Credit Suisse International | | | 3/10/16 | | | | (6,203 | ) |
| PLN | | | 2,550,000 | | | EUR | | | 599,310 | | | Credit Suisse International | | | 3/10/16 | | | | (7,162 | ) |
| PLN | | | 264,874 | | | EUR | | | 60,637 | | | Credit Suisse International | | | 3/10/16 | | | | 1,013 | |
See Notes to Financial Statements.
| | | | | | |
| | | | | | | |
| 38 | | BLACKROCK COREALPHA BOND FUND | | DECEMBER 31, 2015 | | |
| | |
Schedule of Investments (continued) | | CoreAlpha Bond Master Portfolio |
Forward Foreign Currency Exchange Contracts (continued)
| | | | | | | | | | | | | | | | | | | | |
Currency
Purchased | | | Currency
Sold | | | Counterparty | | Settlement
Date | | | Unrealized
Appreciation
(Depreciation) | |
| PLN | | | 85,131 | | | EUR | | | 20,002 | | | Goldman Sachs International | | | 3/10/16 | | | $ | (232 | ) |
| PLN | | | 170,281 | | | EUR | | | 40,004 | | | HSBC Bank PLC | | | 3/10/16 | | | | (461 | ) |
| PLN | | | 750,000 | | | EUR | | | 173,938 | | | JPMorgan Chase Bank N.A. | | | 3/10/16 | | | | 429 | |
| PLN | | | 20,126 | | | EUR | | | 4,609 | | | JPMorgan Chase Bank N.A. | | | 3/10/16 | | | | 76 | |
| PLN | | | 1,375,000 | | | EUR | | | 317,706 | | | Société Générale | | | 3/10/16 | | | | 2,070 | |
| PLN | | | 900,000 | | | EUR | | | 206,375 | | | Société Générale | | | 3/10/16 | | | | 3,072 | |
| PLN | | | 1,375,000 | | | EUR | | | 318,037 | | | Société Générale | | | 3/10/16 | | | | 1,710 | |
| PLN | | | 85,129 | | | EUR | | | 20,002 | | | UBS AG | | | 3/10/16 | | | | (233 | ) |
| PLN | | | 408,159 | | | EUR | | | 95,820 | | | UBS AG | | | 3/10/16 | | | | (1,030 | ) |
| PLN | | | 1,100,000 | | | USD | | | 276,097 | | | Barclays Bank PLC | | | 3/10/16 | | | | 2,106 | |
| PLN | | | 2,150,000 | | | USD | | | 542,409 | | | Barclays Bank PLC | | | 3/10/16 | | | | 1,352 | |
| PLN | | | 550,000 | | | USD | | | 138,756 | | | Barclays Bank PLC | | | 3/10/16 | | | | 346 | |
| PLN | | | 253,843 | | | USD | | | 65,293 | | | Barclays Bank PLC | | | 3/10/16 | | | | (1,093 | ) |
| PLN | | | 27,005 | | | USD | | | 6,946 | | | Barclays Bank PLC | | | 3/10/16 | | | | (116 | ) |
| PLN | | | 132,323 | | | USD | | | 34,036 | | | Barclays Bank PLC | | | 3/10/16 | | | | (570 | ) |
| PLN | | | 396,249 | | | USD | | | 102,125 | | | Barclays Bank PLC | | | 3/10/16 | | | | (1,909 | ) |
| PLN | | | 81,608 | | | USD | | | 21,033 | | | Barclays Bank PLC | | | 3/10/16 | | | | (393 | ) |
| PLN | | | 760,185 | | | USD | | | 195,922 | | | Barclays Bank PLC | | | 3/10/16 | | | | (3,662 | ) |
| PLN | | | 408,194 | | | USD | | | 105,412 | | | Barclays Bank PLC | | | 3/10/16 | | | | (2,175 | ) |
| PLN | | | 84,068 | | | USD | | | 21,710 | | | Barclays Bank PLC | | | 3/10/16 | | | | (448 | ) |
| PLN | | | 783,101 | | | USD | | | 202,228 | | | Barclays Bank PLC | | | 3/10/16 | | | | (4,173 | ) |
| PLN | | | 1,100,000 | | | USD | | | 283,250 | | | Barclays Bank PLC | | | 3/10/16 | | | | (5,047 | ) |
| PLN | | | 1,450,000 | | | USD | | | 364,780 | | | Barclays Bank PLC | | | 3/10/16 | | | | 1,943 | |
| PLN | | | 550,000 | | | USD | | | 138,365 | | | Barclays Bank PLC | | | 3/10/16 | | | | 737 | |
| PLN | | | 400,000 | | | USD | | | 100,398 | | | BNP Paribas S.A. | | | 3/10/16 | | | | 767 | |
| PLN | | | 600,000 | | | USD | | | 150,597 | | | BNP Paribas S.A. | | | 3/10/16 | | | | 1,151 | |
| PLN | | | 275,000 | | | USD | | | 69,380 | | | BNP Paribas S.A. | | | 3/10/16 | | | | 171 | |
| PLN | | | 925,000 | | | USD | | | 233,368 | | | BNP Paribas S.A. | | | 3/10/16 | | | | 576 | |
| PLN | | | 215,000 | | | USD | | | 54,839 | | | BNP Paribas S.A. | | | 3/10/16 | | | | (463 | ) |
| PLN | | | 415,000 | | | USD | | | 105,852 | | | BNP Paribas S.A. | | | 3/10/16 | | | | (894 | ) |
| PLN | | | 105,000 | | | USD | | | 26,782 | | | BNP Paribas S.A. | | | 3/10/16 | | | | (226 | ) |
| PLN | | | 1,525,000 | | | USD | | | 392,253 | | | BNP Paribas S.A. | | | 3/10/16 | | | | (6,562 | ) |
| PLN | | | 795,000 | | | USD | | | 204,486 | | | BNP Paribas S.A. | | | 3/10/16 | | | | (3,421 | ) |
| PLN | | | 1,350,000 | | | USD | | | 339,759 | | | BNP Paribas S.A. | | | 3/10/16 | | | | 1,672 | |
| PLN | | | 160,000 | | | USD | | | 41,154 | | | BNP Paribas S.A. | | | 3/10/16 | | | | (688 | ) |
| PLN | | | 1,200,000 | | | USD | | | 308,523 | | | BNP Paribas S.A. | | | 3/10/16 | | | | (5,028 | ) |
| PLN | | | 1,050,000 | | | USD | | | 264,844 | | | BNP Paribas S.A. | | | 3/10/16 | | | | 714 | |
| PLN | | | 1,050,000 | | | USD | | | 264,040 | | | Credit Suisse International | | | 3/10/16 | | | | 1,518 | |
| PLN | | | 700,000 | | | USD | | | 176,697 | | | Credit Suisse International | | | 3/10/16 | | | | 341 | |
| PLN | | | 322,426 | | | USD | | | 82,922 | | | Credit Suisse International | | | 3/10/16 | | | | (1,376 | ) |
| PLN | | | 65,801 | | | USD | | | 16,923 | | | Credit Suisse International | | | 3/10/16 | | | | (281 | ) |
| PLN | | | 618,532 | | | USD | | | 159,074 | | | Credit Suisse International | | | 3/10/16 | | | | (2,640 | ) |
| PLN | | | 1,700,000 | | | USD | | | 438,605 | | | Credit Suisse International | | | 3/10/16 | | | | (8,655 | ) |
| PLN | | | 1,290,000 | | | USD | | | 332,824 | | | Credit Suisse International | | | 3/10/16 | | | | (6,568 | ) |
| PLN | | | 27,190 | | | USD | | | 7,011 | | | Deutsche Bank AG | | | 3/10/16 | | | | (134 | ) |
| PLN | | | 253,279 | | | USD | | | 65,309 | | | Deutsche Bank AG | | | 3/10/16 | | | | (1,252 | ) |
| PLN | | | 132,022 | | | USD | | | 34,043 | | | Deutsche Bank AG | | | 3/10/16 | | | | (653 | ) |
| PLN | | | 54,327 | | | USD | | | 14,023 | | | Deutsche Bank AG | | | 3/10/16 | | | | (283 | ) |
| PLN | | | 263,786 | | | USD | | | 68,089 | | | Deutsche Bank AG | | | 3/10/16 | | | | (1,375 | ) |
| PLN | | | 506,061 | | | USD | | | 130,626 | | | Deutsche Bank AG | | | 3/10/16 | | | | (2,637 | ) |
| PLN | | | 925,000 | | | USD | | | 233,578 | | | Goldman Sachs International | | | 3/10/16 | | | | 365 | |
| PLN | | | 275,000 | | | USD | | | 69,442 | | | Goldman Sachs International | | | 3/10/16 | | | | 109 | |
| PLN | | | 105,000 | | | USD | | | 26,746 | | | Goldman Sachs International | | | 3/10/16 | | | | (190 | ) |
| PLN | | | 215,000 | | | USD | | | 54,766 | | | Goldman Sachs International | | | 3/10/16 | | | | (390 | ) |
| PLN | | | 415,000 | | | USD | | | 105,711 | | | Goldman Sachs International | | | 3/10/16 | | | | (752 | ) |
| PLN | | | 130,000 | | | USD | | | 33,106 | | | Goldman Sachs International | | | 3/10/16 | | | | (227 | ) |
| PLN | | | 500,000 | | | USD | | | 127,330 | | | Goldman Sachs International | | | 3/10/16 | | | | (874 | ) |
| PLN | | | 260,000 | | | USD | | | 66,212 | | | Goldman Sachs International | | | 3/10/16 | | | | (455 | ) |
| PLN | | | 265,000 | | | USD | | | 67,509 | | | JPMorgan Chase Bank N.A. | | | 3/10/16 | | | | (487 | ) |
| PLN | | | 540,000 | | | USD | | | 137,565 | | | JPMorgan Chase Bank N.A. | | | 3/10/16 | | | | (992 | ) |
| PLN | | | 1,040,000 | | | USD | | | 264,940 | | | JPMorgan Chase Bank N.A. | | | 3/10/16 | | | | (1,911 | ) |
| PLN | | | 1,160,000 | | | USD | | | 297,897 | | | JPMorgan Chase Bank N.A. | | | 3/10/16 | | | | (4,519 | ) |
| PLN | | | 290,000 | | | USD | | | 74,474 | | | JPMorgan Chase Bank N.A. | | | 3/10/16 | | | | (1,130 | ) |
| PLN | | | 600,000 | | | USD | | | 154,085 | | | JPMorgan Chase Bank N.A. | | | 3/10/16 | | | | (2,338 | ) |
See Notes to Financial Statements.
| | | | | | |
| | | | | | | |
| | BLACKROCK COREALPHA BOND FUND | | DECEMBER 31, 2015 | | 39 |
| | |
Schedule of Investments (continued) | | CoreAlpha Bond Master Portfolio |
Forward Foreign Currency Exchange Contracts (continued)
| | | | | | | | | | | | | | | | | | | | |
Currency
Purchased | | | Currency
Sold | | | Counterparty | | Settlement
Date | | | Unrealized
Appreciation
(Depreciation) | |
| PLN | | | 1,300,000 | | | USD | | | 333,898 | | | JPMorgan Chase Bank N.A. | | | 3/10/16 | | | $ | (5,113 | ) |
| PLN | | | 1,000,000 | | | USD | | | 258,019 | | | JPMorgan Chase Bank N.A. | | | 3/10/16 | | | | (5,107 | ) |
| PLN | | | 760,000 | | | USD | | | 196,095 | | | JPMorgan Chase Bank N.A. | | | 3/10/16 | | | | (3,882 | ) |
| PLN | | | 1,100,000 | | | USD | | | 276,607 | | | Morgan Stanley & Co. International PLC | | | 3/10/16 | | | | 1,597 | |
| PLN | | | 1,400,000 | | | USD | | | 353,821 | | | Société Générale | | | 3/10/16 | | | | 256 | |
| PLN | | | 620,000 | | | USD | | | 158,653 | | | UBS AG | | | 3/10/16 | | | | (1,848 | ) |
| PLN | | | 155,000 | | | USD | | | 39,663 | | | UBS AG | | | 3/10/16 | | | | (462 | ) |
| PLN | | | 320,000 | | | USD | | | 81,885 | | | UBS AG | | | 3/10/16 | | | | (954 | ) |
| RON | | | 1,700,000 | | | USD | | | 404,170 | | | Barclays Bank PLC | | | 3/10/16 | | | | 4,304 | |
| RON | | | 600,000 | | | USD | | | 147,108 | | | BNP Paribas S.A. | | | 3/10/16 | | | | (2,940 | ) |
| RUB | | | 14,700,000 | | | USD | | | 205,865 | | | Barclays Bank PLC | | | 3/10/16 | | | | (7,625 | ) |
| RUB | | | 6,100,000 | | | USD | | | 84,016 | | | JPMorgan Chase Bank N.A. | | | 3/10/16 | | | | (1,753 | ) |
| RUB | | | 6,000,000 | | | USD | | | 86,931 | | | JPMorgan Chase Bank N.A. | | | 3/10/16 | | | | (6,017 | ) |
| RUB | | | 9,600,000 | | | USD | | | 129,144 | | | Morgan Stanley & Co. International PLC | | | 3/10/16 | | | | 319 | |
| SEK | | | 3,000,000 | | | USD | | | 355,301 | | | Citibank N.A. | | | 3/10/16 | | | | 1,204 | |
| SEK | | | 2,900,000 | | | USD | | | 341,816 | | | Citibank N.A. | | | 3/10/16 | | | | 2,806 | |
| SEK | | | 12,900,000 | | | USD | | | 1,523,086 | | | Credit Suisse International | | | 3/10/16 | | | | 9,884 | |
| SEK | | | 3,200,000 | | | USD | | | 381,738 | | | Credit Suisse International | | | 3/10/16 | | | | (1,466 | ) |
| SEK | | | 1,000,000 | | | USD | | | 118,817 | | | Credit Suisse International | | | 3/10/16 | | | | 18 | |
| SEK | | | 4,300,000 | | | USD | | | 510,913 | | | Credit Suisse International | | | 3/10/16 | | | | 77 | |
| SEK | | | 11,900,000 | | | USD | | | 1,373,460 | | | Goldman Sachs International | | | 3/10/16 | | | | 40,676 | |
| SEK | | | 1,600,000 | | | USD | | | 188,249 | | | Goldman Sachs International | | | 3/10/16 | | | | 1,887 | |
| SEK | | | 2,400,000 | | | USD | | | 282,373 | | | Goldman Sachs International | | | 3/10/16 | | | | 2,831 | |
| SEK | | | 6,200,000 | | | USD | | | 743,985 | | | HSBC Bank PLC | | | 3/10/16 | | | | (7,209 | ) |
| SEK | | | 2,400,000 | | | USD | | | 282,542 | | | JPMorgan Chase Bank N.A. | | | 3/10/16 | | | | 2,662 | |
| SEK | | | 800,000 | | | USD | | | 94,851 | | | JPMorgan Chase Bank N.A. | | | 3/10/16 | | | | 217 | |
| SEK | | | 8,500,000 | | | USD | | | 1,007,787 | | | JPMorgan Chase Bank N.A. | | | 3/10/16 | | | | 2,310 | |
| SEK | | | 1,700,000 | | | USD | | | 198,812 | | | Morgan Stanley & Co. International PLC | | | 3/10/16 | | | | 3,208 | |
| SEK | | | 1,800,000 | | | USD | | | 210,507 | | | Morgan Stanley & Co. International PLC | | | 3/10/16 | | | | 3,396 | |
| SGD | | | 550,000 | | | USD | | | 389,394 | | | Barclays Bank PLC | | | 3/10/16 | | | | (2,506 | ) |
| SGD | | | 670,000 | | | USD | | | 474,353 | | | Barclays Bank PLC | | | 3/10/16 | | | | (3,053 | ) |
| SGD | | | 320,243 | | | USD | | | 226,528 | | | BNP Paribas S.A. | | | 3/10/16 | | | | (1,259 | ) |
| SGD | | | 1,091,788 | | | USD | | | 775,773 | | | Citibank N.A. | | | 3/10/16 | | | | (7,773 | ) |
| SGD | | | 259,591 | | | USD | | | 183,446 | | | Citibank N.A. | | | 3/10/16 | | | | (841 | ) |
| SGD | | | 24,775 | | | USD | | | 17,517 | | | Deutsche Bank AG | | | 3/10/16 | | | | (89 | ) |
| SGD | | | 96,624 | | | USD | | | 68,315 | | | Deutsche Bank AG | | | 3/10/16 | | | | (346 | ) |
| SGD | | | 80,520 | | | USD | | | 56,929 | | | Deutsche Bank AG | | | 3/10/16 | | | | (289 | ) |
| SGD | | | 548,212 | | | USD | | | 389,690 | | | Deutsche Bank AG | | | 3/10/16 | | | | (4,059 | ) |
| SGD | | | 488,439 | | | USD | | | 348,869 | | | Deutsche Bank AG | | | 3/10/16 | | | | (5,284 | ) |
| SGD | | | 692,471 | | | USD | | | 494,599 | | | Deutsche Bank AG | | | 3/10/16 | | | | (7,491 | ) |
| SGD | | | 350,000 | | | USD | | | 246,887 | | | Goldman Sachs International | | | 3/10/16 | | | | (686 | ) |
| SGD | | | 490,000 | | | USD | | | 347,419 | | | Goldman Sachs International | | | 3/10/16 | | | | (2,737 | ) |
| SGD | | | 300,000 | | | USD | | | 212,653 | | | Goldman Sachs International | | | 3/10/16 | | | | (1,623 | ) |
| SGD | | | 390,000 | | | USD | | | 275,556 | | | HSBC Bank PLC | | | 3/10/16 | | | | (1,217 | ) |
| SGD | | | 240,000 | | | USD | | | 170,394 | | | HSBC Bank PLC | | | 3/10/16 | | | | (1,570 | ) |
| SGD | | | 300,000 | | | USD | | | 212,992 | | | HSBC Bank PLC | | | 3/10/16 | | | | (1,962 | ) |
| SGD | | | 160,167 | | | USD | | | 113,268 | | | JPMorgan Chase Bank N.A. | | | 3/10/16 | | | | (601 | ) |
| SGD | | | 301,561 | | | USD | | | 215,410 | | | JPMorgan Chase Bank N.A. | | | 3/10/16 | | | | (3,282 | ) |
| SGD | | | 427,529 | | | USD | | | 305,391 | | | JPMorgan Chase Bank N.A. | | | 3/10/16 | | | | (4,653 | ) |
| SGD | | | 1,460,000 | | | USD | | | 1,033,412 | | | JPMorgan Chase Bank N.A. | | | 3/10/16 | | | | (6,400 | ) |
| SGD | | | 1,540,000 | | | USD | | | 1,088,001 | | | UBS AG | | | 3/10/16 | | | | (4,713 | ) |
| SGD | | | 480,000 | | | USD | | | 339,117 | | | UBS AG | | | 3/10/16 | | | | (1,469 | ) |
| SGD | | | 569,480 | | | USD | | | 402,670 | | | UBS AG | | | 3/10/16 | | | | (2,079 | ) |
| SGD | | | 683,376 | | | USD | | | 483,205 | | | UBS AG | | | 3/10/16 | | | | (2,495 | ) |
| SGD | | | 175,225 | | | USD | | | 123,899 | | | UBS AG | | | 3/10/16 | | | | (640 | ) |
| SGD | | | 1,090,000 | | | USD | | | 769,905 | | | UBS AG | | | 3/10/16 | | | | (3,162 | ) |
| THB | | | 14,800,000 | | | USD | | | 407,938 | | | Barclays Bank PLC | | | 3/10/16 | | | | 2,672 | |
| THB | | | 6,700,000 | | | USD | | | 185,185 | | | Barclays Bank PLC | | | 3/10/16 | | | | 699 | |
| THB | | | 13,100,000 | | | USD | | | 364,395 | | | Deutsche Bank AG | | | 3/10/16 | | | | (949 | ) |
| THB | | | 7,400,000 | | | USD | | | 205,556 | | | Goldman Sachs International | | | 3/10/16 | | | | (250 | ) |
| THB | | | 12,000,000 | | | USD | | | 332,247 | | | HSBC Bank PLC | | | 3/10/16 | | | | 680 | |
| THB | | | 4,700,000 | | | USD | | | 130,275 | | | JPMorgan Chase Bank N.A. | | | 3/10/16 | | | | 121 | |
| THB | | | 6,500,000 | | | USD | | | 178,621 | | | JPMorgan Chase Bank N.A. | | | 3/10/16 | | | | 1,715 | |
| THB | | | 6,600,000 | | | USD | | | 182,113 | | | Morgan Stanley & Co. International PLC | | | 3/10/16 | | | | 997 | |
See Notes to Financial Statements.
| | | | | | |
| | | | | | | |
| 40 | | BLACKROCK COREALPHA BOND FUND | | DECEMBER 31, 2015 | | |
| | |
Schedule of Investments (continued) | | CoreAlpha Bond Master Portfolio |
Forward Foreign Currency Exchange Contracts (continued)
| | | | | | | | | | | | | | | | | | | | |
Currency
Purchased | | | Currency
Sold | | | Counterparty | | Settlement
Date | | | Unrealized
Appreciation
(Depreciation) | |
| THB | | | 10,100,000 | | | USD | | | 278,688 | | | Morgan Stanley & Co. International PLC | | | 3/10/16 | | | $ | 1,526 | |
| TRY | | | 579,230 | | | USD | | | 194,980 | | | Barclays Bank PLC | | | 3/10/16 | | | | (223 | ) |
| TRY | | | 540,000 | | | USD | | | 182,106 | | | Citibank N.A. | | | 3/10/16 | | | | (539 | ) |
| TRY | | | 540,000 | | | USD | | | 180,672 | | | Deutsche Bank AG | | | 3/10/16 | | | | 895 | |
| TRY | | | 430,770 | | | USD | | | 144,976 | | | HSBC Bank PLC | | | 3/10/16 | | | | (136 | ) |
| TRY | | | 820,000 | | | USD | | | 274,500 | | | JPMorgan Chase Bank N.A. | | | 3/10/16 | | | | 1,213 | |
| TRY | | | 760,000 | | | USD | | | 254,439 | | | JPMorgan Chase Bank N.A. | | | 3/10/16 | | | | 1,099 | |
| TRY | | | 830,000 | | | USD | | | 279,471 | | | JPMorgan Chase Bank N.A. | | | 3/10/16 | | | | (396 | ) |
| TRY | | | 460,000 | | | USD | | | 155,037 | | | UBS AG | | | 3/10/16 | | | | (369 | ) |
| TRY | | | 780,000 | | | USD | | | 262,889 | | | UBS AG | | | 3/10/16 | | | | (626 | ) |
| TWD | | | 4,650,000 | | | USD | | | 141,790 | | | Bank of America N.A. | | | 3/10/16 | | | | (130 | ) |
| TWD | | | 18,100,000 | | | USD | | | 551,913 | | | Bank of America N.A. | | | 3/10/16 | | | | (508 | ) |
| TWD | | | 2,700,000 | | | USD | | | 81,793 | | | Citibank N.A. | | | 3/10/16 | | | | 460 | |
| TWD | | | 15,100,000 | | | USD | | | 461,069 | | | Goldman Sachs International | | | 3/10/16 | | | | (1,056 | ) |
| TWD | | | 4,750,000 | | | USD | | | 144,553 | | | Goldman Sachs International | | | 3/10/16 | | | | 153 | |
| TWD | | | 22,700,000 | | | USD | | | 690,809 | | | Goldman Sachs International | | | 3/10/16 | | | | 732 | |
| TWD | | | 13,500,000 | | | USD | | | 410,135 | | | HSBC Bank PLC | | | 3/10/16 | | | | 1,135 | |
| TWD | | | 4,700,000 | | | USD | | | 142,988 | | | HSBC Bank PLC | | | 3/10/16 | | | | 195 | |
| TWD | | | 4,860,360 | | | USD | | | 148,051 | | | HSBC Bank PLC | | | 3/10/16 | | | | 17 | |
| TWD | | | 4,857,092 | | | USD | | | 148,014 | | | HSBC Bank PLC | | | 3/10/16 | | | | (46 | ) |
| TWD | | | 5,344,154 | | | USD | | | 162,515 | | | HSBC Bank PLC | | | 3/10/16 | | | | 291 | |
| TWD | | | 1,644,355 | | | USD | | | 50,005 | | | HSBC Bank PLC | | | 3/10/16 | | | | 90 | |
| TWD | | | 4,266,246 | | | USD | | | 129,713 | | | JPMorgan Chase Bank N.A. | | | 3/10/16 | | | | 256 | |
| TWD | | | 8,900,000 | | | USD | | | 269,493 | | | Morgan Stanley & Co. International PLC | | | 3/10/16 | | | | 1,640 | |
| TWD | | | 8,900,000 | | | USD | | | 269,493 | | | Morgan Stanley & Co. International PLC | | | 3/10/16 | | | | 1,640 | |
| TWD | | | 11,300,000 | | | USD | | | 341,798 | | | Morgan Stanley & Co. International PLC | | | 3/10/16 | | | | 2,450 | |
| TWD | | | 6,355,645 | | | USD | | | 193,268 | | | Morgan Stanley & Co. International PLC | | | 3/10/16 | | | | 353 | |
| TWD | | | 20,655,846 | | | USD | | | 628,120 | | | Morgan Stanley & Co. International PLC | | | 3/10/16 | | | | 1,148 | |
| TWD | | | 12,500,000 | | | USD | | | 381,997 | | | Morgan Stanley & Co. International PLC | | | 3/10/16 | | | | (1,192 | ) |
| TWD | | | 2,916,302 | | | USD | | | 88,830 | | | UBS AG | | | 3/10/16 | | | | 13 | |
| TWD | | | 4,650,000 | | | USD | | | 141,768 | | | UBS AG | | | 3/10/16 | | | | (109 | ) |
| TWD | | | 18,100,000 | | | USD | | | 551,829 | | | UBS AG | | | 3/10/16 | | | | (424 | ) |
| TWD | | | 14,800,000 | | | USD | | | 448,757 | | | UBS AG | | | 3/10/16 | | | | 2,116 | |
| TWD | | | 4,600,000 | | | USD | | | 139,478 | | | UBS AG | | | 3/10/16 | | | | 658 | |
| TWD | | | 4,750,000 | | | USD | | | 144,641 | | | UBS AG | | | 3/10/16 | | | | 65 | |
| TWD | | | 22,700,000 | | | USD | | | 691,230 | | | UBS AG | | | 3/10/16 | | �� | | 312 | |
| USD | | | 101,848 | | | AUD | | | 140,000 | | | Barclays Bank PLC | | | 3/10/16 | | | | 318 | |
| USD | | | 474,698 | | | AUD | | | 663,085 | | | Barclays Bank PLC | | | 3/10/16 | | | | (6,182 | ) |
| USD | | | 47,204 | | | AUD | | | 65,741 | | | Citibank N.A. | | | 3/10/16 | | | | (472 | ) |
| USD | | | 77,482 | | | AUD | | | 107,909 | | | Citibank N.A. | | | 3/10/16 | | | | (775 | ) |
| USD | | | 164,735 | | | AUD | | | 230,000 | | | Citibank N.A. | | | 3/10/16 | | | | (2,065 | ) |
| USD | | | 451,230 | | | AUD | | | 630,000 | | | Citibank N.A. | | | 3/10/16 | | | | (5,655 | ) |
| USD | | | 615,965 | | | AUD | | | 860,000 | | | Citibank N.A. | | | 3/10/16 | | | | (7,720 | ) |
| USD | | | 172,793 | | | AUD | | | 240,000 | | | Citibank N.A. | | | 3/10/16 | | | | (1,259 | ) |
| USD | | | 110,667 | | | AUD | | | 154,150 | | | Citibank N.A. | | | 3/10/16 | | | | (1,125 | ) |
| USD | | | 69,238 | | | AUD | | | 96,344 | | | Citibank N.A. | | | 3/10/16 | | | | (632 | ) |
| USD | | | 90,900 | | | AUD | | | 126,915 | | | Citibank N.A. | | | 3/10/16 | | | | (1,140 | ) |
| USD | | | 1,173,225 | | | AUD | | | 1,631,367 | | | Credit Suisse International | | | 3/10/16 | | | | (9,865 | ) |
| USD | | | 714,765 | | | AUD | | | 993,879 | | | Credit Suisse International | | | 3/10/16 | | | | (6,010 | ) |
| USD | | | 355,314 | | | AUD | | | 493,061 | | | HSBC Bank PLC | | | 3/10/16 | | | | (2,260 | ) |
| USD | | | 583,218 | | | AUD | | | 809,317 | | | HSBC Bank PLC | | | 3/10/16 | | | | (3,710 | ) |
| USD | | | 65,203 | | | AUD | | | 90,000 | | | HSBC Bank PLC | | | 3/10/16 | | | | (66 | ) |
| USD | | | 43,469 | | | AUD | | | 60,000 | | | HSBC Bank PLC | | | 3/10/16 | | | | (44 | ) |
| USD | | | 118,116 | | | AUD | | | 164,354 | | | Morgan Stanley & Co. International PLC | | | 3/10/16 | | | | (1,076 | ) |
| USD | | | 193,877 | | | AUD | | | 269,772 | | | Morgan Stanley & Co. International PLC | | | 3/10/16 | | | | (1,765 | ) |
| USD | | | 100,273 | | | AUD | | | 139,506 | | | Morgan Stanley & Co. International PLC | | | 3/10/16 | | | | (899 | ) |
| USD | | | 227,456 | | | AUD | | | 320,000 | | | Morgan Stanley & Co. International PLC | | | 3/10/16 | | | | (4,613 | ) |
| USD | | | 184,808 | | | AUD | | | 260,000 | | | Morgan Stanley & Co. International PLC | | | 3/10/16 | | | | (3,748 | ) |
| USD | | | 367,722 | | | AUD | | | 510,000 | | | Morgan Stanley & Co. International PLC | | | 3/10/16 | | | | (2,137 | ) |
| USD | | | 403,773 | | | AUD | | | 560,000 | | | Morgan Stanley & Co. International PLC | | | 3/10/16 | | | | (2,347 | ) |
| USD | | | 252,358 | | | AUD | | | 350,000 | | | Morgan Stanley & Co. International PLC | | | 3/10/16 | | | | (1,467 | ) |
| USD | | | 71,997 | | | AUD | | | 100,000 | | | Morgan Stanley & Co. International PLC | | | 3/10/16 | | | | (524 | ) |
| USD | | | 806,302 | | | AUD | | | 1,130,000 | | | Morgan Stanley & Co. International PLC | | | 3/10/16 | | | | (13,190 | ) |
| USD | | | 399,584 | | | AUD | | | 560,000 | | | Morgan Stanley & Co. International PLC | | | 3/10/16 | | | | (6,537 | ) |
See Notes to Financial Statements.
| | | | | | |
| | | | | | | |
| | BLACKROCK COREALPHA BOND FUND | | DECEMBER 31, 2015 | | 41 |
| | |
Schedule of Investments (continued) | | CoreAlpha Bond Master Portfolio |
Forward Foreign Currency Exchange Contracts (continued)
| | | | | | | | | | | | | | | | | | | | |
Currency
Purchased | | | Currency
Sold | | | Counterparty | | Settlement
Date | | | Unrealized
Appreciation
(Depreciation) | |
| USD | | | 77,480 | | | AUD | | | 107,909 | | | UBS AG | | | 3/10/16 | | | $ | (777 | ) |
| USD | | | 47,203 | | | AUD | | | 65,741 | | | UBS AG | | | 3/10/16 | | | | (474 | ) |
| USD | | | 1,238,724 | | | AUD | | | 1,700,000 | | | Westpac Banking Corp. | | | 3/10/16 | | | | 5,859 | |
| USD | | | 2,586,747 | | | AUD | | | 3,550,000 | | | Westpac Banking Corp. | | | 3/10/16 | | | | 12,236 | |
| USD | | | 141,815 | | | AUD | | | 197,224 | | | Westpac Banking Corp. | | | 3/10/16 | | | | (1,215 | ) |
| USD | | | 232,778 | | | AUD | | | 323,727 | | | Westpac Banking Corp. | | | 3/10/16 | | | | (1,994 | ) |
| USD | | | 181,570 | | | AUD | | | 250,000 | | | Westpac Banking Corp. | | | 3/10/16 | | | | 266 | |
| USD | | | 413,978 | | | AUD | | | 570,000 | | | Westpac Banking Corp. | | | 3/10/16 | | | | 606 | |
| USD | | | 275,986 | | | AUD | | | 380,000 | | | Westpac Banking Corp. | | | 3/10/16 | | | | 404 | |
| USD | | | 195,737 | | | AUD | | | 270,000 | | | Westpac Banking Corp. | | | 3/10/16 | | | | (71 | ) |
| USD | | | 282,731 | | | AUD | | | 390,000 | | | Westpac Banking Corp. | | | 3/10/16 | | | | (103 | ) |
| USD | | | 152,137 | | | AUD | | | 210,000 | | | Westpac Banking Corp. | | | 3/10/16 | | | | (158 | ) |
| USD | | | 217,338 | | | AUD | | | 300,000 | | | Westpac Banking Corp. | | | 3/10/16 | | | | (226 | ) |
| USD | | | 300,019 | | | CAD | | | 410,000 | | | Barclays Bank PLC | | | 3/10/16 | | | | 4,816 | |
| USD | | | 63,210 | | | CAD | | | 87,947 | | | Barclays Bank PLC | | | 3/10/16 | | | | (113 | ) |
| USD | | | 353,771 | | | CAD | | | 488,522 | | | BNP Paribas S.A. | | | 3/10/16 | | | | 2,031 | |
| USD | | | 186,714 | | | CAD | | | 250,000 | | | Citibank N.A. | | | 3/10/16 | | | | 6,712 | |
| USD | | | 309,524 | | | CAD | | | 420,000 | | | Citibank N.A. | | | 3/10/16 | | | | 7,121 | |
| USD | | | 181,859 | | | CAD | | | 253,226 | | | Citibank N.A. | | | 3/10/16 | | | | (466 | ) |
| USD | | | 187,208 | | | CAD | | | 260,674 | | | Citibank N.A. | | | 3/10/16 | | | | (479 | ) |
| USD | | | 172,413 | | | CAD | | | 230,000 | | | Goldman Sachs International | | | 3/10/16 | | | | 6,811 | |
| USD | | | 268,141 | | | CAD | | | 360,000 | | | Goldman Sachs International | | | 3/10/16 | | | | 8,938 | |
| USD | | | 285,832 | | | CAD | | | 400,000 | | | Goldman Sachs International | | | 3/10/16 | | | | (2,172 | ) |
| USD | | | 478,768 | | | CAD | | | 670,000 | | | Goldman Sachs International | | | 3/10/16 | | | | (3,637 | ) |
| USD | | | 1,066,764 | | | CAD | | | 1,473,349 | | | HSBC Bank PLC | | | 3/10/16 | | | | 5,941 | |
| USD | | | 180,672 | | | CAD | | | 250,000 | | | HSBC Bank PLC | | | 3/10/16 | | | | 670 | |
| USD | | | 361,343 | | | CAD | | | 500,000 | | | HSBC Bank PLC | | | 3/10/16 | | | | 1,339 | |
| USD | | | 488,166 | | | CAD | | | 670,000 | | | JPMorgan Chase Bank N.A. | | | 3/10/16 | | | | 5,760 | |
| USD | | | 1,012,762 | | | CAD | | | 1,390,000 | | | JPMorgan Chase Bank N.A. | | | 3/10/16 | | | | 11,950 | |
| USD | | | 450,285 | | | CAD | | | 620,000 | | | Morgan Stanley & Co. International PLC | | | 3/10/16 | | | | 3,880 | |
| USD | | | 404,069 | | | CAD | | | 558,130 | | | Morgan Stanley & Co. International PLC | | | 3/10/16 | | | | 2,211 | |
| USD | | | 208,057 | | | CAD | | | 290,000 | | | Morgan Stanley & Co. International PLC | | | 3/10/16 | | | | (746 | ) |
| USD | | | 80,516 | | | CAD | | | 112,053 | | | Morgan Stanley & Co. International PLC | | | 3/10/16 | | | | (163 | ) |
| USD | | | 62,360 | | | CAD | | | 86,774 | | | Morgan Stanley & Co. International PLC | | | 3/10/16 | | | | (118 | ) |
| USD | | | 64,194 | | | CAD | | | 89,326 | | | Morgan Stanley & Co. International PLC | | | 3/10/16 | | | | (121 | ) |
| USD | | | 1,858,694 | | | CAD | | | 2,490,000 | | | UBS AG | | | 3/10/16 | | | | 65,874 | |
| USD | | | 272,459 | | | CAD | | | 365,000 | | | UBS AG | | | 3/10/16 | | | | 9,656 | |
| USD | | | 1,854,962 | | | CAD | | | 2,485,000 | | | UBS AG | | | 3/10/16 | | | | 65,742 | |
| USD | | | 817,378 | | | CAD | | | 1,095,000 | | | UBS AG | | | 3/10/16 | | | | 28,969 | |
| USD | | | 272,581 | | | CAD | | | 365,000 | | | Westpac Banking Corp. | | | 3/10/16 | | | | 9,778 | |
| USD | | | 817,744 | | | CAD | | | 1,095,000 | | | Westpac Banking Corp. | | | 3/10/16 | | | | 29,335 | |
| USD | | | 1,859,527 | | | CAD | | | 2,490,000 | | | Westpac Banking Corp. | | | 3/10/16 | | | | 66,707 | |
| USD | | | 1,855,793 | | | CAD | | | 2,485,000 | | | Westpac Banking Corp. | | | 3/10/16 | | | | 66,573 | |
| USD | | | 482,831 | | | CAD | | | 670,000 | | | Westpac Banking Corp. | | | 3/10/16 | | | | 425 | |
| USD | | | 654,708 | | | CLP | | | 469,000,000 | | | Bank of America N.A. | | | 3/10/16 | | | | (2,267 | ) |
| USD | | | 435,998 | | | CLP | | | 312,000,000 | | | Bank of America N.A. | | | 3/10/16 | | | | (1,052 | ) |
| USD | | | 1,029,246 | | | CLP | | | 732,000,000 | | | BNP Paribas S.A. | | | 3/10/16 | | | | 3,860 | |
| USD | | | 123,318 | | | CLP | | | 88,000,000 | | | BNP Paribas S.A. | | | 3/10/16 | | | | 48 | |
| USD | | | 260,907 | | | CLP | | | 183,000,000 | | | Credit Suisse International | | | 3/10/16 | | | | 4,560 | |
| USD | | | 125,463 | | | CLP | | | 88,000,000 | | | Credit Suisse International | | | 3/10/16 | | | | 2,193 | |
| USD | | | 1,060,393 | | | CLP | | | 755,000,000 | | | Deutsche Bank AG | | | 3/10/16 | | | | 2,789 | |
| USD | | | 173,303 | | | CLP | | | 121,000,000 | | | Goldman Sachs International | | | 3/10/16 | | | | 3,806 | |
| USD | | | 305,694 | | | CLP | | | 217,000,000 | | | HSBC Bank PLC | | | 3/10/16 | | | | 1,720 | |
| USD | | | 114,607 | | | CLP | | | 82,000,000 | | | HSBC Bank PLC | | | 3/10/16 | | | | (259 | ) |
| USD | | | 257,167 | | | CLP | | | 184,000,000 | | | HSBC Bank PLC | | | 3/10/16 | | | | (580 | ) |
| USD | | | 187,258 | | | CLP | | | 133,000,000 | | | Morgan Stanley & Co. International PLC | | | 3/10/16 | | | | 952 | |
| USD | | | 88,412 | | | COP | | | 280,000,000 | | | Citibank N.A. | | | 3/10/16 | | | | 821 | |
| USD | | | 400,838 | | | COP | | | 1,340,000,000 | | | Goldman Sachs International | | | 3/10/16 | | | | (18,345 | ) |
| USD | | | 153,986 | | | COP | | | 510,000,000 | | | Goldman Sachs International | | | 3/10/16 | | | | (5,554 | ) |
| USD | | | 1,062,863 | | | COP | | | 3,390,000,000 | | | JPMorgan Chase Bank N.A. | | | 3/10/16 | | | | 2,392 | |
| USD | | | 896,692 | | | COP | | | 2,860,000,000 | | | JPMorgan Chase Bank N.A. | | | 3/10/16 | | | | 2,018 | |
| USD | | | 332,340 | | | COP | | | 1,060,000,000 | | | JPMorgan Chase Bank N.A. | | | 3/10/16 | | | | 748 | |
| USD | | | 142,988 | | | COP | | | 470,000,000 | | | Morgan Stanley & Co. International PLC | | | 3/10/16 | | | | (4,039 | ) |
| USD | | | 197,749 | | | COP | | | 650,000,000 | | | Morgan Stanley & Co. International PLC | | | 3/10/16 | | | | (5,586 | ) |
See Notes to Financial Statements.
| | | | | | |
| | | | | | | |
| 42 | | BLACKROCK COREALPHA BOND FUND | | DECEMBER 31, 2015 | | |
| | |
Schedule of Investments (continued) | | CoreAlpha Bond Master Portfolio |
Forward Foreign Currency Exchange Contracts (continued)
| | | | | | | | | | | | | | | | | | | | |
Currency
Purchased | | | Currency
Sold | | | Counterparty | | Settlement
Date | | | Unrealized
Appreciation
(Depreciation) | |
| USD | | | 2,579,627 | | | EUR | | | 2,430,000 | | | Barclays Bank PLC | | | 3/10/16 | | | $ | (64,366 | ) |
| USD | | | 366,243 | | | EUR | | | 345,000 | | | Barclays Bank PLC | | | 3/10/16 | | | | (9,138 | ) |
| USD | | | 257,654 | | | EUR | | | 235,000 | | | BNP Paribas S.A. | | | 3/10/16 | | | | 1,959 | |
| USD | | | 548,199 | | | EUR | | | 500,000 | | | BNP Paribas S.A. | | | 3/10/16 | | | | 4,168 | |
| USD | | | 361,978 | | | EUR | | | 330,000 | | | BNP Paribas S.A. | | | 3/10/16 | | | | 2,917 | |
| USD | | | 405,854 | | | EUR | | | 370,000 | | | BNP Paribas S.A. | | | 3/10/16 | | | | 3,270 | |
| USD | | | 1,260,514 | | | EUR | | | 1,155,000 | | | BNP Paribas S.A. | | | 3/10/16 | | | | 3,801 | |
| USD | | | 102,767 | | | EUR | | | 94,471 | | | BNP Paribas S.A. | | | 3/10/16 | | | | (24 | ) |
| USD | | | 562,196 | | | EUR | | | 516,814 | | | BNP Paribas S.A. | | | 3/10/16 | | | | (129 | ) |
| USD | | | 273,732 | | | EUR | | | 250,000 | | | Citibank N.A. | | | 3/10/16 | | | | 1,716 | |
| USD | | | 574,837 | | | EUR | | | 525,000 | | | Citibank N.A. | | | 3/10/16 | | | | 3,604 | |
| USD | | | 175,674 | | | EUR | | | 160,000 | | | Citibank N.A. | | | 3/10/16 | | | | 1,584 | |
| USD | | | 1,266,359 | | | EUR | | | 1,155,000 | | | Credit Suisse International | | | 3/10/16 | | | | 9,647 | |
| USD | | | 377,295 | | | EUR | | | 346,955 | | | Credit Suisse International | | | 3/10/16 | | | | (214 | ) |
| USD | | | 76,671 | | | EUR | | | 70,000 | | | Credit Suisse International | | | 3/10/16 | | | | 507 | |
| USD | | | 594,296 | | | EUR | | | 540,000 | | | Deutsche Bank AG | | | 3/10/16 | | | | 6,742 | |
| USD | | | 211,645 | | | EUR | | | 192,954 | | | Goldman Sachs International | | | 3/10/16 | | | | 1,699 | |
| USD | | | 638,054 | | | EUR | | | 580,000 | | | Goldman Sachs International | | | 3/10/16 | | | | 6,977 | |
| USD | | | 1,434,967 | | | EUR | | | 1,300,000 | | | HSBC Bank PLC | | | 3/10/16 | | | | 20,485 | |
| USD | | | 383,349 | | | EUR | | | 350,000 | | | HSBC Bank PLC | | | 3/10/16 | | | | 2,527 | |
| USD | | | 608,297 | | | EUR | | | 555,000 | | | JPMorgan Chase Bank N.A. | | | 3/10/16 | | | | 4,422 | |
| USD | | | 290,448 | | | EUR | | | 265,000 | | | JPMorgan Chase Bank N.A. | | | 3/10/16 | | | | 2,111 | |
| USD | | | 1,751,714 | | | EUR | | | 1,610,000 | | | JPMorgan Chase Bank N.A. | | | 3/10/16 | | | | (68 | ) |
| USD | | | 912,710 | | | EUR | | | 840,000 | | | Morgan Stanley & Co. International PLC | | | 3/10/16 | | | | (1,263 | ) |
| USD | | | 2,004,244 | | | EUR | | | 1,840,000 | | | Morgan Stanley & Co. International PLC | | | 3/10/16 | | | | 2,208 | |
| USD | | | 522,846 | | | EUR | | | 480,000 | | | Morgan Stanley & Co. International PLC | | | 3/10/16 | | | | 576 | |
| USD | | | 150,178 | | | EUR | | | 137,046 | | | Morgan Stanley & Co. International PLC | | | 3/10/16 | | | | 1,063 | |
| USD | | | 1,086,558 | | | EUR | | | 1,003,045 | | | Morgan Stanley & Co. International PLC | | | 3/10/16 | | | | (4,819 | ) |
| USD | | | 82,150 | | | EUR | | | 75,529 | | | Morgan Stanley & Co. International PLC | | | 3/10/16 | | | | (30 | ) |
| USD | | | 449,406 | | | EUR | | | 413,186 | | | Morgan Stanley & Co. International PLC | | | 3/10/16 | | | | (167 | ) |
| USD | | | 2,580,879 | | | EUR | | | 2,430,000 | | | UBS AG | | | 3/10/16 | | | | (63,115 | ) |
| USD | | | 366,421 | | | EUR | | | 345,000 | | | UBS AG | | | 3/10/16 | | | | (8,961 | ) |
| USD | | | 193,591 | | | GBP | | | 130,000 | | | Barclays Bank PLC | | | 3/10/16 | | | | 1,963 | |
| USD | | | 574,799 | | | GBP | | | 380,000 | | | BNP Paribas S.A. | | | 3/10/16 | | | | 14,657 | |
| USD | | | 340,209 | | | GBP | | | 224,143 | | | Citibank N.A. | | | 3/10/16 | | | | 9,809 | |
| USD | | | 120,074 | | | GBP | | | 79,109 | | | Citibank N.A. | | | 3/10/16 | | | | 3,462 | |
| USD | | | 466,953 | | | GBP | | | 307,647 | | | Citibank N.A. | | | 3/10/16 | | | | 13,463 | |
| USD | | | 593,431 | | | GBP | | | 400,000 | | | Citibank N.A. | | | 3/10/16 | | | | 3,808 | |
| USD | | | 452,167 | | | GBP | | | 300,000 | | | Deutsche Bank AG | | | 3/10/16 | | | | 9,949 | |
| USD | | | 465,950 | | | GBP | | | 310,000 | | | Goldman Sachs International | | | 3/10/16 | | | | 8,992 | |
| USD | | | 210,261 | | | GBP | | | 140,000 | | | HSBC Bank PLC | | | 3/10/16 | | | | 3,893 | |
| USD | | | 4,800,288 | | | GBP | | | 3,200,000 | | | HSBC Bank PLC | | | 3/10/16 | | | | 83,301 | |
| USD | | | 615,037 | | | GBP | | | 410,000 | | | HSBC Bank PLC | | | 3/10/16 | | | | 10,673 | |
| USD | | | 606,143 | | | GBP | | | 400,000 | | | HSBC Bank PLC | | | 3/10/16 | | | | 16,519 | |
| USD | | | 136,482 | | | GBP | | | 90,000 | | | HSBC Bank PLC | | | 3/10/16 | | | | 3,817 | |
| USD | | | 530,763 | | | GBP | | | 350,000 | | | HSBC Bank PLC | | | 3/10/16 | | | | 14,843 | |
| USD | | | 386,699 | | | GBP | | | 255,000 | | | HSBC Bank PLC | | | 3/10/16 | | | | 10,814 | |
| USD | | | 298,851 | | | GBP | | | 200,000 | | | HSBC Bank PLC | | | 3/10/16 | | | | 4,039 | |
| USD | | | 16,529 | | | GBP | | | 10,891 | | | Morgan Stanley & Co. International PLC | | | 3/10/16 | | | | 475 | |
| USD | | | 46,832 | | | GBP | | | 30,857 | | | Morgan Stanley & Co. International PLC | | | 3/10/16 | | | | 1,347 | |
| USD | | | 64,280 | | | GBP | | | 42,353 | | | Morgan Stanley & Co. International PLC | | | 3/10/16 | | | | 1,849 | |
| USD | | | 178,850 | | | GBP | | | 120,000 | | | UBS AG | | | 3/10/16 | | | | 1,963 | |
| USD | | | 211,425 | | | HUF | | | 61,000,000 | | | Bank of America N.A. | | | 3/10/16 | | | | 1,960 | |
| USD | | | 67,888 | | | HUF | | | 19,620,238 | | | Barclays Bank PLC | | | 3/10/16 | | | | 515 | |
| USD | | | 124,443 | | | HUF | | | 36,000,000 | | | Barclays Bank PLC | | | 3/10/16 | | | | 823 | |
| USD | | | 273,082 | | | HUF | | | 79,000,000 | | | Barclays Bank PLC | | | 3/10/16 | | | | 1,807 | |
| USD | | | 13,273 | | | HUF | | | 3,840,195 | | | Barclays Bank PLC | | | 3/10/16 | | | | 86 | |
| USD | | | 11,208 | | | HUF | | | 3,242,831 | | | Barclays Bank PLC | | | 3/10/16 | | | | 73 | |
| USD | | | 59,870 | | | HUF | | | 17,466,324 | | | Barclays Bank PLC | | | 3/10/16 | | | | (107 | ) |
| USD | | | 216,828 | | | HUF | | | 63,256,418 | | | Barclays Bank PLC | | | 3/10/16 | | | | (386 | ) |
| USD | | | 298,513 | | | HUF | | | 85,375,000 | | | Barclays Bank PLC | | | 3/10/16 | | | | 5,347 | |
| USD | | | 641,956 | | | HUF | | | 183,600,000 | | | Barclays Bank PLC | | | 3/10/16 | | | | 11,498 | |
| USD | | | 292,097 | | | HUF | | | 83,540,000 | | | Barclays Bank PLC | | | 3/10/16 | | | | 5,232 | |
| USD | | | 684,166 | | | HUF | | | 196,000,000 | | | Barclays Bank PLC | | | 3/10/16 | | | | 11,129 | |
See Notes to Financial Statements.
| | | | | | |
| | | | | | | |
| | BLACKROCK COREALPHA BOND FUND | | DECEMBER 31, 2015 | | 43 |
| | |
Schedule of Investments (continued) | | CoreAlpha Bond Master Portfolio |
Forward Foreign Currency Exchange Contracts (continued)
| | | | | | | | | | | | | | | | | | | | |
Currency
Purchased | | | Currency
Sold | | | Counterparty | | Settlement
Date | | | Unrealized
Appreciation
(Depreciation) | |
| USD | | | 294,752 | | | HUF | | | 84,625,000 | | | Barclays Bank PLC | | | 3/10/16 | | | $ | 4,161 | |
| USD | | | 81,782 | | | HUF | | | 23,480,000 | | | Barclays Bank PLC | | | 3/10/16 | | | | 1,155 | |
| USD | | | 128,684 | | | HUF | | | 37,000,000 | | | BNP Paribas S.A. | | | 3/10/16 | | | | 1,631 | |
| USD | | | 150,477 | | | HUF | | | 43,680,000 | | | BNP Paribas S.A. | | | 3/10/16 | | | | 486 | |
| USD | | | 267,092 | | | HUF | | | 77,000,000 | | | BNP Paribas S.A. | | | 3/10/16 | | | | 2,685 | |
| USD | | | 268,065 | | | HUF | | | 77,000,000 | | | Credit Suisse International | | | 3/10/16 | | | | 3,657 | |
| USD | | | 59,535 | | | HUF | | | 17,245,908 | | | Credit Suisse International | | | 3/10/16 | | | | 315 | |
| USD | | | 98,206 | | | HUF | | | 28,306,546 | | | Credit Suisse International | | | 3/10/16 | | | | 1,005 | |
| USD | | | 116,296 | | | HUF | | | 33,520,909 | | | Credit Suisse International | | | 3/10/16 | | | | 1,190 | |
| USD | | | 44,422 | | | HUF | | | 12,835,891 | | | Credit Suisse International | | | 3/10/16 | | | | 345 | |
| USD | | | 202,759 | | | HUF | | | 59,000,000 | | | Credit Suisse International | | | 3/10/16 | | | | 161 | |
| USD | | | 233,571 | | | HUF | | | 67,186,181 | | | Credit Suisse International | | | 3/10/16 | | | | 2,863 | |
| USD | | | 64,800 | | | HUF | | | 18,639,593 | | | Credit Suisse International | | | 3/10/16 | | | | 794 | |
| USD | | | 169,741 | | | HUF | | | 48,880,407 | | | Deutsche Bank AG | | | 3/10/16 | | | | 1,893 | |
| USD | | | 611,830 | | | HUF | | | 176,188,819 | | | Deutsche Bank AG | | | 3/10/16 | | | | 6,822 | |
| USD | | | 540,820 | | | HUF | | | 157,000,000 | | | JPMorgan Chase Bank N.A. | | | 3/10/16 | | | | 1,703 | |
| USD | | | 134,344 | | | HUF | | | 39,000,000 | | | JPMorgan Chase Bank N.A. | | | 3/10/16 | | | | 423 | |
| USD | | | 81,121 | | | HUF | | | 23,453,854 | | | JPMorgan Chase Bank N.A. | | | 3/10/16 | | | | 584 | |
| USD | | | 322,903 | | | HUF | | | 93,000,000 | | | JPMorgan Chase Bank N.A. | | | 3/10/16 | | | | 3,554 | |
| USD | | | 25,995 | | | HUF | | | 7,460,000 | | | JPMorgan Chase Bank N.A. | | | 3/10/16 | | | | 379 | |
| USD | | | 57,148 | | | HUF | | | 16,400,000 | | | JPMorgan Chase Bank N.A. | | | 3/10/16 | | | | 832 | |
| USD | | | 26,570 | | | HUF | | | 7,625,000 | | | JPMorgan Chase Bank N.A. | | | 3/10/16 | | | | 387 | |
| USD | | | 517,830 | | | HUF | | | 149,000,000 | | | JPMorgan Chase Bank N.A. | | | 3/10/16 | | | | 6,185 | |
| USD | | | 1,059,988 | | | HUF | | | 305,000,000 | | | JPMorgan Chase Bank N.A. | | | 3/10/16 | | | | 12,660 | |
| USD | | | 13,135 | | | HUF | | | 3,798,568 | | | Morgan Stanley & Co. International PLC | | | 3/10/16 | | | | 91 | |
| USD | | | 11,092 | | | HUF | | | 3,207,680 | | | Morgan Stanley & Co. International PLC | | | 3/10/16 | | | | 77 | |
| USD | | | 138,818 | | | HUF | | | 40,164,109 | | | Morgan Stanley & Co. International PLC | | | 3/10/16 | | | | 900 | |
| USD | | | 242,378 | | | HUF | | | 70,743,582 | | | Morgan Stanley & Co. International PLC | | | 3/10/16 | | | | (546 | ) |
| USD | | | 66,925 | | | HUF | | | 19,533,676 | | | Morgan Stanley & Co. International PLC | | | 3/10/16 | | | | (151 | ) |
| USD | | | 357,074 | | | HUF | | | 104,000,000 | | | Société Générale | | | 3/10/16 | | | | (48 | ) |
| USD | | | 11,208 | | | HUF | | | 3,242,943 | | | UBS AG | | | 3/10/16 | | | | 72 | |
| USD | | | 13,272 | | | HUF | | | 3,840,328 | | | UBS AG | | | 3/10/16 | | | | 85 | |
| USD | | | 72,281 | | | IDR | | | 1,030,000,000 | | | Citibank N.A. | | | 3/10/16 | | | | (1,260 | ) |
| USD | | | 134,035 | | | IDR | | | 1,910,000,000 | | | Citibank N.A. | | | 3/10/16 | | | | (2,336 | ) |
| USD | | | 395,027 | | | IDR | | | 5,560,000,000 | | | Citibank N.A. | | | 3/10/16 | | | | (1,950 | ) |
| USD | | | 220,771 | | | IDR | | | 3,110,000,000 | | | HSBC Bank PLC | | | 3/10/16 | | | | (1,279 | ) |
| USD | | | 218,042 | | | IDR | | | 3,130,000,000 | | | HSBC Bank PLC | | | 3/10/16 | | | | (5,435 | ) |
| USD | | | 131,661 | | | IDR | | | 1,890,000,000 | | | HSBC Bank PLC | | | 3/10/16 | | | | (3,282 | ) |
| USD | | | 138,724 | | | IDR | | | 1,990,000,000 | | | HSBC Bank PLC | | | 3/10/16 | | | | (3,359 | ) |
| USD | | | 97,595 | | | IDR | | | 1,400,000,000 | | | HSBC Bank PLC | | | 3/10/16 | | | | (2,363 | ) |
| USD | | | 255,229 | | | IDR | | | 3,600,000,000 | | | HSBC Bank PLC | | | 3/10/16 | | | | (1,807 | ) |
| USD | | | 235,923 | | | IDR | | | 3,310,000,000 | | | JPMorgan Chase Bank N.A. | | | 3/10/16 | | | | (407 | ) |
| USD | | | 36,351 | | | IDR | | | 510,000,000 | | | JPMorgan Chase Bank N.A. | | | 3/10/16 | | | | (63 | ) |
| USD | | | 134,622 | | | IDR | | | 1,950,000,000 | | | Morgan Stanley & Co. International PLC | | | 3/10/16 | | | | (4,605 | ) |
| USD | | | 265,102 | | | IDR | | | 3,840,000,000 | | | Morgan Stanley & Co. International PLC | | | 3/10/16 | | | | (9,069 | ) |
| USD | | | 89,058 | | | IDR | | | 1,290,000,000 | | | Morgan Stanley & Co. International PLC | | | 3/10/16 | | | | (3,047 | ) |
| USD | | | 367,753 | | | IDR | | | 5,360,000,000 | | | Morgan Stanley & Co. International PLC | | | 3/10/16 | | | | (14,944 | ) |
| USD | | | 659,249 | | | IDR | | | 9,480,000,000 | | | Morgan Stanley & Co. International PLC | | | 3/10/16 | | | | (17,610 | ) |
| USD | | | 164,721 | | | IDR | | | 2,300,000,000 | | | Morgan Stanley & Co. International PLC | | | 3/10/16 | | | | 504 | |
| USD | | | 269,122 | | | IDR | | | 3,800,000,000 | | | UBS AG | | | 3/10/16 | | | | (2,193 | ) |
| USD | | | 936,261 | | | IDR | | | 13,220,000,000 | | | UBS AG | | | 3/10/16 | | | | (7,630 | ) |
| USD | | | 270,972 | | | IDR | | | 3,860,000,000 | | | UBS AG | | | 3/10/16 | | | | (4,627 | ) |
| USD | | | 124,956 | | | IDR | | | 1,780,000,000 | | | UBS AG | | | 3/10/16 | | | | (2,134 | ) |
| USD | | | 191,982 | | | ILS | | | 743,307 | | | Barclays Bank PLC | | | 3/10/16 | | | | 710 | |
| USD | | | 34,248 | | | ILS | | | 132,961 | | | Barclays Bank PLC | | | 3/10/16 | | | | 33 | |
| USD | | | 13,856 | | | ILS | | | 54,012 | | | Barclays Bank PLC | | | 3/10/16 | | | | (43 | ) |
| USD | | | 4,330 | | | ILS | | | 16,879 | | | Barclays Bank PLC | | | 3/10/16 | | | | (13 | ) |
| USD | | | 13,639 | | | ILS | | | 53,084 | | | BNP Paribas S.A. | | | 3/10/16 | | | | (21 | ) |
| USD | | | 64,595 | | | ILS | | | 250,000 | | | Citibank N.A. | | | 3/10/16 | | | | 264 | |
| USD | | | 21,249 | | | ILS | | | 82,134 | | | Citibank N.A. | | | 3/10/16 | | | | 114 | |
| USD | | | 16,999 | | | ILS | | | 65,707 | | | Citibank N.A. | | | 3/10/16 | | | | 91 | |
| USD | | | 99,869 | | | ILS | | | 386,030 | | | Citibank N.A. | | | 3/10/16 | | | | 534 | |
| USD | | | 297,059 | | | ILS | | | 1,150,000 | | | Credit Suisse International | | | 3/10/16 | | | | 1,135 | |
| USD | | | 208,374 | | | ILS | | | 800,000 | | | Credit Suisse International | | | 3/10/16 | | | | 2,513 | |
See Notes to Financial Statements.
| | | | | | |
| | | | | | | |
| 44 | | BLACKROCK COREALPHA BOND FUND | | DECEMBER 31, 2015 | | |
| | |
Schedule of Investments (continued) | | CoreAlpha Bond Master Portfolio |
Forward Foreign Currency Exchange Contracts (continued)
| | | | | | | | | | | | | | | | | | | | |
Currency
Purchased | | | Currency
Sold | | | Counterparty | | Settlement
Date | | | Unrealized
Appreciation
(Depreciation) | |
| USD | | | 339,577 | | | ILS | | | 1,310,125 | | | Credit Suisse International | | | 3/10/16 | | | $ | 2,448 | |
| USD | | | 92,530 | | | ILS | | | 357,535 | | | Credit Suisse International | | | 3/10/16 | | | | 528 | |
| USD | | | 176,649 | | | ILS | | | 682,566 | | | Credit Suisse International | | | 3/10/16 | | | | 1,007 | |
| USD | | | 194,901 | | | ILS | | | 750,000 | | | Credit Suisse International | | | 3/10/16 | | | | 1,907 | |
| USD | | | 621,998 | | | ILS | | | 2,406,693 | | | Credit Suisse International | | | 3/10/16 | | | | 2,693 | |
| USD | | | 57,800 | | | ILS | | | 223,000 | | | Credit Suisse International | | | 3/10/16 | | | | 417 | |
| USD | | | 72,250 | | | ILS | | | 278,750 | | | Credit Suisse International | | | 3/10/16 | | | | 521 | |
| USD | | | 364,978 | | | ILS | | | 1,417,039 | | | Credit Suisse International | | | 3/10/16 | | | | 338 | |
| USD | | | 124,123 | | | ILS | | | 483,121 | | | Credit Suisse International | | | 3/10/16 | | | | (197 | ) |
| USD | | | 397,193 | | | ILS | | | 1,545,988 | | | Credit Suisse International | | | 3/10/16 | | | | (629 | ) |
| USD | | | 34,758 | | | ILS | | | 135,243 | | | Credit Suisse International | | | 3/10/16 | | | | (43 | ) |
| USD | | | 594,345 | | | ILS | | | 2,311,673 | | | Credit Suisse International | | | 3/10/16 | | | | (508 | ) |
| USD | | | 141,321 | | | ILS | | | 550,000 | | | Deutsche Bank AG | | | 3/10/16 | | | | (208 | ) |
| USD | | | 415,823 | | | ILS | | | 1,600,000 | | | HSBC Bank PLC | | | 3/10/16 | | | | 4,102 | |
| USD | | | 69,264 | | | ILS | | | 267,728 | | | HSBC Bank PLC | | | 3/10/16 | | | | 371 | |
| USD | | | 11,790 | | | ILS | | | 45,571 | | | HSBC Bank PLC | | | 3/10/16 | | | | 63 | |
| USD | | | 95,016 | | | ILS | | | 367,434 | | | HSBC Bank PLC | | | 3/10/16 | | | | 466 | |
| USD | | | 49,770 | | | ILS | | | 192,465 | | | HSBC Bank PLC | | | 3/10/16 | | | | 244 | |
| USD | | | 14,737 | | | ILS | | | 56,963 | | | HSBC Bank PLC | | | 3/10/16 | | | | 79 | |
| USD | | | 21,250 | | | ILS | | | 82,153 | | | Morgan Stanley & Co. International PLC | | | 3/10/16 | | | | 110 | |
| USD | | | 99,875 | | | ILS | | | 386,117 | | | Morgan Stanley & Co. International PLC | | | 3/10/16 | | | | 517 | |
| USD | | | 17,000 | | | ILS | | | 65,722 | | | Morgan Stanley & Co. International PLC | | | 3/10/16 | | | | 88 | |
| USD | | | 385,455 | | | ILS | | | 1,500,000 | | | UBS AG | | | 3/10/16 | | | | (533 | ) |
| USD | | | 141,334 | | | ILS | | | 550,000 | | | UBS AG | | | 3/10/16 | | | | (195 | ) |
| USD | | | 123,370 | | | INR | | | 8,342,290 | | | Barclays Bank PLC | | | 3/10/16 | | | | (1,416 | ) |
| USD | | | 205,224 | | | INR | | | 13,750,000 | | | Barclays Bank PLC | | | 3/10/16 | | | | (452 | ) |
| USD | | | 90,708 | | | INR | | | 6,150,000 | | | Citibank N.A. | | | 3/10/16 | | | | (1,285 | ) |
| USD | | | 394,582 | | | INR | | | 26,800,000 | | | Citibank N.A. | | | 3/10/16 | | | | (6,299 | ) |
| USD | | | 97,173 | | | INR | | | 6,600,000 | | | Citibank N.A. | | | 3/10/16 | | | | (1,551 | ) |
| USD | | | 97,503 | | | INR | | | 6,600,000 | | | Citibank N.A. | | | 3/10/16 | | | | (1,221 | ) |
| USD | | | 217,166 | | | INR | | | 14,700,000 | | | Citibank N.A. | | | 3/10/16 | | | | (2,720 | ) |
| USD | | | 155,119 | | | INR | | | 10,500,000 | | | Citibank N.A. | | | 3/10/16 | | | | (1,943 | ) |
| USD | | | 96,283 | | | INR | | | 6,450,000 | | | Citibank N.A. | | | 3/10/16 | | | | (198 | ) |
| USD | | | 3,909,185 | | | INR | | | 264,300,000 | | | HSBC Bank PLC | | | 3/10/16 | | | | (44,282 | ) |
| USD | | | 90,752 | | | INR | | | 6,150,000 | | | HSBC Bank PLC | | | 3/10/16 | | | | (1,241 | ) |
| USD | | | 1,184,548 | | | INR | | | 80,400,000 | | | HSBC Bank PLC | | | 3/10/16 | | | | (18,096 | ) |
| USD | | | 217,102 | | | INR | | | 14,700,000 | | | HSBC Bank PLC | | | 3/10/16 | | | | (2,784 | ) |
| USD | | | 155,073 | | | INR | | | 10,500,000 | | | HSBC Bank PLC | | | 3/10/16 | | | | (1,989 | ) |
| USD | | | 97,475 | | | INR | | | 6,600,000 | | | HSBC Bank PLC | | | 3/10/16 | | | | (1,250 | ) |
| USD | | | 200,599 | | | INR | | | 13,400,000 | | | HSBC Bank PLC | | | 3/10/16 | | | | 158 | |
| USD | | | 241,625 | | | INR | | | 16,200,000 | | | HSBC Bank PLC | | | 3/10/16 | | | | (699 | ) |
| USD | | | 98,966 | | | INR | | | 6,700,000 | | | JPMorgan Chase Bank N.A. | | | 3/10/16 | | | | (1,254 | ) |
| USD | | | 305,150 | | | INR | | | 20,500,000 | | | Morgan Stanley & Co. International PLC | | | 3/10/16 | | | | (1,494 | ) |
| USD | | | 148,735 | | | INR | | | 10,057,710 | | | UBS AG | | | 3/10/16 | | | | (1,711 | ) |
| USD | | | 96,269 | | | INR | | | 6,450,000 | | | UBS AG | | | 3/10/16 | | | | (212 | ) |
| USD | | | 403,346 | | | INR | | | 27,000,000 | | | UBS AG | | | 3/10/16 | | | | (527 | ) |
| USD | | | 333,134 | | | INR | | | 22,300,000 | | | UBS AG | | | 3/10/16 | | | | (435 | ) |
| USD | | | 205,193 | | | INR | | | 13,750,000 | | | UBS AG | | | 3/10/16 | | | | (483 | ) |
| USD | | | 306,964 | | | JPY | | | 37,000,000 | | | Barclays Bank PLC | | | 3/10/16 | | | | (1,047 | ) |
| USD | | | 16,676 | | | JPY | | | 2,047,126 | | | BNP Paribas S.A. | | | 3/10/16 | | | | (366 | ) |
| USD | | | 197,514 | | | JPY | | | 24,000,000 | | | Citibank N.A. | | | 3/10/16 | | | | (2,276 | ) |
| USD | | | 1,205,091 | | | JPY | | | 147,952,874 | | | Credit Suisse International | | | 3/10/16 | | | | (26,560 | ) |
| USD | | | 1,628,796 | | | JPY | | | 198,000,000 | | | Credit Suisse International | | | 3/10/16 | | | | (19,479 | ) |
| USD | | | 314,407 | | | JPY | | | 38,000,000 | | | HSBC Bank PLC | | | 3/10/16 | | | | (1,929 | ) |
| USD | | | 212,295 | | | JPY | | | 26,000,000 | | | Westpac Banking Corp. | | | 3/10/16 | | | | (4,145 | ) |
| USD | | | 316,142 | | | JPY | | | 38,000,000 | | | Westpac Banking Corp. | | | 3/10/16 | | | | (193 | ) |
| USD | | | 180,486 | | | KRW | | | 213,750,000 | | | Bank of America N.A. | | | 3/10/16 | | | | (1,537 | ) |
| USD | | | 71,772 | | | KRW | | | 85,000,000 | | | Bank of America N.A. | | | 3/10/16 | | | | (611 | ) |
| USD | | | 210,949 | | | KRW | | | 247,707,278 | | | Citibank N.A. | | | 3/10/16 | | | | 9 | |
| USD | | | 75,995 | | | KRW | | | 89,237,209 | | | Citibank N.A. | | | 3/10/16 | | | | 3 | |
| USD | | | 37,997 | | | KRW | | | 44,617,450 | | | Citibank N.A. | | | 3/10/16 | | | | 2 | |
| USD | | | 76,757 | | | KRW | | | 90,915,056 | | | Goldman Sachs International | | | 3/10/16 | | | | (664 | ) |
| USD | | | 159,417 | | | KRW | | | 188,823,578 | | | Goldman Sachs International | | | 3/10/16 | | | | (1,379 | ) |
| USD | | | 51,171 | | | KRW | | | 60,610,037 | | | Goldman Sachs International | | | 3/10/16 | | | | (443 | ) |
See Notes to Financial Statements.
| | | | | | |
| | | | | | | |
| | BLACKROCK COREALPHA BOND FUND | | DECEMBER 31, 2015 | | 45 |
| | |
Schedule of Investments (continued) | | CoreAlpha Bond Master Portfolio |
Forward Foreign Currency Exchange Contracts (continued)
| | | | | | | | | | | | | | | | | | | | |
Currency
Purchased | | | Currency
Sold | | | Counterparty | | Settlement
Date | | | Unrealized
Appreciation
(Depreciation) | |
| USD | | | 251,320 | | | KRW | | | 297,500,000 | | | HSBC Bank PLC | | | 3/10/16 | | | $ | (2,022 | ) |
| USD | | | 71,803 | | | KRW | | | 85,000,000 | | | HSBC Bank PLC | | | 3/10/16 | | | | (581 | ) |
| USD | | | 180,563 | | | KRW | | | 213,750,000 | | | HSBC Bank PLC | | | 3/10/16 | | | | (1,460 | ) |
| USD | | | 457,008 | | | KRW | | | 536,665,000 | | | HSBC Bank PLC | | | 3/10/16 | | | | 1 | |
| USD | | | 164,639 | | | KRW | | | 193,335,000 | | | HSBC Bank PLC | | | 3/10/16 | | | | — | |
| USD | | | 82,317 | | | KRW | | | 96,665,000 | | | HSBC Bank PLC | | | 3/10/16 | | | | — | |
| USD | | | 88,625 | | | KRW | | | 104,097,791 | | | HSBC Bank PLC | | | 3/10/16 | | | | (22 | ) |
| USD | | | 246,007 | | | KRW | | | 288,957,722 | | | HSBC Bank PLC | | | 3/10/16 | | | | (60 | ) |
| USD | | | 44,311 | | | KRW | | | 52,047,550 | | | HSBC Bank PLC | | | 3/10/16 | | | | (11 | ) |
| USD | | | 456,927 | | | KRW | | | 536,670,000 | | | HSBC Bank PLC | | | 3/10/16 | | | | (85 | ) |
| USD | | | 82,306 | | | KRW | | | 96,670,000 | | | HSBC Bank PLC | | | 3/10/16 | | | | (15 | ) |
| USD | | | 123,636 | | | KRW | | | 145,000,000 | | | HSBC Bank PLC | | | 3/10/16 | | | | 158 | |
| USD | | | 164,603 | | | KRW | | | 193,330,000 | | | HSBC Bank PLC | | | 3/10/16 | | | | (31 | ) |
| USD | | | 2,437,979 | | | KRW | | | 2,845,000,000 | | | JPMorgan Chase Bank N.A. | | | 3/10/16 | | | | 15,263 | |
| USD | | | 205,664 | | | KRW | | | 240,000,000 | | | JPMorgan Chase Bank N.A. | | | 3/10/16 | | | | 1,288 | |
| USD | | | 612,708 | | | KRW | | | 715,000,000 | | | JPMorgan Chase Bank N.A. | | | 3/10/16 | | | | 3,836 | |
| USD | | | 724,110 | | | KRW | | | 845,000,000 | | | JPMorgan Chase Bank N.A. | | | 3/10/16 | | | | 4,533 | |
| USD | | | 180,486 | | | KRW | | | 213,750,000 | | | JPMorgan Chase Bank N.A. | | | 3/10/16 | | | | (1,537 | ) |
| USD | | | 71,772 | | | KRW | | | 85,000,000 | | | JPMorgan Chase Bank N.A. | | | 3/10/16 | | | | (611 | ) |
| USD | | | 103,088 | | | KRW | | | 120,000,000 | | | Morgan Stanley & Co. International PLC | | | 3/10/16 | | | | 900 | |
| USD | | | 401,058 | | | KRW | | | 470,000,000 | | | Morgan Stanley & Co. International PLC | | | 3/10/16 | | | | 820 | |
| USD | | | 183,463 | | | KRW | | | 215,000,000 | | | Morgan Stanley & Co. International PLC | | | 3/10/16 | | | | 375 | |
| USD | | | 159,417 | | | KRW | | | 188,791,216 | | | Morgan Stanley & Co. International PLC | | | 3/10/16 | | | | (1,351 | ) |
| USD | | | 51,171 | | | KRW | | | 60,599,650 | | | Morgan Stanley & Co. International PLC | | | 3/10/16 | | | | (434 | ) |
| USD | | | 76,757 | | | KRW | | | 90,899,475 | | | Morgan Stanley & Co. International PLC | | | 3/10/16 | | | | (651 | ) |
| USD | | | 473,590 | | | KRW | | | 555,000,000 | | | Morgan Stanley & Co. International PLC | | | 3/10/16 | | | | 969 | |
| USD | | | 7,422 | | | KRW | | | 8,790,313 | | | UBS AG | | | 3/10/16 | | | | (64 | ) |
| USD | | | 11,133 | | | KRW | | | 13,185,469 | | | UBS AG | | | 3/10/16 | | | | (96 | ) |
| USD | | | 23,122 | | | KRW | | | 27,385,206 | | | UBS AG | | | 3/10/16 | | | | (199 | ) |
| USD | | | 251,288 | | | KRW | | | 297,500,000 | | | UBS AG | | | 3/10/16 | | | | (2,054 | ) |
| USD | | | 180,212 | | | KRW | | | 213,750,000 | | | UBS AG | | | 3/10/16 | | | | (1,811 | ) |
| USD | | | 71,663 | | | KRW | | | 85,000,000 | | | UBS AG | | | 3/10/16 | | | | (720 | ) |
| USD | | | 105,630 | | | MXN | | | 1,800,000 | | | Bank of America N.A. | | | 3/10/16 | | | | 1,889 | |
| USD | | | 140,612 | | | MXN | | | 2,400,000 | | | Citibank N.A. | | | 3/10/16 | | | | 2,290 | |
| USD | | | 232,591 | | | MXN | | | 4,000,000 | | | Citibank N.A. | | | 3/10/16 | | | | 2,054 | |
| USD | | | 1,600,381 | | | MXN | | | 27,700,000 | | | Citibank N.A. | | | 3/10/16 | | | | 3,912 | |
| USD | | | 363,531 | | | MXN | | | 6,237,032 | | | Citibank N.A. | | | 3/10/16 | | | | 4,064 | |
| USD | | | 49,691 | | | MXN | | | 852,544 | | | Citibank N.A. | | | 3/10/16 | | | | 556 | |
| USD | | | 587,079 | | | MXN | | | 10,200,000 | | | Citibank N.A. | | | 3/10/16 | | | | (790 | ) |
| USD | | | 571,295 | | | MXN | | | 9,500,000 | | | Credit Suisse International | | | 3/10/16 | | | | 23,769 | |
| USD | | | 126,286 | | | MXN | | | 2,100,000 | | | Credit Suisse International | | | 3/10/16 | | | | 5,254 | |
| USD | | | 130,188 | | | MXN | | | 2,200,000 | | | Credit Suisse International | | | 3/10/16 | | | | 3,392 | |
| USD | | | 511,063 | | | MXN | | | 8,500,000 | | | Deutsche Bank AG | | | 3/10/16 | | | | 21,172 | |
| USD | | | 1,575,277 | | | MXN | | | 26,200,000 | | | Deutsche Bank AG | | | 3/10/16 | | | | 65,259 | |
| USD | | | 817,089 | | | MXN | | | 14,000,000 | | | Deutsche Bank AG | | | 3/10/16 | | | | 10,209 | |
| USD | | | 615,528 | | | MXN | | | 10,600,000 | | | Deutsche Bank AG | | | 3/10/16 | | | | 4,604 | |
| USD | | | 139,365 | | | MXN | | | 2,400,000 | | | Deutsche Bank AG | | | 3/10/16 | | | | 1,042 | |
| USD | | | 139,365 | | | MXN | | | 2,400,000 | | | Deutsche Bank AG | | | 3/10/16 | | | | 1,042 | |
| USD | | | 203,240 | | | MXN | | | 3,500,000 | | | Deutsche Bank AG | | | 3/10/16 | | | | 1,520 | |
| USD | | | 401,208 | | | MXN | | | 7,000,000 | | | Goldman Sachs International | | | 3/10/16 | | | | (2,232 | ) |
| USD | | | 310,036 | | | MXN | | | 5,300,000 | | | Goldman Sachs International | | | 3/10/16 | | | | 4,574 | |
| USD | | | 198,891 | | | MXN | | | 3,400,000 | | | Goldman Sachs International | | | 3/10/16 | | | | 2,934 | |
| USD | | | 98,425 | | | MXN | | | 1,700,000 | | | HSBC Bank PLC | | | 3/10/16 | | | | 446 | |
| USD | | | 440,016 | | | MXN | | | 7,600,000 | | | HSBC Bank PLC | | | 3/10/16 | | | | 1,995 | |
| USD | | | 138,952 | | | MXN | | | 2,400,000 | | | HSBC Bank PLC | | | 3/10/16 | | | | 630 | |
| USD | | | 647,995 | | | MXN | | | 10,900,000 | | | JPMorgan Chase Bank N.A. | | | 3/10/16 | | | | 19,782 | |
| USD | | | 755,004 | | | MXN | | | 12,700,000 | | | JPMorgan Chase Bank N.A. | | | 3/10/16 | | | | 23,048 | |
| USD | | | 273,506 | | | MXN | | | 4,700,000 | | | JPMorgan Chase Bank N.A. | | | 3/10/16 | | | | 2,625 | |
| USD | | | 203,674 | | | MXN | | | 3,500,000 | | | JPMorgan Chase Bank N.A. | | | 3/10/16 | | | | 1,954 | |
| USD | | | 296,783 | | | MXN | | | 5,100,000 | | | JPMorgan Chase Bank N.A. | | | 3/10/16 | | | | 2,848 | |
| USD | | | 315,574 | | | MXN | | | 5,500,000 | | | JPMorgan Chase Bank N.A. | | | 3/10/16 | | | | (1,414 | ) |
| USD | | | 120,492 | | | MXN | | | 2,100,000 | | | JPMorgan Chase Bank N.A. | | | 3/10/16 | | | | (540 | ) |
| USD | | | 172,131 | | | MXN | | | 3,000,000 | | | JPMorgan Chase Bank N.A. | | | 3/10/16 | | | | (772 | ) |
| USD | | | 60,909 | | | MXN | | | 1,047,456 | | | JPMorgan Chase Bank N.A. | | | 3/10/16 | | | | 540 | |
See Notes to Financial Statements.
| | | | | | |
| | | | | | | |
| 46 | | BLACKROCK COREALPHA BOND FUND | | DECEMBER 31, 2015 | | |
| | |
Schedule of Investments (continued) | | CoreAlpha Bond Master Portfolio |
Forward Foreign Currency Exchange Contracts (continued)
| | | | | | | | | | | | | | | | | | | | |
Currency
Purchased | | | Currency
Sold | | | Counterparty | | Settlement
Date | | | Unrealized
Appreciation
(Depreciation) | |
| USD | | | 445,598 | | | MXN | | | 7,662,968 | | | JPMorgan Chase Bank N.A. | | | 3/10/16 | | | $ | 3,948 | |
| USD | | | 469,838 | | | MXN | | | 8,100,000 | | | Morgan Stanley & Co. International PLC | | | 3/10/16 | | | | 3,000 | |
| USD | | | 71,062 | | | MYR | | | 305,000 | | | Bank of America N.A. | | | 3/10/16 | | | | 349 | |
| USD | | | 73,538 | | | MYR | | | 315,000 | | | Barclays Bank PLC | | | 3/10/16 | | | | 506 | |
| USD | | | 108,495 | | | MYR | | | 475,640 | | | Citibank N.A. | | | 3/10/16 | | | | (1,781 | ) |
| USD | | | 48,220 | | | MYR | | | 211,396 | | | Citibank N.A. | | | 3/10/16 | | | | (792 | ) |
| USD | | | 84,385 | | | MYR | | | 369,943 | | | Citibank N.A. | | | 3/10/16 | | | | (1,385 | ) |
| USD | | | 471,921 | | | MYR | | | 2,000,000 | | | HSBC Bank PLC | | | 3/10/16 | | | | 8,226 | |
| USD | | | 105,932 | | | MYR | | | 453,792 | | | HSBC Bank PLC | | | 3/10/16 | | | | 722 | |
| USD | | | 84,746 | | | MYR | | | 363,034 | | | HSBC Bank PLC | | | 3/10/16 | | | | 577 | |
| USD | | | 187,117 | | | MYR | | | 800,000 | | | HSBC Bank PLC | | | 3/10/16 | | | | 1,639 | |
| USD | | | 347,584 | | | MYR | | | 1,500,000 | | | HSBC Bank PLC | | | 3/10/16 | | | | (186 | ) |
| USD | | | 220,137 | | | MYR | | | 950,000 | | | HSBC Bank PLC | | | 3/10/16 | | | | (118 | ) |
| USD | | | 230,947 | | | MYR | | | 1,000,000 | | | HSBC Bank PLC | | | 3/10/16 | | | | (900 | ) |
| USD | | | 73,564 | | | MYR | | | 315,000 | | | HSBC Bank PLC | | | 3/10/16 | | | | 532 | |
| USD | | | 83,770 | | | MYR | | | 360,000 | | | HSBC Bank PLC | | | 3/10/16 | | | | 305 | |
| USD | | | 139,308 | | | MYR | | | 600,000 | | | HSBC Bank PLC | | | 3/10/16 | | | | 200 | |
| USD | | | 232,180 | | | MYR | | | 1,000,000 | | | HSBC Bank PLC | | | 3/10/16 | | | | 333 | |
| USD | | | 87,230 | | | MYR | | | 375,000 | | | HSBC Bank PLC | | | 3/10/16 | | | | 287 | |
| USD | | | 451,360 | | | MYR | | | 1,900,000 | | | Morgan Stanley & Co. International PLC | | | 3/10/16 | | | | 10,850 | |
| USD | | | 356,337 | | | MYR | | | 1,500,000 | | | Morgan Stanley & Co. International PLC | | | 3/10/16 | | | | 8,566 | |
| USD | | | 296,033 | | | MYR | | | 1,250,000 | | | Morgan Stanley & Co. International PLC | | | 3/10/16 | | | | 6,224 | |
| USD | | | 331,557 | | | MYR | | | 1,400,000 | | | Morgan Stanley & Co. International PLC | | | 3/10/16 | | | | 6,971 | |
| USD | | | 128,700 | | | MYR | | | 550,000 | | | Morgan Stanley & Co. International PLC | | | 3/10/16 | | | | 1,184 | |
| USD | | | 8,630 | | | MYR | | | 36,966 | | | Morgan Stanley & Co. International PLC | | | 3/10/16 | | | | 59 | |
| USD | | | 10,787 | | | MYR | | | 46,208 | | | Morgan Stanley & Co. International PLC | | | 3/10/16 | | | | 74 | |
| USD | | | 89,385 | | | MYR | | | 388,604 | | | Morgan Stanley & Co. International PLC | | | 3/10/16 | | | | (711 | ) |
| USD | | | 201,117 | | | MYR | | | 874,360 | | | Morgan Stanley & Co. International PLC | | | 3/10/16 | | | | (1,601 | ) |
| USD | | | 156,425 | | | MYR | | | 680,057 | | | Morgan Stanley & Co. International PLC | | | 3/10/16 | | | | (1,245 | ) |
| USD | | | 417,633 | | | MYR | | | 1,800,000 | | | Morgan Stanley & Co. International PLC | | | 3/10/16 | | | | 309 | |
| USD | | | 231,054 | | | MYR | | | 1,000,000 | | | Morgan Stanley & Co. International PLC | | | 3/10/16 | | | | (794 | ) |
| USD | | | 92,518 | | | MYR | | | 400,000 | | | Morgan Stanley & Co. International PLC | | | 3/10/16 | | | | (221 | ) |
| USD | | | 185,035 | | | MYR | | | 800,000 | | | Morgan Stanley & Co. International PLC | | | 3/10/16 | | | | (442 | ) |
| USD | | | 127,212 | | | MYR | | | 550,000 | | | Morgan Stanley & Co. International PLC | | | 3/10/16 | | | | (304 | ) |
| USD | | | 73,427 | | | MYR | | | 315,000 | | | Morgan Stanley & Co. International PLC | | | 3/10/16 | | | | 395 | |
| USD | | | 393,838 | | | MYR | | | 1,700,000 | | | Morgan Stanley & Co. International PLC | | | 3/10/16 | | | | (303 | ) |
| USD | | | 48,837 | | | MYR | | | 210,000 | | | Morgan Stanley & Co. International PLC | | | 3/10/16 | | | | 149 | |
| USD | | | 6,977 | | | MYR | | | 30,000 | | | Morgan Stanley & Co. International PLC | | | 3/10/16 | | | | 21 | |
| USD | | | 697,756 | | | MYR | | | 3,000,000 | | | Morgan Stanley & Co. International PLC | | | 3/10/16 | | | | 2,214 | |
| USD | | | 86,967 | | | MYR | | | 375,000 | | | Morgan Stanley & Co. International PLC | | | 3/10/16 | | | | 24 | |
| USD | | | 377,715 | | | MYR | | | 1,600,000 | | | UBS AG | | | 3/10/16 | | | | 6,759 | |
| USD | | | 1,244,980 | | | MYR | | | 5,270,000 | | | Westpac Banking Corp. | | | 3/10/16 | | | | 23,145 | |
| USD | | | 2,456,886 | | | MYR | | | 10,400,000 | | | Westpac Banking Corp. | | | 3/10/16 | | | | 45,676 | |
| USD | | | 183,881 | | | NOK | | | 1,600,000 | | | BNP Paribas S.A. | | | 3/10/16 | | | | 3,237 | |
| USD | | | 824,433 | | | NOK | | | 7,200,000 | | | Citibank N.A. | | | 3/10/16 | | | | 11,533 | |
| USD | | | 193,766 | | | NOK | | | 1,700,000 | | | Credit Suisse International | | | 3/10/16 | | | | 1,831 | |
| USD | | | 182,368 | | | NOK | | | 1,600,000 | | | Credit Suisse International | | | 3/10/16 | | | | 1,724 | |
| USD | | | 283,953 | | | NOK | | | 2,500,000 | | | Credit Suisse International | | | 3/10/16 | | | | 1,696 | |
| USD | | | 1,284,261 | | | NOK | | | 11,100,000 | | | JPMorgan Chase Bank N.A. | | | 3/10/16 | | | | 31,040 | |
| USD | | | 2,487,533 | | | NOK | | | 21,500,000 | | | JPMorgan Chase Bank N.A. | | | 3/10/16 | | | | 60,123 | |
| USD | | | 613,206 | | | NOK | | | 5,300,000 | | | JPMorgan Chase Bank N.A. | | | 3/10/16 | | | | 14,821 | |
| USD | | | 359,126 | | | NOK | | | 3,100,000 | | | JPMorgan Chase Bank N.A. | | | 3/10/16 | | | | 9,128 | |
| USD | | | 307,332 | | | NOK | | | 2,700,000 | | | JPMorgan Chase Bank N.A. | | | 3/10/16 | | | | 2,494 | |
| USD | | | 543,086 | | | NOK | | | 4,679,254 | | | Morgan Stanley & Co. International PLC | | | 3/10/16 | | | | 14,785 | |
| USD | | | 257,373 | | | NOK | | | 2,220,746 | | | UBS AG | | | 3/10/16 | | | | 6,645 | |
| USD | | | 124,870 | | | NZD | | | 186,795 | | | Bank of America N.A. | | | 3/10/16 | | | | (2,510 | ) |
| USD | | | 146,482 | | | NZD | | | 219,125 | | | Bank of America N.A. | | | 3/10/16 | | | | (2,944 | ) |
| USD | | | 39,622 | | | NZD | | | 59,272 | | | Bank of America N.A. | | | 3/10/16 | | | | (796 | ) |
| USD | | | 66,646 | | | NZD | | | 98,466 | | | Bank of America N.A. | | | 3/10/16 | | | | (499 | ) |
| USD | | | 34,434 | | | NZD | | | 50,874 | | | Bank of America N.A. | | | 3/10/16 | | | | (258 | ) |
| USD | | | 11,385 | | | NZD | | | 16,821 | | | Bank of America N.A. | | | 3/10/16 | | | | (85 | ) |
| USD | | | 268,311 | | | NZD | | | 400,000 | | | Citibank N.A. | | | 3/10/16 | | | | (4,457 | ) |
| USD | | | 623,823 | | | NZD | | | 930,000 | | | Citibank N.A. | | | 3/10/16 | | | | (10,362 | ) |
| USD | | | 172,371 | | | NZD | | | 254,369 | | | Citibank N.A. | | | 3/10/16 | | | | (1,089 | ) |
See Notes to Financial Statements.
| | | | | | |
| | | | | | | |
| | BLACKROCK COREALPHA BOND FUND | | DECEMBER 31, 2015 | | 47 |
| | |
Schedule of Investments (continued) | | CoreAlpha Bond Master Portfolio |
Forward Foreign Currency Exchange Contracts (continued)
| | | | | | | | | | | | | | | | | | | | |
Currency
Purchased | | | Currency
Sold | | | Counterparty | | Settlement
Date | | | Unrealized
Appreciation
(Depreciation) | |
| USD | | | 333,621 | | | NZD | | | 492,328 | | | Citibank N.A. | | | 3/10/16 | | | $ | (2,107 | ) |
| USD | | | 56,994 | | | NZD | | | 84,106 | | | Citibank N.A. | | | 3/10/16 | | | | (360 | ) |
| USD | | | 185,217 | | | NZD | | | 280,000 | | | Credit Suisse International | | | 3/10/16 | | | | (5,720 | ) |
| USD | | | 445,686 | | | NZD | | | 666,410 | | | Credit Suisse International | | | 3/10/16 | | | | (8,752 | ) |
| USD | | | 141,420 | | | NZD | | | 211,457 | | | Credit Suisse International | | | 3/10/16 | | | | (2,777 | ) |
| USD | | | 522,824 | | | NZD | | | 781,750 | | | Credit Suisse International | | | 3/10/16 | | | | (10,267 | ) |
| USD | | | 658,561 | | | NZD | | | 972,249 | | | Credit Suisse International | | | 3/10/16 | | | | (4,435 | ) |
| USD | | | 340,256 | | | NZD | | | 502,329 | | | Credit Suisse International | | | 3/10/16 | | | | (2,292 | ) |
| USD | | | 112,504 | | | NZD | | | 166,093 | | | Credit Suisse International | | | 3/10/16 | | | | (758 | ) |
| USD | | | 16,894 | | | NZD | | | 25,155 | | | Credit Suisse International | | | 3/10/16 | | | | (260 | ) |
| USD | | | 9,900 | | | NZD | | | 14,728 | | | Credit Suisse International | | | 3/10/16 | | | | (143 | ) |
| USD | | | 4,311 | | | NZD | | | 6,414 | | | Credit Suisse International | | | 3/10/16 | | | | (62 | ) |
| USD | | | 34,433 | | | NZD | | | 50,874 | | | JPMorgan Chase Bank N.A. | | | 3/10/16 | | | | (258 | ) |
| USD | | | 11,385 | | | NZD | | | 16,821 | | | JPMorgan Chase Bank N.A. | | | 3/10/16 | | | | (85 | ) |
| USD | | | 66,645 | | | NZD | | | 98,466 | | | JPMorgan Chase Bank N.A. | | | 3/10/16 | | | | (500 | ) |
| USD | | | 67,821 | | | NZD | | | 100,879 | | | JPMorgan Chase Bank N.A. | | | 3/10/16 | | | | (970 | ) |
| USD | | | 29,535 | | | NZD | | | 43,931 | | | JPMorgan Chase Bank N.A. | | | 3/10/16 | | | | (423 | ) |
| USD | | | 623,644 | | | NZD | | | 940,000 | | | Morgan Stanley & Co. International PLC | | | 3/10/16 | | | | (17,361 | ) |
| USD | | | 617,009 | | | NZD | | | 930,000 | | | Morgan Stanley & Co. International PLC | | | 3/10/16 | | | | (17,176 | ) |
| USD | | | 179,197 | | | NZD | | | 270,000 | | | Morgan Stanley & Co. International PLC | | | 3/10/16 | | | | (4,922 | ) |
| USD | | | 617,234 | | | NZD | | | 930,000 | | | Morgan Stanley & Co. International PLC | | | 3/10/16 | | | | (16,952 | ) |
| USD | | | 124,849 | | | NZD | | | 186,795 | | | Morgan Stanley & Co. International PLC | | | 3/10/16 | | | | (2,530 | ) |
| USD | | | 39,615 | | | NZD | | | 59,272 | | | Morgan Stanley & Co. International PLC | | | 3/10/16 | | | | (803 | ) |
| USD | | | 146,457 | | | NZD | | | 219,125 | | | Morgan Stanley & Co. International PLC | | | 3/10/16 | | | | (2,968 | ) |
| USD | | | 85,442 | | | NZD | | | 126,159 | | | Morgan Stanley & Co. International PLC | | | 3/10/16 | | | | (589 | ) |
| USD | | | 500,147 | | | NZD | | | 738,492 | | | Morgan Stanley & Co. International PLC | | | 3/10/16 | | | | (3,446 | ) |
| USD | | | 258,409 | | | NZD | | | 381,554 | | | Morgan Stanley & Co. International PLC | | | 3/10/16 | | | | (1,780 | ) |
| USD | | | 285,078 | | | NZD | | | 424,845 | | | Morgan Stanley & Co. International PLC | | | 3/10/16 | | | | (4,632 | ) |
| USD | | | 214,089 | | | NZD | | | 320,000 | | | Morgan Stanley & Co. International PLC | | | 3/10/16 | | | | (4,125 | ) |
| USD | | | 200,708 | | | NZD | | | 300,000 | | | Morgan Stanley & Co. International PLC | | | 3/10/16 | | | | (3,868 | ) |
| USD | | | 147,707 | | | NZD | | | 219,655 | | | Morgan Stanley & Co. International PLC | | | 3/10/16 | | | | (2,080 | ) |
| USD | | | 339,179 | | | NZD | | | 504,393 | | | Morgan Stanley & Co. International PLC | | | 3/10/16 | | | | (4,776 | ) |
| USD | | | 92,589 | | | NZD | | | 140,000 | | | UBS AG | | | 3/10/16 | | | | (2,880 | ) |
| USD | | | 205,019 | | | NZD | | | 310,000 | | | UBS AG | | | 3/10/16 | | | | (6,377 | ) |
| USD | | | 436,172 | | | NZD | | | 660,000 | | | Westpac Banking Corp. | | | 3/10/16 | | | | (13,896 | ) |
| USD | | | 204,868 | | | NZD | | | 310,000 | | | Westpac Banking Corp. | | | 3/10/16 | | | | (6,527 | ) |
| USD | | | 223,455 | | | NZD | | | 340,000 | | | Westpac Banking Corp. | | | 3/10/16 | | | | (8,398 | ) |
| USD | | | 134,144 | | | PHP | | | 6,400,000 | | | Barclays Bank PLC | | | 3/10/16 | | | | (1,353 | ) |
| USD | | | 204,092 | | | PHP | | | 9,700,000 | | | Deutsche Bank AG | | | 3/10/16 | | | | (1,270 | ) |
| USD | | | 452,370 | | | PHP | | | 21,500,000 | | | Deutsche Bank AG | | | 3/10/16 | | | | (2,816 | ) |
| USD | | | 273,706 | | | PHP | | | 13,100,000 | | | Goldman Sachs International | | | 3/10/16 | | | | (3,640 | ) |
| USD | | | 546,609 | | | PHP | | | 26,000,000 | | | HSBC Bank PLC | | | 3/10/16 | | | | (3,848 | ) |
| USD | | | 125,549 | | | PHP | | | 6,000,000 | | | HSBC Bank PLC | | | 3/10/16 | | | | (1,479 | ) |
| USD | | | 612,053 | | | PHP | | | 29,250,000 | | | HSBC Bank PLC | | | 3/10/16 | | | | (7,212 | ) |
| USD | | | 91,023 | | | PHP | | | 4,350,000 | | | HSBC Bank PLC | | | 3/10/16 | | | | (1,072 | ) |
| USD | | | 271,285 | | | PHP | | | 13,000,000 | | | HSBC Bank PLC | | | 3/10/16 | | | | (3,943 | ) |
| USD | | | 133,556 | | | PHP | | | 6,400,000 | | | HSBC Bank PLC | | | 3/10/16 | | | | (1,941 | ) |
| USD | | | 91,109 | | | PHP | | | 4,350,000 | | | JPMorgan Chase Bank N.A. | | | 3/10/16 | | | | (987 | ) |
| USD | | | 612,630 | | | PHP | | | 29,250,000 | | | JPMorgan Chase Bank N.A. | | | 3/10/16 | | | | (6,635 | ) |
| USD | | | 136,040 | | | PHP | | | 6,500,000 | | | JPMorgan Chase Bank N.A. | | | 3/10/16 | | | | (1,574 | ) |
| USD | | | 202,971 | | | PHP | | | 9,700,000 | | | Morgan Stanley & Co. International PLC | | | 3/10/16 | | | | (2,392 | ) |
| USD | | | 133,919 | | | PHP | | | 6,400,000 | | | Morgan Stanley & Co. International PLC | | | 3/10/16 | | | | (1,578 | ) |
| USD | | | 136,583 | | | PHP | | | 6,500,000 | | | Standard Chartered Bank | | | 3/10/16 | | | | (1,031 | ) |
| USD | | | 198,103 | | | PLN | | | 800,000 | | | Barclays Bank PLC | | | 3/10/16 | | | | (4,226 | ) |
| USD | | | 185,722 | | | PLN | | | 750,000 | | | Barclays Bank PLC | | | 3/10/16 | | | | (3,962 | ) |
| USD | | | 402,516 | | | PLN | | | 1,600,000 | | | Barclays Bank PLC | | | 3/10/16 | | | | (2,144 | ) |
| USD | | | 290,126 | | | PLN | | | 1,150,000 | | | Barclays Bank PLC | | | 3/10/16 | | | | (723 | ) |
| USD | | | 128,750 | | | PLN | | | 500,000 | | | Barclays Bank PLC | | | 3/10/16 | | | | 2,294 | |
| USD | | | 167,375 | | | PLN | | | 650,000 | | | Barclays Bank PLC | | | 3/10/16 | | | | 2,982 | |
| USD | | | 629,184 | | | PLN | | | 2,500,000 | | | BNP Paribas S.A. | | | 3/10/16 | | | | (3,096 | ) |
| USD | | | 175,696 | | | PLN | | | 700,000 | | | BNP Paribas S.A. | | | 3/10/16 | | | | (1,342 | ) |
| USD | | | 62,598 | | | PLN | | | 250,000 | | | BNP Paribas S.A. | | | 3/10/16 | | | | (630 | ) |
| USD | | | 186,541 | | | PLN | | | 745,000 | | | BNP Paribas S.A. | | | 3/10/16 | | | | (1,878 | ) |
| USD | | | 159,266 | | | PLN | | | 635,033 | | | Credit Suisse International | | | 3/10/16 | | | | (1,341 | ) |
See Notes to Financial Statements.
| | | | | | |
| | | | | | | |
| 48 | | BLACKROCK COREALPHA BOND FUND | | DECEMBER 31, 2015 | | |
| | |
Schedule of Investments (continued) | | CoreAlpha Bond Master Portfolio |
Forward Foreign Currency Exchange Contracts (continued)
| | | | | | | | | | | | | | | | | | | | |
Currency
Purchased | | | Currency Sold | | | Counterparty | | Settlement
Date | | | Unrealized
Appreciation
(Depreciation) | |
| USD | | | 52,795 | | | PLN | | | 210,508 | | | Credit Suisse International | | | 3/10/16 | | | $ | (445 | ) |
| USD | | | 138,307 | | | PLN | | | 550,000 | | | Credit Suisse International | | | 3/10/16 | | | | (795 | ) |
| USD | | | 213,747 | | | PLN | | | 850,000 | | | Credit Suisse International | | | 3/10/16 | | | | (1,229 | ) |
| USD | | | 292,834 | | | PLN | | | 1,135,000 | | | Credit Suisse International | | | 3/10/16 | | | | 5,778 | |
| USD | | | 22,434 | | | PLN | | | 89,492 | | | Deutsche Bank AG | | | 3/10/16 | | | | (199 | ) |
| USD | | | 67,677 | | | PLN | | | 269,967 | | | Deutsche Bank AG | | | 3/10/16 | | | | (601 | ) |
| USD | | | 1,335,130 | | | PLN | | | 5,400,000 | | | JPMorgan Chase Bank N.A. | | | 3/10/16 | | | | (30,595 | ) |
| USD | | | 815,913 | | | PLN | | | 3,300,000 | | | JPMorgan Chase Bank N.A. | | | 3/10/16 | | | | (18,697 | ) |
| USD | | | 86,536 | | | PLN | | | 350,000 | | | JPMorgan Chase Bank N.A. | | | 3/10/16 | | | | (1,983 | ) |
| USD | | | 171,583 | | | PLN | | | 665,000 | | | JPMorgan Chase Bank N.A. | | | 3/10/16 | | | | 3,396 | |
| USD | | | 190,069 | | | RON | | | 800,000 | | | BNP Paribas S.A. | | | 3/10/16 | | | | (2,154 | ) |
| USD | | | 189,520 | | | RON | | | 800,000 | | | BNP Paribas S.A. | | | 3/10/16 | | | | (2,704 | ) |
| USD | | | 158,343 | | | RON | | | 650,000 | | | BNP Paribas S.A. | | | 3/10/16 | | | | 2,162 | |
| USD | | | 133,091 | | | RON | | | 550,000 | | | BNP Paribas S.A. | | | 3/10/16 | | | | 938 | |
| USD | | | 133,483 | | | RON | | | 550,000 | | | BNP Paribas S.A. | | | 3/10/16 | | | | 1,329 | |
| USD | | | 133,095 | | | RON | | | 550,000 | | | BNP Paribas S.A. | | | 3/10/16 | | | | 941 | |
| USD | | | 96,666 | | | RON | | | 400,000 | | | BNP Paribas S.A. | | | 3/10/16 | | | | 554 | |
| USD | | | 398,130 | | | RON | | | 1,650,000 | | | BNP Paribas S.A. | | | 3/10/16 | | | | 1,669 | |
| USD | | | 275,353 | | | RON | | | 1,150,000 | | | Morgan Stanley & Co. International PLC | | | 3/10/16 | | | | (968 | ) |
| USD | | | 145,592 | | | RON | | | 600,000 | | | Société Générale | | | 3/10/16 | | | | 1,425 | |
| USD | | | 180,155 | | | RUB | | | 12,800,000 | | | Barclays Bank PLC | | | 3/10/16 | | | | 7,538 | |
| USD | | | 208,893 | | | RUB | | | 15,200,000 | | | Barclays Bank PLC | | | 3/10/16 | | | | 3,910 | |
| USD | | | 92,671 | | | RUB | | | 6,600,000 | | | Citibank N.A. | | | 3/10/16 | | | | 3,665 | |
| USD | | | 98,287 | | | RUB | | | 7,000,000 | | | Citibank N.A. | | | 3/10/16 | | | | 3,887 | |
| USD | | | 525,935 | | | RUB | | | 36,300,000 | | | JPMorgan Chase Bank N.A. | | | 3/10/16 | | | | 36,403 | |
| USD | | | 174,691 | | | RUB | | | 12,300,000 | | | JPMorgan Chase Bank N.A. | | | 3/10/16 | | | | 8,817 | |
| USD | | | 187,584 | | | RUB | | | 13,900,000 | | | JPMorgan Chase Bank N.A. | | | 3/10/16 | | | | 133 | |
| USD | | | 176,537 | | | RUB | | | 12,800,000 | | | Morgan Stanley & Co. International PLC | | | 3/10/16 | | | | 3,920 | |
| USD | | | 82,060 | | | RUB | | | 6,100,000 | | | Morgan Stanley & Co. International PLC | | | 3/10/16 | | | | (203 | ) |
| USD | | | 141,296 | | | RUB | | | 9,700,000 | | | UBS AG | | | 3/10/16 | | | | 10,485 | |
| USD | | | 311,437 | | | SEK | | | 2,700,000 | | | Citibank N.A. | | | 3/10/16 | | | | (9,418 | ) |
| USD | | | 201,857 | | | SEK | | | 1,750,000 | | | Citibank N.A. | | | 3/10/16 | | | | (6,104 | ) |
| USD | | | 271,065 | | | SEK | | | 2,350,000 | | | Citibank N.A. | | | 3/10/16 | | | | (8,197 | ) |
| USD | | | 271,065 | | | SEK | | | 2,350,000 | | | Citibank N.A. | | | 3/10/16 | | | | (8,197 | ) |
| USD | | | 311,437 | | | SEK | | | 2,700,000 | | | Citibank N.A. | | | 3/10/16 | | | | (9,418 | ) |
| USD | | | 201,857 | | | SEK | | | 1,750,000 | | | Citibank N.A. | | | 3/10/16 | | | | (6,104 | ) |
| USD | | | 400,749 | | | SEK | | | 3,400,000 | | | Citibank N.A. | | | 3/10/16 | | | | (3,290 | ) |
| USD | | | 553,977 | | | SEK | | | 4,700,000 | | | Citibank N.A. | | | 3/10/16 | | | | (4,547 | ) |
| USD | | | 577,550 | | | SEK | | | 4,900,000 | | | Citibank N.A. | | | 3/10/16 | | | | (4,741 | ) |
| USD | | | 816,613 | | | SEK | | | 6,936,815 | | | Citibank N.A. | | | 3/10/16 | | | | (7,723 | ) |
| USD | | | 484,271 | | | SEK | | | 4,113,692 | | | Citibank N.A. | | | 3/10/16 | | | | (4,580 | ) |
| USD | | | 218,397 | | | SEK | | | 1,855,195 | | | Citibank N.A. | | | 3/10/16 | | | | (2,065 | ) |
| USD | | | 246,883 | | | SEK | | | 2,097,176 | | | Citibank N.A. | | | 3/10/16 | | | | (2,335 | ) |
| USD | | | 165,807 | | | SEK | | | 1,400,000 | | | Citibank N.A. | | | 3/10/16 | | | | (562 | ) |
| USD | | | 53,172 | | | SEK | | | 448,204 | | | Citibank N.A. | | | 3/10/16 | | | | (90 | ) |
| USD | | | 199,132 | | | SEK | | | 1,700,000 | | | Citibank N.A. | | | 3/10/16 | | | | (2,887 | ) |
| USD | | | 196,088 | | | SEK | | | 1,700,000 | | | Credit Suisse International | | | 3/10/16 | | | | (5,931 | ) |
| USD | | | 52,387 | | | SEK | | | 444,805 | | | Credit Suisse International | | | 3/10/16 | | | | (471 | ) |
| USD | | | 195,882 | | | SEK | | | 1,663,185 | | | Credit Suisse International | | | 3/10/16 | | | | (1,763 | ) |
| USD | | | 59,220 | | | SEK | | | 502,824 | | | Credit Suisse International | | | 3/10/16 | | | | (533 | ) |
| USD | | | 116,162 | | | SEK | | | 986,308 | | | Credit Suisse International | | | 3/10/16 | | | | (1,045 | ) |
| USD | | | 224,331 | | | SEK | | | 1,900,000 | | | Credit Suisse International | | | 3/10/16 | | | | (1,456 | ) |
| USD | | | 94,419 | | | SEK | | | 800,000 | | | Credit Suisse International | | | 3/10/16 | | | | (649 | ) |
| USD | | | 283,376 | | | SEK | | | 2,400,000 | | | Credit Suisse International | | | 3/10/16 | | | | (1,828 | ) |
| USD | | | 212,532 | | | SEK | | | 1,800,000 | | | Credit Suisse International | | | 3/10/16 | | | | (1,371 | ) |
| USD | | | 167,010 | | | SEK | | | 1,400,000 | | | Credit Suisse International | | | 3/10/16 | | | | 641 | |
| USD | | | 124,546 | | | SEK | | | 1,051,796 | | | Deutsche Bank AG | | | 3/10/16 | | | | (444 | ) |
| USD | | | 623,251 | | | SEK | | | 5,400,000 | | | Goldman Sachs International | | | 3/10/16 | | | | (18,458 | ) |
| USD | | | 1,234,960 | | | SEK | | | 10,700,000 | | | Goldman Sachs International | | | 3/10/16 | | | | (36,574 | ) |
| USD | | | 934,876 | | | SEK | | | 8,100,000 | | | Goldman Sachs International | | | 3/10/16 | | | | (27,687 | ) |
| USD | | | 400,028 | | | SEK | | | 3,400,000 | | | Goldman Sachs International | | | 3/10/16 | | | | (4,011 | ) |
| USD | | | 117,097 | | | SEK | | | 990,000 | | | Goldman Sachs International | | | 3/10/16 | | | | (549 | ) |
| USD | | | 24,839 | | | SEK | | | 210,000 | | | Goldman Sachs International | | | 3/10/16 | | | | (117 | ) |
| USD | | | 1,019,980 | | | SEK | | | 8,500,000 | | | HSBC Bank PLC | | | 3/10/16 | | | | 9,883 | |
See Notes to Financial Statements.
| | | | | | |
| | | | | | | |
| | BLACKROCK COREALPHA BOND FUND | | DECEMBER 31, 2015 | | 49 |
| | |
Schedule of Investments (continued) | | CoreAlpha Bond Master Portfolio |
Forward Foreign Currency Exchange Contracts (continued)
| | | | | | | | | | | | | | | | | | | | |
Currency Purchased | | | Currency
Sold | | | Counterparty | | Settlement
Date | | | Unrealized
Appreciation
(Depreciation) | |
| USD | | | 57,973 | | | SEK | | | 490,000 | | | JPMorgan Chase Bank N.A. | | | 3/10/16 | | | $ | (256 | ) |
| USD | | | 273,302 | | | SEK | | | 2,310,000 | | | JPMorgan Chase Bank N.A. | | | 3/10/16 | | | | (1,206 | ) |
| USD | | | 276,116 | | | SGD | | | 390,000 | | | Barclays Bank PLC | | | 3/10/16 | | | | 1,777 | |
| USD | | | 205,237 | | | SGD | | | 290,000 | | | BNP Paribas S.A. | | | 3/10/16 | | | | 1,241 | |
| USD | | | 261,854 | | | SGD | | | 370,000 | | | BNP Paribas S.A. | | | 3/10/16 | | | | 1,584 | |
| USD | | | 141,543 | | | SGD | | | 200,000 | | | BNP Paribas S.A. | | | 3/10/16 | | | | 856 | |
| USD | | | 61,224 | | | SGD | | | 86,552 | | | BNP Paribas S.A. | | | 3/10/16 | | | | 340 | |
| USD | | | 339,792 | | | SGD | | | 480,364 | | | BNP Paribas S.A. | | | 3/10/16 | | | | 1,888 | |
| USD | | | 391,894 | | | SGD | | | 555,000 | | | BNP Paribas S.A. | | | 3/10/16 | | | | 1,488 | |
| USD | | | 165,937 | | | SGD | | | 235,000 | | | BNP Paribas S.A. | | | 3/10/16 | | | | 630 | |
| USD | | | 354,774 | | | SGD | | | 499,293 | | | Citibank N.A. | | | 3/10/16 | | | | 3,555 | |
| USD | | | 542,622 | | | SGD | | | 766,953 | | | Citibank N.A. | | | 3/10/16 | | | | 3,122 | |
| USD | | | 49,580 | | | SGD | | | 70,160 | | | Citibank N.A. | | | 3/10/16 | | | | 227 | |
| USD | | | 275,169 | | | SGD | | | 389,386 | | | Citibank N.A. | | | 3/10/16 | | | | 1,262 | |
| USD | | | 256,131 | | | SGD | | | 358,601 | | | Deutsche Bank AG | | | 3/10/16 | | | | 3,879 | |
| USD | | | 178,212 | | | SGD | | | 250,707 | | | Deutsche Bank AG | | | 3/10/16 | | | | 1,856 | |
| USD | | | 397,847 | | | SGD | | | 560,000 | | | Goldman Sachs International | | | 3/10/16 | | | | 3,924 | |
| USD | | | 134,984 | | | SGD | | | 190,000 | | | Goldman Sachs International | | | 3/10/16 | | | | 1,331 | |
| USD | | | 653,295 | | | SGD | | | 923,047 | | | Goldman Sachs International | | | 3/10/16 | | | | 3,993 | |
| USD | | | 389,864 | | | SGD | | | 550,000 | | | Goldman Sachs International | | | 3/10/16 | | | | 2,975 | |
| USD | | | 290,626 | | | SGD | | | 410,000 | | | Goldman Sachs International | | | 3/10/16 | | | | 2,218 | |
| USD | | | 275,103 | | | SGD | | | 390,000 | | | Goldman Sachs International | | | 3/10/16 | | | | 764 | |
| USD | | | 176,348 | | | SGD | | | 250,000 | | | Goldman Sachs International | | | 3/10/16 | | | | 490 | |
| USD | | | 392,247 | | | SGD | | | 555,000 | | | Goldman Sachs International | | | 3/10/16 | | | | 1,842 | |
| USD | | | 166,087 | | | SGD | | | 235,000 | | | Goldman Sachs International | | | 3/10/16 | | | | 780 | |
| USD | | | 275,556 | | | SGD | | | 390,000 | | | HSBC Bank PLC | | | 3/10/16 | | | | 1,217 | |
| USD | | | 518,280 | | | SGD | | | 730,000 | | | HSBC Bank PLC | | | 3/10/16 | | | | 4,774 | |
| USD | | | 158,149 | | | SGD | | | 221,399 | | | JPMorgan Chase Bank N.A. | | | 3/10/16 | | | | 2,409 | |
| USD | | | 169,902 | | | SGD | | | 240,250 | | | JPMorgan Chase Bank N.A. | | | 3/10/16 | | | | 902 | |
| USD | | | 30,613 | | | SGD | | | 43,288 | | | JPMorgan Chase Bank N.A. | | | 3/10/16 | | | | 163 | |
| USD | | | 637,035 | | | SGD | | | 900,000 | | | JPMorgan Chase Bank N.A. | | | 3/10/16 | | | | 3,945 | |
| USD | | | 318,518 | | | SGD | | | 450,000 | | | JPMorgan Chase Bank N.A. | | | 3/10/16 | | | | 1,973 | |
| USD | | | 443,631 | | | SGD | | | 630,000 | | | Morgan Stanley & Co. International PLC | | | 3/10/16 | | | | 468 | |
| USD | | | 535,174 | | | SGD | | | 760,000 | | | Morgan Stanley & Co. International PLC | | | 3/10/16 | | | | 564 | |
| USD | | | 2,592,833 | | | SGD | | | 3,670,000 | | | UBS AG | | | 3/10/16 | | | | 11,233 | |
| USD | | | 339,041 | | | SGD | | | 480,000 | | | UBS AG | | | 3/10/16 | | | | 1,392 | |
| USD | | | 328,929 | | | THB | | | 11,950,000 | | | Bank of America N.A. | | | 3/10/16 | | | | (2,611 | ) |
| USD | | | 99,092 | | | THB | | | 3,600,000 | | | Bank of America N.A. | | | 3/10/16 | | | | (787 | ) |
| USD | | | 128,500 | | | THB | | | 4,645,262 | | | Barclays Bank PLC | | | 3/10/16 | | | | (378 | ) |
| USD | | | 64,250 | | | THB | | | 2,322,631 | | | Barclays Bank PLC | | | 3/10/16 | | | | (189 | ) |
| USD | | | 64,250 | | | THB | | | 2,322,631 | | | Barclays Bank PLC | | | 3/10/16 | | | | (189 | ) |
| USD | | | 530,680 | | | THB | | | 19,200,000 | | | Barclays Bank PLC | | | 3/10/16 | | | | (2,004 | ) |
| USD | | | 135,434 | | | THB | | | 4,900,000 | | | Barclays Bank PLC | | | 3/10/16 | | | | (511 | ) |
| USD | | | 328,884 | | | THB | | | 11,950,000 | | | Barclays Bank PLC | | | 3/10/16 | | | | (2,656 | ) |
| USD | | | 99,078 | | | THB | | | 3,600,000 | | | Barclays Bank PLC | | | 3/10/16 | | | | (800 | ) |
| USD | | | 342,142 | | | THB | | | 12,300,000 | | | Deutsche Bank AG | | | 3/10/16 | | | | 891 | |
| USD | | | 219,780 | | | THB | | | 7,900,000 | | | Goldman Sachs International | | | 3/10/16 | | | | 603 | |
| USD | | | 183,486 | | | THB | | | 6,600,000 | | | Goldman Sachs International | | | 3/10/16 | | | | 376 | |
| USD | | | 458,716 | | | THB | | | 16,500,000 | | | Goldman Sachs International | | | 3/10/16 | | | | 941 | |
| USD | | | 91,667 | | | THB | | | 3,300,000 | | | Goldman Sachs International | | | 3/10/16 | | | | 112 | |
| USD | | | 405,556 | | | THB | | | 14,600,000 | | | Goldman Sachs International | | | 3/10/16 | | | | 494 | |
| USD | | | 7,089 | | | THB | | | 256,028 | | | Goldman Sachs International | | | 3/10/16 | | | | (14 | ) |
| USD | | | 14,178 | | | THB | | | 512,056 | | | Goldman Sachs International | | | 3/10/16 | | | | (29 | ) |
| USD | | | 7,089 | | | THB | | | 256,028 | | | Goldman Sachs International | | | 3/10/16 | | | | (14 | ) |
| USD | | | 96,260 | | | THB | | | 3,500,000 | | | Goldman Sachs International | | | 3/10/16 | | | | (844 | ) |
| USD | | | 283,278 | | | THB | | | 10,300,000 | | | Goldman Sachs International | | | 3/10/16 | | | | (2,484 | ) |
| USD | | | 176,576 | | | THB | | | 6,400,000 | | | Goldman Sachs International | | | 3/10/16 | | | | (985 | ) |
| USD | | | 253,828 | | | THB | | | 9,200,000 | | | Goldman Sachs International | | | 3/10/16 | | | | (1,416 | ) |
| USD | | | 512,962 | | | THB | | | 18,600,000 | | | Goldman Sachs International | | | 3/10/16 | | | | (3,075 | ) |
| USD | | | 239,934 | | | THB | | | 8,700,000 | | | Goldman Sachs International | | | 3/10/16 | | | | (1,438 | ) |
| USD | | | 133,609 | | | THB | | | 4,850,000 | | | Goldman Sachs International | | | 3/10/16 | | | | (949 | ) |
| USD | | | 198,347 | | | THB | | | 7,200,000 | | | Goldman Sachs International | | | 3/10/16 | | | | (1,409 | ) |
| USD | | | 135,284 | | | THB | | | 4,900,000 | | | HSBC Bank PLC | | | 3/10/16 | | | | (661 | ) |
| USD | | | 270,569 | | | THB | | | 9,800,000 | | | HSBC Bank PLC | | | 3/10/16 | | | | (1,322 | ) |
See Notes to Financial Statements.
| | | | | | |
| | | | | | | |
| 50 | | BLACKROCK COREALPHA BOND FUND | | DECEMBER 31, 2015 | | |
| | |
Schedule of Investments (continued) | | CoreAlpha Bond Master Portfolio |
Forward Foreign Currency Exchange Contracts (concluded)
| | | | | | | | | | | | | | | | | | | | | | |
Currency
Purchased | | | Currency
Sold | | | Counterparty | | Settlement
Date | | | Unrealized
Appreciation
(Depreciation) | | | |
| USD | | | 174,430 | | | THB | | | 6,300,000 | | | HSBC Bank PLC | | | 3/10/16 | | | $ | (357 | ) | | |
| USD | | | 133,620 | | | THB | | | 4,850,000 | | | HSBC Bank PLC | | | 3/10/16 | | | | (938 | ) | | |
| USD | | | 198,364 | | | THB | | | 7,200,000 | | | HSBC Bank PLC | | | 3/10/16 | | | | (1,393 | ) | | |
| USD | | | 360,335 | | | THB | | | 13,000,000 | | | JPMorgan Chase Bank N.A. | | | 3/10/16 | | | | (336 | ) | | |
| USD | | | 684,254 | | | THB | | | 24,900,000 | | | JPMorgan Chase Bank N.A. | | | 3/10/16 | | | | (6,570 | ) | | |
| USD | | | 128,535 | | | THB | | | 4,642,682 | | | Morgan Stanley & Co. International PLC | | | 3/10/16 | | | | (271 | ) | | |
| USD | | | 64,267 | | | THB | | | 2,321,341 | | | Morgan Stanley & Co. International PLC | | | 3/10/16 | | | | (136 | ) | | |
| USD | | | 64,267 | | | THB | | | 2,321,341 | | | Morgan Stanley & Co. International PLC | | | 3/10/16 | | | | (136 | ) | | |
| USD | | | 106,625 | | | TRY | | | 318,249 | | | Barclays Bank PLC | | | 3/10/16 | | | | (381 | ) | | |
| USD | | | 170,405 | | | TRY | | | 520,000 | | | Citibank N.A. | | | 3/10/16 | | | | (4,437 | ) | | |
| USD | | | 138,472 | | | TRY | | | 420,000 | | | Citibank N.A. | | | 3/10/16 | | | | (2,747 | ) | | |
| USD | | | 97,818 | | | TRY | | | 291,751 | | | Citibank N.A. | | | 3/10/16 | | | | (279 | ) | | |
| USD | | | 91,105 | | | TRY | | | 270,000 | | | Deutsche Bank AG | | | 3/10/16 | | | | 322 | | | |
| USD | | | 200,747 | | | TRY | | | 600,000 | | | Deutsche Bank AG | | | 3/10/16 | | | | (994 | ) | | |
| USD | | | 196,913 | | | TRY | | | 590,000 | | | HSBC Bank PLC | | | 3/10/16 | | | | (1,466 | ) | | |
| USD | | | 133,916 | | | TRY | | | 400,000 | | | JPMorgan Chase Bank N.A. | | | 3/10/16 | | | | (579 | ) | | |
| USD | | | 115,263 | | | TWD | | | 3,800,000 | | | Barclays Bank PLC | | | 3/10/16 | | | | (501 | ) | | |
| USD | | | 4,491,100 | | | TWD | | | 147,600,000 | | | Citibank N.A. | | | 3/10/16 | | | | (5,445 | ) | | |
| USD | | | 1,086,871 | | | TWD | | | 35,720,000 | | | Citibank N.A. | | | 3/10/16 | | | | (1,318 | ) | | |
| USD | | | 66,941 | | | TWD | | | 2,200,000 | | | Citibank N.A. | | | 3/10/16 | | | | (81 | ) | | |
| USD | | | 560,436 | | | TWD | | | 18,500,000 | | | Citibank N.A. | | | 3/10/16 | | | | (3,155 | ) | | |
| USD | | | 458,015 | | | TWD | | | 15,000,000 | | | Goldman Sachs International | | | 3/10/16 | | | | 1,049 | | | |
| USD | | | 135,423 | | | TWD | | | 4,450,000 | | | Goldman Sachs International | | | 3/10/16 | | | | (144 | ) | | |
| USD | | | 361,805 | | | TWD | | | 11,877,685 | | | HSBC Bank PLC | | | 3/10/16 | | | | (42 | ) | | |
| USD | | | 361,716 | | | TWD | | | 11,869,699 | | | HSBC Bank PLC | | | 3/10/16 | | | | 112 | | | |
| USD | | | 573,248 | | | TWD | | | 18,900,000 | | | HSBC Bank PLC | | | 3/10/16 | | | | (2,529 | ) | | |
| USD | | | 163,785 | | | TWD | | | 5,400,000 | | | HSBC Bank PLC | | | 3/10/16 | | | | (722 | ) | | |
| USD | | | 157,767 | | | TWD | | | 5,200,000 | | | HSBC Bank PLC | | | 3/10/16 | | | | (648 | ) | | |
| USD | | | 511,226 | | | TWD | | | 16,850,000 | | | HSBC Bank PLC | | | 3/10/16 | | | | (2,099 | ) | | |
| USD | | | 82,142 | | | TWD | | | 2,700,000 | | | HSBC Bank PLC | | | 3/10/16 | | | | (112 | ) | | |
| USD | | | 316,990 | | | TWD | | | 10,425,795 | | | JPMorgan Chase Bank N.A. | | | 3/10/16 | | | | (626 | ) | | |
| USD | | | 133,173 | | | TWD | | | 4,365,826 | | | Morgan Stanley & Co. International PLC | | | 3/10/16 | | | | 170 | | | |
| USD | | | 256,054 | | | TWD | | | 8,384,519 | | | Morgan Stanley & Co. International PLC | | | 3/10/16 | | | | 625 | | | |
| USD | | | 522,571 | | | TWD | | | 17,100,000 | | | Morgan Stanley & Co. International PLC | | | 3/10/16 | | | | 1,630 | | | |
| USD | | | 208,708 | | | TWD | | | 6,900,000 | | | Morgan Stanley & Co. International PLC | | | 3/10/16 | | | | (1,496 | ) | | |
| USD | | | 512,108 | | | TWD | | | 16,749,655 | | | UBS AG | | | 3/10/16 | | | | 1,839 | | | |
| USD | | | 217,083 | | | TWD | | | 7,126,821 | | | UBS AG | | | 3/10/16 | | | | (32 | ) | | |
| USD | | | 135,505 | | | TWD | | | 4,450,000 | | | UBS AG | | | 3/10/16 | | | | (61 | ) | | |
| USD | | | 352,369 | | | TWD | | | 11,600,000 | | | UBS AG | | | 3/10/16 | | | | (1,018 | ) | | |
| USD | | | 157,719 | | | TWD | | | 5,200,000 | | | UBS AG | | | 3/10/16 | | | | (696 | ) | | |
| USD | | | 511,071 | | | TWD | | | 16,850,000 | | | UBS AG | | | 3/10/16 | | | | (2,254 | ) | | |
| Total | | | | | | | | | | | | | | | | | | $ | (301,237 | ) | | |
| | | | | | | | | | | | | | | | | | | |
Centrally Cleared Credit Default Swaps — Buy Protection
| | | | | | | | | | | | | | | | |
| Index | | Pay Fixed Rate | | | Expiration
Date | | Notional
Amount
(000) | | | Unrealized
Appreciation | |
Markit iTraxx XO, Series 24, Version 1 | | | 5.00 | % | | 12/20/20 | | EUR | | | 9,220 | | | $ | 38,359 | |
Centrally Cleared Interest Rate Swaps
| | | | | | | | | | | | | | | | | | | | |
Fixed
Rate | | Floating
Rate | | Effective
Date | | Expiration
Date | | Notional
Amount
(000) | | | Unrealized
Appreciation
(Depreciation) | | | |
0.17%2 | | 6-Month EURIBOR | | N/A | | 11/27/20 | | | EUR | | | | 15,600 | | | $ | (125,683 | ) | | |
1.63%1 | | 3-Month LIBOR | | N/A | | 11/27/20 | | | USD | | | | 17,270 | | | | 62,945 | | | |
1.91%1 | | 3-Month LIBOR | | 3/31/163 | | 10/31/22 | | | USD | | | | 32,320 | | | | 157,542 | | | |
0.75%2 | | 6-Month EURIBOR | | 3/31/163 | | 2/15/25 | | | EUR | | | | 21,510 | | | | (350,981 | ) | | |
1.24%1 | | 6-Month EURIBOR | | N/A | | 11/27/30 | | | EUR | | | | 5,690 | | | | 132,591 | | | |
2.39%2 | | 3-Month LIBOR | | N/A | | 11/27/30 | | | USD | | | | 6,600 | | | | (27,092 | ) | | |
Total | | | | | | | | | | | | | | | | $ | (150,678 | ) | | |
| | | | | | | | | | | | | | | | | |
1 Master Portfolio pays the fixed rate and receives the floating rate. | | | | | | | | | | | |
2 Master Portfolio pays the floating rate and receives the fixed rate. | | | | | | | | | | | |
3 Forward swap. | | | | | | | | | | | |
See Notes to Financial Statements.
| | | | | | |
| | | | | | | |
| | BLACKROCK COREALPHA BOND FUND | | DECEMBER 31, 2015 | | 51 |
| | |
Schedule of Investments (continued) | | CoreAlpha Bond Master Portfolio |
OTC Credit Default Swaps — Sell Protection
| | | | | | | | | | | | | | | | | | | | | | | | | | | | | | | | |
| Index | | Receive
Fixed
Rate | | | Counterparty | | Expiration
Date | | | Credit
Rating1 | | | Notional
Amount
(000)2 | | | Value | | | Premiums
Received | | | Unrealized
Appreciation | |
Markit CMBX North America AM Index, Series 3 | | | 0.08 | % | | Goldman Sachs International | | | 12/13/49 | | | | AA+ | | | USD | | | 13,133 | | | $ | (52,337 | ) | | $ | (84,846 | ) | | $ | 32,509 | |
1 Using Standard & Poor’s rating of the issuer or the underlying securities of the index, as applicable. | | | | | | | | | | | | | | | | | | | |
2 The maximum potential amount the Master Portfolio may pay should a negative credit event take place as defined under the terms of the agreement. | | | | | |
OTC Total Return Swaps
| | | | | | | | | | | | | | | | | | | | | | | | | | | | |
| Reference Entity | | Fixed
Rate | | Counterparty | | Effective
Date | | Expiration
Date | | | Notional
Amount
(000) | | | Value | | | Premiums
Received | | | Unrealized
Appreciation
(Depreciation) | | | |
Change in Return of the Consumer Price Index for All Urban Consumers | | 1.87%1 | | Deutsche Bank AG | | N/A | | | 11/20/25 | | | | 7,125 | | | $ | 21,826 | | | | — | | | $ | 21,826 | | | |
Change in Return of the Consumer Price Index for All Urban Consumers | | 1.94%1 | | Goldman Sachs International | | N/A | | | 11/27/25 | | | | 7,125 | | | | (21,622 | ) | | | — | | | | (21,622 | ) | | |
Change in Return of the Consumer Price Index for All Urban Consumers | | 1.24%2 | | Goldman Sachs International | | N/A | | | 12/21/17 | | | | 28,300 | | | | (82,608 | ) | | | — | | | | (82,608 | ) | | |
Change in Return of the Consumer Price Index for All Urban Consumers | | 1.43%2 | | Deutsche Bank AG | | N/A | | | 9/22/20 | | | | 14,250 | | | | (48,607 | ) | | | — | | | | (48,607 | ) | | |
Total | | | | | | | | | | | | | | | | | | | | | | | | $ | (131,011 | ) | | |
| | | | | | | | | | | | | | | | | | | | | | | | | |
1 Master Portfolio receives the fixed rate and pays the total return of the reference entity. | | | | | | | | | | | | | | | | | | | |
2 Master Portfolio pays the fixed rate and receives the total return of the reference entity. | | | | | | | | | | | | | | | | | | | |
| | | | | | | | | | | | | | | | |
| Transactions in Options Written for the Year Ended December 31, 2015 |
| | | | | | | | | | | | | | | | | | | | | | | | | | |
| | | | | Calls | | | | | Puts | |
| | | | | Contracts | | Notional (000) | | | Premiums
Received | | | | | Contracts | | | Notional (000) | | | Premiums
Received | |
Outstanding options, beginning of year | | | | — | | | — | | | | — | | | | | | 4,780 | | | | — | | | $ | 1,156,129 | |
Options written | | | | — | | | USD 6,930 | | | $ | 161,560 | | | | | | — | | | | USD 12,620 | | | | 74,924 | |
Options expired | | | | — | | | (6,930 | ) | | | (161,560 | ) | | | | | (2,390) | | | | (12,620 | ) | | | (638,845 | ) |
Options excerised | | | | — | | | — | | | | — | | | | | | — | | | | — | | | | — | |
Options closed | | | | — | | | — | | | | — | | | | | | (2,390) | | | | — | | | | (592,208 | ) |
| | | | | |
Outstanding options, end of year | | | | — | | | — | | | | — | | | | | | — | | | | — | | | | — | |
| | | | | |
|
| Derivative Financial Instruments Categorized by Risk Exposure |
| | | | | | | | | | | | | | | | | | | | | | | | | | | | |
As of period end, the fair values of derivative financial instruments located in the Statement of Assets and Liabilities were as follows: | |
| Assets — Derivative Financial Instruments | | Commodity Contracts | | Credit Contracts | | | Equity Contracts | | | Foreign Currency Exchange Contracts | | | Interest Rate Contracts | | | Other
Contracts | | | Total | |
Financial futures contracts | | Net unrealized appreciation1 | | — | | | — | | | | — | | | | — | | | $ | 535,950 | | | | — | | | $ | 535,950 | |
Forward foreign currency exchange contracts | | Net unrealized appreciation on forward foreign currency exchange contracts | | — | | | — | | | | — | | | | $2,744,825 | | | | — | | | | — | | | | 2,744,825 | |
Swaps — OTC | | Unrealized appreciation on OTC swaps | | — | | $ | 32,509 | | | | — | | | | — | | | | — | | | $ | 21,826 | | | | 54,335 | |
Swaps — centrally cleared | | Net unrealized appreciation1 | | — | | | 38,359 | | | | — | | | | — | | | | 353,078 | | | | — | | | | 391,437 | |
| | | | | | | | | | | | | | | | | | | | | | | | | | | | |
Total | | — | | $ | 70,868 | | | | — | | | | $2,744,825 | | | $ | 889,028 | | | | $21,826 | | | $ | 3,726,547 | |
| | | | | | | | | | | | | | | | | | | | | | | | | | | | |
| Liabilities — Derivative Financial Instruments | | | | | | | | | | | | | | | | | | | | |
Financial futures contracts | | Net unrealized depreciation1 | | — | | | — | | | | — | | | | — | | | $ | 204,949 | | | | — | | | $ | 204,949 | |
Forward foreign currency exchange contracts | | Net unrealized depreciation on forward foreign currency exchange contracts | | — | | | — | | | | — | | | | $3,046,062 | | | | — | | | | — | | | | 3,046,062 | |
Swaps — OTC | | Unrealized depreciation on OTC swaps; swap premium received | | — | | $ | 84,846 | | | | — | | | | — | | | | — | | | | $152,837 | | | | 237,683 | |
Swaps — centrally cleared | | Net unrealized depreciation1 | | — | | | — | | | | — | | | | — | | | $ | 503,756 | | | | — | | | | 503,756 | |
| | | | | | | | | | | | | | | | | | | | | | | | | | | | |
Total | | | | — | | $ | 84,846 | | | | — | | | | $3,046,062 | | | $ | 708,705 | | | | $152,837 | | | $ | 3,992,450 | |
| | | | | | | | | | | | | | | | | | | | | | | | | | | | |
1 Includes cumulative appreciation (depreciation) on financial futures contracts and centrally cleared swaps, if any, as reported in the Schedule of Investments. Only current day’s variation margin is reported within the Statement of Assets and Liabilities. | |
See Notes to Financial Statements.
| | | | | | |
| | | | | | | |
| 52 | | BLACKROCK COREALPHA BOND FUND | | DECEMBER 31, 2015 | | |
| | |
Schedule of Investments (continued) | | CoreAlpha Bond Master Portfolio |
For the year ended December 31, 2015, the effect of derivative financial instruments in the Statement of Operations was as follows:
| | | | | | | | | | | | | | | | | | | | | | | | | | | | |
| Net Realized Gain (Loss) from: | | Commodity Contracts | | | Credit Contracts | | | Equity Contracts | | | Foreign Currency Exchange Contracts | | | Interest Rate Contracts | | | Other
Contracts | | | Total | |
Financial futures contracts | | | — | | | | — | | | | — | | | | — | | | $ | 10,097,462 | | | | — | | | $ | 10,097,462 | |
Foreign currency exchange contracts | | | — | | | | — | | | | — | | | $ | (7,205,003 | ) | | | — | | | | — | | | | (7,205,003 | ) |
Options purchased1 | | | — | | | | — | | | | — | | | | (307,854 | ) | | | (1,681,894 | ) | | | — | | | | (1,989,748 | ) |
Options written | | | — | | | | — | | | | — | | | | 236,484 | | | | 1,122,406 | | | | — | | | | 1,358,890 | |
Swaps | | | — | | | $ | 575,522 | | | | — | | | | — | | | | (5,673,207 | ) | | $ | (2,168,101 | ) | | | (7,265,786 | ) |
| | | | | | | | | | | | | | | | | | | | | | | | | | | | |
Total | | | — | | | $ | 575,522 | | | | — | | | | $(7,276,373) | | | $ | 3,864,767 | | | $ | (2,168,101 | ) | | $ | (5,004,185 | ) |
| | | | | | | | | | | | | | | | | | | | | | | | | | | | |
1 Options purchased are included in net realized gain (loss) on investments. | |
| | | | | | |
| Net Change in Unrealized Appreciation (Depreciation) on: | | | | | | | | | | | | | | | | | | | |
Financial futures contracts | | | — | | | | — | | | | — | | | | — | | | $ | (603,756 | ) | | | — | | | $ | (603,756 | ) |
Foreign currency exchange contracts | | | — | | | | — | | | | — | | | $ | (967,815 | ) | | | — | | | | — | | | | (967,815 | ) |
Options purchased2 | | | — | | | | — | | | | — | | | | — | | | | 258,984 | | | | — | | | | 258,984 | |
Options written | | | — | | | | — | | | | — | | | | — | | | | (200,129 | ) | | | — | | | | (200,129 | ) |
Swaps | | | — | | | $ | (72,416 | ) | | | — | | | | — | | | | 732,643 | | | $ | (131,011 | ) | | | 529,216 | |
| | | | | | | | | | | | | | | | | | | | | | | | | | | | |
Total | | | — | | | $ | (72,416 | ) | | | — | | | $ | (967,815 | ) | | $ | 187,742 | | | $ | (131,011 | ) | | $ | (983,500 | ) |
| | | | | | | | | | | | | | | | | | | | | | | | | | | | |
2 Options purchased are included in net change in unrealized appreciation (depreciation) on investments. | |
|
| Average Quarterly Balances of Outstanding Derivative Financial Instruments |
For the year ended December 31, 2015, the average quarterly balances of outstanding derivative financial instruments were as follows:
| | | | |
Financial futures contracts: | | | | |
Average notional value of contracts — long | | $ | 714,027,156 | |
Average notional value of contracts — short. | | $ | 303,421,468 | |
| Forward foreign currency exchange contracts: | | | | |
Average amounts purchased — in USD | | $ | 684,087,605 | |
Average amounts sold — in USD. | | $ | 673,826,728 | |
| Options: | | | | |
Average value of option contracts purchased | | $ | 92,813 | |
Average value of option contracts written | | $ | 76,009 | |
| Credit default swaps: | | | | |
Average notional value — buy protection | | $ | 4,818,550 | |
Average notional value — sell protection. | | $ | 42,654,393 | |
| Interest rate swaps: | | | | |
Average notional value — pays fixed rate | | $ | 213,342,447 | |
Average notional value — receives fixed rate | | $ | 32,268,889 | |
| Total return swaps: | | | | |
Average notional value | | $ | 129,097,500 | |
For information about the Master Portfolio’s investment risks regarding derivative financial instruments, refer to the Notes to Financial Statements.
|
| Derivative Financial Instruments — Offsetting as of Period End |
The Master Portfolio’s derivative assets and liabilities (by type) were as follows:
| | | | | | | | |
| | | Assets | | | Liabilities | |
| Derivative Financial Instruments: | | | | | | | | |
Financial futures contracts | | $ | 289,072 | | | $ | 146,164 | |
Forward foreign currency exchange contracts | | | 2,744,825 | | | | 3,046,062 | |
Swaps — Centrally cleared | | | 35,619 | | | | 97,503 | |
Swaps — OTC1 | | | 54,335 | | | | 237,683 | |
| | | | |
Total derivative assets and liabilities in the Statement of Assets and Liabilities | | $ | 3,123,851 | | | $ | 3,527,412 | |
| | | | |
Derivatives not subject to a Master Netting Agreement or similar agreement (“MNA”) | | | (324,691 | ) | | | (243,667 | ) |
| | | | |
Total derivative assets and liabilities subject to an MNA | | $ | 2,799,160 | | | $ | 3,283,745 | |
| | | | |
1 Includes unrealized appreciation (depreciation) on OTC swaps and swap premiums paid/received in the Statement of Assets and Liabilities. | |
See Notes to Financial Statements.
| | | | | | |
| | | | | | | |
| | BLACKROCK COREALPHA BOND FUND | | DECEMBER 31, 2015 | | 53 |
| | |
Schedule of Investments (continued) | | CoreAlpha Bond Master Portfolio |
The following table presents the Master Portfolio’s derivative assets and liabilities by counterparty net of amounts available for offset under an MNA and net of the related collateral received and pledged by the Master Portfolio:
| | | | | | | | | | | | | | | | | | | | |
| Counterparty | | | | Derivative Assets
Subject to an MNA
by Counterparty | | | Derivatives
Available for
Offset1 | | | Non-cash Collateral
Received | | Cash Collateral
Received | | | Net
Amount of
Derivative
Assets2 | |
Bank of America N.A. | | | | $ | 5,828 | | | $ | (5,828 | ) | | — | | | — | | | | — | |
Barclays Bank PLC | | | | | 174,959 | | | | (174,959 | ) | | — | | | — | | | | — | |
BNP Paribas S.A. | | | | | 93,985 | | | | (93,985 | ) | | — | | | — | | | | — | |
Citibank N.A. | | | | | 201,765 | | | | (201,765 | ) | | — | | | — | | | | — | |
Credit Suisse International | | | | | 135,679 | | | | (135,679 | ) | | — | | | — | | | | — | |
Deutsche Bank AG | | | | | 182,171 | | | | (182,171 | ) | | — | | | — | | | | — | |
Goldman Sachs International | | | | | 202,815 | | | | (202,815 | ) | | — | | | — | | | | — | |
HSBC Bank PLC | | | | | 370,900 | | | | (271,698 | ) | | — | | | — | | | $ | 99,202 | |
JPMorgan Chase Bank N.A. | | | | | 395,572 | | | | (272,173 | ) | | — | | | — | | | | 123,399 | |
Morgan Stanley & Co. International PLC | | | | | 329,306 | | | | (329,306 | ) | | — | | | — | | | | — | |
Société Générale | | | | | 18,669 | | | | (48 | ) | | — | | | — | | | | 18,621 | |
Standard Chartered Bank | | | | | 6,820 | | | | (3,390 | ) | | — | | | — | | | | 3,430 | |
UBS AG | | | | | 398,040 | | | | (184,298 | ) | | — | | | — | | | | 213,742 | |
Westpac Banking Corp. | | | | | 282,651 | | | | (131,723 | ) | | — | | | — | | | | 150,928 | |
| | | | | | | | | | | | | | | | | | | | |
Total | | | | $ | 2,799,160 | | | $ | (2,189,838 | ) | | — | | | — | | | $ | 609,322 | |
| | | | | | | | | | | | | | | | | | | | |
| Counterparty | | | | Derivative Liabilities
Subject to an MNA
by Counterparty | | | Derivatives
Available for
Offset1 | | | Non-cash Collateral
Pledged | | Cash Collateral
Pledged | | | Net
Amount of
Derivative
Liabilities3 | |
Bank of America N.A. | | | | $ | 21,184 | | | $ | (5,828 | ) | | — | | | — | | | $ | 15,356 | |
Barclays Bank PLC | | | | | 209,803 | | | | (174,959 | ) | | — | | | — | | | | 34,844 | |
BNP Paribas S.A. | | | | | 113,800 | | | | (93,985 | ) | | — | | | — | | | | 19,815 | |
Citibank N.A. | | | | | 488,872 | | | | (201,765 | ) | | — | | | — | | | | 287,107 | |
Credit Suisse International | | | | | 313,089 | | | | (135,679 | ) | | — | | | — | | | | 177,410 | |
Deutsche Bank AG | | | | | 256,591 | | | | (182,171 | ) | | — | | | — | | | | 74,420 | |
Goldman Sachs International | | | | | 641,254 | | | | (202,815 | ) | | — | | $ | (200,000 | ) | | | 238,439 | |
HSBC Bank PLC | | | | | 271,698 | | | | (271,698 | ) | | — | | | — | | | | — | |
JPMorgan Chase Bank N.A. | | | | | 272,173 | | | | (272,173 | ) | | — | | | — | | | | — | |
Morgan Stanley & Co. International PLC | | | | | 375,822 | | | | (329,306 | ) | | — | | | — | | | | 46,516 | |
Société Générale | | | | | 48 | | | | (48 | ) | | — | | | — | | | | — | |
Standard Chartered Bank | | | | | 3,390 | | | | (3,390 | ) | | — | | | — | | | | — | |
UBS AG | | | | | 184,298 | | | | (184,298 | ) | | — | | | — | | | | — | |
Westpac Banking Corp. | | | | | 131,723 | | | | (131,723 | ) | | — | | | — | | | | — | |
| | | | | | |
Total | | | | $ | 3,283,745 | | | $ | (2,189,838 | ) | | — | | $ | (200,000 | ) | | $ | 893,907 | |
| | | | | | |
1 The amount of derivatives available for offset is limited to the amount of derivative assets and/or liabilities that are subject to an MNA. | |
2 Net amount represents the net amount receivable from the counterparty in the event of default. | |
3 Net amount represents the net amount payable due to the counterparty in the event of default. | |
| | |
| Fair Value Hierarchy as of Period End | | |
Various inputs are used in determining the fair value of investments and derivative financial instruments. For information about the Master Portfolio’s policy regarding valuation of investments and derivative financial instruments, refer to the Notes to Financial Statements.
The following tables summarize the Master Portfolio’s investments and derivative financial instruments categorized in the disclosure hierarchy:
| | | | | | | | | | | | | | | | |
| | | Level 1 | | | Level 2 | | | Level 3 | | | Total | |
Assets: | | | | | | | | | | | | | | | | |
| Investments: | | | | | | | | | | | | | | | | |
| Long-Term Investments: | | | | | | | | | | | | | | | | |
Asset-Backed Securities | | | — | | | $ | 82,726,582 | | | | — | | | $ | 82,726,582 | |
Corporate Bonds | | | — | | | | 326,933,783 | | | | — | | | | 326,933,783 | |
Foreign Agency Obligations | | | — | | | | 9,741,443 | | | | — | | | | 9,741,443 | |
Investment Companies | | $ | 6,345,757 | | | | — | | | | — | | | | 6,345,757 | |
Municipal Bonds | | | — | | | | 5,942,457 | | | | — | | | | 5,942,457 | |
Non-Agency Mortgage-Backed Securities | | | — | | | | 109,173,509 | | | | — | | | | 109,173,509 | |
Preferred Securities | | | 1,932,680 | | | | 1,482,536 | | | | — | | | | 3,415,216 | |
U.S. Government Sponsored Agency Securities | | | — | | | | 426,025,321 | | | | — | | | | 426,025,321 | |
U.S. Treasury Obligations | | | — | | | | 8,802,002 | | | | — | | | | 8,802,002 | |
Short-Term Securities | | | 19,530,947 | | | | — | | | | — | | | | 19,530,947 | |
Liabilities: | | | | | | | | | | | | | | | | |
| Investments: | | | | | | | | | | | | | | | | |
TBA Sale Commitments | | | — | | | | (60,844,344 | ) | | | — | | | | (60,844,344 | ) |
| | | | | | | | | | | | | | | | |
Total | | $ | 27,809,384 | | | $ | 909,983,289 | | | | — | | | $ | 937,792,673 | |
| | | | | | | | | | | | | | | | |
See Notes to Financial Statements.
| | | | | | |
| | | | | | | |
| 54 | | BLACKROCK COREALPHA BOND FUND | | DECEMBER 31, 2015 | | |
| | |
Schedule of Investments (concluded) | | CoreAlpha Bond Master Portfolio |
| | | | | | | | | | | | | | | | |
| | | Level 1 | | | Level 2 | | | Level 3 | | | Total | |
| Derivative Financial Instruments 1 | | | | | | | | | | | | | | | | |
Assets: | | | | | | | | | | | | | | | | |
Credit contracts | | | — | | | $ | 70,868 | | | | — | | | $ | 70,868 | |
Foreign currency exchange contracts | | | — | | | | 2,744,825 | | | | — | | | | 2,744,825 | |
Interest rate contracts | | $ | 535,950 | | | | 353,078 | | | | — | | | | 889,028 | |
Other contracts | | | — | | | | 21,826 | | | | — | | | | 21,826 | |
Liabilities: | | | | | | | | | | | | | | | | |
Foreign currency exchange contracts | | | — | | | | (3,046,062 | ) | | | — | | | | (3,046,062 | ) |
Interest rate contracts | | | (204,949 | ) | | | (503,756 | ) | | | — | | | | (708,705 | ) |
Other contracts | | | — | | | | (152,837 | ) | | | — | | | | (152,837 | ) |
| | | | | | | | | | | | | | | | |
Total | | $ | 331,001 | | | $ | (512,058 | ) | | | — | | | $ | (181,057 | ) |
| | | | | | | | | | | | | | | | |
1 Derivative financial instruments are financial futures contracts, which are valued at the unrealized appreciation (depreciation) on the instrument. | |
The Master Portfolio may hold assets and/or liabilities in which the fair value approximates the carrying amount for financial statement purposes. As of period end, such assets and/or liabilities are categorized within the disclosure hierarchy as follows:
| | | | | | | | | | | | | | | | |
| | | Level 1 | | | Level 2 | | | Level 3 | | | Total | |
Assets: | | | | | | | | | | | | | | | | |
Cash | | $ | 115,166 | | | | — | | | | — | | | $ | 115,166 | |
Cash pledged as collateral for OTC derivatives | | | 200,000 | | | | — | | | | — | | | | 200,000 | |
Cash pledged as collateral for centrally cleared swaps | | | 997,890 | | | | — | | | | — | | | | 997,890 | |
Cash pledged for financial futures contracts | | | 2,649,000 | | | | — | | | | — | | | | 2,649,000 | |
Foreign currency at value | | | 4,169,837 | | | | — | | | | — | | | | 4,169,837 | |
Liabilities: | | | | | | | | | | | | | | | | |
Cash received as collateral for TBA commitments | | | — | | | $ | (78,000 | ) | | | — | | | | (78,000 | ) |
Collateral on securities loaned at value | | | — | | | | (116,920 | ) | | | — | | | | (116,920 | ) |
| | | | | | | | | | | | | | | | |
Total | | $ | 8,131,893 | | | $ | (194,920 | ) | | | — | | | $ | 7,936,973 | |
| | | | | | | | | | | | | | | | |
During the year ended December 31, 2015, there were no transfers between levels.
See Notes to Financial Statements.
| | | | | | |
| | | | | | | |
| | BLACKROCK COREALPHA BOND FUND | | DECEMBER 31, 2015 | | 55 |
| | |
| Statement of Assets and Liabilities | | CoreAlpha Bond Master Portfolio |
| | | | |
| December 31, 2015 | | | |
| | | | |
| Assets | |
Investments at value — unaffiliated (including securities loaned of $112,011) (cost — $974,636,044) | | $ | 972,760,313 | |
Investments at value — affiliated (cost — $25,904,566) | | | 25,876,704 | |
Cash | | | 115,166 | |
| Cash pledged: | | | | |
Collateral — OTC derivatives | | | 200,000 | |
Financial futures contracts | | | 2,649,000 | |
Centrally cleared swaps | | | 997,890 | |
Foreign currency at value (cost — $4,231,722) | | | 4,169,837 | |
| Receivables: | | | | |
Contributions from investors | | | 9,640,214 | |
Interest | | | 4,469,473 | |
Investments sold | | | 66,236 | |
Swaps | | | 394 | |
Principal paydowns | | | 31,688 | |
TBA sale commitments | | | 60,853,202 | |
Securities lending income — affiliated | | | 702 | |
| Unrealized appreciation on: | | | | |
Forward foreign currency exchange contracts | | | 2,744,825 | |
OTC swaps | | | 54,335 | |
Variation margin receivable on financial futures contracts | | | 289,072 | |
Variation margin receivable on centrally cleared swaps | | | 35,619 | |
| | | | |
Total assets | | | 1,084,954,670 | |
| | | | |
| | | | |
| Liabilities | | | | |
Collateral on securities loaned at value | | | 116,920 | |
TBA sale commitments at value (proceeds — $60,853,202) | | | 60,844,344 | |
Cash received as collateral for TBA Commitments | | | 78,000 | |
| Payables: | | | | |
Investments purchased | | | 204,092,163 | |
Investment advisory fees | | | 170,692 | |
Withdrawals to investors | | | 70,069 | |
Trustees’ fees | | | 20,597 | |
Swaps | | | 1,372 | |
Professional fees | | | 35,662 | |
Swap premiums received | | | 84,846 | |
| Unrealized depreciation on: | | | | |
Forward foreign currency exchange contracts | | | 3,046,062 | |
OTC swaps | | | 152,837 | |
Variation margin payable on financial futures contracts | | | 146,164 | |
Variation margin payable on centrally cleared swaps | | | 97,503 | |
| | | | |
Total liabilities | | | 268,957,231 | |
| | | | |
Net Assets | | $ | 815,997,439 | |
| | | | |
| | | | |
| Net Assets Consist of | | | | |
Investors’ capital | | $ | 818,144,880 | |
Net unrealized appreciation (depreciation) | | | (2,147,441 | ) |
| | | | |
Net Assets | | $ | 815,997,439 | |
| | | | |
| | | | | | |
| See Notes to Financial Statements. | | | | |
| | | | | | | |
| 56 | | BLACKROCK COREALPHA BOND FUND | | DECEMBER 31, 2015 | | |
| | |
| Statement of Operations | | CoreAlpha Bond Master Portfolio |
| | | | |
| Year Ended December 31, 2015 | | | |
| | | | |
| Investment Income | | | | |
Interest — unaffiliated | | $ | 71,252,136 | |
Dividends — affiliated | | | 550,391 | |
Dividends — unaffiliated | | | 306,031 | |
Securities lending — affiliated — net | | | 9,673 | |
| | | | |
Total income | | | 72,118,231 | |
| | | | |
| | | | |
| Expenses | | | | |
Investment advisory | | | 6,340,216 | |
Independent Trustees | | | 80,838 | |
Professional | | | 53,658 | |
| | | | |
Total expenses | | | 6,474,712 | |
Less fees waived by the Manager | | | (164,627 | ) |
| | | | |
Total expenses after fees waived | | | 6,310,085 | |
| | | | |
Net investment income | | | 65,808,146 | |
| | | | |
| | | | |
| Realized and Unrealized Gain (Loss) | | | | |
| Net realized gain (loss) from: | | | | |
Investments | | | 12,491,940 | |
In-kind redemptions — unaffiliated1 | | | 11,029,620 | |
In-kind redemptions — affiliated1 | | | 225,108 | |
Financial futures contracts | | | 10,097,462 | |
Foreign currency transactions | | | (7,317,720 | ) |
Options written | | | 1,358,890 | |
Swaps | | | (7,265,786 | ) |
| | | | |
| | | 20,619,514 | |
| | | | |
| Net change in unrealized appreciation (depreciation) on: | | | | |
Investments — unaffiliated | | | (57,785,735 | ) |
Investments — affiliated | | | (907,412 | ) |
Financial futures contracts | | | (603,756 | ) |
Foreign currency translations | | | (1,049,570 | ) |
Options written | | | (200,129 | ) |
Swaps | | | 529,216 | |
| | | | |
| | | (60,017,386 | ) |
| | | | |
Net realized and unrealized loss | | | (39,397,872 | ) |
| | | | |
Net Increase in Net Assets Resulting from Operations | | $ | 26,410,274 | |
| | | | |
1 See Note 2 of the Notes to Financial Statements. | | | | |
| | | | | | |
| See Notes to Financial Statements. | | | | |
| | | | | | | |
| | BLACKROCK COREALPHA BOND FUND | | DECEMBER 31, 2015 | | 57 |
| | |
| Statements of Changes in Net Assets | | CoreAlpha Bond Master Portfolio |
| | | | | | | | |
| | | Year Ended December 31, | |
| Increase (Decrease) in Net Assets: | | 2015 | | | 2014 | |
| | | | | | | | |
| Operations | | | | | |
Net investment income | | $ | 65,808,146 | | | $ | 86,655,251 | |
Net realized gain | | | 20,619,514 | | | | 56,120,150 | |
Net change in unrealized appreciation (depreciation) | | | (60,017,386 | ) | | | 76,655,028 | |
| | | | | | | | |
Net increase in net assets resulting from operations | | | 26,410,274 | | | | 219,430,429 | |
| | | | | | | | |
| | | | | | | | |
| Capital Transactions | | | | | | | | |
Proceeds from contributions | | | 402,475,509 | | | | 1,468,046,895 | |
Value of withdrawals1 | | | (2,500,269,038 | ) | | | (2,173,243,591 | ) |
| | | | | | | | |
Net decrease in net assets derived from capital transactions | | | (2,097,793,529 | ) | | | (705,196,696 | ) |
| | | | | | | | |
| | | | | | | | |
| Net Assets | | | | | | | | |
Total decrease in net assets | | | (2,071,383,255 | ) | | | (485,766,267 | ) |
Beginning of year | | | 2,887,380,694 | | | | 3,373,146,961 | |
| | | | | | | | |
End of year | | $ | 815,997,439 | | | $ | 2,887,380,694 | |
| | | | | | | | |
1 See Note 2 of Notes to Financial Statements. | | | | | | | | |
| | | | | | |
| See Notes to Financial Statements. | | | | |
| | | | | | | |
| 58 | | BLACKROCK COREALPHA BOND FUND | | DECEMBER 31, 2015 | | |
| | |
| Financial Highlights | | CoreAlpha Bond Master Portfolio |
| | | | | | | | | | | | | | | | | | | | |
| | | Year Ended December 31, | |
| | | 2015 | | | 2014 | | | 2013 | | | 2012 | | | 2011 | |
| | | | | | | | | | | | | | | | | | | | |
| Total Return | | | | | | | | | | | | | | | | | | | | |
Total return | | | 0.60% | | | | 6.64% | | | | (2.39)% | | | | 4.95% | | | | 8.38% | |
| | | | | | | | | | | | | | | | | | | | |
| | | | | | | | | | | | | | | | | | | | |
| Ratios to Average Net Assets | | | | | | | | | | | | | | | | | | | | |
Total expenses | | | 0.25% | | | | 0.25% | | | | 0.25% | | | | 0.25% | | | | 0.27% | |
| | | | | | | | | | | | | | | | | | | | |
Total expenses after fees waived | | | 0.24% | | | | 0.24% | | | | 0.24% | | | | 0.24% | | | | 0.26% | |
| | | | | | | | | | | | | | | | | | | | |
Net investment income | | | 2.53% | | | | 2.52% | | | | 2.23% | | | | 2.36% | | | | 3.22% | |
| | | | | | | | | | | | | | | | | | | | |
| | | | | | | | | | | | | | | | | | | | |
| Supplemental Data | | | | | | | | | | | | | | | | | | | | |
Net assets, end of year (000) | | | $ 815,997 | | | | $ 2,887,381 | | | | $ 3,373,147 | | | | $ 2,789,640 | | | | $ 2,362,453 | |
| | | | | | | | | | | | | | | | | | | | |
Portfolio turnover rate1,2 | | | 612% | | | | 686% | | | | 986% | | | | 2,128% | | | | 1,646% | |
| | | | | | | | | | | | | | | | | | | | |
| | 1 | | Portfolio turnover rates include TBA transactions, if any. |
| | 2 | | Includes mortgage dollar roll transactions (“MDRs”). Additional information regarding portfolio turnover rate is as follows: |
| | | | | | | | | | | | | | | | | | | | |
| | | Year Ended December 31, | |
| | | 2015 | | | 2014 | | | 2013 | | | 2012 | | | 2011 | |
| | | | | | | | | | | | | | | | | | | | |
Portfolio turnover rate (excluding MDRs) | | | 540% | | | | 470% | | | | 736% | | | | 1,774% | | | | 1,510% | |
| | | | | | | | | | | | | | | | | | | | |
| | | | | | |
| See Notes to Financial Statements. | | | | |
| | | | | | | |
| | BLACKROCK COREALPHA BOND FUND | | DECEMBER 31, 2015 | | 59 |
| | |
| Notes to Financial Statements | | CoreAlpha Bond Master Portfolio |
1. Organization:
CoreAlpha Bond Master Portfolio (the “Master Portfolio”), a series of Master Investment Portfolio (“MIP”), is registered under the Investment Company Act of 1940, as amended (the “1940 Act”), as a diversified, open-end management investment company. MIP is organized as a Delaware statutory trust.
The Master Portfolio, together with certain other registered investment companies advised by BlackRock Advisors, LLC (the “Manager”) or its affiliates, is included in a complex of open-end funds referred to as the Equity-Liquidity Complex.
2. Significant Accounting Policies:
The financial statements are prepared in conformity with accounting principles generally accepted in the United States of America (“U.S. GAAP”), which may require management to make estimates and assumptions that affect the reported amounts of assets and liabilities in the financial statements, disclosure of contingent assets and liabilities at the date of the financial statements and the reported amounts of increases and decreases in net assets from operations during the reporting period. Actual results could differ from those estimates. The Master Portfolio is considered an investment company under U.S. GAAP and follows the accounting and reporting guidance applicable to investment companies. Below is a summary of significant accounting policies:
Foreign Currency: The Master Portfolio’s books and records are maintained in U.S. dollars. Purchases and sales of investments are recorded at the rates of exchange prevailing on the respective dates of such transactions. Generally, when the U.S. dollar rises in value against a foreign currency, the investments denominated in that currency will lose value; the opposite effect occurs if the U.S. dollar falls in relative value.
The Master Portfolio does not isolate changes in the exchange rates from the changes in the market prices of investments held or sold for financial reporting purposes. Accordingly, the effects of changes in exchange rates on investments are not segregated in the Statement of Operations from the effects of changes in market prices of those investments, but are included as a component of net realized and unrealized gain (loss) from investments. The Master Portfolio reports realized currency gains (losses) on foreign currency related transactions as components of net realized gain (loss) for financial reporting purposes, whereas such components are generally treated as ordinary income for federal income tax purposes.
Segregation and Collateralization: In cases where the Master Portfolio enters into certain investments (e.g., dollar rolls, TBA sale commitments, financial futures contracts, forward foreign currency exchange contracts, options written and swaps) that would be treated as “senior securities” for 1940 Act purposes, the Master Portfolio may segregate or designate on its books and records cash or liquid assets having a market value at least equal to the amount of its future obligations under such investments. Doing so allows the investment to be excluded from treatment as a “senior security.” Furthermore, if required by an exchange or counterparty agreement, the Master Portfolio may be required to deliver/deposit cash and/or securities to/with an exchange, or broker-dealer or custodian as collateral for certain investments or obligations.
Investment Transactions and Investment Income: For financial reporting purposes, investment transactions are recorded on the dates the transactions are entered into (the trade dates). Realized gains and losses on investment transactions are determined on the identified cost basis. Dividend income is recorded on the ex-dividend date. Interest income, including amortization and accretion of premiums and discounts on debt securities, is recognized on the accrual basis.
In-Kind Redemptions: The Master Portfolio transferred securities and cash to shareholders in connection with an in-kind redemption transaction. For financial reporting purposes, these transactions were treated as a sale of securities and the resulting gains and losses were recognized based on the market value of the securities on the date of the redemption. For the year ended December 31, 2015, the Master Portfolio had in-kind redemptions of $2,013,230,637. For tax purposes, no gains or losses were recognized.
Indemnifications: In the normal course of business, the Master Portfolio enters into contracts that contain a variety of representations that provide general indemnification. The Master Portfolio’s maximum exposure under these arrangements is unknown because it involves future potential claims against the Master Portfolio, which cannot be predicted with any certainty.
Other: Expenses directly related to the Master Portfolio are charged to the Master Portfolio. Other operating expenses shared by several funds, including other funds managed by the Manager, are prorated among those funds on the basis of relative net assets or other appropriate methods.
The Master Portfolio has an arrangement with its custodian whereby fees may be reduced by credits earned on uninvested cash balances, which, if applicable, are shown as fees paid indirectly in the Statement of Operations. The custodian imposes fees on overdrawn cash balances, which can be offset by accumulated credits earned or may result in additional custody charges. Effective September 2015, the arrangement with its custodian for earning credits on uninvested cash balances has ceased and the custodian will be imposing fees on certain uninvested cash balances.
3. Investment Valuation and Fair Value Measurements:
Investment Valuation Policies: The Master Portfolio’s investments are valued at fair value (also referred to as “market value” within the financial statements) as of the close of trading on the New York Stock Exchange (“NYSE”) (generally 4:00 p.m., Eastern time). U.S. GAAP defines fair value as the price the Master Portfolio would receive to sell an asset or pay to transfer a liability in an orderly transaction between market participants at the measurement date. The Master Portfolio determines the fair values of its financial instruments using independent dealers or pricing services under policies approved by
| | | | | | |
| | | | | | | |
| 60 | | BLACKROCK COREALPHA BOND FUND | | DECEMBER 31, 2015 | | |
| | |
| Notes to Financial Statements (continued) | | CoreAlpha Bond Master Portfolio |
the Board Trustees of MIP (the “Board”). The BlackRock Global Valuation Methodologies Committee (the “Global Valuation Committee”) is the committee formed by management to develop global pricing policies and procedures and to provide oversight of the pricing function for the Master Portfolio for all financial instruments.
Fair Value Inputs and Methodologies: The following methods (or “techniques”) and inputs are used to establish the fair value of the Master Portfolio’s assets and liabilities:
| • | | Bond investments are valued on the basis of last available bid prices or current market quotations provided by dealers or pricing services. Floating rate loan interests are valued at the mean of the bid prices from one or more brokers or dealers as obtained from a pricing service. In determining the value of a particular investment, pricing services may use certain information with respect to transactions in such investments, quotations from dealers, pricing matrixes, market transactions in comparable investments, various relationships observed in the market between investments and calculated yield measures. Asset-backed and mortgage-backed securities are valued by independent pricing services using models that consider estimated cash flows of each tranche of the security, establish a benchmark yield and develop an estimated tranche-specific spread to the benchmark yield based on the unique attributes of the tranche. Generally, trading in foreign instruments is substantially completed each day at various times prior to the close of business on the NYSE. Occasionally, events affecting the values of such instruments may occur between the foreign market close and the close of business on the NYSE that may not be reflected in the computation of the Master Portfolio’s net assets |
| • | | Municipal investments (including commitments to purchase such investments on a “when-issued” basis) are valued on the basis of prices provided by dealers or pricing services. In determining the value of a particular investment, pricing services may use certain information with respect to transactions in such investments, quotations from dealers, pricing matrixes, market transactions in comparable investments and information with respect to various relationships between investments. |
| • | | Investments in open-end U.S. mutual funds are valued at NAV each business day. |
| • | | Financial futures contracts traded on exchanges are valued at their last sale price. |
| • | | Securities and other assets and liabilities denominated in foreign currencies are translated into U.S. dollars using exchange rates determined as of the close of business on the NYSE. Forward foreign currency exchange contracts are valued at the mean between the bid and ask prices and are determined as of the close of business on the NYSE. Interpolated values are derived when the settlement date of the contract is an interim date for which quotations are not available. |
| • | | Exchange-traded options are valued at the mean between the last bid and ask prices at the close of the options market in which the options trade. An exchange-traded option for which there is no mean price is valued at the last bid (long positions) or ask (short positions) price. If no bid or ask price is available, the prior day’s price will be used, unless it is determined that the prior day’s price no longer reflects the fair value of the option. Over-the-counter (“OTC”) options are valued by an independent pricing service using a mathematical model, which incorporates a number of market data factors, such as the trades and prices of the underlying instruments. |
| • | | Swap agreements are valued utilizing quotes received daily by the Master Portfolio’s pricing service or through brokers, which are derived using daily swap curves and models that incorporate a number of market data factors, such as discounted cash flows, trades and values of the underlying reference instruments. |
| • | | To-be-announced (“TBA”) commitments are valued on the basis of last available bid prices or current market quotations provided by pricing services. |
If events (e.g., a company announcement, market volatility or a natural disaster) occur that are expected to materially affect the value of such instruments, or in the event that the application of these methods of valuation results in a price for an investment that is deemed not to be representative of the market value of such investment, or if a price is not available, the investment will be valued by the Global Valuation Committee, or its delegate, in accordance with a policy approved by the Board as reflecting fair value (“Fair Valued Investments”). When determining the price for Fair Valued Investments, the Global Valuation Committee, or its delegate, seeks to determine the price that the Master Portfolio might reasonably expect to receive or pay from the current sale or purchase of that asset or liability in an arm’s-length transaction. Fair value determinations shall be based upon all available factors that the Global Valuation Committee, or its delegate, deems relevant consistent with the principles of fair value measurement, which include the market approach, income approach and/or in the case of recent investments, the cost approach, as appropriate. The market approach generally consists of using comparable market transactions. The income approach generally is used to discount future cash flows to present value and is adjusted for liquidity as appropriate. These factors include but are not limited to: (i) attributes specific to the investment or asset; (ii) the principal market for the investment or asset; (iii) the customary participants in the principal market for the investment or asset; (iv) data assumptions by market participants for the investment or asset, if reasonably available; (v) quoted prices for similar investments or assets in active markets; and (vi) other factors, such as future cash flows, interest rates, yield curves, volatilities, prepayment speeds, loss severities, credit risks, recovery rates, liquidation amounts and/or default rates. Due to the inherent uncertainty of valuations of such investments, the fair values may differ from the values that would have been used had an active market existed. The Global Valuation Committee, or its delegate, employs various methods for calibrating valuation approaches for investments where an active market does not exist, including regular due diligence of the Master Portfolio’s pricing vendors, regular reviews of key inputs and assumptions, transactional back-testing
| | | | | | |
| | | | | | | |
| | BLACKROCK COREALPHA BOND FUND | | DECEMBER 31, 2015 | | 61 |
| | |
| Notes to Financial Statements (continued) | | CoreAlpha Bond Master Portfolio |
or disposition analysis to compare unrealized gains and losses to realized gains and losses, reviews of missing or stale prices and large movements in market values and reviews of any market related activity. The pricing of all Fair Valued Investments is subsequently reported to the Board or a committee thereof on a quarterly basis.
Fair Value Hierarchy: Various inputs are used in determining the fair value of investments and derivative financial instruments. These inputs to valuation techniques are categorized into a fair value hierarchy consisting of three broad levels for financial statement purposes as follows:
| • | | Level 1 — unadjusted price quotations in active markets/exchanges for identical assets or liabilities that the Master Portfolio has the ability to access |
| • | | Level 2 — other observable inputs (including, but not limited to, quoted prices for similar assets or liabilities in markets that are active, quoted prices for identical or similar assets or liabilities in markets that are not active, inputs other than quoted prices that are observable for the assets or liabilities (such as interest rates, yield curves, volatilities, prepayment speeds, loss severities, credit risks and default rates) or other market–corroborated inputs) |
| • | | Level 3 — unobservable inputs based on the best information available in the circumstances, to the extent observable inputs are not available (including the Master Portfolio’s own assumptions used in determining the fair value of investments and derivative financial instruments) |
The hierarchy gives the highest priority to unadjusted quoted prices in active markets for identical assets or liabilities (Level 1 measurements) and the lowest priority to unobservable inputs (Level 3 measurements). Accordingly, the degree of judgment exercised in determining fair value is greatest for instruments categorized in Level 3. The inputs used to measure fair value may fall into different levels of the fair value hierarchy. In such cases, for disclosure purposes, the fair value hierarchy classification is determined based on the lowest level input that is significant to the fair value measurement in its entirety. The significant unobservable inputs used by the Global Valuation Committee in determining the price for Fair Valued Investments are typically categorized as Level 3. The fair value hierarchy for the Master Portfolio’s investments and derivative financial instruments has been included in the Schedule of Investments.
Changes in valuation techniques may result in transfers into or out of an assigned level within the hierarchy. In accordance with the Master Portfolio’s policy, transfers between different levels of the fair value hierarchy are deemed to have occurred as of the beginning of the reporting period. The categorization of a value determined for investments and derivative financial instruments is based on the pricing transparency of the investments and derivative financial instruments and is not necessarily an indication of the risks associated with investing in those securities.
4. Securities and Other Investments:
Asset-Backed and Mortgage-Backed Securities: Asset-backed securities are generally issued as pass-through certificates or as debt instruments. Asset-backed securities issued as pass-through certificates represent undivided fractional ownership interests in an underlying pool of assets. Asset-backed securities issued as debt instruments, which are also known as collateralized obligations are typically issued as the debt of a special purpose entity organized solely for the purpose of owning such assets and issuing such debt. Asset-backed securities are often backed by a pool of assets representing the obligations of a number of different parties. The yield characteristics of certain asset-backed securities may differ from traditional debt securities. One such major difference is that all or a principal part of the obligations may be prepaid at any time because the underlying assets (i.e., loans) may be prepaid at any time. As a result, a decrease in interest rates in the market may result in increases in the level of prepayments as borrowers, particularly mortgagors, refinance and repay their loans. An increased prepayment rate with respect to an asset-backed security will have the effect of shortening the maturity of the security. In addition, the Master Portfolio may subsequently have to reinvest the proceeds at lower interest rates. If the Master Portfolio has purchased such an asset-backed security at a premium, a faster than anticipated prepayment rate could result in a loss of principal to the extent of the premium paid.
For mortgage pass through securities, there are a number of important differences among the agencies and instrumentalities of the U.S. Government that issue mortgage-related securities and among the securities that they issue. For example, mortgage-related securities guaranteed by Ginnie Mae are guaranteed as to the timely payment of principal and interest by Ginnie Mae and such guarantee is backed by the full faith and credit of the United States. However, mortgage-related securities issued by Freddie Mac and Fannie Mae, including Freddie Mac and Fannie Mae guaranteed mortgage pass-through certificates, which are solely the obligations of Freddie Mac and Fannie Mae, are not backed by or entitled to the full faith and credit of the United States, but are supported by the right of the issuer to borrow from the U.S. Treasury.
Non-agency mortgage-backed securities are securities issued by non-governmental issuers and have no direct or indirect government guarantees of payment and are subject to various risks. Non-agency mortgage loans are obligations of the borrowers thereunder only and are not typically insured or guaranteed by any other person or entity. The ability of a borrower to repay a loan is dependent upon the income or assets of the borrower. A number of factors, including a general economic downturn, acts of God, terrorism, social unrest and civil disturbances, may impair a borrower’s ability to repay its loans.
Inflation-Indexed Bonds: Inflation-indexed bonds are fixed income securities whose principal value is periodically adjusted according to the rate of inflation. If the index measuring inflation rises or falls, the principal value of inflation-indexed bonds will be adjusted upward or downward, and consequently the interest payable on these securities (calculated with respect to a larger or smaller principal amount) will be increased or reduced, respectively. Any upward or downward adjustment in the principal amount of an inflation-indexed bond will be included as interest income in the
| | | | | | |
| | | | | | | |
| 62 | | BLACKROCK COREALPHA BOND FUND | | DECEMBER 31, 2015 | | |
| | |
| Notes to Financial Statements (continued) | | CoreAlpha Bond Master Portfolio |
Statement of Operations, even though investors do not receive their principal until maturity. Repayment of the original bond principal upon maturity (as adjusted for inflation) is guaranteed in the case of U.S. Treasury inflation-indexed bonds. For bonds that do not provide a similar guarantee, the adjusted principal value of the bond repaid at maturity may be less than the original principal.
Multiple Class Pass-Through Securities: Multiple class pass-through securities, including collateralized mortgage obligations (“CMOs”) and commercial mortgage-backed securities may be issued by Ginnie Mae, U.S. Government agencies or instrumentalities or by trusts formed by private originators of, or investors in, mortgage loans. In general, CMOs are debt obligations of a legal entity that are collateralized by, a pool of residential or commercial mortgage loans or mortgage pass-through securities (the “Mortgage Assets”). The payments on these are used to make payments on the CMOs or multiple pass-through securities. Multiple class pass-through securities represent direct ownership interests in the Mortgage Assets. Classes of CMOs include interest only (“IOs”), principal only (“POs”), planned amortization classes and targeted amortization classes. IOs and POs are stripped mortgage-backed securities representing interests in a pool of mortgages, the cash flow from which has been separated into interest and principal components. IOs receive the interest portion of the cash flow while POs receive the principal portion. IOs and POs can be extremely volatile in response to changes in interest rates. As interest rates rise and fall, the value of IOs tends to move in the same direction as interest rates. POs perform best when prepayments on the underlying mortgages rise since this increases the rate at which the principal is returned and the yield to maturity on the PO. When payments on mortgages underlying a PO are slower than anticipated, the life of the PO is lengthened and the yield to maturity is reduced. If the underlying Mortgage Assets experience greater than anticipated prepayments of principal, the Master Portfolio’s initial investment in the IOs may not fully recoup.
Stripped Mortgage-Backed Securities: Stripped mortgage-backed securities are issued by the U.S. Government, its agencies and instrumentalities. Stripped mortgage-backed securities are usually structured with two classes that receive different proportions of the interest (IOs) and principal (POs) distributions on a pool of Mortgage Assets. The Master Portfolio also may invest in stripped mortgage-backed securities that are privately issued.
Zero-Coupon Bonds: Zero-coupon bonds are normally issued at a significant discount from face value and do not provide for periodic interest payments. These bonds may experience greater volatility in market value than other debt obligations of similar maturity which provide for regular interest payments.
Capital Securities and Trust Preferred Securities: Capital securities, including trust preferred securities, are typically issued by corporations, generally in the form of interest-bearing notes with preferred securities characteristics, or in the case of trust preferred securities, by an affiliated business trust of a corporation, generally in the form of beneficial interests in subordinated debentures or similarly structured securities. The securities can be structured as either fixed or adjustable coupon securities that can have either a perpetual or stated maturity date. For trust preferred securities, the issuing bank or corporation pays interest to the trust, which is then distributed to holders of the trust preferred securities as a dividend. Dividends can be deferred without creating an event of default or acceleration, although maturity cannot take place unless all cumulative payment obligations have been met. The deferral of payments does not affect the purchase or sale of these securities in the open market. Payments on these securities are treated as interest rather than dividends for federal income tax purposes. These securities generally are rated below that of the issuing company’s senior debt securities and are freely callable at the issuer’s option.
Preferred Stock: Preferred stock has a preference over common stock in liquidation (and generally in receiving dividends as well) but is subordinated to the liabilities of the issuer in all respects. As a general rule, the market value of preferred stock with a fixed dividend rate and no conversion element varies inversely with interest rates and perceived credit risk, while the market price of convertible preferred stock generally also reflects some element of conversion value. Because preferred stock is junior to debt securities and other obligations of the issuer, deterioration in the credit quality of the issuer will cause greater changes in the value of a preferred stock than in a more senior debt security with similar stated yield characteristics. Unlike interest payments on debt securities, preferred stock dividends are payable only if declared by the issuer’s board of directors. Preferred stock also may be subject to optional or mandatory redemption provisions.
TBA Commitments: TBA commitments are forward agreements for the purchase or sale of mortgage-backed securities for a fixed price, with payment and delivery on an agreed upon future settlement date. The specific securities to be delivered are not identified at the trade date. However, delivered securities must meet specified terms, including issuer, rate and mortgage terms. When entering into TBA commitments, the Master Portfolio may take possession of or deliver the underlying mortgage-backed securities but can extend the settlement or roll the transaction. TBA commitments involve a risk of loss if the value of the security to be purchased or sold declines or increases, respectively, prior to settlement date.
In order to better define contractual rights and to secure rights that will help the Master Portfolio mitigate its counterparty risk, TBA commitments may be entered into by the Master Portfolio under Master Securities Forward Transaction Agreements (each, an “MSFTA”). An MSFTA typically contains, among other things, collateral posting terms and netting provisions in the event of default and/or termination event. The collateral requirements are typically calculated by netting the mark-to-market amount for each transaction under such agreement and comparing that amount to the value of the collateral currently pledged by the Master Portfolio and the counterparty. Cash collateral that has been pledged to cover the obligations of the Master Portfolio and cash collateral received from the counterparty, if any, is reported separately on the Statement of Assets and Liabilities as cash pledged as collateral for TBA commitments or cash received as collateral for TBA commitments, respectively. Non-cash collateral pledged by the Master Portfolio, if any, is noted in the Schedule of Investments. Typically, the Master Portfolio is permitted to sell, repledge or use the collateral it receives; however, the counterparty is not permitted to do so. To the extent amounts due to the Master Portfolio is not fully collateralized, contractually or otherwise, the Master Portfolio bears the risk of loss from counterparty non-performance.
| | | | | | |
| | | | | | | |
| | BLACKROCK COREALPHA BOND FUND | | DECEMBER 31, 2015 | | 63 |
| | |
| Notes to Financial Statements (continued) | | CoreAlpha Bond Master Portfolio |
Mortgage Dollar Roll Transactions: The Master Portfolio may sell TBA mortgage-backed securities and simultaneously contract to repurchase substantially similar (i.e., same type, coupon and maturity) securities on a specific future date at an agreed upon price. During the period between the sale and repurchase, the Master Portfolio is not entitled to receive interest and principal payments on the securities sold. Mortgage dollar roll transactions are treated as purchases and sales and realize gains and losses on these transactions. Mortgage dollar rolls involve the risk that the market value of the securities that the Master Portfolio is required to purchase may decline below the agreed upon repurchase price of those securities.
Securities Lending: The Master Portfolio may lend its securities to approved borrowers, such as brokers, dealers and other financial institutions. The borrower pledges and maintains with the Master Portfolio collateral consisting of cash, an irrevocable letter of credit issued by a bank, or securities issued or guaranteed by the U.S. Government. The initial collateral received by the Master Portfolio is required to have a value of at least 102% of the current value of the loaned securities for securities traded on U.S. exchanges and a value of at least 105% for all other securities. The collateral is maintained thereafter, at a value equal to at least 100% of the current market value of the securities on loan. The market value of the loaned securities is determined at the close of each business day of the Master Portfolio and any additional required collateral is delivered to the Master Portfolio, or excess collateral returned by the Master Portfolio, on the next business day. During the term of the loan, the Master Portfolio’s is entitled to all distributions made on or in respect of the loaned securities. Loans of securities are terminable at any time and the borrower, after notice, is required to return borrowed securities within the standard time period for settlement of securities transactions.
The market value of any securities on loan, all of which were classified as corporate bonds in the Master Portfolio’s Schedule of Investments, and the value of any related collateral are shown separately in the Statement of Assets and Liabilities as a component of investments at value — unaffiliated, and collateral on securities loaned at value, respectively. As of period end, any securities on loan were collateralized by cash. The cash collateral invested by the securities lending agent, BlackRock Institutional Trust Company, N.A. (“BTC”), if any, is disclosed in the Schedule of Investments.
Securities lending transactions are entered into by the Master Portfolio under Master Securities Lending Agreements (each, an “MSLA”), which provide the right, in the event of default (including bankruptcy or insolvency), for the non-defaulting party to liquidate the collateral and calculate a net exposure to the defaulting party or request additional collateral. In the event that a borrower defaults, the Master Portfolio, as lender, would offset the market value of the collateral received against the market value of the securities loaned. When the value of the collateral is greater than that of the market value of the securities loaned, the lender is left with a net amount payable to the defaulting party. However, bankruptcy or insolvency laws of a particular jurisdiction may impose restrictions on or prohibitions against such a right of offset in the event of an MSLA counterparty’s bankruptcy or insolvency. Under the MSLA, absent an event of default the borrower can resell or re-pledge the loaned securities, and the Master Portfolio can reinvest cash collateral received in connection with loaned securities. Upon an event of default, the parties’ obligations to return the securities or collateral to the other party are extinguished, and the parties can resell or re-pledge the loaned securities or the collateral received in connection with the loaned securities in order to satisfy the defaulting party’s net payment obligation for all transactions under the MSLA. The defaulting party remains liable for any deficiency.
As of period end, the following table is a summary of the Master Portfolio securities lending agreements by counterparty which are subject to offset under an MSLA:
| | | | | | | | | | | | |
| Counterparty | | Securities
Loaned
at Value | | | Cash
Collateral
Received1 | | | Net Amount | |
Citigroup Global Markets, Inc. | | $ | 112,011 | | | $ | (112,011 | ) | | | — | |
| | | | | | | | | | | | |
Total | | $ | 112,011 | | | $ | (112,011 | ) | | | — | |
| | | | | | | | | | | | |
| | 1 | | Collateral with a value of $116,290 has been received in connection with securities lending agreements. Collateral received in excess of the value of securities loaned from the individual counterparty is not shown for financial reporting purposes in the table above. |
The risks of securities lending include the risk that the borrower may not provide additional collateral when required or may not return the securities when due. To mitigate these risks, the Master Portfolio benefits from a borrower default indemnity provided by BlackRock, Inc. (“BlackRock”). BlackRock’s indemnity allows for full replacement of the securities loaned if the collateral received does not cover the value on the securities loaned in the event of borrower default. The Master Portfolio could suffer a loss if the value of an investment purchased with cash collateral falls below the market value of loaned securities or if the value of an investment purchased with cash collateral falls below the value of the original cash collateral received.
5. Derivative Financial Instruments:
The Master Portfolio engages in various portfolio investment strategies using derivative contracts both to increase the returns of the Master Portfolio and/or to manage economically its exposure to certain risks such as credit risk, interest rate risk, foreign currency exchange rate risk, or other risk (e.g., inflation risk). These contracts may be transacted on an exchange or OTC.
Financial Futures Contracts: The Master Portfolio invests in long and/or short positions in financial futures contracts and options on financial futures contracts to gain exposure to, or economically hedge against, changes in interest rates (interest rate risk). Financial futures contracts are agreements between the Master Portfolio and a counterparty to buy or sell a specific quantity of an underlying instrument at a specified price and at a specified date. Depending on the terms of the particular contract, financial futures contracts are settled either through physical delivery of the underlying instrument on the settlement date or by payment of a cash settlement amount on the settlement date.
| | | | | | |
| | | | | | | |
| 64 | | BLACKROCK COREALPHA BOND FUND | | DECEMBER 31, 2015 | | |
| | |
| Notes to Financial Statements (continued) | | CoreAlpha Bond Master Portfolio |
Upon entering into a financial futures contract, the Master Portfolio is required to deposit initial margin with the broker in the form of cash or securities in an amount that varies depending on a contract’s size and risk profile. The initial margin deposit must then be maintained at an established level over the life of the contract. Securities deposited as initial margin are designated on the Schedule of Investments and cash deposited, if any, is recorded on the Statement of Assets and Liabilities as cash pledged for financial futures contracts. Pursuant to the contract, the Master Portfolio agrees to receive from or pay to the broker an amount of cash equal to the daily fluctuation in value of the contract. Such receipts or payments are known as variation margin. Variation margin is recorded by the Master Portfolio as unrealized appreciation (depreciation) and, if applicable, as a receivable or payable for variation margin in the Statement of Assets and Liabilities.
When the contract is closed, the Master Portfolio records a realized gain or loss equal to the difference between the value of the contract at the time it was opened and the value at the time it was closed. The use of financial futures contracts involves the risk of an imperfect correlation in the movements in the price of financial futures contracts, interest or foreign currency exchange rates and the underlying assets.
Forward Foreign Currency Exchange Contracts: The Master Portfolio enters into forward foreign currency exchange contracts as an economic hedge against either specific transactions or portfolio instruments or to obtain exposure to, or hedge exposure away from, foreign currencies (foreign currency exchange rate risk). A forward foreign currency exchange contract is an agreement between two parties to buy and sell a currency at a set exchange rate on a future date. Forward foreign currency exchange contracts, when used by the Master Portfolio, help to manage the overall exposure to the currencies in which some of the investments held by the Master Portfolio are denominated. Non-deliverable forward foreign currency exchange contracts are settled with the counterparty in cash without the delivery of foreign currency. The contract is marked-to-market daily and the change in market value is recorded by the Master Portfolio as an unrealized gain or loss. When the contract is closed, the Master Portfolio records a realized gain or loss equal to the difference between the value at the time it was opened and the value at the time it was closed. The use of forward foreign currency exchange contracts involves the risk that the value of a forward foreign currency exchange contract changes unfavorably due to movements in the value of the referenced foreign currencies.
Options: The Master Portfolio purchases and writes call and put options to increase or decrease its exposure to underlying instruments including interest rate risk and/or, in the case of options written, to generate gains from options premiums. A call option gives the purchaser (holder) of the option the right (but not the obligation) to buy, and obligates the seller (writer) to sell (when the option is exercised) the underlying instrument at the exercise or strike price at any time or at a specified time during the option period. A put option gives the holder the right to sell and obligates the writer to buy the underlying instrument at the exercise or strike price at any time or at a specified time during the option period. When the Master Portfolio purchases (writes) an option, an amount equal to the premium paid (received) by the Master Portfolio is reflected as an asset (liability). The amount of the asset (liability) is subsequently marked-to-market to reflect the current market value of the option purchased (written). When an instrument is purchased or sold through an exercise of an option, the related premium paid (or received) is added to (or deducted from) the basis of the instrument acquired or deducted from (or added to) the proceeds of the instrument sold. When an option expires (or the Master Portfolio enters into a closing transaction), the Master Portfolio realizes a gain or loss on the option to the extent of the premiums received or paid (or gain or loss to the extent the cost of the closing transaction exceeds the premiums received or paid). When the Master Portfolio writes a call option, such option is “covered,” meaning that the Master Portfolio holds the underlying instrument subject to being called by the option counterparty. When the Master Portfolio writes a put option, such option is covered by cash in an amount sufficient to cover the obligation.
In purchasing and writing options, the Master Portfolio bears the risk of an unfavorable change in the value of the underlying instrument or the risk that the Master Portfolio may not be able to enter into a closing transaction due to an illiquid market. Exercise of a written option could result in the Master Portfolio purchasing or selling a security when it otherwise would not, or at a price different from the current market value.
Swaps: The Master Portfolio enters into swap agreements in which the Master Portfolio and a counterparty agree either to make periodic net payments on a specified notional amount or a net payment upon termination. Swap agreements are privately negotiated in the OTC market and may be entered into as a bilateral contract (“OTC swaps”) or centrally cleared (“centrally cleared swaps”). Swaps are marked-to-market daily and changes in value are recorded as unrealized appreciation (depreciation).
For OTC swaps, any upfront premiums paid are recorded as assets and any upfront fees received are recorded as liabilities and are shown as swap premiums paid and swap premiums received, respectively, in the Statement of Assets and Liabilities and amortized over the term of the OTC swap. Payments received or made by the Master Portfolio for OTC swaps are recorded in the Statement of Operations as realized gains or losses, respectively. When an OTC swap is terminated, the Master Portfolio will record a realized gain or loss equal to the difference between the proceeds from (or cost of) the closing transaction and the Master Portfolio’s basis in the contract, if any. Generally, the basis of the contract is the premium received or paid.
In a centrally cleared swap, immediately following execution of the swap agreement, the swap agreement is novated to a central counterparty (the “CCP”) and the Master Portfolio’s counterparty on the swap agreement becomes the CCP. The Master Portfolio is required to interface with the CCP through a broker. Upon entering into a centrally cleared swap, the Master Portfolio is required to deposit initial margin with the broker in the form of cash or securities in an amount that varies depending on the size and risk profile of the particular swap. Securities deposited as initial margin are designated on the Schedule of Investments and cash deposited is recorded on the Statement of Assets and Liabilities as cash pledged for centrally cleared swaps. The daily change in valuation of centrally cleared swaps is recorded as a receivable or payable for variation margin in the Statement of Assets and Liabilities. Payments received from (paid to) the counterparty, including at termination, are recorded as realized gain (loss) in the Statement of Operations.
| | | | | | |
| | | | | | | |
| | BLACKROCK COREALPHA BOND FUND | | DECEMBER 31, 2015 | | 65 |
| | |
| Notes to Financial Statements (continued) | | CoreAlpha Bond Master Portfolio |
Swap transactions involve, to varying degrees, elements of interest rate, credit and market risk in excess of the amounts recognized in the Statement of Assets and Liabilities. Such risks involve the possibility that there will be no liquid market for these agreements, that the counterparty to the agreements may default on its obligation to perform or disagree as to the meaning of the contractual terms in the agreements, and that there may be unfavorable changes in interest rates and/or market values associated with these transactions.
| • | | Credit default swaps — The Master Portfolio enters into credit default swaps to manage its exposure to the market or certain sectors of the market, to reduce its risk exposure to defaults of corporate and/or sovereign issuers or to create exposure to corporate and/or sovereign issuers to which it is not otherwise exposed (credit risk). The Master Portfolio may either buy or sell (write) credit default swaps on single-name issuers (corporate or sovereign), a combination or basket of single-name issuers or traded indexes. Credit default swaps on single-name issuers are agreements in which the protection buyer pays fixed periodic payments to the seller in consideration for a guarantee from the protection seller to make a specific payment should a negative credit event take place with respect to the referenced entity (e.g., bankruptcy, failure to pay, obligation accelerators, repudiation, moratorium or restructuring). Credit default swaps on traded indexes are agreements in which the buyer pays fixed periodic payments to the seller in consideration for a guarantee from the seller to make a specific payment should a write-down, principal or interest shortfall or default of all or individual underlying securities included in the index occur. As a buyer, if an underlying credit event occurs, the Master Portfolio will either (i) receive from the seller an amount equal to the notional amount of the swap and deliver the referenced security or underlying securities comprising the index, or (ii) receive a net settlement of cash equal to the notional amount of the swap less the recovery value of the security or underlying securities comprising the index. As a seller (writer), if an underlying credit event occurs, the Master Portfolio will either pay the buyer an amount equal to the notional amount of the swap and take delivery of the referenced security or underlying securities comprising the index or pay a net settlement of cash equal to the notional amount of the swap less the recovery value of the security or underlying securities comprising the index. |
| • | | Total return swaps — The Master Portfolio enters into total return swaps to obtain exposure to a security or market without owning such security or investing directly in that market or to transfer the risk/return of one market (e.g., fixed income) to another market (e.g., equity or commodity prices) (equity risk, commodity price risk and/or interest rate risk). Total return swaps are agreements in which there is an exchange of cash flows whereby one party commits to make payments based on the total return (coupons plus capital gains/losses) of an underlying instrument in exchange for fixed or floating rate interest payments. To the extent the total return of the instrument or index underlying the transaction exceeds or falls short of the offsetting interest rate obligation, the Master Portfolio will receive a payment from or make a payment to the counterparty. |
| • | | Interest rate swaps — The Master Portfolio enters into interest rate swaps to gain or reduce exposure to interest rates or to manage duration, the yield curve or interest rate risk by economically hedging the value of the fixed rate bonds, which may decrease when interest rates rise (interest rate risk). Interest rate swaps are agreements in which one party pays a stream of interest payments, either fixed or floating, for another party’s stream of interest payments, either fixed or floating, on the same notional amount for a specified period of time. In more complex swaps, the notional principal amount may decline (or amortize) over time. |
| • | | Forward interest rate swaps — The Master Portfolio enters into forward interest rate swaps and forward total return swaps. In a forward swap, the Master Portfolio and the counterparty agree to make either periodic net payments beginning on a specified future effective date or a net payment at termination, unless terminated earlier. |
Master Netting Arrangements: In order to better define the Master Portfolio’s contractual rights and to secure rights that will help it mitigate its counterparty risk, the Master Portfolio may enter into an International Swaps and Derivatives Association, Inc. Master Agreement (“ISDA Master Agreement”) or similar agreement with its counterparties. An ISDA Master Agreement is a bilateral agreement between the Fund and a counterparty that governs certain OTC derivatives and typically contains, among other things, collateral posting terms and netting provisions in the event of a default and/or termination event. Under an ISDA Master Agreement, the Fund may, under certain circumstances, offset with the counterparty certain derivative financial instruments’ payables and/or receivables with collateral held and/or posted and create one single net payment. The provisions of the ISDA Master Agreement typically permit a single net payment in the event of default including the bankruptcy or insolvency of the counterparty. Bankruptcy or insolvency laws of a particular jurisdiction may restrict or prohibit the right of offset in bankruptcy, insolvency or other events. In addition, certain ISDA Master Agreements allow counterparties to terminate derivative contracts prior to maturity in the event the Master Portfolio’s net assets decline by a stated percentage or the Master Portfolio fails to meet the terms of its ISDA Master Agreements. The result would cause the Master Portfolio to accelerate payment of any net liability owed to the counterparty.
Collateral Requirements: For derivatives traded under an ISDA Master Agreement, the collateral requirements are typically calculated by netting the mark-to-market amount for each transaction under such agreement and comparing that amount to the value of any collateral currently pledged by the Master Portfolio and the counterparty.
Cash collateral that has been pledged to cover obligations of the Master Portfolio and cash collateral received from the counterparty, if any, is reported separately on the Statement of Assets and Liabilities as cash pledged as collateral and cash received as collateral, respectively. Non-cash collateral pledged by the Master Portfolio, if any, is noted in the Schedule of Investments. Generally, the amount of collateral due from or to a party has to exceed a minimum transfer amount threshold (typically either $250,000 or $500,000) before a transfer is required, which is determined at the close of business of
| | | | | | |
| | | | | | | |
| 66 | | BLACKROCK COREALPHA BOND FUND | | DECEMBER 31, 2015 | | |
| | |
| Notes to Financial Statements (continued) | | CoreAlpha Bond Master Portfolio |
the Master Portfolio. Any additional required collateral is delivered to/pledged by the Master Portfolio on the next business day. Typically, the Master Portfolio’s counterparty is not permitted to sell, re-pledge or use cash and non-cash collateral it receives. The Master Portfolio generally agrees not to use non-cash collateral that it receives but may, absent default or certain other circumstances defined in the underlying ISDA Master Agreement, be permitted to use cash collateral received. In such cases, the Master Portfolio may pay interest pursuant to the collateral arrangement with the counterparty. To the extent amounts due to the Master Portfolio from its counterparties are not fully collateralized, the Master Portfolio bears the risk of loss from counterparty non-performance. Likewise, to the extent the Master Portfolio has delivered collateral to a counterparty and stands ready to perform under the terms of its agreement with such counterparty, the Master Portfolio bears the risk of loss from a counterparty in the amount of the value of the collateral in the event the counterparty fails to return such collateral. Based on the terms of agreements, collateral may not be required for all derivative contracts.
Cash collateral that has been pledged to cover obligations of the Master Portfolio and cash collateral received from the counterparty, if any, is reported separately on the Statement of Assets and Liabilities as cash pledged as collateral and cash received as collateral, respectively. Non-cash collateral pledged by the Master Portfolio, if any, is noted in the Schedule of Investments. Generally, the amount of collateral due from or to a party has to exceed a minimum transfer amount threshold (typically either $250,000 or $500,000) before a transfer is required, which is determined at the close of business of the Master Portfolio. Any additional required collateral is delivered to/pledged by the Master Portfolio on the next business day. Typically, the Master Portfolio and its counterparties are not permitted to sell, re-pledge or use the collateral they receive. To the extent amounts due to the Master Portfolio from its counterparties are not fully collateralized, the Master Portfolio bears the risk of loss from counterparty non-performance. Likewise, to the extent the Master Portfolio has delivered collateral to a counterparty and stands ready to perform under the terms of its agreement with such counterparty, the Master Portfolio bears the risk of loss from a counterparty in the amount of the value of the collateral in the event the counterparty fails to return such collateral.
For financial reporting purposes, the Master Portfolio does not offset derivative assets and derivative liabilities that are subject to netting arrangements, if any, in the Statement of Assets and Liabilities.
6. Investment Advisory Agreement and Other Transactions with Affiliates:
The PNC Financial Services Group, Inc. is the largest stockholder and an affiliate of BlackRock for 1940 Act purposes.
MIP, on behalf of the Master Portfolio, entered into an Investment Advisory Agreement with the Manager, the Master Portfolio’s investment advisor, an indirect, wholly owned subsidiary of BlackRock, to provide investment advisory services. The Manager is responsible for the management of the Master Portfolio’s portfolio and provides the personnel, facilities, equipment and certain other services necessary to the operations of the Master Portfolio. For such services, the Master Portfolio pays the Manager a monthly fee based on a percentage of the Master Portfolio’s average daily net assets at the following annual rates:
| | | | |
| Average Daily Net Assets | | Investment Advisory Fee | |
First $1 Billion | | | 0.25% | |
$1 Billion — $3 Billion | | | 0.24% | |
$3 Billion — $5 Billion | | | 0.23% | |
$5 Billion — $10 Billion | | | 0.22% | |
Greater than $10 Billion | | | 0.21% | |
The Manager entered into a sub-advisory agreement with BlackRock International Limited (“BIL”) and BlackRock Fund Advisors (“BFA”), both affiliates of the Manager. The Manager pays BIL and BFA, for services they provide, a monthly fee that is a percentage of the investment advisory fees paid by the Master Portfolio to the Manager.
The Manager voluntarily agreed to waive its investment advisory fees by the amount of investment advisory fees the Master Portfolio pays to the Manager indirectly through its investment in affiliated money market funds. This amount is included in fees waived by the Manager in the Statement of Operations. However, the Manager does not waive its investment advisory fees by the amount of investment advisory fees paid in connection with the Master Portfolio’s investments in other affiliated investment companies, if any. For the year ended December 31, 2015, the amount waived was $30,131.
The fees and expenses of the MIP’s trustees who are not “interested persons” of MIP, as defined in the 1940 Act (“Independent Trustees”), counsel to the Independent Trustees and the MIP’s independent registered public accounting firm (together, the “independent expenses”) are paid directly by the Master Portfolio. BAL has contractually agreed to reimburse the Master Portfolio or provide an offsetting credit against the administration fees paid by the Master Portfolio in an amount equal to these independent expenses through April 30, 2016. If the Master Portfolio does not pay administration fees, BFA agrees to cap the expenses of the Master Portfolio at the rate at which it pays an investment advisory fee to BFA. The amount is included in fees waived by the Manager in the Statement of Operations. For the year ended December 31, 2015, the Manager waived $134,496 pursuant to this agreement.
The U.S. Securities and Exchange Commission has issued an exemptive order which permits BTC, an affiliate of the Manager, to serve as securities lending agent for the Master Portfolio, subject to applicable conditions. As securities lending agent, BTC bears all operational costs directly related to securities lending. The Master Portfolio is responsible for fees in connection with the investment of cash collateral received for securities on loan in a money market fund managed by the Manager or its affiliates, however, BTC has agreed to reduce the amount of securities lending income it receives in order to effectively limit the collateral investment fees the Master Portfolio bears to an annual rate of 0.04% (the “collateral investment fees”).
| | | | | | |
| | | | | | | |
| | BLACKROCK COREALPHA BOND FUND | | DECEMBER 31, 2015 | | 67 |
| | |
| Notes to Financial Statements (continued) | | CoreAlpha Bond Master Portfolio |
Securities lending income is equal to the total of income earned from the reinvestment of cash collateral, net of fees and other payments to and from borrowers of securities, and less the collateral investment fees. The Master Portfolio retains a portion of securities lending income and remits a remaining portion to BTC as compensation for its services as securities lending agent.
Pursuant to a securities lending agreement, BTC may lend securities only when the difference between the borrower rebate rate and the risk free rate exceeds a certain level (such securities, the “specials only securities”).
Pursuant to such agreement, the Master Portfolio retains 80% of securities lending income. In addition, commencing the business day following the date that the aggregate securities lending income earned across certain funds in the Equity-Liquidity Complex in a calendar year exceeds a specified threshold, the Master Portfolio, pursuant to the securities lending agreement, will retain for the remainder of the calendar year securities lending income in an amount equal to 85% of securities lending income.
The share of securities lending income earned by the Master Portfolio, if any, is shown as securities lending — affiliated — net in the Statement of Operations. For the year ended December 31, 2015, the Master Portfolio paid BTC $2,314 for securities lending agent services and collateral investment fees.
Certain officers and/or trustees of MIP are officers and/or directors of BlackRock or its affiliates.
The Master Portfolio may purchase securities from, or sell securities to, an affiliated fund provided the affiliation is due solely to having a common investment advisor, common officers, or common trustees. For the year ended December 31, 2015, the purchase and sale transactions with an affiliated fund in compliance with Rule 17a-7 under the 1940 Act were as follows:
| | | | | | | | |
| | | Purchases | | | Sales | |
| | | | — | | | $ | 880,261 | |
7. Purchases and Sales:
For the year ended December 31, 2015, purchases and sales of investments including paydowns and mortgage dollar rolls and excluding short-term securities and in-kind redemptions, were as follows:
| | | | | | | | |
| | | Purchases | | | Sales | |
Non-U.S. Government Securities | | $ | 17,388,442,783 | | | $ | 17,713,028,597 | |
U.S. Government Securities | | $ | 333,749,816 | | | $ | 575,702,072 | |
For the year ended December 31, 2015, purchases and sales related to mortgage dollar rolls were $2,084,050,823 and $2,086,284,565, respectively.
8. Income Tax Information:
The Master Portfolio is classified as a partnership for federal income tax purposes. As such, each investor in the Master Portfolio is treated as the owner of its proportionate share of net assets, income, expenses and realized and unrealized gains and losses of the Master Portfolio. Therefore, no federal income tax provision is required. It is intended that the Master Portfolio’s assets will be managed so an investor in the Master Portfolio can satisfy the requirements of Subchapter M of the Internal Revenue Code of 1986, as amended.
The Master Portfolio files U.S. federal and various state and local tax returns. No income tax returns are currently under examination. The statute of limitations on the Master Portfolio’s U.S. federal tax returns remains open for each of the four years ended December 31, 2015. The statutes of limitations on the Master Portfolio’s state and local tax returns may remain open for an additional year depending upon the jurisdiction.
Management has analyzed tax laws and regulations and their application to the Master Portfolio as of December 31, 2015, inclusive of the open tax return years, and does not believe there are any uncertain tax positions that require recognition of a tax liability in the Master Portfolio’s financial statements.
As of period end, gross unrealized appreciation and depreciation based on cost for federal income tax purposes were as follows:
| | | | |
Tax cost | | $ | 1,001,426,330 | |
| | | | |
Gross unrealized appreciation | | $ | 8,914,464 | |
Gross unrealized depreciation | | | (11,703,777 | ) |
| | | | |
Net unrealized depreciation | | $ | (2,789,313 | ) |
| | | | |
9. Bank Borrowings:
MIP, on behalf of the Master Portfolio, along with certain other funds managed by the Manager and its affiliates (“Participating Funds”), is a party to a 364-day, $2.1 billion credit agreement with a group of lenders, under which the Master Portfolio may borrow to fund shareholder redemptions. Excluding commitments designated for certain funds, the Participating Funds, including the Master Portfolio, can borrow up to an aggregate commitment amount of $1.6 billion at any time outstanding, subject to asset coverage and other limitations as specified in the agreement. The credit agreement has the following
| | | | | | |
| | | | | | | |
| 68 | | BLACKROCK COREALPHA BOND FUND | | DECEMBER 31, 2015 | | |
| | |
| Notes to Financial Statements (continued) | | CoreAlpha Bond Master Portfolio |
terms: a fee of 0.06% per annum on unused commitment amounts and interest at a rate equal to the higher of (a) one-month LIBOR (but, in any event, not less than 0.00%) on the date the loan is made plus 0.80% per annum or (b) the Fed Funds rate (but, in any event, not less than 0.00%) in effect from time to time plus 0.80% per annum on amounts borrowed. The agreement expires in April 2016 unless extended or renewed. Participating Funds paid administration, legal and arrangement fees, which, if applicable, are included in miscellaneous expenses in the Statement of Operations, and along with commitment fees, were allocated among such funds based upon portions of the aggregate commitment available to them and relative net assets of Participating Funds. During the year ended December 31, 2015, the Master Portfolio did not borrow under the credit agreement.
10. Principal Risks:
In the normal course of business, the Master Portfolio invests in securities and enters into transactions where risks exist due to fluctuations in the market (market risk) or failure of the issuer to meet all its obligations, including the ability to pay principal and interest when due (issuer credit risk). The value of securities held by the Master Portfolio may decline in response to certain events, including those directly involving the issuers of securities owned by the Master Portfolio. Changes arising from the general economy, the overall market and local, regional or global political or/and social instability, as well as currency, interest rate and price fluctuations, may also affect the securities’ value.
The Master Portfolio may be exposed to prepayment risk, which is the risk that borrowers may exercise their option to prepay principal earlier than scheduled during periods of declining interest rates, which would force the Master Portfolio to reinvest in lower yielding securities. The Master Portfolio may also be exposed to reinvestment risk, which is the risk that income from the Master Portfolio’s portfolio will decline if the Master Portfolio invests the proceeds from matured, traded or called fixed income securities at market interest rates that are below the Master Portfolio’s portfolio current earnings rate.
Counterparty Credit Risk: Similar to issuer credit risk, the Master Portfolio may be exposed to counterparty credit risk, or the risk that an entity may fail to or be unable to perform on its commitments related to unsettled or open transactions. The Master Portfolio manages counterparty credit risk by entering into transactions only with counterparties that the Manager believes have the financial resources to honor their obligations and by monitoring the financial stability of those counterparties. Financial assets, which potentially expose the Master Portfolio to market, issuer and counterparty credit risks, consist principally of financial instruments and receivables due from counterparties. The extent of the Master Portfolio’s exposure to market, issuer and counterparty credit risks with respect to these financial assets is approximately their value recorded in the Statement of Assets and Liabilities, less any collateral held by the Master Portfolio.
A derivative contract may suffer a mark-to-market loss if the value of the contract decreases due to an unfavorable change in the market rates or values of the underlying instrument. Losses can also occur if the counterparty does not perform under the contract.
The Master Portfolio’s risk of loss from counterparty credit risk on OTC derivatives is generally limited to the aggregate unrealized gain less the value of any collateral held by the Master Portfolio.
For OTC options purchased, the Master Portfolio bears the risk of loss of the amount of the premiums paid plus the positive change in market values net of any collateral held by the Master Portfolio should the counterparty fail to perform under the contracts. Options written by the Master Portfolio do not typically give rise to counterparty credit risk, as options written generally obligate the Master Portfolio, and not the counterparty, to perform. The Master Portfolio may be exposed to counterparty credit risk with respect to options written to the extent the Master Portfolio deposits collateral with its counterparty to a written option.
With exchange-traded options purchased and futures and centrally cleared swaps, there is less counterparty credit risk to the Master Portfolio since the exchange or clearinghouse, as counterparty to such instruments, guarantees against a possible default. The clearinghouse stands between the buyer and the seller of the contract; therefore, credit risk is limited to failure of the clearinghouse. While offset rights may exist under applicable law, the Master Portfolio does not have a contractual right of offset against a clearing broker or clearinghouse in the event of a default (including the bankruptcy or insolvency). Additionally, credit risk exists in exchange-traded futures and centrally cleared swaps with respect to initial and variation margin that is held in a clearing broker’s customer accounts. While clearing brokers are required to segregate customer margin from their own assets, in the event that a clearing broker becomes insolvent or goes into bankruptcy and at that time there is a shortfall in the aggregate amount of margin held by the clearing broker for all its clients, typically the shortfall would be allocated on a pro rata basis across all the clearing broker’s customers, potentially resulting in losses to the Master Portfolio.
Concentration Risk: The Master Portfolio invests a significant portion of its assets in fixed-income securities and/or uses derivatives tied to the fixed-income markets. Changes in market interest rates or economic conditions may affect the value and/or liquidity of such investments. Interest rate risk is the risk that prices of bonds and other fixed-income securities will increase as interest rates fall and decrease as interest rates rise. The Master Portfolio may be subject to a greater risk of rising interest rates due to the current period of historically low rates.
The Master Portfolio invests a significant portion of its assets in securities backed by commercial or residential mortgage loans or in issuers that hold mortgage and other asset-backed securities. Investment percentages in these securities are presented in the Schedule of Investments. Changes in economic conditions, including delinquencies and/or defaults on assets underlying these securities, can affect the value, income and/or liquidity of such positions.
| | | | | | |
| | | | | | | |
| | BLACKROCK COREALPHA BOND FUND | | DECEMBER 31, 2015 | | 69 |
| | |
| Notes to Financial Statements (concluded) | | CoreAlpha Bond Master Portfolio |
11. Subsequent Events:
Management has evaluated the impact of all subsequent events on the Fund through the date the financial statements were issued and has determined that there were no subsequent events requiring adjustment or additional disclosure in the financial statements.
| | | | | | |
| | | | | | | |
| 70 | | BLACKROCK COREALPHA BOND FUND | | DECEMBER 31, 2015 | | |
| | |
| Report of Independent Registered Public Accounting Firm | | |
To the Board of Trustees of Master Investment Portfolio and the Interestholders of CoreAlpha Bond Master Portfolio:
In our opinion, the accompanying statement of assets and liabilities, including the schedule of investments, and the related statements of operations and of changes in net assets and the financial highlights present fairly, in all material respects, the financial position of CoreAlpha Bond Master Portfolio (the “Master Portfolio”), a series of Master Investment Portfolio, at December 31, 2015, the results of its operations for the year then ended, the changes in its net assets for each of the two years in the period then ended and the financial highlights for each of the five years in the period then ended, in conformity with accounting principles generally accepted in the United States of America. These financial statements and financial highlights (hereafter referred to as “financial statements”) are the responsibility of the Master Portfolio’s management. Our responsibility is to express an opinion on these financial statements based on our audits. We conducted our audits of these financial statements in accordance with the standards of the Public Company Accounting Oversight Board (United States). Those standards require that we plan and perform the audit to obtain reasonable assurance about whether the financial statements are free of material misstatement. An audit includes examining, on a test basis, evidence supporting the amounts and disclosures in the financial statements, assessing the accounting principles used and significant estimates made by management, and evaluating the overall financial statement presentation. We believe that our audits, which included confirmation of securities at December 31, 2015 by correspondence with the custodian, brokers and transfer agent, provide a reasonable basis for our opinion.
/s/PricewaterhouseCoopers LLP
Philadelphia, Pennsylvania
February 24, 2016
| | | | | | |
| | | | | | | |
| | BLACKROCK COREALPHA BOND FUND | | DECEMBER 31, 2015 | | 71 |
| | | | | | | | | | |
Name, Address1
and Year of Birth | | Position(s)
Held with
the Trust/MIP | | Length
of Time
Served as
a Trustee3 | | Principal Occupation(s) During Past Five Years | | Number of BlackRock-
Advised Registered
Investment Companies
(“RICs”) Consisting of
Investment Portfolios
(“Portfolios”) Overseen | | Public
Directorships |
| Independent Trustees2 |
Rodney D. Johnson 1941 | | Chair of the Board and Trustee | | Since 2009 | | President, Fairmount Capital Advisors, Inc. from 1987 to 2013; Member of the Archdiocesan Investment Committee of the Archdiocese of Philadelphia from 2004 to 2012; Director, The Committee of Seventy (civic) from 2006 to 2012; Director, Fox Chase Cancer Center from 2004 to 2011. | | 33 RICs consisting of
155 Portfolios | | None |
David O. Beim 1940 | | Trustee | | Since 2009 | | Professor of Professional Practice at the Columbia University Graduate School of Business since 1991; Trustee, Phillips Exeter Academy from 2002 to 2012; Chairman, Wave Hill, Inc. (public garden and cultural center) from 1990 to 2006. | | 33 RICs consisting of
155 Portfolios | | None |
Collette Chilton 1958 | | Trustee | | Since 2015 | | Chief Investment Officer, Williams College since 2006; Chief Investment Officer, Lucent Asset Management Corporation from 1998 to 2006. | | 33 RICs consisting of
155 Portfolios | | None |
Frank J. Fabozzi 1948 | | Trustee | | Since 2014 | | Editor of and Consultant for The Journal of Portfolio Management since 2006; Professor of Finance, EDHEC Business School since 2011; Visiting Professor, Princeton University from 2013 to 2014; Professor in the Practice of Finance and Becton Fellow, Yale University School of Management from 2006 to 2011. | | 108 RICs consisting of
230 Portfolios | | None |
Dr. Matina S. Horner 1939 | | Trustee | | Since 2009 | | Executive Vice President, Teachers Insurance and Annuity Association and College Retirement Equities Fund from 1989 to 2003. | | 33 RICs consisting of
155 Portfolios | | NSTAR (electric and gas utility) |
Herbert I. London 1939 | | Trustee | | Since 2009 | | Professor Emeritus, New York University since 2005; President, London Center for Policy Research since 2012; John M. Olin Professor of Humanities, New York University from 1993 to 2005 and Professor thereof from 1980 to 2005; President Emeritus, Hudson Institute (policy research organization) from 2011 to 2012, President thereof from 1997 to 2011 and Trustee from 1980 to 2012; Chairman of the Board of Trustees for Grantham University since 2006; Director, InnoCentive, Inc. (global internet service) since 2005; Director, Cerego, LLC (educational software) since 2005; Director, Cybersettle (online adjudication) since 2009; Director, AIMS Worldwide, Inc. (marketing) from 2007 to 2012. | | 33 RICs consisting of
155 Portfolios | | None |
Cynthia A. Montgomery 1952 | | Trustee | | Since 2009 | | Professor, Harvard Business School since 1989; Director, McLean Hospital from 2005 to 2012; Director, Harvard Business School Publishing from 2005 to 2010. | | 33 RICs consisting of
155 Portfolios | | Newell Rubbermaid, Inc. (manufacturing) |
Joseph P. Platt 1947 | | Trustee | | Since 2009 | | Director, Jones and Brown (Canadian insurance broker) since 1998; General Partner, Thorn Partners, LP (private investments) since 1998; Director, WQED Multi-Media (public broadcasting not-for-profit) since 2001; Director, The West Penn Allegheny Health System (a not-for-profit health system) from 2008 to 2013; Partner, Amarna Corporation, LLC (private investment company) from 2002 to 2008. | | 33 RICs consisting of
155 Portfolios | | Greenlight Capital Re, Ltd. (reinsurance company) |
Robert C. Robb, Jr. 1945 | | Trustee | | Since 2009 | | Partner, Lewis, Eckert, Robb and Company (management and financial consulting firm) since 1981. | | 33 RICs consisting of
155 Portfolios | | None |
Toby Rosenblatt 1938 | | Trustee | | Since 2009 | | President, Founders Investments Ltd. (private investments) since 1999; Director, Forward Management, LLC since 2007; Director, College Futures Foundation (philanthropic foundation) since 2009; Director, The James Irvine Foundation (philanthropic foundation) from 1998 to 2008. | | 33 RICs consisting of
155 Portfolios | | None |
Mark Stalnecker 1951 | | Trustee | | Since 2015 | | Chief Investment Officer, University of Delaware from 1999 to 2013; Trustee, Winterthur Museum and Country Estate since 2001; Member of the Investment Committee, Delaware Public Employees’ Retirement System since 2002; Member of the Investment Committee, Christiana Care Health System since 2009; Member of the Investment Committee, Delaware Community Foundation from 2013 to 2014. | | 33 RICs consisting of
155 Portfolios | | None |
| | | | | | |
| | | | | | | |
| 72 | | BLACKROCK COREALPHA BOND FUND | | DECEMBER 31, 2015 | | |
| | | | |
| Officers and Trustees (continued) | | |
| | | | | | | | | | |
Name, Address1
and Year of Birth | | Position(s)
Held with
the Trust/MIP | | Length
of Time
Served as
a Trustee3 | | Principal Occupation(s) During Past Five Years | | Number of BlackRock-
Advised Registered
Investment Companies
(“RICs”) Consisting of
Investment Portfolios
(“Portfolios”) Overseen | | Public
Directorships |
| Independent Trustees2 |
Kenneth L. Urish 1951 | | Trustee | | Since 2009 | | Managing Partner, Urish Popeck & Co., LLC (certified public accountants and consultants) since 1976; Immediate past- Chairman of the Professional Ethics Committee of the Pennsylvania Institute of Certified Public Accountants and Committee Member thereof since 2007; Member of External Advisory Board, The Pennsylvania State University Accounting Department since 2001; Principal, UP Strategic Wealth Investment Advisors, LLC since 2013; Trustee, The Holy Family Institute from 2001 to 2010; President and Trustee, Pittsburgh Catholic Publishing Associates from 2003 to 2008; Director, Inter-Tel from 2006 to 2007. | | 33 RICs consisting of
155 Portfolios | | None |
Frederick W. Winter 1945 | | Trustee | | Since 2009 | | Director, Alkon Corporation (pneumatics) since 1992; Professor and Dean Emeritus of the Joseph M. Katz School of Business, University of Pittsburgh from 2005 to 2013 and Dean thereof from 1997 to 2005; Director, Tippman Sports (recreation) from 2005 to 2013; Director, Indotronix International (IT services) from 2004 to 2008. | | 33 RICs consisting of
155 Portfolios | | None |
| | 1 The address of each Trustee is c/o BlackRock, Inc., 55 East 52nd Street, New York, NY 10055. |
| | 2 Independent Trustees serve until their resignation, retirement, removal or death, or until December 31 of the year in which they turn 75. The Board has determined to extend the terms of Independent Trustees on a case-by-case basis, as appropriate. The Board has unanimously approved extending the mandatory retirement age for David O. Beim and Dr. Matina S. Horner until December 31, 2016, which the Board believes is in the best interests of the shareholders of the Trust/MIP. |
| | 3 Date shown is the earliest date a person has served for the Trust/MIP. In connection with the acquisition of Barclays Global Investors by BlackRock, Inc. (“BlackRock”) in December 2009, the Trustees were elected to the Trust/MIP Board. As a result, although the chart shows certain Independent Trustees as joining the Trust’s/MIP’s board in 2009, those Independent Trustees first became members of the boards of other funds advised by BlackRock Advisors, LLC or its affiliates as follows: David O. Beim, 1998; Dr. Matina S. Horner, 2004; Rodney D. Johnson, 1995; Herbert I. London, 1987; Cynthia A. Montgomery, 1994; Joseph P. Platt, 1999; Robert C. Robb, Jr., 1998; Toby Rosenblatt, 2005; Kenneth L. Urish, 1999; and Frederick W. Winter, 1999. Frank J. Fabozzi first became a member of the board of other funds advised by BlackRock Advisors, LLC or its affiliates in 1988. |
| Interested Trustees4 |
Barbara G. Novick 1960 | | Trustee | | Since 2015 | | Vice Chairman of BlackRock since 2006; Chair of BlackRock’s Government Relations Steering Committee since 2009; Head of the Global Client Group of BlackRock from 1988 to 2008. | | 108 RICs consisting of
230 Portfolios | | None |
John M. Perlowski 1964 | | Trustee, President and Chief Executive Officer | | Since 2015 (Trustee); since 2010 (President and Chief Executive Officer) | | Managing Director of BlackRock since 2009; Head of BlackRock Global Fund Services since 2009; Managing Director and Chief Operating Officer of the Global Product Group at Goldman Sachs Asset Management, L.P. from 2003 to 2009; Treasurer of Goldman Sachs Mutual Funds from 2003 to 2009 and Senior Vice President thereof from 2007 to 2009; Director of Goldman Sachs Offshore Funds from 2002 to 2009; Director of Family Resource Network (charitable foundation) since 2009. | | 136 RICs consisting of
328 Portfolios | | None |
| | 4 Mr. Perlowski and Ms. Novick are both “interested persons,” as defined in the 1940 Act, of the Trust/MIP based on their positions with BlackRock and its affiliates. Mr. Perlowski and Ms. Novick are also board members of a complex of BlackRock registered open-end funds. Mr. Perlowski is also a board member of the BlackRock Equity-Bond Complex and the BlackRock Equity-Liquidity Complex, and Ms. Novick is also a board member of the BlackRock Equity-Liquidity Complex. Interested Trustees serve until their resignation, retirement, removal or death, or until December 31 of the year in which they turn 75. The maximum age limitation may be waived as to any Trustee by action of a majority of the Trustees upon a finding of good cause therefor. |
| | | | | | |
| | | | | | | |
| | BLACKROCK COREALPHA BOND FUND | | DECEMBER 31, 2015 | | 73 |
| | |
| Officers and Trustees (concluded) | | |
| | | | | | |
Name, Address1
and Year of Birth | | Position(s)
Held with
the Trust/MIP | | Length of
Time Served
as an Officer | | Principal Occupation(s) During Past Five Years |
| Trust/MIP Officers2 |
John M. Perlowski 1964 | | Trustee, President and Chief Executive Officer | | Since 2015 (Trustee); since 2010 (President and Chief Executive Officer) | | Managing Director of BlackRock since 2009; Head of BlackRock Global Fund Services since 2009; Managing Director and Chief Operating Officer of the Global Product Group at Goldman Sachs Asset Management, L.P. from 2003 to 2009; Treasurer of Goldman Sachs Mutual Funds from 2003 to 2009 and Senior Vice President thereof from 2007 to 2009; Director of Goldman Sachs Offshore Funds from 2002 to 2009; Director of Family Resource Network (charitable foundation) since 2009. |
Richard Hoerner, CFA 1958 | | Vice President | | Since 2009 | | Managing Director of BlackRock since 2000; Head of the Global Cash Group since 2013; Co-head of the Global Cash and Securities Lending Group from 2010 to 2013; Member of the Cash Management Group Executive Committee since 2005. |
Jennifer McGovern 1977 | | Vice President | | Since 2014 | | Director of BlackRock since 2011; Head of Product Structure and Oversight for BlackRock’s U.S. Wealth Advisory Group since 2013; Vice President of BlackRock from 2008 to 2010. |
Neal Andrews 1966 | | Chief Financial Officer | | Since 2009 | | Managing Director of BlackRock since 2006; Senior Vice President and Line of Business Head of Fund Accounting and Administration at PNC Global Investment Servicing (U.S.) Inc. from 1992 to 2006. |
Jay Fife 1970 | | Treasurer | | Since 2009 | | Managing Director of BlackRock since 2007; Director of BlackRock in 2006; Assistant Treasurer of the MLIM and Fund Asset Management, L.P. advised funds from 2005 to 2006; Director of MLIM Fund Services Group from 2001 to 2006. |
Charles Park 1967 | | Chief Compliance Officer | | Since 2014 | | Anti-Money Laundering Compliance Officer for the BlackRock-advised Funds in the Equity-Bond Complex, the Equity-Liquidity Complex and the Closed-End Complex from 2014 to 2015; Chief Compliance Officer of BlackRock Advisors, LLC and the BlackRock-advised Funds in the Equity-Bond Complex, the Equity-Liquidity Complex and the Closed-End Complex since 2014; Principal of and Chief Compliance Officer for iShares® Delaware Trust Sponsor LLC since 2012 and BlackRock Fund Advisors (“BFA”) since 2006; Chief Compliance Officer for the BFA-advised iShares exchange traded funds since 2006; Chief Compliance Officer for BlackRock Asset Management International Inc. since 2012. |
Fernanda Piedra 1969 | | Anti-Money Laundering Compliance Officer | | Since 2015 | | Director of BlackRock since 2014; Anti-Money Laundering Compliance Officer and Regional Head of Financial Crime for the Americas at BlackRock since 2014; Head of Regulatory Changes and Remediation for the Asset Wealth Management Division of Deutsche Bank from 2010 to 2014; Vice President of Goldman Sachs (Anti-Money Laundering/Suspicious Activities Group) from 2004 to 2010. |
Benjamin Archibald 1975 | | Secretary | | Since 2012 | | Managing Director of BlackRock since 2014; Director of BlackRock from 2010 to 2013; Secretary of the iShares exchange traded funds since 2015; Secretary of the BlackRock-advised mutual funds since 2012. |
| | 1 The address of each Officer is c/o BlackRock, Inc., 55 East 52nd Street, New York, NY 10055. |
| | | 2 Officers of the Trust/MIP serve at the pleasure of the Board. |
| | Further information about the Officers and Trustees is available in the Trust’s/MIP’s Statement of Additional Information, which can be obtained without charge by calling (800) 441-7762 |
Effective September 25, 2015, John M. Perlowski was appointed to serve as a Trustee of the Trust/MIP.
Effective December 31, 2015, Herbert I. London and Toby Rosenblatt retired as Trustees of the Trust/MIP.
| | | | | | |
| | | | |
Investment Advisor and Administrator BlackRock Advisors, LLC Wilmington, DE 19809 | | Accounting Agent and Custodian State Street Bank and Trust Company Boston, MA 02110 | | Distributor BlackRock Investments, LLC New York, NY 10022 | | Legal Counsel Sidley Austin LLP New York, NY 10019 |
| | | |
Sub-Advisors BlackRock Fund Advisors San Francisco, CA 94105 BlackRock International Limited Edinburgh, EH3 8BL United Kingdom | | Transfer Agent BNY Mellon Investment Servicing (US) Inc. Wilmington, DE 19809 | | Independent Registered Public Accounting Firm PricewaterhouseCoopers LLP Philadelphia, PA 19103 | | Address of the Trust/MIP 400 Howard Street San Francisco, CA 94105 |
| | | | | | |
| | | | | | | |
| 74 | | BLACKROCK COREALPHA BOND FUND | | DECEMBER 31, 2015 | | |
Householding
The Fund will mail only one copy of shareholder documents, including prospectuses, annual and semi-annual reports and proxy statements, to shareholders with multiple accounts at the same address. This practice is commonly called “householding” and is intended to reduce expenses and eliminate duplicate mailings of shareholder documents. Mailings of your shareholder documents may be householded indefinitely unless you instruct us otherwise. If you do not want the mailing of these documents to be combined with those for other members of your household, please call the Fund at (800) 441-7762.
Availability of Quarterly Schedule of Investments
The Fund/Master Portfolio files its complete schedule of portfolio holdings with the SEC for the first and third quarters of each fiscal year on Form N-Q. The Fund’s/Master Portfolio’s Forms N-Q are available on the SEC’s website at http://www.sec.gov and may also be reviewed and copied at the SEC’s Public Reference Room in Washington, D.C. Information on how to access documents on the SEC’s website without charge may be obtained by calling (800) SEC-0330. The Fund’s/Master Portfolio’s Forms N-Q may also be obtained upon request and without charge by calling (800) 441-7762.
Availability of Proxy Voting Policies and Procedures
A description of the policies and procedures that the Fund/Master Portfolio uses to determine how to vote proxies relating to portfolio securities is available upon request and without charge (1) by calling (800) 441-7762; (2) at http://www.blackrock.com; and (3) on the SEC’s website at http://www.sec.gov.
Availability of Proxy Voting Record
Information about how the Fund/Master Portfolio voted proxies relating to securities held in the Fund’s/Master Portfolio’s portfolio during the most recent 12-month period ended June 30 is available upon request and without charge (1) at http://www.blackrock.com or by calling (800) 441-7762 and (2) on the SEC’s website at http://www.sec.gov.
BlackRock’s Mutual Fund Family
BlackRock offers a diverse lineup of open-end mutual funds crossing all investment styles and managed by experts in equity, fixed income and tax-exempt investing. Visit http://www.blackrock.com for more information.
Account Information
Call us at (800) 441-7762 from 8:00 AM to 6:00 PM EST on any business day to get information about your account balances, recent transactions and share prices. You can also reach us on the Web at http://www.blackrock.com/funds.
Automatic Investment Plans
Investor Class shareholders who want to invest regularly can arrange to have $50 or more automatically deducted from their checking or savings account and invested in any of the BlackRock funds.
Systematic Withdrawal Plans
Investor Class shareholders can establish a systematic withdrawal plan and receive periodic payments of $50 or more from their BlackRock funds, as long as their account balance is at least $10,000.
Retirement Plans
Shareholders may make investments in conjunction with Traditional, Rollover, Roth, Coverdell, Simple IRAs, SEP IRAs and 403(b) Plans.
| | | | | | |
| | | | | | | |
| | BLACKROCK COREALPHA BOND FUND | | DECEMBER 31, 2015 | | 75 |
| | |
| Additional Information (concluded) | | |
|
| BlackRock Privacy Principles |
BlackRock is committed to maintaining the privacy of its current and former fund investors and individual clients (collectively, “Clients”) and to safeguarding their non-public personal information. The following information is provided to help you understand what personal information BlackRock collects, how we protect that information and why in certain cases we share such information with select parties.
If you are located in a jurisdiction where specific laws, rules or regulations require BlackRock to provide you with additional or different privacy-related rights beyond what is set forth below, then BlackRock will comply with those specific laws, rules or regulations.
BlackRock obtains or verifies personal non-public information from and about you from different sources, including the following: (i) information we receive from you or, if applicable, your financial intermediary, on applications, forms or other documents; (ii) information about your transactions with us, our affiliates, or others; (iii) information we receive from a consumer reporting agency; and (iv) from visits to our websites.
BlackRock does not sell or disclose to non-affiliated third parties any non-public personal information about its Clients, except as permitted by law or as is necessary to respond to regulatory requests or to service Client accounts. These non-affiliated third parties are required to protect the confidentiality and security of this information and to use it only for its intended purpose.
We may share information with our affiliates to service your account or to provide you with information about other BlackRock products or services that may be of interest to you. In addition, BlackRock restricts access to non-public personal information about its Clients to those BlackRock employees with a legitimate business need for the information. BlackRock maintains physical, electronic and procedural safeguards that are designed to protect the non-public personal information of its Clients, including procedures relating to the proper storage and disposal of such information.
| | | | | | |
| | | | | | | |
| 76 | | BLACKROCK COREALPHA BOND FUND | | DECEMBER 31, 2015 | | |
This report is intended for current holders. It is not authorized for use as an offer of sale or a solicitation of an offer to buy shares of the Fund unless preceded or accompanied by the Fund’s current prospectus. Past performance results shown in this report should not be considered a representation of future performance. Investment returns and principal value of shares will fluctuate so that shares, when redeemed, may be worth more or less than their original cost. Statements and other information herein are as dated and are subject to change.

| | |
| CAB-12/15-AR | |  |
DECEMBER 31, 2015
| | | | | | |
ANNUAL REPORT | | | | | |  |
BlackRock Disciplined International Fund | of BlackRock Funds III
|
| Not FDIC Insured • May Lose Value • No Bank Guarantee |

| | | | | | |
| | | | | | | |
| 2 | | BLACKROCK DISCIPLINED INTERNATIONAL FUND | | DECEMBER 31, 2015 | | |
Dear Shareholder,
Diverging monetary policies and shifting economic outlooks across regions have been the overarching themes driving financial markets over the past couple of years. With U.S. growth outpacing the global economic recovery in 2015 while inflationary pressures remained low, investors spent most of the year anticipating a short-term rate hike from the Federal Reserve (the “Fed”), which ultimately came to fruition in December. In contrast, the European Central Bank (“ECB”) and the Bank of Japan moved to a more accommodative stance during the year. In this environment, the U.S. dollar strengthened considerably, causing profit challenges for U.S. exporters and high levels of volatility in emerging market currencies and commodities. Oil prices were particularly volatile and below the historical norm due to an ongoing imbalance in global supply and demand.
Market volatility broadly increased in the middle of 2015, beginning with a sharp, but temporary, selloff in June as Greece’s long-brewing debt troubles came to an impasse. Just as these concerns abated, Chinese equities tumbled amid weakness in the country’s economy. This, combined with a depreciation of the yuan and declining confidence in China’s policymakers, stoked worries about the potential impact to the broader world economy, causing heightened volatility to spread throughout markets globally. Given a dearth of meaningful growth across most of the world, financial markets became more reliant on central bank policies to drive performance. In that vein, risk assets (such as equities and high yield bonds) rallied in October when China’s central bank provided more stimulus, the ECB hinted at further easing, and soft U.S. data pushed back expectations for a Fed rate hike. As the period came to a close, however, the ECB disappointed investors with its subdued policy changes. The Fed’s December rate hike had a positive impact on the markets as it removed a source of uncertainty, but this was counteracted by the dampening effect of a stronger U.S. dollar, falling oil prices and tighter credit conditions.
At BlackRock, we believe investors need to think globally, extend their scope across a broad array of asset classes and be prepared to move freely as market conditions change over time. We encourage you to talk with your financial advisor and visit blackrock.com for further insight about investing in today’s markets.
Sincerely,

Rob Kapito
President, BlackRock Advisors, LLC

Rob Kapito
President, BlackRock Advisors, LLC
| | | | | | | | |
| Total Returns as of December 31, 2015 | |
| | | 6-month | | | 12-month | |
U.S. large cap equities
(S&P 500® Index) | | | 0.15 | % | | | 1.38 | % |
U.S. small cap equities
(Russell 2000® Index) | | | (8.75 | ) | | | (4.41 | ) |
International equities
(MSCI Europe, Australasia,
Far East Index) | | | (6.01 | ) | | | (0.81 | ) |
Emerging market equities
(MSCI Emerging
Markets Index) | | | (17.35 | ) | | | (14.92 | ) |
3-month Treasury bills
(BofA Merrill Lynch 3-Month
U.S. Treasury Bill Index) | | | 0.04 | | | | 0.05 | |
U.S. Treasury securities
(BofA Merrill Lynch 10-Year
U.S. Treasury Index) | | | 1.43 | | | | 0.91 | |
U.S. investment-grade
bonds (Barclays
U.S. Aggregate Bond Index) | | | 0.65 | | | | 0.55 | |
Tax-exempt municipal
bonds (S&P Municipal
Bond Index) | | | 3.31 | | | | 3.32 | |
U.S. high yield bonds
(Barclays U.S.
Corporate High Yield 2%
Issuer Capped Index) | | | (6.79 | ) | | | (4.43 | ) |
| Past performance is no guarantee of future results. Index performance is shown for illustrative purposes only. You cannot invest directly in an index. | |
| | | | | | |
| | | | | | | |
| | THIS PAGE NOT PART OF YOUR FUND REPORT | | | | 3 |
| | | | |
| Fund Summary as of December 31, 2015 | | |
BlackRock Disciplined International Fund’s (the “Fund”) investment objective is to seek to provide long-term returns in excess of the total rate of return of the MSCI Europe Australasia Far East (“EAFE”) Index.
| | | | | | | | | | | | | | | | | | | | | | | | | | | | |
| | | Actual | | | Hypothetical3 | | | | |
| | | Beginning
Account Value
September 9, 20151 | | | Ending
Account Value
December 31, 2015 | | | Expenses Paid
During the
Period2 | | | Beginning
Account Value
September 9, 20151 | | | Ending
Account Value
December 31, 2015 | | | Expenses Paid
During the
Period2 | | | Annualized
Expense Ratio | |
Institutional | | $ | 1,000.00 | | | $ | 1,010.30 | | | $ | 2.21 | | | $ | 1,000.00 | | | $ | 1,013.28 | | | $ | 2.21 | | | | 0.71 | % |
Investor A | | $ | 1,000.00 | | | $ | 1,009.50 | | | $ | 2.99 | | | $ | 1,000.00 | | | $ | 1,012.51 | | | $ | 2.99 | | | | 0.96 | % |
Class K | | $ | 1,000.00 | | | $ | 1,011.00 | | | $ | 1.56 | | | $ | 1,000.00 | | | $ | 1,013.93 | | | $ | 1.56 | | | | 0.50 | % |
| | 1 | | Commencement of operations. |
| | 2 | | For each class of the Fund, expenses are equal to the annualized net expense ratio for the class, multiplied by the average account value over the period, multiplied by 113/365 (to reflect the period from September 9, 2015, commencement of operations, to December 31, 2015). Because the Fund invests all of its assets in the Master Portfolio, the expense example reflects the net expenses of both the Fund and the Master Portfolio in which it invests. |
| | 3 | | Hypothetical 5% annual return before expenses is calculated by prorating the number of days in the most recent fiscal half year divided by 365. |
| | | | See “Disclosure of Expenses” on page 5 for further information on how expenses were calculated. |
| | | | | | |
| | | | | | | |
| 4 | | BLACKROCK DISCIPLINED INTERNATIONAL FUND | | DECEMBER 31, 2015 | | |
| • | | Institutional and Class K Shares are not subject to any sales charge. These shares bear no ongoing distribution or service fees and are available only to certain eligible investors. |
| • | | Investor A Shares are subject to a maximum initial sales charge (front-end load) of 5.25% and a service fee of 0.25% (but no distribution fee). Certain redemptions of these shares may be subject to a contingent deferred sales charge (“CDSC”) where no initial sales charge was paid at the time of purchase. These shares are generally available through financial intermediaries. |
Performance information reflects past performance and does not guarantee future results. Current performance may be lower or higher than the performance data quoted. Refer to www.blackrock.com/funds to obtain performance data current to the most recent month-end. Performance results do not reflect the deduction of taxes that a share-
holder would pay on fund distributions or the redemption of fund shares. Figures shown in the performance table on the previous page assume reinvestment of all distributions, if any, at net asset value (“NAV”) on the ex-dividend date. Investment return and principal value of shares will fluctuate so that shares, when redeemed, may be worth more or less than their original cost. Distributions paid to each class of shares will vary because of the different levels of administration, service and distribution fees applicable to each class, which are deducted from the income available to be paid to shareholders. BlackRock Advisors, LLC (“BAL” or the “Administrator”), the Fund’s administrator, voluntarily waived a portion of the Fund’s expenses. Without such waiver, the Fund’s performance would have been lower. The Administrator is under no obligation to waive or to continue waiving its fees and such voluntary waiver may be reduced or discontinued at any time. See Note 4 of the Notes to Financial Statements for additional information on waivers.
Shareholders of the Fund may incur the following charges: (a) transactional expenses, such as sales charges; and (b) operating expenses, including administration fees, service and distribution fees, including 12b-1 fees, acquired fund fees and expenses and other Fund expenses. The expense example on previous page (which is based on a hypothetical investment of $1,000 invested on September 9, 2015 (commencement of operations) and held through December 31, 2015) is intended to assist shareholders both in calculating expenses based on an investment in the Fund and in comparing these expenses with similar costs of investing in other mutual funds.
The expense example provides information about actual account values and actual expenses. In order to estimate the expenses a shareholder paid during the period covered by this report, shareholders can divide their account value by $1,000 and then multiply the result by the number corresponding to their share class under the heading entitled “Expenses Paid During the Period.”
The expense example also provides information about hypothetical account values and hypothetical expenses based on the Fund’s actual expense ratio and an assumed rate of return of 5% per year before expenses. In order to assist shareholders in comparing the ongoing expenses of investing in the Fund and other funds, compare the 5% hypothetical example with the 5% hypothetical examples that appear in shareholder reports of other funds.
The expenses shown in the expense example are intended to highlight shareholders’ ongoing costs only and do not reflect any transactional expenses, such as sales charges, if any. Therefore, the hypothetical example is useful in comparing ongoing expenses only, and will not help shareholders determine the relative total expenses of owning different funds. If these transactional expenses were included, shareholder expenses would have been higher.
|
| Derivative Financial Instruments |
The Master Portfolio may invest in various derivative financial instruments. Derivative financial instruments are used to obtain exposure to a security, index and/or market without owning or taking physical custody of securities or to manage market, equity, credit, interest rate, foreign currency exchange rate, commodity and/or other risks. Derivative financial instruments may give rise to a form of economic leverage. Derivative financial instruments also involve risks, including the imperfect correlation between the value of a derivative financial instrument and the underlying asset, possible default of the counterparty to the transaction or illiquidity of the derivative financial instru-
ment. The Master Portfolio’s ability to use a derivative financial instrument successfully depends on the investment advisor’s ability to predict pertinent market movements accurately, which cannot be assured. The use of derivative financial instruments may result in losses greater than if they had not been used, may limit the amount of appreciation the Master Portfolio can realize on an investment and/or may result in lower distributions paid to shareholders. The Master Portfolio’s investments in these instruments, if any, are discussed in detail in the Notes to Financial Statements.
| | | | | | |
| | | | | | | |
| | BLACKROCK DISCIPLINED INTERNATIONAL FUND | | DECEMBER 31, 2015 | | 5 |
| | |
| Statement of Assets and Liabilities | | BlackRock Disciplined International Fund |
| | | | |
| December 31, 2015 | | | |
| | | | |
| Assets | | | | |
Investments at value — Master Portfolio (cost — $4,831,964) | | $ | 4,858,262 | |
Receivables from the Administrator | | | 5,084 | |
| | | | |
Total assets | | | 4,863,346 | |
| | | | |
| | | | |
| Liabilities | | | | |
| Payables: | | | | |
Professional fees | | | 18,532 | |
Administration fees | | | 433 | |
Service fees | | | 10 | |
| | | | |
Total liabilities | | | 18,975 | |
| | | | |
Net Assets | | $ | 4,844,371 | |
| | | | |
| | | | |
| Net Assets Consist of | | | | |
Paid-in capital | | $ | 5,001,439 | |
Distributions in excess of net investment income | | | (859 | ) |
Accumulated net realized loss allocated from the Master Portfolio | | | (182,507 | ) |
Net unrealized appreciation (depreciation) allocated from the Master Portfolio | | | 26,298 | |
| | | | |
Net Assets | | $ | 4,844,371 | |
| | | | |
| | | | |
| Net Asset Value | | | | |
Institutional — Based on net assets of $48,430 and 5,000 shares outstanding, unlimited number of shares authorized, no par value | | $ | 9.69 | |
| | | | |
Investor A — Based on net assets of $49,881 and 5,150 shares outstanding, unlimited number of shares authorized, no par value | | $ | 9.69 | |
| | | | |
Class K — Based on net assets of $4,746,060 and 490,000 shares outstanding, unlimited number of shares authorized, no par value | | $ | 9.69 | |
| | | | |
| | | | | | |
| See Notes to Financial Statements. | | | | |
| | | | | | | |
| 6 | | BLACKROCK DISCIPLINED INTERNATIONAL FUND | | DECEMBER 31, 2015 | | |
| | |
| Statement of Operations | | BlackRock Disciplined International Fund |
| | | | |
| Period September 9, 20151 to December 31, 2015 | | | |
| | | | |
| Investment Income | | | | |
Net investment income allocated from the Master Portfolio: | | | | |
Dividends — unaffiliated | | $ | 38,020 | |
Dividends — affiliated | | | 29 | |
Securities lending — affiliated — net | | | 360 | |
Foreign taxes withheld | | | (3,527 | ) |
Expenses | | | (7,200 | ) |
Fees waived | | | 1,027 | |
| | | | |
Total income | | | 28,709 | |
| | | | |
| | | | |
| Fund Expenses | | | | |
Administration — Institutional | | | 46 | |
Administration — Investor A | | | 47 | |
Administration — Class K | | | 1,521 | |
Service — Investor A | | | 38 | |
Professional | | | 18,532 | |
| | | | |
Total expenses | | | 20,184 | |
Less fees waived by the Administrator | | | (18,532 | ) |
| | | | |
Total expenses after fees waived | | | 1,652 | |
| | | | |
Net investment income | | | 27,057 | |
| | | | |
| | | | |
| Realized and Unrealized Gain (Loss) Allocated from the Master Portfolio | | | | |
Net realized loss from investments, in-kind redemptions2, financial futures contracts and foreign currency transactions | | | (1,992 | ) |
Net change in unrealized appreciation (depreciation) on investments, financial futures contracts and foreign currency transactions | | | 26,298 | |
| | | | |
Net realized and unrealized gain | | | 24,306 | |
| | | | |
Net Increase in Net Assets Resulting from Operations | | $ | 51,363 | |
| | | | |
| | 1 | | Commencement of operations. |
| | 2 | | See Note 2 of the Notes to Financial Statements. |
| | | | | | |
| See Notes to Financial Statements. | | | | |
| | | | | | | |
| | BLACKROCK DISCIPLINED INTERNATIONAL FUND | | DECEMBER 31, 2015 | | 7 |
| | |
| Statement of Changes in Net Assets | | BlackRock Disciplined International Fund |
| | | | | | |
| Increase (Decrease) in Net Assets: | | Period September 9, 20151
to December 31,
2015 |
| | | | | | |
| Operations | | | | | | |
Net investment income | | $ | 27,057 | | | |
Net realized loss | | | (1,992 | ) | | |
Net change in unrealized appreciation (depreciation) | | | 26,298 | | | |
| | | |
Net increase in net assets resulting from operations | | | 51,363 | | | |
| | | |
| | | | | | |
| Distributions to Shareholders2 | | | | | | |
| From net investment income: | | | | | | |
Institutional | | | (249 | ) | | |
Investor A | | | (210 | ) | | |
Class K | | | (27,457 | ) | | |
| Net realized gain: | | | | | | |
Institutional | | | (1,805 | ) | | |
Investor A | | | (1,805 | ) | | |
Class K | | | (176,905 | ) | | |
| | | |
Decrease in net assets resulting from distributions to shareholders | | | (208,431 | ) | | |
| | | |
| | | | | | |
| Capital Share Transactions | | | | | | |
Increase in net assets resulting from capital share transactions | | | 5,001,439 | | | |
| | | |
| | | | | | |
| Net Assets | | | | | | |
Total increase in net assets | | | 4,844,371 | | | |
Beginning of period | | | — | | | |
| | | |
End of period | | $ | 4,844,371 | | | |
| | | |
Distributions in excess of net investment income, end of period | | $ | (859 | ) | | |
| | | |
| | 1 | | Commencement of operations. |
| | 2 | | Distributions for annual periods determined in accordance with federal income tax regulations. |
| | | | | | |
| See Notes to Financial Statements. | | | | |
| | | | | | | |
| 8 | | BLACKROCK DISCIPLINED INTERNATIONAL FUND | | DECEMBER 31, 2015 | | |
| | | | |
| | | Institutional | |
| | | Period
September 9, 20151
to December 31,
2015 | |
| | | | |
| Per Share Operating Performance | | | | |
Net asset value, beginning of period | | $ | 10.00 | |
| | | | |
Net investment income2 | | | 0.05 | |
Net realized and unrealized gain | | | 0.05 | |
| | | | |
Net increase from investment operations | | | 0.10 | |
| | | | |
| Distributions:3 | | | | |
From net investment income | | | (0.05 | ) |
From net realized gain | | | (0.36 | ) |
| | | | |
Total distributions | | | (0.41 | ) |
| | | | |
Net asset value, end of period | | $ | 9.69 | |
| | | | |
| | | | |
| Total Return4 | | | | |
Based on net asset value | | | 1.03% | 5 |
| | | | |
| | | | |
| Ratios to Average Net Assets6 | | | | |
Total expenses | | | 1.08% | 7,8,9 |
| | | | |
Total expenses after fees waived | | | 0.71% | 7,8 |
| | | | |
Net investment income | | | 1.56% | 7,8 |
| | | | |
| | | | |
| Supplemental Data | | | | |
Net assets, end of period (000) | | $ | 48 | |
| | | | |
Portfolio turnover of the Master Portfolio | | | 107% | |
| | | | |
| | 1 | | Commencement of operations. |
| | 2 | | Based on average shares outstanding. |
| | 3 | | Distributions for annual periods determined in accordance with federal income tax regulations. |
| | 4 | | Where applicable, assumes the reinvestment of distributions. |
| | 5 | | Aggregate total return. |
| | 6 | | Includes the Fund’s share of the Master Portfolio’s allocated expenses and/or net investment income. |
| | 7 | | Includes the Fund’s share of the Master Portfolio’s allocated fees waived of 0.07% |
| | 9 | | Audit fees were not annualized in the calculation of the expense ratios. If these expenses were annualized, the total expenses would have been 1.91%. |
| | | | | | |
| See Notes to Financial Statements. | | | | |
| | | | | | | |
| | BLACKROCK DISCIPLINED INTERNATIONAL FUND | | DECEMBER 31, 2015 | | 9 |
| | |
| Financial Highlights (continued) | | |
| | | | |
| | | Investor A | |
| | | Period
September 9, 20151
to December 31,
2015 | |
| | | | |
| Per Share Operating Performance | | | | |
Net asset value, beginning of period | | $ | 10.00 | |
| | | | |
Net investment income2 | | | 0.04 | |
Net realized and unrealized gain | | | 0.05 | |
| | | | |
Net increase from investment operations | | | 0.09 | |
| | | | |
| Distributions:3 | | | | |
From net investment income | | | (0.04 | ) |
From net realized gain | | | (0.36 | ) |
| | | | |
Total distributions | | | (0.40 | ) |
| | | | |
Net asset value, end of period | | $ | 9.69 | |
| | | | |
| | | | |
| Total Return4 | | | | |
Based on net asset value | | | 0.95% | 5 |
| | | | |
| | | | |
| Ratios to Average Net Assets6 | | | | |
Total expenses | | | 1.33% | 7,8,9 |
| | | | |
Total expenses after fees waived | | | 0.96% | 7,8 |
| | | | |
Net investment income | | | 1.31% | 7,8 |
| | | | |
| | | | |
| Supplemental Data | | | | |
Net assets, end of period (000) | | $ | 50 | |
| | | | |
Portfolio turnover of the Master Portfolio | | | 107% | |
| | | | |
| | 1 | | Commencement of operations. |
| | 2 | | Based on average shares outstanding. |
| | 3 | | Distributions for annual periods determined in accordance with federal income tax regulations. |
| | 4 | | Where applicable, excludes the effects of any sales charges and assumes the reinvestment of distributions. |
| | 5 | | Aggregate total return. |
| | 6 | | Includes the Fund’s share of the Master Portfolio’s allocated expenses and/or net investment income. |
| | 7 | | Includes the Fund’s share of the Master Portfolio’s allocated fees waived of 0.07% |
| | 9 | | Audit fees were not annualized in the calculation of the expense ratios. if these expenses were annualized, the total expenses would have been 2.16%. |
| | | | | | |
| See Notes to Financial Statements. | | | | |
| | | | | | | |
| 10 | | BLACKROCK DISCIPLINED INTERNATIONAL FUND | | DECEMBER 31, 2015 | | |
| | |
| Financial Highlights (concluded) | | |
| | | | |
| | | Class K | |
| | | Period
September 9, 20151
to December 31,
2015 | |
| | | | |
| Per Share Operating Performance | | | | |
Net asset value, beginning of period | | $ | 10.00 | |
| | | | |
Net investment income2 | | | 0.05 | |
Net realized and unrealized gain | | | 0.06 | |
| | | | |
Net increase from investment operations | | | 0.11 | |
| | | | |
| Distributions:3 | | | | |
From net investment income | | | (0.06 | ) |
From net realized gain | | | (0.36 | ) |
| | | | |
Total distributions | | | (0.42 | ) |
| | �� | | |
Net asset value, end of period | | $ | 9.69 | |
| | | | |
| | | | |
| Total Return4 | | | | |
Based on net asset value | | | 1.10% | 5 |
| | | | |
| | | | |
| Ratios to Average Net Assets6 | | | | |
Total expenses | | | 0.88% | 7,8,9 |
| | | | |
Total expenses after fees waived | | | 0.50% | 7,8 |
| | | | |
Net investment income | | | 1.77% | 7,8 |
| | | | |
| | | | |
| Supplemental Data | | | | |
Net assets, end of period (000) | | $ | 4,746 | |
| | | | |
Portfolio turnover of the Master Portfolio | | | 107% | |
| | | | |
| | 1 | | Commencement of operations. |
| | 2 | | Based on average shares outstanding. |
| | 3 | | Distributions for annual periods determined in accordance with federal income tax regulations. |
| | 4 | | Where applicable, assumes the reinvestment of distributions. |
| | 5 | | Aggregate total return. |
| | 6 | | Includes the Fund’s share of the Master Portfolio’s allocated expenses and/or net investment income. |
| | 7 | | Includes the Fund’s share of the Master Portfolio’s allocated fees waived of 0.07% |
| | 9 | | Audit fees were not annualized in the calculating of the expense ratios. If these expenses were annualized, the total expenses would have been 1.71%. |
| | | | | | |
| See Notes to Financial Statements. | | | | |
| | | | | | | |
| | BLACKROCK DISCIPLINED INTERNATIONAL FUND | | DECEMBER 31, 2015 | | 11 |
| | |
| Notes to Financial Statements | | BlackRock Disciplined International Fund |
1. Organization:
BlackRock Disciplined International Fund (the “Fund”), a series of BlackRock Funds III (the “Trust”), is registered under the Investment Company Act of 1940, as amended (the “1940 Act”), as a diversified, open-end management investment company. The Trust is organized as a Delaware statutory trust. The Fund seeks to achieve its investment objective by investing all of its assets in International Tilts Master Portfolio (the “Master Portfolio”), a series of Master Investment Portfolio (“MIP”), an affiliate of the Fund, which has the same investment objective and strategies as the Fund. The value of the Fund’s investment in the Master Portfolio reflects the Fund’s proportionate interest in the net assets of the Master Portfolio. The performance of the Fund is directly affected by the performance of the Master Portfolio. At December 31, 2015, the percentage of the Master Portfolio owned by the Fund was 1.6%. The financial statements of the Master Portfolio, including the Schedule of Investments, are included elsewhere in this report and should be read in conjunction with the Fund’s financial statements.
The Fund offers multiple classes of shares. All classes of shares have identical voting, dividend, liquidation and other rights and are subject to the same terms and conditions, except that Investor A Shares bear certain expenses related to shareholder servicing of such shares. Institutional and Class K Shares are sold only to certain eligible investors. Investor A Shares are generally available through financial intermediaries. Each class has exclusive voting rights with respect to matters relating to its shareholder servicing and distribution expenditures. The Board of Trustees of the Trust and Board of Trustees of MIP are referred to throughout this report as the “Board of Trustees” or the “Board” and the members are referred to as “Trustees.”
| | | | | | | | | | | | |
| Share Class | | Initial Sales Charge | | | CDSC | | | Conversion Privilege | |
Institutional Shares | | | No | | | | No | | | | None | |
Investor A Shares | | | Yes | | | | No | 1 | | | None | |
Class K Shares | | | No | | | | No | | | | None | |
| | 1 | | Investor A shares may be subjected to CDSC where no initial sales charge was paid at the time of purchase. |
The Fund, together with certain other registered investment companies advised by BAL or its affiliates, is included in a complex of open-end funds referred to as the Equity-Liquidity Complex.
2. Significant Accounting Policies:
The financial statements are prepared in conformity with accounting principles generally accepted in the United States of America (“U.S. GAAP”), which may require management to make estimates and assumptions that affect the reported amounts of assets and liabilities in the financial statements, disclosure of contingent assets and liabilities at the date of the financial statements and the reported amounts of increases and decreases in net assets from operations during the reporting period. Actual results could differ from those estimates. The Fund is considered an investment company under U.S. GAAP and follows the accounting and reporting guidance applicable to investment companies. Below is a summary of significant accounting policies:
Investment Transactions and Investment Income: For financial reporting purposes, contributions to and withdrawals from the Master Portfolio are accounted on a trade date basis. The Fund records daily its proportionate share of the Master Portfolio’s income, expenses and realized and unrealized gains and losses. Realized and unrealized gains and losses are adjusted utilizing partnership tax allocation rules. In addition, the Fund accrues its own expenses. Income, expenses and realized and unrealized gains and losses are allocated daily to each class based on its relative net assets.
Distributions: Distributions paid by the Fund are recorded on the ex-dividend date. The character and timing of distributions are determined in accordance with federal income tax regulations, which may differ from U.S. GAAP.
In-Kind Redemptions: The Master Portfolio satisfied certain redemptions in investors’ capital through an in-kind redemption of securities and cash. For financial reporting purposes, these transactions were treated as a sale of securities and the resulting gains and losses were recognized at the Master Portfolio based on the market value of the securities on the date of the transfer. For the year ended December 31, 2015, the Fund was allocated realized loss from the in-kind redemptions of $92,253. For tax purposes, no gains or losses were recognized.
Indemnifications: In the normal course of business, the Fund enters into contracts that contain a variety of representations that provide general indemnification. The Fund’s maximum exposure under these arrangements is unknown because it involves future potential claims against the Fund, which cannot be predicted with any certainty.
Other: Expenses directly related to the Fund or its classes are charged to the Fund or the applicable class. Other operating expenses shared by several funds, including other funds managed by BAL, are prorated among those funds on the basis of relative net assets or other appropriate methods. Expenses directly related to the Fund and other shared expenses prorated to the Fund are allocated daily to each class based on its relative net assets or other appropriate methods.
| | | | | | |
| | | | | | | |
| 12 | | BLACKROCK DISCIPLINED INTERNATIONAL FUND | | DECEMBER 31, 2015 | | |
| | | | |
| Notes to Financial Statements (continued) | | BlackRock Disciplined International Fund |
3. Investment Valuation and Fair Value Measurements:
Investment Valuation Policies: The Fund’s policy is to fair value its financial instruments at fair value. The Fund records its investment in the Master Portfolio at fair value based on the Fund’s proportionate interest in the net assets of the Master Portfolio. Valuation of securities held by the Master Portfolio is discussed in Note 3 of the Master Portfolio’s Notes to Financial Statements, which are included elsewhere in this report.
4. Administration Agreement and Other Transactions with Affiliates:
The PNC Financial Services Group, Inc. is the largest stockholder and an affiliate of BlackRock, Inc. (“BlackRock”) for 1940 Act purposes.
The Trust, on behalf of the Fund, entered into an Administration Agreement with BAL, which has agreed to provide general administration services (other than investment advice and related portfolio activities). BAL, in consideration thereof, has agreed to bear all of the Fund’s ordinary operating expenses, excluding, generally, investment advisory fees, distribution fees, brokerage and other expenses related to the execution of portfolio transactions, extraordinary expenses and certain other expenses which are borne by the Fund. BAL is entitled to receive for these administration services an annual fee based on the average daily net assets attributed to each share class as follows:
| | | | | | | | | | | | |
| | | Institutional | | | Investor A | | | Class K | |
Rate | | | 0.30% | | | | 0.30% | | | | 0.10% | |
BAL is entitled to receive an annual administrative fee of 0.05% of the Master Portfolio’s average daily net assets. BAL has contractually agreed to waive this administration fee until May 1, 2017. This waiver agreement may be terminated upon 90 days’ notice by a majority of the non-interested trustees of MIP or by a majority of the outstanding voting securities of the Master Portfolio.
From time to time, BAL may waive such fees in whole or in part. Any such waiver will reduce the expenses of the Fund and, accordingly, have a favorable impact on its performance. BAL may delegate certain of its administration duties to sub-administrators.
The fees and expenses of the Fund’s trustees who are not “interested persons” of the Trust, as defined in the 1940 Act (“Independent Trustees”), counsel to the Independent Trustees and the Trust’s independent registered public accounting firm (together, the “independent expenses”) are paid directly by the Fund. BAL has contractually agreed to provide an offsetting credit against the administration fees paid by the Fund in an amount equal to the independent expenses through April 30, 2016. The amount of the waiver, if any, is shown as fees waived in the Statement of Operations.
The Trust, on behalf of the Fund, entered into a Distribution Agreement and a Service Plan with BlackRock Investments, LLC (“BRIL”), an affiliate of BAL. Pursuant to the Service Plan and in accordance with Rule 12b-1 under the 1940 Act, the Fund pays BRIL ongoing service fees. The fees are accrued daily and paid monthly at an annual rate of 0.25% based upon the average daily net assets of the Investor A Shares.
Pursuant to sub-agreements with BRIL, broker-dealers and BRIL provide shareholder servicing services to the Fund. The ongoing service fee compensates BRIL and each broker-dealer for providing shareholder servicing related services to the shareholders.
For the year ended December 31, 2015, affiliates earned underwriting discounts, direct commissions and dealer concessions of $3 on sales of the Fund’s Investor A Shares.
Certain officers and/or trustees of the Trust are officers and/or directors of BlackRock or its affiliates.
5. Income Tax Information:
It is the Fund’s policy to comply with the requirements of the Internal Revenue Code of 1986, as amended, applicable to regulated investment companies, and to distribute substantially all of its taxable income to its shareholders. Therefore, no federal income tax provision is required.
The Fund files U.S. federal and various state and local tax returns. No income tax returns are currently under examination. The statute of limitations on the Fund’s U.S. federal tax returns remains open for the period ended December 31, 2015. The statutes of limitations on the Fund’s state and local tax returns may remain open for an additional year depending upon the jurisdiction.
Management has analyzed tax laws and regulations and their application to the Fund as of December 31, 2015, inclusive of the open tax return years, and does not believe there are any uncertain tax positions that require recognition of a tax liability in the Fund’s financial statements.
| | | | | | |
| | | | | | | |
| | BLACKROCK DISCIPLINED INTERNATIONAL FUND | | DECEMBER 31, 2015 | | 13 |
| | |
| Notes to Financial Statements (concluded) | | BlackRock Disciplined International Fund |
The tax character of distributions paid was as follows:
| | | | |
| | | 12/31/15 | |
Ordinary income | | $ | 27,916 | |
Long-term capital gain | | | 180,515 | |
| | | | |
Total | | $ | 208,431 | |
| | | | |
As of period end, the tax components of accumulated net earnings (losses) were as follows:
| | | | |
Net unrealized gains (losses)1 | | $ | (106,912 | ) |
Qualified late year losses2 | | | (50,156 | ) |
| | | | |
Total | | $ | (157,068 | ) |
| | | | |
| | 1 | | The differences between book-basis and tax-basis net unrealized gains (losses) was attributable primarily to the timing and recognition of partnership income. |
| | 2 | | The Fund has elected to defer certain qualified late-year losses and recognize such losses in the next taxable year. |
6. Capital Share Transactions:
Transactions in capital shares for each class were as follows:
| | | | | | | | |
| | | Period
September 9, 20151
to December 31,
2015 | |
| | | Shares | | | Amount | |
| Institutional | | | | | | | | |
Shares sold | | | 5,000 | | | $ | 50,000 | |
| | | | | | | | |
Net increase | | | 5,000 | | | $ | 50,000 | |
| | | | | | | | |
| | | | | | | | |
| Investor A | | | | | | | | |
Shares sold | | | 5,150 | | | $ | 51,439 | |
| | | | | | | | |
Net increase | | | 5,150 | | | $ | 51,439 | |
| | | | | | | | |
| | | | | | | | |
| Class K | | | | | | | | |
Shares sold | | | 490,000 | | | $ | 4,900,000 | |
| | | | | | | | |
Net increase | | | 490,000 | | | $ | 4,900,000 | |
| | | | | | | | |
Total Net Increase | | | 500,150 | | | $ | 5,001,439 | |
| | | | | | | | |
| | 1 | | Commencement of operations. |
At period end, shares owned by BlackRock HoldCo2, Inc., an affiliate of the Fund, were as follows:
| | | | |
Institutional | | | 5,000 | |
Investor A | | | 5,000 | |
Class K | | | 490,000 | |
7. Subsequent Events:
Management has evaluated the impact of all subsequent events on the Fund through the date the financial statements were issued and has determined that there were no subsequent events requiring adjustment or additional disclosure in the financial statements.
| | | | | | |
| | | | | | | |
| 14 | | BLACKROCK DISCIPLINED INTERNATIONAL FUND | | DECEMBER 31, 2015 | | |
| | | | |
| Report of Independent Registered Public Accounting Firm | | BlackRock Disciplined International Fund |
To the Board of Trustees of BlackRock Funds III and the Shareholders of BlackRock Disciplined International Fund:
In our opinion, the accompanying statement of assets and liabilities and the related statements of operations and of changes in net assets and the financial highlights present fairly, in all material respects, the financial position of BlackRock Disciplined International Fund, (the “Fund”), a series of BlackRock Funds III, at December 31, 2015, and the results of its operations, the changes in its net assets and the financial highlights for the period September 9, 2015 (commencement of operations) through December 31, 2015, in conformity with accounting principles generally accepted in the United States of America. These financial statements and financial highlights (hereafter referred to as “financial statements”) are the responsibility of the Fund’s management. Our responsibility is to express an opinion on these financial statements based on our audit. We conducted our audit of these financial statements in accordance with the standards of the Public Company Accounting Oversight Board (United States). Those standards require that we plan and perform the audit to obtain reasonable assurance about whether the financial statements are free of material misstatement. An audit includes examining, on a test basis, evidence supporting the amounts and disclosures in the financial statements, assessing the accounting principles used and significant estimates made by management, and evaluating the overall financial statement presentation. We believe that our audit provides a reasonable basis for our opinion.
/s/PricewaterhouseCoopers LLP
Philadelphia, Pennsylvania
February 24, 2016
| | |
| Important Tax Information (Unaudited) | | |
During the fiscal year ended December 31, 2015, the following information is provided with respect to the ordinary income distributions paid by the Fund.
| | | | | | | | |
| | | Payable Dates | | | | |
Qualified Dividend Income for Individuals1 | | | Quarterly | | | | 100.00% | |
Foreign Source Income2 | | | Quarterly | | | | 88.63% | |
Foreign Taxes Paid Per Share3 | | | 9/30/15 | | | | $0.002286689 | |
| | | | 12/31/15 | | | | $0.004873309 | |
| | 1 | | The Fund hereby designates the percentage indicated above or the maximum amount allowed by law. |
| | 2 | | Expressed as a percentage of distributions grossed up for foreign taxes. |
| | 3 | | The foreign taxes paid represent taxes paid by the Fund from foreign sources. Foreign taxes paid may be included in taxable income with an offsetting deduction for gross income or may be taken as a credit for taxes paid to foreign governments. You should consult your tax advisor regarding the appropriate treatment of foreign taxes paid. |
Additionally, the Fund distributed long-term capital gains of $0.36103 per share to shareholders on record December 8, 2015.
| | | | | | |
| | | | | | | |
| | BLACKROCK DISCIPLINED INTERNATIONAL FUND | | DECEMBER 31, 2015 | | 15 |
| | |
| Portfolio Information as of December 31, 2015 | | |
| | | | |
| Ten Largest Holdings | | Percent of
Net Assets | |
Roche Holding AG | | | 2 | % |
Novo Nordisk A/S, Class B | | | 2 | |
HSBC Holdings PLC | | | 1 | |
Bayer AG, Registered Shares | | | 1 | |
Sanofi | | | 1 | |
Murata Manufacturing Co. Ltd. | | | 1 | |
Australia & New Zealand Banking Group Ltd. | | | 1 | |
Intesa Sanpaolo SpA | | | 1 | |
Singapore Telecommunications Ltd. | | | 1 | |
Toyota Motor Corp. | | | 1 | |
| | | | |
| Geographic Allocation | | Percent of
Net Assets | |
Japan | | | 24 | % |
United Kingdom | | | 15 | |
France | | | 8 | |
Australia | | | 8 | |
United States | | | 8 | |
Germany | | | 7 | |
Switzerland | | | 6 | |
Netherlands | | | 5 | |
Spain | | | 4 | |
Singapore | | | 3 | |
Italy | | | 3 | |
Sweden | | | 3 | |
Hong Kong | | | 3 | |
Denmark | | | 2 | |
Finland | | | 2 | |
Norway | | | 2 | |
Other1 | | | 2 | |
Liabilities in Excess of Other Assets | | | (5 | ) |
| | 1 | | Other includes a 1% or less investment in each of the following countries: Austria, Belgium, Faeroe Islands, Ireland, Isle of Man, Israel, New Zealand and Portugal. |
| | |
| Portfolio Information as of December 31, 2015 | | |
|
| Derivative Financial Instruments |
The Master Portfolio may invest in various derivative financial instruments. Derivative financial instruments are used to obtain exposure to a security, index and/or market without owning or taking physical custody of securities or to manage market, equity, credit, interest rate, foreign currency exchange rate, commodity and/or other risks. Derivative financial instruments may give rise to a form of economic leverage. Derivative financial instruments also involve risks, including the imperfect correlation between the value of a derivative financial instrument and the underlying asset, possible default of the counterparty to the transaction or illiquidity of the derivative financial instrument. The Master Portfolio’s ability to use a derivative financial instrument successfully depends on the investment advisor’s ability to predict pertinent market movements accurately, which cannot be assured. The use of derivative financial instruments may result in losses greater than if they had not been used, may limit the amount of appreciation the Master Portfolio can realize on an investment and/or may result in lower distributions paid to shareholders. The Master Portfolio’s investments in these instruments, if any, are discussed in detail in the Notes to Financial Statements.
| | | | | | |
| | | | | | | |
| 16 | | BLACKROCK DISCIPLINED INTERNATIONAL FUND | | DECEMBER 31, 2015 | | |
| | |
Schedule of Investments December 31, 2015 | | International Tilts Master Portfolio (Percentages shown are based on Net Assets) |
| | | | | | | | |
| Common Stocks | | Shares | | | Value | |
Australia — 7.9% | | | | | | | | |
Amcor Ltd. | | | 18,807 | | | $ | 182,714 | |
Aristocrat Leisure Ltd. | | | 115,546 | | | | 853,179 | |
Australia & New Zealand Banking Group Ltd. | | | 174,314 | | | | 3,517,617 | |
BHP Billiton Ltd. | | | 135,819 | | | | 1,747,931 | |
Caltex Australia Ltd. | | | 97,169 | | | | 2,655,990 | |
Commonwealth Bank of Australia | | | 11,791 | | | | 728,972 | |
CSL Ltd. | | | 27,765 | | | | 2,116,794 | |
CSR Ltd. | | | 36,523 | | | | 76,229 | |
Independence Group NL | | | 5,474 | | | | 10,046 | |
Lend Lease Group (a) | | | 11,143 | | | | 114,968 | |
Macquarie Group Ltd. | | | 24,661 | | | | 1,475,293 | |
Mirvac Group | | | 54,477 | | | | 77,986 | |
National Australia Bank Ltd. | | | 58,322 | | | | 1,272,692 | |
Qantas Airways Ltd. (b) | | | 473,597 | | | | 1,403,775 | |
Rio Tinto Ltd. | | | 6,279 | | | | 203,060 | |
Sonic Healthcare Ltd. | | | 8,297 | | | | 107,423 | |
Spotless Group Holdings Ltd. | | | 37,689 | | | | 29,531 | |
Stockland | | | 192,082 | | | | 570,192 | |
Suncorp Group Ltd. | | | 12,454 | | | | 109,346 | |
Sydney Airport (a) | | | 299,982 | | | | 1,380,612 | |
Telstra Corp. Ltd. | | | 392,062 | | | | 1,593,220 | |
Wesfarmers Ltd. | | | 1,694 | | | | 51,071 | |
Westfield Corp. | | | 34,802 | | | | 239,435 | |
Westpac Banking Corp. | | | 105,659 | | | | 2,561,150 | |
Woodside Petroleum Ltd. | | | 41,214 | | | | 858,651 | |
| | | | | | | | |
| | | | | 23,937,877 | |
Austria — 0.1% | | | | | | | | |
ams AG | | | 1,500 | | | | 50,143 | |
Raiffeisen Bank International AG (b) | | | 839 | | | | 12,296 | |
Schoeller-Bleckmann Oilfield Equipment AG (c) | | | 4,672 | | | | 256,261 | |
Vienna Insurance Group AG | | | 1,137 | | | | 31,100 | |
| | | | | | | | |
| | | | | 349,800 | |
Belgium — 0.9% | | | | | | | | |
Ageas | | | 18,259 | | | | 847,471 | |
bpost SA | | | 58,547 | | | | 1,436,590 | |
Delhaize Group | | | 1,194 | | | �� | 116,208 | |
Groupe Bruxelles Lambert SA | | | 1,947 | | | | 166,599 | |
Proximus | | | 7,107 | | | | 231,268 | |
| | | | | | | | |
| | | | | 2,798,136 | |
Denmark — 2.4% | | | | | | | | |
Carlsberg A/S, Class B | | | 2,685 | | | | 237,869 | |
Danske Bank A/S | | | 5,210 | | | | 139,796 | |
Genmab A/S (b) | | | 675 | | | | 89,751 | |
GN Store Nord A/S | | | 3,504 | | | | 63,592 | |
Jyske Bank A/S (b) | | | 3 | | | | 136 | |
NKT Holding A/S | | | 3,721 | | | | 192,079 | |
Novo Nordisk A/S, Class B | | | 81,167 | | | | 4,699,424 | |
Pandora A/S | | | 3,197 | | | | 403,090 | |
Vestas Wind Systems A/S | | | 22,151 | | | | 1,546,998 | |
| | | | | | | | |
| | | | | 7,372,735 | |
| | | | | | | | |
| Common Stocks | | Shares | | | Value | |
Faeroe Islands — 0.0% | | | | | | | | |
Bakkafrost P/F | | | 344 | | | $ | 10,135 | |
Finland — 2.4% | | | | | | | | |
Elisa OYJ | | | 1,662 | | | | 62,532 | |
Fortum OYJ | | | 11,176 | | | | 168,382 | |
Kesko OYJ, Class B | | | 1,320 | | | | 46,269 | |
Kone OYJ, Class B | | | 37,179 | | | | 1,574,198 | |
Metso OYJ | | | 2,745 | | | | 61,489 | |
Neste Oil OYJ | | | 42,259 | | | | 1,261,258 | |
Nokia OYJ | | | 278,432 | | | | 1,969,771 | |
Sampo OYJ, Class A | | | 1,931 | | | | 98,060 | |
Stora Enso OYJ, Class R | | | 173,892 | | | | 1,572,355 | |
UPM-Kymmene OYJ | | | 20,211 | | | | 375,224 | |
| | | | | | | | |
| | | | | 7,189,538 | |
France — 8.0% | | | | | | | | |
Alstom SA (b) | | | 5,373 | | | | 164,118 | |
ArcelorMittal (c) | | | 9,941 | | | | 41,943 | |
AtoS | | | 2,023 | | | | 169,836 | |
AXA SA | | | 32,033 | | | | 875,255 | |
BNP Paribas SA | | | 29,110 | | | | 1,646,966 | |
Bouygues SA | | | 2,614 | | | | 103,647 | |
Cie Generale des Etablissements Michelin | | | 17,608 | | | | 1,675,975 | |
CNP Assurances | | | 11,273 | | | | 152,065 | |
Compagnie de Saint-Gobain | | | 28,681 | | | | 1,242,899 | |
Credit Agricole SA | | | 61,639 | | | | 726,362 | |
Danone SA | | | 2,602 | | | | 175,826 | |
Electricite de France SA | | | 45,656 | | | | 672,398 | |
Faurecia | | | 4,916 | | | | 196,983 | |
Gecina SA | | | 580 | | | | 70,511 | |
Hermes International | | | 25 | | | | 8,451 | |
ICADE | | | 1,050 | | | | 70,476 | |
Lagardere SCA | | | 17,220 | | | | 513,869 | |
LVMH Moet Hennessy Louis Vuitton SA | | | 701 | | | | 110,106 | |
Metropole Television SA | | | 35,183 | | | | 605,014 | |
Orange SA | | | 42,800 | | | | 715,861 | |
Peugeot SA (b) | | | 72,768 | | | | 1,275,543 | |
Plastic Omnium SA | | | 2,535 | | | | 80,579 | |
Publicis Groupe SA | | | 3,601 | | | | 239,450 | |
Renault SA | | | 4,500 | | | | 450,430 | |
Safran SA | | | 33,888 | | | | 2,328,198 | |
Sanofi | | | 43,437 | | | | 3,701,776 | |
SCOR SE | | | 6,802 | | | | 254,515 | |
Societe Generale SA | | | 18,540 | | | | 854,363 | |
Technicolor SA, Registered Shares | | | 42,004 | | | | 340,923 | |
Technip SA | | | 10,115 | | | | 503,021 | |
Thales SA | | | 23,388 | | | | 1,750,584 | |
Total SA | | | 37,821 | | | | 1,695,567 | |
Valeo SA | | | 6,322 | | | | 974,692 | |
Wendel SA | | | 826 | | | | 98,232 | |
| | | | | | | | |
| | | | | 24,486,434 | |
Germany — 7.2% | | | | | | | | |
Allianz SE, Registered Shares | | | 6,625 | | | | 1,167,842 | |
Bayer AG, Registered Shares | | | 34,657 | | | | 4,328,324 | |
| | |
| CVA | | Certificaten Van Aandelen (Dutch Certificate) |
| FTSE | | Financial Times Stock Exchange |
See Notes to Financial Statements.
| | | | | | |
| | | | | | | |
| | BLACKROCK DISCIPLINED INTERNATIONAL FUND | | DECEMBER 31, 2015 | | 17 |
| | |
Schedule of Investments (continued) | | International Tilts Master Portfolio |
| | | | | | | | |
| Common Stocks | | Shares | | | Value | |
Germany (continued) | | | | | | | | |
Continental AG | | | 3,189 | | | $ | 771,450 | |
Daimler AG, Registered Shares | | | 35,940 | | | | 3,002,929 | |
Deutsche Lufthansa AG, Registered Shares (b)(c) | | | 18,497 | | | | 291,347 | |
Deutsche Post AG, Registered Shares | | | 20,753 | | | | 580,208 | |
Deutsche Telekom AG, Registered Shares (c) | | | 76,012 | | | | 1,365,225 | |
Dialog Semiconductor PLC (b) | | | 12,620 | | | | 421,112 | |
Duerr AG | | | 9,377 | | | | 744,179 | |
E.ON SE | | | 34,600 | | | | 332,229 | |
Evonik Industries AG | | | 27,631 | | | | 913,950 | |
Fresenius SE & Co. KGaA | | | 6,308 | | | | 449,333 | |
Infineon Technologies AG | | | 45,253 | | | | 659,730 | |
K+S AG, Registered Shares | | | 13,525 | | | | 344,767 | |
KION Group AG (b) | | | 5,523 | | | | 273,873 | |
Merck KGaA | | | 1,173 | | | | 113,571 | |
Metro AG | | | 3,970 | | | | 126,474 | |
OSRAM Licht AG | | | 7,098 | | | | 296,547 | |
Porsche Automobil Holding SE, Preference Shares | | | 3,887 | | | | 209,188 | |
Rheinmetall AG | | | 5,017 | | | | 333,489 | |
RWE AG (c) | | | 6,415 | | | | 80,876 | |
Salzgitter AG | | | 4,046 | | | | 98,873 | |
SAP SE | | | 23,217 | | | | 1,842,341 | |
Siemens AG, Registered Shares | | | 15,465 | | | | 1,496,174 | |
Symrise AG | | | 15,120 | | | | 1,000,920 | |
Talanx AG | | | 3,508 | | | | 107,887 | |
TUI AG | | | 21,468 | | | | 383,313 | |
Volkswagen AG | | | 801 | | | | 123,087 | |
| | | | | | | | |
| | | | | 21,859,238 | |
Hong Kong — 2.4% | | | | | | | | |
AIA Group Ltd. | | | 34,000 | | | | 203,153 | |
BOC Hong Kong Holdings Ltd. | | | 11,500 | | | | 34,995 | |
Cheung Kong Property Holdings Ltd. | | | 186,184 | | | | 1,204,421 | |
CK Hutchison Holdings Ltd. | | | 202,684 | | | | 2,724,462 | |
CLP Holdings Ltd. | | | 62,500 | | | | 529,750 | |
Hang Lung Properties Ltd. | | | 73,000 | | | | 165,408 | |
Henderson Land Development Co. Ltd. | | | 25,900 | | | | 157,990 | |
HK Electric Investments & HK Electric Investments Ltd. (a)(d)(c) | | | 62,500 | | | | 52,369 | |
Hong Kong Exchanges & Clearing Ltd. | | | 14,300 | | | | 364,289 | |
Hongkong Land Holdings Ltd. | | | 54,900 | | | | 383,355 | |
Kerry Properties Ltd. | | | 35,500 | | | | 96,608 | |
New World Development Co. Ltd. | | | 131,000 | | | | 128,634 | |
Power Assets Holdings Ltd. | | | 15,500 | | | | 142,097 | |
Sands China Ltd. (c) | | | 156,000 | | | | 528,870 | |
SJM Holdings Ltd. (c) | | | 172,000 | | | | 121,887 | |
Sun Hung Kai Properties Ltd. | | | 7,000 | | | | 84,137 | |
Swire Properties Ltd. | | | 56,800 | | | | 163,319 | |
Techtronic Industries Co. Ltd. | | | 16,500 | | | | 66,796 | |
Wheelock & Co. Ltd. | | | 74,000 | | | | 310,518 | |
| | | | | | | | |
| | | | | 7,463,058 | |
Ireland — 0.8% | | | | | | | | |
DCC PLC | | | 16,779 | | | | 1,401,750 | |
Glanbia PLC | | | 1,109 | | | | 20,416 | |
Shire PLC | | | 14,377 | | | | 986,368 | |
| | | | | | | | |
| | | | | 2,408,534 | |
Isle of Man — 0.0% | | | | | | | | |
Playtech PLC | | | 2,779 | | | | 34,023 | |
Israel — 0.0% | | | | | | | | |
Azrieli Group | | | 345 | | | | 12,852 | |
| | | | | | | | |
| Common Stocks | | Shares | | | Value | |
Italy — 3.2% | | | | | | | | |
Assicurazioni Generali SpA | | | 29,814 | | | $ | 544,603 | |
Banca Popolare dell’Emilia Romagna | | | 1,508 | | | | 11,438 | |
Banca Popolare di Milano Scarl | | | 42,274 | | | | 41,871 | |
Enel SpA | | | 262,690 | | | | 1,101,538 | |
Intesa Sanpaolo SpA | | | 1,010,974 | | | | 3,354,087 | |
Mediaset SpA | | | 109,422 | | | | 453,433 | |
Mediobanca SpA | | | 153,393 | | | | 1,470,434 | |
Moncler SpA | | | 27,902 | | | | 388,282 | |
Parmalat SpA | | | 48,024 | | | | 124,734 | |
Prada SpA (c) | | | 13,400 | | | | 41,669 | |
Recordati SpA | | | 498 | | | | 12,993 | |
Saras SpA (b) | | | 5,281 | | | | 10,183 | |
Snam SpA | | | 51,507 | | | | 268,812 | |
UniCredit SpA | | | 366,746 | | | | 2,027,625 | |
| | | | | | | | |
| | | | | 9,851,702 | |
Japan — 23.5% | | | | | | | | |
ABC-Mart, Inc. | | | 3,800 | | | | 208,005 | |
Adastria Holdings Co. Ltd. | | | 300 | | | | 16,787 | |
Ajinomoto Co., Inc. | | | 57,000 | | | | 1,349,516 | |
ANA Holdings, Inc. | | | 62,000 | | | | 178,877 | |
Asahi Group Holdings Ltd. | | | 83,600 | | | | 2,617,048 | |
Asahi Kasei Corp. | | | 139,000 | | | | 939,932 | |
Astellas Pharma, Inc. | | | 211,300 | | | | 3,008,015 | |
Calbee, Inc. (c) | | | 7,000 | | | | 295,603 | |
Casio Computer Co. Ltd. | | | 7,600 | | | | 177,663 | |
Central Japan Railway Co. | | | 1,000 | | | | 177,534 | |
Chubu Electric Power Co., Inc. | | | 15,300 | | | | 209,514 | |
Chugoku Electric Power Co., Inc. | | | 1,200 | | | | 15,844 | |
COMSYS Holdings Corp. (c) | | | 28,900 | | | | 406,358 | |
CyberAgent, Inc. | | | 500 | | | | 20,601 | |
Dai-ichi Life Insurance Co. Ltd. | | | 53,400 | | | | 888,452 | |
Daicel Corp. | | | 42,700 | | | | 635,457 | |
Daiichi Sankyo Co. Ltd. | | | 24,200 | | | | 499,481 | |
Daito Trust Construction Co. Ltd. | | | 11,200 | | | | 1,293,718 | |
Daiwa House Industry Co. Ltd. | | | 12,800 | | | | 367,953 | |
Daiwa Securities Group, Inc. | | | 29,000 | | | | 177,297 | |
DIC Corp. | | | 6,000 | | | | 16,235 | |
Disco Corp. | | | 7,600 | | | | 715,703 | |
Dowa Holdings Co. Ltd. | | | 38,000 | | | | 273,225 | |
East Japan Railway Co. | | | 10,100 | | | | 951,075 | |
Electric Power Development Co. Ltd. | | | 1,100 | | | | 39,178 | |
Fuji Electric Co. Ltd. | | | 20,000 | | | | 83,877 | |
Fuji Heavy Industries Ltd. | | | 78,100 | | | | 3,217,428 | |
FUJIFILM Holdings Corp. | | | 26,000 | | | | 1,085,045 | |
Fujitsu General Ltd. | | | 61,000 | | | | 775,830 | |
GungHo Online Entertainment, Inc. (c) | | | 10,900 | | | | 29,611 | |
Hankyu Hanshin Holdings, Inc. | | | 40,000 | | | | 259,995 | |
Haseko Corp. | | | 81,300 | | | | 898,883 | |
Hazama Ando Corp. | | | 30,300 | | | | 163,383 | |
Hitachi Capital Corp. | | | 1,500 | | | | 40,302 | |
Hitachi Ltd. | | | 114,000 | | | | 645,966 | |
Honda Motor Co. Ltd. | | | 5,900 | | | | 188,573 | |
Hoya Corp. | | | 70,500 | | | | 2,882,926 | |
Hulic Co. Ltd. | | | 5,800 | | | | 50,927 | |
Ichigo Group Holdings Co Ltd. (c) | | | 6,600 | | | | 20,545 | |
Iida Group Holdings Co. Ltd. | | | 10,800 | | | | 200,167 | |
Isuzu Motors Ltd. | | | 14,200 | | | | 152,971 | |
ITOCHU Corp. | | | 19,800 | | | | 234,203 | |
Izumi Co. Ltd. | | | 400 | | | | 15,529 | |
Japan Aviation Electronics Industry Ltd. | | | 3,000 | | | | 43,034 | |
See Notes to Financial Statements.
| | | | | | |
| | | | | | | |
| 18 | | BLACKROCK DISCIPLINED INTERNATIONAL FUND | | DECEMBER 31, 2015 | | |
| | |
Schedule of Investments (continued) | | International Tilts Master Portfolio |
| | | | | | | | |
| Common Stocks | | Shares | | | Value | |
Japan (continued) | | | | | | | | |
Japan Display, Inc. (b) | | | 4,100 | | | $ | 11,813 | |
Japan Exchange Group, Inc. | | | 4,900 | | | | 76,596 | |
Japan Petroleum Exploration Co. | | | 12,300 | | | | 330,345 | |
Japan Real Estate Investment Corp. | | | 30 | | | | 145,582 | |
Japan Tobacco, Inc. (c) | | | 61,300 | | | | 2,250,553 | |
Kaken Pharmaceutical Co. Ltd. | | | 2,500 | | | | 170,833 | |
Kansai Electric Power Co., Inc. (b) | | | 10,500 | | | | 125,893 | |
Kao Corp. | | | 21,000 | | | | 1,079,163 | |
Kikkoman Corp. | | | 18,000 | | | | 623,654 | |
Kumagai Gumi Co. Ltd. | | | 13,000 | | | | 37,324 | |
Kyushu Electric Power Co., Inc. (b) | | | 3,700 | | | | 40,327 | |
Lawson, Inc. | | | 1,200 | | | | 97,405 | |
Lintec Corp. | | | 13,900 | | | | 292,389 | |
Minebea Co. Ltd. | | | 3,000 | | | | 25,686 | |
Miraca Holdings, Inc. | | | 800 | | | | 35,201 | |
Mitsubishi Electric Corp. | | | 82,000 | | | | 860,741 | |
Mitsubishi Estate Co. Ltd. | | | 32,000 | | | | 665,387 | |
Mitsubishi Gas Chemical Co., Inc. | | | 16,000 | | | | 81,816 | |
Mitsubishi Heavy Industries Ltd. | | | 16,000 | | | | 69,960 | |
Mitsubishi UFJ Financial Group, Inc. | | | 109,700 | | | | 679,509 | |
Mitsui & Co. Ltd. | | | 47,300 | | �� | | 562,020 | |
Mitsui Mining & Smelting Co. Ltd. | | | 10,000 | | | | 18,543 | |
Mitsui OSK Lines Ltd. | | | 10,000 | | | | 25,223 | |
Mixi, Inc. | | | 1,100 | | | | 41,144 | |
Mizuho Financial Group, Inc. | | | 1,200,100 | | | | 2,400,200 | |
Murata Manufacturing Co. Ltd. | | | 25,200 | | | | 3,625,806 | |
Nexon Co. Ltd. (c) | | | 45,600 | | | | 741,808 | |
NGK Spark Plug Co. Ltd. | | | 3,300 | | | | 86,884 | |
NH Foods Ltd. | | | 56,000 | | | | 1,097,593 | |
Nippon Steel & Sumitomo Metal | | | 8,200 | | | | 162,215 | |
Nippon Telegraph & Telephone Corp. | | | 48,300 | | | | 1,922,249 | |
Nippon Yusen KK | | | 36,000 | | | | 87,253 | |
Nishimatsu Construction Co. Ltd. | | | 11,000 | | | | 41,691 | |
Nissan Chemical Industries Ltd. | | | 19,800 | | | | 449,482 | |
Nissan Motor Co. Ltd. | | | 304,900 | | | | 3,192,528 | |
Nissin Foods Holdings Co. Ltd. | | | 1,600 | | | | 84,902 | |
Nitto Denko Corp. | | | 3,300 | | | | 240,919 | |
Nomura Holdings, Inc. | | | 9,600 | | | | 53,473 | |
Nomura Real Estate Holdings, Inc. | | | 32,600 | | | | 604,802 | |
NTT DoCoMo, Inc. | | | 62,300 | | | | 1,277,872 | |
Obic Co. Ltd. | | | 15,800 | | | | 836,367 | |
Oki Electric Industry Co. Ltd. (c) | | | 192,000 | | | | 240,347 | |
OKUMA Corp. | | | 7,000 | | | | 56,610 | |
Omron Corp. | | | 7,700 | | | | 256,771 | |
ORIX Corp. | | | 103,600 | | | | 1,453,349 | |
OSG Corp. (c) | | | 7,600 | | | | 143,678 | |
Panasonic Corp. | | | 22,800 | | | | 231,135 | |
Penta-Ocean Construction Co. Ltd. | | | 2,100 | | | | 8,774 | |
Pigeon Corp. | | | 2,700 | | | | 65,502 | |
Resona Holdings, Inc. | | | 168,500 | | | | 818,276 | |
Santen Pharmaceutical Co. Ltd. | | | 4,300 | | | | 70,793 | |
Seiko Holdings Corp. | | | 17,000 | | | | 95,982 | |
Sekisui Chemical Co. Ltd. | | | 1,600 | | | | 20,890 | |
Senshu Ikeda Holdings, Inc. | | | 21,500 | | | | 88,631 | |
Shin-Etsu Chemical Co. Ltd. | | | 6,600 | | | | 358,814 | |
Shionogi & Co. Ltd. | | | 24,600 | | | | 1,112,664 | |
Skylark Co. Ltd. | | | 7,800 | | | | 100,784 | |
SMC Corp. (c) | | | 800 | | | | 207,787 | |
Sompo Japan Nipponkoa Holdings, Inc. | | | 6,200 | | | | 203,575 | |
Sony Corp. | | | 11,500 | | | | 282,633 | |
Start Today Co. Ltd. | | | 1,000 | | | | 32,191 | |
| | | | | | | | |
| Common Stocks | | Shares | | | Value | |
Japan (continued) | | | | | | | | |
Sumco Corp. | | | 7,000 | | | $ | 52,812 | |
Sumitomo Chemical Co. Ltd. | | | 9,000 | | | | 51,688 | |
Sumitomo Corp. | | | 6,100 | | | | 62,191 | |
Sumitomo Dainippon Pharma Co. Ltd. (c) | | | 10,300 | | | | 121,349 | |
Sumitomo Electric Industries Ltd. | | | 22,200 | | | | 313,482 | |
Sumitomo Mitsui Trust Holdings, Inc. | | | 544,000 | | | | 2,060,308 | |
Sumitomo Realty & Development Co. Ltd. | | | 7,000 | | | | 199,799 | |
Sundrug Co. Ltd. | | | 700 | | | | 45,008 | |
Tadano Ltd. | | | 77,000 | | | | 932,154 | |
Taiyo Yuden Co Ltd. | | | 17,000 | | | | 235,105 | |
Takeda Pharmaceutical Co. Ltd. | | | 4,100 | | | | 204,424 | |
TDK Corp. | | | 3,900 | | | | 249,771 | |
Teijin Ltd. | | | 13,000 | | | | 44,302 | |
Tohoku Electric Power Co., Inc. | | | 5,100 | | | | 63,757 | |
Tokio Marine Holdings, Inc. | | | 82,000 | | | | 3,167,217 | |
Tokyo Electric Power Co., Inc. (b) | | | 36,600 | | | | 210,752 | |
Tokyo Electron Ltd. | | | 6,400 | | | | 387,743 | |
Tokyo Gas Co. Ltd. | | | 23,000 | | | | 108,072 | |
Tokyo Steel Manufacturing Co. Ltd. | | | 50,500 | | | | 313,531 | |
Toshiba Corp. (b) | | | 47,000 | | | | 96,596 | |
Tosoh Corp. | | | 53,000 | | | | 272,632 | |
Toyota Motor Corp. | | | 53,400 | | | | 3,288,317 | |
TS Tech Co. Ltd. | | | 8,500 | | | | 219,838 | |
United Arrows Ltd. | | | 900 | | | | 38,800 | |
West Japan Railway Co. | | | 8,000 | | | | 552,984 | |
Yahoo! Japan Corp. | | | 40,900 | | | | 166,255 | |
Yakult Honsha Co. Ltd. | | | 1,600 | | | | 78,312 | |
Yokogawa Electric Corp. | | | 800 | | | | 9,621 | |
Zeon Corp. | | | 55,000 | | | | 442,526 | |
| | | | | | | | |
| | | | | 71,559,949 | |
Netherlands — 5.0% | | | | | | | | |
Akzo Nobel NV | | | 2,685 | | | | 179,408 | |
Altice NV Class A (b) | | | 9,438 | | | | 135,598 | |
Altice NV Class B (b) | | | 6,868 | | | | 100,104 | |
ASM International NV | | | 3,815 | | | | 149,562 | |
ASML Holding NV | | | 3,185 | | | | 282,992 | |
Eurocommercial Properties NV CVA | | | 8,173 | | | | 353,076 | |
Euronext NV (d) | | | 3,938 | | | | 202,054 | |
GrandVision NV (d) | | | 2,659 | | | | 79,787 | |
Heineken Holding NV | | | 2,469 | | | | 190,080 | |
Heineken NV | | | 3,608 | | | | 307,462 | |
ING Groep NV CVA | | | 136,392 | | | | 1,845,388 | |
Koninklijke Ahold NV | | | 76,799 | | | | 1,619,954 | |
Koninklijke BAM Groep NV (b) | | | 2,202 | | | | 12,242 | |
Koninklijke DSM NV | | | 20,068 | | | | 1,006,318 | |
NN Group NV | | | 10,009 | | | | 353,147 | |
Randstad Holding NV | | | 5,361 | | | | 333,837 | |
RELX NV | | | 24,259 | | | | 408,577 | |
Royal Dutch Shell PLC, A Shares | | | 42,916 | | | | 978,788 | |
Royal Dutch Shell PLC, Class A | | | 72,128 | | | | 1,633,638 | |
Royal Dutch Shell PLC, Class B | | | 57,736 | | | | 1,315,857 | |
Unilever NV CVA | | | 72,390 | | | | 3,155,053 | |
Wereldhave NV | | | 3,303 | | | | 185,278 | |
Wolters Kluwer NV | | | 11,981 | | | | 402,364 | |
| | | | | | | | |
| | | | | 15,230,564 | |
New Zealand — 0.0% | | | | | | | | |
Contact Energy Ltd. | | | 10,505 | | | | 34,001 | |
Vector Ltd. | | | 5,687 | | | | 12,330 | |
| | | | | | | | |
| | | | | 46,331 | |
See Notes to Financial Statements.
| | | | | | |
| | | | | | | |
| | BLACKROCK DISCIPLINED INTERNATIONAL FUND | | DECEMBER 31, 2015 | | 19 |
| | |
Schedule of Investments (continued) | | International Tilts Master Portfolio |
| | | | | | | | |
| Common Stocks | | Shares | | | Value | |
Norway — 2.0% | | | | | | | | |
Aker Solutions ASA | | | 9,845 | | | $ | 33,522 | |
BW LPG Ltd. (d) | | | 944 | | | | 7,738 | |
DnB NOR ASA | | | 103,298 | | | | 1,272,758 | |
DNO ASA (b)(c) | | | 63,189 | | | | 42,649 | |
Fred Olsen Energy ASA (b) | | | 8 | | | | 31 | |
Norsk Hydro ASA (c) | | | 310,454 | | | | 1,153,988 | |
Orkla ASA | | | 70,154 | | | | 553,439 | |
Schibsted ASA, Class A | | | 6,403 | | | | 210,509 | |
Seadrill Ltd. (b)(c) | | | 41,437 | | | | 143,099 | |
Statoil ASA | | | 85,541 | | | | 1,193,020 | |
Storebrand ASA (b) | | | 12,492 | | | | 48,923 | |
Subsea 7 SA (b)(c) | | | 31,459 | | | | 222,666 | |
Telenor ASA | | | 19,198 | | | | 320,003 | |
Yara International ASA | | | 19,656 | | | | 845,371 | |
| | | | | | | | |
| | | | | 6,047,716 | |
Portugal — 0.0% | | | | | | | | |
Jeronimo Martins SGPS SA | | | 1,021 | | | | 13,286 | |
Singapore — 3.4% | | | | | | | | |
Ascendas Real Estate Investment Trust | | | 109,900 | | | | 176,132 | |
CapitaLand Commercial Trust Ltd. | | | 529,700 | | | | 502,569 | |
CapitaLand Ltd. | | | 239,600 | | | | 563,177 | |
CapitaLand Mall Trust | | | 117,400 | | | | 159,299 | |
City Developments Ltd. | | | 97,600 | | | | 525,050 | |
ComfortDelGro Corp. Ltd. | | | 578,900 | | | | 1,239,583 | |
DBS Group Holdings Ltd. | | | 82,200 | | | | 963,343 | |
Ezion Holdings Ltd. (c) | | | 268,900 | | | | 115,111 | |
Global Logistic Properties Ltd. | | | 23,600 | | | | 35,640 | |
Jardine Cycle & Carriage Ltd. | | | 600 | | | | 14,668 | |
Keppel Corp. Ltd. (c) | | | 28,900 | | | | 132,020 | |
Noble Group Ltd. (c) | | | 44 | | | | 12 | |
Oversea-Chinese Banking Corp. Ltd. (c) | | | 133,400 | | | | 824,735 | |
Singapore Airlines Ltd. | | | 100,900 | | | | 795,039 | |
Singapore Telecommunications Ltd. | | | 1,292,800 | | | | 3,333,179 | |
Wilmar International Ltd. | | | 11,600 | | | | 23,935 | |
Yangzijiang Shipbuilding Holdings Ltd. | | | 1,339,600 | | | | 1,034,948 | |
| | | | | | | | |
| | | | | 10,438,440 | |
Spain — 4.1% | | | | | | | | |
Abertis Infraestructuras SA (c) | | | 515 | | | | 8,054 | |
ACS Actividades de Construccion y Servicios SA | | | 22,215 | | | | 649,955 | |
Aena SA (b)(d) | | | 5,844 | | | | 669,192 | |
Banco Bilbao Vizcaya Argentaria SA (c) | | | 109,869 | | | | 802,789 | |
Banco de Sabadell SA | | | 30,460 | | | | 53,984 | |
Banco Popular Espanol SA (c) | | | 90,261 | | | | 297,399 | |
Bankinter SA | | | 45,142 | | | | 320,116 | |
CaixaBank SA | | | 282,063 | | | | 981,751 | |
Ebro Foods SA | | | 1,004 | | | | 19,750 | |
Ferrovial SA | | | 13,625 | | | | 308,105 | |
Gamesa Corp. Tecnologica SA | | | 44,915 | | | | 768,943 | |
Grifols SA (c) | | | 9,423 | | | | 435,548 | |
Iberdrola SA | | | 286,379 | | | | 2,030,132 | |
Industria de Diseno Textil SA | | | 54,204 | | | | 1,862,130 | |
International Consolidated Airlines Group SA | | | 21,245 | | | | 190,423 | |
Mediaset Espana Comunicacion SA | | | 39,453 | | | | 429,241 | |
Repsol SA (c) | | | 104,291 | | | | 1,148,166 | |
Tecnicas Reunidas SA (c) | | | 6,901 | | | | 260,925 | |
Telefonica SA | | | 108,526 | | | | 1,203,979 | |
| | | | | | | | |
| | | | | 12,440,582 | |
| | | | | | | | |
| Common Stocks | | Shares | | | Value | |
Sweden — 3.1% | | | | | | | | |
Assa Abloy AB | | | 16,281 | | | $ | 340,805 | |
BillerudKorsnas AB | | | 3,361 | | | | 62,201 | |
Castellum AB | | | 15,530 | | | | 221,167 | |
Electrolux AB, Class B | | | 1,780 | | | | 42,947 | |
Hennes & Mauritz AB, Class B | | | 65,537 | | | | 2,331,169 | |
Hexpol AB | | | 9,441 | | | | 101,229 | |
Husqvarna AB, Class B | | | 7,535 | | | | 49,726 | |
Intrum Justitia AB | | | 84,470 | | | | 2,874,318 | |
Investment AB Kinnevik, Class B | | | 6,016 | | | | 185,300 | |
Investor AB, Class B | | | 11,606 | | | | 426,522 | |
Peab AB | | | 7,305 | | | | 55,937 | |
Skanska AB, Class B | | | 46,058 | | | | 893,230 | |
Svenska Cellulosa AB, B Shares | | | 4,944 | | | | 143,278 | |
Swedbank AB, Class A | | | 6,419 | | | | 141,369 | |
Telefonaktiebolaget LM Ericsson, Class B | | | 16,212 | | | | 156,305 | |
TeliaSonera AB | | | 58,368 | | | | 289,849 | |
Volvo AB, Class B | | | 119,478 | | | | 1,107,866 | |
| | | | | | | | |
| | | | | 9,423,218 | |
Switzerland — 6.0% | | | | | | | | |
Actelion Ltd., Registered Shares (b) | | | 6,202 | | | | 861,728 | |
Adecco SA, Registered Shares (b) | | | 3,652 | | | | 249,953 | |
Baloise Holding AG, Registered Shares | | | 11,672 | | | | 1,479,289 | |
BB Biotech AG, Registered Shares (b) | | | 279 | | | | 81,059 | |
Cie Financiere Richemont SA, Registered Shares (c) | | | 4,968 | | | | 355,574 | |
EMS-Chemie Holding AG, Registered Shares | | | 209 | | | | 91,980 | |
Givaudan SA, Registered Shares (b) | | | 89 | | | | 161,532 | |
Glencore PLC (b)(c) | | | 722,489 | | | | 957,389 | |
Lonza Group AG, Registered Shares (b) | | | 4,744 | | | | 771,539 | |
Nestle SA, Registered Shares | | | 40,954 | | | | 3,040,230 | |
Novartis AG, Registered Shares | | | 19,986 | | | | 1,719,181 | |
Roche Holding AG | | | 18,659 | | | | 5,170,565 | |
Sonova Holding AG, Registered Shares | | | 1,313 | | | | 166,821 | |
STMicroelectronics NV | | | 1,874 | | | | 12,546 | |
Straumann Holding AG, Registered Shares | | | 164 | | | | 49,775 | |
Swiss Life Holding AG, Registered Shares (b) | | | 11,440 | | | | 3,081,361 | |
Swiss Prime Site AG, Registered Shares (b) | | | 1,310 | | | | 102,307 | |
Transocean Ltd. (c) | | | 2,218 | | | | 27,726 | |
| | | | | | | | |
| | | | | 18,380,555 | |
United Kingdom — 14.7% | | | | | | | | |
Anglo American PLC | | | 24,272 | | | | 106,486 | |
ARM Holdings PLC | | | 39,681 | | | | 604,819 | |
AstraZeneca PLC | | | 30,705 | | | | 2,074,040 | |
Aviva PLC | | | 18,614 | | | | 141,289 | |
Babcock International Group PLC (c) | | | 49,578 | | | | 741,942 | |
Barclays PLC | | | 252,332 | | | | 812,198 | |
Berkeley Group Holdings PLC | | | 155 | | | | 8,426 | |
BG Group PLC | | | 35,405 | | | | 513,225 | |
BHP Billiton PLC | | | 57,003 | | | | 635,687 | |
BP PLC | | | 284,738 | | | | 1,479,692 | |
British American Tobacco PLC | | | 13,537 | | | | 751,764 | |
Britvic PLC | | | 134,437 | | | | 1,440,386 | |
BT Group PLC | | | 448,332 | | | | 3,113,026 | |
BTG PLC (b) | | | 4,118 | | | | 41,727 | |
Burberry Group PLC | | | 11,858 | | | | 208,630 | |
Capita PLC | | | 9,473 | | | | 168,548 | |
Centrica PLC | | | 150,737 | | | | 484,012 | |
Close Brothers Group PLC | | | 16,220 | | | | 319,850 | |
Derwent London PLC | | | 2,027 | | | | 109,635 | |
Diageo PLC | | | 39,242 | | | | 1,071,610 | |
See Notes to Financial Statements.
| | | | | | |
| | | | | | | |
| 20 | | BLACKROCK DISCIPLINED INTERNATIONAL FUND | | DECEMBER 31, 2015 | | |
| | |
Schedule of Investments (continued) | | International Tilts Master Portfolio |
| | | | | | | | |
| Common Stocks | | Shares | | | Value | |
United Kingdom (continued) | | | | | | | | |
Dixons Carphone PLC | | | 49,199 | | | $ | 362,059 | |
DS Smith PLC | | | 1,045 | | | | 6,113 | |
easyJet PLC | | | 29,129 | | | | 747,071 | |
Fiat Chrysler Automobiles NV (b) | | | 78,212 | | | | 1,086,196 | |
GlaxoSmithKline PLC | | | 38,520 | | | | 777,943 | |
Hammerson PLC | | | 24,655 | | | | 217,959 | |
Hikma Pharmaceuticals PLC | | | 24,006 | | | | 813,791 | |
Howden Joinery Group PLC | | | 54,111 | | | | 419,254 | |
HSBC Holdings PLC | | | 551,624 | | | | 4,354,636 | |
Imperial Tobacco Group PLC | | | 13,709 | | | | 724,077 | |
Inchcape PLC | | | 10,676 | | | | 123,176 | |
Indivior PLC | | | 29,245 | | | | 80,817 | |
Intermediate Capital Group PLC | | | 10,878 | | | | 100,279 | |
ITV PLC | | | 669,749 | | | | 2,726,781 | |
J. Sainsbury PLC (c) | | | 217,568 | | | | 828,543 | |
Land Securities Group PLC | | | 1,770 | | | | 30,683 | |
Legal & General Group PLC | | | 135,523 | | | | 534,760 | |
Lloyds Banking Group PLC | | | 2,410,088 | | | | 2,593,239 | |
Man Group PLC | | | 6,123 | | | | 15,751 | |
Mondi PLC | | | 4,690 | | | | 91,927 | |
National Grid PLC | | | 47,270 | | | | 651,928 | |
Old Mutual PLC | | | 5,775 | | | | 15,192 | |
Paragon Group of Cos. PLC | | | 44,653 | | | | 232,137 | |
Persimmon PLC (b) | | | 277 | | | | 8,264 | |
Provident Financial PLC | | | 8,121 | | | | 402,661 | |
Prudential PLC | | | 17,663 | | | | 397,938 | |
Qinetiq Group PLC | | | 39,732 | | | | 158,360 | |
Reckitt Benckiser Group PLC | | | 1,798 | | | | 166,362 | |
Rightmove PLC | | | 6,767 | | | | 411,231 | |
Rio Tinto PLC | | | 28,840 | | | | 839,684 | |
Royal Bank of Scotland Group PLC (b) | | | 29,092 | | | | 129,316 | |
SABMiller PLC | | | 14,290 | | | | 854,885 | |
Schroders PLC | | | 9,603 | | | | 420,602 | |
Segro PLC | | | 12,686 | | | | 80,283 | |
Severn Trent PLC | | | 10,646 | | | | 340,316 | |
Sky PLC | | | 166,621 | | | | 2,731,375 | |
Spirax-Sarco Engineering PLC | | | 4,647 | | | | 224,742 | |
SSE PLC | | | 93,086 | | | | 2,090,129 | |
Standard Chartered PLC | | | 52,211 | | | | 433,203 | |
Standard Life PLC | | | 38,771 | | | | 222,023 | |
| | | | | | | | |
| Common Stocks | | Shares | | | Value | |
United Kingdom (continued) | | | | | | | | |
Tate & Lyle PLC | | | 73,550 | | | $ | 647,853 | |
Thomas Cook Group PLC (b) | | | 90,901 | | | | 162,194 | |
Unilever PLC | | | 7,246 | | | | 310,797 | |
UNITE Group PLC | | | 2,920 | | | | 28,209 | |
United Utilities Group PLC | | | 1,032 | | | | 14,210 | |
Vedanta Resources PLC (c) | | | 11,912 | | | | 47,984 | |
Vodafone Group PLC | | | 308,727 | | | | 1,001,130 | |
Wolseley PLC | | | 3,721 | | | | 202,098 | |
| | | | | | | | |
| | | | | 44,687,153 | |
| Total Common Stocks — 97.1% | | | | 296,041,856 | |
| | | | | | | | |
| | | | | | | | | |
| | |
| Rights | | | | | | |
Singapore — 0.0% | | | | | | | | |
Ascendas Real Estate Investment Trust (Expires 01/13/16) (b) | | | 2,940 | | | | 129 | |
Spain — 0.0% | | | | | | | | |
Repsol SA (Expires 01/14/16) (b)(c) | | | 112,223 | | | | 55,979 | |
| Total Rights — 0.0% | | | | 56,108 | |
Total Long-Term Investments (Cost — $299,507,759) — 97.1% | | | | 296,097,964 | |
| | | | | | | | |
| | | | | | | | | |
| | |
| Short-Term Securities | | | | | | |
BlackRock Cash Funds: Institutional,
SL Agency Shares, 0.35% (e)(f)(g) | | | 18,111,897 | | | | 18,111,897 | |
BlackRock Cash Funds: Prime,
SL Agency Shares, 0.31% (e)(f)(g) | | | 4,733,349 | | | | 4,733,349 | |
Total Short-Term Securities
(Cost — $22,845,246) — 7.5% | | | | 22,845,246 | |
| Total Investments (Cost — $322,353,005) — 104.6% | | | | 318,943,210 | |
Liabilities in Excess of Other
Assets — (4.6)% | | | | (14,092,137 | ) |
| | | | | | | | |
Net Assets — 100.0% | | | $ | 304,851,073 | |
| | | | | | | | |
|
| Notes to Schedule of Investments |
| (a) | | A security contractually bound to one or more other securities to form a single saleable unit which cannot be sold separately. |
| (b) | | Non-income producing security. |
| (c) | | Security, or a portion of security, is on loan. |
| (d) | | Security exempt from registration pursuant to Rule 144A under the Securities Act of 1933, as amended. These securities may be resold in transactions exempt from registration to qualified institutional investors. |
| (e) | | During the year ended December 31, 2015, investments in issuers considered to be affiliates of the Master Portfolio for purposes of Section 2(a)(3) of the Investment Company Act of 1940, as amended, were as follows: |
| | | | | | | | | | | | | | | | |
| Affiliate | | Shares Held
at December 31,
2014 | | | Net Activity | | | Shares Held
at December 31,
2015 | | | Income | |
BlackRock Cash Funds: Institutional, SL Agency Shares | | | 5,215,771 | | | | 12,896,126 | | | | 18,111,897 | | | $ | 254,626 | 1 |
BlackRock Cash Funds: Prime, SL Agency Shares | | | 3,749,270 | | | | 984,079 | | | | 4,733,349 | | | $ | 184,495 | 1 |
1 Represents all or a portion of securities lending income earned from the reinvestment of cash collateral from loaned securities, net of fees and collateral investment expenses, and other payments to and from borrowers of securities. | |
| (f) | | Current yield as of period end. |
| (g) | | All or a portion of security was purchased with the cash collateral from loaned securities. |
See Notes to Financial Statements.
| | | | | | |
| | | | | | | |
| | BLACKROCK DISCIPLINED INTERNATIONAL FUND | | DECEMBER 31, 2015 | | 21 |
| | |
Schedule of Investments (continued) | | International Tilts Master Portfolio |
|
| Derivative Financial Instruments Outstanding as of Period End |
Financial Futures Contracts
| | | | | | | | | | | | | | | | |
Contracts
Long | | | Issue | | | | Expiration | | Notional
Value | | Unrealized
Appreciation
(Depreciation) | | | |
| | 120 | | | Euro Stoxx 50 Index | | | | March 2016 | | $4,280,056 | | $ | (1,260 | ) | | |
| | 26 | | | FTSE 100 Index | | | | March 2016 | | $2,375,644 | | | (7,969 | ) | | |
| | 11 | | | SPI 200 Index | | | | March 2016 | | $1,053,463 | | | 19,586 | | | |
| | 31 | | | Yen Denom Nikkei Index | | | | March 2016 | | $2,419,235 | | | (6,297 | ) | | |
| | Total | | | | | | | | | | | $ | 4,060 | | | |
| | | | | | | | | | | | | |
|
| Derivative Financial Instruments Categorized by Risk Exposure |
As of period end, the fair values of derivative financial instruments located in the Statement of Assets and Liabilities were as follows:
| | | | | | | | | | | | | | | | | | | | | | | | | | | | | | |
Assets — Derivative
Financial Instruments | | Commodity
Contracts | | | Credit
Contracts | | | Equity
Contracts | | | Foreign
Currency
Exchange
Contracts
| | | Interest Rate
Contracts | | | Other
Contacts | | | Total | |
Financial futures contracts | | Net unrealized appreciation1 | | | — | | | | — | | | $ | 19,586 | | | | — | | | | — | | | | — | | | $ | 19,586 | |
| | | | | | | | |
Liabilities — Derivative
Financial Instruments | | | | | | | | | | | | | | | | | | | | | |
Financial futures contracts | | Net unrealized depreciation1 | | | — | | | | — | | | $ | 15,526 | | | | — | | | | — | | | | — | | | $ | 15,526 | |
1 Includes cumulative appreciation (depreciation) on financial futures contracts, if any, as reported in the Schedule of Investments. Only current day’s variation margin is reported within the Statement of Assets and Liabilities. | |
For the year ended December 31, 2015, the effect of derivative financial instruments in the Statement of Operations was as follows:
| | | | | | | | | | | | | | | | | | | | | | | | | | | | |
| Net Realized Gain From: | | Commodity
Contracts | | | Credit
Contracts | | | Equity
Contracts | | | Foreign
Currency
Exchange
Contracts | | | Interest Rate
Contracts | | | Other
Contacts | | | Total | |
Financial futures contracts | | | — | | | | — | | | $ | 1,951,621 | | | | — | | | | — | | | | — | | | $ | 1,951,621 | |
| | | | | | | | | | | | | | | | | | | | | | | | | | | | |
| | | | | | | | |
Net Change in Unrealized
Appreciation (Depreciation) on: | | | | | | | | | | | | | | | | | | | | | |
Financial futures contracts | | | — | | | | — | | | $ | (367,928 | ) | | | — | | | | — | | | | — | | | $ | (367,928 | ) |
| | | | | | | | | | | | | | | | | | | | | | | | | | | | | |
|
| Average Quarterly Balances of Outstanding Derivative Financial Instruments |
| | | | |
| Financial futures contracts: | | | | |
Average notional value of contracts — long | | $ | 30,444,348 | |
For more information about the Master Portfolio’s investment risks regarding derivative financial instruments, refer to the Notes to Financial Statements.
|
| Fair Value Hierarchy as of Period End |
Various inputs are used in determining the fair value of investments and derivative financial instruments. For information about the Master Portfolio’s policy regarding valuation of investments and derivative financial instruments, refer to the Notes to Financial Statements.
The following tables summarize the Master Portfolio’s investments and derivative financial instruments categorized in the disclosure hierarchy:
| | | | | | | | | | | | | | | | |
| | | Level 1 | | | Level 2 | | | Level 3 | | | Total | |
Assets: | | | | | | | | | | | | | | | | |
| Investments: | | | | | | | | | | | | | | | | |
Common Stocks: | | | | | | | | | | | | | | | | |
Australia | | | — | | | $ | 23,937,877 | | | | — | | | $ | 23,937,877 | |
Austria | | | — | | | | 349,800 | | | | — | | | | 349,800 | |
Belgium | | | — | | | | 2,798,136 | | | | — | | | | 2,798,136 | |
See Notes to Financial Statements.
| | | | | | |
| | | | | | | |
| 22 | | BLACKROCK DISCIPLINED INTERNATIONAL FUND | | DECEMBER 31, 2015 | | |
| | |
Schedule of Investments (concluded) | | International Tilts Master Portfolio |
| | | | | | | | | | | | | | | | |
| | | Level 1 | | | Level 2 | | | Level 3 | | | Total | |
Assets (concluded): | | | | | | | | | | | | | | | | |
Investments (concluded): | | | | | | | | | | | | | | | | |
Common Stocks (concluded): | | | | | | | | | | | | | | | | |
Denmark | | | — | | | $ | 7,372,735 | | | | — | | | $ | 7,372,735 | |
Faeroe Islands | | | — | | | | 10,135 | | | | — | | | | 10,135 | |
Finland | | | — | | | | 7,189,538 | | | | — | | | | 7,189,538 | |
France | | | — | | | | 24,486,434 | | | | — | | | | 24,486,434 | |
Germany | | | — | | | | 21,859,238 | | | | — | | | | 21,859,238 | |
Hong Kong | | | — | | | | 7,463,058 | | | | — | | | | 7,463,058 | |
Ireland | | | — | | | | 2,408,534 | | | | — | | | | 2,408,534 | |
Isle of Man | | | — | | | | 34,023 | | | | — | | | | 34,023 | |
Israel | | | — | | | | 12,852 | | | | — | | | | 12,852 | |
Italy | | $ | 166,403 | | | | 9,685,299 | | | | — | | | | 9,851,702 | |
Japan | | | — | | | | 71,559,949 | | | | — | | | | 71,559,949 | |
Netherlands | | | 5,000,441 | | | | 10,230,123 | | | | — | | | | 15,230,564 | |
New Zealand | | | 12,330 | | | | 34,001 | | | | — | | | | 46,331 | |
Norway | | | — | | | | 6,047,716 | | | | — | | | | 6,047,716 | |
Portugal | | | — | | | | 13,286 | | | | — | | | | 13,286 | |
Singapore | | | — | | | | 10,438,440 | | | | — | | | | 10,438,440 | |
Spain | | | — | | | | 12,440,582 | | | | — | | | | 12,440,582 | |
Sweden | | | — | | | | 9,423,218 | | | | — | | | | 9,423,218 | |
Switzerland | | | — | | | | 18,380,555 | | | | — | | | | 18,380,555 | |
United Kingdom | | | — | | | | 44,687,153 | | | | — | | | | 44,687,153 | |
Rights | | | 55,979 | | | | 129 | | | | — | | | | 56,108 | |
Short-Term Securities | | | 22,845,246 | | | | — | | | | — | | | | 22,845,246 | |
| | | | |
Total | | $ | 28,080,399 | | | $ | 290,862,811 | | | | — | | | $ | 318,943,210 | |
| | | | |
| | | | | | | | | | | | | | | | |
| | | Level 1 | | | Level 2 | | | Level 3 | | | Total | |
| Derivative Financial Instruments1 | | | | | | | | | | | | | | | | |
Assets: | | | | | | | | | | | | | | | | |
Equity contracts | | $ | 19,586 | | | | — | | | | — | | | $ | 19,586 | |
Liabilities: | | | | | | | | | | | | | | | | |
Equity contracts | | | (15,526 | ) | | | — | | | | — | | | | (15,526 | ) |
| | | | |
Total | | $ | 4,060 | | | | — | | | | — | | | $ | 4,060 | |
| | | | |
1 Derivative financial instruments are financial futures contracts, which are valued at the unrealized appreciation (depreciation) on the instrument. | |
The Master Portfolio may hold assets and/or liabilities in which the fair value approximates the carrying amount for financial statement purposes. As of period end, such assets and/or liabilities are categorized within the disclosure hierarchy as follows:
| | | | | | | | | | | | | | | | |
| | | Level 1 | | | Level 2 | | | Level 3 | | | Total | |
Assets: | | | | | | | | | | | | | | | | |
Cash pledged for financial futures contracts | | $ | 752,910 | | | | — | | | | — | | | $ | 752,910 | |
Foreign currency at value | | | 669,447 | | | | — | | | | — | | | | 669,447 | |
Liabilities: | | | | | | | | | | | | | | | | |
Collateral on securities loaned at value | | | — | | | $ | (10,863,424 | ) | | | — | | | | (10,863,424 | ) |
| | | | |
Total | | $ | 1,422,357 | | | $ | (10,863,424 | ) | | | — | | | $ | (9,441,067 | ) |
| | | | |
Transfers between Level 1 and Level 2 were as follows:
| | | | | | | | |
| | | Transfers into
Level 11 | | | Transfers out
of Level 21 | |
Assets: | | | | | | | | |
| Investments: | | | | | | | | |
Common Stocks: | | | | | | | | |
Netherlands | | $ | 9,477,344 | | | $ | (9,477,344 | ) |
New Zealand | | | 60,764 | | | | (60,764 | ) |
Italy | | | 306,086 | | | | (306,086 | ) |
| | | | |
Total | | $ | 9,844,194 | | | $ | (9,844,194 | ) |
| | | | |
1 Systematic Fair Value Prices were not utilized at period end for these investments. | |
See Notes to Financial Statements.
| | | | | | |
| | | | | | | |
| | BLACKROCK DISCIPLINED INTERNATIONAL FUND | | DECEMBER 31, 2015 | | 23 |
| | |
| Statement of Assets and Liabilities | | International Tilts Master Portfolio |
| | | | |
| December 31, 2015 | |
| | | | |
| Assets | | | | |
Investments at value — unaffiliated (including securities loaned of $10,168,613) (cost — $299,507,759) | | $ | 296,097,964 | |
Investments at value — affiliated (cost — $22,845,246) | | | 22,845,246 | |
Cash pledged for financial futures contracts | | | 752,910 | |
Foreign currency at value (cost — $669,547) | | | 669,447 | |
| Receivables: | | | | |
Investments sold | | | 639,531 | |
Dividends | | | 383,854 | |
Securities lending income — affiliated | | | 5,605 | |
| | | | |
Total assets | | | 321,394,557 | |
| | | | |
| | | | |
| Liabilities | | | | |
Collateral on securities loaned at value | | | 10,863,424 | |
Variation margin payable on financial futures contracts | | | 42,197 | |
| Payables: | | | | |
Withdrawals to investors | | | 5,165,758 | |
Investments purchased | | | 331,141 | |
Investment advisory fees | | | 90,415 | |
Administration fees | | | 13,664 | |
Trustees’ fees | | | 9,579 | |
Other accrued expenses | | | 27,306 | |
| | | | |
Total liabilities | | | 16,543,484 | |
| | | | |
Net Assets | | $ | 304,851,073 | |
| | | | |
| | | | |
| Net Assets Consist of | | | | |
Investors’ capital | | $ | 308,261,056 | |
Net unrealized appreciation (depreciation) | | | (3,409,983 | ) |
| | | | |
Net Assets | | $ | 304,851,073 | |
| | | | |
| | | | | | |
| See Notes to Financial Statements. | | | | |
| | | | | | | |
| 24 | | BLACKROCK DISCIPLINED INTERNATIONAL FUND | | DECEMBER 31, 2015 | | |
| | |
| Statement of Operations | | International Tilts Master Portfolio |
| | | | |
| Year Ended December 31, 2015 | |
| | | | |
| Investment Income | | | | |
Dividends — unaffiliated | | $ | 40,697,293 | |
Securities lending — affiliated — net | | | 423,432 | |
Dividends — affiliated | | | 15,689 | |
Foreign taxes withheld | | | (4,534,717 | ) |
| | | | |
Total income | | | 36,601,697 | |
| | | | |
| | | | |
| Expenses | | | | |
Investment advisory | | | 4,686,104 | |
Administration | | | 593,279 | |
Professional | | | 43,020 | |
Trustees | | | 42,735 | |
| | | | |
Total expenses | | | 5,365,138 | |
Less fees waived by the Manager | | | (211,412 | ) |
| | | | |
Total expenses after fees waived | | | 5,153,726 | |
| | | | |
Net investment income | | | 31,447,971 | |
| | | | |
| | | | |
| Realized and Unrealized Gain (Loss) | | | | |
Net realized gain (loss) from: | | | | |
Investments | | | (7,423,225 | ) |
In-kind redemptions1 | | | (24,357,588 | ) |
Financial futures contracts | | | 1,951,621 | |
Foreign currency transactions | | | (3,518,793 | ) |
| | | | |
| | | (33,347,985 | ) |
| | | | |
| Net change in unrealized appreciation (depreciation) on: | | | | |
Investments | | | 51,555,332 | |
Financial futures contracts | | | (367,928 | ) |
Foreign currency translations | | | 1,562,064 | |
| | | | |
| | | 52,749,468 | |
| | | | |
Net realized and unrealized gain | | | 19,401,483 | |
| | | | |
Net Increase in Net Assets Resulting from Operations | | $ | 50,849,454 | |
| | | | |
1 See Note 2 of the Notes to Financial Statements. | | | | |
| | | | | | |
| See Notes to Financial Statements. | | | | |
| | | | | | | |
| | BLACKROCK DISCIPLINED INTERNATIONAL FUND | | DECEMBER 31, 2015 | | 25 |
| | |
| Statements of Changes in Net Assets | | |
| | | | | | | | |
| | | International Tilts
Master Portfolio | |
| | | Year Ended December 31, | |
| Increase (Decrease) in Net Assets: | | 2015 | | | 2014 | |
| Operations | | | | | | | | |
Net investment income | | $ | 31,447,971 | | | $ | 28,896,622 | |
Net realized loss | | | (33,347,985 | ) | | | (16,672,273 | ) |
Net change in unrealized appreciation (depreciation) | | | 52,749,468 | | | | (62,457,072 | ) |
| | | | |
Net increase (decrease) in net assets resulting from operations | | | 50,849,454 | | | | (50,232,723 | ) |
| | | | |
| | | | | | | | |
| Capital Transactions | | | | | | | | |
Proceeds from contributions | | | 211,647,509 | | | | 1,877,904,975 | |
Value of withdrawals | | | (1,207,440,039 | ) | | | (1,130,695,994 | ) |
| | | | |
Net increase (decrease) in net assets derived from capital transactions | | | (995,792,530 | ) | | | 747,208,981 | |
| | | | |
| | | | | | | | |
| Net Assets | | | | | | | | |
Total increase (decrease) in net assets | | | (944,943,076 | ) | | | 696,976,258 | |
Beginning of year | | | 1,249,794,149 | | | | 552,817,891 | |
| | | | |
End of year | | $ | 304,851,073 | | | $ | 1,249,794,149 | |
| | | | |
| | | | | | |
| See Notes to Financial Statements. | | | | |
| | | | | | | |
| 26 | | BLACKROCK DISCIPLINED INTERNATIONAL FUND | | DECEMBER 31, 2015 | | |
| | |
| Financial Highlights | | International Tilts Master Portfolio |
| | | | | | | | | | | | |
| | | Year Ended December 31, | | | Period
October 31,
20131 to
December 31, 2013 | |
| | | 2015 | | | 2014 | | |
| | | | | | | | | | | | |
| Total Return | | | | | | | | | | | | |
Total return | | | 2.25% | | | | (3.94)% | | | | 1.60% | 2 |
| | | | |
| | | | | | | | | | | | |
| Ratio to Average Net Assets | | | | | | | | | | | | |
Total expenses | | | 0.45% | | | | 0.46% | | | | 0.53% | 3 |
| | | | |
Total expenses after fees waived | | | 0.43% | | | | 0.45% | | | | 0.45% | 3 |
| | | | |
Net investment income | | | 2.65% | | | | 2.84% | | | | 1.17% | 3 |
| | | | |
| | | | | | | | | | | | |
| Supplemental Data | | | | | | | | | | | | |
Net assets, end of period (000) | | | $ 304,851 | | | | $ 1,249,794 | | | | $ 552,818 | |
| | | | |
Portfolio turnover rate | | | 107% | | | | 120% | | | | 15% | |
| | | | |
| | 1 | | Commencement of operations. |
| | 2 | | Aggregate total return. |
| | | | | | |
| See Notes to Financial Statements. | | | | |
| | | | | | | |
| | BLACKROCK DISCIPLINED INTERNATIONAL FUND | | DECEMBER 31, 2015 | | 27 |
| | |
| Notes to Financial Statements | | International Tilts Master Portfolio |
1. Organization:
International Tilts Master Portfolio (the “Master Portfolio”), a series of Master Investment Portfolio (“MIP”), is registered under the Investment Company Act of 1940, as amended (the “1940 Act”), as a diversified, open-end management investment company. MIP is organized as a Delaware statutory trust.
The Master Portfolio, together with certain other registered investment companies advised by BlackRock Advisors, LLC (the “Manager”) or its affiliates, is included in a complex of open-end funds referred to as the Equity-Liquidity Complex.
2. Significant Accounting Policies:
The financial statements are prepared in conformity with accounting principles generally accepted in the United States of America (“U.S. GAAP”), which may require management to make estimates and assumptions that affect the reported amounts of assets and liabilities in the financial statements, disclosure of contingent assets and liabilities at the date of the financial statements and the reported amounts of increases and decreases in net assets from operations during the reporting period. Actual results could differ from those estimates. The Master Portfolio is considered an investment company under U.S. GAAP and follows the accounting and reporting guidance applicable to investment companies. Below is a summary of significant accounting policies:
Foreign Currency: The Master Portfolio’s books and records are maintained in U.S. dollars. Purchases and sales of investments are recorded at the rates of exchange prevailing on the respective dates of such transactions. Generally, when the U.S. dollar rises in value against a foreign currency, the investments denominated in that currency will lose value; the opposite effect occurs if the U.S. dollar falls in relative value.
The Master Portfolio does not isolate changes in the exchange rates from the changes in the market prices of investments held or sold for financial reporting purposes. Accordingly, the effects of changes in exchange rates on investments are not segregated in the Statement of Operations from the effects of changes in market prices of those investments, but are included as a component of net realized and unrealized gain (loss) from investments. The Master Portfolio reports realized currency gains (losses) on foreign currency related transactions as components of net realized gain (loss) for financial reporting purposes, whereas such components are generally treated as ordinary income for federal income tax purposes.
Segregation and Collateralization: In cases where the Master Portfolio enters into certain investments (e.g., financial futures contracts) that would be treated as “senior securities” for 1940 Act purposes, the Master Portfolio may segregate or designate on its books and records cash or liquid assets having a market value at least equal to the amount of its future obligations under such investments. Doing so allows the investment to be excluded from treatment as a “senior security.” Furthermore, if required by an exchange or counterparty agreement, the Master Portfolio may be required to deliver/deposit cash and/or securities to/with an exchange, or broker-dealer or custodian as collateral for certain investments or obligations.
Investment Transactions and Investment Income: For financial reporting purposes, investment transactions are recorded on the dates the transactions are entered into (the trade dates). Realized gains and losses on investment transactions are determined on the identified cost basis. Dividend income is recorded on the ex-dividend date. Dividends from foreign securities where the ex-dividend date may have passed are subsequently recorded when the Master Portfolio is informed of the ex-dividend date. Under the applicable foreign tax laws, a withholding tax at various rates may be imposed on capital gains, dividends and interest. Upon notification from issuers, some of the dividend income received from a real estate investment trust may be redesignated as a reduction of cost of the related investment and/or realized gain.
In-Kind Redemptions: The Master Portfolio transferred securities and cash to shareholders in connection with an in-kind redemption transaction. For financial reporting purposes, these transactions were treated as a sale of securities and the resulting gains and losses were recognized based on the market value of the securities on the date of the redemption. For the year ended December 31, 2015, the Master Portfolio had in-kind redemptions of $1,014,456,524. For tax purposes, no gains or losses were recognized.
Indemnifications: In the normal course of business, the Master Portfolio enters into contracts that contain a variety of representations that provide general indemnification. The Master Portfolio’s maximum exposure under these arrangements is unknown because it involves future potential claims against the Master Portfolio, which cannot be predicted with any certainty.
Other: Expenses directly related to the Master Portfolio are charged to the Master Portfolio. Other operating expenses shared by several funds, including other funds managed by the Manager, are prorated among those funds on the basis of relative net assets or other appropriate methods.
The Master Portfolio has an arrangement with its custodian whereby fees may be reduced by credits earned on uninvested cash balances, which, if applicable, are shown as fees paid indirectly in the Statement of Operations. The custodian imposes fees on overdrawn cash balances, which can be
| | | | | | |
| | | | | | | |
| 28 | | BLACKROCK DISCIPLINED INTERNATIONAL FUND | | DECEMBER 31, 2015 | | |
| | |
| Notes to Financial Statements (continued) | | International Tilts Master Portfolio |
offset by accumulated credits earned or may result in additional custody charges. Effective September 2015, the arrangement with its custodian for earning credits on uninvested cash balances has ceased and the custodian will be imposing fees on certain uninvested cash balances.
3. Investment Valuation and Fair Value Measurements:
Investment Valuation Policies: The Master Portfolio’s investments are valued at fair value (also referred to as “market value” within the financial statements) as of the close of trading on the New York Stock Exchange (“NYSE”) (generally 4:00 p.m., Eastern time). U.S. GAAP defines fair value as the price the Master Portfolio would receive to sell an asset or pay to transfer a liability in an orderly transaction between market participants at the measurement date. The Master Portfolio determines the fair values of its financial instruments using independent dealers or pricing services under policies approved by the Board of Trustees of MIP (the “Board”). The BlackRock Global Valuation Methodologies Committee (the “Global Valuation Committee”) is the committee formed by management to develop global pricing policies and procedures and to provide oversight of the pricing function for the Master Portfolio for all financial instruments.
Fair Value Inputs and Methodologies: The following methods (or “techniques”) and inputs are used to establish the fair value of the Master Portfolio’s assets and liabilities:
| • | | Equity investments traded on a recognized securities exchange are valued at the official close price each day, if available. For equity investments traded on more than one exchange, the official close price on the exchange where the stock is primarily traded is used. Equity investments traded on a recognized exchange for which there were no sales on that day may be valued at the last available bid (long positions) or ask (short positions) price. Generally, trading in foreign instruments is substantially completed each day at various times prior to the close of business on the NYSE. Occasionally, events affecting the values of such instruments may occur between the foreign market close and the close of business on the NYSE that may not be reflected in the computation of the Master Portfolio’s net assets. Each business day, the Master Portfolio uses a pricing service to assist with the valuation of certain foreign exchange-traded equity securities and foreign exchange-traded and over-the-counter (“OTC”) options (the “Systematic Fair Value Price”). Using current market factors, the Systematic Fair Value Price is designed to value such foreign securities and foreign options at fair value as of the close of business on the NYSE, which follows the close of the local markets. |
| • | | Financial futures contracts traded on exchanges are valued at their last sale price. |
| • | | Investments in open-end U.S. mutual funds are valued at NAV each business day. |
| • | | Securities and other assets and liabilities denominated in foreign currencies are translated into U.S. dollars using exchange rates determined as of the close of business on the NYSE. Forward foreign currency exchange contracts are valued at the mean between the bid and ask prices and are determined as of the close of business on the NYSE. Interpolated values are derived when the settlement date of the contract is an interim date for which quotations are not available. |
If events (e.g., a company announcement, market volatility or a natural disaster) occur that are expected to materially affect the value of such instruments, or in the event that the application of these methods of valuation results in a price for an investment that is deemed not to be representative of the market value of such investment, or if a price is not available, the investment will be valued by the Global Valuation Committee, or its delegate, in accordance with a policy approved by the Board as reflecting fair value (“Fair Valued Investments”). When determining the price for Fair Valued Investments, the Global Valuation Committee, or its delegate, seeks to determine the price that the Master Portfolio might reasonably expect to receive or pay from the current sale or purchase of that asset or liability in an arm’s-length transaction. Fair value determinations shall be based upon all available factors that the Global Valuation Committee, or its delegate, deems relevant consistent with the principles of fair value measurement. The pricing of all Fair Valued Investments is subsequently reported to the Board or a committee thereof on a quarterly basis.
Fair Value Hierarchy: Various inputs are used in determining the fair value of investments and derivative financial instruments. These inputs to valuation techniques are categorized into a fair value hierarchy consisting of three broad levels for financial statement purposes as follows:
| • | | Level 1 — unadjusted price quotations in active markets/exchanges for identical assets or liabilities that the Master Portfolio has the ability to access |
| • | | Level 2 — other observable inputs (including, but not limited to, quoted prices for similar assets or liabilities in markets that are active, quoted prices for identical or similar assets or liabilities in markets that are not active, inputs other than quoted prices that are observable for the assets or liabilities (such as interest rates, yield curves, volatilities, prepayment speeds, loss severities, credit risks and default rates) or other market–corroborated inputs) |
| • | | Level 3 — unobservable inputs based on the best information available in the circumstances, to the extent observable inputs are not available (including the Master Portfolio’s own assumptions used in determining the fair value of investments and derivative financial instruments) |
| | | | | | |
| | | | | | | |
| | BLACKROCK DISCIPLINED INTERNATIONAL FUND | | DECEMBER 31, 2015 | | 29 |
| | |
| Notes to Financial Statements (continued) | | International Tilts Master Portfolio |
The hierarchy gives the highest priority to unadjusted quoted prices in active markets for identical assets or liabilities (Level 1 measurements) and the lowest priority to unobservable inputs (Level 3 measurements). Accordingly, the degree of judgment exercised in determining fair value is greatest for instruments categorized in Level 3. The inputs used to measure fair value may fall into different levels of the fair value hierarchy. In such cases, for disclosure purposes, the fair value hierarchy classification is determined based on the lowest level input that is significant to the fair value measurement in its entirety. The significant unobservable inputs used by the Global Valuation Committee in determining the price for Fair Valued Investments are typically categorized as Level 3. The fair value hierarchy for the Master Portfolio’s investments and derivative financial instruments has been included in the Schedule of Investments.
Changes in valuation techniques may result in transfers into or out of an assigned level within the hierarchy. In accordance with the Master Portfolio’s policy, transfers between different levels of the fair value hierarchy are deemed to have occurred as of the beginning of the reporting period. The categorization of a value determined for investments and derivative financial instruments is based on the pricing transparency of the investments and derivative financial instruments and is not necessarily an indication of the risks associated with investing in those securities.
4. Securities and Other Investments:
Securities Lending: The Master Portfolio may lend its securities to approved borrowers, such as brokers, dealers and other financial institutions. The borrower pledges and maintains with the Master Portfolio collateral consisting of cash, an irrevocable letter of credit issued by a bank, or securities issued or guaranteed by the U.S. Government. The initial collateral received by the Master Portfolio is required to have a value of at least 102% of the current value of the loaned securities for securities traded on U.S. exchanges and a value of at least 105% for all other securities. The collateral is maintained thereafter, at a value equal to at least 100% of the current market value of the securities on loan. The market value of the loaned securities is determined at the close of each business day of the Master Portfolio and any additional required collateral is delivered to the Master Portfolio, or excess collateral returned by the Master Portfolio, on the next business day. During the term of the loan, the Master Portfolio is entitled to all distributions made on or in respect of the loaned securities. Loans of securities are terminable at any time and the borrower, after notice, is required to return borrowed securities within the standard time period for settlement of securities transactions.
The market value of any securities on loan, all of which were classified as common stocks in the Master Portfolio’s Schedule of Investments, and the value of any related collateral are shown separately in the Statement of Assets and Liabilities as a component of investments at value-unaffiliated, and collateral on securities loaned at value, respectively. As of period end, any securities on loan were collateralized by cash. The cash collateral invested by the securities lending agent, BlackRock Institutional Trust Company, N.A. (“BTC”), if any, is disclosed in the Schedule of Investments.
Securities lending transactions are entered into by the Master Portfolio under Master Securities Lending Agreements (each, an “MSLA”), which provide the right, in the event of default (including bankruptcy or insolvency), for the non-defaulting party to liquidate the collateral and calculate a net exposure to the defaulting party or request additional collateral. In the event that a borrower defaults, the Master Portfolio, as lender, would offset the market value of the collateral received against the market value of the securities loaned. When the value of the collateral is greater than that of the market value of the securities loaned, the lender is left with a net amount payable to the defaulting party. However, bankruptcy or insolvency laws of a particular jurisdiction may impose restrictions on or prohibitions against such a right of offset in the event of an MSLA counterparty’s bankruptcy or insolvency. Under the MSLA, absent an event of default the borrower can resell or re-pledge the loaned securities, and the Master Portfolio can reinvest cash collateral received in connection with loaned securities. Upon an event of default, the parties’ obligations to return the securities or collateral to the other party are extinguished, and the parties can resell or re-pledge the loaned securities or the collateral received in connection with the loaned securities in order to satisfy the defaulting party’s net payment obligation for all transactions under the MSLA. The defaulting party remains liable for any deficiency.
As of period end, the following table is a summary of the Master Portfolio’s securities lending agreements by counterparty which are subject to offset under an MSLA:
| | | | | | | | | | | | |
| Counterparty | | Securities
Loaned
at Value | | | Cash
Collateral
Received1 | | | Net
Amount | |
Credit Suisse Securities (USA) LLC | | $ | 536,829 | | | $ | (536,829 | ) | | | — | |
Deutsche Bank Securities, Inc. | | | 135,974 | | | | (135,974 | ) | | | — | |
Goldman Sachs & Co. | | | 2,509,188 | | | | (2,509,188 | ) | | | — | |
JP Morgan Clearing Corp. | | | 110,184 | | | | (110,184 | ) | | | — | |
Morgan Stanley & Co. LLC | | | 1,171,479 | | | | (1,171,479 | ) | | | — | |
State Street Bank & Trust Co. | | | 5,704,959 | | | | (5,704,959 | ) | | | — | |
| | | | |
Total | | $ | 10,168,613 | | | $ | (10,168,613 | ) | | | — | |
| | | | |
| | 1 | | Collateral with a value of $10,863,424 has been received in connection with securities lending agreements. Excess of collateral received from the individual counterparty is not shown for financial reporting purposes. |
| | | | | | |
| | | | | | | |
| 30 | | BLACKROCK DISCIPLINED INTERNATIONAL FUND | | DECEMBER 31, 2015 | | |
| | |
| Notes to Financial Statements (continued) | | International Tilts Master Portfolio |
The risks of securities lending include the risk that the borrower may not provide additional collateral when required or may not return the securities when due. To mitigate these risks, the Master Portfolio benefits from a borrower default indemnity provided by BlackRock, Inc. (“BlackRock”). BlackRock’s indemnity allows for full replacement of the securities loaned if the collateral received does not cover the value on the securities loaned in the event of borrower default. The Master Portfolio could suffer a loss if the value of an investment purchased with cash collateral falls below the market value of loaned securities or if the value of an investment purchased with cash collateral falls below the value of the original cash collateral received.
5. Derivative Financial Instruments:
The Master Portfolio engages in various portfolio investment strategies using derivative contracts both to increase the returns of the Master Portfolio and/or to manage economically its exposure to certain risks such as equity risk. These contracts may be transacted on an exchange or OTC.
Financial Futures Contracts: The Master Portfolio invests in long and/or short positions in financial futures contracts and options on financial futures contracts to gain exposure to, or economically hedge against, changes in the value of equity securities (equity risk). Financial futures contracts are agreements between the Master Portfolio and a counterparty to buy or sell a specific quantity of an underlying instrument at a specified price and at a specified date. Depending on the terms of the particular contract, financial futures contracts are settled either through physical delivery of the underlying instrument on the settlement date or by payment of a cash settlement amount on the settlement date.
Upon entering into a financial futures contract, the Master Portfolio is required to deposit initial margin with the broker in the form of cash or securities in an amount that varies depending on a contract’s size and risk profile. The initial margin deposit must then be maintained at an established level over the life of the contract. Securities deposited as initial margin are designated on the Schedule of Investments and cash deposited, if any, is recorded on the Statement of Assets and Liabilities as cash pledged for financial futures contracts. Pursuant to the contract, the Master Portfolio agrees to receive from or pay to the broker an amount of cash equal to the daily fluctuation in value of the contract. Such receipts or payments are known as variation margin. Variation margin is recorded by the Master Portfolio as unrealized appreciation (depreciation) and, if applicable, as a receivable or payable for variation margin in the Statement of Assets and Liabilities.
When the contract is closed, the Master Portfolio records a realized gain or loss equal to the difference between the value of the contract at the time it was opened and the value at the time it was closed. The use of financial futures contracts involves the risk of an imperfect correlation in the movements in the price of financial futures contracts, interest or foreign currency exchange rates and the underlying assets.
6. Investment Advisory Agreement and Other Transactions with Affiliates:
The PNC Financial Services Group, Inc. is the largest stockholder and an affiliate of BlackRock for 1940 Act purposes.
MIP, on behalf of the Master Portfolio, entered into an Investment Advisory Agreement with the Manager, the Master Portfolio’s investment advisor, an indirect, wholly owned subsidiary of BlackRock, to provide investment advisory services. The Manager is responsible for the management of the Master Portfolio’s portfolio and provides the personnel, facilities, equipment and certain other services necessary to the operations of the Master Portfolio. For such services, the Master Portfolio pays the Manager a monthly fee based on a percentage of the Master Portfolio’s average daily net assets at the following annual rates:
| | | | |
| Average Daily Net Assets | | Investment Advisory Fee | |
First $1 Billion | | | 0.40% | |
$1 Billion — $3 Billion | | | 0.38% | |
$3 Billion — $5 Billion | | | 0.36% | |
$5 Billion — $10 Billion | | | 0.35% | |
Greater than $10 Billion | | | 0.34% | |
The Manager entered into a sub-advisory agreement with BlackRock Fund Advisors (“BFA”), an affiliate of the Manager. The Manager pays BFA, for services it provides, a monthly fee that is a percentage of the investment advisory fees paid by the Master Portfolio to the Manager.
MIP, on behalf of the Master Portfolio, entered into an Administration Agreement with the Manager, which has agreed to provide general administration services (other than investment advice and related portfolio activities). The Manager, in consideration thereof, has agreed to bear all of the Master Portfolio’s ordinary operating expenses, excluding, generally, investment advisory fees, distribution fees, brokerage and other expenses related to the execution of portfolio transactions, extraordinary expenses and certain other expenses which are borne by the Master Portfolio. The Manager is entitled to receive for these administration services an annual fee of 0.05% based on the average daily net assets of the Master Portfolio. The Manager has contractually agreed to waive this administration fee until May 1, 2017.
| | | | | | |
| | | | | | | |
| | BLACKROCK DISCIPLINED INTERNATIONAL FUND | | DECEMBER 31, 2015 | | 31 |
| | |
| Notes to Financial Statements (continued) | | International Tilts Master Portfolio |
From time to time, the Manager may waive such fees in whole or in part. Any such waiver will reduce the expenses of the Master Portfolio and, accordingly, have a favorable impact on its performance. The Manager may delegate certain of its administration duties to sub-administrators. For the year ended December 31, 2015, the Manager waived $119,534 pursuant to this agreement.
The fees and expenses of the Master Portfolio’s trustees who are not “interested persons” of MIP, as defined in the 1940 Act (“Independent Trustees”), counsel to the Independent Trustees and MIP’s independent registered public accounting firm (together, the “independent expenses”) are paid directly by the Master Portfolio. The Manager has contractually agreed to provide an offsetting credit against the administration fees paid by the Master Portfolio in an amount equal to the independent expenses through April 30, 2017. The amount of the waiver, if any, is included in fees waived by the Manager in the Statement of Operations. For the year ended December 31, 2015, the Manager waived $85,755 pursuant to this agreement.
The Manager voluntarily agreed to waive its investment advisory fees by the amount of investment advisory fees the Master Portfolio pays to the Manager indirectly through its investment in affiliated money market funds. This amount is included in fees waived by the Manager in the Statement of Operations. However, the Manager does not waive its investment advisory fees by the amount of investment advisory fees paid in connection with the Master Portfolio’s investments in other affiliated investment companies, if any. For the year ended December 31, 2015, the amounts waived was $6,123.
The U.S. Securities and Exchange Commission has issued an exemptive order which permits BTC, an affiliate of the Manager, to serve as securities lending agent for the Master Portfolio, subject to applicable conditions. As securities lending agent, BTC bears all operational costs directly related to securities lending. The Master Portfolio is responsible for fees in connection with the investment of cash collateral received for securities on loan in a money market fund managed by the Manager or its affiliates, however, BTC has agreed to reduce the amount of securities lending income it receives in order to effectively limit the collateral investment fees the Master Portfolio bears to an annual rate of 0.04% (the “collateral investment fees”).
Securities lending income is equal to the total of income earned from the reinvestment of cash collateral, net of fees and other payments to and from borrowers of securities, and less the collateral investment fees. The Master Portfolio retains a portion of securities lending income and remits a remaining portion to BTC as compensation for its services as securities lending agent.
Pursuant to a securities lending agreement, the Master Portfolio retains 80% of securities lending income, and this amount retained can never be less than 70% of the total of securities lending income plus the collateral investment fees. In addition, commencing the business day following the date that the aggregate securities lending income earned across certain funds in the Equity-Liquidity Complex in a calendar year exceeds a specified threshold, the Master Portfolio, pursuant to the securities lending agreement, will retain for the remainder of the calendar year securities lending income in an amount equal to 85% of securities lending income, and this amount retained can never be less than 70% of the total of securities lending income plus the collateral investment fees.
The share of securities lending income earned by the Master Portfolio is shown as securities lending — affiliated — net in the Statement of Operations. For the year ended December 31, 2015, the Master Portfolio paid BTC $103,218 in total for securities lending agent services and collateral investment fees.
Certain officers and/or trustees of MIP are officers and/or directors of BlackRock or its affiliates.
7. Purchases and Sales:
For the year ended December 31, 2015, purchases and sales of investments excluding short-term securities and in-kind redemptions, were $1,200,347,748 and $1,153,975,832, respectively.
8. Income Tax Information:
The Master Portfolio is classified as a partnership for federal income tax purposes. As such, each investor in the Master Portfolio is treated as the owner of its proportionate share of net assets, income, expenses and realized and unrealized gains and losses of the Master Portfolio. Therefore, no federal income tax provision is required. It is intended that the Master Portfolio’s assets will be managed so an investor in the Master Portfolio can satisfy the requirements of Subchapter M of the Internal Revenue Code of 1986, as amended.
The Master Portfolio files U.S. federal and various state and local tax returns. No income tax returns are currently under examination. The statute of limitations on the Master Portfolio’s U.S. federal tax returns remains open for each of the two years ended December 31, 2015 and the period ended December 31, 2013. The statutes of limitations on the Master Portfolio’s state and local tax returns may remain open for an additional year depending upon the jurisdiction.
| | | | | | |
| | | | | | | |
| 32 | | BLACKROCK DISCIPLINED INTERNATIONAL FUND | | DECEMBER 31, 2015 | | |
| | |
| Notes to Financial Statements (continued) | | International Tilts Master Portfolio |
Management has analyzed tax laws and regulations and their application to the Master Portfolio as of December 31, 2015, inclusive of the open tax return years, and does not believe there are any uncertain tax positions that require recognition of a tax liability in the Master Portfolio’s financial statements.
As of period end, gross unrealized appreciation and depreciation based on cost for federal income tax purposes were as follows:
| | | | |
Tax cost | | $ | 330,898,759 | |
| | | | |
Gross unrealized appreciation | | $ | 14,055,375 | |
Gross unrealized depreciation | | | (26,010,924 | ) |
| | | | |
Net unrealized depreciation | | $ | (11,955,549 | ) |
| | | | |
9. Bank Borrowings:
MIP, on behalf of the Master Portfolio, along with certain other funds managed by the Manager and its affiliates (“Participating Funds”), is a party to a 364-day, $2.1 billion credit agreement with a group of lenders, under which the Master Portfolio may borrow to fund shareholder redemptions. Excluding commitments designated for certain funds, the Participating Funds, including the Master Portfolio, can borrow up to an aggregate commitment amount of $1.6 billion at any time outstanding, subject to asset coverage and other limitations as specified in the agreement. The credit agreement has the following terms: a fee of 0.06% per annum on unused commitment amounts and interest at a rate equal to the higher of (a) one-month LIBOR (but, in any event, not less than 0.00%) on the date the loan is made plus 0.80% per annum or (b) the Fed Funds rate (but, in any event, not less than 0.00%) in effect from time to time plus 0.80% per annum on amounts borrowed. The agreement expires in April 2016 unless extended or renewed. Participating Funds paid administration, legal and arrangement fees, which, if applicable, are included in miscellaneous expenses in the Statement of Operations, and along with commitment fees, were allocated among such funds based upon portions of the aggregate commitment available to them and relative net assets of Participating Funds. During the year ended December 31, 2015, the Master Portfolio did not borrow under the credit agreement.
10. Principal Risks:
In the normal course of business, the Master Portfolio invests in securities and enters into transactions where risks exist due to fluctuations in the market (market risk) or failure of the issuer to meet all its obligations, including the ability to pay principal and interest when due (issuer credit risk). The value of securities held by the Master Portfolio may decline in response to certain events, including those directly involving the issuers of securities owned by the Master Portfolio. Changes arising from the general economy, the overall market and local, regional or global political or/and social instability, as well as currency, interest rate and price fluctuations, may also affect the securities’ value.
Counterparty Credit Risk: Similar to issuer credit risk, the Master Portfolio may be exposed to counterparty credit risk, or the risk that an entity may fail to or be unable to perform on its commitments related to unsettled or open transactions. The Master Portfolio manages counterparty credit risk by entering into transactions only with counterparties that the Manager believes have the financial resources to honor their obligations and by monitoring the financial stability of those counterparties. Financial assets, which potentially expose the Master Portfolio to market, issuer and counterparty credit risks, consist principally of financial instruments and receivables due from counterparties. The extent of the Master Portfolio’s exposure to market, issuer and counterparty credit risks with respect to these financial assets is approximately their value recorded in the Statement of Assets and Liabilities, less any collateral held by the Master Portfolio.
A derivative contract may suffer a mark-to-market loss if the value of the contract decreases due to an unfavorable change in the market rates or values of the underlying instrument. Losses can also occur if the counterparty does not perform under the contract.
With exchange-traded futures, there is less counterparty credit risk to the Master Portfolio since the exchange or clearinghouse, as counterparty to such instruments, guarantees against a possible default. The clearinghouse stands between the buyer and the seller of the contract; therefore, credit risk is limited to failure of the clearinghouse. While offset rights may exist under applicable law, the Master Portfolio does not have a contractual right of offset against a clearing broker or clearinghouse in the event of a default (including the bankruptcy or insolvency). Additionally, credit risk exists in exchange-traded futures with respect to initial and variation margin that is held in a clearing broker’s customer accounts. While clearing brokers are required to segregate customer margin from their own assets, in the event that a clearing broker becomes insolvent or goes into bankruptcy and at that time there is a shortfall in the aggregate amount of margin held by the clearing broker for all its clients, typically the shortfall would be allocated on a pro rata basis across all the clearing broker’s customers, potentially resulting in losses to the Master Portfolio.
| | | | | | |
| | | | | | | |
| | BLACKROCK DISCIPLINED INTERNATIONAL FUND | | DECEMBER 31, 2015 | | 33 |
| | |
| Notes to Financial Statements (concluded) | | International Tilts Master Portfolio |
Concentration Risk: The Master Portfolio invests a significant portion of its assets in securities of issuers located in Europe or with significant exposure to European issuers or countries. The European financial markets have recently experienced volatility and adverse trends due to concerns about economic downturns in, or rising government debt levels of, several European countries. These events may spread to other countries in Europe and may affect the value and liquidity of certain of the Master Portfolio’s investments.
11. Subsequent Events:
Management has evaluated the impact of all subsequent events on the Master Portfolio through the date the financial statements were issued and has determined that there were no subsequent events requiring adjustment or additional disclosure in the financial statements.
| | | | | | |
| | | | | | | |
| 34 | | BLACKROCK DISCIPLINED INTERNATIONAL FUND | | DECEMBER 31, 2015 | | |
| | | | |
| Report of Independent Registered Public Accounting Firm | | |
To the Board of Trustees of Master Investment Portfolio and the Interestholders of International Tilts Master Portfolio:
In our opinion, the accompanying statement of assets and liabilities, including the schedule of investments, and the related statements of operations and of changes in net assets and the financial highlights present fairly, in all material respects, the financial position of International Tilts Master Portfolio (the “Master Portfolio”), a series of Master Investment Portfolio, at December 31, 2015, the results of its operations for the year then ended, the changes in its net assets for each of the two years in the period then ended and the financial highlights for each of the periods presented, in conformity with accounting principles generally accepted in the United States of America. These financial statements and financial highlights (hereafter referred to as “financial statements”) are the responsibility of the Master Portfolio’s management. Our responsibility is to express an opinion on these financial statements based on our audits. We conducted our audits of these financial statements in accordance with the standards of the Public Company Accounting Oversight Board (United States). Those standards require that we plan and perform the audit to obtain reasonable assurance about whether the financial statements are free of material misstatement. An audit includes examining, on a test basis, evidence supporting the amounts and disclosures in the financial statements, assessing the accounting principles used and significant estimates made by management, and evaluating the overall financial statement presentation. We believe that our audits, which included confirmation of securities at December 31, 2015 by correspondence with the custodian, transfer agent, and brokers, provide a reasonable basis for our opinion.
/s/PricewaterhouseCoopers LLP
Philadelphia, Pennsylvania
February 24, 2016
| | | | | | |
| | | | | | | |
| | BLACKROCK DISCIPLINED INTERNATIONAL FUND | | DECEMBER 31, 2015 | | 35 |
| | |
| Disclosure of Investment Advisory Agreement and Sub-Advisory Agreement |
The Board of Trustees (the “Board,” and the members of which are referred to as “Board Members”) of BlackRock Funds III (the “Fund”) met in person on May 18-20, 2015 (the “Meeting”) to review and approve the organization of BlackRock Disciplined International Fund (the “Portfolio”), a series of the Fund. The Portfolio is a “feeder” fund that invests all of its investable assets in International Tilts Master Portfolio (the “Master Portfolio”), a series of Master Investment Portfolio (the “Master Fund”). The Master Portfolio commenced operations in October 2013. The Portfolio commenced operations in September 2015.
At the Meeting, the Board of the Fund noted that because the Portfolio invests all of its investable assets in the Master Portfolio, the Portfolio will not have an investment advisory agreement. Accordingly, the Board of the Fund reviewed the Master Fund’s investment advisory agreement (the “Advisory Agreement”) with BlackRock Advisors, LLC (the “Manager”) on behalf of the Master Portfolio. The Board of the Fund also reviewed the sub-advisory agreement (the “Sub-Advisory Agreement”) between the Manager and BlackRock Fund Advisors (the “Sub-Advisor”) with respect to the Master Portfolio. The Advisory Agreement and the Sub-Advisory Agreement are referred to herein as the “Agreements.” The Board of Trustees of the Master Fund (the “Master Fund Board”) met in person on April 21, 2015 and May 18-20, 2015 to consider the approval of the continuation of the Agreements; and at the May 18-20, 2015 meeting, the Master Fund Board approved the continuation of the Agreements, each for a one-year term ending June 30, 2016. A discussion regarding the basis for the Master Fund Board’s approval of the Agreements is available in the Master Portfolio’s semi-annual report for the period ending June 30, 2015. The factors considered by the Board of the Fund in reviewing the Agreements were substantially the same as the factors considered by the Master Fund Board in approving the continuation of the Agreements. The Agreements were substantially the same as an investment advisory agreement and sub-advisory agreements that had previously been reviewed by the Board of the Fund with respect to another series of the Master Fund in which a series of the Fund invests. The Manager and the Sub-Advisor are referred to herein as “BlackRock.”
Activities and Composition of the Board
On the date of the Meeting, the Board of the Fund consisted of fourteen individuals, thirteen of whom were not “interested persons” of the Fund as defined in the Investment Company Act of 1940, as amended (the “1940 Act”) (the “Independent Board Members”). The Board Members are responsible for the oversight of the operations of the Portfolio and perform the various duties imposed on the directors of investment companies by the 1940 Act. The Independent Board Members have retained independent legal counsel to assist them in connection with their duties. The Chair of the Board is an Independent Board Member. The Board has established five standing committees: an Audit Committee, a Governance and Nominating Committee, a Compliance Committee, a Performance Oversight and Contract Committee and an Executive Committee, each of which is chaired by an Independent Board Member and composed of Independent Board Members (except for the Executive Committee, which also has one interested Board Member).
Board Considerations in Reviewing the Agreements
A. Nature, Extent and Quality of the Services: At the Meeting, the Board, including the Independent Board Members, reviewed materials relating to its consideration of the Agreements and met with the relevant investment advisory personnel from BlackRock. The Board considered all factors it believed relevant with respect to the Portfolio including, among other factors: (a) the nature, extent and quality of the services to be provided by BlackRock; (b) the investment performance of BlackRock portfolio management; (c) the advisory fee and the cost of the services to be provided and profits to be realized by BlackRock and its affiliates from their relationship with the Portfolio; (d) the sharing of potential economies of scale; (e) fall out benefits to BlackRock and its affiliates from their relationship with the Portfolio; (f) possible alternatives to the proposed Agreements; (g) the policies and practices of BlackRock with respect to portfolio transactions for the Portfolio; (h) BlackRock’s portfolio compliance systems and capabilities; and (i) other factors deemed relevant by the Board Members. As noted above, the factors considered by the Board in reviewing the Agreements were substantially the same as the factors considered by the Master Fund Board in approving the continuation of the Agreements, as discussed in the Master Portfolio’s semi-annual report for the period ending June 30, 2015.
B. The Investment Performance of the Portfolio and BlackRock: The Board, including the Independent Board Members, previously received and considered information about BlackRock’s investment performance for other funds. The Board was informed that the Master Portfolio has delivered strong performance since its inception date. The Board, however, did not consider the performance history of the Portfolio because the Portfolio is newly organized and had not yet commenced operations as of the date of the Meeting.
| | | | | | |
| | | | | | | |
| 36 | | BLACKROCK DISCIPLINED INTERNATIONAL FUND | | DECEMBER 31, 2015 | | |
|
| Disclosure of Investment Advisory Agreement and Sub-Advisory Agreement (concluded) |
C. Consideration of the Advisory Fees and the Cost of the Services and Profits to be Realized by BlackRock and its Affiliates from their Relationship with the Portfolio: The Board received materials in advance of the Meeting relating to its review of the Agreements, including fees and estimated expense ratios of each class of the Portfolio, and for a representative class of the Portfolio, as compared with the fees and expense ratios of a peer group of funds. Both the peer group and the funds within the peer group (collectively, the “Peer Group”) were selected by Lipper, Inc. (“Lipper”), which is not affiliated with BlackRock.1
The Board, including the Independent Board Members, reviewed the Master Portfolio’s contractual advisory fee rate compared with the other funds in the Portfolio’s Peer Group. The contractual advisory fee rate is shown before taking into account any reimbursements or fee waivers. The Board also compared the Portfolio’s estimated total expense ratio, as well as the Master Portfolio’s estimated actual advisory fee rate, to those of other funds in the Portfolio’s Peer Group. The total expense ratio represents a fund’s total net operating expenses, including any 12b-1 or non 12b-1 service fees. The total expense ratio gives effect to any expense reimbursements or fee waivers that benefit a fund, and the actual advisory fee rate gives effect to any management fee reimbursements or waivers that benefit a fund. Additionally, the Board noted information received at prior Board meetings concerning the services provided and the fees charged by BlackRock and its affiliates to other types of clients with similar investment mandates, as applicable, including institutional accounts and sub-advised mutual funds.
The Board noted that the Master Portfolio’s contractual advisory fee rate ranked in the first quartile, and that the estimated actual advisory fee rate and the estimated total expense ratio each ranked in the first quartile, relative to the Portfolio’s Peer Group. The Board also noted that the Master Portfolio has an advisory fee arrangement that includes breakpoints that adjust the fee rate downward as the size of the Master Portfolio increases above certain contractually specified levels. The Board further noted that BlackRock and its affiliates have contractually agreed to reimburse or otherwise compensate the Portfolio for the Portfolio’s allocable portion of the fees and expenses of the independent trustees of the Fund and the Master Fund, counsel to such independent trustees and the accounting firm that provides audit services to the Portfolio and the Master Portfolio.
Following consideration of this information, the Board, including the independent Board Members, concluded that the fees to be paid pursuant to the Agreements were fair and reasonable in light of the services provided.
As the Portfolio had not commenced operations as of the date of the Meeting, BlackRock was not able to provide the Board with specific information concerning the expected profits to be realized by BlackRock and its affiliates from their relationships with the Portfolio. BlackRock, however, will provide the Board with such information at future meetings.
D. Economies of Scale: The Board, including the Independent Board Members, considered the extent to which economies of scale might be realized as the assets of the Master Portfolio and the Portfolio increase. The Board noted the existence of breakpoints in the advisory fee based upon the asset level of the Master Portfolio. The Board further noted the existence of expense caps, as applicable.
Conclusion
All the Board Members present at the Meeting, including all the Independent Board Members present, considered the Advisory Agreement between the Manager and the Master Fund with respect to the Master Portfolio and the Sub-Advisory Agreement between the Manager and the Sub-Advisor with respect to the Master Portfolio and found the Agreements to be satisfactory. Based upon its evaluation of the relevant factors in their totality, the Board, including the Independent Board Members, was satisfied that the terms of the Agreements were fair and reasonable. In arriving at this conclusion, the Board did not identify any single factor or group of factors as all-important or controlling, but considered all factors together, and different Board Members may have attributed different weights to the various factors considered. The Independent Board Members were also assisted by the advice of independent legal counsel in making this determination.
| 1 | | Funds are ranked by Lipper in quartiles, ranging from first to fourth, where first is the most desirable quartile position and fourth is the least desirable. |
| | | | | | |
| | | | | | | |
| | BLACKROCK DISCIPLINED INTERNATIONAL FUND | | DECEMBER 31, 2015 | | 37 |
| | | | | | | | | | |
Name, Address1
and Year of Birth | | Position(s)
Held with
the Trust/MIP | | Length
of Time
Served as
a Trustee3 | | Principal Occupation(s) During Past Five Years | | Number of BlackRock-
Advised Registered
Investment Companies
(“RICs”) Consisting of
Investment Portfolios
(“Portfolios”) Overseen | | Public
Directorships |
| Independent Trustees2 |
Rodney D. Johnson 1941 | | Chair of the Board and Trustee | | Since 2009 | | President, Fairmount Capital Advisors, Inc. from 1987 to 2013; Member of the Archdiocesan Investment Committee of the Archdiocese of Philadelphia from 2004 to 2012; Director, The Committee of Seventy (civic) from 2006 to 2012; Director, Fox Chase Cancer Center from 2004 to 2011. | | 33 RICs consisting of
155 Portfolios | | None |
David O. Beim 1940 | | Trustee | | Since 2009 | | Professor of Professional Practice at the Columbia University Graduate School of Business since 1991; Trustee, Phillips Exeter Academy from 2002 to 2012; Chairman, Wave Hill, Inc. (public garden and cultural center) from 1990 to 2006. | | 33 RICs consisting of
155 Portfolios | | None |
Collette Chilton 1958 | | Trustee | | Since 2015 | | Chief Investment Officer, Williams College since 2006; Chief Investment Officer, Lucent Asset Management Corporation from 1998 to 2006. | | 33 RICs consisting of
155 Portfolios | | None |
Frank J. Fabozzi 1948 | | Trustee | | Since 2014 | | Editor of and Consultant for The Journal of Portfolio Management since 2006; Professor of Finance, EDHEC Business School since 2011; Visiting Professor, Princeton University from 2013 to 2014; Professor in the Practice of Finance and Becton Fellow, Yale University School of Management from 2006 to 2011. | | 108 RICs consisting of
230 Portfolios | | None |
Dr. Matina S. Horner 1939 | | Trustee | | Since 2009 | | Executive Vice President, Teachers Insurance and Annuity Association and College Retirement Equities Fund from 1989 to 2003. | | 33 RICs consisting of
155 Portfolios | | NSTAR (electric and gas utility) |
Herbert I. London 1939 | | Trustee | | Since 2009 | | Professor Emeritus, New York University since 2005; President, London Center for Policy Research since 2012; John M. Olin Professor of Humanities, New York University from 1993 to 2005 and Professor thereof from 1980 to 2005; President Emeritus, Hudson Institute (policy research organization) from 2011 to 2012, President thereof from 1997 to 2011 and Trustee from 1980 to 2012; Chairman of the Board of Trustees for Grantham University since 2006; Director, InnoCentive, Inc. (global internet service) since 2005; Director, Cerego, LLC (educational software) since 2005; Director, Cybersettle (online adjudication) since 2009; Director, AIMS Worldwide, Inc. (marketing) from 2007 to 2012. | | 33 RICs consisting of
155 Portfolios | | None |
Cynthia A. Montgomery 1952 | | Trustee | | Since 2009 | | Professor, Harvard Business School since 1989; Director, McLean Hospital from 2005 to 2012; Director, Harvard Business School Publishing from 2005 to 2010. | | 33 RICs consisting of
155 Portfolios | | Newell Rubbermaid, Inc. (manufacturing) |
Joseph P. Platt 1947 | | Trustee | | Since 2009 | | Director, Jones and Brown (Canadian insurance broker) since 1998; General Partner, Thorn Partners, LP (private investments) since 1998; Director, WQED Multi-Media (public broadcasting not-for-profit) since 2001; Director, The West Penn Allegheny Health System (a not-for-profit health system) from 2008 to 2013; Partner, Amarna Corporation, LLC (private investment company) from 2002 to 2008. | | 33 RICs consisting of
155 Portfolios | | Greenlight Capital Re, Ltd. (reinsurance company) |
Robert C. Robb, Jr. 1945 | | Trustee | | Since 2009 | | Partner, Lewis, Eckert, Robb and Company (management and financial consulting firm) since 1981. | | 33 RICs consisting of
155 Portfolios | | None |
Toby Rosenblatt 1938 | | Trustee | | Since 2009 | | President, Founders Investments Ltd. (private investments) since 1999; Director, Forward Management, LLC since 2007; Director, College Futures Foundation (philanthropic foundation) since 2009; Director, The James Irvine Foundation (philanthropic foundation) from 1998 to 2008. | | 33 RICs consisting of
155 Portfolios | | None |
| | | | | | |
| | | | | | | |
| 38 | | BLACKROCK DISCIPLINED INTERNATIONAL FUND | | DECEMBER 31, 2015 | | |
| | | | |
| Officers and Trustees (continued) | | |
| | | | | | | | | | |
Name, Address1
and Year of Birth | | Position(s)
Held with
the Trust/MIP | | Length
of Time
Served as
a Trustee3 | | Principal Occupation(s) During Past Five Years | | Number of BlackRock-
Advised Registered
Investment Companies
(“RICs”) Consisting of
Investment Portfolios
(“Portfolios”) Overseen | | Public
Directorships |
| Independent Trustees2 |
Mark Stalnecker 1951 | | Trustee | | Since 2015 | | Chief Investment Officer, University of Delaware from 1999 to 2013; Trustee, Winterthur Museum and Country Estate since 2001; Member of the Investment Committee, Delaware Public Employees’ Retirement System since 2002; Member of the Investment Committee, Christiana Care Health System since 2009; Member of the Investment Committee, Delaware Community Foundation from 2013 to 2014. | | 33 RICs consisting of
155 Portfolios | | None |
Kenneth L. Urish 1951 | | Trustee | | Since 2009 | | Managing Partner, Urish Popeck & Co., LLC (certified public accountants and consultants) since 1976; Immediate past- Chairman of the Professional Ethics Committee of the Pennsylvania Institute of Certified Public Accountants and Committee Member thereof since 2007; Member of External Advisory Board, The Pennsylvania State University Accounting Department since 2001; Principal, UP Strategic Wealth Investment Advisors, LLC since 2013; Trustee, The Holy Family Institute from 2001 to 2010; President and Trustee, Pittsburgh Catholic Publishing Associates from 2003 to 2008; Director, Inter-Tel from 2006 to 2007. | | 33 RICs consisting of
155 Portfolios | | None |
Frederick W. Winter 1945 | | Trustee | | Since 2009 | | Director, Alkon Corporation (pneumatics) since 1992; Professor and Dean Emeritus of the Joseph M. Katz School of Business, University of Pittsburgh from 2005 to 2013 and Dean thereof from 1997 to 2005; Director, Tippman Sports (recreation) from 2005 to 2013; Director, Indotronix International (IT services) from 2004 to 2008. | | 33 RICs consisting of
155 Portfolios | | None |
| | 1 The address of each Trustee is c/o BlackRock, Inc., 55 East 52nd Street, New York, NY 10055. |
| | 2 Independent Trustees serve until their resignation, retirement, removal or death, or until December 31 of the year in which they turn 75. The Board has determined to extend the terms of Independent Trustees on a case-by-case basis, as appropriate. The Board has unanimously approved extending the mandatory retirement age for David O. Beim and Dr. Matina Horner until December 31, 2016, which the Board believes is in the best interests of the shareholders of the Trust/MIP. |
| | 3 Date shown is the earliest date a person has served for the Trust/MIP. In connection with the acquisition of Barclays Global Investors by BlackRock, Inc. (“BlackRock”) in December 2009, the Trustees were elected to the Trust/MIP Board. As a result, although the chart shows certain Independent Trustees as joining the Trust’s/MIP’s board in 2009, those Independent Trustees first became members of the boards of other funds advised by BlackRock Advisors, LLC or its affiliates as follows: David O. Beim, 1998; Dr. Matina S. Horner, 2004; Rodney D. Johnson, 1995; Herbert I. London, 1987; Cynthia A. Montgomery, 1994; Joseph P. Platt, 1999; Robert C. Robb, Jr., 1998; Toby Rosenblatt, 2005; Kenneth L. Urish, 1999; and Frederick W. Winter, 1999. Frank J. Fabozzi first became a member of the board of other funds advised by BlackRock Advisors, LLC or its affiliates in 1988. |
| Interested Trustees4 | | | | | | | | | | |
Barbara G. Novick 1960 | | Trustee | | Since 2015 | | Vice Chairman of BlackRock since 2006; Chair of BlackRock’s Government Relations Steering Committee since 2009; Head of the Global Client Group of BlackRock from 1988 to 2008. | | 108 RICs consisting of
230 Portfolios | | None |
John M. Perlowski 1964 | | Trustee, President and Chief Executive Officer | | Since 2015 (Trustee); Since 2010 (President and Chief Executive Officer) | | Managing Director of BlackRock since 2009; Head of BlackRock Global Fund Services since 2009; Managing Director and Chief Operating Officer of the Global Product Group at Goldman Sachs Asset Management, L.P. from 2003 to 2009; Treasurer of Goldman Sachs Mutual Funds from 2003 to 2009 and Senior Vice President thereof from 2007 to 2009; Director of Goldman Sachs Offshore Funds from 2002 to 2009; Director of Family Resource Network (charitable foundation) since 2009. | | 136 RICs consisting of
328 Portfolios | | None |
| | 4 Mr. Perlowski and Ms. Novick are both “interested persons,” as defined in the 1940 Act, of the Funds based on their positions with BlackRock and its affiliates. Mr. Perlowski and Ms. Novick are also board members of a complex of BlackRock registered open-end funds. Mr. Perlowski is also a board member of the BlackRock Equity-Bond Complex and the BlackRock Equity-Liquidity Complex, and Ms. Novick is also a board member of the BlackRock Equity-Liquidity Complex. Interested Trustees serve until their resignation, retirement, removal or death, or until December 31 of the year in which they turn 75. The maximum age limitation may be waived as to any Trustee by action of a majority of the Trustees upon a finding of good cause therefor. |
| | | | | | |
| | | | | | | |
| | BLACKROCK DISCIPLINED INTERNATIONAL FUND | | DECEMBER 31, 2015 | | 39 |
| | |
| Officers and Trustees (concluded) | | |
| | | | | | |
Name, Address1
and Year of Birth | | Position(s)
Held with
the Trust/MIP | | Length of
Time Served
as an Officer | | Principal Occupation(s) During Past Five Years |
| Trust/MIP Officers2 |
John M. Perlowski 1964 | | Trustee, President and Chief Executive Officer | | Since 2015 (Trustee); Since 2010 (President and Chief Executive Officer) | | Managing Director of BlackRock since 2009; Head of BlackRock Global Fund Services since 2009; Managing Director and Chief Operating Officer of the Global Product Group at Goldman Sachs Asset Management, L.P. from 2003 to 2009; Treasurer of Goldman Sachs Mutual Funds from 2003 to 2009 and Senior Vice President thereof from 2007 to 2009; Director of Goldman Sachs Offshore Funds from 2002 to 2009; Director of Family Resource Network (charitable foundation) since 2009. |
Richard Hoerner, CFA 1958 | | Vice President | | Since 2009 | | Managing Director of BlackRock since 2000; Head of the Global Cash Group since 2013; Co-head of the Global Cash and Securities Lending Group from 2010 to 2013; Member of the Cash Management Group Executive Committee since 2005. |
Jennifer McGovern 1977 | | Vice President | | Since 2014 | | Director of BlackRock since 2011; Head of Product Structure and Oversight for BlackRock’s U.S. Wealth Advisory Group since 2013; Vice President of BlackRock from 2008 to 2010. |
Neal Andrews 1966 | | Chief Financial Officer | | Since 2009 | | Managing Director of BlackRock since 2006; Senior Vice President and Line of Business Head of Fund Accounting and Administration at PNC Global Investment Servicing (U.S.) Inc. from 1992 to 2006. |
Jay Fife 1970 | | Treasurer | | Since 2009 | | Managing Director of BlackRock since 2007; Director of BlackRock in 2006; Assistant Treasurer of the MLIM and Fund Asset Management, L.P. advised funds from 2005 to 2006; Director of MLIM Fund Services Group from 2001 to 2006. |
Charles Park 1967 | | Chief Compliance Officer | | Since 2014 | | Anti-Money Laundering Compliance Officer for the BlackRock-advised Funds in the Equity-Bond Complex, the Equity-Liquidity Complex and the Closed-End Complex from 2014 to 2015; Chief Compliance Officer of BlackRock Advisors, LLC and the BlackRock-advised Funds in the Equity-Bond Complex, the Equity-Liquidity Complex and the Closed-End Complex since 2014; Principal of and Chief Compliance Officer for iShares® Delaware Trust Sponsor LLC since 2012 and BlackRock Fund Advisors (“BFA”) since 2006; Chief Compliance Officer for the BFA-advised iShares exchange traded funds since 2006; Chief Compliance Officer for BlackRock Asset Management International Inc. since 2012. |
Fernanda Piedra 1969 | | Anti-Money Laundering Compliance Officer | | Since 2015 | | Director of BlackRock since 2014; Anti-Money Laundering Compliance Officer and Regional Head of Financial Crime for the Americas at BlackRock since 2014; Head of Regulatory Changes and Remediation for the Asset Wealth Management Division of Deutsche Bank from 2010 to 2014; Vice President of Goldman Sachs (Anti-Money Laundering/Suspicious Activities Group) from 2004 to 2010. |
Benjamin Archibald 1975 | | Secretary | | Since 2012 | | Managing Director of BlackRock since 2014; Director of BlackRock from 2010 to 2013; Secretary of the iShares exchange traded funds since 2015; Secretary of the BlackRock-advised mutual funds since 2012. |
| | 1 The address of each Officer is c/o BlackRock, Inc., 55 East 52nd Street, New York, NY 10055. |
| | | 2 Officers of the Trust/MIP serve at the pleasure of the Board. |
| | Further information about the Officers and Trustees is available in the Trust’s/MIP’s Statement of Additional Information, which can be obtained without charge by calling (800) 441-7762 |
Effective September 25, 2015, John M. Perlowski was appointed to serve as a Trustee of the Trust/MIP.
Effective December 31, 2015, Herbert I. London and Toby Rosenblatt retired as Trustees of the Trust/MIP.
| | | | |
| | | |
Investment Advisor and Administrator BlackRock Advisors, LLC Wilmington, DE 19809 | | Accounting Agent and Custodian State Street Bank and Trust Company Boston, MA 02110 | | Independent Registered Public Accounting Firm PricewaterhouseCoopers LLP Philadelphia, PA 19103 |
| | |
Sub-Advisor BlackRock Fund Advisors San Francisco, CA 94105 | | Transfer Agent BNY Mellon Investment Servicing (US) Inc. Wilmington, DE 19809 | | Legal Counsel Sidley Austin LLP New York, NY 10019 |
| | |
| | | | Address of the Trust/MIP 400 Howard Street San Francisco, CA 94105 |
| | | | | | |
| | | | | | | |
| 40 | | BLACKROCK DISCIPLINED INTERNATIONAL FUND | | DECEMBER 31, 2015 | | |
| | |
| Availability of Quarterly Schedule of Investments | | |
The Master Portfolio files its complete schedule of portfolio holdings with the SEC for the first and third quarters of each fiscal year on Form N-Q. The Master Portfolio’s Forms N-Q are available on the SEC’s website at http://www.sec.gov and may also be reviewed and copied at the SEC’s Public Reference Room in Washington, D.C. Information on how to access documents on the SEC’s website without charge may be obtained by calling (800) SEC-0330. The Master Portfolio’s Forms N-Q may also be obtained upon request and without charge by calling (800) 441-7762.
| | |
| Availability of Proxy Voting Policies and Procedures | | |
A description of the policies and procedures that the Master Portfolio uses to determine how to vote proxies relating to portfolio securities is available (1) without charge, upon request, by calling (800) 441-7762; (2) at http://www.blackrock.com; and (3) on the SEC’s website at http://www.sec.gov.
| | |
| Availability of Proxy Voting Record | | |
Information about how the Master Portfolio voted proxies relating to securities held in the Master Portfolio’s portfolio during the most recent 12-month period ended June 30 is available upon request and without charge (1) at http://www.blackrock.com; and (2) on the SEC’s website at http://www.sec.gov.
| | | | | | |
| | | | | | | |
| | BLACKROCK DISCIPLINED INTERNATIONAL FUND | | DECEMBER 31, 2015 | | 41 |
Householding
The Fund will mail only one copy of shareholder documents, including prospectuses, annual and semi-annual reports and proxy statements, to shareholders with multiple accounts at the same address. This practice is commonly called “householding” and is intended to reduce expenses and eliminate duplicate mailings of shareholder documents. Mailings of your shareholder documents may be householded indefinitely unless you instruct us otherwise. If you do not want the mailing of these documents to be combined with those for other members of your household, please call the Fund at (800) 441-7762.
Availability of Quarterly Schedule of Investments
The Fund/Master Portfolio file their complete schedule of portfolio holdings with the SEC for the first and third quarters of each fiscal year on Form N-Q. The Fund’s/Master Portfolio’s Forms N-Q are available on the SEC’s website at http://www.sec.gov and may also be reviewed and copied at the SEC’s Public Reference Room in Washington, D.C. Information on how to access documents on the SEC’s website without charge may be obtained by calling (800) SEC-0330. The Fund’s/Master Portfolio’s Forms N-Q may also be obtained upon request and without charge by calling (800) 441-7762.
Availability of Proxy Voting Policies and Procedures
A description of the policies and procedures that the Fund/Master Portfolio use to determine how to vote proxies relating to portfolio securities is available upon request and without charge (1) by calling (800) 441-7762; (2) at http://www.blackrock.com; and (3) on the SEC’s website at http://www.sec.gov.
Availability of Proxy Voting Record
Information about how the Fund/Master Portfolio voted proxies relating to securities held in the Fund’s/Master Portfolio’s portfolio during the most recent 12-month period ended June 30 is available upon request and without charge (1) at http://www.blackrock.com or by calling (800) 441-7762 and (2) on the SEC’s website at http://www.sec.gov.
BlackRock’s Mutual Fund Family
BlackRock offers a diverse lineup of open-end mutual funds crossing all investment styles and managed by experts in equity, fixed income and tax-exempt investing. Visit http://www.blackrock.com for more information.
Account Information
Call us at (800) 441-7762 from 8:00 AM to 6:00 PM EST on any business day to get information about your account balances, recent transactions and share prices. You can also reach us on the Web at http://www.blackrock.com/funds.
Automatic Investment Plans
Investor Class shareholders who want to invest regularly can arrange to have $50 or more automatically deducted from their checking or savings account and invested in any of the BlackRock funds.
Systematic Withdrawal Plans
Investor Class shareholders can establish a systematic withdrawal plan and receive periodic payments of $50 or more from their BlackRock funds, as long as their account balance is at least $10,000.
Retirement Plans
Shareholders may make investments in conjunction with Traditional, Rollover, Roth, Coverdell, Simple IRAs, SEP IRAs and 403(b) Plans.
| | | | | | |
| | | | | | | |
| 42 | | BLACKROCK DISCIPLINED INTERNATIONAL FUND | | DECEMBER 31, 2015 | | |
| | |
| Additional Information (concluded) | | |
| | |
| BlackRock Privacy Principles | | |
BlackRock is committed to maintaining the privacy of its current and former fund investors and individual clients (collectively, “Clients”) and to safeguarding their non-public personal information. The following information is provided to help you understand what personal information BlackRock collects, how we protect that information and why in certain cases we share such information with select parties.
If you are located in a jurisdiction where specific laws, rules or regulations require BlackRock to provide you with additional or different privacy-related rights beyond what is set forth below, then BlackRock will comply with those specific laws, rules or regulations.
BlackRock obtains or verifies personal non-public information from and about you from different sources, including the following: (i) information we receive from you or, if applicable, your financial intermediary, on applications, forms or other documents; (ii) information about your transactions with us, our affiliates, or others; (iii) information we receive from a consumer reporting agency; and (iv) from visits to our websites.
BlackRock does not sell or disclose to non-affiliated third parties any non-public personal information about its Clients, except as permitted by law or as is necessary to respond to regulatory requests or to service Client accounts. These non-affiliated third parties are required to protect the confidentiality and security of this information and to use it only for its intended purpose.
We may share information with our affiliates to service your account or to provide you with information about other BlackRock products or services that may be of interest to you. In addition, BlackRock restricts access to non-public personal information about its Clients to those BlackRock employees with a legitimate business need for the information. BlackRock maintains physical, electronic and procedural safeguards that are designed to protect the non-public personal information of its Clients, including procedures relating to the proper storage and disposal of such information.
| | | | | | |
| | | | | | | |
| | BLACKROCK DISCIPLINED INTERNATIONAL FUND | | DECEMBER 31, 2015 | | 43 |
This report is intended for current holders. It is not authorized for use as an offer of sale or a solicitation of an offer to buy shares of the Fund unless preceded or accompanied by the Fund’s current prospectus. Past performance results shown in this report should not be considered a representation of future performance. Investment returns and principal value of shares will fluctuate so that shares, when redeemed, may be worth more or less than their original cost. Statements and other information herein are as dated and are subject to change.

| | |
| DIF-12/15-AR | | |
| |
| |  |
DECEMBER 31, 2015
| | | | |
ANNUAL REPORT | | | |  |
BlackRock Large Cap Index Fund | of BlackRock Funds III
|
| Not FDIC Insured • May Lose Value • No Bank Guarantee |

| | | | | | |
| | | | | | | |
| 2 | | BLACKROCK LARGE CAP INDEX FUND | | DECEMBER 31, 2015 | | |
Dear Shareholder,
Diverging monetary policies and shifting economic outlooks across regions have been the overarching themes driving financial markets over the past couple of years. With U.S. growth outpacing the global economic recovery in 2015 while inflationary pressures remained low, investors spent most of the year anticipating a short-term rate hike from the Federal Reserve (the “Fed”), which ultimately came to fruition in December. In contrast, the European Central Bank (“ECB”) and the Bank of Japan moved to a more accommodative stance during the year. In this environment, the U.S. dollar strengthened considerably, causing profit challenges for U.S. exporters and high levels of volatility in emerging market currencies and commodities. Oil prices were particularly volatile and below the historical norm due to an ongoing imbalance in global supply and demand.
Market volatility broadly increased in the middle of 2015, beginning with a sharp, but temporary, selloff in June as Greece’s long-brewing debt troubles came to an impasse. Just as these concerns abated, Chinese equities tumbled amid weakness in the country’s economy. This, combined with a depreciation of the yuan and declining confidence in China’s policymakers, stoked worries about the potential impact to the broader world economy, causing heightened volatility to spread throughout markets globally. Given a dearth of meaningful growth across most of the world, financial markets became more reliant on central bank policies to drive performance. In that vein, risk assets (such as equities and high yield bonds) rallied in October when China’s central bank provided more stimulus, the ECB hinted at further easing, and soft U.S. data pushed back expectations for a Fed rate hike. As the period came to a close, however, the ECB disappointed investors with its subdued policy changes. The Fed’s December rate hike had a positive impact on the markets as it removed a source of uncertainty, but this was counteracted by the dampening effect of a stronger U.S. dollar, falling oil prices and tighter credit conditions.
At BlackRock, we believe investors need to think globally, extend their scope across a broad array of asset classes and be prepared to move freely as market conditions change over time. We encourage you to talk with your financial advisor and visit blackrock.com for further insight about investing in today’s markets.
Sincerely,
Rob Kapito
President, BlackRock Advisors, LLC
Rob Kapito
President, BlackRock Advisors, LLC
| | | | | | | | |
| Total Returns as of December 31, 2015 | |
| | | 6-month | | | 12-month | |
U.S. large cap equities
(S&P 500® Index) | | | 0.15 | % | | | 1.38 | % |
U.S. small cap equities
(Russell 2000® Index) | | | (8.75 | ) | | | (4.41 | ) |
International equities
(MSCI Europe, Australasia,
Far East Index) | | | (6.01 | ) | | | (0.81 | ) |
Emerging market equities
(MSCI Emerging
Markets Index) | | | (17.35 | ) | | | (14.92 | ) |
3-month Treasury bills
(BofA Merrill Lynch 3-Month
U.S. Treasury Bill Index) | | | 0.04 | | | | 0.05 | |
U.S. Treasury securities
(BofA Merrill Lynch 10-Year
U.S. Treasury Index) | | | 1.43 | | | | 0.91 | |
U.S. investment-grade
bonds (Barclays
U.S. Aggregate Bond Index) | | | 0.65 | | | | 0.55 | |
Tax-exempt municipal
bonds (S&P Municipal
Bond Index) | | | 3.31 | | | | 3.32 | |
U.S. high yield bonds
(Barclays U.S.
Corporate High Yield 2%
Issuer Capped Index) | | | (6.79 | ) | | | (4.43 | ) |
| Past performance is no guarantee of future results. Index performance is shown for illustrative purposes only. You cannot invest directly in an index. | |
| | | | | | |
| | | | | | | |
| | THIS PAGE NOT PART OF YOUR FUND REPORT | | | | 3 |
| | |
| Fund Summary as of December 31, 2015 | | |
BlackRock Large Cap Index Fund’s (formerly known as BlackRock Russell 1000® Index Fund) (the “Fund”) investment objective is to match the performance of the Russell 1000® Index as closely as possible before the deduction of Fund expenses.
|
| Portfolio Management Commentary |
How did the Fund perform?
| • | | For the 12-month period ended December 31, 2015, the Fund’s Institutional Shares returned 0.82%, Investor A Shares returned 0.56% and Class K Shares returned 0.86%. The benchmark Russell 1000® Index returned 0.92% for the same period. |
| • | | Returns for the Fund’s respective share classes differ from the benchmark index due to individual share-class expenses. The Fund invests all of its assets in Large Cap Index Master Portfolio (formerly known as BlackRock Russell 1000® Index Master Portfolio), (the “Master Portfolio”), a series of Master Investment Portfolio. |
Describe the market environment.
| • | | The year started with U.S. stock prices falling as lower oil prices punished the energy sector and the negative impact of a stronger dollar began to show in the earnings of large global exporting companies. U.S. equities came back into favor in the spring, after a powerful rally in European equities left valuations in the United States looking more appealing by comparison. U.S. stocks continued to outperform international markets into the summer as increasing turmoil around Greece’s debt troubles drove investors to the relative stability of U.S. markets. |
| • | | The second half of the year started well with strong manufacturing and construction data and merger and acquisition activity. This momentum stuttered as volatility and uncertainty became major themes through the remainder of 2015 given a sharp selloff in Chinese equities, falling oil prices and anticipation of a rate hike from the Federal Reserve (the “Fed”). |
| • | | With easy monetary policy in the beginning of 2015, many markets reached all-time highs, but hit considerable headwinds in the latter half of the year. Geopolitical strife in the Middle East and Russia, terrorist attacks in France and San Bernardino, California, slowing growth globally, oil price instability, and the Fed starting a tightening cycle were significant events that shaped 2015 market returns. |
| • | | The U.S. dollar strengthened against most major currencies for the year, posting a 19.9% gain against the Canadian dollar, a 12.5% gain versus the Australian dollar, an 11.4% gain versus the euro, and a 5.8% gain versus the British pound. A key theme heading into 2016 is the divergence in monetary policy between the United States and the rest of the world. |
Describe recent portfolio activity.
| • | | During the period, as changes were made to the composition of the Russell 1000® Index, the Master Portfolio purchased and sold securities to maintain its objective of replicating the risks and return of the benchmark index. |
Describe portfolio positioning at period end.
| • | | The Master Portfolio remains positioned to attempt to match the risk characteristics of its benchmark index, irrespective of the market’s future direction. |
| | | | | | |
| | | | | | | |
| 4 | | BLACKROCK LARGE CAP INDEX FUND | | DECEMBER 31, 2015 | | |
|
| Total Return Based on a $10,000 Investment |
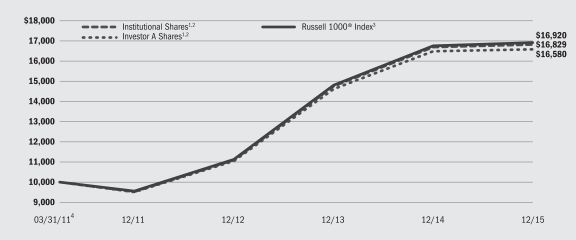
| | 1 | | Assuming transaction costs and other operating expenses, including administration fees, if any. |
| | 2 | | The Fund invests all of its assets in the Master Portfolio. The Master Portfolio will be substantially invested in securities in the Russell 1000® Index and will invest, under normal circumstances, at least 80% of its assets in securities or other financial instruments that are components of or have economic characteristics similar to the securities included in the Russell 1000® Index. |
| | 3 | | An index that measures the performance of the large cap segment of the U.S. equity universe. It is a subset of the Russell 3000® Index and includes approximately 1,000 of the largest securities based on a combination of their market capitalization and current index membership. The index represents approximately 92% of the total market capitalization of the Russell 3000® Index. |
| | 4 | | Commencement of operations. |
|
| Performance Summary for the Period Ended December 31, 2015 |
| | | | | | | | | | | | |
| | | | | | Average Annual Total Returns5 | |
| | | 6-Month
Total Returns | | | 1 Year | | | Since
Inception6 | |
Institutional | | | (0.77 | )% | | | 0.82 | % | | | 11.57 | % |
Investor A | | | (0.90 | ) | | | 0.56 | | | | 11.22 | |
Class K | | | (0.75 | ) | | | 0.86 | | | | 11.54 | |
Russell 1000® Index | | | (0.78 | ) | | | 0.92 | | | | 11.70 | |
| | 5 | | See “About Fund Performance” on Page 6 for a detailed description of share classes, including any related sales charges and fees. |
| | 6 | | The Fund commenced operations on March 31, 2011. |
| | | | Past performance is not indicative of future results. |
| | | | | | | | | | | | | | | | | | | | | | | | | | | | |
| | | Actual | | | Hypothetical8 | | | | |
| | | Beginning
Account Value
July 1, 2015 | | | Ending
Account Value
December 31, 2015 | | | Expenses Paid
During the
Period7 | | | Beginning
Account Value
July 1, 2015 | | | Ending
Account Value
December 31, 2015 | | | Expenses Paid
During the
Period7 | | | Annualized
Expense Ratio | |
Institutional | | $ | 1,000.00 | | | $ | 992.30 | | | $ | 0.65 | | | $ | 1,000.00 | | | $ | 1,024.55 | | | $ | 0.66 | | | | 0.13 | % |
Investor A | | $ | 1,000.00 | | | $ | 991.00 | | | $ | 1.91 | | | $ | 1,000.00 | | | $ | 1,023.29 | | | $ | 1.94 | | | | 0.38 | % |
Class K | | $ | 1,000.00 | | | $ | 992.50 | | | $ | 0.40 | | | $ | 1,000.00 | | | $ | 1,024.80 | | | $ | 0.41 | | | | 0.08 | % |
| | 7 | | For each class of the Fund, expenses are equal to the annualized net expense ratio for the class, multiplied by the average account value over the period, multiplied by 184/365 (to reflect the one-half year period shown). Because the Fund invests all of its assets in the Master Portfolio, the expense example reflects the net expenses of both the Fund and the Master Portfolio in which it invests. |
| | 8 | | Hypothetical 5% annual return before expenses is calculated by prorating the number of days in the most recent fiscal half year divided by 365. |
| | | | See “Disclosure of Expenses” on page 6 for further information on how expenses were calculated. |
| | | | | | |
| | | | | | | |
| | BLACKROCK LARGE CAP INDEX FUND | | DECEMBER 31, 2015 | | 5 |
| • | | Institutional and Class K Shares are not subject to any sales charge. These shares bear no ongoing distribution or service fees and are available only to certain eligible investors. |
| • | | Investor A Shares are not subject to any sales charge and bear no ongoing distribution fee. These shares are subject to an ongoing service fee of 0.25% per year. These shares are generally available through financial intermediaries. |
Performance information reflects past performance and does not guarantee future results. Current performance may be lower or higher than the performance data quoted. Refer to www.blackrock.com/funds to obtain performance data current to the most recent month-end. Performance results do not reflect the deduction of taxes that a shareholder would pay on fund distributions or the redemption of fund shares. Figures shown in the performance table on the previous page
assume reinvestment of all distributions, if any, at net asset value (“NAV”) on the ex-dividend date. Investment return and principal value of shares will fluctuate so that shares, when redeemed, may be worth more or less than their original cost. Distributions paid to each class of shares will vary because of the different levels of administration and distribution fees applicable to each class, which are deducted from the income available to be paid to shareholders.
BlackRock Advisors, LLC (the “Administrator”), the Fund’s administrator, has contractually agreed to waive and/or reimburse a portion of the Fund’s expenses. Without such waiver and/or reimbursement, the Fund’s performance would have been lower. The Administrator is under no obligation to continue waiving and/or reimbursing its fees after the applicable termination date of such agreement. See Note 4 of the Notes to Financial Statements for additional information on waivers and/or reimbursements.
Shareholders of the Fund may incur the following charges: (a) transactional expenses, such as sales charges; and (b) operating expenses, including administration fees, service and distribution fees, including 12b-1 fees, acquired fund fees and expenses and other Fund expenses. The expense example on the previous page (which is based on a hypothetical investment of $1,000 invested on July 1, 2015 and held through December 31, 2015) is intended to assist shareholders both in calculating expenses based on an investment in the Fund and in comparing these expenses with similar costs of investing in other mutual funds.
The expense example provides information about actual account values and actual expenses. In order to estimate the expenses a shareholder paid during the period covered by this report, shareholders can divide their account value by $1,000 and then multiply the result by the number corresponding to their share class under the heading entitled “Expenses Paid During the Period.”
The expense example also provides information about hypothetical account values and hypothetical expenses based on the Fund’s actual expense ratio and an assumed rate of return of 5% per year before expenses. In order to assist shareholders in comparing the ongoing expenses of investing in the Fund and other funds, compare the 5% hypothetical example with the 5% hypothetical examples that appear in shareholder reports of other funds.
The expenses shown in the expense example are intended to highlight shareholders’ ongoing costs only and do not reflect any transactional expenses, such as sales charges, if any. Therefore, the hypothetical example is useful in comparing ongoing expenses only, and will not help shareholders determine the relative total expenses of owning different funds. If these transactional expenses were included, shareholder expenses would have been higher.
|
| Derivative Financial Instruments |
The Master Portfolio may invest in various derivative financial instruments. Derivative financial instruments are used to obtain exposure to a security, index and/or market without owning or taking physical custody of securities or to manage market, equity, credit, interest rate, foreign currency exchange rate, commodity and/or other risks. Derivative financial instruments may give rise to a form of economic leverage. Derivative financial instruments also involve risks, including the imperfect correlation between the value of a derivative financial instrument and the underlying asset, possible default of the counterparty to the transaction or illiquidity of the derivative financial instrument. The
Master Portfolio’s ability to use a derivative financial instrument successfully depends on the investment advisor’s ability to predict pertinent market movements accurately, which cannot be assured. The use of derivative financial instruments may result in losses greater than if they had not been used, may limit the amount of appreciation the Master Portfolio can realize on an investment and/or may result in lower distributions paid to shareholders. The Master Portfolio’s investments, in these instruments if any, are discussed in detail in the Master Portfolio’s Notes to Financial Statements.
| | | | | | |
| | | | | | | |
| 6 | | BLACKROCK LARGE CAP INDEX FUND | | DECEMBER 31, 2015 | | |
| | |
| Statement of Assets and Liabilities | | BlackRock Large Cap Index Fund |
| | | | |
| December 31, 2015 | | | |
| | | | |
| Assets | | | | |
Investments at value — Master Portfolio (cost — $94,729,586) | | $ | 98,463,993 | |
| Receivables: | | | | |
Capital shares sold | | | 19,447 | |
From the Administrator | | | 18,112 | |
Withdrawals from the Master Portfolio | | | 12,399 | |
Prepaid expenses | | | 17,614 | |
| | | | |
Total assets | | | 98,531,565 | |
| | | | |
| | | | |
| Liabilities | | | | |
| Payables: | | | | |
Capital shares redeemed | | | 31,846 | |
Service fees | | | 3,712 | |
Administration fees | | | 826 | |
Officer’s fees | | | 74 | |
Other accrued expenses | | | 34,426 | |
| | | | |
Total liabilities | | | 70,884 | |
| | | | |
Net Assets | | $ | 98,460,681 | |
| | | | |
| | | | |
| Net Assets Consist of | | | | |
Paid-in capital | | $ | 75,520,733 | |
Distributions in excess of net investment income | | | (122,138 | ) |
Accumulated net realized gain allocated from the Master Portfolio | | | 19,327,679 | |
Net unrealized appreciation (depreciation) allocated from the Master Portfolio | | | 3,734,407 | |
| | | | |
Net Assets | | $ | 98,460,681 | |
| | | | |
| | | | |
| Net Asset Value | | | | |
Institutional — Based on net assets of $3,431,423 and 243,734 shares outstanding, unlimited number of shares authorized, no par value | | $ | 14.08 | |
| | | | |
Investor A — Based on net assets of $17,397,157 and 1,241,712 shares outstanding, unlimited number of shares authorized, no par value | | $ | 14.01 | |
| | | | |
Class K — Based on net assets of $77,632,101 and 5,533,558 shares outstanding, unlimited number of shares authorized, no par value | | $ | 14.03 | |
| | | | |
| | | | | | |
| See Notes to Financial Statements. | | | | |
| | | | | | | |
| | BLACKROCK LARGE CAP INDEX FUND | | DECEMBER 31, 2015 | | 7 |
| | |
| Statement of Operations | | BlackRock Large Cap Index Fund |
| | | | |
| Year Ended December 31, 2015 | | | |
| | | | |
| Investment Income | | | | |
| Net investment income allocated from the Master Portfolio: | | | | |
Dividends — unaffiliated | | $ | 1,876,888 | |
Securities lending — affiliated — net | | | 22,945 | |
Dividends — affiliated | | | 12,705 | |
Interest — affiliated | | | 4,183 | |
Foreign taxes withheld | | | (472 | ) |
Expenses | | | (43,032 | ) |
Fees waived | | | 1,533 | |
| | | | |
Total income | | | 1,874,750 | |
| | | | |
| | | | |
| Fund Expenses | | | | |
Administration | | | 9,570 | |
Service — Investor A | | | 42,776 | |
Transfer agent — Institutional | | | 1,860 | |
Transfer agent — Investor A | | | 18,326 | |
Professional | | | 50,956 | |
Registration | | | 49,694 | |
Printing | | | 19,096 | |
Officer and Trustees | | | 69 | |
Miscellaneous | | | 8,108 | |
| | | | |
Total expenses | | | 200,455 | |
| Less: | | | | |
Administration fees waived | | | (9,570 | ) |
Transfer agent fees waived — Institutional | | | (260 | ) |
Transfer agent fees waived — Investor A | | | (1,674 | ) |
Transfer agent fees reimbursed — Institutional | | | (592 | ) |
Transfer agent fees reimbursed — Investor A | | | (8,156 | ) |
Fees waived and/or reimbursed by the administrator | | | (86,045 | ) |
| | | | |
Total expenses after fees waived and/or reimbursed | | | 94,158 | |
| | | | |
Net investment income | | | 1,780,592 | |
| | | | |
| | | | |
| Realized and Unrealized Gain (Loss) Allocated from the Master Portfolio | | | | |
Net realized gain from investments, in-kind redemptions1 and financial futures contracts | | | 23,655,263 | |
Net change in unrealized appreciation (depreciation) on investments, in-kind redemptions1 and financial futures contracts | | | (24,271,610 | ) |
| | | | |
Net realized and unrealized loss | | | (616,347 | ) |
| | | | |
Net Increase in Net Assets Resulting from Operations | | $ | 1,164,245 | |
| | | | |
1 See Note 2 of the Notes to Financial Statements. | | | | |
| | | | | | |
| See Notes to Financial Statements. | | | | |
| | | | | | | |
| 8 | | BLACKROCK LARGE CAP INDEX FUND | | DECEMBER 31, 2015 | | |
| | |
| Statements of Changes in Net Assets | | BlackRock Large Cap Index Fund |
| | | | | | | | |
| | | Year Ended December 31, | |
| Increase (Decrease) in Net Assets: | | 2015 | | | 2014 | |
| | | | | | | | |
| Operations | |
Net investment income | | $ | 1,780,592 | | | $ | 1,476,837 | |
Net realized gain | | | 23,655,263 | | | | 1,393,663 | |
Net change in unrealized appreciation (depreciation) | | | (24,271,610 | ) | | | 7,399,707 | |
| | | | |
Net increase in net assets resulting from operations | | | 1,164,245 | | | | 10,270,207 | |
| | | | |
| | | | | | | | |
| Distributions to Shareholders1 | | | | | | | | |
| From net investment income: | | | | | | | | |
Institutional | | | (49,031 | ) | | | (4,929 | ) |
Investor A | | | (294,975 | ) | | | (210,349 | ) |
Class K | | | (1,564,063 | ) | | | (1,260,548 | ) |
| From net realized gain: | | | | | | | | |
Institutional | | | (108,722 | ) | | | (6,123 | ) |
Investor A | | | (563,699 | ) | | | (296,423 | ) |
Class K | | | (2,500,143 | ) | | | (1,259,884 | ) |
| | | | |
Decrease in net assets resulting from distributions to shareholders | | | (5,080,633 | ) | | | (3,038,256 | ) |
| | | | |
| | | | | | | | |
| Capital Share Transactions | | | | | | | | |
Net increase in net assets derived from capital share transactions | | | 14,158,685 | | | | 7,103,413 | |
| | | | |
| | | | | | | | |
| Net Assets | | | | | | | | |
Total increase in net assets | | | 10,242,297 | | | | 14,335,364 | |
Beginning of year | | | 88,218,384 | | | | 73,883,020 | |
| | | | |
End of year | | $ | 98,460,681 | | | $ | 88,218,384 | |
| | | | |
Undistributed (distributions in excess of) net investment income, end of year | | $ | (122,138 | ) | | $ | 5,339 | |
| | | | |
1 Distributions for annual periods determined in accordance with federal income tax regulations. | |
| | | | | | |
| See Notes to Financial Statements. | | | | |
| | | | | | | |
| | BLACKROCK LARGE CAP INDEX FUND | | DECEMBER 31, 2015 | | 9 |
| | |
| Financial Highlights | | BlackRock Large Cap Index Fund |
| | | | | | | | | | | | | | | | | | | | |
| | | Institutional | |
| | | Year Ended December 31, | | | Period
March 31, 20111
to December 31, 2011 | |
| | | 2015 | | | 2014 | | | 2013 | | | 2012 | | |
| | | | | | | | | | | | | | | | | | | | |
| Per Share Operating Performance | | | | | | | | | | | | | | | | | | | | |
Net asset value, beginning of period | | $ | 14.72 | | | $ | 13.49 | | | $ | 10.62 | | | $ | 9.40 | | | $ | 10.00 | |
| | | | |
Net investment income2 | | | 0.28 | | | | 0.26 | | | | 0.23 | | | | 0.21 | | | | 0.13 | |
Net realized and unrealized gain (loss) | | | (0.16 | ) | | | 1.49 | | | | 3.26 | | | | 1.33 | | | | (0.60 | ) |
| | | | |
Net increase (decrease) from investment operations | | | 0.12 | | | | 1.75 | | | | 3.49 | | | | 1.54 | | | | (0.47 | ) |
| | | | |
| Distributions:3 | | | | | | | | | | | | | | | | | | | | |
From net investment income | | | (0.29 | ) | | | (0.25 | ) | | | (0.23 | ) | | | (0.21 | ) | | | (0.13 | ) |
From net realized gain | | | (0.47 | ) | | | (0.27 | ) | | | (0.39 | ) | | | (0.11 | ) | | | (0.00 | )4 |
From return of capital | | | — | | | | — | | | | — | | | | — | | | | (0.00 | )4 |
| | | | |
Total distributions | | | (0.76 | ) | | | (0.52 | ) | | | (0.62 | ) | | | (0.32 | ) | | | (0.13 | ) |
| | | | |
Net asset value, end of period | | $ | 14.08 | | | $ | 14.72 | | | $ | 13.49 | | | $ | 10.62 | | | $ | 9.40 | |
| | | | |
| | | | | | | | | | | | | | | | | | | | |
| Total Return5 | | | | | | | | | | | | | | | | | | | | |
Based on net asset value | | | 0.82% | | | | 13.07% | | | | 33.09% | | | | 16.42% | | | | (4.72)% | 6 |
| | | | |
| | | | | | | | | | | | | | | | | | | | |
| Ratios to Average Net Assets7 | | | | | | | | | | | | | | | | | | | | |
Total expenses | | | 0.27% | 9 | | | 0.59% | | | | 0.56% | 8 | | | 0.65% | 9 | | | 1.84% | 10,11,12 |
| | | | |
Total expenses after fees waived and/or reimbursed | | | 0.13% | 9 | | | 0.16% | | | | 0.23% | 8 | | | 0.23% | 9 | | | 0.22% | 10,11 |
| | | | |
Net investment income | | | 1.93% | 9 | | | 1.81% | | | | 1.80% | 8 | | | 2.07% | 9 | | | 1.86% | 10,11 |
| | | | |
| | | | | | | | | | | | | | | | | | | | |
| Supplemental Data | | | | | | | | | | | | | | | | | | | | |
Net assets, end of period (000) | | $ | 3,431 | | | $ | 363 | | | $ | 183 | | | $ | 28 | | | $ | 24 | |
| | | | |
Portfolio turnover rate of the Master Portfolio | | | 6% | | | | 6% | | | | 14% | | | | 16% | | | | 10% | |
| | | | |
| | 1 | | Commencement of operations. |
| | 2 | | Based on average shares outstanding |
| | 3 | | Distributions for annual periods determined in accordance with federal income tax regulations. |
| | 4 | | Amount is greater than $(0.005) per share. |
| | 5 | | Where applicable, assumes the reinvestment of distributions. |
| | 6 | | Aggregate total return. |
| | 7 | | Includes the Fund’s share of the Master Portfolio’s allocated expenses and/or net investment income. |
| | 8 | | Excludes expenses incurred indirectly as a result of investments in underlying funds of approximately 0.01% for the year ended December 31, 2013. |
| | 9 | | Includes the Fund’s share of the Master Portfolio’s allocated fees waived of less than 0.01%. |
| | 11 | | Includes the Fund’s share of the Master Portfolio’s allocated fees waived of 0.24%. |
| | 12 | | Organization costs were not annualized in the calculation of the expense ratio. If these expenses were annualized, the total expenses would have been 1.84%. |
| | | | | | |
| See Notes to Financial Statements. | | | | |
| | | | | | | |
| 10 | | BLACKROCK LARGE CAP INDEX FUND | | DECEMBER 31, 2015 | | |
| | |
| Financial Highlights (continued) | | BlackRock Large Cap Index Fund |
| | | | | | | | | | | | | | | | | | | | |
| | | Investor A | |
| | | Year Ended December 31, | | | Period
March 31, 20111
to December 31, 2011 | |
| | | 2015 | | | 2014 | | | 2013 | | | 2012 | | |
| | | | | | | | | | | | | | | | | | | | |
| Per Share Operating Performance | | | | | | | | | | | | | | | | | | | | |
Net asset value, beginning of period | | $ | 14.65 | | | $ | 13.43 | | | $ | 10.61 | | | $ | 9.39 | | | $ | 10.00 | |
| | | | |
Net investment income2 | | | 0.24 | | | | 0.22 | | | | 0.19 | | | | 0.19 | | | | 0.13 | |
Net realized and unrealized gain (loss) | | | (0.16 | ) | | | 1.49 | | | | 3.22 | | | | 1.33 | | | | (0.62 | ) |
| | | | |
Net increase (decrease) from investment operations | | | 0.08 | | | | 1.71 | | | | 3.41 | | | | 1.52 | | | | (0.49 | ) |
| | | | |
| Distributions:3 | | | | | | | | | | | | | | | | | | | | |
From net investment income | | | (0.25 | ) | | | (0.22 | ) | | | (0.20 | ) | | | (0.19 | ) | | | (0.12 | ) |
From net realized gain | | | (0.47 | ) | | | (0.27 | ) | | | (0.39 | ) | | | (0.11 | ) | | | (0.00 | )4 |
From return of capital | | | — | | | | — | | | | — | | | | — | | | | (0.00 | )4 |
| | | | |
Total distributions | | | (0.72 | ) | | | (0.49 | ) | | | (0.59 | ) | | | (0.30 | ) | | | (0.12 | ) |
| | | | |
Net asset value, end of period | | $ | 14.01 | | | $ | 14.65 | | | $ | 13.43 | | | $ | 10.61 | | | $ | 9.39 | |
| | | | |
| | | | | | | | | | | | | | | | | | | | |
| Total Return5 | | | | | | | | | | | | | | | | | | | | |
Based on net asset value | | | 0.56% | | | | 12.79% | | | | 32.35% | | | | 16.18% | | | | (4.93)% | 6 |
| | | | |
| | | | | | | | | | | | | | | | | | | | |
| Ratios to Average Net Assets7 | | | | | | | | | | | | | | | | | | | | |
Total expenses | | | 0.54% | 9 | | | 0.57% | | | | 0.66% | 8 | | | 0.83% | 8,9 | | | 1.40% | 10,11,12 |
| | | | |
Total expenses after fees waived and/or reimbursed | | | 0.39% | 9 | | | 0.41% | | | | 0.48% | 8 | | | 0.45% | 8,9 | | | 0.45% | 10,11 |
| | | | |
Net investment income | | | 1.62% | 9 | | | 1.56% | | | | 1.56% | 8 | | | 1.83% | 8,9 | | | 1.80% | 10,11 |
| | | | |
| | | | | | | | | | | | | | | | | | | | |
| Supplemental Data | | | | | | | | | | | | | | | | | | | | |
Net assets, end of period (000) | | $ | 17,397 | | | $ | 17,507 | | | $ | 6,454 | | | $ | 2,310 | | | $ | 1,918 | |
| | | | |
Portfolio turnover rate of the Master Portfolio | | | 6% | | | | 6% | | | | 14% | | | | 16% | | | | 10% | |
| | | | |
| | 1 | | Commencement of operations. |
| | 2 | | Based on average shares outstanding. |
| | 3 | | Distributions for annual periods determined in accordance with federal income tax regulations. |
| | 4 | | Amount is greater than $(0.005) per share. |
| | 5 | | Where applicable, assumes the reinvestment of distributions. |
| | 6 | | Aggregate total return. |
| | 7 | | Includes the Fund’s share of the Master Portfolio’s allocated expenses and/or net investment income. |
| | 8 | | Excludes expenses incurred indirectly as a result of investments in underlying funds of approximately 0.01% for the year ended December 31, 2013. |
| | 9 | | Includes the Fund’s share of the Master Portfolio’s allocated fees waived of less than 0.01%. |
| | 11 | | Includes the Fund’s share of the Master Portfolio’s allocated fees waived of 0.24%. |
| | 12 | | Organization costs were not annualized in the calculation of the expense ratio. If these expenses were annualized, the total expenses would have been 1.40%. |
| | | | | | |
| See Notes to Financial Statements. | | | | |
| | | | | | | |
| | BLACKROCK LARGE CAP INDEX FUND | | DECEMBER 31, 2015 | | 11 |
| | |
| Financial Highlights (concluded) | | BlackRock Large Cap Index Fund |
| | | | | | | | | | | | | | | | | | | | |
| | | Class K | |
| | | Year Ended December 31, | | | Period
March 31, 20111
to December 31,
2011 | |
| | | 2015 | | | 2014 | | | 2013 | | | 2012 | | |
| | | | | | | | | | | | | | | | | | | | |
| Per Share Operating Performance | | | | | | | | | | | | | | | | | | | | |
Net asset value, beginning of period | | $ | 14.67 | | | $ | 13.44 | | | $ | 10.61 | | | $ | 9.40 | | | $ | 10.00 | |
| | | | |
Net investment income2 | | | 0.28 | | | | 0.26 | | | | 0.23 | | | | 0.22 | | | | 0.13 | |
Net realized and unrealized gain (loss) | | | (0.15 | ) | | | 1.50 | | | | 3.22 | | | | 1.32 | | | | (0.60 | ) |
| | | | |
Net increase (decrease) from investment operations | | | 0.13 | | | | 1.76 | | | | 3.45 | | | | 1.54 | | | | (0.47 | ) |
| | | | |
| Distributions:3 | | | | | | | | | | | | | | | | | | | | |
From net investment income | | | (0.30 | ) | | | (0.27 | ) | | | (0.23 | ) | | | (0.22 | ) | | | (0.13 | ) |
From net realized gain | | | (0.47 | ) | | | (0.26 | ) | | | (0.39 | ) | | | (0.11 | ) | | | (0.00 | )4 |
From return of capital | | | — | | | | — | | | | — | | | | — | | | | (0.00 | )4 |
| | | | |
Total distributions | | | (0.77 | ) | | | (0.53 | ) | | | (0.62 | ) | | | (0.33 | ) | | | (0.13 | ) |
| | | | |
Net asset value, end of period | | $ | 14.03 | | | $ | 14.67 | | | $ | 13.44 | | | $ | 10.61 | | | $ | 9.40 | |
| | | | |
| | | | | | | | | | | | | | | | | | | | |
| Total Return5 | | | | | | | | | | | | | | | | | | | | |
Based on net asset value | | | 0.86% | | | | 13.17% | | | | 32.80% | | | | 16.37% | | | | (4.68)% | 6 |
| | | | |
| | | | | | | | | | | | | | | | | | | | |
| Ratios to Average Net Assets7 | | | | | | | | | | | | | | | | | | | | |
Total expenses | | | 0.19% | 9 | | | 0.24% | | | | 0.33% | 8 | | | 0.52% | 9 | | | 1.11% | 10,11,12 |
| | | | |
Total expenses after fees waived and/or reimbursed | | | 0.09% | 9 | | | 0.12% | | | | 0.18% | 8 | | | 0.18% | 9 | | | 0.18% | 10,11 |
| | | | |
Net investment income | | | 1.91% | 9 | | | 1.83% | | | | 1.85% | 8 | | | 2.11% | 9 | | | 2.02% | 10,11 |
| | | | |
| | | | | | | | | | | | | | | | | | | | |
| Supplemental Data | | | | | | | | | | | | | | | | | | | | |
Net assets, end of period (000) | | $ | 77,632 | | | $ | 70,348 | | | $ | 6,746 | | | $ | 56,654 | | | $ | 46,785 | |
| | | | |
Portfolio turnover rate of the Master Portfolio | | | 6% | | | | 6% | | | | 14% | | | | 16% | | | | 10% | |
| | | | |
| | 1 | | Commencement of operations. |
| | 2 | | Based on average shares outstanding. |
| | 3 | | Distributions for annual periods determined in accordance with federal income tax regulations. |
| | 4 | | Amount is greater than $(0.005) per share. |
| | 5 | | Where applicable, assumes the reinvestment of distributions. |
| | 6 | | Aggregate total return. |
| | 7 | | Includes the Fund’s share of the Master Portfolio’s allocated expenses and/or net investment income. |
| | 8 | | Excludes expenses incurred indirectly as a result of investments in underlying funds of approximately 0.01% for the year ended December 31, 2013. |
| | 9 | | Includes the Fund’s share of the Master Portfolio’s allocated fees waived of less than 0.01%. |
| | 11 | | Includes the Fund’s share of the Master Portfolio’s allocated fees waived of 0.24%. |
| | 12 | | Organization costs were not annualized in the calculation of the expense ratio. If these expenses were annualized, the total expenses would have been 1.12%. |
| | | | | | |
| See Notes to Financial Statements. | | | | |
| | | | | | | |
| 12 | | BLACKROCK LARGE CAP INDEX FUND | | DECEMBER 31, 2015 | | |
| | | | |
| Notes to Financial Statements | | BlackRock Large Cap Index Fund |
1. Organization:
BlackRock Large Cap Index Fund (formerly known as BlackRock Russell 1000® Index Fund) (the “Fund”), a series of BlackRock Funds III (the “Trust”), is registered under the Investment Company Act of 1940, as amended (the “1940 Act”), as a diversified, open-end management investment company. The Trust is organized as a Delaware statutory trust. The Fund seeks to achieve its investment objective by investing all of its assets in Large Cap Index Master Portfolio (formerly known as Russell 1000® Index Fund Master Portfolio) (the “Master Portfolio”), a series of Master Investment Portfolio (“MIP”), an affiliate of the Fund, which has the same investment objective and strategies as the Fund. The value of the Fund’s investment in the Master Portfolio reflects the Fund’s proportionate interest in the net assets of the Master Portfolio. The performance of the Fund is directly affected by the performance of the Master Portfolio. At December 31, 2015, the percentage of the Master Portfolio owned by the Fund was 3.9%. As such, the financial statements of the Master Portfolio, including the Schedule of Investments, are included elsewhere in this report and should be read in conjunction with the Fund’s financial statements.
The Fund offers multiple classes of shares. All classes of shares have identical voting, dividend, liquidation and other rights and are subject to the same terms and conditions, except that Investor A Shares bear certain expenses related to shareholder servicing of such shares. Institutional and Class K Shares are sold only certain eligible investors. Investor A Shares are generally available through financial intermediaries. Each class has exclusive voting rights with respect to matters relating to its shareholder servicing and distribution expenditures.
| | | | | | | | | | |
| Share Class | | Initial Sales Charge | | | CDSC | | | Conversion Privilege |
Institutional Shares | | | No | | | | No | | | None |
Investor A Shares | | | No | | | | No | | | None |
Class K Shares | | | No | | | | No | | | None |
The Board of Trustees of the Fund and Board of Trustees of MIP are referred to throughout this report as the “Board of Trustees” or the “Board” and the members are referred to as “Trustees.”
The Fund, together with certain other registered investment companies advised by BlackRock Fund Advisors, LLC (“BAL” or the “Administrator”) or its affiliates, is included in a complex of open-end funds referred to as the Equity Liquidity Complex.
2. Significant Accounting Policies:
The financial statements are prepared in conformity with accounting principles generally accepted in the United States of America (“U.S. GAAP”), which may require management to make estimates and assumptions that affect the reported amounts of assets and liabilities in the financial statements, disclosure of contingent assets and liabilities at the date of the financial statements and the reported amounts of increases and decreases in net assets from operations during the reporting period. Actual results could differ from those estimates. The Fund is considered an investment company under U.S. GAAP and follows the accounting and reporting guidance applicable to investment companies. Below is a summary of significant accounting policies:
Investment Transactions and Investment Income: For financial reporting purposes, contributions to and withdrawals from the Master Portfolio are accounted on a trade date basis. The Fund records daily its proportionate share of the Master Portfolio’s income, expenses and realized and unrealized gains and losses. Realized and unrealized gains and losses are adjusted utilizing partnership tax allocation rules. In addition, the Fund accrues its own expenses. Income, expenses and realized and unrealized gains and losses are allocated daily to each class based on its relative net assets.
In-Kind Redemptions: The Master Portfolio satisfied certain redemptions in investors’ capital through an in-kind redemption of securities and cash. For financial reporting purposes, these transactions were treated as a sale of securities and the resulting gains and losses were recognized at the Master Portfolio based on the market value of the securities on the date of the transfer. For the year ended December 31, 2015, the Fund were allocated realized gain from the in-kind redemptions of $8,070,015. For tax purposes, no gains or losses were recognized.
Distributions: Distributions paid by the Fund are recorded on the ex-dividend date. The character and timing of distributions are determined in accordance with federal income tax regulations, which may differ from U.S. GAAP.
Indemnifications: In the normal course of business, the Fund enters into contracts that contain a variety of representations that provide general indemnification. The Fund’s maximum exposure under these arrangements is unknown because it involves future potential claims against the Fund, which cannot be predicted with any certainty.
| | | | | | |
| | | | | | | |
| | BLACKROCK LARGE CAP INDEX FUND | | DECEMBER 31, 2015 | | 13 |
| | |
| Notes to Financial Statements (continued) | | BlackRock Large Cap Index Fund |
Other: Expenses directly related to the Fund or its classes are charged to the Fund or the applicable class. Other operating expenses shared by several funds, including other funds managed by the Administrator, are prorated among those funds on the basis of relative net assets or other appropriate methods. Expenses directly related to the Fund and other shared expenses prorated to the Fund are allocated daily to each class based on its relative net assets or other appropriate methods.
3. Investment Valuation and Fair Value Measurements:
Investment Valuation Policies: The Fund’s policy is to fair value its financial instruments at market value. The Fund records its investment in the Master Portfolio at fair value based on the Fund’s proportionate interest in the net assets of the Master Portfolio. Valuation of securities held by the Master Portfolio is discussed in Note 3 of the Master Portfolio’s Notes to Financial Statements, which are included elsewhere in this report.
4. Administration Agreement and Other Transactions with Affiliates:
The PNC Financial Services Group, Inc. is the largest stockholder and an affiliate of BlackRock, Inc. (“BlackRock”) for 1940 Act purposes.
The Trust, on behalf of the Fund, entered into an Administration Agreement with BlackRock Advisors, LLC (“BAL” or the “Administrator”), an indirect, wholly owned subsidiary of BlackRock, to provide administrative services (other than investment advice and related portfolio activities). For such services, the Fund pays the Administrator a monthly fee at an annual rate of 0.01% of the average daily value of the Fund’s net assets. The Fund does not pay an investment advisory fee or investment management fee.
BFA, the investment advisor for the Master Portfolio, and BAL contractually agreed to waive and/or reimburse fees or expenses in order to limit expenses, excluding interest expense, dividend expense, tax expense, acquired fund fees and expenses and certain other fund expenses, which constitute extraordinary expenses not incurred in the ordinary course of Fund’s business. The expense limitations as a percentage of average daily net assets are as follows:
| | | | | | | | | | | | |
| | | Institutional | | | Investor A | | | Class K | |
Rate | | | 0.13% | | | | 0.38% | | | | 0.08% | |
BFA and BAL have agreed not to reduce or discontinue this contractual expense limitation prior to May 1, 2016, unless approved by the Board, including a majority of the Independent Trustees.
Prior to April 30, 2015, the expense limitations as a percentage of average daily net assets were as follows:
| | | | | | | | | | | | |
| | | Institutional | | | Investor A | | | Class K | |
Rate | | | 0.15% | | | | 0.40% | | | | 0.10% | |
If during the Fund’s fiscal year the operating expenses of a share class, that at any time during the prior two fiscal years received a waiver or reimbursement from BFA or BAL, are less than the expense limit for that share class, BFA or BAL is entitled to be reimbursed by such share class up to the lesser of (a) the amount of fees waived or expenses reimbursed during those prior two fiscal years under the agreement and (b) the amount by which the expense limit for that share class exceeds the operating expenses of the share class for the current fiscal year, provided that: (1) the Fund of which the share class is a part, has more than $50 million in assets for the fiscal year and (2) BFA or BAL or an affiliate continues to serve as the Fund’s investment advisor or administrator. In the event the expense limit for a share class is changed subsequent to a fiscal year in which the BFA or BAL, as applicable, becomes entitled to reimbursement for fees waived or reimbursed, the amount available to reimburse BFA or BAL, as applicable, shall be calculated by reference to the expense limit for that share class in effect at the time the BFA or BAL became entitled to receive such reimbursement, rather than the subsequently changed expense limit for that share class.
As of period end, the Fund level and class specific waivers and/or reimbursements subject to possible future recoupment under the expense limitation agreement are as follows:
| | | | | | | | |
| | | Expiring December 31, | |
| | | 2016 | | | 2017 | |
Fund level | | $ | 99,938 | | | $ | 95,615 | |
Institutional | | $ | 758 | | | $ | 852 | |
Investor A | | $ | 4,985 | | | $ | 9,830 | |
Class K | | $ | 70 | | | | — | |
| | | | | | |
| | | | | | | |
| 14 | | BLACKROCK LARGE CAP INDEX FUND | | DECEMBER 31, 2015 | | |
| | | | |
| Notes to Financial Statements (continued) | | BlackRock Large Cap Index Fund |
The following Fund level and class specific waivers and/or reimbursements previously recorded by the Fund, which were subject to recoupment by BAL and BFA, expired on December 31, 2015:
| | | | |
Fund level | | $ | 100,089 | |
Institutional | | $ | 186 | |
Investor A | | $ | 981 | |
Class K | | $ | 149 | |
The Trust, on behalf of the Fund, entered into a Distribution Agreement and a Distribution and Service Plan with BlackRock Investments, LLC (“BRIL”), an affiliate of the Administrator. Pursuant to the Distribution and Service Plan and in accordance with Rule 12b-1 under the 1940 Act, the Fund pays BRIL ongoing service and distribution fees. The fees are accrued daily and paid monthly at annual rate of 0.25% based upon the average daily net assets of the Investor A Shares.
Pursuant to sub-agreements with BRIL, broker-dealers and BRIL provide shareholder servicing and distribution services to the Fund. The ongoing service and/or distribution fee compensates BRIL and each broker-dealer for providing shareholder servicing and/or distribution related services to Investor A shareholders.
BAL maintains a call center, which is responsible for providing certain shareholder services to the Fund, such as responding to shareholder inquiries and processing transactions based upon instructions from shareholders with respect to the subscription and redemption of Fund shares. For the year ended December 31, 2015, the Fund reimbursed the BAL the following amounts for costs incurred in running the call center, which are included in transfer agent — class specific in the Statement of Operations:
| | | | | | | | |
| Institutional | | Investor A | | | Class K | |
$295 | | $ | 1,683 | | | | — | |
Certain officers and/or trustees of the Trust are officers and/or directors of BlackRock or its affiliates. The Fund reimburses the Administrator for a portion of the compensation paid to the Trust’s Chief Compliance Officer, which is included in officer and trustees in the Statement of Operations.
5. Income Tax Information:
It is the Fund’s policy to comply with the requirements of the Internal Revenue Code of 1986, as amended, applicable to regulated investment companies, and to distribute substantially all of its taxable income to its shareholders. Therefore, no federal income tax provision is required.
The Fund files U.S. federal and various state and local tax returns. No income tax returns are currently under examination. The statute of limitations on the Fund’s U.S. federal tax returns remains open for each of the four years ended December 31, 2015. The statutes of limitations on the Fund’s state and local tax returns may remain open for an additional year depending upon the jurisdiction.
Management has analyzed tax laws and regulations and their application to the Fund as of December 31, 2015, inclusive of the open tax return years, and does not believe there are any uncertain tax positions that require recognition of a tax liability in the Fund’s financial statements.
The tax character of distributions paid was as follows:
| | | | | | | | |
| | | 2015 | | | 2014 | |
Ordinary income | | $ | 2,615,289 | | | $ | 1,852,288 | |
Long-term capital gains | | | 2,465,344 | | | | 1,185,968 | |
| | | | |
Total | | $ | 5,080,633 | | | $ | 3,038,256 | |
| | | | |
As of period end, the tax components of accumulated net earnings (losses) were as follows:
| | | | |
Undistributed ordinary income | | $ | 39,109 | |
Undistributed long-term capital gains | | | 433,372 | |
Net unrealized gains1 | | | 22,467,467 | |
| | | | |
Total | | $ | 22,939,948 | |
| | | | |
| | 1 | | The difference between book-basis and tax-basis net unrealized gains (losses) was attributable primarily to the timing and recognition of partnership income. |
| | | | | | |
| | | | | | | |
| | BLACKROCK LARGE CAP INDEX FUND | | DECEMBER 31, 2015 | | 15 |
| | |
| Notes to Financial Statements (concluded) | | BlackRock Large Cap Index Fund |
6. Capital Share Transactions:
Transactions in capital shares for each class were as follows:
| | | | | | | | | | | | | | | | | | |
| | | Year Ended
December 31, 2015 | | | | | Year Ended
December 31, 2014 | |
| | | Shares | | | Amount | | | | | Shares | | | Amount | |
| Institutional | | | | | | | | | | | | | | | | | | |
Shares sold | | | 235,121 | | | $ | 3,472,697 | | | | | | 12,718 | | | $ | 182,477 | |
Shares issued in reinvestment of distributions | | | 11,038 | | | | 157,118 | | | | | | 649 | | | | 9,418 | |
Shares redeemed | | | (27,116 | ) | | | (399,482 | ) | | | | | (2,256 | ) | | | (32,808 | ) |
| | | | | | | | | | |
Net increase | | | 219,043 | | | $ | 3,230,333 | | | | | | 11,111 | | | $ | 159,087 | |
| | | | | | | | | | |
| | | | | | | | | | | | | | | | | | |
| Investor A | | | | | | | | | | | | | | | | | | |
Shares sold | | | 551,765 | | | $ | 8,156,831 | | | | | | 915,164 | | | $ | 12,739,622 | |
Shares issued in reinvestment of distributions | | | 60,105 | | | | 853,788 | | | | | | 35,002 | | | | 505,651 | |
Shares redeemed | | | (565,416 | ) | | | (8,408,598 | ) | | | | | (235,628 | ) | | | (3,301,283 | ) |
| | | | | | | | | | |
Net increase | | | 46,454 | | | $ | 602,021 | | | | | | 714,538 | | | $ | 9,943,990 | |
| | | | | | | | | | |
| | | | | | | | | | | | | | | | | | |
| Class K | | | | | | | | | | | | | | | | | | |
Shares sold | | | 960,151 | | | $ | 13,837,654 | | | | | | 626,336 | | | $ | 8,676,816 | |
Shares issued in reinvestment of distributions | | | 285,513 | | | | 4,064,205 | | | | | | 175,001 | | | | 2,519,103 | |
Shares redeemed | | | (508,830 | ) | | | (7,575,528 | ) | | | | | (1,008,042 | ) | | | (14,195,583 | ) |
| | | | | | | | | | |
Net increase (decrease) | | | 736,834 | | | $ | 10,326,331 | | | | | | (206,705 | ) | | $ | (2,999,664 | ) |
| | | | | | | | | | |
Total Net Increase | | | 1,002,331 | | | $ | 14,158,685 | | | | | | 518,944 | | | $ | 7,103,413 | |
| | | | | | | | | | |
7. Subsequent Events:
Management has evaluated the impact of all subsequent events on the Fund through the date the financial statements were issued and has determined that there were no subsequent events requiring adjustment or additional disclosure in the financial statements.
| | | | | | |
| | | | | | | |
| 16 | | BLACKROCK LARGE CAP INDEX FUND | | DECEMBER 31, 2015 | | |
| | | | |
| Report of Independent Registered Public Accounting Firm | | BlackRock Large Cap Index Fund |
To the Board of Trustees of BlackRock Funds III and the Shareholders of BlackRock Large Cap Index Fund:
In our opinion, the accompanying statement of assets and liabilities and the related statements of operations and of changes in net assets and the financial highlights present fairly, in all material respects, the financial position of BlackRock Large Cap Index Fund (the “Fund”), a series of BlackRock Funds III, at December 31, 2015, the results of its operations for the year then ended, the changes in its net assets for each of the two years in the period then ended and the financial highlights for each of the periods presented, in conformity with accounting principles generally accepted in the United States of America. These financial statements and financial highlights (hereafter referred to as “financial statements”) are the responsibility of the Fund’s management. Our responsibility is to express an opinion on these financial statements based on our audits. We conducted our audits of these financial statements in accordance with the standards of the Public Company Accounting Oversight Board (United States). Those standards require that we plan and perform the audit to obtain reasonable assurance about whether the financial statements are free of material misstatement. An audit includes examining, on a test basis, evidence supporting the amounts and disclosures in the financial statements, assessing the accounting principles used and significant estimates made by management, and evaluating the overall financial statement presentation. We believe that our audits provide a reasonable basis for our opinion.
/s/PricewaterhouseCoopers LLP
Philadelphia, Pennsylvania
February 24, 2016
| | |
| Important Tax Information (Unaudited) | | |
The following information is provided with respect to the ordinary income distributions paid during the taxable year ended December 31, 2015.
| | | | |
| | | January — December 2015 | |
Qualified Dividend Income for Individuals1 | | | 73.26% | |
| |
Dividends Qualifying for the Dividend Received Deductions for Corporations1 | | | 68.91% | |
| | 1 | | The Fund hereby designates the percentage indicated above or the maximum amount allowable by law. |
Additionally, the Fund distributed long-term capital gains of $0.018216 and $0.347132 per share to shareholders on record June 29, 2015 and December 29, 2015, respectively.
| | | | | | |
| | | | | | | |
| | BLACKROCK LARGE CAP INDEX FUND | | DECEMBER 31, 2015 | | 17 |
| | |
| Master Portfolio Information | | Large Cap Index Master Portfolio |
| | |
| Ten Largest Holdings | | Percent of
Net Assets |
| | | | |
Apple, Inc. | | | 3 | % |
Microsoft Corp. | | | 2 | |
Exxon Mobil Corp. | | | 2 | |
General Electric Co. | | | 1 | |
Johnson & Johnson | | | 1 | |
Amazon.Com, Inc., | | | 1 | |
Wells Fargo & Co. | | | 1 | |
Berkshire Hathaway, Inc., Class B | | | 1 | |
JPMorgan Chase & Co. | | | 1 | |
Facebook, Inc. | | | 1 | |
| | |
| Sector Allocation | | Percent of
Net Assets |
| | | | |
Information Technology | | | 20 | % |
Financials | | | 18 | |
Health Care | | | 15 | |
Consumer Discretionary | | | 14 | |
Industrials | | | 11 | |
Consumer Staples | | | 9 | |
Energy | | | 6 | |
Materials | | | 3 | |
Utilities | | | 3 | |
Telecommunication Services | | | 2 | |
Shot-Term Securities | | | 12 | |
Liabilities in Excess of Other Assets | | | (13 | ) |
For Master Portfolio compliance purposes, the Master Portfolio’s sector classifications refer to any one or more of the sector sub-classifications used by one or more widely recognized market indexes or ratings group indexes, and/or as defined by the investment advisor. These definitions may not apply for purposes of this report, which may combine such sector sub-classifications for reporting ease.
| | | | | | |
| | | | | | | |
| 18 | | BLACKROCK LARGE CAP INDEX FUND | | DECEMBER 31, 2015 | | |
| | |
Schedule of Investments December 31, 2015 | | Large Cap Index Master Portfolio (Percentages shown are based on Net Assets) |
| | | | | | | | |
| Common Stocks | | Shares | | | Value | |
Aerospace & Defense — 2.7% | | | | | | | | |
B/E Aerospace, Inc. | | | 13,156 | | | $ | 557,420 | |
Boeing Co. | | | 86,489 | | | | 12,505,445 | |
General Dynamics Corp. | | | 36,465 | | | | 5,008,832 | |
Hexcel Corp. (a) | | | 12,107 | | | | 562,370 | |
Honeywell International, Inc. | | | 97,769 | | | | 10,125,935 | |
Huntington Ingalls Industries, Inc. | | | 6,019 | | | | 763,510 | |
L-3 Communications Holdings, Inc. | | | 10,301 | | | | 1,231,073 | |
Lockheed Martin Corp. | | | 33,938 | | | | 7,369,637 | |
Northrop Grumman Corp. | | | 22,811 | | | | 4,306,945 | |
Orbital ATK, Inc. | | | 7,593 | | | | 678,359 | |
Oshkosh Corp. (a) | | | 9,551 | | | | 372,871 | |
Precision Castparts Corp. | | | 17,289 | | | | 4,011,221 | |
Raytheon Co. | | | 38,165 | | | | 4,752,687 | |
Rockwell Collins, Inc. | | | 16,544 | | | | 1,527,011 | |
Spirit Aerosystems Holdings, Inc., Class A (b) | | | 17,769 | | | | 889,694 | |
Textron, Inc. | | | 34,726 | | | | 1,458,839 | |
TransDigm Group, Inc. (b) | | | 6,665 | | | | 1,522,619 | |
Triumph Group, Inc. | | | 6,143 | | | | 244,184 | |
United Technologies Corp. | | | 111,339 | | | | 10,696,338 | |
| | | | | | | | |
| | | | | 68,584,990 | |
Air Freight & Logistics — 0.6% | | | | | | | | |
C.H. Robinson Worldwide, Inc. | | | 18,240 | | | | 1,131,245 | |
Expeditors International of Washington, Inc. (a) | | | 23,923 | | | | 1,078,927 | |
FedEx Corp. (a) | | | 35,490 | | | | 5,287,655 | |
United Parcel Service, Inc., Class B | | | 87,744 | | | | 8,443,605 | |
| | | | | | | | |
| | | | | 15,941,432 | |
Airlines — 0.7% | | | | | | | | |
Alaska Air Group, Inc. (a) | | | 16,214 | | | | 1,305,389 | |
American Airlines Group, Inc. | | | 78,836 | | | | 3,338,705 | |
Copa Holdings SA, Class A (a) | | | 4,227 | | | | 203,995 | |
Delta Air Lines, Inc. | | | 102,096 | | | | 5,175,246 | |
JetBlue Airways Corp. (b) | | | 39,297 | | | | 890,077 | |
Southwest Airlines Co. | | | 83,585 | | | | 3,599,170 | |
Spirit Airlines, Inc. (b) | | | 9,276 | | | | 369,649 | |
United Continental Holdings, Inc. (b) | | | 47,778 | | | | 2,737,679 | |
| | | | | | | | |
| | | | | 17,619,910 | |
Auto Components — 0.5% | | | | | | | | |
Allison Transmission Holdings, Inc. | | | 22,539 | | | | 583,535 | |
BorgWarner, Inc. (a) | | | 28,300 | | | | 1,223,409 | |
Delphi Automotive PLC (a) | | | 36,113 | | | | 3,095,967 | |
Gentex Corp. (a) | | | 36,904 | | | | 590,833 | |
Goodyear Tire & Rubber Co. | | | 33,758 | | | | 1,102,874 | |
Johnson Controls, Inc. | | | 81,901 | | | | 3,234,270 | |
Lear Corp. | | | 9,726 | | | | 1,194,645 | |
Visteon Corp. (b) | | | 5,077 | | | | 581,317 | |
| | | | | | | | |
| | | | | 11,606,850 | |
Automobiles — 0.8% | | | | | | | | |
Ford Motor Co. | | | 488,339 | | | | 6,880,697 | |
General Motors Co. | | | 201,016 | | | | 6,836,554 | |
Harley-Davidson, Inc. (a) | | | 25,346 | | | | 1,150,455 | |
PACCAR, Inc. | | | 44,375 | | | | 2,103,375 | |
Tesla Motors, Inc. (a)(b) | | | 12,197 | | | | 2,927,402 | |
| | | | | | | | |
| Common Stocks | | Shares | | | Value | |
Automobiles (continued) | | | | | | | | |
Thor Industries, Inc. (a) | | | 5,661 | | | $ | 317,865 | |
| | | | | | | | |
| | | | | 20,216,348 | |
Banks — 3.8% | | | | | | | | |
Associated Banc-Corp | | | 18,820 | | | | 352,875 | |
Bank of America Corp. | | | 1,313,508 | | | | 22,106,340 | |
Bank of Hawaii Corp. (a) | | | 5,394 | | | | 339,283 | |
BankUnited, Inc. | | | 12,981 | | | | 468,095 | |
BB&T Corp. | | | 97,027 | | | | 3,668,591 | |
BOK Financial Corp. (a) | | | 3,608 | | | | 215,722 | |
CIT Group, Inc. | | | 21,835 | | | | 866,849 | |
Citizens Financial Group, Inc. | | | 39,122 | | | | 1,024,605 | |
Comerica, Inc. | | | 22,331 | | | | 934,106 | |
Commerce Bancshares, Inc. (a) | | | 10,862 | | | | 462,069 | |
Cullen/Frost Bankers, Inc. (a) | | | 6,470 | | | | 388,200 | |
East West Bancorp, Inc. | | | 18,049 | | | | 750,116 | |
Fifth Third Bancorp (a) | | | 101,300 | | | | 2,036,130 | |
First Horizon National Corp. (a) | | | 27,776 | | | | 403,308 | |
First Niagara Financial Group, Inc. | | | 42,429 | | | | 460,355 | |
First Republic Bank | | | 17,791 | | | | 1,175,273 | |
Huntington Bancshares, Inc. | | | 101,124 | | | | 1,118,431 | |
KeyCorp | | | 106,099 | | | | 1,399,446 | |
M&T Bank Corp. (a) | | | 19,970 | | | | 2,419,965 | |
PacWest Bancorp | | | 14,050 | | | | 605,555 | |
PNC Financial Services Group, Inc. (c) | | | 64,776 | | | | 6,173,801 | |
Popular, Inc. | | | 12,704 | | | | 360,031 | |
Regions Financial Corp. (a) | | | 167,640 | | | | 1,609,344 | |
Signature Bank (b) | | | 6,359 | | | | 975,280 | |
SunTrust Banks, Inc. | | | 64,564 | | | | 2,765,922 | |
SVB Financial Group (b) | | | 6,409 | | | | 762,030 | |
Synovus Financial Corp. | | | 16,934 | | | | 548,323 | |
TCF Financial Corp. | | | 20,940 | | | | 295,673 | |
US Bancorp | | | 209,520 | | | | 8,940,218 | |
Wells Fargo & Co. | | | 582,687 | | | | 31,674,865 | |
Zions Bancorporation (a) | | | 24,583 | | | | 671,116 | |
| | | | | | | | |
| | | | | 95,971,917 | |
Beverages — 2.1% | | | | | | | | |
Brown-Forman Corp., Class A | | | 3,363 | | | | 370,300 | |
Brown-Forman Corp., Class B | | | 15,479 | | | | 1,536,755 | |
Coca-Cola Co. | | | 490,435 | | | | 21,069,088 | |
Coca-Cola Enterprises, Inc. | | | 29,140 | | | | 1,434,854 | |
Constellation Brands, Inc., Class A | | | 20,461 | | | | 2,914,465 | |
Dr Pepper Snapple Group, Inc. | | | 23,980 | | | | 2,234,936 | |
Molson Coors Brewing Co., Class B | | | 17,247 | | | | 1,619,838 | |
Monster Beverage Corp. (b) | | | 18,712 | | | | 2,787,339 | |
PepsiCo, Inc. | | | 184,612 | | | | 18,446,431 | |
| | | | | | | | |
| | | | | 52,414,006 | |
Biotechnology — 3.6% | | | | | | | | |
AbbVie, Inc. | | | 207,027 | | | | 12,264,279 | |
Agios Pharmaceuticals, Inc. (a)(b) | | | 3,280 | | | | 212,938 | |
Alexion Pharmaceuticals, Inc. (b) | | | 26,987 | | | | 5,147,770 | |
Alkermes PLC (b) | | | 18,590 | | | | 1,475,674 | |
Alnylam Pharmaceuticals, Inc. (b) | | | 9,309 | | | | 876,349 | |
Amgen, Inc. | | | 95,095 | | | | 15,436,771 | |
| | | | | | |
| ETF | | Exchange-Traded Fund | | | | |
| REIT | | Real Estate Investment Trust | | | | |
See Notes to Financial Statements.
| | | | | | |
| | | | | | | |
| | BLACKROCK LARGE CAP INDEX FUND | | DECEMBER 31, 2015 | | 19 |
| | |
Schedule of Investments (continued) | | Large Cap Index Master Portfolio |
| | | | | | | | |
| Common Stocks | | Shares | | | Value | |
Biotechnology (continued) | | | | | | | | |
Biogen, Inc. (b) | | | 27,879 | | | $ | 8,540,732 | |
BioMarin Pharmaceutical, Inc. (b) | | | 20,054 | | | | 2,100,857 | |
Bluebird Bio, Inc. (b) | | | 4,594 | | | | 295,027 | |
Celgene Corp. (b) | | | 99,200 | | | | 11,880,192 | |
Gilead Sciences, Inc. (a) | | | 183,805 | | | | 18,599,228 | |
Incyte Corp. (b) | | | 19,568 | | | | 2,122,150 | |
Intercept Pharmaceuticals, Inc. (b) | | | 1,958 | | | | 292,427 | |
Intrexon Corp. (a)(b) | | | 6,076 | | | | 183,191 | |
Ionis Pharmaceuticals, inc. (a)(b) | | | 14,586 | | | | 903,311 | |
Juno Therapeutics, Inc. (a)(b) | | | 1,370 | | | | 60,239 | |
Medivation, Inc. (b) | | | 19,745 | | | | 954,473 | |
OPKO Health, Inc. (a)(b) | | | 38,996 | | | | 391,910 | |
Puma Biotechnology, Inc. (a)(b) | | | 3,179 | | | | 249,234 | |
Regeneron Pharmaceuticals, Inc. (b) | | | 9,812 | | | | 5,326,640 | |
Seattle Genetics, Inc. (a)(b) | | | 13,245 | | | | 594,436 | |
United Therapeutics Corp. (b) | | | 5,801 | | | | 908,495 | |
Vertex Pharmaceuticals, Inc. (b) | | | 30,487 | | | | 3,836,179 | |
| | | | | | | | |
| | | | | 92,652,502 | |
Building Products — 0.2% | | | | | | | | |
Allegion PLC | | | 11,652 | | | | 768,100 | |
AO Smith Corp. | | | 9,203 | | | | 705,042 | |
Armstrong World Industries, Inc. (b) | | | 4,971 | | | | 227,324 | |
Fortune Brands Home & Security, Inc. (a) | | | 20,000 | | | | 1,110,000 | |
Lennox International, Inc. | | | 5,078 | | | | 634,242 | |
Masco Corp. | | | 43,600 | | | | 1,233,880 | |
Owens Corning | | | 14,803 | | | | 696,185 | |
USG Corp. (a)(b) | | | 11,357 | | | | 275,861 | |
| | | | | | | | |
| | | | | 5,650,634 | |
Capital Markets — 2.1% | | | | | | | | |
Affiliated Managers Group, Inc. (b) | | | 6,845 | | | | 1,093,557 | |
Ameriprise Financial, Inc. (a) | | | 22,686 | | | | 2,414,244 | |
Artisan Partners Asset Management, Inc., Class A (a) | | | 4,812 | | | | 173,521 | |
Bank of New York Mellon Corp. | | | 140,269 | | | | 5,781,888 | |
BlackRock, Inc. (c) | | | 15,691 | | | | 5,343,099 | |
Charles Schwab Corp. | | | 143,291 | | | | 4,718,573 | |
E*Trade Financial Corp. (b) | | | 36,368 | | | | 1,077,948 | |
Eaton Vance Corp. (a) | | | 14,864 | | | | 482,040 | |
Federated Investors, Inc., Class B (a) | | | 11,520 | | | | 330,048 | |
Franklin Resources, Inc. | | | 48,511 | | | | 1,786,175 | |
Goldman Sachs Group, Inc. | | | 54,033 | | | | 9,738,368 | |
Invesco Ltd. | | | 53,869 | | | | 1,803,534 | |
Lazard Ltd., Class A | | | 8,183 | | | | 368,317 | |
Legg Mason, Inc. (a) | | | 12,271 | | | | 481,391 | |
LPL Financial Holdings, Inc. (a) | | | 10,056 | | | | 428,888 | |
Morgan Stanley | | | 191,730 | | | | 6,098,931 | |
Northern Trust Corp. | | | 29,188 | | | | 2,104,163 | |
NorthStar Asset Management Group, Inc. | | | 23,656 | | | | 287,184 | |
Raymond James Financial, Inc. | | | 16,029 | | | | 929,201 | |
SEI Investments Co. | | | 17,488 | | | | 916,371 | |
State Street Corp. | | | 51,490 | | | | 3,416,876 | |
T. Rowe Price Group, Inc. (a) | | | 32,592 | | | | 2,330,002 | |
TD Ameritrade Holding Corp. | | | 33,395 | | | | 1,159,140 | |
Waddell & Reed Financial, Inc., Class A (a) | | | 10,275 | | | | 294,482 | |
| | | | | | | | |
| | | | | 53,557,941 | |
Chemicals — 2.2% | | | | | | | | |
Air Products & Chemicals, Inc. | | | 26,861 | | | | 3,494,885 | |
Airgas, Inc. | | | 8,563 | | | | 1,184,434 | |
| | | | | | | | |
| Common Stocks | | Shares | | | Value | |
Chemicals (continued) | | | | | | | | |
Albemarle Corp. (a) | | | 13,653 | | | $ | 764,705 | |
Ashland, Inc. (a) | | | 8,479 | | | | 870,793 | |
Axalta Coating Systems Ltd. (b) | | | 12,403 | | | | 330,540 | |
Cabot Corp. | | | 8,046 | | | | 328,920 | |
Celanese Corp., Series A | | | 19,166 | | | | 1,290,447 | |
CF Industries Holdings, Inc. | | | 29,438 | | | | 1,201,365 | |
Chemours Co. | | | 21,176 | | | | 113,503 | |
Dow Chemical Co. | | | 139,926 | | | | 7,203,390 | |
E.I. du Pont de Nemours & Co. | | | 113,219 | | | | 7,540,385 | |
Eastman Chemical Co. | | | 18,593 | | | | 1,255,213 | |
Ecolab, Inc. (a) | | | 33,021 | | | | 3,776,942 | |
FMC Corp. (a) | | | 16,474 | | | | 644,628 | |
Huntsman Corp. | | | 23,823 | | | | 270,868 | |
International Flavors & Fragrances, Inc. (a) | | | 10,117 | | | | 1,210,398 | |
LyondellBasell Industries NV, Class A | | | 45,731 | | | | 3,974,024 | |
Monsanto Co. | | | 55,011 | | | | 5,419,684 | |
Mosaic Co. | | | 43,580 | | | | 1,202,372 | |
NewMarket Corp. (a) | | | 1,041 | | | | 396,340 | |
Platform Specialty Products Corp. (a)(b) | | | 15,803 | | | | 202,752 | |
PPG Industries, Inc. | | | 34,001 | | | | 3,359,979 | |
Praxair, Inc. (a) | | | 36,060 | | | | 3,692,544 | |
RPM International, Inc. | | | 16,697 | | | | 735,670 | |
Scotts Miracle-Gro Co., Class A | | | 5,556 | | | | 358,418 | |
Sherwin-Williams Co. (a) | | | 10,128 | | | | 2,629,229 | |
Valspar Corp. (a) | | | 10,162 | | | | 842,938 | |
Westlake Chemical Corp. | | | 5,081 | | | | 276,000 | |
WR Grace & Co. (a)(b) | | | 9,131 | | | | 909,356 | |
| | | | | | | | |
| | | | | 55,480,722 | |
Commercial Services & Supplies — 0.5% | | | | | | | | |
ADT Corp. (a) | | | 20,799 | | | | 685,951 | |
Cintas Corp. | | | 11,262 | | | | 1,025,405 | |
Clean Harbors, Inc. (a)(b) | | | 7,222 | | | | 300,796 | |
Copart, Inc. (b) | | | 15,082 | | | | 573,267 | |
Covanta Holding Corp. (a) | | | 14,432 | | | | 223,552 | |
Iron Mountain, Inc. | | | 26,499 | | | | 715,738 | |
KAR Auction Services, Inc. | | | 17,562 | | | | 650,321 | |
Pitney Bowes, Inc. (a) | | | 25,552 | | | | 527,649 | |
Republic Services, Inc. | | | 30,326 | | | | 1,334,041 | |
Rollins, Inc. | | | 11,742 | | | | 304,118 | |
RR Donnelley & Sons Co. (a) | | | 25,456 | | | | 374,712 | |
Stericycle, Inc. (b) | | | 10,637 | | | | 1,282,822 | |
Tyco International PLC | | | 52,659 | | | | 1,679,295 | |
Waste Connections, Inc. | | | 15,492 | | | | 872,509 | |
Waste Management, Inc. | | | 57,261 | | | | 3,056,020 | |
| | | | | | | | |
| | | | | 13,606,196 | |
Communications Equipment — 1.4% | | | | | | | | |
Arista Networks, Inc. (a)(b) | | | 4,187 | | | | 325,916 | |
ARRIS Group, Inc. (a)(b) | | | 17,034 | | | | 520,729 | |
Brocade Communications Systems, Inc. | | | 52,421 | | | | 481,225 | |
Cisco Systems, Inc. | | | 636,097 | | | | 17,273,214 | |
CommScope Holding Co., Inc. (b) | | | 12,850 | | | | 332,687 | |
EchoStar Corp., Class A (b) | | | 5,607 | | | | 219,290 | |
F5 Networks, Inc. (b) | | | 8,765 | | | | 849,854 | |
Harris Corp. | | | 15,458 | | | | 1,343,300 | |
Juniper Networks, Inc. (a) | | | 49,383 | | | | 1,362,971 | |
Lumentum Holdings, Inc. (b) | | | 5,370 | | | | 118,247 | |
Motorola Solutions, Inc. (a) | | | 22,101 | | | | 1,512,813 | |
Palo Alto Networks, Inc. (b) | | | 9,077 | | | | 1,598,823 | |
QUALCOMM, Inc. (a) | | | 187,994 | | | | 9,396,880 | |
See Notes to Financial Statements.
| | | | | | |
| | | | | | | |
| 20 | | BLACKROCK LARGE CAP INDEX FUND | | DECEMBER 31, 2015 | | |
| | |
Schedule of Investments (continued) | | Large Cap Index Master Portfolio |
| | | | | | | | |
| Common Stocks | | Shares | | | Value | |
Communications Equipment (continued) | | | | | | | | |
Viavi Solutions, Inc. (b) | | | 31,174 | | | $ | 189,850 | |
| | | | | | | | |
| | | | | 35,525,799 | |
Construction & Engineering — 0.1% | | | | | | | | |
AECOM (a)(b) | | | 18,865 | | | | 566,516 | |
Chicago Bridge & Iron Co. NV | | | 12,294 | | | | 479,343 | |
Fluor Corp. (a) | | | 18,388 | | | | 868,281 | |
Jacobs Engineering Group, Inc. (b) | | | 15,756 | | | | 660,964 | |
KBR, Inc. | | | 17,963 | | | | 303,934 | |
Quanta Services, Inc. (b) | | | 25,271 | | | | 511,738 | |
| | | | | | | | |
| | | | | 3,390,776 | |
Construction Materials — 0.1% | | | | | | | | |
Eagle Materials, Inc. | | | 6,431 | | | | 388,626 | |
Martin Marietta Materials, Inc. (a) | | | 8,440 | | | | 1,152,735 | |
Vulcan Materials Co. | | | 16,592 | | | | 1,575,742 | |
| | | | | | | | |
| | | | | 3,117,103 | |
Consumer Finance — 0.8% | | | | | | | | |
Ally Financial, Inc. (b) | | | 58,642 | | | | 1,093,087 | |
American Express Co. | | | 108,082 | | | | 7,517,103 | |
Capital One Financial Corp. (a) | | | 68,342 | | | | 4,932,926 | |
Credit Acceptance Corp. (a)(b) | | | 1,093 | | | | 233,924 | |
Discover Financial Services | | | 55,345 | | | | 2,967,599 | |
Navient Corp. | | | 47,860 | | | | 547,997 | |
OneMain Holdings, Inc. (b) | | | 6,513 | | | | 270,550 | |
Santander Consumer USA Holdings, Inc. (b) | | | 11,331 | | | | 179,596 | |
SLM Corp. (b) | | | 50,149 | | | | 326,971 | |
Synchrony Financial (b) | | | 104,276 | | | | 3,171,033 | |
| | | | | | | | |
| | | | | 21,240,786 | |
Containers & Packaging — 0.4% | | | | | | | | |
AptarGroup, Inc. | | | 7,897 | | | | 573,717 | |
Avery Dennison Corp. | | | 11,255 | | | | 705,238 | |
Ball Corp. | | | 17,242 | | | | 1,254,011 | |
Bemis Co., Inc. | | | 12,328 | | | | 550,938 | |
Crown Holdings, Inc. (b) | | | 17,468 | | | | 885,628 | |
Graphic Packaging Holding Co. | | | 41,384 | | | | 530,957 | |
Owens-Illinois, Inc. (b) | | | 19,046 | | | | 331,781 | |
Packaging Corp. of America | | | 12,254 | | | | 772,615 | |
Sealed Air Corp. | | | 25,620 | | | | 1,142,652 | |
Silgan Holdings, Inc. (a) | | | 5,111 | | | | 274,563 | |
Sonoco Products Co. | | | 12,798 | | | | 523,054 | |
WestRock Co. | | | 32,678 | | | | 1,490,770 | |
| | | | | | | | |
| | | | | 9,035,924 | |
Distributors — 0.1% | | | | | | | | |
Genuine Parts Co. | | | 19,036 | | | | 1,635,002 | |
LKQ Corp. (b) | | | 38,046 | | | | 1,127,303 | |
| | | | | | | | |
| | | | | 2,762,305 | |
Diversified Consumer Services — 0.1% | | | | | | | | |
Graham Holdings Co., Class B | | | 443 | | | | 214,842 | |
H&R Block, Inc. | | | 29,021 | | | | 966,690 | |
Service Corp. International (a) | | | 24,552 | | | | 638,843 | |
ServiceMaster Global Holdings, Inc. (b) | | | 12,851 | | | | 504,273 | |
| | | | | | | | |
| | | | | 2,324,648 | |
Diversified Financial Services — 3.9% | | | | | | | | |
Berkshire Hathaway, Inc., Class B (b) | | | 232,614 | | | | 30,714,352 | |
CBOE Holdings, Inc. (a) | | | 10,474 | | | | 679,763 | |
Citigroup, Inc. | | | 379,483 | | | | 19,638,245 | |
| | | | | | | | |
| Common Stocks | | Shares | | | Value | |
Diversified Financial Services (continued) | | | | | | | | |
CME Group, Inc. | | | 40,095 | | | $ | 3,632,607 | |
FactSet Research Systems, Inc. | | | 5,248 | | | | 853,167 | |
Interactive Brokers Group, Inc., Class A | | | 7,210 | | | | 314,356 | |
Intercontinental Exchange, Inc. | | | 13,922 | | | | 3,567,652 | |
JPMorgan Chase & Co. (a) | | | 464,150 | | | | 30,647,824 | |
Leucadia National Corp. | | | 41,218 | | | | 716,781 | |
McGraw-Hill Financial, Inc. | | | 34,232 | | | | 3,374,591 | |
Moody’s Corp. | | | 22,202 | | | | 2,227,749 | |
Morningstar, Inc. | | | 2,502 | | | | 201,186 | |
MSCI, Inc. | | | 14,106 | | | | 1,017,466 | |
NASDAQ, Inc. | | | 14,079 | | | | 818,975 | |
Vantiv, Inc., Class A (b) | | | 17,976 | | | | 852,422 | |
| | | | | | | | |
| | | | | 99,257,136 | |
Diversified Telecommunication Services — 2.2% | | | | | | | | |
AT&T, Inc. (a) | | | 761,353 | | | | 26,198,157 | |
CenturyLink, Inc. (a) | | | 70,509 | | | | 1,774,006 | |
Frontier Communications Corp. (a) | | | 146,551 | | | | 684,393 | |
Level 3 Communications, Inc. (b) | | | 36,175 | | | | 1,966,473 | |
Verizon Communications, Inc. | | | 510,101 | | | | 23,576,868 | |
Zayo Group Holdings, Inc. (b) | | | 17,955 | | | | 477,424 | |
| | | | | | | | |
| | | | | 54,677,321 | |
Electric Utilities — 1.6% | | | | | | | | |
American Electric Power Co., Inc. | | | 61,278 | | | | 3,570,669 | |
Avangrid, Inc. (b) | | | 7,055 | | | | 270,912 | |
Duke Energy Corp. | | | 86,492 | | | | 6,174,664 | |
Edison International | | | 40,750 | | | | 2,412,808 | |
Entergy Corp. | | | 22,453 | | | | 1,534,887 | |
Eversource Energy | | | 39,729 | | | | 2,028,960 | |
Exelon Corp. | | | 115,011 | | | | 3,193,855 | |
FirstEnergy Corp. | | | 52,784 | | | | 1,674,836 | |
Great Plains Energy, Inc. | | | 19,562 | | | | 534,238 | |
Hawaiian Electric Industries, Inc. | | | 13,151 | | | | 380,721 | |
ITC Holdings Corp. | | | 19,472 | | | | 764,276 | |
NextEra Energy, Inc. (a) | | | 55,548 | | | | 5,770,882 | |
OGE Energy Corp. (a) | | | 24,216 | | | | 636,639 | |
Pepco Holdings, Inc. | | | 31,875 | | | | 829,069 | |
Pinnacle West Capital Corp. | | | 13,896 | | | | 896,014 | |
PPL Corp. | | | 83,561 | | | | 2,851,937 | |
Southern Co. | | | 113,598 | | | | 5,315,250 | |
Westar Energy, Inc. | | | 17,721 | | | | 751,548 | |
Xcel Energy, Inc. (a) | | | 63,401 | | | | 2,276,730 | |
| | | | | | | | |
| | | | | 41,868,895 | |
Electrical Equipment — 0.5% | | | | | | | | |
Acuity Brands, Inc. | | | 5,432 | | | | 1,270,002 | |
AMETEK, Inc. | | | 30,208 | | | | 1,618,847 | |
Babcock & Wilcox Enterprises, Inc. (b) | | | 6,136 | | | | 128,058 | |
Eaton Corp. PLC (a) | | | 58,421 | | | | 3,040,229 | |
Emerson Electric Co. (a) | | | 83,586 | | | | 3,997,918 | |
Hubbell, Inc. | | | 7,141 | | | | 721,527 | |
Regal-Beloit Corp. | | | 5,501 | | | | 321,919 | |
Rockwell Automation, Inc. | | | 16,832 | | | | 1,727,131 | |
SolarCity Corp. (a)(b) | | | 7,306 | | | | 372,752 | |
| | | | | | | | |
| | | | | 13,198,383 | |
Electronic Equipment, Instruments & Components — 0.5% | | | | | |
Amphenol Corp., Class A (a) | | | 38,638 | | | | 2,018,063 | |
Arrow Electronics, Inc. (b) | | | 11,855 | | | | 642,304 | |
Avnet, Inc. | | | 16,482 | | | | 706,089 | |
See Notes to Financial Statements.
| | | | | | |
| | | | | | | |
| | BLACKROCK LARGE CAP INDEX FUND | | DECEMBER 31, 2015 | | 21 |
| | |
Schedule of Investments (continued) | | Large Cap Index Master Portfolio |
| | | | | | | | |
| Common Stocks | | Shares | | | Value | |
Electronic Equipment, Instruments & Components (continued) | |
CDW Corp. | | | 16,546 | | | $ | 695,594 | |
Cognex Corp. | | | 10,678 | | | | 360,596 | |
Corning, Inc. | | | 147,957 | | | | 2,704,654 | |
Dolby Laboratories, Inc., Class A (a) | | | 6,445 | | | | 216,874 | |
Fitbit, Inc., Series A (a)(b) | | | 5,114 | | | | 151,323 | |
FLIR Systems, Inc. | | | 17,809 | | | | 499,899 | |
Ingram Micro, Inc., Class A | | | 19,701 | | | | 598,516 | |
IPG Photonics Corp. (a)(b) | | | 4,244 | | | | 378,395 | |
Jabil Circuit, Inc. (a) | | | 24,567 | | | | 572,165 | |
Keysight Technologies, Inc. (b) | | | 20,920 | | | | 592,664 | |
National Instruments Corp. | | | 13,730 | | | | 393,914 | |
Trimble Navigation Ltd. (b) | | | 32,248 | | | | 691,720 | |
Zebra Technologies Corp., Class A (a)(b) | | | 6,493 | | | | 452,237 | |
| | | | | | | | |
| | | | | 11,675,007 | |
Energy Equipment & Services — 1.0% | | | | | | | | |
Baker Hughes, Inc. | | | 54,366 | | | | 2,508,991 | |
Cameron International Corp. (b) | | | 23,940 | | | | 1,513,008 | |
Diamond Offshore Drilling, Inc. (a) | | | 8,654 | | | | 182,599 | |
Dril-Quip, Inc. (b) | | | 4,833 | | | | 286,259 | |
Ensco PLC, Class A (a) | | | 29,475 | | | | 453,620 | |
FMC Technologies, Inc. (b) | | | 28,967 | | | | 840,333 | |
Frank’s International NV | | | 3,948 | | | | 65,892 | |
Halliburton Co. | | | 106,420 | | | | 3,622,537 | |
Helmerich & Payne, Inc. (a) | | | 11,908 | | | | 637,673 | |
Nabors Industries Ltd. | | | 41,837 | | | | 356,033 | |
National Oilwell Varco, Inc. (a) | | | 48,512 | | | | 1,624,667 | |
Noble Corp. PLC (a) | | | 29,687 | | | | 313,198 | |
Oceaneering International, Inc. | | | 12,401 | | | | 465,285 | |
Patterson-UTI Energy, Inc. (a) | | | 18,522 | | | | 279,312 | |
Rowan Cos. PLC, Class A | | | 15,767 | | | | 267,251 | |
RPC, Inc. (a) | | | 6,673 | | | | 79,742 | |
Schlumberger Ltd. | | | 158,806 | | | | 11,076,718 | |
Seadrill Ltd. (a)(b) | | | 46,104 | | | | 156,293 | |
Superior Energy Services, Inc. (a) | | | 19,011 | | | | 256,078 | |
Weatherford International PLC (a)(b) | | | 97,186 | | | | 815,391 | |
| | | | | | | | |
| | | | | 25,800,880 | |
Food & Staples Retailing — 2.2% | | | | | | | | |
Costco Wholesale Corp. | | | 55,028 | | | | 8,887,022 | |
CVS Health Corp. | | | 141,122 | | | | 13,797,498 | |
Kroger Co. (a) | | | 122,621 | | | | 5,129,236 | |
Rite Aid Corp. (b) | | | 124,039 | | | | 972,466 | |
Sprouts Farmers Market, Inc. (a)(b) | | | 18,751 | | | | 498,589 | |
Sysco Corp. | | | 74,263 | | | | 3,044,783 | |
Wal-Mart Stores, Inc. | | | 197,560 | | | | 12,110,428 | |
Walgreens Boots Alliance, Inc. | | | 107,526 | | | | 9,156,377 | |
Whole Foods Market, Inc. (a) | | | 44,811 | | | | 1,501,168 | |
| | | | | | | | |
| | | | | 55,097,567 | |
Food Products — 1.7% | | | | | | | | |
Archer-Daniels-Midland Co. | | | 77,591 | | | | 2,846,038 | |
Blue Buffalo Pet Products, Inc. (b) | | | 4,730 | | | | 88,498 | |
Bunge Ltd. | | | 17,962 | | | | 1,226,445 | |
Campbell Soup Co. (a) | | | 21,777 | | | | 1,144,381 | |
ConAgra Foods, Inc. | | | 53,412 | | | | 2,251,850 | |
Flowers Foods, Inc. (a) | | | 21,993 | | | | 472,630 | |
General Mills, Inc. | | | 74,554 | | | | 4,298,784 | |
Hain Celestial Group, Inc. (a)(b) | | | 12,353 | | | | 498,938 | |
Hershey Co. (a) | | | 18,221 | | | | 1,626,589 | |
Hormel Foods Corp. (a) | | | 16,737 | | | | 1,323,562 | |
| | | | | | | | |
| Common Stocks | | Shares | | | Value | |
Food Products (continued) | | | | | | | | |
Ingredion, Inc. | | | 8,915 | | | $ | 854,414 | |
J.M. Smucker Co. | | | 14,967 | | | | 1,846,030 | |
Kellogg Co. | | | 31,235 | | | | 2,257,353 | |
Keurig Green Mountain, Inc. (a) | | | 16,213 | | | | 1,458,846 | |
Kraft Heinz Co. | | | 74,035 | | | | 5,386,787 | |
McCormick & Co., Inc. (a) | | | 15,983 | | | | 1,367,505 | |
Mead Johnson Nutrition Co. | | | 25,334 | | | | 2,000,119 | |
Mondelez International, Inc., Class A | | | 203,444 | | | | 9,122,429 | |
Pilgrim’s Pride Corp. (a) | | | 8,670 | | | | 191,520 | |
Pinnacle Foods, Inc. | | | 14,453 | | | | 613,674 | |
Tyson Foods, Inc., Class A | | | 36,865 | | | | 1,966,010 | |
WhiteWave Foods Co. (b) | | | 21,969 | | | | 854,814 | |
| | | | | | | | |
| | | | | 43,697,216 | |
Gas Utilities — 0.1% | | | | | | | | |
AGL Resources, Inc. | | | 15,001 | | | | 957,214 | |
Atmos Energy Corp. | | | 12,315 | | | | 776,338 | |
National Fuel Gas Co. (a) | | | 10,592 | | | | 452,808 | |
Questar Corp. | | | 20,886 | | | | 406,859 | |
UGI Corp. | | | 20,883 | | | | 705,010 | |
| | | | | | | | |
| | | | | 3,298,229 | |
Health Care Equipment & Supplies — 2.5% | | | | | | | | |
Abbott Laboratories | | | 186,201 | | | | 8,362,287 | |
Alere, Inc. (b) | | | 10,767 | | | | 420,882 | |
Align Technology, Inc. (b) | | | 10,132 | | | | 667,192 | |
Baxter International, Inc. | | | 68,071 | | | | 2,596,909 | |
Becton Dickinson & Co. | | | 26,189 | | | | 4,035,463 | |
Boston Scientific Corp. (b) | | | 167,680 | | | | 3,092,019 | |
C.R. Bard, Inc. | | | 9,287 | | | | 1,759,329 | |
Cooper Cos., Inc. (a) | | | 6,061 | | | | 813,386 | |
Danaher Corp. | | | 74,583 | | | | 6,927,269 | |
DENTSPLY International, Inc. (a) | | | 17,540 | | | | 1,067,309 | |
DexCom, Inc. (b) | | | 9,918 | | | | 812,284 | |
Edwards Lifesciences Corp. (b) | | | 26,905 | | | | 2,124,957 | |
Hill-Rom Holdings, Inc. | | | 6,936 | | | | 333,344 | |
Hologic, Inc. (b) | | | 30,754 | | | | 1,189,872 | |
IDEXX Laboratories, Inc. (a)(b) | | | 11,799 | | | | 860,383 | |
Intuitive Surgical, Inc. (b) | | | 4,610 | | | | 2,517,798 | |
Medtronic PLC | | | 178,235 | | | | 13,709,836 | |
ResMed, Inc. (a) | | | 17,679 | | | | 949,186 | |
Sirona Dental Systems, Inc. (b) | | | 6,860 | | | | 751,650 | |
St. Jude Medical, Inc. | | | 35,168 | | | | 2,172,327 | |
Stryker Corp. | | | 42,245 | | | | 3,926,250 | |
Teleflex, Inc. (a) | | | 5,132 | | | | 674,602 | |
Varian Medical Systems, Inc. (a)(b) | | | 12,521 | | | | 1,011,697 | |
Zimmer Biomet Holdings, Inc. (a) | | | 21,313 | | | | 2,186,501 | |
| | | | | | | | |
| | | | | 62,962,732 | |
Health Care Providers & Services — 2.6% | | | | | | | | |
Acadia Healthcare Co., Inc. (b) | | | 6,486 | | | | 405,116 | |
Aetna, Inc. | | | 43,675 | | | | 4,722,141 | |
AmerisourceBergen Corp. | | | 25,719 | | | | 2,667,318 | |
Anthem, Inc. (a) | | | 32,944 | | | | 4,593,711 | |
Brookdale Senior Living, Inc. (b) | | | 22,853 | | | | 421,866 | |
Cardinal Health, Inc. | | | 41,378 | | | | 3,693,814 | |
Centene Corp. (b) | | | 14,919 | | | | 981,820 | |
Cigna Corp. | | | 32,190 | | | | 4,710,363 | |
Community Health Systems, Inc. (b) | | | 15,087 | | | | 400,258 | |
DaVita HealthCare Partners, Inc. (b) | | | 22,066 | | | | 1,538,221 | |
Envision Healthcare Holdings, Inc. (b) | | | 23,288 | | | | 604,789 | |
See Notes to Financial Statements.
| | | | | | |
| | | | | | | |
| 22 | | BLACKROCK LARGE CAP INDEX FUND | | DECEMBER 31, 2015 | | |
| | |
Schedule of Investments (continued) | | Large Cap Index Master Portfolio |
| | | | | | | | |
| Common Stocks | | Shares | | | Value | |
Health Care Providers & Services (continued) | | | | | | | | |
Express Scripts Holding Co. (a)(b) | | | 84,515 | | | $ | 7,387,456 | |
HCA Holdings, Inc. (b) | | | 40,099 | | | | 2,711,895 | |
Health Net, Inc. (b) | | | 9,679 | | | | 662,624 | |
Henry Schein, Inc. (b) | | | 10,459 | | | | 1,654,509 | |
Humana, Inc. | | | 18,734 | | | | 3,344,206 | |
Laboratory Corp. of America Holdings (b) | | | 12,558 | | | | 1,552,671 | |
LifePoint Hospitals, Inc. (b) | | | 5,543 | | | | 406,856 | |
McKesson Corp. | | | 28,961 | | | | 5,711,978 | |
MEDNAX, Inc. (a)(b) | | | 11,735 | | | | 840,930 | |
Patterson Cos., Inc. | | | 10,957 | | | | 495,366 | |
Premier, Inc., Class A (b) | | | 5,018 | | | | 176,985 | |
Quest Diagnostics, Inc. | | | 17,965 | | | | 1,278,030 | |
Tenet Healthcare Corp. (a)(b) | | | 12,532 | | | | 379,720 | |
UnitedHealth Group, Inc. | | | 119,056 | | | | 14,005,748 | |
Universal Health Services, Inc., Class B | | | 11,485 | | | | 1,372,343 | |
VCA, Inc. (b) | | | 10,338 | | | | 568,590 | |
| | | | | | | | |
| | | | | 67,289,324 | |
Health Care Technology — 0.1% | | | | | | | | |
Athenahealth, Inc. (a)(b) | | | 4,839 | | | | 778,934 | |
Cerner Corp. (b) | | | 37,479 | | | | 2,255,111 | |
IMS Health Holdings, Inc. (b) | | | 17,002 | | | | 433,041 | |
Inovalon Holdings, Inc. (a)(b) | | | 2,901 | | | | 49,317 | |
Veeva Systems, Inc., Class A (a)(b) | | | 9,139 | | | | 263,660 | |
| | | | | | | | |
| | | | | 3,780,063 | |
Hotels, Restaurants & Leisure — 2.1% | | | | | | | | |
ARAMARK | | | 24,192 | | | | 780,192 | |
Brinker International, Inc. (a) | | | 7,457 | | | | 357,563 | |
Carnival Corp. | | | 53,125 | | | | 2,894,250 | |
Chipotle Mexican Grill, Inc. (b) | | | 3,884 | | | | 1,863,737 | |
Choice Hotels International, Inc. (a) | | | 4,561 | | | | 229,920 | |
Darden Restaurants, Inc. (a) | | | 15,733 | | | | 1,001,248 | |
Domino’s Pizza, Inc. (a) | | | 6,904 | | | | 768,070 | |
Dunkin’ Brands Group, Inc. (a) | | | 12,095 | | | | 515,126 | |
Extended Stay America, Inc. | | | 6,383 | | | | 101,490 | |
Hilton Worldwide Holdings, Inc. | | | 64,963 | | | | 1,390,208 | |
Hyatt Hotels Corp., Class A (a)(b) | | | 4,404 | | | | 207,076 | |
International Game Technology PLC | | | 12,326 | | | | 199,435 | |
Las Vegas Sands Corp. | | | 45,725 | | | | 2,004,584 | |
Marriott International, Inc., Class A (a) | | | 25,755 | | | | 1,726,615 | |
McDonald’s Corp. (a) | | | 119,883 | | | | 14,162,978 | |
MGM Resorts International (b) | | | 55,700 | | | | 1,265,504 | |
Norwegian Cruise Line Holdings Ltd. (b) | | | 16,483 | | | | 965,904 | |
Panera Bread Co., Class A (b) | | | 3,179 | | | | 619,206 | |
Royal Caribbean Cruises Ltd. | | | 21,511 | | | | 2,177,128 | |
Six Flags Entertainment Corp. | | | 8,791 | | | | 482,978 | |
Starbucks Corp. | | | 187,669 | | | | 11,265,770 | |
Starwood Hotels & Resorts Worldwide, Inc. | | | 21,373 | | | | 1,480,721 | |
Wendy’s Co. (a) | | | 25,917 | | | | 279,126 | |
Wyndham Worldwide Corp. (a) | | | 15,015 | | | | 1,090,840 | |
Wynn Resorts Ltd. (a) | | | 10,225 | | | | 707,468 | |
Yum! Brands, Inc. | | | 54,081 | | | | 3,950,617 | |
| | | | | | | | |
| | | | | 52,487,754 | |
Household Durables — 0.6% | | | | | | | | |
D.R. Horton, Inc. | | | 41,058 | | | | 1,315,088 | |
Garmin Ltd. (a) | | | 14,860 | | | | 552,346 | |
GoPro, Inc., Class A (a)(b) | | | 10,387 | | | | 187,070 | |
Harman International Industries, Inc. | | | 8,929 | | | | 841,201 | |
Jarden Corp. (b) | | | 26,398 | | | | 1,507,854 | |
| | | | | | | | |
| Common Stocks | | Shares | | | Value | |
Household Durables (continued) | | | | | | | | |
Leggett & Platt, Inc. | | | 17,245 | | | $ | 724,635 | |
Lennar Corp., Class A (a) | | | 21,750 | | | | 1,063,792 | |
Lennar Corp., Class B | | | 1,116 | | | | 44,841 | |
Mohawk Industries, Inc. (b) | | | 7,721 | | | | 1,462,280 | |
Newell Rubbermaid, Inc. | | | 33,607 | | | | 1,481,396 | |
NVR, Inc. (b) | | | 495 | | | | 813,285 | |
PulteGroup, Inc. | | | 45,739 | | | | 815,069 | |
Tempur Sealy International, Inc. (b) | | | 7,670 | | | | 540,428 | |
Toll Brothers, Inc. (b) | | | 21,966 | | | | 731,468 | |
TopBuild Corp. (b) | | | 4,545 | | | | 139,850 | |
Tupperware Brands Corp. (a) | | | 6,189 | | | | 344,418 | |
Whirlpool Corp. | | | 9,837 | | | | 1,444,760 | |
| | | | | | | | |
| | | | | 14,009,781 | |
Household Products — 1.7% | | | | | | | | |
Church & Dwight Co., Inc. | | | 16,369 | | | | 1,389,401 | |
Clorox Co. | | | 16,407 | | | | 2,080,900 | |
Colgate-Palmolive Co. | | | 113,136 | | | | 7,537,120 | |
Energizer Holdings, Inc. (a) | | | 7,914 | | | | 269,551 | |
Kimberly-Clark Corp. | | | 45,539 | | | | 5,797,115 | |
Procter & Gamble Co. | | | 339,317 | | | | 26,945,163 | |
Spectrum Brands Holdings, Inc. | | | 3,147 | | | | 320,364 | |
| | | | | | | | |
| | | | | 44,339,614 | |
Independent Power and Renewable Electricity Producers — 0.1% | |
AES Corp. (a) | | | 85,606 | | | | 819,249 | |
Calpine Corp. (b) | | | 46,603 | | | | 674,345 | |
NRG Energy, Inc. | | | 42,144 | | | | 496,035 | |
TerraForm Power, Inc., Class A (a)(b) | | | 6,982 | | | | 87,834 | |
| | | | | | | | |
| | | | | 2,077,463 | |
Industrial Conglomerates — 2.0% | | | | | | | | |
3M Co. | | | 79,338 | | | | 11,951,476 | |
BWX Technologies, Inc. | | | 13,195 | | | | 419,205 | |
Carlisle Cos., Inc. | | | 8,141 | | | | 722,025 | |
General Electric Co. | | | 1,176,238 | | | | 36,639,814 | |
Roper Technologies, Inc. | | | 12,573 | | | | 2,386,230 | |
| | | | | | | | |
| | | | | 52,118,750 | |
Insurance — 3.1% | | | | | | | | |
ACE Ltd. | | | 40,848 | | | | 4,773,089 | |
Aflac, Inc. | | | 54,267 | | | | 3,250,593 | |
Alleghany Corp. (b) | | | 2,010 | | | | 960,639 | |
Allied World Assurance Co. Holdings AG | | | 12,202 | | | | 453,792 | |
Allstate Corp. | | | 48,441 | | | | 3,007,702 | |
American Financial Group, Inc. | | | 8,654 | | | | 623,780 | |
American International Group, Inc. | | | 154,715 | | | | 9,587,689 | |
American National Insurance Co. | | | 831 | | | | 84,986 | |
AmTrust Financial Services, Inc. (a) | | | 4,788 | | | | 294,845 | |
Aon PLC | | | 35,251 | | | | 3,250,495 | |
Arch Capital Group Ltd. (b) | | | 15,513 | | | | 1,082,032 | |
Arthur J Gallagher & Co. | | | 21,071 | | | | 862,647 | |
Aspen Insurance Holdings Ltd. | | | 7,589 | | | | 366,549 | |
Assurant, Inc. | | | 8,522 | | | | 686,362 | |
Assured Guaranty Ltd. | | | 19,193 | | | | 507,271 | |
Axis Capital Holdings Ltd. | | | 12,470 | | | | 701,063 | |
Brown & Brown, Inc. | | | 14,515 | | | | 465,931 | |
Chubb Corp. | | | 28,736 | | | | 3,811,543 | |
Cincinnati Financial Corp. | | | 20,557 | | | | 1,216,358 | |
CNA Financial Corp. | | | 3,088 | | | | 108,543 | |
Endurance Specialty Holdings Ltd. | | | 7,860 | | | | 502,961 | |
Erie Indemnity Co., Class A | | | 3,059 | | | | 292,563 | |
See Notes to Financial Statements.
| | | | | | |
| | | | | | | |
| | BLACKROCK LARGE CAP INDEX FUND | | DECEMBER 31, 2015 | | 23 |
| | |
Schedule of Investments (continued) | | Large Cap Index Master Portfolio |
| | | | | | | | |
| Common Stocks | | Shares | | | Value | |
Insurance (continued) | | | | | | | | |
Everest Re Group Ltd. | | | 5,576 | | | $ | 1,020,910 | |
FNF Group | | | 35,077 | | | | 1,216,120 | |
Genworth Financial, Inc., Class A (a)(b) | | | 61,794 | | | | 230,492 | |
Hanover Insurance Group, Inc. | | | 5,260 | | | | 427,848 | |
Hartford Financial Services Group, Inc. | | | 52,521 | | | | 2,282,563 | |
Lincoln National Corp. | | | 31,646 | | | | 1,590,528 | |
Loews Corp. | | | 38,938 | | | | 1,495,219 | |
Markel Corp. (b) | | | 1,745 | | | | 1,541,446 | |
Marsh & McLennan Cos., Inc. | | | 67,149 | | | | 3,723,412 | |
Mercury General Corp. (a) | | | 845 | | | | 39,352 | |
MetLife, Inc. | | | 117,164 | | | | 5,648,476 | |
Old Republic International Corp. | | | 33,011 | | | | 614,995 | |
PartnerRe Ltd. | | | 5,971 | | | | 834,387 | |
Principal Financial Group, Inc. | | | 36,820 | | | | 1,656,164 | |
ProAssurance Corp. | | | 6,806 | | | | 330,295 | |
Progressive Corp. (a) | | | 73,382 | | | | 2,333,548 | |
Prudential Financial, Inc. | | | 56,658 | | | | 4,612,528 | |
Reinsurance Group of America, Inc. | | | 8,306 | | | | 710,578 | |
RenaissanceRe Holdings Ltd. | | | 5,780 | | | | 654,238 | |
StanCorp Financial Group, Inc. | | | 5,297 | | | | 603,222 | |
Torchmark Corp. | | | 15,821 | | | | 904,328 | |
Travelers Cos., Inc. | | | 39,860 | | | | 4,498,600 | |
Unum Group | | | 31,301 | | | | 1,042,010 | |
Validus Holdings Ltd. | | | 10,579 | | | | 489,702 | |
Voya Financial, Inc. | | | 27,827 | | | | 1,027,095 | |
W.R. Berkley Corp. | | | 12,200 | | | | 667,950 | |
White Mountains Insurance Group Ltd. | | | 758 | | | | 550,922 | |
XL Group PLC | | | 38,352 | | | | 1,502,631 | |
| | | | | | | | |
| | | | | 79,140,992 | |
Internet & Catalog Retail — 2.1% | | | | | | | | |
Amazon.com, Inc. (b) | | | 47,675 | | | | 32,223,056 | |
Expedia, Inc. | | | 14,787 | | | | 1,838,024 | |
Groupon, Inc. (a)(b) | | | 63,718 | | | | 195,614 | |
Liberty Interactive Corp QVC Group, Series A (b) | | | 61,649 | | | | 1,684,250 | |
Liberty Ventures, Series A (b) | | | 17,762 | | | | 801,244 | |
Netflix, Inc. (a)(b) | | | 53,076 | | | | 6,070,833 | |
Priceline Group, Inc. (b) | | | 6,484 | | | | 8,266,776 | |
TripAdvisor, Inc. (b) | | | 14,028 | | | | 1,195,887 | |
| | | | | | | | |
| | | | | 52,275,684 | |
Internet Software & Services — 4.0% | | | | | | | | |
Akamai Technologies, Inc. (b) | | | 22,333 | | | | 1,175,386 | |
Alphabet, Inc., Class A (b) | | | 36,054 | | | | 28,050,373 | |
Alphabet, Inc., Class C (b) | | | 36,791 | | | | 27,919,954 | |
CoStar Group, Inc. (b) | | | 4,060 | | | | 839,161 | |
eBay, Inc. (b) | | | 151,939 | | | | 4,175,284 | |
Facebook, Inc., Class A (b) | | | 270,657 | | | | 28,326,962 | |
GoDaddy, Inc., Class A (a)(b) | | | 2,708 | | | | 86,818 | |
IAC/InterActiveCorp | | | 9,098 | | | | 546,335 | |
LendingClub Corp. (b) | | | 7,587 | | | | 83,836 | |
LinkedIn Corp., Class A (b) | | | 13,686 | | | | 3,080,445 | |
Match Group, Inc. (b) | | | 4,391 | | | | 59,498 | |
Pandora Media, Inc. (b) | | | 26,886 | | | | 360,541 | |
Twitter, Inc. (b) | | | 70,689 | | | | 1,635,743 | |
VeriSign, Inc. (a)(b) | | | 12,980 | | | | 1,133,933 | |
Yahoo!, Inc. (b) | | | 117,372 | | | | 3,903,793 | |
Yelp, Inc. (a)(b) | | | 8,596 | | | | 247,565 | |
Zillow Group, Inc., Class A (a)(b) | | | 5,795 | | | | 150,902 | |
Zillow Group, Inc., Class C (a)(b) | | | 10,928 | | | | 256,589 | |
| | | | | | | | |
| | | | | 102,033,118 | |
| | | | | | | | |
| Common Stocks | | Shares | | | Value | |
IT Services — 3.7% | | | | | | | | |
Accenture PLC, Class A | | | 78,562 | | | $ | 8,209,729 | |
Alliance Data Systems Corp. (b) | | | 7,761 | | | | 2,146,460 | |
Amdocs Ltd. | | | 19,339 | | | | 1,055,329 | |
Automatic Data Processing, Inc. | | | 58,724 | | | | 4,975,097 | |
Black Knight Financial Services, Inc., Class A Class A (a)(b) | | | 2,376 | | | | 78,551 | |
Booz Allen Hamilton Holding Corp. | | | 12,568 | | | | 387,723 | |
Cognizant Technology Solutions Corp., Class A (b) | | | 76,359 | | | | 4,583,067 | |
Computer Sciences Corp. | | | 16,906 | | | | 552,488 | |
CoreLogic, Inc. (b) | | | 10,700 | | | | 362,302 | |
CSRA, Inc. | | | 16,906 | | | | 507,180 | |
DST Systems, Inc. | | | 4,636 | | | | 528,782 | |
Fidelity National Information Services, Inc. | | | 35,454 | | | | 2,148,513 | |
First Data Corp., Class A (b) | | | 22,148 | | | | 354,811 | |
Fiserv, Inc. (b) | | | 29,616 | | | | 2,708,679 | |
FleetCor Technologies, Inc. (b) | | | 11,483 | | | | 1,641,265 | |
Gartner, Inc. (b) | | | 10,417 | | | | 944,822 | |
Genpact Ltd. (b) | | | 19,900 | | | | 497,102 | |
Global Payments, Inc. | | | 16,624 | | | | 1,072,414 | |
International Business Machines Corp. | | | 113,570 | | | | 15,629,504 | |
Jack Henry & Associates, Inc. | | | 9,969 | | | | 778,180 | |
Leidos Holdings, Inc. | | | 8,224 | | | | 462,682 | |
Mastercard, Inc., Class A | | | 125,028 | | | | 12,172,726 | |
Paychex, Inc. | | | 40,580 | | | | 2,146,276 | |
PayPal Holdings, Inc. (b) | | | 151,939 | | | | 5,500,192 | |
Sabre Corp. | | | 13,901 | | | | 388,811 | |
Square, Inc. (a)(b) | | | 3,823 | | | | 50,043 | |
Teradata Corp. (b) | | | 17,841 | | | | 471,359 | |
Total System Services, Inc. | | | 20,666 | | | | 1,029,167 | |
VeriFone Systems, Inc. (b) | | | 13,454 | | | | 376,981 | |
Visa, Inc., Class A (a) | | | 244,818 | | | | 18,985,636 | |
Western Union Co. (a) | | | 64,576 | | | | 1,156,556 | |
WEX, Inc. (b) | | | 4,927 | | | | 435,547 | |
Xerox Corp. | | | 134,585 | | | | 1,430,639 | |
| | | | | | | | |
| | | | | 93,768,613 | |
Leisure Products — 0.1% | | | | | | | | |
Brunswick Corp. | | | 11,631 | | | | 587,482 | |
Hasbro, Inc. (a) | | | 13,976 | | | | 941,424 | |
Mattel, Inc. (a) | | | 42,443 | | | | 1,153,176 | |
Polaris Industries, Inc. (a) | | | 8,055 | | | | 692,327 | |
Vista Outdoor, Inc. (b) | | | 7,847 | | | | 349,270 | |
| | | | | | | | |
| | | | | 3,723,679 | |
Life Sciences Tools & Services — 0.7% | | | | | | | | |
Agilent Technologies, Inc. | | | 41,649 | | | | 1,741,345 | |
Bio-Rad Laboratories, Inc., Class A (b) | | | 2,543 | | | | 352,612 | |
Bio-Techne Corp. (a) | | | 4,659 | | | | 419,310 | |
Bruker Corp. (b) | | | 14,132 | | | | 342,984 | |
Charles River Laboratories International, Inc. (b) | | | 5,776 | | | | 464,332 | |
Illumina, Inc. (b) | | | 18,023 | | | | 3,459,425 | |
Mettler-Toledo International, Inc. (b) | | | 3,498 | | | | 1,186,277 | |
PerkinElmer, Inc. | | | 13,962 | | | | 747,944 | |
QIAGEN NV (b) | | | 29,095 | | | | 804,477 | |
Quintiles Transnational Holdings, Inc. (b) | | | 9,579 | | | | 657,694 | |
Thermo Fisher Scientific, Inc. | | | 49,786 | | | | 7,062,144 | |
VWR Corp. (a)(b) | | | 3,415 | | | | 96,679 | |
Waters Corp. (b) | | | 10,343 | | | | 1,391,961 | |
| | | | | | | | |
| | | | | 18,727,184 | |
See Notes to Financial Statements.
| | | | | | |
| | | | | | | |
| 24 | | BLACKROCK LARGE CAP INDEX FUND | | DECEMBER 31, 2015 | | |
| | |
Schedule of Investments (continued) | | Large Cap Index Master Portfolio |
| | | | | | | | |
| Common Stocks | | Shares | | | Value | |
Machinery — 1.3% | | | | | | | | |
AGCO Corp. (a) | | | 8,999 | | | $ | 408,465 | |
Caterpillar, Inc. (a) | | | 75,499 | | | | 5,130,912 | |
Colfax Corp. (b) | | | 11,654 | | | | 272,121 | |
Crane Co. | | | 5,982 | | | | 286,179 | |
Cummins, Inc. | | | 22,677 | | | | 1,995,803 | |
Deere & Co. (a) | | | 41,758 | | | | 3,184,883 | |
Donaldson Co., Inc. (a) | | | 17,232 | | | | 493,869 | |
Dover Corp. (a) | | | 20,060 | | | | 1,229,879 | |
Flowserve Corp. (a) | | | 16,864 | | | | 709,637 | |
Graco, Inc. | | | 7,451 | | | | 536,994 | |
IDEX Corp. | | | 9,450 | | | | 723,964 | |
Illinois Tool Works, Inc. | | | 37,424 | | | | 3,468,456 | |
Ingersoll-Rand PLC | | | 33,109 | | | | 1,830,597 | |
ITT Corp. | | | 10,902 | | | | 395,961 | |
Joy Global, Inc. (a) | | | 12,156 | | | | 153,287 | |
Kennametal, Inc. (a) | | | 10,039 | | | | 192,749 | |
Lincoln Electric Holdings, Inc. | | | 9,520 | | | | 493,993 | |
Manitowoc Co., Inc. (a) | | | 17,197 | | | | 263,974 | |
Middleby Corp. (a)(b) | | | 7,170 | | | | 773,428 | |
Nordson Corp. (a) | | | 7,666 | | | | 491,774 | |
Parker Hannifin Corp. | | | 17,345 | | | | 1,682,118 | |
Pentair PLC | | | 22,468 | | | | 1,112,840 | |
Snap-on, Inc. | | | 7,266 | | | | 1,245,610 | |
SPX Corp. | | | 4,707 | | | | 43,916 | |
SPX FLOW, Inc. (b) | | | 5,394 | | | | 150,546 | |
Stanley Black & Decker, Inc. | | | 19,227 | | | | 2,052,098 | |
Terex Corp. | | | 13,103 | | | | 242,143 | |
Timken Co. (a) | | | 9,692 | | | | 277,094 | |
Toro Co. | | | 7,072 | | | | 516,751 | |
Trinity Industries, Inc. (a) | | | 19,610 | | | | 471,032 | |
Valmont Industries, Inc. (a) | | | 2,933 | | | | 310,957 | |
WABCO Holdings, Inc. (b) | | | 6,853 | | | | 700,788 | |
Wabtec Corp. (a) | | | 12,139 | | | | 863,326 | |
Xylem, Inc. | | | 22,685 | | | | 828,002 | |
| | | | | | | | |
| | | | | 33,534,146 | |
Marine — 0.0% | | | | | | | | |
Kirby Corp. (b) | | | 7,125 | | | | 374,918 | |
Media — 3.3% | | | | | | | | |
AMC Networks, Inc., Class A (b) | | | 7,517 | | | | 561,370 | |
Cable One, Inc. | | | 460 | | | | 199,484 | |
Cablevision Systems Corp., New York Group, Class A | | | 25,387 | | | | 809,845 | |
CBS Corp., Class B | | | 61,553 | | | | 2,900,993 | |
Charter Communications, Inc., Class A (a)(b) | | | 9,375 | | | | 1,716,562 | |
Cinemark Holdings, Inc. | | | 14,625 | | | | 488,914 | |
Clear Channel Outdoor Holdings, Inc., Class A (b) | | | 4,142 | | | | 23,154 | |
Comcast Corp., Class A | | | 313,189 | | | | 17,673,255 | |
Discovery Communications, Inc., Class A (a)(b) | | | 19,533 | | | | 521,140 | |
Discovery Communications, Inc., Class C (b) | | | 34,398 | | | | 867,518 | |
DISH Network Corp., Class A (b) | | | 27,219 | | | | 1,556,382 | |
Gannett Co., Inc. (a) | | | 14,707 | | | | 239,577 | |
Interpublic Group of Cos., Inc. | | | 51,647 | | | | 1,202,342 | |
John Wiley & Sons, Inc., Class A | | | 5,778 | | | | 260,183 | |
Liberty Broadband Corp., Class A (b) | | | 3,460 | | | | 178,709 | |
Liberty Broadband Corp., Class C (b) | | | 8,333 | | | | 432,149 | |
Liberty Media Corp., Class A (b) | | | 13,298 | | | | 521,946 | |
Liberty Media Corp., Class C (b) | | | 25,157 | | | | 957,979 | |
Lions Gate Entertainment Corp. | | | 11,248 | | | | 364,323 | |
Live Nation Entertainment, Inc. (b) | | | 17,323 | | | | 425,626 | |
| | | | | | | | |
| Common Stocks | | Shares | | | Value | |
Media (continued) | | | | | | | | |
The Madison Square Garden Co., Class A (b) | | | 2,596 | | | $ | 420,033 | |
MSG Networks, Inc., Class A (a)(b) | | | 7,351 | | | | 152,901 | |
News Corp., Class A | | | 47,503 | | | | 634,640 | |
News Corp., Class B (a) | | | 15,642 | | | | 218,362 | |
Omnicom Group, Inc. (a) | | | 30,557 | | | | 2,311,943 | |
Regal Entertainment Group, Class A (a) | | | 10,795 | | | | 203,702 | |
Scripps Networks Interactive, Inc., Class A (a) | | | 11,335 | | | | 625,805 | |
Sirius XM Holdings, Inc. (b) | | | 287,467 | | | | 1,169,991 | |
Starz, Class A (b) | | | 10,534 | | | | 352,889 | |
TEGNA, Inc. | | | 28,459 | | | | 726,274 | |
Thomson Reuters Corp. | | | 41,230 | | | | 1,560,555 | |
Time Warner Cable, Inc. | | | 35,356 | | | | 6,561,720 | |
Time Warner, Inc. | | | 103,134 | | | | 6,669,676 | |
Tribune Media Co., Class A | | | 9,860 | | | | 333,367 | |
Twenty-First Century Fox, Inc., Class A | | | 148,098 | | | | 4,022,342 | |
Twenty-First Century Fox, Inc., Class B | | | 60,485 | | | | 1,647,006 | |
Viacom, Inc., Class A (a) | | | 1,186 | | | | 52,172 | |
Viacom, Inc., Class B | | | 43,349 | | | | 1,784,245 | |
Walt Disney Co. | | | 212,216 | | | | 22,299,657 | |
| | | | | | | | |
| | | | | 83,648,731 | |
Metals & Mining — 0.3% | | | | | | | | |
Alcoa, Inc. | | | 163,792 | | | | 1,616,627 | |
Allegheny Technologies, Inc. (a) | | | 13,962 | | | | 157,073 | |
Compass Minerals International, Inc. | | | 4,161 | | | | 313,199 | |
Freeport-McMoRan, Inc. (a) | | | 139,421 | | | | 943,880 | |
Newmont Mining Corp. | | | 66,170 | | | | 1,190,398 | |
Nucor Corp. (a) | | | 39,915 | | | | 1,608,575 | |
Reliance Steel & Aluminum Co. | | | 9,344 | | | | 541,111 | |
Royal Gold, Inc. (a) | | | 7,935 | | | | 289,389 | |
Southern Copper Corp. (a) | | | 13,983 | | | | 365,236 | |
Steel Dynamics, Inc. | | | 30,333 | | | | 542,051 | |
Tahoe Resources, Inc. (a) | | | 20,878 | | | | 181,012 | |
United States Steel Corp. (a) | | | 18,129 | | | | 144,669 | |
| | | | | | | | |
| | | | | 7,893,220 | |
Multi-Utilities — 1.1% | | | | | | | | |
Alliant Energy Corp. | | | 14,211 | | | | 887,477 | |
Ameren Corp. | | | 30,347 | | | | 1,311,901 | |
CenterPoint Energy, Inc. | | | 53,966 | | | | 990,816 | |
CMS Energy Corp. (a) | | | 34,620 | | | | 1,249,090 | |
Consolidated Edison, Inc. (a) | | | 36,631 | | | | 2,354,274 | |
Dominion Resources, Inc. | | | 74,227 | | | | 5,020,714 | |
DTE Energy Co. | | | 22,429 | | | | 1,798,581 | |
MDU Resources Group, Inc. | | | 23,128 | | | | 423,705 | |
NiSource, Inc. (a) | | | 39,854 | | | | 777,551 | |
PG&E Corp. | | | 60,031 | | | | 3,193,049 | |
Public Service Enterprise Group, Inc. | | | 63,269 | | | | 2,447,878 | |
SCANA Corp. (a) | | | 17,929 | | | | 1,084,525 | |
Sempra Energy (a) | | | 30,966 | | | | 2,911,114 | |
TECO Energy, Inc. | | | 28,611 | | | | 762,483 | |
Vectren Corp. | | | 9,842 | | | | 417,498 | |
WEC Energy Group, Inc. | | | 39,485 | | | | 2,025,975 | |
| | | | | | | | |
| | | | | 27,656,631 | |
Multiline Retail — 0.6% | | | | | | | | |
Dillard’s, Inc., Class A (a) | | | 2,571 | | | | 168,940 | |
Dollar General Corp. | | | 37,985 | | | | 2,729,982 | |
Dollar Tree, Inc. (b) | | | 28,797 | | | | 2,223,704 | |
JC Penney Co., Inc. (a)(b) | | | 37,826 | | | | 251,921 | |
Kohl’s Corp. (a) | | | 24,644 | | | | 1,173,794 | |
See Notes to Financial Statements.
| | | | | | |
| | | | | | | |
| | BLACKROCK LARGE CAP INDEX FUND | | DECEMBER 31, 2015 | | 25 |
| | |
Schedule of Investments (continued) | | Large Cap Index Master Portfolio |
| | | | | | | | |
| Common Stocks | | Shares | | | Value | |
Multiline Retail (continued) | | | | | | | | |
Macy’s, Inc. | | | 41,988 | | | $ | 1,468,740 | |
Nordstrom, Inc. (a) | | | 17,555 | | | | 874,415 | |
Sears Holdings Corp. (a)(b) | | | 1,520 | | | | 31,251 | |
Target Corp. | | | 79,857 | | | | 5,798,417 | |
| | | | | | | | |
| | | | | 14,721,164 | |
Oil, Gas & Consumable Fuels — 5.2% | | | | | | | | |
Anadarko Petroleum Corp. | | | 63,529 | | | | 3,086,239 | |
Antero Resources Corp. (a)(b) | | | 9,062 | | | | 197,552 | |
Apache Corp. (a) | | | 47,164 | | | | 2,097,383 | |
Cabot Oil & Gas Corp. (a) | | | 51,769 | | | | 915,794 | |
California Resources Corp. (a) | | | 42,469 | | | | 98,953 | |
Cheniere Energy, Inc. (b) | | | 29,616 | | | | 1,103,196 | |
Chesapeake Energy Corp. (a) | | | 72,945 | | | | 328,253 | |
Chevron Corp. | | | 235,194 | | | | 21,158,052 | |
Cimarex Energy Co. | | | 11,846 | | | | 1,058,795 | |
Cobalt International Energy, Inc. (b) | | | 44,915 | | | | 242,541 | |
Columbia Pipeline Group, Inc. | | | 49,192 | | | | 983,840 | |
Concho Resources, Inc. (b) | | | 16,153 | | | | 1,499,968 | |
ConocoPhillips | | | 154,206 | | | | 7,199,878 | |
CONSOL Energy, Inc. (a) | | | 29,632 | | | | 234,093 | |
Continental Resources, Inc. (b) | | | 10,642 | | | | 244,553 | |
CVR Energy, Inc. (a) | | | 1,794 | | | | 70,594 | |
Denbury Resources, Inc. (a) | | | 48,109 | | | | 97,180 | |
Devon Energy Corp. | | | 51,417 | | | | 1,645,344 | |
Diamondback Energy, Inc. (b) | | | 8,351 | | | | 558,682 | |
Energen Corp. | | | 9,886 | | | | 405,227 | |
EOG Resources, Inc. (a) | | | 68,656 | | | | 4,860,158 | |
EP Energy Corp., Class A (a)(b) | | | 3,903 | | | | 17,095 | |
EQT Corp. (a) | | | 19,055 | | | | 993,337 | |
Exxon Mobil Corp. (a) | | | 522,936 | | | | 40,762,861 | |
Golar LNG Ltd. (a) | | | 10,974 | | | | 173,279 | |
Gulfport Energy Corp. (b) | | | 13,652 | | | | 335,430 | |
Hess Corp. | | | 31,534 | | | | 1,528,768 | |
HollyFrontier Corp. | | | 23,672 | | | | 944,276 | |
Kinder Morgan, Inc. | | | 223,325 | | | | 3,332,009 | |
Kosmos Energy Ltd. (a)(b) | | | 21,624 | | | | 112,445 | |
Laredo Petroleum, Inc. (a)(b) | | | 16,102 | | | | 128,655 | |
Marathon Oil Corp. (a) | | | 84,625 | | | | 1,065,429 | |
Marathon Petroleum Corp. | | | 67,948 | | | | 3,522,424 | |
Memorial Resource Development Corp. (a)(b) | | | 10,821 | | | | 174,759 | |
Murphy Oil Corp. (a) | | | 21,971 | | | | 493,249 | |
Murphy USA, Inc. (b) | | | 5,616 | | | | 341,116 | |
Newfield Exploration Co. (b) | | | 19,830 | | | | 645,665 | |
Noble Energy, Inc. | | | 53,672 | | | | 1,767,419 | |
Occidental Petroleum Corp. | | | 96,070 | | | | 6,495,293 | |
ONEOK, Inc. (a) | | | 26,188 | | | | 645,796 | |
PBF Energy, Inc., Class A | | | 12,094 | | | | 445,180 | |
Phillips 66 | | | 67,743 | | | | 5,541,377 | |
Pioneer Natural Resources Co. | | | 18,673 | | | | 2,341,221 | |
QEP Resources, Inc. (a) | | | 22,213 | | | | 297,654 | |
Range Resources Corp. (a) | | | 21,263 | | | | 523,282 | |
SM Energy Co. (a) | | | 8,512 | | | | 167,346 | |
Southwestern Energy Co. (a)(b) | | | 48,724 | | | | 346,428 | |
Spectra Energy Corp. | | | 83,964 | | | | 2,010,098 | |
Targa Resources Corp. (a) | | | 7,111 | | | | 192,424 | |
Teekay Corp. | | | 6,094 | | | | 60,148 | |
Tesoro Corp. | | | 15,738 | | | | 1,658,313 | |
Valero Energy Corp. | | | 60,223 | | | | 4,258,368 | |
Whiting Petroleum Corp. (a)(b) | | | 25,607 | | | | 241,730 | |
Williams Cos., Inc. | | | 93,674 | | | | 2,407,422 | |
| | | | | | | | |
| Common Stocks | | Shares | | | Value | |
Oil, Gas & Consumable Fuels (continued) | | | | | | | | |
World Fuel Services Corp. (a) | | | 8,908 | | | $ | 342,602 | |
WPX Energy, Inc. (b) | | | 31,019 | | | | 178,049 | |
| | | | | | | | |
| | | | | 132,577,222 | |
Paper & Forest Products — 0.1% | | | | | | | | |
Domtar Corp. (a) | | | 7,922 | | | | 292,718 | |
International Paper Co. | | | 52,644 | | | | 1,984,679 | |
| | | | | | | | |
| | | | | 2,277,397 | |
Personal Products — 0.2% | | | | | | | | |
Avon Products, Inc. (a) | | | 56,352 | | | | 228,225 | |
Coty, Inc., Class A (a) | | | 10,371 | | | | 265,809 | |
Edgewell Personal Care Co. | | | 7,490 | | | | 586,991 | |
Estee Lauder Cos., Inc., Class A | | | 26,236 | | | | 2,310,342 | |
Herbalife Ltd. (a)(b) | | | 9,271 | | | | 497,111 | |
Nu Skin Enterprises, Inc., Class A (a) | | | 7,258 | | | | 275,006 | |
| | | | | | | | |
| | | | | 4,163,484 | |
Pharmaceuticals — 5.3% | | | | | | | | |
Akorn, Inc. (b) | | | 9,575 | | | | 357,243 | |
Allergan PLC (b) | | | 49,084 | | | | 15,338,750 | |
Baxalta, Inc. | | | 68,071 | | | | 2,656,811 | |
Bristol-Myers Squibb Co. | | | 208,491 | | | | 14,342,096 | |
Eli Lilly & Co. | | | 122,380 | | | | 10,311,739 | |
Endo International PLC (b) | | | 28,316 | | | | 1,733,506 | |
Jazz Pharmaceuticals PLC (b) | | | 7,638 | | | | 1,073,597 | |
Johnson & Johnson | | | 346,828 | | | | 35,626,172 | |
Mallinckrodt PLC (b) | | | 14,631 | | | | 1,091,912 | |
Merck & Co., Inc. | | | 353,354 | | | | 18,664,158 | |
Mylan NV (b) | | | 52,563 | | | | 2,842,081 | |
Perrigo Co. PLC | | | 18,295 | | | | 2,647,286 | |
Pfizer, Inc. | | | 770,146 | | | | 24,860,313 | |
Zoetis, Inc. | | | 62,531 | | | | 2,996,486 | |
| | | | | | | | |
| | | | | 134,542,150 | |
Professional Services — 0.4% | | | | | | | | |
Dun & Bradstreet Corp. | | | 4,561 | | | | 474,025 | |
Equifax, Inc. | | | 14,885 | | | | 1,657,742 | |
IHS, Inc., Class A (b) | | | 8,632 | | | | 1,022,288 | |
ManpowerGroup, Inc. | | | 9,830 | | | | 828,571 | |
Nielsen Holdings PLC (a) | | | 46,034 | | | | 2,145,184 | |
Robert Half International, Inc. | | | 16,945 | | | | 798,787 | |
Towers Watson & Co., Class A | | | 8,671 | | | | 1,113,877 | |
TransUnion (b) | | | 3,953 | | | | 108,984 | |
Verisk Analytics, Inc. (a)(b) | | | 21,146 | | | | 1,625,705 | |
| | | | | | | | |
| | | | | 9,775,163 | |
Real Estate Investment Trusts (REITs) — 3.6% | |
Alexandria Real Estate Equities, Inc. | | | 9,076 | | | | 820,107 | |
American Campus Communities, Inc. | | | 14,241 | | | | 588,723 | |
American Capital Agency Corp. | | | 44,403 | | | | 769,948 | |
American Homes 4 Rent, Class A | | | 20,511 | | | | 341,713 | |
American Tower Corp. | | | 52,917 | | | | 5,130,303 | |
Annaly Capital Management, Inc. | | | 118,531 | | | | 1,111,821 | |
Apartment Investment & Management Co., Class A | | | 19,015 | | | | 761,170 | |
Apple Hospitality REIT, Inc. (a) | | | 20,845 | | | | 416,275 | |
AvalonBay Communities, Inc. | | | 16,533 | | | | 3,044,221 | |
BioMed Realty Trust, Inc. | | | 25,691 | | | | 608,620 | |
Boston Properties, Inc. | | | 19,187 | | | | 2,447,110 | |
Brandywine Realty Trust | | | 22,544 | | | | 307,951 | |
Brixmor Property Group, Inc. | | | 21,889 | | | | 565,174 | |
Camden Property Trust | | | 10,862 | | | | 833,767 | |
See Notes to Financial Statements.
| | | | | | |
| | | | | | | |
| 26 | | BLACKROCK LARGE CAP INDEX FUND | | DECEMBER 31, 2015 | | |
| | |
Schedule of Investments (continued) | | Large Cap Index Master Portfolio |
| | | | | | | | |
| Common Stocks | | Shares | | | Value | |
Real Estate Investment Trusts (REITs) (continued) | |
Care Capital Properties, Inc. | | | 10,380 | | | $ | 317,317 | |
CBL & Associates Properties, Inc. | | | 20,740 | | | | 256,554 | |
Chimera Investment Corp. | | | 25,297 | | | | 345,051 | |
Columbia Property Trust, Inc. | | | 15,461 | | | | 363,024 | |
Communications Sales & Leasing, Inc. (b) | | | 14,998 | | | | 280,313 | |
Corporate Office Properties Trust | | | 11,942 | | | | 260,694 | |
Corrections Corp. of America | | | 13,836 | | | | 366,516 | |
Crown Castle International Corp. | | | 41,743 | | | | 3,608,682 | |
DDR Corp. | | | 37,995 | | | | 639,836 | |
Digital Realty Trust, Inc. | | | 18,304 | | | | 1,384,148 | |
Douglas Emmett, Inc. | | | 18,419 | | | | 574,304 | |
Duke Realty Corp. | | | 43,353 | | | | 911,280 | |
Empire State Realty Trust, Inc., Class A | | | 14,151 | | | | 255,709 | |
Equinix, Inc. | | | 7,702 | | | | 2,329,085 | |
Equity Commonwealth (b) | | | 15,439 | | | | 428,123 | |
Equity Lifestyle Properties, Inc. | | | 10,571 | | | | 704,769 | |
Equity Residential | | | 45,525 | | | | 3,714,385 | |
Essex Property Trust, Inc. | | | 8,174 | | | | 1,956,937 | |
Extra Space Storage, Inc. | | | 15,357 | | | | 1,354,641 | |
Federal Realty Investment Trust (a) | | | 8,591 | | | | 1,255,145 | |
Four Corners Property Trust, Inc. (b) | | | 5,096 | | | | 123,119 | |
Gaming and Leisure Properties, Inc. | | | 10,885 | | | | 302,603 | |
General Growth Properties, Inc. | | | 72,170 | | | | 1,963,746 | |
HCP, Inc. | | | 57,743 | | | | 2,208,092 | |
Healthcare Trust of America, Inc., Class A | | | 15,338 | | | | 413,666 | |
Hospitality Properties Trust | | | 17,944 | | | | 469,236 | |
Host Hotels & Resorts, Inc. | | | 94,764 | | | | 1,453,680 | |
Kilroy Realty Corp. (a) | | | 11,044 | | | | 698,864 | |
Kimco Realty Corp. | | | 51,624 | | | | 1,365,971 | |
Lamar Advertising Co., Class A | | | 10,173 | | | | 610,177 | |
Liberty Property Trust | | | 18,750 | | | | 582,187 | |
Macerich Co. | | | 19,794 | | | | 1,597,178 | |
MFA Financial, Inc. | | | 45,788 | | | | 302,201 | |
Mid-America Apartment Communities, Inc. | | | 9,432 | | | | 856,520 | |
National Retail Properties, Inc. (a) | | | 16,813 | | | | 673,361 | |
NorthStar Realty Europe Corp. | | | 7,628 | | | | 90,087 | |
NorthStar Realty Finance Corp. | | | 22,885 | | | | 389,732 | |
Omega Healthcare Investors, Inc. | | | 22,854 | | | | 799,433 | |
Outfront Media, Inc. | | | 16,839 | | | | 367,595 | |
Paramount Group, Inc. | | | 21,905 | | | | 396,480 | |
Piedmont Office Realty Trust, Inc., Class A (a) | | | 19,095 | | | | 360,514 | |
Plum Creek Timber Co., Inc. (a) | | | 22,033 | | | | 1,051,415 | |
Post Properties, Inc. | | | 6,686 | | | | 395,544 | |
Prologis, Inc. | | | 65,544 | | | | 2,813,148 | |
Public Storage | | | 18,116 | | | | 4,487,333 | |
Rayonier, Inc. | | | 15,584 | | | | 345,965 | |
Realty Income Corp. (a) | | | 31,216 | | | | 1,611,682 | |
Regency Centers Corp. | | | 11,469 | | | | 781,268 | |
Retail Properties of America, Inc., Class A | | | 28,263 | | | | 417,445 | |
Senior Housing Properties Trust | | | 28,563 | | | | 423,875 | |
Simon Property Group, Inc. | | | 38,931 | | | | 7,569,744 | |
SL Green Realty Corp. (a) | | | 12,455 | | | | 1,407,166 | |
Spirit Realty Capital, Inc. | | | 55,657 | | | | 557,683 | |
Starwood Property Trust, Inc. | | | 29,872 | | | | 614,168 | |
Tanger Factory Outlet Centers, Inc. | | | 11,735 | | | | 383,734 | |
Taubman Centers, Inc. | | | 7,730 | | | | 593,046 | |
Two Harbors Investment Corp. | | | 46,159 | | | | 373,888 | |
UDR, Inc. (a) | | | 32,392 | | | | 1,216,967 | |
Ventas, Inc. | | | 41,384 | | | | 2,335,299 | |
VEREIT, Inc. | | | 113,545 | | | | 899,276 | |
| | | | | | | | |
| Common Stocks | | Shares | | | Value | |
Real Estate Investment Trusts (REITs) (continued) | |
Vornado Realty Trust | | | 23,548 | | | $ | 2,353,858 | |
Weingarten Realty Investors | | | 15,697 | | | | 542,802 | |
Welltower, Inc. | | | 43,854 | | | | 2,983,388 | |
Weyerhaeuser Co. | | | 64,755 | | | | 1,941,355 | |
WP Carey, Inc. | | | 13,066 | | | | 770,894 | |
WP Glimcher, Inc. | | | 23,138 | | | | 245,494 | |
| | | | | | | | |
| | | | | 92,194,295 | |
Real Estate Management & Development — 0.2% | | | | | | | | |
CBRE Group, Inc., Class A (b) | | | 35,774 | | | | 1,237,065 | |
Forest City Enterprises, Inc., Class A (b) | | | 27,398 | | | | 600,838 | |
Howard Hughes Corp. (a)(b) | | | 4,926 | | | | 557,426 | |
Jones Lang LaSalle, Inc. | | | 5,629 | | | | 899,852 | |
Realogy Holdings Corp. (b) | | | 17,722 | | | | 649,866 | |
| | | | | | | | |
| | | | | 3,945,047 | |
Road & Rail — 0.8% | | | | | | | | |
AMERCO, Inc. | | | 905 | | | | 352,498 | |
Avis Budget Group, Inc. (b) | | | 13,277 | | | | 481,822 | |
CSX Corp. | | | 123,568 | | | | 3,206,590 | |
Genesee & Wyoming, Inc., Class A (b) | | | 7,089 | | �� | | 380,608 | |
Hertz Global Holdings, Inc. (a)(b) | | | 50,915 | | | | 724,521 | |
JB Hunt Transport Services, Inc. (a) | | | 11,541 | | | | 846,648 | |
Kansas City Southern (a) | | | 13,826 | | | | 1,032,387 | |
Landstar System, Inc. (a) | | | 5,453 | | | | 319,818 | |
Norfolk Southern Corp. | | | 38,128 | | | | 3,225,248 | |
Old Dominion Freight Line, Inc. (b) | | | 8,776 | | | | 518,398 | |
Ryder System, Inc. | | | 6,751 | | | | 383,659 | |
Union Pacific Corp. | | | 109,511 | | | | 8,563,760 | |
| | | | | | | | |
| | | | | 20,035,957 | |
Semiconductors & Semiconductor Equipment — 2.4% | |
Analog Devices, Inc. | | | 39,215 | | | | 2,169,374 | |
Applied Materials, Inc. | | | 143,724 | | | | 2,683,327 | |
Atmel Corp. | | | 52,202 | | | | 449,459 | |
Avago Technologies Ltd. | | | 32,092 | | | | 4,658,154 | |
Broadcom Corp., Class A | | | 69,100 | | | | 3,995,362 | |
Cree, Inc. (b) | | | 12,947 | | | | 345,296 | |
Cypress Semiconductor Corp. (a)(b) | | | 40,493 | | | | 397,236 | |
First Solar, Inc. (b) | | | 9,449 | | | | 623,539 | |
Intel Corp. | | | 593,337 | | | | 20,440,460 | |
KLA-Tencor Corp. | | | 20,002 | | | | 1,387,139 | |
Lam Research Corp. (a) | | | 19,802 | | | | 1,572,675 | |
Linear Technology Corp. | | | 29,951 | | | | 1,272,019 | |
Marvell Technology Group Ltd. (a) | | | 56,289 | | | | 496,469 | |
Maxim Integrated Products, Inc. | | | 35,521 | | | | 1,349,798 | |
Microchip Technology, Inc. (a) | | | 26,153 | | | | 1,217,161 | |
Micron Technology, Inc. (b) | | | 135,270 | | | | 1,915,423 | |
NVIDIA Corp. (a) | | | 67,289 | | | | 2,217,845 | |
ON Semiconductor Corp. (b) | | | 53,842 | | | | 527,652 | |
Qorvo, Inc. (b) | | | 18,747 | | | | 954,222 | |
Skyworks Solutions, Inc. | | | 23,901 | | | | 1,836,314 | |
SunEdison, Inc. (a)(b) | | | 34,752 | | | | 176,888 | |
SunPower Corp. (a)(b) | | | 7,281 | | | | 218,503 | |
Teradyne, Inc. | | | 27,295 | | | | 564,188 | |
Texas Instruments, Inc. | | | 130,120 | | | | 7,131,877 | |
Xilinx, Inc. | | | 32,354 | | | | 1,519,667 | |
| | | | | | | | |
| | | | | 60,120,047 | |
See Notes to Financial Statements.
| | | | | | |
| | | | | | | |
| | BLACKROCK LARGE CAP INDEX FUND | | DECEMBER 31, 2015 | | 27 |
| | |
Schedule of Investments (continued) | | Large Cap Index Master Portfolio |
| | | | | | | | |
| Common Stocks | | Shares | | | Value | |
Software — 4.5% | | | | | | | | |
Activision Blizzard, Inc. (a) | | | 63,109 | | | $ | 2,442,949 | |
Adobe Systems, Inc. (b) | | | 62,570 | | | | 5,877,826 | |
Allscripts Healthcare Solutions, Inc. (b) | | | 22,498 | | | | 346,019 | |
ANSYS, Inc. (b) | | | 11,228 | | | | 1,038,590 | |
Autodesk, Inc. (a)(b) | | | 28,473 | | | | 1,734,860 | |
Broadridge Financial Solutions, Inc. | | | 14,993 | | | | 805,574 | |
CA, Inc. | | | 38,368 | | | | 1,095,790 | |
Cadence Design Systems, Inc. (b) | | | 36,653 | | | | 762,749 | |
CDK Global, Inc. | | | 20,112 | | | | 954,717 | |
Citrix Systems, Inc. (b) | | | 20,048 | | | | 1,516,631 | |
Electronic Arts, Inc. (a)(b) | | | 39,349 | | | | 2,704,063 | |
FireEye, Inc. (a)(b) | | | 17,065 | | | | 353,928 | |
Fortinet, Inc. (a)(b) | | �� | 17,874 | | | | 557,133 | |
Intuit, Inc. | | | 34,479 | | | | 3,327,223 | |
King Digital Entertainment PLC | | | 10,991 | | | | 196,519 | |
Microsoft Corp. | | | 1,011,771 | | | | 56,133,055 | |
NetSuite, Inc. (a)(b) | | | 5,023 | | | | 425,046 | |
Nuance Communications, Inc. (b) | | | 31,901 | | | | 634,511 | |
Oracle Corp. | | | 396,279 | | | | 14,476,072 | |
PTC, Inc. (b) | | | 14,519 | | | | 502,793 | |
Rackspace Hosting, Inc. (a)(b) | | | 15,767 | | | | 399,220 | |
Red Hat, Inc. (a)(b) | | | 22,928 | | | | 1,898,668 | |
salesforce.com, Inc. (b) | | | 82,047 | | | | 6,432,485 | |
ServiceNow, Inc. (b) | | | 19,236 | | | | 1,665,068 | |
SolarWinds, Inc. (b) | | | 7,547 | | | | 444,518 | |
Solera Holdings, Inc. | | | 8,220 | | | | 450,703 | |
Splunk, Inc. (a)(b) | | | 15,722 | | | | 924,611 | |
SS&C Technologies Holdings, Inc. | | | 10,199 | | | | 696,286 | |
Symantec Corp. | | | 85,140 | | | | 1,787,940 | |
Synopsys, Inc. (b) | | | 19,457 | | | | 887,434 | |
Tableau Software, Inc., Class A (b) | | | 6,219 | | | | 585,954 | |
Ultimate Software Group, Inc. (b) | | | 3,587 | | | | 701,294 | |
VMware, Inc., Class A (b) | | | 10,354 | | | | 585,726 | |
Workday, Inc., Class A (a)(b) | | | 13,310 | | | | 1,060,541 | |
Zynga, Inc., Class A (b) | | | 98,125 | | | | 262,975 | |
| | | | | | | | |
| | | | | 114,669,471 | |
Specialty Retail — 2.6% | | | | | | | | |
Aaron’s, Inc. | | | 8,079 | | | | 180,889 | |
Advance Auto Parts, Inc. | | | 9,159 | | | | 1,378,521 | |
AutoNation, Inc. (b) | | | 9,163 | | | | 546,665 | |
AutoZone, Inc. (b) | | | 3,908 | | | | 2,899,384 | |
Bed Bath & Beyond, Inc. (b) | | | 21,426 | | | | 1,033,804 | |
Best Buy Co., Inc. (a) | | | 37,959 | | | | 1,155,852 | |
Cabela’s, Inc. (a)(b) | | | 6,301 | | | | 294,446 | |
CarMax, Inc. (b) | | | 26,169 | | | | 1,412,341 | |
CST Brands, Inc. | | | 9,503 | | | | 371,947 | |
Dick’s Sporting Goods, Inc. (a) | | | 11,559 | | | | 408,611 | |
DSW, Inc., Class A (a) | | | 9,334 | | | | 222,709 | |
Foot Locker, Inc. (a) | | | 17,492 | | | | 1,138,554 | |
GameStop Corp., Class A (a) | | | 13,445 | | | | 376,998 | |
Gap, Inc. (a) | | | 29,895 | | | | 738,407 | |
GNC Holdings, Inc., Class A | | | 11,087 | | | | 343,919 | |
Home Depot, Inc. | | | 162,465 | | | | 21,485,996 | |
L Brands, Inc. | | | 30,950 | | | | 2,965,629 | |
Lowe’s Cos., Inc. | | | 119,031 | | | | 9,051,117 | |
Michaels Cos., Inc. (b) | | | 8,298 | | | | 183,469 | |
O’Reilly Automotive, Inc. (b) | | | 12,631 | | | | 3,200,948 | |
Office Depot, Inc. (b) | | | 69,193 | | | | 390,249 | |
Penske Automotive Group, Inc. | | | 5,383 | | | | 227,916 | |
Ross Stores, Inc. | | | 51,754 | | | | 2,784,883 | |
| | | | | | | | |
| Common Stocks | | Shares | | | Value | |
Specialty Retail (continued) | | | | | | | | |
Sally Beauty Holdings, Inc. (b) | | | 19,961 | | | $ | 556,712 | |
Signet Jewelers Ltd. | | | 10,044 | | | | 1,242,342 | |
Staples, Inc. | | | 77,903 | | | | 737,741 | |
Tiffany & Co. | | | 14,127 | | | | 1,077,749 | |
TJX Cos., Inc. | | | 85,097 | | | | 6,034,228 | |
Tractor Supply Co. | | | 17,064 | | | | 1,458,972 | |
Ulta Salon Cosmetics & Fragrance, Inc. (b) | | | 8,036 | | | | 1,486,660 | |
Urban Outfitters, Inc. (a)(b) | | | 10,723 | | | | 243,948 | |
Williams-Sonoma, Inc. | | | 11,497 | | | | 671,540 | |
| | | | | | | | |
| | | | | 66,303,146 | |
Technology Hardware, Storage & Peripherals — 3.7% | |
3D Systems Corp. (a)(b) | | | 14,838 | | | | 128,942 | |
Apple, Inc. | | | 720,538 | | | | 75,843,830 | |
EMC Corp. | | | 242,896 | | | | 6,237,569 | |
Hewlett Packard Enterprise Co. (a) | | | 227,324 | | | | 3,455,325 | |
HP, Inc. | | | 227,324 | | | | 2,691,516 | |
Lexmark International, Inc., Class A | | | 7,836 | | | | 254,278 | |
NCR Corp. (b) | | | 21,324 | | | | 521,585 | |
NetApp, Inc. | | | 36,884 | | | | 978,533 | |
SanDisk Corp. | | | 26,001 | | | | 1,975,816 | |
Western Digital Corp. | | | 28,104 | | | | 1,687,645 | |
| | | | | | | | |
| | | | | 93,775,039 | |
Textiles, Apparel & Luxury Goods — 0.9% | | | | | | | | |
Carter’s, Inc. | | | 6,514 | | | | 579,941 | |
Coach, Inc. | | | 34,556 | | | | 1,131,018 | |
Fossil Group, Inc. (a)(b) | | | 5,223 | | | | 190,953 | |
Hanesbrands, Inc. | | | 50,237 | | | | 1,478,475 | |
Kate Spade & Co. (a)(b) | | | 15,871 | | | | 282,028 | |
lululemon athletica, Inc. (a)(b) | | | 13,953 | | | | 732,114 | |
Michael Kors Holdings Ltd. (a)(b) | | | 24,927 | | | | 998,576 | |
NIKE, Inc., Class B | | | 169,610 | | | | 10,600,625 | |
PVH Corp. | | | 10,385 | | | | 764,855 | |
Ralph Lauren Corp. | | | 7,508 | | | | 836,992 | |
Skechers U.S.A., Inc., Class A (b) | | | 15,398 | | | | 465,174 | |
Under Armour, Inc., Class A (a)(b) | | | 22,343 | | | | 1,801,069 | |
VF Corp. | | | 42,273 | | | | 2,631,494 | |
| | | | | | | | |
| | | | | 22,493,314 | |
Thrifts & Mortgage Finance — 0.1% | | | | | | | | |
New York Community Bancorp, Inc. (a) | | | 60,653 | | | | 989,857 | |
People’s United Financial, Inc. (a) | | | 38,776 | | | | 626,232 | |
TFS Financial Corp. | | | 8,385 | | | | 157,890 | |
| | | | | | | | |
| | | | | 1,773,979 | |
Tobacco — 1.4% | | | | | | | | |
Altria Group, Inc. | | | 245,960 | | | | 14,317,332 | |
Philip Morris International, Inc. | | | 193,754 | | | | 17,032,914 | |
Reynolds American, Inc. | | | 103,274 | | | | 4,766,095 | |
| | | | | | | | |
| | | | | 36,116,341 | |
Trading Companies & Distributors — 0.3% | | | | | | | | |
Air Lease Corp. (a) | | | 12,203 | | | | 408,556 | |
Fastenal Co. (a) | | | 36,766 | | | | 1,500,788 | |
GATX Corp. (a) | | | 5,559 | | | | 236,535 | |
HD Supply Holdings, Inc. (b) | | | 21,065 | | | | 632,582 | |
MSC Industrial Direct Co., Inc., Class A (a) | | | 5,819 | | | | 327,435 | |
NOW, Inc. (b) | | | 13,786 | | | | 218,095 | |
United Rentals, Inc. (b) | | | 12,167 | | | | 882,594 | |
W.W. Grainger, Inc. (a) | | | 7,854 | | | | 1,591,142 | |
Watsco, Inc. | | | 3,183 | | | | 372,825 | |
See Notes to Financial Statements.
| | | | | | |
| | | | | | | |
| 28 | | BLACKROCK LARGE CAP INDEX FUND | | DECEMBER 31, 2015 | | |
| | |
Schedule of Investments (continued) | | Large Cap Index Master Portfolio |
| | | | | | | | |
| Common Stocks | | Shares | | | Value | |
Trading Companies & Distributors (continued) | |
WESCO International, Inc. (a)(b) | | | 5,511 | | | $ | 240,721 | |
| | | | | | | | |
| | | | | 6,411,273 | |
Transportation Infrastructure — 0.0% | | | | | | | | |
Macquarie Infrastructure Corp. | | | 8,534 | | | | 619,568 | |
Water Utilities — 0.1% | | | | | | | | |
American Water Works Co., Inc. | | | 22,509 | | | | 1,344,913 | |
Aqua America, Inc. (a) | | | 22,214 | | | | 661,977 | |
| | | | | | | | |
| | | | | 2,006,890 | |
Wireless Telecommunication Services — 0.1% | | | | | | | | |
SBA Communications Corp., Class A (b) | | | 16,191 | | | | 1,701,189 | |
Sprint Corp. (a)(b) | | | 88,539 | | | | 320,511 | |
T-Mobile U.S., Inc. (b) | | | 34,334 | | | | 1,343,146 | |
Telephone & Data Systems, Inc. | | | 11,630 | | | | 301,101 | |
United States Cellular Corp. (b) | | | 1,509 | | | | 61,582 | |
| | | | | | | | |
| | | | | 3,727,529 | |
Total Long-Term Investments
(Cost — $2,499,753,360) — 100.4% | | | | 2,553,362,296 | |
| | | | | |
| | | | | | | | |
| Short-Term Securities — 12.4% | | Shares | | | Value | |
BlackRock Cash Funds:
Institutional, SL Agency Shares, 0.35%, (c)(d)(e) | | | 198,484,859 | | | $ | 198,484,859 | |
BlackRock Cash Funds:
Prime, SL Agency Shares, 0.31%, (c)(d)(e) | | | 115,638,588 | | | | 115,638,588 | |
| | | | | | | | |
| | | | | 314,123,447 | |
Total Short-Term Securities
(Cost — $314,123,447) — 12.4% | | | | | | | 314,123,447 | |
| Total Investments (Cost — $2,813,876,807) — 112.8% | | | | 2,867,485,743 | |
| Liabilities in Excess of Other Assets — (12.8)% | | | | (324,857,213 | ) |
| | | | | | | | |
Net Assets — 100.0% | | | | | | $ | 2,542,628,530 | |
| | | | | | | | |
|
| Notes to Schedule of Investments |
| (a) | | Security, or a portion of security, is on loan. |
| (b) | | Non-income producing security. |
| (c) | | During the year ended December 31, 2015, investments in issuers considered to be affiliates of the Master Portfolio for purposes of Section 2(a)(3) of the Investment Company Act of 1940, as amended, were as follows: |
| | | | | | | | | | | | | | | | | | | | | | | | | | | | |
| Affiliate | | Shares Held
at December 31,
2014 | | | Shares
Purchased | | | Shares
Sold | | | Shares Held
at December 31,
2015 | | | Value at
December 31,
2015 | | | Income | | | Realized
Gain | |
BlackRock Cash Funds:
Institutional, SL Agency Shares | | | 79,872,532 | | | | 118,612,327 | 1 | | | — | | | | 198,484,859 | | | $ | 198,484,859 | | | $ | 569,426 | 2 | | | — | |
BlackRock Cash Funds:
Prime, SL Agency Shares | | | 33,734,031 | | | | 81,904,557 | 1 | | | — | | | | 115,638,588 | | | $ | 115,638,588 | | | $ | 330,706 | 2 | | | — | |
BlackRock, Inc. | | | 16,270 | | | | 6,421 | | | | (7,000 | ) | | | 15,691 | | | $ | 5,343,099 | | | $ | 162,024 | | | $ | 916,863 | 3 |
PNC Financial Services Group, Inc. | | | 68,164 | | | | 26,790 | | | | (30,178 | ) | | | 64,776 | | | $ | 6,173,801 | | | $ | 166,058 | | | $ | 749,189 | 4 |
iShares Russell 1000 ETF | | | 191,542 | | | | — | | | | (191,542 | ) | | | — | | | $ | — | | | | — | | | $ | 2,938,679 | |
| |
1 Represents net shares purchased. 2 Represents all or a portion of securities lending income earned from the reinvestment of cash collateral from loaned securities, net of fees and collateral investment expenses, and other payments to and from borrowers of securities. | | | | | | | | | |
3 Includes $896,616 of gains and losses from in-kind redemption transactions. See Note 2 of the Notes to Financial Statements. | |
4 Includes $713,212 of gains and losses from in-kind redemption transactions. See Note 2 of the Notes to Financial Statements. | |
| (d) | | Current yield as of period end. |
| (e) | | All or a portion of security was purchased with the cash collateral from loaned securities. |
|
| Derivative Financial Instruments Outstanding as of Period End |
Financial Futures Contracts
| | | | | | | | | | | | | | | | | | |
Contracts
Long | | | Issue | | | Expiration | | | Notional
Value | | | Unrealized
Depreciation | |
| | 164 | | | | S&P 500 E-Mini Index | | | | March 2016 | | | $ | 16,690,280 | | | $ | (118,658 | ) |
| | 12 | | | | S&P MidCap 400 E-Mini Index | | | | March 2016 | | | $ | 1,672,200 | | | | (18,313 | ) |
| | Total | | | | | | | | | | | | | | | $ | (136,971 | ) |
| | | | | | | | | | | | | | | | | | |
See Notes to Financial Statements.
| | | | | | |
| | | | | | | |
| | BLACKROCK LARGE CAP INDEX FUND | | DECEMBER 31, 2015 | | 29 |
| | |
Schedule of Investments (continued) | | Large Cap Index Master Portfolio |
|
| Derivative Financial Instruments Categorized by Risk Exposure |
As of period end, the fair values of derivative financial instruments located in the Statement of Assets and Liabilities were as follows:
| | | | | | | | | | | | | | | | | | | | |
Liabilities — Derivative
Financial Instruments | | Commodity
Contracts | | Credit
Contracts | | Equity
Contracts | | | Foreign
Currency
Exchange
Contracts | | Interest Rate
Contracts | | Other
Contacts | | Total | |
Financial futures contracts | | Net unrealized depreciation1 | | — | | — | | $ | 136,971 | | | — | | — | | — | | $ | 136,971 | |
1 Includes cumulative depreciation on financial futures contracts as reported in the Schedule of Investments. Only current day’s variation margin is reported within the Statement of Assets and Liabilities. | |
For the year ended December 31, 2015, the effect of derivative financial instruments in the Statement of Operations was as follows:
| | | | | | | | | | | | | | | | | | |
| Net Realized Gain From: | | Commodity
Contracts | | Credit
Contracts | | Equity
Contracts | | | Foreign
Currency
Exchange
Contracts | | Interest Rate
Contracts | | Other
Contacts | | Total | |
Financial futures contracts | | — | | — | | $ | 342,037 | | | — | | — | | — | | $ | 342,037 | |
| | | | | | | | | | | | | | | | | | |
| | | | | | | | |
| Net Change in Unrealized Appreciation (Depreciation) on: | | | | | | | | | | | | | | | | |
Financial futures contracts | | — | | — | | $ | (838,925 | ) | | — | | — | | — | | $ | (838,925 | ) |
| | |
| Average Quarterly Balances of Outstanding Derivative Financial Instruments |
| | | | |
| Financial futures contracts: | | | | |
Average notional value of contracts — long | | $ | 47,989,288 | |
For more information about the Master Portfolio’s investment risks regarding derivative financial instruments, refer to the Notes to Financial Statements.
|
| Fair Value Hierarchy as of Period End |
Various inputs are used in determining the fair value of investments and derivative financial instruments. For information about the Master Portfolio’s policy regarding valuation of investments and derivative financial instruments, refer to the Notes to Financial Statements.
The following tables summarize the Master Portfolio’s investments and derivative financial instruments categorized in the disclosure hierarchy:
| | | | | | | | | | | | |
| | | Level 1 | | | Level 2 | | Level 3 | | Total | |
Assets: | | | | | | | | | | | | |
| Investments: | | | | | | | | | | | | |
| Long-Term Investments: | | | | | | | | | | | | |
Common Stocks1 | | $ | 2,553,362,296 | | | — | | — | | $ | 2,553,362,296 | |
Short-Term Securities | | | 314,123,447 | | | — | | — | | | 314,123,447 | |
| | | | |
Total | | $ | 2,867,485,743 | | | — | | — | | $ | 2,867,485,743 | |
| | | | |
1 See above Schedule of Investments for values in each sector. | | | | | | | | | | | | |
| | | Level 1 | | | Level 2 | | Level 3 | | Total | |
| Derivative Financial Instruments1 | | | | | | | | | | | | |
Liabilities: | | | | | | | | | | | | |
Equity contracts | | $ | (136,971 | ) | | — | | — | | $ | (136,971 | ) |
1 Derivative financial instruments are financial futures contracts, which are valued at the unrealized appreciation (depreciation) on the instrument. | |
See Notes to Financial Statements.
| | | | | | |
| | | | | | | |
| 30 | | BLACKROCK LARGE CAP INDEX FUND | | DECEMBER 31, 2015 | | |
| | |
Schedule of Investments (concluded) | | Large Cap Index Master Portfolio |
The Master Portfolio may hold assets and/or liabilities in which the fair value approximates the carrying amount for financial statement purposes. As of period end, such assets and/or liabilities are categorized within the disclosure hierarchy as follows:
| | | | | | | | | | | | | | |
| | | Level 1 | | | Level 2 | | | Level 3 | | Total | |
Assets: | | | | | | | | | | | | | | |
Cash | | $ | 3,826 | | | | — | | | — | | $ | 3,826 | |
Cash pledged for financial futures contracts | | | 2,172,100 | | | | — | | | — | | | 2,172,100 | |
Liabilities: | | | | | | | | | | | | | | |
Collateral on securities loaned at value | | | — | | | $ | (265,400,040 | ) | | — | | | (265,400,040 | ) |
| | | | |
Total | | $ | 2,175,926 | | | $ | (265,400,040 | ) | | — | | $ | (263,224,114 | ) |
| | | | |
During the year ended December 31, 2015, there were no transfers between levels.
See Notes to Financial Statements.
| | | | | | |
| | | | | | | |
| | BLACKROCK LARGE CAP INDEX FUND | | DECEMBER 31, 2015 | | 31 |
| | |
| Statement of Assets and Liabilities | | Large Cap Index Master Portfolio |
| | | | |
| December 31, 2015 | | | |
| | | | |
| Assets | | | | |
Investments at value — unaffiliated (including securities loaned at value of $257,887,517) (cost — $2,488,913,135) | | $ | 2,541,845,396 | |
Investments at value — affiliated (cost — $324,963,672) | | | 325,640,347 | |
Cash | | | 3,826 | |
Cash pledged for financial futures contracts | | | 2,172,100 | |
| Receivables: | | | | |
Dividends | | | 3,386,814 | |
Investments sold | | | 39,608 | |
Securities lending income — affiliated | | | 68,376 | |
Prepaid expenses | | | 15,258 | |
| | | | |
Total assets | | | 2,873,171,725 | |
| | | | |
| | | | |
| Liabilities | | | | |
Collateral on securities loaned at value | | | 265,400,040 | |
Variation margin payable on financial futures contracts | | | 488,823 | |
| Payables: | | | | |
Investment advisory fees | | | 62,506 | |
Trustees’ fees | | | 22,350 | |
Other accrued expenses | | | 111,635 | |
Withdrawals to investors | | | 64,457,841 | |
| | | | |
Total liabilities | | | 330,543,195 | |
| | | | |
Net Assets | | $ | 2,542,628,530 | |
| | | | |
| | | | |
| Net Assets Consist of | | | | |
Investors’ capital | | $ | 2,489,156,565 | |
Net unrealized appreciation (depreciation) | | | 53,471,965 | |
| | | | |
Net Assets | | $ | 2,542,628,530 | |
| | | | |
| | | | | | |
| See Notes to Financial Statements. | | | | |
| | | | | | | |
| 32 | | BLACKROCK LARGE CAP INDEX FUND | | DECEMBER 31, 2015 | | |
| | |
| Statement of Operations | | Large Cap Index Master Portfolio |
| | | | |
| Year Ended December 31, 2015 | | | |
| | | | |
| Investment Income | | | | |
Dividends — unaffiliated | | $ | 62,710,489 | |
Securities lending — affiliated — net | | | 758,997 | |
Dividends — affiliated | | | 328,082 | |
Interest — affiliated | | | 141,135 | |
Foreign taxes withheld | | | (15,892 | ) |
| | | | |
Total income | | | 63,922,811 | |
| | | | |
| | | | |
| Expenses | | | | |
Investment advisory | | | 1,171,900 | |
Accounting services | | | 144,097 | |
Trustees | | | 97,484 | |
Professional | | | 37,247 | |
Printing | | | 2,965 | |
Miscellaneous | | | 8,866 | |
| | | | |
Total expenses | | | 1,462,559 | |
Less fees waived and/or reimbursed by the Manager | | | (52,419 | ) |
| | | | |
Total expenses after fees waived and/or reimbursed | | | 1,410,140 | |
| | | | |
Net investment income | | | 62,512,671 | |
| | | | |
| | | | |
| Realized and Unrealized Gain (Loss) | | | | |
| Net realized gain (loss) from: | | | | |
Investments — unaffiliated | | | 26,735,604 | |
Investments — affiliated | | | 2,994,903 | |
In-kind redemptions — unaffiliated1 | | | 304,715,248 | |
In-kind redemptions — affiliated1 | | | 1,609,828 | |
Financial futures contracts | | | 342,037 | |
| | | | |
| | | 336,397,620 | |
| | | | |
| Net change in unrealized appreciation (depreciation) on: | | | | |
Investments — unaffiliated | | | (342,935,736 | ) |
Investments — affiliated | | | (3,948,411 | ) |
Financial futures contracts | | | (838,925 | ) |
| | | | |
| | | (347,723,072 | ) |
| | | | |
Net realized and unrealized loss | | | (11,325,452 | ) |
| | | | |
Net Increase in Net Assets Resulting from Operations | | $ | 51,187,219 | |
| | | | |
1 See Note 2 of the Notes to Financial Statements. | | | | |
| | | | | | |
| See Notes to Financial Statements. | | | | |
| | | | | | | |
| | BLACKROCK LARGE CAP INDEX FUND | | DECEMBER 31, 2015 | | 33 |
| | |
| Statements of Changes in Net Assets | | Large Cap Index Master Portfolio |
| | | | | | | | |
| | | Year Ended December 31, | |
| Increase (Decrease) in Net Assets: | | 2015 | | | 2014 | |
| | | | | | | | |
| Operations | | | | | | | | |
Net investment income | | $ | 62,512,671 | | | $ | 34,627,320 | |
Net realized gain | | | 336,397,620 | | | | 14,179,093 | |
Net change in unrealized appreciation (depreciation) | | | (347,723,072 | ) | | | 187,555,527 | |
| | | | |
Net increase in net assets resulting from operations | | | 51,187,219 | | | | 236,361,940 | |
| | | | |
| | | | | | | | |
| Capital Transactions | | | | | | | | |
Proceeds from contributions | | | 1,332,533,563 | | | | 3,160,600,185 | |
Value of withdrawals | | | (1,614,489,855 | ) | | | (1,756,436,556 | ) |
| | | | |
Net increase (decrease) in net assets derived from capital transactions | | | (281,956,292 | ) | | | 1,404,163,629 | |
| | | | |
| | | | | | | | |
| Net Assets | | | | | | | | |
Total increase (decrease) in net assets | | | (230,769,073 | ) | | | 1,640,525,569 | |
Beginning of year | | | 2,773,397,603 | | | | 1,132,872,034 | |
| | | | |
End of year | | $ | 2,542,628,530 | | | $ | 2,773,397,603 | |
| | | | |
| | | | | | |
| See Notes to Financial Statements. | | | | |
| | | | | | | |
| 34 | | BLACKROCK LARGE CAP INDEX FUND | | DECEMBER 31, 2015 | | |
| | |
| Financial Highlights | | Large Cap Index Master Portfolio |
| | | | | | | | | | | | | | | | | | | | |
| | | Year Ended December 31, | | | Period
March 31,
20111 to
December 31,
2011 | |
| | | 2015 | | | 2014 | | | 2013 | | | 2012 | | |
| | | | | | | | | | | | | | | | | | | | |
| Total Return | | | | | | | | | | | | | | | | | | | | |
Total return | | | 0.92% | | | | 13.27% | | | | 32.88% | | | | 16.39% | | | | (4.68)% | 2 |
| | | | | | | | | | | | | | | | | | | | |
| | | | | | | | | | | | | | | | | | | | |
| Ratios to Average Net Assets | | | | | | | | | | | | | | | | | | | | |
Total expenses | | | 0.05% | | | | 0.06% | | | | 0.08% | 3 | | | 0.09% | | | | 0.40% | 4,5 |
| | | | | | | | | | | | | | | | | | | | |
Total expenses after fees waived and/or reimbursed | | | 0.04% | | | | 0.06% | | | | 0.08% | 3 | | | 0.09% | | | | 0.16% | 4 |
| | | | | | | | | | | | | | | | | | | | |
Net investment income | | | 1.93% | | | | 1.92% | | | | 1.96% | 3 | | | 2.30% | | | | 2.04% | 4 |
| | | | | | | | | | | | | | | | | | | | |
| | | | | | | | | | | | | | | | | | | | |
| Supplemental Data | | | | | | | | | | | | | | | | | | | | |
Net assets, end of year (000) | | | $ 2,542,629 | | | | $ 2,773,398 | | | | $ 1,132,872 | | | | $ 440,092 | | | | $ 56,881 | |
| | | | | | | | | | | | | | | | | | | | |
Portfolio turnover rate | | | 6% | | | | 6% | | | | 14% | | | | 16% | | | | 9% | |
| | | | | | | | | | | | | | | | | | | | |
| | 1 | | Commencement of operations. |
| | 2 | | Aggregate total return. |
| | 3 | | Excludes expenses incurred indirectly as a result of investments in underlying funds of approximately 0.01% for the year ended December 31, 2013. |
| | 5 | | Organization costs were not annualized in the calculation of the expense ratio. |
| | | | | | |
| See Notes to Financial Statements. | | | | |
| | | | | | | |
| | BLACKROCK LARGE CAP INDEX FUND | | DECEMBER 31, 2015 | | 35 |
| | |
| Notes to Financial Statements | | Large Cap Index Master Portfolio |
1. Organization:
Large Cap Index Master Portfolio (formerly known as Russell 1000® Index Master Portfolio) (the “Master Portfolio”), a series of Master Investment Portfolio (“MIP”), is registered under the Investment Company Act of 1940, as amended (the “1940 Act”), as a diversified, open-end management investment company. MIP is organized as a Delaware statutory trust.
The Master Portfolio, together with certain other registered investment companies advised by BlackRock Fund Advisors (the “Manager”) or its affiliates, is included in a complex of open-end funds referred to as the Equity-Liquidity Complex.
2. Significant Accounting Policies:
The financial statements are prepared in conformity with accounting principles generally accepted in the United States of America (“U.S. GAAP”), which may require management to make estimates and assumptions that affect the reported amounts of assets and liabilities in the financial statements, disclosure of contingent assets and liabilities at the date of the financial statements and the reported amounts of increases and decreases in net assets from operations during the reporting period. Actual results could differ from those estimates. The Master Portfolio is considered an investment company under U.S. GAAP and follows the accounting and reporting guidance applicable to investment companies. Below is a summary of significant accounting policies:
Segregation and Collateralization: In cases where the Master Portfolio enters into certain investments (e.g., financial futures contracts) that would be treated as “senior securities” for 1940 Act purposes, the Master Portfolio may segregate or designate on its books and records cash or liquid assets having a market value at least equal to the amount of its future obligations under such investments. Doing so allows the investment to be excluded from treatment as a “senior security.” Furthermore, if required by an exchange or counterparty agreement, the Master Portfolio may be required to deliver/deposit cash and/or securities to/with an exchange, or broker-dealer or custodian as collateral for certain investments or obligations.
Investment Transactions and Investment Income: For financial reporting purposes, investment transactions are recorded on the dates the transactions are entered into (the trade dates). Realized gains and losses on investment transactions are determined on the identified cost basis. Dividend income is recorded on the ex-dividend date. Dividends from foreign securities where the ex-dividend date may have passed are subsequently recorded when the Master Portfolio is informed of the ex-dividend date. Under the applicable foreign tax laws, a withholding tax at various rates may be imposed on capital gains, dividends and interest. Upon notification from issuers, some of the dividend income received from a real estate investment trust may be redesignated as a reduction of cost of the related investment and/or realized gain.
In-Kind Redemptions: The Master Portfolio transferred securities and cash to shareholders in connection with an in-kind redemption transaction. For financial reporting purposes, these transactions were treated as a sale of securities and the resulting gains and losses were recognized based on the market value of the securities on the date of the redemption. For the year ended December 31, 2015, the Master Portfolio had in-kind redemptions of $1,074,853,386. For tax purposes, no gains or losses were recognized.
Indemnifications: In the normal course of business, the Master Portfolio enters into contracts that contain a variety of representations that provide general indemnification. The Master Portfolio’s maximum exposure under these arrangements is unknown because it involves future potential claims against the Master Portfolio, which cannot be predicted with any certainty.
Other: Expenses directly related to the Master Portfolio are charged to the Master Portfolio. Other operating expenses shared by several funds, including other funds managed by the Manager, are prorated among those funds on the basis of relative net assets or other appropriate methods.
The Master Portfolio has an arrangement with its custodian whereby fees may be reduced by credits earned on uninvested cash balances, which, if applicable, are shown as fees paid indirectly in the Statement of Operations. The custodian imposes fees on overdrawn cash balances, which can be offset by accumulated credits earned or may result in additional custody charges. Effective September 2015, the arrangement with its custodian for earning credits on uninvested cash balances has ceased and the custodian will be imposing fees on certain uninvested cash balances.
3. Investment Valuation and Fair Value Measurements:
Investment Valuation Policies: The Master Portfolio’s investments are valued at fair value (also referred to as “market value” within the financial statements) as of the close of trading on the New York Stock Exchange (“NYSE”) (generally 4:00 p.m., Eastern time). U.S. GAAP defines fair value as the price the Master Portfolio would receive to sell an asset or pay to transfer a liability in an orderly transaction between market participants at the measurement date. The Master Portfolio determines the fair values of its financial instruments using independent dealers or pricing services under
| | | | | | |
| | | | | | | |
| 36 | | BLACKROCK LARGE CAP INDEX FUND | | DECEMBER 31, 2015 | | |
| | |
| Notes to Financial Statements (continued) | | Large Cap Index Master Portfolio |
policies approved by the Board of Trustees of MIP (the “Board”). The BlackRock Global Valuation Methodologies Committee (the “Global Valuation Committee”) is the committee formed by management to develop global pricing policies and procedures and to provide oversight of the pricing function for the Master Portfolio for all financial instruments.
Fair Value Inputs and Methodologies: The following methods (or “techniques”) and inputs are used to establish the fair value of the Master Portfolio’s assets and liabilities:
| • | | Equity investments traded on a recognized securities exchange are valued at the official close price each day, if available. For equity investments traded on more than one exchange, the official close price on the exchange where the stock is primarily traded is used. Equity investments traded on a recognized exchange for which there were no sales on that day may be valued at the last available bid (long positions) or ask (short positions) price. |
| • | | Investments in open-end U.S. mutual funds are valued at net asset value (“NAV”) each business day. |
| • | | Financial futures contracts traded on exchanges are valued at their last sale price. |
If events (e.g., a company announcement, market volatility or a natural disaster) occur that are expected to materially affect the value of such instruments, or in the event that the application of these methods of valuation results in a price for an investment that is deemed not to be representative of the market value of such investment, or if a price is not available, the investment will be valued by the Global Valuation Committee, or its delegate, in accordance with a policy approved by the Board as reflecting fair value (“Fair Valued Investments”). When determining the price for Fair Valued Investments, the Global Valuation Committee, or its delegate, seeks to determine the price that the Master Portfolio might reasonably expect to receive or pay from the current sale or purchase of that asset or liability in an arm’s-length transaction. Fair value determinations shall be based upon all available factors that the Global Valuation Committee, or its delegate, deems relevant consistent with the principles of fair value measurement. The pricing of all Fair Valued Investments is subsequently reported to the Board or a committee thereof on a quarterly basis.
Fair Value Hierarchy: Various inputs are used in determining the fair value of investments and derivative financial instruments. These inputs to valuation techniques are categorized into a fair value hierarchy consisting of three broad levels for financial statement purposes as follows:
| • | | Level 1 — unadjusted price quotations in active markets/exchanges for identical assets or liabilities that the Master Portfolio has the ability to access |
| • | | Level 2 — other observable inputs (including, but not limited to, quoted prices for similar assets or liabilities in markets that are active, quoted prices for identical or similar assets or liabilities in markets that are not active, inputs other than quoted prices that are observable for the assets or liabilities (such as interest rates, yield curves, volatilities, prepayment speeds, loss severities, credit risks and default rates) or other market–corroborated inputs) |
| • | | Level 3 — unobservable inputs based on the best information available in the circumstances, to the extent observable inputs are not available (including the Master Portfolio’s own assumptions used in determining the fair value of investments and derivative financial instruments) |
The hierarchy gives the highest priority to unadjusted quoted prices in active markets for identical assets or liabilities (Level 1 measurements) and the lowest priority to unobservable inputs (Level 3 measurements). Accordingly, the degree of judgment exercised in determining fair value is greatest for instruments categorized in Level 3. The inputs used to measure fair value may fall into different levels of the fair value hierarchy. In such cases, for disclosure purposes, the fair value hierarchy classification is determined based on the lowest level input that is significant to the fair value measurement in its entirety. The significant unobservable inputs used by the Global Valuation Committee in determining the price for Fair Valued Investments are typically categorized as Level 3. The fair value hierarchy for the Master Portfolio’s investments and derivative financial instruments has been included in the Schedule of Investments.
Changes in valuation techniques may result in transfers into or out of an assigned level within the hierarchy. In accordance with the Master Portfolio’s policy, transfers between different levels of the fair value hierarchy are deemed to have occurred as of the beginning of the reporting period. The categorization of a value determined for investments and derivative financial instruments is based on the pricing transparency of the investments and derivative financial instruments and is not necessarily an indication of the risks associated with investing in those securities.
4. Securities and Other Investments:
Securities Lending: The Master Portfolio may lend its securities to approved borrowers, such as brokers, dealers and other financial institutions. The borrower pledges and maintains with the Master Portfolio collateral consisting of cash, an irrevocable letter of credit issued by a bank, or securities
| | | | | | |
| | | | | | | |
| | BLACKROCK LARGE CAP INDEX FUND | | DECEMBER 31, 2015 | | 37 |
| | |
| Notes to Financial Statements (continued) | | Large Cap Index Master Portfolio |
issued or guaranteed by the U.S. Government. The initial collateral received by the Master Portfolio is required to have a value of at least 102% of the current value of the loaned securities for securities traded on U.S. exchanges and a value of at least 105% for all other securities. The collateral is maintained thereafter, at a value equal to at least 100% of the current market value of the securities on loan. The market value of the loaned securities is determined at the close of each business day of the Master Portfolio and any additional required collateral is delivered to the Master Portfolio, or excess collateral returned by the Master Portfolio, on the next business day. During the term of the loan, the Master Portfolio is entitled to all distributions made on or in respect of the loaned securities. Loans of securities are terminable at any time and the borrower, after notice, is required to return borrowed securities within the standard time period for settlement of securities transactions.
The market value of any securities on loan, all of which were classified as common stocks in the Master Portfolio’s Schedule of Investments, and the value of any related collateral are shown separately in the Statement of Assets and Liabilities as a component of investments at value-unaffiliated, and collateral on securities loaned at value, respectively. As of period end, any securities on loan were collateralized by cash. The cash collateral invested by the securities lending agent, BlackRock Institutional Trust Company, N.A. (“BTC”), if any, is disclosed in the Schedule of Investments.
Securities lending transactions are entered into by the Master Portfolio under Master Securities Lending Agreements (each, an “MSLA”), which provide the right, in the event of default (including bankruptcy or insolvency), for the non-defaulting party to liquidate the collateral and calculate a net exposure to the defaulting party or request additional collateral. In the event that a borrower defaults, the Master Portfolio as lender, would offset the market value of the collateral received against the market value of the securities loaned. When the value of the collateral is greater than that of the market value of the securities loaned, the lender is left with a net amount payable to the defaulting party. However, bankruptcy or insolvency laws of a particular jurisdiction may impose restrictions on or prohibitions against such a right of offset in the event of an MSLA counterparty’s bankruptcy or insolvency. Under the MSLA, absent an event of default the borrower can resell or re-pledge the loaned securities, and the Master Portfolio can reinvest cash collateral received in connection with loaned securities. Upon an event of default, the parties’ obligations to return the securities or collateral to the other party are extinguished, and the parties can resell or re-pledge the loaned securities or the collateral received in connection with the loaned securities in order to satisfy the defaulting party’s net payment obligation for all transactions under the MSLA. The defaulting party remains liable for any deficiency.
As of period end, the following table is a summary of the Master Portfolio’s securities lending agreements by counterparty which are subject to offset under an MSLA:
| | | | | | | | | | | | |
| Counterparty | | Securities
Loaned
at Value | | | Cash
Collateral
Received1 | | | Net
Amount | |
Barclays Capital, Inc. | | $ | 1,790,081 | | | $ | (1,790,081 | ) | | | — | |
BNP Paribas S.A. | | | 7,403,161 | | | | (7,403,161 | ) | | | — | |
Credit Suisse Securities (USA) LLC | | | 7,393,419 | | | | (7,393,419 | ) | | | — | |
Deutsche Bank Securities, Inc. | | | 9,788,622 | | | | (9,788,622 | ) | | | — | |
Goldman Sachs & Co. | | | 107,109,582 | | | | (107,109,582 | ) | | | — | |
HSBC Bank PLC | | | 1,460,827 | | | | (1,460,827 | ) | | | — | |
Jefferies LLC | | | 4,949,787 | | | | (4,949,787 | ) | | | — | |
JP Morgan Securities LLC | | | 40,429,941 | | | | (40,429,941 | ) | | | — | |
Merrill Lynch, Pierce, Fenner & Smith, Inc. | | | 19,966,692 | | | | (19,966,692 | ) | | | — | |
Morgan Stanley | | | 22,830,643 | | | | (22,830,643 | ) | | | — | |
Scotia Capital (USA), Inc. | | | 3,345,243 | | | | (3,345,243 | ) | | | — | |
SG Americas Securities LLC | | | 248,145 | | | | (248,145 | ) | | | — | |
State Street Bank & Trust Co. | | | 20,840,460 | | | | (20,840,460 | ) | | | — | |
UBS Securities LLC | | | 10,330,914 | | | | (10,330,914 | ) | | | — | |
| | | | |
Total | | $ | 257,887,517 | | | $ | (257,887,517 | ) | | | — | |
| | | | |
| | 1 | | Collateral with a value of $265,400,040 has been received in connection with securities lending agreements. Collateral received in excess of the value of securities loaned from the individual counterparty is not shown for financial reporting purposes in the table above. |
The risks of securities lending include the risk that the borrower may not provide additional collateral when required or may not return the securities when due. To mitigate these risks, the Master Portfolio benefits from a borrower default indemnity provided by BlackRock, Inc. (“BlackRock”). BlackRock’s indemnity allows for full replacement of the securities loaned if the collateral received does not cover the value on the securities loaned in the event of borrower default. The Master Portfolio could suffer a loss if the value of an investment purchased with cash collateral falls below the market value of loaned securities or if the value of an investment purchased with cash collateral falls below the value of the original cash collateral received.
| | | | | | |
| | | | | | | |
| 38 | | BLACKROCK LARGE CAP INDEX FUND | | DECEMBER 31, 2015 | | |
| | |
| Notes to Financial Statements (continued) | | Large Cap Index Master Portfolio |
5. Derivative Financial Instruments:
The Master Portfolio engages in various portfolio investment strategies using derivative contracts both to increase the returns of the Master Portfolio and/or to manage economically its exposure to certain risks such as equity risk. These contracts may be transacted on an exchange.
Financial Futures Contracts: The Master Portfolio invests in long and/or short positions in financial futures contracts and options on financial futures contracts to gain exposure to, or economically hedge against, changes in the value of equity securities (equity risk). Financial futures contracts are agreements between the Master Portfolio and a counterparty to buy or sell a specific quantity of an underlying instrument at a specified price and at a specified date. Depending on the terms of the particular contract, financial futures contracts are settled either through physical delivery of the underlying instrument on the settlement date or by payment of a cash settlement amount on the settlement date.
Upon entering into a financial futures contract, the Master Portfolio is required to deposit initial margin with the broker in the form of cash or securities in an amount that varies depending on a contract’s size and risk profile. The initial margin deposit must then be maintained at an established level over the life of the contract. Securities deposited as initial margin are designated on the Schedule of Investment and cash deposited, if any, is recorded on the Statement of Assets and Liabilities as cash pledged for financial futures contracts. Pursuant to the contract, the Master Portfolio agrees to receive from or pay to the broker an amount of cash equal to the daily fluctuation in value of the contract. Such receipts or payments are known as variation margin. Variation margin is recorded by the Master Portfolio as unrealized appreciation (depreciation) and, if applicable, as a receivable or payable for variation margin in the Statement of Assets and Liabilities.
When the contract is closed, the Master Portfolio records a realized gain or loss equal to the difference between the value of the contract at the time it was opened and the value at the time it was closed. The use of financial futures contracts involves the risk of an imperfect correlation in the movements in the price of financial futures contracts, interest or foreign currency exchange rates and the underlying assets.
6. Investment Advisory Agreement and Other Transactions with Affiliates:
The PNC Financial Services Group, Inc. is the largest stockholder and an affiliate of BlackRock for 1940 Act purposes.
MIP, on behalf of the Master Portfolio, entered into an Investment Advisory Agreement with the Manager, the Master Portfolio’s investment advisor, an indirect, wholly owned subsidiary of BlackRock, to provide investment advisory and administration services. The Manager is responsible for the management of the Master Portfolio’s portfolio and provides the personnel, facilities, equipment and certain other services necessary to the operations of the Master Portfolio. Effective April 30, 2015, for such services, the Master Portfolio pays the Manager a monthly fee based on a percentage of the Master Portfolio’s average daily net assets at an annual rate of 0.03%. Prior to April 30, 2015, the Master Portfolio paid the Manager a monthly fee at an annual rate of 0.05%.
The Manager contractually agreed to waive and/or reimburse fees or expenses in order to limit expenses, excluding interest expense, dividend expense, tax expense, acquired fund fees and expenses, and certain other fund expenses, which constitute extraordinary expenses not incurred in the ordinary course of the Master Portfolio’s business in order to limit expenses of certain feeder funds which invest their assets in the Master Portfolio. The Manager has agreed not to reduce or discontinue this contractual waiver or reimbursement prior to May 1, 2016, unless approved by the Board, including a majority of the Independent Trustees.
The Manager voluntarily agreed to waive its investment advisory fees by the amount of investment advisory fees the Master Portfolio pays to the Manager indirectly through its investment in affiliated money market funds. This amount is included in fees waived and/or reimbursed by the Manager in the Statement of Operations. However, the Manager does not waive its investment advisory fees by the amount of investment advisory fees paid in connection with the Master Portfolio’s investments in other affiliated investment companies, if any. For the year ended December 31, 2015, the amount waived was $52,419.
The U.S. Securities and Exchange Commission has issued an exemptive order which permits BTC, an affiliate of the Manager, to serve as securities lending agent for the Master Portfolio, subject to applicable conditions. As securities lending agent, BTC bears all operational costs directly related to securities lending. The Master Portfolio is responsible for fees in connection with the investment of cash collateral received for securities on loan in a money market fund managed by the Manager or its affiliates, however, BTC has agreed to reduce the amount of securities lending income it receives in order to effectively limit the collateral investment fees the Master Portfolio bears to an annual rate of 0.04% (the “collateral investment fees”).
| | | | | | |
| | | | | | | |
| | BLACKROCK LARGE CAP INDEX FUND | | DECEMBER 31, 2015 | | 39 |
| | |
| Notes to Financial Statements (continued) | | Large Cap Index Master Portfolio |
Securities lending income is equal to the total of income earned from the reinvestment of cash collateral, net of fees and other payments to and from borrowers of securities, and less the collateral investment fees. The Master Portfolio retains a portion of securities lending income and remits a remaining portion to BTC as compensation for its services as securities lending agent.
Pursuant to a securities lending agreement, the Master Portfolio retains 71.5% of securities lending income, and this amount retained can never be less than 65% of the total of securities lending income plus the collateral investment fees. In addition, commencing the business day following the date that the aggregate securities lending income earned across certain funds in the Equity-Liquidity Complex in a calendar year exceeds a specified threshold, the Master Portfolio, pursuant to the securities lending agreement, will retain for the remainder of the calendar year securities lending income in an amount equal to 75% of securities lending income, and this amount retained can never be less than 65% of the total of securities lending income plus the collateral investment fees.
The share of securities lending income earned by the Master Portfolio is shown as securities lending — affiliated — net in the Statement of Operations. For the year ended December 31, 2015, the Master Portfolio paid BTC $275,957 in total for securities lending agent services and collateral investment fees.
Certain officers and/or trustees MIP are officers and/or directors of BlackRock or its affiliates.
The Master Portfolio may purchase securities from, or sell securities to, an affiliated fund provided the affiliation is due solely to having a common investment advisor, common officers, or common trustees. For the year ended December 31, 2015, the purchase and sale transactions with an affiliated fund in compliance with Rule 17a-7 under the 1940 Act were $268,100,986 and $61,963,829, respectively.
7. Purchases and Sales:
For the year ended December 31, 2015, purchases and sales of investments, excluding short-term securities and in-kind redemptions, were $1,136,709,842 and $179,106,198, respectively.
8. Income Tax Information:
The Master Portfolio is classified as a partnership for federal income tax purposes. As such, each investor in the Master Portfolio is treated as the owner of its proportionate share of net assets, income, expenses and realized and unrealized gains and losses of the Master Portfolio. Therefore, no federal income tax provision is required. It is intended that the Master Portfolio’s assets will be managed so an investor in the Master Portfolio can satisfy the requirements of Subchapter M of the Internal Revenue Code of 1986, as amended.
The Master Portfolio files U.S. federal and various state and local tax returns. No income tax returns are currently under examination. The statute of limitations on the Master Portfolio’s U.S. federal tax returns remains open for each of the four years ended December 31, 2015. The statutes of limitations on the Master Portfolio’s state and local tax returns may remain open for an additional year depending upon the jurisdiction.
Management has analyzed tax laws and regulations and their application to the Master Portfolio as of December 31, 2015, inclusive of the open tax return years, and does not believe there are any uncertain tax positions that require recognition of a tax liability in the Master Portfolio’s financial statements.
As of period end, gross unrealized appreciation and depreciation based on cost for federal income tax purposes were as follows:
| | | | |
Tax cost | | $ | 2,821,133,904 | |
| | | | |
Gross unrealized appreciation | | $ | 220,952,395 | |
Gross unrealized depreciation | | | (174,600,556 | ) |
| | | | |
Net unrealized appreciation | | $ | 46,351,839 | |
| | | | |
9. Bank Borrowings:
MIP, on behalf of the Master Portfolio, along with certain other funds managed by the Manager and its affiliates (“Participating Funds”), is a party to a 364-day, $2.1 billion credit agreement with a group of lenders, under which the Master Portfolio may borrow to fund shareholder redemptions. Excluding commitments designated for certain funds, the Participating Funds, including the Master Portfolio, can borrow up to an aggregate commitment amount of $1.6 billion at any time outstanding, subject to asset coverage and other limitations as specified in the agreement. The credit agreement has the following terms: a fee of 0.06% per annum on unused commitment amounts and interest at a rate equal to the higher of
| | | | | | |
| | | | | | | |
| 40 | | BLACKROCK LARGE CAP INDEX FUND | | DECEMBER 31, 2015 | | |
| | |
| Notes to Financial Statements (concluded) | | Large Cap Index Master Portfolio |
(a) one-month LIBOR (but, in any event, not less than 0.00%) on the date the loan is made plus 0.80% per annum or (b) the Fed Funds rate (but, in any event, not less than 0.00%) in effect from time to time plus 0.80% per annum on amounts borrowed. The agreement expires in April 2016 unless extended or renewed. Participating Funds paid administration, legal and arrangement fees, which, if applicable, are included in miscellaneous expenses in the Statement of Operations, and along with commitment fees, were allocated among such funds based upon portions of the aggregate commitment available to them and relative net assets of Participating Funds. During the year ended December 31, 2015, the Master Portfolio did not borrow under the credit agreement.
10. Principal Risks:
In the normal course of business, the Master Portfolio invests in securities and enters into transactions where risks exist due to fluctuations in the market (market risk) or failure of the issuer to meet all its obligations, including the ability to pay principal and interest when due (issuer credit risk). The value of securities held by the Master Portfolio may decline in response to certain events, including those directly involving the issuers of securities owned by the Master Portfolio. Changes arising from the general economy, the overall market and local, regional or global political or/and social instability, as well as currency, interest rate and price fluctuations, may also affect the securities’ value.
Counterparty Credit Risk: Similar to issuer credit risk, the Master Portfolio may be exposed to counterparty credit risk, or the risk that an entity may fail to or be unable to perform on its commitments related to unsettled or open transactions. The Master Portfolio manages counterparty credit risk by entering into transactions only with counterparties that the Manager believes have the financial resources to honor their obligations and by monitoring the financial stability of those counterparties. Financial assets, which potentially expose the Master Portfolio to market, issuer and counterparty credit risks, consist principally of financial instruments and receivables due from counterparties. The extent of the Master Portfolio’s exposure to market, issuer and counterparty credit risks with respect to these financial assets is approximately their value recorded in the Statement of Assets and Liabilities, less any collateral held by the Master Portfolio.
A derivative contract may suffer a mark-to-market loss if the value of the contract decreases due to an unfavorable change in the market rates or values of the underlying instrument. Losses can also occur if the counterparty does not perform under the contract.
With exchange-traded futures, there is less counterparty credit risk to the Master Portfolio since the exchange or clearinghouse, as counterparty to such instruments, guarantees against a possible default. The clearinghouse stands between the buyer and the seller of the contract; therefore, credit risk is limited to failure of the clearinghouse. While offset rights may exist under applicable law, the Master Portfolio does not have a contractual right of offset against a clearing broker or clearinghouse in the event of a default (including the bankruptcy or insolvency). Additionally, credit risk exists in exchange-traded futures with respect to initial and variation margin that is held in a clearing broker’s customer accounts. While clearing brokers are required to segregate customer margin from their own assets, in the event that a clearing broker becomes insolvent or goes into bankruptcy and at that time there is a shortfall in the aggregate amount of margin held by the clearing broker for all its clients, typically the shortfall would be allocated on a pro rata basis across all the clearing broker’s customers, potentially resulting in losses to the Master Portfolio.
11. Subsequent Events:
Management has evaluated the impact of all subsequent events on the Master Portfolio through the date the financial statements were issued and has determined that there were no subsequent events requiring adjustment or additional disclosure in the financial statements.
| | | | | | |
| | | | | | | |
| | BLACKROCK LARGE CAP INDEX FUND | | DECEMBER 31, 2015 | | 41 |
| | |
| Report of Independent Registered Public Accounting Firm | | Large Cap Index Master Portfolio |
To the Board of Trustees of Master Investment Portfolio and the Interestholders of Large Cap Index Master Portfolio:
In our opinion, the accompanying statement of assets and liabilities, including the schedule of investments, and the related statements of operations and of changes in net assets and the financial highlights present fairly, in all material respects, the financial position of Large Cap Index Master Portfolio (the “Master Portfolio”), a series of Master Investment Portfolio, at December 31, 2015, the results of its operations for the year then ended, the changes in its net assets for each of the two years in the period then ended and the financial highlights for each of the periods presented, in conformity with accounting principles generally accepted in the United States of America. These financial statements and financial highlights (hereafter referred to as “financial statements”) are the responsibility of the Master Portfolio’s management. Our responsibility is to express an opinion on these financial statements based on our audits. We conducted our audits of these financial statements in accordance with the standards of the Public Company Accounting Oversight Board (United States). Those standards require that we plan and perform the audit to obtain reasonable assurance about whether the financial statements are free of material misstatement. An audit includes examining, on a test basis, evidence supporting the amounts and disclosures in the financial statements, assessing the accounting principles used and significant estimates made by management, and evaluating the overall financial statement presentation. We believe that our audits, which included confirmation of securities at December 31, 2015 by correspondence with the custodian, transfer agent, and brokers, provide a reasonable basis for our opinion.
/s/PricewaterhouseCoopers LLP
Philadelphia, Pennsylvania
February 24, 2016
| | | | | | |
| | | | | | | |
| 42 | | BLACKROCK LARGE CAP INDEX FUND | | DECEMBER 31, 2015 | | |
| | | | | | | | | | |
Name, Address1
and Year of Birth | | Position(s)
Held with
the Trust/MIP | | Length
of Time
Served as
a Trustee3 | | Principal Occupation(s) During Past Five Years | | Number of BlackRock-
Advised Registered
Investment Companies
(“RICs”) Consisting of
Investment Portfolios
(“Portfolios”) Overseen | | Public
Directorships |
| Independent Trustees2 |
Rodney D. Johnson 1941 | | Chair of the Board and Trustee | | Since 2009 | | President, Fairmount Capital Advisors, Inc. from 1987 to 2013; Member of the Archdiocesan Investment Committee of the Archdiocese of Philadelphia from 2004 to 2012; Director, The Committee of Seventy (civic) from 2006 to 2012; Director, Fox Chase Cancer Center from 2004 to 2011. | | 33 RICs consisting of
155 Portfolios | | None |
David O. Beim 1940 | | Trustee | | Since 2009 | | Professor of Professional Practice at the Columbia University Graduate School of Business since 1991; Trustee, Phillips Exeter Academy from 2002 to 2012; Chairman, Wave Hill, Inc. (public garden and cultural center) from 1990 to 2006. | | 33 RICs consisting of
155 Portfolios | | None |
Collette Chilton 1958 | | Trustee | | Since 2015 | | Chief Investment Officer, Williams College since 2006; Chief Investment Officer, Lucent Asset Management Corporation from 1998 to 2006. | | 33 RICs consisting of
155 Portfolios | | None |
Frank J. Fabozzi 1948 | | Trustee | | Since 2014 | | Editor of and Consultant for The Journal of Portfolio Management since 2006; Professor of Finance, EDHEC Business School since 2011; Visiting Professor, Princeton University from 2013 to 2014; Professor in the Practice of Finance and Becton Fellow, Yale University School of Management from 2006 to 2011. | | 108 RICs consisting of
230 Portfolios | | None |
Dr. Matina S. Horner 1939 | | Trustee | | Since 2009 | | Executive Vice President, Teachers Insurance and Annuity Association and College Retirement Equities Fund from 1989 to 2003. | | 33 RICs consisting of
155 Portfolios | | NSTAR (electric and gas utility) |
Herbert I. London 1939 | | Trustee | | Since 2009 | | Professor Emeritus, New York University since 2005; President, London Center for Policy Research since 2012; John M. Olin Professor of Humanities, New York University from 1993 to 2005 and Professor thereof from 1980 to 2005; President Emeritus, Hudson Institute (policy research organization) from 2011 to 2012, President thereof from 1997 to 2011 and Trustee from 1980 to 2012; Chairman of the Board of Trustees for Grantham University since 2006; Director, InnoCentive, Inc. (global internet service) since 2005; Director, Cerego, LLC (educational software) since 2005; Director, Cybersettle (online adjudication) since 2009; Director, AIMS Worldwide, Inc. (marketing) from 2007 to 2012. | | 33 RICs consisting of
155 Portfolios | | None |
Cynthia A. Montgomery 1952 | | Trustee | | Since 2009 | | Professor, Harvard Business School since 1989; Director, McLean Hospital from 2005 to 2012; Director, Harvard Business School Publishing from 2005 to 2010. | | 33 RICs consisting of
155 Portfolios | | Newell Rubbermaid, Inc. (manufacturing) |
Joseph P. Platt 1947 | | Trustee | | Since 2009 | | Director, Jones and Brown (Canadian insurance broker) since 1998; General Partner, Thorn Partners, LP (private investments) since 1998; Director, WQED Multi-Media (public broadcasting not-for-profit) since 2001; Director, The West Penn Allegheny Health System (a not-for-profit health system) from 2008 to 2013; Partner, Amarna Corporation, LLC (private investment company) from 2002 to 2008. | | 33 RICs consisting of
155 Portfolios | | Greenlight Capital Re, Ltd. (reinsurance company) |
Robert C. Robb, Jr. 1945 | | Trustee | | Since 2009 | | Partner, Lewis, Eckert, Robb and Company (management and financial consulting firm) since 1981. | | 33 RICs consisting of
155 Portfolios | | None |
Toby Rosenblatt 1938 | | Trustee | | Since 2009 | | President, Founders Investments Ltd. (private investments) since 1999; Director, Forward Management, LLC since 2007; Director, College Futures Foundation (philanthropic foundation) since 2009; Director, The James Irvine Foundation (philanthropic foundation) from 1998 to 2008. | | 33 RICs consisting of
155 Portfolios | | None |
| | | | | | |
| | | | | | | |
| | BLACKROCK LARGE CAP INDEX FUND | | DECEMBER 31, 2015 | | 43 |
| | | | |
| Officers and Trustees (continued) | | |
| | | | | | | | | | |
Name, Address1
and Year of Birth | | Position(s)
Held with
the Trust/MIP | | Length
of Time
Served as
a Trustee3 | | Principal Occupation(s) During Past Five Years | | Number of BlackRock-
Advised Registered
Investment Companies
(“RICs”) Consisting of
Investment Portfolios
(“Portfolios”) Overseen | | Public
Directorships |
| Independent Trustees2 (concluded) |
Mark Stalnecker 1951 | | Trustee | | Since 2015 | | Chief Investment Officer, University of Delaware from 1999 to 2013; Trustee, Winterthur Museum and Country Estate since 2001; Member of the Investment Committee, Delaware Public Employees’ Retirement System since 2002; Member of the Investment Committee, Christiana Care Health System since 2009; Member of the Investment Committee, Delaware Community Foundation from 2013 to 2014. | | 33 RICs consisting of
155 Portfolios | | None |
Kenneth L. Urish 1951 | | Trustee | | Since 2009 | | Managing Partner, Urish Popeck & Co., LLC (certified public accountants and consultants) since 1976; Immediate past- Chairman of the Professional Ethics Committee of the Pennsylvania Institute of Certified Public Accountants and Committee Member thereof since 2007; Member of External Advisory Board, The Pennsylvania State University Accounting Department since 2001; Principal, UP Strategic Wealth Investment Advisors, LLC since 2013; Trustee, The Holy Family Institute from 2001 to 2010; President and Trustee, Pittsburgh Catholic Publishing Associates from 2003 to 2008; Director, Inter-Tel from 2006 to 2007. | | 33 RICs consisting of
155 Portfolios | | None |
Frederick W. Winter 1945 | | Trustee | | Since 2009 | | Director, Alkon Corporation (pneumatics) since 1992; Professor and Dean Emeritus of the Joseph M. Katz School of Business, University of Pittsburgh from 2005 to 2013 and Dean thereof from 1997 to 2005; Director, Tippman Sports (recreation) from 2005 to 2013; Director, Indotronix International (IT services) from 2004 to 2008. | | 33 RICs consisting of
155 Portfolios | | None |
| | 1 The address of each Trustee is c/o BlackRock, Inc., 55 East 52nd Street, New York, NY 10055. |
| | 2 Independent Trustees serve until their resignation, retirement, removal or death, or until December 31 of the year in which they turn 75. The Board has determined to extend the terms of Independent Trustees on a case-by-case basis, as appropriate. The Board has unanimously approved extending the mandatory retirement age for David O. Beim and Dr. Matina S. Horner until December 31, 2016, which the Board believes is in the best interests of shareholders of the Trust/MIP. |
| | 3 Date shown is the earliest date a person has served for the Trust/MIP. In connection with the acquisition of Barclays Global Investors by BlackRock, Inc. (“BlackRock”) in December 2009, the Trustees were elected to the Trust/MIP Board. As a result, although the chart shows certain Independent Trustees as joining the Trust’s/MIP’s board in 2009, those Independent Trustees first became members of the boards of other funds advised by BlackRock Advisors, LLC or its affiliates as follows: David O. Beim, 1998; Dr. Matina S. Horner, 2004; Rodney D. Johnson, 1995; Herbert I. London, 1987; Cynthia A. Montgomery, 1994; Joseph P. Platt, 1999; Robert C. Robb, Jr., 1998; Toby Rosenblatt, 2005; Kenneth L. Urish, 1999; and Frederick W. Winter, 1999. Frank J. Fabozzi first became a member of the board of other funds advised by BlackRock Advisors, LLC or its affiliates in 1988. |
| Interested Trustees4 | | | | | | | | | | |
Barbara G. Novick 1960 | | Trustee | | Since 2015 | | Vice Chairman of BlackRock since 2006; Chair of BlackRock’s Government Relations Steering Committee since 2009; Head of the Global Client Group of BlackRock from 1988 to 2008. | | 108 RICs consisting of
230 Portfolios | | None |
John M. Perlowski 1964 | | Trustee, President, and Chief Executive Officer | | Since 2015 (Trustee); Since 2010 (President and Chief Executive Officer) | | Managing Director of BlackRock since 2009; Head of BlackRock Global Fund Services since 2009; Managing Director and Chief Operating Officer of the Global Product Group at Goldman Sachs Asset Management, L.P. from 2003 to 2009; Treasurer of Goldman Sachs Mutual Funds from 2003 to 2009 and Senior Vice President thereof from 2007 to 2009; Director of Goldman Sachs Offshore Funds from 2002 to 2009; Director of Family Resource Network (charitable foundation) since 2009. | | 136 RICs consisting of
328 Portfolios | | None |
| | 4 Mr. Perlowski and Ms. Novick are both “interested persons,” as defined in the 1940 Act, of the Trust/MIP based on their positions with BlackRock and its affiliates. Mr. Perlowski and Ms. Novick are also board members of a complex of BlackRock registered open-end funds. Mr. Perlowski is also a board member of the BlackRock Equity-Bond Complex and the BlackRock Equity-Liquidity Complex, and Ms. Novick is also a board member of the BlackRock Equity-Liquidity Complex. Interested Trustees serve until their resignation, retirement, removal or death, or until December 31 of the year in which they turn 75. The maximum age limitation may be waived as to any Trustee by action of a majority of the Trustees upon a finding of good cause therefor. |
| | | | | | |
| | | | | | | |
| 44 | | BLACKROCK LARGE CAP INDEX FUND | | DECEMBER 31, 2015 | | |
| | |
| Officers and Trustees (concluded) | | |
| | | | | | |
Name, Address1
and Year of Birth | | Position(s)
Held with
the Trust/MIP | | Length of
Time Served
as an Officer | | Principal Occupation(s) During Past Five Years |
| Trust/MIP Officers2 |
John M. Perlowski 1964 | | Trustee, President and Chief Executive Officer | | Since 2015 (Trustee); Since 2010 (President and Chief Executive Officer) | | Managing Director of BlackRock since 2009; Head of BlackRock Global Fund Services since 2009; Managing Director and Chief Operating Officer of the Global Product Group at Goldman Sachs Asset Management, L.P. from 2003 to 2009; Treasurer of Goldman Sachs Mutual Funds from 2003 to 2009 and Senior Vice President thereof from 2007 to 2009; Director of Goldman Sachs Offshore Funds from 2002 to 2009; Director of Family Resource Network (charitable foundation) since 2009. |
Richard Hoerner, CFA 1958 | | Vice President | | Since 2009 | | Managing Director of BlackRock since 2000; Head of the Global Cash Group since 2013; Co-head of the Global Cash and Securities Lending Group from 2010 to 2013; Member of the Cash Management Group Executive Committee since 2005. |
Jennifer McGovern 1977 | | Vice President | | Since 2014 | | Director of BlackRock since 2011; Head of Product Structure and Oversight for BlackRock’s U.S. Wealth Advisory Group since 2013; Vice President of BlackRock from 2008 to 2010. |
Neal Andrews 1966 | | Chief Financial Officer | | Since 2007 | | Managing Director of BlackRock since 2006; Senior Vice President and Line of Business Head of Fund Accounting and Administration at PNC Global Investment Servicing (U.S.) Inc. from 1992 to 2006. |
Jay Fife 1970 | | Treasurer | | Since 2007 | | Managing Director of BlackRock since 2007; Director of BlackRock in 2006; Assistant Treasurer of the MLIM and Fund Asset Management, L.P. advised funds from 2005 to 2006; Director of MLIM Fund Services Group from 2001 to 2006. |
Charles Park 1967 | | Chief Compliance Officer | | Since 2014 | | Anti-Money Laundering Compliance Officer for the BlackRock-advised Funds in the Equity-Bond Complex, the Equity-Liquidity Complex and the Closed-End Complex from 2014 to 2015; Chief Compliance Officer of BlackRock Advisors, LLC and the BlackRock-advised Funds in the Equity-Bond Complex, the Equity-Liquidity Complex and the Closed-End Complex since 2014; Principal of and Chief Compliance Officer for iShares® Delaware Trust Sponsor LLC since 2012 and BlackRock Fund Advisors (“BFA”) since 2006; Chief Compliance Officer for the BFA-advised iShares exchange traded funds since 2006; Chief Compliance Officer for BlackRock Asset Management International Inc. since 2012. |
Fernanda Piedra 1969 | | Anti-Money Laundering Compliance Officer | | Since 2015 | | Director of BlackRock since 2014; Anti-Money Laundering Compliance Officer and Regional Head of Financial Crime for the Americas at BlackRock since 2014; Head of Regulatory Changes and Remediation for the Asset Wealth Management Division of Deutsche Bank from 2010 to 2014; Vice President of Goldman Sachs (Anti-Money Laundering/Suspicious Activities Group) from 2004 to 2010. |
Benjamin Archibald 1975 | | Secretary | | Since 2012 | | Managing Director of BlackRock since 2014; Director of BlackRock from 2010 to 2013; Secretary of the iShares exchange traded funds since 2015; Secretary of the BlackRock-advised mutual funds since 2012. |
| | 1 The address of each Officer is c/o BlackRock, Inc., 55 East 52nd Street, New York, NY 10055. |
| | | 2 Officers of the Trust/MIP serve at the pleasure of the Board. |
| | Further information about the Officers and Trustees is available in the Trust’s/MIP’s Statement of Additional Information, which can be obtained without charge by calling (800) 441-7762 |
Effective September 25, 2015, John M. Perlowski was appointed to serve as a Trustee of the Trust/MIP.
Effective December 31, 2015, Herbert I. London and Toby Rosenblatt retired as Trustees of the Trust/MIP.
| | | | | | |
| | | | |
Investment Advisor BlackRock Fund Advisors San Francisco, CA 94105 | | Accounting Agent and Custodian State Street Bank and Trust Company Boston, MA 02110 | | Distributor BlackRock Investments, LLC New York, NY 10022 | | Legal Counsel Sidley Austin LLP New York, NY 10019 |
| | | |
Administrator BlackRock Advisors, LLC Wilmington, DE 19809 | | Transfer Agent BNY Mellon Investment Servicing (US) Inc. Wilmington, DE 19809 | | Independent Registered Public Accounting Firm PricewaterhouseCoopers LLP Philadelphia, PA 19103 | | Address of the Trust/MIP 400 Howard Street San Francisco, CA 94105 |
| | | | | | |
| | | | | | | |
| | BLACKROCK LARGE CAP INDEX FUND | | DECEMBER 31, 2015 | | 45 |
Householding
The Fund will mail only one copy of shareholder documents, including prospectuses, annual and semi-annual reports and proxy statements, to shareholders with multiple accounts at the same address. This practice is commonly called “householding” and is intended to reduce expenses and eliminate duplicate mailings of shareholder documents. Mailings of your shareholder documents may be householded indefinitely unless you instruct us otherwise. If you do not want the mailing of these documents to be combined with those for other members of your household, please call the Fund at (800) 441-7762.
Availability of Quarterly Schedule of Investments
The Fund/Master Portfolio file their complete schedule of portfolio holdings with the SEC for the first and third quarters of each fiscal year on Form N-Q. The Fund’s/Master Portfolio’s Forms N-Q are available on the SEC’s website at http://www.sec.gov and may also be reviewed and copied at the SEC’s Public Reference Room in Washington, D.C. Information on how to access documents on the SEC’s website without charge may be obtained by calling (800) SEC-0330. The Fund’s/Master Portfolio’s Forms N-Q may also be obtained upon request and without charge by calling (800) 441-7762.
Availability of Proxy Voting Policies and Procedures
A description of the policies and procedures that the Fund/Master Portfolio use to determine how to vote proxies relating to portfolio securities is available upon request and without charge (1) by calling (800) 441-7762; (2) at http://www.blackrock.com; and (3) on the SEC’s website at http://www.sec.gov.
Availability of Proxy Voting Record
Information about how the Fund/Master Portfolio voted proxies relating to securities held in the Fund’s/Master Portfolio’s portfolio during the most recent 12-month period ended June 30 is available upon request and without charge (1) at http://www.blackrock.com; or by calling (800) 441-7762; and (2) on the SEC’s website at http://www.sec.gov.
BlackRock’s Mutual Fund Family
BlackRock offers a diverse lineup of open-end mutual funds crossing all investment styles and managed by experts in equity, fixed income and tax-exempt investing. Visit http://www.blackrock.com for more information.
Account Information
Call us at (800) 441-7762 from 8:00 AM to 6:00 PM EST on any business day to get information about your account balances, recent transactions and share prices. You can also reach us on the Web at http://www.blackrock.com/funds.
Automatic Investment Plans
Investor Class shareholders who want to invest regularly can arrange to have $50 or more automatically deducted from their checking or savings account and invested in any of the BlackRock funds.
Systematic Withdrawal Plans
Investor Class shareholders can establish a systematic withdrawal plan and receive periodic payments of $50 or more from their BlackRock funds, as long as their account balance is at least $10,000.
Retirement Plans
Shareholders may make investments in conjunction with Traditional, Rollover, Roth, Coverdell, Simple IRAs, SEP IRAs and 403(b) Plans.
| | | | | | |
| | | | | | | |
| 46 | | BLACKROCK LARGE CAP INDEX FUND | | DECEMBER 31, 2015 | | |
| | |
| Additional Information (concluded) | | |
|
| BlackRock Privacy Principles |
BlackRock is committed to maintaining the privacy of its current and former fund investors and individual clients (collectively, “Clients”) and to safeguarding their non-public personal information. The following information is provided to help you understand what personal information BlackRock collects, how we protect that information and why in certain cases we share such information with select parties.
If you are located in a jurisdiction where specific laws, rules or regulations require BlackRock to provide you with additional or different privacy-related rights beyond what is set forth below, then BlackRock will comply with those specific laws, rules or regulations.
BlackRock obtains or verifies personal non-public information from and about you from different sources, including the following: (i) information we receive from you or, if applicable, your financial intermediary, on applications, forms or other documents; (ii) information about your transactions with us, our affiliates, or others; (iii) information we receive from a consumer reporting agency; and (iv) from visits to our websites.
BlackRock does not sell or disclose to non-affiliated third parties any non-public personal information about its Clients, except as permitted by law or as is necessary to respond to regulatory requests or to service Client accounts. These non-affiliated third parties are required to protect the confidentiality and security of this information and to use it only for its intended purpose.
We may share information with our affiliates to service your account or to provide you with information about other BlackRock products or services that may be of interest to you. In addition, BlackRock restricts access to non-public personal information about its Clients to those BlackRock employees with a legitimate business need for the information. BlackRock maintains physical, electronic and procedural safeguards that are designed to protect the non-public personal information of its Clients, including procedures relating to the proper storage and disposal of such information.
| | | | | | |
| | | | | | | |
| | BLACKROCK LARGE CAP INDEX FUND | | DECEMBER 31, 2015 | | 47 |
This report is intended for current holders. It is not authorized for use as an offer of sale or a solicitation of an offer to buy shares of the Fund unless preceded or accompanied by the Fund’s current prospectus. Past performance results shown in this report should not be considered a representation of future performance. Investment returns and principal value of shares will fluctuate so that shares, when redeemed, may be worth more or less than their original cost. Statements and other information herein are as dated and are subject to change.

| | |
| LCI-12/15-AR | | |
| |
| |  |
DECEMBER 31, 2015
| | | | |
ANNUAL REPORT | | | |  |
BlackRock Funds III
| Ø | BlackRock LifePath® 2025 Fund |
| Ø | BlackRock LifePath® 2035 Fund |
| Ø | BlackRock LifePath® 2045 Fund |
| Ø | BlackRock LifePath® 2055 Fund |
|
| Not FDIC Insured • May Lose Value • No Bank Guarantee |

| | | | | | |
| | | | | | | |
| 2 | | BLACKROCK FUNDS III | | DECEMBER 31, 2015 | | |
Dear Shareholder,
Diverging monetary policies and shifting economic outlooks across regions have been the overarching themes driving financial markets over the past couple of years. With U.S. growth outpacing the global economic recovery in 2015 while inflationary pressures remained low, investors spent most of the year anticipating a short-term rate hike from the Federal Reserve (the “Fed”), which ultimately came to fruition in December. In contrast, the European Central Bank (“ECB”) and the Bank of Japan moved to a more accommodative stance during the year. In this environment, the U.S. dollar strengthened considerably, causing profit challenges for U.S. exporters and high levels of volatility in emerging market currencies and commodities. Oil prices were particularly volatile and below the historical norm due to an ongoing imbalance in global supply and demand.
Market volatility broadly increased in the middle of 2015, beginning with a sharp, but temporary, selloff in June as Greece’s long-brewing debt troubles came to an impasse. Just as these concerns abated, Chinese equities tumbled amid weakness in the country’s economy. This, combined with a depreciation of the yuan and declining confidence in China’s policymakers, stoked worries about the potential impact to the broader world economy, causing heightened volatility to spread throughout markets globally. Given a dearth of meaningful growth across most of the world, financial markets became more reliant on central bank policies to drive performance. In that vein, risk assets (such as equities and high yield bonds) rallied in October when China’s central bank provided more stimulus, the ECB hinted at further easing, and soft U.S. data pushed back expectations for a Fed rate hike. As the period came to a close, however, the ECB disappointed investors with its subdued policy changes. The Fed’s December rate hike had a positive impact on the markets as it removed a source of uncertainty, but this was counteracted by the dampening effect of a stronger U.S. dollar, falling oil prices and tighter credit conditions.
At BlackRock, we believe investors need to think globally, extend their scope across a broad array of asset classes and be prepared to move freely as market conditions change over time. We encourage you to talk with your financial advisor and visit blackrock.com for further insight about investing in today’s markets.
Sincerely,
Rob Kapito
President, BlackRock Advisors, LLC
Rob Kapito
President, BlackRock Advisors, LLC
| | | | | | | | |
| Total Returns as of December 31, 2015 | |
| | | 6-month | | | 12-month | |
U.S. large cap equities
(S&P 500® Index) | | | 0.15 | % | | | 1.38 | % |
U.S. small cap equities
(Russell 2000® Index) | | | (8.75 | ) | | | (4.41 | ) |
International equities
(MSCI Europe, Australasia,
Far East Index) | | | (6.01 | ) | | | (0.81 | ) |
Emerging market equities
(MSCI Emerging Markets Index) | | | (17.35 | ) | | | (14.92 | ) |
3-month Treasury bills
(BofA Merrill Lynch 3-Month
U.S. Treasury Bill Index) | | | 0.04 | | | | 0.05 | |
U.S. Treasury securities
(BofA Merrill Lynch
10-Year U.S. Treasury
Index) | | | 1.43 | | | | 0.91 | |
U.S. investment-grade bonds
(Barclays U.S.
Aggregate Bond Index) | | | 0.65 | | | | 0.55 | |
Tax-exempt municipal
bonds (S&P Municipal
Bond Index) | | | 3.31 | | | | 3.32 | |
U.S. high yield bonds
(Barclays U.S. Corporate
High Yield 2% Issuer
Capped Index) | | | (6.79 | ) | | | (4.43 | ) |
| Past performance is no guarantee of future results. Index performance is shown for illustrative purposes only. You cannot invest directly in an index. | |
| | | | | | |
| | | | | | | |
| | THIS PAGE NOT PART OF YOUR FUND REPORT | | | | 3 |
| | | | |
| Fund Summary as of December 31, 2015 | | BlackRock LifePath Funds |
|
| Portfolio Management Commentary |
How did each Fund perform?
| • | | The BlackRock LifePath Funds with target dates of 2025, 2035, 2045 and 2055 (altogether, the “LifePath Funds”) invest in their respective LifePath Master Portfolio. |
| • | | Effective as of December 14, 2015, each LifePath Fund has the ability to adjust its equity allocation along the glide path, based on a strategic assessment of market conditions among other factors as described below. Effective as of December 14, 2015, each LifePath Fund’s principal investment strategy was amended to permit each LifePath Fund to invest directly, through each LifePath Fund’s corresponding LifePath Master Portfolio, in equity securities and related derivatives of issuers that are primarily engaged in or related to the real estate industry. |
| • | | For the 12-month period ended December 31, 2015, the LifePath Funds underperformed the custom benchmark across various LifePath Fund target dates, with the exception of LifePath 2045 Class K Shares, which outperformed the custom benchmark and LifePath 2055 Class K Shares, which performed in-line with the custom benchmark. The returns for the LifePath Funds include Fund expenses. The custom benchmarks have no expenses associated with performance. |
What factors influenced performance?
| • | | The underperformance of Active Stock Master Portfolio was the largest detractor from performance relative to the benchmark. The allocation to BlackRock Basic Value Fund, Inc. drove the largest proportion of the underperformance, which was due to negative stock selection in the consumer discretionary, financials and utilities sectors. This allocation overshadowed strong results in health care and consumer staples, as well as positive sector allocation. |
| • | | In replicating the asset classes within the custom benchmark there are some cases where benchmark mismatches occur, either due to the underlying security selection within the fund or to the vehicles/funds that are available to gain that asset class exposure. In 2015, given additional market volatility, there were mismatches relative to the Global Real Estate benchmark and the Global International Equity benchmark, which resulted in positive contributions to relative performance. The relative performance differences were more positive in the farther-dated funds than in the near-dated funds. |
Describe recent portfolio activity.
| • | | Each LifePath Fund has its own time horizon, which affects its acceptable level of risk and, in turn, the strategic allocation of its holdings across asset classes. On a quarterly basis, the strategic allocation of each LifePath Fund is systematically adjusted to reflect the shareholders’ remaining investment time horizon. During the period, the LifePath Funds were rebalanced in accordance with their updated strategic allocations, and daily cash flows were allocated to the underlying funds and instruments as appropriate. On December 14, 2015, the LifePath Funds moved from index (passive) exposure to Global REITs to an actively managed World Real Estate Securities strategy. While the benchmark of the REIT exposure remains unchanged and is still the FTSE/EPRA NAREIT Developed Real Estate Index, the underlying strategy is being actively managed. |
Describe portfolio positioning at period end.
| • | | At period end, each of the LifePath Funds was invested according to its respective strategic allocation benchmark within tolerance limits. |
The views expressed reflect the opinions of BlackRock as of the date of this report and are subject to change based on changes in market, economic or other conditions. These views are not intended to be a forecast of future events and are no guarantee of future results.
| | | | | | |
| | | | | | | |
| 4 | | BLACKROCK FUNDS III | | DECEMBER 31, 2015 | | |
Under normal circumstances, the asset allocation of each LifePath Fund will change over time according to a glide path as each LifePath Fund approaches its respective target date. The glide path represents the shifting of asset classes over time, as well as potential adjustments. Each LifePath Fund’s asset mix becomes more conservative prior to retirement as time elapses. This reflects the need for reduced investment risks as retirement approaches and the need for lower volatility of each LifePath Fund, which may be a primary source of income after retirement. As each LifePath Fund approaches its target date, its asset allocation will shift so that each LifePath Fund invests a greater percentage of its assets in fixed income funds. The asset allocation targets are established by a committee of BlackRock investment professionals. The investment team, including the portfolio managers and this investment committee, meets
regularly to assess market conditions, review the asset allocation targets of each LifePath Fund, and determine whether any changes are required to enable each LifePath Fund to achieve its investment objective.
Although the asset allocation targets listed for the glide path are general, long-term targets, BlackRock investment professionals may periodically adjust the proportion of equity funds, securities and related derivatives and fixed income funds in the LifePath Fund, based on a strategic assessment of market conditions, including expected market volatility and BlackRock’s view on the equity markets. The adjustments will be no more than +/- 5% at retirement, with a lesser allowable adjustment for LifePath Funds further from retirement.
| | | | | | |
| | | | | | | |
| | BLACKROCK FUNDS III | | DECEMBER 31, 2015 | | 5 |
| | | | |
| | | BlackRock LifePath 2025 Fund |
The investment objective of BlackRock LifePath® 2025 Fund (“LifePath 2025 Fund” or the “LifePath Fund”) is to seek to provide for retirement outcomes based on quantitatively measured risk. In pursuit of this objective, LifePath 2025 Fund will be broadly diversified across global asset classes, with asset allocations becoming more conservative over time.
Effective March 31, 2015, the LifePath® 2025 Portfolio changed its name to the BlackRock LifePath® 2025 Fund.
|
| Total Return Based on a $10,000 Investment |
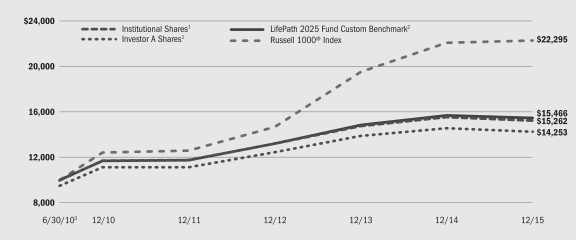
| | 1 | | Assuming maximum sales charges, transaction costs and other operating expenses, including advisory fees, if any. Institutional Shares do not have a sales charge. |
| | 2 | | The LifePath Fund compares its performance to that of a customized weighted index (the “LifePath 2025 Fund Custom Benchmark”), comprised of the indexes indicated below, which reflects the investment advisor’s changes to the benchmark’s weightings over time. The investment advisor adjusts the weightings of these indexes periodically based upon its evaluation and adjustment of the LifePath Fund’s asset allocation strategy. The weightings are presented annually but they are adjusted quarterly. |
| | 3 | | Commencement of operations. |
LifePath Fund’s custom benchmark consists of the following:
| | | | | | | | | | | | | | | | | | | | | | | | | | | | | | | | | | | | | | | | |
| Period | | Barclays U.S.
Aggregate
Bond Index | | | Barclays U.S.
Treasury
Inflation
Protected
Securities (TIPS) Index
(Series L) | | | Bloomberg
Commodity
Index4 | | | FTSE
EPRA/NAREIT
Developed
Real Estate
Index | | | MSCI
ACWI ex USA
IMI Index | | | Russell
1000®
Index | | | Russell
2000®
Index | | | S&P
MidCap
400® Index | | | S&P 500®
Index | | | S&P
SmallCap
600® Index | |
6/30/10 to 12/31/10 | | | 28.5 | % | | | 4.4 | % | | | N/A | | | | 4.9 | % | | | 18.8 | % | | | N/A | | | | N/A | | | | 5.9 | % | | | 34.9 | % | | | 2.6 | % |
1/01/11 to 12/31/11 | | | 29.8 | | | | 4.6 | | | | N/A | | | | 4.8 | | | | 18.9 | | | | 15.2 | % | | | 1.4 | % | | | 3.5 | | | | 20.3 | | | | 1.5 | |
1/01/12 to 12/31/12 | | | 31.9 | | | | 5.0 | | | | 1.0 | % | | | 4.7 | | | | 18.2 | | | | 35.9 | | | | 3.3 | | | | N/A | | | | N/A | | | | N/A | |
1/01/13 to 12/31/13 | | | 33.7 | | | | 5.2 | | | | 3.8 | | | | 4.3 | | | | 17.1 | | | | 32.6 | | | | 3.3 | | | | N/A | | | | N/A | | | | N/A | |
1/01/14 to 12/31/14 | | | 34.3 | | | | 5.3 | | | | 3.8 | | | | 4.5 | | | | 17.3 | | | | 31.5 | | | | 3.3 | | | | N/A | | | | N/A | | | | N/A | |
1/01/15 to 12/31/15 | | | 31.0 | | | | 5.0 | | | | 3.8 | | | | 5.3 | | | | 18.8 | | | | 33.1 | | | | 3.0 | | | | N/A | | | | N/A | | | | N/A | |
| | 4 | | Prior to July 1, 2014, the Bloomberg Commodity Index was known as the Dow Jones-UBS Commodity Index. |
| | | | See “About Fund Performance” on page 14 for descriptions of the indexes. |
| | | | | | |
| | | | | | | |
| 6 | | BLACKROCK FUNDS III | | DECEMBER 31, 2015 | | |
| | |
| | | BlackRock LifePath 2025 Fund |
|
| Performance Summary for the Period Ended December 31, 2015 |
| | | | | | | | | | | | | | | | | | | | | | | | | | | | |
| | | | | | Average Annual Total Returns | |
| | | | | | 1 Year | | | 5 Year | | | Since Inception1 | |
| | | 6-Month
Total Returns | | | w/o sales
charge | | | w/sales
charge | | | w/o sales
charge | | | w/sales
charge | | | w/o sales
charge | | | w/sales
charge | |
Institutional | | | (3.18 | )% | | | (1.92 | )% | | | N/A | | | | 5.39 | % | | | N/A | | | | 7.98 | % | | | N/A | |
Investor A | | | (3.33 | ) | | | (2.17 | ) | | | (7.31 | )% | | | 5.11 | | | | 3.98 | % | | | 7.70 | | | | 6.65 | % |
Investor C | | | (3.63 | ) | | | (2.86 | ) | | | (3.80 | ) | | | 4.33 | | | | 4.33 | | | | 6.90 | | | | 6.90 | |
Class K | | | (3.02 | ) | | | (1.64 | ) | | | N/A | | | | 5.58 | | | | N/A | | | | 8.19 | | | | N/A | |
Class R | | | (3.42 | ) | | | (2.36 | ) | | | N/A | | | | 4.86 | | | | N/A | | | | 7.44 | | | | N/A | |
LifePath 2025 Fund Custom Benchmark | | | (2.84 | ) | | | (1.45 | ) | | | N/A | | | | 5.77 | | | | N/A | | | | 8.24 | | | | N/A | |
Barclays U.S. Aggregate Bond Index | | | 0.65 | | | | 0.55 | | | | N/A | | | | 3.25 | | | | N/A | | | | 3.16 | | | | N/A | |
Barclays U.S. TIPS Index (Series L) | | | (1.78 | ) | | | (1.44 | ) | | | N/A | | | | 2.55 | | | | N/A | | | | 2.65 | | | | N/A | |
Bloomberg Commodity Index | | | (23.46 | ) | | | (24.66 | ) | | | N/A | | | | (13.47 | ) | | | N/A | | | | (8.13 | ) | | | N/A | |
FTSE EPRA/NAREIT Developed Real Estate Index | | | 2.49 | | | | (0.79 | ) | | | N/A | | | | 7.17 | | | | N/A | | | | 10.96 | | | | N/A | |
MSCI ACWI ex USA IMI Index | | | (8.78 | ) | | | (4.60 | ) | | | N/A | | | | 1.27 | | | | N/A | | | | 5.46 | | | | N/A | |
Russell 1000® Index | | | (0.78 | ) | | | 0.92 | | | | N/A | | | | 12.44 | | | | N/A | | | | 15.68 | | | | N/A | |
Russell 2000® Index | | | (8.75 | ) | | | (4.41 | ) | | | N/A | | | | 9.19 | | | | N/A | | | | 13.50 | | | | N/A | |
| | 1 | | The LifePath Fund commenced operations on June 30, 2010. |
| | | | Past performance is not indicative of future results. |
| | | | N/A — Not applicable as share class and index do not have a sales charge. |
| | | | | | |
| | | | | | | |
| | BLACKROCK FUNDS III | | DECEMBER 31, 2015 | | 7 |
| | | | |
| | | BlackRock LifePath 2035 Fund |
The investment objective of BlackRock LifePath® 2035 Fund (“LifePath 2035 Fund” or the “LifePath Fund”) is to seek to provide for retirement outcomes based on quantitatively measured risk. In pursuit of this objective, LifePath 2035 Fund will be broadly diversified across global asset classes, with asset allocations becoming more conservative over time.
Effective March 31, 2015, the LifePath® 2035 Portfolio changed its name to the BlackRock LifePath® 2035 Fund.
|
| Total Return Based on a $10,000 Investment |
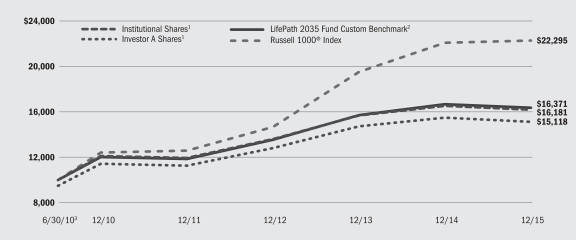
| | 1 | | Assuming maximum sales charges, transaction costs and other operating expenses, including advisory fees, if any. Institutional Shares do not have a sales charge. |
| | 2 | | The LifePath Fund compares its performance to that of a customized weighted index (the “LifePath 2035 Fund Custom Benchmark”), comprised of the indexes indicated below, which reflects the investment advisor’s changes to the benchmark’s weightings over time. The investment advisor adjusts the weightings of these indexes periodically based upon its evaluation and adjustment of the LifePath Fund’s asset allocation strategy. The weightings are presented annually but they are adjusted quarterly. |
| | 3 | | Commencement of operations. |
The LifePath Fund’s custom benchmark consists of the following:
| | | | | | | | | | | | | | | | | | | | | | | | | | | | | | | | | | | | | | | | |
| Period | | Barclays U.S.
Aggregate
Bond Index | | | Barclays U.S.
Treasury
Inflation
Protected
Securities
(TIPS) Index
(Series L) | | | Bloomberg
Commodity
Index4 | | | FTSE
EPRA/NAREIT
Developed
Real Estate
Index | | | MSCI
ACWI ex USA
IMI Index | | | Russell
1000®
Index | | | Russell
2000®
Index | | | S&P
MidCap
400® Index | | | S&P 500®
Index | | | S&P
SmallCap
600® Index | |
6/30/10 to 12/31/10 | | | 16.6 | % | | | 2.2 | % | | | N/A | | | | 6.8 | % | | | 22.7 | % | | | N/A | | | | N/A | | | | 6.4 | % | | | 42.5 | % | | | 2.8 | % |
1/01/11 to 12/31/11 | | | 17.8 | | | | 2.3 | | | | N/A | | | | 7.0 | | | | 22.8 | | | | 18.6 | % | | | 1.2 | % | | | 3.9 | | | | 24.7 | | | | 1.7 | |
1/01/12 to 12/31/12 | | | 20.3 | | | | 2.6 | | | | 1.0 | % | | | 7.2 | | | | 21.1 | | | | 44.1 | | | | 2.7 | | | | N/A | | | | N/A | | | | N/A | |
1/01/13 to 12/31/13 | | | 22.1 | | | | 2.9 | | | | 3.9 | | | | 6.9 | | | | 21.3 | | | | 40.3 | | | | 2.6 | | | | N/A | | | | N/A | | | | N/A | |
1/01/14 to 12/31/14 | | | 21.4 | | | | 2.8 | | | | 3.9 | | | | 7.6 | | | | 22.2 | | | | 39.6 | | | | 2.5 | | | | N/A | | | | N/A | | | | N/A | |
1/01/15 to 12/31/15 | | | 13.2 | | | | 1.9 | | | | 3.9 | | | | 9.8 | | | | 25.4 | | | | 43.6 | | | | 2.2 | | | | N/A | | | | N/A | | | | N/A | |
| | 4 | | Prior to July 1, 2014, the Bloomberg Commodity Index was known as the Dow Jones-UBS Commodity Index. |
| | | | See “About Fund Performance” on page 14 for descriptions of the indexes. |
| | | | | | |
| | | | | | | |
| 8 | | BLACKROCK FUNDS III | | DECEMBER 31, 2015 | | |
| | |
| | | BlackRock LifePath 2035 Fund |
|
| Performance Summary for the Period Ended December 31, 2015 |
| | | | | | | | | | | | | | | | | | | | | | | | | | | | |
| | | | | | Average Annual Total Returns | |
| | | | | | 1 Year | | | 5 Year | | | Since Inception1 | |
| | | 6-Month
Total Returns | | | w/o sales
charge | | | w/sales
charge | | | w/o sales
charge | | | w/sales
charge | | | w/o sales
charge | | | w/sales
charge | |
Institutional | | | (3.74 | )% | | | (2.15 | )% | | | N/A | | | | 5.99 | % | | | N/A | | | | 9.13 | % | | | N/A | |
Investor A | | | (3.89 | ) | | | (2.40 | ) | | | (7.52 | )% | | | 5.73 | | | | 4.60 | % | | | 8.85 | | | | 7.79 | % |
Investor C | | | (4.20 | ) | | | (3.13 | ) | | | (4.06 | ) | | | 4.94 | | | | 4.94 | | | | 8.04 | | | | 8.04 | |
Class K | | | (3.65 | ) | | | (1.83 | ) | | | N/A | | | | 6.45 | | | | N/A | | | | 9.60 | | | | N/A | |
Class R | | | (4.03 | ) | | | (2.65 | ) | | | N/A | | | | 5.46 | | | | N/A | | | | 8.59 | | | | N/A | |
LifePath 2035 Fund Custom Benchmark | | | (3.42 | ) | | | (1.77 | ) | | | N/A | | | | 6.39 | | | | N/A | | | | 9.38 | | | | N/A | |
Barclays U.S. Aggregate Bond Index | | | 0.65 | | | | 0.55 | | | | N/A | | | | 3.25 | | | | N/A | | | | 3.16 | | | | N/A | |
Barclays U.S. TIPS Index (Series L) | | | (1.78 | ) | | | (1.44 | ) | | | N/A | | | | 2.55 | | | | N/A | | | | 2.65 | | | | N/A | |
Bloomberg Commodity Index | | | (23.46 | ) | | | (24.66 | ) | | | N/A | | | | (13.47 | ) | | | N/A | | | | (8.13 | ) | | | N/A | |
FTSE EPRA/NAREIT Developed Real Estate Index | | | 2.49 | | | | (0.79 | ) | | | N/A | | | | 7.17 | | | | N/A | | | | 10.96 | | | | N/A | |
MSCI ACWI ex USA IMI Index | | | (8.78 | ) | | | (4.60 | ) | | | N/A | | | | 1.27 | | | | N/A | | | | 5.46 | | | | N/A | |
Russell 1000® Index | | | (0.78 | ) | | | 0.92 | | | | N/A | | | | 12.44 | | | | N/A | | | | 15.68 | | | | N/A | |
Russell 2000® Index | | | (8.75 | ) | | | (4.41 | ) | | | N/A | | | | 9.19 | | | | N/A | | | | 13.50 | | | | N/A | |
| | 1 | | The LifePath Fund commenced operations on June 30, 2010. |
| | | | Past performance is not indicative of future results. |
| | | | N/A — Not applicable as share class and index do not have a sales charge. |
| | | | | | |
| | | | | | | |
| | BLACKROCK FUNDS III | | DECEMBER 31, 2015 | | 9 |
| | | | |
| | | BlackRock LifePath 2045 Fund |
The investment objective of BlackRock LifePath® 2045 Fund (“LifePath 2045 Fund” or the “LifePath Fund”) is to seek to provide for retirement outcomes based on quantitatively measured risk. In pursuit of this objective, LifePath 2045 Fund will be broadly diversified across global asset classes, with asset allocations becoming more conservative over time.
Effective March 31, 2015, the LifePath® 2045 Portfolio changed its name to the BlackRock LifePath® 2045 Fund.
|
| Total Return Based on a $10,000 Investment |
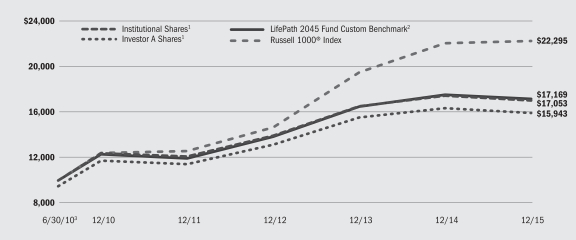
| | 1 | | Assuming maximum sales charges, transaction costs and other operating expenses, including advisory fees, if any. Institutional Shares do not have a sales charge. |
| | 2 | | The LifePath Fund compares its performance to that of a customized weighted index (the “LifePath 2045 Fund Custom Benchmark”), comprised of the indexes indicated below, which reflects the investment advisor’s changes to the benchmark’s weightings over time. The investment advisor adjusts the weightings of these indexes periodically based upon its evaluation and adjustment of the LifePath Fund’s asset allocation strategy. The weightings are presented annually but they are adjusted quarterly. |
| | 3 | | Commencement of operations. |
The LifePath Fund’s custom benchmark consists of the following:
| | | | | | | | | | | | | | | | | | | | | | | | | | | | | | | | | | | | | | | | |
| Period | | Barclays U.S.
Aggregate
Bond Index | | | Barclays
U.S. Treasury
Inflation
Protected
Securities
(TIPS) Index
(Series L) | | | Bloomberg
Commodity
Index4 | | | FTSE
EPRA/NAREIT
Developed
Real Estate
Index | | | MSCI
ACWI ex USA
IMI Index | | | Russell
1000®
Index | | | Russell
2000®
Index | | | S&P
MidCap
400® Index | | | S&P 500®
Index | | | S&P
SmallCap
600® Index | |
6/30/10 to 12/31/10 | | | 6.8 | % | | | N/A | | | | N/A | | | | 8.5 | % | | | 25.9 | % | | | N/A | | | | N/A | | | | 6.8 | % | | | 49.0 | % | | | 3.0 | % |
1/01/11 to 12/31/11 | | | 8.2 | | | | N/A | | | | N/A | | | | 8.7 | | | | 26.1 | | | | 21.5 | % | | | 1.1 | % | | | 4.2 | | | | 28.4 | | | | 1.8 | |
1/01/12 to 12/31/12 | | | 11.2 | | | | N/A | | | | 1.0 | % | | | 9.2 | | | | 25.3 | | | | 51.0 | | | | 2.3 | | | | N/A | | | | N/A | | | | N/A | |
1/01/13 to 12/31/13 | | | 13.5 | | | | N/A | | | | 3.9 | | | | 9.1 | | | | 24.8 | | | | 46.7 | | | | 2.0 | | | | N/A | | | | N/A | | | | N/A | |
1/01/14 to 12/31/14 | | | 12.5 | | | | N/A | | | | 3.9 | | | | 10.1 | | | | 25.9 | | | | 45.6 | | | | 2.0 | | | | N/A | | | | N/A | | | | N/A | |
1/01/15 to 12/31/15 | | | 1.8 | | | | 0.2 | % | | | 4.2 | | | | 13.4 | | | | 29.6 | | | | 48.8 | | | | 2.0 | | | | N/A | | | | N/A | | | | N/A | |
| | 4 | | Prior to July 1, 2014, the Bloomberg Commodity Index was known as the Dow Jones-UBS Commodity Index. |
| | | | See “About Fund Performance” on page 14 for descriptions of the indexes. |
| | | | | | |
| | | | | | | |
| 10 | | BLACKROCK FUNDS III | | DECEMBER 31, 2015 | | |
| | |
| | | BlackRock LifePath 2045 Fund |
|
| Performance Summary for the Period Ended December 31, 2015 |
| | | | | | | | | | | | | | | | | | | | | | | | | | | | |
| | | | | | Average Annual Total Returns | |
| | | | | | 1 Year | | | 5 Year | | | Since Inception1 | |
| | | 6-Month
Total Returns | | | w/o sales
charge | | | w/sales
charge | | | w/o sales
charge | | | w/sales
charge | | | w/o sales
charge | | | w/sales
charge | |
Institutional | | | (4.18 | )% | | | (2.37 | )% | | | N/A | | | | 6.58 | % | | | N/A | | | | 10.18 | % | | | N/A | |
Investor A | | | (4.32 | ) | | | (2.61 | ) | | | (7.73 | )% | | | 6.32 | | | | 5.18 | % | | | 9.91 | | | | 8.84 | % |
Investor C | | | (4.69 | ) | | | (3.43 | ) | | | (4.36 | ) | | | 5.51 | | | | 5.51 | | | | 9.06 | | | | 9.06 | |
Class K | | | (4.02 | ) | | | (2.04 | ) | | | N/A | | | | 6.94 | | | | N/A | | | | 10.55 | | | | N/A | |
Class R | | | (4.42 | ) | | | (2.80 | ) | | | N/A | | | | 6.06 | | | | N/A | | | | 9.63 | | | | N/A | |
LifePath 2045 Fund Custom Benchmark | | | (3.88 | ) | | | (2.10 | ) | | | N/A | | | | 6.89 | | | | N/A | | | | 10.32 | | | | N/A | |
Barclays U.S. Aggregate Bond Index | | | 0.65 | | | | 0.55 | | | | N/A | | | | 3.25 | | | | N/A | | | | 3.16 | | | | N/A | |
Barclays U.S. TIPS Index (Series L) | | | (1.78 | ) | | | (1.44 | ) | | | N/A | | | | 2.55 | | | | N/A | | | | 2.65 | | | | N/A | |
Bloomberg Commodity Index | | | (23.46 | ) | | | (24.66 | ) | | | N/A | | | | (13.47 | ) | | | N/A | | | | (8.13 | ) | | | N/A | |
FTSE EPRA/NAREIT Developed Real Estate Index | | | 2.49 | | | | (0.79 | ) | | | N/A | | | | 7.17 | | | | N/A | | | | 10.96 | | | | N/A | |
MSCI ACWI ex USA IMI Index | | | (8.78 | ) | | | (4.60 | ) | | | N/A | | | | 1.27 | | | | N/A | | | | 5.46 | | | | N/A | |
Russell 1000® Index | | | (0.78 | ) | | | 0.92 | | | | N/A | | | | 12.44 | | | | N/A | | | | 15.68 | | | | N/A | |
Russell 2000® Index | | | (8.75 | ) | | | (4.41 | ) | | | N/A | | | | 9.19 | | | | N/A | | | | 13.50 | | | | N/A | |
| | 1 | | The LifePath Fund commenced operations on June 30, 2010. |
| | | | Past performance is not indicative of future results. |
| | | | N/A — Not applicable as share class and index do not have a sales charge. |
| | | | | | |
| | | | | | | |
| | BLACKROCK FUNDS III | | DECEMBER 31, 2015 | | 11 |
| | | | |
| | | BlackRock LifePath 2055 Fund |
The investment objective of BlackRock LifePath® 2055 Fund (“LifePath 2055 Fund” or the “LifePath Fund”) is to seek to provide for retirement outcomes based on quantitatively measured risk. In pursuit of this objective, LifePath 2055 Fund will be broadly diversified across global asset classes, with asset allocations becoming more conservative over time.
Effective March 31, 2015, the LifePath® 2055 Portfolio changed its name to the BlackRock LifePath® 2055 Fund.
|
| Total Return Based on a $10,000 Investment |
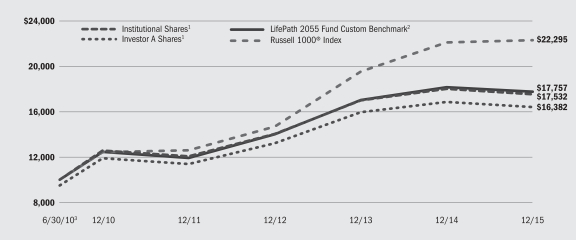
| | 1 | | Assuming maximum sales charges, transaction costs and other operating expenses, including advisory fees, if any. Institutional Shares do not have a sales charge. |
| | 2 | | The LifePath Fund compares its performance to that of a customized weighted index (the “LifePath 2055 Fund Custom Benchmark”), comprised of the indexes indicated below, which reflects the investment advisor’s changes to the benchmark’s weightings over time. The investment advisor adjusts the weightings of these indexes periodically based upon its evaluation and adjustment of the LifePath Fund’s asset allocation strategy. The weightings are presented annually but they are adjusted quarterly. |
| | 3 | | Commencement of operations. |
The LifePath Fund’s custom benchmark consists of the following:
| | | | | | | | | | | | | | | | | | | | | | | | | | | | | | | | | | | | |
| Period | | Barclays U.S.
Aggregate
Bond Index | | | Bloomberg
Commodity
Index4 | | | FTSE
EPRA/NAREIT
Developed
Real Estate
Index | | | MSCI
ACWI ex USA
IMI Index | | | Russell
1000®
Index | | | Russell
2000®
Index | | | S&P
MidCap
400® Index | | | S&P 500®
Index | | | S&P
SmallCap
600® Index | |
6/30/10 to 12/31/10 | | | 1.0 | % | | | N/A | | | | 9.0 | % | | | 28.2 | % | | | N/A | | | | N/A | | | | 8.1 | % | | | 50.1 | % | | | 3.6 | % |
1/01/11 to 12/31/11 | | | 1.0 | | | | N/A | | | | 9.7 | | | | 28.8 | | | | 22.0 | % | | | 2.0 | % | | | 4.9 | | | | 29.5 | | | | 2.1 | |
1/01/12 to 12/31/12 | | | 1.3 | | | | 1.0 | % | | | 11.3 | | | | 28.6 | | | | 54.5 | | | | 3.3 | | | | N/A | | | | N/A | | | | N/A | |
1/01/13 to 12/31/13 | | | 3.1 | | | | 4.1 | | | | 11.5 | | | | 27.8 | | | | 51.7 | | | | 1.8 | | | | N/A | | | | N/A | | | | N/A | |
1/01/14 to 12/31/14 | | | 4.0 | | | | 4.0 | | | | 12.2 | | | | 28.6 | | | | 49.4 | | | | 1.8 | | | | N/A | | | | N/A | | | | N/A | |
1/01/15 to 12/31/15 | | | 1.0 | | | | 4.2 | | | | 13.7 | | | | 29.9 | | | | 49.2 | | | | 2.0 | | | | N/A | | | | N/A | | | | N/A | |
| | 4 | | Prior to July 1, 2014, the Bloomberg Commodity Index was known as the Dow Jones-UBS Commodity Index. |
| | | | See “About Fund Performance” on page 14 for descriptions of the indexes. |
| | | | | | |
| | | | | | | |
| 12 | | BLACKROCK FUNDS III | | DECEMBER 31, 2015 | | |
| | |
| | | BlackRock LifePath 2055 Fund |
|
| Performance Summary for the Period Ended December 31, 2015 |
| | | | | | | | | | | | | | | | | | | | | | | | | | | | |
| | | | | | Average Annual Total Returns | |
| | | | | | 1 Year | | | 5 Year | | | Since Inception1 | |
| | | 6-Month
Total Returns | | | w/o sales
charge | | | w/sales
charge | | | w/o sales
charge | | | w/sales
charge | | | w/o sales
charge | | | w/sales
charge | |
Institutional | | | (4.36 | )% | | | (2.52 | )% | | | N/A | | | | 6.90 | % | | | N/A | | | | 10.73 | % | | | N/A | |
Investor A | | | (4.42 | ) | | | (2.67 | ) | | | (7.78 | )% | | | 6.61 | | | | 5.47 | % | | | 10.45 | | | | 9.37 | % |
Investor C | | | (4.76 | ) | | | (3.48 | ) | | | (4.42 | ) | | | 5.83 | | | | 5.83 | | | | 9.63 | | | | 9.63 | |
Class K | | | (4.14 | ) | | | (2.15 | ) | | | N/A | | | | 7.32 | | | | N/A | | | | 11.17 | | | | N/A | |
Class R | | | (4.52 | ) | | | (3.00 | ) | | | N/A | | | | 6.35 | | | | N/A | | | | 10.17 | | | | N/A | |
LifePath 2055 Fund Custom Benchmark | | | (3.91 | ) | | | (2.12 | ) | | | N/A | | | | 7.35 | | | | N/A | | | | 11.00 | | | | N/A | |
Barclays U.S. Aggregate Bond Index | | | 0.65 | | | | 0.55 | | | | N/A | | | | 3.25 | | | | N/A | | | | 3.16 | | | | N/A | |
Bloomberg Commodity Index | | | (23.46 | ) | | | (24.66 | ) | | | N/A | | | | (13.47 | ) | | | N/A | | | | (8.13 | ) | | | N/A | |
FTSE EPRA/NAREIT Developed Real Estate Index | | | 2.49 | | | | (0.79 | ) | | | N/A | | | | 7.17 | | | | N/A | | | | 10.96 | | | | N/A | |
MSCI ACWI ex USA IMI Index | | | (8.78 | ) | | | (4.60 | ) | | | N/A | | | | 1.27 | | | | N/A | | | | 5.46 | | | | N/A | |
Russell 1000® Index | | | (0.78 | ) | | | 0.92 | | | | N/A | | | | 12.44 | | | | N/A | | | | 15.68 | | | | N/A | |
Russell 2000® Index | | | (8.75 | ) | | | (4.41 | ) | | | N/A | | | | 9.19 | | | | N/A | | | | 13.50 | | | | N/A | |
| | 1 | | The LifePath Fund commenced operations on June 30, 2010. |
| | | | Past performance is not indicative of future results. |
| | | | N/A — Not applicable as share class and index do not have a sales charge. |
| | | | | | |
| | | | | | | |
| | BLACKROCK FUNDS III | | DECEMBER 31, 2015 | | 13 |
| • | | Institutional Shares are not subject to any sales charge. These shares bear no ongoing distribution or service fees and are available only to certain eligible investors. |
| • | | Investor A Shares are subject to a maximum initial sales charge (front-end load) of 5.25% and a service fee of 0.25% per year (but no distribution fee). Certain redemptions of these shares may be subject to a contingent deferred sales charge (“CDSC”) where no initial sales charge was paid at the time of purchase. These shares are generally available through financial intermediaries. |
| • | | Investor C Shares are subject to a 1.00% CDSC if redeemed within one year of purchase. In addition, these shares are subject to a distribution fee of 0.75% per year and a service fee of 0.25% per year. These shares are generally available through financial intermediaries. |
| • | | Class K Shares are not subject to any sales charge. These shares bear no ongoing distribution or service fees and are available only to certain eligible investors. |
| • | | Class R Shares are not subject to any sales charge. These shares are subject to a distribution fee of 0.25% per year and a service fee of 0.25% per year. These shares are available only to certain employer-sponsored retirement plans. |
Performance information reflects past performance and does not guarantee future results. Current performance may be lower or higher than the performance data quoted. Refer to www.blackrock.com/funds to obtain performance data current to the most recent month end. Performance results do not reflect the deduction of taxes that a shareholder would pay on LifePath Fund distributions or the redemption of LifePath Fund shares. Figures shown in each of the performance tables on the previous pages assume reinvestment of all distributions, if any, at net asset value (“NAV”) on the ex-dividend date. Investment return and principal value of shares will fluctuate so that shares, when redeemed, may be worth more or less than their original cost. Distributions paid to each class of shares will vary because of the different levels of administration and distribution fees applicable to each class, which are deducted from the income available to be paid to shareholders.
BlackRock Advisors, LLC (“BAL” or the “Administrator”), each LifePath Funds’ administrator, waived and/or reimbursed a portion of each LifePath Fund’s expenses. Without such waiver, each LifePath Fund’s performance would have been lower. The Administrator is under no
obligation to continue waiving and/or reimbursing its fees after the applicable termination date of such agreement. See Note 4 of the Notes to Financial Statements for additional information on waivers and/or reimbursements.
The LifePath Funds’ custom benchmarks are hypothetical representations of the performance of the respective LifePath Fund’s asset classes according to their weightings as of the most recent quarter-end. The weightings of the various indexes that are included in the LifePath Funds’ custom benchmarks are adjusted quarterly to reflect the LifePath Funds’ changing asset allocations over time. As of December 31, 2015, the following indexes are used to calculate the LifePath Funds’ custom benchmarks: Barclays U.S. Aggregate Bond Index, Barclays U.S. TIPS Index (Series L), Bloomberg Commodity Index, FTSE EPRA/NAREIT Developed Real Estate Index, MSCI ACWI ex USA IMI Index, Russell 1000® Index and Russell 2000® Index, as applicable.
The Barclays U.S. Aggregate Bond Index is a widely recognized unmanaged market-weighted index, comprised of investment-grade corporate bonds rated BBB or better, mortgages and U.S. Treasury and U.S. Government agency issues with at least one year to maturity. The Barclays U.S. TIPS Index (Series L) is an unmanaged index that measures the performance of the inflation-protected public obligations of the U.S. Treasury. The Bloomberg Commodity Index is a broadly diversified index that allows investors to track commodity futures through a single, simple measure. The FTSE EPRA/NAREIT Developed Real Estate Index is a global market capitalization weighted index composed of listed real estate securities from developed market countries in North America, Europe and Asia. The MSCI ACWI ex USA IMI Index is a free float-adjusted market capitalization weighted index that measures the equity market performance of the developed (excluding the U.S.) and emerging investable market universe. The Russell 1000® Index is an index that measures the performance of the large cap segment of the U.S. equity universe. It is a subset of the Russell 3000® Index and includes approximately 1,000 of the largest securities based on a combination of their market capitalization and current index membership. The index represents approximately 92% of the total market capitalization of the Russell 3000® Index. The Russell 2000® Index is an unmanaged index that is a subset of the Russell 3000® Index representing approximately 10% of the total market capitalization of that index. It includes approximately 2000 of the smallest securities based on a combination of their market cap and current index membership.
| | | | | | |
| | | | | | | |
| 14 | | BLACKROCK FUNDS III | | DECEMBER 31, 2015 | | |
Shareholders of each LifePath Fund may incur the following charges: (a) transactional expenses, such as sales charges; and (b) operating expenses, including administration fees, service and distribution fees, including 12b-1 fees, and other fund expenses. The expense examples shown below (which are based on a hypothetical investment of $1,000 invested on July 1, 2015 and held through December 31, 2015) are intended to assist shareholders both in calculating expenses based on an investment in a LifePath Fund and in comparing these expenses with similar costs of investing in other mutual funds.
The expense examples provide information about actual account values and actual expenses. In order to estimate the expenses a shareholder paid during the period covered by this report, shareholders can divide their account value by $1,000 and then multiply the result by the number corresponding to their LifePath Fund and their share class under the heading entitled “Expenses Paid During the Period.”
The expense examples also provide information about hypothetical account values and hypothetical expenses based on each LifePath Fund’s actual expense ratio and an assumed rate of return of 5% per year before expenses. In order to assist shareholders in comparing the ongoing expenses of investing in a LifePath Fund and other funds, compare the 5% hypothetical examples with the 5% hypothetical examples that appear in shareholder reports of other funds.
The expenses shown in the expense examples are intended to highlight shareholders’ ongoing costs only and do not reflect any transactional expenses, such as sales charges, if any. Therefore, the hypothetical examples are useful in comparing ongoing expenses only, and will not help shareholders determine the relative total expenses of owning different funds. If these transactional expenses were included, shareholder expenses would have been higher.
| | | | | | | | | | | | | | | | | | | | | | | | | | | | |
| | | Actual | | | Hypothetical2 | | | | |
| | | Beginning
Account Value July 1, 2015 | | | Ending
Account Value
December 31, 2015 | | | Expenses Paid
During the Period1 | | | Beginning
Account Value
July 1, 2015 | | | Ending
Account Value
December 31, 2015 | | | Expenses Paid
During the Period1 | | | Annualized
Expense Ratio | |
| LifePath 2025 Fund | | | | | | | | | | | | | | | | | | | | | |
Institutional . . . . . . . . | | $ | 1,000.00 | | | $ | 967.40 | | | $ | 3.47 | | | $ | 1,000.00 | | | $ | 1,021.68 | | | $ | 3.57 | | | | 0.70 | % |
Investor A . . . . . . . . . . | | $ | 1,000.00 | | | $ | 966.70 | | | $ | 4.71 | | | $ | 1,000.00 | | | $ | 1,020.42 | | | $ | 4.84 | | | | 0.95 | % |
Investor C . . . . . . . . . . | | $ | 1,000.00 | | | $ | 963.70 | | | $ | 8.46 | | | $ | 1,000.00 | | | $ | 1,016.59 | | | $ | 8.69 | | | | 1.71 | % |
Class K . . . . . . . . . | | $ | 1,000.00 | | | $ | 969.80 | | | $ | 1.89 | | | $ | 1,000.00 | | | $ | 1,023.29 | | | $ | 1.94 | | | | 0.38 | % |
Class R . . . . . . . . . . . . . | | $ | 1,000.00 | | | $ | 965.80 | | | $ | 5.90 | | | $ | 1,000.00 | | | $ | 1,019.21 | | | $ | 6.06 | | | | 1.19 | % |
| LifePath 2035 Fund | |
Institutional . . . . . . . . | | $ | 1,000.00 | | | $ | 962.60 | | | $ | 3.36 | | | $ | 1,000.00 | | | $ | 1,021.78 | | | $ | 3.47 | | | | 0.68 | % |
Investor A . . . . . . . . . . | | $ | 1,000.00 | | | $ | 961.10 | | | $ | 4.60 | | | $ | 1,000.00 | | | $ | 1,020.52 | | | $ | 4.74 | | | | 0.93 | % |
Investor C . . . . . . . . . . | | $ | 1,000.00 | | | $ | 958.00 | | | $ | 8.34 | | | $ | 1,000.00 | | | $ | 1,016.69 | | | $ | 8.59 | | | | 1.69 | % |
Class K . . . . . . . . . | | $ | 1,000.00 | | | $ | 963.50 | | | $ | 1.78 | | | $ | 1,000.00 | | | $ | 1,023.39 | | | $ | 1.84 | | | | 0.36 | % |
Class R . . . . . . . . . . . . . | | $ | 1,000.00 | | | $ | 959.70 | | | $ | 5.78 | | | $ | 1,000.00 | | | $ | 1,019.31 | | | $ | 5.96 | | | | 1.17 | % |
| LifePath 2045 Fund | | | | | | | | | |
Institutional . . . . . . . . | | $ | 1,000.00 | | | $ | 958.20 | | | $ | 3.21 | | | $ | 1,000.00 | | | $ | 1,021.93 | | | $ | 3.31 | | | | 0.65 | % |
Investor A . . . . . . . . . . | | $ | 1,000.00 | | | $ | 956.80 | | | $ | 4.44 | | | $ | 1,000.00 | | | $ | 1,020.67 | | | $ | 4.58 | | | | 0.90 | % |
Investor C . . . . . . . . . . | | $ | 1,000.00 | | | $ | 953.10 | | | $ | 8.17 | | | $ | 1,000.00 | | | $ | 1,016.84 | | | $ | 8.44 | | | | 1.66 | % |
Class K . . . . . . . . . | | $ | 1,000.00 | | | $ | 959.80 | | | $ | 1.73 | | | $ | 1,000.00 | | | $ | 1,023.44 | | | $ | 1.79 | | | | 0.35 | % |
Class R . . . . . . . . . . . . . | | $ | 1,000.00 | | | $ | 955.80 | | | $ | 5.62 | | | $ | 1,000.00 | | | $ | 1,019.46 | | | $ | 5.80 | | | | 1.14 | % |
| LifePath 2055 Fund | |
Institutional . . . . . . . . | | $ | 1,000.00 | | | $ | 956.40 | | | $ | 3.21 | | | $ | 1,000.00 | | | $ | 1,021.93 | | | $ | 3.31 | | | | 0.65 | % |
Investor A . . . . . . . . . . | | $ | 1,000.00 | | | $ | 955.80 | | | $ | 4.44 | | | $ | 1,000.00 | | | $ | 1,020.67 | | | $ | 4.58 | | | | 0.90 | % |
Investor C . . . . . . . . . . | | $ | 1,000.00 | | | $ | 952.40 | | | $ | 8.17 | | | $ | 1,000.00 | | | $ | 1,016.84 | | | $ | 8.44 | | | | 1.66 | % |
Class K . . . . . . . . . | | $ | 1,000.00 | | | $ | 958.60 | | | $ | 1.63 | | | $ | 1,000.00 | | | $ | 1,023.54 | | | $ | 1.68 | | | | 0.33 | % |
Class R . . . . . . . . . . . . . | | $ | 1,000.00 | | | $ | 954.80 | | | $ | 5.62 | | | $ | 1,000.00 | | | $ | 1,019.46 | | | $ | 5.80 | | | | 1.14 | % |
| | 1 | | For each class of the LifePath Fund, expenses are equal to the annualized net expense ratio for the class, multiplied by the average account value over the period, multiplied by 184/365 (to reflect the one-half year period shown). Because each LifePath Fund invests all of its assets in a LifePath Master Portfolio, the expense examples reflect the net expenses of both the LifePath Fund and the LifePath Master Portfolio in which it invests. |
| | 2 | | Hypothetical 5% annual return before expenses is calculated by prorating the number of days in the most recent fiscal half year divided by 365. |
| | | | | | |
| | | | | | | |
| | BLACKROCK FUNDS III | | DECEMBER 31, 2015 | | 15 |
| | | | |
| Derivative Financial Instruments | | |
The LifePath Master Portfolios may invest in various derivative financial instruments. Derivative financial instruments are used to obtain exposure to a security, index and/or market without owning or taking physical custody of securities or to manage market, equity, credit, interest rate, foreign currency exchange rate, commodity and/or other risks. Derivative financial instruments may give rise to a form of economic leverage. Derivative financial instruments also involve risks, including the imperfect correlation between the value of a derivative financial instrument and the underlying asset, possible default of the counterparty to the transaction or
illiquidity of the derivative financial instrument. The LifePath Master Portfolios’ ability to use a derivative financial instrument successfully depends on the investment advisor’s ability to predict pertinent market movements accurately, which cannot be assured. The use of derivative financial instruments may result in losses greater than if they had not been used, may limit the amount of appreciation a LifePath Fund can realize on an investment and/or may result in lower distributions paid to shareholders. The LifePath Master Portfolios’ investments in these instruments, if any, are discussed in detail in the Notes to Financial Statements.
| | | | | | |
| | | | | | | |
| 16 | | BLACKROCK FUNDS III | | DECEMBER 31, 2015 | | |
| | |
| Statements of Assets and Liabilities | | BlackRock Funds III |
| | | | | | | | | | | | | | | | |
| December 31, 2015 | | BlackRock
LifePath
2025 Fund | | | BlackRock
LifePath
2035 Fund | | | BlackRock
LifePath
2045 Fund | | | BlackRock
LifePath
2055 Fund | |
| | | | | | | | | | | | | | | | |
| Assets | | | | | | | | | | | | | | | | |
Investments at value — from the applicable LifePath Master Portfolio1 | | $ | 65,089,814 | | | $ | 56,083,428 | | | $ | 34,499,328 | | | $ | 15,832,403 | |
| Receivables: | | | | | | | | | | | | | | | | |
Capital shares sold | | | 276,998 | | | | 144,554 | | | | 156,431 | | | | 123,002 | |
From the administrator | | | — | | | | — | | | | 4,038 | | | | 9,560 | |
Withdrawals from the LifePath Master Portfolio | | | 16,305 | | | | 86,820 | | | | — | | | | — | |
| | | | |
Total assets | | | 65,383,117 | | | | 56,314,802 | | | | 34,659,797 | | | | 15,964,965 | |
| | | | |
| | | | | | | | | | | | | | | | |
| Liabilities | | | | | | | | | | | | | | | | |
| Payables: | | | | | | | | | | | | | | | | |
Capital shares redeemed | | | 293,303 | | | | 231,374 | | | | 153,900 | | | | 59,504 | |
Professional fees | | | 12,012 | | | | 12,013 | | | | 12,017 | | | | 11,998 | |
Service and distribution fees | | | 10,310 | | | | 8,613 | | | | 5,126 | | | | 2,187 | |
Administration fees | | | 5,096 | | | | 2,510 | | | | — | | | | — | |
Contributions to the LifePath Master Portfolio | | | — | | | | — | | | | 2,531 | | | | 63,498 | |
| | | | |
Total liabilities | | | 320,721 | | | | 254,510 | | | | 173,574 | | | | 137,187 | |
| | | | |
Net Assets | | $ | 65,062,396 | | | $ | 56,060,292 | | | $ | 34,486,223 | | | $ | 15,827,778 | |
| | | | |
| | | | | | | | | | | | | | | | |
| Net Assets Consist of | | | | | | | | | | | | | | | | |
Paid-in capital | | $ | 66,561,285 | | | $ | 57,442,011 | | | $ | 35,379,587 | | | $ | 16,192,784 | |
Distributions in excess of net investment income | | | (153,490 | ) | | | (86,387 | ) | | | (24,976 | ) | | | (6,603 | ) |
Accumulated net realized gain allocated from the LifePath Master Portfolio | | | 571,924 | | | | 354,368 | | | | 153,200 | | | | 63,629 | |
Net unrealized appreciation (depreciation) allocated from the LifePath Master Portfolio | | | (1,917,323 | ) | | | (1,649,700 | ) | | | (1,021,588 | ) | | | (422,032 | ) |
| | | | |
Net Assets | | $ | 65,062,396 | | | $ | 56,060,292 | | | $ | 34,486,223 | | | $ | 15,827,778 | |
| | | | |
| | | | | | | | | | | | | | | | |
| Net Asset Value | | | | | | | | | | | | | | | | |
| Institutional: | | | | | | | | | | | | | | | | |
Net assets | | $ | 27,821,457 | | | $ | 22,071,399 | | | $ | 15,105,053 | | | $ | 7,380,634 | |
| | | | |
Shares outstanding2 | | | 2,308,056 | | | | 1,755,156 | | | | 1,153,377 | | | | 548,209 | |
| | | | |
Net asset value | | $ | 12.05 | | | $ | 12.58 | | | $ | 13.10 | | | $ | 13.46 | |
| | | | |
| Investor A: | | | | | | | | | | | | | | | | |
Net assets | | $ | 30,373,377 | | | $ | 30,358,781 | | | $ | 16,743,981 | | | $ | 7,560,557 | |
| | | | |
Shares outstanding2 | | | 2,522,610 | | | | 2,417,091 | | | | 1,279,172 | | | | 562,741 | |
| | | | |
Net asset value | | $ | 12.04 | | | $ | 12.56 | | | $ | 13.09 | | | $ | 13.44 | |
| | | | |
Maximum offering price per share (100/94.75 of net assets) | | $ | 12.71 | | | $ | 13.26 | | | $ | 13.82 | | | $ | 14.18 | |
| | | | |
| Investor C: | | | | | | | | | | | | | | | | |
Net assets | | $ | 2,899,694 | | | $ | 2,006,649 | | | $ | 1,420,396 | | | $ | 542,647 | |
| | | | |
Shares outstanding2 | | | 241,930 | | | | 160,967 | | | | 109,728 | | | | 40,769 | |
| | | | |
Net asset value | | $ | 11.99 | | | $ | 12.47 | | | $ | 12.94 | | | $ | 13.31 | |
| | | | |
| Class K: | | | | | | | | | | | | | | | | |
Net assets | | $ | 1,278,315 | | | $ | 756,926 | | | $ | 523,641 | | | $ | 52,432 | |
| | | | |
Shares outstanding2 | | | 106,261 | | | | 59,414 | | | | 39,610 | | | | 3,849 | |
| | | | |
Net asset value | | $ | 12.03 | | | $ | 12.74 | | | $ | 13.22 | | | $ | 13.62 | |
| | | | |
| Class R: | | | | | | | | | | | | | | | | |
Net assets | | $ | 2,689,553 | | | $ | 866,537 | | | $ | 693,152 | | | $ | 291,508 | |
| | | | |
Shares outstanding2 | | | 223,420 | | | | 68,882 | | | | 52,967 | | | | 21,692 | |
| | | | |
Net asset value | | $ | 12.04 | | | $ | 12.58 | | | $ | 13.09 | | | $ | 13.44 | |
| | | | |
1 Investments at cost — from the applicable LifePath Master Portfolio | | $ | 67,007,137 | | | $ | 57,733,128 | | | $ | 35,520,916 | | | $ | 16,254,435 | |
2 No par value, unlimited number of shares authorized. | | | | | | | | | | | | | | | | |
| | | | | | |
| See Notes to Financial Statements. | | | | |
| | | | | | | |
| | BLACKROCK FUNDS III | | DECEMBER 31, 2015 | | 17 |
| | |
| Statements of Operations | | BlackRock Funds III |
| | | | | | | | | | | | | | | | |
| Year Ended December 31, 2015 | | BlackRock
LifePath
2025
Fund | | | BlackRock
LifePath
2035
Fund | | | BlackRock
LifePath
2045
Fund | | | BlackRock
LifePath
2055
Fund | |
| | | | | | | | | | | | | | | | |
| Investment Income | | | | | | | | | | | | | | | | |
| Net investment income allocated from the applicable LifePath Master Portfolio: | | | | | | | | | | | | | | | | |
Dividends — unaffiliated | | $ | 18,007 | | | $ | 29,975 | | | $ | 24,924 | | | $ | 11,568 | |
Dividends — affiliated | | | 895,911 | | | | 1,024,555 | | | | 716,943 | | | | 301,169 | |
Interest — affiliated | | | 607,011 | | | | 247,778 | | | | 31,513 | | | | 9,386 | |
Securities lending — affiliated — net | | | 2,610 | | | | 3,065 | | | | 1,844 | | | | 1,490 | |
Income — affiliated | | | 269 | | | | 166 | | | | 221 | | | | 70 | |
Foreign taxes withheld | | | (2,203 | ) | | | (3,668 | ) | | | (3,050 | ) | | | (1,415 | ) |
Expenses | | | (426,752 | ) | | | (364,734 | ) | | | (230,885 | ) | | | (116,656 | ) |
Fees waived | | | 272,102 | | | | 249,904 | | | | 170,695 | | | | 91,373 | |
| | | | |
Total income | | | 1,366,955 | | | | 1,187,041 | | | | 712,205 | | | | 296,985 | |
| | | | |
| | | | | | | | | | | | | | | | |
| Fund Expenses | | | | | | | | | | | | | | | | |
Administration — Institutional | | | 136,503 | | | | 113,315 | | | | 75,933 | | | | 34,041 | |
Administration — Investor A | | | 167,327 | | | | 157,220 | | | | 85,025 | | | | 33,251 | |
Administration — Investor C | | | 18,306 | | | | 9,794 | | | | 7,898 | | | | 2,714 | |
Administration — Class K | | | 910 | | | | 277 | | | | 87 | | | | 48 | |
Administration — Class R | | | 8,695 | | | | 3,311 | | | | 2,580 | | | | 903 | |
Service — Investor A | | | 85,666 | | | | 80,658 | | | | 43,639 | | | | 17,157 | |
Service and distribution — Investor C | | | 37,303 | | | | 19,979 | | | | 16,099 | | | | 5,534 | |
Service and distribution — Class R | | | 9,086 | | | | 3,452 | | | | 2,681 | | | | 951 | |
Professional | | | 19,411 | | | | 19,411 | | | | 19,411 | | | | 19,411 | |
Miscellaneous | | | 325 | | | | 325 | | | | 325 | | | | 325 | |
| | | | |
Total expenses | | | 483,532 | | | | 407,742 | | | | 253,678 | | | | 114,335 | |
Less fees waived by the administrator | | | (19,411 | ) | | | (19,411 | ) | | | (19,411 | ) | | | (19,411 | ) |
| | | | |
Total expenses after fees waived | | | 464,121 | | | | 388,331 | | | | 234,267 | | | | 94,924 | |
| | | | |
Net investment income | | | 902,834 | | | | 798,710 | | | | 477,938 | | | | 202,061 | |
| | | | |
| | | | | | | | | | | | | | | | |
| Realized and Unrealized Gain (Loss) Allocated from the LifePath Master Portfolio | | | | | | | | | | | | | | | | |
Net realized gain from investments, financial futures contracts, swaps, foreign currency transactions and in-kind redemptions1 | | | 2,035,397 | | | | 1,954,281 | | | | 1,285,632 | | | | 470,460 | |
Net change in unrealized appreciation (depreciation) on investments, financial futures contracts, swaps and foreign currency translations | | | (4,550,254 | ) | | | (4,206,454 | ) | | | (2,669,151 | ) | | | (1,101,709 | ) |
| | | | |
Net realized and unrealized loss | | | (2,514,857 | ) | | | (2,252,173 | ) | | | (1,383,519 | ) | | | (631,249 | ) |
| | | | |
Net Decrease in Net Assets Resulting from Operations | | $ | (1,612,023 | ) | | $ | (1,453,463 | ) | | $ | (905,581 | ) | | $ | (429,188 | ) |
| | | | |
1 See Note 2 of the Notes to Financial Statements. | | | | | | | | | | | | | | | | |
| | | | | | |
| See Notes to Financial Statements. | | | | |
| | | | | | | |
| 18 | | BLACKROCK FUNDS III | | DECEMBER 31, 2015 | | |
| | |
| Statements of Changes in Net Assets | | |
| | | | | | | | | | | | | | | | | | |
| | | BlackRock LifePath 2025 Fund | | | | | BlackRock LifePath 2035 Fund | |
| | | Year Ended December 31, | | | | | Year Ended December 31, | |
| Increase (Decrease) in Net Assets: | | 2015 | | | 2014 | | | | | 2015 | | | 2014 | |
| | | | | | | | | | | | | | | | | | |
| Operations | | | | | | | | | | | |
Net investment income | | $ | 902,834 | | | $ | 919,845 | | | | | $ | 798,710 | | | $ | 791,822 | |
Net realized gain | | | 2,035,397 | | | | 3,053,636 | | | | | | 1,954,281 | | | | 2,767,003 | |
Net change in unrealized appreciation (depreciation) | | | (4,550,254 | ) | | | (942,332 | ) | | | | | (4,206,454 | ) | | | (906,421 | ) |
| | | | | | | | | | |
Net increase (decrease) in net assets resulting from operations | | | (1,612,023 | ) | | | 3,031,149 | | | | | | (1,453,463 | ) | | | 2,652,404 | |
| | | | | | | | | | |
| | | | | | | | | | | | | | | | | | |
| Distributions to Shareholders1 | | | | | | | | | | | | | | | | | | |
| From net investment income: | | | | | | | | | | | | | | | | | | |
Institutional | | | (457,154 | ) | | | (420,027 | ) | | | | | (370,041 | ) | | | (381,547 | ) |
Investor A | | | (472,452 | ) | | | (467,797 | ) | | | | | (444,086 | ) | | | (401,365 | ) |
Investor C | | | (23,600 | ) | | | (16,080 | ) | | | | | (14,029 | ) | | | (10,392 | ) |
Class K | | | (16,121 | ) | | | (11,572 | ) | | | | | (7,088 | ) | | | (4,870 | ) |
Class R | | | (29,082 | ) | | | (19,809 | ) | | | | | (8,944 | ) | | | (6,233 | ) |
| From net realized gain: | | | | | | | | | | | | | | | | | | |
Institutional | | | (633,373 | ) | | | (1,420,337 | ) | | | | | (599,762 | ) | | | (1,405,216 | ) |
Investor A | | | (702,920 | ) | | | (2,069,079 | ) | | | | | (829,270 | ) | | | (1,927,115 | ) |
Investor C | | | (71,606 | ) | | | (166,033 | ) | | | | | (55,514 | ) | | | (110,090 | ) |
Class K | | | (23,595 | ) | | | (26,416 | ) | | | | | (16,379 | ) | | | (12,538 | ) |
Class R | | | (52,796 | ) | | | (97,886 | ) | | | | | (20,443 | ) | | | (36,835 | ) |
| From return of capital: | | | | | | | | | | | | | | | | | | |
Institutional | | | (24,704 | ) | | | — | | | | | | (7,657 | ) | | | — | |
Investor A | | | (30,201 | ) | | | — | | | | | | (10,622 | ) | | | — | |
Investor C | | | (3,278 | ) | | | — | | | | | | (657 | ) | | | — | |
Class K | | | (534 | ) | | | — | | | | | | (62 | ) | | | — | |
Class R | | | (1,601 | ) | | | — | | | | | | (227 | ) | | | — | |
| | | | | | | | | | |
Decrease in net assets resulting from distributions to shareholders | | | (2,543,017 | ) | | | (4,715,036 | ) | | | | | (2,384,781 | ) | | | (4,296,201 | ) |
| | | | | | | | | | |
| | | | | | | | | | | | | | | | | | |
| Capital Share Transactions | | | | | | | | | | | | | | | | | | |
Net increase in net assets derived from capital share transactions | | | 5,421,219 | | | | 6,965,153 | | | | | | 4,313,067 | | | | 11,943,495 | |
| | | | | | | | | | |
| | | | | | | | | | | | | | | | | | |
| Net Assets | | | | | | | | | | | | | | | | | | |
Total increase in net assets | | | 1,266,179 | | | | 5,281,266 | | | | | | 474,823 | | | | 10,299,698 | |
Beginning of year | | | 63,796,217 | | | | 58,514,951 | | | | | | 55,585,469 | | | | 45,285,771 | |
| | | | | | | | | | |
End of year | | $ | 65,062,396 | | | $ | 63,796,217 | | | | | $ | 56,060,292 | | | $ | 55,585,469 | |
| | | | | | | | | | |
Distributions in excess of net investment income, end of year | | $ | (153,490 | ) | | $ | (57,915 | ) | | | | $ | (86,387 | ) | | $ | (40,909 | ) |
| | | | | | | | | | |
1 Distributions for annual periods determined in accordance with federal income tax regulations. | | | | | | | | | | |
| | | | | | |
| See Notes to Financial Statements. | | | | |
| | | | | | | |
| | BLACKROCK FUNDS III | | DECEMBER 31, 2015 | | 19 |
| | |
| Statements of Changes in Net Assets | | |
| | | | | | | | | | | | | | | | | | |
| | | BlackRock LifePath 2045 Fund | | | | | BlackRock LifePath 2055 Fund | |
| | | Year Ended December 31, | | | | | Year Ended December 31, | |
| Increase (Decrease) in Net Assets: | | 2015 | | | 2014 | | | | | 2015 | | | 2014 | |
| | | | | | | | | | | | | | | | | | |
| Operations | | | | | | | | | | | |
Net investment income | | $ | 477,938 | | | $ | 467,866 | | | | | $ | 202,061 | | | $ | 170,531 | |
Net realized gain | | | 1,285,632 | | | | 1,650,581 | | | | | | 470,460 | | | | 592,753 | |
Net change in unrealized appreciation (depreciation) | | | (2,669,151 | ) | | | (522,584 | ) | | | | | (1,101,709 | ) | | | (124,640 | ) |
| | | | | | | | | | |
Net increase (decrease) in net assets resulting from operations | | | (905,581 | ) | | | 1,595,863 | | | | | | (429,188 | ) | | | 638,644 | |
| | | | | | | | | | |
| | | | | | | | | | | | | | | | | | |
| Distributions to Shareholders1 | | | | | | | | | | | | | | | | | | |
| From net investment income: | | | | | | | | | | | | | | | | | | |
Institutional | | | (237,262 | ) | | | (250,163 | ) | | | | | (104,375 | ) | | | (100,701 | ) |
Investor A | | | (225,525 | ) | | | (207,777 | ) | | | | | (90,276 | ) | | | (68,668 | ) |
Investor C | | | (9,617 | ) | | | (8,768 | ) | | | | | (3,186 | ) | | | (3,091 | ) |
Class K | | | (3,515 | ) | | | (2,386 | ) | | | | | (700 | ) | | | (1,462 | ) |
Class R | | | (6,511 | ) | | | (5,926 | ) | | | | | (2,224 | ) | | | (1,505 | ) |
| From net realized gain: | | | | | | | | | | | | | | | | | | |
Institutional | | | (459,944 | ) | | | (982,819 | ) | | | | | (159,148 | ) | | | (417,600 | ) |
Investor A | | | (510,798 | ) | | | (1,031,608 | ) | | | | | (163,009 | ) | | | (341,066 | ) |
Investor C | | | (48,009 | ) | | | (94,176 | ) | | | | | (12,905 | ) | | | (32,641 | ) |
Class K | | | (12,210 | ) | | | (5,442 | ) | | | | | (1,036 | ) | | | (3,653 | ) |
Class R | | | (17,867 | ) | | | (33,305 | ) | | | | | (5,133 | ) | | | (8,089 | ) |
| | | | | | | | | | |
Decrease in net assets resulting from distributions to shareholders | | | (1,531,258 | ) | | | (2,622,370 | ) | | | | | (541,992 | ) | | | (978,476 | ) |
| | | | | | | | | | |
| | | | | | | | | | | | | | | | | | |
| Capital Share Transactions | | | | | | | | | | | | | | | | | | |
Net increase in net assets derived from capital share transactions | | | 2,333,808 | | | | 10,215,915 | | | | | | 3,808,319 | | | | 4,383,495 | |
| | | | | | | | | | |
| | | | | | | | | | | | | | | | | | |
| Net Assets | | | | | | | | | | | | | | | | | | |
Total increase (decrease) in net assets | | | (103,031 | ) | | | 9,189,408 | | | | | | 2,837,139 | | | | 4,043,663 | |
Beginning of year | | | 34,589,254 | | | | 25,399,846 | | | | | | 12,990,639 | | | | 8,946,976 | |
| | | | | | | | | | |
End of year | | $ | 34,486,223 | | | $ | 34,589,254 | | | | | $ | 15,827,778 | | | $ | 12,990,639 | |
| | | | | | | | | | |
Distributions in excess of net investment income, end of year | | $ | (24,976 | ) | | $ | (20,484 | ) | | | | $ | (6,603 | ) | | $ | (7,903 | ) |
| | | | | | | | | | |
1 Distributions for annual periods determined in accordance with federal income tax regulations. | | | | | | | | | | |
| | | | | | |
| See Notes to Financial Statements. | | | | |
| | | | | | | |
| 20 | | BLACKROCK FUNDS III | | DECEMBER 31, 2015 | | |
| | |
| Financial Highlights | | BlackRock LifePath 2025 Fund |
| | | | | | | | | | | | | | | | | | | | |
| | | Institutional | |
| | | Year Ended December 31, | |
| | | 2015 | | | 2014 | | | 2013 | | | 2012 | | | 2011 | |
| | | | | | | | | | | | | | | | | | | | |
| Per Share Operating Performance | | | | | | | | | | | | | | | | | | | | |
Net asset value, beginning of year | | $ | 12.80 | | | $ | 13.11 | | | $ | 12.19 | | | $ | 11.07 | | | $ | 11.21 | |
| | | | |
Net investment income1 | | | 0.19 | | | | 0.21 | | | | 0.21 | | | | 0.22 | | | | 0.25 | |
Net realized and unrealized gain (loss) | | | (0.44 | ) | | | 0.48 | | | | 1.22 | | | | 1.11 | | | | (0.19 | ) |
| | | | |
Net increase (decrease) from investment operations | | | (0.25 | ) | | | 0.69 | | | | 1.43 | | | | 1.33 | | | | 0.06 | |
| | | | |
| Distributions:2 | | | | | | | | | | | | | | | | | | | | |
From net investment income | | | (0.21 | ) | | | (0.21 | ) | | | (0.19 | ) | | | (0.21 | ) | | | (0.20 | ) |
From net realized gain | | | (0.28 | ) | | | (0.79 | ) | | | (0.32 | ) | | | (0.00 | )3 | | | (0.00 | )3 |
From return of capital | | | (0.01 | ) | | | — | | | | — | | | | — | | | | — | |
| | | | |
Total distributions | | | (0.50 | ) | | | (1.00 | ) | | | (0.51 | ) | | | (0.21 | ) | | | (0.20 | ) |
| | | | |
Net asset value, end of year | | $ | 12.05 | | | $ | 12.80 | | | $ | 13.11 | | | $ | 12.19 | | | $ | 11.07 | |
| | | | |
| | | | | | | | | | | | | | | | | | | | |
| Total Return4 | | | | | | | | | | | | | | | | | | | | |
Based on net asset value | | | (1.92)% | | | | 5.23% | | | | 11.84% | | | | 12.07% | | | | 0.49% | |
| | | | |
| | | | | | | | | | | | | | | | | | | | |
| Ratios to Average Net Assets5,6,7 | | | | | | | | | | | | | | | | | | | | |
Total expenses | | | 0.74% | | | | 0.75% | | | | 0.79% | | | | 0.86% | | | | 1.06% | |
| | | | |
Total expenses after fees waived and/or reimbursed | | | 0.71% | | | | 0.73% | | | | 0.75% | | | | 0.76% | | | | 0.74% | |
| | | | |
Net investment income | | | 1.51% | | | | 1.53% | | | | 1.60% | | | | 1.85% | | | | 2.25% | |
| | | | |
| | | | | | | | | | | | | | | | | | | | |
| Supplemental Data | | | | | | | | | | | | | | | | | | | | |
Net assets, end of year (000) | | $ | 27,821 | | | $ | 23,625 | | | $ | 25,882 | | | $ | 15,816 | | | $ | 3,233 | |
| | | | |
Portfolio turnover rate of the LifePath Master Portfolio | | | 51% | 8 | | | 50% | 9 | | | 30% | 9 | | | 4% | 10 | | | 24% | 10 |
| | | | |
| | 1 | | Based on average shares outstanding. |
| | 2 | | Distributions for annual periods determined in accordance with federal income tax regulations. |
| | 3 | | Amount is greater than $(0.005) per share. |
| | 4 | | Where applicable, assumes the reinvestment of distributions. |
| | 5 | | Includes the LifePath Fund’s share of its corresponding LifePath Master Portfolio’s allocated net expenses and/or net investment income. |
| | 6 | | Includes the LifePath Fund’s share of the LifePath Master Portfolio’s allocated fees waived of 0.40%, 0.40%, 0.40%, 0.48% and 0.82% for the years ended December 31, 2015, December 31, 2014, December 31, 2013, December 31, 2012 and December 31, 2011, respectively. |
| | 7 | | Includes the LifePath Fund’s share of the LifePath Master Portfolio’s allocated expenses and/or net investment income. Excludes expenses incurred indirectly as a result of the LifePath Master Portfolio’s investments in underlying funds as follows: |
| | | | | | | | | | | | | | | | | | | | |
| | | Year Ended December 31, | |
| | | 2015 | | | 2014 | | | 2013 | | | 2012 | | | 2011 | |
| | | | |
Investments in underlying funds | | | 0.13% | | | | 0.13% | | | | 0.10% | | | | 0.10% | | | | 0.12% | |
| | | | |
| | 8 | | Includes the LifePath Master Portfolio’s purchases and sales of the underlying funds and Active Stock Master Portfolio, CoreAlpha Bond Master Portfolio, International Tilts Master Portfolio, Large Cap Index Master Portfolio and Master Small Cap Index Series. |
| | 9 | | Includes the LifePath Master Portfolio’s purchases and sales of the underlying funds and Active Stock Master Portfolio, CoreAlpha Bond Master Portfolio, International Tilts Master Portfolio, Large Cap Index Master Portfolio, Master Small Cap Index Series and Total International ex U.S. Index Master Portfolio. |
| | 10 | | Excludes the LifePath Master Portfolio’s purchases and sales of the Active Stock Master Portfolio, CoreAlpha Bond Master Portfolio, Master Small Cap Index Series and Total International ex U.S. Index Master Portfolio. If these transactions had been included to conform to the current year presentation, the portfolio turnover rate would have been 17% and 58% for the years ended December 31, 2012 and December 31, 2011, respectively. |
| | | | | | |
| See Notes to Financial Statements. | | | | |
| | | | | | | |
| | BLACKROCK FUNDS III | | DECEMBER 31, 2015 | | 21 |
| | |
| Financial Highlights (continued) | | BlackRock LifePath 2025 Fund |
| | | | | | | | | | | | | | | | | | | | |
| | | Investor A | |
| | | Year Ended December 31, | |
| | | 2015 | | | 2014 | | | 2013 | | | 2012 | | | 2011 | |
| | | | | | | | | | | | | | | | | | | | |
| Per Share Operating Performance | | | | | | | | | | | | | | | | | | | | |
Net asset value, beginning of year | | $ | 12.78 | | | $ | 13.10 | | | $ | 12.19 | | | $ | 11.06 | | | $ | 11.21 | |
| | | | |
Net investment income1 | | | 0.16 | | | | 0.17 | | | | 0.18 | | | | 0.18 | | | | 0.21 | |
Net realized and unrealized gain (loss) | | | (0.43 | ) | | | 0.48 | | | | 1.22 | | | | 1.12 | | | | (0.19 | ) |
| | | | |
Net increase (decrease) from investment operations | | | (0.27 | ) | | | 0.65 | | | | 1.40 | | | | 1.30 | | | | 0.02 | |
| | | | |
| Distributions:2 | | | | | | | | | | | | | | | | | | | | |
From net investment income | | | (0.18 | ) | | | (0.18 | ) | | | (0.17 | ) | | | (0.17 | ) | | | (0.17 | ) |
From net realized gain | | | (0.28 | ) | | | (0.79 | ) | | | (0.32 | ) | | | (0.00 | )3 | | | (0.00 | )3 |
From return of capital | | | (0.01 | ) | | | — | | | | — | | | | — | | | | — | |
| | | | |
Total distributions | | | (0.47 | ) | | | (0.97 | ) | | | (0.49 | ) | | | (0.17 | ) | | | (0.17 | ) |
| | | | |
Net asset value, end of year | | $ | 12.04 | | | $ | 12.78 | | | $ | 13.10 | | | $ | 12.19 | | | $ | 11.06 | |
| | | | |
| | | | | | | | | | | | | | | | | | | | |
| Total Return4 | | | | | | | | | | | | | | | | | | | | |
Based on net asset value | | | (2.17)% | | | | 4.95% | | | | 11.52% | | | | 11.84% | | | | 0.18% | |
| | | | |
| | | | | | | | | | | | | | | | | | | | |
| Ratios to Average Net Assets5,6,7 | | | | | | | | | | | | | | | | | | | | |
Total expenses | | | 0.99% | | | | 1.00% | | | | 1.05% | | | | 1.11% | | | | 1.32% | |
| | | | |
Total expenses after fees waived and/or reimbursed | | | 0.96% | | | | 0.98% | | | | 1.00% | | | | 1.01% | | | | 0.99% | |
| | | | |
Net investment income | | | 1.26% | | | | 1.31% | | | | 1.37% | | | | 1.54% | | | | 1.87% | |
| | | | |
| | | | | | | | | | | | | | | | | | | | |
| Supplemental Data | | | | | | | | | | | | | | | | | | | | |
Net assets, end of year (000) | | $ | 30,373 | | | $ | 35,324 | | | $ | 29,049 | | | $ | 13,981 | | | $ | 7,076 | |
| | | | |
Portfolio turnover rate of the LifePath Master Portfolio | | | 51% | 8 | | | 50% | 9 | | | 30% | 9 | | | 4% | 10 | | | 24% | 10 |
| | | | |
| | 1 | | Based on average shares outstanding. |
| | 2 | | Distributions for annual periods determined in accordance with federal income tax regulations. |
| | 3 | | Amount is greater than $(0.005) per share. |
| | 4 | | Where applicable, excludes the effects of any sales charges and assumes the reinvestment of distributions. |
| | 5 | | Includes the LifePath Fund’s share of its corresponding LifePath Master Portfolio’s allocated net expenses and/or net investment income. |
| | 6 | | Includes the LifePath Fund’s share of the LifePath Master Portfolio’s allocated fees waived of 0.40%, 0.40%, 0.40%, 0.48% and 0.86% for the years ended December 31, 2015, December 31, 2014, December 31, 2013, December 31, 2012 and December 31, 2011, respectively. |
| | 7 | | Includes the LifePath Fund’s share of the LifePath Master Portfolio’s allocated expenses and/or net investment income. Excludes expenses incurred indirectly as a result of the LifePath Master Portfolio’s investments in underlying funds as follows: |
| | | | | | | | | | | | | | | | | | | | |
| | | Year Ended December 31, | |
| | | 2015 | | | 2014 | | | 2013 | | | 2012 | | | 2011 | |
| | | | |
Investments in underlying funds | | | 0.13% | | | | 0.13% | | | | 0.10% | | | | 0.10% | | | | 0.12% | |
| | | | |
| | 8 | | Includes the LifePath Master Portfolio’s purchases and sales of the underlying funds and Active Stock Master Portfolio, CoreAlpha Bond Master Portfolio, International Tilts Master Portfolio, Large Cap Index Master Portfolio and Master Small Cap Index Series. |
| | 9 | | Includes the LifePath Master Portfolio’s purchases and sales of the underlying funds and Active Stock Master Portfolio, CoreAlpha Bond Master Portfolio, International Tilts Master Portfolio, Large Cap Index Master Portfolio, Master Small Cap Index Series and Total International ex U.S. Index Master Portfolio. |
| | 10 | | Excludes the LifePath Master Portfolio’s purchases and sales of the Active Stock Master Portfolio, CoreAlpha Bond Master Portfolio, Master Small Cap Index Series and Total International ex U.S. Index Master Portfolio. If these transactions had been included to conform to the current year presentation, the portfolio turnover rate would have been 17% and 58% for the years ended December 31, 2012 and December 31, 2011, respectively. |
| | | | | | |
| See Notes to Financial Statements. | | | | |
| | | | | | | |
| 22 | | BLACKROCK FUNDS III | | DECEMBER 31, 2015 | | |
| | |
| Financial Highlights (continued) | | BlackRock LifePath 2025 Fund |
| | | | | | | | | | | | | | | | | | | | |
| | | Investor C | |
| | | Year Ended December 31, | |
| | | 2015 | | | 2014 | | | 2013 | | | 2012 | | | 2011 | |
| | | | | | | | | | | | | | | | | | | | |
| Per Share Operating Performance | | | | | | | | | | | | | | | | | | | | |
Net asset value, beginning of year | | $ | 12.72 | | | $ | 13.06 | | | $ | 12.15 | | | $ | 11.05 | | | $ | 11.21 | |
| | | | |
Net investment income1 | | | 0.06 | | | | 0.07 | | | | 0.07 | | | | 0.10 | | | | 0.14 | |
Net realized and unrealized gain (loss) | | | (0.42 | ) | | | 0.47 | | | | 1.23 | | | | 1.11 | | | | (0.20 | ) |
| | | | |
Net increase (decrease) from investment operations | | | (0.36 | ) | | | 0.54 | | | | 1.30 | | | | 1.21 | | | | (0.06 | ) |
| | | | |
| Distributions:2 | | | | | | | | | | | | | | | | | | | | |
From net investment income | | | (0.09 | ) | | | (0.09 | ) | | | (0.07 | ) | | | (0.11 | ) | | | (0.10 | ) |
From net realized gain | | | (0.27 | ) | | | (0.79 | ) | | | (0.32 | ) | | | (0.00 | )3 | | | (0.00 | )3 |
From return of capital | | | (0.01 | ) | | | — | | | | — | | | | — | | | | — | |
| | | | |
Total distributions | | | (0.37 | ) | | | (0.88 | ) | | | (0.39 | ) | | | (0.11 | ) | | | (0.10 | ) |
| | | | |
Net asset value, end of year | | $ | 11.99 | | | $ | 12.72 | | | $ | 13.06 | | | $ | 12.15 | | | $ | 11.05 | |
| | | | |
| | | | | | | | | | | | | | | | | | | | |
| Total Return4 | | | | | | | | | | | | | | | | | | | | |
Based on net asset value | | | (2.86)% | | | | 4.08% | | | | 10.73% | | | | 10.99% | | | | (0.54)% | |
| | | | |
| | | | | | | | | | | | | | | | | | | | |
| Ratios to Average Net Assets5,6,7 | | | | | | | | | | | | | | | | | | | | |
Total expenses | | | 1.75% | | | | 1.75% | | | | 1.80% | | | | 1.85% | | | | 2.10% | |
| | | | |
Total expenses after fees waived and/or reimbursed | | | 1.72% | | | | 1.73% | | | | 1.76% | | | | 1.76% | | | | 1.75% | |
| | | | |
Net investment income | | | 0.51% | | | | 0.56% | | | | 0.57% | | | | 0.87% | | | | 1.25% | |
| | | | |
| | | | | | | | | | | | | | | | | | | | |
| Supplemental Data | | | | | | | | | | | | | | | | | | | | |
Net assets, end of year (000) | | $ | 2,900 | | | $ | 2,849 | | | $ | 1,997 | | | $ | 992 | | | $ | 245 | |
| | | | |
Portfolio turnover rate of the LifePath Master Portfolio | | | 51% | 8 | | | 50% | 9 | | | 30% | 9 | | | 4% | 10 | | | 24% | 10 |
| | | | |
| | 1 | | Based on average shares outstanding. |
| | 2 | | Distributions for annual periods determined in accordance with federal income tax regulations. |
| | 3 | | Amount is greater than $(0.005) per share. |
| | 4 | | Where applicable, excludes the effects of any sales charges and assumes the reinvestment of distributions. |
| | 5 | | Includes the LifePath Fund’s share of its corresponding LifePath Master Portfolio’s allocated net expenses and/or net investment income. |
| | 6 | | Includes the LifePath Fund’s share of the LifePath Master Portfolio’s allocated fees waived of 0.40%, 0.40%, 0.40%, 0.48% and 0.82% for the years ended December 31, 2015, December 31, 2014, December 31, 2013, December 31, 2012 and December 31, 2011, respectively. |
| | 7 | | Includes the LifePath Fund’s share of the LifePath Master Portfolio’s allocated expenses and/or net investment income. Excludes expenses incurred indirectly as a result of the LifePath Master Portfolio’s investments in underlying funds as follows: |
| | | | | | | | | | | | | | | | | | | | |
| | | Year Ended December 31, | |
| | | 2015 | | | 2014 | | | 2013 | | | 2012 | | | 2011 | |
| | | | |
Investments in underlying funds | | | 0.13% | | | | 0.13% | | | | 0.10% | | | | 0.10% | | | | 0.12% | |
| | | | |
| | 8 | | Includes the LifePath Master Portfolio’s purchases and sales of the underlying funds and Active Stock Master Portfolio, CoreAlpha Bond Master Portfolio, International Tilts Master Portfolio, Large Cap Index Master Portfolio and Master Small Cap Index Series. |
| | 9 | | Includes the LifePath Master Portfolio’s purchases and sales of the underlying funds and Active Stock Master Portfolio, CoreAlpha Bond Master Portfolio, International Tilts Master Portfolio, Large Cap Index Master Portfolio, Master Small Cap Index Series and Total International ex U.S. Index Master Portfolio. |
| | 10 | | Excludes the LifePath Master Portfolio’s purchases and sales of the Active Stock Master Portfolio, CoreAlpha Bond Master Portfolio, Master Small Cap Index Series and Total International ex U.S. Index Master Portfolio. If these transactions had been included to conform to the current year presentation, the portfolio turnover rate would have been 17% and 58% for the years ended December 31, 2012 and December 31, 2011, respectively. |
| | | | | | |
| See Notes to Financial Statements. | | | | |
| | | | | | | |
| | BLACKROCK FUNDS III | | DECEMBER 31, 2015 | | 23 |
| | |
| Financial Highlights (continued) | | BlackRock LifePath 2025 Fund |
| | | | | | | | | | | | | | | | | | | | |
| | | Class K | |
| | | Year Ended December 31, | |
| | | 2015 | | | 2014 | | | 2013 | | | 2012 | | | 2011 | |
| | | | | | | | | | | | | | | | | | | | |
| Per Share Operating Performance | | | | | | | | | | | | | | | | | | | | |
Net asset value, beginning of year | | $ | 12.78 | | | $ | 13.10 | | | $ | 12.22 | | | $ | 11.09 | | | $ | 11.21 | |
| | | | |
Net investment income1 | | | 0.25 | | | | 0.26 | | | | 0.20 | | | | 0.26 | | | | 0.26 | |
Net realized and unrealized gain (loss) | | | (0.45 | ) | | | 0.46 | | | | 1.20 | | | | 1.11 | | | | (0.16 | ) |
| | | | |
Net increase (decrease) from investment operations | | | (0.20 | ) | | | 0.72 | | | | 1.40 | | | | 1.37 | | | | 0.10 | |
| | | | |
| Distributions:2 | | | | | | | | | | | | | | | | | | | | |
From net investment income | | | (0.26 | ) | | | (0.25 | ) | | | (0.20 | ) | | | (0.24 | ) | | | (0.22 | ) |
From net realized gain | | | (0.28 | ) | | | (0.79 | ) | | | (0.32 | ) | | | (0.00 | )3 | | | (0.00 | )3 |
From return of capital | | | (0.01 | ) | | | — | | | | — | | | | — | | | | — | |
| | | | |
Total distributions | | | (0.55 | ) | | | (1.04 | ) | | | (0.52 | ) | | | (0.24 | ) | | | (0.22 | ) |
| | | | |
Net asset value, end of year | | $ | 12.03 | | | $ | 12.78 | | | $ | 13.10 | | | $ | 12.22 | | | $ | 11.09 | |
| | | | |
| | | | | | | | | | | | | | | | | | | | |
| Total Return4 | | | | | | | | | | | | | | | | | | | | |
Based on net asset value | | | (1.64)% | | | | 5.51% | | | | 11.47% | | | | 12.44% | | | | 0.87% | |
| | | | |
| | | | | | | | | | | | | | | | | | | | |
| Ratios to Average Net Assets5,6,7 | | | | | | | | | | | | | | | | | | | | |
Total expenses | | | 0.41% | | | | 0.40% | | | | 0.44% | | | | 0.51% | | | | 0.71% | |
| | | | |
Total expenses after fees waived and/or reimbursed | | | 0.38% | | | | 0.37% | | | | 0.40% | | | | 0.41% | | | | 0.38% | |
| | | | |
Net investment income | | | 2.00% | | | | 1.91% | | | | 1.57% | | | | 2.20% | | | | 2.31% | |
| | | | |
| | | | | | | | | | | | | | | | | | | | |
| Supplemental Data | | | | | | | | | | | | | | | | | | | | |
Net assets, end of year (000) | | $ | 1,278 | | | $ | 317 | | | $ | 102 | | | $ | 1,941 | | | $ | 1,590 | |
| | | | |
Portfolio turnover rate of the LifePath Master Portfolio | | | 51% | 8 | | | 50% | 9 | | | 30% | 9 | | | 4% | 10 | | | 24% | 10 |
| | | | |
| | 1 | | Based on average shares outstanding. |
| | 2 | | Distributions for annual periods determined in accordance with federal income tax regulations. |
| | 3 | | Amount is greater than $(0.005) per share. |
| | 4 | | Where applicable, assumes the reinvestment of distributions. |
| | 5 | | Includes the LifePath Fund’s share of its corresponding LifePath Master Portfolio’s allocated net expenses and/or net investment income. |
| | 6 | | Includes the LifePath Fund’s share of the LifePath Master Portfolio’s allocated fees waived of 0.40%, 0.40%, 0.40%, 0.49% and 0.89% for the years ended December 31, 2015, December 31, 2014, December 31, 2013, December 31, 2012 and December 31, 2011, respectively. |
| | 7 | | Includes the LifePath Fund’s share of the LifePath Master Portfolio’s allocated expenses and/or net investment income. Excludes expenses incurred indirectly as a result of the LifePath Master Portfolio’s investments in underlying funds as follows: |
| | | | | | | | | | | | | | | | | | | | |
| | | Year Ended December 31, | |
| | | 2015 | | | 2014 | | | 2013 | | | 2012 | | | 2011 | |
| | | | |
Investments in underlying funds | | | 0.13% | | | | 0.13% | | | | 0.10% | | | | 0.10% | | | | 0.12% | |
| | | | |
| | 8 | | Includes the LifePath Master Portfolio’s purchases and sales of the underlying funds and Active Stock Master Portfolio, CoreAlpha Bond Master Portfolio, International Tilts Master Portfolio, Large Cap Index Master Portfolio and Master Small Cap Index Series. |
| | 9 | | Includes the LifePath Master Portfolio’s purchases and sales of the underlying funds and Active Stock Master Portfolio, CoreAlpha Bond Master Portfolio, International Tilts Master Portfolio, Large Cap Index Master Portfolio, Master Small Cap Index Series and Total International ex U.S. Index Master Portfolio. |
| | 10 | | Excludes the LifePath Master Portfolio’s purchases and sales of the Active Stock Master Portfolio, CoreAlpha Bond Master Portfolio, Master Small Cap Index Series and Total International ex U.S. Index Master Portfolio. If these transactions had been included to conform to the current year presentation, the portfolio turnover rate would have been 17% and 58% for the years ended December 31, 2012 and December 31, 2011, respectively. |
| | | | | | |
| See Notes to Financial Statements. | | | | |
| | | | | | | |
| 24 | | BLACKROCK FUNDS III | | DECEMBER 31, 2015 | | |
| | |
| Financial Highlights (concluded) | | BlackRock LifePath 2025 Fund |
| | | | | | | | | | | | | | | | | | | | |
| | | Class R | |
| | | Year Ended December 31, | |
| | | 2015 | | | 2014 | | | 2013 | | | 2012 | | | 2011 | |
| | | | | | | | | | | | | | | | | | | | |
| Per Share Operating Performance | | | | | | | | | | | | | | | | | | | | |
Net asset value, beginning of year | | $ | 12.79 | | | $ | 13.11 | | | $ | 12.19 | | | $ | 11.09 | | | $ | 11.21 | |
| | | | |
Net investment income1 | | | 0.13 | | | | 0.14 | | | | 0.13 | | | | 0.18 | | | | 0.17 | |
Net realized and unrealized gain (loss) | | | (0.43 | ) | | | 0.48 | | | | 1.24 | | | | 1.08 | | | | (0.17 | ) |
| | | | |
Net increase (decrease) from investment operations | | | (0.30 | ) | | | 0.62 | | | | 1.37 | | | | 1.26 | | | | — | |
| | | | |
| Distributions:2 | | | | | | | | | | | | | | | | | | | | |
From net investment income | | | (0.17 | ) | | | (0.15 | ) | | | (0.13 | ) | | | (0.16 | ) | | | (0.12 | ) |
From net realized gain | | | (0.27 | ) | | | (0.79 | ) | | | (0.32 | ) | | | (0.00 | )3 | | | (0.00 | )3 |
From return of capital | | | (0.01 | ) | | | — | | | | — | | | | — | | | | — | |
| | | | |
Total distributions | | | (0.45 | ) | | | (0.94 | ) | | | (0.45 | ) | | | (0.16 | ) | | | (0.12 | ) |
| | | | |
Net asset value, end of year | | $ | 12.04 | | | $ | 12.79 | | | $ | 13.11 | | | $ | 12.19 | | | $ | 11.09 | |
| | | | |
| | | | | | | | | | | | | | | | | | | | |
| Total Return4 | | | | | | | | | | | | | | | | | | | | |
Based on net asset value | | | (2.36)% | | | | 4.69% | | | | 11.26% | | | | 11.45% | | | | 0.02% | |
| | | | |
| | | | | | | | | | | | | | | | | | | | |
| Ratios to Average Net Assets5,6,7 | | | | | | | | | | | | | | | | | | | | |
Total expenses | | | 1.24% | | | | 1.26% | | | | 1.30% | | | | 1.35% | | | | 1.57% | |
| | | | |
Total expenses after fees waived and/or reimbursed | | | 1.21% | | | | 1.23% | | | | 1.25% | | | | 1.26% | | | | 1.23% | |
| | | | |
Net investment income | | | 1.06% | | | | 1.04% | | | | 1.05% | | | | 1.54% | | | | 1.46% | |
| | | | |
| | | | | | | | | | | | | | | | | | | | |
| Supplemental Data | | | | | | | | | | | | | | | | | | | | |
Net assets, end of year (000) | | $ | 2,690 | | | $ | 1,682 | | | $ | 1,484 | | | $ | 1,282 | | | $ | 22 | |
| | | | |
Portfolio turnover rate of the LifePath Master Portfolio | | | 51% | 8 | | | 50% | 9 | | | 30% | 9 | | | 4% | 10 | | | 24% | 10 |
| | | | |
| | 1 | | Based on average shares outstanding. |
| | 2 | | Distributions for annual periods determined in accordance with federal income tax regulations. |
| | 3 | | Amount is greater than $(0.005) per share. |
| | 4 | | Where applicable, assumes the reinvestment of distributions. |
| | 5 | | Includes the LifePath Fund’s share of its corresponding LifePath Master Portfolio’s allocated net expenses and/or net investment income. |
| | 6 | | Includes the LifePath Fund’s share of the LifePath Master Portfolio’s allocated fees waived of 0.40%, 0.40%, 0.40%, 0.48% and 0.91% for the years ended December 31, 2015, December 31, 2014, December 31, 2013, December 31, 2012 and December 31, 2011, respectively. |
| | 7 | | Includes the LifePath Fund’s share of the LifePath Master Portfolio’s allocated expenses and/or net investment income. Excludes expenses incurred indirectly as a result of the LifePath Master Portfolio’s investments in underlying funds as follows: |
| | | | | | | | | | | | | | | | | | | | |
| | | Year Ended December 31, | |
| | | 2015 | | | 2014 | | | 2013 | | | 2012 | | | 2011 | |
| | | | |
Investments in underlying funds | | | 0.13% | | | | 0.13% | | | | 0.10% | | | | 0.10% | | | | 0.12% | |
| | | | |
| | 8 | | Includes the LifePath Master Portfolio’s purchases and sales of the underlying funds and Active Stock Master Portfolio, CoreAlpha Bond Master Portfolio, International Tilts Master Portfolio, Large Cap Index Master Portfolio and Master Small Cap Index Series. |
| | 9 | | Includes the LifePath Master Portfolio’s purchases and sales of the underlying funds and Active Stock Master Portfolio, CoreAlpha Bond Master Portfolio, International Tilts Master Portfolio, Large Cap Index Master Portfolio, Master Small Cap Index Series and Total International ex U.S. Index Master Portfolio. |
| | 10 | | Excludes the LifePath Master Portfolio’s purchases and sales of the Active Stock Master Portfolio, CoreAlpha Bond Master Portfolio, Master Small Cap Index Series and Total International ex U.S. Index Master Portfolio. If these transactions had been included to conform to the current year presentation, the portfolio turnover rate would have been 17% and 58% for the years ended December 31, 2012 and December 31, 2011, respectively. |
| | | | | | |
| See Notes to Financial Statements. | | | | |
| | | | | | | |
| | BLACKROCK FUNDS III | | DECEMBER 31, 2015 | | 25 |
| | |
| Financial Highlights | | BlackRock LifePath 2035 Fund |
| | | | | | | | | | | | | | | | | | | | |
| | | Institutional | |
| | | Year Ended December 31, | |
| | | 2015 | | | 2014 | | | 2013 | | | 2012 | | | 2011 | |
| | | | | | | | | | | | | | | | | | | | |
| Per Share Operating Performance | | | | | | | | | | | | | | | | | | | | |
Net asset value, beginning of year | | $ | 13.43 | | | $ | 13.77 | | | $ | 12.51 | | | $ | 11.18 | | | $ | 11.52 | |
| | | | |
Net investment income1 | | | 0.21 | | | | 0.22 | | | | 0.24 | | | | 0.24 | | | | 0.24 | |
Net realized and unrealized gain (loss) | | | (0.49 | ) | | | 0.54 | | | | 1.67 | | | | 1.30 | | | | (0.39 | ) |
| | | | |
Net increase (decrease) from investment operations | | | (0.28 | ) | | | 0.76 | | | | 1.91 | | | | 1.54 | | | | (0.15 | ) |
| | | | |
| Distributions:2 | | | | | | | | | | | | | | | | | | | | |
From net investment income | | | (0.22 | ) | | | (0.22 | ) | | | (0.23 | ) | | | (0.21 | ) | | | (0.19 | ) |
From net realized gain | | | (0.35 | ) | | | (0.88 | ) | | | (0.42 | ) | | | — | | | | (0.00 | )3 |
From return of capital | | | (0.00 | )3 | | | — | | | | — | | | | (0.00 | )3 | | | — | |
| | | | |
Total distributions | | | (0.57 | ) | | | (1.10 | ) | | | (0.65 | ) | | | (0.21 | ) | | | (0.19 | ) |
| | | | |
Net asset value, end of year | | $ | 12.58 | | | $ | 13.43 | | | $ | 13.77 | | | $ | 12.51 | | | $ | 11.18 | |
| | | | |
| | | | | | | | | | | | | | | | | | | | |
| Total Return4 | | | | | | | | | | | | | | | | | | | | |
Based on net asset value | | | (2.15)% | | | | 5.51% | | | | 15.33% | | | | 13.85% | | | | (1.32)% | |
| | | | |
| | | | | | | | | | | | | | | | | | | | |
| Ratios to Average Net Assets5,6,7 | | | | | | | | | | | | | | | | | | | | |
Total expenses | | | 0.72% | | | | 0.74% | | | | 0.80% | | | | 0.89% | | | | 1.22% | |
| | | | |
Total expenses after fees waived and/or reimbursed | | | 0.68% | | | | 0.71% | | | | 0.75% | | | | 0.75% | | | | 0.72% | |
| | | | |
Net investment income | | | 1.54% | | | | 1.55% | | | | 1.78% | | | | 1.98% | | | | 2.13% | |
| | | | |
| | | | | | | | | | | | | | | | | | | | |
| Supplemental Data | | | | | | | | | | | | | | | | | | | | |
Net assets, end of year (000) | | $ | 22,071 | | | $ | 22,004 | | | $ | 22,266 | | | $ | 12,853 | | | $ | 2,033 | |
| | | | |
Portfolio turnover rate of the LifePath Master Portfolio | | | 44% | 8 | | | 54% | 9 | | | 39% | 9 | | | 4% | 10 | | | 21% | 10 |
| | | | |
| | 1 | | Based on average shares outstanding. |
| | 2 | | Distributions for annual periods determined in accordance with federal income tax regulations. |
| | 3 | | Amount is greater than $(0.005) per share. |
| | 4 | | Where applicable, assumes the reinvestment of distributions. |
| | 5 | | Includes the LifePath Fund’s share of its corresponding LifePath Master Portfolio’s allocated net expenses and/or net investment income. |
| | 6 | | Includes the LifePath Fund’s share of the LifePath Master Portfolio’s allocated fees waived of 0.43%, 0.43%, 0.43%, 0.56% and 1.10% for the years ended December 31, 2015, December 31, 2014, December 31, 2013, December 31, 2012 and December 31, 2011, respectively. |
| | 7 | | Includes the LifePath Fund’s share of the LifePath Master Portfolio’s allocated expenses and/or net investment income. Excludes expenses incurred indirectly as a result of the LifePath Master Portfolio’s investments in underlying funds as follows: |
| | | | | | | | | | | | | | | | | | | | |
| | | Year Ended December 31, | |
| | | 2015 | | | 2014 | | | 2013 | | | 2012 | | | 2011 | |
| | | | |
Investments in underlying funds | | | 0.16% | | | | 0.15% | | | | 0.11% | | | | 0.11% | | | | 0.14% | |
| | | | |
| | 8 | | Includes the LifePath Master Portfolio’s purchases and sales of the underlying funds and Active Stock Master Portfolio, CoreAlpha Bond Master Portfolio, International Tilts Master Portfolio, Large Cap Index Master Portfolio and Master Small Cap Index Series. |
| | 9 | | Includes the LifePath Master Portfolio’s purchases and sales of the underlying funds and Active Stock Master Portfolio, CoreAlpha Bond Master Portfolio, International Tilts Master Portfolio, Large Cap Index Master Portfolio, Master Small Cap Index Series and Total International ex U.S. Index Master Portfolio. |
| | 10 | | Excludes the LifePath Master Portfolio’s purchases and sales of the Active Stock Master Portfolio, CoreAlpha Bond Master Portfolio, Master Small Cap Index Series and Total International ex U.S. Index Master Portfolio. If these transactions had been included to conform to the current year presentation, the portfolio turnover rate would have been 13% and 47% for the years ended December 31, 2012 and December 31, 2011, respectively. |
| | | | | | |
| See Notes to Financial Statements. | | | | |
| | | | | | | |
| 26 | | BLACKROCK FUNDS III | | DECEMBER 31, 2015 | | |
| | |
| Financial Highlights (continued) | | BlackRock LifePath 2035 Fund |
| | | | | | | | | | | | | | | | | | | | |
| | | Investor A | |
| | | Year Ended December 31, | |
| | | 2015 | | | 2014 | | | 2013 | | | 2012 | | | 2011 | |
| | | | | | | | | | | | | | | | | | | | |
| Per Share Operating Performance | | | | | | | | | | | | | | | | | | | | |
Net asset value, beginning of year | | $ | 13.41 | | | $ | 13.77 | | | $ | 12.51 | | | $ | 11.17 | | | $ | 11.51 | |
| | | | |
Net investment income1 | | | 0.17 | | | | 0.19 | | | | 0.21 | | | | 0.20 | | | | 0.20 | |
Net realized and unrealized gain (loss) | | | (0.48 | ) | | | 0.52 | | | | 1.67 | | | | 1.32 | | | | (0.37 | ) |
| | | | |
Net increase (decrease) from investment operations | | | (0.31 | ) | | | 0.71 | | | | 1.88 | | | | 1.52 | | | | (0.17 | ) |
| | | | |
| Distributions:2 | | | | | | | | | | | | | | | | | | | | |
From net investment income | | | (0.19 | ) | | | (0.19 | ) | | | (0.20 | ) | | | (0.18 | ) | | | (0.17 | ) |
From net realized gain | | | (0.35 | ) | | | (0.88 | ) | | | (0.42 | ) | | | — | | | | (0.00 | )3 |
From return of capital | | | (0.00 | )3 | | | — | | | | — | | | | (0.00 | )3 | | | — | |
| | | | |
Total distributions | | | (0.54 | ) | | | (1.07 | ) | | | (0.62 | ) | | | (0.18 | ) | | | (0.17 | ) |
| | | | |
Net asset value, end of year | | $ | 12.56 | | | $ | 13.41 | | | $ | 13.77 | | | $ | 12.51 | | | $ | 11.17 | |
| | | | |
| | | | | | | | | | | | | | | | | | | | |
| Total Return4 | | | | | | | | | | | | | | | | | | | | |
Based on net asset value | | | (2.40)% | | | | 5.17% | | | | 15.08% | | | | 13.63% | | | | (1.55)% | |
| | | | |
| | | | | | | | | | | | | | | | | | | | |
| Ratios to Average Net Assets5,6,7 | | | | | | | | | | | | | | | | | | | | |
Total expenses | | | 0.97% | | | | 0.99% | | | | 1.05% | | | | 1.14% | | | | 1.48% | |
| | | | |
Total expenses after fees waived and/or reimbursed | | | 0.93% | | | | 0.96% | | | | 1.00% | | | | 1.00% | | | | 0.97% | |
| | | | |
Net investment income | | | 1.30% | | | | 1.33% | | | | 1.55% | | | | 1.63% | | | | 1.77% | |
| | | | |
| | | | | | | | | | | | | | | | | | | | |
| Supplemental Data | | | | | | | | | | | | | | | | | | | | |
Net assets, end of year (000) | | $ | 30,359 | | | $ | 31,048 | | | $ | 21,423 | | | $ | 9,966 | | | $ | 4,121 | |
| | | | |
Portfolio turnover rate of the LifePath Master Portfolio | | | 44% | 8 | | | 54% | 9 | | | 39% | 9 | | | 4% | 10 | | | 21% | 10 |
| | | | |
| | 1 | | Based on average shares outstanding. |
| | 2 | | Distributions for annual periods determined in accordance with federal income tax regulations. |
| | 3 | | Amount is greater than $(0.005) per share. |
| | 4 | | Where applicable, excludes the effects of any sales charges and assumes the reinvestment of distributions. |
| | 5 | | Includes the LifePath Fund’s share of its corresponding LifePath Master Portfolio’s allocated net expenses and/or net investment income. |
| | 6 | | Includes the LifePath Fund’s share of the LifePath Master Portfolio’s allocated fees waived of 0.43%, 0.43%, 0.43%, 0.56% and 1.15% for the years ended December 31, 2015, December 31, 2014, December 31, 2013, December 31, 2012 and December 31, 2011, respectively. |
| | 7 | | Includes the LifePath Fund’s share of the LifePath Master Portfolio’s allocated expenses and/or net investment income. Excludes expenses incurred indirectly as a result of the LifePath Master Portfolio’s investments in underlying funds as follows: |
| | | | | | | | | | | | | | | | | | | | |
| | | Year Ended December 31, | |
| | | 2015 | | | 2014 | | | 2013 | | | 2012 | | | 2011 | |
| | | | |
Investments in underlying funds | | | 0.16% | | | | 0.15% | | | | 0.11% | | | | 0.11% | | | | 0.14% | |
| | | | |
| | 8 | | Includes the LifePath Master Portfolio’s purchases and sales of the underlying funds and Active Stock Master Portfolio, CoreAlpha Bond Master Portfolio, International Tilts Master Portfolio, Large Cap Index Master Portfolio and Master Small Cap Index Series. |
| | 9 | | Includes the LifePath Master Portfolio’s purchases and sales of the underlying funds and Active Stock Master Portfolio, CoreAlpha Bond Master Portfolio, International Tilts Master Portfolio, Large Cap Index Master Portfolio, Master Small Cap Index Series and Total International ex U.S. Index Master Portfolio. |
| | 10 | | Excludes the LifePath Master Portfolio’s purchases and sales of the Active Stock Master Portfolio, CoreAlpha Bond Master Portfolio, Master Small Cap Index Series and Total International ex U.S. Index Master Portfolio. If these transactions had been included to conform to the current year presentation, the portfolio turnover rate would have been 13% and 47% for the years ended December 31, 2012 and December 31, 2011, respectively. |
| | | | | | |
| See Notes to Financial Statements. | | | | |
| | | | | | | |
| | BLACKROCK FUNDS III | | DECEMBER 31, 2015 | | 27 |
| | |
| Financial Highlights (continued) | | BlackRock LifePath 2035 Fund |
| | | | | | | | | | | | | | | | | | | | |
| | | Investor C | |
| | | Year Ended December 31, | |
| | | 2015 | | | 2014 | | | 2013 | | | 2012 | | | 2011 | |
| | | | | | | | | | | | | | | | | | | | |
| Per Share Operating Performance | | | | | | | | | | | | | | | | | | | | |
Net asset value, beginning of year | | $ | 13.32 | | | $ | 13.69 | | | $ | 12.45 | | | $ | 11.14 | | | $ | 11.49 | |
| | | | |
Net investment income1 | | | 0.07 | | | | 0.08 | | | | 0.11 | | | | 0.11 | | | | 0.09 | |
Net realized and unrealized gain (loss) | | | (0.48 | ) | | | 0.53 | | | | 1.66 | | | | 1.30 | | | | (0.35 | ) |
| | | | |
Net increase (decrease) from investment operations | | | (0.41 | ) | | | 0.61 | | | | 1.77 | | | | 1.41 | | | | (0.26 | ) |
| | | | |
| Distributions:2 | | | | | | | | | | | | | | | | | | | | |
From net investment income | | | (0.09 | ) | | | (0.10 | ) | | | (0.11 | ) | | | (0.10 | ) | | | (0.09 | ) |
From net realized gain | | | (0.35 | ) | | | (0.88 | ) | | | (0.42 | ) | | | — | | | | (0.00 | )3 |
From return of capital | | | (0.00 | )3 | | | — | | | | — | | | | (0.00 | )3 | | | — | |
| | | | |
Total distributions | | | (0.44 | ) | | | (0.98 | ) | | | (0.53 | ) | | | (0.10 | ) | | | (0.09 | ) |
| | | | |
Net asset value, end of year | | $ | 12.47 | | | $ | 13.32 | | | $ | 13.69 | | | $ | 12.45 | | | $ | 11.14 | |
| | | | |
| | | | | | | | | | | | | | | | | | | | |
| Total Return4 | | | | | | | | | | | | | | | | | | | | |
Based on net asset value | | | (3.13)% | | | | 4.43% | | | | 14.22% | | | | 12.70% | | | | (2.28)% | |
| | | | |
| | | | | | | | | | | | | | | | | | | | |
| Ratios to Average Net Assets5,6,7 | | | | | | | | | | | | | | | | | | | | |
Total expenses | | | 1.72% | | | | 1.74% | | | | 1.81% | | | | 1.89% | | | | 2.24% | |
| | | | |
Total expenses after fees waived and/or reimbursed | | | 1.69% | | | | 1.71% | | | | 1.75% | | | | 1.75% | | | | 1.72% | |
| | | | |
Net investment income | | | 0.55% | | | | 0.58% | | | | 0.81% | | | | 0.92% | | | | 0.80% | |
| | | | |
| | | | | | | | | | | | | | | | | | | | |
| Supplemental Data | | | | | | | | | | | | | | | | | | | | |
Net assets, end of year (000) | | $ | 2,007 | | | $ | 1,816 | | | $ | 1,028 | | | $ | 533 | | | $ | 190 | |
| | | | |
Portfolio turnover rate of the LifePath Master Portfolio | | | 44% | 8 | | | 54% | 9 | | | 39% | 9 | | | 4% | 10 | | | 21% | 10 |
| | | | |
| | 1 | | Based on average shares outstanding. |
| | 2 | | Distributions for annual periods determined in accordance with federal income tax regulations. |
| | 3 | | Amount is greater than $(0.005) per share. |
| | 4 | | Where applicable, excludes the effects of any sales charges and assumes the reinvestment of distributions. |
| | 5 | | Includes the LifePath Fund’s share of its corresponding LifePath Master Portfolio’s allocated net expenses and/or net investment income. |
| | 6 | | Includes the LifePath Fund’s share of the LifePath Master Portfolio’s allocated fees waived of 0.43%, 0.43%, 0.43%, 0.56% and 1.09% for the years ended December 31, 2015, December 31, 2014, December 31, 2013, December 31, 2012 and December 31, 2011, respectively. |
| | 7 | | Includes the LifePath Fund’s share of the LifePath Master Portfolio’s allocated expenses and/or net investment income. Excludes expenses incurred indirectly as a result of the LifePath Master Portfolio’s investments in underlying funds as follows: |
| | | | | | | | | | | | | | | | | | | | |
| | | Year Ended December 31, | |
| | | 2015 | | | 2014 | | | 2013 | | | 2012 | | | 2011 | |
| | | | |
Investments in underlying funds | | | 0.16% | | | | 0.15% | | | | 0.11% | | | | 0.11% | | | | 0.14% | |
| | | | |
| | 8 | | Includes the LifePath Master Portfolio’s purchases and sales of the underlying funds and Active Stock Master Portfolio, CoreAlpha Bond Master Portfolio, International Tilts Master Portfolio, Large Cap Index Master Portfolio and Master Small Cap Index Series. |
| | 9 | | Includes the LifePath Master Portfolio’s purchases and sales of the underlying funds and Active Stock Master Portfolio, CoreAlpha Bond Master Portfolio, International Tilts Master Portfolio, Large Cap Index Master Portfolio, Master Small Cap Index Series and Total International ex U.S. Index Master Portfolio. |
| | 10 | | Excludes the LifePath Master Portfolio’s purchases and sales of the Active Stock Master Portfolio, CoreAlpha Bond Master Portfolio, Master Small Cap Index Series and Total International ex U.S. Index Master Portfolio. If these transactions had been included to conform to the current year presentation, the portfolio turnover rate would have been 13% and 47% for the years ended December 31, 2012 and December 31, 2011, respectively. |
| | | | | | |
| See Notes to Financial Statements. | | | | |
| | | | | | | |
| 28 | | BLACKROCK FUNDS III | | DECEMBER 31, 2015 | | |
| | |
| Financial Highlights (continued) | | BlackRock LifePath 2035 Fund |
| | | | | | | | | | | | | | | | | | | | |
| | | Class K | |
| | | Year Ended December 31, | |
| | | 2015 | | | 2014 | | | 2013 | | | 2012 | | | 2011 | |
| | | | | | | | | | | | | | | | | | | | |
| Per Share Operating Performance | | | | | | | | | | | | | | | | | | | | |
Net asset value, beginning of year | | $ | 13.60 | | | $ | 13.94 | | | $ | 12.55 | | | $ | 11.20 | | | $ | 11.52 | |
| | | | |
Net investment income1 | | | 0.30 | | | | 0.23 | | | | 0.22 | | | | 0.27 | | | | 0.25 | |
Net realized and unrealized gain (loss) | | | (0.54 | ) | | | 0.57 | | | | 1.82 | | | | 1.32 | | | | (0.35 | ) |
| | | | |
Net increase (decrease) from investment operations | | | (0.24 | ) | | | 0.80 | | | | 2.04 | | | | 1.59 | | | | (0.10 | ) |
| | | | |
| Distributions:2 | | | | | | | | | | | | | | | | | | | | |
From net investment income | | | (0.27 | ) | | | (0.26 | ) | | | (0.23 | ) | | | (0.24 | ) | | | (0.22 | ) |
From net realized gain | | | (0.35 | ) | | | (0.88 | ) | | | (0.42 | ) | | | — | | | | (0.00 | )3 |
From return of capital | | | (0.00 | )3 | | | — | | | | — | | | | (0.00 | )3 | | | — | |
| | | | |
Total distributions | | | (0.62 | ) | | | (1.14 | ) | | | (0.65 | ) | | | (0.24 | ) | | | (0.22 | ) |
| | | | |
Net asset value, end of year | | $ | 12.74 | | | $ | 13.60 | | | $ | 13.94 | | | $ | 12.55 | | | $ | 11.20 | |
| | | | |
| | | | | | | | | | | | | | | | | | | | |
| Total Return4 | | | | | | | | | | | | | | | | | | | | |
Based on net asset value | | | (1.83)% | | | | 5.73% | | | | 16.32% | | | | 14.30% | | | | (0.94)% | |
| | | | |
| | | | | | | | | | | | | | | | | | | | |
| Ratios to Average Net Assets5,6,7 | | | | | | | | | | | | | | | | | | | | |
Total expenses | | | 0.39% | | | | 0.38% | | | | 0.45% | | | | 0.55% | | | | 0.87% | |
| | | | |
Total expenses after fees waived and/or reimbursed | | | 0.35% | | | | 0.35% | | | | 0.38% | | | | 0.40% | | | | 0.36% | |
| | | | |
Net investment income | | | 2.30% | | | | 1.91% | | | | 1.65% | | | | 2.26% | | | | 2.17% | |
| | | | |
| | | | | | | | | | | | | | | | | | | | |
| Supplemental Data | | | | | | | | | | | | | | | | | | | | |
Net assets, end of year (000) | | $ | 757 | | | $ | 138 | | | $ | 95 | | | $ | 1,999 | | | $ | 1,050 | |
| | | | |
Portfolio turnover rate of the LifePath Master Portfolio | | | 44% | 8 | | | 54% | 9 | | | 39% | 9 | | | 4% | 10 | | | 21% | 10 |
| | | | |
| | 1 | | Based on average shares outstanding. |
| | 2 | | Distributions for annual periods determined in accordance with federal income tax regulations. |
| | 3 | | Amount is greater than $(0.005) per share. |
| | 4 | | Where applicable, assumes the reinvestment of distributions. |
| | 5 | | Includes the LifePath Fund’s share of its corresponding LifePath Master Portfolio’s allocated net expenses and/or net investment income. |
| | 6 | | Includes the LifePath Fund’s share of the LifePath Master Portfolio’s allocated fees waived of 0.43%, 0.43%, 0.43%, 0.57% and 1.20% for the years ended December 31, 2015, December 31, 2014, December 31, 2013, December 31, 2012 and December 31, 2011, respectively. |
| | 7 | | Includes the LifePath Fund’s share of the LifePath Master Portfolio’s allocated expenses and/or net investment income. Excludes expenses incurred indirectly as a result of the LifePath Master Portfolio’s investments in underlying funds as follows: |
| | | | | | | | | | | | | | | | | | | | |
| | | Year Ended December 31, | |
| | | 2015 | | | 2014 | | | 2013 | | | 2012 | | | 2011 | |
| | | | |
Investments in underlying funds | | | 0.16% | | | | 0.15% | | | | 0.11% | | | | 0.11% | | | | 0.14% | |
| | | | |
| | 8 | | Includes the LifePath Master Portfolio’s purchases and sales of the underlying funds and Active Stock Master Portfolio, CoreAlpha Bond Master Portfolio, International Tilts Master Portfolio, Large Cap Index Master Portfolio and Master Small Cap Index Series. |
| | 9 | | Includes the LifePath Master Portfolio’s purchases and sales of the underlying funds and Active Stock Master Portfolio, CoreAlpha Bond Master Portfolio, International Tilts Master Portfolio, Large Cap Index Master Portfolio, Master Small Cap Index Series and Total International ex U.S. Index Master Portfolio. |
| | 10 | | Excludes the LifePath Master Portfolio’s purchases and sales of the Active Stock Master Portfolio, CoreAlpha Bond Master Portfolio, Master Small Cap Index Series and Total International ex U.S. Index Master Portfolio. If these transactions had been included to conform to the current year presentation, the portfolio turnover rate would have been 13% and 47% for the years ended December 31, 2012 and December 31, 2011, respectively. |
| | | | | | |
| See Notes to Financial Statements. | | | | |
| | | | | | | |
| | BLACKROCK FUNDS III | | DECEMBER 31, 2015 | | 29 |
| | |
| Financial Highlights (concluded) | | BlackRock LifePath 2035 Fund |
| | | | | | | | | | | | | | | | | | | | |
| | | Class R | |
| | | Year Ended December 31, | |
| | | 2015 | | | 2014 | | | 2013 | | | 2012 | | | 2011 | |
| | | | | | | | | | | | | | | | | | | | |
| Per Share Operating Performance | | | | | | | | | | | | | | | | | | | | |
Net asset value, beginning of year | | $ | 13.44 | | | $ | 13.78 | | | $ | 12.52 | | | $ | 11.19 | | | $ | 11.52 | |
| | | | |
Net investment income1 | | | 0.14 | | | | 0.14 | | | | 0.17 | | | | 0.21 | | | | 0.15 | |
Net realized and unrealized gain (loss) | | | (0.49 | ) | | | 0.54 | | | | 1.67 | | | | 1.28 | | | | (0.36 | ) |
| | | | |
Net increase (decrease) from investment operations | | | (0.35 | ) | | | 0.68 | | | | 1.84 | | | | 1.49 | | | | (0.21 | ) |
| | | | |
| Distributions:2 | | | | | | | | | | | | | | | | | | | | |
From net investment income | | | (0.16 | ) | | | (0.14 | ) | | | (0.16 | ) | | | (0.16 | ) | | | (0.12 | ) |
From net realized gain | | | (0.35 | ) | | | (0.88 | ) | | | (0.42 | ) | | | — | | | | (0.00 | )3 |
From return of capital | | | (0.00 | )3 | | | — | | | | — | | | | (0.00 | )3 | | | — | |
| | | | |
Total distributions | | | (0.51 | ) | | | (1.02 | ) | | | (0.58 | ) | | | (0.16 | ) | | | (0.12 | ) |
| | | | |
Net asset value, end of year | | $ | 12.58 | | | $ | 13.44 | | | $ | 13.78 | | | $ | 12.52 | | | $ | 11.19 | |
| | | | |
| | | | | | | | | | | | | | | | | | | | |
| Total Return4 | | | | | | | | | | | | | | | | | | | | |
Based on net asset value | | | (2.65)% | | | | 4.96% | | | | 14.74% | | | | 13.37% | | | | (1.85)% | |
| | | | |
| | | | | | | | | | | | | | | | | | | | |
| Ratios to Average Net Assets5,6,7 | | | | | | | | | | | | | | | | | | | | |
Total expenses | | | 1.21% | | | | 1.24% | | | | 1.30% | | | | 1.38% | | | | 1.72% | |
| | | | |
Total expenses after fees waived and/or reimbursed | | | 1.18% | | | | 1.21% | | | | 1.25% | | | | 1.25% | | | | 1.21% | |
| | | | |
Net investment income | | | 1.09% | | | | 1.03% | | | | 1.25% | | | | 1.71% | | | | 1.31% | |
| | | | |
| | | | | | | | | | | | | | | | | | | | |
| Supplemental Data | | | | | | | | | | | | | | | | | | | | |
Net assets, end of year (000) | | $ | 867 | | | $ | 579 | | | $ | 474 | | | $ | 359 | | | $ | 22 | |
| | | | |
Portfolio turnover rate of the LifePath Master Portfolio | | | 44% | 8 | | | 54% | 9 | | | 39% | 9 | | | 4% | 10 | | | 21% | 10 |
| | | | |
| | 1 | | Based on average shares outstanding. |
| | 2 | | Distributions for annual periods determined in accordance with federal income tax regulations. |
| | 3 | | Amount is greater than $(0.005) per share. |
| | 4 | | Where applicable, assumes the reinvestment of distributions. |
| | 5 | | Includes the LifePath Fund’s share of its corresponding LifePath Master Portfolio’s allocated net expenses and/or net investment income. |
| | 6 | | Includes the LifePath Fund’s share of the LifePath Master Portfolio’s allocated fees waived of 0.43%, 0.43%, 0.43%, 0.55% and 1.19% for the years ended December 31, 2015, December 31, 2014, December 31, 2013, December 31, 2012 and December 31, 2011, respectively. |
| | 7 | | Includes the LifePath Fund’s share of the LifePath Master Portfolio’s allocated expenses and/or net investment income. Excludes expenses incurred indirectly as a result of the LifePath Master Portfolio’s investments in underlying funds as follows: |
| | | | | | | | | | | | | | | | | | | | |
| | | Year Ended December 31, | |
| | | 2015 | | | 2014 | | | 2013 | | | 2012 | | | 2011 | |
| | | | |
Investments in underlying funds | | | 0.16% | | | | 0.15% | | | | 0.11% | | | | 0.11% | | | | 0.14% | |
| | | | |
| | 8 | | Includes the LifePath Master Portfolio’s purchases and sales of the underlying funds and Active Stock Master Portfolio, CoreAlpha Bond Master Portfolio, International Tilts Master Portfolio, Large Cap Index Master Portfolio and Master Small Cap Index Series. |
| | 9 | | Includes the LifePath Master Portfolio’s purchases and sales of the underlying funds and Active Stock Master Portfolio, CoreAlpha Bond Master Portfolio, International Tilts Master Portfolio, Large Cap Index Master Portfolio, Master Small Cap Index Series and Total International ex U.S. Index Master Portfolio. |
| | 10 | | Excludes the LifePath Master Portfolio’s purchases and sales of the Active Stock Master Portfolio, CoreAlpha Bond Master Portfolio, Master Small Cap Index Series and Total International ex U.S. Index Master Portfolio. If these transactions had been included to conform to the current year presentation, the portfolio turnover rate would have been 13% and 47% for the years ended December 31, 2012 and December 31, 2011, respectively. |
| | | | | | |
| See Notes to Financial Statements. | | | | |
| | | | | | | |
| 30 | | BLACKROCK FUNDS III | | DECEMBER 31, 2015 | | |
| | |
| Financial Highlights | | BlackRock LifePath 2045 Fund |
| | | | | | | | | | | | | | | | | | | | |
| | | Institutional | |
| | | Year Ended December 31, | |
| | | 2015 | | | 2014 | | | 2013 | | | 2012 | | | 2011 | |
| | | | | | | | | | | | | | | | | | | | |
| Per Share Operating Performance | | | | | | | | | | | | | | | | | | | | |
Net asset value, beginning of year | | $ | 14.05 | | | $ | 14.39 | | | $ | 12.74 | | | $ | 11.24 | | | $ | 11.70 | |
| | | | |
Net investment income1 | | | 0.21 | | | | 0.23 | | | | 0.27 | | | | 0.25 | | | | 0.23 | |
Net realized and unrealized gain (loss) | | | (0.54 | ) | | | 0.58 | | | | 2.07 | | | | 1.47 | | | | (0.51 | ) |
| | | | |
Net increase (decrease) from investment operations | | | (0.33 | ) | | | 0.81 | | | | 2.34 | | | | 1.72 | | | | (0.28 | ) |
| | | | |
| Distributions:2 | | | | | | | | | | | | | | | | | | | | |
From net investment income | | | (0.21 | ) | | | (0.23 | ) | | | (0.25 | ) | | | (0.22 | ) | | | (0.18 | ) |
From net realized gain | | | (0.41 | ) | | | (0.92 | ) | | | (0.44 | ) | | | — | | | | — | |
From return of capital | | | — | | | | — | | | | — | | | | (0.00 | )3 | | | — | |
| | | | |
Total distributions | | | (0.62 | ) | | | (1.15 | ) | | | (0.69 | ) | | | (0.22 | ) | | | (0.18 | ) |
| | | | |
Net asset value, end of year | | $ | 13.10 | | | $ | 14.05 | | | $ | 14.39 | | | $ | 12.74 | | | $ | 11.24 | |
| | | | |
| | | | | | | | | | | | | | | | | | | | |
| Total Return4 | | | | | | | | | | | | | | | | | | | | |
Based on net asset value | | | (2.37)% | | | | 5.66% | | | | 18.49% | | | | 15.34% | | | | (2.46)% | |
| | | | |
| | | | | | | | | | | | | | | | | | | | |
| Ratios to Average Net Assets5,6,7 | | | | | | | | | | | | | | | | | | | | |
Total expenses | | | 0.71% | | | | 0.75% | | | | 0.85% | | | | 1.06% | | | | 2.00% | |
| | | | |
Total expenses after fees waived and/or reimbursed | | | 0.66% | | | | 0.69% | | | | 0.74% | | | | 0.75% | | | | 0.70% | |
| | | | |
Net investment income | | | 1.53% | | | | 1.57% | | | | 1.94% | | | | 2.04% | | | | 2.02% | |
| | | | |
| | | | | | | | | | | | | | | | | | | | |
| Supplemental Data | | | | | | | | | | | | | | | | | | | | |
Net assets, end of year (000) | | $ | 15,105 | | | $ | 15,678 | | | $ | 12,832 | | | $ | 7,066 | | | $ | 1,646 | |
| | | | |
Portfolio turnover rate of the LifePath Master Portfolio | | | 50% | 8 | | | 54% | 9 | | | 38% | 9 | | | 4% | 10 | | | 35% | 10 |
| | | | |
| | 1 | | Based on average shares outstanding. |
| | 2 | | Distributions for annual periods determined in accordance with federal income tax regulations. |
| | 3 | | Amount is greater than $(0.005) per share. |
| | 4 | | Where applicable, assumes the reinvestment of distributions. |
| | 5 | | Includes the LifePath Fund’s share of its corresponding LifePath Master Portfolio’s allocated net expenses and/or net investment income. |
| | 6 | | Includes the LifePath Fund’s share of the LifePath Master Portfolio’s allocated fees waived of 0.48%, 0.49%, 0.51%, 0.83% and 2.51% for the years ended December 31, 2015, December 31, 2014, December 31, 2013, December 31, 2012 and December 31, 2011, respectively. |
| | 7 | | Includes the LifePath Fund’s share of the LifePath Master Portfolio’s allocated expenses and/or net investment income. Excludes expenses incurred indirectly as a result of the LifePath Master Portfolio’s investments in underlying funds as follows: |
| | | | | | | | | | | | | | | | | | | | |
| | | Year Ended December 31, | |
| | | 2015 | | | 2014 | | | 2013 | | | 2012 | | | 2011 | |
| | | | |
Investments in underlying funds | | | 0.18% | | | | 0.16% | | | | 0.11% | | | | 0.11% | | | | 0.16% | |
| | | | |
| | 8 | | Includes the LifePath Master Portfolio’s purchases and sales of the underlying funds and Active Stock Master Portfolio, CoreAlpha Bond Master Portfolio, International Tilts Master Portfolio, Large Cap Index Master Portfolio and Master Small Cap Index Series. |
| | 9 | | Includes the LifePath Master Portfolio’s purchases and sales of the underlying funds and Active Stock Master Portfolio, CoreAlpha Bond Master Portfolio, International Tilts Master Portfolio, Large Cap Index Master Portfolio, Master Small Cap Index Series and Total International ex U.S. Index Master Portfolio. |
| | 10 | | Excludes the LifePath Master Portfolio’s purchases and sales of the Active Stock Master Portfolio, CoreAlpha Bond Master Portfolio, Master Small Cap Index Series and Total International ex U.S. Index Master Portfolio. If these transactions had been included to conform to the current year presentation, the portfolio turnover rate would have been 15% and 71% for the years ended December 31, 2012 and December 31, 2011, respectively. |
| | | | | | |
| See Notes to Financial Statements. | | | | |
| | | | | | | |
| | BLACKROCK FUNDS III | | DECEMBER 31, 2015 | | 31 |
| | |
| Financial Highlights (continued) | | BlackRock LifePath 2045 Fund |
| | | | | | | | | | | | | | | | | | | | |
| | | Investor A | |
| | | Year Ended December 31, | |
| | | 2015 | | | 2014 | | | 2013 | | | 2012 | | | 2011 | |
| | | | | | | | | | | | | | | | | | | | |
| Per Share Operating Performance | | | | | | | | | | | | | | | | | | | | |
Net asset value, beginning of year | | $ | 14.04 | | | $ | 14.39 | | | $ | 12.75 | | | $ | 11.25 | | | $ | 11.70 | |
| | | | |
Net investment income1 | | | 0.18 | | | | 0.20 | | | | 0.25 | | | | 0.21 | | | | 0.19 | |
Net realized and unrealized gain (loss) | | | (0.54 | ) | | | 0.57 | | | | 2.05 | | | | 1.47 | | | | (0.49 | ) |
| | | | |
Net increase (decrease) from investment operations | | | (0.36 | ) | | | 0.77 | | | | 2.30 | | | | 1.68 | | | | (0.30 | ) |
| | | | |
| Distributions:2 | | | | | | | | | | | | | | | | | | | | |
From net investment income | | | (0.18 | ) | | | (0.20 | ) | | | (0.22 | ) | | | (0.18 | ) | | | (0.15 | ) |
From net realized gain | | | (0.41 | ) | | | (0.92 | ) | | | (0.44 | ) | | | — | | | | (0.00 | )3 |
From return of capital | | | — | | | | — | | | | — | | | | (0.00 | )3 | | | — | |
| | | | |
Total distributions | | | (0.59 | ) | | | (1.12 | ) | | | (0.66 | ) | | | (0.18 | ) | | | (0.15 | ) |
| | | | |
Net asset value, end of year | | $ | 13.09 | | | $ | 14.04 | | | $ | 14.39 | | | $ | 12.75 | | | $ | 11.25 | |
| | | | |
| | | | | | | | | | | | | | | | | | | | |
| Total Return4 | | | | | | | | | | | | | | | | | | | | |
Based on net asset value | | | (2.61)% | | | | 5.37% | | | | 18.17% | | | | 15.03% | | | | (2.61)% | |
| | | | |
| | | | | | | | | | | | | | | | | | | | |
| Ratios to Average Net Assets5,6,7 | | | | | | | | | | | | | | | | | | | | |
Total expenses | | | 0.96% | | | | 1.00% | | | | 1.10% | | | | 1.31% | | | | 2.20% | |
| | | | |
Total expenses after fees waived and/or reimbursed | | | 0.91% | | | | 0.94% | | | | 0.99% | | | | 0.99% | | | | 0.95% | |
| | | | |
Net investment income | | | 1.28% | | | | 1.35% | | | | 1.77% | | | | 1.75% | | | | 1.65% | |
| | | | |
| | | | | | | | | | | | | | | | | | | | |
| Supplemental Data | | | | | | | | | | | | | | | | | | | | |
Net assets, end of year (000) | | $ | 16,744 | | | $ | 16,814 | | | $ | 11,044 | | | $ | 3,512 | | | $ | 1,228 | |
| | | | |
Portfolio turnover rate of the LifePath Master Portfolio | | | 50% | 8 | | | 54% | 9 | | | 38% | 9 | | | 4% | 10 | | | 35% | 10 |
| | | | |
| | 1 | | Based on average shares outstanding. |
| | 2 | | Distributions for annual periods determined in accordance with federal income tax regulations. |
| | 3 | | Amount is greater than $(0.005) per share. |
| | 4 | | Where applicable, excludes the effects of any sales charges and assumes the reinvestment of distributions. |
| | 5 | | Includes the LifePath Fund’s share of its corresponding LifePath Master Portfolio’s allocated net expenses and/or net investment income. |
| | 6 | | Includes the LifePath Fund’s share of the LifePath Master Portfolio’s allocated fees waived of 0.48%, 0.49%, 0.51%, 0.83% and 2.23% for the years ended December 31, 2015, December 31, 2014, December 31, 2013, December 31, 2012 and December 31, 2011, respectively. |
| | 7 | | Includes the LifePath Fund’s share of the LifePath Master Portfolio’s allocated expenses and/or net investment income. Excludes expenses incurred indirectly as a result of the LifePath Master Portfolio’s investments in underlying funds as follows: |
| | | | | | | | | | | | | | | | | | | | |
| | | Year Ended December 31, | |
| | | 2015 | | | 2014 | | | 2013 | | | 2012 | | | 2011 | |
| | | | |
Investments in underlying funds | | | 0.18% | | | | 0.16% | | | | 0.11% | | | | 0.11% | | | | 0.16% | |
| | | | |
| | 8 | | Includes the LifePath Master Portfolio’s purchases and sales of the underlying funds and Active Stock Master Portfolio, CoreAlpha Bond Master Portfolio, International Tilts Master Portfolio, Large Cap Index Master Portfolio and Master Small Cap Index Series. |
| | 9 | | Includes the LifePath Master Portfolio’s purchases and sales of the underlying funds and Active Stock Master Portfolio, CoreAlpha Bond Master Portfolio, International Tilts Master Portfolio, Large Cap Index Master Portfolio, Master Small Cap Index Series and Total International ex U.S. Index Master Portfolio. |
| | 10 | | Excludes the LifePath Master Portfolio’s purchases and sales of the Active Stock Master Portfolio, CoreAlpha Bond Master Portfolio, Master Small Cap Index Series and Total International ex U.S. Index Master Portfolio. If these transactions had been included to conform to the current year presentation, the portfolio turnover rate would have been 15% and 71% for the years ended December 31, 2012 and December 31, 2011, respectively. |
| | | | | | |
| See Notes to Financial Statements. | | | | |
| | | | | | | |
| 32 | | BLACKROCK FUNDS III | | DECEMBER 31, 2015 | | |
| | |
| Financial Highlights (continued) | | BlackRock LifePath 2045 Fund |
| | | | | | | | | | | | | | | | | | | | |
| | | Investor C | |
| | | Year Ended December 31, | |
| | | 2015 | | | 2014 | | | 2013 | | | 2012 | | | 2011 | |
| | | | | | | | | | | | | | | | | | | | |
| Per Share Operating Performance | | | | | | | | | | | | | | | | | | | | |
Net asset value, beginning of year | | $ | 13.90 | | | $ | 14.26 | | | $ | 12.65 | | | $ | 11.18 | | | $ | 11.67 | |
| | | | |
Net investment income1 | | | 0.07 | | | | 0.09 | | | | 0.13 | | | | 0.13 | | | | 0.11 | |
Net realized and unrealized gain (loss) | | | (0.54 | ) | | | 0.57 | | | | 2.05 | | | | 1.45 | | | | (0.50 | ) |
| | | | |
Net increase (decrease) from investment operations | | | (0.47 | ) | | | 0.66 | | | | 2.18 | | | | 1.58 | | | | (0.39 | ) |
| | | | |
| Distributions:2 | | | | | | | | | | | | | | | | | | | | |
From net investment income | | | (0.08 | ) | | | (0.10 | ) | | | (0.13 | ) | | | (0.11 | ) | | | (0.10 | ) |
From net realized gain | | | (0.41 | ) | | | (0.92 | ) | | | (0.44 | ) | | | — | | | | (0.00 | )3 |
From return of capital | | | — | | | | — | | | | — | | | | (0.00 | )3 | | | — | |
| | | | |
Total distributions | | | (0.49 | ) | | | (1.02 | ) | | | (0.57 | ) | | | (0.11 | ) | | | (0.10 | ) |
| | | | |
Net asset value, end of year | | $ | 12.94 | | | $ | 13.90 | | | $ | 14.26 | | | $ | 12.65 | | | $ | 11.18 | |
| | | | |
| | | | | | | | | | | | | | | | | | | | |
| Total Return4 | | | | | | | | | | | | | | | | | | | | |
Based on net asset value | | | (3.43)% | | | | 4.63% | | | | 17.31% | | | | 14.15% | | | | (3.37)% | |
| | | | |
| | | | | | | | | | | | | | | | | | | | |
| Ratios to Average Net Assets5,6,7 | | | | | | | | | | | | | | | | | | | | |
Total expenses | | | 1.72% | | | | 1.75% | | | | 1.85% | | | | 2.04% | | | | 2.99% | |
| | | | |
Total expenses after fees waived and/or reimbursed | | | 1.67% | | | | 1.69% | | | | 1.74% | | | | 1.75% | | | | 1.70% | |
| | | | |
Net investment income | | | 0.53% | | | | 0.61% | | | | 0.97% | | | | 1.07% | | | | 0.94% | |
| | | | |
| | | | | | | | | | | | | | | | | | | | |
| Supplemental Data | | | | | | | | | | | | | | | | | | | | |
Net assets, end of year (000) | | $ | 1,420 | | | $ | 1,549 | | | $ | 935 | | | $ | 463 | | | $ | 95 | |
| | | | |
Portfolio turnover rate of the LifePath Master Portfolio | | | 50% | 8 | | | 54% | 9 | | | 38% | 9 | | | 4% | 10 | | | 35% | 10 |
| | | | |
| | 1 | | Based on average shares outstanding. |
| | 2 | | Distributions for annual periods determined in accordance with federal income tax regulations. |
| | 3 | | Amount is greater than $(0.005) per share. |
| | 4 | | Where applicable, excludes the effects of any sales charges and assumes the reinvestment of distributions. |
| | 5 | | Includes the LifePath Fund’s share of its corresponding LifePath Master Portfolio’s allocated net expenses and/or net investment income. |
| | 6 | | Includes the LifePath Fund’s share of the LifePath Master Portfolio’s allocated fees waived of 0.48%, 0.49%, 0.51%, 0.81% and 2.41% for the years ended December 31, 2015, December 31, 2014, December 31, 2013, December 31, 2012 and December 31, 2011, respectively. |
| | 7 | | Includes the LifePath Fund’s share of the LifePath Master Portfolio’s allocated expenses and/or net investment income. Excludes expenses incurred indirectly as a result of the LifePath Master Portfolio’s investments in underlying funds as follows: |
| | | | | | | | | | | | | | | | | | | | |
| | | Year Ended December 31, | |
| | | 2015 | | | 2014 | | | 2013 | | | 2012 | | | 2011 | |
| | | | |
Investments in underlying funds | | | 0.18% | | | | 0.16% | | | | 0.11% | | | | 0.11% | | | | 0.16% | |
| | | | |
| | 8 | | Includes the LifePath Master Portfolio’s purchases and sales of the underlying funds and Active Stock Master Portfolio, CoreAlpha Bond Master Portfolio, International Tilts Master Portfolio, Large Cap Index Master Portfolio and Master Small Cap Index Series. |
| | 9 | | Includes the LifePath Master Portfolio’s purchases and sales of the underlying funds and Active Stock Master Portfolio, CoreAlpha Bond Master Portfolio, International Tilts Master Portfolio, Large Cap Index Master Portfolio, Master Small Cap Index Series and Total International ex U.S. Index Master Portfolio. |
| | 10 | | Excludes the LifePath Master Portfolio’s purchases and sales of the Active Stock Master Portfolio, CoreAlpha Bond Master Portfolio, Master Small Cap Index Series and Total International ex U.S. Index Master Portfolio. If these transactions had been included to conform to the current year presentation, the portfolio turnover rate would have been 15% and 71% for the years ended December 31, 2012 and December 31, 2011, respectively. |
| | | | | | |
| See Notes to Financial Statements. | | | | |
| | | | | | | |
| | BLACKROCK FUNDS III | | DECEMBER 31, 2015 | | 33 |
| | |
| Financial Highlights (continued) | | BlackRock LifePath 2045 Fund |
| | | | | | | | | | | | | | | | | | | | |
| | | Class K | |
| | | Year Ended December 31, | |
| | | 2015 | | | 2014 | | | 2013 | | | 2012 | | | 2011 | |
| | | | | | | | | | | | | | | | | | | | |
| Per Share Operating Performance | | | | | | | | | | | | | | | | | | | | |
Net asset value, beginning of year | | $ | 14.18 | | | $ | 14.50 | | | $ | 12.77 | | | $ | 11.26 | | | $ | 11.70 | |
| | | | |
Net investment income1 | | | 0.40 | | | | 0.29 | | | | 0.21 | | | | 0.30 | | | | 0.24 | |
Net realized and unrealized gain (loss) | | | (0.68 | ) | | | 0.55 | | | | 2.21 | | | | 1.46 | | | | (0.48 | ) |
| | | | |
Net increase (decrease) from investment operations | | | (0.28 | ) | | | 0.84 | | | | 2.42 | | | | 1.76 | | | | (0.24 | ) |
| | | | |
| Distributions:2 | | | | | | | | | | | | | | | | | | | | |
From net investment income | | | (0.27 | ) | | | (0.24 | ) | | | (0.25 | ) | | | (0.25 | ) | | | (0.20 | ) |
From net realized gain | | | (0.41 | ) | | | (0.92 | ) | | | (0.44 | ) | | | — | | | | (0.00 | )3 |
From return of capital | | | — | | | | — | | | | — | | | | (0.00 | )3 | | | — | |
| | | | |
Total distributions | | | (0.68 | ) | | | (1.16 | ) | | | (0.69 | ) | | | (0.25 | ) | | | (0.20 | ) |
| | | | |
Net asset value, end of year | | $ | 13.22 | | | $ | 14.18 | | | $ | 14.50 | | | $ | 12.77 | | | $ | 11.26 | |
| | | | |
| | | | | | | | | | | | | | | | | | | | |
| Total Return4 | | | | | | | | | | | | | | | | | | | | |
Based on net asset value | | | (2.04)% | | | | 5.80% | | | | 19.11% | | | | 15.72% | | | | (2.08)% | |
| | | | |
| | | | | | | | | | | | | | | | | | | | |
| Ratios to Average Net Assets5,6,7 | | | | | | | | | | | | | | | | | | | | |
Total expenses | | | 0.40% | | | | 0.38% | | | | 0.49% | | | | 0.70% | | | | 1.72% | |
| | | | |
Total expenses after fees waived and/or reimbursed | | | 0.34% | | | | 0.33% | | | | 0.38% | | | | 0.39% | | | | 0.35% | |
| | | | |
Net investment income | | | 3.08% | | | | 1.92% | | | | 1.60% | | | | 2.41% | | | | 2.04% | |
| | | | |
| | | | | | | | | | | | | | | | | | | | |
| Supplemental Data | | | | | | | | | | | | | | | | | | | | |
Net assets, end of year (000) | | $ | 524 | | | $ | 28 | | | $ | 29 | | | $ | 697 | | | $ | 259 | |
| | | | |
Portfolio turnover rate of the LifePath Master Portfolio | | | 50% | 8 | | | 54% | 9 | | | 38% | 9 | | | 4% | 10 | | | 35% | 10 |
| | | | |
| | 1 | | Based on average shares outstanding. |
| | 2 | | Distributions for annual periods determined in accordance with federal income tax regulations. |
| | 3 | | Amount is greater than $(0.005) per share. |
| | 4 | | Where applicable, assumes the reinvestment of distributions. |
| | 5 | | Includes the LifePath Fund’s share of its corresponding LifePath Master Portfolio’s allocated net expenses and/or net investment income. |
| | 6 | | Includes the LifePath Fund’s share of the LifePath Master Portfolio’s allocated fees waived of 0.49%, 0.48%, 0.55%, 0.83% and 2.71% for the years ended December 31, 2015, December 31, 2014, December 31, 2013, December 31, 2012 and December 31, 2011, respectively. |
| | 7 | | Includes the LifePath Fund’s share of the LifePath Master Portfolio’s allocated expenses and/or net investment income. Excludes expenses incurred indirectly as a result of the LifePath Master Portfolio’s investments in underlying funds as follows: |
| | | | | | | | | | | | | | | | | | | | |
| | | Year Ended December 31, | |
| | | 2015 | | | 2014 | | | 2013 | | | 2012 | | | 2011 | |
| | | | |
Investments in underlying funds | | | 0.18% | | | | 0.16% | | | | 0.11% | | | | 0.11% | | | | 0.16% | |
| | | | |
| | 8 | | Includes the LifePath Master Portfolio’s purchases and sales of the underlying funds and Active Stock Master Portfolio, CoreAlpha Bond Master Portfolio, International Tilts Master Portfolio, Large Cap Index Master Portfolio and Master Small Cap Index Series. |
| | 9 | | Includes the LifePath Master Portfolio’s purchases and sales of the underlying funds and Active Stock Master Portfolio, CoreAlpha Bond Master Portfolio, International Tilts Master Portfolio, Large Cap Index Master Portfolio, Master Small Cap Index Series and Total International ex U.S. Index Master Portfolio. |
| | 10 | | Excludes the LifePath Master Portfolio’s purchases and sales of the Active Stock Master Portfolio, CoreAlpha Bond Master Portfolio, Master Small Cap Index Series and Total International ex U.S. Index Master Portfolio. If these transactions had been included to conform to the current year presentation, the portfolio turnover rate would have been 15% and 71% for the years ended December 31, 2012 and December 31, 2011, respectively. |
| | | | | | |
| See Notes to Financial Statements. | | | | |
| | | | | | | |
| 34 | | BLACKROCK FUNDS III | | DECEMBER 31, 2015 | | |
| | |
| Financial Highlights (concluded) | | BlackRock LifePath 2045 Fund |
| | | | | | | | | | | | | | | | | | | | |
| | | Class R | |
| | | Year Ended December 31, | |
| | | 2015 | | | 2014 | | | 2013 | | | 2012 | | | 2011 | |
| | | | | | | | | | | | | | | | | | | | |
| Per Share Operating Performance | | | | | | | | | | | | | | | | | | | | |
Net asset value, beginning of year | | $ | 14.04 | | | $ | 14.38 | | | $ | 12.73 | | | $ | 11.24 | | | $ | 11.69 | |
| | | | |
Net investment income1 | | | 0.15 | | | | 0.15 | | | | 0.19 | | | | 0.23 | | | | 0.14 | |
Net realized and unrealized gain (loss) | | | (0.53 | ) | | | 0.58 | | | | 2.08 | | | | 1.42 | | | | (0.48 | ) |
| | | | |
Net increase (decrease) from investment operations | | | (0.38 | ) | | | 0.73 | | | | 2.27 | | | | 1.65 | | | | (0.34 | ) |
| | | | |
| Distributions:2 | | | | | | | | | | | | | | | | | | | | |
From net investment income | | | (0.16 | ) | | | (0.15 | ) | | | (0.18 | ) | | | (0.16 | ) | | | (0.11 | ) |
From net realized gain | | | (0.41 | ) | | | (0.92 | ) | | | (0.44 | ) | | | — | | | | (0.00 | )3 |
From return of capital | | | — | | | | — | | | | — | | | | (0.00 | )3 | | | — | |
| | | | |
Total distributions | | | (0.57 | ) | | | (1.07 | ) | | | (0.62 | ) | | | (0.16 | ) | | | (0.11 | ) |
| | | | |
Net asset value, end of year | | $ | 13.09 | | | $ | 14.04 | | | $ | 14.38 | | | $ | 12.73 | | | $ | 11.24 | |
| | | | |
| | | | | | | | | | | | | | | | | | | | |
| Total Return4 | | | | | | | | | | | | | | | | | | | | |
Based on net asset value | | | (2.80)% | | | | 5.08% | | | | 17.91% | | | | 14.77% | | | | (2.93)% | |
| | | | |
| | | | | | | | | | | | | | | | | | | | |
| Ratios to Average Net Assets5,6,7 | | | | | | | | | | | | | | | | | | | | |
Total expenses | | | 1.21% | | | | 1.25% | | | | 1.35% | | | | 1.55% | | | | 2.57% | |
| | | | |
Total expenses after fees waived and/or reimbursed | | | 1.15% | | | | 1.19% | | | | 1.24% | | | | 1.25% | | | | 1.19% | |
| | | | |
Net investment income | | | 1.09% | | | | 1.04% | | | | 1.36% | | | | 1.84% | | | | 1.17% | |
| | | | |
| | | | | | | | | | | | | | | | | | | | |
| Supplemental Data | | | | | | | | | | | | | | | | | | | | |
Net assets, end of year (000) | | $ | 693 | | | $ | 520 | | | $ | 560 | | | $ | 423 | | | $ | 22 | |
| | | | |
Portfolio turnover rate of the LifePath Master Portfolio | | | 50% | 8 | | | 54% | 9 | | | 38% | 9 | | | 4% | 10 | | | 35% | 10 |
| | | | |
| | 1 | | Based on average shares outstanding. |
| | 2 | | Distributions for annual periods determined in accordance with federal income tax regulations. |
| | 3 | | Amount is greater than $(0.005) per share. |
| | 4 | | Where applicable, assumes the reinvestment of distributions. |
| | 5 | | Includes the LifePath Fund’s share of its corresponding LifePath Master Portfolio’s allocated net expenses and/or net investment income. |
| | 6 | | Includes the LifePath Fund’s share of the LifePath Master Portfolio’s allocated fees waived of 0.48%, 0.49%, 0.52%, 0.82% and 2.71% for the years ended December 31, 2015, December 31, 2014, December 31, 2013, December 31, 2012 and December 31, 2011, respectively. |
| | 7 | | Includes the LifePath Fund’s share of the LifePath Master Portfolio’s allocated expenses and/or net investment income. Excludes expenses incurred indirectly as a result of the LifePath Master Portfolio’s investments in underlying funds as follows: |
| | | | | | | | | | | | | | | | | | | | |
| | | Year Ended December 31, | |
| | | 2015 | | | 2014 | | | 2013 | | | 2012 | | | 2011 | |
| | | | |
Investments in underlying funds | | | 0.18% | | | | 0.16% | | | | 0.11% | | | | 0.11% | | | | 0.16% | |
| | | | |
| | 8 | | Includes the LifePath Master Portfolio’s purchases and sales of the underlying funds and Active Stock Master Portfolio, CoreAlpha Bond Master Portfolio, International Tilts Master Portfolio, Large Cap Index Master Portfolio and Master Small Cap Index Series. |
| | 9 | | Includes the LifePath Master Portfolio’s purchases and sales of the underlying funds and Active Stock Master Portfolio, CoreAlpha Bond Master Portfolio, International Tilts Master Portfolio, Large Cap Index Master Portfolio, Master Small Cap Index Series and Total International ex U.S. Index Master Portfolio. |
| | 10 | | Excludes the LifePath Master Portfolio’s purchases and sales of the Active Stock Master Portfolio, CoreAlpha Bond Master Portfolio, Master Small Cap Index Series and Total International ex U.S. Index Master Portfolio. If these transactions had been included to conform to the current year presentation, the portfolio turnover rate would have been 15% and 71% for the years ended December 31, 2012 and December 31, 2011, respectively. |
| | | | | | |
| See Notes to Financial Statements. | | | | |
| | | | | | | |
| | BLACKROCK FUNDS III | | DECEMBER 31, 2015 | | 35 |
| | |
| Financial Highlights | | BlackRock LifePath 2055 Fund |
| | | | | | | | | | | | | | | | | | | | |
| | | Institutional | |
| | | Year Ended December 31, | |
| | | 2015 | | | 2014 | | | 2013 | | | 2012 | | | 2011 | |
| | | | | | | | | | | | | | | | | | | | |
| Per Share Operating Performance | | | | | | | | | | | | | | | | | | | | |
Net asset value, beginning of year | | $ | 14.33 | | | $ | 14.64 | | | $ | 12.74 | | | $ | 11.13 | | | $ | 11.85 | |
| | | | |
Net investment income1 | | | 0.22 | | | | 0.23 | | | | 0.30 | | | | 0.27 | | | | 0.23 | |
Net realized and unrealized gain (loss) | | | (0.57 | ) | | | 0.63 | | | | 2.36 | | | | 1.56 | | | | (0.70 | ) |
| | | | |
Net increase (decrease) from investment operations | | | (0.35 | ) | | | 0.86 | | | | 2.66 | | | | 1.83 | | | | (0.47 | ) |
| | | | |
| Distributions:2 | | | | | | | | | | | | | | | | | | | | |
From net investment income | | | (0.21 | ) | | | (0.23 | ) | | | (0.26 | ) | | | (0.21 | ) | | | (0.16 | ) |
From net realized gain | | | (0.31 | ) | | | (0.94 | ) | | | (0.50 | ) | | | (0.01 | ) | | | (0.09 | ) |
| | | | |
Total distributions | | | (0.52 | ) | | | (1.17 | ) | | | (0.76 | ) | | | (0.22 | ) | | | (0.25 | ) |
| | | | |
Net asset value, end of year | | $ | 13.46 | | | $ | 14.33 | | | $ | 14.64 | | | $ | 12.74 | | | $ | 11.13 | |
| | | | |
| | | | | | | | | | | | | | | | | | | | |
| Total Return3 | | | | | | | | | | | | | | | | | | | | |
Based on net asset value | | | (2.52)% | | | | 5.90% | | | | 20.99% | | | | 16.46% | | | | (4.02)% | |
| | | | |
| | | | | | | | | | | | | | | | | | | | |
| Ratios to Average Net Assets4,5,6 | | | | | | | | | | | | | | | | | | | | |
Total expenses | | | 0.79% | | | | 0.82% | | | | 1.05% | | | | 2.00% | | | | 9.82% | |
| | | | |
Total expenses after fees waived and/or reimbursed | | | 0.66% | | | | 0.67% | | | | 0.74% | | | | 0.75% | | | | 0.69% | |
| | | | |
Net investment income | | | 1.53% | | | | 1.54% | | | | 2.11% | | | | 2.17% | | | | 1.94% | |
| | | | |
| | | | | | | | | | | | | | | | | | | | |
| Supplemental Data | | | | | | | | | | | | | | | | | | | | |
Net assets, end of year (000) | | $ | 7,381 | | | $ | 6,773 | | | $ | 4,546 | | | $ | 1,981 | | | $ | 164 | |
| | | | |
Portfolio turnover rate of the LifePath Master Portfolio | | | 49% | 7 | | | 48% | 8 | | | 67% | 8 | | | 7% | 9 | | | 51% | 9 |
| | | | |
| | 1 | | Based on average shares outstanding. |
| | 2 | | Distributions for annual periods determined in accordance with federal income tax regulations. |
| | 3 | | Where applicable, assumes the reinvestment of distributions. |
| | 4 | | Includes the LifePath Fund’s share of its corresponding LifePath Master Portfolio’s allocated net expenses and/or net investment income. |
| | 5 | | Includes the LifePath Fund’s share of the LifePath Master Portfolio’s allocated fees waived of 0.62%, 0.66%, 0.83%, 2.22% and 15.11% for the years ended December 31, 2015, December 31, 2014, December 31, 2013, December 31, 2012 and December 31, 2011, respectively. |
| | 6 | | Includes the LifePath Fund’s share of the LifePath Master Portfolio’s allocated expenses and/or net investment income. Excludes expenses incurred indirectly as a result of the LifePath Master Portfolio’s investments in underlying funds as follows: |
| | | | | | | | | | | | | | | | | | | | |
| | | Year Ended December 31, | |
| | | 2015 | | | 2014 | | | 2013 | | | 2012 | | | 2011 | |
| | | | |
Investments in underlying funds | | | 0.18% | | | | 0.18% | | | | 0.12% | | | | 0.11% | | | | 0.17% | |
| | | | |
| | 7 | | Includes the LifePath Master Portfolio’s purchases and sales of the underlying funds and Active Stock Master Portfolio, CoreAlpha Bond Master Portfolio, International Tilts Master Portfolio, Large Cap Index Master Portfolio and Master Small Cap Index Series. |
| | 8 | | Includes the LifePath Master Portfolio’s purchases and sales of the underlying funds and Active Stock Master Portfolio, CoreAlpha Bond Master Portfolio, International Tilts Master Portfolio, Large Cap Index Master Portfolio, Master Small Cap Index Series and Total International ex U.S. Index Master Portfolio. |
| | 9 | | Excludes the LifePath Master Portfolio’s purchases and sales of the Active Stock Master Portfolio, CoreAlpha Bond Master Portfolio, Master Small Cap Index Series and Total International ex U.S. Index Master Portfolio. If these transactions had been included to conform to the current year presentation, the portfolio turnover rate would have been 27% and 95% for the years ended December 31, 2012 and December 31, 2011, respectively. |
| | | | | | |
| See Notes to Financial Statements. | | | | |
| | | | | | | |
| 36 | | BLACKROCK FUNDS III | | DECEMBER 31, 2015 | | |
| | |
| Financial Highlights (continued) | | BlackRock LifePath 2055 Fund |
| | | | | | | | | | | | | | | | | | | | |
| | | Investor A | |
| | | Year Ended December 31, | |
| | | 2015 | | | 2014 | | | 2013 | | | 2012 | | | 2011 | |
| | | | | | | | | | | | | | | | | | | | |
| Per Share Operating Performance | | | | | | | | | | | | | | | | | | | | |
Net asset value, beginning of year | | $ | 14.30 | | | $ | 14.62 | | | $ | 12.73 | | | $ | 11.13 | | | $ | 11.85 | |
| | | | |
Net investment income1 | | | 0.19 | | | | 0.20 | | | | 0.28 | | | | 0.23 | | | | 0.16 | |
Net realized and unrealized gain (loss) | | | (0.56 | ) | | | 0.62 | | | | 2.34 | | | | 1.56 | | | | (0.67 | ) |
| | | | |
Net increase (decrease) from investment operations | | | (0.37 | ) | | | 0.82 | | | | 2.62 | | | | 1.79 | | | | (0.51 | ) |
| | | | |
| Distributions:2 | | | | | | | | | | | | | | | | | | | | |
From net investment income | | | (0.18 | ) | | | (0.20 | ) | | | (0.23 | ) | | | (0.18 | ) | | | (0.12 | ) |
From net realized gain | | | (0.31 | ) | | | (0.94 | ) | | | (0.50 | ) | | | (0.01 | ) | | | (0.09 | ) |
| | | | |
Total distributions | | | (0.49 | ) | | | (1.14 | ) | | | (0.73 | ) | | | (0.19 | ) | | | (0.21 | ) |
| | | | |
Net asset value, end of year | | $ | 13.44 | | | $ | 14.30 | | | $ | 14.62 | | | $ | 12.73 | | | $ | 11.13 | |
| | | | |
| | | | | | | | | | | | | | | | | | | | |
| Total Return3 | | | | | | | | | | | | | | | | | | | | |
Based on net asset value | | | (2.67)% | | | | 5.60% | | | | 20.71% | | | | 16.09% | | | | (4.35)% | |
| | | | |
| | | | | | | | | | | | | | | | | | | | |
| Ratios to Average Net Assets4,5,6 | | | | | | | | | | | | | | | | | | | | |
Total expenses | | | 1.04% | | | | 1.08% | | | | 1.30% | | | | 2.29% | | | | 8.94% | |
| | | | |
Total expenses after fees waived and/or reimbursed | | | 0.91% | | | | 0.92% | | | | 0.99% | | | | 1.00% | | | | 0.94% | |
| | | | |
Net investment income | | | 1.30% | | | | 1.32% | | | | 1.98% | | | | 1.88% | | | | 1.43% | |
| | | | |
| | | | | | | | | | | | | | | | | | | | |
| Supplemental Data | | | | | | | | | | | | | | | | | | | | |
Net assets, end of year (000) | | $ | 7,561 | | | $ | 5,543 | | | $ | 3,951 | | | $ | 1,043 | | | $ | 163 | |
| | | | |
Portfolio turnover rate of the LifePath Master Portfolio | | | 49% | 7 | | | 48% | 8 | | | 67% | 8 | | | 7% | 9 | | | 51% | 9 |
| | | | |
| | 1 | | Based on average shares outstanding. |
| | 2 | | Distributions for annual periods determined in accordance with federal income tax regulations. |
| | 3 | | Where applicable, excludes the effects of any sales charges and assumes the reinvestment of distributions. |
| | 4 | | Includes the LifePath Fund’s share of its corresponding LifePath Master Portfolio’s allocated net expenses and/or net investment income. |
| | 5 | | Includes the LifePath Fund’s share of the LifePath Master Portfolio’s allocated fees waived of 0.62%, 0.66%, 0.82%, 2.28% and 12.56% for the years ended December 31, 2015, December 31, 2014, December 31, 2013, December 31, 2012 and December 31, 2011, respectively. |
| | 6 | | Includes the LifePath Fund’s share of the LifePath Master Portfolio’s allocated expenses and/or net investment income. Excludes expenses incurred indirectly as a result of the LifePath Master Portfolio’s investments in underlying funds as follows: |
| | | | | | | | | | | | | | | | | | | | |
| | | Year Ended December 31, | |
| | | 2015 | | | 2014 | | | 2013 | | | 2012 | | | 2011 | |
| | | | |
Investments in underlying funds | | | 0.18% | | | | 0.18% | | | | 0.12% | | | | 0.11% | | | | 0.17% | |
| | | | |
| | 7 | | Includes the LifePath Master Portfolio’s purchases and sales of the underlying funds and Active Stock Master Portfolio, CoreAlpha Bond Master Portfolio, International Tilts Master Portfolio, Large Cap Index Master Portfolio and Master Small Cap Index Series. |
| | 8 | | Includes the LifePath Master Portfolio’s purchases and sales of the underlying funds and Active Stock Master Portfolio, CoreAlpha Bond Master Portfolio, International Tilts Master Portfolio, Large Cap Index Master Portfolio, Master Small Cap Index Series and Total International ex U.S. Index Master Portfolio. |
| | 9 | | Excludes the LifePath Master Portfolio’s purchases and sales of the Active Stock Master Portfolio, CoreAlpha Bond Master Portfolio, Master Small Cap Index Series and Total International ex U.S. Index Master Portfolio. If these transactions had been included to conform to the current year presentation, the portfolio turnover rate would have been 27% and 95% for the years ended December 31, 2012 and December 31, 2011, respectively. |
| | | | | | |
| See Notes to Financial Statements. | | | | |
| | | | | | | |
| | BLACKROCK FUNDS III | | DECEMBER 31, 2015 | | 37 |
| | |
| Financial Highlights (continued) | | BlackRock LifePath 2055 Fund |
| | | | | | | | | | | | | | | | | | | | |
| | | Investor C | |
| | | Year Ended December 31, | |
| | | 2015 | | | 2014 | | | 2013 | | | 2012 | | | 2011 | |
| | | | | | | | | | | | | | | | | | | | |
| Per Share Operating Performance | | | | | | | | | | | | | | | | | | | | |
Net asset value, beginning of year | | $ | 14.18 | | | $ | 14.51 | | | $ | 12.64 | | | $ | 11.06 | | | $ | 11.82 | |
| | | | |
Net investment income1 | | | 0.08 | | | | 0.08 | | | | 0.15 | | | | 0.13 | | | | 0.10 | |
Net realized and unrealized gain (loss) | | | (0.56 | ) | | | 0.62 | | | | 2.35 | | | | 1.56 | | | | (0.69 | ) |
| | | | |
Net increase (decrease) from investment operations | | | (0.48 | ) | | | 0.70 | | | | 2.50 | | | | 1.69 | | | | (0.59 | ) |
| | | | |
| Distributions:2 | | | | | | | | | | | | | | | | | | | | |
From net investment income | | | (0.08 | ) | | | (0.09 | ) | | | (0.13 | ) | | | (0.10 | ) | | | (0.08 | ) |
From net realized gain | | | (0.31 | ) | | | (0.94 | ) | | | (0.50 | ) | | | (0.01 | ) | | | (0.09 | ) |
| | | | |
Total distributions | | | (0.39 | ) | | | (1.03 | ) | | | (0.63 | ) | | | (0.11 | ) | | | (0.17 | ) |
| | | | |
Net asset value, end of year | | $ | 13.31 | | | $ | 14.18 | | | $ | 14.51 | | | $ | 12.64 | | | $ | 11.06 | |
| | | | |
| | | | | | | | | | | | | | | | | | | | |
| Total Return3 | | | | | | | | | | | | | | | | | | | | |
Based on net asset value | | | (3.48)% | | | | 4.85% | | | | 19.81% | | | | 15.27% | | | | (5.01)% | |
| | | | |
| | | | | | | | | | | | | | | | | | | | |
| Ratios to Average Net Assets4,5,6 | | | | | | | | | | | | | | | | | | | | |
Total expenses | | | 1.80% | | | | 1.83% | | | | 2.06% | | | | 3.12% | | | | 11.00% | |
| | | | |
Total expenses after fees waived and/or reimbursed | | | 1.67% | | | | 1.67% | | | | 1.75% | | | | 1.75% | | | | 1.69% | |
| | | | |
Net investment income | | | 0.54% | | | | 0.56% | | | | 1.07% | | | | 1.05% | | | | 0.88% | |
| | | | |
| | | | | | | | | | | | | | | | | | | | |
| Supplemental Data | | | | | | | | | | | | | | | | | | | | |
Net assets, end of year (000) | | $ | 543 | | | $ | 528 | | | $ | 313 | | | $ | 231 | | | $ | 109 | |
| | | | |
Portfolio turnover rate of the LifePath Master Portfolio | | | 49% | 7 | | | 48% | 8 | | | 67% | 8 | | | 7% | 9 | | | 51% | 9 |
| | | | |
| | 1 | | Based on average shares outstanding. |
| | 2 | | Distributions for annual periods determined in accordance with federal income tax regulations. |
| | 3 | | Where applicable, excludes the effects of any sales charges and assumes the reinvestment of distributions. |
| | 4 | | Includes the LifePath Fund’s share of its corresponding LifePath Master Portfolio’s allocated net expenses and/or net investment income. |
| | 5 | | Includes the LifePath Fund’s share of the LifePath Master Portfolio’s allocated fees waived of 0.62%, 0.66%, 0.83%, 2.42% and 14.29% for the years ended December 31, 2015, December 31, 2014, December 31, 2013, December 31, 2012 and December 31, 2011, respectively. |
| | 6 | | Includes the LifePath Fund’s share of the LifePath Master Portfolio’s allocated expenses and/or net investment income. Excludes expenses incurred indirectly as a result of the LifePath Master Portfolio’s investments in underlying funds as follows: |
| | | | | | | | | | | | | | | | | | | | |
| | | Year Ended December 31, | |
| | | 2015 | | | 2014 | | | 2013 | | | 2012 | | | 2011 | |
| | | | |
Investments in underlying funds | | | 0.18% | | | | 0.18% | | | | 0.12% | | | | 0.11% | | | | 0.17% | |
| | | | |
| | 7 | | Includes the LifePath Master Portfolio’s purchases and sales of the underlying funds and Active Stock Master Portfolio, CoreAlpha Bond Master Portfolio, International Tilts Master Portfolio, Large Cap Index Master Portfolio and Master Small Cap Index Series. |
| | 8 | | Includes the LifePath Master Portfolio’s purchases and sales of the underlying funds and Active Stock Master Portfolio, CoreAlpha Bond Master Portfolio, International Tilts Master Portfolio, Large Cap Index Master Portfolio, Master Small Cap Index Series and Total International ex U.S. Index Master Portfolio. |
| | 9 | | Excludes the LifePath Master Portfolio’s purchases and sales of the Active Stock Master Portfolio, CoreAlpha Bond Master Portfolio, Master Small Cap Index Series and Total International ex U.S. Index Master Portfolio. If these transactions had been included to conform to the current year presentation, the portfolio turnover rate would have been 27% and 95% for the years ended December 31, 2012 and December 31, 2011, respectively. |
| | | | | | |
| See Notes to Financial Statements. | | | | |
| | | | | | | |
| 38 | | BLACKROCK FUNDS III | | DECEMBER 31, 2015 | | |
| | |
| Financial Highlights (continued) | | BlackRock LifePath 2055 Fund |
| | | | | | | | | | | | | | | | | | | | |
| | | Class K | |
| | | Year Ended December 31, | |
| | | 2015 | | | 2014 | | | 2013 | | | 2012 | | | 2011 | |
| | | | | | | | | | | | | | | | | | | | |
| Per Share Operating Performance | | | | | | | | | | | | | | | | | | | | |
Net asset value, beginning of year | | $ | 14.49 | | | $ | 14.77 | | | $ | 12.77 | | | $ | 11.15 | | | $ | 11.86 | |
| | | | |
Net investment income1 | | | 0.28 | | | | 0.30 | | | | 0.22 | | | | 0.35 | | | | 0.23 | |
Net realized and unrealized gain (loss) | | | (0.58 | ) | | | 0.62 | | | | 2.54 | | | | 1.52 | | | | (0.66 | ) |
| | | | |
Net increase (decrease) from investment operations | | | (0.30 | ) | | | 0.92 | | | | 2.76 | | | | 1.87 | | | | (0.43 | ) |
| | | | |
| Distributions:2 | | | | | | | | | | | | | | | | | | | | |
From net investment income | | | (0.26 | ) | | | (0.26 | ) | | | (0.26 | ) | | | (0.24 | ) | | | (0.19 | ) |
From net realized gain | | | (0.31 | ) | | | (0.94 | ) | | | (0.50 | ) | | | (0.01 | ) | | | (0.09 | ) |
| | | | |
Total distributions | | | (0.57 | ) | | | (1.20 | ) | | | (0.76 | ) | | | (0.25 | ) | | | (0.28 | ) |
| | | | |
Net asset value, end of year | | $ | 13.62 | | | $ | 14.49 | | | $ | 14.77 | | | $ | 12.77 | | | $ | 11.15 | |
| | | | |
| | | | | | | | | | | | | | | | | | | | |
| Total Return3 | | | | | | | | | | | | | | | | | | | | |
Based on net asset value | | | (2.15)% | | | | 6.26% | | | | 21.74% | | | | 16.83% | | | | (3.71)% | |
| | | | |
| | | | | | | | | | | | | | | | | | | | |
| Ratios to Average Net Assets4,5,6 | | | | | | | | | | | | | | | | | | | | |
Total expenses | | | 0.46% | | | | 0.46% | | | | 0.75% | | | | 1.27% | | | | 9.68% | |
| | | | |
Total expenses after fees waived and/or reimbursed | | | 0.32% | | | | 0.32% | | | | 0.38% | | | | 0.40% | | | | 0.33% | |
| | | | |
Net investment income | | | 1.97% | | | | 1.93% | | | | 1.61% | | | | 2.80% | | | | 1.99% | |
| | | | |
| | | | | | | | | | | | | | | | | | | | |
| Supplemental Data | | | | | | | | | | | | | | | | | | | | |
Net assets, end of year (000) | | $ | 52 | | | $ | 29 | | | $ | 30 | | | $ | 448 | | | $ | 22 | |
| | | | |
Portfolio turnover rate of the LifePath Master Portfolio | | | 49% | 7 | | | 48% | 8 | | | 67% | 8 | | | 7% | 9 | | | 51% | 9 |
| | | | |
| | 1 | | Based on average shares outstanding. |
| | 2 | | Distributions for annual periods determined in accordance with federal income tax regulations. |
| | 3 | | Where applicable, assumes the reinvestment of distributions. |
| | 4 | | Includes the LifePath Fund’s share of its corresponding LifePath Master Portfolio’s allocated net expenses and/or net investment income. |
| | 5 | | Includes the LifePath Fund’s share of the LifePath Master Portfolio’s allocated fees waived of 0.63%, 0.65%, 0.95%, 1.71% and 16.23% for the years ended December 31, 2015, December 31, 2014, December 31, 2013, December 31, 2012 and December 31, 2011, respectively. |
| | 6 | | Includes the LifePath Fund’s share of the LifePath Master Portfolio’s allocated expenses and/or net investment income. Excludes expenses incurred indirectly as a result of the LifePath Master Portfolio’s investments in underlying funds as follows: |
| | | | | | | | | | | | | | | | | | | | |
| | | Year Ended December 31, | |
| | | 2015 | | | 2014 | | | 2013 | | | 2012 | | | 2011 | |
| | | | |
Investments in underlying funds | | | 0.18% | | | | 0.18% | | | | 0.12% | | | | 0.11% | | | | 0.17% | |
| | | | |
| | 7 | | Includes the LifePath Master Portfolio’s purchases and sales of the underlying funds and Active Stock Master Portfolio, CoreAlpha Bond Master Portfolio, International Tilts Master Portfolio, Large Cap Index Master Portfolio and Master Small Cap Index Series. |
| | 8 | | Includes the LifePath Master Portfolio’s purchases and sales of the underlying funds and Active Stock Master Portfolio, CoreAlpha Bond Master Portfolio, International Tilts Master Portfolio, Large Cap Index Master Portfolio, Master Small Cap Index Series and Total International ex U.S. Index Master Portfolio. |
| | 9 | | Excludes the LifePath Master Portfolio’s purchases and sales of the Active Stock Master Portfolio, CoreAlpha Bond Master Portfolio, Master Small Cap Index Series and Total International ex U.S. Index Master Portfolio. If these transactions had been included to conform to the current year presentation, the portfolio turnover rate would have been 27% and 95% for the years ended December 31, 2012 and December 31, 2011, respectively. |
| | | | | | |
| See Notes to Financial Statements. | | | | |
| | | | | | | |
| | BLACKROCK FUNDS III | | DECEMBER 31, 2015 | | 39 |
| | |
| Financial Highlights (concluded) | | BlackRock LifePath 2055 Fund |
| | | | | | | | | | | | | | | | | | | | |
| | | Class R | |
| | | Year Ended December 31, | |
| | | 2015 | | | 2014 | | | 2013 | | | 2012 | | | 2011 | |
| | | | | | | | | | | | | | | | | | | | |
| Per Share Operating Performance | | | | | | | | | | | | | | | | | | | | |
Net asset value, beginning of year | | $ | 14.32 | | | $ | 14.62 | | | $ | 12.72 | | | $ | 11.12 | | | $ | 11.84 | |
| | | | |
Net investment income1 | | | 0.15 | | | | 0.15 | | | | 0.22 | | | | 0.19 | | | | 0.13 | |
Net realized and unrealized gain (loss) | | | (0.57 | ) | | | 0.63 | | | | 2.37 | | | | 1.56 | | | | (0.66 | ) |
| | | | |
Net increase (decrease) from investment operations | | | (0.42 | ) | | | 0.78 | | | | 2.59 | | | | 1.75 | | | | (0.53 | ) |
| | | | |
| Distributions:2 | | | | | | | | | | | | | | | | | | | | |
From net investment income | | | (0.15 | ) | | | (0.14 | ) | | | (0.19 | ) | | | (0.14 | ) | | | (0.10 | ) |
From net realized gain | | | (0.31 | ) | | | (0.94 | ) | | | (0.50 | ) | | | (0.01 | ) | | | (0.09 | ) |
| | | | |
Total distributions | | | (0.46 | ) | | | (1.08 | ) | | | (0.69 | ) | | | (0.15 | ) | | | (0.19 | ) |
| | | | |
Net asset value, end of year | | $ | 13.44 | | | $ | 14.32 | | | $ | 14.62 | | | $ | 12.72 | | | $ | 11.12 | |
| | | | |
| | | | | | | | | | | | | | | | | | | | |
| Total Return3 | | | | | | | | | | | | | | | | | | | | |
Based on net asset value | | | (3.00)% | | | | 5.37% | | | | 20.44% | | | | 15.75% | | | | (4.54)% | |
| | | | |
| | | | | | | | | | | | | | | | | | | | |
| Ratios to Average Net Assets4,5,6 | | | | | | | | | | | | | | | | | | | | |
Total expenses | | | 1.29% | | | | 1.32% | | | | 1.56% | | | | 2.75% | | | | 10.53% | |
| | | | |
Total expenses after fees waived and/or reimbursed | | | 1.15% | | | | 1.17% | | | | 1.25% | | | | 1.25% | | | | 1.18% | |
| | | | |
Net investment income | | | 1.07% | | | | 0.98% | | | | 1.58% | | | | 1.53% | | | | 1.14% | |
| | | | |
| | | | | | | | | | | | | | | | | | | | |
| Supplemental Data | | | | | | | | | | | | | | | | | | | | |
Net assets, end of year (000) | | $ | 292 | | | $ | 118 | | | $ | 106 | | | $ | 59 | | | $ | 22 | |
| | | | |
Portfolio turnover rate of the LifePath Master Portfolio | | | 49% | 7 | | | 48% | 8 | | | 67% | 8 | | | 7% | 9 | | | 51% | 9 |
| | | | |
| | 1 | | Based on average shares outstanding. |
| | 2 | | Distributions for annual periods determined in accordance with federal income tax regulations. |
| | 3 | | Where applicable, assumes the reinvestment of distributions. |
| | 4 | | Includes the LifePath Fund’s share of its corresponding LifePath Master Portfolio’s allocated net expenses and/or net investment income. |
| | 5 | | Includes the LifePath Fund’s share of the LifePath Master Portfolio’s allocated fees waived of 0.62%, 0.65%, 0.84%, 2.60% and 16.23% for the years ended December 31, 2015, December 31, 2014, December 31, 2013, December 31, 2012 and December 31, 2011, respectively. |
| | 6 | | Includes the LifePath Fund’s share of the LifePath Master Portfolio’s allocated expenses and/or net investment income. Excludes expenses incurred indirectly as a result of the LifePath Master Portfolio’s investments in underlying funds as follows: |
| | | | | | | | | | | | | | | | | | | | |
| | | Year Ended December 31, | |
| | | 2015 | | | 2014 | | | 2013 | | | 2012 | | | 2011 | |
| | | | |
Investments in underlying funds | | | 0.18% | | | | 0.18% | | | | 0.12% | | | | 0.11% | | | | 0.17% | |
| | | | |
| | 7 | | Includes the LifePath Master Portfolio’s purchases and sales of the underlying funds and Active Stock Master Portfolio, CoreAlpha Bond Master Portfolio, International Tilts Master Portfolio, Large Cap Index Master Portfolio and Master Small Cap Index Series. |
| | 8 | | Includes the LifePath Master Portfolio’s purchases and sales of the underlying funds and Active Stock Master Portfolio, CoreAlpha Bond Master Portfolio, International Tilts Master Portfolio, Large Cap Index Master Portfolio, Master Small Cap Index Series and Total International ex U.S. Index Master Portfolio. |
| | 9 | | Excludes the LifePath Master Portfolio’s purchases and sales of the Active Stock Master Portfolio, CoreAlpha Bond Master Portfolio, Master Small Cap Index Series and Total International ex U.S. Index Master Portfolio. If these transactions had been included to conform to the current year presentation, the portfolio turnover rate would have been 27% and 95% for the years ended December 31, 2012 and December 31, 2011, respectively. |
| | | | | | |
| See Notes to Financial Statements. | | | | |
| | | | | | | |
| 40 | | BLACKROCK FUNDS III | | DECEMBER 31, 2015 | | |
| | |
| Notes to Financial Statements | | |
1. Organization:
Blackrock Funds III (the “Trust”) is registered under the Investment Company Act of 1940, as amended (the “1940 Act”), an open-end management investment company. The Trust is organized as a Delaware statutory trust. The following series of the Trust are referred to herein collectively as the “LifePath Funds” or individually, as a “LifePath Fund”:
| | | | | | |
| Fund Name | | Herein Referred To As | | Diversification
Classification | |
BlackRock LifePath® 2025 Fund | | LifePath 2025 Fund | | | Diversified | |
BlackRock LifePath® 2035 Fund | | LifePath 2035 Fund | | | Diversified | |
BlackRock LifePath® 2045 Fund | | LifePath 2045 Fund | | | Diversified | |
BlackRock LifePath® 2055 Fund | | LifePath 2055 Fund | | | Diversified | |
Each LifePath Fund seeks to achieve its investment objective by investing all of its assets in a corresponding series of the Master Investment Portfolio (“MIP”): LifePath® 2025 Master Portfolio, LifePath® 2035 Master Portfolio, LifePath® 2045 Master Portfolio and LifePath® 2055 Master Portfolio (each, a “LifePath Master Portfolio” and together, the “LifePath Master Portfolios”). MIP is an affiliate of the Trust. Each LifePath Master Portfolio has the same investment objective and strategies as its corresponding LifePath Fund. The value of each LifePath Fund’s investment in its corresponding LifePath Master Portfolio reflects the LifePath Fund’s proportionate interest in the net assets of the LifePath Master Portfolio. The performance of each LifePath Fund is directly affected by the performance of the corresponding LifePath Master Portfolio. At December 31, 2015, the percentage of the LifePath Master Portfolio owned by the corresponding LifePath Fund was 100.0%, for each LifePath 2025 Fund, LifePath 2035 Fund, LifePath 2045 Fund and 99.9% for LifePath 2055 Fund, respectively. As such, the financial statements of each corresponding LifePath Master Portfolio, including the Schedule of Investments, are included elsewhere in this report and should be read in conjunction with the LifePath Funds’ financial statements.
Each LifePath Fund offers multiple classes of shares. Institutional and Class K Shares are sold only to certain eligible investors. Investor A and Investor C Shares are generally available through financial intermediaries. Class R Shares are available only to certain employer-sponsored retirement plans. Each class has exclusive voting rights with respect to matters relating to its shareholder servicing and distribution expenditures. All classes of shares have identical voting, dividend, liquidation and other rights and are subject to the same terms and conditions, except that certain classes bear expenses related to the shareholder servicing and distribution of such shares.
| | | | | | | | | | | | |
| Share Class | | Initial Sales Charge | | | CDSC | | | Conversion Privilege | |
Institutional, Class K and Class R | | | No | | | | No | | | | None | |
Investor A | | | Yes | | | | No | 1 | | | None | |
Investor C | | | No | | | | Yes | | | | None | |
| | 1 | | Investor A Shares may be subject to a CDSC for certain redemptions where no initial sales charge was paid at the time of purchase. |
The LifePath Funds, together with certain other registered investment companies advised by BlackRock Fund Advisors (“BFA” or the “Manager”) or its affiliates, are included in a complex of open end funds referred to as the Equity-Liquidity Complex.
2. Significant Accounting Policies:
The financial statements are prepared in conformity with accounting principles generally accepted in the United States of America (“U.S. GAAP”), which may require management to make estimates and assumptions that affect the reported amounts of assets and liabilities in the financial statements, disclosure of contingent assets and liabilities at the date of the financial statements and the reported amounts of increases and decreases in net assets from operations during the reporting period. Actual results could differ from those estimates. Each LifePath Fund is considered an investment company under U.S. GAAP and follows the accounting and reporting guidance applicable to investment companies. Below is a summary of significant accounting policies:
Investment Transactions and Investment Income: For financial reporting purposes, contributions to and withdrawals from each LifePath Master Portfolio are accounted on a trade date basis. Each LifePath Fund records daily its proportionate share of its LifePath Master Portfolio’s income, expenses and realized and unrealized gains and losses. Realized and unrealized gains and losses are adjusted utilizing partnership tax allocation rules. In addition, each LifePath Fund accrues its own expenses. Income, expenses and realized and unrealized gains and losses are allocated daily to each class based on its relative net assets.
In-Kind Redemptions: The LifePath Master Portfolios satisfied certain redemptions in investors’ capital through an in-kind redemption of securities and cash. For financial reporting purposes, these transactions were treated as a sale of securities and the resulting gains and losses were recognized at the LifePath Master Portfolios based on the market value of the securities on the date of the redemption. For the year ended December 31, 2015, the LifePath Funds were allocated realized gain from the in-kind redemptions. For tax purposes, no gains or losses were recognized. Gains and losses resulting from such in-kind redemptions, which are included in the Statements of Operations were as follows:
| | | | | | | | | | | | |
LifePath 2025 Fund | | LifePath 2035
Fund | | | LifePath 2045
Fund | | | LifePath 2055
Fund | |
$1,722,499 | | $ | 1,722,851 | | | $ | 1,130,592 | | | $ | 481,283 | |
Distributions: Distributions from net investment income are declared and paid quarterly. Distributions of capital gains are recorded on the ex-dividend date. The portion of distributions, if any, that exceeds a LifePath Fund’s current and accumulated earnings and profits, as measured on a tax basis, constitute a non-taxable return of capital. The character and timing of distributions are determined in accordance with federal income tax regulations, which may differ from U.S. GAAP.
| | | | | | |
| | | | | | | |
| | BLACKROCK FUNDS III | | DECEMBER 31, 2015 | | 41 |
| | | | |
| Notes to Financial Statements (continued) | | |
Indemnifications: In the normal course of business, a LifePath Fund enters into contracts that contain a variety of representations that provide general indemnification. A LifePath Fund’s maximum exposure under these arrangements is unknown because it involves future potential claims against a LifePath Fund, which cannot be predicted with any certainty.
Other: Expenses directly related to a LifePath Fund or its classes are charged to that LifePath Fund or the applicable class. Other operating expenses shared by several funds, including other funds managed by the Manager, are prorated among those funds on the basis of relative net assets or other appropriate methods. Expenses directly related to the LifePath Funds are allocated daily to each class based on its relative net assets or other appropriate methods.
3. Investment Valuation and Fair Value Measurements:
Investment Valuation Policies: The LifePath Funds’ investments are valued at fair value (also referred to as “market value” within the financial statements) as of the close of trading on the New York Stock Exchange (“NYSE”) (generally 4:00 p.m., Eastern time). U.S. GAAP defines fair value as the price the LifePath Funds would receive to sell an asset or pay to transfer a liability in an orderly transaction between market participants at the measurement date.
The LifePath Funds’ policy is to fair value its financial instruments at market value. Each LifePath Fund records its investment in the LifePath Master Portfolio at fair value based on the LifePath Fund’s proportionate interest in the net assets of the LifePath Master Portfolio. Valuation of securities held by the LifePath Master Portfolio are discussed in Note 3 of the LifePath Master Portfolio’s Notes to Financial Statements, which are included elsewhere in this report.
4. Administration Agreement and Other Transactions with Affiliates:
The PNC Financial Services Group, Inc. is the largest stockholder and an affiliate of BlackRock, Inc. (“BlackRock”) for 1940 Act purposes.
The Trust, on behalf of the LifePath Funds, entered into an Administration Agreement with BlackRock Advisors, LLC (“BAL” or the “Administrator”), which has agreed to provide general administration services (other than investment advice and related portfolio activities). BAL, in consideration thereof, has agreed to bear all of the LifePath Funds’ ordinary operating expenses, excluding, generally, investment advisory fees, distribution fees, brokerage and other expenses related to the execution of portfolio transactions, extraordinary expenses and certain other expenses which are borne by the LifePath Funds. BAL is entitled to receive for these administration services an annual fee of 0.35% based on the average daily net assets of each LifePath Fund’s Institutional and Investor A, 0.40% based on the average daily net assets of Investor C Shares, 0.30% based on the average daily net assets of Class R Shares and 0.15% based on average daily net assets of Class K Shares. Prior to November 30, 2015, the annual fees based on average daily net assets were 0.50% for each LifePath Fund’s Institutional, Investor A, Investor C and Class R Shares. The fee for Class K shares remains unchanged.
From time to time, BAL may waive such fees in whole or in part. Any such waiver will reduce the expenses of the LifePath Funds and, accordingly, have a favorable impact on their performance. BAL may delegate certain of its administration duties to sub-administrators.
The fees and expenses of the Trust’s trustees who are not “interested persons” of the Trust, as defined in the 1940 Act (“Independent Trustees”), counsel to the Independent Trustees and the Trust’s independent registered public accounting firm (together, the “independent expenses”) are paid directly by the LifePath Funds. BAL has contractually agreed to provide an offsetting credit against the administration fees paid by the LifePath Funds in an amount equal to the independent expenses through April 30, 2026. These amounts are included in fees waived by the administrator in the Statements of Operations.
The Trust, on behalf of the LifePath Funds, entered into a Distribution Agreement and a Distribution and Service Plan with BlackRock Investments, LLC (“BRIL”), an affiliate of the Administrator. Pursuant to the Distribution and Service Plan and in accordance with Rule 12b-1 under the 1940 Act, each LifePath Fund pays BRIL ongoing distribution fees. The fees are accrued daily and paid monthly at annual rates based upon the average daily net assets of the relevant share class of each LifePath Fund as follows:
| | | | | | | | |
| | | Service Fee | | | Distribution Fee | |
Investor A | | | 0.25% | | | | — | |
Investor C | | | 0.25% | | | | 0.75% | |
Class R | | | 0.25% | | | | 0.25% | |
Pursuant to sub-agreements with BRIL, broker-dealers and BRIL provide shareholder servicing and distribution services to the LifePath Funds. The ongoing service and/or distribution fee compensates BRIL and each broker-dealer for providing shareholder servicing and/or distribution related services to the shareholders.
For the year ended December 31, 2015 affiliates earned underwriting discounts, direct commissions and dealer concessions on sales of the LifePath Funds’ Investor A Shares as follows:
| | | | | | | | | | | | | | | | |
| | | LifePath 2025
Fund | | | LifePath 2035
Fund | | | LifePath 2045
Fund | | | LifePath 2055
Fund | |
Investor A | | $ | 453 | | | $ | 1,297 | | | $ | 530 | | | $ | 241 | |
| | | | | | |
| | | | | | | |
| 42 | | BLACKROCK FUNDS III | | DECEMBER 31, 2015 | | |
| | |
| Notes to Financial Statements (continued) | | |
For the year ended December 31, 2015, affiliates received CDSCs as follows:
| | | | | | | | | | | | | | | | |
| | | LifePath 2025
Fund | | | LifePath 2035
Fund | | | LifePath 2045
Fund | | | LifePath 2045
Fund | |
Investor C | | $ | 18 | | | $ | 1,147 | | | $ | 472 | | | $ | 2 | |
Certain officers and/or trustees of the Trust are officers and/or directors of BlackRock or its affiliates.
5. Income Tax Information:
It is the LifePath Funds’ policy to comply with the requirements of the Internal Revenue Code of 1986, as amended, applicable to regulated investment companies, and to distribute substantially all of their taxable income to their shareholders. Therefore, no federal income tax provision is required.
Each LifePath Fund files U.S. federal and various state and local tax returns. No income tax returns are currently under examination. The statute of limitations on each LifePath Fund’s U.S. federal tax returns remains open for each of the four years ended December 31, 2015. The statutes of limitations on each LifePath Fund’s state and local tax returns may remain open for an additional year depending upon the jurisdiction.
Management has analyzed tax laws and regulations and their application to the LifePath Funds as of December 31, 2015, inclusive of the open tax return years, and does not believe there are any uncertain tax positions that require recognition of a tax liability in the LifePath Funds’ financial statements.
The tax character of distributions paid was as follows:
| | | | | | | | | | | | | | | | | | | | |
| | | | | | LifePath 2025
Fund | | | LifePath 2035
Fund | | | LifePath 2045
Fund | | | LifePath 2055
Fund | |
Ordinary Income | | | 12/31/15 | | | $ | 1,146,932 | | | $ | 924,943 | | | $ | 514,964 | | | $ | 203,965 | |
| | | 12/31/14 | | | $ | 1,673,511 | | | $ | 1,429,966 | | | $ | 821,156 | | | $ | 302,050 | |
Long-term capital gains | | | 12/31/15 | | | $ | 1,335,767 | | | $ | 1,440,613 | | | $ | 1,016,294 | | | $ | 338,027 | |
| | | 12/31/14 | | | $ | 3,041,525 | | | $ | 2,866,235 | | | $ | 1,801,214 | | | $ | 676,426 | |
Tax return of capital | | | 12/31/15 | | | $ | 60,318 | | | $ | 19,225 | | | | — | | | | — | |
| | | | | | | | | | | | | | | | | | | | |
Total | | | 12/31/15 | | | $ | 2,543,017 | | | $ | 2,384,781 | | | $ | 1,531,258 | | | $ | 541,992 | |
| | | | | | | | | | | | | | | | | | | | |
| | | 12/31/14 | | | $ | 4,715,036 | | | $ | 4,296,201 | | | $ | 2,622,370 | | | $ | 978,476 | |
| | | | | | | | | | | | | | | | | | | | |
As of period end, the tax components of accumulated net losses were as follows:
| | | | | | | | | | | | | | | | | | | | |
| | | LifePath 2025
Fund | | LifePath 2035
Fund | | | LifePath 2045
Fund | | | LifePath 2055
Fund | |
Undistributed ordinary income | | | | | — | | | | | | — | | | $ | 9,966 | | | $ | 4,461 | |
Net unrealized losses1 | | | | $ | (1,340,409 | ) | | | | $ | (1,194,123 | ) | | | (745,414 | ) | | | (302,286 | ) |
Qualified late-year losses2 | | | | | (158,480 | ) | | | | | (187,596 | ) | | | (157,916 | ) | | | (67,181 | ) |
| | | | | | | | | | | | | | | | | | | | |
Total | | | | $ | (1,498,889 | ) | | | | $ | (1,381,719 | ) | | $ | (893,364 | ) | | $ | (365,006 | ) |
| | | | | | | | | | | | | | | | | | | | |
| | 1 | | The differences between book-basis and tax-basis net unrealized losses were attributable primarily to the timing and recognition of partnership income. |
| | 2 | | The LifePath Funds have elected to defer certain qualified late-year losses and recognize such losses in the next taxable year. |
6. Capital Share Transactions:
Transactions in capital shares for each class were as follows:
| | | | | | | | | | | | | | | | | | |
| | | Year Ended
December 31, 2015 | | | | | Year Ended
December 31, 2014 | |
| LifePath 2025 Fund | | Shares | | | Amount | | | | | Shares | | | Amount | |
| Institutional | | | | | | | | | | | | | | | | | | |
Shares sold | | | 1,695,717 | | | $ | 22,026,427 | | | | | | 901,653 | | | $ | 12,046,203 | |
Shares issued in reinvestment of distributions | | | 90,453 | | | | 1,115,230 | | | | | | 141,562 | | | | 1,840,363 | |
Shares redeemed | | | (1,324,284 | ) | | | (17,169,467 | ) | | | | | (1,171,103 | ) | | | (15,610,001 | ) |
| | | | | | | | | | | | | | |
Net increase (decrease) | | | 461,886 | | | $ | 5,972,190 | | | | | | (127,888 | ) | | $ | (1,723,435 | ) |
| | | | | | | | | | |
| | | | | | | | | | | | | | | | | | |
| Investor A | | | | | | | | | | | | | | | | | | |
Shares sold | | | 484,539 | | | $ | 6,176,197 | | | | | | 1,249,072 | | | $ | 16,755,157 | |
Shares issued in reinvestment of distributions | | | 97,698 | | | | 1,205,545 | | | | | | 195,900 | | | | 2,536,696 | |
Shares redeemed | | | (823,014 | ) | | | (10,365,276 | ) | | | | | (898,439 | ) | | | (12,003,995 | ) |
| | | | | | | | | | | | | | |
Net increase (decrease) | | | (240,777 | ) | | $ | (2,983,534 | ) | | | | | 546,533 | | | $ | 7,287,858 | |
| | | | | | | | | | |
| | | | | | |
| | | | | | | |
| | BLACKROCK FUNDS III | | DECEMBER 31, 2015 | | 43 |
| | | | |
| Notes to Financial Statements (continued) | | |
| | | | | | | | | | | | | | | | | | |
| | | Year Ended
December 31, 2015 | | | | | Year Ended
December 31, 2014 | |
| LifePath 2025 Fund (concluded) | | Shares | | | Amount | | | | | Shares | | | Amount | |
| Investor C | | | | | | | | | | | | | | | | | | |
Shares sold | | | 191,836 | | | $ | 2,439,322 | | | | | | 155,070 | | | $ | 2,059,006 | |
Shares issued in reinvestment of distributions | | | 8,028 | | | | 98,474 | | | | | | 14,181 | | | | 182,113 | |
Shares redeemed | | | (181,855 | ) | | | (2,252,503 | ) | | | | | (98,326 | ) | | | (1,304,067 | ) |
| | | | | | | | | | | | | | |
Net increase | | | 18,009 | | | $ | 285,293 | | | | | | 70,925 | | | $ | 937,052 | |
| | | | | | | | | | |
| | | | | | | | | | | | | | | | | | |
| Class K | | | | | | | | | | | | | | | | | | |
Shares sold | | | 135,809 | | | $ | 1,698,832 | | | | | | 98,832 | | | $ | 1,339,988 | |
Shares issued in reinvestment of distributions | | | 3,199 | | | | 39,154 | | | | | | 2,723 | | | | 35,904 | |
Shares redeemed | | | (57,521 | ) | | | (713,464 | ) | | | | | (84,601 | ) | | | (1,143,088 | ) |
| | | | | | | | | | | | | | |
Net increase | | | 81,487 | | | $ | 1,024,522 | | | | | | 16,954 | | | $ | 232,804 | |
| | | | | | | | | | |
| | | | | | | | | | | | | | | | | | |
| Class R | | | | | | | | | | | | | | | | | | |
Shares sold | | | 198,458 | | | $ | 2,505,656 | | | | | | 79,505 | | | $ | 1,064,199 | |
Shares issued in reinvestment of distributions | | | 6,691 | | | | 82,119 | | | | | | 8,934 | | | | 115,827 | |
Shares redeemed | | | (113,165 | ) | | | (1,465,027 | ) | | | | | (70,180 | ) | | | (949,152 | ) |
| | | | | | | | | | |
Net increase | | | 91,984 | | | $ | 1,122,748 | | | | | | 18,259 | | | $ | 230,874 | |
| | | | | | | | | | |
Total Net Increase | | | 412,589 | | | $ | 5,421,219 | | | | | | 524,783 | | | $ | 6,965,153 | |
| | | | | | | | | | |
| | | | | | | | | | | | | | | | | | |
| LifePath 2035 Fund | | | | | | | | | | | | | | |
| Institutional | | | | | | | | | | | | | | | | | | |
Shares sold | | | 935,048 | | | $ | 12,689,214 | | | | | | 698,213 | | | $ | 9,795,954 | |
Shares issued in reinvestment of distributions | | | 75,760 | | | | 977,461 | | | | | | 130,961 | | | | 1,786,762 | |
Shares redeemed | | | (894,648 | ) | | | (12,126,312 | ) | | | | | (806,981 | ) | | | (11,297,194 | ) |
| | | | | | | | | | | | | | | | | | |
Net increase | | | 116,160 | | | $ | 1,540,363 | | | | | | 22,193 | | | $ | 285,522 | |
| | | | | | | | | | | | | | | | | | |
| | | | | | | | | | | | | | | | | | |
| Investor A | | | | | | | | | | | | | | | | | | |
Shares sold | | | 561,099 | | | $ | 7,536,029 | | | | | | 1,234,302 | | | $ | 17,374,827 | |
Shares issued in reinvestment of distributions | | | 99,598 | | | | 1,283,978 | | | | | | 171,287 | | | | 2,328,481 | |
Shares redeemed | | | (558,814 | ) | | | (7,357,563 | ) | | | | | (646,590 | ) | | | (9,069,583 | ) |
| | | | | | | | | | | | | | | | | | |
Net increase | | | 101,883 | | | $ | 1,462,444 | | | | | | 758,999 | | | $ | 10,633,725 | |
| | | | | | | | | | | | | | | | | | |
| | | | | | | | | | | | | | | | | | |
| Investor C | | | | | | | | | | | | | | | | | | |
Shares sold | | | 105,262 | | | $ | 1,406,620 | | | | | | 102,383 | | | $ | 1,438,909 | |
Shares issued in reinvestment of distributions | | | 5,495 | | | | 70,017 | | | | | | 8,787 | | | | 118,207 | |
Shares redeemed | | | (86,166 | ) | | | (1,137,058 | ) | | | | | (49,907 | ) | | | (702,265 | ) |
| | | | | | | | | | | | | | | | | | |
Net increase | | | 24,591 | | | $ | 339,579 | | | | | | 61,263 | | | $ | 854,851 | |
| | | | | | | | | | | | | | | | | | |
| | | | | | | | | | | | | | | | | | |
| Class K | | | | | | | | | | | | | | | | | | |
Shares sold | | | 48,795 | | | $ | 636,575 | | | | | | 38,968 | | | $ | 566,459 | |
Shares issued in reinvestment of distributions | | | 1,730 | | | | 22,287 | | | | | | 1,074 | | | | 15,129 | |
Shares redeemed | | | (1,248 | ) | | | (17,127 | ) | | | | | (36,710 | ) | | | (531,744 | ) |
| | | | | | | | | | | | | | | | | | |
Net increase | | | 49,277 | | | $ | 641,735 | | | | | | 3,332 | | | $ | 49,844 | |
| | | | | | | | | | | | | | | | | | |
| | | | | | | | | | | | | | | | | | |
| Class R | | | | | | | | | | | | | | | | | | |
Shares sold | | | 55,006 | | | $ | 724,120 | | | | | | 40,609 | | | $ | 573,114 | |
Shares issued in reinvestment of distributions | | | 2,302 | | | | 29,614 | | | | | | 3,008 | | | | 41,022 | |
Shares redeemed | | | (31,541 | ) | | | (424,788 | ) | | | | | (34,879 | ) | | | (494,583 | ) |
| | | | | | | | | | | | | | | | | | |
Net increase | | | 25,767 | | | $ | 328,946 | | | | | | 8,738 | | | $ | 119,553 | |
| | | | | | | | | | | | | | | | | | |
Total Net Increase | | | 317,678 | | | $ | 4,313,067 | | | | | | 854,525 | | | $ | 11,943,495 | |
| | | | | | | | | | | | | | | | | | |
| | | | | | |
| | | | | | | |
| 44 | | BLACKROCK FUNDS III | | DECEMBER 31, 2015 | | |
| | |
| Notes to Financial Statements (continued) | | |
| | | | | | | | | | | | | | | | | | |
| | | Year Ended
December 31, 2015 | | | | | Year Ended
December 31, 2014 | |
| LifePath 2045 Fund | | Shares | | | Amount | | | | | Shares | | | Amount | |
| Institutional | | | | | | | | | | | | | | | | | | |
Shares sold | | | 559,557 | | | $ | 7,929,643 | | | | | | 568,413 | | | $ | 8,346,244 | |
Shares issued in reinvestment of distributions | | | 51,781 | | | | 697,205 | | | | | | 86,364 | | | | 1,232,981 | |
Shares redeemed | | | (573,820 | ) | | | (8,169,111 | ) | | | | | (430,563 | ) | | | (6,275,685 | ) |
| | | | | | | | | | | | | | | | | | |
Net increase | | | 37,518 | | | $ | 457,737 | | | | | | 224,214 | | | $ | 3,303,540 | |
| | | | | | | | | | | | | | | | | | |
| | | | | | | | | | | | | | | | | | |
| Investor A | | | | | | | | | | | | | | | | | | |
Shares sold | | | 380,095 | | | $ | 5,344,885 | | | | | | 607,385 | | | $ | 8,947,428 | |
Shares issued in reinvestment of distributions | | | 54,687 | | | | 736,323 | | | | | | 87,027 | | | | 1,239,384 | |
Shares redeemed | | | (352,998 | ) | | | (4,912,618 | ) | | | | | (264,546 | ) | | | (3,908,096 | ) |
| | | | | | | | | | | | | | | | | | |
Net increase | | | 81,784 | | | $ | 1,168,590 | | | | | | 429,866 | | | $ | 6,278,716 | |
| | | | | | | | | | | | | | | | | | |
| | | | | | | | | | | | | | | | | | |
| Investor C | | | | | | | | | | | | | | | | | | |
Shares sold | | | 67,371 | | | $ | 938,567 | | | | | | 60,642 | | | $ | 879,755 | |
Shares issued in reinvestment of distributions | | | 4,325 | | | | 57,482 | | | | | | 7,168 | | | | 100,693 | |
Shares redeemed | | | (73,452 | ) | | | (999,367 | ) | | | | | (21,880 | ) | | | (319,032 | ) |
| | | | | | | | | | | | | | | | | | |
Net increase (decrease) | | | (1,756 | ) | | $ | (3,318 | ) | | | | | 45,930 | | | $ | 661,416 | |
| | | | | | | | | | | | | | | | | | |
| | | | | | | | | | | | | | | | | | |
| Class K | | | | | | | | | | | | | | | | | | |
Shares sold | | | 37,110 | | | $ | 497,656 | | | | | | 23,669 | | | $ | 360,858 | |
Shares issued in reinvestment of distributions | | | 1,078 | | | | 14,363 | | | | | | 365 | | | | 5,506 | |
Shares redeemed | | | (581 | ) | | | (7,775 | ) | | | | | (24,034 | ) | | | (362,768 | ) |
| | | | | | | | | | | | | | | | | | |
Net increase | | | 37,607 | | | $ | 504,244 | | | | | | — | | | $ | 3,596 | |
| | | | | | | | | | | | | | | | | | |
| | | | | | | | | | | | | | | | | | |
| Class R | | | | | | | | | | | | | | | | | | |
Shares sold | | | 46,692 | | | $ | 642,929 | | | | | | 22,356 | | | $ | 328,462 | |
Shares issued in reinvestment of distributions | | | 1,810 | | | | 24,378 | | | | | | 2,594 | | | | 37,089 | |
Shares redeemed | | | (32,584 | ) | | | (460,752 | ) | | | | | (26,829 | ) | | | (396,904 | ) |
| | | | | | | | | | | | | | | | | | |
Net increase (decrease) | | | 15,918 | | | $ | 206,555 | | | | | | (1,879 | ) | | $ | (31,353 | ) |
| | | | | | | | | | | | | | | | | | |
Total Net Increase | | | 171,071 | | | $ | 2,333,808 | | | | | | 698,131 | | | $ | 10,215,915 | |
| | | | | | | | | | | | | | | | | | |
| | | | | | | | | | | | | | | | | | |
| LifePath 2055 Fund | | | | | | | | | | | | | | |
| Institutional | | | | | | | | | | | | | | | | | | |
Shares sold | | | 344,455 | | | $ | 4,949,851 | | | | | | 348,366 | | | $ | 5,205,213 | |
Shares issued in reinvestment of distributions | | | 19,079 | | | | 263,523 | | | | | | 35,626 | | | | 518,300 | |
Shares redeemed | | | (287,976 | ) | | | (4,174,534 | ) | | | | | (221,931 | ) | | | (3,307,959 | ) |
| | | | | | | | | | | | | | | | | | |
Net increase | | | 75,558 | | | $ | 1,038,840 | | | | | | 162,061 | | | $ | 2,415,554 | |
| | | | | | | | | | | | | | | | | | |
| | | | | | | | | | | | | | | | | | |
| Investor A | | | | | | | | | | | | | | | | | | |
Shares sold | | | 255,129 | | | $ | 3,630,190 | | | | | | 247,660 | | | $ | 3,708,400 | |
Shares issued in reinvestment of distributions | | | 18,377 | | | | 253,284 | | | | | | 28,241 | | | | 409,734 | |
Shares redeemed | | | (98,266 | ) | | | (1,381,504 | ) | | | | | (158,705 | ) | | | (2,392,815 | ) |
| | | | | | | | | | | | | | | | | | |
Net increase | | | 175,240 | | | $ | 2,501,970 | | | | | | 117,196 | | | $ | 1,725,319 | |
| | | | | | | | | | | | | | | | | | |
| | | | | | | | | | | | | | | | | | |
| Investor C | | | | | | | | | | | | | | | | | | |
Shares sold | | | 25,419 | | | $ | 359,459 | | | | | | 28,126 | | | $ | 413,363 | |
Shares issued in reinvestment of distributions | | | 1,179 | | | | 16,091 | | | | | | 2,346 | | | | 33,663 | |
Shares redeemed | | | (23,073 | ) | | | (320,424 | ) | | | | | (14,822 | ) | | | (219,461 | ) |
| | | | | | | | | | | | | | | | | | |
Net increase | | | 3,525 | | | $ | 55,126 | | | | | | 15,650 | | | $ | 227,565 | |
| | | | | | | | | | | | | | | | | | |
| | | | | | |
| | | | | | | |
| | BLACKROCK FUNDS III | | DECEMBER 31, 2015 | | 45 |
| | | | |
| Notes to Financial Statements (concluded) | | |
| | | | | | | | | | | | | | | | | | |
| | | Year Ended
December 31, 2015 | | | | | Year Ended
December 31, 2014 | |
| LifePath 2055 Fund (concluded) | | Shares | | | Amount | | | | | Shares | | | Amount | |
| Class K | | | | | | | | | | | | | | | | | | |
Shares sold | | | 1,965 | | | $ | 27,326 | | | | | | 11,181 | | | $ | 174,276 | |
Shares issued in reinvestment of distributions | | | 43 | | | | 600 | | | | | | 176 | | | | 2,712 | |
Shares redeemed | | | (160 | ) | | | (2,412 | ) | | | | | (11,357 | ) | | | (175,350 | ) |
| | | | | | | | | | | | | | | | | | |
Net increase | | | 1,848 | | | $ | 25,514 | | | | | | — | | | $ | 1,638 | |
| | | | | | | | | | | | | | | | | | |
| | | | | | | | | | | | | | | | | | |
| Class R | | | | | | | | | | | | | | | | | | |
Shares sold | | | 23,493 | | | $ | 330,212 | | | | | | 8,973 | | | $ | 134,484 | |
Shares issued in reinvestment of distributions | | | 459 | | | | 6,304 | | | | | | 507 | | | | 7,425 | |
Shares redeemed | | | (10,535 | ) | | | (149,647 | ) | | | | | (8,476 | ) | | | (128,490 | ) |
| | | | | | | | | | | | | | | | | | |
Net increase | | | 13,417 | | | $ | 186,869 | | | | | | 1,004 | | | $ | 13,419 | |
| | | | | | | | | | | | | | | | | | |
Total Net Increase | | | 269,588 | | | $ | 3,808,319 | | | | | | 295,911 | | | $ | 4,383,495 | |
| | | | | | | | | | | | | | | | | | |
At December 31, 2015, shares of the LifePath Funds were owned by BlackRock HoldCo 2, Inc., an affiliate of the LifePath Funds, as follows:.
| | | | | | | | | | | | | | | | |
| | | LifePath 2025
Fund | | | LifePath 2035
Fund | | | LifePath 2045
Fund | | | LifePath 2055
Fund | |
Class K | | | 2,006 | | | | 2,004 | | | | 2,003 | | | | 2,001 | |
Class R | | | — | | | | — | | | | — | | | | 2,000 | |
7. Subsequent Events:
Management has evaluated the impact of all subsequent events on the LifePath Funds through the date the financial statements were issued and has determined that there were no subsequent events requiring adjustment or additional disclosure in the financial statements.
| | | | | | |
| | | | | | | |
| 46 | | BLACKROCK FUNDS III | | DECEMBER 31, 2015 | | |
| | |
| Report of Independent Registered Public Accounting Firm | | BlackRock Funds III |
To the Board of Trustees of BlackRock Funds III and the Shareholders of BlackRock LifePath® 2025 Fund, BlackRock LifePath® 2035 Fund, BlackRock LifePath® 2045 Fund and BlackRock LifePath® 2055 Fund:
In our opinion, the accompanying statements of assets and liabilities and the related statements of operations and of changes in net assets and the financial highlights present fairly, in all material respects, the financial position of BlackRock LifePath® 2025 Fund, BlackRock LifePath® 2035 Fund, BlackRock LifePath® 2045 Fund and BlackRock LifePath® 2055 Fund (the “Funds”), each a series of BlackRock Funds III, at December 31, 2015, the results of each of their operations for the year then ended, the changes in each of their net assets for each of the two years in the period then ended and the financial highlights for each of the five years in the period then ended, in conformity with accounting principles generally accepted in the United States of America. These financial statements and financial highlights (hereafter referred to as “financial statements”) are the responsibility of the Funds’ management. Our responsibility is to express an opinion on these financial statements based on our audits. We conducted our audits of these financial statements in accordance with the standards of the Public Company Accounting Oversight Board (United States). Those standards require that we plan and perform the audit to obtain reasonable assurance about whether the financial statements are free of material misstatement. An audit includes examining, on a test basis, evidence supporting the amounts and disclosures in the financial statements, assessing the accounting principles used and significant estimates made by management, and evaluating the overall financial statement presentation. We believe that our audits provide a reasonable basis for our opinion.
/s/PricewaterhouseCoopers LLP
Philadelphia, Pennsylvania
February 24, 2016
|
| Important Tax Information (Unaudited) |
The following information is provided with respect to the ordinary income distributions paid during the taxable year ended December 31, 2015:
| | | | | | | | | | | | | | | | | | | | |
| | | Payable Dates | | | LifePath
2025
Fund | | | LifePath
2035
Fund | | | LifePath
2045
Fund | | | LifePath
2055
Fund | |
Qualified Dividend Income for Individuals1 | | | 03/31/15 - 12/30/15 | | | | 68.70% | | | | 96.18% | | | | 100% | | | | 100% | |
Dividends Qualifying for the Dividend Received Deduction for Corporations1 | | | 03/31/15 - 12/30/15 | | | | 34.90% | | | | 47.81% | | | | 57.87% | | | | 60.33% | |
Federal Obligation Interest2 | | | 03/31/15 - 12/30/15 | | | | 2.07% | | | | 1.11% | | | | — | | | | — | |
Interest-Related Dividends and Qualified Short-Term Capital Gains for Non-U.S. Residents3 | | | 03/31/15 - 12/30/15 | | | | 45.43% | | | | 29.80% | | | | 18.22% | | | | 13.46% | |
| 1 | | The LifePath Funds hereby designate the percentage indicated above or the maximum amount allowable by law. |
| 2 | | The law varies in each state as to whether and what percentage of dividend income attributable to federal obligations is exempt from state income tax. We recommend that you consult your tax advisor to determine if any portion of the dividends you received is exempt from state income taxes. |
| 3 | | Represents the portion of the taxable ordinary income dividends eligible for exemption from U.S. withholding tax for nonresident aliens and foreign corporations. |
Additionally, the LifePath Funds distributed long-term capital gains per share to shareholders of record on the following dates:
| | | | | | | | | | |
| | | Record Dates | | June 29, 2015 | | | December 29, 2015 | |
LifePath 2025 Fund | | | | $ | 0.046928 | | | $ | 0.202168 | |
LifePath 2035 Fund | | | | $ | 0.063016 | | | $ | 0.265970 | |
LifePath 2045 Fund | | | | $ | 0.088394 | | | $ | 0.310592 | |
LifePath 2055 Fund | | | | $ | 0.078867 | | | $ | 0.225471 | |
| | | | | | |
| | | | | | | |
| | BLACKROCK FUNDS III | | DECEMBER 31, 2015 | | 47 |
| | |
| Master Portfolio Information as of December 31, 2015 | | Master Investment Portfolio |
|
| LifePath® 2025 Master Portfolio |
| | |
| Portfolio Composition | | Percent of
Total Net Assets |
| | | | |
Equity Funds | | | 57 | % |
Fixed Income Funds | | | 38 | |
Common Stocks | | | 5 | |
| | |
| Ten Largest Holdings | | Percent of
Total Net Assets |
| | | | |
CoreAlpha Bond Master Portfolio | | | 34 | % |
Active Stock Master Portfolio | | | 21 | |
International Tilts Master Portfolio | | | 13 | |
Large Cap Index Master Portfolio | | | 10 | |
iShares TIPS Bond ETF | | | 4 | |
BlackRock Commodity Strategies Fund | | | 3 | |
BlackRock Emerging Markets Fund, Inc. | | | 3 | |
Master Small Cap Index Series | | | 3 | |
iShares MSCI EAFE Small-Cap ETF | | | 2 | |
iShares MSCI Canada ETF | | | 1 | |
|
| LifePath® 2035 Master Portfolio |
| | |
| Portfolio Composition | | Percent of
Total Net Assets |
| | | | |
Equity Funds | | | 74 | % |
Fixed Income Funds | | | 16 | |
Common Stocks | | | 10 | |
| | |
| Ten Largest Holdings | | Percent of
Total Net Assets |
| | | | |
Active Stock Master Portfolio | | | 25 | % |
International Tilts Master Portfolio | | | 17 | |
Large Cap Index Master Portfolio | | | 17 | |
CoreAlpha Bond Master Portfolio | | | 16 | |
BlackRock Emerging Markets Fund, Inc. | | | 4 | |
BlackRock Commodity Strategies Fund | | | 4 | |
iShares MSCI EAFE Small-Cap ETF | | | 2 | |
Master Small Cap Index Series | | | 2 | |
iShares MSCI Canada ETF | | | 1 | |
Simon Property Group, Inc. | | | 1 | |
The LifePath Master Portfolios’ allocation and holdings listed above are current as of the report date. However, the LifePath Master Portfolios are regularly monitored and their composition may vary throughout various periods.
| | | | | | |
| | | | | | | |
| 48 | | BLACKROCK FUNDS III | | DECEMBER 31, 2015 | | |
| | |
| Master Portfolio Information as of December 31, 2015 (concluded) | | Master Investment Portfolio |
| | |
| LifePath® 2045 Master Portfolio |
| | |
| Portfolio Composition | | Percent of Total Net Assets |
| | | | |
Equity Funds | | | 84 | % |
Common Stocks | | | 13 | |
Fixed Income Funds | | | 3 | |
| | |
| Ten Largest Holdings | | Percent of Total Net Assets |
| | | | |
Active Stock Master Portfolio | | | 28 | % |
International Tilts Master Portfolio | | | 21 | |
Large Cap Index Master Portfolio | | | 19 | |
BlackRock Emerging Markets Fund, Inc. | | | 5 | |
BlackRock Commodity Strategies Fund | | | 4 | |
iShares MSCI EAFE Small-Cap ETF | | | 3 | |
CoreAlpha Bond Master Portfolio | | | 3 | |
Master Small Cap Index Series | | | 2 | |
iShares MSCI Canada ETF | | | 2 | |
Simon Property Group, Inc. | | | 1 | |
| | |
| LifePath® 2055 Master Portfolio |
| | |
| Portfolio Composition | | Percent of
Total Net Assets |
| | | | |
Equity Funds | | | 84 | % |
Common Stocks | | | 13 | |
Fixed Income Funds | | | 2 | |
Other Assets | | | 1 | |
| | |
| Ten Largest Holdings | | Percent of
Total Net Assets |
| | | | |
Active Stock Master Portfolio | | | 33 | % |
International Tilts Master Portfolio | | | 21 | |
Large Cap Index Master Portfolio | | | 14 | |
BlackRock Emerging Markets Fund, Inc. | | | 5 | |
BlackRock Commodity Strategies Fund | | | 4 | |
iShares MSCI EAFE Small-Cap ETF | | | 3 | |
Master Small Cap Index Series | | | 2 | |
iShares MSCI Canada ETF | | | 2 | |
CoreAlpha Bond Master Portfolio | | | 2 | |
Simon Property Group, Inc. | | | 1 | |
The LifePath Master Portfolios’ allocation and holdings listed above are current as of the report date. However, the LifePath Master Portfolios are regularly monitored and their composition may vary throughout various periods.
| | | | | | |
| | | | | | | |
| | BLACKROCK FUNDS III | | DECEMBER 31, 2015 | | 49 |
| | |
Schedule of Investments December 31, 2015 | | LifePath 2025 Master Portfolio (Percentages shown are based on Net Assets) |
| | | | | | | | |
| Affiliated Investment Companies (a) | | Shares/
Beneficial Interest | | | Value | |
Equity Funds — 56.7% | | | | | | | | |
Active Stock Master Portfolio | | $ | 13,646,396 | | | $ | 13,646,396 | |
BlackRock Commodity Strategies Fund | | | 366,318 | | | | 2,227,211 | |
BlackRock Emerging Markets Fund, Inc. | | | 135,188 | | | | 2,111,633 | |
International Tilts Master Portfolio | | $ | 8,424,203 | | | | 8,424,203 | |
iShares MSCI Canada ETF (b) | | | 29,702 | | | | 638,593 | |
iShares MSCI EAFE Small-Cap ETF | | | 24,094 | | | | 1,203,495 | |
Large Cap Index Master Portfolio
(fka Russell 1000® Index Master Portfolio) | | $ | 6,667,009 | | | | 6,667,009 | |
Master Small Cap Index Series | | $ | 1,989,173 | | | | 1,989,173 | |
| | | | | | | | |
| | | | | | | | 36,907,713 | |
Fixed Income Funds — 37.7% | |
CoreAlpha Bond Master Portfolio | | $ | 22,012,998 | | | | 22,012,998 | |
iShares TIPS Bond ETF | | | 23,345 | | | | 2,560,480 | |
| | | | | | | | |
| | | | | | | | 24,573,478 | |
Short-Term Securities — 0.0% | |
BlackRock Cash Funds: Institutional, SL Agency Shares, 0.38% (c)(d) | | | 1,667 | | | | 1,667 | |
BlackRock Cash Funds: Prime, SL Agency Shares, 0.36% (c)(d) | | | 1,261 | | | | 1,261 | |
| | | | | | | | |
| | | | | | | | 2,928 | |
| Total Affiliated Investment Companies — 94.4% | | | | 61,484,119 | |
| | | | | | | | |
| | | | | | | | | |
| | |
| Common Stocks | | | | | | |
Hotels, Restaurants & Leisure — 0.1% | |
Hilton Worldwide Holdings, Inc. | | | 804 | | | | 17,206 | |
Pebblebrook Hotel Trust | | | 865 | | | | 24,237 | |
RLJ Lodging Trust | | | 1,224 | | | | 26,475 | |
| | | | | | | | |
| | | | | | | | 67,918 | |
Real Estate Investment Trusts (REITs) — 4.0% | |
Alexandria Real Estate Equities, Inc. | | | 555 | | | | 50,150 | |
Allied Properties Real Estate Investment Trust | | | 2,295 | | | | 52,362 | |
AvalonBay Communities, Inc. | | | 541 | | | | 99,614 | |
Beni Stabili SpA SIIQ | | | 33,511 | | | | 25,258 | |
Boston Properties, Inc. | | | 1,002 | | | | 127,795 | |
British Land Co. PLC | | | 6,215 | | | | 71,913 | |
Cambridge Industrial Trust | | | 86,000 | | | | 34,269 | |
CareTrust REIT, Inc. | | | 3,439 | | | | 37,657 | |
CubeSmart | | | 1,908 | | | | 58,423 | |
CyrusOne, Inc. | | | 939 | | | | 35,166 | |
Derwent London PLC | | | 779 | | | | 42,134 | |
Duke Realty Corp. | | | 2,119 | | | | 44,541 | |
Empiric Student Property PLC | | | 15,463 | | | | 25,873 | |
EPR Properties | | | 652 | | | | 38,109 | |
Equity One, Inc. | | | 1,584 | | | | 43,006 | |
Equity Residential | | | 1,310 | | | | 106,883 | |
Essex Property Trust, Inc. | | | 315 | | | | 75,414 | |
Extra Space Storage, Inc. | | | 842 | | | | 74,273 | |
Federal Realty Investment Trust | | | 90 | | | | 13,149 | |
General Growth Properties, Inc. | | | 628 | | | | 17,088 | |
Goodman Group | | | 21,527 | | | | 97,548 | |
| | | | | | | | |
| Common Stocks | | Shares | | | Value | |
Real Estate Investment Trusts (REITs) (continued) | |
Gramercy Property Trust | | | 3,229 | | | $ | 24,924 | |
Japan Rental Housing Investments, Inc. | | | 46 | | | | 32,503 | |
Kenedix Retail REIT Corp. | | | 23 | | | | 48,689 | |
Kilroy Realty Corp. | | | 961 | | | | 60,812 | |
Kimco Realty Corp. | | | 1,359 | | | | 35,959 | |
Land Securities Group PLC | | | 4,434 | | | | 76,864 | |
Link REIT | | | 9,500 | | | | 56,638 | |
Macerich Co. | | | 561 | | | | 45,267 | |
Merlin Properties Socimi SA | | | 2,080 | | | | 26,057 | |
National Health Investors, Inc. | | | 590 | | | | 35,913 | |
Parkway Properties, Inc. | | | 2,163 | | | | 33,808 | |
Physicians Realty Trust | | | 227 | | | | 3,827 | |
Prologis, Inc. | | | 2,057 | | | | 88,286 | |
Retail Properties of America, Inc., Class A | | | 4,498 | | | | 66,435 | |
Sekisui House REIT, Inc. | | | 17 | | | | 18,525 | |
Simon Property Group, Inc. | | | 1,077 | | | | 209,412 | |
SL Green Realty Corp. | | | 396 | | | | 44,740 | |
STAG Industrial, Inc. | | | 2,032 | | | | 37,490 | |
STORE Capital Corp. | | | 821 | | | | 19,047 | |
Sunstone Hotel Investors, Inc. | | | 3,599 | | | | 44,952 | |
Taubman Centers, Inc. | | | 165 | | | | 12,659 | |
UDR, Inc. | | | 1,344 | | | | 50,494 | |
Vastned Retail NV | | | 980 | | | | 45,022 | |
Vicinity Centres | | | 45,237 | | | | 91,771 | |
Welltower, Inc. | | | 1,516 | | | | 103,134 | |
Wereldhave NV | | | 677 | | | | 37,976 | |
Westfield Corp. | | | 10,440 | | | | 71,826 | |
| | | | | | | | |
| | | | | | | | 2,593,655 | |
Real Estate Management & Development — 1.1% | |
Castellum AB | | | 2,878 | | | | 40,986 | |
Cheung Kong Property Holdings Ltd. | | | 12,000 | | | | 77,628 | |
Deutsche Wohnen AG, Bearer Shares | | | 1,830 | | | | 50,603 | |
First Capital Realty, Inc. | | | 1,880 | | | | 24,932 | |
Heiwa Real Estate Co., Ltd. | | | 4,200 | | | | 45,958 | |
Howard Hughes Corp. (e) | | | 145 | | | | 16,408 | |
Kennedy Wilson Europe Real Estate PLC | | | 953 | | | | 16,948 | |
Kungsleden AB | | | 3,651 | | | | 26,088 | |
KWG Property Holding Ltd. | | | 45,500 | | | | 33,541 | |
LEG Immobilien AG | | | 217 | | | | 17,686 | |
Leopalace21 Corp. (e) | | | 2,900 | | | | 15,697 | |
Nomura Real Estate Holdings, Inc. | | | 1,900 | | | | 35,249 | |
Sumitomo Realty & Development Co., Ltd. | | | 3,000 | | | | 85,628 | |
Sun Hung Kai Properties Ltd. | | | 7,000 | | | | 84,137 | |
VIB Vermoegen AG | | | 1,250 | | | | 23,222 | |
Vonovia SE | | | 1,356 | | | | 41,891 | |
Wharf Holdings Ltd. | | | 10,000 | | | | 55,135 | |
| | | | | | | | |
| | | | | | | | 691,737 | |
| Total Common Stocks — 5.2% | | | | | | | 3,353,310 | |
| Total Investments (Cost — $66,733,365) — 99.6% | | | | | | | 64,837,429 | |
| Other Assets Less Liabilities — 0.4% | | | | | | | 267,993 | |
| | | | | | | | |
Net Assets — 100.0% | | | | | | $ | 65,105,422 | |
| | | | | | | | |
| | | | | | | | | | |
| AUD | | Australian Dollar | | HKD | | Hong Kong Dollar | | SEK | | Swedish Krona |
| CAD | | Canadian Dollar | | ILS | | Israeli New Shekel | | SGD | | Singapore Dollar |
| CHF | | Swiss Franc | | JPY | | Japanese Yen | | USD | | U.S. Dollar |
EUR | | Euro | | NOK | | Norwegian Krone | | | | |
GBP | | British Pound | | NZD | | New Zealand Dollar | | | | |
See Notes to Financial Statements.
| | | | | | |
| | | | | | | |
| 50 | | BLACKROCK FUNDS III | | DECEMBER 31, 2015 | | |
| | |
Schedule of Investments (continued) | | LifePath 2025 Master Portfolio |
|
| Notes to Schedule of Investments |
| (a) | | During the year ended December 31, 2015, investments in issuers considered to be affiliates of LifePath Master Portfolio for purposes of Section 2(a)(3) of the Investment Company Act of 1940, as amended, were as follows: |
| | | | | | | | | | | | | | | | | | | | | | | | | | | | |
| Affiliate | | Shares/
Beneficial
Interest Held at
December 31, 2014 | | | Shares/ Beneficial
Interest
Purchased | | | Shares/ Beneficial
Interest Sold | | | Shares/ Beneficial
Interest Held at
December 31, 2015 | | | Value at
December 31, 2015 | | | Net Income | | | Realized
Gain (Loss) | |
Active Stock Master Portfolio | | $ | 15,992,282 | | | | — | | | $ | (2,345,886 | )1 | | $ | 13,646,396 | | | $ | 13,646,396 | | | $ | 247,500 | | | $ | 1,873,881 | 2 |
BlackRock Cash Funds: Institutional, SL Agency Shares | | | 39,034 | | | | — | | | | (37,367 | )1 | | | 1,667 | | | $ | 1,667 | | | $ | 1,743 | 3 | | | — | |
BlackRock Cash Funds: Prime, SL Agency Shares | | | — | | | | 1,261 | 4 | | | — | | | | 1,261 | | | $ | 1,261 | | | $ | 1,138 | 3 | | | — | |
BlackRock Commodity Strategies Fund | | | 297,619 | | | | 135,663 | | | | (66,964 | ) | | | 366,318 | | | $ | 2,227,211 | | | | — | | | $ | (183,053 | ) |
BlackRock Emerging Markets Fund, Inc. | | | 125,241 | | | | 45,894 | | | | (35,947 | ) | | | 135,188 | | | $ | 2,111,633 | | | $ | 27,911 | | | $ | (40,475 | ) |
CoreAlpha Bond Master Portfolio | | $ | 19,692,253 | | | $ | 2,320,745 | 4 | | | — | | | $ | 22,012,998 | | | $ | 22,012,998 | | | $ | 547,960 | | | $ | 95,610 | 2 |
International Tilts Master Portfolio | | $ | 7,554,212 | | | $ | 869,991 | 4 | | | — | | | $ | 8,424,203 | | | $ | 8,424,203 | | | $ | 231,346 | | | $ | (430,610 | )2 |
iShares Cohen & Steers REIT ETF5 | | | 19,497 | | | | 6,594 | | | | (26,091 | ) | | | — | | | | — | | | $ | 44,059 | | | $ | 286,788 | |
iShares International Developed Real Estate ETF5 | | | 53,688 | | | | 17,360 | | | | (71,048 | ) | | | — | | | | — | | | $ | 48,543 | | | $ | (162,282 | ) |
iShares MSCI Canada ETF | | | 27,681 | | | | 8,411 | | | | (6,390 | ) | | | 29,702 | | | $ | 638,593 | | | $ | 14,658 | | | $ | (28,306 | ) |
iShares MSCI EAFE Small-Cap ETF | | | 24,879 | | | | 4,364 | | | | (5,149 | ) | | | 24,094 | | | $ | 1,203,495 | | | $ | 25,372 | | | $ | 5,239 | |
iShares TIPS Bond ETF | | | 25,680 | | | | 9,498 | | | | (11,833 | ) | | | 23,345 | | | $ | 2,560,480 | | | $ | 10,819 | | | $ | (56,226 | ) |
Large Cap Index Master Portfolio
(fka Russell 1000® Index Master Portfolio) | | $ | 5,483,712 | | | $ | 1,183,297 | 4 | | | — | | | $ | 6,667,009 | | | $ | 6,667,009 | | | $ | 156,192 | | | $ | 326,873 | 2 |
Master Small Cap Index Series | | $ | 1,907,031 | | | $ | 82,142 | 4 | | | — | | | $ | 1,989,173 | | | $ | 1,989,173 | | | $ | 31,117 | | | $ | 349,209 | 2 |
1 Represents net shares/beneficial interest sold. | |
2 Includes the following gains and (losses) from in-kind redemptions from affiliated holdings. See Note 2 of the Notes to Financial Statements. | |
| | | | | | | | | | | | | | | | | | |
Active Stock
Master Portfolio | | | CoreAlpha Bond
Master Portfolio | | | International Tilts
Master Portfolio | | | Large Cap Index
Master Portfolio
(fka Russell
1000® Index
Master Portfolio) | | | Master Small Cap
Index Series | |
| $ | 715,452 | | | $ | 81,662 | | | $ | (160,901 | ) | | $ | 697,910 | | | $ | 388,786 | |
| | | | | | | | | | | | | | |
|
3 Represents all or a portion of securities lending income earned from the reinvestment of cash collateral from loaned securities, net of fees, and collateral investment expenses, and other payments to and from borrowers of securities. |
4 Represents net shares/beneficial interest purchased. |
5 No longer held by LifePath Master Portfolio as of report date. |
| (b) | | Security, or a portion of security, is on loan. |
| (c) | | Current yield as of period end. |
| (d) | | All or a portion of security was purchased with the cash collateral from loaned securities. |
| (e) | | Non-income producing security. |
|
| Derivative Financial Instruments Outstanding as of Period End |
Forward Foreign Currency Exchange Contracts
| | | | | | | | | | | | | | | | | | | | | | |
Currency
Purchased | | | Currency
Sold | | | Counterparty | | Settlement
Date | | | Unrealized
Appreciation
(Depreciation) | | | |
| CAD | | | 10,000 | | | USD | | | 7,227 | | | Morgan Stanley & Co. International PLC | | | 1/21/16 | | | $ | (28 | ) | | |
| CAD | | | 8,000 | | | USD | | | 5,823 | | | Northern Trust Co. | | | 1/21/16 | | | | (64 | ) | | |
| CHF | | | 27,000 | | | USD | | | 27,280 | | | Goldman Sachs International | | | 1/21/16 | | | | (288 | ) | | |
| CHF | | | 3,000 | | | USD | | | 3,013 | | | Morgan Stanley & Co. International PLC | | | 1/21/16 | | | | (14 | ) | | |
| EUR | | | 65,000 | | | USD | | | 71,027 | | | Goldman Sachs International | | | 1/21/16 | | | | (389 | ) | | |
| EUR | | | 13,000 | | | USD | | | 14,141 | | | Morgan Stanley & Co. International PLC | | | 1/21/16 | | | | (13 | ) | | |
| GBP | | | 11,000 | | | USD | | | 16,213 | | | Morgan Stanley & Co. International PLC | | | 1/21/16 | | | | 1 | | | |
| ILS | | | 13,000 | | | USD | | | 3,358 | | | Deutsche Bank AG | | | 1/21/16 | | | | (16 | ) | | |
| JPY | | | 9,298,000 | | | USD | | | 76,518 | | | Standard Chartered Bank | | | 1/21/16 | | | | 804 | | | |
| JPY | | | 2,547,000 | | | USD | | | 21,209 | | | UBS AG | | | 1/21/16 | | | | (28 | ) | | |
| NOK | | | 17,000 | | | USD | | | 1,957 | | | Morgan Stanley & Co. International PLC | | | 1/21/16 | | | | (37 | ) | | |
| NZD | | | 4,300 | | | USD | | | 2,895 | | | Goldman Sachs International | | | 1/21/16 | | | | 46 | | | |
| SEK | | | 25,000 | | | USD | | | 2,962 | | | Northern Trust Co. | | | 1/21/16 | | | | 5 | | | |
| SGD | | | 70,000 | | | USD | | | 49,662 | | | Barclays Bank PLC | | | 1/21/16 | | | | (348 | ) | | |
See Notes to Financial Statements.
| | | | | | |
| | | | | | | |
| | BLACKROCK FUNDS III | | DECEMBER 31, 2015 | | 51 |
| | |
Schedule of Investments (continued) | | LifePath 2025 Master Portfolio |
Forward Foreign Currency Exchange Contracts (continued)
| | | | | | | | | | | | | | | | | | | | | | |
Currency
Purchased | | | Currency
Sold | | | Counterparty | | Settlement
Date | | | Unrealized
Appreciation
(Depreciation) | | | |
| SGD | | | 6,000 | | | USD | | | 4,232 | | | Morgan Stanley & Co. International PLC | | | 1/21/16 | | | $ | (5 | ) | | |
| USD | | | 4,327 | | | AUD | | | 6,000 | | | Barclays Bank PLC | | | 1/21/16 | | | | (35 | ) | | |
| USD | | | 6,582 | | | AUD | | | 9,000 | | | Goldman Sachs International | | | 1/21/16 | | | | 40 | | | |
| USD | | | 55,966 | | | AUD | | | 78,000 | | | Royal Bank of Canada | | | 1/21/16 | | | | (739 | ) | | |
| USD | | | 1,089 | | | EUR | | | 1,000 | | | Goldman Sachs International | | | 1/21/16 | | | | 2 | | | |
| USD | | | 6,493 | | | EUR | | | 6,000 | | | Goldman Sachs International | | | 1/21/16 | | | | (28 | ) | | |
| USD | | | 32,557 | | | EUR | | | 30,000 | | | Royal Bank of Scotland PLC | | | 1/21/16 | | | | (45 | ) | | |
| USD | | | 5,463 | | | EUR | | | 5,000 | | | Royal Bank of Scotland PLC | | | 1/21/16 | | | | 29 | | | |
| USD | | | 14,885 | | | GBP | | | 10,000 | | | Bank of America N.A. | | | 1/21/16 | | | | 145 | | | |
| USD | | | 7,525 | | | GBP | | | 5,000 | | | Morgan Stanley & Co. International PLC | | | 1/21/16 | | | | 155 | | | |
| USD | | | 5,960 | | | GBP | | | 4,000 | | | Royal Bank of Scotland PLC | | | 1/21/16 | | | | 64 | | | |
| USD | | | 60,780 | | | HKD | | | 471,000 | | | Goldman Sachs International | | | 1/21/16 | | | | (2 | ) | | |
| USD | | | 15,528 | | | SEK | | | 133,000 | | | Bank of America N.A. | | | 1/21/16 | | | | (255 | ) | | |
| USD | | | 12,828 | | | SEK | | | 109,000 | | | HSBC Bank PLC | | | 1/21/16 | | | | (107 | ) | | |
| USD | | | 11,339 | | | SGD | | | 16,000 | | | Citibank N.A. | | | 1/21/16 | | | | 67 | | | |
| USD | | | 9,185 | | | SGD | | | 13,000 | | | Standard Chartered Bank | | | 1/21/16 | | | | 26 | | | |
| Total | | | | | | | | | | | | | | | | | | $ | (1,057 | ) | | |
| | | | | | | | | | | | | | | | | | | |
|
| Derivative Financial Instruments Categorized by Risk Exposure |
As of period end, the fair values of derivative financial instruments located in the Statements of Assets and Liabilities were as follows:
| | | | | | | | | | | | | | | | | | | | | | | | | | |
| Assets — Derivative Financial Instruments | | | | Commodity Contracts | | Credit Contracts | | | Equity Contracts | | Foreign Currency Exchange Contracts | | | Interest Rate Contracts | | | Other Contracts | | | Total | |
Forward foreign currency exchange contracts | | Net unrealized appreciation on forward currency exchange contracts | | — | | | — | | | — | | $ | 1,384 | | | | — | | | | — | | | $ | 1,384 | |
Liabilities — Derivative Financial Instruments | | | | | | | | | | | | | | | | | | | | | | | | | | |
Forward foreign currency exchange contracts | | Net unrealized depreciation on forward currency exchange contracts | | — | | | — | | | — | | $ | 2,441 | | | | — | | | | — | | | $ | 2,441 | |
For the year ended December 31, 2015, the effect of derivative financial instruments in the Statements of Operations was as follows:
| | | | | | | | | | | | | | | | | | | | | | | | |
| Net Change in Unrealized Appreciation (Depreciation) on: | | Commodity Contracts | | | Credit Contracts | | Equity Contracts | | | Foreign Currency Exchange Contracts | | Interest Rate Contracts | | | Other Contracts | | | Total | |
Forward foreign currency exchange contracts | | | — | | | — | | | — | | | $(1,057) | | | — | | | | — | | | $ | (1,057 | ) |
|
| Average Quarterly Balances of Outstanding Derivative Financial Instruments |
| | | | |
| Forward foreign currency exchange contracts: | | | | |
Average amounts purchased — in USD | | $ | 62,627 | |
Average amounts sold — in USD | | $ | 76,879 | |
For more information about the LifePath Master Portfolio’s investment risks regarding derivative financial instruments, refer to the Notes to Financial Statements.
|
| Derivative Financial Instruments — Offsetting as of Period End |
The LifePath Master Portfolio’s derivative assets and liabilities (by type) were as follows:
| | | | | | | | |
| | | Assets | | | Liabilities | |
Derivative Financial Instruments: | | | | | | | | |
Forward foreign currency exchange contracts | | $ | 1,384 | | | $ | 2,441 | |
| | | | |
Total derivative assets and liabilities in the Statements of Assets and Liabilities | | $ | 1,384 | | | $ | 2,441 | |
| | | | |
Derivatives not subject to a Master Netting Agreement or similar agreement (“MNA”) | | | — | | | | — | |
| | | | |
Total derivative assets and liabilities subject to an MNA | | $ | 1,384 | | | $ | 2,441 | |
| | | | |
See Notes to Financial Statements.
| | | | | | |
| | | | | | | |
| 52 | | BLACKROCK FUNDS III | | DECEMBER 31, 2015 | | |
| | |
Schedule of Investments (continued) | | LifePath 2025 Master Portfolio |
The following table presents the LifePath Master Portfolio’s derivative assets and liabilities by counterparty net of amounts available for offset under an Master Netting Agreement (“MNA”) and net of the related collateral received and pledged by the LifePath Master Portfolio:
| | | | | | | | | | | | | | | | | | | | |
| Counterparty | | Derivative Assets
Subject to an MNA
by Counterparty | | | Derivatives
Available
for Offset1 | | | Non-cash
Collateral
Received | | | Cash
Collateral
Received | | | Net Amount of
Derivative
Assets2 | |
Bank of America N.A. | | $ | 145 | | | $ | (145 | ) | | | — | | | | — | | | | — | |
Citibank N.A. | | | 67 | | | | — | | | | — | | | | — | | | $ | 67 | |
Goldman Sachs International | | | 88 | | | | (88 | ) | | | — | | | | — | | | | — | |
Morgan Stanley & Co. International PLC | | | 156 | | | | (97 | ) | | | — | | | | — | | | | 59 | |
Northern Trust Co. | | | 5 | | | | (5 | ) | | | — | | | | — | | | | — | |
Royal Bank of Scotland PLC | | | 93 | | | | (45 | ) | | | — | | | | — | | | | 48 | |
Standard Chartered Bank | | | 830 | | | | — | | | | — | | | | — | | | | 830 | |
| | | | |
Total | | $ | 1,384 | | | $ | (380 | ) | | | — | | | | — | | | $ | 1,004 | |
| | | | |
| | | | | | | | | | | | | | | | | | | | |
| Counterparty | | Derivative Liabilities
Subject to an MNA
by Counterparty | | | Derivatives
Available
for Offset1 | | | Non-cash
Collateral
Pledged | | | Cash
Collateral
Pledged | | | Net Amount of
Derivative
Liabilities3 | |
Bank of America N.A. | | $ | 255 | | | $ | (145 | ) | | | — | | | | — | | | $ | 110 | |
Barclays Bank PLC | | | 383 | | | | — | | | | — | | | | — | | | | 383 | |
Deutsche Bank AG | | | 16 | | | | — | | | | — | | | | — | | | | 16 | |
Goldman Sachs International | | | 707 | | | | (88 | ) | | | — | | | | — | | | | 619 | |
HSBC Bank PLC | | | 107 | | | | — | | | | — | | | | — | | | | 107 | |
Morgan Stanley & Co. International PLC | | | 97 | | | | (97 | ) | | | — | | | | — | | | | — | |
Northern Trust Co. | | | 64 | | | | (5 | ) | | | — | | | | — | | | | 59 | |
Royal Bank of Canada | | | 739 | | | | — | | | | — | | | | — | | | | 739 | |
Royal Bank of Scotland PLC | | | 45 | | | | (45 | ) | | | — | | | | — | | | | — | |
UBS AG | | | 28 | | | | — | | | | — | | | | — | | | | 28 | |
| | | | |
Total | | $ | 2,441 | | | $ | (380 | ) | | | — | | | | — | | | $ | 2,061 | |
| | | | |
1 The amount of derivatives available for offset is limited to the amount of derivative assets and/or liabilities that are subject to an MNA. | |
2 Net amount represents the net amount receivable from the counterparty in the event of default. | |
3 Net amount represents the net amount payable due to the counterparty in the event of default. | |
|
| Fair Value Hierarchy as of Period End |
Various inputs are used in determining the fair value of investments and derivative financial instruments. For information about LifePath Master Portfolio’s policy regarding valuation of investments and derivative financial instruments, refer to the Notes to Financial Statements.
The following tables summarize LifePath Master Portfolio’s investments and derivative financial instruments categorized in the disclosure hierarchy:
| | | | | | | | | | | | | | | | |
| | | Level 1 | | | Level 2 | | | Level 3 | | | Total | |
Assets: | | | | | | | | | | | | | | | | |
| Investments: | | | | | | | | | | | | | | | | |
Affiliated Investment Companies: | | | | | | | | | | | | | | | | |
Equity Funds | | $ | 6,180,932 | | | $ | 30,726,781 | | | | — | | | $ | 36,907,713 | |
Fixed Income Funds | | | 2,560,480 | | | | 22,012,998 | | | | — | | | | 24,573,478 | |
Short-Term Securities | | | 2,928 | | | | — | | | | — | | | | 2,928 | |
Common Stocks: | | | | | | | | | | | | | | | | |
Hotels, Restaurants & Leisure | | | 67,918 | | | | — | | | | — | | | | 67,918 | |
Real Estate Investment Trusts (REITs) | | | 1,850,931 | | | | 742,724 | | | | — | | | | 2,593,655 | |
Real Estate Management & Development | | | 64,562 | | | | 627,175 | | | | — | | | | 691,737 | |
| | | | | | | | | | | | | | | | |
Total | | $ | 10,727,751 | | | $ | 54,109,678 | | | | — | | | $ | 64,837,429 | |
| | | | | | | | | | | | | | | | |
| | | | | | | | | | | | | | | | |
| | | Level 1 | | | Level 2 | | | Level 3 | | | Total | |
| Derivative Financial Instruments 1 | | | | | | | | | | | | | | | | |
Assets: | | | | | | | | | | | | | | | | |
Forward foreign currency exchange contracts | | | — | | | $ | 1,384 | | | | — | | | $ | 1,384 | |
Liabilities: | | | | | | | | | | | | | | | | |
Forward foreign currency exchange contracts | | | — | | | | (2,441 | ) | | | — | | | | (2,441 | ) |
| | | | |
Total | | | — | | | $ | (1,057 | ) | | | — | | | $ | (1,057 | ) |
| | | | |
1 Derivative financial instruments are forward foreign currency exchange contracts that are valued at the unrealized appreciation (depreciation) on the instrument. | |
See Notes to Financial Statements.
| | | | | | |
| | | | | | | |
| | BLACKROCK FUNDS III | | DECEMBER 31, 2015 | | 53 |
| | |
Schedule of Investments (concluded) | | LifePath 2025 Master Portfolio |
The LifePath Master Portfolio may hold assets and/or liabilities in which the fair value approximates the carrying amount for financial statement purposes. As of period end, such assets and/or liabilities are categorized within the disclosure hierarchy as follows:
| | | | | | | | | | | | | | | | |
| | | Level 1 | | | Level 2 | | | Level 3 | | | Total | |
Assets: | | | | | | | | | | | | | | | | |
Cash | | $ | 65,981 | | | | — | | | | — | | | $ | 65,981 | |
Foreign currency at value | | | 18,216 | | | | — | | | | — | | | | 18,216 | |
Liabilities: | | | | | | | | | | | | | | | | |
Collateral on securities loaned at value | | | — | | | $ | (2,895 | ) | | | — | | | | (2,895 | ) |
| | | | |
Total | | $ | 84,197 | | | $ | (2,895 | ) | | | — | | | $ | 81,302 | |
| | | | |
During the year ended December 31, 2015, there were no transfers between levels.
See Notes to Financial Statements.
| | | | | | |
| | | | | | | |
| 54 | | BLACKROCK FUNDS III | | DECEMBER 31, 2015 | | |
| | |
Schedule of Investments December 31, 2015 | | LifePath 2035 Master Portfolio (Percentages shown are based on Net Assets) |
| | | | | | | | |
| Affiliated Investment Companies (a) | | Shares/
Beneficial Interest | | | Value | |
Equity Funds — 73.4% | | | | | | | | |
Active Stock Master Portfolio | | $ | 14,054,616 | | | $ | 14,054,616 | |
BlackRock Commodity Strategies Fund | | | 335,825 | | | | 2,041,815 | |
BlackRock Emerging Markets Fund, Inc. | | | 159,122 | | | | 2,485,481 | |
International Tilts Master Portfolio | | $ | 9,806,167 | | | | 9,806,167 | |
iShares MSCI Canada ETF | | | 34,847 | | | | 749,210 | |
iShares MSCI EAFE Small-Cap ETF | | | 27,791 | | | | 1,388,160 | |
Large Cap Index Master Portfolio
(fka Russell 1000® Index Master Portfolio) | | $ | 9,308,017 | | | | 9,308,017 | |
Master Small Cap Index Series | | $ | 1,323,109 | | | | 1,323,109 | |
| | | | | | | | |
| | | | | | | | 41,156,575 | |
Fixed Income Fund — 16.4% | |
CoreAlpha Bond Master Portfolio | | $ | 9,231,410 | | | | 9,231,410 | |
Short-Term Securities — 0.2% | |
BlackRock Cash Funds: Institutional,
SL Agency Shares, 0.38% (b) | | | 114,578 | | | | 114,578 | |
| Total Affiliated Investment Companies — 90.0% | | | | 50,502,563 | |
| | | | | | | | |
| | | | | | | | | |
| | |
| Common Stocks | | | | | | |
Hotels, Restaurants & Leisure — 0.2% | |
Hilton Worldwide Holdings, Inc. | | | 1,338 | | | | 28,633 | |
Pebblebrook Hotel Trust | | | 1,394 | | | | 39,060 | |
RLJ Lodging Trust | | | 1,971 | | | | 42,633 | |
| | | | | | | | |
| | | | | | | | 110,326 | |
Real Estate Investment Trusts (REITs) — 7.4% | |
Alexandria Real Estate Equities, Inc. | | | 895 | | | | 80,872 | |
Allied Properties Real Estate Investment Trust | | | 3,671 | | | | 83,756 | |
AvalonBay Communities, Inc. | | | 870 | | | | 160,193 | |
Beni Stabili SpA SIIQ | | | 55,800 | | | | 42,058 | |
Boston Properties, Inc. | | | 1,614 | | | | 205,850 | |
British Land Co. PLC | | | 10,009 | | | | 115,813 | |
Cambridge Industrial Trust | | | 138,600 | | | | 55,229 | |
CubeSmart | | | 3,072 | | | | 94,065 | |
CyrusOne, Inc. | | | 1,509 | | | | 56,512 | |
Derwent London PLC | | | 1,254 | | | | 67,826 | |
Duke Realty Corp. | | | 3,413 | | | | 71,741 | |
Empiric Student Property PLC | | | 25,500 | | | | 42,667 | |
EPR Properties | | | 1,048 | | | | 61,256 | |
Equity One, Inc. | | | 2,551 | | | | 69,260 | |
Equity Residential | | | 2,111 | | | | 172,236 | |
Essex Property Trust, Inc. | | | 507 | | | | 121,381 | |
Extra Space Storage, Inc. | | | 1,356 | | | | 119,613 | |
Federal Realty Investment Trust | | | 139 | | | | 20,308 | |
General Growth Properties, Inc. | | | 1,000 | | | | 27,210 | |
Goodman Group | | | 34,670 | | | | 157,105 | |
Gramercy Property Trust | | | 5,053 | | | | 39,006 | |
Japan Rental Housing Investments, Inc. | | | 77 | | | | 54,407 | |
Kenedix Retail REIT Corp. | | | 39 | | | | 82,560 | |
Kilroy Realty Corp. | | | 1,548 | | | | 97,957 | |
Kimco Realty Corp. | | | 2,172 | | | | 57,471 | |
Land Securities Group PLC | | | 7,141 | | | | 123,789 | |
Link REIT | | | 15,000 | | | | 89,428 | |
Macerich Co. | | | 901 | | | | 72,702 | |
Merlin Properties Socimi SA | | | 3,350 | | | | 41,966 | |
National Health Investors, Inc. | | | 950 | | | | 57,827 | |
Parkway Properties, Inc. | | | 3,484 | | | | 54,455 | |
Physicians Realty Trust | | | 377 | | | | 6,356 | |
Prologis, Inc. | | | 3,313 | | | | 142,194 | |
Retail Properties of America, Inc., Class A | | | 7,245 | | | | 107,009 | |
Sekisui House REIT, Inc. | | | 28 | | | | 30,511 | |
Simon Property Group, Inc. | | | 1,734 | | | | 337,159 | |
SL Green Realty Corp. | | | 637 | | | | 71,968 | |
STAG Industrial, Inc. | | | 3,273 | | | | 60,387 | |
| | | | | | | | |
| Common Stocks | |
Shares | | | Value | |
Real Estate Investment Trusts (REITs) (continued) | |
STORE Capital Corp. | | | 1,274 | | | $ | 29,557 | |
Sunstone Hotel Investors, Inc. | | | 5,727 | | | | 71,530 | |
Taubman Centers, Inc. | | | 262 | | | | 20,101 | |
UDR, Inc. | | | 2,164 | | | | 81,301 | |
Vastned Retail NV | | | 1,586 | | | | 72,863 | |
Vicinity Centres | | | 72,857 | | | | 147,803 | |
Welltower, Inc. | | | 2,456 | | | | 167,082 | |
Wereldhave NV | | | 1,090 | | | | 61,142 | |
Westfield Corp. | | | 16,815 | | | | 115,686 | |
| | | | | | | | |
| | | | | | | | 4,119,168 | |
Real Estate Management & Development — 2.1% | |
CareTrust REIT, Inc. | | | 5,472 | | | | 59,918 | |
Castellum AB | | | 4,793 | | | | 68,258 | |
Cheung Kong Property Holdings Ltd. | | | 19,000 | | | | 122,911 | |
Deutsche Wohnen AG, Bearer Shares | | | 3,048 | | | | 84,283 | |
First Capital Realty, Inc. | | | 3,028 | | | | 40,156 | |
Heiwa Real Estate Co., Ltd. | | | 7,000 | | | | 76,596 | |
Howard Hughes Corp. (c) | | | 234 | | | | 26,479 | |
Kennedy Wilson Europe Real Estate PLC | | | 1,536 | | | | 27,316 | |
Kungsleden AB | | | 6,079 | | | | 43,437 | |
KWG Property Holding Ltd. | | | 72,500 | | | | 53,444 | |
LEG Immobilien AG | | | 361 | | | | 29,422 | |
Leopalace21 Corp. (c) | | | 4,800 | | | | 25,981 | |
Nomura Real Estate Holdings, Inc. | | | 3,100 | | | | 57,512 | |
Sumitomo Realty & Development Co., Ltd. | | | 5,000 | | | | 142,713 | |
Sun Hung Kai Properties Ltd. | | | 12,000 | | | | 144,235 | |
VIB Vermoegen AG | | | 2,081 | | | | 38,661 | |
Vonovia SE | | | 2,257 | | | | 69,726 | |
Wharf Holdings Ltd. | | | 16,000 | | | | 88,216 | |
| | | | | | | | |
| | | | | | | | 1,199,264 | |
| Total Common Stocks — 9.7% | | | | | | | 5,428,758 | |
| Total Investments (Cost — $57,578,516) — 99.7% | | | | | | | 55,931,321 | |
| Other Assets Less Liabilities — 0.3% | | | | | | | 168,648 | |
| | | | | | | | |
Net Assets — 100.0% | | | | | | $ | 56,099,969 | |
| | | | | | | | |
See Notes to Financial Statements.
| | | | | | |
| | | | | | | |
| | BLACKROCK FUNDS III | | DECEMBER 31, 2015 | | 55 |
| | |
Schedule of Investments (continued) | | LifePath 2035 Master Portfolio |
|
| Notes to Schedule of Investments |
| (a) | | During the year ended December 31, 2015, investments in issuers considered to be affiliates of LifePath Master Portfolio for purposes of Section 2(a)(3) of the Investment Company Act of 1940, as amended, were as follows: |
| | | | | | | | | | | | | | | | | | | | | | | | | | | | |
| Affiliate | | Shares/ Beneficial
Interest Held at
December 31, 2014 | | | Shares/ Beneficial
Interest
Purchased | | | Shares/
Beneficial
Interest
Sold | | | Shares/ Beneficial
Interest Held at
December 31, 2015 | | | Value at
December 31, 2015 | | | Net Income | | | Realized
Gain (Loss) | |
Active Stock Master Portfolio | | $ | 15,858,279 | | | | — | | | $ | (1,803,663 | )1 | | $ | 14,054,616 | | | $ | 14,054,616 | | | $ | 255,739 | | | $ | 1,813,850 | 2 |
BlackRock Cash Funds: Institutional, SL Agency Shares | | | 105,615 | | | | 8,963 | 3 | | | — | | | | 114,578 | | | $ | 114,578 | | | $ | 166 | | | | — | |
BlackRock Cash Funds: Prime, SL Agency Shares4 | | | — | | | | — | | | | — | | | | — | | | | — | | | $ | 3,066 | 5 | | | — | |
BlackRock Commodity Strategies Fund | | | 266,087 | | | | 121,130 | | | | (51,392 | ) | | | 335,825 | | | $ | 2,041,815 | | | | — | | | $ | (152,128 | ) |
BlackRock Emerging Markets Fund, Inc. | | | 147,219 | | | | 47,380 | | | | (35,477 | ) | | | 159,122 | | | $ | 2,485,481 | | | $ | 32,852 | | | $ | (42,852 | ) |
CoreAlpha Bond Master Portfolio | | $ | 7,576,096 | | | $ | 1,655,314 | 3 | | | — | | | $ | 9,231,410 | | | $ | 9,231,410 | | | $ | 216,586 | | | $ | 84,691 | 2 |
International Tilts Master Portfolio | | $ | 8,798,849 | | | $ | 1,007,318 | 3 | | | — | | | $ | 9,806,167 | | | $ | 9,806,167 | | | $ | 259,152 | | | $ | (480,680 | )2 |
iShares Cohen & Steers REIT ETF4 | | | 30,677 | | | | 10,288 | | | | (40,965 | ) | | | — | | | | — | | | $ | 70,648 | | | $ | 410,996 | |
iShares International Developed Real Estate ETF4 | | | 84,556 | | | | 25,726 | | | | (110,282 | ) | | | — | | | | — | | | $ | 77,242 | | | $ | (288,924 | ) |
iShares MSCI Canada ETF | | | 32,043 | | | | 7,375 | | | | (4,571 | ) | | | 34,847 | | | $ | 749,210 | | | $ | 17,150 | | | $ | (18,493 | ) |
iShares MSCI EAFE Small-Cap ETF | | | 28,911 | | | | 4,879 | | | | (5,999 | ) | | | 27,791 | | | $ | 1,388,160 | | | $ | 29,128 | | | $ | (2,938 | ) |
iShares TIPS Bond ETF4 | | | 3,848 | | | | 200 | | | | (4,048 | ) | | | — | | | | — | | | $ | 1,310 | | | $ | (12,616 | ) |
Large Cap Index Master Portfolio
(fka Russell 1000® Index Master Portfolio) | | $ | 8,787,621 | | | $ | 520,396 | 3 | | | — | | | $ | 9,308,017 | | | $ | 9,308,017 | | | $ | 200,607 | | | $ | 423,183 | 2 |
Master Small Cap Index Series | | $ | 1,338,461 | | | | — | | | $ | (15,352 | )1 | | $ | 1,323,109 | | | $ | 1,323,109 | | | $ | 20,130 | | | $ | 221,619 | 2 |
| |
1 Represents net shares/beneficial interest sold. | |
2 Includes the following gains and (losses) from in-kind redemptions from affiliated holdings. See Note 2 of the Notes to Financial Statements. | |
| | | | | | | | | | | | | | | | | | |
Active Stock
Master Portfolio | | | CoreAlpha Bond
Master Portfolio | | | International Tilts
Master Portfolio | | | Large Cap Index
Master Portfolio
(fka Russell
1000® Index
Master Portfolio) | | | Master Small Cap
Index Series | |
| $ | 762,647 | | | $ | 33,848 | | | $ | (183,669 | ) | | $ | 864,887 | | | $ | 245,638 | |
| | | | | | | | | | | | | | |
3 Represents net shares/beneficial interest purchased. |
4 No longer held by LifePath Master Portfolio as of report date. |
5 Represents securities lending income earned from the reinvestment of cash collateral from loaned securities, net of fees, and collateral investment expenses, and other payments to and from borrowers of securities. |
| (b) | | Current yield as of period end. |
| (c) | | Non-income producing security. |
|
| Derivative Financial Instruments Outstanding as of Period End |
Forward Foreign Currency Exchange Contracts
| | | | | | | | | | | | | | | | | | | | | | |
Currency
Purchased | | | Currency
Sold | | | Counterparty | | Settlement
Date | | | Unrealized
Appreciation
(Depreciation) | | | |
| CAD | | | 9,000 | | | USD | | | 6,504 | | | Morgan Stanley & Co. International PLC | | | 1/21/16 | | | $ | (25 | ) | | |
| CAD | | | 14,000 | | | USD | | | 10,190 | | | Northern Trust Co. | | | 1/21/16 | | | | (112 | ) | | |
| CHF | | | 45,000 | | | USD | | | 45,466 | | | Goldman Sachs International | | | 1/21/16 | | | | (480 | ) | | |
| CHF | | | 4,000 | | | USD | | | 4,018 | | | Morgan Stanley & Co. International PLC | | | 1/21/16 | | | | (19 | ) | | |
| EUR | | | 109,000 | | | USD | | | 119,105 | | | HSBC Bank PLC | | | 1/21/16 | | | | (651 | ) | | |
| EUR | | | 13,000 | | | USD | | | 14,141 | | | Morgan Stanley & Co. International PLC | | | 1/21/16 | | | | (13 | ) | | |
| GBP | | | 10,000 | | | USD | | | 14,739 | | | Morgan Stanley & Co. International PLC | | | 1/21/16 | | | | 1 | | | |
| HKD | | | 65,000 | | | USD | | | 8,388 | | | Barclays Bank PLC | | | 1/21/16 | | | | — | | | |
| ILS | | | 22,000 | | | USD | | | 5,682 | | | Deutsche Bank AG | | | 1/21/16 | | | | (27 | ) | | |
| JPY | | | 1,714,000 | | | USD | | | 14,272 | | | Goldman Sachs International | | | 1/21/16 | | | | (19 | ) | | |
| JPY | | | 15,454,000 | | | USD | | | 127,179 | | | Standard Chartered Bank | | | 1/21/16 | | | | 1,336 | | | |
| NOK | | | 29,000 | | | USD | | | 3,339 | | | Morgan Stanley & Co. International PLC | | | 1/21/16 | | | | (64 | ) | | |
| NZD | | | 8,000 | | | USD | | | 5,386 | | | Goldman Sachs International | | | 1/21/16 | | | | 86 | | | |
| SEK | | | 23,000 | | | USD | | | 2,725 | | | Northern Trust Co. | | | 1/21/16 | | | | 5 | | | |
| SGD | | | 117,000 | | | USD | | | 83,007 | | | Barclays Bank PLC | | | 1/21/16 | | | | (581 | ) | | |
| SGD | | | 8,000 | | | USD | | | 5,643 | | | Morgan Stanley & Co. International PLC | | | 1/21/16 | | | | (7 | ) | | |
See Notes to Financial Statements.
| | | | | | |
| | | | | | | |
| 56 | | BLACKROCK FUNDS III | | DECEMBER 31, 2015 | | |
| | |
Schedule of Investments (continued) | | LifePath 2035 Master Portfolio |
Forward Foreign Currency Exchange Contracts (continued)
| | | | | | | | | | | | | | | | | | | | | | |
Currency
Purchased | | | Currency
Sold | | | Counterparty | | Settlement
Date | | | Unrealized
Appreciation
(Depreciation) | | | |
| USD | | | 7,314 | | | AUD | | | 10,000 | | | Goldman Sachs International | | | 1/21/16 | | | $ | 44 | | | |
| USD | | | 7,932 | | | AUD | | | 11,000 | | | Morgan Stanley & Co. International PLC | | | 1/21/16 | | | | (65 | ) | | |
| USD | | | 93,277 | | | AUD | | | 130,000 | | | Royal Bank of Canada | | | 1/21/16 | | | | (1,232 | ) | | |
| USD | | | 11,903 | | | EUR | | | 11,000 | | | Goldman Sachs International | | | 1/21/16 | | | | (51 | ) | | |
| USD | | | 2,177 | | | EUR | | | 2,000 | | | Goldman Sachs International | | | 1/21/16 | | | | 4 | | | |
| USD | | | 54,261 | | | EUR | | | 50,000 | | | Royal Bank of Scotland PLC | | | 1/21/16 | | | | (75 | ) | | |
| USD | | | 8,741 | | | EUR | | | 8,000 | | | Royal Bank of Scotland PLC | | | 1/21/16 | | | | 47 | | | |
| USD | | | 23,816 | | | GBP | | | 16,000 | | | Bank of America N.A. | | | 1/21/16 | | | | 232 | | | |
| USD | | | 13,545 | | | GBP | | | 9,000 | | | Morgan Stanley & Co. International PLC | | | 1/21/16 | | | | 279 | | | |
| USD | | | 10,430 | | | GBP | | | 7,000 | | | Royal Bank of Scotland PLC | | | 1/21/16 | | | | 112 | | | |
| USD | | | 103,236 | | | HKD | | | 800,000 | | | Goldman Sachs International | | | 1/21/16 | | | | (4 | ) | | |
| USD | | | 6,194 | | | HKD | | | 48,000 | | | Northern Trust Co. | | | 1/21/16 | | | | — | | | |
| USD | | | 25,803 | | | SEK | | | 221,000 | | | Bank of America N.A. | | | 1/21/16 | | | | (423 | ) | | |
| USD | | | 21,420 | | | SEK | | | 182,000 | | | HSBC Bank PLC | | | 1/21/16 | | | | (178 | ) | | |
| USD | | | 18,419 | | | SGD | | | 26,000 | | | Northern Trust Co. | | | 1/21/16 | | | | 102 | | | |
| USD | | | 15,544 | | | SGD | | | 22,000 | | | Standard Chartered Bank | | | 1/21/16 | | | | 45 | | | |
| Total | | | | | | | | | | | | | | | | | | $ | (1,733 | ) | | |
| | | | | | | | | | | | | | | | | | | |
|
| Derivative Financial Instruments Categorized by Risk Exposure |
As of period end, the fair values of derivative financial instruments located in the Statements of Assets and Liabilities were as follows:
| | | | | | | | | | | | | | | | | | | | | | | | | | | | | | |
| Assets — Derivative Financial Instruments | | | | Commodity Contracts | | | Credit Contracts | | | Equity Contracts | | | Foreign Currency Exchange Contracts | | | Interest Rate Contracts | | | Other Contracts | | | Total | |
Forward foreign currency exchange contracts | | Net unrealized appreciation on forward currency exchange contracts | | | — | | | | — | | | | — | | | $ | 2,293 | | | | — | | | | — | | | $ | 2,293 | |
Liabilities — Derivative Financial Instruments | | | | | | | | | | | | | | | | | | | | | | | | | | | | | | |
Forward foreign currency exchange contracts | | Net unrealized depreciation on forward currency exchange contracts | | | — | | | | — | | | | — | | | $ | 4,026 | | | | — | | | | — | | | $ | 4,026 | |
For the year ended December 31, 2015, the effect of derivative financial instruments in the Statements of Operations was as follows:
| | | | | | | | | | | | | | | | | | | | | | | | | | | | |
| Net Change in Unrealized Appreciation (Depreciation) on: | | Commodity Contracts | | | Credit Contracts | | | Equity Contracts | | | Foreign Currency Exchange Contracts | | | Interest Rate Contracts | | | Other Contracts | | | Total | |
Forward foreign currency exchange contracts | | | — | | | | — | | | | — | | | $ | (1,733 | ) | | | — | | | | — | | | $ | (1,733 | ) |
|
| Average Quarterly Balances of Outstanding Derivative Financial Instruments |
| | | | |
| Forward foreign currency exchange contracts: | | | | |
Average amounts purchased — in USD | | $ | 106,003 | |
Average amounts sold — in USD | | $ | 117,446 | |
For more information about the LifePath Master Portfolio’s investment risks regarding derivative financial instruments, refer to the Notes to Financial Statements.
|
| Derivative Financial Instruments — Offsetting as of Period End |
The LifePath Master Portfolio’s derivative assets and liabilities (by type) were as follows:
| | | | | | | | |
| | | Assets | | | Liabilities | |
Derivative Financial Instruments: | | | | | | | | |
Forward foreign currency exchange contracts | | $ | 2,293 | | | $ | 4,026 | |
| | | | |
Total derivative assets and liabilities in the Statements of Assets and Liabilities | | $ | 2,293 | | | $ | 4,026 | |
| | | | |
Derivatives not subject to a Master Netting Agreement or similar agreement (“MNA”) | | | — | | | | — | |
| | | | |
Total derivative assets and liabilities subject to an MNA | | $ | 2,293 | | | $ | 4,026 | |
| | | | |
See Notes to Financial Statements.
| | | | | | |
| | | | | | | |
| | BLACKROCK FUNDS III | | DECEMBER 31, 2015 | | 57 |
| | |
Schedule of Investments (concluded) | | LifePath 2035 Master Portfolio |
The following table presents the LifePath Master Portfolio’s derivative assets and liabilities by counterparty net of amounts available for offset under an Master Netting Agreement (“MNA”) and net of the related collateral received and pledged by the LifePath Master Portfolio:
| | | | | | | | | | | | | | | | | | | | |
| Counterparty | | Derivative Assets
Subject to an MNA
by Counterparty | | | Derivatives
Available
for Offset1 | | | Non-cash
Collateral
Received | | | Cash
Collateral
Received | | | Net Amount of
Derivative
Assets2 | |
Bank of America N.A. | | $ | 232 | | | $ | (232 | ) | | | — | | | | — | | | | — | |
Goldman Sachs International | | | 134 | | | | (134 | ) | | | — | | | | — | | | | — | |
Morgan Stanley & Co. International PLC | | | 280 | | | | (193 | ) | | | — | | | | — | | | $ | 87 | |
Northern Trust Co. | | | 107 | | | | (107 | ) | | | — | | | | — | | | | — | |
Royal Bank of Scotland PLC | | | 159 | | | | (75 | ) | | | — | | | | — | | | | 84 | |
Standard Chartered Bank | | | 1,381 | | | | — | | | | — | | | | — | | | | 1,381 | |
| | | | |
Total | | $ | 2,293 | | | $ | (741 | ) | | | — | | | | — | | | $ | 1,552 | |
| | | | |
| | | | | | | | | | | | | | | | | | | | |
| Counterparty | | Derivative Liabilities
Subject to an MNA
by Counterparty | | | Derivatives
Available
for Offset1 | | | Non-cash
Collateral
Pledged | | | Cash
Collateral
Pledged | | | Net Amount of
Derivative
Liabilities3 | |
Bank of America N.A. | | $ | 423 | | | $ | (232 | ) | | | — | | | | — | | | $ | 191 | |
Barclays Bank PLC | | | 581 | | | | — | | | | — | | | | — | | | | 581 | |
Deutsche Bank AG | | | 27 | | | | — | | | | — | | | | — | | | | 27 | |
Goldman Sachs International | | | 554 | | | | (134 | ) | | | — | | | | — | | | | 420 | |
HSBC Bank PLC | | | 829 | | | | — | | | | — | | | | — | | | | 829 | |
Morgan Stanley & Co. International PLC | | | 193 | | | | (193 | ) | | | — | | | | — | | | | — | |
Northern Trust Co. | | | 112 | | | | (107 | ) | | | — | | | | — | | | | 5 | |
Royal Bank of Canada | | | 1,232 | | | | — | | | | — | | | | — | | | | 1,232 | |
Royal Bank of Scotland PLC | | | 75 | | | | (75 | ) | | | — | | | | — | | | | — | |
| | | | |
Total | | $ | 4,026 | | | $ | (741 | ) | | | — | | | | — | | | $ | 3,285 | |
| | | | |
1 The amount of derivatives available for offset is limited to the amount of derivative assets and/or liabilities that are subject to an MNA. | |
2 Net amount represents the net amount receivable from the counterparty in the event of default. | |
3 Net amount represents the net amount payable due to the counterparty in the event of default. | |
|
| Fair Value Hierarchy as of Period End |
Various inputs are used in determining the fair value of investments and derivative financial instruments. For information about LifePath Master Portfolio’s policy regarding valuation of investments and derivative financial instruments, refer to the Notes to Financial Statements.
The following tables summarize LifePath Master Portfolio’s investments and derivative financial instruments categorized in the disclosure hierarchy:
| | | | | | | | | | | | | | | | |
| | | Level 1 | | | Level 2 | | | Level 3 | | | Total | |
Assets: | | | | | | | | | | | | | | | | |
| Investments: | | | | | | | | | | | | | | | | |
Affiliated Investment Companies: | | | | | | | | | | | | | | | | |
Equity Funds | | $ | 6,664,666 | | | $ | 34,491,909 | | | | — | | | $ | 41,156,575 | |
Fixed Income Fund | | | — | | | | 9,231,410 | | | | — | | | | 9,231,410 | |
Short-Term Securities | | | 114,578 | | | | — | | | | — | | | | 114,578 | |
Common Stocks: | | | | | | | | | | | | | | | | |
Hotels, Restaurants & Leisure | | | 110,326 | | | | — | | | | — | | | | 110,326 | |
Real Estate Investment Trusts (REITs) | | | 2,916,210 | | | | 1,202,958 | | | | — | | | | 4,119,168 | |
Real Estate Management & Development | | | 165,215 | | | | 1,034,049 | | | | — | | | | 1,199,264 | |
| | | | | | | | | | | | | | | | |
Total | | $ | 9,970,995 | | | $ | 45,960,326 | | | | — | | | $ | 55,931,321 | |
| | | | | | | | | | | | | | | | |
| |
| | | Level 1 | | | Level 2 | | | Level 3 | | | Total | |
| Derivative Financial Instruments 1 | | | | | | | | | |
Assets: | | | | | | | | | | | | | | | | |
Forward foreign currency exchange contracts | | | — | | | $ | 2,293 | | | | — | | | $ | 2,293 | |
Liabilities: | | | | | | | | | | | | | | | | |
Forward foreign currency exchange contracts | | | — | | | | (4,026 | ) | | | — | | | | (4,026 | ) |
| | | | |
Total | | | — | | | $ | (1,733 | ) | | | — | | | $ | (1,733 | ) |
| | | | |
1 Derivative financial instruments are forward foreign currency exchange contracts that are valued at the unrealized appreciation (depreciation) on the instrument. | |
The LifePath Master Portfolio may hold assets and/or liabilities in which the fair value approximates the carrying amount for financial statement purposes. As of period end, such assets and/or liabilities are categorized within the disclosure hierarchy as follows:
| | | | | | | | | | | | | | | | |
| | | Level 1 | | | Level 2 | | | Level 3 | | | Total | |
Assets: | | | | | | | | | | | | | | | | |
Cash | | $ | 88,258 | | | | — | | | | — | | | $ | 88,258 | |
Foreign currency at value | | | 29,679 | | | | — | | | | — | | | | 29,679 | |
| | | | |
Total | | $ | 117,937 | | | | — | | | | — | | | $ | 117,937 | |
| | | | |
During the year ended December 31, 2015, there were no transfers between levels.
See Notes to Financial Statements.
| | | | | | |
| | | | | | | |
| 58 | | BLACKROCK FUNDS III | | DECEMBER 31, 2015 | | |
| | |
Schedule of Investments December 31, 2015 | | LifePath 2045 Master Portfolio (Percentages shown are based on Net Assets) |
| | | | | | | | |
| Affiliated Investment Companies (a) | | Shares/
Beneficial Interest | | | Value | |
Equity Funds — 83.5% | | | | | | | | |
Active Stock Master Portfolio | | $ | 9,661,693 | | | $ | 9,661,693 | |
BlackRock Commodity Strategies Fund | | | 218,114 | | | | 1,326,135 | |
BlackRock Emerging Markets Fund, Inc. | | | 115,074 | | | | 1,797,459 | |
International Tilts Master Portfolio | | $ | 7,130,177 | | | | 7,130,177 | |
iShares MSCI Canada ETF | | | 25,466 | | | | 547,519 | |
iShares MSCI EAFE Small-Cap ETF | | | 20,165 | | | | 1,007,242 | |
Large Cap Index Master Portfolio
(fka Russell 1000® Index Master Portfolio) | | $ | 6,622,730 | | | | 6,622,730 | |
Master Small Cap Index Series | | $ | 739,657 | | | | 739,657 | |
| | | | | | | | |
| | | | | | | | 28,832,612 | |
Fixed Income Fund — 2.7% | |
CoreAlpha Bond Master Portfolio | | $ | 919,479 | | | | 919,479 | |
Short-Term Securities — 0.2% | |
BlackRock Cash Funds: Institutional,
SL Agency Share, 0.38% (b) | | | 69,510 | | | | 69,510 | |
| Total Affiliated Investment Companies — 86.4% | | | | 29,821,601 | |
| | | | | | | | |
| | | | | | | | | |
| | |
| Common Stocks | | | | | | |
Hotels, Restaurants & Leisure — 0.3% | |
Hilton Worldwide Holdings, Inc. | | | 1,113 | | | | 23,818 | |
Pebblebrook Hotel Trust | | | 1,156 | | | | 32,391 | |
RLJ Lodging Trust | | | 1,635 | | | | 35,365 | |
| | | | | | | | |
| | | | | | | | 91,574 | |
Real Estate Investment Trusts (REITs) — 9.9% | |
Alexandria Real Estate Equities, Inc. | | | 742 | | | | 67,047 | |
Allied Properties Real Estate Investment Trust | | | 3,052 | | | | 69,633 | |
AvalonBay Communities, Inc. | | | 724 | | | | 133,310 | |
Beni Stabili SpA SIIQ | | | 46,397 | | | | 34,970 | |
Boston Properties, Inc. | | | 1,339 | | | | 170,776 | |
British Land Co. PLC | | | 8,303 | | | | 96,073 | |
Cambridge Industrial Trust | | | 112,800 | | | | 44,948 | |
CareTrust REIT, Inc. | | | 4,550 | | | | 49,823 | |
CubeSmart | | | 2,549 | | | | 78,050 | |
CyrusOne, Inc. | | | 1,255 | | | | 47,000 | |
Derwent London PLC | | | 1,040 | | | | 56,251 | |
Duke Realty Corp. | | | 2,831 | | | | 59,508 | |
Empiric Student Property PLC | | | 21,189 | | | | 35,454 | |
EPR Properties | | | 871 | | | | 50,910 | |
Equity One, Inc. | | | 2,078 | | | | 56,418 | |
Equity Residential | | | 1,751 | | | | 142,864 | |
Essex Property Trust, Inc. | | | 420 | | | | 100,552 | |
Extra Space Storage, Inc. | | | 1,125 | | | | 99,236 | |
Federal Realty Investment Trust | | | 116 | | | | 16,948 | |
General Growth Properties, Inc. | | | 832 | | | | 22,639 | |
Goodman Group | | | 28,762 | | | | 130,333 | |
Gramercy Property Trust | | | 4,201 | | | | 32,431 | |
Japan Rental Housing Investments, Inc. | | | 64 | | | | 45,222 | |
Kenedix Retail REIT Corp. | | | 32 | | | | 67,742 | |
Kilroy Realty Corp. | | | 1,284 | | | | 81,252 | |
Kimco Realty Corp. | | | 1,806 | | | | 47,787 | |
Land Securities Group PLC | | | 5,924 | | | | 102,693 | |
Link REIT | | | 12,500 | | | | 74,524 | |
Macerich Co. | | | 749 | | | | 60,437 | |
Merlin Properties Socimi SA | | | 2,779 | | | | 34,813 | |
National Health Investors, Inc. | | | 788 | | | | 47,966 | |
Parkway Properties, Inc. | | | 2,890 | | | | 45,171 | |
Physicians Realty Trust | | | 314 | | | | 5,294 | |
Prologis, Inc. | | | 2,748 | | | | 117,944 | |
Retail Properties of America, Inc., Class A | | | 6,010 | | | | 88,768 | |
Sekisui House REIT, Inc. | | | 24 | | | | 26,152 | |
Simon Property Group, Inc. | | | 1,439 | | | | 279,799 | |
SL Green Realty Corp. | | | 529 | | | | 59,766 | |
| | | | | | | | |
Common Stocks | |
Shares | | | Value | |
Real Estate Investment Trusts (REITs) (continued) | |
STAG Industrial, Inc. | | | 2,716 | | | $ | 50,110 | |
STORE Capital Corp. | | | 1,059 | | | | 24,569 | |
Sunstone Hotel Investors, Inc. | | | 4,762 | | | | 59,477 | |
Taubman Centers, Inc. | | | 218 | | | | 16,725 | |
UDR, Inc. | | | 1,795 | | | | 67,438 | |
Vastned Retail NV | | | 1,318 | | | | 60,550 | |
Vicinity Centres | | | 60,440 | | | | 122,613 | |
Welltower, Inc. | | | 2,043 | | | | 138,985 | |
Wereldhave NV | | | 885 | | | | 49,643 | |
Westfield Corp. | | | 13,949 | | | | 95,968 | |
| | | | | | | | |
| | | | | | | | 3,466,582 | |
Real Estate Management & Development — 2.8% | |
Castellum AB | | | 3,985 | | | | 56,751 | |
Cheung Kong Property Holdings Ltd. | | | 15,500 | | | | 100,269 | |
Deutsche Wohnen AG, Bearer Shares | | | 2,534 | | | | 70,070 | |
First Capital Realty, Inc. | | | 2,435 | | | | 32,292 | |
Heiwa Real Estate Co., Ltd. | | | 5,800 | | | | 63,466 | |
Howard Hughes Corp. (c) | | | 184 | | | | 20,822 | |
Kennedy Wilson Europe Real Estate PLC | | | 1,214 | | | | 21,589 | |
Kungsleden AB | | | 5,055 | | | | 36,120 | |
KWG Property Holding Ltd. | | | 60,500 | | | | 44,598 | |
LEG Immobilien AG | | | 300 | | | | 24,450 | |
Leopalace21 Corp. (c) | | | 4,000 | | | | 21,651 | |
Nomura Real Estate Holdings, Inc. | | | 2,600 | | | | 48,236 | |
Sumitomo Realty & Development Co. Ltd. | | | 4,000 | | | | 114,171 | |
Sun Hung Kai Properties Ltd. | | | 10,000 | | | | 120,196 | |
VIB Vermoegen AG | | | 1,730 | | | | 32,140 | |
Vonovia SE | | | 1,877 | | | | 57,986 | |
Wharf Holdings Ltd. | | | 13,000 | | | | 71,675 | |
| | | | | | | | |
| | | | | | | | 936,482 | |
| Total Common Stocks — 13.0% | | | | | | | 4,494,638 | |
| Total Investments (Cost — $35,335,254) — 99.4% | | | | | | $ | 34,316,239 | |
| Other Assets Less Liabilities — 0.6% | | | | | | | 200,531 | |
| | | | | | | | |
Net Assets — 100.0% | | | | | | $ | 34,516,770 | |
| | | | | | | | |
See Notes to Financial Statements.
| | | | | | |
| | | | | | | |
| | BLACKROCK FUNDS III | | DECEMBER 31, 2015 | | 59 |
| | |
Schedule of Investments (continued) | | LifePath 2045 Master Portfolio |
|
| Notes to Schedule of Investments |
| (a) | | During the year ended December 31, 2015, investments in issuers considered to be affiliates of LifePath Master Portfolio for purposes of Section 2(a)(3) of the Investment Company Act of 1940, as amended, were as follows: |
| | | | | | | | | | | | | | | | | | | | | | | | | | | | |
| Affiliate | | Shares/ Beneficial
Interest Held at
December 31, 2014 | | | Shares/ Beneficial
Interest
Purchased | | | Shares/ Beneficial
Interest
Sold | | | Shares/ Beneficial
Interest Held at
December 31, 2015 | | | Value at
December 31, 2015 | | | Net Income | | | Realized
Gain (Loss) | |
Active Stock Master Portfolio | | $ | 10,880,891 | | | | — | | | $ | (1,219,198 | )1 | | $ | 9,661,693 | | | $ | 9,661,693 | | | $ | 172,676 | | | $ | 1,197,533 | 2 |
BlackRock Cash Funds: Institutional, SL Agency Shares | | | 75,058 | | | | — | | | | (5,548 | )1 | | | 69,510 | | | $ | 69,510 | | | $ | 221 | | | | — | |
BlackRock Cash Funds: Prime, SL Agency Shares3 | | | — | | | | — | | | | — | | | | — | | | | — | | | $ | 1,845 | 4 | | | — | |
BlackRock Commodity Strategies Fund | | | 178,939 | | | | 79,410 | | | | (40,235 | ) | | | 218,114 | | | $ | 1,326,135 | | | | — | | | $ | (108,972 | ) |
BlackRock Emerging Markets Fund, Inc. | | | 104,984 | | | | 39,932 | | | | (29,842 | ) | | | 115,074 | | | $ | 1,797,459 | | | $ | 23,559 | | | $ | (32,257 | ) |
CoreAlpha Bond Master Portfolio | | $ | 644,004 | | | $ | 275,475 | 5 | | | — | | | $ | 919,479 | | | $ | 919,479 | | | $ | 20,935 | | | $ | 43,883 | 2 |
International Tilts Master Portfolio | | $ | 6,367,614 | | | $ | 762,563 | 5 | | | — | | | $ | 7,130,177 | | | $ | 7,130,177 | | | $ | 180,493 | | | $ | (326,538 | )2 |
iShares Cohen & Steers REIT ETF3 | | | 25,214 | | | | 9,472 | | | | (34,686 | ) | | | — | | | | — | | | $ | 57,157 | | | $ | 315,846 | |
iShares International Developed Real Estate ETF3 | | | 69,082 | | | | 22,438 | | | | (91,520 | ) | | | — | | | | — | | | $ | 62,285 | | | $ | (236,652 | ) |
iShares MSCI Canada ETF | | | 23,208 | | | | 5,439 | | | | (3,181 | ) | | | 25,466 | | | $ | 547,519 | | | $ | 12,273 | | | $ | (6,986 | ) |
iShares MSCI EAFE Small-Cap ETF | | | 20,569 | | | | 3,702 | | | | (4,106 | ) | | | 20,165 | | | $ | 1,007,242 | | | $ | 20,433 | | | $ | 7,303 | |
Large Cap Index Master Portfolio
(fka Russell 1000® Index Master Portfolio) | | $ | 6,174,176 | | | $ | 448,554 | 5 | | | — | | | $ | 6,622,730 | | | $ | 6,622,730 | | | $ | 135,844 | | | $ | 338,528 | 2 |
Master Small Cap Index Series | | $ | 865,739 | | | | — | | | $ | (126,082 | )1 | | $ | 739,657 | | | $ | 739,657 | | | $ | 11,834 | | | $ | 95,949 | 2 |
| |
1 Represents net shares/beneficial interest sold. | |
2 Includes the following gains and (losses) from in-kind redemptions from affiliated holdings. See Note 2 of the Notes to Financial Statements. | |
| | | | | | | | | | | | | | | | | | |
Active Stock
Master Portfolio | | | CoreAlpha Bond
Master Portfolio | | | International Tilts
Master Portfolio | | | Large Cap Index
Master Portfolio
(fka Russell
1000® Index
Master Portfolio) | | | Master Small Cap
Index Series | |
| $ | 523,278 | | | $ | 3,501 | | | $ | (131,856 | ) | | $ | 592,252 | | | $ | 143,983 | |
| | | | | | | | | | | | | | |
3 No longer held by LifePath Master Portfolio as of report date. |
4 Represents securities lending income earned from the reinvestment of cash collateral from loaned securities, net of fees, and collateral investment expenses, and other payments to and from borrowers of securities. 5 Represents net shares/beneficial interest purchased. |
| (b) | Current yield as of period end. |
| (c) | Non-income producing security. |
|
| Derivative Financial Instruments Outstanding as of Period End |
Forward Foreign Currency Exchange Contracts
| | | | | | | | | | | | | | | | | | | | | | |
Currency
Purchased | | | Currency
Sold | | | Counterparty | | Settlement
Date | | | Unrealized
Appreciation
(Depreciation) | | | |
| CAD | | | 7,000 | | | USD | | | 5,059 | | | Morgan Stanley & Co. International PLC | | | 1/21/16 | | | $ | (19 | ) | | |
| CAD | | | 12,000 | | | USD | | | 8,735 | | | Northern Trust Co. | | | 1/21/16 | | | | (96 | ) | | |
| CHF | | | 38,000 | | | USD | | | 38,394 | | | Goldman Sachs International | | | 1/21/16 | | | | (405 | ) | | |
| CHF | | | 3,000 | | | USD | | | 3,013 | | | Morgan Stanley & Co. International PLC | | | 1/21/16 | | | | (14 | ) | | |
| EUR | | | 90,000 | | | USD | | | 98,343 | | | HSBC Bank PLC | | | 1/21/16 | | | | (538 | ) | | |
| EUR | | | 10,000 | | | USD | | | 10,877 | | | Morgan Stanley & Co. International PLC | | | 1/21/16 | | | | (10 | ) | | |
| GBP | | | 5,000 | | | USD | | | 7,370 | | | Morgan Stanley & Co. International PLC | | | 1/21/16 | | | | — | | | |
| GBP | | | 3,000 | | | USD | | | 4,463 | | | Royal Bank of Scotland PLC | | | 1/21/16 | | | | (41 | ) | | |
| HKD | | | 30,000 | | | USD | | | 3,872 | | | Barclays Bank PLC | | | 1/21/16 | | | | — | | | |
| ILS | | | 18,000 | | | USD | | | 4,649 | | | Deutsche Bank AG | | | 1/21/16 | | | | (22 | ) | | |
| JPY | | | 1,278,000 | | | USD | | | 10,642 | | | Goldman Sachs International | | | 1/21/16 | | | | (14 | ) | | |
| JPY | | | 13,389,000 | | | USD | | | 110,185 | | | Standard Chartered Bank | | | 1/21/16 | | | | 1,157 | | | |
| NOK | | | 24,000 | | | USD | | | 2,763 | | | Morgan Stanley & Co. International PLC | | | 1/21/16 | | | | (52 | ) | | |
| NZD | | | 6,000 | | | USD | | | 4,039 | | | Goldman Sachs International | | | 1/21/16 | | | | 64 | | | |
| SEK | | | 19,000 | | | USD | | | 2,251 | | | Northern Trust Co. | | | 1/21/16 | | | | 4 | | | |
| SGD | | | 97,000 | | | USD | | | 68,818 | | | Barclays Bank PLC | | | 1/21/16 | | | | (482 | ) | | |
| SGD | | | 8,000 | | | USD | | | 5,643 | | | Morgan Stanley & Co. International PLC | | | 1/21/16 | | | | (7 | ) | | |
| USD | | | 5,769 | | | AUD | | | 8,000 | | | Barclays Bank PLC | | | 1/21/16 | | | | (47 | ) | | |
See Notes to Financial Statements.
| | | | | | |
| | | | | | | |
| 60 | | BLACKROCK FUNDS III | | DECEMBER 31, 2015 | | |
| | |
Schedule of Investments (continued) | | LifePath 2045 Master Portfolio |
Forward Foreign Currency Exchange Contracts (continued)
| | | | | | | | | | | | | | | | | | | | | | |
Currency
Purchased | | | Currency
Sold | | | Counterparty | | Settlement
Date | | | Unrealized
Appreciation
(Depreciation) | | | |
| USD | | | 5,120 | | | AUD | | | 7,000 | | | Goldman Sachs International | | | 1/21/16 | | | $ | 31 | | | |
| USD | | | 77,491 | | | AUD | | | 108,000 | | | Royal Bank of Canada | | | 1/21/16 | | | | (1,023 | ) | | |
| USD | | | 10,821 | | | EUR | | | 10,000 | | | Goldman Sachs International | | | 1/21/16 | | | | (46 | ) | | |
| USD | | | 44,494 | | | EUR | | | 41,000 | | | Royal Bank of Scotland PLC | | | 1/21/16 | | | | (62 | ) | | |
| USD | | | 7,648 | | | EUR | | | 7,000 | | | Royal Bank of Scotland PLC | | | 1/21/16 | | | | 41 | | | |
| USD | | | 19,350 | | | GBP | | | 13,000 | | | Bank of America N.A. | | | 1/21/16 | | | | 189 | | | |
| USD | | | 12,040 | | | GBP | | | 8,000 | | | Morgan Stanley & Co. International PLC | | | 1/21/16 | | | | 248 | | | |
| USD | | | 8,940 | | | GBP | | | 6,000 | | | Royal Bank of Scotland PLC | | | 1/21/16 | | | | 96 | | | |
| USD | | | 85,686 | | | HKD | | | 664,000 | | | Goldman Sachs International | | | 1/21/16 | | | | (3 | ) | | |
| USD | | | 21,483 | | | SEK | | | 184,000 | | | Bank of America N.A. | | | 1/21/16 | | | | (353 | ) | | |
| USD | | | 17,772 | | | SEK | | | 151,000 | | | HSBC Bank PLC | | | 1/21/16 | | | | (148 | ) | | |
| USD | | | 14,882 | | | SGD | | | 21,000 | | | Citibank N.A. | | | 1/21/16 | | | | 88 | | | |
| USD | | | 13,424 | | | SGD | | | 19,000 | | | Standard Chartered Bank | | | 1/21/16 | | | | 39 | | | |
| Total | | | | | | | | | | | | | | | | | | $ | (1,425 | ) | | |
| | | | | | | | | | | | | | | | | | | |
|
| Derivative Financial Instruments Categorized by Risk Exposure |
As of period end, the fair values of derivative financial instruments located in the Statements of Assets and Liabilities were as follows:
| | | | | | | | | | | | | | | | | | | | | | | | | | | | | | |
| Assets — Derivative Financial Instruments | | | | Commodity Contracts | | | Credit Contracts | | | Equity Contracts | | | Foreign Currency Exchange Contracts | | | Interest Rate Contracts | | | Other Contracts | | | Total | |
Forward foreign currency exchange contracts | | Net unrealized appreciation on forward currency exchange contracts | | | — | | | | — | | | | — | | | $ | 1,957 | | | | — | | | | — | | | $ | 1,957 | |
Liabilities — Derivative Financial Instruments | | | | | | | | | | | | | | | | | | | | | | | | | | | | | | |
Forward foreign currency exchange contracts | | Net unrealized depreciation on forward currency exchange contracts | | | — | | | | — | | | | — | | | $ | 3,382 | | | | — | | | | — | | | $ | 3,382 | |
For the year ended December 31, 2015, the effect of derivative financial instruments in the Statements of Operations was as follows:
| | | | | | | | | | | | | | | | | | | | | | | | | | | | |
| Net Change in Unrealized Appreciation (Depreciation) on: | | Commodity Contracts | | | Credit Contracts | | | Equity Contracts | | | Foreign Currency Exchange Contracts | | | Interest Rate Contracts | | | Other Contracts | | | Total | |
Forward foreign currency exchange contracts | | | — | | | | — | | | | — | | | $ | (1,425 | ) | | | — | | | | — | | | $ | (1,425 | ) |
|
| Average Quarterly Balances of Outstanding Derivative Financial Instruments |
| | | | |
| Forward foreign currency exchange contracts: | | | | |
Average amounts purchased — in USD | | $ | 86,230 | |
Average amounts sold — in USD | | $ | 97,279 | |
For more information about the LifePath Master Portfolio’s investment risks regarding derivative financial instruments, refer to the Notes to Financial Statements.
|
| Derivative Financial Instruments — Offsetting as of Period End |
The LifePath Master Portfolio’s derivative assets and liabilities (by type) were as follows:
| | | | | | | | |
| | | Assets | | | Liabilities | |
Derivative Financial Instruments: | | | | | | | | |
Forward foreign currency exchange contracts | | $ | 1,957 | | | $ | 3,382 | |
| | | | |
Total derivative assets and liabilities in the Statements of Assets and Liabilities | | $ | 1,957 | | | $ | 3,382 | |
| | | | |
Derivatives not subject to a Master Netting Agreement or similar agreement (“MNA”) | | | — | | | | — | |
| | | | |
Total derivative assets and liabilities subject to an MNA | | $ | 1,957 | | | $ | 3,382 | |
| | | | |
See Notes to Financial Statements.
| | | | | | |
| | | | | | | |
| | BLACKROCK FUNDS III | | DECEMBER 31, 2015 | | 61 |
| | |
Schedule of Investments (concluded) | | LifePath 2045 Master Portfolio |
The following table presents the LifePath Master Portfolio’s derivative assets and liabilities by counterparty net of amounts available for offset under an Master Netting Agreement (“MNA”) and net of the related collateral received and pledged by the LifePath Master Portfolio:
| | | | | | | | | | | | | | | | | | | | |
| Counterparty | | Derivative Assets
Subject to an MNA
by Counterparty | | | Derivatives
Available
for Offset1 | | | Non-cash
Collateral
Received | | | Cash
Collateral
Received | | | Net Amount of
Derivative
Assets2 | |
Bank of America N.A. | | $ | 189 | | | $ | (189 | ) | | | — | | | | — | | | | — | |
Citibank N.A. | | | 88 | | | | — | | | | — | | | | — | | | $ | 88 | |
Goldman Sachs International | | | 95 | | | | (95 | ) | | | — | | | | — | | | | — | |
Morgan Stanley & Co. International PLC | | | 248 | | | | (102 | ) | | | — | | | | — | | | | 146 | |
Northern Trust Co. | | | 4 | | | | (4 | ) | | | — | | | | — | | | | — | |
Royal Bank of Scotland PLC | | | 137 | | | | (103 | ) | | | — | | | | — | | | | 34 | |
Standard Chartered Bank | | | 1,196 | | | | — | | | | — | | | | — | | | | 1,196 | |
| | | | |
Total | | $ | 1,957 | | | $ | (493 | ) | | | — | | | | — | | | $ | 1,464 | |
| | | | |
| | | | | | | | | | | | | | | | | | | | |
| Counterparty | | Derivative Liabilities
Subject to an MNA
by Counterparty | | | Derivatives
Available
for Offset1 | | | Non-cash
Collateral
Pledged | | | Cash
Collateral
Pledged | | | Net Amount of
Derivative
Liabilities3 | |
Bank of America N.A. | | $ | 353 | | | $ | (189 | ) | | | — | | | | — | | | $ | 164 | |
Barclays Bank PLC | | | 529 | | | | — | | | | — | | | | — | | | | 529 | |
Deutsche Bank AG | | | 22 | | | | — | | | | — | | | | — | | | | 22 | |
Goldman Sachs International | | | 468 | | | | (95 | ) | | | — | | | | — | | | | 373 | |
HSBC Bank PLC | | | 686 | | | | — | | | | — | | | | — | | | | 686 | |
Morgan Stanley & Co. International PLC | | | 102 | | | | (102 | ) | | | — | | | | — | | | | — | |
Northern Trust Co. | | | 96 | | | | (4 | ) | | | — | | | | — | | | | 92 | |
Royal Bank of Canada | | | 1,023 | | | | — | | | | — | | | | — | | | | 1,023 | |
Royal Bank of Scotland PLC | | | 103 | | | | (103 | ) | | | — | | | | — | | | | — | |
| | | | |
Total | | $ | 3,382 | | | $ | (493 | ) | | | — | | | | — | | | $ | 2,889 | |
| | | | |
1 The amount of derivatives available for offset is limited to the amount of derivative assets and/or liabilities that are subject to an MNA. | | | | | |
2 Net amount represents the net amount receivable from the counterparty in the event of default. | | | | | |
3 Net amount represents the net amount payable due to the counterparty in the event of default. | | | | | |
|
| Fair Value Hierarchy as of Period End |
Various inputs are used in determining the fair value of investments and derivative financial instruments. For information about LifePath Master Portfolio’s policy regarding valuation of investments and derivative financial instruments, refer to the Notes to Financial Statements.
The following tables summarize LifePath Master Portfolio’s investments and derivative financial instruments categorized in the disclosure hierarchy:
| | | | | | | | | | | | | | | | |
| | | Level 1 | | | Level 2 | | | Level 3 | | | Total | |
Assets: | | | | | | | | | | | | | | | | |
| Investments: | | | | | | | | | | | | | | | | |
Affiliated Investment Companies: | | | | | | | | | | | | | | | | |
Equity Funds | | $ | 4,678,355 | | | $ | 24,154,257 | | | | — | | | $ | 28,832,612 | |
Fixed Income Fund | | | — | | | | 919,479 | | | | — | | | | 919,479 | |
Short-Term Securities | | | 69,510 | | | | — | | | | — | | | | 69,510 | |
Common Stocks: | | | | | | | | | | | | | | | | |
Hotels, Restaurants & Leisure | | | 91,574 | | | | — | | | | — | | | | 91,574 | |
Real Estate Investment Trusts (REITs) | | | 2,469,035 | | | | 997,547 | | | | — | | | | 3,466,582 | |
Real Estate Management & Development | | | 85,254 | | | | 851,228 | | | | — | | | | 936,482 | |
| | | | | | | | | | | | | | | | |
Total | | $ | 7,393,728 | | | $ | 26,922,511 | | | | — | | | $ | 34,316,239 | |
| | | | | | | | | | | | | | | | |
| | | | | | | | | | | | | | | | |
| | | Level 1 | | | Level 2 | | | Level 3 | | | Total | |
| Derivative Financial Instruments 1 | | | | | | | | | |
Assets: | | | | | | | | | | | | | | | | |
Forward foreign currency exchange contracts | | | — | | | $ | 1,957 | | | | — | | | $ | 1,957 | |
Liabilities: | | | | | | | | | | | | | | | | |
Forward foreign currency exchange contracts | | | — | | | | (3,382 | ) | | | — | | | | (3,382 | ) |
| | | | |
Total | | | — | | | $ | (1,425 | ) | | | — | | | $ | (1,425 | ) |
| | | | |
1 Derivative financial instruments are forward foreign currency exchange contracts that are valued at the unrealized appreciation (depreciation) on the instrument. | |
The LifePath Master Portfolio may hold assets and/or liabilities in which the fair value approximates the carrying amount for financial statement purposes. As of period end, such assets and/or liabilities are categorized within the disclosure hierarchy as follows:
| | | | | | | | | | | | | | | | |
| | | Level 1 | | | Level 2 | | | Level 3 | | | Total | |
Assets: | | | | | | | | | | | | | | | | |
Cash | | $ | 106,066 | | | | — | | | | — | | | $ | 106,066 | |
Foreign currency at value | | | 25,224 | | | | — | | | | — | | | | 25,224 | |
| | | | |
Total | | $ | 131,290 | | | | — | | | | — | | | $ | 131,290 | |
| | | | |
During the year ended December 31, 2015, there were no transfers between levels.
See Notes to Financial Statements.
| | | | | | |
| | | | | | | |
| 62 | | BLACKROCK FUNDS III | | DECEMBER 31, 2015 | | |
| | |
Schedule of Investments December 31, 2015 | | LifePath 2055 Master Portfolio (Percentages shown are based on Net Assets) |
| | | | | | | | |
| Affiliated Investment Companies (a) | | Shares/
Beneficial Interest | | | Value | |
Equity Funds — 84.2% | | | | | | | | |
Active Stock Master Portfolio | | $ | 5,262,393 | | | $ | 5,262,393 | |
BlackRock Commodity Strategies Fund | | | 98,531 | | | | 599,069 | |
BlackRock Emerging Markets Fund, Inc. | | | 54,081 | | | | 844,751 | |
International Tilts Master Portfolio | | $ | 3,333,398 | | | | 3,333,398 | |
iShares MSCI Canada ETF | | | 11,738 | | | | 252,367 | |
iShares MSCI EAFE Small-Cap ETF | | | 9,332 | | | | 466,134 | |
Large Cap Index Master Portfolio
(fka Russell 1000® Index Master Portfolio) | | $ | 2,261,152 | | | | 2,261,152 | |
Master Small Cap Index Series | | $ | 327,450 | | | | 327,450 | |
| | | | | | | | |
| | | | | | | | 13,346,714 | |
Fixed Income Fund — 1.5% | | | | | | | | |
CoreAlpha Bond Master Portfolio | | $ | 239,880 | | | | 239,880 | |
Short-Term Securities — 0.2% | | | | | | | | |
BlackRock Cash Funds: Institutional,
SL Agency Shares, 0.38% (b) | | | 35,783 | | | | 35,783 | |
| Total Affiliated Investment Companies — 85.9% | | | | 13,622,377 | |
| | | | | | | | |
| | | | | | | | | |
| | |
| Common Stocks | | | | | | |
Hotels, Restaurants & Leisure — 0.3% | |
Hilton Worldwide Holdings, Inc. | | | 517 | | | | 11,064 | |
Pebblebrook Hotel Trust | | | 543 | | | | 15,215 | |
RLJ Lodging Trust | | | 768 | | | | 16,612 | |
| | | | | | | | |
| | | | | | | | 42,891 | |
Real Estate Investment Trusts (REITs) — 10.1% | |
Alexandria Real Estate Equities, Inc. | | | 349 | | | | 31,536 | |
Allied Properties Real Estate Investment Trust | | | 1,440 | | | | 32,854 | |
AvalonBay Communities, Inc. | | | 340 | | | | 62,604 | |
Beni Stabili SpA SIIQ | | | 21,545 | | | | 16,239 | |
Boston Properties, Inc. | | | 629 | | | | 80,223 | |
British Land Co. PLC | | | 3,900 | | | | 45,126 | |
Cambridge Industrial Trust | | | 54,000 | | | | 21,518 | |
CareTrust REIT, Inc. | | | 2,158 | | | | 23,630 | |
CubeSmart | | | 1,197 | | | | 36,652 | |
CyrusOne, Inc. | | | 583 | | | | 21,833 | |
Derwent London PLC | | | 489 | | | | 26,449 | |
Duke Realty Corp. | | | 1,330 | | | | 27,957 | |
Empiric Student Property PLC | | | 9,871 | | | | 16,516 | |
EPR Properties | | | 405 | | | | 23,672 | |
Equity One, Inc. | | | 994 | | | | 26,987 | |
Equity Residential | | | 822 | | | | 67,067 | |
Essex Property Trust, Inc. | | | 197 | | | | 47,164 | |
Extra Space Storage, Inc. | | | 528 | | | | 46,575 | |
Federal Realty Investment Trust | | | 54 | | | | 7,889 | |
General Growth Properties, Inc. | | | 386 | | | | 10,503 | |
Goodman Group | | | 13,508 | | | | 61,211 | |
Gramercy Property Trust | | | 2,025 | | | | 15,634 | |
Japan Rental Housing Investments, Inc. | | | 30 | | | | 21,198 | |
Kenedix Retail REIT Corp. | | | 15 | | | | 31,754 | |
Kilroy Realty Corp. | | | 603 | | | | 38,158 | |
Kimco Realty Corp. | | | 839 | | | | 22,200 | |
Land Securities Group PLC | | | 2,782 | | | | 48,226 | |
Link REIT | | | 6,000 | | | | 35,771 | |
Macerich Co. | | | 348 | | | | 28,080 | |
Merlin Properties Socimi SA | | | 1,305 | | | | 16,348 | |
National Health Investors, Inc. | | | 370 | | | | 22,522 | |
Parkway Properties, Inc. | | | 1,357 | | | | 21,210 | |
Physicians Realty Trust | | | 146 | | | | 2,462 | |
Prologis, Inc. | | | 1,291 | | | | 55,410 | |
Retail Properties of America, Inc., Class A | | | 2,823 | | | | 41,696 | |
Sekisui House REIT, Inc. | | | 11 | | | | 11,987 | |
Simon Property Group, Inc. | | | 676 | | | | 131,441 | |
SL Green Realty Corp. | | | 248 | | | | 28,019 | |
| | | | | | | | |
| Common Stocks | |
Shares | | | Value | |
Real Estate Investment Trusts (REITs) (continued) | |
STAG Industrial, Inc. | | | 1,275 | | | $ | 23,524 | |
STORE Capital Corp. | | | 515 | | | | 11,948 | |
Sunstone Hotel Investors, Inc. | | | 2,256 | | | | 28,177 | |
Taubman Centers, Inc. | | | 101 | | | | 7,749 | |
UDR, Inc. | | | 843 | | | | 31,671 | |
Vastned Retail NV | | | 612 | | | | 28,116 | |
Vicinity Centres | | | 28,385 | | | | 57,584 | |
Welltower, Inc. | | | 948 | | | | 64,492 | |
Wereldhave NV | | | 425 | | | | 23,840 | |
Westfield Corp. | | | 6,551 | | | | 45,070 | |
| | | | | | | | |
| | | | | | | | 1,628,492 | |
Real Estate Management & Development — 3.0% | |
Castellum AB | | | 1,851 | | | | 26,360 | |
Cheung Kong Property Holdings Ltd. | | | 7,500 | | | | 48,517 | |
Deutsche Wohnen AG, Bearer Shares | | | 1,177 | | | | 32,546 | |
First Capital Realty, Inc. | | | 1,180 | | | | 15,649 | |
Heiwa Real Estate Co., Ltd. | | | 2,700 | | | | 29,544 | |
Howard Hughes Corp. (c) | | | 91 | | | | 10,298 | |
Kennedy Wilson Europe Real Estate PLC | | | 598 | | | | 10,635 | |
Kungsleden AB | | | 2,347 | | | | 16,770 | |
KWG Property Holding Ltd. | | | 28,000 | | | | 20,641 | |
LEG Immobilien AG | | | 139 | | | | 11,329 | |
Leopalace21 Corp. (c) | | | 1,900 | | | | 10,284 | |
Nomura Real Estate Holdings, Inc. | | | 1,200 | | | | 22,263 | |
Sumitomo Realty & Development Co., Ltd. | | | 2,000 | | | | 57,085 | |
Sun Hung Kai Properties Ltd. | | | 5,000 | | | | 60,098 | |
VIB Vermoegen AG | | | 803 | | | | 14,918 | |
Vonovia SE | | | 872 | | | | 26,939 | |
Wharf Holdings Ltd. | | | 6,000 | | | | 33,081 | |
| | | | | | | | |
| | | | | | | | 446,957 | |
| Total Common Stocks — 13.4% | | | | | | | 2,118,340 | |
Total Investments
(Cost — $16,161,635) — 99.3% | | | | | | | 15,740,717 | |
| Other Assets Less Liabilities — 0.7% | | | | | | | 109,593 | |
| | | | | | | | |
Net Assets — 100.0% | | | | | | $ | 15,850,310 | |
| | | | | | | | |
See Notes to Financial Statements.
| | | | | | |
| | | | | | | |
| | BLACKROCK FUNDS III | | DECEMBER 31, 2015 | | 63 |
| | |
Schedule of Investments (continued) | | LifePath 2055 Master Portfolio |
|
| Notes to Schedule of investments |
| (a) | | During the year ended December 31, 2015, investments in issuers considered to be affiliates of LifePath Master Portfolio for purposes of Section 2(a)(3) of the Investment Company Act of 1940, as amended, were as follows: |
| | | | | | | | | | | | | | | | | | | | | | | | | | | | |
| Affiliate | | Shares/ Beneficial
Interest Held at
December 31, 2014 | | | Shares/ Beneficial
Interest
Purchased | | | Shares/ Beneficial
Interest
Sold | | | Shares/ Beneficial
Interest Held at
December 31, 2015 | | | Value at
December 31, 2015 | | | Net Income | | | Realized
Gain (Loss) | |
Active Stock Master Portfolio | | $ | 4,678,399 | | | $ | 583,994 | 1 | | | — | | | $ | 5,262,393 | | | $ | 5,262,393 | | | $ | 82,084 | | | $ | 474,040 | 2 |
BlackRock Cash Funds: Institutional, SL Agency Shares | | | 25,991 | | | | 9,792 | 1 | | | — | | | | 35,783 | | | $ | 35,783 | | | $ | 70 | | | | — | |
BlackRock Cash Funds: Prime, SL Agency Shares3 | | | — | | | | — | | | | — | | | | — | | | | — | | | $ | 1,492 | 4 | | | — | |
BlackRock Commodity Strategies Fund | | | 68,577 | | | | 49,311 | | | | (19,357 | ) | | | 98,531 | | | $ | 599,069 | | | | — | | | $ | (46,777 | ) |
BlackRock Emerging Markets Fund, Inc. | | | 40,487 | | | | 26,459 | | | | (12,865 | ) | | | 54,081 | | | $ | 844,751 | | | $ | 11,039 | | | $ | (12,430 | ) |
CoreAlpha Bond Master Portfolio | | $ | 115,070 | | | $ | 124,810 | 1 | | | — | | | $ | 239,880 | | | $ | 239,880 | | | $ | 5,198 | | | $ | 3,854 | 2 |
International Tilts Master Portfolio | | $ | 2,416,757 | | | $ | 916,641 | 1 | | | — | | | $ | 3,333,398 | | | $ | 3,333,398 | | | $ | 75,843 | | | $ | (145,075 | )2 |
iShares Cohen & Steers REIT ETF3 | | | 9,602 | | | | 5,233 | | | | (14,835 | ) | | | — | | | | — | | | $ | 23,837 | | | $ | 136,600 | |
iShares International Developed Real Estate ETF3 | | | 26,550 | | | | 13,097 | | | | (39,647 | ) | | | — | | | | — | | | $ | 25,951 | | | $ | (114,903 | ) |
iShares MSCI Canada ETF | | | 8,714 | | | | 4,224 | | | | (1,200 | ) | | | 11,738 | | | $ | 252,367 | | | $ | 5,429 | | | $ | (1,866 | ) |
iShares MSCI EAFE Small-Cap ETF | | | 7,943 | | | | 2,889 | | | | (1,500 | ) | | | 9,332 | | | $ | 466,134 | | | $ | 8,772 | | | $ | (2,120 | ) |
Large Cap Index Master Portfolio
(fka Russell 1000® Index Master Portfolio) | | $ | 1,751,127 | | | $ | 510,025 | 1 | | | — | | | $ | 2,261,152 | | | $ | 2,261,152 | | | $ | 45,801 | | | $ | 153,232 | 2 |
Master Small Cap Index Series | | $ | 342,105 | | | | — | | | $ | (14,655 | )5 | | $ | 327,450 | | | $ | 327,450 | | | $ | 5,103 | | | $ | 28,339 | 2 |
1 Represents net shares/beneficial interest purchased. | |
2 Includes the following gains and (losses) from in-kind redemptions from affiliated holdings. See Note 2 of the Notes to Financial Statements. | |
| | | | | | | | | | | | | | | | | | |
Active Stock
Master Portfolio | | | CoreAlpha Bond
Master Portfolio | | | International Tilts
Master Portfolio | | | Large Cap Index
Master Portfolio
(fka Russell
1000® Index
Master Portfolio) | | | Master Small Cap
Index Series | |
| $ | 261,557 | | | $ | 918 | | | $ | (59,189 | ) | | $ | 213,993 | | | $ | 64,567 | |
| | | | | | | | | | | | | | |
3 No longer held by LifePath Master Portfolio as of report date. |
4 Represents securities lending income earned from the reinvestment of cash collateral from loaned securities, net of fees, and collateral investment expenses, and other payments to and from borrowers of securities. |
5 Represents net shares/beneficial interest sold. |
| (b) | | Current yield as of period end. |
| (c) | | Non-income producing security. |
|
| Derivative Financial Instruments Outstanding as of Period End |
Forward Foreign Currency Exchange Contracts
| | | | | | | | | | | | | | | | | | | | | | |
Currency
Purchased | | | Currency
Sold | | | Counterparty | | Settlement
Date | | | Unrealized
Appreciation
(Depreciation) | | | |
| CAD | | | 5,000 | | | USD | | | 3,613 | | | Morgan Stanley & Co. International PLC | | | 1/21/16 | | | $ | (14 | ) | | |
| CAD | | | 5,000 | | | USD | | | 3,639 | | | Northern Trust Co. | | | 1/21/16 | | | | (40 | ) | | |
| CHF | | | 17,400 | | | USD | | | 17,580 | | | Goldman Sachs International | | | 1/21/16 | | | | (186 | ) | | |
| CHF | | | 2,000 | | | USD | | | 2,009 | | | Morgan Stanley & Co. International PLC | | | 1/21/16 | | | | (9 | ) | | |
| EUR | | | 42,000 | | | USD | | | 45,895 | | | Morgan Stanley & Co. International PLC | | | 1/21/16 | | | | (252 | ) | | |
| EUR | | | 6,000 | | | USD | | | 6,526 | | | Morgan Stanley & Co. International PLC | | | 1/21/16 | | | | (6 | ) | | |
| GBP | | | 3,000 | | | USD | | | 4,422 | | | Morgan Stanley & Co. International PLC | | | 1/21/16 | | | | — | | | |
| GBP | | | 2,000 | | | USD | | | 2,975 | | | Northern Trust Co. | | | 1/21/16 | | | | (27 | ) | | |
| ILS | | | 9,000 | | | USD | | | 2,325 | | | Deutsche Bank AG | | | 1/21/16 | | | | (11 | ) | | |
| JPY | | | 924,000 | | | USD | | | 7,694 | | | Citibank N.A. | | | 1/21/16 | | | | (10 | ) | | |
| JPY | | | 5,657,000 | | | USD | | | 46,554 | | | Standard Chartered Bank | | | 1/21/16 | | | | 489 | | | |
| NOK | | | 11,000 | | | USD | | | 1,267 | | | Morgan Stanley & Co. International PLC | | | 1/21/16 | | | | (24 | ) | | |
| NZD | | | 3,000 | | | USD | | | 2,020 | | | Goldman Sachs International | | | 1/21/16 | | | | 32 | | | |
| SEK | | | 11,000 | | | USD | | | 1,303 | | | Northern Trust Co. | | | 1/21/16 | | | | 2 | | | |
| SGD | | | 45,000 | | | USD | | | 31,926 | | | Barclays Bank PLC | | | 1/21/16 | | | | (223 | ) | | |
| SGD | | | 3,000 | | | USD | | | 2,116 | | | Morgan Stanley & Co. International PLC | | | 1/21/16 | | | | (2 | ) | | |
| USD | | | 2,163 | | | AUD | | | 3,000 | | | Goldman Sachs International | | | 1/21/16 | | | | (18 | ) | | |
| USD | | | 4,388 | | | AUD | | | 6,000 | | | Goldman Sachs International | | | 1/21/16 | | | | 26 | | | |
See Notes to Financial Statements.
| | | | | | |
| | | | | | | |
| 64 | | BLACKROCK FUNDS III | | DECEMBER 31, 2015 | | |
| | |
Schedule of Investments (continued) | | LifePath 2055 Master Portfolio |
Forward Foreign Currency Exchange Contracts (continued):
| | | | | | | | | | | | | | | | | | | | | | |
Currency
Purchased | | | Currency
Sold | | | Counterparty | | Settlement
Date | | | Unrealized
Appreciation
(Depreciation) | | | |
| USD | | | 35,876 | | | AUD | | | 50,000 | | | Royal Bank of Canada | | | 1/21/16 | | | $ | (474 | ) | | |
| USD | | | 5,411 | | | EUR | | | 5,000 | | | Goldman Sachs International | | | 1/21/16 | | | | (23 | ) | | |
| USD | | | 20,619 | | | EUR | | | 19,000 | | | Royal Bank of Scotland PLC | | | 1/21/16 | | | | (29 | ) | | |
| USD | | | 3,278 | | | EUR | | | 3,000 | | | Royal Bank of Scotland PLC | | | 1/21/16 | | | | 18 | | | |
| USD | | | 8,931 | | | GBP | | | 6,000 | | | Bank of America N.A. | | | 1/21/16 | | | | 87 | | | |
| USD | | | 6,020 | | | GBP | | | 4,000 | | | Morgan Stanley & Co. International PLC | | | 1/21/16 | | | | 124 | | | |
| USD | | | 4,470 | | | GBP | | | 3,000 | | | Royal Bank of Scotland PLC | | | 1/21/16 | | | | 48 | | | |
| USD | | | 28,648 | | | HKD | | | 222,000 | | | Goldman Sachs International | | | 1/21/16 | | | | (1 | ) | | |
| USD | | | 14,840 | | | HKD | | | 115,000 | | | UBS AG | | | 1/21/16 | | | | — | | | |
| USD | | | 9,924 | | | SEK | | | 85,000 | | | Bank of America N.A. | | | 1/21/16 | | | | (163 | ) | | |
| USD | | | 8,353 | | | SEK | | | 71,000 | | | Northern Trust Co. | | | 1/21/16 | | | | (73 | ) | | |
| USD | | | 7,087 | | | SGD | | | 10,000 | | | Citibank N.A. | | | 1/21/16 | | | | 42 | | | |
| USD | | | 6,359 | | | SGD | | | 9,000 | | | Standard Chartered Bank | | | 1/21/16 | | | | 18 | | | |
| Total | | | | | | | | | | | | | | | | | | $ | (699 | ) | | |
| | | | | | | | | | | | | | | | | | | |
|
| Derivative Financial Instruments Categorized by Risk Exposure |
As of period end, the fair values of derivative financial instruments located in the Statements of Assets and Liabilities were as follows:
| | | | | | | | | | | | | | | | | | | | | | | | | | |
| Assets — Derivative Financial Instruments | | | | Commodity Contracts | | Credit Contracts | | | Equity Contracts | | Foreign Currency Exchange Contracts | | | Interest Rate Contracts | | | Other Contracts | | | Total | |
Forward foreign currency exchange contracts | | Net unrealized appreciation on forward currency exchange contracts | | — | | | — | | | — | | $ | 886 | | | | — | | | | — | | | $ | 886 | |
Liabilities — Derivative Financial Instruments | | | | | | | | | | | | | | | | | | | | | | | | |
Forward foreign currency exchange contracts | | Net unrealized depreciation on forward currency exchange contracts | | — | | | — | | | — | | $ | 1,585 | | | | — | | | | — | | | $ | 1,585 | |
For the year ended December 31, 2015, the effect of derivative financial instruments in the Statements of Operations was as follows:
| | | | | | | | | | | | | | | | | | | | | | | | | | | | |
| Net Change in Unrealized Appreciation (Depreciation) on: | | Commodity Contracts | | | Credit Contracts | | | Equity Contracts | | | Foreign Currency Exchange Contracts | | | Interest Rate Contracts | | | Other Contracts | | | Total | |
Forward foreign currency exchange contracts | | | — | | | | — | | | | — | | | $ | (699 | ) | | | — | | | | — | | | $ | (699 | ) |
|
| Average Quarterly Balances of Outstanding Derivative Financial Instruments |
| | | | |
| Forward foreign currency exchange contracts: | | | | |
Average amounts purchased — in USD | | $ | 41,592 | |
Average amounts sold — in USD | | $ | 45,466 | |
For more information about the LifePath Master Portfolio’s investment risks regarding derivative financial instruments, refer to the Notes to Financial Statements.
|
| Derivative Financial Instruments — Offsetting as of Period End |
The LifePath Master Portfolio’s derivative assets and liabilities (by type) were as follows:
| | | | | | | | |
| | | Assets | | | Liabilities | |
Derivative Financial Instruments: | | | | | | | | |
Forward foreign currency exchange contracts | | $ | 886 | | | $ | 1,585 | |
| | | | |
Total derivative assets and liabilities in the Statements of Assets and Liabilities | | $ | 886 | | | $ | 1,585 | |
| | | | |
Derivatives not subject to a Master Netting Agreement or similar agreement (“MNA”) | | | — | | | | — | |
| | | | |
Total derivative assets and liabilities subject to an MNA | | $ | 886 | | | $ | 1,585 | |
| | | | |
See Notes to Financial Statements.
| | | | | | |
| | | | | | | |
| | BLACKROCK FUNDS III | | DECEMBER 31, 2015 | | 65 |
| | |
Schedule of Investments (concluded) | | LifePath 2055 Master Portfolio |
The following table presents the LifePath Master Portfolio’s derivative assets and liabilities by counterparty net of amounts available for offset under an Master Netting Agreement (“MNA”) and net of the related collateral received and pledged by the LifePath Master Portfolio:
| | | | | | | | | | | | | | | | | | | | |
| Counterparty | | Derivative Assets
Subject to an MNA
by Counterparty | | | Derivatives
Available
for Offset1 | | | Non-cash
Collateral
Received | | | Cash
Collateral
Received | | | Net Amount of
Derivative
Assets2 | |
Bank of America N.A. | | $ | 87 | | | $ | (87 | ) | | | — | | | | — | | | | — | |
Citibank N.A. | | | 42 | | | | (10 | ) | | | — | | | | — | | | $ | 32 | |
Goldman Sachs International | | | 58 | | | | (58 | ) | | | — | | | | — | | | | — | |
Morgan Stanley & Co. International PLC | | | 124 | | | | (124 | ) | | | — | | | | — | | | | — | |
Northern Trust Co. | | | 2 | | | | (2 | ) | | | — | | | | — | | | | — | |
Royal Bank of Scotland PLC | | | 66 | | | | (29 | ) | | | — | | | | — | | | | 37 | |
Standard Chartered Bank | | | 507 | | | | — | | | | — | | | | — | | | | 507 | |
| | | | |
Total | | $ | 886 | | | $ | (310 | ) | | | — | | | | — | | | $ | 576 | |
| | | | |
| | | | | | | | | | | | | | | | | | | | |
| Counterparty | | Derivative Liabilities
Subject to an MNA
by Counterparty | | | Derivatives
Available
for Offset1 | | | Non-cash
Collateral
Pledged | | | Cash
Collateral
Pledged | | | Net Amount of
Derivative
Liabilities3 | |
Bank of America N.A. | | $ | 163 | | | $ | (87 | ) | | | — | | | | — | | | $ | 76 | |
Barclays Bank PLC | | | 223 | | | | — | | | | — | | | | — | | | | 223 | |
Citibank N.A. | | | 10 | | | | (10 | ) | | | — | | | | — | | | | — | |
Deutsche Bank AG | | | 11 | | | | — | | | | — | | | | — | | | | 11 | |
Goldman Sachs International | | | 228 | | | | (58 | ) | | | — | | | | — | | | | 170 | |
Morgan Stanley & Co. International PLC | | | 307 | | | | (124 | ) | | | — | | | | — | | | | 183 | |
Northern Trust Co. | | | 140 | | | | (2 | ) | | | — | | | | — | | | | 138 | |
Royal Bank of Canada | | | 474 | | | | — | | | | — | | | | — | | | | 474 | |
Royal Bank of Scotland PLC | | | 29 | | | | (29 | ) | | | — | | | | — | | | | — | |
UBS AG | | | — | | | | — | | | | — | | | | — | | | | — | |
| | | | |
Total | | $ | 1,585 | | | $ | (310 | ) | | | — | | | | — | | | $ | 1,275 | |
| | | | |
1 The amount of derivatives available for offset is limited to the amount of derivative assets and/or liabilities that are subject to an MNA. | |
2 Net amount represents the net amount receivable from the counterparty in the event of default. | |
3 Net amount represents the net amount payable due to the counterparty in the event of default. | |
|
| Fair Value Hierarchy as of Period End |
Various inputs are used in determining the fair value of investments and derivative financial instruments. For information about LifePath Master Portfolio’s policy regarding valuation of investments and derivative financial instruments, refer to the Notes to Financial Statements.
The following tables summarize LifePath Master Portfolio’s investments and derivative financial instruments categorized in the disclosure hierarchy:
| | | | | | | | | | | | | | | | |
| | | Level 1 | | | Level 2 | | | Level 3 | | | Total | |
Assets: | | | | | | | | | | | | | | | | |
| Investments: | | | | | | | | | | | | | | | | |
Affiliated Investment Companies: | | | | | | | | | | | | | | | | |
Equity Funds | | $ | 2,162,321 | | | $ | 11,184,393 | | | | — | | | $ | 13,346,714 | |
Fixed Income Fund | | | — | | | | 239,880 | | | | — | | | | 239,880 | |
Short-Term Securities | | | 35,783 | | | | — | | | | — | | | | 35,783 | |
Common Stocks: | | | | | | | | | | | | | | | | |
Hotels, Restaurants & Leisure | | | 42,891 | | | | — | | | | — | | | | 42,891 | |
Real Estate Investment Trusts (REITs) | | | 1,159,574 | | | | 468,918 | | | | — | | | | 1,628,492 | |
Real Estate Management & Development | | | 40,864 | | | | 406,093 | | | | — | | | | 446,957 | |
| | | | | | | | | | | | | | | | |
Total | | $ | 3,441,433 | | | $ | 12,299,284 | | | | — | | | $ | 15,740,717 | |
| | | | | | | | | | | | | | | | |
| | | | | | | | | | | | | | | | |
| | | Level 1 | | | Level 2 | | | Level 3 | | | Total | |
Derivative Financial Instruments 1 | | | | | | | | | | | | | | | | |
Assets: | | | | | | | | | | | | | | | | |
Forward foreign currency exchange contracts | | | — | | | $ | 886 | | | | — | | | $ | 886 | |
Liabilities: | | | | | | | | | | | | | | | | |
Forward foreign currency exchange contracts | | | — | | | | (1,585 | ) | | | — | | | | (1,585 | ) |
| | | | |
Total | | | — | | | $ | (699 | ) | | | — | | | $ | (699 | ) |
| | | | |
1 Derivative financial instruments are forward foreign currency exchange contracts that are valued at the unrealized appreciation (depreciation) on the instrument. | |
The LifePath Master Portfolio may hold assets and/or liabilities in which the fair value approximates the carrying amount for financial statement purposes. As of period end, such assets and/or liabilities are categorized within the disclosure hierarchy as follows:
| | | | | | | | | | | | | | | | |
| | | Level 1 | | | Level 2 | | | Level 3 | | | Total | |
Assets: | | | | | | | | | | | | | | | | |
Cash | | $ | 62,504 | | | | — | | | | — | | | $ | 62,504 | |
Foreign currency at value | | | 13,202 | | | | — | | | | — | | | | 13,202 | |
| | | | |
Total | | $ | 75,706 | | | | — | | | | — | | | $ | 75,706 | |
| | | | |
During the year ended December 31, 2015, there were no transfers between levels.
See Notes to Financial Statements.
| | | | | | |
| | | | | | | |
| 66 | | BLACKROCK FUNDS III | | DECEMBER 31, 2015 | | |
| | |
| Statements of Assets and Liabilities | | Master Investment Portfolio |
| | | | | | | | | | | | | | | | |
| December 31, 2015 | | LifePath
2025
Master
Portfolio | | | LifePath
2035
Master
Portfolio | | | LifePath
2045
Master
Portfolio | | | LifePath
2055
Master
Portfolio | |
| | | | | | | | | | | | | | | | |
| Assets | | | | | | | | | | | | | | | | |
Investments at value — unaffiliated1 | | $ | 3,353,310 | | | $ | 5,428,758 | | | $ | 4,494,638 | | | $ | 2,118,340 | |
Investments at value — affiliated2,3 | | | 61,484,119 | | | | 50,502,563 | | | | 29,821,601 | | | | 13,622,377 | |
Cash | | | 65,981 | | | | 88,258 | | | | 106,066 | | | | 62,504 | |
Foreign currency at value4 | | | 18,216 | | | | 29,679 | | | | 25,224 | | | | 13,202 | |
| Receivables: | | | | | | | | | | | | | | | | |
Contributions from investors | | | — | | | | — | | | | 2,531 | | | | 63,498 | |
Dividends — unaffiliated | | | 15,806 | | | | 26,319 | | | | 21,886 | | | | 10,164 | |
From the Manager | | | 20,615 | | | | 20,635 | | | | 21,544 | | | | 22,423 | |
Investments sold — unaffiliated | | | 80,986 | | | | 10,197 | | | | 8,639 | | | | 3,652 | |
Investments sold — affiliated | | | 1,774,763 | | | | 1,141,194 | | | | 368,000 | | | | 358,000 | |
Securities lending income — affiliated | | | 270 | | | | 349 | | | | 250 | | | | 113 | |
Unrealized appreciation on forward foreign currency exchange contracts | | | 1,384 | | | | 2,293 | | | | 1,957 | | | | 886 | |
| | | | |
Total assets | | | 66,815,450 | | | | 57,250,245 | | | | 34,872,336 | | | | 16,275,159 | |
| | | | |
| | | | | | | | | | | | | | | | |
| Liabilities | | | | | | | | | | | | | | | | |
Collateral on securities loaned at value | | | 2,895 | | | | — | | | | — | | | | — | |
| Payables: | | | | | | | | | | | | | | | | |
Investments purchased — unaffiliated | | | 149,589 | | | | 94,725 | | | | 63,520 | | | | 66,881 | |
Investments purchased — affiliated | | | 1,521,000 | | | | 947,000 | | | | 271,100 | | | | 338,946 | |
Withdrawals to investors | | | 16,305 | | | | 86,820 | | | | — | | | | — | |
Professional fees | | | 16,201 | | | | 16,175 | | | | 16,181 | | | | 16,165 | |
Independent Trustees’ fees | | | 1,597 | | | | 1,530 | | | | 1,383 | | | | 1,272 | |
Unrealized depreciation on forward foreign currency exchange contracts | | | 2,441 | | | | 4,026 | | | | 3,382 | | | | 1,585 | |
| | | | |
Total liabilities | | | 1,710,028 | | | | 1,150,276 | | | | 355,566 | | | | 424,849 | |
| | | | |
Net Assets | | $ | 65,105,422 | | | $ | 56,099,969 | | | $ | 34,516,770 | | | $ | 15,850,310 | |
| | | | |
| | | | | | | | | | | | | | | | |
| Net Assets Consist of | | | | | | | | | | | | | | | | |
Investors’ capital | | $ | 67,002,581 | | | $ | 57,749,084 | | | $ | 35,537,371 | | | $ | 16,272,023 | |
Net unrealized appreciation (depreciation) | | | (1,897,159 | ) | | | (1,649,115 | ) | | | (1,020,601 | ) | | | (421,713 | ) |
| | | | |
Net Assets | | $ | 65,105,422 | | | $ | 56,099,969 | | | $ | 34,516,770 | | | $ | 15,850,310 | |
| | | | |
1 Investments at cost — unaffiliated | | $ | 3,316,732 | | | $ | 5,367,358 | | | $ | 4,443,500 | | | $ | 2,094,739 | |
2 Investments at cost — affiliated | | $ | 63,416,633 | | | $ | 52,211,158 | | | $ | 30,891,754 | | | $ | 14,066,896 | |
3 Securities loaned at value | | $ | 2,817 | | | | — | | | | — | | | | — | |
4 Foreign currency at cost | | $ | 18,316 | | | $ | 29,824 | | | $ | 25,355 | | | $ | 13,275 | |
| | | | | | |
| See Notes to Financial Statements. | | | | |
| | | | | | | |
| | BLACKROCK FUNDS III | | DECEMBER 31, 2015 | | 67 |
| | |
| Statements of Operations | | Master Investment Portfolio |
| | | | | | | | | | | | | | | | |
| Year Ended December 31, 2015 | | LifePath 2025
Master
Portfolio
| | | LifePath 2035
Master
Portfolio
| | | LifePath 2045
Master
Portfolio
| | | LifePath 2055
Master
Portfolio
| |
| | | | | | | | | | | | | | | | |
| Investment Income | | | | | | | | | | | | | | | | |
Dividends — affiliated | | $ | 171,362 | | | $ | 228,330 | | | $ | 175,707 | | | $ | 75,028 | |
Dividends — unaffiliated | | | 18,011 | | | | 29,990 | | | | 24,939 | | | | 11,582 | |
Securities lending — affiliated — net | | | 2,612 | | | | 3,066 | | | | 1,845 | | | | 1,492 | |
Income — affiliated | | | 269 | | | | 166 | | | | 221 | | | | 70 | |
Foreign taxes withheld | | | (2,204 | ) | | | (3,669 | ) | | | (3,051 | ) | | | (1,417 | ) |
| Net investment income allocated from the applicable Underlying Master Portfolios: | | | | | | | | | | | | | | | | |
Dividends | | | 724,758 | | | | 796,517 | | | | 541,599 | | | | 226,519 | |
Interest | | | 607,154 | | | | 247,849 | | | | 31,527 | | | | 9,398 | |
Expenses | | | (151,480 | ) | | | (126,037 | ) | | | (73,897 | ) | | | (32,502 | ) |
Fees waived | | | 33,683 | | | | 33,885 | | | | 22,553 | | | | 10,614 | |
| | | | |
Total income | | | 1,404,165 | | | | 1,210,097 | | | | 721,443 | | | | 300,784 | |
| | | | |
| | | | | | | | | | | | | | | | |
| Expenses | | | | | | | | | | | | | | | | |
Investment advisory | | | 239,906 | | | | 204,589 | | | | 123,515 | | | | 51,295 | |
Professional | | | 26,993 | | | | 25,950 | | | | 25,903 | | | | 25,831 | |
Independent Trustees | | | 8,465 | | | | 8,253 | | | | 7,673 | | | | 7,159 | |
| | | | |
Total expenses | | | 275,364 | | | | 238,792 | | | | 157,091 | | | | 84,285 | |
Less fees waived and/or reimbursed by the Manager | | | (238,476 | ) | | | (216,082 | ) | | | (148,219 | ) | | | (80,860 | ) |
| | | | |
Total expenses after fees waived and/or reimbursed | | | 36,888 | | | | 22,710 | | | | 8,872 | | | | 3,425 | |
| | | | |
Net investment income | | | 1,367,277 | | | | 1,187,387 | | | | 712,571 | | | | 297,359 | |
| | | | |
| | | | | | | | | | | | | | | | |
| Realized and Unrealized Gain (Loss) | | | | | | | | | | | | | | | | |
Net realized gain (loss) from: | | | | | | | | | | | | | | | | |
Investments — unaffiliated | | | 58 | | | | (21 | ) | | | (31 | ) | | | (1 | ) |
Investments — affiliated | | | (178,315 | ) | | | (106,955 | ) | | | (61,718 | ) | | | (41,496 | ) |
Foreign currency transactions | | | 584 | | | | 973 | | | | 808 | | | | 384 | |
Allocation from the applicable Underlying Master Portfolios from investments, financial futures contracts, swaps and foreign currency transactions | | | 492,054 | | | | 339,312 | | | | 218,197 | | | | 32,544 | |
Allocation from the applicable Underlying Master Portfolios from in-kind redemptions1 | | | 1,722,909 | | | | 1,723,351 | | | | 1,131,158 | | | | 481,846 | |
| | | | |
| | | 2,037,290 | | | | 1,956,660 | | | | 1,288,414 | | | | 473,277 | |
| | | | |
Net change in unrealized appreciation (depreciation) on: | | | | | | | | | | | | | | | | |
Investments — unaffiliated | | | 36,578 | | | | 61,400 | | | | 51,138 | | | | 23,600 | |
Investments — affiliated | | | (1,299,585 | ) | | | (1,380,969 | ) | | | (959,208 | ) | | | (399,963 | ) |
Foreign currency translations | | | (1,223 | ) | | | (1,920 | ) | | | (1,586 | ) | | | (795 | ) |
Allocation from the applicable Underlying Master Portfolios from investments, financial futures contracts, swaps and foreign currency translations | | | (3,288,472 | ) | | | (2,887,971 | ) | | | (1,762,982 | ) | | | (728,109 | ) |
| | | | |
| | | (4,552,702 | ) | | | (4,209,460 | ) | | | (2,672,638 | ) | | | (1,105,267 | ) |
| | | | |
Net realized and unrealized loss | | | (2,515,412 | ) | | | (2,252,800 | ) | | | (1,384,224 | ) | | | (631,990 | ) |
| | | | |
Net Decrease in Net Assets Resulting from Operations | | $ | (1,148,135 | ) | | $ | (1,065,413 | ) | | $ | (671,653 | ) | | $ | (334,631 | ) |
| | | | |
1 See Note 2 of the Notes to Financial Statements. | | | | | | | | | | | | | | | | |
| | | | | | |
| See Notes to Financial Statements. | | | | |
| | | | | | | |
| 68 | | BLACKROCK FUNDS III | | DECEMBER 31, 2015 | | |
| | |
| Statements of Changes in Net Assets | | Master Investment Portfolio |
| | | | | | | | | | | | | | | | | | |
| | | LifePath 2025 Master Portfolio | | | | | LifePath 2035 Master Portfolio | |
| | | Year Ended December 31, | | | | | Year Ended December 31, | |
| Increase (Decrease) in Net Assets: | | 2015 | | | 2014 | | | | | 2015 | | | 2014 | |
| | | | | | | | | | | | | | | | | | |
| Operations | | | | | | | | | | | | | | | | | | |
Net investment income | | $ | 1,367,277 | | | $ | 1,371,375 | | | | | $ | 1,187,387 | | | $ | 1,161,183 | |
Net realized gain | | | 2,037,290 | | | | 3,054,668 | | | | | | 1,956,660 | | | | 2,768,344 | |
Net change in unrealized appreciation (depreciation) | | | (4,552,702 | ) | | | (942,823 | ) | | | | | (4,209,460 | ) | | | (907,150 | ) |
| | | | | | | | | | | | | | |
Net increase (decrease) in net assets resulting from operations | | | (1,148,135 | ) | | | 3,483,220 | | | | | | (1,065,413 | ) | | | 3,022,377 | |
| | | | | | | | | | | | | | |
| | | | | | | | | | | | | | | | | | |
| Capital Transactions | | | | | | | | | | | | | | | | | | |
Proceeds from contributions | | | 34,846,434 | | | | 26,135,006 | | | | | | 22,992,558 | | | | 24,161,049 | |
Value of withdrawals | | | (32,667,282 | ) | | | (24,205,432 | ) | | | | | (21,589,751 | ) | | | (16,783,453 | ) |
| | | | | | | | | | | | | | |
Net increase in net assets derived from capital transactions | | | 2,179,152 | | | | 1,929,574 | | | | | | 1,402,807 | | | | 7,377,596 | |
| | | | | | | | | | | | | | |
| | | | | | | | | | | | | | | | | | |
| Net Assets | | | | | | | | | | | | | | | | | | |
Total increase in net assets | | | 1,031,017 | | | | 5,412,794 | | | | | | 337,394 | | | | 10,399,973 | |
Beginning of year | | | 64,074,405 | | | | 58,661,611 | | | | | | 55,762,575 | | | | 45,362,602 | |
| | | | | | | | | | | | | | |
End of year | | $ | 65,105,422 | | | $ | 64,074,405 | | | | | $ | 56,099,969 | | | $ | 55,762,575 | |
| | | | | | | | | | | | | | |
| | | | | | | | | | | | | | | | | | |
| | | LifePath 2045 Master Portfolio | | | | | LifePath 2055 Master Portfolio | |
| | | Year Ended December 31, | | | | | Year Ended December 31, | |
| Increase (Decrease) in Net Assets: | | 2015 | | | 2014 | | | | | 2015 | | | 2014 | |
| | | | | | | | | | | | | | | | | | |
| Operations | | | | | | | | | | | | | | | | | | |
Net investment income | | $ | 712,571 | | | $ | 684,393 | | | | | $ | 297,359 | | | $ | 249,641 | |
Net realized gain | | | 1,288,414 | | | | 1,652,212 | | | | | | 473,277 | | | | 594,792 | |
Net change in unrealized appreciation (depreciation) | | | (2,672,638 | ) | | | (523,538 | ) | | | | | (1,105,267 | ) | | | (125,941 | ) |
| | | | | | | | | | | | | | |
Net increase (decrease) in net assets resulting from operations | | | (671,653 | ) | | | 1,813,067 | | | | | | (334,631 | ) | | | 718,492 | |
| | | | | | | | | | | | | | |
| | | | | | | | | | | | | | | | | | |
| Capital Transactions | | | | | | | | | | | | | | | | | | |
Proceeds from contributions | | | 15,353,680 | | | | 15,976,732 | | | | | | 9,297,038 | | | | 7,680,460 | |
Value of withdrawals | | | (14,907,021 | ) | | | (8,526,879 | ) | | | | | (6,168,994 | ) | | | (4,319,994 | ) |
| | | | | | | | | | | | | | |
Net increase in net assets derived from capital transactions | | | 446,659 | | | | 7,449,853 | | | | | | 3,128,044 | | | | 3,360,466 | |
| | | | | | | | | | | | | | |
| | | | | | | | | | | | | | | | | | |
| Net Assets | | | | | | | | | | | | | | | | | | |
Total increase (decrease) in net assets | | | (224,994 | ) | | | 9,262,920 | | | | | | 2,793,413 | | | | 4,078,958 | |
Beginning of year | | | 34,741,764 | | | | 25,478,844 | | | | | | 13,056,897 | | | | 8,977,939 | |
| | | | | | | | | | | | | | |
End of year | | $ | 34,516,770 | | | $ | 34,741,764 | | | | | $ | 15,850,310 | | | $ | 13,056,897 | |
| | | | | | | | | | | | | | |
| | | | | | |
| See Notes to Financial Statements. | | | | |
| | | | | | | |
| | BLACKROCK FUNDS III | | DECEMBER 31, 2015 | | 69 |
| | |
| Financial Highlights | | Master Investment Portfolio |
| | | | | | | | | | | | | | | | | | | | |
| | | LifePath 2025 Master Portfolio | |
| | | Year Ended December 31, | |
| | | 2015 | | | 2014 | | | 2013 | | | 2012 | | | 2011 | |
| | | | | | | | | | | | | | | | | | | | |
| Total Return | | | | | | | | | | | | | | | | | | | | |
Total return | | | (1.50)% | | | | 5.73% | | | | 12.34% | | | | 12.57% | | | | 0.99% | |
| | | | |
| | | | | | | | | | | | | | | | | | | | |
| Ratios to Average Net Assets | | | | | | | | | | | | | | | | | | | | |
Total expenses | | | 0.57% | 1,2,3 | | | 0.58% | 4,5,6 | | | 0.61% | 4,5,6 | | | 0.69% | 7,8,9 | | | 1.07% | 7,8,9 |
| | | | |
Total expenses after fees waived and/or reimbursed | | | 0.23% | 1,2,3 | | | 0.22% | 4,5,6 | | | 0.25% | 4,5,6 | | | 0.26% | 7,8,9 | | | 0.24% | 7,8,9 |
| | | | |
Net investment income10 | | | 1.98% | 1,2,3 | | | 2.05% | 4,5,6 | | | 2.11% | 4,5,6 | | | 2.32% | 7,8,9 | | | 2.62% | 7,8,9 |
| | | | |
| | | | | | | | | | | | | | | | | | | | |
| Supplemental Data | | | | | | | | | | | | | | | | | | | | |
Net assets, end of year (000) | | | $ 65,105 | | | | $ 64,074 | | | | $ 58,662 | | | | $ 34,044 | | | | $ 12,178 | |
| | | | |
Portfolio turnover rate | | | 51% | 11 | | | 50% | 12 | | | 30% | 12 | | | 4% | 13 | | | 24% | 13 |
| | | | |
| | 1 | | Includes the LifePath Master Portfolio’s pro rata portion of expenses from Active Stock Master Portfolio, CoreAlpha Bond Master Portfolio, International Tilts Master Portfolio, Large Cap Index Master Portfolio and Master Small Cap Index Series. These ratios do not reflect any expenses incurred indirectly as a result of investments in BlackRock Cash Funds: Institutional, BlackRock Commodity Strategies Fund, BlackRock Emerging Markets Fund, Inc. and iShares exchange-traded funds. |
| | 2 | | Includes the LifePath Master Portfolio’s share of Active Stock Master Portfolio, CoreAlpha Bond Master Portfolio, International Tilts Master Portfolio, Large Cap Index Master Portfolio and Master Small Cap Index Series allocated fees waived of 0.05% for the year ended December 31, 2015. |
| | 3 | | Excludes expenses incurred indirectly as a result of investments in underlying funds of approximately 0.13% for the year ended December 31, 2015, although the ratio does include the LifePath Master Portfolio’s share of Active Stock Master Portfolio, CoreAlpha Bond Master Portfolio, International Tilts Master Portfolio, Large Cap Index Master Portfolio and Master Small Cap Index Series allocated expenses and/or net investment income. |
| | 4 | | Includes the LifePath Master Portfolio’s pro rata portion of expenses from Active Stock Master Portfolio, CoreAlpha Bond Master Portfolio, International Tilts Master Portfolio, Large Cap Index Master Portfolio, Master Small Cap Index Series and Total International ex U.S. Index Master Portfolio. These ratios do not reflect any expenses incurred indirectly as a result of investments in BlackRock Cash Funds: Institutional, BlackRock Commodity Strategies Fund, BlackRock Emerging Markets Fund, Inc. and iShares exchange-traded funds. |
| | 5 | | Includes the LifePath Master Portfolio’s share of Active Stock Master Portfolio, CoreAlpha Bond Master Portfolio, International Tilts Master Portfolio, Large Cap Index Master Portfolio, Master Small Cap Index Series and Total International ex U.S. Index Master Portfolio allocated fees waived of 0.05% and 0.04% for the years ended December 31, 2014 and December 31, 2013, respectively. |
| | 6 | | Excludes expenses incurred indirectly as a result of investments in underlying funds of approximately 0.13% and 0.10% for the years ended December 31, 2014 and December 31, 2013, respectively, although the ratio does include the LifePath Master Portfolio’s share of Active Stock Master Portfolio, CoreAlpha Bond Master Portfolio, International Tilts Master Portfolio, Large Cap Index Master Portfolio, Master Small Cap Index Series and Total International ex U.S. Index Master Portfolio allocated expenses and/or net investment income. |
| | 7 | | Includes the LifePath Master Portfolio’s pro rata portion of expenses from Active Stock Master Portfolio, CoreAlpha Bond Master Portfolio, Large Cap Index Master Portfolio, Master Small Cap Index Series, and Total International ex U.S. Index Master Portfolio. These ratios do not reflect any expenses incurred indirectly as a result of investments in BlackRock Cash Funds: Institutional, BlackRock Commodity Strategies Fund, BlackRock Emerging Markets Fund, Inc. and iShares exchange-traded funds |
| | 8 | | Includes the LifePath Master Portfolio’s share of Active Stock Master Portfolio, CoreAlpha Bond Master Portfolio, Large Cap Index Master Portfolio, Master Small Cap Index Series and Total International ex U.S. Index Master Portfolio allocated fees waived of 0.04% and 0.03% for the years ended December 31, 2012 and December 31, 2011, respectively. |
| | 9 | | Excludes expenses incurred indirectly as a result of investments in underlying funds of approximately 0.10% and 0.12% for the years ended December 31, 2012 and December 31, 2011, respectively, although the ratio does include the LifePath Master Portfolio’s share of Active Stock Master Portfolio, CoreAlpha Bond Master Portfolio, Master Small Cap Index Series and Total International ex U.S. Index Master Portfolio allocated expenses and/or net investment income. |
| | 10 | | Includes the LifePath Master Portfolio’s share of the allocated net investment income from Active Stock Master Portfolio, CoreAlpha Bond Master Portfolio, Master Small Cap Index Series and Total International ex U.S. Index Master Portfolio, except for the years ended December 31, 2015, December 31, 2014 and December 31, 2013, which also includes International Tilts Master Portfolio. For the year ended December 31, 2015, the ratio does not include Total International ex U.S. Index Master Portfolio, which is no longer held by the LifePath Master Portfolio. |
| | 11 | | Includes the purchases and sales of the underlying funds and Active Stock Master Portfolio, CoreAlpha Bond Master Portfolio, International Tilts Master Portfolio, Large Cap Index Master Portfolio and Master Small Cap Index Series. |
| | 12 | | Includes the purchases and sales of the underlying funds and Active Stock Master Portfolio, CoreAlpha Bond Master Portfolio, International Tilts Master Portfolio, Large Cap Index Master Portfolio, Master Small Cap Index Series and Total International ex U.S. Index Master Portfolio. |
| | 13 | | Excludes purchases and sales of Active Stock Master Portfolio, CoreAlpha Bond Master Portfolio, Master Small Cap Index Series, and Total International ex U.S. Index Master Portfolio. If these transactions had been included to conform to the current year presentation, the portfolio turnover rate would have been 17% and 58% for the years ended December 31, 2012 and December 31, 2011, respectively. |
| | | | | | |
| See Notes to Financial Statements. | | | | |
| | | | | | | |
| 70 | | BLACKROCK FUNDS III | | DECEMBER 31, 2015 | | |
| | |
| Financial Highlights | | Master Investment Portfolio |
| | | | | | | | | | | | | | | | | | | | |
| | | LifePath 2035 Master Portfolio | |
| | | Year Ended December 31, | |
| | | 2015 | | | 2014 | | | 2013 | | | 2012 | | | 2011 | |
| | | | | | | | | | | | | | | | | | | | |
| Total Return | | | | | | | | | | | | | | | | | | | | |
Total return | | | (1.65)% | | | | 6.01% | | | | 15.83% | | | | 14.35% | | | | (0.82)% | |
| | | | |
| | | | | | | | | | | | | | | | | | | | |
| Ratios to Average Net Assets | | | | | | | | | | | | | | | | | | | | |
Total expenses | | | 0.57% | 1,2,3 | | | 0.58% | 4,5,6 | | | 0.63% | 4,5,6 | | | 0.76% | 7,8,9 | | | 1.34% | 7,8,9 |
| | | | |
Total expenses after fees waived and/or reimbursed | | | 0.20% | 1,2,3 | | | 0.20% | 4,5,6 | | | 0.25% | 4,5,6 | | | 0.25% | 7,8,9 | | | 0.22% | 7,8,9 |
| | | | |
Net investment income10 | | | 2.02% | 1,2,3 | | | 2.06% | 4,5,6 | | | 2.29% | 4,5,6 | | | 2.42% | 7,8,9 | | | 2.50% | 7,8,9 |
| | | | |
| | | | | | | | | | | | | | | | | | | | |
| Supplemental Data | | | | | | | | | | | | | | | | | | | | |
Net assets, end of year (000) | | | $ 56,100 | | | | $ 55,763 | | | | $ 45,363 | | | | $ 25,732 | | | | $ 7,426 | |
| | | | |
Portfolio turnover rate | | | 44% | 11 | | | 54% | 12 | | | 39% | 12 | | | 4% | 13 | | | 21% | 13 |
| | | | |
| | 1 | | Includes the LifePath Master Portfolio’s pro rata portion of expenses from Active Stock Master Portfolio, CoreAlpha Bond Master Portfolio, International Tilts Master Portfolio, Large Cap Index Master Portfolio and Master Small Cap Index Series. These ratios do not reflect any expenses incurred indirectly as a result of investments in BlackRock Cash Funds: Institutional, BlackRock Commodity Strategies Fund, BlackRock Emerging Markets Fund, Inc. and iShares exchange-traded funds. |
| | 2 | | Includes the LifePath Master Portfolio’s share of Active Stock Master Portfolio, CoreAlpha Bond Master Portfolio, International Tilts Master Portfolio, Large Cap Index Master Portfolio and Master Small Cap Index Series allocated fees waived of 0.06% for the year ended December 31, 2015. |
| | 3 | | Excludes expenses incurred indirectly as a result of investments in underlying funds of approximately 0.16% for the year ended December 31, 2015, although the ratio does include the LifePath Master Portfolio’s share of Active Stock Master Portfolio, CoreAlpha Bond Master Portfolio, International Tilts Master Portfolio, Large Cap Index Master Portfolio and Master Small Cap Index Series allocated expenses and/or net investment income. |
| | 4 | | Includes the LifePath Master Portfolio’s pro rata portion of expenses from Active Stock Master Portfolio, CoreAlpha Bond Master Portfolio, International Tilts Master Portfolio, Large Cap Index Master Portfolio, Master Small Cap Index Series and Total International ex U.S. Index Master Portfolio. These ratios do not reflect any expenses incurred indirectly as a result of investments in BlackRock Cash Funds: Institutional, BlackRock Commodity Strategies Fund, BlackRock Emerging Markets Fund, Inc. and iShares exchange-traded funds. |
| | 5 | | Includes the LifePath Master Portfolio’s share of Active Stock Master Portfolio, CoreAlpha Bond Master Portfolio, International Tilts Master Portfolio, Large Cap Index Master Portfolio, Master Small Cap Index Series and Total International ex U.S. Index Master Portfolio allocated fees waived of 0.06% and 0.05% for the years ended December 31, 2014 and December 31, 2013, respectively. |
| | 6 | | Excludes expenses incurred indirectly as a result of investments in underlying funds of approximately 0.15% and 0.11% for the years ended December 31, 2014 and December 31, 2013, respectively, although the ratio does include the LifePath Master Portfolio’s share of Active Stock Master Portfolio, CoreAlpha Bond Master Portfolio, International Tilts Master Portfolio, Large Cap Index Master Portfolio, Master Small Cap Index Series and Total International ex U.S. Index Master Portfolio allocated expenses and/or net investment income. |
| | 7 | | Includes the LifePath Master Portfolio’s pro rata portion of expenses from Active Stock Master Portfolio, CoreAlpha Bond Master Portfolio, Large Cap Index Master Portfolio, Master Small Cap Index Series, and Total International ex U.S. Index Master Portfolio. These ratios do not reflect any expenses incurred indirectly as a result of investments in BlackRock Cash Funds: Institutional, BlackRock Commodity Strategies Fund, BlackRock Emerging Markets Fund, Inc. and iShares exchange-traded funds |
| | 8 | | Includes the LifePath Master Portfolio’s share of Active Stock Master Portfolio, CoreAlpha Bond Master Portfolio, Large Cap Index Master Portfolio, Master Small Cap Index Series and Total International ex U.S. Index Master Portfolio allocated fees waived of 0.05% and 0.04% for the years ended December 31, 2012 and December 31, 2011, respectively. |
| | 9 | | Excludes expenses incurred indirectly as a result of investments in underlying funds of approximately 0.11% and 0.14% for the years ended December 31, 2012 and December 31, 2011, respectively, although the ratio does include the LifePath Master Portfolio’s share of Active Stock Master Portfolio, CoreAlpha Bond Master Portfolio, Master Small Cap Index Series and Total International ex U.S. Index Master Portfolio allocated expenses and/or net investment income. |
| | 10 | | Includes the LifePath Master Portfolio’s share of the allocated net investment income from Active Stock Master Portfolio, CoreAlpha Bond Master Portfolio, Master Small Cap Index Series and Total International ex U.S. Index Master Portfolio, except for the years ended December 31, 2015, December 31, 2014 and December 31, 2013, which also includes International Tilts Master Portfolio. For the year ended December 31, 2015, the ratio does not include Total International ex U.S. Index Master Portfolio, which is no longer held by the LifePath Master Portfolio. |
| | 11 | | Includes the purchases and sales of the underlying funds and Active Stock Master Portfolio, CoreAlpha Bond Master Portfolio, International Tilts Master Portfolio, Large Cap Index Master Portfolio and Master Small Cap Index Series. |
| | 12 | | Includes the purchases and sales of the underlying funds and Active Stock Master Portfolio, CoreAlpha Bond Master Portfolio, International Tilts Master Portfolio, Large Cap Index Master Portfolio, Master Small Cap Index Series and Total International ex U.S. Index Master Portfolio. |
| | 13 | | Excludes purchases and sales of Active Stock Master Portfolio, CoreAlpha Bond Master Portfolio, Master Small Cap Index Series, and Total International ex U.S. Index Master Portfolio. If these transactions had been included to conform to the current year presentation, the portfolio turnover rate would have been 13% and 47% for the years ended December 31, 2012 and December 31, 2011, respectively. |
| | | | | | |
| See Notes to Financial Statements. | | | | |
| | | | | | | |
| | BLACKROCK FUNDS III | | DECEMBER 31, 2015 | | 71 |
| | |
| Financial Highlights | | Master Investment Portfolio |
| | | | | | | | | | | | | | | | | | | | |
| | | LifePath 2045 Master Portfolio | |
| | | Year Ended December 31, | |
| | | 2015 | | | 2014 | | | 2013 | | | 2012 | | | 2011 | |
| | | | | | | | | | | | | | | | | | | | |
| Total Return | | | | | | | | | | | | | | | | | | | | |
Total return | | | (1.87)% | | | | 6.16% | | | | 18.99% | | | | 15.84% | | | | (1.96)% | |
| | | | |
| | | | | | | | | | | | | | | | | | | | |
| Ratios to Average Net Assets | | | | | | | | | | | | | | | | | | | | |
Total expenses | | | 0.59% | 1,2,3 | | | 0.61% | 4,5,6 | | | 0.70% | 4,5,6 | | | 1.01% | 7,8,9 | | | 2.58% | 7,8,9 |
| | | | |
Total expenses after fees waived and/or reimbursed | | | 0.17% | 1,2,3 | | | 0.19% | 4,5,6 | | | 0.24% | 4,5,6 | | | 0.24% | 7,8,9 | | | 0.20% | 7,8,9 |
| | | | |
Net investment income10 | | | 2.02% | 1,2,3 | | | 2.08% | 4,5,6 | | | 2.47% | 4,5,6 | | | 2.54% | 7,8,9 | | | 2.43% | 7,8,9 |
| | | | |
| | | | | | | | | | | | | | | | | | | | |
| Supplemental Data | | | | | | | | | | | | | | | | | | | | |
Net assets, end of year (000) | | | $ 34,517 | | | | $ 34,742 | | | | $ 25,479 | | | | $ 12,178 | | | | $ 3,249 | |
| | | | |
Portfolio turnover rate | | | 50% | 11 | | | 54% | 12 | | | 38% | 12 | | | 4% | 13 | | | 35% | 13 |
| | | | |
| | 1 | | Includes the LifePath Master Portfolio’s pro rata portion of expenses from Active Stock Master Portfolio, CoreAlpha Bond Master Portfolio, International Tilts Master Portfolio, Large Cap Index Master Portfolio and Master Small Cap Index Series. These ratios do not reflect any expenses incurred indirectly as a result of investments in BlackRock Cash Funds: Institutional, BlackRock Commodity Strategies Fund, BlackRock Emerging Markets Fund, Inc. and iShares exchange-traded funds. |
| | 2 | | Includes the LifePath Master Portfolio’s share of Active Stock Master Portfolio, CoreAlpha Bond Master Portfolio, International Tilts Master Portfolio, Large Cap Index Master Portfolio and Master Small Cap Index Series allocated fees waived of 0.06% for the year ended December 31, 2015. |
| | 3 | | Excludes expenses incurred indirectly as a result of investments in underlying funds of approximately 0.18% for the year ended December 31, 2015, although the ratio does include the LifePath Master Portfolio’s share of Active Stock Master Portfolio, CoreAlpha Bond Master Portfolio, International Tilts Master Portfolio, Large Cap Index Master Portfolio and Master Small Cap Index Series allocated expenses and/or net investment income. |
| | 4 | | Includes the LifePath Master Portfolio’s pro rata portion of expenses from Active Stock Master Portfolio, CoreAlpha Bond Master Portfolio, International Tilts Master Portfolio, Large Cap Index Master Portfolio, Master Small Cap Index Series and Total International ex U.S. Index Master Portfolio. These ratios do not reflect any expenses incurred indirectly as a result of investments in BlackRock Cash Funds: Institutional, BlackRock Commodity Strategies Fund, BlackRock Emerging Markets Fund, Inc. and iShares exchange-traded funds. |
| | 5 | | Includes the LifePath Master Portfolio’s share of Active Stock Master Portfolio, CoreAlpha Bond Master Portfolio, International Tilts Master Portfolio, Large Cap Index Master Portfolio, Master Small Cap Index Series and Total International ex U.S. Index Master Portfolio allocated fees waived of 0.06% and 0.05% for the years ended December 31, 2014 and December 31, 2013, respectively. |
| | 6 | | Excludes expenses incurred indirectly as a result of investments in underlying funds of approximately 0.16% and 0.11% for the years ended December 31, 2014 and December 31, 2013, respectively, although the ratio does include the LifePath Master Portfolio’s share of Active Stock Master Portfolio, CoreAlpha Bond Master Portfolio, International Tilts Master Portfolio, Large Cap Index Master Portfolio, Master Small Cap Index Series and Total International ex U.S. Index Master Portfolio allocated expenses and/or net investment income. |
| | 7 | | Includes the LifePath Master Portfolio’s pro rata portion of expenses from Active Stock Master Portfolio, CoreAlpha Bond Master Portfolio, Large Cap Index Master Portfolio, Master Small Cap Index Series, and Total International ex U.S. Index Master Portfolio. These ratios do not reflect any expenses incurred indirectly as a result of investments in BlackRock Cash Funds: Institutional, BlackRock Commodity Strategies Fund, BlackRock Emerging Markets Fund, Inc. and iShares exchange-traded funds |
| | 8 | | Includes the LifePath Master Portfolio’s share of Active Stock Master Portfolio, CoreAlpha Bond Master Portfolio, Large Cap Index Master Portfolio, Master Small Cap Index Series and Total International ex U.S. Index Master Portfolio allocated fees waived of 0.06% and 0.03% for the years ended December 31, 2012 and December 31, 2011, respectively. |
| | 9 | | Excludes expenses incurred indirectly as a result of investments in underlying funds of approximately 0.11% and 0.16% for the years ended December 31, 2012 and December 31, 2011, respectively, although the ratio does include the LifePath Master Portfolio’s share of Active Stock Master Portfolio, CoreAlpha Bond Master Portfolio, Master Small Cap Index Series and Total International ex U.S. Index Master Portfolio allocated expenses and/or net investment income. |
| | 10 | | Includes the LifePath Master Portfolio’s share of the allocated net investment income from Active Stock Master Portfolio, CoreAlpha Bond Master Portfolio, Master Small Cap Index Series and Total International ex U.S. Index Master Portfolio, except for the years ended December 31, 2015, December 31, 2014 and December 31, 2013, which also includes International Tilts Master Portfolio. For the year ended December 31, 2015, the ratio does not include Total International ex U.S. Index Master Portfolio, which is no longer held by the LifePath Master Portfolio. |
| | 11 | | Includes the purchases and sales of the underlying funds and Active Stock Master Portfolio, CoreAlpha Bond Master Portfolio, International Tilts Master Portfolio, Large Cap Index Master Portfolio and Master Small Cap Index Series. |
| | 12 | | Includes the purchases and sales of the underlying funds and Active Stock Master Portfolio, CoreAlpha Bond Master Portfolio, International Tilts Master Portfolio, Large Cap Index Master Portfolio, Master Small Cap Index Series and Total International ex U.S. Index Master Portfolio. |
| | 13 | | Excludes purchases and sales of Active Stock Master Portfolio, CoreAlpha Bond Master Portfolio, Master Small Cap Index Series, and Total International ex U.S. Index Master Portfolio. If these transactions had been included to conform to the current year presentation, the portfolio turnover rate would have been 15% and 71% for the years ended December 31, 2012 and December 31, 2011, respectively. |
| | | | | | |
| See Notes to Financial Statements. | | | | |
| | | | | | | |
| 72 | | BLACKROCK FUNDS III | | DECEMBER 31, 2015 | | |
| | |
| Financial Highlights | | Master Investment Portfolio |
| | | | | | | | | | | | | | | | | | | | |
| | | LifePath 2055 Master Portfolio | |
| | | Year Ended December 31, | |
| | | 2015 | | | 2014 | | | 2013 | | | 2012 | | | 2011 | |
| | | | | | | | | | | | | | | | | | | | |
| Total Return | | | | | | | | | | | | | | | | | | | | |
Total return | | | (2.02)% | | | | 6.40% | | | | 21.49% | | | | 16.96% | | | | (3.52)% | |
| | | | |
| | | | | | | | | | | | | | | | | | | | |
| Ratios to Average Net Assets | | | | | | | | | | | | | | | | | | | | |
Total expenses | | | 0.72% | 1,2,3 | | | 0.76% | 4,5,6 | | | 1.01% | 4,5,6 | | | 2.41% | 7,8,9 | | | 14.66% | 7,8,9 |
| | | | |
Total expenses after fees waived and/or reimbursed | | | 0.17% | 1,2,3 | | | 0.17% | 4,5,6 | | | 0.24% | 4,5,6 | | | 0.25% | 7,8,9 | | | 0.19% | 7,8,9 |
| | | | |
Net investment income10 | | | 2.03% | 1,2,3 | | | 2.06% | 4,5,6 | | | 2.65% | 4,5,6 | | | 2.66% | 7,8,9 | | | 2.30% | 7,8,9 |
| | | | |
| | | | | | | | | | | | | | | | | | | | |
| Supplemental Data | | | | | | | | | | | | | | | | | | | | |
Net assets, end of year (000) | | | $ 15,850 | | | | $ 13,057 | | | | $ 8,978 | | | | $ 3,775 | | | | $ 494 | |
| | | | |
Portfolio turnover rate | | | 49% | 11 | | | 48% | 12 | | | 67% | 12 | | | 7% | 13 | | | 51% | 13 |
| | | | |
| | 1 | | Includes the LifePath Master Portfolio’s pro rata portion of expenses from Active Stock Master Portfolio, CoreAlpha Bond Master Portfolio, International Tilts Master Portfolio, Large Cap Index Master Portfolio and Master Small Cap Index Series. These ratios do not reflect any expenses incurred indirectly as a result of investments in BlackRock Cash Funds: Institutional, BlackRock Commodity Strategies Fund, BlackRock Emerging Markets Fund, Inc. and iShares exchange-traded funds. |
| | 2 | | Includes the LifePath Master Portfolio’s share of Active Stock Master Portfolio, CoreAlpha Bond Master Portfolio, International Tilts Master Portfolio, Large Cap Index Master Portfolio and Master Small Cap Index Series allocated fees waived of 0.07 for the year ended December 31, 2015. |
| | 3 | | Excludes expenses incurred indirectly as a result of investments in underlying funds of approximately 0.18% for the year ended December 31, 2015, although the ratio does include the LifePath Master Portfolio’s share of Active Stock Master Portfolio, CoreAlpha Bond Master Portfolio, International Tilts Master Portfolio, Large Cap Index Master Portfolio and Master Small Cap Index Series allocated expenses and/or net investment income. |
| | 4 | | Includes the LifePath Master Portfolio’s pro rata portion of expenses from Active Stock Master Portfolio, CoreAlpha Bond Master Portfolio, International Tilts Master Portfolio, Large Cap Index Master Portfolio, Master Small Cap Index Series and Total International ex U.S. Index Master Portfolio. These ratios do not reflect any expenses incurred indirectly as a result of investments in BlackRock Cash Funds: Institutional, BlackRock Commodity Strategies Fund, BlackRock Emerging Markets Fund, Inc. and iShares exchange-traded funds. |
| | 5 | | Includes the LifePath Master Portfolio’s share of Active Stock Master Portfolio, CoreAlpha Bond Master Portfolio, International Tilts Master Portfolio, Large Cap Index Master Portfolio, Master Small Cap Index Series and Total International ex U.S. Index Master Portfolio allocated fees waived of 0.07% and 0.06% for the years ended December 31, 2014 and December 31, 2013, respectively. |
| | 6 | | Excludes expenses incurred indirectly as a result of investments in underlying funds of approximately 0.18%, and 0.12% for the years ended December 31, 2014 and December 31, 2013, respectively, although the ratio does include the LifePath Master Portfolio’s share of Active Stock Master Portfolio, CoreAlpha Bond Master Portfolio, International Tilts Master Portfolio, Large Cap Index Master Portfolio, Master Small Cap Index Series and Total International ex U.S. Index Master Portfolio allocated expenses and/or net investment income. |
| | 7 | | Includes the LifePath Master Portfolio’s pro rata portion of expenses from Active Stock Master Portfolio, CoreAlpha Bond Master Portfolio, Large Cap Index Master Portfolio, Master Small Cap Index Series, and Total International ex U.S. Index Master Portfolio. These ratios do not reflect any expenses incurred indirectly as a result of investments in BlackRock Cash Funds: Institutional, BlackRock Commodity Strategies Fund, BlackRock Emerging Markets Fund, Inc. and iShares exchange-traded funds |
| | 8 | | Includes the LifePath Master Portfolio’s share of Active Stock Master Portfolio, CoreAlpha Bond Master Portfolio, Large Cap Index Master Portfolio, Master Small Cap Index Series and Total International ex U.S. Index Master Portfolio allocated fees waived of 0.07% and 0.06% for the years ended December 31, 2012 and December 31, 2011, respectively. |
| | 9 | | Excludes expenses incurred indirectly as a result of investments in underlying funds of approximately 0.11% and 0.17% for the years ended December 31, 2012 and December 31, 2011, respectively, although the ratio does include the LifePath Master Portfolio’s share of Active Stock Master Portfolio, CoreAlpha Bond Master Portfolio, Master Small Cap Index Series and Total International ex U.S. Index Master Portfolio allocated expenses and/or net investment income. |
| | 10 | | Includes the LifePath Master Portfolio’s share of the allocated net investment income from Active Stock Master Portfolio, CoreAlpha Bond Master Portfolio, Master Small Cap Index Series and Total International ex U.S. Index Master Portfolio, except for the years ended December 31, 2015, December 31, 2014 and December 31, 2013, which also includes International Tilts Master Portfolio. For the year ended December 31, 2015, the ratio does not include Total International ex U.S. Index Master Portfolio, which is no longer held by the LifePath Master Portfolio. |
| | 11 | | Includes the purchases and sales of the underlying funds and Active Stock Master Portfolio, CoreAlpha Bond Master Portfolio, International Tilts Master Portfolio, Large Cap Index Master Portfolio and Master Small Cap Index Series. |
| | 12 | | Includes the purchases and sales of the underlying funds and Active Stock Master Portfolio, CoreAlpha Bond Master Portfolio, International Tilts Master Portfolio, Large Cap Index Master Portfolio, Master Small Cap Index Series and Total International ex U.S. Index Master Portfolio. |
| | 13 | | Excludes purchases and sales of Active Stock Master Portfolio, CoreAlpha Bond Master Portfolio, Master Small Cap Index Series, and Total International ex U.S. Index Master Portfolio. If these transactions had been included to conform to the current year presentation, the portfolio turnover rate would have been 27% and 95% for the years ended December 31, 2012 and December 31, 2011, respectively. |
| | | | | | |
| See Notes to Financial Statements. | | | | |
| | | | | | | |
| | BLACKROCK FUNDS III | | DECEMBER 31, 2015 | | 73 |
| | |
| Notes to Financial Statements | | Master Investment Portfolio |
1. Organization:
Master Investment Portfolio (“MIP”) is registered under the Investment Company Act of 1940, as amended (the “1940 Act”), as a diversified, open-end management investment company. MIP is organized as a Delaware statutory trust. The financial statements and these accompanying notes relate to four series of MIP: LifePath® 2025 Master Portfolio, LifePath® 2035 Master Portfolio, LifePath® 2045 Master Portfolio and LifePath® 2055 Master Portfolio (each, a “LifePath Master Portfolio” and collectively, the “LifePath Master Portfolios”).
As of period end, the investment of LifePath 2035 Master Portfolio, LifePath 2045 Master Portfolio and LifePath 2055 Master Portfolio in the Active Stock Master Portfolio represented 25.0%, 28.0% and 33.2%, respectively, of net assets. The investment of LifePath 2025 Master Portfolio in CoreAlpha Bond Master Portfolio represented 33.8% of net assets. As such, financial statements of Active Stock Master Portfolio and CoreAlpha Bond Master Portfolio, including the Schedules of Investments, should be read in conjunction with each respective LifePath Master Portfolio’s financial statements. Active Stock Master Portfolio and CoreAlpha Bond Master Portfolio financial statements are available, without charge, on the U.S. Securities and Exchange Commission’s (“SEC’s”) website at http://www.sec.gov.
The LifePath Master Portfolios will generally invest in other registered investment companies (each, an “Underlying Fund” and collectively the “Underlying Funds”) that are managed by subsidiaries of BlackRock, Inc. (“BlackRock”) and its affiliates and affiliates of the LifePath Master Portfolios. The LifePath Master Portfolios may also invest in other master portfolios (“Underlying Master Portfolios”) that are managed by subsidiaries of BlackRock.
The value of a LifePath Master Portfolio’s investment in each of Active Stock Master Portfolio, CoreAlpha Bond Master Portfolio, International Tilts Master Portfolio, Large Cap Index Master Portfolio and Master Small Cap Index Series reflects that LifePath Master Portfolio’s proportionate interest in the net assets of that master portfolio. As of period end, the LifePath Master Portfolios held interests in Active Stock Master Portfolio, CoreAlpha Bond Master Portfolio, International Tilts Master Portfolio, Large Cap Index Master Portfolio and Master Small Cap Index Series as follows:
| | | | | | | | | | | | | | | | | | | | |
| | | Active Stock
Master Portfolio | | | CoreAlpha Bond
Master Portfolio | | | International Tilts
Master Portfolio | | | Large Cap Index
Master Portfolio | | | Master Small Cap
Index Series | |
LifePath 2025 Master Portfolio | | | 3.06% | | | | 2.70% | | | | 2.76% | | | | 0.26% | | | | 0.43% | |
LifePath 2035 Master Portfolio | | | 3.15% | | | | 1.13% | | | | 3.22% | | | | 0.37% | | | | 0.28% | |
LifePath 2045 Master Portfolio | | | 2.17% | | | | 0.11% | | | | 2.34% | | | | 0.26% | | | | 0.16% | |
LifePath 2055 Master Portfolio | | | 1.18% | | | | 0.03% | | | | 1.09% | | | | 0.09% | | | | 0.07% | |
The LifePath Master Portfolios, together with certain other registered investment companies advised by BlackRock Fund Advisors (“BFA” or the “Manager”) or its affiliates, are included in a complex of open-end funds referred to as the Equity-Liquidity Complex.
2. Significant Accounting Policies:
The financial statements are prepared in conformity with accounting principles generally accepted in the United States of America (“U.S. GAAP”), which may require management to make estimates and assumptions that affect the reported amounts of assets and liabilities in the financial statements, disclosure of contingent assets and liabilities at the date of the financial statements and the reported amounts of increases and decreases in net assets from operations during the reporting period. Actual results could differ from those estimates. Each LifePath Master Portfolio is considered an investment company under U.S. GAAP and follows the accounting and reporting guidance applicable to investment companies. Below is a summary of significant accounting policies:
Foreign Currency: Each LifePath Master Portfolio’s books and records are maintained in U.S. dollars. Purchases and sales of investments are recorded at the rates of exchange prevailing on the respective dates of such transactions. Generally, when the U.S. dollar rises in value against a foreign currency, the investments denominated in that currency will lose value; the opposite effect occurs if the U.S. dollar falls in relative value.
Each LifePath Master Portfolio does not isolate changes in the exchange rates from the changes in the market prices of investments held or sold for financial reporting purposes. Accordingly, the effects of changes in exchange rates on investments are not segregated in the Statements of Operations from the effects of changes in market prices of those investments, but are included as a component of net realized and unrealized gain (loss) from investments. Each LifePath Master Portfolio reports realized currency gains (losses) on foreign currency related transactions as components of net realized gain (loss) for financial reporting purposes, whereas such components are generally treated as ordinary income for federal income tax purposes.
Segregation and Collateralization: In cases where a LifePath Master Portfolio enters into certain investments (e.g., forward foreign currency exchange contracts) that would be treated as “senior securities” for 1940 Act purposes, a LifePath Master Portfolio may segregate or designate on its books and records cash or liquid assets having a market value at least equal to the amount of its future obligations under such investments. Doing so allows the investment to be excluded from treatment as a “senior security.” Furthermore, if required by an exchange or counterparty agreement, the LifePath Master Portfolios may be required to deliver/deposit cash and/or securities to/with an exchange, or broker-dealer or custodian as collateral for certain investments or obligations.
Investment Transactions and Investment Income: For financial reporting purposes, investment transactions are recorded on the dates the transactions are entered into (the trade dates). Realized gains and losses on investment transactions are determined on the identified cost basis. Dividend income is
| | | | | | |
| | | | | | | |
| 74 | | BLACKROCK FUNDS III | | DECEMBER 31, 2015 | | |
| | |
| Notes to Financial Statements (continued) | | Master Investment Portfolio |
recorded on the ex-dividend date. Dividends from foreign securities where the ex-dividend date may have passed are subsequently recorded when the LifePath Master Portfolios are informed of the ex-dividend date. Under the applicable foreign tax laws, a withholding tax at various rates may be imposed on capital gains, dividends and interest. Upon notification from issuers, some of the dividend income received from a real estate investment trust may be redesignated as a reduction of cost of the related investment and/or realized gain. Interest income, including amortization and accretion of premiums and discounts on debt securities, is recognized on the accrual basis.
Each LifePath Master Portfolio records daily its proportionate share of the Underlying Master Portfolios’ income, expenses and realized and unrealized gains and losses.
In-Kind Redemptions: Certain underlying investments in the LifePath Master Portfolios satisfied redemptions in investors’ capital through an in-kind redemption of securities and cash received from the Master Portfolios upon their redemptions from the Master Portfolios. For financial reporting purposes, these transactions were treated as a sale of securities and the resulting gains and losses were recognized based on the market value of the securities on the date of the redemption. Gains and losses resulting from such redemptions in-kind are included in allocation from the applicable Underlying Master Portfolios from in-kind redemptions in the Statement of Operations. For tax purposes, no gains or losses were recognized.
Indemnifications: In the normal course of business, each LifePath Master Portfolio enters into contracts that contain a variety of representations that provide general indemnification. Each LifePath Master Portfolio’s maximum exposure under these arrangements is unknown because it involves future potential claims against each LifePath Master Portfolio, which cannot be predicted with any certainty.
Other: Expenses directly related to a LifePath Master Portfolio are charged to that LifePath Master Portfolio. Other operating expenses shared by several funds, including other funds managed by the Manager, are prorated among those funds on the basis of relative net assets or other appropriate methods.
The LifePath Master Portfolios have an arrangement with their custodian whereby fees may be reduced by credits earned on uninvested cash balances, which, if applicable, are shown as fees paid indirectly in the Statements of Operations. The custodian imposes fees on overdrawn cash balances, which can be offset by accumulated credits earned or may result in additional custody charges. Effective September 2015, the arrangement with their custodian for earning credits on uninvested cash balances has ceased and the custodian will be imposing fees on certain uninvested cash balances.
3. Investment Valuation and Fair Value Measurements:
Investment Valuation Policies: The LifePath Master Portfolios’ investments are valued at fair value (also referred to as “market value” within the financial statements) as of the close of trading on the New York Stock Exchange (“NYSE”) (generally 4:00 p.m., Eastern time). U.S. GAAP defines fair value as the price the LifePath Master Portfolios would receive to sell an asset or pay to transfer a liability in an orderly transaction between market participants at the measurement date. The LifePath Master Portfolios determine the fair values of their financial instruments using independent dealers or pricing services under policies approved by the Board of Trustees of MIP (the “Board”). The BlackRock Global Valuation Methodologies Committee (the “Global Valuation Committee”) is the committee formed by management to develop global pricing policies and procedures and to provide oversight of the pricing function for the LifePath Master Portfolios for all financial instruments.
Fair Value Inputs and Methodologies: The following methods (or “techniques”) and inputs are used to establish the fair value of each LifePath Master Portfolio’s assets and liabilities:
| • | | Equity investments traded on a recognized securities exchange are valued at the official close price each day, if available. For equity investments traded on more than one exchange, the official close price on the exchange where the stock is primarily traded is used. Equity investments traded on a recognized exchange for which there were no sales on that day may be valued at the last available bid (long positions) or ask (short positions) price. Generally, trading in foreign instruments is substantially completed each day at various times prior to the close of business on the NYSE. Occasionally, events affecting the values of such instruments may occur between the foreign market close and the close of business on the NYSE that may not be reflected in the computation of the LifePath Master Portfolios’ net assets. Each business day, the LifePath Master Portfolios use a pricing service to assist with the valuation of certain foreign exchange-traded equity securities and foreign exchange-traded and over-the-counter (“OTC”) options (the “Systematic Fair Value Price”). Using current market factors, the Systematic Fair Value Price is designed to value such foreign securities and foreign options at fair value as of the close of business on the NYSE, which follows the close of the local markets. |
| • | | The market value of the LifePath Master Portfolios’ investments in the underlying open-end mutual funds is based on the published net asset value (“NAV”) of each fund computed as of the close of regular trading on the NYSE on days when the NYSE is open. |
| • | | Securities and other assets and liabilities denominated in foreign currencies are translated into U.S. dollars using exchange rates determined as of the close of business on the NYSE. Forward foreign currency exchange contracts are valued at the mean between the bid and ask prices and are determined as of the close of business on the NYSE. Interpolated values are derived when the settlement date of the contract is an interim date for which quotations are not available. |
| | | | | | |
| | | | | | | |
| | BLACKROCK FUNDS III | | DECEMBER 31, 2015 | | 75 |
| | |
| Notes to Financial Statements (continued) | | Master Investment Portfolio |
If events (e.g., a company announcement, market volatility or a natural disaster) occur that are expected to materially affect the value of such instruments, or in the event that the application of these methods of valuation results in a price for an investment that is deemed not to be representative of the market value of such investment, or if a price is not available, the investment will be valued by the Global Valuation Committee, or its delegate, in accordance with a policy approved by the Board as reflecting fair value (“Fair Valued Investments”). When determining the price for Fair Valued Investments, the Global Valuation Committee, or its delegate, seeks to determine the price that each LifePath Master Portfolio might reasonably expect to receive or pay from the current sale or purchase of that asset or liability in an arm’s-length transaction. Fair value determinations shall be based upon all available factors that the Global Valuation Committee, or its delegate, deems relevant consistent with the principles of fair value measurement. The pricing of all Fair Valued Investments is subsequently reported to the Board or a committee thereof on a quarterly basis.
Fair Value Hierarchy: Various inputs are used in determining the fair value of investments and derivative financial instruments. These inputs to valuation techniques are categorized into a fair value hierarchy consisting of three broad levels for financial statement purposes as follows:
| • | | Level 1 — unadjusted price quotations in active markets/exchanges for identical assets or liabilities that each LifePath Master Portfolio has the ability to access |
| • | | Level 2 — other observable inputs (including, but not limited to, quoted prices for similar assets or liabilities in markets that are active, quoted prices for identical or similar assets or liabilities in markets that are not active, inputs other than quoted prices that are observable for the assets or liabilities (such as interest rates, yield curves, volatilities, prepayment speeds, loss severities, credit risks and default rates) or other market–corroborated inputs) |
| • | | Level 3 — unobservable inputs based on the best information available in the circumstances, to the extent observable inputs are not available (including each LifePath Master Portfolio’s own assumptions used in determining the fair value of investments and derivative financial instruments) |
The hierarchy gives the highest priority to unadjusted quoted prices in active markets for identical assets or liabilities (Level 1 measurements) and the lowest priority to unobservable inputs (Level 3 measurements). Accordingly, the degree of judgment exercised in determining fair value is greatest for instruments categorized in Level 3. The inputs used to measure fair value may fall into different levels of the fair value hierarchy. In such cases, for disclosure purposes, the fair value hierarchy classification is determined based on the lowest level input that is significant to the fair value measurement in its entirety. The significant unobservable inputs used by the Global Valuation Committee in determining the price for Fair Valued Investments are typically categorized as Level 3. The fair value hierarchy for each LifePath Master Portfolio’s investments and derivative financial instruments have been included in the Schedules of Investments.
Changes in valuation techniques may result in transfers into or out of an assigned level within the hierarchy. In accordance with each LifePath Master Portfolio’s policy, transfers between different levels of the fair value hierarchy are deemed to have occurred as of the beginning of the reporting period. The categorization of a value determined for investments and derivative financial instruments is based on the pricing transparency of the investments and derivative financial instruments and is not necessarily an indication of the risks associated with investing in those securities.
4. Securities and Other Investments:
Securities Lending: Certain LifePath Master Portfolios may lend their securities to approved borrowers, such as brokers, dealers and other financial institutions. The borrower pledges and maintains with the LifePath Master Portfolios collateral consisting of cash, an irrevocable letter of credit issued by a bank, or securities issued or guaranteed by the U.S. Government. The initial collateral received by each LifePath Master Portfolio are required to have a value of at least 102% of the current value of the loaned securities for securities traded on U.S. exchanges and a value of at least 105% for all other securities. The collateral is maintained thereafter, at a value equal to at least 100% of the current market value of the securities on loan. The market value of the loaned securities is determined at the close of each business day of LifePath Master Portfolios and any additional required collateral is delivered to the LifePath Master Portfolio, or excess collateral returned by the LifePath Master Portfolio, on the next business day. During the term of the loan, the LifePath Master Portfolios are entitled to all distributions made on or in respect of the loaned securities. Loans of securities are terminable at any time and the borrower, after notice, is required to return borrowed securities within the standard time period for settlement of securities transactions.
The market value of any securities on loan, all of which were classified as common stocks or affiliated investments in the LifePath Master Portfolios’ Schedules of Investments, and the value of any related collateral are shown separately in the Statements of Assets and Liabilities as a component of investments at value-unaffiliated and collateral on securities loaned at value, respectively. As of period end, any securities on loan were collateralized by cash. The cash collateral invested by the securities lending agent, BlackRock Institutional Trust Company, N.A. (“BTC”), if any, is disclosed in the Schedules of Investments.
Securities lending transactions are entered into by the LifePath Master Portfolios under Master Securities Lending Agreements (each, an “MSLA”), which provide the right, in the event of default (including bankruptcy or insolvency), for the non-defaulting party to liquidate the collateral and calculate a net exposure to the defaulting party or request additional collateral. In the event that a borrower defaults, the LifePath Master Portfolios, as lender, would offset the market value of the collateral received against the market value of the securities loaned. When the value of the collateral is greater than that of the market value of the securities loaned, the lender is left with a net amount payable to the defaulting party. However, bankruptcy or insolvency laws of a particular jurisdiction may impose restrictions on or prohibitions against such a right of offset in the event of an MSLA counterparty’s bankruptcy or
| | | | | | |
| | | | | | | |
| 76 | | BLACKROCK FUNDS III | | DECEMBER 31, 2015 | | |
| | |
| Notes to Financial Statements (continued) | | Master Investment Portfolio |
insolvency. Under the MSLA, absent an event of default the borrower can resell or re-pledge the loaned securities, and the LifePath Master Portfolio can reinvest cash collateral received in connection with loaned securities. Upon an event of default, the parties’ obligations to return the securities or collateral to the other party are extinguished, and the parties can resell or re-pledge the loaned securities or the collateral received in connection with the loaned securities in order to satisfy the defaulting party’s net payment obligation for all transactions under the MSLA. The defaulting party remains liable for any deficiency.
As of period end, the following table is a summary of LifePath 2025 Master Portfolio’s securities lending agreements by counterparty which are subject to offset under an MSLA:
| | | | | | | | | | | | |
| Counterparty | | Securities
Loaned
at Value | | | Cash
Collateral
Received1 | | | Net
Amount | |
Credit Suisse Securities (USA) LLC | | $ | 2,817 | | | $ | (2,817 | ) | | | — | |
| | 1 | | Collateral with a value of $2,895 has been received in connection with securities lending agreements. Collateral received in excess of the value of securities loaned from the individual counterparty is not shown for financial reporting purposes in the table above. |
The risks of securities lending include the risk that the borrower may not provide additional collateral when required or may not return the securities when due. To mitigate these risks, the LifePath Master Portfolios benefits from a borrower default indemnity provided by BlackRock. BlackRock’s indemnity allows for full replacement of the securities loaned if the collateral received does not cover the value on the securities loaned in the event of borrower default. Each LifePath Master Portfolio could suffer a loss if the value of an investment purchased with cash collateral falls below the market value of loaned securities or if the value of an investment purchased with cash collateral falls below the value of the original cash collateral received.
5. Derivative Financial Instruments:
The LifePath Master Portfolios engage in various portfolio investment strategies using derivative contracts both to increase the returns of the LifePath Master Portfolios and/or to manage economically their exposure to certain risks such as foreign currency exchange rate risk. These contracts may be transacted on an exchange or OTC.
Forward Foreign Currency Exchange Contracts: Certain LifePath Master Portfolios enter into forward foreign currency exchange contracts as an economic hedge against either specific transactions or portfolio instruments or to obtain exposure to, or hedge exposure away from, foreign currencies (foreign currency exchange rate risk). A forward foreign currency exchange contract is an agreement between two parties to buy and sell a currency at a set exchange rate on a future date. Forward foreign currency exchange contracts, when used by the LifePath Master Portfolios help to manage the overall exposure to the currencies in which some of the investments held by the LifePath Master Portfolios are denominated. Non-deliverable forward foreign currency exchange contracts are settled with the counterparty in cash without the delivery of foreign currency. The contract is marked-to-market daily and the change in market value is recorded by the LifePath Master Portfolios as an unrealized gain or loss. When the contract is closed, the LifePath Master Portfolios record a realized gain or loss equal to the difference between the value at the time it was opened and the value at the time it was closed. The use of forward foreign currency exchange contracts involves the risk that the value of a forward foreign currency exchange contract changes unfavorably due to movements in the value of the referenced foreign currencies.
Master Netting Arrangements: In order to better define their contractual rights and to secure rights that will help them mitigate their counterparty risk, the LifePath Master Portfolios may enter into an International Swaps and Derivatives Association, Inc. Master Agreement (“ISDA Master Agreement”) or similar agreement with their counterparties. An ISDA Master Agreement is a bilateral agreement between each LifePath Master Portfolio and a counterparty that governs certain OTC derivatives and typically contains, among other things, collateral posting terms and netting provisions in the event of a default and/or termination event. Under an ISDA Master Agreement, each LifePath Master Portfolio may, under certain circumstances, offset with the counterparty certain derivative financial instruments’ payables and/or receivables with collateral held and/or posted and create one single net payment. The provisions of the ISDA Master Agreement typically permit a single net payment in the event of default including the bankruptcy or insolvency of the counterparty. Bankruptcy or insolvency laws of a particular jurisdiction may restrict or prohibit the right of offset in bankruptcy, insolvency or other events. In addition, certain ISDA Master Agreements allow counterparties to terminate derivative contracts prior to maturity in the event the LifePath Master Portfolios’ net assets decline by a stated percentage or the LifePath Master Portfolios fail to meet the terms of their ISDA Master Agreements. The result would cause the LifePath Master Portfolios to accelerate payment of any net liability owed to the counterparty.
Collateral Requirements: For derivatives traded under an ISDA Master Agreement, the collateral requirements are typically calculated by netting the mark-to-market amount for each transaction under such agreement and comparing that amount to the value of any collateral currently pledged by the LifePath Master Portfolios and the counterparty.
Cash collateral that has been pledged to cover obligations of the LifePath Master Portfolios and cash collateral received from the counterparty, if any, is reported separately on the Statements of Assets and Liabilities as cash pledged as collateral and cash received as collateral, respectively. Non-cash collateral pledged by the LifePath Master Portfolios, if any, is noted in the Schedules of Investments. Generally, the amount of collateral due from or to a party has to exceed a minimum transfer amount threshold (typically either $250,000 or $500,000) before a transfer is required, which is determined at
| | | | | | |
| | | | | | | |
| | BLACKROCK FUNDS III | | DECEMBER 31, 2015 | | 77 |
| | |
| Notes to Financial Statements (continued) | | Master Investment Portfolio |
the close of business of the LifePath Master Portfolios. Any additional required collateral is delivered to/pledged by the LifePath Master Portfolios on the next business day. Typically, a the LifePath Master Portfolio’s counterparty is not permitted to sell, re-pledge or use cash and non-cash collateral it receives. A LifePath Master Portfolio generally agrees not to use non-cash collateral that it receives but may, absent default or certain other circumstances defined in the underlying ISDA Master Agreement, be permitted to use cash collateral received. In such cases, a LifePath Master Portfolio may pay interest pursuant to the collateral arrangement with the counterparty. To the extent amounts due to the LifePath Master Portfolios from their counterparties are not fully collateralized, the LifePath Master Portfolios bear the risk of loss from counterparty non-performance. Likewise, to the extent the LifePath Master Portfolios have delivered collateral to a counterparty and stand ready to perform under the terms of their agreement with such counterparty, the LifePath Master Portfolios bear the risk of loss from a counterparty in the amount of the value of the collateral in the event the counterparty fails to return such collateral. Based on the terms of agreements, collateral may not be required to all derivative contracts.
6. Investment Advisory Agreement and Other Transactions with Affiliates:
The PNC Financial Services Group, Inc. is the largest stockholder and an affiliate of BlackRock for 1940 Act purposes.
MIP, on behalf of the LifePath Master Portfolios, entered into an Investment Advisory Agreement with BFA, the LifePath Master Portfolios’ investment advisor, an indirect, wholly owned subsidiary of BlackRock, to provide investment advisory services. The Manager is responsible for the management of each LifePath Master Portfolios and provides the personnel, facilities, equipment and certain other services necessary to the operations of each LifePath Master Portfolio. For such services, each LifePath Master Portfolio pays BFA a monthly fee based on a percentage of each LifePath Master Portfolio’s average daily net assets at an annual rate of 0.35%.
MIP, with respect to LifePath Master Portfolios, entered into a sub-advisory agreement with BlackRock International Limited (“BIL”) and BlackRock (Singapore) Limited (“BRS”), affiliates of the Manager. The Manager pays BIL and BRS, for services they provide, a monthly fee that is a percentage of the investment advisory fees paid by each LifePath Master Portfolio to the Manager.
MIP, on behalf of the LifePath Master Portfolios, entered into an Administration Agreement with BlackRock Advisors, LLC (“BAL”), which has agreed to provide general administration services (other than investment advice and related portfolio activities). BAL, in consideration thereof, has agreed to bear all of the LifePath Master Portfolios’ ordinary operating expenses, excluding, generally, investment advisory fees, distribution fees, brokerage and other expenses related to the execution of portfolio transactions, extraordinary expenses and certain other expenses which are borne by the LifePath Master Portfolios.
From time to time, BAL may waive such fees in whole or in part. Any such waiver will reduce the expenses of a LifePath Master Portfolio and, accordingly, have a favorable impact on its performance. BAL may delegate certain of its administration duties to sub-administrators.
BAL is not entitled to compensation for providing administration service to the LifePath Master Portfolios, for so long as BAL is entitled to compensation for providing administration services to corresponding feeder funds that invest substantially all of their assets in the LifePath Master Portfolios, or BAL (or an affiliate) receives investment advisory fees from the LifePath Master Portfolios.
Effective November 30, 2015, the Manager voluntarily agreed to waive its investment advisory fees by the amount of investment advisory fees the LifePath Master Portfolios pay to the Manager indirectly through their investments in affiliated money market funds. However, the Manager does not waive its investment advisory fees by the amount of investment advisory fees paid in connection with the LifePath Master Portfolios’ investment in other affiliated investment companies, if any. These amounts, if any, are included in fees waived by the Manager in the Statements of Operations. For the year ended December 31, 2015, there were no waivers on the LifePath Master Portfolios.
The fees and expenses of MIP’s trustees who are not “interested persons” of MIP, as defined in the 1940 Act (“Independent Trustees”), counsel to the Independent Trustees and MIP’s independent registered public accounting firm (together, the “independent expenses”) are paid directly by the LifePath Master Portfolios. BFA has also contractually agreed to reimburse the LifePath Master Portfolios or provide an offsetting credit against the investment advisory fees paid by the LifePath Master Portfolios in an amount equal to the independent expenses. These contractual waivers are effective through April 30, 2026. For the year ended December 31, 2015, the amounts waived are included in fees waived by the Manager in the Statements of Operations as follows:
| | | | | | | | | | | | |
LifePath 2025
Master Portfolio | | LifePath 2035
Master Portfolio | | | LifePath 2045
Master Portfolio | | | LifePath 2055
Master Portfolio | |
$35,458 | | $ | 34,203 | | | $ | 33,576 | | | $ | 32,990 | |
Prior to November 30, 2015, BFA had contractually agreed to waive investment advisory fees charged to each LifePath Master Portfolio in an amount equal to investment advisory fees and administration fees, if any, received by BFA or BAL, from each affiliated investment company in which the LifePath Master Portfolios invest. For the year ended December 31, 2015, the amounts waived are included in fees waived by the Manager in the Statements of Operations as follows:
| | | | | | |
| | | | | | | |
| 78 | | BLACKROCK FUNDS III | | DECEMBER 31, 2015 | | |
| | |
| Notes to Financial Statements (continued) | | Master Investment Portfolio |
| | | | | | | | | | | | |
LifePath 2025
Master Portfolio | | LifePath 2035
Master Portfolio | | | LifePath 2045
Master Portfolio | | | LifePath 2055
Master Portfolio | |
$185,698 | | $ | 166,991 | | | $ | 105,575 | | | $ | 43,733 | |
Effective November 30, 2015, BFA has agreed to contractually waive 0.30% of its advisory fees through April 30, 2017. For the year ended December 31, 2015, the amounts waived are included in fees waived by the Manager in the Statements of Operations as follows:
| | | | | | | | | | | | |
LifePath 2025 Master Portfolio | | LifePath 2035 Master Portfolio | | | LifePath 2045 Master Portfolio | | | LifePath 2055 Master Portfolio | |
$17,320 | | $ | 14,888 | | | $ | 9,068 | | | $ | 4,137 | |
The SEC has issued an exemptive order which permits BTC, an affiliate of the Manager, to serve as securities lending agent for the LifePath Master Portfolios, subject to applicable conditions. As securities lending agent, BTC bears all operational costs directly related to securities lending. The LifePath Master Portfolios are responsible for fees in connection with the investment of cash collateral received for securities on loan in a money market fund managed by the Manager or its affiliates, however, BTC has agreed to reduce the amount of securities lending income it receives in order to effectively limit the collateral investment fees the LifePath Master Portfolios bear to an annual rate of 0.04% (the “collateral investment fees”).
Securities lending income is equal to the total of income earned from the reinvestment of cash collateral, net of fees and other payments to and from borrowers of securities, and less the collateral investment fees. Each LifePath Master Portfolio retains a portion of securities lending income and remits a remaining portion to BTC as compensation for its services as securities lending agent.
Pursuant to a securities lending agreement, each LifePath Master Portfolio retain 80% of securities lending income, and this amount retained can never be less than 70% of the total of securities lending income plus the collateral investment fees. In addition, commencing the business day following the date that the aggregate securities lending income earned across certain funds in the Equity-Liquidity Complex in a calendar year exceeds a specified threshold, each LifePath Master Portfolio, pursuant to the securities lending agreement, will retain for the remainder of the calendar year securities lending income in an amount equal to 85% of securities lending income, and this amount retained can never be less than 70% of the total of securities lending income plus the collateral investment fees.
The share of securities lending income earned by each LifePath Master Portfolio is shown as securities lending — affiliated – net in the Statements of Operations. For the year ended December 31, 2015, each LifePath Master Portfolio paid BTC the following amounts in total for securities lending agent services and collateral investment fees:
| | | | | | | | | | | | |
LifePath 2025
Master Portfolio | | LifePath 2035
Master Portfolio | | | LifePath 2045
Master Portfolio | | | LifePath 2055
Master Portfolio | |
$564 | | $ | 666 | | | $ | 391 | | | $ | 342 | |
Each LifePath Master Portfolio may invest its positive cash balances in certain money market funds managed by the Manager or an affiliate. The income earned on these temporary cash investments is shown as income-affiliated in the Statements of Operations.
Certain officers and/or trustees of the MIP are officers and/or directors of BlackRock or its affiliates.
7. Purchases and Sales:
For the year ended December 31, 2015, purchases and sales of investments in the Underlying Funds and Master Portfolios, excluding short-term securities, were as follows:
| | | | | | | | | | | | | | | | |
| | | LifePath 2025
Master Portfolio | | | LifePath 2035
Master Portfolio | | | LifePath 2045
Master Portfolio | | | LifePath 2055
Master Portfolio | |
Purchases | | $ | 36,490,324 | | | $ | 27,009,824 | | | $ | 17,839,932 | | | $ | 10,217,539 | |
Sales | | $ | 34,174,588 | | | $ | 25,494,383 | | | $ | 17,307,011 | | | $ | 7,093,001 | |
8. Income Tax Information:
The LifePath Master Portfolios are classified as a partnership for federal income tax purposes. As such, each investor in the LifePath Master Portfolios is treated as the owner of their proportionate share of net assets, income, expenses and realized and unrealized gains and losses of the LifePath Master Portfolios. Therefore, no federal income tax provision is required. It is intended that the LifePath Master Portfolios’ assets will be managed so an investor in the LifePath Master Portfolios can satisfy the requirements of Subchapter M of the Internal Revenue Code of 1986, as amended.
Each LifePath Master Portfolio files U.S. federal and various state and local tax returns. No income tax returns are currently under examination. The statute of limitations on each LifePath Master Portfolio’s U.S. federal tax returns remains open for each of the four years ended December 31, 2015. The statutes of limitations on each LifePath Master Portfolio’s state and local tax returns may remain open for an additional year depending upon the jurisdiction.
| | | | | | |
| | | | | | | |
| | BLACKROCK FUNDS III | | DECEMBER 31, 2015 | | 79 |
| | |
| Notes to Financial Statements (concluded) | | Master Investment Portfolio |
Management has analyzed tax laws and regulations and their application to the LifePath Master Portfolios’ as of December 31, 2015, inclusive of the open tax return years, and does not believe there are any uncertain tax positions that require recognition of a tax liability in the LifePath Master Portfolios’ financial statements.
As of period end, gross unrealized appreciation and depreciation based on cost for federal income tax purposes were as follows:
| | | | | | | | | | | | | | | | |
| | | LifePath 2025
Master Portfolio | | | LifePath 2035
Master Portfolio | | | LifePath 2045
Master Portfolio | | | LifePath 2055
Master Portfolio | |
Tax cost | | $ | 66,259,193 | | | $ | 57,243,375 | | | $ | 35,192,539 | | | $ | 16,118,747 | |
| | | | |
Gross unrealized appreciation | | $ | 3,128,059 | | | $ | 3,952,946 | | | $ | 2,543,944 | | | $ | 1,605,295 | |
Gross unrealized depreciation | | | (4,549,823 | ) | | | (5,265,000 | ) | | | (3,420,244 | ) | | | (1,983,325 | ) |
| | | | |
Net unrealized depreciation | | $ | (1,421,764 | ) | | $ | (1,312,054 | ) | | $ | (876,300 | ) | | $ | (378,030 | ) |
| | | | |
9. Bank Borrowings:
MIP, on behalf of the LifePath Master Portfolios, along with certain other funds managed by the Manager and its affiliates (“Participating Funds”), is a party to a 364-day, $2.1 billion credit agreement with a group of lenders, under which the LifePath Master Portfolios may borrow to fund shareholder redemptions. Excluding commitments designated for certain funds, the Participating Funds, including the LifePath Master Portfolios, can borrow up to an aggregate commitment amount of $1.6 billion at any time outstanding, subject to asset coverage and other limitations as specified in the agreement. The credit agreement has the following terms: a fee of 0.06% per annum on unused commitment amounts and interest at a rate equal to the higher of (a) one-month LIBOR (but, in any event, not less than 0.00%) on the date the loan is made plus 0.80% per annum or (b) the Fed Funds rate (but, in any event, not less than 0.00%) in effect from time to time plus 0.80% per annum on amounts borrowed. The agreement expires in April 2016 unless extended or renewed. Participating Funds paid administration, legal and arrangement fees, which, if applicable, are included in miscellaneous expenses in the Statements of Operations, and along with commitment fees, were allocated among such funds based upon portions of the aggregate commitment available to them and relative net assets of Participating Funds. During the year ended December 31, 2015, the LifePath Master Portfolios did not borrow under the credit agreement.
10. Principal Risks:
In the normal course of business, certain LifePath Master Portfolios invest in securities and enter into transactions where risks exist due to fluctuations in the market (market risk) or failure of the issuer to meet all its obligations, including the ability to pay principal and interest when due (issuer credit risk). The value of securities held by the LifePath Master Portfolios may decline in response to certain events, including those directly involving the issuers of securities owned by the LifePath Master Portfolios. Changes arising from the general economy, the overall market and local, regional or global political or/and social instability, as well as currency, interest rate and price fluctuations, may also affect the securities’ value.
Counterparty Credit Risk: Similar to issuer credit risk, the LifePath Master Portfolios may be exposed to counterparty credit risk, or the risk that an entity may fail to or be unable to perform on its commitments related to unsettled or open transactions. The LifePath Master Portfolios manage counterparty credit risk by entering into transactions only with counterparties that the Manager believes have the financial resources to honor their obligations and by monitoring the financial stability of those counterparties. Financial assets, which potentially expose the LifePath Master Portfolios to market, issuer and counterparty credit risks, consist principally of financial instruments and receivables due from counterparties. The extent of the LifePath Master Portfolios’ exposure to market, issuer and counterparty credit risks with respect to these financial assets is approximately their value recorded in the Statements of Assets and Liabilities, less any collateral held by the LifePath Master Portfolios.
A derivative contract may suffer a mark-to-market loss if the value of the contract decreases due to an unfavorable change in the market rates or values of the underlying instrument. Losses can also occur if the counterparty does not perform under the contract.
The LifePath Master Portfolios’ risk of loss from counterparty credit risk on OTC derivatives is generally limited to the aggregate unrealized gain less the value of any collateral held by such LifePath Master Portfolios.
11. Subsequent Events:
Management has evaluated the impact of all subsequent events on the LifePath Master Portfolios through the date the financial statements were issued and has determined that there were no subsequent events requiring adjustment or additional disclosure in the financial statements.
| | | | | | |
| | | | | | | |
| 80 | | BLACKROCK FUNDS III | | DECEMBER 31, 2015 | | |
| | |
| Report of Independent Registered Public Accounting Firm | | Master Investment Portfolio |
To the Board of Trustees of Master Investment Portfolio and the Interestholders of LifePath® 2025 Master Portfolio, LifePath® 2035 Master Portfolio, LifePath® 2045 Master Portfolio and LifePath® 2055 Master Portfolio:
In our opinion, the accompanying statements of assets and liabilities, including the schedules of investments, and the related statements of operations and of changes in net assets and the financial highlights present fairly, in all material respects, the financial position of LifePath® 2025 Master Portfolio, LifePath® 2035 Master Portfolio, LifePath® 2045 Master Portfolio and LifePath® 2055 Master Portfolio (the “Master Portfolios”), each a series of Master Investment Portfolio, at December 31, 2015, the results of each of their operations for the year then ended, the changes in each of their net assets for each of the two years in the period then ended and the financial highlights for each of the five years in the period then ended, in conformity with accounting principles generally accepted in the United States of America. These financial statements and financial highlights (hereafter referred to as “financial statements”) are the responsibility of the Master Portfolios’ management. Our responsibility is to express an opinion on these financial statements based on our audits. We conducted our audits of these financial statements in accordance with the standards of the Public Company Accounting Oversight Board (United States). Those standards require that we plan and perform the audit to obtain reasonable assurance about whether the financial statements are free of material misstatement. An audit includes examining, on a test basis, evidence supporting the amounts and disclosures in the financial statements, assessing the accounting principles used and significant estimates made by management, and evaluating the overall financial statement presentation. We believe that our audits, which included confirmation of securities at December 31, 2015 by correspondence with the custodian, brokers and transfer agent, provide a reasonable basis for our opinion.
/s/PricewaterhouseCoopers LLP
Philadelphia, Pennsylvania
February 24, 2016
| | | | | | |
| | | | | | | |
| | BLACKROCK FUNDS III | | DECEMBER 31, 2015 | | 81 |
| | | | |
| Disclosure of Sub-Advisory Agreement | | |
The Board of Trustees of Master Investment Portfolio (the “Master Fund”) met in person on November 18-20, 2015 (the “November Meeting”) to consider the initial approval of (a) the sub-advisory agreement between BlackRock Fund Advisors (the “Manager”), the Master Fund’s investment advisor, and BlackRock International Limited (“BIL”) with respect to LifePath® 2025 Master Portfolio, LifePath® 2035 Master Portfolio, LifePath® 2045 Master Portfolio and LifePath® 2055 Master Portfolio (each, a “Master Portfolio” and collectively, the “Master Portfolios”), each a series of the Master Fund (the “BIL Sub-Advisory Agreement”) and (b) the sub-advisory agreement between the Manager and BlackRock (Singapore) Limited (“BRS”) with respect to each of the Master Portfolios (the “BRS Sub-Advisory Agreement,” and together with the BIL Sub-Advisory Agreement, the “Sub-Advisory Agreements”). Each of BlackRock LifePath® 2025 Fund, BlackRock LifePath® 2035 Fund, BlackRock LifePath® 2045 Fund and BlackRock LifePath® 2055 Fund (each, a “Portfolio” and collectively, the “Portfolios”), each a series of BlackRock Funds III (the “Fund”), is a “feeder” fund that invests all of its investable assets in the corresponding Master Portfolio. Accordingly, the Board of Trustees of the Fund also considered the approval of each Sub-Advisory Agreement with respect to each Master Portfolio. For simplicity, as pertinent, the Board of Trustees of the Master Fund and the Board of Trustees of the Fund are referred to herein collectively as the “Board,” and the members are referred to as “Board Members.”
On the date of the Meeting, the Board consisted of fifteen individuals, thirteen of whom were not “interested persons” of the Master Fund or the Fund as defined in the Investment Company Act of 1940, as amended (the “1940 Act”) (the “Independent Board Members”). Pursuant to the 1940 Act, the Board is required to consider the initial approval of the Sub-Advisory Agreements.
At the November Meeting, the Board reviewed materials relating to its consideration of the proposed Sub-Advisory Agreements. The Master Fund’s investment advisory agreement (the “Advisory Agreement”) with the Manager on behalf of each Master Portfolio was most recently approved by the Board of the Master Fund at an in-person meeting on May 18-20, 2015 (the “May Meeting”). A discussion of the basis for the Board of the Master Fund’s approval and the Board of the Fund’s consideration of the Advisory Agreement at the May Meeting is included in the Portfolios’ shareholder report for the period ended June 30, 2015. The factors considered by the Board at the November Meeting in connection with approval of the proposed Sub-Advisory Agreements were substantially the same as the factors considered at the May Meeting.
Following discussion, all the Board Members of the Master Fund present at the November Meeting, including all the Independent Board Members present, approved the BIL Sub-Advisory Agreement between the Manager and BIL with respect to each Master Portfolio and the BRS Sub-Advisory Agreement between the Manager and BRS with respect to each Master Portfolio, each for a two-year term beginning on the effective date of the pertinent Sub-Advisory Agreement. Based upon its evaluation of all of the aforementioned factors in their totality, the Board of the Master Fund, including the Independent Board Members, was satisfied that the terms of the Sub-Advisory Agreements were fair and reasonable and in the best interest of each Master Portfolio and its interest holders. The Board of the Fund, including the Independent Board Members, also considered each Sub-Advisory Agreement with respect to each Master Portfolio and found the Sub-Advisory Agreements to be satisfactory. In arriving at its decision to approve the Sub-Advisory Agreements, the Board of the Master Fund did not identify any single factor or group of factors as all-important or controlling, but considered all factors together, and different Board Members may have attributed different weights to the various factors considered. The Independent Board Members were also assisted by the advice of independent legal counsel in making this determination.
| | | | | | |
| | | | | | | |
| 82 | | BLACKROCK FUNDS III | | DECEMBER 31, 2015 | | |
| | | | | | | | | | |
Name, Address1
and Year of Birth | | Position(s)
Held with
the Trust/MIP | | Length
of Time
Served as
a Trustee3 | | Principal Occupation(s) During Past Five Years | | Number of BlackRock-
Advised Registered
Investment Companies
(“RICs”) Consisting of
Investment Portfolios
(“Portfolios”) Overseen | | Public
Directorships |
| Independent Trustees2 |
Rodney D. Johnson 1941 | | Chair of the Board and Trustee | | Since 2009 | | President, Fairmount Capital Advisors, Inc. from 1987 to 2013; Member of the Archdiocesan Investment Committee of the Archdiocese of Philadelphia from 2004 to 2012; Director, The Committee of Seventy (civic) from 2006 to 2012; Director, Fox Chase Cancer Center from 2004 to 2011. | | 33 RICs consisting of
155 Portfolios | | None |
David O. Beim 1940 | | Trustee | | Since 2009 | | Professor of Professional Practice at the Columbia University Graduate School of Business since 1991; Trustee, Phillips Exeter Academy from 2002 to 2012; Chairman, Wave Hill, Inc. (public garden and cultural center) from 1990 to 2006. | | 33 RICs consisting of
155 Portfolios | | None |
Collette Chilton 1958 | | Trustee | | Since 2015 | | Chief Investment Officer, Williams College since 2006; Chief Investment Officer, Lucent Asset Management Corporation from 1998 to 2006. | | 33 RICs consisting of
155 Portfolios | | None |
Frank J. Fabozzi 1948 | | Trustee | | Since 2014 | | Editor of and Consultant for The Journal of Portfolio Management since 2006; Professor of Finance, EDHEC Business School since 2011; Visiting Professor, Princeton University from 2013 to 2014; Professor in the Practice of Finance and Becton Fellow, Yale University School of Management from 2006 to 2011. | | 108 RICs consisting of
230 Portfolios | | None |
Dr. Matina S. Horner 1939 | | Trustee | | Since 2009 | | Executive Vice President, Teachers Insurance and Annuity Association and College Retirement Equities Fund from 1989 to 2003. | | 33 RICs consisting of
155 Portfolios | | NSTAR (electric and gas utility) |
Herbert I. London 1939 | | Trustee | | Since 2009 | | Professor Emeritus, New York University since 2005; President, London Center for Policy Research since 2012; John M. Olin Professor of Humanities, New York University from 1993 to 2005 and Professor thereof from 1980 to 2005; President Emeritus, Hudson Institute (policy research organization) from 2011 to 2012, President thereof from 1997 to 2011 and Trustee from 1980 to 2012; Chairman of the Board of Trustees for Grantham University since 2006; Director, InnoCentive, Inc. (global internet service) since 2005; Director, Cerego, LLC (educational software) since 2005; Director, Cybersettle (online adjudication) since 2009; Director, AIMS Worldwide, Inc. (marketing) from 2007 to 2012. | | 33 RICs consisting of
155 Portfolios | | None |
Cynthia A. Montgomery 1952 | | Trustee | | Since 2009 | | Professor, Harvard Business School since 1989; Director, McLean Hospital from 2005 to 2012; Director, Harvard Business School Publishing from 2005 to 2010. | | 33 RICs consisting of
155 Portfolios | | Newell Rubbermaid, Inc. (manufacturing) |
Joseph P. Platt 1947 | | Trustee | | Since 2009 | | Director, Jones and Brown (Canadian insurance broker) since 1998; General Partner, Thorn Partners, LP (private investments) since 1998; Director, WQED Multi-Media (public broadcasting not-for-profit) since 2001; Director, The West Penn Allegheny Health System (a not-for-profit health system) from 2008 to 2013; Partner, Amarna Corporation, LLC (private investment company) from 2002 to 2008. | | 33 RICs consisting of
155 Portfolios | | Greenlight Capital Re, Ltd. (reinsurance company) |
Robert C. Robb, Jr. 1945 | | Trustee | | Since 2009 | | Partner, Lewis, Eckert, Robb and Company (management and financial consulting firm) since 1981. | | 33 RICs consisting of
155 Portfolios | | None |
Toby Rosenblatt 1938 | | Trustee | | Since 2009 | | President, Founders Investments Ltd. (private investments) since 1999; Director, Forward Management, LLC since 2007; Director, College Futures Foundation (philanthropic foundation) since 2009; Director, The James Irvine Foundation (philanthropic foundation) from 1998 to 2008. | | 33 RICs consisting of
155 Portfolios | | None |
| | | | | | |
| | | | | | | |
| | BLACKROCK FUNDS III | | DECEMBER 31, 2015 | | 83 |
| | | | |
| Officers and Trustees (continued) | | |
| | | | | | | | | | |
Name, Address1
and Year of Birth | | Position(s)
Held with
the Trust/MIP | | Length
of Time
Served as
a Trustee3 | | Principal Occupation(s) During Past Five Years | | Number of BlackRock-
Advised Registered
Investment Companies
(“RICs”) Consisting of
Investment Portfolios
(“Portfolios”) Overseen | | Public
Directorships |
| Independent Trustees2 (concluded) |
Mark Stalnecker 1951 | | Trustee | | Since 2015 | | Chief Investment Officer, University of Delaware from 1999 to 2013; Trustee, Winterthur Museum and Country Estate since 2001; Member of the Investment Committee, Delaware Public Employees’ Retirement System since 2002; Member of the Investment Committee, Christiana Care Health System since 2009; Member of the Investment Committee, Delaware Community Foundation from 2013 to 2014. | | 33 RICs consisting of
155 Portfolios | | None |
Kenneth L. Urish 1951 | | Trustee | | Since 2009 | | Managing Partner, Urish Popeck & Co., LLC (certified public accountants and consultants) since 1976; Immediate past- Chairman of the Professional Ethics Committee of the Pennsylvania Institute of Certified Public Accountants and Committee Member thereof since 2007; Member of External Advisory Board, The Pennsylvania State University Accounting Department since 2001; Principal, UP Strategic Wealth Investment Advisors, LLC since 2013; Trustee, The Holy Family Institute from 2001 to 2010; President and Trustee, Pittsburgh Catholic Publishing Associates from 2003 to 2008; Director, Inter-Tel from 2006 to 2007. | | 33 RICs consisting of
155 Portfolios | | None |
Frederick W. Winter 1945 | | Trustee | | Since 2009 | | Director, Alkon Corporation (pneumatics) since 1992; Professor and Dean Emeritus of the Joseph M. Katz School of Business, University of Pittsburgh from 2005 to 2013 and Dean thereof from 1997 to 2005; Director, Tippman Sports (recreation) from 2005 to 2013; Director, Indotronix International (IT services) from 2004 to 2008. | | 33 RICs consisting of
155 Portfolios | | None |
| | 1 The address of each Trustee is c/o BlackRock, Inc., 55 East 52nd Street, New York, NY 10055. |
| | 2 Independent Trustees serve until their resignation, retirement, removal or death, or until December 31 of the year in which they turn 75. The Board has determined to extend the terms of Independent Trustees on a case-by-case basis, as appropriate. The Board has unanimously approved extending the mandatory retirement age for David O. Beim and Dr. Matina S. Horner until December 31, 2016, which the Board believes is in the best interests of shareholders of the Trust/MIP. |
| | 3 Date shown is the earliest date a person has served for the Trust/MIP. In connection with the acquisition of Barclay’s Global Investors by BlackRock, Inc. (“BlackRock”) in December 2009, the Trustees were elected to the Trust/MIP’s Board. As a result, although the chart shows certain Independent Trustees as joining the Trust/MIP’s board in 2009, those Independent Trustees first became members of the boards of other funds advised by BlackRock Advisors, LLC or its affiliates as follows: David O. Beim, 1998; Dr. Matina S. Horner, 2004; Rodney D. Johnson, 1995; Herbert I. London, 1987; Cynthia A. Montgomery, 1994; Joseph P. Platt, 1999; Robert C. Robb, Jr., 1998; Toby Rosenblatt, 2005; Kenneth L. Urish, 1999; and Frederick W. Winter, 1999. Frank J. Fabozzi first became a member of the boards of other funds advised by BlackRock Advisors, LLC or its affiliates in 1988. |
| Interested Trustees4 | | | | | | | | | | |
Barbara G. Novick 1960 | | Trustee | | Since 2015 | | Vice Chairman of BlackRock since 2006; Chair of BlackRock’s Government Relations Steering Committee since 2009; Head of the Global Client Group of BlackRock from 1988 to 2008. | | 108 RICs consisting of
230 Portfolios | | None |
John M. Perlowski 1964 | | Trustee, President, and Chief Executive Officer | | Since 2015 (Trustee); Since 2010 (President and Chief Executive Officer) | | Managing Director of BlackRock since 2009; Head of BlackRock Global Fund Services since 2009; Managing Director and Chief Operating Officer of the Global Product Group at Goldman Sachs Asset Management, L.P. from 2003 to 2009; Treasurer of Goldman Sachs Mutual Funds from 2003 to 2009 and Senior Vice President thereof from 2007 to 2009; Director of Goldman Sachs Offshore Funds from 2002 to 2009; Director of Family Resource Network (charitable foundation) since 2009. | | 136 RICs consisting of
328 Portfolios | | None |
| | 4 Mr. Perlowski and Ms. Novick are both “interested persons,” as defined in the 1940 Act, of the Trust/MIP based on their positions with BlackRock and its affiliates. Mr. Perlowski and Ms. Novick are also board members of a complex of BlackRock registered open-end funds. Mr. Perlowski is also a board member of the BlackRock Equity-Bond Complex and the BlackRock Equity-Liquidity Complex, and Ms. Novick is also a board member of the BlackRock Equity-Liquidity Complex. Interested Trustees serve until their resignation, retirement, removal or death, or until December 31 of the year in which they turn 75. The maximum age limitation may be waived as to any Trustee by action of a majority of the Trustees upon a finding of good cause therefor. |
| | | | | | |
| | | | | | | |
| 84 | | BLACKROCK FUNDS III | | DECEMBER 31, 2015 | | |
| | |
| Officers and Trustees (concluded) | | |
| | | | | | |
Name, Address1
and Year of Birth | | Position(s)
Held with
the Trust/MIP | | Length of
Time Served
as an Officer | | Principal Occupation(s) During Past Five Years |
| Officers2 |
John M. Perlowski 1964 | | Trustee, President and Chief Executive Officer | | Since 2015 (Trustee); Since 2010 (President and Chief Executive Officer) | | Managing Director of BlackRock since 2009; Head of BlackRock Global Fund Services since 2009; Managing Director and Chief Operating Officer of the Global Product Group at Goldman Sachs Asset Management, L.P. from 2003 to 2009; Treasurer of Goldman Sachs Mutual Funds from 2003 to 2009 and Senior Vice President thereof from 2007 to 2009; Director of Goldman Sachs Offshore Funds from 2002 to 2009; Director of Family Resource Network (charitable foundation) since 2009. |
Richard Hoerner, CFA 1958 | | Vice President | | Since 2009 | | Managing Director of BlackRock since 2000; Head of the Global Cash Group since 2013; Co-head of the Global Cash and Securities Lending Group from 2010 to 2013; Member of the Cash Management Group Executive Committee since 2005. |
Jennifer McGovern 1977 | | Vice President | | Since 2014 | | Director of BlackRock since 2011; Head of Product Structure and Oversight for BlackRock’s U.S. Wealth Advisory Group since 2013; Vice President of BlackRock from 2008 to 2010. |
Neal Andrews 1966 | | Chief Financial Officer | | Since 2009 | | Managing Director of BlackRock since 2006; Senior Vice President and Line of Business Head of Fund Accounting and Administration at PNC Global Investment Servicing (U.S.) Inc. from 1992 to 2006. |
Jay Fife 1970 | | Treasurer | | Since 2009 | | Managing Director of BlackRock since 2007; Director of BlackRock in 2006; Assistant Treasurer of the MLIM and Fund Asset Management, L.P. advised funds from 2005 to 2006; Director of MLIM Fund Services Group from 2001 to 2006. |
Charles Park 1967 | | Chief Compliance Officer | | Since 2014 | | Anti-Money Laundering Compliance Officer for the BlackRock-advised Funds in the Equity-Bond Complex, the Equity-Liquidity Complex and the Closed-End Complex from 2014 to 2015; Chief Compliance Officer of BlackRock Advisors, LLC and the BlackRock-advised Funds in the Equity-Bond Complex, the Equity-Liquidity Complex and the Closed-End Complex since 2014; Principal of and Chief Compliance Officer for iShares® Delaware Trust Sponsor LLC since 2012 and BlackRock Fund Advisors (“BFA”) since 2006; Chief Compliance Officer for the BFA-advised iShares exchange traded funds since 2006; Chief Compliance Officer for BlackRock Asset Management International Inc. since 2012. |
Fernanda Piedra 1969 | | Anti-Money Laundering Compliance Officer | | Since 2015 | | Director of BlackRock since 2014; Anti-Money Laundering Compliance Officer and Regional Head of Financial Crime for the Americas at BlackRock since 2014; Head of Regulatory Changes and Remediation for the Asset Wealth Management Division of Deutsche Bank from 2010 to 2014; Vice President of Goldman Sachs (Anti-Money Laundering/Suspicious Activities Group) from 2004 to 2010. |
Benjamin Archibald 1975 | | Secretary | | Since 2012 | | Managing Director of BlackRock since 2014; Director of BlackRock from 2010 to 2013; Secretary of the iShares exchange traded funds since 2015; Secretary of the BlackRock-advised mutual funds since 2012. |
| | 1 The address of each Officer is c/o BlackRock, Inc., 55 East 52nd Street, New York, NY 10055. |
| | 2 Officers of the Trust/MIP serve at the pleasure of the Board. |
| | Further information about the Trust/MIP’s Officers and Trustees is available in the LifePath Fund’s Statement of Additional Information, which can be obtained without charge by calling (800) 441-7762. |
Effective September 25, 2015, John M. Perlowski was appointed to serve as a Trustee of the Trust/MIP.
Effective December 31, 2015, Herbert I. London and Toby Rosenblatt retired as Trustees of the Trust/MIP.
| | | | | | |
| | | | |
Investment Advisor BlackRock Fund Advisors San Francisco, CA 94105 | | Custodian and Accounting Agent State Street Bank and Trust Company Boston, MA 02110 | | Distributor BlackRock Investments, LLC New York, NY 10022 | | Legal Counsel Sidley Austin LLP New York, NY 10019 |
| | | |
Sub-Advisors BlackRock International Limited Edinburgh, United Kingdom BlackRock (Singapore) Limited Singapore | | Transfer Agent BNY Mellon Investment Servicing (US) Inc. Wilmington, DE 19809 | | Independent Registered Public Accounting Firm PricewaterhouseCoopers LLP Philadelphia, PA 19103 | | Address of the Trust/MIP 400 Howard Street San Francisco, CA 94105 |
| | | |
Administrator BlackRock Advisors, LLC Wilmington, DE 19809 | | | | | | |
| | | | | | |
| | | | | | | |
| | BLACKROCK FUNDS III | | DECEMBER 31, 2015 | | 85 |
Householding
The LifePath Funds will mail only one copy of shareholder documents, including prospectuses, annual and semi-annual reports and proxy statements, to shareholders with multiple accounts at the same address. This practice is commonly called “householding” and is intended to reduce expenses and eliminate duplicate mailings of shareholder documents. Mailings of your shareholder documents may be householded indefinitely unless you instruct us otherwise. If you do not want the mailing of these documents to be combined with those for other members of your household, please call the LifePath Funds at (800) 441-7762.
Availability of Quarterly Schedule of Investments
The LifePath Funds/LifePath Master Portfolios file their complete schedule of portfolio holdings with the SEC for the first and third quarters of each fiscal year on Form N-Q. The LifePath Funds’/LifePath Master Portfolios’ Forms N-Q are available on the SEC’s website at http://www.sec.gov and may also be reviewed and copied at the SEC’s Public Reference Room in Washington, D.C. Information on how to access documents on the SEC’s website without charge may be obtained by calling (800) SEC-0330. The LifePath Funds’/LifePath Master Portfolios’ Forms N-Q may also be obtained upon request and without charge by calling (800) 441-7762.
Availability of Proxy Voting Policies and Procedures
A description of the policies and procedures that the LifePath Funds/LifePath Master Portfolios to determine how to vote proxies relating to portfolio securities is available upon request and without charge (1) by calling (800) 441-7762; (2) at http://www.blackrock.com; and (3) on the SEC’s website at http://www.sec.gov.
Availability of Proxy Voting Record
Information about how each LifePath Fund/LifePath Master Portfolio voted proxies relating to securities held in each LifePath Fund’s/LifePath Master Portfolio’s portfolio during the most recent 12-month period ended June 30 is available upon request and without charge (1) at http://www.blackrock.com or by calling (800) 441-7762 and (2) on the SEC’s website at http://www.sec.gov.
BlackRock’s Mutual Fund Family
BlackRock offers a diverse lineup of open-end mutual funds crossing all investment styles and managed by experts in equity, fixed income and tax-exempt investing. Visit http://www.blackrock.com for more information.
Account Information
Call us at (800) 441-7762 from 8:00 AM to 6:00 PM EST on any business day to get information about your account balances, recent transactions and share prices. You can also reach us on the Web at http://www.blackrock.com/funds.
Automatic Investment Plans
Investor Class shareholders who want to invest regularly can arrange to have $50 or more automatically deducted from their checking or savings account and invested in any of the BlackRock funds.
Systematic Withdrawal Plans
Investor Class shareholders can establish a systematic withdrawal plan and receive periodic payments of $50 or more from their BlackRock funds, as long as their account balance is at least $10,000.
Retirement Plans
Shareholders may make investments in conjunction with Traditional, Rollover, Roth, Coverdell, Simple IRAs, SEP IRAs and 403(b) Plans.
| | | | | | |
| | | | | | | |
| 86 | | BLACKROCK FUNDS III | | DECEMBER 31, 2015 | | |
| | | | |
| Additional Information (concluded) | | |
|
| BlackRock Privacy Principles |
BlackRock is committed to maintaining the privacy of its current and former fund investors and individual clients (collectively, “Clients”) and to safeguarding their non-public personal information. The following information is provided to help you understand what personal information BlackRock collects, how we protect that information and why in certain cases we share such information with select parties.
If you are located in a jurisdiction where specific laws, rules or regulations require BlackRock to provide you with additional or different privacy-related rights beyond what is set forth below, then BlackRock will comply with those specific laws, rules or regulations.
BlackRock obtains or verifies personal non-public information from and about you from different sources, including the following: (i) information we receive from you or, if applicable, your financial intermediary, on applications, forms or other documents; (ii) information about your transactions with us, our affiliates, or others; (iii) information we receive from a consumer reporting agency; and (iv) from visits to our websites.
BlackRock does not sell or disclose to non-affiliated third parties any non-public personal information about its Clients, except as permitted by law or as is necessary to respond to regulatory requests or to service Client accounts. These non-affiliated third parties are required to protect the confidentiality and security of this information and to use it only for its intended purpose.
We may share information with our affiliates to service your account or to provide you with information about other BlackRock products or services that may be of interest to you. In addition, BlackRock restricts access to non-public personal information about its Clients to those BlackRock employees with a legitimate business need for the information. BlackRock maintains physical, electronic and procedural safeguards that are designed to protect the non-public personal information of its Clients, including procedures relating to the proper storage and disposal of such information.
| | | | | | |
| | | | | | | |
| | BLACKROCK FUNDS III | | DECEMBER 31, 2015 | | 87 |
This report is intended for current holders. It is not authorized for use as an offer of sale or a solicitation of an offer to buy shares of a LifePath Fund unless preceded or accompanied by that LifePath Fund’s current prospectus. Past performance results shown in this report should not be considered a representation of future performance. Investment returns and principal value of shares will fluctuate so that shares, when redeemed, may be worth more or less than their original cost. Statements and other information herein are as dated and are subject to change.

| | |
| LPincre-12/15-AR | |  |
DECEMBER 31, 2015
| | | | |
ANNUAL REPORT | | | |  |
BlackRock Funds III
| Ø | BlackRock LifePath® Retirement Fund |
| Ø | BlackRock LifePath® 2020 Fund |
| Ø | BlackRock LifePath® 2030 Fund |
| Ø | BlackRock LifePath® 2040 Fund |
| Ø | BlackRock LifePath® 2050 Fund |
|
| Not FDIC Insured • May Lose Value • No Bank Guarantee |

| | | | | | |
| | | | | | | |
| 2 | | BLACKROCK FUNDS III | | DECEMBER 31, 2015 | | |
Dear Shareholder,
Diverging monetary policies and shifting economic outlooks across regions have been the overarching themes driving financial markets over the past couple of years. With U.S. growth outpacing the global economic recovery in 2015 while inflationary pressures remained low, investors spent most of the year anticipating a short-term rate hike from the Federal Reserve (the “Fed”), which ultimately came to fruition in December. In contrast, the European Central Bank (“ECB”) and the Bank of Japan moved to a more accommodative stance during the year. In this environment, the U.S. dollar strengthened considerably, causing profit challenges for U.S. exporters and high levels of volatility in emerging market currencies and commodities. Oil prices were particularly volatile and below the historical norm due to an ongoing imbalance in global supply and demand.
Market volatility broadly increased in the middle of 2015, beginning with a sharp, but temporary, selloff in June as Greece’s long-brewing debt troubles came to an impasse. Just as these concerns abated, Chinese equities tumbled amid weakness in the country’s economy. This, combined with a depreciation of the yuan and declining confidence in China’s policymakers, stoked worries about the potential impact to the broader world economy, causing heightened volatility to spread throughout markets globally. Given a dearth of meaningful growth across most of the world, financial markets became more reliant on central bank policies to drive performance. In that vein, risk assets (such as equities and high yield bonds) rallied in October when China’s central bank provided more stimulus, the ECB hinted at further easing, and soft U.S. data pushed back expectations for a Fed rate hike. As the period came to a close, however, the ECB disappointed investors with its subdued policy changes. The Fed’s December rate hike had a positive impact on the markets as it removed a source of uncertainty, but this was counteracted by the dampening effect of a stronger U.S. dollar, falling oil prices and tighter credit conditions.
At BlackRock, we believe investors need to think globally, extend their scope across a broad array of asset classes and be prepared to move freely as market conditions change over time. We encourage you to talk with your financial advisor and visit blackrock.com for further insight about investing in today’s markets.
Sincerely,
Rob Kapito
President, BlackRock Advisors, LLC
Rob Kapito
President, BlackRock Advisors, LLC
| | | | | | | | |
| Total Returns as of December 31, 2015 | |
| | | 6-month | | | 12-month | |
U.S. large cap equities
(S&P 500® Index) | | | 0.15 | % | | | 1.38 | % |
U.S. small cap equities
(Russell 2000® Index) | | | (8.75 | ) | | | (4.41 | ) |
International equities
(MSCI Europe, Australasia,
Far East Index) | | | (6.01 | ) | | | (0.81 | ) |
Emerging market equities
(MSCI Emerging Markets Index) | | | (17.35 | ) | | | (14.92 | ) |
3-month Treasury bills
(BofA Merrill Lynch 3-Month
U.S. Treasury Bill Index) | | | 0.04 | | | | 0.05 | |
U.S. Treasury securities
(BofA Merrill Lynch
10-Year U.S. Treasury
Index) | | | 1.43 | | | | 0.91 | |
U.S. investment-grade bonds
(Barclays U.S.
Aggregate Bond Index) | | | 0.65 | | | | 0.55 | |
Tax-exempt municipal
bonds (S&P Municipal
Bond Index) | | | 3.31 | | | | 3.32 | |
U.S. high yield bonds
(Barclays U.S. Corporate
High Yield 2% Issuer
Capped Index) | | | (6.79 | ) | | | (4.43 | ) |
| Past performance is no guarantee of future results. Index performance is shown for illustrative purposes only. You cannot invest directly in an index. | |
| | | | | | |
| | | | | | | |
| | THIS PAGE NOT PART OF YOUR FUND REPORT | | | | 3 |
| | | | |
| Fund Summary as of December 31, 2015 | | BlackRock LifePath Funds |
|
| Portfolio Management Commentary |
How did each Fund perform?
| • | | The BlackRock LifePath Funds with target dates of 2020, 2030, 2040 and 2050 and the LifePath Retirement Fund (altogether, the “LifePath Funds”) invest in their respective LifePath Master Portfolio. |
| • | | Effective as of December 14, 2015, each LifePath Fund has the ability to adjust its equity allocation along the glide path, based on a strategic assessment of market conditions among other factors as described below. Effective as of December 14, 2015, each LifePath Fund’s principal investment strategy was amended to permit each LifePath Fund to invest directly, through each LifePath Fund’s corresponding LifePath Master Portfolio, in equity securities and related derivatives of issuers that are primarily engaged in or related to the real estate industry. |
| • | | For the 12-month period ended December 31, 2015, the LifePath Funds underperformed the custom benchmark across various LifePath Fund target dates, with the exception of LifePath 2050 Class K Shares, which outperformed the custom benchmark. The returns for the LifePath Funds include fund expenses. The custom benchmarks have no expenses associated with performance. |
What factors influenced performance?
| • | | The underperformance of Active Stock Master Portfolio was the largest detractor from performance relative to the benchmark. The allocation to BlackRock Basic Value Fund, Inc. drove the largest proportion of the underperformance, which was due to poor stock selection in the consumer discretionary, financials and utilities sectors, that overshadowed strong results in health care and consumer staples, as well as positive sector allocation. |
| • | | In replicating the asset classes within the custom benchmark, there are some cases where benchmark mismatches occur, either due to the underlying security selection within the fund or to the vehicles/funds that are available to gain that asset class exposure. In 2015, given additional market volatility, there were mismatches relative to the Global Real Estate (REIT) benchmark and the Global International Equity benchmark, which resulted in positive contributions to relative performance, where the differences were more positive in the farther-dated funds than in the near-dated funds. |
Describe recent portfolio activity.
| • | | Each LifePath Fund has its own time horizon, which affects its acceptable level of risk and, the strategic allocation of its holdings across asset classes. On a quarterly basis, the strategic allocation of each LifePath Fund is systematically adjusted to reflect the shareholders’ remaining investment time horizon. During the period, the LifePath Funds were rebalanced in accordance with their updated strategic allocations, and daily cash flows were allocated to the underlying funds and instruments as appropriate. On December 14, 2015, the LifePath Funds moved from an index (passive) exposure to Global REITs to an actively managed World Real Estate Securities strategy. While the benchmark of the REIT exposure remains unchanged and is still the FTSE EPRA/NAREIT Developed Real Estate Index, the underlying strategy is being actively managed. |
Describe portfolio positioning at period end.
| • | | At period end, each of the LifePath Funds was invested according to its respective strategic allocation benchmark within tolerance limits. |
The views expressed reflect the opinions of BlackRock as of the date of this report and are subject to change based on changes in market, economic or other conditions. These views are not intended to be a forecast of future events and are no guarantee of future results.
| | | | | | |
| | | | | | | |
| 4 | | BLACKROCK FUNDS III | | DECEMBER 31, 2015 | | |
Under normal circumstances, the asset allocation of each LifePath Fund will change over time according to a glide path as each LifePath Fund approaches its respective target date. The glide path represents the shifting of asset classes over time, as well as potential adjustments. Each LifePath Fund’s asset mix becomes more conservative prior to retirement as time elapses. This reflects the need for reduced investment risks as retirement approaches and the need for lower volatility of each LifePath Fund, which may be a primary source of income after retirement. As each LifePath Fund approaches its target date, its asset allocation will shift so that each LifePath Fund invests a greater percentage of its assets in fixed income funds. The asset allocation targets are established by a committee of BlackRock investment professionals. The investment team, including the portfolio managers and this investment committee, meets regularly to assess market conditions, review the asset allocation targets of each LifePath Fund, and determine whether any changes are required to enable each LifePath Fund to achieve its investment objective.
Although the asset allocation targets listed for the glide path are general, long-term targets, BlackRock investment professionals may periodically adjust the proportion of equity funds, securities and related derivatives and fixed income funds in the LifePath Fund, based on a strategic assessment of market conditions, including expected market volatility and BlackRock’s view on the equity markets. The adjustments will be no more than +/- 5% at retirement, with a lesser allowable adjustment for LifePath Funds further from retirement.
| | | | | | |
| | | | | | | |
| | BLACKROCK FUNDS III | | DECEMBER 31, 2015 | | 5 |
| | | | |
| | | BlackRock LifePath Retirement Fund |
The investment objective of BlackRock LifePath® Retirement Fund (“LifePath Retirement Fund” or the “LifePath Fund”) is to seek to provide for retirement outcomes based on quantitatively measured risk. In pursuit of this objective, LifePath Retirement Fund will be broadly diversified across global asset classes.
Effective March 31, 2015, the LifePath® Retirement Portfolio changed its name to the BlackRock LifePath® Retirement Fund.
|
| Total Return Based on a $10,000 Investment |
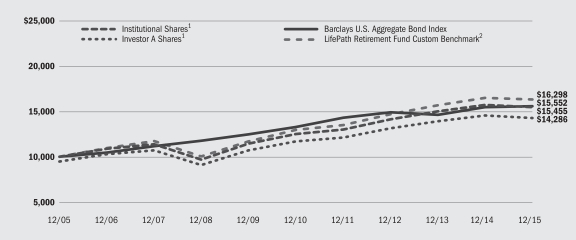
| | 1 | | Assuming maximum sales charges, transaction costs and other operating expenses, including advisory fees, if any. Institutional Shares do not have a sales charge. |
| | 2 | | The LifePath Fund compares its performance to that of a customized weighted index (the “LifePath Retirement Fund Custom Benchmark”), comprised of the indexes indicated below, which reflects the investment advisor’s changes to the benchmark’s weightings over time. The investment advisor adjusts the weightings of these indexes periodically based upon its evaluation and adjustment of the LifePath Fund’s asset allocation strategy. The weightings are presented annually but they are adjusted quarterly. |
LifePath Fund’s custom benchmark consists of the following:
| | | | | | | | | | | | | | | | | | | | | | | | | | | | | | | | | | | | | | | | | | | | | | | | | | | | | | | | | | | | |
| Period | | Barclays
U.S. Aggregate
Bond Index | | Barclays
U.S. Treasury
Inflation
Protected
Securities
(TIPS) Index | | Cohen &
Steers
Realty
Majors
Index | | Bloomberg Commodity Index3 | | FTSE
EPRA/NAREIT
Developed
Real Estate
Index | | MSCI
ACWI ex USA
IMI Index | | MSCI
EAFE
Index | | Russell
1000®
Index | | Russell
2000®
Index | | S&P
MidCap
400® Index | | S&P 500®
Index | | S&P
SmallCap
600® Index |
1/01/06 to 12/31/06 | | | | 52.0 | % | | | | 10.2 | % | | | | 2.7 | % | | | | N/A | | | | | N/A | | | | | N/A | | | | | 9.9 | % | | | | N/A | | | | | N/A | | | | | 3.3 | % | | | | 20.2 | % | | | | 1.7 | % |
1/01/07 to 12/31/07 | | | | 52.6 | | | | | 9.6 | | | | | 2.8 | | | | | N/A | | | | | N/A | | | | | 2.7 | % | | | | 7.7 | | | | | N/A | | | | | N/A | | | | | 3.6 | | | | | 19.2 | | | | | 1.8 | |
1/01/08 to 12/31/08 | | | | 53.0 | | | | | 9.0 | | | | | 1.3 | | | | | N/A | | | | | 1.3 | % | | | | 11.4 | | | | | N/A | | | | | N/A | | | | | N/A | | | | | 4.1 | | | | | 18 | | | | | 1.9 | |
1/01/09 to 12/31/09 | | | | 52.9 | | | | | 9.1 | | | | | N/A | | | | | N/A | | | | | 1.6 | | | | | 10.8 | | | | | N/A | | | | | N/A | | | | | N/A | | | | | 4.7 | | | | | 18.7 | | | | | 2.2 | |
1/01/10 to 12/31/10 | | | | 52.9 | | | | | 9.1 | | | | | N/A | | | | | N/A | | | | | 1.1 | | | | | 10.8 | | | | | N/A | | | | | N/A | | | | | N/A | | | | | 5.0 | | | | | 18.9 | | | | | 2.2 | |
1/01/11 to 12/31/11 | | | | 52.9 | | | | | 9.1 | | | | | N/A | | | | | N/A | | | | | 0.8 | | | | | 11.3 | | | | | N/A | | | | | 8.6 | % | | | | 1.7 | % | | | | 2.8 | | | | | 11.6 | | | | | 1.2 | |
1/01/12 to 12/31/12 | | | | 52.9 | | | | | 9.1 | | | | | N/A | | | | | 1.0 | % | | | | 0.3 | | | | | 11.3 | | | | | N/A | | | | | 21.2 | | | | | 4.2 | | | | | N/A | | | | | N/A | | | | | N/A | |
1/01/13 to 12/31/13 | | | | 52.9 | | | | | 9.1 | | | | | N/A | | | | | 3.7 | | | | | 0.1 | | | | | 10.1 | | | | | N/A | | | | | 19.7 | | | | | 4.4 | | | | | N/A | | | | | N/A | | | | | N/A | |
1/01/14 to 12/31/14 | | | | 52.6 | | | | | 9.0 | | | | | N/A | | | | | 3.8 | | | | | 0.2 | | | | | 10.2 | | | | | N/A | | | | | 19.9 | | | | | 4.3 | | | | | N/A | | | | | N/A | | | | | N/A | |
1/01/15 to 12/31/15 | | | | 51.2 | | | | | 8.8 | | | | | N/A | | | | | 3.8 | | | | | 0.5 | | | | | 11.0 | | | | | N/A | | | | | 21.0 | | | | | 3.8 | | | | | N/A | | | | | N/A | | | | | N/A | |
| | 3 | | Prior to July 1, 2014, the Bloomberg Commodity Index was known as the Dow Jones-UBS Commodity Index. |
| | | | See “About Fund Performance” on page 16 for descriptions of the indexes. |
| | | | | | |
| | | | | | | |
| 6 | | BLACKROCK FUNDS III | | DECEMBER 31, 2015 | | |
| | |
| | | BlackRock LifePath Retirement Fund |
|
| Performance Summary for the Period Ended December 31, 2015 |
| | | | | | | | | | | | | | | | | | | | | | | | | | | | |
| | | | | | Average Annual Total Returns | |
| | | | | | 1 Year | | | 5 Years | | | 10 Years | |
| | | 6-Month
Total Returns | | | w/o sales
charge | | | w/sales
charge | | | w/o sales
charge | | | w/sales
charge | | | w/o sales
charge | | | w/sales
charge | |
Institutional | | | (2.34 | )% | | | (1.52 | )% | | | N/A | | | | 4.36 | % | | | N/A | | | | 4.45 | % | | | N/A | |
Investor A | | | (2.50 | ) | | | (1.78 | ) | | | (6.94 | )% | | | 4.10 | | | | 2.98 | % | | | 4.19 | | | | 3.63 | % |
Investor C | | | (2.96 | ) | | | (2.56 | ) | | | (3.49 | ) | | | 3.28 | | | | 3.28 | | | | 3.43 | | | | 3.43 | |
Class K | | | (2.29 | ) | | | (1.28 | ) | | | N/A | | | | 4.70 | | | | N/A | | | | 4.76 | | | | N/A | |
Class R | | | (2.69 | ) | | | (2.10 | ) | | | N/A | | | | 3.81 | | | | N/A | | | | 3.92 | | | | N/A | |
LifePath Retirement Fund Custom Benchmark | | | (2.16 | ) | | | (1.14 | ) | | | N/A | | | | 4.69 | | | | N/A | | | | 5.01 | | | | N/A | |
Barclays U.S. Aggregate Bond Index | | | 0.65 | | | | 0.55 | | | | N/A | | | | 3.25 | | | | N/A | | | | 4.51 | | | | N/A | |
Barclays U.S. TIPS Index | | | (1.78 | ) | | | (1.44 | ) | | | N/A | | | | 2.55 | | | | N/A | | | | 3.93 | | | | N/A | |
Bloomberg Commodity Index | | | (23.46 | ) | | | (24.66 | ) | | | N/A | | | | (13.47 | ) | | | N/A | | | | (6.43 | ) | | | N/A | |
FTSE EPRA/NAREIT Developed Real Estate Index | | | 2.49 | | | | (0.79 | ) | | | N/A | | | | 7.17 | | | | N/A | | | | 4.67 | | | | N/A | |
MSCI ACWI ex USA IMI Index | | | (8.78 | ) | | | (4.60 | ) | | | N/A | | | | 1.27 | | | | N/A | | | | 3.18 | | | | N/A | |
Russell 1000® Index | | | (0.78 | ) | | | 0.92 | | | | N/A | | | | 12.44 | | | | N/A | | | | 7.40 | | | | N/A | |
Russell 2000® Index | | | (8.75 | ) | | | (4.41 | ) | | | N/A | | | | 9.19 | | | | N/A | | | | 6.80 | | | | N/A | |
| | | | N/A — Not applicable as share class and index do not have a sales charge. |
| | | | Past performance is not indicative of future results. |
| | | | Performance results do not include adjustments made for financial reporting purposes in accordance with U.S. generally accepted accounting principles and may differ from amounts reported in the financial highlights. |
| | | | | | |
| | | | | | | |
| | BLACKROCK FUNDS III | | DECEMBER 31, 2015 | | 7 |
| | | | |
| | | BlackRock LifePath 2020 Fund |
The investment objective of BlackRock LifePath® 2020 Fund (“LifePath 2020 Fund” or the “LifePath Fund”) is to seek to provide for retirement outcomes based on quantitatively measured risk. In pursuit of this objective, LifePath 2020 Fund will be broadly diversified across global asset classes, with asset allocations becoming more conservative over time.
Effective March 31, 2015, the LifePath® 2020 Portfolio changed its name to the BlackRock LifePath® 2020 Fund.
|
| Total Return Based on a $10,000 Investment |
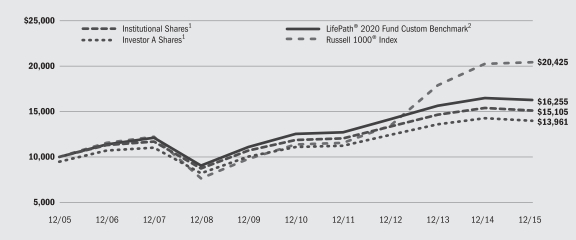
| | 1 | | Assuming maximum sales charges, transaction costs and other operating expenses, including advisory fees, if any. Institutional Shares do not have a sales charge. |
| | 2 | | The LifePath Fund compares its performance to that of a customized weighted index (the “LifePath 2020 Fund Custom Benchmark”), comprised of the indexes indicated below, which reflects the investment advisor’s changes to the benchmark’s weightings over time. The investment advisor adjusts the weightings of these indexes periodically based upon its evaluation and adjustment of the LifePath Fund’s asset allocation strategy. The weightings are presented annually but they are adjusted quarterly. |
LifePath Fund’s custom benchmark consists of the following:
| | | | | | | | | | | | | | | | | | | | | | | | | | | | | | | | | | | | | | | | | | | | | | | | | | | | | | | | | | | | |
| Period | | Barclays
U.S. Aggregate
Bond Index | | Barclays
U.S. Treasury
Inflation
Protected
Securities
(TIPS) Index | | Cohen &
Steers
Realty
Majors
Index | | Bloomberg
Commodity
Index3 | | FTSE
EPRA/NAREIT
Developed
Real Estate
Index | | MSCI
ACWI ex USA
IMI Index | | MSCI
EAFE
Index | | Russell
1000®
Index | | Russell
2000®
Index | | S&P
MidCap
400® Index | | S&P 500®
Index | | S&P
SmallCap
600® Index |
1/01/06 to 12/31/06 | | | | 29.0 | % | | | | 5.2 | % | | | | 4.3 | % | | | | N/A | | | | | N/A | | | | | N/A | | | | | 16.8 | % | | | | N/A | | | | | N/A | | | | | 5.1 | % | | | | 37.5 | % | | | | 2.6 | % |
1/01/07 to 12/31/07 | | | | 29.7 | | | | | 5.0 | | | | | 4.5 | | | | | N/A | | | | | N/A | | | | | 17.2 | % | | | | N/A | | | | | N/A | | | | | N/A | | | | | 5.4 | | | | | 35.4 | | | | | 2.8 | |
1/01/08 to 12/31/08 | | | | 31.6 | | | | | 5.1 | | | | | 2.2 | | | | | N/A | | | | | 2.2 | % | | | | 18.4 | | | | | N/A | | | | | N/A | | | | | N/A | | | | | 5.8 | | | | | 32.0 | | | | | 2.7 | |
1/01/09 to 12/31/09 | | | | 33.8 | | | | | 5.5 | | | | | N/A | | | | | N/A | | | | | 4.8 | | | | | 16.9 | | | | | N/A | | | | | N/A | | | | | N/A | | | | | 5.8 | | | | | 30.4 | | | | | 2.8 | |
1/01/10 to 12/31/10 | | | | 35.2 | | | | | 5.7 | | | | | N/A | | | | | N/A | | | | | 4.0 | | | | | 16.5 | | | | | N/A | | | | | N/A | | | | | N/A | | | | | 5.8 | | | | | 30.2 | | | | | 2.6 | |
1/01/11 to 12/31/11 | | | | 36.9 | | | | | 6.0 | | | | | N/A | | | | | N/A | | | | | 3.6 | | | | | 16.6 | | | | | N/A | | | | | 13.1 | % | | | | 1.5 | % | | | | 3.3 | | | | | 17.6 | | | | | 1.4 | |
1/01/12 to 12/31/12 | | | | 39.0 | | | | | 6.3 | | | | | N/A | | | | | 1.0 | % | | | | 3.2 | | | | | 15.9 | | | | | N/A | | | | | 31.0 | | | | | 3.6 | | | | | N/A | | | | | N/A | | | | | N/A | |
1/01/13 to 12/31/13 | | | | 40.8 | | | | | 6.6 | | | | | N/A | | | | | 3.8 | | | | | 2.8 | | | | | 14.5 | | | | | N/A | | | | | 27.8 | | | | | 3.7 | | | | | N/A | | | | | N/A | | | | | N/A | |
1/01/14 to 12/31/14 | | | | 42.0 | | | | | 6.8 | | | | | N/A | | | | | 3.8 | | | | | 2.6 | | | | | 14.4 | | | | | N/A | | | | | 26.7 | | | | | 3.7 | | | | | N/A | | | | | N/A | | | | | N/A | |
1/01/15 to 12/31/15 | | | | 40.4 | | | | | 6.7 | | | | | N/A | | | | | 3.8 | | | | | 2.9 | | | | | 15.3 | | | | | N/A | | | | | 27.5 | | | | | 3.4 | | | | | N/A | | | | | N/A | | | | | N/A | |
| | 3 | | Prior to July 1, 2014, the Bloomberg Commodity Index was known as the Dow Jones-UBS Commodity Index. |
| | | | See “About Fund Performance” on page 16 for descriptions of the indexes. |
| | | | | | |
| | | | | | | |
| 8 | | BLACKROCK FUNDS III | | DECEMBER 31, 2015 | | |
| | |
| | | BlackRock LifePath 2020 Fund |
|
| Performance Summary for the Period Ended December 31, 2015 |
| | | | | | | | | | | | | | | | | | | | | | | | | | | | |
| | | | | | Average Annual Total Returns | |
| | | | | | 1 Year | | | 5 Years | | | 10 Years | |
| | | 6-Month
Total Returns | | | w/o sales
charge | | | w/sales
charge | | | w/o sales
charge | | | w/sales
charge | | | w/o sales
charge | | | w/sales
charge | |
Institutional | | | (2.85 | )% | | | (1.78 | )% | | | N/A | | | | 4.97 | % | | | N/A | | | | 4.21 | % | | | N/A | |
Investor A | | | (3.01 | ) | | | (2.03 | ) | | | (7.17 | )% | | | 4.71 | | | | 3.58 | % | | | 3.95 | | | | 3.39 | % |
Investor C | | | (3.41 | ) | | | (2.77 | ) | | | (3.68 | ) | | | 3.92 | | | | 3.92 | | | | 3.15 | | | | 3.15 | |
Class K | | | (2.73 | ) | | | (1.46 | ) | | | N/A | | | | 5.32 | | | | N/A | | | | 4.52 | | | | N/A | |
Class R | | | (3.08 | ) | | | (2.25 | ) | | | N/A | | | | 4.46 | | | | N/A | | | | 3.66 | | | | N/A | |
LifePath 2020 Fund Custom Benchmark | | | (2.55 | ) | | | (1.31 | ) | | | N/A | | | | 5.37 | | | | N/A | | | | 4.98 | | | | N/A | |
Barclays U.S. Aggregate Bond Index | | | 0.65 | | | | 0.55 | | | | N/A | | | | 3.25 | | | | N/A | | | | 4.51 | | | | N/A | |
Barclays U.S. TIPS Index | | | (1.78 | ) | | | (1.44 | ) | | | N/A | | | | 2.55 | | | | N/A | | | | 3.93 | | | | N/A | |
Bloomberg Commodity Index | | | (23.46 | ) | | | (24.66 | ) | | | N/A | | | | (13.47 | ) | | | N/A | | | | (6.43 | ) | | | N/A | |
FTSE EPRA/NAREIT Developed Real Estate Index | | | 2.49 | | | | (0.79 | ) | | | N/A | | | | 7.17 | | | | N/A | | | | 4.67 | | | | N/A | |
MSCI ACWI ex USA IMI Index | | | (8.78 | ) | | | (4.60 | ) | | | N/A | | | | 1.27 | | | | N/A | | | | 3.18 | | | | N/A | |
Russell 1000® Index | | | (0.78 | ) | | | 0.92 | | | | N/A | | | | 12.44 | | | | N/A | | | | 7.40 | | | | N/A | |
Russell 2000® Index | | | (8.75 | ) | | | (4.41 | ) | | | N/A | | | | 9.19 | | | | N/A | | | | 6.80 | | | | N/A | |
| | | | N/A — Not applicable as share class and index do not have a sales charge. |
| | | | Past performance is not indicative of future results. |
| | | | | | |
| | | | | | | |
| | BLACKROCK FUNDS III | | DECEMBER 31, 2015 | | 9 |
| | | | |
| | | BlackRock LifePath 2030 Fund |
The investment objective of BlackRock LifePath® 2030 Fund (“LifePath 2030 Fund” or the “LifePath Fund”) is to seek to provide for retirement outcomes based on quantitatively measured risk. In pursuit of this objective, LifePath 2030 Fund will be broadly diversified across global asset classes, with asset allocations becoming more conservative over time.
Effective March 31, 2015, the LifePath® 2030 Portfolio changed its name to the BlackRock LifePath® 2030 Fund.
|
| Total Return Based on a $10,000 Investment |
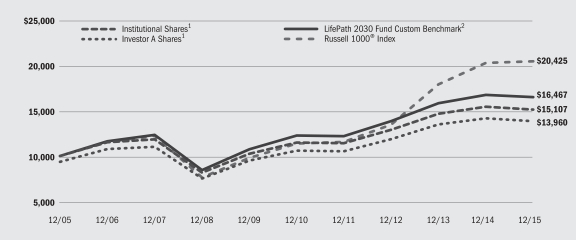
| | 1 | | Assuming maximum sales charges, transaction costs and other operating expenses, including advisory fees, if any. Institutional Shares do not have a sales charge. |
| | 2 | | The LifePath Fund compares its performance to that of a customized weighted index (the “LifePath 2030 Fund Custom Benchmark”), comprised of the indexes indicated below, which reflects the investment advisor’s changes to the benchmark’s weightings over time. The investment advisor adjusts the weightings of these indexes periodically based upon its evaluation and adjustment of the LifePath Fund’s asset allocation strategy. The weightings are presented annually but they are adjusted quarterly. |
LifePath Fund’s custom benchmark consists of the following:
| | | | | | | | | | | | | | | | | | | | | | | | | | | | | | | | | | | | | | | | | | | | | | | | |
| Period | | Barclays
U.S. Aggregate
Bond Index | | | Barclays
U.S. Treasury
Inflation
Protected
Securities
(TIPS) Index | | | Cohen &
Steers
Realty
Majors
Index | | | Bloomberg
Commodity
Index3 | | | FTSE
EPRA/NAREIT
Developed
Real Estate
Index | | | MSCI
ACWI ex USA
IMI Index | | | MSCI
EAFE
Index | | | Russell
1000®
Index | | | Russell
2000®
Index | | | S&P
MidCap
400® Index | | | S&P 500®
Index | | | S&P
SmallCap
600® Index | |
1/01/06 to 12/31/06 | | | 16.7 | % | | | 2.7 | % | | | 5.1 | % | | | N/A | | | | N/A | | | | N/A | | | | 20.3 | % | | | N/A | | | | N/A | | | | 6.0 | % | | | 46.2 | % | | | 3.0 | % |
1/01/07 to 12/31/07 | | | 17.4 | | | | 2.6 | | | | 5.4 | | | | N/A | | | | N/A | | | | 20.9 | % | | | N/A | | | | N/A | | | | N/A | | | | 6.4 | | | | 44.1 | | | | 3.2 | |
1/01/08 to 12/31/08 | | | 19.0 | | | | 2.8 | | | | 5.5 | | | | N/A | | | | N/A | | | | 22.4 | | | | N/A | | | | N/A | | | | N/A | | | | 6.9 | | | | 40.2 | | | | 3.2 | |
1/01/09 to 12/31/09 | | | 21.0 | | | | 3.1 | | | | N/A | | | | N/A | | | | 7.0 | % | | | 21.0 | | | | N/A | | | | N/A | | | | N/A | | | | 6.6 | | | | 38.2 | | | | 3.1 | |
1/01/10 to 12/31/10 | | | 22.0 | | | | 3.2 | | | | N/A | | | | N/A | | | | 6.3 | | | | 20.7 | | | | N/A | | | | N/A | | | | N/A | | | | 6.4 | | | | 38.6 | | | | 2.8 | |
1/01/11 to 12/31/11 | | | 23.5 | | | | 3.4 | | | | N/A | | | | N/A | | | | 6.0 | | | | 20.9 | | | | N/A | | | | 17.0 | % | | | 1.3 | % | | | 3.7 | | | | 22.6 | | | | 1.6 | |
1/01/12 to 12/31/12 | | | 25.8 | | | | 3.8 | | | | N/A | | | | 1.0 | % | | | 6.0 | | | | 20.2 | | | | N/A | | | | 40.2 | | | | 3.0 | | | | N/A | | | | N/A | | | | N/A | |
1/01/13 to 12/31/13 | | | 27.6 | | | | 4.0 | | | | N/A | | | | 3.9 | | | | 5.7 | | | | 19.3 | | | | N/A | | | | 36.6 | | | | 2.9 | | | | N/A | | | | N/A | | | | N/A | |
1/01/14 to 12/31/14 | | | 27.5 | | | | 4.0 | | | | N/A | | | | 3.9 | | | | 6.1 | | | | 19.8 | | | | N/A | | | | 35.8 | | | | 2.9 | | | | N/A | | | | N/A | | | | N/A | |
1/01/15 to 12/31/15 | | | 21.8 | | | | 3.4 | | | | N/A | | | | 3.9 | | | | 7.7 | | | | 22.2 | | | | N/A | | | | 38.5 | | | | 2.5 | | | | N/A | | | | N/A | | | | N/A | |
| | 3 | | Prior to July 1, 2014, the Bloomberg Commodity Index was known as the Dow Jones-UBS Commodity Index. |
| | | | See “About Fund Performance” on page 16 for descriptions of the indexes. |
| | | | | | |
| | | | | | | |
| 10 | | BLACKROCK FUNDS III | | DECEMBER 31, 2015 | | |
| | |
| | | BlackRock LifePath 2030 Fund |
|
| Performance Summary for the Period Ended December 31, 2015 |
| | | | | | | | | | | | | | | | | | | | | | | | | | | | |
| | | | | | Average Annual Total Returns | |
| | | | | | 1 Year | | | 5 Years | | | 10 Years | |
| | | 6-Month
Total Returns | | | w/o sales
charge | | | w/sales
charge | | | w/o sales
charge | | | w/sales
charge | | | w/o sales
charge | | | w/sales
charge | |
Institutional | | | (3.52 | )% | | | (2.05 | )% | | | N/A | | | | 5.67 | % | | | N/A | | | | 4.21 | % | | | N/A | |
Investor A | | | (3.59 | ) | | | (2.25 | ) | | | (7.38 | )% | | | 5.41 | | | | 4.28 | % | | | 3.95 | | | | 3.39 | % |
Investor C | | | (4.01 | ) | | | (3.01 | ) | | | (3.90 | ) | | | 4.62 | | | | 4.62 | | | | 3.11 | | | | 3.11 | |
Class K | | | (3.33 | ) | | | (1.66 | ) | | | N/A | | | | 6.05 | | | | N/A | | | | 4.54 | | | | N/A | |
Class R | | | (3.74 | ) | | | (2.50 | ) | | | N/A | | | | 5.14 | | | | N/A | | | | 3.62 | | | | N/A | |
LifePath 2030 Fund Custom Benchmark | | | (3.14 | ) | | | (1.61 | ) | | | N/A | | | | 6.10 | | | | N/A | | | | 5.11 | | | | N/A | |
Barclays U.S. Aggregate Bond Index | | | 0.65 | | | | 0.55 | | | | N/A | | | | 3.25 | | | | N/A | | | | 4.51 | | | | N/A | |
Barclays U.S. TIPS Index | | | (1.78 | ) | | | (1.44 | ) | | | N/A | | | | 2.55 | | | | N/A | | | | 3.93 | | | | N/A | |
Bloomberg Commodity Index | | | (23.46 | ) | | | (24.66 | ) | | | N/A | | | | (13.47 | ) | | | N/A | | | | (6.43 | ) | | | N/A | |
FTSE EPRA/NAREIT Developed Real Estate Index | | | 2.49 | | | | (0.79 | ) | | | N/A | | | | 7.17 | | | | N/A | | | | 4.67 | | | | N/A | |
MSCI ACWI ex USA IMI Index | | | (8.78 | ) | | | (4.60 | ) | | | N/A | | | | 1.27 | | | | N/A | | | | 3.18 | | | | N/A | |
Russell 1000® Index | | | (0.78 | ) | | | 0.92 | | | | N/A | | | | 12.44 | | | | N/A | | | | 7.40 | | | | N/A | |
Russell 2000® Index | | | (8.75 | ) | | | (4.41 | ) | | | N/A | | | | 9.19 | | | | N/A | | | | 6.80 | | | | N/A | |
| | | | N/A — Not applicable as share class and index do not have a sales charge. |
| | | | Past performance is not indicative of future results. |
| | | | | | |
| | | | | | | |
| | BLACKROCK FUNDS III | | DECEMBER 31, 2015 | | 11 |
| | | | |
| | | BlackRock LifePath 2040 Fund |
The investment objective of BlackRock LifePath® 2040 Fund (“LifePath 2040 Fund” or the “LifePath Fund”) is to seek to provide for retirement outcomes based on quantitatively measured risk. In pursuit of this objective, LifePath 2040 Fund will be broadly diversified across global asset classes, with asset allocations becoming more conservative over time.
Effective March 31, 2015, the LifePath® 2040 Portfolio changed its name to the BlackRock LifePath® 2040 Fund.
|
| Total Return Based on a $10,000 Investment |
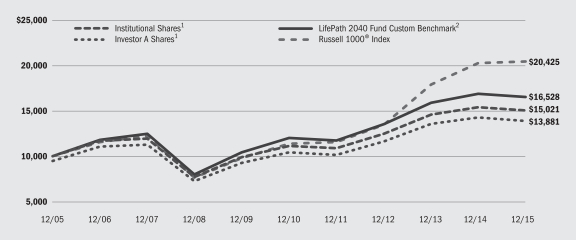
| | 1 | | Assuming maximum sales charges, transaction costs and other operating expenses, including advisory fees, if any. Institutional Shares do not have a sales charge. |
| | 2 | | The LifePath Fund compares its performance to that of a customized weighted index (the “LifePath 2040 Fund Custom Benchmark”), comprised of the indexes indicated below, which reflects the investment advisor’s changes to the benchmark’s weightings over time. The investment advisor adjusts the weightings of these indexes periodically based upon its evaluation and adjustment of the LifePath Fund’s asset allocation strategy. The weightings are presented annually but they are adjusted quarterly. |
LifePath Fund’s custom benchmark consists of the following:
| | | | | | | | | | | | | | | | | | | | | | | | | | | | | | | | | | | | | | | | | | | | | | | | | | | | | | | | | | | | |
| Period | | Barclays
U.S. Aggregate
Bond Index | | Barclays
U.S. Treasury
Inflation
Protected
Securities
(TIPS) Index | | Cohen &
Steers
Realty
Majors
Index | | Bloomberg
Commodity
Index3 | | FTSE
EPRA/NAREIT
Developed
Real Estate
Index | | MSCI
ACWI ex USA
IMI Index | | MSCI
EAFE
Index | | Russell
1000®
Index | | Russell
2000®
Index | | S&P
MidCap
400® Index | | S&P 500®
Index | | S&P
SmallCap
600® Index |
1/01/06 to 12/31/06 | | | | 7.4 | % | | | | N/A | | | | | 5.8 | % | | | | N/A | | | | | N/A | | | | | N/A | | | | | 23.2 | % | | | | N/A | | | | | N/A | | | | | 6.8 | % | | | | 53.4 | % | | | | 3.4 | % |
1/01/07 to 12/31/07 | | | | 7.7 | | | | | N/A | | | | | 5.9 | | | | | N/A | | | | | N/A | | | | | N/A | | | | | 23.5 | | | | | N/A | | | | | N/A | | | | | 7.2 | | | | | 51.9 | | | | | 3.7 | |
1/01/08 to 12/31/08 | | | | 9.1 | | | | | 0.5 | % | | | | 3.2 | | | | | N/A | | | | | 3.2 | % | | | | 25.8 | % | | | | N/A | | | | | N/A | | | | | N/A | | | | | 7.7 | | | | | 46.9 | | | | | 3.6 | |
1/01/09 to 12/31/09 | | | | 10.4 | | | | | 1.1 | | | | | N/A | | | | | N/A | | | | | 8.8 | | | | | 24.5 | | | | | N/A | | | | | N/A | | | | | N/A | | | | | 7.2 | | | | | 44.6 | | | | | 3.4 | |
1/01/10 to 12/31/10 | | | | 11.2 | | | | | 1.1 | | | | | N/A | | | | | N/A | | | | | 8.1 | | | | | 24.2 | | | | | N/A | | | | | N/A | | | | | N/A | | | | | 6.9 | | | | | 45.5 | | | | | 3.0 | |
1/01/11 to 12/31/11 | | | | 12.7 | | | | | 1.3 | | | | | N/A | | | | | N/A | | | | | 7.9 | | | | | 24.5 | | | | | N/A | | | | | 20.1 | % | | | | 1.2 | % | | | | 4.0 | | | | | 26.6 | | | | | 1.7 | |
1/01/12 to 12/31/12 | | | | 15.3 | | | | | 1.6 | | | | | N/A | | | | | 1.0 | % | | | | 8.2 | | | | | 23.7 | | | | | N/A | | | | | 47.7 | | | | | 2.5 | | | | | N/A | | | | | N/A | | | | | N/A | |
1/01/13 to 12/31/13 | | | | 17.3 | | | | | 1.7 | | | | | N/A | | | | | 3.9 | | | | | 8.1 | | | | | 23.1 | | | | | N/A | | | | | 43.6 | | | | | 2.3 | | | | | N/A | | | | | N/A | | | | | N/A | |
1/01/14 to 12/31/14 | | | | 16.1 | | | | | 1.6 | | | | | N/A | | | | | 3.9 | | | | | 9.0 | | | | | 24.2 | | | | | N/A | | | | | 42.9 | | | | | 2.3 | | | | | N/A | | | | | N/A | | | | | N/A | |
1/01/15 to 12/31/15 | | | | 5.7 | | | | | 0.7 | | | | | N/A | | | | | 4.1 | | | | | 12.1 | | | | | 28.1 | | | | | N/A | | | | | 47.3 | | | | | 2.0 | | | | | N/A | | | | | N/A | | | | | N/A | |
| | 3 | | Prior to July 1, 2014, the Bloomberg Commodity Index was known as the Dow Jones-UBS Commodity Index. |
| | | | See “About Fund Performance” on page 16 for descriptions of the indexes. |
| | | | | | |
| | | | | | | |
| 12 | | BLACKROCK FUNDS III | | DECEMBER 31, 2015 | | |
| | |
| | | BlackRock LifePath 2040 Fund |
|
| Performance Summary for the Period Ended December 31, 2015 |
| | | | | | | | | | | | | | | | | | | | | | | | | | | | |
| | | | | | Average Annual Total Returns | |
| | | | | | 1 Year | | | 5 Years | | | 10 Years | |
| | | 6-Month
Total Returns | | | w/o sales
charge | | | w/sales
charge | | | w/o sales
charge | | | w/sales
charge | | | w/o sales
charge | | | w/sales
charge | |
Institutional | | | (4.07 | )% | | | (2.29 | )% | | | N/A | | | | 6.18 | % | | | N/A | | | | 4.15 | % | | | N/A | |
Investor A | | | (4.19 | ) | | | (2.57 | ) | | | (7.69 | )% | | | 5.91 | | | | 4.77 | % | | | 3.89 | | | | 3.33 | % |
Investor C | | | (4.58 | ) | | | (3.28 | ) | | | (4.16 | ) | | | 5.13 | | | | 5.13 | | | | 3.02 | | | | 3.02 | |
Class K | | | (3.90 | ) | | | (1.98 | ) | | | N/A | | | | 6.57 | | | | N/A | | | | 4.48 | | | | N/A | |
Class R | | | (4.28 | ) | | | (2.75 | ) | | | N/A | | | | 5.66 | | | | N/A | | | | 3.54 | | | | N/A | |
LifePath 2040 Fund Custom Benchmark | | | (3.71 | ) | | | (1.96 | ) | | | N/A | | | | 6.63 | | | | N/A | | | | 5.15 | | | | N/A | |
Barclays U.S. Aggregate Bond Index | | | 0.65 | | | | 0.55 | | | | N/A | | | | 3.25 | | | | N/A | | | | 4.51 | | | | N/A | |
Barclays U.S. TIPS Index | | | (1.78 | ) | | | (1.44 | ) | | | N/A | | | | 2.55 | | | | N/A | | | | 3.93 | | | | N/A | |
Bloomberg Commodity Index | | | (23.46 | ) | | | (24.66 | ) | | | N/A | | | | (13.47 | ) | | | N/A | | | | (6.43 | ) | | | N/A | |
FTSE EPRA/NAREIT Developed Real Estate Index | | | 2.49 | | | | (0.79 | ) | | | N/A | | | | 7.17 | | | | N/A | | | | 4.67 | | | | N/A | |
MSCI ACWI ex USA IMI Index | | | (8.78 | ) | | | (4.60 | ) | | | N/A | | | | 1.27 | | | | N/A | | | | 3.18 | | | | N/A | |
Russell 1000® Index | | | (0.78 | ) | | | 0.92 | | | | N/A | | | | 12.44 | | | | N/A | | | | 7.40 | | | | N/A | |
Russell 2000® Index | | | (8.75 | ) | | | (4.41 | ) | | | N/A | | | | 9.19 | | | | N/A | | | | 6.80 | | | | N/A | |
| | | | N/A — Not applicable as share class and index do not have a sales charge. |
| | | | Past performance is not indicative of future results. |
| | | | | | |
| | | | | | | |
| | BLACKROCK FUNDS III | | DECEMBER 31, 2015 | | 13 |
| | | | |
| | | BlackRock LifePath 2050 Fund |
The investment objective of BlackRock LifePath® 2050 Fund (“LifePath 2050 Fund” or the “LifePath Fund”) is to seek to provide for retirement outcomes based on quantitatively measured risk. In pursuit of this objective, LifePath 2050 Fund will be broadly diversified across global asset classes, with asset allocations becoming more conservative over time.
Effective March 31, 2015, the LifePath® 2050 Portfolio changed its name to the BlackRock LifePath® 2050 Fund.
| | |
| Total Return Based on a $10,000 Investment |
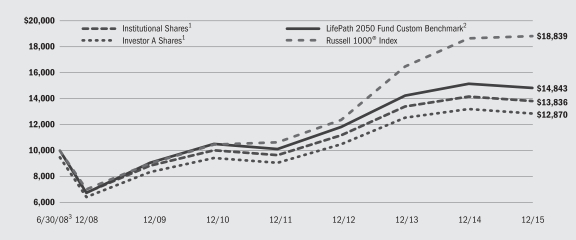
| | 1 | | Assuming maximum sales charges, transaction costs and other operating expenses, including advisory fees, if any. Institutional Shares do not have a sales charge. |
| | 2 | | The LifePath Fund compares its performance to that of a customized weighted index (the “LifePath 2050 Fund Custom Benchmark”), comprised of the indexes indicated below, which reflects the investment advisor’s changes to the benchmark’s weightings over time. The investment advisor adjusts the weightings of these indexes periodically based upon its evaluation and adjustment of the LifePath Fund’s asset allocation strategy. The weightings are presented annually but they are adjusted quarterly. |
| | 3 | | Commencement of operations. |
LifePath Fund’s custom benchmark consists of the following:
| | | | | | | | | | | | | | | | | | | | | | | | | | | | | | | | | | | | |
| Period | | Barclays
U.S. Aggregate
Bond Index | | | Bloomberg
Commodity
Index4 | | | FTSE
EPRA/NAREIT
Developed
Real Estate
Index | | | MSCI
ACWI ex USA
IMI Index | | | Russell
1000®
Index | | | Russell
2000®
Index | | | S&P
MidCap
400® Index | | | S&P 500®
Index | | | S&P
SmallCap
600® Index | |
1/01/08 to 12/31/08 | | | 1.0 | % | | | N/A | | | | 3.6 | % | | | 30.4 | % | | | N/A | | | | N/A | | | | 10.5 | % | | | 49.7 | % | | | 4.8 | % |
1/01/09 to 12/31/09 | | | 1.0 | | | | N/A | | | | 9.1 | | | | 28.3 | | | | N/A | | | | N/A | | | | 9.5 | | | | 47.5 | | | | 4.6 | |
1/01/10 to 12/31/10 | | | 1.1 | | | | N/A | | | | 9.8 | | | | 27.4 | | | | N/A | | | | N/A | | | | 7.6 | | | | 50.7 | | | | 3.4 | |
1/01/11 to 12/31/11 | | | 2.7 | | | | N/A | | | | 9.7 | | | | 27.6 | | | | 22.8 | % | | | 1.1 | % | | | 4.4 | | | | 29.9 | | | | 1.8 | |
1/01/12 to 12/31/12 | | | 5.9 | | | | 1.0 | % | | | 10.2 | | | | 26.8 | | | | 54.0 | | | | 2.1 | | | | N/A | | | | N/A | | | | N/A | |
1/01/13 to 12/31/13 | | | 8.2 | | | | 4.0 | | | | 10.1 | | | | 26.3 | | | | 49.6 | | | | 1.8 | | | | N/A | | | | N/A | | | | N/A | |
1/01/14 to 12/31/14 | | | 8.2 | | | | 3.9 | | | | 11.0 | | | | 27.3 | | | | 47.8 | | | | 1.8 | | | | N/A | | | | N/A | | | | N/A | |
1/01/15 to 12/31/15 | | | 1.0 | | | | 4.2 | | | | 13.7 | | | | 29.9 | | | | 49.2 | | | | 2.0 | | | | N/A | | | | N/A | | | | N/A | |
| | 4 | | Prior to July 1, 2014, the Bloomberg Commodity Index was known as the Dow Jones-UBS Commodity Index. |
| | | | See “About Fund Performance” on page 16 for descriptions of the indexes. |
| | | | | | |
| | | | | | | |
| 14 | | BLACKROCK FUNDS III | | DECEMBER 31, 2015 | | |
| | |
| | | BlackRock LifePath 2050 Fund |
|
| Performance Summary for the Period Ended December 31, 2015 |
| | | | | | | | | | | | | | | | | | | | | | | | | | | | |
| | | | | | Average Annual Total Returns | |
| | | | | | 1 Year | | | 5 Years | | | Since Inception1 | |
| | | 6-Month
Total Returns | | | w/o sales
charge | | | w/sales
charge | | | w/o sales
charge | | | w/sales
charge | | | w/o sales
charge | | | w/sales
charge | |
Institutional | | | (4.33 | )% | | | (2.46 | )% | | | N/A | | | | 6.65 | % | | | N/A | | | | 4.42 | % | | | N/A | |
Investor A | | | (4.40 | ) | | | (2.65 | ) | | | (7.76 | )% | | | 6.39 | | | | 5.25 | % | | | 4.17 | | | | 3.42 | % |
Investor C | | | (5.66 | ) | | | (3.41 | ) | | | (4.30 | ) | | | 5.59 | | | | 5.59 | | | | 3.21 | | | | 3.21 | |
Class K | | | (4.14 | ) | | | (2.10 | ) | | | N/A | | | | 7.03 | | | | N/A | | | | 4.78 | | | | N/A | |
Class R | | | (4.51 | ) | | | (2.92 | ) | | | N/A | | | | 6.13 | | | | N/A | | | | 3.75 | | | | N/A | |
LifePath 2050 Fund Custom Benchmark | | | (3.91 | ) | | | (2.12 | ) | | | N/A | | | | 7.14 | | | | N/A | | | | 5.40 | | | | N/A | |
Barclays U.S. Aggregate Bond Index | | | 0.65 | | | | 0.55 | | | | N/A | | | | 3.25 | | | | N/A | | | | 4.37 | | | | N/A | |
Bloomberg Commodity Index | | | (23.46 | ) | | | (24.66 | ) | | | N/A | | | | (13.47 | ) | | | N/A | | | | (13.36 | ) | | | N/A | |
FTSE EPRA/NAREIT Developed Real Estate Index | | | 2.49 | | | | (0.79 | ) | | | N/A | | | | 7.17 | | | | N/A | | | | 4.57 | | | | N/A | |
MSCI ACWI ex USA IMI Index | | | (8.78 | ) | | | (4.60 | ) | | | N/A | | | | 1.27 | | | | N/A | | | | 0.50 | | | | N/A | |
Russell 1000® Index | | | (0.78 | ) | | | 0.92 | | | | N/A | | | | 12.44 | | | | N/A | | | | 8.80 | | | | N/A | |
Russell 2000® Index | | | (8.75 | ) | | | (4.41 | ) | | | N/A | | | | 9.19 | | | | N/A | | | | 8.38 | | | | N/A | |
| | 1 | | The LifePath Fund commenced operations on June 30, 2008. |
| | | | N/A — Not applicable as share class and index do not have a sales charge. |
| | | | Past performance is not indicative of future results. |
| | | | | | |
| | | | | | | |
| | BLACKROCK FUNDS III | | DECEMBER 31, 2015 | | 15 |
| • | | Institutional Shares are not subject to any sales charge. These shares bear no ongoing distribution or service fees and are available only to certain eligible investors. |
| • | | Investor A Shares are subject to a maximum initial sales charge (front-end load) of 5.25% and a service fee of 0.25% per year (but no distribution fee). Certain redemptions of these shares may be subject to a contingent deferred sales charge (“CDSC”) where no initial sales charge was paid at the time of purchase. These shares are generally available through financial intermediaries. |
| • | | Investor C Shares are subject to a 1.00% CDSC if redeemed within one year of purchase. In addition, these shares are subject to a distribution fee of 0.75% per year and a service fee of 0.25% per year. These shares are generally available through financial intermediaries. Prior to May 3, 2010, Investor C Shares’ performance results are those of Institutional Shares restated to reflect Investor C Shares’ fees. |
| • | | Class K Shares are not subject to any sales charge. These shares bear no ongoing distribution or service fees and are available only to certain eligible investors. Prior to May 30, 2008 for LifePath Retirement, LifePath 2020, LifePath 2030 and LifePath 2040 Funds, Class K Shares’ performance results are those of Institutional Shares restated to reflect Class K Shares’ fees. |
| • | | Class R Shares are not subject to any sales charge. These shares are subject to a distribution fee of 0.25% per year and a service fee of 0.25% per year. These shares are available only to certain employer-sponsored retirement plans. Prior to May 3, 2010, Class R Shares’ performance results are those of Institutional Shares restated to reflect Class R Shares’ fees. |
Performance information reflects past performance and does not guarantee future results. Current performance may be lower or higher than the performance data quoted. Refer to www.blackrock.com/funds to obtain performance data current to the most recent month end. Performance results do not reflect the deduction of taxes that a shareholder would pay on LifePath Fund distributions or the redemption of LifePath Fund shares. Figures shown in the performance tables on the previous pages assume reinvestment of all distributions, if any, at net asset value (“NAV”) on the ex-dividend date. Investment return and principal value of shares will fluctuate so that shares, when redeemed, may be worth more or less than their original cost. Distributions paid to each class of shares will vary because of the different levels of administration and distribution fees applicable to each class, which are deducted from the income available to be paid to shareholders.
BlackRock Advisors, LLC (“BAL” or the “Administrator”), each LifePath Funds’ administrator, waived and/or reimbursed a portion of each LifePath Fund’s expenses. Without such waivers, each LifePath Fund’s performance would have been lower. The Administrator is under no obligation to continue waiving and/or reimbursing its fees after the applicable termination date of such agreement. See Note 4 of the Notes to Financial Statements for additional information on waivers and/or reimbursements.
The LifePath Funds’ custom benchmarks are hypothetical representations of the performance of the respective LifePath Fund’s asset classes according to their weightings as of the most recent quarter-end. The weightings of the various indexes that are included in the LifePath Funds’ custom benchmarks are adjusted quarterly to reflect the LifePath Funds’ changing asset allocations over time. As of December 31, 2015, the following indexes are used to calculate the LifePath Fund’s custom benchmarks: Barclays U.S. Aggregate Bond Index, Barclays U.S. TIPS Index, (Series L), Bloomberg Commodity Index, FTSE EPRA/NAREIT Developed Real Estate Index, MSCI ACWI ex USA IMI Index, Russell 1000® Index and Russell 2000® Index, as applicable.
The Barclays U.S. Aggregate Bond Index is a widely recognized unmanaged market-weighted index, comprised of investment-grade corporate bonds rated BBB or better, mortgages and U.S. Treasury and U.S. Government agency issues with at least one year to maturity. The Barclays U.S. TIPS Index (Series L) is an unmanaged index that measures the performance of the inflation-protected public obligations of the U.S. Treasury. The Bloomberg Commodity Index is a broadly diversified index that allows investors to track commodity futures through a single, simple measure. The FTSE EPRA/NAREIT Developed Real Estate Index is a global market capitalization weighted index composed of listed real estate securities from developed market countries in North America, Europe, and Asia. The MSCI ACWI ex USA IMI Index is a free float-adjusted market capitalization index designed to measure the combined equity market performance of developed and emerging market countries, excluding the United States. The Russell 1000® Index is an index that measures the performance of the large cap segment of the U.S. equity universe. It is a subset of the Russell 3000® Index and includes approximately 1,000 of the largest securities based on a combination of their market capitalization and current index membership. The index represents approximately 92% of the total market capitalization of the Russell 3000® Index. The Russell 2000® Index is an unmanaged index that is a subset of the Russell 3000® Index representing approximately 10% of the total market capitalization of that index. It includes approximately 2000 of the smallest securities based on a combination of their market cap and current index membership.
| | | | | | |
| | | | | | | |
| 16 | | BLACKROCK FUNDS III | | DECEMBER 31, 2015 | | |
Shareholders of each LifePath Fund may incur the following charges: (a) transactional expenses, such as sales charges; and (b) operating expenses, including administration fees, service and distribution fees, including 12b-1 fees, and other fund expenses. The expense examples shown below (which are based on a hypothetical investment of $1,000 invested on July 1, 2015 and held through December 31, 2015) are intended to assist shareholders both in calculating expenses based on an investment in a LifePath Fund and in comparing these expenses with similar costs of investing in other mutual funds.
The expense examples provide information about actual account values and actual expenses. In order to estimate the expenses a shareholder paid during the period covered by this report, shareholders can divide their account value by $1,000 and then multiply the result by the number corresponding to their LifePath Fund and their share class under the heading entitled “Expenses Paid During the Period.”
The expense examples also provide information about hypothetical account values and hypothetical expenses based on each LifePath Fund’s actual expense ratio and an assumed rate of return of 5% per year before expenses. In order to assist shareholders in comparing the ongoing expenses of investing in a LifePath Fund and other funds, compare the 5% hypothetical examples with the 5% hypothetical examples that appear in other funds’ shareholder reports.
The expenses shown in the expense examples are intended to highlight shareholders’ ongoing costs only and do not reflect any transactional expenses, such as sales charges, if any. Therefore, the hypothetical examples are useful in comparing ongoing expenses only, and will not help shareholders determine the relative total expenses of owning different funds. If these transactional expenses were included, shareholder expenses would have been higher.
| | | | | | | | | | | | | | | | | | | | | | | | | | | | | | |
| | | Actual | | | Hypothetical2 | | | | |
| | | Beginning
Account Value
July 1, 2015 | | | Ending
Account Value
December 31, 2015 | | | Expenses Paid
During the Period1 | | | Beginning
Account Value
July 1, 2015 | | | Ending
Account Value
December 31, 2015 | | | Expenses Paid
During the Period1 | | | Annualized
Expense Ratio | |
| LifePath Retirement Fund | | | | |
Institutional | | $ | 1,000.00 | | | $ | 976.60 | | | $ | 3.49 | | | $ | 1,000.00 | | | $ | 1,021.98 | | | $ | 3.57 | | | | 0.70 | % |
Investor A | | $ | 1,000.00 | | | $ | 975.00 | | | $ | 4.73 | | | $ | 1,000.00 | | | $ | 1,020.72 | | | $ | 4.84 | | | | 0.95 | % |
Investor C | | $ | 1,000.00 | | | $ | 970.40 | | | $ | 8.49 | | | $ | 1,000.00 | | | $ | 1,016.84 | | | $ | 8.69 | | | | 1.71 | % |
Class K | | $ | 1,000.00 | | | $ | 977.10 | | | $ | 2.09 | | | $ | 1,000.00 | | | $ | 1,023.09 | | | $ | 2.14 | | | | 0.42 | % |
Class R | | $ | 1,000.00 | | | $ | 973.10 | | | $ | 5.87 | | | $ | 1,000.00 | | | $ | 1,019.51 | | | $ | 6.01 | | | | 1.18 | % |
| LifePath 2020 Fund | | | | | | | | | | | | | | | | | | | | | |
Institutional | | $ | 1,000.00 | | | $ | 971.50 | | | $ | 3.53 | | | $ | 1,000.00 | | | $ | 1,021.63 | | | $ | 3.62 | | | | 0.71 | % |
Investor A | | $ | 1,000.00 | | | $ | 969.90 | | | $ | 4.82 | | | $ | 1,000.00 | | | $ | 1,020.32 | | | $ | 4.94 | | | | 0.97 | % |
Investor C | | $ | 1,000.00 | | | $ | 965.90 | | | $ | 8.57 | | | $ | 1,000.00 | | | $ | 1,016.48 | | | $ | 8.79 | | | | 1.73 | % |
Class K | | $ | 1,000.00 | | | $ | 972.70 | | | $ | 2.04 | | | $ | 1,000.00 | | | $ | 1,023.14 | | | $ | 2.09 | | | | 0.41 | % |
Class R | | $ | 1,000.00 | | | $ | 969.20 | | | $ | 6.01 | | | $ | 1,000.00 | | | $ | 1,019.11 | | | $ | 6.16 | | | | 1.21 | % |
| LifePath 2030 Fund | | | | | | | | | | | | | | | | | | | | | |
Institutional | | $ | 1,000.00 | | | $ | 964.80 | | | $ | 3.42 | | | $ | 1,000.00 | | | $ | 1,021.73 | | | $ | 3.52 | | | | 0.69 | % |
Investor A | | $ | 1,000.00 | | | $ | 964.10 | | | $ | 4.65 | | | $ | 1,000.00 | | | $ | 1,020.47 | | | $ | 4.79 | | | | 0.94 | % |
Investor C | | $ | 1,000.00 | | | $ | 959.90 | | | $ | 8.40 | | | $ | 1,000.00 | | | $ | 1,016.64 | | | $ | 8.64 | | | | 1.70 | % |
Class K | | $ | 1,000.00 | | | $ | 966.70 | | | $ | 1.88 | | | $ | 1,000.00 | | | $ | 1,023.29 | | | $ | 1.94 | | | | 0.38 | % |
Class R | | $ | 1,000.00 | | | $ | 962.60 | | | $ | 5.84 | | | $ | 1,000.00 | | | $ | 1,019.26 | | | $ | 6.01 | | | | 1.18 | % |
| LifePath 2040 Fund | | | | | | | | | | | | | | | | | | | | | | | |
Institutional | | $ | 1,000.00 | | | $ | 959.30 | | | $ | 3.26 | | | $ | 1,000.00 | | | $ | 1,021.88 | | | $ | 3.36 | | | | 0.66 | % |
Investor A | | $ | 1,000.00 | | | $ | 958.10 | | | $ | 4.54 | | | $ | 1,000.00 | | | $ | 1,020.57 | | | $ | 4.69 | | | | 0.92 | % |
Investor C | | $ | 1,000.00 | | | $ | 954.20 | | | $ | 8.28 | | | $ | 1,000.00 | | | $ | 1,016.74 | | | $ | 8.54 | | | | 1.68 | % |
Class K | | $ | 1,000.00 | | | $ | 961.00 | | | $ | 1.78 | | | $ | 1,000.00 | | | $ | 1,023.39 | | | $ | 1.84 | | | | 0.36 | % |
Class R | | $ | 1,000.00 | | | $ | 957.20 | | | $ | 5.72 | | | $ | 1,000.00 | | | $ | 1,019.36 | | | $ | 5.90 | | | | 1.16 | % |
| LifePath 2050 Fund | | | | | | | | | | | | | | | | | | | | |
Institutional | | $ | 1,000.00 | | | $ | 956.70 | | | $ | 3.11 | | | $ | 1,000.00 | | | $ | 1,022.03 | | | $ | 3.21 | | | | 0.63 | % |
Investor A | | $ | 1,000.00 | | | $ | 956.00 | | | $ | 4.49 | | | $ | 1,000.00 | | | $ | 1,020.62 | | | $ | 4.63 | | | | 0.91 | % |
Investor C | | $ | 1,000.00 | | | $ | 943.40 | | | $ | 8.18 | | | $ | 1,000.00 | | | $ | 1,016.79 | | | $ | 8.49 | | | | 1.67 | % |
Class K | | $ | 1,000.00 | | | $ | 958.60 | | | $ | 1.68 | | | $ | 1,000.00 | | | $ | 1,023.49 | | | $ | 1.73 | | | | 0.34 | % |
Class R | | $ | 1,000.00 | | | $ | 954.90 | | | $ | 5.67 | | | $ | 1,000.00 | | | $ | 1,019.41 | | | $ | 5.85 | | | | 1.15 | % |
| | 1 | | For each class of the LifePath Fund, expenses are equal to the annualized net expense ratio for the class, multiplied by the average account value over the period, multiplied by 184/365 (to reflect the one-half year period shown). Because each LifePath Fund invests all of its assets in a LifePath Master Portfolio, the expense examples reflect the net expenses of both the LifePath Fund and the LifePath Master Portfolio in which it invests. |
| | 2 | | Hypothetical 5% annual return before expenses is calculated by prorating the number of days in the most recent fiscal half year divided by 365. |
| | | | | | |
| | | | | | | |
| | BLACKROCK FUNDS III | | DECEMBER 31, 2015 | | 17 |
| | | | |
| Derivative Financial Instruments | | |
The LifePath Master Portfolios may invest in various derivative financial instruments. Derivative financial instruments are used to obtain exposure to a security, index and/or market without owning or taking physical custody of securities or to manage market, equity, credit, interest rate, foreign currency exchange rate, commodity and/or other risks. Derivative financial instruments may give rise to a form of economic leverage. Derivative financial instruments also involve risks, including the imperfect correlation between the value of a derivative financial instrument and the underlying asset, possible default of the counterparty to the transaction or
illiquidity of the derivative financial instrument. The LifePath Master Portfolios’ ability to use a derivative financial instrument successfully depends on the investment advisor’s ability to predict pertinent market movements accurately, which cannot be assured. The use of derivative financial instruments may result in losses greater than if they had not been used, may limit the amount of appreciation a LifePath Fund can realize on an investment and/or may result in lower distributions paid to shareholders. The LifePath Master Portfolios’ investments in these instruments, if any, are discussed in detail in the Notes to Financial Statements.
| | | | | | |
| | | | | | | |
| 18 | | BLACKROCK FUNDS III | | DECEMBER 31, 2015 | | |
| | |
| Statements of Assets and Liabilities | | |
| | | | | | | | | | | | | | | | | | | | |
| December 31, 2015 | | BlackRock
LifePath
Retirement
Fund | | | BlackRock
LifePath
2020
Fund | | | BlackRock
LifePath
2030
Fund | | | BlackRock
LifePath
2040
Fund | | | BlackRock
LifePath
2050
Fund | |
| | | | | | | | | | | | | | | | | | | | |
| Assets | | | | | | | | | | | | | | | | | | | | |
Investments at value — from the applicable LifePath Master Portfolio1 | | $ | 254,157,504 | | | $ | 580,794,718 | | | $ | 543,837,045 | | | $ | 425,945,889 | | | $ | 114,893,763 | |
Receivables: | | | | | | | | | | | | | | | | | | | | |
Withdrawals from the LifePath Master Portfolio | | | 1,864,523 | | | | 2,133,300 | | | | 2,698,718 | | | | 1,990,400 | | | | 2,151,233 | |
Capital shares sold | | | 40,623 | | | | 639,669 | | | | 573,087 | | | | 403,165 | | | | 280,436 | |
| | | | |
Total assets | | | 256,062,650 | | | | 583,567,687 | | | | 547,108,850 | | | | 428,339,454 | | | | 117,325,432 | |
| | | | |
| | | | | | | | | | | | | | | | | | | | |
| Liabilities | | | | | | | | | | | | | | | | | | | | |
| Payables: | | | | | | | | | | | | | | | | | | | | |
Capital shares redeemed | | | 1,905,146 | | | | 2,772,969 | | | | 3,271,805 | | | | 2,393,565 | | | | 2,431,669 | |
Administration fees | | | 74,889 | | | | 174,979 | | | | 164,531 | | | | 127,756 | | | | 32,564 | |
Service and distribution fees | | | 23,697 | | | | 68,036 | | | | 68,789 | | | | 50,320 | | | | 16,749 | |
Professional fees | | | 12,005 | | | | 12,017 | | | | 11,997 | | | | 12,014 | | | | 12,004 | |
| | | | |
Total liabilities | | | 2,015,737 | | | | 3,028,001 | | | | 3,517,122 | | | | 2,583,655 | | | | 2,492,986 | |
| | | | |
Net Assets | | $ | 254,046,913 | | | $ | 580,539,686 | | | $ | 543,591,728 | | | $ | 425,755,799 | | | $ | 114,832,446 | |
| | | | |
| | | | | | | | | | | | | | | | | | | | |
| Net Assets Consist of | | | | | | | | | | | | | | | | | | | | |
Paid-in capital | | $ | 233,761,436 | | | $ | 540,692,355 | | | $ | 537,303,089 | | | $ | 383,547,386 | | | $ | 113,292,448 | |
Distributions in excess of net investment income | | | (2,100,390 | ) | | | (3,946,086 | ) | | | (2,400,446 | ) | | | (1,128,714 | ) | | | (143,774 | ) |
Accumulated net realized gain (loss) allocated from the LifePath Master Portfolio | | | (6,053,617 | ) | | | (22,073,134 | ) | | | (22,711,532 | ) | | | (13,732,427 | ) | | | (2,495,855 | ) |
Net unrealized appreciation (depreciation) allocated from the LifePath Master Portfolio | | | 28,439,484 | | | | 65,866,551 | | | | 31,400,617 | | | | 57,069,554 | | | | 4,179,627 | |
| | | | |
Net Assets | | $ | 254,046,913 | | | $ | 580,539,686 | | | $ | 543,591,728 | | | $ | 425,755,799 | | | $ | 114,832,446 | |
| | | | |
| | | | | | | | | | | | | | | | | | | | |
| Net Asset Value | | | | | | | | | | | | | | | | | | | | |
| Institutional: | | | | | | | | | | | | | | | | | | | | |
Net assets | | $ | 141,033,970 | | | $ | 259,410,915 | | | $ | 222,490,958 | | | $ | 186,356,969 | | | $ | 40,444,090 | |
| | | | |
Shares outstanding2 | | | 13,654,063 | | | | 18,260,940 | | | | 16,854,124 | | | | 11,473,360 | | | | 2,307,549 | |
| | | | |
Net asset value | | $ | 10.33 | | | $ | 14.21 | | | $ | 13.20 | | | $ | 16.24 | | | $ | 17.53 | |
| | | | |
| Investor A: | | | | | | | | | | | | | | | | | | | | |
Net assets | | $ | 102,206,825 | | | $ | 297,027,431 | | | $ | 298,579,221 | | | $ | 221,048,022 | | | $ | 70,473,438 | |
| | | | |
Shares outstanding2 | | | 11,043,596 | | | | 22,537,866 | | | | 23,365,214 | | | | 14,635,487 | | | | 4,029,795 | |
| | | | |
Net asset value | | $ | 9.25 | | | $ | 13.18 | | | $ | 12.78 | | | $ | 15.10 | | | $ | 17.49 | |
| | | | |
| Investor C: | | | | | | | | | | | | | | | | | | | | |
Net assets | | $ | 1,572,775 | | | $ | 2,232,882 | | | $ | 3,173,105 | | | $ | 2,491,830 | | | $ | 717,339 | |
| | | | |
Shares outstanding2 | | | 153,839 | | | | 158,886 | | | | 243,910 | | | | 155,252 | | | | 41,355 | |
| | | | |
Net asset value | | $ | 10.22 | | | $ | 14.05 | | | $ | 13.01 | | | $ | 16.05 | | | $ | 17.35 | |
| | | | |
| Class K: | | | | | | | | | | | | | | | | | | | | |
Net assets | | $ | 8,577,078 | | | $ | 18,411,629 | | | $ | 16,170,807 | | | $ | 14,469,924 | | | $ | 1,647,438 | |
| | | | |
Shares outstanding2 | | | 832,748 | | | | 1,300,079 | | | | 1,226,198 | | | | 886,648 | | | | 93,720 | |
| | | | |
Net asset value | | $ | 10.30 | | | $ | 14.16 | | | $ | 13.19 | | | $ | 16.32 | | | $ | 17.58 | |
| | | | |
| Class R: | | | | | | | | | | | | | | | | | | | | |
Net assets | | $ | 656,265 | | | $ | 3,456,829 | | | $ | 3,177,637 | | | $ | 1,389,054 | | | $ | 1,550,141 | |
| | | | |
Shares outstanding2 | | | 63,943 | | | | 244,541 | | | | 242,734 | | | | 86,013 | | | | 88,844 | |
| | | | |
Net asset value | | $ | 10.26 | | | $ | 14.14 | | | $ | 13.09 | | | $ | 16.15 | | | $ | 17.45 | |
| | | | |
1 Investments at cost — from the applicable LifePath Master Portfolio | | $ | 225,718,020 | | | $ | 514,928,167 | | | $ | 512,436,428 | | | $ | 368,876,335 | | | $ | 110,714,136 | |
2 No par value, unlimited number of shares authorized. | | | | | |
| | | | | | |
| See Notes to Financial Statements. | | | | |
| | | | | | | |
| | BLACKROCK FUNDS III | | DECEMBER 31, 2015 | | 19 |
| | | | | | | | | | | | | | | | | | | | |
| Year Ended December 31, 2015 | | BlackRock
LifePath
Retirement Fund | | | BlackRock
LifePath 2020 Fund | | | BlackRock
LifePath 2030 Fund | | | BlackRock
LifePath 2040 Fund | | | BlackRock
LifePath 2050 Fund | |
| | | | | | | | | | | | | | | | | | | | |
| Investment Income | | | | | | | | | | | | | | | | | | | | |
| Net investment income allocated from the applicable LifePath Master Portfolio: | | | | | | | | | | | | | | | | | | | | |
Interest — affiliated | | $ | 4,480,683 | | | $ | 8,218,647 | | | $ | 4,467,826 | | | $ | 1,187,479 | | | $ | 101,189 | |
Dividends — affiliated | | | 2,532,768 | | | | 7,758,198 | | | | 10,587,257 | | | | 11,345,133 | | | | 3,413,733 | |
Dividends — unaffiliated | | | 5,161 | | | | 82,905 | | | | 224,830 | | | | 278,845 | | | | 86,597 | |
Securities lending — affiliated — net | | | 13,116 | | | | 32,778 | | | | 49,264 | | | | 45,796 | | | | 15,321 | |
Income — affiliated | | | 3,592 | | | | 6,279 | | | | 6,917 | | | | 5,283 | | | | 1,610 | |
Expenses | | | (1,820,235 | ) | | | (4,208,113 | ) | | | (4,000,927 | ) | | | (3,320,670 | ) | | | (956,007 | ) |
Fees waived | | | 1,005,719 | | | | 2,454,200 | | | | 2,538,423 | | | | 2,262,315 | | | | 680,829 | |
Foreign taxes withheld | | | (651 | ) | | | (10,579 | ) | | | (28,744 | ) | | | (35,811 | ) | | | (10,600 | ) |
| | | | |
Total income | | | 6,220,153 | | | | 14,334,315 | | | | 13,844,846 | | | | 11,768,370 | | | | 3,332,672 | |
| | | | |
| | | | | | | | | | | | | | | | | | | | |
| Fund Expenses | | | | | | | | | | | | | | | | | | | | |
Administration — Institutional | | | 925,936 | | | | 1,828,346 | | | | 1,674,066 | | | | 1,581,439 | | | | 436,170 | |
Administration — Investor A | | | 606,056 | | | | 1,652,304 | | | | 1,631,038 | | | | 1,224,817 | | | | 360,797 | |
Administration — Investor C | | | 7,530 | | | | 13,776 | | | | 16,802 | | | | 12,477 | | | | 3,565 | |
Administration — Class K | | | 8,912 | | | | 22,780 | | | | 21,343 | | | | 16,203 | | | | 2,184 | |
Administration — Class R | | | 3,637 | | | | 14,882 | | | | 13,183 | | | | 6,180 | | | | 6,109 | |
Service — Investor A | | | 309,489 | | | | 845,604 | | | | 835,463 | | | | 627,058 | | | | 185,386 | |
Service and distribution — Investor C | | | 15,357 | | | | 27,973 | | | | 34,183 | | | | 25,401 | | | | 7,280 | |
Service and distribution — Class R | | | 3,742 | | | | 15,459 | | | | 13,721 | | | | 6,403 | | | | 6,385 | |
Professional | | | 19,777 | | | | 19,868 | | | | 19,839 | | | | 19,839 | | | | 19,746 | |
Miscellaneous | | | 325 | | | | 325 | | | | 325 | | | | 325 | | | | 325 | |
| | | | |
Total expenses | | | 1,900,761 | | | | 4,441,317 | | | | 4,259,963 | | | | 3,520,142 | | | | 1,027,947 | |
Less fees waived by the administrator | | | (164,451 | ) | | | (19,868 | ) | | | (19,839 | ) | | | (19,839 | ) | | | (19,746 | ) |
| | | | |
Total expenses after fees waived | | | 1,736,310 | | | | 4,421,449 | | | | 4,240,124 | | | | 3,500,303 | | | | 1,008,201 | |
| | | | |
Net investment income | | | 4,483,843 | | | | 9,912,866 | | | | 9,604,722 | | | | 8,268,067 | | | | 2,324,471 | |
| | | | |
| | | | | | | | | | | | | | | | | | | | |
| Realized and Unrealized Gain (Loss) Allocated from the LifePath Master Portfolio | | | | | | | | | | | | | | | | | | | | |
Net realized gain from investments, financial futures contracts, swaps, foreign currency transactions and in-kind redemptions1 | | | 6,260,131 | | | | 37,234,799 | | | | 42,635,544 | | | | 39,968,484 | | | | 5,287,562 | |
Net change in unrealized appreciation (depreciation) on investments, financial futures contracts, swaps and foreign currency translations | | | (14,207,577 | ) | | | (55,072,147 | ) | | | (60,423,454 | ) | | | (53,419,747 | ) | | | (9,113,775 | ) |
| | | | |
Net realized and unrealized loss | | | (7,947,446 | ) | | | (17,837,348 | ) | | | (17,787,910 | ) | | | (13,451,263 | ) | | | (3,826,213 | ) |
| | | | |
Net Decrease in Net Assets Resulting from Operations | | $ | (3,463,603 | ) | | $ | (7,924,482 | ) | | $ | (8,183,188 | ) | | $ | (5,183,196 | ) | | $ | (1,501,742 | ) |
| | | | |
1 See Note 2 of the Notes to Financial Statements. | |
| | | | | | |
| See Notes to Financial Statements. | | | | |
| | | | | | | |
| 20 | | BLACKROCK FUNDS III | | DECEMBER 31, 2015 | | |
| | |
| Statements of Changes in Net Assets | | |
| | | | | | | | | | | | | | | | | | |
| | | BlackRock LifePath
Retirement Fund | | | | | BlackRock LifePath 2020 Fund | |
| | | Year Ended December 31, | | | | | Year Ended December 31, | |
| Increase (Decrease) in Net Assets: | | 2015 | | | 2014 | | | | | 2015 | | | 2014 | |
| | | | | | | | | | | | | | | | | | |
| Operations | | | | | | | | | | | | | | | | | | |
Net investment income | | $ | 4,483,843 | | | $ | 6,420,547 | | | | | $ | 9,912,866 | | | $ | 14,100,507 | |
Net realized gain | | | 6,260,131 | | | | 30,328,592 | | | | | | 37,234,799 | | | | 82,240,605 | |
Net change in unrealized appreciation (depreciation) | | | (14,207,577 | ) | | | (15,887,725 | ) | | | | | (55,072,147 | ) | | | (48,739,044 | ) |
| | | | | | | | | | |
Net increase (decrease) in net assets resulting from operations | | | (3,463,603 | ) | | | 20,861,414 | | | | | | (7,924,482 | ) | | | 47,602,068 | |
| | | | | | | | | | |
| | | | | | | | | | | | | | | | | | |
| Distributions to Shareholders1 | | | | | | | | | | | | | | | | | | |
| From net investment income: | | | | | | | | | | | | | | | | | | |
Institutional | | | (3,127,076 | ) | | | (4,404,816 | ) | | | | | (5,744,451 | ) | | | (8,895,767 | ) |
Investor A | | | (2,150,315 | ) | | | (2,300,181 | ) | | | | | (5,423,081 | ) | | | (5,462,819 | ) |
Investor C | | | (14,652 | ) | | | (8,193 | ) | | | | | (20,432 | ) | | | (17,875 | ) |
Class K | | | (162,220 | ) | | | (75,012 | ) | | | | | (374,112 | ) | | | (191,706 | ) |
Class R | | | (9,953 | ) | | | (16,034 | ) | | | | | (43,593 | ) | | | (36,574 | ) |
| From net realized gain: | | | | | | | | | | | | | | | | | | |
Institutional | | | (5,334,035 | ) | | | (20,795,931 | ) | | | | | (16,437,737 | ) | | | (51,643,775 | ) |
Investor A | | | (4,072,705 | ) | | | (13,315,477 | ) | | | | | (19,138,626 | ) | | | (38,760,115 | ) |
Investor C | | | (53,135 | ) | | | (110,551 | ) | | | | | (151,851 | ) | | | (293,404 | ) |
Class K | | | (286,046 | ) | | | (275,163 | ) | | | | | (1,094,350 | ) | | | (973,553 | ) |
Class R | | | (24,096 | ) | | | (89,990 | ) | | | | | (192,139 | ) | | | (274,368 | ) |
| From return of capital: | | | | | | | | | | | | | | | | | | |
Institutional | | | (229,822 | ) | | | — | | | | | | (414,898 | ) | | | — | |
Investor A | | | (150,783 | ) | | | — | | | | | | (376,514 | ) | | | — | |
Investor C | | | (1,865 | ) | | | — | | | | | | (3,113 | ) | | | — | |
Class K | | | (7,227 | ) | | | — | | | | | | (16,893 | ) | | | — | |
Class R | | | (912 | ) | | | — | | | | | | (3,437 | ) | | | — | |
| | | | | | | | | | |
Decrease in net assets resulting from distributions to shareholders | | | (15,624,842 | ) | | | (41,391,348 | ) | | | | | (49,435,227 | ) | | | (106,549,956 | ) |
| | | | | | | | | | |
| | | | | | | | | | | | | | | | | | |
| Capital Share Transactions | | | | | | | | | | | | | | | | | | |
Net decrease in net assets derived from capital shares transactions | | | (106,205,622 | ) | | | (104,392,035 | ) | | | | | (234,934,031 | ) | | | (168,709,426 | ) |
| | | | | | | | | | |
| | | | | | | | | | | | | | | | | | |
| Net Assets | | | | | | | | | | | | | | | | | | |
Total decrease in net assets | | | (125,294,067 | ) | | | (124,921,969 | ) | | | | | (292,293,740 | ) | | | (227,657,314 | ) |
Beginning of year | | | 379,340,980 | | | | 504,262,949 | | | | | | 872,833,426 | | | | 1,100,490,740 | |
| | | | | | | | | | |
End of year | | $ | 254,046,913 | | | $ | 379,340,980 | | | | | $ | 580,539,686 | | | $ | 872,833,426 | |
| | | | | | | | | | |
Distributions in excess of net investment income, end of year | | $ | (2,100,390 | ) | | $ | (1,120,017 | ) | | | | $ | (3,946,086 | ) | | $ | (2,253,283 | ) |
| | | | | | | | | | |
1 Distributions for annual periods determined in accordance with federal income tax regulations. | | | | | | | | | | | | | | |
| | | | | | |
| See Notes to Financial Statements. | | | | |
| | | | | | | |
| | BLACKROCK FUNDS III | | DECEMBER 31, 2015 | | 21 |
| | |
| Statements of Changes in Net Assets | | |
| | | | | | | | | | | | | | | | | | |
| | | BlackRock LifePath 2030 Fund | | | | | BlackRock LifePath 2040 Fund | |
| | | Year Ended December 31, | | | | | Year Ended December 31, | |
| Increase (Decrease) in Net Assets: | | 2015 | | | 2014 | | | | | 2015 | | | 2014 | |
| | | | | | | | | | | | | | | | | | |
| Operations | | | | | | | | | | | | | | | | | | |
Net investment income | | $ | 9,604,722 | | | $ | 13,273,261 | | | | | $ | 8,268,067 | | | $ | 11,459,541 | |
Net realized gain | | | 42,635,544 | | | | 89,981,059 | | | | | | 39,968,484 | | | | 84,054,967 | |
Net change in unrealized appreciation (depreciation) | | | (60,423,454 | ) | | | (56,323,113 | ) | | | | | (53,419,747 | ) | | | (54,209,797 | ) |
| | | | | | | | | | |
Net increase (decrease) in net assets resulting from operations | | | (8,183,188 | ) | | | 46,931,207 | | | | | | (5,183,196 | ) | | | 41,304,711 | |
| | | | | | | | | | |
| | | | | | | | | | | | | | | | | | |
| Distributions to Shareholders1 | | | | | | | | | | | | | | | | | | |
| From net investment income: | | | | | | | | | | | | | | | | | | |
Institutional | | | (5,245,965 | ) | | | (8,716,567 | ) | | | | | (4,627,517 | ) | | | (7,938,976 | ) |
Investor A | | | (5,139,428 | ) | | | (5,155,801 | ) | | | | | (3,769,172 | ) | | | (3,937,683 | ) |
Investor C | | | (28,327 | ) | | | (19,700 | ) | | | | | (18,841 | ) | | | (13,501 | ) |
Class K | | | (347,476 | ) | | | (210,259 | ) | | | | | (276,680 | ) | | | (110,778 | ) |
Class R | | | (37,723 | ) | | | (38,613 | ) | | | | | (16,799 | ) | | | (15,968 | ) |
| From net realized gain: | | | | | | | | | | | | | | | | | | |
Institutional | | | (16,480,125 | ) | | | (55,632,148 | ) | | | | | (16,944,291 | ) | | | (55,495,147 | ) |
Investor A | | | (21,374,712 | ) | | | (42,009,267 | ) | | | | | (19,564,019 | ) | | | (33,978,812 | ) |
Investor C | | | (229,534 | ) | | | (348,719 | ) | | | | | (207,034 | ) | | | (269,943 | ) |
Class K | | | (1,118,319 | ) | | | (1,143,468 | ) | | | | | (1,178,255 | ) | | | (629,230 | )�� |
Class R | | | (206,273 | ) | | | (361,514 | ) | | | | | (112,003 | ) | | | (149,272 | ) |
| From return of capital: | | | | | | | | | | | | | | | | | | |
Institutional | | | (153,051 | ) | | | — | | | | | | — | | | | — | |
Investor A | | | (149,932 | ) | | | — | | | | | | — | | | | — | |
Investor C | | | (1,533 | ) | | | — | | | | | | — | | | | — | |
Class K | | | (6,383 | ) | | | — | | | | | | — | | | | — | |
Class R | | | (1,230 | ) | | | — | | | | | | — | | | | — | |
| | | | | | | | | | |
Decrease in net assets resulting from distributions to shareholders | | | (50,520,011 | ) | | | (113,636,056 | ) | | | | | (46,714,611 | ) | | | (102,539,310 | ) |
| | | | | | | | | | |
| | | | | | | | | | | | | | | | | | |
| Capital Share Transactions | | | | | | | | | | | | | | | | | | |
Net decrease in net assets derived from capital share transactions | | | (212,874,136 | ) | | | (163,153,810 | ) | | | | | (229,125,964 | ) | | | (119,373,132 | ) |
| | | | | | | | | | |
| | | | | | | | | | | | | | | | | | |
| Net Assets | | | | | | | | | | | | | | | | | | |
Total decrease in net assets | | | (271,577,335 | ) | | | (229,858,659 | ) | | | | | (281,023,771 | ) | | | (180,607,731 | ) |
Beginning of year | | | 815,169,063 | | | | 1,045,027,722 | | | | | | 706,779,570 | | | | 887,387,301 | |
| | | | | | | | | | |
End of year | | $ | 543,591,728 | | | $ | 815,169,063 | | | | | $ | 425,755,799 | | | $ | 706,779,570 | |
| | | | | | | | | | |
Distributions in excess of net investment income, end of year | | $ | (2,400,446 | ) | | $ | (1,206,249 | ) | | | | $ | (1,128,714 | ) | | $ | (687,772 | ) |
| | | | | | | | | | |
1 Distributions for annual periods determined in accordance with federal income tax regulations. | | | | | | | | | | | | | | |
| | | | | | |
| See Notes to Financial Statements. | | | | |
| | | | | | | |
| 22 | | BLACKROCK FUNDS III | | DECEMBER 31, 2015 | | |
| | |
| Statements of Changes in Net Assets | | |
| | | | | | | | |
| | | BlackRock LifePath 2050 Fund | |
| | | Year Ended December 31, | |
| Increase (Decrease) in Net Assets: | | 2015 | | | 2014 | |
| | | | | | | | |
| Operations | | | | | | | | |
Net investment income | | $ | 2,324,471 | | | $ | 2,706,534 | |
Net realized gain | | | 5,287,562 | | | | 18,096,514 | |
Net change in unrealized appreciation (depreciation) | | | (9,113,775 | ) | | | (12,262,296 | ) |
| | | | |
Net increase (decrease) in net assets resulting from operations | | | (1,501,742 | ) | | | 8,540,752 | |
| | | | |
| | | | | | | | |
| Distributions to Shareholders1 | | | | | | | | |
| From net investment income: | | | | | | | | |
Institutional | | | (1,220,284 | ) | | | (1,788,582 | ) |
Investor A | | | (1,059,368 | ) | | | (928,790 | ) |
Investor C | | | (5,625 | ) | | | (3,293 | ) |
Class K | | | (31,254 | ) | | | (22,890 | ) |
Class R | | | (16,286 | ) | | | (16,004 | ) |
| From net realized gain: | | | | | | | | |
Institutional | | | (3,318,877 | ) | | | (13,592,448 | ) |
Investor A | | | (5,011,499 | ) | | | (8,614,787 | ) |
Investor C | | | (50,455 | ) | | | (72,196 | ) |
Class K | | | (110,679 | ) | | | (152,131 | ) |
Class R | | | (103,788 | ) | | | (147,025 | ) |
| | | | |
Decrease in net assets resulting from distributions to shareholders | | | (10,928,115 | ) | | | (25,338,146 | ) |
| | | | |
| | | | | | | | |
| Capital Share Transactions | | | | | | | | |
Net decrease in net assets derived from capital share transactions | | | (54,874,122 | ) | | | (32,842,244 | ) |
| | | | |
| | | | | | | | |
| Net Assets | | | | | | | | |
Total decrease in net assets | | | (67,303,979 | ) | | | (49,639,638 | ) |
Beginning of year | | | 182,136,425 | | | | 231,776,063 | |
| | | | |
End of year | | $ | 114,832,446 | | | $ | 182,136,425 | |
| | | | |
Distributions in excess of net investment income, end of year | | $ | (143,774 | ) | | $ | (135,428 | ) |
| | | | |
1 Distributions for annual periods determined in accordance with federal income tax regulations. | | | | |
| | | | | | |
| See Notes to Financial Statements. | | | | |
| | | | | | | |
| | BLACKROCK FUNDS III | | DECEMBER 31, 2015 | | 23 |
| | |
| Financial Highlights | | BlackRock LifePath Retirement Fund |
| | | | | | | | | | | | | | | | | | | | |
| | | Institutional | |
| | | Year Ended December 31, | |
| | | 2015 | | | 2014 | | | 2013 | | | 2012 | | | 2011 | |
| | | | | | | | | | | | | | | | | | | | |
| Per Share Operating Performance | | | | | | | | | | | | | | | | | | | | |
Net asset value, beginning of year | | $ | 11.07 | | | $ | 11.72 | | | $ | 11.80 | | | $ | 11.39 | | | $ | 11.55 | |
| | | | |
Net investment income1 | | | 0.16 | | | | 0.18 | | | | 0.16 | | | | 0.20 | | | | 0.27 | |
Net realized and unrealized gain (loss) | | | (0.33 | ) | | | 0.38 | | | | 0.57 | | | | 0.77 | | | | 0.18 | |
| | | | |
Net increase (decrease) from investment operations | | | (0.17 | ) | | | 0.56 | | | | 0.73 | | | | 0.97 | | | | 0.45 | |
| | | | |
| Distributions:2 | | | | | | | | | | | | | | | | | | | | |
From net investment income | | | (0.20 | ) | | | (0.19 | ) | | | (0.16 | ) | | | (0.21 | ) | | | (0.26 | ) |
From net realized gain | | | (0.36 | ) | | | (1.02 | ) | | | (0.65 | ) | | | (0.35 | ) | | | (0.35 | ) |
From return of capital | | | (0.01 | ) | | | — | | | | — | | | | — | | | | — | |
| | | | |
Total distributions | | | (0.57 | ) | | | (1.21 | ) | | | (0.81 | ) | | | (0.56 | ) | | | (0.61 | ) |
| | | | |
Net asset value, end of year | | $ | 10.33 | | | $ | 11.07 | | | $ | 11.72 | | | $ | 11.80 | | | $ | 11.39 | |
| | | | |
| | | | | | | | | | | | | | | | | | | | |
| Total Return3 | | | | | | | | | | | | | | | | | | | | |
Based on net asset value | | | (1.52)% | | | | 4.75% | | | | 6.25% | | | | 8.61% | | | | 3.96% | |
| | | | |
| | | | | | | | | | | | | | | | | | | | |
| Ratios to Average Net Assets4,5,6 | | | | | | | | | | | | | | | | | | | | |
Total expenses | | | 0.75% | | | | 0.75% | | | | 0.76% | | | | 0.78% | | | | 0.77% | |
| | | | |
Total expenses after fees waived and/or reimbursed | | | 0.70% | | | | 0.75% | | | | 0.75% | | | | 0.78% | | | | 0.77% | |
| | | | |
Net investment income | | | 1.48% | | | | 1.52% | | | | 1.34% | | | | 1.70% | | | | 2.27% | |
| | | | |
| | | | | | | | | | | | | | | | | | | | |
| Supplemental Data | | | | | | | | | | | | | | | | | | | | |
Net assets, end of year (000) | | $ | 141,034 | | | $ | 234,280 | | | $ | 342,615 | | | $ | 390,150 | | | $ | 431,982 | |
| | | | |
Portfolio turnover rate of the LifePath Master Portfolio | | | 21% | 7 | | | 14% | 8 | | | 17% | 8 | | | 4% | 9 | | | 4% | 9 |
| | | | |
| | 1 | | Based on average shares outstanding. |
| | 2 | | Distributions for annual periods determined in accordance with federal income tax regulations. |
| | 3 | | Where applicable, assumes the reinvestment of distributions. |
| | 4 | | Includes the LifePath Fund’s share of its corresponding LifePath Master Portfolio’s allocated net expenses and/or net investment income. |
| | 5 | | Includes the LifePath Fund’s share of the LifePath Master Portfolio’s allocated fees waived of 0.31%, 0.31%, 0.30%, 0.29% and 0.30% for the years ended December 31, 2015, December 31, 2014, December 31, 2013, December 31, 2012 and December 31, 2011, respectively. |
| | 6 | | Includes the LifePath Fund’s share of the LifePath Master Portfolio’s allocated expenses and/or net investment income. Excludes expenses incurred indirectly as a result of the LifePath Master Portfolio’s investments in underlying funds as follows: |
| | | | | | | | | | | | | | | | | | | | |
| | | Year Ended December 31, | |
| | | 2015 | | | 2014 | | | 2013 | | | 2012 | | | 2011 | |
| | | | | | | | | | | | | | | | | | | | |
Investments in underlying funds | | | 0.09% | | | | 0.10% | | | | 0.10% | | | | 0.08% | | | | 0.08% | |
| | | | |
| | 7 | | Includes the LifePath Master Portfolio’s purchases and sales of the underlying funds and Active Stock Master Portfolio, CoreAlpha Bond Master Portfolio, International Tilts Master Portfolio, Large Cap Index Master Portfolio and Master Small Cap Index Series. |
| | 8 | | Includes the LifePath Master Portfolio’s purchases and sales of the underlying funds and Active Stock Master Portfolio, CoreAlpha Bond Master Portfolio, International Tilts Master Portfolio, Large Cap Index Master Portfolio, Master Small Cap Index Series and Total International ex U.S. Index Master Portfolio. |
| | 9 | | Excludes the LifePath Master Portfolio’s purchases and sales of the Active Stock Master Portfolio, CoreAlpha Bond Master Portfolio, Master Small Cap Index Series and Total International ex U.S. Index Master Portfolio. If these transactions had been included to conform to the current year presentation, the portfolio turnover rate would have been 13% and 20% for the years ended December 31, 2012 and December 31, 2011, respectively. |
| | | | | | |
| See Notes to Financial Statements. | | | | |
| | | | | | | |
| 24 | | BLACKROCK FUNDS III | | DECEMBER 31, 2015 | | |
| | |
| Financial Highlights (continued) | | BlackRock LifePath Retirement Fund |
| | | | | | | | | | | | | | | | | | | | |
| | | Investor A | |
| | | Year Ended December 31, | |
| | | 2015 | | | 2014 | | | 2013 | | | 2012 | | | 2011 | |
| | | | | | | | | | | | | | | | | | | | |
| Per Share Operating Performance | | | | | | | | | | | | | | | | | | | | |
Net asset value, beginning of year | | $ | 9.99 | | | $ | 10.69 | | | $ | 10.84 | | | $ | 10.50 | | | $ | 10.71 | |
| | | | |
Net investment income1 | | | 0.12 | | | | 0.14 | | | | 0.12 | | | | 0.16 | | | | 0.22 | |
Net realized and unrealized gain (loss) | | | (0.30 | ) | | | 0.35 | | | | 0.51 | | | | 0.72 | | | | 0.16 | |
| | | | |
Net increase (decrease) from investment operations | | | (0.18 | ) | | | 0.49 | | | | 0.63 | | | | 0.88 | | | | 0.38 | |
| | | | |
| Distributions:2 | | | | | | | | | | | | | | | | | | | | |
From net investment income | | | (0.19 | ) | | | (0.17 | ) | | | (0.13 | ) | | | (0.19 | ) | | | (0.24 | ) |
From net realized gain | | | (0.36 | ) | | | (1.02 | ) | | | (0.65 | ) | | | (0.35 | ) | | | (0.35 | ) |
From return of capital | | | (0.01 | ) | | | — | | | | — | | | | — | | | | — | |
| | | | |
Total distributions | | | (0.56 | ) | | | (1.19 | ) | | | (0.78 | ) | | | (0.54 | ) | | | (0.59 | ) |
| | | | |
Net asset value, end of year | | $ | 9.25 | | | $ | 9.99 | | | $ | 10.69 | | | $ | 10.84 | | | $ | 10.50 | |
| | | | |
| | | | | | | | | | | | | | | | | | | | |
| Total Return3 | | | | | | | | | | | | | | | | | | | | |
Based on net asset value | | | (1.89)% | | | | 4.56% | | | | 5.94% | | | | 8.46% | | | | 3.60% | |
| | | | |
| | | | | | | | | | | | | | | | | | | | |
| Ratios to Average Net Assets4,5,6 | | | | | | | | | | | | | | | | | | | | |
Total expenses | | | 1.00% | | | �� | 1.01% | | | | 1.01% | | | | 1.03% | | | | 1.02% | |
| | | | |
Total expenses after fees waived and/or reimbursed | | | 0.95% | | | | 1.00% | | | | 1.00% | | | | 1.03% | | | | 1.02% | |
| | | | |
Net investment income | | | 1.25% | | | | 1.27% | | | | 1.08% | | | | 1.47% | | | | 2.03% | |
| | | | |
| | | | | | | | | | | | | | | | | | | | |
| Supplemental Data | | | | | | | | | | | | | | | | | | | | |
Net assets, end of year (000) | | $ | 102,207 | | | $ | 139,853 | | | $ | 155,402 | | | $ | 189,898 | | | $ | 183,967 | |
| | | | |
Portfolio turnover rate of the LifePath Master Portfolio | | | 21% | 7 | | | 14% | 8 | | | 17% | 8 | | | 4% | 9 | | | 4% | 9 |
| | | | |
| | 1 | | Based on average shares outstanding. |
| | 2 | | Distributions for annual periods determined in accordance with federal income tax regulations. |
| | 3 | | Where applicable, excludes the effects of any sales charges and assumes the reinvestment of distributions. |
| | 4 | | Includes the LifePath Fund’s share of its corresponding LifePath Master Portfolio’s allocated net expenses and/or net investment income. |
| | 5 | | Includes the LifePath Fund’s share of the LifePath Master Portfolio’s allocated fees waived of 0.31%, 0.33%, 0.30%, 0.29% and 0.30% for the years ended December 31, 2015, December 31, 2014, December 31, 2013, December 31, 2012 and December 31, 2011, respectively. |
| | 6 | | Includes the LifePath Fund’s share of the LifePath Master Portfolio’s allocated expenses and/or net investment income. Excludes expenses incurred indirectly as a result of the LifePath Master Portfolio’s investments in underlying funds as follows: |
| | | | | | | | | | | | | | | | | | | | |
| | | Year Ended December 31, | |
| | | 2015 | | | 2014 | | | 2013 | | | 2012 | | | 2011 | |
| | | | | | | | | | | | | | | | | | | | |
Investments in underlying funds | | | 0.09% | | | | 0.10% | | | | 0.10% | | | | 0.08% | | | | 0.08% | |
| | | | |
| | 7 | | Includes the LifePath Master Portfolio’s purchases and sales of the underlying funds and Active Stock Master Portfolio, CoreAlpha Bond Master Portfolio, International Tilts Master Portfolio, Large Cap Index Master Portfolio and Master Small Cap Index Series. |
| | 8 | | Includes the LifePath Master Portfolio’s purchases and sales of the underlying funds and Active Stock Master Portfolio, CoreAlpha Bond Master Portfolio, International Tilts Master Portfolio, Large Cap Index Master Portfolio, Master Small Cap Index Series and Total International ex U.S. Index Master Portfolio. |
| | 9 | | Excludes the LifePath Master Portfolio’s purchases and sales of the Active Stock Master Portfolio, CoreAlpha Bond Master Portfolio, Master Small Cap Index Series and Total International ex U.S. Index Master Portfolio. If these transactions had been included to conform to the current year presentation, the portfolio turnover rate would have been 13% and 20% for the years ended December 31, 2012 and December 31, 2011, respectively. |
| | | | | | |
| See Notes to Financial Statements. | | | | |
| | | | | | | |
| | BLACKROCK FUNDS III | | DECEMBER 31, 2015 | | 25 |
| | |
| Financial Highlights (continued) | | BlackRock LifePath Retirement Fund |
| | | | | | | | | | | | | | | | | | | | |
| | | Investor C | |
| | | Year Ended December 31, | |
| | | 2015 | | | 2014 | | | 2013 | | | 2012 | | | 2011 | |
| | | | | | | | | | | | | | | | | | | | |
| Per Share Operating Performance | | | | | | | | | | | | | | | | | | | | |
Net asset value, beginning of year | | $ | 10.97 | | | $ | 11.64 | | | $ | 11.76 | | | $ | 11.36 | | | $ | 11.55 | |
| | | | |
Net investment income1 | | | 0.06 | | | | 0.07 | | | | 0.04 | | | | 0.08 | | | | 0.17 | |
Net realized and unrealized gain (loss) | | | (0.34 | ) | | | 0.36 | | | | 0.56 | | | | 0.77 | | | | 0.16 | |
| | | | |
Net increase (decrease) from investment operations | | | (0.28 | ) | | | 0.43 | | | | 0.60 | | | | 0.85 | | | | 0.33 | |
| | | | |
| Distributions:2 | | | | | | | | | | | | | | | | | | | | |
From net investment income | | | (0.10 | ) | | | (0.08 | ) | | | (0.07 | ) | | | (0.10 | ) | | | (0.17 | ) |
From net realized gain | | | (0.36 | ) | | | (1.02 | ) | | | (0.65 | ) | | | (0.35 | ) | | | (0.35 | ) |
From return of capital | | | (0.01 | ) | | | — | | | | — | | | | — | | | | — | |
| | | | |
Total distributions | | | (0.47 | ) | | | (1.10 | ) | | | (0.72 | ) | | | (0.45 | ) | | | (0.52 | ) |
| | | | |
Net asset value, end of year | | $ | 10.22 | | | $ | 10.97 | | | $ | 11.64 | | | $ | 11.76 | | | $ | 11.36 | |
| | | | |
| | | | | | | | | | | | | | | | | | | | |
| Total Return3 | | | | | | | | | | | | | | | | | | | | |
Based on net asset value | | | (2.56)% | | | | 3.70% | | | | 5.12% | | | | 7.55% | | | | 2.86% | |
| | | | |
| | | | | | | | | | | | | | | | | | | | |
| Ratios to Average Net Assets4,5,6 | | | | | | | | | | | | | | | | | | | | |
Total expenses | | | 1.76% | | | | 1.76% | | | | 1.77% | | | | 1.78% | | | | 1.78% | |
| | | | |
Total expenses after fees waived and/or reimbursed | | | 1.70% | | | | 1.75% | | | | 1.76% | | | | 1.78% | | | | 1.78% | |
| | | | |
Net investment income | | | 0.56% | | | | 0.56% | | | | 0.33% | | | | 0.70% | | | | 1.42% | |
| | | | |
| | | | | | | | | | | | | | | | | | | | |
| Supplemental Data | | | | | | | | | | | | | | | | | | | | |
Net assets, end of year (000) | | $ | 1,573 | | | $ | 1,295 | | | $ | 511 | | | $ | 135 | | | $ | 55 | |
| | | | |
Portfolio turnover rate of the LifePath Master Portfolio | | | 21% | 7 | | | 14% | 8 | | | 17% | 8 | | | 4% | 9 | | | 4% | 9 |
| | | | |
| | 1 | | Based on average shares outstanding. |
| | 2 | | Distributions for annual periods determined in accordance with federal income tax regulations. |
| | 3 | | Where applicable, excludes the effects of any sales charges and assumes the reinvestment of distributions. |
| | 4 | | Includes the LifePath Fund’s share of its corresponding LifePath Master Portfolio’s allocated net expenses and/or net investment income. |
| | 5 | | Includes the LifePath Fund’s share of the LifePath Master Portfolio’s allocated fees waived of 0.31%, 0.33%, 0.30%, 0.29% and 0.30% for the years ended December 31, 2015, December 31, 2014, December 31, 2013, December 31, 2012 and December 31, 2011, respectively. |
| | 6 | | Includes the LifePath Fund’s share of the LifePath Master Portfolio’s allocated expenses and/or net investment income. Excludes expenses incurred indirectly as a result of the LifePath Master Portfolio’s investments in underlying funds as follows: |
| | | | | | | | | | | | | | | | | | | | |
| | | Year Ended December 31, | |
| | | 2015 | | | 2014 | | | 2013 | | | 2012 | | | 2011 | |
| | | | | | | | | | | | | | | | | | | | |
Investments in underlying funds | | | 0.09% | | | | 0.10% | | | | 0.10% | | | | 0.08% | | | | 0.08% | |
| | | | |
| | 7 | | Includes the LifePath Master Portfolio’s purchases and sales of the underlying funds and Active Stock Master Portfolio, CoreAlpha Bond Master Portfolio, International Tilts Master Portfolio, Large Cap Index Master Portfolio and Master Small Cap Index Series. |
| | 8 | | Includes the LifePath Master Portfolio’s purchases and sales of the underlying funds and Active Stock Master Portfolio, CoreAlpha Bond Master Portfolio, International Tilts Master Portfolio, Large Cap Index Master Portfolio, Master Small Cap Index Series and Total International ex U.S. Index Master Portfolio. |
| | 9 | | Excludes the LifePath Master Portfolio’s purchases and sales of the Active Stock Master Portfolio, CoreAlpha Bond Master Portfolio, Master Small Cap Index Series and Total International ex U.S. Index Master Portfolio. If these transactions had been included to conform to the current year presentation, the portfolio turnover rate would have been 13% and 20% for the years ended December 31, 2012 and December 31, 2011, respectively. |
| | | | | | |
| See Notes to Financial Statements. | | | | |
| | | | | | | |
| 26 | | BLACKROCK FUNDS III | | DECEMBER 31, 2015 | | |
| | |
| Financial Highlights (continued) | | BlackRock LifePath Retirement Fund |
| | | | | | | | | | | | | | | | | | | | |
| | | Class K | |
| | | Year Ended December 31, | |
| | | 2015 | | | 2014 | | | 2013 | | | 2012 | | | 2011 | |
| | | | | | | | | | | | | | | | | | | | |
| Per Share Operating Performance | | | | | | | | | | | | | | | | | | | | |
Net asset value, beginning of year | | $ | 11.05 | | | $ | 11.69 | | | $ | 11.78 | | | $ | 11.37 | | | $ | 11.54 | |
| | | | |
Net investment income1 | | | 0.21 | | | | 0.22 | | | | 0.20 | | | | 0.25 | | | | 0.32 | |
Net realized and unrealized gain (loss) | | | (0.35 | ) | | | 0.39 | | | | 0.56 | | | | 0.77 | | | | 0.17 | |
| | | | |
Net increase (decrease) from investment operations | | | (0.14 | ) | | | 0.61 | | | | 0.76 | | | | 1.02 | | | | 0.49 | |
| | | | |
| Distributions:2 | | | | | | | | | | | | | | | | | | | | |
From net investment income | | | (0.24 | ) | | | (0.23 | ) | | | (0.20 | ) | | | (0.26 | ) | | | (0.31 | ) |
From net realized gain | | | (0.36 | ) | | | (1.02 | ) | | | (0.65 | ) | | | (0.35 | ) | | | (0.35 | ) |
From return of capital | | | (0.01 | ) | | | — | | | | — | | | | — | | | | — | |
| | | | |
Total distributions | | | (0.61 | ) | | | (1.25 | ) | | | (0.85 | ) | | | (0.61 | ) | | | (0.66 | ) |
| | | | |
Net asset value, end of year | | $ | 10.30 | | | $ | 11.05 | | | $ | 11.69 | | | $ | 11.78 | | | $ | 11.37 | |
| | | | |
| | | | | | | | | | | | | | | | | | | | |
| Total Return3 | | | | | | | | | | | | | | | | | | | | |
Based on net asset value | | | (1.28)% | | | | 5.24% | | | | 6.54% | | | | 9.03% | | | | 4.27% | |
| | | | |
| | | | | | | | | | | | | | | | | | | | |
| Ratios to Average Net Assets4,5,6 | | | | | | | | | | | | | | | | | | | | |
Total expenses | | | 0.42% | | | | 0.40% | | | | 0.40% | | | | 0.43% | | | | 0.44% | |
| | | | |
Total expenses after fees waived and/or reimbursed | | | 0.42% | | | | 0.40% | | | | 0.40% | | | | 0.43% | | | | 0.43% | |
| | | | |
Net investment income | | | 1.96% | | | | 1.86% | | | | 1.67% | | | | 2.07% | | | | 2.69% | |
| | | | |
| | | | | | | | | | | | | | | | | | | | |
| Supplemental Data | | | | | | | | | | | | | | | | | | | | |
Net assets, end of year (000) | | $ | 8,577 | | | $ | 3,019 | | | $ | 3,675 | | | $ | 7,378 | | | $ | 4,309 | |
| | | | |
Portfolio turnover rate of the LifePath Master Portfolio | | | 21% | 7 | | | 14% | 8 | | | 17% | 8 | | | 4% | 9 | | | 4% | 9 |
| | | | |
| | 1 | | Based on average shares outstanding. |
| | 2 | | Distributions for annual periods determined in accordance with federal income tax regulations. |
| | 3 | | Where applicable, assumes the reinvestment of distributions. |
| | 4 | | Includes the LifePath Fund’s share of its corresponding LifePath Master Portfolio’s allocated net expenses and/or net investment income. |
| | 5 | | Includes the LifePath Fund’s share of the LifePath Master Portfolio’s allocated fees waived of 0.30%, 0.33%, 0.30%, 0.30% and 0.29% for the years ended December 31, 2015, December 31, 2014, December 31, 2013, December 31, 2012 and December 31, 2011, respectively. |
| | 6 | | Includes the LifePath Fund’s share of the LifePath Master Portfolio’s allocated expenses and/or net investment income. Excludes expenses incurred indirectly as a result of the LifePath Master Portfolio’s investments in underlying funds as follows: |
| | | | | | | | | | | | | | | | | | | | |
| | | Year Ended December 31, | |
| | | 2015 | | | 2014 | | | 2013 | | | 2012 | | | 2011 | |
| | | | | | | | | | | | | | | | | | | | |
Investments in underlying funds | | | 0.09% | | | | 0.10% | | | | 0.10% | | | | 0.08% | | | | 0.08% | |
| | | | |
| | 7 | | Includes the LifePath Master Portfolio’s purchases and sales of the underlying funds and Active Stock Master Portfolio, CoreAlpha Bond Master Portfolio, International Tilts Master Portfolio, Large Cap Index Master Portfolio and Master Small Cap Index Series. |
| | 8 | | Includes the LifePath Master Portfolio’s purchases and sales of the underlying funds and Active Stock Master Portfolio, CoreAlpha Bond Master Portfolio, International Tilts Master Portfolio, Large Cap Index Master Portfolio, Master Small Cap Index Series and Total International ex U.S. Index Master Portfolio. |
| | 9 | | Excludes the LifePath Master Portfolio’s purchases and sales of the Active Stock Master Portfolio, CoreAlpha Bond Master Portfolio, Master Small Cap Index Series and Total International ex U.S. Index Master Portfolio. If these transactions had been included to conform to the current year presentation, the portfolio turnover rate would have been 13% and 20% for the years ended December 31, 2012 and December 31, 2011, respectively. |
| | | | | | |
| See Notes to Financial Statements. | | | | |
| | | | | | | |
| | BLACKROCK FUNDS III | | DECEMBER 31, 2015 | | 27 |
| | |
| Financial Highlights (concluded) | | BlackRock LifePath Retirement Fund |
| | | | | | | | | | | | | | | | | | | | |
| | | Class R | |
| | | Year Ended December 31, | |
| | | 2015 | | | 2014 | | | 2013 | | | 2012 | | | 2011 | |
| | | | | | | | | | | | | | | | | | | | |
| Per Share Operating Performance | | | | | | | | | | | | | | | | | | | | |
Net asset value, beginning of year | | $ | 11.01 | | | $ | 11.65 | | | $ | 11.75 | | | $ | 11.36 | | | $ | 11.54 | |
| | | | |
Net investment income1 | | | 0.10 | | | | 0.12 | | | | 0.10 | | | | 0.17 | | | | 0.21 | |
Net realized and unrealized gain (loss) | | | (0.33 | ) | | | 0.38 | | | | 0.55 | | | | 0.76 | | | | 0.17 | |
| | | | |
Net increase (decrease) from investment operations | | | (0.23 | ) | | | 0.50 | | | | 0.65 | | | | 0.93 | | | | 0.38 | |
| | | | |
| Distributions:2 | | | | | | | | | | | | | | | | | | | | |
From net investment income | | | (0.15 | ) | | | (0.12 | ) | | | (0.10 | ) | | | (0.19 | ) | | | (0.21 | ) |
From net realized gain | | | (0.36 | ) | | | (1.02 | ) | | | (0.65 | ) | | | (0.35 | ) | | | (0.35 | ) |
From return of capital | | | (0.01 | ) | | | — | | | | — | | | | — | | | | — | |
| | | | |
Total distributions | | | (0.52 | ) | | | (1.14 | ) | | | (0.75 | ) | | | (0.54 | ) | | | (0.56 | ) |
| | | | |
Net asset value, end of year | | $ | 10.26 | | | $ | 11.01 | | | $ | 11.65 | | | $ | 11.75 | | | $ | 11.36 | |
| | | | |
| | | | | | | | | | | | | | | | | | | | |
| Total Return3 | | | | | | | | | | | | | | | | | | | | |
Based on net asset value | | | (2.10)% | | | | 4.25% | | | | 5.61% | | | | 8.26% | | | | 3.32% | |
| | | | |
| | | | | | | | | | | | | | | | | | | | |
| Ratios to Average Net Assets4,5,6 | | | | | | | | | | | | | | | | | | | | |
Total expenses | | | 1.25% | | | | 1.25% | | | | 1.26% | | | | 1.27% | | | | 1.28% | |
| | | | |
Total expenses after fees waived and/or reimbursed | | | 1.19% | | | | 1.25% | | | | 1.25% | | | | 1.26% | | | | 1.27% | |
| | | | |
Net investment income | | | 0.99% | | | | 0.98% | | | | 0.85% | | | | 1.38% | | | | 1.76% | |
| | | | |
| | | | | | | | | | | | | | | | | | | | |
| Supplemental Data | | | | | | | | | | | | | | | | | | | | |
Net assets, end of year (000) | | $ | 656 | | | $ | 895 | | | $ | 2,060 | | | $ | 2,609 | | | $ | 41 | |
| | | | |
Portfolio turnover rate of the LifePath Master Portfolio | | | 21% | 7 | | | 14% | 8 | | | 17% | 8 | | | 4% | 9 | | | 4% | 9 |
| | | | |
| | 1 | | Based on average shares outstanding. |
| | 2 | | Distributions for annual periods determined in accordance with federal income tax regulations. |
| | 3 | | Where applicable, assumes the reinvestment of distributions. |
| | 4 | | Includes the LifePath Fund’s share of its corresponding LifePath Master Portfolio’s allocated net expenses and/or net investment income. |
| | 5 | | Includes the LifePath Fund’s share of the LifePath Master Portfolio’s allocated fees waived of 0.31%, 0.31%, 0.30%, 0.32% and 0.29% for the years ended December 31, 2015, December 31, 2014, December 31, 2013, December 31, 2012 and December 31, 2011, respectively. |
| | 6 | | Includes the LifePath Fund’s share of the LifePath Master Portfolio’s allocated expenses and/or net investment income. Excludes expenses incurred indirectly as a result of the LifePath Master Portfolio’s investments in underlying funds as follows: |
| | | | | | | | | | | | | | | | | | | | |
| | | Year Ended December 31, | |
| | | 2015 | | | 2014 | | | 2013 | | | 2012 | | | 2011 | |
| | | | | | | | | | | | | | | | | | | | |
Investments in underlying funds | | | 0.09% | | | | 0.10% | | | | 0.10% | | | | 0.08% | | | | 0.08% | |
| | | | |
| | 7 | | Includes the LifePath Master Portfolio’s purchases and sales of the underlying funds and Active Stock Master Portfolio, CoreAlpha Bond Master Portfolio, International Tilts Master Portfolio, Large Cap Index Master Portfolio and Master Small Cap Index Series. |
| | 8 | | Includes the LifePath Master Portfolio’s purchases and sales of the underlying funds and Active Stock Master Portfolio, CoreAlpha Bond Master Portfolio, International Tilts Master Portfolio, Large Cap Index Master Portfolio, Master Small Cap Index Series and Total International ex U.S. Index Master Portfolio. |
| | 9 | | Excludes the LifePath Master Portfolio’s purchases and sales of the Active Stock Master Portfolio, CoreAlpha Bond Master Portfolio, Master Small Cap Index Series and Total International ex U.S. Index Master Portfolio. If these transactions had been included to conform to the current year presentation, the portfolio turnover rate would have been 13% and 20% for the years ended December 31, 2012 and December 31, 2011, respectively. |
| | | | | | |
| See Notes to Financial Statements. | | | | |
| | | | | | | |
| 28 | | BLACKROCK FUNDS III | | DECEMBER 31, 2015 | | |
| | |
| Financial Highlights | | BlackRock LifePath 2020 Fund |
| | | | | | | | | | | | | | | | | | | | |
| | | Institutional | |
| | | Year Ended December 31, | |
| | | 2015 | | | 2014 | | | 2013 | | | 2012 | | | 2011 | |
| | | | | | | | | | | | | | | | | | | | |
| Per Share Operating Performance | | | | | | | | | | | | | | | | | | | | |
Net asset value, beginning of year | | $ | 15.65 | | | $ | 16.75 | | | $ | 16.42 | | | $ | 15.22 | | | $ | 15.92 | |
| | | | |
Net investment income1 | | | 0.23 | | | | 0.26 | | | | 0.25 | | | | 0.29 | | | | 0.33 | |
Net realized and unrealized gain (loss) | | | (0.49 | ) | | | 0.58 | | | | 1.32 | | | | 1.38 | | | | (0.09 | ) |
| | | | |
Net increase (decrease) from investment operations | | | (0.26 | ) | | | 0.84 | | | | 1.57 | | | | 1.67 | | | | 0.24 | |
| | | | |
| Distributions:2 | | | | | | | | | | | | | | | | | | | | |
From net investment income | | | (0.27 | ) | | | (0.26 | ) | | | (0.26 | ) | | | (0.29 | ) | | | (0.33 | ) |
From net realized gain | | | (0.89 | ) | | | (1.68 | ) | | | (0.98 | ) | | | (0.18 | ) | | | (0.61 | ) |
From return of capital | | | (0.02 | ) | | | — | | | | — | | | | — | | | | — | |
| | | | |
Total distributions | | | (1.18 | ) | | | (1.94 | ) | | | (1.24 | ) | | | (0.47 | ) | | | (0.94 | ) |
| | | | |
Net asset value, end of year | | $ | 14.21 | | | $ | 15.65 | | | $ | 16.75 | | | $ | 16.42 | | | $ | 15.22 | |
| | | | |
| | | | | | | | | | | | | | | | | | | | |
| Total Return3 | | | | | | | | | | | | | | | | | | | | |
Based on net asset value | | | (1.78)% | | | | 5.06% | | | | 9.67% | | | | 10.99% | | | | 1.46% | |
| | | | |
| | | | | | | | | | | | | | | | | | | | |
| Ratios to Average Net Assets4,5,6 | | | | | | | | | | | | | | | | | | | | |
Total expenses | | | 0.73% | | | | 0.74% | | | | 0.73% | | | | 0.75% | | | | 0.75% | |
| | | | |
Total expenses after fees waived and/or reimbursed | | | 0.73% | | | | 0.74% | | | | 0.73% | | | | 0.75% | | | | 0.74% | |
| | | | |
Net investment income | | | 1.44% | | | | 1.50% | | | | 1.47% | | | | 1.77% | | | | 2.05% | |
| | | | |
| | | | | | | | | | | | | | | | | | | | |
| Supplemental Data | | | | | | | | | | | | | | | | | | | | |
Net assets, end of year (000) | | $ | 259,411 | | | $ | 490,447 | | | $ | 698,251 | | | $ | 688,545 | | | $ | 752,092 | |
| | | | |
Portfolio turnover rate of the LifePath Master Portfolio | | | 18% | 7 | | | 21% | 8 | | | 19% | 8 | | | 5% | 9 | | | 5% | 9 |
| | | | |
| | 1 | | Based on average shares outstanding. |
| | 2 | | Distributions for annual periods determined in accordance with federal income tax regulations. |
| | 3 | | Where applicable, assumes the reinvestment of distributions. |
| | 4 | | Includes the LifePath Fund’s share of its corresponding LifePath Master Portfolio’s allocated net expenses and/or net investment income. |
| | 5 | | Includes the LifePath Fund’s share of the LifePath Master Portfolio’s allocated fees waived of 0.34%, 0.34%, 0.32%, 0.32% and 0.32% for the years ended December 31, 2015, December 31, 2014, December 31, 2013, December 31, 2012 and December 31, 2011, respectively. |
| | 6 | | Includes the LifePath Fund’s share of the LifePath Master Portfolio’s allocated expenses and/or net investment income. Excludes expenses incurred indirectly as a result of the LifePath Master Portfolio’s investments in underlying funds as follows: |
| | | | | | | | | | | | | | | | | | | | |
| | | Year Ended December 31, | |
| | | 2015 | | | 2014 | | | 2013 | | | 2012 | | | 2011 | |
| | | | | | | | | | | | | | | | | | | | |
Investments in underlying funds | | | 0.11% | | | | 0.11% | | | | 0.12% | | | | 0.11% | | | | 0.11% | |
| | | | |
| | 7 | | Includes the LifePath Master Portfolio’s purchases and sales of the underlying funds and Active Stock Master Portfolio, CoreAlpha Bond Master Portfolio, International Tilts Master Portfolio, Large Cap Index Master Portfolio and Master Small Cap Index Series. |
| | 8 | | Includes the LifePath Master Portfolio’s purchases and sales of the underlying funds and Active Stock Master Portfolio, CoreAlpha Bond Master Portfolio, International Tilts Master Portfolio, Large Cap Index Master Portfolio, Master Small Cap Index Series and Total International ex U.S. Index Master Portfolio. |
| | 9 | | Excludes the LifePath Master Portfolio’s purchases and sales of the Active Stock Master Portfolio, CoreAlpha Bond Master Portfolio, Master Small Cap Index Series and Total International ex U.S. Index Master Portfolio. If these transactions had been included to conform to the current year presentation, the portfolio turnover rate would have been 15% and 23% for the years ended December 31, 2012 and December 31, 2011, respectively. |
| | | | | | |
| See Notes to Financial Statements. | | | | |
| | | | | | | |
| | BLACKROCK FUNDS III | | DECEMBER 31, 2015 | | 29 |
| | |
| Financial Highlights (continued) | | BlackRock LifePath 2020 Fund |
| | | | | | | | | | | | | | | | | | | | |
| | | Investor A | |
| | | Year Ended December 31, | |
| | | 2015 | | | 2014 | | | 2013 | | | 2012 | | | 2011 | |
| | | | | | | | | | | | | | | | | | | | |
| Per Share Operating Performance | | | | | | | | | | | | | | | | | | | | |
Net asset value, beginning of year | | $ | 14.61 | | | $ | 15.77 | | | $ | 15.53 | | | $ | 14.43 | | | $ | 15.14 | |
| | | | |
Net investment income1 | | | 0.18 | | | | 0.20 | | | | 0.19 | | | | 0.24 | | | | 0.28 | |
Net realized and unrealized gain (loss) | | | (0.46 | ) | | | 0.55 | | | | 1.25 | | | | 1.30 | | | | (0.09 | ) |
| | | | |
Net increase (decrease) from investment operations | | | (0.28 | ) | | | 0.75 | | | | 1.44 | | | | 1.54 | | | | 0.19 | |
| | | | |
| Distributions:2 | | | | | | | | | | | | | | | | | | | | |
From net investment income | | | (0.24 | ) | | | (0.23 | ) | | | (0.22 | ) | | | (0.26 | ) | | | (0.29 | ) |
From net realized gain | | | (0.89 | ) | | | (1.68 | ) | | | (0.98 | ) | | | (0.18 | ) | | | (0.61 | ) |
From return of capital | | | (0.02 | ) | | | — | | | | — | | | | — | | | | — | |
| | | | |
Total distributions | | | (1.15 | ) | | | (1.91 | ) | | | (1.20 | ) | | | (0.44 | ) | | | (0.90 | ) |
| | | | |
Net asset value, end of year | | $ | 13.18 | | | $ | 14.61 | | | $ | 15.77 | | | $ | 15.53 | | | $ | 14.43 | |
| | | | |
| | | | | | | | | | | | | | | | | | | | |
| Total Return3 | | | | | | | | | | | | | | | | | | | | |
Based on net asset value | | | (2.03)% | | | | 4.79% | | | | 9.39% | | | | 10.67% | | | | 1.26% | |
| | | | |
| | | | | | | | | | | | | | | | | | | | |
| Ratios to Average Net Assets4,5,6 | | | | | | | | | | | | | | | | | | | | |
Total expenses | | | 0.98% | | | | 0.99% | | | | 0.98% | | | | 1.00% | | | | 1.00% | |
| | | | |
Total expenses after fees waived and/or reimbursed | | | 0.98% | | | | 0.98% | | | | 0.98% | | | | 1.00% | | | | 1.00% | |
| | | | |
Net investment income | | | 1.24% | | | | 1.26% | | | | 1.21% | | | | 1.55% | | | | 1.82% | |
| | | | |
| | | | | | | | | | | | | | | | | | | | |
| Supplemental Data | | | | | | | | | | | | | | | | | | | | |
Net assets, end of year (000) | | $ | 297,027 | | | $ | 367,281 | | | $ | 390,380 | | | $ | 410,926 | | | $ | 401,477 | |
| | | | |
Portfolio turnover rate of the LifePath Master Portfolio | | | 18% | 7 | | | 21% | 8 | | | 19% | 8 | | | 5% | 9 | | | 5% | 9 |
| | | | |
| | 1 | | Based on average shares outstanding. |
| | 2 | | Distributions for annual periods determined in accordance with federal income tax regulations. |
| | 3 | | Where applicable, excludes the effects of any sales charges and assumes the reinvestment of distributions. |
| | 4 | | Includes the LifePath Fund’s share of its corresponding LifePath Master Portfolio’s allocated net expenses and/or net investment income. |
| | 5 | | Includes the LifePath Fund’s share of the LifePath Master Portfolio’s allocated fees waived of 0.33%, 0.35%, 0.32%, 0.32% and 0.32% for the years ended December 31, 2015, December 31, 2014, December 31, 2013, December 31, 2012 and December 31, 2011, respectively. |
| | 6 | | Includes the LifePath Fund’s share of the LifePath Master Portfolio’s allocated expenses and/or net investment income. Excludes expenses incurred indirectly as a result of the LifePath Master Portfolio’s investments in underlying funds as follows: |
| | | | | | | | | | | | | | | | | | | | |
| | | Year Ended December 31, | |
| | | 2015 | | | 2014 | | | 2013 | | | 2012 | | | 2011 | |
| | | | | | | | | | | | | | | | | | | | |
Investments in underlying funds | | | 0.11% | | | | 0.11% | | | | 0.12% | | | | 0.11% | | | | 0.11% | |
| | | | |
| | 7 | | Includes the LifePath Master Portfolio’s purchases and sales of the underlying funds and Active Stock Master Portfolio, CoreAlpha Bond Master Portfolio, International Tilts Master Portfolio, Large Cap Index Master Portfolio and Master Small Cap Index Series. |
| | 8 | | Includes the LifePath Master Portfolio’s purchases and sales of the underlying funds and Active Stock Master Portfolio, CoreAlpha Bond Master Portfolio, International Tilts Master Portfolio, Large Cap Index Master Portfolio, Master Small Cap Index Series and Total International ex U.S. Index Master Portfolio. |
| | 9 | | Excludes the LifePath Master Portfolio’s purchases and sales of the Active Stock Master Portfolio, CoreAlpha Bond Master Portfolio, Master Small Cap Index Series and Total International ex U.S. Index Master Portfolio. If these transactions had been included to conform to the current year presentation, the portfolio turnover rate would have been 15% and 23% for the years ended December 31, 2012 and December 31, 2011, respectively. |
| | | | | | |
| See Notes to Financial Statements. | | | | |
| | | | | | | |
| 30 | | BLACKROCK FUNDS III | | DECEMBER 31, 2015 | | |
| | |
| Financial Highlights (continued) | | BlackRock LifePath 2020 Fund |
| | | | | | | | | | | | | | | | | | | | |
| | | Investor C | |
| | | Year Ended December 31, | |
| | | 2015 | | | 2014 | | | 2013 | | | 2012 | | | 2011 | |
| | | | | | | | | | | | | | | | | | | | |
| Per Share Operating Performance | | | | | | | | | | | | | | | | | | | | |
Net asset value, beginning of year | | $ | 15.49 | | | $ | 16.62 | | | $ | 16.32 | | | $ | 15.16 | | | $ | 15.89 | |
| | | | |
Net investment income1 | | | 0.08 | | | | 0.09 | | | | 0.09 | | | | 0.14 | | | | 0.17 | |
Net realized and unrealized gain (loss) | | | (0.50 | ) | | | 0.57 | | | | 1.30 | | | | 1.36 | | | | (0.09 | ) |
| | | | |
Net increase (decrease) from investment operations | | | (0.42 | ) | | | 0.66 | | | | 1.39 | | | | 1.50 | | | | 0.08 | |
| | | | |
| Distributions:2 | | | | | | | | | | | | | | | | | | | | |
From net investment income | | | (0.11 | ) | | | (0.11 | ) | | | (0.11 | ) | | | (0.16 | ) | | | (0.20 | ) |
From net realized gain | | | (0.89 | ) | | | (1.68 | ) | | | (0.98 | ) | | | (0.18 | ) | | | (0.61 | ) |
From return of capital | | | (0.02 | ) | | | — | | | | — | | | | — | | | | — | |
| | | | |
Total distributions | | | (1.02 | ) | | | (1.79 | ) | | | (1.09 | ) | | | (0.34 | ) | | | (0.81 | ) |
| | | | |
Net asset value, end of year | | $ | 14.05 | | | $ | 15.49 | | | $ | 16.62 | | | $ | 16.32 | | | $ | 15.16 | |
| | | | |
| | | | | | | | | | | | | | | | | | | | |
| Total Return3 | | | | | | | | | | | | | | | | | | | | |
Based on net asset value | | | (2.77)% | | | | 3.98% | | | | 8.58% | | | | 9.87% | | | | 0.47% | |
| | | | |
| | | | | | | | | | | | | | | | | | | | |
| Ratios to Average Net Assets4,5,6 | | | | | | | | | | | | | | | | | | | | |
Total expenses | | | 1.74% | | | | 1.74% | | | | 1.73% | | | | 1.75% | | | | 1.75% | |
| | | | |
Total expenses after fees waived and/or reimbursed | | | 1.73% | | | | 1.73% | | | | 1.73% | | | | 1.75% | | | | 1.75% | |
| | | | |
Net investment income | | | 0.49% | | | | 0.54% | | | | 0.51% | | | | 0.87% | | | | 1.05% | |
| | | | |
| | | | | | | | | | | | | | | | | | | | |
| Supplemental Data | | | | | | | | | | | | | | | | | | | | |
Net assets, end of year (000) | | $ | 2,233 | | | $ | 2,981 | | | $ | 2,193 | | | $ | 1,262 | | | $ | 301 | |
| | | | |
Portfolio turnover rate of the LifePath Master Portfolio | | | 18% | 7 | | | 21% | 8 | | | 19% | 8 | | | 5% | 9 | | | 5% | 9 |
| | | | |
| | 1 | | Based on average shares outstanding. |
| | 2 | | Distributions for annual periods determined in accordance with federal income tax regulations. |
| | 3 | | Where applicable, excludes the effects of any sales charges and assumes the reinvestment of distributions. |
| | 4 | | Includes the LifePath Fund’s share of its corresponding LifePath Master Portfolio’s allocated net expenses and/or net investment income. |
| | 5 | | Includes the LifePath Fund’s share of the LifePath Master Portfolio’s allocated fees waived of 0.33%, 0.36%, 0.32%, 0.32% and 0.32% for the years ended December 31, 2015, December 31, 2014, December 31, 2013, December 31, 2012 and December 31, 2011, respectively. |
| | 6 | | Includes the LifePath Fund’s share of the LifePath Master Portfolio’s allocated expenses and/or net investment income. Excludes expenses incurred indirectly as a result of the LifePath Master Portfolio’s investments in underlying funds as follows: |
| | | | | | | | | | | | | | | | | | | | |
| | | Year Ended December 31, | |
| | | 2015 | | | 2014 | | | 2013 | | | 2012 | | | 2011 | |
| | | | | | | | | | | | | | | | | | | | |
Investments in underlying funds | | | 0.11% | | | | 0.11% | | | | 0.12% | | | | 0.11% | | | | 0.11% | |
| | | | |
| | 7 | | Includes the LifePath Master Portfolio’s purchases and sales of the underlying funds and Active Stock Master Portfolio, CoreAlpha Bond Master Portfolio, International Tilts Master Portfolio, Large Cap Index Master Portfolio and Master Small Cap Index Series. |
| | 8 | | Includes the LifePath Master Portfolio’s purchases and sales of the underlying funds and Active Stock Master Portfolio, CoreAlpha Bond Master Portfolio, International Tilts Master Portfolio, Large Cap Index Master Portfolio, Master Small Cap Index Series and Total International ex U.S. Index Master Portfolio. |
| | 9 | | Excludes the LifePath Master Portfolio’s purchases and sales of the Active Stock Master Portfolio, CoreAlpha Bond Master Portfolio, Master Small Cap Index Series and Total International ex U.S. Index Master Portfolio. If these transactions had been included to conform to the current year presentation, the portfolio turnover rate would have been 15% and 23% for the years ended December 31, 2012 and December 31, 2011, respectively. |
| | | | | | |
| See Notes to Financial Statements. | | | | |
| | | | | | | |
| | BLACKROCK FUNDS III | | DECEMBER 31, 2015 | | 31 |
| | |
| Financial Highlights (continued) | | BlackRock LifePath 2020 Fund |
| | | | | | | | | | | | | | | | | | | | |
| | | Class K | |
| | | Year Ended December 31, | |
| | | 2015 | | | 2014 | | | 2013 | | | 2012 | | | 2011 | |
| | | | | | | | | | | | | | | | | | | | |
| Per Share Operating Performance | | | | | | | | | | | | | | | | | | | | |
Net asset value, beginning of year | | $ | 15.61 | | | $ | 16.73 | | | $ | 16.39 | | | $ | 15.20 | | | $ | 15.91 | |
| | | | |
Net investment income1 | | | 0.30 | | | | 0.32 | | | | 0.30 | | | | 0.35 | | | | 0.40 | |
Net realized and unrealized gain (loss) | | | (0.51 | ) | | | 0.57 | | | | 1.33 | | | | 1.37 | | | | (0.12 | ) |
| | | | |
Net increase (decrease) from investment operations | | | (0.21 | ) | | | 0.89 | | | | 1.63 | | | | 1.72 | | | | 0.28 | |
| | | | |
| Distributions:2 | | | | | | | | | | | | | | | | | | | | |
From net investment income | | | (0.33 | ) | | | (0.33 | ) | | | (0.31 | ) | | | (0.35 | ) | | | (0.38 | ) |
From net realized gain | | | (0.89 | ) | | | (1.68 | ) | | | (0.98 | ) | | | (0.18 | ) | | | (0.61 | ) |
From return of capital | | | (0.02 | ) | | | — | | | | — | | | | — | | | | — | |
| | | | |
Total distributions | | | (1.24 | ) | | | (2.01 | ) | | | (1.29 | ) | | | (0.53 | ) | | | (0.99 | ) |
| | | | |
Net asset value, end of year | | $ | 14.16 | | | $ | 15.61 | | | $ | 16.73 | | | $ | 16.39 | | | $ | 15.20 | |
| | | | |
| | | | | | | | | | | | | | | | | | | | |
| Total Return3 | | | | | | | | | | | | | | | | | | | | |
Based on net asset value | | | (1.46)% | | | | 5.35% | | | | 10.11% | | | | 11.36% | | | | 1.78% | |
| | | | |
| | | | | | | | | | | | | | | | | | | | |
| Ratios to Average Net Assets4,5,6 | | | | | | | | | | | | | | | | | | | | |
Total expenses | | | 0.40% | | | | 0.39% | | | | 0.38% | | | | 0.40% | | | | 0.40% | |
| | | | |
Total expenses after fees waived and/or reimbursed | | | 0.40% | | | | 0.38% | | | | 0.37% | | | | 0.40% | | | | 0.40% | |
| | | | |
Net investment income | | | 1.96% | | | | 1.90% | | | | 1.77% | | | | 2.18% | | | | 2.47% | |
| | | | |
| | | | | | | | | | | | | | | | | | | | |
| Supplemental Data | | | | | | | | | | | | | | | | | | | | |
Net assets, end of year (000) | | $ | 18,412 | | | $ | 9,545 | | | $ | 6,500 | | | $ | 11,609 | | | $ | 6,224 | |
| | | | |
Portfolio turnover rate of the LifePath Master Portfolio | | | 18% | 7 | | | 21% | 8 | | | 19% | 8 | | | 5% | 9 | | | 5% | 9 |
| | | | |
| | 1 | | Based on average shares outstanding. |
| | 2 | | Distributions for annual periods determined in accordance with federal income tax regulations. |
| | 3 | | Where applicable, assumes the reinvestment of distributions. |
| | 4 | | Includes the LifePath Fund’s share of its corresponding LifePath Master Portfolio’s allocated net expenses and/or net investment income. |
| | 5 | | Includes the LifePath Fund’s share of the LifePath Master Portfolio’s allocated fees waived of 0.33%, 0.36%, 0.32%, 0.32% and 0.32% for the years ended December 31, 2015, December 31, 2014, December 31, 2013, December 31, 2012 and December 31, 2011, respectively. |
| | 6 | | Includes the LifePath Fund’s share of the LifePath Master Portfolio’s allocated expenses and/or net investment income. Excludes expenses incurred indirectly as a result of the LifePath Master Portfolio’s investments in underlying funds as follows: |
| | | | | | | | | | | | | | | | | | | | |
| | | Year Ended December 31, | |
| | | 2015 | | | 2014 | | | 2013 | | | 2012 | | | 2011 | |
| | | | | | | | | | | | | | | | | | | | |
Investments in underlying funds | | | 0.11% | | | | 0.11% | | | | 0.12% | | | | 0.11% | | | | 0.11% | |
| | | | |
| | 7 | | Includes the LifePath Master Portfolio’s purchases and sales of the underlying funds and Active Stock Master Portfolio, CoreAlpha Bond Master Portfolio, International Tilts Master Portfolio, Large Cap Index Master Portfolio and Master Small Cap Index Series . |
| | 8 | | Includes the LifePath Master Portfolio’s purchases and sales of the underlying funds and Active Stock Master Portfolio, CoreAlpha Bond Master Portfolio, International Tilts Master Portfolio, Large Cap Index Master Portfolio, Master Small Cap Index Series and Total International ex U.S. Index Master Portfolio. |
| | 9 | | Excludes the LifePath Master Portfolio’s purchases and sales of the Active Stock Master Portfolio, CoreAlpha Bond Master Portfolio, Master Small Cap Index Series and Total International ex U.S. Index Master Portfolio. If these transactions had been included to conform to the current year presentation, the portfolio turnover rate would have been 15% and 23% for the years ended December 31, 2012 and December 31, 2011, respectively. |
| | | | | | |
| See Notes to Financial Statements. | | | | |
| | | | | | | |
| 32 | | BLACKROCK FUNDS III | | DECEMBER 31, 2015 | | |
| | |
| Financial Highlights (concluded) | | BlackRock LifePath 2020 Fund |
| | | | | | | | | | | | | | | | | | | | |
| | | Class R | |
| | | Year Ended December 31, | |
| | | 2015 | | | 2014 | | | 2013 | | | 2012 | | | 2011 | |
| | | | | | | | | | | | | | | | | | | | |
| Per Share Operating Performance | | | | | | | | | | | | | | | | | | | | |
Net asset value, beginning of year | | $ | 15.59 | | | $ | 16.70 | | | $ | 16.36 | | | $ | 15.20 | | | $ | 15.88 | |
| | | | |
Net investment income1 | | | 0.16 | | | | 0.17 | | | | 0.16 | | | | 0.25 | | | | 0.24 | |
Net realized and unrealized gain (loss) | | | (0.50 | ) | | | 0.58 | | | | 1.33 | | | | 1.32 | | | | (0.07 | ) |
| | | | |
Net increase (decrease) from investment operations | | | (0.34 | ) | | | 0.75 | | | | 1.49 | | | | 1.57 | | | | 0.17 | |
| | | | |
| Distributions:2 | | | | | | | | | | | | | | | | | | | | |
From net investment income | | | (0.20 | ) | | | (0.18 | ) | | | (0.17 | ) | | | (0.23 | ) | | | (0.24 | ) |
From net realized gain | | | (0.89 | ) | | | (1.68 | ) | | | (0.98 | ) | | | (0.18 | ) | | | (0.61 | ) |
From return of capital | | | (0.02 | ) | | | — | | | | — | | | | — | | | | — | |
| | | | |
Total distributions | | | (1.11 | ) | | | (1.86 | ) | | | (1.15 | ) | | | (0.41 | ) | | | (0.85 | ) |
| | | | |
Net asset value, end of year | | $ | 14.14 | | | $ | 15.59 | | | $ | 16.70 | | | $ | 16.36 | | | $ | 15.20 | |
| | | | |
| | | | | | | | | | | | | | | | | | | | |
| Total Return3 | | | | | | | | | | | | | | | | | | | | |
Based on net asset value | | | (2.25)% | | | | 4.49% | | | | 9.20% | | | | 10.36% | | | | 1.06% | |
| | | | |
| | | | | | | | | | | | | | | | | | | | |
| Ratios to Average Net Assets4,5,6 | | | | | | | | | | | | | | | | | | | | |
Total expenses | | | 1.23% | | | | 1.24% | | | | 1.23% | | | | 1.25% | | | | 1.25% | |
| | | | |
Total expenses after fees waived and/or reimbursed | | | 1.23% | | | | 1.23% | | | | 1.23% | | | | 1.25% | | | | 1.25% | |
| | | | |
Net investment income | | | 1.04% | | | | 1.01% | | | | 0.94% | | | | 1.53% | | | | 1.51% | |
| | | | |
| | | | | | | | | | | | | | | | | | | | |
| Supplemental Data | | | | | | | | | | | | | | | | | | | | |
Net assets, end of year (000) | | $ | 3,457 | | | $ | 2,580 | | | $ | 3,167 | | | $ | 2,862 | | | $ | 161 | |
| | | | |
Portfolio turnover rate of the LifePath Master Portfolio | | | 18% | 7 | | | 21% | 8 | | | 19% | 8 | | | 5% | 9 | | | 5% | 9 |
| | | | |
| | 1 | | Based on average shares outstanding. |
| | 2 | | Distributions for annual periods determined in accordance with federal income tax regulations. |
| | 3 | | Where applicable, assumes the reinvestment of distributions. |
| | 4 | | Includes the LifePath Fund’s share of its corresponding LifePath Master Portfolio’s allocated net expenses and/or net investment income. |
| | 5 | | Includes the LifePath Fund’s share of the LifePath Master Portfolio’s allocated fees waived of 0.33%, 0.35%, 0.32%, 0.33% and 0.32% for the years ended December 31, 2015, December 31, 2014, December 31, 2013, December 31, 2012 and December 31, 2011, respectively. |
| | 6 | | Includes the LifePath Fund’s share of the LifePath Master Portfolio’s allocated expenses and/or net investment income. Excludes expenses incurred indirectly as a result of the LifePath Master Portfolio’s investments in underlying funds as follows: |
| | | | | | | | | | | | | | | | | | | | |
| | | Year Ended December 31, | |
| | | 2015 | | | 2014 | | | 2013 | | | 2012 | | | 2011 | |
| | | | | | | | | | | | | | | | | | | | |
Investments in underlying funds | | | 0.11% | | | | 0.11% | | | | 0.12% | | | | 0.11% | | | | 0.11% | |
| | | | |
| | 7 | | Includes the LifePath Master Portfolio’s purchases and sales of the underlying funds and Active Stock Master Portfolio, CoreAlpha Bond Master Portfolio, International Tilts Master Portfolio, Large Cap Index Master Portfolio and Master Small Cap Index Series. |
| | 8 | | Includes the LifePath Master Portfolio’s purchases and sales of the underlying funds and Active Stock Master Portfolio, CoreAlpha Bond Master Portfolio, International Tilts Master Portfolio, Large Cap Index Master Portfolio, Master Small Cap Index Series and Total International ex U.S. Index Master Portfolio. |
| | 9 | | Excludes the LifePath Master Portfolio’s purchases and sales of the Active Stock Master Portfolio, CoreAlpha Bond Master Portfolio, Master Small Cap Index Series and Total International ex U.S. Index Master Portfolio. If these transactions had been included to conform to the current year presentation, the portfolio turnover rate would have been 15% and 23% for the years ended December 31, 2012 and December 31, 2011, respectively. |
| | | | | | |
| See Notes to Financial Statements. | | | | |
| | | | | | | |
| | BLACKROCK FUNDS III | | DECEMBER 31, 2015 | | 33 |
| | |
| Financial Highlights | | BlackRock LifePath 2030 Fund |
| | | | | | | | | | | | | | | | | | | | |
| | | Institutional | |
| | | Year Ended December 31, | |
| | | 2015 | | | 2014 | | | 2013 | | | 2012 | | | 2011 | |
| | | | | | | | | | | | | | | | | | | | |
| Per Share Operating Performance | | | | | | | | | | | | | | | | | | | | |
Net asset value, beginning of year | | $ | 14.71 | | | $ | 16.01 | | | $ | 15.25 | | | $ | 14.11 | | | $ | 14.63 | |
| | | | |
Net investment income1 | | | 0.22 | | | | 0.24 | | | | 0.26 | | | | 0.28 | | | | 0.28 | |
Net realized and unrealized gain (loss) | | | (0.51 | ) | | | 0.61 | | | | 1.80 | | | | 1.56 | | | | (0.37 | ) |
| | | | |
Net increase (decrease) from investment operations | | | (0.29 | ) | | | 0.85 | | | | 2.06 | | | | 1.84 | | | | (0.09 | ) |
| | | | |
| Distributions:2 | | | | | | | | | | | | | | | | | | | | |
From net investment income | | | (0.25 | ) | | | (0.26 | ) | | | (0.26 | ) | | | (0.28 | ) | | | (0.27 | ) |
From net realized gain | | | (0.96 | ) | | | (1.89 | ) | | | (1.04 | ) | | | (0.42 | ) | | | (0.16 | ) |
From return of capital | | | (0.01 | ) | | | — | | | | — | | | | — | | | | — | |
| | | | |
Total distributions | | | (1.22 | ) | | | (2.15 | ) | | | (1.30 | ) | | | (0.70 | ) | | | (0.43 | ) |
| | | | |
Net asset value, end of year | | $ | 13.20 | | | $ | 14.71 | | | $ | 16.01 | | | $ | 15.25 | | | $ | 14.11 | |
| | | | |
| | | | | | | | | | | | | | | | | | | | |
| Total Return3 | | | | | | | | | | | | | | | | | | | | |
Based on net asset value | | | (2.05)% | | | | 5.32% | | | | 13.66% | | | | 13.09% | | | | (0.63)% | |
| | | | |
| | | | | | | | | | | | | | | | | | | | |
| Ratios to Average Net Assets4,5,6 | | | | | | | | | | | | | | | | | | | | |
Total expenses | | | 0.70% | | | | 0.71% | | | | 0.70% | | | | 0.73% | | | | 0.73% | |
| | | | |
Total expenses after fees waived and/or reimbursed | | | 0.70% | | | | 0.71% | | | | 0.70% | | | | 0.73% | | | | 0.72% | |
| | | | |
Net investment income | | | 1.46% | | | | 1.50% | | | | 1.62% | | | | 1.84% | | | | 1.88% | |
| | | | |
| | | | | | | | | | | | | | | | | | | | |
| Supplemental Data | | | | | | | | | | | | | | | | | | | | |
Net assets, end of year (000) | | $ | 222,491 | | | $ | 449,354 | | | $ | 674,558 | | | $ | 630,131 | | | $ | 642,867 | |
| | | | |
Portfolio turnover rate of the LifePath Master Portfolio | | | 21% | 7 | | | 33% | 8 | | | 22% | 8 | | | 5% | 9 | | | 7% | 9 |
| | | | |
| | 1 | | Based on average shares outstanding. |
| | 2 | | Distributions for annual periods determined in accordance with federal income tax regulations. |
| | 3 | | Where applicable, assumes the reinvestment of distributions. |
| | 4 | | Includes the LifePath Fund’s share of its corresponding LifePath Master Portfolio’s allocated net expenses and/or net investment income. |
| | 5 | | Includes the LifePath Fund’s share of the LifePath Master Portfolio’s allocated fees waived of 0.37%, 0.37%, 0.33%, 0.34% and 0.34% for the years ended December 31, 2015, December 31, 2014, December 31, 2013, December 31, 2012 and December 31, 2011, respectively. |
| | 6 | | Includes the LifePath Fund’s share of the LifePath Master Portfolio’s allocated expenses and/or net investment income. Excludes expenses incurred indirectly as a result of the LifePath Master Portfolio’s investments in underlying funds as follows: |
| | | | | | | | | | | | | | | | | | | | |
| | | Year Ended December 31, | |
| | | 2015 | | | 2014 | | | 2013 | | | 2012 | | | 2011 | |
| | | | | | | | | | | | | | | | | | | | |
Investments in underlying funds | | | 0.14% | | | | 0.14% | | | | 0.15% | | | | 0.13% | | | | 0.13% | |
| | | | |
| | 7 | | Includes the LifePath Master Portfolio’s purchases and sales of the underlying funds and Active Stock Master Portfolio, CoreAlpha Bond Master Portfolio, International Tilts Master Portfolio, Large Cap Index Master Portfolio and Master Small Cap Index Series. |
| | 8 | | Includes the LifePath Master Portfolio’s purchases and sales of the underlying funds and Active Stock Master Portfolio, CoreAlpha Bond Master Portfolio, International Tilts Master Portfolio, Large Cap Index Master Portfolio, Master Small Cap Index Series and Total International ex U.S. Index Master Portfolio. |
| | 9 | | Excludes the LifePath Master Portfolio’s purchases and sales of the Active Stock Master Portfolio, CoreAlpha Bond Master Portfolio, Master Small Cap Index Series and Total International ex U.S. Index Master Portfolio. If these transactions had been included to conform to the current year presentation, the portfolio turnover rate would have been 16% and 20% for the years ended December 31, 2012 and December 31, 2011, respectively. |
| | | | | | |
| See Notes to Financial Statements. | | | | |
| | | | | | | |
| 34 | | BLACKROCK FUNDS III | | DECEMBER 31, 2015 | | |
| | |
| Financial Highlights (continued) | | BlackRock LifePath 2030 Fund |
| | | | | | | | | | | | | | | | | | | | |
| | | Investor A | |
| | | Year Ended December 31, | |
| | | 2015 | | | 2014 | | | 2013 | | | 2012 | | | 2011 | |
| | | | | | | | | | | | | | | | | | | | |
| Per Share Operating Performance | | | | | | | | | | | | | | | | | | | | |
Net asset value, beginning of year | | $ | 14.28 | | | $ | 15.62 | | | $ | 14.90 | | | $ | 13.81 | | | $ | 14.33 | |
| | | | |
Net investment income1 | | | 0.18 | | | | 0.20 | | | | 0.21 | | | | 0.24 | | | | 0.24 | |
Net realized and unrealized gain (loss) | | | (0.49 | ) | | | 0.58 | | | | 1.77 | | | | 1.52 | | | | (0.36 | ) |
| | | | |
Net increase (decrease) from investment operations | | | (0.31 | ) | | | 0.78 | | | | 1.98 | | | | 1.76 | | | | (0.12 | ) |
| | | | |
| Distributions:2 | | | | | | | | | | | | | | | | | | | | |
From net investment income | | | (0.22 | ) | | | (0.23 | ) | | | (0.22 | ) | | | (0.25 | ) | | | (0.24 | ) |
From net realized gain | | | (0.96 | ) | | | (1.89 | ) | | | (1.04 | ) | | | (0.42 | ) | | | (0.16 | ) |
From return of capital | | | (0.01 | ) | | | — | | | | — | | | | — | | | | — | |
| | | | |
Total distributions | | | (1.19 | ) | | | (2.12 | ) | | | (1.26 | ) | | | (0.67 | ) | | | (0.40 | ) |
| | | | |
Net asset value, end of year | | $ | 12.78 | | | $ | 14.28 | | | $ | 15.62 | | | $ | 14.90 | | | $ | 13.81 | |
| | | | |
| | | | | | | | | | | | | | | | | | | | |
| Total Return3 | | | | | | | | | | | | | | | | | | | | |
Based on net asset value | | | (2.25)% | | | | 4.98% | | | | 13.44% | | | | 12.75% | | | | (0.87)% | |
| | | | |
| | | | | | | | | | | | | | | | | | | | |
| Ratios to Average Net Assets4,5,6 | | | | | | | | | | | | | | | | | | | | |
Total expenses | | | 0.95% | | | | 0.96% | | | | 0.95% | | | | 0.98% | | | | 0.98% | |
| | | | |
Total expenses after fees waived and/or reimbursed | | | 0.95% | | | | 0.96% | | | | 0.95% | | | | 0.98% | | | | 0.97% | |
| | | | |
Net investment income | | | 1.28% | | | | 1.28% | | | | 1.36% | | | | 1.62% | | | | 1.65% | |
| | | | |
| | | | | | | | | | | | | | | | | | | | |
| Supplemental Data | | | | | | | | | | | | | | | | | | | | |
Net assets, end of year (000) | | $ | 298,579 | | | $ | 350,201 | | | $ | 356,117 | | | $ | 343,885 | | | $ | 339,249 | |
| | | | |
Portfolio turnover rate of the LifePath Master Portfolio | | | 21% | 7 | | | 33% | 8 | | | 22% | 8 | | | 5% | 9 | | | 7% | 9 |
| | | | |
| | 1 | | Based on average shares outstanding. |
| | 2 | | Distributions for annual periods determined in accordance with federal income tax regulations. |
| | 3 | | Where applicable, excludes the effects of any sales charges and assumes the reinvestment of distributions. |
| | 4 | | Includes the LifePath Fund’s share of its corresponding LifePath Master Portfolio’s allocated net expenses and/or net investment income. |
| | 5 | | Includes the LifePath Fund’s share of the LifePath Master Portfolio’s allocated fees waived of 0.36%, 0.37%, 0.33%, 0.34% and 0.34% for the years ended December 31, 2015, December 31, 2014, December 31, 2013, December 31, 2012 and December 31, 2011, respectively. |
| | 6 | | Includes the LifePath Fund’s share of the LifePath Master Portfolio’s allocated expenses and/or net investment income. Excludes expenses incurred indirectly as a result of the LifePath Master Portfolio’s investments in underlying funds as follows: |
| | | | | | | | | | | | | | | | | | | | |
| | | Year Ended December 31, | |
| | | 2015 | | | 2014 | | | 2013 | | | 2012 | | | 2011 | |
| | | | | | | | | | | | | | | | | | | | |
Investments in underlying funds | | | 0.14% | | | | 0.14% | | | | 0.15% | | | | 0.13% | | | | 0.13% | |
| | | | |
| | 7 | | Includes the LifePath Master Portfolio’s purchases and sales of the underlying funds and Active Stock Master Portfolio, CoreAlpha Bond Master Portfolio, International Tilts Master Portfolio, Large Cap Index Master Portfolio and Master Small Cap Index Series. |
| | 8 | | Includes the LifePath Master Portfolio’s purchases and sales of the underlying funds and Active Stock Master Portfolio, CoreAlpha Bond Master Portfolio, International Tilts Master Portfolio, Large Cap Index Master Portfolio, Master Small Cap Index Series and Total International ex U.S. Index Master Portfolio. |
| | 9 | | Excludes the LifePath Master Portfolio’s purchases and sales of the Active Stock Master Portfolio, CoreAlpha Bond Master Portfolio, Master Small Cap Index Series and Total International ex U.S. Index Master Portfolio. If these transactions had been included to conform to the current year presentation, the portfolio turnover rate would have been 16% and 20% for the years ended December 31, 2012 and December 31, 2011, respectively. |
| | | | | | |
| See Notes to Financial Statements. | | | | |
| | | | | | | |
| | BLACKROCK FUNDS III | | DECEMBER 31, 2015 | | 35 |
| | |
| Financial Highlights (continued) | | BlackRock LifePath 2030 Fund |
| | | | | | | | | | | | | | | | | | | | |
| | | Investor C | |
| | | Year Ended December 31, | |
| | | 2015 | | | 2014 | | | 2013 | | | 2012 | | | 2011 | |
| | | | | | | | | | | | | | | | | | | | |
| Per Share Operating Performance | | | | | | | | | | | | | | | | | | | | |
Net asset value, beginning of year | | $ | 14.52 | | | $ | 15.85 | | | $ | 15.13 | | | $ | 14.05 | | | $ | 14.62 | |
| | | | |
Net investment income1 | | | 0.08 | | | | 0.09 | | | | 0.13 | | | | 0.16 | | | | 0.14 | |
Net realized and unrealized gain (loss) | | | (0.51 | ) | | | 0.58 | | | | 1.76 | | | | 1.51 | | | | (0.38 | ) |
| | | | |
Net increase (decrease) from investment operations | | | (0.43 | ) | | | 0.67 | | | | 1.89 | | | | 1.67 | | | | (0.24 | ) |
| | | | |
| Distributions:2 | | | | | | | | | | | | | | | | | | | | |
From net investment income | | | (0.11 | ) | | | (0.11 | ) | | | (0.13 | ) | | | (0.17 | ) | | | (0.17 | ) |
From net realized gain | | | (0.96 | ) | | | (1.89 | ) | | | (1.04 | ) | | | (0.42 | ) | | | (0.16 | ) |
From return of capital | | | (0.01 | ) | | | — | | | | — | | | | — | | | | — | |
| | | | |
Total distributions | | | (1.08 | ) | | | (2.00 | ) | | | (1.17 | ) | | | (0.59 | ) | | | (0.33 | ) |
| | | | |
Net asset value, end of year | | $ | 13.01 | | | $ | 14.52 | | | $ | 15.85 | | | $ | 15.13 | | | $ | 14.05 | |
| | | | |
| | | | | | | | | | | | | | | | | | | | |
| Total Return3 | | | | | | | | | | | | | | | | | | | | |
Based on net asset value | | | (3.01)% | | | | 4.23% | | | | 12.59% | | | | 11.92% | | | | (1.63)% | |
| | | | |
| | | | | | | | | | | | | | | | | | | | |
| Ratios to Average Net Assets4,5,6 | | | | | | | | | | | | | | | | | | | | |
Total expenses | | | 1.71% | | | | 1.71% | | | | 1.71% | | | | 1.72% | | | | 1.74% | |
| | | | |
Total expenses after fees waived and/or reimbursed | | | 1.71% | | | | 1.71% | | | | 1.71% | | | | 1.72% | | | | 1.74% | |
| | | | |
Net investment income | | | 0.56% | | | | 0.55% | | | | 0.79% | | | | 1.05% | | | | 1.01% | |
| | | | |
| | | | | | | | | | | | | | | | | | | | |
| Supplemental Data | | | | | | | | | | | | | | | | | | | | |
Net assets, end of year (000) | �� | $ | 3,173 | | | $ | 3,053 | | | $ | 2,531 | | | $ | 1,010 | | | $ | 154 | |
| | | | |
Portfolio turnover rate of the LifePath Master Portfolio | | | 21% | 7 | | | 33% | 8 | | | 22% | 8 | | | 5% | 9 | | | 7% | 9 |
| | | | |
| | 1 | | Based on average shares outstanding. |
| | 2 | | Distributions for annual periods determined in accordance with federal income tax regulations. |
| | 3 | | Where applicable, excludes the effects of any sales charges and assumes the reinvestment of distributions. |
| | 4 | | Includes the LifePath Fund’s share of its corresponding LifePath Master Portfolio’s allocated net expenses and/or net investment income. |
| | 5 | | Includes the LifePath Fund’s share of the LifePath Master Portfolio’s allocated fees waived of 0.36%, 0.38%, 0.34%, 0.35% and 0.34% for the years ended December 31, 2015, December 31, 2014, December 31, 2013, December 31, 2012 and December 31, 2011, respectively. |
| | 6 | | Includes the LifePath Fund’s share of the LifePath Master Portfolio’s allocated expenses and/or net investment income. Excludes expenses incurred indirectly as a result of the LifePath Master Portfolio’s investments in underlying funds as follows: |
| | | | | | | | | | | | | | | | | | | | |
| | | Year Ended December 31, | |
| | | 2015 | | | 2014 | | | 2013 | | | 2012 | | | 2011 | |
| | | | | | | | | | | | | | | | | | | | |
Investments in underlying funds | | | 0.14% | | | | 0.14% | | | | 0.15% | | | | 0.13% | | | | 0.13% | |
| | | | |
| | 7 | | Includes the LifePath Master Portfolio’s purchases and sales of the underlying funds and Active Stock Master Portfolio, CoreAlpha Bond Master Portfolio, International Tilts Master Portfolio, Large Cap Index Master Portfolio and Master Small Cap Index Series. |
| | 8 | | Includes the LifePath Master Portfolio’s purchases and sales of the underlying funds and Active Stock Master Portfolio, CoreAlpha Bond Master Portfolio, International Tilts Master Portfolio, Large Cap Index Master Portfolio, Master Small Cap Index Series and Total International ex U.S. Index Master Portfolio. |
| | 9 | | Excludes the LifePath Master Portfolio’s purchases and sales of the Active Stock Master Portfolio, CoreAlpha Bond Master Portfolio, Master Small Cap Index Series and Total International ex U.S. Index Master Portfolio. If these transactions had been included to conform to the current year presentation, the portfolio turnover rate would have been 16% and 20% for the years ended December 31, 2012 and December 31, 2011, respectively. |
| | | | | | |
| See Notes to Financial Statements. | | | | |
| | | | | | | |
| 36 | | BLACKROCK FUNDS III | | DECEMBER 31, 2015 | | |
| | |
| Financial Highlights (continued) | | BlackRock LifePath 2030 Fund |
| | | | | | | | | | | | | | | | | | | | |
| | | Class K | |
| | | Year Ended December 31, | |
| | | 2015 | | | 2014 | | | 2013 | | | 2012 | | | 2011 | |
| | | | | | | | | | | | | | | | | | | | |
| Per Share Operating Performance | | | | | | | | | | | | | | | | | | | | |
Net asset value, beginning of year | | $ | 14.70 | | | $ | 16.01 | | | $ | 15.25 | | | $ | 14.12 | | | $ | 14.63 | |
| | | | |
Net investment income1 | | | 0.29 | | | | 0.31 | | | | 0.31 | | | | 0.34 | | | | 0.35 | |
Net realized and unrealized gain (loss) | | | (0.52 | ) | | | 0.60 | | | | 1.81 | | | | 1.55 | | | | (0.37 | ) |
| | | | |
Net increase (decrease) from investment operations | | | (0.23 | ) | | | 0.91 | | | | 2.12 | | | | 1.89 | | | | (0.02 | ) |
| | | | |
| Distributions:2 | | | | | | | | | | | | | | | | | | | | |
From net investment income | | | (0.31 | ) | | | (0.33 | ) | | | (0.32 | ) | | | (0.34 | ) | | | (0.33 | ) |
From net realized gain | | | (0.96 | ) | | | (1.89 | ) | | | (1.04 | ) | | | (0.42 | ) | | | (0.16 | ) |
From return of capital | | | (0.01 | ) | | | — | | | | — | | | | — | | | | — | |
| | | | |
Total distributions | | | (1.28 | ) | | | (2.22 | ) | | | (1.36 | ) | | | (0.76 | ) | | | (0.49 | ) |
| | | | |
Net asset value, end of year | | $ | 13.19 | | | $ | 14.70 | | | $ | 16.01 | | | $ | 15.25 | | | $ | 14.12 | |
| | | | |
| | | | | | | | | | | | | | | | | | | | |
| Total Return3 | | | | | | | | | | | | | | | | | | | | |
Based on net asset value | | | (1.66)% | | | | 5.66% | | | | 14.05% | | | | 13.43% | | | | (0.20)% | |
| | | | |
| | | | | | | | | | | | | | | | | | | | |
| Ratios to Average Net Assets4,5,6 | | | | | | | | | | | | | | | | | | | | |
Total expenses | | | 0.37% | | | | 0.36% | | | | 0.35% | | | | 0.38% | | | | 0.38% | |
| | | | |
Total expenses after fees waived and/or reimbursed | | | 0.37% | | | | 0.36% | | | | 0.35% | | | | 0.38% | | | | 0.38% | |
| | | | |
Net investment income | | | 2.01% | | | | 1.89% | | | | 1.95% | | | | 2.26% | | | | 2.41% | |
| | | | |
| | | | | | | | | | | | | | | | | | | | |
| Supplemental Data | | | | | | | | | | | | | | | | | | | | |
Net assets, end of year (000) | | $ | 16,171 | | | $ | 9,518 | | | $ | 8,666 | | | $ | 11,077 | | | $ | 6,448 | |
| | | | |
Portfolio turnover rate of the LifePath Master Portfolio | | | 21% | 7 | | | 33% | 8 | | | 22% | 8 | | | 5% | 9 | | | 7% | 9 |
| | | | |
| | 1 | | Based on average shares outstanding. |
| | 2 | | Distributions for annual periods determined in accordance with federal income tax regulations. |
| | 3 | | Where applicable, assumes the reinvestment of distributions. |
| | 4 | | Includes the LifePath Fund’s share of its corresponding LifePath Master Portfolio’s allocated net expenses and/or net investment income. |
| | 5 | | Includes the LifePath Fund’s share of the LifePath Master Portfolio’s allocated fees waived of 0.36%, 0.36%, 0.34%, 0.35% and 0.34% for the years ended December 31, 2015, December 31, 2014, December 31, 2013, December 31, 2012 and December 31, 2011, respectively. |
| | 6 | | Includes the LifePath Fund’s share of the LifePath Master Portfolio’s allocated expenses and/or net investment income. Excludes expenses incurred indirectly as a result of the LifePath Master Portfolio’s investments in underlying funds as follows: |
| | | | | | | | | | | | | | | | | | | | |
| | | Year Ended December 31, | |
| | | 2015 | | | 2014 | | | 2013 | | | 2012 | | | 2011 | |
| | | | | | | | | | | | | | | | | | | | |
Investments in underlying funds | | | 0.14% | | | | 0.14% | | | | 0.15% | | �� | | 0.13% | | | | 0.13% | |
| | | | |
| | 7 | | Includes the LifePath Master Portfolio’s purchases and sales of the underlying funds and Active Stock Master Portfolio, CoreAlpha Bond Master Portfolio, International Tilts Master Portfolio, Large Cap Index Master Portfolio and Master Small Cap Index Series. |
| | 8 | | Includes the LifePath Master Portfolio’s purchases and sales of the underlying funds and Active Stock Master Portfolio, CoreAlpha Bond Master Portfolio, International Tilts Master Portfolio, Large Cap Index Master Portfolio, Master Small Cap Index Series and Total International ex U.S. Index Master Portfolio. |
| | 9 | | Excludes the LifePath Master Portfolio’s purchases and sales of the Active Stock Master Portfolio, CoreAlpha Bond Master Portfolio, Master Small Cap Index Series and Total International ex U.S. Index Master Portfolio. If these transactions had been included to conform to the current year presentation, the portfolio turnover rate would have been 16% and 20% for the years ended December 31, 2012 and December 31, 2011, respectively. |
| | | | | | |
| See Notes to Financial Statements. | | | | |
| | | | | | | |
| | BLACKROCK FUNDS III | | DECEMBER 31, 2015 | | 37 |
| | |
| Financial Highlights (concluded) | | BlackRock LifePath 2030 Fund |
| | | | | | | | | | | | | | | | | | | | |
| | | Class R | |
| | | Year Ended December 31, | |
| | | 2015 | | | 2014 | | | 2013 | | | 2012 | | | 2011 | |
| | | | | | | | | | | | | | | | | | | | |
| Per Share Operating Performance | | | | | | | | | | | | | | | | | | | | |
Net asset value, beginning of year | | $ | 14.60 | | | $ | 15.92 | | | $ | 15.17 | | | $ | 14.08 | | | $ | 14.60 | |
| | | | |
Net investment income1 | | | 0.15 | | | | 0.17 | | | | 0.18 | | | | 0.28 | | | | 0.20 | |
Net realized and unrealized gain (loss) | | | (0.50 | ) | | | 0.59 | | | | 1.80 | | | | 1.47 | | | | (0.36 | ) |
| | | | |
Net increase (decrease) from investment operations | | | (0.35 | ) | | | 0.76 | | | | 1.98 | | | | 1.75 | | | | (0.16 | ) |
| | | | |
| Distributions:2 | | | | | | | | | | | | | | | | | | | | |
From net investment income | | | (0.19 | ) | | | (0.19 | ) | | | (0.19 | ) | | | (0.24 | ) | | | (0.20 | ) |
From net realized gain | | | (0.96 | ) | | | (1.89 | ) | | | (1.04 | ) | | | (0.42 | ) | | | (0.16 | ) |
From return of capital | | | (0.01 | ) | | | — | | | | — | | | | — | | | | — | |
| | | | |
Total distributions | | | (1.16 | ) | | | (2.08 | ) | | | (1.23 | ) | | | (0.66 | ) | | | (0.36 | ) |
| | | | |
Net asset value, end of year | | $ | 13.09 | | | $ | 14.60 | | | $ | 15.92 | | | $ | 15.17 | | | $ | 14.08 | |
| | | | |
| | | | | | | | | | | | | | | | | | | | |
| Total Return3 | | | | | | | | | | | | | | | | | | | | |
Based on net asset value | | | (2.50)% | | | | 4.73% | | | | 13.14% | | | | 12.48% | | | | (1.12)% | |
| | | | |
| | | | | | | | | | | | | | | | | | | | |
| Ratios to Average Net Assets4,5,6 | | | | | | | | | | | | | | | | | | | | |
Total expenses | | | 1.20% | | | | 1.21% | | | | 1.21% | | | | 1.22% | | | | 1.23% | |
| | | | |
Total expenses after fees waived and/or reimbursed | | | 1.20% | | | | 1.21% | | | | 1.21% | | | | 1.22% | | | | 1.23% | |
| | | | |
Net investment income | | | 1.07% | | | | 1.02% | | | | 1.15% | | | | 1.84% | | | | 1.41% | |
| | | | |
| | | | | | | | | | | | | | | | | | | | |
| Supplemental Data | | | | | | | | | | | | | | | | | | | | |
Net assets, end of year (000) | | $ | 3,178 | | | $ | 3,044 | | | $ | 3,155 | | | $ | 2,088 | | | $ | 188 | |
| | | | |
Portfolio turnover rate of the LifePath Master Portfolio | | | 21% | 7 | | | 33% | 8 | | | 22% | 8 | | | 5% | 9 | | | 7% | 9 |
| | | | |
| | 1 | | Based on average shares outstanding. |
| | 2 | | Distributions for annual periods determined in accordance with federal income tax regulations. |
| | 3 | | Where applicable, assumes the reinvestment of distributions. |
| | 4 | | Includes the LifePath Fund’s share of its corresponding LifePath Master Portfolio’s allocated net expenses and/or net investment income. |
| | 5 | | Includes the LifePath Fund’s share of the LifePath Master Portfolio’s allocated fees waived of 0.36%, 0.34%, 0.34%, 0.35% and 0.34% for the years ended December 31, 2015, December 31, 2014, December 31, 2013, December 31, 2012 and December 31, 2011, respectively. |
| | 6 | | Includes the LifePath Fund’s share of the LifePath Master Portfolio’s allocated expenses and/or net investment income. Excludes expenses incurred indirectly as a result of the LifePath Master Portfolio’s investments in underlying funds as follows: |
| | | | | | | | | | | | | | | | | | | | |
| | | Year Ended December 31, | |
| | | 2015 | | | 2014 | | | 2013 | | | 2012 | | | 2011 | |
| | | | | | | | | | | | | | | | | | | | |
Investments in underlying funds | | | 0.14% | | | | 0.14% | | | | 0.15% | | | | 0.13% | | | | 0.13% | |
| | | | |
| | 7 | | Includes the LifePath Master Portfolio’s purchases and sales of the underlying funds and Active Stock Master Portfolio, CoreAlpha Bond Master Portfolio, International Tilts Master Portfolio, Large Cap Index Master Portfolio and Master Small Cap Index Series. |
| | 8 | | Includes the LifePath Master Portfolio’s purchases and sales of the underlying funds and Active Stock Master Portfolio, CoreAlpha Bond Master Portfolio, International Tilts Master Portfolio, Large Cap Index Master Portfolio, Master Small Cap Index Series and Total International ex U.S. Index Master Portfolio. |
| | 9 | | Excludes the LifePath Master Portfolio’s purchases and sales of the Active Stock Master Portfolio, CoreAlpha Bond Master Portfolio, Master Small Cap Index Series and Total International ex U.S. Index Master Portfolio. If these transactions had been included to conform to the current year presentation, the portfolio turnover rate would have been 16% and 20% for the years ended December 31, 2012 and December 31, 2011, respectively. |
| | | | | | |
| See Notes to Financial Statements. | | | | |
| | | | | | | |
| 38 | | BLACKROCK FUNDS III | | DECEMBER 31, 2015 | | |
| | |
| Financial Highlights | | BlackRock LifePath 2040 Fund |
| | | | | | | | | | | | | | | | | | | | |
| | | Institutional | |
| | | Year Ended December 31, | |
| | | 2015 | | | 2014 | | | 2013 | | | 2012 | | | 2011 | |
| | | | | | | | | | | | | | | | | | | | |
| Per Share Operating Performance | | | | | | | | | | | | | | | | | | | | |
Net asset value, beginning of year | | $ | 18.37 | | | $ | 20.06 | | | $ | 18.62 | | | $ | 16.98 | | | $ | 17.78 | |
| | | | |
Net investment income1 | | | 0.27 | | | | 0.31 | | | | 0.35 | | | | 0.35 | | | | 0.31 | |
Net realized and unrealized gain (loss) | | | (0.67 | ) | | | 0.79 | | | | 2.77 | | | | 2.14 | | | | (0.73 | ) |
| | | | |
Net increase (decrease) from investment operations | | | (0.40 | ) | | | 1.10 | | | | 3.12 | | | | 2.49 | | | | (0.42 | ) |
| | | | |
| Distributions:2 | | | | | | | | | | | | | | | | | | | | |
From net investment income | | | (0.30 | ) | | | (0.32 | ) | | | (0.34 | ) | | | (0.36 | ) | | | (0.30 | ) |
From net realized gain | | | (1.43 | ) | | | (2.47 | ) | | | (1.34 | ) | | | (0.49 | ) | | | (0.08 | ) |
| | | | |
Total distributions | | | (1.73 | ) | | | (2.79 | ) | | | (1.68 | ) | | | (0.85 | ) | | | (0.38 | ) |
| | | | |
Net asset value, end of year | | $ | 16.24 | | | $ | 18.37 | | | $ | 20.06 | | | $ | 18.62 | | | $ | 16.98 | |
| | | | |
| | | | | | | | | | | | | | | | | | | | |
| Total Return3 | | | | | | | | | | | | | | | | | | | | |
Based on net asset value | | | (2.29)% | | | | 5.48% | | | | 16.92% | | | | 14.73% | | | | (2.38)% | |
| | | | |
| | | | | | | | | | | | | | | | | | | | |
| Ratios to Average Net Assets4,5,6 | | | | | | | | | | | | | | | | | | | | |
Total expenses | | | 0.67% | | | | 0.69% | | | | 0.69% | | | | 0.71% | | | | 0.71% | |
| | | | |
Total expenses after fees waived and/or reimbursed | | | 0.67% | | | | 0.69% | | | | 0.68% | | | | 0.71% | | | | 0.70% | |
| | | | |
Net investment income | | | 1.46% | | | | 1.51% | | | | 1.75% | | | | 1.91% | | | | 1.73% | |
| | | | |
| | | | | | | | | | | | | | | | | | | | |
| Supplemental Data | | | | | | | | | | | | | | | | | | | | |
Net assets, end of year (000) | | $ | 186,357 | | | $ | 434,049 | | | $ | 615,699 | | | $ | 536,902 | | | $ | 528,655 | |
| | | | |
Portfolio turnover rate of the LifePath Master Portfolio | | | 19% | 7 | | | 42% | 8 | | | 26% | 8 | | | 4% | 9 | | | 8% | 9 |
| | | | |
| | 1 | | Based on average shares outstanding. |
| | 2 | | Distributions for annual periods determined in accordance with federal income tax regulations. |
| | 3 | | Where applicable, assumes the reinvestment of distributions. |
| | 4 | | Includes the LifePath Fund’s share of its corresponding LifePath Master Portfolio’s allocated net expenses and/or net investment income. |
| | 5 | | Includes the LifePath Fund’s share of the LifePath Master Portfolio’s allocated fees waived of 0.39%, 0.39%, 0.35%, 0.36% and 0.35% for the years ended December 31, 2015, December 31, 2014, December 31, 2013, December 31, 2012 and December 31, 2011, respectively. |
| | 6 | | Includes the LifePath Fund’s share of the LifePath Master Portfolio’s allocated expenses and/or net investment income. Excludes expenses incurred indirectly as a result of the LifePath Master Portfolio’s investments in underlying funds as follows: |
| | | | | | | | | | | | | | | | | | | | |
| | | Year Ended December 31, | |
| | | 2015 | | | 2014 | | | 2013 | | | 2012 | | | 2011 | |
| | | | | | | | | | | | | | | | | | | | |
Investments in underlying funds | | | 0.17% | | | | 0.16% | | | | 0.17% | | | | 0.15% | | | | 0.15% | |
| | | | |
| | 7 | | Includes the LifePath Master Portfolio’s purchases and sales of the underlying funds and Active Stock Master Portfolio, CoreAlpha Bond Master Portfolio, International Tilts Master Portfolio, Large Cap Index Master Portfolio and Master Small Cap Index Series. |
| | 8 | | Includes the LifePath Master Portfolio’s purchases and sales of the underlying funds and Active Stock Master Portfolio, CoreAlpha Bond Master Portfolio, International Tilts Master Portfolio, Large Cap Index Master Portfolio, Master Small Cap Index Series and Total International ex U.S. Index Master Portfolio. |
| | 9 | | Excludes the LifePath Master Portfolio’s purchases and sales of the Active Stock Master Portfolio, CoreAlpha Bond Master Portfolio, Master Small Cap Index Series and Total International ex U.S. Index Master Portfolio. If these transactions had been included to conform to the current year presentation, the portfolio turnover rate would have been 14% and 20% for the years ended December 31, 2012 and December 31, 2011, respectively. |
| | | | | | |
| See Notes to Financial Statements. | | | | |
| | | | | | | |
| | BLACKROCK FUNDS III | | DECEMBER 31, 2015 | | 39 |
| | |
| Financial Highlights (continued) | | BlackRock LifePath 2040 Fund |
| | | | | | | | | | | | | | | | | | | | |
| | | Investor A | |
| | | Year Ended December 31, | |
| | | 2015 | | | 2014 | | | 2013 | | | 2012 | | | 2011 | |
| | | | | | | | | | | | | | | | | | | | |
| Per Share Operating Performance | | | | | | | | | | | | | | | | | | | | |
Net asset value, beginning of year | | $ | 17.22 | | | $ | 18.98 | | | $ | 17.69 | | | $ | 16.18 | | | $ | 16.97 | |
| | | | |
Net investment income1 | | | 0.23 | | | | 0.25 | | | | 0.28 | | | | 0.30 | | | | 0.25 | |
Net realized and unrealized gain (loss) | | | (0.65 | ) | | | 0.75 | | | | 2.64 | | | | 2.02 | | | | (0.70 | ) |
| | | | |
Net increase (decrease) from investment operations | | | (0.42 | ) | | | 1.00 | | | | 2.92 | | | | 2.32 | | | | (0.45 | ) |
| | | | |
| Distributions:2 | | | | | | | | | | | | | | | | | | | | |
From net investment income | | | (0.27 | ) | | | (0.29 | ) | | | (0.29 | ) | | | (0.32 | ) | | | (0.26 | ) |
From net realized gain | | | (1.43 | ) | | | (2.47 | ) | | | (1.34 | ) | | | (0.49 | ) | | | (0.08 | ) |
| | | | |
Total distributions | | | (1.70 | ) | | | (2.76 | ) | | | (1.63 | ) | | | (0.81 | ) | | | (0.34 | ) |
| | | | |
Net asset value, end of year | | $ | 15.10 | | | $ | 17.22 | | | $ | 18.98 | | | $ | 17.69 | | | $ | 16.18 | |
| | | | |
| | | | | | | | | | | | | | | | | | | | |
| Total Return3 | | | | | | | | | | | | | | | | | | | | |
Based on net asset value | | | (2.57)% | | | | 5.23% | | | | 16.70% | | | | 14.41% | | | | (2.65)% | |
| | | | |
| | | | | | | | | | | | | �� | | | | | | | |
| Ratios to Average Net Assets4,5,6 | | | | | | | | | | | | | | | | | | | | |
Total expenses | | | 0.93% | | | | 0.94% | | | | 0.94% | | | | 0.96% | | | | 0.96% | |
| | | | |
Total expenses after fees waived and/or reimbursed | | | 0.92% | | | | 0.94% | | | | 0.93% | | | | 0.96% | | | | 0.95% | |
| | | | |
Net investment income | | | 1.31% | | | | 1.30% | | | | 1.48% | | | | 1.69% | | | | 1.50% | |
| | | | |
| | | | | | | | | | | | | | | | | | | | |
| Supplemental Data | | | | | | | | | | | | | | | | | | | | |
Net assets, end of year (000) | | $ | 221,048 | | | $ | 264,312 | | | $ | 262,573 | | | $ | 247,317 | | | $ | 233,427 | |
| | | | |
Portfolio turnover rate of the LifePath Master Portfolio | | | 19% | 7 | | | 42% | 8 | | | 26% | 8 | | | 4% | 9 | | | 8% | 9 |
| | | | |
| | 1 | | Based on average shares outstanding. |
| | 2 | | Distributions for annual periods determined in accordance with federal income tax regulations. |
| | 3 | | Where applicable, excludes the effects of any sales charges and assumes the reinvestment of distributions. |
| | 4 | | Includes the LifePath Fund’s share of its corresponding LifePath Master Portfolio’s allocated net expenses and/or net investment income. |
| | 5 | | Includes the LifePath Fund’s share of the LifePath Master Portfolio’s allocated fees waived of 0.38%, 0.40%, 0.35%, 0.36% and 0.35% for the years ended December 31, 2015, December 31, 2014, December 31, 2013, December 31, 2012 and December 31, 2011, respectively. |
| | 6 | | Includes the LifePath Fund’s share of the LifePath Master Portfolio’s allocated expenses and/or net investment income. Excludes expenses incurred indirectly as a result of the LifePath Master Portfolio’s investments in underlying funds as follows: |
| | | | | | | | | | | | | | | | | | | | |
| | | Year Ended December 31, | |
| | | 2015 | | | 2014 | | | 2013 | | | 2012 | | | 2011 | |
| | | | | | | | | | | | | | | | | | | | |
Investments in underlying funds | | | 0.17% | | | | 0.16% | | | | 0.17% | | | | 0.15% | | | | 0.15% | |
| | | | |
| | 7 | | Includes the LifePath Master Portfolio’s purchases and sales of the underlying funds and Active Stock Master Portfolio, CoreAlpha Bond Master Portfolio, International Tilts Master Portfolio, Large Cap Index Master Portfolio and Master Small Cap Index Series. |
| | 8 | | Includes the LifePath Master Portfolio’s purchases and sales of the underlying funds and Active Stock Master Portfolio, CoreAlpha Bond Master Portfolio, International Tilts Master Portfolio, Large Cap Index Master Portfolio, Master Small Cap Index Series and Total International ex U.S. Index Master Portfolio. |
| | 9 | | Excludes the LifePath Master Portfolio’s purchases and sales of the Active Stock Master Portfolio, CoreAlpha Bond Master Portfolio, Master Small Cap Index Series and Total International ex U.S. Index Master Portfolio. If these transactions had been included to conform to the current year presentation, the portfolio turnover rate would have been 14% and 20% for the years ended December 31, 2012 and December 31, 2011, respectively. |
| | | | | | |
| See Notes to Financial Statements. | | | | |
| | | | | | | |
| 40 | | BLACKROCK FUNDS III | | DECEMBER 31, 2015 | | |
| | |
| Financial Highlights (continued) | | BlackRock LifePath 2040 Fund |
| | | | | | | | | | | | | | | | | | | | |
| | | Investor C | |
| | | Year Ended December 31, | |
| | | 2015 | | | 2014 | | | 2013 | | | 2012 | | | 2011 | |
| | | | | | | | | | | | | | | | | | | | |
| Per Share Operating Performance | | | | | | | | | | | | | | | | | | | | |
Net asset value, beginning of year | | $ | 18.19 | | | $ | 19.89 | | | $ | 18.49 | | | $ | 16.92 | | | $ | 17.77 | |
| | | | |
Net investment income1 | | | 0.11 | | | | 0.11 | | | | 0.17 | | | | 0.21 | | | | 0.13 | |
Net realized and unrealized gain (loss) | | | (0.69 | ) | | | 0.79 | | | | 2.73 | | | | 2.08 | | | | (0.73 | ) |
| | | | |
Net increase (decrease) from investment operations | | | (0.58 | ) | | | 0.90 | | | | 2.90 | | | | 2.29 | | | | (0.60 | ) |
| | | | |
| Distributions:2 | | | | | | | | | | | | | | | | | | | | |
From net investment income | | | (0.13 | ) | | | (0.13 | ) | | | (0.16 | ) | | | (0.23 | ) | | | (0.17 | ) |
From net realized gain | | | (1.43 | ) | | | (2.47 | ) | | | (1.34 | ) | | | (0.49 | ) | | | (0.08 | ) |
| | | | |
Total distributions | | | (1.56 | ) | | | (2.60 | ) | | | (1.50 | ) | | | (0.72 | ) | | | (0.25 | ) |
| | | | |
Net asset value, end of year | | $ | 16.05 | | | $ | 18.19 | | | $ | 19.89 | | | $ | 18.49 | | | $ | 16.92 | |
| | | | |
| | | | | | | | | | | | | | | | | | | | |
| Total Return3 | | | | | | | | | | | | | | | | | | | | |
Based on net asset value | | | (3.28)% | | | | 4.49% | | | | 15.80% | | | | 13.59% | | | | (3.39)% | |
| | | | |
| | | | | | | | | | | | | | | | | | | | |
| Ratios to Average Net Assets4,5,6 | | | | | | | | | | | | | | | | | | | | |
Total expenses | | | 1.68% | | | | 1.69% | | | | 1.69% | | | | 1.71% | | | | 1.72% | |
| | | | |
Total expenses after fees waived and/or reimbursed | | | 1.68% | | | | 1.69% | | | | 1.69% | | | | 1.71% | | | | 1.71% | |
| | | | |
Net investment income | | | 0.61% | | | | 0.55% | | | | 0.85% | | | | 1.12% | | | | 0.72% | |
| | | | |
| | | | | | | | | | | | | | | | | | | | |
| Supplemental Data | | | | | | | | | | | | | | | | | | | | |
Net assets, end of year (000) | | $ | 2,492 | | | $ | 2,277 | | | $ | 1,944 | | | $ | 1,185 | | | $ | 98 | |
| | | | |
Portfolio turnover rate of the LifePath Master Portfolio | | | 19% | 7 | | | 42% | 8 | | | 26% | 8 | | | 4% | 9 | | | 8% | 9 |
| | | | |
| | 1 | | Based on average shares outstanding. |
| | 2 | | Distributions for annual periods determined in accordance with federal income tax regulations. |
| | 3 | | Where applicable, excludes the effects of any sales charges and assumes the reinvestment of distributions. |
| | 4 | | Includes the LifePath Fund’s share of its corresponding LifePath Master Portfolio’s allocated net expenses and/or net investment income. |
| | 5 | | Includes the LifePath Fund’s share of the LifePath Master Portfolio’s allocated fees waived of 0.38%, 0.41%, 0.35%, 0.36% and 0.35% for the years ended December 31, 2015, December 31, 2014, December 31, 2013, December 31, 2012 and December 31, 2011, respectively. |
| | 6 | | Includes the LifePath Fund’s share of the LifePath Master Portfolio’s allocated expenses and/or net investment income. Excludes expenses incurred indirectly as a result of the LifePath Master Portfolio’s investments in underlying funds as follows: |
| | | | | | | | | | | | | | | | | | | | |
| | | Year Ended December 31, | |
| | | 2015 | | | 2014 | | | 2013 | | | 2012 | | | 2011 | |
| | | | | | | | | | | | | | | | | | | | |
Investments in underlying funds | | | 0.17% | | | | 0.16% | | | | 0.17% | | | | 0.15% | | | | 0.15% | |
| | | | |
| | 7 | | Includes the LifePath Master Portfolio’s purchases and sales of the underlying funds and Active Stock Master Portfolio, CoreAlpha Bond Master Portfolio, International Tilts Master Portfolio, Large Cap Index Master Portfolio and Master Small Cap Index Series. |
| | 8 | | Includes the LifePath Master Portfolio’s purchases and sales of the underlying funds and Active Stock Master Portfolio, CoreAlpha Bond Master Portfolio, International Tilts Master Portfolio, Large Cap Index Master Portfolio, Master Small Cap Index Series and Total International ex U.S. Index Master Portfolio. |
| | 9 | | Excludes the LifePath Master Portfolio’s purchases and sales of the Active Stock Master Portfolio, CoreAlpha Bond Master Portfolio, Master Small Cap Index Series and Total International ex U.S. Index Master Portfolio. If these transactions had been included to conform to the current year presentation, the portfolio turnover rate would have been 14% and 20% for the years ended December 31, 2012 and December 31, 2011, respectively. |
| | | | | | |
| See Notes to Financial Statements. | | | | |
| | | | | | | |
| | BLACKROCK FUNDS III | | DECEMBER 31, 2015 | | 41 |
| | |
| Financial Highlights (continued) | | BlackRock LifePath 2040 Fund |
| | | | | | | | | | | | | | | | | | | | |
| | | Class K | |
| | | Year Ended December 31, | |
| | | 2015 | | | 2014 | | | 2013 | | | 2012 | | | 2011 | |
| | | | | | | | | | | | | | | | | | | | |
| Per Share Operating Performance | | | | | | | | | | | | | | | | | | | | |
Net asset value, beginning of year | | $ | 18.47 | | | $ | 20.16 | | | $ | 18.69 | | | $ | 17.05 | | | $ | 17.84 | |
| | | | |
Net investment income1 | | | 0.40 | | | | 0.39 | | | | 0.41 | | | | 0.44 | | | | 0.46 | |
Net realized and unrealized gain (loss) | | | (0.75 | ) | | | 0.79 | | | | 2.81 | | | | 2.12 | | | | (0.80 | ) |
| | | | |
Net increase (decrease) from investment operations | | | (0.35 | ) | | | 1.18 | | | | 3.22 | | | | 2.56 | | | | (0.34 | ) |
| | | | |
| Distributions:2 | | | | | | | | | | | | | | | | | | | | |
From net investment income | | | (0.37 | ) | | | (0.40 | ) | | | (0.41 | ) | | | (0.43 | ) | | | (0.37 | ) |
From net realized gain | | | (1.43 | ) | | | (2.47 | ) | | | (1.34 | ) | | | (0.49 | ) | | | (0.08 | ) |
| | | | |
Total distributions | | | (1.80 | ) | | | (2.87 | ) | | | (1.75 | ) | | | (0.92 | ) | | | (0.45 | ) |
| | | | |
Net asset value, end of year | | $ | 16.32 | | | $ | 18.47 | | | $ | 20.16 | | | $ | 18.69 | | | $ | 17.05 | |
| | | | |
| | | | | | | | | | | | | | | | | | | | |
| Total Return3 | | | | | | | | | | | | | | | | | | | | |
Based on net asset value | | | (1.98)% | | | | 5.85% | | | | 17.41% | | | | 15.08% | | | | (1.95)% | |
| | | | |
| | | | | | | | | | | | | | | | | | | | |
| Ratios to Average Net Assets4,5,6 | | | | | | | | | | | | | | | | | | | | |
Total expenses | | | 0.36% | | | | 0.34% | | | | 0.33% | | | | 0.36% | | | | 0.37% | |
| | | | |
Total expenses after fees waived and/or reimbursed | | | 0.35% | | | | 0.34% | | | | 0.33% | | | | 0.36% | | | | 0.36% | |
| | | | |
Net investment income | | | 2.21% | | | | 1.90% | | | | 2.05% | | | | 2.36% | , | | | 2.60% | |
| | | | |
| | | | | | | | | | | | | | | | | | | | |
| Supplemental Data | | | | | | | | | | | | | | | | | | | | |
Net assets, end of year (000) | | $ | 14,470 | | | $ | 4,980 | | | $ | 5,733 | | | $ | 8,038 | | | $ | 4,749 | |
| | | | |
Portfolio turnover rate of the LifePath Master Portfolio | | | 19% | 7 | | | 42% | 8 | | | 26% | 8 | | | 4% | 9 | | | 8% | 9 |
| | | | |
| | 1 | | Based on average shares outstanding. |
| | 2 | | Distributions for annual periods determined in accordance with federal income tax regulations. |
| | 3 | | Where applicable, assumes the reinvestment of distributions. |
| | 4 | | Includes the LifePath Fund’s share of its corresponding LifePath Master Portfolio’s allocated net expenses and/or net investment income. |
| | 5 | | Includes the LifePath Fund’s share of the LifePath Master Portfolio’s allocated fees waived of 0.38%, 0.40%, 0.35%, 0.36% and 0.35% for the years ended December 31, 2015, December 31, 2014, December 31, 2013, December 31, 2012 and December 31, 2011, respectively. |
| | 6 | | Includes the LifePath Fund’s share of the LifePath Master Portfolio’s allocated expenses and/or net investment income. Excludes expenses incurred indirectly as a result of the LifePath Master Portfolio’s investments in underlying funds as follows: |
| | | | | | | | | | | | | | | | | | | | |
| | | Year Ended December 31, | |
| | | 2015 | | | 2014 | | | 2013 | | | 2012 | | | 2011 | |
| | | | | | | | | | | | | | | | | | | | |
Investments in underlying funds | | | 0.17% | | | | 0.16% | | | | 0.17% | | | | 0.15% | | | | 0.15% | |
| | | | |
| | 7 | | Includes the LifePath Master Portfolio’s purchases and sales of the underlying funds and Active Stock Master Portfolio, CoreAlpha Bond Master Portfolio, International Tilts Master Portfolio, Large Cap Index Master Portfolio and Master Small Cap Index Series. |
| | 8 | | Includes the LifePath Master Portfolio’s purchases and sales of the underlying funds and Active Stock Master Portfolio, CoreAlpha Bond Master Portfolio, International Tilts Master Portfolio, Large Cap Index Master Portfolio, Master Small Cap Index Series and Total International ex U.S. Index Master Portfolio. |
| | 9 | | Excludes the LifePath Master Portfolio’s purchases and sales of the Active Stock Master Portfolio, CoreAlpha Bond Master Portfolio, Master Small Cap Index Series and Total International ex U.S. Index Master Portfolio. If these transactions had been included to conform to the current year presentation, the portfolio turnover rate would have been 14% and 20% for the years ended December 31, 2012 and December 31, 2011, respectively. |
| | | | | | |
| See Notes to Financial Statements. | | | | |
| | | | | | | |
| 42 | | BLACKROCK FUNDS III | | DECEMBER 31, 2015 | | |
| | |
| Financial Highlights (concluded) | | BlackRock LifePath 2040 Fund |
| | | | | | | | | | | | | | | | | | | | |
| | | Class R | |
| | | Year Ended December 31, | |
| | | 2015 | | | 2014 | | | 2013 | | | 2012 | | | 2011 | |
| | | | | | | | | | | | | | | | | | | | |
| Per Share Operating Performance | | | | | | | | | | | | | | | | | | | | |
Net asset value, beginning of year | | $ | 18.29 | | | $ | 19.98 | | | $ | 18.54 | | | $ | 16.93 | | | $ | 17.74 | |
| | | | |
Net investment income1 | | | 0.21 | | | | 0.20 | | | | 0.22 | | | | 0.34 | | | | 0.23 | |
Net realized and unrealized gain (loss) | | | (0.69 | ) | | | 0.80 | | | | 2.78 | | | | 2.05 | | | | (0.74 | ) |
| | | | |
Net increase (decrease) from investment operations | | | (0.48 | ) | | | 1.00 | | | | 3.00 | | | | 2.39 | | | | (0.51 | ) |
| | | | |
| Distributions:2 | | | | | | | | | | | | | | | | | | | | |
From net investment income | | | (0.23 | ) | | | (0.22 | ) | | | (0.22 | ) | | | (0.29 | ) | | | (0.22 | ) |
From net realized gain | | | (1.43 | ) | | | (2.47 | ) | | | (1.34 | ) | | | (0.49 | ) | | | (0.08 | ) |
| | | | |
Total distributions | | | (1.66 | ) | | | (2.69 | ) | | | (1.56 | ) | | | (0.78 | ) | | | (0.30 | ) |
| | | | |
Net asset value, end of year | | $ | 16.15 | | | $ | 18.29 | | | $ | 19.98 | | | $ | 18.54 | | | $ | 16.93 | |
| | | | |
| | | | | | | | | | | | | | | | | | | | |
| Total Return3 | | | | | | | | | | | | | | | | | | | | |
Based on net asset value | | | (2.75)% | | | | 4.96% | | | | 16.33% | | | | 14.19% | | | | (2.88)% | |
| | | | |
| | | | | | | | | | | | | | | | | | | | |
| Ratios to Average Net Assets4,5,6 | | | | | | | | | | | | | | | | | | | | |
Total expenses | | | 1.17% | | | | 1.19% | | | | 1.19% | | | | 1.21% | | | | 1.22% | |
| | | | |
Total expenses after fees waived and/or reimbursed | | | 1.17% | | | | 1.19% | | | | 1.18% | | | | 1.21% | | | | 1.22% | |
| | | | |
Net investment income | | | 1.13% | | | | 1.01% | | | | 1.12% | | | | 1.83% | | | | 1.35% | |
| | | | |
| | | | | | | | | | | | | | | | | | | | |
| Supplemental Data | | | | | | | | | | | | | | | | | | | | |
Net assets, end of year (000) | | $ | 1,389 | | | $ | 1,162 | | | $ | 1,438 | | | $ | 1,917 | | | $ | 460 | |
| | | | |
Portfolio turnover rate of the LifePath Master Portfolio | | | 19% | 7 | | | 42% | 8 | | | 26% | 8 | | | 4% | 9 | | | 8% | 9 |
| | | | |
| | 1 | | Based on average shares outstanding. |
| | 2 | | Distributions for annual periods determined in accordance with federal income tax regulations. |
| | 3 | | Where applicable, assumes the reinvestment of distributions. |
| | 4 | | Includes the LifePath Fund’s share of its corresponding LifePath Master Portfolio’s allocated net expenses and/or net investment income. |
| | 5 | | Includes the LifePath Fund’s share of the LifePath Master Portfolio’s allocated fees waived of 0.38%, 0.39%, 0.35%, 0.37% and 0.35% for the years ended December 31, 2015, December 31, 2014, December 31, 2013, December 31, 2012 and December 31, 2011, respectively. |
| | 6 | | Includes the LifePath Fund’s share of the LifePath Master Portfolio’s allocated expenses and/or net investment income. Excludes expenses incurred indirectly as a result of the LifePath Master Portfolio’s investments in underlying funds as follows: |
| | | | | | | | | | | | | | | | | | | | |
| | | Year Ended December 31, | |
| | | 2015 | | | 2014 | | | 2013 | | | 2012 | | | 2011 | |
| | | | | | | | | | | | | | | | | | | | |
Investments in underlying funds | | | 0.17% | | | | 0.16% | | | | 0.17% | | | | 0.15% | | | | 0.15% | |
| | | | |
| | 7 | | Includes the LifePath Master Portfolio’s purchases and sales of the underlying funds and Active Stock Master Portfolio, CoreAlpha Bond Master Portfolio, International Tilts Master Portfolio, Large Cap Index Master Portfolio and Master Small Cap Index Series. |
| | 8 | | Includes the LifePath Master Portfolio’s purchases and sales of the underlying funds and Active Stock Master Portfolio, CoreAlpha Bond Master Portfolio, International Tilts Master Portfolio, Large Cap Index Master Portfolio, Master Small Cap Index Series and Total International ex U.S. Index Master Portfolio. |
| | 9 | | Excludes the LifePath Master Portfolio’s purchases and sales of the Active Stock Master Portfolio, CoreAlpha Bond Master Portfolio, Master Small Cap Index Series and Total International ex U.S. Index Master Portfolio. If these transactions had been included to conform to the current year presentation, the portfolio turnover rate would have been 14% and 20% for the years ended December 31, 2012 and December 31, 2011, respectively. |
| | | | | | |
| See Notes to Financial Statements. | | | | |
| | | | | | | |
| | BLACKROCK FUNDS III | | DECEMBER 31, 2015 | | 43 |
| | |
| Financial Highlights | | BlackRock LifePath 2050 Fund |
| | | | | | | | | | | | | | | | | | | | |
| | | Institutional | |
| | | Year Ended December 31, | |
| | | 2015 | | | 2014 | | | 2013 | | | 2012 | | | 2011 | |
| | | | | | | | | | | | | | | | | | | | |
| Per Share Operating Performance | | | | | | | | | | | | | | | | | | | | |
Net asset value, beginning of year | | $ | 19.59 | | | $ | 21.37 | | | $ | 19.18 | | | $ | 17.16 | | | $ | 18.58 | |
| | | | |
Net investment income1 | | | 0.28 | | | | 0.33 | | | | 0.41 | | | | 0.37 | | | | 0.31 | |
Net realized and unrealized gain (loss) | | | (0.74 | ) | | | 0.89 | | | | 3.36 | | | | 2.37 | | | | (0.99 | ) |
| | | | |
Net increase (decrease) from investment operations | | | (0.46 | ) | | | 1.22 | | | | 3.77 | | | | 2.74 | | | | (0.68 | ) |
| | | | |
| Distributions:2 | | | | | | | | | | | | | | | | | | | | |
From net investment income | | | (0.30 | ) | | | (0.34 | ) | | | (0.39 | ) | | | (0.37 | ) | | | (0.29 | ) |
From net realized gain | | | (1.30 | ) | | | (2.66 | ) | | | (1.19 | ) | | | (0.35 | ) | | | (0.45 | ) |
| | | | |
Total distributions | | | (1.60 | ) | | | (3.00 | ) | | | (1.58 | ) | | | (0.72 | ) | | | (0.74 | ) |
| | | | |
Net asset value, end of year | | $ | 17.53 | | | $ | 19.59 | | | $ | 21.37 | | | $ | 19.18 | | | $ | 17.16 | |
| | | | |
| | | | | | | | | | | | | | | | | | | | |
| Total Return3 | | | | | | | | | | | | | | | | | | | | |
Based on net asset value | | | (2.46)% | | | | 5.73% | | | | 19.82% | | | | 16.05% | | | | (3.78)% | |
| | | | |
| | | | | | | | | | | | | | | | | | | | |
| Ratios to Average Net Assets4,5,6 | | | | | | | | | | | | | | | | | | | | |
Total expenses | | | 0.66% | | | | 0.68% | | | | 0.71% | | | | 0.72% | | | | 0.71% | |
| | | | |
Total expenses after fees waived and/or reimbursed | | | 0.65% | | | | 0.67% | | | | 0.70% | | | | 0.71% | | | | 0.68% | |
| | | | |
Net investment income | | | 1.42% | | | | 1.51% | | | | 1.97% | | | | 1.99% | | | | 1.69% | |
| | | | |
| | | | | | | | | | | | | | | | | | | | |
| Supplemental Data | | | | | | | | | | | | | | | | | | | | |
Net assets, end of year (000) | | $ | 40,444 | | | $ | 108,741 | | | $ | 166,385 | | | $ | 106,813 | | | $ | 70,555 | |
| | | | |
Portfolio turnover rate of the LifePath Master Portfolio | | | 36% | 7 | | | 48% | 8 | | | 28% | 8 | | | 5% | 9 | | | 13% | 9 |
| | | | |
| | 1 | | Based on average shares outstanding. |
| | 2 | | Distributions for annual periods determined in accordance with federal income tax regulations. |
| | 3 | | Where applicable, assumes the reinvestment of distributions. |
| | 4 | | Includes the LifePath Fund’s share of its corresponding LifePath Master Portfolio’s allocated net expenses and/or net investment income. |
| | 5 | | Includes the LifePath Fund’s share of the LifePath Master Portfolio’s allocated fees waived of 0.42%, 0.41%, 0.36%, 0.39% and 0.40% for the years ended December 31, 2015, December 31, 2014, December 31, 2013, December 31, 2012 and December 31, 2011, respectively. |
| | 6 | | Includes the LifePath Fund’s share of the LifePath Master Portfolio’s allocated expenses and/or net investment income. Excludes expenses incurred indirectly as a result of the LifePath Master Portfolio’s investments in underlying funds as follows: |
| | | | | | | | | | | | | | | | | | | | |
| | | Year Ended December 31, | |
| | | 2015 | | | 2014 | | | 2013 | | | 2012 | | | 2011 | |
| | | | | | | | | | | | | | | | | | | | |
Investments in underlying funds | | | 0.19% | | | | 0.17% | | | | 0.15% | | | | 0.15% | | | | 0.17% | |
| | | | |
| | 7 | | Includes the LifePath Master Portfolio’s purchases and sales of the underlying funds and Active Stock Master Portfolio, CoreAlpha Bond Master Portfolio, International Tilts Master Portfolio, Large Cap Index Master Portfolio and Master Small Cap Index Series. |
| | 8 | | Includes the LifePath Master Portfolio’s purchases and sales of the underlying funds and Active Stock Master Portfolio, CoreAlpha Bond Master Portfolio, International Tilts Master Portfolio, Large Cap Index Master Portfolio, Master Small Cap Index Series and Total International ex U.S. Index Master Portfolio. |
| | 9 | | Excludes the LifePath Master Portfolio’s purchases and sales of the Active Stock Master Portfolio, CoreAlpha Bond Master Portfolio, Master Small Cap Index Series and Total International ex U.S. Index Master Portfolio. If these transactions had been included to conform to the current year presentation, the portfolio turnover rate would have been 15% and 19% for the years ended December 31, 2012 and December 31, 2011, respectively. |
| | | | | | |
| See Notes to Financial Statements. | | | | |
| | | | | | | |
| 44 | | BLACKROCK FUNDS III | | DECEMBER 31, 2015 | | |
| | |
| Financial Highlights (continued) | | BlackRock LifePath 2050 Fund |
| | | | | | | | | | | | | | | | | | | | |
| | | Investor A | |
| | | Year Ended December 31, | |
| | | 2015 | | | 2014 | | | 2013 | | | 2012 | | | 2011 | |
| | | | | | | | | | | | | | | | | | | | |
| Per Share Operating Performance | | | | | | | | | | | | | | | | | | | | |
Net asset value, beginning of year | | $ | 19.56 | | | $ | 21.35 | | | $ | 19.17 | | | $ | 17.15 | | | $ | 18.58 | |
| | | | |
Net investment income1 | | | 0.27 | | | | 0.28 | | | | 0.35 | | | | 0.33 | | | | 0.26 | |
Net realized and unrealized gain (loss) | | | (0.77 | ) | | | 0.89 | | | | 3.36 | | | | 2.36 | | | | (0.99 | ) |
| | | | |
Net increase (decrease) from investment operations | | | (0.50 | ) | | | 1.17 | | | | 3.71 | | | | 2.69 | | | | (0.73 | ) |
| | | | |
| Distributions:2 | | | | | | | | | | | | | | | | | | | | |
From net investment income | | | (0.27 | ) | | | (0.30 | ) | | | (0.34 | ) | | | (0.32 | ) | | | (0.25 | ) |
From net realized gain | | | (1.30 | ) | | | (2.66 | ) | | | (1.19 | ) | | | (0.35 | ) | | | (0.45 | ) |
| | | | |
Total distributions | | | (1.57 | ) | | | (2.96 | ) | | | (1.53 | ) | | | (0.67 | ) | | | (0.70 | ) |
| | | | |
Net asset value, end of year | | $ | 17.49 | | | $ | 19.56 | | | $ | 21.35 | | | $ | 19.17 | | | $ | 17.15 | |
| | | | |
| | | | | | | | | | | | | | | | | | | | |
| Total Return3 | | | | | | | | | | | | | | | | | | | | |
Based on net asset value | | | (2.65)% | | | | 5.47% | | | | 19.48% | | | | 15.80% | | | | (4.06)% | |
| | | | |
| | | | | | | | | | | | | | | | | | | | |
| Ratios to Average Net Assets4,5,6 | | | | | | | | | | | | | | | | | | | | |
Total expenses | | | 0.92% | | | | 0.93% | | | | 0.96% | | | | 0.97% | | | | 0.96% | |
| | | | |
Total expenses after fees waived and/or reimbursed | | | 0.91% | | | | 0.92% | | | | 0.95% | | | | 0.96% | | | | 0.94% | |
| | | | |
Net investment income | | | 1.38% | | | | 1.30% | | | | 1.67% | | | | 1.77% | | | | 1.44% | |
| | | | |
| | | | | | | | | | | | | | | | | | | | |
| Supplemental Data | | | | | | | | | | | | | | | | | | | | |
Net assets, end of year (000) | | $ | 70,473 | | | $ | 70,442 | | | $ | 62,891 | | | $ | 46,189 | | | $ | 32,617 | |
| | | | |
Portfolio turnover rate of the LifePath Master Portfolio | | | 36% | 7 | | | 48% | 8 | | | 28% | 8 | | | 5% | 9 | | | 13% | 9 |
| | | | |
| | 1 | | Based on average shares outstanding. |
| | 2 | | Distributions for annual periods determined in accordance with federal income tax regulations. |
| | 3 | | Where applicable, excludes the effects of any sales charges and assumes the reinvestment of distributions. |
| | 4 | | Includes the LifePath Fund’s share of its corresponding LifePath Master Portfolio’s allocated net expenses and/or net investment income. |
| | 5 | | Includes the LifePath Fund’s share of the LifePath Master Portfolio’s allocated fees waived of 0.40%, 0.42%, 0.36%, 0.39% and 0.40% for the years ended December 31, 2015, December 31, 2014, December 31, 2013, December 31, 2012 and December 31, 2011, respectively. |
| | 6 | | Includes the LifePath Fund’s share of the LifePath Master Portfolio’s allocated expenses and/or net investment income. Excludes expenses incurred indirectly as a result of the LifePath Master Portfolio’s investments in underlying funds as follows: |
| | | | | | | | | | | | | | | | | | | | |
| | | Year Ended December 31, | |
| | | 2015 | | | 2014 | | | 2013 | | | 2012 | | | 2011 | |
| | | | | | | | | | | | | | | | | | | | |
Investments in underlying funds | | | 0.19% | | | | 0.17% | | | | 0.15% | | | | 0.15% | | | | 0.17% | |
| | | | |
| | 7 | | Includes the LifePath Master Portfolio’s purchases and sales of the underlying funds and Active Stock Master Portfolio, CoreAlpha Bond Master Portfolio, International Tilts Master Portfolio, Large Cap Index Master Portfolio and Master Small Cap Index Series. |
| | 8 | | Includes the LifePath Master Portfolio’s purchases and sales of the underlying funds and Active Stock Master Portfolio, CoreAlpha Bond Master Portfolio, International Tilts Master Portfolio, Large Cap Index Master Portfolio, Master Small Cap Index Series and Total International ex U.S. Index Master Portfolio. |
| | 9 | | Excludes the LifePath Master Portfolio’s purchases and sales of the Active Stock Master Portfolio, CoreAlpha Bond Master Portfolio, Master Small Cap Index Series and Total International ex U.S. Index Master Portfolio. If these transactions had been included to conform to the current year presentation, the portfolio turnover rate would have been 15% and 19% for the years ended December 31, 2012 and December 31, 2011, respectively. |
| | | | | | |
| See Notes to Financial Statements. | | | | |
| | | | | | | |
| | BLACKROCK FUNDS III | | DECEMBER 31, 2015 | | 45 |
| | |
| Financial Highlights (continued) | | BlackRock LifePath 2050 Fund |
| | | | | | | | | | | | | | | | | | | | |
| | | Investor C | |
| | | Year Ended December 31, | |
| | | 2015 | | | 2014 | | | 2013 | | | 2012 | | | 2011 | |
| | | | | | | | | | | | | | | | | | | | |
| Per Share Operating Performance | | | | | | | | | | | | | | | | | | | | |
Net asset value, beginning of year | | $ | 19.43 | | | $ | 21.23 | | | $ | 19.10 | | | $ | 17.10 | | | $ | 18.57 | |
| | | | |
Net investment income1 | | | 0.13 | | | | 0.12 | | | | 0.24 | | | | 0.17 | | | | 0.12 | |
Net realized and unrealized gain (loss) | | | (0.77 | ) | | | 0.87 | | | | 3.30 | | | | 2.37 | | | | (0.99 | ) |
| | | | |
Net increase (decrease) from investment operations | | | (0.64 | ) | | | 0.99 | | | | 3.54 | | | | 2.54 | | | | (0.87 | ) |
| | | | |
| Distributions:2 | | | | | | | | | | | | | | | | | | | | |
From net investment income | | | (0.14 | ) | | | (0.13 | ) | | | (0.22 | ) | | | (0.19 | ) | | | (0.15 | ) |
From net realized gain | | | (1.30 | ) | | | (2.66 | ) | | | (1.19 | ) | | | (0.35 | ) | | | (0.45 | ) |
| | | | |
Total distributions | | | (1.44 | ) | | | (2.79 | ) | | | (1.41 | ) | | | (0.54 | ) | | | (0.60 | ) |
| | | | |
Net asset value, end of year | | $ | 17.35 | | | $ | 19.43 | | | $ | 21.23 | | | $ | 19.10 | | | $ | 17.10 | |
| | | | |
| | | | | | | | | | | | | | | | | | | | |
| Total Return3 | | | | | | | | | | | | | | | | | | | | |
Based on net asset value | | | (3.41)% | | | | 4.67% | | | | 18.60% | | | | 14.93% | | | | (4.76)% | |
| | | | |
| | | | | | | | | | | | | | | | | | | | |
| Ratios to Average Net Assets4,5,6 | | | | | | | | | | | | | | | | | | | | |
Total expenses | | | 1.68% | | | | 1.69% | | | | 1.72% | | | | 1.72% | | | | 1.71% | |
| | | | |
Total expenses after fees waived and/or reimbursed | | | 1.67% | | | | 1.68% | | | | 1.71% | | | | 1.70% | | | | 1.69% | |
| | | | |
Net investment income | | | 0.66% | | | | 0.55% | | | | 1.14% | | | | 0.91% | | | | 0.63% | |
| | | | |
| | | | | | | | | | | | | | | | | | | | |
| Supplemental Data | | | | | | | | | | | | | | | | | | | | |
Net assets, end of year (000) | | $ | 717 | | | $ | 605 | | | $ | 553 | | | $ | 118 | | | $ | 39 | |
| | | | |
Portfolio turnover rate of the LifePath Master Portfolio | | | 36% | 7 | | | 48% | 8 | | | 28% | 8 | | | 5% | 9 | | | 13% | 9 |
| | | | |
| | 1 | | Based on average shares outstanding. |
| | 2 | | Distributions for annual periods determined in accordance with federal income tax regulations. |
| | 3 | | Where applicable, excludes the effects of any sales charges and assumes the reinvestment of distributions. |
| | 4 | | Includes the LifePath Fund’s share of its corresponding LifePath Master Portfolio’s allocated net expenses and/or net investment income. |
| | 5 | | Includes the LifePath Fund’s share of the LifePath Master Portfolio’s allocated fees waived of 0.40%, 0.42%, 0.36%, 0.39% and 0.40% for the years ended December 31, 2015, December 31, 2014, December 31, 2013, December 31, 2012 and December 31, 2011, respectively. |
| | 6 | | Includes the LifePath Fund’s share of the LifePath Master Portfolio’s allocated expenses and/or net investment income. Excludes expenses incurred indirectly as a result of the LifePath Master Portfolio’s investments in underlying funds as follows: |
| | | | | | | | | | | | | | | | | | | | |
| | | Year Ended December 31, | |
| | | 2015 | | | 2014 | | | 2013 | | | 2012 | | | 2011 | |
| | | | | | | | | | | | | | | | | | | | |
Investments in underlying funds | | | 0.19% | | | | 0.17% | | | | 0.15% | | | | 0.15% | | | | 0.17% | |
| | | | |
| | 7 | | Includes the LifePath Master Portfolio’s purchases and sales of the underlying funds and Active Stock Master Portfolio, CoreAlpha Bond Master Portfolio, International Tilts Master Portfolio, Large Cap Index Master Portfolio and Master Small Cap Index Series. |
| | 8 | | Includes the LifePath Master Portfolio’s purchases and sales of the underlying funds and Active Stock Master Portfolio, CoreAlpha Bond Master Portfolio, International Tilts Master Portfolio, Large Cap Index Master Portfolio, Master Small Cap Index Series and Total International ex U.S. Index Master Portfolio. |
| | 9 | | Excludes the LifePath Master Portfolio’s purchases and sales of the Active Stock Master Portfolio, CoreAlpha Bond Master Portfolio, Master Small Cap Index Series and Total International ex U.S. Index Master Portfolio. If these transactions had been included to conform to the current year presentation, the portfolio turnover rate would have been 15% and 19% for the years ended December 31, 2012 and December 31, 2011, respectively. |
| | | | | | |
| See Notes to Financial Statements. | | | | |
| | | | | | | |
| 46 | | BLACKROCK FUNDS III | | DECEMBER 31, 2015 | | |
| | |
| Financial Highlights (continued) | | BlackRock LifePath 2050 Fund |
| | | | | | | | | | | | | | | | | | | | |
| | | Class K | |
| | | Year Ended December 31, | |
| | | 2015 | | | 2014 | | | 2013 | | | 2012 | | | 2011 | |
| | | | | | | | | | | | | | | | | | | | |
| Per Share Operating Performance | | | | | | | | | | | | | | | | | | | | |
Net asset value, beginning of year | | $ | 19.66 | | | $ | 21.44 | | | $ | 19.24 | | | $ | 17.20 | | | $ | 18.63 | |
| | | | |
Net investment income1 | | | 0.39 | | | | 0.42 | | | | 0.46 | | | | 0.45 | | | | 0.47 | |
Net realized and unrealized gain (loss) | | | (0.78 | ) | | | 0.89 | | | | 3.39 | | | | 2.37 | | | | (1.10 | ) |
| | | | |
Net increase (decrease) from investment operations | | | (0.39 | ) | | | 1.31 | | | | 3.85 | | | | 2.82 | | | | (0.63 | ) |
| | | | |
| Distributions:2 | | | | | | | | | | | | | | | | | | | | |
From net investment income | | | (0.39 | ) | | | (0.43 | ) | | | (0.46 | ) | | | (0.43 | ) | | | (0.35 | ) |
From net realized gain | | | (1.30 | ) | | | (2.66 | ) | | | (1.19 | ) | | | (0.35 | ) | | | (0.45 | ) |
| | | | |
Total distributions | | | (1.69 | ) | | | (3.09 | ) | | | (1.65 | ) | | | (0.78 | ) | | | (0.80 | ) |
| | | | |
Net asset value, end of year | | $ | 17.58 | | | $ | 19.66 | | | $ | 21.44 | | | $ | 19.24 | | | $ | 17.20 | |
| | | | |
| | | | | | | | | | | | | | | | | | | | |
| Total Return3 | | | | | | | | | | | | | | | | | | | | |
Based on net asset value | | | (2.10)% | | | | 6.12% | | | | 20.19% | | | | 16.53% | | | | (3.48)% | |
| | | | |
| | | | | | | | | | | | | | | | | | | | |
| Ratios to Average Net Assets4,5,6 | | | | | | | | | | | | | | | | | | | | |
Total expenses | | | 0.34% | | | | 0.33% | | | | 0.36% | | | | 0.37% | | | | 0.36% | |
| | | | |
Total expenses after fees waived and/or reimbursed | | | 0.33% | | | | 0.32% | | | | 0.35% | | | | 0.36% | | | | 0.34% | |
| | | | |
Net investment income | | | 2.01% | | | | 1.95% | | | | 2.22% | | | | 2.38% | | | | 2.56% | |
| | | | |
| | | | | | | | | | | | | | | | | | | | |
| Supplemental Data | | | | | | | | | | | | | | | | | | | | |
Net assets, end of year (000) | | $ | 1,647 | | | $ | 1,257 | | | $ | 821 | | | $ | 1,018 | | | $ | 625 | |
| | | | |
Portfolio turnover rate of the LifePath Master Portfolio | | | 36% | 7 | | | 48% | 8 | | | 28% | 8 | | | 5% | 9 | | | 13% | 9 |
| | | | |
| | 1 | | Based on average shares outstanding. |
| | 2 | | Distributions for annual periods determined in accordance with federal income tax regulations. |
| | 3 | | Where applicable, assumes the reinvestment of distributions. |
| | 4 | | Includes the LifePath Fund’s share of its corresponding LifePath Master Portfolio’s allocated net expenses and/or net investment income. |
| | 5 | | Includes the LifePath Fund’s share of the LifePath Master Portfolio’s allocated fees waived of 0.40%, 0.43%, 0.36%, 0.39% and 0.40% for the years ended December 31, 2015, December 31, 2014, December 31, 2013, December 31, 2012 and December 31, 2011, respectively. |
| | 6 | | Includes the LifePath Fund’s share of the LifePath Master Portfolio’s allocated expenses and/or net investment income. Excludes expenses incurred indirectly as a result of the LifePath Master Portfolio’s investments in underlying funds as follows: |
| | | | | | | | | | | | | | | | | | | | |
| | | Year Ended December 31, | |
| | | 2015 | | | 2014 | | | 2013 | | | 2012 | | | 2011 | |
| | | | | | | | | | | | | | | | | | | | |
Investments in underlying funds | | | 0.19% | | | | 0.17% | | | | 0.15% | | | | 0.15% | | | | 0.17% | |
| | | | |
| | 7 | | Includes the LifePath Master Portfolio’s purchases and sales of the underlying funds and Active Stock Master Portfolio, CoreAlpha Bond Master Portfolio, International Tilts Master Portfolio, Large Cap Index Master Portfolio and Master Small Cap Index Series. |
| | 8 | | Includes the LifePath Master Portfolio’s purchases and sales of the underlying funds and Active Stock Master Portfolio, CoreAlpha Bond Master Portfolio, International Tilts Master Portfolio, Large Cap Index Master Portfolio, Master Small Cap Index Series and Total International ex U.S. Index Master Portfolio. |
| | 9 | | Excludes the LifePath Master Portfolio’s purchases and sales of the Active Stock Master Portfolio, CoreAlpha Bond Master Portfolio, Master Small Cap Index Series and Total International ex U.S. Index Master Portfolio. If these transactions had been included to conform to the current year presentation, the portfolio turnover rate would have been 15% and 19% for the years ended December 31, 2012 and December 31, 2011, respectively. |
| | | | | | |
| See Notes to Financial Statements. | | | | |
| | | | | | | |
| | BLACKROCK FUNDS III | | DECEMBER 31, 2015 | | 47 |
| | |
| Financial Highlights (concluded) | | BlackRock LifePath 2050 Fund |
| | | | | | | | | | | | | | | | | | | | |
| | | Class R | |
| | | Year Ended December 31, | |
| | | 2015 | | | 2014 | | | 2013 | | | 2012 | | | 2011 | |
| | | | | | | | | | | | | | | | | | | | |
| Per Share Operating Performance | | | | | | | | | | | | | | | | | | | | |
Net asset value, beginning of year | | $ | 19.53 | | | $ | 21.31 | | | $ | 19.14 | | | $ | 17.13 | | | $ | 18.56 | |
| | | | |
Net investment income1 | | | 0.23 | | | | 0.22 | | | | 0.30 | | | | 0.37 | | | | 0.22 | |
Net realized and unrealized gain (loss) | | | (0.78 | ) | | | 0.89 | | | | 3.35 | | | | 2.29 | | | | (1.00 | ) |
| | | | |
Net increase (decrease) from investment operations | | | (0.55 | ) | | | 1.11 | | | | 3.65 | | | | 2.66 | | | | (0.78 | ) |
| | | | |
| Distributions:2 | | | | | | | | | | | | | | | | | | | | |
From net investment income | | | (0.23 | ) | | | (0.23 | ) | | | (0.29 | ) | | | (0.30 | ) | | | (0.20 | ) |
From net realized gain | | | (1.30 | ) | | | (2.66 | ) | | | (1.19 | ) | | | (0.35 | ) | | | (0.45 | ) |
| | | | |
Total distributions | | | (1.53 | ) | | | (2.89 | ) | | | (1.48 | ) | | | (0.65 | ) | | | (0.65 | ) |
| | | | |
Net asset value, end of year | | $ | 17.45 | | | $ | 19.53 | | | $ | 21.31 | | | $ | 19.14 | | | $ | 17.13 | |
| | | | |
| | | | | | | | | | | | | | | | | | | | |
| Total Return3 | | | | | | | | | | | | | | | | | | | | |
Based on net asset value | | | (2.92)% | | | | 5.21% | | | | 19.19% | | | | 15.59% | | | | (4.29)% | |
| | | | |
| | | | | | | | | | | | | | | | | | | | |
| Ratios to Average Net Assets4,5,6 | | | | | | | | | | | | | | | | | | | | |
Total expenses | | | 1.17% | | | | 1.18% | | | | 1.21% | | | | 1.22% | | | | 1.21% | |
| | | | |
Total expenses after fees waived and/or reimbursed | | | 1.16% | | | | 1.17% | | | | 1.20% | | | | 1.20% | | | | 1.19% | |
| | | | |
Net investment income | | | 1.20% | | | | 1.01% | | | | 1.42% | | | | 1.98% | | | | 1.18% | |
| | | | |
| | | | | | | | | | | | | | | | | | | | |
| Supplemental Data | | | | | | | | | | | | | | | | | | | | |
Net assets, end of year (000) | | $ | 1,550 | | | $ | 1,091 | | | $ | 1,126 | | | $ | 796 | | | $ | 53 | |
| | | | |
Portfolio turnover rate of the LifePath Master Portfolio | | | 36% | 7 | | | 48% | 8 | | | 28% | 8 | | | 5% | 9 | | | 13% | 9 |
| | | | |
| | 1 | | Based on average shares outstanding. |
| | 2 | | Distributions for annual periods determined in accordance with federal income tax regulations. |
| | 3 | | Where applicable, assumes the reinvestment of distributions. |
| | 4 | | Includes the LifePath Fund’s share of its corresponding LifePath Master Portfolio’s allocated net expenses and/or net investment income. |
| | 5 | | Includes the LifePath Fund’s share of the LifePath Master Portfolio’s allocated fees waived of 0.40%, 0.40%, 0.36%, 0.39% and 0.40% for the years ended December 31, 2015, December 31, 2014, December 31, 2013, December 31, 2012 and December 31, 2011, respectively. |
| | 6 | | Includes the LifePath Fund’s share of the LifePath Master Portfolio’s allocated expenses and/or net investment income. Excludes expenses incurred indirectly as a result of the LifePath Master Portfolio’s investments in underlying funds as follows: |
| | | | | | | | | | | | | | | | | | | | |
| | | Year Ended December 31, | |
| | | 2015 | | | 2014 | | | 2013 | | | 2012 | | | 2011 | |
| | | | | | | | | | | | | | | | | | | | |
Investments in underlying funds | | | 0.19% | | | | 0.17% | | | | 0.15% | | | | 0.15% | | | | 0.17% | |
| | | | |
| | 7 | | Includes the LifePath Master Portfolio’s purchases and sales of the underlying funds and Active Stock Master Portfolio, CoreAlpha Bond Master Portfolio, International Tilts Master Portfolio, Large Cap Index Master Portfolio and Master Small Cap Index Series. |
| | 8 | | Includes the LifePath Master Portfolio’s purchases and sales of the underlying funds and Active Stock Master Portfolio, CoreAlpha Bond Master Portfolio, International Tilts Master Portfolio, Large Cap Index Master Portfolio, Master Small Cap Index Series and Total International ex U.S. Index Master Portfolio. |
| | 9 | | Excludes the LifePath Master Portfolio’s purchases and sales of the Active Stock Master Portfolio, CoreAlpha Bond Master Portfolio, Master Small Cap Index Series and Total International ex U.S. Index Master Portfolio. If these transactions had been included to conform to the current year presentation, the portfolio turnover rate would have been 15% and 19% for the years ended December 31, 2012 and December 31, 2011, respectively. |
| | | | | | |
| See Notes to Financial Statements. | | | | |
| | | | | | | |
| 48 | | BLACKROCK FUNDS III | | DECEMBER 31, 2015 | | |
| | |
| Notes to Financial Statements | | |
1. Organization:
BlackRock Funds III (the “Trust”) is registered under the Investment Company Act of 1940, as amended (the “1940 Act”), as an open-end management investment company. The Trust is organized as a Delaware statutory trust. The following series of the Trust are referred to herein collectively as the “LifePath Funds” or individually, as a “LifePath Fund”:
| | | | |
| Fund Name | | Herein Referred To As | | Diversification Classification |
BlackRock LifePath® Retirement Fund | | LifePath Retirement Fund | | Diversified |
BlackRock LifePath® 2020 Fund | | LifePath 2020 Fund | | Diversified |
BlackRock LifePath® 2030 Fund | | LifePath 2030 Fund | | Diversified |
BlackRock LifePath® 2040 Fund | | LifePath 2040 Fund | | Diversified |
| BlackRock LifePath® 2050 Fund | | LifePath 2050 Fund | | Diversified |
Each LifePath Fund seeks to achieve its investment objective by investing all of its assets in a corresponding series of Master Investment Portfolio (“MIP”): LifePath® Retirement Master Portfolio, LifePath® 2020 Master Portfolio, LifePath® 2030 Master Portfolio, LifePath® 2040 Master Portfolio and LifePath® 2050 Master Portfolio (each, a “LifePath Master Portfolio” and together, the “LifePath Master Portfolios”). MIP is an affiliate of the Trust. Each LifePath Master Portfolio has the same investment objective and strategies as its corresponding LifePath Fund. The value of each LifePath Fund’s investment in its corresponding LifePath Master Portfolio reflects the LifePath Fund’s proportionate interest in the net assets of the LifePath Master Portfolio. The performance of each LifePath Fund is directly affected by the performance of the corresponding LifePath Master Portfolio. At December 31, 2015, the percentage of the LifePath Master Portfolio owned by the corresponding LifePath Fund was 100.0% for all Funds. As such, the financial statements of each corresponding LifePath Master Portfolio, including the Schedule of Investments, are included elsewhere in this report and should be read in conjunction with the LifePath Funds’ financial statements.
Each LifePath Fund offers multiple classes of shares. Institutional and Class K Shares are sold only to certain eligible investors. Investor A and Investor C Shares are generally available through financial intermediaries. Class R Shares are available only to certain employer-sponsored retirement plans. Each class has exclusive voting rights with respect to matters relating to its shareholder servicing and distribution expenditures. All classes of shares have identical voting, dividend, liquidation and other rights and are subject to the same terms and conditions, except that certain classes bear expenses related to the shareholder servicing and distribution of such shares.
| | | | | | | | | | |
| Share Class | | Initial Sales Charge | | CDSC | | | Conversion Privilege | |
Institutional, Class K and Class R | | No | | | No | | | | None | |
Investor A | | Yes | | | No | 1 | | | None | |
| Investor C | | No | | | Yes | | | | None | |
| | 1 | | Investor A Shares may be subject to a CDSC for certain redemptions where no initial sales charge was paid at the time of purchase. |
The LifePath Funds, together with certain other registered investment companies advised by BlackRock Fund Advisors (“BFA” or the “Manager”) or its affiliates, are included in a complex of open end funds referred to as the Equity-Liquidity Complex.
2. Significant Accounting Policies:
The financial statements are prepared in conformity with accounting principles generally accepted in the United States of America (“U.S. GAAP”), which may require management to make estimates and assumptions that affect the reported amounts of assets and liabilities in the financial statements, disclosure of contingent assets and liabilities at the date of the financial statements and the reported amounts of increases and decreases in net assets from operations during the reporting period. Actual results could differ from those estimates. Each LifePath Fund is considered an investment company under U.S. GAAP and follows the accounting and reporting guidance applicable to investment companies. Below is a summary of significant accounting policies:
Investment Transactions and Investment Income: For financial reporting purposes, contributions to and withdrawals from each LifePath Master Portfolio are accounted on a trade date basis. Each LifePath Fund records daily its proportionate share of its LifePath Master Portfolio’s income, expenses and realized and unrealized gains and losses. Realized and unrealized gains and losses are adjusted utilizing partnership tax allocation rules. In addition, each LifePath Fund accrues its own expenses. Income, expenses and realized and unrealized gains and losses are allocated daily to each class based on its relative net assets.
In-Kind Redemptions: The LifePath Master Portfolios satisfied certain redemptions in investors’ capital through an in-kind redemption of securities and cash. For financial reporting purposes, these transactions were treated as a sale of securities and the resulting gains and losses were recognized at the LifePath Master Portfolios based on the market value of the securities on the date of the redemption. For the year ended December 31, 2015, the LifePath Funds were allocated realized gain from the in-kind redemptions. For tax purposes, no gains or losses were recognized. Gains and losses resulting from such in-kind redemptions, which are included in the Statements of Operations, were as follows:
| | | | | | | | | | | | | | | | |
LifePath Retirement
Fund | | LifePath 2020
Fund | | | LifePath 2030
Fund | | | LifePath 2040
Fund | | | LifePath 2050
Fund | |
$8,250,633 | | $ | 25,934,769 | | | $ | 30,933,600 | | | $ | 28,098,726 | | | $ | 5,702,859 | |
| | | | | | |
| | | | | | | |
| | BLACKROCK FUNDS III | | DECEMBER 31, 2015 | | 49 |
| | | | |
| Notes to Financial Statements (continued) | | |
Distributions: Distributions from net investment income are declared and paid quarterly. Distributions of capital gains are recorded on the ex-dividend date. The portion of distributions, if any, that exceeds a LifePath Index Fund’s current and accumulated earnings and profits, as measured on a tax basis, constitute a non-taxable return of capital. The character and timing of distributions are determined in accordance with federal income tax regulations, which may differ from U.S. GAAP.
Indemnifications: In the normal course of business, a LifePath Fund enters into contracts that contain a variety of representations that provide general indemnification. A LifePath Fund’s maximum exposure under these arrangements is unknown because it involves future potential claims against a LifePath Fund, which cannot be predicted with any certainty.
Other: Expenses directly related to a LifePath Fund or its classes are charged to that LifePath Fund or the applicable class. Other operating expenses shared by several funds, including other funds managed by BlackRock Fund Advisors (“BFA” or the “Manager”), are prorated among those funds on the basis of relative net assets or other appropriate methods. Expenses directly related to the LifePath Funds and other shared expenses prorated to the LifePath Funds are allocated daily to each class based on its relative net assets or other appropriate methods.
3. Investment Valuation and Fair Value Measurements:
Investment Valuation Policies: The LifePath Funds’ investments are valued at fair value (also referred to as “market value” within the financial statements) as of the close of trading on the New York Stock Exchange (“NYSE”) (generally 4:00 p.m., Eastern time). U.S. GAAP defines fair value as the price the LifePath Funds would receive to sell an asset or pay to transfer a liability in an orderly transaction between market participants at the measurement date.
The LifePath Funds’ policy is to fair value its financial instruments at market value. Each LifePath Fund records its investment in the LifePath Master Portfolio at fair value based on the LifePath Funds’ proportionate interest in the net assets of the LifePath Master Portfolio. Valuation of securities held by the LifePath Master Portfolio is discussed in Note 3 of the LifePath Master Portfolio’s Notes to Financial Statements, which are included elsewhere in this report.
4. Administration Agreement and Other Transactions with Affiliates:
The PNC Financial Services Group, Inc. is the largest stockholder and an affiliate of BlackRock, Inc. (“BlackRock”) for 1940 Act purposes.
The Trust, on behalf of the LifePath Funds, entered into an Administration Agreement with BAL, an indirect wholly owned subsidiary of BlackRock, which has agreed to provide general administration services (other than investment advice and related portfolio activities). BAL, in consideration thereof, has agreed to bear all of the LifePath Funds’ ordinary operating expenses, excluding, generally, investment advisory fees, distribution fees, brokerage and other expenses related to the execution of portfolio transactions, extraordinary expenses and certain other expenses which are borne by the LifePath Funds. BAL is entitled to receive for these administration services an annual fee of 0.35% based on the average daily net assets of each LifePath Fund’s Institutional and Investor A Shares, 0.40% based on the average daily net assets of each LifePath Fund’s Investor C Shares, 0.30% based on the average daily net assets of each LifePath Fund’s Class R Shares and 0.15% based on the average daily net assets of the Class K Shares. Prior to November 30, 2015, the annual fees based on average daily net assets were 0.50% for each LifePath Fund’s Institutional, Investor A, Investor C and Class R Shares. The fee for Class K shares remains unchanged.
From time to time, BAL may waive such fees in whole or in part. Any such waiver will reduce the expenses of the LifePath Funds and, accordingly, have a favorable impact on their performance. BAL may delegate certain of its administration duties to sub-administrators.
Effective June 1, 2015, BAL had voluntarily agreed to waive 0.10% of the administration fee payable with respect to the LifePath Retirement Fund’s Institutional, Investor A, Investor C and Class R Shares. These amounts are included in the fees waived by the administrator in the Statements of Operations. For the year ended December 31, 2015, the amount waived was $144,674. As of November 30, 2015, the agreement was terminated.
The fees and expenses of the Trust’s trustees who are not “interested persons” of the Trust, as defined in the 1940 Act (“Independent Trustees”), counsel to the Independent Trustees and the Trust’s independent registered public accounting firm (together, the “independent expenses”) are paid directly by the LifePath Funds. BAL has contractually agreed to provide an offsetting credit against the administration fees paid by the LifePath Funds in an amount equal to the independent expenses through April 30, 2026. These amounts are included in fees waived by the administrator in the Statements of Operations.
The Trust, on behalf of the LifePath Funds, entered into a Distribution Agreement and a Distribution and Service Plan with BlackRock Investments, LLC (“BRIL”), an affiliate of the Administrator. Pursuant to the Distribution and Service Plan and in accordance with Rule 12b-1 under the 1940 Act, each LifePath Fund pays BRIL ongoing distribution fees. The fees are accrued daily and paid monthly at annual rates based upon the average daily net assets of the relevant share class of each LifePath Fund as follows:
| | | | | | | | |
| | | Service Fee | | | Distribution Fee | |
Investor A | | | 0.25% | | | | — | |
Investor C | | | 0.25% | | | | 0.75% | |
Class R | | | 0.25% | | | | 0.25% | |
| | | | | | |
| | | | | | | |
| 50 | | BLACKROCK FUNDS III | | DECEMBER 31, 2015 | | |
| | |
| Notes to Financial Statements (continued) | | |
Pursuant to sub-agreements with BRIL, broker-dealers and BRIL provide shareholder servicing and distribution services to the LifePath Funds. The ongoing service and/or distribution fee compensates BRIL and each broker-dealer for providing shareholder servicing and/or distribution related services to the shareholders.
For the year ended December 31, 2015, affiliates earned underwriting discounts, direct commissions and dealer concessions on sales of the LifePath Funds’ Investor A Shares as follows:
| | | | | | | | | | | | | | | | | | | | | | | | |
| | | LifePath
Retirement
Fund | | LifePath
2020
Fund | | | LifePath
2030
Fund | | | LifePath
2040
Fund | | | LifePath
2050
Fund | |
Investor A | | | | $ | 1,200 | | | | | $ | 1,635 | | | $ | 1,368 | | | $ | 3,026 | | | $ | 371 | |
For the year ended December 31, 2015, affiliates received CDSCs as follows:
| | | | | | | | | | | | | | | | |
| | | LifePath
Retirement Fund | | | LifePath
2020
Fund | | | LifePath
2030
Fund | | | LifePath
2050 Fund | |
Investor A | | $ | 10,162 | | | | — | | | | — | | | | — | |
Investor C | | $ | 97 | | | $ | 16 | | | $ | 38 | | | $ | 114 | |
Certain officers and/or trustees of the Trust are officers and/or directors of BlackRock or its affiliates.
5. Income Tax Information:
It is the LifePath Funds’ policy to comply with the requirements of the Internal Revenue Code of 1986, as amended, applicable to regulated investment companies, and to distribute substantially all of their taxable income to their shareholders. Therefore, no federal income tax provision is required.
Each LifePath Fund files U.S. federal and various state and local tax returns. No income tax returns are currently under examination. The statute of limitations on each LifePath Fund’s U.S. federal tax returns remains open for each of the four years ended December 31, 2015. The statutes of limitations on each LifePath Fund’s state and local tax returns may remain open for an additional year depending upon the jurisdiction.
Management has analyzed tax laws and regulations and their application to the LifePath Funds as of December 31, 2015, inclusive of the open tax return years, and does not believe there are any uncertain tax positions that require recognition of a tax liability in the LifePath Funds’ financial statements.
The tax character of distributions paid was as follows:
| | | | | | | | | | | | | | | | | | | | | | | | |
| | | | | | LifePath
Retirement
Fund | | | LifePath
2020
Fund | | | LifePath
2030
Fund | | | LifePath
2040
Fund | | | LifePath
2050
Fund | |
Ordinary Income | | | 12/31/15 | | | $ | 10,594,975 | | | $ | 26,990,403 | | | $ | 25,665,726 | | | $ | 21,220,128 | | | $ | 4,442,571 | |
| | | 12/31/14 | | | $ | 14,474,026 | | | $ | 33,847,124 | | | $ | 34,515,112 | | | $ | 30,444,900 | | | $ | 7,024,025 | |
Long-term capital gains | | | 12/31/15 | | | $ | 4,639,258 | | | $ | 21,629,969 | | | $ | 24,542,156 | | | $ | 25,494,483 | | | $ | 6,485,544 | |
| | | 12/31/14 | | | $ | 26,917,322 | | | $ | 72,702,832 | | | $ | 79,120,944 | | | $ | 72,094,410 | | | $ | 18,314,121 | |
Tax return of capital | | | 12/31/15 | | | $ | 390,609 | | | $ | 814,855 | | | $ | 312,129 | | | | — | | | | — | |
| | | | |
Total | | | 12/31/15 | | | $ | 15,624,842 | | | $ | 49,435,227 | | | $ | 50,520,011 | | | $ | 46,714,611 | | | $ | 10,928,115 | |
| | | | |
| | | 12/31/14 | | | $ | 41,391,348 | | | $ | 106,549,956 | | | $ | 113,636,056 | | | $ | 102,539,310 | | | $ | 25,338,146 | |
| | | | |
As of period end, the tax components of accumulated net earnings (losses) were as follows:
| | | | | | | | | | | | | | | | | | | | |
| | | LifePath
Retirement
Fund | | | LifePath
2020
Fund | | | LifePath
2030
Fund | | | LifePath
2040
Fund | | | LifePath
2050
Fund | |
Undistributed ordinary income | | | — | | | | — | | | | — | | | $ | 2,806,790 | | | $ | 38,352 | |
Net unrealized gains1 | | $ | 24,429,854 | | | $ | 46,301,582 | | | $ | 7,473,918 | | | | 40,678,175 | | | | 4,131,449 | |
Qualified late-year losses2 | | | (4,144,378 | ) | | | (6,454,251 | ) | | | (1,185,279 | ) | | | (1,276,552 | ) | | | (2,629,803 | ) |
| | | | |
Total | | $ | 20,285,476 | | | $ | 39,847,331 | | | $ | 6,288,639 | | | $ | 42,208,413 | | | $ | 1,539,998 | |
| | | | |
| | 1 | | The differences between book-basis and tax-basis net unrealized gains were attributable primarily to the timing and recognition of partnership income. |
| | 2 | | The LifePath Funds have elected to defer certain qualified late-year losses and recognize such losses in the next taxable year. |
| | | | | | |
| | | | | | | |
| | BLACKROCK FUNDS III | | DECEMBER 31, 2015 | | 51 |
| | |
| Notes to Financial Statements (continued) | | |
6. Capital Share Transactions:
Transactions in capital shares for each class were as follows:
| | | | | | | | | | | | | | | | | | |
| | | Year Ended
December 31, 2015 | | | | | Year Ended
December 31, 2014 | |
| LifePath Retirement Fund | | Shares | | | Amount | | | | | Shares | | | Amount | |
| Institutional | | | | | | | | | | | | | | | | | | |
Shares sold | | | 3,082,419 | | | $ | 34,185,070 | | | | | | 3,901,030 | | | $ | 46,463,867 | |
Shares issued in reinvestment of distributions | | | 816,982 | | | | 8,689,281 | | | | | | 2,226,827 | | | | 25,197,554 | |
Shares redeemed | | | (11,402,092 | ) | | | (125,957,082 | ) | | | | | (14,214,774 | ) | | | (168,660,124 | ) |
| | | | | | | | | | |
Net decrease | | | (7,502,691 | ) | | $ | (83,082,731 | ) | | | | | (8,086,917 | ) | | $ | (96,998,703 | ) |
| | | | | | | | | | |
| | | | | | | | | | | | | | | | | | |
| Investor A | | | | | | | | | | | | | | | | | | |
Shares sold | | | 1,024,947 | | | $ | 10,156,190 | | | | | | 2,530,337 | | | $ | 27,559,878 | |
Shares issued in reinvestment of distributions | | | 668,737 | | | | 6,373,801 | | | | | | 1,531,174 | | | | 15,615,397 | |
Shares redeemed | | | (4,653,270 | ) | | | (46,034,385 | ) | | | | | (4,600,164 | ) | | | (49,794,241 | ) |
| | | | | | | | | | |
Net decrease | | | (2,959,586 | ) | | $ | (29,504,394 | ) | | | | | (538,653 | ) | | $ | (6,618,966 | ) |
| | | | | | | | | | |
| | | | | | | | | | | | | | | | | | |
| Investor C | | | | | | | | | | | | | | | | | | |
Shares sold | | | 81,259 | | | $ | 877,768 | | | | | | 93,516 | | | $ | 1,101,560 | |
Shares issued in reinvestment of distributions | | | 6,687 | | | | 69,832 | | | | | | 10,491 | | | | 116,780 | |
Shares redeemed | | | (52,089 | ) | | | (558,971 | ) | | | | | (29,952 | ) | | | (354,613 | ) |
| | | | | | | | | | |
Net increase | | | 35,857 | | | $ | 388,629 | | | | | | 74,055 | | | $ | 863,727 | |
| | | | | | | | | | |
| | | | | | | | | | | | | | | | | | |
| Class K | | | | | | | | | | | | | | | | | | |
Shares sold | | | 600,351 | | | $ | 6,640,487 | | | | | | 244,334 | | | $ | 2,914,944 | |
Shares issued in reinvestment of distributions | | | 43,257 | | | | 455,494 | | | | | | 30,903 | | | | 350,175 | |
Shares redeemed | | | (84,046 | ) | | | (908,724 | ) | | | | | (316,285 | ) | | | (3,759,750 | ) |
| | | | | | | | | | |
Net increase (decrease) | | | 559,562 | | | $ | 6,187,257 | | | | | | (41,048 | ) | | $ | (494,631 | ) |
| | | | | | | | | | |
| | | | | | | | | | | | | | | | | | |
| Class R | | | | | | | | | | | | | | | | | | |
Shares sold | | | 21,123 | | | $ | 228,653 | | | | | | 9,270 | | | $ | 109,704 | |
Shares issued in reinvestment of distributions | | | 3,314 | | | | 34,961 | | | | | | 9,360 | | | | 106,023 | |
Shares redeemed | | | (41,754 | ) | | | (457,997 | ) | | | | | (114,241 | ) | | | (1,359,189 | ) |
| | | | | | | | | | |
Net decrease | | | (17,317 | ) | | $ | (194,383 | ) | | | | | (95,611 | ) | | $ | (1,143,462 | ) |
| | | | | | | | | | |
Total Net Decrease | | | (9,884,175 | ) | | $ | (106,205,622 | ) | | | | | (8,688,174 | ) | | $ | (104,392,035 | ) |
| | | | | | | | | | |
| | | | | | | | | | | | | | | | | | |
| LifePath 2020 Fund | | | | | | | | | | | | | | |
| Institutional | | | | | | | | | | | | | | | | | | |
Shares sold | | | 4,215,109 | | | $ | 66,252,877 | | | | | | 5,490,343 | | | $ | 93,369,522 | |
Shares issued in reinvestment of distributions | | | 1,538,593 | | | | 22,595,121 | | | | | | 3,770,681 | | | | 60,533,779 | |
Shares redeemed | | | (18,834,441 | ) | | | (295,907,148 | ) | | | | | (19,597,685 | ) | | | (330,407,643 | ) |
| | | | | | | | | | |
Net decrease | | | (13,080,739 | ) | | $ | (207,059,150 | ) | | | | | (10,336,661 | ) | | $ | (176,504,342 | ) |
| | | | | | | | | | |
| | | | | | | | | | | | | | | | | | |
| Investor A | | | | | | | | | | | | | | | | | | |
Shares sold | | | 1,338,679 | | | $ | 19,437,877 | | | | | | 2,783,548 | | | $ | 44,566,411 | |
Shares issued in reinvestment of distributions | | | 1,838,939 | | | | 24,938,220 | | | | | | 2,956,438 | | | | 44,222,933 | |
Shares redeemed | | | (5,778,076 | ) | | | (83,791,873 | ) | | | | | (5,348,859 | ) | | | (85,352,258 | ) |
| | | | | | | | | | |
Net increase (decrease) | | | (2,600,458 | ) | | $ | (39,415,776 | ) | | | | | 391,127 | | | $ | 3,437,086 | |
| | | | | | | | | | |
| | | | | | | | | | | | | | | | | | |
| Investor C | | | | | | | | | | | | | | | | | | |
Shares sold | | | 51,355 | | | $ | 790,022 | | | | | | 92,681 | | | $ | 1,568,498 | |
Shares issued in reinvestment of distributions | | | 12,177 | | | | 175,330 | | | | | | 19,730 | | | | 311,205 | |
Shares redeemed | | | (97,038 | ) | | | (1,455,576 | ) | | | | | (51,937 | ) | | | (874,902 | ) |
| | | | | | | | | | |
Net increase (decrease) | | | (33,506 | ) | | $ | (490,224 | ) | | | | | 60,474 | | | $ | 1,004,801 | |
| | | | | | | | | | |
| | | | | | |
| | | | | | | |
| 52 | | BLACKROCK FUNDS III | | DECEMBER 31, 2015 | | |
| | | | |
| Notes to Financial Statements (continued) | | |
| | | | | | | | | | | | | | | | | | |
| | | Year Ended
December 31, 2015 | | | | | Year Ended
December 31, 2014 | |
| LifePath 2020 Fund (concluded) | | Shares | | | Amount | | | | | Shares | | | Amount | |
| Class K | | | | | | | | | | | | | | | | | | |
Shares sold | | | 906,154 | | | $ | 14,234,945 | | | | | | 460,561 | | | $ | 7,894,629 | |
Shares issued in reinvestment of distributions | | | 102,104 | | | | 1,485,355 | | | | | | 72,788 | | | | 1,165,258 | |
Shares redeemed | | | (319,506 | ) | | | (4,878,569 | ) | | | | | (310,592 | ) | | | (5,281,867 | ) |
| | | | | | | | | | |
Net increase | | | 688,752 | | | $ | 10,841,731 | | | | | | 222,757 | | | $ | 3,778,020 | |
| | | | | | | | | | |
| | | | | | | | | | | | | | | | | | |
| Class R | | | | | | | | | | | | | | | | | | |
Shares sold | | | 153,240 | | | $ | 2,359,038 | | | | | | 91,690 | | | $ | 1,556,487 | |
Shares issued in reinvestment of distributions | | | 16,501 | | | | 239,167 | | | | | | 19,412 | | | | 310,941 | |
Shares redeemed | | | (90,678 | ) | | | (1,408,817 | ) | | | | | (135,284 | ) | | | (2,292,419 | ) |
| | | | | | | | | | |
Net increase (decrease) | | | 79,063 | | | $ | 1,189,388 | | | | | | (24,182 | ) | | $ | (424,991 | ) |
| | | | | | | | | | |
Total Net Decrease | | | (14,946,888 | ) | | $ | (234,934,031 | ) | | | | | (9,686,485 | ) | | $ | (168,709,426 | ) |
| | | | | | | | | | |
| | | | | | | | | | | | | | | | | | |
| LifePath 2030 Fund | | | | | | | | | | | | | | |
| Institutional | | | | | | | | | | | | | | | | | | |
Shares sold | | | 5,213,448 | | | $ | 76,881,977 | | | | | | 6,018,990 | | | $ | 97,829,378 | |
Shares issued in reinvestment of distributions | | | 1,593,135 | | | | 21,846,676 | | | | | | 4,245,327 | | | | 64,286,433 | |
Shares redeemed | | | (20,505,711 | ) | | | (303,358,679 | ) | | | | | (21,840,580 | ) | | | (351,719,418 | ) |
| | | | | | | | | | |
Net decrease | | | (13,699,128 | ) | | $ | (204,630,026 | ) | | | | | (11,576,263 | ) | | $ | (189,603,607 | ) |
| | | | | | | | | | |
| | | | | | | | | | | | | | | | | | |
| Investor A | | | | | | | | | | | | | | | | | | |
Shares sold | | | 1,856,330 | | | $ | 26,432,452 | | | | | | 3,382,841 | | | $ | 53,696,141 | |
Shares issued in reinvestment of distributions | | | 2,024,081 | | | | 26,664,070 | | | | | | 3,223,542 | | | | 47,165,061 | |
Shares redeemed | | | (5,033,944 | ) | | | (70,961,535 | ) | | | | | (4,890,982 | ) | | | (77,053,211 | ) |
| | | | | | | | | | |
Net increase (decrease) | | | (1,153,533 | ) | | $ | (17,865,013 | ) | | | | | 1,715,401 | | | $ | 23,807,991 | |
| | | | | | | | | | |
| | | | | | | | | | | | | | | | | | |
| Investor C | | | | | | | | | | | | | | | | | | |
Shares sold | | | 138,615 | | | $ | 2,028,091 | | | | | | 66,718 | | | $ | 1,073,462 | |
Shares issued in reinvestment of distributions | | | 19,359 | | | | 258,835 | | | | | | 24,898 | | | | 368,390 | |
Shares redeemed | | | (124,341 | ) | | | (1,774,867 | ) | | | | | (41,087 | ) | | | (653,792 | ) |
| | | | | | | | | | |
Net increase | | | 33,633 | | | $ | 512,059 | | | | | | 50,529 | | | $ | 788,060 | |
| | | | | | | | | | |
| | | | | | | | | | | | | | | | | | |
| Class K | | | | | | | | | | | | | | | | | | |
Shares sold | | | 857,844 | | | $ | 12,732,460 | | | | | | 490,402 | | | $ | 8,085,095 | |
Shares issued in reinvestment of distributions | | | 108,207 | | | | 1,472,178 | | | | | | 89,430 | | | | 1,353,726 | |
Shares redeemed | | | (387,243 | ) | | | (5,532,178 | ) | | | | | (473,630 | ) | | | (7,722,039 | ) |
| | | | | | | | | | |
Net increase | | | 578,808 | | | $ | 8,672,460 | | | | | | 106,202 | | | $ | 1,716,782 | |
| | | | | | | | | | |
| | | | | | | | | | | | | | | | | | |
| Class R | | | | | | | | | | | | | | | | | | |
Shares sold | | | 104,545 | | | $ | 1,486,750 | | | | | | 56,385 | | | $ | 909,776 | |
Shares issued in reinvestment of distributions | | | 18,287 | | | | 245,226 | | | | | | 26,691 | | | | 399,574 | |
Shares redeemed | | | (88,538 | ) | | | (1,295,592 | ) | | | | | (72,822 | ) | | | (1,172,386 | ) |
| | | | | | | | | | |
Net increase | | | 34,294 | | | $ | 436,384 | | | | | | 10,254 | | | $ | 136,964 | |
| | | | | | | | | | |
Total Net Decrease | | | (14,205,926 | ) | | $ | (212,874,136 | ) | | | | | (9,693,877 | ) | | $ | (163,153,810 | ) |
| | | | | | | | | | |
| | | | | | | | | | | | | | | | | | |
| LifePath 2040 Fund | | | | | | | | | | | | | | |
| Institutional | | | | | | | | | | | | | | |
Shares sold | | | 3,838,975 | | | $ | 71,051,113 | | | | | | 4,547,603 | | | $ | 92,415,386 | |
Shares issued in reinvestment of distributions | | | 1,271,130 | | | | 21,570,928 | | | | | | 3,351,708 | | | | 63,432,704 | |
Shares redeemed | | | (17,261,307 | ) | | | (319,896,632 | ) | | | | | (14,960,406 | ) | | | (301,406,787 | ) |
| | | | | | | | | | |
Net decrease | | | (12,151,202 | ) | | $ | (227,274,591 | ) | | | | | (7,061,095 | ) | | $ | (145,558,697 | ) |
| | | | | | | | | | |
| | | | | | | | | | | | | | | | | | |
| | | | | | |
| | | | | | | |
| | BLACKROCK FUNDS III | | DECEMBER 31, 2015 | | 53 |
| | |
| Notes to Financial Statements (continued) | | |
| | | | | | | | | | | | | | | | | | |
| | | Year Ended
December 31, 2015 | | | | | Year Ended
December 31, 2014 | |
| LifePath 2040 Fund (concluded) | | Shares | | | Amount | | | | | Shares | | | Amount | |
| Investor A | | | | | | | | | | | | | | | | | | |
Shares sold | | | 1,308,200 | | | $ | 22,522,484 | | | | | | 2,109,212 | | | $ | 40,550,132 | |
Shares issued in reinvestment of distributions | | | 1,495,264 | | | | 23,333,183 | | | | | | 2,145,088 | | | | 37,916,491 | |
Shares redeemed | | | (3,519,184 | ) | | | (60,270,739 | ) | | | | | (2,736,990 | ) | | | (52,332,409 | ) |
| | | | | | | | | | |
Net increase (decrease) | | | (715,720 | ) | | $ | (14,415,072 | ) | | | | | 1,517,310 | | | $ | 26,134,214 | |
| | | | | | | | | | |
| | | | | | | | | | | | | | | | | | |
| Investor C | | | | | | | | | | | | | | | | | | |
Shares sold | | | 80,026 | | | $ | 1,463,438 | | | | | | 45,298 | | | $ | 908,758 | |
Shares issued in reinvestment of distributions | | | 13,679 | | | | 225,450 | | | | | | 15,261 | | | | 283,251 | |
Shares redeemed | | | (63,608 | ) | | | (1,156,085 | ) | | | | | (33,165 | ) | | | (673,789 | ) |
| | | | | | | | | | |
Net increase | | | 30,097 | | | $ | 532,803 | | | | | | 27,394 | | | $ | 518,220 | |
| | | | | | | | | | |
| | | | | | | | | | | | | | | | | | |
| Class K | | | | | | | | | | | | | | | | | | |
Shares sold | | | 787,006 | | | $ | 14,765,461 | | | | | | 209,407 | | | $ | 4,362,508 | |
Shares issued in reinvestment of distributions | | | 86,454 | | | | 1,454,936 | | | | | | 38,807 | | | | 740,009 | |
Shares redeemed | | | (256,507 | ) | | | (4,573,411 | ) | | | | | (262,901 | ) | | | (5,382,812 | ) |
| | | | | | | | | | |
Net increase (decrease) | | | 616,953 | | | $ | 11,646,986 | | | | | | (14,687 | ) | | $ | (280,295 | ) |
| | | | | | | | | | |
| | | | | | | | | | | | | | | | | | |
| Class R | | | | | | | | | | | | | | | | | | |
Shares sold | | | 55,743 | | | $ | 1,007,207 | | | | | | 46,362 | | | $ | 942,164 | |
Shares issued in reinvestment of distributions | | | 7,749 | | | | 128,802 | | | | | | 8,593 | | | | 162,063 | |
Shares redeemed | | | (40,978 | ) | | | (752,099 | ) | | | | | (63,404 | ) | | | (1,290,801 | ) |
| | | | | | | | | | |
Net increase (decrease) | | | 22,514 | | | $ | 383,910 | | | | | | (8,449 | ) | | $ | (186,574 | ) |
| | | | | | | | | | |
Total Net Decrease | | | (12,197,358 | ) | | $ | (229,125,964 | ) | | | | | (5,539,527 | ) | | $ | (119,373,132 | ) |
| | | | | | | | | | |
| | | | | | | | | | | | | | | | | | |
| LifePath 2050 Fund | | | | | | | | | | | | | | |
| Institutional | | | | | | | | | | | | | | | | | | |
Shares sold | | | 2,156,166 | | | $ | 42,661,367 | | | | | | 2,138,402 | | | $ | 46,251,744 | |
Shares issued in reinvestment of distributions | | | 246,435 | | | | 4,538,084 | | | | | | 762,452 | | | | 15,338,372 | |
Shares redeemed | | | (5,646,501 | ) | | | (111,606,012 | ) | | | | | (5,137,073 | ) | | | (108,715,541 | ) |
| | | | | | | | | | |
Net decrease | | | (3,243,900 | ) | | $ | (64,406,561 | ) | | | | | (2,236,219 | ) | | $ | (47,125,425 | ) |
| | | | | | | | | | |
| | | | | | | | | | | | | | | | | | |
| Investor A | | | | | | | | | | | | | | | | | | |
Shares sold | | | 822,426 | | | $ | 16,036,796 | | | | | | 890,323 | | | $ | 19,351,097 | |
Shares issued in reinvestment of distributions | | | 338,012 | | | | 6,070,846 | | | | | | 475,626 | | | | 9,543,129 | |
Shares redeemed | | | (731,224 | ) | | | (13,958,447 | ) | | | | | (710,551 | ) | | | (15,312,160 | ) |
| | | | | | | | | | |
Net increase | | | 429,214 | | | $ | 8,149,195 | | | | | | 655,398 | | | $ | 13,582,066 | |
| | | | | | | | | | |
| | | | | | | | | | | | | | | | | | |
| Investor C | | | | | | | | | | | | | | | | | | |
Shares sold | | | 30,293 | | | $ | 584,184 | | | | | | 17,404 | | | $ | 372,119 | |
Shares issued in reinvestment of distributions | | | 3,156 | | | | 56,080 | | | | | | 3,648 | | | | 72,339 | |
Shares redeemed | | | (23,249 | ) | | | (440,677 | ) | | | | | (15,969 | ) | | | (341,292 | ) |
| | | | | | | | | | |
Net increase | | | 10,200 | | | $ | 199,587 | | | | | | 5,083 | | | $ | 103,166 | |
| | | | | | | | | | |
| | | | | | | | | | | | | | | | | | |
| Class K | | | | | | | | | | | | | | | | | | |
Shares sold | | | 39,619 | | | $ | 760,896 | | | | | | 37,882 | | | $ | 794,194 | |
Shares issued in reinvestment of distributions | | | 7,855 | | | | 141,933 | | | | | | 8,661 | | | | 214,902 | |
Shares redeemed | | | (17,717 | ) | | | (338,992 | ) | | | | | (20,895 | ) | | | (453,493 | ) |
| | | | | | | | | | |
Net increase | | | 29,757 | | | $ | 563,837 | | | | | | 25,648 | | | $ | 555,603 | |
| | | | | | | | | | |
| | | | | | | | | | | | | | | | | | |
| | | | | | |
| | | | | | | |
| 54 | | BLACKROCK FUNDS III | | DECEMBER 31, 2015 | | |
| | | | |
| Notes to Financial Statements (concluded) | | |
| | | | | | | | | | | | | | | | | | |
| | | Year Ended
December 31, 2015 | | | | | Year Ended
December 31, 2014 | |
| LifePath 2050 Fund (concluded) | | Shares | | | Amount | | | | | Shares | | | Amount | |
| Class R | | | | | | | | | | | | | | | | | | |
Shares sold | | | 37,131 | | | $ | 712,379 | | | | | | 41,449 | | | $ | 891,512 | |
Shares issued in reinvestment of distributions | | | 6,733 | | | | 120,074 | | | | | | 7,899 | | | | 159,772 | |
Shares redeemed | | | (10,892 | ) | | | (212,633 | ) | | | | | (46,310 | ) | | | (1,008,938 | ) |
| | | | | | | | | | |
Net increase | | | 32,972 | | | $ | 619,820 | | | | | | 3,038 | | | $ | 42,346 | |
| | | | | | | | | | |
Total Net Decrease | | | (2,741,757 | ) | | $ | (54,874,122 | ) | | | | | (1,547,052 | ) | | $ | (32,842,244 | ) |
| | | | | | | | | | |
7. Subsequent Events:
Management has evaluated the impact of all subsequent events on the LifePath Funds through the date the financial statements were issued and has determined that there were no subsequent events requiring adjustment or additional disclosure in the financial statements.
| | | | | | |
| | | | | | | |
| | BLACKROCK FUNDS III | | DECEMBER 31, 2015 | | 55 |
| | |
| Report of Independent Registered Public Accounting Firm | | BlackRock Funds III |
To the Board of Trustees of BlackRock Funds III and the Shareholders of BlackRock LifePath® Retirement Fund, BlackRock LifePath® 2020 Fund, BlackRock LifePath® 2030 Fund, BlackRock LifePath® 2040 Fund and BlackRock LifePath® 2050 Fund:
In our opinion, the accompanying statements of assets and liabilities and the related statements of operations and of changes in net assets and the financial highlights present fairly, in all material respects, the financial position of BlackRock LifePath® Retirement Fund, BlackRock LifePath® 2020 Fund, BlackRock LifePath® 2030 Fund, BlackRock LifePath® 2040 Fund and BlackRock LifePath® 2050 Fund (the “Funds”), each a series of BlackRock Funds III, at December 31, 2015, the results of each of their operations for the year then ended, the changes in each of their net assets for each of the two years in the period then ended and the financial highlights for each of the five years in the period then ended, in conformity with accounting principles generally accepted in the United States of America. These financial statements and financial highlights (hereafter referred to as “financial statements”) are the responsibility of the Funds’ management. Our responsibility is to express an opinion on these financial statements based on our audits. We conducted our audits of these financial statements in accordance with the standards of the Public Company Accounting Oversight Board (United States). Those standards require that we plan and perform the audit to obtain reasonable assurance about whether the financial statements are free of material misstatement. An audit includes examining, on a test basis, evidence supporting the amounts and disclosures in the financial statements, assessing the accounting principles used and significant estimates made by management, and evaluating the overall financial statement presentation. We believe that our audits provide a reasonable basis for our opinion.
/s/PricewaterhouseCoopers LLP
Philadelphia, Pennsylvania
February 24, 2016
| | |
| Important Tax Information (Unaudited) | | |
The following information is provided with respect to the ordinary income distributions paid during the tax year ended December 31, 2015.
| | | | | | | | | | | | | | | | | | | | | | |
| | | Payable
Dates | | LifePath
Retirement
Fund | | | LifePath
2020
Fund | | | LifePath
2030
Fund | | | LifePath
2040
Fund | | | LifePath
2050
Fund | |
Qualified Dividend Income for Individuals1 | | 3/31/15 - 12/30/15 | | | 21.74% | | | | 26.57% | | | | 34.92% | | | | 45.37% | | | | 64.67% | |
Dividends Qualifying for the Dividend Received Deduction for Corporations1 | | 3/31/15 - 12/30/15 | | | 12.50% | | | | 13.48% | | | | 17.95% | | | | 22.61% | | | | 31.15% | |
Federal Obligation Interest2 | | 3/31/15 - 12/30/15 | | | 1.76% | | | | 1.25% | | | | — | | | | — | | | | — | |
Interest Related Dividends and Short-Term Capital Gains for Non-U.S. Residents3 | | 3/31/15 - 12/30/15 | | | 68.61% | | | | 72.53% | | | | 67.58% | | | | 65.08% | | | | 54.06% | |
| | 1 | | The LifePath Funds hereby designate the percentages indicated above or the maximum amount allowable by law. |
| | 2 | | The law varies in each state as to whether and what percentage of dividend income attributable to federal obligations is exempt from state income tax. We recommend that you consult your tax advisor to determine if any portion of the dividends you received is exempt from state income taxes. |
| | 3 | | Represents the portion of the taxable ordinary income dividends eligible for exemption from U.S. withholding tax for nonresident aliens and foreign corporations. |
Additionally, the LifePath Funds distributed long-term capital gains per share to shareholders of record on the following dates:
| | | | | | | | | | |
| | | Record Dates: | | June 29, 2015 | | | December 29, 2015 | |
LifePath Retirement Fund | | | | $ | 0.057433 | | | $ | 0.113625 | |
LifePath 2020 Fund | | | | $ | 0.093470 | | | $ | 0.425383 | |
LifePath 2030 Fund | | | | $ | 0.107287 | | | $ | 0.491691 | |
LifePath 2040 Fund | | | | $ | 0.139285 | | | $ | 0.821577 | |
LifePath 2050 Fund | | | | $ | 0.111624 | | | $ | 0.865017 | |
| | | | | | |
| | | | | | | |
| 56 | | BLACKROCK FUNDS III | | DECEMBER 31, 2015 | | |
| | |
| Master Portfolio Information as of December 31, 2015 | | Master Investment Portfolio |
| | |
| LifePath® Retirement Master Portfolio |
| | |
| Portfolio Composition | | Percent of
Total Net Assets |
| | | | |
Fixed Income Funds | | | 60 | % |
Equity Funds | | | 39 | |
Common Stocks | | | 1 | |
| | |
| Ten Largest Holdings | | Percent of
Total Net Assets |
| | | | |
CoreAlpha Bond Master Portfolio | | | 51 | % |
Active Stock Master Portfolio | | | 11 | |
Large Cap Index Master Portfolio | | | 10 | |
iShares TIPS Bond ETF | | | 9 | |
International Tilts Master Portfolio | | | 8 | |
Master Small Cap Index Series | | | 4 | |
BlackRock Commodity Strategies Fund | | | 3 | |
BlackRock Emerging Markets Fund, Inc. | | | 2 | |
iShares MSCI EAFE Small-Cap ETF | | | 1 | |
iShares MSCI Canada ETF | | | 1 | |
| | |
| LifePath® 2020 Master Portfolio |
| | |
| Portfolio Composition | | Percent of
Total Net Assets |
| | | | |
Fixed Income Funds | | | 49 | % |
Equity Funds | | | 48 | |
Common Stocks | | | 3 | |
Short-Term Securities | | | 1 | |
Liabilities in excess of Other Assets | | | (1 | ) |
| | |
| Ten Largest Holdings | | Percent of
Total Net Assets |
| | | | |
CoreAlpha Bond Master Portfolio | | | 42 | % |
Active Stock Master Portfolio | | | 17 | |
International Tilts Master Portfolio | | | 11 | |
Large Cap Index Master Portfolio | | | 9 | |
iShares TIPS Bond ETF | | | 6 | |
Master Small Cap Index Series | | | 4 | |
BlackRock Commodity Strategies Fund | | | 3 | |
BlackRock Emerging Markets Fund, Inc. | | | 3 | |
iShares MSCI EAFE Small-Cap ETF | | | 1 | |
iShares MSCI Canada ETF | | | 1 | |
| | |
| LifePath® 2030 Master Portfolio |
| | |
| Portfolio Composition | | Percent of
Total Net Assets |
| | | | |
Equity Funds | | | 65 | % |
Fixed Income Funds | | | 27 | |
Common Stocks | | | 8 | |
| | |
| Ten Largest Holdings | | Percent of
Total Net Assets |
| | | | |
CoreAlpha Bond Master Portfolio | | | 25 | % |
Active Stock Master Portfolio | | | 23 | |
International Tilts Master Portfolio | | | 15 | |
Large Cap Index Master Portfolio | | | 13 | |
BlackRock Emerging Markets Fund, Inc. | | | 4 | |
BlackRock Commodity Strategies Fund | | | 4 | |
Master Small Cap Index Series | | | 3 | |
iShares MSCI EAFE Small-Cap ETF | | | 2 | |
iShares TIPS Bond ETF | | | 2 | |
iShares MSCI Canada ETF | | | 1 | |
The LifePath Master Portfolios’ allocation and holdings listed above are current as of the report date. However, the LifePath Master Portfolios are regularly monitored and their composition may vary throughout various periods.
| | | | | | |
| | | | | | | |
| | BLACKROCK FUNDS III | | DECEMBER 31, 2015 | | 57 |
| | |
| Master Portfolio Information as of December 31, 2015 (concluded) | | Master Investment Portfolio |
| | |
| LifePath® 2040 Master Portfolio |
| | |
| Portfolio Composition | | Percent of
Total Net Assets |
| | | | |
Equity Funds | | | 80 | % |
Common Stocks | | | 12 | |
Fixed Income Funds | | | 7 | |
Other Assets | | | 1 | |
| | |
| Ten Largest Holdings | | Percent of
Total Net Assets |
| | | | |
Active Stock Master Portfolio | | | 27 | % |
International Tilts Master Portfolio | | | 19 | |
Large Cap Index Master Portfolio | | | 19 | |
CoreAlpha Bond Master Portfolio | | | 7 | |
BlackRock Emerging Markets Fund, Inc. | | | 5 | |
BlackRock Commodity Strategies Fund | | | 4 | |
iShares MSCI EAFE Small-Cap ETF | | | 3 | |
Master Small Cap Index Series | | | 2 | |
iShares MSCI Canada ETF | | | 1 | |
Simon Property Group, Inc. | | | 1 | |
| | |
| LifePath® 2050 Master Portfolio |
| | |
| Portfolio Composition | | Percent of
Total Net Assets |
| | | | |
Equity Funds | | | 85 | % |
Common Stocks | | | 14 | |
Short-Term Securities | | | 1 | |
Fixed Income Funds | | | 1 | |
Liabilities in excess of Other Assets | | | (1 | ) |
| | |
| Ten Largest Holdings | | Percent of
Total Net Assets |
| | | | |
Active Stock Master Portfolio | | | 31 | % |
International Tilts Master Portfolio | | | 21 | |
Large Cap Index Master Portfolio | | | 17 | |
BlackRock Emerging Markets Fund, Inc. | | | 5 | |
BlackRock Commodity Strategies Fund | | | 4 | |
iShares MSCI EAFE Small-Cap ETF | | | 3 | |
Master Small Cap Index Series | | | 2 | |
iShares MSCI Canada ETF | | | 2 | |
CoreAlpha Bond Master Portfolio | | | 2 | |
BlackRock Cash Funds: Prime, SL Agency Shares | | | 1 | |
The LifePath Master Portfolios’ allocation and holdings listed above are current as of the report date. However, the LifePath Master Portfolios are regularly monitored and their composition may vary throughout various periods.
| | | | | | |
| | | | | | | |
| 58 | | BLACKROCK FUNDS III | | DECEMBER 31, 2015 | | |
| | |
Schedule of Investments December 31, 2015 | | LifePath Retirement Master Portfolio (Percentages shown are based on Net Assets) |
| | | | | | | | |
| Affiliated Investment Companies (a) | | Shares/
Beneficial Interest | | | Value | |
Equity Funds — 39.3% | |
Active Stock Master Portfolio | | $ | 28,411,425 | | | $ | 28,411,425 | |
BlackRock Commodity Strategies Fund | | | 1,399,391 | | | | 8,508,296 | |
BlackRock Emerging Markets Fund, Inc. | | | 325,916 | | | | 5,090,805 | |
International Tilts Master Portfolio | | $ | 20,042,535 | | | | 20,042,535 | |
iShares MSCI Canada ETF | | | 68,752 | | | | 1,478,168 | |
iShares MSCI EAFE Small-Cap ETF | | | 53,861 | | | | 2,690,357 | |
Large Cap Index Master Portfolio (fka Russell 1000® Index Master Portfolio) | | $ | 24,159,652 | | | | 24,159,652 | |
Master Small Cap Index Series | | $ | 9,573,489 | | | | 9,573,489 | |
| | | | | | | | |
| | | | | | | | 99,954,727 | |
Fixed Income Funds — 59.9% | | | | | | | | |
CoreAlpha Bond Master Portfolio | | $ | 129,362,345 | | | | 129,362,345 | |
iShares TIPS Bond ETF | | | 208,795 | | | | 22,900,636 | |
| | | | | | | | |
| | | | | 152,262,981 | |
Short-Term Securities — 0.2% | | | | | | | | |
BlackRock Cash Funds: Institutional, SL Agency Shares, 0.38% (b) | | | 517,747 | | | | 517,747 | |
| Total Affiliated Investment Companies — 99.4% | | | | 252,735,455 | |
| | | | | | | | |
| | | | | | | | | |
| | |
| Common Stocks | | | | | | |
Hotels, Restaurants & Leisure — 0.0% | | | | | | | | |
Hilton Worldwide Holdings, Inc. | | | 428 | | | | 9,159 | |
Pebblebrook Hotel Trust | | | 467 | | | | 13,085 | |
RLJ Lodging Trust | | | 655 | | | | 14,168 | |
| | | | | | | | |
| | | | | 36,412 | |
Real Estate Investment Trusts (REITs) — 0.6% | |
Alexandria Real Estate Equities, Inc. | | | 299 | | | | 27,018 | |
Allied Properties Real Estate Investment Trust | | | 1,235 | | | | 28,177 | |
AvalonBay Communities, Inc. | | | 291 | | | | 53,582 | |
Beni Stabili SpA SIIQ | | | 9,899 | | | | 7,461 | |
Boston Properties, Inc. | | | 539 | | | | 68,744 | |
British Land Co. PLC | | | 3,343 | | | | 38,681 | |
Cambridge Industrial Trust | | | 46,300 | | | | 18,449 | |
CareTrust REIT, Inc. | | | 1,849 | | | | 20,247 | |
CubeSmart | | | 1,026 | | | | 31,416 | |
CyrusOne, Inc. | | | 505 | | | | 18,912 | |
Derwent London PLC | | | 419 | | | | 22,663 | |
Duke Realty Corp. | | | 1,140 | | | | 23,963 | |
Empiric Student Property PLC | | | 5,668 | | | | 9,484 | |
EPR Properties | | | 351 | | | | 20,516 | |
Equity One, Inc. | | | 852 | | | | 23,132 | |
Equity Residential | | | 705 | | | | 57,521 | |
Essex Property Trust, Inc. | | | 169 | | | | 40,460 | |
Extra Space Storage, Inc. | | | 453 | | | | 39,959 | |
Federal Realty Investment Trust | | | 49 | | | | 7,159 | |
General Growth Properties, Inc. | | | 338 | | | | 9,197 | |
Goodman Group | | | 11,579 | | | | 52,470 | |
Gramercy Property Trust | | | 1,736 | | | | 13,405 | |
Japan Rental Housing Investments, Inc. | | | 14 | | | | 9,892 | |
Kenedix Retail REIT Corp. | | | 6 | | | | 12,702 | |
Kilroy Realty Corp. | | | 517 | | | | 32,716 | |
Kimco Realty Corp. | | | 731 | | | | 19,342 | |
Land Securities Group PLC | | | 2,385 | | | | 41,344 | |
Link REIT | | | 5,000 | | | | 29,809 | |
| | | | | | | | |
| Common Stocks | |
Shares | | | Value | |
Real Estate Investment Trusts (REITs) (continued) | |
Macerich Co. | | | 302 | | | $ | 24,368 | |
Merlin Properties Socimi SA | | | 1,119 | | | | 14,018 | |
National Health Investors, Inc. | | | 317 | | | | 19,296 | |
Parkway Properties, Inc. | | | 1,164 | | | | 18,193 | |
Physicians Realty Trust | | | 124 | | | | 2,091 | |
Prologis, Inc. | | | 1,106 | | | | 47,470 | |
Retail Properties of America, Inc., Class A | | | 2,420 | | | | 35,743 | |
Sekisui House REIT, Inc. | | | 5 | | | | 5,448 | |
Simon Property Group, Inc. | | | 579 | | | | 112,581 | |
SL Green Realty Corp. | | | 213 | | | | 24,065 | |
STAG Industrial, Inc. | | | 1,093 | | | | 20,166 | |
STORE Capital Corp. | | | 441 | | | | 10,231 | |
Sunstone Hotel Investors, Inc. | | | 1,959 | | | | 24,468 | |
Taubman Centers, Inc. | | | 89 | | | | 6,828 | |
UDR, Inc. | | | 723 | | | | 27,163 | |
Vastned Retail NV | | | 527 | | | | 24,211 | |
Vicinity Centres | | | 24,332 | | | | 49,362 | |
Welltower, Inc. | | | 816 | | | | 55,512 | |
Wereldhave NV | | | 364 | | | | 20,418 | |
Westfield Corp. | | | 5,615 | | | | 38,631 | |
| | | | | | | | |
| | | | | | | | 1,358,684 | |
Real Estate Management & Development — 0.1% | | | | | | | | |
Castellum AB | | | 850 | | | | 12,105 | |
Cheung Kong Property Holdings Ltd. | | | 6,500 | | | | 42,048 | |
Deutsche Wohnen AG, Bearer Shares | | | 541 | | | | 14,960 | |
First Capital Realty, Inc. | | | 1,011 | | | | 13,407 | |
Heiwa Real Estate Co., Ltd. | | | 1,200 | | | | 13,131 | |
Howard Hughes Corp. (c) | | | 78 | | | | 8,827 | |
Kennedy Wilson Europe Real Estate PLC | | | 513 | | | | 9,123 | |
Kungsleden AB | | | 1,078 | | | | 7,703 | |
KWG Property Holding Ltd. | | | 24,500 | | | | 18,061 | |
LEG Immobilien AG | | | 64 | | | | 5,216 | |
Leopalace21 Corp. (c) | | | 900 | | | | 4,871 | |
Nomura Real Estate Holdings, Inc. | | | 500 | | | | 9,276 | |
Sumitomo Realty & Development Co., Ltd. | | | 1,000 | | | | 28,543 | |
Sun Hung Kai Properties Ltd. | | | 4,000 | | | | 48,078 | |
VIB Vermoegen AG | | | 369 | | | | 6,855 | |
Vonovia SE | | | 400 | | | | 12,357 | |
Wharf Holdings Ltd. | | | 5,000 | | | | 27,567 | |
| | | | | | | | |
| | | | | | | | 282,128 | |
Total Common Stocks — 0.7% | | | | 1,677,224 | |
| Total Investments (Cost — $240,622,741) — 100.1% | | | | 254,412,679 | |
Liabilities in Excess of Other Assets — (0.1)% | | | | (245,329 | ) |
| | | | | | | | |
| Net Assets — 100.0% | | | $ | 254,167,350 | |
| | | | | |
| | |
| AUD | | Australian Dollar |
| CAD | | Canadian Dollar |
| CHF | | Swiss Franc |
| EUR | | Euro |
| GBP | | British Pound |
| | |
| HKD | | Hong Kong Dollar |
| ILS | | Israeli New Shekel |
| JPY | | Japanese Yen |
| NOK | | Norwegian Krone |
| | |
| NZD | | New Zealand Dollar |
| SEK | | Swedish Krona |
| SGD | | Singapore Dollar |
| USD | | U.S. Dollar |
See Notes to Financial Statements.
| | | | | | |
| | | | | | | |
| | BLACKROCK FUNDS III | | DECEMBER 31, 2015 | | 59 |
| | |
Schedule of Investments (continued) | | LifePath Retirement Master Portfolio |
|
| Notes to Schedule of investments |
| (a) | | During the year ended December 31, 2015, investments in issuers considered to be affiliates of LifePath Master Portfolio for purposes of Section 2(a)(3) of the Investment Company Act of 1940, as amended, were as follows: |
| | | | | | | | | | | | | | | | | | | | | | | | | | | | |
| Affiliate | | Shares/
Beneficial
Interest Held at
December 31, 2014 | | | Shares/
Beneficial
Interest
Purchased | | | Shares/
Beneficial
Interest
Sold | | | Shares/
Beneficial
Interest Held at
December 31, 2015 | | | Value at
December 31, 2015 | | | Net Income | | | Realized
Gain (Loss) | |
Active Stock Master Portfolio | | $ | 261,549,322 | | | | — | | | $ | (233,137,897 | )1 | | $ | 28,411,425 | | | $ | 28,411,425 | | | $ | 2,558,673 | | | $ | 31,691,861 | 2 |
BlackRock Cash Funds: Institutional, SL Agency Shares | | | 3,367,223 | | | | — | | | | (2,849,476 | )1 | | | 517,747 | | | $ | 517,747 | | | $ | 3,592 | | | | — | |
BlackRock Cash Funds: Prime, SL Agency Shares3 | | | — | | | | — | | | | — | | | | — | | | | — | | | $ | 49,600 | 4 | | | — | |
BlackRock Commodity Strategies Fund | | | 6,449,996 | | | | 1,684,292 | | | | (6,734,897 | ) | | | 1,399,391 | | | $ | 8,508,296 | | | | — | | | $ | (22,647,161 | ) |
BlackRock Emerging Markets Fund, Inc. | | | 1,751,608 | | | | 366,189 | | | | (1,791,881 | ) | | | 325,916 | | | $ | 5,090,805 | | | $ | 67,288 | | | $ | (4,616,821 | ) |
CoreAlpha Bond Master Portfolio | | $ | 808,534,591 | | | | — | | | $ | (679,172,246 | )1 | | $ | 129,362,345 | | | $ | 129,362,345 | | | $ | 17,183,546 | | | $ | 4,391,501 | 2 |
International Tilts Master Portfolio | | $ | 113,464,710 | | | | — | | | $ | (93,422,175 | )1 | | $ | 20,042,535 | | | $ | 20,042,535 | | | $ | 2,796,615 | | | $ | (3,313,595 | )2 |
iShares Cohen & Steers REIT ETF3 | | | 45,789 | | | | 485 | | | | (46,274 | ) | | | — | | | | — | | | $ | 96,690 | | | $ | 561,915 | |
iShares International Developed Real Estate ETF3 | | | 71,776 | | | | 2,576 | | | | (74,352 | ) | | | — | | | | — | | | $ | 63,113 | | | $ | (138,100 | )2 |
iShares MSCI Canada ETF | | | 369,599 | | | | 60,518 | | | | (361,365 | ) | | | 68,752 | | | $ | 1,478,168 | | | $ | 101,878 | | | $ | (688,329 | )2 |
iShares MSCI EAFE Small-Cap ETF | | | 338,648 | | | | 19,907 | | | | (304,694 | ) | | | 53,861 | | | $ | 2,690,357 | | | $ | 223,835 | | | $ | 3,646,344 | 2 |
iShares TIPS Bond ETF | | | 1,328,000 | | | | 77,462 | | | | (1,196,667 | ) | | | 208,795 | | | $ | 22,900,636 | | | $ | 488,717 | | | $ | 6,918,847 | 2 |
Large Cap Index Master Portfolio (fka Russell 1000® Index Master Portfolio) | | $ | 71,857,425 | | | | — | | | $ | (47,697,773 | )1 | | $ | 24,159,652 | | | $ | 24,159,652 | | | $ | 2,506,011 | | | $ | 3,073,751 | 2 |
Master Small Cap Index Series | | $ | 61,149,952 | | | | — | | | $ | (51,576,463 | )1 | | $ | 9,573,489 | | | $ | 9,573,489 | | | $ | 680,524 | | | $ | 19,422,298 | 2 |
1 Represents net shares/beneficial interest sold. | |
2 Includes the following gains and (losses) from in-kind redemptions from affiliated holdings. See Note 2 of the Notes to Financial Statements. | |
| | | | | | | | | | | | | | | | | | | | | | | | | | | | | | | | | | | | | | |
Active Stock
Master
Portfolio | | | CoreAlpha
Bond Master
Portfolio | | | International Tilts
Master Portfolio | | | iShares Cohen &
Steers REIT ETF | | | iShares
International
Developed Real
Estate ETF | | | iShares MSCI
Canada ETF | | | iShares MSCI
EAFE Small-
Cap ETF | | | iShares TIPS
Bond ETF | | | Large Cap Index Master
Portfolio (fka Russell 1000®
Index Master Portfolio) | | | Master Small
Cap Index
Series | |
| | $7,656,041 | | | $ | 2,999,197 | | | $ | (2,278,297 | ) | | $ | 431,930 | | | $ | (87,433 | ) | | $ | (607,746 | ) | | $ | 3,446,265 | | | $ | 6,993,161 | | | $ | 16,008,976 | | | $ | 11,063,702 | |
| | | | | | | | | | | | | | |
3 No longer held by LifePath Master Portfolio as of period end. |
4 Represents securities lending income earned from the reinvestment of cash collateral from loaned securities, net of fees and collateral investment expenses, and other payments to and from borrowers of securities. |
| (b) | | Current yield as of period end. |
| (c) | | Non-income producing security. |
|
| Derivative Financial Instruments Outstanding as of Period End |
Forward Foreign Currency Exchange Contracts
| | | | | | | | | | | | | | | | | | | | | | |
Currency
Purchased | | | Currency
Sold | | | Counterparty | | Settlement
Date | | | Unrealized
Appreciation
(Depreciation) | | | |
| CAD | | | 33,000 | | | USD | | | 23,849 | | | Morgan Stanley & Co. International PLC | | | 1/21/16 | | | $ | (92 | ) | | |
| CAD | | | 2,000 | | | USD | | | 1,456 | | | Northern Trust Co. | | | 1/21/16 | | | | (16 | ) | | |
| CHF | | | 8,000 | | | USD | | | 8,083 | | | Goldman Sachs International | | | 1/21/16 | | | | (85 | ) | | |
| CHF | | | 8,000 | | | USD | | | 8,035 | | | Morgan Stanley & Co. International PLC | | | 1/21/16 | | | | (38 | ) | | |
| EUR | | | 50,000 | | | USD | | | 54,387 | | | Morgan Stanley & Co. International PLC | | | 1/21/16 | | | | (50 | ) | | |
| EUR | | | 19,000 | | | USD | | | 20,762 | | | Morgan Stanley & Co. International PLC | | | 1/21/16 | | | | (114 | ) | | |
| GBP | | | 4,000 | | | USD | | | 5,896 | | | Morgan Stanley & Co. International PLC | | | 1/21/16 | | | | — | | | |
| ILS | | | 4,000 | | | USD | | | 1,033 | | | Deutsche Bank AG | | | 1/21/16 | | | | (5 | ) | | |
| ILS | | | 4,000 | | | USD | | | 1,028 | | | UBS AG | | | 1/21/16 | | | | — | | | |
| JPY | | | 12,237,000 | | | USD | | | 101,897 | | | Goldman Sachs International | | | 1/21/16 | | | | (135 | ) | | |
| JPY | | | 2,680,000 | | | USD | | | 22,055 | | | Standard Chartered Bank | | | 1/21/16 | | | | 232 | | | |
| NOK | | | 5,000 | | | USD | | | 576 | | | Morgan Stanley & Co. International PLC | | | 1/21/16 | | | | (11 | ) | | |
| NZD | | | 1,300 | | | USD | | | 875 | | | Goldman Sachs International | | | 1/21/16 | | | | 14 | | | |
| NZD | | | 1,000 | | | USD | | | 685 | | | Northern Trust Co. | | | 1/21/16 | | | | (1 | ) | | |
| SEK | | | 92,000 | | | USD | | | 10,899 | | | Northern Trust Co. | | | 1/21/16 | | | | 19 | | | |
| SGD | | | 21,000 | | | USD | | | 14,899 | | | Barclays Bank PLC | | | 1/21/16 | | | | (104 | ) | | |
| SGD | | | 13,000 | | | USD | | | 9,169 | | | Morgan Stanley & Co. International PLC | | | 1/21/16 | | | | (11 | ) | | |
| USD | | | 1,442 | | | AUD | | | 2,000 | | | Goldman Sachs International | | | 1/21/16 | | | | (12 | ) | | |
| USD | | | 16,090 | | | AUD | | | 22,000 | | | Goldman Sachs International | | | 1/21/16 | | | | 96 | | | |
See Notes to Financial Statements.
| | | | | | |
| | | | | | | |
| 60 | | BLACKROCK FUNDS III | | DECEMBER 31, 2015 | | |
| | |
Schedule of Investments (continued) | | LifePath Retirement Master Portfolio |
Forward Foreign Currency Exchange Contracts (continued)
| | | | | | | | | | | | | | | | | | | | | | |
Currency
Purchased | | | Currency
Sold | | | Counterparty | | Settlement
Date | | | Unrealized
Appreciation
(Depreciation) | | | |
| USD | | | 1,450 | | | AUD | | | 2,000 | | | Northern Trust Co. | | | 1/21/16 | | | $ | (4 | ) | | |
| USD | | | 16,503 | | | AUD | | | 23,000 | | | Royal Bank of Canada | | | 1/21/16 | | | | (218 | ) | | |
| USD | | | 2,164 | | | EUR | | | 2,000 | | | Goldman Sachs International | | | 1/21/16 | | | | (9 | ) | | |
| USD | | | 1,089 | | | EUR | | | 1,000 | | | Goldman Sachs International | | | 1/21/16 | | | | 2 | | | |
| USD | | | 1,098 | | | EUR | | | 1,000 | | | Morgan Stanley & Co. International PLC | | | 1/21/16 | | | | 12 | | | |
| USD | | | 9,767 | | | EUR | | | 9,000 | | | Royal Bank of Scotland PLC | | | 1/21/16 | | | | (13 | ) | | |
| USD | | | 1,093 | | | EUR | | | 1,000 | | | Royal Bank of Scotland PLC | | | 1/21/16 | | | | 6 | | | |
| USD | | | 4,465 | | | GBP | | | 3,000 | | | Bank of America N.A. | | | 1/21/16 | | | | 44 | | | |
| USD | | | 3,010 | | | GBP | | | 2,000 | | | Morgan Stanley & Co. International PLC | | | 1/21/16 | | | | 62 | | | |
| USD | | | 1,490 | | | GBP | | | 1,000 | | | Royal Bank of Scotland PLC | | | 1/21/16 | | | | 16 | | | |
| USD | | | 18,195 | | | HKD | | | 141,000 | | | Goldman Sachs International | | | 1/21/16 | | | | (1 | ) | | |
| USD | | | 1,291 | | | HKD | | | 10,000 | | | Northern Trust Co. | | | 1/21/16 | | | | — | | | |
| USD | | | 1,548 | | | HKD | | | 12,000 | | | UBS AG | | | 1/21/16 | | | | — | | | |
| USD | | | 11,743 | | | HKD | | | 91,000 | | | UBS AG | | | 1/21/16 | | | | — | | | |
| USD | | | 2,345 | | | JPY | | | 282,000 | | | Morgan Stanley & Co. International PLC | | | 1/21/16 | | | | (1 | ) | | |
| USD | | | 4,553 | | | SEK | | | 39,000 | | | Bank of America N.A. | | | 1/21/16 | | | | (75 | ) | | |
| USD | | | 3,765 | | | SEK | | | 32,000 | | | Northern Trust Co. | | | 1/21/16 | | | | (32 | ) | | |
| USD | | | 3,543 | | | SGD | | | 5,000 | | | Citibank N.A. | | | 1/21/16 | | | | 20 | | | |
| USD | | | 2,826 | | | SGD | | | 4,000 | | | Standard Chartered Bank | | | 1/21/16 | | | | 8 | | | |
| Total | | | | | | | | | | | | | | | | | | $ | (496 | ) | | |
| | | | | | | | | | | | | | | | | | | |
|
| Derivative Financial Instruments Categorized by Risk Exposure |
As of period end, the fair values of derivative financial instruments located in the Statements of Assets and Liabilities were as follows:
| | | | | | | | | | | | | | | | | | | | | | | | | | | | | | |
| Assets — Derivative Financial Instruments | | Commodity Contracts | | | Credit Contracts | | | Equity Contracts | | | Foreign Currency Exchange Contracts | | | Interest Rate Contracts | | | Other Contracts | | | Total | |
Forward foreign currency exchange contracts | | Net unrealized appreciation on forward currency exchange contracts | | | — | | | | — | | | | — | | | $ | 531 | | | | — | | | | — | | | $ | 531 | |
Liabilities — Derivative Financial Instruments | | | | | | | | | | | | | | | | | | | | | | | | | | | | |
Forward foreign currency exchange contracts | | Net unrealized depreciation on forward currency exchange contracts | | | — | | | | — | | | | — | | | $ | 1,027 | | | | — | | | | — | | | $ | 1,027 | |
For the year ended December 31, 2015, the effect of derivative financial instruments in the Statements of Operations was as follows:
| | | | | | | | | | | | | | | | | | | | | | | | | | | | |
| Net Change in Unrealized Appreciation (Depreciation) on: | | Commodity Contracts | | | Credit Contracts | | | Equity Contracts | | | Foreign Currency Exchange Contracts | | | Interest Rate Contracts | | | Other Contracts | | | Total | |
Forward foreign currency exchange contracts | | | — | | | | — | | | | — | | | $ | (496 | ) | | | — | | | | — | | | $ | (496 | ) |
|
| Average Quarterly Balances of Outstanding Derivative Financial Instruments |
| | | | |
| Forward foreign currency exchange contracts: | | | | |
Average amounts purchased — in USD | | $ | 27,368 | |
Average amounts sold — in USD | | $ | 71,396 | |
For more information about the LifePath Fund’s investment risks regarding derivative financial instruments, refer to the Notes to Financial Statements.
|
| Derivative Financial Instruments — Offsetting as of Period End |
The LifePath Master Portfolio’s derivative assets and liabilities (by type) were as follows:
| | | | | | | | |
| | | Assets | | | Liabilities | |
Derivative Financial Instruments: | | | | | | | | |
Forward foreign currency exchange contracts | | $ | 531 | | | $ | 1,027 | |
| | | | |
Total derivative assets and liabilities in the Statements of Assets and Liabilities | | $ | 531 | | | $ | 1,027 | |
| | | | |
Derivatives not subject to a Master Netting Agreement or similar agreement (“MNA”) | | | — | | | | — | |
| | | | |
Total derivative assets and liabilities subject to an MNA | | $ | 531 | | | $ | 1,027 | |
| | | | |
See Notes to Financial Statements.
| | | | | | |
| | | | | | | |
| | BLACKROCK FUNDS III | | DECEMBER 31, 2015 | | 61 |
| | |
Schedule of Investments (concluded) | | LifePath Retirement Master Portfolio |
The following table presents the LifePath Master Portfolio’s derivative assets and liabilities by counterparty net of amounts available for offset under an Master Netting Agreement (“MNA”) and net of the related collateral received and pledged by the LifePath Master Portfolio:
| | | | | | | | | | | | | | | | | | | | |
| Counterparty | | Derivative Assets
Subject to an MNA
by Counterparty | | | Derivatives
Available
for Offset1 | | | Non-cash
Collateral
Received | | | Cash
Collateral
Received | | | Net Amount of
Derivative
Assets2 | |
Bank of America N.A. | | $ | 44 | | | $ | (44 | ) | | | — | | | | — | | | | — | |
Citibank N.A. | | | 20 | | | | — | | | | — | | | | — | | | $ | 20 | |
Goldman Sachs International | | | 112 | | | | (112 | ) | | | — | | | | — | | | | — | |
Morgan Stanley & Co. International PLC | | | 74 | | | | (74 | ) | | | — | | | | — | | | | — | |
Northern Trust Co. | | | 19 | | | | (19 | ) | | | — | | | | — | | | | — | |
Royal Bank of Scotland PLC | | | 22 | | | | (13 | ) | | | — | | | | — | | | | 9 | |
Standard Chartered Bank | | | 240 | | | | — | | | | — | | | | — | | | | 240 | |
| | | | |
Total | | $ | 531 | | | $ | (262 | ) | | | — | | | | — | | | $ | 269 | |
| | | | |
| | | | | | | | | | | | | | | | | | | | |
| Counterparty | | Derivative Liabilities
Subject to an MNA
by Counterparty | | | Derivatives
Available
for Offset1 | | | Non-cash
Collateral
Pledged | | �� | Cash
Collateral
Pledged | | | Net Amount of
Derivative
Liabilities3 | |
Bank of America N.A. | | $ | 75 | | | $ | (44 | ) | | | — | | | | — | | | $ | 31 | |
Barclays Bank PLC | | | 104 | | | | — | | | | — | | | | — | | | | 104 | |
Deutsche Bank AG | | | 5 | | | | — | | | | — | | | | — | | | | 5 | |
Goldman Sachs International | | | 242 | | | | (112 | ) | | | — | | | | — | | | | 130 | |
Morgan Stanley & Co. International PLC | | | 317 | | | | (74 | ) | | | — | | | | — | | | | 243 | |
Northern Trust Co. | | | 53 | | | | (19 | ) | | | — | | | | — | | | | 34 | |
Royal Bank of Canada | | | 218 | | | | — | | | | — | | | | — | | | | 218 | |
Royal Bank of Scotland PLC | | | 13 | | | | (13 | ) | | | — | | | | — | | | | — | |
| | | | |
Total | | $ | 1,027 | | | $ | (262 | ) | | | — | | | | — | | | $ | 765 | |
| | | | |
1 The amount of derivatives available for offset is limited to the amount of derivative assets and/or liabilities that are subject to an MNA. | |
2 Net amount represents the net amount receivable from the counterparty in the event of default. | |
3 Net amount represents the net amount payable due to the counterparty in the event of default. | |
|
| Fair Value Hierarchy as of Period End |
Various inputs are used in determining the fair value of investments and derivative financial instruments. For information about LifePath Master Portfolio’s policy regarding valuation of investments and derivative financial instruments, refer to the Notes to Financial Statements.
The following tables summarize LifePath Master Portfolio’s investments and derivative financial instruments categorized in the disclosure hierarchy:
| | | | | | | | | | | | | | |
| | | Level 1 | | | Level 2 | | | Level 3 | | Total | |
Assets: | | | | | | | | | | | | | | |
| Investments: | | | | | | | | | | | | | | |
Affiliated Investment Companies: | | | | | | | | | | | | | | |
Equity Funds | | $ | 17,767,626 | | | $ | 82,187,101 | | | — | | $ | 99,954,727 | |
Fixed Income Funds | | | 22,900,636 | | | | 129,362,345 | | | — | | | 152,262,981 | |
Short-Term Securities | | | 517,747 | | | | — | | | — | | | 517,747 | |
Common Stocks: | | | | | | | | | | | | | | |
Hotels, Restaurants & Leisure | | | 36,412 | | | | — | | | — | | | 36,412 | |
Real Estate Investment Trusts (REITs) | | | 991,574 | | | | 367,110 | | | — | | | 1,358,684 | |
Real Estate Management & Development | | | 29,089 | | | | 253,039 | | | — | | | 282,128 | |
| | | | | | | | | | | | | | |
Total | | $ | 42,243,084 | | | $ | 212,169,595 | | | — | | $ | 254,412,679 | |
| | | | | | | | | | | | | | |
| | | | | | | | | | | | |
| | | Level 1 | | Level 2 | | | Level 3 | | Total | |
| Derivative Financial Instruments1 | | | | | | | | | | | | |
Assets: | | | | | | | | | | | | |
Forward foreign currency exchange contracts | | — | | $ | 531 | | | — | | $ | 531 | |
Liabilities: | | | | | | | | | | | | |
Forward foreign currency exchange contracts | | — | | | (1,027 | ) | | — | | | (1,027 | ) |
| | | |
Total | | — | | $ | (496 | ) | | — | | $ | (496 | ) |
| | | |
1 Derivative financial instruments are forward foreign currency exchange contracts that are valued at the unrealized appreciation (depreciation) on the instrument. | |
The LifePath Master Portfolio may hold assets and/or liabilities in which the fair value approximates the carrying amount for financial statement purposes. As of period end, such assets and/or liabilities are categorized within the disclosure hierarchy as follows:
| | | | | | | | | | | | |
| | | Level 1 | | | Level 2 | | Level 3 | | Total | |
Assets: | | | | | | | | | | | | |
Cash | | $ | 1,447 | | | — | | — | | $ | 1,447 | |
Foreign currency at value | | | 7,500 | | | — | | — | | | 7,500 | |
| | | | |
Total | | $ | 8,947 | | | — | | — | | $ | 8,947 | |
| | | | |
During the year ended December 31, 2015, there were no transfers between levels.
See Notes to Financial Statements.
| | | | | | |
| | | | | | | |
| 62 | | BLACKROCK FUNDS III | | DECEMBER 31, 2015 | | |
| | |
Schedule of Investments December 31, 2015 | | LifePath 2020 Master Portfolio (Percentages shown are based on Net Assets) |
| | | | | | | | |
| Affiliated Investment Companies (a) | | Shares/ Beneficial Interest | | | Value | |
| Equity Funds — 48.3% | |
Active Stock Master Portfolio | | $ | 98,938,953 | | | $ | 98,938,953 | |
BlackRock Commodity Strategies Fund | | | 3,062,221 | | | | 18,618,302 | |
BlackRock Emerging Markets Fund, Inc. | | | 1,006,837 | | | | 15,726,791 | |
International Tilts Master Portfolio | | $ | 61,723,700 | | | | 61,723,700 | |
iShares MSCI Canada ETF | | | 220,099 | | | | 4,732,128 | |
iShares MSCI EAFE Small-Cap ETF | | | 172,841 | | | | 8,633,408 | |
Large Cap Index Master Portfolio (fka Russell 1000® Index Master Portfolio) | | $ | 51,535,999 | | | | 51,535,999 | |
Master Small Cap Index Series | | $ | 20,833,677 | | | | 20,833,677 | |
| | | | | | | | |
| | | | | | | | 280,742,958 | |
Fixed Income Funds — 48.9% | | | | | | | | |
CoreAlpha Bond Master Portfolio | | $ | 246,301,565 | | | | 246,301,565 | |
iShares TIPS Bond ETF (b) | | | 342,392 | | | | 37,553,555 | |
| | | | | | | | |
| | | | | | | | 283,855,120 | |
Short-Term Securities — 0.7% | | | | | | | | |
BlackRock Cash Funds: Institutional, SL Agency Shares, 0.38% (c)(d) | | | 2,831,794 | | | | 2,831,794 | |
BlackRock Cash Funds: Prime, SL Agency Shares, 0.36% (c)(d) | | | 1,196,918 | | | | 1,196,918 | |
| | | | | | | | |
| | | | | | | | 4,028,712 | |
| Total Affiliated Investment Companies — 97.9% | | | | 568,626,790 | |
| | | | | | | | |
| | | | | | | | | |
| |
| Common Stocks | | | |
Hotels, Restaurants & Leisure — 0.1% | | | | | | | | |
Hilton Worldwide Holdings, Inc. | | | 3,857 | | | | 82,540 | |
Pebblebrook Hotel Trust | | | 4,001 | | | | 112,108 | |
RLJ Lodging Trust | | | 5,614 | | | | 121,431 | |
| | | | | | | | |
| | | | | | | | 316,079 | |
Real Estate Investment Trusts (REITs) — 2.0% | | | | | |
Alexandria Real Estate Equities, Inc. | | | 2,561 | | | | 231,412 | |
Allied Properties Real Estate Investment Trust | | | 10,582 | | | | 241,435 | |
AvalonBay Communities, Inc. | | | 2,496 | | | | 459,588 | |
Beni Stabili SpA SIIQ | | | 160,870 | | | | 121,251 | |
Boston Properties, Inc. | | | 4,620 | | | | 589,235 | |
British Land Co. PLC | | | 28,651 | | | | 331,517 | |
Cambridge Industrial Trust | | | 391,100 | | | | 155,844 | |
CareTrust REIT, Inc. | | | 15,774 | | | | 172,725 | |
CubeSmart | | | 8,696 | | | | 266,271 | |
CyrusOne, Inc. | | | 4,351 | | | | 162,945 | |
Derwent London PLC | | | 3,590 | | | | 194,174 | |
Duke Realty Corp. | | | 9,770 | | | | 205,365 | |
Empiric Student Property PLC | | | 73,367 | | | | 122,759 | |
EPR Properties | | | 3,020 | | | | 176,519 | |
Equity One, Inc. | | | 7,203 | | | | 195,561 | |
Equity Residential | | | 6,041 | | | | 492,885 | |
Essex Property Trust, Inc. | | | 1,450 | | | | 347,144 | |
Extra Space Storage, Inc. | | | 3,881 | | | | 342,343 | |
Federal Realty Investment Trust | | | 401 | | | | 58,586 | |
General Growth Properties, Inc. | | | 2,884 | | | | 78,474 | |
Goodman Group | | | 99,244 | | | | 449,719 | |
Gramercy Property Trust | | | 14,568 | | | | 112,464 | |
Japan Rental Housing Investments, Inc. | | | 222 | | | | 156,862 | |
Kenedix Retail REIT Corp. | | | 111 | | | | 234,979 | |
Kilroy Realty Corp. | | | 4,431 | | | | 280,394 | |
Kimco Realty Corp. | | | 6,263 | | | | 165,719 | |
Land Securities Group PLC | | | 20,440 | | | | 354,328 | |
Link REIT | | | 43,000 | | | | 256,361 | |
Macerich Co. | | | 2,598 | | | | 209,633 | |
Merlin Properties Socimi SA | | | 9,590 | | | | 120,136 | |
National Health Investors, Inc. | | | 2,719 | | | | 165,506 | |
Parkway Properties, Inc. | | | 9,973 | | | | 155,878 | |
Physicians Realty Trust | | | 1,088 | | | | 18,344 | |
| | | | | | | | |
| Common Stocks | |
Shares | | | Value | |
Real Estate Investment Trusts (REITs) (continued) | | | | | |
Prologis, Inc. | | | 9,483 | | | $ | 407,010 | |
Retail Properties of America, Inc., Class A | | | 20,739 | | | | 306,315 | |
Sekisui House REIT, Inc. | | | 82 | | | | 89,354 | |
Simon Property Group, Inc. | | | 4,965 | | | | 965,395 | |
SL Green Realty Corp. | | | 1,824 | | | | 206,075 | |
STAG Industrial, Inc. | | | 9,370 | | | | 172,876 | |
STORE Capital Corp. | | | 3,672 | | | | 85,190 | |
Sunstone Hotel Investors, Inc. | | | 16,617 | | | | 207,546 | |
Taubman Centers, Inc. | | | 756 | | | | 58,000 | |
UDR, Inc. | | | 6,194 | | | | 232,709 | |
Vastned Retail NV | | | 4,571 | | | | 209,997 | |
Vicinity Centres | | | 208,554 | | | | 423,089 | |
Welltower, Inc. | | | 6,990 | | | | 475,530 | |
Wereldhave NV | | | 3,069 | | | | 172,152 | |
Westfield Corp. | | | 48,132 | | | | 331,144 | |
| | | | | | | | |
| | | | | | | | 11,968,738 | |
Real Estate Management & Development — 0.6% | | | | | |
Castellum AB | | | 13,817 | | | | 196,771 | |
Cheung Kong Property Holdings Ltd. | | | 54,500 | | | | 352,560 | |
Deutsche Wohnen AG, Bearer Shares | | | 8,787 | | | | 242,977 | |
First Capital Realty, Inc. | | | 8,442 | | | | 111,954 | |
Heiwa Real Estate Co., Ltd. | | | 20,300 | | | | 222,130 | |
Howard Hughes Corp. (e) | | | 670 | | | | 75,817 | |
Kennedy Wilson Europe Real Estate PLC | | | 4,396 | | | | 78,177 | |
Kungsleden AB | | | 17,525 | | | | 125,224 | |
KWG Property Holding Ltd. | | | 209,000 | | | | 154,067 | |
LEG Immobilien AG | | | 1,041 | | | | 84,842 | |
Leopalace21 Corp. (e) | | | 13,800 | | | | 74,696 | |
Nomura Real Estate Holdings, Inc. | | | 9,100 | | | | 168,825 | |
Sumitomo Realty & Development Co., Ltd. | | | 13,000 | | | | 371,055 | |
Sun Hung Kai Properties Ltd. | | | 34,000 | | | | 408,666 | |
VIB Vermoegen AG | | | 5,999 | | | | 111,449 | |
Vonovia SE | | | 6,508 | | | | 201,052 | |
Wharf Holdings Ltd. | | | 46,000 | | | | 253,620 | |
| | | | | | | | |
| | | | | | | | 3,233,882 | |
| Total Common Stocks — 2.7% | | | | | | | 15,518,699 | |
| Total Investments (Cost — $578,667,496) — 100.6% | | | | | | | 584,145,489 | |
| Liabilities in Excess of Other Assets — (0.6)% | | | | | | | (3,340,935 | ) |
| | | | | | | | |
| Net Assets — 100.0% | | | | | | $ | 580,804,554 | |
| | | | | | | | |
See Notes to Financial Statements.
| | | | | | |
| | | | | | | |
| | BLACKROCK FUNDS III | | DECEMBER 31, 2015 | | 63 |
| | |
Schedule of Investments (continued) | | LifePath 2020 Master Portfolio |
|
| Notes to Schedule of Investments |
| (a) | | During the year ended December 31, 2015, investments in issuers considered to be affiliates of LifePath Master Portfolio for purposes of Section 2(a)(3) of the Investment Company Act of 1940, as amended, were as follows: |
| | | | | | | | | | | | | | | | | | | | | | | | | | | | |
| Affiliate | | Shares/ Beneficial
Interest Held at
December 31, 2014 | | | Shares/ Beneficial
Interest
Purchased | | | Shares/ Beneficial
Interest Sold | | | Shares/ Beneficial
Interest Held at
December 31, 2015 | | | Value at
December 31, 2015 | | | Net Income | | | Realized
Gain (Loss) | |
Active Stock Master Portfolio | | $ | 627,945,748 | | | | — | | | $ | (529,006,795 | )1 | | $ | 98,938,953 | | | $ | 98,938,953 | | | $ | 7,205,225 | | | $ | 77,345,798 | 2 |
BlackRock Cash Funds: Institutional, SL Agency Shares | | | 5,279,010 | | | | — | | | | (2,447,216 | )1 | | | 2,831,794 | | | $ | 2,831,794 | | | $ | 65,770 | 3 | | | — | |
BlackRock Cash Funds: Prime, SL Agency Shares | | | 6,776,550 | | | | — | | | | (5,579,632 | )1 | | | 1,196,918 | | | $ | 1,196,918 | | | $ | 45,935 | 3 | | | — | |
BlackRock Commodity Strategies Fund | | | 12,567,336 | | | | 1,751,133 | | | | (11,256,248 | ) | | | 3,062,221 | | | $ | 18,618,302 | | | | — | | | $ | (38,057,247 | ) |
BlackRock Emerging Markets Fund, Inc. | | | 4,505,579 | | | | 758,250 | | | | (4,256,992 | ) | | | 1,006,837 | | | $ | 15,726,791 | | | $ | 217,718 | | | $ | (10,617,069 | ) |
CoreAlpha Bond Master Portfolio | | $ | 1,143,592,277 | | | | — | | | $ | (897,290,712 | )1 | | $ | 246,301,565 | | | $ | 246,301,565 | | | $ | 24,806,322 | | | $ | 7,630,171 | 2 |
International Tilts Master Portfolio | | $ | 282,798,820 | | | | — | | | $ | (221,075,120 | )1 | | $ | 61,723,700 | | | $ | 61,723,700 | | | $ | 6,998,481 | | | $ | (7,417,034 | )2 |
iShares Cohen & Steers REIT ETF4 | | | 498,805 | | | | 9,721 | | | | (508,526 | ) | | | — | | | | — | | | $ | 1,008,201 | | | $ | 22,608,887 | 2 |
iShares International Developed Real Estate ETF4 | | | 1,382,421 | | | | 28,766 | | | | (1,411,187 | ) | | | — | | | | — | | | $ | 1,099,969 | | | $ | 8,846,974 | 2 |
iShares MSCI Canada ETF | | | 967,873 | | | | 83,363 | | | | (831,137 | ) | | | 220,099 | | | $ | 4,732,128 | | | $ | 265,321 | | | $ | (2,649,290 | )2 |
iShares MSCI EAFE Small-Cap ETF | | | 881,531 | | | | 26,229 | | | | (734,919 | ) | | | 172,841 | | | $ | 8,633,408 | | | $ | 570,217 | | | $ | 9,871,027 | 2 |
iShares TIPS Bond ETF | | | 1,673,332 | | | | 107,283 | | | | (1,438,223 | ) | | | 342,392 | | | $ | 37,553,555 | | | $ | 618,880 | | | $ | 9,645,757 | |
Large Cap Index Master Portfolio (fka Russell 1000® Index Master Portfolio) | | $ | 176,865,168 | | | | — | | | $ | (125,329,169 | )1 | | $ | 51,535,999 | | | $ | 51,535,999 | | | $ | 4,446,427 | | | $ | (610,852 | )2 |
Master Small Cap Index Series | | $ | 99,172,892 | | | | — | | | $ | (78,339,215 | )1 | | $ | 20,833,677 | | | $ | 20,833,677 | | | $ | 1,144,038 | | | $ | 36,048,448 | 2 |
1 Represents net shares/beneficial interest sold. | |
2 Includes the following gains and (losses) from in-kind redemptions from affiliated holdings. See Note 2 of the Notes to Financial Statements. | |
| | | | | | | | | | | | | | | | | | | | | | | | | | | | | | | | | | | | | | |
Active Stock
Master
Portfolio | | | CoreAlpha
Bond Master
Portfolio | | | International Tilts
Master Portfolio | | | iShares Cohen &
Steers REIT ETF | | | iShares
International
Developed Real
Estate ETF | | | iShares MSCI
Canada ETF | | | iShares MSCI
EAFE Small-
Cap ETF | | | iShares TIPS
Bond ETF | | | Large Cap Index Master
Portfolio (fka Russell 1000®
Index Master Portfolio) | | | Master Small
Cap Index
Series | |
| | $23,054,941 | | | $ | 4,296,866 | | | $ | (5,471,472 | ) | | $ | 18,601,069 | | | $ | 8,468,823 | | | $ | (2,267,584 | ) | | $ | 9,239,022 | | | $ | 10,188,462 | | | $ | 25,594,178 | | | $ | 18,237,204 | |
| | | | | | | | | | | | | | |
3 Represents all or a portion of securities lending income earned from the reinvestment of cash collateral from loaned securities, net of fees and collateral investment expenses, and other payments to and from borrowers of securities. |
4 No longer held by LifePath Master Portfolio as of period end. |
| (b) | | Security, or a portion of security, is on loan. |
| (c) | | Current yield as of period end. |
| (d) | | All or a portion of security was purchased with the cash collateral from loaned securities. |
| (e) | | Non-income producing security. |
|
| Derivative Financial Instruments Outstanding as of Period End |
Forward Foreign Currency Exchange Contracts
| | | | | | | | | | | | | | | | | | | | | | |
Currency
Purchased | | | Currency
Sold | | | Counterparty | | Settlement
Date | | | Unrealized
Appreciation
(Depreciation) | | | |
| AUD | | | 23,000 | | | USD | | | 16,823 | | | Northern Trust Co. | | | 1/21/16 | | | $ | (102 | ) | | |
| CAD | | | 34,000 | | | USD | | | 24,571 | | | Morgan Stanley & Co. International PLC | | | 1/21/16 | | | | (94 | ) | | |
| CAD | | | 43,000 | | | USD | | | 31,299 | | | Northern Trust Co. | | | 1/21/16 | | | | (342 | ) | | |
| CHF | | | 130,000 | | | USD | | | 131,346 | | | Goldman Sachs International | | | 1/21/16 | | | | (1,387 | ) | | |
| CHF | | | 10,000 | | | USD | | | 10,044 | | | Morgan Stanley & Co. International PLC | | | 1/21/16 | | | | (47 | ) | | |
| EUR | | | 315,000 | | | USD | | | 344,201 | | | HSBC Bank PLC | | | 1/21/16 | | | | (1,882 | ) | | |
| EUR | | | 70,000 | | | USD | | | 76,141 | | | Morgan Stanley & Co. International PLC | | | 1/21/16 | | | | (70 | ) | | |
| GBP | | | 42,000 | | | USD | | | 61,904 | | | Morgan Stanley & Co. International PLC | | | 1/21/16 | | | | 2 | | | |
| HKD | | | 480,000 | | | USD | | | 61,946 | | | Barclays Bank PLC | | | 1/21/16 | | | | (2 | ) | | |
| ILS | | | 64,000 | | | USD | | | 16,531 | | | Deutsche Bank AG | | | 1/21/16 | | | | (79 | ) | | |
| JPY | | | 49,206,000 | | | USD | | | 404,942 | | | Standard Chartered Bank | | | 1/21/16 | | | | 4,254 | | | |
| JPY | | | 11,304,000 | | | USD | | | 94,126 | | | UBS AG | | | 1/21/16 | | | | (122 | ) | | |
| NOK | | | 84,000 | | | USD | | | 9,672 | | | Morgan Stanley & Co. International PLC | | | 1/21/16 | | | | (184 | ) | | |
| NZD | | | 22,000 | | | USD | | | 14,810 | | | Goldman Sachs International | | | 1/21/16 | | | | 236 | | | |
| SEK | | | 111,000 | | | USD | | | 13,150 | | | Northern Trust Co. | | | 1/21/16 | | | | 23 | | | |
See Notes to Financial Statements.
| | | | | | |
| | | | | | | |
| 64 | | BLACKROCK FUNDS III | | DECEMBER 31, 2015 | | |
| | |
Schedule of Investments (continued) | | LifePath 2020 Master Portfolio |
Forward Foreign Currency Exchange Contracts (continued)
| | | | | | | | | | | | | | | | | | | | | | |
Currency
Purchased | | | Currency
Sold | | | Counterparty | | Settlement
Date | | | Unrealized
Appreciation
(Depreciation) | | | |
| SGD | | | 339,000 | | | USD | | | 240,508 | | | Barclays Bank PLC | | | 1/21/16 | | | $ | (1,683 | ) | | |
| SGD | | | 25,000 | | | USD | | | 17,633 | | | Morgan Stanley & Co. International PLC | | | 1/21/16 | | | | (21 | ) | | |
| USD | | | 29,565 | | | AUD | | | 41,000 | | | Goldman Sachs International | | | 1/21/16 | | | | (242 | ) | | |
| USD | | | 28,992 | | | AUD | | | 40,000 | | | Northern Trust Co. | | | 1/21/16 | | | | (87 | ) | | |
| USD | | | 267,632 | | | AUD | | | 373,000 | | | Royal Bank of Canada | | | 1/21/16 | | | | (3,534 | ) | | |
| USD | | | 7,918 | | | CAD | | | 11,000 | | | Northern Trust Co. | | | 1/21/16 | | | | (1 | ) | | |
| USD | | | 35,710 | | | EUR | | | 33,000 | | | Goldman Sachs International | | | 1/21/16 | | | | (153 | ) | | |
| USD | | | 15,240 | | | EUR | | | 14,000 | | | Goldman Sachs International | | | 1/21/16 | | | | 26 | | | |
| USD | | | 31,849 | | | EUR | | | 29,000 | | | Morgan Stanley & Co. International PLC | | | 1/21/16 | | | | 334 | | | |
| USD | | | 154,102 | | | EUR | | | 142,000 | | | Royal Bank of Scotland PLC | | | 1/21/16 | | | | (213 | ) | | |
| USD | | | 27,315 | | | EUR | | | 25,000 | | | Royal Bank of Scotland PLC | | | 1/21/16 | | | | 147 | | | |
| USD | | | 68,470 | | | GBP | | | 46,000 | | | Bank of America N.A. | | | 1/21/16 | | | | 668 | | | |
| USD | | | 37,624 | | | GBP | | | 25,000 | | | Morgan Stanley & Co. International PLC | | | 1/21/16 | | | | 774 | | | |
| USD | | | 26,797 | | | GBP | | | 18,000 | | | Northern Trust Co. | | | 1/21/16 | | | | 265 | | | |
| USD | | | 31,290 | | | GBP | | | 21,000 | | | Royal Bank of Scotland PLC | | | 1/21/16 | | | | 337 | | | |
| USD | | | 286,221 | | | HKD | | | 2,218,000 | | | Goldman Sachs International | | | 1/21/16 | | | | (10 | ) | | |
| USD | | | 25,939 | | | HKD | | | 201,000 | | | Northern Trust Co. | | | 1/21/16 | | | | — | | | |
| USD | | | 38,066 | | | HKD | | | 295,000 | | | UBS AG | | | 1/21/16 | | | | (3 | ) | | |
| USD | | | 43,473 | | | JPY | | | 5,229,000 | | | Morgan Stanley & Co. International PLC | | | 1/21/16 | | | | (11 | ) | | |
| USD | | | 22,239 | | | JPY | | | 2,688,000 | | | Royal Bank of Scotland PLC | | | 1/21/16 | | | | (114 | ) | | |
| USD | | | 74,373 | | | SEK | | | 637,000 | | | Bank of America N.A. | | | 1/21/16 | | | | (1,220 | ) | | |
| USD | | | 61,671 | | | SEK | | | 524,000 | | | HSBC Bank PLC | | | 1/21/16 | | | | (513 | ) | | |
| USD | | | 6,699 | | | SEK | | | 56,000 | | | Royal Bank of Scotland PLC | | | 1/21/16 | | | | 53 | | | |
| USD | | | 52,423 | | | SGD | | | 74,000 | | | Northern Trust Co. | | | 1/21/16 | | | | 290 | | | |
| USD | | | 45,924 | | | SGD | | | 65,000 | | | Standard Chartered Bank | | | 1/21/16 | | | | 132 | | | |
| Total | | | | | | | | | | | | | | | | | | $ | (4,575 | ) | | |
| | | | | | | | | | | | | | | | | | | |
|
| Derivative Financial Instruments Categorized by Risk Exposure |
As of period end, the fair values of derivative financial instruments located in the Statements of Assets and Liabilities were as follows:
| | | | | | | | | | | | | | | | | | | | | | | | | | | | | | |
| Assets — Derivative Financial Instruments | | Commodity Contracts | | | Credit Contracts | | | Equity Contracts | | | Foreign Currency Exchange Contracts | | | Interest Rate Contracts | | | Other Contracts | | | Total | |
Forward foreign currency exchange contracts | | Net unrealized appreciation on forward currency exchange contracts | | | — | | | | — | | | | — | | | $ | 7,541 | | | | — | | | | — | | | $ | 7,541 | |
Liabilities — Derivative Financial Instruments | | | | | | | | | | | | | | | | | | | | | | | | | | | | |
Forward foreign currency exchange contracts | | Net unrealized depreciation on forward currency exchange contracts | | | — | | | | — | | | | — | | | $ | 12,116 | | | | — | | | | — | | | $ | 12,116 | |
For the year ended December 31, 2015, the effect of derivative financial instruments in the Statements of Operations was as follows:
| | | | | | | | | | | | | | | | | | | | | | | | | | | | |
| Net Change in Unrealized Appreciation (Depreciation) on: | | Commodity
Contracts | | | Credit
Contracts | | | Equity Contracts | | | Foreign Currency Exchange Contracts | | | Interest Rate Contracts | | | Other Contracts | | | Total | |
Forward foreign currency exchange contracts | | | — | | | | — | | | | — | | | $ | (4,575 | ) | | | — | | | | — | | | $ | (4,575 | ) |
|
| Average Quarterly Balances of Outstanding Derivative Financial Instruments |
| | | | |
| Forward foreign currency exchange contracts: | | | | |
Average amounts purchased — in USD | | $ | 354,883 | |
Average amounts sold — in USD | | $ | 392,412 | |
For more information about the LifePath Fund’s investment risks regarding derivative financial instruments, refer to the Notes to Financial Statements.
See Notes to Financial Statements.
| | | | | | |
| | | | | | | |
| | BLACKROCK FUNDS III | | DECEMBER 31, 2015 | | 65 |
| | |
Schedule of Investments (continued) | | LifePath 2020 Master Portfolio |
|
| Derivative Financial Instruments — Offsetting as of Period End |
The LifePath Master Portfolio’s derivative assets and liabilities (by type) were as follows:
| | | | | | | | |
| | | Assets | | | Liabilities | |
Derivative Financial Instruments: | | | | | | | | |
Forward foreign currency exchange contracts | | $ | 7,541 | | | $ | 12,116 | |
| | | | |
Total derivative assets and liabilities in the Statements of Assets and Liabilities | | $ | 7,541 | | | $ | 12,116 | |
| | | | |
Derivatives not subject to a Master Netting Agreement or similar agreement (“MNA”) | | | — | | | | — | |
| | | | |
Total derivative assets and liabilities subject to an MNA | | $ | 7,541 | | | $ | 12,116 | |
| | | | |
The following table presents the LifePath Master Portfolio’s derivative assets and liabilities by counterparty net of amounts available for offset under an Master Netting Agreement (“MNA”) and net of the related collateral received and pledged by the LifePath Master Portfolio:
| | | | | | | | | | | | | | | | | | | | |
| Counterparty | | Derivative Assets
Subject to an MNA
by Counterparty | | | Derivatives
Available
for Offset1 | | | Non-cash
Collateral
Received | | | Cash
Collateral
Received | | | Net Amount of Derivative
Assets2 | |
Bank of America N.A. | | $ | 668 | | | $ | (668 | ) | | | — | | | | — | | | | — | |
Goldman Sachs International | | | 262 | | | | (262 | ) | | | — | | | | — | | | | — | |
Morgan Stanley & Co. International PLC | | | 1,110 | | | | (427 | ) | | | — | | | | — | | | $ | 683 | |
Northern Trust Co. | | | 578 | | | | (532 | ) | | | — | | | | — | | | | 46 | |
Royal Bank of Scotland PLC | | | 537 | | | | (327 | ) | | | — | | | | — | | | | 210 | |
Standard Chartered Bank | | | 4,386 | | | | — | | | | — | | | | — | | | | 4,386 | |
| | | | |
Total | | $ | 7,541 | | | $ | (2,216 | ) | | | — | | | | — | | | $ | 5,325 | |
| | | | |
| | | | | | | | | | | | | | | | | | | | |
| Counterparty | | Derivative Liabilities
Subject to an MNA
by Counterparty | | | Derivatives Available
for Offset1 | | | Non-cash
Collateral
Pledged | | | Cash
Collateral
Pledged | | | Net Amount of Derivative
Liabilities3 | |
Bank of America N.A. | | $ | 1,220 | | | $ | (668 | ) | | | — | | | | — | | | $ | 552 | |
Barclays Bank PLC | | | 1,685 | | | | — | | | | — | | | | — | | | | 1,685 | |
Deutsche Bank AG | | | 79 | | | | — | | | | — | | | | — | | | | 79 | |
Goldman Sachs International | | | 1,792 | | | | (262 | ) | | | — | | | | — | | | | 1,530 | |
HSBC Bank PLC | | | 2,395 | | | | — | | | | — | | | | — | | | | 2,395 | |
Morgan Stanley & Co. International PLC | | | 427 | | | | (427 | ) | | | — | | | | — | | | | — | |
Northern Trust Co. | | | 532 | | | | (532 | ) | | | — | | | | — | | | | — | |
Royal Bank of Canada | | | 3,534 | | | | — | | | | — | | | | — | | | | 3,534 | |
Royal Bank of Scotland PLC | | | 327 | | | | (327 | ) | | | — | | | | — | | | | — | |
UBS AG | | | 125 | | | | — | | | | — | | | | — | | | | 125 | |
| | | | |
Total | | $ | 12,116 | | | $ | (2,216 | ) | | | — | | | | — | | | $ | 9,900 | |
| | | | |
1 The amount of derivatives available for offset is limited to the amount of derivative assets and/or liabilities that are subject to an MNA. | |
2 Net amount represents the net amount receivable from the counterparty in the event of default. | |
3 Net amount represents the net amount payable due to the counterparty in the event of default. | |
|
| Fair Value Hierarchy as of Period End |
Various inputs are used in determining the fair value of investments and derivative financial instruments. For information about LifePath Master Portfolio’s policy regarding valuation of investments and derivative financial instruments, refer to the Notes to Financial Statements.
The following tables summarize LifePath Master Portfolio’s investments and derivative financial instruments categorized in the disclosure hierarchy:
| | | | | | | | | | | | | | | | |
| | | Level 1 | | | Level 2 | | | Level 3 | | | Total | |
Assets: | | | | | | | | | | | | | | | | |
| Investments: | | | | | | | | | | | | | | | | |
Affiliated Investment Companies: | | | | | | | | | | | | | | | | |
Equity Funds | | $ | 47,710,629 | | | $ | 233,032,329 | | | | — | | | $ | 280,742,958 | |
Fixed Income Funds | | | 37,553,555 | | | | 246,301,565 | | | | — | | | | 283,855,120 | |
Short-Term Securities | | | 4,028,712 | | | | — | | | | — | | | | 4,028,712 | |
Common Stocks: | | | | | | | | | | | | | | | | |
Hotels, Restaurants & Leisure | | | 316,079 | | | | — | | | | — | | | | 316,079 | |
Real Estate Investment Trusts (REITs) | | | 8,523,676 | | | | 3,445,062 | | | | — | | | | 11,968,738 | |
Real Estate Management & Development | | | 299,220 | | | | 2,934,662 | | | | — | | | | 3,233,882 | |
| | | | | | | | | | | | | | | | |
Total | | $ | 98,431,871 | | | $ | 485,713,618 | | | | — | | | $ | 584,145,489 | |
| | | | | | | | | | | | | | | | |
See Notes to Financial Statements.
| | | | | | |
| | | | | | | |
| 66 | | BLACKROCK FUNDS III | | DECEMBER 31, 2015 | | |
| | |
Schedule of Investments (concluded) | | LifePath 2020 Master Portfolio |
| | | | | | | | | | | | | | |
| | | Level 1 | | Level 2 | | | Level 3 | | | Total | |
| Derivative Financial Instruments1 | | | | | | | | | |
Assets: | | | | | | | | | | | | | | |
Forward foreign currency exchange contracts | | — | | $ | 7,541 | | | | — | | | $ | 7,541 | |
| Liabilities: | | | | | | | | | | | | | | |
Forward foreign currency exchange contracts | | — | | | (12,116 | ) | | | — | | | | (12,116 | ) |
| | | |
Total | | — | | $ | (4,575 | ) | | | — | | | $ | (4,575 | ) |
| | | |
1 Derivative financial instruments are forward foreign currency exchange contracts that are valued at the unrealized appreciation (depreciation) on the instrument. | |
The LifePath Master Portfolio may hold assets and/or liabilities in which the fair value approximates the carrying amount for financial statement purposes. As of period end, such assets and/or liabilities are categorized within the disclosure hierarchy as follows:
| | | | | | | | | | | | | | | | |
| | | Level 1 | | | Level 2 | | | Level 3 | | | Total | |
| Assets: | | | | | | | | | | | | | | | | |
Cash | | $ | 47,259 | | | | — | | | | — | | | $ | 47,259 | |
Foreign currency at value | | | 94,013 | | | | — | | | | — | | | | 94,013 | |
Liabilities: | | | | | | | | | | | | | | | | |
Collateral on securities loaned at value | | | — | | | $ | (2,747,024 | ) | | | — | | | | (2,747,024 | ) |
| | | | |
Total | | $ | 141,272 | | | $ | (2,747,024 | ) | | | — | | | $ | (2,605,752 | ) |
| | | | |
During the year ended December 31, 2015, there were no transfers between levels.
See Notes to Financial Statements.
| | | | | | |
| | | | | | | |
| | BLACKROCK FUNDS III | | DECEMBER 31, 2015 | | 67 |
| | |
Schedule of Investments December 31, 2015 | | LifePath 2030 Master Portfolio (Percentages shown are based on Net Assets) |
| | | | | | | | |
| Affiliated Investment Companies (a) | | Shares/
Beneficial Interest | | | Value | |
Equity Funds — 65.3% | |
Active Stock Master Portfolio | | $ | 127,705,255 | | | $ | 127,705,255 | |
BlackRock Commodity Strategies Fund | | | 3,173,206 | | | | 19,293,094 | |
BlackRock Emerging Markets Fund, Inc. | | | 1,377,544 | | | | 21,517,244 | |
International Tilts Master Portfolio | | $ | 82,549,286 | | | | 82,549,286 | |
iShares MSCI Canada ETF (b) | | | 297,289 | | | | 6,391,713 | |
iShares MSCI EAFE Small-Cap ETF | | | 233,145 | | | | 11,645,593 | |
Large Cap Index Master Portfolio (fka Russell 1000® Index Master Portfolio) | | $ | 71,445,267 | | | | 71,445,267 | |
Master Small Cap Index Series | | $ | 14,504,592 | | | | 14,504,592 | |
| | | | | | | | |
| | | | | | | | 355,052,044 | |
Fixed Income Funds — 26.8% | |
CoreAlpha Bond Master Portfolio | | $ | 135,910,507 | | | | 135,910,507 | |
iShares TIPS Bond ETF | | | 91,590 | | | | 10,045,591 | |
| | | | | | | | |
| | | | | | | | 145,956,098 | |
Short-Term Securities — 0.4% | |
BlackRock Cash Funds: Institutional,
SL Agency Shares, 0.38% (c)(d) | | | 1,688,189 | | | | 1,688,189 | |
BlackRock Cash Funds: Prime,
SL Agency Shares, 0.36% (c)(d) | | | 439,558 | | | | 439,558 | |
| | | | | | | | |
| | | | | | | | 2,127,747 | |
| Total Affiliated Investment Companies — 92.5% | | | | 503,135,889 | |
| | | | | | | | |
| | | | | | | | | |
| | |
| Common Stocks | | | | | | |
Hotels, Restaurants & Leisure — 0.1% | |
Hilton Worldwide Holdings, Inc. | | | 10,481 | | | | 224,293 | |
Pebblebrook Hotel Trust | | | 10,497 | | | | 294,126 | |
RLJ Lodging Trust | | | 14,730 | | | | 318,610 | |
| | | | | | | | |
| | | | | | | | 837,029 | |
Real Estate Investment Trusts (REITs) — 5.8% | |
Alexandria Real Estate Equities, Inc. | | | 6,770 | | | | 611,737 | |
Allied Properties Real Estate Investment Trust | | | 28,753 | | | | 656,018 | |
AvalonBay Communities, Inc. | | | 6,550 | | | | 1,206,051 | |
Beni Stabili SpA SIIQ | | | 437,103 | | | | 329,453 | |
Boston Properties, Inc. | | | 12,122 | | | | 1,546,040 | |
British Land Co. PLC | | | 74,797 | | | | 865,466 | |
Cambridge Industrial Trust | | | 1,062,600 | | | | 423,421 | |
CareTrust REIT, Inc. | | | 42,861 | | | | 469,328 | |
CubeSmart | | | 23,075 | | | | 706,557 | |
CyrusOne, Inc. | | | 11,823 | | | | 442,771 | |
Derwent London PLC | | | 9,442 | | | | 510,694 | |
Duke Realty Corp. | | | 26,060 | | | | 547,781 | |
Empiric Student Property PLC | | | 197,144 | | | | 329,865 | |
EPR Properties | | | 8,207 | | | | 479,699 | |
Equity One, Inc. | | | 19,572 | | | | 531,380 | |
Equity Residential | | | 15,851 | | | | 1,293,283 | |
Essex Property Trust, Inc. | | | 3,805 | | | | 910,955 | |
Extra Space Storage, Inc. | | | 10,183 | | | | 898,242 | |
Federal Realty Investment Trust | | | 1,090 | | | | 159,249 | |
General Growth Properties, Inc. | | | 7,835 | | | | 213,190 | |
Goodman Group | | | 267,150 | | | | 1,210,576 | |
Gramercy Property Trust | | | 39,582 | | | | 305,575 | |
Japan Rental Housing Investments, Inc. | | | 602 | | | | 425,366 | |
Kenedix Retail REIT Corp. | | | 302 | | | | 639,312 | |
Kilroy Realty Corp. | | | 11,627 | | | | 735,757 | |
Kimco Realty Corp. | | | 17,018 | | | | 450,296 | |
Land Securities Group PLC | | | 53,631 | | | | 929,695 | |
Link REIT | | | 116,000 | | | | 691,578 | |
Macerich Co. | | | 7,059 | | | | 569,591 | |
Merlin Properties Socimi SA | | | 24,795 | | | | 310,612 | |
National Health Investors, Inc. | | | 7,111 | | | | 432,847 | |
| | | | | | | | |
| Common Stocks | | Shares | | | Value | |
Real Estate Investment Trusts (REITs) (continued) | |
Parkway Properties, Inc. | | | 26,148 | | | $ | 408,693 | |
Physicians Realty Trust | | | 2,956 | | | | 49,838 | |
Prologis, Inc. | | | 24,880 | | | | 1,067,850 | |
Retail Properties of America, Inc., Class A | | | 54,414 | | | | 803,695 | |
Sekisui House REIT, Inc. | | | 223 | | | | 243,000 | |
Simon Property Group, Inc. | | | 13,027 | | | | 2,532,970 | |
SL Green Realty Corp. | | | 4,768 | | | | 538,689 | |
STAG Industrial, Inc. | | | 24,492 | | | | 451,877 | |
STORE Capital Corp. | | | 9,977 | | | | 231,466 | |
Sunstone Hotel Investors, Inc. | | | 43,560 | | | | 544,064 | |
Taubman Centers, Inc. | | | 2,053 | | | | 157,506 | |
UDR, Inc. | | | 16,412 | | | | 616,599 | |
Vastned Retail NV | | | 12,420 | | | | 570,589 | |
Vicinity Centres | | | 561,130 | | | | 1,138,351 | |
Welltower, Inc. | | | 18,341 | | | | 1,247,738 | |
Wereldhave NV | | | 8,339 | | | | 467,766 | |
Westfield Corp. | | | 129,310 | | | | 889,642 | |
| | | | | | | | |
| | | | | | | | 31,792,718 | |
Real Estate Management & Development — 1.7% | |
Castellum AB | | | 37,543 | | | | 534,659 | |
Cheung Kong Property Holdings Ltd. | | | 146,000 | | | | 944,472 | |
Deutsche Wohnen AG, Bearer Shares | | | 23,875 | | | | 660,187 | |
First Capital Realty, Inc. | | | 22,939 | | | | 304,207 | |
Heiwa Real Estate Co., Ltd. | | | 55,100 | | | | 602,923 | |
Howard Hughes Corp. (e) | | | 1,734 | | | | 196,219 | |
Kennedy Wilson Europe Real Estate PLC | | | 11,438 | | | | 203,410 | |
Kungsleden AB | | | 47,619 | | | | 340,260 | |
KWG Property Holding Ltd. | | | 567,500 | | | | 418,340 | |
LEG Immobilien AG | | | 2,828 | | | | 230,484 | |
Leopalace21 Corp. (e) | | | 37,600 | | | | 203,519 | |
Nomura Real Estate Holdings, Inc. | | | 24,600 | | | | 456,385 | |
Sumitomo Realty & Development Co., Ltd. | | | 36,000 | | | | 1,027,536 | |
Sun Hung Kai Properties Ltd. | | | 92,000 | | | | 1,105,801 | |
VIB Vermoegen AG | | | 16,300 | | | | 302,821 | |
Vonovia SE | | | 17,683 | | | | 546,282 | |
Wharf Holdings Ltd. | | | 124,000 | | | | 683,671 | |
| | | | | | | | |
| | | | | | | | 8,761,176 | |
| Total Common Stocks — 7.6% | | | | 41,390,923 | |
| Total Investments (Cost — $542,459,509) — 100.1% | | | | 544,526,812 | |
| Liabilities in Excess of Other Assets — (0.1)% | | | | | | | (679,947 | ) |
| | | | | | | | |
| Net Assets — 100.0% | | | | | | $ | 543,846,865 | |
| | | | | | | | |
See Notes to Financial Statements.
| | | | | | |
| | | | | | | |
| 68 | | BLACKROCK FUNDS III | | DECEMBER 31, 2015 | | |
| | |
Schedule of Investments (continued) | | LifePath 2030 Master Portfolio |
| | |
| Notes to Schedule of Investments | | |
| (a) | | During the year ended December 31, 2015, investments in issuers considered to be affiliates of LifePath Master Portfolio for purposes of Section 2(a)(3) of the Investment Company Act of 1940, as amended, were as follows: |
| | | | | | | | | | | | | | | | | | | | | | | | | | | | |
| Affiliate | | Shares/
Beneficial
Interest Held at
December 31, 2014 | | | Shares/ Beneficial Interest Purchased | | | Shares/ Beneficial Interest Sold | | | Shares/
Beneficial
Interest Held at
December 31, 2015 | | | Value at December 31, 2015 | | | Net Income | | | Realized
Gain (Loss) | |
Active Stock Master Portfolio | | $ | 732,007,711 | | | | — | | | $ | (604,302,456 | )1 | | $ | 127,705,255 | | | $ | 127,705,255 | | | $ | 9,357,776 | | | $ | 94,966,910 | 2 |
BlackRock Cash Funds: Institutional, SL Agency Shares | | | 5,873,387 | | | | — | | | | (4,105,198 | )1 | | | 1,688,189 | | | $ | 1,688,189 | | | $ | 98,854 | 3 | | | — | |
BlackRock Cash Funds: Prime, SL Agency Shares | | | 8,407,500 | | | | — | | | | (7,967,942 | )1 | | | 439,558 | | | $ | 439,558 | | | $ | 70,989 | 3 | | | — | |
BlackRock Commodity Strategies Fund | | | 12,540,270 | | | | 2,236,704 | | | | (11,603,768 | ) | | | 3,173,206 | | | $ | 19,293,094 | | | | — | | | $ | (36,829,057 | ) |
BlackRock Emerging Markets Fund, Inc. | | | 6,115,000 | | | | 1,127,696 | | | | (5,865,152 | ) | | | 1,377,544 | | | $ | 21,517,244 | | | $ | 292,384 | | | $ | (15,459,424 | ) |
CoreAlpha Bond Master Portfolio | | $ | 591,843,692 | | | | — | | | $ | (455,933,185 | )1 | | $ | 135,910,507 | | | $ | 135,910,507 | | | $ | 13,352,007 | | | $ | 4,565,718 | 2 |
International Tilts Master Portfolio | | $ | 378,538,181 | | | | — | | | $ | (295,988,895 | )1 | | $ | 82,549,286 | | | $ | 82,549,286 | | | $ | 9,506,373 | | | $ | (9,480,741 | )2 |
iShares Cohen & Steers REIT ETF4 | | | 1,164,738 | | | | 150,554 | | | | (1,315,292 | ) | | | — | | | | — | | | $ | 2,531,521 | | | $ | 40,777,885 | 2 |
iShares International Developed Real Estate ETF4 | | | 3,234,964 | | | | 301,660 | | | | (3,536,624 | ) | | | — | | | | — | | | $ | 2,725,121 | | | $ | 10,776,892 | 2 |
iShares MSCI Canada ETF | | | 1,320,806 | | | | 150,241 | | | | (1,173,758 | ) | | | 297,289 | | | $ | 6,391,713 | | | $ | 371,052 | | | $ | (4,460,095 | )2 |
iShares MSCI EAFE Small-Cap ETF | | | 1,198,374 | | | | 52,655 | | | | (1,017,884 | ) | | | 233,145 | | | $ | 11,645,593 | | | $ | 797,607 | | | $ | 11,671,739 | 2 |
iShares TIPS Bond ETF | | | 587,067 | | | | 55,245 | | | | (550,722 | ) | | | 91,590 | | | $ | 10,045,591 | | | $ | 224,182 | | | $ | 4,524,318 | 2 |
Large Cap Index Master Portfolio (fka Russell 1000® Index Master Portfolio) | | $ | 325,759,398 | | | | — | | | $ | (254,314,131 | )1 | | $ | 71,445,267 | | | $ | 71,445,267 | | | $ | 6,240,640 | | | $ | 14,015,438 | 2 |
Master Small Cap Index Series | | $ | 75,431,704 | | | | — | | | $ | (60,927,112 | )1 | | $ | 14,504,592 | | | $ | 14,504,592 | | | $ | 855,857 | | | $ | 19,972,790 | 2 |
1 Represents net shares/beneficial interest sold. | |
2 Includes the following gains and (losses) from in-kind redemptions from affiliated holdings. See Note 2 of the Notes to Financial Statements. | |
| | | | | | | | | | | | | | | | | | | | | | | | | | | | | | | | | | | | | | |
Active Stock
Master
Portfolio | | | CoreAlpha
Bond Master
Portfolio | | | International Tilts
Master Portfolio | | | iShares Cohen &
Steers REIT ETF | | | iShares
International
Developed Real
Estate ETF | | | iShares MSCI
Canada ETF | | | iShares MSCI
EAFE Small-
Cap ETF | | | iShares TIPS
Bond ETF | | | Large Cap Index Master
Portfolio (fka Russell 1000®
Index Master Portfolio) | | | Master Small
Cap Index
Series | |
| | $32,304,256 | | | $ | 2,366,029 | | | $ | (7,449,640 | ) | | $ | 36,247,642 | | | $ | 13,186,757 | | | $ | (3,946,774 | ) | | $ | 11,318,801 | | | $ | 4,645,871 | | | $ | 33,165,406 | | | $ | 13,331,530 | |
| | | | | | | | | | | | | | |
3 Represents all or a portion of securities lending income earned from the reinvestment of cash collateral from loaned securities, net of fees and collateral investment expenses, and other payments to and from borrowers of securities. |
4 No longer held by LifePath Master Portfolio as of period end. |
| (b) | | Security, or a portion of security, is on loan. |
| (c) | | Current yield as of period end. |
| (d) | | All or a portion of security was purchased with the cash collateral from loaned securities. |
| (e) | | Non-income producing security. |
|
| Derivative Financial Instruments Outstanding as of Period End |
Forward Foreign Currency Exchange Contracts
| | | | | | | | | | | | | | | | | | | | | | |
Currency
Purchased | | | Currency
Sold | | | Counterparty | | Settlement
Date | | | Unrealized
Appreciation
(Depreciation) | | | |
| CAD | | | 43,000 | | | USD | | | 31,076 | | | Morgan Stanley & Co. International PLC | | | 1/21/16 | | | $ | (119 | ) | | |
| CAD | | | 118,000 | | | USD | | | 85,889 | | | Northern Trust Co. | | | 1/21/16 | | | | (939 | ) | | |
| CHF | | | 353,000 | | | USD | | | 356,656 | | | Goldman Sachs International | | | 1/21/16 | | | | (3,766 | ) | | |
| EUR | | | 856,000 | | | USD | | | 935,354 | | | HSBC Bank PLC | | | 1/21/16 | | | | (5,113 | ) | | |
| EUR | | | 88,000 | | | USD | | | 95,720 | | | Morgan Stanley & Co. International PLC | | | 1/21/16 | | | | (88 | ) | | |
| GBP | | | 53,000 | | | USD | | | 78,117 | | | Morgan Stanley & Co. International PLC | | | 1/21/16 | | | | 3 | | | |
| HKD | | | 714,000 | | | USD | | | 92,144 | | | Barclays Bank PLC | | | 1/21/16 | | | | (3 | ) | | |
| ILS | | | 174,000 | | | USD | | | 44,943 | | | Deutsche Bank AG | | | 1/21/16 | | | | (216 | ) | | |
| JPY | | | 131,587,000 | | | USD | | | 1,082,898 | | | Standard Chartered Bank | | | 1/21/16 | | | | 11,376 | | | |
| JPY | | | 11,921,000 | | | USD | | | 99,266 | | | UBS AG | | | 1/21/16 | | | | (132 | ) | | |
| NOK | | | 228,000 | | | USD | | | 26,253 | | | Morgan Stanley & Co. International PLC | | | 1/21/16 | | | | (498 | ) | | |
| NZD | | | 59,000 | | | USD | | | 39,719 | | | Goldman Sachs International | | | 1/21/16 | | | | 634 | | | |
| SEK | | | 161,000 | | | USD | | | 19,073 | | | Northern Trust Co. | | | 1/21/16 | | | | 33 | | | |
| SGD | | | 921,000 | | | USD | | | 653,416 | | | Barclays Bank PLC | | | 1/21/16 | | | | (4,573 | ) | | |
| SGD | | | 26,000 | | | USD | | | 18,339 | | | Morgan Stanley & Co. International PLC | | | 1/21/16 | | | | (22 | ) | | |
| USD | | | 72,831 | | | AUD | | | 101,000 | | | Barclays Bank PLC | | | 1/21/16 | | | | (595 | ) | | |
See Notes to Financial Statements.
| | | | | | |
| | | | | | | |
| | BLACKROCK FUNDS III | | DECEMBER 31, 2015 | | 69 |
| | |
Schedule of Investments (continued) | | LifePath 2030 Master Portfolio |
Forward Foreign Currency Exchange Contracts (continued)
| | | | | | | | | | | | | | | | | | | | | | |
Currency
Purchased | | | Currency
Sold | | | Counterparty | | Settlement
Date | | | Unrealized
Appreciation
(Depreciation) | | | |
| USD | | | 90,601 | | | AUD | | | 125,000 | | | Northern Trust Co. | | | 1/21/16 | | | $ | (272 | ) | | |
| USD | | | 726,840 | | | AUD | | | 1,013,000 | | | Royal Bank of Canada | | | 1/21/16 | | | | (9,598 | ) | | |
| USD | | | 24,473 | | | CAD | | | 34,000 | | | Northern Trust Co. | | | 1/21/16 | | | | (5 | ) | | |
| USD | | | 97,390 | | | EUR | | | 90,000 | | | Goldman Sachs International | | | 1/21/16 | | | | (416 | ) | | |
| USD | | | 26,126 | | | EUR | | | 24,000 | | | Goldman Sachs International | | | 1/21/16 | | | | 44 | | | |
| USD | | | 75,401 | | | EUR | | | 69,000 | | | Morgan Stanley & Co. International PLC | | | 1/21/16 | | | | 417 | | | |
| USD | | | 105,431 | | | EUR | | | 96,000 | | | Morgan Stanley & Co. International PLC | | | 1/21/16 | | | | 1,105 | | | |
| USD | | | 418,898 | | | EUR | | | 386,000 | | | Royal Bank of Scotland PLC | | | 1/21/16 | | | | (580 | ) | | |
| USD | | | 184,573 | | | GBP | | | 124,000 | | | Bank of America N.A. | | | 1/21/16 | | | | 1,800 | | | |
| USD | | | 103,841 | | | GBP | | | 69,000 | | | Morgan Stanley & Co. International PLC | | | 1/21/16 | | | | 2,138 | | | |
| USD | | | 77,412 | | | GBP | | | 52,000 | | | Northern Trust Co. | | | 1/21/16 | | | | 766 | | | |
| USD | | | 86,421 | | | GBP | | | 58,000 | | | Royal Bank of Scotland PLC | | | 1/21/16 | | | | 931 | | | |
| USD | | | 774,398 | | | HKD | | | 6,001,000 | | | Goldman Sachs International | | | 1/21/16 | | | | (27 | ) | | |
| USD | | | 61,299 | | | HKD | | | 475,000 | | | Goldman Sachs International | | | 1/21/16 | | | | 1 | | | |
| USD | | | 117,812 | | | HKD | | | 913,000 | | | UBS AG | | | 1/21/16 | | | | (10 | ) | | |
| USD | | | 140,205 | | | JPY | | | 16,864,000 | | | Morgan Stanley & Co. International PLC | | | 1/21/16 | | | | (36 | ) | | |
| USD | | | 46,935 | | | JPY | | | 5,673,000 | | | Royal Bank of Scotland PLC | | | 1/21/16 | | | | (242 | ) | | |
| USD | | | 201,986 | | | SEK | | | 1,730,000 | | | Bank of America N.A. | | | 1/21/16 | | | | (3,314 | ) | | |
| USD | | | 167,476 | | | SEK | | | 1,423,000 | | | HSBC Bank PLC | | | 1/21/16 | | | | (1,392 | ) | | |
| USD | | | 19,260 | | | SEK | | | 161,000 | | | Royal Bank of Scotland PLC | | | 1/21/16 | | | | 154 | | | |
| USD | | | 141,685 | | | SGD | | | 200,000 | | | Northern Trust Co. | | | 1/21/16 | | | | 785 | | | |
| USD | | | 125,055 | | | SGD | | | 177,000 | | | Standard Chartered Bank | | | 1/21/16 | | | | 359 | | | |
| Total | | | | | | | | | | | | | | | | | | $ | (11,410 | ) | | |
| | | | | | | | | | | | | | | | | | | |
|
| Derivative Financial Instruments Categorized by Risk Exposure |
As of period end, the fair values of derivative financial instruments located in the Statements of Assets and Liabilities were as follows:
| | | | | | | | | | | | | | | | | | | | | | | | | | | | | | |
| Assets — Derivative Financial Instruments | | Commodity Contracts | | | Credit Contracts | | | Equity Contracts | | | Foreign Currency Exchange Contracts | | | Interest Rate Contracts | | | Other Contracts | | | Total | |
Forward foreign currency exchange contracts | | Net unrealized appreciation on forward currency exchange contracts | | | — | | | | — | | | | — | | | $ | 20,546 | | | | — | | | | — | | | $ | 20,546 | |
Liabilities — Derivative Financial Instruments | | | | | | | | | | | | | | | | | | | | | | | | | | | | |
Forward foreign currency exchange contracts | | Net unrealized depreciation on forward currency exchange contracts | | | — | | | | — | | | | — | | | $ | 31,956 | | | | — | | | | — | | | $ | 31,956 | |
For the year ended December 31, 2015, the effect of derivative financial instruments in the Statements of Operations was as follows:
| | | | | | | | | | | | | | | | | | | | | | | | | | | | |
| Net Change in Unrealized Appreciation (Depreciation) on: | | Commodity Contracts | | | Credit Contracts | | | Equity Contracts | | | Foreign Currency Exchange Contracts | | | Interest Rate Contracts | | | Other Contracts | | | Total | |
Forward foreign currency exchange contracts | | | — | | | | — | | | | — | | | $ | (11,410 | ) | | | — | | | | — | | | $ | (11,410 | ) |
|
| Average Quarterly Balances of Outstanding Derivative Financial Instruments |
| | | | | | |
| Forward foreign currency exchange contracts: | | | | | | |
Average amounts purchased — in USD | | $ | 971,587 | | | |
Average amounts sold — in USD | | $ | 914,716 | | | |
For more information about the LifePath Fund’s investment risks regarding derivative financial instruments, refer to the Notes to Financial Statements.
|
| Derivative Financial Instruments — Offsetting as of Period End |
The LifePath Master Portfolio’s derivative assets and liabilities (by type) were as follows:
| | | | | | | | |
| | | Assets | | | Liabilities | |
Derivative Financial Instruments: | | | | | | | | |
Forward foreign currency exchange contracts | | $ | 20,546 | | | $ | 31,956 | |
| | | | |
Total derivative assets and liabilities in the Statements of Assets and Liabilities | | $ | 20,546 | | | $ | 31,956 | |
| | | | |
Derivatives not subject to a Master Netting Agreement or similar agreement (“MNA”) | | | — | | | | — | |
| | | | |
Total derivative assets and liabilities subject to an MNA | | $ | 20,546 | | | $ | 31,956 | |
| | | | |
See Notes to Financial Statements.
| | | | | | |
| | | | | | | |
| 70 | | BLACKROCK FUNDS III | | DECEMBER 31, 2015 | | |
| | |
Schedule of Investments (concluded) | | LifePath 2030 Master Portfolio |
The following table presents the LifePath Master Portfolio’s derivative assets and liabilities by counterparty net of amounts available for offset under an Master Netting Agreement (“MNA”) and net of the related collateral received and pledged by the LifePath Master Portfolio:
| | | | | | | | | | | | | | | | | | | | |
| Counterparty | | Derivative Assets
Subject to an MNA
by Counterparty | | | Derivatives
Available
for Offset1 | | | Non-cash
Collateral
Received | | | Cash
Collateral
Received | | | Net Amount of
Derivative
Assets2 | |
Bank of America N.A. | | $ | 1,800 | | | $ | (1,800 | ) | | | — | | | | — | | | | — | |
Goldman Sachs International | | | 679 | | | | (679 | ) | | | — | | | | — | | | | — | |
Morgan Stanley & Co. International PLC | | | 3,663 | | | | (763 | ) | | | — | | | | — | | | $ | 2,900 | |
Northern Trust Co. | | | 1,584 | | | | (1,216 | ) | | | — | | | | — | | | | 368 | |
Royal Bank of Scotland PLC | | | 1,085 | | | | (822 | ) | | | — | | | | — | | | | 263 | |
Standard Chartered Bank | | | 11,735 | | | | — | | | | — | | | | — | | | | 11,735 | |
| | | | | | | | | | | | | | | | | | | | |
| Total | | $ | 20,546 | | | $ | (5,280 | ) | | | — | | | | — | | | $ | 15,266 | |
| | | | | | | | | | | | | | | | | | | | |
| | | | | | | | | | | | | | | | | | | | |
| Counterparty | | Derivative Liabilities
Subject to an MNA
by Counterparty | | | Derivatives
Available
for Offset1 | | | Non-cash
Collateral
Pledged | | | Cash
Collateral
Pledged | | | Net Amount of
Derivative
Liabilities3 | |
Bank of America N.A. | | $ | 3,314 | | | $ | (1,800 | ) | | | — | | | | — | | | $ | 1,514 | |
Barclays Bank PLC | | | 5,171 | | | | — | | | | — | | | | — | | | | 5,171 | |
Deutsche Bank AG | | | 216 | | | | — | | | | — | | | | — | | | | 216 | |
Goldman Sachs International | | | 4,209 | | | | (679 | ) | | | — | | | | — | | | | 3,530 | |
HSBC Bank PLC | | | 6,505 | | | | — | | | | — | | | | — | | | | 6,505 | |
Morgan Stanley & Co. International PLC | | | 763 | | | | (763 | ) | | | — | | | | — | | | | — | |
Northern Trust Co. | | | 1,216 | | | | (1,216 | ) | | | — | | | | — | | | | — | |
Royal Bank of Canada | | | 9,598 | | | | — | | | | — | | | | — | | | | 9,598 | |
Royal Bank of Scotland PLC | | | 822 | | | | (822 | ) | | | — | | | | — | | | | — | |
UBS AG | �� | | 142 | | | | — | | | | — | | | | — | | | | 142 | |
| | | | | | | | | | | | | | | | | | | | |
Total | | $ | 31,956 | | | $ | (5,280 | ) | | | — | | | | — | | | $ | 26,676 | |
| | | | | | | | | | | | | | | | | | | | |
1 The amount of derivatives available for offset is limited to the amount of derivative assets and/or liabilities that are subject to an MNA. | |
2 Net amount represents the net amount receivable from the counterparty in the event of default. | | | | | |
3 Net amount represents the net amount payable due to the counterparty in the event of default. | | | | | |
|
| Fair Value Hierarchy as of Period End |
Various inputs are used in determining the fair value of investments and derivative financial instruments. For information about LifePath Master Portfolio’s policy regarding valuation of investments and derivative financial instruments, refer to the Notes to Financial Statements.
The following tables summarize LifePath Master Portfolio’s investments and derivative financial instruments categorized in the disclosure hierarchy:
| | | | | | | | | | | | | | | | |
| | | Level 1 | | | Level 2 | | | Level 3 | | | Total | |
Assets: | | | | | | | | | | | | | | | | |
| Investments: | | | | | | | | | | | | | | | | |
Affiliated Investment Companies: | | | | | | | | | | | | | | | | |
Equity Funds | | $ | 58,847,644 | | | $ | 296,204,400 | | | | — | | | $ | 355,052,044 | |
Fixed Income Funds | | | 10,045,591 | | | | 135,910,507 | | | | — | | | | 145,956,098 | |
Short-Term Securities | | | 2,127,747 | | | | — | | | | — | | | | 2,127,747 | |
Common Stocks: | | | | | | | | | | | | | | | | |
Hotels, Restaurants & Leisure | | | 837,029 | | | | — | | | | — | | | | 837,029 | |
Real Estate Investment Trusts (REITs) | | | 22,570,619 | | | | 9,222,099 | | | | — | | | | 31,792,718 | |
Real Estate Management & Development | | | 803,247 | | | | 7,957,929 | | | | — | | | | 8,761,176 | |
| | | | | | | | | | | | | | | | |
Total | | $ | 95,231,877 | | | $ | 449,294,935 | | | | — | | | $ | 544,526,812 | |
| | | | | | | | | | | | | | | | |
| | | | | | | | | | | | | | |
| | | Level 1 | | Level 2 | | | Level 3 | | | Total | |
| Derivative Financial Instruments1 | | | | | | | | | | | | | | |
Assets: | | | | | | | | | | | | | | |
Forward foreign currency exchange contracts | | — | | $ | 20,546 | | | | — | | | $ | 20,546 | |
Liabilities: | | | | | | | | | | | | | | |
Forward foreign currency exchange contracts | | — | | | (31,956 | ) | | | — | | | | (31,956 | ) |
| | | | | | | | | | | | | | |
Total | | — | | $ | (11,410 | ) | | | — | | | $ | (11,410 | ) |
| | | | | | | | | | | | | | |
1 Derivative financial instruments are forward foreign currency exchange contracts that are valued at the unrealized appreciation (depreciation) on the instrument. | |
The LifePath Master Portfolio may hold assets and/or liabilities in which the fair value approximates the carrying amount for financial statement purposes. As of period end, such assets and/or liabilities are categorized within the disclosure hierarchy as follows:
| | | | | | | | | | | | | | | | |
| | | Level 1 | | | Level 2 | | | Level 3 | | | Total | |
Assets: | |
Cash | | $ | 180,824 | | | | — | | | | — | | | $ | 180,824 | |
Foreign currency at value | | | 255,917 | | | | — | | | | — | | | | 255,917 | |
Liabilities: | | | | | | | | | | | | | | | | |
Collateral on securities loaned at value | | | — | | | $ | (1,008,821 | ) | | | — | | | | (1,008,821 | ) |
| | | | | | | | | | | | | | | | |
Total | | $ | 436,741 | | | $ | (1,008,821 | ) | | | — | | | $ | (572,080 | ) |
| | | | | | | | | | | | | | | | |
During the year ended December 31, 2015, there were no transfers between levels.
See Notes to Financial Statements.
| | | | | | |
| | | | | | | |
| | BLACKROCK FUNDS III | | DECEMBER 31, 2015 | | 71 |
| | |
Schedule of Investments December 31, 2015 | | LifePath 2040 Master Portfolio (Percentages shown are based on Net Assets) |
| | | | | | | | |
| Affiliated Investment Companies (a) | | Shares/
Beneficial Interest | | | Value | |
Equity Funds — 80.3% | | | | | | | | |
Active Stock Master Portfolio | | $ | 113,154,626 | | | $ | 113,154,626 | |
BlackRock Commodity Strategies Fund | | | 2,587,499 | | | | 15,731,994 | |
BlackRock Emerging Markets Fund, Inc. | | | 1,391,835 | | | | 21,740,457 | |
International Tilts Master Portfolio | | $ | 82,910,552 | | | | 82,910,552 | |
iShares MSCI Canada ETF | | | 294,258 | | | | 6,326,547 | |
iShares MSCI EAFE Small-Cap ETF | | | 236,258 | | | | 11,801,087 | |
Large Cap Index Master Portfolio (fka Russell 1000® Index Master Portfolio) | | $ | 81,187,428 | | | | 81,187,428 | |
Master Small Cap Index Series | | $ | 9,147,421 | | | | 9,147,421 | |
| | | | | | | | |
| | | | | | | | 342,000,112 | |
Fixed Income Fund — 7.4% | |
CoreAlpha Bond Master Portfolio | | $ | 31,354,405 | | | | 31,354,405 | |
Short-Term Securities — 0.2% | |
BlackRock Cash Funds: Institutional, SL Agency Shares, 0.38% (b) | | | 931,298 | | | | 931,298 | |
| Total Affiliated Investment Companies — 87.9% | | | | 374,285,815 | |
| | | | | | | | |
| | | | | |
| | |
| Common Stocks | | | | | | |
Hotels, Restaurants & Leisure — 0.2% | | | | | | | | |
Hilton Worldwide Holdings, Inc. | | | 11,814 | | | | 252,820 | |
Pebblebrook Hotel Trust | | | 12,878 | | | | 360,842 | |
RLJ Lodging Trust | | | 18,072 | | | | 390,897 | |
| | | | | | | | |
| | | | | 1,004,559 | |
Real Estate Investment Trusts (REITs) — 9.1% | |
Alexandria Real Estate Equities, Inc. | | | 8,243 | | | | 744,837 | |
Allied Properties Real Estate Investment Trust | | | 35,823 | | | | 817,325 | |
AvalonBay Communities, Inc. | | | 8,036 | | | | 1,479,669 | |
Beni Stabili SpA SIIQ | | | 544,570 | | | | 410,453 | |
Boston Properties, Inc. | | | 14,873 | | | | 1,896,902 | |
British Land Co. PLC | | | 93,186 | | | | 1,078,242 | |
Cambridge Industrial Trust | | | 1,323,900 | | | | 527,543 | |
CareTrust REIT, Inc. | | | 53,399 | | | | 584,719 | |
CubeSmart | | | 28,311 | | | | 866,883 | |
CyrusOne, Inc. | | | 13,938 | | | | 521,978 | |
Derwent London PLC | | | 11,763 | | | | 636,231 | |
Duke Realty Corp. | | | 32,467 | | | | 682,456 | |
Empiric Student Property PLC | | | 245,615 | | | | 410,967 | |
EPR Properties | | | 9,671 | | | | 565,270 | |
Equity One, Inc. | | | 24,384 | | | | 662,026 | |
Equity Residential | | | 19,448 | | | | 1,586,762 | |
Essex Property Trust, Inc. | | | 4,669 | | | | 1,117,805 | |
Extra Space Storage, Inc. | | | 12,493 | | | | 1,102,008 | |
Federal Realty Investment Trust | | | 1,358 | | | | 198,404 | |
General Growth Properties, Inc. | | | 9,761 | | | | 265,597 | |
Goodman Group | | | 332,830 | | | | 1,508,201 | |
Gramercy Property Trust | | | 49,314 | | | | 380,706 | |
Japan Rental Housing Investments, Inc. | | | 751 | | | | 530,648 | |
Kenedix Retail REIT Corp. | | | 377 | | | | 798,082 | |
Kilroy Realty Corp. | | | 14,207 | | | | 899,019 | |
Kimco Realty Corp. | | | 20,173 | | | | 533,778 | |
Land Securities Group PLC | | | 65,800 | | | | 1,140,645 | |
Link REIT | | | 144,500 | | | | 861,492 | |
Macerich Co. | | | 8,321 | | | | 671,421 | |
Merlin Properties Socimi SA | | | 30,891 | | | | 386,978 | |
National Health Investors, Inc. | | | 8,859 | | | | 539,247 | |
Parkway Properties, Inc. | | | 32,577 | | | | 509,179 | |
Physicians Realty Trust | | | 3,683 | | | | 62,095 | |
Prologis, Inc. | | | 30,525 | | | | 1,310,133 | |
Retail Properties of America, Inc., Class A | | | 66,761 | | | | 986,060 | |
Sekisui House REIT, Inc. | | | 278 | | | | 302,933 | |
| | | | | | | | |
| Common Stocks | |
Shares | | | Value | |
Real Estate Investment Trusts (REITs) (continued) | |
Simon Property Group, Inc. | | | 15,983 | | | $ | 3,107,735 | |
SL Green Realty Corp. | | | 5,941 | | | | 671,214 | |
STAG Industrial, Inc. | | | 30,514 | | | | 562,983 | |
STORE Capital Corp. | | | 12,430 | | | | 288,376 | |
Sunstone Hotel Investors, Inc. | | | 53,421 | | | | 667,228 | |
Taubman Centers, Inc. | | | 2,558 | | | | 196,250 | |
UDR, Inc. | | | 20,448 | | | | 768,231 | |
Vastned Retail NV | | | 15,474 | | | | 710,893 | |
Vicinity Centres | | | 699,090 | | | | 1,418,227 | |
Welltower, Inc. | | | 22,502 | | | | 1,530,811 | |
Wereldhave NV | | | 10,389 | | | | 582,758 | |
Westfield Corp. | | | 161,110 | | | | 1,108,423 | |
| | | | | | | | |
| | | | | | | | 39,189,823 | |
Real Estate Management & Development — 2.7% | |
Castellum AB | | | 46,773 | | | | 666,106 | |
Cheung Kong Property Holdings Ltd. | | | 182,000 | | | | 1,177,355 | |
Deutsche Wohnen AG, Bearer Shares | | | 29,745 | | | | 822,503 | |
First Capital Realty, Inc. | | | 28,579 | | | | 379,002 | |
Heiwa Real Estate Co., Ltd. | | | 68,700 | | | | 751,739 | |
Howard Hughes Corp. (c) | | | 2,161 | | | | 244,539 | |
Kennedy Wilson Europe Real Estate PLC | | | 14,251 | | | | 253,436 | |
Kungsleden AB | | | 59,326 | | | | 423,911 | |
KWG Property Holding Ltd. | | | 707,000 | | | | 521,175 | |
LEG Immobilien AG | | | 3,523 | | | | 287,126 | |
Leopalace21 Corp. (c) | | | 46,800 | | | | 253,316 | |
Nomura Real Estate Holdings, Inc. | | | 30,700 | | | | 569,553 | |
Sumitomo Realty & Development Co., Ltd. | | | 45,000 | | | | 1,284,420 | |
Sun Hung Kai Properties Ltd. | | | 114,000 | | | | 1,370,232 | |
VIB Vermoegen AG | | | 20,307 | | | | 377,263 | |
Vonovia SE | | | 22,031 | | | | 680,605 | |
Wharf Holdings Ltd. | | | 155,000 | | | | 854,590 | |
| | | | | | | | |
| | | | | | | | 10,916,871 | |
| Total Common Stocks — 12.0% | | | | 51,111,253 | |
| Total Investments (Cost — $422,802,051) — 99.9% | | | | 425,397,068 | |
| Other Assets Less Liabilities — 0.1% | | | | 558,626 | |
| | | | | | | | |
Net Assets — 100.0% | | | $ | 425,955,694 | |
| | | | | | | | |
See Notes to Financial Statements.
| | | | | | |
| | | | | | | |
| 72 | | BLACKROCK FUNDS III | | DECEMBER 31, 2015 | | |
| | |
Schedule of Investments (continued) | | LifePath 2040 Master Portfolio |
|
| Notes to Schedule of Investments |
| (a) | | During the year ended December 31, 2015, investments in issuers considered to be affiliates of LifePath Master Portfolio for purposes of Section 2(a)(3) of the Investment Company Act of 1940, as amended, were as follows: |
| | | | | | | | | | | | | | | | | | | | | | | | | | | | |
| Affiliate | | Shares/
Beneficial
Interest Held at
December 31, 2014 | | | Shares/ Beneficial
Interest
Purchased | | | Shares/ Beneficial
Interest Sold | | | Shares/
Beneficial
Interest Held at
December 31, 2015 | | | Value at
December 31, 2015 | | | Net Income | | | Realized
Gain (Loss) | |
Active Stock Master Portfolio | | $ | 617,793,419 | | | | — | | | $ | (504,638,793 | )1 | | $ | 113,154,626 | | | $ | 113,154,626 | | | $ | 8,096,943 | | | $ | 82,955,872 | 2 |
BlackRock Cash Funds: Institutional, SL Agency Shares | | | 4,210,819 | | | | — | | | | (3,279,521 | )1 | | | 931,298 | | | $ | 931,298 | | | $ | 5,283 | | | | — | |
BlackRock Cash Funds: Prime, SL Agency Shares3 | | | 16,314,800 | | | | — | | | | (16,314,800 | )1 | | | — | | | | — | | | $ | 140,919 | 4 | | | — | |
BlackRock Commodity Strategies Fund | | | 10,188,103 | | | | 1,745,798 | | | | (9,346,402 | ) | | | 2,587,499 | | | $ | 15,731,994 | | | | — | | | $ | (29,168,486 | ) |
BlackRock Emerging Markets Fund, Inc. | | | 5,989,668 | | | | 928,677 | | | | (5,526,510 | ) | | | 1,391,835 | | | $ | 21,740,457 | | | $ | 291,036 | | | $ | (14,481,276 | ) |
CoreAlpha Bond Master Portfolio | | $ | 124,444,002 | | | | — | | | $ | (93,089,597 | )1 | | $ | 31,354,405 | | | $ | 31,354,405 | | | $ | 2,941,234 | | | $ | 2,912,107 | 2 |
International Tilts Master Portfolio | | $ | 367,981,472 | | | | — | | | $ | (285,070,920 | )1 | | $ | 82,910,552 | | | $ | 82,910,552 | | | $ | 9,153,944 | | | $ | (9,149,915 | )2 |
iShares Cohen & Steers REIT ETF3 | | | 1,402,976 | | | | 195,791 | | | | (1,598,767 | ) | | | — | | | | — | | | $ | 3,021,839 | | | $ | 42,833,072 | 2 |
iShares International Developed Real Estate ETF3 | | | 3,883,740 | | | | 379,389 | | | | (4,263,129 | ) | | | — | | | | — | | | $ | 3,292,393 | | | $ | 9,027,132 | 2 |
iShares MSCI Canada ETF | | | 1,285,655 | | | | 140,080 | | | | (1,131,477 | ) | | | 294,258 | | | $ | 6,326,547 | | | $ | 362,645 | | | $ | (4,181,510 | )2 |
iShares MSCI EAFE Small-Cap ETF | | | 1,170,755 | | | | 55,263 | | | | (989,760 | ) | | | 236,258 | | | $ | 11,801,087 | | | $ | 774,987 | | | $ | 10,319,818 | 2 |
Large Cap Index Master Portfolio (fka Russell 1000® Index Master Portfolio) | | $ | 379,569,351 | | | | — | | | $ | (298,381,923 | )1 | | $ | 81,187,428 | | | $ | 81,187,428 | | | $ | 6,615,901 | | | $ | 17,461,365 | 2 |
Master Small Cap Index Series | | $ | 50,915,660 | | | | — | | | $ | (41,768,239 | )1 | | $ | 9,147,421 | | | $ | 9,147,421 | | | $ | 542,081 | | | $ | 12,904,058 | 2 |
1 Represents net shares/beneficial interest sold. | |
2 Includes the following gains and (losses) from in-kind redemptions from affiliated holdings. See Note 2 of the Notes to Financial Statements. | |
| | | | | | | | | | | | | | | | | | | | | | | | | | | | | | | | | | |
Active Stock
Master
Portfolio | | | CoreAlpha
Bond Master
Portfolio | | | International Tilts
Master Portfolio | | | iShares Cohen &
Steers REIT ETF | | | iShares
International
Developed Real
Estate ETF | | | iShares MSCI
Canada ETF | | | iShares MSCI
EAFE Small-
Cap ETF | | | Large Cap Index Master
Portfolio (fka Russell 1000®
Index Master Portfolio) | | | Master Small
Cap Index
Series | |
| | $27,156,891 | | | $ | 531,526 | | | $ | (6,886,200 | ) | | $ | 36,631,556 | | | $ | 12,596,893 | | | $ | (3,464,193 | ) | | $ | 9,374,779 | | | $ | 32,956,171 | | | $ | 7,597,361 | |
| | | | | | | | | | | | | | |
3 No longer held by LifePath Master Portfolio as of period end. |
4 Represents securities lending income earned from the reinvestment of cash collateral from loaned securities, net of fees and collateral investment expenses, and other payments to and from borrowers of securities. |
| (b) | | Current yield as of period end. |
| (c) | | Non-income producing security. |
|
| Derivative Financial Instruments Outstanding as of Period End |
Forward Foreign Currency Exchange Contracts
| | | | | | | | | | | | | | | | | | | | | | |
Currency
Purchased | | | Currency
Sold | | | Counterparty | | Settlement
Date | | | Unrealized
Appreciation
(Depreciation) | | | |
| CAD | | | 38,000 | | | USD | | | 27,462 | | | Morgan Stanley & Co. International PLC | | | 1/21/16 | | | $ | (105 | ) | | |
| CAD | | | 146,000 | | | USD | | | 106,270 | | | Northern Trust Co. | | | 1/21/16 | | | | (1,162 | ) | | |
| CHF | | | 440,000 | | | USD | | | 444,557 | | | Goldman Sachs International | | | 1/21/16 | | | | (4,694 | ) | | |
| EUR | | | 1,067,000 | | | USD | | | 1,165,978 | | | Citibank N.A. | | | 1/21/16 | | | | (6,438 | ) | | |
| EUR | | | 75,000 | | | USD | | | 81,580 | | | Morgan Stanley & Co. International PLC | | | 1/21/16 | | | | (75 | ) | | |
| GBP | | | 48,000 | | | USD | | | 70,748 | | | Morgan Stanley & Co. International PLC | | | 1/21/16 | | | | 3 | | | |
| HKD | | | 664,000 | | | USD | | | 85,691 | | | Barclays Bank PLC | | | 1/21/16 | | | | (3 | ) | | |
| ILS | | | 217,000 | | | USD | | | 56,050 | | | Deutsche Bank AG | | | 1/21/16 | | | | (269 | ) | | |
| JPY | | | 162,969,000 | | | USD | | | 1,341,156 | | | Standard Chartered Bank | | | 1/21/16 | | | | 14,089 | | | |
| JPY | | | 9,437,000 | | | USD | | | 78,580 | | | UBS AG | | | 1/21/16 | | | | (102 | ) | | |
| NOK | | | 284,000 | | | USD | | | 32,701 | | | Morgan Stanley & Co. International PLC | | | 1/21/16 | | | | (621 | ) | | |
| NZD | | | 73,000 | | | USD | | | 49,144 | | | Goldman Sachs International | | | 1/21/16 | | | | 785 | | | |
| SEK | | | 158,000 | | | USD | | | 18,718 | | | Northern Trust Co. | | | 1/21/16 | | | | 32 | | | |
| SGD | | | 1,148,000 | | | USD | | | 814,464 | | | Barclays Bank PLC | | | 1/21/16 | | | | (5,700 | ) | | |
| SGD | | | 45,000 | | | USD | | | 31,740 | | | Morgan Stanley & Co. International PLC | | | 1/21/16 | | | | (38 | ) | | |
| USD | | | 87,975 | | | AUD | | | 122,000 | | | Goldman Sachs International | | | 1/21/16 | | | | (717 | ) | | |
| USD | | | 138,438 | | | AUD | | | 191,000 | | | Northern Trust Co. | | | 1/21/16 | | | | (416 | ) | | |
| USD | | | 905,500 | | | AUD | | | 1,262,000 | | | Royal Bank of Canada | | | 1/21/16 | | | | (11,958 | ) | | |
See Notes to Financial Statements.
| | | | | | |
| | | | | | | |
| | BLACKROCK FUNDS III | | DECEMBER 31, 2015 | | 73 |
| | |
Schedule of Investments (continued) | | LifePath 2040 Master Portfolio |
Forward Foreign Currency Exchange Contracts (continued)
| | | | | | | | | | | | | | | | | | | | | | |
Currency
Purchased | | | Currency
Sold | | | Counterparty | | Settlement
Date | | | Unrealized
Appreciation
(Depreciation) | | | |
| USD | | | 39,588 | | | CAD | | | 55,000 | | | Northern Trust Co. | | | 1/21/16 | | | $ | (7 | ) | | |
| USD | | | 121,196 | | | EUR | | | 112,000 | | | Goldman Sachs International | | | 1/21/16 | | | | (518 | ) | | |
| USD | | | 10,886 | | | EUR | | | 10,000 | | | Goldman Sachs International | | | 1/21/16 | | | | 18 | | | |
| USD | | | 170,228 | | | EUR | | | 155,000 | | | Morgan Stanley & Co. International PLC | | | 1/21/16 | | | | 1,784 | | | |
| USD | | | 521,994 | | | EUR | | | 481,000 | | | Royal Bank of Scotland PLC | | | 1/21/16 | | | | (723 | ) | | |
| USD | | | 92,871 | | | EUR | | | 85,000 | | | Royal Bank of Scotland PLC | | | 1/21/16 | | | | 499 | | | |
| USD | | | 18,664 | | | EUR | | | 17,000 | | | Royal Bank of Scotland PLC | | | 1/21/16 | | | | 190 | | | |
| USD | | | 230,716 | | | GBP | | | 155,000 | | | Bank of America N.A. | | | 1/21/16 | | | | 2,251 | | | |
| USD | | | 129,425 | | | GBP | | | 86,000 | | | Morgan Stanley & Co. International PLC | | | 1/21/16 | | | | 2,664 | | | |
| USD | | | 120,585 | | | GBP | | | 81,000 | | | Northern Trust Co. | | | 1/21/16 | | | | 1,193 | | | |
| USD | | | 107,281 | | | GBP | | | 72,000 | | | Royal Bank of Scotland PLC | | | 1/21/16 | | | | 1,156 | | | |
| USD | | | 960,609 | | | HKD | | | 7,444,000 | | | Goldman Sachs International | | | 1/21/16 | | | | (34 | ) | | |
| USD | | | 72,655 | | | HKD | | | 563,000 | | | Northern Trust Co. | | | 1/21/16 | | | | — | | | |
| USD | | | 178,718 | | | HKD | | | 1,385,000 | | | UBS AG | | | 1/21/16 | | | | (15 | ) | | |
| USD | | | 276,278 | | | JPY | | | 33,231,000 | | | Morgan Stanley & Co. International PLC | | | 1/21/16 | | | | (70 | ) | | |
| USD | | | 251,723 | | | SEK | | | 2,156,000 | | | Bank of America N.A. | | | 1/21/16 | | | | (4,130 | ) | | |
| USD | | | 208,603 | | | SEK | | | 1,773,000 | | | Citibank N.A. | | | 1/21/16 | | | | (1,800 | ) | | |
| USD | | | 28,590 | | | SEK | | | 239,000 | | | Royal Bank of Scotland PLC | | | 1/21/16 | | | | 228 | | | |
| USD | | | 177,169 | | | SGD | | | 250,000 | | | Citibank N.A. | | | 1/21/16 | | | | 1,045 | | | |
| USD | | | 24,850 | | | SGD | | | 35,000 | | | Northern Trust Co. | | | 1/21/16 | | | | 192 | | | |
| USD | | | 156,142 | | | SGD | | | 221,000 | | | Standard Chartered Bank | | | 1/21/16 | | | | 447 | | | |
| Total | | | | | | | | | | | | | | | | | | $ | (13,019 | ) | | |
| | | | | | | | | | | | | | | | | | | |
|
| Derivative Financial Instruments Categorized by Risk Exposure |
As of period end, the fair values of derivative financial instruments located in the Statements of Assets and Liabilities were as follows:
| | | | | | | | | | | | | | | | | | | | | | | | | | | | | | |
| Assets — Derivative Financial Instruments | | Commodity Contracts | | | Credit Contracts | | | Equity Contracts | | | Foreign Currency Exchange Contracts | | | Interest Rate Contracts | | | Other Contracts | | | Total | |
Forward foreign currency exchange contracts | | Net unrealized appreciation
on forward currency
exchange contracts | | | — | | | | — | | | | — | | | $ | 26,576 | | | | — | | | | — | | | $ | 26,576 | |
| Liabilities — Derivative Financial Instruments | | | | | | | | | | | | | | | | | | | | | |
Forward foreign currency exchange contracts | | Net unrealized depreciation
on forward currency
exchange contracts | | | — | | | | — | | | | — | | | $ | 39,595 | | | | — | | | | — | | | $ | 39,595 | |
For the year ended December 31, 2015, the effect of derivative financial instruments in the Statements of Operations was as follows:
| | | | | | | | | | | | | | | | | | | | | | | | | | | | |
| Net Change in Unrealized Appreciation (Depreciation) on: | | Commodity Contracts | | | Credit Contracts | | | Equity Contracts | | | Foreign Currency Exchange Contracts | | | Interest Rate Contracts | | | Other Contracts | | | Total | |
Forward foreign currency exchange contracts | | | — | | | | — | | | | — | | | $ | (13,019 | ) | | | — | | | | — | | | $ | (13,019 | ) |
|
| Average Quarterly Balances of Outstanding Derivative Financial Instruments |
| | | | | | |
| Forward foreign currency exchange contracts: | | | | | | |
Average amounts purchased — in USD | | $ | 1,257,671 | | | |
Average amounts sold — in USD | | $ | 1,101,210 | | | |
For more information about the LifePath Fund’s investment risks regarding derivative financial instruments, refer to the Notes to Financial Statements.
|
| Derivative Financial Instruments — Offsetting as of Period End |
The LifePath Master Portfolio’s derivative assets and liabilities (by type) were as follows:
| | | | | | | | |
| | | Assets | | | Liabilities | |
Derivative Financial Instruments: | | | | | | | | |
Forward foreign currency exchange contracts | | $ | 26,576 | | | $ | 39,595 | |
| | | | |
Total derivative assets and liabilities in the Statements of Assets and Liabilities | | $ | 26,576 | | | $ | 39,595 | |
| | | | |
Derivatives not subject to a Master Netting Agreement or similar agreement (“MNA”) | | | — | | | | — | |
| | | | |
Total derivative assets and liabilities subject to an MNA | | $ | 26,576 | | | $ | 39,595 | |
| | | | |
See Notes to Financial Statements.
| | | | | | |
| | | | | | | |
| 74 | | BLACKROCK FUNDS III | | DECEMBER 31, 2015 | | |
| | |
Schedule of Investments (continued) | | LifePath 2040 Master Portfolio |
The following table presents the LifePath Master Portfolio’s derivative assets and liabilities by counterparty net of amounts available for offset under an Master Netting Agreement (“MNA”) and net of the related collateral received and pledged by the LifePath Master Portfolio:
| | | | | | | | | | | | | | | | | | | | |
| Counterparty | | Derivative Assets
Subject to an MNA
by Counterparty | | | Derivatives
Available
for Offset1 | | | Non-cash
Collateral
Received | | | Cash
Collateral
Received | | | Net Amount of
Derivative
Assets2 | |
Bank of America N.A. | | $ | 2,251 | | | $ | (2,251 | ) | | | — | | | | — | | | | — | |
Citibank N.A. | | | 1,045 | | | | (1,045 | ) | | | — | | | | — | | | | — | |
Goldman Sachs International | | | 803 | | | | (803 | ) | | | — | | | | — | | | | — | |
Morgan Stanley & Co. International PLC | | | 4,451 | | | | (909 | ) | | | — | | | | — | | | $ | 3,542 | |
Northern Trust Co. | | | 1,417 | | | | (1,417 | ) | | | — | | | | — | | | | — | |
Royal Bank of Scotland PLC | | | 2,073 | | | | (723 | ) | | | — | | | | — | | | | 1,350 | |
Standard Chartered Bank | | | 14,536 | | | | — | | | | — | | | | — | | | | 14,536 | |
| | | | |
| Total | | $ | 26,576 | | | $ | (7,148 | ) | | | — | | | | — | | | $ | 19,428 | |
| | | | |
| | | | | | | | | | | | | | | | | | | | |
| Counterparty | | Derivative Liabilities
Subject to an MNA
by Counterparty | | | Derivatives
Available
for Offset1 | | | Non-cash
Collateral
Pledged | | | Cash
Collateral
Pledged | | | Net Amount of
Derivative
Liabilities3 | |
Bank of America N.A. | | $ | 4,130 | | | $ | (2,251 | ) | | | — | | | | — | | | $ | 1,879 | |
Barclays Bank PLC | | | 5,703 | | | | — | | | | — | | | | — | | | | 5,703 | |
Citibank N.A. | | | 8,238 | | | | (1,045 | ) | | | — | | | | — | | | | 7,193 | |
Deutsche Bank AG | | | 269 | | | | — | | | | — | | | | — | | | | 269 | |
Goldman Sachs International | | | 5,963 | | | | (803 | ) | | | — | | | | — | | | | 5,160 | |
Morgan Stanley & Co. International PLC | | | 909 | | | | (909 | ) | | | — | | | | — | | | | — | |
Northern Trust Co. | | | 1,585 | | | | (1,417 | ) | | | — | | | | — | | | | 168 | |
Royal Bank of Canada | | | 11,958 | | | | — | | | | — | | | | — | | | | 11,958 | |
Royal Bank of Scotland PLC | | | 723 | | | | (723 | ) | | | — | | | | — | | | | — | |
UBS AG | | | 117 | | | | — | | | | — | | | | — | | | | 117 | |
| | | | |
| Total | | $ | 39,595 | | | $ | (7,148 | ) | | | — | | | | — | | | $ | 32,447 | |
| | | | |
1 The amount of derivatives available for offset is limited to the amount of derivative assets and/or liabilities that are subject to an MNA. | |
2 Net amount represents the net amount receivable from the counterparty in the event of default. | |
3 Net amount represents the net amount payable due to the counterparty in the event of default. | |
|
| Fair Value Hierarchy as of Period End |
Various inputs are used in determining the fair value of investments and derivative financial instruments. For information about LifePath Master Portfolio’s policy regarding valuation of investments and derivative financial instruments, refer to the Notes to Financial Statements.
The following tables summarize LifePath Master Portfolio’s investments and derivative financial instruments categorized in the disclosure hierarchy:
| | | | | | | | | | | | | | | | |
| | | Level 1 | | | Level 2 | | | Level 3 | | | Total | |
Assets: | | | | | | | | | | | | | | | | |
| Investments: | | | | | | | | | | | | | | | | |
Affiliated Investment Companies: | | | | | | | | | | | | | | | | |
Equity Funds | | $ | 55,600,085 | | | $ | 286,400,027 | | | | — | | | $ | 342,000,112 | |
Fixed Income Funds | | | — | | | | 31,354,405 | | | | — | | | | 31,354,405 | |
Short-Term Securities | | | 931,298 | | | | — | | | | — | | | | 931,298 | |
Common Stocks: | | | | | | | | | | | | | | | | |
Hotels, Restaurants & Leisure | | | 1,004,559 | | | | — | | | | — | | | | 1,004,559 | |
Real Estate Investment Trusts (REITs) | | | 27,715,618 | | | | 11,474,205 | | | | — | | | | 39,189,823 | |
Real Estate Management & Development | | | 1,000,804 | | | | 9,916,067 | | | | — | | | | 10,916,871 | |
| | | | | | | | | | | | | | | | |
Total | | $ | 86,252,364 | | | $ | 339,144,704 | | | | — | | | $ | 425,397,068 | |
| | | | | | | | | | | | | | | | |
| | | | | | | | | | | | | | |
| | | Level 1 | | Level 2 | | | Level 3 | | | Total | |
| Derivative Financial Instruments1 | | | | | | | | | | | | | | |
Assets: | | | | | | | | | | | | | | |
Forward foreign currency exchange contracts | | — | | $ | 26,576 | | | | — | | | $ | 26,576 | |
Liabilities: | | | | | | | | | | | | | | |
Forward foreign currency exchange contracts | | — | | | (39,595 | ) | | | — | | | | (39,595 | ) |
| | | |
Total | | — | | $ | (13,019 | ) | | | — | | | $ | (13,019 | ) |
| | | |
1 Derivative financial instruments are forward foreign currency exchange contracts that are valued at the unrealized appreciation (depreciation) on the instrument. | |
See Notes to Financial Statements.
| | | | | | |
| | | | | | | |
| | BLACKROCK FUNDS III | | DECEMBER 31, 2015 | | 75 |
| | |
Schedule of Investments (concluded) | | LifePath 2040 Master Portfolio |
The LifePath Master Portfolio may hold assets and/or liabilities in which the fair value approximates the carrying amount for financial statement purposes. As of period end, such assets and/or liabilities are categorized within the disclosure hierarchy as follows:
| | | | | | | | | | | | | | | | |
| | | Level 1 | | | Level 2 | | | Level 3 | | | Total | |
Assets: | | | | | | | | | | | | | | | | |
Cash | | $ | 211,877 | | | | — | | | | — | | | $ | 211,877 | |
Foreign currency at value | | | 328,562 | | | | — | | | | — | | | | 328,562 | |
| | | | |
Total | | $ | 540,439 | | | | — | | | | — | | | $ | 540,439 | |
| | | | |
During the year ended December 31, 2015, there were no transfers between levels.
See Notes to Financial Statements.
| | | | | | |
| | | | | | | |
| 76 | | BLACKROCK FUNDS III | | DECEMBER 31, 2015 | | |
| | |
Schedule of Investments December 31, 2015 | | LifePath 2050 Master Portfolio (Percentages shown are based on Net Assets) |
| | | | | | | | |
| Affiliated Investment Companies (a) | | Shares/
Beneficial Interest | | | Value | |
Equity Funds — 84.5% | | | | | | | | |
Active Stock Master Portfolio | | $ | 35,160,143 | | | $ | 35,160,143 | |
BlackRock Commodity Strategies Fund | | | 731,981 | | | | 4,450,447 | |
BlackRock Emerging Markets Fund, Inc. | | | 392,434 | | | | 6,129,812 | |
International Tilts Master Portfolio | | $ | 24,072,801 | | | | 24,072,801 | |
iShares MSCI Canada ETF (b) | | | 85,881 | | | | 1,846,442 | |
iShares MSCI EAFE Small-Cap ETF | | | 70,032 | | | | 3,498,098 | |
Large Cap Index Master Portfolio (fka Russell 1000® Index Master Portfolio) | | $ | 19,606,042 | | | | 19,606,042 | |
Master Small Cap Index Series | | $ | 2,338,662 | | | | 2,338,662 | |
| | | | | | | | |
| | | | | 97,102,447 | |
Fixed Income Fund — 1.4% | | | | | | | | |
CoreAlpha Bond Master Portfolio | | $ | 1,595,987 | | | | 1,595,987 | |
Short-Term Securities — 1.5% | | | | | | | | |
BlackRock Cash Funds: Institutional, SL Agency Shares, 0.38% (c)(d) | | | 1,133,330 | | | | 1,133,330 | |
BlackRock Cash Funds: Prime, SL Agency Shares, 0.36% (c)(d) | | | 650,208 | | | | 650,208 | |
| | | | | | | | |
| | | | | 1,783,538 | |
| Total Affiliated Investment Companies — 87.4% | | | | 100,481,972 | |
| | | | | | | | |
| | | | | | | | | |
| |
| Common Stocks | | | |
Hotels, Restaurants & Leisure — 0.3% | | | | | | | | |
Hilton Worldwide Holdings, Inc. | | | 3,865 | | | | 82,711 | |
Pebblebrook Hotel Trust | | | 4,016 | | | | 112,528 | |
RLJ Lodging Trust | | | 5,682 | | | | 122,902 | |
| | | | | | | | |
| | | | | 318,141 | |
Real Estate Investment Trusts (REITs) — 10.3% | | | | | |
Alexandria Real Estate Equities, Inc. | | | 2,578 | | | | 232,948 | |
Allied Properties Real Estate Investment Trust | | | 10,604 | | | | 241,937 | |
AvalonBay Communities, Inc. | | | 2,515 | | | | 463,087 | |
Beni Stabili SpA SIIQ | | | 161,201 | | | | 121,500 | |
Boston Properties, Inc. | | | 4,652 | | | | 593,316 | |
British Land Co. PLC | | | 28,847 | | | | 333,785 | |
Cambridge Industrial Trust | | | 391,900 | | | | 156,163 | |
CareTrust REIT, Inc. | | | 15,807 | | | | 173,087 | |
CubeSmart | | | 8,855 | | | | 271,140 | |
CyrusOne, Inc. | | | 4,360 | | | | 163,282 | |
Derwent London PLC | | | 3,614 | | | | 195,472 | |
Duke Realty Corp. | | | 9,836 | | | | 206,753 | |
Empiric Student Property PLC | | | 73,618 | | | | 123,179 | |
EPR Properties | | | 3,027 | | | | 176,928 | |
Equity One, Inc. | | | 7,353 | | | | 199,634 | |
Equity Residential | | | 6,083 | | | | 496,312 | |
Essex Property Trust, Inc. | | | 1,460 | | | | 349,539 | |
Extra Space Storage, Inc. | | | 3,907 | | | | 344,636 | |
Federal Realty Investment Trust | | | 402 | | | | 58,732 | |
General Growth Properties, Inc. | | | 2,889 | | | | 78,610 | |
Goodman Group | | | 99,924 | | | | 452,800 | |
Gramercy Property Trust | | | 14,600 | | | | 112,710 | |
Japan Rental Housing Investments, Inc. | | | 222 | | | | 156,863 | |
Kenedix Retail REIT Corp. | | | 111 | | | | 234,979 | |
Kilroy Realty Corp. | | | 4,462 | | | | 282,355 | |
Kimco Realty Corp. | | | 6,276 | | | | 166,063 | |
Land Securities Group PLC | | | 20,581 | | | | 356,772 | |
Link REIT | | | 43,500 | | | | 259,342 | |
Macerich Co. | | | 2,603 | | | | 210,036 | |
Merlin Properties Socimi SA | | | 9,656 | | | | 120,963 | |
National Health Investors, Inc. | | | 2,737 | | | | 166,601 | |
Parkway Properties, Inc. | | | 10,041 | | | | 156,941 | |
Physicians Realty Trust | | | 1,090 | | | | 18,377 | |
| | | | | | | | |
| Common Stocks | | Shares | | | Value | |
Real Estate Investment Trusts (REITs) (continued) | |
Prologis, Inc. | | | 9,547 | | | $ | 409,757 | |
Retail Properties of America, Inc., Class A | | | 20,881 | | | | 308,412 | |
Sekisui House REIT, Inc. | | | 82 | | | | 89,354 | |
Simon Property Group, Inc. | | | 4,999 | | | | 972,006 | |
SL Green Realty Corp. | | | 1,837 | | | | 207,544 | |
STAG Industrial, Inc. | | | 9,434 | | | | 174,057 | |
STORE Capital Corp. | | | 3,680 | | | | 85,376 | |
Sunstone Hotel Investors, Inc. | | | 16,545 | | | | 206,647 | |
Taubman Centers, Inc. | | | 757 | | | | 58,077 | |
UDR, Inc. | | | 6,236 | | | | 234,287 | |
Vastned Retail NV | | | 4,581 | | | | 210,456 | |
Vicinity Centres | | | 209,983 | | | | 425,988 | |
Welltower, Inc. | | | 7,097 | | | | 482,809 | |
Wereldhave NV | | | 3,142 | | | | 176,247 | |
Westfield Corp. | | | 48,462 | | | | 333,414 | |
| | | | | | | | |
| | | | | 12,049,273 | |
Real Estate Management & Development — 3.0% | |
Castellum AB | | | 13,846 | | | | 197,184 | |
Cheung Kong Property Holdings Ltd. | | | 54,500 | | | | 352,560 | |
Deutsche Wohnen AG, Bearer Shares | | | 8,805 | | | | 243,474 | |
First Capital Realty, Inc. | | | 8,728 | | | | 115,747 | |
Heiwa Real Estate Co., Ltd. | | | 20,300 | | | | 222,130 | |
Howard Hughes Corp. (e) | | | 674 | | | | 76,270 | |
Kennedy Wilson Europe Real Estate PLC | | | 4,426 | | | | 78,711 | |
Kungsleden AB | | | 17,561 | | | | 125,481 | |
KWG Property Holding Ltd. | | | 209,500 | | | | 154,436 | |
LEG Immobilien AG | | | 1,043 | | | | 85,005 | |
Leopalace21 Corp. (e) | | | 13,900 | | | | 75,237 | |
Nomura Real Estate Holdings, Inc. | | | 9,100 | | | | 168,825 | |
Sumitomo Realty & Development Co., Ltd. | | | 13,000 | | | | 371,055 | |
Sun Hung Kai Properties Ltd. | | | 34,000 | | | | 408,665 | |
VIB Vermoegen AG | | | 6,011 | | | | 111,672 | |
Vonovia SE | | | 6,522 | | | | 201,485 | |
Wharf Holdings Ltd. | | | 46,000 | | | | 253,619 | |
| | | | | | | | |
| | | | | 3,241,556 | |
| Total Common Stocks — 13.6% | | | | 15,608,970 | |
| Total Investments (Cost — $112,650,842) — 101.0% | | | | 116,090,942 | |
| Liabilities in Excess of Other Assets — (1.0)% | | | | (1,187,381 | ) |
| | | | | | | | |
| Net Assets — 100.0% | | | $ | 114,903,561 | |
| | | | | | | | |
See Notes to Financial Statements.
| | | | | | |
| | | | | | | |
| | BLACKROCK FUNDS III | | DECEMBER 31, 2015 | | 77 |
| | |
Schedule of Investments (continued) | | LifePath 2050 Master Portfolio |
|
| Notes to Schedule of Investments |
| (a) | | During the year ended December 31, 2015, investments in issuers considered to be affiliates of LifePath Master Portfolio for purposes of Section 2(a)(3) of the Investment Company Act of 1940, as amended, were as follows: |
| | | | | | | | | | | | | | | | | | | | | | | | | | | | |
| Affiliate | | Shares/ Beneficial
Interest Held at December 31, 2014 | | | Shares/ Beneficial
Interest
Purchased | | | Shares/ Beneficial
Interest Sold | | | Shares/ Beneficial
Interest Held at December 31, 2015 | | | Value at
December 31, 2015 | | | Net Income | | | Realized
Gain (Loss) | |
Active Stock Master Portfolio | | $ | 147,719,967 | | | | — | | | $ | (112,559,824 | )1 | | $ | 35,160,143 | | | $ | 35,160,143 | | | $ | 2,065,481 | | | $ | 16,482,916 | 2 |
| BlackRock Cash Funds: | | | | | | | | | | | | | | | | | | | | | | | | | | | | |
Institutional, SL Agency Shares | | | 1,215,707 | | | | — | | | | (82,377 | )1 | | | 1,133,330 | | | $ | 1,133,330 | | | $ | 21,681 | 3 | | | — | |
BlackRock Cash Funds: Prime, SL Agency Shares | | | 2,950,000 | | | | — | | | | (2,299,792 | )1 | | | 650,208 | | | $ | 650,208 | | | $ | 15,499 | 3 | | | — | |
BlackRock Commodity Strategies Fund | | | 2,193,346 | | | | 703,836 | | | | (2,165,201 | ) | | | 731,981 | | | $ | 4,450,447 | | | | — | | | $ | (6,082,859 | ) |
BlackRock Emerging Markets Fund, Inc. | | | 1,329,101 | | | | 398,421 | | | | (1,335,088 | ) | | | 392,434 | | | $ | 6,129,812 | | | $ | 80,709 | | | $ | (3,642,960 | ) |
CoreAlpha Bond Master Portfolio | | $ | 4,957,761 | | | | — | | | $ | (3,361,774 | )1 | | $ | 1,595,987 | | | $ | 1,595,987 | | | $ | 138,927 | | | $ | 350,554 | 2 |
International Tilts Master Portfolio | | $ | 81,873,561 | | | | — | | | $ | (57,800,760 | )1 | | $ | 24,072,801 | | | $ | 24,072,801 | | | $ | 2,218,578 | | | $ | (2,484,699 | )2 |
iShares Cohen & Steers REIT ETF4 | | | 327,853 | | | | 108,868 | | | | (436,721 | ) | | | — | | | | — | | | $ | 758,295 | | | $ | 6,820,779 | 2 |
iShares International Developed Real Estate ETF4 | | | 901,660 | | | | 263,918 | | | | (1,165,578 | ) | | | — | | | | — | | | $ | 840,986 | | | $ | (1,021,576 | )2 |
iShares MSCI Canada ETF | | | 285,386 | | | | 67,758 | | | | (267,263 | ) | | | 85,881 | | | $ | 1,846,442 | | | $ | 92,382 | | | $ | (1,095,044 | )2 |
iShares MSCI EAFE Small-Cap ETF | | | 260,026 | | | | 43,667 | | | | (233,661 | ) | | | 70,032 | | | $ | 3,498,098 | | | $ | 196,277 | | | $ | 1,951,036 | 2 |
Large Cap Index Master Portfolio (fka Russell 1000® Index Master Portfolio) | | $ | 69,086,943 | | | | — | | | $ | (49,480,901 | )1 | | $ | 19,606,042 | | | $ | 19,606,042 | | | $ | 1,353,270 | | | $ | 4,241,583 | 2 |
Master Small Cap Index Series | | $ | 11,565,177 | | | | — | | | $ | (9,226,515 | )1 | | $ | 2,338,662 | | | $ | 2,338,662 | | | $ | 128,962 | | | $ | 869,960 | 2 |
1 Represents net shares/beneficial interest sold. | |
2 Includes the following gains and (losses) from in-kind redemptions from affiliated holdings. See Note 2 of the Notes to Financial Statements. | |
| | | | | | | | | | | | | | | | | | | | | | | | | | | | | | | | | | |
Active Stock
Master
Portfolio | | | CoreAlpha
Bond Master
Portfolio | | | International Tilts
Master Portfolio | | | iShares Cohen &
Steers REIT ETF | | | iShares
International
Developed Real
Estate ETF | | | iShares MSCI
Canada ETF | | | iShares MSCI
EAFE Small-
Cap ETF | | | Large Cap Index Master
Portfolio (fka Russell 1000®
Index Master Portfolio) | | | Master Small
Cap Index
Series | |
| | $6,815,899 | | | $ | 25,317 | | | $ | (1,644,112 | ) | | $ | 4,930,170 | | | $ | 260,526 | | | $ | (875,583 | ) | | $ | 1,951,711 | | | $ | 6,733,895 | | | $ | 1,767,652 | |
| | | | | | | | | | | | | | |
3 Represents all or a portion of securities lending income earned from the reinvestment of cash collateral from loaned securities, net of fees, and collateral investment expenses, and other payments to and from borrowers of securities. |
4 No longer held by LifePath Master Portfolio as of period end. |
| (b) | | Security, or a portion of security, is on loan. |
| (c) | | Current yield as of period end. |
| (d) | | All or a portion of security was purchased with the cash collateral from loaned securities. |
| (e) | | Non-income producing security. |
|
| Derivative Financial Instruments Outstanding as of Period End |
Forward Foreign Currency Exchange Contracts
| | | | | | | | | | | | | | | | | | | | | | |
Currency
Purchased | | | Currency
Sold | | | Counterparty | | Settlement
Date | | | Unrealized
Appreciation
(Depreciation) | | | |
| CAD | | | 25,000 | | | USD | | | 18,067 | | | Morgan Stanley & Co. International PLC | | | 1/21/16 | | | $ | (69 | ) | | |
| CAD | | | 43,000 | | | USD | | | 31,299 | | | Northern Trust Co. | | | 1/21/16 | | | | (342 | ) | | |
| CHF | | | 130,000 | | | USD | | | 131,346 | | | Goldman Sachs International | | | 1/21/16 | | | | (1,387 | ) | | |
| CHF | | | 11,000 | | | USD | | | 11,049 | | | Morgan Stanley & Co. International PLC | | | 1/21/16 | | | | (52 | ) | | |
| EUR | | | 315,000 | | | USD | | | 344,207 | | | Goldman Sachs International | | | 1/21/16 | | | | (1,887 | ) | | |
| EUR | | | 38,000 | | | USD | | | 41,334 | | | Morgan Stanley & Co. International PLC | | | 1/21/16 | | | | (38 | ) | | |
| GBP | | | 29,000 | | | USD | | | 42,744 | | | Morgan Stanley & Co. International PLC | | | 1/21/16 | | | | 1 | | | |
| HKD | | | 184,000 | | | USD | | | 23,746 | | | Barclays Bank PLC | | | 1/21/16 | | | | (1 | ) | | |
| ILS | | | 64,000 | | | USD | | | 16,531 | | | Deutsche Bank AG | | | 1/21/16 | | | | (79 | ) | | |
| JPY | | | 4,411,000 | | | USD | | | 36,730 | | | Goldman Sachs International | | | 1/21/16 | | | | (48 | ) | | |
| JPY | | | 49,565,000 | | | USD | | | 407,896 | | | Standard Chartered Bank | | | 1/21/16 | | | | 4,285 | | | |
| NOK | | | 84,000 | | | USD | | | 9,672 | | | Morgan Stanley & Co. International PLC | | | 1/21/16 | | | | (184 | ) | | |
| NZD | | | 21,000 | | | USD | | | 14,137 | | | Goldman Sachs International | | | 1/21/16 | | | | 226 | | | |
See Notes to Financial Statements.
| | | | | | |
| | | | | | | |
| 78 | | BLACKROCK FUNDS III | | DECEMBER 31, 2015 | | |
| | |
Schedule of Investments (continued) | | LifePath 2050 Master Portfolio |
Forward Foreign Currency Exchange Contracts (continued)
| | | | | | | | | | | | | | | | | | | | | | |
Currency
Purchased | | | Currency
Sold | | | Counterparty | | Settlement
Date | | | Unrealized
Appreciation
(Depreciation) | | | |
| SEK | | | 65,000 | | | USD | | | 7,700 | | | Northern Trust Co. | | | 1/21/16 | | | $ | 13 | | | |
| SGD | | | 339,000 | | | USD | | | 240,508 | | | Barclays Bank PLC | | | 1/21/16 | | | | (1,683 | ) | | |
| SGD | | | 27,000 | | | USD | | | 19,044 | | | Morgan Stanley & Co. International PLC | | | 1/21/16 | | | | (23 | ) | | |
| USD | | | 24,518 | | | AUD | | | 34,000 | | | Goldman Sachs International | | | 1/21/16 | | | | (200 | ) | | |
| USD | | | 18,284 | | | AUD | | | 25,000 | | | Goldman Sachs International | | | 1/21/16 | | | | 110 | | | |
| USD | | | 268,349 | | | AUD | | | 374,000 | | | Royal Bank of Canada | | | 1/21/16 | | | | (3,544 | ) | | |
| USD | | | 35,710 | | | EUR | | | 33,000 | | | Goldman Sachs International | | | 1/21/16 | | | | (153 | ) | | |
| USD | | | 6,531 | | | EUR | | | 6,000 | | | Goldman Sachs International | | | 1/21/16 | | | | 11 | | | |
| USD | | | 154,102 | | | EUR | | | 142,000 | | | Royal Bank of Scotland PLC | | | 1/21/16 | | | | (213 | ) | | |
| USD | | | 28,408 | | | EUR | | | 26,000 | | | Royal Bank of Scotland PLC | | | 1/21/16 | | | | 153 | | | |
| USD | | | 68,470 | | | GBP | | | 46,000 | | | Bank of America N.A. | | | 1/21/16 | | | | 668 | | | |
| USD | | | 39,129 | | | GBP | | | 26,000 | | | Morgan Stanley & Co. International PLC | | | 1/21/16 | | | | 805 | | | |
| USD | | | 31,290 | | | GBP | | | 21,000 | | | Royal Bank of Scotland PLC | | | 1/21/16 | | | | 337 | | | |
| USD | | | 287,383 | | | HKD | | | 2,227,000 | | | Goldman Sachs International | | | 1/21/16 | | | | (10 | ) | | |
| USD | | | 20,132 | | | HKD | | | 156,000 | | | Northern Trust Co. | | | 1/21/16 | | | | — | | | |
| USD | | | 74,489 | | | SEK | | | 638,000 | | | Bank of America N.A. | | | 1/21/16 | | | | (1,222 | ) | | |
| USD | | | 61,756 | | | SEK | | | 525,000 | | | Citibank N.A. | | | 1/21/16 | | | | (546 | ) | | |
| USD | | | 51,733 | | | SGD | | | 73,000 | | | Citibank N.A. | | | 1/21/16 | | | | 305 | | | |
| USD | | | 46,631 | | | SGD | | | 66,000 | | | Standard Chartered Bank | | | 1/21/16 | | | | 134 | | | |
| Total | | | | | | | | | | | | | | | | | | $ | (4,633 | ) | | |
| | | | | | | | | | | | | | | | | | | |
|
| Derivative Financial Instruments Categorized by Risk Exposure |
As of period end, the fair values of derivative financial instruments located in the Statements of Assets and Liabilities were as follows:
| | | | | | | | | | | | | | | | | | | | | | | | | | | | | | |
| Assets — Derivative Financial Instruments | | Commodity Contracts | | | Credit Contracts | | | Equity Contracts | | | Foreign Currency Exchange Contracts | | | Interest Rate Contracts | | | Other Contracts | | | Total | |
Forward foreign currency exchange contracts | | Net unrealized appreciation
on forward currency
exchange contracts | | | — | | | | — | | | | — | | | $ | 7,048 | | | | — | | | | — | | | $ | 7,048 | |
Liabilities — Derivative Financial Instruments | | | | | | | | | | | | | | | | | | | | | | | | | | | | |
Forward foreign currency exchange contracts | | Net unrealized depreciation
on forward currency
exchange contracts | | | — | | | | — | | | | — | | | $ | 11,681 | | | | — | | | | — | | | $ | 11,681 | |
For the year ended December 31, 2015, the effect of derivative financial instruments in the Statements of Operations was as follows:
| | | | | | | | | | | | | | | | | | | | | | | | | | | | |
| Net Change in Unrealized Appreciation (Depreciation) on: | | Commodity Contracts | | | Credit Contracts | | | Equity Contracts | | | Foreign Currency Exchange Contracts | | | Interest Rate Contracts | | | Other Contracts | | | Total | |
Forward foreign currency exchange contracts | | | — | | | | — | | | | — | | | $ | (4,633 | ) | | | — | | | | — | | | $ | (4,633 | ) |
| | | | |
| Average Quarterly Balances of Outstanding Derivative Financial Instruments | |
| Forward foreign currency exchange contracts: | | | | |
Average amounts purchased — in USD | | | $304,229 | |
Average amounts sold — in USD | | | $349,002 | |
For more information about the LifePath Fund’s investment risks regarding derivative financial instruments, refer to the Notes to Financial Statements.
|
| Derivative Financial Instruments — Offsetting as of Period End |
The LifePath Master Portfolio’s derivative assets and liabilities (by type) were as follows:
| | | | | | | | |
| | | Assets | | | Liabilities | |
| Derivative Financial Instruments: | | | | | | | | |
Forward foreign currency exchange contracts | | $ | 7,048 | | | $ | 11,681 | |
| | | | |
Total derivative assets and liabilities in the Statements of Assets and Liabilities | | $ | 7,048 | | | $ | 11,681 | |
| | | | |
Derivatives not subject to a Master Netting Agreement or similar agreement (“MNA”) | | | — | | | | — | |
| | | | |
Total derivative assets and liabilities subject to an MNA | | $ | 7,048 | | | $ | 11,681 | |
| | | | |
See Notes to Financial Statements.
| | | | | | |
| | | | | | | |
| | BLACKROCK FUNDS III | | DECEMBER 31, 2015 | | 79 |
| | |
Schedule of Investments (continued) | | LifePath 2050 Master Portfolio |
The following table presents the LifePath Master Portfolio’s derivative assets and liabilities by counterparty net of amounts available for offset under an Master Netting Agreement (“MNA”) and net of the related collateral received and pledged by the LifePath Master Portfolio:
| | | | | | | | | | | | | | | | | | | | |
| Counterparty | | Derivative Assets
Subject to an MNA
by Counterparty | | | Derivatives
Available
for Offset1 | | | Non-cash
Collateral
Received | | | Cash
Collateral
Received | | | Net Amount of
Derivative
Assets2 | |
Bank of America N.A. | | $ | 668 | | | $ | (668 | ) | | | — | | | | — | | | | — | |
Citibank N.A. | | | 305 | | | | (305 | ) | | | — | | | | — | | | | — | |
Goldman Sachs International | | | 347 | | | | (347 | ) | | | — | | | | — | | | | — | |
Morgan Stanley & Co. International PLC | | | 806 | | | | (366 | ) | | | — | | | | — | | | $ | 440 | |
Northern Trust Co. | | | 13 | | | | (13 | ) | | | — | | | | — | | | | — | |
Royal Bank of Scotland PLC | | | 490 | | | | (213 | ) | | | — | | | | — | | | | 277 | |
Standard Chartered Bank | | | 4,419 | | | | — | | | | — | | | | — | | | | 4,419 | |
| | | | | | | | | | | | | | | | | | | | |
Total | | $ | 7,048 | | | $ | (1,912 | ) | | | — | | | | — | | | $ | 5,136 | |
| | | | | | | | | | | | | | | | | | | | |
| | | | | | | | | | | | | | | | | | | | |
| Counterparty | | Derivative Liabilities
Subject to an MNA
by Counterparty | | | Derivatives
Available
for Offset1 | | | Non-cash
Collateral
Pledged | | | Cash
Collateral
Pledged | | | Net Amount of
Derivative
Liabilities3 | |
Bank of America N.A. | | $ | 1,222 | | | $ | (668 | ) | | | — | | | | — | | | $ | 554 | |
Barclays Bank PLC | | | 1,684 | | | | — | | | | — | | | | — | | | | 1,684 | |
Citibank N.A. | | | 546 | | | | (305 | ) | | | — | | | | — | | | | 241 | |
Deutsche Bank AG | | | 79 | | | | — | | | | — | | | | — | | | | 79 | |
Goldman Sachs International | | | 3,685 | | | | (347 | ) | | | — | | | | — | | | | 3,338 | |
Morgan Stanley & Co. International PLC | | | 366 | | | | (366 | ) | | | — | | | | — | | | | — | |
Northern Trust Co. | | | 342 | | | | (13 | ) | | | — | | | | — | | | | 329 | |
Royal Bank of Canada | | | 3,544 | | | | — | | | | — | | | | — | | | | 3,544 | |
Royal Bank of Scotland PLC | | | 213 | | | | (213 | ) | | | — | | | | — | | | | — | |
| | | | | | | | | | | | | | | | | | | | |
Total | | $ | 11,681 | | | $ | (1,912 | ) | | | — | | | | — | | | $ | 9,769 | |
| | | | | | | | | | | | | | | | | | | | |
1 The amount of derivatives available for offset is limited to the amount of derivative assets and/or liabilities that are subject to an MNA. | |
2 Net amount represents the net amount receivable from the counterparty in the event of default. | |
3 Net amount represents the net amount payable due to the counterparty in the event of default. | |
|
| Fair Value Hierarchy as of Period End |
Various inputs are used in determining the fair value of investments and derivative financial instruments. For information about LifePath Master Portfolio’s policy regarding valuation of investments and derivative financial instruments, refer to the Notes to Financial Statements.
The following tables summarize LifePath Master Portfolio’s investments and derivative financial instruments categorized in the disclosure hierarchy:
| | | | | | | | | | | | | | | | |
| | | Level 1 | | | Level 2 | | | Level 3 | | | Total | |
Assets: | | | | | | | | | | | | | | | | |
| Investments: | | | | | | | | | | | | | | | | |
Affiliated Investment Companies: | | | | | | | | | | | | | | | | |
Equity Funds | | $ | 15,924,799 | | | $ | 81,177,648 | | | | — | | | $ | 97,102,447 | |
Fixed Income Funds | | | — | | | | 1,595,987 | | | | — | | | | 1,595,987 | |
Short-Term Securities | | | 1,783,538 | | | | — | | | | — | | | | 1,783,538 | |
Common Stocks: | | | | | | | | | | | | | | | | |
Hotels, Restaurants & Leisure | | | 318,141 | | | | — | | | | — | | | | 318,141 | |
Real Estate Investment Trusts (REITs) | | | 8,581,338 | | | | 3,467,935 | | | | — | | | | 12,049,273 | |
Real Estate Management & Development | | | 303,689 | | | | 2,937,867 | | | | — | | | | 3,241,556 | |
| | | | | | | | | | | | | | | | |
Total | | $ | 26,911,505 | | | $ | 89,179,437 | | | | — | | | $ | 116,090,942 | |
| | | | | | | | | | | | | | | | |
| | | | | | | | | | | | | | |
| | | Level 1 | | Level 2 | | | Level 3 | | | Total | |
| Derivative Financial Instruments1 | | | | | | | | | | | | | | |
Assets: | | | | | | | | | | | | | | |
Forward foreign currency exchange contracts | | — | | $ | 7,048 | | | | — | | | $ | 7,048 | |
Liabilities: | | | | | | | | | | | | | | |
Forward foreign currency exchange contracts | | — | | | (11,681 | ) | | | — | | | | (11,681 | ) |
| | | | | | | | | | | | | | |
Total | | — | | $ | (4,633 | ) | | | — | | | $ | (4,633 | ) |
| | | | | | | | | | | | | | |
1 Derivative financial instruments are forward foreign currency exchange contracts that are valued at the unrealized appreciation (depreciation) on the instrument. | |
See Notes to Financial Statements.
| | | | | | |
| | | | | | | |
| 80 | | BLACKROCK FUNDS III | | DECEMBER 31, 2015 | | |
| | |
Schedule of Investments (concluded) | | LifePath 2050 Master Portfolio |
The LifePath Master Portfolio may hold assets and/or liabilities in which the fair value approximates the carrying amount for financial statement purposes. As of period end, such assets and/or liabilities are categorized within the disclosure hierarchy as follows:
| | | | | | | | | | | | | | | | |
| | | Level 1 | | | Level 2 | | | Level 3 | | | Total | |
Assets: | | | | | | | | | | | | | | | | |
Cash | | $ | 340,224 | | | | — | | | | — | | | $ | 340,224 | |
Foreign currency at value | | | 82,332 | | | | — | | | | — | | | | 82,332 | |
Liabilities: | | | | | | | | | | | | | | | | |
Collateral on securities loaned at value | | | — | | | $ | (1,492,280 | ) | | | — | | | | (1,492,280 | ) |
| | | | | | | | | | | | | | | | |
Total | | $ | 422,556 | | | $ | (1,492,280 | ) | | | — | | | $ | (1,069,724 | ) |
| | | | | | | | | | | | | | | | |
During the year ended December 31, 2015, there were no transfers between levels.
See Notes to Financial Statements.
| | | | | | |
| | | | | | | |
| | BLACKROCK FUNDS III | | DECEMBER 31, 2015 | | 81 |
| | |
| Statements of Assets and Liabilities | | Master Investment Portfolio |
| | | | | | | | | | | | | | | | | | | | |
| December 31, 2015 | | LifePath
Retirement
Master
Portfolio | | | LifePath 2020 Master Portfolio | | | LifePath 2030 Master Portfolio | | | LifePath 2040 Master Portfolio | | | LifePath 2050 Master Portfolio | |
| | | | | | | | | | | | | | | | | | | | |
| Assets | | | | | | | | | | | | | | | | | | | | |
Investments at value — unaffiliated1 | | $ | 1,677,224 | | | $ | 15,518,699 | | | $ | 41,390,923 | | | $ | 51,111,253 | | | $ | 15,608,970 | |
Investments at value — affiliated2,3 | | | 252,735,455 | | | | 568,626,790 | | | | 503,135,889 | | | | 374,285,815 | | | | 100,481,972 | |
Cash | | | 1,447 | | | | 47,259 | | | | 180,824 | | | | 211,877 | | | | 340,224 | |
Foreign currency at value4 | | | 7,500 | | | | 94,013 | | | | 255,917 | | | | 328,562 | | | | 82,332 | |
| Receivables: | | | | | | | | | | | | | | | | | | | | |
Dividends — unaffiliated | | | 4,632 | | | | 72,369 | | | | 196,115 | | | | 243,064 | | | | 76,040 | |
Investments sold — unaffiliated | | | 97 | | | | 3,586 | | | | 10,004 | | | | 12,883 | | | | 30,090 | |
Investments sold — affiliated | | | 8,683,034 | | | | 16,444,834 | | | | 15,837,085 | | | | 5,525,458 | | | | 3,785,353 | |
Securities lending income — affiliated | | | 1,027 | | | | 1,927 | | | | 3,363 | | | | 2,828 | | | | 1,323 | |
Unrealized appreciation on forward foreign currency exchange contracts | | | 531 | | | | 7,541 | | | | 20,546 | | | | 26,576 | | | | 7,048 | |
| | | | |
Total assets | | | 263,110,947 | | | | 600,817,018 | | | | 561,030,666 | | | | 431,748,316 | | | | 120,413,352 | |
| | | | |
| | | | | | | | | | | | | | | | | | | | |
| Liabilities | | | | | | | | | | | | | | | | | | | | |
Collateral on securities loaned at value | | | — | | | | 2,747,024 | | | | 1,008,821 | | | | — | | | | 1,492,280 | |
| Payables: | | | | | | | | | | | | | | | | | | | | |
Investments purchased — unaffiliated | | | 476,052 | | | | 458,014 | | | | 584,029 | | | | 678,611 | | | | 249,984 | |
Investments purchased — affiliated | | | 6,564,696 | | | | 14,600,000 | | | | 12,802,000 | | | | 3,035,000 | | | | 1,582,000 | |
Withdrawals to investors | | | 1,864,523 | | | | 2,133,300 | | | | 2,698,718 | | | | 1,990,400 | | | | 2,151,233 | |
Professional fees | | | 19,826 | | | | 21,785 | | | | 21,033 | | | | 19,635 | | | | 16,244 | |
Independent Trustees’ fees | | | 11,359 | | | | 19,038 | | | | 18,294 | | | | 13,713 | | | | 3,905 | |
Investment advisory fees | | | 6,114 | | | | 21,187 | | | | 18,950 | | | | 15,668 | | | | 2,464 | |
Unrealized depreciation on forward foreign currency exchange contracts | | | 1,027 | | | | 12,116 | | | | 31,956 | | | | 39,595 | | | | 11,681 | |
| | | | |
Total liabilities | | | 8,943,597 | | | | 20,012,464 | | | | 17,183,801 | | | | 5,792,622 | | | | 5,509,791 | |
| | | | |
Net Assets | | $ | 254,167,350 | | | $ | 580,804,554 | | | $ | 543,846,865 | | | $ | 425,955,694 | | | $ | 114,903,561 | |
| | | | |
| | | | | | | | | | | | | | | | | | | | |
| Net Assets Consist of | | | | | | | | | | | | | | | | | | | | |
Investors’ capital | | $ | 240,378,259 | | | $ | 575,331,731 | | | $ | 541,792,458 | | | $ | 423,375,597 | | | $ | 111,468,653 | |
Net unrealized appreciation (depreciation) | | | 13,789,091 | | | | 5,472,823 | | | | 2,054,407 | | | | 2,580,097 | | | | 3,434,908 | |
| | | | |
Net Assets | | $ | 254,167,350 | | | $ | 580,804,554 | | | $ | 543,846,865 | | | $ | 425,955,694 | | | $ | 114,903,561 | |
| | | | |
1 Investments at cost — unaffiliated | | $ | 1,677,303 | | | $ | 15,338,628 | | | $ | 40,904,080 | | | $ | 50,515,308 | | | $ | 15,425,909 | |
2 Investments at cost — affiliated | | $ | 238,945,438 | | | $ | 563,328,868 | | | $ | 501,555,429 | | | $ | 372,286,743 | | | $ | 97,224,933 | |
3 Securities loaned at value | | | — | | | $ | 2,690,121 | | | $ | 981,432 | | | | — | | | $ | 1,451,766 | |
4 Foreign currency at cost | | $ | 7,540 | | | $ | 94,526 | | | $ | 257,331 | | | $ | 330,371 | | | $ | 82,782 | |
| | | | | | |
| See Notes to Financial Statements. | | | | |
| | | | | | | |
| 82 | | BLACKROCK FUNDS III | | DECEMBER 31, 2015 | | |
| | |
| Statements of Operations | | Master Investment Portfolio |
| | | | | | | | | | | | | | | | | | | | |
| Year Ended December 31, 2015 | | LifePath
Retirement
Master
Portfolio | | | LifePath 2020 Master Portfolio | | | LifePath 2030 Master Portfolio | | | LifePath 2040 Master Portfolio | | | LifePath 2050 Master Portfolio | |
| | | | | | | | | | | | | | | | | | | | |
| Investment Income | | | | | | | | | | | | | | | | | | | | |
Dividends — affiliated | | $ | 1,041,521 | | | $ | 3,780,306 | | | $ | 6,941,867 | | | $ | 7,742,900 | | | $ | 1,968,649 | |
Dividends — unaffiliated | | | 5,209 | | | | 82,955 | | | | 224,878 | | | | 278,898 | | | | 86,647 | |
Securities lending — affiliated — net | | | 49,600 | | | | 105,426 | | | | 162,926 | | | | 140,919 | | | | 35,570 | |
Income — affiliated | | | 3,592 | | | | 6,279 | | | | 6,917 | | | | 5,283 | | | | 1,610 | |
Foreign taxes withheld | | | (651 | ) | | | (10,579 | ) | | | (28,744 | ) | | | (35,811 | ) | | | (10,601 | ) |
| Net investment income allocated from the applicable Underlying Master Portfolios: | | | | | | | | | | | | | | | | | | | | |
Dividends | | | 9,315,132 | | | | 21,615,165 | | | | 28,239,219 | | | | 26,444,572 | | | | 6,256,264 | |
Interest | | | 18,865,927 | | | | 27,355,187 | | | | 14,968,800 | | | | 3,602,680 | | | | 247,891 | |
Expenses | | | (2,837,578 | ) | | | (5,373,351 | ) | | | (5,151,400 | ) | | | (3,765,549 | ) | | | (868,888 | ) |
Fees waived | | | 381,888 | | | | 1,003,492 | | | | 1,256,034 | | | | 1,068,400 | | | | 269,951 | |
| | | | |
Total income | | | 26,824,640 | | | | 48,564,880 | | | | 46,620,497 | | | | 35,482,292 | | | | 7,987,093 | |
| | | | |
| | | | | | | | | | | | | | | | | | | | |
| Expenses | | | | | | | | | | | | | | | | | | | | |
Investment advisory | | | 4,768,478 | | | | 8,606,026 | | | | 8,240,377 | | | | 6,293,827 | | | | 1,421,461 | |
Independent Trustees | | | 48,370 | | | | 80,874 | | | | 77,890 | | | | 60,417 | | | | 18,830 | |
Professional | | | 26,739 | | | | 27,650 | | | | 27,558 | | | | 27,284 | | | | 26,166 | |
| | | | |
Total expenses | | | 4,843,587 | | | | 8,714,550 | | | | 8,345,825 | | | | 6,381,528 | | | | 1,466,457 | |
Less fees waived by the Manager | | | (3,806,273 | ) | | | (7,183,787 | ) | | | (7,327,185 | ) | | | (5,886,031 | ) | | | (1,389,246 | ) |
| | | | |
Total expenses after fees waived | | | 1,037,314 | | | | 1,530,763 | | | | 1,018,640 | | | | 495,497 | | | | 77,211 | |
| | | | |
Net investment income | | | 25,787,326 | | | | 47,034,117 | | | | 45,601,857 | | | | 34,986,795 | | | | 7,909,882 | |
| | | | |
| | | | | | | | | | | | | | | | | | | | |
| Realized and Unrealized Gain (Loss) | | | | | | | | | | | | | | | | | | | | |
| Net realized gain (loss) from: | | | | | | | | | | | | | | | | | | | | |
Investments — unaffiliated | | | 385 | | | | 6,359 | | | | 19,477 | | | | 34,398 | | | | (81 | ) |
Investments — affiliated | | | (27,139,482 | ) | | | (44,580,753 | ) | | | (50,450,039 | ) | | | (40,790,285 | ) | | | (9,337,448 | ) |
In-kind redemptions — affiliated1 | | | 10,176,177 | | | | 44,229,792 | | | | 61,452,297 | | | | 55,139,035 | | | | 6,266,824 | |
Foreign currency transactions | | | 166 | | | | 2,802 | | | | 7,596 | | | | 9,460 | | | | 2,801 | |
Allocation from the applicable Underlying Master Portfolios from investments, financial futures contracts, swaps and foreign currency transactions | | | 19,816,197 | | | | 47,284,814 | | | | 50,322,534 | | | | 45,727,738 | | | | 5,761,663 | |
Allocation from the applicable Underlying Master Portfolios from in-kind redemptions1 | | | 35,449,619 | | | | 65,711,717 | | | | 73,717,581 | | | | 61,355,749 | | | | 13,698,651 | |
| | | | |
| | | 38,303,062 | | | | 112,654,731 | | | | 135,069,446 | | | | 121,476,095 | | | | 16,392,410 | |
| | | | |
| Net change in unrealized appreciation (depreciation) on: | | | | | | | | | | | | | | | | | | | | |
Investments — unaffiliated | | | 9,074 | | | | 174,901 | | | | 473,495 | | | | 581,024 | | | | 177,869 | |
Investments — affiliated | | | (960,390 | ) | | | (86,397,767 | ) | | | (53,282,789 | ) | | | (52,571,285 | ) | | | (6,569,933 | ) |
Foreign currency translations | | | (847 | ) | | | (5,170 | ) | | | (12,896 | ) | | | (14,920 | ) | | | (5,192 | ) |
Allocation from the applicable Underlying Master Portfolios from investments, financial futures contracts, swaps and foreign currency translations | | | (62,532,271 | ) | | | (73,075,723 | ) | | | (128,231,592 | ) | | | (103,920,333 | ) | | | (18,789,649 | ) |
| | | | | | | | | | | | | | | | | | | | |
| | | (63,484,434 | ) | | | (159,303,759 | ) | | | (181,053,782 | ) | | | (155,925,514 | ) | | | (25,186,905 | ) |
| | | | |
Net realized and unrealized loss | | | (25,181,372 | ) | | | (46,649,029 | ) | | | (45,984,335 | ) | | | (34,449,419 | ) | | | (8,794,494 | ) |
| | | | |
Net Increase (Decrease) in Net Assets Resulting from Operations | | $ | 605,954 | | | $ | 385,089 | | | $ | (382,479 | ) | | $ | 537,376 | | | $ | (884,613 | ) |
| | | | |
1 See Note 2 of the Notes to Financial Statements. | | | | | | | | | | | | | | | | | | | | |
| | | | | | |
| See Notes to Financial Statements. | | | | |
| | | | | | | |
| | BLACKROCK FUNDS III | | DECEMBER 31, 2015 | | 83 |
| | |
| Statements of Changes in Net Assets | | Master Investment Portfolio |
| | | | | | | | | | | | | | | | | | |
| | | LifePath Retirement Master Portfolio | | | | | LifePath 2020 Master Portfolio | |
| | | Year Ended December 31, | | | | | Year Ended December 31, | |
| Increase (Decrease) in Net Assets: | | 2015 | | | 2014 | | | | | 2015 | | | 2014 | |
| | | | | | | | | | | | | | | | | | |
| Operations | | | | | | | | | | | | | | | | | | |
Net investment income | | $ | 25,787,326 | | | $ | 32,131,672 | | | | | $ | 47,034,117 | | | $ | 57,673,762 | |
Net realized gain | | | 38,303,062 | | | | 83,848,609 | | | | | | 112,654,731 | | | | 189,153,644 | |
Net change in unrealized appreciation (depreciation) | | | (63,484,434 | ) | | | (33,798,562 | ) | | | | | (159,303,759 | ) | | | (94,650,978 | ) |
| | | | | | | | | | |
Net increase in net assets resulting from operations | | | 605,954 | | | | 82,181,719 | | | | | | 385,089 | | | | 152,176,428 | |
| | | | | | | | | | |
| | | | | | | | | | | | | | | | | | |
| Capital Transactions | | | | | | | | | | | | | | | | | | |
Proceeds from contributions | | | 300,179,102 | | | | 175,047,598 | | | | | | 464,173,999 | | | | 288,154,878 | |
Value of withdrawals1 | | | (1,636,813,035 | ) | | | (253,441,996 | ) | | | | | (2,759,248,995 | ) | | | (396,106,580 | ) |
| | | | | | | | | | |
Net decrease in net assets derived from capital transactions | | | (1,336,633,933 | ) | | | (78,394,398 | ) | | | | | (2,295,074,996 | ) | | | (107,951,702 | ) |
| | | | | | | | | | |
| | | | | | | | | | | | | | | | | | |
| Net Assets | | | | | | | | | | | | | | | | | | |
Total increase (decrease) in net assets | | | (1,336,027,979 | ) | | | 3,787,321 | | | | | | (2,294,689,907 | ) | | | 44,224,726 | |
Beginning of year | | | 1,590,195,329 | | | | 1,586,408,008 | | | | | | 2,875,494,461 | | | | 2,831,269,735 | |
| | | | | | | | | | |
End of year | | $ | 254,167,350 | | | $ | 1,590,195,329 | | | | | $ | 580,804,554 | | | $ | 2,875,494,461 | |
| | | | | | | | | | |
1 See Note 2 of the Notes to Financial Statements. | |
| | | | | | |
| See Notes to Financial Statements. | | | | |
| | | | | | | |
| 84 | | BLACKROCK FUNDS III | | DECEMBER 31, 2015 | | |
| | |
| Statements of Changes in Net Assets | | Master Investment Portfolio |
| | | | | | | | | | | | | | | | | | |
| | | LifePath 2030 Master Portfolio | | | | | LifePath 2040 Master Portfolio | |
| | | Year Ended December 31, | | | | | Year Ended December 31, | |
| Increase (Decrease) in Net Assets: | | 2015 | | | 2014 | | | | | 2015 | | | 2014 | |
| | | | | | | | | | | | | | | | | | |
| Operations | | | | | | | | | | | | | | | | | | |
Net investment income | | $ | 45,601,857 | | | $ | 54,291,020 | | | | | $ | 34,986,795 | | | $ | 42,311,359 | |
Net realized gain | | | 135,036,446 | | | | 209,284,609 | | | | | | 121,476,095 | | | | 184,817,567 | |
Net change in unrealized appreciation (depreciation) | | | (181,053,782 | ) | | | (114,220,706 | ) | | | | | (155,925,514 | ) | | | (107,609,728 | ) |
| | | | | | | | | | |
Net increase in net assets resulting from operations | | | (382,479 | ) | | | 149,354,923 | | | | | | 537,376 | | | | 119,519,198 | |
| | | | | | | | | | |
| | | | | | | | | | | | | | | | | | |
| Capital Transactions | | | | | | | | | | | | | | | | | | |
Proceeds from contributions | | | 520,309,935 | | | | 299,751,622 | | | | | | 394,402,394 | | | | 231,414,329 | |
Value of withdrawals1 | | | (2,678,876,359 | ) | | | (397,791,695 | ) | | | | | (2,058,297,441 | ) | | | (326,313,422 | ) |
| | | | | | | | | | |
Net decrease in net assets derived from capital transactions | | | (2,158,566,424 | ) | | | (98,040,073 | ) | | | | | (1,663,895,047 | ) | | | (94,899,093 | ) |
| | | | | | | | | | |
| | | | | | | | | | | | | | | | | | |
| Net Assets | | | | | | | | | | | | | | | | | | |
Total increase (decrease) in net assets | | | (2,158,948,903 | ) | | | 51,314,850 | | | | | | (1,663,357,671 | ) | | | 24,620,105 | |
Beginning of year | | | 2,702,795,768 | | | | 2,651,480,918 | | | | | | 2,089,313,365 | | | | 2,064,693,260 | |
| | | | | | | | | | |
End of year | | $ | 543,846,865 | | | $ | 2,702,795,768 | | | | | $ | 425,955,694 | | | $ | 2,089,313,365 | |
| | | | | | | | | | |
1 See Note 2 of the Notes to Financial Statements. | | | | |
| | | | | | |
| See Notes to Financial Statements. | | | | |
| | | | | | | |
| | BLACKROCK FUNDS III | | DECEMBER 31, 2015 | | 85 |
| | |
| Statements of Changes in Net Assets | | Master Investment Portfolio |
| | | | | | | | |
| | | LifePath 2050 Master Portfolio | |
| | | Year Ended December 31, | |
| Increase (Decrease) in Net Assets: | | 2015 | | | 2014 | |
| | | | | | | | |
| Operations | | | | | | | | |
Net investment income | | $ | 7,909,882 | | | $ | 8,351,985 | |
Net realized gain | | | 16,392,410 | | | | 32,258,986 | |
Net change in unrealized appreciation (depreciation) | | | (25,186,905 | ) | | | (18,115,900 | ) |
| | | | |
Net increase (decrease) in net assets resulting from operations | | | (884,613 | ) | | | 22,495,071 | |
| | | | |
| | | | | | | | |
| Capital Transactions | | | | | | | | |
Proceeds from contributions | | | 154,043,711 | | | | 110,692,340 | |
Value of withdrawals1 | | | (477,699,188 | ) | | | (109,007,078 | ) |
| | | | |
Net increase (decrease) in net assets derived from capital transactions | | | (323,655,477 | ) | | | 1,685,262 | |
| | | | |
| | | | | | | | |
| Net Assets | | | | | | | | |
Total increase (decrease) in net assets | | | (324,540,090 | ) | | | 24,180,333 | |
Beginning of year | | | 439,443,651 | | | | 415,263,318 | |
| | | | |
End of year | | $ | 114,903,561 | | | $ | 439,443,651 | |
| | | | |
1 �� See Note 2 of the Notes to Financial Statements. | | | | | | | | |
| | | | | | |
| See Notes to Financial Statements. | | | | |
| | | | | | | |
| 86 | | BLACKROCK FUNDS III | | DECEMBER 31, 2015 | | |
| | |
| Financial Highlights | | Master Investment Portfolio |
| | | | | | | | | | | | | | | | | | | | |
| | | LifePath Retirement Master Portfolio | |
| | | Year Ended December 31, | |
| | | 2015 | | | 2014 | | | 2013 | | | 2012 | | | 2011 | |
| | | | | | | | | | | | | | | | | | | | |
| Total Return | | | | | | | | | | | | | | | | | | | | |
Total return | | | (1.02)% | | | | 5.25% | | | | 6.75% | | | | 9.11% | | | | 4.46% | |
| | | | |
| | | | | | | | | | | | | | | | | | | | |
| Ratios to Average Net Assets | | | | | | | | | | | | | | | | | | | | |
Total expenses | | | 0.54% | 1,2,3 | | | 0.54% | 4,5,6 | | | 0.54% | 4,5,6 | | | 0.55% | 7,8,9 | | | 0.55% | 7,8,9 |
| | | | |
Total expenses after fees waived and/or reimbursed | | | 0.26% | 1,2,3 | | | 0.25% | 4,5,6 | | | 0.25% | 4,5,6 | | | 0.28% | 7,8,9 | | | 0.27% | 7,8,9 |
| | | | |
Net investment income10 | | | 1.88% | 1,2,3 | | | 2.02% | 4,5,6 | | | 1.83% | 4,5,6 | | | 2.22% | 7,8,9 | | | 2.77% | 7,8,9 |
| | | | |
| | | | | | | | | | | | | | | | | | | | |
| Supplemental Data | | | | | | | | | | | | | | | | | | | | |
Net assets, end of year (000) | | | $ 254,167 | | | | $ 1,590,195 | | | | $ 1,586,408 | | | | $ 1,491,576 | | | | $ 1,387,033 | |
| | | | |
Portfolio turnover rate | | | 21% | 11 | | | 14% | 12 | | | 17% | 12 | | | 4% | 13 | | | 4% | 13 |
| | | | |
| | 1 | | Includes the LifePath Master Portfolio’s pro rata portion of expenses from Active Stock Master Portfolio, CoreAlpha Bond Master Portfolio, International Tilts Master Portfolio, Large Cap Index Master Portfolio and Master Small Cap Index Series. These ratios do not reflect any expenses incurred indirectly as a result of investments in BlackRock Cash Funds: Institutional, BlackRock Commodity Strategies Fund, BlackRock Emerging Markets Fund, Inc. and iShares exchange-traded funds. |
| | 2 | | Includes the LifePath Master Portfolio’s share of Active Stock Master Portfolio, CoreAlpha Bond Master Portfolio, International Tilts Master Portfolio, Large Cap Index Master Portfolio and Master Small Cap Index Series allocated fees waived of 0.03% for the year ended December 31, 2015. |
| | 3 | | Excludes expenses incurred indirectly as a result of investments in underlying funds of approximately 0.09% for the year ended December 31, 2015, although the ratio does include the LifePath Master Portfolio’s share of Active Stock Master Portfolio, CoreAlpha Bond Master Portfolio, International Tilts Master Portfolio, Large Cap Index Master Portfolio and Master Small Cap Index Series allocated expenses and/or net investment income. |
| | 4 | | Includes the LifePath Master Portfolio’s pro rata portion of expenses from Active Stock Master Portfolio, CoreAlpha Bond Master Portfolio, International Tilts Master Portfolio, Large Cap Index Master Portfolio, Master Small Cap Index Series and Total International ex U.S. Index Master Portfolio. These ratios do not reflect any expenses incurred indirectly as a result of investments in BlackRock Cash Funds: Institutional, BlackRock Commodity Strategies Fund, BlackRock Emerging Markets Fund, Inc. and iShares exchange-traded funds. |
| | 5 | | Includes the LifePath Master Portfolio’s share of Active Stock Master Portfolio, CoreAlpha Bond Master Portfolio, International Tilts Master Portfolio, Large Cap Index Master Portfolio, Master Small Cap Index Series and Total International ex U.S. Index Master Portfolio allocated fees waived of 0.03% and 0.03% for the years ended December 31, 2014 and December 31, 2013, respectively. |
| | 6 | | Excludes expenses incurred indirectly as a result of investments in underlying funds of approximately 0.10% and 0.10% for the years ended December 31, 2014 and December 31, 2013, respectively, although the ratio does include the LifePath Master Portfolio’s share of Active Stock Master Portfolio, CoreAlpha Bond Master Portfolio, International Tilts Master Portfolio, Large Cap Index Master Portfolio, Master Small Cap Index Series and Total International ex U.S. Index Master Portfolio allocated expenses and/or net investment income. |
| | 7 | | Includes the LifePath Master Portfolio’s pro rata portion of expenses from Active Stock Master Portfolio, CoreAlpha Bond Master Portfolio, Large Cap Index Master Portfolio, Master Small Cap Index Series, and Total International ex U.S. Index Master Portfolio. These ratios do not reflect any expenses incurred indirectly as a result of investments in BlackRock Cash Funds: Institutional, BlackRock Commodity Strategies Fund, BlackRock Emerging Markets Fund, Inc. and iShares exchange-traded funds. |
| | 8 | | Includes the LifePath Master Portfolio’s share of Active Stock Master Portfolio, CoreAlpha Bond Master Portfolio, Large Cap Index Master Portfolio, Master Small Cap Index Series and Total International ex U.S. Index Master Portfolio allocated fees waived of 0.03% and 0.02% for the years ended December 31, 2012 and December 31, 2011, respectively. |
| | 9 | | Excludes expenses incurred indirectly as a result of investments in underlying funds of approximately 0.08% and 0.08% for the years ended December 31, 2012 and December 31, 2011, respectively, although the ratio does include the LifePath Master Portfolio’s share of Active Stock Master Portfolio, CoreAlpha Bond Master Portfolio, Master Small Cap Index Series and Total International ex U.S. Index Master Portfolio allocated expenses and/or net investment income. |
| | 10 | | Includes the LifePath Master Portfolio’s share of the allocated net investment income from Active Stock Master Portfolio, CoreAlpha Bond Master Portfolio, Master Small Cap Index Series and Total International ex U.S. Index Master Portfolio, except for the years ended December 31, 2015, December 31, 2014 and December 31, 2013, which also includes International Tilts Master Portfolio. For the year ended December 31, 2015, the ratio does not include Total International ex U.S. Index Master Portfolio, which is no longer held by the LifePath Master Portfolio. |
| | 11 | | Includes the purchases and sales of the underlying funds and Active Stock Master Portfolio, CoreAlpha Bond Master Portfolio, International Tilts Master Portfolio, Large Cap Index Master Portfolio and Master Small Cap Index Series. |
| | 12 | | Includes the purchases and sales of the underlying funds and Active Stock Master Portfolio, CoreAlpha Bond Master Portfolio, International Tilts Master Portfolio, Large Cap Index Master Portfolio, Master Small Cap Index Series and Total International ex U.S. Index Master Portfolio. |
| | 13 | | Excludes purchases and sales of Active Stock Master Portfolio, CoreAlpha Bond Master Portfolio, Master Small Cap Index Series and Total International ex U.S. Index Master Portfolio. If these transactions had been included to conform to the current year presentation, the portfolio turnover rate would have been 13% and 20% for the years ended December 31, 2012 and December 31, 2011, respectively. |
| | | | | | |
| See Notes to Financial Statements. | | | | |
| | | | | | | |
| | BLACKROCK FUNDS III | | DECEMBER 31, 2015 | | 87 |
| | |
| Financial Highlights | | Master Investment Portfolio |
| | | | | | | | | | | | | | | | | | | | |
| | | LifePath 2020 Master Portfolio | |
| | | Year Ended December 31, | |
| | | 2015 | | | 2014 | | | 2013 | | | 2012 | | | 2011 | |
| | | | | | | | | | | | | | | | | | | | |
| Total Return | | | | | | | | | | | | | | | | | | | | |
Total return | | | (1.28)% | | | | 5.56% | | | | 10.17% | | | | 11.49% | | | | 1.96% | |
| | | | |
| | | | | | | | | | | | | | | | | | | | |
| Ratios to Average Net Assets | | | | | | | | | | | | | | | | | | | | |
Total expenses | | | 0.53% | 1,2,3 | | | 0.54% | 4,5,6 | | | 0.53% | 4,5,6 | | | 0.53% | 7,8,9 | | | 0.53% | 7,8,9 |
| | | | |
Total expenses after fees waived and/or reimbursed | | | 0.24% | 1,2,3 | | | 0.24% | 4,5,6 | | | 0.23% | 4,5,6 | | | 0.25% | 7,8,9 | | | 0.25% | 7,8,9 |
| | | | |
Net investment income10 | | | 1.90% | 1,2,3 | | | 2.01% | 4,5,6 | | | 1.97% | 4,5,6 | | | 2.30% | 7,8,9 | | | 2.56% | 7,8,9 |
| | | | |
| | | | | | | | | | | | | | | | | | | | |
| Supplemental Data | | | | | | | | | | | | | | | | | | | | |
Net assets, end of year (000) | | | $ 580,805 | | | | $ 2,875,494 | | | | $ 2,831,270 | | | | $ 2,524,316 | | | | $ 2,358,583 | |
| | | | |
Portfolio turnover rate | | | 18% | 11 | | | 21% | 12 | | | 19% | 12 | | | 5% | 13 | | | 5% | 13 |
| | | | |
| | 1 | | Includes the LifePath Master Portfolio’s pro rata portion of expenses from Active Stock Master Portfolio, CoreAlpha Bond Master Portfolio, International Tilts Master Portfolio, Large Cap Index Master Portfolio and Master Small Cap Index Series. These ratios do not reflect any expenses incurred indirectly as a result of investments in BlackRock Cash Funds: Institutional, BlackRock Commodity Strategies Fund, BlackRock Emerging Markets Fund, Inc. and iShares exchange-traded funds. |
| | 2 | | Includes the LifePath Master Portfolio’s share of Active Stock Master Portfolio, CoreAlpha Bond Master Portfolio, International Tilts Master Portfolio, Large Cap Index Master Portfolio and Master Small Cap Index Series allocated fees waived of 0.04% for the year ended December 31, 2015. |
| | 3 | | Excludes expenses incurred indirectly as a result of investments in underlying funds of approximately 0.11% for the year ended December 31, 2015, although the ratio does include the LifePath Master Portfolio’s share of Active Stock Master Portfolio, CoreAlpha Bond Master Portfolio, International Tilts Master Portfolio, Large Cap Index Master Portfolio and Master Small Cap Index Series allocated expenses and/or net investment income. |
| | 4 | | Includes the LifePath Master Portfolio’s pro rata portion of expenses from Active Stock Master Portfolio, CoreAlpha Bond Master Portfolio, International Tilts Master Portfolio, Large Cap Index Master Portfolio, Master Small Cap Index Series and Total International ex U.S. Index Master Portfolio. These ratios do not reflect any expenses incurred indirectly as a result of investments in BlackRock Cash Funds: Institutional, BlackRock Commodity Strategies Fund, BlackRock Emerging Markets Fund, Inc. and iShares exchange-traded funds. |
| | 5 | | Includes the LifePath Master Portfolio’s share of Active Stock Master Portfolio, CoreAlpha Bond Master Portfolio, International Tilts Master Portfolio, Large Cap Index Master Portfolio, Master Small Cap Index Series and Total International ex U.S. Index Master Portfolio allocated fees waived of 0.04% and 0.03% for the years ended December 31, 2014 and December 31, 2013, respectively. |
| | 6 | | Excludes expenses incurred indirectly as a result of investments in underlying funds of approximately 0.11% and 0.12% for the years ended December 31, 2014 and December 31, 2013, respectively, although the ratio does include the LifePath Master Portfolio’s share of Active Stock Master Portfolio, CoreAlpha Bond Master Portfolio, International Tilts Master Portfolio, Large Cap Index Master Portfolio, Master Small Cap Index Series and Total International ex U.S. Index Master Portfolio allocated expenses and/or net investment income. |
| | 7 | | Includes the LifePath Master Portfolio’s pro rata portion of expenses from Active Stock Master Portfolio, CoreAlpha Bond Master Portfolio, Large Cap Index Master Portfolio, Master Small Cap Index Series, and Total International ex U.S. Index Master Portfolio. These ratios do not reflect any expenses incurred indirectly as a result of investments in BlackRock Cash Funds: Institutional, BlackRock Commodity Strategies Fund, BlackRock Emerging Markets Fund, Inc. and iShares exchange-traded funds. |
| | 8 | | Includes the LifePath Master Portfolio’s share of Active Stock Master Portfolio, CoreAlpha Bond Master Portfolio, Large Cap Index Master Portfolio, Master Small Cap Index Series and Total International ex U.S. Index Master Portfolio allocated fees waived of 0.03% and 0.03% for the years ended December 31, 2012 and December 31, 2011, respectively. |
| | 9 | | Excludes expenses incurred indirectly as a result of investments in underlying funds of approximately 0.11% and 0.11% for the years ended December 31, 2012 and December 31, 2011, respectively, although the ratio does include the LifePath Master Portfolio’s share of Active Stock Master Portfolio, CoreAlpha Bond Master Portfolio, Master Small Cap Index Series and Total International ex U.S. Index Master Portfolio allocated expenses and/or net investment income. |
| | 10 | | Includes the LifePath Master Portfolio’s share of the allocated net investment income from Active Stock Master Portfolio, CoreAlpha Bond Master Portfolio, Master Small Cap Index Series and Total International ex U.S. Index Master Portfolio, except for the years ended December 31, 2015, December 31, 2014 and December 31, 2013, which also includes International Tilts Master Portfolio. For the year ended December 31, 2015, the ratio does not include Total International ex U.S. Index Master Portfolio, which is no longer held by the LifePath Master Portfolio. |
| | 11 | | Includes the purchases and sales of the underlying funds and Active Stock Master Portfolio, CoreAlpha Bond Master Portfolio, International Tilts Master Portfolio, Large Cap Index Master Portfolio and Master Small Cap Index Series. |
| | 12 | | Includes the purchases and sales of the underlying funds and Active Stock Master Portfolio, CoreAlpha Bond Master Portfolio, International Tilts Master Portfolio, Large Cap Index Master Portfolio, Master Small Cap Index Series and Total International ex U.S. Index Master Portfolio. |
| | 13 | | Excludes purchases and sales of Active Stock Master Portfolio, CoreAlpha Bond Master Portfolio, Master Small Cap Index Series and Total International ex U.S. Index Master Portfolio. If these transactions had been included to conform to the current year presentation, the portfolio turnover rate would have been 15% and 23% for the years ended December 31, 2012 and December 31, 2011, respectively. |
| | | | | | |
| See Notes to Financial Statements. | | | | |
| | | | | | | |
| 88 | | BLACKROCK FUNDS III | | DECEMBER 31, 2015 | | |
| | |
| Financial Highlights | | Master Investment Portfolio |
| | | | | | | | | | | | | | | | | | | | |
| | | LifePath 2030 Master Portfolio | |
| | | Year Ended December 31, | |
| | | 2015 | | | 2014 | | | 2013 | | | 2012 | | | 2011 | |
| | | | | | | | | | | | | | | | | | | | |
| Total Return | | | | | | | | | | | | | | | | | | | | |
Total return | | | (1.55)% | | | | 5.82% | | | | 14.16% | | | | 13.59% | | | | (0.13)% | |
| | | | |
| | | | | | | | | | | | | | | | | | | | |
| Ratios to Average Net Assets | | | | | | | | | | | | | | | | | | | | |
Total expenses | | | 0.52% | 1,2,3 | | | 0.53% | 4,5,6 | | | 0.52% | 4,5,6 | | | 0.53% | 7,8,9 | | | 0.52% | 7,8,9 |
| | | | |
Total expenses after fees waived and/or reimbursed | | | 0.21% | 1,2,3 | | | 0.21% | 4,5,6 | | | 0.20% | 4,5,6 | | | 0.23% | 7,8,9 | | | 0.22% | 7,8,9 |
| | | | |
Net investment income10 | | | 1.93% | 1,2,3 | | | 2.02% | 4,5,6 | | | 2.13% | 4,5,6 | | | 2.37% | 7,8,9 | | | 2.39% | 7,8,9 |
| | | | |
| | | | | | | | | | | | | | | | | | | | |
| Supplemental Data | | | | | | | | | | | | | | | | | | | | |
Net assets, end of year (000) | | | $ 543,847 | | | | $ 2,702,796 | | | | $ 2,651,481 | | | | $ 2,237,444 | | | | $ 2,014,111 | |
| | | | |
Portfolio turnover rate | | | 21% | 11 | | | 33% | 12 | | | 22% | 12 | | | 5% | 13 | | | 7% | 13 |
| | | | |
| | 1 | | Includes the LifePath Master Portfolio’s pro rata portion of expenses from Active Stock Master Portfolio, CoreAlpha Bond Master Portfolio, International Tilts Master Portfolio, Large Cap Index Master Portfolio and Master Small Cap Index Series. These ratios do not reflect any expenses incurred indirectly as a result of investments in BlackRock Cash Funds: Institutional, BlackRock Commodity Strategies Fund, BlackRock Emerging Markets Fund, Inc. and iShares exchange-traded funds. |
| | 2 | | Includes the LifePath Master Portfolio’s share of Active Stock Master Portfolio, CoreAlpha Bond Master Portfolio, International Tilts Master Portfolio, Large Cap Index Master Portfolio and Master Small Cap Index Series allocated fees waived of 0.05% for the year ended December 31, 2015. |
| | 3 | | Excludes expenses incurred indirectly as a result of investments in underlying funds of approximately 0.14% for the year ended December 31, 2015, although the ratio does include the LifePath Master Portfolio’s share of Active Stock Master Portfolio, CoreAlpha Bond Master Portfolio, International Tilts Master Portfolio, Large Cap Index Master Portfolio and Master Small Cap Index Series allocated expenses and/or net investment income. |
| | 4 | | Includes the LifePath Master Portfolio’s pro rata portion of expenses from Active Stock Master Portfolio, CoreAlpha Bond Master Portfolio, International Tilts Master Portfolio, Large Cap Index Master Portfolio, Master Small Cap Index Series and Total International ex U.S. Index Master Portfolio. These ratios do not reflect any expenses incurred indirectly as a result of investments in BlackRock Cash Funds: Institutional, BlackRock Commodity Strategies Fund, BlackRock Emerging Markets Fund, Inc. and iShares exchange-traded funds. |
| | 5 | | Includes the LifePath Master Portfolio’s share of Active Stock Master Portfolio, CoreAlpha Bond Master Portfolio, International Tilts Master Portfolio, Large Cap Index Master Portfolio, Master Small Cap Index Series and Total International ex U.S. Index Master Portfolio allocated fees waived of 0.05% and 0.05% for the years ended December 31, 2014 and December 31, 2013, respectively. |
| | 6 | | Excludes expenses incurred indirectly as a result of investments in underlying funds of approximately 0.14% and 0.15% for the years ended December 31, 2014 and December 31, 2013, respectively, although the ratio does include the LifePath Master Portfolio’s share of Active Stock Master Portfolio, CoreAlpha Bond Master Portfolio, International Tilts Master Portfolio, Large Cap Index Master Portfolio, Master Small Cap Index Series and Total International ex U.S. Index Master Portfolio allocated expenses and/or net investment income. |
| | 7 | | Includes the LifePath Master Portfolio’s pro rata portion of expenses from Active Stock Master Portfolio, CoreAlpha Bond Master Portfolio, Large Cap Index Master Portfolio, Master Small Cap Index Series, and Total International ex U.S. Index Master Portfolio. These ratios do not reflect any expenses incurred indirectly as a result of investments in BlackRock Cash Funds: Institutional, BlackRock Commodity Strategies Fund, BlackRock Emerging Markets Fund, Inc. and iShares exchange-traded funds. |
| | 8 | | Includes the LifePath Master Portfolio’s share of Active Stock Master Portfolio, CoreAlpha Bond Master Portfolio, Large Cap Index Master Portfolio, Master Small Cap Index Series and Total International ex U.S. Index Master Portfolio allocated fees waived of 0.04% and 0.04% for the years ended December 31, 2012 and December 31, 2011, respectively. |
| | 9 | | Excludes expenses incurred indirectly as a result of investments in underlying funds of approximately 0.13% for the years ended December 31, 2012 and December 31, 2011, respectively, although the ratio does include the LifePath Master Portfolio’s share of Active Stock Master Portfolio, CoreAlpha Bond Master Portfolio, Master Small Cap Index Series and Total International ex U.S. Index Master Portfolio allocated expenses and/or net investment income. |
| | 10 | | Includes the LifePath Master Portfolio’s share of the allocated net investment income from Active Stock Master Portfolio, CoreAlpha Bond Master Portfolio, Master Small Cap Index Series and Total International ex U.S. Index Master Portfolio, except for the years ended December 31, 2015, December 31, 2014 and December 31, 2013, which also includes International Tilts Master Portfolio. For the year ended December 31, 2015, the ratio does not include Total International ex U.S. Index Master Portfolio, which is no longer held by the LifePath Master Portfolio. |
| | 11 | | Includes the purchases and sales of the underlying funds and Active Stock Master Portfolio, CoreAlpha Bond Master Portfolio, International Tilts Master Portfolio, Large Cap Index Master Portfolio and Master Small Cap Index Series. |
| | 12 | | Includes the purchases and sales of the underlying funds and Active Stock Master Portfolio, CoreAlpha Bond Master Portfolio, International Tilts Master Portfolio, Large Cap Index Master Portfolio, Master Small Cap Index Series and Total International ex U.S. Index Master Portfolio. |
| | 13 | | Excludes purchases and sales of Active Stock Master Portfolio, CoreAlpha Bond Master Portfolio, Master Small Cap Index Series and Total International ex U.S. Index Master Portfolio. If these transactions had been included to conform to the current year presentation, the portfolio turnover rate would have been 16% and 20% for the years ended December 31, 2012 and December 31, 2011, respectively. |
| | | | | | |
| See Notes to Financial Statements. | | | | |
| | | | | | | |
| | BLACKROCK FUNDS III | | DECEMBER 31, 2015 | | 89 |
| | |
| Financial Highlights | | Master Investment Portfolio |
| | | | | | | | | | | | | | | | | | | | |
| | | LifePath 2040 Master Portfolio | |
| | | Year Ended December 31, | |
| | | 2015 | | | 2014 | | | 2013 | | | 2012 | | | 2011 | |
| | | | | | | | | | | | | | | | | | | | |
| Total Return | | | | | | | | | | | | | | | | | | | | |
Total return | | | (1.79)% | | | | 5.98% | | | | 17.42% | | | | 15.23% | | | | (1.88)% | |
| | | | |
| | | | | | | | | | | | | | | | | | | | |
| Ratios to Average Net Assets | | | | | | | | | | | | | | | | | | | | |
Total expenses | | | 0.50% | 1,2,3 | | | 0.53% | 4,5,6 | | | 0.51% | 4,5,6 | | | 0.52% | 7,8,9 | | | 0.52% | 7,8,9 |
| | | | |
Total expenses after fees waived and/or reimbursed | | | 0.18% | 1,2,3 | | | 0.19% | 4,5,6 | | | 0.18% | 4,5,6 | | | 0.21% | 7,8,9 | | | 0.20% | 7,8,9 |
| | | | |
Net investment income10 | | | 1.94% | 1,2,3 | | | 2.03% | 4,5,6 | | | 2.26% | 4,5,6 | | | 2.44% | 7,8,9 | | | 2.24% | 7,8,9 |
| | | | |
| | | | | | | | | | | | | | | | | | | | |
| Supplemental Data | | | | | | | | | | | | | | | | | | | | |
Net assets, end of year (000) | | | $ 425,956 | | | | $ 2,089,313 | | | | $ 2,064,693 | | | | $ 1,701,257 | | | | $ 1,509,756 | |
| | | | |
Portfolio turnover rate | | | 19% | 11 | | | 42% | 12 | | | 26% | 12 | | | 4% | 13 | | | 8% | 13 |
| | | | |
| | 1 | | Includes the LifePath Master Portfolio’s pro rata portion of expenses from Active Stock Master Portfolio, CoreAlpha Bond Master Portfolio, International Tilts Master Portfolio, Large Cap Index Master Portfolio and Master Small Cap Index Series. These ratios do not reflect any expenses incurred indirectly as a result of investments in BlackRock Cash Funds: Institutional, BlackRock Commodity Strategies Fund, BlackRock Emerging Markets Fund, Inc. and iShares exchange-traded funds. |
| | 2 | | Includes the LifePath Master Portfolio’s share of Active Stock Master Portfolio, CoreAlpha Bond Master Portfolio, International Tilts Master Portfolio, Large Cap Index Master Portfolio and Master Small Cap Index Series allocated fees waived of 0.06% for the year ended December 31, 2015. |
| | 3 | | Excludes expenses incurred indirectly as a result of investments in underlying funds of approximately 0.17% for the year ended December 31, 2015, although the ratio does include the LifePath Master Portfolio’s share of Active Stock Master Portfolio, CoreAlpha Bond Master Portfolio, International Tilts Master Portfolio, Large Cap Index Master Portfolio and Master Small Cap Index Series allocated expenses and/or net investment income. |
| | 4 | | Includes the LifePath Master Portfolio’s pro rata portion of expenses from Active Stock Master Portfolio, CoreAlpha Bond Master Portfolio, International Tilts Master Portfolio, Large Cap Index Master Portfolio, Master Small Cap Index Series and Total International ex U.S. Index Master Portfolio. These ratios do not reflect any expenses incurred indirectly as a result of investments in BlackRock Cash Funds: Institutional, BlackRock Commodity Strategies Fund, BlackRock Emerging Markets Fund, Inc. and iShares exchange-traded funds. |
| | 5 | | Includes the LifePath Master Portfolio’s share of Active Stock Master Portfolio, CoreAlpha Bond Master Portfolio, International Tilts Master Portfolio, Large Cap Index Master Portfolio, Master Small Cap Index Series and Total International ex U.S. Index Master Portfolio allocated fees waived of 0.06% and 0.05% for the years ended December 31, 2014 and December 31, 2013, respectively. |
| | 6 | | Excludes expenses incurred indirectly as a result of investments in underlying funds of approximately 0.16% and 0.17% for the years ended December 31, 2014 and December 31, 2013, respectively, although the ratio does include the LifePath Master Portfolio’s share of Active Stock Master Portfolio, CoreAlpha Bond Master Portfolio, International Tilts Master Portfolio, Large Cap Index Master Portfolio, Master Small Cap Index Series and Total International ex U.S. Index Master Portfolio allocated expenses and/or net investment income. |
| | 7 | | Includes the LifePath Master Portfolio’s pro rata portion of expenses from Active Stock Master Portfolio, CoreAlpha Bond Master Portfolio, Large Cap Index Master Portfolio, Master Small Cap Index Series, and Total International ex U.S. Index Master Portfolio. These ratios do not reflect any expenses incurred indirectly as a result of investments in BlackRock Cash Funds: Institutional, BlackRock Commodity Strategies Fund, BlackRock Emerging Markets Fund, Inc. and iShares exchange-traded funds. |
| | 8 | | Includes the LifePath Master Portfolio’s share of Active Stock Master Portfolio, CoreAlpha Bond Master Portfolio, Large Cap Index Master Portfolio, Master Small Cap Index Series and Total International ex U.S. Index Master Portfolio allocated fees waived of 0.05% and 0.04% for the years ended December 31, 2012 and December 31, 2011, respectively. |
| | 9 | | Excludes expenses incurred indirectly as a result of investments in underlying funds of approximately 0.15% and 0.15% for the years ended December 31, 2012 and December 31, 2011, respectively, although the ratio does include the LifePath Master Portfolio’s share of Active Stock Master Portfolio, CoreAlpha Bond Master Portfolio, Master Small Cap Index Series and Total International ex U.S. Index Master Portfolio allocated expenses and/or net investment income. |
| | 10 | | Includes the LifePath Master Portfolio’s share of the allocated net investment income from Active Stock Master Portfolio, CoreAlpha Bond Master Portfolio, Master Small Cap Index Series and Total International ex U.S. Index Master Portfolio, except for the years ended December 31, 2015, December 31, 2014 and December 31, 2013, which also includes International Tilts Master Portfolio. For the year ended December 31, 2015, the ratio does not include Total International ex U.S. Index Master Portfolio, which is no longer held by the LifePath Master Portfolio. |
| | 11 | | Includes the purchases and sales of the underlying funds and Active Stock Master Portfolio, CoreAlpha Bond Master Portfolio, International Tilts Master Portfolio, Large Cap Index Master Portfolio and Master Small Cap Index Series. |
| | 12 | | Includes the purchases and sales of the underlying funds and Active Stock Master Portfolio, CoreAlpha Bond Master Portfolio, International Tilts Master Portfolio, Large Cap Index Master Portfolio, Master Small Cap Index Series and Total International ex U.S. Index Master Portfolio. |
| | 13 | | Excludes purchases and sales of Active Stock Master Portfolio, CoreAlpha Bond Master Portfolio, Master Small Cap Index Series and Total International ex U.S. Index Master Portfolio. If these transactions had been included to conform to the current year presentation, the portfolio turnover rate would have been 14% and 20% for the years ended December 31, 2012 and December 31, 2011, respectively. |
| | | | | | |
| See Notes to Financial Statements. | | | | |
| | | | | | | |
| 90 | | BLACKROCK FUNDS III | | DECEMBER 31, 2015 | | |
| | |
| Financial Highlights | | Master Investment Portfolio |
| | | | | | | | | | | | | | | | | | | | |
| | | LifePath 2050 Master Portfolio | |
| | | Year Ended December 31, | |
| | | 2015 | | | 2014 | | | 2013 | | | 2012 | | | 2011 | |
| | | | | | | | | | | | | | | | | | | | |
| Total Return | | | | | | | | | | | | | | | | | | | | |
Total return | | | (1.96)% | | | | 6.23% | | | | 20.32% | | | | 16.55% | | | | (3.28)% | |
| | | | |
| | | | | | | | | | | | | | | | | | | | |
| Ratios to Average Net Assets | | | | | | | | | | | | | | | | | | | | |
Total expenses | | | 0.51% | 1,2,3 | | | 0.53% | 4,5,6 | | | 0.53% | 4,5,6 | | | 0.54% | 7,8,9 | | | 0.53% | 7,8,9 |
| | | | |
Total expenses after fees waived and/or reimbursed | | | 0.17% | 1,2,3 | | | 0.18% | 4,5,6 | | | 0.20% | 4,5,6 | | | 0.21% | 7,8,9 | | | 0.18% | 7,8,9 |
| | | | |
Net investment income10 | | | 1.94% | 1,2,3 | | | 2.04% | 4,5,6 | | | 2.46% | 4,5,6 | | | 2.51% | 7,8,9 | | | 2.18% | 7,8,9 |
| | | | |
| | | | | | | | | | | | | | | | | | | | |
| Supplemental Data | | | | | | | | | | | | | | | | | | | | |
Net assets, end of year (000) | | | $ 114,904 | | | | $ 439,444 | | | | $ 415,263 | | | | $ 267,851 | | | | $ 180,087 | |
| | | | |
Portfolio turnover rate | | | 36%11 | | | | 48% | 12 | | | 28% | 12 | | | 5% | 13 | | | 13% | 13 |
| | | | |
| | 1 | | Includes the LifePath Master Portfolio’s pro rata portion of expenses from Active Stock Master Portfolio, CoreAlpha Bond Master Portfolio, International Tilts Master Portfolio, Large Cap Index Master Portfolio and Master Small Cap Index Series. These ratios do not reflect any expenses incurred indirectly as a result of investments in BlackRock Cash Funds: Institutional, BlackRock Commodity Strategies Fund, BlackRock Emerging Markets Fund, Inc. and iShares exchange-traded funds. |
| | 2 | | Includes the LifePath Master Portfolio’s share of Active Stock Master Portfolio, CoreAlpha Bond Master Portfolio, International Tilts Master Portfolio, Large Cap Index Master Portfolio and Master Small Cap Index Series allocated fees waived of 0.07% for the year ended December 31, 2015. |
| | 3 | | Excludes expenses incurred indirectly as a result of investments in underlying funds of approximately 0.19% for the year ended December 31, 2015, although the ratio does include the LifePath Master Portfolio’s share of Active Stock Master Portfolio, CoreAlpha Bond Master Portfolio, International Tilts Master Portfolio, Large Cap Index Master Portfolio and Master Small Cap Index Series allocated expenses and/or net investment income. |
| | 4 | | Includes the LifePath Master Portfolio’s pro rata portion of expenses from Active Stock Master Portfolio, CoreAlpha Bond Master Portfolio, International Tilts Master Portfolio, Large Cap Index Master Portfolio, Master Small Cap Index Series and Total International ex U.S. Index Master Portfolio. These ratios do not reflect any expenses incurred indirectly as a result of investments in BlackRock Cash Funds: Institutional, BlackRock Commodity Strategies Fund, BlackRock Emerging Markets Fund, Inc. and iShares exchange-traded funds. |
| | 5 | | Includes the LifePath Master Portfolio’s share of Active Stock Master Portfolio, CoreAlpha Bond Master Portfolio, International Tilts Master Portfolio, Large Cap Index Master Portfolio, Master Small Cap Index Series and Total International ex U.S. Index Master Portfolio allocated fees waived of 0.07% and 0.06% for the years ended December 31, 2014 and December 31, 2013, respectively. |
| | 6 | | Excludes expenses incurred indirectly as a result of investments in underlying funds of approximately 0.17% and 0.15% for the years ended December 31, 2014 and December 31, 2013, respectively, although the ratio does include the LifePath Master Portfolio’s share of Active Stock Master Portfolio, CoreAlpha Bond Master Portfolio, International Tilts Master Portfolio, Large Cap Index Master Portfolio, Master Small Cap Index Series and Total International ex U.S. Index Master Portfolio allocated expenses and/or net investment income. |
| | 7 | | Includes the LifePath Master Portfolio’s pro rata portion of expenses from Active Stock Master Portfolio, CoreAlpha Bond Master Portfolio, Large Cap Index Master Portfolio, Master Small Cap Index Series, and Total International ex U.S. Index Master Portfolio. These ratios do not reflect any expenses incurred indirectly as a result of investments in BlackRock Cash Funds: Institutional, BlackRock Commodity Strategies Fund, BlackRock Emerging Markets Fund, Inc. and iShares exchange-traded funds. |
| | 8 | | Includes the LifePath Master Portfolio’s share of Active Stock Master Portfolio, CoreAlpha Bond Master Portfolio, Large Cap Index Master Portfolio, Master Small Cap Index Series and Total International ex U.S. Index Master Portfolio allocated fees waived of 0.06% and 0.05% for the years ended December 31, 2012 and December 31, 2011, respectively. |
| | 9 | | Excludes expenses incurred indirectly as a result of investments in underlying funds of approximately 0.15% and 0.17% for the years ended December 31, 2012 and December 31, 2011, respectively, although the ratio does include the LifePath Master Portfolio’s share of Active Stock Master Portfolio, CoreAlpha Bond Master Portfolio, Master Small Cap Index Series and Total International ex U.S. Index Master Portfolio allocated expenses and/or net investment income. |
| | 10 | | Includes the LifePath Master Portfolio’s share of the allocated net investment income from Active Stock Master Portfolio, CoreAlpha Bond Master Portfolio, Master Small Cap Index Series and Total International ex U.S. Index Master Portfolio, except for the years ended December 31, 2015, December 31, 2014 and December 31, 2013, which also includes International Tilts Master Portfolio. For the year ended December 31, 2015, the ratio does not include Total International ex U.S. Index Master Portfolio, which is no longer held by the LifePath Master Portfolio. |
| | 11 | | Includes the purchases and sales of the underlying funds and Active Stock Master Portfolio, CoreAlpha Bond Master Portfolio, International Tilts Master Portfolio, Large Cap Index Master Portfolio and Master Small Cap Index Series. |
| | 12 | | Includes the purchases and sales of the underlying funds and Active Stock Master Portfolio, CoreAlpha Bond Master Portfolio, International Tilts Master Portfolio, Large Cap Index Master Portfolio, Master Small Cap Index Series and Total International ex U.S. Index Master Portfolio. |
| | 13 | | Excludes purchases and sales of Active Stock Master Portfolio, CoreAlpha Bond Master Portfolio, Master Small Cap Index Series and Total International ex U.S. Index Master Portfolio. If these transactions had been included to conform to the current year presentation, the portfolio turnover rate would have been 15% and 29% for the years ended December 31, 2012 and December 31, 2011, respectively. |
| | | | | | |
| See Notes to Financial Statements. | | | | |
| | | | | | | |
| | BLACKROCK FUNDS III | | DECEMBER 31, 2015 | | 91 |
| | |
| Notes to Financial Statements | | Master Investment Portfolio |
1. Organization:
Master Investment Portfolio (“MIP”) is registered under the Investment Company Act of 1940, as amended (the “1940 Act”), as a diversified, open-end management investment company. MIP is organized as a Delaware statutory trust. The financial statements and these accompanying notes relate to five series of MIP: LifePath® Retirement Master Portfolio, LifePath® 2020 Master Portfolio, LifePath® 2030 Master Portfolio, LifePath® 2040 Master Portfolio and LifePath® 2050 Master Portfolio (each, a “LifePath Master Portfolio” and together, the “LifePath Master Portfolios”).
As of period end, the investment of LifePath 2040 Master Portfolio and LifePath 2050 Master Portfolio in the Active Stock Master Portfolio represented 26.6% and 30.6%, respectively, of net assets. The investment of LifePath Retirement Master Portfolio, LifePath 2020 Master Portfolio and LifePath 2030 Master Portfolio in the CoreAlpha Bond Master Portfolio represented 50.9%, 42.4% and 25.0% of net assets, respectively. As such, financial statements of Active Stock Master Portfolio and CoreAlpha Bond Master Portfolio, including the Schedules of Investments, should be read in conjunction with each respective LifePath Master Portfolio’s financial statements. Active Stock Master Portfolio’s, CoreAlpha Bond Master Portfolio’s and International Tilts Master Portfolio’s financial statements are available, without charge, on the U.S. Securities and Exchange Commission’s (“SEC’s”) website at http://www.sec.gov.
The LifePath Master Portfolios will generally invest in other registered investment companies (each, an “Underlying Fund” and collectively the “Underlying Funds”) that are managed by subsidiaries of BlackRock, Inc. (“BlackRock”) and its affiliates and affiliates of the LifePath Master Portfolios. The LifePath Master Portfolios may also invest in other master portfolios (“Underlying Master Portfolios”) that are managed by subsidiaries of BlackRock.
The value of a LifePath Master Portfolio’s investment in each of Active Stock Master Portfolio, CoreAlpha Bond Master Portfolio, International Tilts Master Portfolio, Large Cap Index Master Portfolio and Master Small Cap Index Series reflects that LifePath Master Portfolio’s proportionate interest in the net assets of that master portfolio. As of period end, the LifePath Master Portfolios held interests in Active Stock Master Portfolio, CoreAlpha Bond Master Portfolio, International Tilts Master Portfolio, Large Cap Index Master Portfolio and Master Small Cap Index Series as follows:
| | | | | | | | | | | | | | | | | | | | |
| | | Active Stock
Master Portfolio | | | CoreAlpha Bond
Master Portfolio | | | International Tilts
Master Portfolio | | | Large Cap Index
Master Portfolio | | | Master Small Cap
Index Series | |
LifePath Retirement Master Portfolio | | | 6.4% | | | | 15.9% | | | | 6.6% | | | | 1.0% | | | | 2.1% | |
LifePath 2020 Master Portfolio | | | 22.2% | | | | 30.2% | | | | 20.2% | | | | 2.0% | | | | 4.5% | |
LifePath 2030 Master Portfolio | | | 28.6% | | | | 16.7% | | | | 27.1% | | | | 2.8% | | | | 3.1% | |
LifePath 2040 Master Portfolio | | | 25.4% | | | | 3.8% | | | | 27.2% | | | | 3.2% | | | | 2.0% | |
LifePath 2050 Master Portfolio | | | 7.9% | | | | 0.2% | | | | 7.9% | | | | 0.8% | | | | 0.5% | |
The LifePath Master Portfolios, together with certain other registered investment companies advised by BlackRock Fund Advisors (“BFA” or the “Manager”) or its affiliates, is included in a complex of open-end funds referred to as the Equity-Liquidity Complex.
2. Significant Accounting Policies:
The financial statements are prepared in conformity with accounting principles generally accepted in the United States of America (“U.S. GAAP”), which may require management to make estimates and assumptions that affect the reported amounts of assets and liabilities in the financial statements, disclosure of contingent assets and liabilities at the date of the financial statements and the reported amounts of increases and decreases in net assets from operations during the reporting period. Actual results could differ from those estimates. Each LifePath Master Portfolio is considered an investment company under U.S. GAAP and follows the accounting and reporting guidance applicable to investment companies. Below is a summary of significant accounting policies:
Foreign Currency: Each LifePath Master Portfolio’s books and records are maintained in U.S. dollars. Purchases and sales of investments are recorded at the rates of exchange prevailing on the respective dates of such transactions. Generally, when the U.S. dollar rises in value against a foreign currency, the investments denominated in that currency will lose value; the opposite effect occurs if the U.S. dollar falls in relative value.
Each LifePath Master Portfolio does not isolate changes in the exchange rates from the changes in the market prices of investments held or sold for financial reporting purposes. Accordingly, the effects of changes in exchange rates on investments are not segregated in the Statements of Operations from the effects of changes in market prices of those investments, but are included as a component of net realized and unrealized gain (loss) from investments. Each LifePath Master Portfolio reports realized currency gains (losses) on foreign currency related transactions as components of net realized gain (loss) for financial reporting purposes, whereas such components are generally treated as ordinary income for federal income tax purposes.
Segregation and Collateralization: In cases where a LifePath Master Portfolio enters into certain investments (e.g., forward foreign currency exchange contracts) that would be treated as “senior securities” for 1940 Act purposes, a LifePath Master Portfolio may segregate or designate on its books and records cash or liquid assets having a market value at least equal to the amount of its future obligations under such investments. Doing so allows the investment to be excluded from treatment as a “senior security.” Furthermore, if required by an exchange or counterparty agreement, the LifePath Master Portfolios may be required to deliver/deposit cash and/or securities to/with an exchange, or broker-dealer or custodian as collateral for certain investments or obligations.
| | | | | | |
| | | | | | | |
| 92 | | BLACKROCK FUNDS III | | DECEMBER 31, 2015 | | |
| | |
| Notes to Financial Statements (continued) | | Master Investment Portfolio |
Investment Transactions and Investment Income: For financial reporting purposes, investment transactions are recorded on the dates the transactions are entered into (the trade dates). Realized gains and losses on investment transactions are determined on the identified cost basis. Dividend income is recorded on the ex-dividend date. Dividends from foreign securities where the ex-dividend date may have passed are subsequently recorded when the LifePath Master Portfolios are informed of the ex-dividend date. Under the applicable foreign tax laws, a withholding tax at various rates may be imposed on capital gains, dividends and interest. Upon notification from issuers, some of the dividend income received from a real estate investment trust may be redesignated as a reduction of cost of the related investment and/or realized gain. Interest income, including amortization and accretion of premiums and discounts on debt securities, is recognized on the accrual basis.
Each LifePath Master Portfolio records daily its proportionate share of the Underlying Master Portfolios’ income, expenses and realized and unrealized gains and losses.
In-Kind Redemptions: The LifePath Master Portfolios satisfied certain redemptions in investors’ capital through an in-kind redemption of securities, mutual funds and cash received from the Master Portfolios. For financial reporting purposes, these transactions were treated as a sale of securities and the resulting gains and losses were recognized based on the market value of the securities on the date of the redemption. Gains and losses resulting from such redemptions in-kind are included in in-kind redemptions - affiliated and the allocation from the applicable Underlying Master Portfolios from in-kind redemptions in the Statements of Operations. For tax purposes, no gains or losses were recognized. For the year ended December 31, 2015, the LifePath Master Portfolios had redemptions-in-kind of:
| | | | | | | | | | | | | | | | |
LifePath Retirement
Master Portfolio | | LifePath 2020
Master Portfolio | | | LifePath 2030
Master Portfolio | | | LifePath 2040
Master Portfolio | | | LifePath 2050
Master Portfolio | |
$214,660,215 | | $ | 370,308,876 | | | $ | 425,280,989 | | | $ | 364,218,851 | | | $ | 83,345,198 | |
Indemnifications: In the normal course of business, a LifePath Master Portfolio enters into contracts that contain a variety of representations that provide general indemnification. A LifePath Master Portfolio’s maximum exposure under these arrangements is unknown because it involves future potential claims against a LifePath Master Portfolio, which cannot be predicted with any certainty.
Other: Expenses directly related to a LifePath Master Portfolio are charged to that LifePath Master Portfolio. Other operating expenses shared by several funds, including other funds managed by the Manager, are prorated among those funds on the basis of relative net assets or other appropriate methods.
The LifePath Master Portfolios have an arrangement with their custodian whereby fees may be reduced by credits earned on uninvested cash balances, which, if applicable, are shown as fees paid indirectly in the Statements of Operations. The custodian imposes fees on overdrawn cash balances, which can be offset by accumulated credits earned or may result in additional custody charges. Effective September 2015, the arrangement with their custodian for earning credits on uninvested cash balances has ceased and the custodian will be imposing fees on certain uninvested cash balances.
3. Investment Valuation and Fair Value Measurements:
Investment Valuation Policies: The LifePath Master Portfolios’ investments are valued at fair value (also referred to as “market value” within the financial statements) as of the close of trading on the New York Stock Exchange (“NYSE”) (generally 4:00 p.m., Eastern time). U.S. GAAP defines fair value as the price the LifePath Master Portfolios would receive to sell an asset or pay to transfer a liability in an orderly transaction between market participants at the measurement date. The LifePath Master Portfolios determine the fair values of their financial instruments using independent dealers or pricing services under policies approved by the Board of Trustees of MIP (the “Board”). The BlackRock Global Valuation Methodologies Committee (the “Global Valuation Committee”) is the committee formed by management to develop global pricing policies and procedures and to provide oversight of the pricing function for the LifePath Master Portfolios for all financial instruments.
Fair Value Inputs and Methodologies: The following methods (or “techniques”) and inputs are used to establish the fair value of each LifePath Master Portfolio’s assets and liabilities:
| • | | Equity investments traded on a recognized securities exchange are valued at the official close price each day, if available. For equity investments traded on more than one exchange, the official close price on the exchange where the stock is primarily traded is used. Equity investments traded on a recognized exchange for which there were no sales on that day may be valued at the last available bid (long positions) or ask (short positions) price. Generally, trading in foreign instruments is substantially completed each day at various times prior to the close of business on the NYSE. Occasionally, events affecting the values of such instruments may occur between the foreign market close and the close of business on the NYSE that may not be reflected in the computation of the LifePath Master Portfolios’ net assets. Each business day, the LifePath Master Portfolios use a pricing service to assist with the valuation of certain foreign exchange-traded equity securities and foreign exchange-traded and over-the-counter (“OTC”) options (the “Systematic Fair Value Price”). Using current market factors, the Systematic Fair Value Price is designed to value such foreign securities and foreign options at fair value as of the close of business on the NYSE, which follows the close of the local markets. |
| • | | The market value of the LifePath Master Portfolios’ investments in the Underlying Funds is based on the published net asset value (“NAV”) of each Underlying Fund computed as of the close of regular trading on the NYSE on days when the NYSE is open. |
| • | | Investments in open-end U.S. mutual funds are valued at NAV each business day. |
| | | | | | |
| | | | | | | |
| | BLACKROCK FUNDS III | | DECEMBER 31, 2015 | | 93 |
| | |
| Notes to Financial Statements (continued) | | Master Investment Portfolio |
| • | | Securities and other assets and liabilities denominated in foreign currencies are translated into U.S. dollars using exchange rates determined as of the close of business on the NYSE. Forward foreign currency exchange contracts are valued at the mean between the bid and ask prices and are determined as of the close of business on the NYSE. Interpolated values are derived when the settlement date of the contract is an interim date for which quotations are not available. |
If events (e.g., a company announcement, market volatility or a natural disaster) occur that are expected to materially affect the value of such instruments, or in the event that the application of these methods of valuation results in a price for an investment that is deemed not to be representative of the market value of such investment, or if a price is not available, the investment will be valued by the Global Valuation Committee, or its delegate, in accordance with a policy approved by the Board as reflecting fair value (“Fair Valued Investments”). When determining the price for Fair Valued Investments, the Global Valuation Committee, or its delegate, seeks to determine the price that each LifePath Master Portfolio might reasonably expect to receive or pay from the current sale or purchase of that asset or liability in an arm’s-length transaction. Fair value determinations shall be based upon all available factors that the Global Valuation Committee, or its delegate, deems relevant consistent with the principles of fair value measurement. The pricing of all Fair Valued Investments is subsequently reported to the Board or a committee thereof on a quarterly basis.
Fair Value Hierarchy: Various inputs are used in determining the fair value of investments and derivative financial instruments. These inputs to valuation techniques are categorized into a fair value hierarchy consisting of three broad levels for financial statement purposes as follows:
| • | | Level 1 — unadjusted price quotations in active markets/exchanges for identical assets or liabilities that each LifePath Master Portfolio has the ability to access |
| • | | Level 2 — other observable inputs (including, but not limited to, quoted prices for similar assets or liabilities in markets that are active, quoted prices for identical or similar assets or liabilities in markets that are not active, inputs other than quoted prices that are observable for the assets or liabilities (such as interest rates, yield curves, volatilities, prepayment speeds, loss severities, credit risks and default rates) or other market–corroborated inputs) |
| • | | Level 3 — unobservable inputs based on the best information available in the circumstances, to the extent observable inputs are not available (including each LifePath Master Portfolio’s own assumptions used in determining the fair value of investments and derivative financial instruments) |
The hierarchy gives the highest priority to unadjusted quoted prices in active markets for identical assets or liabilities (Level 1 measurements) and the lowest priority to unobservable inputs (Level 3 measurements). Accordingly, the degree of judgment exercised in determining fair value is greatest for instruments categorized in Level 3. The inputs used to measure fair value may fall into different levels of the fair value hierarchy. In such cases, for disclosure purposes, the fair value hierarchy classification is determined based on the lowest level input that is significant to the fair value measurement in its entirety. The significant unobservable inputs used by the Global Valuation Committee in determining the price for Fair Valued Investments are typically categorized as Level 3. The fair value hierarchy for each LifePath Master Portfolio’s investments and derivative financial instruments has been included in the Schedules of Investments.
Changes in valuation techniques may result in transfers into or out of an assigned level within the hierarchy. In accordance with each LifePath Master Portfolio’s policy, transfers between different levels of the fair value hierarchy are deemed to have occurred as of the beginning of the reporting period. The categorization of a value determined for investments and derivative financial instruments is based on the pricing transparency of the investments and derivative financial instruments and is not necessarily an indication of the risks associated with investing in those securities.
4. Securities and Other Investments:
Securities Lending: Certain LifePath Master Portfolios may lend their securities to approved borrowers, such as brokers, dealers and other financial institutions. The borrower pledges and maintains with the LifePath Master Portfolios collateral consisting of cash, an irrevocable letter of credit issued by a bank, or securities issued or guaranteed by the U.S. Government. The initial collateral received by each LifePath Master Portfolio is required to have a value of at least 102% of the current value of the loaned securities for securities traded on U.S. exchanges and a value of at least 105% for all other securities. The collateral is maintained thereafter, at a value equal to at least 100% of the current market value of the securities on loan. The market value of the loaned securities is determined at the close of each business day of the LifePath Master Portfolio and any additional required collateral is delivered to the LifePath Master Portfolio, or excess collateral returned by the LifePath Master Portfolio, on the next business day. During the term of the loan, the LifePath Master Portfolios are entitled to all distributions made on or in respect of the loaned securities. Loans of securities are terminable at any time and the borrower, after notice, is required to return borrowed securities within the standard time period for settlement of securities transactions.
The market value of any securities on loan, all of which were classified as common stocks or affiliated investments in the LifePath Master Portfolios’ Schedules of Investments, and the value of any related collateral are shown separately in the Statements of Assets and Liabilities as a component of investments at value-unaffiliated and collateral on securities loaned at value, respectively. As of period end, any securities on loan were collateralized by cash. The cash collateral invested by the securities lending agent, BlackRock Institutional Trust Company, N.A. (“BTC”), if any, is disclosed in the Schedules of Investments.
Securities lending transactions are entered into by the LifePath Master Portfolios under Master Securities Lending Agreements (each, an “MSLA”), which provide the right, in the event of default (including bankruptcy or insolvency), for the non-defaulting party to liquidate the collateral and calculate a net
| | | | | | |
| | | | | | | |
| 94 | | BLACKROCK FUNDS III | | DECEMBER 31, 2015 | | |
| | |
| Notes to Financial Statements (continued) | | Master Investment Portfolio |
exposure to the defaulting party or request additional collateral. In the event that a borrower defaults, the LifePath Master Portfolios, as lender, would offset the market value of the collateral received against the market value of the securities loaned. When the value of the collateral is greater than that of the market value of the securities loaned, the lender is left with a net amount payable to the defaulting party. However, bankruptcy or insolvency laws of a particular jurisdiction may impose restrictions on or prohibitions against such a right of offset in the event of an MSLA counterparty’s bankruptcy or insolvency. Under the MSLA, absent an event of default the borrower can resell or re-pledge the loaned securities, and the LifePath Master Portfolio can reinvest cash collateral received in connection with loaned securities. Upon an event of default, the parties’ obligations to return the securities or collateral to the other party are extinguished, and the parties can resell or re-pledge the loaned securities or the collateral received in connection with the loaned securities in order to satisfy the defaulting party’s net payment obligation for all transactions under the MSLA. The defaulting party remains liable for any deficiency.
As of period end, the following table is a summary of the LifePath Master Portfolios’ securities lending agreements by counterparty which are subject to offset under an MSLA:
| | | | | | | | | | | | |
| LifePath 2020 Master Portfolio | | | | | | | | | |
| Counterparty | | Securities
Loaned
at Value | | | Cash
Collateral
Received1 | | | Net
Amount | |
JP Morgan Securities LLC | | $ | 2,690,121 | | | $ | (2,690,121 | ) | | | — | |
| | | | |
| | | | | | | | | | | | |
| LifePath 2030 Master Portfolio | | | | | | | | | |
| Counterparty | | Securities
Loaned
at Value | | | Cash
Collateral
Received1 | | | Net
Amount | |
Credit Suisse Securities (USA) LLC | | $ | 981,432 | | | $ | (981,432 | ) | | | — | |
| | | | |
| | | | | | | | | | | | |
| LifePath 2050 Master Portfolio | | | | | | | | | |
| Counterparty | | Securities
Loaned
at Value | | | Cash
Collateral
Received1 | | | Net
Amount | |
Credit Suisse Securities (USA) LLC | | $ | 1,451,766 | | | $ | (1,451,766 | ) | | | — | |
| | | | |
| | 1 | | Collateral received in excess of the value of securities loaned from the individual counterparty is not shown for financial reporting purposes in the tables above. Collateral has been received in connection with securities lending agreements as follows: |
| | | | |
LifePath 2020 Master Portfolio | | LifePath 2030 Master Portfolio | | LifePath 2050 Master Portfolio |
$2,747,024 | | $1,008,821 | | $1,492,280 |
The risks of securities lending include the risk that the borrower may not provide additional collateral when required or may not return the securities when due. To mitigate these risks, the LifePath Master Portfolios benefit from a borrower default indemnity provided by BlackRock, Inc. (“BlackRock”). BlackRock’s indemnity allows for full replacement of the securities loaned if the collateral received does not cover the value on the securities loaned in the event of borrower default. Each LifePath Master Portfolio could suffer a loss if the value of an investment purchased with cash collateral falls below the market value of loaned securities or if the value of an investment purchased with cash collateral falls below the value of the original cash collateral received.
5. Derivative Financial Instruments:
The LifePath Master Portfolios engage in various portfolio investment strategies using derivative contracts both to increase the returns of the LifePath Master Portfolios and/or to manage economically their exposure to certain risks such as interest rate risk and foreign currency exchange rate risk. These contracts may be transacted on an exchange or OTC.
Forward Foreign Currency Exchange Contracts: Certain LifePath Master Portfolios enter into forward foreign currency exchange contracts as an economic hedge against either specific transactions or portfolio instruments or to obtain exposure to, or hedge exposure away from, foreign currencies (foreign currency exchange rate risk). A forward foreign currency exchange contract is an agreement between two parties to buy and sell a currency at a set exchange rate on a future date. Forward foreign currency exchange contracts, when used by the LifePath Master Portfolios, help to manage the overall exposure to the currencies in which some of the investments held by the LifePath Master Portfolios are denominated. Non-deliverable forward foreign currency exchange contracts are settled with the counterparty in cash without the delivery of foreign currency. The contract is marked-to-market daily and the change in market value is recorded by the LifePath Master Portfolios as an unrealized gain or loss. When the contract is closed, the LifePath Master Portfolios record a realized gain or loss equal to the difference between the value at the time it was opened and the value at the time it was closed. The use of forward foreign currency exchange contracts involves the risk that the value of a forward foreign currency exchange contract changes unfavorably due to movements in the value of the referenced foreign currencies.
| | | | | | |
| | | | | | | |
| | BLACKROCK FUNDS III | | DECEMBER 31, 2015 | | 95 |
| | |
| Notes to Financial Statements (continued) | | Master Investment Portfolio |
Master Netting Arrangements: In order to better define their contractual rights and to secure rights that will help them mitigate their counterparty risk, the LifePath Master Portfolios may enter into an International Swaps and Derivatives Association, Inc. Master Agreement (“ISDA Master Agreement”) or similar agreement with their counterparties. An ISDA Master Agreement is a bilateral agreement between each LifePath Master Portfolio and a counterparty that governs certain OTC derivatives and typically contains, among other things, collateral posting terms and netting provisions in the event of a default and/or termination event. Under an ISDA Master Agreement, each LifePath Master Portfolio may, under certain circumstances, offset with the counterparty certain derivative financial instruments’ payables and/or receivables with collateral held and/or posted and create one single net payment. The provisions of the ISDA Master Agreement typically permit a single net payment in the event of default including the bankruptcy or insolvency of the counterparty. Bankruptcy or insolvency laws of a particular jurisdiction may restrict or prohibit the right of offset in bankruptcy, insolvency or other events. In addition, certain ISDA Master Agreements allow counterparties to terminate derivative contracts prior to maturity in the event the LifePath Master Portfolios’ net assets decline by a stated percentage or the LifePath Master Portfolios fail to meet the terms of their ISDA Master Agreements. The result would cause the LifePath Master Portfolios to accelerate payment of any net liability owed to the counterparty.
Collateral Requirements: For derivatives traded under an ISDA Master Agreement, the collateral requirements are typically calculated by netting the mark-to-market amount for each transaction under such agreement and comparing that amount to the value of any collateral currently pledged by the LifePath Master Portfolios and the counterparty.
Cash collateral that has been pledged to cover obligations of the LifePath Master Portfolios and cash collateral received from the counterparty, if any, is reported separately on the Statements of Assets and Liabilities as cash pledged as collateral and cash received as collateral, respectively. Non-cash collateral pledged by the LifePath Master Portfolios, if any, is noted in the Schedules of Investments. Generally, the amount of collateral due from or to a party has to exceed a minimum transfer amount threshold (typically either $250,000 or $500,000) before a transfer is required, which is determined at the close of business of the LifePath Master Portfolios. Any additional required collateral is delivered to/pledged by the LifePath Master Portfolios on the next business day. Typically, a LifePath Master Portfolio’s counterparty is not permitted to sell, re-pledge or use cash and non-cash collateral it receives. A LifePath Master Portfolio generally agrees not to use non-cash collateral that it receives but may, absent default or certain other circumstances defined in the underlying ISDA Master Agreement, be permitted to use cash collateral received. In such cases, a LifePath Master Portfolio may pay interest pursuant to the collateral arrangement with the counterparty. To the extent amounts due to the LifePath Master Portfolios from their counterparties are not fully collateralized, the LifePath Master Portfolios bear the risk of loss from counterparty non-performance. Likewise, to the extent the LifePath Master Portfolios have delivered collateral to a counterparty and stand ready to perform under the terms of their agreement with such counterparty, the LifePath Master Portfolios bear the risk of loss from a counterparty in the amount of the value of the collateral in the event the counterparty fails to return such collateral. Based on the terms of agreements, collateral may not be required to all derivative contracts.
6. Investment Advisory Agreement and Other Transactions with Affiliates:
The PNC Financial Services Group, Inc. is the largest stockholder and an affiliate of BlackRock for 1940 Act purposes.
MIP, on behalf of the LifePath Master Portfolios, entered into an Investment Advisory Agreement with BFA, the LifePath Master Portfolios’ investment advisor, an indirect, wholly owned subsidiary of BlackRock, to provide investment advisory services. The Manager is responsible for the management of each LifePath Master Portfolio’s investments and provides the personnel, facilities, equipment and certain other services necessary to the operations of each LifePath Master Portfolio. For such services, each LifePath Master Portfolio pays BFA a monthly fee based on a percentage of each LifePath Master Portfolio’s average daily net assets at an annual rate of 0.35%.
MIP, with respect to the LifePath Master Portfolios, entered into a sub-advisory agreement with BlackRock International Limited (“BIL”) and BlackRock (Singapore) Limited (“BRS”), affiliates of the Manager. The Manager pays BIL and BRS, for services they provide, a monthly fee that is a percentage of the investment advisory fees paid by the LifePath Master Portfolio to the Manager.
MIP, on behalf of the LifePath Master Portfolios, entered into an Administration Agreement with BlackRock Advisors, LLC (“BAL”), which has agreed to provide general administration services (other than investment advice and related portfolio activities). BAL, in consideration thereof, has agreed to bear all of the LifePath Master Portfolios’ ordinary operating expenses, excluding, generally, investment advisory fees, distribution fees, brokerage and other expenses related to the execution of portfolio transactions, extraordinary expenses and certain other expenses which are borne by the LifePath Master Portfolios.
From time to time, BAL may waive such fees in whole or in part. Any such waiver will reduce the expenses of the LifePath Master Portfolios and, accordingly, have a favorable impact on its performance. BAL may delegate certain of its administration duties to sub-administrators.
BAL is not entitled to compensation for providing administration services to the LifePath Master Portfolios, for so long as BAL is entitled to compensation for providing administration service to corresponding feeder funds that invest substantially all of their assets in the LifePath Master Portfolios, or BAL (or an affiliate) receives investment advisory fees from the LifePath Master Portfolios.
Effective November 30, 2015, the Manager voluntarily agreed to waive its investment advisory fees by the amount of investment advisory fees the LifePath Master Portfolios pay to the Manager indirectly through their investments in affiliated money market funds. However, the Manager does not waive its
| | | | | | |
| | | | | | | |
| 96 | | BLACKROCK FUNDS III | | DECEMBER 31, 2015 | | |
| | |
| Notes to Financial Statements (continued) | | Master Investment Portfolio |
investment advisory fees by the amount of investment advisory fees paid in connection with the LifePath Master Portfolios’ investment in other affiliated investment companies, if any. These amounts, if any, are included in fees waived by the Manager in the Statements of Operations. For the year ended December 31, 2015, there were no waivers on the LifePath Master Portfolios.
The fees and expenses of MIP’s trustees who are not “interested persons” of MIP, as defined in the 1940 Act (“Independent Trustees”), counsel to the Independent Trustees and MIP’s independent registered public accounting firm (together, the “independent expenses”) are paid directly by the LifePath Master Portfolios. BFA has also contractually agreed to reimburse the LifePath Master Portfolios or provide an offsetting credit against the investment advisory fees paid by the LifePath Master Portfolios in an amount equal to the independent expenses. These contractual waivers are effective through April 30, 2026. For the year ended December 31, 2015, the amounts waived are included in fees waived by the Manager in the Statements of Operations as follows:
| | | | | | | | |
LifePath Retirement
Master Portfolio | | LifePath 2020
Master Portfolio | | LifePath 2030
Master Portfolio | | LifePath 2040
Master Portfolio | | LifePath 2050
Master Portfolio |
$75,109 | | $108,524 | | $105,448 | | $87,701 | | $44,996 |
Prior to November 30, 2015, BFA had contractually agreed to waive investment advisory fees charged to each LifePath Master Portfolio in an amount equal to investment advisory fees, if any, received by BFA, from each affiliated investment company in which the LifePath Master Portfolios invest. For the year ended December 31, 2015, the amounts waived are included in fees waived by the Manager in the Statements of Operations as follows:
| | | | | | | | |
LifePath Retirement
Master Portfolio | | LifePath 2020
Master Portfolio | | LifePath 2030
Master Portfolio | | LifePath 2040
Master Portfolio | | LifePath 2050
Master Portfolio |
$3,661,914 | | $6,915,464 | | $7,071,560 | | $5,680,990 | | $1,313,421 |
Effective November 30, 2015, BFA has agreed to contractually waive 0.30% of its advisory fees through April 30, 2017. For the year ended December 31, 2015, the amounts waived are included in fees waived by the Manager in the Statements of Operations as follows:
| | | | | | | | |
LifePath Retirement
Master Portfolio | | LifePath 2020
Master Portfolio | | LifePath 2030
Master Portfolio | | LifePath 2040
Master Portfolio | | LifePath 2050
Master Portfolio |
$69,250 | | $159,799 | | $150,177 | | $117,340 | | $30,829 |
The SEC has issued an exemptive order which permits BTC, an affiliate of the Manager, to serve as securities lending agent for the LifePath Master Portfolios, subject to applicable conditions. As securities lending agent, BTC bears all operational costs directly related to securities lending. The LifePath Master Portfolios are responsible for fees in connection with the investment of cash collateral received for securities on loan in a money market fund managed by the Manager or its affiliates, however, BTC has agreed to reduce the amount of securities lending income it receives in order to effectively limit the collateral investment fees the LifePath Master Portfolios bears to an annual rate of 0.04% (the “collateral investment fees”).
Securities lending income is equal to the total of income earned from the reinvestment of cash collateral, net of fees and other payments to and from borrowers of securities, and less the collateral investment fees. Each LifePath Master Portfolio retains a portion of securities lending income and remits a remaining portion to BTC as compensation for its services as securities lending agent.
Pursuant to a securities lending agreement, each LifePath Master Portfolios retains 80% of securities lending income, and this amount retained can never be less than 70% of the total of securities lending income plus the collateral investment fees. In addition, commencing the business day following the date that the aggregate securities lending income earned across certain funds in the Equity-Liquidity Complex in a calendar year exceeds a specified threshold, each LifePath Master Portfolio, pursuant to the securities lending agreement, will retain for the remainder of the calendar year securities lending income in an amount equal to 85% of securities lending income, and this amount retained can never be less than 70% of the total of securities lending income plus the collateral investment fees.
The share of securities lending income earned by each LifePath Master Portfolio is shown as securities lending — affiliated – net in the Statements of Operations. For the year ended December 31, 2015, each LifePath Master Portfolio paid BTC the following amounts in total for securities lending agent services and collateral investment fees:
| | | | | | | | |
LifePath Retirement
Master Portfolio | | LifePath 2020
Master Portfolio | | LifePath 2030
Master Portfolio | | LifePath 2040
Master Portfolio | | LifePath 2050
Master Portfolio |
$11,512 | | $24,897 | | $38,632 | | $33,578 | | $8,367 |
Each LifePath Master Portfolio may invest its positive cash balances in certain money market funds managed by the Manager or an affiliate. The income earned on these temporary cash investments is shown as income — affiliated in the Statements of Operations.
Certain officers and/or trustees of MIP are officers and/or directors of BlackRock or its affiliates.
7. Purchases and Sales:
For the year ended December 31, 2015, purchases and sales of investments in the Underlying Funds and Underlying Master Portfolios, excluding short-term securities and in-kind redemptions, were as follows:
| | | | | | | | | | | | | | | | | | | | |
| | | LifePath Retirement
Master Portfolio | | | LifePath 2020
Master Portfolio | | | LifePath 2030
Master Portfolio | | | LifePath 2040
Master Portfolio | | | LifePath 2050
Master Portfolio | |
Purchases | | $ | 264,340,601 | | | $ | 417,613,824 | | | $ | 463,536,625 | | | $ | 318,970,284 | | | $ | 138,223,727 | |
Sales | | $ | 396,627,439 | | | $ | 743,019,215 | | | $ | 706,628,448 | | | $ | 607,759,712 | | | $ | 174,440,015 | |
| | | | | | |
| | | | | | | |
| | BLACKROCK FUNDS III | | DECEMBER 31, 2015 | | 97 |
| | |
| Notes to Financial Statements (concluded) | | Master Investment Portfolio |
8. Income Tax Information:
The LifePath Master Portfolios are classified as a partnership for federal income tax purposes. As such, each investor in the LifePath Master Portfolios is treated as the owner of its proportionate share of net assets, income, expenses and realized and unrealized gains and losses of the LifePath Master Portfolios. Therefore, no federal income tax provision is required. It is intended that the LifePath Master Portfolios’ assets will be managed so an investor in the LifePath Master Portfolios can satisfy the requirements of Subchapter M of the Internal Revenue Code of 1986, as amended.
Each LifePath Master Portfolio files U.S. federal and various state and local tax returns. No income tax returns are currently under examination. The statute of limitations on each LifePath Master Portfolio’s U.S. federal tax returns remains open for each of the four years ended December 31, 2015. The statutes of limitations on each LifePath Master Portfolio’s state and local tax returns may remain open for an additional year depending upon the jurisdiction.
Management has analyzed tax laws and regulations and their application to the LifePath Master Portfolios as of December 31, 2015, inclusive of the open tax return years, and does not believe there are any uncertain tax positions that require recognition of a tax liability in the LifePath Master Portfolios’ financial statements.
As of period end, gross unrealized appreciation and depreciation based on cost for federal income tax purposes were as follows:
| | | | | | | | | | | | | | | | | | | | |
| | | Lifepath Retirement
Master Portfolio | | | Lifepath 2020
Master Portfolio | | | Lifepath 2030
Master Portfolio | | | Lifepath 2040
Master Portfolio | | | Lifepath 2050
Master Portfolio | |
Tax cost | | $ | 206,321,691 | | | $ | 570,699,629 | | | $ | 529,725,654 | | | $ | 401,532,382 | | | $ | 110,869,756 | |
| | | | |
Gross unrealized appreciation | | $ | 49,866,489 | | | $ | 39,309,088 | | | $ | 52,480,116 | | | $ | 57,546,535 | | | $ | 10,426,857 | |
Gross unrealized depreciation | | | (1,775,501 | ) | | | (25,863,228 | ) | | | (37,678,958 | ) | | | (33,681,849 | ) | | | (5,205,671 | ) |
| | | | |
Net unrealized appreciation | | $ | 48,090,988 | | | $ | 13,445,860 | | | $ | 14,801,158 | | | $ | 23,864,686 | | | $ | 5,221,186 | |
| | | | |
9. Bank Borrowings:
MIP, on behalf of the LifePath Master Portfolios, along with certain other funds managed by the Manager and its affiliates (“Participating Funds”), is a party to a 364-day, $2.1 billion credit agreement with a group of lenders, under which the LifePath Master Portfolios may borrow to fund shareholder redemptions. Excluding commitments designated for certain funds, the Participating Funds, including the LifePath Master Portfolios, can borrow up to an aggregate commitment amount of $1.6 billion at any time outstanding, subject to asset coverage and other limitations as specified in the agreement. The credit agreement has the following terms: a fee of 0.06% per annum on unused commitment amounts and interest at a rate equal to the higher of (a) one-month LIBOR (but, in any event, not less than 0.00%) on the date the loan is made plus 0.80% per annum or (b) the Fed Funds rate (but, in any event, not less than 0.00%) in effect from time to time plus 0.80% per annum on amounts borrowed. The agreement expires in April 2016 unless extended or renewed. Participating Funds paid administration, legal and arrangement fees, which, if applicable, are included in miscellaneous expenses in the Statements of Operations, and along with commitment fees, were allocated among such funds based upon portions of the aggregate commitment available to them and relative net assets of Participating Funds. During the year ended December 31, 2015, the LifePath Master Portfolios did not borrow under the credit agreement.
10. Principal Risks:
In the normal course of business, certain LifePath Master Portfolios invest in securities and enter into transactions where risks exist due to fluctuations in the market (market risk) or failure of the issuer to meet all its obligations, including the ability to pay principal and interest when due (issuer credit risk). The value of securities held by the LifePath Master Portfolios may decline in response to certain events, including those directly involving the issuers of securities owned by the LifePath Master Portfolios. Changes arising from the general economy, the overall market and local, regional or global political or/and social instability, as well as currency, interest rate and price fluctuations, may also affect the securities’ value.
Counterparty Credit Risk: Similar to issuer credit risk, the LifePath Master Portfolios may be exposed to counterparty credit risk, or the risk that an entity may fail to or be unable to perform on its commitments related to unsettled or open transactions. The LifePath Master Portfolios manage counterparty credit risk by entering into transactions only with counterparties that the Manager believes have the financial resources to honor their obligations and by monitoring the financial stability of those counterparties. Financial assets, which potentially expose the LifePath Master Portfolios to market, issuer and counterparty credit risks, consist principally of financial instruments and receivables due from counterparties. The extent of the LifePath Master Portfolios’ exposure to market, issuer and counterparty credit risks with respect to these financial assets is approximately their value recorded in the Statements of Assets and Liabilities, less any collateral held by the LifePath Master Portfolios.
A derivative contract may suffer a mark-to-market loss if the value of the contract decreases due to an unfavorable change in the market rates or values of the underlying instrument. Losses can also occur if the counterparty does not perform under the contract.
The LifePath Master Portfolios’ risk of loss from counterparty credit risk on OTC derivatives is generally limited to the aggregate unrealized gain less the value of any collateral held by such LifePath Master Portfolio.
11. Subsequent Events:
Management has evaluated the impact of all subsequent events on the LifePath Master Portfolios through the date the financial statements were issued and has determined that there were no subsequent events requiring adjustment or additional disclosure in the financial statements.
| | | | | | |
| | | | | | | |
| 98 | | BLACKROCK FUNDS III | | DECEMBER 31, 2015 | | |
| | |
| Report of Independent Registered Public Accounting Firm | | Master Investment Portfolio |
To the Board of Trustees of Master Investment Portfolio and the Interestholders of LifePath® Retirement Master Portfolio, LifePath® 2020 Master Portfolio, LifePath® 2030 Master Portfolio, LifePath® 2040 Master Portfolio and LifePath® 2050 Master Portfolio:
In our opinion, the accompanying statements of assets and liabilities, including the schedules of investments, and the related statements of operations and of changes in net assets and the financial highlights present fairly, in all material respects, the financial position of LifePath® Retirement Master Portfolio, LifePath® 2020 Master Portfolio, LifePath® 2030 Master Portfolio, LifePath® 2040 Master Portfolio and LifePath® 2050 Master Portfolio (the “Master Portfolios”), each a series of Master Investment Portfolio, at December 31, 2015, the results of each of their operations for the year then ended, the changes in each of their net assets for each of the two years in the period then ended and the financial highlights for each of the five years in the period then ended, in conformity with accounting principles generally accepted in the United States of America. These financial statements and financial highlights (hereafter referred to as “financial statements”) are the responsibility of the Master Portfolios’ management. Our responsibility is to express an opinion on these financial statements based on our audits. We conducted our audits of these financial statements in accordance with the standards of the Public Company Accounting Oversight Board (United States). Those standards require that we plan and perform the audit to obtain reasonable assurance about whether the financial statements are free of material misstatement. An audit includes examining, on a test basis, evidence supporting the amounts and disclosures in the financial statements, assessing the accounting principles used and significant estimates made by management, and evaluating the overall financial statement presentation. We believe that our audits, which included confirmation of securities at December 31, 2015 by correspondence with the custodian, brokers and transfer agent, provide a reasonable basis for our opinion.
/s/PricewaterhouseCoopers LLP
Philadelphia, Pennsylvania
February 24, 2016
| | | | | | |
| | | | | | | |
| | BLACKROCK FUNDS III | | DECEMBER 31, 2015 | | 99 |
| | |
| Disclosure of Sub-Advisory Agreement | | |
The Board of Trustees of Master Investment Portfolio (the “Master Fund”) met in person on November 18-20, 2015 (the “November Meeting”) to consider the initial approval of (a) the sub-advisory agreement between BlackRock Fund Advisors (the “Manager”), the Master Fund’s investment advisor, and BlackRock International Limited (“BIL”) with respect to LifePath® Retirement Master Portfolio, LifePath® 2020 Master Portfolio, LifePath® 2030 Master Portfolio, LifePath® 2040 Master Portfolio and LifePath® 2050 Master Portfolio (each, a “Master Portfolio” and collectively, the “Master Portfolios”), each a series of the Master Fund (the “BIL Sub-Advisory Agreement”) and (b) the sub-advisory agreement between the Manager and BlackRock (Singapore) Limited (“BRS”) with respect to each Master Portfolio (the “BRS Sub-Advisory Agreement,” and together with the BIL Sub-Advisory Agreement, the “Sub-Advisory Agreements”). Each of BlackRock LifePath® Retirement Fund, BlackRock LifePath® 2020 Fund, BlackRock LifePath® 2030 Fund, BlackRock LifePath® 2040 Fund and BlackRock LifePath® 2050 Fund (each, a “Portfolio” and collectively, the “Portfolios”), each a series of BlackRock Funds III (the “Fund”), is a “feeder” fund that invests all of its investable assets in the corresponding Master Portfolio. Accordingly, the Board of Trustees of the Fund also considered the approval of each Sub-Advisory Agreement with respect to each Master Portfolio. For simplicity, as pertinent, the Board of Trustees of the Master Fund and the Board of Trustees of the Fund are referred to herein collectively as the “Board,” and the members are referred to as “Board Members.”
On the date of the Meeting, the Board consisted of fifteen individuals, thirteen of whom were not “interested persons” of the Master Fund or the Fund as defined in the Investment Company Act of 1940, as amended (the “1940 Act”) (the “Independent Board Members”). Pursuant to the 1940 Act, the Board is required to consider the initial approval of the Sub-Advisory Agreements.
At the November Meeting, the Board reviewed materials relating to its consideration of the proposed Sub-Advisory Agreements. The Master Fund’s investment advisory agreement (the “Advisory Agreement”) with the Manager on behalf of each Master Portfolio was most recently approved by the Board of the Master Fund at an in-person meeting on May 18-20, 2015 (the “May Meeting”). A discussion of the basis for the Board of the Master Fund’s approval and the Board of the Fund’s consideration of the Advisory Agreement at the May Meeting is included in the Portfolios’ shareholder report for the period ended June 30, 2015. The factors considered by the Board at the November Meeting in connection with approval of the proposed Sub-Advisory Agreements were substantially the same as the factors considered at the May Meeting.
Following discussion, all the Board Members of the Master Fund present at the November Meeting, including all the Independent Board Members present, approved the BIL Sub-Advisory Agreement between the Manager and BIL with respect to each Master Portfolio and the BRS Sub-Advisory Agreement between the Manager and BRS with respect to each Master Portfolio, each for a two-year term beginning on the effective date of the pertinent Sub-Advisory Agreement. Based upon its evaluation of all of the aforementioned factors in their totality, the Board of the Master Fund, including the Independent Board Members, was satisfied that the terms of the Sub-Advisory Agreements were fair and reasonable and in the best interest of each Master Portfolio and its interest holders. The Board of the Fund, including the Independent Board Members, also considered each Sub-Advisory Agreement with respect to each Master Portfolio and found the Sub-Advisory Agreements to be satisfactory. In arriving at its decision to approve the Sub-Advisory Agreements, the Board of the Master Fund did not identify any single factor or group of factors as all-important or controlling, but considered all factors together, and different Board Members may have attributed different weights to the various factors considered. The Independent Board Members were also assisted by the advice of independent legal counsel in making this determination.
| | | | | | |
| | | | | | | |
| 100 | | BLACKROCK FUNDS III | | DECEMBER 31, 2015 | | |
| | | | | | | | | | |
Name, Address1
and Year of Birth | | Position(s)
Held with
the Trust/MIP | | Length
of Time
Served as
a Trustee3 | | Principal Occupation(s) During Past Five Years | | Number of BlackRock-
Advised Registered
Investment Companies
(“RICs”) Consisting of
Investment Portfolios
(“Portfolios”) Overseen | | Public
Directorships |
| Independent Trustees2 |
Rodney D. Johnson 1941 | | Chair of the Board and Trustee | | Since 2009 | | President, Fairmount Capital Advisors, Inc. from 1987 to 2013; Member of the Archdiocesan Investment Committee of the Archdiocese of Philadelphia from 2004 to 2012; Director, The Committee of Seventy (civic) from 2006 to 2012; Director, Fox Chase Cancer Center from 2004 to 2011. | | 33 RICs consisting of
155 Portfolios | | None |
David O. Beim 1940 | | Trustee | | Since 2009 | | Professor of Professional Practice at the Columbia University Graduate School of Business since 1991; Trustee, Phillips Exeter Academy from 2002 to 2012; Chairman, Wave Hill, Inc. (public garden and cultural center) from 1990 to 2006. | | 33 RICs consisting of
155 Portfolios | | None |
Collette Chilton 1958 | | Trustee | | Since 2015 | | Chief Investment Officer, Williams College since 2006; Chief Investment Officer, Lucent Asset Management Corporation from 1998 to 2006. | | 33 RICs consisting of
155 Portfolios | | None |
Frank J. Fabozzi 1948 | | Trustee | | Since 2014 | | Editor of and Consultant for The Journal of Portfolio Management since 2006; Professor of Finance, EDHEC Business School since 2011; Visiting Professor, Princeton University from 2013 to 2014; Professor in the Practice of Finance and Becton Fellow, Yale University School of Management from 2006 to 2011. | | 108 RICs consisting of
230 Portfolios | | None |
Dr. Matina S. Horner 1939 | | Trustee | | Since 2009 | | Executive Vice President, Teachers Insurance and Annuity Association and College Retirement Equities Fund from 1989 to 2003. | | 33 RICs consisting of
155 Portfolios | | NSTAR (electric and gas utility) |
Herbert I. London 1939 | | Trustee | | Since 2009 | | Professor Emeritus, New York University since 2005; President, London Center for Policy Research since 2012; John M. Olin Professor of Humanities, New York University from 1993 to 2005 and Professor thereof from 1980 to 2005; President Emeritus, Hudson Institute (policy research organization) from 2011 to 2012, President thereof from 1997 to 2011 and Trustee from 1980 to 2012; Chairman of the Board of Trustees for Grantham University since 2006; Director, InnoCentive, Inc. (global internet service) since 2005; Director, Cerego, LLC (educational software) since 2005; Director, Cybersettle (online adjudication) since 2009; Director, AIMS Worldwide, Inc. (marketing) from 2007 to 2012. | | 33 RICs consisting of
155 Portfolios | | None |
Cynthia A. Montgomery 1952 | | Trustee | | Since 2009 | | Professor, Harvard Business School since 1989; Director, McLean Hospital from 2005 to 2012; Director, Harvard Business School Publishing from 2005 to 2010. | | 33 RICs consisting of
155 Portfolios | | Newell Rubbermaid, Inc. (manufacturing) |
Joseph P. Platt 1947 | | Trustee | | Since 2009 | | Director, Jones and Brown (Canadian insurance broker) since 1998; General Partner, Thorn Partners, LP (private investments) since 1998; Director, WQED Multi-Media (public broadcasting not-for-profit) since 2001; Director, The West Penn Allegheny Health System (a not-for-profit health system) from 2008 to 2013; Partner, Amarna Corporation, LLC (private investment company) from 2002 to 2008. | | 33 RICs consisting of
155 Portfolios | | Greenlight Capital Re, Ltd. (reinsurance company) |
Robert C. Robb, Jr. 1945 | | Trustee | | Since 2009 | | Partner, Lewis, Eckert, Robb and Company (management and financial consulting firm) since 1981. | | 33 RICs consisting of
155 Portfolios | | None |
Toby Rosenblatt 1938 | | Trustee | | Since 2009 | | President, Founders Investments Ltd. (private investments) since 1999; Director, Forward Management, LLC since 2007; Director, College Futures Foundation (philanthropic foundation) since 2009; Director, The James Irvine Foundation (philanthropic foundation) from 1998 to 2008. | | 33 RICs consisting of
155 Portfolios | | None |
| | | | | | |
| | | | | | | |
| | BLACKROCK FUNDS III | | DECEMBER 31, 2015 | | 101 |
| | |
| Officers and Trustees (continued) | | |
| | | | | | | | | | |
Name, Address1
and Year of Birth | | Position(s)
Held with
the Trust/MIP | | Length
of Time
Served as
a Trustee3 | | Principal Occupation(s) During Past Five Years | | Number of BlackRock-
Advised Registered
Investment Companies
(“RICs”) Consisting of
Investment Portfolios
(“Portfolios”) Overseen | | Public
Directorships |
| Independent Trustees2 (concluded) |
Mark Stalnecker 1951 | | Trustee | | Since 2015 | | Chief Investment Officer, University of Delaware from 1999 to 2013; Trustee, Winterthur Museum and Country Estate since 2001; Member of the Investment Committee, Delaware Public Employees’ Retirement System since 2002; Member of the Investment Committee, Christiana Care Health System since 2009; Member of the Investment Committee, Delaware Community Foundation from 2013 to 2014. | | 33 RICs consisting of
155 Portfolios | | None |
Kenneth L. Urish 1951 | | Trustee | | Since 2009 | | Managing Partner, Urish Popeck & Co., LLC (certified public accountants and consultants) since 1976; Immediate past- Chairman of the Professional Ethics Committee of the Pennsylvania Institute of Certified Public Accountants and Committee Member thereof since 2007; Member of External Advisory Board, The Pennsylvania State University Accounting Department since 2001; Principal, UP Strategic Wealth Investment Advisors, LLC since 2013; Trustee, The Holy Family Institute from 2001 to 2010; President and Trustee, Pittsburgh Catholic Publishing Associates from 2003 to 2008; Director, Inter-Tel from 2006 to 2007. | | 33 RICs consisting of
155 Portfolios | | None |
Frederick W. Winter 1945 | | Trustee | | Since 2009 | | Director, Alkon Corporation (pneumatics) since 1992; Professor and Dean Emeritus of the Joseph M. Katz School of Business, University of Pittsburgh from 2005 to 2013 and Dean thereof from 1997 to 2005; Director, Tippman Sports (recreation) from 2005 to 2013; Director, Indotronix International (IT services) from 2004 to 2008. | | 33 RICs consisting of
155 Portfolios | | None |
| | 1 The address of each Trustee is c/o BlackRock, Inc., 55 East 52nd Street, New York, NY 10055. |
| | 2 Independent Trustees serve until their resignation, retirement, removal or death, or until December 31 of the year in which they turn 75. The Board has determined to extend the terms of Independent Trustees on a case-by-case basis, as appropriate. The Board has unanimously approved extending the mandatory retirement age for David O. Beim and Dr. Matina S. Horner until December 31, 2016, which the Board believes is in the best interests of shareholders of the Trust/MIP. |
| | 3 Date shown is the earliest date a person has served for the Trust/MIP. In connection with the acquisition of Barclay’s Global Investors by BlackRock, Inc. (“BlackRock”) in December 2009, the Trustees were elected to the Trust/MIP’s Board. As a result, although the chart shows certain Independent Trustees as joining the Trust/MIP’s board in 2009, those Independent Trustees first became members of the boards of other funds advised by BlackRock Advisors, LLC or its affiliates as follows: David O. Beim, 1998; Dr. Matina S. Horner, 2004; Rodney D. Johnson, 1995; Herbert I. London, 1987; Cynthia A. Montgomery, 1994; Joseph P. Platt, 1999; Robert C. Robb, Jr., 1998; Toby Rosenblatt, 2005; Kenneth L. Urish, 1999; and Frederick W. Winter, 1999. Frank J. Fabozzi first became a member of the boards of other funds advised by BlackRock Advisors, LLC or its affiliates in 1988. |
| Interested Trustees4 | | | | | | | | | | |
Barbara G. Novick 1960 | | Trustee | | Since 2015 | | Vice Chairman of BlackRock since 2006; Chair of BlackRock’s Government Relations Steering Committee since 2009; Head of the Global Client Group of BlackRock from 1988 to 2008. | | 108 RICs consisting of
230 Portfolios | | None |
John M. Perlowski 1964 | | Trustee, President, and Chief Executive Officer | | Since 2015 (Trustee); Since 2010 (President and Chief Executive Officer) | | Managing Director of BlackRock since 2009; Head of BlackRock Global Fund Services since 2009; Managing Director and Chief Operating Officer of the Global Product Group at Goldman Sachs Asset Management, L.P. from 2003 to 2009; Treasurer of Goldman Sachs Mutual Funds from 2003 to 2009 and Senior Vice President thereof from 2007 to 2009; Director of Goldman Sachs Offshore Funds from 2002 to 2009; Director of Family Resource Network (charitable foundation) since 2009. | | 136 RICs consisting of
328 Portfolios | | None |
| | 4 Mr. Perlowski and Ms. Novick are both “interested persons,” as defined in the 1940 Act, of the Trust/MIP based on their positions with BlackRock and its affiliates. Mr. Perlowski and Ms. Novick are also board members of a complex of BlackRock registered open-end funds. Mr. Perlowski is also a board member of the BlackRock Equity-Bond Complex and the BlackRock Equity-Liquidity Complex, and Ms. Novick is also a board member of the BlackRock Equity-Liquidity Complex. Interested Trustees serve until their resignation, retirement, removal or death, or until December 31 of the year in which they turn 75. The maximum age limitation may be waived as to any Trustee by action of a majority of the Trustees upon a finding of good cause therefor. |
| | | | | | |
| | | | | | | |
| 102 | | BLACKROCK FUNDS III | | DECEMBER 31, 2015 | | |
| | | | |
| Officers and Trustees (concluded) | | |
| | | | | | |
Name, Address1
and Year of Birth | | Position(s)
Held with
the Trust/MIP | | Length of
Time Served
as an Officer | | Principal Occupation(s) During Past Five Years |
| Officers2 |
John M. Perlowski 1964 | | Trustee, President and Chief Executive Officer | | Since 2015 (Trustee); Since 2010 (President and Chief Executive Officer) | | Managing Director of BlackRock since 2009; Head of BlackRock Global Fund Services since 2009; Managing Director and Chief Operating Officer of the Global Product Group at Goldman Sachs Asset Management, L.P. from 2003 to 2009; Treasurer of Goldman Sachs Mutual Funds from 2003 to 2009 and Senior Vice President thereof from 2007 to 2009; Director of Goldman Sachs Offshore Funds from 2002 to 2009; Director of Family Resource Network (charitable foundation) since 2009. |
Richard Hoerner, CFA 1958 | | Vice President | | Since 2009 | | Managing Director of BlackRock since 2000; Head of the Global Cash Group since 2013; Co-head of the Global Cash and Securities Lending Group from 2010 to 2013; Member of the Cash Management Group Executive Committee since 2005. |
Jennifer McGovern 1977 | | Vice President | | Since 2014 | | Director of BlackRock since 2011; Head of Product Structure and Oversight for BlackRock’s U.S. Wealth Advisory Group since 2013; Vice President of BlackRock from 2008 to 2010. |
Neal Andrews 1966 | | Chief Financial Officer | | Since 2009 | | Managing Director of BlackRock since 2006; Senior Vice President and Line of Business Head of Fund Accounting and Administration at PNC Global Investment Servicing (U.S.) Inc. from 1992 to 2006. |
Jay Fife 1970 | | Treasurer | | Since 2009 | | Managing Director of BlackRock since 2007; Director of BlackRock in 2006; Assistant Treasurer of the MLIM and Fund Asset Management, L.P. advised funds from 2005 to 2006; Director of MLIM Fund Services Group from 2001 to 2006. |
Charles Park 1967 | | Chief Compliance Officer | | Since 2014 | | Anti-Money Laundering Compliance Officer for the BlackRock-advised Funds in the Equity-Bond Complex, the Equity-Liquidity Complex and the Closed-End Complex from 2014 to 2015; Chief Compliance Officer of BlackRock Advisors, LLC and the BlackRock-advised Funds in the Equity-Bond Complex, the Equity-Liquidity Complex and the Closed-End Complex since 2014; Principal of and Chief Compliance Officer for iShares® Delaware Trust Sponsor LLC since 2012 and BlackRock Fund Advisors (“BFA”) since 2006; Chief Compliance Officer for the BFA-advised iShares exchange traded funds since 2006; Chief Compliance Officer for BlackRock Asset Management International Inc. since 2012. |
Fernanda Piedra 1969 | | Anti-Money Laundering Compliance Officer | | Since 2015 | | Director of BlackRock since 2014; Anti-Money Laundering Compliance Officer and Regional Head of Financial Crime for the Americas at BlackRock since 2014; Head of Regulatory Changes and Remediation for the Asset Wealth Management Division of Deutsche Bank from 2010 to 2014; Vice President of Goldman Sachs (Anti-Money Laundering/Suspicious Activities Group) from 2004 to 2010. |
Benjamin Archibald 1975 | | Secretary | | Since 2012 | | Managing Director of BlackRock since 2014; Director of BlackRock from 2010 to 2013; Secretary of the iShares exchange traded funds since 2015; Secretary of the BlackRock-advised mutual funds since 2012. |
| | 1 The address of each Officer is c/o BlackRock, Inc., 55 East 52nd Street, New York, NY 10055. |
| | | 2 Officers of the Trust/MIP serve at the pleasure of the Board. |
Effective September 25, 2015, John M. Perlowski was appointed to serve as a Trustee of the Trust/MIP.
Effective December 31, 2015, Herbert I. London and Toby Rosenblatt retired as Trustees of the Trust/MIP.
| | | | | | |
| | | | |
Investment Advisor BlackRock Fund Advisors San Francisco, CA 94105 | | Custodian and Accounting Agent State Street Bank and Trust Company Boston, MA 02110 | | Distributor BlackRock Investments, LLC New York, NY 10022 | | Legal Counsel Sidley Austin LLP New York, NY 10019 |
| | | |
Sub-Advisors
BlackRock International Limited Edinburgh, United Kingdom BlackRock (Singapore) Limited Singapore | | Transfer Agent BNY Mellon Investment Servicing (US) Inc. Wilmington, DE 19809 | | Independent Registered Public Accounting Firm PricewaterhouseCoopers LLP Philadelphia, PA 19103 | | Address of the Trust/MIP 400 Howard Street San Francisco, CA 94105 |
| | | |
Administrator BlackRock Advisors, LLC Wilmington, DE 19809 | | | | | | |
| | | | | | |
| | | | | | | |
| | BLACKROCK FUNDS III | | DECEMBER 31, 2015 | | 103 |
Householding
The LifePath Funds will mail only one copy of shareholder documents, including prospectuses, annual and semi-annual reports and proxy statements, to shareholders with multiple accounts at the same address. This practice is commonly called “householding” and is intended to reduce expenses and eliminate duplicate mailings of shareholder documents. Mailings of your shareholder documents may be householded indefinitely unless you instruct us otherwise. If you do not want the mailing of these documents to be combined with those for other members of your household, please call the LifePath Funds at (800) 441-7762.
Availability of Quarterly Schedule of Investments
The LifePath Funds/LifePath Master Portfolios file their complete schedule of portfolio holdings with the SEC for the first and third quarters of each fiscal year on Form N-Q. The LifePath Funds’/LifePath Master Portfolios’ Forms N-Q are available on the SEC’s website at http://www.sec.gov and may also be reviewed and copied at the SEC’s Public Reference Room in Washington, D.C. Information on how to access documents on the SEC’s website without charge may be obtained by calling (800) SEC-0330. The LifePath Funds’/LifePath Master Portfolios’ Forms N-Q may also be obtained upon request and without charge by calling (800) 441-7762.
Availability of Proxy Voting Policies and Procedures
A description of the policies and procedures that the LifePath Funds/LifePath Master Portfolios use to determine how to vote proxies relating to portfolio securities is available upon request and without charge (1), by calling (800) 441-7762; (2) at http://www.blackrock.com; and (3) on the SEC’s website at http://www.sec.gov.
Availability of Proxy Voting Record
Information about how the LifePath Funds/LifePath Master Portfolios voted proxies relating to securities held in the LifePath Funds’/LifePath Master Portfolios’ portfolios during the most recent 12-month period ended June 30 is available upon request and without charge (1) at http://www.blackrock.com or by calling (800) 441-7762 and (2) on the SEC’s website at http://www.sec.gov.
BlackRock’s Mutual Fund Family
BlackRock offers a diverse lineup of open-end mutual funds crossing all investment styles and managed by experts in equity, fixed income and tax-exempt investing. Visit http://www.blackrock.com for more information.
Account Information
Call us at (800) 441-7762 from 8:00 AM to 6:00 PM EST on any business day to get information about your account balances, recent transactions and share prices. You can also reach us on the Web at http://www.blackrock.com/funds.
Automatic Investment Plans
Investor Class shareholders who want to invest regularly can arrange to have $50 or more automatically deducted from their checking or savings account and invested in any of the BlackRock funds.
Systematic Withdrawal Plans
Investor Class shareholders can establish a systematic withdrawal plan and receive periodic payments of $50 or more from their BlackRock funds, as long as their account balance is at least $10,000.
Retirement Plans
Shareholders may make investments in conjunction with Traditional, Rollover, Roth, Coverdell, Simple IRAs, SEP IRAs and 403(b) Plans.
| | | | | | |
| | | | | | | |
| 104 | | BLACKROCK FUNDS III | | DECEMBER 31, 2015 | | |
| | |
| Additional Information (concluded) | | |
| | |
| BlackRock Privacy Principles | | |
BlackRock is committed to maintaining the privacy of its current and former fund investors and individual clients (collectively, “Clients”) and to safeguarding their non-public personal information. The following information is provided to help you understand what personal information BlackRock collects, how we protect that information and why in certain cases we share such information with select parties.
If you are located in a jurisdiction where specific laws, rules or regulations require BlackRock to provide you with additional or different privacy-related rights beyond what is set forth below, then BlackRock will comply with those specific laws, rules or regulations.
BlackRock obtains or verifies personal non-public information from and about you from different sources, including the following: (i) information we receive from you or, if applicable, your financial intermediary, on applications, forms or other documents; (ii) information about your transactions with us, our affiliates, or others; (iii) information we receive from a consumer reporting agency; and (iv) from visits to our websites.
BlackRock does not sell or disclose to non-affiliated third parties any non-public personal information about its Clients, except as permitted by law or as is necessary to respond to regulatory requests or to service Client accounts. These non-affiliated third parties are required to protect the confidentiality and security of this information and to use it only for its intended purpose.
We may share information with our affiliates to service your account or to provide you with information about other BlackRock products or services that may be of interest to you. In addition, BlackRock restricts access to non-public personal information about its Clients to those BlackRock employees with a legitimate business need for the information. BlackRock maintains physical, electronic and procedural safeguards that are designed to protect the non-public personal information of its Clients, including procedures relating to the proper storage and disposal of such information.
| | | | | | |
| | | | | | | |
| | BLACKROCK FUNDS III | | DECEMBER 31, 2015 | | 105 |
This report are intended for current holders. It is not authorized for use as an offer of sale or a solicitation of an offer to buy shares of a LifePath Fund unless preceded or accompanied by that LifePath Fund’s current prospectus. Past performance results shown in this report should not be considered a representation of future performance. Investment returns and principal value of shares will fluctuate so that shares, when redeemed, may be worth more or less than their original cost. Statements and other information herein are as dated and are subject to change.

| | |
| LifePath-12/15-AR | |  |
DECEMBER 31, 2015
| | | | |
ANNUAL REPORT | | | |  |
BlackRock Funds III
| Ø | BlackRock LifePath® Index Retirement Fund |
| Ø | BlackRock LifePath® Index 2020 Fund |
| Ø | BlackRock LifePath® Index 2025 Fund |
| Ø | BlackRock LifePath® Index 2030 Fund |
| Ø | BlackRock LifePath® Index 2035 Fund |
| Ø | BlackRock LifePath® Index 2040 Fund |
| Ø | BlackRock LifePath® Index 2045 Fund |
| Ø | BlackRock LifePath® Index 2050 Fund |
| Ø | BlackRock LifePath® Index 2055 Fund |
|
| Not FDIC Insured • May Lose Value • No Bank Guarantee |

| | | | | | |
| | | | | | | |
| 2 | | BLACKROCK FUNDS III | | DECEMBER 31, 2015 | | |
Dear Shareholder,
Diverging monetary policies and shifting economic outlooks across regions have been the overarching themes driving financial markets over the past couple of years. With U.S. growth outpacing the global economic recovery in 2015 while inflationary pressures remained low, investors spent most of the year anticipating a short-term rate hike from the Federal Reserve (the “Fed”), which ultimately came to fruition in December. In contrast, the European Central Bank (“ECB”) and the Bank of Japan moved to a more accommodative stance during the year. In this environment, the U.S. dollar strengthened considerably, causing profit challenges for U.S. exporters and high levels of volatility in emerging market currencies and commodities. Oil prices were particularly volatile and below the historical norm due to an ongoing imbalance in global supply and demand.
Market volatility broadly increased in the middle of 2015, beginning with a sharp, but temporary, selloff in June as Greece’s long-brewing debt troubles came to an impasse. Just as these concerns abated, Chinese equities tumbled amid weakness in the country’s economy. This, combined with a depreciation of the yuan and declining confidence in China’s policymakers, stoked worries about the potential impact to the broader world economy, causing heightened volatility to spread throughout markets globally. Given a dearth of meaningful growth across most of the world, financial markets became more reliant on central bank policies to drive performance. In that vein, risk assets (such as equities and high yield bonds) rallied in October when China’s central bank provided more stimulus, the ECB hinted at further easing, and soft U.S. data pushed back expectations for a Fed rate hike. As the period came to a close, however, the ECB disappointed investors with its subdued policy changes. The Fed’s December rate hike had a positive impact on the markets as it removed a source of uncertainty, but this was counteracted by the dampening effect of a stronger U.S. dollar, falling oil prices and tighter credit conditions.
At BlackRock, we believe investors need to think globally, extend their scope across a broad array of asset classes and be prepared to move freely as market conditions change over time. We encourage you to talk with your financial advisor and visit blackrock.com for further insight about investing in today’s markets.
Sincerely,
Rob Kapito
President, BlackRock Advisors, LLC
Rob Kapito
President, BlackRock Advisors, LLC
| | | | | | | | |
| Total Returns as of December 31, 2015 | |
| | | 6-month | | | 12-month | |
U.S. large cap equities
(S&P 500® Index) | | | 0.15 | % | | | 1.38 | % |
U.S. small cap equities
(Russell 2000® Index) | | | (8.75 | ) | | | (4.41 | ) |
International equities
(MSCI Europe, Australasia,
Far East Index) | | | (6.01 | ) | | | (0.81 | ) |
Emerging market equities
(MSCI Emerging Markets Index) | | | (17.35 | ) | | | (14.92 | ) |
3-month Treasury bills
(BofA Merrill Lynch 3-Month
U.S. Treasury Bill Index) | | | 0.04 | | | | 0.05 | |
U.S. Treasury securities
(BofA Merrill Lynch
10-Year U.S. Treasury
Index) | | | 1.43 | | | | 0.91 | |
U.S. investment-grade bonds
(Barclays U.S.
Aggregate Bond Index) | | | 0.65 | | | | 0.55 | |
Tax-exempt municipal
bonds (S&P Municipal
Bond Index) | | | 3.31 | | | | 3.32 | |
U.S. high yield bonds
(Barclays U.S. Corporate
High Yield 2% Issuer
Capped Index) | | | (6.79 | ) | | | (4.43 | ) |
| Past performance is no guarantee of future results. Index performance is shown for illustrative purposes only. You cannot invest directly in an index. | |
| | | | | | |
| | | | | | | |
| | THIS PAGE NOT PART OF YOUR FUND REPORT | | | | 3 |
| | | | |
| Fund Summary as of December 31, 2015 | | BlackRock LifePath Index Funds |
|
| Portfolio Management Commentary |
How did each Fund perform?
| • | | Each of the BlackRock LifePath Index Funds with target dates of 2020, 2025, 2030, 2035, 2040, 2045, 2050, 2055 and the BlackRock LifePath Index Retirement Fund (together, the “LifePath Index Funds”) invest in their respective LifePath Index Master Portfolio. |
| • | | For the 12-month period ended December 31, 2015, the LifePath Index Funds with target dates of 2045, 2050 and 2055 outperformed their respective custom benchmarks, while the LifePath Index Funds with target dates of 2020, 2025, 2030, 2035 and 2040 had mixed performance. LifePath Index 2020 Fund’s Institutional Shares performed in line with the custom benchmark, while Investor A and Class K Shares underperformed the custom benchmark. LifePath Index 2025 Fund’s Institutional and Class K Shares performed in line with the custom benchmark, while Investor A Shares underperformed the custom benchmark. LifePath Index 2030 Fund’s Institutional and Class K Shares outperformed the custom benchmark, while Investor A Shares underperformed the custom benchmark. LifePath Index 2035 and 2040 Funds’ Institutional and Class K Shares outperformed the custom benchmark, while Investor A Shares performed in line the custom benchmark. The LifePath Index Retirement Fund underperformed the custom benchmark. The returns for the LifePath Index Funds include fund expenses. The custom benchmarks have no expenses associated with performance. |
What factors influenced performance?
| • | | While most of the LifePath Index Funds outperformed their benchmark, the outperformance was greater in the longer-dated LifePath Index Funds (2025 to 2055). Positive performance differences were largely due to the real estate instruments as well as the composition of the LifePath Index Funds’ international exposure, which is now more in line with the custom benchmark’s international exposure. |
| • | | The largest detractor was fair value pricing for the international funds that are components within the LifePath Index Funds. |
Describe recent portfolio activity.
| • | | Each LifePath Index Fund has its own time horizon, which affects its acceptable level of risk and, in turn, the strategic allocation of its holdings across asset classes. On a quarterly basis, the strategic allocation of each LifePath Index Fund is systematically adjusted to reflect the shareholders’ remaining investment time horizon. During the period, the LifePath Index Funds were rebalanced in accordance with their updated strategic allocations. Daily cash flows were allocated to the underlying funds and instruments as appropriate. |
Describe portfolio positioning at period end.
| • | | At period end, each of the LifePath Index Funds was invested according to its respective strategic allocation benchmark within tolerance limits. |
The views expressed reflect the opinions of BlackRock as of the date of this report and are subject to change based on changes in market, economic or other conditions. These views are not intended to be a forecast of future events and are no guarantee of future results.
Under normal circumstances, the asset allocation of each LifePath Index Fund will change over time according to a predetermined “glide path” as each LifePath Index Fund approaches its respective target date. The glide path represents the shifting of asset classes over time. Each LifePath Index Fund’s asset mix becomes more conservative prior to retirement as time elapses. This reflects the need for reduced investment risks as retirement approaches and the need for lower volatility of each LifePath Index Fund, which may be a primary source of income after retirement. As each LifePath Index Fund approaches its target date, its asset allocation will shift so that each LifePath Index Fund invests a greater percentage of its assets in fixed income funds. The asset allocation targets are established by a committee of BlackRock Fund Advisors (“BFA” or the “Manager”) investment professionals. The investment team, including the portfolio managers and this investment committee, meets regularly to assess market conditions, review the asset allocation targets of each
LifePath Index Fund, and determine whether any changes are required to enable each LifePath Index Fund to achieve its investment objective.
Although the asset allocation targets listed for the glide path are general, long-term targets, BFA may periodically adjust the proportion of equity and fixed income index funds in each LifePath Index Fund, based on an assessment of the current market conditions, the potential contribution of each asset class to the expected risk and return characteristics of each LifePath Index Fund, reallocations of each LifePath Index Fund’s composition to reflect intra-year movement along the glide path and other factors. In general, such adjustments will be limited, however, BFA may determine that a greater degree of variation is warranted to protect each LifePath Index Fund or achieve each LifePath Index Fund’s investment objective.
| | | | | | |
| | | | | | | |
| 4 | | BLACKROCK FUNDS III | | DECEMBER 31, 2015 | | |
| | | | |
| | | BlackRock LifePath Index Retirement Fund |
BlackRock LifePath® Index Retirement Fund’s (“LifePath Index Retirement Fund” or the “LifePath Index Fund”) investment objective is to seek to provide for retirement outcomes based on quantitatively measured risk. In pursuit of this objective, the LifePath Index Fund will be broadly diversified across global asset classes.
Effective March 31, 2015, the LifePath® Index Retirement Portfolio changed its name to the BlackRock LifePath® Index Retirement Fund.
|
| Total Return Based on a $10,000 Investment |
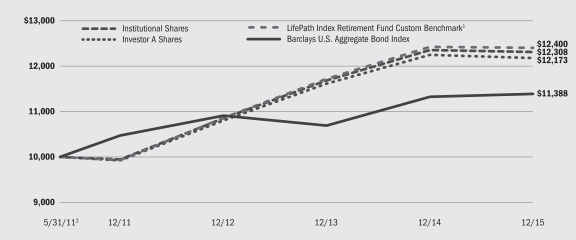
| | 1 | | The LifePath Index Fund compares its performance to that of a customized weighted index (the “LifePath Index Retirement Fund Custom Benchmark”), comprised of the indexes indicated below, which reflects the investment advisor’s changes to the benchmark’s weightings over time. The investment advisor adjusts the weightings of these indexes periodically based upon its evaluation and adjustment of the LifePath Index Fund’s asset allocation strategy. The weightings are presented annually but they are adjusted quarterly. |
| | 2 | | Commencement of operations. |
LifePath Index Fund’s custom benchmark consists of the following:
| | | | | | | | | | | | | | | | | | | | | | | | |
| Period3 | | Barclays
U.S. Aggregate
Bond Index | | | Barclays
U.S. Treasury
Inflation
Protected
Securities
(TIPS) Index
(Series L) | | | FTSE
EPRA/NAREIT
Developed
Real Estate
Index | | | MSCI
ACWI ex USA
IMI Index | | | Russell 1000®
Index | | | Russell 2000®
Index | |
5/31/11 to 12/31/11 | | | 52.9 | % | | | 9.1 | % | | | N/A | | | | 10.9 | % | | | 23.2 | % | | | 3.9 | % |
1/01/12 to 12/31/12 | | | 52.9 | | | | 9.1 | | | | 0.2 | % | | | 11.3 | | | | 22.5 | | | | 4.0 | |
1/01/13 to 12/31/13 | | | 52.9 | | | | 9.0 | | | | 0.3 | | | | 12.0 | | | | 21.4 | | | | 21.5 | |
1/01/14 to 12/31/14 | | | 52.6 | | | | 9.0 | | | | 0.3 | | | | 12.3 | | | | 21.5 | | | | 4.3 | |
1/01/15 to 12/31/15 | | | 51.2 | | | | 8.8 | | | | 0.5 | | | | 13.1 | | | | 22.5 | | | | 3.9 | |
See “About Fund Performance” on page 14 for descriptions of the indexes.
|
| Performance Summary for the Period Ended December 31, 2015 |
| | | | | | | | | | | | |
| | | | | | Average Annual Total Returns | |
| | | 6-Month Total Returns | | | 1 Year | | | Since Inception3 | |
Institutional | | | (1.52 | )% | | | (0.36 | )% | | | 4.63 | % |
Investor A | | | (1.65 | ) | | | (0.61 | ) | | | 4.38 | |
Class K | | | (1.49 | ) | | | (0.31 | ) | | | 4.67 | |
LifePath Index Retirement Fund Custom Benchmark | | | (1.39 | ) | | | (0.19 | ) | | | 4.80 | |
Barclays U.S. Aggregate Bond Index | | | 0.65 | | | | 0.55 | | | | 2.87 | |
Barclays U.S. TIPS Index (Series L) | | | (1.78 | ) | | | (1.44 | ) | | | 1.70 | |
FTSE EPRA/NAREIT Developed Real Estate Index | | | 2.49 | | | | (0.79 | ) | | | 5.95 | |
MSCI ACWI ex USA IMI Index | | | (8.78 | ) | | | (4.60 | ) | | | 0.28 | |
Russell 1000® Index | | | (0.78 | ) | | | 0.92 | | | | 11.69 | |
Russell 2000® Index | | | (8.75 | ) | | | (4.41 | ) | | | 8.07 | |
| | 3 | | The LifePath Index Fund commenced operations on May 31, 2011. |
| | | | Past performance is not indicative of future results. |
| | | | | | |
| | | | | | | |
| | BLACKROCK FUNDS III | | DECEMBER 31, 2015 | | 5 |
| | |
| | | BlackRock LifePath Index 2020 Fund |
BlackRock LifePath® Index 2020 Fund’s (“LifePath Index 2020 Fund” or the “LifePath Index Fund”) investment objective is to seek to provide for retirement outcomes based on quantitatively measured risk. In pursuit of this objective, the LifePath Index Fund will be broadly diversified across global asset classes, with asset allocations becoming more conservative over time.
Effective March 31, 2015, the LifePath® Index 2020 Portfolio changed its name to the BlackRock LifePath® Index 2020 Fund.
|
| Total Return Based on a $10,000 Investment |
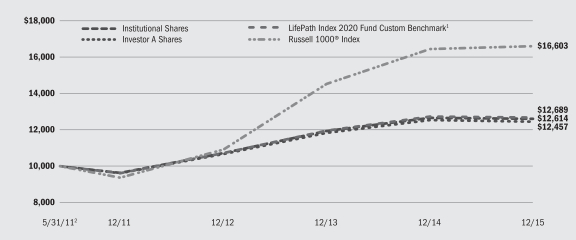
| | 1 | | The LifePath Index Fund compares its performance to that of a customized weighted index (the “LifePath Index 2020 Fund Custom Benchmark”), comprised of the indexes indicated below, which reflects the investment advisor’s changes to the benchmark’s weightings over time. The investment advisor adjusts the weightings of these indexes periodically based upon its evaluation and adjustment of the LifePath Index Fund’s asset allocation strategy. The weightings are presented annually but they are adjusted quarterly. |
| | 2 | | Commencement of operations. |
LifePath Index Fund’s custom benchmark consists of the following:
| | | | | | | | | | | | | | | | | | | | | | | | |
| Period3 | | Barclays
U.S. Aggregate
Bond Index | | | Barclays
U.S. Treasury
Inflation
Protected
Securities
(TIPS) Index
(Series L) | | | FTSE
EPRA/NAREIT
Developed
Real Estate
Index | | | MSCI
ACWI ex USA
IMI Index | | | Russell 1000®
Index | | | Russell 2000®
Index | |
5/31/11 to 12/31/11 | | | 37.1 | % | | | 6.0 | % | | | N/A | | | | 17.5 | % | | | 35.7 | % | | | 3.7 | % |
1/01/12 to 12/31/12 | | | 39.0 | | | | 6.3 | | | | 1.6 | % | | | 16.6 | | | | 32.9 | | | | 3.6 | |
1/01/13 to 12/31/13 | | | 40.9 | | | | 6.6 | | | | 3.1 | | | | 16.0 | | | | 29.7 | | | | 3.7 | |
1/01/14 to 12/31/14 | | | 42.1 | | | | 6.8 | | | | 3.0 | | | | 16.0 | | | | 28.4 | | | | 3.7 | |
1/01/15 to 12/31/15 | | | 40.4 | | | | 6.7 | | | | 3.3 | | | | 16.9 | | | | 29.3 | | | | 3.4 | |
See “About Fund Performance” on page 14 for descriptions of the indexes.
|
| Performance Summary for the Period Ended December 31, 2015 |
| | | | | | | | | | | | |
| | | 6-Month | | | Average Annual Total Returns | |
| | | Total Returns | | | 1 Year | | | Since Inception3 | |
Institutional | | | (1.78 | )% | | | (0.38 | )% | | | 5.19 | % |
Investor A | | | (1.92 | ) | | | (0.63 | ) | | | 4.90 | |
Class K | | | (1.85 | ) | | | (0.42 | ) | | | 5.21 | |
LifePath Index 2020 Fund Custom Benchmark | | | (1.73 | ) | | | (0.35 | ) | | | 5.33 | |
Barclays U.S. Aggregate Bond Index | | | 0.65 | | | | 0.55 | | | | 2.87 | |
Barclays U.S. TIPS Index (Series L) | | | (1.78 | ) | | | (1.44 | ) | | | 1.70 | |
FTSE EPRA/NAREIT Developed Real Estate Index | | | 2.49 | | | | (0.79 | ) | | | 5.95 | |
MSCI ACWI ex USA IMI Index | | | (8.78 | ) | | | (4.60 | ) | | | 0.28 | |
Russell 1000® Index | | | (0.78 | ) | | | 0.92 | | | | 11.69 | |
Russell 2000® Index | | | (8.75 | ) | | | (4.41 | ) | | | 8.07 | |
| | 3 | | The LifePath Index Fund commenced operations on May 31, 2011. |
| | | | Past performance is not indicative of future results. |
| | | | | | |
| | | | | | | |
| 6 | | BLACKROCK FUNDS III | | DECEMBER 31, 2015 | | |
| | | | |
| | | BlackRock LifePath Index 2025 Fund |
BlackRock LifePath® Index 2025 Fund’s (“LifePath Index 2025 Fund” or the “LifePath Index Fund”) investment objective is to seek to provide for retirement outcomes based on quantitatively measured risk. In pursuit of this objective, the LifePath Index Fund will be broadly diversified across global asset classes, with asset allocations becoming more conservative over time.
Effective March 31, 2015, the LifePath® Index 2025 Portfolio changed its name to the BlackRock LifePath® Index 2025 Fund.
|
| Total Return Based on a $10,000 Investment |
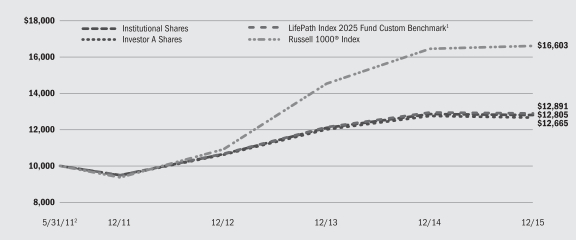
| | 1 | | The LifePath Index Fund compares its performance to that of a customized weighted index (the “LifePath Index 2025 Fund Custom Benchmark”), comprised of the indexes indicated below, which reflects the investment advisor’s changes to the benchmark’s weightings over time. The investment advisor adjusts the weightings of these indexes periodically based upon its evaluation and adjustment of the LifePath Index Fund’s asset allocation strategy. The weightings are presented annually but they are adjusted quarterly. |
| | 2 | | Commencement of operations. |
LifePath Index Fund’s custom benchmark consists of the following:
| | | | | | | | | | | | | | | | | | | | | | | | |
| Period3 | | Barclays
U.S. Aggregate
Bond Index | | | Barclays
U.S. Treasury
Inflation
Protected
Securities
(TIPS) Index
(Series L) | | | FTSE
EPRA/NAREIT
Developed
Real Estate
Index | | | MSCI
ACWI ex USA
IMI Index | | | Russell 1000®
Index | | | Russell 2000®
Index | |
5/31/11 to 12/31/11 | | | 30.0 | % | | | 4.7 | % | | | N/A | | | | 20.5 | % | | | 41.2 | % | | | 3.6 | % |
1/01/12 to 12/31/12 | | | 31.9 | | | | 8.0 | | | | 2.4 | % | | | 19.3 | | | | 38.1 | | | | 3.3 | |
1/01/13 to 12/31/13 | | | 33.7 | | | | 5.3 | | | | 4.8 | | | | 18.3 | | | | 34.6 | | | | 3.3 | |
1/01/14 to 12/31/14 | | | 34.5 | | | | 5.4 | | | | 4.9 | | | | 18.5 | | | | 33.4 | | | | 3.3 | |
1/01/15 to 12/31/15 | | | 30.9 | | | | 5.0 | | | | 5.9 | | | | 20.1 | | | | 35.1 | | | | 3.0 | |
See “About Fund Performance” on page 14 for descriptions of the indexes.
|
| Performance Summary for the Period Ended December 31, 2015 |
| | | | | | | | | | | | |
| | | 6-Month | | | Average Annual Total Returns | |
| | | Total Returns | | | 1 Year | | | Since Inception3 | |
Institutional | | | (2.00 | )% | | | (0.42 | )% | | | 5.54 | % |
Investor A | | | (2.13 | ) | | | (0.67 | ) | | | 5.29 | |
Class K | | | (1.98 | ) | | | (0.45 | ) | | | 5.57 | |
LifePath Index 2025 Fund Custom Benchmark | | | (2.00 | ) | | | (0.47 | ) | | | 5.69 | |
Barclays U.S. Aggregate Bond Index | | | 0.65 | | | | 0.55 | | | | 2.87 | |
Barclays U.S. TIPS Index (Series L) | | | (1.78 | ) | | | (1.44 | ) | | | 1.70 | |
FTSE EPRA/NAREIT Developed Real Estate Index | | | 2.49 | | | | (0.79 | ) | | | 5.95 | |
MSCI ACWI ex USA IMI Index | | | (8.78 | ) | | | (4.60 | ) | | | 0.28 | |
Russell 1000® Index | | | (0.78 | ) | | | 0.92 | | | | 11.69 | |
Russell 2000® Index | | | (8.75 | ) | | | (4.41 | ) | | | 8.07 | |
| | 3 | | The LifePath Index Fund commenced operations on May 31, 2011. |
| | | | Past performance is not indicative of future results. |
| | | | | | |
| | | | | | | |
| | BLACKROCK FUNDS III | | DECEMBER 31, 2015 | | 7 |
| | |
| | | BlackRock LifePath Index 2030 Fund |
BlackRock LifePath® Index 2030 Fund’s (“LifePath Index 2030 Fund” or the “LifePath Index Fund”) investment objective is to seek to provide for retirement outcomes based on quantitatively measured risk. In pursuit of this objective, the LifePath Index Fund will be broadly diversified across global asset classes, with asset allocations becoming more conservative over time.
Effective March 31, 2015, the LifePath® Index 2030 Portfolio changed its name to the BlackRock LifePath® Index 2030 Fund.
|
| Total Return Based on a $10,000 Investment |
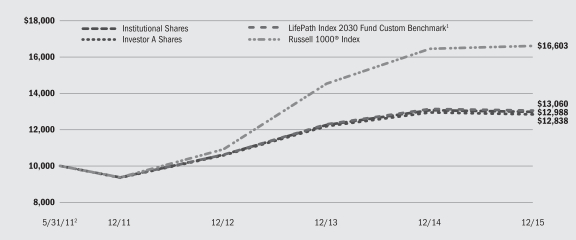
| | 1 | | The LifePath Index Fund compares its performance to that of a customized weighted index (the “LifePath Index 2030 Fund Custom Benchmark”), comprised of the indexes indicated below, which reflects the investment advisor’s changes to the benchmark’s weightings over time. The investment advisor adjusts the weightings of these indexes periodically based upon its evaluation and adjustment of the LifePath Index Fund’s asset allocation strategy. The weightings are presented annually but they are adjusted quarterly. |
| | 2 | | Commencement of operations. |
LifePath Index Fund’s custom benchmark consists of the following:
| | | | | | | | | | | | | | | | | | | | | | | | |
| Period3 | | Barclays
U.S. Aggregate
Bond Index | | | Barclays
U.S. Treasury
Inflation
Protected
Securities
(TIPS) Index
(Series L) | | | FTSE
EPRA/NAREIT
Developed
Real Estate
Index | | | MSCI
ACWI exUSA
IMI Index | | | Russell 1000®
Index | | | Russell 2000®
Index | |
5/31/11 to 12/31/11 | | | 23.8 | % | | | 3.5 | % | | | N/A | | | | 23.1 | % | | | 46.1 | % | | | 3.5 | % |
1/01/12 to 12/31/12 | | | 25.8 | | | | 3.8 | | | | 3.1 | % | | | 21.6 | | | | 42.6 | | | | 3.1 | |
1/01/13 to 12/31/13 | | | 27.6 | | | | 4.0 | | | | 6.2 | | | | 20.3 | | | | 38.9 | | | | 3.0 | |
1/01/14 to 12/31/14 | | | 27.7 | | | | 4.1 | | | | 6.6 | | | | 20.9 | | | | 37.8 | | | | 2.9 | |
1/01/15 to 12/31/15 | | | 21.8 | | | | 3.4 | | | | 8.3 | | | | 23.1 | | | | 40.8 | | | | 2.6 | |
See “About Fund Performance” on page 14 for descriptions of the indexes.
|
| Performance Summary for the Period Ended December 31, 2015 |
| | | | | | | | | | | | |
| | | 6-Month | | | Average Annual Total Returns | |
| | | Total Returns | | | 1 Year | | | Since Inception3 | |
Institutional | | | (2.24 | )% | | | (0.55 | )% | | | 5.86 | % |
Investor A | | | (2.37 | ) | | | (0.80 | ) | | | 5.60 | |
Class K | | | (2.21 | ) | | | (0.50 | ) | | | 5.88 | |
LifePath Index 2030 Fund Custom Benchmark | | | (2.27 | ) | | | (0.61 | ) | | | 5.99 | |
Barclays U.S. Aggregate Bond Index | | | 0.65 | | | | 0.55 | | | | 2.87 | |
Barclays U.S. TIPS Index (Series L) | | | (1.78 | ) | | | (1.44 | ) | | | 1.70 | |
FTSE EPRA/NAREIT Developed Real Estate Index | | | 2.49 | | | | (0.79 | ) | | | 5.95 | |
MSCI ACWI ex USA IMI Index | | | (8.78 | ) | | | (4.60 | ) | | | 0.28 | |
Russell 1000® Index | | | (0.78 | ) | | | 0.92 | | | | 11.69 | |
Russell 2000® Index | | | (8.75 | ) | | | (4.41 | ) | | | 8.07 | |
| | 3 | | The LifePath Index Fund commenced operations on May 31, 2011. |
| | | | Past performance is not indicative of future results. |
| | | | | | |
| | | | | | | |
| 8 | | BLACKROCK FUNDS III | | DECEMBER 31, 2015 | | |
| | | | |
| | | BlackRock LifePath Index 2035 Fund |
BlackRock LifePath® Index 2035 Fund’s (“LifePath Index 2035 Fund” or the “LifePath Index Fund”) investment objective is to seek to provide for retirement outcomes based on quantitatively measured risk. In pursuit of this objective, the LifePath Index Fund will be broadly diversified across global asset classes, with asset allocations becoming more conservative over time.
Effective March 31, 2015, the LifePath® Index 2035 Portfolio changed its name to the BlackRock LifePath® Index 2035 Fund.
|
| Total Return Based on a $10,000 Investment |
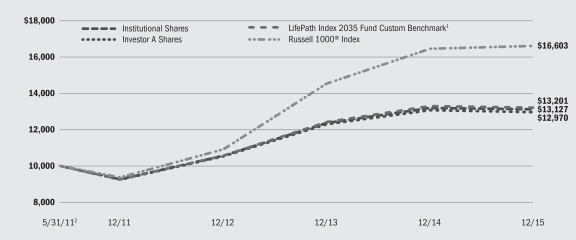
| | 1 | | The LifePath Index Fund compares its performance to that of a customized weighted index (the “LifePath Index 2035 Fund Custom Benchmark”), comprised of the indexes indicated below, which reflects the investment advisor’s changes to the benchmark’s weightings over time. The investment advisor adjusts the weightings of these indexes periodically based upon its evaluation and adjustment of the LifePath Index Fund’s asset allocation strategy. The weightings are presented annually but they are adjusted quarterly. |
| | 2 | | Commencement of operations. |
LifePath Index Fund’s custom benchmark consists of the following:
| | | | | | | | | | | | | | | | | | | | | | | | |
| Period3 | | Barclays
U.S. Aggregate
Bond Index | | | Barclays
U.S. Treasury
Inflation
Protected
Securities
(TIPS) Index
(Series L) | | | FTSE
EPRA/NAREIT
Developed
Real Estate
Index | | | MSCI
ACWI ex USA
IMI Index | | | Russell 1000®
Index | | | Russell 2000®
Index | |
5/31/11 to 12/31/11 | | | 18.2 | % | | | 2.4 | % | | | N/A | | | | 25.4 | % | | | 50.5 | % | | | 3.5 | % |
1/01/12 to 12/31/12 | | | 20.3 | | | | 2.6 | | | | 3.7 | % | | | 23.7 | | | | 46.7 | | | | 3.0 | |
1/01/13 to 12/31/13 | | | 22.1 | | | | 2.9 | | | | 7.5 | | | | 22.2 | | | | 42.7 | | | | 2.6 | |
1/01/14 to 12/31/14 | | | 21.6 | | | | 2.9 | | | | 8.1 | | | | 23.0 | | | | 41.8 | | | | 2.6 | |
1/01/15 to 12/31/15 | | | 13.2 | | | | 1.9 | | | | 10.6 | | | | 26.0 | | | | 46.0 | | | | 2.3 | |
See “About Fund Performance” on page 14 for descriptions of the indexes.
|
| Performance Summary for the Period Ended December 31, 2015 |
| | | | | | | | | | | | |
| | | 6-Month | | | Average Annual Total Returns | |
| | | Total Returns | | | 1 Year | | | Since Inception3 | |
Institutional | | | (2.45 | )% | | | (0.53 | )% | | | 6.11 | % |
Investor A | | | (2.50 | ) | | | (0.78 | ) | | | 5.83 | |
Class K | | | (2.43 | ) | | | (0.56 | ) | | | 6.12 | |
LifePath Index 2035 Fund Custom Benchmark | | | (2.52 | ) | | | (0.75 | ) | | | 6.24 | |
Barclays U.S. Aggregate Bond Index | | | 0.65 | | | | 0.55 | | | | 2.87 | |
Barclays U.S. TIPS Index (Series L) | | | (1.78 | ) | | | (1.44 | ) | | | 1.70 | |
FTSE EPRA/NAREIT Developed Real Estate Index | | | 2.49 | | | | (0.79 | ) | | | 5.95 | |
MSCI ACWI ex USA IMI Index | | | (8.78 | ) | | | (4.60 | ) | | | 0.28 | |
Russell 1000® Index | | | (0.78 | ) | | | 0.92 | | | | 11.69 | |
Russell 2000® Index | | | (8.75 | ) | | | (4.41 | ) | | | 8.07 | |
| | 3 | | The LifePath Index Fund commenced operations on May 31, 2011. |
| | | | Past performance is not indicative of future results. |
| | | | | | |
| | | | | | | |
| | BLACKROCK FUNDS III | | DECEMBER 31, 2015 | | 9 |
| | |
| | | BlackRock LifePath Index 2040 Fund |
BlackRock LifePath® Index 2040 Fund’s (“LifePath Index 2040 Fund” or the “LifePath Index Fund”) investment objective is to seek to provide for retirement outcomes based on quantitatively measured risk. In pursuit of this objective, the LifePath Index Fund will be broadly diversified across global asset classes, with asset allocations becoming more conservative over time.
Effective March 31, 2015, the LifePath® Index 2040 Portfolio changed its name to the BlackRock LifePath® Index 2040 Fund.
|
| Total Return Based on a $10,000 Investment |
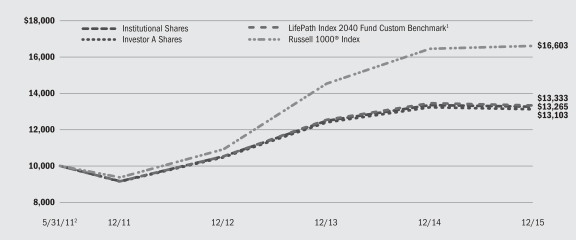
| | 1 | | The LifePath Index Fund compares its performance to that of a customized weighted index (the “LifePath Index 2040 Fund Custom Benchmark”), comprised of the indexes indicated below, which reflects the investment advisor’s changes to the benchmark’s weightings over time. The investment advisor adjusts the weightings of these indexes periodically based upon its evaluation and adjustment of the LifePath Index Fund’s asset allocation strategy. The weightings are presented annually but they are adjusted quarterly. |
| | 2 | | Commencement of operations. |
LifePath Index Fund’s custom benchmark consists of the following:
| | | | | | | | | | | | | | | | | | | | | | | | |
| Period3 | | Barclays
U.S. Aggregate
Bond Index | | | Barclays
U.S. Treasury
Inflation
Protected
Securities
(TIPS) Index
(Series L) | | | FTSE
EPRA/NAREIT
Developed
Real Estate
Index | | | MSCI
ACWI ex USA
IMI Index | | | Russell 1000®
Index | | | Russell 2000®
Index | |
5/31/11 to 12/31/11 | | | 13.1 | % | | | 1.3 | % | | | N/A | | | | 27.6 | % | | | 54.6 | % | | | 3.4 | % |
1/01/12 to 12/31/12 | | | 15.3 | | | | 1.6 | | | | 4.2 | % | | | 25.6 | | | | 50.5 | | | | 2.8 | |
1/01/13 to 12/31/13 | | | 17.1 | | | | 1.7 | | | | 8.7 | | | | 23.9 | | | | 46.2 | | | | 2.4 | |
1/01/14 to 12/31/14 | | | 16.3 | | | | 1.6 | | | | 9.5 | | | | 24.9 | | | | 45.3 | | | | 2.4 | |
1/01/15 to 12/31/15 | | | 5.6 | | | | 0.7 | | | | 12.9 | | | | 28.6 | | | | 50.1 | | | | 2.1 | |
See “About Fund Performance” on page 14 for descriptions of the indexes.
|
| Performance Summary for the Period Ended December 31, 2015 |
| | | | | | | | | | | | |
| | | 6-Month | | | Average Annual Total Returns | |
| | | Total Returns | | | 1 Year | | | Since Inception3 | |
Institutional | | | (2.64 | )% | | | (0.69 | )% | | | 6.35 | % |
Investor A | | | (2.77 | ) | | | (0.94 | ) | | | 6.07 | |
Class K | | | (2.61 | ) | | | (0.56 | ) | | | 6.39 | |
LifePath Index 2040 Fund Custom Benchmark | | | (2.76 | ) | | | (0.90 | ) | | | 6.47 | |
Barclays U.S. Aggregate Bond Index | | | 0.65 | | | | 0.55 | | | | 2.87 | |
Barclays U.S. TIPS Index (Series L) | | | (1.78 | ) | | | (1.44 | ) | | | 1.70 | |
FTSE EPRA/NAREIT Developed Real Estate Index | | | 2.49 | | | | (0.79 | ) | | | 5.95 | |
MSCI ACWI ex USA IMI Index | | | (8.78 | ) | | | (4.60 | ) | | | 0.28 | |
Russell 1000® Index | | | (0.78 | ) | | | 0.92 | | | | 11.69 | |
Russell 2000® Index | | | (8.75 | ) | | | (4.41 | ) | | | 8.07 | |
| | 3 | | The LifePath Index Fund commenced operations on May 31, 2011. |
| | | | Past performance is not indicative of future results. |
| | | | | | |
| | | | | | | |
| 10 | | BLACKROCK FUNDS III | | DECEMBER 31, 2015 | | |
| | | | |
| | | BlackRock LifePath Index 2045 Fund |
BlackRock LifePath® Index 2045 Fund’s (“LifePath Index 2045 Fund” or the “LifePath Index Fund”) investment objective is to seek to provide for retirement outcomes based on quantitatively measured risk. In pursuit of this objective, the LifePath Index Fund will be broadly diversified across global asset classes, with asset allocations becoming more conservative over time.
Effective March 31, 2015, the LifePath® Index 2045 Portfolio changed its name to the BlackRock LifePath® Index 2045 Fund.
|
| Total Return Based on a $10,000 Investment |
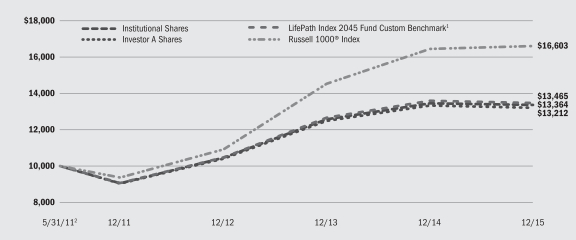
| | 1 | | The LifePath Index Fund compares its performance to that of a customized weighted index (the “LifePath Index 2045 Fund Custom Benchmark”), comprised of the indexes indicated below, which reflects the investment advisor’s changes to the benchmark’s weightings over time. The investment advisor adjusts the weightings of these indexes periodically based upon its evaluation and adjustment of the LifePath Index Fund’s asset allocation strategy. The weightings are presented annually but they are adjusted quarterly. |
| | 2 | | Commencement of operations. |
LifePath Index Fund’s custom benchmark consists of the following:
| | | | | | | | | | | | | | | | | | | | | | | | |
| Period3 | | Barclays
U.S. Aggregate
Bond Index | | | Barclays
U.S. Treasury
Inflation
Protected
Securities
(TIPS) Index
(Series L) | | | FTSE
EPRA/NAREIT
Developed
Real Estate
Index | | | MSCI
ACWI ex USA
IMI Index | | | Russell 1000®
Index | | | Russell 2000®
Index | |
5/31/11 to 12/31/11 | | | 8.7 | % | | | N/A | | | | N/A | | | | 29.6 | % | | | 58.3 | % | | | 3.4 | % |
1/01/12 to 12/31/12 | | | 11.2 | | | | N/A | | | | 4.8 | % | | | 27.4 | | | | 54.0 | | | | 2.6 | |
1/01/13 to 12/31/13 | | | 13.2 | | | | N/A | | | | 9.8 | | | | 25.4 | | | | 49.5 | | | | 2.1 | |
1/01/14 to 12/31/14 | | | 12.6 | | | | N/A | | | | 10.7 | | | | 26.4 | | | | 48.1 | | | | 2.2 | |
1/01/15 to 12/31/15 | | | 1.8 | | | | 0.2 | % | | | 14.2 | | | | 30.0 | | | | 51.7 | | | | 2.1 | |
See “About Fund Performance” on page 14 for descriptions of the indexes.
|
| Performance Summary for the Period Ended December 31, 2015 |
| | | | | | | | | | | | |
| | | 6-Month | | | Average Annual Total Returns | |
| | | Total Returns | | | 1 Year | | | Since Inception3 | |
Institutional | | | (2.70 | )% | | | (0.70 | )% | | | 6.52 | % |
Investor A | | | (2.91 | ) | | | (0.94 | ) | | | 6.26 | |
Class K | | | (2.68 | ) | | | (0.64 | ) | | | 6.58 | |
LifePath Index 2045 Fund Custom Benchmark | | | (2.90 | ) | | | (1.00 | ) | | | 6.70 | |
Barclays U.S. Aggregate Bond Index | | | 0.65 | | | | 0.55 | | | | 2.87 | |
Barclays U.S. TIPS Index (Series L) | | | (1.78 | ) | | | (1.44 | ) | | | 1.70 | |
FTSE EPRA/NAREIT Developed Real Estate Index | | | 2.49 | | | | (0.79 | ) | | | 5.95 | |
MSCI ACWI ex USA IMI Index | | | (8.78 | ) | | | (4.60 | ) | | | 0.28 | |
Russell 1000® Index | | | (0.78 | ) | | | 0.92 | | | | 11.69 | |
Russell 2000® Index | | | (8.75 | ) | | | (4.41 | ) | | | 8.07 | |
| | 3 | | The LifePath Index Fund commenced operations on May 31, 2011. |
| | | | Past performance is not indicative of future results. |
| | | | | | |
| | | | | | | |
| | BLACKROCK FUNDS III | | DECEMBER 31, 2015 | | 11 |
| | |
| | | BlackRock LifePath Index 2050 Fund |
BlackRock LifePath® Index 2050 Fund’s (“LifePath Index 2050 Fund” or the “LifePath Index Fund”) investment objective is to seek to provide for retirement outcomes based on quantitatively measured risk. In pursuit of this objective, the LifePath Index Fund will be broadly diversified across global asset classes, with asset allocations becoming more conservative over time.
Effective March 31, 2015, the LifePath® Index 2050 Portfolio changed its name to the BlackRock LifePath® Index 2050 Fund.
|
| Total Return Based on a $10,000 Investment |
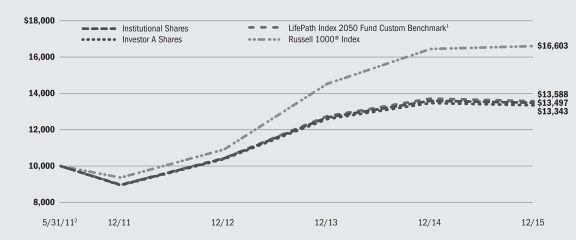
| | 1 | | The LifePath Index Fund compares its performance to that of a customized weighted index (the “LifePath Index 2050 Fund Custom Benchmark”), comprised of the indexes indicated below, which reflects the investment advisor’s changes to the benchmark’s weightings over time. The investment advisor adjusts the weightings of these indexes periodically based upon its evaluation and adjustment of the LifePath Index Fund’s asset allocation strategy. The weightings are presented annually but they are adjusted quarterly. |
| | 2 | | Commencement of operations. |
LifePath Index Fund’s custom benchmark consists of the following:
| | | | | | | | | | | | | | | | | | | | |
| Period3 | | Barclays
U.S. Aggregate
Bond Index | | | FTSE
EPRA/NAREIT
Developed
Real Estate
Index | | | MSCI
ACWI ex USA
IMI Index | | | Russell 1000®
Index | | | Russell 2000®
Index | |
5/31/11 to 12/31/11 | | | 3.3 | % | | | N/A | | | | 31.6 | % | | | 61.7 | % | | | 3.4 | % |
1/01/12 to 12/31/12 | | | 5.8 | | | | 5.3 | % | | | 29.2 | | | | 57.1 | | | | 2.6 | |
1/01/13 to 12/31/13 | | | 7.9 | | | | 10.8 | | | | 26.9 | | | | 52.5 | | | | 1.9 | |
1/01/14 to 12/31/14 | | | 8.3 | | | | 11.7 | | | | 27.7 | | | | 50.4 | | | | 1.9 | |
1/01/15 to 12/31/15 | | | 1.0 | | | | 14.5 | | | | 30.3 | | | | 52.1 | | | | 2.1 | |
See “About Fund Performance” on page 14 for descriptions of the indexes.
|
| Performance Summary for the Period Ended December 31, 2015 |
| | | | | | | | | | | | |
| | | 6-Month | | | Average Annual Total Returns | |
| | | Total Returns | | | 1 Year | | | Since Inception3 | |
Institutional | | | (2.78 | )% | | | (0.72 | )% | | | 6.76 | % |
Investor A | | | (2.91 | ) | | | (0.96 | ) | | | 6.49 | |
Class K | | | (2.75 | ) | | | (0.67 | ) | | | 6.80 | |
LifePath Index 2050 Fund Custom Benchmark | | | (2.93 | ) | | | (1.02 | ) | | | 6.91 | |
Barclays U.S. Aggregate Bond Index | | | 0.65 | | | | 0.55 | | | | 2.87 | |
FTSE EPRA/NAREIT Developed Real Estate Index | | | 2.49 | | | | (0.79 | ) | | | 5.95 | |
MSCI ACWI ex USA IMI Index | | | (8.78 | ) | | | (4.60 | ) | | | 0.28 | |
Russell 1000® Index | | | (0.78 | ) | | | 0.92 | | | | 11.69 | |
Russell 2000® Index | | | (8.75 | ) | | | (4.41 | ) | | | 8.07 | |
| | 3 | | The LifePath Index Fund commenced operations on May 31, 2011. |
| | | | Past performance is not indicative of future results. |
| | | | | | |
| | | | | | | |
| 12 | | BLACKROCK FUNDS III | | DECEMBER 31, 2015 | | |
| | | | |
| | | BlackRock LifePath Index 2055 Fund |
BlackRock LifePath® Index 2055 Fund’s (“LifePath Index 2055 Fund” or the “LifePath Index Fund”) investment objective is to seek to provide for retirement outcomes based on quantitatively measured risk. In pursuit of this objective, the LifePath Index Fund will be broadly diversified across global asset classes, with asset allocations becoming more conservative over time.
Effective March 31, 2015, the LifePath® Index 2055 Portfolio changed its name to the BlackRock LifePath® Index 2055 Fund.
|
| Total Return Based on a $10,000 Investment |
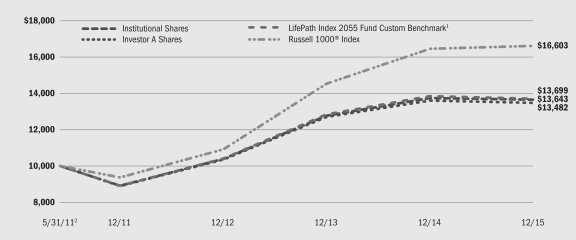
| | 1 | | The LifePath Index Fund compares its performance to that of a customized weighted index (the “LifePath Index 2055 Fund Custom Benchmark”), comprised of the indexes indicated below, which reflects the investment advisor’s changes to the benchmark’s weightings over time. The investment advisor adjusts the weightings of these indexes periodically based upon its evaluation and adjustment of the LifePath Index Fund’s asset allocation strategy. The weightings are presented annually but they are adjusted quarterly. |
| | 2 | | Commencement of operations. |
LifePath Index Fund’s custom benchmark consists of the following:
| | | | | | | | | | | | | | | | | | | | |
| Period3 | | Barclays
U.S. Aggregate
Bond Index | | | FTSE
EPRA/NAREIT
Developed
Real Estate
Index | | | MSCI
ACWI ex USA
IMI Index | | | Russell 1000®
Index | | | Russell 2000®
Index | |
5/31/11 to 12/31/11 | | | 1.0 | % | | | N/A | | | | 33.2 | % | | | 59.8 | % | | | 6.0 | % |
1/01/12 to 12/31/12 | | | 1.1 | | | | 5.9 | % | | | 31.4 | | | | 57.4 | | | | 4.2 | |
1/01/13 to 12/31/13 | | | 2.7 | | | | 12.2 | | | | 28.4 | | | | 54.8 | | | | 1.9 | |
1/01/14 to 12/31/14 | | | 4.2 | | | | 12.8 | | | | 29.0 | | | | 52.1 | | | | 1.9 | |
1/01/15 to 12/31/15 | | | 1.0 | | | | 14.5 | | | | 30.3 | | | | 52.1 | | | | 2.1 | |
See “About Fund Performance” on page 14 for descriptions of the indexes.
|
| Performance Summary for the Period Ended December 31, 2015 |
| | | | | | | | | | | | |
| | | 6-Month | | | Average Annual Total Returns | |
| | | Total Returns | | | 1 Year | | | Since Inception3 | |
Institutional | | | (2.72 | )% | | | (0.64 | )% | | | 7.00 | % |
Investor A | | | (2.85 | ) | | | (0.88 | ) | | | 6.73 | |
Class K | | | (2.69 | ) | | | (0.60 | ) | | | 7.04 | |
LifePath Index 2055 Fund Custom Benchmark | | | (2.93 | ) | | | (1.02 | ) | | | 7.10 | |
Barclays U.S. Aggregate Bond Index | | | 0.65 | | | | 0.55 | | | | 2.87 | |
FTSE EPRA/NAREIT Developed Real Estate Index | | | 2.49 | | | | (0.79 | ) | | | 5.95 | |
MSCI ACWI ex USA IMI Index | | | (8.78 | ) | | | (4.60 | ) | | | 0.28 | |
Russell 1000® Index | | | (0.78 | ) | | | 0.92 | | | | 11.69 | |
Russell 2000® Index | | | (8.75 | ) | | | (4.41 | ) | | | 8.07 | |
| | 3 | | The LifePath Index Fund commenced operations on May 31, 2011. |
| | | | Past performance is not indicative of future results. |
| | | | | | |
| | | | | | | |
| | BLACKROCK FUNDS III | | DECEMBER 31, 2015 | | 13 |
| • | | Institutional Shares are not subject to any sales charge. These shares bear no ongoing distribution or service fees and are available only to certain eligible investors. |
| • | | Investor A Shares are not subject to any sales charge and bear no ongoing distribution fee. These shares are subject to an ongoing service fee of 0.25% per year. These shares are generally available through financial intermediaries. |
| • | | Class K Shares are not subject to any sales charge. These shares bear no ongoing distribution or service fees and are available only to certain eligible investors. |
Performance information reflects past performance and does not guarantee future results. Current performance may be lower or higher than the performance data quoted. Refer to www.blackrock.com/funds to obtain performance data current to the most recent month end. Performance results do not reflect the deduction of taxes that a shareholder would pay on LifePath Index Fund distributions or the redemption of LifePath Index Fund shares. Figures shown in the performance tables on the previous pages assume reinvestment of all distributions, if any, at net asset value (“NAV”) on the ex-dividend date. Investment return and principal value of shares will fluctuate so that shares, when redeemed, may be worth more or less than their original cost. Distributions paid to each class of shares will vary because of the different levels of administration and service fees applicable to each class, which are deducted from the income available to be paid to shareholders.
BlackRock Advisors, LLC (“BAL” or the “Administrator”), each LifePath Index Funds’ administrator, waived and/or reimbursed a portion of each LifePath Index Fund’s expenses. Without such waiver and/or reimbursement, each LifePath Index Fund’s performance would have been lower. The Administrator is under no obligation to continue waiving and/or reimbursing its fees after the applicable termination date of such agreement. See Note 4 of the Notes to Financial Statements for additional information on waivers and/or reimbursements.
The LifePath Index Funds’ custom benchmarks are hypothetical representations of the performance of the respective LifePath Index Fund’s asset classes according to their weightings as of the most recent quarter-end. The weightings of the various indexes that are included in the LifePath Index Funds’ custom benchmarks are adjusted quarterly to reflect the LifePath Index Fund’s changing asset allocations over time. As of December 31, 2015, the following indexes are used to calculate the LifePath Index Funds’ custom benchmarks: Barclays U.S. Aggregate Bond Index, Barclays U.S. TIPS Index (Series L), FTSE EPRA/NAREIT Developed Real Estate Index, MSCI ACWI ex USA IMI Index, Russell 1000® Index and Russell 2000® Index, as applicable.
The Barclays U.S. Aggregate Bond Index is a widely recognized unmanaged market-weighted index comprised of investment-grade corporate bonds rated BBB or better, mortgages and U.S. Treasury and U.S. Government agency issues with at least one year to maturity. The Barclays U.S. TIPS Index (Series L) is a market value-weighted index that tracks inflation-protected securities issued by the U.S. Treasury. The FTSE EPRA/NAREIT Developed Real Estate Index a global market capitalization weighted index composed of listed real estate securities from developed market countries in North America, Europe, and Asia. The MSCI ACWI ex USA IMI Index is a free float-adjusted market capitalization weighted index that measures the equity market performance of the developed (excluding the U.S.) and emerging investable market universe. The Russell 1000® Index is an index that measures the performance of the large cap segment of the U.S. equity universe. It is a subset of the Russell 3000® Index and includes approximately 1,000 of the largest securities based on a combination of their market capitalization and current index membership. The Index represents approximately 92% of the total market capitalization of the Russell 3000® Index. The Russell 2000® Index is an unmanaged index that is a subset of the Russell 3000® Index representing approximately 10% of the total market capitalization of that Index. It includes approximately 2000 of the smallest securities based on a combination of their market cap and current index membership.
| | | | | | |
| | | | | | | |
| 14 | | BLACKROCK FUNDS III | | DECEMBER 31, 2015 | | |
Shareholders of each LifePath Index Fund may incur the following charges: (a) transactional expenses, such as sales charges; and (b) operating expenses, including administration fees, service and distribution fees, including 12b-1 fees, and other fund expenses. The expense examples shown below (which are based on a hypothetical investment of $1,000 invested on July 1, 2015 and held through December 31, 2015) are intended to assist shareholders both in calculating expenses based on an investment in a LifePath Index Fund and in comparing these expenses with similar costs of investing in other mutual funds.
The expense examples provide information about actual account values and actual expenses. In order to estimate the expenses a shareholder paid during the period covered by this report, shareholders can divide their account value by $1,000 and then multiply the result by the number corresponding to their LifePath Index Fund and their share class under the heading entitled “Expenses Paid During the Period.”
The expense examples also provide information about hypothetical account values and hypothetical expenses based on each LifePath Index Fund’s actual expense ratio and an assumed rate of return of 5% per year before expenses. In order to assist shareholders in comparing the ongoing expenses of investing in a LifePath Index Fund and other funds, compare the 5% hypothetical examples with the 5% hypothetical examples that appear in shareholder reports of other funds.
The expenses shown in the expense examples are intended to highlight shareholders’ ongoing costs only and do not reflect any transactional expenses, such as sales charges, if any. Therefore, the hypothetical examples are useful in comparing ongoing expenses only, and will not help shareholders determine the relative total expenses of owning different funds. If these transactional expenses were included, shareholder expenses would have been higher.
| | | | | | | | | | | | | | | | | | | | | | | | | | | | |
| | | Actual | | | Hypothetical2 | | | | |
| | | Beginning
Account Value
July 1, 2015 | | | Ending
Account Value
December 31, 2015 | | | Expenses Paid
During the Period1 | | | Beginning
Account Value
July 1, 2015 | | | Ending
Account Value
December 31, 2015 | | | Expenses Paid
During the Period1 | | | Annualized
Expense
Ratio | |
| LifePath Index Retirement Fund | | | | | | | | | | | | | | | | | | | |
Institutional | | | $1,000.00 | | | | $984.80 | | | | $0.65 | | | | $1,000.00 | | | | $1,024.55 | | | | $0.66 | | | | 0.13% | |
Investor A | | | $1,000.00 | | | | $983.50 | | | | $1.90 | | | | $1,000.00 | | | | $1,023.29 | | | | $1.94 | | | | 0.38% | |
Class K | | | $1,000.00 | | | | $985.10 | | | | $0.40 | | | | $1,000.00 | | | | $1,024.80 | | | | $0.41 | | | | 0.08% | |
| LifePath Index 2020 Fund | | | | | | | | | | | | | | | | | | | | | |
Institutional | | | $1,000.00 | | | | $982.20 | | | | $0.65 | | | | $1,000.00 | | | | $1,024.55 | | | | $0.66 | | | | 0.13% | |
Investor A | | | $1,000.00 | | | | $980.80 | | | | $1.90 | | | | $1,000.00 | | | | $1,023.29 | | | | $1.94 | | | | 0.38% | |
Class K | | | $1,000.00 | | | | $981.50 | | | | $0.40 | | | | $1,000.00 | | | | $1,024.80 | | | | $0.41 | | | | 0.08% | |
| LifePath Index 2025 Fund | | | | | | | | | | | | | | | | | | | | | |
Institutional | | | $1,000.00 | | | | $980.00 | | | | $0.65 | | | | $1,000.00 | | | | $1,024.55 | | | | $0.66 | | | | 0.13% | |
Investor A | | | $1,000.00 | | | | $978.70 | | | | $1.90 | | | | $1,000.00 | | | | $1,023.29 | | | | $1.94 | | | | 0.38% | |
Class K | | | $1,000.00 | | | | $980.20 | | | | $0.40 | | | | $1,000.00 | | | | $1,024.80 | | | | $0.41 | | | | 0.08% | |
| LifePath Index 2030 Fund | | | | | | | | | | | | | | | | | | | | | |
Institutional | | | $1,000.00 | | | | $977.60 | | | | $0.65 | | | | $1,000.00 | | | | $1,024.55 | | | | $0.66 | | | | 0.13% | |
Investor A | | | $1,000.00 | | | | $976.30 | | | | $1.89 | | | | $1,000.00 | | | | $1,023.29 | | | | $1.94 | | | | 0.38% | |
Class K | | | $1,000.00 | | | | $977.90 | | | | $0.40 | | | | $1,000.00 | | | | $1,024.80 | | | | $0.41 | | | | 0.08% | |
| LifePath Index 2035 Fund | | | | | | | | | | | | | | | | | | | | | |
Institutional | | | $1,000.00 | | | | $975.50 | | | | $0.60 | | | | $1,000.00 | | | | $1,024.60 | | | | $0.61 | | | | 0.12% | |
Investor A | | | $1,000.00 | | | | $975.00 | | | | $1.84 | | | | $1,000.00 | | | | $1,023.34 | | | | $1.89 | | | | 0.37% | |
Class K | | | $1,000.00 | | | | $975.70 | | | | $0.35 | | | | $1,000.00 | | | | $1,024.85 | | | | $0.36 | | | | 0.07% | |
| LifePath Index 2040 Fund | | | | | | | | | | | | | | | | | | | | | |
Institutional | | | $1,000.00 | | | | $973.60 | | | | $0.60 | | | | $1,000.00 | | | | $1,024.60 | | | | $0.61 | | | | 0.12% | |
Investor A | | | $1,000.00 | | | | $972.30 | | | | $1.84 | | | | $1,000.00 | | | | $1,023.34 | | | | $1.89 | | | | 0.37% | |
Class K | | | $1,000.00 | | | | $973.90 | | | | $0.35 | | | | $1,000.00 | | | | $1,024.85 | | | | $0.36 | | | | 0.07% | |
| LifePath Index 2045 Fund | | | | | | | | | | | | | | | | | | | | | |
Institutional | | | $1,000.00 | | | | $973.00 | | | | $0.55 | | | | $1,000.00 | | | | $1,024.65 | | | | $0.56 | | | | 0.11% | |
Investor A | | | $1,000.00 | | | | $970.90 | | | | $1.79 | | | | $1,000.00 | | | | $1,023.39 | | | | $1.84 | | | | 0.36% | |
Class K | | | $1,000.00 | | | | $973.20 | | | | $0.30 | | | | $1,000.00 | | | | $1,024.90 | | | | $0.31 | | | | 0.06% | |
| LifePath Index 2050 Fund | | | | | | | | | | | | | | | | | | | | | |
Institutional | | | $1,000.00 | | | | $972.20 | | | | $0.55 | | | | $1,000.00 | | | | $1,024.65 | | | | $0.56 | | | | 0.11% | |
Investor A | | | $1,000.00 | | | | $970.90 | | | | $1.79 | | | | $1,000.00 | | | | $1,023.39 | | | | $1.84 | | | | 0.36% | |
Class K | | | $1,000.00 | | | | $972.50 | | | | $0.30 | | | | $1,000.00 | | | | $1,024.90 | | | | $0.31 | | | | 0.06% | |
| LifePath Index 2055 Fund | | | | | | | | | | | | | | | | | | | | | |
Institutional | | | $1,000.00 | | | | $972.80 | | | | $0.50 | | | | $1,000.00 | | | | $1,024.70 | | | | $0.51 | | | | 0.10% | |
Investor A | | | $1,000.00 | | | | $971.50 | | | | $1.74 | | | | $1,000.00 | | | | $1,023.44 | | | | $1.79 | | | | 0.35% | |
Class K | | | $1,000.00 | | | | $973.10 | | | | $0.25 | | | | $1,000.00 | | | | $1,024.95 | | | | $0.26 | | | | 0.05% | |
| | 1 | | For each class of the LifePath Index Fund, expenses are equal to the annualized expense ratio for the class, multiplied by the average account value over the period, multiplied by 184/365 (to reflect the one-half year period shown). Because each LifePath Index Fund invests all its assets in a LifePath Index Master Portfolio, the expense examples reflect the net expenses of both the LifePath Index Fund and the LifePath Index Master Portfolio in which it invests. |
| | 2 | | Hypothetical 5% annual return before expenses is calculated by prorating the number of days in the most recent fiscal half year divided by 365. |
| | | | | | |
| | | | | | | |
| | BLACKROCK FUNDS III | | DECEMBER 31, 2015 | | 15 |
| | |
| Statements of Assets and Liabilities | | |
| | | | | | | | | | | | | | | | | | | | |
| December 31, 2015 | | BlackRock LifePath Index Retirement Fund | | | BlackRock LifePath Index
2020 Fund | | | BlackRock LifePath Index
2025 Fund | | | BlackRock LifePath Index
2030 Fund | | | BlackRock LifePath Index 2035 Fund | |
| | | | | | | | | | | | | | | | | | | | |
| Assets | | | | | | | | | | | | | | | | | | | | |
Investments at value — from the applicable LifePath Index Master Portfolio1 | | $ | 499,736,681 | | | $ | 1,075,144,145 | | | $ | 776,522,512 | | | $ | 1,076,668,469 | | | $ | 609,558,710 | |
| Receivables: | | | | | | | | | | | | | | | | | | | | |
Withdrawals from the LifePath Index Master Portfolio | | | 5,769,816 | | | | 18,882,108 | | | | 290,749 | | | | 23,026,318 | | | | 2,511,011 | |
Capital shares sold | | | 562,143 | | | | 1,754,207 | | | | 846,750 | | | | 2,137,557 | | | | 919,581 | |
From the administrator | | | 35,212 | | | | 50,937 | | | | 50,185 | | | | 55,979 | | | | 45,659 | |
Prepaid expenses | | | 21,641 | | | | 24,524 | | | | 21,263 | | | | 25,077 | | | | 21,091 | |
| | | | |
Total assets | | | 506,125,493 | | | | 1,095,855,921 | | | | 777,731,459 | | | | 1,101,913,400 | | | | 613,056,052 | |
| | | | |
| | | | | | | | | | | | | | | | | | | | |
| Liabilities | | | | | | | | | | | | | | | | | | | | |
| Payables: | | | | | | | | | | | | | | | | | | | | |
Capital shares redeemed | | | 6,331,959 | | | | 20,636,315 | | | | 1,137,499 | | | | 25,163,875 | | | | 3,430,592 | |
Professional fees | | | 15,567 | | | | 13,009 | | | | 14,381 | | | | 13,265 | | | | 14,842 | |
Service fees | | | 14,290 | | | | 27,289 | | | | 22,111 | | | | 29,705 | | | | 20,360 | |
Transfer agent fees | | | 12,476 | | | | 18,789 | | | | 11,506 | | | | 17,023 | | | | 8,398 | |
Registration fees | | | 8,712 | | | | 25,305 | | | | 27,361 | | | | 31,796 | | | | 21,863 | |
Printing fees | | | 4,152 | | | | 3,714 | | | | 3,706 | | | | 3,717 | | | | 3,704 | |
Trustees’ fees | | | 313 | | | | 643 | | | | 367 | | | | 570 | | | | 287 | |
Other accrued expenses | | | 971 | | | | 728 | | | | 787 | | | | 743 | | | | 821 | |
| | | | |
Total liabilities | | | 6,388,440 | �� | | | 20,725,792 | | | | 1,217,718 | | | | 25,260,694 | | | | 3,500,867 | |
| | | | |
Net Assets | | $ | 499,737,053 | | | $ | 1,075,130,129 | | | $ | 776,513,741 | | | $ | 1,076,652,706 | | | $ | 609,555,185 | |
| | | | |
| | | | | | | | | | | | | | | | | | | | |
| Net Assets Consist of | | | | | | | | | | | | | | | | | | | | |
Paid-in capital | | $ | 485,771,364 | | | $ | 1,041,117,686 | | | $ | 764,035,444 | | | $ | 1,042,132,619 | | | $ | 598,821,370 | |
Distributions in excess of net investment income | | | (963,864 | ) | | | (1,725,582 | ) | | | (924,419 | ) | | | (1,415,570 | ) | | | (574,845 | ) |
Accumulated net realized gain allocated from the applicable LifePath Index Master Portfolio | | | 19,990,756 | | | | 46,749,415 | | | | 24,379,987 | | | | 50,126,618 | | | | 21,839,664 | |
Net unrealized appreciation (depreciation) allocated from the applicable LifePath Index Master Portfolio | | | (5,061,203 | ) | | | (11,011,390 | ) | | | (10,977,271 | ) | | | (14,190,961 | ) | | | (10,531,004 | ) |
| | | | |
Net Assets | | $ | 499,737,053 | | | $ | 1,075,130,129 | | | $ | 776,513,741 | | | $ | 1,076,652,706 | | | $ | 609,555,185 | |
| | | | |
| | | | | | | | | | | | | | | | | | | | |
| Net Asset Value | | | | | | | | | | | | | | | | | | | | |
| Institutional: | | | | | | | | | | | | | | | | | | | | |
Net assets | | $ | 68,492,468 | | | $ | 89,772,864 | | | $ | 73,993,458 | | | $ | 88,245,876 | | | $ | 57,252,457 | |
| | | | |
Shares outstanding2 | | | 6,241,979 | | | | 8,017,998 | | | | 6,496,155 | | | | 7,706,504 | | | | 4,944,298 | |
| | | | |
Net asset value | | $ | 10.97 | | | $ | 11.20 | | | $ | 11.39 | | | $ | 11.45 | | | $ | 11.58 | |
| | | | |
| Investor A: | | | | | | | | | | | | | | | | | | | | |
Net assets | | $ | 61,885,685 | | | $ | 109,566,384 | | | $ | 104,993,155 | | | $ | 117,745,350 | | | $ | 94,830,288 | |
| | | | |
Shares outstanding2 | | | 5,643,917 | | | | 9,800,266 | | | | 9,225,998 | | | | 10,287,237 | | | | 8,205,602 | |
| | | | |
Net asset value | | $ | 10.97 | | | $ | 11.18 | | | $ | 11.38 | | | $ | 11.45 | | | $ | 11.56 | |
| | | | |
| Class K: | | | | | | | | | | | | | | | | | | | | |
Net assets | | $ | 369,358,900 | | | $ | 875,790,881 | | | $ | 597,527,128 | | | $ | 870,661,480 | | | $ | 457,472,440 | |
| | | | |
Shares outstanding2 | | | 33,676,633 | | | | 78,232,488 | | | | 52,441,957 | | | | 76,110,371 | | | | 39,541,133 | |
| | | | |
Net asset value | | $ | 10.97 | | | $ | 11.19 | | | $ | 11.39 | | | $ | 11.44 | | | $ | 11.57 | |
| | | | |
1 Investments at cost — from the applicable LifePath Index Master Portfolio | | $ | 504,797,884 | | | $ | 1,086,155,535 | | | $ | 787,499,783 | | | $ | 1,090,859,430 | | | $ | 620,089,714 | |
2 No par value, unlimited number of shares authorized. | |
| | | | | | |
| See Notes to Financial Statements. | | | | |
| | | | | | | |
| 16 | | BLACKROCK FUNDS III | | DECEMBER 31, 2015 | | |
| | |
| Statements of Assets and Liabilities | | |
| | | | | | | | | | | | | | | | |
| December 31, 2015 | | BlackRock
LifePath Index
2040 Fund | | | BlackRock
LifePath Index
2045 Fund | | | BlackRock
LifePath Index
2050 Fund | | | BlackRock
LifePath Index
2055 Fund | |
| | | | | | | | | | | | | | | | |
| Assets | | | | | | | | | | | | | | | | |
Investments at value — from the applicable LifePath Index Master Portfolio1 | | $ | 751,292,270 | | | $ | 341,216,673 | | | $ | 337,050,881 | | | $ | 106,990,415 | |
| Receivables: | | | | | | | | | | | | | | | | |
Withdrawals from the LifePath Index Master Portfolio | | | 17,003,924 | | | | 3,801,861 | | | | 7,830,751 | | | | 1,849,436 | |
Capital shares sold | | | 2,756,023 | | | | 1,196,979 | | | | 934,047 | | | | 487,508 | |
From the administrator | | | 49,757 | | | | 31,993 | | | | 35,177 | | | | 30,287 | |
Prepaid expenses | | | 23,093 | | | | 19,193 | | | | 20,949 | | | | 18,626 | |
| | | | |
Total assets | | | 771,125,067 | | | | 346,266,699 | | | | 345,871,805 | | | | 109,376,272 | |
| | | | |
| | | | | | | | | | | | | | | | |
| Liabilities | | | | | | | | | | | | | | | | |
Payables: | | | | | | | | | | | | | | | | |
Capital shares redeemed | | | 19,759,947 | | | | 4,998,840 | | | | 8,764,798 | | | | 2,336,944 | |
Registration fees | | | 24,210 | | | | 12,097 | | | | 12,139 | | | | 4,834 | |
Service fees | | | 18,067 | | | | 9,446 | | | | 6,902 | | | | 3,030 | |
Professional fees | | | 14,412 | | | | 15,625 | | | | 15,718 | | | | 16,478 | |
Transfer agent fees | | | 9,519 | | | | — | | | | — | | | | — | |
Printing fees | | | 3,723 | | | | 3,700 | | | | 3,701 | | | | 3,710 | |
Trustees’ fees | | | 383 | | | | 34 | | | | 153 | | | | 2 | |
Other accrued expenses | | | 787 | | | | 934 | | | | 935 | | | | 955 | |
| | | | |
Total liabilities | | | 19,831,048 | | | | 5,040,676 | | | | 8,804,346 | | | | 2,365,953 | |
| | | | |
Net Assets | | $ | 751,294,019 | | | $ | 341,226,023 | | | $ | 337,067,459 | | | $ | 107,010,319 | |
| | | | |
| | | | | | | | | | | | | | | | |
| Net Assets Consist of | | | | | | | | | | | | | | | | |
Paid-in capital | | $ | 730,538,602 | | | $ | 336,693,717 | | | $ | 332,897,642 | | | $ | 106,846,332 | |
Distributions in excess of net investment income | | | (741,196 | ) | | | (268,192 | ) | | | (260,190 | ) | | | (66,588 | ) |
Accumulated net realized gain allocated from the applicable LifePath Index Master Portfolio | | | 34,850,552 | | | | 12,269,201 | | | | 12,572,126 | | | | 2,243,575 | |
Net unrealized appreciation (depreciation) allocated from the applicable LifePath Index Master Portfolio | | | (13,353,939 | ) | | | (7,468,703 | ) | | | (8,142,119 | ) | | | (2,013,000 | ) |
| | | | |
Net Assets | | $ | 751,294,019 | | | $ | 341,226,023 | | | $ | 337,067,459 | | | $ | 107,010,319 | |
| | | | |
| | | | | | | | | | | | | | | | |
| Net Asset Value | | | | | | | | | | | | | | | | |
| Institutional: | | | | | | | | | | | | | | | | |
Net assets | | $ | 66,512,220 | | | $ | 45,227,968 | | | $ | 38,476,330 | | | $ | 19,214,210 | |
| | | | |
Shares outstanding2 | | | 5,708,492 | | | | 3,832,344 | | | | 3,218,906 | | | | 1,579,069 | |
| | | | |
Net asset value | | $ | 11.65 | | | $ | 11.80 | | | $ | 11.95 | | | $ | 12.17 | |
| | | | |
| Investor A: | | | | | | | | | | | | | | | | |
Net assets | | $ | 69,659,513 | | | $ | 43,155,476 | | | $ | 27,412,902 | | | $ | 13,139,870 | |
| | | | |
Shares outstanding2 | | | 5,986,896 | | | | 3,662,325 | | | | 2,297,090 | | | | 1,081,405 | |
| | | | |
Net asset value | | $ | 11.64 | | | $ | 11.78 | | | $ | 11.93 | | | $ | 12.15 | |
| | | | |
| Class K: | | | | | | | | | | | | | | | | |
Net assets | | $ | 615,122,286 | | | $ | 252,842,579 | | | $ | 271,178,227 | | | $ | 74,656,239 | |
| | | | |
Shares outstanding2 | | | 52,805,005 | | | | 21,410,659 | | | | 22,687,829 | | | | 6,135,364 | |
| | | | |
Net asset value | | $ | 11.65 | | | $ | 11.81 | | | $ | 11.95 | | | $ | 12.17 | |
| | | | |
1 Investments at cost — from the applicable LifePath Index Master Portfolio | | $ | 764,646,209 | | | $ | 348,685,376 | | | $ | 345,193,000 | | | $ | 109,003,415 | |
2 No par value, unlimited number of shares authorized. | | | | | | | | | | | | | |
| | | | | | |
| See Notes to Financial Statements. | | | | |
| | | | | | | |
| | BLACKROCK FUNDS III | | DECEMBER 31, 2015 | | 17 |
| | | | | | | | | | | | | | | | | | | | |
| Year Ended December 31, 2015 | | BlackRock
LifePath Index
Retirement
Fund | | | BlackRock
LifePath Index
2020
Fund | | | BlackRock
LifePath Index
2025
Fund | | | BlackRock
LifePath Index
2030
Fund | | | BlackRock
LifePath Index
2035
Fund | |
| | | | | | | | | | | | | | | | | | | | |
| Investment Income | | | | | | | | | | | | | | | | | | | | |
| Net investment income allocated from the LifePath Index Master Portfolio: | | | | | | | | | | | | | | | | | | | | |
Dividends — affiliated | | $ | 4,379,943 | | | $ | 12,645,302 | | | $ | 9,949,412 | | | $ | 17,752,397 | | | $ | 10,501,937 | |
Interest — affiliated | | | 4,918,156 | | | | 8,403,804 | | | | 4,136,616 | | | | 4,502,667 | | | | 1,456,846 | |
Securities lending — affiliated — net | | | 8,904 | | | | 9,125 | | | | 12,961 | | | | 8,095 | | | | 5,241 | |
Income — affiliated | | | 2,057 | | | | 4,315 | | | | 3,785 | | | | 5,295 | | | | 3,249 | |
Expenses | | | (541,624 | ) | | | (1,104,718 | ) | | | (671,744 | ) | | | (1,033,206 | ) | | | (534,650 | ) |
Fees waived | | | 109,117 | | | | 169,481 | | | | 92,114 | | | | 133,691 | | | | 117,053 | |
| | | | |
Total income | | | 8,876,553 | | | | 20,127,309 | | | | 13,523,144 | | | | 21,368,939 | | | | 11,549,676 | |
| | | | |
| | | | | | | | | | | | | | | | | | | | |
| Fund Expenses | | | | | | | | | | | | | | | | | | | | |
Administration | | | 144,589 | | | | 310,409 | | | | 196,632 | | | | 298,831 | | | | 153,594 | |
Service — Investor A | | | 166,908 | | | | 318,633 | | | | 254,105 | | | | 349,284 | | | | 233,557 | |
Transfer agent — Institutional | | | 42,303 | | | | 52,380 | | | | 40,683 | | | | 50,138 | | | | 29,415 | |
Transfer agent — Investor A | | | 39,882 | | | | 73,082 | | | | 59,629 | | | | 80,589 | | | | 55,782 | |
Transfer agent — Class K | | | 28,606 | | | | 33,797 | | | | 18,417 | | | | 35,863 | | | | 19,221 | |
Registration | | | 64,972 | | | | 92,065 | | | | 78,950 | | | | 97,007 | | | | 71,042 | |
Professional | | | 32,203 | | | | 34,659 | | | | 31,995 | | | | 34,138 | | | | 31,412 | |
Printing | | | 18,060 | | | | 25,002 | | | | 20,028 | | | | 24,718 | | | | 18,126 | |
Independent Trustees | | | 306 | | | | 607 | | | | 347 | | | | 547 | | | | 268 | |
Miscellaneous | | | 7,962 | | | | 8,386 | | | | 7,745 | | | | 8,358 | | | | 7,745 | |
Recoupment of past waived fees — class specific | | | 4,558 | | | | 6,783 | | | | 7,008 | | | | 7,728 | | | | 6,924 | |
| | | | |
Total expenses | | | 550,349 | | | | 955,803 | | | | 715,539 | | | | 987,201 | | | | 627,086 | |
Less administration fees waived | | | (144,589 | ) | | | (310,409 | ) | | | (196,632 | ) | | | (298,831 | ) | | | (153,594 | ) |
Transfer agent fees waived and/or reimbursed — Institutional | | | (8,299 | ) | | | (9,855 | ) | | | (9,037 | ) | | | (9,386 | ) | | | (6,733 | ) |
Transfer agent fees waived and/or reimbursed — Investor A | | | (10,921 | ) | | | (14,496 | ) | | | (13,405 | ) | | | (16,428 | ) | | | (13,808 | ) |
Transfer agent fees waived and/or reimbursed — Class K | | | (28,603 | ) | | | (33,794 | ) | | | (18,415 | ) | | | (35,861 | ) | | | (19,219 | ) |
Less fees reimbursed by the administrator | | | (123,178 | ) | | | (160,394 | ) | | | (138,739 | ) | | | (164,443 | ) | | | (128,269 | ) |
| | | | |
Total expenses after fees waived and/or reimbursed | | | 234,759 | | | | 426,855 | | | | 339,311 | | | | 462,252 | | | | 305,463 | |
| | | | |
Net investment income | | | 8,641,794 | | | | 19,700,454 | | | | 13,183,833 | | | | 20,906,687 | | | | 11,244,213 | |
| | | | |
| | | | | | | | | | | | | | | | | | | | |
| Realized and Unrealized Gain (Loss) Allocated from the LifePath Index Master Portfolio | |
| | | | | | | | | | | | | | | | | | | | |
Net realized gain from investments, financial futures contracts, foreign currency transactions and in-kind redemptions1 | | | 25,091,156 | | | | 57,467,254 | | | | 29,568,229 | | | | 61,509,874 | | | | 27,014,851 | |
| | | | |
Net change in unrealized appreciation (depreciation) on investments, financial futures contracts and foreign currency translations | | | (35,849,607 | ) | | | (83,870,133 | ) | | | (48,301,927 | ) | | | (90,984,619 | ) | | | (43,393,602 | ) |
| | | | |
Net realized and unrealized loss | | | (10,758,451 | ) | | | (26,402,879 | ) | | | (18,733,698 | ) | | | (29,474,745 | ) | | | (16,378,751 | ) |
| | | | |
Net Decrease in Net Assets Resulting from Operations | | $ | (2,116,657 | ) | | $ | (6,702,425 | ) | | $ | (5,549,865 | ) | | $ | (8,568,058 | ) | | $ | (5,134,538 | ) |
| | | | |
1 See Note 2 of the Notes to Financial Statements. | |
| | | | | | |
| See Notes to Financial Statements. | | | | |
| | | | | | | |
| 18 | | BLACKROCK FUNDS III | | DECEMBER 31, 2015 | | |
| | | | | | | | | | | | | | | | |
| Year Ended December 31, 2015 | | BlackRock
LifePath Index
2040
Fund | | | BlackRock
LifePath Index
2045
Fund | | | BlackRock
LifePath Index
2050
Fund | | | BlackRock
LifePath Index
2055
Fund | |
| | | | | | | | | | | | | | | | |
| Investment Income | | | | | | | | | | | | | | | | |
| Net investment income allocated from the LifePath Index Master Portfolio: | | | | | | | | | | | | | | | | |
Dividends — affiliated | | $ | 15,441,479 | | | $ | 6,968,022 | | | $ | 7,303,323 | | | $ | 2,143,318 | |
Interest — affiliated | | | 933,733 | | | | 176,258 | | | | 146,687 | | | | 41,773 | |
Securities lending — affiliated — net | | | 8,679 | | | | 2,806 | | | | 9,589 | | | | 5,496 | |
Income — affiliated | | | 4,130 | | | | 2,011 | | | | 1,999 | | | | 749 | |
Expenses | | | (694,999 | ) | | | (311,474 | ) | | | (324,544 | ) | | | (122,372 | ) |
Fees waived | | | 131,731 | | | | 98,552 | | | | 102,637 | | | | 66,911 | |
| | | | |
Total income | | | 15,824,753 | | | | 6,936,175 | | | | 7,239,691 | | | | 2,135,875 | |
| | | | |
| | | | | | | | | | | | | | | | |
| Fund Expenses | | | | | | | | | | | | | | | | |
Administration | | | 203,875 | | | | 87,098 | | | | 90,818 | | | | 26,311 | |
Service — Investor A | | | 201,787 | | | | 103,289 | | | | 74,132 | | | | 30,262 | |
Transfer agent — Institutional | | | 37,026 | | | | 25,387 | | | | 25,068 | | | | 13,956 | |
Transfer agent — Investor A | | | 46,877 | | | | 26,431 | | | | 19,780 | | | | 9,265 | |
Transfer agent — Class K | | | 34,607 | | | | 19,916 | | | | 34,779 | | | | 19,562 | |
Registration | | | 89,237 | | | | 60,034 | | | | 67,716 | | | | 51,391 | |
Professional | | | 32,117 | | | | 30,311 | | | | 30,526 | | | | 29,207 | |
Printing | | | 20,507 | | | | 15,138 | | | | 15,413 | | | | 11,843 | |
Independent Trustees | | | 378 | | | | 152 | | | | 152 | | | | — | |
Miscellaneous | | | 7,745 | | | | 7,714 | | | | 7,714 | | | | 7,714 | |
Recoupment of past waived fees — class specific | | | 5,116 | | | | 4,269 | | | | 2,227 | | | | 733 | |
| | | | |
Total expenses | | | 679,272 | | | | 379,739 | | | | 368,325 | | | | 200,244 | |
Less administration fees waived | | | (203,875 | ) | | | (87,098 | ) | | | (90,818 | ) | | | (26,311 | ) |
Transfer agent fees waived and/or reimbursed — Institutional | | | (8,016 | ) | | | (7,596 | ) | | | (8,506 | ) | | | (6,771 | ) |
Transfer agent fees waived and/or reimbursed — Investor A | | | (9,826 | ) | | | (7,392 | ) | | | (5,578 | ) | | | (3,365 | ) |
Transfer agent fees waived and/or reimbursed — Class K | | | (34,605 | ) | | | (19,915 | ) | | | (34,777 | ) | | | (19,560 | ) |
Less fees reimbursed by the administrator | | | (149,659 | ) | | | (113,025 | ) | | | (121,197 | ) | | | (99,920 | ) |
| | | | |
Total expenses after fees waived and/or reimbursed | | | 273,291 | | | | 144,713 | | | | 107,449 | | | | 44,317 | |
| | | | |
Net investment income | | | 15,551,462 | | | | 6,791,462 | | | | 7,132,242 | | | | 2,091,558 | |
| | | | |
| | | | | | | | | | | | | | | | |
| Realized and Unrealized Gain (Loss) Allocated from the LifePath Index Master Portfolio | | | | | | | | | | | | | | | | |
Net realized gain from investments, financial futures contracts, foreign currency transactions and in-kind redemptions1 | | | 43,354,569 | | | | 15,256,959 | | | | 15,525,064 | | | | 3,730,516 | |
| | | | |
Net change in unrealized appreciation (depreciation) on investments, financial futures contracts and foreign currency translations | | | (66,075,844 | ) | | | (25,245,810 | ) | | | (26,110,210 | ) | | | (6,917,381 | ) |
| | | | |
Net realized and unrealized loss | | | (22,721,275 | ) | | | (9,988,851 | ) | | | (10,585,146 | ) | | | (3,186,865 | ) |
| | | | |
Net Decrease in Net Assets Resulting from Operations | | $ | (7,169,813 | ) | | $ | (3,197,389 | ) | | $ | (3,452,904 | ) | | $ | (1,095,307 | ) |
| | | | |
1 See Note 2 of the Notes to Financial Statements. | |
| | | | | | |
| See Notes to Financial Statements. | | | | |
| | | | | | | |
| | BLACKROCK FUNDS III | | DECEMBER 31, 2015 | | 19 |
| | |
| Statements of Changes in Net Assets | | |
| | | | | | | | | | | | | | | | | | |
| | | BlackRock LifePath Index
Retirement Fund | | | | | BlackRock LifePath
Index 2020 Fund | |
| | | Year Ended December 31, | | | | | Year Ended December 31, | |
| Increase (Decrease) in Net Assets: | | 2015 | | | 2014 | | | | | 2015 | | | 2014 | |
| | | | | | | | | | | | | | | | | | |
| Operations | | | | | | | | | | | |
Net investment income | | $ | 8,641,794 | | | $ | 6,754,544 | | | | | $ | 19,700,454 | | | $ | 14,578,806 | |
Net realized gain | | | 25,091,156 | | | | 5,266,766 | | | | | | 57,467,254 | | | | 9,750,563 | |
Net change in unrealized appreciation (depreciation) | | | (35,849,607 | ) | | | 8,358,774 | | | | | | (83,870,133 | ) | | | 19,682,605 | |
| | | | | | | | | | |
Net increase (decrease) in net assets resulting from operations | | | (2,116,657 | ) | | | 20,380,084 | | | | | | (6,702,425 | ) | | | 44,011,974 | |
| | | | | | | | | | |
| | | | | | | | | | | | | | | | | | |
| Distributions to Shareholders1 | | | | | | | | | | | | | | | | | | |
| From net investment income: | | | | | | | | | | | | | | | | | | |
Institutional | | | (1,277,848 | ) | | | (1,003,476 | ) | | | | | (1,703,517 | ) | | | (1,290,937 | ) |
Investor A | | | (1,083,250 | ) | | | (645,501 | ) | | | | | (2,187,020 | ) | | | (1,371,308 | ) |
Class K | | | (6,712,304 | ) | | | (5,189,643 | ) | | | | | (16,717,448 | ) | | | (12,046,964 | ) |
| From net realized gain: | | | | | | | | | | | | | | | | | | |
Institutional | | | (671,047 | ) | | | (831,394 | ) | | | | | (797,026 | ) | | | (946,287 | ) |
Investor A | | | (661,044 | ) | | | (642,610 | ) | | | | | (1,155,335 | ) | | | (1,151,106 | ) |
Class K | | | (3,568,084 | ) | | | (3,851,560 | ) | | | | | (7,783,760 | ) | | | (8,329,236 | ) |
| | | | | | | | | | |
Decrease in net assets resulting from distributions to shareholders | | | (13,973,577 | ) | | | (12,164,184 | ) | | | | | (30,344,106 | ) | | | (25,135,838 | ) |
| | | | | | | | | | |
| | | | | | | | | | | | | | | | | | |
| Capital Share Transactions | | | | | | | | | | | | | | | | | | |
Net increase in net assets derived from capital share transactions | | | 84,341,187 | | | | 101,799,062 | | | | | | 231,104,256 | | | | 246,310,875 | |
| | | | | | | | | | |
| | | | | | | | | | | | | | | | | | |
| Net Assets | | | | | | | | | | | | | | | | | | |
Total increase in net assets | | | 68,250,953 | | | | 110,014,962 | | | | | | 194,057,725 | | | | 265,187,011 | |
Beginning of year | | | 431,486,100 | | | | 321,471,138 | | | | | | 881,072,404 | | | | 615,885,393 | |
| | | | | | | | | | |
End of year | | $ | 499,737,053 | | | $ | 431,486,100 | | | | | $ | 1,075,130,129 | | | $ | 881,072,404 | |
| | | | | | | | | | |
Distributions in excess of net investment income, end of year | | $ | (963,864 | ) | | $ | (532,256 | ) | | | | $ | (1,725,582 | ) | | $ | (818,051 | ) |
| | | | | | | | | | |
1 Distributions for annual periods determined in accordance with federal income tax regulations. | | | | | | | | | | | |
| | | | | | |
| See Notes to Financial Statements. | | | | |
| | | | | | | |
| 20 | | BLACKROCK FUNDS III | | DECEMBER 31, 2015 | | |
| | |
| Statements of Changes in Net Assets | | |
| | | | | | | | | | | | | | | | | | |
| | | BlackRock LifePath
Index 2025 Fund | | | | | BlackRock LifePath
Index 2030 Fund | |
| | | Year Ended December 31, | | | | | Year Ended December 31, | |
| Increase (Decrease) in Net Assets: | | 2015 | | | 2014 | | | | | 2015 | | | 2014 | |
| | | | | | | | | | | | | | | | | | |
| Operations | | | | | | | | | | | |
Net investment income | | $ | 13,183,833 | | | $ | 7,980,893 | | | | | $ | 20,906,687 | | | $ | 14,132,713 | |
Net realized gain | | | 29,568,229 | | | | 4,243,950 | | | | | | 61,509,874 | | | | 7,450,237 | |
Net change in unrealized appreciation (depreciation) | | | (48,301,927 | ) | | | 11,493,129 | | | | | | (90,984,619 | ) | | | 20,621,536 | |
| | | | | | | | | | |
Net increase (decrease) in net assets resulting from operations | | | (5,549,865 | ) | | | 23,717,972 | | | | | | (8,568,058 | ) | | | 42,204,486 | |
| | | | | | | | | | |
| | | | | | | | | | | | | | | | | | |
| Distributions to Shareholders1 | | | | | | | | | | | | | | | | | | |
| From net investment income: | | | | | | | | | | | | | | | | | | |
Institutional | | | (1,377,536 | ) | | | (813,427 | ) | | | | | (1,813,762 | ) | | | (1,216,088 | ) |
Investor A | | | (1,805,811 | ) | | | (1,216,103 | ) | | | | | (2,626,280 | ) | | | (1,658,504 | ) |
Class K | | | (10,608,523 | ) | | | (5,998,530 | ) | | | | | (17,338,274 | ) | | | (11,318,329 | ) |
| From net realized gain: | | | | | | | | | | | | | | | | | | |
Institutional | | | (407,135 | ) | | | (508,503 | ) | | | | | (716,183 | ) | | | (827,120 | ) |
Investor A | | | (592,391 | ) | | | (853,702 | ) | | | | | (1,160,733 | ) | | | (1,251,411 | ) |
Class K | | | (3,270,147 | ) | | | (3,603,809 | ) | | | | | (7,146,165 | ) | | | (7,287,063 | ) |
| From return of capital: | | | | | | | | | | | | | | | | | | |
Institutional | | | (9,315 | ) | | | — | | | | | | — | | | | — | |
Investor A | | | (13,769 | ) | | | — | | | | | | — | | | | — | |
Class K | | | (65,804 | ) | | | — | | | | | | — | | | | — | |
| | | | | | | | | | |
Decrease in net assets resulting from distributions to shareholders | | | (18,150,431 | ) | | | (12,994,074 | ) | | | | | (30,801,397 | ) | | | (23,558,515 | ) |
| | | | | | | | | | |
| | | | | | | | | | | | | | | | | | |
| Capital Share Transactions | | | | | | | | | | | | | | | | | | |
Net increase in net assets derived from capital share transactions | | | 282,075,364 | | | | 228,806,845 | | | | | | 297,955,479 | | | | 271,075,569 | |
| | | | | | | | | | |
| | | | | | | | | | | | | | | | | | |
| Net Assets | | | | | | | | | | | | | | | | | | |
Total increase in net assets | | | 258,375,068 | | | | 239,530,743 | | | | | | 258,586,024 | | | | 289,721,540 | |
Beginning of year | | | 518,138,673 | | | | 278,607,930 | | | | | | 818,066,682 | | | | 528,345,142 | |
| | | | | | | | | | |
End of year | | $ | 776,513,741 | | | $ | 518,138,673 | | | | | $ | 1,076,652,706 | | | $ | 818,066,682 | |
| | | | | | | | | | |
Distributions in excess of net investment income, end of year | | $ | (924,419 | ) | | $ | (316,382 | ) | | | | $ | (1,415,570 | ) | | $ | (543,941 | ) |
| | | | | | | | | | |
1 Distributions for annual periods determined in accordance with federal income tax regulations. | |
| | | | | | |
| See Notes to Financial Statements. | | | | |
| | | | | | | |
| | BLACKROCK FUNDS III | | DECEMBER 31, 2015 | | 21 |
| | |
| Statements of Changes in Net Assets | | |
| | | | | | | | | | | | | | | | | | |
| | | BlackRock LifePath
Index 2035 Fund | | | | | BlackRock LifePath
Index 2040 Fund | |
| | | Year Ended December 31, | | | | | Year Ended December 31, | |
| Increase (Decrease) in Net Assets: | | 2015 | | | 2014 | | | | | 2015 | | | 2014 | |
| | | | | | | | | | | | | | | | | | |
| Operations | | | | | | | | | | | | | | | | | | |
Net investment income | | $ | 11,244,213 | | | $ | 6,623,719 | | | | | $ | 15,551,462 | | | $ | 9,659,334 | |
Net realized gain | | | 27,014,851 | | | | 2,777,692 | | | | | | 43,354,569 | | | | 4,084,987 | |
Net change in unrealized appreciation (depreciation) | | | (43,393,602 | ) | | | 9,904,332 | | | | | | (66,075,844 | ) | | | 14,271,549 | |
| | | | | | | | | | |
Net increase (decrease) in net assets resulting from operations | | | (5,134,538 | ) | | | 19,305,743 | | | | | | (7,169,813 | ) | | | 28,015,870 | |
| | | | | | | | | | |
| | | | | | | | | | | | | | | | | | |
| Distributions to Shareholders1 | | | | | | | | | | | | | | | | | | |
| From net investment income: | | | | | | | | | | | | | | | | | | |
Institutional | | | (1,117,568 | ) | | | (576,033 | ) | | | | | (1,422,218 | ) | | | (851,152 | ) |
Investor A | | | (1,835,251 | ) | | | (1,172,332 | ) | | | | | (1,669,244 | ) | | | (918,989 | ) |
Class K | | | (8,692,886 | ) | | | (4,885,446 | ) | | | | | (12,960,520 | ) | | | (7,898,009 | ) |
| From net realized gain: | | | | | | | | | | | | | | | | | | |
Institutional | | | (373,420 | ) | | | (326,421 | ) | | | | | (569,482 | ) | | | (501,303 | ) |
Investor A | | | (639,622 | ) | | | (731,035 | ) | | | | | (758,603 | ) | | | (597,551 | ) |
Class K | | | (2,991,293 | ) | | | (2,643,917 | ) | | | | | (5,436,087 | ) | | | (4,405,145 | ) |
| | | | | | | | | | |
Decrease in net assets resulting from distributions to shareholders | | | (15,650,040 | ) | | | (10,335,184 | ) | | | | | (22,816,154 | ) | | | (15,172,149 | ) |
| | | | | | | | | | |
| | | | | | | | | | | | | | | | | | |
| Capital Share Transactions | | | | | | | | | | | | | | | | | | |
Net increase in net assets derived from capital share transactions | | | 220,348,776 | | | | 193,854,314 | | | | | | 234,932,488 | | | | 206,933,374 | |
| | | | | | | | | | |
| | | | | | | | | | | | | | | | | | |
| Net Assets | | | | | | | | | | | | | | | | | | |
Total increase in net assets | | | 199,564,198 | | | | 202,824,873 | | | | | | 204,946,521 | | | | 219,777,095 | |
Beginning of year | | | 409,990,987 | | | | 207,166,114 | | | | | | 546,347,498 | | | | 326,570,403 | |
| | | | | | | | | | |
End of year | | $ | 609,555,185 | | | $ | 409,990,987 | | | | | $ | 751,294,019 | | | $ | 546,347,498 | |
| | | | | | | | | | |
Distributions in excess of net investment income, end of year | | $ | (574,845 | ) | | $ | (173,353 | ) | | | | $ | (741,196 | ) | | $ | (240,676 | ) |
| | | | | | | | | | |
1 Distributions for annual periods determined in accordance with federal income tax regulations. | | | | | | | | | | | | | | | | | | |
| | | | | | |
| See Notes to Financial Statements. | | | | |
| | | | | | | |
| 22 | | BLACKROCK FUNDS III | | DECEMBER 31, 2015 | | |
| | |
| Statements of Changes in Net Assets | | |
| | | | | | | | | | | | | | | | | | |
| | | BlackRock LifePath
Index 2045 Fund | | | | | BlackRock LifePath
Index 2050 Fund | |
| | | Year Ended December 31, | | | | | Year Ended December 31, | |
| Increase (Decrease) in Net Assets: | | 2015 | | | 2014 | | | | | 2015 | | | 2014 | |
| | | | | | | | | | | | | | | | | | |
| Operations | | | | | | | | | | | | | | | | | | |
Net investment income | | $ | 6,791,462 | | | $ | 3,764,889 | | | | | $ | 7,132,242 | | | $ | 3,822,906 | |
Net realized gain | | | 15,256,959 | | | | 1,288,242 | | | | | | 15,525,064 | | | | 1,120,653 | |
Net change in unrealized appreciation (depreciation) | | | (25,245,810 | ) | | | 5,861,300 | | | | | | (26,110,210 | ) | | | 6,166,502 | |
| | | | | | | | | | |
Net increase (decrease) in net assets resulting from operations | | | (3,197,389 | ) | | | 10,914,431 | | | | | | (3,452,904 | ) | | | 11,110,061 | |
| | | | | | | | | | |
| | | | | | | | | | | | | | | | | | |
| Distributions to Shareholders1 | | | | | | | | | | | | | | | | | | |
| From net investment income: | | | | | | | | | | | | | | | | | | |
Institutional | | | (959,840 | ) | | | (414,254 | ) | | | | | (848,474 | ) | | | (394,456 | ) |
Investor A | | | (878,566 | ) | | | (497,652 | ) | | | | | (637,156 | ) | | | (371,110 | ) |
Class K | | | (5,161,906 | ) | | | (2,855,754 | ) | | | | | (5,861,725 | ) | | | (3,060,125 | ) |
| From net realized gain: | | | | | | | | | | | | | | | | | | |
Institutional | | | (322,391 | ) | | | (196,532 | ) | | | | | (273,605 | ) | | | (161,182 | ) |
Investor A | | | (327,816 | ) | | | (250,858 | ) | | | | | (236,197 | ) | | | (169,181 | ) |
Class K | | | (1,825,857 | ) | | | (1,230,202 | ) | | | | | (1,956,362 | ) | | | (1,223,613 | ) |
| | | | | | | | | | |
Decrease in net assets resulting from distributions to shareholders | | | (9,476,376 | ) | | | (5,445,252 | ) | | | | | (9,813,519 | ) | | | (5,379,667 | ) |
| | | | | | | | | | |
| | | | | | | | | | | | | | | | | | |
| Capital Share Transactions | | | | | | | | | | | | | | | | | | |
Net increase in net assets derived from capital share transactions | | | 127,142,109 | | | | 116,729,238 | | | | | | 117,465,063 | | | | 123,424,472 | |
| | | | | | | | | | |
| | | | | | | | | | | | | | | | | | |
| Net Assets | | | | | | | | | | | | | | | | | | |
Total increase in net assets | | | 114,468,344 | | | | 122,198,417 | | | | | | 104,198,640 | | | | 129,154,866 | |
Beginning of year | | | 226,757,679 | | | | 104,559,262 | | | | | | 232,868,819 | | | | 103,713,953 | |
| | | | | | | | | | |
End of year | | $ | 341,226,023 | | | $ | 226,757,679 | | | | | $ | 337,067,459 | | | $ | 232,868,819 | |
| | | | | | | | | | |
Distributions in excess of net investment income, end of year | | $ | (268,192 | ) | | $ | (59,342 | ) | | | | $ | (260,190 | ) | | $ | (45,077 | ) |
| | | | | | | | | | |
1 Distributions for annual periods determined in accordance with federal income tax regulations. | | | | | | | | | | | | | | | |
| | | | | | |
| See Notes to Financial Statements. | | | | |
| | | | | | | |
| | BLACKROCK FUNDS III | | DECEMBER 31, 2015 | | 23 |
| | |
| Statements of Changes in Net Assets | | |
| | | | | | | | |
| | | BlackRock LifePath
Index 2055 Fund | |
| | | Year Ended December 31, | |
| Increase (Decrease) in Net Assets: | | 2015 | | | 2014 | |
| | | | | | | | |
| Operations | |
Net investment income | | $ | 2,091,558 | | | $ | 965,125 | |
Net realized gain | | | 3,730,516 | | | | 249,732 | |
Net change in unrealized appreciation (depreciation) | | | (6,917,381 | ) | | | 1,523,881 | |
| | | | |
Net increase (decrease) in net assets resulting from operations | | | (1,095,307 | ) | | | 2,738,738 | |
| | | | |
| | | | | | | | |
| Distributions to Shareholders1 | | | | | | | | |
| From net investment income: | | | | | | | | |
Institutional | | | (383,507 | ) | | | (107,419 | ) |
Investor A | | | (263,372 | ) | | | (133,343 | ) |
Class K | | | (1,505,805 | ) | | | (723,754 | ) |
| From net realized gain: | | | | | | | | |
Institutional | | | (99,073 | ) | | | (39,649 | ) |
Investor A | | | (76,262 | ) | | | (48,206 | ) |
Class K | | | (391,251 | ) | | | (236,207 | ) |
| | | | |
Decrease in net assets resulting from distributions to shareholders | | | (2,719,270 | ) | | | (1,288,578 | ) |
| | | | |
| | | | | | | | |
| Capital Share Transactions | | | | | | | | |
Net increase in net assets derived from capital share transactions | | | 48,966,574 | | | | 36,470,547 | |
| | | | |
| | | | | | | | |
| Net Assets | | | | | | | | |
Total increase in net assets | | | 45,151,997 | | | | 37,920,707 | |
Beginning of year | | | 61,858,322 | | | | 23,937,615 | |
| | | | |
End of year | | $ | 107,010,319 | | | $ | 61,858,322 | |
| | | | |
Distributions in excess of net investment income, end of year | | $ | (66,588 | ) | | $ | (5,462 | ) |
| | | | |
1 Distributions for annual periods determined in accordance with federal income tax regulations. | |
| | | | | | |
| See Notes to Financial Statements. | | | | |
| | | | | | | |
| 24 | | BLACKROCK FUNDS III | | DECEMBER 31, 2015 | | |
| | |
| Financial Highlights | | BlackRock LifePath Index Retirement Fund |
| | | | | | | | | | | | | | | | | | | | |
| | | Institutional | |
| | | Year Ended December 31, | | | Period
May 31, 20111 to December 31, 2011 | |
| | | 2015 | | | 2014 | | | 2013 | | | 2012 | | |
| | | | | | | | | | | | | | | | | | | | |
| Per Share Operating Performance | | | | | | | | | | | | | | | | | | | | |
Net asset value, beginning of period | | $ | 11.33 | | | $ | 11.05 | | | $ | 10.49 | | | $ | 9.77 | | | $ | 10.00 | |
| | | | |
Net investment income2 | | | 0.21 | | | | 0.21 | | | | 0.18 | | | | 0.21 | | | | 0.16 | |
Net realized and unrealized gain (loss) | | | (0.25 | ) | | | 0.42 | | | | 0.62 | | | | 0.68 | | | | (0.22 | ) |
| | | | |
Net increase (decrease) from investment operations | | | (0.04 | ) | | | 0.63 | | | | 0.80 | | | | 0.89 | | | | (0.06 | ) |
| | | | |
| Distributions:3 | | | | | | | | | | | | | | | | | | | | |
From net investment income | | | (0.21 | ) | | | (0.21 | ) | | | (0.19 | ) | | | (0.15 | ) | | | (0.16 | ) |
From net realized gain | | | (0.11 | ) | | | (0.14 | ) | | | (0.05 | ) | | | (0.02 | ) | | | — | |
From return of capital | | | — | | | | — | | | | — | | | | — | | | | (0.01 | ) |
| | | | |
Total distributions | | | (0.32 | ) | | | (0.35 | ) | | | (0.24 | ) | | | (0.17 | ) | | | (0.17 | ) |
| | | | |
Net asset value, end of period | | $ | 10.97 | | | $ | 11.33 | | | $ | 11.05 | | | $ | 10.49 | | | $ | 9.77 | |
| | | | |
| | | | | | | | | | | | | | | | | | | | |
| Total Return4 | | | | | | | | | | | | | | | | | | | | |
Based on net asset value | | | (0.36)% | | | | 5.73% | | | | 7.68% | | | | 9.16% | | | | (0.61)% | 5 |
| | | | |
| | | | | | | | | | | | | | | | | | | | |
| Ratios to Average Net Assets6 | | | | | | | | | | | | | | | | | | | | |
Total expenses7,8 | | | 0.21% | | | | 0.23% | | | | 0.26% | | | | 0.38% | | | | 6.81% | 9,10 |
| | | | |
Total expenses after fees waived and/or reimbursed7,8 | | | 0.14% | | | | 0.16% | | | | 0.18% | | | | 0.16% | | | | 0.18% | 9 |
| | | | |
Net investment income7,8 | | | 1.79% | | | | 1.82% | | | | 1.70% | | | | 2.00% | | | | 2.84% | 9 |
| | | | |
| | | | | | | | | | | | | | | | | | | | |
| Supplemental Data | | | | | | | | | | | | | | | | | | | | |
Net assets, end of period (000) | | $ | 68,492 | | | $ | 68,385 | | | $ | 39,793 | | | $ | 20,223 | | | $ | 24 | |
| | | | |
Portfolio turnover rate of the LifePath Index Master Portfolio | | | 25% | 11 | | | 15% | 11 | | | 18% | 11 | | | 1% | 12 | | | 1% | 12 |
| | | | |
| | 1 | | Commencement of operations. |
| | 2 | | Based on average shares outstanding. |
| | 3 | | Distributions for annual periods determined in accordance with federal income tax regulations. |
| | 4 | | Where applicable, assumes the reinvestment of distributions. |
| | 5 | | Aggregate total return. |
| | 6 | | Includes the LifePath Index Fund’s share of its corresponding LifePath Index Master Portfolio’s allocated net expenses and/or net investment income. |
| | 7 | | Includes the LifePath Index Fund’s share of the LifePath Index Master Portfolio’s allocated fees waived of 0.02%, 0.03%, 0.02%, 0.06%, and 3.37% for the years ended December 31, 2015, December 31, 2014, December 31, 2013 and December 31, 2012 and the period ended December 31, 2011, respectively. |
| | 8 | | Includes the LifePath Index Fund’s share of the LifePath Index Master Portfolio’s allocated expenses and/or net investment income. Excludes expenses incurred indirectly as a result of the LifePath Index Master Portfolio’s investments in underlying funds as follows: |
| | | | | | | | | | | | | | | | | | | | |
| | | Year Ended December 31, | | | Period May 31, 20111 to December 31, 2011 | |
| | | 2015 | | | 2014 | | | 2013 | | | 2012 | | |
| | | | | | | | | | | | | | | | | | | | |
Investments in underlying funds | | | 0.03% | | | | 0.03% | | | | 0.02% | | | | 0.02% | | | | 0.04% | |
| | | | |
| | 10 | | Organization costs were not annualized in the calculation of the expense ratio. If these expenses were annualized, the total expenses would have been 6.84%. |
| | 11 | | Includes the LifePath Index Master Portfolio’s purchases and sales of the underlying funds and Large Cap Index Master Portfolio, Master Small Cap Index Series, Total International ex U.S. Index Master Portfolio and U.S. Total Bond Index Master Portfolio. |
| | 12 | | Excludes the LifePath Index Master Portfolio’s purchases and sales of the Large Cap Index Master Portfolio, Master International Index Series, Master Small Cap Index Series, Total International ex U.S. Index Master Portfolio and U.S. Total Bond Index Master Portfolio. If these transactions had been included to conform to the current year presentation, the portfolio turnover rate would have been 15% and 9% for the years ended December 31, 2012 and the period ended December 31, 2011, respectively. |
| | | | | | |
| See Notes to Financial Statements. | | | | |
| | | | | | | |
| | BLACKROCK FUNDS III | | DECEMBER 31, 2015 | | 25 |
| | |
| Financial Highlights (continued) | | BlackRock LifePath Index Retirement Fund |
| | | | | | | | | | | | | | | | | | | | |
| | | Investor A | |
| | | Year Ended December 31, | | | Period
May 31, 20111
to December 31,
2011 | |
| | | 2015 | | | 2014 | | | 2013 | | | 2012 | | |
| | | | | | | | | | | | | | | | | | | | |
| Per Share Operating Performance | | | | | | | | | | | | | | | | | | | | |
Net asset value, beginning of period | | $ | 11.33 | | | $ | 11.05 | | | $ | 10.49 | | | $ | 9.77 | | | $ | 10.00 | |
| | | | |
Net investment income2 | | | 0.17 | | | | 0.17 | | | | 0.16 | | | | 0.18 | | | | 0.15 | |
Net realized and unrealized gain (loss) | | | (0.24 | ) | | | 0.43 | | | | 0.62 | | | | 0.69 | | | | (0.23 | ) |
| | | | |
Net increase (decrease) from investment operations | | | (0.07 | ) | | | 0.60 | | | | 0.78 | | | | 0.87 | | | | (0.08 | ) |
| | | | |
| Distributions:3 | | | | | | | | | | | | | | | | | | | | |
From net investment income | | | (0.18 | ) | | | (0.18 | ) | | | (0.17 | ) | | | (0.13 | ) | | | (0.14 | ) |
From net realized gain | | | (0.11 | ) | | | (0.14 | ) | | | (0.05 | ) | | | (0.02 | ) | | | — | |
From return of capital | | | — | | | | — | | | | — | | | | — | | | | (0.01 | ) |
| | | | |
Total distributions | | | (0.29 | ) | | | (0.32 | ) | | | (0.22 | ) | | | (0.15 | ) | | | (0.15 | ) |
| | | | |
Net asset value, end of period | | $ | 10.97 | | | $ | 11.33 | | | $ | 11.05 | | | $ | 10.49 | | | $ | 9.77 | |
| | | | |
| | | | | | | | | | | | | | | | | | | | |
| Total Return4 | | | | | | | | | | | | | | | | | | | | |
Based on net asset value | | | (0.61)% | | | | 5.50% | | | | 7.44% | | | | 8.88% | | | | (0.76)% | 5 |
| | | | |
| | | | | | | | | | | | | | | | | | | | |
| Ratios to Average Net Assets6 | | | | | | | | | | | | | | | | | | | | |
Total expenses7,8 | | | 0.46% | | | | 0.48% | | | | 0.51% | | | | 0.81% | | | | 7.16% | 9,10 |
| | | | |
Total expenses after fees waived and/or reimbursed7,8 | | | 0.39% | | | | 0.41% | | | | 0.43% | | | | 0.41% | | | | 0.43% | 9 |
| | | | |
Net investment income7,8 | | | 1.54% | | | | 1.55% | | | | 1.45% | | | | 1.71% | | | | 2.58% | 9 |
| | | | |
| | | | | | | | | | | | | | | | | | | | |
| Supplemental Data | | | | | | | | | | | | | | | | | | | | |
Net assets, end of period (000) | | $ | 61,886 | | | $ | 55,156 | | | $ | 28,215 | | | $ | 7,967 | | | $ | 24 | |
| | | | |
Portfolio turnover rate of the LifePath Index Master Portfolio | | | 25% | 11 | | | 15% | 11 | | | 18% | 11 | | | 1% | 12 | | | 1% | 12 |
| | | | |
| | 1 | | Commencement of operations. |
| | 2 | | Based on average shares outstanding. |
| | 3 | | Distributions for annual periods determined in accordance with federal income tax regulations. |
| | 4 | | Where applicable, assumes the reinvestment of distributions. |
| | 5 | | Aggregate total return. |
| | 6 | | Includes the LifePath Index Fund’s share of its corresponding LifePath Index Master Portfolio’s allocated net expenses and/or net investment income. |
| | 7 | | Includes the LifePath Index Fund’s share of the LifePath Index Master Portfolio’s allocated fees waived of 0.02%, 0.03%, 0.02%, 0.13%, and 3.37% for the years ended December 31, 2015, December 31, 2014, December 31, 2013 and December 31, 2012 and the period ended December 31, 2011, respectively. |
| | 8 | | Includes the LifePath Index Fund’s share of the LifePath Index Master Portfolio’s allocated expenses and/or net investment income. Excludes expenses incurred indirectly as a result of the LifePath Index Master Portfolio’s investments in underlying funds as follows: |
| | | | | | | | | | | | | | | | | | | | |
| | | Year Ended December 31, | | | Period
May 31, 20111
to December 31, 2011 | |
| | | 2015 | | | 2014 | | | 2013 | | | 2012 | | |
| | | | | | | | | | | | | | | | | | | | |
Investments in underlying funds | | | 0.03% | | | | 0.03% | | | | 0.02% | | | | 0.02% | | | | 0.04% | |
| | | | |
| | 10 | | Organization costs were not annualized in the calculation of the expense ratio. If these expenses were annualized, the total expenses would have been 7.10%. |
| | 11 | | Includes the LifePath Index Master Portfolio’s purchases and sales of the underlying funds and Large Cap Index Master Portfolio, Master Small Cap Index Series, Total International ex U.S. Index Master Portfolio and U.S. Total Bond Index Master Portfolio. |
| | 12 | | Excludes the LifePath Index Master Portfolio’s purchases and sales of the Large Cap Index Master Portfolio, Master International Index Series, Master Small Cap Index Series, Total International ex U.S. Index Master Portfolio and U.S. Total Bond Index Master Portfolio. If these transactions had been included to conform to the current year presentation, the portfolio turnover rate would have been 15% and 9% for the years ended December 31, 2012 and the period ended December 31, 2011, respectively. |
| | | | | | |
| See Notes to Financial Statements. | | | | |
| | | | | | | |
| 26 | | BLACKROCK FUNDS III | | DECEMBER 31, 2015 | | |
| | |
| Financial Highlights (concluded) | | BlackRock LifePath Index Retirement Fund |
| | | | | | | | | | | | | | | | | | | | |
| | | Class K | |
| | | Year Ended December 31, | | | Period
May 31, 20111
to December 31, 2011 | |
| | | 2015 | | | 2014 | | | 2013 | | | 2012 | | |
| | | | | | | | | | | | | | | | | | | | |
| Per Share Operating Performance | | | | | | | | | | | | | | | | | | | | |
Net asset value, beginning of period | | $ | 11.33 | | | $ | 11.05 | | | $ | 10.49 | | | $ | 9.77 | | | $ | 10.00 | |
| | | | |
Net investment income2 | | | 0.20 | | | | 0.21 | | | | 0.19 | | | | 0.21 | | | | 0.16 | |
Net realized and unrealized gain (loss) | | | (0.23 | ) | | | 0.42 | | | | 0.61 | | | | 0.69 | | | | (0.22 | ) |
| | | | |
Net increase (decrease) from investment operations | | | (0.03 | ) | | | 0.63 | | | | 0.80 | | | | 0.90 | | | | (0.06 | ) |
| | | | |
| Distributions:3 | | | | | | | | | | | | | | | | | | | | |
From net investment income | | | (0.22 | ) | | | (0.21 | ) | | | (0.19 | ) | | | (0.16 | ) | | | (0.16 | ) |
From net realized gain | | | (0.11 | ) | | | (0.14 | ) | | | (0.05 | ) | | | (0.02 | ) | | | — | |
From return of capital | | | — | | | | — | | | | — | | | | — | | | | (0.01 | ) |
| | | | |
Total distributions | | | (0.33 | ) | | | (0.35 | ) | | | (0.24 | ) | | | (0.18 | ) | | | (0.17 | ) |
| | | | |
Net asset value, end of period | | $ | 10.97 | | | $ | 11.33 | | | $ | 11.05 | | | $ | 10.49 | | | $ | 9.77 | |
| | | | |
| | | | | | | | | | | | | | | | | | | | |
| Total Return4 | | | | | | | | | | | | | | | | | | | | |
Based on net asset value | | | (0.31)% | | | | 5.78% | | | | 7.72% | | | | 9.17% | | | | (0.59)% | 5 |
| | | | |
| | | | | | | | | | | | | | | | | | | | |
| Ratios to Average Net Assets6 | | | | | | | | | | | | | | | | | | | | |
Total expenses7,8 | | | 0.15% | | | | 0.19% | | | | 0.22% | | | | 0.28% | | | | 6.71% | 9,10 |
| | | | |
Total expenses after fees waived and/or reimbursed7,8 | | | 0.09% | | | | 0.11% | | | | 0.14% | | | | 0.15% | | | | 0.15% | 9 |
| | | | |
Net investment income7,8 | | | 1.84% | | | | 1.87% | | | | 1.74% | | | | 2.02% | | | | 2.87% | 9 |
| | | | |
| | | | | | | | | | | | | | | | | | | | |
| Supplemental Data | | | | | | | | | | | | | | | | | | | | |
Net assets, end of period (000) | | $ | 369,359 | | | $ | 307,946 | | | $ | 253,463 | | | $ | 173,667 | | | $ | 1,905 | |
| | | | |
Portfolio turnover rate of the LifePath Index Master Portfolio | | | 25% | 11 | | | 15% | 11 | | | 18% | 11 | | | 1% | 12 | | | 1% | 12 |
| | | | |
| | 1 | | Commencement of operations. |
| | 2 | | Based on average shares outstanding. |
| | 3 | | Distributions for annual periods determined in accordance with federal income tax regulations. |
| | 4 | | Where applicable, assumes the reinvestment of distributions. |
| | 5 | | Aggregate total return. |
| | 6 | | Includes the LifePath Index Fund’s share of its corresponding LifePath Index Master Portfolio’s allocated net expenses and/or net investment income. |
| | 7 | | Includes the LifePath Index Fund’s share of the LifePath Index Master Portfolio’s allocated fees waived of 0.02%, 0.03%, 0.02%, 0.04%, and 3.38% for the years ended December 31, 2015, December 31, 2014, December 31, 2013 and December 31, 2012 and the period ended December 31, 2011, respectively. |
| | 8 | | Includes the LifePath Index Fund’s share of the LifePath Index Master Portfolio’s allocated expenses and/or net investment income. Excludes expenses incurred indirectly as a result of the LifePath Index Master Portfolio’s investments in underlying funds as follows: |
| | | | | | | | | | | | | | | | | | | | |
| | | Year Ended December 31, | | | Period
May 31, 20111
to December 31, 2011 | |
| | | 2015 | | | 2014 | | | 2013 | | | 2012 | | |
| | | | | | | | | | | | | | | | | | | | |
Investments in underlying funds | | | 0.03% | | | | 0.03% | | | | 0.02% | | | | 0.02% | | | | 0.04% | |
| | | | |
| | 10 | | Organization costs were not annualized in the calculation of the expense ratio. If these expenses were annualized, the total expenses would have been 6.74%. |
| | 11 | | Includes the LifePath Index Master Portfolio’s purchases and sales of the underlying funds and Large Cap Index Master Portfolio, Master Small Cap Index Series, Total International ex U.S. Index Master Portfolio and U.S. Total Bond Index Master Portfolio. |
| | 12 | | Excludes the LifePath Index Master Portfolio’s purchases and sales of the Large Cap Index Master Portfolio, Master International Index Series, Master Small Cap Index Series, Total International ex U.S. Index Master Portfolio and U.S. Total Bond Index Master Portfolio. If these transactions had been included to conform to the current year presentation, the portfolio turnover rate would have been 15% and 9% for the years ended December 31, 2012 and the period ended December 31, 2011, respectively. |
| | | | | | |
| See Notes to Financial Statements. | | | | |
| | | | | | | |
| | BLACKROCK FUNDS III | | DECEMBER 31, 2015 | | 27 |
| | |
| Financial Highlights | | BlackRock LifePath Index 2020 Fund |
| | | | | | | | | | | | | | | | | | | | |
| | | Institutional | |
| | | Year Ended December 31, | | | Period May 31, 20111 to December 31, 2011 | |
| | | 2015 | | | 2014 | | | 2013 | | | 2012 | | |
| | | | | | | | | | | | | | | | | | | | |
| Per Share Operating Performance | | | | | | | | | | | | | | | | | | | | |
Net asset value, beginning of period | | $ | 11.57 | | | $ | 11.25 | | | $ | 10.36 | | | $ | 9.48 | | | $ | 10.00 | |
| | | | |
Net investment income2 | | | 0.22 | | | | 0.22 | | | | 0.22 | | | | 0.22 | | | | 0.15 | |
Net realized and unrealized gain (loss) | | | (0.27 | ) | | | 0.46 | | | | 0.94 | | | | 0.85 | | | | (0.53 | ) |
| | | | |
Net increase (decrease) from investment operations | | | (0.05 | ) | | | 0.68 | | | | 1.16 | | | | 1.07 | | | | (0.38 | ) |
| | | | |
| Distributions:3 | | | | | | | | | | | | | | | | | | | | |
From net investment income | | | (0.22 | ) | | | (0.22 | ) | | | (0.21 | ) | | | (0.16 | ) | | | (0.13 | ) |
From net realized gain | | | (0.10 | ) | | | (0.14 | ) | | | (0.06 | ) | | | (0.03 | ) | | | — | |
From return of capital | | | — | | | | — | | | | — | | | | — | | | | (0.01 | ) |
| | | | |
Total distributions | | | (0.32 | ) | | | (0.36 | ) | | | (0.27 | ) | | | (0.19 | ) | | | (0.14 | ) |
| | | | |
Net asset value, end of period | | $ | 11.20 | | | $ | 11.57 | | | $ | 11.25 | | | $ | 10.36 | | | $ | 9.48 | |
| | | | |
| | | | | | | | | | | | | | | | | | | | |
| Total Return4 | | | | | | | | | | | | | | | | | | | | |
Based on net asset value | | | (0.38)% | | | | 6.10% | | | | 11.32% | | | | 11.35% | | | | (3.72)% | 5 |
| | | | |
| | | | | | | | | | | | | | | | | | | | |
| Ratios to Average Net Assets6 | | | | | | | | | | | | | | | | | | | | |
Total expenses7,8 | | | 0.20% | | | | 0.22% | | | | 0.26% | | | | 0.36% | | | | 6.91% | 9,10 |
| | | | |
Total expenses after fees waived and/or reimbursed7,8 | | | 0.14% | | | | 0.16% | | | | 0.18% | | | | 0.17% | | | | 0.20% | 9 |
| | | | |
Net investment income7,8 | | | 1.89% | | | | 1.93% | | | | 1.98% | | | | 2.14% | | | | 2.66% | 9 |
| | | | |
| | | | | | | | | | | | | | | | | | | | |
| Supplemental Data | | | | | | | | | | | | | | | | | | | | |
Net assets, end of period (000) | | $ | 89,773 | | | $ | 81,485 | | | $ | 42,447 | | | $ | 19,786 | | | $ | 24 | |
| | | | |
Portfolio turnover rate of the LifePath Index Master Portfolio | | | 14% | 11 | | | 12% | 11 | | | 12% | 11 | | | 1% | 12 | | | 1% | 12 |
| | | | |
| | 1 | | Commencement of operations. |
| | 2 | | Based on average shares outstanding. |
| | 3 | | Distributions for annual periods determined in accordance with federal income tax regulations. |
| | 4 | | Where applicable, assumes the reinvestment of distributions. |
| | 5 | | Aggregate total return. |
| | 6 | | Includes the LifePath Index Fund’s share of its corresponding LifePath Index Master Portfolio’s allocated net expenses and/or net investment income. |
| | 7 | | Includes the LifePath Index Fund’s share of the LifePath Index Master Portfolio’s allocated fees waived of 0.02%, 0.02%, 0.01%, 0.06%, and 3.48% for the years ended December 31, 2015, December 31, 2014, December 31, 2013 and December 31, 2012 and the period ended December 31, 2011, respectively. |
| | 8 | | Includes the LifePath Index Fund’s share of the LifePath Index Master Portfolio’s allocated expenses and/or net investment income. Excludes expenses incurred indirectly as a result of the LifePath Index Master Portfolio’s investments in underlying funds as follows: |
| | | | | | | | | | | | | | | | | | | | |
| | | Year Ended December 31, | | | Period May 31, 20111 to December 31, 2011 | |
| | | 2015 | | | 2014 | | | 2013 | | | 2012 | | |
| | | | | | | | | | | | | | | | | | | | |
Investments in underlying funds | | | 0.04% | | | | 0.04% | | | | 0.03% | | | | 0.03% | | | | 0.05% | |
| | | | |
| | 10 | | Organization costs were not annualized in the calculation of the expense ratios. If these expenses were annualized, the total expenses for Institutional Shares would have been 6.94%. |
| | 11 | | Includes the LifePath Index Master Portfolio’s purchases and sales of the underlying funds and Large Cap Index Master Portfolio, Master Small Cap Index Series, Total International ex U.S. Index Master Portfolio and U.S. Total Bond Index Master Portfolio. |
| | 12 | | Excludes the LifePath Index Master Portfolio’s purchases and sales of the Large Cap Index Master Portfolio, Master International Index Series, Master Small Cap Index Series, Total International ex U.S. Index Master Portfolio and U.S. Total Bond Index Master Portfolio. If these transactions had been included to conform to the current year presentation, the portfolio turnover rate would have been 13% and 8% for the years ended December 31, 2012 and the period ended December 31, 2011, respectively. |
| | | | | | |
| See Notes to Financial Statements. | | | | |
| | | | | | | |
| 28 | | BLACKROCK FUNDS III | | DECEMBER 31, 2015 | | |
| | |
| Financial Highlights (continued) | | BlackRock LifePath Index 2020 Fund |
| | | | | | | | | | | | | | | | | | | | |
| | | Investor A | |
| | | Year Ended December 31, | | | Period May 31, 20111
to December 31,
2011 | |
| | | 2015 | | | 2014 | | | 2013 | | | 2012 | | |
| | | | | | | | | | | | | | | | | | | | |
| Per Share Operating Performance | | | | | | | | | | | | | | | | | | | | |
Net asset value, beginning of period | | $ | 11.55 | | | $ | 11.23 | | | $ | 10.35 | | | $ | 9.48 | | | $ | 10.00 | |
| | | | |
Net investment income2 | | | 0.19 | | | | 0.19 | | | | 0.19 | | | | 0.19 | | | | 0.13 | |
Net realized and unrealized gain (loss) | | | (0.26 | ) | | | 0.46 | | | | 0.94 | | | | 0.85 | | | | (0.52 | ) |
| | | | |
Net increase (decrease) from investment operations | | | (0.07 | ) | | | 0.65 | | | | 1.13 | | | | 1.04 | | | | (0.39 | ) |
| | | | |
| Distribution:3 | | | | | | | | | | | | | | | | | | | | |
From net investment income | | | (0.20 | ) | | | (0.19 | ) | | | (0.19 | ) | | | (0.14 | ) | | | (0.12 | ) |
From net realized gain | | | (0.10 | ) | | | (0.14 | ) | | | (0.06 | ) | | | (0.03 | ) | | | — | |
From return of capital | | | — | | | | — | | | | — | | | | — | | | | (0.01 | ) |
| | | | |
Total distributions | | | (0.30 | ) | | | (0.33 | ) | | | (0.25 | ) | | | (0.17 | ) | | | (0.13 | ) |
| | | | |
Net asset value, end of period | | $ | 11.18 | | | $ | 11.55 | | | $ | 11.23 | | | $ | 10.35 | | | $ | 9.48 | |
| | | | |
| | | | |
| Total Return4 | | | | | | | | | | | | | | | | | | | | |
Based on net asset value | | | (0.63)% | | | | 5.87% | | | | 10.99% | | | | 10.98% | | | | (3.87)% | 5 |
| | | | |
| | | | | | | | | | | | | | | | | | | | |
| Ratios to Average Net Assets6 | | | | | | | | | | | | | | | | | | | | |
Total expenses7,8 | | | 0.45% | | | | 0.47% | | | | 0.51% | | | | 0.68% | | | | 7.16% | 9,10 |
| | | | |
Total expenses after fees waived and/or reimbursed7,8 | | | 0.39% | | | | 0.41% | | | | 0.44% | | | | 0.42% | | | | 0.46% | 9 |
| | | | |
Net investment income7,8 | | | 1.64% | | | | 1.68% | | | | 1.75% | | | | 1.85% | | | | 2.42% | 9 |
| | | | |
| | | | | | | | | | | | | | | | | | | | |
| Supplemental Data | | | | | | | | | | | | | | | | | | | | |
Net assets, end of period (000) | | $ | 109,566 | | | $ | 99,790 | | | $ | 61,996 | | | $ | 17,944 | | | $ | 24 | |
| | | | |
Portfolio turnover rate of the LifePath Index Master Portfolio | | | 14% | 11 | | | 12% | 11 | | | 12% | 11 | | | 1% | 12 | | | 1% | 12 |
| | | | |
| | 1 | | Commencement of operations. |
| | 2 | | Based on average shares outstanding. |
| | 3 | | Distributions for annual periods determined in accordance with federal income tax regulations. |
| | 4 | | Where applicable, assumes the reinvestment of distributions. |
| | 5 | | Aggregate total return. |
| | 6 | | Includes the LifePath Index Fund’s share of its corresponding LifePath Index Master Portfolio’s allocated net expenses and/or net investment income. |
| | 7 | | Includes the LifePath Index Fund’s share of the LifePath Index Master Portfolio’s allocated fees waived of 0.02%, 0.02%, 0.01%, 0.06%, and 3.48% for the years ended December 31, 2015, December 31, 2014, December 31, 2013 and December 31, 2012 and the period ended December 31, 2011, respectively. |
| | 8 | | Includes the LifePath Index Fund’s share of the LifePath Index Master Portfolio’s allocated expenses and/or net investment income. Excludes expenses incurred indirectly as a result of the LifePath Index Master Portfolio’s investments in underlying funds as follows: |
| | | | | | | | | | | | | | | | | | | | |
| | | Year Ended December 31, | | | Period May 31, 20111
to December 31,
2011 | |
| | | 2015 | | | 2014 | | | 2013 | | | 2012 | | |
| | | | | | | | | | | | | | | | | | | | |
Investments in underlying funds | | | 0.04% | | | | 0.04% | | | | 0.03% | | | | 0.03% | | | | 0.05% | |
| | | | | | | | | | | | | | | | | | | | |
| | 10 | | Organization costs were not annualized in the calculation of the expense ratios. If these expenses were annualized, the total expenses for Investor A Shares would have been 7.19%. |
| | 11 | | Includes the LifePath Index Master Portfolio’s purchases and sales of the underlying funds and Large Cap Index Master Portfolio, Master Small Cap Index Series, Total International ex U.S. Index Master Portfolio and U.S. Total Bond Index Master Portfolio. |
| | 12 | | Excludes the LifePath Index Master Portfolio’s purchases and sales of the Large Cap Index Master Portfolio, Master International Index Series, Master Small Cap Index Series, Total International ex U.S. Index Master Portfolio and U.S. Total Bond Index Master Portfolio. If these transactions had been included to conform to the current year presentation, the portfolio turnover rate would have been 13% and 8% for the years ended December 31, 2012 and the period ended December 31, 2011, respectively. |
| | | | | | |
| See Notes to Financial Statements. | | | | |
| | | | | | | |
| | BLACKROCK FUNDS III | | DECEMBER 31, 2015 | | 29 |
| | |
| Financial Highlights (concluded) | | BlackRock LifePath Index 2020 Fund |
| | | | | | | | | | | | | | | | | | | | |
| | | Class K | |
| | | Year Ended December 31, | | | Period May 31, 20111
to December 31,
2011 | |
| | 2015 | | | 2014 | | | 2013 | | | 2012 | | |
| | | | | | | | | | | | | | | | | | | | |
| Per Share Operating Performance | | | | | | | | | | | | | | | | | | | | |
Net asset value, beginning of period | | $ | 11.57 | | | $ | 11.25 | | | $ | 10.36 | | | $ | 9.48 | | | $ | 10.00 | |
| | | | |
Net investment income2 | | | 0.23 | | | | 0.23 | | | | 0.22 | | | | 0.22 | | | | 0.15 | |
Net realized and unrealized gain (loss) | | | (0.28 | ) | | | 0.46 | | | | 0.94 | | | | 0.85 | | | | (0.52 | ) |
| | | | |
Net increase (decrease) from investment operations | | | (0.05 | ) | | | 0.69 | | | | 1.16 | | | | 1.07 | | | | (0.37 | ) |
| | | | |
Distributions:3 | | | | | | | | | | | | | | | | | | | | |
From net investment income | | | (0.23 | ) | | | (0.23 | ) | | | (0.21 | ) | | | (0.16 | ) | | | (0.14 | ) |
From net realized gain | | | (0.10 | ) | | | (0.14 | ) | | | (0.06 | ) | | | (0.03 | ) | | | — | |
From return of capital | | | — | | | | — | | | | — | | | | — | | | | (0.01 | ) |
| | | | |
Total distributions | | | (0.33 | ) | | | (0.37 | ) | | | (0.27 | ) | | | (0.19 | ) | | | (0.15 | ) |
| | | | |
Net asset value, end of period | | $ | 11.19 | | | $ | 11.57 | | | $ | 11.25 | | | $ | 10.36 | | | $ | 9.48 | |
| | | | |
| | | | | | | | | | | | | | | | | | | | |
| Total Return4 | | | | | | | | | | | | | | | | | | | | |
Based on net asset value | | | (0.42) | % | | | 6.15% | | | | 11.36% | | | | 11.36% | | | | (3.71)% | 5 |
| | | | |
| | | | | | | | | | | | | | | | | | | | |
| Ratios to Average Net Assets6 | | | | | | | | | | | | | | | | | | | | |
Total expenses7,8 | | | 0.14% | | | | 0.17% | | | | 0.21% | | | | 0.28% | | | | 6.81% | 9,10 |
| | | | |
Total expenses after fees waived and/or reimbursed7,8 | | | 0.09% | | | | 0.11% | | | | 0.14% | | | | 0.16% | | | | 0.18% | 9 |
| | | | |
Net investment income7,8 | | | 1.95% | | | | 1.98% | | | | 2.00% | | | | 2.20% | | | | 2.70% | 9 |
| | | | |
| | | | | | | | | | | | | | | | | | | | |
| Supplemental Data | | | | | | | | | | | | | | | | | | | | |
Net assets, end of period (000) | | $ | 875,791 | | | $ | 699,797 | | | $ | 511,443 | | | $ | 249,157 | | | $ | 1,848 | |
| | | | |
Portfolio turnover rate of the LifePath Index Master Portfolio | | | 14% | 11 | | | 12% | 11 | | | 12% | 11 | | | 1% | 12 | | | 1% | 12 |
| | | | |
| | 1 | | Commencement of operations. |
| | 2 | | Based on average shares outstanding. |
| | 3 | | Distributions for annual periods determined in accordance with federal income tax regulations. |
| | 4 | | Where applicable, assumes the reinvestment of distributions. |
| | 5 | | Aggregate total return. |
| | 6 | | Includes the LifePath Index Fund’s share of its corresponding LifePath Index Master Portfolio’s allocated net expenses and/or net investment income. |
| | 7 | | Includes the LifePath Index Fund’s share of the LifePath Index Master Portfolio’s allocated fees waived of 0.02%, 0.02%, 0.01%, 0.04%, and 3.48% for the years ended December 31, 2015, December 31, 2014, December 31, 2013 and December 31, 2012 and the period ended December 31, 2011, respectively. |
| | 8 | | Includes the LifePath Index Fund’s share of the LifePath Index Master Portfolio’s allocated expenses and/or net investment income. Excludes expenses incurred indirectly as a result of the LifePath Index Master Portfolio’s investments in underlying funds as follows: |
| | | | | | | | | | | | | | | | | | | | |
| | | Year Ended December 31, | | | Period May 31, 20111
to December 31,
2011 | |
| | | 2015 | | | 2014 | | | 2013 | | | 2012 | | |
| | | | | | | | | | | | | | | | | | | | |
Investments in underlying funds | | | 0.04% | | | | 0.04% | | | | 0.03% | | | | 0.03% | | | | 0.05% | |
| | | | |
| | 10 | | Organization costs were not annualized in the calculation of the expense ratio. If these expenses were annualized, the total expenses would have been 6.84%. |
| | 11 | | Includes the LifePath Index Master Portfolio’s purchases and sales of the underlying funds and Large Cap Index Master Portfolio, Master Small Cap Index Series, Total International ex U.S. Index Master Portfolio and U.S. Total Bond Index Master Portfolio. |
| | 12 | | Excludes the LifePath Index Master Portfolio’s purchases and sales of the Large Cap Index Master Portfolio, Master International Index Series, Master Small Cap Index Series, Total International ex U.S. Index Master Portfolio and U.S. Total Bond Index Master Portfolio. If these transactions had been included to conform to the current year presentation, the portfolio turnover rate would have been 13% and 8% for the years ended December 31, 2012 and the period ended December 31, 2011, respectively. |
| | | | | | |
| See Notes to Financial Statements. | | | | |
| | | | | | | |
| 30 | | BLACKROCK FUNDS III | | DECEMBER 31, 2015 | | |
| | |
| Financial Highlights | | BlackRock LifePath Index 2025 Fund |
| | | | | | | | | | | | | | | | | | | | |
| | | Institutional | |
| | | Year Ended December 31, | | | Period May 31, 20111 to December 31, 2011 | |
| | | 2015 | | | 2014 | | | 2013 | | | 2012 | | |
| | | | | | | | | | | | | | | | | | | | |
| Per Share Operating Performance | | | | | | | | | | | | | | | | | | | | |
Net asset value, beginning of period | | $ | 11.74 | | | $ | 11.37 | | | $ | 10.30 | | | $ | 9.35 | | | $ | 10.00 | |
| | | | |
Net investment income2 | | | 0.24 | | | | 0.24 | | | | 0.25 | | | | 0.23 | | | | 0.14 | |
Net realized and unrealized gain (loss) | | | (0.29 | ) | | | 0.47 | | | | 1.12 | | | | 0.92 | | | | (0.65 | ) |
| | | | |
Net increase (decrease) from investment operations | | | (0.05 | ) | | | 0.71 | | | | 1.37 | | | | 1.15 | | | | (0.51 | ) |
| | | | |
| Distributions:3 | | | | | | | | | | | | | | | | | | | | |
From net investment income | | | (0.23 | ) | | | (0.22 | ) | | | (0.22 | ) | | | (0.16 | ) | | | (0.13 | ) |
From net realized gain | | | (0.07 | ) | | | (0.12 | ) | | | (0.08 | ) | | | (0.04 | ) | | | — | |
From return of capital | | | (0.00 | )4 | | | — | | | | — | | | | — | | | | (0.01 | ) |
| | | | |
Total distributions | | | (0.30 | ) | | | (0.34 | ) | | | (0.30 | ) | | | (0.20 | ) | | | (0.14 | ) |
| | | | |
Net asset value, end of period | | $ | 11.39 | | | $ | 11.74 | | | $ | 11.37 | | | $ | 10.30 | | | $ | 9.35 | |
| | | | |
| | | | | | | | | | | | | | | | | | | | |
| Total Return5 | | | | | | | | | | | | | | | | | | | | |
Based on net asset value | | | (0.42)% | | | | 6.33% | | | | 13.46% | | | | 12.34% | | | | (5.12)%6 | |
| | | | |
| | | | | | | | | | | | | | | | | | | | |
| Ratios to Average Net Assets7 | | | | | | | | | | | | | | | | | | | | |
Total expenses8,9 | | | 0.20% | | | | 0.23% | | | | 0.27% | | | | 0.51% | | | | 6.97% | 10 |
| | | | |
Total expenses after fees waived and/or reimbursed8,9 | | | 0.14% | | | | 0.16% | | | | 0.17% | | | | 0.18% | | | | 0.21% | 10,11 |
| | | | |
Net investment income8,9 | | | 2.00% | | | | 2.03% | | | | 2.25% | | | | 2.26% | | | | 2.55% | 10 |
| | | | |
| | | | | | | | | | | | | | | | | | | | |
| Supplemental Data | | | | | | | | | | | | | | | | | | | | |
Net assets, end of period (000) | | $ | 73,993 | | | $ | 53,760 | | | $ | 21,097 | | | $ | 4,844 | | | $ | 23 | |
| | | | |
Portfolio turnover rate of the LifePath Index Master Portfolio | | | 12% | 12 | | | 15% | 12 | | | 13% | 12 | | | 0% | 13,14 | | | 0% | 13,14 |
| | | | |
| | 1 | | Commencement of operations. |
| | 2 | | Based on average shares outstanding. |
| | 3 | | Distributions for annual periods determined in accordance with federal income tax regulations. |
| | 4 | | Amount is greater than $(0.005) per share. |
| | 5 | | Where applicable, assumes the reinvestment of distributions. |
| | 6 | | Aggregate total return. |
| | 7 | | Includes the LifePath Index Fund’s share of its corresponding LifePath Index Master Portfolio’s allocated net expenses and/or net investment income. |
| | 8 | | Includes the LifePath Index Fund’s share of the LifePath Index Master Portfolio’s allocated fees waived of 0.01%, 0.02%, 0.02%, 0.12%, and 3.53% for the years ended December 31, 2015, December 31, 2014, December 31, 2013 and December 31, 2012 and the period ended December 31, 2011, respectively. |
| | 9 | | Includes the LifePath Index Fund’s share of the LifePath Master Portfolio’s allocated expenses and/or net investment income. Excludes expenses incurred indirectly as a result of LifePath Master Portfolio’s investments in underlying funds as follows: |
| | | | | | | | | | | | | | | | | | | | |
| | | Year Ended December 31, | | | Period May 31, 20111 to December 31, 2011 | |
| | | 2015 | | | 2014 | | | 2013 | | | 2012 | | |
| | | | | | | | | | | | | | | | | | | | |
Investments in underlying funds | | | 0.05% | | | | 0.05% | | | | 0.04% | | | | 0.03% | | | | 0.06% | |
| | | | |
| | 11 | | Organization costs were not annualized in the calculation of the expense ratio. If these expenses were annualized, the total expenses would have been 6.99%. |
| | 12 | | Includes the LifePath Index Master Portfolio’s purchases and sales of the underlying funds and Large Cap Index Master Portfolio, Master Small Cap Index Series, Total International ex U.S. Index Master Portfolio and U.S. Total Bond Index Master Portfolio. |
| | 13 | | Excludes the LifePath Index Master Portfolio’s purchases and sales of the Large Cap Index Master Portfolio, Master International Index Series, Master Small Cap Index Series, Total International ex U.S. Index Master Portfolio and U.S. Total Bond Index Master Portfolio. If these transactions had been included to conform to the current year presentation, the portfolio turnover rate would have been 14% and 8% for the years ended December 31, 2012 and the period ended December 31, 2011, respectively. |
| | 14 | | Rounds to less than 1%. |
| | | | | | |
| See Notes to Financial Statements. | | | | |
| | | | | | | |
| | BLACKROCK FUNDS III | | DECEMBER 31, 2015 | | 31 |
| | |
| Financial Highlights (continued) | | BlackRock LifePath Index 2025 Fund |
| | | | | | | | | | | | | | | | | | | | |
| | | Investor A | |
| | | Year Ended December 31, | | | Period May 31, 20111 to December 31, 2011 | |
| | | 2015 | | | 2014 | | | 2013 | | | 2012 | | |
| | | | | | | | | | | | | | | | | | | | |
| Per Share Operating Performance | | | | | | | | | | | | | | | | | | | | |
Net asset value, beginning of period | | $ | 11.73 | | | $ | 11.36 | | | $ | 10.30 | | | $ | 9.35 | | | $ | 10.00 | |
| | | | |
Net investment income2 | | | 0.20 | | | | 0.21 | | | | 0.23 | | | | 0.22 | | | | 0.13 | |
Net realized and unrealized gain (loss) | | | (0.28 | ) | | | 0.48 | | | | 1.11 | | | | 0.91 | | | | (0.66 | ) |
| | | | |
Net increase (decrease) from investment operations | | | (0.08 | ) | | | 0.69 | | | | 1.34 | | | | 1.13 | | | | (0.53 | ) |
| | | | |
| Distributions:3 | | | | | | | | | | | | | | | | | | | | |
From net investment income | | | (0.20 | ) | | | (0.20 | ) | | | (0.20 | ) | | | (0.14 | ) | | | (0.11 | ) |
From net realized gain | | | (0.07 | ) | | | (0.12 | ) | | | (0.08 | ) | | | (0.04 | ) | | | — | |
From return of capital | | | (0.00 | )4 | | | — | | | | — | | | | — | | | | (0.01 | ) |
| | | | |
Total distributions | | | (0.27 | ) | | | (0.32 | ) | | | (0.28 | ) | | | (0.18 | ) | | | (0.12 | ) |
| | | | |
Net asset value, end of period | | $ | 11.38 | | | $ | 11.73 | | | $ | 11.36 | | | $ | 10.30 | | | $ | 9.35 | |
| | | | |
| | | | | | | | | | | | | | | | | | | | |
| Total Return5 | | | | | | | | | | | | | | | | | | | | |
Based on net asset value | | | (0.67)% | | | | 6.10% | | | | 13.13% | | | | 12.12% | | | | (5.26)% | 6 |
| | | | |
| | | | | | | | | | | | | | | | | | | | |
| Ratios to Average Net Assets7 | | | | | | | | | | | | | | | | | | | | |
Total expenses8,9 | | | 0.45% | | | | 0.48% | | | | 0.52% | | | | 0.85% | | | | 7.22% | 10,11 |
| | | | |
Total expenses after fees waived and/or reimbursed8,9 | | | 0.39% | | | | 0.41% | | | | 0.43% | | | | 0.44% | | | | 0.46% | 10 |
| | | | |
Net investment income8,9 | | | 1.75% | | | | 1.77% | | | | 2.04% | | | | 2.21% | | | | 2.30% | 10 |
| | | | |
| | | | | | | | | | | | | | | | | | | | |
| Supplemental Data | | | | | | | | | | | | | | | | | | | | |
Net assets, end of period (000) | | $ | 104,993 | | | $ | 89,983 | | | $ | 49,232 | | | $ | 3,918 | | | $ | 23 | |
| | | | |
Portfolio turnover rate of the LifePath Index Master Portfolio | | | 12% | 12 | | | 15% | 12 | | | 13% | 12 | | | 0% | 13,14 | | | 0% | 13,14 |
| | | | |
| | 1 | | Commencement of operations. |
| | 2 | | Based on average shares outstanding. |
| | 3 | | Distributions for annual periods determined in accordance with federal income tax regulations. |
| | 4 | | Amount is greater than $(0.005) per share. |
| | 5 | | Where applicable, assumes the reinvestment of distributions. |
| | 6 | | Aggregate total return. |
| | 7 | | Includes the LifePath Index Fund’s share of its corresponding LifePath Index Master Portfolio’s allocated net expenses and/or net investment income. |
| | 8 | | Includes the LifePath Index Fund’s share of the LifePath Index Master Portfolio’s allocated fees waived of 0.01%, 0.02%, 0.02%, 0.13%, and 3.53% for the years ended December 31, 2015, December 31, 2014, December 31, 2013 and December 31, 2012 and the period ended December 31, 2011, respectively. |
| | 9 | | Includes the LifePath Index Fund’s share of the LifePath Master Portfolio’s allocated expenses and/or net investment income. Excludes expenses incurred indirectly as a result of LifePath Index Master Portfolio’s investments in underlying funds as follows: |
| | | | | | | | | | | | | | | | | | | | |
| | | Year Ended December 31, | | | Period May 31, 20111 to December 31, 2011 | |
| | | 2015 | | | 2014 | | | 2013 | | | 2012 | | |
| | | | | | | | | | | | | | | | | | | | |
Investments in underlying funds | | | 0.05% | | | | 0.05% | | | | 0.04% | | | | 0.03% | | | | 0.06% | |
| | | | |
| | 11 | | Organization costs were not annualized in the calculation of the expense ratio. If these expenses were annualized, the total expenses would have been 7.24%. |
| | 12 | | Includes the LifePath Index Master Portfolio’s purchases and sales of the underlying funds and Large Cap Index Master Portfolio, Master Small Cap Index Series, Total International ex U.S. Index Master Portfolio and U.S. Total Bond Index Master Portfolio. |
| | 13 | | Excludes the LifePath Index Master Portfolio’s purchases and sales of the Large Cap Index Master Portfolio, Master International Index Series, Master Small Cap Index Series, Total International ex U.S. Index Master Portfolio and U.S. Total Bond Index Master Portfolio. If these transactions had been included to conform to the current year presentation, the portfolio turnover rate would have been 14% and 8% for the years ended December 31, 2012 and the period ended December 31, 2011, respectively. |
| | 14 | | Rounds to less than 1%. |
| | | | | | |
| See Notes to Financial Statements. | | | | |
| | | | | | | |
| 32 | | BLACKROCK FUNDS III | | DECEMBER 31, 2015 | | |
| | |
| Financial Highlights (concluded) | | BlackRock LifePath Index 2025 Fund |
| | | | | | | | | | | | | | | | | | | | |
| | | Class K | |
| | | Year Ended December 31, | | | Period
May 31, 20111
to December 31,
2011 | |
| | | 2015 | | | 2014 | | | 2013 | | | 2012 | | |
| | | | | | | | | | | | | | | | | | | | |
| Per Share Operating Performance | | | | | | | | | | | | | | | | | | | | |
Net asset value, beginning of period | | $ | 11.75 | | | $ | 11.37 | | | $ | 10.30 | | | $ | 9.35 | | | $ | 10.00 | |
| | | | |
Net investment income2 | | | 0.24 | | | | 0.24 | | | | 0.24 | | | | 0.23 | | | | 0.14 | |
Net realized and unrealized gain (loss) | | | (0.29 | ) | | | 0.49 | | | | 1.14 | | | | 0.92 | | | | (0.65 | ) |
| | | | |
Net increase (decrease) from investment operations | | | (0.05 | ) | | | 0.73 | | | | 1.38 | | | | 1.15 | | | | (0.51 | ) |
| | | | |
| Distributions:3 | | | | | | | | | | | | | | | | | | | | |
From net investment income | | | (0.24 | ) | | | (0.23 | ) | | | (0.23 | ) | | | (0.16 | ) | | | (0.13 | ) |
From net realized gain | | | (0.07 | ) | | | (0.12 | ) | | | (0.08 | ) | | | (0.04 | ) | | | — | |
From return of capital | | | (0.00 | )4 | | | — | | | | — | | | | — | | | | (0.01 | ) |
| | | | |
Total distributions | | | (0.31 | ) | | | (0.35 | ) | | | (0.31 | ) | | | (0.20 | ) | | | (0.14 | ) |
| | | | |
Net asset value, end of period | | $ | 11.39 | | | $ | 11.75 | | | $ | 11.37 | | | $ | 10.30 | | | $ | 9.35 | |
| | | | |
| | | | | | | | | | | | | | | | | | | | |
| Total Return5 | | | | | | | | | | | | | | | | | | | | |
Based on net asset value | | | (0.45)% | | | | 6.47% | | | | 13.48% | | | | 12.34% | | | | (5.10)% | 6 |
| | | | |
| | | | | | | | | | | | | | | | | | | | |
| Ratios to Average Net Assets7 | | | | | | | | | | | | | | | | | | | | |
Total expenses8,9 | | | 0.14% | | | | 0.18% | | | | 0.23% | | | | 0.37% | | | | 6.87% | 10,11 |
| | | | |
Total expenses after fees waived and/or reimbursed8,9 | | | 0.09% | | | | 0.11% | | | | 0.14% | | | | 0.16% | | | | 0.18% | 10 |
| | | | |
Net investment income8,9 | | | 2.06% | | | | 2.08% | | | | 2.16% | | | | 2.26% | | | | 2.58% | 10 |
| | | | |
| | | | | | | | | | | | | | | | | | | | |
| Supplemental Data | | | | | | | | | | | | | | | | | | | | |
Net assets, end of period (000) | | $ | 597,527 | | | $ | 374,396 | | | $ | 208,280 | | | $ | 113,655 | | | $ | 1,823 | |
| | | | |
Portfolio turnover rate of the LifePath Index Master Portfolio | | | 12% | 12 | | | 15% | 12 | | | 13% | 12 | | | 0% | 13,14 | | | 0% | 13,14 |
| | | | |
| | 1 | | Commencement of operations. |
| | 2 | | Based on average shares outstanding. |
| | 3 | | Distributions for annual periods determined in accordance with federal income tax regulations. |
| | 4 | | Amount is greater than $(0.005) per share. |
| | 5 | | Where applicable, assumes the reinvestment of distributions. |
| | 6 | | Aggregate total return. |
| | 7 | | Includes the LifePath Index Fund’s share of its corresponding LifePath Index Master Portfolio’s allocated net expenses and/or net investment income. |
| | 8 | | Includes the LifePath Index Fund’s share of the LifePath Index Master Portfolio’s allocated fees waived of 0.01%, 0.02%, 0.02%, 0.07%, and 3.53% for the years ended December 31, 2015, December 31, 2014, December 31, 2013 and December 31, 2012 and the period ended December 31, 2011, respectively. |
| | 9 | | Includes the LifePath Index Fund’s share of the LifePath Master Portfolio’s allocated expenses and/or net investment income. Excludes expenses incurred indirectly as a result of LifePath Master Portfolio’s investments in underlying funds as follows: |
| | | | | | | | | | | | | | | | | | | | |
| | | Year Ended December 31, | | | Period May 31, 20111
to December 31,
2011 | |
| | | 2015 | | | 2014 | | | 2013 | | | 2012 | | |
| | | | | | | | | | | | | | | | | | | | |
Investments in underlying funds | | | 0.05% | | | | 0.05% | | | | 0.04% | | | | 0.03% | | | | 0.06% | |
| | | | |
| | 11 | | Organization costs were not annualized in the calculation of the expense ratio. If these expenses were annualized, the total expenses would have been 6.89%. |
| | 12 | | Includes the LifePath Index Master Portfolio’s purchases and sales of the underlying funds and Large Cap Index Master Portfolio, Master Small Cap Index Series, Total International ex U.S. Index Master Portfolio and U.S. Total Bond Index Master Portfolio. |
| | 13 | | Excludes the LifePath Index Master Portfolio’s purchases and sales of the Large Cap Index Master Portfolio, Master International Index Series, Master Small Cap Index Series, Total International ex U.S. Index Master Portfolio and U.S. Total Bond Index Master Portfolio. If these transactions had been included to conform to the current year presentation, the portfolio turnover rate would have been 14% and 8% for the years ended December 31, 2012 and the period ended December 31, 2011, respectively. |
| | 14 | | Rounds to less than 1%. |
| | | | | | |
| See Notes to Financial Statements. | | | | |
| | | | | | | |
| | BLACKROCK FUNDS III | | DECEMBER 31, 2015 | | 33 |
| | |
| Financial Highlights | | BlackRock LifePath Index 2030 Fund |
| | | | | | | | | | | | | | | | | | | | |
| | | Institutional | |
| | | Year Ended December 31, | | | Period May 31, 20111
to December 31, 2011 | |
| | | 2015 | | | 2014 | | | 2013 | | | 2012 | | |
| | | | | | | | | | | | | | | | | | | | |
| Per Share Operating Performance | | | | | | | | | | | | | | | | | | | | |
Net asset value, beginning of period | | $ | 11.86 | | | $ | 11.49 | | | $ | 10.26 | | | $ | 9.24 | | | $ | 10.00 | |
| | | | |
Net investment income2 | | | 0.25 | | | | 0.25 | | | | 0.25 | | | | 0.23 | | | | 0.13 | |
Net realized and unrealized gain (loss) | | | (0.31 | ) | | | 0.51 | | | | 1.31 | | | | 1.00 | | | | (0.76 | ) |
| | | | |
Net increase (decrease) from investment operations | | | (0.06 | ) | | | 0.76 | | | | 1.56 | | | | 1.23 | | | | (0.63 | ) |
| | | | |
| Distributions:3 | | | | | | | | | | | | | | | | | | | | |
From net investment income | | | (0.25 | ) | | | (0.24 | ) | | | (0.24 | ) | | | (0.17 | ) | | | (0.12 | ) |
From net realized gain | | | (0.10 | ) | | | (0.15 | ) | | | (0.09 | ) | | | (0.04 | ) | | | — | |
From return of capital | | | — | | | | — | | | | — | | | | — | | | | (0.01 | ) |
| | | | |
Total distributions | | | (0.35 | ) | | | (0.39 | ) | | | (0.33 | ) | | | (0.21 | ) | | | (0.13 | ) |
| | | | |
Net asset value, end of period | | $ | 11.45 | | | $ | 11.86 | | | $ | 11.49 | | | $ | 10.26 | | | $ | 9.24 | |
| | | | |
| | | | | | | | | | | | | | | | | | | | |
| Total Return4 | | | | | | | | | | | | | | | | | | | | |
Based on net asset value | | | (0.55)% | | | | 6.58% | | | | 15.34% | | | | 13.38% | | | | (6.30)%5 | |
| | | | |
| | | | | | | | | | | | | | | | | | | | |
| Ratios to Average Net Assets6 | | | | | | | | | | | | | | | | | | | | |
Total expenses7,8 | | | 0.20% | | | | 0.22% | | | | 0.27% | | | | 0.41% | | | | 7.04% | 9,10 |
| | | | |
Total expenses after fees waived and/or reimbursed7,8 | | | 0.14% | | | | 0.16% | | | | 0.19% | | | | 0.18% | | | | 0.22% | 9 |
| | | | |
Net investment income7,8 | | | 2.08% | | | | 2.10% | | | | 2.30% | | | | 2.27% | | | | 2.47% | 9 |
| | | | |
| | | | | | | | | | | | | | | | | | | | |
| Supplemental Data | | | | | | | | | | | | | | | | | | | | |
Net assets, end of period (000) | | $ | 88,246 | | | $ | 73,640 | | | $ | 32,538 | | | $ | 16,158 | | | $ | 23 | |
| | | | |
Portfolio turnover rate of the LifePath Index Master Portfolio | | | 12% | 11 | | | 20% | 11 | | | 12% | 11 | | | 2% | 12 | | | 0% | 12,13 |
| | | | |
| | 1 | | Commencement of operations. |
| | 2 | | Based on average shares outstanding. |
| | 3 | | Distributions for annual periods determined in accordance with federal income tax regulations. |
| | 4 | | Where applicable, assumes the reinvestment of distributions. |
| | 5 | | Aggregate total return. |
| | 6 | | Includes the LifePath Index Fund’s share of its corresponding LifePath Index Master Portfolio’s allocated net expenses and/or net investment income. |
| | 7 | | Includes the LifePath Index Fund’s share of the LifePath Index Master Portfolio’s allocated fees waived of 0.01%, 0.02%, 0.01%, 0.07%, and 3.57% for the years ended December 31, 2015, December 31, 2014, December 31, 2013 and December 31, 2012 and the period ended December 31, 2011, respectively. |
| | 8 | | Includes the LifePath Index Fund’s share of the LifePath Index Master Portfolio’s allocated expenses and/or net investment income. Excludes expenses incurred indirectly as a result of the LifePath Index Master Portfolio’s investments in underlying funds as follows: |
| | | | | | | | | | | | | | | | | | | | |
| | | Year Ended December 31, | | | Period May 31, 20111 to December 31, 2011 | |
| | | 2015 | | | 2014 | | | 2013 | | | 2012 | | |
| | | | | | | | | | | | | | | | | | | | |
Investments in underlying funds | | | 0.06% | | | | 0.05% | | | | 0.04% | | | | 0.04% | | | | 0.06% | |
| | | | |
| | 10 | | Organization costs were not annualized in the calculation of the expense ratios. If these expenses were annualized, the total expenses for Institutional Shares would have been 7.06%. |
| | 11 | | Includes the LifePath Index Master Portfolio’s purchases and sales of the underlying funds and Large Cap Index Master Portfolio, Master Small Cap Index Series, Total International ex U.S. Index Master Portfolio and U.S. Total Bond Index Master Portfolio. |
| | 12 | | Excludes the LifePath Index Master Portfolio’s purchases and sales of the Large Cap Index Master Portfolio, Master International Index Series, Master Small Cap Index Series, Total International ex U.S. Index Master Portfolio and U.S. Total Bond Index Master Portfolio. If these transactions had been included to conform to the current year presentation, the portfolio turnover rate would have been 18% and 6% for the years ended December 31, 2012 and the period ended December 31, 2011, respectively. |
| | 13 | | Rounds to less than 1%. |
| | | | | | |
| See Notes to Financial Statements. | | | | |
| | | | | | | |
| 34 | | BLACKROCK FUNDS III | | DECEMBER 31, 2015 | | |
| | |
| Financial Highlights (continued) | | BlackRock LifePath Index 2030 Fund |
| | | | | | | | | | | | | | | | | | | | |
| | | Investor A | |
| | | Year Ended December 31, | | | Period May 31, 20111
to December 31, 2011 | |
| | | 2015 | | | 2014 | | | 2013 | | | 2012 | | |
| | | | | | | | | | | | | | | | | | | | |
| Per Share Operating Performance | | | | | | | | | | | | | | | | | | | | |
Net asset value, beginning of period | | $ | 11.85 | | | $ | 11.49 | | | $ | 10.26 | | | $ | 9.24 | | | $ | 10.00 | |
| | | | |
Net investment income2 | | | 0.22 | | | | 0.22 | | | | 0.23 | | | | 0.20 | | | | 0.12 | |
Net realized and unrealized gain (loss) | | | (0.30 | ) | | | 0.50 | | | | 1.30 | | | | 1.01 | | | | (0.77 | ) |
| | | | |
Net increase (decrease) from investment operations | | | (0.08 | ) | | | 0.72 | | | | 1.53 | | | | 1.21 | | | | (0.65 | ) |
| | | | |
| Distributions:3 | | | | | | | | | | | | | | | | | | | | |
From net investment income | | | (0.22 | ) | | | (0.21 | ) | | | (0.21 | ) | | | (0.15 | ) | | | (0.10 | ) |
From net realized gain | | | (0.10 | ) | | | (0.15 | ) | | | (0.09 | ) | | | (0.04 | ) | | | — | |
From return of capital | | | — | | | | — | | | | — | | | | — | | | | (0.01 | ) |
| | | | |
Total distributions | | | (0.32 | ) | | | (0.36 | ) | | | (0.30 | ) | | | (0.19 | ) | | | (0.11 | ) |
| | | | |
Net asset value, end of period | | $ | 11.45 | | | $ | 11.85 | | | $ | 11.49 | | | $ | 10.26 | | | $ | 9.24 | |
| | | | |
| | | | | | | | | | | | | | | | | | | | |
| Total Return4 | | | | | | | | | | | | | | | | | | | | |
Based on net asset value | | | (0.80)% | | | | 6.26% | | | | 15.09% | | | | 13.11% | | | | (6.44)%5 | |
| | | | |
| | | | | | | | | | | | | | | | | | | | |
| Ratios to Average Net Assets6 | | | | | | | | | | | | | | | | | | | | |
Total expenses7,8 | | | 0.45% | | | | 0.47% | | | | 0.52% | | | | 0.72% | | | | 7.29% | 9,10 |
| | | | |
Total expenses after fees waived and/or reimbursed7,8 | | | 0.39% | | | | 0.41% | | | | 0.45% | | | | 0.44% | | | | 0.47% | 9 |
| | | | |
Net investment income7,8 | | | 1.84% | | | | 1.84% | | | | 2.10% | | | | 1.99% | | | | 2.22% | 9 |
| | | | |
| | | | | | | | | | | | | | | | | | | | |
| Supplemental Data | | | | | | | | | | | | | | | | | | | | |
Net assets, end of period (000) | | $ | 117,745 | | | $ | 111,333 | | | $ | 62,487 | | | $ | 13,908 | | | $ | 23 | |
| | | | |
Portfolio turnover rate of the LifePath Index Master Portfolio | | | 12% | 11 | | | 20% | 11 | | | 12% | 11 | | | 2% | 12 | | | 0% | 12,13 |
| | | | |
| | 1 | | Commencement of operations. |
| | 2 | | Based on average shares outstanding. |
| | 3 | | Distributions for annual periods determined in accordance with federal income tax regulations. |
| | 4 | | Where applicable, assumes the reinvestment of distributions. |
| | 5 | | Aggregate total return. |
| | 6 | | Includes the LifePath Index Fund’s share of its corresponding LifePath Index Master Portfolio’s allocated net expenses and/or net investment income. |
| | 7 | | Includes the LifePath Index Fund’s share of the LifePath Index Master Portfolio’s allocated fees waived of 0.01%, 0.02%, 0.01%, 0.07%, and 3.57% for the years ended December 31, 2015, December 31, 2014, December 31, 2013 and December 31, 2012 and the period ended December 31, 2011, respectively. |
| | 8 | | Includes the LifePath Index Fund’s share of the LifePath Index Master Portfolio’s allocated expenses and/or net investment income. Excludes expenses incurred indirectly as a result of the LifePath Index Master Portfolio’s investments in underlying funds as follows: |
| | | | | | | | | | | | | | | | | | | | |
| | | Year Ended December 31, | | | Period May 31, 20111 to December 31, 2011 | |
| | | 2015 | | | 2014 | | | 2013 | | | 2012 | | |
| | | | | | | | | | | | | | | | | | | | |
Investments in underlying funds | | | 0.06% | | | | 0.05% | | | | 0.04% | | | | 0.04% | | | | 0.06% | |
| | | | |
| | 10 | | Organization costs were not annualized in the calculation of the expense ratios. If these expenses were annualized, the total expenses for Investor A Shares would have been 7.32%. |
| | 11 | | Includes the LifePath Index Master Portfolio’s purchases and sales of the underlying funds and Large Cap Index Master Portfolio, Master Small Cap Index Series, Total International ex U.S. Index Master Portfolio and U.S. Total Bond Index Master Portfolio. |
| | 12 | | Excludes the LifePath Index Master Portfolio’s purchases and sales of the Large Cap Index Master Portfolio, Master International Index Series, Master Small Cap Index Series, Total International ex U.S. Index Master Portfolio and U.S. Total Bond Index Master Portfolio. If these transactions had been included to conform to the current year presentation, the portfolio turnover rate would have been 18% and 6% for the years ended December 31, 2012 and the period ended December 31, 2011, respectively. |
| | 13 | | Rounds to less than 1%. |
| | | | | | |
| See Notes to Financial Statements. | | | | |
| | | | | | | |
| | BLACKROCK FUNDS III | | DECEMBER 31, 2015 | | 35 |
| | |
| Financial Highlights (concluded) | | BlackRock LifePath Index 2030 Fund |
| | | | | | | | | | | | | | | | | | | | |
| | | Class K | |
| | | Year Ended December 31, | | | Period May 31, 20111
to December 31,
2011 | |
| | | 2015 | | | 2014 | | | 2013 | | | 2012 | | |
| | | | | | | | | | | | | | | | | | | | |
| Per Share Operating Performance | | | | | | | | | | | | | | | | | | | | |
Net asset value, beginning of period | | $ | 11.85 | | | $ | 11.48 | | | $ | 10.25 | | | $ | 9.24 | | | $ | 10.00 | |
| | | | |
Net investment income2 | | | 0.26 | | | | 0.25 | | | | 0.26 | | | | 0.24 | | | | 0.14 | |
Net realized and unrealized gain (loss) | | | (0.32 | ) | | | 0.51 | | | | 1.30 | | | | 0.98 | | | | (0.77 | ) |
| | | | |
Net increase (decrease) from investment operations | | | (0.06 | ) | | | 0.76 | | | | 1.56 | | | | 1.22 | | | | (0.63 | ) |
| | | | |
| Distributions:3 | | | | | | | | | | | | | | | | | | | | |
From net investment income | | | (0.25 | ) | | | (0.24 | ) | | | (0.24 | ) | | | (0.17 | ) | | | (0.12 | ) |
From net realized gain | | | (0.10 | ) | | | (0.15 | ) | | | (0.09 | ) | | | (0.04 | ) | | | — | |
From return of capital | | | — | | | | — | | | | — | | | | — | | | | (0.01 | ) |
| | | | |
Total distributions | | | (0.35 | ) | | | (0.39 | ) | | | (0.33 | ) | | | (0.21 | ) | | | (0.13 | ) |
| | | | |
Net asset value, end of period | | $ | 11.44 | | | $ | 11.85 | | | $ | 11.48 | | | $ | 10.25 | | | $ | 9.24 | |
| | | | |
| | | | | | | | | | | | | | | | | | | | |
| Total Return4 | | | | | | | | | | | | | | | | | | | | |
Based on net asset value | | | (0.50)% | | | | 6.64% | | | | 15.40% | | | | 13.28% | | | | (6.28)% | 5 |
| | | | |
| | | | | | | | | | | | | | | | | | | | |
| Ratios to Average Net Assets6 | | | | | | | | | | | | | | | | | | | | |
Total expenses7,8 | | | 0.14% | | | | 0.17% | | | | 0.22% | | | | 0.31% | | | | 6.94% | 9,10 |
| | | | |
Total expenses after fees waived and/or reimbursed7,8 | | | 0.09% | | | | 0.11% | | | | 0.15% | | | | 0.17% | | | | 0.19% | 9 |
| | | | |
Net investment income7,8 | | | 2.15% | | | | 2.14% | | | | 2.32% | | | | 2.37% | | | | 2.50% | 9 |
| | | | |
| | | | | | | | | | | | | | | | | | | | |
| Supplemental Data | | | | | | | | | | | | | | | | | | | | |
Net assets, end of period (000) | | $ | 870,661 | | | $ | 633,093 | | | $ | 433,320 | | | $ | 175,849 | | | $ | 1,802 | |
| | | | |
Portfolio turnover rate of the LifePath Index Master Portfolio | | | 12% | 11 | | | 20% | 11 | | | 12% | 11 | | | 2% | 12 | | | 0% | 12,13 |
| | | | |
| | 1 | | Commencement of operations. |
| | 2 | | Based on average shares outstanding. |
| | 3 | | Distributions for annual periods determined in accordance with federal income tax regulations. |
| | 4 | | Where applicable, assumes the reinvestment of distributions. |
| | 5 | | Aggregate total return. |
| | 6 | | Includes the LifePath Index Fund’s share of its corresponding LifePath Index Master Portfolio’s allocated net expenses and/or net investment income. |
| | 7 | | Includes the LifePath Index Fund’s share of the LifePath Index Master Portfolio’s allocated fees waived of 0.01%, 0.02%, 0.01%, 0.09%, and 3.57% for the years ended December 31, 2015, December 31, 2014, December 31, 2013 and December 31, 2012 and the period ended December 31, 2011, respectively. |
| | 8 | | Includes the LifePath Index Fund’s share of the LifePath Index Master Portfolio’s allocated expenses and/or net investment income. Excludes expenses incurred indirectly as a result of the LifePath Index Master Portfolio’s investments in underlying funds as follows: |
| | | | | | | | | | | | | | | | | | | | |
| | | Year Ended December 31, | | | Period May 31, 20111
to December 31,
2011 | |
| | 2015 | | | 2014 | | | 2013 | | | 2012 | | |
| | | | | | | | | | | | | | | | | | | | |
Investments in underlying funds | | | 0.06% | | | | 0.05% | | | | 0.04% | | | | 0.04% | | | | 0.06% | |
| | | | |
| | 10 | | Organization costs were not annualized in the calculation of the expense ratios. If these expenses were annualized, the total expenses for Class K Shares would have been 6.96%. |
| | 11 | | Includes the LifePath Index Master Portfolio’s purchases and sales of the underlying funds and Large Cap Index Master Portfolio, Master Small Cap Index Series, Total International ex U.S. Index Master Portfolio and U.S. Total Bond Index Master Portfolio. |
| | 12 | | Excludes the LifePath Index Master Portfolio’s purchases and sales of the Large Cap Index Master Portfolio, Master International Index Series, Master Small Cap Index Series, Total International ex U.S. Index Master Portfolio and U.S. Total Bond Index Master Portfolio. If these transactions had been included to conform to the current year presentation, the portfolio turnover rate would have been 18% and 6% for the years ended December 31, 2012 and the period ended December 31, 2011, respectively. |
| | 13 | | Rounds to less than 1%. |
| | | | | | |
| See Notes to Financial Statements. | | | | |
| | | | | | | |
| 36 | | BLACKROCK FUNDS III | | DECEMBER 31, 2015 | | |
| | |
| Financial Highlights | | BlackRock LifePath Index 2035 Fund |
| | | | | | | | | | | | | | | | | | | | |
| | | Institutional | |
| | | Year Ended December 31, | | | Period May 31, 20111
to December 31,
2011 | |
| | | 2015 | | | 2014 | | | 2013 | | | 2012 | | |
| | | | | | | | | | | | | | | | | | | | |
| Per Share Operating Performance | | | | | | | | | | | | | | | | | | | | |
Net asset value, beginning of period | | $ | 11.98 | | | $ | 11.57 | | | $ | 10.21 | | | $ | 9.14 | | | $ | 10.00 | |
| | | | |
Net investment income2 | | | 0.26 | | | | 0.26 | | | | 0.29 | | | | 0.25 | | | | 0.13 | |
Net realized and unrealized gain (loss) | | | (0.32 | ) | | | 0.51 | | | | 1.43 | | | | 1.04 | | | | (0.87 | ) |
| | | | |
Net increase (decrease) from investment operations | | | (0.06 | ) | | | 0.77 | | | | 1.72 | | | | 1.29 | | | | (0.74 | ) |
| | | | |
| Distributions:3 | | | | | | | | | | | | | | | | | | | | |
From net investment income | | | (0.26 | ) | | | (0.24 | ) | | | (0.25 | ) | | | (0.17 | ) | | | (0.11 | ) |
From net realized gain | | | (0.08 | ) | | | (0.12 | ) | | | (0.11 | ) | | | (0.05 | ) | | | — | |
From return of capital | | | — | | | | — | | | | — | | | | — | | | | (0.01 | ) |
| | | | |
Total distributions | | | (0.34 | ) | | | (0.36 | ) | | | (0.36 | ) | | | (0.22 | ) | | | (0.12 | ) |
| | | | |
Net asset value, end of period | | $ | 11.58 | | | $ | 11.98 | | | $ | 11.57 | | | $ | 10.21 | | | $ | 9.14 | |
| | | | |
| | | | | | | | | | | | | | | | | | | | |
| Total Return4 | | | | | | | | | | | | | | | | | | | | |
Based on net asset value | | | (0.53 | )% | | | 6.68% | | | | 16.98% | | | | 14.16% | | | | (7.37)% | 5 |
| | | | |
| | | | | | | | | | | | | | | | | | | | |
| Ratios to Average Net Assets6 | | | | | | | | | | | | | | | | | | | | |
Total expenses7,8 | | | 0.20% | | | | 0.24% | | | | 0.28% | | | | 0.86% | | | | 7.12% | 9,10 |
| | | | |
Total expenses after fees waived and/or reimbursed7,8 | | | 0.13% | | | | 0.15% | | | | 0.18% | | | | 0.20% | | | | 0.23% | 9 |
| | | | |
Net investment income7,8 | | | 2.19% | | | | 2.18% | | | | 2.59% | | | | 2.52% | | | | 2.40% | 9 |
| | | | |
| | | | | | | | | | | | | | | | | | | | |
| Supplemental Data | | | | | | | | | | | | | | | | | | | | |
Net assets, end of period (000) | | $ | 57,253 | | | $ | 37,073 | | | $ | 10,605 | | | $ | 1,835 | | | $ | 23 | |
| | | | |
Portfolio turnover rate of the LifePath Index Master Portfolio | | | 10% | 11 | | | 25% | 11 | | | 12% | 11 | | | 1% | 12 | | | 0% | 12,13 |
| | | | |
| | 1 | | Commencement of operations. |
| | 2 | | Based on average shares outstanding. |
| | 3 | | Distributions for annual periods determined in accordance with federal income tax regulations. |
| | 4 | | Where applicable, assumes the reinvestment of distributions. |
| | 5 | | Aggregate total return. |
| | 6 | | Includes the LifePath Index Fund’s share of its corresponding LifePath Index Master Portfolio’s allocated net expenses and/or net investment income. |
| | 7 | | Includes the LifePath Index Fund’s share of the LifePath Index Master Portfolio’s allocated fees waived of 0.02%, 0.02%, 0.03%, 0.21%, and 3.61% for the years ended December 31, 2015, December 31, 2014, December 31, 2013 and December 31, 2012 and the period ended December 31, 2011, respectively. |
| | 8 | | Includes the LifePath Index Fund’s share of the LifePath Index Master Portfolio’s allocated expenses and/or net investment income. Excludes expenses incurred indirectly as a result of the LifePath Index Master Portfolio’s investments in underlying funds as follows: |
| | | | | | | | | | | | | | | | | | | | |
| | | Year Ended December 31, | | | Period May 31, 20111
to December 31,
2011 | |
| | 2015 | | | 2014 | | | 2013 | | | 2012 | | |
| | | | | | | | | | | | | | | | | | | | |
Investments in underlying funds | | | 0.07% | | | | 0.06% | | | | 0.05% | | | | 0.04% | | | | 0.06% | |
| | | | |
| | 10 | | Organization costs were not annualized in the calculation of the expense ratios. If these expenses were annualized, the total expenses for would have been 7.15%. |
| | 11 | | Includes the LifePath Index Master Portfolio’s purchases and sales of the underlying funds and Large Cap Index Master Portfolio, Master Small Cap Index Series, Total International ex U.S. Index Master Portfolio and U.S. Total Bond Index Master Portfolio. |
| | 12 | | Excludes the LifePath Index Master Portfolio’s purchases and sales of the Large Cap Index Master Portfolio, Master International Index Series, Master Small Cap Index Series, Total International ex U.S. Index Master Portfolio and U.S. Total Bond Index Master Portfolio. If these transactions had been included to conform to the current year presentation, the portfolio turnover rate would have been 24% and 7% for the years ended December 31, 2012 and the period ended December 31, 2011, respectively. |
| | 13 | | Rounds to less than 1%. |
| | | | | | |
| See Notes to Financial Statements. | | | | |
| | | | | | | |
| | BLACKROCK FUNDS III | | DECEMBER 31, 2015 | | 37 |
| | |
| Financial Highlights (continued) | | BlackRock LifePath Index 2035 Fund |
| | | | | | | | | | | | | | | | | | | | |
| | | Investor A | |
| | | Year Ended December 31, | | | Period
May 31, 20111
to December 31,
2011 | |
| | | 2015 | | | 2014 | | | 2013 | | | 2012 | | |
| | | | | | | | | | | | | | | | | | | | |
| Per Share Operating Performance | | | | | | | | | | | | | | | | | | | | |
Net asset value, beginning of period | | $ | 11.96 | | | $ | 11.56 | | | $ | 10.20 | | | $ | 9.14 | | | $ | 10.00 | |
| | | | |
Net investment income2 | | | 0.23 | | | | 0.23 | | | | 0.25 | | | | 0.26 | | | | 0.12 | |
Net realized and unrealized gain (loss) | | | (0.32 | ) | | | 0.51 | | | | 1.45 | | | | 1.00 | | | | (0.87 | ) |
| | | | |
Net increase (decrease) from investment operations | | | (0.09 | ) | | | 0.74 | | | | 1.70 | | | | 1.26 | | | | (0.75 | ) |
| | | | |
| Distributions:3 | | | | | | | | | | | | | | | | | | | | |
From net investment income | | | (0.23 | ) | | | (0.22 | ) | | | (0.23 | ) | | | (0.15 | ) | | | (0.10 | ) |
From net realized gain | | | (0.08 | ) | | | (0.12 | ) | | | (0.11 | ) | | | (0.05 | ) | | | — | |
From return of capital | | | — | | | | — | | | | — | | | | — | | | | (0.01 | ) |
| | | | |
Total distributions | | | (0.31 | ) | | | (0.34 | ) | | | (0.34 | ) | | | (0.20 | ) | | | (0.11 | ) |
| | | | |
Net asset value, end of period | | $ | 11.56 | | | $ | 11.96 | | | $ | 11.56 | | | $ | 10.20 | | | $ | 9.14 | |
| | | | |
| | | | | | | | | | | | | | | | | | | | |
| Total Return4 | | | | | | | | | | | | | | | | | | | | |
Based on net asset value | | | (0.78 | )% | | | 6.37% | | | | 16.74% | | | | 13.83% | | | | (7.52 | )%5 |
| | | | |
| | | | | | | | | | | | | | | | | | | | |
| Ratios to Average Net Assets6 | | | | | | | | | | | | | | | | | | | | |
Total expenses7,8 | | | 0.45% | | | | 0.48% | | | | 0.54% | | | | 0.89% | | | | 7.47% | 9,10 |
| | | | |
Total expenses after fees waived and/or reimbursed7,8 | | | 0.38% | | | | 0.41% | | | | 0.44% | | | | 0.45% | | | | 0.48% | 9 |
| | | | |
Net investment income7,8 | | | 1.95% | | | | 1.91% | | | | 2.29% | | | | 2.59% | | | | 2.14% | 9 |
| | | | |
| | | | | | | | | | | | | | | | | | | | |
| Supplemental Data | | | | | | | | | | | | | | | | | | | | |
Net assets, end of period (000) | | $ | 94,830 | | | $ | 83,587 | | | $ | 38,107 | | | $ | 3,798 | | | $ | 23 | |
| | | | |
Portfolio turnover rate of the LifePath Index Master Portfolio | | | 10% | 11 | | | 25% | 11 | | | 12% | 11 | | | 1% | 12 | | | 0% | 12,13 |
| | | | |
| | 1 | | Commencement of operations. |
| | 2 | | Based on average shares outstanding. |
| | 3 | | Distributions for annual periods determined in accordance with federal income tax regulations. |
| | 4 | | Where applicable, assumes the reinvestment of distributions. |
| | 5 | | Aggregate total return. |
| | 6 | | Includes the LifePath Index Fund’s share of its corresponding LifePath Index Master Portfolio’s allocated net expenses and/or net investment income. |
| | 7 | | Includes the LifePath Index Fund’s share of the LifePath Index Master Portfolio’s allocated fees waived of 0.02%, 0.02%, 0.03%, 0.09%, and 3.61% for the years ended December 31, 2015, December 31, 2014, December 31, 2013 and December 31, 2012 and the period ended December 31, 2011, respectively. |
| | 8 | | Includes the LifePath Index Fund’s share of the LifePath Index Master Portfolio’s allocated expenses and/or net investment income. Excludes expenses incurred indirectly as a result of the LifePath Index Master Portfolio’s investments in underlying funds as follows: |
| | | | | | | | | | | | | | | | | | | | |
| | | Year Ended December 31, | | | Period
May 31, 20111
to December 31,
2011 | |
| | 2015 | | | 2014 | | | 2013 | | | 2012 | | |
| | | | | | | | | | | | | | | | | | | | |
Investments in underlying funds | | | 0.07% | | | | 0.06% | | | | 0.05% | | | | 0.04% | | | | 0.06% | |
| | | | | | | | | | | | | | | | | | | | |
| | 10 | | Organization costs were not annualized in the calculation of the expense ratios. If these expenses were annualized, the total expenses for would have been 7.50%. |
| | 11 | | Includes the LifePath Index Master Portfolio’s purchases and sales of the underlying funds and Large Cap Index Master Portfolio, Master Small Cap Index Series, Total International ex U.S. Index Master Portfolio and U.S. Total Bond Index Master Portfolio. |
| | 12 | | Excludes the LifePath Index Master Portfolio’s purchases and sales of the Large Cap Index Master Portfolio, Master International Index Series, Master Small Cap Index Series, Total International ex U.S. Index Master Portfolio and U.S. Total Bond Index Master Portfolio. If these transactions had been included to conform to the current year presentation, the portfolio turnover rate would have been 24% and 7% for the years ended December 31, 2012 and the period ended December 31, 2011, respectively. |
| | 13 | | Rounds to less than 1%. |
| | | | | | |
| See Notes to Financial Statements. | | | | |
| | | | | | | |
| 38 | | BLACKROCK FUNDS III | | DECEMBER 31, 2015 | | |
| | |
| Financial Highlights (concluded) | | BlackRock LifePath Index 2035 Fund |
| | | | | | | | | | | | | | | | | | | | |
| | | Class K | |
| | | Year Ended December 31, | | | Period May 31, 20111
to December 31, 2011 | |
| | 2015 | | | 2014 | | | 2013 | | | 2012 | | |
| | | | | | | | | | | | | | | | | | | | |
| Per Share Operating Performance | | | | | | | | | | | | | | | | | | | | |
Net asset value, beginning of period | | $ | 11.98 | | | $ | 11.56 | | | $ | 10.20 | | | $ | 9.14 | | | $ | 10.00 | |
| | | | |
Net investment income2 | | | 0.27 | | | | 0.26 | | | | 0.27 | | | | 0.24 | | | | 0.13 | |
Net realized and unrealized gain (loss) | | | (0.33 | ) | | | 0.53 | | | | 1.45 | | | | 1.04 | | | | (0.87 | ) |
| | | | |
Net increase (decrease) from investment operations | | | (0.06 | ) | | | 0.79 | | | | 1.72 | | | | 1.28 | | | | (0.74 | ) |
| | | | |
| Distributions:3 | | | | | | | | | | | | | | | | | | | | |
From net investment income | | | (0.27 | ) | | | (0.25 | ) | | | (0.25 | ) | | | (0.17 | ) | | | (0.11 | ) |
From net realized gain | | | (0.08 | ) | | | (0.12 | ) | | | (0.11 | ) | | | (0.05 | ) | | | — | |
From return of capital | | | — | | | | — | | | | — | | | | — | | | | (0.01 | ) |
| | | | |
Total distributions | | | (0.35 | ) | | | (0.37 | ) | | | (0.36 | ) | | | (0.22 | ) | | | (0.12 | ) |
| | | | |
Net asset value, end of period | | $ | 11.57 | | | $ | 11.98 | | | $ | 11.56 | | | $ | 10.20 | | | $ | 9.14 | �� |
| | | | |
| | | | | | | | | | | | | | | | | | | | |
| Total Return4 | | | | | | | | | | | | | | | | | | | | |
Based on net asset value | | | (0.56 | )% | | | 6.82% | | | | 17.02% | | | | 14.07% | | | | (7.35 | )%5 |
| | | | |
| | | | | | | | | | | | | | | | | | | | |
| Ratios to Average Net Assets6 | | | | | | | | | | | | | | | | | | | | |
Total expenses7,8 | | | 0.14% | | | | 0.19% | | | | 0.25% | | | | 0.48% | | | | 7.02% | 9,10 |
| | | | |
Total expenses after fees waived and/or reimbursed7,8 | | | 0.08% | | | | 0.11% | | | | 0.15% | | | | 0.17% | | | | 0.19% | 9 |
| | | | |
Net investment income7,8 | | | 2.26% | | | | 2.22% | | | | 2.44% | | | | 2.43% | | | | 2.43% | 9 |
| | | | |
| | | | | | | | | | | | | | | | | | | | |
| Supplemental Data | | | | | | | | | | | | | | | | | | | | |
Net assets, end of period (000) | | $ | 457,472 | | | $ | 289,331 | | | $ | 158,455 | | | $ | 76,095 | | | $ | 1,782 | |
| | | | |
Portfolio turnover rate of the LifePath Index Master Portfolio | | | 10% | 11 | | | 25% | 11 | | | 12% | 11 | | | 1% | 12 | | | 0% | 12,13 |
| | | | |
| | 1 | | Commencement of operations. |
| | 2 | | Based on average shares outstanding. |
| | 3 | | Distributions for annual periods determined in accordance with federal income tax regulations. |
| | 4 | | Where applicable, assumes the reinvestment of distributions. |
| | 5 | | Aggregate total return. |
| | 6 | | Includes the LifePath Index Fund’s share of its corresponding LifePath Index Master Portfolio’s allocated net expenses and/or net investment income. |
| | 7 | | Includes the LifePath Index Fund’s share of the LifePath Index Master Portfolio’s allocated fees waived of 0.02%, 0.02%, 0.03%, 0.10%, and 3.61% for the years ended December 31, 2015, December 31, 2014, December 31, 2013 and December 31, 2012 and the period ended December 31, 2011, respectively. |
| | 8 | | Includes the LifePath Index Fund’s share of the LifePath Index Master Portfolio’s allocated expenses and/or net investment income. Excludes expenses incurred indirectly as a result of the LifePath Index Master Portfolio’s investments in underlying funds as follows: |
| | | | | | | | | | | | | | | | | | | | |
| | | Year Ended December 31, | | | Period May 31, 20111
to December 31, 2011 | |
| | 2015 | | | 2014 | | | 2013 | | | 2012 | | |
| | | | | | | | | | | | | | | | | | | | |
Investments in underlying funds | | | 0.07% | | | | 0.06% | | | | 0.05% | | | | 0.04% | | | | 0.06% | |
| | | | | | | | | | | | | | | | | | | | |
| | 10 | | Organization costs were not annualized in the calculation of the expense ratios. If these expenses were annualized, the total expenses for would have been 7.05%. |
| | 11 | | Includes the LifePath Index Master Portfolio’s purchases and sales of the underlying funds and Large Cap Index Master Portfolio, Master Small Cap Index Series, Total International ex U.S. Index Master Portfolio and U.S. Total Bond Index Master Portfolio. |
| | 12 | | Excludes the LifePath Index Master Portfolio’s purchases and sales of the Large Cap Index Master Portfolio, Master International Index Series, Master Small Cap Index Series, Total International ex U.S. Index Master Portfolio and U.S. Total Bond Index Master Portfolio. If these transactions had been included to conform to the current year presentation, the portfolio turnover rate would have been 24% and 7% for the years ended December 31, 2012 and the period ended December 31, 2011, respectively. |
| | 13 | | Rounds to less than 1%. |
| | | | | | |
| See Notes to Financial Statements. | | | | |
| | | | | | | |
| | BLACKROCK FUNDS III | | DECEMBER 31, 2015 | | 39 |
| | |
| Financial Highlights | | BlackRock LifePath Index 2040 Fund |
| | | | | | | | | | | | | | | | | | | | |
| | | Institutional | |
| | | Year Ended December 31, | | | Period May 31, 20111
to December 31,
2011 | |
| | 2015 | | | 2014 | | | 2013 | | | 2012 | | |
| | | | | | | | | | | | | | | | | | | | |
| Per Share Operating Performance | | | | | | | | | | | | | | | | | | | | |
Net asset value, beginning of period | | $ | 12.11 | | | $ | 11.69 | | | $ | 10.18 | | | $ | 9.04 | | | $ | 10.00 | |
| | | | |
Net investment income2 | | | 0.28 | | | | 0.27 | | | | 0.28 | | | | 0.23 | | | | 0.13 | |
Net realized and unrealized gain (loss) | | | (0.36 | ) | | | 0.54 | | | | 1.60 | | | | 1.12 | | | | (0.98 | ) |
| | | | |
Net increase (decrease) from investment operations | | | (0.08 | ) | | | 0.81 | | | | 1.88 | | | | 1.35 | | | | (0.85 | ) |
| | | | |
| Distributions:3 | | | | | | | | | | | | | | | | | | | | |
From net investment income | | | (0.27 | ) | | | (0.26 | ) | | | (0.26 | ) | | | (0.18 | ) | | | (0.10 | ) |
From net realized gain | | | (0.11 | ) | | | (0.13 | ) | | | (0.11 | ) | | | (0.03 | ) | | | — | |
From return of capital | | | — | | | | — | | | | — | | | | — | | | | (0.01 | ) |
| | | | |
Total distributions | | | (0.38 | ) | | | (0.39 | ) | | | (0.37 | ) | | | (0.21 | ) | | | (0.11 | ) |
| | | | |
Net asset value, end of period | | $ | 11.65 | | | $ | 12.11 | | | $ | 11.69 | | | $ | 10.18 | | | $ | 9.04 | |
| | | | |
| | | | | | | | | | | | | | | | | | | | |
| Total Return4 | | | | | | | | | | | | | | | | | | | | |
Based on net asset value | | | (0.69)% | | | | 6.94% | | | | 18.61% | | | | 15.01% | | | | (8.44)% | 5 |
| | | | |
| | | | | | | | | | | | | | | | | | | | |
| Ratios to Average Net Assets6 | | | | | | | | | | | | | | | | | | | | |
Total expenses7,8 | | | 0.20% | | | | 0.23% | | | | 0.29% | | | | 0.53% | | | | 7.17% | 9,10 |
| | | | |
Total expenses after fees waived and/or reimbursed7,8 | | | 0.13% | | | | 0.16% | | | | 0.20% | | | | 0.19% | | | | 0.23% | 9 |
| | | | |
Net investment income7,8 | | | 2.26% | | | | 2.23% | | | | 2.55% | | | | 2.36% | | | | 2.34% | 9 |
| | | | |
| | | | | | | | | | | | | | | | | | | | |
| Supplemental Data | | | | | | | | | | | | | | | | | | | | |
Net assets, end of period (000) | | $ | 66,512 | | | $ | 50,054 | | | $ | 19,346 | | | $ | 9,554 | | | $ | 23 | |
| | | | |
Portfolio turnover rate of the LifePath Index Master Portfolio | | | 11% | 11 | | | 29% | 11 | | | 12% | 11 | | | 3% | 12 | | | 0% | 12,13 |
| | | | |
| | 1 | | Commencement of operations. |
| | 2 | | Based on average shares outstanding. |
| | 3 | | Distributions for annual periods determined in accordance with federal income tax regulations. |
| | 4 | | Where applicable, assumes the reinvestment of distributions. |
| | 5 | | Aggregate total return. |
| | 6 | | Includes the LifePath Index Fund’s share of its corresponding LifePath Index Master Portfolio’s allocated net expenses and/or net investment income. |
| | 7 | | Includes the LifePath Index Fund’s share of the LifePath Index Master Portfolio’s allocated fees waived of 0.02%, 0.02%, 0.02%, 0.11%, and 3.65% for the years ended December 31, 2015, December 31, 2014, December 31, 2013 and December 31, 2012 and the period ended December 31, 2011, respectively. |
| | 8 | | Includes the LifePath Index Fund’s share of the LifePath Index Master Portfolio’s allocated expenses and/or net investment income. Excludes expenses incurred indirectly as a result of the LifePath Index Master Portfolio’s investments in underlying funds as follows: |
| | | | | | | | | | | | | | | | | | | | |
| | | Year Ended December 31, | | | Period May 31, 20111
to December 31,
2011 | |
| | 2015 | | | 2014 | | | 2013 | | | 2012 | | |
| | | | | | | | | | | | | | | | | | | | |
Investments in underlying funds | | | 0.07% | | | | 0.06% | | | | 0.05% | | | | 0.04% | | | | 0.07% | |
| | | | |
| | 10 | | Organization costs were not annualized in the calculation of the expense ratios. If these expenses were annualized, the total expenses would have been 7.19%. |
| | 11 | | Includes the LifePath Index Master Portfolio’s purchases and sales of the underlying funds and Large Cap Index Master Portfolio, Master Small Cap Index Series, Total International ex U.S. Index Master Portfolio and U.S. Total Bond Index Master Portfolio. |
| | 12 | | Excludes the LifePath Index Master Portfolio’s purchases and sales of the Large Cap Index Master Portfolio, Master International Index Series, Master Small Cap Index Series, Total International ex U.S. Index Master Portfolio and U.S. Total Bond Index Master Portfolio. If these transactions had been included to conform to the current year presentation, the portfolio turnover rate would have been 21% and 5% for the years ended December 31, 2012 and the period ended December 31, 2011, respectively. |
| | 13 | | Rounds to less than 1%. |
| | | | | | |
| See Notes to Financial Statements. | | | | |
| | | | | | | |
| 40 | | BLACKROCK FUNDS III | | DECEMBER 31, 2015 | | |
| | |
| Financial Highlights (continued) | | BlackRock LifePath Index 2040 Fund |
| | | | | | | | | | | | | | | | | | | | |
| | | Investor A | |
| | | Year Ended December 31, | | | Period
May 31, 20111
to December 31,
2011 | |
| | 2015 | | | 2014 | | | 2013 | | | 2012 | | |
| | | | | | | | | | | | | | | | | | | | |
| Per Share Operating Performance | | | | | | | | | | | | | | | | | | | | |
Net asset value, beginning of period | | $ | 12.09 | | | $ | 11.68 | | | $ | 10.17 | | | $ | 9.04 | | | $ | 10.00 | |
| | | | |
Net investment income2 | | | 0.25 | | | | 0.24 | | | | 0.27 | | | | 0.21 | | | | 0.11 | |
Net realized and unrealized gain (loss) | | | (0.35 | ) | | | 0.53 | | | | 1.58 | | | | 1.11 | | | | (0.97 | ) |
| | | | |
Net increase (decrease) from investment operations | | | (0.10 | ) | | | 0.77 | | | | 1.85 | | | | 1.32 | | | | (0.86 | ) |
| | | | |
| Distributions:3 | | | | | | | | | | | | | | | | | | | | |
From net investment income | | | (0.24 | ) | | | (0.23 | ) | | | (0.23 | ) | | | (0.16 | ) | | | (0.09 | ) |
From net realized gain | | | (0.11 | ) | | | (0.13 | ) | | | (0.11 | ) | | | (0.03 | ) | | | — | |
From return of capital | | | — | | | | — | | | | — | | | | — | | | | (0.01 | ) |
| | | | |
Total distributions | | | (0.35 | ) | | | (0.36 | ) | | | (0.34 | ) | | | (0.19 | ) | | | (0.10 | ) |
| | | | |
Net asset value, end of period | | $ | 11.64 | | | $ | 12.09 | | | $ | 11.68 | | | $ | 10.17 | | | $ | 9.04 | |
| | | | |
| | | | | | | | | | | | | | | | | | | | |
| Total Return4 | | | | | | | | | | | | | | | | | | | | |
Based on net asset value | | | (0.94)% | | | | 6.62% | | | | 18.38% | | | | 14.63% | | | | (8.58)% | 5 |
| | | | |
| | | | | | | | | | | | | | | | | | | | |
| Ratios to Average Net Assets6 | | | | | | | | | | | | | | | | | | | | |
Total expenses7,8 | | | 0.45% | | | | 0.48% | | | | 0.53% | | | | 0.85% | | | | 7.42% | 9,10 |
| | | | |
Total expenses after fees waived and/or reimbursed7,8 | | | 0.38% | | | | 0.41% | | | | 0.45% | | | | 0.45% | | | | 0.48% | 9 |
| | | | |
Net investment income7,8 | | | 2.02% | | | | 1.98% | | | | 2.39% | | | | 2.13% | | | | 2.08% | 9 |
| | | | |
| | | | | | | | | | | | | | | | | | | | |
| Supplemental Data | | | | | | | | | | | | | | | | | | | | |
Net assets, end of period (000) | | $ | 69,660 | | | $ | 58,952 | | | $ | 31,753 | | | $ | 7,563 | | | $ | 23 | |
| | | | |
Portfolio turnover rate of the LifePath Index Master Portfolio | | | 11% | 11 | | | 29% | 11 | | | 12% | 11 | | | 3% | 12 | | | 0% | 12,13 |
| | | | |
| | 1 | | Commencement of operations. |
| | 2 | | Based on average shares outstanding. |
| | 3 | | Distributions for annual periods determined in accordance with federal income tax regulations. |
| | 4 | | Where applicable, assumes the reinvestment of distributions. |
| | 5 | | Aggregate total return. |
| | 6 | | Includes the LifePath Index Fund’s share of its corresponding LifePath Index Master Portfolio’s allocated net expenses and/or net investment income. |
| | 7 | | Includes the LifePath Index Fund’s share of the LifePath Index Master Portfolio’s allocated fees waived of 0.02%, 0.02%, 0.02%, 0.14%, and 3.65% for the years ended December 31, 2015, December 31, 2014, December 31, 2013 and December 31, 2012 and the period ended December 31, 2011, respectively. |
| | 8 | | Includes the LifePath Index Fund’s share of the LifePath Index Master Portfolio’s allocated expenses and/or net investment income. Excludes expenses incurred indirectly as a result of the LifePath Index Master Portfolio’s investments in underlying funds as follows: |
| | | | | | | | | | | | | | | | | | | | |
| | | Year Ended December 31, | | | Period May 31, 20111
to December 31,
2011 | |
| | 2015 | | | 2014 | | | 2013 | | | 2012 | | |
| | | | | | | | | | | | | | | | | | | | |
Investments in underlying funds | | | 0.07% | | | | 0.06% | | | | 0.05% | | | | 0.04% | | | | 0.07% | |
| | | | |
| | 10 | | Organization costs were not annualized in the calculation of the expense ratios. If these expenses were annualized, the total expenses would have been 7.45%. |
| | 11 | | Includes the LifePath Index Master Portfolio’s purchases and sales of the underlying funds and Large Cap Index Master Portfolio, Master Small Cap Index Series, Total International ex U.S. Index Master Portfolio and U.S. Total Bond Index Master Portfolio. |
| | 12 | | Excludes the LifePath Index Master Portfolio’s purchases and sales of the Large Cap Index Master Portfolio, Master International Index Series, Master Small Cap Index Series, Total International ex U.S. Index Master Portfolio and U.S. Total Bond Index Master Portfolio. If these transactions had been included to conform to the current year presentation, the portfolio turnover rate would have been 21% and 5% for the years ended December 31, 2012 and the period ended December 31, 2011, respectively. |
| | 13 | | Rounds to less than 1%. |
| | | | | | |
| See Notes to Financial Statements. | | | | |
| | | | | | | |
| | BLACKROCK FUNDS III | | DECEMBER 31, 2015 | | 41 |
| | |
| Financial Highlights (concluded) | | BlackRock LifePath Index 2040 Fund |
| | | | | | | | | | | | | | | | | | | | |
| | | Class K | |
| | | Year Ended December 31, | | | Period May 31, 20111
to December 31, 2011 | |
| | | 2015 | | | 2014 | | | 2013 | | | 2012 | | |
| | | | | | | | | | | | | | | | | | | | |
| Per Share Operating Performance | | | | | | | | | | | | | | | | | | | | |
Net asset value, beginning of period | | $ | 12.10 | | | $ | 11.69 | | | $ | 10.18 | | | $ | 9.04 | | | $ | 10.00 | |
| | | | |
Net investment income2 | | | 0.28 | | | | 0.27 | | | | 0.29 | | | | 0.25 | | | | 0.13 | |
Net realized and unrealized gain (loss) | | | (0.34 | ) | | | 0.53 | | | | 1.59 | | | | 1.10 | | | | (0.97 | ) |
| | | | |
Net increase (decrease) from investment operations | | | (0.06 | ) | | | 0.80 | | | | 1.88 | | | | 1.35 | | | | (0.84 | ) |
| | | | |
| Distributions:3 | | | | | | | | | | | | | | | | | | | | |
From net investment income | | | (0.28 | ) | | | (0.26 | ) | | | (0.26 | ) | | | (0.18 | ) | | | (0.11 | ) |
From net realized gain | | | (0.11 | ) | | | (0.13 | ) | | | (0.11 | ) | | | (0.03 | ) | | | — | |
From return of capital | | | — | | | | — | | | | — | | | | — | | | | (0.01 | ) |
| | | | |
Total distributions | | | (0.39 | ) | | | (0.39 | ) | | | (0.37 | ) | | | (0.21 | ) | | | (0.12 | ) |
| | | | |
Net asset value, end of period | | $ | 11.65 | | | $ | 12.10 | | | $ | 11.69 | | | $ | 10.18 | | | $ | 9.04 | |
| | | | |
| | | | | | | | | | | | | | | | | | | | |
| Total Return4 | | | | | | | | | | | | | | | | | | | | |
Based on net asset value | | | (0.56)% | | | | 6.90% | | | | 18.66% | | | | 15.03% | | | | (8.42 | )%5 |
| | | | |
| | | | | | | | | | | | | | | | | | | | |
| Ratios to Average Net Assets6 | | | | | | | | | | | | | | | | | | | | |
Total expenses7,8 | | | 0.14% | | | | 0.18% | | | | 0.24% | | | | 0.39% | | | | 7.06% | 9,10 |
| | | | |
Total expenses after fees waived and/or reimbursed7,8 | | | 0.08% | | | | 0.11% | | | | 0.15% | | | | 0.18% | | | | 0.20% | 9 |
| | | | |
Net investment income7,8 | | | 2.33% | | | | 2.27% | | | | 2.58% | | | | 2.52% | | | | 2.36% | 9 |
| | | | |
| | | | | | | | | | | | | | | | | | | | |
| Supplemental Data | | | | | | | | | | | | | | | | | | | | |
Net assets, end of period (000) | | $ | 615,122 | | | $ | 437,342 | | | $ | 275,471 | | | $ | 90,476 | | | $ | 1,763 | |
| | | | | | | | | | | | | | | | | | | | |
Portfolio turnover rate of the LifePath Index Master Portfolio | | | 11% | 11 | | | 29% | 11 | | | 12% | 11 | | | 3% | 12 | | | 0% | 12,13 |
| | | | |
| | 1 | | Commencement of operations. |
| | 2 | | Based on average shares outstanding. |
| | 3 | | Distributions for annual periods determined in accordance with federal income tax regulations. |
| | 4 | | Where applicable, assumes the reinvestment of distributions. |
| | 5 | | Aggregate total return. |
| | 6 | | Includes the LifePath Index Fund’s share of its corresponding LifePath Index Master Portfolio’s allocated net expenses and/or net investment income. |
| | 7 | | Includes the LifePath Index Fund’s share of the LifePath Index Master Portfolio’s allocated fees waived of 0.02%, 0.02%, 0.02%, 0.14%, and 3.65% for the years ended December 31, 2015, December 31, 2014, December 31, 2013 and December 31, 2012 and the period ended December 31, 2011, respectively. |
| | 8 | | Includes the LifePath Index Fund’s share of the LifePath Index Master Portfolio’s allocated expenses and/or net investment income. Excludes expenses incurred indirectly as a result of the LifePath Index Master Portfolio’s investments in underlying funds as follows: |
| | | | | | | | | | | | | | | | | | | | |
| | | Year Ended December 31, | | | Period May 31, 20111
to December 31,
2011 | |
| | 2015 | | | 2014 | | | 2013 | | | 2012 | | |
| | | | | | | | | | | | | | | | | | | | |
Investments in underlying funds | | | 0.07% | | | | 0.06% | | | | 0.05% | | | | 0.04% | | | | 0.07% | |
| | | | |
| | 10 | | Organization costs were not annualized in the calculation of the expense ratios. If these expenses were annualized, the total expenses would have been 7.09%. |
| | 11 | | Includes the LifePath Index Master Portfolio’s purchases and sales of the underlying funds and Large Cap Index Master Portfolio, Master Small Cap Index Series, Total International ex U.S. Index Master Portfolio and U.S. Total Bond Index Master Portfolio. |
| | 12 | | Excludes the LifePath Index Master Portfolio’s purchases and sales of the Large Cap Index Master Portfolio, Master International Index Series, Master Small Cap Index Series, Total International ex U.S. Index Master Portfolio and U.S. Total Bond Index Master Portfolio. If these transactions had been included to conform to the current year presentation, the portfolio turnover rate would have been 21% and 5% for the years ended December 31, 2012 and the period ended December 31, 2011, respectively. |
| | 13 | | Rounds to less than 1%. |
| | | | | | |
| See Notes to Financial Statements. | | | | |
| | | | | | | |
| 42 | | BLACKROCK FUNDS III | | DECEMBER 31, 2015 | | |
| | |
| Financial Highlights | | BlackRock LifePath Index 2045 Fund |
| | | | | | | | | | | | | | | | | | | | |
| | | Institutional | |
| | | Year Ended December 31, | | | Period
May 31, 20111
to December 31,
2011 | |
| | | 2015 | | | 2014 | | | 2013 | | | 2012 | | |
| | | | | | | | | | | | | | | | | | | | |
| Per Share Operating Performance | | | | | | | | | | | | | | | | | | | | |
Net asset value, beginning of period | | $ | 12.25 | | | $ | 11.78 | | | $ | 10.13 | | | $ | 8.94 | | | $ | 10.00 | |
| | | | |
Net investment income2 | | | 0.29 | | | | 0.29 | | | | 0.34 | | | | 0.26 | | | | 0.12 | |
Net realized and unrealized gain (loss) | | | (0.37 | ) | | | 0.54 | | | | 1.69 | | | | 1.13 | | | | (1.07 | ) |
| | | | |
Net increase (decrease) from investment operations | | | (0.08 | ) | | | 0.83 | | | | 2.03 | | | | 1.39 | | | | (0.95 | ) |
| | | | |
| Distributions:3 | | | | | | | | | | | | | | | | | | | | |
From net investment income | | | (0.28 | ) | | | (0.26 | ) | | | (0.27 | ) | | | (0.18 | ) | | | (0.10 | ) |
From net realized gain | | | (0.09 | ) | | | (0.10 | ) | | | (0.11 | ) | | | (0.02 | ) | | | — | |
From return of capital | | | — | | | | — | | | | — | | | | — | | | | (0.01 | ) |
| | | | |
Total distributions | | | (0.37 | ) | | | (0.36 | ) | | | (0.38 | ) | | | (0.20 | ) | | | (0.11 | ) |
| | | | |
Net asset value, end of period | | $ | 11.80 | | | $ | 12.25 | | | $ | 11.78 | | | $ | 10.13 | | | $ | 8.94 | |
| | | | |
| | | | | | | | | | | | | | | | | | | | |
| Total Return4 | | | | | | | | | | | | | | | | | | | | |
Based on net asset value | | | (0.70 | )% | | | 7.07% | | | | 20.18% | | | | 15.58% | | | | (9.51 | )%5 |
| | | | |
| | | | | | | | | | | | | | | | | | | | |
| Ratios to Average Net Assets6 | | | | | | | | | | | | | | | | | | | | |
Total expenses7,8 | | | 0.21% | | | | 0.26% | | | | 0.35% | | | | 1.35% | | | | 7.23% | 9,10 |
| | | | |
Total expenses after fees waived and/or reimbursed7,8 | | | 0.12% | | | | 0.15% | | | | 0.20% | | | | 0.22% | | | | 0.24% | 9 |
| | | | |
Net investment income7,8 | | | 2.32% | | | | 2.35% | | | | 3.01% | | | | 2.64% | | | | 2.26% | 9 |
| | | | |
| | | | | | | | | | | | | | | | | | | | |
| Supplemental Data | | | | | | | | | | | | | | | | | | | | |
Net assets, end of period (000) | | $ | 45,228 | | | $ | 27,964 | | | $ | 4,117 | | | $ | 532 | | | $ | 22 | |
| | | | |
Portfolio turnover rate of the LifePath Index Master Portfolio | | | 10% | 11 | | | 30% | 11 | | | 12% | 11 | | | 2% | 12 | | | 0% | 12,13 |
| | | | |
| | 1 | | Commencement of operations. |
| | 2 | | Based on average shares outstanding. |
| | 3 | | Distributions for annual periods determined in accordance with federal income tax regulations. |
| | 4 | | Where applicable, assumes the reinvestment of distributions. |
| | 5 | | Aggregate total return. |
| | 6 | | Includes the LifePath Index Fund’s share of its corresponding LifePath Index Master Portfolio’s allocated net expenses and/or net investment income. |
| | 7 | | Includes the LifePath Index Fund’s share of the LifePath Index Master Portfolio’s allocated fees waived of 0.03%, 0.03%, 0.05%, 0.36%, and 3.69% for the years ended December 31, 2015, December 31, 2014, December 31, 2013 and December 31, 2012 and the period ended December 31, 2011, respectively. |
| | 8 | | Includes the LifePath Index Fund’s share of the LifePath Index Master Portfolio’s allocated expenses and/or net investment income. Excludes expenses incurred indirectly as a result of the LifePath Index Master Portfolio’s investments in underlying funds as follows: |
| | | | | | | | | | | | | | | | | | | | |
| | | Year Ended December 31, | | | Period May 31, 20111
to December 31,
2011 | |
| | | 2015 | | | 2014 | | | 2013 | | | 2012 | | |
| | | | | | | | | | | | | | | | | | | | |
Investments in underlying funds | | | 0.08% | | | | 0.07% | | | | 0.05% | | | | 0.04% | | | | 0.07% | |
| | | | |
| | 10 | | Organization costs were not annualized in the calculation of the expense ratio. If these expenses were annualized, the total expenses would have been 7.25%. |
| | 11 | | Includes the LifePath Index Master Portfolio’s purchases and sales of the underlying funds and Large Cap Index Master Portfolio, Master Small Cap Index Series, Total International ex U.S. Index Master Portfolio and U.S. Total Bond Index Master Portfolio. |
| | 12 | | Excludes the LifePath Index Master Portfolio’s purchases and sales of the Large Cap Index Master Portfolio, Master International Index Series, Master Small Cap Index Series, Total International ex U.S. Index Master Portfolio and U.S. Total Bond Index Master Portfolio. If these transactions had been included to conform to the current year presentation, the portfolio turnover rate would have been 22% and 6% for the years ended December 31, 2012 and the period ended December 31, 2011, respectively. |
| | 13 | | Rounds to less than 1%. |
| | | | | | |
| See Notes to Financial Statements. | | | | |
| | | | | | | |
| | BLACKROCK FUNDS III | | DECEMBER 31, 2015 | | 43 |
| | |
| Financial Highlights (continued) | | BlackRock LifePath Index 2045 Fund |
| | | | | | | | | | | | | | | | | | | | |
| | | Investor A | |
| | | Year Ended December 31, | | | Period
May 31, 20111
to December 31,
2011 | |
| | | | | | | | | | | | | | | | | |
| | | 2015 | | | 2014 | | | 2013 | | | 2012 | | |
| | | | | | | | | | | | | | | | | | | | |
| Per Share Operating Performance | | | | | | | | | | | | | | | | | | | | |
Net asset value, beginning of period | | $ | 12.23 | | | $ | 11.77 | | | $ | 10.12 | | | $ | 8.94 | | | $ | 10.00 | |
| | | | |
Net investment income2 | | | 0.26 | | | | 0.25 | | | | 0.29 | | | | 0.27 | | | | 0.11 | |
Net realized and unrealized gain (loss) | | | (0.37 | ) | | | 0.54 | | | | 1.72 | | | | 1.09 | | | | (1.08 | ) |
| | | | |
Net increase (decrease) from investment operations | | | (0.11 | ) | | | 0.79 | | | | 2.01 | | | | 1.36 | | | | (0.97 | ) |
| | | | |
| Distributions:3 | | | | | | | | | | | | | | | | | | | | |
From net investment income | | | (0.25 | ) | | | (0.23 | ) | | | (0.25 | ) | | | (0.16 | ) | | | (0.08 | ) |
From net realized gain | | | (0.09 | ) | | | (0.10 | ) | | | (0.11 | ) | | | (0.02 | ) | | | — | |
From return of capital | | | — | | | | — | | | | — | | | | — | | | | (0.01 | ) |
| | | | |
Total distributions | | | (0.34 | ) | | | (0.33 | ) | | | (0.36 | ) | | | (0.18 | ) | | | (0.09 | ) |
| | | | |
Net asset value, end of period | | $ | 11.78 | | | $ | 12.23 | | | $ | 11.77 | | | $ | 10.12 | | | $ | 8.94 | |
| | | | |
| | | | | | | | | | | | | | | | | | | | |
| Total Return4 | | | | | | | | | | | | | | | | | | | | |
Based on net asset value | | | (0.94)% | | | | 6.74% | | | | 19.96% | | | | 15.27% | | | | (9.64)% | 5 |
| | | | |
| | | | | | | | | | | | | | | | | | | | |
| Ratios to Average Net Assets6 | | | | | | | | | | | | | | | | | | | | |
Total expenses7,8 | | | 0.46% | | | | 0.51% | | | | 0.58% | | | | 1.39% | | | | 7.48% | 9,10 |
| | | | |
Total expenses after fees waived and/or reimbursed7,8 | | | 0.37% | | | | 0.40% | | | | 0.44% | | | | 0.46% | | | | 0.49% | 9 |
| | | | |
Net investment income7,8 | | | 2.09% | | | | 2.04% | | | | 2.61% | | | | 2.75% | | | | 2.00% | 9 |
| | | | |
| | | | | | | | | | | | | | | | | | | | |
| Supplemental Data | | | | | | | | | | | | | | | | | | | | |
Net assets, end of period (000) | | $ | 43,155 | | | $ | 33,859 | | | $ | 16,428 | | | $ | 887 | | | $ | 22 | |
| | | | |
Portfolio turnover rate of the LifePath Index Master Portfolio | | | 10% | 11 | | | 30% | 11 | | | 12% | 11 | | | 2% | 12 | | | 0% | 12,13 |
| | | | |
| | 1 | | Commencement of operations. |
| | 2 | | Based on average shares outstanding. |
| | 3 | | Distributions for annual periods determined in accordance with federal income tax regulations. |
| | 4 | | Where applicable, assumes the reinvestment of distributions. |
| | 5 | | Aggregate total return. |
| | 6 | | Includes the LifePath Index Fund’s share of its corresponding LifePath Index Master Portfolio’s allocated net expenses and/or net investment income. |
| | 7 | | Includes the LifePath Index Fund’s share of the LifePath Index Master Portfolio’s allocated fees waived of 0.03%, 0.03%, 0.06%, 0.25%, and 3.69% for the years ended December 31, 2015, December 31, 2014, December 31, 2013 and December 31, 2012 and the period ended December 31, 2011, respectively. |
| | 8 | | Includes the LifePath Index Fund’s share of the LifePath Index Master Portfolio’s allocated expenses and/or net investment income. Excludes expenses incurred indirectly as a result of the LifePath Index Master Portfolio’s investments in underlying funds as follows: |
| | | | | | | | | | | | | | | | | | | | |
| | | Year Ended December 31, | | | Period
May 31, 20111
to December 31,
2011 | |
| | | 2015 | | | 2014 | | | 2013 | | | 2012 | | |
| | | | | | | | | | | | | | | | | | | | |
Investments in underlying funds | | | 0.08% | | | | 0.07% | | | | 0.05% | | | | 0.04% | | | | 0.07% | |
| | | | |
| | 10 | | Organization costs were not annualized in the calculation of the expense ratio. If these expenses were annualized, the total expenses would have been 7.50%. |
| | 11 | | Includes the LifePath Index Master Portfolio’s purchases and sales of the underlying funds and Large Cap Index Master Portfolio, Master Small Cap Index Series, Total International ex U.S. Index Master Portfolio and U.S. Total Bond Index Master Portfolio. |
| | 12 | | Excludes the LifePath Index Master Portfolio’s purchases and sales of the Large Cap Index Master Portfolio, Master International Index Series, Master Small Cap Index Series, Total International ex U.S. Index Master Portfolio and U.S. Total Bond Index Master Portfolio. If these transactions had been included to conform to the current year presentation, the portfolio turnover rate would have been 22% and 6% for the years ended December 31, 2012 and the period ended December 31, 2011, respectively. |
| | 13 | | Rounds to less than 1%. |
| | | | | | |
| See Notes to Financial Statements. | | | | |
| | | | | | | |
| 44 | | BLACKROCK FUNDS III | | DECEMBER 31, 2015 | | |
| | |
| Financial Highlights (concluded) | | BlackRock LifePath Index 2045 Fund |
| | | | | | | | | | | | | | | | | | | | |
| | | Class K | |
| | | Year Ended December 31, | | | Period May 31, 20111
to December 31,
2011 | |
| | | | | | | | | | | | | | | | | |
| | | 2015 | | | 2014 | | | 2013 | | | 2012 | | |
| | | | | | | | | | | | | | | | | | | | |
| Per Share Operating Performance | | | | | | | | | | | | | | | | | | | | |
Net asset value, beginning of period | | $ | 12.26 | | | $ | 11.79 | | | $ | 10.13 | | | $ | 8.94 | | | $ | 10.00 | |
| | | | |
Net investment income2 | | | 0.29 | | | | 0.28 | | | | 0.30 | | | | 0.26 | | | | 0.12 | |
Net realized and unrealized gain (loss) | | | (0.37 | ) | | | 0.55 | | | | 1.74 | | | | 1.13 | | | | (1.07 | ) |
| | | | |
Net increase (decrease) from investment operations | | | (0.08 | ) | | | 0.83 | | | | 2.04 | | | | 1.39 | | | | (0.95 | ) |
| | | | |
| Distributions:3 | | | | | | | | | | | | | | | | | | | | |
From net investment income | | | (0.28 | ) | | | (0.26 | ) | | | (0.27 | ) | | | (0.18 | ) | | | (0.10 | ) |
From net realized gain | | | (0.09 | ) | | | (0.10 | ) | | | (0.11 | ) | | | (0.02 | ) | | | — | |
From return of capital | | | — | | | | — | | | | — | | | | — | | | | (0.01 | ) |
| | | | |
Total distributions | | | (0.37 | ) | | | (0.36 | ) | | | (0.38 | ) | | | (0.20 | ) | | | (0.11 | ) |
| | | | |
Net asset value, end of period | | $ | 11.81 | | | $ | 12.26 | | | $ | 11.79 | | | $ | 10.13 | | | $ | 8.94 | |
| | | | |
| | | | | | | | | | | | | | | | | | | | |
| Total Return4 | | | | | | | | | | | | | | | | | | | | |
Based on net asset value | | | (0.64)% | | | | 7.10% | | | | 20.32% | | | | 15.61% | | | | (9.49)% | 5 |
| | | | |
| | | | | | | | | | | | | | | | | | | | |
| Ratios to Average Net Assets6 | | | | | | | | | | | | | | | | | | | | |
Total expenses7,8 | | | 0.15% | | | | 0.22% | | | | 0.31% | | | | 0.89% | | | | 7.12% | 9,10 |
| | | | |
Total expenses after fees waived and/or reimbursed7,8 | | | 0.07% | | | | 0.10% | | | | 0.15% | | | | 0.18% | | | | 0.21% | 9 |
| | | | |
Net investment income7,8 | | | 2.39% | | | | 2.33% | | | | 2.73% | | | | 2.60% | | | | 2.29% | 9 |
| | | | |
| | | | | | | | | | | | | | | | | | | | |
| Supplemental Data | | | | | | | | | | | | | | | | | | | | |
Net assets, end of period (000) | | $ | 252,843 | | | $ | 164,934 | | | $ | 84,015 | | | $ | 31,724 | | | $ | 1,744 | |
| | | | |
Portfolio turnover rate of the LifePath Index Master Portfolio | | | 10% | 11 | | | 30% | 11 | | | 12% | 11 | | | 2% | 12 | | | 0% | 12,13 |
| | | | |
| | 1 | | Commencement of operations. |
| | 2 | | Based on average shares outstanding. |
| | 3 | | Distributions for annual periods determined in accordance with federal income tax regulations. |
| | 4 | | Where applicable, assumes the reinvestment of distributions. |
| | 5 | | Aggregate total return. |
| | 6 | | Includes the LifePath Index Fund’s share of its corresponding LifePath Index Master Portfolio’s allocated net expenses and/or net investment income. |
| | 7 | | Includes the LifePath Index Fund’s share of the LifePath Index Master Portfolio’s allocated fees waived of 0.03%, 0.03%, 0.06%, 0.24%, and 3.69% for the years ended December 31, 2015, December 31, 2014, December 31, 2013 and December 31, 2012 and the period ended December 31, 2011, respectively. |
| | 8 | | Includes the LifePath Index Fund’s share of the LifePath Index Master Portfolio’s allocated expenses and/or net investment income. Excludes expenses incurred indirectly as a result of the LifePath Index Master Portfolio’s investments in underlying funds as follows: |
| | | | | | | | | | | | | | | | | | | | |
| | | Year Ended December 31, | | | Period May 31, 20111
to December 31,
2011 | |
| | | 2015 | | | 2014 | | | 2013 | | | 2012 | | |
| | | | | | | | | | | | | | | | | | | | |
Investments in underlying funds | | | 0.08% | | | | 0.07% | | | | 0.05% | | | | 0.04% | | | | 0.07% | |
| | | | |
| | 10 | | Organization costs were not annualized in the calculation of the expense ratio. If these expenses were annualized, the total expenses would have been 7.15%. |
| | 11 | | Includes the LifePath Index Master Portfolio’s purchases and sales of the underlying funds and Large Cap Index Master Portfolio, Master Small Cap Index Series, Total International ex U.S. Index Master Portfolio and U.S. Total Bond Index Master Portfolio. |
| | 12 | | Excludes the LifePath Index Master Portfolio’s purchases and sales of the Large Cap Index Master Portfolio, Master International Index Series, Master Small Cap Index Series, Total International ex U.S. Index Master Portfolio and U.S. Total Bond Index Master Portfolio. If these transactions had been included to conform to the current year presentation, the portfolio turnover rate would have been 22% and 6% for the years ended December 31, 2012 and the period ended December 31, 2011, respectively. |
| | 13 | | Rounds to less than 1%. |
| | | | | | |
| See Notes to Financial Statements. | | | | |
| | | | | | | |
| | BLACKROCK FUNDS III | | DECEMBER 31, 2015 | | 45 |
| | |
| Financial Highlights | | BlackRock LifePath Index 2050 Fund |
| | | | | | | | | | | | | | | | | | | | |
| | | Institutional | |
| | | Year Ended December 31, | | | Period May 31, 20111
to December 31,
2011 | |
| | | 2015 | | | 2014 | | | 2013 | | | 2012 | | |
| | | | | | | | | | | | | | | | | | | | |
| Per Share Operating Performance | | | | | | | | | | | | | | | | | | | | |
Net asset value, beginning of period | | $ | 12.41 | | | $ | 11.91 | | | $ | 10.11 | | | $ | 8.86 | | | $ | 10.00 | |
| | | | |
Net investment income2 | | | 0.29 | | | | 0.29 | | | | 0.34 | | | | 0.24 | | | | 0.12 | |
Net realized and unrealized gain (loss) | | | (0.38 | ) | | | 0.57 | | | | 1.82 | | | | 1.21 | | | | (1.16 | ) |
| | | | |
Net increase (decrease) from investment operations | | | (0.09 | ) | | | 0.86 | | | | 2.16 | | | | 1.45 | | | | (1.04 | ) |
| | | | |
| Distributions:3 | | | | | | | | | | | | | | | | | | | | |
From net investment income | | | (0.28 | ) | | | (0.26 | ) | | | (0.27 | ) | | | (0.19 | ) | | | (0.09 | ) |
From net realized gain | | | (0.09 | ) | | | (0.10 | ) | | | (0.09 | ) | | | (0.01 | ) | | | — | |
From return of capital | | | — | | | | — | | | | — | | | | — | | | | (0.01 | ) |
| | | | |
Total distributions | | | (0.37 | ) | | | (0.36 | ) | | | (0.36 | ) | | | (0.20 | ) | | | (0.10 | ) |
| | | | |
Net asset value, end of period | | $ | 11.95 | | | $ | 12.41 | | | $ | 11.91 | | | $ | 10.11 | | | $ | 8.86 | |
| | | | |
| | | | | | | | | | | | | | | | | | | | |
| Total Return4 | | | | | | | | | | | | | | | | | | | | |
Based on net asset value | | | (0.72)% | | | | 7.23% | | | | 21.56% | | | | 16.35% | | | | (10.36)% | 5 |
| | | | |
| | | | | | | | | | | | | | | | | | | | |
| Ratios to Average Net Assets6 | | | | | | | | | | | | | | | | | | | | |
Total expenses7,8 | | | 0.22% | | | | 0.27% | | | | 0.34% | | | | 1.55% | | | | 7.27% | 9,10 |
| | | | |
Total expenses after fees waived and/or reimbursed7,8 | | | 0.12% | | | | 0.15% | | | | 0.20% | | | | 0.21% | | | | 0.24% | 9 |
| | | | |
Net investment income7,8 | | | 2.32% | | | | 2.33% | | | | 3.03% | | | | 2.44% | | | | 2.22% | 9 |
| | | | |
| | | | | | | | | | | | | | | | | | | | |
| Supplemental Data | | | | | | | | | | | | | | | | | | | | |
Net assets, end of period (000) | | $ | 38,476 | | | $ | 24,618 | | | $ | 7,679 | | | $ | 1,573 | | | $ | 22 | |
| | | | |
Portfolio turnover rate of the LifePath Index Master Portfolio | | | 14% | 11 | | | 22% | 11 | | | 12% | 11 | | | 3% | 12 | | | 0% | 12,13 |
| | | | |
| | 1 | | Commencement of operations. |
| | 2 | | Based on average shares outstanding. |
| | 3 | | Distributions for annual periods determined in accordance with federal income tax regulations. |
| | 4 | | Where applicable, assumes the reinvestment of distributions. |
| | 5 | | Aggregate total return. |
| | 6 | | Includes the LifePath Index Fund’s share of its corresponding LifePath Index Master Portfolio’s allocated net expenses and/or net investment income. |
| | 7 | | Includes the LifePath Index Fund’s share of the LifePath Index Master Portfolio’s allocated fees waived of 0.03%, 0.03%, 0.06%, 0.47%, and 3.71% for the years ended December 31, 2015, December 31, 2014, December 31, 2013 and December 31, 2012 and the period ended December 31, 2011, respectively. |
| | 8 | | Includes the LifePath Index Fund’s share of the LifePath Master Portfolio’s allocated expenses and/or net investment income. Excludes expenses incurred indirectly as a result of LifePath Master Portfolio’s investments in underlying funds as follows: |
| | | | | | | | | | | | | | | | | | | | |
| | | Year Ended December 31, | | | Period
May 31, 20111
to December 31,
2011 | |
| | | 2015 | | | 2014 | | | 2013 | | | 2012 | | |
| | | | | | | | | | | | | | | | | | | | |
Investments in underlying funds | | | 0.09% | | | | 0.08% | | | | 0.06% | | | | 0.05% | | | | 0.07% | |
| | | | |
| | 10 | | Organization costs were not annualized in the calculation of the expense ratio. If these expenses were annualized, the total expenses would have been 7.30%. |
| | 11 | | Includes the LifePath Index Master Portfolio’s purchases and sales of the underlying funds and Large Cap Index Master Portfolio, Master Small Cap Index Series, Total International ex U.S. Index Master Portfolio and U.S. Total Bond Index Master Portfolio. |
| | 12 | | Excludes the LifePath Index Master Portfolio’s purchases and sales of the Large Cap Index Master Portfolio, Master International Index Series, Master Small Cap Index Series, Total International ex U.S. Index Master Portfolio and U.S. Total Bond Index Master Portfolio. If these transactions had been included to conform to the current year presentation, the portfolio turnover rate would have been 26% and 5% for the years ended December 31, 2012 and the period ended December 31, 2011, respectively. |
| | 13 | | Rounds to less than 1%. |
| | | | | | |
| See Notes to Financial Statements. | | | | |
| | | | | | | |
| 46 | | BLACKROCK FUNDS III | | DECEMBER 31, 2015 | | |
| | |
| Financial Highlights (continued) | | BlackRock LifePath Index 2050 Fund |
| | | | | | | | | | | | | | | | | | | | |
| | | Investor A | |
| | | Year Ended December 31, | | | Period
May 31, 20111
to December 31, 2011 | |
| | | 2015 | | | 2014 | | | 2013 | | | 2012 | | |
| | | | | | | | | | | | | | | | | | | | |
| Per Share Operating Performance | | | | | | | | | | | | | | | | | | | | |
Net asset value, beginning of period | | $ | 12.39 | | | $ | 11.89 | | | $ | 10.10 | | | $ | 8.86 | | | $ | 10.00 | |
| | | | |
Net investment income2 | | | 0.26 | | | | 0.26 | | | | 0.32 | | | | 0.28 | | | | 0.10 | |
Net realized and unrealized gain (loss) | | | (0.38 | ) | | | 0.57 | | | | 1.81 | | | | 1.14 | | | | (1.15 | ) |
| | | | |
Net increase (decrease) from investment operations | | | (0.12 | ) | | | 0.83 | | | | 2.13 | | | | 1.42 | | | | (1.05 | ) |
| | | | |
| Distributions:3 | | | | | | | | | | | | | | | | | | | | |
From net investment income | | | (0.25 | ) | | | (0.23 | ) | | | (0.25 | ) | | | (0.17 | ) | | | (0.08 | ) |
From net realized gain | | | (0.09 | ) | | | (0.10 | ) | | | (0.09 | ) | | | (0.01 | ) | | | — | |
From return of capital | | | — | | | | — | | | | — | | | | — | | | | (0.01 | ) |
| | | | |
Total distributions | | | (0.34 | ) | | | (0.33 | ) | | | (0.34 | ) | | | (0.18 | ) | | | (0.09 | ) |
| | | | |
Net asset value, end of period | | $ | 11.93 | | | $ | 12.39 | | | $ | 11.89 | | | $ | 10.10 | | | $ | 8.86 | |
| | | | |
| | | | | | | | | | | | | | | | | | | | |
| Total Return4 | | | | | | | | | | | | | | | | | | | | |
Based on net asset value | | | (0.96)% | | | | 7.01% | | | | 21.25% | | | | 16.00% | | | | (10.49)% | 5 |
| | | | |
| | | | | | | | | | | | | | | | | | | | |
| Ratios to Average Net Assets6 | | | | | | | | | | | | | | | | | | | | |
Total expenses7,8 | | | 0.46% | | | | 0.52% | | | | 0.59% | | | | 1.33% | | | | 7.69% | 9,10 |
| | | | |
Total expenses after fees waived and/or reimbursed7,8 | | | 0.37% | | | | 0.40% | | | | 0.45% | | | | 0.47% | | | | 0.49% | 9 |
| | | | |
Net investment income7,8 | | | 2.09% | | | | 2.08% | | | | 2.85% | | | | 2.86% | | | | 1.97% | 9 |
| | | | |
| | | | | | | | | | | | | | | | | | | | |
| Supplemental Data | | | | | | | | | | | | | | | | | | | | |
Net assets, end of period (000) | | $ | 27,413 | | | $ | 22,053 | | | $ | 12,103 | | | $ | 1,090 | | | $ | 25 | |
| | | | |
Portfolio turnover rate of the LifePath Index Master Portfolio | | | 14% | 11 | | | 22% | 11 | | | 12% | 11 | | | 3% | 12 | | | 0% | 12,13 |
| | | | |
| | 1 | | Commencement of operations. |
| | 2 | | Based on average shares outstanding. |
| | 3 | | Distributions for annual periods determined in accordance with federal income tax regulations. |
| | 4 | | Where applicable, assumes the reinvestment of distributions. |
| | 5 | | Aggregate total return. |
| | 6 | | Includes the LifePath Index Fund’s share of its corresponding LifePath Index Master Portfolio’s allocated net expenses and/or net investment income. |
| | 7 | | Includes the LifePath Index Fund’s share of the LifePath Index Master Portfolio’s allocated fees waived of 0.03%, 0.03%, 0.06%, 0.22%, and 3.71% for the years ended December 31, 2015, December 31, 2014, December 31, 2013 and December 31, 2012 and the period ended December 31, 2011, respectively. |
| | 8 | | Includes the LifePath Index Fund’s share of the LifePath Master Portfolio’s allocated expenses and/or net investment income. Excludes expenses incurred indirectly as a result of LifePath Master Portfolio’s investments in underlying funds as follows: |
| | | | | | | | | | | | | | | | | | | | |
| | | Year Ended December 31, | | | Period
May 31, 20111
to December 31,
2011 | |
| | | 2015 | | | 2014 | | | 2013 | | | 2012 | | |
| | | | | | | | | | | | | | | | | | | | |
Investments in underlying funds | | | 0.09% | | | | 0.08% | | | | 0.06% | | | | 0.05% | | | | 0.07% | |
| | | | |
| | 10 | | Organization costs were not annualized in the calculation of the expense ratio. If these expenses were annualized, the total expenses would have been 7.71%. |
| | 11 | | Includes the LifePath Index Master Portfolio’s purchases and sales of the underlying funds and Large Cap Index Master Portfolio, Master Small Cap Index Series, Total International ex U.S. Index Master Portfolio and U.S. Total Bond Index Master Portfolio. |
| | 12 | | Excludes the LifePath Index Master Portfolio’s purchases and sales of the Large Cap Index Master Portfolio, Master International Index Series, Master Small Cap Index Series, Total International ex U.S. Index Master Portfolio and U.S. Total Bond Index Master Portfolio. If these transactions had been included to conform to the current year presentation, the portfolio turnover rate would have been 26% and 5% for the years ended December 31, 2012 and the period ended December 31, 2011, respectively. |
| | 13 | | Rounds to less than 1%. |
| | | | | | |
| See Notes to Financial Statements. | | | | |
| | | | | | | |
| | BLACKROCK FUNDS III | | DECEMBER 31, 2015 | | 47 |
| | |
| Financial Highlights (concluded) | | BlackRock LifePath Index 2050 Fund |
| | | | | | | | | | | | | | | | | | | | |
| | | Class K | |
| | | Year Ended December 31, | | | Period May 31, 20111
to December 31,
2011 | |
| | | 2015 | | | 2014 | | | 2013 | | | 2012 | | |
| | | | | | | | | | | | | | | | | | | | |
| Per Share Operating Performance | | | | | | | | | | | | | | | | | | | | |
Net asset value, beginning of period | | $ | 12.41 | | | $ | 11.91 | | | $ | 10.11 | | | $ | 8.86 | | | $ | 10.00 | |
| | | | |
Net investment income2 | | | 0.30 | | | | 0.29 | | | | 0.32 | | | | 0.26 | | | | 0.12 | |
Net realized and unrealized gain (loss) | | | (0.38 | ) | | | 0.58 | | | | 1.85 | | | | 1.19 | | | | (1.16 | ) |
| | | | |
Net increase (decrease) from investment operations | | | (0.08 | ) | | | 0.87 | | | | 2.17 | | | | 1.45 | | | | (1.04 | ) |
| | | | |
| Distributions:3 | | | | | | | | | | | | | | | | | | | | |
From net investment income | | | (0.29 | ) | | | (0.27 | ) | | | (0.28 | ) | | | (0.19 | ) | | | (0.09 | ) |
From net realized gain | | | (0.09 | ) | | | (0.10 | ) | | | (0.09 | ) | | | (0.01 | ) | | | — | |
From return of capital | | | — | | | | — | | | | — | | | | — | | | | (0.01 | ) |
| | | | |
Total distributions | | | (0.38 | ) | | | (0.37 | ) | | | (0.37 | ) | | | (0.20 | ) | | | (0.10 | ) |
| | | | |
Net asset value, end of period | | $ | 11.95 | | | $ | 12.41 | | | $ | 11.91 | | | $ | 10.11 | | | $ | 8.86 | |
| | | | |
| | | | | | | | | | | | | | | | | | | | |
| Total Return4 | | | | | | | | | | | | | | | | | | | | |
Based on net asset value | | | (0.67)% | | | | 7.28% | | | | 21.61% | | | | 16.37% | | | | (10.34)% | 5 |
| | | | |
| | | | | | | | | | | | | | | | | | | | |
| Ratios to Average Net Assets6 | | | | | | | | | | | | | | | | | | | | |
Total expenses7,8 | | | 0.16% | | | | 0.23% | | | | 0.33% | | | | 0.99% | | | | 7.17% | 9,10 |
| | | | |
Total expenses after fees waived and/or reimbursed7,8 | | | 0.07% | | | | 0.10% | | | | 0.15% | | | | 0.19% | | | | 0.21% | 9 |
| | | | |
Net investment income7,8 | | | 2.39% | | | | 2.37% | | | | 2.88% | | | | 2.67% | | | | 2.25% | 9 |
| | | | |
| | | | | | | | | | | | | | | | | | | | |
| Supplemental Data | | | | | | | | | | | | | | | | | | | | |
Net assets, end of period (000) | | $ | 271,178 | | | $ | 186,198 | | | $ | 83,933 | | | $ | 23,342 | | | $ | 1,727 | |
| | | | |
Portfolio turnover rate of the LifePath Index Master Portfolio | | | 14% | 11 | | | 22% | 11 | | | 12% | 11 | | | 3% | 12 | | | 0% | 12,13 |
| | | | |
| | 1 | | Commencement of operations. |
| | 2 | | Based on average shares outstanding. |
| | 3 | | Distributions for annual periods determined in accordance with federal income tax regulations. |
| | 4 | | Where applicable, assumes the reinvestment of distributions. |
| | 5 | | Aggregate total return. |
| | 6 | | Includes the LifePath Index Fund’s share of its corresponding LifePath Index Master Portfolio’s allocated net expenses and/or net investment income. |
| | 7 | | Includes the LifePath Index Fund’s share of the LifePath Index Master Portfolio’s allocated fees waived of 0.03%, 0.03%, 0.06%, 0.27%, and 3.71% for the years ended December 31, 2015, December 31, 2014, December 31, 2013 and December 31, 2012 and the period ended December 31, 2011, respectively. |
| | 8 | | Includes the LifePath Index Fund’s share of the LifePath Master Portfolio’s allocated expenses and/or net investment income. Excludes expenses incurred indirectly as a result of LifePath Master Portfolio’s investments in underlying funds as follows: |
| | | | | | | | | | | | | | | | | | | | |
| | | Year Ended December 31, | | | Period May 31, 20111
to December 31,
2011 | |
| | | 2015 | | | 2014 | | | 2013 | | | 2012 | | |
| | | | | | | | | | | | | | | | | | | | |
Investments in underlying funds | | | 0.09% | | | | 0.08% | | | | 0.06% | | | | 0.05% | | | | 0.07% | |
| | | | |
| | 10 | | Organization costs were not annualized in the calculation of the expense ratio. If these expenses were annualized, the total expenses would have been 7.19%. |
| | 11 | | Includes the LifePath Index Master Portfolio’s purchases and sales of the underlying funds and Large Cap Index Master Portfolio, Master Small Cap Index Series, Total International ex U.S. Index Master Portfolio and U.S. Total Bond Index Master Portfolio. |
| | 12 | | Excludes the LifePath Index Master Portfolio’s purchases and sales of the Large Cap Index Master Portfolio, Master International Index Series, Master Small Cap Index Series, Total International ex U.S. Index Master Portfolio and U.S. Total Bond Index Master Portfolio. If these transactions had been included to conform to the current year presentation, the portfolio turnover rate would have been 26% and 5% for the years ended December 31, 2012 and the period ended December 31, 2011, respectively. |
| | 13 | | Rounds to less than 1%. |
| | | | | | |
| See Notes to Financial Statements. | | | | |
| | | | | | | |
| 48 | | BLACKROCK FUNDS III | | DECEMBER 31, 2015 | | |
| | |
| Financial Highlights | | BlackRock LifePath Index 2055 Fund |
| | | | | | | | | | | | | | | | | | | | |
| | | Institutional | |
| | | Year Ended December 31, | | | Period May 31, 20111
to December 31,
2011 | |
| | | 2015 | | | 2014 | | | 2013 | | | 2012 | | |
| | | | | | | | | | | | | | | | | | | | |
| Per Share Operating Performance | | | | | | | | | | | | | | | | | | | | |
Net asset value, beginning of period | | $ | 12.60 | | | $ | 12.05 | | | $ | 10.05 | | | $ | 8.80 | | | $ | 10.00 | |
| | | | |
Net investment income2 | | | 0.30 | | | | 0.31 | | | | 0.37 | | | | 0.24 | | | | 0.12 | |
Net realized and unrealized gain (loss) | | | (0.38 | ) | | | 0.58 | | | | 1.91 | | | | 1.23 | | | | (1.22 | ) |
| | | | |
Net increase (decrease) from investment operations | | | (0.08 | ) | | | 0.89 | | | | 2.28 | | | | 1.47 | | | | (1.10 | ) |
| | | | |
| Distributions:3 | | | | | | | | | | | | | | | | | | | | |
From net investment income | | | (0.28 | ) | | | (0.27 | ) | | | (0.28 | ) | | | (0.22 | ) | | | (0.09 | ) |
From net realized gain | | | (0.07 | ) | | | (0.07 | ) | | | — | | | | — | | | | — | |
From return of capital | | | — | | | | — | | | | — | | | | (0.00 | )4 | | | (0.01 | ) |
| | | | |
Total distributions | | | (0.35 | ) | | | (0.34 | ) | | | (0.28 | ) | | | (0.22 | ) | | | (0.10 | ) |
| | | | |
Net asset value, end of period | | $ | 12.17 | | | $ | 12.60 | | | $ | 12.05 | | | $ | 10.05 | | | $ | 8.80 | |
| | | | |
| | | | | | | | | | | | | | | | | | | | |
| Total Return5 | | | | | | | | | | | | | | | | | | | | |
Based on net asset value | | | (0.64)% | | | | 7.46% | | | | 22.91% | | | | 16.78% | | | | (10.98)% | 6 |
| | | | |
| | | | | | | | | | | | | | | | | | | | |
| Ratios to Average Net Assets7 | | | | | | | | | | | | | | | | | | | | |
Total expenses8,9 | | | 0.30% | | | | 0.43% | | | | 0.75% | | | | 4.43% | | | | 7.32% | 10,11 |
| | | | |
Total expenses after fees waived and/or reimbursed8,9 | | | 0.11% | | | | 0.13% | | | | 0.20% | | | | 0.24% | | | | 0.24% | 10 |
| | | | |
Net investment income8,9 | | | 2.39% | | | | 2.50% | | | | 3.25% | | | | 2.46% | | | | 2.21% | 10 |
| | | | |
| | | | | | | | | | | | | | | | | | | | |
| Supplemental Data | | | | | | | | | | | | | | | | | | | | |
Net assets, end of period (000) | | $ | 19,214 | | | $ | 7,874 | | | $ | 896 | | | $ | 25 | | | $ | 22 | |
| | | | |
Portfolio turnover rate of the LifePath Index Master Portfolio | | | 17% | 12 | | | 22% | 12 | | | 15% | 12 | | | 8% | 13 | | | 0% | 13,14 |
| | | | |
| | 1 | | Commencement of operations. |
| | 2 | | Based on average shares outstanding. |
| | 3 | | Distributions for annual periods determined in accordance with federal income tax regulations. |
| | 4 | | Amount is greater than $(0.005) per share. |
| | 5 | | Where applicable, assumes the reinvestment of distributions. |
| | 6 | | Aggregate total return. |
| | 7 | | Includes the LifePath Index Fund’s share of its corresponding LifePath Index Master Portfolio’s allocated net expenses and/or net investment income. |
| | 8 | | Includes the LifePath Index Fund’s share of the LifePath Index Master Portfolio’s allocated fees waived of 0.05%, 0.10%, 0.26%, 1.36%, and 3.73% for the years ended December 31, 2015, December 31, 2014, December 31, 2013 and December 31, 2012 and the period ended December 31, 2011, respectively. |
| | 9 | | Includes the LifePath Index Fund’s share of the LifePath Index Master Portfolio’s allocated expenses and/or net investment income. Excludes expenses incurred indirectly as a result of the LifePath Index Master Portfolio’s investments in underlying funds as follows: |
| | | | | | | | | | | | | | | | | | | | |
| | | Year Ended December 31, | | | Period May 31, 20111
to December 31,
2011 | |
| | | 2015 | | | 2014 | | | 2013 | | | 2012 | | |
| | | | | | | | | | | | | | | | | | | | |
Investments in underlying funds | | | 0.09 | % | | | 0.09 | % | | | 0.06 | % | | | 0.05 | % | | | 0.08 | % |
| | | | |
| | 11 | | Organization costs were not annualized in the calculation of the expense ratio. If these expenses were annualized, the total expenses would have been 7.34%. |
| | 12 | | Includes the LifePath Index Master Portfolio’s purchases and sales of the underlying funds and Large Cap Index Master Portfolio, Master Small Cap Index Series, Total International ex U.S. Index Master Portfolio and U.S. Total Bond Index Master Portfolio. |
| | 13 | | Excludes the LifePath Index Master Portfolio’s purchases and sales of the Large Cap Index Master Portfolio, Master International Index Series, Master Small Cap Index Series, Total International ex U.S. Index Master Portfolio and U.S. Total Bond Index Master Portfolio. If these transactions had been included to conform to the current year presentation, the portfolio turnover rate would have been 53% and 13% for the years ended December 31, 2012 and the period ended December 31, 2011, respectively. |
| | 14 | | Rounds to less than 1%. |
| | | | | | |
| See Notes to Financial Statements. | | | | |
| | | | | | | |
| | BLACKROCK FUNDS III | | DECEMBER 31, 2015 | | 49 |
| | |
| Financial Highlights (continued) | | BlackRock LifePath Index 2055 Fund |
| | | | | | | | | | | | | | | | | | | | |
| | | Investor A | |
| | | Year Ended December 31, | | | Period
May 31, 20111
to December 31,
2011 | |
| | | 2015 | | | 2014 | | | 2013 | | | 2012 | | |
| | | | | | | | | | | | | | | | | | | | |
| Per Share Operating Performance | | | | | | | | | | | | | | | | | | | | |
Net asset value, beginning of period | | $ | 12.58 | | | $ | 12.04 | | | $ | 10.05 | | | $ | 8.80 | | | $ | 10.00 | |
| | | | |
Net investment income2 | | | 0.27 | | | | 0.27 | | | | 0.33 | | | | 0.25 | | | | 0.10 | |
Net realized and unrealized gain (loss) | | | (0.38 | ) | | | 0.58 | | | | 1.92 | | | | 1.20 | | | | (1.21 | ) |
| | | | |
Net increase (decrease) from investment operations | | | (0.11 | ) | | | 0.85 | | | | 2.25 | | | | 1.45 | | | | (1.11 | ) |
| | | | |
Distributions:3 | | | | | | | | | | | | | | | | | | | | |
From net investment income | | | (0.25 | ) | | | (0.24 | ) | | | (0.26 | ) | | | (0.20 | ) | | | (0.08 | ) |
From net realized gain | | | (0.07 | ) | | | (0.07 | ) | | | — | | | | — | | | | — | |
From return of capital | | | — | | | | — | | | | — | | | | (0.00 | )4 | | | (0.01 | ) |
| | | | |
Total distributions | | | (0.32 | ) | | | (0.31 | ) | | | (0.26 | ) | | | (0.20 | ) | | | (0.09 | ) |
| | | | |
Net asset value, end of period | | $ | 12.15 | | | $ | 12.58 | | | $ | 12.04 | | | $ | 10.05 | | | $ | 8.80 | |
| | | | |
| | | | | | | | | | | | | | | | | | | | |
| Total Return5 | | | | | | | | | | | | | | | | | | | | |
Based on net asset value | | | (0.88 | )% | | | 7.13% | | | | 22.55% | | | | 16.55% | | | | (11.11)% | 6 |
| | | | |
| | | | | | | | | | | | | | | | | | | | |
| Ratios to Average Net Assets7 | | | | | | | | | | | | | | | | | | | | |
Total expenses8,9 | | | 0.53% | | | | 0.69% | | | | 0.91% | | | | 3.98% | | | | 7.57% | 10,11 |
| | | | |
Total expenses after fees waived and/or reimbursed8,9 | | | 0.36% | | | | 0.40% | | | | 0.44% | | | | 0.49% | | | | 0.49% | 10 |
| | | | |
Net investment income8,9 | | | 2.13% | | | | 2.14% | | | | 2.87% | | | | 2.60% | | | | 1.95% | 10 |
| | | | |
| | | | | | | | | | | | | | | | | | | | |
| Supplemental Data | | | | | | | | | | | | | | | | | | | | |
Net assets, end of period (000) | | $ | 13,140 | | | $ | 8,945 | | | $ | 4,696 | | | $ | 129 | | | $ | 22 | |
| | | | |
Portfolio turnover rate of the LifePath Index Master Portfolio | | | 17% | 12 | | | 22% | 12 | | | 15% | 12 | | | 8% | 13 | | | 0% | 13,14 |
| | | | |
| | 1 | | Commencement of operations. |
| | 2 | | Based on average shares outstanding. |
| | 3 | | Distributions for annual periods determined in accordance with federal income tax regulations. |
| | 4 | | Amount is greater than $(0.005) per share. |
| | 5 | | Where applicable, assumes the reinvestment of distributions. |
| | 6 | | Aggregate total return. |
| | 7 | | Includes the LifePath Index Fund’s share of its corresponding LifePath Index Master Portfolio’s allocated net expenses and/or net investment income. |
| | 8 | | Includes the LifePath Index Fund’s share of the LifePath Index Master Portfolio’s allocated fees waived of 0.05%, 0.10%, 0.27%, 1.05%, and 3.74% for the years ended December 31, 2015, December 31, 2014, December 31, 2013 and December 31, 2012 and the period ended December 31, 2011, respectively. |
| | 9 | | Includes the LifePath Index Fund’s share of the LifePath Index Master Portfolio’s allocated expenses and/or net investment income. Excludes expenses incurred indirectly as a result of the LifePath Index Master Portfolio’s investments in underlying funds as follows: |
| | | | | | | | | | | | | | | | | | | | |
| | | Year Ended December 31, | | | Period May 31, 20111
to December 31,
2011 | |
| | | 2015 | | | 2014 | | | 2013 | | | 2012 | | |
| | | | | | | | | | | | | | | | | | | | |
Investments in underlying funds | | | 0.09% | | | | 0.09% | | | | 0.06% | | | | 0.05% | | | | 0.08% | |
| | | | |
| | 11 | | Organization costs were not annualized in the calculation of the expense ratio. If these expenses were annualized, the total expenses would have been 7.59%. |
| | 12 | | Includes the LifePath Index Master Portfolio’s purchases and sales of the underlying funds and Large Cap Index Master Portfolio, Master Small Cap Index Series, Total International ex U.S. Index Master Portfolio and U.S. Total Bond Index Master Portfolio. |
| | 13 | | Excludes the LifePath Index Master Portfolio’s purchases and sales of the Large Cap Index Master Portfolio, Master International Index Series, Master Small Cap Index Series, Total International ex U.S. Index Master Portfolio and U.S. Total Bond Index Master Portfolio. If these transactions had been included to conform to the current year presentation, the portfolio turnover rate would have been 53% and 13% for the years ended December 31, 2012 and the period ended December 31, 2011, respectively. |
| | 14 | | Rounds to less than 1%. |
| | | | | | |
| See Notes to Financial Statements. | | | | |
| | | | | | | |
| 50 | | BLACKROCK FUNDS III | | DECEMBER 31, 2015 | | |
| | |
| Financial Highlights (concluded) | | BlackRock LifePath Index 2055 Fund |
| | | | | | | | | | | | | | | | | | | | |
| | | Class K | |
| | | Year Ended December 31, | | | Period May 31, 20111
to December 31,
2011 | |
| | | 2015 | | | 2014 | | | 2013 | | | 2012 | | |
| | | | | | | | | | | | | | | | | | | | |
| Per Share Operating Performance | | | | | | | | | | | | | | | | | | | | |
Net asset value, beginning of period | | $ | 12.60 | | | $ | 12.05 | | | $ | 10.05 | | | $ | 8.80 | | | $ | 10.00 | |
| | | | |
Net investment income2 | | | 0.31 | | | | 0.30 | | | | 0.34 | | | | 0.26 | | | | 0.12 | |
Net realized and unrealized gain (loss) | | | (0.38 | ) | | | 0.60 | | | | 1.95 | | | | 1.21 | | | | (1.22 | ) |
| | | | |
Net increase (decrease) from investment operations | | | (0.07 | ) | | | 0.90 | | | | 2.29 | | | | 1.47 | | | | (1.10 | ) |
| | | | |
| Distributions:3 | | | | | | | | | | | | | | | | | | | | |
From net investment income | | | (0.29 | ) | | | (0.28 | ) | | | (0.29 | ) | | | (0.22 | ) | | | (0.09 | ) |
From net realized gain | | | (0.07 | ) | | | (0.07 | ) | | | — | | | | — | | | | — | |
From return of capital | | | — | | | | — | | | | — | | | | (0.00 | )4 | | | (0.01 | ) |
| | | | |
Total distributions | | | (0.36 | ) | | | (0.35 | ) | | | (0.29 | ) | | | (0.22 | ) | | | (0.10 | ) |
| | | | |
Net asset value, end of period | | $ | 12.17 | | | $ | 12.60 | | | $ | 12.05 | | | $ | 10.05 | | | $ | 8.80 | |
| | | | |
| | | | | | | | | | | | | | | | | | | | |
| Total Return5 | | | | | | | | | | | | | | | | | | | | |
Based on net asset value | | | (0.60 | )% | | | 7.50% | | | | 22.95% | | | | 16.83% | | | | (10.96 | )%6 |
| | | | |
| | | | | | | | | | | | | | | | | | | | |
| Ratios to Average Net Assets7 | | | | | | | | | | | | | | | | | | | | |
Total expenses8,9 | | | 0.24% | | | | 0.42% | | | | 0.70% | | | | 3.71% | | | | 7.21% | 10,11 |
| | | | |
Total expenses after fees waived and/or reimbursed8,9 | | | 0.06% | | | | 0.10% | | | | 0.15% | | | | 0.19% | | | | 0.21% | 10 |
| | | | |
Net investment income8,9 | | | 2.43% | | | | 2.44% | | | | 3.05% | | | | 2.71% | | | | 2.24% | 10 |
| | | | |
| | | | | | | | | | | | | | | | | | | | |
| Supplemental Data | | | | | | | | | | | | | | | | | | | | |
Net assets, end of period (000) | | $ | 74,656 | | | $ | 45,039 | | | $ | 18,345 | | | $ | 4,706 | | | $ | 1,716 | |
| | | | |
Portfolio turnover rate of the LifePath Index Master Portfolio | | | 17% | 12 | | | 22% | 12 | | | 15% | 12 | | | 8% | 13 | | | 0% | 13,14 |
| | | | |
| | 1 | | Commencement of operations. |
| | 2 | | Based on average shares outstanding. |
| | 3 | | Distributions for annual periods determined in accordance with federal income tax regulations. |
| | 4 | | Amount is greater than $(0.005) per share. |
| | 5 | | Where applicable, assumes the reinvestment of distributions. |
| | 6 | | Aggregate total return. |
| | 7 | | Includes the LifePath Index Fund’s share of its corresponding LifePath Index Master Portfolio’s allocated net expenses and/or net investment income. |
| | 8 | | Includes the LifePath Index Fund’s share of the LifePath Index Master Portfolio’s allocated fees waived of 0.05%, 0.10%, 0.28%, 0.18%, and 3.74% for the years ended December 31, 2015, December 31, 2014, December 31, 2013 and December 31, 2012 and the period ended December 31, 2011, respectively. |
| | 9 | | Includes the LifePath Index Fund’s share of the LifePath Index Master Portfolio’s allocated expenses and/or net investment income. Excludes expenses incurred indirectly as a result of the LifePath Index Master Portfolio’s investments in underlying funds as follows: |
| | | | | | | | | | | | | | | | | | | | |
| | | Year Ended December 31, | | | Period May 31, 20111
to December 31,
2011 | |
| | | 2015 | | | 2014 | | | 2013 | | | 2012 | | |
| | | | | | | | | | | | | | | | | | | | |
Investments in underlying funds | | | 0.09% | | | | 0.09% | | | | 0.06% | | | | 0.05% | | | | 0.08% | |
| | | | |
| | 11 | | Organization costs were not annualized in the calculation of the expense ratio. If these expenses were annualized, the total expenses would have been 7.22%. |
| | 12 | | Includes the LifePath Index Master Portfolio’s purchases and sales of the underlying funds and Large Cap Index Master Portfolio, Master Small Cap Index Series, Total International ex U.S. Index Master Portfolio and U.S. Total Bond Index Master Portfolio. |
| | 13 | | Excludes the LifePath Index Master Portfolio’s purchases and sales of the Large Cap Index Master Portfolio, Master International Index Series, Master Small Cap Index Series, Total International ex U.S. Index Master Portfolio and U.S. Total Bond Index Master Portfolio. If these transactions had been included to conform to the current year presentation, the portfolio turnover rate would have been 53% and 13% for the years ended December 31, 2012 and the period ended December 31, 2011, respectively. |
| | 14 | | Rounds to less than 1%. |
| | | | | | |
| See Notes to Financial Statements. | | | | |
| | | | | | | |
| | BLACKROCK FUNDS III | | DECEMBER 31, 2015 | | 51 |
| | |
| Notes to Financial Statements | | |
1. Organization:
BlackRock Funds III (the “Trust”) is registered under the Investment Company Act of 1940, as amended (the “1940 Act”), as an open-end management investment company. The Trust is organized as a Delaware statutory trust. The following series of the Trust are referred to herein collectively as the “LifePath Index Funds” or individually, as a “LifePath Index Fund”:
| | | | |
| Fund Name | | Herein Referred To As | | Diversification Classification |
BlackRock LifePath® Index Retirement Fund | | LifePath Index Retirement Fund | | Diversified |
BlackRock LifePath® Index 2020 Fund | | LifePath Index 2020 Fund | | Diversified |
BlackRock LifePath® Index 2025 Fund | | LifePath Index 2025 Fund | | Diversified |
BlackRock LifePath® Index 2030 Fund | | LifePath Index 2030 Fund | | Diversified |
BlackRock LifePath® Index 2035 Fund | | LifePath Index 2035 Fund | | Diversified |
BlackRock LifePath® Index 2040 Fund | | LifePath Index 2040 Fund | | Diversified |
BlackRock LifePath® Index 2045 Fund | | LifePath Index 2045 Fund | | Diversified |
BlackRock LifePath® Index 2050 Fund | | LifePath Index 2050 Fund | | Diversified |
BlackRock LifePath® Index 2055 Fund | | LifePath Index 2055 Fund | | Diversified |
Each LifePath Index Fund seeks to achieve its investment objective by investing all of its assets in a corresponding series of the Master Investment Portfolio (“MIP”): LifePath® Index Retirement Master Portfolio, LifePath® Index 2020 Master Portfolio, LifePath® Index 2025 Master Portfolio, LifePath® Index 2030 Master Portfolio, LifePath® Index 2035 Master Portfolio, LifePath® Index 2040 Master Portfolio, LifePath® Index 2045 Master Portfolio, LifePath® Index 2050 Master Portfolio and LifePath® Index 2055 Master Portfolio (each, a “LifePath Index Master Portfolio” and together, the LifePath Index Master Portfolios”). MIP is an affiliate of the Trust. Each LifePath Index Master Portfolio has the same investment objective and strategies as its corresponding LifePath Index Fund. The value of each LifePath Index Fund’s investment in its corresponding LifePath Index Master Portfolio reflects the LifePath Index Fund’s proportionate interest in the net assets of the LifePath Index Master Portfolio. The performance of each LifePath Index Fund is directly affected by the performance of its corresponding LifePath Index Master Portfolio. At December 31, 2015, the percentage of each corresponding LifePath Index Master Portfolio owned by the corresponding LifePath Index Fund was 100.0%. As such, the financial statements of each corresponding LifePath Index Master Portfolio, including the Schedule of Investments, are included elsewhere in this report and should be read in conjunction with the LifePath Index Funds’ financial statements.
Each LifePath Index Fund offers multiple classes of shares. All classes of shares have identical voting, dividend, liquidation and other rights and are subject to the same terms and conditions, except that Investor A Shares bear expenses related to the shareholder servicing of such shares. Institutional and Class K Shares are sold only to certain eligible investors. Investor A Shares are generally available through financial intermediaries. Investor A Shares have exclusive voting rights with respect to matters relating to its shareholder servicing expenditures. The Boards of Trustees of the Trust and Boards of Trustees of MIP are referred to throughout this report as the “Board of Trustees” or the “Board” and the members are referred to as “Trustees.” Each class has exclusive voting rights with respect to matters relating to its shareholder servicing and distribution expenditures.
| | | | | | |
| Share Class | | Initial Sales Charge | | CDSC | | Conversion Privilege |
Institutional and Class K | | No | | No | | None |
Investor A | | No | | No | | None |
The LifePath Index Funds, together with certain other registered investment companies advised by BFA or its affiliates, are included in a complex of open-end funds referred to as the Equity-Liquidity Complex.
2. Significant Accounting Policies:
The financial statements are prepared in conformity with accounting principles generally accepted in the United States of America (“U.S. GAAP”), which may require management to make estimates and assumptions that affect the reported amounts of assets and liabilities in the financial statements, disclosure of contingent assets and liabilities at the date of the financial statements and the reported amounts of increases and decreases in net assets from operations during the reporting period. Actual results could differ from those estimates. Each LifePath Index Fund is considered an investment company under U.S. GAAP and follows the accounting and reporting guidance applicable to investment companies. Below is a summary of significant accounting policies:
Investment Transactions and Investment Income: For financial reporting purposes, contributions to and withdrawals from each LifePath Index Master Portfolio are accounted on a trade date basis. Each LifePath Index Fund records daily its proportionate share of its LifePath Index Master Portfolio’s income, expenses and realized and unrealized gains and losses. In addition, each LifePath Index Fund accrues its own expenses. Income, expenses and realized and unrealized gains and losses are allocated daily to each class based on its relative net assets.
Distributions: Distributions from net investment income are declared and paid quarterly. Distributions of capital gains are recorded on the ex-dividend date. The portion of distributions, if any, that exceeds a LifePath Index Fund’s current and accumulated earnings and profits, as measured on a tax basis, constitute a non-taxable return of capital. The character and timing of distributions are determined in accordance with federal income tax regulations, which may differ from U.S. GAAP.
| | | | | | |
| | | | | | | |
| 52 | | BLACKROCK FUNDS III | | DECEMBER 31, 2015 | | |
| | | | |
| Notes to Financial Statements (continued) | | |
In-Kind Redemptions: The LifePath Index Master Portfolios satisfied certain redemptions in investors’ capital through an in-kind redemption of securities and cash. For financial reporting purposes, these transactions were treated as a sale of securities and the resulting gains and losses were recognized at the LifePath Index Master Portfolios based on the market value of the securities on the date of the redemption. For the year ended December 31, 2015, the LifePath Index Funds were allocated realized gain from the in-kind redemptions. For tax purposes, no gains or losses were recognized. Gains and losses resulting from such in-kind redemptions, which are included in the Statements of Operations, were as follows:
| | | | | | | | | | | | | | | | | | | | | | | | | | | | | | | | |
LifePath Index Retirement Fund | | LifePath Index 2020 Fund | | | LifePath Index 2025 Fund | | | LifePath Index 2030 Fund | | | LifePath Index 2035 Fund | | | LifePath Index 2040 Fund | | | LifePath Index 2045 Fund | | | LifePath Index 2050 Fund | | | LifePath Index 2055 Fund | |
| $13,601,287 | | $ | 34,295,279 | | | $ | 26,222,654 | | | $ | 41,924,245 | | | $ | 24,935,785 | | | $ | 33,677,079 | | | $ | 15,146,397 | | | $ | 15,545,874 | | | $ | 4,742,120 | |
Indemnifications: In the normal course of business, a LifePath Index Fund enters into contracts that contain a variety of representations that provide general indemnification. A LifePath Index Fund’s maximum exposure under these arrangements is unknown because it involves future potential claims against a LifePath Index Fund, which cannot be predicted with any certainty.
Other: Expenses directly related to a LifePath Index Fund or its classes are charged to that LifePath Index Fund or the applicable class. Other operating expenses shared by several funds, including other funds managed by BFA, are prorated among those funds on the basis of relative net assets or other appropriate methods. Expenses directly related to the LifePath Index Funds and other shared expenses prorated to the LifePath Index Funds are allocated daily to each class based on its relative net assets or other appropriate methods.
3. Investment Valuation and Fair Value Measurements:
Investment Valuation Policies: The LifePath Index Funds’ investments are valued at fair value (also referred to as “market value” within the financial statements) as of the close of trading on the New York Stock Exchange (“NYSE”) (generally 4:00 p.m., Eastern time). U.S. GAAP defines fair value as the price the LifePath Index Funds would receive to sell an asset or pay to transfer a liability in an orderly transaction between market participants at the measurement date.
The LifePath Index Funds’ policy is to fair value its financial instruments at market value. Each LifePath Index Fund records its investment in its corresponding LifePath Index Master Portfolio at fair value based on such LifePath Index Fund’s proportionate interest in the net assets of the LifePath Index Master Portfolio. Valuation of securities held by the LifePath Index Master Portfolio is discussed in Note 3 of the LifePath Index Master Portfolio’s Notes to Financial Statements, which are included elsewhere in this report.
4. Administration Agreement and Other Transactions with Affiliates:
The PNC Financial Services Group, Inc. is the largest stockholder and an affiliate of BlackRock, Inc. (“BlackRock”) for 1940 Act purposes.
The Trust, on behalf of the LifePath Index Funds, entered into an Administration Agreement with BAL, an indirect, wholly owned subsidiary of BlackRock, which has agreed to provide general administration services (other than investment advice and related portfolio activities). BAL, in consideration thereof, has agreed to bear all of the LifePath Index Funds’ ordinary operating expenses, excluding, generally, investment advisory fees, distribution fees, brokerage and other expenses related to the execution of portfolio transactions, extraordinary expenses and certain other expenses which are borne by the LifePath Index Funds. BAL is entitled to receive for these administration services an annual fee of 0.03% based on the average daily net assets of each LifePath Index Fund.
From time to time, BAL may waive such fees in whole or in part. Any such waiver will reduce the expenses of the LifePath Index Funds and, accordingly, have a favorable impact on their performance. BAL may delegate certain of its administration duties to sub-administrators.
BFA and BAL contractually agreed to waive and/or reimburse fees or expenses in order to limit expenses, excluding interest expense, dividend expense, tax expense, acquired fund fees and expenses, and certain other fund expenses, which constitute extraordinary expenses not incurred in the ordinary course of the LifePath Index Funds’ business. The expense limitations as a percentage of average daily net assets are as follows: 1.10% for Institutional; 1.35% for Investor A, and 1.05% for Class K. This agreement will automatically renew on May 1 of each year for an additional year until May 1, 2025, unless terminated earlier by the Board, including a majority of the Independent Trustees.
| | | | | | |
| | | | | | | |
| | BLACKROCK FUNDS III | | DECEMBER 31, 2015 | | 53 |
| | |
| Notes to Financial Statements (continued) | | |
In addition, BFA and BAL contractually agreed to waive and/or reimburse fees or expenses in order to limit expenses, excluding interest expense, dividend expense, tax expense, acquired fund fees and expenses and certain other fund expenses, which constitute extraordinary expenses not incurred in the ordinary course of the LifePath Index Fund’s business. The agreement may be terminated upon 90 days’ notice by a majority of the non-interested trustees of the Trust or by a vote of majority of the outstanding voting shares of the LifePath Index Fund. The expense limitations as a percentage of average daily net assets until May 1, 2016 are as follows:
| | | | | | | | | | | | | | | | | | | | | | | | | | | | | | | | | | | | |
| | | LifePath Index Retirement Fund | | | LifePath Index 2020 Fund | | | LifePath Index 2025 Fund | | | LifePath Index 2030 Fund | | | LifePath Index 2035 Fund1 | | | LifePath Index 2040 Fund1 | | | LifePath Index 2045 Fund1 | | | LifePath Index 2050 Fund1 | | | LifePath Index 2055 Fund1 | |
Institutional | | | 0.10% | | | | 0.10% | | | | 0.10% | | | | 0.10% | | | | 0.09% | | | | 0.09% | | | | 0.08% | | | | 0.08% | | | | 0.07% | |
Investor A | | | 0.35% | | | | 0.35% | | | | 0.35% | | | | 0.35% | | | | 0.34% | | | | 0.34% | | | | 0.33% | | | | 0.33% | | | | 0.32% | |
Class K | | | 0.05% | | | | 0.05% | | | | 0.05% | | | | 0.05% | | | | 0.04% | | | | 0.04% | | | | 0.03% | | | | 0.03% | | | | 0.02% | |
| | 1 | | Expense limitations became effective on April 30, 2015. Prior to April 30, 2015, the expense limitations were 0.10% for Institutional, 0.35% for Investor A and 0.05% for Class K. |
These amounts waived or reimbursed are included in fees waived by the administrator, and shown as transfer agent fees waived and/or reimbursed — class specific, in the Statements of Operations. For the year ended December 31, 2015, the amounts included in transfer agent fees waived and/or reimbursed for each class were as follows:
| | | | | | | | | | | | | | | | | | | | | | | | | | | | | | | | |
LifePath Index Retirement Fund | | LifePath Index 2020 Fund | | | LifePath Index 2025 Fund | | | LifePath Index 2030 Fund | | | LifePath Index 2035 Fund | | | LifePath Index 2040 Fund | | | LifePath Index 2045 Fund | | | LifePath Index 2050 Fund | | | LifePath Index 2055 Fund | |
| $45,725 | | $ | 54,363 | | | $ | 38,527 | | | $ | 57,852 | | | $ | 37,801 | | | $ | 49,455 | | | $ | 33,338 | | | $ | 46,760 | | | $ | 28,603 | |
If during a LifePath Index Fund’s fiscal year the operating expenses of a share class, that at any time during the prior two fiscal years received a waiver or reimbursement from BFA or BAL, are less than the expense limit for that share class, BFA or BAL is entitled to be reimbursed by such share class up to the lesser of (a) the amount of fees waived or expenses reimbursed during those prior two fiscal years under the agreement and (b) the amount by which the expense limit for that share class exceeds the operating expenses of the share class for the current fiscal year, provided that: (1) each LifePath Index Fund, of which the share class is a part, has more than $50 million in assets for the fiscal year and (2) BFA or BAL or an affiliate continues to serve as a LifePath Index Fund’s investment advisor or administrator. In the event the expense limit for a share class is changed subsequent to a fiscal year in which BFA or BAL becomes entitled to reimbursement for fees waived or reimbursed, the amount available to reimburse BFA or BAL shall be calculated by reference to the expense limit for that share class in effect at the time BFA or BAL became entitled to receive such reimbursement, rather than the subsequently changed expense limit for that share class.
For the year ended December 31, 2015, BAL recouped the following LifePath Index Fund level and class specific waivers and/or reimbursements previously recorded by the LifePath Index Funds:
| | | | |
| | | BAL | |
| LifePath Index Retirement Fund | | | | |
Institutional | | $ | 1,112 | |
Investor A | | $ | 3,446 | |
| LifePath Index 2020 Fund | | | | |
Institutional | | $ | 2,233 | |
Investor A | | $ | 4,550 | |
| LifePath Index 2025 Fund | | | | |
Institutional | | $ | 2,661 | |
Investor A | | $ | 4,347 | |
| LifePath Index 2030 Fund | | | | |
Institutional | | $ | 2,568 | |
Investor A | | $ | 5,160 | |
| LifePath Index 2035 Fund | | | | |
Institutional | | $ | 2,389 | |
Investor A | | $ | 4,535 | |
| LifePath Index 2040 Fund | | | | |
Institutional | | $ | 2,246 | |
Investor A | | $ | 2,870 | |
| LifePath Index 2045 Fund | | | | |
Institutional | | $ | 2,807 | |
Investor A | | $ | 1,462 | |
| LifePath Index 2050 Fund | | | | |
Institutional | | $ | 1,761 | |
Investor A | | $ | 466 | |
| LifePath Index 2055 Fund | | | | |
Institutional | | $ | 681 | |
Investor A | | $ | 52 | |
| | | | | | |
| | | | | | | |
| 54 | | BLACKROCK FUNDS III | | DECEMBER 31, 2015 | | |
| | | | |
| Notes to Financial Statements (continued) | | |
The following LifePath Index Fund level and class specific waivers and/or reimbursements previously recorded by the LifePath Index Funds, which were subject to recoupment by the Administrator, expired on December 31, 2015:
| | | | |
| | | BAL | |
| LifePath Index Retirement Fund | | | | |
Fund level | | $ | 189,439 | |
Class K | | $ | 40,265 | |
| LifePath Index 2020 Fund | | | | |
Fund level | | $ | 292,083 | |
Class K | | $ | 33,435 | |
| LifePath Index 2025 Fund | | | | |
Fund level | | $ | 163,134 | |
Class K | | $ | 15,549 | |
| LifePath Index 2030 Fund | | | | |
Fund level | | $ | 250,300 | |
Class K | | $ | 31,714 | |
| LifePath Index 2035 Fund | | | | |
Fund level | | $ | 127,727 | |
Class K | | $ | 15,042 | |
| LifePath Index 2040 Fund | | | | |
Fund level | | $ | 173,008 | |
Class K | | $ | 29,287 | |
| LifePath Index 2045 Fund | | | | |
Fund level | | $ | 90,363 | |
Class K | | $ | 14,331 | |
| LifePath Index 2050 Fund | | | | |
Fund level | | $ | 88,935 | |
Investor A | | $ | 65 | |
Class K | | $ | 26,822 | |
| LifePath Index 2055 Fund | | | | |
Fund level | | $ | 67,183 | |
Investor A | | $ | 270 | |
Class K | | $ | 8,027 | |
On December 31, 2015, the LifePath Index Fund level and class specific waivers and/or reimbursements subject to possible future recoupment under the expense limitation agreement are as follows:
| | | | | | | | |
| | | Expiring December 31, | |
| | | 2016 | | | 2017 | |
| LifePath Index Retirement Fund | | | | | | | | |
Fund level | | $ | 236,881 | | | $ | 267,767 | |
Institutional | | $ | 4,112 | | | $ | 8,299 | |
Investor A | | | — | | | $ | 10,921 | |
Class K | | $ | 38,752 | | | $ | 28,603 | |
| LifePath Index 2020 Fund | | | | | | | | |
Fund level | | $ | 378,914 | | | $ | 470,803 | |
Institutional | | $ | 5,309 | | | $ | 9,855 | |
Investor A | | $ | 4,044 | | | $ | 14,496 | |
Class K | | $ | 34,471 | | | $ | 33,794 | |
| LifePath Index 2025 Fund | | | | | | | | |
Fund level | | $ | 251,481 | | | $ | 335,370 | |
Institutional | | $ | 1,845 | | | $ | 9,037 | |
Investor A | | $ | 2,905 | | | $ | 13,405 | |
Class K | | $ | 18,068 | | | $ | 18,415 | |
| LifePath Index 2030 Fund | | | | | | | | |
Fund level | | $ | 360,380 | | | $ | 463,274 | |
Institutional | | $ | 3,365 | | | $ | 9,386 | |
Investor A | | $ | 3,592 | | | $ | 16,428 | |
Class K | | $ | 35,943 | | | $ | 35,861 | |
| LifePath Index 2035 Fund | | | | | | | | |
Fund level | | $ | 217,349 | | | $ | 281,863 | |
Institutional | | $ | 1,495 | | | $ | 6,733 | |
Investor A | | $ | 1,076 | | | $ | 13,808 | |
Class K | | $ | 20,255 | | | $ | 19,219 | |
| LifePath Index 2040 Fund | | | | | | | | |
Fund level | | $ | 274,798 | | | $ | 353,534 | |
Institutional | | $ | 1,865 | | | $ | 8,016 | |
Investor A | | $ | 2,134 | | | $ | 9,826 | |
Class K | | $ | 35,927 | | | $ | 34,605 | |
| | | | | | |
| | | | | | | |
| | BLACKROCK FUNDS III | | DECEMBER 31, 2015 | | 55 |
| | |
| Notes to Financial Statements (continued) | | |
| | | | | | | | |
| | | Expiring December 31, | |
| | | 2016 | | | 2017 | |
| LifePath Index 2045 Fund | | | | | | | | |
Fund level | | $ | 161,498 | | | $ | 200,123 | |
Institutional | | $ | 169 | | | $ | 7,596 | |
Investor A | | $ | 1,843 | | | $ | 7,392 | |
Class K | | $ | 21,336 | | | $ | 19,915 | |
| LifePath Index 2050 Fund | | | | | | | | |
Fund level | | $ | 167,905 | | | $ | 212,015 | |
Institutional | | $ | 1,309 | | | $ | 8,506 | |
Investor A | | $ | 3,247 | | | $ | 5,578 | |
Class K | | $ | 35,911 | | | $ | 34,777 | |
| LifePath Index 2055 Fund | | | | | | | | |
Fund level | | $ | 104,536 | | | $ | 126,231 | |
Institutional | | $ | 1,426 | | | $ | 6,771 | |
Investor A | | $ | 1,708 | | | $ | 3,365 | |
Class K | | $ | 17,946 | | | $ | 19,560 | |
The Trust, on behalf of the LifePath Index Funds, entered into a Distribution Agreement and a Distribution Plan with BlackRock Investments, LLC (“BRIL”), an affiliate of the Administrator. Pursuant to the Distribution and Service Plan and in accordance with Rule 12b-1 under the 1940 Act, each LifePath Index Fund pays BRIL ongoing service fees. The fees are accrued daily and paid monthly at an annual rate of 0.25% based upon the average daily net assets of the Investor A Shares.
Pursuant to sub-agreements with BRIL, broker-dealers and BRIL provide shareholder servicing and distribution services to the LifePath Index Funds. The ongoing service and/or distribution fee compensates BRIL and each broker-dealer for providing shareholder servicing and/or distribution related services to the shareholders.
Pursuant to written agreements, certain financial intermediaries, some of which may be affiliates, provide the LifePath Index Funds with sub-accounting, recordkeeping, sub-transfer agency and other administrative services with respect to sub-accounts they service. For these services, these entities receive an asset-based fee or an annual fee per shareholder account, which will vary depending on share class and/or net assets. For the year ended December 31, 2105, the LifePath Index Funds paid the following amounts to affiliates of BlackRock in return for these services, which are included in transfer agent — class specific in the Statements of Operations:
| | | | | | | | |
| | | Institutional | | | Investor A | |
LifePath Index Retirement Fund | | $ | 38,847 | | | $ | 36,989 | |
LifePath Index 2020 Fund | | $ | 48,436 | | | $ | 68,365 | |
LifePath Index 2025 Fund | | $ | 36,773 | | | $ | 55,545 | |
LifePath Index 2030 Fund | | $ | 45,883 | | | $ | 75,567 | |
LifePath Index 2035 Fund | | $ | 25,289 | | | $ | 51,497 | |
LifePath Index 2040 Fund | | $ | 32,334 | | | $ | 43,010 | |
LifePath Index 2045 Fund | | $ | 20,719 | | | $ | 22,534 | |
LifePath Index 2050 Fund | | $ | 19,423 | | | $ | 15,641 | |
LifePath Index 2055 Fund | | $ | 8,062 | | | $ | 6,095 | |
The Administrator maintains a call center, which is responsible for providing certain shareholder services to the LifePath Index Funds, such as responding to shareholder inquiries and processing transactions based upon instructions from shareholders with respect to the subscription and redemption of LifePath Index Fund shares. For the year ended December 31, 2015, each LifePath Index Fund reimbursed the Administrator the following amounts for costs incurred in running the call center, which are included in transfer agent — class specific in the Statements of Operations:
| | | | | | | | | | | | |
| | | Institutional | | | Investor A | | | Class K | |
LifePath Index Retirement Fund | | $ | 355 | | | $ | 547 | | | $ | 1,325 | |
LifePath Index 2020 Fund | | $ | 399 | | | $ | 981 | | | $ | 2,658 | |
LifePath Index 2025 Fund | | $ | 360 | | | $ | 853 | | | $ | 1,340 | |
LifePath Index 2030 Fund | | $ | 400 | | | $ | 1,040 | | | $ | 2,611 | |
LifePath Index 2035 Fund | | $ | 314 | | | $ | 765 | | | $ | 1,071 | |
LifePath Index 2040 Fund | | $ | 383 | | | $ | 727 | | | $ | 2,102 | |
LifePath Index 2045 Fund | | $ | 341 | | | $ | 657 | | | $ | 741 | |
LifePath Index 2050 Fund | | $ | 328 | | | $ | 530 | | | $ | 1,403 | |
LifePath Index 2055 Fund | | $ | 262 | | | $ | 527 | | | $ | 372 | |
The Administrator reimbursed the LifePath Index Funds a portion of the costs incurred in running the call center. These amounts reimbursed are included in transfer agent fees waived and/or reimbursed — class specific in the Statements of Operations. For the year ended December 31, 2015, the amounts included in transfer agent fees waived and/or reimbursed — class specific were as follow:
| | | | | | | | | | | | | | | | | | | | | | | | | | | | | | | | |
LifePath Index
Retirement
Fund | | LifePath Index
2020
Fund | | | LifePath Index
2025
Fund | | | LifePath Index
2030
Fund | | | LifePath Index
2035
Fund | | | LifePath Index
2040
Fund | | | LifePath Index
2045
Fund | | | LifePath Index
2050
Fund | | | LifePath Index
2055
Fund | |
| $2,098 | | $ | 3,782 | | | $ | 2,330 | | | $ | 3,823 | | | $ | 1,959 | | | $ | 2,992 | | | $ | 1,565 | | | $ | 2,101 | | | $ | 1,093 | |
| | | | | | |
| | | | | | | |
| 56 | | BLACKROCK FUNDS III | | DECEMBER 31, 2015 | | |
| | | | |
| Notes to Financial Statements (continued) | | |
Certain officers and/or trustees of the Trust are officers and/or directors of BlackRock or its affiliates. The LifePath Index Funds reimburse the Administrator for a portion of the compensation paid to the Trust’s Chief Compliance Officer, which is included in independent trustees in the Statements of Operations.
5. Income Tax Information:
It is the LifePath Index Funds’ policy to comply with the requirements of the Internal Revenue Code of 1986, as amended, applicable to regulated investment companies, and to distribute substantially all of their taxable income to their shareholders. Therefore, no federal income tax provision is required.
Each LifePath Index Fund files U.S. federal and various state and local tax returns. No income tax returns are currently under examination. The statute of limitations on each LifePath Index Fund’s U.S. federal tax returns remains open for each of the four years ended December 31, 2015. The statutes of limitations on each LifePath Index Fund’s state and local tax returns may remain open for an additional year depending upon the jurisdiction.
Management has analyzed tax laws and regulations and their application to the LifePath Index Funds as of December 31, 2015, inclusive of the open tax return years, and does not believe there are any uncertain tax positions that require recognition of a tax liability in the LifePath Index Funds’ financial statements.
The tax character of distributions paid was as follows:
| | | | | | | | | | | | | | | | | | | | | | | | | | | | | | | | | | | | | | | | |
| | | | | | LifePath Index
Retirement
Fund | | | LifePath Index
2020 Fund | | | LifePath Index
2025 Fund | | | LifePath Index
2030 Fund | | | LifePath Index
2035 Fund | | | LifePath Index
2040 Fund | | | LifePath Index
2045 Fund | | | LifePath Index
2050 Fund | | | LifePath Index
2055 Fund | |
Ordinary Income | | | 12/31/15 | | | $ | 10,572,327 | | | $ | 22,888,339 | | | $ | 14,722,743 | | | $ | 23,740,137 | | | $ | 12,472,608 | | | $ | 17,442,544 | | | $ | 7,483,496 | | | $ | 7,671,288 | | | $ | 2,206,215 | |
| | | 12/31/14 | | | $ | 8,530,813 | | | $ | 17,809,658 | | | $ | 9,565,301 | | | $ | 16,487,776 | | | $ | 7,559,023 | | | $ | 10,814,066 | | | $ | 4,153,223 | | | $ | 4,115,966 | | | $ | 1,021,949 | |
Long-term capital gains | | | 12/31/15 | | | $ | 3,401,250 | | | $ | 7,455,767 | | | $ | 3,338,800 | | | $ | 7,061,260 | | | $ | 3,177,432 | | | $ | 5,373,610 | | | $ | 1,992,880 | | | $ | 2,142,231 | | | $ | 513,055 | |
| | | 12/31/14 | | | $ | 3,633,371 | | | $ | 7,326,180 | | | $ | 3,428,773 | | | $ | 7,070,739 | | | $ | 2,776,161 | | | $ | 4,358,083 | | | $ | 1,292,029 | | | $ | 1,263,701 | | | $ | 266,629 | |
Return of capital | | | 12/31/15 | | | | — | | | | — | | | $ | 88,888 | | | | — | | | | — | | | | — | | | | — | | | | — | | | | — | |
| | | | |
Total | | | 12/31/15 | | | $ | 13,973,577 | | | $ | 30,344,106 | | | $ | 18,150,431 | | | $ | 30,801,397 | | | $ | 15,650,040 | | | $ | 22,816,154 | | | $ | 9,476,376 | | | $ | 9,813,519 | | | $ | 2,719,270 | |
| | | | |
| | | 12/31/14 | | | $ | 12,164,184 | | | $ | 25,135,838 | | | $ | 12,994,074 | | | $ | 23,558,515 | | | $ | 10,335,184 | | | $ | 15,172,149 | | | $ | 5,445,252 | | | $ | 5,379,667 | | | $ | 1,288,578 | |
| | | | |
As of period end, the tax components of accumulated net earnings were as follows:
| | | | | | | | | | | | | | | | | | | | | | | | | | | | | | | | | | | | |
| | | LifePath Index
Retirement Fund | | | LifePath Index
2020 Fund | | | LifePath Index
2025 Fund | | | LifePath Index
2030 Fund | | | LifePath Index
2035 Fund | | | LifePath Index
2040 Fund | | | LifePath Index
2045 Fund | | | LifePath Index
2050 Fund | | | LifePath Index
2055 Fund | |
Undistributed ordinary income | | | — | | | | — | | | | — | | | | — | | | | — | | | | — | | | | — | | | | — | | | | — | |
Undistributed long-term capital gains | | $ | 508,241 | | | $ | 245,262 | | | | — | | | $ | 380,990 | | | $ | 57,157 | | | $ | 101,447 | | | $ | 23,034 | | | $ | 30,653 | | | $ | 36,157 | |
Net unrealized gains1 | | | 13,587,120 | | | | 34,134,835 | | | $ | 12,626,247 | | | | 34,439,376 | | | | 10,775,010 | | | | 20,757,287 | | | | 4,529,566 | | | | 4,139,164 | | | | 129,017 | |
Qualified late-year losses2 | | | (129,672 | ) | | | (367,654 | ) | | | (147,950 | ) | | | (300,279 | ) | | | (98,352 | ) | | | (103,317 | ) | | | (20,294 | ) | | | — | | | | (1,187 | ) |
| | | | |
Total | | $ | 13,965,689 | | | $ | 34,012,443 | | | $ | 12,478,297 | | | $ | 34,520,087 | | | $ | 10,733,815 | | | $ | 20,755,417 | | | $ | 4,532,306 | | | $ | 4,169,817 | | | $ | 163,987 | |
| | | | |
| | 1 | | The differences between book-basis and tax-basis net unrealized gains were attributable primarily to the timing and recognition of partnership income. |
| | 2 | | The LifePath Index Funds have elected to defer certain qualified late-year losses and recognize such losses in the next taxable year. |
6. Capital Share Transactions:
Transactions in capital shares for each class were as follows:
| | | | | | | | | | | | | | | | | | |
| | | Year Ended
December 31, 2015 | | | | | Year Ended
December 31, 2014 | |
| LifePath Index Retirement Fund | | Shares | | | Amount | | | | | Shares | | | Amount | |
| Institutional | | | | | | | | | | | | | | | | | | |
Shares sold | | | 2,554,950 | | | $ | 29,021,680 | | | | | | 3,680,315 | | | $ | 41,628,878 | |
Shares issued in reinvestment of distributions | | | 175,020 | | | | 1,948,895 | | | | | | 161,743 | | | | 1,834,869 | |
Shares redeemed | | | (2,521,227 | ) | | | (28,805,683 | ) | | | | | (1,409,237 | ) | | | (15,988,870 | ) |
| | | | | | | | | | |
Net increase | | | 208,743 | | | $ | 2,164,892 | | | | | | 2,432,821 | | | $ | 27,474,877 | |
| | | | | | | | | | |
| | | | | | | | | | | | | | | | | | |
| Investor A | | | | | | | | | | | | | | | | | | |
Shares sold | | | 3,392,349 | | | $ | 38,594,002 | | | | | | 3,144,759 | | | $ | 35,707,200 | |
Shares issued in reinvestment of distributions | | | 156,883 | | | | 1,744,295 | | | | | | 113,626 | | | | 1,288,110 | |
Shares redeemed | | | (2,774,607 | ) | | | (31,378,201 | ) | | | | | (943,159 | ) | | | (10,647,862 | ) |
| | | | | | | | | | |
Net increase | | | 774,625 | | | $ | 8,960,096 | | | | | | 2,315,226 | | | $ | 26,347,448 | |
| | | | | | | | | | |
| | | | | | | | | | | | | | | | | | |
| | | | | | |
| | | | | | | |
| | BLACKROCK FUNDS III | | DECEMBER 31, 2015 | | 57 |
| | |
| Notes to Financial Statements (continued) | | |
| | | | | | | | | | | | | | | | | | |
| | | Year Ended
December 31, 2015 | | | | | Year Ended
December 31, 2014 | |
| LifePath Index Retirement Fund (concluded) | | Shares | | | Amount | | | | | Shares | | | Amount | |
| Class K | | | | | | | | | | | | | | | | | | |
Shares sold | | | 16,777,846 | | | $ | 189,800,125 | | | | | | 10,318,651 | | | $ | 116,653,376 | |
Shares issued in reinvestment of distributions | | | 923,943 | | | | 10,276,621 | | | | | | 797,307 | | | | 9,041,203 | |
Shares redeemed | | | (11,204,827 | ) | | | (126,860,547 | ) | | | | | (6,882,045 | ) | | | (77,717,842 | ) |
| | | | | | | | | | |
Net increase | | | 6,496,962 | | | $ | 73,216,199 | | | | | | 4,233,913 | | | $ | 47,976,737 | |
| | | | | | | | | | |
Total Net Increase | | | 7,480,330 | | | $ | 84,341,187 | | | | | | 8,981,960 | | | $ | 101,799,062 | |
| | | | | | | | | | |
| | | | | | | | | | | | | | | | | | |
| LifePath Index 2020 Fund | | | | | | | | | | | | | | | | | | |
| Institutional | | | | | | | | | | | | | | | | | | |
Shares sold | | | 4,515,664 | | | $ | 52,369,745 | | | | | | 4,344,770 | | | $ | 49,739,175 | |
Shares issued in reinvestment of distributions | | | 220,078 | | | | 2,500,544 | | | | | | 193,240 | | | | 2,237,224 | |
Shares redeemed | | | (3,759,343 | ) | | | (43,917,181 | ) | | | | | (1,270,121 | ) | | | (14,589,341 | ) |
| | | | | | | | | | |
Net increase | | | 976,399 | | | $ | 10,953,108 | | | | | | 3,267,889 | | | $ | 37,387,058 | |
| | | | | | | | | | |
| | | | | | | | | | | | | | | | | | |
| Investor A | | | | | | | | | | | | | | | | | | |
Shares sold | | | 4,853,576 | | | $ | 56,122,302 | | | | | | 4,963,332 | | | $ | 57,313,622 | |
Shares issued in reinvestment of distributions | | | 294,782 | | | | 3,342,355 | | | | | | 218,196 | | | | 2,522,414 | |
Shares redeemed | | | (3,984,733 | ) | | | (45,510,700 | ) | | | | | (2,063,570 | ) | | | (23,746,201 | ) |
| | | | | | | | | | |
Net increase | | | 1,163,625 | | | $ | 13,953,957 | | | | | | 3,117,958 | | | $ | 36,089,835 | |
| | | | | | | | | | |
| | | | | | | | | | | | | | | | | | |
| Class K | | | | | | | | | | | | | | | | | | |
Shares sold | | | 30,589,214 | | | $ | 355,194,101 | | | | | | 21,822,723 | | | $ | 251,347,326 | |
Shares issued in reinvestment of distributions | | | 2,157,628 | | | | 24,501,172 | | | | | | 1,759,878 | | | | 20,376,195 | |
Shares redeemed | | | (15,000,205 | ) | | | (173,498,082 | ) | | | | | (8,577,771 | ) | | | (98,889,539 | ) |
| | | | | | | | | | |
Net increase | | | 17,746,637 | | | $ | 206,197,191 | | | | | | 15,004,830 | | | $ | 172,833,982 | |
| | | | | | | | | | |
Total Net Increase | | | 19,886,661 | | | $ | 231,104,256 | | | | | | 21,390,677 | | | $ | 246,310,875 | |
| | | | | | | | | | |
| | | | | | | | | | | | | | | | | | |
| LifePath Index 2025 Fund | | | | | | | | | | | | | | | | | | |
| Institutional | | | | | | | | | | | | | | | | | | |
Shares sold | | | 4,469,528 | | | $ | 52,624,386 | | | | | | 3,451,831 | | | $ | 40,074,916 | |
Shares issued in reinvestment of distributions | | | 153,474 | | | | 1,771,190 | | | | | | 114,546 | | | | 1,344,727 | |
Shares redeemed | | | (2,704,757 | ) | | | (32,206,958 | ) | | | | | (843,810 | ) | | | (9,833,029 | ) |
| | | | | | | | | | |
Net increase | | | 1,918,245 | | | $ | 22,188,618 | | | | | | 2,722,567 | | | $ | 31,586,614 | |
| | | | | | | | | | |
| | | | | | | | | | | | | | | | | | |
| Investor A | | | | | | | | | | | | | | | | | | |
Shares sold | | | 3,065,236 | | | $ | 36,262,072 | | | | | | 4,393,893 | | | $ | 51,408,558 | |
Shares issued in reinvestment of distributions | | | 209,188 | | | | 2,411,971 | | | | | | 176,444 | | | | 2,069,805 | |
Shares redeemed | | | (1,718,276 | ) | | | (20,315,086 | ) | | | | | (1,233,065 | ) | | | (14,379,037 | ) |
| | | | | | | | | | |
Net increase | | | 1,556,148 | | | $ | 18,358,957 | | | | | | 3,337,272 | | | $ | 39,099,326 | |
| | | | | | | | | | |
| | | | | | | | | | | | | | | | | | |
| Class K | | | | | | | | | | | | | | | | | | |
Shares sold | | | 26,119,320 | | | $ | 307,027,110 | | | | | | 15,841,657 | | | $ | 184,774,389 | |
Shares issued in reinvestment of distributions | | | 1,209,314 | | | | 13,941,182 | | | | | | 817,457 | | | | 9,602,335 | |
Shares redeemed | | | (6,759,750 | ) | | | (79,440,503 | ) | | | | | (3,099,720 | ) | | | (36,255,819 | ) |
| | | | | | | | | | |
Net increase | | | 20,568,884 | | | $ | 241,527,789 | | | | | | 13,559,394 | | | $ | 158,120,905 | |
| | | | | | | | | | |
Total Net Increase | | | 24,043,277 | | | $ | 282,075,364 | | | | | | 19,619,233 | | | $ | 228,806,845 | |
| | | | | | | | | | |
| | | | | | | | | | | | | | | | | | |
| | | | | | |
| | | | | | | |
| 58 | | BLACKROCK FUNDS III | | DECEMBER 31, 2015 | | |
| | | | |
| Notes to Financial Statements (continued) | | |
| | | | | | | | | | | | | | | | | | |
| | | Year Ended
December 31, 2015 | | | | | Year Ended
December 31, 2014 | |
| LifePath Index 2030 Fund | | Shares | | | Amount | | | | | Shares | | | Amount | |
| Institutional | | | | | | | | | | | | | | | | | | |
Shares sold | | | 4,274,480 | | | $ | 50,812,514 | | | | | | 4,296,619 | | | $ | 50,359,784 | |
Shares issued in reinvestment of distributions | | | 217,842 | | | | 2,529,945 | | | | | | 172,177 | | | | 2,043,207 | |
Shares redeemed | | | (2,995,796 | ) | | | (36,095,486 | ) | | | | | (1,090,427 | ) | | | (12,831,665 | ) |
| | | | | | | | | | |
Net increase | | | 1,496,526 | | | $ | 17,246,973 | | | | | | 3,378,369 | | | $ | 39,571,326 | |
| | | | | | | | | | |
| | | | | | | | | | | | | | | | | | |
| Investor A | | | | | | | | | | | | | | | | | | |
Shares sold | | | 4,892,193 | | | $ | 58,052,152 | | | | | | 5,239,806 | | | $ | 61,954,488 | |
Shares issued in reinvestment of distributions | | | 326,058 | | | | 3,787,014 | | | | | | 245,328 | | | | 2,909,916 | |
Shares redeemed | | | (4,325,077 | ) | | | (50,669,367 | ) | | | | | (1,530,517 | ) | | | (18,097,416 | ) |
| | | | | | | | | | |
Net increase | | | 893,174 | | | $ | 11,169,799 | | | | | | 3,954,617 | | | $ | 46,766,988 | |
| | | | | | | | | | |
| | | | | | | | | | | | | | | | | | |
| Class K | | | | | | | | | | | | | | | | | | |
Shares sold | | | 31,052,806 | | | $ | 369,413,212 | | | | | | 20,550,362 | | | $ | 242,092,570 | |
Shares issued in reinvestment of distributions | | | 2,111,529 | | | | 24,483,767 | | | | | | 1,569,510 | | | | 18,605,392 | |
Shares redeemed | | | (10,494,964 | ) | | | (124,358,272 | ) | | | | | (6,426,671 | ) | | | (75,960,707 | ) |
| | | | | | | | | | |
Net increase | | | 22,669,371 | | | $ | 269,538,707 | | | | | | 15,693,201 | | | $ | 184,737,255 | |
| | | | | | | | | | |
Total Net Increase | | | 25,059,071 | | | $ | 297,955,479 | | | | | | 23,026,187 | | | $ | 271,075,569 | |
| | | | | | | | | | |
| | | | | | | | | | | | | | | | | | |
| LifePath Index 2035 Fund | | | | | | | | | | | | | | |
| Institutional | | | | | | | | | | | | | | | | | | |
Shares sold | | | 3,454,555 | | | $ | 41,467,537 | | | | | | 2,631,466 | | | $ | 31,076,921 | |
Shares issued in reinvestment of distributions | | | 125,913 | | | | 1,476,870 | | | | | | 76,492 | | | | 916,573 | |
Shares redeemed | | | (1,729,644 | ) | | | (21,158,214 | ) | | | | | (530,896 | ) | | | (6,296,111 | ) |
| | | | | | | | | | |
Net increase | | | 1,850,824 | | | $ | 21,786,193 | | | | | | 2,177,062 | | | $ | 25,697,383 | |
| | | | | | | | | | |
| | | | | | | | | | | | | | | | | | |
| Investor A | | | | | | | | | | | | | | | | | | |
Shares sold | | | 2,571,827 | | | $ | 30,980,524 | | | | | | 4,907,537 | | | $ | 58,434,539 | |
Shares issued in reinvestment of distributions | | | 211,247 | | | | 2,474,873 | | | | | | 159,130 | | | | 1,903,367 | |
Shares redeemed | | | (1,565,151 | ) | | | (18,736,195 | ) | | | | | (1,376,664 | ) | | | (16,362,815 | ) |
| | | | | | | | | | |
Net increase | | | 1,217,923 | | | $ | 14,719,202 | | | | | | 3,690,003 | | | $ | 43,975,091 | |
| | | | | | | | | | |
| | | | | | | | | | | | | | | | | | |
| Class K | | | | | | | | | | | | | | | | | | |
Shares sold | | | 19,333,090 | | | $ | 231,569,790 | | | | | | 11,510,397 | | | $ | 136,714,611 | |
Shares issued in reinvestment of distributions | | | 997,433 | | | | 11,683,839 | | | | | | 628,820 | | | | 7,529,364 | |
Shares redeemed | | | (4,950,460 | ) | | | (59,410,248 | ) | | | | | (1,681,236 | ) | | | (20,062,135 | ) |
| | | | | | | | | | |
Net increase | | | 15,380,063 | | | $ | 183,843,381 | | | | | | 10,457,981 | | | $ | 124,181,840 | |
| | | | | | | | | | |
Total Net Increase | | | 18,448,810 | | | $ | 220,348,776 | | | | | | 16,325,046 | | | $ | 193,854,314 | |
| | | | | | | | | | |
| | | | | | | | | | | | | | | | | | |
| LifePath Index 2040 Fund | | | | | | | | | | | | | | |
| Institutional | | | | | | | | | | | | | | | | | | |
Shares sold | | | 3,742,465 | | | $ | 45,441,390 | | | | | | 3,174,100 | | | $ | 37,944,455 | |
Shares issued in reinvestment of distributions | | | 168,425 | | | | 1,991,699 | | | | | | 111,639 | | | | 1,352,455 | |
Shares redeemed | | | (2,336,755 | ) | | | (28,748,355 | ) | | | | | (805,573 | ) | | | (9,703,017 | ) |
| | | | | | | | | | |
Net increase | | | 1,574,135 | | | $ | 18,684,734 | | | | | | 2,480,166 | | | $ | 29,593,893 | |
| | | | | | | | | | |
| | | | | | | | | | | | | | | | | | |
| Investor A | | | | | | | | | | | | | | | | | | |
Shares sold | | | 3,394,171 | | | $ | 40,987,512 | | | | | | 2,806,932 | | | $ | 33,761,979 | |
Shares issued in reinvestment of distributions | | | 205,645 | | | | 2,427,847 | | | | | | 125,531 | | | | 1,518,489 | |
Shares redeemed | | | (2,488,529 | ) | | | (29,580,282 | ) | | | | | (775,110 | ) | | | (9,342,082 | ) |
| | | | | | | | | | |
Net increase | | | 1,111,287 | | | $ | 13,835,077 | | | | | | 2,157,353 | | | $ | 25,938,386 | |
| | | | | | | | | | |
| | | | | | | | | | | | | | | | | | |
| | | | | | |
| | | | | | | |
| | BLACKROCK FUNDS III | | DECEMBER 31, 2015 | | 59 |
| | |
| Notes to Financial Statements (continued) | | |
| | | | | | | | | | | | | | | | | | |
| | | Year Ended
December 31, 2015 | | | | | Year Ended
December 31, 2014 | |
| LifePath Index 2040 Fund (concluded) | | Shares | | | Amount | | | | | Shares | | | Amount | |
| Class K | | | | | | | | | | | | | | | | | | |
Shares sold | | | 22,594,367 | | | $ | 274,630,234 | | | | | | 16,070,240 | | | $ | 193,551,976 | |
Shares issued in reinvestment of distributions | | | 1,556,425 | | | | 18,395,984 | | | | | | 1,016,216 | | | | 12,303,154 | |
Shares redeemed | | | (7,475,003 | ) | | | (90,613,541 | ) | | | | | (4,518,856 | ) | | | (54,454,035 | ) |
| | | | | | | | | | |
Net increase | | | 16,675,789 | | | $ | 202,412,677 | | | | | | 12,567,600 | | | $ | 151,401,095 | |
| | | | | | | | | | |
Total Net Increase | | | 19,361,211 | | | $ | 234,932,488 | | | | | | 17,205,119 | | | $ | 206,933,374 | |
| | | | | | | | | | |
| | | | | | | | | | | | | | | | | | |
| LifePath Index 2045 Fund | | | | | | | | | | | | | | |
| Institutional | | | | | | | | | | | | | | | | | | |
Shares sold | | | 2,832,028 | | | $ | 34,762,713 | | | | | | 2,193,560 | | | $ | 26,589,302 | |
Shares issued in reinvestment of distributions | | | 107,110 | | | | 1,282,231 | | | | | | 49,880 | | | | 610,784 | |
Shares redeemed | | | (1,389,856 | ) | | | (17,360,373 | ) | | | | | (309,729 | ) | | | (3,769,663 | ) |
| | | | | | | | | | |
Net increase | | | 1,549,282 | | | $ | 18,684,571 | | | | | | 1,933,711 | | | $ | 23,430,423 | |
| | | | | | | | | | |
| | | | | | | | | | | | | | | | | | |
| Investor A | | | | | | | | | | | | | | | | | | |
Shares sold | | | 1,707,713 | | | $ | 21,065,033 | | | | | | 1,838,204 | | | $ | 22,364,142 | |
Shares issued in reinvestment of distributions | | | 100,984 | | | | 1,206,383 | | | | | | 61,245 | | | | 748,510 | |
Shares redeemed | | | (914,620 | ) | | | (11,197,390 | ) | | | | | (527,081 | ) | | | (6,393,801 | ) |
| | | | | | | | | | |
Net increase | | | 894,077 | | | $ | 11,074,026 | | | | | | 1,372,368 | | | $ | 16,718,851 | |
| | | | | | | | | | |
| | | | | | | | | | | | | | | | | | |
| Class K | | | | | | | | | | | | | | | | | | |
Shares sold | | | 10,357,098 | | | $ | 127,174,706 | | | | | | 7,172,251 | | | $ | 86,831,243 | |
Shares issued in reinvestment of distributions | | | 583,925 | | | | 6,985,514 | | | | | | 333,676 | | | | 4,085,944 | |
Shares redeemed | | | (2,987,293 | ) | | | (36,776,708 | ) | | | | | (1,176,328 | ) | | | (14,337,223 | ) |
| | | | | | | | | | |
Net increase | | | 7,953,730 | | | $ | 97,383,512 | | | | | | 6,329,599 | | | $ | 76,579,964 | |
| | | | | | | | | | |
Total Net Increase | | | 10,397,089 | | | $ | 127,142,109 | | | | | | 9,635,678 | | | $ | 116,729,238 | |
| | | | | | | | | | |
| | | | | | | | | | | | | | | | | | |
| LifePath Index 2050 Fund | | | | | | | | | | | | | | |
| Institutional | | | | | | | | | | | | | | | | | | |
Shares sold | | | 2,839,446 | | | $ | 35,471,658 | | | | | | 1,612,987 | | | $ | 19,820,608 | |
Shares issued in reinvestment of distributions | | | 92,590 | | | | 1,122,079 | | | | | | 44,843 | | | | 555,638 | |
Shares redeemed | | | (1,696,316 | ) | | | (21,414,834 | ) | | | | | (319,364 | ) | | | (3,930,861 | ) |
| | | | | | | | | | |
Net increase | | | 1,235,720 | | | $ | 15,178,903 | | | | | | 1,338,466 | | | $ | 16,445,385 | |
| | | | | | | | | | |
| | | | | | | | | | | | | | | | | | |
| Investor A | | | | | | | | | | | | | | | | | | |
Shares sold | | | 1,493,742 | | | $ | 18,562,504 | | | | | | 1,256,520 | | | $ | 15,457,000 | |
Shares issued in reinvestment of distributions | | | 72,199 | | | | 873,353 | | | | | | 43,657 | | | | 540,292 | |
Shares redeemed | | | (1,048,315 | ) | | | (12,800,671 | ) | | | | | (538,221 | ) | | | (6,623,380 | ) |
| | | | | | | | | | |
Net increase | | | 517,626 | | | $ | 6,635,186 | | | | | | 761,956 | | | $ | 9,373,912 | |
| | | | | | | | | | |
| | | | | | | | | | | | | | | | | | |
| Class K | | | | | | | | | | | | | | | | | | |
Shares sold | | | 11,998,246 | | | $ | 149,820,858 | | | | | | 9,378,798 | | | $ | 115,111,348 | |
Shares issued in reinvestment of distributions | | | 645,363 | | | | 7,817,658 | | | | | | 345,755 | | | | 4,283,737 | |
Shares redeemed | | | (4,957,672 | ) | | | (61,987,542 | ) | | | | | (1,770,664 | ) | | | (21,789,910 | ) |
| | | | | | | | | | |
Net increase | | | 7,685,937 | | | $ | 95,650,974 | | | | | | 7,953,889 | | | $ | 97,605,175 | |
| | | | | | | | | | |
Total Net Increase | | | 9,439,283 | | | $ | 117,465,063 | | | | | | 10,054,311 | | | $ | 123,424,472 | |
| | | | | | | | | | |
| | | | | | | | | | | | | | | | | | |
| | | | | | |
| | | | | | | |
| 60 | | BLACKROCK FUNDS III | | DECEMBER 31, 2015 | | |
| | | | |
| Notes to Financial Statements (concluded) | | |
| | | | | | | | | | | | | | | | | | |
| | | Year Ended
December 31, 2015 | | | | | Year Ended
December 31, 2014 | |
| LifePath Index 2055 Fund | | Shares | | | Amount | | | | | Shares | | | Amount | |
| Institutional | | | | | | | | | | | | | | | | | | |
Shares sold | | | 1,466,687 | | | $ | 18,564,571 | | | | | | 675,790 | | | $ | 8,495,924 | |
Shares issued in reinvestment of distributions | | | 39,112 | | | | 481,437 | | | | | | 11,760 | | | | 148,088 | |
Shares redeemed | | | (551,644 | ) | | | (7,052,483 | ) | | | | | (136,992 | ) | | | (1,726,858 | ) |
| | | | | | | | | | |
Net increase | | | 954,155 | | | $ | 11,993,525 | | | | | | 550,558 | | | $ | 6,917,154 | |
| | | | | | | | | | |
| | | | | | | | | | | | | | | | | | |
| Investor A | | | | | | | | | | | | | | | | | | |
Shares sold | | | 695,213 | | | $ | 8,822,753 | | | | | | 400,459 | | | $ | 4,995,206 | |
Shares issued in reinvestment of distributions | | | 27,644 | | | | 339,634 | | | | | | 14,457 | | | | 181,549 | |
Shares redeemed | | | (352,293 | ) | | | (4,399,745 | ) | | | | | (94,087 | ) | | | (1,171,515 | ) |
| | | | | | | | | | |
Net increase | | | 370,564 | | | $ | 4,762,642 | | | | | | 320,829 | | | $ | 4,005,240 | |
| | | | | | | | | | |
| | | | | | | | | | | | | | | | | | |
| Class K | | | | | | | | | | | | | | | | | | |
Shares sold | | | 4,101,454 | | | $ | 51,922,767 | | | | | | 2,641,658 | | | $ | 32,875,468 | |
Shares issued in reinvestment of distributions | | | 154,168 | | | | 1,897,041 | | | | | | 75,550 | | | | 950,127 | |
Shares redeemed | | | (1,694,573 | ) | | | (21,609,401 | ) | | | | | (664,905 | ) | | | (8,277,442 | ) |
| | | | | | | | | | |
Net increase | | | 2,561,049 | | | $ | 32,210,407 | | | | | | 2,052,303 | | | $ | 25,548,153 | |
| | | | | | | | | | |
Total Net Increase | | | 3,885,768 | | | $ | 48,966,574 | | | | | | 2,923,690 | | | $ | 36,470,547 | |
| | | | | | | | | | |
7. Subsequent Events:
Management has evaluated the impact of all subsequent events on the LifePath Index Funds through the date the financial statements were issued and has determined that there were no subsequent events requiring adjustment or additional disclosure in the financial statements.
| | | | | | |
| | | | | | | |
| | BLACKROCK FUNDS III | | DECEMBER 31, 2015 | | 61 |
| | |
| Report of Independent Registered Public Accounting Firm | | BlackRock Funds III |
To the Board of Trustees of BlackRock Funds III and the Shareholders of BlackRock LifePath® Index Retirement Fund, BlackRock LifePath® Index 2020 Fund, BlackRock LifePath® Index 2025 Fund, BlackRock LifePath® Index 2030 Fund, BlackRock LifePath® Index 2035 Fund, BlackRock LifePath® Index 2040 Fund, BlackRock LifePath® Index 2045 Fund, BlackRock LifePath® Index 2050 Fund and BlackRock LifePath® Index 2055 Fund:
In our opinion, the accompanying statements of assets and liabilities and the related statements of operations and of changes in net assets and the financial highlights present fairly, in all material respects, the financial position of BlackRock LifePath® Index Retirement Fund, BlackRock LifePath® Index 2020 Fund, BlackRock LifePath® Index 2025 Fund, BlackRock LifePath® Index 2030 Fund, BlackRock LifePath® Index 2035 Fund, BlackRock LifePath® Index 2040 Fund, BlackRock LifePath® Index 2045 Fund, BlackRock LifePath® Index 2050 Fund and BlackRock LifePath® Index 2055 Fund (the “Funds”), each a series of BlackRock Funds III, at December 31, 2015, the results of each of their operations for the year then ended, the changes in each of their net assets for each of the two years in the period then ended and the financial highlights for each of the periods presented, in conformity with accounting principles generally accepted in the United States of America. These financial statements and financial highlights (hereafter referred to as “financial statements”) are the responsibility of the Funds’ management. Our responsibility is to express an opinion on these financial statements based on our audits. We conducted our audits of these financial statements in accordance with the standards of the Public Company Accounting Oversight Board (United States). Those standards require that we plan and perform the audit to obtain reasonable assurance about whether the financial statements are free of material misstatement. An audit includes examining, on a test basis, evidence supporting the amounts and disclosures in the financial statements, assessing the accounting principles used and significant estimates made by management, and evaluating the overall financial statement presentation. We believe that our audits provide a reasonable basis for our opinion.
/s/PricewaterhouseCoopers LLP
Philadelphia, Pennsylvania
February 24, 2016
| | |
| Important Tax Information (Unaudited) | | |
The following information is provided with respect to the ordinary income distributions paid during the tax year ended December 31, 2015:
| | | | | | | | | | | | | | | | | | | | | | | | | | | | | | | | | | | | | | | | |
| | | Payable Dates | | | LifePath
Index
Retirement
Fund | | | LifePath
Index 2020
Fund | | | LifePath
Index 2025
Fund | | | LifePath
Index 2030
Fund | | | LifePath
Index 2035
Fund | | | LifePath
Index 2040
Fund | | | LifePath
Index 2045
Fund | | | LifePath
Index 2050
Fund | | | LifePath
Index 2050
Fund | |
Qualified Dividend Income for Individuals1 | | | 3/31/15 - 12/30/15 | | | | 37.71% | | | | 48.56% | | | | 57.87% | | | | 63.29% | | | | 70.03% | | | | 72.89% | | | | 75.65% | | | | 76.92% | | | | 78.09% | |
Dividends Qualifying for the Dividend Received Deduction for Corporations1 | | | 3/31/15 - 12/30/15 | | | | 20.83% | | | | 26.27% | | | | 30.92% | | | | 53.68% | | | | 36.66% | | | | 37.60% | | | | 38.79% | | | | 39.34% | | | | 39.83% | |
Federal Obligation Interest2 | | | 3/31/15 - 12/30/15 | | | | 13.74% | | | | 11.38% | | | | 9.54% | | | | 6.44% | | | | 4.16% | | | | 1.73% | | | | — | | | | — | | | | — | |
Interest Related Dividends and Short-Term Capital Gains for Non-U.S. Residents3 | | | 3/31/15 - 12/30/15 | | | | 55.09% | | | | 42.62% | | | | 31.71% | | | | 25.58% | | | | 17.46% | | | | 13.28% | | | | 9.09% | | | | 6.85% | | | | 4.93% | |
| | 1 | | The LifePath Index Funds hereby designate the percentages indicated above or the maximum amount allowable by law. |
| | 2 | | The law varies in each state as to whether and what percentage of dividend income attributable to federal obligations is exempt from state income tax. We recommend that you consult your tax advisor to determine if any portion of the dividends you received is exempt from state income taxes. |
| | 3 | | Represents the portion of the taxable ordinary income dividends eligible for exemption from U.S. withholding tax for nonresident aliens and foreign corporations. |
| | | | | | |
| | | | | | | |
| 62 | | BLACKROCK FUNDS III | | DECEMBER 31, 2015 | | |
| | |
| Master Portfolio Information as of December 31, 2015 | | Master Investment Portfolio |
| | |
| LifePath® Index Retirement Master Portfolio |
| | |
| Portfolio Composition | | Percent of
Affiliated Investment Companies |
| | | | |
Fixed Income Funds | | | 60 | % |
Equity Funds | | | 40 | |
| | |
| Ten Largest Holdings | | Percent of
Affiliated Investment Companies |
| | | | |
U.S. Total Bond Index Master Portfolio | | | 51 | % |
Large Cap Index Master Portfolio | | | 22 | |
iShares TIPS Bond ETF | | | 9 | |
Total International ex U.S. Index Master Portfolio | | | 6 | |
iShares Core MSCI Total International Stock ETF | | | 6 | |
Master Small Cap Index Series | | | 4 | |
| | |
| LifePath® Index 2020 Master Portfolio |
| | |
| Portfolio Composition | | Percent of
Affiliated Investment Companies |
| | | | |
Equity Funds | | | 51 | % |
Fixed Income Funds | | | 48 | |
Short-Term Securities | | | 1 | |
| | |
| Ten Largest Holdings | | Percent of
Affiliated Investment Companies |
| | | | |
U.S. Total Bond Index Master Portfolio | | | 41 | % |
Large Cap Index Master Portfolio | | | 28 | |
Total International ex U.S. Index Master Portfolio | | | 10 | |
iShares TIPS Bond ETF | | | 7 | |
iShares Core MSCI Total International Stock ETF | | | 6 | |
Master Small Cap Index Series | | | 4 | |
iShares Cohen & Steers REIT ETF | | | 2 | |
iShares International Developed Real Estate ETF | | | 1 | |
iShares MSCI EAFE Small-Cap ETF | | | 1 | |
| | |
| LifePath® Index 2025 Master Portfolio |
| | |
| Portfolio Composition | | Percent of
Affiliated Investment Companies |
| | | | |
Equity Funds | | | 62 | % |
Fixed Income Funds | | | 37 | |
Short-Term Securities | | | 1 | |
| | |
| Ten Largest Holdings | | Percent of
Affiliated Investment Companies |
| | | | |
Large Cap Index Master Portfolio | | | 34 | % |
U.S. Total Bond Index Master Portfolio | | | 32 | |
iShares Core MSCI Total International Stock ETF | | | 10 | |
Total International ex U.S. Index Master Portfolio | | | 9 | |
iShares TIPS Bond ETF | | | 5 | |
iShares Cohen & Steers REIT ETF | | | 3 | |
Master Small Cap Index Series | | | 3 | |
iShares International Developed Real Estate ETF | | | 2 | |
iShares MSCI EAFE Small-Cap ETF | | | 1 | |
BlackRock Cash Funds: Institutional, SL Agency Shares | | | 1 | |
The LifePath Index Master Portfolios’ allocation and holdings listed above are current as of the report date. However, the LifePath Index Master Portfolios are regularly monitored and their composition may vary throughout various periods.
| | | | | | |
| | | | | | | |
| | BLACKROCK FUNDS III | | DECEMBER 31, 2015 | | 63 |
| | |
| Master Portfolio Information as of December 31, 2015 (continued) | | Master Investment Portfolio |
| | |
| LifePath® Index 2030 Master Portfolio |
| | |
| Portfolio Composition | | Percent of
Affiliated Investment Companies |
| | | | |
Equity Funds | | | 74 | % |
Fixed Income Funds | | | 26 | |
| | |
| Ten Largest Holdings | | Percent of
Affiliated Investment Companies |
| | | | |
Large Cap Index Master Portfolio | | | 40 | % |
U.S. Total Bond Index Master Portfolio | | | 23 | |
Total International ex U.S. Index Master Portfolio | | | 13 | |
iShares Core MSCI Total International Stock ETF | | | 8 | |
iShares Cohen & Steers REIT ETF | | | 5 | |
iShares International Developed Real Estate ETF | | | 4 | |
iShares TIPS Bond ETF | | | 3 | |
Master Small Cap Index Series | | | 3 | |
iShares MSCI EAFE Small-Cap ETF | | | 1 | |
| | |
| LifePath® Index 2035 Master Portfolio |
| | |
| Portfolio Composition | | Percent of
Affiliated Investment Companies |
| | | | |
Equity Funds | | | 83 | % |
Fixed Income Funds | | | 16 | |
Short-Term Securities | | | 1 | |
| | |
| Ten Largest Holdings | | Percent of
Affiliated Investment Companies |
| | | | |
Large Cap Index Master Portfolio | | | 45 | % |
U.S. Total Bond Index Master Portfolio | | | 14 | |
iShares Core MSCI Total International Stock ETF | | | 12 | |
Total International ex U.S. Index Master Portfolio | | | 12 | |
iShares Cohen & Steers REIT ETF | | | 6 | |
iShares International Developed Real Estate ETF | | | 5 | |
Master Small Cap Index Series | | | 2 | |
iShares TIPS Bond ETF | | | 2 | |
iShares MSCI EAFE Small-Cap ETF | | | 1 | |
BlackRock Cash Funds: Institutional, SL Agency Shares | | | 1 | |
| | |
| LifePath® Index 2040 Master Portfolio |
| | |
| Portfolio Composition | | Percent of
Affiliated Investment Companies |
| | | | |
Equity Funds | | | 93 | % |
Fixed Income Funds | | | 7 | |
| | |
| Ten Largest Holdings | | Percent of
Affiliated Investment Companies |
| | | | |
Large Cap Index Master Portfolio | | | 49 | % |
Total International ex U.S. Index Master Portfolio | | | 16 | |
iShares Core MSCI Total International Stock ETF | | | 11 | |
iShares Cohen & Steers REIT ETF | | | 7 | |
U.S. Total Bond Index Master Portfolio | | | 6 | |
iShares International Developed Real Estate ETF | | | 6 | |
Master Small Cap Index Series | | | 2 | |
iShares MSCI EAFE Small-Cap ETF | | | 2 | |
iShares TIPS Bond ETF | | | 1 | |
The LifePath Index Master Portfolios’ allocation and holdings listed above are current as of the report date. However, the LifePath Index Master Portfolios are regularly monitored and their composition may vary throughout various periods.
| | | | | | |
| | | | | | | |
| 64 | | BLACKROCK FUNDS III | | DECEMBER 31, 2015 | | |
| | |
| Master Portfolio Information as of December 31, 2015 (concluded) | | Master Investment Portfolio |
| | |
| LifePath® Index 2045 Master Portfolio |
| | |
| Portfolio Composition | | Percent of
Affiliated Investment Companies |
| | | | |
Equity Funds | | | 97 | % |
Fixed Income Funds | | | 2 | |
Short-Term Securities | | | 1 | |
| | |
| Ten Largest Holdings | | Percent of
Affiliated Investment Companies |
| | | | |
Large Cap Index Master Portfolio | | | 51 | % |
iShares Core MSCI Total International Stock ETF | | | 15 | |
Total International ex U.S. Index Master Portfolio | | | 13 | |
iShares Cohen & Steers REIT ETF | | | 8 | |
iShares International Developed Real Estate ETF | | | 7 | |
Master Small Cap Index Series | | | 2 | |
U.S. Total Bond Index Master Portfolio | | | 2 | |
iShares MSCI EAFE Small-Cap ETF | | | 1 | |
BlackRock Cash Funds: Institutional, SL Agency Shares | | | 1 | |
| | |
| LifePath® Index 2050 Master Portfolio |
| | |
| Portfolio Composition | | Percent of
Affiliated Investment Companies |
| | | | |
Equity Funds | | | 98 | % |
Fixed Income Funds | | | 1 | |
Short-Term Securities | | | 1 | |
| | |
| Ten Largest Holdings | | Percent of
Affiliated Investment Companies |
| | | | |
Large Cap Index Master Portfolio | | | 51 | % |
iShares Core MSCI Total International Stock ETF | | | 15 | |
Total International ex U.S. Index Master Portfolio | | | 14 | |
iShares Cohen & Steers REIT ETF | | | 8 | |
iShares International Developed Real Estate ETF | | | 7 | |
Master Small Cap Index Series | | | 2 | |
iShares MSCI EAFE Small-Cap ETF | | | 1 | |
U.S. Total Bond Index Master Portfolio | | | 1 | |
BlackRock Cash Funds: Institutional, SL Agency Shares | | | 1 | |
| | |
| LifePath® Index 2055 Master Portfolio |
| | |
| Portfolio Composition | | Percent of
Affiliated Investment Companies |
| | | | |
Equity Funds | | | 95 | % |
Short-Term Securities | | | 4 | |
Fixed Income Funds | | | 1 | |
| | |
| Ten Largest Holdings | | Percent of
Affiliated Investment Companies |
| | | | |
Large Cap Index Master Portfolio | | | 49 | % |
iShares Core MSCI Total International Stock ETF | | | 19 | |
Total International ex U.S. Index Master Portfolio | | | 10 | |
iShares Cohen & Steers REIT ETF | | | 8 | |
iShares International Developed Real Estate ETF | | | 6 | |
BlackRock Cash Funds: Institutional, SL Agency Shares | | | 3 | |
Master Small Cap Index Series | | | 2 | |
U.S. Total Bond Index Master Portfolio | | | 1 | |
iShares MSCI EAFE Small-Cap ETF | | | 1 | |
BlackRock Cash Funds: Prime, SL Agency Shares | | | 1 | |
The LifePath Index Master Portfolios’ allocation and holdings listed above are current as of the report date. However, the LifePath Index Master Portfolios are regularly monitored and their composition may vary throughout various periods.
| | | | | | |
| | | | | | | |
| | BLACKROCK FUNDS III | | DECEMBER 31, 2015 | | 65 |
| | |
Schedule of Investments December 31, 2015 | | LifePath Index Retirement Master Portfolio (Percentages shown are based on Net Assets) |
| | | | | | | | |
| Affiliated Investment Companies (a) | | Shares/
Beneficial Interest | | | Value | |
Equity Funds — 40.1% | | | | | | | | |
iShares Cohen & Steers REIT ETF | | | 14,574 | | | $ | 1,446,324 | |
iShares Core MSCI Total International Stock ETF (b) | | | 640,123 | | | | 31,673,286 | |
iShares International Developed Real Estate ETF | | | 41,936 | | | | 1,169,385 | |
iShares MSCI EAFE Small-Cap ETF | | | 38,878 | | | | 1,941,956 | |
Large Cap Index Master Portfolio (fka Russell 1000® Index Master Portfolio) | | $ | 111,965,799 | | | | 111,965,799 | |
Master Small Cap Index Series | | $ | 19,969,721 | | | | 19,969,721 | |
Total International ex U.S. Index Master Portfolio (fka ACWI ex-U.S. Index Master Portfolio) | | $ | 31,996,970 | | | | 31,996,970 | |
| | | | | | | | |
| | | | | | | | 200,163,441 | |
| | | | | | | | |
| Affiliated Investment Companies (a) | | Shares/
Beneficial Interest | | | Value | |
Fixed Income Funds — 60.0% | | | | | | | | |
iShares TIPS Bond ETF (b) | | | 408,584 | | | $ | 44,813,493 | |
U.S. Total Bond Index Master Portfolio (fka Bond Index Master Portfolio) | | $ | 254,892,164 | | | | 254,892,164 | |
| | | | | | | | |
| | | | | | | | 299,705,657 | |
Short-Term Securities — 0.4% | | | | | | | | |
BlackRock Cash Funds: Institutional,
SL Agency Shares, 0.38% (c)(d) | | | 1,955,906 | | | | 1,955,906 | |
BlackRock Cash Funds: Prime,
SL Agency Shares, 0.36% (c)(d) | | | 229,051 | | | | 229,051 | |
| | | | | | | | |
| | | | | | | | 2,184,957 | |
Total Affiliated Investment Companies
(Cost — $507,055,589) — 100.5% | | | | | | | 502,054,055 | |
| Liabilities in Excess of Other Assets — (0.5)% | | | | (2,305,039 | ) |
| | | | | | | | |
| Net Assets — 100.0% | | | | | | $ | 499,749,016 | |
| | | | | | | | |
|
| Notes to Schedule of Investments |
| (a) | | During the year ended December 31, 2015, investments in issuers considered to be affiliates of LifePath Index Master Portfolio for purposes of Section 2(a)(3) of the Investment Company Act of 1940, as amended, were as follows: |
| | | | | | | | | | | | | | | | | | | | | | | | | | | | |
| Affiliate | | Shares/ Beneficial
Interest Held at
December 31, 2014 | | | Shares/
Beneficial
Interest
Purchased | | | Shares/
Beneficial
Interest
Sold | | | Shares/ Beneficial
Interest Held at
December 31, 2015 | | | Value at
December 31, 2015 | | | Net
Income | | | Realized
Gain (Loss) | |
BlackRock Cash Funds: Institutional, SL Agency Shares | | | 984,033 | | | | 971,873 | 1 | | | — | | | | 1,955,906 | | | $ | 1,955,906 | | | $ | 7,081 | 2 | | | — | |
BlackRock Cash Funds: Prime, SL Agency Shares | | | — | | | | 229,051 | 1 | | | — | | | | 229,051 | | | $ | 229,051 | | | $ | 3,880 | 2 | | | — | |
iShares Cohen & Steers REIT ETF | | | 12,463 | | | | 5,387 | | | | (3,276 | ) | | | 14,574 | | | $ | 1,446,324 | | | $ | 49,789 | | | $ | 45,542 | |
iShares Core MSCI Total International Stock ETF | | | 252,688 | | | | 403,725 | | | | (16,290 | ) | | | 640,123 | | | $ | 31,673,286 | | | $ | 576,813 | | | $ | (45,009 | ) |
iShares International Developed Real Estate ETF | | | 34,882 | | | | 15,497 | | | | (8,443 | ) | | | 41,936 | | | $ | 1,169,385 | | | $ | 44,315 | | | $ | (31,949 | ) |
iShares MSCI EAFE Small-Cap ETF | | | 107,873 | | | | 14,306 | | | | (83,301 | ) | | | 38,878 | | | $ | 1,941,956 | | | $ | 64,091 | | | $ | 745,315 | |
iShares TIPS Bond ETF | | | 342,094 | | | | 129,911 | | | | (63,421 | ) | | | 408,584 | | | $ | 44,813,493 | | | $ | 142,214 | | | $ | (565,299 | ) |
Large Cap Index Master Portfolio (fka Russell 1000® Index Master Portfolio) | | $ | 98,004,312 | | | $ | 13,961,487 | 1 | | | — | | | $ | 111,965,799 | | | $ | 111,965,799 | | | $ | 2,129,132 | | | $ | 21,716,049 | 3 |
Master Small Cap Index Series | | $ | 16,529,780 | | | $ | 3,439,941 | 1 | | | — | | | $ | 19,969,721 | | | $ | 19,969,721 | | | $ | 273,625 | | | $ | 3,030,195 | 3 |
Total International ex U.S. Index Master Portfolio (fka ACWI ex-U.S. Index Master Portfolio) | | $ | 35,792,647 | | | | — | | | $ | (3,795,677 | )4 | | $ | 31,996,970 | | | $ | 31,996,970 | | | $ | 1,097,199 | | | $ | (72,894 | ) |
U.S. Total Bond Index Master Portfolio (fka Bond Index Master Portfolio) | | $ | 221,316,244 | | | $ | 33,575,920 | 1 | | | — | | | $ | 254,892,164 | | | $ | 254,892,164 | | | $ | 4,729,651 | | | $ | 270,592 | |
1 Represents net shares/beneficial interest purchased. | |
2 Represents all or a portion of securities lending income earned from the reinvestment of cash collateral from loaned securities, net of fees and collateral investment expenses, and other payments to and from borrowers of securities. | |
3 Includes the following gains and (losses) from in-kind redemptions from affiliated holdings. See Note 2 of the Notes to Financial Statements. | |
| | | | |
Large Cap Index
Master Portfolio (fka
Russell 1000®
Index Master
Portfolio) | | Master Small Cap
Index Series | |
$9,786,891 | | $ | 3,817,830 | |
| | | | | | | | | | | | | | |
4 Represents net shares/beneficial interest sold. |
| (b) | | Security, or a portion of security, is on loan. |
| (c) | | Current yield as of period end. |
| (d) | | All or a portion of security was purchased with the cash collateral from loaned securities. |
See Notes to Financial Statements.
| | | | | | |
| | | | | | | |
| 66 | | BLACKROCK FUNDS III | | DECEMBER 31, 2015 | | |
| | |
Schedule of Investments (concluded) | | LifePath Index Retirement Master Portfolio |
|
| Fair Value Hierarchy as of Period End |
Various inputs are used in determining the fair value of investments. For information about LifePath Index Master Portfolio’s policy regarding valuation of investments, refer to the Notes to Financial Statements.
The following table summarizes LifePath Index Master Portfolio’s investments categorized in the disclosure hierarchy:
| | | | | | | | | | | | | | | | |
| | | Level 1 | | | Level 2 | | | Level 3 | | | Total | |
Assets: | | | | | | | | | | | | | | | | |
| Investments: | | | | | | | | | | | | | | | | |
Affiliated Investment Companies: | | | | | | | | | | | | | | | | |
Equity Funds | | $ | 36,230,951 | | | $ | 163,932,490 | | | | — | | | $ | 200,163,441 | |
Fixed Income Funds | | | 44,813,493 | | | | 254,892,164 | | | | — | | | | 299,705,657 | |
Short-Term Securities | | | 2,184,957 | | | | — | | | | — | | | | 2,184,957 | |
| | | | |
Total | | $ | 83,229,401 | | | $ | 418,824,654 | | | | — | | | $ | 502,054,055 | |
| | | | |
The LifePath Index Master Portfolio may hold assets and/or liabilities in which the fair value approximates the carrying amount for financial statement purposes. As of period end, collateral on securities loaned at value of $525,690 is categorized as Level 2 within the disclosure hierarchy.
During the year ended December 31, 2015, there were no transfers between levels.
See Notes to Financial Statements.
| | | | | | |
| | | | | | | |
| | BLACKROCK FUNDS III | | DECEMBER 31, 2015 | | 67 |
| | |
Schedule of Investments December 31, 2015 | | LifePath Index 2020 Master Portfolio (Percentages shown are based on Net Assets) |
| | | | | | | | |
| Affiliated Investment Companies (a) | | Shares/
Beneficial Interest | | | Value | |
Equity Funds — 52.4% | | | | | | | | |
iShares Cohen & Steers REIT ETF (b) | | | 188,176 | | | $ | 18,674,586 | |
iShares Core MSCI Total International Stock ETF | | | 1,264,323 | | | | 62,558,702 | |
iShares International Developed Real Estate ETF | | | 555,003 | | | | 15,476,259 | |
iShares MSCI EAFE Small-Cap ETF | | | 204,158 | | | | 10,197,692 | |
Large Cap Index Master Portfolio (fka Russell 1000® Index Master Portfolio) | | $ | 310,598,522 | | | | 310,598,522 | |
Master Small Cap Index Series | | $ | 38,748,461 | | | | 38,748,461 | |
Total International ex U.S. Index Master Portfolio (fka ACWI ex-U.S. Index Master Portfolio) | | $ | 106,850,308 | | | | 106,850,308 | |
| | | | | | | | |
| | | | | | | | 563,104,530 | |
| | | | | | | | |
| Affiliated Investment Companies (a) | | Shares/
Beneficial Interest | | | Value | |
Fixed Income Funds — 49.2% | | | | | | | | |
iShares TIPS Bond ETF (b) | | | 681,438 | | | $ | 74,740,120 | |
U.S. Total Bond Index Master Portfolio (fka Bond Index Master Portfolio) | | $ | 454,062,674 | | | | 454,062,674 | |
| | | | | | | | |
| | | | | | | | 528,802,794 | |
Short-Term Securities — 0.9% | | | | | | | | |
BlackRock Cash Funds: Institutional, SL Agency Shares, 0.38% (c)(d) | | | 7,305,823 | | | | 7,305,823 | |
BlackRock Cash Funds: Prime,
SL Agency Shares, 0.36% (c)(d) | | | 2,715,981 | | | | 2,715,981 | |
| | | | | | | | |
| | | | | | | | 10,021,804 | |
Total Affiliated Investment Companies
(Cost — $1,112,940,368) — 102.5% | | | | 1,101,929,128 | |
| Liabilities in Excess of Other Assets — (2.5)% | | | | (26,772,348 | ) |
| | | | | | | | |
| Net Assets — 100.0% | | | | | | $ | 1,075,156,780 | |
| | | | | | | | |
|
| Notes to Schedule of Investments |
| (a) | | During the year ended December 31, 2015, investments in issuers considered to be affiliates of LifePath Index Master Portfolio for purposes of Section 2(a)(3) of the Investment Company Act of 1940, as amended, were as follows: |
| | | | | | | | | | | | | | | | | | | | | | | | | | | | |
| Affiliate | | Shares/
Beneficial
Interest Held at
December 31, 2014 | | | Shares/
Beneficial
Interest
Purchased | | | Shares/
Beneficial
Interest
Sold | | | Shares/ Beneficial
Interest Held at
December 31, 2015 | | | Value at
December 31, 2015 | | | Net
Income | | | Realized
Gain (Loss) | |
BlackRock Cash Funds: Institutional, SL Agency Shares | | | 2,109,818 | | | | 5,196,005 | 1 | | | — | | | | 7,305,823 | | | $ | 7,305,823 | | | $ | 9,464 | 2 | | | — | |
BlackRock Cash Funds: Prime, SL Agency Shares | | | 1,079,100 | | | | 1,636,881 | 1 | | | — | | | | 2,715,981 | | | $ | 2,715,981 | | | $ | 3,976 | 2 | | | — | |
iShares Cohen & Steers REIT ETF | | | 170,731 | | | | 55,838 | | | | (38,393 | ) | | | 188,176 | | | $ | 18,674,586 | | | $ | 625,798 | | | $ | 499,548 | |
iShares Core MSCI Total International Stock ETF | | | 607,955 | | | | 706,825 | | | | (50,457 | ) | | | 1,264,323 | | | $ | 62,558,702 | | | $ | 1,212,442 | | | $ | (47,643 | ) |
iShares International Developed Real Estate ETF | | | 473,539 | | | | 136,196 | | | | (54,732 | ) | | | 555,003 | | | $ | 15,476,259 | | | $ | 555,793 | | | $ | (209,467 | ) |
iShares MSCI EAFE Small-Cap ETF | | | 288,452 | | | | 46,917 | | | | (131,211 | ) | | | 204,158 | | | $ | 10,197,692 | | | $ | 220,533 | | | $ | 685,090 | |
iShares TIPS Bond ETF | | | 517,118 | | | | 210,173 | | | | (45,853 | ) | | | 681,438 | | | $ | 74,740,120 | | | $ | 239,370 | | | $ | (405,391 | ) |
Large Cap Index Master Portfolio (fka Russell 1000® Index Master Portfolio) | | $ | 264,872,726 | | | $ | 45,725,796 | 1 | | | — | | | $ | 310,598,522 | | | $ | 310,598,522 | | | $ | 5,951,754 | | | $ | 53,664,726 | 3 |
Master Small Cap Index Series | | $ | 29,854,120 | | | $ | 8,894,341 | 1 | | | — | | | $ | 38,748,461 | | | $ | 38,748,461 | | | $ | 526,125 | | | $ | 4,282,218 | 3 |
Total International ex U.S. Index Master Portfolio (fka ACWI ex-U.S. Index Master Portfolio) | | $ | 100,829,252 | | | $ | 6,021,056 | 1 | | | — | | | $ | 106,850,308 | | | $ | 106,850,308 | | | $ | 3,279,208 | | | $ | (976,925 | ) |
U.S. Total Bond Index Master Portfolio (fka Bond Index Master Portfolio) | | $ | 349,364,622 | | | $ | 104,698,052 | 1 | | | — | | | $ | 454,062,674 | | | $ | 454,062,674 | | | $ | 8,020,456 | | | $ | (23,358 | ) |
1 Represents net shares/beneficial interest purchased. 2 Represents all or a portion of securities lending income earned from the reinvestment of cash collateral from loaned securities, net of fees and collateral investment expenses, and other payments to and from borrowers of securities. 3 Includes the following gains and (losses) from in-kind redemptions from affiliated holdings. See Note 2 of the Notes to Financial Statements. | |
| | |
Large Cap Index
Master Portfolio (fka
Russell 1000®
Index Master
Portfolio) | | Master Small Cap
Index Series |
$26,989,461 | | $7,306,009 |
| (b) | | Security, or a portion of security, is on loan. |
| (c) | | Current yield as of period end. |
| (d) | | All or a portion of security was purchased with the cash collateral from loaned securities. |
See Notes to Financial Statements.
| | | | | | |
| | | | | | | |
| 68 | | BLACKROCK FUNDS III | | DECEMBER 31, 2015 | | |
| | |
Schedule of Investments (concluded) | | LifePath Index 2020 Master Portfolio |
|
| Fair Value Hierarchy as of Period End |
Various inputs are used in determining the fair value of investments. For information about LifePath Index Master Portfolio’s policy regarding valuation of investments, refer to the Notes to Financial Statements.
The following table summarizes LifePath Index Master Portfolio’s investments categorized in the disclosure hierarchy:
| | | | | | | | | | | | | | | | |
| | | Level 1 | | | Level 2 | | | Level 3 | | | Total | |
Assets: | | | | | | | | | | | | | | | | |
| Investments: | | | | | | | | | | | | | | | | |
Affiliated Investment Companies: | | | | | | | | | | | | | | | | |
Equity Funds | | $ | 106,907,239 | | | $ | 456,197,291 | | | | — | | | $ | 563,104,530 | |
Fixed Income Funds | | | 74,740,120 | | | | 454,062,674 | | | | — | | | | 528,802,794 | |
Short-Term Securities | | | 10,021,804 | | | | — | | | | — | | | | 10,021,804 | |
| | | | |
Total | | $ | 191,669,163 | | | $ | 910,259,965 | | | | — | | | $ | 1,101,929,128 | |
| | | | |
The LifePath Index Master Portfolio may hold assets and/or liabilities in which the fair value approximates the carrying amount for financial statement purposes. As of period end, collateral on securities loaned at value of $6,233,400 is categorized as Level 2 within the disclosure hierarchy.
During the year ended December 31, 2015, there were no transfers between levels.
See Notes to Financial Statements.
| | | | | | |
| | | | | | | |
| | BLACKROCK FUNDS III | | DECEMBER 31, 2015 | | 69 |
| | |
Schedule of Investments December 31, 2015 | | LifePath Index 2025 Master Portfolio (Percentages shown are based on Net Assets) |
| | | | | | | | |
| Affiliated Investment Companies (a) | | Shares/
Beneficial Interest | | | Value | |
Equity Funds — 62.7% | | | | | | | | |
iShares Cohen & Steers REIT ETF | | | 248,988 | | | $ | 24,709,569 | |
iShares Core MSCI Total International Stock ETF | | | 1,556,261 | | | | 77,003,794 | |
iShares International Developed Real Estate ETF (b) | | | 715,578 | | | | 19,953,893 | |
iShares MSCI EAFE Small-Cap ETF | | | 138,530 | | | | 6,919,574 | |
Large Cap Index Master Portfolio (fka Russell 1000® Index Master Portfolio) | | $ | 266,338,811 | | | | 266,338,811 | |
Master Small Cap Index Series | | $ | 24,045,521 | | | | 24,045,521 | |
Total International ex U.S. Index Master Portfolio (fka ACWI ex-U.S. Index Master Portfolio) | | $ | 68,026,251 | | | | 68,026,251 | |
| | | | | | | | |
| | | | | | | | 486,997,413 | |
| | | | | | | | |
| Affiliated Investment Companies (a) | | Shares/
Beneficial Interest | | | Value | |
Fixed Income Funds — 37.2% | | | | | | | | |
iShares TIPS Bond ETF (b) | | | 361,737 | | | $ | 39,675,315 | |
U.S. Total Bond Index Master Portfolio (fka Bond Index Master Portfolio) | | $ | 248,639,480 | | | | 248,639,480 | |
| | | | | | | | |
| | | | | | | | 288,314,795 | |
Short-Term Securities — 1.1% | | | | | | | | |
BlackRock Cash Funds: Institutional,
SL Agency Shares, 0.38% (c)(d) | | | 6,872,778 | | | | 6,872,778 | |
BlackRock Cash Funds: Prime,
SL Agency Shares, 0.36% (c)(d) | | | 1,883,549 | | | | 1,883,549 | |
| | | | | | | | |
| | | | | | | | 8,756,327 | |
Total Affiliated Investment Companies (Cost — $795,046,619) — 101.0% | | | | | | | 784,068,535 | |
| Liabilities in Excess of Other Assets — (1.0)% | | | | (7,533,189 | ) |
| | | | | | | | |
| Net Assets — 100.0% | | | | | | $ | 776,535,346 | |
| | | | | | | | |
|
| Notes to Schedule of Investments |
| (a) | | During the year ended December 31, 2015, investments in issuers considered to be affiliates of LifePath Index Master Portfolio for purposes of Section 2(a)(3) of the Investment Company Act of 1940, as amended, were as follows: |
| | | | | | | | | | | | | | | | | | | | | | | | | | | | |
| Affiliate | | Shares/
Beneficial
Interest Held at
December 31, 2014 | | | Shares/
Beneficial
Interest
Purchased | | | Shares/
Beneficial
Interest
Sold | | | Shares/ Beneficial
Interest Held at
December 31, 2015 | | | Value at
December 31, 2015 | | | Net Income | | | Realized
Gain (Loss) | |
BlackRock Cash Funds: Institutional, SL Agency Shares | | | 746,905 | | | | 6,125,873 | 1 | | | — | | | | 6,872,778 | | | $ | 6,872,778 | | | $ | 11,099 | 2 | | | — | |
BlackRock Cash Funds: Prime, SL Agency Shares | | | — | | | | 1,883,549 | 1 | | | — | | | | 1,883,549 | | | $ | 1,883,549 | | | $ | 5,647 | 2 | | | — | |
iShares Cohen & Steers REIT ETF | | | 169,929 | | | | 113,911 | | | | (34,852 | ) | | | 248,988 | | | $ | 24,709,569 | | | $ | 728,544 | | | $ | 436,367 | |
iShares Core MSCI Total International Stock ETF | | | 639,667 | | | | 948,820 | | | | (32,226 | ) | | | 1,556,261 | | | $ | 77,003,794 | | | $ | 1,406,743 | | | $ | (32,355 | ) |
iShares International Developed Real Estate ETF | | | 471,056 | | | | 289,859 | | | | (45,337 | ) | | | 715,578 | | | $ | 19,953,893 | | | $ | 619,220 | | | $ | (126,024 | ) |
iShares MSCI EAFE Small-Cap ETF | | | 202,339 | | | | 37,391 | | | | (101,200 | ) | | | 138,530 | | | $ | 6,919,574 | | | $ | 156,094 | | | $ | 343,557 | |
iShares TIPS Bond ETF | | | 224,311 | | | | 156,405 | | | | (18,979 | ) | | | 361,737 | | | $ | 39,675,315 | | | $ | 115,891 | | | $ | (148,678 | ) |
Large Cap Index Master Portfolio (fka Russell 1000® Index Master Portfolio) | | $ | 186,587,207 | | | $ | 79,751,604 | 1 | | | — | | | $ | 266,338,811 | | | $ | 266,338,811 | | | $ | 4,544,029 | | | $ | 28,655,146 | 3 |
Master Small Cap Index Series | | $ | 15,639,897 | | | $ | 8,405,624 | 1 | | | — | | | $ | 24,045,521 | | | $ | 24,045,521 | | | $ | 296,308 | | | $ | 1,457,715 | 3 |
Total International ex U.S. Index Master Portfolio (fka ACWI ex-U.S. Index Master Portfolio) | | $ | 59,342,333 | | | $ | 8,683,918 | 1 | | | — | | | $ | 68,026,251 | | | $ | 68,026,251 | | | $ | 2,053,520 | | | $ | (894,597 | ) |
U.S. Total Bond Index Master Portfolio (fka Bond Index Master Portfolio) | | $ | 156,945,766 | | | $ | 91,693,714 | 1 | | | — | | | $ | 248,639,480 | | | $ | 248,639,480 | | | $ | 3,913,991 | | | $ | (120,578 | ) |
1 Represents net shares/beneficial interest purchased. | |
2 Represents all or a portion of securities lending income earned from the reinvestment of cash collateral from loaned securities, net of fees and collateral investment expenses, and other payments to and from borrowers of securities. | |
3 Includes the following gains and (losses) from in-kind redemptions from affiliated holdings. See Note 2 of the Notes to Financial Statements. | |
| | |
Large Cap Index
Master Portfolio (fka
Russell 1000®
Index Master
Portfolio) | | Master Small Cap
Index Series |
$21,930,994 | | $4,292,115 |
| (b) | | Security, or a portion of security, is on loan. |
| (c) | | Current yield as of period end. |
| (d) | | All or a portion of security was purchased with the cash collateral from loaned securities. |
See Notes to Financial Statements.
| | | | | | |
| | | | | | | |
| 70 | | BLACKROCK FUNDS III | | DECEMBER 31, 2015 | | |
| | |
Schedule of Investments (concluded) | | LifePath Index 2025 Master Portfolio |
|
| Fair Value Hierarchy as of Period End |
Various inputs are used in determining the fair value of investments. For information about LifePath Index Master Portfolio’s policy regarding valuation of investments, refer to the Notes to Financial Statements.
The following table summarizes LifePath Index Master Portfolio’s investments categorized in the disclosure hierarchy:
| | | | | | | | | | | | | | | | |
| | | Level 1 | | | Level 2 | | | Level 3 | | | Total | |
Assets: | | | | | | | | | | | | | | | | |
| Investments: | | | | | | | | | | | | | | | | |
Affiliated Investment Companies: | | | | | | | | | | | | | | | | |
Equity Funds | | $ | 128,586,830 | | | $ | 358,410,583 | | | | — | | | $ | 486,997,413 | |
Fixed Income Funds | | | 39,675,315 | | | | 248,639,480 | | | | — | | | | 288,314,795 | |
Short-Term Securities | | | 8,756,327 | | | | — | | | | — | | | | 8,756,327 | |
| | | | |
Total | | $ | 177,018,472 | | | $ | 607,050,063 | | | | — | | | $ | 784,068,535 | |
| | | | |
The LifePath Index Master Portfolio may hold assets and/or liabilities in which the fair value approximates the carrying amount for financial statement purposes. As of period end, collateral on securities loaned at value of $4,322,900 is categorized as Level 2 within the disclosure hierarchy.
During the year ended December 31, 2015, there were no transfers between levels.
See Notes to Financial Statements.
| | | | | | |
| | | | | | | |
| | BLACKROCK FUNDS III | | DECEMBER 31, 2015 | | 71 |
| | |
Schedule of Investments December 31, 2015 | | LifePath Index 2030 Master Portfolio (Percentages shown are based on Net Assets) |
| | | | | | | | |
| Affiliated Investment Companies (a) | | Shares/
Beneficial Interest | | | Value | |
Equity Funds — 74.0% | | | | | | | | |
iShares Cohen & Steers REIT ETF (b) | | | 509,918 | | | $ | 50,604,262 | |
iShares Core MSCI Total International Stock ETF | | | 1,857,147 | | | | 91,891,633 | |
iShares International Developed Real Estate ETF (b) | | | 1,463,321 | | | | 40,804,706 | |
iShares MSCI EAFE Small-Cap ETF | | | 253,525 | | | | 12,663,574 | |
Large Cap Index Master Portfolio (fka Russell 1000® Index Master Portfolio) | | $ | 429,624,226 | | | | 429,624,226 | |
Master Small Cap Index Series | | $ | 28,641,879 | | | | 28,641,879 | |
Total International ex U.S. Index Master Portfolio (fka ACWI ex-U.S. Index Master Portfolio) | | $ | 142,152,800 | | | | 142,152,800 | |
| | | | | | | | |
| | | | | | | | 796,383,080 | |
| | | | | | | | |
| Affiliated Investment Companies (a) | | Shares/
Beneficial Interest | | | Value | |
Fixed Income Funds — 26.3% | | | | | | | | |
iShares TIPS Bond ETF | | | 350,843 | | | $ | 38,480,461 | |
U.S. Total Bond Index Master Portfolio (fka Bond Index Master Portfolio) | | $ | 245,012,642 | | | | 245,012,642 | |
| | | | | | | | |
| | | | | | | | 283,493,103 | |
Short-Term Securities — 0.4% | | | | | | | | |
BlackRock Cash Funds: Institutional,
SL Agency Shares, 0.38% (c)(d) | | | 4,224,689 | | | | 4,224,689 | |
BlackRock Cash Funds: Prime,
SL Agency Shares, 0.36% (c)(d) | | | 202,078 | | | | 202,078 | |
| | | | | | | | |
| | | | | | | | 4,426,767 | |
Total Affiliated Investment Companies
(Cost — $1,098,494,779) — 100.7% | | | | 1,084,302,950 | |
| Liabilities in Excess of Other Assets — (0.7)% | | | | (7,621,464 | ) |
| | | | | | | | |
| Net Assets — 100.0% | | | $ | 1,076,681,486 | |
| | | | | | | | |
|
| Notes to Schedule of Investments |
| (a) | | During the year ended December 31, 2015, investments in issuers considered to be affiliates of LifePath Index Master Portfolio for purposes of Section 2(a)(3) of the Investment Company Act of 1940, as amended, were as follows: |
| | | | | | | | | | | | | | | | | | | | | | | | | | | | |
| Affiliate | | Shares/
Beneficial
Interest Held at
December 31, 2014 | | | Shares/
Beneficial
Interest
Purchased | | | Shares/
Beneficial
Interest
Sold | | | Shares/
Beneficial
Interest Held at
December 31, 2015 | | | Value at
December 31, 2015 | | | Net Income | | | Realized
Gain (Loss) | |
BlackRock Cash Funds: Institutional, SL Agency Shares | | | 1,973,808 | | | | 2,250,881 | 1 | | | — | | | | 4,224,689 | | | $ | 4,224,689 | | | $ | 9,864 | 2 | | | — | |
BlackRock Cash Funds: Prime, SL Agency Shares | | | — | | | | 202,078 | 1 | | | — | | | | 202,078 | | | $ | 202,078 | | | $ | 3,526 | 2 | | | — | |
iShares Cohen & Steers REIT ETF | | | 372,716 | | | | 214,112 | | | | (76,910 | ) | | | 509,918 | | | $ | 50,604,262 | | | $ | 1,554,704 | | | $ | 918,800 | |
iShares Core MSCI Total International Stock ETF | | | 805,065 | | | | 1,099,804 | | | | (47,722 | ) | | | 1,857,147 | | | $ | 91,891,633 | | | $ | 1,742,414 | | | $ | (49,195 | ) |
iShares International Developed Real Estate ETF | | | 1,033,666 | | | | 519,483 | | | | (89,828 | ) | | | 1,463,321 | | | $ | 40,804,706 | | | $ | 1,342,659 | | | $ | (274,816 | ) |
iShares MSCI EAFE Small-Cap ETF | | | 368,703 | | | | 64,322 | | | | (179,500 | ) | | | 253,525 | | | $ | 12,663,574 | | | $ | 291,731 | | | $ | 713,870 | |
iShares TIPS Bond ETF | | | 230,520 | | | | 133,744 | | | | (13,421 | ) | | | 350,843 | | | $ | 38,480,461 | | | $ | 118,024 | | | $ | (101,536 | ) |
Large Cap Index Master Portfolio (fka Russell 1000® Index Master Portfolio) | | $ | 342,118,889 | | | $ | 87,505,337 | 1 | | | — | | | $ | 429,624,226 | | | $ | 429,624,226 | | | $ | 7,990,939 | | | $ | 59,065,443 | 3 |
Master Small Cap Index Series | | $ | 21,723,664 | | | $ | 6,918,215 | 1 | | | — | | | $ | 28,641,879 | | | $ | 28,641,879 | | | $ | 385,349 | | | $ | 2,681,553 | 3 |
Total International ex U.S. Index Master Portfolio (fka ACWI ex-U.S. Index Master Portfolio) | | $ | 126,495,470 | | | $ | 15,657,330 | 1 | | | — | | | $ | 142,152,800 | | | $ | 142,152,800 | | | $ | 4,252,430 | | | $ | (1,840,055 | ) |
U.S. Total Bond Index Master Portfolio (fka Bond Index Master Portfolio) | | $ | 173,164,163 | | | $ | 71,848,479 | 1 | | | — | | | $ | 245,012,642 | | | $ | 245,012,642 | | | $ | 4,175,600 | | | $ | 398,254 | |
1 Represents net shares/beneficial interest purchased. | |
2 Represents all or a portion of securities lending income earned from the reinvestment of cash collateral from loaned securities, net of fees and collateral investment expenses, and other payments to and from borrowers of securities. 3 Includes the following gains and (losses) from in-kind redemptions from affiliated holdings. See Note 2 of the Notes to Financial Statements. | |
| | |
Large Cap Index
Master Portfolio (fka
Russell 1000®
Index Master
Portfolio) | | Master Small Cap
Index Series |
$36,635,198 | | $5,289,556 |
| (b) | | Security, or a portion of security, is on loan. |
| (c) | | Current yield as of period end. |
| (d) | | All or a portion of security was purchased with the cash collateral from loaned securities. |
See Notes to Financial Statements.
| | | | | | |
| | | | | | | |
| 72 | | BLACKROCK FUNDS III | | DECEMBER 31, 2015 | | |
| | |
Schedule of Investments (concluded) | | LifePath Index 2030 Master Portfolio |
|
| Fair Value Hierarchy as of Period End |
Various inputs are used in determining the fair value of investments. For information about LifePath Index Master Portfolio’s policy regarding valuation of investments, refer to the Notes to Financial Statements.
The following table summarizes LifePath Index Master Portfolio’s investments categorized in the disclosure hierarchy:
| | | | | | | | | | | | | | | | |
| | | Level 1 | | | Level 2 | | | Level 3 | | | Total | |
Assets: | | | | | | | | | | | | | | | | |
| Investments: | | | | | | | | | | | | | | | | |
Affiliated Investment Companies: | | | | | | | | | | | | | | | | |
Equity Funds | | $ | 195,964,175 | | | $ | 600,418,905 | | | | — | | | $ | 796,383,080 | |
Fixed Income Funds | | | 38,480,461 | | | | 245,012,642 | | | | — | | | | 283,493,103 | |
Short-Term Securities | | | 4,426,767 | | | | — | | | | — | | | | 4,426,767 | |
| | | | |
Total | | $ | 238,871,403 | | | $ | 845,431,547 | | | | — | | | $ | 1,084,302,950 | |
| | | | |
The LifePath Index Master Portfolio may hold assets and/or liabilities in which the fair value approximates the carrying amount for financial statement purposes. As of period end, collateral on securities loaned at value of $463,785 is categorized as Level 2 within the disclosure hierarchy.
During the year ended December 31, 2015, there were no transfers between levels.
See Notes to Financial Statements.
| | | | | | |
| | | | | | | |
| | BLACKROCK FUNDS III | | DECEMBER 31, 2015 | | 73 |
| | |
Schedule of Investments December 31, 2015 | | LifePath Index 2035 Master Portfolio (Percentages shown are based on Net Assets) |
| | | | | | | | |
| Affiliated Investment Companies (a) | | Shares/
Beneficial Interest | | | Value | |
Equity Funds — 83.9% | | | | | | | | |
iShares Cohen & Steers REIT ETF | | | 365,844 | | | $ | 36,306,359 | |
iShares Core MSCI Total International Stock ETF | | | 1,508,195 | | | | 74,625,489 | |
iShares International Developed Real Estate ETF | | | 1,046,365 | | | | 29,177,888 | |
iShares MSCI EAFE Small-Cap ETF (b) | | | 140,134 | | | | 6,999,693 | |
Large Cap Index Master Portfolio (fka Russell 1000® Index Master Portfolio) | | $ | 276,036,983 | | | | 276,036,983 | |
Master Small Cap Index Series | | $ | 13,686,883 | | | | 13,686,883 | |
Total International ex U.S. Index Master Portfolio (fka ACWI ex-U.S. Index Master Portfolio) | | $ | 74,464,733 | | | | 74,464,733 | |
| | | | | | | | |
| | | | | | | | 511,298,028 | |
| | | | | | | | |
| Affiliated Investment Companies (a) | | Shares/
Beneficial Interest | | | Value | |
Fixed Income Funds — 16.1% | | | | | | | | |
iShares TIPS Bond ETF | | | 112,159 | | | $ | 12,301,599 | |
U.S. Total Bond Index Master Portfolio (fka Bond Index Master Portfolio) | | $ | 85,746,349 | | | | 85,746,349 | |
| | | | | | | | |
| | | | | | | | 98,047,948 | |
Short-Term Securities — 0.7% | | | | | | | | |
BlackRock Cash Funds: Institutional,
SL Agency Shares, 0.38% (c)(d) | | | 3,748,132 | | | | 3,748,132 | |
BlackRock Cash Funds: Prime,
SL Agency Shares, 0.36% (c)(d) | | | 624,013 | | | | 624,013 | |
| | | | | | | | |
| | | | | | | | 4,372,145 | |
Total Affiliated Investment Companies
(Cost — $624,247,996) — 100.7% | | | | 613,718,121 | |
| Liabilities in Excess of Other Assets — (0.7)% | | | | (4,146,258 | ) |
| | | | | | | | |
| Net Assets — 100.0% | | | | | | $ | 609,571,863 | |
| | | | | | | | |
|
| Notes to Schedule of Investments |
| (a) | | During the year ended December 31, 2015, investments in issuers considered to be affiliates of LifePath Index Master Portfolio for purposes of Section 2(a)(3) of the Investment Company Act of 1940, as amended, were as follows: |
| | | | | | | | | | | | | | | | | | | | | | | | | | | | |
| Affiliate | | Shares/
Beneficial
Interest Held at
December 31, 2014 | | | Shares/
Beneficial
Interest
Purchased | | | Shares/
Beneficial
Interest
Sold | | | Shares/
Beneficial
Interest Held at
December 31, 2015 | | | Value at
December 31, 2015 | | | Net
Income | | | Realized
Gain (Loss) | |
BlackRock Cash Funds: Institutional, SL Agency Shares | | | 1,029,104 | | | | 2,719,028 | 1 | | | — | | | | 3,748,132 | | | $ | 3,748,132 | | | $ | 6,207 | 2 | | | — | |
BlackRock Cash Funds: Prime, SL Agency Shares | | | 9,300 | | | | 614,713 | 1 | | | — | | | | 624,013 | | | $ | 624,013 | | | $ | 2,283 | 2 | | | — | |
iShares Cohen & Steers REIT ETF | | | 236,670 | | | | 173,743 | | | | (44,569 | ) | | | 365,844 | | | $ | 36,306,359 | | | $ | 1,039,343 | | | $ | 524,657 | |
iShares Core MSCI Total International Stock ETF | | | 601,151 | | | | 931,444 | | | | (24,400 | ) | | | 1,508,195 | | | $ | 74,625,489 | | | $ | 1,367,252 | | | $ | (60,371 | ) |
iShares International Developed Real Estate ETF | | | 656,946 | | | | 449,318 | | | | (59,899 | ) | | | 1,046,365 | | | $ | 29,177,888 | | | $ | 876,496 | | | $ | (168,672 | ) |
iShares MSCI EAFE Small-Cap ETF | | | 208,872 | | | | 33,062 | | | | (101,800 | ) | | | 140,134 | | | $ | 6,999,693 | | | $ | 153,048 | | | $ | 416,752 | |
iShares TIPS Bond ETF | | | 64,925 | | | | 49,387 | | | | (2,153 | ) | | | 112,159 | | | $ | 12,301,599 | | | $ | 34,810 | | | $ | (1,997 | ) |
Large Cap Index Master Portfolio (fka Russell 1000® Index Master Portfolio) | | $ | 193,467,131 | | | $ | 82,569,852 | 1 | | | — | | | $ | 276,036,983 | | | $ | 276,036,983 | | | $ | 4,654,000 | | | $ | 26,139,597 | 3 |
Master Small Cap Index Series | | $ | 9,587,520 | | | $ | 4,099,363 | 1 | | | — | | | $ | 13,686,883 | | | $ | 13,686,883 | | | $ | 171,411 | | | $ | 887,100 | 3 |
Total International ex U.S. Index Master Portfolio (fka ACWI ex-U.S. Index Master Portfolio) | | $ | 63,367,924 | | | $ | 11,096,809 | 1 | | | — | | | $ | 74,464,733 | | | $ | 74,464,733 | | | $ | 2,162,380 | | | $ | (1,082,362 | ) |
U.S. Total Bond Index Master Portfolio (fka Bond Index Master Portfolio) | | $ | 51,838,842 | | | $ | 33,907,507 | 1 | | | — | | | $ | 85,746,349 | | | $ | 85,746,349 | | | $ | 1,302,571 | | | $ | 363,027 | |
1 Represents net shares/beneficial interest purchased. | |
2 Represents all or a portion of securities lending income earned from the reinvestment of cash collateral from loaned securities, net of fees and collateral investment expenses, and other payments to and from borrowers of securities. | |
3 Includes the following gains and (losses) from in-kind redemptions from affiliated holdings. See Note 2 of the Notes to Financial Statements. | |
| | |
Large Cap Index
Master Portfolio (fka
Russell 1000®
Index Master
Portfolio) | | Master Small Cap
Index Series |
$22,485,668 | | $2,450,679 |
| (b) | | Security, or a portion of security, is on loan. |
| (c) | | Current yield as of period end. |
| (d) | | All or a portion of security was purchased with the cash collateral from loaned securities. |
See Notes to Financial Statements.
| | | | | | |
| | | | | | | |
| 74 | | BLACKROCK FUNDS III | | DECEMBER 31, 2015 | | |
| | |
Schedule of Investments (concluded) | | LifePath Index 2035 Master Portfolio |
|
| Fair Value Hierarchy as of Period End |
Various inputs are used in determining the fair value of investments. For information about LifePath Index Master Portfolio’s policy regarding valuation of investments, refer to the Notes to Financial Statements.
The following table summarizes LifePath Index Master Portfolio’s investments categorized in the disclosure hierarchy:
| | | | | | | | | | | | | | | | |
| | | Level 1 | | | Level 2 | | | Level 3 | | | Total | |
Assets: | | | | | | | | | | | | | | | | |
| Investments: | | | | | | | | | | | | | | | | |
Affiliated Investment Companies: | | | | | | | | | | | | | | | | |
Equity Funds | | $ | 147,109,429 | | | $ | 364,188,599 | | | | — | | | $ | 511,298,028 | |
Fixed Income Funds | | | 12,301,599 | | | | 85,746,349 | | | | — | | | | 98,047,948 | |
Short-Term Securities | | | 4,372,145 | | | | — | | | | — | | | | 4,372,145 | |
| | | | |
Total | | $ | 163,783,173 | | | $ | 449,934,948 | | | | — | | | $ | 613,718,121 | |
| | | | |
The LifePath Index Master Portfolio may hold assets and/or liabilities in which the fair value approximates the carrying amount for financial statement purposes. As of period end, collateral on securities loaned at value of $1,432,162 is categorized as Level 2 within the disclosure hierarchy.
During the year ended December 31, 2015, there were no transfers between levels.
See Notes to Financial Statements.
| | | | | | |
| | | | | | | |
| | BLACKROCK FUNDS III | | DECEMBER 31, 2015 | | 75 |
| | |
Schedule of Investments December 31, 2015 | | LifePath Index 2040 Master Portfolio (Percentages shown are based on Net Assets) |
| | | | | | | | |
| Affiliated Investment Companies (a) | | Shares/
Beneficial Interest | | | Value | |
Equity Funds — 93.5% | | | | | | | | |
iShares Cohen & Steers REIT ETF | | | 554,158 | | | $ | 54,994,640 | |
iShares Core MSCI Total International Stock ETF | | | 1,745,458 | | | | 86,365,262 | |
iShares International Developed Real Estate ETF | | | 1,585,534 | | | | 44,212,616 | |
iShares MSCI EAFE Small-Cap ETF | | | 229,343 | | | | 11,455,683 | |
Large Cap Index Master Portfolio (fka Russell 1000® Index Master Portfolio) | | $ | 372,521,982 | | | | 372,521,982 | |
Master Small Cap Index Series | | $ | 14,850,473 | | | | 14,850,473 | |
Total International ex U.S. Index Master Portfolio (fka ACWI ex-U.S. Index Master Portfolio) | | $ | 117,826,153 | | | | 117,826,153 | |
| | | | | | | | |
| | | | | | | | 702,226,809 | |
| | | | | | | | |
| Affiliated Investment Companies (a) | | Shares/
Beneficial Interest | | | Value | |
Fixed Income Funds — 6.9% | | | | | | | | |
iShares TIPS Bond ETF | | | 55,895 | | | $ | 6,130,563 | |
U.S. Total Bond Index Master Portfolio (fka Bond Index Master Portfolio) | | $ | 45,832,656 | | | | 45,832,656 | |
| | | | | | | | |
| | | | | | | | 51,963,219 | |
Short-Term Securities — 0.4% | | | | | | | | |
BlackRock Cash Funds: Institutional,
SL Agency Shares, 0.38% (b) | | | 2,836,397 | | | | 2,836,397 | |
Total Affiliated Investment Companies
(Cost — $770,380,439) — 100.8% | | | | 757,026,425 | |
| Liabilities in Excess of Other Assets — (0.8)% | | | | (5,720,859 | ) |
| | | | | | | | |
| Net Assets — 100.0% | | | | | | $ | 751,305,566 | |
| | | | | | | | |
|
| Notes to Schedule of Investments |
| (a) | | During the year ended December 31, 2015, investments in issuers considered to be affiliates of LifePath Index Master Portfolio for purposes of Section 2(a)(3) of the Investment Company Act of 1940, as amended, were as follows: |
| | | | | | | | | | | | | | | | | | | | | | | | | | | | |
| Affiliate | | Shares/
Beneficial
Interest Held at
December 31, 2014 | | | Shares/
Beneficial
Interest
Purchased | | | Shares/ Beneficial
Interest
Sold | | | Shares/
Beneficial
Interest Held at
December 31, 2015 | | | Value at
December 31, 2015 | | | Net
Income | | | Realized
Gain (Loss) | |
BlackRock Cash Funds: Institutional, SL Agency Shares | | | 1,301,475 | | | | 1,534,922 | 1 | | | — | | | | 2,836,397 | | | $ | 2,836,397 | | | $ | 4,130 | | | | — | |
BlackRock Cash Funds: Prime, SL Agency Shares2 | | | — | | | | — | | | | — | | | | — | | | | — | | | $ | 8,679 | 3 | | | — | |
iShares Cohen & Steers REIT ETF | | | 380,890 | | | | 269,599 | | | | (96,331 | ) | | | 554,158 | | | $ | 54,994,640 | | | $ | 1,668,055 | | | $ | 994,082 | |
iShares Core MSCI Total International Stock ETF | | | 722,933 | | | | 1,050,093 | | | | (27,568 | ) | | | 1,745,458 | | | $ | 86,365,262 | | | $ | 1,606,542 | | | $ | (84,636 | ) |
iShares International Developed Real Estate ETF | | | 1,053,806 | | | | 693,229 | | | | (161,501 | ) | | | 1,585,534 | | | $ | 44,212,616 | | | $ | 1,424,662 | | | $ | (637,359 | ) |
iShares MSCI EAFE Small-Cap ETF | | | 304,945 | | | | 57,770 | | | | (133,372 | ) | | | 229,343 | | | $ | 11,455,683 | | | $ | 247,739 | | | $ | 552,221 | |
iShares TIPS Bond ETF | | | 32,531 | | | | 24,486 | | | | (1,122 | ) | | | 55,895 | | | $ | 6,130,564 | | | $ | 17,860 | | | $ | (1,801 | ) |
Large Cap Index Master Portfolio (fka Russell 1000® Index Master Portfolio) | | $ | 278,797,165 | | | $ | 93,724,817 | 1 | | | — | | | $ | 372,521,982 | | | $ | 372,521,982 | | | $ | 6,707,383 | | | $ | 42,243,750 | 4 |
Master Small Cap Index Series | | $ | 12,158,465 | | | $ | 2,692,008 | 1 | | | — | | | $ | 14,850,473 | | | $ | 14,850,473 | | | $ | 207,298 | | | $ | 1,274,089 | 4 |
Total International ex U.S. Index Master Portfolio (fka ACWI ex-U.S. Index Master Portfolio) | | $ | 100,880,849 | | | $ | 16,945,304 | 1 | | | — | | | $ | 117,826,153 | | | $ | 117,826,153 | | | $ | 3,490,166 | | | $ | (1,747,530 | ) |
U.S. Total Bond Index Master Portfolio (fka Bond Index Master Portfolio) | | $ | 28,589,605 | | | $ | 17,243,051 | 1 | | | — | | | $ | 45,832,656 | | | $ | 45,832,656 | | | $ | 734,652 | | | $ | 764,715 | |
1 Represents net shares/beneficial interest purchased. | |
2 No longer held by LifePath Index Master Portfolio as of period end. | |
3 Represents securities lending income earned from the reinvestment of cash collateral from loaned securities, net of fees and collateral investment expenses, and other payments to and from borrowers of securities. | |
4 Includes the following gains and (losses) from in-kind redemptions from affiliated holdings. See Note 2 of the Notes to Financial Statements. | |
| | |
Large Cap Index
Master Portfolio (fka
Russell 1000®
Index Master
Portfolio) | | Master Small Cap
Index Series |
$30,958,818 | | $2,718,868 |
| (b) | | Current yield as of period end. |
|
| Fair Value Hierarchy as of Period End |
Various inputs are used in determining the fair value of investments. For information about LifePath Index Master Portfolio’s policy regarding valuation of investments, refer to the Notes to Financial Statements.
The following table summarizes LifePath Index Master Portfolio’s investments categorized in the disclosure hierarchy:
| | | | | | | | | | | | | | | | |
| | | Level 1 | | | Level 2 | | | Level 3 | | | Total | |
Assets: | | | | | | | | | | | | | | | | |
| Investments: | | | | | | | | | | | | | | | | |
Affiliated Investment Companies: | | | | | | | | | | | | | | | | |
Equity Funds | | $ | 197,028,201 | | | $ | 505,198,608 | | | | — | | | $ | 702,226,809 | |
Fixed Income Funds | | | 6,130,563 | | | | 45,832,656 | | | | — | | | | 51,963,219 | |
Short-Term Securities | | | 2,836,397 | | | | — | | | | — | | | | 2,836,397 | |
| | | | |
Total | | $ | 205,995,161 | | | $ | 551,031,264 | | | | — | | | $ | 757,026,425 | |
| | | | |
During the year ended December 31, 2015, there were no transfers between levels.
See Notes to Financial Statements.
| | | | | | |
| | | | | | | |
| 76 | | BLACKROCK FUNDS III | | DECEMBER 31, 2015 | | |
| | |
Schedule of Investments December 31, 2015 | | LifePath Index 2045 Master Portfolio (Percentages shown are based on Net Assets) |
| | | | | | | | |
| Affiliated Investment Companies (a) | | Shares/
Beneficial Interest | | | Value | |
Equity Funds — 98.2% | | | | | | | | |
iShares Cohen & Steers REIT ETF | | | 276,055 | | | $ | 27,395,698 | |
iShares Core MSCI Total International Stock ETF (b) | | | 1,068,849 | | | | 52,886,649 | |
iShares International Developed Real Estate ETF | | | 789,580 | | | | 22,017,438 | |
iShares MSCI EAFE Small-Cap ETF | | | 95,700 | | | | 4,780,215 | |
Large Cap Index Master Portfolio (fka Russell 1000® Index Master Portfolio) | | $ | 175,431,933 | | | | 175,431,933 | |
Master Small Cap Index Series | | $ | 6,688,764 | | | | 6,688,764 | |
Total International ex U.S. Index Master Portfolio (fka ACWI ex-U.S. Index Master Portfolio) | | $ | 45,792,251 | | | | 45,792,251 | |
| | | | | | | | |
| | | | | | | | 334,992,948 | |
| | | | | | | | |
| Affiliated Investment Companies (a) | | Shares/
Beneficial Interest | | | Value | |
Fixed Income Funds — 2.1% | | | | | | | | |
iShares TIPS Bond ETF (b) | | | 6,225 | | | $ | 682,758 | |
U.S. Total Bond Index Master Portfolio (fka Bond Index Master Portfolio) | | $ | 6,335,194 | | | | 6,335,194 | |
| | | | | | | | |
| | | | | | | | 7,017,952 | |
Short-Term Securities — 0.7% | | | | | | | | |
BlackRock Cash Funds: Institutional,
SL Agency Shares, 0.38% (c)(d) | | | 2,228,251 | | | | 2,228,251 | |
BlackRock Cash Funds: Prime,
SL Agency Shares, 0.36% (c)(d) | | | 306,340 | | | | 306,340 | |
| | | | | | | | |
| | | | | | | | 2,534,591 | |
Total Affiliated Investment Companies
(Cost — $352,014,357) — 101.0% | | | | | | | 344,545,491 | |
| Liabilities in Excess of Other Assets — (1.0)% | | | | (3,315,415 | ) |
| | | | | | | | |
| Net Assets — 100.0% | | | | | | $ | 341,230,076 | |
| | | | | | | | |
|
| Notes to Schedule of Investments |
| (a) | | During the year ended December 31, 2015, investments in issuers considered to be affiliates of LifePath Index Master Portfolio for purposes of Section 2(a)(3) of the Investment Company Act of 1940, as amended, were as follows: |
| | | | | | | | | | | | | | | | | | | | | | | | | | | | |
| Affiliate | | Shares/ Beneficial
Interest Held at
December 31, 2014 | | | Shares/
Beneficial
Interest
Purchased | | | Shares/
Beneficial
Interest
Sold | | | Shares/ Beneficial
Interest Held at
December 31, 2015 | | | Value at
December 31, 2015 | | | Net
Income | | | Realized
Gain (Loss) | |
BlackRock Cash Funds: Institutional, SL Agency Shares | | | 745,850 | | | | 1,482,401 | 1 | | | — | | | | 2,228,251 | | | $ | 2,228,251 | | | $ | 3,594 | 2 | | | — | |
BlackRock Cash Funds: Prime, SL Agency Shares | | | — | | | | 306,340 | 1 | | | — | | | | 306,340 | | | $ | 306,340 | | | $ | 1,223 | 2 | | | — | |
iShares Cohen & Steers REIT ETF | | | 175,568 | | | | 143,893 | | | | (43,406 | ) | | | 276,055 | | | $ | 27,395,698 | | | $ | 797,948 | | | $ | 453,201 | |
iShares Core MSCI Total International Stock ETF | | | 453,977 | | | | 631,972 | | | | (17,100 | ) | | | 1,068,849 | | | $ | 52,886,649 | | | $ | 981,394 | | | $ | (62,138 | ) |
iShares International Developed Real Estate ETF | | | 481,318 | | | | 378,267 | | | | (70,005 | ) | | | 789,580 | | | $ | 22,017,438 | | | $ | 669,871 | | | $ | (239,059 | ) |
iShares MSCI EAFE Small-Cap ETF | | | 133,177 | | | | 24,561 | | | | (62,038 | ) | | | 95,700 | | | $ | 4,780,215 | | | $ | 102,868 | | | $ | 235,351 | |
iShares TIPS Bond ETF | | | 3,400 | | | | 2,875 | | | | (50 | ) | | | 6,225 | | | $ | 682,758 | | | $ | 1,751 | | | $ | (93 | ) |
Large Cap Index Master Portfolio (fka Russell 1000® Index Master Portfolio) | | $ | 119,219,041 | | | $ | 56,212,892 | 1 | | | — | | | $ | 175,431,933 | | | $ | 175,431,933 | | | $ | 2,966,998 | | | $ | 14,875,296 | 3 |
Master Small Cap Index Series | | $ | 5,195,235 | | | $ | 1,493,529 | 1 | | | — | | | $ | 6,688,764 | | | $ | 6,688,764 | | | $ | 89,038 | | | $ | 325,497 | 3 |
Total International ex U.S. Index Master Portfolio (fka ACWI ex-U.S. Index Master Portfolio) | | $ | 36,608,413 | | | $ | 9,183,838 | 1 | | | — | | | $ | 45,792,251 | | | $ | 45,792,251 | | | $ | 1,329,501 | | | $ | (673,337 | ) |
U.S. Total Bond Index Master Portfolio (fka Bond Index Master Portfolio) | | $ | 3,452,564 | | | $ | 2,882,630 | 1 | | | — | | | $ | 6,335,194 | | | $ | 6,335,194 | | | $ | 96,551 | | | $ | 345,670 | |
1 Represents net shares/beneficial interest purchased. | |
2 Represents all or a portion of securities lending income earned from the reinvestment of cash collateral from loaned securities, net of fees and collateral investment expenses, and other payments to and from borrowers of securities. | |
3 Includes the following gains and (losses) from in-kind redemptions from affiliated holdings. See Note 2 of the Notes to Financial Statements. | |
| | |
Large Cap Index
Master Portfolio (fka
Russell 1000®
Index Master
Portfolio) | | Master Small Cap
Index Series |
$13,951,788 | | $1,195,242 |
| (b) | | Security, or a portion of security, is on loan. |
| (c) | | Current yield as of period end. |
| (d) | | All or a portion of security was purchased with the cash collateral from loaned securities. |
See Notes to Financial Statements.
| | | | | | |
| | | | | | | |
| | BLACKROCK FUNDS III | | DECEMBER 31, 2015 | | 77 |
| | |
Schedule of Investments (concluded) | | LifePath Index 2045 Master Portfolio |
|
| Fair Value Hierarchy as of Period End |
Various inputs are used in determining the fair value of investments. For information about LifePath Index Master Portfolio’s policy regarding valuation of investments, refer to the Notes to Financial Statements.
The following table summarizes LifePath Index Master Portfolio’s investments categorized in the disclosure hierarchy:
| | | | | | | | | | | | | | | | |
| | | Level 1 | | | Level 2 | | | Level 3 | | | Total | |
Assets: | | | | | | | | | | | | | | | | |
| Investments: | | | | | | | | | | | | | | | | |
Affiliated Investment Companies: | | | | | | | | | | | | | | | | |
Equity Funds | | $ | 107,080,000 | | | $ | 227,912,948 | | | | — | | | $ | 334,992,948 | |
Fixed Income Funds | | | 682,758 | | | | 6,335,194 | | | | — | | | | 7,017,952 | |
Short-Term Securities | | | 2,534,591 | | | | — | | | | — | | | | 2,534,591 | |
| | | | |
Total | | $ | 110,297,349 | | | $ | 234,248,142 | | | | — | | | $ | 344,545,491 | |
| | | | |
The LifePath Index Master Portfolio may hold assets and/or liabilities in which the fair value approximates the carrying amount for financial statement purposes. As of period end, collateral on securities loaned at value of $703,076 is categorized as Level 2 within the disclosure hierarchy.
During the year ended December 31, 2015, there were no transfers between levels.
See Notes to Financial Statements.
| | | | | | |
| | | | | | | |
| 78 | | BLACKROCK FUNDS III | | DECEMBER 31, 2015 | | |
| | |
Schedule of Investments December 31, 2015 | | LifePath Index 2050 Master Portfolio (Percentages shown are based on Net Assets) |
| | | | | | | | |
| Affiliated Investment Companies (a) | | Shares/ Beneficial Interest | | | Value | |
Equity Funds — 99.5% | | | | | | | | |
iShares Cohen & Steers REIT ETF | | | 282,305 | | | $ | 28,015,948 | |
iShares Core MSCI Total International Stock ETF | | | 1,075,396 | | | | 53,210,594 | |
iShares International Developed Real Estate ETF | | | 806,393 | | | | 22,486,269 | |
iShares MSCI EAFE Small-Cap ETF (b) | | | 89,118 | | | | 4,451,444 | |
Large Cap Index Master Portfolio (fka Russell 1000® Index Master Portfolio) | | $ | 173,705,052 | | | | 173,705,052 | |
Master Small Cap Index Series | | $ | 6,843,092 | | | | 6,843,092 | |
Total International ex U.S. Index Master Portfolio (fka ACWI ex-U.S. Index Master Portfolio) | | $ | 46,580,774 | | | | 46,580,774 | |
| | | | | | | | |
| | | | | | | | 335,293,173 | |
| | | | | | | | |
| Affiliated Investment Companies (a) | | Shares/ Beneficial Interest | | | Value | |
Fixed Income Fund — 1.0% | | | | | | | | |
U.S. Total Bond Index Master Portfolio (fka Bond Index Master Portfolio) | | $ | 3,370,948 | | | $ | 3,370,948 | |
Short-Term Securities — 1.2% | | | | | | | | |
BlackRock Cash Funds: Institutional, SL Agency Shares, 0.38% (c)(d) | | | 3,062,777 | | | | 3,062,777 | |
BlackRock Cash Funds: Prime,
SL Agency Shares, 0.36% (c)(d) | | | 1,208,810 | | | | 1,208,810 | |
| | | | | | | | |
| | | | | | | | 4,271,587 | |
Total Affiliated Investment Companies
(Cost — $351,074,739) — 101.7% | | | | | | | 342,935,708 | |
| Liabilities in Excess of Other Assets — (1.7)% | | | | (5,871,299 | ) |
| | | | | | | | |
| Net Assets — 100.0% | | | | | | $ | 337,064,409 | |
| | | | | | | | |
|
| Notes to Schedule of Investments |
| (a) | | During the year ended December 31, 2015, investments in issuers considered to be affiliates of LifePath Index Master Portfolio for purposes of Section 2(a)(3) of the Investment Company Act of 1940, as amended, were as follows: |
| | | | | | | | | | | | | | | | | | | | | | | | | | | | |
| Affiliate | | Shares/ Beneficial Interest Held at December 31, 2014 | | | Shares/ Beneficial Interest Purchased | | | Shares/ Beneficial Interest Sold | | | Shares/ Beneficial Interest Held at December 31, 2015 | | | Value at December 31, 2015 | | | Net
Income | | | Realized Gain (Loss) | |
BlackRock Cash Funds: Institutional, SL Agency Shares | | | 654,907 | | | | 2,407,870 | 1 | | | — | | | | 3,062,777 | | | $ | 3,062,777 | | | $ | 7,410 | 2 | | | — | |
BlackRock Cash Funds: Prime, SL Agency Shares | | | — | | | | 1,208,810 | 1 | | | — | | | | 1,208,810 | | | $ | 1,208,810 | | | $ | 4,178 | 2 | | | — | |
iShares Cohen & Steers REIT ETF | | | 182,681 | | | | 157,660 | | | | (58,036 | ) | | | 282,305 | | | $ | 28,015,948 | | | $ | 843,326 | | | $ | 563,401 | |
iShares Core MSCI Total International Stock ETF | | | 503,636 | | | | 591,960 | | | | (20,200 | ) | | | 1,075,396 | | | $ | 53,210,594 | | | $ | 1,029,384 | | | $ | (73,283 | ) |
iShares International Developed Real Estate ETF | | | 506,059 | | | | 409,370 | | | | (109,036 | ) | | | 806,393 | | | $ | 22,486,269 | | | $ | 714,780 | | | $ | (345,913 | ) |
iShares MSCI EAFE Small-Cap ETF | | | 138,356 | | | | 32,250 | | | | (81,488 | ) | | | 89,118 | | | $ | 4,451,444 | | | $ | 102,724 | | | $ | 288,687 | |
Large Cap Index Master Portfolio (fka Russell 1000® Index Master Portfolio) | | $ | 122,826,821 | | | $ | 50,878,231 | 1 | | | — | | | $ | 173,705,052 | | | $ | 173,705,052 | | | $ | 3,094,734 | | | $ | 15,298,694 | 3 |
Master Small Cap Index Series | | $ | 5,410,116 | | | $ | 1,432,976 | 1 | | | — | | | $ | 6,843,092 | | | $ | 6,843,092 | | | $ | 93,693 | | | $ | 263,459 | 3 |
Total International ex U.S. Index Master Portfolio (fka ACWI ex-U.S. Index Master Portfolio) | | $ | 36,389,565 | | | $ | 10,191,209 | 1 | | | — | | | $ | 46,580,774 | | | $ | 46,580,774 | | | $ | 1,394,464 | | | $ | (692,254 | ) |
U.S. Total Bond Index Master Portfolio (fka Bond Index Master Portfolio) | | $ | 2,376,518 | | | $ | 994,430 | 1 | | | — | | | $ | 3,370,948 | | | $ | 3,370,948 | | | $ | 64,061 | | | $ | 225,894 | |
1 Represents net shares/beneficial interest purchased. | |
2 Represents all or a portion of securities lending income earned from the reinvestment of cash collateral from loaned securities, net of fees and collateral investment expenses, and other payments to and from borrowers of securities. | |
3 Includes the following gains and (losses) from in-kind redemptions from affiliated holdings. See Note 2 of the Notes to Financial Statements. | |
| | |
Large Cap Index
Master Portfolio (fka
Russell 1000®
Index Master
Portfolio) | | Master Small Cap
Index Series |
$14,326,443 | | $1,220,071 |
| (b) | | Security, or a portion of security, is on loan. |
| (c) | | Current yield as of period end. |
| (d) | | All or a portion of security was purchased with the cash collateral from loaned securities. |
See Notes to Financial Statements.
| | | | | | |
| | | | | | | |
| | BLACKROCK FUNDS III | | DECEMBER 31, 2015 | | 79 |
| | |
Schedule of Investments (concluded) | | LifePath Index 2050 Master Portfolio |
|
| Fair Value Hierarchy as of Period End |
Various inputs are used in determining the fair value of investments. For information about LifePath Index Master Portfolio’s policy regarding valuation of investments, refer to the Notes to Financial Statements.
The following table summarizes LifePath Index Master Portfolio’s investments categorized in the disclosure hierarchy:
| | | | | | | | | | | | | | | | |
| | | Level 1 | | | Level 2 | | | Level 3 | | | Total | |
Assets: | | | | | | | | | | | | | | | | |
| Investments: | | | | | | | | | | | | | | | | |
Affiliated Investment Companies: | | | | | | | | | | | | | | | | |
Equity Funds | | $ | 108,164,255 | | | $ | 227,128,918 | | | | — | | | $ | 335,293,173 | |
Fixed Income Funds | | | — | | | | 3,370,948 | | | | — | | | | 3,370,948 | |
Short-Term Securities | | | 4,271,587 | | | | — | | | | — | | | | 4,271,587 | |
| | | | |
Total | | $ | 112,435,842 | | | $ | 230,499,866 | | | | — | | | $ | 342,935,708 | |
| | | | |
The LifePath Index Master Portfolio may hold assets and/or liabilities in which the fair value approximates the carrying amount for financial statement purposes. As of period end, collateral on securities loaned at value of $2,774,318 is categorized as Level 2 within the disclosure hierarchy.
During the year ended December 31, 2015, there were no transfers between levels.
See Notes to Financial Statements.
| | | | | | |
| | | | | | | |
| 80 | | BLACKROCK FUNDS III | | DECEMBER 31, 2015 | | |
| | |
Schedule of Investments December 31, 2015 | | LifePath Index 2055 Master Portfolio (Percentages shown are based on Net Assets) |
| | | | | | | | |
| Affiliated Investment Companies (a) | | Shares/
Beneficial Interest | | | Value | |
Equity Funds — 99.3% | | | | | | | | |
iShares Cohen & Steers REIT ETF (b) | | | 88,789 | | | $ | 8,811,420 | |
iShares Core MSCI Total International Stock ETF | | | 431,175 | | | | 21,334,539 | |
iShares International Developed Real Estate ETF | | | 253,583 | | | | 7,071,162 | |
iShares MSCI EAFE Small-Cap ETF | | | 21,217 | | | | 1,059,789 | |
Large Cap Index Master Portfolio (fka Russell 1000® Index Master Portfolio) | | $ | 55,147,907 | | | | 55,147,907 | |
Master Small Cap Index Series | | $ | 2,173,646 | | | | 2,173,646 | |
Total International ex U.S. Index Master Portfolio (fka ACWI ex-U.S. Index Master Portfolio) | | $ | 10,703,083 | | | | 10,703,083 | |
| | | | | | | | |
| | | | | | | | 106,301,546 | |
| | | | | | | | |
| Affiliated Investment Companies (a) | | Shares/
Beneficial Interest | | | Value | |
Fixed Income Fund — 1.0% | | | | | | | | |
U.S. Total Bond Index Master Portfolio (fka Bond Index Master Portfolio) | | $ | 1,070,209 | | | $ | 1,070,209 | |
Short-Term Securities — 4.4% | | | | | | | | |
BlackRock Cash Funds: Institutional,
SL Agency Shares, 0.38% (c)(d) | | | 3,001,864 | | | | 3,001,864 | |
BlackRock Cash Funds: Prime,
SL Agency Shares, 0.36% (c)(d) | | | 1,681,340 | | | | 1,681,340 | |
| | | | | | | | |
| | | | | | | | 4,683,204 | |
Total Affiliated Investment Companies
(Cost — $114,066,129) — 104.7% | | | | 112,054,959 | |
| Liabilities in Excess of Other Assets — (4.7)% | | | | (5,050,870 | ) |
| | | | | | | | |
| Net Assets — 100.0% | | | | | | $ | 107,004,089 | |
| | | | | | | | |
|
| Notes to Schedule of Investments |
| (a) | | During the year ended December 31, 2015, investments in issuers considered to be affiliates of LifePath Index Master Portfolio for purposes of Section 2(a)(3) of the Investment Company Act of 1940, as amended, were as follows: |
| | | | | | | | | | | | | | | | | | | | | | | | | | | | |
| Affiliate | | Shares/
Beneficial
Interest Held at
December 31, 2014 | | | Shares/
Beneficial
Interest
Purchased | | | Shares/
Beneficial
Interest
Sold | | | Shares/
Beneficial
Interest Held at
December 31, 2015 | | | Value at
December 31, 2015 | | | Net
Income | | | Realized
Gain (Loss) | |
BlackRock Cash Funds: Institutional, SL Agency Shares | | | 231,529 | | | | 2,770,335 | 1 | | | — | | | | 3,001,864 | | | $ | 3,001,864 | | | $ | 3,850 | 2 | | | — | |
BlackRock Cash Funds: Prime, SL Agency Shares | | | — | | | | 1,681,340 | 1 | | | — | | | | 1,681,340 | | | $ | 1,681,340 | | | $ | 2,395 | 2 | | | — | |
iShares Cohen & Steers REIT ETF | | | 48,162 | | | | 57,114 | | | | (16,487 | ) | | | 88,789 | | | $ | 8,811,420 | | | $ | 250,922 | | | $ | 152,096 | |
iShares Core MSCI Total International Stock ETF | | | 175,107 | | | | 260,068 | | | | (4,000 | ) | | | 431,175 | | | $ | 21,334,539 | | | $ | 393,822 | | | $ | (13,978 | ) |
iShares International Developed Real Estate ETF | | | 132,547 | | | | 153,100 | | | | (32,064 | ) | | | 253,583 | | | $ | 7,071,162 | | | $ | 208,890 | | | $ | (80,677 | ) |
iShares MSCI EAFE Small-Cap ETF | | | 36,496 | | | | 11,321 | | | | (26,600 | ) | | | 21,217 | | | $ | 1,059,789 | | | $ | 28,425 | | | $ | 65,058 | |
Large Cap Index Master Portfolio (fka Russell 1000® Index Master Portfolio) | | $ | 32,623,835 | | | $ | 22,524,072 | 1 | | | — | | | $ | 55,147,907 | | | $ | 55,147,907 | | | $ | 898,221 | | | $ | 3,650,273 | 3 |
Master Small Cap Index Series | | $ | 1,436,584 | | | $ | 737,062 | 1 | | | — | | | $ | 2,173,646 | | | $ | 2,173,646 | | | $ | 27,603 | | | $ | 45,739 | 3 |
Total International ex U.S. Index Master Portfolio (fka ACWI ex-U.S. Index Master Portfolio) | | $ | 7,348,791 | | | $ | 3,354,292 | 1 | | | — | | | $ | 10,703,083 | | | $ | 10,703,083 | | | $ | 328,186 | | | $ | (104,623 | ) |
U.S. Total Bond Index Master Portfolio (fka Bond Index Master Portfolio) | | $ | 703,501 | | | $ | 366,708 | 1 | | | — | | | $ | 1,070,209 | | | $ | 1,070,209 | | | $ | 18,916 | | | $ | 20,553 | |
1 Represents net shares/beneficial interest purchased. | |
2 Represents all or a portion of securities lending income earned from the reinvestment of cash collateral from loaned securities, net of fees and collateral investment expenses, and other payments to and from borrowers of securities. | |
3 Includes the following gains and (losses) from in-kind redemptions from affiliated holdings. See Note 2 of the Notes to Financial Statements. | |
| | |
Large Cap Index
Master Portfolio (fka
Russell 1000®
Index Master
Portfolio) | | Master Small Cap
Index Series |
$4,362,247 | | $380,519 |
| (b) | | Security, or a portion of security, is on loan. |
| (c) | | Current yield as of period end. |
| (d) | | All or a portion of security was purchased with the cash collateral from loaned securities. |
See Notes to Financial Statements.
| | | | | | |
| | | | | | | |
| | BLACKROCK FUNDS III | | DECEMBER 31, 2015 | | 81 |
| | |
Schedule of Investments (concluded) | | LifePath Index 2055 Master Portfolio |
|
| Fair Value Hierarchy as of Period End |
Various inputs are used in determining the fair value of investments. For information about LifePath Index Master Portfolio’s policy regarding valuation of investments, refer to the Notes to Financial Statements.
The following table summarizes LifePath Index Master Portfolio’s investments categorized in the disclosure hierarchy:
| | | | | | | | | | | | | | | | |
| | | Level 1 | | | Level 2 | | | Level 3 | | | Total | |
Assets: | | | | | | | | | | | | | | | | |
| Investments: | | | | | | | | | | | | | | | | |
Affiliated Investment Companies: | | | | | | | | | | | | | | | | |
Equity Funds | | $ | 38,276,910 | | | $ | 68,024,636 | | | | — | | | $ | 106,301,546 | |
Fixed Income Funds | | | — | | | | 1,070,209 | | | | — | | | | 1,070,209 | |
Short-Term Securities | | | 4,683,204 | | | | — | | | | — | | | | 4,683,204 | |
| | | | |
Total | | $ | 42,960,114 | | | $ | 69,094,845 | | | | — | | | $ | 112,054,959 | |
| | | | |
The LifePath Index Master Portfolio may hold assets and/or liabilities in which the fair value approximates the carrying amount for financial statement purposes. As of period end, collateral on securities loaned at value of $3,858,813 is categorized as Level 2 within the disclosure hierarchy.
During the year ended December 31, 2015, there were no transfers between levels.
See Notes to Financial Statements.
| | | | | | |
| | | | | | | |
| 82 | | BLACKROCK FUNDS III | | DECEMBER 31, 2015 | | |
| | |
| Statements of Assets and Liabilities | | Master Investment Portfolio |
| | | | | | | | | | | | | | | | | | | | |
| December 31, 2015 | | LifePath Index
Retirement
Master Portfolio | | | LifePath Index
2020 Master Portfolio | | | LifePath Index
2025 Master Portfolio | | | LifePath Index
2030 Master Portfolio | | | LifePath Index
2035 Master Portfolio | |
| | | | | | | | | | | | | | | | | | | | |
| Assets | | | | | | | | | | | | | | | | | | | | |
Investments at value — affiliated1,2 | | $ | 502,054,055 | | | $ | 1,101,929,128 | | | $ | 784,068,535 | | | $ | 1,084,302,950 | | | $ | 613,718,121 | |
| Receivables: | | | | | | | | | | | | | | | | | | | | |
Investments sold — affiliated | | | 5,682,237 | | | | 1,729,000 | | | | — | | | | 17,682,328 | | | | 2,976,609 | |
Securities lending income — affiliated | | | 71 | | | | 335 | | | | 251 | | | | — | | | | 101 | |
Prepaid expenses | | | 2,075 | | | | 4,628 | | | | 3,056 | | | | 4,425 | | | | 2,414 | |
| | | | |
Total assets | | | 507,738,438 | | | | 1,103,663,091 | | | | 784,071,842 | | | | 1,101,989,703 | | | | 616,697,245 | |
| | | | |
| | | | | | | | | | | | | | | | | | | | |
| Liabilities | | | | | | | | | | | | | | | | | | | | |
Collateral on securities loaned at value | | | 525,690 | | | | 6,233,400 | | | | 4,322,900 | | | | 463,785 | | | | 1,432,162 | |
| Payables: | | | | | | | | | | | | | | | | | | | | |
Withdrawals to investors | | | 5,769,816 | | | | 18,882,108 | | | | 290,749 | | | | 23,026,318 | | | | 2,511,011 | |
Investments purchased | | | 1,653,609 | | | | 3,323,835 | | | | 2,869,065 | | | | 1,750,011 | | | | 3,142,418 | |
Professional fees | | | 18,013 | | | | 18,617 | | | | 18,959 | | | | 18,566 | | | | 17,990 | |
Investment advisory fees | | | 16,102 | | | | 37,496 | | | | 26,449 | | | | 37,902 | | | | 14,009 | |
Independent Trustees’ fees | | | 4,188 | | | | 7,750 | | | | 5,385 | | | | 7,456 | | | | 4,376 | |
Custodian fees | | | 1,540 | | | | 2,111 | | | | 2,477 | | | | 3,075 | | | | 3,073 | |
Other accrued expenses | | | 464 | | | | 994 | | | | 512 | | | | 1,104 | | | | 343 | |
| | | | |
Total liabilities | | | 7,989,422 | | | | 28,506,311 | | | | 7,536,496 | | | | 25,308,217 | | | | 7,125,382 | |
| | | | |
Net Assets | | $ | 499,749,016 | | | $ | 1,075,156,780 | | | $ | 776,535,346 | | | $ | 1,076,681,486 | | | $ | 609,571,863 | |
| | | | |
| | | | | | | | | | | | | | | | | | | | |
| Net Assets Consist of | | | | | | | | | | | | | | | | | | | | |
Investors’ capital | | $ | 504,750,550 | | | $ | 1,086,168,020 | | | $ | 787,513,430 | | | $ | 1,090,873,315 | | | $ | 620,101,738 | |
Net unrealized appreciation (depreciation) | | | (5,001,534 | ) | | | (11,011,240 | ) | | | (10,978,084 | ) | | | (14,191,829 | ) | | | (10,529,875 | ) |
| | | | |
Net Assets | | $ | 499,749,016 | | | $ | 1,075,156,780 | | | $ | 776,535,346 | | | $ | 1,076,681,486 | | | $ | 609,571,863 | |
| | | | |
1 Investments at cost — affiliated | | $ | 507,055,589 | | | $ | 1,112,940,368 | | | $ | 795,046,619 | | | $ | 1,098,494,779 | | | $ | 624,247,996 | |
2 Securities loaned at value | | $ | 513,436 | | | $ | 6,101,904 | | | $ | 4,229,189 | | | $ | 450,083 | | | $ | 1,387,711 | |
| | | | | | |
| See Notes to Financial Statements. | | | | |
| | | | | | | |
| | BLACKROCK FUNDS III | | DECEMBER 31, 2015 | | 83 |
| | |
| Statements of Assets and Liabilities | | Master Investment Portfolio |
| | | | | | | | | | | | | | | | |
| December 31, 2015 | | LifePath Index
2040 Master Portfolio | | | LifePath Index
2045 Master Portfolio | | | LifePath Index
2050 Master Portfolio | | | LifePath Index
2055 Master Portfolio | |
| | | | | | | | | | | | | | | | |
| Assets | | | | | | | | | | | | | | | | |
Investments at value — affiliated1,2 | | $ | 757,026,425 | | | $ | 344,545,491 | | | $ | 342,935,708 | | | $ | 112,054,959 | |
| Receivables: | | | | | | | | | | | | | | | | |
Investment advisor | | | — | | | | — | | | | — | | | | 6,326 | |
Investments sold — affiliated | | | 14,747,030 | | | | 3,332,893 | | | | 6,875,910 | | | | 1,708,892 | |
Securities lending income — affiliated | | | 135 | | | | 218 | | | | 136 | | | | 840 | |
Prepaid expenses | | | 3,053 | | | | 1,330 | | | | 1,363 | | | | 418 | |
| | | | |
Total assets | | | 771,776,643 | | | | 347,879,932 | | | | 349,813,117 | | | | 113,771,435 | |
| | | | |
| | | | | | | | | | | | | | | | |
| Liabilities | | | | | | | | | | | | | | | | |
Collateral on securities loaned at value | | | — | | | | 703,076 | | | | 2,774,318 | | | | 3,858,813 | |
| Payables: | | | | | | | | | | | | | | | | |
Withdrawals to investors | | | 17,003,924 | | | | 3,801,861 | | | | 7,830,751 | | | | 1,849,436 | |
Investments purchased | | | 3,420,273 | | | | 2,115,440 | | | | 2,113,938 | | | | 1,035,163 | |
Investment advisory fees | | | 20,164 | | | | 5,517 | | | | 4,574 | | | | — | |
Professional fees | | | 18,132 | | | | 18,027 | | | | 18,055 | | | | 17,649 | |
Independent Trustees’ fees | | | 5,444 | | | | 3,010 | | | | 3,077 | | | | 1,747 | |
Custodian fees | | | 2,608 | | | | 2,544 | | | | 3,603 | | | | 3,701 | |
Printing fees | | | — | | | | 121 | | | | 120 | | | | 281 | |
Other accrued expenses | | | 532 | | | | 260 | | | | 272 | | | | 556 | |
| | | | |
Total liabilities | | | 20,471,077 | | | | 6,649,856 | | | | 12,748,708 | | | | 6,767,346 | |
| | | | |
Net Assets | | $ | 751,305,566 | | | $ | 341,230,076 | | | $ | 337,064,409 | | | $ | 107,004,089 | |
| | | | |
| | | | | | | | | | | | | | | | |
| Net Assets Consist of | | | | | | | | | | | | | | | | |
Investors’ capital | | $ | 764,659,580 | | | $ | 348,698,942 | | | $ | 345,203,440 | | | $ | 109,015,259 | |
Net unrealized appreciation (depreciation) | | | (13,354,014 | ) | | | (7,468,866 | ) | | | (8,139,031 | ) | | | (2,011,170 | ) |
| | | | |
Net Assets | | $ | 751,305,566 | | | $ | 341,230,076 | | | $ | 337,064,409 | | | $ | 107,004,089 | |
| | | | |
1 Investments at cost — affiliated | | $ | 770,380,439 | | | $ | 352,014,357 | | | $ | 351,074,739 | | | $ | 114,066,129 | |
2 Securities loaned at value | | | — | | | $ | 685,963 | | | $ | 2,688,209 | | | $ | 3,745,218 | |
| | | | | | |
| See Notes to Financial Statements. | | | | |
| | | | | | | |
| 84 | | BLACKROCK FUNDS III | | DECEMBER 31, 2015 | | |
| | |
| Statements of Operations | | Master Investment Portfolio |
| | | | | | | | | | | | | | | | | | | | |
| Year Ended December 31, 2015 | | LifePath Index
Retirement
Master Portfolio | | | LifePath Index
2020 Master Portfolio | | | LifePath Index
2025 Master Portfolio | | | LifePath Index
2030 Master Portfolio | | | LifePath Index
2035 Master Portfolio | |
| | | | | | | | | | | | | | | | | | | | |
| Investment Income | | | | | | | | | | | | | | | | | | | | |
Dividends — affiliated | | $ | 877,222 | | | $ | 2,853,936 | | | $ | 3,026,492 | | | $ | 5,049,532 | | | $ | 3,470,949 | |
Securities lending — affiliated — net | | | 8,904 | | | | 9,125 | | | | 12,961 | | | | 8,095 | | | | 5,241 | |
Income — affiliated | | | 2,057 | | | | 4,315 | | | | 3,785 | | | | 5,295 | | | | 3,249 | |
| Net investment income allocated from the applicable Underlying Master Portfolios: | | | | | | | | | | | | | | | | | | | | |
Dividends | | | 3,502,835 | | | | 9,791,521 | | | | 6,923,115 | | | | 12,703,098 | | | | 7,031,258 | |
Interest | | | 4,918,283 | | | | 8,403,906 | | | | 4,136,694 | | | | 4,502,724 | | | | 1,456,883 | |
Expenses | | | (240,570 | ) | | | (503,574 | ) | | | (275,041 | ) | | | (451,659 | ) | | | (215,826 | ) |
Fees waived | | | 49,059 | | | | 85,690 | | | | 23,080 | | | | 50,155 | | | | 18,047 | |
| | | | |
Total income | | | 9,117,790 | | | | 20,644,919 | | | | 13,851,086 | | | | 21,867,240 | | | | 11,769,801 | |
| | | | |
| | | | | | | | | | | | | | | | | | | | |
| Expenses | | | | | | | | | | | | | | | | | | | | |
Investment advisory | | | 241,024 | | | | 517,435 | | | | 327,774 | | | | 498,138 | | | | 256,036 | |
Professional | | | 30,066 | | | | 32,524 | | | | 30,778 | | | | 32,280 | | | | 30,225 | |
Independent Trustees | | | 19,214 | | | | 33,617 | | | | 23,765 | | | | 32,466 | | | | 19,863 | |
Accounting services | | | 5,655 | | | | 7,096 | | | | 7,724 | | | | 8,616 | | | | 7,736 | |
Printing | | | 428 | | | | 608 | | | | 489 | | | | 608 | | | | 130 | |
Miscellaneous | | | 4,680 | | | | 9,875 | | | | 6,185 | | | | 9,446 | | | | 4,843 | |
| | | | |
Total expenses | | | 301,067 | | | | 601,155 | | | | 396,715 | | | | 581,554 | | | | 318,833 | |
Less fees waived by the Manager | | | (60,059 | ) | | | (83,791 | ) | | | (69,035 | ) | | | (83,536 | ) | | | (99,009 | ) |
| | | | |
Total expenses after fees waived | | | 241,008 | | | | 517,364 | | | | 327,680 | | | | 498,018 | | | | 219,824 | |
| | | | |
Net investment income | | | 8,876,782 | | | | 20,127,555 | | | | 13,523,406 | | | | 21,369,222 | | | | 11,549,977 | |
| | | | |
| | | | | | | | | | | | | | | | | | | | |
| Realized and Unrealized Gain (Loss) | | | | | | | | | | | | | | | | | | | | |
| Net realized gain from: | | | | | | | | | | | | | | | | | | | | |
Investments — affiliated | | | 148,600 | | | | 522,137 | | | | 472,867 | | | | 1,207,123 | | | | 710,369 | |
Allocation from the applicable Underlying Master Portfolios from investments, financial futures contracts and foreign currency transactions | | | 11,339,221 | | | | 22,651,191 | | | | 2,874,577 | | | | 18,380,441 | | | | 1,371,015 | |
Allocation from the applicable Underlying Master Portfolios from in-kind redemptions1 | | | 13,604,721 | | | | 34,295,470 | | | | 26,223,109 | | | | 41,924,754 | | | | 24,936,347 | |
| | | | |
| | | 25,092,542 | | | | 57,468,798 | | | | 29,570,553 | | | | 61,512,318 | | | | 27,017,731 | |
| | | | |
| Net change in unrealized appreciation (depreciation) on: | | | | | | | | | | | | | | | | | | | | |
Investments — affiliated | | | (2,550,726 | ) | | | (5,693,905 | ) | | | (6,125,338 | ) | | | (8,560,103 | ) | | | (6,173,874 | ) |
Allocation from the applicable Underlying Master Portfolios from investments, financial futures contracts and foreign currency translations | | | (33,300,539 | ) | | | (78,178,067 | ) | | | (42,179,226 | ) | | | (82,427,308 | ) | | | (37,222,975 | ) |
| | | | |
| | | (35,851,265 | ) | | | (83,871,972 | ) | | | (48,304,565 | ) | | | (90,987,411 | ) | | | (43,396,849 | ) |
| | | | |
Net realized and unrealized loss | | | (10,758,723 | ) | | | (26,403,174 | ) | | | (18,734,012 | ) | | | (29,475,093 | ) | | | (16,379,118 | ) |
| | | | |
Net Decrease in Net Assets Resulting from Operations | | $ | (1,881,941 | ) | | $ | (6,275,619 | ) | | $ | (5,210,606 | ) | | $ | (8,105,871 | ) | | $ | (4,829,141 | ) |
| | | | |
1 See Note 2 of the Notes to Financial Statements. | |
| | | | | | |
| See Notes to Financial Statements. | | | | |
| | | | | | | |
| | BLACKROCK FUNDS III | | DECEMBER 31, 2015 | | 85 |
| | |
| Statements of Operations | | Master Investment Portfolio |
| | | | | | | | | | | | | | | | |
| Year Ended December 31, 2015 | | LifePath Index
2040 Master Portfolio | | | LifePath Index
2045 Master Portfolio | | | LifePath Index
2050 Master Portfolio | | | LifePath Index
2055 Master Portfolio | |
| | | | | | | | | | | | | | | | |
| Investment Income | | | | | | | | | | | | | | | | |
Dividends — affiliated | | $ | 4,964,858 | | | $ | 2,553,832 | | | $ | 2,690,214 | | | $ | 882,059 | |
Securities lending — affiliated — net | | | 8,679 | | | | 2,806 | | | | 9,589 | | | | 5,496 | |
Income — affiliated | | | 4,130 | | | | 2,011 | | | | 1,999 | | | | 749 | |
| Net investment income allocated from the applicable Underlying Master Portfolios: | | | | | | | | | | | | | | | | |
Dividends | | | 10,476,926 | | | | 4,414,514 | | | | 4,613,439 | | | | 1,261,593 | |
Interest | | | 933,752 | | | | 176,267 | | | | 146,695 | | | | 41,782 | |
Expenses | | | (286,168 | ) | | | (113,115 | ) | | | (117,444 | ) | | | (31,685 | ) |
Fees waived | | | 14,989 | | | | 4,422 | | | | 4,262 | | | | 1,236 | |
| | | | |
Total income | | | 16,117,166 | | | | 7,040,737 | | | | 7,348,754 | | | | 2,161,230 | |
| | | | |
| | | | | | | | | | | | | | | | |
| Expenses | | | | | | | | | | | | | | | | |
Investment advisory | | | 339,847 | | | | 145,186 | | | | 151,381 | | | | 43,855 | |
Professional | | | 30,315 | | | | 29,145 | | | | 29,299 | | | | 28,105 | |
Independent Trustees | | | 24,276 | | | | 14,291 | | | | 14,686 | | | | 9,085 | |
Accounting services | | | 7,456 | | | | 7,090 | | | | 9,019 | | | | 9,525 | |
Printing | | | 517 | | | | – | | | | – | | | | – | |
Miscellaneous | | | 6,434 | | | | 2,662 | | | | 2,730 | | | | 135 | |
| | | | |
Total expenses | | | 408,845 | | | | 198,374 | | | | 207,115 | | | | 90,705 | |
Less fees waived by the Manager | | | (116,744 | ) | | | (94,135 | ) | | | (98,379 | ) | | | (65,686 | ) |
| | | | |
Total expenses after fees waived | | | 292,101 | | | | 104,239 | | | | 108,736 | | | | 25,019 | |
| | | | |
Net investment income | | | 15,825,065 | | | | 6,936,498 | | | | 7,240,018 | | | | 2,136,211 | |
| | | | |
| | | | | | | | | | | | | | | | |
| Realized and Unrealized Gain (Loss) | | | | | | | | | | | | | | | | |
| Net realized gain from: | | | | | | | | | | | | | | | | |
Investments — affiliated | | | 822,507 | | | | 387,262 | | | | 432,892 | | | | 122,499 | |
Allocation from the applicable Underlying Master Portfolios from investments, financial futures contracts and foreign currency transactions | | | 8,857,338 | | | | (273,904 | ) | | | (450,721 | ) | | | (1,130,824 | ) |
Allocation from the applicable Underlying Master Portfolios from in-kind redemptions1 | | | 33,677,686 | | | | 15,147,030 | | | | 15,546,514 | | | | 4,742,766 | |
| | | | |
| | | 43,357,531 | | | | 15,260,388 | | | | 15,528,685 | | | | 3,734,441 | |
| | | | |
| Net change in unrealized appreciation (depreciation) on: | | | | | | | | | | | | | | | | |
Investments — affiliated | | | (7,627,121 | ) | | | (4,242,116 | ) | | | (4,513,581 | ) | | | (1,683,867 | ) |
Allocation from the applicable Underlying Master Portfolios from investments, financial futures contracts and foreign currency translations | | | (58,452,082 | ) | | | (21,007,529 | ) | | | (21,600,666 | ) | | | (5,237,858 | ) |
| | | | |
| | | (66,079,203 | ) | | | (25,249,645 | ) | | | (26,114,247 | ) | | | (6,921,725 | ) |
| | | | |
Net realized and unrealized loss | | | (22,721,672 | ) | | | (9,989,257 | ) | | | (10,585,562 | ) | | | (3,187,284 | ) |
| | | | |
Net Decrease in Net Assets Resulting from Operations | | $ | (6,896,607 | ) | | $ | (3,052,759 | ) | | $ | (3,345,544 | ) | | $ | (1,051,073 | ) |
| | | | |
1 See Note 2 of the Notes to Financial Statements. | |
| | | | | | |
| See Notes to Financial Statements. | | | | |
| | | | | | | |
| 86 | | BLACKROCK FUNDS III | | DECEMBER 31, 2015 | | |
| | |
| Statements of Changes in Net Assets | | Master Investment Portfolio |
| | | | | | | | | | | | | | | | | | |
| | | LifePath Index Retirement
Master Portfolio | | | | | LifePath Index 2020
Master Portfolio | |
| | | Year Ended December 31, | | | | | Year Ended December 31, | |
| Increase (Decrease) in Net Assets: | | 2015 | | | 2014 | | | | | 2015 | | | 2014 | |
| | | | | | | | | | | | | | | | | | |
| Operations | | | | | | | | | | | | | | | | | | |
Net investment income | | $ | 8,876,782 | | | $ | 6,893,461 | | | | | $ | 20,127,555 | | | $ | 14,842,949 | |
Net realized gain | | | 25,092,542 | | | | 5,267,174 | | | | | | 57,468,798 | | | | 9,750,758 | |
Net change in unrealized appreciation (depreciation) | | | (35,851,265 | ) | | | 8,358,818 | | | | | | (83,871,972 | ) | | | 19,682,904 | |
| | | | | | | | | | | | | | |
Net increase (decrease) in net assets resulting from operations | | | (1,881,941 | ) | | | 20,519,453 | | | | | | (6,275,619 | ) | | | 44,276,611 | |
| | | | | | | | | | | | | | |
| | | | | | | | | | | | | | | | | | |
| Capital Transactions | | | | | | | | | | | | | | | | | | |
Proceeds from contributions | | | 257,415,807 | | | | 143,397,604 | | | | | | 463,686,148 | | | | 277,711,443 | |
Value of withdrawals | | | (187,579,951 | ) | | | (53,715,954 | ) | | | | | (263,577,292 | ) | | | (56,667,691 | ) |
| | | | | | | | | | | | | | |
Net increase in net assets derived from capital transactions | | | 69,835,856 | | | | 89,681,650 | | | | | | 200,108,856 | | | | 221,043,752 | |
| | | | | | | | | | | | | | |
| | | | | | | | | | | | | | | | | | |
| Net Assets | | | | | | | | | | | | | | | | | | |
Total increase in net assets | | | 67,953,915 | | | | 110,201,103 | | | | | | 193,833,237 | | | | 265,320,363 | |
Beginning of year | | | 431,795,101 | | | | 321,593,998 | | | | | | 881,323,543 | | | | 616,003,180 | |
| | | | | | | | | | | | | | |
End of year | | $ | 499,749,016 | | | $ | 431,795,101 | | | | | $ | 1,075,156,780 | | | $ | 881,323,543 | |
| | | | | | | | | | | | | | |
| | | | | | |
| See Notes to Financial Statements. | | | | |
| | | | | | | |
| | BLACKROCK FUNDS III | | DECEMBER 31, 2015 | | 87 |
| | |
| Statements of Changes in Net Assets | | Master Investment Portfolio |
| | | | | | | | | | | | | | | | | | |
| | | LifePath Index 2025
Master Portfolio | | | | | LifePath Index 2030
Master Portfolio | |
| | | Year Ended December 31, | | | | | Year Ended December 31, | |
| Increase (Decrease) in Net Assets: | | 2015 | | | 2014 | | | | | 2015 | | | 2014 | |
| | | | | | | | | | | | | | | | | | |
| Operations | | | | | | | | | | | | | | | | | | |
Net investment income | | $ | 13,523,406 | | | $ | 8,199,564 | | | | | $ | 21,369,222 | | | $ | 14,418,016 | |
Net realized gain | | | 29,570,553 | | | | 4,244,272 | | | | | | 61,512,318 | | | | 7,450,561 | |
Net change in unrealized appreciation (depreciation) | | | (48,304,565 | ) | | | 11,493,328 | | | | | | (90,987,411 | ) | | | 20,621,754 | |
| | | | | | | | | | |
Net increase (decrease) in net assets resulting from operations | | | (5,210,606 | ) | | | 23,937,164 | | | | | | (8,105,871 | ) | | | 42,490,331 | |
| | | | | | | | | | |
| | | | | | | | | | | | | | | | | | |
| Capital Transactions | | | | | | | | | | | | | | | | | | |
Proceeds from contributions | | | 395,913,568 | | | | 243,638,235 | | | | | | 478,277,878 | | | | 282,820,961 | |
Value of withdrawals | | | (132,362,034 | ) | | | (27,988,660 | ) | | | | | (211,785,714 | ) | | | (35,497,084 | ) |
| | | | | | | | | | |
Net increase in net assets derived from capital transactions | | | 263,551,534 | | | | 215,649,575 | | | | | | 266,492,164 | | | | 247,323,877 | |
| | | | | | | | | | |
| | | | | | | | | | | | | | | | | | |
| Net Assets | | | | | | | | | | | | | | | | | | |
Total increase in net assets | | | 258,340,928 | | | | 239,586,739 | | | | | | 258,386,293 | | | | 289,814,208 | |
Beginning of year | | | 518,194,418 | | | | 278,607,679 | | | | | | 818,295,193 | | | | 528,480,985 | |
| | | | | | | | | | |
End of year | | $ | 776,535,346 | | | $ | 518,194,418 | | | | | $ | 1,076,681,486 | | | $ | 818,295,193 | |
| | | | | | | | | | |
| | | | | | |
| See Notes to Financial Statements. | | | | |
| | | | | | | |
| 88 | | BLACKROCK FUNDS III | | DECEMBER 31, 2015 | | |
| | |
| Statements of Changes in Net Assets | | Master Investment Portfolio |
| | | | | | | | | | | | | | | | | | |
| | | LifePath Index 2035
Master Portfolio | | | | | LifePath Index 2040
Master Portfolio | |
| | | Year Ended December 31, | | | | | Year Ended December 31, | |
| Increase (Decrease) in Net Assets: | | 2015 | | | 2014 | | | | | 2015 | | | 2014 | |
| | | | | | | | | | | | | | | | | | |
| Operations | | | | | | | | | | | | | | | | | | |
Net investment income | | $ | 11,549,977 | | | $ | 6,809,249 | | | | | $ | 15,825,065 | | | $ | 9,812,969 | |
Net realized gain | | | 27,017,731 | | | | 2,778,041 | | | | | | 43,357,531 | | | | 4,085,183 | |
Net change in unrealized appreciation (depreciation) | | | (43,396,849 | ) | | | 9,904,541 | | | | | | (66,079,203 | ) | | | 14,271,929 | |
| | | | | | | | | | |
Net increase (decrease) in net assets resulting from operations | | | (4,829,141 | ) | | | 19,491,831 | | | | | | (6,896,607 | ) | | | 28,170,081 | |
| | | | | | | | | | |
| | | | | | | | | | | | | | | | | | |
| Capital Transactions | | | | | | | | | | | | | | | | | | |
Proceeds from contributions | | | 304,017,851 | | | | 198,363,584 | | | | | | 361,059,136 | | | | 215,183,238 | |
Value of withdrawals | | | (99,656,977 | ) | | | (14,990,358 | ) | | | | | (149,358,428 | ) | | | (23,545,222 | ) |
| | | | | | | | | | |
Net increase in net assets derived from capital transactions | | | 204,360,874 | | | | 183,373,226 | | | | | | 211,700,708 | | | | 191,638,016 | |
| | | | | | | | | | |
| | | | | | | | | | | | | | | | | | |
| Net Assets | | | | | | | | | | | | | | | | | | |
Total increase in net assets | | | 199,531,733 | | | | 202,865,057 | | | | | | 204,804,101 | | | | 219,808,097 | |
Beginning of year | | | 410,040,130 | | | | 207,175,073 | | | | | | 546,501,465 | | | | 326,693,368 | |
| | | | | | | | | | |
End of year | | $ | 609,571,863 | | | $ | 410,040,130 | | | | | $ | 751,305,566 | | | $ | 546,501,465 | |
| | | | | | | | | | |
| | | | | | |
| See Notes to Financial Statements. | | | | |
| | | | | | | |
| | BLACKROCK FUNDS III | | DECEMBER 31, 2015 | | 89 |
| | |
| Statements of Changes in Net Assets | | Master Investment Portfolio |
| | | | | | | | | | | | | | | | | | |
| | | LifePath Index 2045
Master Portfolio | | | | | LifePath Index 2050
Master Portfolio | |
| | | Year Ended December 31, | | | | | Year Ended December 31, | |
| Increase (Decrease) in Net Assets: | | 2015 | | | 2014 | | | | | 2015 | | | 2014 | |
| | | | | | | | | | | | | | | | | | |
| Operations | | | | | | | | | | | | | | | | | | |
Net investment income | | $ | 6,936,498 | | | $ | 3,844,455 | | | | | $ | 7,240,018 | | | $ | 3,884,535 | |
Net realized gain | | | 15,260,388 | | | | 1,288,616 | | | | | | 15,528,685 | | | | 1,121,033 | |
Net change in unrealized appreciation (depreciation) | | | (25,249,645 | ) | | | 5,861,518 | | | | | | (26,114,247 | ) | | | 6,166,746 | |
| | | | | | | | | | |
Net increase (decrease) in net assets resulting from operations | | | (3,052,759 | ) | | | 10,994,589 | | | | | | (3,345,544 | ) | | | 11,172,314 | |
| | | | | | | | | | |
| | | | | | | | | | | | | | | | | | |
| Capital Transactions | | | | | | | | | | | | | | | | | | |
Proceeds from contributions | | | 183,002,452 | | | | 117,709,595 | | | | | | 203,855,020 | | | | 127,679,053 | |
Value of withdrawals | | | (65,515,857 | ) | | | (6,474,693 | ) | | | | | (96,352,760 | ) | | | (9,666,042 | ) |
| | | | | | | | | | |
Net increase in net assets derived from capital transactions | | | 117,486,595 | | | | 111,234,902 | | | | | | 107,502,260 | | | | 118,013,011 | |
| | | | | | | | | | |
| | | | | | | | | | | | | | | | | | |
| Net Assets | | | | | | | | | | | | | | | | | | |
Total increase in net assets | | | 114,433,836 | | | | 122,229,491 | | | | | | 104,156,716 | | | | 129,185,325 | |
Beginning of year | | | 226,796,240 | | | | 104,566,749 | | | | | | 232,907,693 | | | | 103,722,368 | |
| | | | | | | | | | |
End of year | | $ | 341,230,076 | | | $ | 226,796,240 | | | | | $ | 337,064,409 | | | $ | 232,907,693 | |
| | | | | | | | | | |
| | | | | | |
| See Notes to Financial Statements. | | | | |
| | | | | | | |
| 90 | | BLACKROCK FUNDS III | | DECEMBER 31, 2015 | | |
| | |
| Statements of Changes in Net Assets | | Master Investment Portfolio |
| | | | | | | | |
| | | LifePath Index 2055
Master Portfolio | |
| | | Year Ended December 31, | |
| Increase (Decrease) in Net Assets: | | 2015 | | | 2014 | |
| | | | | | | | |
| Operations | | | | | | | | |
Net investment income | | $ | 2,136,211 | | | $ | 986,900 | |
Net realized gain | | | 3,734,441 | | | | 250,120 | |
Net change in unrealized appreciation (depreciation) | | | (6,921,725 | ) | | | 1,524,141 | |
| | | | | | | | |
Net increase (decrease) in net assets resulting from operations | | | (1,051,073 | ) | | | 2,761,161 | |
| | | | |
| | | | | | | | |
| Capital Transactions | | | | | | | | |
Proceeds from contributions | | | 79,310,091 | | | | 40,430,983 | |
Value of withdrawals | | | (33,130,687 | ) | | | (5,284,411 | ) |
| | | | |
Net increase in net assets derived from capital transactions | | | 46,179,404 | | | | 35,146,572 | |
| | | | |
| | | | | | | | |
| Net Assets | | | | | | | | |
Total increase in net assets | | | 45,128,331 | | | | 37,907,733 | |
Beginning of year | | | 61,875,758 | | | | 23,968,025 | |
| | | | |
End of year | | $ | 107,004,089 | | | $ | 61,875,758 | |
| | | | |
| | | | | | |
| See Notes to Financial Statements. | | | | |
| | | | | | | |
| | BLACKROCK FUNDS III | | DECEMBER 31, 2015 | | 91 |
| | |
| Financial Highlights | | Master Investment Portfolio |
| | | | | | | | | | | | | | | | | | | | |
| | | LifePath Index Retirement Master Portfolio | |
| | | Year Ended December 31, | | | Period May 31,
20111 to
December 31,
2011 | |
| | | 2015 | | | 2014 | | | 2013 | | | 2012 | | |
| | | | | | | | | | | | | | | | | | | | |
| Total Return | | | | | | | | | | | | | | | | | | | | |
Total return | | | (0.31)% | | | | 5.78% | | | | 7.72% | | | | 9.17% | | | | (0.59)% | 2 |
| | | | |
| | | | | | | | | | | | | | | | | | | | |
| Ratios to Average Net Assets | | | | | | | | | | | | | | | | | | | | |
Total expenses3,4,5 | | | 0.10% | | | | 0.13% | | | | 0.16% | | | | 0.18% | | | | 3.44% | 6,7 |
| | | | |
Total expenses after fees waived3,4,5 | | | 0.09% | | | | 0.11% | | | | 0.14% | | | | 0.15% | | | | 0.15% | 6 |
| | | | |
Net investment income4,5,8 | | | 1.84% | | | | 1.87% | | | | 1.74% | | | | 2.02% | | | | 2.87% | 6 |
| | | | |
| | | | | | | | | | | | | | | | | | | | |
| Supplemental Data | | | | | | | | | | | | | | | | | | | | |
Net assets, end of period (000) | | | $ 499,749 | | | | $ 431,795 | | | | $ 321,594 | | | | $ 201,972 | | | | $ 1,968 | |
| | | | |
Portfolio turnover rate | | | 25% | 9 | | | 15% | 9 | | | 18% | 9 | | | 1% | 10 | | | 1% | 10 |
| | | | |
| | 1 | | Commencement of operations. |
| | 2 | | Aggregate total return. |
| | 3 | | Includes the LifePath Index Master Portfolio’s pro rata portion of expenses from Large Cap Index Master Portfolio, Master International Index Series, Master Small Cap Index Series, Total International ex U.S. Index Master Portfolio and U.S. Total Bond Index Master Portfolio (collectively, the “Underlying Master Portfolios”). These ratios do not reflect any expenses incurred indirectly as a result of investments in BlackRock Cash Funds: Institutional, BlackRock Cash Funds: Prime and iShares exchange-traded funds. |
| | 4 | | Includes the LifePath Index Master Portfolio’s share of the Underlying Master Portfolios’ allocated fees waived of 0.01%, 0.01%, 0.00%, 0.02% and 0.08% for the years ended December 31, 2015, December 31, 2014, December 31, 2013 and December 31, 2012 and the period ended December 31, 2011, respectively. |
| | 5 | | Excludes expenses incurred indirectly as a result of investments in underlying funds of approximately 0.03%, 0.03%, 0.02%, 0.02% and 0.04% for the years ended December 31, 2015, December 31, 2014, December 31, 2013 and December 31, 2012 and the period ended December 31, 2011, respectively, although the ratio does include the LifePath Index Master Portfolio’s share of the Underlying Master Portfolios’ allocated expenses and/or net investment income. |
| | 7 | | Organization costs were not annualized in the calculation of the expense ratio. If these expenses were annualized, the total expenses would have been 3.45%. |
| | 8 | | Includes the LifePath Index Master Portfolio’s share of the allocated net investment income from the Underlying Master Portfolios. |
| | 9 | | Includes the purchases and sales of the underlying funds and the Underlying Master Portfolios. |
| | 10 | | Excludes purchases and sales of the Underlying Master Portfolios. If these transactions had been included to conform to the current year presentation, portfolio turnover rate would have been 15% and 9% for the year ended December 31, 2012 and the period ended December 31, 2011, respectively. |
| | | | | | |
| See Notes to Financial Statements. | | | | |
| | | | | | | |
| 92 | | BLACKROCK FUNDS III | | DECEMBER 31, 2015 | | |
| | |
| Financial Highlights | | Master Investment Portfolio |
| | | | | | | | | | | | | | | | | | | | |
| | | LifePath Index 2020 Master Portfolio | |
| | | Year Ended December 31, | | | Period May 31,
20111 to
December 31,
2011 | |
| | | 2015 | | | 2014 | | | 2013 | | | 2012 | | |
| | | | | | | | | | | | | | | | | | | | |
| Total Return | | | | | | | | | | | | | | | | | | | | |
Total return | | | (0.42)% | | | | 6.15% | | | | 11.36% | | | | 11.36% | | | | (3.71)% | 2 |
| | | | |
| | | | | | | | | | | | | | | | | | | | |
| Ratios to Average Net Assets | | | | | | | | | | | | | | | | | | | | |
Total expenses3,4,5 | | | 0.10% | | | | 0.12% | | | | 0.16% | | | | 0.19% | | | | 3.55% | 6,7 |
| | | | |
Total expenses after fees waived3,4,5 | | | 0.09% | | | | 0.11% | | | | 0.14% | | | | 0.16% | | | | 0.18% | 6 |
| | | | |
Net investment income4,5,8 | | | 1.95% | | | | 1.99% | | | | 2.01% | | | | 2.19% | | | | 2.70% | 6 |
| | | | |
| | | | | | | | | | | | | | | | | | | | |
| Supplemental Data | | | | | | | | | | | | | | | | | | | | |
Net assets, end of period (000) | | | $ 1,075,157 | | | | $ 881,324 | | | | $ 616,003 | | | | $ 286,973 | | | | $ 1,908 | |
| | | | |
Portfolio turnover rate | | | 14% | 9 | | | 12% | 9 | | | 12% | 9 | | | 1% | 10 | | | 1% | 10 |
| | | | |
| | 1 | | Commencement of operations. |
| | 2 | | Aggregate total return. |
| | 3 | | Includes the LifePath Index Master Portfolio’s pro rata portion of expenses from Large Cap Index Master Portfolio, Master International Index Series, Master Small Cap Index Series, Total International ex U.S. Index Master Portfolio and U.S. Total Bond Index Master Portfolio (collectively, the “Underlying Master Portfolios”). These ratios do not reflect any expenses incurred indirectly as a result of investments in BlackRock Cash Funds: Institutional, BlackRock Cash Funds: Prime and iShares exchange-traded funds. |
| | 4 | | Includes the LifePath Index Master Portfolio’s share of the Underlying Master Portfolios’ allocated fees waived of 0.01%, 0.01%, 0.00%, 0.02% and 0.10% for the years ended December 31, 2015, December 31, 2014, December 31, 2013 and December 31, 2012 and the period ended December 31, 2011, respectively. |
| | 5 | | Excludes expenses incurred indirectly as a result of investments in underlying funds of approximately 0.04%, 0.04%, 0.03%, 0.03% and 0.05% for the years ended December 31, 2015, December 31, 2014, December 31, 2013 and December 31, 2012 and the period ended December 31, 2011, respectively, although the ratio does include the LifePath Index Master Portfolio’s share of the Underlying Master Portfolios’ allocated expenses and/or net investment income. |
| | 7 | | Organization costs were not annualized in the calculation of the expense ratio. If these expenses were annualized, the total expenses would have been 3.56%. |
| | 8 | | Includes the LifePath Index Master Portfolio’s share of the allocated net investment income from the Underlying Master Portfolios. |
| | 9 | | Includes the purchases and sales of the underlying funds and the Underlying Master Portfolios. |
| | 10 | | Excludes purchases and sales of the Underlying Master Portfolios. If these transactions had been included to conform to the current year presentation, portfolio turnover rate would have been 13% and 8% for the year ended December 31, 2012 and the period ended December 31, 2011, respectively. |
| | | | | | |
| See Notes to Financial Statements. | | | | |
| | | | | | | |
| | BLACKROCK FUNDS III | | DECEMBER 31, 2015 | | 93 |
| | |
| Financial Highlights | | Master Investment Portfolio |
| | | | | | | | | | | | | | | | | | | | |
| | | LifePath Index 2025 Master Portfolio | |
| | | Year Ended December 31, | | | Period May 31,
20111 to
December 31,
2011 | |
| | | 2015 | | | 2014 | | | 2013 | | | 2012 | | |
| | | | | | | | | | | | | | | | | | | | |
| Total Return | | | | | | | | | | | | | | | | | | | | |
Total return | | | (0.45)% | | | | 6.47% | | | | 13.48% | | | | 12.34% | | | | (5.10)% | 2 |
| | | | |
| | | | | | | | | | | | | | | | | | | | |
| Ratios to Average Net Assets | | | | | | | | | | | | | | | | | | | | |
Total expenses3,4,5 | | | 0.10% | | | | 0.12% | | | | 0.17% | | | | 0.23% | | | | 3.59% | 6,7 |
| | | | |
Total expenses after fees waived3,4,5 | | | 0.09% | | | | 0.11% | | | | 0.14% | | | | 0.16% | | | | 0.18% | 6 |
| | | | |
Net investment income4,5,8 | | | 2.06% | | | | 2.08% | | | | 2.19% | | | | 2.27% | | | | 2.58% | 6 |
| | | | |
| | | | | | | | | | | | | | | | | | | | |
| Supplemental Data | | | | | | | | | | | | | | | | | | | | |
Net assets, end of period (000) | | | $ 776,535 | | | | $ 518,194 | | | | $ 278,608 | | | | $ 122,448 | | | | $ 1,882 | |
| | | | |
Portfolio turnover rate | | | 12% | 9 | | | 15% | 9 | | | 13% | 9 | | | 0% | 10,11 | | | 0% | 10,11 |
| | | | |
| | 1 | | Commencement of operations. |
| | 2 | | Aggregate total return. |
| | 3 | | Includes the LifePath Index Master Portfolio’s pro rata portion of expenses from Large Cap Index Master Portfolio, Master International Index Series, Master Small Cap Index Series, Total International ex U.S. Index Master Portfolio and U.S. Total Bond Index Master Portfolio (collectively, the “Underlying Master Portfolios”). These ratios do not reflect any expenses incurred indirectly as a result of investments in BlackRock Cash Funds: Institutional, BlackRock Cash Funds: Prime and iShares exchange-traded funds. |
| | 4 | | Includes the LifePath Index Master Portfolio’s share of the Underlying Master Portfolios’ allocated fees waived of 0.00%, 0.01%, 0.00%, 0.02% and 0.11% for the years ended December 31, 2015, December 31, 2014, December 31, 2013 and December 31, 2012 and the period ended December 31, 2011, respectively. |
| | 5 | | Excludes expenses incurred indirectly as a result of investments in underlying funds of approximately 0.05%, 0.05%, 0.04%, 0.03% and 0.06% for the years ended December 31, 2015, December 31, 2014, December 31, 2013 and December 31, 2012 and the period ended December 31, 2011, respectively, although the ratio does include the LifePath Index Master Portfolio’s share of the Underlying Master Portfolios’ allocated expenses and/or net investment income. |
| | 7 | | Organization costs were not annualized in the calculation of the expense ratio. If these expenses were annualized, the total expenses would have been 3.60%. |
| | 8 | | Includes the LifePath Index Master Portfolio’s share of the allocated net investment income from the Underlying Master Portfolios. |
| | 9 | | Includes the purchases and sales of the underlying funds and the Underlying Master Portfolios. |
| | 10 | | Excludes purchases and sales of the Underlying Master Portfolios. If these transactions had been included to conform to the current year presentation, portfolio turnover rate would have been 14% and 8% for the year ended December 31, 2012 and the period ended December 31, 2011, respectively. |
| | 11 | | Rounds to less than 1%. |
| | | | | | |
| See Notes to Financial Statements. | | | | |
| | | | | | | |
| 94 | | BLACKROCK FUNDS III | | DECEMBER 31, 2015 | | |
| | |
| Financial Highlights | | Master Investment Portfolio |
| | | | | | | | | | | | | | | | | | | | |
| | | LifePath Index 2030 Master Portfolio | |
| | | Year Ended December 31, | | | Period May 31, 20111 to
December 31,
2011 | |
| | | 2015 | | | 2014 | | | 2013 | | | 2012 | | |
| | | | | | | | | | | | | | | | | | | | |
| Total Return | | | | | | | | | | | | | | | | | | | | |
Total return | | | (0.50)% | | | | 6.64% | | | | 15.40% | | | | 13.28% | | | | (6.28)% | 2 |
| | | | |
| | | | | | | | | | | | | | | | | | | | |
| Ratios to Average Net Assets | | | | | | | | | | | | | | | | | | | | |
Total expenses3,4,5 | | | 0.10% | | | | 0.12% | | | | 0.16% | | | | 0.21% | | | | 3.63% | 6,7 |
| | | | |
Total expenses after fees waived3,4,5 | | | 0.09% | | | | 0.11% | | | | 0.15% | | | | 0.17% | | | | 0.19% | 6 |
| | | | |
Net investment income4,5,8 | | | 2.15% | | | | 2.14% | | | | 2.33% | | | | 2.36% | | | | 2.50% | 6 |
| | | | |
| | | | | | | | | | | | | | | | | | | | |
| Supplemental Data | | | | | | | | | | | | | | | | | | | | |
Net assets, end of period (000) | | | $ 1,076,681 | | | | $ 818,295 | | | | $ 528,481 | | | | $ 206,007 | | | | $ 1,859 | |
| | | | |
Portfolio turnover rate | | | 12% | 9 | | | 20% | 9 | | | 12% | 9 | | | 2% | 10 | | | 0% | 10,11 |
| | | | |
| | 1 | | Commencement of operations. |
| | 2 | | Aggregate total return. |
| | 3 | | Includes the LifePath Index Master Portfolio’s pro rata portion of expenses from Large Cap Index Master Portfolio, Master International Index Series, Master Small Cap Index Series, Total International ex U.S. Index Master Portfolio and U.S. Total Bond Index Master Portfolio (collectively, the “Underlying Master Portfolios”). These ratios do not reflect any expenses incurred indirectly as a result of investments in BlackRock Cash Funds: Institutional, BlackRock Cash Funds: Prime and iShares exchange-traded funds. |
| | 4 | | Includes the LifePath Index Master Portfolio’s share of the Underlying Master Portfolios’ allocated fees waived of 0.01%, 0.01%, 0.00%, 0.02% and 0.12% for the years ended December 31, 2015, December 31, 2014, December 31, 2013 and December 31, 2012 and the period ended December 31, 2011, respectively. |
| | 5 | | Excludes expenses incurred indirectly as a result of investments in underlying funds of approximately 0.06%, 0.05%, 0.04%, 0.04% and 0.06% for the years ended December 31, 2015, December 31, 2014, December 31, 2013 and December 31, 2012 and the period ended December 31, 2011, respectively, although the ratio does include the LifePath Index Master Portfolio’s share of the Underlying Master Portfolios’ allocated expenses and/or net investment income. |
| | 7 | | Organization costs were not annualized in the calculation of the expense ratio. If these expenses were annualized, the total expenses would have been 3.64%. |
| | 8 | | Includes the LifePath Index Master Portfolio’s share of the allocated net investment income from the Underlying Master Portfolios. |
| | 9 | | Includes the purchases and sales of the underlying funds and the Underlying Master Portfolios. |
| | 10 | | Excludes purchases and sales of the Underlying Master Portfolios. If these transactions had been included to conform to the current year presentation, portfolio turnover rate would have been 18% and 6% for the year ended December 31, 2012 and the period ended December 31, 2011, respectively. |
| | 11 | | Rounds to less than 1%. |
| | | | | | |
| See Notes to Financial Statements. | | | | |
| | | | | | | |
| | BLACKROCK FUNDS III | | DECEMBER 31, 2015 | | 95 |
| | |
| Financial Highlights | | Master Investment Portfolio |
| | | | | | | | | | | | | | | | | | | | |
| | | LifePath Index 2035 Master Portfolio | |
| | | Year Ended December 31, | | | Period May 31, 20111 to
December 31,
2011 | |
| | | 2015 | | | 2014 | | | 2013 | | | 2012 | | |
| | | | | | | | | | | | | | | | | | | | |
| Total Return | | | | | | | | | | | | | | | | | | | | |
Total return | | | (0.56)% | | | | 6.82% | | | | 17.02% | | | | 14.07% | | | | (7.35)% | 2 |
| | | | |
| | | | | | | | | | | | | | | | | | | | |
| Ratios to Average Net Assets | | | | | | | | | | | | | | | | | | | | |
Total expenses3,4,5 | | | 0.10% | | | | 0.12% | | | | 0.18% | | | | 0.26% | | | | 3.67% | 6,7 |
| | | | |
Total expenses after fees waived3,4,5 | | | 0.08% | | | | 0.11% | | | | 0.15% | | | | 0.17% | | | | 0.19% | 6 |
| | | | |
Net investment income4,5,8 | | | 2.26% | | | | 2.22% | | | | 2.47% | | | | 2.44% | | | | 2.43% | 6 |
| | | | |
| | | | | | | | | | | | | | | | | | | | |
| Supplemental Data | | | | | | | | | | | | | | | | | | | | |
Net assets, end of period (000) | | | $ 609,572 | | | | $ 410,040 | | | | $ 207,175 | | | | $ 81,763 | | | | $ 1,838 | |
| | | | |
Portfolio turnover rate | | | 10% | 9 | | | 25% | 9 | | | 12% | 9 | | | 1% | 10 | | | 0% | 10,11 |
| | | | |
| | 1 | | Commencement of operations. |
| | 2 | | Aggregate total return. |
| | 3 | | Includes the LifePath Index Master Portfolio’s pro rata portion of expenses from Large Cap Index Master Portfolio, Master International Index Series, Master Small Cap Index Series, Total International ex U.S. Index Master Portfolio and U.S. Total Bond Index Master Portfolio (collectively, the “Underlying Master Portfolios”). These ratios do not reflect any expenses incurred indirectly as a result of investments in BlackRock Cash Funds: Institutional, BlackRock Cash Funds: Prime and iShares exchange-traded funds. |
| | 4 | | Includes the LifePath Index Master Portfolio’s share of the Underlying Master Portfolios’ allocated fees waived of 0.00%, 0.01%, 0.00%, 0.02% and 0.13% for the years ended December 31, 2015, December 31, 2014, December 31, 2013 and December 31, 2012 and the period ended December 31, 2011, respectively. |
| | 5 | | Excludes expenses incurred indirectly as a result of investments in underlying funds of approximately 0.07%, 0.06%, 0.05%, 0.04% and 0.06% for the years ended December 31, 2015, December 31, 2014, December 31, 2013 and December 31, 2012 and the period ended December 31, 2011, respectively, although the ratio does include the LifePath Index Master Portfolio’s share of the Underlying Master Portfolios’ allocated expenses and/or net investment income. |
| | 7 | | Organization costs were not annualized in the calculation of the expense ratio. If these expenses were annualized, the total expenses would have been 3.68%. |
| | 8 | | Includes the LifePath Index Master Portfolio’s share of the allocated net investment income from the Underlying Master Portfolios. |
| | 9 | | Includes the purchases and sales of the underlying funds and the Underlying Master Portfolios. |
| | 10 | | Excludes purchases and sales of the Underlying Master Portfolios. If these transactions had been included to conform to the current year presentation, portfolio turnover rate would have been 24% and 7% for the year ended December 31, 2012 and the period ended December 31, 2011, respectively. |
| | 11 | | Rounds to less than 1%. |
| | | | | | |
| See Notes to Financial Statements. | | | | |
| | | | | | | |
| 96 | | BLACKROCK FUNDS III | | DECEMBER 31, 2015 | | |
| | |
| Financial Highlights | | Master Investment Portfolio |
| | | | | | | | | | | | | | | | | | | | |
| | | LifePath Index 2040 Master Portfolio | |
| | | Year Ended December 31, | | | Period May 31, 20111 to
December 31,
2011 | |
| | | 2015 | | | 2014 | | | 2013 | | | 2012 | | |
| | | | | | | | | | | | | | | | | | | | |
| Total Return | | | | | | | | | | | | | | | | | | | | |
Total return | | | (0.56)% | | | | 6.90% | | | | 18.66% | | | | 15.03% | | | | (8.42)% | 2 |
| | | | |
| | | | | | | | | | | | | | | | | | | | |
| Ratios to Average Net Assets | | | | | | | | | | | | | | | | | | | | |
Total expenses3,4,5 | | | 0.10% | | | | 0.12% | | | | 0.17% | | | | 0.24% | | | | 3.70% | 6,7 |
| | | | |
Total expenses after fees waived3,4,5 | | | 0.08% | | | | 0.11% | | | | 0.15% | | | | 0.18% | | | | 0.20% | 6 |
| | | | |
Net investment income4,5,8 | | | 2.33% | | | | 2.27% | | | | 2.59% | | | | 2.50% | | | | 2.36% | 6 |
| | | | |
| | | | | | | | | | | | | | | | | | | | |
| Supplemental Data | | | | | | | | | | | | | | | | | | | | |
Net assets, end of period (000) | | | $ 751,306 | | | | $ 546,501 | | | | $ 326,693 | | | | $ 107,671 | | | | $ 1,819 | |
| | | | |
Portfolio turnover rate | | | 11% | 9 | | | 29% | 9 | | | 12% | 9 | | | 3% | 10 | | | 0% | 10,11 |
| | | | |
| | 1 | | Commencement of operations. |
| | 2 | | Aggregate total return. |
| | 3 | | Includes the LifePath Index Master Portfolio’s pro rata portion of expenses from Large Cap Index Master Portfolio, Master International Index Series, Master Small Cap Index Series, Total International ex U.S. Index Master Portfolio and U.S. Total Bond Index Master Portfolio (collectively, the “Underlying Master Portfolios”). These ratios do not reflect any expenses incurred indirectly as a result of investments in BlackRock Cash Funds: Institutional, BlackRock Cash Funds: Prime and iShares exchange-traded funds. |
| | 4 | | Includes the LifePath Index Master Portfolio’s share of the Underlying Master Portfolios’ allocated fees waived of 0.00%, 0.01%, 0.00%,0.02% and 0.14% for the years ended December 31, 2015, December 31, 2014, December 31, 2013 and December 31, 2012 and the period ended December 31, 2011, respectively. |
| | 5 | | Excludes expenses incurred indirectly as a result of investments in underlying funds of approximately 0.07%, 0.06%, 0.05%,0.04% and 0.07% for the years ended December 31, 2015, December 31, 2014, December 31, 2013 and December 31, 2012 and the period ended December 31, 2011, respectively, although the ratio does include the LifePath Index Master Portfolio’s share of the Underlying Master Portfolios’ allocated expenses and/or net investment income. |
| | 7 | | Organization costs were not annualized in the calculation of the expense ratio. If these expenses were annualized, the total expenses would have been 3.71%. |
| | 8 | | Includes the LifePath Index Master Portfolio’s share of the allocated net investment income from the Underlying Master Portfolios. |
| | 9 | | Includes the purchases and sales of the underlying funds and the Underlying Master Portfolios. |
| | 10 | | Excludes purchases and sales of the Underlying Master Portfolios. If these transactions had been included to conform to the current year presentation, portfolio turnover rate would have been 21% and 5% for the year ended December 31, 2012 and the period ended December 31, 2011, respectively. |
| | 11 | | Rounds to less than 1%. |
| | | | | | |
| See Notes to Financial Statements. | | | | |
| | | | | | | |
| | BLACKROCK FUNDS III | | DECEMBER 31, 2015 | | 97 |
| | |
| Financial Highlights | | Master Investment Portfolio |
| | | | | | | | | | | | | | | | | | | | |
| | | LifePath Index 2045 Master Portfolio | |
| | | Year Ended December 31, | | | Period May 31, 20111 to
December 31,
2011 | |
| | | 2015 | | | 2014 | | | 2013 | | | 2012 | | |
| | | | | | | | | | | | | | | | | | | | |
| Total Return | | | | | | | | | | | | | | | | | | | | |
Total return | | | (0.64)% | | | | 7.10% | | | | 20.33% | | | | 15.61% | | | | (9.49)% | 2 |
| | | | |
| | | | | | | | | | | | | | | | | | | | |
| Ratios to Average Net Assets | | | | | | | | | | | | | | | | | | | | |
Total expenses3,4,5 | | | 0.11% | | | | 0.13% | | | | 0.21% | | | | 0.41% | | | | 3.74% | 6,7 |
| | | | |
Total expenses after fees waived3,4,5 | | | 0.07% | | | | 0.10% | | | | 0.15% | | | | 0.17% | | | | 0.21% | 6 |
| | | | |
Net investment income4,5,8 | | | 2.39% | | | | 2.34% | | | | 2.77% | | | | 2.62% | | | | 2.29% | 6 |
| | | | |
| | | | | | | | | | | | | | | | | | | | |
| Supplemental Data | | | | | | | | | | | | | | | | | | | | |
Net assets, end of period (000) | | | $ 341,230 | | | | $ 226,796 | | | | $ 104,567 | | | | $ 33,177 | | | | $ 1,799 | |
| | | | |
Portfolio turnover rate | | | 10% | 9 | | | 30% | 9 | | | 12% | 9 | | | 2% | 10 | | | 0% | 10,11 |
| | | | |
| | 1 | | Commencement of operations. |
| | 2 | | Aggregate total return. |
| | 3 | | Includes the LifePath Index Master Portfolio’s pro rata portion of expenses from Large Cap Index Master Portfolio, Master International Index Series, Master Small Cap Index Series, Total International ex U.S. Index Master Portfolio and U.S. Total Bond Index Master Portfolio (collectively, the “Underlying Master Portfolios”). These ratios do not reflect any expenses incurred indirectly as a result of investments in BlackRock Cash Funds: Institutional, BlackRock Cash Funds: Prime and iShares exchange-traded funds. |
| | 4 | | Includes the LifePath Index Master Portfolio’s share of the Underlying Master Portfolios’ allocated fees waived of 0.00%, 0.00%, 0.00%, 0.02% and 0.15% for the years ended December 31, 2015, December 31, 2014, December 31, 2013 and December 31, 2012 and the period ended December 31, 2011, respectively. |
| | 5 | | Excludes expenses incurred indirectly as a result of investments in underlying funds of approximately 0.08%, 0.07%, 0.05%, 0.04% and 0.07% for the years ended December 31, 2015, December 31, 2014, December 31, 2013 and December 31, 2012 and the period ended December 31, 2011, respectively, although the ratio does include the LifePath Index Master Portfolio’s share of the Underlying Master Portfolios’ allocated expenses and/or net investment income. |
| | 7 | | Organization costs were not annualized in the calculation of the expense ratio. If these expenses were annualized, the total expenses would have been 3.75%. |
| | 8 | | Includes the LifePath Index Master Portfolio’s share of the allocated net investment income from the Underlying Master Portfolios. |
| | 9 | | Includes the purchases and sales of the underlying funds and the Underlying Master Portfolios. |
| | 10 | | Excludes purchases and sales of the Underlying Master Portfolios. If these transactions had been included to conform to the current year presentation, portfolio turnover rate would have been 22% and 6% for the year ended December 31, 2012 and the period ended December 31, 2011, respectively. |
| | 11 | | Rounds to less than 1%. |
| | | | | | |
| See Notes to Financial Statements. | | | | |
| | | | | | | |
| 98 | | BLACKROCK FUNDS III | | DECEMBER 31, 2015 | | |
| | |
| Financial Highlights | | Master Investment Portfolio |
| | | | | | | | | | | | | | | | | | | | |
| | | LifePath Index 2050 Master Portfolio | |
| | | Year Ended December 31, | | | Period May 31, 20111 to
December 31,
2011 | |
| | | 2015 | | | 2014 | | | 2013 | | | 2012 | | |
| | | | | | | | | | | | | | | | | | | | |
| Total Return | | | | | | | | | | | | | | | | | | | | |
Total return | | | (0.67)% | | | | 7.28% | | | | 21.62% | | | | 16.37% | | | | (10.34)% | 2 |
| | | | |
| | | | | | | | | | | | | | | | | | | | |
| Ratios to Average Net Assets | | | | | | | | | | | | | | | | | | | | |
Total expenses3,4,5 | | | 0.11% | | | | 0.13% | | | | 0.21% | | | | 0.46% | | | | 3.76% | 6,7 |
| | | | |
Total expenses after fees waived3,4,5 | | | 0.07% | | | | 0.10% | | | | 0.15% | | | | 0.18% | | | | 0.21% | 6 |
| | | | |
Net investment income4,5,8 | | | 2.39% | | | | 2.38% | | | | 2.91% | | | | 2.67% | | | | 2.25% | 6 |
| | | | |
| | | | | | | | | | | | | | | | | | | | |
| Supplemental Data | | | | | | | | | | | | | | | | | | | | |
Net assets, end of period (000) | | | $ 337,064 | | | | $ 232,908 | | | | $ 103,722 | | | | $ 26,037 | | | | $ 1,784 | |
| | | | |
Portfolio turnover rate | | | 14% | 9 | | | 22% | 9 | | | 12% | 9 | | | 3% | 10 | | | 0% | 10,11 |
| | | | |
| | 1 | | Commencement of operations. |
| | 2 | | Aggregate total return. |
| | 3 | | Includes the LifePath Index Master Portfolio’s pro rata portion of expenses from Large Cap Index Master Portfolio, Master International Index Series, Master Small Cap Index Series, Total International ex U.S. Index Master Portfolio and U.S. Total Bond Index Master Portfolio (collectively, the “Underlying Master Portfolios”). These ratios do not reflect any expenses incurred indirectly as a result of investments in BlackRock Cash Funds: Institutional, BlackRock Cash Funds: Prime and iShares exchange-traded funds. |
| | 4 | | Includes the LifePath Index Master Portfolio’s share of the Underlying Master Portfolios’ allocated fees waived of 0.00%, 0.00%, 0.00%, 0.02% and 0.15% for the years ended December 31, 2015, December 31, 2014, December 31, 2013 and December 31, 2012 and the period ended December 31, 2011, respectively. |
| | 5 | | Excludes expenses incurred indirectly as a result of investments in underlying funds of approximately 0.09%, 0.08%, 0.06%, 0.05% and 0.07% for the years ended December 31, 2015, December 31, 2014, December 31, 2013 and December 31, 2012 and the period ended December 31, 2011, respectively, although the ratio does include the LifePath Index Master Portfolio’s share of the Underlying Master Portfolios’ allocated expenses and/or net investment income. |
| | 7 | | Organization costs were not annualized in the calculation of the expense ratio. If these expenses were annualized, the total expenses would have been 3.77%. |
| | 8 | | Includes the LifePath Index Master Portfolio’s share of the allocated net investment income from the Underlying Master Portfolios. |
| | 9 | | Includes the purchases and sales of the underlying funds and the Underlying Master Portfolios. |
| | 10 | | Excludes purchases and sales of the Underlying Master Portfolios. If these transactions had been included to conform to the current year presentation, portfolio turnover rate would have been 26% and 5% for the year ended December 31, 2012 and the period ended December 31, 2011, respectively. |
| | 11 | | Rounds to less than 1%. |
| | | | | | |
| See Notes to Financial Statements. | | | | |
| | | | | | | |
| | BLACKROCK FUNDS III | | DECEMBER 31, 2015 | | 99 |
| | |
| Financial Highlights | | Master Investment Portfolio |
| | | | | | | | | | | | | | | | | | | | |
| | | LifePath Index 2055 Master Portfolio | |
| | | Year Ended December 31, | | | Period May 31, 20111 to
December 31,
2011 | |
| | | 2015 | | | 2014 | | | 2013 | | | 2012 | | |
| | | | | | | | | | | | | | | | | | | | |
| Total Return | | | | | | | | | | | | | | | | | | | | |
Total return | | | (0.60)% | | | | 7.50% | | | | 22.99% | | | | 16.83% | | | | (10.96)% | 2 |
| | | | |
| | | | | | | | | | | | | | | | | | | | |
| Ratios to Average Net Assets | | | | | | | | | | | | | | | | | | | | |
Total expenses3,4,5 | | | 0.14% | | | | 0.20% | | | | 0.42% | | | | 1.39% | | | | 3.79% | 6,7 |
| | | | |
Total expenses after fees waived3,4,5 | | | 0.06% | | | | 0.10% | | | | 0.15% | | | | 0.15% | | | | 0.21% | 6 |
| | | | |
Net investment income4,5,8 | | | 2.44% | | | | 2.46% | | | | 3.09% | | | | 2.76% | | | | 2.24% | 6 |
| | | | |
| | | | | | | | | | | | | | | | | | | | |
| Supplemental Data | | | | | | | | | | | | | | | | | | | | |
Net assets, end of period (000) | | | $ 107,004 | | | | $ 61,856 | | | | $ 23,968 | | | | $ 4,908 | | | | $ 1,769 | |
| | | | |
Portfolio turnover rate | | | 17% | 9 | | | 22% | 9 | | | 15% | 9 | | | 8% | 10 | | | 0% | 10,11 |
| | | | |
| | 1 | | Commencement of operations. |
| | 2 | | Aggregate total return. |
| | 3 | | Includes the LifePath Index Master Portfolio’s pro rata portion of expenses from Large Cap Index Master Portfolio, Master International Index Series, Master Small Cap Index Series, Total International ex U.S. Index Master Portfolio and U.S. Total Bond Index Master Portfolio (collectively, the “Underlying Master Portfolios”). These ratios do not reflect any expenses incurred indirectly as a result of investments in BlackRock Cash Funds: Institutional, BlackRock Cash Funds: Prime and iShares exchange-traded funds. |
| | 4 | | Includes the LifePath Index Master Portfolio’s share of the Underlying Master Portfolios’ allocated fees waived of 0.00%, 0.00%, 0.00%,0.02% and 0.15% for the years ended December 31, 2015, December 31, 2014, December 31, 2013 and December 31, 2012 and the period ended December 31, 2011, respectively. |
| | 5 | | Excludes expenses incurred indirectly as a result of investments in underlying funds of approximately 0.09%, 0.09%, 0.06%, 0.05% and 0.08% for the years ended December 31, 2015, December 31, 2014, December 31, 2013 and December 31, 2012 and the period ended December 31, 2011, respectively, although the ratio does include the LifePath Index Master Portfolio’s share of the Underlying Master Portfolios’ allocated expenses and/or net investment income. |
| | 7 | | Organization costs were not annualized in the calculation of the expense ratio. If these expenses were annualized, the total expenses would have been 3.79%. |
| | 8 | | Includes the LifePath Index Master Portfolio’s share of the allocated net investment income from the Underlying Master Portfolios. |
| | 9 | | Includes the purchases and sales of the underlying funds and the Underlying Master Portfolios. |
| | 10 | | Excludes purchases and sales of the Underlying Master Portfolios. If these transactions had been included to conform to the current year presentation, portfolio turnover rate would have been 53% and 13% for the year ended December 31, 2012 and the period ended December 31, 2011, respectively. |
| | 11 | | Rounds to less than 1%. |
| | | | | | |
| See Notes to Financial Statements. | | | | |
| | | | | | | |
| 100 | | BLACKROCK FUNDS III | | DECEMBER 31, 2015 | | |
| | | | |
| Notes to Financial Statements | | Master Investment Portfolio |
1. Organization:
Master Investment Portfolio (“MIP”) is registered under the Investment Company Act of 1940, as amended (the “1940 Act”), as a diversified, open-end management investment company. MIP is organized as a Delaware statutory trust. The financial statements and these accompanying notes relate to nine series of MIP: LifePath® Index Retirement Master Portfolio, LifePath® Index 2020 Master Portfolio, LifePath® Index 2025 Master Portfolio, LifePath® Index 2030 Master Portfolio, LifePath® Index 2035 Master Portfolio, LifePath® Index 2040 Master Portfolio, LifePath® Index 2045 Master Portfolio, LifePath® Index 2050 Master Portfolio and LifePath® Index 2055 Master Portfolio (each, a “LifePath Index Master Portfolio” and together, the “LifePath Index Master Portfolios”).
As of period end, the investment of LifePath Index Master Retirement Portfolio, LifePath Index 2020 Master Portfolio, LifePath Index 2025 Master Portfolio, LifePath Index 2030 Master Portfolio, LifePath Index 2035 Master Portfolio, LifePath Index 2040 Master Portfolio, LifePath Index 2045 Master Portfolio, LifePath Index 2050 Master Portfolio and LifePath Index 2055 Master Portfolio in the Large Cap Index Master Portfolio represented 22.4%, 28.9%, 34.3%, 39.9%, 45.3%, 49.6%, 51.4%, 51.5% and 51.5%, respectively, of net assets. The investment of LifePath Index Retirement Master Portfolio, LifePath Index 2020 Master Portfolio and LifePath Index 2025 Master Portfolio in the U.S. Total Bond Index Master Portfolio represented 51.0%, 42.2% and 32.0%, respectively, of net assets. As such, financial statements of Large Cap Index Master Portfolio and the U.S. Total Bond Index Master Portfolio, including the Schedules of Investments, should be read in conjunction with each respective LifePath Index Master Portfolio’s financial statements. The financial statements of Large Cap Index Master Portfolio, Master Small Cap Index Series, Total International ex U.S. Index Master Portfolio and U.S. Total Bond Index Master Portfolio are included in filings by MIP, except the financial statements of Master Small Cap Index Series, which are included in filings by Quantitative Master Series LLC, are available, without charge, on the U.S. Securities and Exchange Commission’s (“SEC”) website at http://www.sec.gov.
The LifePath Index Master Portfolios will generally invest in other registered investment companies (each, an “Underlying Fund” and collectively the “Underlying Funds”) that are managed by subsidiaries of BlackRock, Inc. (“BlackRock”) and its affiliates and affiliates of the LifePath Index Master Portfolios. The LifePath Index Master Portfolios may also invest in other master portfolios (“Underlying Master Portfolios”) that are managed by subsidiaries of BlackRock.
The value of a LifePath Index Master Portfolio’s investment in each of Large Cap Index Master Portfolio, Master Small Cap Index Series, Total International ex U.S. Index Master Portfolio and U.S. Total Bond Index Master Portfolio reflects that LifePath Index Master Portfolio’s proportionate interest in the net assets of that master portfolio. As of period end, the LifePath Index Master Portfolios held interests in Large Cap Index Master Portfolio, Master Small Cap Index Series, Total International ex U.S. Index Master Portfolio and U.S. Total Bond Index Master Portfolio as follows:
| | | | | | | | | | | | | | | | |
| | | Large Cap Index
Master Portfolio | | | Master Small Cap
Index Series | | | Total International
ex U.S. Index
Master Portfolio | | | U.S. Total Bond
Index Master
Portfolio | |
LifePath Index Retirement Master Portfolio | | | 4.40% | | | | 4.29% | | | | 3.82% | | | | 16.05% | |
LifePath Index 2020 Master Portfolio | | | 12.22% | | | | 8.33% | | | | 12.77% | | | | 28.59% | |
LifePath Index 2025 Master Portfolio | | | 10.47% | | | | 5.17% | | | | 8.13% | | | | 15.65% | |
LifePath Index 2030 Master Portfolio | | | 16.90% | | | | 6.15% | | | | 16.99% | | | | 15.43% | |
LifePath Index 2035 Master Portfolio | | | 10.86% | | | | 2.94% | | | | 8.90% | | | | 5.40% | |
LifePath Index 2040 Master Portfolio | | | 14.65% | | | | 3.19% | | | | 14.08% | | | | 2.89% | |
LifePath Index 2045 Master Portfolio | | | 6.90% | | | | 1.44% | | | | 5.47% | | | | 0.40% | |
LifePath Index 2050 Master Portfolio | | | 6.83% | | | | 1.47% | | | | 5.57% | | | | 0.21% | |
LifePath Index 2055 Master Portfolio | | | 2.17% | | | | 0.47% | | | | 1.28% | | | | 0.07% | |
The LifePath Index Master Portfolios, together with certain other registered investment companies advised by BlackRock Fund Advisors (“BFA” or the “Manager”) or its affiliates, are included in a complex of open-end funds referred to as the Equity-Liquidity Complex.
2. Significant Accounting Policies:
The financial statements are prepared in conformity with accounting principles generally accepted in the United States of America (“U.S. GAAP”), which may require management to make estimates and assumptions that affect the reported amounts of assets and liabilities in the financial statements, disclosure of contingent assets and liabilities at the date of the financial statements and the reported amounts of increases and decreases in net assets from operations during the reporting period. Actual results could differ from those estimates. Each LifePath Index Master Portfolio is considered an investment company under U.S. GAAP and follows the accounting and reporting guidance applicable to investment companies. Below is a summary of significant accounting policies:
Investment Transactions and Investment Income: For financial reporting purposes, investment transactions are recorded on the dates the transactions are entered into (the trade dates). Realized gains and losses on investment transactions are determined on the identified cost basis. Dividend income is recorded on the ex-dividend date. Dividends from foreign securities where the ex-dividend date may have passed are subsequently recorded when the LifePath Index Master Portfolios are informed of the ex-dividend date. Under the applicable foreign tax laws, a withholding tax at various rates may be imposed on capital gains, dividends and interest. Upon notification from issuers, some of the dividend income received from a real estate investment trust may be redesignated as a reduction of cost of the related investment and/or realized gain. Interest income, including amortization and accretion of premiums and discounts on debt securities, is recognized on the accrual basis.
| | | | | | |
| | | | | | | |
| | BLACKROCK FUNDS III | | DECEMBER 31, 2015 | | 101 |
| | |
| Notes to Financial Statements (continued) | | Master Investment Portfolio |
Each LifePath Index Master Portfolio records daily its proportionate share of the Underlying Master Portfolios’ income, expenses and realized and unrealized gains and losses.
In-Kind Redemptions: Certain underlying investments in the LifePath Index Master Portfolios satisfied redemptions in investors’ capital through an in-kind redemption of securities and cash received from the Master Portfolios upon their redemptions from the Master Portfolios. For financial reporting purposes, these transactions were treated as a sale of securities and the resulting gains and losses were recognized based on the market value of the securities on the date of the redemption. Gains and losses resulting from such redemptions in-kind are included in allocation from the applicable Underlying Master Portfolios from in-kind redemptions in the Statements of Operations. For tax purposes, no gains or losses were recognized.
Indemnifications: In the normal course of business, a LifePath Index Master Portfolio enters into contracts that contain a variety of representations that provide general indemnification. A LifePath Index Master Portfolio’s maximum exposure under these arrangements is unknown because it involves future potential claims against a LifePath Index Master Portfolio, which cannot be predicted with any certainty.
Other: Expenses directly related to a LifePath Index Master Portfolio are charged to that LifePath Index Master Portfolio. Other operating expenses shared by several funds, including other funds managed by the Manager, are prorated among those funds on the basis of relative net assets or other appropriate methods.
The LifePath Index Master Portfolios have an arrangement with their custodian whereby fees may be reduced by credits earned on uninvested cash balances, which, if applicable, are shown as fees paid indirectly in the Statements of Operations. The custodian imposes fees on overdrawn cash balances, which can be offset by accumulated credits earned or may result in additional custody charges. Effective September 2015, the arrangement with their custodian for earning credits on uninvested cash balances has ceased and the custodian will be imposing fees on certain uninvested cash balances.
3. Investment Valuation and Fair Value Measurements:
Investment Valuation Policies: The LifePath Index Master Portfolios’ investments are valued at fair value (also referred to as “market value” within the financial statements) as of the close of trading on the New York Stock Exchange (“NYSE”) (generally 4:00 p.m., Eastern time). U.S. GAAP defines fair value as the price the LifePath Index Master Portfolios would receive to sell an asset or pay to transfer a liability in an orderly transaction between market participants at the measurement date. The LifePath Index Master Portfolios determine the fair values of their financial instruments using independent dealers or pricing services under policies approved by the Board of Trustees of MIP (the “Board”). The BlackRock Global Valuation Methodologies Committee (the “Global Valuation Committee”) is the committee formed by management to develop global pricing policies and procedures and to provide oversight of the pricing function for the LifePath Index Master Portfolios for all financial instruments.
Fair Value Inputs and Methodologies: The following methods (or “techniques”) and inputs are used to establish the fair value of each LifePath Index Master Portfolio’s assets and liabilities:
| • | | The market value of the LifePath Index Master Portfolios’ investments in the underlying open-end mutual fund is based on the published net asset value (“NAV”) of each fund computed as of the close of regular trading on the NYSE on days when the NYSE is open. |
If events (e.g., a company announcement, market volatility or a natural disaster) occur that are expected to materially affect the value of such instruments, or in the event that the application of these methods of valuation results in a price for an investment that is deemed not to be representative of the market value of such investment, or if a price is not available, the investment will be valued by the Global Valuation Committee, or its delegate, in accordance with a policy approved by the Board as reflecting fair value (“Fair Valued Investments”). When determining the price for Fair Valued Investments, the Global Valuation Committee, or its delegate, seeks to determine the price that each LifePath Index Master Portfolio might reasonably expect to receive or pay from the current sale or purchase of that asset or liability in an arm’s-length transaction. Fair value determinations shall be based upon all available factors that the Global Valuation Committee, or its delegate, deems relevant consistent with the principles of fair value measurement. The pricing of all Fair Valued Investments is subsequently reported to the Board or a committee thereof on a quarterly basis.
Fair Value Hierarchy: Various inputs are used in determining the fair value of investments. These inputs to valuation techniques are categorized into a fair value hierarchy consisting of three broad levels for financial statement purposes as follows:
| • | | Level 1 — unadjusted price quotations in active markets/exchanges for identical assets or liabilities that each LifePath Index Master Portfolio has the ability to access |
| • | | Level 2 — other observable inputs (including, but not limited to, quoted prices for similar assets or liabilities in markets that are active, quoted prices for identical or similar assets or liabilities in markets that are not active, inputs other than quoted prices that are observable for the assets or liabilities (such as interest rates, yield curves, volatilities, prepayment speeds, loss severities, credit risks and default rates) or other market–corroborated inputs) |
| • | | Level 3 — unobservable inputs based on the best information available in the circumstances, to the extent observable inputs are not available (including each LifePath Index Master Portfolio’s own assumptions used in determining the fair value of investments) |
| | | | | | |
| | | | | | | |
| 102 | | BLACKROCK FUNDS III | | DECEMBER 31, 2015 | | |
| | | | |
| Notes to Financial Statements (continued) | | Master Investment Portfolio |
The hierarchy gives the highest priority to unadjusted quoted prices in active markets for identical assets or liabilities (Level 1 measurements) and the lowest priority to unobservable inputs (Level 3 measurements). Accordingly, the degree of judgment exercised in determining fair value is greatest for instruments categorized in Level 3. The inputs used to measure fair value may fall into different levels of the fair value hierarchy. In such cases, for disclosure purposes, the fair value hierarchy classification is determined based on the lowest level input that is significant to the fair value measurement in its entirety. The significant unobservable inputs used by the Global Valuation Committee in determining the price for Fair Valued Investments are typically categorized as Level 3. The fair value hierarchy for each LifePath Index Master Portfolio’s investments has been included in the Schedules of Investments.
Changes in valuation techniques may result in transfers into or out of an assigned level within the hierarchy. In accordance with each LifePath Index Master Portfolio’s policy, transfers between different levels of the fair value hierarchy are deemed to have occurred as of the beginning of the reporting period. The categorization of a value determined for investments is based on the pricing transparency of the investments and is not necessarily an indication of the risks associated with investing in those securities.
4. Securities and Other Investments:
Securities Lending: Certain LifePath Index Master Portfolios may lend their securities to approved borrowers, such as brokers, dealers and other financial institutions. The borrower pledges and maintains with the LifePath Index Master Portfolios collateral consisting of cash, an irrevocable letter of credit issued by a bank, or securities issued or guaranteed by the U.S. Government. The initial collateral received by each LifePath Index Master Portfolio is required to have a value of at least 102% of the current value of the loaned securities for securities traded on U.S. exchanges and a value of at least 105% for all other securities. The collateral is maintained thereafter, at a value equal to at least 100% of the current market value of the securities on loan. The market value of the loaned securities is determined at the close of each business day of the LifePath Index Master Portfolio and any additional required collateral is delivered to the LifePath Index Master Portfolio, or excess collateral returned by the LifePath Index Master Portfolio, on the next business day. During the term of the loan, the LifePath Index Master Portfolios are entitled to all distributions made on or in respect of the loaned securities. Loans of securities are terminable at any time and the borrower, after notice, is required to return borrowed securities within the standard time period for settlement of securities transactions.
The market value of any securities on loan, all of which were classified as affiliated investments in the LifePath Index Master Portfolios’ Schedules of Investments, and the value of any related collateral are shown separately in the Statements of Assets and Liabilities as a component of investments at value-unaffiliated, and collateral on securities loaned at value, respectively. As of period end, any securities on loan were collateralized by cash. The cash collateral invested by the securities lending agent, BlackRock Institutional Trust Company, N.A. (“BTC”), if any, is disclosed in the Schedules of Investments.
Securities lending transactions are entered into by the LifePath Index Master Portfolios under Master Securities Lending Agreements (each, an “MSLA”), which provide the right, in the event of default (including bankruptcy or insolvency), for the non-defaulting party to liquidate the collateral and calculate a net exposure to the defaulting party or request additional collateral. In the event that a borrower defaults, the LifePath Index Master Portfolios, as lender, would offset the market value of the collateral received against the market value of the securities loaned. When the value of the collateral is greater than that of the market value of the securities loaned, the lender is left with a net amount payable to the defaulting party. However, bankruptcy or insolvency laws of a particular jurisdiction may impose restrictions on or prohibitions against such a right of offset in the event of an MSLA counterparty’s bankruptcy or insolvency. Under the MSLA, absent an event of default the borrower can resell or re-pledge the loaned securities, and a LifePath Index Master Portfolio can reinvest cash collateral received in connection with loaned securities. Upon an event of default, the parties’ obligations to return the securities or collateral to the other party are extinguished, and the parties can resell or re-pledge the loaned securities or the collateral received in connection with the loaned securities in order to satisfy the defaulting party’s net payment obligation for all transactions under the MSLA. The defaulting party remains liable for any deficiency.
As of period end, the following table is a summary of the LifePath Index Master Portfolios’ securities lending agreements by counterparty which are subject to offset under an MSLA:
| | | | | | | | | | | | |
| LifePath Index Retirement Master Portfolio | | | | | | | | | |
| Counterparty | | Securities
Loaned
at Value | | | Cash
Collateral
Received1 | | | Net
Amount | |
Credit Suisse Securities (USA) LLC | | $ | 272,140 | | | $ | (272,140 | ) | | | — | |
UBS Securities LLC | | | 241,296 | | | | (241,296 | ) | | | — | |
| | | | |
Total | | $ | 513,436 | | | $ | (513,436 | ) | | | — | |
| | | | |
| | | | | | | | | | | | |
| | | | | | |
| | | | | | | |
| | BLACKROCK FUNDS III | | DECEMBER 31, 2015 | | 103 |
| | |
| Notes to Financial Statements (continued) | | Master Investment Portfolio |
| | | | | | | | | | | | |
| LifePath Index 2020 Master Portfolio | | | | | | | | | |
| Counterparty | | Securities
Loaned
at Value | | | Cash
Collateral
Received1 | | | Net
Amount | |
Credit Suisse Securities (USA) LLC | | $ | 1,634,232 | | | $ | (1,634,232 | ) | | | — | |
JP Morgan Securities LLC | | | 4,017,984 | | | | (4,017,984 | ) | | | — | |
UBS Securities LLC | | | 449,688 | | | | (449,688 | ) | | | — | |
| | | | |
Total | | $ | 6,101,904 | | | $ | (6,101,904 | ) | | | — | |
| | | | |
| | | | | | | | | | | | |
| LifePath Index 2025 Master Portfolio | | | | | | | | | |
| Counterparty | | Securities
Loaned
at Value | | | Cash
Collateral
Received1 | | | Net
Amount | |
BNP Paribas S.A. | | $ | 225,869 | | | $ | (225,869 | ) | | | — | |
JP Morgan Securities LLC | | | 4,003,320 | | | | (4,003,320 | ) | | | — | |
| | | | |
Total | | $ | 4,229,189 | | | $ | (4,229,189 | ) | | | — | |
| | | | |
| | | | | | | | | | | | |
| LifePath Index 2030 Master Portfolio | | | | | | | | | |
| Counterparty | | Securities
Loaned
at Value | | | Cash
Collateral
Received1 | | | Net
Amount | |
SG Americas Securities LLC | | $ | 441,717 | | | $ | (441,717 | ) | | | — | |
UBS Securities LLC | | | 8,366 | | | | (8,366 | ) | | | — | |
| | | | |
Total | | $ | 450,083 | | | $ | (450,083 | ) | | | — | |
| | | | |
| | | | | | | | | | | | |
| LifePath Index 2035 Master Portfolio | | | | | | | | | |
| Counterparty | | Securities
Loaned
at Value | | | Cash
Collateral
Received1 | | | Net
Amount | |
Citigroup Global Markets, Inc. | | $ | 1,387,711 | | | $ | (1,387,711 | ) | | | — | |
| | | | | | | | | | | | |
| LifePath Index 2045 Master Portfolio | | | | | | | | | |
| Counterparty | | Securities
Loaned
at Value | | | Cash
Collateral
Received1 | | | Net
Amount | |
JP Morgan Securities LLC | | $ | 413,823 | | | $ | (413,823 | ) | | | — | |
Morgan Stanley | | | 272,140 | | | | (272,140 | ) | | | — | |
| | | | |
Total | | $ | 685,963 | | | $ | (685,963 | ) | | | — | |
| | | | |
| | | | | | | | | | | | |
| LifePath Index 2050 Master Portfolio | | | | | | | | | |
| Counterparty | | Securities
Loaned
at Value | | | Cash
Collateral
Received1 | | | Net
Amount | |
Citigroup Global Markets, Inc. | | $ | 2,688,209 | | | $ | (2,688,209 | ) | | | — | |
| | | | | | | | | | | | |
| LifePath Index 2055 Master Portfolio | | | | | | | | | |
| Counterparty | | Securities
Loaned
at Value | | | Cash
Collateral
Received1 | | | Net
Amount | |
SG Americas Securities LLC | | $ | 3,745,218 | | | $ | (3,745,218 | ) | | | — | |
| | 1 | | Collateral received in excess of the value of securities loaned from the individual counterparty is not shown for financial reporting purposes in the tables above. Collateral has been received in connection with securities lending agreements as follows: |
| | | | | | | | | | | | | | |
LifePath Index
Retirement
Master Portfolio | | LifePath Index
2020
Master Portfolio | | LifePath Index
2025
Master Portfolio | | LifePath Index
2030
Master Portfolio | | LifePath Index
2035
Master Portfolio | | LifePath Index
2045
Master Portfolio | | LifePath Index 2050
Master Portfolio | | LifePath Index
2055
Master Portfolio |
$525,690 | | $6,233,400 | | $4,322,900 | | $463,785 | | $1,432,162 | | $703,076 | | $2,774,318 | | $3,858,813 |
The risks of securities lending include the risk that the borrower may not provide additional collateral when required or may not return the securities when due. To mitigate these risks, the LifePath Index Master Portfolios benefit from a borrower default indemnity provided by BlackRock. BlackRock’s indemnity allows for full replacement of the securities loaned if the collateral received does not cover the value on the securities loaned in the event of borrower default. Each LifePath Index Master Portfolio could suffer a loss if the value of an investment purchased with cash collateral falls below the market value of loaned securities or if the value of an investment purchased with cash collateral falls below the value of the original cash collateral received.
| | | | | | |
| | | | | | | |
| 104 | | BLACKROCK FUNDS III | | DECEMBER 31, 2015 | | |
| | | | |
| Notes to Financial Statements (continued) | | Master Investment Portfolio |
5. Investment Advisory Agreement and Other Transactions with Affiliates:
The PNC Financial Services Group, Inc. is the largest stockholder and an affiliate of BlackRock for 1940 Act purposes.
MIP, on behalf of the LifePath Index Master Portfolios, entered into an Investment Advisory Agreement with BFA, the LifePath Index Master Portfolios’ investment advisor, an indirect, wholly owned subsidiary of BlackRock, to provide investment advisory services. The Manager is responsible for the management of each LifePath Index Master Portfolio’s investments and provides the personnel, facilities, equipment and certain other services necessary to the operations of each LifePath Index Master Portfolio. For such services, each LifePath Index Master Portfolio pays BFA a monthly fee based on a percentage of each LifePath Index Master Portfolio’s average daily net assets at an annual rate of 0.05%.
MIP, on behalf of the LifePath Index Master Portfolios, entered into an Administration Agreement with BlackRock Advisors, LLC (“BAL”), which has agreed to provide general administration services (other than investment advice and related portfolio activities). BAL, in consideration thereof, has agreed to bear all of the LifePath Index Master Portfolios’ ordinary operating expenses, excluding, generally, investment advisory fees, distribution fees, brokerage and other expenses related to the execution of portfolio transactions, extraordinary expenses and certain other expenses which are borne by the LifePath Index Master Portfolios.
From time to time, BAL may waive such fees in whole or in part. Any such waiver will reduce the expenses of the LifePath Index Master Portfolios and, accordingly, have a favorable impact on its performance. BAL may delegate certain of its administration duties to sub-administrators.
BAL is not entitled to compensation for providing administration service to the LifePath Index Master Portfolios, for so long as BAL is entitled to compensation for providing administration service to corresponding feeder funds that invest substantially all of their assets in the LifePath Index Master Portfolios, or BAL (or an affiliate) receives investment advisory fees from the LifePath Index Master Portfolios.
The Manager voluntarily agreed to waive its investment advisory fees by the amount of investment advisory fees each LifePath Index Master Portfolio pays to the Manager indirectly through its investments in affiliated money market funds. However, the Manager does not waive its investment advisory fees by the amount of investment advisory fees paid in connection with each LifePath Index Master Portfolio’s investment in other affiliated investment companies, if any. These amounts are included in fees waived by the Manager in the Statements of Operations. For the year ended December 31, 2015, the amounts waived were as follows:
| | | | | | | | | | | | | | | | |
LifePath Index
Retirement
Master Portfolio | | LifePath Index
2020
Master Portfolio | | LifePath Index
2025
Master Portfolio | | LifePath Index
2030
Master Portfolio | | LifePath Index
2035
Master Portfolio | | LifePath Index
2040
Master Portfolio | | LifePath Index
2045
Master Portfolio | | LifePath Index
2050
Master Portfolio | | LifePath Index
2055
Master Portfolio |
$743 | | $1,570 | | $1,364 | | $1,926 | | $1,163 | | $1,489 | | $710 | | $169 | | $265 |
The SEC has issued an exemptive order which permits BTC, an affiliate of the Manager, to serve as securities lending agent for the LifePath Index Master Portfolios, subject to applicable conditions. As securities lending agent, BTC bears all operational costs directly related to securities lending. The LifePath Index Master Portfolios are responsible for fees in connection with the investment of cash collateral received for securities on loan in a money market funds managed by the Manager or its affiliates, however, BTC has agreed to reduce the amount of securities lending income it receives in order to effectively limit the collateral investment fees the LifePath Index Master Portfolios bears to an annual rate of 0.04% (the “collateral investment fees”).
Securities lending income is equal to the total of income earned from the reinvestment of cash collateral, net of fees and other payments to and from borrowers of securities, and less the collateral investment fees. Each LifePath Index Master Portfolio retains a portion of securities lending income and remits a remaining portion to BTC as compensation for its services as securities lending agent.
Pursuant to a securities lending agreement, each LifePath Index Master Portfolio retains 80% of securities lending income, and this amount retained can never be less than 70% of the total of securities lending income plus the collateral investment fees. In addition, commencing the business day following the date that the aggregate securities lending income earned across certain funds in the Equity-Liquidity Complex in a calendar year exceeds a specified threshold, each LifePath Index Master Portfolio, pursuant to the securities lending agreement, will retain for the remainder of the calendar year securities lending income in an amount equal to 85% of securities lending income, and this amount retained can never be less than 70% of the total of securities lending income plus the collateral investment fees.
The share of securities lending income earned by each LifePath Index Master Portfolio is shown as securities lending — affiliated — net in the Statements of Operations. For the year ended December 31, 2015, each LifePath Index Master Portfolio paid BTC the following amounts in total for securities lending agent services and collateral investment fees:
| | | | | | | | | | | | | | | | |
LifePath Index
Retirement
Master Portfolio | | LifePath Index
2020
Master Portfolio | | LifePath Index
2025
Master Portfolio | | LifePath Index
2030
Master Portfolio | | LifePath Index
2035
Master Portfolio | | LifePath Index
2040
Master Portfolio | | LifePath Index
2045
Master Portfolio | | LifePath Index
2050
Master Portfolio | | LifePath Index
2055
Master Portfolio |
$2,022 | | $2,025 | | $3,073 | | $1,793 | | $1,054 | | $1,909 | | $555 | | $2,244 | | $1,008 |
| | | | | | |
| | | | | | | |
| | BLACKROCK FUNDS III | | DECEMBER 31, 2015 | | 105 |
| | |
| Notes to Financial Statements (continued) | | Master Investment Portfolio |
Each LifePath Index Master Portfolio may invest its positive cash balances in certain money market funds managed by the Manager or an affiliate. The income earned on these temporary cash investments is shown as income — affiliated in the Statements of Operations.
Certain officers and/or trustees of MIP are officers and/or directors of BlackRock or its affiliates.
6. Purchases and Sales:
For the year ended December 31, 2015, purchases and sales of investments in the Underlying Funds and Underlying Master Portfolios, excluding short-term securities, were as follows:
| | | | | | | | | | | | | | | | | | |
| | | LifePath Index
Retirement
Master Portfolio | | LifePath Index
2020
Master Portfolio | | LifePath Index
2025
Master Portfolio | | LifePath Index
2030
Master Portfolio | | LifePath Index
2035
Master Portfolio | | LifePath Index
2040
Master Portfolio | | LifePath Index
2045
Master Portfolio | | LifePath Index
2050
Master Portfolio | | LifePath Index
2055
Master Portfolio |
Purchases | | $192,803,783 | | $362,680,256 | | $343,639,069 | | $396,812,783 | | $255,923,333 | | $294,025,408 | | $149,962,931 | | $154,139,741 | | $61,878,194 |
Sales | | $121,120,713 | | $141,608,466 | | $78,173,736 | | $120,841,634 | | $48,455,771 | | $73,619,430 | | $29,165,799 | | $42,724,168 | | $14,383,190 |
7. Income Tax Information:
The LifePath Index Master Portfolios are classified as a partnership for federal income tax purposes. As such, each investor in the LifePath Index Master Portfolios is treated as the owner of its proportionate share of net assets, income, expenses and realized and unrealized gains and losses of the LifePath Index Master Portfolios. Therefore, no federal income tax provision is required. It is intended that the LifePath Index Master Portfolios’ assets will be managed so an investor in the LifePath Index Master Portfolios can satisfy the requirements of Subchapter M of the Internal Revenue Code of 1986, as amended.
Each LifePath Index Master Portfolio files U.S. federal and various state and local tax returns. No income tax returns are currently under examination. The statute of limitations on each LifePath Index Master Portfolio’s U.S. federal tax returns remains open for each of the four years ended December 31, 2015. The statutes of limitations on each LifePath Index Master Portfolio’s state and local tax returns may remain open for an additional year depending upon the jurisdiction.
Management has analyzed tax laws and regulations and their application to the LifePath Index Master Portfolios as of December 31, 2015, inclusive of the open tax return years, and does not believe there are any uncertain tax positions that require recognition of a tax liability in the LifePath Index Master Portfolios’ financial statements.
As of period end, gross unrealized appreciation and depreciation based on cost for federal income tax purposes were as follows:
| | | | | | | | | | | | | | | | | | | | | | | | | | | | | | | | | | | | |
| | | LifePath Index
Retirement
Master Portfolio | | | LifePath Index
2020
Master Portfolio | | | LifePath Index
2025
Master Portfolio | | | LifePath Index
2030
Master Portfolio | | | LifePath Index
2035
Master Portfolio | | | LifePath Index
2040
Master Portfolio | | | LifePath Index
2045
Master Portfolio | | | LifePath Index
2050
Master Portfolio | | | LifePath Index
2055
Master Portfolio | |
Tax cost | | $ | 488,461,775 | | | $ | 1,067,774,133 | | | $ | 771,438,777 | | | $ | 1,049,837,813 | | | $ | 602,938,760 | | | $ | 736,246,989 | | | $ | 340,011,876 | | | $ | 338,790,584 | | | $ | 111,922,408 | |
| | | | | | | | | | | | | | | | | | | | | | | | | | | | | | | | | | | | |
Gross unrealized appreciation | | $ | 29,368,854 | | | $ | 73,637,120 | | | $ | 39,312,976 | | | $ | 81,114,665 | | | $ | 22,799,838 | | | $ | 43,513,282 | | | $ | 22,199,602 | | | $ | 22,659,726 | | | $ | 6,053,585 | |
Gross unrealized depreciation | | | (15,776,574 | ) | | | (39,482,125 | ) | | | (26,683,218 | ) | | | (46,649,528 | ) | | | (12,020,477 | ) | | | (22,733,846 | ) | | | (17,665,987 | ) | | | (18,514,602 | ) | | | (5,921,034 | ) |
| | | | |
Net unrealized appreciation | | $ | 13,592,280 | | | $ | 34,154,995 | | | $ | 12,629,758 | | | $ | 34,465,137 | | | $ | 10,779,361 | | | $ | 20,779,436 | | | $ | 4,533,615 | | | $ | 4,145,124 | | | $ | 132,551 | |
| | | | |
8. Bank Borrowings:
MIP, on behalf of the LifePath Index Master Portfolios, along with certain other funds managed by the Manager and its affiliates (“Participating Funds”), is a party to a 364-day, $2.1 billion credit agreement with a group of lenders, under which the LifePath Index Master Portfolios may borrow to fund shareholder redemptions. Excluding commitments designated for certain funds, the Participating Funds, including the LifePath Index Master Portfolios, can borrow up to an aggregate commitment amount of $1.6 billion at any time outstanding, subject to asset coverage and other limitations as specified in the agreement. The credit agreement has the following terms: a fee of 0.06% per annum on unused commitment amounts and interest at a rate equal to the higher of (a) one-month LIBOR (but, in any event, not less than 0.00%) on the date the loan is made plus 0.80% per annum or (b) the Fed Funds rate (but, in any event, not less than 0.00%) in effect from time to time plus 0.80% per annum on amounts borrowed. The agreement expires in April 2016 unless extended or renewed. Participating Funds paid administration, legal and arrangement fees, which, if applicable, are included in miscellaneous expenses in the Statements of Operations, and along with commitment fees, were allocated among such funds based upon portions of the aggregate commitment available to them and relative net assets of Participating Funds. During the year ended December 31, 2015, the LifePath Index Master Portfolios did not borrow under the credit agreement.
| | | | | | |
| | | | | | | |
| 106 | | BLACKROCK FUNDS III | | DECEMBER 31, 2015 | | |
| | | | |
| Notes to Financial Statements (concluded) | | Master Investment Portfolio |
9. Principal Risks:
In the normal course of business, certain LifePath Index Master Portfolios invest in securities and enter into transactions where risks exist due to fluctuations in the market (market risk) or failure of the issuer to meet all its obligations, including the ability to pay principal and interest when due (issuer credit risk). The value of securities held by the LifePath Index Master Portfolios may decline in response to certain events, including those directly involving the issuers of securities owned by the LifePath Index Master Portfolios. Changes arising from the general economy, the overall market and local, regional or global political or/and social instability, as well as currency, interest rate and price fluctuations, may also affect the securities’ value.
Counterparty Credit Risk: Similar to issuer credit risk, the LifePath Index Master Portfolios may be exposed to counterparty credit risk, or the risk that an entity may fail to or be unable to perform on its commitments related to unsettled or open transactions. The LifePath Index Master Portfolios manage counterparty credit risk by entering into transactions only with counterparties that the Manager believes have the financial resources to honor their obligations and by monitoring the financial stability of those counterparties. Financial assets, which potentially expose the LifePath Index Master Portfolios to market, issuer and counterparty credit risks, consist principally of financial instruments and receivables due from counterparties. The extent of the LifePath Index Master Portfolios’ exposure to market, issuer and counterparty credit risks with respect to these financial assets is approximately their value recorded in the Statements of Assets and Liabilities, less any collateral held by the LifePath Index Master Portfolios.
10. Subsequent Events:
Management has evaluated the impact of all subsequent events on the LifePath Index Master Portfolios through the date the financial statements were issued and has determined that there were no subsequent events requiring adjustment or additional disclosure in the financial statements.
| | | | | | |
| | | | | | | |
| | BLACKROCK FUNDS III | | DECEMBER 31, 2015 | | 107 |
| | |
| Report of Independent Registered Public Accounting Firm | | |
To the Board of Trustees of Master Investment Portfolio and the Interestholders of LifePath® Index Retirement Master Portfolio, LifePath® Index 2020 Master Portfolio, LifePath® Index 2025 Master Portfolio, LifePath® Index 2030 Master Portfolio, LifePath® Index 2035 Master Portfolio, LifePath® Index 2040 Master Portfolio, LifePath® Index 2045 Master Portfolio, LifePath® Index 2050 Master Portfolio and LifePath® Index 2055 Master Portfolio:
In our opinion, the accompanying statements of assets and liabilities, including the schedules of investments, and the related statements of operations and of changes in net assets and the financial highlights present fairly, in all material respects, the financial position of LifePath® Index Retirement Master Portfolio, LifePath® Index 2020 Master Portfolio, LifePath® Index 2025 Master Portfolio, LifePath® Index 2030 Master Portfolio, LifePath® Index 2035 Master Portfolio, LifePath® Index 2040 Master Portfolio, LifePath® Index 2045 Master Portfolio, LifePath® Index 2050 Master Portfolio and LifePath® Index 2055 Master Portfolio (the “Master Portfolios”), each a series of Master Investment Portfolio, at December 31, 2015, the results of each of their operations for the year then ended, the changes in each of their net assets for each of the two years in the period then ended and the financial highlights for each of the periods presented, in conformity with accounting principles generally accepted in the United States of America. These financial statements and financial highlights (hereafter referred to as “financial statements”) are the responsibility of the Master Portfolios’ management. Our responsibility is to express an opinion on these financial statements based on our audits. We conducted our audits of these financial statements in accordance with the standards of the Public Company Accounting Oversight Board (United States). Those standards require that we plan and perform the audit to obtain reasonable assurance about whether the financial statements are free of material misstatement. An audit includes examining, on a test basis, evidence supporting the amounts and disclosures in the financial statements, assessing the accounting principles used and significant estimates made by management, and evaluating the overall financial statement presentation. We believe that our audits, which included confirmation of securities at December 31, 2015 by correspondence with the custodian, transfer agent, and brokers, provide a reasonable basis for our opinion.
/s/PricewaterhouseCoopers LLP
Philadelphia, Pennsylvania
February 24, 2016
| | | | | | |
| | | | | | | |
| 108 | | BLACKROCK FUNDS III | | DECEMBER 31, 2015 | | |
| | | | | | | | | | |
Name, Address1
and Year of Birth | | Position(s)
Held with
the Trust/MIP | | Length
of Time
Served as
a Trustee3 | | Principal Occupation(s) During Past Five Years | | Number of BlackRock-
Advised Registered
Investment Companies
(“RICs”) Consisting of
Investment Portfolios
(“Portfolios”) Overseen | | Public
Directorships |
| Independent Trustees2 |
Rodney D. Johnson 1941 | | Chair of the Board and Trustee | | Since 2009 | | President, Fairmount Capital Advisors, Inc. from 1987 to 2013; Member of the Archdiocesan Investment Committee of the Archdiocese of Philadelphia from 2004 to 2012; Director, The Committee of Seventy (civic) from 2006 to 2012; Director, Fox Chase Cancer Center from 2004 to 2011. | | 33 RICs consisting of
155 Portfolios | | None |
David O. Beim 1940 | | Trustee | | Since 2009 | | Professor of Professional Practice at the Columbia University Graduate School of Business since 1991; Trustee, Phillips Exeter Academy from 2002 to 2012; Chairman, Wave Hill, Inc. (public garden and cultural center) from 1990 to 2006. | | 33 RICs consisting of
155 Portfolios | | None |
Collette Chilton 1958 | | Trustee | | Since 2015 | | Chief Investment Officer, Williams College since 2006; Chief Investment Officer, Lucent Asset Management Corporation from 1998 to 2006. | | 33 RICs consisting of
155 Portfolios | | None |
Frank J. Fabozzi 1948 | | Trustee | | Since 2014 | | Editor of and Consultant for The Journal of Portfolio Management since 2006; Professor of Finance, EDHEC Business School since 2011; Visiting Professor, Princeton University from 2013 to 2014; Professor in the Practice of Finance and Becton Fellow, Yale University School of Management from 2006 to 2011. | | 108 RICs consisting of
230 Portfolios | | None |
Dr. Matina S. Horner 1939 | | Trustee | | Since 2009 | | Executive Vice President, Teachers Insurance and Annuity Association and College Retirement Equities Fund from 1989 to 2003. | | 33 RICs consisting of
155 Portfolios | | NSTAR (electric and gas utility) |
Herbert I. London 1939 | | Trustee | | Since 2009 | | Professor Emeritus, New York University since 2005; President, London Center for Policy Research since 2012; John M. Olin Professor of Humanities, New York University from 1993 to 2005 and Professor thereof from 1980 to 2005; President Emeritus, Hudson Institute (policy research organization) from 2011 to 2012, President thereof from 1997 to 2011 and Trustee from 1980 to 2012; Chairman of the Board of Trustees for Grantham University since 2006; Director, InnoCentive, Inc. (global internet service) since 2005; Director, Cerego, LLC (educational software) since 2005; Director, Cybersettle (online adjudication) since 2009; Director, AIMS Worldwide, Inc. (marketing) from 2007 to 2012. | | 33 RICs consisting of
155 Portfolios | | None |
Cynthia A. Montgomery 1952 | | Trustee | | Since 2009 | | Professor, Harvard Business School since 1989; Director, McLean Hospital from 2005 to 2012; Director, Harvard Business School Publishing from 2005 to 2010. | | 33 RICs consisting of
155 Portfolios | | Newell Rubbermaid, Inc. (manufacturing) |
Joseph P. Platt 1947 | | Trustee | | Since 2009 | | Director, Jones and Brown (Canadian insurance broker) since 1998; General Partner, Thorn Partners, LP (private investments) since 1998; Director, WQED Multi-Media (public broadcasting not-for-profit) since 2001; Director, The West Penn Allegheny Health System (a not-for-profit health system) from 2008 to 2013; Partner, Amarna Corporation, LLC (private investment company) from 2002 to 2008. | | 33 RICs consisting of
155 Portfolios | | Greenlight Capital Re, Ltd. (reinsurance company) |
Robert C. Robb, Jr. 1945 | | Trustee | | Since 2009 | | Partner, Lewis, Eckert, Robb and Company (management and financial consulting firm) since 1981. | | 33 RICs consisting of
155 Portfolios | | None |
Toby Rosenblatt 1938 | | Trustee | | Since 2009 | | President, Founders Investments Ltd. (private investments) since 1999; Director, Forward Management, LLC since 2007; Director, College Futures Foundation (philanthropic foundation) since 2009; Director, The James Irvine Foundation (philanthropic foundation) from 1998 to 2008. | | 33 RICs consisting of
155 Portfolios | | None |
| | | | | | |
| | | | | | | |
| | BLACKROCK FUNDS III | | DECEMBER 31, 2015 | | 109 |
| | |
| Officers and Trustees (continued) | | |
| | | | | | | | | | |
Name, Address1
and Year of Birth | | Position(s)
Held with
the Trust/MIP | | Length
of Time
Served as
a Trustee3 | | Principal Occupation(s) During Past Five Years | | Number of BlackRock-
Advised Registered
Investment Companies
(“RICs”) Consisting of
Investment Portfolios
(“Portfolios”) Overseen | | Public
Directorships |
| Independent Trustees2 (concluded) |
Mark Stalnecker 1951 | | Trustee | | Since 2015 | | Chief Investment Officer, University of Delaware from 1999 to 2013; Trustee, Winterthur Museum and Country Estate since 2001; Member of the Investment Committee, Delaware Public Employees’ Retirement System since 2002; Member of the Investment Committee, Christiana Care Health System since 2009; Member of the Investment Committee, Delaware Community Foundation from 2013 to 2014. | | 33 RICs consisting of
155 Portfolios | | None |
Kenneth L. Urish 1951 | | Trustee | | Since 2009 | | Managing Partner, Urish Popeck & Co., LLC (certified public accountants and consultants) since 1976; Immediate past- Chairman of the Professional Ethics Committee of the Pennsylvania Institute of Certified Public Accountants and Committee Member thereof since 2007; Member of External Advisory Board, The Pennsylvania State University Accounting Department since 2001; Principal, UP Strategic Wealth Investment Advisors, LLC since 2013; Trustee, The Holy Family Institute from 2001 to 2010; President and Trustee, Pittsburgh Catholic Publishing Associates from 2003 to 2008; Director, Inter-Tel from 2006 to 2007. | | 33 RICs consisting of
155 Portfolios | | None |
Frederick W. Winter 1945 | | Trustee | | Since 2009 | | Director, Alkon Corporation (pneumatics) since 1992; Professor and Dean Emeritus of the Joseph M. Katz School of Business, University of Pittsburgh from 2005 to 2013 and Dean thereof from 1997 to 2005; Director, Tippman Sports (recreation) from 2005 to 2013; Director, Indotronix International (IT services) from 2004 to 2008. | | 33 RICs consisting of
155 Portfolios | | None |
| | 1 The address of each Trustee is c/o BlackRock, Inc., 55 East 52nd Street, New York, NY 10055. |
| | 2 Independent Trustees serve until their resignation, retirement, removal or death, or until December 31 of the year in which they turn 75. The Board has determined to extend the terms of Independent Trustees on a case-by-case basis, as appropriate. The Board has unanimously approved extending the mandatory retirement age for David O. Beim and Dr. Matina S. Horner until December 31, 2016, which the Board believes is in the best interests of shareholders of the Trust/MIP. |
| | 3 Date shown is the earliest date a person has served for the Trust/MIP. In connection with the acquisition of Barclay’s Global Investors by BlackRock, Inc. (“BlackRock”) in December 2009, the Trustees were elected to the Trust/MIP’s Board. As a result, although the chart shows certain Independent Trustees as joining the Trust/MIP’s board in 2009, those Independent Trustees first became members of the boards of other funds advised by BlackRock Advisors, LLC or its affiliates as follows: David O. Beim, 1998; Dr. Matina S. Horner, 2004; Rodney D. Johnson, 1995; Herbert I. London, 1987; Cynthia A. Montgomery, 1994; Joseph P. Platt, 1999; Robert C. Robb, Jr., 1998; Toby Rosenblatt, 2005; Kenneth L. Urish, 1999; and Frederick W. Winter, 1999. Frank J. Fabozzi first became a member of the boards of other funds advised by BlackRock Advisors, LLC or its affiliates in 1988. |
| Interested Trustees4 |
Barbara G. Novick 1960 | | Trustee | | Since 2015 | | Vice Chairman of BlackRock since 2006; Chair of BlackRock’s Government Relations Steering Committee since 2009; Head of the Global Client Group of BlackRock from 1988 to 2008. | | 108 RICs consisting of
230 Portfolios | | None |
John M. Perlowski 1964 | | Trustee, President, and Chief Executive Officer | | Since 2015 (Trustee); Since 2010 (President and Chief Executive Officer) | | Managing Director of BlackRock since 2009; Head of BlackRock Global Fund Services since 2009; Managing Director and Chief Operating Officer of the Global Product Group at Goldman Sachs Asset Management, L.P. from 2003 to 2009; Treasurer of Goldman Sachs Mutual Funds from 2003 to 2009 and Senior Vice President thereof from 2007 to 2009; Director of Goldman Sachs Offshore Funds from 2002 to 2009; Director of Family Resource Network (charitable foundation) since 2009. | | 136 RICs consisting of
328 Portfolios | | None |
| | 4 Mr. Perlowski and Ms. Novick are both “interested persons,” as defined in the 1940 Act, of the Trust/MIP based on their positions with BlackRock and its affiliates. Mr. Perlowski and Ms. Novick are also board members of a complex of BlackRock registered open-end funds. Mr. Perlowski is also a board member of the BlackRock Equity-Bond Complex and the BlackRock Equity-Liquidity Complex, and Ms. Novick is also a board member of the BlackRock Equity-Liquidity Complex. Interested Trustees serve until their resignation, retirement, removal or death, or until December 31 of the year in which they turn 75. The maximum age limitation may be waived as to any Trustee by action of a majority of the Trustees upon a finding of good cause therefor. |
| | | | | | |
| | | | | | | |
| 110 | | BLACKROCK FUNDS III | | DECEMBER 31, 2015 | | |
| | | | |
| Officers and Trustees (concluded) | | |
| | | | | | |
Name, Address1
and Year of Birth | | Position(s)
Held with
the Trust/MIP | | Length of
Time Served
as an Officer | | Principal Occupation(s) During Past Five Years |
| Officers2 |
John M. Perlowski 1964 | | Trustee, President and Chief Executive Officer | | Since 2015 (Trustee); Since 2010 (President and Chief
Executive Officer) | | Managing Director of BlackRock since 2009; Head of BlackRock Global Fund Services since 2009; Managing Director and Chief Operating Officer of the Global Product Group at Goldman Sachs Asset Management, L.P. from 2003 to 2009; Treasurer of Goldman Sachs Mutual Funds from 2003 to 2009 and Senior Vice President thereof from 2007 to 2009; Director of Goldman Sachs Offshore Funds from 2002 to 2009; Director of Family Resource Network (charitable foundation) since 2009. |
Richard Hoerner, CFA 1958 | | Vice President | | Since 2009 | | Managing Director of BlackRock since 2000; Head of the Global Cash Group since 2013; Co-head of the Global Cash and Securities Lending Group from 2010 to 2013; Member of the Cash Management Group Executive Committee since 2005. |
Jennifer McGovern 1977 | | Vice President | | Since 2014 | | Director of BlackRock since 2011; Head of Product Structure and Oversight for BlackRock’s U.S. Wealth Advisory Group since 2013; Vice President of BlackRock from 2008 to 2010. |
Neal Andrews 1966 | | Chief Financial Officer | | Since 2009 | | Managing Director of BlackRock since 2006; Senior Vice President and Line of Business Head of Fund Accounting and Administration at PNC Global Investment Servicing (U.S.) Inc. from 1992 to 2006. |
Jay Fife 1970 | | Treasurer | | Since 2009 | | Managing Director of BlackRock since 2007; Director of BlackRock in 2006; Assistant Treasurer of the MLIM and Fund Asset Management, L.P. advised funds from 2005 to 2006; Director of MLIM Fund Services Group from 2001 to 2006. |
Charles Park 1967 | | Chief Compliance Officer | | Since 2014 | | Anti-Money Laundering Compliance Officer for the BlackRock-advised Funds in the Equity-Bond Complex, the Equity-Liquidity Complex and the Closed-End Complex from 2014 to 2015; Chief Compliance Officer of BlackRock Advisors, LLC and the BlackRock-advised Funds in the Equity-Bond Complex, the Equity-Liquidity Complex and the Closed-End Complex since 2014; Principal of and Chief Compliance Officer for iShares® Delaware Trust Sponsor LLC since 2012 and BlackRock Fund Advisors (“BFA”) since 2006; Chief Compliance Officer for the BFA-advised iShares exchange traded funds since 2006; Chief Compliance Officer for BlackRock Asset Management International Inc. since 2012. |
Fernanda Piedra 1969 | | Anti-Money Laundering Compliance Officer | | Since 2015 | | Director of BlackRock since 2014; Anti-Money Laundering Compliance Officer and Regional Head of Financial Crime for the Americas at BlackRock since 2014; Head of Regulatory Changes and Remediation for the Asset Wealth Management Division of Deutsche Bank from 2010 to 2014; Vice President of Goldman Sachs (Anti-Money Laundering/Suspicious Activities Group) from 2004 to 2010. |
Benjamin Archibald 1975 | | Secretary | | Since 2012 | | Managing Director of BlackRock since 2014; Director of BlackRock from 2010 to 2013; Secretary of the iShares exchange traded funds since 2015; Secretary of the BlackRock-advised mutual funds since 2012. |
| | 1 The address of each Officer is c/o BlackRock, Inc., 55 East 52nd Street, New York, NY 10055. |
| | | 2 Officers of the Trust/MIP serve at the pleasure of the Board. |
Effective September 25, 2015, John M. Perlowski was appointed to serve as a Trustee of the Trust/MIP.
Effective December 31, 2015, Herbert I. London and Toby Rosenblatt retired as Trustees of the Trust/MIP.
| | | | | | | | | | |
| | | | |
Investment Advisor BlackRock Fund Advisors San Francisco, CA 94105 | | Custodian and Accounting Agent State Street Bank and Trust Company Boston, MA 02110 | | Distributor BlackRock Investments, LLC New York, NY 10022 | | Legal Counsel Sidley Austin LLP New York, NY 10019 |
| | | |
Administrator BlackRock Advisors, LLC Wilmington, DE 19809 | | Transfer Agent BNY Mellon Investment Servicing (US) Inc. Wilmington, DE 19809 | | Independent Registered Public Accounting Firm PricewaterhouseCoopers LLP Philadelphia, PA 19103 | | Address of the Trust/MIP 400 Howard Street San Francisco, CA 94105 |
| | | | | | |
| | | | | | | |
| | BLACKROCK FUNDS III | | DECEMBER 31, 2015 | | 111 |
Householding
The LifePath Index Funds will mail only one copy of shareholder documents, including prospectuses, annual and semi-annual reports and proxy statements, to shareholders with multiple accounts at the same address. This practice is commonly called “householding” and is intended to reduce expenses and eliminate duplicate mailings of shareholder documents. Mailings of your shareholder documents may be householded indefinitely unless you instruct us otherwise. If you do not want the mailing of these documents to be combined with those for other members of your household, please call the LifePath Index Funds at (800) 441-7762.
Availability of Quarterly Schedule of Investments
The LifePath Index Funds/LifePath Index Master Portfolios file their complete schedule of portfolio holdings with the SEC for the first and third quarters of each fiscal year on Form N-Q. The LifePath Index Funds’/LifePath Index Master Portfolios’ Forms N-Q are available on the SEC’s website at http://www.sec.gov and may also be reviewed and copied at the SEC’s Public Reference Room in Washington, D.C. Information on how to access documents on the SEC’s website without charge may be obtained by calling (800) SEC-0330. The LifePath Index Funds’/ LifePath Index Master Portfolios’ Forms N-Q may also be obtained upon request and without charge by calling (800) 441-7762.
Availability of Proxy Voting Policies and Procedures
A description of the policies and procedures that the LifePath Index Funds/LifePath Index Master Portfolios use to determine how to vote proxies relating to portfolio securities is available upon request and without charge (1) by calling (800) 441-7762; (2) at http://www.blackrock.com; and (3) on the SEC’s website at http://www.sec.gov.
Availability of Proxy Voting Record
Information about how the LifePath Index Funds/LifePath Index Master Portfolios voted proxies relating to securities held in the LifePath Index Funds’/LifePath Index Master Portfolios’ portfolios during the most recent 12-month period ended June 30 is available upon request and without charge (1) at http://www.blackrock.com or by calling (800) 441-7762 and (2) on the SEC’s website at http://www.sec.gov.
BlackRock’s Mutual Fund Family
BlackRock offers a diverse lineup of open-end mutual funds crossing all investment styles and managed by experts in equity, fixed income and tax-exempt investing. Visit http://www.blackrock.com for more information.
Account Information
Call us at (800) 441-7762 from 8:00 AM to 6:00 PM EST on any business day to get information about your account balances, recent transactions and share prices. You can also reach us on the Web at http://www.blackrock.com/funds.
Automatic Investment Plans
Investor Class shareholders who want to invest regularly can arrange to have $50 or more automatically deducted from their checking or savings account and invested in any of the BlackRock funds.
Systematic Withdrawal Plans
Investor Class shareholders can establish a systematic withdrawal plan and receive periodic payments of $50 or more from their BlackRock funds, as long as their account balance is at least $10,000.
Retirement Plans
Shareholders may make investments in conjunction with Traditional, Rollover, Roth, Coverdell, Simple IRAs, SEP IRAs and 403(b) Plans.
| | | | | | |
| | | | | | | |
| 112 | | BLACKROCK FUNDS III | | DECEMBER 31, 2015 | | |
| | |
| Additional Information (concluded) | | |
|
| BlackRock Privacy Principles |
BlackRock is committed to maintaining the privacy of its current and former fund investors and individual clients (collectively, “Clients”) and to safeguarding their non-public personal information. The following information is provided to help you understand what personal information BlackRock collects, how we protect that information and why in certain cases we share such information with select parties.
If you are located in a jurisdiction where specific laws, rules or regulations require BlackRock to provide you with additional or different privacy-related rights beyond what is set forth below, then BlackRock will comply with those specific laws, rules or regulations.
BlackRock obtains or verifies personal non-public information from and about you from different sources, including the following: (i) information we receive from you or, if applicable, your financial intermediary, on applications, forms or other documents; (ii) information about your transactions with us, our affiliates, or others; (iii) information we receive from a consumer reporting agency; and (iv) from visits to our websites.
BlackRock does not sell or disclose to non-affiliated third parties any non-public personal information about its Clients, except as permitted by law or as is necessary to respond to regulatory requests or to service Client accounts. These non-affiliated third parties are required to protect the confidentiality and security of this information and to use it only for its intended purpose.
We may share information with our affiliates to service your account or to provide you with information about other BlackRock products or services that may be of interest to you. In addition, BlackRock restricts access to non-public personal information about its Clients to those BlackRock employees with a legitimate business need for the information. BlackRock maintains physical, electronic and procedural safeguards that are designed to protect the non-public personal information of its Clients, including procedures relating to the proper storage and disposal of such information.
| | | | | | |
| | | | | | | |
| | BLACKROCK FUNDS III | | DECEMBER 31, 2015 | | 113 |
This report is intended for current holders. It is not authorized for use as an offer of sale or a solicitation of an offer to buy shares of a LifePath Index Fund unless preceded or accompanied by that LifePath Index Fund’s current prospectus. Past performance results shown in this report should not be considered a representation of future performance. Investment returns and principal value of shares will fluctuate so that shares, when redeemed, may be worth more or less than their original cost. Statements and other information herein are as dated and are subject to change.

| | |
| LPindex-12/15-AR | |  |
DECEMBER 31, 2015
| | | | | | |
ANNUAL REPORT | | | | | |  |
BlackRock S&P 500 Index Fund | of BlackRock Funds III
|
| Not FDIC Insured • May Lose Value • No Bank Guarantee |

| | | | | | |
| | | | | | | |
| 2 | | BLACKROCK S&P 500 INDEX FUND | | DECEMBER 31, 2015 | | |
Dear Shareholder,
Diverging monetary policies and shifting economic outlooks across regions have been the overarching themes driving financial markets over the past couple of years. With U.S. growth outpacing the global economic recovery in 2015 while inflationary pressures remained low, investors spent most of the year anticipating a short-term rate hike from the Federal Reserve (the “Fed”), which ultimately came to fruition in December. In contrast, the European Central Bank (“ECB”) and the Bank of Japan moved to a more accommodative stance during the year. In this environment, the U.S. dollar strengthened considerably, causing profit challenges for U.S. exporters and high levels of volatility in emerging market currencies and commodities. Oil prices were particularly volatile and below the historical norm due to an ongoing imbalance in global supply and demand.
Market volatility broadly increased in the middle of 2015, beginning with a sharp, but temporary, selloff in June as Greece’s long-brewing debt troubles came to an impasse. Just as these concerns abated, Chinese equities tumbled amid weakness in the country’s economy. This, combined with a depreciation of the yuan and declining confidence in China’s policymakers, stoked worries about the potential impact to the broader world economy, causing heightened volatility to spread throughout markets globally. Given a dearth of meaningful growth across most of the world, financial markets became more reliant on central bank policies to drive performance. In that vein, risk assets (such as equities and high yield bonds) rallied in October when China’s central bank provided more stimulus, the ECB hinted at further easing, and soft U.S. data pushed back expectations for a Fed rate hike. As the period came to a close, however, the ECB disappointed investors with its subdued policy changes. The Fed’s December rate hike had a positive impact on the markets as it removed a source of uncertainty, but this was counteracted by the dampening effect of a stronger U.S. dollar, falling oil prices and tighter credit conditions.
At BlackRock, we believe investors need to think globally, extend their scope across a broad array of asset classes and be prepared to move freely as market conditions change over time. We encourage you to talk with your financial advisor and visit blackrock.com for further insight about investing in today’s markets.
Sincerely,
Rob Kapito
President, BlackRock Advisors, LLC
Rob Kapito
President, BlackRock Advisors, LLC
| | | | | | | | |
| Total Returns as of December 31, 2015 | |
| | | 6-month | | | 12-month | |
U.S. large cap equities
(S&P 500® Index) | | | 0.15 | % | | | 1.38 | % |
U.S. small cap equities
(Russell 2000® Index) | | | (8.75 | ) | | | (4.41 | ) |
International equities
(MSCI Europe, Australasia,
Far East Index) | | | (6.01 | ) | | | (0.81 | ) |
Emerging market equities
(MSCI Emerging
Markets Index) | | | (17.35 | ) | | | (14.92 | ) |
3-month Treasury bills
(BofA Merrill Lynch 3-Month
U.S. Treasury Bill Index) | | | 0.04 | | | | 0.05 | |
U.S. Treasury securities
(BofA Merrill Lynch 10-Year
U.S. Treasury Index) | | | 1.43 | | | | 0.91 | |
U.S. investment-grade
bonds (Barclays
U.S. Aggregate Bond Index) | | | 0.65 | | | | 0.55 | |
Tax-exempt municipal
bonds (S&P Municipal
Bond Index) | | | 3.31 | | | | 3.32 | |
U.S. high yield bonds
(Barclays U.S.
Corporate High Yield 2%
Issuer Capped Index) | | | (6.79 | ) | | | (4.43 | ) |
| Past performance is no guarantee of future results. Index performance is shown for illustrative purposes only. You cannot invest directly in an index. | |
| | | | | | |
| | | | | | | |
| | THIS PAGE NOT PART OF YOUR FUND REPORT | | | | 3 |
| | | | |
| Fund Summary as of December 31, 2015 | | |
BlackRock S&P 500 Index Fund’s (the “Fund”) (formerly known as BlackRock S&P 500 Stock Fund) investment objective is to provide investment results that correspond to the total return performance of publicly-traded common stocks in the aggregate, as represented by the Standard & Poor’s (“S&P”) 500® Index.
| | |
| Portfolio Management Commentary | | |
How did the Fund perform?
| • | | For the 12-month period ended December 31, 2015, the Fund’s Institutional Shares returned 1.28%, Service Shares returned 1.16%, Investor A Shares returned 1.03%, Investor C1 Shares returned 0.30% and Class K Shares returned 1.35%. The benchmark S&P 500® Index returned 1.38% for the same period. |
| • | | Returns for the Fund’s respective share classes differ from the benchmark index due to individual share-class expenses. The Fund invests all of its assets in S&P 500 Index Master Portfolio (the “Master Portfolio”), a series of Master Investment Portfolio. |
Describe the market environment.
| • | | The year started with U.S. stock prices falling as lower oil prices punished the energy sector and the negative impact of a stronger dollar began to show in the earnings of large global exporting companies. U.S. equities came back into favor in the spring, after a powerful rally in European equities left valuations in the United States looking more appealing by comparison. U.S. stocks continued to outperform international markets into the summer as increasing turmoil around Greece’s debt troubles drove investors to the relative stability of U.S. markets. |
| • | | The second half of the year started well with strong manufacturing and construction data and merger and acquisition activity. This momentum stuttered as volatility and uncertainty became major themes through the remainder of 2015 given a sharp selloff in Chinese equities, falling oil prices and anticipation of a rate hike from the Federal Reserve (the “Fed”). |
| • | | With easy monetary policy in the beginning of 2015, many markets reached all-time highs, but hit considerable headwinds in the latter half |
| | | of the year. Geopolitical strife in the Middle East and Russia, terrorist attacks in France and San Bernardino, California, slowing growth globally, oil price instability, and the Fed starting a tightening cycle were significant events that shaped 2015 market returns. |
| • | | The U.S. dollar strengthened against most major currencies for the year, posting a 19.9% gain against the Canadian dollar, a 12.5% gain versus the Australian dollar, an 11.4% gain versus the euro, a 5.8% gain versus the British pound. A key theme heading into 2016 is the divergence in monetary policy between the United States and the rest of the world. |
| • | | From a sector perspective, consumer discretionary stocks (10%) generated the strongest returns in the S&P 500® Index for the year, followed by health care (7%), consumer staples (7%), information technology (6%) and telecommunications services (3%). Conversely, the energy sector (-21%) produced the lowest returns for the year, followed by materials (-8%), utilities (-5%), industrials (-3%) and financials (-1%). |
Describe recent portfolio activity.
| • | | During the period, as changes were made to the composition of the S&P 500® Index, the Master Portfolio purchased and sold securities to maintain its objective of replicating the risks and return of the benchmark index. |
Describe portfolio positioning at period end.
| • | | The Master Portfolio remains positioned to match the risk characteristics of its benchmark index, irrespective of the market’s future direction. |
The views expressed reflect the opinions of BlackRock as of the date of this report and are subject to change based on changes in market, economic or other conditions. These views are not intended to be a forecast of future events and are no guarantee of future results.
| | | | | | |
| | | | | | | |
| 4 | | BLACKROCK S&P 500 INDEX FUND | | DECEMBER 31, 2015 | | |
| | |
| Total Return Based on a $10,000 Investment | | |
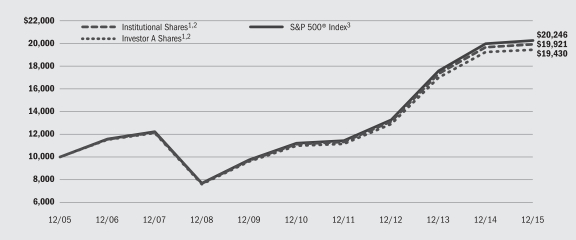
| | 1 | | Assuming transaction costs and other operating expenses, including administration fees, if any. |
| | 2 | | The Fund invests all of its assets in the Master Portfolio. The Master Portfolio invests primarily in a diversified portfolio of equity securities of large companies located in the United States. |
| | 3 | | An unmanaged index that covers 500 leading companies and captures approximately 80% coverage of available market capitalization. |
| | |
| Performance Summary for the Period Ended December 31, 2015 | | |
| | | | | | | | | | | | | | | | |
| | | 6-Month
Total Returns | | | Average Annual Total Returns4 | |
| | | | 1 Year | | | 5 Years | | | 10 Years | |
| | | | w/o sales
charge | | | w/o sales
charge | | | w/o sales
charge | |
Institutional | | | 0.08 | % | | | 1.28 | % | | | 12.38 | % | | | 7.14 | % |
Service | | | 0.02 | | | | 1.16 | | | | 12.23 | | | | 7.00 | |
Investor A | | | (0.05 | ) | | | 1.03 | | | | 12.09 | | | | 6.87 | |
Investor C1 | | | (0.41 | ) | | | 0.30 | | | | 11.29 | | | | 6.10 | |
Class K | | | 0.12 | | | | 1.35 | | | | 12.46 | | | | 7.21 | |
S&P 500® Index | | | 0.15 | | | | 1.38 | | | | 12.57 | | | | 7.31 | |
| | 4 | | Assuming maximum sales charges, if any. Average annual total returns with and without sales charges reflect reductions for distribution and service fees. See “About Fund Performance” on page 6 for a detailed description of share classes, including any related sales charges and fees. |
| | | | Past performance is not indicative of future results. |
| | | | | | | | | | | | | | | | | | | | | | | | | | | | |
| | | Actual | | | Hypothetical6 | | | | |
| | | Beginning
Account Value
July 1, 2015 | | | Ending
Account Value
December 31, 2015 | | | Expenses Paid
During the
Period5 | | | Beginning
Account Value
July 1, 2015 | | | Ending
Account Value
December 31, 2015 | | | Expenses Paid
During the
Period5 | | | Annualized
Expense Ratio | |
Institutional | | $ | 1,000.00 | | | $ | 1,000.80 | | | $ | 0.55 | | | $ | 1,000.00 | | | $ | 1,024.65 | | | $ | 0.56 | | | | 0.11 | % |
Service | | $ | 1,000.00 | | | $ | 1,000.20 | | | $ | 1.16 | | | $ | 1,000.00 | | | $ | 1,024.05 | | | $ | 1.17 | | | | 0.23 | % |
Investor A | | $ | 1,000.00 | | | $ | 999.50 | | | $ | 1.81 | | | $ | 1,000.00 | | | $ | 1,023.39 | | | $ | 1.84 | | | | 0.36 | % |
Investor C1 | | $ | 1,000.00 | | | $ | 995.90 | | | $ | 5.43 | | | $ | 1,000.00 | | | $ | 1,019.76 | | | $ | 5.50 | | | | 1.08 | % |
Class K | | $ | 1,000.00 | | | $ | 1,001.20 | | | $ | 0.20 | | | $ | 1,000.00 | | | $ | 1,025.00 | | | $ | 0.20 | | | | 0.04 | % |
| | 5 | | For each class of the Fund, expenses are equal to the annualized net expense ratio for the class, multiplied by the average account value over the period, multiplied by 184/365 (to reflect the one-half year period shown). Because the Fund invests significantly in the Master Portfolio, the expense example reflects the net expenses of both the Fund and the Master Portfolio in which it invests. |
| | 6 | | Hypothetical 5% annual return before expenses is calculated by prorating the number of days in the most recent fiscal half year divided by 365. |
| | | | See “Disclosure of Expenses” on page 6 for further information on how expenses were calculated. |
| | | | | | |
| | | | | | | |
| | BLACKROCK S&P 500 INDEX FUND | | DECEMBER 31, 2015 | | 5 |
| • | | Institutional and Class K Shares are not subject to any sales charge. These shares bear no ongoing distribution or service fees and are available only to certain eligible investors. |
| • | | Service Shares are not subject to any sales charge. These shares are subject to a service fee of 0.15% per year (but no distribution fee) and are available only to certain eligible investors. |
| • | | Investor A Shares are not subject to any sales charge and bear no ongoing distribution fee. These shares are subject to an ongoing service fee of 0.25% per year. These shares are generally available through financial intermediaries. |
| • | | Investor C1 Shares are not subject to any sales charge. These shares are subject to a distribution fee of 0.75% per year and a service fee of 0.15% per year. These shares are only available for dividend and capital gain reinvestment by existing shareholders and for purchase by certain employer-sponsored retirement plans. |
Performance information reflects past performance and does not guarantee future results. Current performance may be lower or higher than the performance data quoted. Refer to www.blackrock.com/funds
to obtain performance data current to the most recent month-end. Performance results do not reflect the deduction of taxes that a shareholder would pay on fund distributions or the redemption of fund shares. Figures shown in the performance table on the previous page assume reinvestment of all distributions, if any, at net asset value (“NAV”) on the ex-dividend date. Investment return and principal value of shares will fluctuate so that shares, when redeemed, may be worth more or less than their original cost. Distributions paid to each class of shares will vary because of the different levels of administration, service and distribution fees applicable to each class, which are deducted from the income available to be paid to shareholders. BlackRock Advisors, LLC (“BAL” or the “Administrator”), the Fund’s administrator, voluntarily waived a portion of the Fund’s expenses. Without such waiver, the Fund’s performance would have been lower. The Administrator is under no obligation to waive or to continue waiving its fees and such voluntary waiver may be reduced or discontinued at any time. See Note 4 of the Notes to Financial Statements for additional information on waivers.
Shareholders of the Fund may incur the following charges: (a) transactional expenses, such as sales charges; and (b) operating expenses, including administration fees, service and distribution fees, including 12b-1 fees, acquired fund fees and expenses and other Fund expenses. The expense example on previous page (which is based on a hypothetical investment of $1,000 invested on July 1, 2015 and held through December 31, 2015) is intended to assist shareholders both in calculating expenses based on an investment in the Fund and in comparing these expenses with similar costs of investing in other mutual funds.
The expense example provides information about actual account values and actual expenses. In order to estimate the expenses a shareholder paid during the period covered by this report, shareholders can divide their account value by $1,000 and then multiply the result by the number corresponding to their share class under the heading entitled “Expenses Paid During the Period.”
The expense example also provides information about hypothetical account values and hypothetical expenses based on the Fund’s actual expense ratio and an assumed rate of return of 5% per year before expenses. In order to assist shareholders in comparing the ongoing expenses of investing in the Fund and other funds, compare the 5% hypothetical example with the 5% hypothetical examples that appear in shareholder reports of other funds.
The expenses shown in the expense example are intended to highlight shareholders’ ongoing costs only and do not reflect any transactional expenses, such as sales charges, if any. Therefore, the hypothetical example is useful in comparing ongoing expenses only, and will not help shareholders determine the relative total expenses of owning different funds. If these transactional expenses were included, shareholder expenses would have been higher.
|
| Derivative Financial Instruments |
The Master Portfolio may invest in various derivative financial instruments. Derivative financial instruments are used to obtain exposure to a security, index and/or market without owning or taking physical custody of securities or to manage market, equity, credit, interest rate, foreign currency exchange rate, commodity and/or other risks. Derivative financial instruments may give rise to a form of economic leverage. Derivative financial instruments also involve risks, including the imperfect correlation between the value of a derivative financial instrument and the underlying asset, possible default of the counterparty to the transaction
or illiquidity of the derivative financial instrument. The Master Portfolio’s ability to use a derivative financial instrument successfully depends on the investment advisor’s ability to predict pertinent market movements accurately, which cannot be assured. The use of derivative financial instruments may result in losses greater than if they had not been used, may limit the amount of appreciation the Master Portfolio can realize on an investment and/or may result in lower distributions paid to shareholders. The Master Portfolio’s investments in these instruments, if any, are discussed in detail in the Notes to Financial Statements.
| | | | | | |
| | | | | | | |
| 6 | | BLACKROCK S&P 500 INDEX FUND | | DECEMBER 31, 2015 | | |
| | |
| Statement of Assets and Liabilities | | BlackRock S&P 500 Index Fund |
| | | | |
| December 31, 2015 | | | |
| | | | |
| Assets | |
Investments at value — Master Portfolio (cost — $4,464,101,283) | | $ | 6,053,620,189 | |
Capital shares sold receivable | | | 61,785,347 | |
| | | | |
Total assets | | | 6,115,405,536 | |
| | | | |
| | | | |
| Liabilities | | | | |
Payables: | | | | |
Capital shares redeemed | | | 40,682,016 | |
Contributions to the Master Portfolio | | | 21,103,331 | |
Service and distribution fees | | | 366,240 | |
Administration fees | | | 285,122 | |
Professional fees | | | 12,003 | |
Other accrued expenses | | | 298 | |
| | | | |
Total liabilities | | | 62,449,010 | |
| | | | |
Net Assets | | $ | 6,052,956,526 | |
| | | | |
| | | | |
| Net Assets Consist of | | | | |
Paid-in capital | | $ | 4,320,374,234 | |
Distributions in excess of net investment income | | | (2,630,085 | ) |
Accumulated net realized gain allocated from the Master Portfolio | | | 145,693,471 | |
Net unrealized appreciation (depreciation) allocated from the Master Portfolio | | | 1,589,518,906 | |
| | | | |
Net Assets | | $ | 6,052,956,526 | |
| | | | |
| | | | |
| Net Asset Value | | | | |
Institutional — Based on net assets of $3,247,607,247 and 13,281,384 shares outstanding, unlimited number of shares authorized, no par value | | $ | 244.52 | |
| | | | |
Service — Based on net assets of $304,087,740 and 1,243,610 shares outstanding, unlimited number of shares authorized, no par value | | $ | 244.52 | |
| | | | |
Investor A — Based on net assets of $1,281,537,815 and 5,241,067 shares outstanding, unlimited number of shares authorized, no par value | | $ | 244.52 | |
| | | | |
Investor C1 — Based on net assets of $74,558,241 and 304,823 shares outstanding, unlimited number of shares authorized, no par value | | $ | 244.59 | |
| | | | |
Class K — Based on net assets of $1,145,165,483 and 4,682,592 shares outstanding, unlimited number of shares authorized, no par value | | $ | 244.56 | |
| | | | |
| | | | | | |
| See Notes to Financial Statements. | | | | |
| | | | | | | |
| | BLACKROCK S&P 500 INDEX FUND | | DECEMBER 31, 2015 | | 7 |
| | |
| Statement of Operations | | BlackRock S&P 500 Index Fund |
| | | | |
| Year Ended December 31, 2015 | | | |
| | | | |
| Investment Income | | | | |
| Net investment income allocated from the Master Portfolio: | | | | |
Dividends — unaffiliated | | $ | 109,646,924 | |
Dividends — affiliated | | | 639,209 | |
Interest — affiliated | | | 389,646 | |
Securities lending — affiliated — net | | | 286,990 | |
Foreign taxes withheld | | | (7,526 | ) |
Expenses | | | (2,523,867 | ) |
Fees waived | | | 327,295 | |
| | | | |
Total income | | | 108,758,671 | |
| | | | |
| | | | |
| Fund Expenses | | | | |
Administration — Institutional | | | 1,993,000 | |
Administration — Service | | | 115,428 | |
Administration — Investor A | | | 846,466 | |
Administration — Investor C1 | | | 108,289 | |
Service — Service | | | 433,111 | |
Service — Investor A | | | 3,024,575 | |
Service and distribution — Investor C1 | | | 696,136 | |
Professional | | | 20,087 | |
Miscellaneous | | | 325 | |
| | | | |
Total expenses | | | 7,237,417 | |
Less administration fees waived | | | (20,087 | ) |
| | | | |
Total expenses after fees waived | | | 7,217,330 | |
| | | | |
Net investment income | | | 101,541,341 | |
| | | | |
| | | | |
| Realized and Unrealized Gain (Loss) Allocation from the Master Portfolio | | | | |
Net realized gain from investments and financial futures contracts | | | 78,044,657 | |
Net change in unrealized appreciation (depreciation) on investments and financial futures contracts | | | (128,478,964 | ) |
| | | | |
Net realized and unrealized loss | | | (50,434,307 | ) |
| | | | |
Net Increase in Net Assets Resulting from Operations | | $ | 51,107,034 | |
| | | | |
| | | | | | |
| See Notes to Financial Statements. | | | | |
| | | | | | | |
| 8 | | BLACKROCK S&P 500 INDEX FUND | | DECEMBER 31, 2015 | | |
| | |
| Statements of Changes in Net Assets | | BlackRock S&P 500 Index Fund |
| | | | | | | | |
| | | Year Ended December 31, | |
| Increase (Decrease) in Net Assets: | | 2015 | | | 2014 | |
| | | | | | | | |
| Operations | | | | | | | | |
Net investment income | | $ | 101,541,341 | | | $ | 72,193,968 | |
Net realized gain | | | 78,044,657 | | | | 57,400,988 | |
Net change in unrealized appreciation (depreciation) | | | (128,478,964 | ) | | | 382,247,974 | |
| | | | |
Net increase in net assets resulting from operations | | | 51,107,034 | | | | 511,842,930 | |
| | | | |
| | | | | | | | |
| Distributions to Shareholders1 | | | | | | | | |
From net investment income: | | | | | | | | |
Institutional | | | (57,769,260 | ) | | | (32,595,160 | ) |
Service | | | (5,322,477 | ) | | | (4,674,737 | ) |
Investor A | | | (20,472,384 | ) | | | (17,698,998 | ) |
Investor C1 | | | (718,684 | ) | | | (685,660 | ) |
Class K | | | (20,537,451 | ) | | | (16,857,221 | ) |
From net realized gain: | | | | | | | | |
Institutional | | | (15,240,580 | ) | | | — | |
Service | | | (1,436,649 | ) | | | — | |
Investor A | | | (5,932,833 | ) | | | — | |
Investor C1 | | | (349,393 | ) | | | — | |
Class K | | | (5,391,331 | ) | | | — | |
| | | | |
Decrease in net assets resulting from distributions to shareholders | | | (133,171,042 | ) | | | (72,511,776 | ) |
| | | | |
| | | | | | | | |
| Capital Share Transactions | | | | | | | | |
Net increase in net assets derived from capital share transactions | | | 1,795,625,047 | | | | 127,074,885 | |
| | | | |
| | | | | | | | |
| Net Assets | | | | | | | | |
Total increase in net assets | | | 1,713,561,039 | | | | 566,406,039 | |
Beginning of year | | | 4,339,395,487 | | | | 3,772,989,448 | |
| | | | |
End of year | | $ | 6,052,956,526 | | | $ | 4,339,395,487 | |
| | | | |
Undistributed (distributions in excess of) net investment income, end of year | | $ | (2,630,085 | ) | | $ | 648,830 | |
| | | | |
1 Distributions for annual periods determined in accordance with federal income tax regulations. | | | | | | | | |
| | | | | | |
| See Notes to Financial Statements. | | | | |
| | | | | | | |
| | BLACKROCK S&P 500 INDEX FUND | | DECEMBER 31, 2015 | | 9 |
| | |
| Financial Highlights | | BlackRock S&P 500 Index Fund |
| | | | | | | | | | | | |
| | | Institutional | |
| | | Year Ended December 31, | | | Period
April 10, 20131
to December 31, 2013 | |
| | | 2015 | | | 2014 | | |
| | | | | | | | | | | | |
| Per Share Operating Performance | | | | | | | | | | | | |
Net asset value, beginning of period | | $ | 247.36 | | | $ | 221.97 | | | $ | 190.60 | |
| | | | |
Net investment income2 | | | 4.79 | | | | 4.28 | | | | 2.89 | |
Net realized and unrealized gain (loss) | | | (1.71 | ) | | | 25.50 | | | | 31.21 | |
| | | | |
Net increase from investment operations | | | 3.08 | | | | 29.78 | | | | 34.10 | |
| | | | |
| Distributions:3 | | | | | | | | | | | | |
From net investment income | | | (4.77 | ) | | | (4.39 | ) | | | (2.73 | ) |
From net realized gain | | | (1.15 | ) | | | — | | | | — | |
| | | | | | | | | | | | |
Total distributions | | | (5.92 | ) | | | (4.39 | ) | | | (2.73 | ) |
| | | | |
Net asset value, end of period | | $ | 244.52 | | | $ | 247.36 | | | $ | 221.97 | |
| | | | |
| | | | | | | | | | | | |
| Total Return4 | | | | | | | | | | | | |
Based on net asset value | | | 1.28% | | | | 13.53% | | | | 18.03% | 5 |
| | | | |
| | | | | | | | | | | | |
| Ratios to Average Net Assets6 | | | | | | | | | | | | |
Total expenses | | | 0.11% | 7 | | | 0.14% | 8 | | | 0.23% | 8,9 |
| | | | |
Total expenses after fees waived | | | 0.11% | 7 | | | 0.14% | 8 | | | 0.23% | 8,9 |
| | | | |
Net investment income | | | 1.93% | 7 | | | 1.84% | 8 | | | 1.93% | 8,9 |
| | | | |
| | | | | | | | | | | | |
| Supplemental Data | | | | | | | | | | | | |
Net assets, end of period (000) | | $ | 3,247,607 | | | $ | 1,909,077 | | | $ | 1,570,760 | |
| | | | |
Portfolio turnover rate of the Master Portfolio | | | 2% | | | | 3% | | | | 2% | |
| | | | |
| | 1 | | Commencement of operations. |
| | 2 | | Based on average shares outstanding. |
| | 3 | | Distributions for annual periods determined in accordance with federal income tax regulations. |
| | 4 | | Where applicable, assumes the reinvestment of distributions. |
| | 5 | | Aggregate total return. |
| | 6 | | Includes the Fund’s share of the Master Portfolio’s allocated expenses and/or net investment income. |
| | 7 | | Includes the Fund’s share of the Master Portfolio’s allocated fees waived of 0.01%. |
| | 8 | | Includes the Fund’s share of the Master Portfolio’s allocated fees waived of less than 0.01%. |
| | | | | | |
| See Notes to Financial Statements. | | | | |
| | | | | | | |
| 10 | | BLACKROCK S&P 500 INDEX FUND | | DECEMBER 31, 2015 | | |
| | |
| Financial Highlights (continued) | | BlackRock S&P 500 Index Fund |
| | | | | | | | | | | | |
| | | Service | |
| | | Year Ended December 31, | | | Period
April 19, 20131
to December 31,
2013 | |
| | | 2015 | | | 2014 | | |
| | | | | | | | | | | | |
| Per Share Operating Performance | | | | | | | | | | | | |
Net asset value, beginning of period | | $ | 247.35 | | | $ | 221.97 | | | $ | 186.71 | |
| | | | |
Net investment income2 | | | 4.48 | | | | 3.98 | | | | 2.59 | |
Net realized and unrealized gain (loss) | | | (1.69 | ) | | | 25.50 | | | | 35.22 | |
| | | | |
Net increase from investment operations | | | 2.79 | | | | 29.48 | | | | 37.81 | |
| | | | |
| Distributions:3 | | | | | | | | | | | | |
From net investment income | | | (4.47 | ) | | | (4.10 | ) | | | (2.55 | ) |
From net realized gain | | | (1.15 | ) | | | — | | | | — | |
| | | | |
Total distributions | | | (5.62 | ) | | | (4.10 | ) | | | (2.55 | ) |
| | | | |
Net asset value, end of period | | $ | 244.52 | | | $ | 247.35 | | | $ | 221.97 | |
| | | | |
| | | | | | | | | | | | |
| Total Return4 | | | | | | | | | | | | |
Based on net asset value | | | 1.16% | | | | 13.39% | | | | 20.39% | 5 |
| | | | |
| | | | | | | | | | | | |
| Ratios to Average Net Assets6 | | | | | | | | | | | | |
Total expenses | | | 0.23% | 7 | | | 0.27% | 8 | | | 0.35% | 8,9 |
| | | | |
Total expenses after fees waived | | | 0.23% | 7 | | | 0.27% | 8 | | | 0.35% | 8,9 |
| | | | |
Net investment income | | | 1.81% | 7 | | | 1.71% | 8 | | | 1.81% | 8,9 |
| | | | |
| | | | | | | | | | | | |
| Supplemental Data | | | | | | | | | | | | |
Net assets, end of period (000) | | $ | 304,088 | | | $ | 277,856 | | | $ | 252,419 | |
| | | | |
Portfolio turnover rate of the Master Portfolio | | | 2% | | | | 3% | | | | 2% | |
| | | | |
| | 1 | | Commencement of operations. |
| | 2 | | Based on average shares outstanding. |
| | 3 | | Distributions for annual periods determined in accordance with federal income tax regulations. |
| | 4 | | Where applicable, assumes the reinvestment of distributions. |
| | 5 | | Aggregate total return. |
| | 6 | | Includes the Fund’s share of the Master Portfolio’s allocated net expenses and/or net investment income. |
| | 7 | | Includes the Fund’s share of the Master Portfolio’s allocated fees waived of 0.01%. |
| | 8 | | Includes the Fund’s share of the Master Portfolio’s allocated fees waived of less than 0.01%. |
| | | | | | |
| See Notes to Financial Statements. | | | | |
| | | | | | | |
| | BLACKROCK S&P 500 INDEX FUND | | DECEMBER 31, 2015 | | 11 |
| | |
| Financial Highlights (continued) | | BlackRock S&P 500 Index Fund |
| | | | | | | | | | | | |
| | | Investor A | |
| | | Year Ended December 31, | | | Period
April 10, 20131
to December 31,
2013 | |
| | | 2015 | | | 2014 | | |
| | | | | | | | | | | | |
| Per Share Operating Performance | | | | | | | | | | | | |
Net asset value, beginning of period | | $ | 247.35 | | | $ | 221.96 | | | $ | 190.60 | |
| | | | |
Net investment income2 | | | 4.16 | | | | 3.68 | | | | 2.50 | |
Net realized and unrealized gain (loss) | | | (1.69 | ) | | | 25.51 | | | | 31.23 | |
| | | | |
Net increase from investment operations | | | 2.47 | | | | 29.19 | | | | 33.73 | |
| | | | |
Distributions:3 | | | | | | | | | | | | |
From net investment income | | | (4.15 | ) | | | (3.80 | ) | | | (2.37 | ) |
From net realized gain | | | (1.15 | ) | | | — | | | | — | |
| | | | |
Total distributions | | | (5.30 | ) | | | (3.80 | ) | | | (2.37 | ) |
| | | | |
Net asset value, end of period | | $ | 244.52 | | | $ | 247.35 | | | $ | 221.96 | |
| | | | |
| | | | | | | | | | | | |
| Total Return4 | | | | | | | | | | | | |
Based on net asset value | | | 1.03% | | | | 13.25% | | | | 17.82% | 5 |
| | | | |
| | | | | | | | | | | | |
| Ratios to Average Net Assets6 | | | | | | | | | | | | |
Total expenses | | | 0.36% | 7 | | | 0.39% | 8 | | | 0.48% | 8,9 |
| | | | |
Total expenses after fees waived | | | 0.36% | 7 | | | 0.39% | 8 | | | 0.48% | 8,9 |
| | | | |
Net investment income | | | 1.68% | 7 | | | 1.59% | 8 | | | 1.67% | 8,9 |
| | | | |
| | | | | | | | | | | | |
| Supplemental Data | | | | | | | | | | | | |
Net assets, end of period (000) | | $ | 1,281,538 | | | $ | 1,149,714 | | | $ | 1,046,428 | |
| | | | |
Portfolio turnover rate of the Master Portfolio | | | 2% | | | | 3% | | | | 2% | |
| | | | |
| | 1 | | Commencement of operations. |
| | 2 | | Based on average shares outstanding. |
| | 3 | | Distributions for annual periods determined in accordance with federal income tax regulations. |
| | 4 | | Where applicable, assumes the reinvestment of distributions. |
| | 5 | | Aggregate total return. |
| | 6 | | Includes the Fund’s share of the Master Portfolio’s allocated expenses and/or net investment income. |
| | 7 | | Includes the Fund’s share of the Master Portfolio’s allocated fees waived of 0.01%. |
| | 8 | | Includes the Fund’s share of the Master Portfolio’s allocated fees waived of less than 0.01%. |
| | | | | | |
| See Notes to Financial Statements. | | | | |
| | | | | | | |
| 12 | | BLACKROCK S&P 500 INDEX FUND | | DECEMBER 31, 2015 | | |
| | |
| Financial Highlights (continued) | | BlackRock S&P 500 Index Fund |
| | | | | | | | | | | | |
| | | Investor C1 | |
| | | Year Ended December 31, | | | Period
April 19, 20131
to December 31,
2013 | |
| | | 2015 | | | 2014 | | |
| | | | | | | | | | | | |
| Per Share Operating Performance | | | | | | | | | | | | |
Net asset value, beginning of period | | $ | 247.36 | | | $ | 221.98 | | | $ | 186.71 | |
| | | | |
Net investment income2 | | | 2.36 | | | | 1.98 | | | | 1.38 | |
Net realized and unrealized gain (loss) | | | (1.65 | ) | | | 25.48 | | | | 35.22 | |
| | | | |
Net increase from investment operations | | | 0.71 | | | | 27.46 | | | | 36.60 | |
| | | | |
| Distributions:3 | | | | | | | | | | | | |
From net investment income | | | (2.33 | ) | | | (2.08 | ) | | | (1.33 | ) |
Form net realized gain | | | (1.15 | ) | | | — | | | | — | |
| | | | |
Total distributions | | | (3.48 | ) | | | (2.08 | ) | | | (1.33 | ) |
| | | | |
Net asset value, end of period | | $ | 244.59 | | | $ | 247.36 | | | $ | 221.98 | |
| | | | |
| | | | | | | | | | | | |
| Total Return4 | | | | | | | | | | | | |
Based on net asset value | | | 0.30% | | | | 12.42% | | | | 19.68% | 5 |
| | | | |
| | | | | | | | | | | | |
| Ratios to Average Net Assets6 | | | | | | | | | | | | |
Total expenses | | | 1.08% | 7 | | | 1.12% | 8 | | | 1.19% | 8,9 |
| | | | |
Total expenses after fees waived | | | 1.08% | 7 | | | 1.12% | 8 | | | 1.19% | 8,9 |
| | | | |
Net investment income | | | 0.95% | 7 | | | 0.85% | 8 | | | 0.97% | 8,9 |
| | | | |
| | | | | | | | | | | | |
| Supplemental Data | | | | | | | | | | | | |
Net assets, end of period (000) | | $ | 74,558 | | | $ | 79,476 | | | $ | 77,040 | |
| | | | |
Portfolio turnover rate of the Master Portfolio | | | 2% | | | | 3% | | | | 2% | |
| | | | |
| | 1 | | Commencement of operations. |
| | 2 | | Based on average shares outstanding. |
| | 3 | | Distributions for annual periods determined in accordance with federal income tax regulations. |
| | 4 | | Where applicable, assumes the reinvestment of distributions. |
| | 5 | | Aggregate total return. |
| | 6 | | Includes the Fund’s share of the Master Portfolio’s allocated expenses and/or net investment income. |
| | 7 | | Includes the Fund’s share of the Master Portfolio’s allocated fees waived of 0.01%. |
| | 8 | | Includes the Fund’s share of the Master Portfolio’s allocated fees waived of less than 0.01%. |
| | | | | | |
| See Notes to Financial Statements. | | | | |
| | | | | | | |
| | BLACKROCK S&P 500 INDEX FUND | | DECEMBER 31, 2015 | | 13 |
| | |
| Financial Highlights (concluded) | | BlackRock S&P 500 Index Fund |
| | | | | | | | | | | | | | | | | | | | |
| | | Class K | |
| | | Year Ended December 31, | |
| | | 2015 | | | 2014 | | | 2013 | | | 2012 | | | 2011 | |
| | | | | | | | | | | | | | | | | | | | |
| Per Share Operating Performance | | | | | | | | | | | | | | | | | | | | |
Net asset value, beginning of year | | $ | 247.39 | | | $ | 221.99 | | | $ | 171.12 | | | $ | 150.57 | | | $ | 150.60 | |
| | | | |
Net investment income1 | | | 4.97 | | | | 4.44 | | | | 3.91 | | | | 3.57 | | | | 2.97 | |
Net realized and unrealized gain (loss) | | | (1.72) | | | | 25.51 | | | | 50.74 | | | | 20.23 | | | | (0.05) | |
| | | | |
Net increase from investment operations | | | 3.25 | | | | 29.95 | | | | 54.65 | | | | 23.80 | | | | 2.92 | |
| | | | |
| Distributions:2 | | | | | | | | | | | | | | | | | | | | |
From net investment income | | | (4.93) | | | | (4.55) | | | | (3.78) | | | | (3.25) | | | | (2.92) | |
From net realized gain | | | (1.15) | | | | — | | | | — | | | | — | | | | — | |
From return of capital | | | — | | | | — | | | | — | | | | — | | | | (0.03) | |
| | | | | | | | |
Total distributions | | | (6.08) | | | | (4.55) | | | | (3.78) | | | | (3.25) | | | | (2.95) | |
| | | | |
Net asset value, end of year | | $ | 244.56 | | | $ | 247.39 | | | $ | 221.99 | | | $ | 171.12 | | | $ | 150.57 | |
| | | | |
| | | | | | | | | | | | | | | | | | | | |
| Total Return3 | | | | | | | | | | | | | | | | | | | | |
Based on net asset value | | | 1.35% | | | | 13.61% | | | | 32.21% | | | | 15.85% | | | | 2.00% | |
| | | | | | | | | | | | | | | | | | | | |
| | | | | | | | | | | | | | | | | | | | |
| Ratios to Average Net Assets4 | | | | | | | | | | | | | | | | | | | | |
Total expenses | | | 0.04%5 | | | | 0.07%6 | | | | 0.17%6 | | | | 0.26%5 | | | | 0.19%6 | |
| | | | | | | | | | | | | | | | | | | | |
Total expenses after fees waived | | | 0.04%5 | | | | 0.07%6 | | | | 0.16%6 | | | | 0.18%5 | | | | 0.18%6 | |
| | | | | | | | | | | | | | | | | | | | |
Net investment income | | | 2.00%5 | | | | 1.91%6 | | | | 1.96%6 | | | | 2.15%5 | | | | 1.95%6 | |
| | | | | | | | | | | | | | | | | | | | |
| | | | | | | | | | | | | | | | | | | | |
| Supplemental Data | | | | | | | | | | | | | | | | | | | | |
Net assets, end of year (000) | | $ | 1,145,165 | | | $ | 923,271 | | | $ | 826,342 | | | $ | 380,066 | | | $ | 255,280 | |
| | | | |
Portfolio turnover rate of the Master Portfolio | | | 2% | | | | 3% | | | | 2% | | | | 10% | | | | 5% | |
| | | | |
| | 1 | | Based on average shares outstanding. |
| | 2 | | Distributions for annual periods determined in accordance with federal income tax regulations. |
| | 3 | | Where applicable, assumes the reinvestment of distributions. |
| | 4 | | Includes the Fund’s share of the Master Portfolio’s allocated net expenses and/or net investment income. |
| | 5 | | Includes the Fund’s share of the Master Portfolio’s allocated fees waived of 0.01%. |
| | 6 | | Includes the Fund’s share of the Master Portfolio’s allocated fees waived of less than 0.01%. |
| | | | | | |
| See Notes to Financial Statements. | | | | |
| | | | | | | |
| 14 | | BLACKROCK S&P 500 INDEX FUND | | DECEMBER 31, 2015 | | |
| | | | |
| Notes to Financial Statements | | BlackRock S&P 500 Index Fund |
1. Organization:
BlackRock S&P 500 Index Fund (the “Fund”) (formerly known as BlackRock S&P 500 Stock Fund), a series of BlackRock Funds III (the “Trust”), is registered under the Investment Company Act of 1940, as amended (the “1940 Act”), as a diversified, open-end management investment company. The Trust is organized as a Delaware statutory trust. The Fund seeks to achieve its investment objective by investing all of its assets in S&P 500 Index Master Portfolio (the “Master Portfolio”) (formerly known as S&P 500 Stock Master Portfolio), a series of Master Investment Portfolio (“MIP”), an affiliate of the Fund, which has the same investment objective and strategies as the Fund. The value of the Fund’s investment in the Master Portfolio reflects the Fund’s proportionate interest in the net assets of the Master Portfolio. The performance of the Fund is directly affected by the performance of the Master Portfolio. At December 31, 2015, the percentage of the Master Portfolio owned by the Fund was 84.0%. The financial statements of the Master Portfolio, including the Schedule of Investments, are included elsewhere in this report and should be read in conjunction with the Fund’s financial statements.
The Fund offers multiple classes of shares. All classes of shares have identical voting, dividend, liquidation and other rights and are subject to the same terms and conditions, except that Service, Investor A and Investor C1 Shares bear certain expenses related to shareholder servicing of such shares, and Investor C1 Shares also bears certain expenses related to distribution of such shares. Institutional and Class K Shares are sold only certain eligible investors. Investor A Shares are generally available through financial intermediaries. Investor C1 Shares are only available through distribution reinvestments by current holders and for purchase by certain employer-sponsored retirement plans. Each class has exclusive voting rights with respect to matters relating to its shareholder servicing and distribution expenditures. The Board of Trustees of the Trust and Boards of Trustees of MIP are referred to throughout this report as the “Board of Trustees” or the “Board” and the members are referred to as “Trustees.”
| | | | | | | | | | | | |
| Share Class | | Initial Sales Charge | | | CDSC | | | Conversion Privilege | |
Institutional Shares | | | No | | | | No | | | | None | |
Service Shares | | | No | | | | No | | | | None | |
Investor A Shares | | | No | | | | No | | | | None | |
Investor C1 Shares | | | No | | | | No | | | | None | |
Class K Shares | | | No | | | | No | | | | None | |
The Fund, together with certain other registered investment companies advised by BAL or its affiliates, is included in a complex of open-end funds referred to as the Equity-Liquidity Complex.
2. Significant Accounting Policies:
The financial statements are prepared in conformity with accounting principles generally accepted in the United States of America (“U.S. GAAP”), which may require management to make estimates and assumptions that affect the reported amounts of assets and liabilities in the financial statements, disclosure of contingent assets and liabilities at the date of the financial statements and the reported amounts of increases and decreases in net assets from operations during the reporting period. Actual results could differ from those estimates. The Fund is considered an investment company under U.S. GAAP and follows the accounting and reporting guidance applicable to investment companies. Below is a summary of significant accounting policies:
Investment Transactions and Investment Income: For financial reporting purposes, contributions to and withdrawals from the Master Portfolio are accounted on a trade date basis. The Fund records daily its proportionate share of the Master Portfolio’s income, expenses and realized and unrealized gains and losses. Realized and unrealized gains and losses are adjusted utilizing partnership tax allocation rules. In addition, the Fund accrues its own expenses. Income, expenses and realized and unrealized gains and losses are allocated daily to each class based on its relative net assets.
Distributions: Distributions paid by the Fund are recorded on the ex-dividend date. The character and timing of distributions are determined in accordance with federal income tax regulations, which may differ from U.S. GAAP.
Indemnifications: In the normal course of business, the Fund enters into contracts that contain a variety of representations that provide general indemnification. The Fund’s maximum exposure under these arrangements is unknown because it involves future potential claims against the Fund, which cannot be predicted with any certainty.
Other: Expenses directly related to the Fund or its classes are charged to the Fund or the applicable class. Other operating expenses shared by several funds, including other funds managed by the Administrator, are prorated among those funds on the basis of relative net assets or other appropriate methods. Expenses directly related to the Fund and other shared expenses prorated to the Fund are allocated daily to each class based on its relative net assets or other appropriate methods.
| | | | | | |
| | | | | | | |
| | BLACKROCK S&P 500 INDEX FUND | | DECEMBER 31, 2015 | | 15 |
| | |
| Notes to Financial Statements (continued) | | BlackRock S&P 500 Index Fund |
3. Investment Valuation and Fair Value Measurements:
Investment Valuation Policies: The Fund’s policy is to fair value its financial instruments at fair value. The Fund records its investment in the Master Portfolio at fair value based on the Fund’s proportionate interest in the net assets of the Master Portfolio. Valuation of securities held by the Master Portfolio is discussed in Note 3 of the Master Portfolio’s Notes to Financial Statements, which are included elsewhere in this report.
4. Administration Agreement and Other Transactions with Affiliates:
The PNC Financial Services Group, Inc. is the largest stockholder and an affiliate of BlackRock, Inc. (“BlackRock”) for 1940 Act purposes.
The Trust, on behalf of the Fund, entered into an Administration Agreement BAL, which has agreed to provide general administration services (other than investment advice and related portfolio activities). BAL, in consideration thereof, has agreed to bear all of the Fund’s ordinary operating expenses, excluding, generally, investment advisory fees, distribution fees, brokerage and other expenses related to the execution of portfolio transactions, extraordinary expenses and certain other expenses which are borne by the Fund. BAL is entitled to receive for these administration services an annual fee based on the average daily net assets attributed to each share class of the Fund as follows:
| | | | | | | | | | | | | | | | | | | | |
| | | Institutional | | | Service | | | Investor A | | | Investor C1 | | | Class K | |
Rate | | | 0.07% | | | | 0.04% | | | | 0.07% | | | | 0.14% | | | | 0.00% | |
From time to time, BAL may waive such fees in whole or in part. Any such waiver will reduce the expenses of the Fund and, accordingly, have a favorable impact on its performance. BAL may delegate certain of its administration duties to sub-administrators.
The fees and expenses of the Trust’s trustees who are not “interested persons” of the Trust, as defined in the 1940 Act (“Independent Trustees”), counsel to the Independent Trustees and the Trust’s independent registered public accounting firm (together, the “independent expenses”) are paid directly by the Fund. BAL has contractually agreed to provide an offsetting credit against the administration fees paid by the Fund in an amount equal to the independent expenses through April 30, 2016.
The Trust, on behalf of the Fund, entered into a Distribution Agreement and a Distribution and Service Plan with BlackRock Investments, LLC (“BRIL”), an affiliate of BAL. Pursuant to the Distribution and Service Plan and in accordance with Rule 12b-1 under the 1940 Act, the Fund pays BRIL ongoing service and distribution fees. The fees are accrued daily and paid monthly at annual rates based upon the average daily net assets of the relevant share class of the Fund as follows:
| | | | | | | | | | | | |
| | | Service | | | Investor A | | | Investor C1 | |
Service Fee | | | 0.15% | | | | 0.25% | | | | 0.15% | |
Distribution Fee | | | — | | | | — | | | | 0.75% | |
Pursuant to sub-agreements with BRIL, broker-dealers and BRIL provide shareholder servicing and distribution services to the Fund. The ongoing service and/or distribution fee compensates BRIL and each broker-dealer for providing shareholder servicing and/or distribution related services to the shareholders.
For the year ended December 31, 2015, affiliates received CDSCs of $1,534 for Investor C1 Shares.
Certain officers and/or trustees of the Trust are officers and/or directors of BlackRock or its affiliates.
5. Income Tax Information:
It is the Fund’s policy to comply with the requirements of the Internal Revenue Code of 1986, as amended, applicable to regulated investment companies, and to distribute substantially all of its taxable income to its shareholders. Therefore, no federal income tax provision is required.
The Fund files U.S. federal and various state and local tax returns. No income tax returns are currently under examination. The statute of limitations on the Fund’s U.S. federal tax returns remains open for each of the four years ended December 31, 2015. The statutes of limitations on the Fund’s state and local tax returns may remain open for an additional year depending upon the jurisdiction.
Management has analyzed tax laws and regulations and their application to the Fund as of December 31, 2015, inclusive of the open tax return years, and does not believe there are any uncertain tax positions that require recognition of a tax liability in the Fund’s financial statements.
| | | | | | |
| | | | | | | |
| 16 | | BLACKROCK S&P 500 INDEX FUND | | DECEMBER 31, 2015 | | |
| | | | |
| Notes to Financial Statements (continued) | | BlackRock S&P 500 Index Fund |
The tax character of distributions paid was as follows:
| | | | | | | | |
| | | 12/31/15 | | | 12/31/14 | |
Ordinary income | | $ | 104,820,256 | | | $ | 72,511,776 | |
Long-term capital gains | | | 28,350,786 | | | | — | |
| | | | | | | | |
Total | | | 133,171,042 | | | | 72,511,776 | |
| | | | | | | | |
As of period end, the tax components of accumulated net earnings (losses) were as follows:
| | | | |
Undistributed ordinary income | | $ | 3,134,110 | |
Undistributed long-term capital gains | | | 7,688,407 | |
Capital loss carryforwards | | | (101,398,044 | ) |
Net unrealized gains (losses)1 | | | 1,823,157,819 | |
| | | | |
Total | | $ | 1,732,582,292 | |
| | | | |
| | 1 | | The differences between book-basis and tax-basis net unrealized gains (losses) was attributable primarily to the limiting and recognition of partnership income. |
As of period end, the Fund had a capital loss carryforwards available to offset future realized capital gains through the indicated expiration dates as follows:
| | | | |
| Expires December 31, | | | |
2016 | | $ | 50,950,914 | |
2017 | | | 21,080,621 | |
2018 | | | 29,366,509 | |
| | | | |
Total | | $ | 101,398,044 | |
| | | | |
During the year ended December 31, 2015, the Fund utilized $47,062,978 of its capital loss carryforward.
6. Capital Share Transactions:
Transactions in capital shares for each class were as follows:
| | | | | | | | | | | | | | | | | | |
| | | Year Ended
December 31, 2015 | | | | | Year Ended
December 31, 2014 | |
| | | Shares | | | Amount | | | | | Shares | | | Amount | |
| Institutional | | | | | | | | | | | | | | |
Shares sold | | | 9,491,979 | | | $ | 2,366,531,483 | | | | | | 3,533,974 | | | $ | 824,534,139 | |
Shares issued to shareholders in reinvestment of distributions | | | 294,747 | | | | 71,632,015 | | | | | | 134,268 | | | | 31,617,898 | |
Shares redeemed | | | (4,223,183 | ) | | | (1,045,339,030) | | | | | | (3,026,858 | ) | | | (706,662,787 | ) |
| | | | | | | | | | |
Net increase | | | 5,563,543 | | | $ | 1,392,824,468 | | | | | | 641,384 | | | $ | 149,489,250 | |
| | | | | | | | | | |
| | | | | | | | | | | | | | | | | | |
| Service | | | | | | | | | | | | | | | | | | |
Shares sold | | | 363,978 | | | $ | 87,835,046 | | | | | | 171,454 | | | $ | 40,125,114 | |
Shares issued to shareholders in reinvestment of distributions | | | 27,395 | | | | 6,655,833 | | | | | | 19,512 | | | | 4,591,617 | |
Shares redeemed | | | (271,091 | ) | | | (67,543,403 | ) | | | | | (204,834 | ) | | | (47,833,460 | ) |
| | | | | | | | | | |
Net increase (decrease) | | | 120,282 | | | $ | 26,947,476 | | | | | | (13,868 | ) | | $ | (3,116,729 | ) |
| | | | | | | | | | |
| | | | | | | | | | | | | | | | | | |
| Investor A | | | | | | | | | | | | | | | | | | |
Shares sold | | | 1,779,017 | | | $ | 439,866,474 | | | | | | 1,367,982 | | | $ | 318,342,711 | |
Shares issued to shareholders in reinvestment of distributions | | | 103,205 | | | | 25,099,530 | | | | | | 71,007 | | | | 16,706,046 | |
Shares redeemed | | | (1,289,344 | ) | | | (319,724,415 | ) | | | | | (1,505,189 | ) | | | (350,176,620 | ) |
| | | | | | | | | | |
Net increase (decrease) | | | 592,878 | | | $ | 145,241,589 | | | | | | (66,200 | ) | | $ | (15,127,863 | ) |
| | | | | | | | | | |
| | | | | | |
| | | | | | | |
| | BLACKROCK S&P 500 INDEX FUND | | DECEMBER 31, 2015 | | 17 |
| | |
| Notes to Financial Statements (concluded) | | BlackRock S&P 500 Index Fund |
| | | | | | | | | | | | | | | | | | |
| | | Year Ended
December 31, 2015 | | | | | Year Ended
December 31, 2014 | |
| | | Shares | | | Amount | | | | | Shares | | | Amount | |
| Investor C1 | | | | | | | | | | | | | | | | | | |
Shares sold | | | 109 | | | $ | 27,271 | | | | | | 44 | | | $ | 10,057 | |
Shares issued to shareholders in reinvestment of distributions | | | 3,910 | | | | 952,238 | | | | | | 2,574 | | | | 605,881 | |
Shares redeemed | | | (20,498 | ) | | | (5,108,301 | ) | | | | | (28,378 | ) | | | (6,561,824 | ) |
| | | | | | | | | | |
Net decrease | | | (16,479 | ) | | $ | (4,128,792 | ) | | | | | (25,760 | ) | | $ | (5,945,886 | ) |
| | | | | | | | | | |
| | | | | | | | | | | | | | | | | | |
| Class K | | | | | | | | | | | | | | | | | | |
Shares sold | | | 1,648,844 | | | $ | 408,582,198 | | | | | | 931,025 | | | $ | 217,851,261 | |
Shares issued to shareholders in reinvestment of distributions | | | 86,179 | | | | 20,954,346 | | | | | | 54,585 | | | | 12,850,253 | |
Shares redeemed | | | (784,525 | ) | | | (194,796,238 | ) | | | | | (975,948 | ) | | | (228,925,401 | ) |
| | | | | | | | | | |
Net increase | | | 950,498 | | | $ | 234,740,306 | | | | | | 9,662 | | | $ | 1,776,113 | |
| | | | | | | | | | |
Total Net Increase | | | 7,210,722 | | | $ | 1,795,625,047 | | | | | | 545,218 | | | $ | 127,074,885 | |
| | | | | | | | | | |
7. Subsequent Events:
Management has evaluated the impact of all subsequent events on the Fund through the date the financial statements were issued and has determined that there were no subsequent events requiring adjustment or additional disclosure in the financial statements.
| | | | | | |
| | | | | | | |
| 18 | | BLACKROCK S&P 500 INDEX FUND | | DECEMBER 31, 2015 | | |
| | |
| Report of Independent Registered Public Accounting Firm | | BlackRock S&P 500 Index Fund |
To the Board of Trustees of BlackRock Funds III and the Shareholders of BlackRock S&P 500 Index Fund:
In our opinion, the accompanying statement of assets and liabilities and the related statements of operations and of changes in net assets and the financial highlights present fairly, in all material respects, the financial position of BlackRock S&P 500 Index Fund (the “Fund”), a series of BlackRock Funds III, at December 31, 2015, the results of its operations for the year then ended, the changes in its net assets for each of the two years in the period then ended and the financial highlights for each of the periods presented, in conformity with accounting principles generally accepted in the United States of America. These financial statements and financial highlights (hereafter referred to as “financial statements”) are the responsibility of the Fund’s management. Our responsibility is to express an opinion on these financial statements based on our audits. We conducted our audits of these financial statements in accordance with the standards of the Public Company Accounting Oversight Board (United States). Those standards require that we plan and perform the audit to obtain reasonable assurance about whether the financial statements are free of material misstatement. An audit includes examining, on a test basis, evidence supporting the amounts and disclosures in the financial statements, assessing the accounting principles used and significant estimates made by management, and evaluating the overall financial statement presentation. We believe that our audits provide a reasonable basis for our opinion.
/s/ PricewaterhouseCoopers LLP
Philadelphia, Pennsylvania
February 18, 2016
| | |
| Important Tax Information (Unaudited) | | |
During the fiscal year ended December 31, 2015, the following information is provided with respect to the ordinary income distributions paid by the Fund.
| | | | | | |
| | | | | January 2015 — December 2015 | |
Qualified Dividend Income for Individuals1 | | | 100.00% | |
| |
Dividends Qualifying for the Dividends Received Deduction for Corporations1 | | | 100.00% | |
| | 1 | | The Fund hereby designates the percentage indicated above or the maximum amount allowable by law. |
Additionally, the Fund distributed long-term capital gains of $1.168146806 per share to shareholders on record December 8, 2015.
| | | | | | |
| | | | | | | |
| | BLACKROCK S&P 500 INDEX FUND | | DECEMBER 31, 2015 | | 19 |
| | |
| Master Portfolio Information | | S&P 500 Index Master Portfolio |
| | |
| Ten Largest Holdings | | Percent of Net Assets |
| | | | |
Apple, Inc. | | | 3 | % |
Microsoft Corp. | | | 2 | |
Exxon Mobil Corp. | | | 2 | |
General Electric Co. | | | 2 | |
Johnson & Johnson | | | 2 | |
Amazon.com, Inc. | | | 1 | |
Wells Fargo & Co. | | | 1 | |
Berkshire Hathaway, Inc., Class B | | | 1 | |
JPMorgan Chase & Co. | | | 1 | |
Facebook, Inc., Class A | | | 1 | |
| | |
| Sector Allocation | | Percent of Net Assets |
| | | | |
Information Technology | | | 20 | % |
Financials | | | 16 | |
Health Care | | | 14 | |
Consumer Discretionary | | | 12 | |
Consumer Staples | | | 10 | |
Industrials | | | 9 | |
Energy | | | 6 | |
Utilities | | | 3 | |
Materials | | | 2 | |
Telecommunication Services | | | 2 | |
Short-Term Securities | | | 6 | |
For Master Portfolio compliance purposes, the Master Portfolio’s sector classifications refer to one or more of the sector sub-classifications used by one or more widely recognized market indexes or ratings group indexes, and/or as defined by the investment advisor. These definitions may not apply for purposes of this report, which may combine such sector sub-classifications for reporting ease.
| | | | | | |
| | | | | | | |
| 20 | | BLACKROCK S&P 500 INDEX FUND | | DECEMBER 31, 2015 | | |
| | |
Schedule of Investments December 31, 2015 | | S&P 500 Index Master Portfolio (Percentages shown are based on Net Assets) |
| | | | | | | | |
| Common Stocks | | Shares | | | Value | |
Aerospace & Defense — 2.6% | |
Boeing Co. | | | 240,495 | | | $ | 34,773,172 | |
General Dynamics Corp. | | | 113,371 | | | | 15,572,640 | |
Honeywell International, Inc. | | | 294,035 | | | | 30,453,205 | |
L-3 Communications Holdings, Inc. | | | 30,482 | | | | 3,642,904 | |
Lockheed Martin Corp. | | | 100,838 | | | | 21,896,972 | |
Northrop Grumman Corp. | | | 69,580 | | | | 13,137,400 | |
Precision Castparts Corp. | | | 52,489 | | | | 12,177,973 | |
Raytheon Co. | | | 115,181 | | | | 14,343,490 | |
Rockwell Collins, Inc. | | | 50,000 | | | | 4,615,000 | |
Textron, Inc. | | | 104,888 | | | | 4,406,345 | |
United Technologies Corp. | | | 314,280 | | | | 30,192,879 | |
| | | | | | | | |
| | | | | | | | 185,211,980 | |
Air Freight & Logistics — 0.6% | |
C.H. Robinson Worldwide, Inc. | | | 53,806 | | | | 3,337,048 | |
Expeditors International of Washington, Inc. | | | 72,048 | | | | 3,249,365 | |
FedEx Corp. | | | 100,157 | | | | 14,922,391 | |
United Parcel Service, Inc., Class B | | | 265,024 | | | | 25,503,260 | |
| | | | | | | | |
| | | | | | | | 47,012,064 | |
Airlines — 0.6% | |
American Airlines Group, Inc. | | | 239,207 | | | | 10,130,417 | |
Delta Air Lines, Inc. | | | 300,068 | | | | 15,210,447 | |
Southwest Airlines Co. | | | 248,101 | | | | 10,683,229 | |
United Continental Holdings, Inc. (a) | | | 143,341 | | | | 8,213,439 | |
| | | | | | | | |
| | | | | | | | 44,237,532 | |
Auto Components — 0.4% | |
BorgWarner, Inc. | | | 85,875 | | | | 3,712,376 | |
Delphi Automotive PLC | | | 106,934 | | | | 9,167,452 | |
Goodyear Tire & Rubber Co. | | | 102,223 | | | | 3,339,625 | |
Johnson Controls, Inc. | | | 248,185 | | | | 9,800,826 | |
| | | | | | | | |
| | | | | | | | 26,020,279 | |
Automobiles — 0.6% | |
Ford Motor Co. | | | 1,487,023 | | | | 20,952,154 | |
General Motors Co. | | | 540,199 | | | | 18,372,168 | |
Harley-Davidson, Inc. | | | 73,196 | | | | 3,322,366 | |
| | | | | | | | |
| | | | | | | | 42,646,688 | |
Banks — 5.7% | |
Bank of America Corp. | | | 3,972,257 | | | | 66,853,085 | |
BB&T Corp. | | | 295,820 | | | | 11,184,954 | |
Citigroup, Inc. | | | 1,136,435 | | | | 58,810,511 | |
Comerica, Inc. | | | 67,515 | | | | 2,824,153 | |
Fifth Third Bancorp | | | 304,791 | | | | 6,126,299 | |
Huntington Bancshares, Inc. | | | 304,770 | | | | 3,370,756 | |
JPMorgan Chase & Co. | | | 1,403,220 | | | | 92,654,617 | |
KeyCorp | | | 319,063 | | | | 4,208,441 | |
M&T Bank Corp. | | | 61,034 | | | | 7,396,100 | |
PNC Financial Services Group, Inc. (c) | | | 193,874 | | | | 18,478,131 | |
Regions Financial Corp. | | | 502,732 | | | | 4,826,227 | |
SunTrust Banks, Inc. | | | 194,546 | | | | 8,334,351 | |
US Bancorp | | | 628,115 | | | | 26,801,667 | |
Wells Fargo & Co. | | | 1,774,929 | | | | 96,485,141 | |
Zions Bancorporation | | | 77,740 | | | | 2,122,302 | |
| | | | | | | | |
| | | | | | | | 410,476,735 | |
Beverages — 2.2% | |
Brown-Forman Corp., Class B | | | 38,763 | | | | 3,848,391 | |
Coca-Cola Co. | | | 1,493,137 | | | | 64,145,166 | |
Coca-Cola Enterprises, Inc. | | | 79,972 | | | | 3,937,821 | |
| | | | | | | | |
| Common Stocks | | Shares | | | Value | |
Beverages (continued) | |
Constellation Brands, Inc., Class A | | | 66,106 | | | $ | 9,416,139 | |
Dr Pepper Snapple Group, Inc. | | | 72,432 | | | | 6,750,662 | |
Molson Coors Brewing Co., Class B | | | 59,969 | | | | 5,632,288 | |
Monster Beverage Corp. (a) | | | 57,702 | | | | 8,595,290 | |
PepsiCo, Inc. | | | 556,258 | | | | 55,581,299 | |
| | | | | | | | |
| | | | | | | | 157,907,056 | |
Biotechnology — 3.0% | |
Alexion Pharmaceuticals, Inc. (a) | | | 85,814 | | | | 16,369,020 | |
Amgen, Inc. | | | 287,716 | | | | 46,704,938 | |
Baxalta, Inc. | | | 205,499 | | | | 8,020,626 | |
Biogen, Inc. (a) | | | 85,037 | | | | 26,051,085 | |
Celgene Corp. (a) | | | 299,968 | | | | 35,924,168 | |
Gilead Sciences, Inc. | | | 549,816 | | | | 55,635,881 | |
Regeneron Pharmaceuticals, Inc. (a) | | | 29,618 | | | | 16,078,724 | |
Vertex Pharmaceuticals, Inc. (a) | | | 93,745 | | | | 11,795,933 | |
| | | | | | | | |
| | | | | | | | 216,580,375 | |
Building Products — 0.1% | |
Allegion PLC | | | 36,356 | | | | 2,396,587 | |
Masco Corp. | | | 128,376 | | | | 3,633,041 | |
| | | | | | | | |
| | | | | | | | 6,029,628 | |
Capital Markets — 2.0% | |
Affiliated Managers Group, Inc. (a) | | | 20,598 | | | | 3,290,736 | |
Ameriprise Financial, Inc. | | | 66,424 | | | | 7,068,842 | |
Bank of New York Mellon Corp. | | | 417,285 | | | | 17,200,488 | |
BlackRock, Inc. (c) | | | 48,211 | | | | 16,416,810 | |
Charles Schwab Corp. | | | 457,474 | | | | 15,064,619 | |
E*Trade Financial Corp. (a) | | | 110,106 | | | | 3,263,542 | |
Franklin Resources, Inc. | | | 144,547 | | | | 5,322,220 | |
Goldman Sachs Group, Inc. | | | 151,335 | | | | 27,275,107 | |
Invesco Ltd. | | | 162,677 | | | | 5,446,426 | |
Legg Mason, Inc. | | | 42,074 | | | | 1,650,563 | |
Morgan Stanley | | | 578,141 | | | | 18,390,665 | |
Northern Trust Corp. | | | 83,055 | | | | 5,987,435 | |
State Street Corp. | | | 154,858 | | | | 10,276,377 | |
T. Rowe Price Group, Inc. | | | 95,798 | | | | 6,848,599 | |
| | | | | | | | |
| | | | | | | | 143,502,429 | |
Chemicals — 2.0% | |
Air Products & Chemicals, Inc. | | | 73,970 | | | | 9,624,237 | |
Airgas, Inc. | | | 25,115 | | | | 3,473,907 | |
CF Industries Holdings, Inc. | | | 88,430 | | | | 3,608,828 | |
Dow Chemical Co. | | | 429,352 | | | | 22,103,041 | |
E.I. du Pont de Nemours & Co. | | | 334,641 | | | | 22,287,091 | |
Eastman Chemical Co. | | | 56,411 | | | | 3,808,307 | |
Ecolab, Inc. | | | 101,467 | | | | 11,605,795 | |
FMC Corp. | | | 51,233 | | | | 2,004,747 | |
International Flavors & Fragrances, Inc. | | | 30,579 | | | | 3,658,472 | |
LyondellBasell Industries NV, Class A | | | 137,177 | | | | 11,920,681 | |
Monsanto Co. | | | 167,907 | | | | 16,542,198 | |
Mosaic Co. | | | 127,934 | | | | 3,529,699 | |
PPG Industries, Inc. | | | 102,725 | | | | 10,151,285 | |
Praxair, Inc. | | | 108,701 | | | | 11,130,982 | |
Sherwin-Williams Co. | | | 30,064 | | | | 7,804,614 | |
| | | | | | | | |
| | | | | | | | 143,253,884 | |
Commercial Services & Supplies — 0.4% | |
ADT Corp. (b) | | | 64,481 | | | | 2,126,583 | |
Cintas Corp. | | | 33,874 | | | | 3,084,228 | |
Iron Mountain, Inc. | | | 72,798 | | | | 1,966,274 | |
See Notes to Financial Statements.
| | | | | | |
| | | | | | | |
| | BLACKROCK S&P 500 INDEX FUND | | DECEMBER 31, 2015 | | 21 |
| | |
Schedule of Investments (continued) | | S&P 500 Index Master Portfolio |
| | | | | | | | |
| Common Stocks | | Shares | | | Value | |
Commercial Services & Supplies (continued) | |
Pitney Bowes, Inc. | | | 76,940 | | | $ | 1,588,811 | |
Republic Services, Inc. | | | 91,353 | | | | 4,018,619 | |
Stericycle, Inc. (a) | | | 32,190 | | | | 3,882,114 | |
Tyco International PLC | | | 159,943 | | | | 5,100,582 | |
Waste Management, Inc. | | | 159,593 | | | | 8,517,478 | |
| | | | | | | | |
| | | | | | | | 30,284,689 | |
Communications Equipment — 1.3% | |
Cisco Systems, Inc. | | | 1,936,152 | | | | 52,576,207 | |
F5 Networks, Inc. (a) | | | 27,190 | | | | 2,636,342 | |
Harris Corp. | | | 47,079 | | | | 4,091,165 | |
Juniper Networks, Inc. | | | 134,201 | | | | 3,703,948 | |
Motorola Solutions, Inc. | | | 61,006 | | | | 4,175,861 | |
QUALCOMM, Inc. | | | 573,823 | | | | 28,682,543 | |
| | | | | | | | |
| | | | | | | | 95,866,066 | |
Construction & Engineering — 0.1% | |
Fluor Corp. | | | 54,461 | | | | 2,571,648 | |
Jacobs Engineering Group, Inc. (a) | | | 46,610 | | | | 1,955,289 | |
Quanta Services, Inc. (a) | | | 60,930 | | | | 1,233,833 | |
| | | | | | | | |
| | | | | | | | 5,760,770 | |
Construction Materials — 0.1% | |
Martin Marietta Materials, Inc. | | | 25,424 | | | | 3,472,410 | |
Vulcan Materials Co. | | | 50,538 | | | | 4,799,594 | |
| | | | | | | | |
| | | | | | | | 8,272,004 | |
Consumer Finance — 0.8% | |
American Express Co. | | | 319,160 | | | | 22,197,578 | |
Capital One Financial Corp. | | | 203,158 | | | | 14,663,944 | |
Discover Financial Services | | | 163,062 | | | | 8,743,384 | |
Navient Corp. | | | 143,530 | | | | 1,643,419 | |
Synchrony Financial (a) | | | 318,136 | | | | 9,674,516 | |
| | | | | | | | |
| | | | | | | | 56,922,841 | |
Containers & Packaging — 0.2% | |
Avery Dennison Corp. | | | 34,921 | | | | 2,188,150 | |
Ball Corp. | | | 52,428 | | | | 3,813,088 | |
Owens-Illinois, Inc. (a) | | | 60,630 | | | | 1,056,175 | |
Sealed Air Corp. | | | 75,305 | | | | 3,358,603 | |
WestRock Co. | | | 99,358 | | | | 4,532,712 | |
| | | | | | | | |
| | | | | | | | 14,948,728 | |
Distributors — 0.1% | |
Genuine Parts Co. | | | 57,524 | | | | 4,940,736 | |
Diversified Consumer Services — 0.0% | |
H&R Block, Inc. | | | 89,468 | | | | 2,980,179 | |
Diversified Financial Services — 1.9% | |
Berkshire Hathaway, Inc., Class B (a) | | | 715,094 | | | | 94,421,012 | |
CME Group, Inc. | | | 129,039 | | | | 11,690,933 | |
IntercontinentalExchange Group, Inc. | | | 45,292 | | | | 11,606,528 | |
Leucadia National Corp. | | | 128,188 | | | | 2,229,189 | |
McGraw-Hill Financial, Inc. | | | 103,400 | | | | 10,193,172 | |
Moody’s Corp. | | | 66,123 | | | | 6,634,782 | |
NASDAQ OMX Group, Inc. | | | 43,853 | | | | 2,550,929 | |
| | | | | | | | |
| | | | | | | | 139,326,545 | |
Diversified Telecommunication Services — 2.3% | |
AT&T, Inc. | | | 2,346,504 | | | | 80,743,203 | |
CenturyLink, Inc. | | | 209,466 | | | | 5,270,164 | |
Frontier Communications Corp. | | | 443,273 | | | | 2,070,085 | |
| | | | | | | | |
| Common Stocks | | Shares | | | Value | |
Diversified Telecommunication Services (continued) | |
Level 3 Communications, Inc. (a) | | | 109,366 | | | $ | 5,945,136 | |
Verizon Communications, Inc. | | | 1,551,983 | | | | 71,732,654 | |
| | | | | | | | |
| | | | | | | | 165,761,242 | |
Electric Utilities — 1.6% | |
American Electric Power Co., Inc. | | | 187,420 | | | | 10,920,963 | |
Duke Energy Corp. | | | 262,794 | | | | 18,760,864 | |
Edison International | | | 123,628 | | | | 7,320,014 | |
Entergy Corp. | | | 68,122 | | | | 4,656,820 | |
Eversource Energy | | | 120,351 | | | | 6,146,326 | |
Exelon Corp. | | | 350,758 | | | | 9,740,550 | |
FirstEnergy Corp. | | | 160,299 | | | | 5,086,287 | |
NextEra Energy, Inc. | | | 175,850 | | | | 18,269,056 | |
Pepco Holdings, Inc. | | | 96,326 | | | | 2,505,439 | |
Pinnacle West Capital Corp. | | | 42,049 | | | | 2,711,319 | |
PPL Corp. | | | 256,275 | | | | 8,746,666 | |
Southern Co. | | | 346,768 | | | | 16,225,275 | |
Xcel Energy, Inc. | | | 192,460 | | | | 6,911,239 | |
| | | | | | | | |
| | | | | | | | 118,000,818 | |
Electrical Equipment — 0.4% | |
AMETEK, Inc. | | | 91,889 | | | | 4,924,332 | |
Eaton Corp. PLC | | | 177,392 | | | | 9,231,480 | |
Emerson Electric Co. | | | 249,350 | | | | 11,926,410 | |
Rockwell Automation, Inc. | | | 50,887 | | | | 5,221,515 | |
| | | | | | | | |
| | | | | | | | 31,303,737 | |
Electronic Equipment, Instruments & Components — 0.3% | |
Amphenol Corp., Class A | | | 117,305 | | | | 6,126,840 | |
Corning, Inc. | | | 451,663 | | | | 8,256,400 | |
FLIR Systems, Inc. | | | 53,634 | | | | 1,505,506 | |
TE Connectivity Ltd. | | | 147,391 | | | | 9,522,933 | |
| | | | | | | | |
| | | | | | | | 25,411,679 | |
Energy Equipment & Services — 1.0% | |
Baker Hughes, Inc. | | | 165,395 | | | | 7,632,979 | |
Cameron International Corp. (a) | | | 72,670 | | | | 4,592,744 | |
Diamond Offshore Drilling, Inc. | | | 23,577 | | | | 497,475 | |
Ensco PLC, Class A | | | 89,455 | | | | 1,376,712 | |
FMC Technologies, Inc. (a) | | | 87,231 | | | | 2,530,571 | |
Halliburton Co. | | | 326,476 | | | | 11,113,243 | |
Helmerich & Payne, Inc. | | | 41,087 | | | | 2,200,209 | |
National Oilwell Varco, Inc. | | | 143,343 | | | | 4,800,557 | |
Schlumberger Ltd. | | | 480,171 | | | | 33,491,927 | |
Transocean Ltd. (a)(b) | | | 127,604 | | | | 1,579,738 | |
| | | | | | | | |
| | | | | | | | 69,816,155 | |
Food & Staples Retailing — 2.2% | |
Costco Wholesale Corp. | | | 166,763 | | | | 26,932,224 | |
CVS Health Corp. | | | 422,889 | | | | 41,345,858 | |
Kroger Co. | | | 371,604 | | | | 15,544,195 | |
Sysco Corp. | | | 200,307 | | | | 8,212,587 | |
Wal-Mart Stores, Inc. | | | 598,794 | | | | 36,706,072 | |
Walgreens Boots Alliance, Inc. | | | 332,546 | | | | 28,317,955 | |
Whole Foods Market, Inc. | | | 130,299 | | | | 4,365,017 | |
| | | | | | | | |
| | | | | | | | 161,423,908 | |
Food Products — 1.6% | |
Archer-Daniels-Midland Co. | | | 227,849 | | | | 8,357,501 | |
Campbell Soup Co. | | | 68,340 | | | | 3,591,267 | |
ConAgra Foods, Inc. | | | 163,821 | | | | 6,906,693 | |
General Mills, Inc. | | | 227,190 | | | | 13,099,776 | |
See Notes to Financial Statements.
| | | | | | |
| | | | | | | |
| 22 | | BLACKROCK S&P 500 INDEX FUND | | DECEMBER 31, 2015 | | |
| | |
Schedule of Investments (continued) | | S&P 500 Index Master Portfolio |
| | | | | | | | |
| Common Stocks | | Shares | | | Value | |
Food Products (continued) | |
Hershey Co. | | | 55,424 | | | $ | 4,947,701 | |
Hormel Foods Corp. | | | 51,142 | | | | 4,044,309 | |
J.M. Smucker Co. | | | 45,407 | | | | 5,600,499 | |
Kellogg Co. | | | 96,599 | | | | 6,981,210 | |
Keurig Green Mountain, Inc. | | | 44,305 | | | | 3,986,564 | |
Kraft Heinz Co. | | | 227,025 | | | | 16,518,339 | |
McCormick & Co., Inc. | | | 44,003 | | | | 3,764,897 | |
Mead Johnson Nutrition Co. | | | 75,219 | | | | 5,938,540 | |
Mondelez International, Inc., Class A | | | 606,301 | | | | 27,186,537 | |
Tyson Foods, Inc., Class A | | | 112,895 | | | | 6,020,690 | |
| | | | | | | | |
| | | | | | | | 116,944,523 | |
Gas Utilities — 0.0% | |
AGL Resources, Inc. | | | 45,568 | | | | 2,907,694 | |
Health Care Equipment & Supplies — 2.0% | |
Abbott Laboratories | | | 569,068 | | | | 25,556,844 | |
Baxter International, Inc. | | | 207,004 | | | | 7,897,203 | |
Becton Dickinson & Co. | | | 80,403 | | | | 12,389,298 | |
Boston Scientific Corp. (a) | | | 509,961 | | | | 9,403,681 | |
C.R. Bard, Inc. | | | 28,155 | | | | 5,333,683 | |
DENTSPLY International, Inc. | | | 53,050 | | | | 3,228,092 | |
Edwards Lifesciences Corp. (a) | | | 81,594 | | | | 6,444,294 | |
Intuitive Surgical, Inc. (a) | | | 14,254 | | | | 7,784,965 | |
Medtronic PLC | | | 536,610 | | | | 41,276,041 | |
St. Jude Medical, Inc. | | | 106,908 | | | | 6,603,707 | |
Stryker Corp. | | | 120,023 | | | | 11,154,938 | |
Varian Medical Systems, Inc. (a) | | | 37,730 | | | | 3,048,584 | |
Zimmer Biomet Holdings, Inc. | | | 64,820 | | | | 6,649,884 | |
| | | | | | | | |
| | | | | | | | 146,771,214 | |
Health Care Providers & Services — 2.6% | |
Aetna, Inc. | | | 133,113 | | | | 14,392,178 | |
AmerisourceBergen Corp. | | | 74,585 | | | | 7,735,210 | |
Anthem, Inc. | | | 99,259 | | | | 13,840,675 | |
Cardinal Health, Inc. | | | 125,525 | | | | 11,205,617 | |
Cigna Corp. | | | 98,290 | | | | 14,382,776 | |
DaVita HealthCare Partners, Inc. (a) | | | 64,598 | | | | 4,503,127 | |
Express Scripts Holding Co. (a)(b) | | | 258,008 | | | | 22,552,479 | |
HCA Holdings, Inc. (a)(b) | | | 119,741 | | | | 8,098,084 | |
Henry Schein, Inc. (a) | | | 31,645 | | | | 5,005,922 | |
Humana, Inc. | | | 56,213 | | | | 10,034,583 | |
Laboratory Corp. of America Holdings (a) | | | 38,173 | | | | 4,719,710 | |
McKesson Corp. | | | 87,784 | | | | 17,313,638 | |
Patterson Cos., Inc. | | | 32,950 | | | | 1,489,669 | |
Quest Diagnostics, Inc. | | | 54,471 | | | | 3,875,067 | |
Tenet Healthcare Corp. (a)(b) | | | 37,071 | | | | 1,123,251 | |
UnitedHealth Group, Inc. | | | 363,912 | | | | 42,810,608 | |
Universal Health Services, Inc., Class B | | | 34,809 | | | | 4,159,327 | |
| | | | | | | | |
| | | | | | | | 187,241,921 | |
Health Care Technology — 0.1% | |
Cerner Corp. (a) | | | 116,535 | | | | 7,011,911 | |
Hotels, Restaurants & Leisure — 1.8% | |
Carnival Corp. | | | 175,645 | | | | 9,569,140 | |
Chipotle Mexican Grill, Inc. (a)(b) | | | 11,817 | | | | 5,670,388 | |
Darden Restaurants, Inc. | | | 43,263 | | | | 2,753,257 | |
Marriott International, Inc., Class A | | | 73,547 | | | | 4,930,591 | |
McDonald’s Corp. | | | 350,624 | | | | 41,422,719 | |
Royal Caribbean Cruises Ltd. | | | 65,097 | | | | 6,588,467 | |
Starbucks Corp. | | | 566,482 | | | | 34,005,915 | |
Starwood Hotels & Resorts Worldwide, Inc. | | | 64,650 | | | | 4,478,952 | |
| | | | | | | | |
| Common Stocks | | Shares | | | Value | |
Hotels, Restaurants & Leisure (continued) | |
Wyndham Worldwide Corp. | | | 44,319 | | | $ | 3,219,775 | |
Wynn Resorts Ltd. | | | 31,147 | | | | 2,155,061 | |
Yum! Brands, Inc. | | | 163,620 | | | | 11,952,441 | |
| | | | | | | | |
| | | | | 126,746,706 | |
Household Durables — 0.4% | |
D.R. Horton, Inc. | | | 123,864 | | | | 3,967,364 | |
Garmin Ltd. | | | 45,658 | | | | 1,697,108 | |
Harman International Industries, Inc. | | | 27,006 | | | | 2,544,235 | |
Leggett & Platt, Inc. | | | 51,213 | | | | 2,151,970 | |
Lennar Corp., Class A | | | 68,310 | | | | 3,341,042 | |
Mohawk Industries, Inc. (a) | | | 24,120 | | | | 4,568,087 | |
Newell Rubbermaid, Inc. | | | 101,616 | | | | 4,479,233 | |
PulteGroup, Inc. | | | 123,123 | | | | 2,194,052 | |
Whirlpool Corp. | | | 29,756 | | | | 4,370,264 | |
| | | | | | | | |
| | | | | 29,313,355 | |
Household Products — 1.8% | |
Church & Dwight Co., Inc. | | | 50,034 | | | | 4,246,886 | |
Clorox Co. | | | 48,814 | | | | 6,191,079 | |
Colgate-Palmolive Co. | | | 341,553 | | | | 22,754,261 | |
Kimberly-Clark Corp. | | | 138,223 | | | | 17,595,788 | |
Procter & Gamble Co. | | | 1,037,965 | | | | 82,424,801 | |
| | | | | | | | |
| | | | | 133,212,815 | |
Independent Power and Renewable Electricity Producers — 0.1% | |
AES Corp. | | | 259,097 | | | | 2,479,558 | |
NRG Energy, Inc. | | | 124,274 | | | | 1,462,705 | |
| | | | | | | | |
| | | | | 3,942,263 | |
Industrial Conglomerates — 2.4% | |
3M Co. | | | 234,929 | | | | 35,389,705 | |
Danaher Corp. | | | 227,608 | | | | 21,140,231 | |
General Electric Co. | | | 3,600,797 | | | | 112,164,827 | |
Roper Industries, Inc. | | | 38,198 | | | | 7,249,598 | |
| | | | | | | | |
| | | | | 175,944,361 | |
Insurance — 2.6% | |
ACE Ltd. | | | 123,702 | | | | 14,454,579 | |
Aflac, Inc. | | | 163,426 | | | | 9,789,217 | |
Allstate Corp. | | | 147,749 | | | | 9,173,735 | |
American International Group, Inc. | | | 472,012 | | | | 29,250,584 | |
Aon PLC | | | 104,502 | | | | 9,636,129 | |
Assurant, Inc. | | | 25,099 | | | | 2,021,473 | |
Chubb Corp. | | | 86,703 | | | | 11,500,286 | |
Cincinnati Financial Corp. | | | 56,039 | | | | 3,315,828 | |
Hartford Financial Services Group, Inc. | | | 157,412 | | | | 6,841,125 | |
Lincoln National Corp. | | | 95,223 | | | | 4,785,908 | |
Loews Corp. | | | 106,892 | | | | 4,104,653 | |
Marsh & McLennan Cos., Inc. | | | 199,002 | | | | 11,034,661 | |
MetLife, Inc. | | | 423,797 | | | | 20,431,253 | |
Principal Financial Group, Inc. | | | 104,012 | | | | 4,678,460 | |
Progressive Corp. | | | 222,331 | | | | 7,070,126 | |
Prudential Financial, Inc. | | | 171,131 | | | | 13,931,775 | |
Torchmark Corp. | | | 44,249 | | | | 2,529,273 | |
Travelers Cos., Inc. | | | 116,058 | | | | 13,098,306 | |
Unum Group | | | 94,148 | | | | 3,134,187 | |
XL Group PLC | | | 115,071 | | | | 4,508,482 | |
| | | | | | | | |
| | | | | 185,290,040 | |
Internet & Catalog Retail — 2.1% | |
Amazon.com, Inc. (a) | | | 146,627 | | | | 99,103,723 | |
Expedia, Inc. | | | 44,430 | | | | 5,522,649 | |
See Notes to Financial Statements.
| | | | | | |
| | | | | | | |
| | BLACKROCK S&P 500 INDEX FUND | | DECEMBER 31, 2015 | | 23 |
| | |
Schedule of Investments (continued) | | S&P 500 Index Master Portfolio |
| | | | | | | | |
| Common Stocks | | Shares | | | Value | |
Internet & Catalog Retail (continued) | |
Netflix, Inc. (a) | | | 163,054 | | | $ | 18,650,117 | |
Priceline Group, Inc. (a) | | | 19,009 | | | | 24,235,525 | |
TripAdvisor, Inc. (a)(b) | | | 42,846 | | | | 3,652,621 | |
| | | | | | | | |
| | | | | 151,164,635 | |
Internet Software & Services — 4.2% | |
Akamai Technologies, Inc. (a) | | | 67,768 | | | | 3,566,630 | |
Alphabet, Inc., Class A (a) | | | 111,137 | | | | 86,465,698 | |
Alphabet, Inc., Class C (a) | | | 113,316 | | | | 85,993,246 | |
eBay, Inc. (a) | | | 421,413 | | | | 11,580,429 | |
Equinix, Inc. | | | 23,643 | | | | 7,149,643 | |
Facebook, Inc., Class A (a) | | | 866,111 | | | | 90,647,177 | |
VeriSign, Inc. (a)(b) | | | 37,897 | | | | 3,310,682 | |
Yahoo!, Inc. (a) | | | 331,457 | | | | 11,024,260 | |
| | | | | | | | |
| | | | | 299,737,765 | |
IT Services — 3.5% | |
Accenture PLC, Class A | | | 238,296 | | | | 24,901,932 | |
Alliance Data Systems Corp. (a)(b) | | | 23,311 | | | | 6,447,123 | |
Automatic Data Processing, Inc. | | | 176,751 | | | | 14,974,345 | |
Cognizant Technology Solutions Corp., Class A (a) | | | 231,284 | | | | 13,881,666 | |
CSRA, Inc. | | | 52,490 | | | | 1,574,700 | |
Fidelity National Information Services, Inc. | | | 106,846 | | | | 6,474,868 | |
Fiserv, Inc. (a) | | | 87,186 | | | | 7,974,031 | |
International Business Machines Corp. | | | 340,397 | | | | 46,845,435 | |
Mastercard, Inc., Class A | | | 378,687 | | | | 36,868,966 | |
Paychex, Inc. | | | 121,983 | | | | 6,451,681 | |
PayPal Holdings, Inc. (a) | | | 424,460 | | | | 15,365,452 | |
Teradata Corp. (a)(b) | | | 52,962 | | | | 1,399,256 | |
Total System Services, Inc. | | | 64,216 | | | | 3,197,957 | |
Visa, Inc., Class A | | | 742,527 | | | | 57,582,969 | |
Western Union Co. | | | 194,260 | | | | 3,479,197 | |
Xerox Corp. | | | 363,316 | | | | 3,862,049 | |
| | | | | | | | |
| | | | | 251,281,627 | |
Leisure Products — 0.1% | | | | | | | | |
Hasbro, Inc. | | | 42,655 | | | | 2,873,241 | |
Mattel, Inc. | | | 128,486 | | | | 3,490,964 | |
| | | | | | | | |
| | | | | 6,364,205 | |
Life Sciences Tools & Services — 0.6% | | | | | | | | |
Agilent Technologies, Inc. | | | 125,750 | | | | 5,257,608 | |
Illumina, Inc. (a) | | | 55,849 | | | | 10,719,936 | |
PerkinElmer, Inc. | | | 43,434 | | | | 2,326,759 | |
Thermo Fisher Scientific, Inc. | | | 152,246 | | | | 21,596,095 | |
Waters Corp. (a)(b) | | | 31,218 | | | | 4,201,319 | |
| | | | | | | | |
| | | | | 44,101,717 | |
Machinery — 1.1% | | | | | | | | |
Caterpillar, Inc. | | | 222,112 | | | | 15,094,732 | |
Cummins, Inc. | | | 63,044 | | | | 5,548,502 | |
Deere & Co. | | | 118,296 | | | | 9,022,436 | |
Dover Corp. | | | 59,371 | | | | 3,640,036 | |
Flowserve Corp. | | | 49,918 | | | | 2,100,549 | |
Illinois Tool Works, Inc. | | | 125,021 | | | | 11,586,946 | |
Ingersoll-Rand PLC | | | 100,688 | | | | 5,567,040 | |
PACCAR, Inc. | | | 134,692 | | | | 6,384,401 | |
Parker Hannifin Corp. | | | 52,523 | | | | 5,093,681 | |
Pentair PLC | | | 68,322 | | | | 3,383,989 | |
Snap-on, Inc. | | | 22,074 | | | | 3,784,146 | |
Stanley Black & Decker, Inc. | | | 57,121 | | | | 6,096,524 | |
Xylem, Inc. | | | 69,479 | | | | 2,535,983 | |
| | | | | | | | |
| | | | | 79,838,965 | |
| | | | | | | | |
| Common Stocks | | Shares | | | Value | |
Media — 2.9% | | | | | | | | |
Cablevision Systems Corp., New York Group, Class A | | | 84,366 | | | $ | 2,691,275 | |
CBS Corp., Class B | | | 165,455 | | | | 7,797,894 | |
Comcast Corp., Class A | | | 931,729 | | | | 52,577,467 | |
Discovery Communications, Inc., Class A (a)(b) | | | 57,385 | | | | 1,531,032 | |
Discovery Communications, Inc., Class C (a)(b) | | | 97,018 | | | | 2,446,794 | |
Interpublic Group of Cos., Inc. | | | 155,726 | | | | 3,625,301 | |
News Corp., Class A | | | 145,390 | | | | 1,942,410 | |
News Corp., Class B | | | 39,823 | | | | 555,929 | |
Omnicom Group, Inc. | | | 92,186 | | | | 6,974,793 | |
Scripps Networks Interactive, Inc., Class A | | | 35,252 | | | | 1,946,263 | |
TEGNA, Inc. | | | 86,854 | | | | 2,216,514 | |
Time Warner Cable, Inc. | | | 108,106 | | | | 20,063,393 | |
Time Warner, Inc. | | | 305,259 | | | | 19,741,100 | |
Twenty-First Century Fox, Inc., Class A | | | 446,680 | | | | 12,131,829 | |
Twenty-First Century Fox, Inc., Class B | | | 163,618 | | | | 4,455,318 | |
Viacom, Inc., Class B | | | 131,843 | | | | 5,426,658 | |
Walt Disney Co. | | | 580,156 | | | | 60,962,793 | |
| | | | | | | | |
| | | | | 207,086,763 | |
Metals & Mining — 0.2% | | | | | | | | |
Alcoa, Inc. | | | 497,001 | | | | 4,905,400 | |
Freeport-McMoRan, Inc. (a) | | | 431,404 | | | | 2,920,605 | |
Newmont Mining Corp. | | | 200,749 | | | | 3,611,474 | |
Nucor Corp. | | | 121,272 | | | | 4,887,262 | |
| | | | | | | | |
| | | | | 16,324,741 | |
Multi-Utilities — 1.1% | | | | | | | | |
Ameren Corp. | | | 92,068 | | | | 3,980,100 | |
CenterPoint Energy, Inc. | | | 163,262 | | | | 2,997,490 | |
CMS Energy Corp. | | | 104,981 | | | | 3,787,714 | |
Consolidated Edison, Inc. | | | 111,130 | | | | 7,142,325 | |
Dominion Resources, Inc. | | | 227,110 | | | | 15,361,720 | |
DTE Energy Co. | | | 68,102 | | | | 5,461,099 | |
NiSource, Inc. | | | 121,657 | | | | 2,373,528 | |
PG&E Corp. | | | 187,118 | | | | 9,952,806 | |
Public Service Enterprise Group, Inc. | | | 191,949 | | | | 7,426,507 | |
SCANA Corp. | | | 54,230 | | | | 3,280,373 | |
Sempra Energy | | | 89,368 | | | | 8,401,486 | |
TECO Energy, Inc. | | | 89,252 | | | | 2,378,566 | |
WEC Energy Group, Inc. | | | 119,786 | | | | 6,146,220 | |
| | | | | | | | |
| | | | | 78,689,934 | |
Multiline Retail — 0.6% | | | | | | | | |
Dollar General Corp. | | | 111,808 | | | | 8,035,641 | |
Dollar Tree, Inc. (a) | | | 89,064 | | | | 6,877,522 | |
Kohl’s Corp. | | | 72,396 | | | | 3,448,221 | |
Macy’s, Inc. | | | 119,921 | | | | 4,194,836 | |
Nordstrom, Inc. (b) | | | 53,112 | | | | 2,645,509 | |
Target Corp. | | | 235,019 | | | | 17,064,730 | |
| | | | | | | | |
| | | | | 42,266,459 | |
Oil, Gas & Consumable Fuels — 5.2% | | | | | | | | |
Anadarko Petroleum Corp. | | | 192,764 | | | | 9,364,475 | |
Apache Corp. | | | 143,426 | | | | 6,378,154 | |
Cabot Oil & Gas Corp. | | | 157,019 | | | | 2,777,666 | |
Chesapeake Energy Corp. (a)(b) | | | 196,223 | | | | 883,003 | |
Chevron Corp. | | | 718,560 | | | | 64,641,658 | |
Cimarex Energy Co. | | | 35,842 | | | | 3,203,558 | |
Columbia Pipeline Group, Inc. | | | 148,442 | | | | 2,968,840 | |
ConocoPhillips | | | 471,123 | | | | 21,996,733 | |
CONSOL Energy, Inc. (b) | | | 83,199 | | | | 657,272 | |
Devon Energy Corp. | | | 146,596 | | | | 4,691,072 | |
See Notes to Financial Statements.
| | | | | | |
| | | | | | | |
| 24 | | BLACKROCK S&P 500 INDEX FUND | | DECEMBER 31, 2015 | | |
| | |
Schedule of Investments (continued) | | S&P 500 Index Master Portfolio |
| | | | | | | | |
| Common Stocks | | Shares | | | Value | |
Oil, Gas & Consumable Fuels (continued) | | | | | | | | |
EOG Resources, Inc. | | | 209,657 | | | $ | 14,841,619 | |
EQT Corp. | | | 57,830 | | | | 3,014,678 | |
Exxon Mobil Corp. | | | 1,589,368 | | | | 123,891,236 | |
Hess Corp. | | | 91,496 | | | | 4,435,726 | |
Kinder Morgan, Inc. | | | 698,588 | | | | 10,422,933 | |
Marathon Oil Corp. | | | 256,956 | | | | 3,235,076 | |
Marathon Petroleum Corp. | | | 203,444 | | | | 10,546,537 | |
Murphy Oil Corp. | | | 62,282 | | | | 1,398,231 | |
Newfield Exploration Co. (a) | | | 62,278 | | | | 2,027,772 | |
Noble Energy, Inc. | | | 161,290 | | | | 5,311,280 | |
Occidental Petroleum Corp. | | | 291,350 | | | | 19,698,173 | |
ONEOK, Inc. | | | 79,368 | | | | 1,957,215 | |
Phillips 66 | | | 181,687 | | | | 14,861,997 | |
Pioneer Natural Resources Co. | | | 56,655 | | | | 7,103,404 | |
Range Resources Corp. (b) | | | 64,264 | | | | 1,581,537 | |
Southwestern Energy Co. (a)(b) | | | 143,267 | | | | 1,018,628 | |
Spectra Energy Corp. | | | 254,747 | | | | 6,098,643 | |
Tesoro Corp. | | | 45,930 | | | | 4,839,644 | |
Valero Energy Corp. | | | 183,710 | | | | 12,990,134 | |
Williams Cos., Inc. | | | 258,873 | | | | 6,653,036 | |
| | | | | | | | |
| | | | | 373,489,930 | |
Paper & Forest Products — 0.1% | | | | | | | | |
International Paper Co. | | | 158,511 | | | | 5,975,865 | |
Personal Products — 0.1% | | | | | | | | |
Estee Lauder Cos., Inc., Class A | | | 84,910 | | | | 7,477,175 | |
Pharmaceuticals — 6.0% | | | | | | | | |
AbbVie, Inc. | | | 624,263 | | | | 36,981,340 | |
Allergan PLC (a) | | | 150,475 | | | | 47,023,438 | |
Bristol-Myers Squibb Co. | | | 636,922 | | | | 43,813,864 | |
Eli Lilly & Co. | | | 372,353 | | | | 31,374,464 | |
Endo International PLC (a) | | | 79,034 | | | | 4,838,462 | |
Johnson & Johnson | | | 1,055,453 | | | | 108,416,132 | |
Mallinckrodt PLC (a) | | | 44,526 | | | | 3,322,975 | |
Merck & Co., Inc. | | | 1,065,671 | | | | 56,288,742 | |
Mylan NV (a) | | | 156,676 | | | | 8,471,471 | |
Perrigo Co. PLC | | | 55,506 | | | | 8,031,718 | |
Pfizer, Inc. | | | 2,354,389 | | | | 75,999,677 | |
Zoetis, Inc. | | | 174,177 | | | | 8,346,562 | |
| | | | | | | | |
| | | | | 432,908,845 | |
Professional Services — 0.3% | | | | | | | | |
Dun & Bradstreet Corp. | | | 13,739 | | | | 1,427,894 | |
Equifax, Inc. | | | 44,868 | | | | 4,996,949 | |
Nielsen Holdings PLC | | | 139,204 | | | | 6,486,907 | |
Robert Half International, Inc. | | | 51,201 | | | | 2,413,615 | |
Verisk Analytics, Inc. (a)(b) | | | 58,818 | | | | 4,521,928 | |
| | | | | | | | |
| | | | | 19,847,293 | |
Real Estate Investment Trusts (REITs) — 2.4% | | | | | | | | |
American Tower Corp. | | | 161,543 | | | | 15,661,594 | |
Apartment Investment & Management Co., Class A | | | 58,207 | | | | 2,330,026 | |
AvalonBay Communities, Inc. | | | 52,218 | | | | 9,614,900 | |
Boston Properties, Inc. | | | 58,274 | | | | 7,432,266 | |
Crown Castle International Corp. | | | 126,644 | | | | 10,948,374 | |
Equity Residential | | | 138,150 | | | | 11,271,658 | |
Essex Property Trust, Inc. | | | 24,947 | | | | 5,972,561 | |
General Growth Properties, Inc. | | | 221,800 | | | | 6,035,178 | |
HCP, Inc. | | | 177,556 | | | | 6,789,741 | |
Host Hotels & Resorts, Inc. | | | 285,012 | | | | 4,372,084 | |
Kimco Realty Corp. | | | 156,763 | | | | 4,147,949 | |
| | | | | | | | |
| Common Stocks | | Shares | | | Value | |
Real Estate Investment Trusts (REITs) (continued) | |
Macerich Co. | | | 51,064 | | | $ | 4,120,354 | |
Plum Creek Timber Co., Inc. | | | 66,550 | | | | 3,175,766 | |
Prologis, Inc. (b) | | | 198,879 | | | | 8,535,887 | |
Public Storage | | | 56,134 | | | | 13,904,392 | |
Realty Income Corp. (b) | | | 94,705 | | | | 4,889,619 | |
Simon Property Group, Inc. | | | 118,036 | | | | 22,950,920 | |
SL Green Realty Corp. | | | 37,799 | | | | 4,270,531 | |
Ventas, Inc. (b) | | | 126,167 | | | | 7,119,604 | |
Vornado Realty Trust | | | 67,234 | | | | 6,720,711 | |
Welltower, Inc. | | | 134,996 | | | | 9,183,778 | |
Weyerhaeuser Co. | | | 195,110 | | | | 5,849,398 | |
| | | | | | | | |
| | | | | 175,297,291 | |
Real Estate Management & Development — 0.1% | | | | | | | | |
CBRE Group, Inc., Class A (a) | | | 109,989 | | | | 3,803,420 | |
Road & Rail — 0.7% | | | | | | | | |
CSX Corp. | | | 373,276 | | | | 9,686,512 | |
JB Hunt Transport Services, Inc. | | | 34,926 | | | | 2,562,171 | |
Kansas City Southern | | | 41,876 | | | | 3,126,881 | |
Norfolk Southern Corp. | | | 114,361 | | | | 9,673,797 | |
Ryder System, Inc. | | | 20,253 | | | | 1,150,978 | |
Union Pacific Corp. | | | 325,793 | | | | 25,477,013 | |
| | | | | | | | |
| | | | | 51,677,352 | |
Semiconductors & Semiconductor Equipment — 2.3% | |
Analog Devices, Inc. | | | 119,023 | | | | 6,584,352 | |
Applied Materials, Inc. | | | 438,421 | | | | 8,185,320 | |
Avago Technologies Ltd. | | | 100,096 | | | | 14,528,935 | |
Broadcom Corp., Class A | | | 214,004 | | | | 12,373,711 | |
First Solar, Inc. (a) | | | 28,806 | | | | 1,900,908 | |
Intel Corp. | | | 1,800,270 | | | | 62,019,302 | |
KLA-Tencor Corp. | | | 59,344 | | | | 4,115,506 | |
Lam Research Corp. | | | 60,024 | | | | 4,767,106 | |
Linear Technology Corp. | | | 90,976 | | | | 3,863,751 | |
Microchip Technology, Inc. | | | 77,565 | | | | 3,609,875 | |
Micron Technology, Inc. (a) | | | 414,099 | | | | 5,863,642 | |
NVIDIA Corp. | | | 194,296 | | | | 6,403,996 | |
Qorvo, Inc. (a) | | | 53,969 | | | | 2,747,022 | |
Skyworks Solutions, Inc. | | | 72,375 | | | | 5,560,571 | |
Texas Instruments, Inc. | | | 387,326 | | | | 21,229,338 | |
Xilinx, Inc. | | | 98,147 | | | | 4,609,965 | |
| | | | | | | | |
| | | | | 168,363,300 | |
Software — 4.2% | | | | | | | | |
Activision Blizzard, Inc. | | | 190,871 | | | | 7,388,616 | |
Adobe Systems, Inc. (a) | | | 190,237 | | | | 17,870,864 | |
Autodesk, Inc. (a) | | | 85,831 | | | | 5,229,683 | |
CA, Inc. | | | 119,417 | | | | 3,410,550 | |
Citrix Systems, Inc. (a)(b) | | | 58,728 | | | | 4,442,773 | |
Electronic Arts, Inc. (a) | | | 118,292 | | | | 8,129,026 | |
Intuit, Inc. | | | 100,694 | | | | 9,716,971 | |
Microsoft Corp. | | | 3,049,891 | | | | 169,207,953 | |
Oracle Corp. | | | 1,221,699 | | | | 44,628,664 | |
Red Hat, Inc. (a) | | | 69,623 | | | | 5,765,481 | |
Salesforce.com, Inc. (a) | | | 238,045 | | | | 18,662,728 | |
Symantec Corp. | | | 259,608 | | | | 5,451,768 | |
| | | | | | | | |
| | | | | | | | 299,905,077 | |
Specialty Retail — 2.5% | | | | | | | | |
Advance Auto Parts, Inc. | | | 27,782 | | | | 4,181,469 | |
AutoNation, Inc. (a) | | | 29,995 | | | | 1,789,502 | |
See Notes to Financial Statements.
| | | | | | |
| | | | | | | |
| | BLACKROCK S&P 500 INDEX FUND | | DECEMBER 31, 2015 | | 25 |
| | |
Schedule of Investments (continued) | | S&P 500 Index Master Portfolio |
| | | | | | | | |
| Common Stocks | | Shares | | | Value | |
Specialty Retail (continued) | | | | | | | | |
AutoZone, Inc. (a) | | | 11,715 | | | $ | 8,691,476 | |
Bed Bath & Beyond, Inc. (a)(b) | | | 64,412 | | | | 3,107,879 | |
Best Buy Co., Inc. | | | 113,776 | | | | 3,464,479 | |
CarMax, Inc. (a) | | | 77,312 | | | | 4,172,529 | |
GameStop Corp., Class A (b) | | | 40,988 | | | | 1,149,303 | |
Gap, Inc. | | | 87,395 | | | | 2,158,656 | |
Home Depot, Inc. | | | 483,709 | | | | 63,970,515 | |
L Brands, Inc. | | | 97,491 | | | | 9,341,588 | |
Lowe’s Cos., Inc. | | | 349,065 | | | | 26,542,902 | |
O’Reilly Automotive, Inc. (a) | | | 37,719 | | | | 9,558,749 | |
Ross Stores, Inc. | | | 154,507 | | | | 8,314,022 | |
Signet Jewelers Ltd. | | | 30,201 | | | | 3,735,562 | |
Staples, Inc. | | | 244,200 | | | | 2,312,574 | |
Tiffany & Co. | | | 42,568 | | | | 3,247,513 | |
TJX Cos., Inc. | | | 255,888 | | | | 18,145,018 | |
Tractor Supply Co. | | | 51,537 | | | | 4,406,413 | |
Urban Outfitters, Inc. (a)(b) | | | 35,003 | | | | 796,318 | |
| | | | | | | | |
| | | | | | | | 179,086,467 | |
Technology Hardware, Storage & Peripherals — 3.9% | | | | | |
Apple, Inc. | | | 2,128,677 | | | | 224,064,541 | |
EMC Corp. | | | 739,659 | | | | 18,994,443 | |
Hewlett Packard Enterprise Co. | | | 685,439 | | | | 10,418,673 | |
HP, Inc. | | | 685,439 | | | | 8,115,598 | |
NetApp, Inc. | | | 113,866 | | | | 3,020,865 | |
SanDisk Corp. (a) | | | 76,543 | | | | 5,816,502 | |
Seagate Technology PLC | | | 114,606 | | | | 4,201,456 | |
Western Digital Corp. | | | 87,426 | | | | 5,249,931 | |
| | | | | | | | |
| | | | | | | | 279,882,009 | |
Textiles, Apparel & Luxury Goods — 0.9% | | | | | |
Coach, Inc. | | | 104,966 | | | | 3,435,537 | |
Fossil Group, Inc. (a)(b) | | | 15,506 | | | | 566,899 | |
Hanesbrands, Inc. | | | 149,505 | | | | 4,399,932 | |
Michael Kors Holdings Ltd. (a) | | | 70,282 | | | | 2,815,497 | |
NIKE, Inc., Class B | | | 514,450 | | | | 32,153,125 | |
| | | | | | | | |
| Common Stocks | | Shares | | | Value | |
Textiles, Apparel & Luxury Goods (continued) | |
PVH Corp. | | | 31,321 | | | $ | 2,306,792 | |
Ralph Lauren Corp. | | | 22,311 | | | | 2,487,230 | |
Under Armour, Inc., Class A (a) | | | 68,287 | | | | 5,504,615 | |
VF Corp. | | | 129,207 | | | | 8,043,136 | |
| | | | | | | | |
| | | | | | | | 61,712,763 | |
Thrifts & Mortgage Finance — 0.0% | | | | | | | | |
People’s United Financial, Inc. | | | 117,626 | | | | 1,899,660 | |
Tobacco — 1.5% | | | | | | | | |
Altria Group, Inc. | | | 748,557 | | | | 43,573,503 | |
Philip Morris International, Inc. | | | 591,603 | | | | 52,007,820 | |
Reynolds American, Inc. | | | 316,220 | | | | 14,593,553 | |
| | | | | | | | |
| | | | | | | | 110,174,876 | |
Trading Companies & Distributors — 0.2% | | | | | |
Fastenal Co. | | | 110,103 | | | | 4,494,404 | |
United Rentals, Inc. (a) | | | 35,826 | | | | 2,598,818 | |
W.W. Grainger, Inc. | | | 22,039 | | | | 4,464,881 | |
| | | | | | | | |
| | | | | | | | 11,558,103 | |
Total Long-Term Investments
(Cost — $4,307,043,966) — 94.7% | | | | | | | 6,829,141,787 | |
| | | | | | | | |
| | | | | | | | | |
| | |
| Short-Term Securities | | | | | | |
Money Market Funds | | | | | | | | |
BlackRock Cash Funds: Institutional, SL Agency Shares, 0.35% (c)(d)(e) | | | 374,887,021 | | | | 374,887,021 | |
BlackRock Cash Funds: Prime, SL Agency Shares, 0.31% (c)(d)(e) | | | 26,986,879 | | | | 26,986,879 | |
Total Short-Term Securities
(Cost — $401,873,900) — 5.6% | | | | | | | 401,873,900 | |
| Total Investments (Cost — $4,708,917,866) — 100.3% | | | | 7,231,015,687 | |
| Liabilities in Excess of Other Assets — (0.3)% | | | | (21,158,377 | ) |
| | | | | | | | |
Net Assets — 100.0% | | | | | | $ | 7,209,857,310 | |
| | | | | | | | |
| | |
| Notes to Schedule of Investments |
| (a) | | Non-income producing security. |
| (b) | | Security, or a portion of security, is on loan. |
| (c) | | During the year ended December 31, 2015, investments in issuers considered to be affiliates of the Master Portfolio for purposes of Section 2(a)(3) of the Investment Company Act of 1940, as amended, were as follows: |
| | | | | | | | | | | | | | | | | | | | | | | | | | | | |
| Affiliate | | Shares Held
at December 31,
2014 | | Shares
Purchased | | | Shares
Sold | | | Shares Held
at December 31,
2015 | | | Value at
December 31, 2015 | | | Income | | | Realized
Gain | |
BlackRock, Inc. | | 39,755 | | | 9,010 | | | | (554 | ) | | | 48,211 | | | $ | 16,416,810 | | | $ | 397,804 | | | $ | 6,560 | |
BlackRock Cash Funds: Institutional, SL Agency Shares | | 76,063,771 | | | 298,823,250 | 1 | | | — | | | | 374,887,021 | | | $ | 374,887,021 | | | $ | 677,147 | 2 | | | — | |
BlackRock Cash Funds: Prime, SL Agency Shares | | 6,710,893 | | | 20,275,986 | 1 | | | — | | | | 26,986,879 | | | $ | 26,986,879 | | | $ | 154,137 | 2 | | | — | |
PNC Financial Services Group, Inc. | | 164,243 | | | 33,605 | | | | (3,974 | ) | | | 193,874 | | | $ | 18,478,131 | | | $ | 363,494 | | | $ | 58,747 | |
1 Represents net shares purchased. | |
2 Represents all or a portion of securities lending income earned from the reinvestment of cash collateral from loaned securities, net of fees and collateral investment expenses, and other payments to and from borrowers of securities. | |
| (d) | | Current yield as of period end. |
| (e) | | All or a portion of security was purchased with the cash collateral from loaned securities. |
See Notes to Financial Statements.
| | | | | | |
| | | | | | | |
| 26 | | BLACKROCK S&P 500 INDEX FUND | | DECEMBER 31, 2015 | | |
| | |
Schedule of Investments (continued) | | S&P 500 Index Master Portfolio |
| | | | | | | | | | | | | | | | | | |
| Derivative Financial Instruments Outstanding as of Period End |
Financial Futures Contracts
| | | | | | | | | | | | | | | | |
Contracts
Long | | | Issue | | | | Expiration | | Notional
Value | | | Unrealized
Depreciation | |
| | 3,529 | | | S&P 500 E-Mini Index | | | | March 2016 | | $ | 359,146,330 | | | $ | (2,019,844 | ) |
| | |
| Derivative Financial Instruments Categorized by Risk Exposure | | |
As of period end, the fair values of derivative financial instruments located in the Statements of Assets and Liabilities were as follows:
| | | | | | | | | | | | | | | | | | | | |
Liabilities — Derivative Financial
Instruments | | | | Commodity
Contracts | | Credit
Contracts | | Equity
Contracts | | Foreign
Currency
Exchange
Contracts | | Interest
Rate
Contracts | | Other
Contacts | | Total | |
Financial futures contracts | | Net unrealized depreciation1 | | — | | — | | $2,019,844 | | — | | — | | — | | $ | 2,019,844 | |
1 Includes cumulative (depreciation) on financial futures contracts, if any, as reported in the Schedule of Investments. Only current day’s variation margin is reported within the Statement of Assets and Liabilities. | |
For the year ended December 31, 2015, the effect of derivative financial instruments in the Statements of Operations was as follows:
| | | | | | | | | | | | | | | | | | |
| Net Realized Gain (Loss) From: | | Commodity
Contracts | | Credit
Contracts | | Equity
Contracts | | | Foreign
Currency
Exchange
Contracts | | Interest
Rate
Contracts | | Other
Contacts | | Total | |
Financial futures contracts | | — | | — | | | $6,310,848 | | | — | | — | | — | | | $6,310,848 | |
Net Change in Unrealized Appreciation (Depreciation) on: | | | | | | | | | | | | | | | | |
Financial futures contracts | | — | | — | | $ | (2,629,831 | ) | | — | | — | | — | | $ | (2,629,831 | ) |
| | | | | | | | | | | | | | | | |
| Average Quarterly Balances of Outstanding Derivative Financial Instruments |
| | | | | | | | | | | | | | | | | | |
| Financial futures contracts: | |
Average notional value of contracts — long | | $ | 257,192,816 | |
For more information about the Master Portfolio’s investment risks regarding derivative financial instruments, refer to the Notes to Financial Statements.
| | | | | | | | | | | | | | | | |
| Fair Value Hierarchy as of Period End |
Various inputs are used in determining the fair value of investments and derivative financial instruments. For information about the Master Portfolio’s policy regarding valuation of investments and derivative financial instruments, refer to the Notes to Financial Statements.
The following tables summarize the Master Portfolio’s investments and derivative financial instruments categorized in the disclosure hierarchy:
| | | | | | | | | | | | | | | | |
| | | Level 1 | | | Level 2 | | | Level 3 | | | Total | |
Assets: | | | | | | | | | | | | | | | | |
| Investments: | | | | | | | | | | | | | | | | |
| Long-Term Investments: | | | | | | | | | | | | | | | | |
Common Stocks1 | | $ | 6,829,141,787 | | | | — | | | | — | | | $ | 6,829,141,787 | |
| Short-Term Securities | | | | | | | | | | | | | | | | |
Money Market Funds | | | 401,873,900 | | | | — | | | | — | | | | 401,873,900 | |
| | | | | | | | | | | | | | | | |
Total | | $ | 7,231,015,687 | | | | — | | | | — | | | $ | 7,231,015,687 | |
| | | | | | | | | | | | | | | | |
1 See above Schedule of Investments for values in each industry. | | | | | | | | | | | | | | | | |
See Notes to Financial Statements.
| | | | | | |
| | | | | | | |
| | BLACKROCK S&P 500 INDEX FUND | | DECEMBER 31, 2015 | | 27 |
| | |
Schedule of Investments (concluded) | | S&P 500 Index Master Portfolio |
| | | | | | | | | | | | | | | | |
| | | | | | | | | | | | | | | | |
| | | Level 1 | | | Level 2 | | | Level 3 | | | Total | |
Derivative Financial Instruments1 | | | | | | | | | | | | | | | | |
Liabilities: | | | | | | | | | | | | | | | | |
Equity contracts | | $ | (2,019,844 | ) | | | — | | | | — | | | $ | (2,019,844 | ) |
| | | | | | | | | | | | | | | | |
1 Derivative financial instruments are financial futures contracts, which are valued at the unrealized appreciation (depreciation) on the instrument. | |
The Master Portfolio may hold assets and/or liabilities in which the fair value approximates the carrying amount for financial statement purposes. As of period end, such assets and/or liabilities are categorized within the disclosure hierarchy as follows:
| | | | | | | | | | | | | | | | |
| | | Level 1 | | | Level 2 | | | Level 3 | | | Total | |
Assets: | | | | | | | | | | | | | | | | |
Cash | | $ | 8,150 | | | | — | | | | — | | | $ | 8,150 | |
Cash pledged for financial futures contracts | | | 15,709,800 | | | | — | | | | — | | | | 15,709,800 | |
Liabilities: | | | | | | | | | | | | | | | | |
Collateral on securities loaned at value | | | — | | | $ | (61,937,100 | ) | | | — | | | | (61,937,100 | ) |
| | | | | | | | | | | | | | | | |
Total | | $ | 15,717,950 | | | $ | (61,937,100 | ) | | | — | | | $ | (46,219,150 | ) |
| | | | | | | | | | | | | | | | |
During the year ended December 31, 2015, there were no transfers between levels.
See Notes to Financial Statements.
| | | | | | |
| | | | | | | |
| 28 | | BLACKROCK S&P 500 INDEX FUND | | DECEMBER 31, 2015 | | |
| | |
| Statement of Assets and Liabilities | | S&P 500 Index Master Portfolio |
| | | | |
| December 31, 2015 | | | |
| | | | |
| Assets | |
Investments at value — unaffiliated (including securities loaned of $60,341,198) (cost — $4,285,016,231) | | $ | 6,794,246,846 | |
Investments at value — affiliated (cost — $423,901,635) | | | 436,768,841 | |
Cash | | | 8,150 | |
Cash pledged for financial futures contracts | | | 15,709,800 | |
Receivables: | | | | |
Contributions from investors | | | 21,561,549 | |
Dividends | | | 9,155,425 | |
Securities lending income — affiliated | | | 26,300 | |
| | | | |
Total assets | | | 7,277,476,911 | |
| | | | |
| | | | |
| Liabilities | | | | |
Collateral on securities loaned at value | | | 61,937,100 | |
Variation margin payable on financial futures contracts | | | 3,372,685 | |
Payables: | | | | |
Withdrawals to investors | | | 1,167,056 | |
Investments purchased | | | 865,403 | |
Investment advisory fees | | | 208,644 | |
Officer’s and Trustees’ fees | | | 45,108 | |
Professional fees | | | 23,605 | |
| | | | |
Total liabilities | | | 67,619,601 | |
| | | | |
Net Assets | | $ | 7,209,857,310 | |
| | | | |
| | | | |
| Net Assets Consist of | | | | |
Investors’ capital | | $ | 4,689,779,333 | |
Net unrealized appreciation (depreciation) | | | 2,520,077,977 | |
| | | | |
Net Assets | | $ | 7,209,857,310 | |
| | | | |
| | | | | | |
| See Notes to Financial Statements. | | | | |
| | | | | | | |
| | BLACKROCK S&P 500 INDEX FUND | | DECEMBER 31, 2015 | | 29 |
| | |
| Statement of Operations | | S&P 500 Index Master Portfolio |
| | | | |
| Year Ended December 31, 2015 | | | |
| | | | |
| Investment Income | | | | |
Dividends — unaffiliated | | $ | 135,199,455 | |
Dividends — affiliated | | | 761,298 | |
Interest — affiliated | | | 477,528 | |
Securities lending — affiliated — net | | | 353,756 | |
Foreign taxes withheld | | | (9,763 | ) |
| | | | |
Total income | | | 136,782,274 | |
| | | | |
| | | | |
| Expenses | | | | |
Investment advisory | | | 2,888,352 | |
Officer and Directors | | | 183,446 | |
Professional | | | 48,834 | |
| | | | |
Total expenses | | | 3,120,632 | |
Less fees waived by the Manager | | | (402,964 | ) |
| | | | |
Total expenses after fees waived | | | 2,717,668 | |
| | | | |
Net investment income | | | 134,064,606 | |
| | | | |
| | | | |
| Realized and Unrealized Gain (Loss) | | | | |
| Net realized gain (loss) from: | | | | |
Investments — unaffiliated | | | 103,859,579 | |
Investments — affiliated | | | 65,307 | |
Financial futures contracts | | | 6,310,848 | |
| | | | |
| | | 110,235,734 | |
| | | | |
| Net change in unrealized appreciation (depreciation) on: | | | | |
Investments — unaffiliated | | | (165,569,685 | ) |
Investments — affiliated | | | (177,627 | ) |
Financial futures contracts | | | (2,629,831 | ) |
| | | | |
| | | (168,377,143 | ) |
| | | | |
Net realized and unrealized loss | | | (58,141,409 | ) |
| | | | |
Net Increase in Net Assets Resulting from Operations | | $ | 75,923,197 | |
| | | | |
| | | | | | |
| See Notes to Financial Statements. | | | | |
| | | | | | | |
| 30 | | BLACKROCK S&P 500 INDEX FUND | | DECEMBER 31, 2015 | | |
| | |
| Statements of Changes in Net Assets | | S&P 500 Index Master Portfolio |
| | | | | | | | |
| | | Year Ended December 31, | |
| Increase (Decrease) in Net Assets: | | 2015 | | | 2014 | |
| | | | | | | | |
| Operations | | | | | | | | |
Net investment income | | $ | 134,064,606 | | | $ | 108,892,318 | |
Net realized gain | | | 110,235,734 | | | | 76,733,344 | |
Net change in unrealized appreciation (depreciation) | | | (168,377,143 | ) | | | 527,569,116 | |
| | | | |
Net increase in net assets resulting from operations | | | 75,923,197 | | | | 713,194,778 | |
| | | | |
| | | | | | | | |
| Capital Transactions | | | | | | | | |
Proceeds from contributions | | | 3,573,168,628 | | | | 539,481,303 | |
Value of withdrawals | | | (2,187,812,801 | ) | | | (775,228,002 | ) |
| | | | | | | | |
Net increase (decrease) in net assets derived from capital transactions | | | 1,385,355,827 | | | | (235,746,699 | ) |
| | | | | | | | |
| | | | | | | | |
| Net Assets | | | | | | | | |
Total increase in net assets | | | 1,461,279,024 | | | | 477,448,079 | |
Beginning of year | | | 5,748,578,286 | | | | 5,271,130,207 | |
| | | | | | | | |
End of year | | $ | 7,209,857,310 | | | $ | 5,748,578,286 | |
| | | | | | | | |
| | |
| Financial Highlights | | S&P 500 Index Master Portfolio |
| | | | | | | | | | | | | | | | | | | | |
| | | Year Ended December 31, | |
| | | 2015 | | | 2014 | | | 2013 | | | 2012 | | | 2011 | |
| | | | | | | | | | | | | | | | | | | | |
| Total Return | | | | | | | | | | | | | | | | | | | | |
Total return | | | 1.35% | | | | 13.63% | | | | 32.33% | | | | 15.98% | | | | 2.13% | |
| | | | | | | | | | | | | | | | | | | | |
| | | | | | | | | | | | | | | | | | | | |
| Ratios to Average Net Assets | | | | | | | | | | | | | | | | | | | | |
Total expenses | | | 0.05% | | | | 0.05% | | | | 0.05% | | | | 0.06% | | | | 0.06% | |
| | | | | | | | | | | | | | | | | | | | |
Total expenses after fees waived and paid indirectly | | | 0.04% | | | | 0.05% | | | | 0.05% | | | | 0.05% | | | | 0.05% | |
| | | | | | | | | | | | | | | | | | | | |
Net investment income | | | 2.00% | | | | 1.98% | | | | 2.08% | | | | 2.22% | | | | 2.08% | |
| | | | | | | | | | | | | | | | | | | | |
| | | | | | | | | | | | | | | | | | | | |
| Supplemental Data | | | | | | | | | | | | | | | | | | | | |
Net assets, end of year (000) | | | $7,209,857 | | | | $5,748,578 | | | | $5,271,130 | | | | $1,717,932 | | | | $2,108,316 | |
| | | | | | | | | | | | | | | | | | | | |
Portfolio turnover rate | | | 2% | | | | 3% | | | | 2% | | | | 10% | | | | 5% | |
| | | | | | | | | | | | | | | | | | | | |
| | | | | | |
| See Notes to Financial Statements. | | | | |
| | | | | | | |
| | BLACKROCK S&P 500 INDEX FUND | | DECEMBER 31, 2015 | | 31 |
| | |
| Notes to Financial Statements | | S&P 500 Index Master Portfolio |
1. Organization:
S&P 500 Index Master Portfolio (the “Master Portfolio”) (formerly known as S&P 500 Master Portfolio), a series of Master Investment Portfolio (“MIP”), is registered under the Investment Company Act of 1940, as amended (the “1940 Act”), as a diversified, open-end management investment company. MIP is organized as a Delaware statutory trust.
The Master Portfolio, together with certain other registered investment companies advised by BlackRock Fund Advisors (the “Manager”) or its affiliates, is included in a complex of open-end funds referred to as the Equity-Liquidity Complex.
2. Significant Accounting Policies:
The financial statements are prepared in conformity with accounting principles generally accepted in the United States of America (“U.S. GAAP”), which may require management to make estimates and assumptions that affect the reported amounts of assets and liabilities in the financial statements, disclosure of contingent assets and liabilities at the date of the financial statements and the reported amounts of increases and decreases in net assets from operations during the reporting period. Actual results could differ from those estimates. The Master Portfolio is considered an investment company under U.S. GAAP and follows the accounting and reporting guidance applicable to investment companies. Below is a summary of significant accounting policies:
Segregation and Collateralization: In cases where the Master Portfolio enters into certain investments (e.g., financial futures contracts) that would be treated as “senior securities” for 1940 Act purposes, the Master Portfolio may segregate or designate on its books and records cash or liquid assets having a market value at least equal to the amount of its future obligations under such investments. Doing so allows the investment to be excluded from treatment as a “senior security.” Furthermore, if required by an exchange or counterparty agreement, the Master Portfolio may be required to deliver/deposit cash and/or securities to/with an exchange, or broker-dealer or custodian as collateral for certain investments or obligations.
Investment Transactions and Investment Income: For financial reporting purposes, investment transactions are recorded on the dates the transactions are entered into (the trade dates). Realized gains and losses on investment transactions are determined on the identified cost basis. Dividend income is recorded on the ex-dividend date. Dividends from foreign securities where the ex-dividend date may have passed are subsequently recorded when the Master Portfolio is informed of the ex-dividend date. Under the applicable foreign tax laws, a withholding tax at various rates may be imposed on capital gains, dividends and interest. Upon notification from issuers, some of the dividend income received from a real estate investment trust may be redesignated as a reduction of cost of the related investment and/or realized gain. Interest income, including amortization and accretion of premiums and discounts on debt securities, is recognized on the accrual basis.
Indemnifications: In the normal course of business, the Master Portfolio enters into contracts that contain a variety of representations that provide general indemnification. The Master Portfolio’s maximum exposure under these arrangements is unknown because it involves future potential claims against the Master Portfolio, which cannot be predicted with any certainty.
Other: Expenses directly related to the Master Portfolio are charged to the Master Portfolio. Other operating expenses shared by several funds, including other funds managed by the Manager, are prorated among those funds on the basis of relative net assets or other appropriate methods.
The Master Portfolio has an arrangement with its custodian whereby fees may be reduced by credits earned on uninvested cash balances, which, if applicable, are shown as fees paid indirectly in the Statement of Operations. The custodian imposes fees on overdrawn cash balances, which can be offset by accumulated credits earned or may result in additional custody charges. Effective September 2015, the arrangement with its custodian for earning credits on uninvested cash balances has ceased and the custodian will be imposing fees on certain uninvested cash balances.
3. Investment Valuation and Fair Value Measurements:
Investment Valuation Policies: The Master Portfolio’s investments are valued at fair value (also referred to as “market value” within the financial statements) as of the close of trading on the New York Stock Exchange (“NYSE”) (generally 4:00 p.m., Eastern time). U.S. GAAP defines fair value as the price the the Master Portfolio would receive to sell an asset or pay to transfer a liability in an orderly transaction between market participants at the measurement date. The Master Portfolio determines the fair values of its financial instruments using independent dealers or pricing services under policies approved by the Board of Trustees of MIP (the “Board”). The BlackRock Global Valuation Methodologies Committee (the “Global Valuation Committee”) is the committee formed by management to develop global pricing policies and procedures and to provide oversight of the pricing function for the Master Portfolio for all financial instruments.
| | | | | | |
| | | | | | | |
| 32 | | BLACKROCK S&P 500 INDEX FUND | | DECEMBER 31, 2015 | | |
| | |
| Notes to Financial Statements (continued) | | S&P 500 Index Master Portfolio |
Fair Value Inputs and Methodologies: The following methods (or “techniques”) and inputs are used to establish the fair value of the Master Portfolio’s assets and liabilities:
| • | | Equity investments traded on a recognized securities exchange are valued at the official close price each day, if available. For equity investments traded on more than one exchange, the official close price on the exchange where the stock is primarily traded is used. Equity investments traded on a recognized exchange for which there were no sales on that day may be valued at the last available bid (long positions) or ask (short positions) price. |
| • | | Investments in open-end U.S. mutual funds are valued at NAV each business day. |
| • | | Financial futures contracts traded on exchanges are valued at their last sale price. |
If events (e.g., a company announcement, market volatility or a natural disaster) occur that are expected to materially affect the value of such instruments, or in the event that the application of these methods of valuation results in a price for an investment that is deemed not to be representative of the market value of such investment, or if a price is not available, the investment will be valued by the Global Valuation Committee, or its delegate, in accordance with a policy approved by the Board as reflecting fair value (“Fair Valued Investments”). When determining the price for Fair Valued Investments, the Global Valuation Committee, or its delegate, seeks to determine the price that the Master Portfolio might reasonably expect to receive or pay from the current sale or purchase of that asset or liability in an arm’s-length transaction. Fair value determinations shall be based upon all available factors that the Global Valuation Committee, or its delegate, deems relevant consistent with the principles of fair value measurement. The pricing of all Fair Valued Investments is subsequently reported to the Board or a committee thereof on a quarterly basis.
Fair Value Hierarchy: Various inputs are used in determining the fair value of investments and derivative financial instruments. These inputs to valuation techniques are categorized into a fair value hierarchy consisting of three broad levels for financial statement purposes as follows:
| • | | Level 1 — unadjusted price quotations in active markets/exchanges for identical assets or liabilities that the Master Portfolio has the ability to access |
| • | | Level 2 — other observable inputs (including, but not limited to, quoted prices for similar assets or liabilities in markets that are active, quoted prices for identical or similar assets or liabilities in markets that are not active, inputs other than quoted prices that are observable for the assets or liabilities (such as interest rates, yield curves, volatilities, prepayment speeds, loss severities, credit risks and default rates) or other market–corroborated inputs) |
| • | | Level 3 — unobservable inputs based on the best information available in the circumstances, to the extent observable inputs are not available (including the Master Portfolio’s own assumptions used in determining the fair value of investments and derivative financial instruments) |
The hierarchy gives the highest priority to unadjusted quoted prices in active markets for identical assets or liabilities (Level 1 measurements) and the lowest priority to unobservable inputs (Level 3 measurements). Accordingly, the degree of judgment exercised in determining fair value is greatest for instruments categorized in Level 3. The inputs used to measure fair value may fall into different levels of the fair value hierarchy. In such cases, for disclosure purposes, the fair value hierarchy classification is determined based on the lowest level input that is significant to the fair value measurement in its entirety. The significant unobservable inputs used by the Global Valuation Committee in determining the price for Fair Valued Investments are typically categorized as Level 3. The fair value hierarchy for the Master Portfolio’s investments and derivative financial instruments has been included in the Schedule of Investments.
Changes in valuation techniques may result in transfers into or out of an assigned level within the hierarchy. In accordance with the Master Portfolio’s policy, transfers between different levels of the fair value hierarchy are deemed to have occurred as of the beginning of the reporting period. The categorization of a value determined for investments and derivative financial instruments is based on the pricing transparency of the investments and derivative financial instruments and is not necessarily an indication of the risks associated with investing in those securities.
4. Securities and Other Investments:
Securities Lending: The Master Portfolio may lend its securities to approved borrowers, such as brokers, dealers and other financial institutions. The borrower pledges and maintains with the Master Portfolio collateral consisting of cash, an irrevocable letter of credit issued by a bank, or securities issued or guaranteed by the U.S. Government. The initial collateral received by the Master Portfolio is required to have a value of at least 102% of the current value of the loaned securities for securities traded on U.S. exchanges and a value of at least 105% for all other securities. The collateral is maintained thereafter, at a value equal to at least 100% of the current market value of the securities on loan. The market value of the loaned securities is determined at the close of each business day of the Master Portfolio and any additional required collateral is delivered to the Master Portfolio,
| | | | | | |
| | | | | | | |
| | BLACKROCK S&P 500 INDEX FUND | | DECEMBER 31, 2015 | | 33 |
| | |
| Notes to Financial Statements (continued) | | S&P 500 Index Master Portfolio |
or excess collateral returned by the Master Portfolio, on the next business day. During the term of the loan, the Master Portfolio is entitled to all distributions made on or in respect of the loaned securities. Loans of securities are terminable at any time and the borrower, after notice, is required to return borrowed securities within the standard time period for settlement of securities transactions.
The market value of any securities on loan, all of which were classified as common stocks in the Master Portfolio’s Schedule of Investments, and the value of any related collateral are shown separately in the Statement of Assets and Liabilities as a component of investments at value-unaffiliated, and collateral on securities loaned at value, respectively. As of period end, any securities on loan were collateralized by cash. The cash collateral invested by the securities lending agent, BlackRock Institutional Trust Company, N.A. (“BTC”), if any, is disclosed in the Schedule of Investments.
Securities lending transactions are entered into by the Master Portfolio under Master Securities Lending Agreements (each, an “MSLA”), which provide the right, in the event of default (including bankruptcy or insolvency), for the non-defaulting party to liquidate the collateral and calculate a net exposure to the defaulting party or request additional collateral. In the event that a borrower defaults, the Master Portfolio, as lender, would offset the market value of the collateral received against the market value of the securities loaned. When the value of the collateral is greater than that of the market value of the securities loaned, the lender is left with a net amount payable to the defaulting party. However, bankruptcy or insolvency laws of a particular jurisdiction may impose restrictions on or prohibitions against such a right of offset in the event of an MSLA counterparty’s bankruptcy or insolvency. Under the MSLA, absent an event of default the borrower can resell or re-pledge the loaned securities, and the Master Portfolio can reinvest cash collateral received in connection with loaned securities. Upon an event of default, the parties’ obligations to return the securities or collateral to the other party are extinguished, and the parties can resell or re-pledge the loaned securities or the collateral received in connection with the loaned securities in order to satisfy the defaulting party’s net payment obligation for all transactions under the MSLA. The defaulting party remains liable for any deficiency.
As of period end, the following table is a summary of the Master Portfolio securities lending agreements by counterparty which are subject to offset under an MSLA:
| | | | | | | | | | | | |
| Counterparty | | Securities Loaned at Value | | | Cash Collateral Received1 | | | Net Amount2 | |
Barclays Capital, Inc. | | $ | 833,142 | | | $ | (761,663 | ) | | $ | 71,479 | |
BNP Paribas S.A. | | | 92,963 | | | | (92,963 | ) | | | — | |
Citigroup Global Markets, Inc. | | | 9,411,295 | | | | (9,411,295 | ) | | | — | |
Credit Suisse Securities (USA) LLC | | | 1,681,290 | | | | (1,681,290 | ) | | | — | |
Deutsche Bank Securities Inc. | | | 2,725,596 | | | | (2,725,596 | ) | | | — | |
Goldman Sachs & Co. | | | 1,772,090 | | | | (1,772,090 | ) | | | — | |
JP Morgan Securities LLC | | | 10,281,600 | | | | (10,281,600 | ) | | | — | |
Merrill Lynch, Pierce, Fenner & Smith, Inc. | | | 22,211,301 | | | | (22,211,301 | ) | | | — | |
Morgan Stanley | | | 24,669 | | | | (24,669 | ) | | | — | |
National Financial Services LLC | | | 490,035 | | | | (490,035 | ) | | | — | |
Scotia Capital (USA) Inc | | | 6,814 | | | | (6,814 | ) | | | — | |
State Street Bank & Trust Co. | | | 7,480,420 | | | | (7,480,420 | ) | | | — | |
UBS Securities LLC | | | 3,144,497 | | | | (3,144,497 | ) | | | — | |
Wells Fargo Securities LLC | | | 185,486 | | | | (169,572 | ) | | | 15,914 | |
| | | | | | | | | | | | |
Total | | $ | 60,341,198 | | | $ | (60,253,805 | ) | | $ | 87,393 | |
| | | | | | | | | | | | |
| | 1 | | Collateral with a value of $61,937,100 has been received in connection with securities lending agreements. Collateral received in excess of the value of securities loaned from the individual counterparty is not shown for financial reporting purposes in the table above. |
| | 2 | | The market value of the loaned securities is determined as of December 31, 2015. Additional collateral is delivered to the Master Portfolio on the next business day in accordance with the MSLA. The net amount would be subject to the borrower default indemnity in the event of default by the counterparty. |
The risks of securities lending include the risk that the borrower may not provide additional collateral when required or may not return the securities when due. To mitigate these risks, the Master Portfolio benefits from a borrower default indemnity provided by BlackRock, Inc. (“BlackRock”). BlackRock’s indemnity allows for full replacement of the securities loaned if the collateral received does not cover the value on the securities loaned in the event of borrower default. The Master Portfolio could suffer a loss if the value of an investment purchased with cash collateral falls below the market value of loaned securities or if the value of an investment purchased with cash collateral falls below the value of the original cash collateral received.
5. Derivative Financial Instruments:
The Master Portfolio engages in various portfolio investment strategies using derivative contracts both to increase the returns of the Master Portfolio and/or to manage economically its exposure to certain risks such as equity risk. These contracts may be transacted on an exchange or over-the-counter (“OTC”).
| | | | | | |
| | | | | | | |
| 34 | | BLACKROCK S&P 500 INDEX FUND | | DECEMBER 31, 2015 | | |
| | |
| Notes to Financial Statements (continued) | | S&P 500 Index Master Portfolio |
Financial Futures Contracts: The Master Portfolio invests in long and/or short positions in financial futures contracts and options on financial futures contracts to gain exposure to, or economically hedge against, changes in the value of equity securities (equity risk). Financial futures contracts are agreements between the Master Portfolio and a counterparty to buy or sell a specific quantity of an underlying instrument at a specified price and at a specified date. Depending on the terms of the particular contract, financial futures contracts are settled either through physical delivery of the underlying instrument on the settlement date or by payment of a cash settlement amount on the settlement date.
Upon entering into a financial futures contract, the Master Portfolio is required to deposit initial margin with the broker in the form of cash or securities in an amount that varies depending on a contract’s size and risk profile. The initial margin deposit must then be maintained at an established level over the life of the contract. Securities deposited as initial margin are designated on the Schedule of Investments and cash deposited, if any, is recorded on the Statement of Assets and Liabilities as cash pledged for financial futures contracts. Pursuant to the contract, the Master Portfolio agrees to receive from or pay to the broker an amount of cash equal to the daily fluctuation in value of the contract. Such receipts or payments are known as variation margin. Variation margin is recorded by the the Master Portfolio as unrealized appreciation (depreciation) and, if applicable, as a receivable or payable for variation margin in the Statement of Assets and Liabilities.
When the contract is closed, the Master Portfolio records a realized gain or loss equal to the difference between the value of the contract at the time it was opened and the value at the time it was closed. The use of financial futures contracts involves the risk of an imperfect correlation in the movements in the price of financial futures contracts, interest or foreign currency exchange rates and the underlying assets.
6. Investment Advisory Agreement and Other Transactions with Affiliates:
The PNC Financial Services Group, Inc. is the largest stockholder and an affiliate of BlackRock for 1940 Act purposes.
MIP, on behalf of the Master Portfolio, entered into an Investment Advisory Agreement with the Manager, the Master Portfolio’s investment advisor, an indirect, wholly owned subsidiary of BlackRock, to provide investment advisory services. The Manager is responsible for the management of the Master Portfolio’s investments and provides the personnel, facilities, equipment and certain other services necessary to the operations of the Master Portfolio. For such services, the Master Portfolio pays the Manager a monthly fee based on a percentage of the Master Portfolio’s average daily net assets an annual rate of 0.04%. Prior to April 30, 2015, the annual rate as a percentage of average daily net assets was 0.05%.
MIP entered into an Administration Agreement with BlackRock Advisors, LLC (“BAL”), which has agreed to provide general administration services (other than investment advice and related portfolio activities). BAL may delegate certain of its administration duties to sub-administrators.
BAL, in consideration thereof, has agreed to bear all of the Master Portfolio’s and MIP’s ordinary operating expenses, excluding, generally, investment advisory fees, distribution fees, brokerage and other expenses related to the execution of portfolio transactions, extraordinary expenses and certain other expenses which are borne by the Master Portfolio.
BAL is not entitled to compensation for providing administration service to the Master Portfolio, for so long as BAL is entitled to compensation for providing administration service to corresponding feeder funds that invest substantially all of their assets in the Master Portfolio, or BAL (or an affiliate) receives investment advisory fees from the Master Portfolio.
The Manager, with respect to the Master Portfolio, voluntarily agreed to waive its investment advisory fees by the amount of investment advisory fees the Master Portfolio pays to the Manager indirectly through its investment in affiliated money market funds. This amount is included in fees waived by the Manager in the Statement of Operations. However, the Manager does not waive its investment advisory fees by the amount of investment advisory fees paid in connection with the Master Portfolio’s investments in other affiliated investment companies, if any. For the year ended December 31, 2015, the amount waived was $170,684.
The fees and expenses of the MIP’s trustees who are not “interested persons” of the MIP, as defined in the 1940 Act (“Independent Trustees”), counsel to the Independent Trustees and the MIP’s independent registered public accounting firm (together, the “independent expenses”) are paid directly by the Master Portfolio. The Manager has contractually agreed to cap the expenses of the Master Portfolio at the rate at which the Master Portfolio pays an advisory fee to the Manager by providing an offsetting credit against the investment advisory fees paid by the Master Portfolio in an amount equal to the independent expenses. This contractual waiver is effective through April 30, 2016. The amount of the waiver, if any, is shown as fees waived in the Statement of Operations.
The U.S. Securities and Exchange Commission has issued an exemptive order which permits BTC, an affiliate of the Manager, to serve as securities lending agent for the Master Portfolio, subject to applicable conditions. As securities lending agent, BTC bears all operational costs directly related to
| | | | | | |
| | | | | | | |
| | BLACKROCK S&P 500 INDEX FUND | | DECEMBER 31, 2015 | | 35 |
| | |
| Notes to Financial Statements (continued) | | S&P 500 Index Master Portfolio |
securities lending. The Master Portfolio is responsible for fees in connection with the investment of cash collateral received for securities on loan in a money market fund managed by the Manager or its affiliates, however, BTC has agreed to reduce the amount of securities lending income it receives in order to effectively limit the collateral investment fees the Master Portfolio bears to an annual rate of 0.04% (the “collateral investment fees”).
Securities lending income is equal to the total of income earned from the reinvestment of cash collateral, net of fees and other payments to and from borrowers of securities, and less the collateral investment fees. The Master Portfolio retains a portion of securities lending income and remits a remaining portion to BTC as compensation for its services as securities lending agent.
Pursuant to a securities lending agreement, BTC may lend securities only when the difference between the borrower rebate rate and the risk free rate exceeds a certain level (such securities, the “specials only securities”).
Pursuant to a securities lending agreement effective March 9, 2015, the Master Portfolio retains 71.5% of securities lending income, and this amount retained can never be less than 65% of the total of securities lending income plus the collateral investment fees. In addition, commencing the business day following the date that the aggregate securities lending income earned across certain funds in the Equity-Liquidity Complex in a calendar year exceeds a specified threshold, the Master Portfolio, pursuant to the securities lending agreement, will retain for the remainder of the calendar year securities lending income in an amount equal to 75% of securities lending income, and this amount retained can never be less than 65% of the total of securities lending income plus the collateral investment fees. For the period January 1, 2015 through March 8, 2015, BTC could lend securities with respect to the Master Portfolio only when the difference between the borrower rebate rate and the risk free rate exceeded a certain level, and the Master Portfolio retained 80% (85% commencing on the business day following the date that the aggregate securities lending income earned across the Equity-Liquidity Complex in the calendar year 2014 exceeded a specified threshold and for the remainder of that calendar year) of securities lending income.
The share of securities lending income earned by the Master Portfolio is shown as securities lending — affiliated — net in the Statement of Operations. For the year ended December 31, 2015, the Master Portfolio Fund paid BTC $122,996 in total for securities lending agent services and collateral investment fees.
Certain officers and/or trustees of MIP are officers and/or directors of BlackRock or its affiliates.
The Master Portfolio may purchase securities from, or sell securities to, an affiliated fund provided the affiliation is due solely to having a common investment advisor, common officers, or common trustees. For the year ended December 31, 2015, the purchase and sale transactions with an affiliated fund in compliance with Rule 17a-7 under the 1940 Act were $164,503,416 and $27,151,440, respectively.
7. Purchases and Sales:
For the year ended December 31, 2015, purchases and sales of investments, excluding short-term securities and in-kind redemptions, were $1,406,173,833 and $148,458,723, respectively.
8. Income Tax Information:
The Master Portfolio is classified as a partnership for federal income tax purposes. As such, each investor in the Master Portfolio is treated as the owner of its proportionate share of net assets, income, expenses and realized and unrealized gains and losses of the Master Portfolio. Therefore, no federal income tax provision is required. It is intended that the Master Portfolio’s assets will be managed so an investor in the Master Portfolio can satisfy the requirements of Subchapter M of the Internal Revenue Code of 1986, as amended.
The Master Portfolio files U.S. federal and various state and local tax returns. No income tax returns are currently under examination. The statute of limitations on the Master Portfolio’s U.S. federal tax returns remains open for each of the four years ended December 31, 2015. The statutes of limitations on the Master Portfolio’s state and local tax returns may remain open for an additional year depending upon the jurisdiction.
Management has analyzed tax laws and regulations and their application to the Master Portfolio as of December 31, 2015, inclusive of the open tax return years, and does not believe there are any uncertain tax positions that require recognition of a tax liability in the the Master Portfolio’s financial statements.
As of period end, gross unrealized appreciation and depreciation based on cost for federal income tax purposes were as follows:
| | | | |
Tax cost | | $ | 4,376,528,200 | |
| | | | |
Gross unrealized appreciation | | $ | 3,014,070,617 | |
Gross unrealized depreciation | | | (159,583,130 | ) |
| | | | |
Net unrealized appreciation | | $ | 2,854,487,487 | |
| | | | |
| | | | | | |
| | | | | | | |
| 36 | | BLACKROCK S&P 500 INDEX FUND | | DECEMBER 31, 2015 | | |
| | |
| Notes to Financial Statements (concluded) | | S&P 500 Index Master Portfolio |
9. Bank Borrowings:
MIP, on behalf of the Master Portfolio, along with certain other funds managed by the Manager and its affiliates (“Participating Funds”), is a party to a 364-day, $2.1 billion credit agreement with a group of lenders, under which the Master Portfolio may borrow to fund shareholder redemptions. Excluding commitments designated for certain funds, the Participating Funds, including the Master Portfolio, can borrow up to an aggregate commitment amount of $1.6 billion at any time outstanding, subject to asset coverage and other limitations as specified in the agreement. The credit agreement has the following terms: a fee of 0.06% per annum on unused commitment amounts and interest at a rate equal to the higher of (a) one-month LIBOR (but, in any event, not less than 0.00%) on the date the loan is made plus 0.80% per annum or (b) the Fed Funds rate (but, in any event, not less than 0.00%) in effect from time to time plus 0.80% per annum on amounts borrowed. The agreement expires in April 2016 unless extended or renewed. Participating Funds paid administration, legal and arrangement fees, which, if applicable, are included in miscellaneous expenses in the Statement of Operations, and along with commitment fees, were allocated among such funds based upon portions of the aggregate commitment available to them and relative net assets of Participating Funds. During the year ended December 31, 2015, the Master Portfolio did not borrow under the credit agreement.
10. Principal Risks:
In the normal course of business, the Master Portfolio invests in securities and enters into transactions where risks exist due to fluctuations in the market (market risk) or failure of the issuer to meet all its obligations, including the ability to pay principal and interest when due (issuer credit risk). The value of securities held by the Master Portfolio may decline in response to certain events, including those directly involving the issuers of securities owned by the Master Portfolio. Changes arising from the general economy, the overall market and local, regional or global political or/and social instability, as well as currency, interest rate and price fluctuations, may also affect the securities’ value.
Counterparty Credit Risk: Similar to issuer credit risk, the Master Portfolio may be exposed to counterparty credit risk, or the risk that an entity may fail to or be unable to perform on its commitments related to unsettled or open transactions. The Master Portfolio manages counterparty credit risk by entering into transactions only with counterparties that the Manager believes have the financial resources to honor their obligations and by monitoring the financial stability of those counterparties. Financial assets, which potentially expose the Master Portfolio to market, issuer and counterparty credit risks, consist principally of financial instruments and receivables due from counterparties. The extent of the Master Portfolio’s exposure to market, issuer and counterparty credit risks with respect to these financial assets is approximately their value recorded in the Statement of Assets and Liabilities, less any collateral held by the Master Portfolio.
A derivative contract may suffer a mark-to-market loss if the value of the contract decreases due to an unfavorable change in the market rates or values of the underlying instrument. Losses can also occur if the counterparty does not perform under the contract.
With exchange-traded futures, there is less counterparty credit risk to the Master Portfolio since the exchange or clearinghouse, as counterparty to such instruments, guarantees against a possible default. The clearinghouse stands between the buyer and the seller of the contract; therefore, credit risk is limited to failure of the clearinghouse. While offset rights may exist under applicable law, the Master Portfolio does not have a contractual right of offset against a clearing broker or clearinghouse in the event of a default (including the bankruptcy or insolvency). Additionally, credit risk exists in exchange-traded futures with respect to initial and variation margin that is held in a clearing broker’s customer accounts. While clearing brokers are required to segregate customer margin from their own assets, in the event that a clearing broker becomes insolvent or goes into bankruptcy and at that time there is a shortfall in the aggregate amount of margin held by the clearing broker for all its clients, typically the shortfall would be allocated on a pro rata basis across all the clearing broker’s customers, potentially resulting in losses to the Master Portfolio.
11. Subsequent Events:
Management has evaluated the impact of all subsequent events on the Master Portfolio through the date the financial statements were issued and has determined that there were no subsequent events requiring adjustment or additional disclosure in the financial statements.
| | | | | | |
| | | | | | | |
| | BLACKROCK S&P 500 INDEX FUND | | DECEMBER 31, 2015 | | 37 |
| | |
| Report of Independent Registered Public Accounting Firm | | S&P 500 Index Master Portfolio |
To the Board of Trustees of Master Investment Portfolio and the Interestholders of S&P 500 Index Master Portfolio:
In our opinion, the accompanying statement of assets and liabilities, including the schedule of investments, and the related statements of operations and of changes in net assets and the financial highlights present fairly, in all material respects, the financial position of S&P 500 Index Master Portfolio (the “Master Portfolio”), a series of Master Investment Portfolio, at December 31, 2015, the results of its operations for the year then ended, the changes in its net assets for each of the two years in the period then ended and the financial highlights for each of the five years in the period then ended, in conformity with accounting principles generally accepted in the United States of America. These financial statements and financial highlights (hereafter referred to as “financial statements”) are the responsibility of the Master Portfolio’s management. Our responsibility is to express an opinion on these financial statements based on our audits. We conducted our audits of these financial statements in accordance with the standards of the Public Company Accounting Oversight Board (United States). Those standards require that we plan and perform the audit to obtain reasonable assurance about whether the financial statements are free of material misstatement. An audit includes examining, on a test basis, evidence supporting the amounts and disclosures in the financial statements, assessing the accounting principles used and significant estimates made by management, and evaluating the overall financial statement presentation. We believe that our audits, which included confirmation of securities at December 31, 2015 by correspondence with the custodian, transfer agent, and brokers, provide a reasonable basis for our opinion.
/s/PricewaterhouseCoopers LLP
Philadelphia, Pennsylvania
February 18, 2016
| | | | | | |
| | | | | | | |
| 38 | | BLACKROCK S&P 500 INDEX FUND | | DECEMBER 31, 2015 | | |
| | | | | | | | | | |
Name, Address1
and Year of Birth | | Position(s)
Held with
the Trust/MIP | | Length
of Time
Served as
a Trustee3 | | Principal Occupation(s) During Past Five Years | | Number of BlackRock-
Advised Registered
Investment Companies
(“RICs”) Consisting of
Investment Portfolios
(“Portfolios”) Overseen | | Public
Directorships |
| Independent Trustees2 |
Rodney D. Johnson 1941 | | Chair of the Board and Trustee | | Since 2009 | | President, Fairmount Capital Advisors, Inc. from 1987 to 2013; Member of the Archdiocesan Investment Committee of the Archdiocese of Philadelphia from 2004 to 2012; Director, The Committee of Seventy (civic) from 2006 to 2012; Director, Fox Chase Cancer Center from 2004 to 2011. | | 33 RICs consisting of
155 Portfolios | | None |
David O. Beim 1940 | | Trustee | | Since 2009 | | Professor of Professional Practice at the Columbia University Graduate School of Business since 1991; Trustee, Phillips Exeter Academy from 2002 to 2012; Chairman, Wave Hill, Inc. (public garden and cultural center) from 1990 to 2006. | | 33 RICs consisting of
155 Portfolios | | None |
Collette Chilton 1958 | | Trustee | | Since 2015 | | Chief Investment Officer, Williams College since 2006; Chief Investment Officer, Lucent Asset Management Corporation from 1998 to 2006. | | 33 RICs consisting of
155 Portfolios | | None |
Frank J. Fabozzi 1948 | | Trustee | | Since 2014 | | Editor of and Consultant for The Journal of Portfolio Management since 2006; Professor of Finance, EDHEC Business School since 2011; Visiting Professor, Princeton University from 2013 to 2014; Professor in the Practice of Finance and Becton Fellow, Yale University School of Management from 2006 to 2011. | | 108 RICs consisting of
230 Portfolios | | None |
Dr. Matina S. Horner 1939 | | Trustee | | Since 2009 | | Executive Vice President, Teachers Insurance and Annuity Association and College Retirement Equities Fund from 1989 to 2003. | | 33 RICs consisting of
155 Portfolios | | NSTAR (electric and gas utility) |
Herbert I. London 1939 | | Trustee | | Since 2009 | | Professor Emeritus, New York University since 2005; President, London Center for Policy Research since 2012; John M. Olin Professor of Humanities, New York University from 1993 to 2005 and Professor thereof from 1980 to 2005; President Emeritus, Hudson Institute (policy research organization) from 2011 to 2012, President thereof from 1997 to 2011 and Trustee from 1980 to 2012; Chairman of the Board of Trustees for Grantham University since 2006; Director, InnoCentive, Inc. (global internet service) since 2005; Director, Cerego, LLC (educational software) since 2005; Director, Cybersettle (online adjudication) since 2009; Director, AIMS Worldwide, Inc. (marketing) from 2007 to 2012. | | 33 RICs consisting of
155 Portfolios | | None |
Cynthia A. Montgomery 1952 | | Trustee | | Since 2009 | | Professor, Harvard Business School since 1989; Director, McLean Hospital from 2005 to 2012; Director, Harvard Business School Publishing from 2005 to 2010. | | 33 RICs consisting of
155 Portfolios | | Newell Rubbermaid, Inc. (manufacturing) |
Joseph P. Platt 1947 | | Trustee | | Since 2009 | | Director, Jones and Brown (Canadian insurance broker) since 1998; General Partner, Thorn Partners, LP (private investments) since 1998; Director, WQED Multi-Media (public broadcasting not-for-profit) since 2001; Director, The West Penn Allegheny Health System (a not-for-profit health system) from 2008 to 2013; Partner, Amarna Corporation, LLC (private investment company) from 2002 to 2008. | | 33 RICs consisting of
155 Portfolios | | Greenlight Capital Re, Ltd. (reinsurance company) |
Robert C. Robb, Jr. 1945 | | Trustee | | Since 2009 | | Partner, Lewis, Eckert, Robb and Company (management and financial consulting firm) since 1981. | | 33 RICs consisting of
155 Portfolios | | None |
Toby Rosenblatt 1938 | | Trustee | | Since 2009 | | President, Founders Investments Ltd. (private investments) since 1999; Director, Forward Management, LLC since 2007; Director, College Futures Foundation (philanthropic foundation) since 2009; Director, The James Irvine Foundation (philanthropic foundation) from 1998 to 2008. | | 33 RICs consisting of
155 Portfolios | | None |
| | | | | | |
| | | | | | | |
| | BLACKROCK S&P 500 INDEX FUND | | DECEMBER 31, 2015 | | 39 |
| | | | |
| Officers and Trustees (continued) | | |
| | | | | | | | | | |
Name, Address1
and Year of Birth | | Position(s)
Held with
the Trust/MIP | | Length
of Time
Served as
a Trustee3 | | Principal Occupation(s) During Past Five Years | | Number of BlackRock-
Advised Registered
Investment Companies
(“RICs”) Consisting of
Investment Portfolios
(“Portfolios”) Overseen | | Public
Directorships |
| Independent Trustees2 |
Mark Stalnecker 1951 | | Trustee | | Since 2015 | | Chief Investment Officer, University of Delaware from 1999 to 2013; Trustee, Winterthur Museum and Country Estate since 2001; Member of the Investment Committee, Delaware Public Employees’ Retirement System since 2002; Member of the Investment Committee, Christiana Care Health System since 2009; Member of the Investment Committee, Delaware Community Foundation from 2013 to 2014. | | 33 RICs consisting of
155 Portfolios | | None |
Kenneth L. Urish 1951 | | Trustee | | Since 2009 | | Managing Partner, Urish Popeck & Co., LLC (certified public accountants and consultants) since 1976; Immediate past-Chairman of the Professional Ethics Committee of the Pennsylvania Institute of Certified Public Accountants and Committee Member thereof since 2007; Member of External Advisory Board, The Pennsylvania State University Accounting Department since 2001; Principal, UP Strategic Wealth Investment Advisors, LLC since 2013; Trustee, The Holy Family Institute from 2001 to 2010; President and Trustee, Pittsburgh Catholic Publishing Associates from 2003 to 2008; Director, Inter-Tel from 2006 to 2007. | | 33 RICs consisting of
155 Portfolios | | None |
Frederick W. Winter 1945 | | Trustee | | Since 2009 | | Director, Alkon Corporation (pneumatics) since 1992; Professor and Dean Emeritus of the Joseph M. Katz School of Business, University of Pittsburgh from 2005 to 2013 and Dean thereof from 1997 to 2005; Director, Tippman Sports (recreation) from 2005 to 2013; Director, Indotronix International (IT services) from 2004 to 2008. | | 33 RICs consisting of
155 Portfolios | | None |
| | 1 The address of each Trustee is c/o BlackRock, Inc., 55 East 52nd Street, New York, NY 10055. |
| | 2 Independent Trustees serve until their resignation, retirement, removal or death, or until December 31 of the year in which they turn 75. The Board has determined to extend the terms of Independent Trustees on a case-by-case basis, as appropriate. The Board has determined to extend the terms of Independent Trustees on a case-by-case basis, as appropriate. The Board has unanimously approved extending the mandatory retirement age for David O. Beim and Dr. Matina S. Horner until December 31, 2016, which the Board believes is in the best interests of shareholders of the Trust/MIP. |
| | 3 Date shown is the earliest date a person has served for the Trust/MIP. In connection with the acquisition of Barclays Global Investors by BlackRock, Inc. (“BlackRock”) in December 2009, the Trustees were elected to the Trust/MIP Board. As a result, although the chart shows certain Independent Trustees as joining the Trust’s/MIP’s board in 2009, those Independent Trustees first became members of the boards of other funds advised by BlackRock Advisors, LLC or its affiliates as follows: David O. Beim, 1998; Dr. Matina S. Horner, 2004; Rodney D. Johnson, 1995; Herbert I. London, 1987; Cynthia A. Montgomery, 1994; Joseph P. Platt, 1999; Robert C. Robb, Jr., 1998; Toby Rosenblatt, 2005; Kenneth L. Urish, 1999; and Frederick W. Winter, 1999. Frank J. Fabozzi first became a member of the board of other funds advised by BlackRock Advisors, LLC or its affiliates in 1988. |
| Interested Trustees4 | | | | | | | | | | |
Barbara G. Novick 1960 | | Trustee | | Since 2015 | | Vice Chairman of BlackRock since 2006; Chair of BlackRock’s Government Relations Steering Committee since 2009; Head of the Global Client Group of BlackRock from 1988 to 2008. | | 108 RICs consisting of
230 Portfolios | | None |
John M. Perlowski 1964 | | Trustee, President and Chief Executive Officer | | Since 2015 (Trustee); Since 2010 (President and Chief Executive Officer) | | Managing Director of BlackRock since 2009; Head of BlackRock Global Fund Services since 2009; Managing Director and Chief Operating Officer of the Global Product Group at Goldman Sachs Asset Management, L.P. from 2003 to 2009; Treasurer of Goldman Sachs Mutual Funds from 2003 to 2009 and Senior Vice President thereof from 2007 to 2009; Director of Goldman Sachs Offshore Funds from 2002 to 2009; Director of Family Resource Network (charitable foundation) since 2009. | | 136 RICs consisting of
328 Portfolios | | None |
| | 4 Mr. Perlowski and Ms. Novick are both “interested persons,” as defined in the 1940 Act, of the Trust/MIP based on their positions with BlackRock and its affiliates. Mr. Perlowski and Ms. Novick are also board members of a complex of BlackRock registered open-end funds. Mr. Perlowski is also a board member of the BlackRock Equity-Bond Complex and the BlackRock Equity-Liquidity Complex, and Ms. Novick is also a board member of the BlackRock Equity-Liquidity Complex. Interested Trustees serve until their resignation, retirement, removal or death, or until December 31 of the year in which they turn 75. The maximum age limitation may be waived as to any Trustee by action of a majority of the Trustees upon a finding of good cause therefor. |
| | | | | | |
| | | | | | | |
| 40 | | BLACKROCK S&P 500 INDEX FUND | | DECEMBER 31, 2015 | | |
| | |
| Officers and Trustees (concluded) | | |
| | | | | | |
Name, Address1
and Year of Birth | | Position(s)
Held with
the Trust/MIP | | Length of
Time Served
as an Officer | | Principal Occupation(s) During Past Five Years |
| Trust/MIP Officers2 |
John M. Perlowski 1964 | | Trustee, President and Chief Executive Officer | | Since 2015 (Trustee); Since 2010 (President and Chief Executive Officer) | | Managing Director of BlackRock since 2009; Head of BlackRock Global Fund Services since 2009; Managing Director and Chief Operating Officer of the Global Product Group at Goldman Sachs Asset Management, L.P. from 2003 to 2009; Treasurer of Goldman Sachs Mutual Funds from 2003 to 2009 and Senior Vice President thereof from 2007 to 2009; Director of Goldman Sachs Offshore Funds from 2002 to 2009; Director of Family Resource Network (charitable foundation) since 2009. |
Richard Hoerner, CFA 1958 | | Vice President | | Since 2009 | | Managing Director of BlackRock since 2000; Head of the Global Cash Group since 2013; Co-head of the Global Cash and Securities Lending Group from 2010 to 2013; Member of the Cash Management Group Executive Committee since 2005. |
Jennifer McGovern 1977 | | Vice President | | Since 2014 | | Director of BlackRock since 2011; Head of Product Structure and Oversight for BlackRock’s U.S. Wealth Advisory Group since 2013; Vice President of BlackRock from 2008 to 2010. |
Neal Andrews 1966 | | Chief Financial Officer | | Since 2007 | | Managing Director of BlackRock since 2006; Senior Vice President and Line of Business Head of Fund Accounting and Administration at PNC Global Investment Servicing (U.S.) Inc. from 1992 to 2006. |
Jay Fife 1970 | | Treasurer | | Since 2007 | | Managing Director of BlackRock since 2007; Director of BlackRock in 2006; Assistant Treasurer of the MLIM and Fund Asset Management, L.P. advised funds from 2005 to 2006; Director of MLIM Fund Services Group from 2001 to 2006. |
Charles Park 1967 | | Chief Compliance Officer | | Since 2014 | | Anti-Money Laundering Compliance Officer for the BlackRock-advised Funds in the Equity-Bond Complex, the Equity-Liquidity Complex and the Closed-End Complex from 2014 to 2015; Chief Compliance Officer of BlackRock Advisors, LLC and the BlackRock-advised Funds in the Equity-Bond Complex, the Equity-Liquidity Complex and the Closed-End Complex since 2014; Principal of and Chief Compliance Officer for iShares® Delaware Trust Sponsor LLC since 2012 and BlackRock Fund Advisors (“BFA”) since 2006; Chief Compliance Officer for the BFA-advised iShares exchange traded funds since 2006; Chief Compliance Officer for BlackRock Asset Management International Inc. since 2012. |
Fernanda Piedra 1969 | | Anti-Money Laundering Compliance Officer | | Since 2015 | | Director of BlackRock since 2014; Anti-Money Laundering Compliance Officer and Regional Head of Financial Crime for the Americas at BlackRock since 2014; Head of Regulatory Changes and Remediation for the Asset Wealth Management Division of Deutsche Bank from 2010 to 2014; Vice President of Goldman Sachs (Anti-Money Laundering/Suspicious Activities Group) from 2004 to 2010. |
Benjamin Archibald 1975 | | Secretary | | Since 2012 | | Managing Director of BlackRock since 2014; Director of BlackRock from 2010 to 2013; Secretary of the iShares exchange traded funds since 2015; Secretary of the BlackRock-advised mutual funds since 2012. |
| | 1 The address of each Officer is c/o BlackRock, Inc., 55 East 52nd Street, New York, NY 10055. |
| | | 2 Officers of the Trust/MIP serve at the pleasure of the Board. |
| | Further information about the Officers and Trustees is available in the Trust’s/MIP’s Statement of Additional Information, which can be obtained without charge by calling (800) 441-7762 |
Effective September 25, 2015, John M. Perlowski was appointed to serve as a Trustee of the Trust/MIP.
Effective December 31, 2015, Herbert I. London and Toby Rosenblatt retired as Trustees of the Trust/MIP.
| | | | | | |
| | | | |
Investment Advisor BlackRock Fund Advisors San Francisco, CA 94105 | | Accounting Agent and Custodian State Street Bank and Trust Company Boston, MA 02110 | | Distributor BlackRock Investments, LLC New York, NY 10022 | | Legal Counsel Sidley Austin LLP New York, NY 10019 |
| | | |
Administrator BlackRock Advisors, LLC Wilmington, DE 19809 | | Transfer Agent BNY Mellon Investment Servicing (US) Inc. Wilmington, DE 19809 | | Independent Registered Public Accounting Firm PricewaterhouseCoopers LLP Philadelphia, PA 19103 | | Address of the Trust/MIP 400 Howard Street San Francisco, CA 94105 |
| | | | | | |
| | | | | | | |
| | BLACKROCK S&P 500 INDEX FUND | | DECEMBER 31, 2015 | | 41 |
Householding
The Fund will mail only one copy of shareholder documents, including prospectuses, annual and semi-annual reports and proxy statements, to shareholders with multiple accounts at the same address. This practice is commonly called “householding” and is intended to reduce expenses and eliminate duplicate mailings of shareholder documents. Mailings of your shareholder documents may be householded indefinitely unless you instruct us otherwise. If you do not want the mailing of these documents to be combined with those for other members of your household, please call the Fund at (800) 441-7762.
Availability of Quarterly Schedule of Investments
The Fund/Master Portfolio file their complete schedule of portfolio holdings with the SEC for the first and third quarters of each fiscal year on Form N-Q. The Fund’s/Master Portfolio’s Forms N-Q are available on the SEC’s website at http://www.sec.gov and may also be reviewed and copied at the SEC’s Public Reference Room in Washington, D.C. Information on how to access documents on the SEC’s website without charge may be obtained by calling (800) SEC-0330. The Fund’s/Master Portfolio’s Forms N-Q may also be obtained upon request and without charge by calling (800) 441-7762.
Availability of Proxy Voting Policies and Procedures
A description of the policies and procedures that the Fund/Master Portfolio use to determine how to vote proxies relating to portfolio securities is available upon request and without charge (1) by calling (800) 441-7762; (2) at http://www.blackrock.com; and (3) on the SEC’s website at http://www.sec.gov.
Availability of Proxy Voting Record
Information about how the Fund/Master Portfolio voted proxies relating to securities held in the Fund’s/Master Portfolio’s portfolio during the most recent 12-month period ended June 30 is available upon request and without charge (1) at http://www.blackrock.com or by calling (800) 441-7762 and (2) on the SEC’s website at http://www.sec.gov.
BlackRock’s Mutual Fund Family
BlackRock offers a diverse lineup of open-end mutual funds crossing all investment styles and managed by experts in equity, fixed income and tax-exempt investing. Visit http://www.blackrock.com for more information.
Account Information
Call us at (800) 441-7762 from 8:00 AM to 6:00 PM EST on any business day to get information about your account balances, recent transactions and share prices. You can also reach us on the Web at http://www.blackrock.com/funds.
Automatic Investment Plans
Investor Class shareholders who want to invest regularly can arrange to have $50 or more automatically deducted from their checking or savings account and invested in any of the BlackRock funds.
Systematic Withdrawal Plans
Investor Class shareholders can establish a systematic withdrawal plan and receive periodic payments of $50 or more from their BlackRock funds, as long as their account balance is at least $10,000.
Retirement Plans
Shareholders may make investments in conjunction with Traditional, Rollover, Roth, Coverdell, Simple IRAs, SEP IRAs and 403(b) Plans.
| | | | | | |
| | | | | | | |
| 42 | | BLACKROCK S&P 500 INDEX FUND | | DECEMBER 31, 2015 | | |
| | |
| Additional Information (concluded) | | |
| | |
| BlackRock Privacy Principles | | |
BlackRock is committed to maintaining the privacy of its current and former fund investors and individual clients (collectively, “Clients”) and to safeguarding their non-public personal information. The following information is provided to help you understand what personal information BlackRock collects, how we protect that information and why in certain cases we share such information with select parties.
If you are located in a jurisdiction where specific laws, rules or regulations require BlackRock to provide you with additional or different privacy-related rights beyond what is set forth below, then BlackRock will comply with those specific laws, rules or regulations.
BlackRock obtains or verifies personal non-public information from and about you from different sources, including the following: (i) information we receive from you or, if applicable, your financial intermediary, on applications, forms or other documents; (ii) information about your transactions with us, our affiliates, or others; (iii) information we receive from a consumer reporting agency; and (iv) from visits to our websites.
BlackRock does not sell or disclose to non-affiliated third parties any non-public personal information about its Clients, except as permitted by law or as is necessary to respond to regulatory requests or to service Client accounts. These non-affiliated third parties are required to protect the confidentiality and security of this information and to use it only for its intended purpose.
We may share information with our affiliates to service your account or to provide you with information about other BlackRock products or services that may be of interest to you. In addition, BlackRock restricts access to non-public personal information about its Clients to those BlackRock employees with a legitimate business need for the information. BlackRock maintains physical, electronic and procedural safeguards that are designed to protect the non-public personal information of its Clients, including procedures relating to the proper storage and disposal of such information.
| | | | | | |
| | | | | | | |
| | BLACKROCK S&P 500 INDEX FUND | | DECEMBER 31, 2015 | | 43 |
This report is intended for current holders. It is not authorized for use as an offer of sale or a solicitation of an offer to buy shares of the Fund unless preceded or accompanied by the Fund’s current prospectus. Past performance results shown in this report should not be considered a representation of future performance. Investment returns and principal value of shares will fluctuate so that shares, when redeemed, may be worth more or less than their original cost. Statements and other information herein are as dated and are subject to change.

| | |
| SPSF-12/15-AR | | |
| |
| |  |
DECEMBER 31, 2015
| | | | | | |
ANNUAL REPORT | | | | | |  |
BlackRock Total International ex U.S. Index Fund | of BlackRock Funds III
|
| Not FDIC Insured • May Lose Value • No Bank Guarantee |

| | | | | | |
| | | | | | | |
| 2 | | BLACKROCK TOTAL INTERNATIONAL ex U.S. INDEX FUND | | DECEMBER 31, 2015 | | |
Dear Shareholder,
Diverging monetary policies and shifting economic outlooks across regions have been the overarching themes driving financial markets over the past couple of years. With U.S. growth outpacing the global economic recovery in 2015 while inflationary pressures remained low, investors spent most of the year anticipating a short-term rate hike from the Federal Reserve (the “Fed”), which ultimately came to fruition in December. In contrast, the European Central Bank (“ECB”) and the Bank of Japan moved to a more accommodative stance during the year. In this environment, the U.S. dollar strengthened considerably, causing profit challenges for U.S. exporters and high levels of volatility in emerging market currencies and commodities. Oil prices were particularly volatile and below the historical norm due to an ongoing imbalance in global supply and demand.
Market volatility broadly increased in the middle of 2015, beginning with a sharp, but temporary, selloff in June as Greece’s long-brewing debt troubles came to an impasse. Just as these concerns abated, Chinese equities tumbled amid weakness in the country’s economy. This, combined with a depreciation of the yuan and declining confidence in China’s policymakers, stoked worries about the potential impact to the broader world economy, causing heightened volatility to spread throughout markets globally. Given a dearth of meaningful growth across most of the world, financial markets became more reliant on central bank policies to drive performance. In that vein, risk assets (such as equities and high yield bonds) rallied in October when China’s central bank provided more stimulus, the ECB hinted at further easing, and soft U.S. data pushed back expectations for a Fed rate hike. As the period came to a close, however, the ECB disappointed investors with its subdued policy changes. The Fed’s December rate hike had a positive impact on the markets as it removed a source of uncertainty, but this was counteracted by the dampening effect of a stronger U.S. dollar, falling oil prices and tighter credit conditions.
At BlackRock, we believe investors need to think globally, extend their scope across a broad array of asset classes and be prepared to move freely as market conditions change over time. We encourage you to talk with your financial advisor and visit blackrock.com for further insight about investing in today’s markets.
Sincerely,
Rob Kapito
President, BlackRock Advisors, LLC
Rob Kapito
President, BlackRock Advisors, LLC
| | | | | | | | |
| Total Returns as of December 31, 2015 | |
| | | 6-month | | | 12-month | |
U.S. large cap equities
(S&P 500® Index) | | | 0.15 | % | | | 1.38 | % |
U.S. small cap equities
(Russell 2000® Index) | | | (8.75 | ) | | | (4.41 | ) |
International equities
(MSCI Europe, Australasia,
Far East Index) | | | (6.01 | ) | | | (0.81 | ) |
Emerging market equities
(MSCI Emerging
Markets Index) | | | (17.35 | ) | | | (14.92 | ) |
3-month Treasury bills
(BofA Merrill Lynch 3-Month
U.S. Treasury Bill Index) | | | 0.04 | | | | 0.05 | |
U.S. Treasury securities
(BofA Merrill Lynch 10-Year
U.S. Treasury Index) | | | 1.43 | | | | 0.91 | |
U.S. investment-grade
bonds (Barclays
U.S. Aggregate Bond Index) | | | 0.65 | | | | 0.55 | |
Tax-exempt municipal
bonds (S&P Municipal
Bond Index) | | | 3.31 | | | | 3.32 | |
U.S. high yield bonds
(Barclays U.S.
Corporate High Yield 2%
Issuer Capped Index) | | | (6.79 | ) | | | (4.43 | ) |
| Past performance is no guarantee of future results. Index performance is shown for illustrative purposes only. You cannot invest directly in an index. | |
| | | | | | |
| | | | | | | |
| | THIS PAGE NOT PART OF YOUR FUND REPORT | | | | 3 |
| | |
| Fund Summary as of December 31, 2015 | | |
BlackRock Total International ex U.S. Index Fund’s (the “Fund”) (formerly known as BlackRock ACWI ex-U.S. Index Fund) investment objective is to match the performance of the MSCI All Country World ex USA Index (the “MSCI ACWI ex USA Index”) in U.S. dollars with net dividends as closely as possible before the deduction of Fund expenses.
| | |
| Portfolio Management Commentary | | |
How did the Fund perform?
| • | | For the 12-month period ended December 31, 2015, the Fund’s Institutional Shares returned (5.89)%, Investor A Shares returned (6.05)% and Class K Shares returned (5.83)%. The benchmark MSCI ACWI ex USA Index returned (5.66)% for the same period. |
| • | | Returns for the Fund’s respective share classes differ from the benchmark index due to individual share-class expenses. The Fund invests all of its assets in the Total International ex U.S. Index Master Portfolio (the “Master Portfolio”), a series of Master Investment Portfolio. |
Describe the market environment.
| • | | The global equity indexes rallied early in the year driven by easy monetary policies. Central banks were center stage, with the European Central Bank (“ECB”) announcing its asset purchase program, and the Swiss National Bank abandoning its approach to align the Swiss Franc to the euro. Markets continued to rally on additional central bank intervention in Australia, China and Denmark. A cease fire agreement between Russia and Ukraine also lifted global markets as political tension in the region subsided. |
| • | | An important theme throughout the year was U.S. dollar strength and speculation of an impending rate hike from the Federal Reserve (the “Fed”). Indexes rallied following a strong start to the earnings season and merger and acquisition activity despite uncertainty around the Fed’s timing for raising rates and underperformance in the energy sector due to tumbling oil prices. |
| • | | Developed equity markets experienced negative performance in the second half of the year driven primarily by weaker global growth expectations. Volatility increased in the eurozone, Asia and the United States as a result of disappointing macro data. A significant selloff in the Chinese equity market, spread across all of the developed areas despite continued Chinese government intervention. This resulted in a European equities selloff into correction territory. |
| • | | The year neared its close with the Fed’s announcement that it would raise short-term rates for the first time in nearly a decade and an announcement from the ECB that it was not going to increase the value of bonds purchased each month under its asset purchase program. A key theme heading into 2016 is the divergence in monetary policy between the United States and the rest of the world. |
Describe recent portfolio activity.
| • | | During the period, as changes were made to the composition of the MSCI ACWI ex U.S. Index, the Master Portfolio purchased and sold securities to maintain its objective of replicating the risks and return of the benchmark index. |
Describe portfolio positioning at period end.
| • | | The Master Portfolio remains positioned to match the risk characteristics of its benchmark index, irrespective of the market’s future direction. |
The views expressed reflect the opinions of BlackRock as of the date of this report and are subject to change based on changes in market, economic or other conditions. These views are not intended to be a forecast of future events and are no guarantee of future results.
| | | | | | |
| | | | | | | |
| 4 | | BLACKROCK TOTAL INTERNATIONAL ex U.S. INDEX FUND | | DECEMBER 31, 2015 | | |
| | |
| Total Return Based on a $10,000 Investment | | |
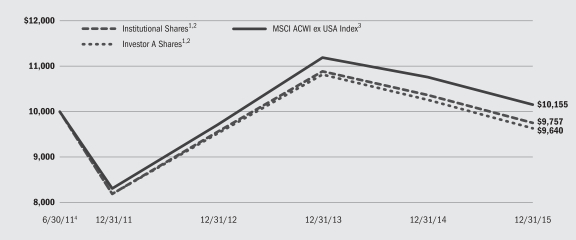
| | 1 | | Assuming transaction costs and other operating expense, including administration fees, if any. |
| | 2 | | The Fund invests all of its assets in the Master Portfolio. The Master Portfolio will be substantially invested in securities in the MSCI ACWI ex USA Index, and will invest, under normal circumstances, at least 80% of its assets in securities or other financial instruments that are components of or have economic characteristics similar to the securities included in the MSCI ACWI ex USA Index. |
| | 3 | | The Index is a free float-adjusted market capitalization index designed to measure the combined equity market performance of developed and emerging market countries, excluding the United States. |
| | 4 | | Commencement of operations. |
| | | | | | | | |
| Performance Summary for the Period Ended December 31, 2015 | | |
| | | | | | | | | | | | |
| | | 6-Month
Total Returns | | | Average Annual Total Returns5 | |
| | | | 1 Year | | | Since Inception6 | |
Institutional | | | (9.81 | )% | | | (5.89 | )% | | | (0.54 | )% |
Investor A | | | (9.99 | ) | | | (6.05 | ) | | | (0.81 | ) |
Class K | | | (9.87 | ) | | | (5.83 | ) | | | (0.04 | ) |
| MSCI ACWI ex USA Index | | (9.32) | | | (5.66) | | | 0.34 | |
| | 5 | | See “About Fund Performance” on page 6 for a detailed description of share classes, including any related sales charges and fees. |
| | 6 | | The Fund commenced operations on June 30, 2011. |
| | | | Past performance is not indicative of future results. |
| | | | | | | | | | | | | | | | | | | | | | | | | | | | |
| | | Actual | | | Hypothetical7 | | | | |
| | | Beginning Account Value July 1, 2015 | | | Ending Account Value December 31, 2015 | | | Expenses Paid
During the
Period6 | | | Beginning Account Value July 1, 2015 | | | Ending Account Value
December 31, 2015 | | | Expenses Paid
During the
Period6 | | | Annualized
Expense Ratio | |
Institutional | | $ | 1,000.00 | | | $ | 901.90 | | | $ | 0.81 | | | $ | 1,000.00 | | | $ | 1,024.35 | | | $ | 0.87 | | | | 0.17 | % |
Investor A | | $ | 1,000.00 | | | $ | 900.10 | | | $ | 1.82 | | | $ | 1,000.00 | | | $ | 1,023.29 | | | $ | 1.94 | | | | 0.38 | % |
Class K | | $ | 1,000.00 | | | $ | 901.30 | | | $ | 0.53 | | | $ | 1,000.00 | | | $ | 1,024.65 | | | $ | 0.56 | | | | 0.11 | % |
| | 6 | | For each class of the Fund, expenses are equal to the annualized net expense ratio for the class, multiplied by the average account value over the period, multiplied by 184/365 (to reflect the one-half year period shown). Because the Fund invests all of its assets in the Master Portfolio, the expense example reflects the net expenses of both the Fund and the Master Portfolio in which it invests. |
| | 7 | | Hypothetical 5% annual return before expenses is calculated by prorating the number of days in the most recent fiscal half year divided by 365. |
| | | | See “Disclosure of Expenses” on page 6 for further information on how expenses were calculated. |
| | | | | | |
| | | | | | | |
| | BLACKROCK TOTAL INTERNATIONAL ex U.S. INDEX FUND | | DECEMBER 31, 2015 | | 5 |
| • | | Institutional and Class K Shares are not subject to any sales charge. These shares bear no ongoing distribution or service fees and are available only to certain eligible investors. |
| • | | Investor A Shares are not subject to any sales charge and bear no ongoing distribution fee. These shares are subject to an ongoing service fee of 0.25% per year. These shares are generally available through financial intermediaries. |
Performance information reflects past performance and does not guarantee future results. Current performance may be lower or higher than the performance data quoted. Refer to www.blackrock.com/funds to obtain performance data current to the most recent month-end. Performance results do not reflect the deduction of taxes that a shareholder would pay on fund distributions or the redemption of fund shares. Figures shown in the performance table on the previous page assume reinvestment of all distributions, if any, at net asset value (“NAV”) on the ex-dividend date. Investment return and principal value of shares will fluctuate so that shares, when redeemed, may be worth more or less than their original cost. Distributions paid to each class of shares will vary because of the different levels of administration and distribution fees applicable to each class, which are deducted from the income available to be paid to shareholders.
BlackRock Advisors, LLC (the “Administrator”), the Fund’s administrator, has contractually agreed to waive and/or reimburse a portion of the Fund’s expenses. Without such waiver and/or reimbursement, the Fund’s performance would have been lower. The Administrator is under no obligation to continue waiving and/or reimbursing its fees after the applicable termination date of such agreement. See Note 4 of the Notes to Financial Statements for additional information on waivers and/or reimbursements.
Shareholders of the Fund may incur the following charges: (a) transactional expenses, such as sales charges; and (b) operating expenses, including administration fees, service and distribution fees, including 12b-1 fees, acquired fund fees and expenses and other Fund expenses. The expense example on the previous page (which is based on a hypothetical investment of $1,000 invested on July 1, 2015 and held through December 31, 2015) is intended to assist shareholders both in calculating expenses based on an investment in the Fund and in comparing these expenses with similar costs of investing in other mutual funds.
The expense example provides information about actual account values and actual expenses. In order to estimate the expenses a shareholder paid during the period covered by this report, shareholders can divide their account value by $1,000 and then multiply the result by the number corresponding to their share class under the heading entitled “Expenses Paid During the Period.”
The expense example also provides information about hypothetical account values and hypothetical expenses based on the Fund’s actual expense ratio and an assumed rate of return of 5% per year before expenses. In order to assist shareholders in comparing the ongoing expenses of investing in the Fund and other funds, compare the 5% hypothetical example with the 5% hypothetical examples that appear in shareholder reports of other funds.
The expenses shown in the expense example are intended to highlight shareholders’ ongoing costs only and do not reflect any transactional expenses, such as sales charges, if any. Therefore, the hypothetical example is useful in comparing ongoing expenses only, and will not help shareholders determine the relative total expenses of owning different funds. If these transactional expenses were included, shareholder expenses would have been higher.
| | |
| Derivative Financial Instruments | | |
The Master Portfolio may invest in various derivative financial instruments. Derivative financial instruments are used to obtain exposure to a security, index and/or market without owning or taking physical custody of securities or to manage market, equity, credit, interest rate, foreign currency exchange rate, commodity and/or other risks. Derivative financial instruments may give rise to a form of economic leverage. Derivative financial instruments also involve risks, including the imperfect correlation between the value of a derivative financial instrument and the underlying asset, possible default of the counterparty to the transaction or illiquidity of the derivative financial instrument. The Master Portfolio’s ability to use a derivative financial instrument successfully depends on the investment advisor’s ability to predict pertinent market movements accurately, which cannot be assured. The use of derivative financial instruments may result in losses greater than if they had not been used, may limit the amount of appreciation the Master Portfolio can realize on an investment and/or may result in lower distributions paid to shareholders. The Master Portfolio’s investments in these instruments, if any, are discussed in detail in the Notes to Financial Statements.
| | | | | | |
| | | | | | | |
| 6 | | BLACKROCK TOTAL INTERNATIONAL ex U.S. INDEX FUND | | DECEMBER 31, 2015 | | |
| | |
| Statement of Assets and Liabilities | | BlackRock Total International ex U.S. Index Fund |
| | | | |
| December 31, 2015 | | | |
| | | | |
| Assets | | | | |
Investments at value — Master Portfolio (cost — $194,990,159) | | $ | 192,233,826 | |
Receivables: | | | | |
Capital shares sold | | | 1,156,678 | |
From administrator | | | 16,178 | |
Prepaid expenses | | | 20,845 | |
| | | | |
Total assets | | | 193,427,527 | |
| | | | |
| | | | |
| Liabilities | | | | |
Payables: | | | | |
Contributions to the Master Portfolio | | | 1,062,996 | |
Capital shares redeemed | | | 93,682 | |
Professional fees | | | 34,007 | |
Service fees | | | 30,764 | |
Income dividends | | | 5,529 | |
Officer’s fees | | | 37 | |
Other accrued expenses | | | 9,953 | |
| | | | |
Total liabilities | | | 1,236,968 | |
| | | | |
Net Assets | | $ | 192,190,559 | |
| | | | |
| | | | |
| Net Assets Consist of | | | | |
Paid-in capital | | $ | 198,169,442 | |
Distributions in excess of net investment income | | | (205,288 | ) |
Accumulated net realized loss | | | (3,017,262 | ) |
Net unrealized appreciation (depreciation) | | | (2,756,333 | ) |
| | | | |
Net Assets | | $ | 192,190,559 | |
| | | | |
| | | | |
| Net Asset Value | | | | |
Institutional — Based on net assets of $40,716,175 and 5,321,230 shares outstanding, unlimited number of shares authorized, no par value | | $ | 7.65 | |
| | | | |
Investor A — Based on net assets of $144,177,277 and 18,889,943 shares outstanding, unlimited number of shares authorized, no par value | | $ | 7.63 | |
| | | | |
Class K — Based on net assets of $7,297,107 and 928,043 shares outstanding, unlimited number of shares authorized, no par value | | $ | 7.86 | |
| | | | |
| | | | | | |
| See Notes to Financial Statements. | | | | |
| | | | | | | |
| | BLACKROCK TOTAL INTERNATIONAL ex U.S. INDEX FUND | | DECEMBER 31, 2015 | | 7 |
| | |
| Statement of Operations | | BlackRock Total International ex U.S. Index Fund |
| | | | |
| Year Ended December 31, 2015 | | | |
| | | | |
| Investment Income | | | | |
| Net investment income allocated from the Master Portfolio: | | | | |
Dividends | | $ | 1,914,106 | |
Securities lending — affiliated — net | | | 31,449 | |
Income — affiliated | | | 1,287 | |
Expenses | | | (48,477 | ) |
Foreign taxes withheld | | | (230,927 | ) |
Fees waived | | | 1,212 | |
| | | | |
Total income | | | 1,668,650 | |
| | | | |
| | | | |
| Fund Expenses | | | | |
Administration | | | 9,133 | |
Service — Investor A | | | 106,344 | |
Transfer agent — Institutional | | | 8,152 | |
Transfer agent — Investor A | | | 1,985 | |
Registration | | | 69,987 | |
Professional | | | 55,438 | |
Printing | | | 19,594 | |
Recoupment of past fees waived and/or reimbursed — class specific | | | 3,049 | |
Officer | | | 31 | |
Miscellaneous | | | 6,002 | |
| | | | |
Total expenses | | | 279,715 | |
| Less: | | | | |
Administration fees waived | | | (7,139 | ) |
Transfer agent fees waived — Institutional | | | (8 | ) |
Transfer agent fees waived — Investor A | | | (240 | ) |
Transfer agent fees reimbursed — Institutional | | | (2 | ) |
Transfer agent fees reimbursed — Investor A | | | (225 | ) |
Fees reimbursed by the administrator | | | (108,614 | ) |
| | | | |
Total expenses after fees waived and/or reimbursed | | | 163,487 | |
| | | | |
Net investment income | | | 1,505,163 | |
| | | | |
| | | | |
| Realized and Unrealized Gain (Loss) Allocated from the Master Portfolio | | | | |
Net realized gain (loss) from investments, financial futures contracts, foreign capital gain tax and foreign currency transactions | | | 1,963,965 | |
Net change in unrealized appreciation (depreciation) on investments, financial futures contracts and foreign currency translations | | | (6,722,869 | ) |
| | | | |
Net realized and unrealized loss | | | (4,758,904 | ) |
| | | | |
Net Decrease in Net Assets Resulting from Operations | | $ | (3,253,741 | ) |
| | | | |
| | | | | | |
| See Notes to Financial Statements. | | | | |
| | | | | | | |
| 8 | | BLACKROCK TOTAL INTERNATIONAL ex U.S. INDEX FUND | | DECEMBER 31, 2015 | | |
| | |
| Statements of Changes in Net Assets | | BlackRock Total International ex U.S. Index Fund |
| | | | | | | | |
| | | Year Ended December 31, | |
| Increase (Decrease) in Net Assets: | | 2015 | | | 2014 | |
| | | | | | | | |
| Operations | | | | | | | | |
Net investment income | | $ | 1,505,163 | | | $ | 505,648 | |
Net realized gain (loss) | | | 1,963,965 | | | | 2,081,148 | |
Net change in unrealized appreciation (depreciation) | | | (6,722,869 | ) | | | (3,625,915 | ) |
| | | | | | | | |
Net decrease in net assets resulting from operations | | | (3,253,741 | ) | | | (1,039,119 | ) |
| | | | | | | | |
| | | | | | | | |
| Distributions to Shareholders1 | | | | | | | | |
| From net investment income: | | | | | | | | |
Institutional | | | (571,448 | ) | | | (471,088 | ) |
Investor A | | | (900,995 | ) | | | (3,912 | ) |
Class K | | | (149,505 | ) | | | (33,598 | ) |
| From net realized gain: | | | | | | | | |
Institutional | | | (493,712 | ) | | | (1,639,808 | ) |
Investor A | | | (1,217,105 | ) | | | (31,240 | ) |
Class K | | | (107,430 | ) | | | (476,304 | ) |
| | | | | | | | |
Decrease in net assets resulting from distributions to shareholders | | | (3,440,195 | ) | | | (2,655,950 | ) |
| | | | | | | | |
| | | | | | | | |
| Capital Share Transactions | | | | | | | | |
Net increase in net assets derived from capital share transactions | | | 174,864,697 | | | | 12,556,607 | |
| | | | | | | | |
| | | | | | | | |
| Net Assets | | | | | | | | |
Total increase in net assets | | | 168,170,761 | | | | 8,861,538 | |
Beginning of year | | | 24,019,798 | | | | 15,158,260 | |
| | | | | | | | |
End of year | | $ | 192,190,559 | | | $ | 24,019,798 | |
| | | | | | | | |
Distributions in excess of net investment income, end of year | | $ | (205,288 | ) | | $ | (88,503 | ) |
| | | | | | | | |
1 Distributions for annual periods determined in accordance with federal income tax regulations. | | | | | | | | |
| | | | | | |
| See Notes to Financial Statements. | | | | |
| | | | | | | |
| | BLACKROCK TOTAL INTERNATIONAL ex U.S. INDEX FUND | | DECEMBER 31, 2015 | | 9 |
| | |
| Financial Highlights | | BlackRock Total International ex U.S. Index Fund |
| | | | | | | | | | | | | | | | | | | | |
| | | Institutional | |
| | | Year Ended December 31, | | | Period from
June 30, 20111
to December 31, 2011 | |
| | | 2015 | | | 2014 | | | 2013 | | | 2012 | | |
| | | | | | | | | | | | | | | | | | | | |
| Per Share Operating Performance | | | | | | | | | | | | | | | | | | | | |
Net asset value, beginning of period | | $ | 8.43 | | | $ | 10.06 | | | $ | 9.06 | | | $ | 8.13 | | | $ | 10.00 | |
| | | | |
Net investment income2 | | | 0.21 | | | | 0.30 | | | | 0.22 | | | | 0.17 | | | | 0.08 | |
Net realized and unrealized gain (loss) | | | (0.69 | ) | | | (0.75 | ) | | | 1.02 | | | | 1.16 | | | | (1.89 | ) |
| | | | |
Net increase (decrease) from investment operations | | | (0.48 | ) | | | (0.45 | ) | | | 1.24 | | | | 1.33 | | | | (1.81 | ) |
| | | | |
| Distributions to Shareholders:3 | | | | | | | | | | | | | | | | | | | | |
From net investment income | | | (0.17 | ) | | | (0.29 | ) | | | (0.24 | ) | | | (0.40 | ) | | | (0.04 | ) |
From net realized gain | | | (0.13 | ) | | | (0.89 | ) | | | — | | | | — | | | | — | |
From return of capital | | | — | | | | — | | | | — | | | | (0.00 | )4 | | | (0.02 | ) |
| | | | |
Total distributions | | | (0.30 | ) | | | (1.18 | ) | | | (0.24 | ) | | | (0.40 | ) | | | (0.06 | ) |
| | | | |
Net asset value, end of period | | $ | 7.65 | | | $ | 8.43 | | | $ | 10.06 | | | $ | 9.06 | | | $ | 8.13 | |
| | | | |
| | | | | | | | | | | | | | | | | | | | |
| Total Return5 | | | | | | | | | | | | | | | | | | | | |
Based on net asset value | | | (5.89)% | | | | (4.78)% | | | | 13.94% | | | | 16.61% | | | | (18.05)% | 6 |
| | | | |
| | | | | | | | | | | | | | | | | | | | |
| Ratios to Average Net Assets7 | | | | | | | | | | | | | | | | | | | | |
Total expenses8 | | | 0.45% | | | | 0.83% | 9 | | | 1.25% | | | | 0.75% | | | | 2.04% | 10,11 |
| | | | |
Total expenses after fees waived and/or reimbursed8 | | | 0.17% | | | | 0.21% | 9 | | | 0.35% | | | | 0.34% | | | | 0.37% | 10 |
| | | | |
Net investment income8 | | | 2.49% | | | | 3.00% | 9 | | | 2.35% | | | | 1.95% | | | | 1.78% | 10 |
| | | | |
| | | | | | | | | | | | | | | | | | | | |
| Supplemental Data | | | | | | | | | | | | | | | | | | | | |
Net assets, end of period (000) | | $ | 40,716 | | | $ | 17,380 | | | $ | 15,013 | | | $ | 9,602 | | | $ | 46 | |
| | | | |
Portfolio turnover rate of the Master Portfolio | | | 6% | | | | 49% | | | | 36% | | | | 42% | | | | 4% | |
| | | | |
| | 1 | | Commencement of operations. |
| | 2 | | Based on average shares outstanding. |
| | 3 | | Distributions for annual periods determined in accordance with federal income tax regulations. |
| | 4 | | Amount is greater than $(0.005) per share. |
| | 5 | | Where applicable, assumes the reinvestment of distributions. |
| | 6 | | Aggregate total return. |
| | 7 | | Includes the Fund’s share of the Master Portfolio’s allocated net expenses and/or net investment income. |
| | 8 | | Includes the Fund’s share of the Master Portfolio’s allocated fees waived of 0.00%, 0.03%, 0.01%, 0.08% and 1.14% for the years ended December 31, 2015, December 31, 2014, December 31, 2013 and December 31, 2012, and the period ended December 31, 2011, respectively. |
| | 9 | | Excludes expenses incurred indirectly as a result of investments in underlying funds of approximately 0.01%. |
| | 11 | | Organization costs were not annualized in the calculation of the expense ratios. If these expenses were annualized, the total expenses for Institutional Shares would have been 2.08%. |
| | | | | | |
| See Notes to Financial Statements. | | | | |
| | | | | | | |
| 10 | | BLACKROCK TOTAL INTERNATIONAL ex U.S. INDEX FUND | | DECEMBER 31, 2015 | | |
| | |
| Financial Highlights (continued) | | BlackRock Total International ex U.S. Index Fund |
| | | | | | | | | | | | | | | | | | | | |
| | | Investor A | |
| | | Year Ended December 31, | | | Period from
June 30, 20111
to December 31,
2011 | |
| | | 2015 | | | 2014 | | | 2013 | | | 2012 | | |
| | | | | | | | | | | | | | | | | | | | |
| Per Share Operating Performance | | | | | | | | | | | | | | | | | | | | |
Net asset value, beginning of period | | $ | 8.41 | | | $ | 10.06 | | | $ | 9.06 | | | $ | 8.13 | | | $ | 10.00 | |
| | | | |
Net investment income2 | | | 0.13 | | | | 0.22 | | | | 0.21 | | | | 0.19 | | | | 0.08 | |
Net realized and unrealized gain (loss) | | | (0.62 | ) | | | (0.71 | ) | | | 1.00 | | | | 1.12 | | | | (1.89 | ) |
| | | | |
Net increase (decrease) from investment operations | | | (0.49 | ) | | | (0.49 | ) | | | 1.21 | | | | 1.31 | | | | (1.81 | ) |
| | | | |
| Distributions to Shareholders:3 | | | | | | | | | | | | | | | | | | | | |
From net investment income | | | (0.16 | ) | | | (0.27 | ) | | | (0.21 | ) | | | (0.38 | ) | | | (0.04 | ) |
From net realized gain | | | (0.13 | ) | | | (0.89 | ) | | | — | | | | — | | | | — | |
From return of capital | | | — | | | | — | | | | — | | | | (0.00 | )4 | | | (0.02 | ) |
| | | | |
Total distributions | | | (0.29 | ) | | | (1.16 | ) | | | (0.21 | ) | | | (0.38 | ) | | | (0.06 | ) |
| | | | |
Net asset value, end of period | | $ | 7.63 | | | $ | 8.41 | | | $ | 10.06 | | | $ | 9.06 | | | $ | 8.13 | |
| | | | |
| | | | | | | | | | | | | | | | | | | | |
| Total Return5 | | | | | | | | | | | | | | | | | | | | |
Based on net asset value | | | (6.05)% | | | | (5.19)% | | | | 13.63% | | | | 16.31% | | | | (18.11)% | 6 |
| | | | |
| | | | | | | | | | | | | | | | | | | | |
| Ratios to Average Net Assets7 | | | | | | | | | | | | | | | | | | | | |
Total expenses8 | | | 0.43% | | | | 1.30% | 9 | | | 1.91% | | | | 1.88% | | | | 2.30% | 10,11 |
| | | | |
Total expenses after fees waived and/or reimbursed8 | | | 0.38% | | | | 0.46% | 9 | | | 0.64% | | | | 0.63% | | | | 0.62% | 10 |
| | | | |
Net investment income8 | | | 1.63% | | | | 2.28% | 9 | | | 2.21% | | | | 2.18% | | | | 1.74% | 10 |
| | | | |
| | | | | | | | | | | | | | | | | | | | |
| Supplemental Data | | | | | | | | | | | | | | | | | | | | |
Net assets, end of period (000) | | $ | 144,177 | | | $ | 372 | | | $ | 65 | | | $ | 39 | | | $ | 20 | |
| | | | |
Portfolio turnover rate of the Master Portfolio | | | 6% | | | | 49% | | | | 36% | | | | 42% | | | | 4% | |
| | | | |
| | 1 | | Commencement of operations. |
| | 2 | | Based on average shares outstanding. |
| | 3 | | Distributions for annual periods determined in accordance with federal income tax regulations. |
| | 4 | | Amount is greater than $(0.005) per share. |
| | 5 | | Where applicable, assumes the reinvestment of distributions. |
| | 6 | | Aggregate total return. |
| | 7 | | Includes the Fund’s share of the Master Portfolio’s allocated net expenses and/or net investment income. |
| | 8 | | Includes the Fund’s share of the Master Portfolio’s allocated fees waived of 0.00%, 0.03%, 0.01%, 0.16% and 1.14% for the years ended December 31,2015, December 31, 2014, December 31, 2013 and December 31, 2012 and the period ended December 31, 2011, respectively. |
| | 9 | | Excludes expenses incurred indirectly as a result of investments in underlying funds of approximately 0.01%. |
| | 11 | | Organization costs were not annualized in the calculation of the expense ratios. If these expenses were annualized, the total expenses for Institutional Shares would have been 2.36%. |
| | | | | | |
| See Notes to Financial Statements. | | | | |
| | | | | | | |
| | BLACKROCK TOTAL INTERNATIONAL ex U.S. INDEX FUND | | DECEMBER 31, 2015 | | 11 |
| | |
| Financial Highlights (concluded) | | BlackRock Total International ex U.S. Index Fund |
| | | | | | | | | | | | | | | | | | | | |
| | | Class K | |
| | | Year Ended December 31, | | | Period from
June 30, 20111
to December 31, 2011 | |
| | | 2015 | | | 2014 | | | 2013 | | | 2012 | | |
| | | | | | | | | | | | | | | | | | | | |
| Per Share Operating Performance | | | | | | | | | | | | | | | | | | | | |
Net asset value, beginning of period | | $ | 8.65 | | | $ | 10.30 | | | $ | 9.27 | | | $ | 8.13 | | | $ | 10.00 | |
| | | | |
Net investment income2 | | | 0.23 | | | | 0.19 | | | | 0.23 | | | | 0.28 | | | | 0.09 | |
Net realized and unrealized gain (loss) | | | (0.71 | ) | | | (0.65 | ) | | | 1.04 | | | | 1.27 | | | | (1.90 | ) |
| | | | |
Net increase (decrease) from investment operations | | | (0.48 | ) | | | (0.46 | ) | | | 1.27 | | | | 1.55 | | | | (1.81 | ) |
| | | | |
| Distributions to Shareholders:3 | | | | | | | | | | | | | | | | | | | | |
From net investment income | | | (0.18 | ) | | | (0.30 | ) | | | (0.24 | ) | | | (0.41 | ) | | | (0.04 | ) |
From net realized gain | | | (0.13 | ) | | | (0.89 | ) | | | — | | | | — | | | | — | |
From return of capital | | | — | | | | — | | | | — | | | | (0.00 | )4 | | | (0.02 | ) |
| | | | |
Total distributions | | | (0.31 | ) | | | (1.19 | ) | | | (0.24 | ) | | | (0.41 | ) | | | (0.06 | ) |
| | | | |
Net asset value, end of period | | $ | 7.86 | | | $ | 8.65 | | | $ | 10.30 | | | $ | 9.27 | | | $ | 8.13 | |
| | | | |
| | | | | | | | | | | | | | | | | | | | |
| Total Return5 | | | | | | | | | | | | | | | | | | | | |
Based on net asset value | | | (5.83)% | | | | (4.84)% | | | | 13.96% | | | | 19.25% | | | | (18.04)% | 6 |
| | | | |
| | | | | | | | | | | | | | | | | | | | |
| Ratios to Average Net Assets7 | | | | | | | | | | | | | | | | | | | | |
Total expenses8 | | | 0.46% | | | | 0.81% | 9 | | | 1.36% | | | | 1.80% | | | | 1.73% | 10,11 |
| | | | |
Total expenses after fees waived and/or reimbursed8 | | | 0.13% | | | | 0.15% | 9 | | | 0.34% | | | | 0.33% | | | | 0.32% | 10 |
| | | | |
Net investment income8 | | | 2.71% | | | | 2.02% | 9 | | | 2.40% | | | | 3.31% | | | | 2.03% | 10 |
| | | | |
| | | | | | | | | | | | | | | | | | | | |
| Supplemental Data | | | | | | | | | | | | | | | | | | | | |
Net assets, end of period (000) | | $ | 7,297 | | | $ | 6,267 | | | $ | 80 | | | $ | 50 | | | $ | 16,224 | |
| | | | |
Portfolio turnover rate of the Master Portfolio | | | 6% | | | | 49% | | | | 36% | | | | 42% | | | | 4% | |
| | | | |
| | 1 | | Commencement of operations. |
| | 2 | | Based on average shares outstanding. |
| | 3 | | Distributions for annual periods determined in accordance with federal income tax regulations. |
| | 4 | | Amount is greater than $(0.005) per share. |
| | 5 | | Where applicable, assumes the reinvestment of distributions. |
| | 6 | | Aggregate total return. |
| | 7 | | Includes the Fund’s share of the Master Portfolio’s allocated expenses and/or net investment income. |
| | 8 | | Includes the Fund’s share of the Master Portfolio’s allocated fees waived of 0.00%, 0.03%, 0.01%, 0.29% and 1.14% for the years ended December 31, 2015, December 31, 2014, December 31, 2013, December 31, 2012, and the period ended December 31, 2011, respectively. |
| | 9 | | Includes the Fund’s share of the Series’ allocated fees waived of less than 0.01%. |
| | 11 | | Organization costs were not annualized in the calculation of the expense ratio. If these expenses were annualized, the total expenses would have been 1.79%. |
| | | | | | |
| See Notes to Financial Statements. | | | | |
| | | | | | | |
| 12 | | BLACKROCK TOTAL INTERNATIONAL ex U.S. INDEX FUND | | DECEMBER 31, 2015 | | |
| | |
| Notes to Financial Statements | | BlackRock Total International ex U.S. Index Fund |
1. Organization:
BlackRock Total International ex U.S. Index Fund (the “Fund”) (formerly known as BlackRock ACWI ex-U.S. Index Fund), a series of BlackRock Funds III (the “Trust”), is registered under the Investment Company Act of 1940, as amended (the “1940 Act”), as a non-diversified, open-end management investment company. The Trust is organized as a Delaware statutory trust. The Fund seeks to achieve its investment objective by investing all of its assets in Total International ex U.S. Index Master Portfolio (the “Master Portfolio”) (formerly known as BlackRock ACWI ex-U.S. Index Master Portfolio), a series of Master Investment Portfolio (“MIP”), an affiliate of the Fund, which has the same investment objective and strategies as the Fund. The value of the Fund’s investment in the Master Portfolio reflects the Fund’s proportionate interest in the net assets of the Master Portfolio. The performance of the Fund is directly affected by the performance of the Master Portfolio. At December 31, 2015, the percentage of the Master Portfolio owned by the Fund was 23.0%. As such, the financial statements of the Master Portfolio, including the Schedule of Investments, are included elsewhere in this report and should be read in conjunction with the Fund’s financial statements.
The Fund offers multiple classes of shares. All classes of shares have identical voting, dividend, liquidation and other rights and are subject to the same terms and conditions, except that Investor A Shares bear certain expenses related to shareholder servicing of such shares. Institutional and Class K Shares are sold only certain eligible investors. Investor A Shares are generally available through financial intermediaries. Each class has exclusive voting rights with respect to matters relating to its shareholder servicing and distribution expenditures.
| | | | | | | | | | | | |
| Share Class | | Initial Sales Charge | | | CDSC | | | Conversion Privilege | |
Institutional Shares | | | No | | | | No | | | | None | |
Investor A Shares | | | No | | | | No | | | | None | |
Class K Shares | | | No | | | | No | | | | None | |
The Board of Trustees of the Fund and Board of Trustees of MIP are referred to throughout this report as the “Board of Trustees” or the “Board” and the members are referred to as “Trustees.”
The Fund, together with certain other registered companies advised by BlackRock Advisors, LLC (“BAL” or the “Administrator”) or its affiliates, is included in a complex of open-end funds referred to as the Equity Liquidity Complex.
2. Significant Accounting Policies:
The financial statements are prepared in conformity with accounting principles generally accepted in the United States of America (“U.S. GAAP”), which may require management to make estimates and assumptions that affect the reported amounts of assets and liabilities in the financial statements, disclosure of contingent assets and liabilities at the date of the financial statements and the reported amounts of increases and decreases in net assets from operations during the reporting period. Actual results could differ from those estimates. The Fund is considered an investment company under U.S. GAAP and follows the accounting and reporting guidance applicable to investment companies. Below is a summary of significant accounting policies:
Investment Transactions and Investment Income: For financial reporting purposes, contributions to and withdrawals from the Master Portfolio are accounted on a trade date basis. The Fund records daily its proportionate share of the Master Portfolio’s income, expenses and realized and unrealized gains and losses. Realized and unrealized gains and losses are adjusted utilizing partnership tax allocation rules. In addition, the Fund accrues its own expenses. Income, expenses and realized and unrealized gains and losses are allocated daily to each class based on its relative net assets.
Distributions: Distributions paid by the Fund are recorded on the ex-dividend date. Distributions of capital gains are recorded on the ex-dividend date. The character and timing of distributions are determined in accordance with federal income tax regulations, which may differ from U.S. GAAP.
Indemnifications: In the normal course of business, the Fund enters into contracts that contain a variety of representations that provide general indemnification. The Fund’s maximum exposure under these arrangements is unknown because it involves future potential claims against the Fund, which cannot be predicted with any certainty.
Other: Expenses directly related to the Fund or its classes are charged to the Fund or the applicable class. Other operating expenses shared by several funds, including other funds managed by the Administrator, are prorated among those funds on the basis of relative net assets or other appropriate methods. Expenses directly related to the Fund and other shared expenses prorated to the Fund are allocated daily to each class based on its relative net assets or other appropriate methods.
| | | | | | |
| | | | | | | |
| | BLACKROCK TOTAL INTERNATIONAL ex U.S. INDEX FUND | | DECEMBER 31, 2015 | | 13 |
| | |
| Notes to Financial Statements (continued) | | BlackRock Total International ex U.S. Index Fund |
3. Investment Valuation and Fair Value Measurements:
Investment Valuation Policies: The Fund’s policy is to fair value its financial instruments at fair value. The Fund records its investment in the Master Portfolio at fair value based on the Fund’s proportionate interest in the net assets of the Master Portfolio. Valuation of securities held by the Master Portfolio is discussed in Note 3 of the Master Portfolio’s Notes to Financial Statements, which are included elsewhere in this report.
4. Administration Agreement and Other Transactions with Affiliates:
The PNC Financial Services Group, Inc. is the largest stockholder and an affiliate of BlackRock, Inc. (“BlackRock”) for 1940 Act purposes.
The Trust, on behalf of the Fund, entered into an Administration Agreement with BlackRock Advisors, LLC (“BAL” or the “Administrator”), an indirect, wholly owned subsidiary of BlackRock, to provide administrative services (other than investment advice and related portfolio activities). Effective April 30, 2015, for such services, the Fund pays BAL a monthly fee at an annual rate of 0.01% of the average daily value of the Fund’s net assets. Prior to April 30, 2015, the Fund paid BAL a monthly fee at an annual rate of 0.03% of the average daily net assets of the Fund. The Fund does not pay an investment advisory fee or investment management fee.
BlackRock Fund Advisors, LLC (“BFA”), the investment advisor for the Master Portfolio, and BAL contractually agreed to waive and/or reimburse fees or expenses in order to limit expenses, excluding interest expense, dividend expense, tax expense, acquired fund fees and expenses and certain other fund expenses, which constitute extraordinary expenses not incurred in the ordinary course of Fund’s business. The expense limitation as a percentage of average daily net assets is as follows:
| | | | | | | | | | | | |
| | | Institutional | | | Investor A | | | Class K | |
Rate | | | 0.17% | | | | 0.42% | | | | 0.12% | |
Prior to April 30, 2015, the expense limitations as a percentage of average daily net assets were as follows:
| | | | | | | | | | | | |
| | | Institutional | | | Investor A | | | Class K | |
Rate | | | 0.20% | | | | 0.45% | | | | 0.15% | |
BFA and BAL have agreed not to reduce or discontinue this contractual waiver or reimbursement prior to May 1, 2016, unless approved by the Board, including a majority of the Independent Trustees. These amounts are shown as, or included in, administration fees waived, transfer agent fees waived — class specific, transfer agent fees reimbursed — class specific and fees reimbursed by administrator in the Statements of Operations.
If during the Fund’s fiscal year the operating expenses of a share class, that at any time during the prior two fiscal years received a waiver or reimbursement from BFA or BAL, are less than the expense limit for that share class, BFA or BAL is entitled to be reimbursed by such share class up to the lesser of (a) the amount of fees waived or expenses reimbursed during those prior two fiscal years under the agreement and (b) the amount by which the expense limit for that share class exceeds the operating expenses of the share class for the current fiscal year, provided that: (1) the Fund of which the share class is a part, has more than $50 million in assets for the fiscal year and (2) BFA or BAL or an affiliate continues to serve as the Fund’s investment advisor or administrator. In the event the expense limit for a share class is changed subsequent to a fiscal year in which the BFA or BAL, as applicable, becomes entitled to reimbursement for fees waived or reimbursed, the amount available to reimburse BFA or BAL, as applicable, shall be calculated by reference to the expense limit for that share class in effect at the time the BFA or BAL became entitled to receive such reimbursement, rather than the subsequently changed expense limit for that share class.
For the year ended December 31, 2015, BAL recouped the following class specific waivers and/or reimbursements previously recorded by the Fund:
| | |
| Institutional | | Investor A |
$2,546 | | $503 |
As of period end, the Fund level and class specific waivers and/or reimbursements subject to possible future recoupment under the expense limitation agreement are as follows:
| | | | | | | | |
| | | Expiring December 31, | |
| | | 2016 | | | 2017 | |
Fund level……………………………………………………………………………………………………………………………… | | $ | 102,174 | | | $ | 115,753 | |
Institutional………………………………………………………………………………………………………………… | | $ | 2,297 | | | $ | 10 | |
Investor A………………………………………………………………………………………………………………………… | | | — | | | $ | 465 | |
Class K………………………………………………………………………………………………………………………………………… | | $ | 18 | | | | — | |
| | | | | | |
| | | | | | | |
| 14 | | BLACKROCK TOTAL INTERNATIONAL ex U.S. INDEX FUND | | DECEMBER 31, 2015 | | |
| | | | |
| Notes to Financial Statements (continued) | | BlackRock Total International ex U.S. Index Fund |
The following Fund level and class specific waivers and/or reimbursements previously recorded by the Fund, which were subject to recoupment by BAL and BFA, expired on December 31, 2015:
| | | | |
Fund level | | $ | 102,028 | |
Institutional | | | — | |
Investor A | | | — | |
Class K | | $ | 84 | |
The Trust, on behalf of the Fund, entered into a Distribution Agreement and a Distribution and Service Plan with BlackRock Investments, LLC (“BRIL”), an affiliate of the Administrator. Pursuant to the Distribution and Service Plan and in accordance with Rule 12b-1 under the 1940 Act, the Fund pays BRIL ongoing service and distribution fees. The fees are accrued daily and paid monthly at annual rate of 0.25% based upon the average daily net assets of the Investor A Shares.
Pursuant to sub-agreements with BRIL, broker-dealers and BRIL provide shareholder servicing and distribution services to the Fund. The ongoing service and/or distribution fee compensates BRIL and each broker-dealer for providing shareholder servicing and/or distribution related services to Investor A shareholders.
BAL maintains a call center, which is responsible for providing certain shareholder services to the Fund, such as responding to shareholder inquiries and processing transactions based upon instructions from shareholders with respect to the subscription and redemption of Fund shares. For the year ended December 31, 2015, the Fund reimbursed the BAL the following amounts for costs incurred in running the call center, which are included in transfer agent — class specific in the Statements of Operations:
| | | | | | | | |
| Institutional | | Investor A | | | Class K | |
$139 | | $ | 141 | | | | — | |
Certain officers and/or trustees of the Trust are officers and/or directors of BlackRock or its affiliates. The Fund reimburses the Administrator for a portion of the compensation paid to the Trust’s Chief Compliance Officer, which is included in officer in the Statement of Operations.
5. Income Tax Information:
It is the Fund’s policy to comply with the requirements of the Internal Revenue Code of 1986, as amended, applicable to regulated investment companies, and to distribute substantially all of its taxable income to its shareholders. Therefore, no federal income tax provision is required.
The Fund files U.S. federal and various state and local tax returns. No income tax returns are currently under examination. The statute of limitations on the Fund’s U.S. federal tax returns remains open for each of the four years ended December 31, 2015. The statutes of limitations on the Fund’s state and local tax returns may remain open for an additional year depending upon the jurisdiction.
Management has analyzed tax laws and regulations and their application to the Fund as of December 31, 2015, inclusive of the open tax return years, and does not believe there are any uncertain tax positions that require recognition of a tax liability in the Fund’s financial statements.
The tax character of distributions paid was as follows:
| | | | | | | | |
Ordinary income | | | 2015 | | | $ | 2,079,999 | |
| | | 2014 | | | | 602,300 | |
| Long-term capital gains | | | 2015 | | | | 1,360,196 | |
| | | 2014 | | | | 2,053,650 | |
| | | | |
Total | | | 2015 | | | $ | 3,440,195 | |
| | | | |
| | | 2014 | | | $ | 2,655,950 | |
| | | | |
As of period end, the tax components of accumulated net earnings (losses) were as follows:
| | | | |
Undistributed long-term capital gains | | $ | 316,721 | |
Net unrealized losses1 | | | (6,290,268 | ) |
Qualified late-year losses2 | | | (5,336 | ) |
| | | | |
Total | | $ | (5,978,883 | ) |
| | | | |
| | 1 | | The difference between book-basis and tax-basis net unrealized losses was attributable primarily to the timing and recognition of partnership income. |
| | 2 | | The Fund has elected to defer certain qualified late-year losses and recognize such losses in the next taxable year. |
| | | | | | |
| | | | | | | |
| | BLACKROCK TOTAL INTERNATIONAL ex U.S. INDEX FUND | | DECEMBER 31, 2015 | | 15 |
| | | | |
| Notes to Financial Statements (concluded) | | BlackRock Total International ex U.S. Index Fund |
6. Capital Share Transactions:
Transactions in capital shares for each class were as follows:
| | | | | | | | | | | | | | | | | | |
| | | Year Ended
December 31, 2015 | | | | | Year Ended
December 31, 2014 | |
| | | Shares | | | Amount | | | | | Shares | | | Amount | |
| Institutional | | | | | | | | | | | | | | | | | | |
Shares sold | | | 3,607,468 | | | $ | 29,199,121 | | | | | | 489,164 | | | $ | 4,780,732 | |
Shares issued to shareholders in reinvestment of distributions | | | 124,878 | | | | 1,009,206 | | | | | | 236,533 | | | | 2,110,279 | |
Shares redeemed | | | (474,006 | ) | | | (3,845,526 | ) | | | | | (154,562 | ) | | | (1,526,584 | ) |
| | | | | | | | | | |
Net increase | | | 3,258,340 | | | $ | 26,362,801 | | | | | | 571,135 | | | $ | 5,364,427 | |
| | | | | | | | | | |
| | | | | | | | | | | | | | | | | | |
| Investor A | | | | | | | | | | | | | | | | | | |
Shares sold | | | 19,293,545 | | | $ | 150,340,411 | | | | | | 36,520 | | | $ | 345,700 | |
Shares issued to shareholders in reinvestment of distributions | | | 275,490 | | | | 2,118,100 | | | | | | 3,748 | | | | 32,243 | |
Shares redeemed | | | (723,364 | ) | | | (5,709,494 | ) | | | | | (2,444 | ) | | | (24,614 | ) |
| | | | | | | | | | |
Net increase | | | 18,845,671 | | | $ | 146,749,017 | | | | | | 37,824 | | | $ | 353,329 | |
| | | | | | | | | | |
| | | | | | | | | | | | | | | | | | |
| Class K | | | | | | | | | | | | | | | | | | |
Shares sold | | | 485,159 | | | $ | 4,219,483 | | | | | | 697,040 | | | $ | 6,707,086 | |
Shares issued to shareholders in reinvestment of distributions | | | 30,429 | | | | 256,936 | | | | | | 58,087 | | | | 506,140 | |
Shares redeemed | | | (312,244 | ) | | | (2,723,540 | ) | | | | | (38,209 | ) | | | (374,375 | ) |
| | | | | | | | | | |
Net increase | | | 203,344 | | | | 1,752,879 | | | | | | 716,918 | | | | 6,838,851 | |
| | | | | | | | | | |
Total Net Increase | | | 22,307,355 | | | $ | 174,864,697 | | | | | | 1,325,877 | | | $ | 12,556,607 | |
| | | | | | | | | | |
7. Subsequent Events:
Management has evaluated the impact of all subsequent events on the Fund through the date the financial statements were issued and has determined that there were no subsequent events requiring adjustment or additional disclosure in the financial statements.
| | | | | | |
| | | | | | | |
| 16 | | BLACKROCK TOTAL INTERNATIONAL ex U.S. INDEX FUND | | DECEMBER 31, 2015 | | |
| | |
| Report of Independent Registered Public Accounting Firm | | BlackRock Total International ex U.S. Index Fund |
To the Board of Trustees of BlackRock Funds III and the Shareholders of BlackRock Total International ex U.S. Index Fund:
In our opinion, the accompanying statement of assets and liabilities and the related statements of operations and of changes in net assets and the financial highlights present fairly, in all material respects, the financial position of BlackRock Total International ex U.S Index Fund, (the “Fund”), a series of BlackRock Funds III, at December 31, 2015, the results of its operations for the year then ended, the changes in its net assets for each of the two years in the period then ended and the financial highlights for each of the periods presented, in conformity with accounting principles generally accepted in the United States of America. These financial statements and financial highlights (hereafter referred to as “financial statements”) are the responsibility of the Fund’s management. Our responsibility is to express an opinion on these financial statements based on our audits. We conducted our audits of these financial statements in accordance with the standards of the Public Company Accounting Oversight Board (United States). Those standards require that we plan and perform the audit to obtain reasonable assurance about whether the financial statements are free of material misstatement. An audit includes examining, on a test basis, evidence supporting the amounts and disclosures in the financial statements, assessing the accounting principles used and significant estimates made by management, and evaluating the overall financial statement presentation. We believe that our audits provide a reasonable basis for our opinion.
/s/PricewaterhouseCoopers LLP
Philadelphia, Pennsylvania
February 24, 2016
| | |
| Important Tax Information (Unaudited) | | |
The following information is provided with respect to the ordinary income distributions paid during the taxable year ended December 31, 2015.
| | | | | | | | |
| | | Payable Dates | | | | |
Qualified Dividend Income for Individuals1 | | | Quarterly | | | | 79.52% | |
| | |
Foreign Source Income2 | | | Quarterly | | | | 67.36% | |
| | |
Foreign Taxes Paid Per Share3 | | | 3/31/2015 | | | | $0.005018062 | |
| | | 6/30/2015 | | | | $0.008635247 | |
| | | 9/30/2015 | | | | $0.001272739 | |
| | | | 12/31/2015 | | | | $0.003980734 | |
| | 1 | | The Fund hereby designates the percentage indicated above or the maximum amount allowable by law. |
| | 2 | | Expressed as a percentage of distributions grossed up for foreign taxes. |
| | 3 | | The foreign taxes paid represent taxes paid by the Fund on income received by the Fund from foreign sources. Foreign taxes paid may be included in taxable income with an offsetting deduction from gross income or may be taken as a credit for taxes paid to foreign governments. You should consult your tax advisor regarding the appropriate treatment of foreign taxes paid. |
Additionally, the Fund distributed long-term capital gains of $0.04257 and $0.048567134 per share to shareholders on record June 29, 2015 and December 29, 2015, respectively.
| | | | | | |
| | | | | | | |
| | BLACKROCK TOTAL INTERNATIONAL ex U.S. INDEX FUND | | DECEMBER 31, 2015 | | 17 |
| | |
| Master Portfolio Information | | Total International ex U.S. Index Master Portfolio |
| | |
| Ten Largest Holdings | | Percent of
Net Assets |
| | | | |
Nestlé SA, Registered Shares | | | 1 | % |
Novartis AG, Registered Shares | | | 1 | |
Roche Holding AG | | | 1 | |
Toyota Motor Corp. | | | 1 | |
HSBC Holdings PLC | | | 1 | |
Samsung Electronics Co. Ltd. | | | 1 | |
Novo Nordisk A/S | | | 1 | |
Taiwan Semiconductor Manufacturing Co. Ltd. | | | 1 | |
Commonwealth Bank of Australia | | | 1 | |
Tencent Holdings Ltd. | | | 1 | |
| | |
| Geographic Allocation | | Percent of
Net Assets |
| | | | |
Japan | | | 17 | % |
United Kingdom | | | 13 | |
France | | | 7 | |
Switzerland | | | 7 | |
Germany | | | 7 | |
Canada | | | 6 | |
United States | | | 5 | |
Australia | | | 5 | |
China | | | 4 | |
Hong Kong | | | 3 | |
South Korea | | | 3 | |
Netherlands | | | 3 | |
Taiwan | | | 2 | |
Spain | | | 2 | |
Sweden | | | 2 | |
India | | | 2 | |
Italy | | | 2 | |
Other1 | | | 15 | |
Liabilities in Excess of Other Assets | | | (5 | ) |
| | 1 | | Other includes a 1% or less holding in each of the following countries: Austria, Belgium, Brazil, Chile, Columbia, Czech Republic, Denmark, Egypt, Finland, Greece, Hungary, Indonesia, Ireland, Israel, Luxembourg, Malaysia, Malta, Mexico, New Zealand, Norway, Peru, Philippines, Poland, Portugal, Qatar, Russia, Singapore, South Africa, Thailand, Turkey and United Arab Emirates. |
| | | | | | |
| | | | | | | |
| 18 | | BLACKROCK TOTAL INTERNATIONAL ex U.S. INDEX FUND | | DECEMBER 31, 2015 | | |
| | |
Schedule of Investments December 31, 2015 | | Total International ex U.S. Index Master Portfolio (Percentages shown are based on Net Assets) |
| | | | | | | | |
| Common Stocks | | Shares | | | Value | |
Australia — 5.0% | |
AGL Energy Ltd. | | | 33,932 | | | $ | 444,004 | |
Alumina Ltd. (a) | | | 80,719 | | | | 67,363 | |
Amcor Ltd. | | | 61,970 | | | | 602,053 | |
AMP Ltd. | | | 140,036 | | | | 590,038 | |
APA Group (b) | | | 66,494 | | | | 418,404 | |
Aristocrat Leisure Ltd. | | | 27,113 | | | | 200,199 | |
Asciano Ltd. | | | 44,883 | | | | 285,352 | |
ASX Ltd. | | | 9,130 | | | | 280,889 | |
Aurizon Holdings Ltd. | | | 104,377 | | | | 331,355 | |
AusNet Services | | | 34,747 | | | | 37,407 | |
Australia & New Zealand Banking Group Ltd. | | | 139,444 | | | | 2,813,949 | |
Bank of Queensland Ltd. (a) | | | 19,847 | | | | 200,209 | |
Bendigo & Adelaide Bank Ltd. (a) | | | 16,747 | | | | 144,859 | |
BHP Billiton Ltd. | | | 161,773 | | | | 2,081,947 | |
Boral Ltd. | | | 39,580 | | | | 169,226 | |
Brambles Ltd. | | | 85,150 | | | | 713,123 | |
Caltex Australia Ltd. | | | 14,445 | | | | 394,836 | |
CIMIC Group Ltd. | | | 1,949 | | | | 34,189 | |
Coca-Cola Amatil Ltd. | | | 16,044 | | | | 108,184 | |
Cochlear Ltd. | | | 3,188 | | | | 220,614 | |
Commonwealth Bank of Australia (a) | | | 86,197 | | | | 5,329,085 | |
Computershare Ltd. | | | 18,081 | | | | 152,143 | |
Crown Resorts Ltd. (a) | | | 12,817 | | | | 115,843 | |
CSL Ltd. | | | 23,163 | | | | 1,765,939 | |
Dexus Property Group | | | 50,587 | | | | 274,393 | |
Flight Centre Travel Group Ltd. (a) | | | 1,384 | | | | 39,916 | |
Fortescue Metals Group Ltd. (a) | | | 63,976 | | | | 86,095 | |
Goodman Group | | | 90,279 | | | | 409,094 | |
GPT Group | | | 85,677 | | | | 296,716 | |
Harvey Norman Holdings Ltd. | | | 13,921 | | | | 42,082 | |
Healthscope Ltd. | | | 82,216 | | | | 158,433 | |
Iluka Resources Ltd. | | | 34,250 | | | | 151,502 | |
Incitec Pivot Ltd. | | | 96,223 | | | | 274,951 | |
Insurance Australia Group Ltd. | | | 120,818 | | | | 485,206 | |
Lend Lease Group (b) | | | 31,290 | | | | 322,836 | |
Macquarie Group Ltd. | | | 15,644 | | | | 935,870 | |
Medibank Pvt Ltd. | | | 149,927 | | | | 233,783 | |
Mirvac Group | | | 212,978 | | | | 304,886 | |
National Australia Bank Ltd. | | | 134,087 | | | | 2,926,022 | |
Newcrest Mining Ltd. (c) | | | 43,527 | | | | 411,862 | |
Oil Search Ltd. | | | 68,503 | | | | 333,428 | |
Orica Ltd. (a) | | | 17,936 | | | | 200,950 | |
Origin Energy Ltd. | | | 77,987 | | | | 263,809 | |
Platinum Asset Management Ltd. | | | 9,023 | | | | 52,725 | |
Qantas Airways Ltd. (c) | | | 21,423 | | | | 63,499 | |
QBE Insurance Group Ltd. (a) | | | 69,084 | | | | 628,331 | |
Ramsay Health Care Ltd. (a) | | | 7,590 | | | | 373,217 | |
REA Group Ltd. | | | 1,087 | | | | 43,250 | |
Rio Tinto Ltd. | | | 22,393 | | | | 724,179 | |
Santos Ltd. (a) | | | 105,104 | | | | 279,941 | |
Scentre Group | | | 288,676 | | | | 875,596 | |
Seek Ltd. (a) | | | 11,674 | | | | 129,933 | |
| | | | | | | | |
| Common Stocks | | Shares | | | Value | |
Australia (continued) | |
Sonic Healthcare Ltd. | | | 20,252 | | | $ | 262,206 | |
South32 Ltd. (c) | | | 304,116 | | | | 233,622 | |
Stockland | | | 120,177 | | | | 356,743 | |
Suncorp Group Ltd. | | | 72,978 | | | | 640,747 | |
Sydney Airport (b) | | | 56,475 | | | | 259,916 | |
Tabcorp Holdings Ltd. | | | 54,398 | | | | 185,216 | |
Tatts Group Ltd. | | | 59,669 | | | | 189,442 | |
Telstra Corp. Ltd. | | | 194,368 | | | | 789,852 | |
TPG Telecom Ltd. | | | 14,159 | | | | 101,373 | |
Transurban Group (b) | | | 101,891 | | | | 772,329 | |
Transurban Group | | | 5,661 | | | | 43,191 | |
Treasury Wine Estates Ltd. | | | 48,858 | | | | 293,350 | |
Vicinity Centres | | | 174,986 | | | | 354,990 | |
Wesfarmers Ltd. | | | 53,148 | | | | 1,602,310 | |
Westfield Corp. | | | 107,826 | | | | 741,834 | |
Westpac Banking Corp. | | | 167,369 | | | | 4,056,986 | |
Woodside Petroleum Ltd. (a) | | | 37,491 | | | | 781,086 | |
Woolworths Ltd. (a) | | | 65,258 | | | | 1,157,841 | |
| | | | | | | | |
| | | | | | | | 41,646,749 | |
Austria — 0.1% | |
Andritz AG | | | 5,013 | | | | 243,974 | |
Erste Group Bank AG (c) | | | 15,117 | | | | 473,012 | |
OMV AG | | | 7,068 | | | | 200,627 | |
Raiffeisen Bank International AG (c) | | | 4,478 | | | | 65,626 | |
Voestalpine AG | | | 4,890 | | | | 149,576 | |
| | | | | | | | |
| | | | | | | | 1,132,815 | |
Belgium — 1.1% | |
Ageas | | | 9,520 | | | | 441,860 | |
Anheuser-Busch InBev NV (a) | | | 41,592 | | | | 5,176,005 | |
Colruyt SA | | | 3,569 | | | | 183,601 | |
Delhaize Group | | | 5,181 | | | | 504,249 | |
Groupe Bruxelles Lambert SA | | | 4,110 | | | | 351,682 | |
KBC Groep NV | | | 12,394 | | | | 774,949 | |
Proximus | | | 7,467 | | | | 242,983 | |
Solvay SA | | | 4,091 | | | | 436,629 | |
Telenet Group Holding NV (c) | | | 1,997 | | | | 107,926 | |
UCB SA (a) | | | 6,867 | | | | 619,836 | |
Umicore SA | | | 5,605 | | | | 235,052 | |
| | | | | | | | |
| | | | | | | | 9,074,772 | |
Brazil — 1.1% | |
AMBEV SA | | | 247,600 | | | | 1,117,134 | |
B2W Cia Digital (c) | | | 17,200 | | | | 66,213 | |
Banco Bradesco SA — ADR | | | 35,196 | | | | 182,374 | |
Banco Bradesco SA, Preference Shares | | | 146,088 | | | | 711,931 | |
Banco do Brasil SA | | | 36,400 | | | | 135,617 | |
Banco Santander Brasil SA | | | 12,700 | | | | 51,490 | |
BB Seguridade Participacoes SA | | | 47,500 | | | | 292,114 | |
BM&FBovespa SA | | | 105,100 | | | | 289,299 | |
BR Malls Participacoes SA | | | 13,700 | | | | 38,438 | |
Braskem SA, Preference A Shares | | | 11,000 | | | | 76,795 | |
| | | | | | | | | | |
| ADR | | American Depositary Receipts | | | | | | | | |
| GDR | | Global Depositary Receipt | | | | | | | | |
| NVDR | | Non-voting Depository Receipts | | | | | | | | |
| REIT | | Real Estate Investment Trust | | | | | | | | |
See Notes to Financial Statements.
| | | | | | |
| | | | | | | |
| | BLACKROCK TOTAL INTERNATIONAL ex U.S. INDEX FUND | | DECEMBER 31, 2015 | | 19 |
| | |
Schedule of Investments (continued) | | Total International ex U.S. Index Master Portfolio |
| | | | | | | | |
| Common Stocks | | Shares | | | Value | |
Brazil (continued) | |
BRF SA | | | 35,100 | | | $ | 491,511 | |
CCR SA | | | 32,500 | | | | 103,096 | |
Centrais Eletricas Brasileiras SA, Preference ‘B’ Shares | | | 1,600 | | | | 4,222 | |
CETIP SA — Mercados Organizado | | | 9,411 | | | | 89,204 | |
Cia Energetica de Minas Gerais, Preference Shares | | | 24,313 | | | | 37,672 | |
Cia Energetica de Sao Paulo, Preference ‘B’ Shares | | | 4,000 | | | | 13,548 | |
Cia Paranaense de Energia, Preference ‘B’ Shares | | | 11,500 | | | | 70,635 | |
Cielo SA | | | 48,332 | | | | 410,356 | |
Companhia de Saneamento Basico do Estado de Sao Paulo | | | 7,000 | | | | 33,494 | |
Companhia Siderurgica Nacional SA | | | 48,700 | | | | 49,239 | |
Cosan SA Industria e Comercio | | | 1,800 | | | | 11,465 | |
CPFL Energia SA (c) | | | 3,715 | | | | 14,254 | |
Duratex SA | | | 5,621 | | | | 8,383 | |
EDP — Energias do Brasil SA | | | 900 | | | | 2,739 | |
Embraer SA | | | 37,700 | | | | 287,687 | |
Equatorial Energia SA | | | 13,600 | | | | 117,703 | |
Estacio Participacoes SA | | | 21,100 | | | | 74,400 | |
Fibria Celulose SA | | | 10,300 | | | | 135,094 | |
Gerdau SA, Preference Shares | | | 30,600 | | | | 35,966 | |
Hypermarcas SA (c) | | | 19,300 | | | | 105,909 | |
Itau Unibanco Holding SA, Preference Shares | | | 164,045 | | | | 1,091,767 | |
Itausa — Investimentos Itau SA, Preference Shares | | | 226,712 | | | | 394,257 | |
JBS SA | | | 31,400 | | | | 98,020 | |
Klabin SA, Preference Shares | | | 22,200 | | | | 131,587 | |
Kroton Educacional SA | | | 59,168 | | | | 142,527 | |
Localiza Rent a Car SA | | | 2,940 | | | | 18,444 | |
Lojas Americanas SA | | | 6,000 | | | | 18,912 | |
Lojas Americanas SA, Preference Shares | | | 12,320 | | | | 60,413 | |
Lojas Renner SA | | | 21,500 | | | | 92,929 | |
M Dias Branco SA | | | 1,500 | | | | 25,213 | |
Multiplan Empreendimentos Imobiliarios SA | | | 4,600 | | | | 44,183 | |
Natura Cosmeticos SA | | | 8,200 | | | | 48,687 | |
Odontoprev SA | | | 600 | | | | 1,433 | |
Petroleo Brasileiro SA (c) | | | 164,300 | | | | 355,906 | |
Petroleo Brasileiro SA, Preference Shares (c) | | | 220,300 | | | | 373,083 | |
Porto Seguro SA | | | 4,400 | | | | 32,019 | |
Qualicorp SA | | | 8,500 | | | | 30,358 | |
Raia Drogasil SA | | | 9,300 | | | | 83,403 | |
Sul America SA | | | 36,638 | | | | 172,343 | |
Suzano Papel e Celulose SA, Preference ‘A’ Shares | | | 13,600 | | | | 64,249 | |
Telefonica Brasil SA, Preference Shares | | | 16,200 | | | | 146,389 | |
Tim Participacoes SA | | | 41,040 | | | | 71,162 | |
Totvs SA | | | 3,300 | | | | 25,883 | |
Tractebel Energia SA | | | 4,600 | | | | 38,939 | |
Transmissora Alianca de Energia Eletrica SA | | | 3,300 | | | | 13,972 | |
Ultrapar Participacoes SA | | | 18,600 | | | | 284,201 | |
Vale SA | | | 65,800 | | | | 216,714 | |
Vale SA, Preference Shares | | | 114,000 | | | | 295,356 | |
WEG SA | | | 18,720 | | | | 70,740 | |
| | | | | | | | |
| | | | | | | | 9,501,071 | |
Canada — 5.9% | |
Agnico Eagle Mines Ltd. | | | 12,637 | | | | 332,158 | |
Agrium, Inc. | | | 7,173 | | | | 641,096 | |
Alimentation Couche Tard, Inc., Class B | | | 20,794 | | | | 915,345 | |
AltaGas Ltd. (a) | | | 5,249 | | | | 117,218 | |
ARC Resources Ltd. (a) | | | 13,939 | | | | 168,231 | |
Atco Ltd. Class I | | | 2,968 | | | | 76,576 | |
Bank of Montreal | | | 32,859 | | | | 1,854,181 | |
| | | | | | | | |
| Common Stocks | | Shares | | | Value | |
Canada (continued) | |
Bank of Nova Scotia (a) | | | 64,560 | | | $ | 2,611,421 | |
Barrick Gold Corp. | | | 55,355 | | | | 409,652 | |
BCE, Inc. | | | 7,340 | | | | 283,585 | |
BlackBerry Ltd. (a)(c) | | | 17,331 | | | | 160,822 | |
Bombardier, Inc., Class B (a) | | | 55,865 | | | | 54,101 | |
Brookfield Asset Management, Inc., Class A | | | 44,288 | | | | 1,397,103 | |
CAE, Inc. | | | 5,726 | | | | 63,521 | |
Cameco Corp. | | | 17,020 | | | | 209,967 | |
Canadian Imperial Bank of Commerce (a) | | | 18,546 | | | | 1,222,237 | |
Canadian National Railway Co. | | | 40,915 | | | | 2,287,183 | |
Canadian Natural Resources Ltd. | | | 56,684 | | | | 1,237,978 | |
Canadian Oil Sands Ltd. | | | 19,702 | | | | 117,753 | |
Canadian Pacific Railway Ltd. | | | 8,246 | | | | 1,053,202 | |
Canadian Tire Corp. Ltd., Class A | | | 4,121 | | | | 351,910 | |
Canadian Utilities Ltd., Class A | | | 9,258 | | | | 213,703 | |
Cenovus Energy, Inc. | | | 39,944 | | | | 505,182 | |
CGI Group, Inc., Class A (c) | | | 12,922 | | | | 517,366 | |
CI Financial Corp. (a) | | | 11,539 | | | | 255,181 | |
Constellation Software, Inc. | | | 1,101 | | | | 459,019 | |
Crescent Point Energy Corp. | | | 30,179 | | | | 351,583 | |
Dollarama, Inc. | | | 6,920 | | | | 399,787 | |
Eldorado Gold Corp. | | | 17,582 | | | | 52,097 | |
Empire Co. Ltd., Class A | | | 12,024 | | | | 223,674 | |
Enbridge, Inc. | | | 42,824 | | | | 1,423,650 | |
Encana Corp. | | | 30,957 | | | | 157,280 | |
Fairfax Financial Holdings Ltd. | | | 1,258 | | | | 597,234 | |
Finning International, Inc. | | | 7,357 | | | | 99,320 | |
First Capital Realty, Inc. | | | 2,654 | | | | 35,196 | |
First Quantum Minerals Ltd. (a) | | | 28,339 | | | | 106,089 | |
Fortis, Inc. | | | 15,891 | | | | 429,632 | |
Franco-Nevada Corp. | | | 9,282 | | | | 424,623 | |
George Weston Ltd. | | | 3,435 | | | | 265,476 | |
Gildan Activewear, Inc. | | | 13,076 | | | | 371,764 | |
Goldcorp, Inc. | | | 40,940 | | | | 473,101 | |
Great-West Lifeco, Inc. | | | 16,984 | | | | 423,833 | |
H&R Real Estate Investment Trust | | | 2,945 | | | | 42,673 | |
Husky Energy, Inc. | | | 15,026 | | | | 155,397 | |
IGM Financial, Inc. | | | 4,062 | | | | 103,744 | |
Imperial Oil Ltd. | | | 16,836 | | | | 548,505 | |
Industrial Alliance Insurance & Financial Services, Inc. | | | 3,523 | | | | 112,358 | |
Intact Financial Corp. | | | 8,105 | | | | 519,442 | |
Inter Pipeline Ltd. | | | 18,400 | | | | 295,341 | |
Jean Coutu Group PJC, Inc., Class A | | | 3,208 | | | | 41,523 | |
Keyera Corp. | | | 8,330 | | | | 242,369 | |
Kinross Gold Corp. (c) | | | 50,110 | | | | 90,898 | |
Loblaw Cos. Ltd. | | | 13,102 | | | | 618,692 | |
Magna International, Inc. | | | 21,261 | | | | 862,302 | |
Manulife Financial Corp. | | | 100,351 | | | | 1,504,141 | |
MEG Energy Corp. (c) | | | 7,620 | | | | 44,166 | |
Methanex Corp. | | | 4,533 | | | | 149,713 | |
Metro, Inc. | | | 13,402 | | | | 375,221 | |
National Bank of Canada (a) | | | 19,207 | | | | 559,539 | |
Onex Corp. | | | 5,499 | | | | 337,085 | |
Open Text Corp. | | | 5,660 | | | | 271,363 | |
Pembina Pipeline Corp. (a) | | | 18,933 | | | | 412,539 | |
Peyto Exploration & Development Corp. | | | 6,142 | | | | 110,394 | |
Potash Corp. of Saskatchewan, Inc. | | | 43,849 | | | | 751,045 | |
Power Corp. of Canada | | | 21,464 | | | | 448,918 | |
Power Financial Corp. (a) | | | 17,668 | | | | 406,171 | |
PrairieSky Royalty Ltd. (a) | | | 5,018 | | | | 79,493 | |
See Notes to Financial Statements.
| | | | | | |
| | | | | | | |
| 20 | | BLACKROCK TOTAL INTERNATIONAL ex U.S. INDEX FUND | | DECEMBER 31, 2015 | | |
| | |
Schedule of Investments (continued) | | Total International ex U.S. Index Master Portfolio |
| | | | | | | | |
| Common Stocks | | Shares | | | Value | |
Canada (continued) | |
Restaurant Brands International, Inc. (a) | | | 11,133 | | | $ | 416,371 | |
RioCan Real Estate Investment Trust | | | 3,112 | | | | 53,280 | |
Rogers Communications, Inc., Class B | | | 18,164 | | | | 626,426 | |
Royal Bank of Canada | | | 71,809 | | | | 3,848,115 | |
Saputo, Inc. | | | 10,940 | | | | 261,700 | |
Shaw Communications, Inc., Class B | | | 19,068 | | | | 327,975 | |
Silver Wheaton Corp. | | | 17,253 | | | | 214,462 | |
SNC-Lavalin Group, Inc. | | | 9,239 | | | | 274,559 | |
Sun Life Financial, Inc. | | | 30,632 | | | | 955,244 | |
Suncor Energy, Inc. | | | 72,194 | | | | 1,863,677 | |
Teck Resources Ltd., Class B (a) | | | 19,684 | | | | 75,965 | |
TELUS Corp. | | | 8,212 | | | | 227,066 | |
Thomson Reuters Corp. | | | 19,582 | | | | 741,702 | |
Toronto-Dominion Bank | | | 92,301 | | | | 3,618,130 | |
Tourmaline Oil Corp. (c) | | | 10,430 | | | | 168,469 | |
TransCanada Corp. (a) | | | 36,953 | | | | 1,206,841 | |
Turquoise Hill Resources Ltd. (c) | | | 39,981 | | | | 101,419 | |
Valeant Pharmaceuticals International, Inc. (c) | | | 16,850 | | | | 1,711,669 | |
Veresen, Inc. | | | 9,589 | | | | 61,400 | |
Vermilion Energy, Inc. (a) | | | 6,754 | | | | 183,579 | |
West Fraser Timber Co. Ltd. | | | 2,687 | | | | 102,008 | |
Yamana Gold, Inc. | | | 26,930 | | | | 50,018 | |
| | | | | | | | |
| | | | | | | | 49,523,137 | |
Chile — 0.2% | | | | | | | | |
AES Gener SA | | | 90,837 | | | | 40,311 | |
Aguas Andinas SA, Class A | | | 76,400 | | | | 39,203 | |
Banco de Chile | | | 1,385,221 | | | | 141,111 | |
Banco de Credito e Inversiones | | | 735 | | | | 27,728 | |
Banco Santander Chile SA | | | 2,103,327 | | | | 94,367 | |
Cencosud SA | | | 46,368 | | | | 92,597 | |
Colbun SA | | | 466,420 | | | | 111,379 | |
Companhia Cervecerias Unidas SA | | | 4,404 | | | | 48,729 | |
CorpBanca | | | 2,375,874 | | | | 19,106 | |
Embotelladora Andina SA, Preference ‘B’ Shares | | | 9,220 | | | | 27,427 | |
Empresa Nacional de Electricidad SA | | | 204,788 | | | | 253,936 | |
Empresa Nacional de Telecomunicaciones SA | | | 2,032 | | | | 18,185 | |
Empresas CMPC SA | | | 36,023 | | | | 77,729 | |
Empresas COPEC SA | | | 24,294 | | | | 208,571 | |
Enersis SA | | | 1,181,655 | | | | 285,291 | |
Latam Airlines Group SA (c) | | | 19,853 | | | | 104,280 | |
SACI Falabella | | | 35,710 | | | | 227,597 | |
Sociedad Quimica y Minera de Chile SA, Preference ‘B’ Shares | | | 1,850 | | | | 34,746 | |
SONDA SA | | | 18,572 | | | | 32,913 | |
| | | | | | | | |
| | | | | | | | 1,885,206 | |
China — 4.2% | | | | | | | | |
AAC Technologies Holdings, Inc. | | | 39,500 | | | | 256,961 | |
Agricultural Bank of China Ltd., Class H | | | 1,110,000 | | | | 451,715 | |
Air China Ltd., Class H | | | 62,000 | | | | 48,626 | |
Alibaba Group Holding Ltd. — SP ADR (c) | | | 25,118 | | | | 2,041,340 | |
Aluminum Corp. of China Ltd., Class H (c) | | | 64,000 | | | | 21,009 | |
Anhui Conch Cement Co. Ltd., Class H | | | 79,500 | | | | 212,510 | |
ANTA Sports Products Ltd. | | | 81,000 | | | | 221,443 | |
AviChina Industry & Technology Co. Ltd., Class H | | | 116,000 | | | | 90,640 | |
Baidu, Inc. — ADR (c) | | | 6,913 | | | | 1,306,833 | |
Bank of China Ltd., Class H | | | 4,049,000 | | | | 1,796,595 | |
Bank of Communications Co. Ltd., Class H | | | 470,700 | | | | 330,091 | |
Beijing Capital International Airport Co. Ltd., Class H | | | 100,000 | | | | 107,405 | |
| | | | | | | | |
| Common Stocks | | Shares | | | Value | |
China (continued) | | | | | | | | |
Byd Co. Ltd., Class H (a)(c) | | | 26,500 | | | $ | 144,553 | |
CGN Power Co. Ltd. (d) | | | 546,000 | | | | 203,287 | |
China Cinda Asset Management Co. Ltd. | | | 681,000 | | | | 250,648 | |
China CITIC Bank Corp. Ltd., Class H (c) | | | 448,000 | | | | 288,742 | |
China Coal Energy Co. Ltd., Class H (a) | | | 107,000 | | | | 40,861 | |
China Communications Construction Co. Ltd., Class H | | | 239,000 | | | | 242,157 | |
China Communications Services Corp. Ltd., Class H | | | 44,000 | | | | 16,459 | |
China Conch Venture Holdings Ltd. | | | 92,500 | | | | 191,367 | |
China Construction Bank Corp., Class H | | | 4,300,000 | | | | 2,933,235 | |
China COSCO Holdings Co. Ltd., Class H (a)(c) | | | 78,000 | | | | 35,233 | |
China Everbright Bank Co. Ltd., Class H | | | 58,000 | | | | 28,084 | |
China Galaxy Securities Co. Ltd., Class H | | | 132,500 | | | | 120,421 | |
China Huishan Dairy Holdings Co. Ltd. (a) | | | 338,000 | | | | 129,263 | |
China International Marine Containers Group Co. Ltd., Class H | | | 41,500 | | | | 75,544 | |
China Life Insurance Co. Ltd., Class H | | | 346,000 | | | | 1,110,728 | |
China Longyuan Power Group Corp., Class H | | | 125,000 | | | | 93,997 | |
China Medical System Holdings Ltd. | | | 109,000 | | | | 159,746 | |
China Mengniu Dairy Co. Ltd. | | | 170,000 | | | | 275,968 | |
China Merchants Bank Co. Ltd., Class H | | | 263,078 | | | | 615,823 | |
China Minsheng Banking Corp. Ltd., Class H | | | 306,400 | | | | 302,263 | |
China National Building Material Co. Ltd., Class H | | | 132,000 | | | | 62,794 | |
China Oilfield Services Ltd., Class H (a) | | | 64,000 | | | | 54,996 | |
China Pacific Insurance Group Co. Ltd., Class H | | | 141,800 | | | | 580,298 | |
China Petroleum & Chemical Corp. Class H | | | 1,278,400 | | | | 767,711 | |
China Railway Construction Corp. Ltd., Class H | | | 72,000 | | | | 88,615 | |
China Railway Group Ltd., Class H | | | 230,000 | | | | 173,463 | |
China Shenhua Energy Co. Ltd., Class H | | | 179,500 | | | | 280,289 | |
China Shipping Container Lines Co. Ltd., Class H (c) | | | 122,000 | | | | 33,738 | |
China Southern Airlines Co. Ltd., Class H | | | 48,000 | | | | 37,003 | |
China Telecom Corp. Ltd., Class H | | | 754,000 | | | | 351,716 | |
China Unicom Hong Kong Ltd. | | | 340,000 | | | | 410,721 | |
China Vanke Co. Ltd., Class H | | | 48,500 | | | | 144,142 | |
Chongqing Changan Automobile Co. Ltd. | | | 21,400 | | | | 47,117 | |
Chongqing Rural Commercial Bank, Co. Ltd., Class H | | | 122,000 | | | | 73,276 | |
CITIC Securities Co. Ltd., Class H | | | 90,500 | | | | 209,702 | |
CNOOC Ltd. | | | 958,000 | | | | 997,063 | |
Country Garden Holdings Co. Ltd. | | | 214,270 | | | | 87,327 | |
CSPC Pharmaceutical Group Ltd. | | | 154,000 | | | | 157,004 | |
CSR Corp. Ltd., Class H | | | 222,350 | | | | 273,148 | |
Ctrip.com International Ltd. — ADR (c) | | | 7,176 | | | | 332,464 | |
Dalian Wanda Commercial Properties Co. Ltd., Class H (d) | | | 24,800 | | | | 143,939 | |
Datang International Power Generation Co. Ltd., Class H | | | 98,000 | | | | 29,668 | |
Dongfeng Motor Group Co. Ltd., Class H | | | 182,000 | | | | 241,099 | |
Evergrande Real Estate Group Ltd. (a) | | | 286,000 | | | | 250,385 | |
Fosun International Ltd. | | | 81,500 | | | | 126,642 | |
GF Securities Co. Ltd., Class H (c) | | | 31,000 | | | | 77,321 | |
Great Wall Motor Co. Ltd., Class H | | | 123,000 | | | | 142,068 | |
Guangzhou Automobile Group Co. Ltd., Class H | | | 52,000 | | | | 46,199 | |
Guangzhou R&F Properties Co. Ltd., Class H (a) | | | 13,200 | | | | 16,185 | |
Haitian International Holdings Ltd. | | | 67,000 | | | | 97,208 | |
Haitong Securities Co. Ltd., Class H | | | 163,200 | | | | 286,198 | |
Hengan International Group Co. Ltd. | | | 39,000 | | | | 366,137 | |
Huadian Power International Corp. Ltd., Class H | | | 68,000 | | | | 44,001 | |
Huaneng Power International, Inc., Class H | | | 192,000 | | | | 164,408 | |
Huaneng Renewables Corp. Ltd., Class H | | | 158,000 | | | | 46,890 | |
See Notes to Financial Statements.
| | | | | | |
| | | | | | | |
| | BLACKROCK TOTAL INTERNATIONAL ex U.S. INDEX FUND | | DECEMBER 31, 2015 | | 21 |
| | |
Schedule of Investments (continued) | | Total International ex U.S. Index Master Portfolio |
| | | | | | | | |
| Common Stocks | | Shares | | | Value | |
China (continued) | | | | | | | | |
Huatai Securities Co. Ltd., Class H (c)(d) | | | 68,800 | | | $ | 159,046 | |
Industrial & Commercial Bank of China Ltd., Class H | | | 3,753,000 | | | | 2,249,617 | |
JD.com, Inc., ADR (c) | | | 8,569 | | | | 276,479 | |
Jiangsu Expressway Co. Ltd., Class H | | | 26,000 | | | | 34,895 | |
Jiangxi Copper Co. Ltd., Class H | | | 36,000 | | | | 42,491 | |
Kingsoft Corp. Ltd. (a) | | | 55,000 | | | | 133,558 | |
Lenovo Group Ltd. | | | 446,000 | | | | 450,100 | |
Longfor Properties Co. Ltd. | | | 51,500 | | | | 76,596 | |
Luye Pharma Group Ltd. (c) | | | 189,500 | | | | 197,160 | |
NetEase, Inc., ADR | | | 1,973 | | | | 357,586 | |
New China Life Insurance Co. Ltd., Class H | | | 29,100 | | | | 121,605 | |
People’s Insurance Co. Group of China Ltd., Class H | | | 272,000 | | | | 132,430 | |
PetroChina Co. Ltd., Class H | | | 1,096,000 | | | | 717,486 | |
PICC Property & Casualty Co. Ltd., Class H | | | 177,532 | | | | 350,362 | |
Ping An Insurance Group Co. of China Ltd., Class H | | | 241,000 | | | | 1,329,043 | |
Qihoo 360 Technology Co. Ltd., ADR (c) | | | 2,335 | | | | 170,011 | |
Semiconductor Manufacturing International Corp. (c) | | | 1,051,000 | | | | 106,881 | |
Shandong Weigao Group Medical Polymer Co. Ltd., Class H | | | 276,000 | | | | 188,723 | |
Shanghai Electric Group Co. Ltd., Class H (a) | | | 104,000 | | | | 54,780 | |
Shanghai Fosun Pharmaceutical Group Co. Ltd., Class H | | | 7,000 | | | | 20,251 | |
Shanghai Pharmaceuticals Holding Co. Ltd., Class H | | | 19,100 | | | | 41,168 | |
Shenzhou International Group Holdings Ltd. | | | 20,000 | | | | 114,616 | |
Shui On Land Ltd. | | | 76,666 | | | | 20,953 | |
Sihuan Pharmaceutical Holdings Group Ltd. | | | 249,000 | | | | 32,129 | |
Sino-Ocean Land Holdings Ltd. | | | 137,000 | | | | 87,353 | |
Sinopec Engineering Group Co. Ltd., Class H | | | 13,500 | | | | 11,484 | |
Sinopec Shanghai Petrochemical Co. Ltd., Class H (c) | | | 123,000 | | | | 48,647 | |
Sinopharm Group Co. Ltd., Class H | | | 47,200 | | | | 188,433 | |
Sinotrans Ltd., Class H | | | 45,000 | | | | 23,954 | |
SOHO China Ltd. (c) | | | 195,000 | | | | 94,101 | |
Sunac China Holdings Ltd. | | | 149,000 | | | | 114,488 | |
Tencent Holdings Ltd. | | | 266,500 | | | | 5,218,062 | |
Tingyi Cayman Islands Holding Corp. | | | 138,000 | | | | 196,054 | |
Tsingtao Brewery Co. Ltd., Class H (a) | | | 14,000 | | | | 63,066 | |
Vipshop Holdings Ltd. — ADR (c) | | | 9,945 | | | | 151,860 | |
Want Want China Holdings Ltd. | | | 339,000 | | | | 251,601 | |
Weichai Power Co. Ltd., Class H | | | 24,400 | | | | 26,871 | |
Yanzhou Coal Mining Co. Ltd., Class H (a) | | | 36,000 | | | | 16,693 | |
Zhejiang Expressway Co. Ltd., Class H | | | 54,000 | | | | 64,521 | |
Zhuzhou CSR Times Electric Co. Ltd., Class H | | | 25,000 | | | | 144,164 | |
Zijin Mining Group Co. Ltd., Class H | | | 218,000 | | | | 57,070 | |
ZTE Corp., Class H | | | 14,400 | | | | 32,689 | |
| | | | | | | | |
| | | | | | | | 35,553,559 | |
Colombia — 0.1% | |
Bancolombia SA | | | 15,644 | | | | 106,445 | |
Cementos Argos SA | | | 38,031 | | | | 116,447 | |
Corp. Financiera Colombiana SA (c) | | | 13 | | | | 157 | |
Corp. Financiera Colombiana SA | | | 1,431 | | | | 17,526 | |
Ecopetrol SA | | | 184,080 | | | | 64,366 | |
Grupo Argos SA | | | 6,618 | | | | 33,773 | |
Grupo Aval Acciones y Valores | | | 125,734 | | | | 43,172 | |
Grupo de Inversiones Suramericana SA | | | 6,592 | | | | 74,133 | |
| | | | | | | | |
| Common Stocks | | Shares | | | Value | |
Colombia (continued) | |
Grupo de Inversiones Suramericana SA, Preference Shares | | | 803 | | | $ | 8,803 | |
Interconexion Electrica SA | | | 6,953 | | | | 16,164 | |
| | | | | | | | |
| | | | | | | | 480,986 | |
Czech Republic — 0.0% | |
CEZ AS | | | 9,764 | | | | 174,132 | |
Komercni Banka AS | | | 558 | | | | 110,780 | |
| | | | | | | | |
| | | | | | | | 284,912 | |
Denmark — 1.4% | | | | | | | | |
A.P. Moeller — Maersk A/S, Class A | | | 220 | | | | 283,297 | |
A.P. Moeller — Maersk A/S, Class B | | | 371 | | | | 483,897 | |
Carlsberg A/S, Class B | | | 4,333 | | | | 383,868 | |
Chr Hansen Holding A/S | | | 4,943 | | | | 309,186 | |
Coloplast A/S, Class B | | | 6,579 | | | | 531,169 | |
Danske Bank A/S | | | 35,120 | | | | 942,350 | |
DSV A/S | | | 8,213 | | | | 323,294 | |
ISS A/S | | | 8,788 | | | | 316,779 | |
Novo Nordisk A/S, Class B | | | 97,867 | | | | 5,666,324 | |
Novozymes A/S, Class B | | | 12,683 | | | | 607,247 | |
Pandora A/S | | | 5,500 | | | | 693,461 | |
TDC A/S | | | 36,256 | | | | 180,520 | |
Tryg A/S | | | 5,025 | | | | 99,855 | |
Vestas Wind Systems A/S | | | 11,244 | | | | 785,267 | |
William Demant Holding A/S (c) | | | 1,605 | | | | 152,883 | |
| | | | | | | | |
| | | | | | | | 11,759,397 | |
Egypt — 0.0% | |
Commercial International Bank | | | 46,150 | | | | 224,501 | |
Global Telecom Holding SAE (c) | | | 69,057 | | | | 18,348 | |
Talaat Moustafa Group | | | 21,412 | | | | 17,664 | |
| | | | | | | | |
| | | | | | | | 260,513 | |
Finland — 0.7% | |
Elisa OYJ | | | 8,970 | | | | 337,495 | |
Fortum OYJ | | | 27,627 | | | | 416,240 | |
Kone OYJ, Class B (a) | | | 16,423 | | | | 695,367 | |
Metso OYJ (a) | | | 9,428 | | | | 211,189 | |
Neste Oil OYJ | | | 5,327 | | | | 158,989 | |
Nokia OYJ | | | 170,387 | | | | 1,205,406 | |
Nokian Renkaat OYJ | | | 4,713 | | | | 168,260 | |
Orion OYJ, Class B | | | 4,256 | | | | 147,250 | |
Sampo OYJ, Class A | | | 21,894 | | | | 1,111,826 | |
Stora Enso OYJ, Class R | | | 32,562 | | | | 294,430 | |
UPM — Kymmene OYJ | | | 27,594 | | | | 512,291 | |
Wartsila OYJ | | | 6,761 | | | | 308,693 | |
| | | | | | | | |
| | | | | | | | 5,567,436 | |
France — 7.2% | |
Accor SA | | | 10,752 | | | | 465,668 | |
Aeroports de Paris | | | 1,132 | | | | 131,729 | |
Air Liquide SA | | | 17,520 | | | | 1,966,909 | |
Airbus Group SE | | | 28,300 | | | | 1,907,061 | |
Alcatel-Lucent (c) | | | 114,729 | | | | 455,088 | |
Alstom SA (a)(c) | | | 10,571 | | | | 322,890 | |
ArcelorMittal (a) | | | 50,614 | | | | 213,551 | |
Arkema | | | 3,739 | | | | 261,725 | |
AtoS | | | 4,829 | | | | 405,406 | |
AXA SA | | | 94,651 | | | | 2,586,202 | |
BNP Paribas SA | | | 53,133 | | | | 3,006,123 | |
Bollore SA | | | 36,855 | | | | 171,731 | |
See Notes to Financial Statements.
| | | | | | |
| | | | | | | |
| 22 | | BLACKROCK TOTAL INTERNATIONAL ex U.S. INDEX FUND | | DECEMBER 31, 2015 | | |
| | |
Schedule of Investments (continued) | | Total International ex U.S. Index Master Portfolio |
| | | | | | | | |
| Common Stocks | | Shares | | | Value | |
France (continued) | |
Bouygues SA | | | 11,139 | | | $ | 441,668 | |
Bureau Veritas SA | | | 11,737 | | | | 233,935 | |
Cap Gemini SA | | | 7,654 | | | | 710,181 | |
Carrefour SA | | | 27,447 | | | | 792,109 | |
Casino Guichard-Perrachon SA | | | 2,964 | | | | 136,168 | |
Christian Dior SA | | | 2,982 | | | | 506,530 | |
Cie Generale des Etablissements Michelin | | | 9,265 | | | | 881,866 | |
CNP Assurances | | | 7,565 | | | | 102,047 | |
Compagnie de Saint-Gobain | | | 23,437 | | | | 1,015,649 | |
Credit Agricole SA | | | 52,014 | | | | 612,940 | |
Danone SA | | | 29,515 | | | | 1,994,431 | |
Dassault Systemes SA | | | 6,665 | | | | 532,739 | |
Edenred | | | 13,608 | | | | 257,233 | |
Electricite de France SA (a) | | | 14,412 | | | | 212,252 | |
Engie SA | | | 75,110 | | | | 1,330,439 | |
Essilor International SA | | | 10,093 | | | | 1,257,950 | |
Eurazeo | | | 1,698 | | | | 117,109 | |
Eutelsat Communications SA | | | 10,133 | | | | 303,386 | |
Fonciere Des Regions | | | 2,240 | | | | 200,349 | |
Gecina SA | | | 1,956 | | | | 237,794 | |
Groupe Eurotunnel SE, Registered Shares | | | 23,156 | | | | 288,086 | |
Hermes International | | | 1,327 | | | | 448,559 | |
ICADE | | | 1,426 | | | | 95,713 | |
Iliad SA | | | 1,504 | | | | 358,521 | |
Imerys SA | | | 704 | | | | 49,175 | |
Ingenico Group SA | | | 2,978 | | | | 375,886 | |
JCDecaux SA | | | 4,756 | | | | 182,320 | |
Kering | | | 4,140 | | | | 707,836 | |
Klepierre | | | 10,381 | | | | 461,433 | |
L’Oreal SA | | | 12,489 | | | | 2,100,710 | |
Lagardere SCA | | | 4,159 | | | | 124,110 | |
Legrand SA | | | 13,403 | | | | 758,144 | |
LVMH Moet Hennessy Louis Vuitton SA | | | 14,269 | | | | 2,241,235 | |
Natixis SA | | | 32,454 | | | | 183,595 | |
Numericable-SFR | | | 5,463 | | | | 198,460 | |
Orange SA | | | 99,208 | | | | 1,659,325 | |
Pernod Ricard SA | | | 10,974 | | | | 1,251,523 | |
Peugeot SA (c) | | | 21,557 | | | | 377,871 | |
Publicis Groupe SA | | | 9,791 | | | | 651,056 | |
Remy Cointreau SA | | | 2,524 | | | | 180,782 | |
Renault SA | | | 9,933 | | | | 994,248 | |
Rexel SA | | | 17,849 | | | | 237,673 | |
Safran SA | | | 14,145 | | | | 971,800 | |
Sanofi | | | 59,127 | | | | 5,038,905 | |
Schneider Electric SE | | | 27,411 | | | | 1,557,052 | |
SCOR SE | | | 9,355 | | | | 350,043 | |
SES SA | | | 16,337 | | | | 452,693 | |
Societe BIC SA | | | 1,438 | | | | 236,630 | |
Societe Generale SA | | | 35,927 | | | | 1,655,593 | |
Sodexo SA | | | 5,001 | | | | 488,582 | |
Suez Environnement Co. | | | 19,703 | | | | 368,511 | |
Technip SA | | | 5,041 | | | | 250,690 | |
Thales SA | | | 4,833 | | | | 361,749 | |
Total SA | | | 107,626 | | | | 4,825,021 | |
Unibail-Rodamco SE | | | 4,674 | | | | 1,186,873 | |
Valeo SA | | | 4,428 | | | | 682,685 | |
Veolia Environnement SA | | | 23,837 | | | | 565,551 | |
Vinci SA | | | 24,208 | | | | 1,551,605 | |
Vivendi SA | | | 56,472 | | | | 1,212,851 | |
Wendel SA | | | 1,358 | | | | 161,500 | |
| | | | | | | | |
| Common Stocks | | Shares | | | Value | |
France (continued) | |
Zodiac Aerospace | | | 9,179 | | | $ | 218,555 | |
| | | | | | | | |
| | | | | | | | 59,834,008 | |
Germany — 6.4% | | | | | | | | |
adidas AG | | | 10,707 | | | | 1,039,211 | |
Allianz SE, Registered Shares | | | 22,421 | | | | 3,952,329 | |
Axel Springer AG | | | 2,564 | | | | 142,585 | |
BASF SE | | | 45,919 | | | | 3,498,018 | |
Bayer AG, Registered Shares | | | 40,938 | | | | 5,112,760 | |
Bayerische Motoren Werke AG | | | 17,155 | | | | 1,807,305 | |
Bayerische Motoren Werke AG, Preference Shares | | | 2,023 | | | | 169,255 | |
Beiersdorf AG | | | 5,135 | | | | 466,727 | |
Brenntag AG | | | 8,520 | | | | 443,958 | |
Commerzbank AG (c) | | | 59,739 | | | | 616,421 | |
Continental AG (a) | | | 5,478 | | | | 1,325,182 | |
Daimler AG, Registered Shares | | | 48,314 | | | | 4,036,826 | |
Deutsche Bank AG, Registered Shares | | | 69,330 | | | | 1,683,655 | |
Deutsche Boerse AG | | | 9,803 | | | | 861,695 | |
Deutsche Lufthansa AG, Registered Shares (a)(c) | | | 12,602 | | | | 198,495 | |
Deutsche Post AG, Registered Shares | | | 47,843 | | | | 1,337,584 | |
Deutsche Telekom AG, Registered Shares | | | 161,500 | | | | 2,900,644 | |
Deutsche Wohnen AG, Bearer Shares | | | 16,491 | | | | 456,006 | |
E.ON SE | | | 97,260 | | | | 933,890 | |
Evonik Industries AG | | | 7,842 | | | | 259,390 | |
Fraport AG Frankfurt Airport Services Worldwide | | | 2,602 | | | | 165,935 | |
Fresenius Medical Care AG & Co. KGaA | | | 11,508 | | | | 967,070 | |
Fresenius SE & Co. KGaA | | | 18,714 | | | | 1,333,039 | |
Fuchs Petrolub SE, Preference Shares | | | 3,377 | | | | 159,011 | |
GEA Group AG | | | 10,847 | | | | 438,228 | |
Hannover Rueck SE | | | 3,514 | | | | 401,262 | |
HeidelbergCement AG | | | 7,796 | | | | 635,355 | |
Henkel AG & Co. KGaA | | | 5,377 | | | | 514,324 | |
Hugo Boss AG | | | 3,305 | | | | 272,692 | |
Infineon Technologies AG | | | 59,995 | | | | 874,649 | |
K+S AG, Registered Shares | | | 10,011 | | | | 255,192 | |
Kabel Deutschland Holding AG | | | 984 | | | | 121,587 | |
Lanxess AG | | | 5,116 | | | | 235,424 | |
Linde AG | | | 9,262 | | | | 1,337,973 | |
MAN SE | | | 2,023 | | | | 203,295 | |
Merck KGaA | | | 6,678 | | | | 646,569 | |
Metro AG | | | 7,442 | | | | 237,082 | |
Muenchener Rueckversicherungs AG, Registered Shares | | | 8,057 | | | | 1,605,252 | |
OSRAM Licht AG | | | 4,893 | | | | 204,424 | |
Porsche Automobil Holding SE, Preference Shares | | | 9,061 | | | | 487,639 | |
ProSiebenSat.1 Media AG, Registered Shares | | | 11,089 | | | | 559,455 | |
RWE AG (a) | | | 24,137 | | | | 304,304 | |
SAP SE | | | 48,938 | | | | 3,883,383 | |
Siemens AG, Registered Shares | | | 39,225 | | | | 3,794,855 | |
Symrise AG | | | 6,340 | | | | 419,698 | |
Telefonica Deutschland Holding AG (a) | | | 33,908 | | | | 178,854 | |
ThyssenKrupp AG | | | 19,076 | | | | 378,150 | |
TUI AG | | | 24,966 | | | | 445,770 | |
United Internet AG, Registered Shares | | | 6,889 | | | | 378,751 | |
Volkswagen AG | | | 1,804 | | | | 277,215 | |
Vonovia SE | | | 25,145 | | | | 776,806 | |
| | | | | | | | |
| | | | | | | | 53,735,179 | |
Greece — 0.1% | | | | | | | | |
Alpha Bank AE (c) | | | 69,105 | | | | 185,193 | |
Eurobank Ergasias SA (c) | | | 92,831 | | | | 103,998 | |
See Notes to Financial Statements.
| | | | | | |
| | | | | | | |
| | BLACKROCK TOTAL INTERNATIONAL ex U.S. INDEX FUND | | DECEMBER 31, 2015 | | 23 |
| | |
Schedule of Investments (continued) | | Total International ex U.S. Index Master Portfolio |
| | | | | | | | |
| Common Stocks | | Shares | | | Value | |
Greece (continued) | | | | | | | | |
FF Group (c) | | | 440 | | | $ | 8,272 | |
Hellenic Telecommunications Organization SA | | | 12,770 | | | | 127,803 | |
JUMBO SA (c) | | | 1,999 | | | | 21,011 | |
National Bank of Greece SA (c) | | | 3,405 | | | | 1,259 | |
OPAP SA | | | 8,833 | | | | 77,512 | |
Piraeus Bank SA (c) | | | 864 | | | | 258 | |
Titan Cement Co. SA | | | 990 | | | | 18,908 | |
| | | | | | | | |
| | | | | | | | 544,214 | |
Hong Kong — 3.4% | | | | | | | | |
AIA Group Ltd. | | | 616,800 | | | | 3,685,429 | |
Alibaba Health Information Technology Ltd. (c) | | | 176,000 | | | | 120,972 | |
Alibaba Pictures Group Ltd. (a)(c) | | | 480,000 | | | | 117,694 | |
ASM Pacific Technology Ltd. | | | 6,300 | | | | 49,187 | |
Bank of East Asia Ltd. (a) | | | 59,000 | | | | 218,859 | |
Beijing Enterprises Holdings Ltd. | | | 38,000 | | | | 229,074 | |
Beijing Enterprises Water Group Ltd. (c) | | | 232,000 | | | | 161,817 | |
Belle International Holdings Ltd. | | | 292,000 | | | | 218,476 | |
BOC Hong Kong Holdings Ltd. | | | 206,500 | | | | 628,384 | |
Brilliance China Automotive Holdings Ltd. | | | 148,000 | | | | 185,111 | |
Cathay Pacific Airways Ltd. | | | 32,000 | | | | 55,061 | |
Cheung Kong Infrastructure Holdings Ltd. (a) | | | 38,000 | | | | 351,077 | |
Cheung Kong Property Holdings Ltd. | | | 142,008 | | | | 918,647 | |
China Everbright International Ltd. | | | 107,000 | | | | 136,819 | |
China Everbright Ltd. | | | 102,000 | | | | 232,970 | |
China Gas Holdings Ltd. | | | 74,000 | | | | 106,329 | |
China Jinmao Holdings Group Ltd. | | | 326,000 | | | | 111,043 | |
China Merchants Holdings International Co. Ltd. | | | 60,000 | | | | 189,772 | |
China Mobile Ltd. | | | 310,500 | | | | 3,495,018 | |
China Overseas Land & Investment Ltd. | | | 216,000 | | | | 751,974 | |
China Power International Development Ltd. | | | 139,000 | | | | 80,013 | |
China Resources Enterprise Ltd. | | | 86,000 | | | | 183,497 | |
China Resources Gas Group Ltd. | | | 48,000 | | | | 143,055 | |
China Resources Land Ltd. | | | 163,111 | | | | 471,994 | |
China Resources Power Holdings Co. Ltd. | | | 118,000 | | | | 228,296 | |
China State Construction International Holdings Ltd. | | | 70,000 | | | | 121,052 | |
China Taiping Insurance Holdings Co. Ltd. (c) | | | 67,872 | | | | 208,334 | |
CITIC Ltd. | | | 220,000 | | | | 387,913 | |
CK Hutchison Holdings Ltd. | | | 134,008 | | | | 1,801,324 | |
CLP Holdings Ltd. | | | 96,500 | | | | 817,934 | |
COSCO Pacific Ltd. | | | 36,000 | | | | 39,572 | |
ENN Energy Holdings Ltd. | | | 34,000 | | | | 180,357 | |
Far East Horizon Ltd. | | | 141,000 | | | | 130,633 | |
First Pacific Co. Ltd. | | | 140,000 | | | | 92,741 | |
Galaxy Entertainment Group Ltd. | | | 152,000 | | | | 476,265 | |
GCL-Poly Energy Holdings Ltd. (a) | | | 431,000 | | | | 64,083 | |
Geely Automobile Holdings Ltd. | | | 365,000 | | | | 192,869 | |
Goldin Properties Holdings Ltd. (a)(c) | | | 39,647 | | | | 45,516 | |
GOME Electrical Appliances Holding Ltd. | | | 627,000 | | | | 103,936 | |
Guangdong Investment Ltd. | | | 164,000 | | | | 231,605 | |
Haier Electronics Group Co. Ltd. | | | 48,000 | | | | 96,888 | |
Hanergy Thin Film Power Group Ltd. (a)(c) | | | 382,000 | | | | — | |
Hang Lung Properties Ltd. | | | 120,000 | | | | 271,903 | |
Hang Seng Bank Ltd. | | | 39,400 | | | | 746,762 | |
Henderson Land Development Co. Ltd. | | | 58,850 | | | | 358,986 | |
HKT Trust & HKT Ltd. (b) | | | 142,900 | | | | 182,542 | |
Hong Kong & China Gas Co. Ltd. | | | 361,330 | | | | 707,137 | |
Hong Kong Exchanges & Clearing Ltd. | | | 56,400 | | | | 1,436,778 | |
Hysan Development Co. Ltd. | | | 25,000 | | | | 102,142 | |
Kerry Properties Ltd. | | | 16,500 | | | | 44,903 | |
Kunlun Energy Co. Ltd. | | | 134,000 | | | | 118,980 | |
| | | | | | | | |
| Common Stocks | | Shares | | | Value | |
Hong Kong (continued) | | | | | | | | |
Li & Fung Ltd. | | | 250,000 | | | $ | 169,072 | |
Link REIT | | | 126,500 | | | | 754,178 | |
MGM China Holdings Ltd. | | | 27,200 | | | | 33,806 | |
MTR Corp. | | | 67,500 | | | | 333,302 | |
New World China Land Ltd. | | | 214,000 | | | | 170,710 | |
New World Development Co. Ltd. | | | 280,666 | | | | 275,596 | |
Nine Dragons Paper Holdings Ltd. | | | 178,000 | | | | 104,525 | |
NWS Holdings Ltd. | | | 52,186 | | | | 77,900 | |
PCCW Ltd. | | | 84,000 | | | | 49,103 | |
Power Assets Holdings Ltd. | | | 78,500 | | | | 719,652 | |
Sands China Ltd. | | | 138,800 | | | | 470,559 | |
Shanghai Industrial Holdings Ltd. | | | 15,000 | | | | 39,159 | |
Shangri-La Asia Ltd. | | | 32,000 | | | | 31,158 | |
Shimao Property Holdings Ltd. | | | 51,000 | | | | 89,901 | |
Sino Biopharmaceutical Ltd. | | | 198,000 | | | | 179,015 | |
Sino Land Co. Ltd. | | | 112,800 | | | | 164,322 | |
SJM Holdings Ltd. (a) | | | 69,000 | | | | 48,896 | |
Sun Art Retail Group Ltd. (a) | | | 110,000 | | | | 82,762 | |
Sun Hung Kai Properties Ltd. | | | 89,000 | | | | 1,069,742 | |
Swire Pacific Ltd., Class A | | | 36,500 | | | | 407,709 | |
Swire Properties Ltd. | | | 42,600 | | | | 122,489 | |
Techtronic Industries Co. Ltd. | | | 74,000 | | | | 299,570 | |
WH Group Ltd. (c)(d) | | | 335,500 | | | | 186,729 | |
Wharf Holdings Ltd. | | | 73,000 | | | | 402,484 | |
Wheelock & Co. Ltd. | | | 32,000 | | | | 134,278 | |
Wynn Macau Ltd. | | | 121,200 | | | | 140,809 | |
Yue Yuen Industrial Holdings Ltd. | | | 19,000 | | | | 64,363 | |
Yuexiu Property Co. Ltd. | | | 284,400 | | | | 48,960 | |
| | | | | | | | |
| | | | | | | | 28,702,472 | |
Hungary — 0.0% | | | | | | | | |
MOL Hungarian Oil & Gas PLC | | | 997 | | | | 48,626 | |
OTP Bank PLC | | | 11,103 | | | | 228,293 | |
Richter Gedeon Nyrt | | | 3,173 | | | | 59,889 | |
| | | | | | | | |
| | | | | | | | 336,808 | |
India — 1.8% | | | | | | | | |
ACC Ltd. | | | 1,747 | | | | 35,826 | |
Adani Ports & Special Economic Zone Ltd. | | | 43,145 | | | | 169,636 | |
Aditya Birla Nuvo Ltd. | | | 1,463 | | | | 47,687 | |
Ambuja Cements Ltd. | | | 26,422 | | | | 80,801 | |
Apollo Hospitals Enterprise Ltd. | | | 8,931 | | | | 197,455 | |
Asian Paints Ltd. | | | 11,155 | | | | 148,604 | |
Aurobindo Pharma Ltd. | | | 13,516 | | | | 178,270 | |
Bajaj Auto Ltd. | | | 3,253 | | | | 124,106 | |
Bharat Forge Ltd. | | | 5,977 | | | | 80,288 | |
Bharat Heavy Electricals Ltd. | | | 22,772 | | | | 57,974 | |
Bharat Petroleum Corp. Ltd. | | | 6,728 | | | | 90,371 | |
Bharti Airtel Ltd. | | | 67,324 | | | | 344,965 | |
Bharti Infratel Ltd. | | | 20,489 | | | | 132,193 | |
Bosch Ltd. | | | 292 | | | | 82,126 | |
Cairn India Ltd. | | | 17,443 | | | | 36,277 | |
Cipla Ltd. | | | 13,384 | | | | 131,201 | |
Coal India Ltd. | | | 42,303 | | | | 209,871 | |
Container Corp. of India | | | 2,401 | | | | 47,588 | |
Dabur India Ltd. | | | 20,426 | | | | 85,344 | |
Divi’s Laboratories Ltd. | | | 3,088 | | | | 53,803 | |
Dr. Reddy’s Laboratories Ltd. | | | 1,820 | | | | 85,442 | |
Dr. Reddy’s Laboratories Ltd. — ADR | | | 4,517 | | | | 209,092 | |
Eicher Motors Ltd. | | | 723 | | | | 183,534 | |
GAIL India Ltd. | | | 12,294 | | | | 69,515 | |
See Notes to Financial Statements.
| | | | | | |
| | | | | | | |
| 24 | | BLACKROCK TOTAL INTERNATIONAL ex U.S. INDEX FUND | | DECEMBER 31, 2015 | | |
| | |
Schedule of Investments (continued) | | Total International ex U.S. Index Master Portfolio |
| | | | | | | | |
| Common Stocks | | Shares | | | Value | |
India (continued) | | | | | | | | |
GlaxoSmithKline Consumer Healthcare Ltd. | | | 391 | | | $ | 37,862 | |
Glenmark Pharmaceuticals Ltd. | | | 5,797 | | | | 80,483 | |
Godrej Consumer Products Ltd. | | | 4,619 | | | | 91,852 | |
HCL Technologies Ltd. | | | 29,571 | | | | 381,375 | |
Hero MotoCorp Ltd. | | | 1,935 | | | | 78,517 | |
Hindalco Industries Ltd. | | | 43,227 | | | | 55,105 | |
Hindustan Unilever Ltd. | | | 40,183 | | | | 523,679 | |
Housing Development Finance Corp. | | | 76,688 | | | | 1,458,593 | |
ICICI Bank Ltd. | | | 30,654 | | | | 121,075 | |
ICICI Bank Ltd. — ADR | | | 20,733 | | | | 162,339 | |
Idea Cellular Ltd. | | | 41,835 | | | | 90,527 | |
Indiabulls Housing Finance Ltd. | | | 8,948 | | | | 99,240 | |
Infosys Ltd. | | | 13,647 | | | | 227,407 | |
Infosys Ltd. — ADR | | | 75,312 | | | | 1,261,476 | |
ITC Ltd. | | | 114,631 | | | | 566,829 | |
JSW Steel Ltd. | | | 3,280 | | | | 51,004 | |
Larsen & Toubro Ltd. | | | 4,639 | | | | 89,168 | |
Larsen & Toubro Ltd. — GDR | | | 12,158 | | | | 234,853 | |
LIC Housing Finance Ltd. | | | 17,978 | | | | 138,410 | |
Lupin Ltd. | | | 11,830 | | | | 327,311 | |
Mahindra & Mahindra Financial Services Ltd. | | | 10,804 | | | | 39,350 | |
Mahindra & Mahindra Ltd. | | | 3,478 | | | | 66,764 | |
Mahindra & Mahindra Ltd. — GDR | | | 13,518 | | | | 258,327 | |
Marico Ltd. | | | 11,032 | | | | 37,656 | |
Marico Ltd. | | | 11,032 | | | | 37,712 | |
Maruti Suzuki India Ltd. | | | 4,295 | | | | 299,109 | |
Motherson Sumi Systems Ltd. | | | 12,306 | | | | 54,337 | |
Nestle India Ltd. | | | 897 | | | | 78,856 | |
NTPC Ltd. | | | 63,930 | | | | 140,971 | |
Oil & Natural Gas Corp. Ltd. | | | 58,267 | | | | 212,493 | |
Piramal Enterprises Ltd. | | | 8,297 | | | | 125,961 | |
Power Finance Corp. Ltd. | | | 10,235 | | | | 30,977 | |
Reliance Communications Ltd. (c) | | | 32,595 | | | | 43,363 | |
Reliance Industries Ltd. | | | 11,768 | | | | 180,184 | |
Reliance Industries Ltd. — GDR (d) | | | 27,499 | | | | 841,469 | |
Rural Electrification Corp. Ltd. | | | 11,484 | | | | 39,143 | |
Shree Cement Ltd. | | | 231 | | | | 40,033 | |
Shriram Transport Finance Co. Ltd. | | | 5,718 | | | | 73,930 | |
Siemens Ltd. | | | 2,761 | | | | 49,961 | |
State Bank of India | | | 34,826 | | | | 117,686 | |
State Bank of India — GDR | | | 5,712 | | | | 192,099 | |
Sun Pharmaceutical Industries Ltd. | | | 47,910 | | | | 592,658 | |
Tata Consultancy Services Ltd. | | | 23,603 | | | | 867,730 | |
Tata Motors Ltd. (c) | | | 29,859 | | | | 176,483 | |
Tata Motors Ltd. — ADR (c) | | | 6,008 | | | | 177,056 | |
Tata Power Co. Ltd. | | | 42,988 | | | | 43,910 | |
Tata Steel Ltd. | | | 11,672 | | | | 45,526 | |
Tech Mahindra Ltd. | | | 11,300 | | | | 88,721 | |
UltraTech Cement Ltd. | | | 1,383 | | | | 57,979 | |
United Breweries Ltd. | | | 2,563 | | | | 36,603 | |
United Spirits Ltd. (c) | | | 3,702 | | | | 167,179 | |
UPL Ltd. | | | 13,245 | | | | 87,226 | |
Vedanta Ltd. — ADR | | | 11,497 | | | | 63,923 | |
Wipro Ltd. | | | 9,623 | | | | 81,105 | |
Wipro Ltd. — ADR | | | 18,332 | | | | 211,551 | |
Zee Entertainment Enterprises Ltd. | | | 20,478 | | | | 134,991 | |
| | | | | | | | |
| | | | | | | | 14,752,096 | |
Indonesia — 0.5% | |
Adaro Energy Tbk PT | | | 230,400 | | | | 8,514 | |
Astra Agro Lestari Tbk PT | | | 11,500 | | | | 13,109 | |
| | | | | | | | |
| Common Stocks | | Shares | | | Value | |
Indonesia (continued) | |
Astra International Tbk PT | | | 1,198,900 | | | $ | 516,429 | |
Bank Central Asia Tbk PT | | | 705,900 | | | | 676,308 | |
Bank Danamon Indonesia Tbk PT | | | 186,600 | | | | 43,153 | |
Bank Mandiri Persero Tbk PT | | | 711,400 | | | | 472,398 | |
Bank Negara Indonesia Persero Tbk PT | | | 405,600 | | | | 145,212 | |
Bank Rakyat Indonesia Persero Tbk PT | | | 660,000 | | | | 541,662 | |
Bumi Serpong Damai Tbk PT | | | 111,800 | | | | 14,421 | |
Charoen Pokphand Indonesia Tbk PT | | | 271,300 | | | | 50,555 | |
Global Mediacom Tbk PT | | | 137,600 | | | | 10,892 | |
Gudang Garam Tbk PT | | | 9,800 | | | | 38,895 | |
Hanjaya Mandala Sampoerna Tbk PT | | | 10,400 | | | | 70,792 | |
Indocement Tunggal Prakarsa Tbk PT | | | 88,600 | | | | 142,080 | |
Indofood CBP Sukses Makmur Tbk PT | | | 18,900 | | | | 18,284 | |
Indofood Sukses Makmur Tbk PT | | | 331,300 | | | | 123,316 | |
Jasa Marga Persero Tbk PT | | | 71,000 | | | | 26,710 | |
Kalbe Farma Tbk PT | | | 858,400 | | | | 81,672 | |
Lippo Karawaci Tbk PT | | | 819,500 | | | | 61,332 | |
Matahari Department Store Tbk PT | | | 98,800 | | | | 125,074 | |
Media Nusantara Citra Tbk PT | | | 60,162 | | | | 8,010 | |
Perusahaan Gas Negara Persero Tbk | | | 426,200 | | | | 84,031 | |
Semen Indonesia Persero Tbk PT | | | 106,000 | | | | 86,855 | |
Summarecon Agung Tbk PT | | | 1,981,500 | | | | 233,854 | |
Surya Citra Media Tbk PT | | | 84,000 | | | | 18,731 | |
Telekomunikasi Indonesia Persero Tbk PT | | | 2,805,700 | | | | 628,413 | |
Tower Bersama Infrastructure Tbk PT (c) | | | 38,000 | | | | 16,075 | |
Unilever Indonesia Tbk PT | | | 62,700 | | | | 167,372 | |
United Tractors Tbk PT | | | 67,700 | | | | 82,432 | |
XL Axiata Tbk PT (c) | | | 82,000 | | | | 21,583 | |
| | | | | | | | |
| | | | | | | | 4,528,164 | |
Ireland — 0.7% | |
Bank of Ireland (c) | | | 1,442,740 | | | | 528,266 | |
CRH PLC | | | 39,330 | | | | 1,134,235 | |
Experian PLC | | | 51,781 | | | | 915,198 | |
James Hardie Industries PLC | | | 24,629 | | | | 310,521 | |
Kerry Group PLC, Class A | | | 8,083 | | | | 668,785 | |
Shire PLC | | | 30,146 | | | | 2,068,238 | |
| | | | | | | | |
| | | | | | | | 5,625,243 | |
Israel — 0.5% | |
Azrieli Group | | | 1,500 | | | | 55,879 | |
Bank Hapoalim BM | | | 66,126 | | | | 341,342 | |
Bank Leumi Le-Israel BM (c) | | | 71,682 | | | | 248,544 | |
Bezeq The Israeli Telecommunication Corp. Ltd. | | | 106,530 | | | | 234,511 | |
Check Point Software Technologies Ltd. (c) | | | 3,390 | | | | 275,878 | |
Delek Group Ltd. | | | 69 | | | | 13,818 | |
Israel Chemicals Ltd. | | | 18,197 | | | | 73,867 | |
Mizrahi Tefahot Bank Ltd. | | | 8,332 | | | | 99,513 | |
NICE Systems Ltd. | | | 2,571 | | | | 147,729 | |
Teva Pharmaceutical Industries Ltd. | | | 44,550 | | | | 2,906,482 | |
| | | | | | | | |
| | | | | | | | 4,397,563 | |
Italy — 1.6% | |
Assicurazioni Generali SpA | | | 55,938 | | | | 1,021,802 | |
Atlantia SpA | | | 21,663 | | | | 573,168 | |
Banca Monte dei Paschi di Siena SpA (c) | | | 108,878 | | | | 144,134 | |
Banco Popolare SC (c) | | | 14,013 | | | | 193,104 | |
Enel Green Power SpA | | | 101,500 | | | | 206,305 | |
Enel SpA | | | 343,622 | | | | 1,440,911 | |
Eni SpA | | | 126,625 | | | | 1,881,418 | |
Exor SpA | | | 6,195 | | | | 281,170 | |
See Notes to Financial Statements.
| | | | | | |
| | | | | | | |
| | BLACKROCK TOTAL INTERNATIONAL ex U.S. INDEX FUND | | DECEMBER 31, 2015 | | 25 |
| | |
Schedule of Investments (continued) | | Total International ex U.S. Index Master Portfolio |
| | | | | | | | |
| Common Stocks | | Shares | | | Value | |
Italy (continued) | |
Finmeccanica SpA (c) | | | 15,326 | | | $ | 213,097 | |
Intesa Sanpaolo SpA | | | 716,693 | | | | 2,371,093 | |
Luxottica Group SpA (a) | | | 9,215 | | | | 600,496 | |
Mediobanca SpA | | | 34,909 | | | | 334,640 | |
Prysmian SpA | | | 10,105 | | | | 220,785 | |
Saipem SpA (a)(c) | | | 17,006 | | | | 137,455 | |
Snam SpA | | | 108,925 | | | | 568,472 | |
Telecom Italia SpA (c) | | | 577,797 | | | | 732,249 | |
Telecom Italia SpA, Non-Convertible Savings Shares | | | 219,492 | | | | 225,271 | |
Tenaris SA (a) | | | 27,208 | | | | 322,179 | |
Terna — Rete Elettrica Nazionale SpA | | | 77,000 | | | | 396,002 | |
UniCredit SpA | | | 237,637 | | | | 1,313,821 | |
Unione di Banche Italiane SCpA | | | 40,601 | | | | 271,273 | |
UnipolSai SpA | | | 92,405 | | | | 235,088 | |
| | | | | | | | |
| | | | | | | | 13,683,933 | |
Japan — 17.1% | |
ABC-Mart, Inc. | | | 300 | | | | 16,421 | |
Acom Co. Ltd. (c) | | | 16,100 | | | | 75,815 | |
Aeon Co. Ltd. | | | 34,200 | | | | 526,940 | |
AEON Financial Service Co. Ltd. | | | 4,000 | | | | 89,355 | |
Aeon Mall Co. Ltd. | | | 5,190 | | | | 89,020 | |
Air Water, Inc. | | | 4,000 | | | | 64,333 | |
Aisin Seiki Co. Ltd. | | | 10,800 | | | | 464,814 | |
Ajinomoto Co., Inc. | | | 29,000 | | | | 686,596 | |
Alfresa Holdings Corp. | | | 8,900 | | | | 175,778 | |
Alps Electric Co. Ltd. | | | 9,900 | | | | 268,468 | |
Amada Co. Ltd. | | | 12,700 | | | | 121,192 | |
ANA Holdings, Inc. | | | 80,000 | | | | 230,808 | |
Aozora Bank Ltd. | | | 70,000 | | | | 244,287 | |
Asahi Glass Co. Ltd. | | | 49,000 | | | | 280,714 | |
Asahi Group Holdings Ltd. | | | 20,300 | | | | 635,479 | |
Asahi Kasei Corp. | | | 68,000 | | | | 459,823 | |
Asics Corp. | | | 6,100 | | | | 126,560 | |
Astellas Pharma, Inc. | | | 105,900 | | | | 1,507,566 | |
Bandai Namco Holdings, Inc. | | | 10,000 | | | | 211,271 | |
Bank of Kyoto Ltd. | | | 15,000 | | | | 139,105 | |
Bank of Yokohama Ltd. | | | 56,000 | | | | 343,257 | |
Benesse Holdings, Inc. (a) | | | 1,100 | | | | 31,678 | |
Bridgestone Corp. (a) | | | 32,600 | | | | 1,118,225 | |
Brother Industries Ltd. | | | 7,500 | | | | 86,158 | |
Calbee, Inc. | | | 3,500 | | | | 147,802 | |
Canon, Inc. (a) | | | 50,500 | | | | 1,527,626 | |
Casio Computer Co. Ltd. | | | 8,100 | | | | 189,352 | |
Central Japan Railway Co. | | | 7,200 | | | | 1,278,244 | |
Chiba Bank Ltd. | | | 41,000 | | | | 290,945 | |
Chubu Electric Power Co., Inc. | | | 33,600 | | | | 460,109 | |
Chugai Pharmaceutical Co. Ltd. | | | 11,800 | | | | 411,308 | |
Chugoku Bank Ltd. | | | 4,000 | | | | 53,375 | |
Chugoku Electric Power Co., Inc. | | | 14,700 | | | | 194,089 | |
Citizen Holdings Co. Ltd. | | | 14,200 | | | | 102,059 | |
Credit Saison Co. Ltd. (a) | | | 7,700 | | | | 151,707 | |
Dai Nippon Printing Co. Ltd. | | | 26,000 | | | | 257,105 | |
Dai-ichi Life Insurance Co. Ltd. | | | 55,200 | | | | 918,400 | |
Daicel Corp. | | | 12,000 | | | | 178,583 | |
Daihatsu Motor Co. Ltd. | | | 8,100 | | | | 109,269 | |
Daiichi Sankyo Co. Ltd. | | | 36,100 | | | | 745,093 | |
Daikin Industries Ltd. | | | 12,000 | | | | 873,860 | |
Daito Trust Construction Co. Ltd. | | | 4,000 | | | | 462,042 | |
Daiwa House Industry Co. Ltd. | | | 29,900 | | | | 859,516 | |
Daiwa Securities Group, Inc. | | | 96,000 | | | | 586,915 | |
| | | | | | | | |
| Common Stocks | | Shares | | | Value | |
Japan (continued) | |
Denso Corp. | | | 24,600 | | | $ | 1,175,523 | |
Dentsu, Inc. | | | 11,900 | | | | 651,075 | |
Don Quijote Holdings Co. Ltd. | | | 6,600 | | | | 231,784 | |
East Japan Railway Co. | | | 16,200 | | | | 1,525,487 | |
Eisai Co. Ltd. | | | 13,100 | | | | 866,575 | |
Electric Power Development Co. Ltd. | | | 7,100 | | | | 252,878 | |
FamilyMart Co. Ltd. | | | 3,300 | | | | 153,565 | |
FANUC Corp. | | | 10,100 | | | | 1,740,128 | |
Fast Retailing Co. Ltd. (a) | | | 2,600 | | | | 909,509 | |
Fuji Electric Co. Ltd. | | | 13,000 | | | | 54,520 | |
Fuji Heavy Industries Ltd. | | | 29,000 | | | | 1,194,692 | |
FUJIFILM Holdings Corp. | | | 24,300 | | | | 1,014,100 | |
Fujitsu Ltd. | | | 103,000 | | | | 514,085 | |
Fukuoka Financial Group, Inc. | | | 34,000 | | | | 168,593 | |
GungHo Online Entertainment, Inc. | | | 8,800 | | | | 23,906 | |
Gunma Bank Ltd. | | | 15,000 | | | | 87,214 | |
Hachijuni Bank Ltd. | | | 10,000 | | | | 61,200 | |
Hakuhodo DY Holdings, Inc. | | | 5,800 | | | | 62,753 | |
Hamamatsu Photonics KK | | | 6,400 | | | | 175,457 | |
Hankyu Hanshin Holdings, Inc. | | | 57,000 | | | | 370,493 | |
Hikari Tsushin, Inc. | | | 1,800 | | | | 122,580 | |
Hino Motors Ltd. | | | 8,600 | | | | 99,394 | |
Hirose Electric Co. Ltd. | | | 1,335 | | | | 161,631 | |
Hiroshima Bank Ltd. | | | 22,000 | | | | 125,043 | |
Hisamitsu Pharmaceutical Co., Inc. | | | 1,100 | | | | 46,181 | |
Hitachi Chemical Co. Ltd. | | | 1,600 | | | | 25,383 | |
Hitachi Construction Machinery Co. Ltd. | | | 4,600 | | | | 71,541 | |
Hitachi High-Technologies Corp. | | | 1,600 | | | | 43,269 | |
Hitachi Ltd. | | | 241,000 | | | | 1,365,595 | |
Hitachi Metals Ltd. | | | 8,000 | | | | 98,706 | |
Hokuhoku Financial Group, Inc. | | | 45,000 | | | | 91,734 | |
Hokuriku Electric Power Co. | | | 7,100 | | | | 104,927 | |
Honda Motor Co. Ltd. | | | 78,900 | | | | 2,521,763 | |
Hoya Corp. | | | 21,700 | | | | 887,369 | |
Hulic Co. Ltd. (a) | | | 9,000 | | | | 79,025 | |
Idemitsu Kosan Co. Ltd. | | | 2,400 | | | | 38,321 | |
IHI Corp. | | | 58,000 | | | | 160,109 | |
Iida Group Holdings Co. Ltd. | | | 6,800 | | | | 126,031 | |
Inpex Corp. | | | 53,500 | | | | 521,566 | |
Isetan Mitsukoshi Holdings Ltd. | | | 20,100 | | | | 262,125 | |
Isuzu Motors Ltd. | | | 31,000 | | | | 333,952 | |
ITOCHU Corp. | | | 80,100 | | | | 947,458 | |
Itochu Techno-Solutions Corp. | | | 6,000 | | | | 119,546 | |
Iyo Bank Ltd. | | | 8,700 | | | | 84,526 | |
J. Front Retailing Co. Ltd. | | | 9,700 | | | | 141,015 | |
Japan Airlines Co. Ltd. | | | 7,400 | | | | 264,867 | |
Japan Airport Terminal Co. Ltd. (a) | | | 1,500 | | | | 66,404 | |
Japan Exchange Group, Inc. | | | 29,800 | | | | 465,826 | |
Japan Post Bank Co. Ltd. (c) | | | 20,200 | | | | 294,105 | |
Japan Post Holdings Co. Ltd. (c) | | | 22,500 | | | | 349,120 | |
Japan Prime Realty Investment Corp. (a) | | | 41 | | | | 140,011 | |
Japan Real Estate Investment Corp. | | | 56 | | | | 271,753 | |
Japan Retail Fund Investment Corp. | | | 141 | | | | 271,267 | |
Japan Tobacco, Inc. | | | 54,600 | | | | 2,004,571 | |
JFE Holdings, Inc. (a) | | | 22,200 | | | | 348,593 | |
JGC Corp. | | | 15,000 | | | | 229,593 | |
Joyo Bank Ltd. | | | 29,000 | | | | 137,137 | |
JSR Corp. | | | 12,500 | | | | 194,804 | |
JTEKT Corp. | | | 12,600 | | | | 206,238 | |
JX Holdings, Inc. | | | 125,300 | | | | 525,894 | |
Kajima Corp. | | | 47,000 | | | | 279,718 | |
See Notes to Financial Statements.
| | | | | | |
| | | | | | | |
| 26 | | BLACKROCK TOTAL INTERNATIONAL ex U.S. INDEX FUND | | DECEMBER 31, 2015 | | |
| | |
Schedule of Investments (continued) | | Total International ex U.S. Index Master Portfolio |
| | | | | | | | |
| Common Stocks | | Shares | | | Value | |
Japan (continued) | |
Kakaku.com, Inc. | | | 7,400 | | | $ | 145,555 | |
Kamigumi Co. Ltd. | | | 18,000 | | | | 154,977 | |
Kaneka Corp. | | | 19,000 | | | | 197,491 | |
Kansai Electric Power Co., Inc. (c) | | | 38,500 | | | | 461,607 | |
Kansai Paint Co. Ltd. | | | 8,000 | | | | 121,262 | |
Kao Corp. | | | 25,800 | | | | 1,325,829 | |
Kawasaki Heavy Industries Ltd. | | | 84,000 | | | | 310,791 | |
KDDI Corp. | | | 87,000 | | | | 2,259,405 | |
Keihan Electric Railway Co. Ltd. | | | 15,000 | | | | 100,459 | |
Keikyu Corp. | | | 22,000 | | | | 181,791 | |
Keio Corp. | | | 27,000 | | | | 233,164 | |
Keisei Electric Railway Co. Ltd. | | | 16,000 | | | | 204,132 | |
Keyence Corp. | | | 2,220 | | | | 1,220,123 | |
Kikkoman Corp. (a) | | | 8,000 | | | | 277,179 | |
Kintetsu Group Holdings Co. Ltd. | | | 91,000 | | | | 369,987 | |
Kirin Holdings Co. Ltd. | | | 35,100 | | | | 476,558 | |
Kobe Steel Ltd. | | | 126,000 | | | | 136,901 | |
Koito Manufacturing Co. Ltd. | | | 6,000 | | | | 246,045 | |
Komatsu Ltd. | | | 48,200 | | | | 788,670 | |
Konami Corp. | | | 5,700 | | | | 135,686 | |
Konica Minolta, Inc. | | | 23,700 | | | | 237,360 | |
Kose Corp. | | | 1,700 | | | | 157,184 | |
Kubota Corp. | | | 56,000 | | | | 865,124 | |
Kuraray Co. Ltd. | | | 19,300 | | | | 233,777 | |
Kurita Water Industries Ltd. | | | 7,400 | | | | 154,966 | |
Kyocera Corp. (a) | | | 16,700 | | | | 775,557 | |
Kyowa Hakko Kirin Co. Ltd. | | | 12,000 | | | | 188,816 | |
Kyushu Electric Power Co., Inc. (c) | | | 25,500 | | | | 277,927 | |
Lawson, Inc. | | | 3,800 | | | | 308,450 | |
LIXIL Group Corp. | | | 13,600 | | | | 302,052 | |
M3, Inc. (a) | | | 9,700 | | | | 201,122 | |
Mabuchi Motor Co. Ltd. (a) | | | 2,300 | | | | 124,648 | |
Makita Corp. | | | 5,800 | | | | 334,235 | |
Marubeni Corp. | | | 87,100 | | | | 447,789 | |
Marui Group Co. Ltd. | | | 9,500 | | | | 154,590 | |
Maruichi Steel Tube Ltd. | | | 2,400 | | | | 70,852 | |
Mazda Motor Corp. | | | 29,500 | | | | 608,725 | |
McDonald’s Holdings Co. Japan Ltd. (a) | | | 1,500 | | | | 32,620 | |
Medipal Holdings Corp. | | | 3,000 | | | | 51,132 | |
Meiji Holdings Co. Ltd. | | | 6,200 | | | | 512,118 | |
Minebea Co. Ltd. (a) | | | 19,000 | | | | 162,677 | |
Miraca Holdings, Inc. | | | 2,400 | | | | 105,604 | |
Mitsubishi Chemical Holdings Corp. | | | 70,100 | | | | 444,765 | |
Mitsubishi Corp. | | | 68,400 | | | | 1,137,705 | |
Mitsubishi Electric Corp. | | | 98,000 | | | | 1,028,691 | |
Mitsubishi Estate Co. Ltd. | | | 59,000 | | | | 1,226,806 | |
Mitsubishi Gas Chemical Co., Inc. (a) | | | 31,000 | | | | 158,519 | |
Mitsubishi Heavy Industries Ltd. | | | 157,000 | | | | 686,483 | |
Mitsubishi Logistics Corp. | | | 2,000 | | | | 26,352 | |
Mitsubishi Materials Corp. | | | 62,000 | | | | 195,278 | |
Mitsubishi Motors Corp. | | | 35,200 | | | | 297,811 | |
Mitsubishi Tanabe Pharma Corp. | | | 11,400 | | | | 196,406 | |
Mitsubishi UFJ Financial Group, Inc. | | | 649,600 | | | | 4,023,784 | |
Mitsubishi UFJ Lease & Finance Co. Ltd. | | | 11,500 | | | | 59,182 | |
Mitsui & Co. Ltd. | | | 84,200 | | | | 1,000,467 | |
Mitsui Chemicals, Inc. | | | 37,000 | | | | 164,095 | |
Mitsui Fudosan Co. Ltd. | | | 47,000 | | | | 1,179,600 | |
Mitsui OSK Lines Ltd. | | | 47,000 | | | | 118,547 | |
Mixi, Inc. | | | 1,800 | | | | 67,326 | |
Mizuho Financial Group, Inc. | | | 1,191,800 | | | | 2,383,600 | |
MS&AD Insurance Group Holdings, Inc. | | | 25,800 | | | | 756,577 | |
| | | | | | | | |
| Common Stocks | | Shares | | | Value | |
Japan (continued) | |
Murata Manufacturing Co. Ltd. | | | 10,100 | | | $ | 1,453,200 | |
Nabtesco Corp. | | | 3,900 | | | | 79,229 | |
Nagoya Railroad Co. Ltd. | | | 31,000 | | | | 129,025 | |
NEC Corp. | | | 108,000 | | | | 342,200 | |
Nexon Co. Ltd. | | | 5,100 | | | | 82,965 | |
NGK Insulators Ltd. | | | 15,000 | | | | 338,103 | |
NGK Spark Plug Co. Ltd. (a) | | | 8,500 | | | | 223,792 | |
NH Foods Ltd. | | | 8,000 | | | | 156,799 | |
NHK Spring Co. Ltd. | | | 14,000 | | | | 140,368 | |
Nidec Corp. | | | 11,100 | | | | 804,927 | |
Nikon Corp. | | | 19,900 | | | | 266,530 | |
Nintendo Co. Ltd. | | | 5,200 | | | | 715,052 | |
Nippon Building Fund, Inc. (a) | | | 75 | | | | 358,391 | |
Nippon Electric Glass Co. Ltd. (a) | | | 28,000 | | | | 141,125 | |
Nippon Express Co. Ltd. | | | 31,000 | | | | 145,676 | |
Nippon Paint Holdings Co. Ltd. (a) | | | 6,000 | | | | 145,212 | |
Nippon Steel & Sumitomo Metal | | | 37,647 | | | | 744,746 | |
Nippon Telegraph & Telephone Corp. | | | 37,500 | | | | 1,492,429 | |
Nippon Yusen KK | | | 93,000 | | | | 225,403 | |
Nissan Motor Co. Ltd. | | | 123,500 | | | | 1,293,136 | |
Nisshin Seifun Group, Inc. | | | 9,000 | | | | 147,010 | |
Nissin Foods Holdings Co. Ltd. | | | 3,500 | | | | 185,723 | |
Nitori Holdings Co. Ltd. | | | 4,000 | | | | 335,927 | |
Nitto Denko Corp. | | | 8,800 | | | | 642,450 | |
NOK Corp. | | | 3,800 | | | | 88,771 | |
Nomura Holdings, Inc. | | | 183,100 | | | | 1,019,877 | |
Nomura Real Estate Holdings, Inc. | | | 5,200 | | | | 96,472 | |
Nomura Research Institute Ltd. | | | 6,710 | | | | 257,689 | |
NSK Ltd. | | | 24,800 | | | | 269,475 | |
NTT Data Corp. | | | 6,800 | | | | 328,753 | |
NTT DoCoMo, Inc. | | | 72,500 | | | | 1,487,090 | |
NTT Urban Development Corp. | | | 2,400 | | | | 23,060 | |
Obayashi Corp. | | | 33,000 | | | | 304,498 | |
Odakyu Electric Railway Co. Ltd. | | | 34,000 | | | | 366,071 | |
Oji Holdings Corp. | | | 39,000 | | | | 156,741 | |
Olympus Corp. | | | 14,300 | | | | 562,972 | |
Omron Corp. | | | 11,500 | | | | 383,489 | |
Ono Pharmaceutical Co. Ltd. | | | 4,200 | | | | 748,909 | |
Oracle Corp. Japan | | | 700 | | | | 32,592 | |
Oriental Land Co. Ltd. | | | 11,100 | | | | 671,511 | |
ORIX Corp. | | | 68,400 | | | | 959,547 | |
Osaka Gas Co. Ltd. | | | 94,000 | | | | 339,522 | |
Otsuka Corp. | | | 2,900 | | | | 142,459 | |
Otsuka Holdings Co. Ltd. (a) | | | 21,300 | | | | 756,766 | |
Panasonic Corp. | | | 112,700 | | | | 1,142,497 | |
Park24 Co. Ltd. | | | 8,400 | | | | 203,510 | |
Rakuten, Inc. | | | 48,300 | | | | 556,308 | |
Recruit Holdings Co. Ltd. | | | 8,500 | | | | 249,847 | |
Resona Holdings, Inc. | | | 113,000 | | | | 548,755 | |
Ricoh Co. Ltd. | | | 39,000 | | | | 401,575 | |
Rinnai Corp. | | | 2,100 | | | | 186,067 | |
Rohm Co. Ltd. | | | 5,400 | | | | 273,515 | |
Ryohin Keikaku Co. Ltd. | | | 1,000 | | | | 202,511 | |
Sankyo Co. Ltd. (a) | | | 3,300 | | | | 123,182 | |
Sanrio Co. Ltd. | | | 4,800 | | | | 112,768 | |
Santen Pharmaceutical Co. Ltd. | | | 20,200 | | | | 332,561 | |
SBI Holdings, Inc. | | | 8,850 | | | | 95,499 | |
Secom Co. Ltd. | | | 10,900 | | | | 738,690 | |
Sega Sammy Holdings, Inc. | | | 6,900 | | | | 64,538 | |
Seibu Holdings, Inc. | | | 6,200 | | | | 126,618 | |
Seiko Epson Corp. | | | 14,900 | | | | 229,447 | |
See Notes to Financial Statements.
| | | | | | |
| | | | | | | |
| | BLACKROCK TOTAL INTERNATIONAL ex U.S. INDEX FUND | | DECEMBER 31, 2015 | | 27 |
| | |
Schedule of Investments (continued) | | Total International ex U.S. Index Master Portfolio |
| | | | | | | | |
| Common Stocks | | Shares | | | Value | |
Japan (continued) | |
Sekisui Chemical Co. Ltd. | | | 19,000 | | | $ | 248,069 | |
Sekisui House Ltd. | | | 33,100 | | | | 556,535 | |
Seven & I Holdings Co. Ltd. | | | 35,900 | | | | 1,643,666 | |
Seven Bank Ltd. | | | 27,800 | | | | 121,917 | |
Shikoku Electric Power Co., Inc. | | | 8,000 | | | | 124,970 | |
Shimadzu Corp. | | | 11,000 | | | | 184,139 | |
Shimamura Co. Ltd. | | | 900 | | | | 105,398 | |
Shimano, Inc. (a) | | | 4,100 | | | | 629,590 | |
Shimizu Corp. | | | 29,000 | | | | 236,473 | |
Shin-Etsu Chemical Co. Ltd. | | | 19,800 | | | | 1,076,443 | |
Shinsei Bank Ltd. | | | 100,000 | | | | 184,029 | |
Shionogi & Co. Ltd. | | | 16,800 | | | | 759,868 | |
Shiseido Co. Ltd. | | | 19,900 | | | | 412,898 | |
Shizuoka Bank Ltd. | | | 30,000 | | | | 290,941 | |
Showa Shell Sekiyu KK | | | 13,900 | | | | 113,426 | |
SMC Corp. | | | 2,900 | | | | 753,228 | |
Softbank Group Corp. | | | 46,400 | | | | 2,341,827 | |
Sompo Japan Nipponkoa Holdings, Inc. | | | 18,100 | | | | 594,308 | |
Sony Corp. | | | 62,700 | | | | 1,540,965 | |
Sony Financial Holdings, Inc. | | | 6,900 | | | | 123,422 | |
Stanley Electric Co. Ltd. | | | 5,100 | | | | 111,882 | |
Sumitomo Chemical Co. Ltd. | | | 79,000 | | | | 453,704 | |
Sumitomo Corp. | | | 64,200 | | | | 654,540 | |
Sumitomo Dainippon Pharma Co. Ltd. (a) | | | 3,900 | | | | 45,948 | |
Sumitomo Electric Industries Ltd. | | | 39,500 | | | | 557,772 | |
Sumitomo Heavy Industries Ltd. | | | 20,000 | | | | 89,657 | |
Sumitomo Metal Mining Co. Ltd. | | | 29,000 | | | | 352,029 | |
Sumitomo Mitsui Financial Group, Inc. | | | 61,500 | | | | 2,321,074 | |
Sumitomo Mitsui Trust Holdings, Inc. | | | 177,000 | | | | 670,357 | |
Sumitomo Realty & Development Co. Ltd. | | | 19,000 | | | | 542,311 | |
Sumitomo Rubber Industries Ltd. | | | 10,500 | | | | 136,535 | |
Suntory Beverage & Food Ltd. | | | 8,500 | | | | 372,097 | |
Suruga Bank Ltd. | | | 8,300 | | | | 171,051 | |
Suzuken Co. Ltd. | | | 1,870 | | | | 71,064 | |
Suzuki Motor Corp. | | | 18,900 | | | | 574,254 | |
Sysmex Corp. | | | 7,800 | | | | 500,328 | |
T&D Holdings, Inc. | | | 31,400 | | | | 414,277 | |
Taiheiyo Cement Corp. | | | 49,000 | | | | 143,095 | |
Taisei Corp. | | | 51,000 | | | | 335,935 | |
Taisho Pharmaceutical Holdings Co. Ltd. | | | 800 | | | | 56,500 | |
Taiyo Nippon Sanso Corp. (a) | | | 4,000 | | | | 36,175 | |
Takashimaya Co. Ltd. (a) | | | 13,000 | | | | 117,071 | |
Takeda Pharmaceutical Co. Ltd. | | | 39,500 | | | | 1,969,448 | |
TDK Corp. | | | 6,800 | | | | 435,499 | |
Teijin Ltd. | | | 59,000 | | | | 201,064 | |
Terumo Corp. (a) | | | 16,500 | | | | 511,391 | |
THK Co. Ltd. (a) | | | 4,000 | | | | 74,136 | |
Tobu Railway Co. Ltd. | | | 57,000 | | | | 281,148 | |
Toho Co. Ltd. | | | 5,000 | | | | 138,361 | |
Toho Gas Co. Ltd. | | | 18,000 | | | | 116,248 | |
Tohoku Electric Power Co., Inc. | | | 22,400 | | | | 280,029 | |
Tokio Marine Holdings, Inc. | | | 33,800 | | | | 1,305,511 | |
Tokyo Electric Power Co., Inc. (c) | | | 70,100 | | | | 403,654 | |
Tokyo Electron Ltd. | | | 8,000 | | | | 484,679 | |
Tokyo Gas Co. Ltd. | | | 124,000 | | | | 582,650 | |
Tokyo Tatemono Co. Ltd. | | | 8,000 | | | | 87,070 | |
Tokyu Corp. | | | 53,000 | | | | 418,827 | |
Tokyu Fudosan Holdings Corp. | | | 30,800 | | | | 193,050 | |
TonenGeneral Sekiyu KK (a) | | | 16,000 | | | | 135,072 | |
Toppan Printing Co. Ltd. (a) | | | 23,000 | | | | 211,903 | |
Toray Industries, Inc. | | | 80,000 | | | | 743,402 | |
| | | | | | | | |
| Common Stocks | | Shares | | | Value | |
Japan (continued) | |
Toshiba Corp. (c) | | | 208,000 | | | $ | 427,487 | |
Toto Ltd. | | | 8,500 | | | | 298,622 | |
Toyo Seikan Kaisha Ltd. (a) | | | 8,500 | | | | 157,668 | |
Toyo Suisan Kaisha Ltd. | | | 5,400 | | | | 188,204 | |
Toyoda Gosei Co. Ltd. | | | 4,300 | | | | 97,683 | |
Toyota Industries Corp. | | | 6,600 | | | | 352,925 | |
Toyota Motor Corp. | | | 135,300 | | | | 8,331,634 | |
Toyota Tsusho Corp. | | | 10,200 | | | | 238,607 | |
Trend Micro, Inc. | | | 4,200 | | | | 170,424 | |
Unicharm Corp. | | | 21,500 | | | | 439,066 | |
United Urban Investment Corp. | | | 132 | | | | 179,197 | |
USS Co. Ltd. | | | 12,100 | | | | 181,812 | |
West Japan Railway Co. | | | 8,200 | | | | 566,809 | |
Yahoo! Japan Corp. | | | 75,400 | | | | 306,494 | |
Yakult Honsha Co. Ltd. | | | 5,200 | | | | 254,512 | |
Yamada Denki Co. Ltd. | | | 39,300 | | | | 169,757 | |
Yamaguchi Financial Group, Inc. | | | 4,000 | | | | 47,389 | |
Yamaha Corp. | | | 9,600 | | | | 231,882 | |
Yamaha Motor Co. Ltd. | | | 14,700 | | | | 329,505 | |
Yamato Holdings Co. Ltd. | | | 17,700 | | | | 375,030 | |
Yamazaki Baking Co. Ltd. | | | 7,000 | | | | 157,400 | |
Yaskawa Electric Corp. | | | 8,100 | | | | 110,214 | |
Yokogawa Electric Corp. | | | 8,400 | | | | 101,018 | |
Yokohama Rubber Co. Ltd. | | | 5,000 | | | | 76,789 | |
| | | | | | | | |
| | | | | | | | 142,766,829 | |
Luxembourg — 0.0% | |
RTL Group SA (c) | | | 2,943 | | | | 245,080 | |
Malaysia — 0.7% | |
AirAsia Bhd | | | 60,100 | | | | 17,980 | |
Alliance Financial Group Bhd | | | 90,800 | | | | 75,179 | |
AMMB Holdings Bhd | | | 68,900 | | | | 72,507 | |
Astro Malaysia Holdings Bhd | | | 29,600 | | | | 18,971 | |
Axiata Group Bhd | | | 165,600 | | | | 246,783 | |
Berjaya Sports Toto Bhd | | | 118,478 | | | | 84,164 | |
British American Tobacco Malaysia Bhd | | | 3,100 | | | | 40,433 | |
Bumi Armada Bhd (a)(c) | | | 45,600 | | | | 10,806 | |
CIMB Group Holdings Bhd | | | 239,100 | | | | 252,104 | |
Dialog Group Bhd | | | 142,134 | | | | 52,826 | |
DiGi.Com Bhd (a) | | | 169,300 | | | | 212,564 | |
Felda Global Ventures Holdings Bhd (a) | | | 89,900 | | | | 35,642 | |
Gamuda Bhd | | | 39,600 | | | | 42,896 | |
Genting Bhd | | | 78,100 | | | | 133,201 | |
Genting Malaysia Bhd | | | 106,100 | | | | 108,088 | |
Genting Plantations Bhd | | | 10,000 | | | | 24,688 | |
Hong Leong Bank Bhd | | | 14,040 | | | | 43,749 | |
Hong Leong Financial Group Bhd | | | 7,000 | | | | 22,704 | |
IHH Healthcare Bhd | | | 176,500 | | | | 270,495 | |
IJM Corp. Bhd | | | 126,600 | | | | 99,535 | |
IOI Corp. Bhd | | | 102,200 | | | | 105,847 | |
IOI Properties Group Sdn Bhd | | | 23,273 | | | | 12,168 | |
Kuala Lumpur Kepong Bhd | | | 17,500 | | | | 93,080 | |
Lafarge Malayan Cement Bhd | | | 17,500 | | | | 36,194 | |
Malayan Banking Bhd (a) | | | 324,600 | | | | 633,883 | |
Malaysia Airports Holdings Bhd | | | 11,300 | | | | 14,716 | |
Maxis Bhd (a) | | | 66,600 | | | | 105,232 | |
MISC Bhd | | | 27,400 | | | | 59,568 | |
Petronas Chemicals Group Bhd | | | 126,000 | | | | 212,834 | |
Petronas Dagangan Bhd | | | 6,100 | | | | 35,320 | |
Petronas Gas Bhd | | | 52,700 | | | | 278,763 | |
See Notes to Financial Statements.
| | | | | | |
| | | | | | | |
| 28 | | BLACKROCK TOTAL INTERNATIONAL ex U.S. INDEX FUND | | DECEMBER 31, 2015 | | |
| | |
Schedule of Investments (continued) | | Total International ex U.S. Index Master Portfolio |
| | | | | | | | |
| Common Stocks | | Shares | | | Value | |
Malaysia (continued) | |
PPB Group Bhd | | | 12,600 | | | $ | 46,517 | |
Public Bank Bhd | | | 156,720 | | | | 675,277 | |
RHB Capital Bhd | | | 12,900 | | | | 17,001 | |
Sapurakencana Petroleum Bhd (a) | | | 220,700 | | | | 103,543 | |
Sime Darby Bhd | | | 159,000 | | | | 285,696 | |
Telekom Malaysia Bhd | | | 55,900 | | | | 88,086 | |
Tenaga Nasional Bhd | | | 208,700 | | | | 646,175 | |
UMW Holdings Bhd | | | 10,900 | | | | 19,939 | |
Westports Holdings Bhd | | | 70,000 | | | | 66,978 | |
YTL Corp. Bhd | | | 113,160 | | | | 41,288 | |
YTL Power International Bhd | | | 42,000 | | | | 14,450 | |
| | | | | | | | |
| | | | | | | | 5,457,870 | |
Malta — 0.0% | |
Brait SE (a)(c) | | | 18,341 | | | | 197,876 | |
Mexico — 0.9% | |
Alfa SAB de CV, Series A | | | 169,400 | | | | 335,173 | |
America Movil SAB de CV, Series L | | | 1,602,800 | | | | 1,127,154 | |
Arca Continental SAB de CV | | | 15,972 | | | | 97,012 | |
Cemex SAB de CV (c) | | | 820,345 | | | | 448,859 | |
Coca-Cola Femsa SAB de CV, Series L (c) | | | 24,300 | | | | 174,694 | |
Controladora Comercial Mexicana SAB de CV | | | 4,900 | | | | 13,451 | |
El Puerto de Liverpool SAB de CV, Series C1 | | | 10,900 | | | | 132,885 | |
Fibra Uno Administracion SA de CV | | | 129,500 | | | | 285,457 | |
Fomento Economico Mexicano SAB de CV | | | 95,700 | | | | 897,502 | |
Gentera SAB de CV | | | 37,100 | | | | 71,791 | |
Gruma SAB de CV | | | 10,000 | | | | 140,271 | |
Grupo Aeroportuario del Pacifico SAB de CV, Class B | | | 15,800 | | | | 139,394 | |
Grupo Aeroportuario del Sureste SAB de CV, Class B | | | 10,700 | | | | 151,419 | |
Grupo Bimbo SAB de CV, Series A (c) | | | 104,600 | | | | 278,881 | |
Grupo Carso SAB de CV, Series A1 | | | 14,900 | | | | 61,365 | |
Grupo Comercial Chedraui SA de CV | | | 41,000 | | | | 109,289 | |
Grupo Financiero Banorte SAB de CV, Series O | | | 142,200 | | | | 783,752 | |
Grupo Financiero Inbursa SAB de CV, Series O | | | 99,700 | | | | 179,911 | |
Grupo Financiero Santander Mexico SAB de CV, Series B | | | 92,800 | | | | 162,883 | |
Grupo Lala SAB de CV | | | 9,900 | | | | 23,017 | |
Grupo Mexico SAB de CV, Series B | | | 196,823 | | | | 420,152 | |
Grupo Televisa SAB CPO | | | 132,200 | | | | 723,650 | |
Industrias Penoles SAB de CV | | | 2,850 | | | | 29,306 | |
Kimberly-Clark de Mexico SAB de CV, Class A (c) | | | 78,500 | | | | 183,878 | |
Mexichem SAB de CV | | | 35,730 | | | | 79,817 | |
OHL Mexico SAB de CV (c) | | | 42,200 | | | | 44,172 | |
Promotora y Operadora de Infraestructura SAB de CV (c) | | | 9,700 | | | | 114,101 | |
Wal-Mart de Mexico SAB de CV | | | 281,300 | | | | 709,840 | |
| | | | | | | | |
| | | | | | | | 7,919,076 | |
Netherlands — 3.1% | |
Aegon NV | | | 103,800 | | | | 587,037 | |
Akzo Nobel NV | | | 12,760 | | | | 852,606 | |
Altice NV Class A (c) | | | 14,627 | | | | 210,150 | |
Altice NV Class B (c) | | | 3,659 | | | | 53,331 | |
ASML Holding NV | | | 17,224 | | | | 1,530,378 | |
CNH Industrial NV (a) | | | 45,146 | | | | 309,202 | |
Gemalto NV | | | 4,250 | | | | 255,008 | |
Heineken Holding NV | | | 5,586 | | | | 430,048 | |
Heineken NV | | | 11,301 | | | | 963,036 | |
ING Groep NV CVA | | | 196,445 | | | | 2,657,908 | |
| | | | | | | | |
| Common Stocks | | Shares | | | Value | |
Netherlands (continued) | |
Koninklijke Ahold NV | | | 45,490 | | | $ | 959,540 | |
Koninklijke Boskalis Westminster NV | | | 4,734 | | | | 193,110 | |
Koninklijke DSM NV | | | 9,500 | | | | 476,381 | |
Koninklijke KPN NV | | | 174,560 | | | | 660,249 | |
Koninklijke Philips Electronics NV | | | 47,377 | | | | 1,209,262 | |
Koninklijke Vopak NV | | | 2,494 | | | | 107,404 | |
NN Group NV | | | 10,990 | | | | 387,759 | |
NXP Semiconductor NV (c) | | | 5,978 | | | | 503,646 | |
OCI NV (c) | | | 3,417 | | | | 84,371 | |
QIAGEN NV (c) | | | 10,835 | | | | 293,674 | |
Randstad Holding NV | | | 7,147 | | | | 445,054 | |
RELX NV | | | 54,257 | | | | 913,812 | |
Royal Dutch Shell PLC, Class A | | | 196,439 | | | | 4,449,177 | |
Royal Dutch Shell PLC, Class B | | | 118,718 | | | | 2,705,693 | |
Steinhoff International Holdings NV | | | 116,440 | | | | 591,122 | |
TNT Express NV | | | 29,376 | | | | 248,487 | |
Unilever NV CVA | | | 81,040 | | | | 3,532,055 | |
Wolters Kluwer NV | | | 16,190 | | | | 543,717 | |
| | | | | | | | |
| | | | | | | | 26,153,217 | |
New Zealand — 0.1% | |
Auckland International Airport Ltd. | | | 55,568 | | | | 217,999 | |
Contact Energy Ltd. | | | 39,025 | | | | 126,310 | |
Fletcher Building Ltd. | | | 30,613 | | | | 153,416 | |
Meridian Energy Ltd. | | | 95,908 | | | | 156,405 | |
Mighty River Power Ltd. | | | 12,773 | | | | 24,236 | |
Ryman Healthcare Ltd. | | | 13,399 | | | | 77,762 | |
Spark New Zealand Ltd. | | | 65,332 | | | | 147,106 | |
| | | | | | | | |
| | | | | | | | 903,234 | |
Norway — 0.4% | |
DnB NOR ASA | | | 51,793 | | | | 638,153 | |
Gjensidige Forsikring ASA | | | 15,619 | | | | 249,984 | |
Norsk Hydro ASA | | | 59,486 | | | | 221,116 | |
Orkla ASA | | | 51,519 | | | | 406,429 | |
Statoil ASA | | | 57,162 | | | | 797,225 | |
Telenor ASA (a) | | | 36,700 | | | | 611,736 | |
Yara International ASA | | | 9,441 | | | | 406,041 | |
| | | | | | | | |
| | | | | | | | 3,330,684 | |
Peru — 0.1% | |
Compania de Minas Buenaventura SA — ADR | | | 4,924 | | | | 21,075 | |
Credicorp Ltd. | | | 4,727 | | | | 460,031 | |
Southern Copper Corp. | | | 10,147 | | | | 265,040 | |
| | | | | | | | |
| | | | | | | | 746,146 | |
Philippines — 0.3% | |
Aboitiz Equity Ventures, Inc. | | | 86,410 | | | | 106,001 | |
Aboitiz Power Corp. | | | 29,200 | | | | 25,877 | |
Alliance Global Group, Inc. | | | 35,800 | | | | 12,202 | |
Ayala Corp. | | | 13,480 | | | | 216,040 | |
Ayala Land, Inc. | | | 389,400 | | | | 284,641 | |
Bank of the Philippine Islands | | | 45,031 | | | | 80,204 | |
BDO Unibank, Inc. | | | 59,814 | | | | 132,957 | |
DMCI Holdings, Inc. | | | 170,000 | | | | 49,710 | |
Energy Development Corp. | | | 642,400 | | | | 84,379 | |
Globe Telecom, Inc. | | | 845 | | | | 33,194 | |
GT Capital Holdings, Inc. | | | 2,625 | | | | 73,541 | |
International Container Terminal Services, Inc. | | | 9,550 | | | | 14,225 | |
JG Summit Holdings, Inc. | | | 156,443 | | | | 243,456 | |
Jollibee Foods Corp. | | | 12,070 | | | | 56,031 | |
See Notes to Financial Statements.
| | | | | | |
| | | | | | | |
| | BLACKROCK TOTAL INTERNATIONAL ex U.S. INDEX FUND | | DECEMBER 31, 2015 | | 29 |
| | |
Schedule of Investments (continued) | | Total International ex U.S. Index Master Portfolio |
| | | | | | | | |
| Common Stocks | | Shares | | | Value | |
Philippines (continued) | |
Megaworld Corp. | | | 600,000 | | | $ | 54,055 | |
Metro Pacific Investments Corp. | | | 1,468,000 | | | | 161,949 | |
Metropolitan Bank & Trust Co. | | | 12,817 | | | | 21,862 | |
Philippine Long Distance Telephone Co. | | | 6,185 | | | | 270,396 | |
SM Investments Corp. | | | 6,035 | | | | 110,244 | |
SM Prime Holdings, Inc. | | | 486,150 | | | | 223,561 | |
Universal Robina Corp. | | | 34,300 | | | | 135,349 | |
| | | | | | | | |
| | | | | | | | 2,389,874 | |
Poland — 0.3% | |
Alior Bank SA (c) | | | 761 | | | | 12,901 | |
Bank Handlowy w Warszawie SA | | | 502 | | | | 9,172 | |
Bank Millennium SA (c) | | | 13,346 | | | | 18,904 | |
Bank Pekao SA | | | 6,396 | | | | 233,600 | |
Bank Zachodni WBK SA (c) | | | 1,160 | | | | 83,585 | |
CCC SA | | | 981 | | | | 34,534 | |
Cyfrowy Polsat SA (c) | | | 8,953 | | | | 47,590 | |
Enea SA | | | 3,084 | | | | 8,850 | |
Energa SA | | | 5,000 | | | | 16,096 | |
Eurocash SA | | | 9,624 | | | | 118,601 | |
Grupa Azoty SA (c) | | | 1,551 | | | | 39,342 | |
Grupa Lotos SA (c) | | | 1,964 | | | | 13,509 | |
KGHM Polska Miedz SA | | | 4,863 | | | | 78,441 | |
LPP SA | | | 55 | | | | 77,721 | |
Mbank (c) | | | 573 | | | | 45,760 | |
Orange Polska SA | | | 32,359 | | | | 54,115 | |
PGE SA | | | 64,372 | | | | 208,699 | |
Polski Koncern Naftowy Orlen SA | | | 15,864 | | | | 273,087 | |
Polskie Gornictwo Naftowe i Gazownictwo SA | | | 93,796 | | | | 122,419 | |
Powszechna Kasa Oszczednosci Bank Polski SA (c) | | | 50,667 | | | | 351,915 | |
Powszechny Zaklad Ubezpieczen SA | | | 33,880 | | | | 292,282 | |
Synthos SA | | | 54,162 | | | | 52,403 | |
Tauron Polska Energia SA | | | 20,989 | | | | 15,378 | |
| | | | | | | | |
| | | | | | | | 2,208,904 | |
Portugal — 0.1% | |
Banco Comercial Portugues SA (a)(c) | | | 1,716,504 | | | | 90,961 | |
EDP — Energias de Portugal SA | | | 94,763 | | | | 341,463 | |
Galp Energia SGPS SA | | | 18,382 | | | | 214,494 | |
Jeronimo Martins SGPS SA | | | 11,973 | | | | 155,797 | |
| | | | | | | | |
| | | | | | | | 802,715 | |
Qatar — 0.2% | |
Barwa Real Estate Co. | | | 2,548 | | | | 27,878 | |
Commercial Bank of Qatar QSC | | | 2,974 | | | | 37,365 | |
Doha Bank QSC | | | 6,076 | | | | 74,055 | |
Ezdan Holding Group QSC | | | 43,351 | | | | 188,565 | |
Industries Qatar QSC | �� | | 10,894 | | | | 331,332 | |
Masraf Al Rayan | | | 13,978 | | | | 143,958 | |
Ooredoo QSC | | | 2,666 | | | | 54,900 | |
Qatar Electricity & Water Co. | | | 1,002 | | | | 59,557 | |
Qatar Insurance Co. SAQ | | | 3,794 | | | | 85,421 | |
Qatar Islamic Bank SAQ | | | 1,671 | | | | 48,817 | |
Qatar National Bank | | | 9,990 | | | | 479,157 | |
Vodafone Qatar | | | 7,760 | | | | 26,960 | |
| | | | | | | | |
| | | | | | | | 1,557,965 | |
Russia — 0.7% | | | | | |
AK Transneft OAO, Preference Shares | | | 32 | | | | 85,146 | |
Alrosa AO | | | 57,800 | | | | 44,377 | |
Federal Hydrogenerating Co. JSC | | | 6,552,000 | | | | 60,205 | |
| | | | | | | | |
| Common Stocks | | Shares | | | Value | |
Russia (continued) | | | | | |
Gazprom OAO | | | 357,230 | | | $ | 666,550 | |
Gazprom OAO — ADR | | | 113,445 | | | | 421,816 | |
Lukoil OAO | | | 17,457 | | | | 563,316 | |
Lukoil PJSC — ADR | | | 12,969 | | | | 419,824 | |
Magnit OJSC — GDR | | | 11,460 | | | | 460,829 | |
MegaFon OAO — GDR | | | 2,296 | | | | 26,710 | |
MMC Norilsk Nickel | | | 3,113 | | | | 390,211 | |
Mobile Telesystems — ADR | | | 27,500 | | | | 169,950 | |
Moscow Exchange MICEX-RTS OAO | | | 63,850 | | | | 79,969 | |
NovaTek OAO — GDR | | | 4,662 | | | | 383,985 | |
Rosneft Oil Co. | | | 21,260 | | | | 74,181 | |
Rosneft Oil Co. OJSC | | | 20,000 | | | | 69,716 | |
Rostelecom OJSC | | | 42,250 | | | | 52,562 | |
Sberbank of Russia | | | 205,970 | | | | 285,971 | |
Sberbank of Russia — ADR | | | 70,000 | | | | 410,647 | |
Severstal OAO | | | 10,830 | | | | 90,705 | |
Sistema JSFC — GDR | | | 2,940 | | | | 17,309 | |
Surgutneftegas OAO | | | 301,050 | | | | 140,401 | |
Surgutneftegas OAO — ADR | | | 24,155 | | | | 112,037 | |
Surgutneftegas OAO, Preference Shares | | | 395,000 | | | | 239,090 | |
Tatneft OAO | | | 79,770 | | | | 345,364 | |
VTB Bank OJSC | | | 86,510,000 | | | | 94,022 | |
VTB Bank OJSC — GDR | | | 50,000 | | | | 105,252 | |
| | | | | | | | |
| | | | | | | | 5,810,145 | |
Singapore — 0.9% | |
Ascendas Real Estate Investment Trust | | | 50,100 | | | | 80,293 | |
CapitaLand Commercial Trust Ltd | | | 80,000 | | | | 75,902 | |
CapitaLand Ltd. | | | 147,400 | | | | 346,462 | |
CapitaLand Mall Trust | | | 210,100 | | | | 285,083 | |
City Developments Ltd. | | | 14,000 | | | | 75,315 | |
ComfortDelGro Corp. Ltd. | | | 86,000 | | | | 184,150 | |
DBS Group Holdings Ltd. | | | 88,484 | | | | 1,036,988 | |
Genting Singapore PLC | | | 233,000 | | | | 125,721 | |
Global Logistic Properties Ltd. | | | 100,600 | | | | 151,922 | |
Golden Agri-Resources Ltd. | | | 270,000 | | | | 64,493 | |
Hutchison Port Holdings Trust | | | 309,000 | | | | 163,282 | |
Jardine Cycle & Carriage Ltd. | | | 4,444 | | | | 108,643 | |
Keppel Corp. Ltd. (a) | | | 76,700 | | | | 350,379 | |
Noble Group Ltd. (a) | | | 131,000 | | | | 36,617 | |
Oversea-Chinese Banking Corp. Ltd. | | | 166,949 | | | | 1,032,149 | |
SembCorp Industries Ltd. | | | 40,000 | | | | 85,739 | |
SembCorp Marine Ltd. (a) | | | 21,000 | | | | 25,839 | |
Singapore Airlines Ltd. | | | 28,600 | | | | 225,353 | |
Singapore Exchange Ltd. | | | 29,000 | | | | 156,844 | |
Singapore Press Holdings Ltd. | | | 48,376 | | | | 134,088 | |
Singapore Technologies Engineering Ltd. | | | 57,000 | | | | 120,492 | |
Singapore Telecommunications Ltd. | | | 438,000 | | | | 1,129,280 | |
StarHub Ltd. | | | 41,600 | | | | 108,259 | |
Suntec Real Estate Investment Trust | | | 86,000 | | | | 93,660 | |
United Overseas Bank Ltd. (a) | | | 65,100 | | | | 897,521 | |
UOL Group Ltd. | | | 22,000 | | | | 96,418 | |
Wilmar International Ltd. (a) | | | 108,500 | | | | 223,871 | |
Yangzijiang Shipbuilding Holdings Ltd. | | | 76,800 | | | | 59,334 | |
| | | | | | | | |
| | | | | | | | 7,474,097 | |
South Africa — 1.3% | |
African Bank Investments Ltd. (c) | | | 20,398 | | | | 13 | |
Anglo American Platinum Ltd. (a)(c) | | | 832 | | | | 10,020 | |
AngloGold Ashanti Ltd. (c) | | | 19,921 | | | | 136,622 | |
Aspen Pharmacare Holdings Ltd. (c) | | | 22,072 | | | | 440,660 | |
See Notes to Financial Statements.
| | | | | | |
| | | | | | | |
| 30 | | BLACKROCK TOTAL INTERNATIONAL ex U.S. INDEX FUND | | DECEMBER 31, 2015 | | |
| | |
Schedule of Investments (continued) | | Total International ex U.S. Index Master Portfolio |
| | | | | | | | |
| Common Stocks | | Shares | | | Value | |
South Africa (continued) | |
Barclays Africa Group Ltd. | | | 20,871 | | | $ | 193,647 | |
Barloworld Ltd. | | | 5,200 | | | | 20,917 | |
Bidvest Group Ltd. | | | 15,736 | | | | 334,000 | |
Capitec Bank Holdings Ltd. | | | 1,291 | | | | 44,896 | |
Coronation Fund Managers Ltd. | | | 27,149 | | | | 92,984 | |
Discovery Holdings Ltd. | | | 20,716 | | | | 177,673 | |
Exxaro Resources Ltd. (a) | | | 34,427 | | | | 97,801 | |
FirstRand Ltd. | | | 194,558 | | | | 531,718 | |
Foschini Group Ltd. | | | 6,363 | | | | 50,000 | |
Gold Fields Ltd. | | | 86,627 | | | | 236,901 | |
Growthpoint Properties Ltd. | | | 126,575 | | | | 189,978 | |
Hyprop Investments Ltd. | | | 7,562 | | | | 50,611 | |
Impala Platinum Holdings Ltd. (c) | | | 29,321 | | | | 47,433 | |
Imperial Holdings Ltd. | | | 3,661 | | | | 28,379 | |
Investec Ltd. | | | 7,549 | | | | 53,328 | |
Liberty Holdings Ltd. | | | 1,922 | | | | 14,304 | |
Life Healthcare Group Holdings Ltd. | | | 20,533 | | | | 46,609 | |
Massmart Holdings Ltd. | | | 14,916 | | | | 96,562 | |
Mediclinic International Ltd. | | | 28,346 | | | | 218,035 | |
MMI Holdings Ltd. | | | 20,454 | | | | 29,006 | |
Mondi Ltd. | | | 3,303 | | | | 65,364 | |
Mr Price Group Ltd. | | | 10,819 | | | | 139,916 | |
MTN Group Ltd. | | | 88,476 | | | | 762,164 | |
Naspers Ltd., Class N | | | 19,485 | | | | 2,663,293 | |
Nedbank Group Ltd. | | | 13,358 | | | | 163,181 | |
Netcare Ltd. | | | 21,846 | | | | 47,847 | |
Pick n Pay Stores Ltd. | | | 28,036 | | | | 117,764 | |
Pioneer Foods Group Ltd. | | | 6,964 | | | | 71,435 | |
PSG Group Ltd. | | | 2,684 | | | | 38,803 | |
Redefine Properties Ltd. | | | 238,334 | | | | 149,607 | |
Remgro Ltd. | | | 24,867 | | | | 393,631 | |
Resilient REIT Ltd. | | | 17,014 | | | | 126,584 | |
RMB Holdings Ltd. | | | 17,898 | | | | 64,170 | |
RMI Holdings | | | 15,066 | | | | 37,662 | |
Sanlam Ltd. | | | 87,998 | | | | 344,221 | |
Sappi Ltd. (c) | | | 10,017 | | | | 42,088 | |
Sasol Ltd. | | | 29,622 | | | | 799,729 | |
Shoprite Holdings Ltd. | | | 26,136 | | | | 242,204 | |
Spar Group Ltd. | | | 4,305 | | | | 51,222 | |
Standard Bank Group Ltd. | | | 67,456 | | | | 494,468 | |
Telkom SA SOC Ltd. | | | 11,210 | | | | 46,574 | |
Tiger Brands Ltd. | | | 7,701 | | | | 157,741 | |
Truworths International Ltd. (a) | | | 20,055 | | | | 118,224 | |
Tsogo Sun Holdings Ltd. | | | 25,000 | | | | 39,285 | |
Vodacom Group Ltd. | | | 23,375 | | | | 230,377 | |
Woolworths Holdings Ltd. | | | 41,426 | | | | 267,996 | |
| | | | | | | | |
| | | | | | | | 10,817,647 | |
South Korea — 3.1% | |
Amorepacific Corp. | | | 2,183 | | | | 706,461 | |
Amorepacific Group | | | 1,096 | | | | 136,924 | |
BGF Retail Co. Ltd. | | | 612 | | | | 88,600 | |
BS Financial Group, Inc. | | | 6,269 | | | | 44,660 | |
Celltrion, Inc. (c) | | | 4,335 | | | | 309,278 | |
Cheil Industries, Inc. (c) | | | 4,015 | | | | 473,918 | |
Cheil Worldwide, Inc. (c) | | | 4,081 | | | | 71,375 | |
CJ CheilJedang Corp. | | | 518 | | | | 165,685 | |
CJ Corp. | | | 848 | | | | 180,121 | |
CJ Korea Express Co. Ltd. (c) | | | 414 | | | | 67,070 | |
Coway Co. Ltd. | | | 1,699 | | | | 120,972 | |
Daelim Industrial Co. Ltd. | | | 1,073 | | | | 60,588 | |
| | | | | | | | |
| Common Stocks | | Shares | | | Value | |
South Korea (continued) | |
Daewoo Engineering & Construction Co. Ltd. (c) | | | 19,237 | | | $ | 90,982 | |
Daewoo International Corp. | | | 1,160 | | | | 15,974 | |
Daewoo Securities Co. Ltd. | | | 8,184 | | | | 64,784 | |
DGB Financial Group, Inc. | | | 5,100 | | | | 43,447 | |
Dongbu Insurance Co. Ltd. | | | 1,160 | | | | 69,404 | |
Doosan Corp. | | | 436 | | | | 32,761 | |
Doosan Heavy Industries & Construction Co. Ltd. | | | 776 | | | | 13,503 | |
E-Mart, Inc. | | | 1,071 | | | | 171,852 | |
GS Engineering & Construction Corp. (c) | | | 6,155 | | | | 101,979 | |
GS Holdings Corp. | | | 1,216 | | | | 52,104 | |
Hana Financial Group, Inc. | | | 14,915 | | | | 298,045 | |
Hankook Tire Co. Ltd. | | | 4,552 | | | | 181,560 | |
Hanmi Pharm Co. Ltd. (c) | | | 208 | | | | 127,409 | |
Hanmi Science Co. Ltd. (c) | | | 709 | | | | 76,869 | |
Hanon Systems | | | 750 | | | | 32,937 | |
Hanssem Co. Ltd. | | | 731 | | | | 143,235 | |
Hanwha Chemical Corp. | | | 4,037 | | | | 91,979 | |
Hanwha Corp. | | | 4,520 | | | | 149,863 | |
Hanwha Life Insurance Co. Ltd. | | | 7,120 | | | | 44,874 | |
Hotel Shilla Co. Ltd. | | | 1,174 | | | | 76,872 | |
Hyosung Corp. | | | 1,140 | | | | 112,750 | |
Hyundai Department Store Co. Ltd. | | | 314 | | | | 33,654 | |
Hyundai Development Co-Engineering & Construction | | | 2,250 | | | | 73,526 | |
Hyundai Engineering & Construction Co. Ltd. | | | 3,298 | | | | 79,173 | |
Hyundai Glovis Co. Ltd. | | | 1,138 | | | | 185,417 | |
Hyundai Heavy Industries Co. Ltd. (c) | | | 1,622 | | | | 119,887 | |
Hyundai Marine & Fire Insurance Co. Ltd. | | | 1,200 | | | | 36,768 | |
Hyundai Mobis Co. Ltd. | | | 3,433 | | | | 718,285 | |
Hyundai Motor Co. | | | 7,769 | | | | 979,855 | |
Hyundai Motor Co., Preference Shares | | | 852 | | | | 74,497 | |
Hyundai Motor Co., Second Preference Shares | | | 1,756 | | | | 156,297 | |
Hyundai Steel Co. | | | 5,604 | | | | 236,150 | |
Hyundai Wia Corp. | | | 513 | | | | 48,504 | |
Industrial Bank of Korea | | | 11,789 | | | | 123,271 | |
Kakao Corp. | | | 1,108 | | | | 108,555 | |
Kangwon Land, Inc. | | | 7,491 | | | | 244,494 | |
KB Financial Group, Inc. | | | 19,467 | | | | 548,459 | |
KCC Corp. | | | 266 | | | | 93,837 | |
KEPCO Plant Service & Engineering Co. Ltd. | | | 707 | | | | 53,480 | |
Kia Motors Corp. | | | 13,276 | | | | 591,977 | |
Korea Aerospace Industries Ltd. | | | 2,530 | | | | 167,012 | |
Korea Electric Power Corp. | | | 12,939 | | | | 548,189 | |
Korea Gas Corp. | | | 753 | | | | 23,495 | |
Korea Investment Holdings Co. Ltd. | | | 1,486 | | | | 62,097 | |
Korea Zinc Co. Ltd. | | | 398 | | | | 158,523 | |
Korean Air Lines Co. Ltd. (c) | | | 3,387 | | | | 79,508 | |
KT Corp. (c) | | | 1,200 | | | | 28,756 | |
KT&G Corp. | | | 5,534 | | | | 491,779 | |
Kumho Petrochemical Co. Ltd. | | | 423 | | | | 18,543 | |
LG Chem Ltd. | | | 2,692 | | | | 743,216 | |
LG Chem Ltd., Preference Shares | | | 179 | | | | 37,397 | |
LG Corp. | | | 5,702 | | | | 342,761 | |
LG Display Co. Ltd. | | | 13,391 | | | | 277,359 | |
LG Electronics, Inc. | | | 4,891 | | | | 222,367 | |
LG Household & Health Care Ltd. | | | 443 | | | | 393,376 | |
LG Innotek Co. Ltd. | | | 954 | | | | 79,300 | |
LG Uplus Corp. | | | 5,020 | | | | 44,328 | |
Lotte Chemical Corp. | | | 1,222 | | | | 249,346 | |
Lotte Confectionery Co. Ltd. | | | 75 | | | | 145,410 | |
Lotte Shopping Co. Ltd. | | | 752 | | | | 147,932 | |
Mirae Asset Securities Co. Ltd. | | | 6,804 | | | | 123,795 | |
See Notes to Financial Statements.
| | | | | | |
| | | | | | | |
| | BLACKROCK TOTAL INTERNATIONAL ex U.S. INDEX FUND | | DECEMBER 31, 2015 | | 31 |
| | |
Schedule of Investments (continued) | | Total International ex U.S. Index Master Portfolio |
| | | | | | | | |
| Common Stocks | | Shares | | | Value | |
South Korea (continued) | |
NAVER Corp. | | | 1,412 | | | $ | 787,387 | |
NCSoft Corp. | | | 540 | | | | 97,349 | |
OCI Co. Ltd. | | | 1,017 | | | | 64,122 | |
Orion Corp. | | | 138 | | | | 136,311 | |
Paradise Co. Ltd. (c) | | | 5,601 | | | | 83,344 | |
POSCO | | | 3,514 | | | | 492,245 | |
S-1 Corp. | | | 442 | | | | 37,582 | |
S-Oil Corp. | | | 3,144 | | | | 210,605 | |
Samsung Card Co. Ltd. | | | 1,210 | | | | 31,678 | |
Samsung Electro-Mechanics Co. Ltd. | | | 2,177 | | | | 115,669 | |
Samsung Electronics Co. Ltd. | | | 5,632 | | | | 6,006,989 | |
Samsung Fire & Marine Insurance Co. Ltd. | | | 1,790 | | | | 467,917 | |
Samsung Heavy Industries Co. Ltd. | | | 4,858 | | | | 44,251 | |
Samsung Life Insurance Co. Ltd. | | | 4,848 | | | | 453,044 | |
Samsung SDI Co. Ltd. | | | 2,189 | | | | 210,439 | |
Samsung SDS Co. Ltd. | | | 1,671 | | | | 359,410 | |
Samsung Securities Co. Ltd. | | | 2,400 | | | | 84,231 | |
Shinhan Financial Group Co. Ltd. | | | 21,504 | | | | 722,357 | |
Shinsegae Co. Ltd. | | | 670 | | | | 130,356 | |
SK Holdings Co. Ltd. | | | 1,734 | | | | 353,294 | |
SK Hynix, Inc. | | | 29,346 | | | | 758,093 | |
SK Innovation Co. Ltd. (c) | | | 3,761 | | | | 412,472 | |
SK Networks Co. Ltd. | | | 14,759 | | | | 68,466 | |
SK Telecom Co. Ltd. | | | 390 | | | | 71,377 | |
Woori Bank | | | 13,531 | | | | 101,202 | |
Woori Investment & Securities Co. Ltd. | | | 5,312 | | | | 44,946 | |
Yuhan Corp. | | | 122 | | | | 28,144 | |
| | | | | | | | |
| | | | | | | | 25,682,690 | |
Spain — 2.3% | | | | | | | | |
Abertis Infraestructuras SA | | | 26,977 | | | | 421,904 | |
ACS Actividades de Construccion y Servicios SA | | | 11,270 | | | | 329,732 | |
Aena SA (c)(d) | | | 3,841 | | | | 439,830 | |
Amadeus IT Holding SA, Class A | | | 23,234 | | | | 1,024,030 | |
Banco Bilbao Vizcaya Argentaria SA | | | 321,616 | | | | 2,349,979 | |
Banco de Sabadell SA (a) | | | 280,858 | | | | 497,762 | |
Banco Popular Espanol SA (a) | | | 90,698 | | | | 298,839 | |
Banco Santander SA | | | 716,016 | | | | 3,522,347 | |
Bankia SA (a) | | | 308,381 | | | | 358,868 | |
Bankinter SA | | | 38,876 | | | | 275,682 | |
CaixaBank SA | | | 148,385 | | | | 516,470 | |
Distribuidora Internacional de Alimentacion SA (a)(c) | | | 38,924 | | | | 229,577 | |
Enagas SA | | | 3,839 | | | | 108,290 | |
Endesa SA | | | 13,298 | | | | 267,152 | |
Ferrovial SA | | | 25,225 | | | | 570,418 | |
Gas Natural SDG SA | | | 17,935 | | | | 365,735 | |
Grifols SA | | | 7,661 | | | | 354,105 | |
Iberdrola SA | | | 276,622 | | | | 1,960,965 | |
Industria de Diseno Textil SA | | | 54,636 | | | | 1,876,971 | |
International Consolidated Airlines Group SA | | | 47,602 | | | | 426,665 | |
Mapfre SA | | | 66,978 | | | | 167,657 | |
Red Electrica Corp. SA | | | 2,074 | | | | 173,240 | |
Repsol SA | | | 45,960 | | | | 505,985 | |
Telefonica SA | | | 224,336 | | | | 2,488,766 | |
Zardoya Otis SA (a) | | | 4,481 | | | | 52,407 | |
| | | | | | | | |
| | | | | | | | 19,583,376 | |
Sweden — 2.1% | | | | | | | | |
Alfa Laval AB | | | 18,245 | | | | 333,082 | |
Assa Abloy AB | | | 50,271 | | | | 1,052,308 | |
Atlas Copco AB, A Shares | | | 33,572 | | | | 823,346 | |
| | | | | | | | |
| Common Stocks | | Shares | | | Value | |
Sweden (continued) | | | | | | | | |
Atlas Copco AB, B Shares | | | 19,981 | | | $ | 459,371 | |
Boliden AB | | | 11,878 | | | | 199,006 | |
Electrolux AB, Class B | | | 12,094 | | | | 291,797 | |
Getinge AB, Class B | | | 11,241 | | | | 294,461 | |
Hennes & Mauritz AB, Class B | | | 46,055 | | | | 1,638,189 | |
Hexagon AB, Class B | | | 14,829 | | | | 548,567 | |
Husqvarna AB, Class B | | | 17,215 | | | | 113,609 | |
ICA Gruppen AB | | | 3,148 | | | | 114,324 | |
Industrivarden AB, Class C | | | 8,883 | | | | 151,970 | |
Investment AB Kinnevik, Class B | | | 12,764 | | | | 393,148 | |
Investor AB, Class B | | | 22,400 | | | | 823,203 | |
Lundin Petroleum AB (c) | | | 9,142 | | | | 131,913 | |
Millicom International Cellular SA | | | 3,166 | | | | 181,665 | |
Nordea Bank AB | | | 151,624 | | | | 1,663,581 | |
Sandvik AB | | | 58,748 | | | | 512,107 | |
Securitas AB, Class B | | | 18,887 | | | | 288,800 | |
Skandinaviska Enskilda Banken AB, Class A | | | 77,659 | | | | 816,700 | |
Skanska AB, Class B | | | 22,371 | | | | 433,854 | |
SKF AB, Class B | | | 18,910 | | | | 305,421 | |
Svenska Cellulosa AB, B Shares | | | 30,011 | | | | 869,721 | |
Svenska Handelsbanken AB, A Shares | | | 76,689 | | | | 1,018,543 | |
Swedbank AB, Class A | | | 46,483 | | | | 1,023,721 | |
Swedish Match AB | | | 11,349 | | | | 401,044 | |
Tele2 AB, Class B | | | 12,243 | | | | 122,093 | |
Telefonaktiebolaget LM Ericsson, Class B | | | 154,231 | | | | 1,486,987 | |
TeliaSonera AB | | | 135,866 | | | | 674,695 | |
Volvo AB, Class B | | | 65,438 | | | | 606,777 | |
| | | | | | | | |
| | | | | | | | 17,774,003 | |
Switzerland — 7.1% | | | | | | | | |
ABB Ltd., Registered Shares (c) | | | 110,190 | | | | 1,966,628 | |
Actelion Ltd., Registered Shares (c) | | | 5,351 | | | | 743,487 | |
Adecco SA, Registered Shares (c) | | | 9,034 | | | | 618,311 | |
Aryzta AG (a)(c) | | | 3,776 | | | | 191,023 | |
Baloise Holding AG, Registered Shares | | | 2,811 | | | | 356,261 | |
Barry Callebaut AG, Registered Shares (c) | | | 143 | | | | 155,329 | |
Cie Financiere Richemont SA, Registered Shares | | | 26,760 | | | | 1,915,292 | |
Coca-Cola HBC AG (c) | | | 2,963 | | | | 63,099 | |
Credit Suisse Group AG, Registered Shares (c) | | | 90,687 | | | | 1,953,576 | |
Dufry AG (c) | | | 2,230 | | | | 265,330 | |
EMS-Chemie Holding AG, Registered Shares | | | 450 | | | | 198,044 | |
Galenica AG | | | 195 | | | | 305,087 | |
Geberit AG, Registered Shares | | | 2,154 | | | | 729,565 | |
Givaudan SA, Registered Shares (c) | | | 474 | | | | 860,291 | |
Glencore PLC (a)(c) | | | 617,224 | | | | 817,900 | |
Julius Baer Group Ltd. (c) | | | 9,335 | | | | 451,601 | |
Kuehne & Nagel International AG, Registered Shares | | | 2,735 | | | | 374,693 | |
LafargeHolcim Ltd. (a)(c) | | | 19,589 | | | | 980,916 | |
Lindt & Spruengli AG (c) | | | 47 | | | | 293,501 | |
Lindt & Spruengli AG, Registered Shares (c) | | | 6 | | | | 447,005 | |
Lonza Group AG, Registered Shares (c) | | | 2,937 | | | | 477,658 | |
Nestle SA, Registered Shares | | | 158,213 | | | | 11,744,979 | |
Novartis AG, Registered Shares | | | 113,895 | | | | 9,797,164 | |
Pargesa Holding SA, Bearer Shares | | | 734 | | | | 46,371 | |
Partners Group Holding AG (a) | | | 939 | | | | 337,697 | |
Roche Holding AG | | | 35,129 | | | | 9,734,540 | |
Schindler Holding AG, Participation Certificates | | | 1,841 | | | | 307,997 | |
Schindler Holding AG, Registered Shares | | | 1,042 | | | | 175,722 | |
SGS SA, Registered Shares | | | 282 | | | | 535,941 | |
Sika AG, Bearer Shares (a) | | | 114 | | | | 411,973 | |
Sonova Holding AG, Registered Shares | | | 2,902 | | | | 368,709 | |
See Notes to Financial Statements.
| | | | | | |
| | | | | | | |
| 32 | | BLACKROCK TOTAL INTERNATIONAL ex U.S. INDEX FUND | | DECEMBER 31, 2015 | | |
| | |
Schedule of Investments (continued) | | Total International ex U.S. Index Master Portfolio |
| | | | | | | | |
| Common Stocks | | Shares | | | Value | |
Switzerland (continued) | | | | | | | | |
STMicroelectronics NV | | | 37,953 | | | $ | 254,086 | |
Sulzer AG, Registered Shares (a) | | | 1,058 | | | | 99,445 | |
Swatch Group AG, Bearer Shares (a) | | | 1,687 | | | | 585,836 | |
Swatch Group AG, Registered Shares | | | 1,971 | | | | 133,103 | |
Swiss Life Holding AG, Registered Shares (c) | | | 1,676 | | | | 451,430 | |
Swiss Prime Site AG, Registered Shares (c) | | | 2,212 | | | | 172,750 | |
Swiss Re AG | | | 17,665 | | | | 1,725,275 | |
Swisscom AG, Registered Shares | | | 1,123 | | | | 561,954 | |
Syngenta AG, Registered Shares | | | 4,690 | | | | 1,835,680 | |
Transocean Ltd. (a) | | | 22,257 | | | | 278,224 | |
UBS Group AG | | | 186,028 | | | | 3,608,843 | |
Zurich Insurance Group AG (c) | | | 7,515 | | | | 1,930,602 | |
| | | | | | | | |
| | | | | | | | 59,262,918 | |
Taiwan — 2.5% | | | | | | | | |
Acer, Inc. (c) | | | 69,504 | | | | 25,461 | |
Advanced Semiconductor Engineering, Inc. | | | 371,097 | | | | 426,287 | |
Advantech Co. Ltd. | | | 8,795 | | | | 56,321 | |
Asia Cement Corp. | | | 57,233 | | | | 47,624 | |
Asia Pacific Telecom Co. Ltd. (c) | | | 33,000 | | | | 11,640 | |
Asustek Computer, Inc. | | | 38,220 | | | | 315,577 | |
AU Optronics Corp. | | | 320,000 | | | | 94,341 | |
Casetek Holdings Ltd. | | | 6,000 | | | | 24,367 | |
Catcher Technology Co. Ltd. | | | 36,000 | | | | 300,111 | |
Cathay Financial Holding Co. Ltd. | | | 455,935 | | | | 638,738 | |
Chailease Holding Co. Ltd. | | | 23,795 | | | | 40,952 | |
Chang Hwa Commercial Bank Ltd. | | | 131,794 | | | | 62,764 | |
Cheng Shin Rubber Industry Co. Ltd. | | | 71,436 | | | | 115,459 | |
Chicony Electronics Co. Ltd. | | | 15,622 | | | | 34,171 | |
China Airlines Ltd. (c) | | | 103,687 | | | | 37,791 | |
China Development Financial Holding Corp. | | | 577,765 | | | | 144,110 | |
China Life Insurance Co. Ltd. | | | 123,900 | | | | 94,614 | |
China Steel Corp. | | | 540,638 | | | | 294,744 | |
Chunghwa Telecom Co. Ltd. | | | 212,000 | | | | 638,649 | |
Compal Electronics, Inc. | | | 192,000 | | | | 107,443 | |
CTBC Financial Holding Co. Ltd. | | | 691,298 | | | | 353,945 | |
Delta Electronics, Inc. | | | 87,000 | | | | 409,212 | |
E.Sun Financial Holding Co. Ltd. | | | 359,437 | | | | 208,683 | |
Eclat Textile Co. Ltd. | | | 7,160 | | | | 98,387 | |
Eva Airways Corp. (c) | | | 67,689 | | | | 38,226 | |
Evergreen Marine Corp. Taiwan Ltd. | | | 83,830 | | | | 33,713 | |
Far Eastern New Century Corp. | | | 210,607 | | | | 164,535 | |
Far EasTone Telecommunications Co. Ltd. | | | 95,000 | | | | 195,244 | |
Feng TAY Enterprise Co. Ltd. | | | 14,420 | | | | 73,333 | |
First Financial Holding Co. Ltd. | | | 445,555 | | | | 206,951 | |
Formosa Chemicals & Fibre Corp. | | | 181,360 | | | | 406,828 | |
Formosa Petrochemical Corp. | | | 74,000 | | | | 177,003 | |
Formosa Plastics Corp. | | | 234,040 | | | | 546,349 | |
Formosa Taffeta Co. Ltd. | | | 31,000 | | | | 28,181 | |
Foxconn Technology Co. Ltd. | | | 42,582 | | | | 89,700 | |
Fubon Financial Holding Co. Ltd. | | | 334,952 | | | | 455,611 | |
Giant Manufacturing Co. Ltd. | | | 10,000 | | | | 66,290 | |
Hermes Microvision, Inc. | | | 1,000 | | | | 35,968 | |
Highwealth Construction Corp. | | | 62,400 | | | | 71,674 | |
Hiwin Technologies Corp. | | | 10,871 | | | | 42,564 | |
Hon Hai Precision Industry Co. Ltd. | | | 724,546 | | | | 1,773,180 | |
Hotai Motor Co. Ltd. | | | 8,000 | | | | 92,006 | |
HTC Corp. | | | 27,050 | | | | 63,913 | |
Hua Nan Financial Holdings Co. Ltd. | | | 354,923 | | | | 164,290 | |
Innolux Corp. | | | 658,494 | | | | 197,924 | |
Inotera Memories, Inc. (c) | | | 93,000 | | | | 78,445 | |
| | | | | | | | |
| Common Stocks | | Shares | | | Value | |
Taiwan (continued) | | | | | | | | |
Inventec Co. Ltd. | | | 218,470 | | | $ | 142,424 | |
Largan Precision Co. Ltd. | | | 5,000 | | | | 342,124 | |
Lite-On Technology Corp. | | | 99,321 | | | | 95,784 | |
MediaTek, Inc. | | | 86,255 | | | | 652,390 | |
Mega Financial Holding Co. Ltd. | | | 510,110 | | | | 328,875 | |
Merida Industry Co. Ltd. | | | 8,150 | | | | 43,710 | |
Nan Ya Plastics Corp. | | | 292,790 | | | | 540,904 | |
Novatek Microelectronics Corp. | | | 23,000 | | | | 89,541 | |
Pegatron Corp. | | | 105,000 | | | | 228,371 | |
Phison Electronics Corp. | | | 15,000 | | | | 105,344 | |
Pou Chen Corp. | | | 92,000 | | | | 120,053 | |
Powertech Technology, Inc. | | | 70,100 | | | | 138,222 | |
President Chain Store Corp. | | | 37,000 | | | | 230,925 | |
Quanta Computer, Inc. | | | 138,000 | | | | 221,386 | |
Radiant Opto-Electronics Corp. | | | 7,729 | | | | 17,589 | |
Realtek Semiconductor Corp. | | | 90,240 | | | | 214,823 | |
Ruentex Development Co. Ltd. | | | 47,757 | | | | 62,051 | |
Ruentex Industries Ltd. | | | 17,521 | | | | 32,577 | |
Shin Kong Financial Holding Co. Ltd. | | | 292,832 | | | | 63,439 | |
Siliconware Precision Industries Co. | | | 34,848 | | | | 55,031 | |
Simplo Technology Co. Ltd. | | | 11,600 | | | | 36,841 | |
SinoPac Financial Holdings Co. Ltd. | | | 494,136 | | | | 140,305 | |
Standard Foods Corp. | | | 6,361 | | | | 15,831 | |
Synnex Technology International Corp. | | | 30,000 | | | | 29,107 | |
Taishin Financial Holding Co. Ltd. (c) | | | 299,398 | | | | 103,446 | |
Taiwan Business Bank (c) | | | 242,073 | | | | 60,109 | |
Taiwan Cement Corp. | | | 105,000 | | | | 86,925 | |
Taiwan Cooperative Financial Holding Co. Ltd. | | | 389,833 | | | | 162,376 | |
Taiwan Fertilizer Co. Ltd. | | | 12,000 | | | | 15,654 | |
Taiwan Mobile Co. Ltd. | | | 98,800 | | | | 300,043 | |
Taiwan Semiconductor Manufacturing Co. Ltd. | | | 1,249,000 | | | | 5,388,486 | |
Teco Electric and Machinery Co. Ltd. | | | 39,000 | | | | 31,076 | |
Transcend Information, Inc. | | | 29,000 | | | | 75,324 | |
Uni-President Enterprises Corp. | | | 251,950 | | | | 419,984 | |
United Microelectronics Corp. | | | 488,000 | | | | 178,333 | |
Vanguard International Semiconductor Corp. | | | 11,000 | | | | 14,205 | |
Wistron Corp. | | | 121,993 | | | | 68,442 | |
WPG Holdings Ltd. | | | 28,270 | | | | 26,837 | |
Yuanta Financial Holding Co. Ltd. | | | 319,260 | | | | 117,107 | |
Yulon Motor Co. Ltd. | | | 14,000 | | | | 12,744 | |
Zhen Ding Technology Holding Ltd. | | | 14,710 | | | | 33,539 | |
| | | | | | | | |
| | | | | | | | 20,625,596 | |
Thailand — 0.4% | | | | | | | | |
Advanced Info Service PCL — NVDR | | | 52,400 | | | | 220,465 | |
Airports of Thailand PCL — NVDR | | | 26,500 | | | | 253,357 | |
Bangkok Bank PCL — NVDR | | | 22,400 | | | | 94,504 | |
Bangkok Bank PCL, Foreign Registered Shares | | | 30,500 | | | | 130,239 | |
Bangkok Dusit Medical Services PCL — NVDR | | | 54,300 | | | | 33,548 | |
Banpu PCL — NVDR (a) | | | 29,500 | | | | 13,046 | |
BEC World PCL — NVDR | | | 16,900 | | | | 14,251 | |
BTS Group Holdings PCL NVDR | | | 152,700 | | | | 38,546 | |
Bumrungrad Hospital PCL NVDR | | | 22,400 | | | | 130,795 | |
Central Pattana PCL — NVDR | | | 27,100 | | | | 35,213 | |
Charoen Pokphand Foods PCL — NVDR | | | 323,700 | | | | 163,528 | |
CP ALL PCL — NVDR | | | 280,500 | | | | 304,597 | |
Delta Electronics Thailand PCL — NVDR | | | 20,000 | | | | 42,261 | |
Energy Absolute PCL | | | 45,000 | | | | 27,998 | |
Glow Energy PCL — NVDR | | | 7,600 | | | | 15,521 | |
Home Product Center PCL | | | 82,832 | | | | 15,585 | |
Indorama Ventures PCL — NVDR | | | 39,200 | | | | 22,955 | |
See Notes to Financial Statements.
| | | | | | |
| | | | | | | |
| | BLACKROCK TOTAL INTERNATIONAL ex U.S. INDEX FUND | | DECEMBER 31, 2015 | | 33 |
| | |
Schedule of Investments (continued) | | Total International ex U.S. Index Master Portfolio |
| | | | | | | | |
| Common Stocks | | Shares | | | Value | |
Thailand (continued) | | | | | | | | |
IRPC PCL — NVDR | | | 492,400 | | | $ | 58,393 | |
Kasikornbank PCL — NVDR | | | 36,500 | | | | 151,716 | |
Kasikornbank PCL, Foreign Registered Shares | | | 48,700 | | | | 201,293 | |
Krung Thai Bank PCL — NVDR (a) | | | 143,775 | | | | 66,308 | |
Minor International PCL — NVDR | | | 34,980 | | | | 35,034 | |
PTT Exploration & Production PCL — NVDR | | | 76,522 | | | | 121,332 | |
PTT Global Chemical PCL — NVDR | | | 52,168 | | | | 72,162 | |
PTT PCL — NVDR | | | 68,800 | | | | 463,467 | |
Siam Cement PCL — NVDR | | | 5,700 | | | | 72,531 | |
Siam Cement PCL, Foreign Registered Shares | | | 19,200 | | | | 244,445 | |
Siam Commercial Bank PCL — NVDR (a) | | | 82,400 | | | | 271,809 | |
Thai Oil PCL — NVDR | | | 17,800 | | | | 32,444 | |
Thai Union Group PCL | | | 14,800 | | | | 7,031 | |
TMB Bank PCL | | | 271,500 | | | | 18,153 | |
True Corp. PCL — NVDR (c) | | | 350,483 | | | | 64,869 | |
| | | | | | | | |
| | | | | | | | 3,437,396 | |
Turkey — 0.3% | | | | | | | | |
Akbank TAS | | | 183,187 | | | | 420,052 | |
Anadolu Efes Biracilik Ve Malt Sanayii AS | | | 3,889 | | | | 25,188 | |
Arcelik AS | | | 3,960 | | | | 18,957 | |
BIM Birlesik Magazalar AS | | | 8,104 | | | | 142,648 | |
Coca-Cola Icecek AS | | | 4,750 | | | | 60,490 | |
Emlak Konut Gayrimenkul Yatirim Ortakligi AS | | | 92,969 | | | | 82,764 | |
Enka Insaat ve Sanayi AS | | | 15,716 | | | | 24,341 | |
Eregli Demir ve Celik Fabrikalari TAS | | | 51,754 | | | | 53,856 | |
Ford Otomotiv Sanayi | | | 2,700 | | | | 28,007 | |
Haci Omer Sabanci Holding AS | | | 32,457 | | | | 92,010 | |
KOC Holding AS | | | 17,992 | | | | 67,384 | |
Petkim Petrokimya Holding (c) | | | 37,514 | | | | 58,967 | |
TAV Havalimanlari Holding AS | | | 2,171 | | | | 13,533 | |
Tofas Turk Otomobil Fabrikasi AS | | | 4,704 | | | | 30,538 | |
Tupras Turkiye Petrol Rafinerileri AS (c) | | | 5,076 | | | | 121,064 | |
Turk Hava Yollari (c) | | | 26,638 | | | | 67,378 | |
Turk Telekomunikasyon AS | | | 10,009 | | | | 18,719 | |
Turkcell Iletisim Hizmetleri AS | | | 33,444 | | | | 113,368 | |
Turkiye Garanti Bankasi AS | | | 133,513 | | | | 325,260 | |
Turkiye Halk Bankasi | | | 79,553 | | | | 282,750 | |
Turkiye Is Bankasi, Class C | | | 88,347 | | | | 139,020 | |
Turkiye Sise ve Cam Fabrikalari AS | | | 39,778 | | | | 43,474 | |
Turkiye Vakiflar Bankasi Tao, Class D | | | 29,827 | | | | 39,089 | |
Ulker Biskuvi Sanayi | | | 3,956 | | | | 23,876 | |
Yapi ve Kredi Bankasi | | | 65,139 | | | | 73,305 | |
| | | | | | | | |
| | | | | | | | 2,366,038 | |
United Arab Emirates — 0.2% | | | | | | | | |
Abu Dhabi Commercial Bank PJSC | | | 80,031 | | | | 142,787 | |
Aldar Properties PJSC | | | 61,586 | | | | 38,522 | |
Arabtec Holding Co. (c) | | | 77,075 | | | | 25,892 | |
DP World Ltd. | | | 10,522 | | | | 213,437 | |
Dubai Financial Market | | | 39,225 | | | | 13,001 | |
Dubai Islamic Bank PJSC | | | 36,085 | | | | 60,391 | |
Emaar Malls Group PJSC (c) | | | 81,000 | | | | 60,623 | |
Emaar Properties PJSC | | | 172,958 | | | | 265,942 | |
Emirates Telecommunications Group Co. PJSC | | | 78,250 | | | | 342,996 | |
First Gulf Bank PJSC | | | 37,011 | | | | 127,098 | |
National Bank of Abu Dhabi PJSC | | | 28,159 | | | | 61,025 | |
| | | | | | | | |
| | | | | | | | 1,351,714 | |
United Kingdom — 13.0% | |
3i Group PLC | | | 35,640 | | | | 252,467 | |
Aberdeen Asset Management PLC | | | 47,482 | | | | 202,331 | |
| | | | | | | | |
| Common Stocks | | Shares | | | Value | |
United Kingdom (continued) | |
Admiral Group PLC | | | 11,495 | | | $ | 280,887 | |
Aggreko PLC | | | 10,191 | | | | 137,188 | |
AMEC Foster Wheeler PLC | | | 19,816 | | | | 125,092 | |
Anglo American PLC (a) | | | 71,409 | | | | 313,286 | |
Antofagasta PLC | | | 26,475 | | | | 182,116 | |
ARM Holdings PLC | | | 70,055 | | | | 1,067,780 | |
Ashtead Group PLC | | | 25,797 | | | | 424,563 | |
Associated British Foods PLC | | | 18,131 | | | | 892,174 | |
AstraZeneca PLC | | | 63,940 | | | | 4,318,975 | |
Aviva PLC | | | 200,561 | | | | 1,522,353 | |
Babcock International Group PLC | | | 15,027 | | | | 224,881 | |
BAE Systems PLC | | | 153,801 | | | | 1,132,361 | |
Barclays PLC | | | 837,787 | | | | 2,696,642 | |
Barratt Developments PLC | | | 48,277 | | | | 444,859 | |
BG Group PLC | | | 170,615 | | | | 2,473,207 | |
BHP Billiton PLC | | | 107,556 | | | | 1,199,444 | |
BP PLC | | | 916,964 | | | | 4,765,169 | |
British American Tobacco PLC | | | 93,149 | | | | 5,172,936 | |
British Land Co. PLC | | | 45,237 | | | | 523,431 | |
BT Group PLC | | | 394,974 | | | | 2,742,530 | |
Bunzl PLC | | | 19,227 | | | | 533,440 | |
Burberry Group PLC | | | 21,472 | | | | 377,779 | |
Capita PLC | | | 33,043 | | | | 587,918 | |
Carnival PLC | | | 9,212 | | | | 524,771 | |
Centrica PLC | | | 257,380 | | | | 826,440 | |
Cobham PLC | | | 65,337 | | | | 272,839 | |
Compass Group PLC | | | 80,904 | | | | 1,401,921 | |
Croda International PLC | | | 7,271 | | | | 325,776 | |
Diageo PLC | | | 125,886 | | | | 3,437,662 | |
Direct Line Insurance Group PLC | | | 65,820 | | | | 394,532 | �� |
Dixons Carphone PLC | | | 53,496 | | | | 393,681 | |
easyJet PLC | | | 8,921 | | | | 228,797 | |
Fiat Chrysler Automobiles NV (c) | | | 45,604 | | | | 633,341 | |
Fresnillo PLC | | | 11,261 | | | | 117,082 | |
G4S PLC | | | 93,084 | | | | 309,205 | |
GKN PLC | | | 101,475 | | | | 460,480 | |
GlaxoSmithKline PLC | | | 246,108 | | | | 4,970,356 | |
Hammerson PLC | | | 42,497 | | | | 375,689 | |
Hargreaves Lansdown PLC | | | 11,100 | | | | 246,427 | |
HSBC Holdings PLC | | | 956,382 | | | | 7,549,880 | |
ICAP PLC | | | 22,617 | | | | 169,765 | |
IMI PLC | | | 17,672 | | | | 224,245 | |
Imperial Tobacco Group PLC | | | 48,754 | | | | 2,575,070 | |
Inmarsat PLC | | | 25,312 | | | | 424,341 | |
InterContinental Hotels Group PLC | | | 10,956 | | | | 427,049 | |
Intertek Group PLC | | | 7,802 | | | | 319,153 | |
Intu Properties PLC (a) | | | 39,383 | | | | 183,994 | |
Investec PLC | | | 22,696 | | | | 160,029 | |
ITV PLC | | | 194,650 | | | | 792,488 | |
J. Sainsbury PLC (a) | | | 77,432 | | | | 294,877 | |
Johnson Matthey PLC | | | 10,652 | | | | 416,684 | |
Kingfisher PLC | | | 117,839 | | | | 570,751 | |
Land Securities Group PLC | | | 41,762 | | | | 723,945 | |
Legal & General Group PLC | | | 291,372 | | | | 1,149,725 | |
Lloyds Banking Group PLC | | | 2,821,957 | | | | 3,036,408 | |
London Stock Exchange Group PLC | | | 15,659 | | | | 633,533 | |
Marks & Spencer Group PLC | | | 87,368 | | | | 581,713 | |
Meggitt PLC | | | 42,920 | | | | 236,972 | |
Melrose Industries PLC (c) | | | 56,908 | | | | 243,762 | |
Merlin Entertainments PLC (d) | | | 43,755 | | | | 293,380 | |
Mondi PLC | | | 18,175 | | | | 356,243 | |
See Notes to Financial Statements.
| | | | | | |
| | | | | | | |
| 34 | | BLACKROCK TOTAL INTERNATIONAL ex U.S. INDEX FUND | | DECEMBER 31, 2015 | | |
| | |
Schedule of Investments (continued) | | Total International ex U.S. Index Master Portfolio |
| | | | | | | | |
| Common Stocks | | Shares | | | Value | |
United Kingdom (continued) | |
National Grid PLC | | | 184,134 | | | $ | 2,539,498 | |
Next PLC | | | 7,051 | | | | 757,072 | |
Old Mutual PLC | | | 250,936 | | | | 660,127 | |
Pearson PLC | | | 43,957 | | | | 475,195 | |
Persimmon PLC (c) | | | 15,176 | | | | 452,751 | |
Petrofac Ltd. (a) | | | 14,308 | | | | 167,828 | |
Provident Financial PLC | | | 7,347 | | | | 364,284 | |
Prudential PLC | | | 126,665 | | | | 2,853,698 | |
Randgold Resources Ltd. | | | 5,702 | | | | 351,281 | |
Reckitt Benckiser Group PLC | | | 32,154 | | | | 2,975,089 | |
RELX PLC | | | 54,420 | | | | 959,746 | |
Rexam PLC | | | 41,271 | | | | 368,117 | |
Rio Tinto PLC (a) | | | 60,525 | | | | 1,762,201 | |
Rolls-Royce Holdings PLC (a)(c) | | | 94,268 | | | | 798,489 | |
Royal Bank of Scotland Group PLC (c) | | | 158,796 | | | | 705,858 | |
Royal Mail PLC | | | 43,082 | | | | 282,182 | |
RSA Insurance Group PLC | | | 54,630 | | | | 342,877 | |
SABMiller PLC | | | 48,428 | | | | 2,897,156 | |
Sage Group PLC | | | 57,581 | | | | 511,611 | |
Schroders PLC | | | 7,414 | | | | 324,726 | |
Segro PLC | | | 45,868 | | | | 290,274 | |
Severn Trent PLC | | | 12,513 | | | | 399,998 | |
Sky PLC | | | 49,764 | | | | 815,769 | |
Smith & Nephew PLC | | | 44,736 | | | | 797,288 | |
Smiths Group PLC | | | 22,769 | | | | 314,870 | |
Sports Direct International PLC (c) | | | 11,394 | | | | 96,827 | |
SSE PLC | | | 49,071 | | | | 1,101,827 | |
St. James’s Place PLC | | | 26,679 | | | | 395,427 | |
Standard Chartered PLC | | | 158,628 | | | | 1,316,161 | |
Standard Life PLC | | | 93,066 | | | | 532,943 | |
Tate & Lyle PLC (a) | | | 18,661 | | | | 164,372 | |
Taylor Wimpey PLC | | | 149,204 | | | | 446,024 | |
Tesco PLC (c) | | | 414,229 | | | | 910,175 | |
Travis Perkins PLC | | | 13,060 | | | | 378,877 | |
Unilever PLC | | | 65,379 | | | | 2,804,246 | |
United Utilities Group PLC | | | 37,850 | | | | 521,168 | |
Vodafone Group PLC | | | 1,335,864 | | | | 4,331,896 | |
Weir Group PLC | | | 13,734 | | | | 201,736 | |
Whitbread PLC | | | 9,265 | | | | 600,525 | |
William Hill PLC | | | 49,735 | | | | 290,258 | |
WM Morrison Supermarkets PLC (a) | | | 110,313 | | | | 240,359 | |
Wolseley PLC | | | 13,631 | | | | 740,339 | |
WPP PLC | | | 63,087 | | | | 1,451,113 | |
| | | | | | | | |
| | | | | | | | 108,569,073 | |
| Total Common Stocks — 99.2% | | | | 830,244,396 | |
| | | | | | | | |
| | | | | | | | |
| Preferred Stocks | | Shares | | | Value | |
Brazil — 0.0% | |
Cia Brasileira de Distribuicao Grupo Pao de Acucar, Preference Shares, 0.00% | | | 5,400 | | | $ | 57,136 | |
Germany — 0.3% | |
Henkel AG & Co. KGaA, Preference Shares, 0.00% | | | 8,849 | | | | 987,565 | |
Volkswagen AG, Preference Shares, 0.00% | | | 7,730 | | | | 1,116,052 | |
| | | | | | | | |
| | | | | | | | 2,103,617 | |
South Korea — 0.1% | |
Samsung Electronics Co. Ltd., Preference Shares, 0.00% | | | 1,036 | | | | 957,666 | |
| Total Preferred Stocks — 0.4% | | | | 3,118,419 | |
| | | | | | | | |
| | | | | | | | | |
| | |
| Rights | | | | | | |
Brazil — 0.0% | |
Banco Bradesco SA — ADR (Expires 02/05/16) (c) | | | 5,937 | | | | 2,882 | |
Hong Kong — 0.0% | |
GCL — Poly Energy Holdings Ltd. (Expires 01/20/16) (c) | | | 86,200 | | | | 445 | |
Italy — 0.0% | |
UBI Banca (Expires 01/12/16) (c) | | | 40,601 | | | | — | |
Singapore — 0.0% | |
Ascendas Real Estate Investment Trust (Expires 01/13/16) (c) | | | 1,878 | | | | 82 | |
Spain — 0.0% | |
Repsol SA (Expires 01/14/16) (a)(c) | | | 45,960 | | | | 22,926 | |
| Total Rights — 0.0% | | | | 26,335 | |
Total Long-Term Investments
(Cost — $873,415,819) — 99.6% | | | | 833,389,150 | |
| | | | | | | | |
| | | | | | | | | |
| | |
| Short-Term Securities | | | | | | |
BlackRock Cash Funds: Institutional, SL Agency Shares, 0.35% (e)(f)(g) | | | 25,023,891 | | | | 25,023,891 | |
BlackRock Cash Funds: Prime, SL Agency Shares, 0.31% (e)(f)(g) | | | 16,634,043 | | | | 16,634,043 | |
Total Short-Term Securities
(Cost — $41,657,934) — 5.0% | | | | 41,657,934 | |
| Total Investments (Cost — $915,073,753) — 104.6% | | | | 875,047,084 | |
| Liabilities in Excess of Other Assets — (4.6)% | | | | (38,410,141 | ) |
| | | | | | | | |
Net Assets — 100.0% | | | $ | 836,636,943 | |
| | | | | | | | |
|
| Notes to Schedule of Investments |
| (a) | | Security, or a portion of security, is on loan. |
| (b) | | A security contractually bound to one or more other securities to form a single saleable unit which cannot be sold separately. |
| (c) | | Non-income producing security. |
| (d) | | Security exempt from registration pursuant to Rule 144A under the Securities Act of 1933, as amended. These securities may be resold in transactions exempt from registration to qualified institutional investors. |
See Notes to Financial Statements.
| | | | | | |
| | | | | | | |
| | BLACKROCK TOTAL INTERNATIONAL ex U.S. INDEX FUND | | DECEMBER 31, 2015 | | 35 |
| | |
Schedule of Investments (continued) | | Total International ex U.S. Index Master Portfolio |
| (e) | | During the year ended December 31, 2015, investments in issuers considered to be affiliates of the Master Portfolio for purposes of Section 2(a)(3) of the Investment Company Act of 1940, as amended, were as follows: |
| | | | | | | | | | | | | | | | | | | | | | | | | | | | |
| Affiliate | | Shares Held
at December 31,
2014 | | | Shares
Purchased | | | Shares Sold | | | Shares Held
at December 31,
2015 | | | Value at
December 31, 2015 | | | Income | | | Realized
Gain | |
BlackRock Cash Funds: Institutional, SL Agency Shares | | | 22,280,035 | | | | — | | | | 2,743,856 | 1 | | | 25,023,891 | | | $ | 25,023,891 | | | $ | 201,619 | 2 | | | — | |
BlackRock Cash Funds: Prime, SL Agency Shares | | | 2,952,909 | | | | 13,681,134 | 1 | | | — | | | | 16,634,043 | | | $ | 16,634,043 | | | $ | 144,020 | 3 | | | — | |
iShares India 50 ETF | | | 288,798 | | | | 65,800 | | | | (354,598 | ) | | | — | | | | — | | | | — | | | $ | 1,817,636 | |
1 Represents net shares purchased 2 Represents all or portion of securities lending income earned from the reinvestment of cash collateral from loaned securities, net of fees, and other payments to and from borrower of securities, and less the collateral investment expenses. | |
| (f) | | Current yield as of period end. |
| (g) | | All or a portion of security was purchased with the cash collateral from loaned securities. |
| | | | | | | | | | | | | | | | | | |
| Derivative Financial Instruments Outstanding as of Period End |
Financial Futures Contracts
| | | | | | | | | | | | | | |
Contracts
Long | | | Issue | | Expiration | | Notional
Value | | | Unrealized
Appreciation | |
| | 60 | | | E-Mini MSCI EAFE Index | | March 2016 | | $ | 5,094,600 | | | $ | 47,675 | |
| | 36 | | | MSCI Emerging Markets Mini Index | | March 2016 | | $ | 1,417,500 | | | | 16,842 | |
| | 16 | | | S&P/TSX 60 Index | | March 2016 | | $ | 608,720 | | | | 2,132 | |
| | Total | | | | | | | | | | | $ | 66,649 | |
| | | | | | | | | | | | | | | | | | |
| Derivative Financial Instruments Categorized by Risk Exposure |
As of period end, the fair values of derivative financial instruments located in the Statement of Assets and Liabilities were as follows:
| | | | | | | | | | | | | | | | | | | | | | | | | | | | | | | | |
Assets — Derivative
Financial Instruments | | | | | Commodity
Contracts | | | Credit
Contracts | | | Equity
Contracts | | | Foreign
Currency
Exchange
Contracts | | | Interest
Rate
Contracts | | | Other
Contacts | | | Total | |
Financial futures contracts | |
| Net unrealized
appreciation |
1 | | | — | | | | — | | | $ | 66,649 | | | | — | | | | — | | | | — | | | $ | 66,649 | |
| | 1 | | Includes cumulative appreciation on financial futures contracts, if any, as reported in the Schedule of Investments. Only current day’s variation margin is reported within the Statement of Assets and Liabilities. |
For the year ended December 31, 2015, the effect of derivative financial instruments in the Statement of Operations was as follows:
| | | | | | | | | | | | | | | | | | | | | | | | | | | | |
| Net Realized Gain (Loss) From: | | Commodity
Contracts | | | Credit
Contracts | | | Equity
Contracts | | | Foreign
Currency
Exchange
Contracts | | | Interest
Rate
Contracts | | | Other
Contacts | | | Total | |
Financial futures contracts | | | — | | | | — | | | $ | (529,452 | ) | | | — | | | | — | | | | — | | | $ | (529,452 | ) |
Forward foreign currency exchange contracts | | | — | | | | — | | | | — | | | $ | 854 | | | | — | | | | — | | | | 854 | |
Total | | | — | | | | — | | | $ | (529,452 | ) | | $ | 854 | | | | — | | | | — | | | $ | (528,598 | ) |
Net Change in Unrealized
Appreciation (Depreciation) on: | | | | | | | | | | | | | | | | | | | | | |
Financial futures contracts | | | — | | | | — | | | $ | 59,206 | | | | — | | | | — | | | | — | | | $ | 59,206 | |
See Notes to Financial Statements.
| | | | | | |
| | | | | | | |
| 36 | | BLACKROCK TOTAL INTERNATIONAL ex U.S. INDEX FUND | | DECEMBER 31, 2015 | | |
| | |
Schedule of Investments (continued) | | Total International ex U.S. Index Master Portfolio |
| | | | | | | | | | | | | | | | |
| Average Quarterly Balances of Outstanding Derivative Financial Instruments |
| | | | |
| Financial futures contracts: | | | | |
Average notional value of contracts — long | | $ | 9,744,069 | |
| Forward foreign currency exchange contracts: | | | | |
Average amounts purchased — in USD | | $ | 4,647 | 1 |
Average amounts sold — in USD | | $ | 27,744 | |
1 Actual amounts for the period are shown due to limited outstanding derivative financial instruments as of each quarter. | |
For more information about the Master Portfolio’s investment risks regarding derivative financial instruments, refer to the Notes to Financial Statements.
|
| Fair Value Hierarchy as of Period End |
Various inputs are used in determining the fair value of investments and derivative financial instruments. For information about the Master Portfolio’s policy regarding valuation of investments and derivative financial instruments, refer to the Notes to Financial Statements.
The following tables summarize the Master Portfolio’s investments and derivative financial instruments categorized in the disclosure hierarchy:
| | | | | | | | | | | | | | | | |
| | | Level 1 | | | Level 2 | | | Level 3 | | | Total | |
Assets: | | | | | | | | | | | | | | | | |
| Investments: | | | | | | | | | | | | | | | | |
| Common Stocks: | | | | | | | | | | | | | | | | |
Australia | | | — | | | $ | 41,646,749 | | | | — | | | $ | 41,646,749 | |
Austria | | | — | | | | 1,132,815 | | | | — | | | | 1,132,815 | |
Belgium | | | — | | | | 9,074,772 | | | | — | | | | 9,074,772 | |
Brazil | | $ | 9,501,071 | | | | — | | | | — | | | | 9,501,071 | |
Canada | | | 49,523,137 | | | | — | | | | — | | | | 49,523,137 | |
Chile | | | 1,885,206 | | | | — | | | | — | | | | 1,885,206 | |
China | | | 4,636,573 | | | | 30,884,857 | | | $ | 32,129 | | | | 35,553,559 | |
Colombia | | | 480,829 | | | | 157 | | | | — | | | | 480,986 | |
Czech Republic | | | — | | | | 284,912 | | | | — | | | | 284,912 | |
Denmark | | | — | | | | 11,759,397 | | | | — | | | | 11,759,397 | |
Egypt | | | 224,501 | | | | 36,012 | | | | — | | | | 260,513 | |
Finland | | | — | | | | 5,567,436 | | | | — | | | | 5,567,436 | |
France | | | 455,088 | | | | 59,378,920 | | | | — | | | | 59,834,008 | |
Germany | | | — | | | | 53,735,179 | | | | — | | | | 53,735,179 | |
Greece | | | 8,272 | | | | 535,942 | | | | — | | | | 544,214 | |
Hong Kong | | | 182,542 | | | | 28,519,930 | | | | — | | | | 28,702,472 | |
Hungary | | | — | | | | 336,808 | | | | — | | | | 336,808 | |
India | | | 3,090,729 | | | | 11,661,367 | | | | — | | | | 14,752,096 | |
Indonesia | | | — | | | | 4,528,164 | | | | — | | | | 4,528,164 | |
Ireland | | | — | | | | 5,625,243 | | | | — | | | | 5,625,243 | |
Israel | | | 275,878 | | | | 4,121,685 | | | | — | | | | 4,397,563 | |
Italy | | | — | | | | 13,683,933 | | | | — | | | | 13,683,933 | |
Japan | | | 643,225 | | | | 142,123,604 | | | | — | | | | 142,766,829 | |
Luxembourg | | | — | | | | 245,080 | | | | — | | | | 245,080 | |
Malaysia | | | 450,861 | | | | 5,007,009 | | | | — | | | | 5,457,870 | |
Malta | | | — | | | | 197,876 | | | | — | | | | 197,876 | |
Mexico | | | 7,919,076 | | | | — | | | | — | | | | 7,919,076 | |
Netherlands | | | 6,693,609 | | | | 19,459,608 | | | | — | | | | 26,153,217 | |
New Zealand | | | — | | | | 903,234 | | | | — | | | | 903,234 | |
Norway | | | — | | | | 3,330,684 | | | | — | | | | 3,330,684 | |
Peru | | | 746,146 | | | | — | | | | — | | | | 746,146 | |
Philippines | | | 25,877 | | | | 2,363,997 | | | | — | | | | 2,389,874 | |
Poland | | | 106,358 | | | | 2,102,546 | | | | — | | | | 2,208,904 | |
Portugal | | | — | | | | 802,715 | | | | — | | | | 802,715 | |
Qatar | | | 140,321 | | | | 1,417,644 | | | | — | | | | 1,557,965 | |
Russia | | | 260,655 | | | | 5,549,490 | | | | — | | | | 5,810,145 | |
Singapore | | | — | | | | 7,474,097 | | | | — | | | | 7,474,097 | |
South Africa | | | 139,916 | | | | 10,677,718 | | | | 13 | | | | 10,817,647 | |
South Korea | | | 82,456 | | | | 25,600,234 | | | | — | | | | 25,682,690 | |
Spain | | | — | | | | 19,583,376 | | | | — | | | | 19,583,376 | |
Sweden | | | — | | | | 17,774,003 | | | | — | | | | 17,774,003 | |
See Notes to Financial Statements.
| | | | | | |
| | | | | | | |
| | BLACKROCK TOTAL INTERNATIONAL ex U.S. INDEX FUND | | DECEMBER 31, 2015 | | 37 |
| | |
Schedule of Investments (concluded) | | Total International ex U.S. Index Master Portfolio |
| | | | | | | | | | | | | | | | |
| | | Level 1 | | | Level 2 | | | Level 3 | | | Total | |
Assets (concluded): | | | | | | | | | | | | | | | | |
Switzerland | | $ | 447,005 | | | $ | 58,815,913 | | | | — | | | $ | 59,262,918 | |
Taiwan | | | — | | | | 20,625,596 | | | | — | | | | 20,625,596 | |
Thailand | | | — | | | | 3,437,396 | | | | — | | | | 3,437,396 | |
Turkey | | | — | | | | 2,366,038 | | | | — | | | | 2,366,038 | |
United Arab Emirates | | | 404,021 | | | | 947,693 | | | | — | | | | 1,351,714 | |
United Kingdom | | | — | | | | 108,569,073 | | | | — | | | | 108,569,073 | |
Preferred Stocks | | | 57,136 | | | | 3,061,283 | | | | — | | | | 3,118,419 | |
Rights | | | 22,926 | | | | 3,409 | | | | — | | | | 26,335 | |
Short-Term Securities | | | 41,657,934 | | | | — | | | | — | | | | 41,657,934 | |
| | | | |
Total | | $ | 130,061,348 | | | $ | 744,953,594 | | | $ | 32,142 | | | $ | 875,047,084 | |
| | | | |
| | | | | | | | | | | | | | | | |
| | | Level 1 | | | Level 2 | | | Level 3 | | | Total | |
| Derivative Financial Instruments 1 | | | | | | | | | | | | | | | | |
Assets: | | | | | | | | | | | | | | | | |
Equity contracts | | $ | 66,649 | | | | — | | | | — | | | $ | 66,649 | |
1 Derivative financial instruments are financial futures contracts, which are valued at the unrealized appreciation (depreciation) on the instrument. | |
|
| The Master Portfolio may hold assets and/or liabilities in which the fair value approximates the carrying amount for financial statement purposes. As of period end, such assets and/or liabilities are categorized within the disclosure hierarchy as follows: | |
| | | Level 1 | | | Level 2 | | | Level 3 | | | Total | |
Assets: | | | | | | | | | | | | | | | | |
Cash | | $ | 5,945 | | | | — | | | | — | | | $ | 5,945 | |
Cash pledged for financial futures contracts | | | 267,620 | | | | — | | | | — | | | | 267,620 | |
Foreign currency at value | | | 2,644,878 | | | | — | | | | — | | | | 2,644,878 | |
Liabilities: | | | | | | | | | | | | | | | | |
Collateral on securities loaned at value | | | — | | | $ | (38,176,492 | ) | | | — | | | | (38,176,492 | ) |
| | | | |
Total | | $ | 2,918,443 | | | $ | (38,176,492 | ) | | | — | | | $ | (35,258,049 | ) |
| | | | |
During the year ended December 31, 2015, there were no transfers between levels.
See Notes to Financial Statements.
| | | | | | |
| | | | | | | |
| 38 | | BLACKROCK TOTAL INTERNATIONAL ex U.S. INDEX FUND | | DECEMBER 31, 2015 | | |
| | |
| Statement of Assets and Liabilities | | Total International ex U.S. Index Master Portfolio |
| | | | |
| December 31, 2015 | | | |
| | | | |
| Assets | | | | |
Investments at value — unaffiliated (including securities loaned of $35,663,020) (cost — $873,415,819) | | $ | 833,389,150 | |
Investments at value — affiliated (cost — $41,657,934) | | | 41,657,934 | |
Cash | | | 5,945 | |
Foreign currency at value (cost — $2,662,271) | | | 2,644,878 | |
Cash pledged for financial futures contracts | | | 267,620 | |
| Receivables: | | | | |
Contributions from investors | | | 1,062,996 | |
Dividends | | | 1,074,645 | |
Securities lending income — affiliated | | | 22,989 | |
Investments sold | | | 12,882 | |
Prepaid expenses | | | 3,621 | |
| | | | |
Total assets | | | 880,142,660 | |
| | | | |
| | | | |
| Liabilities | | | | |
Collateral on securities loaned at value | | | 38,176,492 | |
| Payables: | | | | |
Withdrawals to investors | | | 5,100,000 | |
Investment advisory fees | | | 21,361 | |
Trustees’ fees | | | 6,434 | |
Other accrued expenses | | | 129,470 | |
Variation margin payable on financial futures contracts | | | 71,960 | |
| | | | |
Total liabilities | | | 43,505,717 | |
| | | | |
Net Assets | | $ | 836,636,943 | |
| | | | |
| | | | |
| Net Assets Consist of | | | | |
Investors’ capital | | $ | 876,624,576 | |
Net unrealized appreciation (depreciation) | | | (39,987,633 | ) |
| | | | |
Net Assets | | $ | 836,636,943 | |
| | | | |
| | | | | | |
| See Notes to Financial Statements. | | | | |
| | | | | | | |
| | BLACKROCK TOTAL INTERNATIONAL ex U.S. INDEX FUND | | DECEMBER 31, 2015 | | 39 |
| | |
| Statement of Operations | | Total International ex U.S. Index Master Portfolio |
| | | | |
| Year Ended December 31, 2015 | | | |
| | | | |
| Investment Income | | | | |
Dividends | | $ | 24,180,563 | |
Securities lending — affiliated — net | | | 330,537 | |
Income — affiliated | | | 15,102 | |
Foreign taxes withheld | | | (2,891,070 | ) |
| | | | |
Total income | | | 21,635,132 | |
| | | | |
| | | | |
| Expenses | | | | |
Accounting services | | | 260,787 | |
Investment advisory | | | 256,299 | |
Professional | | | 48,602 | |
Independent Trustees | | | 28,157 | |
Printing | | | 468 | |
Miscellaneous | | | 7,314 | |
| | | | |
Total expenses | | | 601,627 | |
Less fees waived and/or reimbursed by the Manager | | | (26,495 | ) |
| | | | |
Total expenses after fees waived and/or reimbursed | | | 575,132 | |
| | | | |
Net investment income | | | 21,060,000 | |
| | | | |
| | | | |
| Realized and Unrealized Gain (Loss) | | | | |
| Net realized gain (loss) from: | | | | |
Investments — unaffiliated (net of $3,929 foreign capital gain tax) | | | (6,705,799 | ) |
Investments — affiliated | | | 1,817,636 | |
Financial futures contracts | | | (529,452 | ) |
Foreign currency transactions | | | (775,345 | ) |
| | | | |
| | | (6,192,960 | ) |
| | | | |
| Net change in unrealized appreciation (depreciation) on: | | | | |
Investments — unaffiliated | | | (58,833,540 | ) |
Investments — affiliated | | | (1,328,572 | ) |
Financial futures contracts | | | 59,206 | |
Foreign currency translations | | | 33,409 | |
| | | | |
| | | (60,069,497 | ) |
| | | | |
Net realized and unrealized loss | | | (66,262,457 | ) |
| | | | |
Net Decrease in Net Assets Resulting from Operations | | $ | (45,202,457 | ) |
| | | | |
| | | | | | |
| See Notes to Financial Statements. | | | | |
| | | | | | | |
| 40 | | BLACKROCK TOTAL INTERNATIONAL ex U.S. INDEX FUND | | DECEMBER 31, 2015 | | |
| | |
| Statements of Changes in Net Assets | | Total International ex U.S. Index Master Portfolio |
| | | | | | | | |
| | | Year Ended December 31, | |
| Increase (Decrease) in Net Assets: | | 2015 | | | 2014 | |
| | | | | | | | |
| Operations | | | | | | | | |
Net investment income | | $ | 21,060,000 | | | $ | 13,100,009 | |
Net realized gain (loss) | | | (6,192,960 | ) | | | 23,574,766 | |
Net change in unrealized appreciation (depreciation) | | | (60,069,497 | ) | | | (64,382,962 | ) |
| | | | |
Net decrease in net assets resulting from operations | | | (45,202,457 | ) | | | (27,708,187 | ) |
| | | | |
| | | | | | | | |
| Capital Transactions | | | | | | | | |
Proceeds from contributions | | | 352,378,750 | | | | 726,393,826 | |
Value of withdrawals | | | (61,736,783 | ) | | | (663,931,697 | ) |
| | | | |
Net increase in net assets derived from capital transactions | | | 290,641,967 | | | | 62,462,129 | |
| | | | |
| | | | | | | | |
| Net Assets | | | | | | | | |
Total increase in net assets | | | 245,439,510 | | | | 34,753,942 | |
Beginning of year | | | 591,197,433 | | | | 556,443,491 | |
| | | | |
End of year | | $ | 836,636,943 | | | $ | 591,197,433 | |
| | | | |
| | |
| Financial Highlights | | Total International ex U.S. Index Master Portfolio |
| | | | | | | | | | | | | | | | | | | | |
| | | Year Ended December 31, | | | Period from
June 30, 20111
to December 31, 2011 | |
| | | 2015 | | | 2014 | | | 2013 | | | 2012 | | |
| | | | | | | | | | | | | | | | | | | | |
| Total Return | | | | | | | | | | | | | | | | | | | | |
Total Return | | | (5.80)% | | | | (4.68)% | | | | 13.96% | | | | 16.65% | | | | (18.04)% | 2 |
| | | | |
| | | | | | | | | | | | | | | | | | | | |
| Ratios to Average Net Assets | | | | | | | | | | | | | | | | | | | | |
Total expenses | | | 0.08% | | | | 0.15% | 3 | | | 0.25% | | | | 0.42% | | | | 1.47% | 4,5 |
| | | | |
Total expenses after fees waived and/or reimbursed | | | 0.07% | | | | 0.12% | 3 | | | 0.24% | | | | 0.32% | | | | 0.33% | 4 |
| | | | |
Net investment income | | | 2.71% | | | | 3.08% | 3 | | | 2.60% | | | | 2.23% | | | | 1.76% | 4 |
| | | | |
| | | | | | | | | | | | | | | | | | | | |
| Supplemental Data | | | | | | | | | | | | | | | | | | | | |
Net assets, end of period (000) | | | $ 836,637 | | | | $ 591,197 | | | | $ 556,443 | | | | $ 381,056 | | | | $43,554 | |
| | | | |
Portfolio turnover rate | | | 6% | | | | 49% | | | | 36% | | | | 42% | | | | 4% | |
| | | | |
| | 1 | | Commencement of operations. |
| | 2 | | Aggregate total return. |
| | 3 | | Excludes expenses incurred indirectly as a result of investments in underlying funds of approximately 0.01%. |
| | 5 | | Organization costs were not annualized in the calculation of the expense ratio. If these expenses were annualized, the total expenses would have been 1.48%. |
| | | | | | |
| See Notes to Financial Statements. | | | | |
| | | | | | | |
| | BLACKROCK TOTAL INTERNATIONAL ex U.S. INDEX FUND | | DECEMBER 31, 2015 | | 41 |
| | |
| Notes to Financial Statements | | Total International ex U.S. Index Master Portfolio |
1. Organization:
Total International ex U.S. Index Master Portfolio (the “Master Portfolio”) (formerly known as ACWI ex-U.S. Index Master Portfolio), a series of Master Investment Portfolio (“MIP”), is registered under the Investment Company Act of 1940, as amended (the “1940 Act”), as a non-diversified, open-end management investment company. MIP is organized as a Delaware statutory trust.
The Master Portfolio, together with certain other registered investment companies advised by BlackRock Fund Advisors (the “Manager”) or its affiliates, is included in a complex of open-end funds referred to as the Equity-Liquidity Complex.
2. Significant Accounting Policies:
The financial statements are prepared in conformity with accounting principles generally accepted in the United States of America (“U.S. GAAP”), which may require management to make estimates and assumptions that affect the reported amounts of assets and liabilities in the financial statements, disclosure of contingent assets and liabilities at the date of the financial statements and the reported amounts of increases and decreases in net assets from operations during the reporting period. Actual results could differ from those estimates. The Master Portfolio is considered an investment company under U.S. GAAP and follows the accounting and reporting guidance applicable to investment companies. Below is a summary of significant accounting policies:
Foreign Currency: The Master Portfolio’s books and records are maintained in U.S. dollars. Purchases and sales of investments are recorded at the rates of exchange prevailing on the respective dates of such transactions. Generally, when the U.S. dollar rises in value against a foreign currency, the Master Portfolio’s investment denominated in that currency will lose value; the opposite effect occurs if the U.S. dollar falls in relative value.
The Master Portfolio does not isolate changes in the exchange rates from the changes in the market prices of investments held or sold for financial reporting purposes. Accordingly, the effects of changes in exchange rates on investments are not segregated in the Statement of Operations from the effects of changes in market prices of those investments, but are included as a component of net realized and unrealized gain (loss) from investments. The Master Portfolio reports realized currency gains (losses) on foreign currency related transactions as components of net realized gain (loss) for financial reporting purposes, whereas such components are generally treated as ordinary income for federal income tax purposes.
Segregation and Collateralization: In cases where the Master Portfolio enters into certain investments (e.g., financial futures contracts and forward foreign currency exchange contracts) that would be treated as “senior securities” for 1940 Act purposes, the Master Portfolio may segregate or designate on its books and records cash or liquid assets having a market value at least equal to the amount of its future obligations under such investments. Doing so allows the investment to be excluded from treatment as a “senior security.” Furthermore, if required by an exchange or counterparty agreement, the Master Portfolio may be required to deliver/deposit cash and/or securities to/with an exchange, or broker-dealer or custodian as collateral for certain investments or obligations.
Investment Transactions and Investment Income: For financial reporting purposes, investment transactions are recorded on the dates the transactions are entered into (the trade dates). Realized gains and losses on investment transactions are determined on the identified cost basis. Dividend income is recorded on the ex-dividend date. Dividends from foreign securities where the ex-dividend date may have passed are subsequently recorded when the Master Portfolio is informed of the ex-dividend date. Under the applicable foreign tax laws, a withholding tax at various rates may be imposed on capital gains, dividends and interest. Upon notification from issuers, some of the dividend income received from a real estate investment trust may be redesignated as a reduction of cost of the related investment and/or realized gain.
Indemnifications: In the normal course of business, the Master Portfolio enters into contracts that contain a variety of representations that provide general indemnification. The Master Portfolio’s maximum exposure under these arrangements is unknown because it involves future potential claims against the Master Portfolio, which cannot be predicted with any certainty.
Other: Expenses directly related to the Master Portfolio are charged to the Master Portfolio. Other operating expenses shared by several funds, including other funds managed by the Manager, are prorated among those funds on the basis of relative net assets or other appropriate methods.
The Master Portfolio has an arrangement with its custodian whereby fees may be reduced by credits earned on uninvested cash balances, which, if applicable, are shown as fees paid indirectly in the Statement of Operations. The custodian imposes fees on overdrawn cash balances, which can be offset by accumulated credits earned or may result in additional custody charges. Effective September 2015, the arrangement with its custodian for earning credits on uninvested cash balances has ceased and the custodian will be imposing fees on certain uninvested cash balances.
| | | | | | |
| | | | | | | |
| 42 | | BLACKROCK TOTAL INTERNATIONAL ex U.S. INDEX FUND | | DECEMBER 31, 2015 | | |
| | | | |
| Notes to Financial Statements (continued) | | Total International ex U.S. Index Master Portfolio |
3. Investment Valuation and Fair Value Measurements:
Investment Valuation Policies: The Master Portfolio’s investments are valued at fair value (also referred to as “market value” within the financial statements) as of the close of trading on the New York Stock Exchange (“NYSE”) (generally 4:00 p.m., Eastern time) U.S. GAAP defines fair value as the price the Master Portfolio would receive to sell an asset or pay to transfer a liability in an orderly transaction between market participants at the measurement date. The Master Portfolio determines the fair values of its financial instruments using independent dealers or pricing services under policies approved by the Board of Trustees of MIP (the “Board”). The BlackRock Global Valuation Methodologies Committee (the “Global Valuation Committee”) is the committee formed by management to develop global pricing policies and procedures and to provide oversight of the pricing function for the Master Portfolio’s for all financial instruments.
Fair Value Inputs and Methodologies: The following methods (or “techniques”) and inputs are used to establish the fair value of the Master Portfolio’s assets and liabilities:
| • | | Equity investments traded on a recognized securities exchange are valued at the official close price each day, if available. For equity investments traded on more than one exchange, the official close price on the exchange where the stock is primarily traded is used. Equity investments traded on a recognized exchange for which there were no sales on that day may be valued at the last available bid (long positions) or ask (short positions) price. Generally, trading in foreign instruments is substantially completed each day at various times prior to the close of business on the NYSE. Occasionally, events affecting the values of such instruments may occur between the foreign market close and the close of business on the NYSE that may not be reflected in the computation of the Master Portfolio’s net assets. Each business day, the Master Portfolio uses a pricing service to assist with the valuation of certain foreign exchange-traded equity securities and foreign exchange-traded and [over-the-counter (“OTC”) options (the “Systematic Fair Value Price”). Using current market factors, the Systematic Fair Value Price is designed to value such foreign securities and foreign options at fair value as of the close of business on the NYSE, which follows the close of the local markets. |
| • | | Investments in open-end U.S. mutual funds are valued at net asset value (“NAV”) each business day. |
| • | | Financial futures contracts traded on exchanges are valued at their last sale price. |
| • | | Securities and other assets and liabilities denominated in foreign currencies are translated into U.S. dollars using exchange rates determined as of the close of business on the NYSE. Forward foreign currency exchange contracts are valued at the mean between the bid and ask prices and are determined as of the close of business on the NYSE. Interpolated values are derived when the settlement date of the contract is an interim date for which quotations are not available. |
If events (e.g., a company announcement, market volatility or a natural disaster) occur that are expected to materially affect the value of such instruments, or in the event that the application of these methods of valuation results in a price for an investment that is deemed not to be representative of the market value of such investment, or if a price is not available, the investment will be valued by the Global Valuation Committee, or its delegate, in accordance with a policy approved by the Board as reflecting fair value (“Fair Valued Investments”). When determining the price for Fair Valued Investments, the Global Valuation Committee, or its delegate, seeks to determine the price that the Master Portfolio might reasonably expect to receive or pay from the current sale or purchase of that asset or liability in an arm’s-length transaction. Fair value determinations shall be based upon all available factors that the Global Valuation Committee, or its delegate, deems relevant consistent with the principles of fair value measurement, which include the market approach, income approach and/or in the case of recent investments, the cost approach, as appropriate. The market approach generally consists of using comparable market transactions. The income approach generally is used to discount future cash flows to present value and is adjusted for liquidity as appropriate. These factors include but are not limited to: (i) attributes specific to the investment or asset; (ii) the principal market for the investment or asset; (iii) the customary participants in the principal market for the investment or asset; (iv) data assumptions by market participants for the investment or asset, if reasonably available; (v) quoted prices for similar investments or assets in active markets; and (vi) other factors, such as future cash flows, interest rates, yield curves, volatilities, prepayment speeds, loss severities, credit risks, recovery rates, liquidation amounts and/or default rates. Due to the inherent uncertainty of valuations of such investments, the fair values may differ from the values that would have been used had an active market existed. The Global Valuation Committee, or its delegate, employs various methods for calibrating valuation approaches for investments where an active market does not exist, including regular due diligence of the Master Portfolio’s pricing vendors, regular reviews of key inputs and assumptions, transactional back-testing or disposition analysis to compare unrealized gains and losses to realized gains and losses, reviews of missing or stale prices and large movements in market values and reviews of any market related activity. The pricing of all Fair Valued Investments is subsequently reported to the Board or a committee thereof on a quarterly basis.
| | | | | | |
| | | | | | | |
| | BLACKROCK TOTAL INTERNATIONAL ex U.S. INDEX FUND | | DECEMBER 31, 2015 | | 43 |
| | | | |
| Notes to Financial Statements (continued) | | Total International ex U.S. Index Master Portfolio |
Fair Value Hierarchy: Various inputs are used in determining the fair value of investments and derivative financial instruments. These inputs to valuation techniques are categorized into a fair value hierarchy consisting of three broad levels for financial statement purposes as follows:
| • | | Level 1 — unadjusted price quotations in active markets/exchanges for identical assets or liabilities that the Master Portfolio has the ability to access |
| • | | Level 2 — other observable inputs (including, but not limited to, quoted prices for similar assets or liabilities in markets that are active, quoted prices for identical or similar assets or liabilities in markets that are not active, inputs other than quoted prices that are observable for the assets or liabilities (such as interest rates, yield curves, volatilities, prepayment speeds, loss severities, credit risks and default rates) or other market–corroborated inputs) |
| • | | Level 3 — unobservable inputs based on the best information available in the circumstances, to the extent observable inputs are not available (including the Master Portfolio’s own assumptions used in determining the fair value of investments and derivative financial instruments) |
The hierarchy gives the highest priority to unadjusted quoted prices in active markets for identical assets or liabilities (Level 1 measurements) and the lowest priority to unobservable inputs (Level 3 measurements). Accordingly, the degree of judgment exercised in determining fair value is greatest for instruments categorized in Level 3. The inputs used to measure fair value may fall into different levels of the fair value hierarchy. In such cases, for disclosure purposes, the fair value hierarchy classification is determined based on the lowest level input that is significant to the fair value measurement in its entirety. The significant unobservable inputs used by the Global Valuation Committee in determining the price for Fair Valued Investments are typically categorized as Level 3. The fair value hierarchy for the Master Portfolio’s investments and derivative financial instruments have been included in the Schedule of Investments.
Changes in valuation techniques may result in transfers into or out of an assigned level within the hierarchy. In accordance with the Master Portfolio’s policy, transfers between different levels of the fair value hierarchy are deemed to have occurred as of the beginning of the reporting period. The categorization of a value determined for investments and derivative financial instruments is based on the pricing transparency of the investments and derivative financial instruments and is not necessarily an indication of the risks associated with investing in those securities.
4. Securities and Other Investments:
Preferred Stock: Preferred stock has a preference over common stock in liquidation (and generally in receiving dividends as well) but is subordinated to the liabilities of the issuer in all respects. As a general rule, the market value of preferred stock with a fixed dividend rate and no conversion element varies inversely with interest rates and perceived credit risk, while the market price of convertible preferred stock generally also reflects some element of conversion value. Because preferred stock is junior to debt securities and other obligations of the issuer, deterioration in the credit quality of the issuer will cause greater changes in the value of a preferred stock than in a more senior debt security with similar stated yield characteristics. Unlike interest payments on debt securities, preferred stock dividends are payable only if declared by the issuer’s board of directors. Preferred stock also may be subject to optional or mandatory redemption provisions.
Securities Lending: The Master Portfolio may lend its securities to approved borrowers, such as brokers, dealers and other financial institutions. The borrower pledges and maintains with the Master Portfolio collateral consisting of cash, an irrevocable letter of credit issued by a bank, or securities issued or guaranteed by the U.S. Government. The initial collateral received by the Master Portfolio is required to have a value of at least 102% of the current value of the loaned securities for securities traded on U.S. exchanges and a value of at least 105% for all other securities. The collateral is maintained thereafter, at a value equal to at least 100% of the current market value of the securities on loan. The market value of the loaned securities is determined at the close of each business day of the Master Portfolio and any additional required collateral is delivered to the Master Portfolio, or excess collateral returned by the Master Portfolio, on the next business day. During the term of the loan, the Master Portfolio is entitled to all distributions made on or in respect of the loaned securities. Loans of securities are terminable at any time and the borrower, after notice, is required to return borrowed securities within the standard time period for settlement of securities transactions.
The market value of any securities on loan, all of which were classified as common stocks in the Master Portfolio’s Schedule of Investments, and the value of any related collateral are shown separately in the Statement of Assets and Liabilities as a component of investments at value-unaffiliated, and collateral on securities loaned at value, respectively. As of period end, any securities on loan were collateralized by cash. The cash collateral invested by the securities lending agent, BlackRock Institutional Trust Company, N.A. (“BTC”), if any, is disclosed in the Schedule of Investments.
Securities lending transactions are entered into by the Master Portfolio under Master Securities Lending Agreements (each, an “MSLA”), which provide the right, in the event of default (including bankruptcy or insolvency), for the non-defaulting party to liquidate the collateral and calculate a net exposure
| | | | | | |
| | | | | | | |
| 44 | | BLACKROCK TOTAL INTERNATIONAL ex U.S. INDEX FUND | | DECEMBER 31, 2015 | | |
| | | | |
| Notes to Financial Statements (continued) | | Total International ex U.S. Index Master Portfolio |
to the defaulting party or request additional collateral. In the event that a borrower defaults, the Master Portfolio as lender, would offset the market value of the collateral received against the market value of the securities loaned. When the value of the collateral is greater than that of the market value of the securities loaned, the lender is left with a net amount payable to the defaulting party. However, bankruptcy or insolvency laws of a particular jurisdiction may impose restrictions on or prohibitions against such a right of offset in the event of an MSLA counterparty’s bankruptcy or insolvency. Under the MSLA, absent an event of default the borrower can resell or re-pledge the loaned securities, and the Master Portfolio can reinvest cash collateral received in connection with loaned securities. Upon an event of default, the parties’ obligations to return the securities or collateral to the other party are extinguished, and the parties can resell or re-pledge the loaned securities or the collateral received in connection with the loaned securities in order to satisfy the defaulting party’s net payment obligation for all transactions under the MSLA. The defaulting party remains liable for any deficiency.
As of period end, the following table is a summary of the Master Portfolio’s securities lending agreements by counterparty which are subject to offset under an MSLA:
| | | | | | | | | | | | |
| Counterparty | | Securities Loaned at Value | | | Cash Collateral Received1 | | | Net
Amount | |
Citigroup Global Markets, Inc. | | $ | 8,273,357 | | | $ | (8,273,357 | ) | | | — | |
Credit Suisse Securities (USA) LLC . | | | 4,565,184 | | | | (4,565,184 | ) | | | — | |
Deutsche Bank AG | | | 158,053 | | | | (158,053 | ) | | | — | |
Deutsche Bank Securities, Inc. | | | 106,504 | | | | (106,504 | ) | | | — | |
Goldman Sachs & Co. | | | 32,620 | | | | (32,620 | ) | | | — | |
JPMorgan Securities LLC . | | | 2,394,373 | | | | (2,394,373 | ) | | | — | |
Merrill Lynch, Pierce, Fenner & Smith, Inc. | | | 1,196,889 | | | | (1,196,889 | ) | | | — | |
Morgan Stanley & Co. International PLC | | | 140,575 | | | | (140,575 | ) | | | — | |
Morgan Stanley & Co. LLC. | | | 9,070,980 | | | | (9,070,980 | ) | | | — | |
SG Americas Securities LLC. | | | 149,673 | | | | (149,673 | ) | | | — | |
State Street Bank and Trust Co. | | | 9,574,812 | | | | (9,574,812 | ) | | | — | |
| | | | |
Total | | $ | 35,663,020 | | | $ | (35,663,020 | ) | | | — | |
| | | | |
| | 1 | | Collateral with a value of $38,176,492 has been received in connection with securities lending agreements. Collateral received in excess of the value of securities loaned from the individual counterparty is not shown for financial reporting purposes in the table above. |
The risks of securities lending include the risk that the borrower may not provide additional collateral when required or may not return the securities when due. To mitigate these risks, the Master Portfolio benefits from a borrower default indemnity provided by BlackRock, Inc. (“BlackRock”). BlackRock’s indemnity allows for full replacement of the securities loaned if the collateral received does not cover the value on the securities loaned in the event of borrower default. The Master Portfolio could suffer a loss if the value of an investment purchased with cash collateral falls below the market value of loaned securities or if the value of an investment purchased with cash collateral falls below the value of the original cash collateral received.
5. Derivative Financial Instruments:
The Master Portfolio engages in various portfolio investment strategies using derivative contracts both to increase the returns of the Master Portfolio and/or to manage economically its exposure to certain risks such as equity risk and foreign currency exchange rate risk. These contracts may be transacted on an exchange or over-the-counter (“OTC”).
Financial Futures Contracts: The Master Portfolio invests in long and/or short positions in financial futures contracts and options on financial futures contracts to gain exposure to, or economically hedge against, changes in the value of equity securities (equity risk) or foreign currencies (foreign currency exchange rate risk). Financial futures contracts are agreements between the Master Portfolio and a counterparty to buy or sell a specific quantity of an underlying instrument at a specified price and at a specified date. Depending on the terms of the particular contract, financial futures contracts are settled either through physical delivery of the underlying instrument on the settlement date or by payment of a cash settlement amount on the settlement date.
Upon entering into a financial futures contract, the Master Portfolio is required to deposit initial margin with the broker in the form of cash or securities in an amount that varies depending on a contract’s size and risk profile. The initial margin deposit must then be maintained at an established level over the life of the contract. Securities deposited as initial margin are designated on the Schedule of Investment and cash deposited, if any, is recorded on the Statement of Assets and Liabilities as cash pledged for financial futures contracts. Pursuant to the contract, the Master Portfolio
| | | | | | |
| | | | | | | |
| | BLACKROCK TOTAL INTERNATIONAL ex U.S. INDEX FUND | | DECEMBER 31, 2015 | | 45 |
| | | | |
| Notes to Financial Statements (continued) | | Total International ex U.S. Index Master Portfolio |
agrees to receive from or pay to the broker an amount of cash equal to the daily fluctuation in value of the contract. Such receipts or payments are known as variation margin. Variation margin is recorded by the Master Portfolio as unrealized appreciation (depreciation) and, if applicable, as a receivable or payable for variation margin in the Statement of Assets and Liabilities.
When the contract is closed, the Master Portfolio records a realized gain or loss equal to the difference between the value of the contract at the time it was opened and the value at the time it was closed. The use of financial futures contracts involves the risk of an imperfect correlation in the movements in the price of financial futures contracts, interest or foreign currency exchange rates and the underlying assets.
Forward Foreign Currency Exchange Contracts: The Master Portfolio enters into forward foreign currency exchange contracts as an economic hedge against either specific transactions or portfolio instruments or to obtain exposure to, or hedge exposure away from, foreign currencies (foreign currency exchange rate risk). A forward foreign currency exchange contract is an agreement between two parties to buy and sell a currency at a set exchange rate on a future date. Forward foreign currency exchange contracts, when used by the Master Portfolio, help to manage the overall exposure to the currencies in which some of the investments held by the the Master Portfolio is denominated. Non-deliverable forward foreign currency exchange contracts are settled with the counterparty in cash without the delivery of foreign currency. The contract is marked-to-market daily and the change in market value is recorded by the Master Portfolio as an unrealized gain or loss. When the contract is closed, the Master Portfolio records a realized gain or loss equal to the difference between the value at the time it was opened and the value at the time it was closed. The use of forward foreign currency exchange contracts involves the risk that the value of a forward foreign currency exchange contract changes unfavorably due to movements in the value of the referenced foreign currencies.
In order to better define the Master Portfolio contractual rights and to secure rights that will help it mitigate its counterparty risk, the Master Portfolio may enter into an International Swaps and Derivatives Association, Inc. Master Agreement (“ISDA Master Agreement”) or similar agreement with its counterparties. An ISDA Master Agreement is a bilateral agreement between each Fund and a counterparty that governs certain OTC derivatives and typically contains, among other things, collateral posting terms and netting provisions in the event of a default and/or termination event. Under an ISDA Master Agreement, the Master Portfolio may, under certain circumstances, offset with the counterparty certain derivative financial instruments’ payables and/or receivables with collateral held and/or posted and create one single net payment. The provisions of the ISDA Master Agreement typically permit a single net payment in the event of default including the bankruptcy or insolvency of the counterparty. Bankruptcy or insolvency laws of a particular jurisdiction may restrict or prohibit the right of offset in bankruptcy, insolvency or other events. In addition, certain ISDA Master Agreements allow counterparties to terminate derivative contracts prior to maturity in the event the Master Portfolio‘s net assets decline by a stated percentage or the Master Portfolio fails to meet the terms of its ISDA Master Agreements. The result would cause the Master Portfolio to accelerate payment of any net liability owed to the counterparty.
Collateral Requirements: For derivatives traded under an ISDA Master Agreement, the collateral requirements are typically calculated by netting the mark-to-market amount for each transaction under such agreement and comparing that amount to the value of any collateral currently pledged by the Master Portfolio and the counterparty.
Cash collateral that has been pledged to cover obligations of the Master Portfolio and cash collateral received from the counterparty, if any, is reported separately on the Statement of Assets and Liabilities as cash pledged as collateral and cash received as collateral, respectively. Non-cash collateral pledged by the Master Portfolio, if any, is noted in the Schedule of Investments. Generally, the amount of collateral due from or to a party has to exceed a minimum transfer amount threshold (typically either $250,000 or $500,000) before a transfer is required, which is determined at the close of business of the Master Portfolio. Any additional required collateral is delivered to/pledged by the Master Portfolio on the next business day. Typically, the Master Portfolio’s counterparty is not permitted to sell, re-pledge or use cash and non-cash collateral it receives. The Master Portfolio generally agrees not to use non-cash collateral that it receives but may, absent default or certain other circumstances defined in the underlying ISDA Master Agreement, be permitted to use cash collateral received. In such cases, the Master Portfolio may pay interest pursuant to the collateral arrangement with the counterparty. To the extent amounts due to the Master Portfolio from its counterparties are not fully collateralized, the Master Portfolio bears the risk of loss from counterparty non-performance. Likewise, to the extent the Master Portfolio has delivered collateral to a counterparty and stands ready to perform under the terms of its agreement with such counterparty, the Master Portfolio bears the risk of loss from a counterparty in the amount of the value of the collateral in the event the counterparty fails to return such collateral. Based on the terms of agreements, collateral may not be required to all derivative contracts.
For financial reporting purposes, the Master Portfolio not offset derivative assets and derivative liabilities that are subject to netting arrangements, if any, in the Statement of Assets and Liabilities.
| | | | | | |
| | | | | | | |
| 46 | | BLACKROCK TOTAL INTERNATIONAL ex U.S. INDEX FUND | | DECEMBER 31, 2015 | | |
| | | | |
| Notes to Financial Statements (continued) | | Total International ex U.S. Index Master Portfolio |
6. Investment Advisory Agreement and Other Transactions with Affiliates:
The PNC Financial Services Group, Inc. is the largest stockholder and an affiliate of BlackRock for 1940 Act purposes.
MIP, on behalf of the Master Portfolio entered into an Investment Advisory Agreement with the Manager, the Master Portfolio’s investment advisor, an indirect, wholly owned subsidiary of BlackRock, to provide investment advisory and administration services. The Manager is responsible for the management of the Master Portfolio’s portfolio and provides the personnel, facilities, equipment and certain other services necessary to the operations of the Master Portfolio. Effective April 30, 2015, for such services, the Master Portfolio pays the Manager a monthly fee based on a percentage of the Master Portfolio’s average daily net assets at an annual rate of 0.03%. Prior to April 30, 2015, the Master Portfolio paid the Manager a monthly fee at an annual rate of 0.04%.
The Manager contractually agreed to waive and/or reimburse fees or expenses in order to limit expenses, excluding interest expense, dividend expense, tax expense, acquired fund fees and expenses, and certain other fund expenses, which constitute extraordinary expenses not incurred in the ordinary course of the Master Portfolio’s business in order to limit expenses of certain feeder funds which invest their assets in the Master Portfolio. The Manager has agreed not to reduce or discontinue this contractual waiver or reimbursement prior to May 1, 2016, unless approved by the Board, including a majority of the Independent Trustees.
The Manager voluntarily agreed to waive its investment advisory fees by the amount of investment advisory fees the Master Portfolio pays to the Manager indirectly through its investment in the iShares India 50 ETF, an affiliated investment. However, the Manager does not waive its investment advisory fees by the amount of investment advisory fees paid in connection with the Master Portfolio’s investments in other affiliated investment companies, if any. This amount is included in fees waived and/or reimbursed by the Manager in the Statement of Operations. For the year ended December 31, 2015, the amount waived was $20,753. This voluntary waiver expired on April 30, 2015.
The Manager voluntarily agreed to waive its investment advisory fees by the amount of investment advisory fees the Master Portfolio pays to the Manager indirectly through its investment in affiliated money market funds. This amount is included in fees waived by the Manager in the Statement of Operations. However, the Manager does not waive its investment advisory fees by the amount of investment advisory fees paid in connection with the Master Portfolio’s investments in other affiliated investment companies, if any. For the year ended December 31, 2015, the amount waived was $5,742.
The U.S. Securities and Exchange Commission has issued an exemptive order which permits BTC, an affiliate of the Manager, to serve as securities lending agent for the Master Portfolio, subject to applicable conditions. As securities lending agent, BTC bears all operational costs directly related to securities lending. The Master Portfolio is responsible for fees in connection with the investment of cash collateral received for securities on loan in a money market fund managed by the Manager or its affiliates, however, BTC has agreed to reduce the amount of securities lending income it receives in order to effectively limit the collateral investment fees the Master Portfolio bears to an annual rate of 0.04% (the “collateral investment fees”).
Securities lending income is equal to the total of income earned from the reinvestment of cash collateral, net of fees and other payments to and from borrowers of securities, and less the collateral investment fees. The Master Portfolio retains a portion of securities lending income and remits a remaining portion to BTC as compensation for its services as securities lending agent.
Pursuant to a securities lending agreement, the Master Portfolio retains 80% of securities lending income, and this amount retained can never be less than 70% of the total of securities lending income plus the collateral investment fees. In addition, commencing the business day following the date that the aggregate securities lending income earned across certain funds in the Equity-Liquidity Complex in a calendar year exceeds a specified threshold, the Master Portfolio, pursuant to the securities lending agreement, will retain for the remainder of the calendar year securities lending income in an amount equal to 85% of securities lending income, and this amount retained can never be less than 70% of the total of securities lending income plus the collateral investment fees.
The share of securities lending income earned by the Master Portfolio is shown as securities lending — affiliated — net in the Statement of Operations. For the year ended December 31, 2015, the Master Portfolio paid BTC $75,232 in total for securities lending agent services and collateral investment fees.
Certain officers and/or trustees of MIP are officers and/or directors of BlackRock or its affiliates.
7. Purchases and Sales:
For the year ended December 31, 2015, purchases and sales of investments, excluding short-term securities, were $374,737,644 and $42,071,197, respectively.
| | | | | | |
| | | | | | | |
| | BLACKROCK TOTAL INTERNATIONAL ex U.S. INDEX FUND | | DECEMBER 31, 2015 | | 47 |
| | | | |
| Notes to Financial Statements (continued) | | Total International ex U.S. Index Master Portfolio |
8. Income Tax Information:
The Master Portfolio is classified as a partnership for federal income tax purposes. As such, each investor in the Master Portfolio is treated as the owner of its proportionate share of net assets, income, expenses and realized and unrealized gains and losses of the Master Portfolio. Therefore, no federal income tax provision is required. It is intended that the Master Portfolio’s assets will be managed so an investor in the Master Portfolio can satisfy the requirements of Subchapter M of the Internal Revenue Code of 1986, as amended.
The Master Portfolio files U.S. federal and various state and local tax returns. No income tax returns are currently under examination. The statute of limitations on the Master Portfolio’s U.S. federal tax returns remains open for each of the four years ended December 31, 2015. The statutes of limitations on the Master Portfolio’s state and local tax returns may remain open for an additional year depending upon the jurisdiction.
Management has analyzed tax laws and regulations and their application to the Master Portfolio as of December 31, 2015, inclusive of the open tax return years, and does not believe there are any uncertain tax positions that require recognition of a tax liability in the Master Portfolio’s financial statements.
As of period end, gross unrealized appreciation and depreciation based on cost for federal income tax purposes were as follows:
| | | | |
Tax cost | | $ | 918,646,020 | |
| | | | |
Gross unrealized appreciation | | $ | 61,626,989 | |
Gross unrealized depreciation | | | (105,225,925 | ) |
| | | | |
Net unrealized depreciation | | $ | (43,598,936 | ) |
| | | | |
9. Bank Borrowings:
MIP, on behalf of the Master Portfolio, along with certain other funds managed by the Manager and its affiliates (“Participating Funds”), is a party to a 364-day, $2.1 billion credit agreement with a group of lenders, under which the Master Portfolio may borrow to fund shareholder redemptions. Excluding commitments designated for certain funds, the Participating Funds, including the Master Portfolio, can borrow up to an aggregate commitment amount of $1.6 billion at any time outstanding, subject to asset coverage and other limitations as specified in the agreement. The credit agreement has the following terms: a fee of 0.06% per annum on unused commitment amounts and interest at a rate equal to the higher of (a) one-month LIBOR (but, in any event, not less than 0.00%) on the date the loan is made plus 0.80% per annum or (b) the Fed Funds rate (but, in any event, not less than 0.00%) in effect from time to time plus 0.80% per annum on amounts borrowed. The agreement expires in April 2016 unless extended or renewed. Participating Funds paid administration, legal and arrangement fees, which, if applicable, are included in miscellaneous expenses in the Statement of Operations, and along with commitment fees, were allocated among such funds based upon portions of the aggregate commitment available to them and relative net assets of Participating Funds. During the year ended December 31, 2015, the Master Portfolio did not borrow under the credit agreement.
10. Principal Risks:
In the normal course of business, the Master Portfolio invests in securities and enters into transactions where risks exist due to fluctuations in the market (market risk) or failure of the issuer to meet all its obligations, including the ability to pay principal and interest when due (issuer credit risk). The value of securities held by the Master Portfolio may decline in response to certain events, including those directly involving the issuers of securities owned by the Master Portfolio. Changes arising from the general economy, the overall market and local, regional or global political or/and social instability, as well as currency, interest rate and price fluctuations, may also affect the securities’ value.
Counterparty Credit Risk: Similar to issuer credit risk, the Master Portfolio may be exposed to counterparty credit risk, or the risk that an entity may fail to or be unable to perform on its commitments related to unsettled or open transactions. The Master Portfolio manages counterparty credit risk by entering into transactions only with counterparties that the Manager believes have the financial resources to honor their obligations and by monitoring the financial stability of those counterparties. Financial assets, which potentially expose the Master Portfolio to market, issuer and counterparty credit risks, consist principally of financial instruments and receivables due from counterparties. The extent of the Master Portfolio’s exposure to market, issuer and counterparty credit risks with respect to these financial assets is approximately their value recorded in the Statement of Assets and Liabilities, less any collateral held by the Master Portfolio.
A derivative contract may suffer a mark-to-market loss if the value of the contract decreases due to an unfavorable change in the market rates or values of the underlying instrument. Losses can also occur if the counterparty does not perform under the contract.
| | | | | | |
| | | | | | | |
| 48 | | BLACKROCK TOTAL INTERNATIONAL ex U.S. INDEX FUND | | DECEMBER 31, 2015 | | |
| | | | |
| Notes to Financial Statements (concluded) | | Total International ex U.S. Index Master Portfolio |
The Master Portfolio’s risk of loss from counterparty credit risk on OTC derivatives is generally limited to the aggregate unrealized gain less the value of any collateral held by the Master Portfolio.
With exchange-traded futures, there is less counterparty credit risk to the Master Portfolio since the exchange or clearinghouse, as counterparty to such instruments, guarantees against a possible default. The clearinghouse stands between the buyer and the seller of the contract; therefore, credit risk is limited to failure of the clearinghouse. While offset rights may exist under applicable law, the Master Portfolio does not have a contractual right of offset against a clearing broker or clearinghouse in the event of a default (including the bankruptcy or insolvency). Additionally, credit risk exists in exchange-traded futures with respect to initial and variation margin that is held in a clearing broker’s customer accounts. While clearing brokers are required to segregate customer margin from their own assets, in the event that a clearing broker becomes insolvent or goes into bankruptcy and at that time there is a shortfall in the aggregate amount of margin held by the clearing broker for all its clients, typically the shortfall would be allocated on a pro rata basis across all the clearing broker’s customers, potentially resulting in losses to the Master Portfolio.
Concentration Risk:
The Master Portfolio invests a significant portion of its assets in securities of issuers located in Europe or with significant exposure to European issuers or countries. The European financial markets have recently experienced volatility and adverse trends due to concerns about economic downturns in, or rising government debt levels of, several European countries. These events may spread to other countries in Europe and may affect the value and liquidity of certain of the Master Portfolio’s investments.
The Master Portfolio invests a significant portion of its assets in securities of issuers located in Asia or with significant exposure to Asian issuers or countries. The Asian financial markets have recently experienced volatility and adverse trends due to concerns in several Asian countries regarding monetary policy, government intervention in the markets, rising government debt levels or economic downturns. These events may spread to other countries in Asia and may affect the value and liquidity of certain of the Master Portfolio’s investments.
As of period end, the Master Portfolio’s investments had the following industry classifications:
| | | | |
| Industry | | Percentage of
Long Term
Investment | |
Banks | | | 14 | % |
Pharmaceuticals | | | 8 | |
Insurance | | | 6 | |
Oil, Gas & Consumable Fuels | | | 6 | |
Other1 | | | 66 | |
| | 1 | | All other industries held were less than 5% of net assets. |
11. Subsequent Events:
Management has evaluated the impact of all subsequent events on the Master Portfolio through the date the financial statements were issued and has determined that there were no subsequent events requiring adjustment or additional disclosure in the financial statements.
| | | | | | |
| | | | | | | |
| | BLACKROCK TOTAL INTERNATIONAL ex U.S. INDEX FUND | | DECEMBER 31, 2015 | | 49 |
| | |
| Report of Independent Registered Public Accounting Firm | | Total International ex U.S. Index Master Portfolio |
To the Board of Trustees of Master Investment Portfolio and the Interestholders of Total International ex U.S. Index Master Portfolio:
In our opinion, the accompanying statement of assets and liabilities, including the schedule of investments, and the related statements of operations and of changes in net assets and the financial highlights present fairly, in all material respects, the financial position of Total International ex U.S. Index Master Portfolio, (the “Master Portfolio”), a series of Master Investment Portfolio, at December 31, 2015, the results of its operations for the year then ended, the changes in its net assets for each of the two years in the period then ended and the financial highlights for each of the periods presented, in conformity with accounting principles generally accepted in the United States of America. These financial statements and financial highlights (hereafter referred to as “financial statements”) are the responsibility of the Master Portfolio’s management. Our responsibility is to express an opinion on these financial statements based on our audits. We conducted our audits of these financial statements in accordance with the standards of the Public Company Accounting Oversight Board (United States). Those standards require that we plan and perform the audit to obtain reasonable assurance about whether the financial statements are free of material misstatement. An audit includes examining, on a test basis, evidence supporting the amounts and disclosures in the financial statements, assessing the accounting principles used and significant estimates made by management, and evaluating the overall financial statement presentation. We believe that our audits, which included confirmation of securities at December 31, 2015 by correspondence with the custodian, transfer agent, and brokers, provide a reasonable basis for our opinion.
/s/PricewaterhouseCoopers LLP
Philadelphia, Pennsylvania
February 24, 2016
| | | | | | |
| | | | | | | |
| 50 | | BLACKROCK TOTAL INTERNATIONAL ex U.S. INDEX FUND | | DECEMBER 31, 2015 | | |
| | | | | | | | | | |
Name, Address1
and Year of Birth | | Position(s)
Held with
the Trust/MIP | | Length
of Time
Served as
a Trustee3 | | Principal Occupation(s) During Past Five Years | | Number of BlackRock-
Advised Registered
Investment Companies
(“RICs”) Consisting of
Investment Portfolios
(“Portfolios”) Overseen | | Public
Directorships |
| Independent Trustees2 |
Rodney D. Johnson 1941 | | Chair of the Board and Trustee | | Since 2009 | | President, Fairmount Capital Advisors, Inc. from 1987 to 2013; Member of the Archdiocesan Investment Committee of the Archdiocese of Philadelphia from 2004 to 2012; Director, The Committee of Seventy (civic) from 2006 to 2012; Director, Fox Chase Cancer Center from 2004 to 2011. | | 33 RICs consisting of
155 Portfolios | | None |
David O. Beim 1940 | | Trustee | | Since 2009 | | Professor of Professional Practice at the Columbia University Graduate School of Business since 1991; Trustee, Phillips Exeter Academy from 2002 to 2012; Chairman, Wave Hill, Inc. (public garden and cultural center) from 1990 to 2006. | | 33 RICs consisting of
155 Portfolios | | None |
Collette Chilton 1958 | | Trustee | | Since 2015 | | Chief Investment Officer, Williams College since 2006; Chief Investment Officer, Lucent Asset Management Corporation from 1998 to 2006. | | 33 RICs consisting of
155 Portfolios | | None |
Frank J. Fabozzi 1948 | | Trustee | | Since 2014 | | Editor of and Consultant for The Journal of Portfolio Management since 2006; Professor of Finance, EDHEC Business School since 2011; Visiting Professor, Princeton University from 2013 to 2014; Professor in the Practice of Finance and Becton Fellow, Yale University School of Management from 2006 to 2011. | | 108 RICs consisting of
230 Portfolios | | None |
Dr. Matina S. Horner 1939 | | Trustee | | Since 2009 | | Executive Vice President, Teachers Insurance and Annuity Association and College Retirement Equities Fund from 1989 to 2003. | | 33 RICs consisting of
155 Portfolios | | NSTAR (electric and gas utility) |
Herbert I. London 1939 | | Trustee | | Since 2009 | | Professor Emeritus, New York University since 2005; President, London Center for Policy Research since 2012; John M. Olin Professor of Humanities, New York University from 1993 to 2005 and Professor thereof from 1980 to 2005; President Emeritus, Hudson Institute (policy research organization) from 2011 to 2012, President thereof from 1997 to 2011 and Trustee from 1980 to 2012; Chairman of the Board of Trustees for Grantham University since 2006; Director, InnoCentive, Inc. (global internet service) since 2005; Director, Cerego, LLC (educational software) since 2005; Director, Cybersettle (online adjudication) since 2009; Director, AIMS Worldwide, Inc. (marketing) from 2007 to 2012. | | 33 RICs consisting of
155 Portfolios | | None |
Cynthia A. Montgomery 1952 | | Trustee | | Since 2009 | | Professor, Harvard Business School since 1989; Director, McLean Hospital from 2005 to 2012; Director, Harvard Business School Publishing from 2005 to 2010. | | 33 RICs consisting of
155 Portfolios | | Newell Rubbermaid, Inc. (manufacturing) |
Joseph P. Platt 1947 | | Trustee | | Since 2009 | | Director, Jones and Brown (Canadian insurance broker) since 1998; General Partner, Thorn Partners, LP (private investments) since 1998; Director, WQED Multi-Media (public broadcasting not-for-profit) since 2001; Director, The West Penn Allegheny Health System (a not-for-profit health system) from 2008 to 2013; Partner, Amarna Corporation, LLC (private investment company) from 2002 to 2008. | | 33 RICs consisting of
155 Portfolios | | Greenlight Capital Re, Ltd. (reinsurance company) |
Robert C. Robb, Jr. 1945 | | Trustee | | Since 2009 | | Partner, Lewis, Eckert, Robb and Company (management and financial consulting firm) since 1981. | | 33 RICs consisting of
155 Portfolios | | None |
Toby Rosenblatt 1938 | | Trustee | | Since 2009 | | President, Founders Investments Ltd. (private investments) since 1999; Director, Forward Management, LLC since 2007; Director, College Futures Foundation (philanthropic foundation) since 2009; Director, The James Irvine Foundation (philanthropic foundation) from 1998 to 2008. | | 33 RICs consisting of
155 Portfolios | | None |
| | | | | | |
| | | | | | | |
| | BLACKROCK TOTAL INTERNATIONAL ex U.S. INDEX FUND | | DECEMBER 31, 2015 | | 51 |
| | | | |
| Officers and Trustees (continued) | | |
| | | | | | | | | | |
Name, Address1
and Year of Birth | | Position(s)
Held with
the Trust/MIP | | Length
of Time
Served as
a Trustee3 | | Principal Occupation(s) During Past Five Years | | Number of BlackRock-
Advised Registered
Investment Companies
(“RICs”) Consisting of
Investment Portfolios
(“Portfolios”) Overseen | | Public
Directorships |
| Independent Trustees2 (concluded) |
Mark Stalnecker 1951 | | Trustee | | Since 2015 | | Chief Investment Officer, University of Delaware from 1999 to 2013; Trustee, Winterthur Museum and Country Estate since 2001; Member of the Investment Committee, Delaware Public Employees’ Retirement System since 2002; Member of the Investment Committee, Christiana Care Health System since 2009; Member of the Investment Committee, Delaware Community Foundation from 2013 to 2014. | | 33 RICs consisting of
155 Portfolios | | None |
Kenneth L. Urish 1951 | | Trustee | | Since 2009 | | Managing Partner, Urish Popeck & Co., LLC (certified public accountants and consultants) since 1976; Immediate past- Chairman of the Professional Ethics Committee of the Pennsylvania Institute of Certified Public Accountants and Committee Member thereof since 2007; Member of External Advisory Board, The Pennsylvania State University Accounting Department since 2001; Principal, UP Strategic Wealth Investment Advisors, LLC since 2013; Trustee, The Holy Family Institute from 2001 to 2010; President and Trustee, Pittsburgh Catholic Publishing Associates from 2003 to 2008; Director, Inter-Tel from 2006 to 2007. | | 33 RICs consisting of
155 Portfolios | | None |
Frederick W. Winter 1945 | | Trustee | | Since 2009 | | Director, Alkon Corporation (pneumatics) since 1992; Professor and Dean Emeritus of the Joseph M. Katz School of Business, University of Pittsburgh from 2005 to 2013 and Dean thereof from 1997 to 2005; Director, Tippman Sports (recreation) from 2005 to 2013; Director, Indotronix International (IT services) from 2004 to 2008. | | 33 RICs consisting of
155 Portfolios | | None |
| | 1 The address of each Trustee is c/o BlackRock, Inc., 55 East 52nd Street, New York, NY 10055. |
| | 2 Independent Trustees serve until their resignation, retirement, removal or death, or until December 31 of the year in which they turn 75. The Board has determined to extend the terms of Independent Trustees on a case-by-case basis, as appropriate. The Board has unanimously approved extending the mandatory retirement age for David O. Beim and Dr. Matina S. Horner until December 31, 2016, which the Board believes is in the best interests of shareholders of the Trust/MIP. |
| | 3 Date shown is the earliest date a person has served for the Trust/MIP. In connection with the acquisition of Barclays Global Investors by BlackRock, Inc. (“BlackRock”) in December 2009, the Trustees were elected to the Trust/MIP Board. As a result, although the chart shows certain Independent Trustees as joining the Trust’s/MIP’s board in 2009, those Independent Trustees first became members of the boards of other funds advised by BlackRock Advisors, LLC or its affiliates as follows: David O. Beim, 1998; Dr. Matina S. Horner, 2004; Rodney D. Johnson, 1995; Herbert I. London, 1987; Cynthia A. Montgomery, 1994; Joseph P. Platt, 1999; Robert C. Robb, Jr., 1998; Toby Rosenblatt, 2005; Kenneth L. Urish, 1999; and Frederick W. Winter, 1999. Frank J. Fabozzi first became a member of the board of other funds advised by BlackRock Advisors, LLC or its affiliates in 1988. |
| Interested Trustees4 | | | | | | | | | | |
Barbara G. Novick 1960 | | Trustee | | Since 2015 | | Vice Chairman of BlackRock since 2006; Chair of BlackRock’s Government Relations Steering Committee since 2009; Head of the Global Client Group of BlackRock from 1988 to 2008. | | 108 RICs consisting of
230 Portfolios | | None |
John M. Perlowski 1964 | | Trustee, President, and Chief Executive Officer | | Since 2015 (Trustee); Since 2010 (President and Chief Executive Officer) | | Managing Director of BlackRock since 2009; Head of BlackRock Global Fund Services since 2009; Managing Director and Chief Operating Officer of the Global Product Group at Goldman Sachs Asset Management, L.P. from 2003 to 2009; Treasurer of Goldman Sachs Mutual Funds from 2003 to 2009 and Senior Vice President thereof from 2007 to 2009; Director of Goldman Sachs Offshore Funds from 2002 to 2009; Director of Family Resource Network (charitable foundation) since 2009. | | 136 RICs consisting of
328 Portfolios | | None |
| | 4 Mr. Perlowski and Ms. Novick are both “interested persons,” as defined in the 1940 Act, of the Trust/MIP based on their positions with BlackRock and its affiliates. Mr. Perlowski and Ms. Novick are also board members of a complex of BlackRock registered open-end funds. Mr. Perlowski is also a board member of the BlackRock Equity-Bond Complex and the BlackRock Equity-Liquidity Complex, and Ms. Novick is also a board member of the BlackRock Equity-Liquidity Complex. Interested Trustees serve until their resignation, retirement, removal or death, or until December 31 of the year in which they turn 75. The maximum age limitation may be waived as to any Trustee by action of a majority of the Trustees upon a finding of good cause therefor. |
| | | | | | |
| | | | | | | |
| 52 | | BLACKROCK TOTAL INTERNATIONAL ex U.S. INDEX FUND | | DECEMBER 31, 2015 | | |
| | |
| Officers and Trustees (concluded) | | |
| | | | | | |
Name, Address1
and Year of Birth | | Position(s)
Held with the
Trust/MIP | | Length of
Time Served
as an Officer | | Principal Occupation(s) During Past Five Years |
| Trust/MIP Officers2 |
John M. Perlowski 1964 | | Trustee, President and Chief Executive Officer | | Since 2015 (Trustee); Since 2010 (President and Chief Executive Officer) | | Managing Director of BlackRock since 2009; Head of BlackRock Global Fund Services since 2009; Managing Director and Chief Operating Officer of the Global Product Group at Goldman Sachs Asset Management, L.P. from 2003 to 2009; Treasurer of Goldman Sachs Mutual Funds from 2003 to 2009 and Senior Vice President thereof from 2007 to 2009; Director of Goldman Sachs Offshore Funds from 2002 to 2009; Director of Family Resource Network (charitable foundation) since 2009. |
Richard Hoerner, CFA 1958 | | Vice President | | Since 2009 | | Managing Director of BlackRock since 2000; Head of the Global Cash Group since 2013; Co-head of the Global Cash and Securities Lending Group from 2010 to 2013; Member of the Cash Management Group Executive Committee since 2005. |
Jennifer McGovern 1977 | | Vice President | | Since 2014 | | Director of BlackRock since 2011; Head of Product Structure and Oversight for BlackRock’s U.S. Wealth Advisory Group since 2013; Vice President of BlackRock from 2008 to 2010. |
Neal Andrews 1966 | | Chief Financial Officer | | Since 2007 | | Managing Director of BlackRock since 2006; Senior Vice President and Line of Business Head of Fund Accounting and Administration at PNC Global Investment Servicing (U.S.) Inc. from 1992 to 2006. |
Jay Fife 1970 | | Treasurer | | Since 2007 | | Managing Director of BlackRock since 2007; Director of BlackRock in 2006; Assistant Treasurer of the MLIM and Fund Asset Management, L.P. advised funds from 2005 to 2006; Director of MLIM Fund Services Group from 2001 to 2006. |
Charles Park 1967 | | Chief Compliance Officer | | Since 2014 | | Anti-Money Laundering Compliance Officer for the BlackRock-advised Funds in the Equity-Bond Complex, the Equity-Liquidity Complex and the Closed-End Complex from 2014 to 2015; Chief Compliance Officer of BlackRock Advisors, LLC and the BlackRock-advised Funds in the Equity-Bond Complex, the Equity-Liquidity Complex and the Closed-End Complex since 2014; Principal of and Chief Compliance Officer for iShares® Delaware Trust Sponsor LLC since 2012 and BlackRock Fund Advisors (“BFA”) since 2006; Chief Compliance Officer for the BFA-advised iShares exchange traded funds since 2006; Chief Compliance Officer for BlackRock Asset Management International Inc. since 2012. |
Fernanda Piedra 1969 | | Anti-Money Laundering Compliance Officer | | Since 2015 | | Director of BlackRock since 2014; Anti-Money Laundering Compliance Officer and Regional Head of Financial Crime for the Americas at BlackRock since 2014; Head of Regulatory Changes and Remediation for the Asset Wealth Management Division of Deutsche Bank from 2010 to 2014; Vice President of Goldman Sachs (Anti-Money Laundering/Suspicious Activities Group) from 2004 to 2010. |
Benjamin Archibald 1975 | | Secretary | | Since 2012 | | Managing Director of BlackRock since 2014; Director of BlackRock from 2010 to 2013; Secretary of the iShares exchange traded funds since 2015; Secretary of the BlackRock-advised mutual funds since 2012. |
| | 1 The address of each Officer is c/o BlackRock, Inc., 55 East 52nd Street, New York, NY 10055. |
| | | 2 Officers of the Trust/MIP serve at the pleasure of the Board. |
| | Further information about the Officers and Trustees is available in the Trust’s/MIP’s Statement of Additional Information, which can be obtained without charge by calling (800) 441-7762 |
Effective September 25, 2015, John M. Perlowski was appointed to serve as a Trustee of the Trust/MIP.
Effective December 31, 2015, Herbert I. London and Toby Rosenblatt retired as Trustees of the Trust/MIP.
| | | | | | |
| | | | |
Investment Advisor BlackRock Fund Advisors San Francisco, CA 94105 | | Accounting Agent and Custodian State Street Bank and Trust Company Boston, MA 02110 | | Distributor BlackRock Investments, LLC New York, NY 10022 | | Legal Counsel Sidley Austin LLP New York, NY 10019 |
| | | |
Administrator BlackRock Advisors, LLC Wilmington, DE 19809 | | Transfer Agent BNY Mellon Investment Servicing (US) Inc. Wilmington, DE 19809 | | Independent Registered Public Accounting Firm PricewaterhouseCoopers LLP Philadelphia, PA 19103 | | Address of the Trust/MIP 400 Howard Street San Francisco, CA 94105 |
| | | | | | |
| | | | | | | |
| | BLACKROCK TOTAL INTERNATIONAL ex U.S. INDEX FUND | | DECEMBER 31, 2015 | | 53 |
Householding
The Fund will mail only one copy of shareholder documents, including prospectuses, annual and semi-annual reports and proxy statements, to shareholders with multiple accounts at the same address. This practice is commonly called “householding” and is intended to reduce expenses and eliminate duplicate mailings of shareholder documents. Mailings of your shareholder documents may be householded indefinitely unless you instruct us otherwise. If you do not want the mailing of these documents to be combined with those for other members of your household, please call the Fund at (800) 441-7762.
Availability of Quarterly Schedule of Investments
The Fund/Master Portfolio file their complete schedule of portfolio holdings with the SEC for the first and third quarters of each fiscal year on Form N-Q. The Fund’s/Master Portfolio’s Forms N-Q are available on the SEC’s website at http://www.sec.gov and may also be reviewed and copied at the SEC’s Public Reference Room in Washington, D.C. Information on how to access documents on the SEC’s website without charge may be obtained by calling (800) SEC-0330. The Fund’s/ Master Portfolio’s Forms N-Q may also be obtained upon request and without charge by calling (800) 441-7762.
Availability of Proxy Voting Policies and Procedures
A description of the policies and procedures that the Fund/Master Portfolio use to determine how to vote proxies relating to portfolio securities is available upon request and without charge (1) by calling (800) 441-7762; (2) at http://www.blackrock.com; and (3) on the SEC’s website at http://www.sec.gov.
Availability of Proxy Voting Record
Information about how the Fund/Master Portfolio voted proxies relating to securities held in the Fund’s/Master Portfolio’s portfolio during the most recent 12-month period ended June 30 is available upon request and without charge (1) at http://www.blackrock.com; or by calling (800) 441-7762; and (2) on the SEC’s website at http://www.sec.gov.
BlackRock’s Mutual Fund Family
BlackRock offers a diverse lineup of open-end mutual funds crossing all investment styles and managed by experts in equity, fixed income and tax-exempt investing. Visit BlackRock online at http://www.blackrock.com for more information.
Account Information
Call us at (800) 441-7762 from 8:00 AM to 6:00 PM EST on any business day to get information about your account balances, recent transactions and share prices. You can also reach us on the Web at http://www.blackrock.com/funds.
Automatic Investment Plans
Investor Class shareholders who want to invest regularly can arrange to have $50 or more automatically deducted from their checking or savings account and invested in any of the BlackRock funds.
Systematic Withdrawal Plans
Investor Class shareholders can establish a systematic withdrawal plan and receive periodic payments of $50 or more from their BlackRock funds, as long as their account balance is at least $10,000.
Retirement Plans
Shareholders may make investments in conjunction with Traditional, Rollover, Roth, Coverdell, Simple IRAs, SEP IRAs and 403(b) Plans.
| | | | | | |
| | | | | | | |
| 54 | | BLACKROCK TOTAL INTERNATIONAL ex U.S. INDEX FUND | | DECEMBER 31, 2015 | | |
| | |
| Additional Information (concluded) | | |
|
| BlackRock Privacy Principles |
BlackRock is committed to maintaining the privacy of its current and former fund investors and individual clients (collectively, “Clients”) and to safeguarding their non-public personal information. The following information is provided to help you understand what personal information BlackRock collects, how we protect that information and why in certain cases we share such information with select parties.
If you are located in a jurisdiction where specific laws, rules or regulations require BlackRock to provide you with additional or different privacy-related rights beyond what is set forth below, then BlackRock will comply with those specific laws, rules or regulations.
BlackRock obtains or verifies personal non-public information from and about you from different sources, including the following: (i) information we receive from you or, if applicable, your financial intermediary, on applications, forms or other documents; (ii) information about your transactions with us, our affiliates, or others; (iii) information we receive from a consumer reporting agency; and (iv) from visits to our websites.
BlackRock does not sell or disclose to non-affiliated third parties any non-public personal information about its Clients, except as permitted by law or as is necessary to respond to regulatory requests or to service Client accounts. These non-affiliated third parties are required to protect the confidentiality and security of this information and to use it only for its intended purpose.
We may share information with our affiliates to service your account or to provide you with information about other BlackRock products or services that may be of interest to you. In addition, BlackRock restricts access to non-public personal information about its Clients to those BlackRock employees with a legitimate business need for the information. BlackRock maintains physical, electronic and procedural safeguards that are designed to protect the non-public personal information of its Clients, including procedures relating to the proper storage and disposal of such information.
| | | | | | |
| | | | | | | |
| | BLACKROCK TOTAL INTERNATIONAL ex U.S. INDEX FUND | | DECEMBER 31, 2015 | | 55 |
This report is intended for current holders. It is not authorized for use as an offer of sale or a solicitation of an offer to buy shares of the Fund unless preceded or accompanied by the Fund’s current prospectus. Past performance results shown in this report should not be considered a representation of future performance. Investment returns and principal value of shares will fluctuate so that shares, when redeemed, may be worth more or less than their original cost. Statements and other information herein are as dated and are subject to change.

| | |
| TIEXUS-12/15-AR | | |
| |
| |  |
DECEMBER 31, 2015
| | | | | | |
ANNUAL REPORT | | | | | |  |
BlackRock U.S. Total Bond Index Fund | of BlackRock Funds III
|
| Not FDIC Insured • May Lose Value • No Bank Guarantee |

| | | | | | |
| | | | | | | |
| 2 | | BLACKROCK U.S. TOTAL BOND INDEX FUND | | DECEMBER 31, 2015 | | |
Dear Shareholder,
Diverging monetary policies and shifting economic outlooks across regions have been the overarching themes driving financial markets over the past couple of years. With U.S. growth outpacing the global economic recovery in 2015 while inflationary pressures remained low, investors spent most of the year anticipating a short-term rate hike from the Federal Reserve (the “Fed”), which ultimately came to fruition in December. In contrast, the European Central Bank (“ECB”) and the Bank of Japan moved to a more accommodative stance during the year. In this environment, the U.S. dollar strengthened considerably, causing profit challenges for U.S. exporters and high levels of volatility in emerging market currencies and commodities. Oil prices were particularly volatile and below the historical norm due to an ongoing imbalance in global supply and demand.
Market volatility broadly increased in the middle of 2015, beginning with a sharp, but temporary, selloff in June as Greece’s long-brewing debt troubles came to an impasse. Just as these concerns abated, Chinese equities tumbled amid weakness in the country’s economy. This, combined with a depreciation of the yuan and declining confidence in China’s policymakers, stoked worries about the potential impact to the broader world economy, causing heightened volatility to spread throughout markets globally. Given a dearth of meaningful growth across most of the world, financial markets became more reliant on central bank policies to drive performance. In that vein, risk assets (such as equities and high yield bonds) rallied in October when China’s central bank provided more stimulus, the ECB hinted at further easing, and soft U.S. data pushed back expectations for a Fed rate hike. As the period came to a close, however, the ECB disappointed investors with its subdued policy changes. The Fed’s December rate hike had a positive impact on the markets as it removed a source of uncertainty, but this was counteracted by the dampening effect of a stronger U.S. dollar, falling oil prices and tighter credit conditions.
At BlackRock, we believe investors need to think globally, extend their scope across a broad array of asset classes and be prepared to move freely as market conditions change over time. We encourage you to talk with your financial advisor and visit blackrock.com for further insight about investing in today’s markets.
Sincerely,
Rob Kapito
President, BlackRock Advisors, LLC
Rob Kapito
President, BlackRock Advisors, LLC
| | | | | | | | |
| Total Returns as of December 31, 2015 | |
| | | 6-month | | | 12-month | |
U.S. large cap equities
(S&P 500® Index) | | | 0.15 | % | | | 1.38 | % |
U.S. small cap equities
(Russell 2000® Index) | | | (8.75 | ) | | | (4.41 | ) |
International equities
(MSCI Europe, Australasia,
Far East Index) | | | (6.01 | ) | | | (0.81 | ) |
Emerging market equities
(MSCI Emerging
Markets Index) | | | (17.35 | ) | | | (14.92 | ) |
3-month Treasury bills
(BofA Merrill Lynch 3-Month
U.S. Treasury Bill Index) | | | 0.04 | | | | 0.05 | |
U.S. Treasury securities
(BofA Merrill Lynch 10-Year
U.S. Treasury Index) | | | 1.43 | | | | 0.91 | |
U.S. investment-grade
bonds (Barclays
U.S. Aggregate Bond Index) | | | 0.65 | | | | 0.55 | |
Tax-exempt municipal
bonds (S&P Municipal
Bond Index) | | | 3.31 | | | | 3.32 | |
U.S. high yield bonds
(Barclays U.S.
Corporate High Yield 2%
Issuer Capped Index) | | | (6.79 | ) | | | (4.43 | ) |
| Past performance is no guarantee of future results. Index performance is shown for illustrative purposes only. You cannot invest directly in an index. | |
| | | | | | |
| | | | | | | |
| | THIS PAGE NOT PART OF YOUR FUND REPORT | | | | 3 |
| | |
| Fund Summary as of December 31, 2015 | | |
BlackRock U.S. Total Bond Index Fund’s (the “Fund”) (formerly known as BlackRock Bond Index Fund) investment objective is to seek to provide investment results that correspond to the total return performance of fixed-income securities in the aggregate, as represented by the Barclays U.S. Aggregate Bond Index (the “Index”).
|
| Portfolio Management Commentary |
How did the Fund perform?
| • | | For the 12-month period ended December 31, 2015, the Fund’s Institutional Shares returned 0.33%, Investor A Shares returned 0.08% and Class K Shares returned 0.38%. For the same period, the benchmark Index returned 0.55%. |
| • | | Returns for the Fund’s respective share classes differ from the Index based on individual share-class expenses. The Fund invests all of its assets in U.S. Total Bond Index Master Portfolio (formerly known as Bond Index Master Portfolio) (the “Master Portfolio”), a series of Master Investment Portfolio. |
Describe the market environment.
| • | | During the first quarter of 2015, the European Central Bank’s quantitative easing program was a main theme in the global fixed income markets, pushing euro area debt yields to negative levels. This effectively anchored rates lower across the board in Europe, and central banks in emerging markets also announced rate cuts. Economic data in the United States was mixed early in the year, but U.S. labor markets continued to show strength. The much-anticipated March 18, 2015 Fed statement was interpreted as “dovish” by market participants. The highest returns during the quarter came from spread sectors, including commercial mortgage-backed securities, asset-backed securities and credit, while mortgages and agencies continued to underperform. |
| • | | In the second quarter, negative headlines surrounding the debt/liquidity crisis in Greece, combined with weakness in some economic data, prompted pessimistic evaluations of the U.S. economy. Such pessimism appeared to be unwarranted, as a number of economic indicators would show improvement, including payroll growth, that was arguably stronger than at any time over the past 20 years. Labor market strength was also seemingly confirmed by falling unemployment rates and favorable manufacturing reports. |
| • | | The third quarter of 2015 saw a continuation of two main themes in the markets for 2015: concerns regarding future demand and growth prospects in China (and in emerging market countries more broadly), and uncertainty over the timing of monetary policy tightening by the Fed. There was a broad-based negative response to the Fed’s inaction through the first three quarters of the year across asset classes and |
| | | geographies, as markets feared a global economic slowdown. Further complicating the market’s view of Fed policy, the third quarter ended on a weak note for labor markets. The quarter also concluded with a reversal of some of the improvements seen in the manufacturing sector at mid-year, with the September ISM Manufacturing Index ending the quarter at only a neutral level. In terms of the U.S. consumer, the quarter began on a weak note with both retail sales and consumer confidence figures disappointing, but these statistics recovered somewhat by quarter end. |
| • | | The fourth quarter of 2015 witnessed steady improvement in U.S. and European economic data, which contrasted with tepid growth in China and many other emerging market economies. Soft overall global growth, the effects of lower energy prices and a stronger U.S. dollar continued to weigh on trade and manufacturing data. Meanwhile, global risk sentiment remained muted, even as central banks outside the United States continued to be accommodative. Domestically, final third-quarter GDP growth came in at 2% annualized, slightly stronger than the consensus estimate. Oil prices continued to slump following OPEC’s decision not to cap crude oil production. Weaker commodity prices weighed on equity markets, as disappointing earnings growth led S&P 500 stocks to end the year with only a modest positive return after three years of double-digit gains. In large part due to energy-related distress, the Barclays U.S. Corporate High Yield Index closed significantly lower for the year, exacerbating concerns regarding a deteriorating credit cycle. |
Describe recent portfolio activity.
| • | | During the period, the Master Portfolio maintained its objective of seeking to provide investment results that correspond to the total return performance of the Index by selecting securities in accordance with their relative proportion within the Index. Other factors considered in security selection included credit quality, industry, maturity structure, coupon rates and call features. |
| • | | The Master Portfolio held cash committed for pending transactions. The cash balance did not have a material impact on performance. |
Describe portfolio positioning at period end.
| • | | The Master Portfolio remains positioned to attempt to match the risk characteristics of the Index, irrespective of the market’s future direction. |
The views expressed reflect the opinions of BlackRock as of the date of this report and are subject to change based on changes in market, economic or other conditions. These views are not intended to be a forecast of future events and are no guarantee of future results.
| | | | | | |
| | | | | | | |
| 4 | | BLACKROCK U.S. TOTAL BOND INDEX FUND | | DECEMBER 31, 2015 | | |
|
| Total Return Based on a $10,000 Investment |
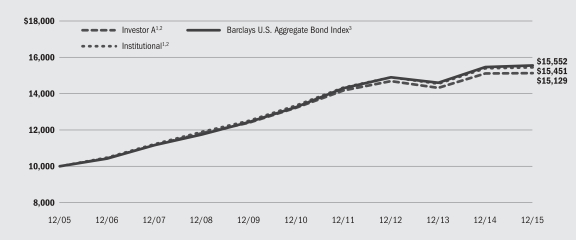
| | 1 | | Assuming transaction costs and other operating expenses, including administration fees, if any. |
| | 2 | | The Fund invests all of its assets in the Master Portfolio. The Master Portfolio invests primarily in investment-grade U.S. Government securities and corporate bonds, as well as investment-grade mortgage-backed, asset-backed and commercial mortgage-backed securities. |
| | 3 | | A widely recognized unmanaged market-capitalization weighted index, comprised of investment-grade corporate bonds rated BBB or better, mortgages and U.S. Treasury and U.S. Government agency issues with at least one year to maturity. |
|
| Performance Summary for the Period Ended December 31, 2015 |
| | | | | | | | | | | | | | | | | | | | | | | | |
| | | Standardized
30-Day Yields | | | Unsubsidized
30-Day Yields | | | 6-Month
Total Returns | | | Average Annual Total Returns | |
| | | | | | 1 Year | | | 5 Years | | | 10 Years | |
Institutional | | | 2.15 | % | | | 2.12 | % | | | 0.51 | % | | | 0.33 | % | | | 2.97 | % | | | 4.45 | % |
Investor A | | | 1.90 | | | | 1.87 | | | | 0.38 | | | | 0.08 | | | | 2.73 | | | | 4.23 | |
Class K | | | 2.19 | | | | 2.17 | | | | 0.54 | | | | 0.38 | | | | 3.03 | | | | 4.48 | |
Barclays U.S. Aggregate Bond Index | | | — | | | | — | | | | 0.65 | | | | 0.55 | | | | 3.25 | | | | 4.51 | |
| | | | See “About Fund Performance” on page 6 for further information on how performance was calculated. |
| | | | Past performance is not indicative of future results. |
| | | | | | | | | | | | | | | | | | | | | | | | | | | | |
| | | Actual | | | Hypothetical5 | | | | |
| | | Beginning
Account Value
July 1, 2015 | | | Ending
Account Value
December 31, 2015 | | | Expenses Paid
During the
Period4 | | | Beginning
Account Value
July 1, 2015 | | | Ending
Account Value
December 31, 2015 | | | Expenses Paid
During the
Period4 | | | Annualized
Expense Ratio | |
Institutional | | $ | 1,000.00 | | | $ | 1,005.10 | | | $ | 0.51 | | | $ | 1,000.00 | | | $ | 1,024.70 | | | $ | 0.51 | | | | 0.10 | % |
Investor A | | $ | 1,000.00 | | | $ | 1,003.80 | | | $ | 1.77 | | | $ | 1,000.00 | | | $ | 1,023.44 | | | $ | 1.79 | | | | 0.35 | % |
Class K | | $ | 1,000.00 | | | $ | 1,005.40 | | | $ | 0.25 | | | $ | 1,000.00 | | | $ | 1,024.95 | | | $ | 0.26 | | | | 0.05 | % |
| | 4 | | For each class of the Fund, expenses are equal to the annualized net expense ratio for the class, multiplied by the average account value over the period, multiplied by 184/365 (to reflect the one-half year period shown). Because the Fund invests all of its assets in the Master Portfolio, the expense example reflects the net expenses of both the Fund and the Master Portfolio. |
| | 5 | | Hypothetical 5% annual return before expenses is calculated by prorating the number of days in the most recent fiscal half year divided by 365. |
| | | | See “Disclosure of Expenses” on page 6 for further information on how expenses were calculated. |
| | | | | | |
| | | | | | | |
| | BLACKROCK U.S. TOTAL BOND INDEX FUND | | DECEMBER 31, 2015 | | 5 |
| • | | Institutional and Class K Shares are not subject to any sales charge. These shares bear no ongoing distribution or service fees and are available only to certain eligible investors. Prior to March 31, 2011, Institutional Shares’ performance results are those of Class K Shares restated to reflect Institutional Shares’ fees. |
| • | | Investor A Shares are not subject to any sales charge and bear no ongoing distribution fee. These shares are subject to an ongoing service fee of 0.25% per year. These shares are generally available through financial intermediaries. Prior to March 31, 2011, Investor A Shares’ performance results are those of Class K Shares restated to reflect Investor A Shares’ fees. |
Performance information reflects past performance and does not guarantee future results. Current performance may be lower or higher than the performance data quoted. Refer to www.blackrock.com/funds to obtain performance data current to the most recent month-end. Performance results do not reflect the deduction of taxes that a shareholder would pay on fund distributions or the redemption of fund shares. Figures shown
in the performance table on the previous page assume reinvestment of all distributions, if any, at net asset value (“NAV”) on the ex-dividend date. Investment return and principal value of shares will fluctuate so that shares, when redeemed, may be worth more or less than their original cost. Distributions paid to each class of shares will vary because of the different levels of services, distribution and transfer agency fees applicable to each class, which are deducted from the income available to be paid to shareholders.
BlackRock Advisors, LLC (the “Administrator”), the Fund’s administrator, voluntarily waived a portion of the Fund’s expenses. Without such waiver, the Fund’s performance would have been lower. The Administrator is under no obligation to waive or to continue waiving its fees and such voluntary waiver may be reduced or discontinued at any time. See Note 4 of the Notes to Financial Statements for additional information on waivers. The standardized 30-day yield includes the effects of any waivers and/or reimbursements. The unsubsidized 30-day yield excludes the effects of any waivers and/or reimbursements.
Shareholders of the Fund may incur the following charges: (a) transactional expenses, such as sales charges; and (b) operating expenses, including administration fees, service and/or distribution fees, including 12b-1 fees, and other Fund expenses. The expense example shown on the previous page (which is based on a hypothetical investment of $1,000 invested on July 1, 2015 and held through December 31, 2015) is intended to assist shareholders both in calculating expenses based on an investment in the Fund and in comparing these expenses with similar costs of investing in other mutual funds.
The expense example provides information about actual account values and actual expenses. In order to estimate the expenses a shareholder paid during the period covered by this report, shareholders can divide their account value by $1,000 and then multiply the result by the number corresponding to their share class under the heading entitled “Expenses Paid During the Period.”
The expense example also provides information about hypothetical account values and hypothetical expenses based on the Fund’s actual expense ratio and an assumed rate of return of 5% per year before expenses. In order to assist shareholders in comparing the ongoing expenses of investing in the Fund and other funds, compare the 5% hypothetical example with the 5% hypothetical examples that appear in shareholder reports of other funds.
The expenses shown in the expense example are intended to highlight shareholders’ ongoing costs only and do not reflect any transactional expenses, such as sales charges, if any. Therefore, the hypothetical example is useful in comparing ongoing expenses only, and will not help shareholders determine the relative total expenses of owning different funds. If these transactional expenses were included, shareholder expenses would have been higher.
| | | | | | |
| | | | | | | |
| 6 | | BLACKROCK U.S. TOTAL BOND INDEX FUND | | DECEMBER 31, 2015 | | |
| | |
| Statement of Assets and Liabilities | | BlackRock U.S. Total Bond Index Fund |
| | | | |
| December 31, 2015 | | | |
| | | | |
| Assets | |
Investments at value — Master Portfolio (cost — $239,786,209) | | $ | 243,411,312 | |
Capital shares sold receivable | | | 11,234,671 | |
| | | | |
Total assets | | | 254,645,983 | |
| | | | |
| | | | |
| Liabilities | | | | |
Contributions payable to the Master Portfolio | | | 11,050,500 | |
| Payables: | | | | |
Capital shares redeemed | | | 184,171 | |
Administration fees | | | 5,019 | |
Service fees | | | 3,955 | |
Other accrued expenses | | | 12,009 | |
| | | | |
Total liabilities | | | 11,255,654 | |
| | | | |
Net Assets | | $ | 243,390,329 | |
| | | | |
| | | | |
| Net Assets Consist of | | | | |
Paid-in capital | | $ | 241,777,876 | |
Distributions in excess of net investment income | | | (780,668 | ) |
Accumulated net realized loss | | | (1,231,982 | ) |
Net unrealized appreciation (depreciation) | | | 3,625,103 | |
| | | | |
Net Assets | | $ | 243,390,329 | |
| | | | |
| | | | |
| Net Asset Value | | | | |
Institutional — Based on net assets of $58,043,185 and 5,808,690 shares outstanding, unlimited shares authorized, no par value | | $ | 9.99 | |
| | | | |
Investor A — Based on net assets of $19,144,640 and 1,916,393 shares outstanding, unlimited shares authorized, no par value | | $ | 9.99 | |
| | | | |
Class K — Based on net assets of $166,202,504 and 16,631,283 shares outstanding, unlimited shares authorized, no par value | | $ | 9.99 | |
| | | | |
| | | | | | |
| See Notes to Financial Statements. | | | | |
| | | | | | | |
| | BLACKROCK U.S. TOTAL BOND INDEX FUND | | DECEMBER 31, 2015 | | 7 |
| | |
| Statement of Operations | | BlackRock U.S. Total Bond Index Fund |
| | | | |
| Year Ended December 31, 2015 | | | |
| | | | |
| Investment Income | | | | |
| Net investment income allocated from the Master Portfolio: | | | | |
Interest | | $ | 4,178,905 | |
Income — affiliated | | | 77,863 | |
Securities lending — affiliated — net | | | 1,450 | |
Expenses | | | (127,818 | ) |
Fees waived | | | 39,652 | |
| | | | |
Total income | | | 4,170,052 | |
| | | | |
| | | | |
| Fund Expenses | | | | |
Administration — Institutional | | | 30,287 | |
Administration — Investor A | | | 10,254 | |
Administration — Class K | | | 31,704 | |
Service — Investor A | | | 36,720 | |
Professional | | | 19,443 | |
Miscellaneous | | | 325 | |
| | | | |
Total expenses | | | 128,733 | |
Less administration fees waived | | | (19,442 | ) |
| | | | |
Total expenses after fees waived | | | 109,291 | |
| | | | |
Net investment income | | | 4,060,761 | |
| | | | |
| | | | |
| Realized and Unrealized Loss Allocated from the Master Portfolio | | | | |
Net realized loss from investments | | | (76,251 | ) |
Net change in unrealized appreciation (depreciation) on investments | | | (3,379,947 | ) |
| | | | |
Net realized and unrealized loss | | | (3,456,198 | ) |
| | | | |
Net Increase in Net Assets Resulting from Operations | | $ | 604,563 | |
| | | | |
| | | | | | |
| See Notes to Financial Statements. | | | | |
| | | | | | | |
| 8 | | BLACKROCK U.S. TOTAL BOND INDEX FUND | | DECEMBER 31, 2015 | | |
| | |
| Statements of Changes in Net Assets | | BlackRock U.S. Total Bond Index Fund |
| | | | | | | | |
| | | Year Ended December 31, | |
| Increase (Decrease) in Net Assets: | | 2015 | | | 2014 | |
| | | | | | | | |
| Operations | | | | | | | | |
Net investment income | | $ | 4,060,761 | | | $ | 2,565,695 | |
Net realized gain (loss) | | | (76,251 | ) | | | 2,209,105 | |
Net change in unrealized appreciation (depreciation) | | | (3,379,947 | ) | | | 3,399,354 | |
| | | | |
Net increase in net assets resulting from operations | | | 604,563 | | | | 8,174,154 | |
| | | | |
| | | | | | | | |
| Distributions to Shareholders1 | | | | | | | | |
| From net investment income: | | | | | | | | |
Institutional | | | (857,237 | ) | | | (404,342 | ) |
Investor A | | | (260,313 | ) | | | (100,112 | ) |
Class K | | | (3,138,838 | ) | | | (2,143,878 | ) |
| From net realized gain: | | | | | | | | |
Institutional | | | (82,778 | ) | | | (203,671 | ) |
Investor A | | | (28,069 | ) | | | (85,653 | ) |
Class K | | | (302,505 | ) | | | (1,462,982 | ) |
| | | | |
Decrease in net assets resulting from distributions to shareholders | | | (4,669,740 | ) | | | (4,400,638 | ) |
| | | | |
| | | | | | | | |
| Capital Share Transactions | | | | | | | | |
Net increase in net assets derived from capital share transactions | | | 42,736,554 | | | | 78,078,795 | |
| | | | |
| | | | | | | | |
| Net Assets | | | | | | | | |
Total increase in net assets | | | 38,671,377 | | | | 81,852,311 | |
Beginning of year | | | 204,718,952 | | | | 122,866,641 | |
| | | | |
End of year | | $ | 243,390,329 | | | $ | 204,718,952 | |
| | | | |
Distributions in excess of net investment income, end of year | | $ | (780,668 | ) | | $ | (585,041 | ) |
| | | | |
1 Distributions for annual periods determined in accordance with federal income tax regulations. | |
| | | | | | |
| See Notes to Financial Statements. | | | | |
| | | | | | | |
| | BLACKROCK U.S. TOTAL BOND INDEX FUND | | DECEMBER 31, 2015 | | 9 |
| | |
| Financial Highlights | | BlackRock U.S. Total Bond Index Fund |
| | | | | | | | | | | | | | | | | | | | |
| | | Institutional | |
| | | Year Ended December 31, | | | Period March 31, 20111 to December 31, 2011 | |
| | | 2015 | | | 2014 | | | 2013 | | | 2012 | | |
| | | | | | | | | | | | | | | | | | | | |
| Per Share Operating Performance | | | | | | | | | | | | | | | | | | | | |
Net asset value, beginning of period | | $ | 10.17 | | | $ | 9.85 | | | $ | 10.65 | | | $ | 10.57 | | | $ | 10.11 | |
| | | | |
Net investment income2 | | | 0.19 | | | | 0.17 | | | | 0.15 | | | | 0.19 | | | | 0.25 | |
Net realized and unrealized gain (loss) | | | (0.16 | ) | | | 0.41 | | | | (0.40 | ) | | | 0.22 | | | | 0.46 | |
| | | | |
Net increase (decrease) from investment operations | | | 0.03 | | | | 0.58 | | | | (0.25 | ) | | | 0.41 | | | | 0.71 | |
| | | | |
| Distributions:3 | | | | | | | | | | | | | | | | | | | | |
From net investment income | | | (0.19 | ) | | | (0.17 | ) | | | (0.18 | ) | | | (0.22 | ) | | | (0.25 | ) |
From net realized gain | | | (0.02 | ) | | | (0.09 | ) | | | (0.37 | ) | | | (0.11 | ) | | | (0.00 | )4 |
| | | | |
Total distributions | | | (0.21 | ) | | | (0.26 | ) | | | (0.55 | ) | | | (0.33 | ) | | | (0.25 | ) |
| | | | |
Net asset value, end of period | | $ | 9.99 | | | $ | 10.17 | | | $ | 9.85 | | | $ | 10.65 | | | $ | 10.57 | |
| | | | |
| | | | | | | | | | | | | | | | | | | | |
| Total Return5 | | | | | | | | | | | | | | | | | | | | |
Based on net asset value | | | 0.33% | | | | 5.88% | | | | (2.39)% | | | | 3.91% | | | | 7.18% | 6 |
| | | | |
| | | | | | | | | | | | | | | | | | | | |
| Ratios to Average Net Assets7 | | | | | | | | | | | | | | | | | | | | |
Total expenses | | | 0.12% | 8,9 | | | 0.17% | 8,9 | | | 0.26% | 10 | | | 0.26% | 10 | | | 0.27% | 11,12 |
| | | | |
Total expenses after fees waived | | | 0.11% | 8,9 | | | 0.16% | 8,9 | | | 0.25% | 10 | | | 0.25% | 10 | | | 0.25% | 11,12 |
| | | | |
Net investment income | | | 1.85% | 8,9 | | | 1.67% | 8,9 | | | 1.48% | 10 | | | 1.71% | 10 | | | 2.98% | 11,12 |
| | | | |
| | | | | | | | | | | | | | | | | | | | |
| Supplemental Data | | | | | | | | | | | | | | | | | | | | |
Net assets, end of period (000) | | $ | 58,043 | | | $ | 34,538 | | | $ | 22,939 | | | $ | 11,534 | | | $ | 53 | |
| | | | |
Portfolio turnover rate of the Master Portfolio13 | | | 356% | | | | 476% | | | | 417% | | | | 436% | | | | 122% | |
| | | | |
| | 1 | | Commencement of operations. |
| | 2 | | Based on average shares outstanding. |
| | 3 | | Distributions for annual periods determined in accordance with federal income tax regulations. |
| | 4 | | Amount is greater than $(0.005) per share. |
| | 5 | | Where applicable, assumes the reinvestment of distributions. |
| | 6 | | Aggregate total return. |
| | 7 | | Includes the Fund’s share of the Master Portfolio’s allocated expenses and/or net investment income. |
| | 8 | | Includes the Fund’s share of the Master Portfolio’s allocated fees waived of 0.02%. |
| | 9 | | Ratios do not include expenses incurred indirectly as a result of investments in underlying funds of approximately 0.02%. |
| | 10 | | Includes the Fund’s share of the Master Portfolio’s allocated fees waived of 0.01%. |
| | 12 | | Includes the Fund’s share of the Master Portfolio’s allocated fees waived of 0.05%. |
| | 13 | | Includes mortgage dollar roll transactions (“MDRs”). Additional information regarding portfolio turnover rate is as follows: |
| | | | | | | | | | | | | | | | | | | | |
| | | Year Ended December 31, | | | Period
March 31, 20111
to December 31, 2011 | |
| | | 2015 | | | 2014 | | | 2013 | | | 2012 | | |
| | | | | | | | | | | | | | | | | | | | |
Portfolio turnover rate (excluding MDRs) | | | 300% | | | | 244% | | | | 214% | | | | 231% | | | | 121% | |
| | | | | | | | | | | | | | | | | | | | |
| | | | | | |
| See Notes to Financial Statements. | | | | |
| | | | | | | |
| 10 | | BLACKROCK U.S. TOTAL BOND INDEX FUND | | DECEMBER 31, 2015 | | |
| | |
| Financial Highlights (continued) | | BlackRock U.S. Total Bond Index Fund |
| | | | | | | | | | | | | | | | | | | | |
| | | Investor A | |
| | | Year Ended December 31, | | | Period
March 31, 20111
to December 31, 2011 | |
| | | 2015 | | | 2014 | | | 2013 | | | 2012 | | |
| | | | | | | | | | | | | | | | | | | | |
| Per Share Operating Performance | | | | | | | | | | | | | | | | | | | | |
Net asset value, beginning of period | | $ | 10.17 | | | $ | 9.85 | | | $ | 10.65 | | | $ | 10.57 | | | $ | 10.11 | |
| | | | |
Net investment income2 | | | 0.16 | | | | 0.15 | | | | 0.11 | | | | 0.16 | | | | 0.22 | |
Net realized and unrealized gain (loss) | | | (0.15 | ) | | | 0.41 | | | | (0.39 | ) | | | 0.22 | | | | 0.48 | |
| | | | |
Net increase (decrease) from investment operations | | | 0.01 | | | | 0.56 | | | | (0.28 | ) | | | 0.38 | | | | 0.70 | |
| | | | |
| Distributions:3 | | | | | | | | | | | | | | | | | | | | |
From net investment income | | | (0.17 | ) | | | (0.15 | ) | | | (0.15 | ) | | | (0.19 | ) | | | (0.24 | ) |
From net realized gain | | | (0.02 | ) | | | (0.09 | ) | | | (0.37 | ) | | | (0.11 | ) | | | (0.00 | )4 |
| | | | |
Total distributions | | | (0.19 | ) | | | (0.24 | ) | | | (0.52 | ) | | | (0.30 | ) | | | (0.24 | ) |
| | | | |
Net asset value, end of period | | $ | 9.99 | | | $ | 10.17 | | | $ | 9.85 | | | $ | 10.65 | | | $ | 10.57 | |
| | | | |
| | | | | | | | | | | | | | | | | | | | |
| Total Return5 | | | | | | | | | | | | | | | | | | | | |
Based on net asset value | | | 0.08% | | | | 5.63% | | | | (2.63) | % | | | 3.66% | | | | 7.01% | 6 |
| | | | |
| | | | | | | | | | | | | | | | | | | | |
| Ratios to Average Net Assets7 | | | | | | | | | | | | | | | | | | | | |
Total expenses | | | 0.37% | 8,9 | | | 0.41% | 8,9 | | | 0.51% | 10 | | | 0.51% | 10 | | | 0.53% | 11,12 |
| | | | |
Total expenses after fees waived | | | 0.36% | 8,9 | | | 0.40% | 8,9 | | | 0.50% | 10 | | | 0.50% | 10 | | | 0.50% | 11,12 |
| | | | |
Net investment income | | | 1.61% | 8,9 | | | 1.44% | 8,9 | | | 1.10% | 10 | | | 1.45% | 10 | | | 2.65% | 11,12 |
| | | | |
| | | | | | | | | | | | | | | | | | | | |
| Supplemental Data | | | | | | | | | | | | | | | | | | | | |
Net assets, end of period (000) | | $ | 19,145 | | | $ | 10,732 | | | $ | 3,735 | | | $ | 1,805 | | | $ | 202 | |
| | | | |
Portfolio turnover rate of the Master Portfolio13 | | | 356% | | | | 476% | | | | 417% | | | | 436% | | | | 122% | |
| | | | |
| | 1 | | Commencement of operations. |
| | 2 | | Based on average shares outstanding. |
| | 3 | | Distributions for annual periods determined in accordance with federal income tax regulations. |
| | 4 | | Amount is greater than $(0.005) per share. |
| | 5 | | Where applicable, assumes the reinvestment of distributions. |
| | 6 | | Aggregate total return. |
| | 7 | | Includes the Fund’s share of the Master Portfolio’s allocated expenses and/or net investment income. |
| | 8 | | Includes the Fund’s share of the Master Portfolio’s allocated fees waived of 0.02%. |
| | 9 | | Ratios do not include expenses incurred indirectly as a result of investments in underlying funds of approximately 0.02%. |
| | 10 | | Includes the Fund’s share of the Master Portfolio’s allocated fees waived of 0.01%. |
| | 12 | | Includes the Fund’s share of the Master Portfolio’s allocated fees waived of 0.05%. |
| | 13 | | Includes MDRs. Additional information regarding portfolio turnover rate is as follows: |
| | | | | | | | | | | | | | | | | | | | |
| | | Year Ended December 31, | | | Period
March 31, 20111
to December 31, 2011 | |
| | | 2015 | | | 2014 | | | 2013 | | | 2012 | | |
| | | | | | | | | | | | | | | | | | | | |
Portfolio turnover rate (excluding MDRs) | | | 300% | | | | 244% | | | | 214% | | | | 231% | | | | 121% | |
| | | | | | | | | | | | | | | | | | | | |
| | | | | | |
| See Notes to Financial Statements. | | | | |
| | | | | | | |
| | BLACKROCK U.S. TOTAL BOND INDEX FUND | | DECEMBER 31, 2015 | | 11 |
| | |
| Financial Highlights (concluded) | | BlackRock U.S. Total Bond Index Fund |
| | | | | | | | | | | | | | | | | | | | |
| | | Class K | |
| | | Year Ended December 31, | |
| | | 2015 | | | 2014 | | | 2013 | | | 2012 | | | 2011 | |
| | | | | | | | | | | | | | | | | | | | |
| Per Share Operating Performance | | | | | | | | | | | | | | | | | | | | |
Net asset value, beginning of year | | $ | 10.17 | | | $ | 9.85 | | | $ | 10.65 | | | $ | 10.57 | | | $ | 10.17 | |
| | | | |
Net investment income1 | | | 0.19 | | | | 0.17 | | | | 0.16 | | | | 0.22 | | | | 0.35 | |
Net realized and unrealized gain (loss) | | | (0.15 | ) | | | 0.41 | | | | (0.41 | ) | | | 0.19 | | | | 0.40 | |
| | | | |
Net increase (decrease) from investment operations | | | 0.04 | | | | 0.58 | | | | (0.25 | ) | | | 0.41 | | | | 0.75 | |
| | | | |
| Distributions:2 | | | | | | | | | | | | | | | | | | | | |
From net investment income | | | (0.20 | ) | | | (0.17 | ) | | | (0.18 | ) | | | (0.22 | ) | | | (0.35 | ) |
From net realized gain | | | (0.02 | ) | | | (0.09 | ) | | | (0.37 | ) | | | (0.11 | ) | | | (0.00 | )3 |
| | | | |
Total distributions | | | (0.22 | ) | | | (0.26 | ) | | | (0.55 | ) | | | (0.33 | ) | | | (0.35 | ) |
| | | | |
Net asset value, end of year | | $ | 9.99 | | | $ | 10.17 | | | $ | 9.85 | | | $ | 10.65 | | | $ | 10.57 | |
| | | | |
| | | | | | | | | | | | | | | | | | | | |
| Total Return4 | | | | | | | | | | | | | | | | | | | | |
Based on net asset value | | | 0.38% | | | | 5.94% | | | | (2.35)% | | | | 3.94% | | | | 7.55% | |
| | | | |
| | | | | | | | | | | | | | | | | | | | |
| Ratios to Average Net Assets5 | | | | | | | | | | | | | | | | | | | | |
Total expenses | | | 0.07% | 6,7 | | | 0.12% | 6,7 | | | 0.21% | 8 | | | 0.21% | 6 | | | 0.23% | 9 |
| | | | |
Total expenses after fees waived | | | 0.06% | 6,7 | | | 0.10% | 6,7 | | | 0.20% | 8 | | | 0.20% | 6 | | | 0.20% | 9 |
| | | | |
Net investment income | | | 1.89% | 6,7 | | | 1.72% | 6,7 | | | 1.52% | 8 | | | 1.96% | 6 | | | 3.19% | 9 |
| | | | |
| | | | | | | | | | | | | | | | | | | | |
| Supplemental Data | | | | | | | | | | | | | | | | | | | | |
Net assets, end of year (000) | | $ | 166,203 | | | $ | 159,449 | | | $ | 96,193 | | | $ | 115,516 | | | $ | 122,015 | |
| | | | |
Portfolio turnover rate of the Master Portfolio10 | | | 356% | | | | 476% | | | | 417% | | | | 436% | | | | 122% | |
| | | | |
| | 1 | | Based on average shares outstanding. |
| | 2 | | Distributions for annual periods determined in accordance with federal income tax regulations. |
| | 3 | | Amount is greater than $(0.005) per share. |
| | 4 | | Where applicable, assumes the reinvestment of distributions. |
| | 5 | | Includes the Fund’s share of the Master Portfolio’s allocated expenses and/or net investment income. |
| | 6 | | Includes the Fund’s share of the Master Portfolio’s allocated fees waived of 0.02%. |
| | 7 | | Ratios do not include expenses incurred indirectly as a result of investments in underlying funds of approximately 0.02%. |
| | 8 | | Includes the Fund’s share of the Master Portfolio’s allocated fees waived of 0.01%. |
| | 9 | | Includes the Fund’s share of the Master Portfolio’s allocated fees waived of 0.05%. |
| | 10 | | Includes MDRs. Additional information regarding portfolio turnover rate is as follows: |
| | | | | | | | | | | | | | | | | | | | |
| | | Year Ended December 31, | |
| | | 2015 | | | 2014 | | | 2013 | | | 2012 | | | 2011 | |
| | | | | | | | | | | | | | | | | | | | |
Portfolio turnover rate (excluding MDRs) | | | 300% | | | | 244% | | | | 214% | | | | 231% | | | | 121% | |
| | | | |
| | | | | | |
| See Notes to Financial Statements. | | | | |
| | | | | | | |
| 12 | | BLACKROCK U.S. TOTAL BOND INDEX FUND | | DECEMBER 31, 2015 | | |
| | |
| Notes to Financial Statements | | BlackRock U.S. Total Bond Index Fund |
1. Organization:
BlackRock U.S. Total Bond Index Fund (the “Fund”) (formerly known as BlackRock Bond Index Fund), a series of BlackRock Funds III (the “Trust”), is registered under the Investment Company Act of 1940, as amended (the “1940 Act”), as a diversified, open-end management investment company. The Trust is organized as a Delaware statutory trust. The Fund seeks to achieve its investment objective by investing all of its assets in U.S. Total Bond Index Master Portfolio (the “Master Portfolio”) (formerly known as Bond Index Master Portfolio), a series of Master Investment Portfolio (“MIP”), an affiliate of the Fund, which has the same investment objective and strategies as the Fund. The value of the Fund’s investment in the Master Portfolio reflects the Fund’s proportionate interest in the net assets of the Master Portfolio. The performance of the Fund is directly affected by the performance of the Master Portfolio. At December 31, 2015, the percentage of the Master Portfolio owned by the Fund was 15.3%. As such, the financial statements of the Master Portfolio, including the Schedule of Investments, are included elsewhere in this report and should be read in conjunction with the Fund’s financial statements.
The Fund offers multiple classes of shares. All classes of shares have identical voting, dividend, liquidation and other rights and are subject to the same terms and conditions, except that Investor A Shares bear certain expenses related to shareholder servicing of such shares. Institutional and Class K Shares are sold only certain eligible investors. Investor A Shares are generally available through financial intermediaries. Each class has exclusive voting rights with respect to matters relating to its shareholder servicing and distribution expenditures.
| | | | | | | | | | | | |
| Share Class | | Initial Sales Charge | | | CDSC | | | Conversion Privilege | |
Institutional Shares | | | No | | | | No | | | | None | |
Investor A Shares | | | No | | | | No | | | | None | |
Class K Shares | | | No | | | | No | | | | None | |
The Board of Trustees of the Trust and Board of Trustees of MIP are referred to throughout this report as the “Board of Trustees” or the “Board” and the members are referred to as “Trustees.”
The Fund, together with certain other registered investment companies advised by BlackRock Advisors, LLC (“BAL” or the “Administrator”) or its affiliates, is included in a complex of open-end funds referred to as the Equity-Liquidity Complex.
2. Significant Accounting Policies:
The financial statements are prepared in conformity with accounting principles generally accepted in the United States of America (“U.S. GAAP”), which may require management to make estimates and assumptions that affect the reported amounts of assets and liabilities in the financial statements, disclosure of contingent assets and liabilities at the date of the financial statements and the reported amounts of increases and decreases in net assets from operations during the reporting period. Actual results could differ from those estimates. The Fund is considered an investment company under U.S. GAAP and follows the accounting and reporting guidance applicable to investment companies. Below is a summary of significant accounting policies:
Investment Transactions and Investment Income: For financial reporting purposes, contributions to and withdrawals from the Master Portfolio are accounted on a trade date basis. The Fund records daily its proportionate share of the Master Portfolio’s income, expenses and realized and unrealized gains and losses. In addition, the Fund accrues its own expenses. Income, expenses and realized and unrealized gains and losses are allocated daily to each class based on its relative net assets.
Distributions: Distributions paid by the Fund are recorded on the ex-dividend date. Distributions of capital gains are recorded on the ex-dividend date. The character and timing of distributions are determined in accordance with federal income tax regulations, which may differ from U.S. GAAP.
Indemnifications: In the normal course of business, the Fund enters into contracts that contain a variety of representations that provide general indemnification. The Fund’s maximum exposure under these arrangements is unknown because it involves future potential claims against the Fund, which cannot be predicted with any certainty.
Other: Expenses directly related to the Fund or its classes are charged to the Fund or the applicable class. Other operating expenses shared by several funds, including other funds managed by the Administrator, are prorated among those funds on the basis of relative net assets or other appropriate methods. Expenses directly related to the Fund and other shared expenses prorated to the Fund are allocated daily to each class based on its relative net assets or other appropriate methods.
| | | | | | |
| | | | | | | |
| | BLACKROCK U.S. TOTAL BOND INDEX FUND | | DECEMBER 31, 2015 | | 13 |
| | |
| Notes to Financial Statements (continued) | | BlackRock U.S. Total Bond Index Fund |
3. Investment Valuation and Fair Value Measurements:
Investment Valuation Policies: The Fund’s policy is to fair value its financial instruments at fair value. The Fund records its investment in the Master Portfolio at fair value based on the Fund’s proportionate interest in the net assets of the Master Portfolio. Valuation of securities held by the Master Portfolio is discussed in Note 3 of the Master Portfolio’s Notes to Financial Statements, which are included elsewhere in this report.
4. Administration Agreement and Other Transactions with Affiliates:
The PNC Financial Services Group, Inc. is the largest stockholder and an affiliate of BlackRock BlackRock, Inc. (“BlackRock”) for 1940 Act purposes.
The Trust, on behalf of the Fund, entered into an Administration Agreement with BlackRock Advisors, LLC (“BAL” or the “Administrator”), an indirect, wholly owned subsidiary of BlackRock, to provide administration services (other than investment advice and related portfolio activities). BAL, in consideration thereof, has agreed to bear all of the Fund’s ordinary operating expenses, excluding, generally, investment advisory fees, distribution fees, brokerage and other expenses related to the execution of portfolio transactions, extraordinary expenses and certain other expenses which are borne by the Fund. BAL is entitled to receive for these administration services an annual fee of 0.02% based on the average daily net assets of Class K Shares and 0.07% of the average daily net assets of Institutional and Investor A Shares.
From time to time, BAL may waive such fees in whole or in part. Any such waiver will reduce the expenses of the Fund and, accordingly, have a favorable impact on its performance. BAL may delegate certain of its administration duties to sub-administrators. For the year ended December 31, 2015, the administrator waived $19,442.
The fees and expenses of the Trust’s trustees who are not “interested persons” of the Trust, as defined in the 1940 Act (“Independent Trustees”), counsel to the Independent Trustees and the Trust’s independent registered public accounting firm (together, the “independent expenses”) are paid directly by the Fund. BAL has contractually agreed to provide an offsetting credit against the administration fees paid by the Fund in an amount equal to the independent expenses through April 30, 2016.
The Trust, on behalf of the Fund, entered into a Distribution Agreement and a Distribution and Service Plan with BlackRock Investments, LLC (“BRIL”), an affiliate of the Administrator. Pursuant to the Distribution and Service Plan and in accordance with Rule 12b-1 under the 1940 Act, the Fund pays BRIL ongoing service and distribution fees. The fees are accrued daily and paid monthly at annual rates of 0.25% based upon the average daily net assets of the Investor A Shares.
Pursuant to sub-agreements with BRIL, broker-dealers and BRIL provide shareholder servicing and distribution services to the Fund. The ongoing service and/or distribution fee compensates BRIL and each broker-dealer for providing shareholder servicing and/or distribution related services to Investor A shareholders.
Certain officers and/or trustees of the Trust are officers and/or directors of BlackRock or its affiliates.
5. Income Tax Information:
It is the Fund’s policy to comply with the requirements of the Internal Revenue Code of 1986, as amended, applicable to regulated investment companies, and to distribute substantially all of its taxable income to its shareholders. Therefore, no federal income tax provision is required.
The Fund files U.S. federal and various state and local tax returns. No income tax returns are currently under examination. The statute of limitations on the Fund’s U.S. federal tax returns remains open for each of the four years ended December 31, 2015. The statutes of limitations on the Fund’s state and local tax returns may remain open for an additional year depending upon the jurisdiction.
Management has analyzed tax laws and regulations and their application to the Fund as of December 31, 2015, inclusive of the open tax return years, and does not believe there are any uncertain tax positions that require recognition of a tax liability in the Fund’s financial statements.
The tax character of distributions paid was as follows:
| | | | | | | | |
| | | 2015 | | | 2014 | |
Ordinary income | | $ | 4,669,740 | | | $ | 4,362,707 | |
Long-term capital gains | | | — | | | | 37,931 | |
| | | | | | | | |
Total | | $ | 4,669,740 | | | $ | 4,400,638 | |
| | | | | | | | |
| | | | | | |
| | | | | | | |
| 14 | | BLACKROCK U.S. TOTAL BOND INDEX FUND | | DECEMBER 31, 2015 | | |
| | | | |
| Notes to Financial Statements (concluded) | | BlackRock U.S. Total Bond Index Fund |
As of December 31, 2015, the tax components of accumulated net earnings were as follows:
| | | | |
Undistributed ordinary income | | $ | 35,792 | |
Capital Loss Carryforward | | | (24,583 | ) |
Net unrealized gains1 | | | 1,893,454 | |
Qualified late-year losses2 | | | (292,210 | ) |
| | | | |
Total | | $ | 1,612,453 | |
| | | | |
| | 1 | | The differences between book-basis and tax-basis net unrealized gains (losses) was attributable primarily to the timing and recognition of partnership income. |
| | 2 | | The Fund has elected to defer certain qualified late-year losses and recognize such losses in the next taxable year. |
As of December 31, 2015, the Fund had a capital loss carryforward, with no expiration date, available to offset future realized capital gains of $24,583.
6. Capital Share Transactions:
Transactions in capital shares for each class were as follows:
| | | | | | | | | | | | | | | | | | |
| | | Year Ended
December 31, 2015 | | | | | Year Ended
December 31, 2014 | |
| | | Shares | | | Amount | | | | | Shares | | | Amount | |
| Institutional | | | | | | | | | | | | | | | | | | |
Shares sold | | | 3,494,789 | | | $ | 35,345,100 | | | | | | 1,738,605 | | | $ | 17,601,977 | |
Shares issued to shareholders in reinvestment of distributions | | | 92,751 | | | | 940,015 | | | | | | 60,060 | | | | 608,013 | |
Shares redeemed | | | (1,175,402 | ) | | | (11,908,283 | ) | | | | | (731,418 | ) | | | (7,404,180 | ) |
| | | | | | | | | | |
Net increase | | | 2,412,138 | | | $ | 24,376,832 | | | | | | 1,067,247 | | | $ | 10,805,810 | |
| | | | | | | | | | |
| | | | | | | | | | | | | | | | | | |
| Investor A | | | | | | | | | | | | | | | | | | |
Shares sold | | | 1,692,928 | | | $ | 17,181,316 | | | | | | 953,418 | | | $ | 9,634,368 | |
Shares issued to shareholders in reinvestment of distributions | | | 28,480 | | | | 288,368 | | | | | | 18,313 | | | | 185,765 | |
Shares redeemed | | | (860,554 | ) | | | (8,749,332 | ) | | | | | (295,415 | ) | | | (2,963,720 | ) |
| | | | | | | | | | |
Net increase | | | 860,854 | | | $ | 8,720,352 | | | | | | 676,316 | | | $ | 6,856,413 | |
| | | | | | | | | | |
| | | | | | | | | | | | | | | | | | |
| Class K | | | | | | | | | | | | | | | | | | |
Shares sold | | | 6,441,775 | | | $ | 65,411,564 | | | | | | 10,203,581 | | | $ | 103,895,691 | |
Shares issued to shareholders in reinvestment of distributions | | | 336,986 | | | | 3,418,699 | | | | | | 354,853 | | | | 3,596,678 | |
Shares redeemed | | | (5,827,054 | ) | | | (59,190,893 | ) | | | | | (4,643,962 | ) | | | (47,075,797 | ) |
| | | | | | | | | | |
Net increase | | | 951,707 | | | $ | 9,639,370 | | | | | | 5,914,472 | | | $ | 60,416,572 | |
| | | | | | | | | | |
Total Net Increase | | | 4,224,699 | | | $ | 42,736,554 | | | | | | 7,658,035 | | | $ | 78,078,795 | |
| | | | | | | | | | |
7. Subsequent Events:
Management has evaluated the impact of all subsequent events on the Fund through the date the financial statements were issued and has determined that there were no subsequent events requiring adjustment or additional disclosure in the financial statements.
| | | | | | |
| | | | | | | |
| | BLACKROCK U.S. TOTAL BOND INDEX FUND | | DECEMBER 31, 2015 | | 15 |
| | |
| Report of Independent Registered Public Accounting Firm | | BlackRock U.S. Total Bond Index Fund |
To the Board of Trustees of BlackRock Funds III and the Shareholders of BlackRock U.S Total Bond Index Fund:
In our opinion, the accompanying statement of assets and liabilities and the related statements of operations and of changes in net assets and the financial highlights present fairly, in all material respects, the financial position of BlackRock U.S. Total Bond Index Fund, (the “Fund”), a series of BlackRock Funds III, at December 31, 2015, the results of its operations for the year then ended, the changes in its net assets for each of the two years in the period then ended and the financial highlights for each of the periods presented, in conformity with accounting principles generally accepted in the United States of America. These financial statements and financial highlights (hereafter referred to as “financial statements”) are the responsibility of the Fund’s management. Our responsibility is to express an opinion on these financial statements based on our audits. We conducted our audits of these financial statements in accordance with the standards of the Public Company Accounting Oversight Board (United States). Those standards require that we plan and perform the audit to obtain reasonable assurance about whether the financial statements are free of material misstatement. An audit includes examining, on a test basis, evidence supporting the amounts and disclosures in the financial statements, assessing the accounting principles used and significant estimates made by management, and evaluating the overall financial statement presentation. We believe that our audits provide a reasonable basis for our opinion.
/s/PricewaterhouseCoopers LLP
Philadelphia, Pennsylvania
February 24, 2016
| | |
| Important Tax Information (Unaudited) | | |
The following information is provided with respect to the ordinary income distributions during the fiscal year ended December 31, 2015.
| | |
| | | January — December 2015 |
Federal Obligation Interest1 | | 27.35% |
| |
Interest-Related Dividends for Non-U.S. Residents2 | | 81.54% |
| | 1 | | The law varies in each state as to whether and what percentage of dividend income attributable to federal obligations is exempt from state income tax. We recommend that you consult your tax advisor to determine if any portion of the dividends you received is exempt from state income taxes. |
| | 2 | | Represents the portion of the taxable ordinary income dividends eligible for exemption from U.S. withholding tax for nonresident aliens and foreign corporations. |
| | | | | | |
| | | | | | | |
| 16 | | BLACKROCK U.S. TOTAL BOND INDEX FUND | | DECEMBER 31, 2015 | | |
| | |
| Master Portfolio Information | | U.S. Total Bond Index Master Portfolio |
| | |
| Portfolio Composition | | Percent of
Total Investments |
| | | | |
U.S. Treasury Obligations | | | 34 | % |
U.S. Government Sponsored Agency Securities | | | 29 | |
Corporate Bonds | | | 22 | |
Foreign Agency Obligations | | | 3 | |
Non-Agency Mortgage-Backed Securities | | | 1 | |
Municipal Bonds | | | 1 | |
Short-Term Securities | | | 11 | |
TBA Sale Commitments | | | (1 | ) |
| | |
| Credit Quality Allocation1 | | Percent of Total Investments |
| | | | |
AAA/Aaa2 | | | 66 | % |
AA/Aa | | | 4 | |
A | | | 9 | |
BBB/Baa | | | 10 | |
NR | | | 11 | |
| | 1 | | For financial reporting purposes, credit quality ratings shown above reflect the highest rating assigned by either Standard & Poor’s or Moody’s Investors Service. These rating agencies are independent, nationally recognized statistical rating organizations and are widely used. Investment grade ratings are credit ratings of BBB/Baa or higher. Below investment grade ratings are credit ratings of BB/Ba or lower. Investments designated N/R are not rated by either rating agency. Unrated investments do not necessarily indicate low credit quality. Credit quality ratings are subject to change. |
| | 2 | | The investment advisor evaluates the credit quality of not-rated investments based upon certain factors including, but not limited to, credit ratings for similar investments and financial analysis of sectors, individual investments and/or issuer. Using this approach, the investment advisor has deemed U.S. Government Sponsored Agency Securities and U.S. Treasury Obligations as AAA/Aaa. |
| | | | | | |
| | | | | | | |
| | BLACKROCK U.S. TOTAL BOND INDEX FUND | | DECEMBER 31, 2015 | | 17 |
| | |
Schedule of Investments December 31, 2015 | | U.S. Total Bond Index Master Portfolio (Percentages shown are based on Net Assets) |
| | | | | | | | |
| Asset-Backed Securities | | Par (000) | | | Value | |
Asset-Backed Securities — 0.5% | | | | | | | | |
BMW Vehicle Owner Trust, Series 2014-A, Class A4, 1.50%, 2/25/21 | | $ | 200 | | | $ | 199,595 | |
Capital One Multi-Asset Execution Trust: | | | | | | | | |
Series 2007-A7, Class A7, 5.75%, 7/15/20 | | | 1,500 | | | | 1,603,147 | |
Series 2014-A5, Class A, 1.48%, 7/15/20 | | | 400 | | | | 400,075 | |
Chase Issuance Trust, Series 2014-A1, Class A, 1.15%, 1/15/19 | | | 1,000 | | | | 999,227 | |
Citibank Credit Card Issuance Trust, Series 2008-A1, Class A1, 5.35%, 2/07/20 | | | 170 | | | | 182,831 | |
Discover Card Execution Note Trust, Series 2014-A3, Class A3, 1.22%, 10/15/19 | | | 1,000 | | | | 998,894 | |
GE Capital Credit Card Master Note Trust, Series 2013-1, Class A, 1.35%, 3/15/21 | | | 750 | | | | 741,562 | |
Honda Auto Receivables Owner Trust, Series 2015-3, Class A4, 1.56%, 10/18/21 | | | 2,000 | | | | 1,987,350 | |
Hyundai Auto Receivables Trust, Series 2015-B, Class A3, 1.12%, 11/15/19 | | | 1,000 | | | | 992,306 | |
Nissan Auto Lease Trust, Series 2014-B, Class A4, 1.29%, 3/16/20 | | | 200 | | | | 199,181 | |
Toyota Auto Receivables Owner Trust, Series 2014-C, Class A4, 1.44%, 4/15/20 | | | 200 | | | | 199,644 | |
| | | | | | | | |
| | | | | | | | 8,503,812 | |
| Total Asset-Backed Securities — 0.5% | | | | | | | 8,503,812 | |
| | | | | | | | |
| | |
|
| Corporate Bonds | |
Aerospace & Defense — 0.4% | | | | | | | | |
Boeing Co.: | | | | | | | | |
2.35%, 10/30/21 | | | 75 | | | | 74,336 | |
6.13%, 2/15/33 | | | 100 | | | | 125,962 | |
3.30%, 3/01/35 | | | 65 | | | | 59,314 | |
Crane Co., 4.45%, 12/15/23 | | | 125 | | | | 128,739 | |
Dover Corp., 3.15%, 11/15/25 | | | 250 | | | | 246,388 | |
Eaton Corp.: | | | | | | | | |
2.75%, 11/02/22 | | | 250 | | | | 241,911 | |
4.00%, 11/02/32 | | | 200 | | | | 190,611 | |
General Dynamics Corp., 3.88%, 7/15/21 | | | 50 | | | | 53,079 | |
Harris Corp.: | | | | | | | | |
3.83%, 4/27/25 | | | 250 | | | | 246,232 | |
4.85%, 4/27/35 | | | 65 | | | | 63,957 | |
Honeywell International, Inc., | | | | | | | | |
5.30%, 3/01/18 | | | 100 | | | | 107,915 | |
Ingersoll-Rand Luxembourg Finance SA, 4.65%, 11/01/44 | | | 30 | | | | 28,713 | |
L-3 Communications Corp.: | | | | | | | | |
1.50%, 5/28/17 | | | 250 | | | | 246,903 | |
4.95%, 2/15/21 | | | 250 | | | | 257,610 | |
Lockheed Martin Corp.: | | | | | | | | |
3.55%, 1/15/26 | | | 250 | | | | 250,880 | |
3.60%, 3/01/35 | | | 65 | | | | 58,127 | |
4.07%, 12/15/42 | | | 100 | | | | 92,542 | |
3.80%, 3/01/45 | | | 500 | | | | 443,185 | |
4.70%, 5/15/46 | | | 250 | | | | 256,093 | |
| | | | | | | | |
| Corporate Bonds | | Par (000) | | | Value | |
Aerospace & Defense (continued) | | | | | | | | |
Northrop Grumman Corp.: | | | | | | | | |
1.75%, 6/01/18 | | $ | 250 | | | $ | 247,771 | |
4.75%, 6/01/43 | | | 125 | | | | 128,654 | |
Parker-Hannifin Corp., 4.20%, 11/21/34 | | | 250 | | | | 253,707 | |
Precision Castparts Corp.: | | | | | | | | |
1.25%, 1/15/18 | | | 75 | | | | 74,420 | |
2.50%, 1/15/23 | | | 150 | | | | 145,011 | |
4.20%, 6/15/35 | | | 250 | | | | 248,650 | |
Raytheon Co.: | | | | | | | | |
4.88%, 10/15/40 | | | 250 | | | | 273,651 | |
4.70%, 12/15/41 | | | 100 | | | | 108,552 | |
Textron, Inc., 3.65%, 3/01/21 | | | 350 | | | | 352,183 | |
Tyco Electronics Group SA, 3.45%, 8/01/24 | | | 75 | | | | 74,655 | |
Tyco International Finance SA, 5.13%, 9/14/45 | | | 250 | | | | 259,550 | |
United Technologies Corp.: | | | | | | | | |
1.80%, 6/01/17 | | | 250 | | | | 251,411 | |
3.10%, 6/01/22 | | | 100 | | | | 101,775 | |
5.70%, 4/15/40 | | | 50 | | | | 58,608 | |
4.50%, 6/01/42 | | | 450 | | | | 453,167 | |
4.15%, 5/15/45 | | | 250 | | | | 238,868 | |
| | | | | | | | |
| | | | | | | | 6,443,130 | |
Agriculture, Fishing & Ranching — 0.0% | | | | | | | | |
Bunge Ltd. Finance Corp., 3.20%, 6/15/17 | | | 150 | | | | 151,470 | |
Air Freight & Logistics — 0.1% | | | | | | | | |
FedEx Corp.: | | | | | | | | |
4.00%, 1/15/24 | | | 250 | | | | 260,920 | |
3.90%, 2/01/35 | | | 190 | | | | 172,955 | |
3.88%, 8/01/42 | | | 50 | | | | 43,277 | |
4.75%, 11/15/45 | | | 160 | | | | 158,522 | |
United Parcel Service, Inc.: | | | | | | | | |
5.13%, 4/01/19 | | | 50 | | | | 55,174 | |
2.45%, 10/01/22 | | | 500 | | | | 494,584 | |
6.20%, 1/15/38 | | | 100 | | | | 128,265 | |
| | | | | | | | |
| | | | | | | | 1,313,697 | |
Airlines — 0.0% | | | | | | | | |
American Airlines Pass-Through Trust, Series 2013-2, Class A, 4.95%, 7/15/24 | | | 174 | | | | 183,112 | |
Continental Airlines Pass Through Trust,
Series 2012-1, Class A, 4.15%, 10/11/25 | | | 44 | | | | 44,988 | |
Delta Air Lines Pass-Through Trust, Series 2012-1, Class A, 4.75%, 11/07/21 | | | 78 | | | | 82,526 | |
Southwest Airlines Co., 2.75%, 11/06/19 | | | 75 | | | | 75,582 | |
United Airlines Pass-Through Trust, Series 2013-1, Class A, 4.30%, 2/15/27 | | | 190 | | | | 197,061 | |
| | | | | | | | |
| | | | | | | | 583,269 | |
Auto Components — 0.0% | | | | | | | | |
BorgWarner, Inc., 3.38%, 3/15/25 | | | 70 | | | | 66,084 | |
Delphi Corp., 5.00%, 2/15/23 | | | 250 | | | | 264,500 | |
Johnson Controls, Inc.: | | | | | | | | |
3.63%, 7/02/24 | | | 80 | | | | 77,230 | |
| | | | | | | | | | |
| COP | | Certificates of Participation | | GO | | General Obligation Bonds | | RB | | Revenue Bonds |
| EDA | | Economic Development Authority | | NPFGC | | National Public Finance Guarantee Corp. | | TBA | | To-be-announced |
See Notes to Financial Statements.
| | | | | | |
| | | | | | | |
| 18 | | BLACKROCK U.S. TOTAL BOND INDEX FUND | | DECEMBER 31, 2015 | | |
| | |
Schedule of Investments (continued) | | U.S. Total Bond Index Master Portfolio |
| | | | | | | | |
| Corporate Bonds | | Par (000) | | | Value | |
Auto Components (continued) | | | | | | | | |
Johnson Controls, Inc. (continued): | | | | | | | | |
4.95%, 7/02/64 | | $ | 250 | | | $ | 203,061 | |
| | | | | | | | |
| | | | | | | | 610,875 | |
Automobiles — 0.1% | | | | | | | | |
Daimler Finance North America LLC, 8.50%, 1/18/31 | | | 100 | | | | 145,050 | |
Ford Motor Co.: | | | | | | | | |
7.45%, 7/16/31 | | | 150 | | | | 185,102 | |
4.75%, 1/15/43 | | | 350 | | | | 329,921 | |
General Motors Co.: | | | | | | | | |
4.88%, 10/02/23 | | | 100 | | | | 102,266 | |
5.20%, 4/01/45 | | | 250 | | | | 234,432 | |
Toyota Motor Credit Corp.: | | | | | | | | |
2.10%, 1/17/19 | | | 250 | | | | 250,525 | |
2.13%, 7/18/19 | | | 350 | | | | 350,627 | |
2.15%, 3/12/20 | | | 500 | | | | 499,871 | |
| | | | | | | | |
| | | | | | | | 2,097,794 | |
Banks — 3.0% | | | | | | | | |
Abbey National Treasury Services PLC: | | | | | | | | |
1.38%, 3/13/17 | | | 250 | | | | 248,967 | |
1.65%, 9/29/17 | | | 250 | | | | 250,227 | |
2.00%, 8/24/18 | | | 195 | | | | 194,697 | |
2.38%, 3/16/20 | | | 250 | | | | 249,590 | |
Asian Development Bank: | | | | | | | | |
1.75%, 9/11/18 | | | 500 | | | | 503,976 | |
1.88%, 4/12/19 | | | 500 | | | | 504,560 | |
Australia & New Zealand Banking Group Ltd.: | | | | | | | | |
1.25%, 6/13/17 | | | 250 | | | | 249,362 | |
1.50%, 1/16/18 | | | 250 | | | | 248,582 | |
2.25%, 6/13/19 | | | 250 | | | | 249,501 | |
Bancolombia SA, 5.95%, 6/03/21 | | | 100 | | | | 103,125 | |
Bank of Montreal: | | | | | | | | |
2.50%, 1/11/17 | | | 150 | | | | 151,788 | |
1.40%, 4/10/18 | | | 230 | | | | 227,879 | |
Bank of New York Mellon Corp.: | | | | | | | | |
1.35%, 3/06/18 | | | 250 | | | | 249,110 | |
2.20%, 5/15/19 | | | 250 | | | | 250,371 | |
2.30%, 9/11/19 | | | 500 | | | | 501,471 | |
3.55%, 9/23/21 | | | 50 | | | | 52,450 | |
3.00%, 2/24/25 | | | 105 | | | | 103,256 | |
Bank of Nova Scotia: | | | | | | | | |
1.10%, 12/13/16 | | | 500 | | | | 499,705 | |
1.30%, 7/21/17 | | | 250 | | | | 249,216 | |
1.38%, 12/18/17 | | | 100 | | | | 99,520 | |
2.05%, 10/30/18 | | | 250 | | | | 250,598 | |
Barclays Bank PLC: | | | | | | | | |
2.00%, 3/16/18 | | | 500 | | | | 497,016 | |
5.13%, 1/08/20 | | | 200 | | | | 219,848 | |
3.75%, 5/15/24 | | | 250 | | | | 254,818 | |
3.65%, 3/16/25 | | | 450 | | | | 432,461 | |
BB&T Corp.: | | | | | | | | |
5.25%, 11/01/19 | | | 100 | | | | 109,319 | |
2.45%, 1/15/20 | | | 250 | | | | 251,675 | |
2.63%, 6/29/20 | | | 250 | | | | 251,454 | |
BNP Paribas SA: | | | | | | | | |
2.38%, 9/14/17 | | | 250 | | | | 252,970 | |
5.00%, 1/15/21 | | | 100 | | | | 110,648 | |
3.25%, 3/03/23 | | | 250 | | | | 249,678 | |
4.25%, 10/15/24 | | | 250 | | | | 247,651 | |
| | | | | | | | |
| Corporate Bonds | | Par (000) | | | Value | |
Banks (continued) | | | | | | | | |
BPCE SA: | | | | | | | | |
2.50%, 12/10/18 | | $ | 250 | | | $ | 252,119 | |
4.00%, 4/15/24 | | | 250 | | | | 256,851 | |
Branch Banking & Trust Co.: | | | | | | | | |
2.30%, 10/15/18 | | | 250 | | | | 252,497 | |
3.80%, 10/30/26 | | | 250 | | | | 253,810 | |
Capital One Financial Corp., 4.20%, 10/29/25 | | | 340 | | | | 335,699 | |
Citizens Bank NA/Providence, 1.60%, 12/04/17 | | | 250 | | | | 247,670 | |
Commonwealth Bank of Australia, New York: | | | | | | | | |
1.63%, 3/12/18 | | | 500 | | | | 498,324 | |
2.25%, 3/13/19 | | | 250 | | | | 250,519 | |
2.30%, 3/12/20 | | | 250 | | | | 247,470 | |
Compass Bank: | | | | | | | | |
2.75%, 9/29/19 | | | 250 | | | | 247,499 | |
3.88%, 4/10/25 | | | 250 | | | | 229,143 | |
Cooperatieve Centrale Raiffeisen-Boerenleenbank BA: | | | | | | | | |
1.70%, 3/19/18 | | | 250 | | | | 249,873 | |
2.25%, 1/14/19 | | | 250 | | | | 250,806 | |
4.63%, 12/01/23 | | | 500 | | | | 521,072 | |
3.38%, 5/21/25 | | | 500 | | | | 495,054 | |
5.25%, 5/24/41 | | | 25 | | | | 28,509 | |
5.25%, 8/04/45 | | | 250 | | | | 261,972 | |
Credit Suisse Group Funding Guernsey Ltd. (a): | | | | | | | | |
3.75%, 3/26/25 | | | 500 | | | | 483,642 | |
4.88%, 5/15/45 | | | 250 | | | | 246,522 | |
Credit Suisse, New York: | | | | | | | | |
1.75%, 1/29/18 | | | 500 | | | | 498,595 | |
2.30%, 5/28/19 | | | 600 | | | | 600,516 | |
5.40%, 1/14/20 | | | 150 | | | | 164,237 | |
3.00%, 10/29/21 | | | 250 | | | | 249,005 | |
Discover Bank/Greenwood Delaware, 7.00%, 4/15/20 | | | 500 | | | | 569,291 | |
Export-Import Bank of Korea: | | | | | | | | |
4.00%, 1/11/17 | | | 400 | | | | 408,611 | |
1.75%, 2/27/18 | | | 500 | | | | 495,011 | |
Fifth Third Bancorp: | | | | | | | | |
1.45%, 2/28/18 | | | 200 | | | | 198,187 | |
2.88%, 10/01/21 | | | 200 | | | | 199,195 | |
3.50%, 3/15/22 | | | 100 | | | | 101,343 | |
4.30%, 1/16/24 | | | 250 | | | | 256,087 | |
HSBC Bank USA NA, 4.88%, 8/24/20 | | | 500 | | | | 545,874 | |
HSBC Holdings PLC: | | | | | | | | |
4.88%, 1/14/22 | | | 150 | | | | 164,535 | |
4.25%, 3/14/24 | | | 500 | | | | 501,813 | |
4.25%, 8/18/25 | | | 250 | | | | 248,102 | |
6.50%, 5/02/36 | | | 200 | | | | 238,696 | |
6.80%, 6/01/38 | | | 250 | | | | 311,187 | |
5.25%, 3/14/44 | | | 250 | | | | 259,406 | |
HSBC USA, Inc.: | | | | | | | | |
2.25%, 6/23/19 | | | 250 | | | | 248,915 | |
2.35%, 3/05/20 | | | 1,000 | | | | 988,375 | |
2.75%, 8/07/20 | | | 250 | | | | 250,025 | |
Huntington National Bank, 1.38%, 4/24/17 | | | 250 | | | | 248,491 | |
Intesa Sanpaolo SpA: | | | | | | | | |
3.88%, 1/16/18 | | | 200 | | | | 205,082 | |
5.25%, 1/12/24 | | | 250 | | | | 267,571 | |
KeyCorp: | | | | | | | | |
2.30%, 12/13/18 | | | 340 | | | | 340,506 | |
2.90%, 9/15/20 | | | 500 | | | | 498,120 | |
See Notes to Financial Statements.
| | | | | | |
| | | | | | | |
| | BLACKROCK U.S. TOTAL BOND INDEX FUND | | DECEMBER 31, 2015 | | 19 |
| | |
Schedule of Investments (continued) | | U.S. Total Bond Index Master Portfolio |
| | | | | | | | |
| Corporate Bonds | | Par (000) | | | Value | |
Banks (continued) | | | | | | | | |
KeyCorp (continued): | | | | | | | | |
5.10%, 3/24/21 | | $ | 100 | | | $ | 109,295 | |
KFW: | | | | | | | | |
0.88%, 12/15/17 | | | 1,000 | | | | 993,362 | |
1.00%, 1/26/18 | | | 500 | | | | 497,270 | |
1.13%, 8/06/18 | | | 1,500 | | | | 1,487,742 | |
1.88%, 6/30/20 | | | 750 | | | | 748,964 | |
2.13%, 1/17/23 | | | 200 | | | | 197,617 | |
Korea Development Bank: | | | | | | | | |
1.50%, 1/22/18 | | | 200 | | | | 198,130 | |
3.00%, 3/17/19 | | | 350 | | | | 357,619 | |
Landwirtschaftliche Rentenbank: | | | | | | | | |
0.88%, 9/12/17 | | | 750 | | | | 746,418 | |
2.25%, 10/01/21 | | | 500 | | | | 502,294 | |
Lloyds Bank PLC: | | | | | | | | |
2.35%, 9/05/19 | | | 350 | | | | 349,961 | |
2.40%, 3/17/20 | | | 750 | | | | 745,015 | |
2.70%, 8/17/20 | | | 250 | | | | 251,767 | |
Lloyds TSB Bank PLC, 4.20%, 3/28/17 | | | 50 | | | | 51,537 | |
Manufacturers & Traders Trust Co.: | | | | | | | | |
1.40%, 7/25/17 | | | 250 | | | | 248,853 | |
1.45%, 3/07/18 | | | 250 | | | | 247,342 | |
MUFG Union Bank NA, 2.63%, 9/26/18 | | | 250 | | | | 252,400 | |
Oesterreichische Kontrollbank AG, 1.63%, 3/12/19 | | | 500 | | | | 499,308 | |
PNC Bank NA (b): | | | | | | | | |
2.20%, 1/28/19 | | | 500 | | | | 501,632 | |
2.25%, 7/02/19 | | | 350 | | | | 351,554 | |
2.30%, 6/01/20 | | | 500 | | | | 495,523 | |
2.45%, 11/05/20 | | | 250 | | | | 248,877 | |
2.95%, 1/30/23 | | | 250 | | | | 242,404 | |
PNC Funding Corp. (b): | | | | | | | | |
5.63%, 2/01/17 | | | 150 | | | | 155,944 | |
3.30%, 3/08/22 | | | 150 | | | | 153,574 | |
Rabobank Nederland: | | | | | | | | |
3.38%, 1/19/17 | | | 300 | | | | 306,670 | |
3.88%, 2/08/22 | | | 150 | | | | 158,308 | |
Regions Financial Corp., 2.00%, 5/15/18 | | | 250 | | | | 248,233 | |
Royal Bank of Canada: | | | | | | | | |
1.25%, 6/16/17 | | | 250 | | | | 249,750 | |
1.40%, 10/13/17 | | | 225 | | | | 224,421 | |
2.20%, 7/27/18 | | | 250 | | | | 252,019 | |
1.80%, 7/30/18 | | | 250 | | | | 249,234 | |
2.00%, 12/10/18 | | | 250 | | | | 249,787 | |
2.15%, 3/06/20 | | | 250 | | | | 247,545 | |
Santander Holdings USA, Inc.: | | | | | | | | |
3.45%, 8/27/18 | | | 250 | | | | 254,161 | |
2.65%, 4/17/20 | | | 150 | | | | 147,160 | |
Santander Issuances SAU, 5.18%, 11/19/25 | | | 200 | | | | 196,970 | |
Santander UK Group Holdings PLC, 2.88%, 10/16/20 | | | 65 | | | | 64,559 | |
Sumitomo Mitsui Banking Corp.: | | | | | | | | |
1.35%, 7/11/17 | | | 250 | | | | 248,479 | |
1.80%, 7/18/17 | | | 250 | | | | 249,877 | |
2.45%, 1/10/19 | | | 250 | | | | 250,892 | |
2.45%, 1/16/20 | | | 250 | | | | 248,581 | |
2.45%, 10/20/20 | | | 500 | | | | 493,888 | |
SunTrust Banks, Inc.: | | | | | | | | |
3.50%, 1/20/17 | | | 50 | | | | 50,863 | |
2.35%, 11/01/18 | | | 250 | | | | 251,307 | |
| | | | | | | | |
| Corporate Bonds | | Par (000) | | | Value | |
Banks (continued) | | | | | | | | |
Svenska Handelsbanken AB, 1.63%, 3/21/18 | | $ | 250 | | | $ | 248,890 | |
Toronto-Dominion Bank: | | | | | | | | |
1.63%, 3/13/18 | | | 500 | | | | 498,625 | |
1.40%, 4/30/18 | | | 250 | | | | 247,912 | |
2.25%, 11/05/19 | | | 300 | | | | 299,821 | |
US Bancorp: | | | | | | | | |
1.65%, 5/15/17 | | | 250 | | | | 250,756 | |
1.95%, 11/15/18 | | | 225 | | | | 226,382 | |
4.13%, 5/24/21 | | | 50 | | | | 53,938 | |
US Bank NA: | | | | | | | | |
1.35%, 1/26/18 | | | 500 | | | | 498,291 | |
2.13%, 10/28/19 | | | 250 | | | | 249,811 | |
2.80%, 1/27/25 | | | 500 | | | | 486,462 | |
Wells Fargo & Co.: | | | | | | | | |
2.10%, 5/08/17 | | | 150 | | | | 151,488 | |
5.63%, 12/11/17 | | | 250 | | | | 268,210 | |
1.50%, 1/16/18 | | | 250 | | | | 248,935 | |
2.15%, 1/15/19 | | | 250 | | | | 251,397 | |
2.13%, 4/22/19 | | | 350 | | | | 350,423 | |
2.15%, 1/30/20 | | | 460 | | | | 455,970 | |
2.60%, 7/22/20 | | | 500 | | | | 498,719 | |
3.00%, 1/22/21 | | | 250 | | | | 252,739 | |
3.45%, 2/13/23 | | | 450 | | | | 451,060 | |
4.48%, 1/16/24 | | | 250 | | | | 262,941 | |
3.55%, 9/29/25 | | | 1,000 | | | | 1,008,995 | |
4.10%, 6/03/26 | | | 520 | | | | 524,885 | |
4.30%, 7/22/27 | | | 200 | | | | 204,307 | |
5.38%, 11/02/43 | | | 150 | | | | 160,537 | |
5.61%, 1/15/44 | | | 306 | | | | 339,935 | |
4.65%, 11/04/44 | | | 345 | | | | 335,643 | |
3.90%, 5/01/45 | | | 150 | | | | 138,315 | |
4.90%, 11/17/45 | | | 250 | | | | 252,230 | |
Westpac Banking Corp.: | | | | | | | | |
1.50%, 12/01/17 | | | 250 | | | | 249,204 | |
1.60%, 1/12/18 | | | 250 | | | | 249,515 | |
2.25%, 1/17/19 | | | 350 | | | | 350,904 | |
4.88%, 11/19/19 | | | 50 | | | | 54,463 | |
| | | | | | | | |
| | | | | | | | 48,380,125 | |
Beverages — 0.5% | | | | | | | | |
Anheuser-Busch Cos. LLC, 6.45%, 9/01/37 | | | 100 | | | | 118,394 | |
Anheuser-Busch InBev Finance, Inc.: | | | | | | | | |
2.15%, 2/01/19 | | | 500 | | | | 497,110 | |
2.63%, 1/17/23 | | | 500 | | | | 479,838 | |
4.63%, 2/01/44 | | | 400 | | | | 397,576 | |
Anheuser-Busch InBev Worldwide, Inc.: | | | | | | | | |
1.38%, 7/15/17 | | | 500 | | | | 498,337 | |
7.75%, 1/15/19 | | | 250 | | | | 288,984 | |
2.50%, 7/15/22 | | | 200 | | | | 192,417 | |
8.20%, 1/15/39 | | | 150 | | | | 216,218 | |
3.75%, 7/15/42 | | | 50 | | | | 42,960 | |
Beam, Inc., 1.88%, 5/15/17 | | | 100 | | | | 100,109 | |
Coca-Cola Co.: | | | | | | | | |
1.15%, 4/01/18 | | | 250 | | | | 249,298 | |
1.65%, 11/01/18 | | | 500 | | | | 504,169 | |
2.45%, 11/01/20 | | | 350 | | | | 356,375 | |
Coca-Cola Femsa SAB de CV, 2.38%, 11/26/18 | | | 250 | | | | 249,637 | |
Diageo Capital PLC: | | | | | | | | |
1.50%, 5/11/17 | | | 200 | | | | 199,895 | |
5.75%, 10/23/17 | | | 100 | | | | 107,364 | |
See Notes to Financial Statements.
| | | | | | |
| | | | | | | |
| 20 | | BLACKROCK U.S. TOTAL BOND INDEX FUND | | DECEMBER 31, 2015 | | |
| | |
Schedule of Investments (continued) | | U.S. Total Bond Index Master Portfolio |
| | | | | | | | |
| Corporate Bonds | | Par (000) | | | Value | |
Beverages (continued) | | | | | | | | |
Diageo Capital PLC (continued): | | | | | | | | |
3.88%, 4/29/43 | | $ | 125 | | | $ | 116,334 | |
Diageo Investment Corp.: | | | | | | | | |
2.88%, 5/11/22 | | | 100 | | | | 99,119 | |
4.25%, 5/11/42 | | | 250 | | | | 246,221 | |
Dr Pepper Snapple Group, Inc.: | | | | | | | | |
3.20%, 11/15/21 | | | 25 | | | | 25,111 | |
2.70%, 11/15/22 | | | 100 | | | | 96,135 | |
Molson Coors Brewing Co., 3.50%, 5/01/22 | | | 75 | | | | 75,412 | |
PepsiCo, Inc.: | | | | | | | | |
1.25%, 8/13/17 | | | 500 | | | | 500,145 | |
2.25%, 1/07/19 | | | 250 | | | | 253,358 | |
2.75%, 3/05/22 | | | 250 | | | | 250,614 | |
3.10%, 7/17/22 | | | 500 | | | | 513,206 | |
2.75%, 3/01/23 | | | 300 | | | | 298,798 | |
3.60%, 3/01/24 | | | 250 | | | | 261,546 | |
3.50%, 7/17/25 | | | 250 | | | | 258,515 | |
4.88%, 11/01/40 | | | 100 | | | | 106,849 | |
3.60%, 8/13/42 | | | 100 | | | | 90,538 | |
4.45%, 4/14/46 | | | 250 | | | | 258,238 | |
| | | | | | | | |
| | | | | | | | 7,948,820 | |
Biotechnology — 0.4% | | | | | | | | |
Amgen, Inc.: | | | | | | | | |
2.13%, 5/15/17 | | | 300 | | | | 301,831 | |
1.25%, 5/22/17 | | | 750 | | | | 747,180 | |
2.20%, 5/22/19 | | | 250 | | | | 249,684 | |
3.45%, 10/01/20 | | | 100 | | | | 102,916 | |
5.15%, 11/15/41 | | | 550 | | | | 558,379 | |
5.38%, 5/15/43 | | | 250 | | | | 265,603 | |
4.40%, 5/01/45 | | | 175 | | | | 162,141 | |
Biogen, Inc.: | | | | | | | | |
4.05%, 9/15/25 | | | 95 | | | | 95,431 | |
5.20%, 9/15/45 | | | 250 | | | | 250,094 | |
Celgene Corp.: | | | | | | | | |
3.25%, 8/15/22 | | | 150 | | | | 148,811 | |
3.55%, 8/15/22 | | | 750 | | | | 757,291 | |
3.88%, 8/15/25 | | | 500 | | | | 497,975 | |
5.25%, 8/15/43 | | | 145 | | | | 148,154 | |
Gilead Sciences, Inc.: | | | | | | | | |
3.05%, 12/01/16 | | | 150 | | | | 152,537 | |
3.70%, 4/01/24 | | | 500 | | | | 512,159 | |
3.50%, 2/01/25 | | | 170 | | | | 171,418 | |
3.65%, 3/01/26 | | | 75 | | | | 75,636 | |
5.65%, 12/01/41 | | | 50 | | | | 56,966 | |
4.50%, 2/01/45 | | | 150 | | | | 146,725 | |
4.75%, 3/01/46 | | | 500 | | | | 506,013 | |
| | | | | | | | |
| | | | | | | | 5,906,944 | |
Building Products — 0.0% | | | | | | | | |
Owens Corning, 4.20%, 12/15/22 | | | 150 | | | | 150,087 | |
Capital Markets — 1.0% | | | | | | | | |
American Express Credit Corp., 2.60%, 9/14/20 | | | 145 | | | | 145,335 | |
Ameriprise Financial, Inc., 4.00%, 10/15/23 | | | 150 | | | | 155,822 | |
Ares Capital Corp., 3.88%, 1/15/20 | | | 300 | | | | 304,556 | |
Brookfield Asset Management, Inc., 4.00%, 1/15/25 | | | 250 | | | | 244,089 | |
Charles Schwab Corp.: | | | | | | | | |
2.20%, 7/25/18 | | | 75 | | | | 75,156 | |
4.45%, 7/22/20 | | | 100 | | | | 108,838 | |
3.00%, 3/10/25 | | | 80 | | | | 78,681 | |
| | | | | | | | |
| Corporate Bonds | | Par (000) | | | Value | |
Capital Markets (continued) | | | | | | | | |
CME Group, Inc.: | | | | | | | | |
3.00%, 3/15/25 | | $ | 250 | | | $ | 245,264 | |
5.30%, 9/15/43 | | | 100 | | | | 114,494 | |
FMS Wertmanagement AoeR, 0.63%, 1/30/17 | | | 500 | | | | 497,712 | |
Franklin Resources, Inc., 2.80%, 9/15/22 | | | 150 | | | | 146,437 | |
Goldman Sachs Capital I, 6.35%, 2/15/34 | | | 250 | | | | 292,472 | |
Goldman Sachs Group, Inc.: | | | | | | | | |
5.95%, 1/18/18 | | | 300 | | | | 323,093 | |
2.38%, 1/22/18 | | | 250 | | | | 252,160 | |
2.90%, 7/19/18 | | | 500 | | | | 509,773 | |
2.63%, 1/31/19 | | | 500 | | | | 503,575 | |
7.50%, 2/15/19 | | | 150 | | | | 171,639 | |
2.55%, 10/23/19 | | | 755 | | | | 754,705 | |
2.60%, 4/23/20 | | | 600 | | | | 595,444 | |
5.75%, 1/24/22 | | | 350 | | | | 398,027 | |
3.63%, 1/22/23 | | | 150 | | | | 151,703 | |
4.00%, 3/03/24 | | | 425 | | | | 436,211 | |
3.75%, 5/22/25 | | | 250 | | | | 251,667 | |
6.13%, 2/15/33 | | | 400 | | | | 468,574 | |
6.75%, 10/01/37 | | | 650 | | | | 759,808 | |
5.15%, 5/22/45 | | | 250 | | | | 242,847 | |
Invesco Finance PLC, 4.00%, 1/30/24 | | | 250 | | | | 258,457 | |
Lazard Group LLC, 4.25%, 11/14/20 | | | 150 | | | | 155,366 | |
Legg Mason, Inc., 5.63%, 1/15/44 | | | 125 | | | | 124,163 | |
Morgan Stanley: | | | | | | | | |
4.75%, 3/22/17 | | | 760 | | | | 787,222 | |
1.88%, 1/05/18 | | | 250 | | | | 249,755 | |
6.63%, 4/01/18 | | | 500 | | | | 548,265 | |
2.38%, 7/23/19 | | | 500 | | | | 498,324 | |
5.63%, 9/23/19 | | | 250 | | | | 275,900 | |
5.50%, 7/28/21 | | | 100 | | | | 112,037 | |
4.10%, 5/22/23 | | | 250 | | | | 252,550 | |
3.88%, 4/29/24 | | | 250 | | | | 254,845 | |
3.70%, 10/23/24 | | | 500 | | | | 502,404 | |
4.00%, 7/23/25 | | | 155 | | | | 159,615 | |
5.00%, 11/24/25 | | | 250 | | | | 265,387 | |
4.35%, 9/08/26 | | | 500 | | | | 501,634 | |
3.95%, 4/23/27 | | | 250 | | | | 242,645 | |
7.25%, 4/01/32 | | | 50 | | | | 65,528 | |
6.38%, 7/24/42 | | | 50 | | | | 61,827 | |
4.30%, 1/27/45 | | | 250 | | | | 238,527 | |
Murray Street Investment Trust I, 4.65%, 3/09/17 (c) | | | 200 | | | | 206,059 | |
NASDAQ OMX Group, Inc., 4.25%, 6/01/24 | | | 250 | | | | 252,134 | |
Nomura Holdings, Inc., 2.75%, 3/19/19 | | | 250 | | | | 251,349 | |
State Street Corp.: | | | | | | | | |
3.10%, 5/15/23 | | | 250 | | | | 247,051 | |
3.30%, 12/16/24 | | | 405 | | | | 408,825 | |
TD Ameritrade Holding Corp., 2.95%, 4/01/22 | | | 250 | | | | 247,635 | |
| | | | | | | | |
| | | | | | | | 15,395,586 | |
Chemicals — 0.5% | | | | | | | | |
Agrium, Inc.: | | | | | | | | |
3.15%, 10/01/22 | | | 50 | | | | 47,833 | |
3.50%, 6/01/23 | | | 250 | | | | 238,649 | |
3.38%, 3/15/25 | | | 145 | | | | 132,292 | |
Airgas, Inc., 2.38%, 2/15/20 | | | 250 | | | | 247,040 | |
Albemarle Corp., 4.15%, 12/01/24 | | | 250 | | | | 238,918 | |
CF Industries, Inc.: | | | | | | | | |
6.88%, 5/01/18 | | | 200 | | | | 216,704 | |
5.15%, 3/15/34 | | | 250 | | | | 219,929 | |
See Notes to Financial Statements.
| | | | | | |
| | | | | | | |
| | BLACKROCK U.S. TOTAL BOND INDEX FUND | | DECEMBER 31, 2015 | | 21 |
| | |
Schedule of Investments (continued) | | U.S. Total Bond Index Master Portfolio |
| | | | | | | | |
| Corporate Bonds | | Par (000) | | | Value | |
Chemicals (continued) | | | | | | | | |
Cytec Industries, Inc., 3.50%, 4/01/23 | | $ | 250 | | | $ | 235,682 | |
Dow Chemical Co.: | | | | | | | | |
8.55%, 5/15/19 | | | 100 | | | | 117,865 | |
4.25%, 11/15/20 | | | 186 | | | | 194,698 | |
4.13%, 11/15/21 | | | 50 | | | | 52,420 | |
3.00%, 11/15/22 | | | 250 | | | | 239,329 | |
4.25%, 10/01/34 | | | 250 | | | | 225,630 | |
5.25%, 11/15/41 | | | 100 | | | | 97,476 | |
E.I. du Pont de Nemours & Co.: | | | | | | | | |
6.00%, 7/15/18 | | | 325 | | | | 354,349 | |
2.80%, 2/15/23 | | | 250 | | | | 237,556 | |
Eastman Chemical Co.: | | | | | | | | |
3.60%, 8/15/22 | | | 200 | | | | 199,046 | |
3.80%, 3/15/25 | | | 300 | | | | 290,530 | |
Ecolab, Inc.: | | | | | | | | |
2.25%, 1/12/20 | | | 135 | | | | 134,223 | |
4.35%, 12/08/21 | | | 150 | | | | 160,165 | |
EI du Pont de Nemours & Co., 4.25%, 4/01/21 | | | 500 | | | | 529,783 | |
LYB International Finance BV: | | | | | | | | |
4.00%, 7/15/23 | | | 200 | | | | 199,373 | |
5.25%, 7/15/43 | | | 75 | | | | 72,007 | |
LyondellBasell Industries NV: | | | | | | | | |
6.00%, 11/15/21 | | | 250 | | | | 280,621 | |
4.63%, 2/26/55 | | | 100 | | | | 81,098 | |
Methanex Corp., 3.25%, 12/15/19 | | | 250 | | | | 238,576 | |
Monsanto Co.: | | | | | | | | |
4.20%, 7/15/34 | | | 300 | | | | 257,991 | |
4.40%, 7/15/44 | | | 150 | | | | 124,190 | |
3.95%, 4/15/45 | | | 120 | | | | 93,109 | |
Mosaic Co.: | | | | | | | | |
3.75%, 11/15/21 | | | 50 | | | | 50,134 | |
5.45%, 11/15/33 | | | 250 | | | | 252,670 | |
Potash Corp. of Saskatchewan, Inc.: | | | | | | | | |
3.25%, 12/01/17 | | | 250 | | | | 255,430 | |
3.63%, 3/15/24 | | | 250 | | | | 243,121 | |
3.00%, 4/01/25 | | | 250 | | | | 234,858 | |
PPG Industries, Inc., 2.30%, 11/15/19 | | | 350 | | | | 346,382 | |
Praxair, Inc.: | | | | | | | | |
1.25%, 11/07/18 | | | 250 | | | | 246,655 | |
2.65%, 2/05/25 | | | 165 | | | | 158,035 | |
3.20%, 1/30/26 | | | 250 | | | | 250,617 | |
Rohm & Haas Co., 7.85%, 7/15/29 | | | 250 | | | | 318,125 | |
Sherwin-Williams Co., 1.35%, 12/15/17 | | | 200 | | | | 198,291 | |
| | | | | | | | |
| | | | | | | | 8,311,400 | |
Commercial Services & Supplies — 0.1% | |
3M Co., 1.63%, 6/15/19 | | | 350 | | | | 349,730 | |
Northwestern University, 3.87%, 12/01/48 | | | 100 | | | | 97,978 | |
Republic Services, Inc.: | | | | | | | | |
5.25%, 11/15/21 | | | 50 | | | | 55,277 | |
3.55%, 6/01/22 | | | 250 | | | | 255,297 | |
3.20%, 3/15/25 | | | 250 | | | | 240,675 | |
Vanderbilt University, 5.25%, 4/01/19 | | | 100 | | | | 109,754 | |
Waste Management, Inc.: | | | | | | | | |
4.60%, 3/01/21 | | | 100 | | | | 107,858 | |
2.90%, 9/15/22 | | | 200 | | | | 196,292 | |
3.90%, 3/01/35 | | | 315 | | | | 293,322 | |
| | | | | | | | |
| | | | | | | | 1,706,183 | |
| | | | | | | | |
| Corporate Bonds | | Par (000) | | | Value | |
Commercial Services & Supplies — 0.0% | |
3M Co., 3.00%, 8/07/25 | | $ | 250 | | | $ | 255,043 | |
Communications Equipment — 0.2% | |
Cisco Systems, Inc.: | | | | | | | | |
1.10%, 3/03/17 | | | 500 | | | | 500,421 | |
2.13%, 3/01/19 | | | 500 | | | | 504,292 | |
2.45%, 6/15/20 | | | 500 | | | | 504,746 | |
2.90%, 3/04/21 | | | 125 | | | | 128,490 | |
5.50%, 1/15/40 | | | 350 | | | | 410,459 | |
Motorola Solutions, Inc.: | | | | | | | | |
3.75%, 5/15/22 | | | 150 | | | | 137,426 | |
3.50%, 3/01/23 | | | 250 | | | | 219,311 | |
| | | | | | | | |
| | | | | | | | 2,405,145 | |
Construction & Engineering — 0.0% | |
ABB Finance USA, Inc.: | | | | | | | | |
1.63%, 5/08/17 | | | 150 | | | | 150,101 | |
2.88%, 5/08/22 | | | 100 | | | | 98,558 | |
Fluor Corp., 3.50%, 12/15/24 | | | 250 | | | | 249,793 | |
| | | | | | | | |
| | | | | | | | 498,452 | |
Consumer Finance — 0.3% | |
American Express Co.: | | | | | | | | |
1.55%, 5/22/18 | | | 250 | | | | 248,048 | |
3.63%, 12/05/24 | | | 300 | | | | 293,604 | |
4.05%, 12/03/42 | | | 67 | | | | 63,973 | |
Automatic Data Processing, Inc., 2.25%, 9/15/20 | | | 500 | | | | 501,893 | |
Block Financial LLC, 4.13%, 10/01/20 | | | 500 | | | | 506,270 | |
Capital One Bank USA NA: | | | | | | | | |
1.30%, 6/05/17 | | | 250 | | | | 247,993 | |
2.25%, 2/13/19 | | | 250 | | | | 248,901 | |
Capital One Financial Corp.: | | | | | | | | |
2.45%, 4/24/19 | | | 250 | | | | 250,457 | |
3.50%, 6/15/23 | | | 110 | | | | 109,328 | |
Caterpillar Financial Services Corp.: | | | | | | | | |
1.70%, 6/16/18 | | | 250 | | | | 249,882 | |
3.30%, 6/09/24 | | | 250 | | | | 248,292 | |
Discover Financial Services, 3.75%, 3/04/25 | | | 75 | | | | 72,023 | |
HSBC Finance Corp., 6.68%, 1/15/21 | | | 161 | | | | 184,776 | |
MasterCard, Inc., 3.38%, 4/01/24 | | | 250 | | | | 255,485 | |
Synchrony Financial: | | | | | | | | |
3.75%, 8/15/21 | | | 500 | | | | 499,453 | |
4.50%, 7/23/25 | | | 190 | | | | 189,550 | |
Visa, Inc., 3.15%, 12/14/25 | | | 195 | | | | 195,241 | |
| | | | | | | | |
| | | | | | | | 4,365,169 | |
Containers & Packaging — 0.0% | |
Packaging Corp. of America, 4.50%, 11/01/23 | | | 250 | | | | 262,506 | |
Diversified Financial Services — 2.8% | |
Air Lease Corp.: | | | | | | | | |
2.13%, 1/15/18 | | | 175 | | | | 171,938 | |
3.38%, 1/15/19 | | | 250 | | | | 251,250 | |
3.88%, 4/01/21 | | | 175 | | | | 175,875 | |
American Express Credit Corp.: | | | | | | | | |
2.38%, 3/24/17 | | | 100 | | | | 101,086 | |
1.13%, 6/05/17 | | | 500 | | | | 497,694 | |
1.55%, 9/22/17 | | | 105 | | | | 104,958 | |
2.13%, 3/18/19 | | | 400 | | | | 399,961 | |
2.25%, 8/15/19 | | | 250 | | | | 250,044 | |
American Honda Finance Corp.: | | | | | | | | |
1.55%, 12/11/17 | | | 250 | | | | 250,055 | |
See Notes to Financial Statements.
| | | | | | |
| | | | | | | |
| 22 | | BLACKROCK U.S. TOTAL BOND INDEX FUND | | DECEMBER 31, 2015 | | |
| | |
Schedule of Investments (continued) | | U.S. Total Bond Index Master Portfolio |
| | | | | | | | |
| Corporate Bonds | | Par (000) | | | Value | |
Diversified Financial Services (continued) | |
American Honda Finance Corp. (continued): | | | | | | | | |
2.15%, 3/13/20 | | $ | 250 | | | $ | 248,779 | |
Bank of America Corp.: | | | | | | | | |
3.88%, 3/22/17 | | | 300 | | | | 306,559 | |
1.70%, 8/25/17 | | | 250 | | | | 249,285 | |
2.00%, 1/11/18 | | | 1,050 | | | | 1,048,661 | |
6.88%, 4/25/18 | | | 400 | | | | 441,303 | |
2.60%, 1/15/19 | | | 500 | | | | 501,629 | |
5.63%, 7/01/20 | | | 150 | | | | 166,615 | |
2.63%, 10/19/20 | | | 750 | | | | 740,566 | |
5.00%, 5/13/21 | | | 100 | | | | 109,255 | |
5.70%, 1/24/22 | | | 100 | | | | 112,769 | |
4.20%, 8/26/24 | | | 500 | | | | 496,089 | |
4.00%, 1/22/25 | | | 250 | | | | 244,732 | |
3.88%, 8/01/25 | | | 250 | | | | 253,782 | |
4.25%, 10/22/26 | | | 290 | | | | 287,052 | |
6.11%, 1/29/37 | | | 100 | | | | 113,470 | |
7.75%, 5/14/38 | | | 200 | | | | 271,356 | |
5.88%, 2/07/42 | | | 100 | | | | 116,708 | |
5.00%, 1/21/44 | | | 250 | | | | 260,923 | |
4.88%, 4/01/44 | | | 175 | | | | 181,204 | |
Series L, 2.65%, 4/01/19 | | | 500 | | | | 501,219 | |
Series L, 3.95%, 4/21/25 | | | 655 | | | | 637,819 | |
Bank of America NA: | | | | | | | | |
1.65%, 3/26/18 | | | 750 | | | | 744,358 | |
1.75%, 6/05/18 | | | 1,000 | | | | 993,571 | |
Bank of New York Mellon Corp., 2.45%, 11/27/20 | | | 190 | | | | 189,163 | |
Barclays PLC, 4.38%, 9/11/24 | | | 500 | | | | 488,911 | |
Boeing Capital Corp., 4.70%, 10/27/19 | | | 250 | | | | 274,285 | |
Capital One Bank USA NA, 3.38%, 2/15/23 | | | 350 | | | | 342,502 | |
Citigroup, Inc.: | | | | | | | | |
1.35%, 3/10/17 | | | 250 | | | | 249,075 | |
1.80%, 2/05/18 | | | 480 | | | | 478,163 | |
2.50%, 9/26/18 | | | 350 | | | | 353,040 | |
2.05%, 12/07/18 | | | 250 | | | | 248,679 | |
2.50%, 7/29/19 | | | 250 | | | | 249,623 | |
2.40%, 2/18/20 | | | 695 | | | | 686,868 | |
4.05%, 7/30/22 | | | 250 | | | | 255,716 | |
3.50%, 5/15/23 | | | 250 | | | | 245,804 | |
3.88%, 3/26/25 | | | 500 | | | | 486,644 | |
3.30%, 4/27/25 | | | 155 | | | | 152,224 | |
4.40%, 6/10/25 | | | 500 | | | | 505,004 | |
4.30%, 11/20/26 | | | 150 | | | | 149,260 | |
4.45%, 9/29/27 | | | 500 | | | | 496,690 | |
6.63%, 6/15/32 | | | 100 | | | | 118,013 | |
6.13%, 8/25/36 | | | 184 | | | | 209,193 | |
8.13%, 7/15/39 | | | 75 | | | | 107,571 | |
6.68%, 9/13/43 | | | 250 | | | | 306,542 | |
Credit Suisse Group Funding Guernsey Ltd. 3.13%, 12/10/20 (a) | | | 250 | | | | 248,865 | |
Deutsche Bank AG, London: | | | | | | | | |
1.40%, 2/13/17 | | | 500 | | | | 497,173 | |
2.50%, 2/13/19 | | | 250 | | | | 251,864 | |
3.70%, 5/30/24 | | | 215 | | | | 214,136 | |
Ford Motor Credit Co. LLC: | | | | | | | | |
4.25%, 2/03/17 | | | 250 | | | | 255,427 | |
1.72%, 12/06/17 | | | 250 | | | | 246,149 | |
2.38%, 1/16/18 | | | 250 | | | | 249,403 | |
| | | | | | | | |
| Corporate Bonds | | Par (000) | | | Value | |
Diversified Financial Services (continued) | |
Ford Motor Credit Co. LLC (continued): | | | | | | | | |
2.24%, 6/15/18 | | $ | 250 | | | $ | 247,727 | |
2.38%, 3/12/19 | | | 500 | | | | 492,903 | |
2.60%, 11/04/19 | | | 250 | | | | 245,460 | |
2.46%, 3/27/20 | | | 250 | | | | 242,373 | |
4.38%, 8/06/23 | | | 220 | | | | 226,068 | |
4.13%, 8/04/25 | | | 500 | | | | 498,207 | |
GE Capital International Funding Co. (a): | | | | | | | | |
2.34%, 11/15/20 | | | 770 | | | | 763,578 | |
3.37%, 11/15/25 | | | 227 | | | | 231,105 | |
4.42%, 11/15/35 | | | 1,435 | | | | 1,464,392 | |
General Electric Capital Corp.: | | | | | | | | |
2.90%, 1/09/17 | | | 100 | | | | 101,666 | |
6.00%, 8/07/19 | | | 100 | | | | 113,284 | |
4.38%, 9/16/20 | | | 50 | | | | 54,279 | |
4.63%, 1/07/21 | | | 72 | | | | 79,083 | |
4.65%, 10/17/21 | | | 201 | | | | 222,541 | |
3.45%, 5/15/24 | | | 86 | | | | 88,909 | |
6.75%, 3/15/32 | | | 144 | | | | 188,151 | |
5.88%, 1/14/38 | | | 215 | | | | 263,066 | |
6.88%, 1/10/39 | | | 72 | | | | 98,141 | |
General Motors Financial Co., Inc.: | | | | | | | | |
2.40%, 4/10/18 | | | 155 | | | | 154,239 | |
3.20%, 7/13/20 | | | 1,000 | | | | 984,603 | |
3.45%, 4/10/22 | | | 150 | | | | 143,889 | |
4.00%, 1/15/25 | | | 250 | | | | 237,189 | |
Goldman Sachs Group, Inc., 4.25%, 10/21/25 | | | 1,050 | | | | 1,041,975 | |
Intercontinental Exchange, Inc.: | | | | | | | | |
2.50%, 10/15/18 | | | 250 | | | | 252,190 | |
3.75%, 12/01/25 | | | 115 | | | | 115,316 | |
Jefferies Group LLC: | | | | | | | | |
8.50%, 7/15/19 | | | 125 | | | | 145,582 | |
5.13%, 1/20/23 | | | 150 | | | | 148,819 | |
John Deere Capital Corp.: | | | | | | | | |
1.95%, 12/13/18 | | | 500 | | | | 502,126 | |
2.25%, 4/17/19 | | | 100 | | | | 100,433 | |
2.05%, 3/10/20 | | | 1,000 | | | | 987,760 | |
2.80%, 3/04/21 | | | 250 | | | | 250,577 | |
3.90%, 7/12/21 | | | 50 | | | | 52,961 | |
JPMorgan Chase & Co.: | | | | | | | | |
1.35%, 2/15/17 | | | 1,250 | | | | 1,247,481 | |
2.00%, 8/15/17 | | | 250 | | | | 250,848 | |
1.80%, 1/25/18 | | | 1,000 | | | | 998,655 | |
1.63%, 5/15/18 | | | 500 | | | | 496,290 | |
2.35%, 1/28/19 | | | 500 | | | | 502,121 | |
2.20%, 10/22/19 | | | 500 | | | | 495,951 | |
2.55%, 10/29/20 | | | 500 | | | | 495,805 | |
4.35%, 8/15/21 | | | 500 | | | | 532,116 | |
4.50%, 1/24/22 | | | 300 | | | | 323,582 | |
3.25%, 9/23/22 | | | 200 | | | | 201,154 | |
3.20%, 1/25/23 | | | 150 | | | | 149,510 | |
3.38%, 5/01/23 | | | 250 | | | | 245,704 | |
3.88%, 9/10/24 | | | 300 | | | | 298,423 | |
3.13%, 1/23/25 | | | 250 | | | | 243,200 | |
3.90%, 7/15/25 | | | 250 | | | | 257,631 | |
4.13%, 12/15/26 | | | 250 | | | | 249,311 | |
6.40%, 5/15/38 | | | 100 | | | | 127,456 | |
5.50%, 10/15/40 | | | 125 | | | | 141,420 | |
5.60%, 7/15/41 | | | 50 | | | | 57,714 | |
5.63%, 8/16/43 | | | 500 | | | | 544,100 | |
See Notes to Financial Statements.
| | | | | | |
| | | | | | | |
| | BLACKROCK U.S. TOTAL BOND INDEX FUND | | DECEMBER 31, 2015 | | 23 |
| | |
Schedule of Investments (continued) | | U.S. Total Bond Index Master Portfolio |
| | | | | | | | |
| Corporate Bonds | | Par (000) | | | Value | |
Diversified Financial Services (continued) | |
JPMorgan Chase & Co. (continued): | | | | | | | | |
4.85%, 2/01/44 | | $ | 100 | | | $ | 106,618 | |
4.95%, 6/01/45 | | | 250 | | | | 249,952 | |
JPMorgan Chase Bank NA, 6.00%, 10/01/17 | | | 250 | | | | 267,290 | |
Leucadia National Corp., 5.50%, 10/18/23 | | | 150 | | | | 146,428 | |
Moody’s Corp.: | | | | | | | | |
2.75%, 7/15/19 | | | 40 | | | | 40,339 | |
4.50%, 9/01/22 | | | 50 | | | | 52,991 | |
Morgan Stanley: | | | | | | | | |
2.65%, 1/27/20 | | | 500 | | | | 498,640 | |
4.88%, 11/01/22 | | | 500 | | | | 530,626 | |
MUFG Americas Holdings Corp., 3.00%, 2/10/25 | | | 250 | | | | 239,344 | |
National Rural Utilities Cooperative Finance Corp.: | | | | | | | | |
2.30%, 11/15/19 | | | 250 | | | | 248,840 | |
3.40%, 11/15/23 | | | 350 | | | | 358,916 | |
2.85%, 1/27/25 | | | 250 | | | | 243,396 | |
NCUA Guaranteed Notes, 3.00%, 6/12/19 | | | 1,000 | | | | 1,043,850 | |
ORIX Corp., 3.75%, 3/09/17 | | | 100 | | | | 101,877 | |
PACCAR Financial Corp., 2.20%, 9/15/19 | | | 250 | | | | 248,984 | |
Royal Bank of Scotland Group PLC: | | | | | | | | |
1.88%, 3/31/17 | | | 175 | | | | 174,268 | |
6.40%, 10/21/19 | | | 250 | | | | 277,370 | |
Toyota Motor Credit Corp., 1.38%, 1/10/18 | | | 200 | | | | 200,406 | |
UBS AG/Stamford CT: | | | | | | | | |
2.38%, 8/14/19 | | | 800 | | | | 799,064 | |
2.35%, 3/26/20 | | | 500 | | | | 499,414 | |
| | | | | | | | |
| | | | | | | | 44,712,229 | |
Diversified Telecommunication Services — 1.1% | |
AT&T, Inc.: | | | | | | | | |
1.70%, 6/01/17 | | | 500 | | | | 501,379 | |
2.38%, 11/27/18 | | | 500 | | | | 503,407 | |
2.45%, 6/30/20 | | | 1,500 | | | | 1,477,236 | |
3.40%, 5/15/25 | | | 500 | | | | 480,545 | |
4.50%, 5/15/35 | | | 310 | | | | 286,707 | |
6.30%, 1/15/38 | | | 200 | | | | 218,863 | |
5.35%, 9/01/40 | | | 463 | | | | 457,313 | |
5.55%, 8/15/41 | | | 200 | | | | 200,974 | |
4.30%, 12/15/42 | | | 151 | | | | 129,029 | |
4.35%, 6/15/45 | | | 759 | | | | 649,302 | |
4.75%, 5/15/46 | | | 350 | | | | 320,459 | |
British Telecommunications PLC: | | | | | | | | |
2.35%, 2/14/19 | | | 250 | | | | 250,669 | |
9.63%, 12/15/30 | | | 150 | | | | 218,873 | |
CC Holdings GS V LLC/Crown Castle GS III Corp., 2.38%, 12/15/17 | | | 325 | | | | 325,358 | |
Deutsche Telekom International Finance BV,
8.75%, 6/15/30 | | | 400 | | | | 554,576 | |
Embarq Corp., 8.00%, 6/01/36 | | | 100 | | | | 103,000 | |
Orange SA: | | | | | | | | |
4.13%, 9/14/21 | | | 650 | | | | 687,825 | |
5.38%, 1/13/42 | | | 225 | | | | 232,521 | |
Qwest Corp.: | | | | | | | | |
6.50%, 6/01/17 | | | 150 | | | | 156,971 | |
6.75%, 12/01/21 | | | 50 | | | | 52,375 | |
6.88%, 9/15/33 | | | 212 | | | | 203,434 | |
Telefonaktiebolaget LM Ericsson, 4.13%, 5/15/22 | | | 100 | | | | 102,522 | |
Telefonica Emisiones SAU: | | | | | | | | |
3.19%, 4/27/18 | | | 250 | | | | 254,851 | |
| | | | | | | | |
| Corporate Bonds | | Par (000) | | | Value | |
Diversified Telecommunication Services (continued) | |
Telefonica Emisiones SAU (continued): | | | | | | | | |
5.46%, 2/16/21 | | $ | 50 | | | $ | 55,881 | |
4.57%, 4/27/23 | | | 200 | | | | 209,665 | |
7.05%, 6/20/36 | | | 75 | | | | 90,131 | |
Telefonica Europe BV, 8.25%, 9/15/30 | | | 300 | | | | 392,240 | |
Verizon Communications, Inc.: | | | | | | | | |
1.35%, 6/09/17 | | | 250 | | | | 249,278 | |
1.10%, 11/01/17 | | | 250 | | | | 247,707 | |
3.65%, 9/14/18 | | | 500 | | | | 522,845 | |
2.55%, 6/17/19 | | | 500 | | | | 506,301 | |
2.63%, 2/21/20 | | | 250 | | | | 250,869 | |
3.50%, 11/01/21 | | | 400 | | | | 408,400 | |
5.15%, 9/15/23 | | | 500 | | | | 549,663 | |
4.15%, 3/15/24 | | | 250 | | | | 256,916 | |
3.50%, 11/01/24 | | | 500 | | | | 493,850 | |
7.75%, 12/01/30 | | | 100 | | | | 128,036 | |
6.40%, 9/15/33 | | | 500 | | | | 569,639 | |
5.05%, 3/15/34 | | | 500 | | | | 498,159 | |
4.40%, 11/01/34 | | | 500 | | | | 461,315 | |
4.27%, 1/15/36 | | | 250 | | | | 225,700 | |
6.40%, 2/15/38 | | | 200 | | | | 228,082 | |
6.00%, 4/01/41 | | | 250 | | | | 270,045 | |
3.85%, 11/01/42 | | | 250 | | | | 204,346 | |
6.55%, 9/15/43 | | | 750 | | | | 890,407 | |
5.01%, 8/21/54 | | | 650 | | | | 595,134 | |
4.67%, 3/15/55 | | | 250 | | | | 217,050 | |
| | | | | | | | |
| | | | | | | | 16,889,848 | |
Electric Utilities — 1.4% | | | | | | | | |
Alabama Power Co.: | | | | | | | | |
5.50%, 10/15/17 | | | 100 | | | | 106,009 | |
3.75%, 3/01/45 | | | 250 | | | | 224,611 | |
Ameren Illinois Co.: | | | | | | | | |
2.70%, 9/01/22 | | | 100 | | | | 98,313 | |
4.30%, 7/01/44 | | | 250 | | | | 251,200 | |
American Electric Power Co., Inc.: | | | | | | | | |
1.65%, 12/15/17 | | | 200 | | | | 198,520 | |
Series F, 2.95%, 12/15/22 | | | 500 | | | | 493,868 | |
Arizona Public Service Co., 3.15%, 5/15/25 | | | 250 | | | | 249,071 | |
Berkshire Hathaway Energy Co.: | | | | | | | | |
1.10%, 5/15/17 | | | 500 | | | | 495,431 | |
2.00%, 11/15/18 | | | 500 | | | | 496,713 | |
3.50%, 2/01/25 | | | 110 | | | | 109,080 | |
6.13%, 4/01/36 | | | 250 | | | | 291,536 | |
5.15%, 11/15/43 | | | 250 | | | | 263,808 | |
4.50%, 2/01/45 | | | 400 | | | | 384,317 | |
CenterPoint Energy Houston Electric LLC, 3.55%, 8/01/42 | | | 100 | | | | 89,934 | |
Commonwealth Edison Co.: | | | | | | | | |
2.15%, 1/15/19 | | | 500 | | | | 497,674 | |
3.10%, 11/01/24 | | | 250 | | | | 247,617 | |
5.90%, 3/15/36 | | | 50 | | | | 60,326 | |
Connecticut Light & Power Co., 2.50%, 1/15/23 | | | 150 | | | | 145,219 | |
Consolidated Edison Co. of New York, Inc., 3.30%, 12/01/24 | | | 250 | | | | 249,670 | |
Dominion Gas Holdings LLC, 3.60%, 12/15/24 | | | 250 | | | | 247,402 | |
Dominion Resources, Inc., 7.00%, 6/15/38 | | | 250 | | | | 300,552 | |
DTE Electric Co.: | | | | | | | | |
4.00%, 4/01/43 | | | 150 | | | | 145,253 | |
See Notes to Financial Statements.
| | | | | | |
| | | | | | | |
| 24 | | BLACKROCK U.S. TOTAL BOND INDEX FUND | | DECEMBER 31, 2015 | | |
| | |
Schedule of Investments (continued) | | U.S. Total Bond Index Master Portfolio |
| | | | | | | | |
| Corporate Bonds | | Par (000) | | | Value | |
Electric Utilities (continued) | | | | | | | | |
DTE Electric Co. (continued): | | | | | | | | |
3.70%, 3/15/45 | | $ | 145 | | | $ | 133,231 | |
Duke Energy Carolinas LLC, 6.05%, 4/15/38 | | | 100 | | | | 124,149 | |
Duke Energy Corp.: | | | | | | | | |
1.63%, 8/15/17 | | | 250 | | | | 249,662 | |
3.95%, 10/15/23 | | | 250 | | | | 257,286 | |
Duke Energy Indiana, Inc.: | | | | | | | | |
4.20%, 3/15/42 | | | 150 | | | | 147,029 | |
4.90%, 7/15/43 | | | 250 | | | | 270,136 | |
Duke Energy Progress, Inc.: | | | | | | | | |
4.10%, 5/15/42 | | | 150 | | | | 145,427 | |
4.10%, 3/15/43 | | | 250 | | | | 242,645 | |
4.38%, 3/30/44 | | | 100 | | | | 101,576 | |
4.20%, 8/15/45 | | | 250 | | | | 246,308 | |
Entergy Corp.: | | | | | | | | |
4.70%, 1/15/17 | | | 150 | | | | 153,815 | |
4.00%, 7/15/22 | | | 200 | | | | 204,036 | |
Entergy Louisiana LLC, 4.05%, 9/01/23 | | | 250 | | | | 257,868 | |
Eversource Energy, Series H, 3.15%, 1/15/25 | | | 125 | | | | 122,008 | |
Exelon Corp. (a): | | | | | | | | |
3.95%, 6/15/25 | | | 250 | | | | 249,667 | |
5.10%, 6/15/45 | | | 250 | | | | 251,823 | |
Exelon Generation Co. LLC, 6.25%, 10/01/39 | | | 150 | | | | 151,739 | |
Florida Power & Light Co.: | | | | | | | | |
2.75%, 6/01/23 | | | 250 | | | | 247,178 | |
5.95%, 2/01/38 | | | 50 | | | | 62,279 | |
Georgia Power Co., 4.30%, 3/15/42 | | | 200 | | | | 184,721 | |
Great Plains Energy, Inc., 5.29%, 6/15/22 (c) | | | 150 | | | | 164,032 | |
Indiana Michigan Power Co., 6.05%, 3/15/37 | | | 175 | | | | 198,928 | |
Interstate Power & Light Co., 3.25%, 12/01/24 | | | 250 | | | | 251,328 | |
Kansas City Power & Light Co., 3.65%, 8/15/25 | | | 150 | | | | 151,055 | |
LG&E and KU Energy LLC, 3.75%, 11/15/20 | | | 50 | | | | 51,626 | |
Louisville Gas & Electric Co., 4.65%, 11/15/43 | | | 250 | | | | 263,711 | |
Nevada Power Co., 5.45%, 5/15/41 | | | 50 | | | | 56,182 | |
NextEra Energy Capital Holdings, Inc., 3.63%, 6/15/23 | | | 1,000 | | | | 996,278 | |
Nisource Finance Corp.: | | | | | | | | |
6.13%, 3/01/22 | | | 500 | | | | 572,314 | |
5.95%, 6/15/41 | | | 50 | | | | 57,407 | |
5.25%, 2/15/43 | | | 75 | | | | 79,680 | |
Northeast Utilities, 1.45%, 5/01/18 | | | 250 | | | | 245,922 | |
Northern States Power Co.: | | | | | | | | |
3.40%, 8/15/42 | | | 200 | | | | 176,541 | |
4.00%, 8/15/45 | | | 85 | | | | 83,092 | |
Oglethorpe Power Corp., 4.55%, 6/01/44 | | | 250 | | | | 236,906 | |
Oncor Electric Delivery Co. LLC: | | | | | | | | |
7.00%, 9/01/22 | | | 100 | | | | 120,075 | |
5.30%, 6/01/42 | | | 75 | | | | 78,057 | |
3.75%, 4/01/45 | | | 250 | | | | 207,783 | |
Pacific Gas & Electric Co.: | | | | | | | | |
3.25%, 6/15/23 | | | 500 | | | | 501,184 | |
6.05%, 3/01/34 | | | 250 | | | | 294,560 | |
5.13%, 11/15/43 | | | 250 | | | | 273,488 | |
4.75%, 2/15/44 | | | 250 | | | | 259,786 | |
PacifiCorp: | | | | | | | | |
2.95%, 2/01/22 | | | 100 | | | | 100,742 | |
2.95%, 6/01/23 | | | 300 | | | | 299,418 | |
Pennsylvania Electric Co., 6.15%, 10/01/38 | | | 250 | | | | 264,894 | |
Potomac Electric Power Co., 3.60%, 3/15/24 | | | 250 | | | | 258,583 | |
| | | | | | | | |
| Corporate Bonds | | Par (000) | | | Value | |
Electric Utilities (continued) | | | | | | | | |
PPL Capital Funding, Inc.: | | | | | | | | |
1.90%, 6/01/18 | | $ | 250 | | | $ | 247,656 | |
3.40%, 6/01/23 | | | 250 | | | | 249,184 | |
PPL Electric Utilities Corp., 4.75%, 7/15/43 | | | 250 | | | | 269,696 | |
Progress Energy, Inc.: | | | | | | | | |
4.40%, 1/15/21 | | | 100 | | | | 105,772 | |
7.75%, 3/01/31 | | | 50 | | | | 64,435 | |
Public Service Co. of Colorado: | | | | | | | | |
3.95%, 3/15/43 | | | 200 | | | | 194,757 | |
4.30%, 3/15/44 | | | 75 | | | | 76,501 | |
Public Service Electric & Gas Co.: | | | | | | | | |
1.80%, 6/01/19 | | | 250 | | | | 247,426 | |
3.50%, 8/15/20 | | | 50 | | | | 52,198 | |
2.38%, 5/15/23 | | | 250 | | | | 239,343 | |
3.05%, 11/15/24 | | | 250 | | | | 248,986 | |
3.95%, 5/01/42 | | | 50 | | | | 48,267 | |
3.65%, 9/01/42 | | | 50 | | | | 46,152 | |
Series K, 4.05%, 5/01/45 | | | 500 | | | | 489,571 | |
Puget Energy, Inc.: | | | | | | | | |
5.63%, 7/15/22 | | | 500 | | | | 554,690 | |
3.65%, 5/15/25 | | | 250 | | | | 242,222 | |
South Carolina Electric & Gas Co., 4.60%, 6/15/43 | | | 250 | | | | 250,951 | |
Southern California Edison Co.: | | | | | | | | |
1.13%, 5/01/17 | | | 500 | | | | 496,740 | |
2.40%, 2/01/22 | | | 250 | | | | 245,154 | |
5.50%, 3/15/40 | | | 50 | | | | 58,971 | |
4.65%, 10/01/43 | | | 350 | | | | 369,472 | |
Tampa Electric Co., 4.10%, 6/15/42 | | | 250 | | | | 237,306 | |
Toledo Edison Co., 6.15%, 5/15/37 | | | 100 | | | | 112,564 | |
Virginia Electric & Power Co.: | | | | | | | | |
2.95%, 1/15/22 | | | 400 | | | | 402,342 | |
4.00%, 1/15/43 | | | 250 | | | | 239,251 | |
4.45%, 2/15/44 | | | 150 | | | | 154,280 | |
WEC Energy Group, Inc., 3.55%, 6/15/25 | | | 350 | | | | 351,969 | |
| | | | | | | | |
| | | | | | | | 21,988,135 | |
Electrical Equipment — 0.1% | |
Amphenol Corp., 2.55%, 1/30/19 | | | 350 | | | | 350,061 | |
Emerson Electric Co.: | | | | | | | | |
5.00%, 4/15/19 | | | 100 | | | | 109,083 | |
2.63%, 2/15/23 | | | 350 | | | | 342,654 | |
Pentair Finance SA, 1.88%, 9/15/17 | | | 250 | | | | 247,285 | |
Roper Industries, Inc., 3.13%, 11/15/22 | | | 150 | | | | 145,810 | |
| | | | | | | | |
| | | | | | | | 1,194,893 | |
Electronic Equipment, Instruments & Components — 0.1% | |
Arrow Electronics, Inc., 3.00%, 3/01/18 | | | 750 | | | | 749,396 | |
Corning, Inc.: | | | | | | | | |
3.70%, 11/15/23 | | | 250 | | | | 246,181 | |
4.75%, 3/15/42 | | | 50 | | | | 46,934 | |
Ingram Micro, Inc., 4.95%, 12/15/24 | | | 200 | | | | 199,263 | |
Jabil Circuit, Inc., 4.70%, 9/15/22 | | | 250 | | | | 242,500 | |
Tyco Electronics Group SA: | | | | | | | | |
6.55%, 10/01/17 | | | 50 | | | | 53,884 | |
3.50%, 2/03/22 | | | 100 | | | | 101,816 | |
| | | | | | | | |
| | | | | | | | 1,639,974 | |
Energy Equipment & Services — 0.2% | |
Baker Hughes, Inc., 5.13%, 9/15/40 | | | 100 | | | | 98,916 | |
See Notes to Financial Statements.
| | | | | | |
| | | | | | | |
| | BLACKROCK U.S. TOTAL BOND INDEX FUND | | DECEMBER 31, 2015 | | 25 |
| | |
Schedule of Investments (continued) | | U.S. Total Bond Index Master Portfolio |
| | | | | | | | |
| Corporate Bonds | | Par (000) | | | Value | |
Energy Equipment & Services (continued) | |
Ensco PLC: | | | | | | | | |
4.70%, 3/15/21 | | $ | 100 | | | $ | 80,518 | |
4.50%, 10/01/24 | | | 250 | | | | 172,093 | |
5.20%, 3/15/25 | | | 65 | | | | 46,259 | |
FMC Technologies, Inc., 3.45%, 10/01/22 | | | 100 | | | | 87,641 | |
Halliburton Co.: | | | | | | | | |
6.15%, 9/15/19 | | | 100 | | | | 112,548 | |
3.80%, 11/15/25 | | | 300 | | | | 292,117 | |
4.85%, 11/15/35 | | | 250 | | | | 245,590 | |
4.50%, 11/15/41 | | | 50 | | | | 45,398 | |
4.75%, 8/01/43 | | | 250 | | | | 234,697 | |
5.00%, 11/15/45 | | | 175 | | | | 172,995 | |
National Oilwell Varco, Inc., 3.95%, 12/01/42 | | | 150 | | | | 114,261 | |
Noble Holding International Ltd.: | | | | | | | | |
2.50%, 3/15/17 | | | 150 | | | | 141,513 | |
5.95%, 4/01/25 | | | 200 | | | | 137,969 | |
5.25%, 3/15/42 | | | 50 | | | | 27,723 | |
TransCanada PipeLines Ltd., 6.20%, 10/15/37 | | | 200 | | | | 210,439 | |
Transcontinental Gas Pipe Line Co. LLC, 4.45%, 8/01/42 | | | 250 | | | | 167,295 | |
| | | | | | | | |
| | | | | | | | 2,387,972 | |
Food & Staples Retailing — 0.6% | |
Coca-Cola Co., 2.88%, 10/27/25 | | | 125 | | | | 123,232 | |
Costco Wholesale Corp.: | | | | | | | | |
1.13%, 12/15/17 | | | 150 | | | | 149,868 | |
2.25%, 2/15/22 | | | 85 | | | | 83,418 | |
CVS Health Corp.: | | | | | | | | |
2.25%, 8/12/19 | | | 500 | | | | 499,342 | |
4.00%, 12/05/23 | | | 500 | | | | 519,609 | |
4.88%, 7/20/35 | | | 1,000 | | | | 1,032,491 | |
Kraft Heinz Foods Co. (a): | | | | | | | | |
2.00%, 7/02/18 | | | 1,000 | | | | 995,280 | |
5.00%, 7/15/35 | | | 500 | | | | 512,259 | |
Kroger Co.: | | | | | | | | |
6.15%, 1/15/20 | | | 100 | | | | 113,177 | |
3.30%, 1/15/21 | | | 500 | | | | 507,601 | |
3.40%, 4/15/22 | | | 100 | | | | 101,308 | |
5.15%, 8/01/43 | | | 125 | | | | 130,952 | |
Lowe’s Cos., Inc., 3.38%, 9/15/25 | | | 500 | | | | 507,646 | |
NIKE, Inc., 3.88%, 11/01/45 | | | 500 | | | | 482,501 | |
Target Corp., 2.30%, 6/26/19 | | | 750 | | | | 758,693 | |
Wal-Mart Stores, Inc.: | | | | | | | | |
1.00%, 4/21/17 | | | 500 | | | | 500,366 | |
1.13%, 4/11/18 | | | 250 | | | | 248,957 | |
1.95%, 12/15/18 | | | 750 | | | | 761,120 | |
3.63%, 7/08/20 | | | 150 | | | | 160,495 | |
6.20%, 4/15/38 | | | 250 | | | | 313,479 | |
5.63%, 4/15/41 | | | 500 | | | | 594,780 | |
4.00%, 4/11/43 | | | 150 | | | | 145,663 | |
4.75%, 10/02/43 | | | 250 | | | | 268,893 | |
4.30%, 4/22/44 | | | 250 | | | | 254,866 | |
Walgreen Co., 3.10%, 9/15/22 | | | 200 | | | | 193,687 | |
Walgreens Boots Alliance, Inc.: | | | | | | | | |
4.50%, 11/18/34 | | | 155 | | | | 141,546 | |
4.80%, 11/18/44 | | | 150 | | | | 135,688 | |
| | | | | | | | |
| | | | | | | | 10,236,917 | |
Food Products — 0.3% | |
Archer-Daniels-Midland Co., 4.54%, 3/26/42 | | | 75 | | | | 76,910 | |
| | | | | | | | |
| Corporate Bonds | | Par (000) | | | Value | |
Food Products (continued) | |
ConAgra Foods, Inc.: | | | | | | | | |
3.25%, 9/15/22 | | $ | 200 | | | $ | 193,033 | |
4.65%, 1/25/43 | | | 165 | | | | 147,183 | |
General Mills, Inc.: | | | | | | | | |
2.20%, 10/21/19 | | | 300 | | | | 300,067 | |
3.15%, 12/15/21 | | | 150 | | | | 150,112 | |
JM Smucker Co. | | | | | | | | |
3.50%, 10/15/21 | | | 50 | | | | 51,443 | |
4.25%, 3/15/35 | | | 250 | | | | 244,235 | |
Kellogg Co., Series B, 7.45%, 4/01/31 | | | 100 | | | | 127,147 | |
Kraft Foods Group, Inc.: | | | | | | | | |
5.38%, 2/10/20 | | | 52 | | | | 56,937 | |
6.50%, 2/09/40 | | | 250 | | | | 291,435 | |
5.00%, 6/04/42 | | | 200 | | | | 201,378 | |
Mead Johnson Nutrition Co., 4.60%, 6/01/44 | | | 250 | | | | 231,421 | |
Mondelez International, Inc.: | | | | | | | | |
2.25%, 2/01/19 | | | 250 | | | | 249,908 | |
4.00%, 2/01/24 | | | 250 | | | | 257,699 | |
Sysco Corp.: | | | | | | | | |
3.75%, 10/01/25 | | | 100 | | | | 101,372 | |
4.85%, 10/01/45 | | | 150 | | | | 156,058 | |
Tyson Foods, Inc.: | | | | | | | | |
2.65%, 8/15/19 | | | 500 | | | | 500,277 | |
4.50%, 6/15/22 | | | 150 | | | | 159,654 | |
4.88%, 8/15/34 | | | 70 | | | | 71,443 | |
Unilever Capital Corp.: | | | | | | | | |
2.20%, 3/06/19 | | | 200 | | | | 202,976 | |
4.25%, 2/10/21 | | | 200 | | | | 218,391 | |
| | | | | | | | |
| | | | | | | | 3,989,079 | |
Gas Utilities — 0.0% | |
AGL Capital Corp., 3.50%, 9/15/21 | | | 50 | | | | 50,127 | |
Atmos Energy Corp., 4.15%, 1/15/43 | | | 100 | | | | 96,817 | |
National Fuel Gas Co., 3.75%, 3/01/23 | | | 300 | | | | 277,852 | |
| | | | | | | | |
| | | | | | | | 424,796 | |
Health Care Equipment & Supplies — 0.4% | |
Baxter International, Inc., 1.85%, 6/15/18 | | | 250 | | | | 248,506 | |
Becton Dickinson & Co.: | | | | | | | | |
1.80%, 12/15/17 | | | 250 | | | | 249,637 | |
2.68%, 12/15/19 | | | 500 | | | | 502,722 | |
3.30%, 3/01/23 | | | 200 | | | | 197,636 | |
6.00%, 5/15/39 | | | 250 | | | | 287,052 | |
Boston Scientific Corp.: | | | | | | | | |
6.00%, 1/15/20 | | | 100 | | | | 111,041 | |
4.13%, 10/01/23 | | | 100 | | | | 101,180 | |
3.85%, 5/15/25 | | | 250 | | | | 245,987 | |
Covidien International Finance SA: | | | | | | | | |
2.95%, 6/15/23 | | | 250 | | | | 246,034 | |
6.55%, 10/15/37 | | | 25 | | | | 31,340 | |
Medtronic, Inc.: | | | | | | | | |
1.38%, 4/01/18 | | | 300 | | | | 298,391 | |
4.13%, 3/15/21 | | | 50 | | | | 53,203 | |
3.15%, 3/15/22 | | | 350 | | | | 353,821 | |
2.75%, 4/01/23 | | | 500 | | | | 487,346 | |
3.63%, 3/15/24 | | | 400 | | | | 409,710 | |
4.38%, 3/15/35 | | | 350 | | | | 353,795 | |
4.00%, 4/01/43 | | | 150 | | | | 139,196 | |
4.63%, 3/15/45 | | | 500 | | | | 515,727 | |
See Notes to Financial Statements.
| | | | | | |
| | | | | | | |
| 26 | | BLACKROCK U.S. TOTAL BOND INDEX FUND | | DECEMBER 31, 2015 | | |
| | |
Schedule of Investments (continued) | | U.S. Total Bond Index Master Portfolio |
| | | | | | | | |
| Corporate Bonds | | Par (000) | | | Value | |
Health Care Equipment & Supplies (continued) | |
St. Jude Medical, Inc.: | | | | | | | | |
3.25%, 4/15/23 | | $ | 150 | | | $ | 147,278 | |
3.88%, 9/15/25 | | | 45 | | | | 45,420 | |
Stryker Corp.: | | | | | | | | |
1.30%, 4/01/18 | | | 200 | | | | 198,561 | |
3.38%, 11/01/25 | | | 80 | | | | 78,961 | |
Zimmer Holdings, Inc.: | | | | | | | | |
3.15%, 4/01/22 | | | 500 | | | | 491,540 | |
4.25%, 8/15/35 | | | 295 | | | | 275,016 | |
| | | | | | | | |
| | | | | | | | 6,069,100 | |
Health Care Providers & Services — 0.6% | |
Aetna, Inc.: | | | | | | | | |
1.50%, 11/15/17 | | | 250 | | | | 249,058 | |
4.13%, 6/01/21 | | | 250 | | | | 261,616 | |
2.75%, 11/15/22 | | | 250 | | | | 242,861 | |
3.50%, 11/15/24 | | | 70 | | | | 69,874 | |
6.75%, 12/15/37 | | | 50 | | | | 62,952 | |
4.75%, 3/15/44 | | | 25 | | | | 25,343 | |
AmerisourceBergen Corp.: | | | | | | | | |
1.15%, 5/15/17 | | | 250 | | | | 248,211 | |
4.25%, 3/01/45 | | | 250 | | | | 229,783 | |
Anthem, Inc.: | | | | | | | | |
1.88%, 1/15/18 | | | 450 | | | | 448,048 | |
2.25%, 8/15/19 | | | 225 | | | | 223,582 | |
3.13%, 5/15/22 | | | 200 | | | | 196,286 | |
3.30%, 1/15/23 | | | 100 | | | | 97,182 | |
4.63%, 5/15/42 | | | 50 | | | | 47,216 | |
5.10%, 1/15/44 | | | 150 | | | | 150,591 | |
4.85%, 8/15/54 | | | 150 | | | | 139,829 | |
Cardinal Health, Inc.: | | | | | | | | |
3.20%, 6/15/22 | | | 50 | | | | 49,388 | |
3.50%, 11/15/24 | | | 250 | | | | 250,290 | |
4.60%, 3/15/43 | | | 50 | | | | 49,271 | |
Cigna Corp.: | | | | | | | | |
4.00%, 2/15/22 | | | 25 | | | | 25,840 | |
3.25%, 4/15/25 | | | 300 | | | | 294,379 | |
5.38%, 2/15/42 | | | 50 | | | | 54,817 | |
Dignity Health: | | | | | | | | |
2.64%, 11/01/19 | | | 100 | | | | 100,400 | |
5.27%, 11/01/64 | | | 100 | | | | 102,588 | |
Express Scripts Holding Co.: | | | | | | | | |
2.65%, 2/15/17 | | | 350 | | | | 353,437 | |
2.25%, 6/15/19 | | | 350 | | | | 347,937 | |
4.75%, 11/15/21 | | | 300 | | | | 321,678 | |
3.50%, 6/15/24 | | | 250 | | | | 246,298 | |
Humana, Inc., 4.95%, 10/01/44 | | | 250 | | | | 248,353 | |
Kaiser Foundation Hospitals, 3.50%, 4/01/22 | | | 100 | | | | 101,606 | |
Laboratory Corp. of America Holdings: | | | | | | | | |
3.75%, 8/23/22 | | | 100 | | | | 100,647 | |
4.00%, 11/01/23 | | | 100 | | | | 101,008 | |
3.60%, 2/01/25 | | | 75 | | | | 72,370 | |
McKesson Corp.: | | | | | | | | |
2.85%, 3/15/23 | | | 150 | | | | 143,903 | |
4.88%, 3/15/44 | | | 250 | | | | 249,875 | |
Quest Diagnostics, Inc.: | | | | | | | | |
4.70%, 4/01/21 | | | 100 | | | | 105,898 | |
4.25%, 4/01/24 | | | 250 | | | | 257,466 | |
3.50%, 3/30/25 | | | 370 | | | | 357,463 | |
| | | | | | | | |
| Corporate Bonds | | Par (000) | | | Value | |
Health Care Providers & Services (continued) | |
UnitedHealth Group, Inc.: | | | | | | | | |
1.40%, 10/15/17 | | $ | 250 | | | $ | 249,521 | |
1.63%, 3/15/19 | | | 550 | | | | 543,922 | |
2.30%, 12/15/19 | | | 250 | | | | 251,215 | |
2.88%, 3/15/23 | | | 250 | | | | 247,343 | |
4.63%, 7/15/35 | | | 555 | | | | 576,155 | |
6.88%, 2/15/38 | | | 100 | | | | 130,789 | |
5.95%, 2/15/41 | | | 100 | | | | 118,927 | |
3.95%, 10/15/42 | | | 150 | | | | 139,614 | |
4.75%, 7/15/45 | | | 250 | | | | 263,322 | |
WellPoint, Inc., 3.50%, 8/15/24 | | | 250 | | | | 244,096 | |
| | | | | | | | |
| | | | | | | | 9,392,248 | |
Hotels, Restaurants & Leisure — 0.1% | |
Carnival Corp., 3.95%, 10/15/20 | | | 250 | | | | 261,130 | |
Hyatt Hotels Corp., 3.38%, 7/15/23 | | | 190 | | | | 180,412 | |
Marriott International, Inc.: | | | | | | | | |
3.00%, 3/01/19 | | | 100 | | | | 101,361 | |
3.25%, 9/15/22 | | | 100 | | | | 98,836 | |
McDonald’s Corp.: | | | | | | | | |
1.88%, 5/29/19 | | | 100 | | | | 98,778 | |
3.50%, 7/15/20 | | | 50 | | | | 51,576 | |
3.25%, 6/10/24 | | | 400 | | | | 394,614 | |
3.38%, 5/26/25 | | | 500 | | | | 489,782 | |
4.70%, 12/09/35 | | | 65 | | | | 64,759 | |
3.70%, 2/15/42 | | | 100 | | | | 83,649 | |
Starbucks Corp., 3.85%, 10/01/23 | | | 250 | | | | 265,257 | |
Starwood Hotels & Resorts | | | | | | | | |
Worldwide, Inc., 4.50%, 10/01/34 | | | 250 | | | | 225,366 | |
Wyndham Worldwide Corp., 4.25%, 3/01/22 | | | 50 | | | | 50,328 | |
| | | | | | | | |
| | | | | | | | 2,365,848 | |
Household Durables — 0.0% | |
Leggett & Platt, Inc., 3.80%, 11/15/24 | | | 200 | | | | 201,073 | |
Mohawk Industries, Inc., 3.85%, 2/01/23 | | | 125 | | | | 126,561 | |
Newell Rubbermaid, Inc., 4.00%, 12/01/24 | | | 250 | | | | 230,781 | |
Whirlpool Corp., 5.15%, 3/01/43 | | | 200 | | | | 196,649 | |
| | | | | | | | |
| | | | | | | | 755,064 | |
Household Products — 0.1% | |
Clorox Co.: | | | | | | | | |
3.05%, 9/15/22 | | | 50 | | | | 49,364 | |
3.50%, 12/15/24 | | | 250 | | | | 249,511 | |
Kimberly-Clark Corp.: | | | | | | | | |
1.90%, 5/22/19 | | | 500 | | | | 497,916 | |
3.63%, 8/01/20 | | | 50 | | | | 52,910 | |
2.65%, 3/01/25 | | | 85 | | | | 82,050 | |
Procter & Gamble Co.: | | | | | | | | |
2.30%, 2/06/22 | | | 250 | | | | 249,822 | |
5.55%, 3/05/37 | | | 250 | | | | 303,815 | |
| | | | | | | | |
| | | | | | | | 1,485,388 | |
Independent Power and Renewable Electricity Producers — 0.1% | |
Exelon Generation Co. LLC: | | | | | | | | |
4.25%, 6/15/22 | | | 500 | | | | 506,597 | |
5.60%, 6/15/42 | | | 50 | | | | 46,559 | |
Southern Power Co., 5.25%, 7/15/43 | | | 500 | | | | 477,096 | |
| | | | | | | | |
| | | | | | | | 1,030,252 | |
See Notes to Financial Statements.
| | | | | | |
| | | | | | | |
| | BLACKROCK U.S. TOTAL BOND INDEX FUND | | DECEMBER 31, 2015 | | 27 |
| | |
Schedule of Investments (continued) | | U.S. Total Bond Index Master Portfolio |
| | | | | | | | |
| Corporate Bonds | | Par (000) | | | Value | |
Industrial Conglomerates — 0.1% | |
General Electric Co.: | | | | | | | | |
5.25%, 12/06/17 | | $ | 750 | | | $ | 800,763 | |
2.70%, 10/09/22 | | | 150 | | | | 149,371 | |
4.50%, 3/11/44 | | | 500 | | | | 514,566 | |
Koninklijke Philips NV, 3.75%, 3/15/22 | | | 250 | | | | 256,636 | |
| | | | | | | | |
| | | | | | | | 1,721,336 | |
Insurance — 1.0% | |
ACE INA Holdings, Inc.: | | | | | | | | |
3.35%, 5/03/26 | | | 795 | | | | 792,564 | |
4.15%, 3/13/43 | | | 150 | | | | 146,770 | |
Aflac, Inc.: | | | | | | | | |
2.65%, 2/15/17 | | | 250 | | | | 253,292 | |
3.63%, 6/15/23 | | | 250 | | | | 258,815 | |
3.63%, 11/15/24 | | | 250 | | | | 254,430 | |
Alleghany Corp., 4.95%, 6/27/22 | | | 50 | | | | 53,576 | |
Allstate Corp.: | | | | | | | | |
3.15%, 6/15/23 | | | 250 | | | | 249,806 | |
4.50%, 6/15/43 | | | 150 | | | | 152,409 | |
American International Group, Inc.: | | | | | | | | |
2.30%, 7/16/19 | | | 500 | | | | 495,766 | |
3.38%, 8/15/20 | | | 250 | | | | 257,040 | |
4.88%, 6/01/22 | | | 250 | | | | 269,985 | |
4.13%, 2/15/24 | | | 250 | | | | 256,728 | |
3.75%, 7/10/25 | | | 250 | | | | 247,765 | |
4.70%, 7/10/35 | | | 500 | | | | 496,965 | |
Aon PLC: | | | | | | | | |
2.80%, 3/15/21 | | | 250 | | | | 249,056 | |
4.45%, 5/24/43 | | | 200 | | | | 187,055 | |
Arch Capital Group US, Inc., 5.14%, 11/01/43 | | | 125 | | | | 126,475 | |
Assurant, Inc., 2.50%, 3/15/18 | | | 250 | | | | 249,588 | |
Assured Guaranty US Holdings, Inc., 5.00%, 7/01/24 | | | 110 | | | | 114,278 | |
AXA SA, 8.60%, 12/15/30 | | | 50 | | | | 67,187 | |
Berkshire Hathaway Finance Corp.: | | | | | | | | |
4.40%, 5/15/42 | | | 100 | | | | 99,012 | |
4.30%, 5/15/43 | | | 250 | | | | 245,169 | |
Berkshire Hathaway, Inc.: | | | | | | | | |
1.90%, 1/31/17 | | | 100 | | | | 100,868 | |
1.55%, 2/09/18 | | | 500 | | | | 500,813 | |
2.10%, 8/14/19 | | | 500 | | | | 503,054 | |
4.50%, 2/11/43 | | | 100 | | | | 100,693 | |
Chubb Corp.: | | | | | | | | |
6.00%, 5/11/37 | | | 50 | | | | 61,293 | |
Series 1, 6.50%, 5/15/38 | | | 100 | | | | 129,329 | |
CNA Financial Corp., 5.75%, 8/15/21 | | | 100 | | | | 111,924 | |
First American Financial Corp., 4.60%, 11/15/24 | | | 200 | | | | 202,476 | |
Hartford Financial Services Group, Inc.: | | | | | | | | |
6.30%, 3/15/18 | | | 250 | | | | 272,428 | |
6.63%, 3/30/40 | | | 100 | | | | 123,587 | |
6.10%, 10/01/41 | | | 100 | | | | 116,072 | |
Lincoln National Corp.: | | | | | | | | |
4.85%, 6/24/21 | | | 300 | | | | 323,078 | |
4.20%, 3/15/22 | | | 100 | | | | 104,553 | |
4.00%, 9/01/23 | | | 200 | | | | 204,781 | |
3.35%, 3/09/25 | | | 65 | | | | 62,671 | |
Loews Corp., 2.63%, 5/15/23 | | | 250 | | | | 238,212 | |
Markel Corp., 3.63%, 3/30/23 | | | 250 | | | | 246,528 | |
Marsh & McLennan Cos., Inc.: | | | | | | | | |
2.35%, 9/10/19 | | | 235 | | | | 234,451 | |
2.35%, 3/06/20 | | | 190 | | | | 188,341 | |
| | | | | | | | |
| Corporate Bonds | | Par (000) | | | Value | |
Insurance (continued) | |
Marsh & McLennan Cos., Inc. (continued): | | | | | | | | |
4.80%, 7/15/21 | | $ | 50 | | | $ | 54,425 | |
MetLife, Inc.: | | | | | | | | |
4.75%, 2/08/21 | | | 200 | | | | 218,906 | |
3.00%, 3/01/25 | | | 650 | | | | 624,562 | |
4.13%, 8/13/42 | | | 300 | | | | 284,713 | |
4.88%, 11/13/43 | | | 250 | | | | 262,276 | |
Old Republic International Corp., 4.88%, 10/01/24 | | | 250 | | | | 256,191 | |
Principal Financial Group, Inc.: | | | | | | | | |
1.85%, 11/15/17 | | | 250 | | | | 250,208 | |
3.40%, 5/15/25 | | | 250 | | | | 245,072 | |
4.63%, 9/15/42 | | | 50 | | | | 48,733 | |
Progressive Corp.: | | | | | | | | |
3.75%, 8/23/21 | | | 50 | | | | 52,865 | |
4.35%, 4/25/44 | | | 100 | | | | 100,820 | |
3.70%, 1/26/45 | | | 200 | | | | 181,009 | |
Prudential Financial, Inc.: | | | | | | | | |
2.35%, 8/15/19 | | | 350 | | | | 348,344 | |
5.38%, 6/21/20 | | | 350 | | | | 389,120 | |
5.10%, 8/15/43 | | | 250 | | | | 260,525 | |
5.20%, 3/15/44 (d) | | | 100 | | | | 96,550 | |
5.38%, 5/15/45 (d) | | | 250 | | | | 249,688 | |
8.88%, 6/15/68 (d) | | | 100 | | | | 112,500 | |
Travelers Cos., Inc.: | | | | | | | | |
3.90%, 11/01/20 | | | 250 | | | | 265,586 | |
4.60%, 8/01/43 | | | 100 | | | | 105,084 | |
Travelers Property Casualty Corp., 6.38%, 3/15/33 | | | 100 | | | | 122,665 | |
Voya Financial, Inc., 2.90%, 2/15/18 | | | 750 | | | | 758,107 | |
WR Berkley Corp., 4.63%, 3/15/22 | | | 200 | | | | 211,202 | |
XLIT Ltd.: | | | | | | | | |
2.30%, 12/15/18 | | | 250 | | | | 250,046 | |
5.75%, 10/01/21 | | | 100 | | | | 111,434 | |
| | | | | | | | |
| | | | | | | | 15,209,514 | |
Internet & Catalog Retail — 0.1% | |
Amazon.com, Inc.: | | | | | | | | |
1.20%, 11/29/17 | | | 250 | | | | 249,226 | |
2.60%, 12/05/19 | | | 350 | | | | 355,488 | |
4.80%, 12/05/34 | | | 250 | | | | 263,219 | |
| | | | | | | | |
| | | | | | | | 867,933 | |
Internet Software & Services — 0.1% | |
Baidu, Inc.: | | | | | | | | |
3.25%, 8/06/18 | | | 205 | | | | 207,626 | |
2.75%, 6/09/19 | | | 350 | | | | 346,954 | |
eBay, Inc.: | | | | | | | | |
2.20%, 8/01/19 | | | 500 | | | | 494,319 | |
3.25%, 10/15/20 | | | 50 | | | | 50,819 | |
2.60%, 7/15/22 | | | 50 | | | | 46,542 | |
Expedia, Inc., 4.50%, 8/15/24 | | | 250 | | | | 241,287 | |
Google, Inc., 3.63%, 5/19/21 | | | 25 | | | | 26,620 | |
| | | | | | | | |
| | | | | | | | 1,414,167 | |
IT Services — 0.3% | |
Alibaba Group Holding Ltd. | | | | | | | | |
3.13%, 11/28/21 | | | 225 | | | | 218,222 | |
4.50%, 11/28/34 | | | 250 | | | | 239,191 | |
Fidelity National Information Services, Inc.: | | | | | | | | |
1.45%, 6/05/17 | | | 250 | | | | 246,617 | |
2.00%, 4/15/18 | | | 250 | | | | 245,808 | |
See Notes to Financial Statements.
| | | | | | |
| | | | | | | |
| 28 | | BLACKROCK U.S. TOTAL BOND INDEX FUND | | DECEMBER 31, 2015 | | |
| | |
Schedule of Investments (continued) | | U.S. Total Bond Index Master Portfolio |
| | | | | | | | |
| Corporate Bonds | | Par (000) | | | Value | |
IT Services (continued) | |
Fidelity National Information Services, Inc. (continued): | | | | | | | | |
3.50%, 4/15/23 | | $ | 25 | | | $ | 23,870 | |
5.00%, 10/15/25 | | | 500 | | | | 513,745 | |
Fiserv, Inc., 2.70%, 6/01/20 | | | 500 | | | | 495,851 | |
International Business Machines Corp.: | | | | | | | | |
1.25%, 2/08/18 | | | 500 | | | | 499,039 | |
1.95%, 2/12/19 | | | 250 | | | | 251,177 | |
1.88%, 5/15/19 | | | 250 | | | | 249,689 | |
2.90%, 11/01/21 | | | 100 | | | | 101,389 | |
3.63%, 2/12/24 | | | 275 | | | | 283,090 | |
4.00%, 6/20/42 | | | 350 | | | | 327,386 | |
Total System Services, Inc., 2.38%, 6/01/18 | | | 250 | | | | 247,403 | |
Verisk Analytics, Inc., 4.00%, 6/15/25 | | | 250 | | | | 242,826 | |
Western Union Co.: | | | | | | | | |
2.88%, 12/10/17 | | | 250 | | | | 252,972 | |
6.20%, 11/17/36 | | | 25 | | | | 24,306 | |
Xerox Corp.: | | | | | | | | |
5.63%, 12/15/19 | | | 100 | | | | 106,379 | |
2.80%, 5/15/20 | | | 500 | | | | 476,798 | |
| | | | | | | | |
| | | | | | | | 5,045,758 | |
Leisure Products — 0.0% | |
Hasbro, Inc., 5.10%, 5/15/44 | | | 60 | | | | 57,006 | |
Mattel, Inc., 1.70%, 3/15/18 | | | 200 | | | | 197,343 | |
| | | | | | | | |
| | | | | | | | 254,349 | |
Life Sciences Tools & Services — 0.1% | |
Agilent Technologies, Inc., 3.88%, 7/15/23 | | | 200 | | | | 200,142 | |
Life Technologies Corp., 6.00%, 3/01/20 | | | 100 | | | | 110,855 | |
Thermo Fisher Scientific, Inc.: | | | | | | | | |
2.40%, 2/01/19 | | | 500 | | | | 499,781 | |
3.30%, 2/15/22 | | | 55 | | | | 54,865 | |
3.15%, 1/15/23 | | | 250 | | | | 243,372 | |
| | | | | | | | |
| | | | | | | | 1,109,015 | |
Machinery — 0.2% | |
Caterpillar, Inc.: | | | | | | | | |
3.90%, 5/27/21 | | | 50 | | | | 53,084 | |
3.40%, 5/15/24 | | | 500 | | | | 506,506 | |
5.20%, 5/27/41 | | | 100 | | | | 107,968 | |
3.80%, 8/15/42 | | | 250 | | | | 223,767 | |
Danaher Corp., 3.90%, 6/23/21 | | | 50 | | | | 53,143 | |
Deere & Co., 3.90%, 6/09/42 | | | 50 | | | | 47,800 | |
Flowserve Corp., 3.50%, 9/15/22 | | | 100 | | | | 97,127 | |
Illinois Tool Works, Inc.: | | | | | | | | |
1.95%, 3/01/19 | | | 250 | | | | 250,263 | |
4.88%, 9/15/41 | | | 50 | | | | 54,246 | |
3.90%, 9/01/42 | | | 75 | | | | 71,106 | |
Ingersoll-Rand Global Holding Co. Ltd.: | | | | | | | | |
6.88%, 8/15/18 | | | 50 | | | | 55,190 | |
2.88%, 1/15/19 | | | 500 | | | | 505,012 | |
Joy Global, Inc., 5.13%, 10/15/21 | | | 50 | | | | 39,140 | |
Stanley Black & Decker, Inc., 2.90%, 11/01/22 | | | 150 | | | | 146,942 | |
Trinity Industries, Inc., 4.55%, 10/01/24 | | | 250 | | | | 228,999 | |
Valmont Industries, Inc., 5.00%, 10/01/44 | | | 250 | | | | 218,143 | |
| | | | | | | | |
| | | | | | | | 2,658,436 | |
| | | | | | | | |
| Corporate Bonds | | Par (000) | | | Value | |
Media — 1.2% | |
21st Century Fox America, Inc.: | | | | | | | | |
4.50%, 2/15/21 | | $ | 100 | | | $ | 107,603 | |
3.00%, 9/15/22 | | | 150 | | | | 147,813 | |
3.70%, 10/15/25 (a) | | | 830 | | | | 827,942 | |
6.20%, 12/15/34 | | | 100 | | | | 113,544 | |
6.15%, 2/15/41 | | | 150 | | | | 168,559 | |
4.75%, 9/15/44 | | | 500 | | | | 480,928 | |
CBS Corp.: | | | | | | | | |
4.00%, 1/15/26 | | | 500 | | | | 487,569 | |
4.85%, 7/01/42 | | | 325 | | | | 291,699 | |
CCO Safari II LLC (a): | | | | | | | | |
3.58%, 7/23/20 | | | 500 | | | | 497,004 | |
4.91%, 7/23/25 | | | 430 | | | | 429,582 | |
6.48%, 10/23/45 | | | 500 | | | | 500,819 | |
Cintas Corp. No 2, 4.30%, 6/01/21 | | | 25 | | | | 26,392 | |
Comcast Corp.: | | | | | | | | |
5.15%, 3/01/20 | | | 350 | | | | 391,065 | |
3.60%, 3/01/24 | | | 250 | | | | 258,410 | |
3.38%, 2/15/25 | | | 500 | | | | 504,611 | |
3.38%, 8/15/25 | | | 500 | | | | 506,186 | |
4.25%, 1/15/33 | | | 650 | | | | 638,706 | |
4.20%, 8/15/34 | | | 235 | | | | 232,789 | |
4.40%, 8/15/35 | | | 250 | | | | 251,490 | |
6.45%, 3/15/37 | | | 200 | | | | 248,915 | |
4.65%, 7/15/42 | | | 150 | | | | 152,640 | |
DIRECTV Holdings LLC/DIRECTV Financing Co., Inc.: | | | | | | | | |
2.40%, 3/15/17 | | | 250 | | | | 252,012 | |
3.80%, 3/15/22 | | | 250 | | | | 251,581 | |
4.45%, 4/01/24 | | | 500 | | | | 513,546 | |
3.95%, 1/15/25 | | | 350 | | | | 345,033 | |
5.15%, 3/15/42 | | | 150 | | | | 139,851 | |
Discovery Communications LLC: | | | | | | | | |
4.38%, 6/15/21 | | | 50 | | | | 51,240 | |
3.25%, 4/01/23 | | | 50 | | | | 46,068 | |
4.95%, 5/15/42 | | | 50 | | | | 41,890 | |
4.88%, 4/01/43 | | | 150 | | | | 123,467 | |
Grupo Televisa SAB, 5.00%, 5/13/45 | | | 200 | | | | 171,961 | |
Interpublic Group of Cos., Inc., 4.20%, 4/15/24 | | | 250 | | | | 247,691 | |
McGraw Hill Financial, Inc., 4.40%, 2/15/26 | | | 250 | | | | 255,791 | |
NBCUniversal Media LLC: | | | | | | | | |
4.38%, 4/01/21 | | | 600 | | | | 651,738 | |
2.88%, 1/15/23 | | | 250 | | | | 248,237 | |
5.95%, 4/01/41 | | | 250 | | | | 298,979 | |
Omnicom Group, Inc.: | | | | | | | | |
3.63%, 5/01/22 | | | 125 | | | | 126,180 | |
3.65%, 11/01/24 | | | 70 | | | | 69,338 | |
Scripps Networks Interactive, Inc., 3.90%, 11/15/24 | | | 250 | | | | 239,015 | |
Thomson Reuters Corp.: | | | | | | | | |
6.50%, 7/15/18 | | | 250 | | | | 275,971 | |
4.30%, 11/23/23 | | | 250 | | | | 255,292 | |
Time Warner Cable, Inc.: | | | | | | | | |
8.25%, 4/01/19 | | | 300 | | | | 344,490 | |
5.00%, 2/01/20 | | | 500 | | | | 529,281 | |
4.13%, 2/15/21 | | | 100 | | | | 102,108 | |
6.55%, 5/01/37 | | | 150 | | | | 151,798 | |
6.75%, 6/15/39 | | | 50 | | | | 50,180 | |
5.50%, 9/01/41 | | | 250 | | | | 225,911 | |
4.50%, 9/15/42 | | | 475 | | | | 372,771 | |
See Notes to Financial Statements.
| | | | | | |
| | | | | | | |
| | BLACKROCK U.S. TOTAL BOND INDEX FUND | | DECEMBER 31, 2015 | | 29 |
| | |
Schedule of Investments (continued) | | U.S. Total Bond Index Master Portfolio |
| | | | | | | | |
| Corporate Bonds | | Par (000) | | | Value | |
Media (continued) | |
Time Warner, Inc.: | | | | | | | | |
4.88%, 3/15/20 | | $ | 250 | | | $ | 270,296 | |
3.60%, 7/15/25 | | | 250 | | | | 243,370 | |
7.63%, 4/15/31 | | | 250 | | | | 309,338 | |
7.70%, 5/01/32 | | | 250 | | | | 312,041 | |
6.25%, 3/29/41 | | | 150 | | | | 166,586 | |
5.35%, 12/15/43 | | | 250 | | | | 249,639 | |
4.65%, 6/01/44 | | | 250 | | | | 229,338 | |
Viacom, Inc.: | | | | | | | | |
2.50%, 9/01/18 | | | 500 | | | | 498,751 | |
5.63%, 9/15/19 | | | 250 | | | | 269,976 | |
3.13%, 6/15/22 | | | 150 | | | | 138,969 | |
3.25%, 3/15/23 | | | 200 | | | | 182,612 | |
6.88%, 4/30/36 | | | 250 | | | | 247,650 | |
4.38%, 3/15/43 | | | 70 | | | | 51,276 | |
5.85%, 9/01/43 | | | 100 | | | | 89,798 | |
Walt Disney Co.: | | | | | | | | |
1.85%, 5/30/19 | | | 500 | | | | 500,775 | |
2.15%, 9/17/20 | | | 500 | | | | 499,708 | |
3.75%, 6/01/21 | | | 50 | | | | 53,409 | |
2.35%, 12/01/22 | | | 300 | | | | 296,149 | |
3.15%, 9/17/25 | | | 165 | | | | 166,793 | |
WPP Finance 2010: | | | | | | | | |
4.75%, 11/21/21 | | | 100 | | | | 107,747 | |
3.75%, 9/19/24 | | | 250 | | | | 248,703 | |
| | | | | | | | |
| | | | | | | | 18,778,610 | |
Metals & Mining — 0.3% | | | | | | | | |
Barrick Gold Corp., 4.10%, 5/01/23 | | | 157 | | | | 134,684 | |
Barrick North America Finance LLC, 5.70%, 5/30/41 | | | 50 | | | | 33,522 | |
BHP Billiton Finance USA Ltd.: | | | | | | | | |
1.63%, 2/24/17 | | | 100 | | | | 99,797 | |
2.05%, 9/30/18 | | | 175 | | | | 171,904 | |
2.88%, 2/24/22 | | | 250 | | | | 230,472 | |
5.00%, 9/30/43 | | | 350 | | | | 314,581 | |
Carpenter Technology Corp., 4.45%, 3/01/23 | | | 250 | | | | 240,190 | |
Freeport-McMoRan, Inc.: | | | | | | | | |
2.15%, 3/01/17 | | | 100 | | | | 91,500 | |
3.55%, 3/01/22 | | | 50 | | | | 29,000 | |
5.40%, 11/14/34 | | | 350 | | | | 185,500 | |
5.45%, 3/15/43 | | | 350 | | | | 182,000 | |
Goldcorp, Inc.: | | | | | | | | |
2.13%, 3/15/18 | | | 150 | | | | 145,372 | |
3.63%, 6/09/21 | | | 250 | | | | 234,759 | |
Kinross Gold Corp., 5.95%, 3/15/24 | | | 200 | | | | 132,000 | |
Newmont Mining Corp.: | | | | | | | | |
3.50%, 3/15/22 | | | 450 | | | | 401,088 | |
4.88%, 3/15/42 | | | 50 | | | | 35,728 | |
Reliance Steel & Aluminum Co., 4.50%, 4/15/23 | | | 25 | | | | 23,271 | |
Rio Tinto Finance USA Ltd.: | | | | | | | | |
1.63%, 8/21/17 | | | 250 | | | | 246,412 | |
4.13%, 5/20/21 | | | 150 | | | | 150,213 | |
2.88%, 8/21/22 | | | 100 | | | | 90,697 | |
3.75%, 6/15/25 | | | 500 | | | | 453,875 | |
5.20%, 11/02/40 | | | 350 | | | | 321,169 | |
4.75%, 3/22/42 | | | 100 | | | | 85,790 | |
Southern Copper Corp.: | | | | | | | | |
6.75%, 4/16/40 | | | 100 | | | | 85,534 | |
5.88%, 4/23/45 | | | 365 | | | | 279,635 | |
| | | | | | | | |
| Corporate Bonds | | Par (000) | | | Value | |
Metals & Mining (continued) | | | | | | | | |
Vale Overseas Ltd.: | | | | | | | | |
4.38%, 1/11/22 (e) | | $ | 750 | | | $ | 567,622 | |
6.88%, 11/21/36 | | | 200 | | | | 139,808 | |
Vale SA, 5.63%, 9/11/42 | | | 250 | | | | 165,337 | |
| | | | | | | | |
| | | | | | | | 5,271,460 | |
Multi-Utilities — 0.2% | | | | | | | | |
CMS Energy Corp., 4.70%, 3/31/43 | | | 200 | | | | 197,053 | |
Consolidated Edison Co. of New York, Inc.: | | | | | | | | |
6.65%, 4/01/19 | | | 100 | | | | 113,500 | |
4.20%, 3/15/42 | | | 150 | | | | 143,853 | |
3.95%, 3/01/43 | | | 150 | | | | 138,545 | |
4.45%, 3/15/44 | | | 250 | | | | 249,795 | |
Dominion Resources, Inc.: | | | | | | | | |
1.40%, 9/15/17 | | | 250 | | | | 247,433 | |
3.63%, 12/01/24 | | | 250 | | | | 247,600 | |
4.90%, 8/01/41 | | | 50 | | | | 48,928 | |
ONE Gas, Inc., 4.66%, 2/01/44 | | | 250 | | | | 258,969 | |
San Diego Gas & Electric Co.: | | | | | | | | |
3.60%, 9/01/23 | | | 250 | | | | 260,267 | |
4.30%, 4/01/42 | | | 100 | | | | 101,105 | |
SCANA Corp., 4.13%, 2/01/22 | | | 100 | | | | 97,969 | |
Sempra Energy: | | | | | | | | |
2.30%, 4/01/17 | | | 250 | | | | 251,454 | |
2.40%, 3/15/20 | | | 250 | | | | 245,022 | |
4.05%, 12/01/23 | | | 250 | | | | 257,520 | |
3.55%, 6/15/24 | | | 250 | | | | 248,621 | |
3.75%, 11/15/25 | | | 250 | | | | 249,404 | |
| | | | | | | | |
| | | | | | | | 3,357,038 | |
Multiline Retail — 0.1% | | | | | | | | |
Dollar General Corp., 1.88%, 4/15/18 | | | 250 | | | | 247,592 | |
Kohl’s Corp.: | | | | | | | | |
4.00%, 11/01/21 | | | 50 | | | | 51,320 | |
5.55%, 7/17/45 | | | 100 | | | | 93,070 | |
Nordstrom, Inc., 4.00%, 10/15/21 | | | 100 | | | | 105,658 | |
Target Corp.: | | | | | | | | |
2.90%, 1/15/22 | | | 150 | | | | 152,571 | |
4.00%, 7/01/42 | | | 350 | | | | 341,732 | |
| | | | | | | | |
| | | | | | | | 991,943 | |
Oil, Gas & Consumable Fuels — 2.5% | | | | | | | | |
Alberta Energy Co. Ltd., 7.38%, 11/01/31 | | | 50 | | | | 45,622 | |
Anadarko Petroleum Corp.: | | | | | | | | |
6.45%, 9/15/36 | | | 350 | | | | 337,351 | |
4.50%, 7/15/44 | | | 250 | | | | 191,396 | |
Apache Corp.: | | | | | | | | |
3.25%, 4/15/22 | | | 145 | | | | 138,104 | |
6.00%, 1/15/37 | | | 100 | | | | 96,584 | |
4.75%, 4/15/43 | | | 250 | | | | 208,923 | |
4.25%, 1/15/44 | | | 100 | | | | 78,285 | |
Boardwalk Pipelines LP, 3.38%, 2/01/23 | | | 200 | | | | 160,813 | |
BP Capital Markets PLC: | | | | | | | | |
1.85%, 5/05/17 | | | 250 | | | | 251,197 | |
1.38%, 5/10/18 | | | 250 | | | | 246,416 | |
2.24%, 9/26/18 | | | 300 | | | | 300,912 | |
2.24%, 5/10/19 | | | 500 | | | | 500,663 | |
2.52%, 1/15/20 | | | 115 | | | | 114,626 | |
2.32%, 2/13/20 | | | 250 | | | | 246,315 | |
4.74%, 3/11/21 | | | 50 | | | | 54,914 | |
See Notes to Financial Statements.
| | | | | | |
| | | | | | | |
| 30 | | BLACKROCK U.S. TOTAL BOND INDEX FUND | | DECEMBER 31, 2015 | | |
| | |
Schedule of Investments (continued) | | U.S. Total Bond Index Master Portfolio |
| | | | | | | | |
| Corporate Bonds | | Par (000) | | | Value | |
Oil, Gas & Consumable Fuels (continued) | | | | | | | | |
BP Capital Markets PLC (continued): | | | | | | | | |
3.06%, 3/17/22 | | $ | 210 | | | $ | 205,775 | |
3.25%, 5/06/22 | | | 100 | | | | 98,754 | |
3.99%, 9/26/23 | | | 250 | | | | 255,665 | |
Buckeye Partners LP, 4.15%, 7/01/23 | | | 250 | | | | 214,200 | |
Canadian Natural Resources Ltd.: | | | | | | | | |
3.45%, 11/15/21 | | | 100 | | | | 94,238 | |
3.80%, 4/15/24 | | | 250 | | | | 220,707 | |
3.90%, 2/01/25 | | | 250 | | | | 218,126 | |
6.25%, 3/15/38 | | | 50 | | | | 45,509 | |
Cenovus Energy, Inc.: | | | | | | | | |
5.70%, 10/15/19 | | | 150 | | | | 157,203 | |
3.00%, 8/15/22 | | | 100 | | | | 88,689 | |
5.20%, 9/15/43 | | | 250 | | | | 195,697 | |
Chevron Corp.: | | | | | | | | |
1.72%, 6/24/18 | | | 500 | | | | 497,446 | |
2.19%, 11/15/19 | | | 555 | | | | 554,754 | |
2.43%, 6/24/20 | | | 550 | | | | 550,553 | |
2.41%, 3/03/22 | | | 145 | | | | 141,130 | |
CNOOC Finance 2013 Ltd., 3.00%, 5/09/23 | | | 300 | | | | 280,790 | |
CNOOC Finance 2015 USA LLC, 3.50%, 5/05/25 | | | 500 | | | | 475,923 | |
CNOOC Nexen Finance 2014 ULC, 4.25%, 4/30/24 | | | 500 | | | | 503,962 | |
ConocoPhillips Co.: | | | | | | | | |
1.05%, 12/15/17 | | | 1,000 | | | | 981,871 | |
4.15%, 11/15/34 | | | 395 | | | | 342,443 | |
6.50%, 2/01/39 | | | 400 | | | | 421,522 | |
ConocoPhillips Holding Co., 6.95%, 4/15/29 | | | 100 | | | | 114,539 | |
Continental Resources, Inc.: | | | | | | | | |
5.00%, 9/15/22 | | | 250 | | | | 184,375 | |
4.50%, 4/15/23 | | | 300 | | | | 215,538 | |
Devon Energy Corp.: | | | | | | | | |
2.25%, 12/15/18 | | | 500 | | | | 456,331 | |
4.00%, 7/15/21 | | | 150 | | | | 137,349 | |
5.00%, 6/15/45 | | | 500 | | | | 378,951 | |
Diamond Offshore Drilling, Inc., 4.88%, 11/01/43 | | | 250 | | | | 151,772 | |
Ecopetrol SA: | | | | | | | | |
7.63%, 7/23/19 | | | 100 | | | | 108,478 | |
5.38%, 6/26/26 | | | 250 | | | | 213,125 | |
5.88%, 5/28/45 | | | 250 | | | | 177,500 | |
Enable Midstream Partners LP, 2.40%, 5/15/19 | | | 350 | | | | 310,966 | |
Enbridge Energy Partners LP: | | | | | | | | |
4.20%, 9/15/21 | | | 100 | | | | 95,326 | |
5.88%, 10/15/25 | | | 500 | | | | 481,880 | |
Enbridge, Inc., 3.50%, 6/10/24 | | | 65 | | | | 54,432 | |
Encana Corp., 3.90%, 11/15/21 | | | 700 | | | | 577,796 | |
Energy Transfer Partners LP: | | | | | | | | |
9.70%, 3/15/19 | | | 44 | | | | 48,458 | |
5.20%, 2/01/22 | | | 250 | | | | 233,564 | |
3.60%, 2/01/23 | | | 150 | | | | 123,474 | |
4.90%, 2/01/24 | | | 250 | | | | 222,863 | |
4.75%, 1/15/26 | | | 500 | | | | 420,541 | |
4.90%, 3/15/35 | | | 250 | | | | 181,778 | |
5.95%, 10/01/43 | | | 150 | | | | 120,338 | |
EnLink Midstream Partners LP, 5.05%, 4/01/45 | | | 150 | | | | 93,012 | |
Enterprise Products Operating LLC: | | | | | | | | |
2.55%, 10/15/19 | | | 500 | | | | 479,356 | |
3.90%, 2/15/24 | | | 125 | | | | 116,626 | |
3.75%, 2/15/25 | | | 40 | | | | 36,588 | |
3.70%, 2/15/26 | | | 210 | | | | 188,370 | |
| | | | | | | | |
| Corporate Bonds | | Par (000) | | | Value | |
Oil, Gas & Consumable Fuels (continued) | | | | | | | | |
Enterprise Products Operating LLC (continued): | | | | | | | | |
5.95%, 2/01/41 | | $ | 150 | | | $ | 137,781 | |
4.45%, 2/15/43 | | | 75 | | | | 57,217 | |
4.85%, 3/15/44 | | | 200 | | | | 161,926 | |
5.10%, 2/15/45 | | | 250 | | | | 209,410 | |
4.90%, 5/15/46 | | | 350 | | | | 286,016 | |
EOG Resources, Inc.: | | | | | | | | |
5.63%, 6/01/19 | | | 150 | | | | 164,598 | |
3.15%, 4/01/25 | | | 80 | | | | 75,666 | |
EQT Corp., 4.88%, 11/15/21 | | | 50 | | | | 47,603 | |
Exxon Mobil Corp.: | | | | | | | | |
2.40%, 3/06/22 | | | 500 | | | | 492,310 | |
3.18%, 3/15/24 | | | 250 | | | | 253,747 | |
2.71%, 3/06/25 | | | 250 | | | | 244,460 | |
Hess Corp.: | | | | | | | | |
8.13%, 2/15/19 | | | 200 | | | | 226,675 | |
5.60%, 2/15/41 | | | 300 | | | | 252,875 | |
Husky Energy, Inc., 3.95%, 4/15/22 | | | 150 | | | | 139,041 | |
Kinder Morgan Energy Partners LP: | | | | | | | | |
2.65%, 2/01/19 | | | 245 | | | | 226,496 | |
5.00%, 10/01/21 | | | 200 | | | | 188,777 | |
3.95%, 9/01/22 | | | 225 | | | | 195,867 | |
4.15%, 2/01/24 | | | 250 | | | | 215,700 | |
4.25%, 9/01/24 | | | 155 | | | | 131,849 | |
6.50%, 2/01/37 | | | 100 | | | | 85,905 | |
5.00%, 8/15/42 | | | 75 | | | | 55,336 | |
5.40%, 9/01/44 | | | 250 | | | | 188,931 | |
Kinder Morgan, Inc.: | | | | | | | | |
3.05%, 12/01/19 | | | 250 | | | | 231,378 | |
4.30%, 6/01/25 | | | 160 | | | | 138,241 | |
5.30%, 12/01/34 | | | 250 | | | | 197,010 | |
5.55%, 6/01/45 | | | 250 | | | | 195,158 | |
5.05%, 2/15/46 | | | 250 | | | | 185,403 | |
Magellan Midstream Partners LP, 3.20%, 3/15/25 | | | 500 | | | | 436,521 | |
Marathon Oil Corp.: | | | | | | | | |
5.90%, 3/15/18 | | | 100 | | | | 101,133 | |
2.80%, 11/01/22 | | | 400 | | | | 318,844 | |
3.85%, 6/01/25 | | | 250 | | | | 201,212 | |
Marathon Petroleum Corp.: | | | | | | | | |
5.13%, 3/01/21 | | | 150 | | | | 157,438 | |
3.63%, 9/15/24 | | | 115 | | | | 107,161 | |
4.75%, 9/15/44 | | | 250 | | | | 204,349 | |
Murphy Oil Corp., 4.00%, 6/01/22 | | | 100 | | | | 75,816 | |
Nabors Industries, Inc.: | | | | | | | | |
5.00%, 9/15/20 | | | 50 | | | | 43,869 | |
4.63%, 9/15/21 | | | 250 | | | | 205,440 | |
Nexen Energy ULC, 6.40%, 5/15/37 | | | 100 | | | | 111,841 | |
Noble Energy, Inc.: | | | | | | | | |
4.15%, 12/15/21 | | | 150 | | | | 145,371 | |
5.88%, 6/01/22 | | | 250 | | | | 237,825 | |
5.25%, 11/15/43 | | | 250 | | | | 201,679 | |
Occidental Petroleum Corp.: | | | | | | | | |
4.10%, 2/01/21 | | | 50 | | | | 52,458 | |
3.50%, 6/15/25 | | | 250 | | | | 244,175 | |
ONEOK Partners LP: | | | | | | | | |
2.00%, 10/01/17 | | | 250 | | | | 238,798 | |
3.38%, 10/01/22 | | | 500 | | | | 405,562 | |
6.13%, 2/01/41 | | | 50 | | | | 38,208 | |
See Notes to Financial Statements.
| | | | | | |
| | | | | | | |
| | BLACKROCK U.S. TOTAL BOND INDEX FUND | | DECEMBER 31, 2015 | | 31 |
| | |
Schedule of Investments (continued) | | U.S. Total Bond Index Master Portfolio |
| | | | | | | | |
| Corporate Bonds | | Par (000) | | | Value | |
Oil, Gas & Consumable Fuels (continued) | | | | | | | | |
Petroleos Mexicanos: | | | | | | | | |
3.50%, 7/18/18 | | $ | 350 | | | $ | 347,294 | |
3.13%, 1/23/19 | | | 250 | | | | 241,847 | |
4.88%, 1/24/22 | | | 400 | | | | 385,000 | |
3.50%, 1/30/23 | | | 400 | | | | 349,000 | |
4.50%, 1/23/26 (a) | | | 1,000 | | | | 878,500 | |
6.50%, 6/02/41 | | | 300 | | | | 259,350 | |
6.38%, 1/23/45 | | | 750 | | | | 634,786 | |
Phillips 66: | | | | | | | | |
4.65%, 11/15/34 | | | 355 | | | | 332,730 | |
5.88%, 5/01/42 | | | 100 | | | | 100,236 | |
Pioneer Natural Resources Co., 3.95%, 7/15/22 | | | 150 | | | | 136,935 | |
Plains All American Pipeline LP/PAA Finance Corp.: | | | | | | | | |
2.85%, 1/31/23 | | | 250 | | | | 206,216 | |
5.15%, 6/01/42 | | | 50 | | | | 36,277 | |
4.70%, 6/15/44 | | | 250 | | | | 174,009 | |
Plains Exploration & Production Co., 6.50%, 11/15/20 | | | 162 | | | | 104,490 | |
Rowan Cos., Inc.: | | | | | | | | |
4.75%, 1/15/24 | | | 50 | | | | 35,556 | |
5.40%, 12/01/42 | | | 100 | | | | 59,821 | |
Shell International Finance BV: | | | | | | | | |
4.38%, 3/25/20 | | | 100 | | | | 107,403 | |
2.13%, 5/11/20 | | | 750 | | | | 737,823 | |
2.25%, 11/10/20 | | | 120 | | | | 118,235 | |
4.13%, 5/11/35 | | | 500 | | | | 477,263 | |
6.38%, 12/15/38 | | | 300 | | | | 354,660 | |
5.50%, 3/25/40 | | | 50 | | | | 54,031 | |
4.55%, 8/12/43 | | | 200 | | | | 194,405 | |
Southwestern Energy Co.: | | | | | | | | |
4.05%, 1/23/20 | | | 500 | | | | 362,500 | |
4.10%, 3/15/22 | | | 100 | | | | 62,896 | |
Spectra Energy Capital LLC, 3.30%, 3/15/23 | | | 150 | | | | 128,331 | |
Spectra Energy Partners LP: | | | | | | | | |
4.75%, 3/15/24 | | | 250 | | | | 242,169 | |
3.50%, 3/15/25 | | | 250 | | | | 218,673 | |
Statoil ASA: | | | | | | | | |
1.95%, 11/08/18 | | | 250 | | | | 249,819 | |
2.65%, 1/15/24 | | | 500 | | | | 467,690 | |
3.70%, 3/01/24 | | | 250 | | | | 253,285 | |
5.10%, 8/17/40 | | | 100 | | | | 105,531 | |
Suncor Energy, Inc.: | | | | | | | | |
6.10%, 6/01/18 | | | 200 | | | | 215,112 | |
3.60%, 12/01/24 | | | 165 | | | | 155,410 | |
6.50%, 6/15/38 | | | 500 | | | | 534,989 | |
Sunoco Logistics Partners Operations LP: | | | | | | | | |
4.95%, 1/15/43 | | | 250 | | | | 178,787 | |
5.30%, 4/01/44 | | | 100 | | | | 74,423 | |
Talisman Energy, Inc., 3.75%, 2/01/21 | | | 300 | | | | 272,008 | |
TC PipeLines LP, 4.38%, 3/13/25 | | | 250 | | | | 219,566 | |
Tennessee Gas Pipeline Co. LLC, 7.50%, 4/01/17 | | | 100 | | | | 102,705 | |
Total Capital Canada Ltd., 2.75%, 7/15/23 | | | 150 | | | | 143,933 | |
Total Capital International SA: | | | | | | | | |
1.50%, 2/17/17 | | | 100 | | | | 100,178 | |
2.13%, 1/10/19 | | | 350 | | | | 350,627 | |
2.75%, 6/19/21 | | | 250 | | | | 249,036 | |
2.70%, 1/25/23 | | | 500 | | | | 479,325 | |
Total Capital SA, 2.13%, 8/10/18 | | | 500 | | | | 501,445 | |
TransCanada PipeLines Ltd.: | | | | | | | | |
1.88%, 1/12/18 | | | 1,000 | | | | 996,051 | |
| | | | | | | | |
| Corporate Bonds | | Par (000) | | | Value | |
Oil, Gas & Consumable Fuels (continued) | | | | | | | | |
TransCanada PipeLines Ltd. (continued): | | | | | | | | |
4.63%, 3/01/34 | | $ | 250 | | | $ | 236,368 | |
5.00%, 10/16/43 | | | 150 | | | | 137,951 | |
Valero Energy Corp.: | | | | | | | | |
6.13%, 2/01/20 | | | 150 | | | | 165,419 | |
6.63%, 6/15/37 | | | 300 | | | | 301,626 | |
Weatherford International Ltd., 9.63%, 3/01/19 | | | 160 | | | | 155,800 | |
Williams Cos., Inc.: | | | | | | | | |
7.88%, 9/01/21 | | | 31 | | | | 27,900 | |
3.70%, 1/15/23 | | | 100 | | | | 69,076 | |
4.55%, 6/24/24 | | | 45 | | | | 31,256 | |
5.75%, 6/24/44 | | | 250 | | | | 148,439 | |
Williams Partners LP: | | | | | | | | |
4.00%, 11/15/21 | | | 250 | | | | 208,519 | |
4.30%, 3/04/24 | | | 250 | | | | 198,110 | |
3.90%, 1/15/25 | | | 250 | | | | 187,863 | |
4.00%, 9/15/25 | | | 250 | | | | 187,190 | |
| | | | | | | | |
| | | | | | | | 38,999,353 | |
Paper & Forest Products — 0.1% | |
Celulosa Arauco y Constitucion SA, 4.75%, 1/11/22 | | | 50 | | | | 50,889 | |
Georgia-Pacific LLC, 8.88%, 5/15/31 | | | 25 | | | | 35,014 | |
International Paper Co.: | | | | | | | | |
3.65%, 6/15/24 | | | 500 | | | | 489,026 | |
5.00%, 9/15/35 | | | 250 | | | | 247,905 | |
Westvaco Corp., 8.20%, 1/15/30 | | | 100 | | | | 129,582 | |
| | | | | | | | |
| | | | | | | | 952,416 | |
Personal Products — 0.0% | |
Colgate-Palmolive Co.: | | | | | | | | |
1.75%, 3/15/19 | | | 250 | | | | 250,556 | |
3.25%, 3/15/24 | | | 250 | | | | 259,877 | |
| | | | | | | | |
| | | | | | | | 510,433 | |
Pharmaceuticals — 1.1% | |
Abbott Laboratories, 2.55%, 3/15/22 | | | 1,000 | | | | 993,778 | |
AbbVie, Inc.: | | | | | | | | |
1.75%, 11/06/17 | | | 300 | | | | 299,418 | |
2.00%, 11/06/18 | | | 150 | | | | 149,332 | |
2.50%, 5/14/20 | | | 500 | | | | 499,899 | |
4.50%, 5/14/35 | | | 450 | | | | 440,819 | |
4.40%, 11/06/42 | | | 400 | | | | 373,569 | |
4.70%, 5/14/45 | | | 250 | | | | 244,367 | |
Actavis Funding SCS: | | | | | | | | |
2.35%, 3/12/18 | | | 750 | | | | 750,781 | |
3.45%, 3/15/22 | | | 155 | | | | 155,169 | |
4.55%, 3/15/35 | | | 130 | | | | 126,341 | |
4.85%, 6/15/44 | | | 250 | | | | 247,355 | |
4.75%, 3/15/45 | | | 500 | | | | 487,522 | |
Actavis, Inc., 3.25%, 10/01/22 | | | 150 | | | | 147,472 | |
Allergan, Inc., 1.35%, 3/15/18 | | | 250 | | | | 245,627 | |
AstraZeneca PLC: | | | | | | | | |
5.90%, 9/15/17 | | | 100 | | | | 107,104 | |
1.95%, 9/18/19 | | | 500 | | | | 497,265 | |
2.38%, 11/16/20 | | | 500 | | | | 496,430 | |
3.38%, 11/16/25 | | | 350 | | | | 347,465 | |
6.45%, 9/15/37 | | | 100 | | | | 126,460 | |
4.38%, 11/16/45 | | | 150 | | | | 150,304 | |
See Notes to Financial Statements.
| | | | | | |
| | | | | | | |
| 32 | | BLACKROCK U.S. TOTAL BOND INDEX FUND | | DECEMBER 31, 2015 | | |
| | |
Schedule of Investments (continued) | | U.S. Total Bond Index Master Portfolio |
| | | | | | | | |
| Corporate Bonds | | Par (000) | | | Value | |
Pharmaceuticals (continued) | |
Baxalta, Inc. (a): | | | | | | | | |
2.88%, 6/23/20 | | $ | 500 | | | $ | 493,795 | |
4.00%, 6/23/25 | | | 100 | | | | 98,961 | |
Bristol-Myers Squibb Co.: | | | | | | | | |
1.75%, 3/01/19 | | | 250 | | | | 249,034 | |
2.00%, 8/01/22 | | | 250 | | | | 242,530 | |
4.50%, 3/01/44 | | | 250 | | | | 270,255 | |
Eli Lilly & Co.: | | | | | | | | |
1.95%, 3/15/19 | | | 250 | | | | 252,150 | |
2.75%, 6/01/25 | | | 45 | | | | 44,427 | |
3.70%, 3/01/45 | | | 250 | | | | 233,855 | |
GlaxoSmithKline Capital PLC, 2.85%, 5/08/22 | | | 150 | | | | 151,165 | |
GlaxoSmithKline Capital, Inc.: | | | | | | | | |
5.65%, 5/15/18 | | | 100 | | | | 108,988 | |
6.38%, 5/15/38 | | | 300 | | | | 383,103 | |
Johnson & Johnson: | | | | | | | | |
2.45%, 12/05/21 | | | 450 | | | | 456,525 | |
4.38%, 12/05/33 | | | 250 | | | | 275,745 | |
4.50%, 9/01/40 | | | 100 | | | | 110,160 | |
Merck & Co., Inc.: | | | | | | | | |
3.88%, 1/15/21 | | | 250 | | | | 268,014 | |
2.75%, 2/10/25 | | | 70 | | | | 68,146 | |
4.15%, 5/18/43 | | | 250 | | | | 248,119 | |
3.70%, 2/10/45 | | | 400 | | | | 369,380 | |
Merck Sharp & Dohme Corp., 5.00%, 6/30/19 | | | 500 | | | | 551,632 | |
Mylan, Inc., 4.20%, 11/29/23 | | | 250 | | | | 247,903 | |
Novartis Capital Corp.: | | | | | | | | |
4.40%, 4/24/20 | | | 100 | | | | 109,514 | |
3.40%, 5/06/24 | | | 650 | | | | 671,052 | |
3.00%, 11/20/25 | | | 350 | | | | 345,114 | |
Perrigo Co. PLC, 2.30%, 11/08/18 | | | 250 | | | | 246,451 | |
Perrigo Finance PLC, 3.90%, 12/15/24 | | | 250 | | | | 241,213 | |
Pfizer, Inc.: | | | | | | | | |
1.10%, 5/15/17 | | | 850 | | | | 849,312 | |
1.50%, 6/15/18 | | | 500 | | | | 499,291 | |
5.80%, 8/12/23 | | | 500 | | | | 584,696 | |
4.30%, 6/15/43 | | | 500 | | | | 500,383 | |
4.40%, 5/15/44 | | | 250 | | | | 253,888 | |
Sanofi, 1.25%, 4/10/18 | | | 250 | | | | 248,907 | |
Teva Pharmaceutical Finance Co. BV: | | | | | | | | |
3.65%, 11/10/21 | | | 113 | | | | 114,596 | |
2.95%, 12/18/22 | | | 59 | | | | 56,484 | |
Zoetis, Inc., 4.70%, 2/01/43 | | | 150 | | | | 130,949 | |
| | | | | | | | |
| | | | | | | | 16,862,214 | |
Producer Durables: Miscellaneous — 0.0% | |
Oracle Corp., 2.95%, 5/15/25 | | | 500 | | | | 487,095 | |
Real Estate — 0.2% | |
AvalonBay Communities, Inc.: | | | | | | | | |
2.95%, 9/15/22 | | | 100 | | | | 99,141 | |
3.45%, 6/01/25 | | | 100 | | | | 98,740 | |
Boston Properties LP: | | | | | | | | |
3.70%, 11/15/18 | | | 200 | | | | 207,185 | |
3.13%, 9/01/23 | | | 250 | | | | 243,404 | |
Brandywine Operating Partnership LP, 3.95%, 2/15/23 | | | 250 | | | | 243,376 | |
Duke Realty LP, 3.63%, 4/15/23 | | | 250 | | | | 244,267 | |
Host Hotels & Resorts LP: | | | | | | | | |
5.25%, 3/15/22 | | | 250 | | | | 268,358 | |
Series E, 4.00%, 6/15/25 | | | 190 | | | | 182,135 | |
| | | | | | | | |
| Corporate Bonds | | Par (000) | | | Value | |
Real Estate (continued) | |
Liberty Property LP, 4.40%, 2/15/24 | | $ | 250 | | | $ | 253,403 | |
Prologis LP, 3.75%, 11/01/25 | | | 45 | | | | 44,639 | |
Simon Property Group LP: | | | | | | | | |
2.80%, 1/30/17 | | | 100 | | | | 101,313 | |
2.15%, 9/15/17 | | | 250 | | | | 252,320 | |
4.13%, 12/01/21 | | | 100 | | | | 106,595 | |
3.38%, 3/15/22 | | | 100 | | | | 103,104 | |
4.25%, 10/01/44 | | | 250 | | | | 248,917 | |
Ventas Realty LP/Ventas Capital Corp.: | | | | | | | | |
2.70%, 4/01/20 | | | 250 | | | | 246,516 | |
4.25%, 3/01/22 | | | 100 | | | | 103,095 | |
| | | | | | | | |
| | | | | | | | 3,046,508 | |
Real Estate Investment Trusts (REITs) — 0.4% | |
Alexandria Real Estate Equities, Inc., 4.30%, 1/15/26 | | | 250 | | | | 246,513 | |
American Tower Corp.: | | | | | | | | |
3.40%, 2/15/19 | | | 250 | | | | 256,447 | |
2.80%, 6/01/20 | | | 250 | | | | 247,123 | |
5.05%, 9/01/20 | | | 25 | | | | 26,989 | |
5.90%, 11/01/21 | | | 500 | | | | 556,971 | |
4.70%, 3/15/22 | | | 100 | | | | 105,103 | |
3.50%, 1/31/23 | | | 150 | | | | 146,612 | |
DDR Corp.: | | | | | | | | |
4.63%, 7/15/22 | | | 100 | | | | 103,311 | |
4.25%, 2/01/26 | | | 250 | | | | 243,849 | |
ERP Operating LP: | | | | | | | | |
4.75%, 7/15/20 | | | 100 | | | | 108,018 | |
4.50%, 7/01/44 | | | 150 | | | | 150,452 | |
Essex Portfolio LP, 3.88%, 5/01/24 | | | 100 | | | | 99,911 | |
HCP, Inc.: | | | | | | | | |
6.00%, 1/30/17 | | | 100 | | | | 104,170 | |
2.63%, 2/01/20 | | | 250 | | | | 246,146 | |
5.38%, 2/01/21 | | | 250 | | | | 272,238 | |
3.15%, 8/01/22 | | | 100 | | | | 95,509 | |
4.00%, 12/01/22 | | | 250 | | | | 248,844 | |
Healthcare Realty Trust, Inc., 3.75%, 4/15/23 | | | 150 | | | | 146,729 | |
Hospitality Properties Trust, 5.00%, 8/15/22 | | | 200 | | | | 205,440 | |
Kilroy Realty LP, 6.63%, 6/01/20 | | | 250 | | | | 283,156 | |
Kimco Realty Corp., 3.20%, 5/01/21 | | | 250 | | | | 250,268 | |
Mid-America Apartments LP, 4.30%, 10/15/23 | | | 200 | | | | 204,935 | |
Omega Healthcare Investors, Inc.: | | | | | | | | |
5.88%, 3/15/24 | | | 250 | | | | 258,750 | |
4.50%, 4/01/27 | | | 250 | | | | 235,397 | |
Realty Income Corp., 4.65%, 8/01/23 | | | 250 | | | | 260,225 | |
Simon Property Group LP, 4.75%, 3/15/42 | | | 100 | | | | 106,791 | |
Ventas Realty LP, 4.13%, 1/15/26 | | | 250 | | | | 249,209 | |
Welltower, Inc.: | | | | | | | | |
4.13%, 4/01/19 | | | 200 | | | | 208,580 | |
5.25%, 1/15/22 | | | 50 | | | | 54,081 | |
4.00%, 6/01/25 | | | 250 | | | | 245,917 | |
Weyerhaeuser Co., 7.38%, 3/15/32 | | | 350 | | | | 416,494 | |
| | | | | | | | |
| | | | | | | | 6,384,178 | |
Real Estate Management & Development — 0.0% | |
CBRE Services, Inc., 4.88%, 3/01/26 | | | 250 | | | | 249,030 | |
Road & Rail — 0.4% | | | | | | | | |
Burlington Northern Santa Fe LLC: | | | | | | | | |
4.70%, 10/01/19 | | | 750 | | | | 811,110 | |
See Notes to Financial Statements.
| | | | | | |
| | | | | | | |
| | BLACKROCK U.S. TOTAL BOND INDEX FUND | | DECEMBER 31, 2015 | | 33 |
| | |
Schedule of Investments (continued) | | U.S. Total Bond Index Master Portfolio |
| | | | | | | | |
| Corporate Bonds | | Par (000) | | | Value | |
Road & Rail (continued) | | | | | | | | |
Burlington Northern Santa Fe LLC (continued): | | | | | | | | |
3.75%, 4/01/24 | | $ | 50 | | | $ | 51,219 | |
3.65%, 9/01/25 | | | 750 | | | | 759,934 | |
5.40%, 6/01/41 | | | 50 | | | | 54,358 | |
4.40%, 3/15/42 | | | 150 | | | | 142,634 | |
4.45%, 3/15/43 | | | 200 | | | | 190,165 | |
4.55%, 9/01/44 | | | 250 | | | | 241,339 | |
Canadian National Railway Co.: | | | | | | | | |
2.95%, 11/21/24 | | | 305 | | | | 300,433 | |
3.50%, 11/15/42 | | | 100 | | | | 89,725 | |
Canadian Pacific Railway Co.: | | | | | | | | |
2.90%, 2/01/25 | | | 250 | | | | 235,324 | |
5.75%, 1/15/42 | | | 25 | | | | 27,121 | |
4.80%, 8/01/45 | | | 110 | | | | 107,059 | |
CSX Corp.: | | | | | | | | |
3.70%, 10/30/20 | | | 100 | | | | 104,342 | |
3.35%, 11/01/25 | | | 250 | | | | 242,805 | |
4.75%, 5/30/42 | | | 100 | | | | 99,640 | |
3.95%, 5/01/50 | | | 200 | | | | 169,164 | |
4.50%, 8/01/54 | | | 250 | | | | 226,811 | |
Norfolk Southern Corp.: | | | | | | | | |
7.70%, 5/15/17 | | | 150 | | | | 162,126 | |
3.00%, 4/01/22 | | | 250 | | | | 247,115 | |
3.85%, 1/15/24 | | | 250 | | | | 254,582 | |
3.95%, 10/01/42 | | | 100 | | | | 86,075 | |
4.45%, 6/15/45 | | | 250 | | | | 235,566 | |
Union Pacific Corp.: | | | | | | | | |
4.16%, 7/15/22 | | | 100 | | | | 108,125 | |
3.25%, 8/15/25 | | | 250 | | | | 254,024 | |
4.30%, 6/15/42 | | | 50 | | | | 49,982 | |
4.75%, 12/15/43 | | | 250 | | | | 268,664 | |
4.05%, 11/15/45 | | | 250 | | | | 241,884 | |
| | | | | | | | |
| | | | | | | | 5,761,326 | |
Semiconductors & Semiconductor Equipment — 0.2% | |
Applied Materials, Inc.: | | | | | | | | |
3.90%, 10/01/25 | | | 160 | | | | 160,861 | |
5.85%, 6/15/41 | | | 50 | | | | 53,948 | |
Intel Corp.: | | | | | | | | |
1.35%, 12/15/17 | | | 300 | | | | 300,399 | |
4.80%, 10/01/41 | | | 300 | | | | 312,743 | |
4.90%, 7/29/45 | | | 500 | | | | 528,481 | |
KLA-Tencor Corp., 4.65%, 11/01/24 | | | 305 | | | | 306,877 | |
Lam Research Corp., 3.80%, 3/15/25 | | | 230 | | | | 216,489 | |
Maxim Integrated Products, Inc., 3.38%, 3/15/23 | | | 100 | | | | 99,160 | |
QUALCOMM, Inc.: | | | | | | | | |
3.45%, 5/20/25 | | | 250 | | | | 239,790 | |
4.65%, 5/20/35 | | | 250 | | | | 231,895 | |
Seagate HDD Cayman: | | | | | | | | |
3.75%, 11/15/18 | | | 125 | | | | 124,063 | |
4.75%, 6/01/23 | | | 250 | | | | 218,820 | |
Texas Instruments, Inc., 1.75%, 5/01/20 | | | 250 | | | | 243,525 | |
Xilinx, Inc., 3.00%, 3/15/21 | | | 75 | | | | 75,192 | |
| | | | | | | | |
| | | | | | | | 3,112,243 | |
Software — 0.4% | |
Autodesk, Inc., 1.95%, 12/15/17 | | | 75 | | | | 74,750 | |
CA, Inc., 4.50%, 8/15/23 | | | 170 | | | | 172,001 | |
HP Enterprise Co., TBA, 4.40%, 10/15/22 (a) | | | 500 | | | | 498,084 | |
| | | | | | | | |
| Corporate Bonds | | Par (000) | | | Value | |
Software (continued) | |
Microsoft Corp.: | | | | | | | | |
1.63%, 12/06/18 | | $ | 250 | | | $ | 251,595 | |
1.85%, 2/12/20 | | | 500 | | | | 500,965 | |
3.00%, 10/01/20 | | | 50 | | | | 52,218 | |
2.00%, 11/03/20 | | | 500 | | | | 500,140 | |
3.13%, 11/03/25 | | | 250 | | | | 251,326 | |
3.50%, 2/12/35 | | | 165 | | | | 152,500 | |
5.30%, 2/08/41 | | | 100 | | | | 115,199 | |
3.75%, 5/01/43 | | | 150 | | | | 138,840 | |
4.45%, 11/03/45 | | | 250 | | | | 257,806 | |
4.00%, 2/12/55 | | | 500 | | | | 449,136 | |
4.75%, 11/03/55 | | | 250 | | | | 258,949 | |
Oracle Corp.: | | | | | | | | |
1.20%, 10/15/17 | | | 750 | | | | 750,397 | |
5.75%, 4/15/18 | | | 150 | | | | 163,670 | |
2.25%, 10/08/19 | | | 500 | | | | 505,218 | |
3.88%, 7/15/20 | | | 100 | | | | 106,867 | |
3.25%, 5/15/30 | | | 250 | | | | 234,782 | |
4.30%, 7/08/34 | | | 250 | | | | 248,702 | |
3.90%, 5/15/35 | | | 500 | | | | 468,802 | |
5.38%, 7/15/40 | | | 150 | | | | 166,867 | |
4.50%, 7/08/44 | | | 250 | | | | 251,532 | |
Symantec Corp., 2.75%, 6/15/17 | | | 150 | | | | 149,804 | |
| | | | | | | | |
| | | | | | | | 6,720,150 | |
Specialty Retail — 0.3% | | | | | | | | |
Advance Auto Parts, Inc., 4.50%, 12/01/23 | | | 250 | | | | 254,907 | |
AutoZone, Inc.: | | | | | | | | |
3.70%, 4/15/22 | | | 50 | | | | 50,869 | |
3.13%, 7/15/23 | | | 250 | | | | 245,218 | |
3.25%, 4/15/25 | | | 165 | | | | 159,536 | |
Bed Bath & Beyond, Inc., 5.17%, 8/01/44 | | | 250 | | | | 211,754 | |
Home Depot, Inc.: | | | | | | | | |
2.00%, 6/15/19 | | | 350 | | | | 352,452 | |
4.40%, 4/01/21 | | | 150 | | | | 165,183 | |
2.63%, 6/01/22 | | | 750 | | | | 749,216 | |
3.35%, 9/15/25 | | | 545 | | | | 556,915 | |
5.88%, 12/16/36 | | | 100 | | | | 121,884 | |
4.20%, 4/01/43 | | | 250 | | | | 250,436 | |
4.40%, 3/15/45 | | | 250 | | | | 258,389 | |
Lowe’s Cos., Inc.: | | | | | | | | |
1.63%, 4/15/17 | | | 200 | | | | 201,242 | |
4.63%, 4/15/20 | | | 100 | | | | 108,233 | |
3.12%, 4/15/22 | | | 100 | | | | 102,265 | |
5.00%, 9/15/43 | | | 150 | | | | 164,772 | |
4.25%, 9/15/44 | | | 250 | | | | 248,818 | |
Macy’s Retail Holdings, Inc.: | | | | | | | | |
5.90%, 12/01/16 | | | 11 | | | | 11,414 | |
3.88%, 1/15/22 | | | 300 | | | | 295,407 | |
4.38%, 9/01/23 | | | 200 | | | | 199,214 | |
3.63%, 6/01/24 | | | 250 | | | | 229,341 | |
QVC, Inc., 5.45%, 8/15/34 | | | 200 | | | | 173,006 | |
Staples, Inc., 2.75%, 1/12/18 | | | 150 | | | | 149,061 | |
| | | | | | | | |
| | | | | | | | 5,259,532 | |
Technology Hardware, Storage & Peripherals — 0.3% | |
Adobe Systems, Inc., 3.25%, 2/01/25 | | | 70 | | | | 68,319 | |
Apple, Inc.: | | | | | | | | |
1.05%, 5/05/17 | | | 500 | | | | 500,293 | |
1.00%, 5/03/18 | | | 500 | | | | 495,937 | |
See Notes to Financial Statements.
| | | | | | |
| | | | | | | |
| 34 | | BLACKROCK U.S. TOTAL BOND INDEX FUND | | DECEMBER 31, 2015 | | |
| | |
Schedule of Investments (continued) | | U.S. Total Bond Index Master Portfolio |
| | | | | | | | |
| Corporate Bonds | | Par (000) | | | Value | |
Technology Hardware, Storage & Peripherals (continued) | |
Apple, Inc. (continued): | | | | | | | | |
2.50%, 2/09/25 | | $ | 140 | | | $ | 133,686 | |
3.20%, 5/13/25 | | | 750 | | | | 759,077 | |
3.85%, 5/04/43 | | | 250 | | | | 230,328 | |
4.45%, 5/06/44 | | | 250 | | | | 252,141 | |
3.45%, 2/09/45 | | | 350 | | | | 301,335 | |
EMC Corp.: | | | | | | | | |
1.88%, 6/01/18 | | | 250 | | | | 233,270 | |
2.65%, 6/01/20 | | | 250 | | | | 222,052 | |
Hewlett Packard Enterprise Co., 4.90%, 10/15/25 (a) | | | 750 | | | | 735,460 | |
Hewlett-Packard Co.: | | | | | | | | |
4.65%, 12/09/21 | | | 100 | | | | 99,622 | |
6.00%, 9/15/41 | | | 150 | | | | 130,970 | |
NetApp, Inc.: | | | | | | | | |
2.00%, 12/15/17 | | | 350 | | | | 347,654 | |
3.38%, 6/15/21 | | | 105 | | | | 102,528 | |
| | | | | | | | |
| | | | | | | | 4,612,672 | |
Textiles, Apparel & Luxury Goods — 0.0% | | | | | | | | |
VF Corp., 3.50%, 9/01/21 | | | 100 | | | | 104,529 | |
Tobacco — 0.3% | | | | | | | | |
Altria Group, Inc.: | | | | | | | | |
9.25%, 8/06/19 | | | 45 | | | | 55,079 | |
2.63%, 1/14/20 | | | 250 | | | | 250,464 | |
2.85%, 8/09/22 | | | 250 | | | | 243,720 | |
10.20%, 2/06/39 | | | 33 | | | | 54,115 | |
4.50%, 5/02/43 | | | 400 | | | | 379,699 | |
5.38%, 1/31/44 | | | 70 | | | | 75,295 | |
Philip Morris International, Inc.: | | | | | | | | |
1.13%, 8/21/17 | | | 250 | | | | 249,638 | |
1.88%, 1/15/19 | | | 250 | | | | 249,295 | |
4.13%, 5/17/21 | | | 50 | | | | 53,107 | |
2.63%, 3/06/23 | | | 250 | | | | 245,125 | |
3.38%, 8/11/25 | | | 750 | | | | 758,967 | |
4.50%, 3/20/42 | | | 50 | | | | 49,621 | |
3.88%, 8/21/42 | | | 100 | | | | 91,341 | |
4.13%, 3/04/43 | | | 200 | | | | 189,051 | |
Reynolds American, Inc.: | | | | | | | | |
6.88%, 5/01/20 | | | 250 | | | | 288,404 | |
3.25%, 6/12/20 | | | 250 | | | | 254,076 | |
5.70%, 8/15/35 | | | 75 | | | | 82,186 | |
4.75%, 11/01/42 | | | 150 | | | | 143,172 | |
6.15%, 9/15/43 | | | 150 | | | | 170,161 | |
5.85%, 8/15/45 | | | 250 | | | | 277,935 | |
| | | | | | | | |
| | | | | | | | 4,160,451 | |
Trading Companies & Distributors — 0.0% | | | | | | | | |
GATX Corp.: | | | | | | | | |
1.25%, 3/04/17 | | | 500 | | | | 494,991 | |
2.38%, 7/30/18 | | | 150 | | | | 148,915 | |
| | | | | | | | |
| | | | | | | | 643,906 | |
Transportation Infrastructure — 0.0% | | | | | | | | |
Ryder System, Inc.: | | | | | | | | |
2.50%, 3/01/17 | | | 150 | | | | 151,003 | |
2.35%, 2/26/19 | | | 500 | | | | 495,552 | |
| | | | | | | | |
| | | | | | | | 646,555 | |
| | | | | | | | |
| Corporate Bonds | | Par (000) | | | Value | |
Water Utilities — 0.0% | | | | | | | | |
American Water Capital Corp.: | | | | | | | | |
3.40%, 3/01/25 | | $ | 250 | | | $ | 253,989 | |
4.30%, 9/01/45 | | | 250 | | | | 253,026 | |
United Utilities PLC, 5.38%, 2/01/19 | | | 50 | | | | 53,649 | |
| | | | | | | | |
| | | | | | | | 560,664 | |
Wireless Telecommunication Services — 0.1% | |
America Movil SAB de CV: | | | | | | | | |
5.00%, 3/30/20 | | | 200 | | | | 217,026 | |
4.38%, 7/16/42 | | | 350 | | | | 309,139 | |
Rogers Communications, Inc.: | | | | | | | | |
3.00%, 3/15/23 | | | 150 | | | | 145,639 | |
3.63%, 12/15/25 | | | 65 | | | | 63,935 | |
5.00%, 3/15/44 | | | 250 | | | | 251,689 | |
Vodafone Group PLC: | | | | | | | | |
1.63%, 3/20/17 | | | 250 | | | | 249,623 | |
7.88%, 2/15/30 | | | 100 | | | | 121,948 | |
4.38%, 2/19/43 | | | 450 | | | | 370,941 | |
| | | | | | | | |
| | | | | | | | 1,729,940 | |
| Total Corporate Bonds — 24.5% | | | | | | | 388,830,192 | |
| | | | | | | | |
| | | | | | | | | |
| | |
| Foreign Agency Obligations | | | | | | |
Asian Development Bank: | | | | | | | | |
0.75%, 7/28/17 | | | 750 | | | | 745,819 | |
1.50%, 9/28/18 | | | 1,000 | | | | 1,001,985 | |
Brazilian Government International Bond: | | | | | | | | |
8.00%, 1/15/18 | | | 69 | | | | 71,701 | |
5.88%, 1/15/19 | | | 150 | | | | 153,000 | |
4.88%, 1/22/21 | | | 299 | | | | 276,575 | |
2.63%, 1/05/23 | | | 250 | | | | 190,000 | |
4.25%, 1/07/25 | | | 500 | | | | 402,500 | |
5.63%, 1/07/41 | | | 100 | | | | 72,500 | |
Canada Government International Bond, 1.63%, 2/27/19 | | | 500 | | | | 500,450 | |
Colombia Government International Bond: | | | | | | | | |
4.38%, 7/12/21 | | | 250 | | | | 251,250 | |
2.63%, 3/15/23 | | | 250 | | | | 219,625 | |
4.00%, 2/26/24 | | | 750 | | | | 714,375 | |
4.50%, 1/28/26 | | | 250 | | | | 238,750 | |
7.38%, 9/18/37 | | | 100 | | | | 110,250 | |
5.63%, 2/26/44 | | | 200 | | | | 182,500 | |
5.00%, 6/15/45 | | | 250 | | | | 208,750 | |
Corporacion Andina de Fomento, 1.50%, 8/08/17 | | | 143 | | | | 142,263 | |
Council of Europe Development Bank: | | | | | | | | |
1.00%, 3/07/18 | | | 250 | | | | 248,339 | |
1.63%, 3/10/20 | | | 250 | | | | 247,916 | |
European Bank for Reconstruction & Development, 1.00%, 2/16/17 | | | 1,250 | | | | 1,252,187 | |
European Investment Bank: | | | | | | | | |
1.75%, 3/15/17 | | | 500 | | | | 504,191 | |
0.88%, 4/18/17 | | | 1,500 | | | | 1,496,662 | |
1.63%, 6/15/17 | | | 500 | | | | 503,846 | |
1.00%, 8/17/17 | | | 1,500 | | | | 1,495,791 | |
1.00%, 3/15/18 | | | 250 | | | | 247,959 | |
1.00%, 6/15/18 | | | 250 | | | | 247,564 | |
1.13%, 8/15/18 | | | 1,000 | | | | 991,218 | |
1.88%, 3/15/19 | | | 500 | | | | 503,707 | |
1.75%, 6/17/19 | | | 500 | | | | 501,333 | |
See Notes to Financial Statements.
| | | | | | |
| | | | | | | |
| | BLACKROCK U.S. TOTAL BOND INDEX FUND | | DECEMBER 31, 2015 | | 35 |
| | |
Schedule of Investments (continued) | | U.S. Total Bond Index Master Portfolio |
| | | | | | | | |
| Foreign Agency Obligations | | Par (000) | | | Value | |
European Investment Bank (continued): | | | | | | | | |
1.38%, 6/15/20 | | $ | 1,000 | | | $ | 976,446 | |
1.63%, 12/15/20 | | | 500 | | | | 490,602 | |
Export Development Canada: | | | | | | | | |
1.75%, 8/19/19 | | | 500 | | | | 501,798 | |
1.75%, 7/21/20 | | | 500 | | | | 498,135 | |
Inter-American Development Bank: | | | | | | | | |
1.25%, 1/16/18 | | | 1,000 | | | | 1,001,763 | |
0.88%, 3/15/18 | | | 1,000 | | | | 992,243 | |
1.75%, 10/15/19 | | | 500 | | | | 501,741 | |
1.75%, 4/14/22 | | | 750 | | | | 733,520 | |
Series GDP, 1.25%, 10/15/19 | | | 500 | | | | 492,138 | |
International Bank for Reconstruction & Development: | | | | | | | | |
1.00%, 10/05/18 | | | 1,000 | | | | 988,661 | |
Series GDIF, 1.00%, 11/15/17 | | | 500 | | | | 499,164 | |
Series GDIF, 1.38%, 4/10/18 | | | 1,000 | | | | 1,003,864 | |
Series GDIF, 1.00%, 6/15/18 | | | 1,500 | | | | 1,487,517 | |
International Finance Corp., 1.75%, 9/16/19 | | | 1,500 | | | | 1,498,729 | |
Israel Government International Bond, 4.50%, 1/30/43 | | | 200 | | | | 200,500 | |
Italian Government International Bond: | | | | | | | | |
6.88%, 9/27/23 | | | 100 | | | | 122,871 | |
5.38%, 6/15/33 | | | 250 | | | | 285,351 | |
Japan Bank for International Cooperation, 2.13%, 2/07/19 | | | 200 | | | | 201,056 | |
KFW: | | | | | | | | |
1.25%, 2/15/17 | | | 750 | | | | 751,132 | |
0.75%, 3/17/17 | | | 1,500 | | | | 1,495,132 | |
1.50%, 4/20/20 | | | 500 | | | | 492,543 | |
2.75%, 10/01/20 | | | 500 | | | | 517,867 | |
Korea International Bond, 4.13%, 6/10/44 | | | 250 | | | | 281,800 | |
Mexico Government International Bond: | | | | | | | | |
5.63%, 1/15/17 | | | 500 | | | | 519,500 | |
8.13%, 12/30/19 | | | 100 | | | | 124,250 | |
5.13%, 1/15/20 | | | 100 | | | | 109,000 | |
3.63%, 3/15/22 | | | 500 | | | | 503,000 | |
4.00%, 10/02/23 | | | 250 | | | | 253,250 | |
3.60%, 1/30/25 | | | 500 | | | | 487,250 | |
6.75%, 9/27/34 | | | 150 | | | | 180,000 | |
6.05%, 1/11/40 | | | 300 | | | | 328,500 | |
4.75%, 3/08/44 | | | 450 | | | | 409,950 | |
5.55%, 1/21/45 | | | 775 | | | | 794,375 | |
Nordic Investment Bank, 1.13%, 3/19/18 | | | 500 | | | | 498,418 | |
Panama Government International Bond: | | | | | | | | |
5.20%, 1/30/20 | | | 350 | | | | 379,750 | |
3.75%, 3/16/25 | | | 500 | | | | 490,000 | |
6.70%, 1/26/36 | | | 350 | | | | 415,625 | |
Peruvian Government International Bond: | | | | | | | | |
7.35%, 7/21/25 | | | 400 | | | | 501,500 | |
8.75%, 11/21/33 | | | 191 | | | | 269,310 | |
5.63%, 11/18/50 | | | 150 | | | | 153,000 | |
Philippine Government International Bond: | | | | | | | | |
4.00%, 1/15/21 | | | 500 | | | | 541,057 | |
4.20%, 1/21/24 | | | 500 | | | | 541,593 | |
7.75%, 1/14/31 | | | 500 | | | | 702,485 | |
6.38%, 10/23/34 | | | 250 | | | | 325,943 | |
3.95%, 1/20/40 | | | 250 | | | | 252,909 | |
Poland Government International Bond: | | | | | | | | |
6.38%, 7/15/19 | | | 250 | | | | 285,625 | |
3.00%, 3/17/23 | | | 200 | | | | 198,000 | |
| | | | | | | | |
| Foreign Agency Obligations | | Par (000) | | | Value | |
Poland Government International Bond (continued): | | | | | | | | |
4.00%, 1/22/24 | | $ | 250 | | | $ | 263,000 | |
Province of Manitoba Canada, 1.13%, 6/01/18 | | | 500 | | | | 494,334 | |
Province of Ontario Canada: | | | | | | | | |
1.20%, 2/14/18 | | | 750 | | | | 745,623 | |
2.00%, 9/27/18 | | | 500 | | | | 504,124 | |
2.00%, 1/30/19 | | | 500 | | | | 502,238 | |
4.40%, 4/14/20 | | | 200 | | | | 218,587 | |
1.88%, 5/21/20 | | | 500 | | | | 495,252 | |
Province of Quebec Canada: | | | | | | | | |
3.50%, 7/29/20 | | | 500 | | | | 528,781 | |
2.75%, 8/25/21 | | | 500 | | | | 505,896 | |
2.63%, 2/13/23 | | | 250 | | | | 247,839 | |
South Africa Government International Bond: | | | | | | | | |
4.67%, 1/17/24 | | | 200 | | | | 190,250 | |
5.38%, 7/24/44 | | | 200 | | | | 180,000 | |
Svensk Exportkredit AB, 1.88%, 6/17/19 | | | 500 | | | | 500,972 | |
Turkey Government International Bond: | | | | | | | | |
7.50%, 11/07/19 | | | 500 | | | | 560,635 | |
5.63%, 3/30/21 | | | 500 | | | | 528,702 | |
3.25%, 3/23/23 | | | 750 | | | | 687,042 | |
5.75%, 3/22/24 | | | 700 | | | | 739,564 | |
4.25%, 4/14/26 | | | 500 | | | | 468,776 | |
6.88%, 3/17/36 | | | 250 | | | | 279,970 | |
6.00%, 1/14/41 | | | 500 | | | | 510,875 | |
6.63%, 2/17/45 | | | 250 | | | | 280,150 | |
Uruguay Government International Bond: | | | | | | | | |
8.00%, 11/18/22 | | | 150 | | | | 186,570 | |
4.50%, 8/14/24 | | | 250 | | | | 253,750 | |
5.10%, 6/18/50 | | | 250 | | | | 215,625 | |
| Total Foreign Agency Obligations — 3.1% | | | | | | | 49,090,424 | |
| | | | | | | | |
| | | | | | | | | |
| | |
| Municipal Bonds | | | | | | |
American Municipal Power, Inc., RB, Build America Bonds, Combined Hydroelectric Projects, Series B, 7.83%, 2/15/41 | | | 150 | | | | 205,728 | |
Bay Area Toll Authority, RB, Build America Bonds, San Francisco Toll Bridge: | | | | | | | | |
Series S-1, 6.92%, 4/01/40 | | | 100 | | | | 131,722 | |
Series S-1, 7.04%, 4/01/50 | | | 100 | | | | 137,618 | |
Series S-3, 6.91%, 10/01/50 | | | 200 | | | | 273,038 | |
Chicago Transit Authority, RB, Series A, 6.90%, 12/01/40 | | | 100 | | | | 115,405 | |
City & County of Denver Colorado School District No. 1, COP, Refunding, Series B, 4.24%, 12/15/37 | | | 50 | | | | 49,445 | |
City & County of San Francisco California Public Utilities Commission Water Revenue, RB, Build America Bonds, Sub-Series G, 6.95%, 11/01/50 | | | 100 | | | | 139,907 | |
City of Los Angeles California Department of Water & Power, RB, Build America Bonds: | | | | | | | | |
5.72%, 7/01/39 | | | 100 | | | | 120,459 | |
6.60%, 7/01/50 | | | 90 | | | | 122,756 | |
City of New York New York, GO, 5.97%, 3/01/36 | | | 100 | | | | 123,617 | |
City of New York New York Transitional Finance Authority, RB, Build America Bonds, Future Tax Secured, Sub-Series B-1, 5.57%, 11/01/38 | | | 100 | | | | 120,556 | |
City Public Service Board of San Antonio Texas, RB, 4.43%, 2/01/42 | | | 170 | | | | 178,779 | |
See Notes to Financial Statements.
| | | | | | |
| | | | | | | |
| 36 | | BLACKROCK U.S. TOTAL BOND INDEX FUND | | DECEMBER 31, 2015 | | |
| | |
Schedule of Investments (continued) | | U.S. Total Bond Index Master Portfolio |
| | | | | | | | |
| Municipal Bonds | | Par (000) | | | Value | |
Commonwealth of Massachusetts, GO, Build America Bonds, 5.46%, 12/01/39 | | $ | 100 | | | $ | 120,548 | |
Commonwealth of Pennsylvania, GO, Build America Bonds, 4.65%, 2/15/26 | | | 100 | | | | 107,708 | |
County of Los Angeles California Metropolitan Transportation Authority, RB, Build America Bonds, 5.74%, 6/01/39 | | | 100 | | | | 121,551 | |
County of San Diego California Water Authority, RB, Build America Bonds, Series B, 6.14%, 5/01/49 | | | 100 | | | | 129,698 | |
County of Sonoma California, Refunding RB, Series A, 6.00%, 12/01/29 | | | 100 | | | | 116,632 | |
Dallas Area Rapid Transit, RB, Build America Bonds, Senior Lien, Series B, 5.02%, 12/01/48 | | | 160 | | | | 186,885 | |
District of Columbia, RB, Series E, 5.59%, 12/01/34 | | | 200 | | | | 239,502 | |
East Bay Municipal Utility District, RB, Build America Bonds, 5.87%, 6/01/40 | | | 100 | | | | 124,926 | |
Florida Hurricane Catastrophe Fund Finance Corp., RB, Series A, 3.00%, 7/01/20 | | | 100 | | | | 101,412 | |
Illinois State Toll Highway Authority, RB, Build America Bonds, 5.85%, 12/01/34 | | | 100 | | | | 120,372 | |
JobsOhio Beverage System, Refunding RB, Series B, 4.53%, 1/01/35 | | | 100 | | | | 105,825 | |
Los Angeles Community College District, GO, 6.75%, 8/01/49 | | | 100 | | | | 141,305 | |
Los Angeles Unified School District, GO, 6.76%, 7/01/34 | | | 150 | | | | 197,628 | |
Massachusetts Institute of Technology, 4.68%, 7/01/14 | | | 300 | | | | 309,525 | |
Massachusetts School Building Authority, RB, 5.72%, 8/15/39 | | | 100 | | | | 121,645 | |
Metropolitan Transportation Authority, RB, Build America Bonds, Series C-1, 6.69%, 11/15/40 | | | 305 | | | | 399,187 | |
Metropolitan Water Reclamation District of Greater Chicago, GO, Build America Bonds, 5.72%, 12/01/38 | | | 150 | | | | 172,104 | |
Municipal Electric Authority of Georgia Plant Vogtle Units 3 & 4, Refunding RB, Build America Bonds, Series A, 6.64%, 4/01/57 | | | 125 | | | | 148,874 | |
New Jersey EDA, RB, Series A (NPFGC), 7.43%, 2/15/29 | | | 200 | | | | 227,116 | |
New Jersey State Turnpike Authority, RB, Build America Bonds, Series F, 7.41%, 1/01/40 | | | 400 | | | | 568,544 | |
New York City Transitional Finance Authority Future Tax Secured Revenue, RB, Future Tax Secured, Build America Bonds, 5.77%, 8/01/36 | | | 100 | | | | 120,728 | |
New York City Water & Sewer System, RB, Build America Bonds, 2nd General Resolution, Fiscal 2020, Series DD, 5.95%, 6/15/42 | | | 115 | | | | 148,506 | |
New York State Dormitory Authority, RB, Build America Bonds, Series H, 5.43%, 3/15/39 | | | 135 | | | | 159,174 | |
New York State Urban Development Corp., RB, 5.77%, 3/15/39 | | | 200 | | | | 242,508 | |
North Texas Tollway Authority, RB, Build America Bonds, Series B, 6.72%, 1/01/49 | | | 100 | | | | 137,050 | |
Ohio State University, RB, Build America Bonds, Series C, 4.91%, 6/01/40 | | | 100 | | | | 112,147 | |
Ohio State Water Development Authority, RB, Build America Bonds, Series B-2, 4.88%, 12/01/34 | | | 100 | | | | 112,031 | |
Port Authority of New York & New Jersey, RB: | | | | | | | | |
158th Series, 5.86%, 12/01/24 | | | 100 | | | | 121,608 | |
159th Series, 6.04%, 12/01/29 | | | 200 | | | | 240,356 | |
| | | | | | | | |
| Municipal Bonds | | Par (000) | | | Value | |
Port Authority of New York & New Jersey, RB (continued): | | | | | | | | |
182nd Series, 5.31%, 8/01/46 | | $ | 100 | | | $ | 105,630 | |
Port Authority of New York & New Jersey, Refunding RB, 174th Series, 4.46%, 10/01/62 | | | 100 | | | | 95,216 | |
Regents of the University of California Medical Center Pooled Revenue, Refunding RB, Series F, 6.58%, 5/15/49 | | | 100 | | | | 128,393 | |
Santa Clara Valley Transportation Authority, RB, Build America Bonds, Series A, 5.88%, 4/01/32 | | | 100 | | | | 119,849 | |
State of California, GO: | | | | | | | | |
5.70%, 11/01/21 | | | 200 | | | | 234,274 | |
Build America Bonds, Various Purpose, 7.50%, 4/01/34 | | | 145 | | | | 203,022 | |
Build America Bonds, Various Purpose, 7.55%, 4/01/39 | | | 675 | | | | 981,227 | |
Build America Bonds, Various Purpose, 7.35%, 11/01/39 | | | 100 | | | | 140,382 | |
Build America Bonds, Various Purposes, 7.60%, 11/01/40 | | | 200 | | | | 297,280 | |
State of Connecticut, GO, Build America Bonds, Series D, 5.09%, 10/01/30 | | | 150 | | | | 166,095 | |
State of Illinois, GO: | | | | | | | | |
5.67%, 3/01/18 | | | 200 | | | | 210,790 | |
Pension, 5.10%, 6/01/33 | | | 900 | | | | 851,445 | |
State of Oregon, GO, Pension, 5.76%, 6/01/23 | | | 100 | | | | 114,388 | |
State of Texas, GO, Build America Bonds, Series A, 5.52%, 4/01/39 | | | 100 | | | | 124,929 | |
State of Washington, GO, Build America Bonds, Series D, 5.48%, 8/01/39 | | | 175 | | | | 211,568 | |
Texas Transportation Commission, RB, 1st Tier, Build America Bonds, Series B, 5.18%, 4/01/30 | | | 200 | | | | 235,140 | |
University of California, RB, Series AD, 4.86%, 5/15/12 | | | 300 | | | | 286,977 | |
University of California, Refunding RB, Series AJ, 4.60%, 5/15/31 | | | 150 | | | | 159,859 | |
University of California Medical Center, RB, Build America Bonds, Series H, 6.55%, 5/15/48 | | | 50 | | | | 64,335 | |
University of North Carolina at Chapel Hill, Refunding RB, 3.85%, 12/01/34 | | | 400 | | | | 414,936 | |
University of Virginia, RB, Build America Bonds, 6.20%, 9/01/39 | | | 140 | | | | 191,325 | |
Virginia Commonwealth Transportation Board, RB, Build America Bonds, Series A-2, 5.35%, 5/15/35 | | | 75 | | | | 86,182 | |
| Total Municipal Bonds — 0.8% | | | | | | | 12,297,367 | |
| | | | | | | | |
| | | | | | | | | |
|
| Non-Agency Mortgage-Backed Securities | |
Commercial Mortgage-Backed Securities — 1.4% | |
Banc of America Commercial Mortgage Trust, Series 2007-5, Class A4, 5.49%, 2/10/51 | | | 339 | | | | 351,210 | |
Bear Stearns Commercial Mortgage Securities Trust (d): | | | | | | | | |
Series 2007-PW16, Class AM, 5.72%, 6/11/40 | | | 700 | | | | 728,657 | |
Series 2007-T26, Class A4, 5.47%, 1/12/45 | | | 1,237 | | | | 1,272,820 | |
Citigroup Commercial Mortgage Trust, Class A4: | | | | | | | | |
Series 2013-GC17, 4.13%, 11/10/46 | | | 750 | | | | 794,168 | |
See Notes to Financial Statements.
| | | | | | |
| | | | | | | |
| | BLACKROCK U.S. TOTAL BOND INDEX FUND | | DECEMBER 31, 2015 | | 37 |
| | |
Schedule of Investments (continued) | | U.S. Total Bond Index Master Portfolio |
| | | | | | | | |
| Non-Agency Mortgage-Backed Securities | | Par (000) | | | Value | |
Commercial Mortgage-Backed Securities (continued) | |
Citigroup Commercial Mortgage Trust, Class A4 (continued): | | | | | | | | |
Series 2014-GC25, 3.64%, 10/10/47 | | $ | 500 | | | $ | 508,295 | |
Commercial Mortgage Trust: | | | | | | | | |
Series 2013-CR09, Class A4,
4.23%, 7/10/45 (d) | | | 700 | | | | 752,214 | |
Series 2013-CR12, Class A4,
4.05%, 10/10/46 | | | 300 | | | | 316,549 | |
Series 2013-CR8, Class A5,
3.61%, 6/10/46 (d) | | | 1,900 | | | | 1,956,794 | |
Series 2014-UBS2, Class A5,
3.96%, 3/10/47 | | | 500 | | | | 518,545 | |
Series 2015-PC1, Class A5,
3.90%, 7/10/50 | | | 1,500 | | | | 1,544,363 | |
Credit Suisse Commercial Mortgage Trust Series, Series 2007-C3, Class A4, 5.70%, 6/15/39 (d) | | | 220 | | | | 225,968 | |
CSAIL Commercial Mortgage Securities Trust, Series 2015-C3, Class A4, 3.72%, 8/15/48 | | | 1,000 | | | | 1,013,057 | |
Greenwich Capital Commercial Funding Corp., Series 2007-GG11, Class A4, 5.74%, 12/10/49 | | | 282 | | | | 290,521 | |
GS Mortgage Securities Corp. II: | | | | | | | | |
Series 2012-GCJ9, Class A3,
2.77%, 11/10/45 | | | 250 | | | | 245,924 | |
Series 2015-GC30, Class A4,
3.38%, 5/10/50 | | | 600 | | | | 596,874 | |
GS Mortgage Securities Trust, Series 2007-GG10, Class A4, 5.79%, 8/10/45 (d) | | | 269 | | | | 276,171 | |
JPMBB Commercial Mortgage Securities Trust: | | | | | | | | |
Series 2014-C18, Class A5, 4.08%, 2/15/47 | | | 250 | | | | 262,808 | |
Series 2014-C22, Class A4, 3.80%, 9/15/47 | | | 300 | | | | 307,141 | |
Series 2015-C29, Class A2, 2.92%, 5/15/48 | | | 1,000 | | | | 1,014,848 | |
JPMorgan Chase Commercial Mortgage Securities Trust: | | | | | | | | |
Series 2011-C5, Class A3, 4.17%, 8/15/46 | | | 650 | | | | 692,181 | |
Series 2012-LC9, Class A3, 2.48%, 12/15/47 | | | 300 | | | | 296,883 | |
Series 2013-C16, Class A2, 3.07%, 12/15/46 | | | 850 | | | | 867,711 | |
Series 2014-C19, Class A2, 3.05%, 4/15/47 | | | 300 | | | | 306,189 | |
Series 2014-C20, Class A5, 3.80%, 7/15/47 | | | 1,400 | | | | 1,441,723 | |
LB-UBS Commercial Mortgage Trust,
Series 2007-C7, Class A3, 5.87%, 9/15/45 (d) | | | 258 | | | | 270,530 | |
ML-CFC Commercial Mortgage Trust, Series 2007-9, Class AM, 5.86%, 9/12/49 (d) | | | 675 | | | | 719,245 | |
Morgan Stanley Capital I Trust, Series 2007-IQ14, Class A4, 5.69%, 4/15/49 (d) | | | 1,500 | | | | 1,538,438 | |
Wells Fargo Commercial Mortgage Trust: | | | | | | | | |
Series 2013-LC12, Class A4, 4.22%, 7/15/46 (d) | | | 200 | | | | 213,134 | |
Series 2015-C27, Class A5, 3.45%, 2/15/48 | | | 1,500 | | | | 1,498,720 | |
WFRBS Commercial Mortgage Trust,
Series 2013-C11, Class A5, 3.07%, 3/15/45 | | | 500 | | | | 498,500 | |
| | | | | | | | |
| | | | | | | | 21,320,181 | |
| Total Non-Agency Mortgage-Backed Securities — 1.4% | | | | 21,320,181 | |
| | | | | | | | |
| Preferred Securities | | Par (000) | | | Value | |
| | |
| Capital Trusts | | | | | | |
Diversified Financial Services — 0.0% | |
General Electric Capital Corp., 6.38%, 11/15/67 (d) | | $ | 250 | | | $ | 261,075 | |
Insurance — 0.0% | | | | | | | | |
MetLife, Inc. 6.40%, 12/15/66 | | | 100 | | | | 109,250 | |
Prudential Financial, Inc.
5.63%, 6/15/43 (d) | | | 100 | | | | 102,250 | |
| | | | | | | | |
| | | | | | | | 211,500 | |
| Total Preferred Securities — 0.0% | | | | | | | 472,575 | |
| | | | | | | | |
| | | | | | | | | |
| | |
| U.S. Government Sponsored Agency Securities | | | | | | |
Agency Obligations — 2.4% | | | | | | | | |
Fannie Mae: | | | | | | | | |
0.88%, 12/20/17 - 5/21/18 | | | 4,828 | | | | 4,794,182 | |
1.13%, 4/27/17 - 7/20/18 | | | 5,310 | | | | 5,301,579 | |
1.63%, 1/21/20 | | | 500 | | | | 498,115 | |
3.50%, 12/01/45 | | | 5,424 | | | | 5,600,510 | |
6.25%, 5/15/29 | | | 2,850 | | | | 3,863,953 | |
6.63%, 11/15/30 | | | 149 | | | | 211,004 | |
7.25%, 5/15/30 | | | 550 | | | | 813,029 | |
Federal Home Loan Bank, 5.50%, 7/15/36 | | | 100 | | | | 129,898 | |
Federal Home Loan Mortgage Corp.: | | | | | | | | |
0.75%, 1/12/18 | | | 2,000 | | | | 1,983,904 | |
1.20%, 10/29/18 | | | 2,200 | | | | 2,183,933 | |
Financing Corp., 8.60%, 9/26/19 | | | 200 | | | | 249,228 | |
Freddie Mac: | | | | | | | | |
0.88%, 3/07/18 | | | 1,500 | | | | 1,489,474 | |
1.75%, 5/30/19 | | | 420 | | | | 423,148 | |
2.38%, 1/13/22 | | | 7,430 | | | | 7,533,218 | |
4.88%, 6/13/18 | | | 250 | | | | 271,486 | |
6.25%, 7/15/32 | | | 1,300 | | | | 1,807,318 | |
Tennessee Valley Authority: | | | | | | | | |
3.50%, 12/15/42 | | | 140 | | | | 129,286 | |
6.25%, 12/15/17 | | | 400 | | | | 438,569 | |
| | | | | | | | |
| | | | | | | | 37,721,834 | |
Commercial Mortgage-Backed Securities — 0.3% | |
Fannie Mae, Class A2 (d): | | | | | | | | |
Series 2014-M6, 2.68%, 5/25/21 | | | 150 | | | | 152,043 | |
Series 2014-M13, 3.02%, 8/25/24 | | | 500 | | | | 505,862 | |
Freddie Mac: | | | | | | | | |
Series K713, Class A2, 2.31%, 3/25/20 | | | 300 | | | | 302,048 | |
Series K026, Class A2, 2.51%, 11/25/22 | | | 200 | | | | 198,467 | |
Series K038, Class A1, 2.60%, 10/25/23 | | | 230 | | | | 233,730 | |
Series K014, Class A1, 2.79%, 10/25/20 | | | 97 | | | | 99,106 | |
Series K017, Class A2, 2.87%, 12/25/21 | | | 500 | | | | 513,270 | |
Series K033, Class A2, 3.06%, 7/25/23 (d) | | | 100 | | | | 101,985 | |
Series K031, Class A2, 3.30%, 4/25/23 (d) | | | 100 | | | | 103,669 | |
Series K006, Class A1, 3.40%, 7/25/19 | | | 395 | | | | 406,879 | |
Series K004, Class A1, 3.41%, 5/25/19 | | | 427 | | | | 440,596 | |
Series K037, Class A2, 3.49%, 1/25/24 | | | 200 | | | | 208,820 | |
Series K034, Class A2, 3.53%, 7/25/23 (d) | | | 1,400 | | | | 1,470,742 | |
Series K003, Class A5, 5.09%, 3/25/19 | | | 300 | | | | 326,394 | |
Series K013, Class A2, 3.97%, 1/25/21 | | | 500 | | | | 538,963 | |
| | | | | | | | |
| | | | | | | | 5,602,574 | |
See Notes to Financial Statements.
| | | | | | |
| | | | | | | |
| 38 | | BLACKROCK U.S. TOTAL BOND INDEX FUND | | DECEMBER 31, 2015 | | |
| | |
Schedule of Investments (continued) | | U.S. Total Bond Index Master Portfolio |
| | | | | | | | |
| U.S. Government Sponsored Agency Securities | | Par (000) | | | Value | |
Mortgage-Backed Securities — 29.7% | | | | | | | | |
Fannie Mae Mortgage-Backed Securities: | | | | | | | | |
1.89%, 4/01/43 (d) | | $ | 345 | | | $ | 352,495 | |
1.93%, 5/01/43 (d) | | | 802 | | | | 821,371 | |
2.06%, 6/01/43 (d) | | | 768 | | | | 777,735 | |
2.48%, 8/01/42 (d) | | | 256 | | | | 262,004 | |
2.50%, 9/01/46 (f) | | | 18,074 | | | | 18,207,299 | |
2.84%, 8/01/41 (d) | | | 73 | | | | 76,693 | |
3.00%, 1/01/27 - 1/01/46 (f) | | | 48,437 | | | | 49,006,516 | |
3.13%, 11/01/40 (d) | | | 40 | | | | 42,530 | |
3.50%, 2/01/26 - 1/01/46 (f)(g) | | | 62,958 | | | | 61,681,487 | |
4.00%, 10/01/25 - 1/01/46 (f) | | | 44,174 | | | | 44,687,544 | |
4.50%, 5/01/24 - 1/01/46 (f) | | | 18,004 | | | | 19,399,396 | |
5.00%, 1/01/19 - 1/01/46 (f) | | | 12,944 | | | | 14,229,869 | |
5.50%, 4/01/36 - 1/01/46 (f) | | | 8,001 | | | | 8,920,875 | |
6.00%, 3/01/34 - 1/01/46 (f) | | | 8,026 | | | | 9,074,789 | |
6.50%, 7/01/32 | | | 192 | | | | 222,875 | |
7.00%, 2/01/32 | | | 40 | | | | 44,831 | |
Freddie Mac Mortgage-Backed Securities: | | | | | | | | |
1.76%, 6/01/43 (d) | | | 179 | | | | 182,035 | |
2.50%, 7/01/28 - 1/01/31 (f) | | | 8,866 | | | | 8,951,563 | |
2.51%, 9/01/40 (d) | | | 66 | | | | 70,102 | |
2.95%, 8/01/41 (d) | | | 47 | | | | 49,882 | |
3.00%, 3/01/27 - 1/01/46 (f)(g) | | | 30,980 | | | | 31,331,107 | |
3.50%, 1/01/31 - 1/01/46 (f) | | | 38,097 | | | | 39,325,904 | |
4.00%, 5/01/19 - 1/01/46 (f)(g) | | | 24,601 | | | | 25,978,148 | |
4.50%, 4/01/18 - 1/01/46 (f) | | | 11,621 | | | | 12,491,308 | |
5.00%, 10/01/18 - 1/01/46 (f) | | | 3,684 | | | | 4,027,727 | |
5.50%, 6/01/35 - 1/01/46 (f) | | | 3,450 | | | | 3,812,076 | |
6.50%, 6/01/31 | | | 93 | | | | 106,099 | |
8.00%, 12/01/24 | | | 192 | | | | 212,698 | |
Ginnie Mae Mortgage-Backed Securities: | | | | | | | | |
2.50%, 5/20/45 | | | 1,227 | | | | 1,194,879 | |
3.00%, 5/15/43 - 1/01/46 (f) | | | 22,610 | | | | 22,923,978 | |
3.50%, 9/20/42 - 1/01/46 (f)(g) | | | 43,760 | | | | 45,664,862 | |
4.00%, 3/15/41 - 1/01/46 (f) | | | 24,256 | | | | 25,773,536 | |
4.50%, 7/15/39 - 1/01/46 (f) | | | 13,089 | | | | 14,104,723 | |
5.00%, 11/15/39 - 1/01/46 (f) | | | 5,286 | | | | 5,837,812 | |
5.50%, 12/15/32 - 7/20/40 | | | 628 | | | | 694,512 | |
6.00%, 3/15/35 - 10/20/38 | | | 386 | | | | 438,312 | |
6.50%, 9/15/36 | | | 182 | | | | 219,027 | |
7.50%, 12/15/23 | | | 195 | | | | 223,065 | |
| | | | | | | | |
| | | | | | | | 471,421,664 | |
| Total U.S. Government Sponsored Agency Securities — 32.4% | | | | 514,746,072 | |
| | | | | | | | |
| | | | | | | | | |
| | |
| U.S. Treasury Obligations | | | | | | |
U.S. Treasury Bonds: | | | | | | | | |
8.75%, 5/15/17 | | | 2,100 | | | | 2,321,813 | |
8.75%, 8/15/20 | | | 400 | | | | 523,812 | |
7.63%, 11/15/22 | | | 3,400 | | | | 4,614,439 | |
6.25%, 8/15/23 | | | 50 | | | | 64,535 | |
7.63%, 2/15/25 | | | 375 | | | | 542,139 | |
6.00%, 2/15/26 | | | 3,750 | | | | 5,006,689 | |
6.50%, 11/15/26 | | | 400 | | | | 559,672 | |
6.13%, 11/15/27 | | | 2,080 | | | | 2,879,419 | |
6.13%, 8/15/29 | | | 2,500 | | | | 3,548,047 | |
5.38%, 2/15/31 | | | 1,500 | | | | 2,034,083 | |
4.75%, 2/15/37 | | | 2,500 | | | | 3,313,672 | |
| | | | | | | | |
| U.S. Treasury Obligations | | Par (000) | | | Value | |
U.S. Treasury Bonds (continued): | | | | | | | | |
4.38%, 2/15/38 | | $ | 2,500 | | | $ | 3,154,883 | |
4.50%, 5/15/38 | | | 1,000 | | | | 1,283,984 | |
3.50%, 2/15/39 | | | 1,300 | | | | 1,437,922 | |
4.25%, 5/15/39 | | | 2,775 | | | | 3,427,883 | |
4.50%, 8/15/39 | | | 1,700 | | | | 2,175,669 | |
4.38%, 11/15/39 | | | 1,800 | | | | 2,263,289 | |
4.63%, 2/15/40 | | | 1,230 | | | | 1,602,123 | |
4.38%, 5/15/40 | | | 1,650 | | | | 2,076,164 | |
3.88%, 8/15/40 | | | 860 | | | | 1,005,461 | |
4.25%, 11/15/40 | | | 4,528 | | | | 5,597,917 | |
4.75%, 2/15/41 | | | 200 | | | | 265,859 | |
4.38%, 5/15/41 | | | 610 | | | | 769,815 | |
3.75%, 8/15/41 | | | 1,550 | | | | 1,780,502 | |
3.13%, 11/15/41 | | | 400 | | | | 413,250 | |
3.13%, 2/15/42 | | | 4,850 | | | | 5,007,814 | |
3.00%, 5/15/42 | | | 480 | | | | 482,963 | |
2.75%, 8/15/42 | | | 750 | | | | 716,865 | |
2.75%, 11/15/42 | | | 4,200 | | | | 4,004,603 | |
3.13%, 2/15/43 | | | 3,050 | | | | 3,126,012 | |
2.88%, 5/15/43 | | | 250 | | | | 243,750 | |
3.63%, 8/15/43 | | | 2,500 | | | | 2,815,528 | |
3.75%, 11/15/43 | | | 1,700 | | | | 1,958,055 | |
3.63%, 2/15/44 | | | 1,000 | | | | 1,124,922 | |
3.38%, 5/15/44 | | | 1,600 | | | | 1,717,125 | |
3.13%, 8/15/44 | | | 2,500 | | | | 2,554,980 | |
3.00%, 11/15/44 | | | 5,500 | | | | 5,480,018 | |
2.50%, 2/15/45 | | | 4,500 | | | | 4,037,521 | |
3.00%, 5/15/45 | | | 7,800 | | | | 7,764,354 | |
2.88%, 8/15/45 | | | 5,000 | | | | 4,856,055 | |
3.00%, 11/15/45 | | | 2,300 | | | | 2,293,082 | |
U.S. Treasury Notes: | | | | | | | | |
0.88%, 1/31/17 | | | 7,600 | | | | 7,600,593 | |
0.63%, 2/15/17 | | | 15,200 | | | | 15,161,407 | |
4.63%, 2/15/17 | | | 3,650 | | | | 3,799,851 | |
0.88%, 2/28/17 | | | 2,950 | | | | 2,951,153 | |
1.00%, 3/31/17 | | | 5,000 | | | | 5,007,810 | |
0.88%, 4/15/17 | | | 4,000 | | | | 3,999,064 | |
0.63%, 5/31/17 | | | 6,500 | | | | 6,471,309 | |
2.75%, 5/31/17 | | | 5,000 | | | | 5,126,560 | |
0.63%, 6/30/17 | | | 7,000 | | | | 6,964,727 | |
0.75%, 6/30/17 | | | 1,510 | | | | 1,505,281 | |
2.50%, 6/30/17 | | | 3,280 | | | | 3,353,032 | |
0.88%, 7/15/17 | | | 4,000 | | | | 3,993,280 | |
0.50%, 7/31/17 | | | 900 | | | | 893,180 | |
2.38%, 7/31/17 | | | 3,000 | | | | 3,063,282 | |
4.75%, 8/15/17 | | | 3,800 | | | | 4,028,148 | |
0.63%, 8/31/17 | | | 521 | | | | 517,662 | |
1.88%, 8/31/17 | | | 1,870 | | | | 1,895,640 | |
1.00%, 9/15/17 | | | 9,000 | | | | 8,994,726 | |
0.88%, 10/15/17 | | | 4,710 | | | | 4,695,832 | |
1.88%, 10/31/17 | | | 5,000 | | | | 5,072,460 | |
0.88%, 11/15/17 | | | 14,000 | | | | 13,951,322 | |
2.25%, 11/30/17 | | | 7,000 | | | | 7,154,763 | |
1.00%, 12/15/17 | | | 8,344 | | | | 8,332,594 | |
2.63%, 1/31/18 | | | 2,000 | | | | 2,061,876 | |
1.00%, 2/15/18 | | | 4,500 | | | | 4,485,937 | |
0.75%, 2/28/18 | | | 4,500 | | | | 4,461,678 | |
2.75%, 2/28/18 | | | 1,300 | | | | 1,344,637 | |
1.00%, 3/15/18 | | | 5,000 | | | | 4,982,615 | |
0.75%, 4/15/18 | | | 9,000 | | | | 8,912,808 | |
See Notes to Financial Statements.
| | | | | | |
| | | | | | | |
| | BLACKROCK U.S. TOTAL BOND INDEX FUND | | DECEMBER 31, 2015 | | 39 |
| | |
Schedule of Investments (continued) | | U.S. Total Bond Index Master Portfolio |
| | | | | | | | |
| U.S. Treasury Obligations | | Par (000) | | | Value | |
U.S. Treasury Notes (continued): | | | | | | | | |
0.63%, 4/30/18 | | $ | 1,500 | | | $ | 1,480,722 | |
2.63%, 4/30/18 | | | 5,000 | | | | 5,168,165 | |
1.00%, 5/15/18 | | | 7,000 | | | | 6,965,273 | |
2.25%, 7/31/18 | | | 3,000 | | | | 3,078,282 | |
4.00%, 8/15/18 | | | 500 | | | | 536,387 | |
1.38%, 9/30/18 | | | 2,400 | | | | 2,407,500 | |
0.88%, 10/15/18 | | | 7,000 | | | | 6,922,888 | |
1.25%, 10/31/18 | | | 7,700 | | | | 7,689,174 | |
1.75%, 10/31/18 | | | 2,250 | | | | 2,278,917 | |
1.38%, 12/31/18 | | | 4,030 | | | | 4,032,990 | |
1.50%, 12/31/18 | | | 31,315 | | | | 31,456,888 | |
1.25%, 1/31/19 | | | 6,400 | | | | 6,378,502 | |
1.63%, 3/31/19 | | | 1,500 | | | | 1,509,375 | |
1.25%, 4/30/19 | | | 4,300 | | | | 4,272,622 | |
1.13%, 5/31/19 | | | 1,880 | | | | 1,858,997 | |
1.00%, 6/30/19 | | | 2,000 | | | | 1,966,954 | |
1.63%, 6/30/19 | | | 2,000 | | | | 2,008,984 | |
0.88%, 7/31/19 | | | 1,500 | | | | 1,466,133 | |
1.00%, 8/31/19 | | | 2,300 | | | | 2,254,628 | |
1.63%, 8/31/19 | | | 2,000 | | | | 2,005,704 | |
3.38%, 11/15/19 | | | 3,100 | | | | 3,310,217 | |
1.50%, 11/30/19 | | | 6,500 | | | | 6,474,104 | |
1.13%, 12/31/19 | | | 4,750 | | | | 4,659,826 | |
1.63%, 12/31/19 | | | 12,500 | | | | 12,500,487 | |
1.38%, 1/31/20 | | | 750 | | | | 742,178 | |
3.63%, 2/15/20 | | | 2,500 | | | | 2,696,485 | |
1.25%, 2/29/20 | | | 6,200 | | | | 6,098,525 | |
1.38%, 2/29/20 | | | 5,700 | | | | 5,634,541 | |
1.13%, 3/31/20 | | | 1,500 | | | | 1,466,250 | |
1.13%, 4/30/20 | | | 2,700 | | | | 2,638,300 | |
1.38%, 4/30/20 | | | 6,200 | | | | 6,119,834 | |
1.38%, 5/31/20 | | | 4,400 | | | | 4,336,750 | |
1.88%, 6/30/20 | | | 2,000 | | | | 2,013,984 | |
2.00%, 7/31/20 | | | 6,500 | | | | 6,574,646 | |
2.63%, 8/15/20 | | | 4,140 | | | | 4,300,586 | |
2.13%, 8/31/20 | | | 7,000 | | | | 7,112,931 | |
1.38%, 10/31/20 | | | 10,000 | | | | 9,823,440 | |
1.75%, 10/31/20 | | | 500 | | | | 499,219 | |
2.63%, 11/15/20 | | | 1,000 | | | | 1,038,984 | |
1.63%, 11/30/20 | | | 6,000 | | | | 5,964,372 | |
2.00%, 11/30/20 | | | 8,300 | | | | 8,383,971 | |
2.38%, 12/31/20 | | | 5,400 | | | | 5,552,086 | |
2.13%, 1/31/21 | | | 2,800 | | | | 2,841,345 | |
3.63%, 2/15/21 | | | 2,310 | | | | 2,510,952 | |
2.00%, 2/28/21 | | | 7,700 | | | | 7,764,064 | |
2.25%, 3/31/21 | | | 7,500 | | | | 7,652,340 | |
2.00%, 8/31/21 | | | 4,500 | | | | 4,519,687 | |
2.13%, 9/30/21 | | | 4,900 | | | | 4,951,680 | |
2.00%, 11/15/21 | | | 3,700 | | | | 3,710,841 | |
1.88%, 11/30/21 | | | 11,000 | | | | 10,954,449 | |
2.13%, 12/31/21 | | | 7,000 | | | | 7,061,796 | |
1.50%, 1/31/22 | | | 6,000 | | | | 5,832,654 | |
2.00%, 2/15/22 | | | 1,500 | | | | 1,502,696 | |
1.75%, 3/31/22 | | | 9,100 | | | | 8,959,942 | |
1.75%, 4/30/22 | | | 3,000 | | | | 2,951,952 | |
| | | | | | | | |
| U.S. Treasury Obligations | | Par (000) | | | Value | |
U.S. Treasury Notes (continued): | | | | | | | | |
2.13%, 6/30/22 | | $ | 8,000 | | | $ | 8,041,248 | |
1.63%, 8/15/22 | | | 3,000 | | | | 2,922,069 | |
1.88%, 8/31/22 | | | 2,000 | | | | 1,976,954 | |
1.63%, 11/15/22 | | | 3,000 | | | | 2,914,335 | |
2.00%, 11/30/22 | | | 14,000 | | | | 13,923,434 | |
1.75%, 5/15/23 | | | 1,000 | | | | 974,258 | |
2.75%, 11/15/23 | | | 2,500 | | | | 2,609,083 | |
2.50%, 5/15/24 | | | 2,300 | | | | 2,350,223 | |
2.38%, 8/15/24 | | | 7,500 | | | | 7,578,225 | |
2.25%, 11/15/24 | | | 8,980 | | | | 8,975,438 | |
2.00%, 2/15/25 | | | 11,984 | | | | 11,714,827 | |
2.25%, 11/15/25 | | | 1,800 | | | | 1,795,991 | |
4.50%, 2/15/36 | | | 2,616 | | | | 3,352,566 | |
Total U.S. Treasury Obligations — 37.5% | | | | 595,653,765 | |
Total Long-Term Investments (Cost — $1,599,765,702) — 100.2% | | | | 1,590,914,388 | |
| | | | | | | | |
| | |
| | |
| Short-Term Securities | | Shares | | | | |
Short-Term Securities — 12.0% | |
BlackRock Cash Funds: Institutional, SL Agency Shares, 0.35% (b)(h)(i) | | | 190,311,931 | | | | 190,311,931 | |
BlackRock Cash Funds: Prime, SL Agency Shares, 0.31 (b)(h)(i) | | | 258,161 | | | | 258,161 | |
Total Short-Term Securities (Cost — $190,570,092) — 12.0% | | | | 190,570,092 | |
Total Investments Before TBA Sale Commitments (Cost — $1,790,335,794) — 112.2% | | | | 1,781,484,480 | |
| | | | | | | | |
| | | | | | | | | |
| | |
| TBA Sale Commitments | | Par (000) | | | | |
Fannie Mae Mortgage-Backed Securities (f): | | | | | | | | |
2.50%, 1/01/31 | | $ | 1,764 | | | | (1,778,057 | ) |
3.00%, 1/01/46 | | | 283 | | | | (283,000 | ) |
3.50%, 1/01/31 – 1//01/46 | | | 8,230 | | | | (8,496,073 | ) |
4.00%, 1/01/46 | | | 4,266 | | | | (4,514,628 | ) |
Freddie Mac Mortgage-Backed Securities (f): | | | | | | | | |
3.00%, 1/01/46 | | | 440 | | | | (439,381 | ) |
3.50%, 1/01/46 | | | 5,472 | | | | (5,634,450 | ) |
4.00%, 1/01/46 | | | 2,194 | | | | (2,318,098 | ) |
4.50%, 1/01/31 | | | 150 | | | | (154,828 | ) |
5.00%, 1/01/46 | | | 800 | | | | (873,500 | ) |
Ginnie Mae Mortgage-Backed Securities, TBA, 3.50%, 1/15/46 (f) | | | 760 | | | | (792,419 | ) |
Total TBA Sale Commitments (Proceeds — $25,268,803) — (1.6)% | | | | (25,284,434 | ) |
Total Investments, Net of TBA Sale Commitments (Cost — $1,765,066,991) — 110.6% | | | | 1,756,200,046 | |
| Liabilities in Excess of Other Assets — (10.6)% | | | | (167,826,028 | ) |
| | | | | | | | |
| Net Assets — 100.0% | | | $ | 1,588,374,018 | |
| | | | | | | | |
See Notes to Financial Statements.
| | | | | | |
| | | | | | | |
| 40 | | BLACKROCK U.S. TOTAL BOND INDEX FUND | | DECEMBER 31, 2015 | | |
| | |
Schedule of Investments (continued) | | U.S. Total Bond Index Master Portfolio |
|
| Notes to Schedule of Investments |
| (a) | | Security exempt from registration pursuant to Rule 144A under the Securities Act of 1933, as amended. These securities may be resold in transactions exempt from registration to qualified institutional investors. |
| (b) | | During the year ended December 31, 2015, investments in issuers considered to be affiliates of the Master Portfolio for purposes of Section 2(a)(3) of the Investment Company Act of 1940, as amended, were as follows: |
| | | | | | | | | | | | | | | | | | | | | | | | |
| Affiliate | | Shares/Par
Held at
December 31,
2014 | | | Shares/Par
Purchased | | | Shares/Par
Sold | | | Shares/Par
Held at
December 31,
2015 | | | Value at
December 31,
2015 | | | Income | |
BlackRock Cash Funds: | | | | | | | | | | | | | | | | | | | | | | | | |
Institutional, SL Agency Shares | | | 251,106,435 | | | | — | | | | (60,794,504 | )1 | | | 190,311,931 | | | $ | 190,311,931 | | | $ | 458,650 | 3 |
| BlackRock Cash Funds: | | | | | | | | | | | | | | | | | | | | | | | | |
Prime, SL Agency Shares | | | — | | | | 258,161 | 2 | | | — | | | | 258,161 | | | $ | 258,161 | | | $ | 4,247 | 3 |
PNC Bank NA, 2.20%, 1/28/19 | | $ | 500,000 | | | | — | | | | — | | | $ | 500,000 | | | $ | 501,632 | | | $ | 11,000 | |
PNC Bank NA, 2.25%, 7/02/19 | | $ | 350,000 | | | | — | | | | — | | | $ | 350,000 | | | $ | 351,554 | | | $ | 7,875 | |
PNC Bank NA, 2.30%, 6/1/20 | | | — | | | $ | 500,000 | | | | — | | | $ | 500,000 | | | $ | 495,523 | | | $ | 5,590 | |
PNC Bank NA, 2.45%, 11/5/20 | | | — | | | $ | 250,000 | | | | — | | | $ | 250,000 | | | $ | 248,877 | | | $ | 476 | |
PNC Bank NA, 2.95%, 1/30/23 | | $ | 250,000 | | | | — | | | | — | | | $ | 250,000 | | | $ | 242,404 | | | $ | 7,375 | |
PNC Funding Corp., 5.63, 2/1/17 | | $ | 150,000 | | | | — | | | | — | | | $ | 150,000 | | | $ | 155,944 | | | $ | 8,438 | |
PNC Funding Corp., 3.30%, 3/08/22 | | $ | 150,000 | | | | — | | | | — | | | $ | 150,000 | | | $ | 153,574 | | | $ | 4,950 | |
1 Represents net shares sold. | | | | | | | | | |
2 Represents net shares purchased. | | | | | | | | | |
3 Represents all or a portion of securities lending income earned from the reinvestment of cash collateral from loaned securities, net of fees, and other payments to and from borrowers of securities, and less the collateral investment expenses. | |
| (c) | | Step-up bond that pays an initial coupon rate for the first period and then a higher coupon rate for the following periods. Rate as of period end. |
| (d) | | Variable rate security. Rate as of period end. |
| (e) | | Security, or a portion of security, is on loan. |
| (f) | | Represents or includes a TBA transaction. As of period end, unsettled TBA transactions were as follows: |
| | | | | | | | |
| Counterparty | | Value | | | Unrealized
Appreciation
(Depreciation) | |
Bank of America Securities LLC | | $ | 794,187 | | | $ | 2,422 | |
Barclays Bank PLC | | $ | 9,712,969 | | | $ | (2,452 | ) |
Citigroup GlobalMarkets, Inc. | | $ | 48,525,268 | | | $ | 45,086 | |
Credit Suisse Securities (USA) LLC | | $ | 39,141,147 | | | $ | (34,258 | ) |
Goldman Sachs & Co. | | $ | 3,208,002 | | | $ | 2,743 | |
J.P.Morgan Securities LLC | | $ | 29,393,930 | | | $ | (7,418 | ) |
Morgan Stanley & Co. LLC | | $ | 9,584,488 | | | $ | 43 | |
Nomura Securities International, Inc. | | $ | 6,151,151 | | | $ | (2,514 | ) |
RBC CapitalMarkets, LLC | | $ | (4,901,007 | ) | | $ | (15,665 | ) |
Wells Fargo Securities, LLC | | $ | 12,567,046 | | | $ | 40,730 | |
| (g) | | When-issued security. |
| (h) | | Current yield as of period end. |
| (i) | | All or a portion of security was purchased with the cash collateral from loaned securities. |
| | |
| Fair Value Hierarchy as of Period End | | |
Various inputs are used in determining the fair value of investments. For information about the Master Portfolio’s policy regarding valuation of investments, refer to the Notes to Financial Statements.
See Notes to Financial Statements.
| | | | | | |
| | | | | | | |
| | BLACKROCK U.S. TOTAL BOND INDEX FUND | | DECEMBER 31, 2015 | | 41 |
| | |
Schedule of Investments (concluded) | | U.S. Total Bond Index Master Portfolio |
The following table summarizes the Master Portfolio’s investments categorized in the disclosure hierarchy:
| | | | | | | | | | | | | | | | |
| | | Level 1 | | | Level 2 | | | Level 3 | | | Total | |
Assets: | | | | | | | | | | | | | | | | |
| Investments: | | | | | | | | | | | | | | | | |
| Long-Term Investments: | | | | | | | | | | | | | | | | |
Asset-Backed Securities | | | — | | | $ | 8,503,812 | | | | — | | | $ | 8,503,812 | |
Corporate Bonds | | | — | | | | 388,830,192 | | | | — | | | | 388,830,192 | |
Foreign Agency Obligations | | | — | | | | 49,090,424 | | | | — | | | | 49,090,424 | |
Municipal Bonds1 | | | — | | | | 12,297,367 | | | | — | | | | 12,297,367 | |
Non-Agency Mortgage-Backed Securities | | | — | | | | 21,320,181 | | | | — | | | | 21,320,181 | |
Preferred Securities | | | — | | | | 472,575 | | | | — | | | | 472,575 | |
U.S. Government Sponsored Agency Securities | | | — | | | | 514,746,072 | | | | — | | | | 514,746,072 | |
U.S. Treasury Obligations | | | — | | | | 595,653,765 | | | | — | | | | 595,653,765 | |
Short-Term Securities | | $ | 190,570,092 | | | | — | | | | — | | | | 190,570,092 | |
Liabilities: | | | | | | | | | | | | | | | | |
| Investments: | | | | | | | | | | | | | | | | |
TBA Sale Commitments | | | — | | | | (25,284,434 | ) | | | — | | | | (25,284,434 | ) |
| | | | |
Total | | $ | 190,570,092 | | | $ | 1,565,629,954 | | | | — | | | $ | 1,756,200,046 | |
| | | | |
The Master Portfolio may hold assets and/or liabilities in which the fair value approximates the carrying amount for financial statement purposes. As of period end, such assets and/or liabilities are categorized within the disclosure hierarchy as follows:
| | | | | | | | | | | | | | | | |
| | | Level 1 | | | Level 2 | | | Level 3 | | | Total | |
Assets: | | | | | | | | | | | | | | | | |
Cash | | $ | 28,320 | | | | — | | | | — | | | $ | 28,320 | |
Liabilities: | | | | | | | | | | | | | | | | |
Cash received as collateral for TBA commitments | | | — | | | $ | (11,000 | ) | | | — | | | | (11,000 | ) |
Collateral on securities loaned at value | | | — | | | | (592,500 | ) | | | — | | | | (592,500 | ) |
| | | | |
Total | | $ | 28,320 | | | $ | (603,500 | ) | | | — | | | $ | (575,180 | ) |
| | | | |
During the year ended December 31, 2015, there were no transfers between levels.
See Notes to Financial Statements.
| | | | | | |
| | | | | | | |
| 42 | | BLACKROCK U.S. TOTAL BOND INDEX FUND | | DECEMBER 31, 2015 | | |
| | |
| Statement of Assets and Liabilities | | U.S. Total Bond Index Master Portfolio |
| | | | |
| December 31, 2015 | | | |
| | | | |
| Assets | |
Investments at value — unaffiliated (including securities loaned of $567,622) (cost — $1,597,614,703) | | $ | 1,588,764,880 | |
Investments at value — affiliated (cost — $192,721,091) | | | 192,719,600 | |
Cash | | | 28,320 | |
| Receivables: | | | | |
TBA sale commitments | | | 25,268,803 | |
Investments sold | | | 17,878,988 | |
Interest | | | 8,203,538 | |
Contributions from investors | | | 11,050,500 | |
Principal paydowns | | | 7,600 | |
Securities lending income — affiliated | | | 2,050 | |
| | | | |
Total assets | | | 1,843,924,279 | |
| | | | |
| | | | |
| Liabilities | |
TBA sale commitments at value (proceeds — $25,268,803) | | | 25,284,434 | |
Collateral on securities loaned at value | | | 592,500 | |
| Payables: | | | | |
Investments purchased | | | 220,652,728 | |
Withdrawals payable to investors | | | 8,941,194 | |
Investment advisory fees | | | 32,004 | |
Trustees’ fees payable | | | 10,911 | |
Other accrued expenses | | | 25,490 | |
Cash received as collateral for TBA commitments | | | 11,000 | |
| | | | |
Total liabilities | | | 255,550,261 | |
| | | | |
Net Assets | | $ | 1,588,374,018 | |
| | | | |
| | | | |
| Net Assets Consist of | |
Investors’ capital | | $ | 1,597,240,963 | |
Net unrealized appreciation (depreciation) | | | (8,866,945 | ) |
| | | | |
Net Assets | | $ | 1,588,374,018 | |
| | | | |
| | | | | | |
| See Notes to Financial Statements. | | | | |
| | | | | | | |
| | BLACKROCK U.S. TOTAL BOND INDEX FUND | | DECEMBER 31, 2015 | | 43 |
| | |
| Statement of Operations | | U.S. Total Bond Index Master Portfolio |
| | | | |
| Year Ended December 31, 2015 | | | |
| | | | |
| Investment Income | | | | |
Interest | | $ | 27,272,266 | |
Income — affiliated | | | 498,853 | |
Securities lending — affiliated — net | | | 9,748 | |
| | | | |
Total income | | | 27,780,867 | |
| | | | |
| | | | |
| Expenses | | | | |
Investment advisory | | | 733,273 | |
Professional | | | 46,057 | |
Trustees | | | 43,477 | |
| | | | |
Total expenses | | | 822,807 | |
Less fees waived by the Manager | | | (257,513 | ) |
| | | | |
Total expenses after fees waived | | | 565,294 | |
| | | | |
Net investment income | | | 27,215,573 | |
| | | | |
| | | | |
| Realized and Unrealized Gain (Loss) | | | | |
Net realized gain from investments | | | 2,186,271 | |
| Net change in unrealized appreciation (depreciation) on: | | | | |
Investments — unaffiliated | | | (25,907,001 | ) |
Investments affiliated | | | (6,498 | ) |
| | | | |
| | | (25,913,499 | ) |
| | | | |
Net realized and unrealized loss | | | (23,727,228 | ) |
| | | | |
Net Increase in Net Assets Resulting from Operations | | $ | 3,488,345 | |
| | | | |
| | | | | | |
| See Notes to Financial Statements. | | | | |
| | | | | | | |
| 44 | | BLACKROCK U.S. TOTAL BOND INDEX FUND | | DECEMBER 31, 2015 | | |
| | |
| Statements of Changes in Net Assets | | U.S. Total Bond Index Master Portfolio |
| | | | | | | | |
| | | Year Ended December 31, | |
| Increase (Decrease) in Net Assets: | | 2015 | | | 2014 | |
| | | | | | | | |
| Operations | | | | | | | | |
Net investment income | | $ | 27,215,573 | | | $ | 20,593,194 | |
Net realized gain | | | 2,186,271 | | | | 14,296,029 | |
Net change in unrealized appreciation (depreciation) | | | (25,913,499 | ) | | | 31,803,664 | |
| | | | |
Net increase in net assets resulting from operations | | | 3,488,345 | | | | 66,692,887 | |
| | | | |
| | | | | | | | |
| Capital Transactions | | | | | | | | |
Proceeds from contributions | | | 653,907,369 | | | | 924,146,923 | |
Value of withdrawals | | | (261,514,633 | ) | | | (732,116,664 | ) |
| | | | |
Net increase in net assets derived from capital transactions | | | 392,392,736 | | | | 192,030,259 | |
| | | | |
| | | | | | | | |
| Net Assets | | | | | | | | |
Total increase in net assets | | | 395,881,081 | | | | 258,723,146 | |
Beginning of year | | | 1,192,492,937 | | | | 933,769,791 | |
| | | | |
End of year | | $ | 1,588,374,018 | | | $ | 1,192,492,937 | |
| | | | |
| | | | | | |
| See Notes to Financial Statements. | | | | |
| | | | | | | |
| | BLACKROCK U.S. TOTAL BOND INDEX FUND | | DECEMBER 31, 2015 | | 45 |
| | |
| Financial Highlights | | U.S. Total Bond Index Master Portfolio |
| | | | | | | | | | | | | | | | | | | | |
| | | Year Ended December 31, | |
| | | 2015 | | | 2014 | | | 2013 | | | 2012 | | | 2011 | |
| | | | | | | | | | | | | | | | | | | | |
| Total Return | | | | | | | | | | | | | | | | | | | | |
Total Return | | | 0.40% | | | | 5.98% | | | | (2.23)% | | | | 4.06% | | | | 7.67% | |
| | | | |
| | | | | | | | | | | | | | | | | | | | |
| Ratios to Average Net Assets | | | | | | | | | | | | | | | | | | | | |
Total expenses | | | 0.06% | | | | 0.09% | | | | 0.09% | | | | 0.09% | | | | 0.13% | |
| | | | |
Total expenses after fees waived | | | 0.04% | | | | 0.07% | | | | 0.08% | | | | 0.08% | | | | 0.08% | |
| | | | |
Net investment income | | | 1.93% | | | | 1.76% | | | | 1.63% | | | | 1.86% | | | | 3.36% | |
| | | | |
| | | | | | | | | | | | | | | | | | | | |
| Supplemental Data | | | | | | | | | | | | | | | | | | | | |
Net assets, end of year (000) | | | $ 1,588,374 | | | | $ 1,192,493 | | | | $ 933,770 | | | | $ 481,572 | | | | $ 127,484 | |
| | | | |
Portfolio turnover rate1,2 | | | 356% | | | | 476% | | | | 417% | | | | 436% | | | | 122% | |
| | | | |
| | 1 | | Portfolio turnover rate includes TBA transactions, if any. |
| | 2 | | Includes MDRs. Additional information regarding portfolio turnover rate is as follows: |
| | | | | | | | | | | | | | | | | | | | |
| | | Year Ended December 31, | |
| | | 2015 | | | 2014 | | | 2013 | | | 2012 | | | 2011 | |
| | | | | | | | | | | | | | | | | | | | |
Portfolio turnover rate (excluding MDRs) | | | 300% | | | | 244% | | | | 214% | | | | 231% | | | | 121% | |
| | | | | | | | | | | | | | | | | | | | |
| | | | | | |
| See Notes to Financial Statements. | | | | |
| | | | | | | |
| 46 | | BLACKROCK U.S. TOTAL BOND INDEX FUND | | DECEMBER 31, 2015 | | |
| | | | |
| Notes to Financial Statements | | U.S. Total Bond Index Master Portfolio |
1. Organization
U.S. Total Bond Index Master Portfolio (the “Master Portfolio”) (formerly known as Bond Index Master Portfolio), a series of Master Investment Portfolio (“MIP”), is registered under the Investment Company Act of 1940, as amended (the “1940 Act”), as a diversified, open-end management investment company. MIP is organized as a Delaware statutory trust.
The Master Portfolio, together with certain other registered investment companies advised by BlackRock Fund Advisors (the “Manager”) or its affiliates, is included in a complex of open-end funds referred to as the Equity-Liquidity Complex.
2. Significant Accounting Policies:
The Master Portfolio’s financial statements are prepared in conformity with accounting principles generally accepted in the United States of America (“U.S. GAAP”), which may require management to make estimates and assumptions that affect the reported amounts of assets and liabilities in the financial statements, disclosure of contingent assets and liabilities at the date of the financial statements and the reported amounts of increases and decreases in net assets from operations during the reporting period. Actual results could differ from those estimates. The Master Portfolio is considered an investment company under U.S. GAAP and follows the accounting and reporting guidance applicable to investment companies. Below is a summary of significant accounting policies:
Segregation and Collateralization: In cases where the Master Portfolio enters into certain investments (e.g., financial futures contracts and forward foreign currency exchange contracts) that would be treated as “senior securities” for 1940 Act purposes, the Master Portfolio may segregate or designate on its books and records cash or liquid assets having a market value at least equal to the amount of its future obligations under such investments. Doing so allows the investment to be excluded from treatment as a “senior security.” Furthermore, if required by an exchange or counterparty agreement, the Master Portfolio may be required to deliver/deposit cash and/or securities to/with an exchange, or broker-dealer or custodian as collateral for certain investments or obligations.
Investment Transactions and Investment Income: For financial reporting purposes, investment transactions are recorded on the dates the transactions are entered into (the trade dates). Realized gains and losses on investment transactions are determined on the identified cost basis. Interest income, including amortization and accretion of premiums and discounts on debt securities, is recognized on the accrual basis.
Indemnifications: In the normal course of business, the Master Portfolio enters into contracts that contain a variety of representations that provide general indemnification. The Master Portfolio’s maximum exposure under these arrangements is unknown because it involves future potential claims against the Master Portfolio, which cannot be predicted with any certainty.
Other: Expenses directly related to the Master Portfolio are charged to the Master Portfolio. Other operating expenses shared by several funds, including other funds managed by the Manager, are prorated among those funds on the basis of relative net assets or other appropriate methods.
The Master Portfolio has an arrangement with its custodian whereby fees may be reduced by credits earned on uninvested cash balances, which, if applicable, are shown as fees paid indirectly in the Statement of Operations. The custodian imposes fees on overdrawn cash balances, which can be offset by accumulated credits earned or may result in additional custody charges. Effective September 2015, the arrangement with its custodian for earning credits on uninvested cash balances has ceased and the custodian will be imposing fees on certain uninvested cash balances.
3. Investment Valuation and Fair Value Measurements:
Investment Valuation Policies: The Master Portfolio’s investments are valued at fair value (also referred to as “market value” within the financial statements) as of the close of trading on the New York Stock Exchange (“NYSE”) (generally 4:00 p.m., Eastern time). U.S. GAAP defines fair value as the price the Master Portfolio would receive to sell an asset or pay to transfer a liability in an orderly transaction between market participants at the measurement date. The Master Portfolio determines the fair values of its financial instruments using independent dealers or pricing services under policies approved by the Board of Trustees of MIP (the “Board”). The BlackRock Global Valuation Methodologies Committee (the “Global Valuation Committee”) is the committee formed by management to develop global pricing policies and procedures and to provide oversight of the pricing function for the Master Portfolio’s for all financial instruments.
Fair Value Inputs and Methodologies: The following methods (or “techniques”) and inputs are used to establish the fair value of the Master Portfolio assets and liabilities:
| • | | Bond investments are valued on the basis of last available bid prices or current market quotations provided by dealers or pricing services. Floating rate loan interests are valued at the mean of the bid prices from one or more brokers or dealers as obtained from a pricing service. In determining |
| | | | | | |
| | | | | | | |
| | BLACKROCK U.S. TOTAL BOND INDEX FUND | | DECEMBER 31, 2015 | | 47 |
| | |
| Notes to Financial Statements (continued) | | U.S. Total Bond Index Master Portfolio |
| | the value of a particular investment, pricing services may use certain information with respect to transactions in such investments, quotations from dealers, pricing matrixes, market transactions in comparable investments, various relationships observed in the market between investments and calculated yield measures. Asset-backed and mortgage-backed securities are valued by independent pricing services using models that consider estimated cash flows of each tranche of the security, establish a benchmark yield and develop an estimated tranche-specific spread to the benchmark yield based on the unique attributes of the tranche. Generally, trading in foreign instruments is substantially completed each day at various times prior to the close of business on the NYSE. Occasionally, events affecting the values of such instruments may occur between the foreign market close and the close of business on the NYSE that may not be reflected in the computation of the Master Portfolio’s net assets. |
| • | | Municipal investments (including commitments to purchase such investments on a “when-issued” basis) are valued on the basis of prices provided by dealers or pricing services. In determining the value of a particular investment, pricing services may use certain information with respect to transactions in such investments, quotations from dealers, pricing matrixes, market transactions in comparable investments and information with respect to various relationships between investments. |
| • | | TBA commitments are valued on the basis of last available bid prices or current market quotations provided by pricing services. |
| • | | Investments in open-end U.S. mutual funds are valued at net asset value (“NAV”) each business day. |
If events (e.g., a company announcement, market volatility or a natural disaster) occur that are expected to materially affect the value of such instruments, or in the event that the application of these methods of valuation results in a price for an investment that is deemed not to be representative of the market value of such investment, or if a price is not available, the investment will be valued by the Global Valuation Committee, or its delegate, in accordance with a policy approved by the Board as reflecting fair value (“Fair Valued Investments”). When determining the price for Fair Valued Investments, the Global Valuation Committee, or its delegate, seeks to determine the price that the Master Portfolio might reasonably expect to receive or pay from the current sale or purchase of that asset or liability in an arm’s-length transaction. Fair value determinations shall be based upon all available factors that the Global Valuation Committee, or its delegate, deems relevant consistent with the principles of fair value measurement. The pricing of all Fair Valued Investments is subsequently reported to the Board or a committee thereof on a quarterly basis.
Fair Value Hierarchy: Various inputs are used in determining the fair value of investments. These inputs to valuation techniques are categorized into a fair value hierarchy consisting of three broad levels for financial statement purposes as follows:
| • | | Level 1 — unadjusted price quotations in active markets/exchanges for identical assets or liabilities that the Master Portfolio has the ability to access |
| • | | Level 2 — other observable inputs (including, but not limited to, quoted prices for similar assets or liabilities in markets that are active, quoted prices for identical or similar assets or liabilities in markets that are not active, inputs other than quoted prices that are observable for the assets or liabilities (such as interest rates, yield curves, volatilities, prepayment speeds, loss severities, credit risks and default rates) or other market–corroborated inputs) |
| • | | Level 3 — unobservable inputs based on the best information available in the circumstances, to the extent observable inputs are not available (including the Master Portfolio’s own assumptions used in determining the fair value of investments) |
The hierarchy gives the highest priority to unadjusted quoted prices in active markets for identical assets or liabilities (Level 1 measurements) and the lowest priority to unobservable inputs (Level 3 measurements). Accordingly, the degree of judgment exercised in determining fair value is greatest for instruments categorized in Level 3. The inputs used to measure fair value may fall into different levels of the fair value hierarchy. In such cases, for disclosure purposes, the fair value hierarchy classification is determined based on the lowest level input that is significant to the fair value measurement in its entirety. The significant unobservable inputs used by the Global Valuation Committee in determining the price for Fair Valued Investments are typically categorized as Level 3. The fair value hierarchy for the Master Portfolio’s investments have been included in the Schedule of Investments.
Changes in valuation techniques may result in transfers into or out of an assigned level within the hierarchy. In accordance with the Master Portfolio’s policy, transfers between different levels of the fair value hierarchy are deemed to have occurred as of the beginning of the reporting period. The categorization of a value determined for investments is based on the pricing transparency of the investments and is not necessarily an indication of the risks associated with investing in those securities.
| | | | | | |
| | | | | | | |
| 48 | | BLACKROCK U.S. TOTAL BOND INDEX FUND | | DECEMBER 31, 2015 | | |
| | |
| Notes to Financial Statements (continued) | | U.S. Total Bond Index Master Portfolio |
4. Securities and Other Investments:
Asset-Backed and Mortgage-Backed Securities: Asset-backed securities are generally issued as pass-through certificates or as debt instruments. Asset-backed securities issued as pass-through certificates represent undivided fractional ownership interests in an underlying pool of assets. Asset-backed securities issued as debt instruments, which are also known as collateralized obligations are typically issued as the debt of a special purpose entity organized solely for the purpose of owning such assets and issuing such debt. Asset-backed securities are often backed by a pool of assets representing the obligations of a number of different parties. The yield characteristics of certain asset-backed securities may differ from traditional debt securities. One such major difference is that all or a principal part of the obligations may be prepaid at any time because the underlying assets (i.e., loans) may be prepaid at any time. As a result, a decrease in interest rates in the market may result in increases in the level of prepayments as borrowers, particularly mortgagors, refinance and repay their loans. An increased prepayment rate with respect to an asset-backed security will have the effect of shortening the maturity of the security. In addition, the Master Portfolio may subsequently have to reinvest the proceeds at lower interest rates. If the Master Portfolio has purchased such an asset-backed security at a premium, a faster than anticipated prepayment rate could result in a loss of principal to the extent of the premium paid.
For mortgage pass through securities, there are a number of important differences among the agencies and instrumentalities of the U.S. Government that issue mortgage-related securities and among the securities that they issue. For example, mortgage-related securities guaranteed by Ginnie Mae are guaranteed as to the timely payment of principal and interest by Ginnie Mae and such guarantee is backed by the full faith and credit of the United States. However, mortgage-related securities issued by Freddie Mac and Fannie Mae, including Freddie Mac and Fannie Mae guaranteed mortgage pass-through certificates, which are solely the obligations of Freddie Mac and Fannie Mae, are not backed by or entitled to the full faith and credit of the United States, but are supported by the right of the issuer to borrow from the U.S. Treasury.
Non-agency mortgage-backed securities are securities issued by non-governmental issuers and have no direct or indirect government guarantees of payment and are subject to various risks. Non-agency mortgage loans are obligations of the borrowers thereunder only and are not typically insured or guaranteed by any other person or entity. The ability of a borrower to repay a loan is dependent upon the income or assets of the borrower. A number of factors, including a general economic downturn, acts of God, terrorism, social unrest and civil disturbances, may impair a borrower’s ability to repay its loans.
Multiple Class Pass-Through Securities: Multiple class pass-through securities, including collateralized mortgage obligations (“CMOs”) and commercial mortgage-backed securities may be issued by Ginnie Mae, U.S. Government agencies or instrumentalities or by trusts formed by private originators of, or investors in, mortgage loans. In general, CMOs are debt obligations of a legal entity that are collateralized by a pool of residential or commercial mortgage loans or mortgage pass-through securities (the “Mortgage Assets”). The payments on these are used to make payments on the CMOs or multiple pass-through securities. Multiple class pass-through securities represent direct ownership interests in the Mortgage Assets. Classes of CMOs include interest only (“IOs”), principal only (“POs”), planned amortization classes and targeted amortization classes. IOs and POs are stripped mortgage-backed securities representing interests in a pool of mortgages, the cash flow from which has been separated into interest and principal components. IOs receive the interest portion of the cash flow while POs receive the principal portion. IOs and POs can be extremely volatile in response to changes in interest rates. As interest rates rise and fall, the value of IOs tends to move in the same direction as interest rates. POs perform best when prepayments on the underlying mortgages rise since this increases the rate at which the principal is returned and the yield to maturity on the PO. When payments on mortgages underlying a PO are slower than anticipated, the life of the PO is lengthened and the yield to maturity is reduced. If the underlying Mortgage Assets experience greater than anticipated prepayments of principal, the Master Portfolio initial investment in the IOs may not fully recoup.
Capital Securities and Trust Preferred Securities: Capital securities, including trust preferred securities, are typically issued by corporations, generally in the form of interest-bearing notes with preferred securities characteristics, or in the case of trust preferred securities, by an affiliated business trust of a corporation, generally in the form of beneficial interests in subordinated debentures or similarly structured securities. The securities can be structured as either fixed or adjustable coupon securities that can have either a perpetual or stated maturity date. For trust preferred securities, the issuing bank or corporation pays interest to the trust, which is then distributed to holders of the trust preferred securities as a dividend. Dividends can be deferred without creating an event of default or acceleration, although maturity cannot take place unless all cumulative payment obligations have been met. The deferral of payments does not affect the purchase or sale of these securities in the open market. Payments on these securities are treated as interest rather than dividends for federal income tax purposes. These securities generally are rated below that of the issuing company’s senior debt securities and are freely callable at the issuer’s option.
| | | | | | |
| | | | | | | |
| | BLACKROCK U.S. TOTAL BOND INDEX FUND | | DECEMBER 31, 2015 | | 49 |
| | |
| Notes to Financial Statements (continued) | | U.S. Total Bond Index Master Portfolio |
TBA Commitments: TBA commitments are forward agreements for the purchase or sale of mortgage-backed securities for a fixed price, with payment and delivery on an agreed upon future settlement date. The specific securities to be delivered are not identified at the trade date. However, delivered securities must meet specified terms, including issuer, rate and mortgage terms. When entering into TBA commitments, the Master Portfolio may take possession of or deliver the underlying mortgage-backed securities but can extend the settlement or roll the transaction. TBA commitments involve a risk of loss if the value of the security to be purchased or sold declines or increases, respectively, prior to settlement date.
In order to better define contractual rights and to secure rights that will help the Master Portfolio mitigate its counterparty risk, TBA commitments may be entered into by the Master Portfolio under Master Securities Forward Transaction Agreements (each, an “MSFTA”). An MSFTA typically contains, among other things, collateral posting terms and netting provisions in the event of default and/or termination event. The collateral requirements are typically calculated by netting the mark-to-market amount for each transaction under such agreement and comparing that amount to the value of the collateral currently pledged by the Master Portfolio and the counterparty. Cash collateral that has been pledged to cover the obligations of the Master Portfolio and cash collateral received from the counterparty, if any, is reported separately on the Statement of Assets and Liabilities as cash pledged as collateral for TBA commitments or cash received as collateral for TBA commitments, respectively. Non-cash collateral pledged by the Master Portfolio, if any, is noted in the Schedule of Investments. Typically, the Master Portfolio is permitted to sell, repledge or use the collateral it receives; however, the counterparty is not permitted to do so. To the extent amounts due to the Master Portfolio is not fully collateralized, contractually or otherwise, the Master Portfolio bears the risk of loss from counterparty non-performance.
Securities Lending: The Master Portfolio may lend its securities to approved borrowers, such as brokers, dealers and other financial institutions. The borrower pledges and maintains with the Master Portfolio collateral consisting of cash, an irrevocable letter of credit issued by a bank, or securities issued or guaranteed by the U.S. Government. The initial collateral received by the Master Portfolio is required to have a value of at least 102% of the current value of the loaned securities for securities traded on U.S. exchanges and a value of at least 105% for all other securities. The collateral is maintained thereafter, at a value equal to at least 100% of the current market value of the securities on loan. The market value of the loaned securities is determined at the close of each business day of the Master Portfolio and any additional required collateral is delivered to the Master Portfolio, or excess collateral returned by the Master Portfolio, on the next business day. During the term of the loan, the Master Portfolio is entitled to all distributions made on or in respect of the loaned securities. Loans of securities are terminable at any time and the borrower, after notice, is required to return borrowed securities within the standard time period for settlement of securities transactions.
The market value of any securities on loan, all of which were classified as common stocks in the Master Portfolio’s Schedule of Investments, and the value of any related collateral are shown separately in the Statement of Assets and Liabilities as a component of investments at value-unaffiliated, and collateral on securities loaned at value, respectively. As of period end, any securities on loan were collateralized by cash. The cash collateral invested by the securities lending agent, BlackRock Institutional Trust Company, N.A. (“BTC”), if any, is disclosed in the Schedule of Investments.
Securities lending transactions are entered into by the Master Portfolio under Master Securities Lending Agreements (each, an “MSLA”), which provide the right, in the event of default (including bankruptcy or insolvency), for the non-defaulting party to liquidate the collateral and calculate a net exposure to the defaulting party or request additional collateral. In the event that a borrower defaults, the Master Portfolio as lender, would offset the market value of the collateral received against the market value of the securities loaned. When the value of the collateral is greater than that of the market value of the securities loaned, the lender is left with a net amount payable to the defaulting party. However, bankruptcy or insolvency laws of a particular jurisdiction may impose restrictions on or prohibitions against such a right of offset in the event of an MSLA counterparty’s bankruptcy or insolvency. Under the MSLA, absent an event of default the borrower can resell or re-pledge the loaned securities, and the Master Portfolio can reinvest cash collateral received in connection with loaned securities. Upon an event of default, the parties’ obligations to return the securities or collateral to the other party are extinguished, and the parties can resell or re-pledge the loaned securities or the collateral received in connection with the loaned securities in order to satisfy the defaulting party’s net payment obligation for all transactions under the MSLA. The defaulting party remains liable for any deficiency.
As of period end, the following table is a summary of the Master Portfolio’s securities lending agreements by counterparty which are subject to offset under an MSLA:
| | | | | | | | | | | | |
| Counterparty | | Securities
Loaned
at Value | | | Cash
Collateral
Received1 | | | Net Amount | |
CitiGroup Global Markets, Inc. | | $ | 567,622 | | | $ | 567,622 | | | | — | |
| | 1 | | Collateral with a value of $592,500 has been received in connection with securities lending agreements. Collateral received in excess of the value of securities loaned from the individual counterparty is not shown for financial reporting purposes in the table above. |
| | | | | | |
| | | | | | | |
| 50 | | BLACKROCK U.S. TOTAL BOND INDEX FUND | | DECEMBER 31, 2015 | | |
| | |
| Notes to Financial Statements (continued) | | U.S. Total Bond Index Master Portfolio |
The risks of securities lending include the risk that the borrower may not provide additional collateral when required or may not return the securities when due. To mitigate these risks, the Master Portfolio benefits from a borrower default indemnity provided by BlackRock, Inc. (“BlackRock”). BlackRock’s indemnity allows for full replacement of the securities loaned if the collateral received does not cover the value on the securities loaned in the event of borrower default. the Master Portfolio could suffer a loss if the value of an investment purchased with cash collateral falls below the market value of loaned securities or if the value of an investment purchased with cash collateral falls below the value of the original cash collateral received.
5. Investment Advisory Agreement and Other Transactions with Affiliates:
The PNC Financial Services Group, Inc. is the largest stockholder and an affiliate of BlackRock for 1940 Act purposes.
MIP, on behalf of the Master Portfolio, entered into an Investment Advisory Agreement with the Manager, the Master Portfolio’s investment advisor, an indirect, wholly owned subsidiary of BlackRock, to provide investment advisory and administration services. The Manager is responsible for the management of the Master Portfolio’s portfolio and provides the personnel, facilities, equipment and certain other services necessary to the operations of the Master Portfolio. Effective April 30, 2015, for such services, the Master Portfolio pays the Manager a monthly fee based on a percentage of the Master Portfolio’s average daily net assets at an annual rate of 0.04%. Prior to April 30, 2015, the annual rate as a percentage of average daily net assets was 0.08%.
MIP entered into an Administration Agreement with BlackRock Advisors, LLC (“BAL”) which has agreed to provide general administration services (other than investment advice and related portfolio activities). BAL, in consideration thereof, has agreed to bear all of the Master Portfolio’s ordinary operating expenses excluding, generally, investment advisory fees, distribution fees, brokerage and other expenses related to the execution of portfolio transactions, extraordinary expenses and certain other expenses which are borne by the Master Portfolio. BAL may delegate certain of its administration duties to sub-administrators.
BAL is not entitled to compensation for providing administration services to the Master Portfolio, for so long as BAL is entitled to compensation for providing administration services to corresponding feeder funds that invest substantially all of their assets in the Master Portfolio, or BAL (or an affiliate) receives investment advisory fees from the Master Portfolio.
The Manager contractually agreed to waive its investment advisory fees by the amount of investment advisory fees the Master Portfolio pays to the Manager indirectly through its investment in affiliated money market funds. This amount is included in fees waived by the Manager in the Statement of Operations. However, the Manager does not waive its investment advisory fees by the amount of investment advisory fees paid in connection with the Master Portfolio’s investments in other affiliated investment companies, if any. For the year ended December 31, 2015, the amount waived was $167,980.
The fees and expenses of the MIP’s trustees who are not “interested persons” of the MIP, as defined in the 1940 Act (“Independent Trustees”), counsel to the Independent Trustees and the MIP’s independent registered public accounting firm (together, the “independent expenses”) are paid directly by the Master Portfolio. BAL has contractually agreed to reimburse the Master Portfolio or provide an offsetting credit against the administration fees paid by the Master Portfolio in an amount equal to the independent expenses through April 30, 2016. If the Master Portfolio does not pay administration fees, BFA agrees to cap the expenses of the Master Portfolio at the rate at which it pays an investment advisory fee to BFA. The amount of the waiver, if any, is included in fees waived by the Manager in the Statement of Operations. For the year ended December 31, 2015, the Manager waived $89,533 pursuant to the agreement.
The U.S. Securities and Exchange Commission has issued an exemptive order which permits BTC, an affiliate of the Manager, to serve as securities lending agent for the Master Portfolio, subject to applicable conditions. As securities lending agent, BTC bears all operational costs directly related to securities lending. The Master Portfolio is responsible for fees in connection with the investment of cash collateral received for securities on loan in a money market fund managed by the Manager or its affiliates, however, BTC has agreed to reduce the amount of securities lending income it receives in order to effectively limit the collateral investment fees the Master Portfolio bears to an annual rate of 0.04% (the “collateral investment fees”).
Securities lending income is equal to the total of income earned from the reinvestment of cash collateral, net of fees and other payments to and from borrowers of securities, and less the collateral investment fees. The Master Portfolio retains a portion of securities lending income and remits a remaining portion to BTC as compensation for its services as securities lending agent.
Pursuant to a securities lending agreement, BTC may lend securities only when the difference between the borrower rebate rate and the risk free rate exceeds a certain level (such securities, the “specials only securities”).
Pursuant to such agreement, the Master Portfolio retains 80% of securities lending income. In addition, commencing the business day following the date that the aggregate securities lending income earned across certain funds in the Equity-Liquidity Complex in a calendar year exceeds a specified
| | | | | | |
| | | | | | | |
| | BLACKROCK U.S. TOTAL BOND INDEX FUND | | DECEMBER 31, 2015 | | 51 |
| | |
| Notes to Financial Statements (continued) | | U.S. Total Bond Index Master Portfolio |
threshold, the Master Portfolio, pursuant to the securities lending agreement, will retain for the remainder of the calendar year securities lending income in an amount equal to 85% of securities lending income.
The share of securities lending income earned by the Master Portfolio is shown as securities lending — affiliated – net in the Statement of Operations. For the year ended December 31, 2015, the Master Portfolio paid BTC $2,093 in total for securities lending agent services and collateral investment fees.
Certain officers and/or trustees of MIP are officers and/or directors of BlackRock or its affiliates.
The Master Portfolio may purchase securities from, or sell securities to, an affiliated fund provided the affiliation is due solely to having a common investment advisor, common officers, or common trustees. For the year ended December 31, 2015, the purchase and sale transactions with an affiliated fund in compliance with Rule 17a-7 under the 1940 Act were $561,729 and $249,396, respectively.
6. Purchases and Sales:
For the year ended December 31, 2015, purchases and sales of investments, including mortgage dollar rolls and excluding short-term securities, were as follows:
| | | | | | | | |
| | | Purchases | | | Sales | |
Non-U.S. Government Securities | | $ | 5,016,286,039 | | | $ | 4,786,503,503 | * |
U.S. Government Securities | | $ | 326,708,859 | | | $ | 154,069,181 | |
| | | | | | | | |
Total | | $ | 5,342,994,898 | | | $ | 4,940,572,684 | |
| | | | | | | | |
For the year ended December 31, 2015, purchases and sales related to mortgage dollar rolls were $774,812,569 and $776,208,746, respectively.
7. Income Tax Information:
The Master Portfolio is classified as a partnership for federal income tax purposes. As such, each investor in the Master Portfolio is treated as the owner of its proportionate share of net assets, income, expenses and realized and unrealized gains and losses of the Master Portfolio. Therefore, no federal income tax provision is required. It is intended that the Master Portfolio’s assets will be managed so an investor in the Master Portfolio can satisfy the requirements of Subchapter M of the Internal Revenue Code of 1986, as amended.
The Master Portfolio files U.S. federal and various state and local tax returns. No income tax returns are currently under examination. The statute of limitations on the Master Portfolio’s U.S. federal tax returns remains open for each of the four years ended December 31, 2015. The statutes of limitations on the Master Portfolio’s state and local tax returns may remain open for an additional year depending upon the jurisdiction.
Management has analyzed tax laws and regulations and their application to the Master Portfolio as of December 31, 2015, inclusive of the open tax return years, and does not believe there are any uncertain tax positions that require recognition of a tax liability in the Master Portfolio’s financial statements.
As of period end, gross unrealized appreciation and depreciation based on cost for federal income tax purposes were as follows:
| | | | |
Tax cost | | $ | 1,790,465,989 | |
| | | | |
Gross unrealized appreciation | | $ | 10,783,324 | |
Gross unrealized depreciation | | | (19,764,833 | ) |
| | | | |
Net unrealized depreciation | | $ | (8,981,509 | ) |
| | | | |
8. Bank Borrowings:
MIP, on behalf of the Master Portfolio, along with certain other funds managed by the Manager and its affiliates (“Participating Funds”), is a party to a 364-day, $2.1 billion credit agreement with a group of lenders, under which the Master Portfolio may borrow to fund shareholder redemptions. Excluding commitments designated for certain funds, the Participating Funds, including the Master Portfolio, can borrow up to an aggregate commitment amount of $1.6 billion at any time outstanding, subject to asset coverage and other limitations as specified in the agreement. The credit agreement has the following terms: a fee of 0.06% per annum on unused commitment amounts and interest at a rate equal to the higher of (a) one-month LIBOR (but, in any event, not less than 0.00%) on the date the loan is made plus 0.80% per annum or (b) the Fed Funds rate (but, in any event, not less than 0.00%) in effect from time to time plus 0.80% per annum on amounts borrowed. The agreement expires in April 2016 unless extended or renewed. Participating
| | | | | | |
| | | | | | | |
| 52 | | BLACKROCK U.S. TOTAL BOND INDEX FUND | | DECEMBER 31, 2015 | | |
| | |
| Notes to Financial Statements (concluded) | | U.S. Total Bond Index Master Portfolio |
Funds paid administration, legal and arrangement fees, which, if applicable, are included in miscellaneous expenses in the Statement of Operations, and along with commitment fees, were allocated among such funds based upon portions of the aggregate commitment available to them and relative net assets of Participating Funds. During the year ended December 31, 2015, the Master Portfolio did not borrow under the credit agreement.
9. Principal Risks:
Many municipalities insure repayment of their bonds, which may reduce the potential for loss due to credit risk. The market value of these bonds may fluctuate for other reasons, including market perception of the value of such insurance, and there is no guarantee that the insurer will meet its obligation.
In the normal course of business, the Master Portfolio invests in securities and enters into transactions where risks exist due to fluctuations in the market (market risk) or failure of the issuer to meet all its obligations, including the ability to pay principal and interest when due (issuer credit risk). The value of securities held by the Master Portfolio may decline in response to certain events, including those directly involving the issuers of securities owned by the Master Portfolio. Changes arising from the general economy, the overall market and local, regional or global political or/and social instability, as well as currency, interest rate and price fluctuations, may also affect the securities’ value.
Counterparty Credit Risk: Similar to issuer credit risk, the Master Portfolio may be exposed to counterparty credit risk, or the risk that an entity may fail to or be unable to perform on its commitments related to unsettled or open transactions. The Master Portfolio manages counterparty credit risk by entering into transactions only with counterparties that the Manager believes have the financial resources to honor their obligations and by monitoring the financial stability of those counterparties. Financial assets, which potentially expose the Master Portfolio to market, issuer and counterparty credit risks, consist principally of financial instruments and receivables due from counterparties. The extent of the Master Portfolio’s exposure to market, issuer and counterparty credit risks with respect to these financial assets is approximately their value recorded in the Statement of Assets and Liabilities, less any collateral held by the Master Portfolio.
A derivative contract may suffer a mark-to-market loss if the value of the contract decreases due to an unfavorable change in the market rates or values of the underlying instrument. Losses can also occur if the counterparty does not perform under the contract.
The Master Portfolio’s risk of loss from counterparty credit risk on OTC derivatives is generally limited to the aggregate unrealized gain less the value of any collateral held by the Master Portfolio.
With exchange-traded futures, there is less counterparty credit risk to the Master Portfolio since the exchange or clearinghouse, as counterparty to such instruments, guarantees against a possible default. The clearinghouse stands between the buyer and the seller of the contract; therefore, credit risk is limited to failure of the clearinghouse. While offset rights may exist under applicable law, the Master Portfolio does not have a contractual right of offset against a clearing broker or clearinghouse in the event of a default (including the bankruptcy or insolvency). Additionally, credit risk exists in exchange-traded futures with respect to initial and variation margin that is held in a clearing broker’s customer accounts. While clearing brokers are required to segregate customer margin from their own assets, in the event that a clearing broker becomes insolvent or goes into bankruptcy and at that time there is a shortfall in the aggregate amount of margin held by the clearing broker for all its clients, typically the shortfall would be allocated on a pro rata basis across all the clearing broker’s customers, potentially resulting in losses to the Master Portfolio.
Concentration Risk:
The Master Portfolio invests a significant portion of its assets in fixed-income securities and/or uses derivatives tied to the fixed-income markets. Changes in market interest rates or economic conditions may affect the value and/or liquidity of such investments. Interest rate risk is the risk that prices of bonds and other fixed-income securities will increase as interest rates fall and decrease as interest rates rise. The Master Portfolio may be subject to a greater risk of rising interest rates due to the current period of historically low rates.
The Master Portfolio invests a significant portion of its assets in securities backed by commercial or residential mortgage loans or in issuers that hold mortgage and other asset-backed securities. Investment percentages in these securities are presented in the Schedule of Investments. Changes in economic conditions, including delinquencies and/or defaults on assets underlying these securities, can affect the value, income and/or liquidity of such positions.
10. Subsequent Events:
Management has evaluated the impact of all subsequent events on the Master Portfolio through the date the financial statements were issued and has determined that there were no subsequent events requiring adjustment or additional disclosure in the financial statements.
| | | | | | |
| | | | | | | |
| | BLACKROCK U.S. TOTAL BOND INDEX FUND | | DECEMBER 31, 2015 | | 53 |
| | |
| Report of Independent Registered Public Accounting Firm | | U.S. Total Bond Index Master Portfolio |
To the Board of Trustees of Master Investment Portfolio and the Interestholders of U.S Total Bond Index Master Portfolio:
In our opinion, the accompanying statement of assets and liabilities, including the schedule of investments, and the related statements of operations and of changes in net assets and the financial highlights present fairly, in all material respects, the financial position of U.S. Total Bond Index Master Portfolio (the “Master Portfolio”), a series of Master Investment Portfolio, at December 31, 2015, the results of its operations for the year then ended, the changes in its net assets for each of the two years in the period then ended and the financial highlights for each of the five years in the period then ended, in conformity with accounting principles generally accepted in the United States of America. These financial statements and financial highlights (hereafter referred to as “financial statements”) are the responsibility of the Master Portfolio’s management. Our responsibility is to express an opinion on these financial statements based on our audits. We conducted our audits of these financial statements in accordance with the standards of the Public Company Accounting Oversight Board (United States). Those standards require that we plan and perform the audit to obtain reasonable assurance about whether the financial statements are free of material misstatement. An audit includes examining, on a test basis, evidence supporting the amounts and disclosures in the financial statements, assessing the accounting principles used and significant estimates made by management, and evaluating the overall financial statement presentation. We believe that our audits, which included confirmation of securities at December 31, 2015 by correspondence with the custodian, transfer agent, and brokers, provide a reasonable basis for our opinion.
/s/PricewaterhouseCoopers LLP
Philadelphia, Pennsylvania
February 24, 2016
| | | | | | |
| | | | | | | |
| 54 | | BLACKROCK U.S. TOTAL BOND INDEX FUND | | DECEMBER 31, 2015 | | |
| | | | | | | | | | |
Name, Address1
and Year of Birth | | Position(s)
Held with
the Trust/MIP | | Length
of Time
Served as
a Trustee3 | | Principal Occupation(s) During Past Five Years | | Number of BlackRock-
Advised Registered
Investment Companies
(“RICs”) Consisting of
Investment Portfolios
(“Portfolios”) Overseen | | Public
Directorships |
| Independent Trustees2 |
Rodney D. Johnson 1941 | | Chair of the Board and Trustee | | Since 2009 | | President, Fairmount Capital Advisors, Inc. from 1987 to 2013; Member of the Archdiocesan Investment Committee of the Archdiocese of Philadelphia from 2004 to 2012; Director, The Committee of Seventy (civic) from 2006 to 2012; Director, Fox Chase Cancer Center from 2004 to 2011. | | 33 RICs consisting of
155 Portfolios | | None |
David O. Beim 1940 | | Trustee | | Since 2009 | | Professor of Professional Practice at the Columbia University Graduate School of Business since 1991; Trustee, Phillips Exeter Academy from 2002 to 2012; Chairman, Wave Hill, Inc. (public garden and cultural center) from 1990 to 2006. | | 33 RICs consisting of
155 Portfolios | | None |
Collette Chilton 1958 | | Trustee | | Since 2015 | | Chief Investment Officer, Williams College since 2006; Chief Investment Officer, Lucent Asset Management Corporation from 1998 to 2006. | | 33 RICs consisting of
155 Portfolios | | None |
Frank J. Fabozzi 1948 | | Trustee | | Since 2014 | | Editor of and Consultant for The Journal of Portfolio Management since 2006; Professor of Finance, EDHEC Business School since 2011; Visiting Professor, Princeton University from 2013 to 2014; Professor in the Practice of Finance and Becton Fellow, Yale University School of Management from 2006 to 2011. | | 108 RICs consisting of
230 Portfolios | | None |
Dr. Matina S. Horner 1939 | | Trustee | | Since 2009 | | Executive Vice President, Teachers Insurance and Annuity Association and College Retirement Equities Fund from 1989 to 2003. | | 33 RICs consisting of
155 Portfolios | | NSTAR (electric and gas utility) |
Herbert I. London 1939 | | Trustee | | Since 2009 | | Professor Emeritus, New York University since 2005; President, London Center for Policy Research since 2012; John M. Olin Professor of Humanities, New York University from 1993 to 2005 and Professor thereof from 1980 to 2005; President Emeritus, Hudson Institute (policy research organization) from 2011 to 2012, President thereof from 1997 to 2011 and Trustee from 1980 to 2012; Chairman of the Board of Trustees for Grantham University since 2006; Director, InnoCentive, Inc. (global internet service) since 2005; Director, Cerego, LLC (educational software) since 2005; Director, Cybersettle (online adjudication) since 2009; Director, AIMS Worldwide, Inc. (marketing) from 2007 to 2012. | | 33 RICs consisting of
155 Portfolios | | None |
Cynthia A. Montgomery 1952 | | Trustee | | Since 2009 | | Professor, Harvard Business School since 1989; Director, McLean Hospital from 2005 to 2012; Director, Harvard Business School Publishing from 2005 to 2010. | | 33 RICs consisting of
155 Portfolios | | Newell Rubbermaid, Inc. (manufacturing) |
Joseph P. Platt 1947 | | Trustee | | Since 2009 | | Director, Jones and Brown (Canadian insurance broker) since 1998; General Partner, Thorn Partners, LP (private investments) since 1998; Director, WQED Multi-Media (public broadcasting not-for-profit) since 2001; Director, The West Penn Allegheny Health System (a not-for-profit health system) from 2008 to 2013; Partner, Amarna Corporation, LLC (private investment company) from 2002 to 2008. | | 33 RICs consisting of
155 Portfolios | | Greenlight Capital Re, Ltd. (reinsurance company) |
Robert C. Robb, Jr. 1945 | | Trustee | | Since 2009 | | Partner, Lewis, Eckert, Robb and Company (management and financial consulting firm) since 1981. | | 33 RICs consisting of
155 Portfolios | | None |
Toby Rosenblatt 1938 | | Trustee | | Since 2009 | | President, Founders Investments Ltd. (private investments) since 1999; Director, Forward Management, LLC since 2007; Director, College Futures Foundation (philanthropic foundation) since 2009; Director, The James Irvine Foundation (philanthropic foundation) from 1998 to 2008. | | 33 RICs consisting of
155 Portfolios | | None |
| | | | | | |
| | | | | | | |
| | BLACKROCK U.S. TOTAL BOND INDEX FUND | | DECEMBER 31, 2015 | | 55 |
| | | | |
| Officers and Trustees (continued) | | |
| | | | | | | | | | |
Name, Address1
and Year of Birth | | Position(s)
Held with
the Trust/MIP | | Length
of Time
Served as
a Trustee3 | | Principal Occupation(s) During Past Five Years | | Number of BlackRock-
Advised Registered
Investment Companies
(“RICs”) Consisting of
Investment Portfolios
(“Portfolios”) Overseen | | Public
Directorships |
| Independent Trustees2 (concluded) |
Mark Stalnecker 1951 | | Trustee | | Since 2015 | | Chief Investment Officer, University of Delaware from 1999 to 2013; Trustee, Winterthur Museum and Country Estate since 2001; Member of the Investment Committee, Delaware Public Employees’ Retirement System since 2002; Member of the Investment Committee, Christiana Care Health System since 2009; Member of the Investment Committee, Delaware Community Foundation from 2013 to 2014. | | 33 RICs consisting of
155 Portfolios | | None |
Kenneth L. Urish 1951 | | Trustee | | Since 2009 | | Managing Partner, Urish Popeck & Co., LLC (certified public accountants and consultants) since 1976; Immediate past- Chairman of the Professional Ethics Committee of the Pennsylvania Institute of Certified Public Accountants and Committee Member thereof since 2007; Member of External Advisory Board, The Pennsylvania State University Accounting Department since 2001; Principal, UP Strategic Wealth Investment Advisors, LLC since 2013; Trustee, The Holy Family Institute from 2001 to 2010; President and Trustee, Pittsburgh Catholic Publishing Associates from 2003 to 2008; Director, Inter-Tel from 2006 to 2007. | | 33 RICs consisting of
155 Portfolios | | None |
Frederick W. Winter 1945 | | Trustee | | Since 2009 | | Director, Alkon Corporation (pneumatics) since 1992; Professor and Dean Emeritus of the Joseph M. Katz School of Business, University of Pittsburgh from 2005 to 2013 and Dean thereof from 1997 to 2005; Director, Tippman Sports (recreation) from 2005 to 2013; Director, Indotronix International (IT services) from 2004 to 2008. | | 33 RICs consisting of
155 Portfolios | | None |
| | 1 The address of each Trustee is c/o BlackRock, Inc., 55 East 52nd Street, New York, NY 10055. |
| | 2 Independent Trustees serve until their resignation, retirement, removal or death, or until December 31 of the year in which they turn 75. The Board has determined to extend the terms of Independent Trustees on a case-by-case basis, as appropriate. The Board has unanimously approved extending the mandatory retirement age for David O. Beim and Dr. Matina S. Horner until December 31, 2016, which the Board believes is in the best interests of shareholders of the Trust/MIP. |
| | 3 Date shown is the earliest date a person has served for the Trust/MIP. In connection with the acquisition of Barclays Global Investors by BlackRock, Inc. (“BlackRock”) in December 2009, the Trustees were elected to the Trust/MIP Board. As a result, although the chart shows certain Independent Trustees as joining the Trust’s/MIP’s board in 2009, those Independent Trustees first became members of the boards of other funds advised by BlackRock Advisors, LLC or its affiliates as follows: David O. Beim, 1998; Dr. Matina S. Horner, 2004; Rodney D. Johnson, 1995; Herbert I. London, 1987; Cynthia A. Montgomery, 1994; Joseph P. Platt, 1999; Robert C. Robb, Jr., 1998; Toby Rosenblatt, 2005; Kenneth L. Urish, 1999; and Frederick W. Winter, 1999. Frank J. Fabozzi first became a member of the board of other funds advised by BlackRock Advisors, LLC or its affiliates in 1988. |
| Interested Trustees4 | | | | | | | | | | |
Barbara G. Novick 1960 | | Trustee | | Since 2015 | | Vice Chairman of BlackRock since 2006; Chair of BlackRock’s Government Relations Steering Committee since 2009; Head of the Global Client Group of BlackRock from 1988 to 2008. | | 108 RICs consisting of
230 Portfolios | | None |
John M. Perlowski 1964 | | Trustee, President, and Chief Executive Officer | | Since 2015 (Trustee); Since 2010 (President and Chief Executive Officer) | | Managing Director of BlackRock since 2009; Head of BlackRock Global Fund Services since 2009; Managing Director and Chief Operating Officer of the Global Product Group at Goldman Sachs Asset Management, L.P. from 2003 to 2009; Treasurer of Goldman Sachs Mutual Funds from 2003 to 2009 and Senior Vice President thereof from 2007 to 2009; Director of Goldman Sachs Offshore Funds from 2002 to 2009; Director of Family Resource Network (charitable foundation) since 2009. | | 136 RICs consisting of
328 Portfolios | | None |
| | 4 Mr. Perlowski and Ms. Novick are both “interested persons,” as defined in the 1940 Act, of the Trust/MIP based on their positions with BlackRock and its affiliates. Mr. Perlowski and Ms. Novick are also board members of a complex of BlackRock registered open-end funds. Mr. Perlowski is also a board member of the BlackRock Equity-Bond Complex and the BlackRock Equity-Liquidity Complex, and Ms. Novick is also a board member of the BlackRock Equity-Liquidity Complex. Interested Trustees serve until their resignation, retirement, removal or death, or until December 31 of the year in which they turn 75. The maximum age limitation may be waived as to any Trustee by action of a majority of the Trustees upon a finding of good cause therefor. |
| | | | | | |
| | | | | | | |
| 56 | | BLACKROCK U.S. TOTAL BOND INDEX FUND | | DECEMBER 31, 2015 | | |
| | |
| Officers and Trustees (concluded) | | |
| | | | | | |
Name, Address1
and Year of Birth | | Position(s)
Held with
the Trust/MIP | | Length of
Time Served
as an Officer | | Principal Occupation(s) During Past Five Years |
| Trust/MIP Officers2 |
John M. Perlowski 1964 | | Trustee, President and Chief Executive Officer | | Since 2015 (Trustee); Since 2010 (President and Chief Executive Officer) | | Managing Director of BlackRock since 2009; Head of BlackRock Global Fund Services since 2009; Managing Director and Chief Operating Officer of the Global Product Group at Goldman Sachs Asset Management, L.P. from 2003 to 2009; Treasurer of Goldman Sachs Mutual Funds from 2003 to 2009 and Senior Vice President thereof from 2007 to 2009; Director of Goldman Sachs Offshore Funds from 2002 to 2009; Director of Family Resource Network (charitable foundation) since 2009. |
Richard Hoerner, CFA 1958 | | Vice President | | Since 2009 | | Managing Director of BlackRock since 2000; Head of the Global Cash Group since 2013; Co-head of the Global Cash and Securities Lending Group from 2010 to 2013; Member of the Cash Management Group Executive Committee since 2005. |
Jennifer McGovern 1977 | | Vice President | | Since 2014 | | Director of BlackRock since 2011; Head of Product Structure and Oversight for BlackRock’s U.S. Wealth Advisory Group since 2013; Vice President of BlackRock from 2008 to 2010. |
Neal Andrews 1966 | | Chief Financial Officer | | Since 2007 | | Managing Director of BlackRock since 2006; Senior Vice President and Line of Business Head of Fund Accounting and Administration at PNC Global Investment Servicing (U.S.) Inc. from 1992 to 2006. |
Jay Fife 1970 | | Treasurer | | Since 2007 | | Managing Director of BlackRock since 2007; Director of BlackRock in 2006; Assistant Treasurer of the MLIM and Fund Asset Management, L.P. advised funds from 2005 to 2006; Director of MLIM Fund Services Group from 2001 to 2006. |
Charles Park 1967 | | Chief Compliance Officer | | Since 2014 | | Anti-Money Laundering Compliance Officer for the BlackRock-advised Funds in the Equity-Bond Complex, the Equity-Liquidity Complex and the Closed-End Complex from 2014 to 2015; Chief Compliance Officer of BlackRock Advisors, LLC and the BlackRock-advised Funds in the Equity-Bond Complex, the Equity-Liquidity Complex and the Closed-End Complex since 2014; Principal of and Chief Compliance Officer for iShares® Delaware Trust Sponsor LLC since 2012 and BlackRock Fund Advisors (“BFA”) since 2006; Chief Compliance Officer for the BFA-advised iShares exchange traded funds since 2006; Chief Compliance Officer for BlackRock Asset Management International Inc. since 2012. |
Fernanda Piedra 1969 | | Anti-Money Laundering Compliance Officer | | Since 2015 | | Director of BlackRock since 2014; Anti-Money Laundering Compliance Officer and Regional Head of Financial Crime for the Americas at BlackRock since 2014; Head of Regulatory Changes and Remediation for the Asset Wealth Management Division of Deutsche Bank from 2010 to 2014; Vice President of Goldman Sachs (Anti-Money Laundering/Suspicious Activities Group) from 2004 to 2010. |
Benjamin Archibald 1975 | | Secretary | | Since 2012 | | Managing Director of BlackRock since 2014; Director of BlackRock from 2010 to 2013; Secretary of the iShares exchange traded funds since 2015; Secretary of the BlackRock-advised mutual funds since 2012. |
| | 1 The address of each Officer is c/o BlackRock, Inc., 55 East 52nd Street, New York, NY 10055. |
| | | 2 Officers of the Trust/MIP serve at the pleasure of the Board. |
| | Further information about the Officers and Trustees is available in the Trust’s/MIP’s Statement of Additional Information, which can be obtained without charge by calling (800) 441-7762 |
Effective September 25, 2015, John M. Perlowski was appointed to serve as a Trustee of the Trust/MIP.
Effective December 31, 2015, Herbert I. London and Toby Rosenblatt retired as Trustees of the Trust/MIP.
| | | | | | |
| | | | |
Investment Advisor BlackRock Fund Advisors San Francisco, CA 94105 | | Accounting Agent and Custodian State Street Bank and Trust Company Boston, MA 02110 | | Distributor BlackRock Investments, LLC New York, NY 10022 | | Legal Counsel Sidley Austin LLP New York, NY 10019 |
| | | |
Administrator BlackRock Advisors, LLC Wilmington, DE 19809 | | Transfer Agent BNY Mellon Investment Servicing (US) Inc. Wilmington, DE 19809 | | Independent Registered Public Accounting Firm PricewaterhouseCoopers LLP Philadelphia, PA 19103 | | Address of the Trust/MIP 400 Howard Street San Francisco, CA 94105 |
| | | | | | |
| | | | | | | |
| | BLACKROCK U.S. TOTAL BOND INDEX FUND | | DECEMBER 31, 2015 | | 57 |
Householding
The Fund will mail only one copy of shareholder documents, including prospectuses, annual and semi-annual reports and proxy statements, to shareholders with multiple accounts at the same address. This practice is commonly called “householding” and is intended to reduce expenses and eliminate duplicate mailings of shareholder documents. Mailings of your shareholder documents may be householded indefinitely unless you instruct us otherwise. If you do not want the mailing of these documents to be combined with those for other members of your household, please call the Fund at (800) 441-7762.
Availability of Quarterly Schedule of Investments
The Fund/Master Portfolio file their complete schedule of portfolio holdings with the SEC for the first and third quarters of each fiscal year on Form N-Q. The Fund’s/Master Portfolio’s Forms N-Q are available on the SEC’s website at http://www.sec.gov and may also be reviewed and copied at the SEC’s Public Reference Room in Washington, DC. Information on how to access documents on the SEC’s website without charge may be obtained by calling (800) SEC-0330. The Fund’s/Master Portfolio’s Forms N-Q may also be obtained upon request and without charge by calling (800) 441-7762.
Availability of Proxy Voting Policies and Procedures
A description of the policies and procedures that the Fund/Master Portfolio use to determine how to vote proxies relating to portfolio securities is available upon request and without charge (1) by calling (800) 441-7762; (2) at http://www.blackrock.com; and (3) on the SEC’s website at http://www.sec.gov.
Availability of Proxy Voting Record
Information about how the Fund/Master Portfolio voted proxies relating to securities held in the Fund’s/Master Portfolio’s portfolio during the most recent 12-month period ended June 30 is available upon request and without charge (1) at http://www.blackrock.com or by calling (800) 441-7762 and (2) on the SEC’s website at http://www.sec.gov.
BlackRock’s Mutual Fund Family
BlackRock offers a diverse lineup of open-end mutual funds crossing all investment styles and managed by experts in equity, fixed income and tax-exempt investing. Visit http://www.blackrock.com for more information.
Account Information
Call us at (800) 441-7762 from 8:00 AM to 6:00 PM EST on any business day to get information about your account balances, recent transactions and share prices. You can also reach us on the Web at http://www.blackrock.com/funds.
Automatic Investment Plans
Investor Class shareholders who want to invest regularly can arrange to have $50 or more automatically deducted from their checking or savings account and invested in any of the BlackRock funds.
Systematic Withdrawal Plans
Investor Class shareholders can establish a systematic withdrawal plan and receive periodic payments of $50 or more from their BlackRock funds, as long as their account balance is at least $10,000.
Retirement Plans
Shareholders may make investments in conjunction with Traditional, Rollover, Roth, Coverdell, Simple IRAs, SEP IRAs and 403(b) Plans.
| | | | | | |
| | | | | | | |
| 58 | | BLACKROCK U.S. TOTAL BOND INDEX FUND | | DECEMBER 31, 2015 | | |
| | | | |
| Additional Information (concluded) | | |
| | |
| BlackRock Privacy Principles | | |
BlackRock is committed to maintaining the privacy of its current and former fund investors and individual clients (collectively, “Clients”) and to safeguarding their non-public personal information. The following information is provided to help you understand what personal information BlackRock collects, how we protect that information and why in certain cases we share such information with select parties.
If you are located in a jurisdiction where specific laws, rules or regulations require BlackRock to provide you with additional or different privacy-related rights beyond what is set forth below, then BlackRock will comply with those specific laws, rules or regulations.
BlackRock obtains or verifies personal non-public information from and about you from different sources, including the following: (i) information we receive from you or, if applicable, your financial intermediary, on applications, forms or other documents; (ii) information about your transactions with us, our affiliates, or others; (iii) information we receive from a consumer reporting agency; and (iv) from visits to our websites.
BlackRock does not sell or disclose to non-affiliated third parties any non-public personal information about its Clients, except as permitted by law or as is necessary to respond to regulatory requests or to service Client accounts. These non-affiliated third parties are required to protect the confidentiality and security of this information and to use it only for its intended purpose.
We may share information with our affiliates to service your account or to provide you with information about other BlackRock products or services that may be of interest to you. In addition, BlackRock restricts access to non-public personal information about its Clients to those BlackRock employees with a legitimate business need for the information. BlackRock maintains physical, electronic and procedural safeguards that are designed to protect the non-public personal information of its Clients, including procedures relating to the proper storage and disposal of such information.
| | | | | | |
| | | | | | | |
| | BLACKROCK U.S. TOTAL BOND INDEX FUND | | DECEMBER 31, 2015 | | 59 |
This report is intended for current holders. It is not authorized for use as an offer of sale or a solicitation of an offer to buy shares of the Fund unless preceded or accompanied by the Fund’s current prospectus. Past performance results shown in this report should not be considered a representation of future performance. Investment returns and principal value of shares will fluctuate so that shares, when redeemed, may be worth more or less than their original cost. Statements and other information herein are as dated and are subject to change.

| | |
| USTB-12/15-AR | |  |
| | |
| Portfolio Information as of December 31, 2015 | | |
| | | | |
| Ten Largest Holdings | | Percent of
Net Assets | |
Apple, Inc. | | | 3 | % |
JPMorgan Chase & Co. | | | 2 | |
Microsoft Corp. | | | 2 | |
Comcast Corp., Class A | | | 2 | |
Alphabet, Inc., Class A | | | 2 | |
Altria Group, Inc. | | | 2 | |
Amgen, Inc. | | | 2 | |
Lowe’s Cos., Inc. | | | 2 | |
Alphabet, Inc., Class C | | | 2 | |
Cisco Systems, Inc. | | | 2 | |
| | | | |
| Sector Allocation | | Percent of
Net Assets | |
Information Technology | | | 23 | % |
Financials | | | 17 | |
Health Care | | | 16 | |
Consumer Discretionary | | | 15 | |
Industrials | | | 8 | |
Consumer Staples | | | 7 | |
Energy | | | 6 | |
Utilities | | | 2 | |
Materials | | | 2 | |
Telecommunication Services | | | 2 | |
Short-Term Securities | | | 9 | |
Liabilities in Excess of Other Assets | | | (7 | ) |
For Master Portfolio compliance purposes, the Master Portfolio’s sector classifications refer to any one or more of the sector sub-classifications used by one or more widely recognized market indexes or ratings group indexes and/or as defined by the investment advisor. These definitions may not apply for purposes of this report, which may combine sector sub-classifications for reporting ease.
| | |
| Portfolio Information as of December 31, 2015 | | |
|
| Derivative Financial Instruments |
The Master Portfolio may invest in various derivative financial instruments. Derivative financial instruments are used to obtain exposure to a security, index and/or market without owning or taking physical custody of securities or to manage market, equity, credit, interest rate, foreign currency exchange rate, commodity and/or other risks. Derivative financial instruments may give rise to a form of economic leverage. Derivative financial instruments also involve risks, including the imperfect correlation between the value of a derivative financial instrument and the underlying asset, possible default of the counterparty to the transaction or illiquidity of the derivative financial instrument. The Master Portfolio’s ability to use a derivative financial instrument successfully depends on the investment advisor’s ability to predict pertinent market movements accurately, which cannot be assured. The use of derivative financial instruments may result in losses greater than if they had not been used, may limit the amount of appreciation the Master Portfolio can realize on an investment and/or may result in lower distributions paid to shareholders. The Master Portfolio’s investments in these instruments, if any, are discussed in detail in the Notes to Financial Statements.
| | | | | | |
| | | | | | | |
| | ACTIVE STOCK MASTER PORTFOLIO | | DECEMBER 31, 2015 | | 1 |
| | |
Schedule of Investments December 31, 2015 | | (Percentages shown are based on Net Assets) |
| | | | | | | | |
| Common Stocks | | Shares | | | Value | |
Aerospace & Defense — 1.7% | | | | | | | | |
Boeing Co. | | | 1,328 | | | $ | 192,016 | |
General Dynamics Corp. | | | 18,045 | | | | 2,478,661 | |
Honeywell International, Inc. | | | 3,423 | | | | 354,520 | |
Huntington Ingalls Industries, Inc. | | | 760 | | | | 96,406 | |
Lockheed Martin Corp. | | | 2,226 | | | | 483,376 | |
Orbital ATK, Inc. | | | 3,817 | | | | 341,011 | |
Raytheon Co. | | | 21,837 | | | | 2,719,362 | |
Rockwell Collins, Inc. | | | 9,628 | | | | 888,664 | |
Vectrus, Inc. (a) | | | 6,769 | | | | 141,404 | |
| | | | | | | | |
| | | | | 7,695,420 | |
Air Freight & Logistics — 0.6% | | | | | | | | |
FedEx Corp. | | | 19,529 | | | | 2,909,626 | |
Airlines — 1.6% | | | | | | | | |
American Airlines Group, Inc. | | | 6,179 | | | | 261,681 | |
Delta Air Lines, Inc. | | | 23,253 | | | | 1,178,694 | |
JetBlue Airways Corp. (a) | | | 19,938 | | | | 451,596 | |
Southwest Airlines Co. (b) | | | 87,391 | | | | 3,763,056 | |
United Continental Holdings, Inc. (a) | | | 24,946 | | | | 1,429,406 | |
| | | | | | | | |
| | | | | 7,084,433 | |
Auto Components — 1.2% | | | | | | | | |
Lear Corp. | | | 43,464 | | | | 5,338,683 | |
Automobiles — 0.6% | | | | | | | | |
Ferrari NV (a)(b) | | | 1,640 | | | | 78,720 | |
Ford Motor Co. | | | 56,388 | | | | 794,507 | |
PACCAR, Inc. | | | 37,376 | | | | 1,771,622 | |
Thor Industries, Inc. | | | 3,325 | | | | 186,699 | |
| | | | | | | | |
| | | | | 2,831,548 | |
Banks — 2.8% | | | | | | | | |
Bank of America Corp. | | | 7,040 | | | | 118,483 | |
CIT Group, Inc. | | | 6,839 | | | | 271,508 | |
Citizens Financial Group, Inc. | | | 11,566 | | | | 302,914 | |
East West Bancorp, Inc. | | | 10,904 | | | | 453,170 | |
KeyCorp | | | 165,045 | | | | 2,176,944 | |
Regions Financial Corp. | | | 89,459 | | | | 858,806 | |
Umpqua Holdings Corp. | | | 18,156 | | | | 288,680 | |
US Bancorp | | | 66,510 | | | | 2,837,982 | |
Wells Fargo & Co. | | | 97,694 | | | | 5,310,646 | |
| | | | | | | | |
| | | | | 12,619,133 | |
Beverages — 1.3% | | | | | |
Coca-Cola Enterprises, Inc. | | | 7,380 | | | | 363,391 | |
Constellation Brands, Inc., Class A | | | 1,368 | | | | 194,858 | |
Dr Pepper Snapple Group, Inc. | | | 57,354 | | | | 5,345,393 | |
| | | | | | | | |
| | | | | 5,903,642 | |
Biotechnology — 3.2% | | | | | | | | |
AbbVie, Inc. | | | 1,990 | | | | 117,888 | |
Amgen, Inc. | | | 46,668 | | | | 7,575,616 | |
Biogen, Inc. (a) | | | 868 | | | | 265,912 | |
Celgene Corp. (a) | | | 1,962 | | | | 234,969 | |
Gilead Sciences, Inc. | | | 55,193 | | | | 5,584,980 | |
United Therapeutics Corp. (a) | | | 2,769 | | | | 433,653 | |
| | | | | | | | |
| | | | | 14,213,018 | |
Building Products — 0.3% | | | | | | | | |
Masco Corp. (b) | | | 41,632 | | | | 1,178,186 | |
Capital Markets — 1.4% | | | | | | | | |
Affiliated Managers Group, Inc. (a) | | | 2,206 | | | | 352,430 | |
Ameriprise Financial, Inc. | | | 24,717 | | | | 2,630,383 | |
E*Trade Financial Corp. (a) | | | 738 | | | | 21,874 | |
Capital Markets (continued) | | | | | | | | |
Goldman Sachs Group, Inc. | | | 9,686 | | | $ | 1,745,708 | |
KKR & Co. LP | | | 14,585 | | | | 227,380 | |
Morgan Stanley | | | 28,281 | | | | 899,619 | |
TD Ameritrade Holding Corp. | | | 6,001 | | | | 208,295 | |
| | | | | | | | |
| | | | | 6,085,689 | |
Chemicals — 1.6% | | | | | | | | |
Air Products & Chemicals, Inc. | | | 10,799 | | | | 1,405,058 | |
Akzo Nobel NV — ADR | | | 8,776 | | | | 194,959 | |
Ashland, Inc. | | | 400 | | | | 41,080 | |
Axalta Coating Systems Ltd. (a) | | | 12,022 | | | | 320,386 | |
Chemours Co. (b) | | | 36,282 | | | | 194,471 | |
Dow Chemical Co. | | | 21,121 | | | | 1,087,309 | |
E.I. du Pont de Nemours & Co. | | | 3,363 | | | | 223,976 | |
Eastman Chemical Co. | | | 16,490 | | | | 1,113,240 | |
LyondellBasell Industries NV, Class A | | | 17,742 | | | | 1,541,780 | |
PPG Industries, Inc. | | | 9,288 | | | | 917,840 | |
| | | | | | | | |
| | | | | 7,040,099 | |
Communications Equipment — 3.3% | | | | | | | | |
Cisco Systems, Inc. | | | 246,415 | | | | 6,691,399 | |
F5 Networks, Inc. (a) | | | 947 | | | | 91,821 | |
Harris Corp. | | | 18,429 | | | | 1,601,480 | |
Juniper Networks, Inc. | | | 5,481 | | | | 151,276 | |
Lumentum Holdings, Inc. (a) | | | 27,192 | | | | 598,768 | |
Nokia OYJ — ADR (b) | | | 84,678 | | | | 594,440 | |
QUALCOMM, Inc. | | | 77,241 | | | | 3,860,891 | |
Telefonaktiebolaget LM Ericsson — ADR (b) | | | 140,913 | | | | 1,354,174 | |
| | | | | | | | |
| | | | | 14,944,249 | |
Construction & Engineering — 0.1% | | | | | | | | |
AECOM (a)(b) | | | 12,665 | | | | 380,330 | |
Jacobs Engineering Group, Inc. (a) | | | 990 | | | | 41,530 | |
| | | | | | | | |
| | | | | 421,860 | |
Consumer Finance — 2.2% | | | | | | | | |
Ally Financial, Inc. (a)(b) | | | 71,389 | | | | 1,330,691 | |
Capital One Financial Corp. | | | 38,057 | | | | 2,746,954 | |
Discover Financial Services (b) | | | 69,177 | | | | 3,709,271 | |
SLM Corp. (a) | | | 256,008 | | | | 1,669,172 | |
Synchrony Financial (a) | | | 13,625 | | | | 414,336 | |
| | | | | | | | |
| | | | | | | | 9,870,424 | |
Containers & Packaging — 0.6% | | | | | | | | |
AptarGroup, Inc. (b) | | | 1,809 | | | | 131,424 | |
Avery Dennison Corp. | | | 1,010 | | | | 63,286 | |
Bemis Co., Inc. | | | 5,459 | | | | 243,963 | |
Crown Holdings, Inc. (a) | | | 3,464 | | | | 175,625 | |
Packaging Corp. of America | | | 22,634 | | | | 1,427,074 | |
Sonoco Products Co. | | | 2,120 | | | | 86,644 | |
WestRock Co. | | | 12,905 | | | | 588,726 | |
| | | | | | | | |
| | | | | | | | 2,716,742 | |
Diversified Consumer Services — 0.1% | | | | | | | | |
ServiceMaster Global Holdings, Inc. (a) | | | 11,520 | | | | 452,045 | |
Diversified Financial Services — 4.9% | | | | | | | | |
Berkshire Hathaway, Inc., Class B (a) | | | 1,339 | | | | 176,802 | |
Citigroup, Inc. | | | 116,846 | | | | 6,046,780 | |
CME Group, Inc. | | | 14,630 | | | | 1,325,478 | |
Intercontinental Exchange, Inc. | | | 8,957 | | | | 2,295,321 | |
JPMorgan Chase & Co. (b) | | | 135,879 | | | | 8,972,090 | |
Moody’s Corp. | | | 2,603 | | | | 261,185 | |
NASDAQ, Inc. | | | 44,087 | | | | 2,564,541 | |
Vantiv, Inc., Class A (a) | | | 4,650 | | | | 220,503 | |
| | | | | | | | |
| | | | | | | | 21,862,700 | |
| | |
| ADR | | American Depositary Receipts |
| S&P | | Standard and Poor’s |
See Notes to Financial Statements.
| | | | | | |
| | | | | | | |
| 2 | | ACTIVE STOCK MASTER PORTFOLIO | | DECEMBER 31, 2015 | | |
| | |
Schedule of Investments (continued) | | (Percentages shown are based on Net Assets) |
| | | | | | | | |
| Common Stocks | | Shares | | | Value | |
Diversified Telecommunication Services — 1.6% | | | | | | | | |
AT&T, Inc. | | | 48,121 | | | $ | 1,655,844 | |
Level 3 Communications, Inc. (a) | | | 4,982 | | | | 270,821 | |
Verizon Communications, Inc. | | | 105,125 | | | | 4,858,877 | |
Zayo Group Holdings, Inc. (a) | | | 5,667 | | | | 150,686 | |
| | | | | | | | |
| | | | | | | | 6,936,228 | |
Electric Utilities — 1.0% | | | | | | | | |
American Electric Power Co., Inc. | | | 3,289 | | | | 191,650 | |
Duke Energy Corp. | | | 550 | | | | 39,264 | |
Edison International | | | 204 | | | | 12,079 | |
Exelon Corp. | | | 81,062 | | | | 2,251,092 | |
FirstEnergy Corp. | | | 1,040 | | | | 32,999 | |
NextEra Energy, Inc. | | | 15,538 | | | | 1,614,243 | |
OGE Energy Corp. (b) | | | 5,376 | | | | 141,335 | |
| | | | | | | | |
| | | | | | | | 4,282,662 | |
Electrical Equipment — 0.2% | | | | | | | | |
Babcock & Wilcox Enterprises, Inc. (a) | | | 15,488 | | | | 323,234 | |
Regal-Beloit Corp. (b) | | | 1,832 | | | | 107,209 | |
SolarCity Corp. (a)(b) | | | 9,060 | | | | 462,241 | |
| | | | | | | | |
| | | | | | | | 892,684 | |
Electronic Equipment, Instruments &
Components — 0.8% | | | | | | | | |
CDW Corp. | | | 45,338 | | | | 1,906,009 | |
Fitbit, Inc., Series A (a)(b) | | | 5,374 | | | | 159,017 | |
Flextronics International Ltd. (a) | | | 38,267 | | | | 428,973 | |
FLIR Systems, Inc. | | | 44,839 | | | | 1,258,631 | |
| | | | | | | | |
| | | | | | | | 3,752,630 | |
Energy Equipment & Services — 1.1% | | | | | | | | |
Atwood Oceanics, Inc. (b) | | | 20,233 | | | | 206,984 | |
Baker Hughes, Inc. | | | 21,717 | | | | 1,002,239 | |
Cameron International Corp. (a) | | | 1,801 | | | | 113,823 | |
Dril-Quip, Inc. (a)(b) | | | 7,646 | | | | 452,872 | |
Halliburton Co. | | | 9,173 | | | | 312,249 | |
Schlumberger Ltd. | | | 29,301 | | | | 2,043,745 | |
Superior Energy Services, Inc. | | | 56,491 | | | | 760,934 | |
| | | | | | | | |
| | | | | | | | 4,892,846 | |
Food & Staples Retailing — 2.1% | | | | | | | | |
CVS Health Corp. | | | 64,446 | | | | 6,300,885 | |
Kroger Co. | | | 33,234 | | | | 1,390,178 | |
Supervalu, Inc. (a) | | | 62,246 | | | | 422,028 | |
Wal-Mart Stores, Inc. | | | 21,973 | | | | 1,346,945 | |
| | | | | | | | |
| | | | | | | | 9,460,036 | |
Food Products — 1.0% | | | | | | | | |
Bunge Ltd. | | | 4,554 | | | | 310,947 | |
Cal-Maine Foods, Inc. (b) | | | 11,831 | | | | 548,249 | |
Hain Celestial Group, Inc. (a) | | | 733 | | | | 29,606 | |
Hormel Foods Corp. (b) | | | 12,694 | | | | 1,003,841 | |
Kellogg Co. | | | 465 | | | | 33,606 | |
Pilgrim’s Pride Corp. (b) | | | 64,180 | | | | 1,417,736 | |
Post Holdings, Inc. (a) | | | 349 | | | | 21,533 | |
Tyson Foods, Inc., Class A | | | 24,252 | | | | 1,293,359 | |
| | | | | | | | |
| | | | | | | | 4,658,877 | |
Gas Utilities — 0.0% | | | | | | | | |
Questar Corp. | | | 3,369 | | | | 65,628 | |
Health Care Equipment & Supplies — 2.4% | | | | | | | | |
Abbott Laboratories | | | 26,336 | | | | 1,182,750 | |
Baxter International, Inc. | | | 32,852 | | | | 1,253,304 | |
Becton Dickinson & Co. | | | 197 | | | | 30,356 | |
C.R. Bard, Inc. | | | 4,400 | | | | 833,536 | |
Danaher Corp. | | | 23,292 | | | | 2,163,361 | |
DENTSPLY International, Inc. | | | 4,545 | | | | 276,563 | |
Medtronic PLC | | | 17,885 | | | | 1,375,714 | |
Stryker Corp. | | | 21,663 | | | | 2,013,359 | |
Zimmer Biomet Holdings, Inc. (b) | | | 15,239 | | | | 1,563,369 | |
| | | | | | | | |
| | | | | | | | 10,692,312 | |
Health Care Providers & Services — 5.8% | | | | | | | | |
Aetna, Inc. | | | 28,817 | | | $ | 3,115,694 | |
AmerisourceBergen Corp. | | | 5,940 | | | | 616,037 | |
Anthem, Inc. | | | 8,713 | | | | 1,214,941 | |
Cardinal Health, Inc. | | | 11,456 | | | | 1,022,677 | |
Centene Corp. (a) | | | 30,098 | | | | 1,980,749 | |
Cigna Corp. | | | 21,400 | | | | 3,131,462 | |
Community Health Systems, Inc. (a) | | | 26,675 | | | | 707,688 | |
Health Net, Inc. (a) | | | 730 | | | | 49,976 | |
Laboratory Corp. of America Holdings (a)(b) | | | 14,436 | | | | 1,784,867 | |
McKesson Corp. | | | 20,131 | | | | 3,970,437 | |
Quest Diagnostics, Inc. | | | 14,710 | | | | 1,046,470 | |
UnitedHealth Group, Inc. | | | 40,013 | | | | 4,707,129 | |
Universal Health Services, Inc., Class B | | | 15,352 | | | | 1,834,411 | |
VCA, Inc. (a) | | | 8,765 | | | | 482,075 | |
| | | | | | | | |
| | | | | | | | 25,664,613 | |
Hotels, Restaurants & Leisure — 1.2% | | | | | | | | |
Extended Stay America, Inc. | | | 89,627 | | | | 1,425,069 | |
J Alexander’s Holdings, Inc. (a) | | | 11,021 | | | | 120,349 | |
Jack in the Box, Inc. | | | 5,063 | | | | 388,383 | |
Las Vegas Sands Corp. | | | 8,529 | | | | 373,911 | |
Starbucks Corp. | | | 49,151 | | | | 2,950,535 | |
Starwood Hotels & Resorts Worldwide, Inc. | | | 3,538 | | | | 245,113 | |
Wyndham Worldwide Corp. | | | 519 | | | | 37,705 | |
| | | | | | | | |
| | | | | | | | 5,541,065 | |
Household Durables — 1.3% | | | | | | | | |
D.R. Horton, Inc. | | | 32,258 | | | | 1,033,224 | |
GoPro, Inc., Class A (a)(b) | | | 3,997 | | | | 71,986 | |
Lennar Corp., Class A (b) | | | 12,764 | | | | 624,287 | |
Mohawk Industries, Inc. (a) | | | 2,633 | | | | 498,664 | |
Newell Rubbermaid, Inc. | | | 58,557 | | | | 2,581,192 | |
NVR, Inc. (a) | | | 250 | | | | 410,750 | |
Toll Brothers, Inc. (a) | | | 13,752 | | | | 457,942 | |
TopBuild Corp. (a) | | | 6,525 | | | | 200,774 | |
Tupperware Brands Corp. (b) | | | 2,188 | | | | 121,762 | |
| | | | | | | | |
| | | | | | | | 6,000,581 | |
Household Products — 0.6% | | | | | | | | |
Church & Dwight Co., Inc. | | | 413 | | | | 35,055 | |
Clorox Co. | | | 8,150 | | | | 1,033,664 | |
Energizer Holdings, Inc. (b) | | | 9,125 | | | | 310,798 | |
Kimberly-Clark Corp. | | | 9,099 | | | | 1,158,303 | |
| | | | | | | | |
| | | | | | | | 2,537,820 | |
Independent Power and Renewable Electricity Producers — 0.7% | | | | | | | | |
AES Corp. | | | 189,759 | | | | 1,815,994 | |
Dynegy, Inc. (a)(b) | | | 61,788 | | | | 827,959 | |
Talen Energy Corp. (a)(b) | | | 43,466 | | | | 270,793 | |
| | | | | | | | |
| | | | | | | | 2,914,746 | |
Industrial Conglomerates — 0.3% | | | | | | | | |
3M Co. | | | 5,127 | | | | 772,331 | |
General Electric Co. | | | 19,806 | | | | 616,957 | |
| | | | | | | | |
| | | | | | | | 1,389,288 | |
Insurance — 3.4% | | | | | | | | |
CNA Financial Corp. | | | 30,130 | | | | 1,059,070 | |
Genworth Financial, Inc., Class A (a) | | | 111,440 | | | | 415,671 | |
Hartford Financial Services Group, Inc. | | | 63,479 | | | | 2,758,797 | |
Lincoln National Corp. | | | 49,697 | | | | 2,497,771 | |
MetLife, Inc. | | | 9,945 | | | | 479,448 | |
Prudential Financial, Inc. | | | 41,950 | | | | 3,415,150 | |
Travelers Cos., Inc. | | | 17,098 | | | | 1,929,680 | |
Voya Financial, Inc. | | | 37,100 | | | | 1,369,361 | |
XL Group PLC | | | 30,404 | | | | 1,191,229 | |
| | | | | | | | |
| | | | | | | | 15,116,177 | |
See Notes to Financial Statements.
| | | | | | |
| | | | | | | |
| | ACTIVE STOCK MASTER PORTFOLIO | | DECEMBER 31, 2015 | | 3 |
| | |
Schedule of Investments (continued) | �� | (Percentages shown are based on Net Assets) |
| | | | | | | | |
| Common Stocks | | Shares | | | Value | |
Internet & Catalog Retail — 1.3% | | | | | | | | |
Amazon.com, Inc. (a) | | | 1,739 | | | $ | 1,175,373 | |
Liberty TripAdvisor Holdings, Inc., Series A (a) | | | 2,275 | | | | 69,023 | |
Liberty Ventures, Series A (a) | | | 34,278 | | | | 1,546,281 | |
Priceline Group, Inc. (a) | | | 2,456 | | | | 3,131,277 | |
| | | | | | | | |
| | | | | | | | 5,921,954 | |
Internet Software & Services — 4.7% | | | | | | | | |
Alphabet, Inc., Class A (a) | | | 10,477 | | | | 8,151,211 | |
Alphabet, Inc., Class C (a) | | | 9,110 | | | | 6,913,397 | |
eBay, Inc. (a) | | | 16,222 | | | | 445,780 | |
Facebook, Inc., Class A (a) | | | 46,295 | | | | 4,845,235 | |
IAC/InterActiveCorp | | | 7,260 | | | | 435,963 | |
VeriSign, Inc. (a) | | | 918 | | | | 80,196 | |
| | | | | | | | |
| | | | | | | | 20,871,782 | |
IT Services — 4.4% | | | | | | | | |
Alliance Data Systems Corp. (a) | | | 8,676 | | | | 2,399,521 | |
Amdocs Ltd. | | | 30,113 | | | | 1,643,266 | |
Cognizant Technology Solutions Corp., Class A (a) | | | 56,873 | | | | 3,413,518 | |
CSRA, Inc. | | | 12,689 | | | | 380,670 | |
DST Systems, Inc. | | | 17,650 | | | | 2,013,159 | |
First Data Corp., Class A (a) | | | 30,946 | | | | 495,755 | |
Global Payments, Inc. | | | 1,308 | | | | 84,379 | |
Mastercard, Inc., Class A | | | 43,462 | | | | 4,231,460 | |
PayPal Holdings, Inc. (a) | | | 7,096 | | | | 256,875 | |
Square, Inc. (a)(b) | | | 856 | | | | 11,205 | |
Total System Services, Inc. | | | 33,212 | | | | 1,653,958 | |
Visa, Inc., Class A (b) | | | 39,479 | | | | 3,061,597 | |
Xerox Corp. (b) | | | 19,032 | | | | 202,310 | |
| | | | | | | | |
| | | | | | | | 19,847,673 | |
Life Sciences Tools & Services — 0.2% | | | | | | | | |
Bruker Corp. (a) | | | 5,638 | | | | 136,834 | |
Charles River Laboratories International, Inc. (a) | | | 342 | | | | 27,493 | |
INC Research Holdings, Inc., Class A (a) | | | 2,114 | | | | 102,550 | |
Quintiles Transnational Holdings, Inc. (a) | | | 7,487 | | | | 514,058 | |
Waters Corp. (a) | | | 1,877 | | | | 252,607 | |
| | | | | | | | |
| | | | | | | | 1,033,542 | |
Machinery — 1.0% | | | | | | | | |
Illinois Tool Works, Inc. | | | 6,018 | | | | 557,748 | |
Parker Hannifin Corp. (b) | | | 3,645 | | | | 353,492 | |
SPX Corp. | | | 26,056 | | | | 243,103 | |
SPX FLOW, Inc. (a) | | | 14,780 | | | | 412,510 | |
Stanley Black & Decker, Inc. | | | 20,929 | | | | 2,233,752 | |
WABCO Holdings, Inc. (a) | | | 6,239 | | | | 638,000 | |
| | | | | | | | |
| | | | | | | | 4,438,605 | |
Media — 3.9% | | | | | | | | |
Cablevision Systems Corp., New York Group, Class A | | | 1,915 | | | | 61,089 | |
CBS Corp., Class B | | | 15,613 | | | | 735,841 | |
Comcast Corp., Class A | | | 144,899 | | | | 8,176,651 | |
Discovery Communications, Inc., Class C (a) | | | 2,201 | | | | 55,509 | |
Interpublic Group of Cos., Inc. | | | 27,704 | | | | 644,949 | |
Liberty Global PLC LiLAC, Class A (a) | | | 3,616 | | | | 149,594 | |
Omnicom Group, Inc. (b) | | | 32,694 | | | | 2,473,628 | |
Scripps Networks Interactive, Inc., Class A (b) | | | 15,063 | | | | 831,628 | |
Time Warner, Inc. | | | 29,999 | | | | 1,940,035 | |
Viacom, Inc., Class B | | | 38,959 | | | | 1,603,552 | |
Walt Disney Co. | | | 6,529 | | | | 686,067 | |
| | | | | | | | |
| | | | | | | | 17,358,543 | |
Metals & Mining — 0.1% | | | | | | | | |
Allegheny Technologies, Inc. (b) | | | 4,207 | | | | 47,329 | |
Reliance Steel & Aluminum Co. | | | 5,245 | | | | 303,738 | |
| | | | | | | | |
| | | | | | | | 351,067 | |
Multi-Utilities — 0.4% | | | | | | | | |
Ameren Corp. | | | 2,147 | | | $ | 92,815 | |
CenterPoint Energy, Inc. | | | 84,122 | | | | 1,544,480 | |
PG&E Corp. | | | 234 | | | | 12,446 | |
TECO Energy, Inc. | | | 2,223 | | | | 59,243 | |
| | | | | | | | |
| | | | | | | | 1,708,984 | |
Multiline Retail — 0.3% | | | | | | | | |
Dollar General Corp. | | | 300 | | | | 21,561 | |
Macy’s, Inc. | | | 31,309 | | | | 1,095,189 | |
Target Corp. | | | 1,826 | | | | 132,586 | |
| | | | | | | | |
| | | | | | | | 1,249,336 | |
Oil, Gas & Consumable Fuels — 5.1% | | | | | | | | |
Anadarko Petroleum Corp. | | | 3,156 | | | | 153,318 | |
Apache Corp. | | | 55,551 | | | | 2,470,353 | |
Devon Energy Corp. | | | 53,091 | | | | 1,698,912 | |
EnLink Midstream LLC (b) | | | 17,879 | | | | 269,794 | |
EOG Resources, Inc. | | | 17,854 | | | | 1,263,885 | |
EP Energy Corp., Class A (a) | | | 12,177 | | | | 53,335 | |
Exxon Mobil Corp. | | | 19,864 | | | | 1,548,399 | |
Gulfport Energy Corp. (a) | | | 53,599 | | | | 1,316,927 | |
Hess Corp. | | | 1,404 | | | | 68,066 | |
Marathon Oil Corp. | | | 175,988 | | | | 2,215,689 | |
Marathon Petroleum Corp. | | | 50,714 | | | | 2,629,014 | |
Memorial Resource Development Corp. (a) | | | 5,628 | | | | 90,892 | |
Newfield Exploration Co. (a) | | | 41,728 | | | | 1,358,664 | |
Occidental Petroleum Corp. | | | 7,862 | | | | 531,550 | |
PBF Energy, Inc., Class A | | | 10,942 | | | | 402,775 | |
Phillips 66 | | | 3,077 | | | | 251,699 | |
Suncor Energy, Inc. | | | 50,789 | | | | 1,310,356 | |
Teekay Corp. (b) | | | 7,205 | | | | 71,113 | |
Tesoro Corp. | | | 4,580 | | | | 482,595 | |
Valero Energy Corp. (b) | | | 59,021 | | | | 4,173,375 | |
Whiting Petroleum Corp. (a) | | | 20,044 | | | | 189,215 | |
World Fuel Services Corp. | | | 2,969 | | | | 114,188 | |
| | | | | | | | |
| | | | | | | | 22,664,114 | |
Personal Products — 0.1% | | | | | | | | |
Estee Lauder Cos., Inc., Class A | | | 3,366 | | | | 296,410 | |
Herbalife Ltd. (a)(b) | | | 693 | | | | 37,159 | |
| | | | | | | | |
| | | | | | | | 333,569 | |
Pharmaceuticals — 5.2% | | | | | | | | |
Allergan PLC (a) | | | 2,940 | | | | 918,750 | |
Baxalta, Inc. (b) | | | 75,777 | | | | 2,957,576 | |
Bristol-Myers Squibb Co. | | | 16,586 | | | | 1,140,951 | |
Eli Lilly & Co. | | | 20,991 | | | | 1,768,702 | |
Johnson & Johnson | | | 4,706 | | | | 483,400 | |
Merck & Co., Inc. (b) | | | 84,858 | | | | 4,482,200 | |
Perrigo Co. PLC | | | 6,171 | | | | 892,944 | |
Pfizer, Inc. | | | 171,100 | | | | 5,523,108 | |
Teva Pharmaceutical Industries Ltd. — ADR (b) | | | 40,943 | | | | 2,687,499 | |
Zoetis, Inc. | | | 47,007 | | | | 2,252,575 | |
| | | | | | | | |
| | | | | | | | 23,107,705 | |
Professional Services — 0.9% | | | | | | | | |
Dun & Bradstreet Corp. | | | 100 | | | | 10,393 | |
Equifax, Inc. | | | 4,361 | | | | 485,685 | |
ManpowerGroup, Inc. | | | 10,345 | | | | 871,980 | |
Nielsen Holdings PLC (b) | | | 48,637 | | | | 2,266,484 | |
Robert Half International, Inc. | | | 5,311 | | | | 250,360 | |
| | | | | | | | |
| | | | | | | | 3,884,902 | |
Real Estate Investment Trusts (REITs) — 2.0% | | | | | | | | |
Blackstone Mortgage Trust, Inc., Class A | | | 2,336 | | | | 62,511 | |
Brixmor Property Group, Inc. | | | 9,659 | | | | 249,396 | |
Crown Castle International Corp. | | | 12,907 | | | | 1,115,810 | |
Equity Lifestyle Properties, Inc. | | | 5,169 | | | | 344,617 | |
See Notes to Financial Statements.
| | | | | | |
| | | | | | | |
| 4 | | ACTIVE STOCK MASTER PORTFOLIO | | DECEMBER 31, 2015 | | |
| | |
Schedule of Investments (continued) | | (Percentages shown are based on Net Assets) |
| | | | | | | | |
| Common Stocks | | Shares | | | Value | |
Real Estate Investment Trusts (REITs) (continued) | | | | | | | | |
Mid-America Apartment Communities, Inc. | | | 18,448 | | | $ | 1,675,263 | |
Outfront Media, Inc. | | | 35,840 | | | | 782,387 | |
RLJ Lodging Trust | | | 7,278 | | | | 157,423 | |
Simon Property Group, Inc. | | | 13,961 | | | | 2,714,577 | |
Starwood Property Trust, Inc. | | | 42,221 | | | | 868,064 | |
Weingarten Realty Investors | | | 20,869 | | | | 721,650 | |
WP Glimcher, Inc. | | | 39,860 | | | | 422,915 | |
| | | | | | | | |
| | | | | | | | 9,114,613 | |
Real Estate Management & Development — 0.3% | | | | | | | | |
Jones Lang LaSalle, Inc. | | | 7,549 | | | | 1,206,783 | |
Realogy Holdings Corp. (a) | | | 1,810 | | | | 66,373 | |
| | | | | | | | |
| | | | | | | | 1,273,156 | |
Road & Rail — 0.6% | | | | | | | | |
Union Pacific Corp. | | | 34,019 | | | | 2,660,286 | |
Semiconductors & Semiconductor Equipment — 1.7% | | | | | | | | |
Analog Devices, Inc. | | | 15,839 | | | | 876,213 | |
Intel Corp. (b) | | | 19,244 | | | | 662,956 | |
Lam Research Corp. (b) | | | 11,768 | | | | 934,615 | |
Micron Technology, Inc. (a) | | | 28,127 | | | | 398,278 | |
NVIDIA Corp. (b) | | | 43,080 | | | | 1,419,917 | |
Skyworks Solutions, Inc. (b) | | | 23,679 | | | | 1,819,258 | |
Teradyne, Inc. | | | 40,897 | | | | 845,341 | |
Texas Instruments, Inc. | | | 11,335 | | | | 621,271 | |
Xilinx, Inc. | | | 4,719 | | | | 221,652 | |
| | | | | | | | |
| | | | | | | | 7,799,501 | |
Software — 3.9% | | | | | | | | |
Adobe Systems, Inc. (a) | | | 11,729 | | | | 1,101,822 | |
Atlassian Corp. PLC, Class A (a)(b) | | | 1,203 | | | | 36,186 | |
Broadridge Financial Solutions, Inc. | | | 8,010 | | | | 430,377 | |
Check Point Software Technologies Ltd. (a)(b) | | | 25,043 | | | | 2,037,999 | |
Citrix Systems, Inc. (a) | | | 1,575 | | | | 119,149 | |
Intuit, Inc. | | | 7,504 | | | | 724,136 | |
Microsoft Corp. | | | 150,813 | | | | 8,367,105 | |
Oracle Corp. | | | 72,084 | | | | 2,633,229 | |
Rackspace Hosting, Inc. (a) | | | 10,772 | | | | 272,747 | |
salesforce.com, Inc. (a) | | | 796 | | | | 62,406 | |
Synopsys, Inc. (a) | | | 10,406 | | | | 474,618 | |
Take-Two Interactive Software, Inc. (a) | | | 1,447 | | | | 50,414 | |
Verint Systems, Inc. (a) | | | 4,674 | | | | 189,578 | |
VMware, Inc., Class A (a)(b) | | | 12,740 | | | | 720,702 | |
| | | | | | | | |
| | | | | | | | 17,220,468 | |
Specialty Retail — 4.4% | | | | | | | | |
Aaron’s, Inc. | | | 27,981 | | | | 626,495 | |
Cabela’s, Inc. (a)(b) | | | 501 | | | | 23,412 | |
Dick’s Sporting Goods, Inc. (b) | | | 8,383 | | | | 296,339 | |
Gap, Inc. (b) | | | 21,859 | | | | 539,917 | |
GNC Holdings, Inc., Class A | | | 26,418 | | | | 819,486 | |
Home Depot, Inc. | | | 42,137 | | | | 5,572,618 | |
Lowe’s Cos., Inc. | | | 92,464 | | | | 7,030,963 | |
Penske Automotive Group, Inc. | | | 12,200 | | | | 516,548 | |
Ross Stores, Inc. | | | 29,646 | | | | 1,595,251 | |
Sears Hometown and Outlet Stores, Inc. (a)(b) | | | 5,368 | | | | 42,944 | |
TJX Cos., Inc. | | | 35,002 | | | | 2,481,992 | |
| | | | | | | | |
| | | | | | | | 19,545,965 | |
Technology Hardware, Storage & Peripherals — 3.9% | | | | | | | | |
Apple, Inc. | | | 142,781 | | | | 15,029,128 | |
EMC Corp. | | | 37,380 | | | | 959,918 | |
Western Digital Corp. | | | 26,929 | | | | 1,617,087 | |
| | | | | | | | |
| | | | | | | | 17,606,133 | |
Textiles, Apparel & Luxury Goods — 0.7% | | | | | | | | |
Fossil Group, Inc. (a)(b) | | | 8,583 | | | $ | 313,794 | |
NIKE, Inc., Class B | | | 42,141 | | | | 2,633,813 | |
| | | | | | | | |
| | | | | | | | 2,947,607 | |
Tobacco — 1.7% | | | | | | | | |
Altria Group, Inc. | | | 130,364 | | | | 7,588,488 | |
Vector Group Ltd. | | | 1 | | | | 24 | |
| | | | | | | | |
| | | | | | | | 7,588,512 | |
Trading Companies & Distributors — 0.1% | | | | | | | | |
AerCap Holdings NV (a) | | | 14,305 | | | | 617,404 | |
Water Utilities — 0.3% | | | | | | | | |
American Water Works Co., Inc. (b) | | | 17,091 | | | | 1,021,187 | |
Aqua America, Inc. (b) | | | 4,992 | | | | 148,762 | |
| | | | | | | | |
| | | | | | | | 1,169,949 | |
Wireless Telecommunication Services — 0.7% | | | | | | | | |
SBA Communications Corp., Class A (a) | | | 5,606 | | | | 589,023 | |
Telephone & Data Systems, Inc. | | | 73,615 | | | | 1,905,892 | |
United States Cellular Corp. (a) | | | 11,511 | | | | 469,764 | |
| | | | | | | | |
| | | | | | | | 2,964,679 | |
| Total Common Stocks — 98.9% | | | | | | | 441,245,739 | |
| | | | | | | | |
| | | | | | | | | |
| | |
| Preferred Stocks | | | | | | |
Food Products — 0.1% | | | | | | | | |
Tyson Foods, Inc., 2.38% | | | 6,488 | | | | 393,692 | |
Machinery — 0.0% | | | | | | | | |
Stanley Black & Decker, Inc., 6.25% (c) | | | 847 | | | | 98,921 | |
| Total Preferred Securities — 0.1% | | | | | | | 492,613 | |
Total Long-Term Investments
(Cost — $437,509,979) — 99.0% | | | | | | | 441,738,352 | |
| | | | | | | | |
| | | | | | | | | |
| | |
| Short-Term Securities | | | | | | |
BlackRock Cash Funds: Institutional,
SL Agency Shares, 0.35% (d)(e)(f) | | | 21,712,891 | | | | 21,712,891 | |
BlackRock Cash Funds: Prime,
SL Agency Shares, 0.31% (d)(e)(f) | | | 14,799,184 | | | | 14,799,184 | |
| | | | | | | | |
| | | | | | | | 36,512,075 | |
Total Short-Term Securities
(Cost — $36,512,075) — 8.2% | | | | | | | 36,512,075 | |
Total Investments
(Cost — $474,022,054) — 107.2% | | | | | | | 478,250,427 | |
| Liabilities in Excess of Other Assets — (7.2)% | | | | | | | (32,254,919 | ) |
| | | | | | | | |
| Net Assets — 100.0% | | | | | | $ | 445,995,508 | |
| | | | | | | | |
See Notes to Financial Statements.
| | | | | | |
| | | | | | | |
| | ACTIVE STOCK MASTER PORTFOLIO | | DECEMBER 31, 2015 | | 5 |
| | |
Schedule of Investments (continued) | | |
| | |
| Notes to Schedule of Investments |
| (a) | | Non-income producing security. |
| (b) | | Security, or a portion of security, is on loan. |
| (c) | | Convertible security. |
| (d) | | During the year ended December 31, 2015, investments in issuers considered to be affiliates of the Master Portfolio for purposes of Section 2(a)(3) of the Investment Company Act of 1940, as amended, were as follows: |
| | | | | | | | | | | | | | | | |
| Affiliate | | Shares Held
at December 31,
2014 | | | Net
Activity | | | Shares Held
at December 31,
2015 | | | Income | |
BlackRock Cash Funds: Institutional, SL Agency Shares | | | 60,987,578 | | | | (39,274,687 | ) | | | 21,712,891 | | | $ | 261,456 | 1 |
BlackRock Cash Funds: Prime, SL Agency Shares | | | 5,562,536 | | | | 9,236,648 | | | | 14,799,184 | | | $ | 154,710 | 1 |
1 Represents all or a portion of securities lending income earned from the reinvestment of cash collateral from loaned securities, net of fees and collateral investment expenses, and other payments to and from borrowers of securities. | |
| (e) | | Current yield as of period end. |
| (f) | | All or a portion of security was purchased with the cash collateral from loaned securities. |
| | |
| Derivative Financial Instruments Outstanding as of Period End |
Financial Futures Contracts
| | | | | | | | | | | | | | | | | | | | |
Contracts Long | | | Issue | | Expiration | | | Notional Value | | | Unrealized
Depreciation | |
| | 13 | | | S&P 500 E-Mini Index | | | March 2016 | | | | USD 1,323,010 | | | $ | (361 | ) |
| | |
| Derivative Financial Instruments Categorized by Risk Exposure |
As of period end, the fair values of derivative financial instruments located in the Statement of Assets and Liabilities were as follows:
| | | | | | | | | | | | | | | | | | | | | | | | | | | | | | | | |
Liabilities — Derivative
Financial Instruments | | | Commodity
Contracts | | | Credit
Contracts | | | Equity
Contracts | | | Foreign
Currency
Exchange
Contracts | | | Interest Rate
Contracts | | | Other
Contacts | | | Total | |
Financial futures contracts | | | Net unrealized depreciation | 1 | | | — | | | | — | | | $ | 361 | | | | — | | | | — | | | | — | | | $ | 361 | |
1 Includes cumulative (depreciation) on financial futures contracts, if any, as reported in the Schedule of Investments. Only current day’s variation margin is reported within the Statement of Assets and Liabilities. | |
For the year ended December 31, 2015, the effect of derivative financial instruments in the Statement of Operations was as follows:
| | | | | | | | | | | | | | | | | | | | | | | | | | | | | | |
| Net Realized Gain (Loss) From: | | Commodity
Contracts | | | Credit
Contracts | | | Equity
Contracts | | | Foreign
Currency
Exchange
Contracts | | | Interest Rate
Contracts | | Other
Contacts | | | Total | |
Financial futures contracts | | | — | | | | — | | | $ | 236,757 | | | | — | | | — | | | — | | | $ | 236,757 | |
Net Change in Unrealized
Appreciation (Depreciation) on: | | | | | | | | | | | | | | | | | |
Financial futures contracts | | | — | | | | — | | | $ | (234,749 | ) | | | — | | | — | | | — | | | $ | (234,749 | ) |
| | |
| Average Quarterly Balances of Outstanding Derivative Financial Instruments |
| | | | | | | | | | | | | | | | | | | | |
| Financial futures contracts: | | | |
Average notional value of contracts — long | | $ | 7,461,144 | | | |
Average notional value of contracts — short | | $ | 929,070 | 1 | | |
1 Actual amounts for the period are shown due to limited outstanding derivative financial instruments as of each quarter. |
For more information about the Master Portfolio’s investment risks regarding derivative financial instruments, refer to the Notes to Financial Statements.
See Notes to Financial Statements.
| | | | | | |
| | | | | | | |
| 6 | | ACTIVE STOCK MASTER PORTFOLIO | | DECEMBER 31, 2015 | | |
| | |
Schedule of Investments (concluded) | | |
| | |
| Fair Value Hierarchy as of Period End |
Various inputs are used in determining the fair value of investments and derivative financial instruments. For information about the Master Portfolio’s policy regarding valuation of investments and derivative financial instruments, refer to the Notes to Financial Statements.
The following tables summarize the Master Portfolio’s investments and derivative financial instruments categorized in the disclosure hierarchy:
| | | | | | | | | | | | | | | | |
| | | Level 1 | | | Level 2 | | | Level 3 | | | Total | |
Assets: | | | | | | | | | | | | | | | | |
| Investments: | | | | | | | | | | | | | | | | |
| Long-Term Investments: | | | | | | | | | | | | | | | | |
Common Stocks1 | | $ | 441,245,739 | | | | — | | | | — | | | | 441,245,739 | |
Preferred Stocks1 | | | 492,613 | | | | — | | | | — | | | | 492,613 | |
Short-Term Securities | | | 36,512,075 | | | | — | | | | — | | | | 36,512,075 | |
| | | | | | | | | | | | |
Total | | $ | 478,250,427 | | | | — | | | | — | | | | 478,250,427 | |
| | | | | | | | | | | | | | | | |
1 See above Schedule of Investments for values in each industry. | |
| | | Level 1 | | | Level 2 | | | Level 3 | | | Total | |
| Derivative Financial Instruments1 | | | | | | | | | | | | | | | | |
Liabilities: | | | | | | | | | | | | | | | | |
Equity contracts | | $ | (361 | ) | | | — | | | | — | | | $ | (361 | ) |
| | | | | | | | | | | | | | | | |
1 Derivative financial instruments are financial futures contracts, which are valued at the unrealized appreciation (depreciation) on the instrument. | |
The Master Portfolio may hold assets and/or liabilities in which the fair value approximates the carrying amount for financial statement purposes. As of period end, such assets and/or liabilities are categorized within the disclosure hierarchy as follows: | |
| | | Level 1 | | | Level 2 | | | Level 3 | | | Total | |
Assets: | | | | | | | | | | | | | | | | |
Cash | | $ | 15,824 | | | | — | | | | — | | | $ | 15,824 | |
Cash pledged for financial futures contracts | | | 51,000 | | | | — | | | | — | | | | 51,000 | |
Liabilities: | | | | | | | | | | | | | | | | |
Collateral on securities loaned at value | | | — | | | $ | (33,965,341 | ) | | | — | | | | (33,965,341 | ) |
| | | | | | | | | | | | | | | | |
Total | | $ | 66,824 | | | $ | (33,965,341 | ) | | | — | | | $ | (33,898,517 | ) |
| | | | | | | | | | | | | | | | |
During the year ended December 31, 2015, there were no transfers between levels.
See Notes to Financial Statements.
| | | | | | |
| | | | | | | |
| | ACTIVE STOCK MASTER PORTFOLIO | | DECEMBER 31, 2015 | | 7 |
| | |
| Statement of Assets and Liabilities | | |
| | | | |
| December 31, 2015 | | | |
| | | | |
| Assets | | | | |
Investments at value — unaffiliated (including securities loaned of $32,928,680) (cost — $437,509,979) | | $ | 441,738,352 | |
Investments at value — affiliated (cost — $36,512,075) | | | 36,512,075 | |
Cash | | | 15,824 | |
Cash pledged for financial futures contracts | | | 51,000 | |
| Receivables: | | | | |
Contributions from investors | | | 23,025,708 | |
Investments sold | | | 3,606,508 | |
Dividends | | | 559,474 | |
Securities lending income — affiliated | | | 19,975 | |
Prepaid expenses | | | 1,306 | |
| | | | |
Total assets | | | 505,530,222 | |
| | | | |
| | | | |
| Liabilities | | | | |
Collateral on securities loaned at value | | | 33,965,341 | |
Variation margin payable on financial futures contracts | | | 10,892 | |
| Payables: | | | | |
Investments purchased | | | 25,459,499 | |
Investment advisory fees | | | 57,596 | |
Trustees’ fees | | | 13,256 | |
Other accrued expenses | | | 28,130 | |
| | | | |
Total liabilities | | | 59,534,714 | |
| | | | |
Net Assets | | $ | 445,995,508 | |
| | | | |
| | | | |
| Net Assets Consist of | | | | |
Investors’ capital | | $ | 441,767,455 | |
Net unrealized appreciation (depreciation) | | | 4,228,053 | |
| | | | |
Net Assets | | $ | 445,995,508 | |
| | | | |
| | | | | | |
| See Notes to Financial Statements. | | | | |
| | | | | | | |
| 8 | | ACTIVE STOCK MASTER PORTFOLIO | | DECEMBER 31, 2015 | | |
| | | | |
| Year Ended December 31, 2015 | | | |
| | | | |
| Investment Income | | | | |
Dividends — unaffiliated | | $ | 32,679,455 | |
Securities lending — affiliated — net | | | 355,073 | |
Dividends — affiliated | | | 61,093 | |
Foreign taxes withheld | | | (353,350 | ) |
| | | | |
Total income | | | 32,742,271 | |
| | | | |
| | | | |
| Expenses | | | | |
Investment advisory | | | 4,449,725 | |
Administration | | | 1,816,284 | |
Trustees | | | 60,649 | |
Professional | | | 43,256 | |
| | | | |
Total expenses | | | 6,369,914 | |
| Less: | | | | |
Fees waived by the Manager | | | (1,853,456 | ) |
Fees waived by the Administrator | | | (1,816,284 | ) |
| | | | |
Total expenses after fees waived | | | 2,700,174 | |
| | | | |
Net investment income | | | 30,042,097 | |
| | | | |
| | | | |
| Realized and Unrealized Gain (Loss) | | | | |
Net realized gain (loss) from: | | | | |
Investments | | | 209,342,400 | |
In-kind redemptions1 | | | 99,250,963 | |
Financial futures contracts | | | 236,757 | |
Foreign currency transactions | | | (34,381 | ) |
| | | | |
| | | 308,795,739 | |
| | | | |
| Net change in unrealized appreciation (depreciation) on: | | | | |
Investments | | | (311,786,058 | ) |
Financial futures contracts | | | (234,749 | ) |
Foreign currency translations | | | 7,451 | |
| | | | |
| | | (312,013,356 | ) |
| | | | |
Net realized and unrealized loss | | | (3,217,617 | ) |
| | | | |
Net Increase in Net Assets Resulting from Operations | | $ | 26,824,480 | |
| | | | |
1 See Note 2 of the Notes to Financial Statements. | | | | |
| | | | | | |
| See Notes to Financial Statements. | | | | |
| | | | | | | |
| | ACTIVE STOCK MASTER PORTFOLIO | | DECEMBER 31, 2015 | | 9 |
| | |
| Statements of Changes in Net Assets | | |
| | | | | | | | |
| | | Year Ended December 31, | |
| Increase (Decrease) in Net Assets: | | 2015 | | | 2014 | |
| | | | | | | | |
| Operations | | | | | | | | |
Net investment income | | $ | 30,042,097 | | | $ | 40,597,242 | |
Net realized gain | | | 308,795,739 | | | | 485,318,772 | |
Net change in unrealized appreciation (depreciation) | | | (312,013,356 | ) | | | (246,323,337 | ) |
| | | | | | | | |
Net increase in net assets resulting from operations | | | 26,824,480 | | | | 279,592,677 | |
| | | | | | | | |
| | | | | | | | |
| Capital Transactions | | | | | | | | |
Proceeds from contributions | | | 233,706,507 | | | | 998,522,489 | |
Value of withdrawals | | | (2,248,961,465 | ) | | | (1,784,231,951 | ) |
| | | | | | | | |
Net decrease in net assets from capital transactions | | | (2,015,254,958 | ) | | | (785,709,462 | ) |
| | | | | | | | |
| | | | | | | | |
| Net Assets | | | | | | | | |
Total decrease in net assets | | | (1,988,430,478 | ) | | | (506,116,785 | ) |
Beginning of year | | | 2,434,425,986 | | | | 2,940,542,771 | |
| | | | | | | | |
End of year | | $ | 445,995,508 | | | $ | 2,434,425,986 | |
| | | | | | | | |
| | | | | | |
| See Notes to Financial Statements. | | | | |
| | | | | | | |
| 10 | | ACTIVE STOCK MASTER PORTFOLIO | | DECEMBER 31, 2015 | | |
| | | | | | | | | | | | | | | | | | | | |
| | | Year Ended December 31, | |
| | | 2015 | | | 2014 | | | 2013 | | | 2012 | | | 2011 | |
| | | | | | | | | | | | | | | | | | | | |
| Total Return | | | | | | | | | | | | | | | | | | | | |
Total return | | | (1.20)% | | | | 11.74% | | | | 34.02% | | | | 15.55% | | | | 2.20% | |
| | | | | | | | | | | | | | | | | | | | |
| | | | | | | | | | | | | | | | | | | | |
| Ratio to Average Net Assets | | | | | | | | | | | | | | | | | | | | |
Total expenses | | | 0.35% | | | | 0.35% | | | | 0.35% | | | | 0.35% | | | | 0.35% | |
| | | | | | | | | | | | | | | | | | | | |
Total expenses after fees waived | | | 0.15% | | | | 0.17% | | | | 0.23% | | | | 0.26% | | | | 0.27% | |
| | | | | | | | | | | | | | | | | | | | |
Net investment income | | | 1.65% | | | | 1.56% | | | | 1.55% | | | | 2.03% | | | | 1.70% | |
| | | | | | | | | | | | | | | | | | | | |
| | | | | | | | | | | | | | | | | | | | |
| Supplemental Data | | | | | | | | | | | | | | | | | | | | |
Net assets, end of year (000) | | | $445,996 | | | | $2,434,426 | | | | $2,940,543 | | | | $2,792,818 | | | | $2,717,250 | |
| | | | | | | | | | | | | | | | | | | | |
Portfolio turnover rate | | | 132% | | | | 119% | | | | 153% | | | | 120% | | | | 275% | |
| | | | | | | | | | | | | | | | | | | | |
| | | | | | |
| See Notes to Financial Statements. | | | | |
| | | | | | | |
| | ACTIVE STOCK MASTER PORTFOLIO | | DECEMBER 31, 2015 | | 11 |
| | |
| Notes to Financial Statements | | |
1. Organization:
Active Stock Master Portfolio (the “Master Portfolio”) a series of Master Investment Portfolio (“MIP”), is registered under the Investment Company Act of 1940, as amended (the “1940 Act”), as a diversified, open-end management investment company. MIP is organized as a Delaware statutory trust.
The Master Portfolio, together with certain other registered investment companies advised by BlackRock Fund Advisors (the “Manager”) or its affiliates, is included in a complex of open-end funds referred to as the Equity-Liquidity Complex.
2. Significant Accounting Policies:
The financial statements are prepared in conformity with accounting principles generally accepted in the United States of America (“U.S. GAAP”), which may require management to make estimates and assumptions that affect the reported amounts of assets and liabilities in the financial statements, disclosure of contingent assets and liabilities at the date of the financial statements and the reported amounts of increases and decreases in net assets from operations during the reporting period. Actual results could differ from those estimates. The Master Portfolio is considered an investment company under U.S. GAAP and follows the accounting and reporting guidance applicable to investment companies. Below is a summary of significant accounting policies:
Foreign Currency: The Master Portfolio’s books and records are maintained in U.S. dollars. Purchases and sales of investments are recorded at the rates of exchange prevailing on the respective dates of such transactions. Generally, when the U.S. dollar rises in value against a foreign currency, the investments denominated in that currency will lose value; the opposite effect occurs if the U.S. dollar falls in relative value.
The Master Portfolio does not isolate changes in the exchange rates from the changes in the market prices of investments held or sold for financial reporting purposes. Accordingly, the effects of changes in exchange rates on investments are not segregated in the Statement of Operations from the effects of changes in market prices of those investments, but are included as a component of net realized and unrealized gain (loss) from investments. The Master Portfolio reports realized currency gains (losses) on foreign currency related transactions as components of net realized gain (loss) for financial reporting purposes, whereas such components are generally treated as ordinary income for federal income tax purposes.
Segregation and Collateralization: In cases where the Master Portfolio enters into certain investments (e.g., financial futures contracts) that would be treated as “senior securities” for 1940 Act purposes, the Master Portfolio may segregate or designate on its books and records cash or liquid assets having a market value at least equal to the amount of its future obligations under such investments. Doing so allows the investment to be excluded from treatment as a “senior security.” Furthermore, if required by an exchange or counterparty agreement, the Master Portfolio may be required to deliver/deposit cash and/or securities to/with an exchange, or broker-dealer or custodian as collateral for certain investments or obligations.
Investment Transactions and Investment Income: For financial reporting purposes, investment transactions are recorded on the dates the transactions are entered into (the trade dates). Realized gains and losses on investment transactions are determined on the identified cost basis. Dividend income is recorded on the ex-dividend date. Dividends from foreign securities where the ex-dividend date may have passed are subsequently recorded when the Master Portfolio is informed of the ex-dividend date. Under the applicable foreign tax laws, a withholding tax at various rates may be imposed on capital gains, dividends and interest. Upon notification from issuers, some of the dividend income received from a real estate investment trust may be redesignated as a reduction of cost of the related investment and/or realized gain.
In-Kind Redemptions: The Master Portfolio transferred securities and cash to shareholders in connection with an in-kind redemption transaction. For financial reporting purposes, these transactions were treated as a sale of securities and the resulting gains and losses were recognized based on the market value of the securities on the date of the redemption. For the year ended December 31, 2015, the Master Portfolio had in-kind redemptions of $1,419,799,062. For tax purposes, no gains or losses were recognized.
Indemnifications: In the normal course of business, the Master Portfolio enters into contracts that contain a variety of representations that provide general indemnification. The Master Portfolio’s maximum exposure under these arrangements is unknown because it involves future potential claims against the Master Portfolio, which cannot be predicted with any certainty.
Other: Expenses directly related to the Master Portfolio are charged to the Master Portfolio. Other operating expenses shared by several funds, including other funds managed by the Manager, are prorated among those funds on the basis of relative net assets or other appropriate methods.
The Master Portfolio has an arrangement with its custodian whereby fees may be reduced by credits earned on uninvested cash balances, which, if applicable, are shown as fees paid indirectly in the Statement of Operations. The custodian imposes fees on overdrawn cash balances, which can be offset by accumulated credits earned or may result in additional custody charges.
3. Investment Valuation and Fair Value Measurements:
Investment Valuation Policies: The Master Portfolio’s investments are valued at fair value (also referred to as “market value” within the financial statements) as of the close of trading on the New York Stock Exchange (“NYSE”) (generally 4:00 p.m., Eastern time). U.S. GAAP defines fair value as the price the Master Portfolio would receive to sell an asset or pay to transfer a liability in an orderly transaction between market participants at the measurement date. The Master Portfolio determines the fair values of its financial instruments using independent dealers or pricing services under policies approved by
| | | | | | |
| | | | | | | |
| 12 | | ACTIVE STOCK MASTER PORTFOLIO | | DECEMBER 31, 2015 | | |
| | |
| Notes to Financial Statements (continued) | | |
the Board of Trustees of MIP (the “Board”). The BlackRock Global Valuation Methodologies Committee (the “Global Valuation Committee”) is the committee formed by management to develop global pricing policies and procedures and to provide oversight of the pricing function for the Master Portfolio for all financial instruments.
Fair Value Inputs and Methodologies: The following methods (or “techniques”) and inputs are used to establish the fair value of the Master Portfolio’s assets and liabilities:
| • | | Equity investments traded on a recognized securities exchange are valued at the official close price each day, if available. For equity investments traded on more than one exchange, the official close price on the exchange where the stock is primarily traded is used. Equity investments traded on a recognized exchange for which there were no sales on that day may be valued at the last available bid (long positions) or ask (short positions) price. Generally, trading in foreign instruments is substantially completed each day at various times prior to the close of business on the NYSE. Occasionally, events affecting the values of such instruments may occur between the foreign market close and the close of business on the NYSE that may not be reflected in the computation of the Master Portfolio’s net assets. Each business day, the Master Portfolio uses a pricing service to assist with the valuation of certain foreign exchange-traded equity securities and foreign exchange-traded and over-the-counter (“OTC”) options (the “Systematic Fair Value Price”). Using current market factors, the Systematic Fair Value Price is designed to value such foreign securities and foreign options at fair value as of the close of business on the NYSE, which follows the close of the local markets. |
| • | | Investments in open-end U.S. mutual funds are valued at net asset value (“NAV”) each business day. |
| • | | Financial futures contracts traded on exchanges are valued at their last sale price. |
| • | | Securities and other assets and liabilities denominated in foreign currencies are translated into U.S. dollars using exchange rates determined as of the close of business on the NYSE. Forward foreign currency exchange contracts are valued at the mean between the bid and ask prices and are determined as of the close of business on the NYSE. Interpolated values are derived when the settlement date of the contract is an interim date for which quotations are not available. |
If events (e.g., a company announcement, market volatility or a natural disaster) occur that are expected to materially affect the value of such instruments, or in the event that the application of these methods of valuation results in a price for an investment that is deemed not to be representative of the market value of such investment, or if a price is not available, the investment will be valued by the Global Valuation Committee, or its delegate, in accordance with a policy approved by the Board as reflecting fair value (“Fair Valued Investments”). When determining the price for Fair Valued Investments, the Global Valuation Committee, or its delegate, seeks to determine the price that the Master Portfolio might reasonably expect to receive or pay from the current sale or purchase of that asset or liability in an arm’s-length transaction. Fair value determinations shall be based upon all available factors that the Global Valuation Committee, or its delegate, deems relevant consistent with the principles of fair value measurement. The pricing of all Fair Valued Investments is subsequently reported to the Board or a committee thereof on a quarterly basis.
Fair Value Hierarchy: Various inputs are used in determining the fair value of investments and derivative financial instruments. These inputs to valuation techniques are categorized into a fair value hierarchy consisting of three broad levels for financial statement purposes as follows:
| • | | Level 1 — unadjusted price quotations in active markets/exchanges for identical assets or liabilities that the Master Portfolio has the ability to access |
| • | | Level 2 — other observable inputs (including, but not limited to, quoted prices for similar assets or liabilities in markets that are active, quoted prices for identical or similar assets or liabilities in markets that are not active, inputs other than quoted prices that are observable for the assets or liabilities (such as interest rates, yield curves, volatilities, prepayment speeds, loss severities, credit risks and default rates) or other market–corroborated inputs) |
| • | | Level 3 — unobservable inputs based on the best information available in the circumstances, to the extent observable inputs are not available (including the Master Portfolio’s own assumptions used in determining the fair value of investments and derivative financial instruments) |
The hierarchy gives the highest priority to unadjusted quoted prices in active markets for identical assets or liabilities (Level 1 measurements) and the lowest priority to unobservable inputs (Level 3 measurements). Accordingly, the degree of judgment exercised in determining fair value is greatest for instruments categorized in Level 3. The inputs used to measure fair value may fall into different levels of the fair value hierarchy. In such cases, for disclosure purposes, the fair value hierarchy classification is determined based on the lowest level input that is significant to the fair value measurement in its entirety. The significant unobservable inputs used by the Global Valuation Committee in determining the price for Fair Valued Investments are typically categorized as Level 3. The fair value hierarchy for the Master Portfolio’s investments and derivative financial instruments has been included in the Schedule of Investments.
Changes in valuation techniques may result in transfers into or out of an assigned level within the hierarchy. In accordance with the Master Portfolio’s policy, transfers between different levels of the fair value hierarchy are deemed to have occurred as of the beginning of the reporting period. The categorization of a value determined for investments and derivative financial instruments is based on the pricing transparency of the investments and derivative financial instruments and is not necessarily an indication of the risks associated with investing in those securities.
| | | | | | |
| | | | | | | |
| | ACTIVE STOCK MASTER PORTFOLIO | | DECEMBER 31, 2015 | | 13 |
| | |
| Notes to Financial Statements (continued) | | |
4. Securities and Other Investments:
Preferred Stock: Preferred stock has a preference over common stock in liquidation (and generally in receiving dividends as well) but is subordinated to the liabilities of the issuer in all respects. As a general rule, the market value of preferred stock with a fixed dividend rate and no conversion element varies inversely with interest rates and perceived credit risk, while the market price of convertible preferred stock generally also reflects some element of conversion value. Because preferred stock is junior to debt securities and other obligations of the issuer, deterioration in the credit quality of the issuer will cause greater changes in the value of a preferred stock than in a more senior debt security with similar stated yield characteristics. Unlike interest payments on debt securities, preferred stock dividends are payable only if declared by the issuer’s board of directors. Preferred stock also may be subject to optional or mandatory redemption provisions.
Securities Lending: The Master Portfolio may lend its securities to approved borrowers, such as brokers, dealers and other financial institutions. The borrower pledges and maintains with the Master Portfolio collateral consisting of cash, an irrevocable letter of credit issued by a bank, or securities issued or guaranteed by the U.S. Government. The initial collateral received by the Master Portfolio is required to have a value of at least 102% of the current value of the loaned securities for securities traded on U.S. exchanges and a value of at least 105% for all other securities. The collateral is maintained thereafter, at a value equal to at least 100% of the current market value of the securities on loan. The market value of the loaned securities is determined at the close of each business day of the Master Portfolio and any additional required collateral is delivered to the Master Portfolio, or excess collateral returned by the Master Portfolio, on the next business day. During the term of the loan, the Master Portfolio is entitled to all distributions made on or in respect of the loaned securities. Loans of securities are terminable at any time and the borrower, after notice, is required to return borrowed securities within the standard time period for settlement of securities transactions.
The market value of any securities on loan, all of which were classified as common stocks in the Master Portfolio’s Schedule of Investments, and the value of any related collateral are shown separately in the Statement of Assets and Liabilities as a component of investments at value-unaffiliated, and collateral on securities loaned at value, respectively. As of period end, any securities on loan were collateralized by cash. The cash collateral invested by the securities lending agent, BlackRock Institutional Trust Company, N.A. (“BTC”), if any, is disclosed in the Schedule of Investments.
Securities lending transactions are entered into by the Master Portfolio under Master Securities Lending Agreements (each, an “MSLA”), which provide the right, in the event of default (including bankruptcy or insolvency), for the non-defaulting party to liquidate the collateral and calculate a net exposure to the defaulting party or request additional collateral. In the event that a borrower defaults, the Master Portfolio, as lender, would offset the market value of the collateral received against the market value of the securities loaned. When the value of the collateral is greater than that of the market value of the securities loaned, the lender is left with a net amount payable to the defaulting party. However, bankruptcy or insolvency laws of a particular jurisdiction may impose restrictions on or prohibitions against such a right of offset in the event of an MSLA counterparty’s bankruptcy or insolvency. Under the MSLA, absent an event of default the borrower can resell or re-pledge the loaned securities, and the Master Portfolio can reinvest cash collateral received in connection with loaned securities. Upon an event of default, the parties’ obligations to return the securities or collateral to the other party are extinguished, and the parties can resell or re-pledge the loaned securities or the collateral received in connection with the loaned securities in order to satisfy the defaulting party’s net payment obligation for all transactions under the MSLA. The defaulting party remains liable for any deficiency.
As of period end, the following table is a summary of the Master Portfolio’s securities lending agreements by counterparty which are subject to offset under an MSLA:
| | | | | | | | | | | | |
| Counterparty | | Securities
Loaned
at Value | | | Cash
Collateral
Received1 | | | Net
Amount | |
Citigroup Global Markets, Inc. | | $ | 2,121,635 | | | $ | (2,121,635 | ) | | | — | |
Credit Suisse Securities (USA) LLC | | | 3,469,746 | | | | (3,469,746 | ) | | | — | |
Deutsche Bank Securities, Inc. | | | 871,220 | | | | (871,220 | ) | | | — | |
Goldman Sachs & Co | | | 5,875,551 | | | | (5,875,551 | ) | | | — | |
Jefferies & Co., LLC | | | 2,236,342 | | | | (2,236,342 | ) | | | — | |
JP Morgan Clearing Corp. | | | 3,945,815 | | | | (3,945,815 | ) | | | — | |
Merrill Lynch, Pierce, Fenner & Smith, Inc. | | | 5,674,899 | | | | (5,674,899 | ) | | | — | |
Morgan Stanley & Co. LLC | | | 3,149,069 | | | | (3,149,069 | ) | | | — | |
National Financial Services LLC | | | 338,189 | | | | (338,189 | ) | | | — | |
State Street Bank & Trust Co. | | | 2,037,348 | | | | (2,037,348 | ) | | | — | |
Wells Fargo Securities, LLC | | | 3,208,866 | | | | (3,208,866 | ) | | | — | |
| | | | | | | | | | | | |
Total | | $ | 32,928,680 | | | $ | (32,928,680 | ) | | | — | |
| | | | | | | | | | | | |
| | 1 | | Collateral with a value of $33,965,341 has been received in connection with securities lending agreements. Excess of collateral received from the individual counterparty is not shown for financial reporting purposes. |
The risks of securities lending include the risk that the borrower may not provide additional collateral when required or may not return the securities when due. To mitigate these risks, the Master Portfolio benefits from a borrower default indemnity provided by BlackRock, Inc. (“BlackRock”). BlackRock’s indemnity allows for full replacement of the securities loaned if the collateral received does not cover the value on the securities loaned in the event of
| | | | | | |
| | | | | | | |
| 14 | | ACTIVE STOCK MASTER PORTFOLIO | | DECEMBER 31, 2015 | | |
| | |
| Notes to Financial Statements (continued) | | |
borrower default. The Master Portfolio could suffer a loss if the value of an investment purchased with cash collateral falls below the market value of loaned securities or if the value of an investment purchased with cash collateral falls below the value of the original cash collateral received.
5. Derivative Financial Instruments:
The Master Portfolio engages in various portfolio investment strategies using derivative contracts both to increase the returns of the Master Portfolio and/or to manage economically its exposure to certain risks such as equity risk. These contracts may be transacted on an exchange or OTC.
Financial Futures Contracts: The Master Portfolio invests in long and/or short positions in financial futures contracts and options on financial futures contracts to gain exposure to, or economically hedge against, changes in the value of equity securities (equity risk). Financial futures contracts are agreements between the Master Portfolio and a counterparty to buy or sell a specific quantity of an underlying instrument at a specified price and at a specified date. Depending on the terms of the particular contract, financial futures contracts are settled either through physical delivery of the underlying instrument on the settlement date or by payment of a cash settlement amount on the settlement date.
Upon entering into a financial futures contract, the Master Portfolio is required to deposit initial margin with the broker in the form of cash or securities in an amount that varies depending on a contract’s size and risk profile. The initial margin deposit must then be maintained at an established level over the life of the contract. Securities deposited as initial margin are designated on the Schedule of Investments and cash deposited, if any, is recorded on the Statement of Assets and Liabilities as cash pledged for financial futures contracts. Pursuant to the contract, the Master Portfolio agrees to receive from or pay to the broker an amount of cash equal to the daily fluctuation in value of the contract. Such receipts or payments are known as variation margin. Variation margin is recorded by the Master Portfolio as unrealized appreciation (depreciation) and, if applicable, as a receivable or payable for variation margin in the Statement of Assets and Liabilities.
When the contract is closed, the Master Portfolio records a realized gain or loss equal to the difference between the value of the contract at the time it was opened and the value at the time it was closed. The use of financial futures contracts involves the risk of an imperfect correlation in the movements in the price of financial futures contracts, interest or foreign currency exchange rates and the underlying assets.
6. Investment Advisory Agreement and Other Transactions with Affiliates:
The PNC Financial Services Group, Inc. is the largest stockholder and an affiliate of BlackRock for 1940 Act purposes.
MIP, on behalf of the Master Portfolio, entered into an Investment Advisory Agreement with the Manager, the Master Portfolio’s investment advisor, an indirect, wholly owned subsidiary of BlackRock, to provide investment advisory services. The Manager is responsible for the management of the Master Portfolio’s portfolio and provides the personnel, facilities, equipment and certain other services necessary to the operations of the Master Portfolio. For such services, the Master Portfolio pays the Manager a monthly fee based on a percentage of the Master Portfolio’s average daily net assets at the following annual rates:
| | | | |
| Average Daily Net Assets | | Investment Advisory Fee | |
First $1 Billion | | | 0.25% | |
$1 Billion — $3 Billion | | | 0.24% | |
$3 Billion — $5 Billion | | | 0.23% | |
$5 Billion — $10 Billion | | | 0.22% | |
Greater than $10 Billion | | | 0.21% | |
MIP, on behalf of the Master Portfolio, entered into an Administration Agreement with BlackRock Advisors, LLC (the “Administrator”), which has agreed to provide general administration services (other than investment advice and related portfolio activities). The Administrator, in consideration thereof, has agreed to bear all of the Master Portfolio’s, ordinary operating expenses, excluding, generally, investment advisory fees, distribution fees, brokerage and other expenses related to the execution of portfolio transactions, extraordinary expenses and certain other expenses which are borne by the Master Portfolio. The Administrator is entitled to receive for these administration services an annual fee of 0.10% based on the average daily net assets of the Master Portfolio. The Administrator voluntarily agreed to waive a portion of its administration fees payable by the Master Portfolio. This arrangement is voluntary and may be terminated by the Administrator at any time.
From time to time, the Administrator may waive such fees in whole or in part. Any such waiver will reduce the expenses of the Master Portfolio and, accordingly, have a favorable impact on its performance. The Administrator may delegate certain of its administration duties to sub-administrators. For the year ended December 31, 2015, the Administrator waived $1,816,284 pursuant to this agreement.
The fees and expenses of the Master Portfolio’s trustees who are not “interested persons” of the MIP, as defined in the 1940 Act (“Independent Trustees”), counsel to the Independent Trustees and MIP’s independent registered public accounting firm (together, the “independent expenses”) are paid directly by the Master Portfolio. The Administrator has contractually agreed to provide an offsetting credit against the administration fees paid by the Master Portfolio in an amount equal to the independent expenses through April 30, 2016. The amount of the waiver, if any, is shown as fees waived in the Statement of Operations. For the year ended December 31, 2015, the Manager waived $103,905 pursuant to this agreement.
| | | | | | |
| | | | | | | |
| | ACTIVE STOCK MASTER PORTFOLIO | | DECEMBER 31, 2015 | | 15 |
| | |
| Notes to Financial Statements (continued) | | |
The Manager has voluntarily agreed to waive a portion of its investment advisory fees payable by the Master Portfolio. This voluntary waiver may be terminated at any time. This amount is included in fees waived by the Manager in the Statement of Operations. For the year ended December 31, 2015, the Manager waived $1,725,470 pursuant to this agreement.
The Manager voluntarily agreed to waive its investment advisory fees by the amount of investment advisory fees the Master Portfolio pays to the Manager indirectly through its investment in affiliated money market funds. This amount is included in fees waived by the Manager in the Statement of Operations. However, the Manager does not waive its investment advisory fees by the amount of investment advisory fees paid in connection with the Master Portfolio’s investments in other affiliated investment companies, if any. For the year ended December 31, 2015, the amount waived was $24,081.
The U.S. Securities and Exchange Commission has issued an exemptive order which permits BTC, an affiliate of the Manager, to serve as securities lending agent for the Master Portfolio, subject to applicable conditions. As securities lending agent, BTC bears all operational costs directly related to securities lending. The Master Portfolio is responsible for fees in connection with the investment of cash collateral received for securities on loan in a money market fund managed by the Manager or its affiliates, however, BTC has agreed to reduce the amount of securities lending income it receives in order to effectively limit the collateral investment fees the Master Portfolio bears to an annual rate of 0.04% (the “collateral investment fees”).
Securities lending income is equal to the total of income earned from the reinvestment of cash collateral, net of fees and other payments to and from borrowers of securities, and less the collateral investment fees. The Master Portfolio retains a portion of securities lending income and remits a remaining portion to BTC as compensation for its services as securities lending agent.
Pursuant to a securities lending agreement, the Master Portfolio retains 71.5% of securities lending income, and this amount retained can never be less than 65% of the total of securities lending income plus the collateral investment fees. In addition, commencing the business day following the date that the aggregate securities lending income earned across certain funds in the Equity-Liquidity Complex in a calendar year exceeds a specified threshold, the Master Portfolio, pursuant to the securities lending agreement, will retain for the remainder of the calendar year securities lending income in an amount equal to 75% of securities lending income, and this amount retained can never be less than 65% of the total of securities lending income plus the collateral investment fees.
The share of securities lending income earned by the Master Portfolio is shown as securities lending — affiliated – net in the Statement of Operations. For the year ended December 31, 2015, the Master Portfolio paid BTC $127,858 in total for securities lending agent services and collateral investment fees.
Certain officers and/or trustees of MIP are officers and/or directors of BlackRock or its affiliates.
The Master Portfolio may purchase securities from, or sell securities to, an affiliated fund provided the affiliation is due solely to having a common investment advisor, common officers, or common trustees. For the year ended December 31, 2015, the purchase and sale transactions with an affiliated fund in compliance with Rule 17a-7 under the 1940 Act were $636,566 and $1,714,712, respectively.
7. Purchases and Sales:
For the year ended December 31, 2015, purchases and sales of investments excluding short-term securities and in-kind redemptions, were $2,211,057,056 and $2,745,327,447, respectively.
8. Income Tax Information:
The Master Portfolio is classified as a partnership for federal income tax purposes. As such, each investor in the Master Portfolio is treated as the owner of its proportionate share of net assets, income, expenses and realized and unrealized gains and losses of the Master Portfolio. Therefore, no federal income tax provision is required. It is intended that the Master Portfolio’s assets will be managed so an investor in the Master Portfolio can satisfy the requirements of Subchapter M of the Internal Revenue Code of 1986, as amended.
The Master Portfolio files U.S. federal and various state and local tax returns. No income tax returns are currently under examination. The statute of limitations on the Master Portfolio’s U.S. federal tax returns remains open for each of the four years ended December 31, 2015. The statutes of limitations on the Master Portfolio’s state and local tax returns may remain open for an additional year depending upon the jurisdiction.
Management has analyzed tax laws and regulations and their application to the Master Portfolio as of December 31, 2015, inclusive of the open tax return years, and does not believe there are any uncertain tax positions that require recognition of a tax liability in the Master Portfolio’s financial statements.
As of period end, gross unrealized appreciation and depreciation based on cost for federal income tax purposes were as follows:
| | | | |
Tax cost | | $ | 486,683,091 | |
| | | | |
Gross unrealized appreciation | | $ | 22,602,602 | |
Gross unrealized depreciation | | | (31,035,266 | ) |
| | | | |
Net unrealized depreciation | | $ | (8,432,664 | ) |
| | | | |
| | | | | | |
| | | | | | | |
| 16 | | ACTIVE STOCK MASTER PORTFOLIO | | DECEMBER 31, 2015 | | |
| | |
| Notes to Financial Statements (concluded) | | |
9. Bank Borrowings:
MIP, on behalf of the Master Portfolio, along with certain other funds managed by the Manager and its affiliates (“Participating Funds”), is a party to a 364-day, $2.1 billion credit agreement with a group of lenders, under which the Master Portfolio may borrow to fund shareholder redemptions. Excluding commitments designated for certain funds, the Participating Funds, including the Master Portfolio, can borrow up to an aggregate commitment amount of $1.6 billion at any time outstanding, subject to asset coverage and other limitations as specified in the agreement. The credit agreement has the following terms: a fee of 0.06% per annum on unused commitment amounts and interest at a rate equal to the higher of (a) one-month LIBOR (but, in any event, not less than 0.00%) on the date the loan is made plus 0.80% per annum or (b) the Fed Funds rate (but, in any event, not less than 0.00%) in effect from time to time plus 0.80% per annum on amounts borrowed. The agreement expires in April 2016 unless extended or renewed. Participating Funds paid administration, legal and arrangement fees, which, if applicable, are included in miscellaneous expenses in the Statement of Operations, and along with commitment fees, were allocated among such funds based upon portions of the aggregate commitment available to them and relative net assets of Participating Funds. During the year ended December 31, 2015, the Master Portfolio did not borrow under the credit agreement.
10. Principal Risks:
In the normal course of business, the Master Portfolio invests in securities and enters into transactions where risks exist due to fluctuations in the market (market risk) or failure of the issuer to meet all its obligations, including the ability to pay principal and interest when due (issuer credit risk). The value of securities held by the Master Portfolio may decline in response to certain events, including those directly involving the issuers of securities owned by the Master Portfolio. Changes arising from the general economy, the overall market and local, regional or global political or/and social instability, as well as currency, interest rate and price fluctuations, may also affect the securities’ value.
Counterparty Credit Risk: Similar to issuer credit risk, the Master Portfolio may be exposed to counterparty credit risk, or the risk that an entity may fail to or be unable to perform on its commitments related to unsettled or open transactions. The Master Portfolio manages counterparty credit risk by entering into transactions only with counterparties that the Manager believes have the financial resources to honor their obligations and by monitoring the financial stability of those counterparties. Financial assets, which potentially expose the Master Portfolio to market, issuer and counterparty credit risks, consist principally of financial instruments and receivables due from counterparties. The extent of the Master Portfolio’s exposure to market, issuer and counterparty credit risks with respect to these financial assets is approximately their value recorded in the Statement of Assets and Liabilities, less any collateral held by the Master Portfolio.
A derivative contract may suffer a mark-to-market loss if the value of the contract decreases due to an unfavorable change in the market rates or values of the underlying instrument. Losses can also occur if the counterparty does not perform under the contract.
With exchange-traded futures, there is less counterparty credit risk to the Master Portfolio since the exchange or clearinghouse, as counterparty to such instruments, guarantees against a possible default. The clearinghouse stands between the buyer and the seller of the contract; therefore, credit risk is limited to failure of the clearinghouse. While offset rights may exist under applicable law, the Master Portfolio does not have a contractual right of offset against a clearing broker or clearinghouse in the event of a default (including the bankruptcy or insolvency). Additionally, credit risk exists in exchange-traded futures with respect to initial and variation margin that is held in a clearing broker’s customer accounts. While clearing brokers are required to segregate customer margin from their own assets, in the event that a clearing broker becomes insolvent or goes into bankruptcy and at that time there is a shortfall in the aggregate amount of margin held by the clearing broker for all its clients, typically the shortfall would be allocated on a pro rata basis across all the clearing broker’s customers, potentially resulting in losses to the Master Portfolio.
11. Subsequent Events:
Management has evaluated the impact of all subsequent events on the Master Portfolio through the date the financial statements were issued and has determined that there were no subsequent events requiring adjustment or additional disclosure in the financial statements.
| | | | | | |
| | | | | | | |
| | ACTIVE STOCK MASTER PORTFOLIO | | DECEMBER 31, 2015 | | 17 |
| | |
| Report of Independent Registered Public Accounting Firm | | |
To the Board of Trustees of Master Investment Portfolio and the Interestholders of Active Stock Master Portfolio:
In our opinion, the accompanying statement of assets and liabilities, including the schedule of investments, and the related statements of operations and of changes in net assets and the financial highlights present fairly, in all material respects, the financial position of Active Stock Master Portfolio (the “Master Portfolio”), a series of Master Investment Portfolio, at December 31, 2015, the results of its operations for the year then ended, the changes in its net assets for each of the two years in the period then ended and the financial highlights for each of the five years in the period then ended, in conformity with accounting principles generally accepted in the United States of America. These financial statements and financial highlights (hereafter referred to as “financial statements”) are the responsibility of the Master Portfolio’s management. Our responsibility is to express an opinion on these financial statements based on our audits. We conducted our audits of these financial statements in accordance with the standards of the Public Company Accounting Oversight Board (United States). Those standards require that we plan and perform the audit to obtain reasonable assurance about whether the financial statements are free of material misstatement. An audit includes examining, on a test basis, evidence supporting the amounts and disclosures in the financial statements, assessing the accounting principles used and significant estimates made by management, and evaluating the overall financial statement presentation. We believe that our audits, which included confirmation of securities at December 31, 2015 by correspondence with the custodian, transfer agent, and brokers, provide a reasonable basis for our opinion.
/s/PricewaterhouseCoopers LLP
Philadelphia, Pennsylvania
February 24, 2016
| | | | | | |
| | | | | | | |
| 18 | | ACTIVE STOCK MASTER PORTFOLIO | | DECEMBER 31, 2015 | | |
| | | | | | | | | | |
Name, Address1
and Year of Birth | | Position(s)
Held with
MIP | | Length
of Time
Served as
a Trustee3 | | Principal Occupation(s) During Past Five Years | | Number of BlackRock-
Advised Registered
Investment Companies
(“RICs”) Consisting of
Investment Portfolios
(“Portfolios”) Overseen | | Public
Directorships |
| Independent Trustees2 |
Rodney D. Johnson 1941 | | Chair of the Board and Trustee | | Since 2009 | | President, Fairmount Capital Advisors, Inc. from 1987 to 2013; Member of the Archdiocesan Investment Committee of the Archdiocese of Philadelphia from 2004 to 2012; Director, The Committee of Seventy (civic) from 2006 to 2012; Director, Fox Chase Cancer Center from 2004 to 2011. | | 33 RICs consisting of
155 Portfolios | | None |
David O. Beim 1940 | | Trustee | | Since 2009 | | Professor of Professional Practice at the Columbia University Graduate School of Business since 1991; Trustee, Phillips Exeter Academy from 2002 to 2012; Chairman, Wave Hill, Inc. (public garden and cultural center) from 1990 to 2006. | | 33 RICs consisting of
155 Portfolios | | None |
Collette Chilton 1958 | | Trustee | | Since 2015 | | Chief Investment Officer, Williams College since 2006; Chief Investment Officer, Lucent Asset Management Corporation from 1998 to 2006. | | 33 RICs consisting of
155 Portfolios | | None |
Frank J. Fabozzi 1948 | | Trustee | | Since 2014 | | Editor of and Consultant for The Journal of Portfolio Management since 2006; Professor of Finance, EDHEC Business School since 2011; Visiting Professor, Princeton University from 2013 to 2014; Professor in the Practice of Finance and Becton Fellow, Yale University School of Management from 2006 to 2011. | | 108 RICs consisting of
230 Portfolios | | None |
Dr. Matina S. Horner 1939 | | Trustee | | Since 2009 | | Executive Vice President, Teachers Insurance and Annuity Association and College Retirement Equities Fund from 1989 to 2003. | | 33 RICs consisting of
155 Portfolios | | NSTAR (electric and gas utility) |
Herbert I. London 1939 | | Trustee | | Since 2009 | | Professor Emeritus, New York University since 2005; President, London Center for Policy Research since 2012; John M. Olin Professor of Humanities, New York University from 1993 to 2005 and Professor thereof from 1980 to 2005; President Emeritus, Hudson Institute (policy research organization) from 2011 to 2012, President thereof from 1997 to 2011 and Trustee from 1980 to 2012; Chairman of the Board of Trustees for Grantham University since 2006; Director, InnoCentive, Inc. (global internet service) since 2005; Director, Cerego, LLC (educational software) since 2005; Director, Cybersettle (online adjudication) since 2009; Director, AIMS Worldwide, Inc. (marketing) from 2007 to 2012. | | 33 RICs consisting of
155 Portfolios | | None |
Cynthia A. Montgomery 1952 | | Trustee | | Since 2009 | | Professor, Harvard Business School since 1989; Director, McLean Hospital from 2005 to 2012; Director, Harvard Business School Publishing from 2005 to 2010. | | 33 RICs consisting of
155 Portfolios | | Newell Rubbermaid, Inc. (manufacturing) |
Joseph P. Platt 1947 | | Trustee | | Since 2009 | | Director, Jones and Brown (Canadian insurance broker) since 1998; General Partner, Thorn Partners, LP (private investments) since 1998; Director, WQED Multi-Media (public broadcasting not-for-profit) since 2001; Director, The West Penn Allegheny Health System (a not-for-profit health system) from 2008 to 2013; Partner, Amarna Corporation, LLC (private investment company) from 2002 to 2008. | | 33 RICs consisting of
155 Portfolios | | Greenlight Capital Re, Ltd. (reinsurance company) |
Robert C. Robb, Jr. 1945 | | Trustee | | Since 2009 | | Partner, Lewis, Eckert, Robb and Company (management and financial consulting firm) since 1981. | | 33 RICs consisting of
155 Portfolios | | None |
Toby Rosenblatt 1938 | | Trustee | | Since 2009 | | President, Founders Investments Ltd. (private investments) since 1999; Director, Forward Management, LLC since 2007; Director, College Futures Foundation (philanthropic foundation) since 2009; Director, The James Irvine Foundation (philanthropic foundation) from 1998 to 2008. | | 33 RICs consisting of
155 Portfolios | | None |
Mark Stalnecker 1951 | | Trustee | | Since 2015 | | Chief Investment Officer, University of Delaware from 1999 to 2013; Trustee, Winterthur Museum and Country Estate since 2001; Member of the Investment Committee, Delaware Public Employees’ Retirement System since 2002; Member of the Investment Committee, Christiana Care Health System since 2009; Member of the Investment Committee, Delaware Community Foundation from 2013 to 2014. | | 33 RICs consisting of
155 Portfolios | | None |
| | | | | | |
| | | | | | | |
| | ACTIVE STOCK MASTER PORTFOLIO | | DECEMBER 31, 2015 | | 19 |
| | | | |
| Officers and Trustees (continued) | | |
| | | | | | | | | | |
Name, Address1
and Year of Birth | | Position(s)
Held with
MIP | | Length
of Time
Served as
a Trustee3 | | Principal Occupation(s) During Past Five Years | | Number of BlackRock-
Advised Registered
Investment Companies
(“RICs”) Consisting of
Investment Portfolios
(“Portfolios”) Overseen | | Public
Directorships |
| Independent Trustees2 (concluded) |
Kenneth L. Urish 1951 | | Trustee | | Since 2009 | | Managing Partner, Urish Popeck & Co., LLC (certified public accountants and consultants) since 1976; Immediate past- Chairman of the Professional Ethics Committee of the Pennsylvania Institute of Certified Public Accountants and Committee Member thereof since 2007; Member of External Advisory Board, The Pennsylvania State University Accounting Department since 2001; Principal, UP Strategic Wealth Investment Advisors, LLC since 2013; Trustee, The Holy Family Institute from 2001 to 2010; President and Trustee, Pittsburgh Catholic Publishing Associates from 2003 to 2008; Director, Inter-Tel from 2006 to 2007. | | 33 RICs consisting of
155 Portfolios | | None |
Frederick W. Winter 1945 | | Trustee | | Since 2009 | | Director, Alkon Corporation (pneumatics) since 1992; Professor and Dean Emeritus of the Joseph M. Katz School of Business, University of Pittsburgh from 2005 to 2013 and Dean thereof from 1997 to 2005; Director, Tippman Sports (recreation) from 2005 to 2013; Director, Indotronix International (IT services) from 2004 to 2008. | | 33 RICs consisting of
155 Portfolios | | None |
| | 1 The address of each Trustee is c/o BlackRock, Inc., 55 East 52nd Street, New York, NY 10055. |
| | 2 Independent Trustees serve until their resignation, retirement, removal or death, or until December 31 of the year in which they turn 75. The Board has determined to extend the terms of Independent Trustees on a case-by-case basis, as appropriate. The Board has unanimously approved extending the mandatory retirement age for David O. Beim and Dr. Matina Horner until December 31, 2016, which the Board believes is in the best interests of the shareholders of MIP. |
| | 3 Date shown is the earliest date a person has served for MIP. In connection with the acquisition of Barclays Global Investors by BlackRock, Inc. (“BlackRock”) in December 2009, the Trustees were elected to the MIP Board. As a result, although the chart shows certain Independent Trustees as joining MIP’s board in 2009, those Independent Trustees first became members of the boards of other funds advised by BlackRock Advisors, LLC or its affiliates as follows: David 0. Beim, 1998; Dr. Matina S. Horner, 2004; Rodney D. Johnson, 1995; Herbert I. London, 1987; Cynthia A. Montgomery, 1994; Joseph P. Platt, 1999; Robert C. Robb, Jr., 1998; Toby Rosenblatt, 2005; Kenneth L. Urish, 1999; and Frederick W. Winter, 1999. Frank J. Fabozzi first became a member of the board of other funds advised by BlackRock Advisors, LLC or its affiliates in 1988. |
| Interested Trustees4 | | | | | | | | | | |
Barbara G. Novick 1960 | | Trustee | | Since 2015 | | Vice Chairman of BlackRock since 2006; Chair of BlackRock’s Government Relations Steering Committee since 2009; Head of the Global Client Group of BlackRock from 1988 to 2008. | | 108 RICs consisting of
230 Portfolios | | None |
John M. Perlowski 1964 | | Trustee, President and Chief Executive Officer | | Since 2015 (Trustee); Since 2010 (President and Chief Executive Officer) | | Managing Director of BlackRock since 2009; Head of BlackRock Global Fund Services since 2009; Managing Director and Chief Operating Officer of the Global Product Group at Goldman Sachs Asset Management, L.P. from 2003 to 2009; Treasurer of Goldman Sachs Mutual Funds from 2003 to 2009 and Senior Vice President thereof from 2007 to 2009; Director of Goldman Sachs Offshore Funds from 2002 to 2009; Director of Family Resource Network (charitable foundation) since 2009. | | 136 RICs consisting of
328 Portfolios | | None |
| | 4 Mr. Perlowski and Ms. Novick are both “interested persons,” as defined in the 1940 Act, of MIP based on their positions with BlackRock and its affiliates. Mr. Perlowski and Ms. Novick are also board members of a complex of BlackRock registered open-end funds. Mr. Perlowski is also a board member of the BlackRock Equity-Bond Complex and the BlackRock Equity-Liquidity Complex, and Ms. Novick is also a board member of the BlackRock Equity-Liquidity Complex. Interested Trustees serve until their resignation, retirement, removal or death, or until December 31 of the year in which they turn 75. The maximum age limitation may be waived as to any Trustee by action of a majority of the Trustees upon a finding of good cause therefor. |
| | | | | | |
| | | | | | | |
| 20 | | ACTIVE STOCK MASTER PORTFOLIO | | DECEMBER 31, 2015 | | |
| | |
Officers and Trustees (concluded) | | |
| | | | | | |
| | | |
Name, Address1
and Year of Birth | | Position(s)
Held with
MIP | | Length
of Time
Served as
an Officer | | Principal Occupation(s) During Past Five Years |
| MIP Officers2 |
John M. Perlowski 1964 | | Trustee, President and Chief Executive Officer | | Since 2015 (Trustee); Since 2010 (President and Chief Executive Officer) | | Managing Director of BlackRock since 2009; Head of BlackRock Global Fund Services since 2009; Managing Director and Chief Operating Officer of the Global Product Group at Goldman Sachs Asset Management, L.P. from 2003 to 2009; Treasurer of Goldman Sachs Mutual Funds from 2003 to 2009 and Senior Vice President thereof from 2007 to 2009; Director of Goldman Sachs Offshore Funds from 2002 to 2009; Director of Family Resource Network (charitable foundation) since 2009. |
Richard Hoerner, CFA 1958 | | Vice President | | Since 2009 | | Managing Director of BlackRock since 2000; Head of the Global Cash Group since 2013; Co-head of the Global Cash and Securities Lending Group from 2010 to 2013; Member of the Cash Management Group Executive Committee since 2015. |
Jennifer McGovern 1977 | | Vice President | | Since 2014 | | Director of BlackRock since 2011; Head of Product Structure and Oversight for BlackRock’s U.S. Wealth Advisory Group since 2013; Vice President of BlackRock from 2008 to 2010. |
Neal Andrews 1966 | | Chief Financial Officer | | Since 2009 | | Managing Director of BlackRock since 2006; Senior Vice President and Line of Business Head of Fund Accounting and Administration at PNC Global Investment Servicing (U.S.) Inc. from 1992 to 2006. |
Jay Fife 1970 | | Treasurer | | Since 2009 | | Managing Director of BlackRock since 2007; Director of BlackRock in 2006; Assistant Treasurer of the MLIM and Fund Asset Management, L.P. advised funds from 2005 to 2006; Director of MLIM Fund Services Group from 2001 to 2006. |
Charles Park 1967 | | Chief Compliance Officer | | Since 2014 | | Anti-Money Laundering Compliance Officer for the BlackRock-advised Funds in the Equity-Bond Complex, the Equity-Liquidity Complex and the Closed-End Complex from 2014 to 2015; Chief Compliance Officer of BlackRock Advisors, LLC and the BlackRock-advised Funds in the Equity-Bond Complex, the Equity-Liquidity Complex and the Closed-End Complex since 2014; Principal of and Chief Compliance Officer for iShares® Delaware Trust Sponsor LLC since 2012 and BlackRock Fund Advisors (“BFA”) since 2006; Chief Compliance Officer for the BFA-advised iShares exchange traded funds since 2006; Chief Compliance Officer for BlackRock Asset Management International Inc. since 2012. |
Fernanda Piedra 1969 | | Anti-Money Laundering Compliance Officer | | Since 2015 | | Director of BlackRock since 2014; Anti-Money Laundering Compliance Officer and Regional Head of Financial Crime for the Americas at BlackRock since 2014; Head of Regulatory Changes and Remediation for the Asset Wealth Management Division of Deutsche Bank from 2010 to 2014; Vice President of Goldman Sachs (Anti-Money Laundering/Suspicious Activities Group) from 2004 to 2010. |
Benjamin Archibald 1975 | | Secretary | | Since 2012 | | Managing Director of BlackRock since 2014; Director of BlackRock from 2010 to 2013; Secretary of the iShares exchange traded funds since 2015; Secretary of the BlackRock-advised mutual funds since 2012. |
| | 1 The address of each Officer is c/o BlackRock, Inc., 55 East 52nd Street, New York, NY 10055. |
| | | 2 Officers of MIP serve at the pleasure of the Board. |
| | Further information about the Officers and Trustees is available in MIP’s Statement of Additional Information, which can be obtained without charge by calling (800) 441-7762 |
Effective September 25, 2015, John M. Perlowski was appointed to serve as a Trustee of MIP.
Effective December 31, 2015, Herbert I. London and Toby Rosenblatt retired as Trustees of MIP.
| | | | |
| | | |
Investment Advisor BlackRockFund Advisors San Francisco, CA 94105 | | Accounting Agent and Custodian State Street Bank and Trust Company Boston, MA 02110 | | Legal Counsel Sidley Austin LLP New York, NY 10019 |
| | |
Administrator BlackRock Advisors, LLC Wilmington, DE 19809 | | Independent Registered Public Accounting Firm PricewaterhouseCoopers LLP Philadelphia, PA 19103 | | Address of MIP 400 Howard Street San Francisco, CA 94105 |
| | | | | | |
| | | | | | | |
| | ACTIVE STOCK MASTER PORTFOLIO | | DECEMBER 31, 2015 | | 21 |
|
| Availability of Quarterly Schedule of Investments |
The Master Portfolio files its complete schedule of portfolio holdings with the SEC for the first and third quarters of each fiscal year on Form N-Q. The Master Portfolio’s Forms N-Q are available on the SEC’s website at http://www.sec.gov and may also be reviewed and copied at the SEC’s Public Reference Room in Washington, D.C. Information on how to access documents on the SEC’s website without charge may be obtained by calling (800) SEC-0330. The Master Portfolio’s Forms N-Q may also be obtained upon request and without charge by calling (800) 441-7762.
|
| Availability of Proxy Voting Policies and Procedures |
A description of the policies and procedures that the Master Portfolio uses to determine how to vote proxies relating to portfolio securities is available upon request and without charge (1) by calling (800) 441-7762; (2) at http://www.blackrock.com; and (3) on the SEC’s website at http://www.sec.gov.
|
| Availability of Proxy Voting Record |
Information about how the Master Portfolio voted proxies relating to securities held in the Master Portfolio’s portfolio during the most recent 12-month period ended June 30 is available upon request and without charge (1) at http://www.blackrock.com or by calling (800) 441-7762 and (2) on the SEC’s website at http://www.sec.gov.
| | | | | | |
| | | | | | | |
| 22 | | ACTIVE STOCK MASTER PORTFOLIO | | DECEMBER 31, 2015 | | |
| | |
| |
| Item 2 – | | Code of Ethics – Each registrant (or “Fund”) has adopted a code of ethics, as of the end of the period covered by this report, applicable to the registrant’s principal executive officer, principal financial officer, principal accounting officer or controller, or persons performing similar functions. During the period covered by this report, the code of ethics was amended to update certain information and to make other non-material changes. During the period covered by this report, there have been no waivers granted under the code of ethics. Each registrant undertakes to provide a copy of the code of ethics to any person upon request, without charge, by calling 1-800-441-7762. |
| |
| Item 3 – | | Audit Committee Financial Expert – Each registrant’s board of directors (the “board of directors”), has determined that (i) the registrant has the following audit committee financial expert serving on its audit committee and (ii) each audit committee financial expert is independent: Kenneth L. Urish Under applicable securities laws, a person determined to be an audit committee financial expert will not be deemed an “expert” for any purpose, including without limitation for the purposes of Section 11 of the Securities Act of 1933, as a result of being designated or identified as an audit committee financial expert. The designation or identification of a person as an audit committee financial expert does not impose on such person any duties, obligations, or liabilities greater than the duties, obligations, and liabilities imposed on such person as a member of the audit committee and board of directors in the absence of such designation or identification. |
| |
| Item 4 – | | Principal Accountant Fees and Services |
| |
| | The following table presents fees billed by PricewaterhouseCoopers LLP (“PwC”) in each of the last two fiscal years for the services rendered to the Funds: |
| | | | | | | | | | | | | | | | | | | | | | | | | | | | | | |
| | | (a) Audit Fees | | (b) Audit-Related Fees1 | | (c) Tax Fees2 | | (d) All Other Fees3 |
| Entity Name | | Current Fiscal
Year End | | | | Previous
Fiscal
Year End | | | | Current
Fiscal
Year End | | | | Previous
Fiscal
Year End | | | | Current
Fiscal Year
End | | | | Previous
Fiscal
Year End | | | | Current
Fiscal
Year End | | | | Previous
Fiscal
Year End |
| BlackRock Cash Funds: Institutional | | $10,962 | | | | $10,962 | | | | $0 | | | | $0 | | | | $2,425 | | | | $2,425 | | | | $0 | | | | $0 |
| BlackRock Cash Funds: Prime | | $10,962 | | | | $10,962 | | | | $0 | | | | $0 | | | | $2,425 | | | | $2,425 | | | | $0 | | | | $0 |
| BlackRock Cash Funds: Treasury | | $10,962 | | | | $10,962 | | | | $0 | | | | $0 | | | | $2,425 | | | | $2,425 | | | | $0 | | | | $0 |
| BlackRock CoreAlpha Bond Fund | | $10,962 | | | | $10,962 | | | | $0 | | | | $0 | | | | $7,566 | | | | $7,566 | | | | $0 | | | | $0 |
BlackRock Disciplined International Fund | | $9,900 | | | | N/A | | | | $0 | | | | N/A | | | | $7,566 | | | | N/A | | | | $0 | | | | N/A |
| BlackRock Large Cap Index Fund | | $10,962 | | | | $10,962 | | | | $0 | | | | $0 | | | | $7,566 | | | | $7,566 | | | | $0 | | | | $0 |
| BlackRock LifePath Retirement Fund | | $10,962 | | | | $10,962 | | | | $0 | | | | $0 | | | | $7,566 | | | | $7,566 | | | | $0 | | | | $0 |
BlackRock LifePath 2020 Fund | | $10,962 | | | | $10,962 | | | | $0 | | | | $0 | | | | $7,566 | | | | $7,566 | | | | $0 | | | | $0 |
| BlackRock LifePath 2025 Fund | | $10,962 | | | | $10,962 | | | | $0 | | | | $0 | | | | $7,566 | | | | $7,566 | | | | $0 | | | | $0 |
| BlackRock LifePath 2030 Fund | | $10,962 | | | | $10,962 | | | | $0 | | | | $0 | | | | $7,566 | | | | $7,566 | | | | $0 | | | | $0 |
| BlackRock LifePath 2035 Fund | | $10,962 | | | | $10,962 | | | | $0 | | | | $0 | | | | $7,566 | | | | $7,566 | | | | $0 | | | | $0 |
| BlackRock LifePath 2040 Fund | | $10,962 | | | | $10,962 | | | | $0 | | | | $0 | | | | $7,566 | | | | $7,566 | | | | $0 | | | | $0 |
| BlackRock LifePath 2045 Fund | | $10,962 | | | | $10,962 | | | | $0 | | | | $0 | | | | $7,566 | | | | $7,566 | | | | $0 | | | | $0 |
| BlackRock LifePath 2050 Fund | | $10,962 | | | | $10,962 | | | | $0 | | | | $0 | | | | $7,566 | | | | $7,566 | | | | $0 | | | | $0 |
| BlackRock LifePath 2055 Fund | | $10,962 | | | | $10,962 | | | | $0 | | | | $0 | | | | $7,566 | | | | $7,566 | | | | $0 | | | | $0 |
BlackRock LifePath Index Retirement Fund | | $10,962 | | | | $10,962 | | | | $0 | | | | $0 | | | | $7,566 | | | | $7,566 | | | | $0 | | | | $0 |
3
| | | | | | | | | | | | | | | | | | | | | | | | | | | | | | |
BlackRock LifePath Index 2020 Fund | | $10,962 | | | | $10,962 | | | | $0 | | | | $0 | | | | $7,566 | | | | $7,566 | | | | $0 | | | | $0 |
BlackRock LifePath Index 2025 Fund | | $10,962 | | | | $10,962 | | | | $0 | | | | $0 | | | | $7,566 | | | | $7,566 | | | | $0 | | | | $0 |
BlackRock LifePath Index 2030 Fund | | $10,962 | | | | $10,962 | | | | $0 | | | | $0 | | | | $7,566 | | | | $7,566 | | | | $0 | | | | $0 |
BlackRock LifePath Index 2035 Fund | | $10,962 | | | | $10,962 | | | | $0 | | | | $0 | | | | $7,566 | | | | $7,566 | | | | $0 | | | | $0 |
BlackRock LifePath Index 2040 Fund | | $10,962 | | | | $10,962 | | | | $0 | | | | $0 | | | | $7,566 | | | | $7,566 | | | | $0 | | | | $0 |
BlackRock LifePath Index 2045 Fund | | $10,962 | | | | $10,962 | | | | $0 | | | | $0 | | | | $7,566 | | | | $7,566 | | | | $0 | | | | $0 |
BlackRock LifePath Index 2050 Fund | | $10,962 | | | | $10,962 | | | | $0 | | | | $0 | | | | $7,566 | | | | $7,566 | | | | $0 | | | | $0 |
BlackRock LifePath Index 2055 Fund | | $10,962 | | | | $10,962 | | | | $0 | | | | $0 | | | | $7,566 | | | | $7,566 | | | | $0 | | | | $0 |
BlackRock S&P 500 Index Fund | | $10,962 | | | | $10,962 | | | | $0 | | | | $0 | | | | $7,566 | | | | $7,566 | | | | $0 | | | | $0 |
BlackRock Total International ex U.S. Index Fund | | $10,962 | | | | $10,962 | | | | $0 | | | | $0 | | | | $7,566 | | | | $7,566 | | | | $0 | | | | $0 |
BlackRock U.S. Total Bond Index Fund | | $10,962 | | | | $10,962 | | | | $0 | | | | $0 | | | | $7,566 | | | | $7,566 | | | | $0 | | | | $0 |
Active Stock Master Portfolio | | $20,640 | | | | $20,640 | | | | $0 | | | | $0 | | | | $20,161 | | | | $20,161 | | | | $0 | | | | $0 |
CoreAlpha Bond Master Portfolio | | $34,305 | | | | $27,805 | | | | $0 | | | | $0 | | | | $20,161 | | | | $20,161 | | | | $0 | | | | $0 |
International Tilts Master Portfolio | | $20,640 | | | | $20,640 | | | | $0 | | | | $0 | | | | $15,126 | | | | $15,126 | | | | $0 | | | | $0 |
Large Cap Index Master Portfolio | | $20,640 | | | | $20,640 | | | | $0 | | | | $0 | | | | $15,156 | | | | $15,156 | | | | $0 | | | | $0 |
LifePath Retirement Master Portfolio | | $12,790 | | | | $12,790 | | | | $0 | | | | $0 | | | | $13,119 | | | | $13,119 | | | | $0 | | | | $0 |
LifePath 2020 Master Portfolio | | $12,790 | | | | $12,790 | | | | $0 | | | | $0 | | | | $13,119 | | | | $13,119 | | | | $0 | | | | $0 |
LifePath 2025 Master Portfolio | | $12,790 | | | | $12,790 | | | | $0 | | | | $0 | | | | $13,119 | | | | $13,119 | | | | $0 | | | | $0 |
LifePath 2030 Master Portfolio | | $12,790 | | | | $12,790 | | | | $0 | | | | $0 | | | | $13,119 | | | | $13,119 | | | | $0 | | | | $0 |
LifePath 2035 Master Portfolio | | $12,790 | | | | $12,790 | | | | $0 | | | | $0 | | | | $13,119 | | | | $13,119 | | | | $0 | | | | $0 |
LifePath 2040 Master Portfolio | | $12,790 | | | | $12,790 | | | | $0 | | | | $0 | | | | $13,119 | | | | $13,119 | | | | $0 | | | | $0 |
LifePath 2045 Master Portfolio | | $12,790 | | | | $12,790 | | | | $0 | | | | $0 | | | | $13,119 | | | | $13,119 | | | | $0 | | | | $0 |
LifePath 2050 Master Portfolio | | $12,790 | | | | $12,790 | | | | $0 | | | | $0 | | | | $13,119 | | | | $13,119 | | | | $0 | | | | $0 |
LifePath 2055 Master Portfolio | | $12,790 | | | | $12,790 | | | | $0 | | | | $0 | | | | $13,119 | | | | $13,119 | | | | $0 | | | | $0 |
LifePath Index Retirement Master Portfolio | | $12,790 | | | | $12,790 | | | | $0 | | | | $0 | | | | $13,119 | | | | $13,119 | | | | $0 | | | | $0 |
LifePath Index 2020 Master Portfolio | | $12,790 | | | | $12,790 | | | | $0 | | | | $0 | | | | $13,119 | | | | $13,119 | | | | $0 | | | | $0 |
LifePath Index 2025 Master Portfolio | | $12,790 | | | | $12,790 | | | | $0 | | | | $0 | | | | $13,119 | | | | $13,119 | | | | $0 | | | | $0 |
LifePath Index 2030 Master Portfolio | | $12,790 | | | | $12,790 | | | | $0 | | | | $0 | | | | $13,119 | | | | $13,119 | | | | $0 | | | | $0 |
LifePath Index 2035 Master Portfolio | | $12,790 | | | | $12,790 | | | | $0 | | | | $0 | | | | $13,119 | | | | $13,119 | | | | $0 | | | | $0 |
LifePath Index 2040 Master Portfolio | | $12,790 | | | | $12,790 | | | | $0 | | | | $0 | | | | $13,119 | | | | $13,119 | | | | $0 | | | | $0 |
LifePath Index 2045 Master Portfolio | | $12,790 | | | | $12,790 | | | | $0 | | | | $0 | | | | $13,119 | | | | $13,119 | | | | $0 | | | | $0 |
LifePath Index 2050 Master Portfolio | | $12,790 | | | | $12,790 | | | | $0 | | | | $0 | | | | $13,119 | | | | $13,119 | | | | $0 | | | | $0 |
LifePath Index 2055 Master Portfolio | | $12,790 | | | | $12,790 | | | | $0 | | | | $0 | | | | $13,119 | | | | $13,119 | | | | $0 | | | | $0 |
Money Market Master Portfolio | | $12,298 | | | | $12,298 | | | | $0 | | | | $0 | | | | $3,633 | | | | $3,633 | | | | $0 | | | | $0 |
Prime Money Market Master Portfolio | | $12,298 | | | | $12,298 | | | | $0 | | | | $0 | | | | $3,633 | | | | $3,633 | | | | $0 | | | | $0 |
S&P 500 Index Master Portfolio | | $20,640 | | | | $20,640 | | | | $0 | | | | $0 | | | | $15,126 | | | | $15,126 | | | | $0 | | | | $0 |
Total International ex U.S. Index Master Portfolio | | $20,640 | | | | $20,640 | | | | $0 | | | | $0 | | | | $15,126 | | | | $15,126 | | | | $0 | | | | $0 |
Treasury Money Market Master Portfolio | | $12,298 | | | | $12,298 | | | | $0 | | | | $0 | | | | $3,633 | | | | $3,633 | | | | $0 | | | | $0 |
U.S. Total Bond Index Master Portfolio | | $23,963 | | | | $19,463 | | | | $0 | | | | $0 | | | | $15,126 | | | | $15,126 | | | | $0 | | | | $0 |
The following table presents fees billed by PwC that were required to be approved by each registrant’s audit committee (each a “Committee”) for services that relate directly to the operations or financial reporting of the Fund and that are
4
rendered on behalf of BlackRock Advisors, LLC (“Investment Adviser” or “BlackRock”) and entities controlling, controlled by, or under common control with BlackRock (not including any sub-adviser whose role is primarily portfolio management and is subcontracted with or overseen by another investment adviser) that provide ongoing services to the Fund (“Fund Service Providers”):
| | | | |
| | | Current Fiscal Year End | | Previous Fiscal Year End |
(b) Audit-Related Fees1 | | $690,797 | | $602,463 |
(c) Tax Fees2 | | $11,821,636 | | $12,495,765 |
(d) All Other Fees3 | | $404,124 | | $558,341 |
1 The nature of the services includes assurance and related services reasonably related to the performance of the audit of financial statements not included in Audit Fees.
2 The nature of the services includes tax compliance, tax advice and tax planning.
3 Aggregate fees borne by BlackRock in connection with the review of compliance procedures and attestation thereto performed by PwC with respect to all of the registered closed-end funds and some of the registered open-end funds advised by BlackRock.
(e)(1) Audit Committee Pre-Approval Policies and Procedures:
Each Committee has adopted policies and procedures with regard to the pre-approval of services. Audit, audit-related and tax compliance services provided to the registrant on an annual basis require specific pre-approval by the registrant’s Committee. The Committee also must approve other non-audit services provided to the registrant and those non-audit services provided to the Investment Adviser and Fund Service Providers that relate directly to the operations and the financial reporting of the registrant. Certain of these non-audit services that the Committee believes are (a) consistent with the SEC’s auditor independence rules and (b) routine and recurring services that will not impair the independence of the independent accountants may be approved by the Committee without consideration on a specific case-by-case basis (“general pre-approval”). The term of any general pre-approval is 12 months from the date of the pre-approval, unless the Committee provides for a different period. Tax or other non-audit services provided to the registrant which have a direct impact on the operations or financial reporting of the registrant will only be deemed pre-approved provided that any individual project does not exceed $10,000 attributable to the registrant or $50,000 per project. For this purpose, multiple projects will be aggregated to determine if they exceed the previously mentioned cost levels.
Any proposed services exceeding the pre-approved cost levels will require specific pre-approval by the registrant’s Committee, as will any other services not subject to general pre-approval (e.g., unanticipated but permissible services). The Committee is informed of each service approved subject to general pre-approval at the next regularly scheduled in-person board meeting. At this meeting, an analysis of such services is presented to the Committee for ratification. The Committee may delegate to the Committee Chairman the authority to approve the provision of and fees for any specific engagement of permitted non-audit services, including services exceeding pre-approved cost levels.
(e)(2) None of the services described in each of Items 4(b) through (d) were approved by either Committee pursuant to the de minimus exception in paragraph (c)(7)(i)(C) of Rule 2-01 of Regulation S-X.
(f) Not Applicable
5
(g) The aggregate non-audit fees paid to the accountant for services rendered by the accountant to the registrant, the Investment Adviser and the Fund Service Providers were:
| | | | | | | | |
| Entity Name | | Current
Fiscal
Year End | | | Previous
Fiscal Year
End | |
BlackRock Cash Funds: Institutional | | | $2,425 | | | | $2,425 | |
BlackRock Cash Funds: Prime | | | $2,425 | | | | $2,425 | |
BlackRock Cash Funds: Treasury | | | $2,425 | | | | $2,425 | |
BlackRock CoreAlpha Bond Fund | | | $7,566 | | | | $7,566 | |
BlackRock Large Cap Index Fund | | | $7,566 | | | | $7,566 | |
BlackRock Disciplined International Fund | | | $7,566 | | | | N/A | |
LifePath Retirement Fund | | | $7,566 | | | | $7,566 | |
LifePath 2020 Fund | | | $7,566 | | | | $7,566 | |
LifePath 2025 Fund | | | $7,566 | | | | $7,566 | |
LifePath 2030 Fund | | | $7,566 | | | | $7,566 | |
LifePath 2035 Fund | | | $7,566 | | | | $7,566 | |
LifePath 2040 Fund | | | $7,566 | | | | $7,566 | |
LifePath 2045 Fund | | | $7,566 | | | | $7,566 | |
LifePath 2050 Fund | | | $7,566 | | | | $7,566 | |
LifePath 2055 Fund | | | $7,566 | | | | $7,566 | |
LifePath Index Retirement Fund | | | $7,566 | | | | $7,566 | |
LifePath Index 2020 Fund | | | $7,566 | | | | $7,566 | |
LifePath Index 2025 Fund | | | $7,566 | | | | $7,566 | |
LifePath Index 2030 Fund | | | $7,566 | | | | $7,566 | |
LifePath Index 2035 Fund | | | $7,566 | | | | $7,566 | |
LifePath Index 2040 Fund | | | $7,566 | | | | $7,566 | |
LifePath Index 2045 Fund | | | $7,566 | | | | $7,566 | |
LifePath Index 2050 Fund | | | $7,566 | | | | $7,566 | |
LifePath Index 2055 Fund | | | $7,566 | | | | $7,566 | |
BlackRock S&P 500 IndexFund | | | $7,566 | | | | $7,566 | |
BlackRock Total International ex U.S. Index Fund | | | $7,566 | | | | $7,566 | |
BlackRock U.S. Total Bond Index Fund | | | $7,566 | | | | $7,566 | |
Active Stock Master Portfolio | | | $20,161 | | | | $20,161 | |
CoreAlpha Bond Master Portfolio | | | $20,161 | | | | $20,161 | |
International Tilts Master Portfolio | | | $15,126 | | | | $15,126 | |
Large Cap Index Master Portfolio | | | $15,156 | | | | $15,156 | |
LifePath Retirement Master Portfolio | | | $13,119 | | | | $13,119 | |
LifePath 2020 Master Portfolio | | | $13,119 | | | | $13,119 | |
LifePath 2025 Master Portfolio | | | $13,119 | | | | $13,119 | |
LifePath 2030 Master Portfolio | | | $13,119 | | | | $13,119 | |
LifePath 2035 Master Portfolio | | | $13,119 | | | | $13,119 | |
LifePath 2040 Master Portfolio | | | $13,119 | | | | $13,119 | |
LifePath 2045 Master Portfolio | | | $13,119 | | | | $13,119 | |
LifePath 2050 Master Portfolio | | | $13,119 | | | | $13,119 | |
LifePath 2055 Master Portfolio | | | $13,119 | | | | $13,119 | |
LifePath Index Retirement Master Portfolio | | | $13,119 | | | | $13,119 | |
LifePath Index 2020 Master Portfolio | | | $13,119 | | | | $13,119 | |
6
| | | | | | | | |
LifePath Index 2025 Master Portfolio | | | $13,119 | | | | $13,119 | |
LifePath Index 2030 Master Portfolio | | | $13,119 | | | | $13,119 | |
LifePath Index 2035 Master Portfolio | | | $13,119 | | | | $13,119 | |
LifePath Index 2040 Master Portfolio | | | $13,119 | | | | $13,119 | |
LifePath Index 2045 Master Portfolio | | | $13,119 | | | | $13,119 | |
LifePath Index 2050 Master Portfolio | | | $13,119 | | | | $13,119 | |
LifePath Index 2055 Master Portfolio | | | $13,119 | | | | $13,119 | |
Money Market Master Portfolio | | | $3,633 | | | | $3,633 | |
Prime Money Market Master Portfolio | | | $3,633 | | | | $3,633 | |
S&P 500 Index Master Portfolio | | | $15,126 | | | | $15,126 | |
Total International ex U.S. Index Master Portfolio | | | $15,156 | | | | $15,156 | |
Treasury Money Market Master Portfolio | | | $3,633 | | | | $3,633 | |
U.S. Total Bond Index Master Portfolio | | | $15,156 | | | | $15,156 | |
(h) Each Committee has considered and determined that the provision of non-audit services that were rendered to the Investment Adviser and the Fund Service Providers that were not pre-approved pursuant to paragraph (c)(7)(ii) of Rule 2-01 of Regulation S-X is compatible with maintaining the principal accountant’s independence.
| Item 5 – | Audit Committee of Listed Registrants – Not Applicable |
(a) The registrants’ Schedules of Investments are included as part of the Report to Stockholders filed under Item 1 of this Form.
(b) Not Applicable due to no such divestments during the semi-annual period covered since the previous Form N-CSR filing.
| Item 7 – | Disclosure of Proxy Voting Policies and Procedures for Closed-End Management Investment Companies – Not Applicable |
| Item 8 – | Portfolio Managers of Closed-End Management Investment Companies – Not Applicable |
| Item 9 – | Purchases of Equity Securities by Closed-End Management Investment Company and Affiliated Purchasers – Not Applicable |
| Item 10 – | Submission of Matters to a Vote of Security Holders – There have been no material changes to these procedures. |
| Item 11 – | Controls and Procedures |
(a) – The registrants’ principal executive and principal financial officers, or persons performing similar functions, have concluded that the registrants’ disclosure controls and procedures (as defined in Rule 30a-3(c) under the Investment Company Act of 1940, as amended (the “1940 Act”)) are effective as of a date within 90 days of the filing of this report based on the evaluation of these controls and procedures required by Rule 30a-3(b) under the 1940 Act and Rule 15(d)-15(b) under the Securities Exchange Act of 1934, as amended.
(b) – There were no changes in the registrants’ internal control over financial reporting (as defined in Rule 30a-3(d) under the 1940 Act) that occurred during the second fiscal quarter of the period covered by this report that have materially affected, or are reasonably likely to materially affect, the registrants’ internal control over financial reporting.
7
| Item 12 | – Exhibits attached hereto |
(a)(1) – Code of Ethics – See Item 2
(a)(2) – Certifications – Attached hereto
(a)(3) – Not Applicable
(b) – Certifications – Attached hereto
8
Pursuant to the requirements of the Securities Exchange Act of 1934 and the Investment Company Act of 1940, each registrant has duly caused this report to be signed on its behalf by the undersigned, thereunto duly authorized.
BlackRock Funds III and Master Investment Portfolio
| | | | |
| By: | | /s/ John M. Perlowski | | |
| | John M. Perlowski | | |
| | Chief Executive Officer (principal executive officer) of | | |
| | BlackRock Funds III and Master Investment Portfolio | | |
| |
| Date: March 1, 2016 | | |
Pursuant to the requirements of the Securities Exchange Act of 1934 and the Investment Company Act of 1940, this report has been signed below by the following persons on behalf of each registrant and in the capacities and on the dates indicated.
| | | | |
| By: | | /s/ John M. Perlowski | | |
| | John M. Perlowski | | |
| | Chief Executive Officer (principal executive officer) of | | |
| | BlackRock Funds III and Master Investment Portfolio | | |
| |
| Date: March 1, 2016 | | |
| | |
| By: | | /s/ Neal J. Andrews | | |
| | Neal J. Andrews | | |
| | Chief Financial Officer (principal financial officer) of | | |
| | BlackRock Funds III and Master Investment Portfolio | | |
| |
| Date: March 1, 2016 | | |
9