0000915802 fit:C000200957Member 2022-01-31 0000915802 fit:ALPSCoreCommodityManagementCompleteCommodities174StrategyFundClassIBloombergCommodityTotalReturnIndexMember 2019-01-31 0000915802 fit:C000093015Member fit:FortisHealthcareLtdMember 2024-10-31 0000915802 fit:C000093017Member fit:CommunicationServicesMember 2024-10-31 0000915802 fit:ALPSGlobalOpportunityFundInvestorSharesMorningstarDevelopedMarketsIndexMember 2023-03-31 0000915802 fit:ALPSGlobalOpportunityFundClassIRedRocksGlobalListedPrivateEquityIndexMember 2016-10-31 0000915802 fit:RiverFrontAssetAllocationGrowthampIncomeInvestorSharesBloombergUSAggregateBondIndexMember 2019-04-30 0000915802 fit:RiverFrontAssetAllocationGrowthampIncomeClassCBloombergUSAggregateBondIndexMember 2016-04-30 0000915802 fit:RiverFrontAssetAllocationGrowthampIncomeClassIBloombergUSAggregateBondIndexMember 2024-03-31 0000915802 fit:ALPSSmithShortDurationBondFundClassIBloomberg13YearUSGovernmentCreditIndexMember 2018-08-31 0000915802 fit:ALPSSmithCreditOpportunitiesFundClassIBloombergUSCorporateHYBondIndexMember 2020-09-15
UNITED STATES
SECURITIES AND EXCHANGE COMMISSION
Washington, D.C. 20549
FORM N-CSR
CERTIFIED SHAREHOLDER REPORT OF REGISTERED
MANAGEMENT INVESTMENT COMPANIES
Investment Company Act file number: 811-08194
FINANCIAL INVESTORS TRUST
(Exact name of registrant as specified in charter)
1290 Broadway, Suite 1000, Denver, Colorado 80203
(Address of principal executive offices) (Zip code)
Brendan Hamill, Secretary
Financial Investors Trust
1290 Broadway, Suite 1000
Denver, Colorado 80203
(Name and address of agent for service)
Registrant’s telephone number, including area code: 303-623-2577
Date of fiscal year end: October 31
Date of reporting period: November 1, 2023 - October 31, 2024
Item 1. Reports to Stockholders.
| (a) | Report of Shareholders. |
ALPS | CoreCommodity Management CompleteCommodities® Strategy Fund - Investor Shares | FINANCIAL INVESTORS TRUST |
JCRAX | |
This annual shareholder report contains important information about ALPS | CoreCommodity Management CompleteCommodities® Strategy Fund (the "Fund" or "JCRAX") for the period of November 1, 2023 to October 31, 2024 (the "Period"). You can find additional information about the Fund at https://www.alpsfunds.com/mutual-funds/jcrix. You can also request this information by contacting us at 866-759-5679.
This report describes changes to the Fund that occurred during the reporting period.
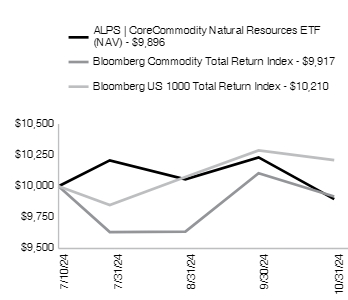
The ALPS | CoreCommodity Management Complete Commodities® Strategy Fund Investor Class shares, net of fees, returned 0.36% at net asset value (NAV) for the 12 months ending October 31, 2024. The Fund outperformed the Bloomberg Commodity Total Return Index (the "BCOM") by 1.54% over the period.
Top Contributors to relative performance
Within the energy sector, the Fund's deferred positioning in natural gas and exposure to energy equities was additive to relative performance.
Within the industrial metals sector, an overweight to copper, aluminum, and zinc and the inclusion of industrial metals equities was additive to relative performance.
Within agriculture, an underweight to staple crops (corn, soybeans, wheat) and the inclusion of agriculture equities was additive to relative performance.
Detractors from relative performance
Within precious metals, an underweight to gold detracted from relative performance.
Within livestock, an underweight to each constituent and deferred positioning in lean hogs and live cattle detracted from relative performance.
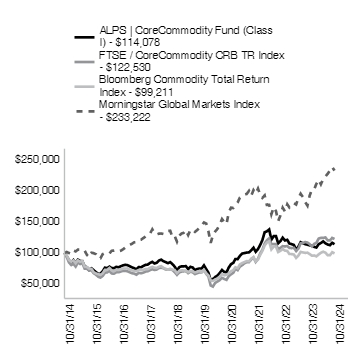
The Fund's past performance is not a good predictor of the Fund's future performance. The chart and the table below do not reflect the deduction of taxes that a shareholder would pay on Fund distributions or sale of Fund shares.
| 10/31/2014 | 10000 | 10000 | 10000 | 10000 |
| 11/30/2014 | 9456 | 9353 | 9593 | 10155 |
| 12/31/2014 | 8787 | 8456 | 8861 | 9983 |
| 01/31/2015 | 8483 | 8047 | 8566 | 9841 |
| 02/28/2015 | 8828 | 8240 | 8786 | 10379 |
| 03/31/2015 | 8305 | 7791 | 8335 | 10246 |
| 04/30/2015 | 8891 | 8439 | 8813 | 10530 |
| 05/31/2015 | 8661 | 8207 | 8575 | 10531 |
| 06/30/2015 | 8619 | 8354 | 8723 | 10293 |
| 07/31/2015 | 7803 | 7450 | 7797 | 10359 |
| 08/31/2015 | 7657 | 7433 | 7725 | 9670 |
| 09/30/2015 | 7207 | 7127 | 7461 | 9322 |
| 10/31/2015 | 7479 | 7195 | 7428 | 10030 |
| 11/30/2015 | 7186 | 6714 | 6889 | 9959 |
| 12/31/2015 | 6872 | 6481 | 6676 | 9780 |
| 01/31/2016 | 6590 | 6136 | 6564 | 9176 |
| 02/29/2016 | 6611 | 6008 | 6457 | 9126 |
| 03/31/2016 | 6998 | 6279 | 6704 | 9812 |
| 04/30/2016 | 7584 | 6799 | 7275 | 9967 |
| 05/31/2016 | 7510 | 6857 | 7261 | 9982 |
| 06/30/2016 | 7751 | 7095 | 7561 | 9913 |
| 07/31/2016 | 7510 | 6671 | 7175 | 10353 |
| 08/31/2016 | 7490 | 6643 | 7048 | 10383 |
| 09/30/2016 | 7699 | 6870 | 7269 | 10449 |
| 10/31/2016 | 7626 | 6871 | 7233 | 10255 |
| 11/30/2016 | 7793 | 6985 | 7330 | 10356 |
| 12/31/2016 | 7943 | 7106 | 7462 | 10584 |
| 01/31/2017 | 8027 | 7092 | 7472 | 10868 |
| 02/28/2017 | 7964 | 7043 | 7488 | 11168 |
| 03/31/2017 | 7797 | 6872 | 7289 | 11298 |
| 04/30/2017 | 7619 | 6723 | 7179 | 11477 |
| 05/31/2017 | 7472 | 6656 | 7083 | 11719 |
| 06/30/2017 | 7315 | 6476 | 7070 | 11780 |
| 07/31/2017 | 7640 | 6774 | 7230 | 12096 |
| 08/31/2017 | 7619 | 6713 | 7259 | 12138 |
| 09/30/2017 | 7828 | 6802 | 7248 | 12389 |
| 10/31/2017 | 8006 | 6975 | 7403 | 12643 |
| 11/30/2017 | 8048 | 7042 | 7369 | 12896 |
| 12/31/2017 | 8309 | 7224 | 7589 | 13110 |
| 01/31/2018 | 8480 | 7365 | 7740 | 13814 |
| 02/28/2018 | 8223 | 7246 | 7606 | 13241 |
| 03/31/2018 | 8319 | 7309 | 7559 | 12982 |
| 04/30/2018 | 8684 | 7568 | 7754 | 13113 |
| 05/31/2018 | 8835 | 7612 | 7864 | 13145 |
| 06/30/2018 | 8577 | 7532 | 7589 | 13063 |
| 07/31/2018 | 8427 | 7324 | 7427 | 13431 |
| 08/31/2018 | 8255 | 7278 | 7296 | 13555 |
| 09/30/2018 | 8427 | 7373 | 7435 | 13589 |
| 10/31/2018 | 8094 | 7230 | 7275 | 12538 |
| 11/30/2018 | 7697 | 6894 | 7234 | 12728 |
| 12/31/2018 | 7101 | 6454 | 6736 | 11822 |
| 01/31/2019 | 7610 | 6842 | 7103 | 12771 |
| 02/28/2019 | 7732 | 6974 | 7174 | 13118 |
| 03/31/2019 | 7743 | 7026 | 7162 | 13256 |
| 04/30/2019 | 7776 | 7060 | 7131 | 13693 |
| 05/31/2019 | 7300 | 6733 | 6892 | 12890 |
| 06/30/2019 | 7666 | 6963 | 7077 | 13711 |
| 07/31/2019 | 7544 | 6880 | 7029 | 13745 |
| 08/31/2019 | 7157 | 6576 | 6866 | 13411 |
| 09/30/2019 | 7289 | 6725 | 6947 | 13692 |
| 10/31/2019 | 7389 | 6849 | 7087 | 14077 |
| 11/30/2019 | 7389 | 6849 | 6906 | 14424 |
| 12/31/2019 | 7882 | 7213 | 7254 | 14924 |
| 01/31/2020 | 7268 | 6621 | 6720 | 14736 |
| 02/29/2020 | 6710 | 6206 | 6382 | 13530 |
| 03/31/2020 | 5493 | 4742 | 5564 | 11608 |
| 04/30/2020 | 5660 | 4564 | 5479 | 12870 |
| 05/31/2020 | 6029 | 5151 | 5716 | 13471 |
| 06/30/2020 | 6241 | 5375 | 5847 | 13886 |
| 07/31/2020 | 6643 | 5598 | 6180 | 14594 |
| 08/31/2020 | 7134 | 5969 | 6598 | 15479 |
| 09/30/2020 | 6810 | 5787 | 6377 | 14998 |
| 10/31/2020 | 6766 | 5640 | 6467 | 14670 |
| 11/30/2020 | 7503 | 6238 | 6694 | 16519 |
| 12/31/2020 | 8052 | 6540 | 7027 | 17323 |
| 01/31/2021 | 8254 | 6790 | 7212 | 17269 |
| 02/28/2021 | 8869 | 7423 | 7678 | 17716 |
| 03/31/2021 | 8847 | 7210 | 7514 | 18166 |
| 04/30/2021 | 9351 | 7787 | 8136 | 18952 |
| 05/31/2021 | 9721 | 8018 | 8359 | 19232 |
| 06/30/2021 | 9799 | 8319 | 8513 | 19446 |
| 07/31/2021 | 9877 | 8502 | 8670 | 19542 |
| 08/31/2021 | 9900 | 8506 | 8644 | 20031 |
| 09/30/2021 | 10224 | 8925 | 9074 | 19239 |
| 10/31/2021 | 10639 | 9267 | 9309 | 20162 |
| 11/30/2021 | 10001 | 8546 | 8628 | 19618 |
| 12/31/2021 | 10426 | 9061 | 8932 | 20406 |
| 01/31/2022 | 11114 | 9949 | 9717 | 19344 |
| 02/28/2022 | 11830 | 10496 | 10322 | 18911 |
| 03/31/2022 | 13084 | 11519 | 11214 | 19294 |
| 04/30/2022 | 13208 | 12037 | 11678 | 17773 |
| 05/31/2022 | 13524 | 12370 | 11857 | 17778 |
| 06/30/2022 | 11899 | 11392 | 10579 | 16244 |
| 07/31/2022 | 12464 | 11447 | 11030 | 17386 |
| 08/31/2022 | 12464 | 11410 | 11040 | 16773 |
| 09/30/2022 | 11307 | 10569 | 10145 | 15158 |
| 10/31/2022 | 11665 | 10832 | 10347 | 16070 |
| 11/30/2022 | 12188 | 11093 | 10630 | 17312 |
| 12/31/2022 | 11760 | 11053 | 10370 | 16696 |
| 01/31/2023 | 11863 | 11111 | 10319 | 17867 |
| 02/28/2023 | 11273 | 10821 | 9834 | 17369 |
| 03/31/2023 | 11170 | 10781 | 9814 | 17810 |
| 04/30/2023 | 11052 | 10840 | 9740 | 18052 |
| 05/31/2023 | 10299 | 10310 | 9191 | 17833 |
| 06/30/2023 | 10727 | 10687 | 9562 | 18864 |
| 07/31/2023 | 11465 | 11563 | 10161 | 19574 |
| 08/31/2023 | 11302 | 11605 | 10083 | 19024 |
| 09/30/2023 | 11170 | 11764 | 10013 | 18243 |
| 10/31/2023 | 11081 | 11680 | 10039 | 17647 |
| 11/30/2023 | 10963 | 11418 | 9813 | 19273 |
| 12/31/2023 | 10892 | 11056 | 9549 | 20258 |
| 01/31/2024 | 10724 | 11471 | 9587 | 20330 |
| 02/29/2024 | 10633 | 11632 | 9446 | 21177 |
| 03/31/2024 | 11166 | 12326 | 9759 | 21841 |
| 04/30/2024 | 11334 | 12436 | 10022 | 21116 |
| 05/31/2024 | 11594 | 12437 | 10197 | 21957 |
| 06/30/2024 | 11289 | 12501 | 10040 | 22372 |
| 07/31/2024 | 11090 | 12028 | 9635 | 22806 |
| 08/31/2024 | 10983 | 12031 | 9640 | 23345 |
| 09/30/2024 | 11350 | 12427 | 10108 | 23884 |
| 10/31/2024 | 11121 | 12253 | 9921 | 23322 |
| ALPS | CoreCommodity Fund - Investor - NAV | 0.36% | 8.52% | 1.07% |
| Morningstar Global Markets Index# | 32.16% | 10.63% | 8.84% |
| Bloomberg Commodity Total Return Index | -1.18% | 6.96% | -0.08% |
| FTSE / CoreCommodity CRB TR Index | 4.91% | 12.34% | 2.05% |
For the most current month-end performance data, please call 1-866-759-5679.
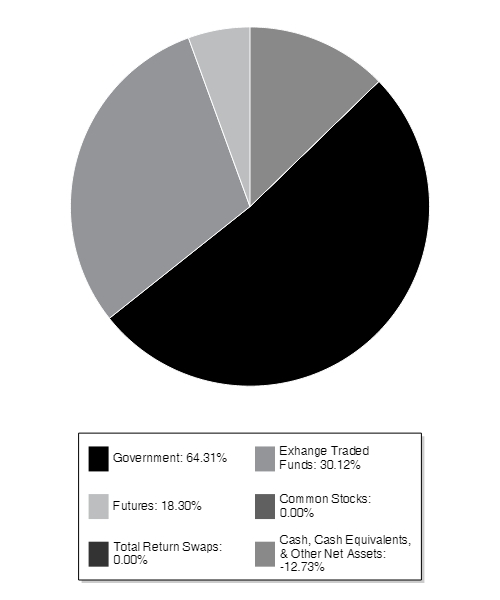
| Net Assets | $940,528,649 |
| Number of Portfolio Holdings | 55 |
| Portfolio Turnover Rate | 72% |
| Total Advisory Fees Paid | $9,426,269 |
| Government | 64.31% |
| Exhange Traded Funds | 30.12% |
| Futures | 18.30% |
| Common Stocks | 0.00% |
| Total Return Swaps | 0.00% |
| Cash, Cash Equivalents, & Other Net Assets | -12.73% |

| |
** | As a percentage of net assets. |
Holdings are subject to change
This is a summary of certain changes to the Fund since April 30, 2024. For more complete information, you may review the Fund's prospectus, which is available at https://www.alpsfunds.com/mutual-funds/jcrix or upon request at 866-759-5679.
Change to Principal Investment Strategy and Principal Risks: With respect to the Commodity Equity Investments portion of its portfolio, the Fund will now invest primarily through underlying exhange-traded funds (ETFs) as oppossed to making such investments directly. The following are now Principal Risks of the Fund: Affiliated ETF Risk and ETF Investment Risk.
If you wish to view additional information about the Fund, including but not limited to the Fund's prospectus, financial information, holdings, and proxy voting information, please visit https://www.alpsfunds.com/mutual-funds/jcrix.
If you have consented to receive a single annual or semi-annual shareholder report at a shared address you may revoke this consent by calling the Transfer Agent 866-759-5679.
ALPS | CoreCommodity Management CompleteCommodities® Strategy Fund - Class A | FINANCIAL INVESTORS TRUST |
JCCSX | |
This annual shareholder report contains important information about ALPS | CoreCommodity Management CompleteCommodities® Strategy Fund (the "Fund" or "JCCSX") for the period of November 1, 2023 to October 31, 2024 (the "Period"). You can find additional information about the Fund at https://www.alpsfunds.com/mutual-funds/jcrix. You can also request this information by contacting us at 866-759-5679.
This report describes changes to the Fund that occurred during the reporting period.
The ALPS | CoreCommodity Management Complete Commodities® Strategy Fund Class A shares, net of fees, returned 0.49% at net asset value (NAV) for the 12 months ending October 31, 2024. The Fund outperformed the Bloomberg Commodity Total Return Index (the "BCOM") by 1.67% over the period.
Top Contributors to relative performance
Within the energy sector, the Fund's deferred positioning in natural gas and exposure to energy equities was additive to relative performance.
Within the industrial metals sector, an overweight to copper, aluminum, and zinc and the inclusion of industrial metals equities was additive to relative performance.
Within agriculture, an underweight to staple crops (corn, soybeans, wheat) and the inclusion of agriculture equities was additive to relative performance.
Detractors from relative performance
Within precious metals, an underweight to gold detracted from relative performance.
Within livestock, an underweight to each constituent and deferred positioning in lean hogs and live cattle detracted from relative performance.
The Fund's past performance is not a good predictor of the Fund's future performance. The chart and the table below do not reflect the deduction of taxes that a shareholder would pay on Fund distributions or sale of Fund shares.
| 10/31/2014 | 9447 | 10000 | 10000 | 10000 |
| 11/30/2014 | 8933 | 9353 | 9593 | 10155 |
| 12/31/2014 | 8300 | 8456 | 8861 | 9983 |
| 01/31/2015 | 8014 | 8047 | 8566 | 9841 |
| 02/28/2015 | 8340 | 8240 | 8786 | 10379 |
| 03/31/2015 | 7846 | 7791 | 8335 | 10246 |
| 04/30/2015 | 8399 | 8439 | 8813 | 10530 |
| 05/31/2015 | 8182 | 8207 | 8575 | 10531 |
| 06/30/2015 | 8142 | 8354 | 8723 | 10293 |
| 07/31/2015 | 7372 | 7450 | 7797 | 10359 |
| 08/31/2015 | 7233 | 7433 | 7725 | 9670 |
| 09/30/2015 | 6808 | 7127 | 7461 | 9322 |
| 10/31/2015 | 7065 | 7195 | 7428 | 10030 |
| 11/30/2015 | 6789 | 6714 | 6889 | 9959 |
| 12/31/2015 | 6492 | 6481 | 6676 | 9780 |
| 01/31/2016 | 6225 | 6136 | 6564 | 9176 |
| 02/29/2016 | 6245 | 6008 | 6457 | 9126 |
| 03/31/2016 | 6611 | 6279 | 6704 | 9812 |
| 04/30/2016 | 7164 | 6799 | 7275 | 9967 |
| 05/31/2016 | 7095 | 6857 | 7261 | 9982 |
| 06/30/2016 | 7322 | 7095 | 7561 | 9913 |
| 07/31/2016 | 7095 | 6671 | 7175 | 10353 |
| 08/31/2016 | 7075 | 6643 | 7048 | 10383 |
| 09/30/2016 | 7273 | 6870 | 7269 | 10449 |
| 10/31/2016 | 7204 | 6871 | 7233 | 10255 |
| 11/30/2016 | 7362 | 6985 | 7330 | 10356 |
| 12/31/2016 | 7504 | 7106 | 7462 | 10584 |
| 01/31/2017 | 7583 | 7092 | 7472 | 10868 |
| 02/28/2017 | 7523 | 7043 | 7488 | 11168 |
| 03/31/2017 | 7365 | 6872 | 7289 | 11298 |
| 04/30/2017 | 7197 | 6723 | 7179 | 11477 |
| 05/31/2017 | 7059 | 6656 | 7083 | 11719 |
| 06/30/2017 | 6910 | 6476 | 7070 | 11780 |
| 07/31/2017 | 7217 | 6774 | 7230 | 12096 |
| 08/31/2017 | 7197 | 6713 | 7259 | 12138 |
| 09/30/2017 | 7395 | 6802 | 7248 | 12389 |
| 10/31/2017 | 7563 | 6975 | 7403 | 12643 |
| 11/30/2017 | 7603 | 7042 | 7369 | 12896 |
| 12/31/2017 | 7849 | 7224 | 7589 | 13110 |
| 01/31/2018 | 8011 | 7365 | 7740 | 13814 |
| 02/28/2018 | 7768 | 7246 | 7606 | 13241 |
| 03/31/2018 | 7859 | 7309 | 7559 | 12982 |
| 04/30/2018 | 8204 | 7568 | 7754 | 13113 |
| 05/31/2018 | 8346 | 7612 | 7864 | 13145 |
| 06/30/2018 | 8102 | 7532 | 7589 | 13063 |
| 07/31/2018 | 7960 | 7324 | 7427 | 13431 |
| 08/31/2018 | 7798 | 7278 | 7296 | 13555 |
| 09/30/2018 | 7960 | 7373 | 7435 | 13589 |
| 10/31/2018 | 7646 | 7230 | 7275 | 12538 |
| 11/30/2018 | 7271 | 6894 | 7234 | 12728 |
| 12/31/2018 | 6708 | 6454 | 6736 | 11822 |
| 01/31/2019 | 7189 | 6842 | 7103 | 12771 |
| 02/28/2019 | 7304 | 6974 | 7174 | 13118 |
| 03/31/2019 | 7314 | 7026 | 7162 | 13256 |
| 04/30/2019 | 7346 | 7060 | 7131 | 13693 |
| 05/31/2019 | 6907 | 6733 | 6892 | 12890 |
| 06/30/2019 | 7241 | 6963 | 7077 | 13711 |
| 07/31/2019 | 7126 | 6880 | 7029 | 13745 |
| 08/31/2019 | 6771 | 6576 | 6866 | 13411 |
| 09/30/2019 | 6886 | 6725 | 6947 | 13692 |
| 10/31/2019 | 6980 | 6849 | 7087 | 14077 |
| 11/30/2019 | 6980 | 6849 | 6906 | 14424 |
| 12/31/2019 | 7446 | 7213 | 7254 | 14924 |
| 01/31/2020 | 6866 | 6621 | 6720 | 14736 |
| 02/29/2020 | 6349 | 6206 | 6382 | 13530 |
| 03/31/2020 | 5189 | 4742 | 5564 | 11608 |
| 04/30/2020 | 5357 | 4564 | 5479 | 12870 |
| 05/31/2020 | 5695 | 5151 | 5716 | 13471 |
| 06/30/2020 | 5906 | 5375 | 5847 | 13886 |
| 07/31/2020 | 6275 | 5598 | 6180 | 14594 |
| 08/31/2020 | 6739 | 5969 | 6598 | 15479 |
| 09/30/2020 | 6444 | 5787 | 6377 | 14998 |
| 10/31/2020 | 6402 | 5640 | 6467 | 14670 |
| 11/30/2020 | 7098 | 6238 | 6694 | 16519 |
| 12/31/2020 | 7617 | 6540 | 7027 | 17323 |
| 01/31/2021 | 7807 | 6790 | 7212 | 17269 |
| 02/28/2021 | 8389 | 7423 | 7678 | 17716 |
| 03/31/2021 | 8368 | 7210 | 7514 | 18166 |
| 04/30/2021 | 8834 | 7787 | 8136 | 18952 |
| 05/31/2021 | 9193 | 8018 | 8359 | 19232 |
| 06/30/2021 | 9267 | 8319 | 8513 | 19446 |
| 07/31/2021 | 9341 | 8502 | 8670 | 19542 |
| 08/31/2021 | 9363 | 8506 | 8644 | 20031 |
| 09/30/2021 | 9669 | 8925 | 9074 | 19239 |
| 10/31/2021 | 10071 | 9267 | 9309 | 20162 |
| 11/30/2021 | 9458 | 8546 | 8628 | 19618 |
| 12/31/2021 | 9860 | 9061 | 8932 | 20406 |
| 01/31/2022 | 10510 | 9949 | 9717 | 19344 |
| 02/28/2022 | 11199 | 10496 | 10322 | 18911 |
| 03/31/2022 | 12370 | 11519 | 11214 | 19294 |
| 04/30/2022 | 12500 | 12037 | 11678 | 17773 |
| 05/31/2022 | 12786 | 12370 | 11857 | 17778 |
| 06/30/2022 | 11264 | 11392 | 10579 | 16244 |
| 07/31/2022 | 11785 | 11447 | 11030 | 17386 |
| 08/31/2022 | 11785 | 11410 | 11040 | 16773 |
| 09/30/2022 | 10705 | 10569 | 10145 | 15158 |
| 10/31/2022 | 11030 | 10832 | 10347 | 16070 |
| 11/30/2022 | 11538 | 11093 | 10630 | 17312 |
| 12/31/2022 | 11119 | 11053 | 10370 | 16696 |
| 01/31/2023 | 11216 | 11111 | 10319 | 17867 |
| 02/28/2023 | 10659 | 10821 | 9834 | 17369 |
| 03/31/2023 | 10561 | 10781 | 9814 | 17810 |
| 04/30/2023 | 10464 | 10840 | 9740 | 18052 |
| 05/31/2023 | 9739 | 10310 | 9191 | 17833 |
| 06/30/2023 | 10157 | 10687 | 9562 | 18864 |
| 07/31/2023 | 10854 | 11563 | 10161 | 19574 |
| 08/31/2023 | 10687 | 11605 | 10083 | 19024 |
| 09/30/2023 | 10575 | 11764 | 10013 | 18243 |
| 10/31/2023 | 10492 | 11680 | 10039 | 17647 |
| 11/30/2023 | 10380 | 11418 | 9813 | 19273 |
| 12/31/2023 | 10313 | 11056 | 9549 | 20258 |
| 01/31/2024 | 10154 | 11471 | 9587 | 20330 |
| 02/29/2024 | 10054 | 11632 | 9446 | 21177 |
| 03/31/2024 | 10558 | 12326 | 9759 | 21841 |
| 04/30/2024 | 10731 | 12436 | 10022 | 21116 |
| 05/31/2024 | 10975 | 12437 | 10197 | 21957 |
| 06/30/2024 | 10687 | 12501 | 10040 | 22372 |
| 07/31/2024 | 10500 | 12028 | 9635 | 22806 |
| 08/31/2024 | 10399 | 12031 | 9640 | 23345 |
| 09/30/2024 | 10759 | 12427 | 10108 | 23884 |
| 10/31/2024 | 10543 | 12253 | 9921 | 23322 |
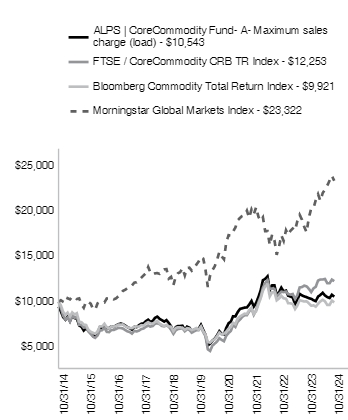
| ALPS | CoreCommodity Fund - Class A - NAV** | 0.49% | 8.60% | 1.10% |
| ALPS | CoreCommodity Fund - Class A -Maximum sales charge (load)*^ | -5.06% | 7.37% | 0.53% |
| Morningstar Global Markets Index# | 32.16% | 10.63% | 8.84% |
| Bloomberg Commodity Total Return Index | -1.18% | 6.96% | -0.08% |
| FTSE / CoreCommodity CRB TR Index | 4.91% | 12.34% | 2.05% |
For the most current month-end performance data, please call 1-866-759-5679.
| Net Assets | $940,528,649 |
| Number of Portfolio Holdings | 55 |
| Portfolio Turnover Rate | 72% |
| Total Advisory Fees Paid | $9,426,269 |
| Government | 64.31% |
| Exhange Traded Funds | 30.12% |
| Futures | 18.30% |
| Common Stocks | 0.00% |
| Total Return Swaps | 0.00% |
| Cash, Cash Equivalents, & Other Net Assets | -12.73% |

| |
** | As a percentage of net assets. |
Holdings are subject to change
This is a summary of certain changes to the Fund since April 30, 2024. For more complete information, you may review the Fund's prospectus, which is available at https://www.alpsfunds.com/mutual-funds/jcrix or upon request at 866-759-5679.
Change to Principal Investment Strategy and Principal Risks: With respect to the Commodity Equity Investments portion of its portfolio, the Fund will now invest primarily through underlying exhange-traded funds (ETFs) as oppossed to making such investments directly. The following are now Principal Risks of the Fund: Affiliated ETF Risk and ETF Investment Risk.
If you wish to view additional information about the Fund, including but not limited to the Fund's prospectus, financial information, holdings, and proxy voting information, please visit https://www.alpsfunds.com/mutual-funds/jcrix.
If you have consented to receive a single annual or semi-annual shareholder report at a shared address you may revoke this consent by calling the Transfer Agent 866-759-5679.
ALPS | CoreCommodity Management CompleteCommodities® Strategy Fund - Class C | FINANCIAL INVESTORS TRUST |
JCRCX | |
This annual shareholder report contains important information about ALPS | CoreCommodity Management CompleteCommodities® Strategy Fund (the "Fund" or "JCRCX") for the period of November 1, 2023 to October 31, 2024 (the "Period"). You can find additional information about the Fund at https://www.alpsfunds.com/mutual-funds/jcrix. You can also request this information by contacting us at 866-759-5679.
This report describes changes to the Fund that occurred during the reporting period.
The ALPS | CoreCommodity Management Complete Commodities® Strategy Fund Class C shares, net of fees, returned -0.31% at net asset value (NAV) for the 12 months ending October 31, 2024. The Fund outperformed the Bloomberg Commodity Total Return Index (the "BCOM") by 0.87% over the period.
Top Contributors to relative performance
Within the energy sector, the Fund's deferred positioning in natural gas and exposure to energy equities was additive to relative performance.
Within the industrial metals sector, an overweight to copper, aluminum, and zinc and the inclusion of industrial metals equities was additive to relative performance.
Within agriculture, an underweight to staple crops (corn, soybeans, wheat) and the inclusion of agriculture equities was additive to relative performance.
Detractors from relative performance
Within precious metals, an underweight to gold detracted from relative performance.
Within livestock, an underweight to each constituent and deferred positioning in lean hogs and live cattle detracted from relative performance.
The Fund's past performance is not a good predictor of the Fund's future performance. The chart and the table below do not reflect the deduction of taxes that a shareholder would pay on Fund distributions or sale of Fund shares.
| 10/31/2014 | 10000 | 10000 | 10000 | 10000 |
| 11/30/2014 | 9457 | 9353 | 9593 | 10155 |
| 12/31/2014 | 8775 | 8456 | 8861 | 9983 |
| 01/31/2015 | 8466 | 8047 | 8566 | 9841 |
| 02/28/2015 | 8818 | 8240 | 8786 | 10379 |
| 03/31/2015 | 8285 | 7791 | 8335 | 10246 |
| 04/30/2015 | 8871 | 8439 | 8813 | 10530 |
| 05/31/2015 | 8637 | 8207 | 8575 | 10531 |
| 06/30/2015 | 8594 | 8354 | 8723 | 10293 |
| 07/31/2015 | 7764 | 7450 | 7797 | 10359 |
| 08/31/2015 | 7625 | 7433 | 7725 | 9670 |
| 09/30/2015 | 7167 | 7127 | 7461 | 9322 |
| 10/31/2015 | 7433 | 7195 | 7428 | 10030 |
| 11/30/2015 | 7135 | 6714 | 6889 | 9959 |
| 12/31/2015 | 6816 | 6481 | 6676 | 9780 |
| 01/31/2016 | 6539 | 6136 | 6564 | 9176 |
| 02/29/2016 | 6550 | 6008 | 6457 | 9126 |
| 03/31/2016 | 6933 | 6279 | 6704 | 9812 |
| 04/30/2016 | 7508 | 6799 | 7275 | 9967 |
| 05/31/2016 | 7433 | 6857 | 7261 | 9982 |
| 06/30/2016 | 7668 | 7095 | 7561 | 9913 |
| 07/31/2016 | 7423 | 6671 | 7175 | 10353 |
| 08/31/2016 | 7401 | 6643 | 7048 | 10383 |
| 09/30/2016 | 7604 | 6870 | 7269 | 10449 |
| 10/31/2016 | 7529 | 6871 | 7233 | 10255 |
| 11/30/2016 | 7689 | 6985 | 7330 | 10356 |
| 12/31/2016 | 7827 | 7106 | 7462 | 10584 |
| 01/31/2017 | 7913 | 7092 | 7472 | 10868 |
| 02/28/2017 | 7849 | 7043 | 7488 | 11168 |
| 03/31/2017 | 7678 | 6872 | 7289 | 11298 |
| 04/30/2017 | 7497 | 6723 | 7179 | 11477 |
| 05/31/2017 | 7359 | 6656 | 7083 | 11719 |
| 06/30/2017 | 7199 | 6476 | 7070 | 11780 |
| 07/31/2017 | 7508 | 6774 | 7230 | 12096 |
| 08/31/2017 | 7487 | 6713 | 7259 | 12138 |
| 09/30/2017 | 7678 | 6802 | 7248 | 12389 |
| 10/31/2017 | 7849 | 6975 | 7403 | 12643 |
| 11/30/2017 | 7881 | 7042 | 7369 | 12896 |
| 12/31/2017 | 8138 | 7224 | 7589 | 13110 |
| 01/31/2018 | 8302 | 7365 | 7740 | 13814 |
| 02/28/2018 | 8051 | 7246 | 7606 | 13241 |
| 03/31/2018 | 8138 | 7309 | 7559 | 12982 |
| 04/30/2018 | 8488 | 7568 | 7754 | 13113 |
| 05/31/2018 | 8630 | 7612 | 7864 | 13145 |
| 06/30/2018 | 8378 | 7532 | 7589 | 13063 |
| 07/31/2018 | 8225 | 7324 | 7427 | 13431 |
| 08/31/2018 | 8051 | 7278 | 7296 | 13555 |
| 09/30/2018 | 8214 | 7373 | 7435 | 13589 |
| 10/31/2018 | 7887 | 7230 | 7275 | 12538 |
| 11/30/2018 | 7494 | 6894 | 7234 | 12728 |
| 12/31/2018 | 6913 | 6454 | 6736 | 11822 |
| 01/31/2019 | 7397 | 6842 | 7103 | 12771 |
| 02/28/2019 | 7510 | 6974 | 7174 | 13118 |
| 03/31/2019 | 7521 | 7026 | 7162 | 13256 |
| 04/30/2019 | 7544 | 7060 | 7131 | 13693 |
| 05/31/2019 | 7093 | 6733 | 6892 | 12890 |
| 06/30/2019 | 7431 | 6963 | 7077 | 13711 |
| 07/31/2019 | 7307 | 6880 | 7029 | 13745 |
| 08/31/2019 | 6936 | 6576 | 6866 | 13411 |
| 09/30/2019 | 7060 | 6725 | 6947 | 13692 |
| 10/31/2019 | 7150 | 6849 | 7087 | 14077 |
| 11/30/2019 | 7150 | 6849 | 6906 | 14424 |
| 12/31/2019 | 7621 | 7213 | 7254 | 14924 |
| 01/31/2020 | 7019 | 6621 | 6720 | 14736 |
| 02/29/2020 | 6485 | 6206 | 6382 | 13530 |
| 03/31/2020 | 5304 | 4742 | 5564 | 11608 |
| 04/30/2020 | 5463 | 4564 | 5479 | 12870 |
| 05/31/2020 | 5815 | 5151 | 5716 | 13471 |
| 06/30/2020 | 6020 | 5375 | 5847 | 13886 |
| 07/31/2020 | 6394 | 5598 | 6180 | 14594 |
| 08/31/2020 | 6860 | 5969 | 6598 | 15479 |
| 09/30/2020 | 6553 | 5787 | 6377 | 14998 |
| 10/31/2020 | 6508 | 5640 | 6467 | 14670 |
| 11/30/2020 | 7212 | 6238 | 6694 | 16519 |
| 12/31/2020 | 7729 | 6540 | 7027 | 17323 |
| 01/31/2021 | 7923 | 6790 | 7212 | 17269 |
| 02/28/2021 | 8515 | 7423 | 7678 | 17716 |
| 03/31/2021 | 8492 | 7210 | 7514 | 18166 |
| 04/30/2021 | 8959 | 7787 | 8136 | 18952 |
| 05/31/2021 | 9323 | 8018 | 8359 | 19232 |
| 06/30/2021 | 9391 | 8319 | 8513 | 19446 |
| 07/31/2021 | 9459 | 8502 | 8670 | 19542 |
| 08/31/2021 | 9482 | 8506 | 8644 | 20031 |
| 09/30/2021 | 9778 | 8925 | 9074 | 19239 |
| 10/31/2021 | 10176 | 9267 | 9309 | 20162 |
| 11/30/2021 | 9550 | 8546 | 8628 | 19618 |
| 12/31/2021 | 9949 | 9061 | 8932 | 20406 |
| 01/31/2022 | 10601 | 9949 | 9717 | 19344 |
| 02/28/2022 | 11297 | 10496 | 10322 | 18911 |
| 03/31/2022 | 12475 | 11519 | 11214 | 19294 |
| 04/30/2022 | 12588 | 12037 | 11678 | 17773 |
| 05/31/2022 | 12886 | 12370 | 11857 | 17778 |
| 06/30/2022 | 11339 | 11392 | 10579 | 16244 |
| 07/31/2022 | 11850 | 11447 | 11030 | 17386 |
| 08/31/2022 | 11850 | 11410 | 11040 | 16773 |
| 09/30/2022 | 10757 | 10569 | 10145 | 15158 |
| 10/31/2022 | 11070 | 10832 | 10347 | 16070 |
| 11/30/2022 | 11581 | 11093 | 10630 | 17312 |
| 12/31/2022 | 11155 | 11053 | 10370 | 16696 |
| 01/31/2023 | 11247 | 11111 | 10319 | 17867 |
| 02/28/2023 | 10682 | 10821 | 9834 | 17369 |
| 03/31/2023 | 10575 | 10781 | 9814 | 17810 |
| 04/30/2023 | 10468 | 10840 | 9740 | 18052 |
| 05/31/2023 | 9734 | 10310 | 9191 | 17833 |
| 06/30/2023 | 10147 | 10687 | 9562 | 18864 |
| 07/31/2023 | 10834 | 11563 | 10161 | 19574 |
| 08/31/2023 | 10666 | 11605 | 10083 | 19024 |
| 09/30/2023 | 10544 | 11764 | 10013 | 18243 |
| 10/31/2023 | 10452 | 11680 | 10039 | 17647 |
| 11/30/2023 | 10330 | 11418 | 9813 | 19273 |
| 12/31/2023 | 10261 | 11056 | 9549 | 20258 |
| 01/31/2024 | 10103 | 11471 | 9587 | 20330 |
| 02/29/2024 | 9992 | 11632 | 9446 | 21177 |
| 03/31/2024 | 10499 | 12326 | 9759 | 21841 |
| 04/30/2024 | 10641 | 12436 | 10022 | 21116 |
| 05/31/2024 | 10879 | 12437 | 10197 | 21957 |
| 06/30/2024 | 10594 | 12501 | 10040 | 22372 |
| 07/31/2024 | 10404 | 12028 | 9635 | 22806 |
| 08/31/2024 | 10293 | 12031 | 9640 | 23345 |
| 09/30/2024 | 10641 | 12427 | 10108 | 23884 |
| 10/31/2024 | 10419 | 12253 | 9921 | 23322 |
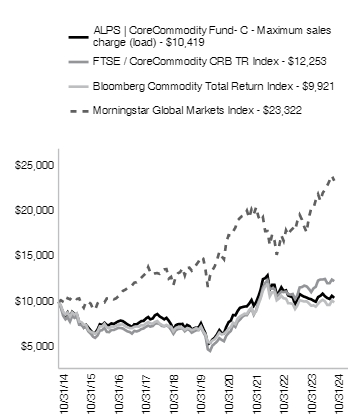
| ALPS | CoreCommodity Fund - Class C - NAV | -0.31% | 7.82% | 0.41% |
| ALPS | CoreCommodity Fund - Class C - Maximim deferred sales charge** | -1.28% | 7.82% | 0.41% |
| Morningstar Global Markets Index# | 32.16% | 10.63% | 8.84% |
| Bloomberg Commodity Total Return Index | -1.18% | 6.96% | -0.08% |
| FTSE / CoreCommodity CRB TR Index | 4.91% | 12.34% | 2.05% |
For the most current month-end performance data, please call 1-866-759-5679.
| Net Assets | $940,528,649 |
| Number of Portfolio Holdings | 55 |
| Portfolio Turnover Rate | 72% |
| Total Advisory Fees Paid | $9,426,269 |
| Government | 64.31% |
| Exhange Traded Funds | 30.12% |
| Futures | 18.30% |
| Common Stocks | 0.00% |
| Total Return Swaps | 0.00% |
| Cash, Cash Equivalents, & Other Net Assets | -12.73% |
| |
** | As a percentage of net assets. |
Holdings are subject to change
This is a summary of certain changes to the Fund since April 30, 2024. For more complete information, you may review the Fund's prospectus, which is available at https://www.alpsfunds.com/mutual-funds/jcrix or upon request at 866-759-5679.
Change to Principal Investment Strategy and Principal Risks: With respect to the Commodity Equity Investments portion of its portfolio, the Fund will now invest primarily through underlying exhange-traded funds (ETFs) as oppossed to making such investments directly. The following are now Principal Risks of the Fund: Affiliated ETF Risk and ETF Investment Risk.
If you wish to view additional information about the Fund, including but not limited to the Fund's prospectus, financial information, holdings, and proxy voting information, please visit https://www.alpsfunds.com/mutual-funds/jcrix.
If you have consented to receive a single annual or semi-annual shareholder report at a shared address you may revoke this consent by calling the Transfer Agent 866-759-5679.
ALPS | CoreCommodity Management CompleteCommodities® Strategy Fund - Class I | FINANCIAL INVESTORS TRUST |
JCRIX | |
This annual shareholder report contains important information about ALPS | CoreCommodity Management CompleteCommodities® Strategy Fund (the "Fund" or "JCRIX") for the period of November 1, 2023 to October 31, 2024 (the "Period"). You can find additional information about the Fund at https://www.alpsfunds.com/mutual-funds/jcrix. You can also request this information by contacting us at 866-759-5679.
This report describes changes to the Fund that occurred during the reporting period.
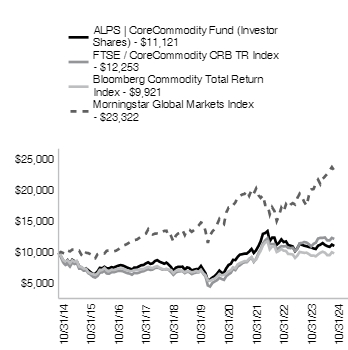
The ALPS | CoreCommodity Management Complete Commodities® Strategy Fund Class I shares, net of fees, returned 0.67% at net asset value (NAV) for the 12 months ending October 31, 2024. The Fund outperformed the Bloomberg Commodity Total Return Index (the "BCOM") by 1.85% over the period.
Top Contributors to relative performance
Within the energy sector, the Fund's deferred positioning in natural gas and exposure to energy equities was additive to relative performance.
Within the industrial metals sector, an overweight to copper, aluminum, and zinc and the inclusion of industrial metals equities was additive to relative performance.
Within agriculture, an underweight to staple crops (corn, soybeans, wheat) and the inclusion of agriculture equities was additive to relative performance.
Detractors from relative performance
Within precious metals, an underweight to gold detracted from relative performance.
Within livestock, an underweight to each constituent and deferred positioning in lean hogs and live cattle detracted from relative performance.
The Fund's past performance is not a good predictor of the Fund's future performance. The chart and the table below do not reflect the deduction of taxes that a shareholder would pay on Fund distributions or sale of Fund shares.
| 10/31/2014 | 100000 | 100000 | 100000 | 100000 |
| 11/30/2014 | 94671 | 93533 | 95930 | 101553 |
| 12/31/2014 | 87932 | 84557 | 88613 | 99834 |
| 01/31/2015 | 84885 | 80471 | 85657 | 98406 |
| 02/28/2015 | 88457 | 82400 | 87863 | 103793 |
| 03/31/2015 | 83204 | 77907 | 83350 | 102459 |
| 04/30/2015 | 89088 | 84392 | 88128 | 105299 |
| 05/31/2015 | 86881 | 82074 | 85750 | 105310 |
| 06/30/2015 | 86461 | 83541 | 87230 | 102934 |
| 07/31/2015 | 78267 | 74499 | 77969 | 103594 |
| 08/31/2015 | 76796 | 74327 | 77252 | 96701 |
| 09/30/2015 | 72279 | 71268 | 74612 | 93221 |
| 10/31/2015 | 75115 | 71946 | 74279 | 100304 |
| 11/30/2015 | 72068 | 67145 | 68889 | 99595 |
| 12/31/2015 | 68917 | 64808 | 66764 | 97795 |
| 01/31/2016 | 66080 | 61364 | 65642 | 91764 |
| 02/29/2016 | 66395 | 60080 | 64575 | 91263 |
| 03/31/2016 | 70283 | 62787 | 67042 | 98119 |
| 04/30/2016 | 76166 | 67988 | 72748 | 99665 |
| 05/31/2016 | 75430 | 68572 | 72613 | 99821 |
| 06/30/2016 | 77847 | 70952 | 75612 | 99125 |
| 07/31/2016 | 75430 | 66712 | 71748 | 103531 |
| 08/31/2016 | 75220 | 66433 | 70483 | 103825 |
| 09/30/2016 | 77426 | 68704 | 72689 | 104489 |
| 10/31/2016 | 76796 | 68707 | 72335 | 102554 |
| 11/30/2016 | 78372 | 69852 | 73300 | 103562 |
| 12/31/2016 | 79920 | 71062 | 74620 | 105835 |
| 01/31/2017 | 80761 | 70919 | 74722 | 108675 |
| 02/28/2017 | 80236 | 70428 | 74878 | 111675 |
| 03/31/2017 | 78553 | 68718 | 72887 | 112980 |
| 04/30/2017 | 76765 | 67225 | 71786 | 114771 |
| 05/31/2017 | 75293 | 66558 | 70833 | 117186 |
| 06/30/2017 | 73716 | 64760 | 70698 | 117797 |
| 07/31/2017 | 77081 | 67739 | 72297 | 120959 |
| 08/31/2017 | 76765 | 67134 | 72588 | 121377 |
| 09/30/2017 | 78868 | 68021 | 72478 | 123887 |
| 10/31/2017 | 80656 | 69745 | 74034 | 126432 |
| 11/30/2017 | 81077 | 70420 | 73693 | 128958 |
| 12/31/2017 | 83740 | 72243 | 75894 | 131098 |
| 01/31/2018 | 85575 | 73648 | 77400 | 138141 |
| 02/28/2018 | 82985 | 72456 | 76063 | 132413 |
| 03/31/2018 | 83956 | 73087 | 75590 | 129819 |
| 04/30/2018 | 87625 | 75680 | 77543 | 131126 |
| 05/31/2018 | 89136 | 76124 | 78640 | 131452 |
| 06/30/2018 | 86654 | 75317 | 75890 | 130629 |
| 07/31/2018 | 85143 | 73245 | 74270 | 134310 |
| 08/31/2018 | 83417 | 72779 | 72959 | 135551 |
| 09/30/2018 | 85143 | 73733 | 74355 | 135892 |
| 10/31/2018 | 81798 | 72298 | 72752 | 125385 |
| 11/30/2018 | 77805 | 68938 | 72339 | 127278 |
| 12/31/2018 | 71747 | 64544 | 67358 | 118224 |
| 01/31/2019 | 76975 | 68425 | 71027 | 127710 |
| 02/28/2019 | 78198 | 69738 | 71744 | 131181 |
| 03/31/2019 | 78309 | 70259 | 71618 | 132558 |
| 04/30/2019 | 78643 | 70600 | 71314 | 136926 |
| 05/31/2019 | 73971 | 67332 | 68919 | 128898 |
| 06/30/2019 | 77531 | 69632 | 70766 | 137115 |
| 07/31/2019 | 76418 | 68799 | 70294 | 137452 |
| 08/31/2019 | 72525 | 65758 | 68661 | 134112 |
| 09/30/2019 | 73860 | 67255 | 69467 | 136924 |
| 10/31/2019 | 74861 | 68495 | 70871 | 140767 |
| 11/30/2019 | 74861 | 68487 | 69058 | 144242 |
| 12/31/2019 | 79858 | 72130 | 72537 | 149241 |
| 01/31/2020 | 73680 | 66206 | 67202 | 147359 |
| 02/29/2020 | 68064 | 62057 | 63816 | 135296 |
| 03/31/2020 | 55709 | 47425 | 55643 | 116084 |
| 04/30/2020 | 57506 | 45642 | 54787 | 128697 |
| 05/31/2020 | 61101 | 51508 | 57161 | 134715 |
| 06/30/2020 | 63347 | 53745 | 58468 | 138859 |
| 07/31/2020 | 67390 | 55983 | 61804 | 145941 |
| 08/31/2020 | 72445 | 59695 | 65983 | 154789 |
| 09/30/2020 | 69187 | 57868 | 63774 | 149985 |
| 10/31/2020 | 68738 | 56401 | 64672 | 146700 |
| 11/30/2020 | 76263 | 62380 | 66945 | 165192 |
| 12/31/2020 | 81830 | 65399 | 70272 | 173225 |
| 01/31/2021 | 83971 | 67900 | 72120 | 172692 |
| 02/28/2021 | 90171 | 74232 | 76784 | 177156 |
| 03/31/2021 | 90058 | 72100 | 75135 | 181659 |
| 04/30/2021 | 95130 | 77870 | 81364 | 189522 |
| 05/31/2021 | 98962 | 80185 | 83586 | 192315 |
| 06/30/2021 | 99751 | 83185 | 85134 | 194458 |
| 07/31/2021 | 100540 | 85016 | 86699 | 195420 |
| 08/31/2021 | 100878 | 85056 | 86441 | 200309 |
| 09/30/2021 | 104147 | 89252 | 90743 | 192386 |
| 10/31/2021 | 108430 | 92675 | 93088 | 201615 |
| 11/30/2021 | 101893 | 85463 | 86281 | 196182 |
| 12/31/2021 | 106249 | 90610 | 89322 | 204059 |
| 01/31/2022 | 113305 | 99490 | 97166 | 193437 |
| 02/28/2022 | 120637 | 104959 | 103218 | 189105 |
| 03/31/2022 | 133504 | 115190 | 112142 | 192938 |
| 04/30/2022 | 134887 | 120369 | 116785 | 177726 |
| 05/31/2022 | 137931 | 123703 | 118569 | 177782 |
| 06/30/2022 | 121468 | 113920 | 105790 | 162438 |
| 07/31/2022 | 127140 | 114474 | 110303 | 173861 |
| 08/31/2022 | 127278 | 114100 | 110400 | 167730 |
| 09/30/2022 | 115519 | 105686 | 101447 | 151581 |
| 10/31/2022 | 119116 | 108323 | 103467 | 160700 |
| 11/30/2022 | 124649 | 110931 | 106301 | 173116 |
| 12/31/2022 | 120132 | 110531 | 103699 | 166960 |
| 01/31/2023 | 121168 | 111114 | 103188 | 178666 |
| 02/28/2023 | 115243 | 108213 | 98343 | 173693 |
| 03/31/2023 | 114206 | 107806 | 98140 | 178099 |
| 04/30/2023 | 113021 | 108396 | 97402 | 180518 |
| 05/31/2023 | 105319 | 103100 | 91911 | 178330 |
| 06/30/2023 | 109763 | 106874 | 95622 | 188640 |
| 07/31/2023 | 117317 | 115630 | 101607 | 195744 |
| 08/31/2023 | 115688 | 116052 | 100827 | 190240 |
| 09/30/2023 | 114206 | 117640 | 100127 | 182426 |
| 10/31/2023 | 113318 | 116800 | 100392 | 176469 |
| 11/30/2023 | 112281 | 114185 | 98132 | 192728 |
| 12/31/2023 | 111475 | 110557 | 95492 | 202580 |
| 01/31/2024 | 109791 | 114709 | 95871 | 203299 |
| 02/29/2024 | 108719 | 116323 | 94463 | 211773 |
| 03/31/2024 | 114231 | 123259 | 97588 | 218414 |
| 04/30/2024 | 116069 | 124360 | 100215 | 211162 |
| 05/31/2024 | 118672 | 124367 | 101974 | 219573 |
| 06/30/2024 | 115609 | 125013 | 100405 | 223723 |
| 07/31/2024 | 113619 | 120277 | 96352 | 228057 |
| 08/31/2024 | 112547 | 120314 | 96398 | 233446 |
| 09/30/2024 | 116375 | 124268 | 101084 | 238845 |
| 10/31/2024 | 114078 | 122530 | 99211 | 233222 |
| ALPS | CoreCommodity Fund - Class I - NAV | 0.67% | 8.79% | 1.33% |
| Morningstar Global Markets Index# | 32.16% | 10.63% | 8.84% |
| Bloomberg Commodity Total Return Index | -1.18% | 6.96% | -0.08% |
| FTSE / CoreCommodity CRB TR Index | 4.91% | 12.34% | 2.05% |
For the most current month-end performance data, please call 1-866-759-5679.
| Net Assets | $940,528,649 |
| Number of Portfolio Holdings | 55 |
| Portfolio Turnover Rate | 72% |
| Total Advisory Fees Paid | $9,426,269 |
| Government | 64.31% |
| Exhange Traded Funds | 30.12% |
| Futures | 18.30% |
| Common Stocks | 0.00% |
| Total Return Swaps | 0.00% |
| Cash, Cash Equivalents, & Other Net Assets | -12.73% |

| |
** | As a percentage of net assets. |
Holdings are subject to change
This is a summary of certain changes to the Fund since April 30, 2024. For more complete information, you may review the Fund's prospectus, which is available at https://www.alpsfunds.com/mutual-funds/jcrix or upon request at 866-759-5679.
Change to Principal Investment Strategy and Principal Risks: With respect to the Commodity Equity Investments portion of its portfolio, the Fund will now invest primarily through underlying exhange-traded funds (ETFs) as oppossed to making such investments directly. The following are now Principal Risks of the Fund: Affiliated ETF Risk and ETF Investment Risk.
If you wish to view additional information about the Fund, including but not limited to the Fund's prospectus, financial information, holdings, and proxy voting information, please visit https://www.alpsfunds.com/mutual-funds/jcrix.
If you have consented to receive a single annual or semi-annual shareholder report at a shared address you may revoke this consent by calling the Transfer Agent 866-759-5679.
ALPS | Kotak India ESG Fund - Investor Shares | FINANCIAL INVESTORS TRUST |
INDAX | |
This annual shareholder report contains important information about ALPS | Kotak India ESG Fund (the "Fund" or "INDAX") for the period of November 1, 2023 to October 31, 2024 (the "Period"). You can find additional information about the Fund at https://www.alpsfunds.com/mutual-funds/indix. You can also request this information by contacting us at 866-759-5679.
For the twelve months ended October 31, 2024, the ALPS | Kotak India ESG Fund Investor Class shares increased by 23.87%. The Fund underperformed the MSCI India Index -net of fees, which was up 32.69%.
Geopolitical concerns, US elections outcome, China recovery and earnings moderation in India corporations led global equity markets to correct from highs in October 2024, which also impacted the Fund's performance.
Top 5 additions to the Fund: Cognizant Technology, Ultratech Cement, Uno Minda, Thermax and Ashok Leyland
Top 5 exits from the Fund: Infosys, Hindustan Unilever, Persistent Systems, Maruti Suzuki India and Bajaj Finance
What contributed and detracted to/from performance?
Top contributors to relative performance
Top detractors from relative performance
There were notable reductions in the Fund's holdings within the Financials, Information Technology, and Consumer Staples sectors and an increase in the Fund's holdings within the Industrials, Communication Services, and Real Estate Sectors.
The Fund's past performance is not a good predictor of the Fund's future performance. The chart and the table below do not reflect the deduction of taxes that a shareholder would pay on Fund distributions or sale of Fund shares.
| 10/31/2014 | 10000 | 10000 | 10000 | 10000 | 10000 |
| 11/30/2014 | 10295 | 10207 | 10160 | 10214 | 10160 |
| 12/31/2014 | 10053 | 9845 | 9555 | 9760 | 9555 |
| 01/31/2015 | 10938 | 10611 | 10313 | 10524 | 10313 |
| 02/28/2015 | 10938 | 10793 | 10505 | 10661 | 10505 |
| 03/31/2015 | 10599 | 10311 | 10070 | 10258 | 10070 |
| 04/30/2015 | 10045 | 9769 | 9412 | 9717 | 9412 |
| 05/31/2015 | 10290 | 10071 | 9678 | 10014 | 9678 |
| 06/30/2015 | 10251 | 10024 | 9706 | 9991 | 9706 |
| 07/31/2015 | 10662 | 10299 | 9879 | 10218 | 9879 |
| 08/31/2015 | 9682 | 9323 | 9011 | 9272 | 9011 |
| 09/30/2015 | 9903 | 9425 | 9052 | 9332 | 9052 |
| 10/31/2015 | 9927 | 9601 | 9194 | 9553 | 9194 |
| 11/30/2015 | 9745 | 9347 | 8755 | 9204 | 8755 |
| 12/31/2015 | 9712 | 9449 | 8970 | 9405 | 8969 |
| 01/31/2016 | 9009 | 8695 | 8352 | 8679 | 8352 |
| 02/29/2016 | 8150 | 7966 | 7734 | 7960 | 7734 |
| 03/31/2016 | 9393 | 9117 | 8746 | 9052 | 8746 |
| 04/30/2016 | 9539 | 9272 | 8787 | 9167 | 8787 |
| 05/31/2016 | 9795 | 9488 | 8952 | 9294 | 8952 |
| 06/30/2016 | 10105 | 9704 | 9071 | 9484 | 9071 |
| 07/31/2016 | 10754 | 10320 | 9586 | 10055 | 9586 |
| 08/31/2016 | 11010 | 10535 | 9697 | 10249 | 9697 |
| 09/30/2016 | 11165 | 10459 | 9608 | 10209 | 9608 |
| 10/31/2016 | 11257 | 10590 | 9561 | 10283 | 9561 |
| 11/30/2016 | 10279 | 9744 | 8848 | 9509 | 8848 |
| 12/31/2016 | 10114 | 9693 | 8841 | 9460 | 8841 |
| 01/31/2017 | 10743 | 10316 | 9226 | 9948 | 9226 |
| 02/28/2017 | 11345 | 10925 | 9770 | 10602 | 9770 |
| 03/31/2017 | 12122 | 11351 | 10355 | 11288 | 10355 |
| 04/30/2017 | 12594 | 11668 | 10554 | 11641 | 10554 |
| 05/31/2017 | 12668 | 11824 | 10740 | 11738 | 10740 |
| 06/30/2017 | 12539 | 11810 | 10656 | 11714 | 10656 |
| 07/31/2017 | 13233 | 12582 | 11477 | 12525 | 11477 |
| 08/31/2017 | 13131 | 12492 | 11391 | 12487 | 11390 |
| 09/30/2017 | 12761 | 12106 | 10970 | 12106 | 10970 |
| 10/31/2017 | 13446 | 13030 | 11779 | 13031 | 11779 |
| 11/30/2017 | 13575 | 13057 | 11696 | 13060 | 11696 |
| 12/31/2017 | 14133 | 13689 | 12267 | 13709 | 12267 |
| 01/31/2018 | 14448 | 14027 | 12690 | 14060 | 12690 |
| 02/28/2018 | 13495 | 13111 | 11839 | 13182 | 11839 |
| 03/31/2018 | 13219 | 12640 | 11414 | 12688 | 11414 |
| 04/30/2018 | 13476 | 13167 | 11884 | 13231 | 11884 |
| 05/31/2018 | 13124 | 12766 | 11457 | 12737 | 11457 |
| 06/30/2018 | 12771 | 12363 | 11346 | 12455 | 11345 |
| 07/31/2018 | 13390 | 13057 | 12084 | 13173 | 12085 |
| 08/31/2018 | 13229 | 13059 | 12201 | 13276 | 12201 |
| 09/30/2018 | 11886 | 11638 | 11090 | 11839 | 11090 |
| 10/31/2018 | 11171 | 10957 | 10316 | 11094 | 10316 |
| 11/30/2018 | 12371 | 12109 | 11386 | 12219 | 11386 |
| 12/31/2018 | 12372 | 12190 | 11371 | 12268 | 11371 |
| 01/31/2019 | 12026 | 11754 | 11152 | 11918 | 11152 |
| 02/28/2019 | 11924 | 11713 | 11156 | 11885 | 11156 |
| 03/31/2019 | 13135 | 12914 | 12185 | 13057 | 12185 |
| 04/30/2019 | 13104 | 12865 | 12253 | 13025 | 12254 |
| 05/31/2019 | 13287 | 13053 | 12280 | 13137 | 12280 |
| 06/30/2019 | 13236 | 12981 | 12246 | 13081 | 12246 |
| 07/31/2019 | 12555 | 12200 | 11608 | 12404 | 11608 |
| 08/31/2019 | 12097 | 11685 | 11268 | 12010 | 11268 |
| 09/30/2019 | 12768 | 12308 | 11615 | 12458 | 11615 |
| 10/31/2019 | 13247 | 12713 | 12117 | 12996 | 12117 |
| 11/30/2019 | 13277 | 12753 | 12049 | 12983 | 12049 |
| 12/31/2019 | 13411 | 12929 | 12233 | 13162 | 12233 |
| 01/31/2020 | 13545 | 12855 | 12136 | 13132 | 12136 |
| 02/29/2020 | 12885 | 11905 | 11253 | 12178 | 11253 |
| 03/31/2020 | 9277 | 8703 | 8425 | 8976 | 8425 |
| 04/30/2020 | 10452 | 9988 | 9785 | 10405 | 9785 |
| 05/31/2020 | 10143 | 9714 | 9516 | 10114 | 9513 |
| 06/30/2020 | 11071 | 10533 | 10164 | 10948 | 10159 |
| 07/31/2020 | 12009 | 11362 | 11231 | 11971 | 11214 |
| 08/31/2020 | 12648 | 12048 | 11627 | 12509 | 11606 |
| 09/30/2020 | 12865 | 11982 | 11700 | 12548 | 11678 |
| 10/31/2020 | 13050 | 12139 | 11840 | 12753 | 11809 |
| 11/30/2020 | 14246 | 13703 | 12865 | 14028 | 12828 |
| 12/31/2020 | 15380 | 14917 | 14177 | 15401 | 14135 |
| 01/31/2021 | 15380 | 14676 | 13848 | 15140 | 13806 |
| 02/28/2021 | 16215 | 15628 | 14577 | 16083 | 14528 |
| 03/31/2021 | 16679 | 15969 | 14911 | 16490 | 14858 |
| 04/30/2021 | 16287 | 15860 | 14775 | 16416 | 14720 |
| 05/31/2021 | 17380 | 17336 | 16063 | 17845 | 15867 |
| 06/30/2021 | 17575 | 17253 | 15956 | 17843 | 15885 |
| 07/31/2021 | 18101 | 17529 | 16106 | 18089 | 16022 |
| 08/31/2021 | 19451 | 19038 | 17870 | 19731 | 17775 |
| 09/30/2021 | 19390 | 19376 | 17983 | 20051 | 17882 |
| 10/31/2021 | 19276 | 19248 | 17845 | 19901 | 17739 |
| 11/30/2021 | 18823 | 18663 | 17307 | 19336 | 17201 |
| 12/31/2021 | 19438 | 19286 | 17956 | 20062 | 17843 |
| 01/31/2022 | 19308 | 19168 | 17712 | 19788 | 17599 |
| 02/28/2022 | 18143 | 18181 | 17009 | 18833 | 16895 |
| 03/31/2022 | 18361 | 18842 | 17632 | 19537 | 17512 |
| 04/30/2022 | 17806 | 18554 | 17339 | 19290 | 17219 |
| 05/31/2022 | 16891 | 17531 | 16341 | 18097 | 16216 |
| 06/30/2022 | 16010 | 16369 | 15248 | 16849 | 15122 |
| 07/31/2022 | 17240 | 17862 | 16678 | 18394 | 16532 |
| 08/31/2022 | 17414 | 18640 | 17372 | 19200 | 17211 |
| 09/30/2022 | 16772 | 17659 | 16277 | 18118 | 16105 |
| 10/31/2022 | 17174 | 18062 | 16701 | 18482 | 16518 |
| 11/30/2022 | 17925 | 19006 | 17574 | 19404 | 17375 |
| 12/31/2022 | 16983 | 18145 | 16612 | 18510 | 16424 |
| 01/31/2023 | 16916 | 17759 | 16120 | 17977 | 15933 |
| 02/28/2023 | 16430 | 17113 | 15388 | 17262 | 15205 |
| 03/31/2023 | 16585 | 17271 | 15568 | 17412 | 15381 |
| 04/30/2023 | 16950 | 18152 | 16219 | 18211 | 16022 |
| 05/31/2023 | 17348 | 18635 | 16699 | 18696 | 16489 |
| 06/30/2023 | 18177 | 19614 | 17493 | 19683 | 17263 |
| 07/31/2023 | 18553 | 20342 | 18021 | 20392 | 17778 |
| 08/31/2023 | 18409 | 20115 | 17687 | 20175 | 17440 |
| 09/30/2023 | 18520 | 20456 | 17994 | 20532 | 17732 |
| 10/31/2023 | 18044 | 19847 | 17463 | 19895 | 17204 |
| 11/30/2023 | 19039 | 21250 | 18637 | 21294 | 18354 |
| 12/31/2023 | 19831 | 23005 | 20149 | 23026 | 19841 |
| 01/31/2024 | 20120 | 23517 | 20636 | 23676 | 20320 |
| 02/29/2024 | 20375 | 23924 | 21209 | 24150 | 20876 |
| 03/31/2024 | 20559 | 23988 | 21382 | 24157 | 21046 |
| 04/30/2024 | 20929 | 24841 | 21878 | 24968 | 21533 |
| 05/31/2024 | 21184 | 25032 | 22044 | 25135 | 21686 |
| 06/30/2024 | 22570 | 26833 | 23596 | 26980 | 23194 |
| 07/31/2024 | 22836 | 27915 | 24541 | 28071 | 24116 |
| 08/31/2024 | 23033 | 28141 | 24812 | 28268 | 24369 |
| 09/30/2024 | 23610 | 28756 | 25344 | 28872 | 24884 |
| 10/31/2024 | 22351 | 26929 | 23406 | 26811 | 22828 |
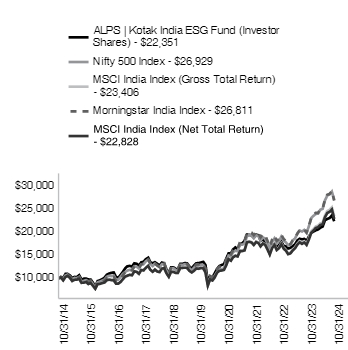
| ALPS | Kotak India ESG Fund - Investor - NAV | 23.87% | 11.03% | 8.38% |
| MSCI India Index (Net Total Return)#*** | 32.69% | 13.50% | 8.60% |
| Morningstar India Index | 34.76% | 15.59% | 10.37% |
| MSCI India Index (Gross Total Return)**** | 34.03% | 14.07% | 8.88% |
| Nifty 500 Index | 35.69% | 16.20% | 10.41% |
For the most current month-end performance data, please call 1-866-759-5679.
| Net Assets | $396,576,901 |
| Number of Portfolio Holdings | 42 |
| Portfolio Turnover Rate | 75% |
| Total Advisory Fees Paid | $2,056,987 |
| ICICI Bank, Ltd. | 8.76% |
| Reliance Industries, Ltd. | 6.61% |
| Axis Bank, Ltd. | 6.13% |
| HDFC Bank, Ltd. | 4.86% |
| Larsen & Toubro, Ltd. | 4.72% |
| Bharti Airtel, Ltd. | 4.48% |
| Cognizant Technology Solutions Corp. | 3.79% |
| Fortis Healthcare, Ltd. | 3.26% |
| Infosys, Ltd. | 3.22% |
| UltraTech Cement, Ltd. | 3.05% |
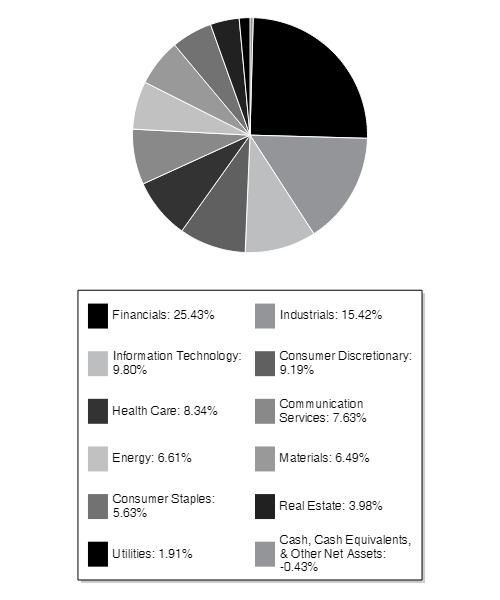
| Financials | 25.43% |
| Industrials | 15.42% |
| Information Technology | 9.80% |
| Consumer Discretionary | 9.19% |
| Health Care | 8.34% |
| Communication Services | 7.63% |
| Energy | 6.61% |
| Materials | 6.49% |
| Consumer Staples | 5.63% |
| Real Estate | 3.98% |
| Utilities | 1.91% |
| Cash, Cash Equivalents, & Other Net Assets | -0.43% |
| |
** | As a percentage of net assets. |
Holdings are subject to change
If you wish to view additional information about the Fund, including but not limited to the Fund's prospectus, financial information, holdings, and proxy voting information, please visit https://www.alpsfunds.com/mutual-funds/indix.
If you have consented to receive a single annual or semi-annual shareholder report at a shared address you may revoke this consent by calling the Transfer Agent 866-759-5679.
ALPS | Kotak India ESG Fund - Class A | FINANCIAL INVESTORS TRUST |
INAAX | |
This annual shareholder report contains important information about ALPS | Kotak India ESG Fund (the "Fund" or "INAAX") for the period of November 1, 2023 to October 31, 2024 (the "Period"). You can find additional information about the Fund at https://www.alpsfunds.com/mutual-funds/indix. You can also request this information by contacting us at 866-759-5679.
For the twelve months ended October 31, 2024, the ALPS | Kotak India ESG Fund Class A shares increased by 23.85%. The Fund underperformed the MSCI India Index -net of fees, which was up 32.69%.
Geopolitical concerns, US elections outcome, China recovery and earnings moderation in India corporations led global equity markets to correct from highs in October 2024, which also impacted the Fund's performance.
Top 5 additions to the Fund: Cognizant Technology, Ultratech Cement, Uno Minda, Thermax and Ashok Leyland
Top 5 exits from the Fund: Infosys, Hindustan Unilever, Persistent Systems, Maruti Suzuki India and Bajaj Finance
What contributed and detracted to/from performance?
Top contributors to relative performance
Top detractors from relative performance
There were notable reductions in the Fund's holdings within the Financials, Information Technology, and Consumer Staples sectors and an increase in the Fund's holdings within the Industrials, Communication Services, and Real Estate Sectors.
The Fund's past performance is not a good predictor of the Fund's future performance. The chart and the table below do not reflect the deduction of taxes that a shareholder would pay on Fund distributions or sale of Fund shares.
| 10/31/2014 | 9449 | 10000 | 10000 | 10000 | 10000 |
| 11/30/2014 | 9728 | 10207 | 10160 | 10214 | 10160 |
| 12/31/2014 | 9499 | 9845 | 9555 | 9760 | 9555 |
| 01/31/2015 | 10335 | 10611 | 10313 | 10524 | 10313 |
| 02/28/2015 | 10335 | 10793 | 10505 | 10661 | 10505 |
| 03/31/2015 | 10014 | 10311 | 10070 | 10258 | 10070 |
| 04/30/2015 | 9492 | 9769 | 9412 | 9717 | 9412 |
| 05/31/2015 | 9723 | 10071 | 9678 | 10014 | 9678 |
| 06/30/2015 | 9686 | 10024 | 9706 | 9991 | 9706 |
| 07/31/2015 | 10074 | 10299 | 9879 | 10218 | 9879 |
| 08/31/2015 | 9148 | 9323 | 9011 | 9272 | 9011 |
| 09/30/2015 | 9357 | 9425 | 9052 | 9332 | 9052 |
| 10/31/2015 | 9380 | 9601 | 9194 | 9553 | 9194 |
| 11/30/2015 | 9208 | 9347 | 8755 | 9204 | 8755 |
| 12/31/2015 | 9177 | 9449 | 8970 | 9405 | 8969 |
| 01/31/2016 | 8512 | 8695 | 8352 | 8679 | 8352 |
| 02/29/2016 | 7701 | 7966 | 7734 | 7960 | 7734 |
| 03/31/2016 | 8875 | 9117 | 8746 | 9052 | 8746 |
| 04/30/2016 | 9013 | 9272 | 8787 | 9167 | 8787 |
| 05/31/2016 | 9255 | 9488 | 8952 | 9294 | 8952 |
| 06/30/2016 | 9548 | 9704 | 9071 | 9484 | 9071 |
| 07/31/2016 | 10161 | 10320 | 9586 | 10055 | 9586 |
| 08/31/2016 | 10403 | 10535 | 9697 | 10249 | 9697 |
| 09/30/2016 | 10550 | 10459 | 9608 | 10209 | 9608 |
| 10/31/2016 | 10636 | 10590 | 9561 | 10283 | 9561 |
| 11/30/2016 | 9712 | 9744 | 8848 | 9509 | 8848 |
| 12/31/2016 | 9557 | 9693 | 8841 | 9460 | 8841 |
| 01/31/2017 | 10151 | 10316 | 9226 | 9948 | 9226 |
| 02/28/2017 | 10720 | 10925 | 9770 | 10602 | 9770 |
| 03/31/2017 | 11454 | 11351 | 10355 | 11288 | 10355 |
| 04/30/2017 | 11900 | 11668 | 10554 | 11641 | 10554 |
| 05/31/2017 | 11970 | 11824 | 10740 | 11738 | 10740 |
| 06/30/2017 | 11848 | 11810 | 10656 | 11714 | 10656 |
| 07/31/2017 | 12503 | 12582 | 11477 | 12525 | 11477 |
| 08/31/2017 | 12407 | 12492 | 11391 | 12487 | 11390 |
| 09/30/2017 | 12057 | 12106 | 10970 | 12106 | 10970 |
| 10/31/2017 | 12704 | 13030 | 11779 | 13031 | 11779 |
| 11/30/2017 | 12827 | 13057 | 11696 | 13060 | 11696 |
| 12/31/2017 | 13354 | 13689 | 12267 | 13709 | 12267 |
| 01/31/2018 | 13651 | 14027 | 12690 | 14060 | 12690 |
| 02/28/2018 | 12751 | 13111 | 11839 | 13182 | 11839 |
| 03/31/2018 | 12490 | 12640 | 11414 | 12688 | 11414 |
| 04/30/2018 | 12733 | 13167 | 11884 | 13231 | 11884 |
| 05/31/2018 | 12400 | 12766 | 11457 | 12737 | 11457 |
| 06/30/2018 | 12067 | 12363 | 11346 | 12455 | 11345 |
| 07/31/2018 | 12652 | 13057 | 12084 | 13173 | 12085 |
| 08/31/2018 | 12490 | 13059 | 12201 | 13276 | 12201 |
| 09/30/2018 | 11222 | 11638 | 11090 | 11839 | 11090 |
| 10/31/2018 | 10547 | 10957 | 10316 | 11094 | 10316 |
| 11/30/2018 | 11690 | 12109 | 11386 | 12219 | 11386 |
| 12/31/2018 | 11681 | 12190 | 11371 | 12268 | 11371 |
| 01/31/2019 | 11354 | 11754 | 11152 | 11918 | 11152 |
| 02/28/2019 | 11258 | 11713 | 11156 | 11885 | 11156 |
| 03/31/2019 | 12402 | 12914 | 12185 | 13057 | 12185 |
| 04/30/2019 | 12363 | 12865 | 12253 | 13025 | 12254 |
| 05/31/2019 | 12536 | 13053 | 12280 | 13137 | 12280 |
| 06/30/2019 | 12479 | 12981 | 12246 | 13081 | 12246 |
| 07/31/2019 | 11835 | 12200 | 11608 | 12404 | 11608 |
| 08/31/2019 | 11412 | 11685 | 11268 | 12010 | 11268 |
| 09/30/2019 | 12036 | 12308 | 11615 | 12458 | 11615 |
| 10/31/2019 | 12488 | 12713 | 12117 | 12996 | 12117 |
| 11/30/2019 | 12517 | 12753 | 12049 | 12983 | 12049 |
| 12/31/2019 | 12644 | 12929 | 12233 | 13162 | 12233 |
| 01/31/2020 | 12770 | 12855 | 12136 | 13132 | 12136 |
| 02/29/2020 | 12157 | 11905 | 11253 | 12178 | 11253 |
| 03/31/2020 | 8747 | 8703 | 8425 | 8976 | 8425 |
| 04/30/2020 | 9858 | 9988 | 9785 | 10405 | 9785 |
| 05/31/2020 | 9565 | 9714 | 9516 | 10114 | 9513 |
| 06/30/2020 | 10403 | 10533 | 10164 | 10948 | 10159 |
| 07/31/2020 | 11290 | 11362 | 11231 | 11971 | 11214 |
| 08/31/2020 | 11884 | 12048 | 11627 | 12509 | 11606 |
| 09/30/2020 | 12088 | 11982 | 11700 | 12548 | 11678 |
| 10/31/2020 | 12264 | 12139 | 11840 | 12753 | 11809 |
| 11/30/2020 | 13394 | 13703 | 12865 | 14028 | 12828 |
| 12/31/2020 | 14465 | 14917 | 14177 | 15401 | 14135 |
| 01/31/2021 | 14465 | 14676 | 13848 | 15140 | 13806 |
| 02/28/2021 | 15244 | 15628 | 14577 | 16083 | 14528 |
| 03/31/2021 | 15683 | 15969 | 14911 | 16490 | 14858 |
| 04/30/2021 | 15303 | 15860 | 14775 | 16416 | 14720 |
| 05/31/2021 | 16335 | 17336 | 16063 | 17845 | 15867 |
| 06/30/2021 | 16520 | 17253 | 15956 | 17843 | 15885 |
| 07/31/2021 | 17017 | 17529 | 16106 | 18089 | 16022 |
| 08/31/2021 | 18293 | 19038 | 17870 | 19731 | 17775 |
| 09/30/2021 | 18225 | 19376 | 17983 | 20051 | 17882 |
| 10/31/2021 | 18137 | 19248 | 17845 | 19901 | 17739 |
| 11/30/2021 | 17699 | 18663 | 17307 | 19336 | 17201 |
| 12/31/2021 | 18285 | 19286 | 17956 | 20062 | 17843 |
| 01/31/2022 | 18161 | 19168 | 17712 | 19788 | 17599 |
| 02/28/2022 | 17060 | 18181 | 17009 | 18833 | 16895 |
| 03/31/2022 | 17277 | 18842 | 17632 | 19537 | 17512 |
| 04/30/2022 | 16752 | 18554 | 17339 | 19290 | 17219 |
| 05/31/2022 | 15908 | 17531 | 16341 | 18097 | 16216 |
| 06/30/2022 | 15075 | 16369 | 15248 | 16849 | 15122 |
| 07/31/2022 | 16237 | 17862 | 16678 | 18394 | 16532 |
| 08/31/2022 | 16402 | 18640 | 17372 | 19200 | 17211 |
| 09/30/2022 | 15805 | 17659 | 16277 | 18118 | 16105 |
| 10/31/2022 | 16196 | 18062 | 16701 | 18482 | 16518 |
| 11/30/2022 | 16896 | 19006 | 17574 | 19404 | 17375 |
| 12/31/2022 | 16005 | 18145 | 16612 | 18510 | 16424 |
| 01/31/2023 | 15942 | 17759 | 16120 | 17977 | 15933 |
| 02/28/2023 | 15492 | 17113 | 15388 | 17262 | 15205 |
| 03/31/2023 | 15649 | 17271 | 15568 | 17412 | 15381 |
| 04/30/2023 | 15994 | 18152 | 16219 | 18211 | 16022 |
| 05/31/2023 | 16370 | 18635 | 16699 | 18696 | 16489 |
| 06/30/2023 | 17154 | 19614 | 17493 | 19683 | 17263 |
| 07/31/2023 | 17510 | 20342 | 18021 | 20392 | 17778 |
| 08/31/2023 | 17364 | 20115 | 17687 | 20175 | 17440 |
| 09/30/2023 | 17468 | 20456 | 17994 | 20532 | 17732 |
| 10/31/2023 | 17029 | 19847 | 17463 | 19895 | 17204 |
| 11/30/2023 | 17970 | 21250 | 18637 | 21294 | 18354 |
| 12/31/2023 | 18719 | 23005 | 20149 | 23026 | 19841 |
| 01/31/2024 | 18992 | 23517 | 20636 | 23676 | 20320 |
| 02/29/2024 | 19232 | 23924 | 21209 | 24150 | 20876 |
| 03/31/2024 | 19407 | 23988 | 21382 | 24157 | 21046 |
| 04/30/2024 | 19746 | 24841 | 21878 | 24968 | 21533 |
| 05/31/2024 | 19997 | 25032 | 22044 | 25135 | 21686 |
| 06/30/2024 | 21309 | 26833 | 23596 | 26980 | 23194 |
| 07/31/2024 | 21549 | 27915 | 24541 | 28071 | 24116 |
| 08/31/2024 | 21735 | 28141 | 24812 | 28268 | 24369 |
| 09/30/2024 | 22281 | 28756 | 25344 | 28872 | 24884 |
| 10/31/2024 | 21090 | 26929 | 23406 | 26811 | 22828 |
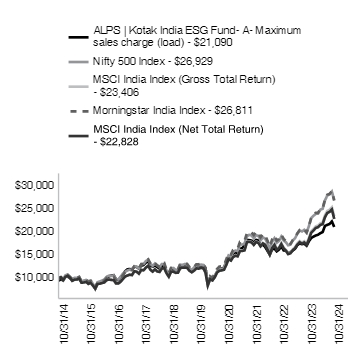
| ALPS | Kotak India ESG Fund - A - NAV** | 23.85% | 11.05% | 8.36% |
| ALPS | Kotak India ESG Fund - A -Maximum sales charge (load)*^ | 17.02% | 9.79% | 7.75% |
| MSCI India Index (Net Total Return)#*** | 32.69% | 13.50% | 8.60% |
| Morningstar India Index | 34.76% | 15.59% | 10.37% |
| MSCI India Index (Gross Total Return)**** | 34.03% | 14.07% | 8.88% |
| Nifty 500 Index | 35.69% | 16.20% | 10.41% |
For the most current month-end performance data, please call 1-866-759-5679.
| Net Assets | $396,576,901 |
| Number of Portfolio Holdings | 42 |
| Portfolio Turnover Rate | 75% |
| Total Advisory Fees Paid | $2,056,987 |
| ICICI Bank, Ltd. | 8.76% |
| Reliance Industries, Ltd. | 6.61% |
| Axis Bank, Ltd. | 6.13% |
| HDFC Bank, Ltd. | 4.86% |
| Larsen & Toubro, Ltd. | 4.72% |
| Bharti Airtel, Ltd. | 4.48% |
| Cognizant Technology Solutions Corp. | 3.79% |
| Fortis Healthcare, Ltd. | 3.26% |
| Infosys, Ltd. | 3.22% |
| UltraTech Cement, Ltd. | 3.05% |
| Financials | 25.43% |
| Industrials | 15.42% |
| Information Technology | 9.80% |
| Consumer Discretionary | 9.19% |
| Health Care | 8.34% |
| Communication Services | 7.63% |
| Energy | 6.61% |
| Materials | 6.49% |
| Consumer Staples | 5.63% |
| Real Estate | 3.98% |
| Utilities | 1.91% |
| Cash, Cash Equivalents, & Other Net Assets | -0.43% |

| |
** | As a percentage of net assets. |
Holdings are subject to change
If you wish to view additional information about the Fund, including but not limited to the Fund's prospectus, financial information, holdings, and proxy voting information, please visit https://www.alpsfunds.com/mutual-funds/indix.
If you have consented to receive a single annual or semi-annual shareholder report at a shared address you may revoke this consent by calling the Transfer Agent 866-759-5679.
ALPS | Kotak India ESG Fund - Class C | FINANCIAL INVESTORS TRUST |
INFCX | |
This annual shareholder report contains important information about ALPS | Kotak India ESG Fund (the "Fund" or "INFCX") for the period of November 1, 2023 to October 31, 2024 (the "Period"). You can find additional information about the Fund at https://www.alpsfunds.com/mutual-funds/indix. You can also request this information by contacting us at 866-759-5679.
For the twelve months ended October 31, 2024, the ALPS | Kotak India ESG Fund Class C shares increased by 22.83%. The Fund underperformed the MSCI India Index -net of fees, which was up 32.69%.
Geopolitical concerns, US elections outcome, China recovery and earnings moderation in India corporations led global equity markets to correct from highs in October 2024, which also impacted the Fund's performance.
Top 5 additions to the Fund: Cognizant Technology, Ultratech Cement, Uno Minda, Thermax and Ashok Leyland
Top 5 exits from the Fund: Infosys, Hindustan Unilever, Persistent Systems, Maruti Suzuki India and Bajaj Finance
What contributed and detracted to/from performance?
Top contributors to relative performance
Top detractors from relative performance
There were notable reductions in the Fund's holdings within the Financials, Information Technology, and Consumer Staples sectors and an increase in the Fund's holdings within the Industrials, Communication Services, and Real Estate Sectors.
The Fund's past performance is not a good predictor of the Fund's future performance. The chart and the table below do not reflect the deduction of taxes that a shareholder would pay on Fund distributions or sale of Fund shares.
| 10/31/2014 | 10000 | 10000 | 10000 | 10000 | 10000 |
| 11/30/2014 | 10280 | 10207 | 10160 | 10214 | 10160 |
| 12/31/2014 | 10036 | 9845 | 9555 | 9760 | 9555 |
| 01/31/2015 | 10915 | 10611 | 10313 | 10524 | 10313 |
| 02/28/2015 | 10907 | 10793 | 10505 | 10661 | 10505 |
| 03/31/2015 | 10568 | 10311 | 10070 | 10258 | 10070 |
| 04/30/2015 | 10003 | 9769 | 9412 | 9717 | 9412 |
| 05/31/2015 | 10245 | 10071 | 9678 | 10014 | 9678 |
| 06/30/2015 | 10197 | 10024 | 9706 | 9991 | 9706 |
| 07/31/2015 | 10600 | 10299 | 9879 | 10218 | 9879 |
| 08/31/2015 | 9624 | 9323 | 9011 | 9272 | 9011 |
| 09/30/2015 | 9842 | 9425 | 9052 | 9332 | 9052 |
| 10/31/2015 | 9866 | 9601 | 9194 | 9553 | 9194 |
| 11/30/2015 | 9673 | 9347 | 8755 | 9204 | 8755 |
| 12/31/2015 | 9639 | 9449 | 8970 | 9405 | 8969 |
| 01/31/2016 | 8937 | 8695 | 8352 | 8679 | 8352 |
| 02/29/2016 | 8075 | 7966 | 7734 | 7960 | 7734 |
| 03/31/2016 | 9302 | 9117 | 8746 | 9052 | 8746 |
| 04/30/2016 | 9452 | 9272 | 8787 | 9167 | 8787 |
| 05/31/2016 | 9696 | 9488 | 8952 | 9294 | 8952 |
| 06/30/2016 | 9995 | 9704 | 9071 | 9484 | 9071 |
| 07/31/2016 | 10632 | 10320 | 9586 | 10055 | 9586 |
| 08/31/2016 | 10867 | 10535 | 9697 | 10249 | 9697 |
| 09/30/2016 | 11017 | 10459 | 9608 | 10209 | 9608 |
| 10/31/2016 | 11101 | 10590 | 9561 | 10283 | 9561 |
| 11/30/2016 | 10136 | 9744 | 8848 | 9509 | 8848 |
| 12/31/2016 | 9967 | 9693 | 8841 | 9460 | 8841 |
| 01/31/2017 | 10574 | 10316 | 9226 | 9948 | 9226 |
| 02/28/2017 | 11173 | 10925 | 9770 | 10602 | 9770 |
| 03/31/2017 | 11922 | 11351 | 10355 | 11288 | 10355 |
| 04/30/2017 | 12378 | 11668 | 10554 | 11641 | 10554 |
| 05/31/2017 | 12444 | 11824 | 10740 | 11738 | 10740 |
| 06/30/2017 | 12312 | 11810 | 10656 | 11714 | 10656 |
| 07/31/2017 | 12986 | 12582 | 11477 | 12525 | 11477 |
| 08/31/2017 | 12881 | 12492 | 11391 | 12487 | 11390 |
| 09/30/2017 | 12511 | 12106 | 10970 | 12106 | 10970 |
| 10/31/2017 | 13166 | 13030 | 11779 | 13031 | 11779 |
| 11/30/2017 | 13280 | 13057 | 11696 | 13060 | 11696 |
| 12/31/2017 | 13824 | 13689 | 12267 | 13709 | 12267 |
| 01/31/2018 | 14127 | 14027 | 12690 | 14060 | 12690 |
| 02/28/2018 | 13188 | 13111 | 11839 | 13182 | 11839 |
| 03/31/2018 | 12914 | 12640 | 11414 | 12688 | 11414 |
| 04/30/2018 | 13149 | 13167 | 11884 | 13231 | 11884 |
| 05/31/2018 | 12806 | 12766 | 11457 | 12737 | 11457 |
| 06/30/2018 | 12454 | 12363 | 11346 | 12455 | 11345 |
| 07/31/2018 | 13051 | 13057 | 12084 | 13173 | 12085 |
| 08/31/2018 | 12875 | 13059 | 12201 | 13276 | 12201 |
| 09/30/2018 | 11564 | 11638 | 11090 | 11839 | 11090 |
| 10/31/2018 | 10859 | 10957 | 10316 | 11094 | 10316 |
| 11/30/2018 | 12033 | 12109 | 11386 | 12219 | 11386 |
| 12/31/2018 | 12014 | 12190 | 11371 | 12268 | 11371 |
| 01/31/2019 | 11678 | 11754 | 11152 | 11918 | 11152 |
| 02/28/2019 | 11573 | 11713 | 11156 | 11885 | 11156 |
| 03/31/2019 | 12738 | 12914 | 12185 | 13057 | 12185 |
| 04/30/2019 | 12696 | 12865 | 12253 | 13025 | 12254 |
| 05/31/2019 | 12864 | 13053 | 12280 | 13137 | 12280 |
| 06/30/2019 | 12790 | 12981 | 12246 | 13081 | 12246 |
| 07/31/2019 | 12129 | 12200 | 11608 | 12404 | 11608 |
| 08/31/2019 | 11689 | 11685 | 11268 | 12010 | 11268 |
| 09/30/2019 | 12318 | 12308 | 11615 | 12458 | 11615 |
| 10/31/2019 | 12780 | 12713 | 12117 | 12996 | 12117 |
| 11/30/2019 | 12801 | 12753 | 12049 | 12983 | 12049 |
| 12/31/2019 | 12918 | 12929 | 12233 | 13162 | 12233 |
| 01/31/2020 | 13046 | 12855 | 12136 | 13132 | 12136 |
| 02/29/2020 | 12407 | 11905 | 11253 | 12178 | 11253 |
| 03/31/2020 | 8928 | 8703 | 8425 | 8976 | 8425 |
| 04/30/2020 | 10045 | 9988 | 9785 | 10405 | 9785 |
| 05/31/2020 | 9747 | 9714 | 9516 | 10114 | 9513 |
| 06/30/2020 | 10588 | 10533 | 10164 | 10948 | 10159 |
| 07/31/2020 | 11481 | 11362 | 11231 | 11971 | 11214 |
| 08/31/2020 | 12077 | 12048 | 11627 | 12509 | 11606 |
| 09/30/2020 | 12279 | 11982 | 11700 | 12548 | 11678 |
| 10/31/2020 | 12450 | 12139 | 11840 | 12753 | 11809 |
| 11/30/2020 | 13588 | 13703 | 12865 | 14028 | 12828 |
| 12/31/2020 | 14663 | 14917 | 14177 | 15401 | 14135 |
| 01/31/2021 | 14663 | 14676 | 13848 | 15140 | 13806 |
| 02/28/2021 | 15440 | 15628 | 14577 | 16083 | 14528 |
| 03/31/2021 | 15876 | 15969 | 14911 | 16490 | 14858 |
| 04/30/2021 | 15493 | 15860 | 14775 | 16416 | 14720 |
| 05/31/2021 | 16525 | 17336 | 16063 | 17845 | 15867 |
| 06/30/2021 | 16706 | 17253 | 15956 | 17843 | 15885 |
| 07/31/2021 | 17185 | 17529 | 16106 | 18089 | 16022 |
| 08/31/2021 | 18462 | 19038 | 17870 | 19731 | 17775 |
| 09/30/2021 | 18387 | 19376 | 17983 | 20051 | 17882 |
| 10/31/2021 | 18281 | 19248 | 17845 | 19901 | 17739 |
| 11/30/2021 | 17834 | 18663 | 17307 | 19336 | 17201 |
| 12/31/2021 | 18408 | 19286 | 17956 | 20062 | 17843 |
| 01/31/2022 | 18284 | 19168 | 17712 | 19788 | 17599 |
| 02/28/2022 | 17168 | 18181 | 17009 | 18833 | 16895 |
| 03/31/2022 | 17359 | 18842 | 17632 | 19537 | 17512 |
| 04/30/2022 | 16829 | 18554 | 17339 | 19290 | 17219 |
| 05/31/2022 | 15949 | 17531 | 16341 | 18097 | 16216 |
| 06/30/2022 | 15115 | 16369 | 15248 | 16849 | 15122 |
| 07/31/2022 | 16265 | 17862 | 16678 | 18394 | 16532 |
| 08/31/2022 | 16423 | 18640 | 17372 | 19200 | 17211 |
| 09/30/2022 | 15803 | 17659 | 16277 | 18118 | 16105 |
| 10/31/2022 | 16175 | 18062 | 16701 | 18482 | 16518 |
| 11/30/2022 | 16863 | 19006 | 17574 | 19404 | 17375 |
| 12/31/2022 | 15965 | 18145 | 16612 | 18510 | 16424 |
| 01/31/2023 | 15896 | 17759 | 16120 | 17977 | 15933 |
| 02/28/2023 | 15437 | 17113 | 15388 | 17262 | 15205 |
| 03/31/2023 | 15575 | 17271 | 15568 | 17412 | 15381 |
| 04/30/2023 | 15907 | 18152 | 16219 | 18211 | 16022 |
| 05/31/2023 | 16275 | 18635 | 16699 | 18696 | 16489 |
| 06/30/2023 | 17044 | 19614 | 17493 | 19683 | 17263 |
| 07/31/2023 | 17388 | 20342 | 18021 | 20392 | 17778 |
| 08/31/2023 | 17239 | 20115 | 17687 | 20175 | 17440 |
| 09/30/2023 | 17331 | 20456 | 17994 | 20532 | 17732 |
| 10/31/2023 | 16883 | 19847 | 17463 | 19895 | 17204 |
| 11/30/2023 | 17801 | 21250 | 18637 | 21294 | 18354 |
| 12/31/2023 | 18531 | 23005 | 20149 | 23026 | 19841 |
| 01/31/2024 | 18785 | 23517 | 20636 | 23676 | 20320 |
| 02/29/2024 | 19014 | 23924 | 21209 | 24150 | 20876 |
| 03/31/2024 | 19170 | 23988 | 21382 | 24157 | 21046 |
| 04/30/2024 | 19496 | 24841 | 21878 | 24968 | 21533 |
| 05/31/2024 | 19725 | 25032 | 22044 | 25135 | 21686 |
| 06/30/2024 | 21003 | 26833 | 23596 | 26980 | 23194 |
| 07/31/2024 | 21232 | 27915 | 24541 | 28071 | 24116 |
| 08/31/2024 | 21413 | 28141 | 24812 | 28268 | 24369 |
| 09/30/2024 | 21932 | 28756 | 25344 | 28872 | 24884 |
| 10/31/2024 | 20738 | 26929 | 23406 | 26811 | 22828 |
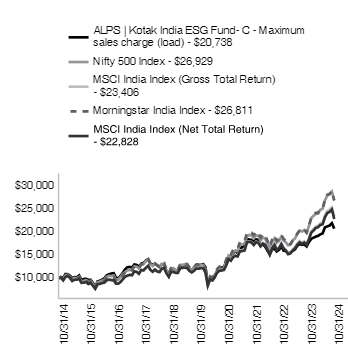
| ALPS | Kotak India ESG Fund - C - NAV | 22.83% | 10.17% | 7.57% |
| ALPS | Kotak India ESG Fund - C - Maximum deferred sales charge** | 21.83% | 10.17% | 7.57% |
| MSCI India Index (Net Total Return)#*** | 32.69% | 13.50% | 8.60% |
| Morningstar India Index | 34.76% | 15.59% | 10.37% |
| MSCI India Index (Gross Total Return)**** | 34.03% | 14.07% | 8.88% |
| Nifty 500 Index | 35.69% | 16.20% | 10.41% |
For the most current month-end performance data, please call 1-866-759-5679.
| Net Assets | $396,576,901 |
| Number of Portfolio Holdings | 42 |
| Portfolio Turnover Rate | 75% |
| Total Advisory Fees Paid | $2,056,987 |
| ICICI Bank, Ltd. | 8.76% |
| Reliance Industries, Ltd. | 6.61% |
| Axis Bank, Ltd. | 6.13% |
| HDFC Bank, Ltd. | 4.86% |
| Larsen & Toubro, Ltd. | 4.72% |
| Bharti Airtel, Ltd. | 4.48% |
| Cognizant Technology Solutions Corp. | 3.79% |
| Fortis Healthcare, Ltd. | 3.26% |
| Infosys, Ltd. | 3.22% |
| UltraTech Cement, Ltd. | 3.05% |
| Financials | 25.43% |
| Industrials | 15.42% |
| Information Technology | 9.80% |
| Consumer Discretionary | 9.19% |
| Health Care | 8.34% |
| Communication Services | 7.63% |
| Energy | 6.61% |
| Materials | 6.49% |
| Consumer Staples | 5.63% |
| Real Estate | 3.98% |
| Utilities | 1.91% |
| Cash, Cash Equivalents, & Other Net Assets | -0.43% |

| |
** | As a percentage of net assets. |
Holdings are subject to change
If you wish to view additional information about the Fund, including but not limited to the Fund's prospectus, financial information, holdings, and proxy voting information, please visit https://www.alpsfunds.com/mutual-funds/indix.
If you have consented to receive a single annual or semi-annual shareholder report at a shared address you may revoke this consent by calling the Transfer Agent 866-759-5679.
ALPS | Kotak India ESG Fund - Class I | FINANCIAL INVESTORS TRUST |
INDIX | |
This annual shareholder report contains important information about ALPS | Kotak India ESG Fund (the "Fund" or "INDIX") for the period of November 1, 2023 to October 31, 2024 (the "Period"). You can find additional information about the Fund at https://www.alpsfunds.com/mutual-funds/indix. You can also request this information by contacting us at 866-759-5679.
For the twelve months ended October 31, 2024, the ALPS | Kotak India ESG Fund Class I shares increased by 24.18%. The Fund underperformed the MSCI India Index -net of fees, which was up 32.69%.
Geopolitical concerns, US elections outcome, China recovery and earnings moderation in India corporations led global equity markets to correct from highs in October 2024, which also impacted the Fund's performance.
Top 5 additions to the Fund: Cognizant Technology, Ultratech Cement, Uno Minda, Thermax and Ashok Leyland
Top 5 exits from the Fund: Infosys, Hindustan Unilever, Persistent Systems, Maruti Suzuki India and Bajaj Finance
What contributed and detracted to/from performance?
Top contributors to relative performance
Top detractors from relative performance
There were notable reductions in the Fund's holdings within the Financials, Information Technology, and Consumer Staples sectors and an increase in the Fund's holdings within the Industrials, Communication Services, and Real Estate Sectors.
The Fund's past performance is not a good predictor of the Fund's future performance. The chart and the table below do not reflect the deduction of taxes that a shareholder would pay on Fund distributions or sale of Fund shares.
| 10/31/2014 | 100000 | 100000 | 100000 | 100000 | 100000 |
| 11/30/2014 | 103010 | 102068 | 101600 | 102142 | 101601 |
| 12/31/2014 | 100710 | 98449 | 95546 | 97601 | 95545 |
| 01/31/2015 | 109546 | 106111 | 103134 | 105239 | 103135 |
| 02/28/2015 | 109624 | 107927 | 105051 | 106614 | 105052 |
| 03/31/2015 | 106184 | 103107 | 100702 | 102585 | 100702 |
| 04/30/2015 | 100710 | 97688 | 94116 | 97169 | 94116 |
| 05/31/2015 | 103212 | 100707 | 96779 | 100143 | 96779 |
| 06/30/2015 | 102821 | 100237 | 97064 | 99912 | 97063 |
| 07/31/2015 | 106966 | 102988 | 98787 | 102177 | 98786 |
| 08/31/2015 | 97192 | 93232 | 90111 | 92723 | 90112 |
| 09/30/2015 | 99459 | 94255 | 90521 | 93319 | 90522 |
| 10/31/2015 | 99772 | 96006 | 91943 | 95531 | 91942 |
| 11/30/2015 | 97895 | 93468 | 87552 | 92042 | 87551 |
| 12/31/2015 | 97657 | 94495 | 89695 | 94048 | 89695 |
| 01/31/2016 | 90624 | 86953 | 83522 | 86785 | 83522 |
| 02/29/2016 | 81967 | 79662 | 77341 | 79603 | 77341 |
| 03/31/2016 | 94501 | 91169 | 87457 | 90524 | 87456 |
| 04/30/2016 | 96034 | 92723 | 87872 | 91666 | 87873 |
| 05/31/2016 | 98559 | 94882 | 89523 | 92944 | 89523 |
| 06/30/2016 | 101805 | 97036 | 90712 | 94835 | 90712 |
| 07/31/2016 | 108298 | 103199 | 95860 | 100552 | 95860 |
| 08/31/2016 | 110823 | 105351 | 96971 | 102490 | 96971 |
| 09/30/2016 | 112446 | 104593 | 96083 | 102094 | 96082 |
| 10/31/2016 | 113438 | 105903 | 95609 | 102830 | 95609 |
| 11/30/2016 | 103609 | 97436 | 88479 | 95088 | 88479 |
| 12/31/2016 | 101892 | 96933 | 88409 | 94596 | 88410 |
| 01/31/2017 | 108192 | 103155 | 92257 | 99479 | 92257 |
| 02/28/2017 | 114400 | 109252 | 97704 | 106019 | 97705 |
| 03/31/2017 | 122252 | 113509 | 103546 | 112875 | 103546 |
| 04/30/2017 | 127000 | 116675 | 105544 | 116409 | 105543 |
| 05/31/2017 | 127822 | 118236 | 107397 | 117376 | 107397 |
| 06/30/2017 | 126543 | 118101 | 106557 | 117138 | 106557 |
| 07/31/2017 | 133574 | 125819 | 114767 | 125249 | 114767 |
| 08/31/2017 | 132661 | 124925 | 113905 | 124872 | 113905 |
| 09/30/2017 | 128917 | 121063 | 109704 | 121056 | 109703 |
| 10/31/2017 | 135765 | 130299 | 117791 | 130312 | 117790 |
| 11/30/2017 | 137134 | 130569 | 116960 | 130602 | 116960 |
| 12/31/2017 | 142826 | 136888 | 122674 | 137091 | 122673 |
| 01/31/2018 | 146018 | 140270 | 126896 | 140601 | 126896 |
| 02/28/2018 | 136440 | 131106 | 118389 | 131820 | 118390 |
| 03/31/2018 | 133717 | 126403 | 114144 | 126879 | 114143 |
| 04/30/2018 | 136346 | 131666 | 118842 | 132313 | 118842 |
| 05/31/2018 | 132872 | 127660 | 114569 | 127374 | 114569 |
| 06/30/2018 | 129304 | 123630 | 113455 | 124546 | 113454 |
| 07/31/2018 | 135595 | 130568 | 120844 | 131732 | 120846 |
| 08/31/2018 | 133905 | 130591 | 122010 | 132760 | 122010 |
| 09/30/2018 | 120383 | 116375 | 110902 | 118395 | 110903 |
| 10/31/2018 | 113153 | 109573 | 103164 | 110944 | 103165 |
| 11/30/2018 | 125454 | 121090 | 113862 | 122194 | 113862 |
| 12/31/2018 | 125466 | 121899 | 113712 | 122684 | 113712 |
| 01/31/2019 | 121961 | 117542 | 111521 | 119179 | 111521 |
| 02/28/2019 | 120960 | 117132 | 111556 | 118855 | 111556 |
| 03/31/2019 | 133276 | 129141 | 121852 | 130571 | 121853 |
| 04/30/2019 | 132875 | 128648 | 122535 | 130253 | 122535 |
| 05/31/2019 | 134878 | 130530 | 122801 | 131370 | 122800 |
| 06/30/2019 | 134177 | 129806 | 122464 | 130806 | 122464 |
| 07/31/2019 | 127368 | 121998 | 116078 | 124036 | 116078 |
| 08/31/2019 | 122762 | 116847 | 112684 | 120098 | 112684 |
| 09/30/2019 | 129571 | 123077 | 116151 | 124585 | 116151 |
| 10/31/2019 | 134478 | 127128 | 121174 | 129956 | 121174 |
| 11/30/2019 | 134778 | 127532 | 120494 | 129833 | 120494 |
| 12/31/2019 | 136196 | 129290 | 122326 | 131622 | 122326 |
| 01/31/2020 | 137717 | 128547 | 121360 | 131320 | 121360 |
| 02/29/2020 | 131024 | 119047 | 112534 | 121781 | 112534 |
| 03/31/2020 | 94313 | 87029 | 84250 | 89762 | 84250 |
| 04/30/2020 | 106279 | 99882 | 97853 | 104053 | 97850 |
| 05/31/2020 | 103135 | 97136 | 95159 | 101141 | 95128 |
| 06/30/2020 | 112161 | 105329 | 101643 | 109481 | 101592 |
| 07/31/2020 | 121694 | 113622 | 112308 | 119709 | 112140 |
| 08/31/2020 | 128184 | 120483 | 116268 | 125094 | 116061 |
| 09/30/2020 | 130415 | 119824 | 117004 | 125478 | 116782 |
| 10/31/2020 | 132342 | 121388 | 118401 | 127532 | 118094 |
| 11/30/2020 | 144511 | 137032 | 128650 | 140283 | 128280 |
| 12/31/2020 | 156072 | 149173 | 141771 | 154010 | 141354 |
| 01/31/2021 | 156174 | 146759 | 138478 | 151397 | 138060 |
| 02/28/2021 | 164692 | 156284 | 145773 | 160826 | 145280 |
| 03/31/2021 | 169459 | 159689 | 149110 | 164900 | 148576 |
| 04/30/2021 | 165504 | 158598 | 147750 | 164162 | 147201 |
| 05/31/2021 | 176659 | 173358 | 160626 | 178447 | 158674 |
| 06/30/2021 | 178687 | 172527 | 159560 | 178428 | 158848 |
| 07/31/2021 | 184062 | 175294 | 161060 | 180894 | 160215 |
| 08/31/2021 | 197854 | 190381 | 178704 | 197313 | 177746 |
| 09/30/2021 | 197245 | 193765 | 179833 | 200511 | 178819 |
| 10/31/2021 | 196231 | 192480 | 178452 | 199007 | 177394 |
| 11/30/2021 | 191566 | 186632 | 173067 | 193363 | 172010 |
| 12/31/2021 | 197953 | 192860 | 179565 | 200616 | 178433 |
| 01/31/2022 | 196670 | 191679 | 177122 | 197875 | 175995 |
| 02/28/2022 | 184799 | 181810 | 170087 | 188328 | 168948 |
| 03/31/2022 | 187152 | 188422 | 176320 | 195366 | 175118 |
| 04/30/2022 | 181484 | 185538 | 173393 | 192897 | 172192 |
| 05/31/2022 | 172287 | 175310 | 163411 | 180969 | 162162 |
| 06/30/2022 | 163304 | 163689 | 152480 | 168491 | 151223 |
| 07/31/2022 | 175923 | 178616 | 166783 | 183935 | 165320 |
| 08/31/2022 | 177741 | 186402 | 173720 | 192005 | 172113 |
| 09/30/2022 | 171217 | 176590 | 162775 | 181177 | 161046 |
| 10/31/2022 | 175388 | 180623 | 167013 | 184824 | 165177 |
| 11/30/2022 | 183088 | 190055 | 175743 | 194036 | 173754 |
| 12/31/2022 | 173505 | 181447 | 166120 | 185098 | 164241 |
| 01/31/2023 | 172854 | 177594 | 161196 | 179773 | 159328 |
| 02/28/2023 | 167968 | 171132 | 153883 | 172624 | 152048 |
| 03/31/2023 | 169596 | 172709 | 155679 | 174122 | 153811 |
| 04/30/2023 | 173396 | 181517 | 162190 | 182114 | 160219 |
| 05/31/2023 | 177522 | 186355 | 166990 | 186962 | 164886 |
| 06/30/2023 | 186100 | 196138 | 174925 | 196833 | 172629 |
| 07/31/2023 | 189900 | 203422 | 180211 | 203924 | 177785 |
| 08/31/2023 | 188489 | 201149 | 176875 | 201747 | 174399 |
| 09/30/2023 | 189683 | 204564 | 179937 | 205320 | 177318 |
| 10/31/2023 | 184906 | 198467 | 174627 | 198950 | 172044 |
| 11/30/2023 | 195112 | 212496 | 186371 | 212945 | 183540 |
| 12/31/2023 | 203327 | 230050 | 201486 | 230260 | 198413 |
| 01/31/2024 | 206272 | 235168 | 206364 | 236759 | 203197 |
| 02/29/2024 | 208991 | 239243 | 212088 | 241496 | 208763 |
| 03/31/2024 | 210916 | 239885 | 213817 | 241569 | 210456 |
| 04/30/2024 | 214654 | 248414 | 218775 | 249684 | 215331 |
| 05/31/2024 | 217486 | 250324 | 220445 | 251352 | 216859 |
| 06/30/2024 | 231759 | 268333 | 235959 | 269804 | 231937 |
| 07/31/2024 | 234477 | 279146 | 245412 | 280707 | 241156 |
| 08/31/2024 | 236630 | 281407 | 248118 | 282681 | 243692 |
| 09/30/2024 | 242633 | 287562 | 253442 | 288717 | 248837 |
| 10/31/2024 | 229607 | 269291 | 234059 | 268115 | 228278 |
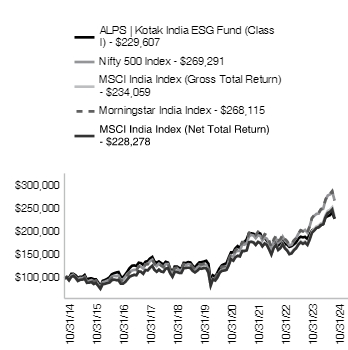
| ALPS | Kotak India ESG Fund - I - NAV | 24.18% | 11.29% | 8.67% |
| MSCI India Index (Net Total Return)#*** | 32.69% | 13.50% | 8.60% |
| Morningstar India Index | 34.76% | 15.59% | 10.37% |
| MSCI India Index (Gross Total Return)**** | 34.03% | 14.07% | 8.88% |
| Nifty 500 Index | 35.69% | 16.20% | 10.41% |
For the most current month-end performance data, please call 1-866-759-5679.
| Net Assets | $396,576,901 |
| Number of Portfolio Holdings | 42 |
| Portfolio Turnover Rate | 75% |
| Total Advisory Fees Paid | $2,056,987 |
| ICICI Bank, Ltd. | 8.76% |
| Reliance Industries, Ltd. | 6.61% |
| Axis Bank, Ltd. | 6.13% |
| HDFC Bank, Ltd. | 4.86% |
| Larsen & Toubro, Ltd. | 4.72% |
| Bharti Airtel, Ltd. | 4.48% |
| Cognizant Technology Solutions Corp. | 3.79% |
| Fortis Healthcare, Ltd. | 3.26% |
| Infosys, Ltd. | 3.22% |
| UltraTech Cement, Ltd. | 3.05% |
| Financials | 25.43% |
| Industrials | 15.42% |
| Information Technology | 9.80% |
| Consumer Discretionary | 9.19% |
| Health Care | 8.34% |
| Communication Services | 7.63% |
| Energy | 6.61% |
| Materials | 6.49% |
| Consumer Staples | 5.63% |
| Real Estate | 3.98% |
| Utilities | 1.91% |
| Cash, Cash Equivalents, & Other Net Assets | -0.43% |

| |
** | As a percentage of net assets. |
Holdings are subject to change
If you wish to view additional information about the Fund, including but not limited to the Fund's prospectus, financial information, holdings, and proxy voting information, please visit https://www.alpsfunds.com/mutual-funds/indix.
If you have consented to receive a single annual or semi-annual shareholder report at a shared address you may revoke this consent by calling the Transfer Agent 866-759-5679.
ALPS | Kotak India ESG Fund - Class II | FINANCIAL INVESTORS TRUST |
INDSX | |
This annual shareholder report contains important information about ALPS | Kotak India ESG Fund (the "Fund" or "INDSX") for the period of November 1, 2023 to October 31, 2024 (the "Period"). You can find additional information about the Fund at https://www.alpsfunds.com/mutual-funds/indix. You can also request this information by contacting us at 866-759-5679.
For the twelve months ended October 31, 2024, the ALPS | Kotak India ESG Fund Class II shares increased by 24.35%. The Fund underperformed the MSCI India Index -net of fees, which was up 32.69%.
Geopolitical concerns, US elections outcome, China recovery and earnings moderation in India corporations led global equity markets to correct from highs in October 2024, which also impacted the Fund's performance.
Top 5 additions to the Fund: Cognizant Technology, Ultratech Cement, Uno Minda, Thermax and Ashok Leyland
Top 5 exits from the Fund: Infosys, Hindustan Unilever, Persistent Systems, Maruti Suzuki India and Bajaj Finance
What contributed and detracted to/from performance?
Top contributors to relative performance
Top detractors from relative performance
There were notable reductions in the Fund's holdings within the Financials, Information Technology, and Consumer Staples sectors and an increase in the Fund's holdings within the Industrials, Communication Services, and Real Estate Sectors.
The Fund's past performance is not a good predictor of the Fund's future performance. The chart and the table below do not reflect the deduction of taxes that a shareholder would pay on Fund distributions or sale of Fund shares.
| 10/31/2014 | 10000000 | 10000000 | 10000000 | 10000000 | 10000000 |
| 11/30/2014 | 10300978 | 10206810 | 10160048 | 10214226 | 10160093 |
| 12/31/2014 | 10071032 | 9844897 | 9554619 | 9760139 | 9554531 |
| 01/31/2015 | 10954593 | 10611125 | 10313416 | 10523888 | 10313472 |
| 02/28/2015 | 10962412 | 10792703 | 10505092 | 10661415 | 10505195 |
| 03/31/2015 | 10618371 | 10310690 | 10070208 | 10258457 | 10070151 |
| 04/30/2015 | 10071032 | 9768801 | 9411612 | 9716864 | 9411578 |
| 05/31/2015 | 10321244 | 10070657 | 9677859 | 10014268 | 9677870 |
| 06/30/2015 | 10282149 | 10023728 | 9706351 | 9991167 | 9706319 |
| 07/31/2015 | 10696562 | 10298759 | 9878669 | 10217727 | 9878605 |
| 08/31/2015 | 9719172 | 9323209 | 9011083 | 9272259 | 9011168 |
| 09/30/2015 | 9945926 | 9425485 | 9052118 | 9331915 | 9052163 |
| 10/31/2015 | 9977203 | 9600629 | 9194307 | 9553142 | 9194232 |
| 11/30/2015 | 9789544 | 9346827 | 8755197 | 9204202 | 8755124 |
| 12/31/2015 | 9765741 | 9449483 | 8969504 | 9404809 | 8969466 |
| 01/31/2016 | 9062391 | 8695282 | 8352215 | 8678545 | 8352241 |
| 02/29/2016 | 8196730 | 7966226 | 7734108 | 7960311 | 7734132 |
| 03/31/2016 | 9450135 | 9116947 | 8745655 | 9052356 | 8745582 |
| 04/30/2016 | 9603430 | 9272273 | 8787234 | 9166628 | 8787284 |
| 05/31/2016 | 9855914 | 9488178 | 8952326 | 9294444 | 8952325 |
| 06/30/2016 | 10180537 | 9703569 | 9071204 | 9483507 | 9071247 |
| 07/31/2016 | 10829783 | 10319862 | 9585975 | 10055227 | 9585984 |
| 08/31/2016 | 11082268 | 10535134 | 9697081 | 10248961 | 9697130 |
| 09/30/2016 | 11244579 | 10459323 | 9608332 | 10209390 | 9608249 |
| 10/31/2016 | 11343769 | 10590264 | 9560890 | 10283034 | 9560892 |
| 11/30/2016 | 10360883 | 9743636 | 8847900 | 9508823 | 8847894 |
| 12/31/2016 | 10189208 | 9693310 | 8840947 | 9459604 | 8841002 |
| 01/31/2017 | 10819186 | 10315533 | 9225662 | 9947942 | 9225686 |
| 02/28/2017 | 11440034 | 10925222 | 9770425 | 10601924 | 9770462 |
| 03/31/2017 | 12225224 | 11350891 | 10354587 | 11287522 | 10354644 |
| 04/30/2017 | 12699990 | 11667547 | 10554442 | 11640854 | 10554319 |
| 05/31/2017 | 12782161 | 11823635 | 10739711 | 11737626 | 10739681 |
| 06/30/2017 | 12654339 | 11810121 | 10655733 | 11713773 | 10655746 |
| 07/31/2017 | 13357358 | 12581912 | 11476695 | 12524922 | 11476710 |
| 08/31/2017 | 13266057 | 12492505 | 11390536 | 12487208 | 11390479 |
| 09/30/2017 | 12891722 | 12106262 | 10970376 | 12105633 | 10970278 |
| 10/31/2017 | 13576481 | 13029933 | 11779068 | 13031156 | 11779050 |
| 11/30/2017 | 13713433 | 13056931 | 11696045 | 13060227 | 11695999 |
| 12/31/2017 | 14282572 | 13688834 | 12267392 | 13709092 | 12267282 |
| 01/31/2018 | 14601840 | 14026976 | 12689597 | 14060056 | 12689603 |
| 02/28/2018 | 13644035 | 13110594 | 11838916 | 13181958 | 11838952 |
| 03/31/2018 | 13371717 | 12640343 | 11414393 | 12687943 | 11414334 |
| 04/30/2018 | 13634644 | 13166586 | 11884177 | 13231318 | 11884189 |
| 05/31/2018 | 13287205 | 12765966 | 11456927 | 12737366 | 11456920 |
| 06/30/2018 | 12930375 | 12362970 | 11345548 | 12454561 | 11345420 |
| 07/31/2018 | 13559522 | 13056767 | 12084441 | 13173239 | 12084570 |
| 08/31/2018 | 13390498 | 13059065 | 12201001 | 13276044 | 12201018 |
| 09/30/2018 | 12038302 | 11637547 | 11090208 | 11839476 | 11090260 |
| 10/31/2018 | 11315252 | 10957309 | 10316415 | 11094425 | 10316476 |
| 11/30/2018 | 12545375 | 12108977 | 11386174 | 12219409 | 11386238 |
| 12/31/2018 | 12546566 | 12189865 | 11371178 | 12268425 | 11371219 |
| 01/31/2019 | 12196103 | 11754199 | 11152100 | 11917920 | 11152106 |
| 02/28/2019 | 12095971 | 11713212 | 11155645 | 11885464 | 11155640 |
| 03/31/2019 | 13327597 | 12914098 | 12185187 | 13057131 | 12185291 |
| 04/30/2019 | 13287544 | 12864843 | 12253487 | 13025319 | 12253499 |
| 05/31/2019 | 13487809 | 13052992 | 12280070 | 13137033 | 12280004 |
| 06/30/2019 | 13417716 | 12980626 | 12246398 | 13080627 | 12246431 |
| 07/31/2019 | 12736817 | 12199776 | 11607842 | 12403585 | 11607824 |
| 08/31/2019 | 12276209 | 11684677 | 11268387 | 12009759 | 11268377 |
| 09/30/2019 | 12957108 | 12307728 | 11615067 | 12458471 | 11615069 |
| 10/31/2019 | 13447756 | 12712837 | 12117432 | 12995580 | 12117437 |
| 11/30/2019 | 13477795 | 12753238 | 12049405 | 12983338 | 12049406 |
| 12/31/2019 | 13619560 | 12928990 | 12232629 | 13162226 | 12232648 |
| 01/31/2020 | 13771677 | 12854700 | 12135973 | 13132023 | 12135991 |
| 02/29/2020 | 13112503 | 11904725 | 11253391 | 12178075 | 11253357 |
| 03/31/2020 | 9441408 | 8702949 | 8425013 | 8976187 | 8425042 |
| 04/30/2020 | 10638063 | 9988236 | 9785285 | 10405342 | 9784952 |
| 05/31/2020 | 10333828 | 9713649 | 9515903 | 10114115 | 9512829 |
| 06/30/2020 | 11236390 | 10532927 | 10164274 | 10948067 | 10159210 |
| 07/31/2020 | 12199799 | 11362185 | 11230761 | 11970882 | 11213952 |
| 08/31/2020 | 12848833 | 12048279 | 11626791 | 12509358 | 11606057 |
| 09/30/2020 | 13071938 | 11982399 | 11700408 | 12547839 | 11678152 |
| 10/31/2020 | 13264620 | 12138817 | 11840143 | 12753216 | 11809443 |
| 11/30/2020 | 14491699 | 13703207 | 12865050 | 14028338 | 12827962 |
| 12/31/2020 | 15657930 | 14917311 | 14177062 | 15400960 | 14135390 |
| 01/31/2021 | 15668072 | 14675949 | 13847832 | 15139705 | 13806015 |
| 02/28/2021 | 16519928 | 15628374 | 14577318 | 16082640 | 14528025 |
| 03/31/2021 | 17006703 | 15968854 | 14911047 | 16490026 | 14857577 |
| 04/30/2021 | 16611198 | 15859803 | 14774992 | 16416249 | 14720102 |
| 05/31/2021 | 17736865 | 17335811 | 16062601 | 17844675 | 15867437 |
| 06/30/2021 | 17949830 | 17252669 | 15955994 | 17842806 | 15884754 |
| 07/31/2021 | 18487310 | 17529367 | 16105953 | 18089388 | 16021522 |
| 08/31/2021 | 19876647 | 19038085 | 17870435 | 19731271 | 17774597 |
| 09/30/2021 | 19825942 | 19376468 | 17983314 | 20051097 | 17881856 |
| 10/31/2021 | 19724530 | 19247982 | 17845214 | 19900715 | 17739433 |
| 11/30/2021 | 19258037 | 18663152 | 17306722 | 19336277 | 17201018 |
| 12/31/2021 | 19905661 | 19286016 | 17956457 | 20061637 | 17843335 |
| 01/31/2022 | 19788003 | 19167908 | 17712159 | 19787521 | 17599484 |
| 02/28/2022 | 18590026 | 18180952 | 17008711 | 18832839 | 16894791 |
| 03/31/2022 | 18825343 | 18842157 | 17631999 | 19536619 | 17511839 |
| 04/30/2022 | 18269140 | 18553835 | 17339304 | 19289740 | 17219218 |
| 05/31/2022 | 17338569 | 17530980 | 16341118 | 18096923 | 16216250 |
| 06/30/2022 | 16440086 | 16368904 | 15248047 | 16849075 | 15122279 |
| 07/31/2022 | 17712936 | 17861552 | 16678254 | 18393530 | 16532019 |
| 08/31/2022 | 17905468 | 18640226 | 17372023 | 19200466 | 17211267 |
| 09/30/2022 | 17242303 | 17658967 | 16277453 | 18117652 | 16104573 |
| 10/31/2022 | 17670152 | 18062298 | 16701294 | 18482402 | 16517706 |
| 11/30/2022 | 18440279 | 19005547 | 17574332 | 19403568 | 17375424 |
| 12/31/2022 | 17481712 | 18144691 | 16612000 | 18509780 | 16424053 |
| 01/31/2023 | 17427421 | 17759407 | 16119586 | 17977327 | 15932817 |
| 02/28/2023 | 16938802 | 17113195 | 15388328 | 17262368 | 15204799 |
| 03/31/2023 | 17112533 | 17270928 | 15567870 | 17412197 | 15381149 |
| 04/30/2023 | 17492570 | 18151659 | 16218969 | 18211430 | 16021876 |
| 05/31/2023 | 17905182 | 18635473 | 16698976 | 18696235 | 16488550 |
| 06/30/2023 | 18773839 | 19613798 | 17492536 | 19683298 | 17262864 |
| 07/31/2023 | 19175592 | 20342235 | 18021076 | 20392439 | 17778485 |
| 08/31/2023 | 19023577 | 20114910 | 17687484 | 20174729 | 17439921 |
| 09/30/2023 | 19153876 | 20456381 | 17993674 | 20531967 | 17731835 |
| 10/31/2023 | 18676115 | 19846679 | 17462680 | 19894964 | 17204375 |
| 11/30/2023 | 19707644 | 21249640 | 18637138 | 21294494 | 18354008 |
| 12/31/2023 | 20540352 | 23005031 | 20148597 | 23025953 | 19841320 |
| 01/31/2024 | 20846080 | 23516754 | 20636375 | 23675851 | 20319656 |
| 02/29/2024 | 21129161 | 23924323 | 21208812 | 24149579 | 20876272 |
| 03/31/2024 | 21310333 | 23988464 | 21381675 | 24156852 | 21045554 |
| 04/30/2024 | 21695323 | 24841374 | 21877496 | 24968439 | 21533079 |
| 05/31/2024 | 21978404 | 25032429 | 22044497 | 25135196 | 21685927 |
| 06/30/2024 | 23427778 | 26833337 | 23595899 | 26980411 | 23193738 |
| 07/31/2024 | 23710859 | 27914587 | 24541191 | 28070749 | 24115599 |
| 08/31/2024 | 23926000 | 28140667 | 24811800 | 28268141 | 24369169 |
| 09/30/2024 | 24537455 | 28756244 | 25344158 | 28871738 | 24883729 |
| 10/31/2024 | 23223960 | 26929101 | 23405859 | 26811460 | 22827785 |
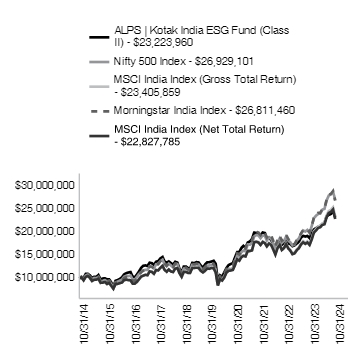
| ALPS | Kotak India ESG Fund - II - NAV* | 24.35% | 11.55% | 8.79% |
| MSCI India Index (Net Total Return)#*** | 32.69% | 13.50% | 8.60% |
| Morningstar India Index | 34.76% | 15.59% | 10.37% |
| MSCI India Index (Gross Total Return)**** | 34.03% | 14.07% | 8.88% |
| Nifty 500 Index | 35.69% | 16.20% | 10.41% |
For the most current month-end performance data, please call 1-866-759-5679.
| Net Assets | $396,576,901 |
| Number of Portfolio Holdings | 42 |
| Portfolio Turnover Rate | 75% |
| Total Advisory Fees Paid | $2,056,987 |
| ICICI Bank, Ltd. | 8.76% |
| Reliance Industries, Ltd. | 6.61% |
| Axis Bank, Ltd. | 6.13% |
| HDFC Bank, Ltd. | 4.86% |
| Larsen & Toubro, Ltd. | 4.72% |
| Bharti Airtel, Ltd. | 4.48% |
| Cognizant Technology Solutions Corp. | 3.79% |
| Fortis Healthcare, Ltd. | 3.26% |
| Infosys, Ltd. | 3.22% |
| UltraTech Cement, Ltd. | 3.05% |
| Financials | 25.43% |
| Industrials | 15.42% |
| Information Technology | 9.80% |
| Consumer Discretionary | 9.19% |
| Health Care | 8.34% |
| Communication Services | 7.63% |
| Energy | 6.61% |
| Materials | 6.49% |
| Consumer Staples | 5.63% |
| Real Estate | 3.98% |
| Utilities | 1.91% |
| Cash, Cash Equivalents, & Other Net Assets | -0.43% |

| |
** | As a percentage of net assets. |
Holdings are subject to change
If you wish to view additional information about the Fund, including but not limited to the Fund's prospectus, financial information, holdings, and proxy voting information, please visit https://www.alpsfunds.com/mutual-funds/indix.
If you have consented to receive a single annual or semi-annual shareholder report at a shared address you may revoke this consent by calling the Transfer Agent 866-759-5679.
ALPS Global Opportunity Fund - Investor Shares | FINANCIAL INVESTORS TRUST |
LPEFX | |
This annual shareholder report contains important information about ALPS Global Opportunity Fund (the "Fund" or "LPEFX") for the period of November 1, 2023 to October 31, 2024 (the "Period"). You can find additional information about the Fund at https://www.alpsfunds.com/mutual-funds/lpeix. You can also request this information by contacting us at 866-759-5679.
For the twelve months ended October 31, 2024, the ALPS Global Opportunity Fund Investor Class shares increased by 37.47%. The Fund outperformed the Morningstar Developed Markets Index-net of fees, which was up 33.13%.
Top contributors to performance included:
U.S. alternative asset managers KKR & Co Inc, Ares Management Corp, Blackstone Inc, and Apollo Global Management
Financial services sector exposure
Private Equity investors 3i Group Plc and HgCapital Trust
Top detractors from performance included:
Small and mid-capitalization stocks which underperformed large company stocks
French private equity investors Eurazeo and Altamir
Reverse merger of Liberty Sirius XM with Sirius XM
The Fund's past performance is not a good predictor of the Fund's future performance. The chart and the table below do not reflect the deduction of taxes that a shareholder would pay on Fund distributions or sale of Fund shares.
| 10/31/2014 | 10000 | 10000 | 10000 |
| 11/30/2014 | 10318 | 10254 | 10186 |
| 12/31/2014 | 10333 | 10214 | 10084 |
| 01/31/2015 | 10364 | 10161 | 9910 |
| 02/28/2015 | 10850 | 10848 | 10487 |
| 03/31/2015 | 10694 | 10757 | 10349 |
| 04/30/2015 | 11054 | 11329 | 10575 |
| 05/31/2015 | 11289 | 11566 | 10621 |
| 06/30/2015 | 11086 | 11358 | 10389 |
| 07/31/2015 | 11244 | 11531 | 10553 |
| 08/31/2015 | 10648 | 10816 | 9876 |
| 09/30/2015 | 10209 | 10244 | 9510 |
| 10/31/2015 | 10601 | 10797 | 10238 |
| 11/30/2015 | 10382 | 10733 | 10200 |
| 12/31/2015 | 10275 | 10348 | 10018 |
| 01/31/2016 | 9493 | 9404 | 9404 |
| 02/29/2016 | 9324 | 9329 | 9350 |
| 03/31/2016 | 10190 | 10331 | 9998 |
| 04/30/2016 | 10360 | 10396 | 10162 |
| 05/31/2016 | 10479 | 10537 | 10225 |
| 06/30/2016 | 9901 | 10073 | 10096 |
| 07/31/2016 | 10377 | 10708 | 10538 |
| 08/31/2016 | 10445 | 10910 | 10544 |
| 09/30/2016 | 10852 | 11088 | 10607 |
| 10/31/2016 | 10682 | 10849 | 10384 |
| 11/30/2016 | 10767 | 11184 | 10557 |
| 12/31/2016 | 11021 | 11505 | 10811 |
| 01/31/2017 | 11435 | 11927 | 11071 |
| 02/28/2017 | 11642 | 12064 | 11368 |
| 03/31/2017 | 11676 | 12215 | 11480 |
| 04/30/2017 | 12383 | 12821 | 11659 |
| 05/31/2017 | 13004 | 13228 | 11899 |
| 06/30/2017 | 13194 | 13420 | 11959 |
| 07/31/2017 | 13591 | 13830 | 12244 |
| 08/31/2017 | 13522 | 13551 | 12259 |
| 09/30/2017 | 13815 | 14180 | 12552 |
| 10/31/2017 | 13884 | 14319 | 12787 |
| 11/30/2017 | 13815 | 14120 | 13065 |
| 12/31/2017 | 14001 | 14413 | 13243 |
| 01/31/2018 | 15000 | 15418 | 13916 |
| 02/28/2018 | 14236 | 14649 | 13345 |
| 03/31/2018 | 13982 | 14276 | 13081 |
| 04/30/2018 | 14158 | 14506 | 13228 |
| 05/31/2018 | 13884 | 14397 | 13333 |
| 06/30/2018 | 13806 | 14375 | 13315 |
| 07/31/2018 | 14197 | 14966 | 13699 |
| 08/31/2018 | 14256 | 15055 | 13878 |
| 09/30/2018 | 14589 | 15145 | 13930 |
| 10/31/2018 | 13296 | 13618 | 12865 |
| 11/30/2018 | 13140 | 13436 | 13017 |
| 12/31/2018 | 12237 | 12319 | 12009 |
| 01/31/2019 | 13403 | 13626 | 12970 |
| 02/28/2019 | 13772 | 14032 | 13363 |
| 03/31/2019 | 13894 | 14117 | 13511 |
| 04/30/2019 | 14631 | 14913 | 13982 |
| 05/31/2019 | 14038 | 14127 | 13174 |
| 06/30/2019 | 14856 | 14959 | 14024 |
| 07/31/2019 | 14973 | 15025 | 14090 |
| 08/31/2019 | 14891 | 14793 | 13788 |
| 09/30/2019 | 15280 | 15094 | 14078 |
| 10/31/2019 | 15792 | 15547 | 14445 |
| 11/30/2019 | 16366 | 16106 | 14850 |
| 12/31/2019 | 17131 | 16837 | 15295 |
| 01/31/2020 | 17367 | 16903 | 15173 |
| 02/29/2020 | 15642 | 15118 | 13878 |
| 03/31/2020 | 11909 | 11107 | 11950 |
| 04/30/2020 | 13255 | 12606 | 13266 |
| 05/31/2020 | 13964 | 13619 | 13941 |
| 06/30/2020 | 14366 | 14200 | 14294 |
| 07/31/2020 | 15193 | 14778 | 14955 |
| 08/31/2020 | 16020 | 15674 | 15939 |
| 09/30/2020 | 15618 | 15176 | 15420 |
| 10/31/2020 | 15288 | 14978 | 14986 |
| 11/30/2020 | 17414 | 17622 | 16935 |
| 12/31/2020 | 18730 | 19129 | 17694 |
| 01/31/2021 | 18262 | 19281 | 17563 |
| 02/28/2021 | 18952 | 20105 | 18053 |
| 03/31/2021 | 19370 | 20711 | 18618 |
| 04/30/2021 | 20699 | 22328 | 19462 |
| 05/31/2021 | 20921 | 22822 | 19726 |
| 06/30/2021 | 21216 | 22636 | 19969 |
| 07/31/2021 | 22053 | 23857 | 20266 |
| 08/31/2021 | 22545 | 24175 | 20776 |
| 09/30/2021 | 21585 | 22946 | 19939 |
| 10/31/2021 | 23111 | 24980 | 21008 |
| 11/30/2021 | 22299 | 23886 | 20470 |
| 12/31/2021 | 23211 | 24476 | 21340 |
| 01/31/2022 | 21578 | 22276 | 20146 |
| 02/28/2022 | 20698 | 20933 | 19694 |
| 03/31/2022 | 20730 | 20766 | 20191 |
| 04/30/2022 | 18531 | 18153 | 18525 |
| 05/31/2022 | 18468 | 18322 | 18527 |
| 06/30/2022 | 16395 | 15837 | 16892 |
| 07/31/2022 | 18060 | 17616 | 18238 |
| 08/31/2022 | 16866 | 16192 | 17489 |
| 09/30/2022 | 14856 | 13843 | 15840 |
| 10/31/2022 | 15987 | 14969 | 16974 |
| 11/30/2022 | 17400 | 16319 | 18166 |
| 12/31/2022 | 16521 | 15568 | 17465 |
| 01/31/2023 | 17997 | 17550 | 18690 |
| 02/28/2023 | 17589 | 17471 | 18245 |
| 03/31/2023 | 17212 | 16687 | 18705 |
| 04/30/2023 | 17652 | 17140 | 19012 |
| 05/31/2023 | 17683 | 16765 | 18783 |
| 06/30/2023 | 18437 | 17723 | 19920 |
| 07/31/2023 | 19128 | 18881 | 20609 |
| 08/31/2023 | 18877 | 18148 | 20097 |
| 09/30/2023 | 18625 | 17683 | 19222 |
| 10/31/2023 | 17714 | 16366 | 18618 |
| 11/30/2023 | 19819 | 19401 | 20361 |
| 12/31/2023 | 21192 | 21559 | 21428 |
| 01/31/2024 | 21358 | 21513 | 21627 |
| 02/29/2024 | 22024 | 22279 | 22524 |
| 03/31/2024 | 22556 | 23013 | 23263 |
| 04/30/2024 | 22090 | 22167 | 22375 |
| 05/31/2024 | 23188 | 22885 | 23362 |
| 06/30/2024 | 22889 | 22476 | 23749 |
| 07/31/2024 | 24253 | 24189 | 24258 |
| 08/31/2024 | 24386 | 24269 | 24861 |
| 09/30/2024 | 24885 | 25520 | 25315 |
| 10/31/2024 | 24353 | 25119 | 24786 |
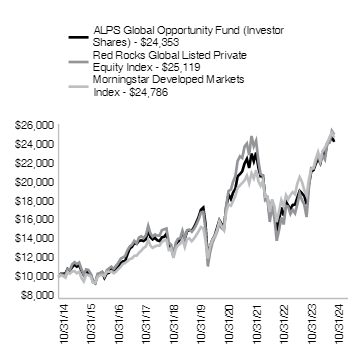
| ALPS Global Opportunity Fund - Investor - NAV | 37.47% | 9.05% | 9.31% |
| Morningstar Developed Markets Index# | 33.13% | 11.40% | 9.50% |
| Red Rocks Global Listed Private Equity Index | 53.48% | 10.07% | 9.65% |
For the most current month-end performance data, please call 1-866-759-5679.
| Net Assets | $65,060,543 |
| Number of Portfolio Holdings | 53 |
| Portfolio Turnover Rate | 37% |
| Total Advisory Fees Paid | $503,602 |
| KKR & Co., Inc. | 6.04% |
| 3i Group PLC | 4.78% |
| Ares Management LP | 4.76% |
| HgCapital Trust PLC | 4.45% |
| Blackstone, Inc. | 4.05% |
| Partners Group Holding AG | 3.29% |
| Brederode SA | 3.25% |
| Intermediate Capital Group PLC | 3.21% |
| Apollo Global Management, Inc. | 3.18% |
| HarbourVest Global Private Equity, Ltd. | 3.11% |
| Financials | 76.48% |
| Technology | 8.16% |
| Industrials | 6.60% |
| Consumer Staples | 2.79% |
| Communications | 2.23% |
| Consumer Discretionary | 1.51% |
| Health Care | 1.43% |
| Cash, Cash Equivalents, & Other Net Assets | 0.80% |

| |
** | As a percentage of net assets. |
Holdings are subject to change
If you wish to view additional information about the Fund, including but not limited to the Fund's prospectus, financial information, holdings, and proxy voting information, please visit https://www.alpsfunds.com/mutual-funds/lpeix.
If you have consented to receive a single annual or semi-annual shareholder report at a shared address you may revoke this consent by calling the Transfer Agent 866-759-5679.
ALPS Global Opportunity Fund - Class A | FINANCIAL INVESTORS TRUST |
LPFAX | |
This annual shareholder report contains important information about ALPS Global Opportunity Fund (the "Fund" or "LPFAX") for the period of November 1, 2023 to October 31, 2024 (the "Period"). You can find additional information about the Fund at https://www.alpsfunds.com/mutual-funds/lpeix. You can also request this information by contacting us at 866-759-5679.
For the twelve months ended October 31, 2024, the ALPS Global Opportunity Fund Class A shares increased by 37.31%. The Fund outperformed the Morningstar Developed Markets Index-net of fees, which was up 33.13%.
Top contributors to performance included:
U.S. alternative asset managers KKR & Co Inc, Ares Management Corp, Blackstone Inc, and Apollo Global Management
Financial services sector exposure
Private Equity investors 3i Group Plc and HgCapital Trust
Top detractors from performance included:
Small and mid-capitalization stocks which underperformed large company stocks
French private equity investors Eurazeo and Altamir
Reverse merger of Liberty Sirius XM with Sirius XM
The Fund's past performance is not a good predictor of the Fund's future performance. The chart and the table below do not reflect the deduction of taxes that a shareholder would pay on Fund distributions or sale of Fund shares.
| 10/31/2014 | 9456 | 10000 | 10000 |
| 11/30/2014 | 9757 | 10254 | 10186 |
| 12/31/2014 | 9771 | 10214 | 10084 |
| 01/31/2015 | 9801 | 10161 | 9910 |
| 02/28/2015 | 10260 | 10848 | 10487 |
| 03/31/2015 | 10112 | 10757 | 10349 |
| 04/30/2015 | 10453 | 11329 | 10575 |
| 05/31/2015 | 10676 | 11566 | 10621 |
| 06/30/2015 | 10483 | 11358 | 10389 |
| 07/31/2015 | 10633 | 11531 | 10553 |
| 08/31/2015 | 10070 | 10816 | 9876 |
| 09/30/2015 | 9654 | 10244 | 9510 |
| 10/31/2015 | 10025 | 10797 | 10238 |
| 11/30/2015 | 9817 | 10733 | 10200 |
| 12/31/2015 | 9716 | 10348 | 10018 |
| 01/31/2016 | 8977 | 9404 | 9404 |
| 02/29/2016 | 8817 | 9329 | 9350 |
| 03/31/2016 | 9636 | 10331 | 9998 |
| 04/30/2016 | 9796 | 10396 | 10162 |
| 05/31/2016 | 9909 | 10537 | 10225 |
| 06/30/2016 | 9363 | 10073 | 10096 |
| 07/31/2016 | 9812 | 10708 | 10538 |
| 08/31/2016 | 9877 | 10910 | 10544 |
| 09/30/2016 | 10262 | 11088 | 10607 |
| 10/31/2016 | 10102 | 10849 | 10384 |
| 11/30/2016 | 10182 | 11184 | 10557 |
| 12/31/2016 | 10422 | 11505 | 10811 |
| 01/31/2017 | 10813 | 11927 | 11071 |
| 02/28/2017 | 11009 | 12064 | 11368 |
| 03/31/2017 | 11042 | 12215 | 11480 |
| 04/30/2017 | 11710 | 12821 | 11659 |
| 05/31/2017 | 12297 | 13228 | 11899 |
| 06/30/2017 | 12477 | 13420 | 11959 |
| 07/31/2017 | 12852 | 13830 | 12244 |
| 08/31/2017 | 12787 | 13551 | 12259 |
| 09/30/2017 | 13064 | 14180 | 12552 |
| 10/31/2017 | 13129 | 14319 | 12787 |
| 11/30/2017 | 13064 | 14120 | 13065 |
| 12/31/2017 | 13240 | 14413 | 13243 |
| 01/31/2018 | 14185 | 15418 | 13916 |
| 02/28/2018 | 13462 | 14649 | 13345 |
| 03/31/2018 | 13222 | 14276 | 13081 |
| 04/30/2018 | 13388 | 14506 | 13228 |
| 05/31/2018 | 13129 | 14397 | 13333 |
| 06/30/2018 | 13055 | 14375 | 13315 |
| 07/31/2018 | 13425 | 14966 | 13699 |
| 08/31/2018 | 13481 | 15055 | 13878 |
| 09/30/2018 | 13796 | 15145 | 13930 |
| 10/31/2018 | 12574 | 13618 | 12865 |
| 11/30/2018 | 12425 | 13436 | 13017 |
| 12/31/2018 | 11580 | 12319 | 12009 |
| 01/31/2019 | 12669 | 13626 | 12970 |
| 02/28/2019 | 13038 | 14032 | 13363 |
| 03/31/2019 | 13135 | 14117 | 13511 |
| 04/30/2019 | 13834 | 14913 | 13982 |
| 05/31/2019 | 13271 | 14127 | 13174 |
| 06/30/2019 | 14048 | 14959 | 14024 |
| 07/31/2019 | 14140 | 15025 | 14090 |
| 08/31/2019 | 14081 | 14793 | 13788 |
| 09/30/2019 | 14431 | 15094 | 14078 |
| 10/31/2019 | 14918 | 15547 | 14445 |
| 11/30/2019 | 15462 | 16106 | 14850 |
| 12/31/2019 | 16189 | 16837 | 15295 |
| 01/31/2020 | 16414 | 16903 | 15173 |
| 02/29/2020 | 14797 | 15118 | 13878 |
| 03/31/2020 | 11249 | 11107 | 11950 |
| 04/30/2020 | 12529 | 12606 | 13266 |
| 05/31/2020 | 13203 | 13619 | 13941 |
| 06/30/2020 | 13585 | 14200 | 14294 |
| 07/31/2020 | 14370 | 14778 | 14955 |
| 08/31/2020 | 15156 | 15674 | 15939 |
| 09/30/2020 | 14775 | 15176 | 15420 |
| 10/31/2020 | 14483 | 14978 | 14986 |
| 11/30/2020 | 16481 | 17622 | 16935 |
| 12/31/2020 | 17732 | 19129 | 17694 |
| 01/31/2021 | 17287 | 19281 | 17563 |
| 02/28/2021 | 17942 | 20105 | 18053 |
| 03/31/2021 | 18340 | 20711 | 18618 |
| 04/30/2021 | 19580 | 22328 | 19462 |
| 05/31/2021 | 19814 | 22822 | 19726 |
| 06/30/2021 | 20071 | 22636 | 19969 |
| 07/31/2021 | 20867 | 23857 | 20266 |
| 08/31/2021 | 21334 | 24175 | 20776 |
| 09/30/2021 | 20422 | 22946 | 19939 |
| 10/31/2021 | 21872 | 24980 | 21008 |
| 11/30/2021 | 21100 | 23886 | 20470 |
| 12/31/2021 | 21968 | 24476 | 21340 |
| 01/31/2022 | 20414 | 22276 | 20146 |
| 02/28/2022 | 19577 | 20933 | 19694 |
| 03/31/2022 | 19607 | 20766 | 20191 |
| 04/30/2022 | 17515 | 18153 | 18525 |
| 05/31/2022 | 17485 | 18322 | 18527 |
| 06/30/2022 | 15512 | 15837 | 16892 |
| 07/31/2022 | 17096 | 17616 | 18238 |
| 08/31/2022 | 15931 | 16192 | 17489 |
| 09/30/2022 | | 13843 | 15840 |
| 10/31/2022 | 15124 | 14969 | 16974 |
| 11/30/2022 | 16439 | 16319 | 18166 |
| 12/31/2022 | 15602 | 15568 | 17465 |
| 01/31/2023 | 17007 | 17550 | 18690 |
| 02/28/2023 | 16648 | 17471 | 18245 |
| 03/31/2023 | 16289 | 16687 | 18705 |
| 04/30/2023 | 16708 | 17140 | 19012 |
| 05/31/2023 | 16738 | 16765 | 18783 |
| 06/30/2023 | 17455 | 17723 | 19920 |
| 07/31/2023 | 18113 | 18881 | 20609 |
| 08/31/2023 | 17844 | 18148 | 20097 |
| 09/30/2023 | 17634 | 17683 | 19222 |
| 10/31/2023 | 16768 | 16366 | 18618 |
| 11/30/2023 | 18740 | 19401 | 20361 |
| 12/31/2023 | 20047 | 21559 | 21428 |
| 01/31/2024 | 20205 | 21513 | 21627 |
| 02/29/2024 | 20839 | 22279 | 22524 |
| 03/31/2024 | 21346 | 23013 | 23263 |
| 04/30/2024 | 20902 | 22167 | 22375 |
| 05/31/2024 | 21916 | 22885 | 23362 |
| 06/30/2024 | 21631 | 22476 | 23749 |
| 07/31/2024 | 22929 | 24189 | 24258 |
| 08/31/2024 | 23056 | 24269 | 24861 |
| 09/30/2024 | 23531 | 25520 | 25315 |
| 10/31/2024 | 23024 | 25119 | 24786 |
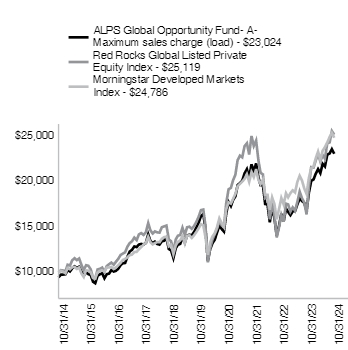
| ALPS Global Opportunity Fund - A - NAV** | 37.31% | 9.07% | 9.31% |
| ALPS Global Opportunity Fund - A - Maximum sales charge (load)*^ | 29.68% | 7.83% | 8.70% |
| Morningstar Developed Markets Index# | 33.13% | 11.40% | 9.50% |
| Red Rocks Global Listed Private Equity Index | 53.48% | 10.07% | 9.65% |
For the most current month-end performance data, please call 1-866-759-5679.
| Net Assets | $65,060,543 |
| Number of Portfolio Holdings | 53 |
| Portfolio Turnover Rate | 37% |
| Total Advisory Fees Paid | $503,602 |
| KKR & Co., Inc. | 6.04% |
| 3i Group PLC | 4.78% |
| Ares Management LP | 4.76% |
| HgCapital Trust PLC | 4.45% |
| Blackstone, Inc. | 4.05% |
| Partners Group Holding AG | 3.29% |
| Brederode SA | 3.25% |
| Intermediate Capital Group PLC | 3.21% |
| Apollo Global Management, Inc. | 3.18% |
| HarbourVest Global Private Equity, Ltd. | 3.11% |
| Financials | 76.48% |
| Technology | 8.16% |
| Industrials | 6.60% |
| Consumer Staples | 2.79% |
| Communications | 2.23% |
| Consumer Discretionary | 1.51% |
| Health Care | 1.43% |
| Cash, Cash Equivalents, & Other Net Assets | 0.80% |

| |
** | As a percentage of net assets. |
Holdings are subject to change
If you wish to view additional information about the Fund, including but not limited to the Fund's prospectus, financial information, holdings, and proxy voting information, please visit https://www.alpsfunds.com/mutual-funds/lpeix.
If you have consented to receive a single annual or semi-annual shareholder report at a shared address you may revoke this consent by calling the Transfer Agent 866-759-5679.
ALPS Global Opportunity Fund - Class C | FINANCIAL INVESTORS TRUST |
LPFCX | |
This annual shareholder report contains important information about ALPS Global Opportunity Fund (the "Fund" or "LPFCX") for the period of November 1, 2023 to October 31, 2024 (the "Period"). You can find additional information about the Fund at https://www.alpsfunds.com/mutual-funds/lpeix. You can also request this information by contacting us at 866-759-5679.
For the twelve months ended October 31, 2024, the ALPS Global Opportunity Fund Class C shares increased by 36.58%. The Fund outperformed the Morningstar Developed Markets Index-net of fees, which was up 33.13%.
Top contributors to performance included:
U.S. alternative asset managers KKR & Co Inc, Ares Management Corp, Blackstone Inc, and Apollo Global Management
Financial services sector exposure
Private Equity investors 3i Group Plc and HgCapital Trust
Top detractors from performance included:
Small and mid-capitalization stocks which underperformed large company stocks
French private equity investors Eurazeo and Altamir
Reverse merger of Liberty Sirius XM with Sirius XM
The Fund's past performance is not a good predictor of the Fund's future performance. The chart and the table below do not reflect the deduction of taxes that a shareholder would pay on Fund distributions or sale of Fund shares.
| 10/31/2014 | 10000 | 10000 | 10000 |
| 11/30/2014 | 10311 | 10254 | 10186 |
| 12/31/2014 | 10319 | 10214 | 10084 |
| 01/31/2015 | 10335 | 10161 | 9910 |
| 02/28/2015 | 10818 | 10848 | 10487 |
| 03/31/2015 | 10657 | 10757 | 10349 |
| 04/30/2015 | 11011 | 11329 | 10575 |
| 05/31/2015 | 11252 | 11566 | 10621 |
| 06/30/2015 | 11027 | 11358 | 10389 |
| 07/31/2015 | 11190 | 11531 | 10553 |
| 08/31/2015 | 10594 | 10816 | 9876 |
| 09/30/2015 | 10143 | 10244 | 9510 |
| 10/31/2015 | 10514 | 10797 | 10238 |
| 11/30/2015 | 10304 | 10733 | 10200 |
| 12/31/2015 | 10200 | 10348 | 10018 |
| 01/31/2016 | 9414 | 9404 | 9404 |
| 02/29/2016 | 9239 | 9329 | 9350 |
| 03/31/2016 | 10077 | 10331 | 9998 |
| 04/30/2016 | 10252 | 10396 | 10162 |
| 05/31/2016 | 10357 | 10537 | 10225 |
| 06/30/2016 | 9798 | 10073 | 10096 |
| 07/31/2016 | 10252 | 10708 | 10538 |
| 08/31/2016 | 10304 | 10910 | 10544 |
| 09/30/2016 | 10706 | 11088 | 10607 |
| 10/31/2016 | 10549 | 10849 | 10384 |
| 11/30/2016 | 10619 | 11184 | 10557 |
| 12/31/2016 | 10854 | 11505 | 10811 |
| 01/31/2017 | 11262 | 11927 | 11071 |
| 02/28/2017 | 11440 | 12064 | 11368 |
| 03/31/2017 | 11475 | 12215 | 11480 |
| 04/30/2017 | 12167 | 12821 | 11659 |
| 05/31/2017 | 12770 | 13228 | 11899 |
| 06/30/2017 | 12947 | 13420 | 11959 |
| 07/31/2017 | 13320 | 13830 | 12244 |
| 08/31/2017 | 13249 | 13551 | 12259 |
| 09/30/2017 | 13533 | 14180 | 12552 |
| 10/31/2017 | 13586 | 14319 | 12787 |
| 11/30/2017 | 13497 | 14120 | 13065 |
| 12/31/2017 | 13689 | 14413 | 13243 |
| 01/31/2018 | 14656 | 15418 | 13916 |
| 02/28/2018 | 13911 | 14649 | 13345 |
| 03/31/2018 | 13648 | 14276 | 13081 |
| 04/30/2018 | 13810 | 14506 | 13228 |
| 05/31/2018 | 13527 | 14397 | 13333 |
| 06/30/2018 | 13447 | 14375 | 13315 |
| 07/31/2018 | 13810 | 14966 | 13699 |
| 08/31/2018 | 13870 | 15055 | 13878 |
| 09/30/2018 | 14173 | 15145 | 13930 |
| 10/31/2018 | 12923 | 13618 | 12865 |
| 11/30/2018 | 12761 | 13436 | 13017 |
| 12/31/2018 | 11875 | 12319 | 12009 |
| 01/31/2019 | 12987 | 13626 | 12970 |
| 02/28/2019 | 13343 | 14032 | 13363 |
| 03/31/2019 | 13448 | 14117 | 13511 |
| 04/30/2019 | 14162 | 14913 | 13982 |
| 05/31/2019 | 13574 | 14127 | 13174 |
| 06/30/2019 | 14371 | 14959 | 14024 |
| 07/31/2019 | 14470 | 15025 | 14090 |
| 08/31/2019 | 14386 | 14793 | 13788 |
| 09/30/2019 | 14743 | 15094 | 14078 |
| 10/31/2019 | 15226 | 15547 | 14445 |
| 11/30/2019 | 15772 | 16106 | 14850 |
| 12/31/2019 | 16497 | 16837 | 15295 |
| 01/31/2020 | 16717 | 16903 | 15173 |
| 02/29/2020 | 15055 | 15118 | 13878 |
| 03/31/2020 | 11438 | 11107 | 11950 |
| 04/30/2020 | 12733 | 12606 | 13266 |
| 05/31/2020 | 13393 | 13619 | 13941 |
| 06/30/2020 | 13760 | 14200 | 14294 |
| 07/31/2020 | 14542 | 14778 | 14955 |
| 08/31/2020 | 15324 | 15674 | 15939 |
| 09/30/2020 | 14933 | 15176 | 15420 |
| 10/31/2020 | 14615 | 14978 | 14986 |
| 11/30/2020 | 16644 | 17622 | 16935 |
| 12/31/2020 | 17907 | 19129 | 17694 |
| 01/31/2021 | 17447 | 19281 | 17563 |
| 02/28/2021 | 18086 | 20105 | 18053 |
| 03/31/2021 | 18469 | 20711 | 18618 |
| 04/30/2021 | 19721 | 22328 | 19462 |
| 05/31/2021 | 19925 | 22822 | 19726 |
| 06/30/2021 | 20181 | 22636 | 19969 |
| 07/31/2021 | 20973 | 23857 | 20266 |
| 08/31/2021 | 21432 | 24175 | 20776 |
| 09/30/2021 | 20513 | 22946 | 19939 |
| 10/31/2021 | 21943 | 24980 | 21008 |
| 11/30/2021 | 21177 | 23886 | 20470 |
| 12/31/2021 | 22019 | 24476 | 21340 |
| 01/31/2022 | 20448 | 22276 | 20146 |
| 02/28/2022 | 19613 | 20933 | 19694 |
| 03/31/2022 | 19613 | 20766 | 20191 |
| 04/30/2022 | 17542 | 18153 | 18525 |
| 05/31/2022 | 17475 | 18322 | 18527 |
| 06/30/2022 | 15470 | 15837 | 16892 |
| 07/31/2022 | 17040 | 17616 | 18238 |
| 08/31/2022 | 15904 | 16192 | 17489 |
| 09/30/2022 | 14000 | 13843 | 15840 |
| 10/31/2022 | 15036 | 14969 | 16974 |
| 11/30/2022 | 16372 | 16319 | 18166 |
| 12/31/2022 | 15537 | 15568 | 17465 |
| 01/31/2023 | 16907 | 17550 | 18690 |
| 02/28/2023 | 16539 | 17471 | 18245 |
| 03/31/2023 | 16172 | 16687 | 18705 |
| 04/30/2023 | 16573 | 17140 | 19012 |
| 05/31/2023 | 16573 | 16765 | 18783 |
| 06/30/2023 | 17308 | 17723 | 19920 |
| 07/31/2023 | 17943 | 18881 | 20609 |
| 08/31/2023 | 17675 | 18148 | 20097 |
| 09/30/2023 | 17441 | 17683 | 19222 |
| 10/31/2023 | 16573 | 16366 | 18618 |
| 11/30/2023 | 18544 | 19401 | 20361 |
| 12/31/2023 | 19819 | 21559 | 21428 |
| 01/31/2024 | 19962 | 21513 | 21627 |
| 02/29/2024 | 20568 | 22279 | 22524 |
| 03/31/2024 | 21031 | 23013 | 23263 |
| 04/30/2024 | 20604 | 22167 | 22375 |
| 05/31/2024 | 21602 | 22885 | 23362 |
| 06/30/2024 | 21317 | 22476 | 23749 |
| 07/31/2024 | 22600 | 24189 | 24258 |
| 08/31/2024 | 22707 | 24269 | 24861 |
| 09/30/2024 | 23170 | 25520 | 25315 |
| 10/31/2024 | 22636 | 25119 | 24786 |

| ALPS Global Opportunity Fund - C - NAV | 36.58% | 8.25% | 8.51% |
| ALPS Global Opportunity Fund - C - Maximim deferred sales charge** | 35.58% | 8.25% | 8.51% |
| Morningstar Developed Markets Index# | 33.13% | 11.40% | 9.50% |
| Red Rocks Global Listed Private Equity Index | 53.48% | 10.07% | 9.65% |
For the most current month-end performance data, please call 1-866-759-5679.
| Net Assets | $65,060,543 |
| Number of Portfolio Holdings | 53 |
| Portfolio Turnover Rate | 37% |
| Total Advisory Fees Paid | $503,602 |
| KKR & Co., Inc. | 6.04% |
| 3i Group PLC | 4.78% |
| Ares Management LP | 4.76% |
| HgCapital Trust PLC | 4.45% |
| Blackstone, Inc. | 4.05% |
| Partners Group Holding AG | 3.29% |
| Brederode SA | 3.25% |
| Intermediate Capital Group PLC | 3.21% |
| Apollo Global Management, Inc. | 3.18% |
| HarbourVest Global Private Equity, Ltd. | 3.11% |
| Financials | 76.48% |
| Technology | 8.16% |
| Industrials | 6.60% |
| Consumer Staples | 2.79% |
| Communications | 2.23% |
| Consumer Discretionary | 1.51% |
| Health Care | 1.43% |
| Cash, Cash Equivalents, & Other Net Assets | 0.80% |

| |
** | As a percentage of net assets. |
Holdings are subject to change
If you wish to view additional information about the Fund, including but not limited to the Fund's prospectus, financial information, holdings, and proxy voting information, please visit https://www.alpsfunds.com/mutual-funds/lpeix.
If you have consented to receive a single annual or semi-annual shareholder report at a shared address you may revoke this consent by calling the Transfer Agent 866-759-5679.
ALPS Global Opportunity Fund - Class I | FINANCIAL INVESTORS TRUST |
LPEIX | |
This annual shareholder report contains important information about ALPS Global Opportunity Fund (the "Fund" or "LPEIX") for the period of November 1, 2023 to October 31, 2024 (the "Period"). You can find additional information about the Fund at https://www.alpsfunds.com/mutual-funds/lpeix. You can also request this information by contacting us at 866-759-5679.
For the twelve months ended October 31, 2024, the ALPS Global Opportunity Fund Class I shares increased by 37.77%. The Fund outperformed the Morningstar Developed Markets Index-net of fees, which was up 33.13%.
Top contributors to performance included:
U.S. alternative asset managers KKR & Co Inc, Ares Management Corp, Blackstone Inc, and Apollo Global Management
Financial services sector exposure
Private Equity investors 3i Group Plc and HgCapital Trust
Top detractors from performance included:
Small and mid-capitalization stocks which underperformed large company stocks
French private equity investors Eurazeo and Altamir
Reverse merger of Liberty Sirius XM with Sirius XM
The Fund's past performance is not a good predictor of the Fund's future performance. The chart and the table below do not reflect the deduction of taxes that a shareholder would pay on Fund distributions or sale of Fund shares.
| 10/31/2014 | 100000 | 100000 | 100000 |
| 11/30/2014 | 103148 | 102544 | 101862 |
| 12/31/2014 | 103482 | 102139 | 100843 |
| 01/31/2015 | 103793 | 101615 | 99104 |
| 02/28/2015 | 108617 | 108484 | 104872 |
| 03/31/2015 | 107061 | 107571 | 103488 |
| 04/30/2015 | 110795 | 113290 | 105749 |
| 05/31/2015 | 113130 | 115665 | 106211 |
| 06/30/2015 | 111107 | 113580 | 103889 |
| 07/31/2015 | 112838 | 115305 | 105527 |
| 08/31/2015 | 106924 | 108157 | 98758 |
| 09/30/2015 | 102410 | 102435 | 95097 |
| 10/31/2015 | 106301 | 107967 | 102381 |
| 11/30/2015 | 104278 | 107329 | 101998 |
| 12/31/2015 | 103271 | 103479 | 100181 |
| 01/31/2016 | 95353 | 94037 | 94044 |
| 02/29/2016 | 93668 | 93292 | 93501 |
| 03/31/2016 | 102260 | 103313 | 99980 |
| 04/30/2016 | 104113 | 103955 | 101619 |
| 05/31/2016 | 105293 | 105366 | 102245 |
| 06/30/2016 | 99565 | 100735 | 100956 |
| 07/31/2016 | 104282 | 107075 | 105375 |
| 08/31/2016 | 105124 | 109100 | 105436 |
| 09/30/2016 | 109167 | 110881 | 106068 |
| 10/31/2016 | 107651 | 108487 | 103843 |
| 11/30/2016 | 108494 | 111840 | 105567 |
| 12/31/2016 | 110938 | 115053 | 108113 |
| 01/31/2017 | 115218 | 119270 | 110707 |
| 02/28/2017 | 117272 | 120638 | 113683 |
| 03/31/2017 | 117615 | 122146 | 114798 |
| 04/30/2017 | 124805 | 128210 | 116593 |
| 05/31/2017 | 130968 | 132275 | 118990 |
| 06/30/2017 | 133023 | 134199 | 119587 |
| 07/31/2017 | 137132 | 138297 | 122438 |
| 08/31/2017 | 136447 | 135512 | 122586 |
| 09/30/2017 | 139528 | 141798 | 125525 |
| 10/31/2017 | 140042 | 143195 | 127868 |
| 11/30/2017 | 139357 | 141198 | 130650 |
| 12/31/2017 | 141436 | 144129 | 132434 |
| 01/31/2018 | 151553 | 154180 | 139157 |
| 02/28/2018 | 143771 | 146485 | 133455 |
| 03/31/2018 | 141242 | 142760 | 130808 |
| 04/30/2018 | 142993 | 145059 | 132282 |
| 05/31/2018 | 140269 | 143969 | 133334 |
| 06/30/2018 | 139491 | 143754 | 133151 |
| 07/31/2018 | 143576 | 149663 | 136993 |
| 08/31/2018 | 144160 | 150545 | 138782 |
| 09/30/2018 | 147467 | 151447 | 139299 |
| 10/31/2018 | 134627 | 136177 | 128654 |
| 11/30/2018 | 133071 | 134356 | 130165 |
| 12/31/2018 | 123893 | 123192 | 120090 |
| 01/31/2019 | 135527 | 136257 | 129698 |
| 02/28/2019 | 139405 | 140321 | 133635 |
| 03/31/2019 | 140630 | 141165 | 135105 |
| 04/30/2019 | 148182 | 149133 | 139818 |
| 05/31/2019 | 142262 | 141272 | 131740 |
| 06/30/2019 | 150631 | 149588 | 140243 |
| 07/31/2019 | 151593 | 150249 | 140902 |
| 08/31/2019 | 150980 | 147935 | 137876 |
| 09/30/2019 | 154862 | 150938 | 140778 |
| 10/31/2019 | 160174 | 155470 | 144452 |
| 11/30/2019 | 165895 | 161058 | 148504 |
| 12/31/2019 | 173831 | 168368 | 152949 |
| 01/31/2020 | 176183 | 169033 | 151727 |
| 02/29/2020 | 158777 | 151178 | 138778 |
| 03/31/2020 | 120670 | 111073 | 119496 |
| 04/30/2020 | 134548 | 126058 | 132664 |
| 05/31/2020 | 141605 | 136194 | 139407 |
| 06/30/2020 | 145839 | 142004 | 142939 |
| 07/31/2020 | 154072 | 147780 | 149545 |
| 08/31/2020 | 162540 | 156744 | 159392 |
| 09/30/2020 | 158541 | 151765 | 154199 |
| 10/31/2020 | 155483 | 149783 | 149856 |
| 11/30/2020 | 177124 | 176217 | 169351 |
| 12/31/2020 | 190462 | 191286 | 176939 |
| 01/31/2021 | 185811 | 192811 | 175630 |
| 02/28/2021 | 192910 | 201045 | 180528 |
| 03/31/2021 | 197072 | 207105 | 186180 |
| 04/30/2021 | 210537 | 223280 | 194615 |
| 05/31/2021 | 212985 | 228221 | 197257 |
| 06/30/2021 | 215922 | 226361 | 199689 |
| 07/31/2021 | 224491 | 238574 | 202661 |
| 08/31/2021 | 229632 | 241752 | 207757 |
| 09/30/2021 | 219839 | | 199391 |
| 10/31/2021 | 235262 | 249804 | 210076 |
| 11/30/2021 | 227429 | 238863 | 204699 |
| 12/31/2021 | 236663 | 244759 | 213400 |
| 01/31/2022 | 219891 | 222756 | 201465 |
| 02/28/2022 | 210884 | 209328 | 196940 |
| 03/31/2022 | 211506 | 207664 | 201907 |
| 04/30/2022 | 189144 | 181534 | 185246 |
| 05/31/2022 | 188523 | 183218 | 185268 |
| 06/30/2022 | 167092 | 158366 | 168923 |
| 07/31/2022 | 184174 | 176163 | 182383 |
| 08/31/2022 | 172062 | 161916 | 174893 |
| 09/30/2022 | 151563 | 138425 | 158397 |
| 10/31/2022 | 163055 | 149694 | 169740 |
| 11/30/2022 | 177652 | 163192 | 181664 |
| 12/31/2022 | 168645 | 155683 | 174652 |
| 01/31/2023 | 183864 | 175501 | 186901 |
| 02/28/2023 | 179826 | 174714 | 182454 |
| 03/31/2023 | 175789 | 166872 | 187051 |
| 04/30/2023 | 180447 | 171401 | 190119 |
| 05/31/2023 | 180758 | 167654 | 187832 |
| 06/30/2023 | 188833 | 177233 | 199196 |
| 07/31/2023 | 195977 | 188812 | 206094 |
| 08/31/2023 | 193181 | 181476 | 200967 |
| 09/30/2023 | 191007 | 176832 | 192216 |
| 10/31/2023 | 181690 | 163660 | 186180 |
| 11/30/2023 | 203120 | 194005 | 203608 |
| 12/31/2023 | 217140 | 215592 | 214285 |
| 01/31/2024 | 219111 | 215130 | 216269 |
| 02/29/2024 | 226009 | 222795 | 225240 |
| 03/31/2024 | 231265 | 230126 | 232635 |
| 04/30/2024 | 226666 | 221673 | 223749 |
| 05/31/2024 | 238164 | 228848 | 233618 |
| 06/30/2024 | 234879 | 224756 | 237494 |
| 07/31/2024 | 249004 | 241887 | 242584 |
| 08/31/2024 | 250647 | 242690 | 248607 |
| 09/30/2024 | 255903 | 255196 | 253149 |
| 10/31/2024 | 250318 | 251189 | 247860 |
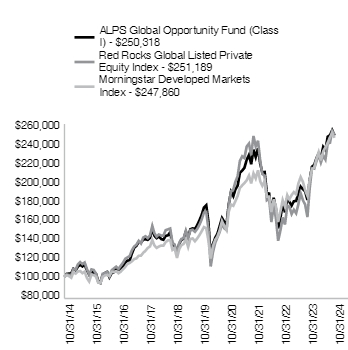
| ALPS Global Opportunity Fund - Institutional - NAV | 37.77% | 9.34% | 9.61% |
| Morningstar Developed Markets Index# | 33.13% | 11.40% | 9.50% |
| Red Rocks Global Listed Private Equity Index | 53.48% | 10.07% | 9.65% |
For the most current month-end performance data, please call 1-866-759-5679.
| Net Assets | $65,060,543 |
| Number of Portfolio Holdings | 53 |
| Portfolio Turnover Rate | 37% |
| Total Advisory Fees Paid | $503,602 |
| KKR & Co., Inc. | 6.04% |
| 3i Group PLC | 4.78% |
| Ares Management LP | 4.76% |
| HgCapital Trust PLC | 4.45% |
| Blackstone, Inc. | 4.05% |
| Partners Group Holding AG | 3.29% |
| Brederode SA | 3.25% |
| Intermediate Capital Group PLC | 3.21% |
| Apollo Global Management, Inc. | 3.18% |
| HarbourVest Global Private Equity, Ltd. | 3.11% |
| Financials | 76.48% |
| Technology | 8.16% |
| Industrials | 6.60% |
| Consumer Staples | 2.79% |
| Communications | 2.23% |
| Consumer Discretionary | 1.51% |
| Health Care | 1.43% |
| Cash, Cash Equivalents, & Other Net Assets | 0.80% |

| |
** | As a percentage of net assets. |
Holdings are subject to change
If you wish to view additional information about the Fund, including but not limited to the Fund's prospectus, financial information, holdings, and proxy voting information, please visit https://www.alpsfunds.com/mutual-funds/lpeix.
If you have consented to receive a single annual or semi-annual shareholder report at a shared address you may revoke this consent by calling the Transfer Agent 866-759-5679.
ALPS Global Opportunity Fund - Class R | FINANCIAL INVESTORS TRUST |
LPERX | |
This annual shareholder report contains important information about ALPS Global Opportunity Fund (the "Fund" or "LPERX") for the period of November 1, 2023 to October 31, 2024 (the "Period"). You can find additional information about the Fund at https://www.alpsfunds.com/mutual-funds/lpeix. You can also request this information by contacting us at 866-759-5679.
For the twelve months ended October 31, 2024, the ALPS Global Opportunity Fund Class R shares increased by 37.41%. The Fund outperformed the Morningstar Developed Markets Index-net of fees, which was up 33.13%.
Top contributors to performance included:
U.S. alternative asset managers KKR & Co Inc, Ares Management Corp, Blackstone Inc, and Apollo Global Management
Financial services sector exposure
Private Equity investors 3i Group Plc and HgCapital Trust
Top detractors from performance included:
Small and mid-capitalization stocks which underperformed large company stocks
French private equity investors Eurazeo and Altamir
Reverse merger of Liberty Sirius XM with Sirius XM
The Fund's past performance is not a good predictor of the Fund's future performance. The chart and the table below do not reflect the deduction of taxes that a shareholder would pay on Fund distributions or sale of Fund shares.
| 10/31/2014 | 10000 | 10000 | 10000 |
| 11/30/2014 | 10307 | 10254 | 10186 |
| 12/31/2014 | 10336 | 10214 | 10084 |
| 01/31/2015 | 10354 | 10161 | 9910 |
| 02/28/2015 | 10834 | 10848 | 10487 |
| 03/31/2015 | 10691 | 10757 | 10349 |
| 04/30/2015 | 11047 | 11329 | 10575 |
| 05/31/2015 | 11278 | 11566 | 10621 |
| 06/30/2015 | 11082 | 11358 | 10389 |
| 07/31/2015 | 11226 | 11531 | 10553 |
| 08/31/2015 | 10640 | 10816 | 9876 |
| 09/30/2015 | 10196 | 10244 | 9510 |
| 10/31/2015 | 10587 | 10797 | 10238 |
| 11/30/2015 | 10374 | 10733 | 10200 |
| 12/31/2015 | 10269 | 10348 | 10018 |
| 01/31/2016 | 9472 | 9404 | 9404 |
| 02/29/2016 | 9316 | 9329 | 9350 |
| 03/31/2016 | 10153 | 10331 | 9998 |
| 04/30/2016 | 10328 | 10396 | 10162 |
| 05/31/2016 | 10444 | 10537 | 10225 |
| 06/30/2016 | 9880 | 10073 | 10096 |
| 07/31/2016 | 10347 | 10708 | 10538 |
| 08/31/2016 | 10405 | 10910 | 10544 |
| 09/30/2016 | 10814 | 11088 | 10607 |
| 10/31/2016 | 10658 | 10849 | 10384 |
| 11/30/2016 | 10736 | 11184 | 10557 |
| 12/31/2016 | 10972 | 11505 | 10811 |
| 01/31/2017 | 11388 | 11927 | 11071 |
| 02/28/2017 | 11586 | 12064 | 11368 |
| 03/31/2017 | 11625 | 12215 | 11480 |
| 04/30/2017 | 12318 | 12821 | 11659 |
| 05/31/2017 | 12932 | 13228 | 11899 |
| 06/30/2017 | 13130 | 13420 | 11959 |
| 07/31/2017 | 13526 | 13830 | 12244 |
| 08/31/2017 | 13447 | 13551 | 12259 |
| 09/30/2017 | 13744 | 14180 | 12552 |
| 10/31/2017 | 13804 | 14319 | 12787 |
| 11/30/2017 | 13724 | 14120 | 13065 |
| 12/31/2017 | 13921 | 14413 | 13243 |
| 01/31/2018 | 14909 | 15418 | 13916 |
| 02/28/2018 | 14151 | 14649 | 13345 |
| 03/31/2018 | 13898 | 14276 | 13081 |
| 04/30/2018 | 14059 | 14506 | 13228 |
| 05/31/2018 | 13784 | 14397 | 13333 |
| 06/30/2018 | 13715 | 14375 | 13315 |
| 07/31/2018 | 14105 | 14966 | 13699 |
| 08/31/2018 | 14151 | 15055 | 13878 |
| 09/30/2018 | 14473 | 15145 | 13930 |
| 10/31/2018 | 13209 | 13618 | 12865 |
| 11/30/2018 | 13048 | 13436 | 13017 |
| 12/31/2018 | 12141 | 12319 | 12009 |
| 01/31/2019 | 13280 | 13626 | 12970 |
| 02/28/2019 | 13668 | 14032 | 13363 |
| 03/31/2019 | 13789 | 14117 | 13511 |
| 04/30/2019 | 14516 | 14913 | 13982 |
| 05/31/2019 | 13910 | 14127 | 13174 |
| 06/30/2019 | 14734 | 14959 | 14024 |
| 07/31/2019 | 14824 | 15025 | 14090 |
| 08/31/2019 | 14776 | 14793 | 13788 |
| 09/30/2019 | 15140 | 15094 | 14078 |
| 10/31/2019 | 15649 | 15547 | 14445 |
| 11/30/2019 | 16207 | 16106 | 14850 |
| 12/31/2019 | 16968 | 16837 | 15295 |
| 01/31/2020 | 17199 | 16903 | 15173 |
| 02/29/2020 | 15496 | 15118 | 13878 |
| 03/31/2020 | 11774 | 11107 | 11950 |
| 04/30/2020 | 13101 | 12606 | 13266 |
| 05/31/2020 | 13794 | 13619 | 13941 |
| 06/30/2020 | 14198 | 14200 | 14294 |
| 07/31/2020 | 15006 | 14778 | 14955 |
| 08/31/2020 | 15814 | 15674 | 15939 |
| 09/30/2020 | 15410 | 15176 | 15420 |
| 10/31/2020 | 15121 | 14978 | 14986 |
| 11/30/2020 | 17199 | 17622 | 16935 |
| 12/31/2020 | 18488 | 19129 | 17694 |
| 01/31/2021 | 18033 | 19281 | 17563 |
| 02/28/2021 | 18731 | 20105 | 18053 |
| 03/31/2021 | 19126 | 20711 | 18618 |
| 04/30/2021 | 20431 | 22328 | 19462 |
| 05/31/2021 | 20644 | 22822 | 19726 |
| 06/30/2021 | 20917 | 22636 | 19969 |
| 07/31/2021 | 21767 | 23857 | 20266 |
| 08/31/2021 | 22253 | 24175 | 20776 |
| 09/30/2021 | 21281 | 22946 | 19939 |
| 10/31/2021 | 22769 | 24980 | 21008 |
| 11/30/2021 | 21980 | 23886 | 20470 |
| 12/31/2021 | 22887 | 24476 | 21340 |
| 01/31/2022 | 21264 | 22276 | 20146 |
| 02/28/2022 | 20390 | 20933 | 19694 |
| 03/31/2022 | 20432 | 20766 | 20191 |
| 04/30/2022 | 18268 | 18153 | 18525 |
| 05/31/2022 | 18185 | 18322 | 18527 |
| 06/30/2022 | 16146 | 15837 | 16892 |
| 07/31/2022 | 17769 | 17616 | 18238 |
| 08/31/2022 | 16604 | 16192 | 17489 |
| 09/30/2022 | 14606 | 13843 | 15840 |
| 10/31/2022 | 15730 | 14969 | 16974 |
| 11/30/2022 | 17103 | 16319 | 18166 |
| 12/31/2022 | 16229 | 15568 | 17465 |
| 01/31/2023 | 17685 | 17550 | 18690 |
| 02/28/2023 | 17311 | 17471 | 18245 |
| 03/31/2023 | 16895 | 16687 | 18705 |
| 04/30/2023 | 17353 | 17140 | 19012 |
| 05/31/2023 | 17394 | 16765 | 18783 |
| 06/30/2023 | 18102 | 17723 | 19920 |
| 07/31/2023 | 18809 | 18881 | 20609 |
| 08/31/2023 | 18559 | 18148 | 20097 |
| 09/30/2023 | 18310 | 17683 | 19222 |
| 10/31/2023 | 17394 | 16366 | 18618 |
| 11/30/2023 | 19475 | 19401 | 20361 |
| 12/31/2023 | 20795 | 21559 | 21428 |
| 01/31/2024 | 20975 | 21513 | 21627 |
| 02/29/2024 | 21606 | 22279 | 22524 |
| 03/31/2024 | 22146 | 23013 | 23263 |
| 04/30/2024 | 21696 | 22167 | 22375 |
| 05/31/2024 | 22731 | 22885 | 23362 |
| 06/30/2024 | 22461 | 22476 | 23749 |
| 07/31/2024 | 23811 | 24189 | 24258 |
| 08/31/2024 | 23901 | 24269 | 24861 |
| 09/30/2024 | 24396 | 25520 | 25315 |
| 10/31/2024 | 23901 | 25119 | 24786 |
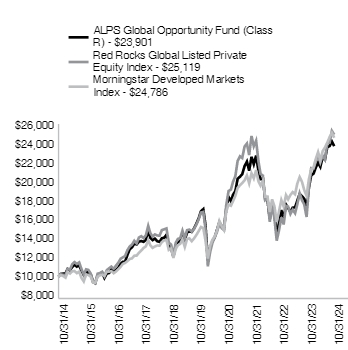
| ALPS Global Opportunity Fund - Retirement - NAV | 37.41% | 8.84% | 9.10% |
| Morningstar Developed Markets Index# | 33.13% | 11.40% | 9.50% |
| Red Rocks Global Listed Private Equity Index | 53.48% | 10.07% | 9.65% |
For the most current month-end performance data, please call 1-866-759-5679.
| Net Assets | $65,060,543 |
| Number of Portfolio Holdings | 53 |
| Portfolio Turnover Rate | 37% |
| Total Advisory Fees Paid | $503,602 |
| KKR & Co., Inc. | 6.04% |
| 3i Group PLC | 4.78% |
| Ares Management LP | 4.76% |
| HgCapital Trust PLC | 4.45% |
| Blackstone, Inc. | 4.05% |
| Partners Group Holding AG | 3.29% |
| Brederode SA | 3.25% |
| Intermediate Capital Group PLC | 3.21% |
| Apollo Global Management, Inc. | 3.18% |
| HarbourVest Global Private Equity, Ltd. | 3.11% |
| Financials | 76.48% |
| Technology | 8.16% |
| Industrials | 6.60% |
| Consumer Staples | 2.79% |
| Communications | 2.23% |
| Consumer Discretionary | 1.51% |
| Health Care | 1.43% |
| Cash, Cash Equivalents, & Other Net Assets | 0.80% |
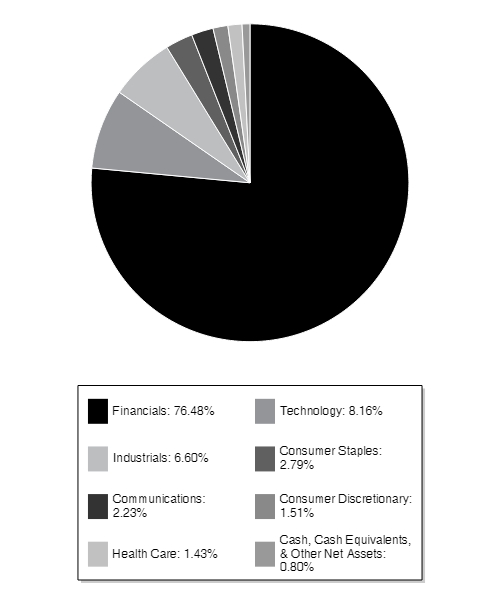
| |
** | As a percentage of net assets. |
Holdings are subject to change
If you wish to view additional information about the Fund, including but not limited to the Fund's prospectus, financial information, holdings, and proxy voting information, please visit https://www.alpsfunds.com/mutual-funds/lpeix.
If you have consented to receive a single annual or semi-annual shareholder report at a shared address you may revoke this consent by calling the Transfer Agent 866-759-5679.
ALPS Balanced Opportunity Fund - Investor Class | FINANCIAL INVESTORS TRUST |
ALIBX | |
This annual shareholder report contains important information about ALPS Balanced Opportunity Fund (formerly, ALPS | Smith Balanced Opportunity Fund) (the "Fund" or "ALIBX") for the period of November 1, 2023 to October 31, 2024 (the "Period"). You can find additional information about the Fund at https://www.alpsfunds.com/mutual-funds/alpbx. You can also request this information by contacting us at 866-759-5679.
This report describes changes to the Fund that occurred during the reporting period.
The ALPS Balanced Opportunity Fund returned 27.42% for Investor Class shares at net asset value (NAV) for the 12 months ended October 31, 2024. The Fund outperformed the blended benchmark of 55% Bloomberg U.S. 1000 TR Index and 45% Bloomberg U.S. Aggregate Bond Index, which returned 24.99%.
Top contributors to relative performance:
Asset allocation, specifically an overweight position in corporate credit—generically including investment grade, high yield, and preferred securities—benefited from tightening risk asset spreads throughout the period.
Security selection across investment grade and high yield credit allocations.
Active portfolio duration positioning throughout market yield fluctuations. Duration position generally moved higher during relatively higher interest rates and vice versa.
Security selection was strong across the equity sleeve of the portfolio.
Technology stocks contributed to both absolute and relative performance. Leading contributors were Taiwan Semiconductor, Nvidia, and Apple.
Consumer Staples stocks were also a standout with overweight positions in Walmart and Costco Wholesale contributing.
Top detractors from relative performance:
Yield curve positioning with U.S. Treasuries, with an overweight to the short and long duration areas of the market and a relative underweight to the belly of the yield curve, which outperformed.
Agency mortgage security selection, with a relative underweight to low-coupon mortgage-backed securities, which outperformed during the period.
Allocations to longer duration AA and A-rated corporates, which underperformed compared to the broader investment grade corporate universe.
The Fund was hurt by an underweight position to the Technology Sector, but the stock selection overcame the sector underweight decision.
An overweight in the Energy sector also was a drag on performance as the sector meaningfully lagged the performance of the broad index.
The Fund's past performance is not a good predictor of the Fund's future performance. The chart and the table below do not reflect the deduction of taxes that a shareholder would pay on Fund distributions or sale of Fund shares.
| 09/15/2020 | 10000 | 10000 | 10000 | 10000 |
| 09/30/2020 | 9950 | 9943 | 9911 | 9980 |
| 10/31/2020 | 9882 | 9795 | 9679 | 9935 |
| 11/30/2020 | 10538 | 10472 | 10818 | 10033 |
| 12/31/2020 | 10803 | 10719 | 11270 | 10047 |
| 01/31/2021 | 10736 | 10641 | 11186 | 9975 |
| 02/28/2021 | 11121 | 10745 | 11517 | 9831 |
| 03/31/2021 | 11395 | 10901 | 11939 | 9708 |
| 04/30/2021 | 11798 | 11261 | 12578 | 9785 |
| 05/31/2021 | 11827 | 11300 | 12625 | 9817 |
| 06/30/2021 | 11877 | 11502 | 12963 | 9886 |
| 07/31/2021 | 12077 | 11695 | 13240 | 9996 |
| 08/31/2021 | 12201 | 11874 | 13628 | 9977 |
| 09/30/2021 | 11814 | 11529 | 13006 | 9891 |
| 10/31/2021 | 12249 | 11969 | 13911 | 9888 |
| 11/30/2021 | 12110 | 11898 | 13727 | 9917 |
| 12/31/2021 | 12481 | 12138 | 14259 | 9892 |
| 01/31/2022 | 11921 | 11633 | 13430 | 9679 |
| 02/28/2022 | 11790 | 11396 | 13056 | 9571 |
| 03/31/2022 | 11932 | 11460 | 13486 | 9305 |
| 04/30/2022 | 11156 | 10694 | 12266 | 8952 |
| 05/31/2022 | 11090 | 10710 | 12234 | 9009 |
| 06/30/2022 | 10296 | 10148 | 11226 | 8868 |
| 07/31/2022 | 11043 | 10783 | 12277 | 9085 |
| 08/31/2022 | 10710 | 10418 | 11806 | 8828 |
| 09/30/2022 | 10025 | 9683 | 10708 | 8447 |
| 10/31/2022 | 10391 | 10050 | 11560 | 8337 |
| 11/30/2022 | 10916 | 10512 | 12178 | 8644 |
| 12/31/2022 | 10465 | 10153 | 11467 | 8605 |
| 01/31/2023 | 11039 | 10670 | 12240 | 8870 |
| 02/28/2023 | 10787 | 10404 | 11944 | 8640 |
| 03/31/2023 | 11032 | 10705 | 12324 | 8860 |
| 04/30/2023 | 11106 | 10804 | 12470 | 8914 |
| 05/31/2023 | 11111 | 10784 | 12540 | 8816 |
| 06/30/2023 | 11494 | 11168 | 13388 | 8785 |
| 07/31/2023 | 11735 | 11376 | 13850 | 8779 |
| 08/31/2023 | 11550 | 11233 | 13605 | 8723 |
| 09/30/2023 | 11132 | 10815 | 12968 | 8501 |
| 10/31/2023 | 10920 | 10593 | 12651 | 8367 |
| 11/30/2023 | 11675 | 11356 | 13839 | 8746 |
| 12/31/2023 | 12179 | 11861 | 14525 | 9081 |
| 01/31/2024 | 12318 | 11936 | 14724 | 9056 |
| 02/29/2024 | 12721 | 12217 | 15525 | 8928 |
| 03/31/2024 | 13060 | 12484 | 16024 | 9010 |
| 04/30/2024 | 12615 | 12046 | 15334 | 8783 |
| 05/31/2024 | 13039 | 12451 | 16057 | 8932 |
| 06/30/2024 | 13306 | 12733 | 16594 | 9016 |
| 07/31/2024 | 13560 | 12966 | 16829 | 9227 |
| 08/31/2024 | 13832 | 13213 | 17215 | 9359 |
| 09/30/2024 | 14067 | 13447 | 17580 | 9485 |
| 10/31/2024 | 13914 | 13241 | 17446 | 9249 |
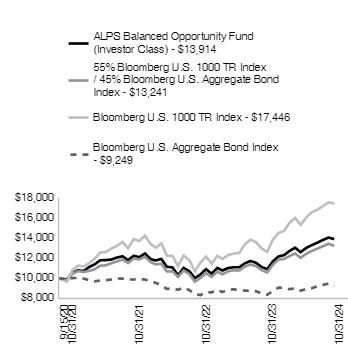
| ALPS Balanced Opportunity Fund - Investor - NAV | 27.42% | 8.33% |
| 55% Bloomberg U.S. 1000 TR Index / 45% Bloomberg U.S. Aggregate Bond Index | 24.99% | 7.04% |
| Bloomberg U.S. Aggregate Bond Index# | 10.55% | -1.87% |
| Bloomberg U.S. 1000 TR Index# | 37.91% | 14.44% |
For the most current month-end performance data, please call 1-866-759-5679.
| Net Assets | $12,616,896 |
| Number of Portfolio Holdings | 66 |
| Portfolio Turnover Rate | 131% |
| Total Advisory Fees Paid* | ($125,395) |
* Represents reimbursement from the adviser to the Fund.
| Common Stock | 71.98% |
| Exchange Traded Fund | 30.71% |
| Collateralized Mortgage Obligations | 0.01% |
| Cash, Cash Equivalents, & Other Net Assets | -2.70% |

| |
** | As a percentage of net assets. |
Holdings are subject to change
| ALPS Smith Core Plus Bond ETF | 30.71% |
| Apple, Inc. | 4.44% |
| NVIDIA Corp. | 3.38% |
| Microsoft Corp. | 2.57% |
| Amazon.com, Inc. | 2.47% |
| Alphabet, Inc. | 2.23% |
| JPMorgan Chase & Co. | 2.08% |
| Taiwan Semiconductor Manufacturing Co., Ltd. | 1.96% |
| UnitedHealth Group, Inc. | 1.79% |
| Walmart, Inc. | 1.71% |
This is a summary of certain changes to the Fund since April 30, 2024. For more complete information, you may review the Fund's prospectus, which is available at https://www.alpsfunds.com/mutual-funds/alpbx or upon request at 866-759-5679.
Change to Fund Name: The ALPS | Smith Balanced Opportunity Fund changed its name to the ALPS Balanced Opportunity Fund.
Termination of Sub-Adviser: Smith Capital Investors, LLC ceased to serve as sub-adviser to the Fund and ALPS Advisors, Inc (the "Adviser"), the Fund's investment adviser, assumed all responsibility for selecting the Fund's investments.
Change to Principal Investment Strategy and Principal Risks: The Fund will now invest, as a principal investment strategy, in underlying exchange-traded funds (ETFs) that are advised by the Adviser to gain fixed income exposure as opposed to making such investments directly. The following are now Principal Risks of the Fund: Affiliated ETF Risk and ETF Investment Risk.
If you wish to view additional information about the Fund, including but not limited to the Fund's prospectus, financial information, holdings, and proxy voting information, please visit https://www.alpsfunds.com/mutual-funds/alpbx.
If you have consented to receive a single annual or semi-annual shareholder report at a shared address you may revoke this consent by calling the Transfer Agent 866-759-5679.
ALPS Balanced Opportunity Fund - Class A | FINANCIAL INVESTORS TRUST |
ALABX | |
This annual shareholder report contains important information about ALPS Balanced Opportunity Fund (formerly, ALPS | Smith Balanced Opportunity Fund) (the "Fund" or "ALABX") for the period of November 1, 2023 to October 31, 2024 (the "Period"). You can find additional information about the Fund at https://www.alpsfunds.com/mutual-funds/alpbx. You can also request this information by contacting us at 866-759-5679.
This report describes changes to the Fund that occurred during the reporting period.
The ALPS Balanced Opportunity Fund returned 27.40% for Class A shares at net asset value (NAV) for the 12 months ended October 31, 2024. The Fund outperformed the blended benchmark of 55% Bloomberg U.S. 1000 TR Index and 45% Bloomberg U.S. Aggregate Bond Index, which returned 24.99%.
Top contributors to relative performance:
Asset allocation, specifically an overweight position in corporate credit—generically including investment grade, high yield, and preferred securities—benefited from tightening risk asset spreads throughout the period.
Security selection across investment grade and high yield credit allocations.
Active portfolio duration positioning throughout market yield fluctuations. Duration position generally moved higher during relatively higher interest rates and vice versa.
Security selection was strong across the equity sleeve of the portfolio.
Technology stocks contributed to both absolute and relative performance. Leading contributors were Taiwan Semiconductor, Nvidia, and Apple.
Consumer Staples stocks were also a standout with overweight positions in Walmart and Costco Wholesale contributing.
Top detractors from relative performance:
Yield curve positioning with U.S. Treasuries, with an overweight to the short and long duration areas of the market and a relative underweight to the belly of the yield curve, which outperformed.
Agency mortgage security selection, with a relative underweight to low-coupon mortgage-backed securities, which outperformed during the period.
Allocations to longer duration AA and A-rated corporates, which underperformed compared to the broader investment grade corporate universe.
The Fund was hurt by an underweight position to the Technology Sector, but the stock selection overcame the sector underweight decision.
An overweight in the Energy sector also was a drag on performance as the sector meaningfully lagged the performance of the broad index.
The Fund's past performance is not a good predictor of the Fund's future performance. The chart and the table below do not reflect the deduction of taxes that a shareholder would pay on Fund distributions or sale of Fund shares.
| 09/15/2020 | 9671 | 10000 | 10000 | 10000 |
| 09/30/2020 | 9623 | 9943 | 9911 | 9980 |
| 10/31/2020 | 9559 | 9795 | 9679 | 9935 |
| 11/30/2020 | 10194 | 10472 | 10818 | 10033 |
| 12/31/2020 | 10441 | 10719 | 11270 | 10047 |
| 01/31/2021 | 10385 | 10641 | 11186 | 9975 |
| 02/28/2021 | 10758 | 10745 | 11517 | 9831 |
| 03/31/2021 | 11023 | 10901 | 11939 | 9708 |
| 04/30/2021 | 11412 | 11261 | 12578 | 9785 |
| 05/31/2021 | 11441 | 11300 | 12625 | 9817 |
| 06/30/2021 | 11489 | 11502 | 12963 | 9886 |
| 07/31/2021 | 11683 | 11695 | 13240 | 9996 |
| 08/31/2021 | 11803 | 11874 | 13628 | 9977 |
| 09/30/2021 | 11429 | 11529 | 13006 | 9891 |
| 10/31/2021 | 11849 | 11969 | 13911 | 9888 |
| 11/30/2021 | 11715 | 11898 | 13727 | 9917 |
| 12/31/2021 | 12074 | 12138 | 14259 | 9892 |
| 01/31/2022 | 11532 | 11633 | 13430 | 9679 |
| 02/28/2022 | 11396 | 11396 | 13056 | 9571 |
| 03/31/2022 | 11543 | 11460 | 13486 | 9305 |
| 04/30/2022 | 10793 | 10694 | 12266 | 8952 |
| 05/31/2022 | 10728 | 10710 | 12234 | 9009 |
| 06/30/2022 | 9960 | 10148 | 11226 | 8868 |
| 07/31/2022 | 10673 | 10783 | 12277 | 9085 |
| 08/31/2022 | 10361 | 10418 | 11806 | 8828 |
| 09/30/2022 | 9698 | 9683 | 10708 | 8447 |
| 10/31/2022 | 10052 | 10050 | 11560 | 8337 |
| 11/30/2022 | 10560 | 10512 | 12178 | 8644 |
| 12/31/2022 | 10124 | 10153 | 11467 | 8605 |
| 01/31/2023 | 10669 | 10670 | 12240 | 8870 |
| 02/28/2023 | 10436 | 10404 | 11944 | 8640 |
| 03/31/2023 | 10671 | 10705 | 12324 | 8860 |
| 04/30/2023 | 10743 | 10804 | 12470 | 8914 |
| 05/31/2023 | 10737 | 10784 | 12540 | 8816 |
| 06/30/2023 | 11107 | 11168 | 13388 | 8785 |
| 07/31/2023 | 11350 | 11376 | 13850 | 8779 |
| 08/31/2023 | 11161 | 11233 | 13605 | 8723 |
| 09/30/2023 | 10766 | 10815 | 12968 | 8501 |
| 10/31/2023 | 10561 | 10593 | 12651 | 8367 |
| 11/30/2023 | 11291 | 11356 | 13839 | 8746 |
| 12/31/2023 | 11778 | 11861 | 14525 | 9081 |
| 01/31/2024 | 11913 | 11936 | 14724 | 9056 |
| 02/29/2024 | 12303 | 12217 | 15525 | 8928 |
| 03/31/2024 | 12629 | 12484 | 16024 | 9010 |
| 04/30/2024 | 12198 | 12046 | 15334 | 8783 |
| 05/31/2024 | 12608 | 12451 | 16057 | 8932 |
| 06/30/2024 | 12866 | 12733 | 16594 | 9016 |
| 07/31/2024 | 13112 | 12966 | 16829 | 9227 |
| 08/31/2024 | 13375 | 13213 | 17215 | 9359 |
| 09/30/2024 | 13603 | 13447 | 17580 | 9485 |
| 10/31/2024 | 13455 | 13241 | 17446 | 9249 |
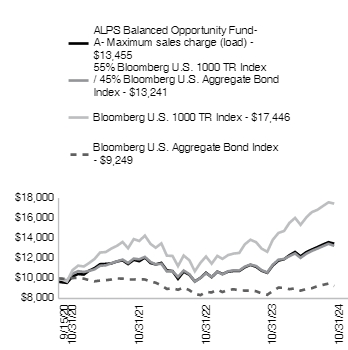
| ALPS Balanced Opportunity Fund - A - NAV | 27.40% | 8.33% |
| ALPS Balanced Opportunity Fund - A - Maximum sales charge (load)*^ | 23.31% | 7.46% |
| 55% Bloomberg U.S. 1000 TR Index / 45% Bloomberg U.S. Aggregate Bond Index | 24.99% | 7.04% |
| Bloomberg U.S. Aggregate Bond Index# | 10.55% | -1.87% |
| Bloomberg U.S. 1000 TR Index# | 37.91% | 14.44% |
For the most current month-end performance data, please call 1-866-759-5679.
| Net Assets | $12,616,896 |
| Number of Portfolio Holdings | 66 |
| Portfolio Turnover Rate | 131% |
| Total Advisory Fees Paid* | ($125,395) |
* Represents reimbursement from the adviser to the Fund.
| Common Stock | 71.98% |
| Exchange Traded Fund | 30.71% |
| Collateralized Mortgage Obligations | 0.01% |
| Cash, Cash Equivalents, & Other Net Assets | -2.70% |

| |
** | As a percentage of net assets. |
Holdings are subject to change
| ALPS Smith Core Plus Bond ETF | 30.71% |
| Apple, Inc. | 4.44% |
| NVIDIA Corp. | 3.38% |
| Microsoft Corp. | 2.57% |
| Amazon.com, Inc. | 2.47% |
| Alphabet, Inc. | 2.23% |
| JPMorgan Chase & Co. | 2.08% |
| Taiwan Semiconductor Manufacturing Co., Ltd. | 1.96% |
| UnitedHealth Group, Inc. | 1.79% |
| Walmart, Inc. | 1.71% |
This is a summary of certain changes to the Fund since April 30, 2024. For more complete information, you may review the Fund's prospectus, which is available at https://www.alpsfunds.com/mutual-funds/alpbx or upon request at 866-759-5679.
Change to Fund Name: The ALPS | Smith Balanced Opportunity Fund changed its name to the ALPS Balanced Opportunity Fund.
Termination of Sub-Adviser: Smith Capital Investors, LLC ceased to serve as sub-adviser to the Fund and ALPS Advisors, Inc (the "Adviser"), the Fund's investment adviser, assumed all responsibility for selecting the Fund's investments.
Change to Principal Investment Strategy and Principal Risks: The Fund will now invest, as a principal investment strategy, in underlying exchange-traded funds (ETFs) that are advised by the Adviser to gain fixed income exposure as opposed to making such investments directly. The following are now Principal Risks of the Fund: Affiliated ETF Risk and ETF Investment Risk.
If you wish to view additional information about the Fund, including but not limited to the Fund's prospectus, financial information, holdings, and proxy voting information, please visit https://www.alpsfunds.com/mutual-funds/alpbx.
If you have consented to receive a single annual or semi-annual shareholder report at a shared address you may revoke this consent by calling the Transfer Agent 866-759-5679.
ALPS Balanced Opportunity Fund - Class C | FINANCIAL INVESTORS TRUST |
ALCBX | |
This annual shareholder report contains important information about ALPS Balanced Opportunity Fund (formerly, ALPS | Smith Balanced Opportunity Fund) (the "Fund" or "ALCBX") for the period of November 1, 2023 to October 31, 2024 (the "Period"). You can find additional information about the Fund at https://www.alpsfunds.com/mutual-funds/alpbx. You can also request this information by contacting us at 866-759-5679.
This report describes changes to the Fund that occurred during the reporting period.
The ALPS Balanced Opportunity Fund returned 26.04% for Class C shares at net asset value (NAV) for the 12 months ended October 31, 2024. The Fund outperformed the blended benchmark of 55% Bloomberg U.S. 1000 TR Index and 45% Bloomberg U.S. Aggregate Bond Index, which returned 24.99%.
Top contributors to relative performance:
Asset allocation, specifically an overweight position in corporate credit—generically including investment grade, high yield, and preferred securities—benefited from tightening risk asset spreads throughout the period.
Security selection across investment grade and high yield credit allocations.
Active portfolio duration positioning throughout market yield fluctuations. Duration position generally moved higher during relatively higher interest rates and vice versa.
Security selection was strong across the equity sleeve of the portfolio.
Technology stocks contributed to both absolute and relative performance. Leading contributors were Taiwan Semiconductor, Nvidia, and Apple.
Consumer Staples stocks were also a standout with overweight positions in Walmart and Costco Wholesale contributing.
Top detractors from relative performance:
Yield curve positioning with U.S. Treasuries, with an overweight to the short and long duration areas of the market and a relative underweight to the belly of the yield curve, which outperformed.
Agency mortgage security selection, with a relative underweight to low-coupon mortgage-backed securities, which outperformed during the period.
Allocations to longer duration AA and A-rated corporates, which underperformed compared to the broader investment grade corporate universe.
The Fund was hurt by an underweight position to the Technology Sector, but the stock selection overcame the sector underweight decision.
An overweight in the Energy sector also was a drag on performance as the sector meaningfully lagged the performance of the broad index.
The Fund's past performance is not a good predictor of the Fund's future performance. The chart and the table below do not reflect the deduction of taxes that a shareholder would pay on Fund distributions or sale of Fund shares.
| 09/15/2020 | 10000 | 10000 | 10000 | 10000 |
| 09/30/2020 | 9950 | 9943 | 9911 | 9980 |
| 10/31/2020 | 9870 | 9795 | 9679 | 9935 |
| 11/30/2020 | 10530 | 10472 | 10818 | 10033 |
| 12/31/2020 | 10780 | 10719 | 11270 | 10047 |
| 01/31/2021 | 10710 | 10641 | 11186 | 9975 |
| 02/28/2021 | 11090 | 10745 | 11517 | 9831 |
| 03/31/2021 | 11350 | 10901 | 11939 | 9708 |
| 04/30/2021 | 11740 | 11261 | 12578 | 9785 |
| 05/31/2021 | 11771 | 11300 | 12625 | 9817 |
| 06/30/2021 | 11811 | 11502 | 12963 | 9886 |
| 07/31/2021 | 12001 | 11695 | 13240 | 9996 |
| 08/31/2021 | 12115 | 11874 | 13628 | 9977 |
| 09/30/2021 | 11725 | 11529 | 13006 | 9891 |
| 10/31/2021 | 12155 | 11969 | 13911 | 9888 |
| 11/30/2021 | 12005 | 11898 | 13727 | 9917 |
| 12/31/2021 | 12369 | 12138 | 14259 | 9892 |
| 01/31/2022 | 11808 | 11633 | 13430 | 9679 |
| 02/28/2022 | 11661 | 11396 | 13056 | 9571 |
| 03/31/2022 | 11795 | 11460 | 13486 | 9305 |
| 04/30/2022 | 11023 | 10694 | 12266 | 8952 |
| 05/31/2022 | 10959 | 10710 | 12234 | 9009 |
| 06/30/2022 | 10165 | 10148 | 11226 | 8868 |
| 07/31/2022 | 10890 | 10783 | 12277 | 9085 |
| 08/31/2022 | 10563 | 10418 | 11806 | 8828 |
| 09/30/2022 | 9877 | 9683 | 10708 | 8447 |
| 10/31/2022 | 10234 | 10050 | 11560 | 8337 |
| 11/30/2022 | 10737 | 10512 | 12178 | 8644 |
| 12/31/2022 | 10295 | 10153 | 11467 | 8605 |
| 01/31/2023 | 10846 | 10670 | 12240 | 8870 |
| 02/28/2023 | 10601 | 10404 | 11944 | 8640 |
| 03/31/2023 | 10824 | 10705 | 12324 | 8860 |
| 04/30/2023 | 10902 | 10804 | 12470 | 8914 |
| 05/31/2023 | 10888 | 10784 | 12540 | 8816 |
| 06/30/2023 | 11259 | 11168 | 13388 | 8785 |
| 07/31/2023 | 11489 | 11376 | 13850 | 8779 |
| 08/31/2023 | 11300 | 11233 | 13605 | 8723 |
| 09/30/2023 | 10891 | 10815 | 12968 | 8501 |
| 10/31/2023 | 10676 | 10593 | 12651 | 8367 |
| 11/30/2023 | 11411 | 11356 | 13839 | 8746 |
| 12/31/2023 | 11889 | 11861 | 14525 | 9081 |
| 01/31/2024 | 12019 | 11936 | 14724 | 9056 |
| 02/29/2024 | 12397 | 12217 | 15525 | 8928 |
| 03/31/2024 | 12720 | 12484 | 16024 | 9010 |
| 04/30/2024 | 12276 | 12046 | 15334 | 8783 |
| 05/31/2024 | 12693 | 12451 | 16057 | 8932 |
| 06/30/2024 | 12936 | 12733 | 16594 | 9016 |
| 07/31/2024 | 13176 | 12966 | 16829 | 9227 |
| 08/31/2024 | 13433 | 13213 | 17215 | 9359 |
| 09/30/2024 | 13655 | 13447 | 17580 | 9485 |
| 10/31/2024 | 13457 | 13241 | 17446 | 9249 |
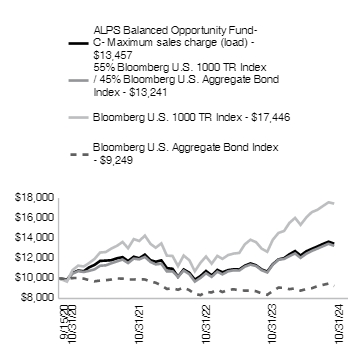
| ALPS Balanced Opportunity Fund - C - NAV | 26.04% | 7.46% |
| ALPS Balanced Opportunity Fund - C - Maximim deferred sales charge** | 25.04% | 7.46% |
| 55% Bloomberg U.S. 1000 TR Index / 45% Bloomberg U.S. Aggregate Bond Index | 24.99% | 7.04% |
| Bloomberg U.S. Aggregate Bond Index# | 10.55% | -1.87% |
| Bloomberg U.S. 1000 TR Index# | 37.91% | 14.44% |
For the most current month-end performance data, please call 1-866-759-5679.
| Net Assets | $12,616,896 |
| Number of Portfolio Holdings | 66 |
| Portfolio Turnover Rate | 131% |
| Total Advisory Fees Paid* | ($125,395) |
* Represents reimbursement from the adviser to the Fund.
| Common Stock | 71.98% |
| Exchange Traded Fund | 30.71% |
| Collateralized Mortgage Obligations | 0.01% |
| Cash, Cash Equivalents, & Other Net Assets | -2.70% |

| |
** | As a percentage of net assets. |
Holdings are subject to change
| ALPS Smith Core Plus Bond ETF | 30.71% |
| Apple, Inc. | 4.44% |
| NVIDIA Corp. | 3.38% |
| Microsoft Corp. | 2.57% |
| Amazon.com, Inc. | 2.47% |
| Alphabet, Inc. | 2.23% |
| JPMorgan Chase & Co. | 2.08% |
| Taiwan Semiconductor Manufacturing Co., Ltd. | 1.96% |
| UnitedHealth Group, Inc. | 1.79% |
| Walmart, Inc. | 1.71% |
This is a summary of certain changes to the Fund since April 30, 2024. For more complete information, you may review the Fund's prospectus, which is available at https://www.alpsfunds.com/mutual-funds/alpbx or upon request at 866-759-5679.
Change to Fund Name: The ALPS | Smith Balanced Opportunity Fund changed its name to the ALPS Balanced Opportunity Fund.
Termination of Sub-Adviser: Smith Capital Investors, LLC ceased to serve as sub-adviser to the Fund and ALPS Advisors, Inc (the "Adviser"), the Fund's investment adviser, assumed all responsibility for selecting the Fund's investments.
Change to Principal Investment Strategy and Principal Risks: The Fund will now invest, as a principal investment strategy, in underlying exchange-traded funds (ETFs) that are advised by the Adviser to gain fixed income exposure as opposed to making such investments directly. The following are now Principal Risks of the Fund: Affiliated ETF Risk and ETF Investment Risk.
If you wish to view additional information about the Fund, including but not limited to the Fund's prospectus, financial information, holdings, and proxy voting information, please visit https://www.alpsfunds.com/mutual-funds/alpbx.
If you have consented to receive a single annual or semi-annual shareholder report at a shared address you may revoke this consent by calling the Transfer Agent 866-759-5679.
ALPS Balanced Opportunity Fund - Class I | FINANCIAL INVESTORS TRUST |
ALPBX | |
This annual shareholder report contains important information about ALPS Balanced Opportunity Fund (formerly, ALPS | Smith Balanced Opportunity Fund) (the "Fund" or "ALPBX") for the period of November 1, 2023 to October 31, 2024 (the "Period"). You can find additional information about the Fund at https://www.alpsfunds.com/mutual-funds/alpbx. You can also request this information by contacting us at 866-759-5679.
This report describes changes to the Fund that occurred during the reporting period.
The ALPS Balanced Opportunity Fund returned 27.38% for Class I shares at net asset value (NAV) for the 12 months ended October 31, 2024. The Fund outperformed the blended benchmark of 55% Bloomberg U.S. 1000 TR Index and 45% Bloomberg U.S. Aggregate Bond Index, which returned 24.99%.
Top contributors to relative performance:
Asset allocation, specifically an overweight position in corporate credit—generically including investment grade, high yield, and preferred securities—benefited from tightening risk asset spreads throughout the period.
Security selection across investment grade and high yield credit allocations.
Active portfolio duration positioning throughout market yield fluctuations. Duration position generally moved higher during relatively higher interest rates and vice versa.
Security selection was strong across the equity sleeve of the portfolio.
Technology stocks contributed to both absolute and relative performance. Leading contributors were Taiwan Semiconductor, Nvidia, and Apple.
Consumer Staples stocks were also a standout with overweight positions in Walmart and Costco Wholesale contributing.
Top detractors from relative performance:
Yield curve positioning with U.S. Treasuries, with an overweight to the short and long duration areas of the market and a relative underweight to the belly of the yield curve, which outperformed.
Agency mortgage security selection, with a relative underweight to low-coupon mortgage-backed securities, which outperformed during the period.
Allocations to longer duration AA and A-rated corporates, which underperformed compared to the broader investment grade corporate universe.
The Fund was hurt by an underweight position to the Technology Sector, but the stock selection overcame the sector underweight decision.
An overweight in the Energy sector also was a drag on performance as the sector meaningfully lagged the performance of the broad index.
The Fund's past performance is not a good predictor of the Fund's future performance. The chart and the table below do not reflect the deduction of taxes that a shareholder would pay on Fund distributions or sale of Fund shares.
| 09/15/2020 | 100000 | 100000 | 100000 | 100000 |
| 09/30/2020 | 99500 | 99430 | 99113 | 99800 |
| 10/31/2020 | 98853 | 97949 | 96791 | 99354 |
| 11/30/2020 | 105437 | 104718 | 108176 | 100329 |
| 12/31/2020 | 108119 | 107195 | 112705 | 100467 |
| 01/31/2021 | 107471 | 106408 | 111862 | 99747 |
| 02/28/2021 | 111354 | 107448 | 115172 | 98307 |
| 03/31/2021 | 114125 | 109010 | 119392 | 97079 |
| 04/30/2021 | 118186 | 112605 | 125780 | 97846 |
| 05/31/2021 | 118492 | 113001 | 126247 | 98166 |
| 06/30/2021 | 119020 | 115025 | 129632 | 98855 |
| 07/31/2021 | 121056 | 116954 | 132401 | 99961 |
| 08/31/2021 | 122310 | 118739 | 136280 | 99771 |
| 09/30/2021 | 118464 | 115294 | 130058 | 98907 |
| 10/31/2021 | 122852 | 119694 | 139110 | 98879 |
| 11/30/2021 | 121497 | 118982 | 137268 | 99172 |
| 12/31/2021 | 125250 | 121383 | 142593 | 98918 |
| 01/31/2022 | 119662 | 116326 | 134305 | 96787 |
| 02/28/2022 | 118273 | 113959 | 130562 | 95707 |
| 03/31/2022 | 119828 | 114595 | 134856 | 93048 |
| 04/30/2022 | 112070 | 106937 | 122656 | 89517 |
| 05/31/2022 | 111416 | 107098 | 122345 | 90094 |
| 06/30/2022 | 103465 | 101485 | 112257 | 88681 |
| 07/31/2022 | 111001 | 107826 | 122766 | 90848 |
| 08/31/2022 | 107681 | 104181 | 118058 | 88281 |
| 09/30/2022 | 100809 | 96830 | 107085 | 84467 |
| 10/31/2022 | 104516 | 100499 | 115598 | 83373 |
| 11/30/2022 | 109822 | 105117 | 121778 | 86439 |
| 12/31/2022 | 105317 | 101529 | 114671 | 86049 |
| 01/31/2023 | 111022 | 106697 | 122396 | 88696 |
| 02/28/2023 | 108614 | 104038 | 119440 | 86403 |
| 03/31/2023 | 111084 | 107050 | 123244 | 88598 |
| 04/30/2023 | 111864 | 108039 | 124704 | 89135 |
| 05/31/2023 | 111821 | 107842 | 125400 | 88164 |
| 06/30/2023 | 115707 | 111677 | 133875 | 87850 |
| 07/31/2023 | 118264 | 113763 | 138497 | 87789 |
| 08/31/2023 | 116328 | 112332 | 136053 | 87228 |
| 09/30/2023 | 112234 | 108152 | 129678 | 85011 |
| 10/31/2023 | 110124 | 105930 | 126508 | 83670 |
| 11/30/2023 | 117762 | 113561 | 138390 | 87458 |
| 12/31/2023 | 122878 | 118611 | 145246 | 90806 |
| 01/31/2024 | 124316 | 119362 | 147244 | 90557 |
| 02/29/2024 | 128306 | 122173 | 155251 | 89278 |
| 03/31/2024 | 131849 | 124841 | 160243 | 90102 |
| 04/30/2024 | 127282 | 120463 | 153336 | 87826 |
| 05/31/2024 | 131688 | 124508 | 160571 | 89315 |
| 06/30/2024 | 134310 | 127328 | 165939 | 90161 |
| 07/31/2024 | 136918 | 129657 | 168286 | 92267 |
| 08/31/2024 | 139794 | 132132 | 172148 | 93592 |
| 09/30/2024 | 142104 | 134470 | 175801 | 94846 |
| 10/31/2024 | 140273 | 132406 | 174463 | 92494 |

| ALPS Balanced Opportunity Fund - I - NAV | 27.38% | 8.55% |
| 55% Bloomberg U.S. 1000 TR Index / 45% Bloomberg U.S. Aggregate Bond Index | 24.99% | 7.04% |
| Bloomberg U.S. Aggregate Bond Index# | 10.55% | -1.87% |
| Bloomberg U.S. 1000 TR Index# | 37.91% | 14.44% |
For the most current month-end performance data, please call 1-866-759-5679.
| Net Assets | $12,616,896 |
| Number of Portfolio Holdings | 66 |
| Portfolio Turnover Rate | 131% |
| Total Advisory Fees Paid* | ($125,395) |
* Represents reimbursement from the adviser to the Fund.
| Common Stock | 71.98% |
| Exchange Traded Fund | 30.71% |
| Collateralized Mortgage Obligations | 0.01% |
| Cash, Cash Equivalents, & Other Net Assets | -2.70% |
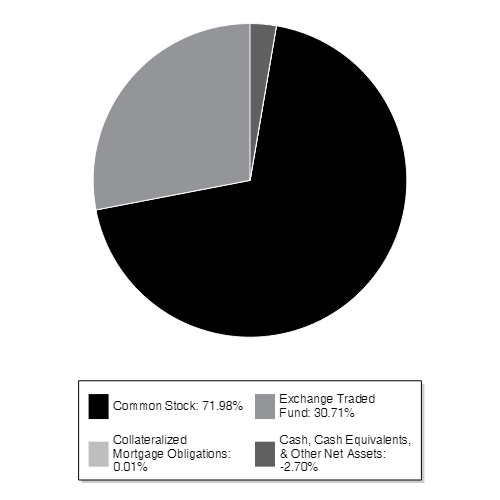
| |
** | As a percentage of net assets. |
Holdings are subject to change
| ALPS Smith Core Plus Bond ETF | 30.71% |
| Apple, Inc. | 4.44% |
| NVIDIA Corp. | 3.38% |
| Microsoft Corp. | 2.57% |
| Amazon.com, Inc. | 2.47% |
| Alphabet, Inc. | 2.23% |
| JPMorgan Chase & Co. | 2.08% |
| Taiwan Semiconductor Manufacturing Co., Ltd. | 1.96% |
| UnitedHealth Group, Inc. | 1.79% |
| Walmart, Inc. | 1.71% |
This is a summary of certain changes to the Fund since April 30, 2024. For more complete information, you may review the Fund's prospectus, which is available at https://www.alpsfunds.com/mutual-funds/alpbx or upon request at 866-759-5679.
Change to Fund Name: The ALPS | Smith Balanced Opportunity Fund changed its name to the ALPS Balanced Opportunity Fund.
Termination of Sub-Adviser: Smith Capital Investors, LLC ceased to serve as sub-adviser to the Fund and ALPS Advisors, Inc (the "Adviser"), the Fund's investment adviser, assumed all responsibility for selecting the Fund's investments.
Change to Principal Investment Strategy and Principal Risks: The Fund will now invest, as a principal investment strategy, in underlying exchange-traded funds (ETFs) that are advised by the Adviser to gain fixed income exposure as opposed to making such investments directly. The following are now Principal Risks of the Fund: Affiliated ETF Risk and ETF Investment Risk.
If you wish to view additional information about the Fund, including but not limited to the Fund's prospectus, financial information, holdings, and proxy voting information, please visit https://www.alpsfunds.com/mutual-funds/alpbx.
If you have consented to receive a single annual or semi-annual shareholder report at a shared address you may revoke this consent by calling the Transfer Agent 866-759-5679.
RiverFront Asset Allocation Growth & Income - Investor Shares | FINANCIAL INVESTORS TRUST |
RLGAX | |
This annual shareholder report contains important information about RiverFront Asset Allocation Growth & Income (the "Fund" or "RLGAX") for the period of November 1, 2023 to October 31, 2024 (the "Period"). You can find additional information about the Fund at https://www.alpsfunds.com/mutual-funds/rliix. You can also request this information by contacting us at 866-759-5679.
RiverFront Asset Allocation Growth & Income returned 23.67% for Investor Class shares at net asset value (NAV) for the 12 months ended October 31, 2024. The Fund outperformed the blended benchmark of 60% Morningstar Global Markets Index and 40% Bloomberg US Aggregate Bond Index which returned 23.14%.
Top contributors to relative performance
Overweight allocation to domestic equities.
Underweight allocation to fixed income.
Selection within fixed income.
Top detractors from relative performance
The Fund's past performance is not a good predictor of the Fund's future performance. The chart and the table below do not reflect the deduction of taxes that a shareholder would pay on Fund distributions or sale of Fund shares.
| 10/31/2014 | 10000 | 10000 | 10000 | 10000 |
| 11/30/2014 | 10153 | 10122 | 10071 | 10155 |
| 12/31/2014 | 10006 | 10023 | 10080 | 9983 |
| 01/31/2015 | 10038 | 10021 | 10292 | 9841 |
| 02/28/2015 | 10526 | 10312 | 10195 | 10379 |
| 03/31/2015 | 10550 | 10252 | 10242 | 10246 |
| 04/30/2015 | 10582 | 10407 | 10206 | 10530 |
| 05/31/2015 | 10638 | 10398 | 10181 | 10531 |
| 06/30/2015 | 10341 | 10212 | 10070 | 10293 |
| 07/31/2015 | 10477 | 10280 | 10140 | 10359 |
| 08/31/2015 | 9810 | 9863 | 10125 | 9670 |
| 09/30/2015 | 9440 | 9677 | 10194 | 9322 |
| 10/31/2015 | 10156 | 10119 | 10196 | 10030 |
| 11/30/2015 | 10260 | 10065 | 10169 | 9959 |
| 12/31/2015 | 9977 | 9943 | 10136 | 9780 |
| 01/31/2016 | 9663 | 9630 | 10275 | 9176 |
| 02/29/2016 | 9489 | 9626 | 10348 | 9126 |
| 03/31/2016 | 9931 | 10095 | 10443 | 9812 |
| 04/30/2016 | 10047 | 10206 | 10483 | 9967 |
| 05/31/2016 | 10138 | 10216 | 10486 | 9982 |
| 06/30/2016 | 10122 | 10247 | 10674 | 9913 |
| 07/31/2016 | 10430 | 10546 | 10742 | 10353 |
| 08/31/2016 | 10414 | 10560 | 10730 | 10383 |
| 09/30/2016 | 10505 | 10598 | 10723 | 10449 |
| 10/31/2016 | 10338 | 10447 | 10641 | 10255 |
| 11/30/2016 | 10414 | 10410 | 10390 | 10356 |
| 12/31/2016 | 10632 | 10553 | 10404 | 10584 |
| 01/31/2017 | 10868 | 10731 | 10425 | 10868 |
| 02/28/2017 | 11111 | 10938 | 10495 | 11168 |
| 03/31/2017 | 11184 | 11012 | 10489 | 11298 |
| 04/30/2017 | 11310 | 11151 | 10570 | 11477 |
| 05/31/2017 | 11495 | 11326 | 10651 | 11719 |
| 06/30/2017 | 11528 | 11357 | 10641 | 11780 |
| 07/31/2017 | 11773 | 11559 | 10687 | 12096 |
| 08/31/2017 | 11841 | 11625 | 10782 | 12138 |
| 09/30/2017 | 12010 | 11747 | 10731 | 12389 |
| 10/31/2017 | 12238 | 11894 | 10737 | 12643 |
| 11/30/2017 | 12339 | 12031 | 10723 | 12896 |
| 12/31/2017 | 12473 | 12173 | 10773 | 13110 |
| 01/31/2018 | 13003 | 12509 | 10649 | 13814 |
| 02/28/2018 | 12586 | 12151 | 10548 | 13241 |
| 03/31/2018 | 12430 | 12039 | 10615 | 12982 |
| 04/30/2018 | 12447 | 12076 | 10536 | 13113 |
| 05/31/2018 | 12525 | 12128 | 10612 | 13145 |
| 06/30/2018 | 12381 | 12077 | 10598 | 13063 |
| 07/31/2018 | 12608 | 12282 | 10601 | 13431 |
| 08/31/2018 | 12643 | 12382 | 10669 | 13555 |
| 09/30/2018 | 12606 | 12369 | 10600 | 13589 |
| 10/31/2018 | 11745 | 11756 | 10517 | 12538 |
| 11/30/2018 | 11745 | 11890 | 10579 | 12728 |
| 12/31/2018 | 11062 | 11470 | 10774 | 11822 |
| 01/31/2019 | 11876 | 12071 | 10888 | 12771 |
| 02/28/2019 | 12051 | 12265 | 10882 | 13118 |
| 03/31/2019 | 12160 | 12437 | 11091 | 13256 |
| 04/30/2019 | 12397 | 12684 | 11094 | 13693 |
| 05/31/2019 | 11736 | 12328 | 11291 | 12890 |
| 06/30/2019 | 12323 | 12861 | 11432 | 13711 |
| 07/31/2019 | 12313 | 12891 | 11458 | 13745 |
| 08/31/2019 | 12053 | 12837 | 11755 | 13411 |
| 09/30/2019 | 12293 | 12971 | 11692 | 13692 |
| 10/31/2019 | 12533 | 13205 | 11727 | 14077 |
| 11/30/2019 | 12731 | 13398 | 11721 | 14424 |
| 12/31/2019 | 13080 | 13673 | 11713 | 14924 |
| 01/31/2020 | 12902 | 13675 | 11938 | 14736 |
| 02/29/2020 | 12115 | 13102 | 12153 | 13530 |
| 03/31/2020 | 10675 | 11954 | 12082 | 11608 |
| 04/30/2020 | 11552 | 12819 | 12297 | 12870 |
| 05/31/2020 | 11943 | 13202 | 12354 | 13471 |
| 06/30/2020 | 12197 | 13479 | 12432 | 13886 |
| 07/31/2020 | 12662 | 13972 | 12617 | 14594 |
| 08/31/2020 | 13084 | 14435 | 12515 | 15479 |
| 09/30/2020 | 12875 | 14163 | 12509 | 14998 |
| 10/31/2020 | 12567 | 13952 | 12453 | 14670 |
| 11/30/2020 | 13480 | 15062 | 12575 | 16519 |
| 12/31/2020 | 13967 | 15510 | 12592 | 17323 |
| 01/31/2021 | 13903 | 15437 | 12502 | 17269 |
| 02/28/2021 | 14063 | 15587 | 12321 | 17716 |
| 03/31/2021 | 14364 | 15747 | 12168 | 18166 |
| 04/30/2021 | 14802 | 16205 | 12264 | 18952 |
| 05/31/2021 | 15015 | 16370 | 12304 | 19232 |
| 06/30/2021 | 15198 | 16525 | 12390 | 19446 |
| 07/31/2021 | 15444 | 16648 | 12529 | 19542 |
| 08/31/2021 | 15668 | 16886 | 12505 | 20031 |
| 09/30/2021 | 14971 | 16426 | 12397 | 19239 |
| 10/31/2021 | 15507 | 16897 | 12393 | 20162 |
| 11/30/2021 | 15336 | 16644 | 12430 | 19618 |
| 12/31/2021 | 15817 | 17028 | 12398 | 20406 |
| 01/31/2022 | 15267 | 16349 | 12131 | 19344 |
| 02/28/2022 | 14933 | 16057 | 11996 | 18911 |
| 03/31/2022 | 15068 | 16074 | 11662 | 19294 |
| 04/30/2022 | 14286 | 15069 | 11220 | 17773 |
| 05/31/2022 | 14427 | 15111 | 11292 | 17778 |
| 06/30/2022 | 13508 | 14234 | 11115 | 16244 |
| 07/31/2022 | 14215 | 14973 | 11387 | 17386 |
| 08/31/2022 | 13649 | 14487 | 11065 | 16773 |
| 09/30/2022 | 12603 | 13400 | 10587 | 15158 |
| 10/31/2022 | 13209 | 13814 | 10450 | 16070 |
| 11/30/2022 | 13990 | 14658 | 10834 | 17312 |
| 12/31/2022 | 13555 | 14319 | 10785 | 16696 |
| 01/31/2023 | 14204 | 15097 | 11117 | 17867 |
| 02/28/2023 | 13845 | 14689 | 10829 | 17369 |
| 03/31/2023 | 14145 | 15062 | 11104 | 17810 |
| 04/30/2023 | 14273 | 15221 | 11172 | 18052 |
| 05/31/2023 | 14156 | 15044 | 11050 | 17833 |
| 06/30/2023 | 14686 | 15544 | 11011 | 18864 |
| 07/31/2023 | 14991 | 15891 | 11003 | 19574 |
| 08/31/2023 | 14675 | 15583 | 10933 | 19024 |
| 09/30/2023 | 14151 | 15040 | 10655 | 18243 |
| 10/31/2023 | 13808 | 14651 | 10487 | 17647 |
| 11/30/2023 | 14790 | 15726 | 10962 | 19273 |
| 12/31/2023 | 15460 | 16449 | 11381 | 20258 |
| 01/31/2024 | 15484 | 16466 | 11350 | 20330 |
| 02/29/2024 | 15758 | 16785 | 11190 | 21177 |
| 03/31/2024 | 16213 | 17163 | 11293 | 21841 |
| 04/30/2024 | 15721 | 16647 | 11008 | 21116 |
| 05/31/2024 | 16344 | 17158 | 11194 | 21957 |
| 06/30/2024 | 16586 | 17418 | 11300 | 22372 |
| 07/31/2024 | 16912 | 17783 | 11564 | 22806 |
| 08/31/2024 | 17190 | 18137 | 11731 | 23345 |
| 09/30/2024 | 17454 | 18486 | 11888 | 23884 |
| 10/31/2024 | 17076 | 18041 | 11593 | 23322 |

| RiverFront Asset Allocation Growth & Income - Investor - NAV | 23.67% | 6.38% | 5.50% |
| Morningstar Global Markets Index# | 32.16% | 10.63% | 8.84% |
| Bloomberg U.S. Aggregate Bond Index | 10.55% | -0.23% | 1.49% |
| 60% Morningstar Global Markets Index / 40% Bloomberg U.S. Aggregate Bond Index | 23.14% | 6.44% | 6.08% |
For the most current month-end performance data, please call 1-866-759-5679.
| Net Assets | $77,544,232 |
| Number of Portfolio Holdings | 20 |
| Portfolio Turnover Rate | 36% |
| Total Advisory Fees Paid | $0 |
| Domestic Equity | 52.31% |
| Traditional Fixed Income | 23.83% |
| International Equity | 19.30% |
| Alternative Fixed Income | 3.45% |
| Cash, Cash Equivalents, & Other Net Assets | 1.11% |

| RiverFront Dynamic US Dividend Advantage ETF | 20.22% |
| First Trust RiverFront Dynamic Developed International ETF | 13.71% |
| JPMorgan Equity Premium Income ETF | 11.22% |
| Vanguard® Long-Term Corporate Bond ETF | 9.56% |
| iShares® Core S&P 500® ETF | 7.23% |
| RiverFront Dynamic Core Income ETF | 6.57% |
| iShares® Core S&P 500® U.S. Technology ETF | 5.28% |
| ALPS Active Equity Opportunity ETF | 3.97% |
| First Trust RiverFront Dynamic Emerging Markets ETF | 3.59% |
| Riverfront Strategic Income Fund | 3.45% |
| |
** | As a percentage of net assets. |
Holdings are subject to change
If you wish to view additional information about the Fund, including but not limited to the Fund's prospectus, financial information, holdings, and proxy voting information, please visit https://www.alpsfunds.com/mutual-funds/rliix.
If you have consented to receive a single annual or semi-annual shareholder report at a shared address you may revoke this consent by calling the Transfer Agent 866-759-5679.
RiverFront Asset Allocation Growth & Income - Class A | FINANCIAL INVESTORS TRUST |
RAGIX | |
This annual shareholder report contains important information about RiverFront Asset Allocation Growth & Income (the "Fund" or "RAGIX") for the period of November 1, 2023 to October 31, 2024 (the "Period"). You can find additional information about the Fund at https://www.alpsfunds.com/mutual-funds/rliix. You can also request this information by contacting us at 866-759-5679.
RiverFront Asset Allocation Growth & Income returned 23.60% for Class A shares at net asset value (NAV) for the 12 months ended October 31, 2024. The Fund outperformed the blended benchmark of 60% Morningstar Global Markets Index and 40% Bloomberg US Aggregate Bond Index which returned 23.14%.
Top contributors to relative performance
Overweight allocation to domestic equities.
Underweight allocation to fixed income.
Selection within fixed income.
Top detractors from relative performance
The Fund's past performance is not a good predictor of the Fund's future performance. The chart and the table below do not reflect the deduction of taxes that a shareholder would pay on Fund distributions or sale of Fund shares.
| 10/31/2014 | 9452 | 10000 | 10000 | 10000 |
| 11/30/2014 | 9596 | 10122 | 10071 | 10155 |
| 12/31/2014 | 9458 | 10023 | 10080 | 9983 |
| 01/31/2015 | 9488 | 10021 | 10292 | 9841 |
| 02/28/2015 | 9949 | 10312 | 10195 | 10379 |
| 03/31/2015 | 9972 | 10252 | 10242 | 10246 |
| 04/30/2015 | 10002 | 10407 | 10206 | 10530 |
| 05/31/2015 | 10055 | 10398 | 10181 | 10531 |
| 06/30/2015 | 9774 | 10212 | 10070 | 10293 |
| 07/31/2015 | 9903 | 10280 | 10140 | 10359 |
| 08/31/2015 | 9273 | 9863 | 10125 | 9670 |
| 09/30/2015 | 8923 | 9677 | 10194 | 9322 |
| 10/31/2015 | 9599 | 10119 | 10196 | 10030 |
| 11/30/2015 | 9698 | 10065 | 10169 | 9959 |
| 12/31/2015 | 9430 | 9943 | 10136 | 9780 |
| 01/31/2016 | 9133 | 9630 | 10275 | 9176 |
| 02/29/2016 | 8969 | 9626 | 10348 | 9126 |
| 03/31/2016 | 9387 | 10095 | 10443 | 9812 |
| 04/30/2016 | 9496 | 10206 | 10483 | 9967 |
| 05/31/2016 | 9582 | 10216 | 10486 | 9982 |
| 06/30/2016 | 9567 | 10247 | 10674 | 9913 |
| 07/31/2016 | 9859 | 10546 | 10742 | 10353 |
| 08/31/2016 | 9843 | 10560 | 10730 | 10383 |
| 09/30/2016 | 9930 | 10598 | 10723 | 10449 |
| 10/31/2016 | 9772 | 10447 | 10641 | 10255 |
| 11/30/2016 | 9843 | 10410 | 10390 | 10356 |
| 12/31/2016 | 10050 | 10553 | 10404 | 10584 |
| 01/31/2017 | 10272 | 10731 | 10425 | 10868 |
| 02/28/2017 | 10502 | 10938 | 10495 | 11168 |
| 03/31/2017 | 10571 | 11012 | 10489 | 11298 |
| 04/30/2017 | 10690 | 11151 | 10570 | 11477 |
| 05/31/2017 | 10865 | 11326 | 10651 | 11719 |
| 06/30/2017 | 10896 | 11357 | 10641 | 11780 |
| 07/31/2017 | 11128 | 11559 | 10687 | 12096 |
| 08/31/2017 | 11192 | 11625 | 10782 | 12138 |
| 09/30/2017 | 11352 | 11747 | 10731 | 12389 |
| 10/31/2017 | 11567 | 11894 | 10737 | 12643 |
| 11/30/2017 | 11663 | 12031 | 10723 | 12896 |
| 12/31/2017 | 11790 | 12173 | 10773 | 13110 |
| 01/31/2018 | 12291 | 12509 | 10649 | 13814 |
| 02/28/2018 | 11896 | 12151 | 10548 | 13241 |
| 03/31/2018 | 11749 | 12039 | 10615 | 12982 |
| 04/30/2018 | 11765 | 12076 | 10536 | 13113 |
| 05/31/2018 | 11839 | 12128 | 10612 | 13145 |
| 06/30/2018 | 11702 | 12077 | 10598 | 13063 |
| 07/31/2018 | 11917 | 12282 | 10601 | 13431 |
| 08/31/2018 | 11950 | 12382 | 10669 | 13555 |
| 09/30/2018 | 11917 | 12369 | 10600 | 13589 |
| 10/31/2018 | 11095 | 11756 | 10517 | 12538 |
| 11/30/2018 | 11095 | 11890 | 10579 | 12728 |
| 12/31/2018 | 10458 | 11470 | 10774 | 11822 |
| 01/31/2019 | 11227 | 12071 | 10888 | 12771 |
| 02/28/2019 | 11392 | 12265 | 10882 | 13118 |
| 03/31/2019 | 11492 | 12437 | 11091 | 13256 |
| 04/30/2019 | 11717 | 12684 | 11094 | 13693 |
| 05/31/2019 | 11091 | 12328 | 11291 | 12890 |
| 06/30/2019 | 11648 | 12861 | 11432 | 13711 |
| 07/31/2019 | 11639 | 12891 | 11458 | 13745 |
| 08/31/2019 | 11393 | 12837 | 11755 | 13411 |
| 09/30/2019 | 11620 | 12971 | 11692 | 13692 |
| 10/31/2019 | 11847 | 13205 | 11727 | 14077 |
| 11/30/2019 | 12034 | 13398 | 11721 | 14424 |
| 12/31/2019 | 12365 | 13673 | 11713 | 14924 |
| 01/31/2020 | 12196 | 13675 | 11938 | 14736 |
| 02/29/2020 | 11451 | 13102 | 12153 | 13530 |
| 03/31/2020 | 10089 | 11954 | 12082 | 11608 |
| 04/30/2020 | 10919 | 12819 | 12297 | 12870 |
| 05/31/2020 | 11289 | 13202 | 12354 | 13471 |
| 06/30/2020 | 11529 | 13479 | 12432 | 13886 |
| 07/31/2020 | 11969 | 13972 | 12617 | 14594 |
| 08/31/2020 | 12369 | 14435 | 12515 | 15479 |
| 09/30/2020 | 12171 | 14163 | 12509 | 14998 |
| 10/31/2020 | 11879 | 13952 | 12453 | 14670 |
| 11/30/2020 | 12743 | 15062 | 12575 | 16519 |
| 12/31/2020 | 13204 | 15510 | 12592 | 17323 |
| 01/31/2021 | 13144 | 15437 | 12502 | 17269 |
| 02/28/2021 | 13295 | 15587 | 12321 | 17716 |
| 03/31/2021 | 13581 | 15747 | 12168 | 18166 |
| 04/30/2021 | 13984 | 16205 | 12264 | 18952 |
| 05/31/2021 | 14186 | 16370 | 12304 | 19232 |
| 06/30/2021 | 14370 | 16525 | 12390 | 19446 |
| 07/31/2021 | 14592 | 16648 | 12529 | 19542 |
| 08/31/2021 | 14815 | 16886 | 12505 | 20031 |
| 09/30/2021 | 14145 | 16426 | 12397 | 19239 |
| 10/31/2021 | 14653 | 16897 | 12393 | 20162 |
| 11/30/2021 | 14490 | 16644 | 12430 | 19618 |
| 12/31/2021 | 14946 | 17028 | 12398 | 20406 |
| 01/31/2022 | 14425 | 16349 | 12131 | 19344 |
| 02/28/2022 | 14109 | 16057 | 11996 | 18911 |
| 03/31/2022 | 14237 | 16074 | 11662 | 19294 |
| 04/30/2022 | 13508 | 15069 | 11220 | 17773 |
| 05/31/2022 | 13642 | 15111 | 11292 | 17778 |
| 06/30/2022 | 12772 | 14234 | 11115 | 16244 |
| 07/31/2022 | 13442 | 14973 | 11387 | 17386 |
| 08/31/2022 | 12906 | 14487 | 11065 | 16773 |
| 09/30/2022 | 11917 | 13400 | 10587 | 15158 |
| 10/31/2022 | 12490 | 13814 | 10450 | 16070 |
| 11/30/2022 | 13219 | 14658 | 10834 | 17312 |
| 12/31/2022 | 12817 | 14319 | 10785 | 16696 |
| 01/31/2023 | 13421 | 15097 | 11117 | 17867 |
| 02/28/2023 | 13091 | 14689 | 10829 | 17369 |
| 03/31/2023 | 13364 | 15062 | 11104 | 17810 |
| 04/30/2023 | 13486 | 15221 | 11172 | 18052 |
| 05/31/2023 | 13386 | 15044 | 11050 | 17833 |
| 06/30/2023 | 13888 | 15544 | 11011 | 18864 |
| 07/31/2023 | 14177 | 15891 | 11003 | 19574 |
| 08/31/2023 | 13877 | 15583 | 10933 | 19024 |
| 09/30/2023 | 13382 | 15040 | 10655 | 18243 |
| 10/31/2023 | 13057 | 14651 | 10487 | 17647 |
| 11/30/2023 | 13976 | 15726 | 10962 | 19273 |
| 12/31/2023 | 14621 | 16449 | 11381 | 20258 |
| 01/31/2024 | 14632 | 16466 | 11350 | 20330 |
| 02/29/2024 | 14903 | 16785 | 11190 | 21177 |
| 03/31/2024 | 15322 | 17163 | 11293 | 21841 |
| 04/30/2024 | 14857 | 16647 | 11008 | 21116 |
| 05/31/2024 | 15446 | 17158 | 11194 | 21957 |
| 06/30/2024 | 15675 | 17418 | 11300 | 22372 |
| 07/31/2024 | 15983 | 17783 | 11564 | 22806 |
| 08/31/2024 | 16246 | 18137 | 11731 | 23345 |
| 09/30/2024 | 16497 | 18486 | 11888 | 23884 |
| 10/31/2024 | 16138 | 18041 | 11593 | 23322 |
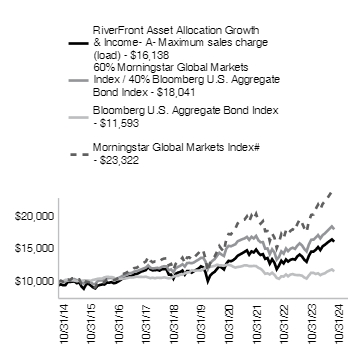
| RiverFront Asset Allocation Growth & Income - A - NAV** | 23.60% | 6.38% | 5.50% |
| RiverFront Asset Allocation Growth & Income - A - Maximum sales charge (load)*^ | 16.79% | 5.18% | 4.90% |
| Morningstar Global Markets Index# | 32.16% | 10.63% | 8.84% |
| Bloomberg U.S. Aggregate Bond Index | 10.55% | -0.23% | 1.49% |
| 60% Morningstar Global Markets Index / 40% Bloomberg U.S. Aggregate Bond Index | 23.14% | 6.44% | 6.08% |
For the most current month-end performance data, please call 1-866-759-5679.
| Net Assets | $77,544,232 |
| Number of Portfolio Holdings | 20 |
| Portfolio Turnover Rate | 36% |
| Total Advisory Fees Paid | $0 |
| Domestic Equity | 52.31% |
| Traditional Fixed Income | 23.83% |
| International Equity | 19.30% |
| Alternative Fixed Income | 3.45% |
| Cash, Cash Equivalents, & Other Net Assets | 1.11% |
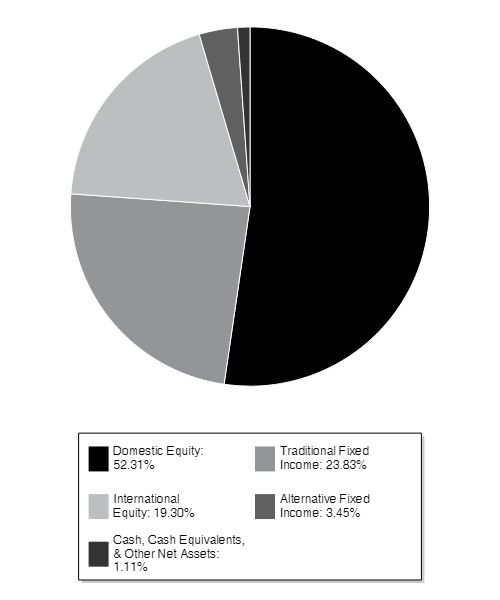
| RiverFront Dynamic US Dividend Advantage ETF | 20.22% |
| First Trust RiverFront Dynamic Developed International ETF | 13.71% |
| JPMorgan Equity Premium Income ETF | 11.22% |
| Vanguard® Long-Term Corporate Bond ETF | 9.56% |
| iShares® Core S&P 500® ETF | 7.23% |
| RiverFront Dynamic Core Income ETF | 6.57% |
| iShares® Core S&P 500® U.S. Technology ETF | 5.28% |
| ALPS Active Equity Opportunity ETF | 3.97% |
| First Trust RiverFront Dynamic Emerging Markets ETF | 3.59% |
| Riverfront Strategic Income Fund | 3.45% |
| |
** | As a percentage of net assets. |
Holdings are subject to change
If you wish to view additional information about the Fund, including but not limited to the Fund's prospectus, financial information, holdings, and proxy voting information, please visit https://www.alpsfunds.com/mutual-funds/rliix.
If you have consented to receive a single annual or semi-annual shareholder report at a shared address you may revoke this consent by calling the Transfer Agent 866-759-5679.
RiverFront Asset Allocation Growth & Income - Class C | FINANCIAL INVESTORS TRUST |
RLGCX | |
This annual shareholder report contains important information about RiverFront Asset Allocation Growth & Income (the "Fund" or "RLGCX") for the period of November 1, 2023 to October 31, 2024 (the "Period"). You can find additional information about the Fund at https://www.alpsfunds.com/mutual-funds/rliix. You can also request this information by contacting us at 866-759-5679.
RiverFront Asset Allocation Growth & Income returned 22.77% for Class C shares at net asset value (NAV) for the 12 months ended October 31, 2024. The Fund outperformed the blended benchmark of 60% Morningstar Global Markets Index and 40% Bloomberg US Aggregate Bond Index which returned 23.14%.
Top contributors to relative performance
Overweight allocation to domestic equities.
Underweight allocation to fixed income.
Selection within fixed income.
Top detractors from relative performance
The Fund's past performance is not a good predictor of the Fund's future performance. The chart and the table below do not reflect the deduction of taxes that a shareholder would pay on Fund distributions or sale of Fund shares.
| 10/31/2014 | 10000 | 10000 | 10000 | 10000 |
| 11/30/2014 | 10154 | 10122 | 10071 | 10155 |
| 12/31/2014 | 9994 | 10023 | 10080 | 9983 |
| 01/31/2015 | 10027 | 10021 | 10292 | 9841 |
| 02/28/2015 | 10511 | 10312 | 10195 | 10379 |
| 03/31/2015 | 10519 | 10252 | 10242 | 10246 |
| 04/30/2015 | 10551 | 10407 | 10206 | 10530 |
| 05/31/2015 | 10600 | 10398 | 10181 | 10531 |
| 06/30/2015 | 10289 | 10212 | 10070 | 10293 |
| 07/31/2015 | 10426 | 10280 | 10140 | 10359 |
| 08/31/2015 | 9754 | 9863 | 10125 | 9670 |
| 09/30/2015 | 9381 | 9677 | 10194 | 9322 |
| 10/31/2015 | 10086 | 10119 | 10196 | 10030 |
| 11/30/2015 | 10183 | 10065 | 10169 | 9959 |
| 12/31/2015 | 9893 | 9943 | 10136 | 9780 |
| 01/31/2016 | 9577 | 9630 | 10275 | 9176 |
| 02/29/2016 | 9393 | 9626 | 10348 | 9126 |
| 03/31/2016 | 9827 | 10095 | 10443 | 9812 |
| 04/30/2016 | 9935 | 10206 | 10483 | 9967 |
| 05/31/2016 | 10027 | 10216 | 10486 | 9982 |
| 06/30/2016 | 10000 | 10247 | 10674 | 9913 |
| 07/31/2016 | 10302 | 10546 | 10742 | 10353 |
| 08/31/2016 | 10276 | 10560 | 10730 | 10383 |
| 09/30/2016 | 10360 | 10598 | 10723 | 10449 |
| 10/31/2016 | 10184 | 10447 | 10641 | 10255 |
| 11/30/2016 | 10260 | 10410 | 10390 | 10356 |
| 12/31/2016 | 10466 | 10553 | 10404 | 10584 |
| 01/31/2017 | 10693 | 10731 | 10425 | 10868 |
| 02/28/2017 | 10929 | 10938 | 10495 | 11168 |
| 03/31/2017 | 10988 | 11012 | 10489 | 11298 |
| 04/30/2017 | 11106 | 11151 | 10570 | 11477 |
| 05/31/2017 | 11283 | 11326 | 10651 | 11719 |
| 06/30/2017 | 11301 | 11357 | 10641 | 11780 |
| 07/31/2017 | 11546 | 11559 | 10687 | 12096 |
| 08/31/2017 | 11597 | 11625 | 10782 | 12138 |
| 09/30/2017 | 11758 | 11747 | 10731 | 12389 |
| 10/31/2017 | 11969 | 11894 | 10737 | 12643 |
| 11/30/2017 | 12062 | 12031 | 10723 | 12896 |
| 12/31/2017 | 12189 | 12173 | 10773 | 13110 |
| 01/31/2018 | 12693 | 12509 | 10649 | 13814 |
| 02/28/2018 | 12285 | 12151 | 10548 | 13241 |
| 03/31/2018 | 12120 | 12039 | 10615 | 12982 |
| 04/30/2018 | 12137 | 12076 | 10536 | 13113 |
| 05/31/2018 | 12198 | 12128 | 10612 | 13145 |
| 06/30/2018 | 12048 | 12077 | 10598 | 13063 |
| 07/31/2018 | 12266 | 12282 | 10601 | 13431 |
| 08/31/2018 | 12293 | 12382 | 10669 | 13555 |
| 09/30/2018 | 12241 | 12369 | 10600 | 13589 |
| 10/31/2018 | 11401 | 11756 | 10517 | 12538 |
| 11/30/2018 | 11393 | 11890 | 10579 | 12728 |
| 12/31/2018 | 10723 | 11470 | 10774 | 11822 |
| 01/31/2019 | 11515 | 12071 | 10888 | 12771 |
| 02/28/2019 | 11670 | 12265 | 10882 | 13118 |
| 03/31/2019 | 11777 | 12437 | 11091 | 13256 |
| 04/30/2019 | 11993 | 12684 | 11094 | 13693 |
| 05/31/2019 | 11344 | 12328 | 11291 | 12890 |
| 06/30/2019 | 11905 | 12861 | 11432 | 13711 |
| 07/31/2019 | 11885 | 12891 | 11458 | 13745 |
| 08/31/2019 | 11626 | 12837 | 11755 | 13411 |
| 09/30/2019 | 11857 | 12971 | 11692 | 13692 |
| 10/31/2019 | 12075 | 13205 | 11727 | 14077 |
| 11/30/2019 | 12262 | 13398 | 11721 | 14424 |
| 12/31/2019 | 12583 | 13673 | 11713 | 14924 |
| 01/31/2020 | 12406 | 13675 | 11938 | 14736 |
| 02/29/2020 | 11645 | 13102 | 12153 | 13530 |
| 03/31/2020 | 10254 | 11954 | 12082 | 11608 |
| 04/30/2020 | 11082 | 12819 | 12297 | 12870 |
| 05/31/2020 | 11459 | 13202 | 12354 | 13471 |
| 06/30/2020 | 11699 | 13479 | 12432 | 13886 |
| 07/31/2020 | 12139 | 13972 | 12617 | 14594 |
| 08/31/2020 | 12537 | 14435 | 12515 | 15479 |
| 09/30/2020 | 12316 | 14163 | 12509 | 14998 |
| 10/31/2020 | 12022 | 13952 | 12453 | 14670 |
| 11/30/2020 | 12883 | 15062 | 12575 | 16519 |
| 12/31/2020 | 13348 | 15510 | 12592 | 17323 |
| 01/31/2021 | 13274 | 15437 | 12502 | 17269 |
| 02/28/2021 | 13421 | 15587 | 12321 | 17716 |
| 03/31/2021 | 13695 | 15747 | 12168 | 18166 |
| 04/30/2021 | 14106 | 16205 | 12264 | 18952 |
| 05/31/2021 | 14295 | 16370 | 12304 | 19232 |
| 06/30/2021 | 14464 | 16525 | 12390 | 19446 |
| 07/31/2021 | 14685 | 16648 | 12529 | 19542 |
| 08/31/2021 | 14895 | 16886 | 12505 | 20031 |
| 09/30/2021 | 14212 | 16426 | 12397 | 19239 |
| 10/31/2021 | 14719 | 16897 | 12393 | 20162 |
| 11/30/2021 | 14550 | 16644 | 12430 | 19618 |
| 12/31/2021 | 14994 | 17028 | 12398 | 20406 |
| 01/31/2022 | 14464 | 16349 | 12131 | 19344 |
| 02/28/2022 | 14136 | 16057 | 11996 | 18911 |
| 03/31/2022 | 14256 | 16074 | 11662 | 19294 |
| 04/30/2022 | 13510 | 15069 | 11220 | 17773 |
| 05/31/2022 | 13638 | 15111 | 11292 | 17778 |
| 06/30/2022 | 12762 | 14234 | 11115 | 16244 |
| 07/31/2022 | 13423 | 14973 | 11387 | 17386 |
| 08/31/2022 | 12879 | 14487 | 11065 | 16773 |
| 09/30/2022 | 11883 | 13400 | 10587 | 15158 |
| 10/31/2022 | 12453 | 13814 | 10450 | 16070 |
| 11/30/2022 | 13175 | 14658 | 10834 | 17312 |
| 12/31/2022 | 12754 | 14319 | 10785 | 16696 |
| 01/31/2023 | 13355 | 15097 | 11117 | 17867 |
| 02/28/2023 | 13015 | 14689 | 10829 | 17369 |
| 03/31/2023 | 13280 | 15062 | 11104 | 17810 |
| 04/30/2023 | 13394 | 15221 | 11172 | 18052 |
| 05/31/2023 | 13280 | 15044 | 11050 | 17833 |
| 06/30/2023 | 13771 | 15544 | 11011 | 18864 |
| 07/31/2023 | 14046 | 15891 | 11003 | 19574 |
| 08/31/2023 | 13748 | 15583 | 10933 | 19024 |
| 09/30/2023 | 13245 | 15040 | 10655 | 18243 |
| 10/31/2023 | 12911 | 14651 | 10487 | 17647 |
| 11/30/2023 | 13822 | 15726 | 10962 | 19273 |
| 12/31/2023 | 14444 | 16449 | 11381 | 20258 |
| 01/31/2024 | 14455 | 16466 | 11350 | 20330 |
| 02/29/2024 | 14699 | 16785 | 11190 | 21177 |
| 03/31/2024 | 15111 | 17163 | 11293 | 21841 |
| 04/30/2024 | 14646 | 16647 | 11008 | 21116 |
| 05/31/2024 | 15216 | 17158 | 11194 | 21957 |
| 06/30/2024 | 15431 | 17418 | 11300 | 22372 |
| 07/31/2024 | 15724 | 17783 | 11564 | 22806 |
| 08/31/2024 | 15970 | 18137 | 11731 | 23345 |
| 09/30/2024 | 16206 | 18486 | 11888 | 23884 |
| 10/31/2024 | 15851 | 18041 | 11593 | 23322 |
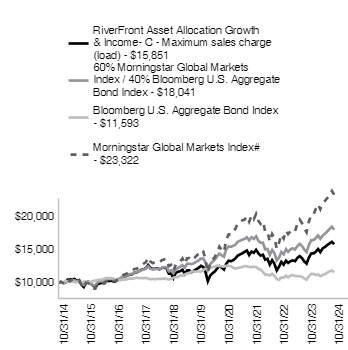
| RiverFront Asset Allocation Growth & Income - C - NAV | 22.77% | 5.59% | 4.71% |
| RiverFront Asset Allocation Growth & Income - C - Maximim deferred sales charge** | 21.77% | 5.59% | 4.71% |
| Morningstar Global Markets Index# | 32.16% | 10.63% | 8.84% |
| Bloomberg U.S. Aggregate Bond Index | 10.55% | -0.23% | 1.49% |
| 60% Morningstar Global Markets Index / 40% Bloomberg U.S. Aggregate Bond Index | 23.14% | 6.44% | 6.08% |
For the most current month-end performance data, please call 1-866-759-5679.
| Net Assets | $77,544,232 |
| Number of Portfolio Holdings | 20 |
| Portfolio Turnover Rate | 36% |
| Total Advisory Fees Paid | $0 |
| Domestic Equity | 52.31% |
| Traditional Fixed Income | 23.83% |
| International Equity | 19.30% |
| Alternative Fixed Income | 3.45% |
| Cash, Cash Equivalents, & Other Net Assets | 1.11% |

| RiverFront Dynamic US Dividend Advantage ETF | 20.22% |
| First Trust RiverFront Dynamic Developed International ETF | 13.71% |
| JPMorgan Equity Premium Income ETF | 11.22% |
| Vanguard® Long-Term Corporate Bond ETF | 9.56% |
| iShares® Core S&P 500® ETF | 7.23% |
| RiverFront Dynamic Core Income ETF | 6.57% |
| iShares® Core S&P 500® U.S. Technology ETF | 5.28% |
| ALPS Active Equity Opportunity ETF | 3.97% |
| First Trust RiverFront Dynamic Emerging Markets ETF | 3.59% |
| Riverfront Strategic Income Fund | 3.45% |
| |
** | As a percentage of net assets. |
Holdings are subject to change
If you wish to view additional information about the Fund, including but not limited to the Fund's prospectus, financial information, holdings, and proxy voting information, please visit https://www.alpsfunds.com/mutual-funds/rliix.
If you have consented to receive a single annual or semi-annual shareholder report at a shared address you may revoke this consent by calling the Transfer Agent 866-759-5679.
RiverFront Asset Allocation Growth & Income - Class I | FINANCIAL INVESTORS TRUST |
RLIIX | |
This annual shareholder report contains important information about RiverFront Asset Allocation Growth & Income (the "Fund" or "RLIIX") for the period of November 1, 2023 to October 31, 2024 (the "Period"). You can find additional information about the Fund at https://www.alpsfunds.com/mutual-funds/rliix. You can also request this information by contacting us at 866-759-5679.
RiverFront Asset Allocation Growth & Income returned 23.94% for Class I shares at net asset value (NAV) for the 12 months ended October 31, 2024. The Fund outperformed the blended benchmark of 60% Morningstar Global Markets Index and 40% Bloomberg US Aggregate Bond Index which returned 23.14%.
Top contributors to relative performance
Overweight allocation to domestic equities.
Underweight allocation to fixed income.
Selection within fixed income.
Top detractors from relative performance
The Fund's past performance is not a good predictor of the Fund's future performance. The chart and the table below do not reflect the deduction of taxes that a shareholder would pay on Fund distributions or sale of Fund shares.
| 10/31/2014 | 100000 | 100000 | 100000 | 100000 |
| 11/30/2014 | 101613 | 101216 | 100710 | 101553 |
| 12/31/2014 | 100102 | 100226 | 100804 | 99834 |
| 01/31/2015 | 100505 | 100206 | 102917 | 98406 |
| 02/28/2015 | 105417 | 103121 | 101950 | 103793 |
| 03/31/2015 | 105578 | 102517 | 102423 | 102459 |
| 04/30/2015 | 105981 | 104074 | 102056 | 105299 |
| 05/31/2015 | 106625 | 103981 | 101810 | 105310 |
| 06/30/2015 | 103616 | 102119 | 100700 | 102934 |
| 07/31/2015 | 105075 | 102797 | 101400 | 103594 |
| 08/31/2015 | 98346 | 98633 | 101254 | 96701 |
| 09/30/2015 | 94698 | 96771 | 101939 | 93221 |
| 10/31/2015 | 101832 | 101188 | 101956 | 100304 |
| 11/30/2015 | 102886 | 100652 | 101687 | 99595 |
| 12/31/2015 | 100152 | 99431 | 101358 | 97795 |
| 01/31/2016 | 96897 | 96299 | 102753 | 91764 |
| 02/29/2016 | 95228 | 96257 | 103482 | 91263 |
| 03/31/2016 | 99630 | 100949 | 104431 | 98119 |
| 04/30/2016 | 100883 | 102059 | 104832 | 99665 |
| 05/31/2016 | 101801 | 102165 | 104859 | 99821 |
| 06/30/2016 | 101701 | 102472 | 106743 | 99125 |
| 07/31/2016 | 104816 | 105463 | 107418 | 103531 |
| 08/31/2016 | 104648 | 105595 | 107295 | 103825 |
| 09/30/2016 | 105649 | 105975 | 107232 | 104489 |
| 10/31/2016 | 103877 | 104474 | 106412 | 102554 |
| 11/30/2016 | 104720 | 104101 | 103895 | 103562 |
| 12/31/2016 | 106976 | 105531 | 104041 | 105835 |
| 01/31/2017 | 109353 | 107313 | 104246 | 108675 |
| 02/28/2017 | 111815 | 109379 | 104946 | 111675 |
| 03/31/2017 | 112536 | 110123 | 104891 | 112980 |
| 04/30/2017 | 113810 | 111510 | 105701 | 114771 |
| 05/31/2017 | 115765 | 113261 | 106514 | 117186 |
| 06/30/2017 | 116085 | 113570 | 106407 | 117797 |
| 07/31/2017 | 118651 | 115594 | 106865 | 120959 |
| 08/31/2017 | 119250 | 116249 | 107823 | 121377 |
| 09/30/2017 | 121047 | 117470 | 107310 | 123887 |
| 10/31/2017 | 123356 | 118945 | 107372 | 126432 |
| 11/30/2017 | 124383 | 120310 | 107234 | 128958 |
| 12/31/2017 | 125790 | 121728 | 107726 | 131098 |
| 01/31/2018 | 131160 | 125091 | 106486 | 138141 |
| 02/28/2018 | 126934 | 121505 | 105476 | 132413 |
| 03/31/2018 | 125438 | 120389 | 106153 | 129819 |
| 04/30/2018 | 125614 | 120758 | 105363 | 131126 |
| 05/31/2018 | 126406 | 121282 | 106115 | 131452 |
| 06/30/2018 | 125025 | 120767 | 105984 | 130629 |
| 07/31/2018 | 127330 | 122821 | 106010 | 134310 |
| 08/31/2018 | 127685 | 123818 | 106692 | 135551 |
| 09/30/2018 | 127301 | 123686 | 106005 | 135892 |
| 10/31/2018 | 118571 | 117557 | 105167 | 125385 |
| 11/30/2018 | 118660 | 118902 | 105795 | 127278 |
| 12/31/2018 | 111785 | 114701 | 107738 | 118224 |
| 01/31/2019 | 120046 | 120710 | 108883 | 127710 |
| 02/28/2019 | 121824 | 122651 | 108820 | 131181 |
| 03/31/2019 | 123018 | 124366 | 110909 | 132558 |
| 04/30/2019 | 125432 | 126837 | 110938 | 136926 |
| 05/31/2019 | 118714 | 123276 | 112907 | 128898 |
| 06/30/2019 | 124757 | 128610 | 114325 | 137115 |
| 07/31/2019 | 124652 | 128913 | 114576 | 137452 |
| 08/31/2019 | 122008 | 128370 | 117545 | 134112 |
| 09/30/2019 | 124513 | 129711 | 116919 | 136924 |
| 10/31/2019 | 126952 | 132052 | 117272 | 140767 |
| 11/30/2019 | 128967 | 133981 | 117212 | 144242 |
| 12/31/2019 | 132472 | 136729 | 117130 | 149241 |
| 01/31/2020 | 130763 | | 119384 | 147359 |
| 02/29/2020 | 122857 | 131015 | 121533 | 135296 |
| 03/31/2020 | 108181 | 119544 | 120818 | 116084 |
| 04/30/2020 | 117115 | 128188 | 122965 | 128697 |
| 05/31/2020 | 121098 | 132023 | 123538 | 134715 |
| 06/30/2020 | 123789 | 134792 | 124316 | 138859 |
| 07/31/2020 | 128525 | 139723 | 126173 | 145941 |
| 08/31/2020 | 132831 | 144354 | 125154 | 154789 |
| 09/30/2020 | 130673 | 141634 | 125086 | 149985 |
| 10/31/2020 | 127536 | 139520 | 124527 | 146700 |
| 11/30/2020 | 136947 | 150620 | 125749 | 165192 |
| 12/31/2020 | 141864 | 155097 | 125922 | 173225 |
| 01/31/2021 | 141321 | 154366 | 125019 | 172692 |
| 02/28/2021 | 142950 | 155869 | 123214 | 177156 |
| 03/31/2021 | 146010 | 157467 | 121676 | 181659 |
| 04/30/2021 | 150471 | 162055 | 122637 | 189522 |
| 05/31/2021 | 152647 | 163699 | 123037 | 192315 |
| 06/30/2021 | 154615 | 165254 | 123902 | 194458 |
| 07/31/2021 | 157014 | 166483 | 125287 | 195420 |
| 08/31/2021 | 159413 | 168856 | 125049 | 200309 |
| 09/30/2021 | 152283 | 164264 | 123966 | 192386 |
| 10/31/2021 | 157874 | 168973 | 123932 | 201615 |
| 11/30/2021 | 156120 | 166441 | 124299 | 196182 |
| 12/31/2021 | 161106 | 170281 | 123981 | 204059 |
| 01/31/2022 | 155486 | 163495 | 121310 | 193437 |
| 02/28/2022 | 152070 | 160569 | 119956 | 189105 |
| 03/31/2022 | 153537 | 160737 | 116624 | 192938 |
| 04/30/2022 | 145655 | 150693 | 112198 | 177726 |
| 05/31/2022 | 147098 | 151110 | 112921 | 177782 |
| 06/30/2022 | 137678 | 142337 | 111150 | 162438 |
| 07/31/2022 | 145030 | 149733 | 113866 | 173861 |
| 08/31/2022 | 139238 | 144873 | 110649 | 167730 |
| 09/30/2022 | 128620 | 134001 | 105868 | 151581 |
| 10/31/2022 | 134820 | 138143 | 104496 | 160700 |
| 11/30/2022 | 142711 | 146579 | 108339 | 173116 |
| 12/31/2022 | 138425 | 143187 | 107851 | 166960 |
| 01/31/2023 | 144960 | 150973 | 111169 | 178666 |
| 02/28/2023 | 141396 | 146890 | 108294 | 173693 |
| 03/31/2023 | 144440 | 150618 | 111045 | 178099 |
| 04/30/2023 | 145758 | 152211 | 111718 | 180518 |
| 05/31/2023 | 144680 | 150441 | 110502 | 178330 |
| 06/30/2023 | 150210 | 155445 | 110107 | 188640 |
| 07/31/2023 | 153340 | 158914 | 110031 | 195744 |
| 08/31/2023 | 150090 | 155827 | 109328 | 190240 |
| 09/30/2023 | 144811 | 150402 | 106550 | 182426 |
| 10/31/2023 | 141285 | 146507 | 104868 | 176469 |
| 11/30/2023 | 151256 | 157259 | 109617 | 192728 |
| 12/31/2023 | 158194 | 164490 | 113813 | 202580 |
| 01/31/2024 | 158439 | 164660 | 113501 | 203299 |
| 02/29/2024 | 161382 | 167847 | 111897 | 211773 |
| 03/31/2024 | 166027 | 171625 | 112931 | 218414 |
| 04/30/2024 | 160977 | 166472 | 110078 | 211162 |
| 05/31/2024 | 167382 | 171580 | 111944 | 219573 |
| 06/30/2024 | 169965 | 174175 | 113004 | 223723 |
| 07/31/2024 | 173320 | 177828 | 115644 | 228057 |
| 08/31/2024 | 176177 | 181371 | 117305 | 233446 |
| 09/30/2024 | 179010 | 184859 | 118876 | 238845 |
| 10/31/2024 | 175113 | 180414 | 115928 | 233222 |
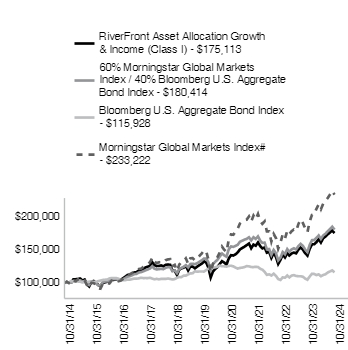
| RiverFront Asset Allocation Growth & Income - I - NAV | 23.94% | 6.64% | 5.76% |
| Morningstar Global Markets Index# | 32.16% | 10.63% | 8.84% |
| Bloomberg U.S. Aggregate Bond Index | 10.55% | -0.23% | 1.49% |
| 60% Morningstar Global Markets Index / 40% Bloomberg U.S. Aggregate Bond Index | 23.14% | 6.44% | 6.08% |
For the most current month-end performance data, please call 1-866-759-5679.
| Net Assets | $77,544,232 |
| Number of Portfolio Holdings | 20 |
| Portfolio Turnover Rate | 36% |
| Total Advisory Fees Paid | $0 |
| Domestic Equity | 52.31% |
| Traditional Fixed Income | 23.83% |
| International Equity | 19.30% |
| Alternative Fixed Income | 3.45% |
| Cash, Cash Equivalents, & Other Net Assets | 1.11% |

| RiverFront Dynamic US Dividend Advantage ETF | 20.22% |
| First Trust RiverFront Dynamic Developed International ETF | 13.71% |
| JPMorgan Equity Premium Income ETF | 11.22% |
| Vanguard® Long-Term Corporate Bond ETF | 9.56% |
| iShares® Core S&P 500® ETF | 7.23% |
| RiverFront Dynamic Core Income ETF | 6.57% |
| iShares® Core S&P 500® U.S. Technology ETF | 5.28% |
| ALPS Active Equity Opportunity ETF | 3.97% |
| First Trust RiverFront Dynamic Emerging Markets ETF | 3.59% |
| Riverfront Strategic Income Fund | 3.45% |
| |
** | As a percentage of net assets. |
Holdings are subject to change
If you wish to view additional information about the Fund, including but not limited to the Fund's prospectus, financial information, holdings, and proxy voting information, please visit https://www.alpsfunds.com/mutual-funds/rliix.
If you have consented to receive a single annual or semi-annual shareholder report at a shared address you may revoke this consent by calling the Transfer Agent 866-759-5679.
ALPS | Smith Short Duration Bond Fund - Investor Shares | FINANCIAL INVESTORS TRUST |
SMRSX | |
This annual shareholder report contains important information about ALPS | Smith Short Duration Bond Fund (the "Fund" or "SMRSX") for the period of November 1, 2023 to October 31, 2024 (the "Period"). You can find additional information about the Fund at https://www.alpsfunds.com/mutual-funds/smdsx. You can also request this information by contacting us at 866-759-5679.
The ALPS | Smith Short Duration Bond Fund returned 6.79% for Investor Class shares at net asset value (NAV) for the 12 months ended October 31, 2024. The Fund outperformed the Bloomberg 1-3 Year US Government/Credit Index, which returned 6.25%.
Top contributors to relative performance
Asset allocation, specifically an overweight positioning in corporate credit and short duration government guaranteed securitized assets, benefited from tightening risk asset spreads throughout the period.
Security selection across both the investment grade and high yield credit universes.
Underweight positioning in U.S. Treasuries, which underperformed compared to the Bloomberg U.S. Aggregate Bond Index given lower yield profiles.
Top detractors from relative performance
Shorter aggregate portfolio duration compared to that of the index.
Yield curve positioning focused on an underweight of the 2–3 year key rate duration with overweight positioning in the 5 year key rate sector which underperformed relative to the U.S. Aggregate Bond Index.
The Fund's past performance is not a good predictor of the Fund's future performance. The chart and the table below do not reflect the deduction of taxes that a shareholder would pay on Fund distributions or sale of Fund shares.
| 06/29/2018 | 10000 | 10000 | 10000 |
| 06/30/2018 | 10000 | 10000 | 10000 |
| 07/31/2018 | 9990 | 10008 | 10005 |
| 08/31/2018 | 10024 | 10073 | 10041 |
| 09/30/2018 | 10018 | 10006 | 10033 |
| 10/31/2018 | 10025 | 9919 | 10044 |
| 11/30/2018 | 10052 | 9966 | 10073 |
| 12/31/2018 | 10108 | 10152 | 10152 |
| 01/31/2019 | 10168 | 10271 | 10191 |
| 02/28/2019 | 10196 | 10265 | 10207 |
| 03/31/2019 | 10267 | 10483 | 10274 |
| 04/30/2019 | 10299 | 10488 | 10298 |
| 05/31/2019 | 10349 | 10694 | 10369 |
| 06/30/2019 | 10398 | 10852 | 10427 |
| 07/31/2019 | 10417 | 10869 | 10420 |
| 08/31/2019 | 10486 | 11223 | 10504 |
| 09/30/2019 | 10493 | 11138 | 10499 |
| 10/31/2019 | 10531 | 11170 | 10535 |
| 11/30/2019 | 10536 | 11159 | 10535 |
| 12/31/2019 | 10568 | 11137 | 10561 |
| 01/31/2020 | 10635 | 11403 | 10619 |
| 02/29/2020 | 10702 | 11641 | 10706 |
| 03/31/2020 | 10530 | 11512 | 10739 |
| 04/30/2020 | 10804 | 11769 | 10807 |
| 05/31/2020 | 10933 | 11836 | 10843 |
| 06/30/2020 | 11028 | 11940 | 10865 |
| 07/31/2020 | 11113 | 12180 | 10885 |
| 08/31/2020 | 11131 | 12039 | 10889 |
| 09/30/2020 | 11129 | 12033 | 10890 |
| 10/31/2020 | 11147 | 11960 | 10892 |
| 11/30/2020 | 11196 | 12120 | 10903 |
| 12/31/2020 | 11231 | 12131 | 10913 |
| 01/31/2021 | 11235 | 12005 | 10917 |
| 02/28/2021 | 11218 | 11794 | 10913 |
| 03/31/2021 | 11211 | 11612 | 10908 |
| 04/30/2021 | 11236 | 11714 | 10917 |
| 05/31/2021 | 11251 | 11774 | 10930 |
| 06/30/2021 | 11244 | 11893 | 10913 |
| 07/31/2021 | 11258 | 12050 | 10931 |
| 08/31/2021 | 11263 | 12026 | 10932 |
| 09/30/2021 | 11256 | 11897 | 10923 |
| 10/31/2021 | 11232 | 11903 | 10887 |
| 11/30/2021 | 11201 | 11958 | 10878 |
| 12/31/2021 | 11201 | 11919 | 10861 |
| 01/31/2022 | 11133 | 11628 | 10784 |
| 02/28/2022 | 11084 | 11492 | 10736 |
| 03/31/2022 | 10974 | 11164 | 10591 |
| 04/30/2022 | 10906 | 10722 | 10534 |
| 05/31/2022 | 10960 | 10773 | 10599 |
| 06/30/2022 | 10843 | 10602 | 10524 |
| 07/31/2022 | 10920 | 10832 | 10579 |
| 08/31/2022 | 10872 | 10549 | 10497 |
| 09/30/2022 | 10761 | 10119 | 10369 |
| 10/31/2022 | 10748 | 9994 | 10356 |
| 11/30/2022 | 10844 | 10350 | 10441 |
| 12/31/2022 | 10882 | 10301 | 10461 |
| 01/31/2023 | 10984 | 10611 | 10545 |
| 02/28/2023 | 10933 | 10336 | 10466 |
| 03/31/2023 | 10974 | 10627 | 10619 |
| 04/30/2023 | 11025 | 10695 | 10655 |
| 05/31/2023 | 11012 | 10562 | 10622 |
| 06/30/2023 | 11001 | 10528 | 10579 |
| 07/31/2023 | 11069 | 10520 | 10624 |
| 08/31/2023 | 11103 | 10458 | 10661 |
| 09/30/2023 | 11096 | 10213 | 10656 |
| 10/31/2023 | 11112 | 10068 | 10690 |
| 11/30/2023 | 11260 | 10504 | 10814 |
| 12/31/2023 | 11397 | 10890 | 10943 |
| 01/31/2024 | 11458 | 10865 | 10986 |
| 02/29/2024 | 11434 | 10718 | 10946 |
| 03/31/2024 | 11495 | 10812 | 10990 |
| 04/30/2024 | 11468 | 10555 | 10953 |
| 05/31/2024 | 11541 | 10723 | 11032 |
| 06/30/2024 | 11604 | 10817 | 11094 |
| 07/31/2024 | 11736 | 11059 | 11226 |
| 08/31/2024 | 11822 | 11212 | 11328 |
| 09/30/2024 | 11914 | 11368 | 11422 |
| 10/31/2024 | 11866 | 11098 | 11358 |
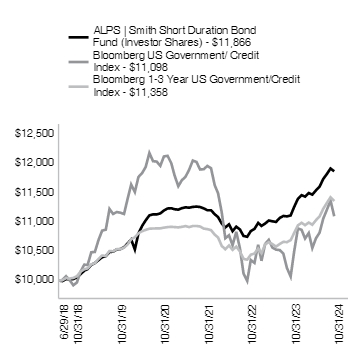
| ALPS | Smith Short Duration Bond Fund - Investor - NAV | 6.79% | 2.42% | 2.74% |
| Bloomberg 1-3 Year US Government/Credit Index | 6.25% | 1.51% | 2.03% |
| Bloomberg US Government/ Credit Index# | 10.23% | -0.13% | 1.66% |
For the most current month-end performance data, please call 1-866-759-5679.
| Net Assets | $577,017,028 |
| Number of Portfolio Holdings | 161 |
| Portfolio Turnover Rate | 157% |
| Total Advisory Fees Paid | $1,695,999 |
| Corporate Bonds | 68.04% |
| Government Bonds | 29.13% |
| Mortgage-Backed Securities | 1.08% |
| Bank Loan | 0.26% |
| Commercial Mortgage-Backed Securities | 0.05% |
| Collateralized Mortgage Obligations | 0.04% |
| Cash, Cash Equivalents, & Other Net Assets | 1.40% |
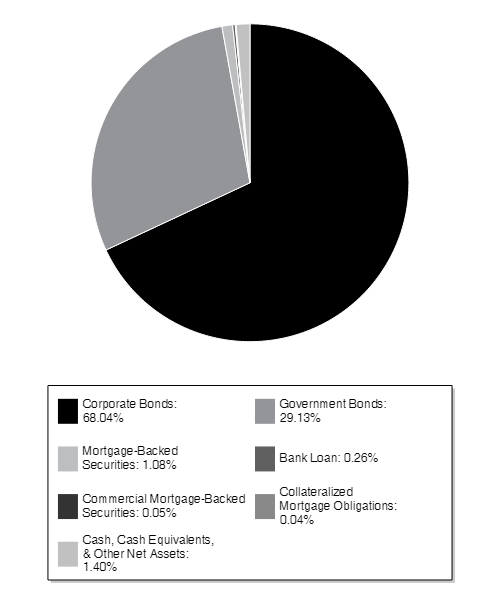
| U.S. Treasury Note 3.50% 09/30/2026 | 4.55% |
| U.S. Treasury Note 4.375% 07/31/2026 | 4.33% |
| U.S. Treasury Note 3.75% 08/31/2026 | 4.09% |
| U.S. Treasury Note 4.25% 03/15/2027 | 4.08% |
| U.S. Treasury Note 4.50% 04/15/2027 | 3.91% |
| U.S. Treasury Note 4.50% 05/15/2027 | 3.44% |
| U.S. Treasury Note 3.50% 09/30/2029 | 3.04% |
| U.S. Treasury Note 4.875% 05/31/2026 | 1.69% |
| Danske Bank A/S 1Y US TI + 2.10% 01/09/2026 | 1.48% |
| Gray Oak Pipeline LLC 2.60% 10/15/2025 | 1.29% |
| Sovereign | 29.13% |
| Banks | 18.34% |
| Diversified Finan Serv | 5.90% |
| Auto Manufacturers | 5.24% |
| Healthcare-Products | 4.47% |
| Oil&Gas | 3.91% |
| Electric | 3.44% |
| Pipelines | 3.22% |
| Food | 3.21% |
| Aerospace/Defense | 3.12% |
| Commercial Services | 1.57% |
| Biotechnology | 1.45% |
| Healthcare-Services | 1.34% |
| Mortgage Securities | 1.17% |
| Iron/Steel | 1.14% |
| Entertainment | 1.13% |
| REITS | 1.04% |
| Other Industries (each less than 1%) | 9.78% |
| Cash, Cash Equivalents, & Other Net Assets | 1.40% |
| |
** | As a percentage of net assets. |
Holdings are subject to change
If you wish to view additional information about the Fund, including but not limited to the Fund's prospectus, financial information, holdings, and proxy voting information, please visit https://www.alpsfunds.com/mutual-funds/smdsx.
If you have consented to receive a single annual or semi-annual shareholder report at a shared address you may revoke this consent by calling the Transfer Agent 866-759-5679.
ALPS | Smith Short Duration Bond Fund - Class A | FINANCIAL INVESTORS TRUST |
SMASX | |
This annual shareholder report contains important information about ALPS | Smith Short Duration Bond Fund (the "Fund" or "SMASX") for the period of November 1, 2023 to October 31, 2024 (the "Period"). You can find additional information about the Fund at https://www.alpsfunds.com/mutual-funds/smdsx. You can also request this information by contacting us at 866-759-5679.
The ALPS | Smith Short Duration Bond Fund returned 6.82% for Class A shares at net asset value (NAV) for the 12 months ended October 31, 2024. The Fund outperformed the Bloomberg 1-3 Year US Government/Credit Index, which returned 6.25%.
Top contributors to relative performance
Asset allocation, specifically an overweight positioning in corporate credit and short duration government guaranteed securitized assets, benefited from tightening risk asset spreads throughout the period.
Security selection across both the investment grade and high yield credit universes.
Underweight positioning in U.S. Treasuries, which underperformed compared to the Bloomberg U.S. Aggregate Bond Index given lower yield profiles.
Top detractors from relative performance
Shorter aggregate portfolio duration compared to that of the index.
Yield curve positioning focused on an underweight of the 2–3 year key rate duration with overweight positioning in the 5 year key rate sector which underperformed relative to the U.S. Aggregate Bond Index.
The Fund's past performance is not a good predictor of the Fund's future performance. The chart and the table below do not reflect the deduction of taxes that a shareholder would pay on Fund distributions or sale of Fund shares.
| 06/29/2018 | 9452 | 10000 | 10000 |
| 06/30/2018 | 9452 | 10000 | 10000 |
| 07/31/2018 | 9452 | 10008 | 10005 |
| 08/31/2018 | 9474 | 10073 | 10041 |
| 09/30/2018 | 9470 | 10006 | 10033 |
| 10/31/2018 | 9478 | 9919 | 10044 |
| 11/30/2018 | 9503 | 9966 | 10073 |
| 12/31/2018 | 9555 | 10152 | 10152 |
| 01/31/2019 | 9612 | 10271 | 10191 |
| 02/28/2019 | 9641 | 10265 | 10207 |
| 03/31/2019 | 9698 | 10483 | 10274 |
| 04/30/2019 | 9729 | 10488 | 10298 |
| 05/31/2019 | 9776 | 10694 | 10369 |
| 06/30/2019 | 9832 | 10852 | 10427 |
| 07/31/2019 | 9850 | 10869 | 10420 |
| 08/31/2019 | 9915 | 11223 | 10504 |
| 09/30/2019 | 9921 | 11138 | 10499 |
| 10/31/2019 | 9947 | 11170 | 10535 |
| 11/30/2019 | 9962 | 11159 | 10535 |
| 12/31/2019 | 9992 | 11137 | 10561 |
| 01/31/2020 | 10046 | 11403 | 10619 |
| 02/29/2020 | 10119 | 11641 | 10706 |
| 03/31/2020 | 9956 | 11512 | 10739 |
| 04/30/2020 | 10206 | 11769 | 10807 |
| 05/31/2020 | 10337 | 11836 | 10843 |
| 06/30/2020 | 10417 | 11940 | 10865 |
| 07/31/2020 | 10496 | 12180 | 10885 |
| 08/31/2020 | 10524 | 12039 | 10889 |
| 09/30/2020 | 10511 | 12033 | 10890 |
| 10/31/2020 | 10528 | 11960 | 10892 |
| 11/30/2020 | 10584 | 12120 | 10903 |
| 12/31/2020 | 10617 | 12131 | 10913 |
| 01/31/2021 | 10611 | 12005 | 10917 |
| 02/28/2021 | 10605 | 11794 | 10913 |
| 03/31/2021 | 10599 | 11612 | 10908 |
| 04/30/2021 | 10612 | 11714 | 10917 |
| 05/31/2021 | 10637 | 11774 | 10930 |
| 06/30/2021 | 10630 | 11893 | 10913 |
| 07/31/2021 | 10643 | 12050 | 10931 |
| 08/31/2021 | 10648 | 12026 | 10932 |
| 09/30/2021 | 10631 | 11897 | 10923 |
| 10/31/2021 | 10609 | 11903 | 10887 |
| 11/30/2021 | 10581 | 11958 | 10878 |
| 12/31/2021 | 10590 | 11919 | 10861 |
| 01/31/2022 | 10526 | 11628 | 10784 |
| 02/28/2022 | 10479 | 11492 | 10736 |
| 03/31/2022 | 10376 | 11164 | 10591 |
| 04/30/2022 | 10311 | 10722 | 10534 |
| 05/31/2022 | 10353 | 10773 | 10599 |
| 06/30/2022 | 10254 | 10602 | 10524 |
| 07/31/2022 | 10326 | 10832 | 10579 |
| 08/31/2022 | 10270 | 10549 | 10497 |
| 09/30/2022 | 10176 | 10119 | 10369 |
| 10/31/2022 | 10164 | 9994 | 10356 |
| 11/30/2022 | 10255 | 10350 | 10441 |
| 12/31/2022 | 10291 | 10301 | 10461 |
| 01/31/2023 | 10388 | 10611 | 10545 |
| 02/28/2023 | 10329 | 10336 | 10466 |
| 03/31/2023 | 10377 | 10627 | 10619 |
| 04/30/2023 | 10425 | 10695 | 10655 |
| 05/31/2023 | 10406 | 10562 | 10622 |
| 06/30/2023 | 10405 | 10528 | 10579 |
| 07/31/2023 | 10460 | 10520 | 10624 |
| 08/31/2023 | 10502 | 10458 | 10661 |
| 09/30/2023 | 10497 | 10213 | 10656 |
| 10/31/2023 | 10512 | 10068 | 10690 |
| 11/30/2023 | 10652 | 10504 | 10814 |
| 12/31/2023 | 10783 | 10890 | 10943 |
| 01/31/2024 | 10830 | 10865 | 10986 |
| 02/29/2024 | 10817 | 10718 | 10946 |
| 03/31/2024 | 10876 | 10812 | 10990 |
| 04/30/2024 | 10849 | 10555 | 10953 |
| 05/31/2024 | 10920 | 10723 | 11032 |
| 06/30/2024 | 10979 | 10817 | 11094 |
| 07/31/2024 | 11104 | 11059 | 11226 |
| 08/31/2024 | 11187 | 11212 | 11328 |
| 09/30/2024 | 11274 | 11368 | 11422 |
| 10/31/2024 | 11228 | 11098 | 11358 |
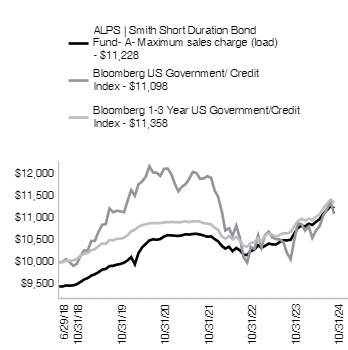
| ALPS | Smith Short Duration Bond Fund - A - NAV | 6.82% | 2.45% | 2.75% |
| ALPS | Smith Short Duration Bond Fund - A - Maximum sales charge (load)*^ | 4.41% | 1.29% | 1.84% |
| Bloomberg 1-3 Year US Government/Credit Index | 6.25% | 1.51% | 2.03% |
| Bloomberg US Government/ Credit Index# | 10.23% | -0.13% | 1.66% |
For the most current month-end performance data, please call 1-866-759-5679.
| Net Assets | $577,017,028 |
| Number of Portfolio Holdings | 161 |
| Portfolio Turnover Rate | 157% |
| Total Advisory Fees Paid | $1,695,999 |
| Corporate Bonds | 68.04% |
| Government Bonds | 29.13% |
| Mortgage-Backed Securities | 1.08% |
| Bank Loan | 0.26% |
| Commercial Mortgage-Backed Securities | 0.05% |
| Collateralized Mortgage Obligations | 0.04% |
| Cash, Cash Equivalents, & Other Net Assets | 1.40% |

| U.S. Treasury Note 3.50% 09/30/2026 | 4.55% |
| U.S. Treasury Note 4.375% 07/31/2026 | 4.33% |
| U.S. Treasury Note 3.75% 08/31/2026 | 4.09% |
| U.S. Treasury Note 4.25% 03/15/2027 | 4.08% |
| U.S. Treasury Note 4.50% 04/15/2027 | 3.91% |
| U.S. Treasury Note 4.50% 05/15/2027 | 3.44% |
| U.S. Treasury Note 3.50% 09/30/2029 | 3.04% |
| U.S. Treasury Note 4.875% 05/31/2026 | 1.69% |
| Danske Bank A/S 1Y US TI + 2.10% 01/09/2026 | 1.48% |
| Gray Oak Pipeline LLC 2.60% 10/15/2025 | 1.29% |
| Sovereign | 29.13% |
| Banks | 18.34% |
| Diversified Finan Serv | 5.90% |
| Auto Manufacturers | 5.24% |
| Healthcare-Products | 4.47% |
| Oil&Gas | 3.91% |
| Electric | 3.44% |
| Pipelines | 3.22% |
| Food | 3.21% |
| Aerospace/Defense | 3.12% |
| Commercial Services | 1.57% |
| Biotechnology | 1.45% |
| Healthcare-Services | 1.34% |
| Mortgage Securities | 1.17% |
| Iron/Steel | 1.14% |
| Entertainment | 1.13% |
| REITS | 1.04% |
| Other Industries (each less than 1%) | 9.78% |
| Cash, Cash Equivalents, & Other Net Assets | 1.40% |
| |
** | As a percentage of net assets. |
Holdings are subject to change
If you wish to view additional information about the Fund, including but not limited to the Fund's prospectus, financial information, holdings, and proxy voting information, please visit https://www.alpsfunds.com/mutual-funds/smdsx.
If you have consented to receive a single annual or semi-annual shareholder report at a shared address you may revoke this consent by calling the Transfer Agent 866-759-5679.
ALPS | Smith Short Duration Bond Fund - Class C | FINANCIAL INVESTORS TRUST |
SMCMX | |
This annual shareholder report contains important information about ALPS | Smith Short Duration Bond Fund (the "Fund" or "SMCMX") for the period of November 1, 2023 to October 31, 2024 (the "Period"). You can find additional information about the Fund at https://www.alpsfunds.com/mutual-funds/smdsx. You can also request this information by contacting us at 866-759-5679.
The ALPS | Smith Short Duration Bond Fund returned 6.07% for Class C shares at net asset value (NAV) for the 12 months ended October 31, 2024. The Fund underperformed the Bloomberg 1-3 Year US Government/Credit Index, which returned 6.25%.
Top contributors to relative performance
Asset allocation, specifically an overweight positioning in corporate credit and short duration government guaranteed securitized assets, benefited from tightening risk asset spreads throughout the period.
Security selection across both the investment grade and high yield credit universes.
Underweight positioning in U.S. Treasuries, which underperformed compared to the Bloomberg U.S. Aggregate Bond Index given lower yield profiles.
Top detractors from relative performance
Shorter aggregate portfolio duration compared to that of the index.
Yield curve positioning focused on an underweight of the 2–3 year key rate duration with overweight positioning in the 5 year key rate sector which underperformed relative to the U.S. Aggregate Bond Index.
The Fund's past performance is not a good predictor of the Fund's future performance. The chart and the table below do not reflect the deduction of taxes that a shareholder would pay on Fund distributions or sale of Fund shares.
| 06/29/2018 | 10000 | 10000 | 10000 |
| 06/30/2018 | 10000 | 10000 | 10000 |
| 07/31/2018 | 9990 | 10008 | 10005 |
| 08/31/2018 | 10017 | 10073 | 10041 |
| 09/30/2018 | 10006 | 10006 | 10033 |
| 10/31/2018 | 10009 | 9919 | 10044 |
| 11/30/2018 | 10031 | 9966 | 10073 |
| 12/31/2018 | 10071 | 10152 | 10152 |
| 01/31/2019 | 10134 | 10271 | 10191 |
| 02/28/2019 | 10157 | 10265 | 10207 |
| 03/31/2019 | 10211 | 10483 | 10274 |
| 04/30/2019 | 10235 | 10488 | 10298 |
| 05/31/2019 | 10279 | 10694 | 10369 |
| 06/30/2019 | 10333 | 10852 | 10427 |
| 07/31/2019 | 10344 | 10869 | 10420 |
| 08/31/2019 | 10396 | 11223 | 10504 |
| 09/30/2019 | 10407 | 11138 | 10499 |
| 10/31/2019 | 10428 | 11170 | 10535 |
| 11/30/2019 | 10427 | 11159 | 10535 |
| 12/31/2019 | 10452 | 11137 | 10561 |
| 01/31/2020 | 10513 | 11403 | 10619 |
| 02/29/2020 | 10573 | 11641 | 10706 |
| 03/31/2020 | 10406 | 11512 | 10739 |
| 04/30/2020 | 10661 | 11769 | 10807 |
| 05/31/2020 | 10792 | 11836 | 10843 |
| 06/30/2020 | 10870 | 11940 | 10865 |
| 07/31/2020 | 10946 | 12180 | 10885 |
| 08/31/2020 | 10958 | 12039 | 10889 |
| 09/30/2020 | 10949 | 12033 | 10890 |
| 10/31/2020 | 10960 | 11960 | 10892 |
| 11/30/2020 | 11001 | 12120 | 10903 |
| 12/31/2020 | 11030 | 12131 | 10913 |
| 01/31/2021 | 11020 | 12005 | 10917 |
| 02/28/2021 | 11009 | 11794 | 10913 |
| 03/31/2021 | 10989 | 11612 | 10908 |
| 04/30/2021 | 11009 | 11714 | 10917 |
| 05/31/2021 | 11020 | 11774 | 10930 |
| 06/30/2021 | 11009 | 11893 | 10913 |
| 07/31/2021 | 11009 | 12050 | 10931 |
| 08/31/2021 | 11009 | 12026 | 10932 |
| 09/30/2021 | 10989 | 11897 | 10923 |
| 10/31/2021 | 10959 | 11903 | 10887 |
| 11/30/2021 | 10928 | 11958 | 10878 |
| 12/31/2021 | 10923 | 11919 | 10861 |
| 01/31/2022 | 10850 | 11628 | 10784 |
| 02/28/2022 | 10798 | 11492 | 10736 |
| 03/31/2022 | 10684 | 11164 | 10591 |
| 04/30/2022 | 10612 | 10722 | 10534 |
| 05/31/2022 | 10648 | 10773 | 10599 |
| 06/30/2022 | 10540 | 10602 | 10524 |
| 07/31/2022 | 10598 | 10832 | 10579 |
| 08/31/2022 | 10544 | 10549 | 10497 |
| 09/30/2022 | 10429 | 10119 | 10369 |
| 10/31/2022 | 10410 | 9994 | 10356 |
| 11/30/2022 | 10498 | 10350 | 10441 |
| 12/31/2022 | 10528 | 10301 | 10461 |
| 01/31/2023 | 10632 | 10611 | 10545 |
| 02/28/2023 | 10566 | 10336 | 10466 |
| 03/31/2023 | 10609 | 10627 | 10619 |
| 04/30/2023 | 10642 | 10695 | 10655 |
| 05/31/2023 | 10623 | 10562 | 10622 |
| 06/30/2023 | 10616 | 10528 | 10579 |
| 07/31/2023 | 10665 | 10520 | 10624 |
| 08/31/2023 | 10692 | 10458 | 10661 |
| 09/30/2023 | 10679 | 10213 | 10656 |
| 10/31/2023 | 10687 | 10068 | 10690 |
| 11/30/2023 | 10835 | 10504 | 10814 |
| 12/31/2023 | 10961 | 10890 | 10943 |
| 01/31/2024 | 11003 | 10865 | 10986 |
| 02/29/2024 | 10984 | 10718 | 10946 |
| 03/31/2024 | 11025 | 10812 | 10990 |
| 04/30/2024 | 10993 | 10555 | 10953 |
| 05/31/2024 | 11068 | 10723 | 11032 |
| 06/30/2024 | 11111 | 10817 | 11094 |
| 07/31/2024 | 11232 | 11059 | 11226 |
| 08/31/2024 | 11307 | 11212 | 11328 |
| 09/30/2024 | 11390 | 11368 | 11422 |
| 10/31/2024 | 11336 | 11098 | 11358 |
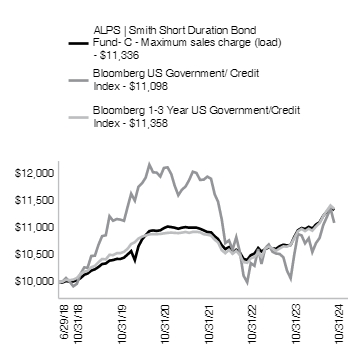
| ALPS | Smith Short Duration Bond Fund - C - NAV* | 6.07% | 1.68% | 2.00% |
| ALPS | Smith Short Duration Bond Fund - C - Maximim deferred sales charge** | 5.07% | 1.68% | 2.00% |
| Bloomberg 1-3 Year US Government/Credit Index | 6.25% | 1.51% | 2.03% |
| Bloomberg US Government/ Credit Index# | 10.23% | -0.13% | 1.66% |
For the most current month-end performance data, please call 1-866-759-5679.
| Net Assets | $577,017,028 |
| Number of Portfolio Holdings | 161 |
| Portfolio Turnover Rate | 157% |
| Total Advisory Fees Paid | $1,695,999 |
| Corporate Bonds | 68.04% |
| Government Bonds | 29.13% |
| Mortgage-Backed Securities | 1.08% |
| Bank Loan | 0.26% |
| Commercial Mortgage-Backed Securities | 0.05% |
| Collateralized Mortgage Obligations | 0.04% |
| Cash, Cash Equivalents, & Other Net Assets | 1.40% |

| U.S. Treasury Note 3.50% 09/30/2026 | 4.55% |
| U.S. Treasury Note 4.375% 07/31/2026 | 4.33% |
| U.S. Treasury Note 3.75% 08/31/2026 | 4.09% |
| U.S. Treasury Note 4.25% 03/15/2027 | 4.08% |
| U.S. Treasury Note 4.50% 04/15/2027 | 3.91% |
| U.S. Treasury Note 4.50% 05/15/2027 | 3.44% |
| U.S. Treasury Note 3.50% 09/30/2029 | 3.04% |
| U.S. Treasury Note 4.875% 05/31/2026 | 1.69% |
| Danske Bank A/S 1Y US TI + 2.10% 01/09/2026 | 1.48% |
| Gray Oak Pipeline LLC 2.60% 10/15/2025 | 1.29% |
| Sovereign | 29.13% |
| Banks | 18.34% |
| Diversified Finan Serv | 5.90% |
| Auto Manufacturers | 5.24% |
| Healthcare-Products | 4.47% |
| Oil&Gas | 3.91% |
| Electric | 3.44% |
| Pipelines | 3.22% |
| Food | 3.21% |
| Aerospace/Defense | 3.12% |
| Commercial Services | 1.57% |
| Biotechnology | 1.45% |
| Healthcare-Services | 1.34% |
| Mortgage Securities | 1.17% |
| Iron/Steel | 1.14% |
| Entertainment | 1.13% |
| REITS | 1.04% |
| Other Industries (each less than 1%) | 9.78% |
| Cash, Cash Equivalents, & Other Net Assets | 1.40% |
| |
** | As a percentage of net assets. |
Holdings are subject to change
If you wish to view additional information about the Fund, including but not limited to the Fund's prospectus, financial information, holdings, and proxy voting information, please visit https://www.alpsfunds.com/mutual-funds/smdsx.
If you have consented to receive a single annual or semi-annual shareholder report at a shared address you may revoke this consent by calling the Transfer Agent 866-759-5679.
ALPS | Smith Short Duration Bond Fund - Class I | FINANCIAL INVESTORS TRUST |
SMDSX | |
This annual shareholder report contains important information about ALPS | Smith Short Duration Bond Fund (the "Fund" or "SMDSX") for the period of November 1, 2023 to October 31, 2024 (the "Period"). You can find additional information about the Fund at https://www.alpsfunds.com/mutual-funds/smdsx. You can also request this information by contacting us at 866-759-5679.
The ALPS | Smith Short Duration Bond Fund returned 7.10% for Class I shares at net asset value (NAV) for the 12 months ended October 31, 2024. The Fund outperformed the Bloomberg 1-3 Year US Government/Credit Index, which returned 6.25%.
Top contributors to relative performance
Asset allocation, specifically an overweight positioning in corporate credit and short duration government guaranteed securitized assets, benefited from tightening risk asset spreads throughout the period.
Security selection across both the investment grade and high yield credit universes.
Underweight positioning in U.S. Treasuries, which underperformed compared to the Bloomberg U.S. Aggregate Bond Index given lower yield profiles.
Top detractors from relative performance
Shorter aggregate portfolio duration compared to that of the index.
Yield curve positioning focused on an underweight of the 2–3 year key rate duration with overweight positioning in the 5 year key rate sector which underperformed relative to the U.S. Aggregate Bond Index.
The Fund's past performance is not a good predictor of the Fund's future performance. The chart and the table below do not reflect the deduction of taxes that a shareholder would pay on Fund distributions or sale of Fund shares.
| 06/29/2018 | 100000 | 100000 | 100000 |
| 06/30/2018 | 100000 | 100000 | 100000 |
| 07/31/2018 | 100000 | 100077 | 100054 |
| 08/31/2018 | 100310 | 100728 | 100406 |
| 09/30/2018 | 100388 | 100058 | 100334 |
| 10/31/2018 | 100498 | 99190 | 100444 |
| 11/30/2018 | 100699 | 99660 | 100734 |
| 12/31/2018 | 101284 | 101515 | 101518 |
| 01/31/2019 | 101911 | 102710 | 101915 |
| 02/28/2019 | 102312 | 102647 | 102073 |
| 03/31/2019 | 102944 | 104825 | 102742 |
| 04/30/2019 | 103271 | 104880 | 102977 |
| 05/31/2019 | 103801 | 106940 | 103690 |
| 06/30/2019 | 104419 | 108522 | 104267 |
| 07/31/2019 | 104625 | 108686 | 104205 |
| 08/31/2019 | 105341 | 112233 | 105044 |
| 09/30/2019 | 105437 | 111382 | 104987 |
| 10/31/2019 | 105734 | 111695 | 105355 |
| 11/30/2019 | 105911 | 111593 | 105351 |
| 12/31/2019 | 106261 | 111373 | 105609 |
| 01/31/2020 | 106965 | 114029 | 106192 |
| 02/29/2020 | 107656 | 116411 | 107059 |
| 03/31/2020 | 105952 | 115123 | 107391 |
| 04/30/2020 | 108631 | 117685 | 108070 |
| 05/31/2020 | 110050 | 118364 | 108432 |
| 06/30/2020 | 110925 | 119398 | 108650 |
| 07/31/2020 | 111787 | 121795 | 108851 |
| 08/31/2020 | 112109 | 120387 | 108893 |
| 09/30/2020 | 112001 | 120328 | 108902 |
| 10/31/2020 | 112206 | 119604 | 108921 |
| 11/30/2020 | 112830 | 121204 | 109030 |
| 12/31/2020 | 113214 | 121313 | 109129 |
| 01/31/2021 | 113182 | 120047 | 109166 |
| 02/28/2021 | 113139 | 117940 | 109132 |
| 03/31/2021 | 113099 | 116118 | 109082 |
| 04/30/2021 | 113270 | 117141 | 109167 |
| 05/31/2021 | 113550 | 117739 | 109299 |
| 06/30/2021 | 113506 | 118931 | 109130 |
| 07/31/2021 | 113674 | 120500 | 109314 |
| 08/31/2021 | 113742 | 120257 | 109318 |
| 09/30/2021 | 113589 | 118974 | 109227 |
| 10/31/2021 | 113381 | 119030 | 108868 |
| 11/30/2021 | 113112 | 119578 | 108780 |
| 12/31/2021 | 113242 | 119191 | 108613 |
| 01/31/2022 | 112470 | 116283 | 107836 |
| 02/28/2022 | 112107 | 114919 | 107364 |
| 03/31/2022 | 111020 | 111643 | 105909 |
| 04/30/2022 | 110362 | 107219 | 105341 |
| 05/31/2022 | 110824 | 107730 | 105986 |
| 06/30/2022 | 109785 | 106024 | 105240 |
| 07/31/2022 | 110484 | 108318 | 105793 |
| 08/31/2022 | 110013 | 105495 | 104968 |
| 09/30/2022 | 108914 | 101191 | 103687 |
| 10/31/2022 | 108809 | 99937 | 103556 |
| 11/30/2022 | 109811 | 103501 | 104410 |
| 12/31/2022 | 110223 | 103009 | 104609 |
| 01/31/2023 | 111397 | 106113 | 105449 |
| 02/28/2023 | | 103361 | 104664 |
| 03/31/2023 | 111334 | 106271 | 106188 |
| 04/30/2023 | 111771 | 106946 | 106550 |
| 05/31/2023 | 111677 | 105618 | 106224 |
| 06/30/2023 | 111696 | 105282 | 105793 |
| 07/31/2023 | 112309 | 105200 | 106236 |
| 08/31/2023 | 112677 | 104580 | 106613 |
| 09/30/2023 | 112640 | 102129 | 106563 |
| 10/31/2023 | 112824 | 100676 | 106898 |
| 11/30/2023 | 114471 | 105036 | 108142 |
| 12/31/2023 | 115896 | 108902 | 109434 |
| 01/31/2024 | 116429 | 108649 | 109859 |
| 02/29/2024 | 116323 | 107175 | 109458 |
| 03/31/2024 | 116856 | 108115 | 109895 |
| 04/30/2024 | 116610 | 105548 | 109528 |
| 05/31/2024 | 117502 | 107233 | 110325 |
| 06/30/2024 | 118050 | 108165 | 110941 |
| 07/31/2024 | 119428 | 110590 | 112257 |
| 08/31/2024 | 120444 | 112119 | 113279 |
| 09/30/2024 | 121300 | 113684 | 114223 |
| 10/31/2024 | 120837 | 110976 | 113576 |

| ALPS | Smith Short Duration Bond Fund - I - NAV | 7.10% | 2.71% | 3.03% |
| Bloomberg 1-3 Year US Government/Credit Index | 6.25% | 1.51% | 2.03% |
| Bloomberg US Government/ Credit Index# | 10.23% | -0.13% | 1.66% |
For the most current month-end performance data, please call 1-866-759-5679.
| Net Assets | $577,017,028 |
| Number of Portfolio Holdings | 161 |
| Portfolio Turnover Rate | 157% |
| Total Advisory Fees Paid | $1,695,999 |
| Corporate Bonds | 68.04% |
| Government Bonds | 29.13% |
| Mortgage-Backed Securities | 1.08% |
| Bank Loan | 0.26% |
| Commercial Mortgage-Backed Securities | 0.05% |
| Collateralized Mortgage Obligations | 0.04% |
| Cash, Cash Equivalents, & Other Net Assets | 1.40% |

| U.S. Treasury Note 3.50% 09/30/2026 | 4.55% |
| U.S. Treasury Note 4.375% 07/31/2026 | 4.33% |
| U.S. Treasury Note 3.75% 08/31/2026 | 4.09% |
| U.S. Treasury Note 4.25% 03/15/2027 | 4.08% |
| U.S. Treasury Note 4.50% 04/15/2027 | 3.91% |
| U.S. Treasury Note 4.50% 05/15/2027 | 3.44% |
| U.S. Treasury Note 3.50% 09/30/2029 | 3.04% |
| U.S. Treasury Note 4.875% 05/31/2026 | 1.69% |
| Danske Bank A/S 1Y US TI + 2.10% 01/09/2026 | 1.48% |
| Gray Oak Pipeline LLC 2.60% 10/15/2025 | 1.29% |
| Sovereign | 29.13% |
| Banks | 18.34% |
| Diversified Finan Serv | 5.90% |
| Auto Manufacturers | 5.24% |
| Healthcare-Products | 4.47% |
| Oil&Gas | 3.91% |
| Electric | 3.44% |
| Pipelines | 3.22% |
| Food | 3.21% |
| Aerospace/Defense | 3.12% |
| Commercial Services | 1.57% |
| Biotechnology | 1.45% |
| Healthcare-Services | 1.34% |
| Mortgage Securities | 1.17% |
| Iron/Steel | 1.14% |
| Entertainment | 1.13% |
| REITS | 1.04% |
| Other Industries (each less than 1%) | 9.78% |
| Cash, Cash Equivalents, & Other Net Assets | 1.40% |
| |
** | As a percentage of net assets. |
Holdings are subject to change
If you wish to view additional information about the Fund, including but not limited to the Fund's prospectus, financial information, holdings, and proxy voting information, please visit https://www.alpsfunds.com/mutual-funds/smdsx.
If you have consented to receive a single annual or semi-annual shareholder report at a shared address you may revoke this consent by calling the Transfer Agent 866-759-5679.
ALPS | Smith Total Return Bond Fund - Investor Shares | FINANCIAL INVESTORS TRUST |
SMTRX | |
This annual shareholder report contains important information about ALPS | Smith Total Return Bond Fund (the "Fund" or "SMTRX") for the period of November 1, 2023 to October 31, 2024 (the "Period"). You can find additional information about the Fund at https://www.alpsfunds.com/mutual-funds/smthx. You can also request this information by contacting us at 866-759-5679.
The ALPS | Smith Total Return Bond Fund returned 11.63% for Investor Class shares at net asset value (NAV) for the 12 months ended October 31, 2024. The Fund outperformed the Bloomberg US Aggregate Bond Index, which returned 10.55%.
Top contributors to relative performance
Asset allocation, specifically an overweight position in corporate credit—generically including investment grade, high yield, and preferred securities—benefited from tightening risk asset spreads throughout the period.
Security selection across investment grade and high yield credit allocations.
Active portfolio duration positioning throughout market yield fluctuations, during the period. Duration position generally moved higher during relatively higher interest rates and vice versa.
Top detractors from relative performance
Yield curve positioning with U.S. Treasuries, with an overweight to the short and long duration areas of the market and a relative underweight to the belly of the yield curve, which outperformed.
Agency mortgage security selection, with a relative underweight to low-coupon mortgage-backed securities, which outperformed during the period.
Allocations to longer duration AA and A-rated corporates, which underperformed compared to the broader investment grade corporate universe.
The Fund's past performance is not a good predictor of the Fund's future performance. The chart and the table below do not reflect the deduction of taxes that a shareholder would pay on Fund distributions or sale of Fund shares.
| 06/29/2018 | 10000 | 10000 |
| 06/30/2018 | 10000 | 10000 |
| 07/31/2018 | 10070 | 10002 |
| 08/31/2018 | 10165 | 10067 |
| 09/30/2018 | 10141 | 10002 |
| 10/31/2018 | 10100 | 9923 |
| 11/30/2018 | 10142 | 9982 |
| 12/31/2018 | 10322 | 10166 |
| 01/31/2019 | 10445 | 10273 |
| 02/28/2019 | 10485 | 10268 |
| 03/31/2019 | 10681 | 10465 |
| 04/30/2019 | 10713 | 10467 |
| 05/31/2019 | 10878 | 10653 |
| 06/30/2019 | 10997 | 10787 |
| 07/31/2019 | 11035 | 10811 |
| 08/31/2019 | 11308 | 11091 |
| 09/30/2019 | 11272 | 11032 |
| 10/31/2019 | 11289 | 11065 |
| 11/30/2019 | 11283 | 11059 |
| 12/31/2019 | 11285 | 11052 |
| 01/31/2020 | 11475 | 11264 |
| 02/29/2020 | 11648 | 11467 |
| 03/31/2020 | 11299 | 11400 |
| 04/30/2020 | 11646 | 11602 |
| 05/31/2020 | 11787 | 11656 |
| 06/30/2020 | 11921 | 11730 |
| 07/31/2020 | 12234 | 11905 |
| 08/31/2020 | 12157 | 11809 |
| 09/30/2020 | 12120 | 11802 |
| 10/31/2020 | 12073 | 11750 |
| 11/30/2020 | 12279 | 11865 |
| 12/31/2020 | 12341 | 11881 |
| 01/31/2021 | 12260 | 11796 |
| 02/28/2021 | 12113 | 11626 |
| 03/31/2021 | 12001 | 11481 |
| 04/30/2021 | 12102 | 11571 |
| 05/31/2021 | 12142 | 11609 |
| 06/30/2021 | 12243 | 11691 |
| 07/31/2021 | 12345 | 11821 |
| 08/31/2021 | 12331 | 11799 |
| 09/30/2021 | 12238 | 11697 |
| 10/31/2021 | 12225 | 11693 |
| 11/30/2021 | 12224 | 11728 |
| 12/31/2021 | 12233 | 11698 |
| 01/31/2022 | 11964 | 11446 |
| 02/28/2022 | 11824 | 11318 |
| 03/31/2022 | 11559 | 11004 |
| 04/30/2022 | 11175 | 10586 |
| 05/31/2022 | 11189 | 10654 |
| 06/30/2022 | 10956 | 10487 |
| 07/31/2022 | 11238 | 10744 |
| 08/31/2022 | 10962 | 10440 |
| 09/30/2022 | 10550 | 9989 |
| 10/31/2022 | 10425 | 9860 |
| 11/30/2022 | 10763 | 10222 |
| 12/31/2022 | 10714 | 10176 |
| 01/31/2023 | 11082 | 10489 |
| 02/28/2023 | 10849 | 10218 |
| 03/31/2023 | 11006 | 10477 |
| 04/30/2023 | 11073 | 10541 |
| 05/31/2023 | 10962 | 10426 |
| 06/30/2023 | 10976 | 10389 |
| 07/31/2023 | 10979 | 10382 |
| 08/31/2023 | 10924 | 10316 |
| 09/30/2023 | 10641 | 10053 |
| 10/31/2023 | 10449 | 9895 |
| 11/30/2023 | 10939 | 10343 |
| 12/31/2023 | 11349 | 10739 |
| 01/31/2024 | 11353 | 10709 |
| 02/29/2024 | 11240 | 10558 |
| 03/31/2024 | 11340 | 10655 |
| 04/30/2024 | 11086 | 10386 |
| 05/31/2024 | 11271 | 10562 |
| 06/30/2024 | 11359 | 10662 |
| 07/31/2024 | 11603 | 10911 |
| 08/31/2024 | 11752 | 11068 |
| 09/30/2024 | 11911 | 11216 |
| 10/31/2024 | 11664 | 10938 |

| ALPS | Smith Total Return Bond Fund - Investor - NAV | 11.63% | 0.66% | 2.46% |
| Bloomberg US AggregateBond Index# | 10.55% | -0.23% | 1.42% |
For the most current month-end performance data, please call 1-866-759-5679.
| Net Assets | $3,251,025,895 |
| Number of Portfolio Holdings | 1,640 |
| Portfolio Turnover Rate | 135% |
| Total Advisory Fees Paid | $11,583,263 |
| Corporate Bonds | 34.47% |
| Government Bonds | 34.08% |
| Mortgage-Backed Securities | 14.23% |
| Collateralized Mortgage Obligations | 8.51% |
| Bank Loans | 2.08% |
| Commercial Mortgage-Backed Securities | 1.71% |
| Preferred Stock | 2.56% |
| Cash, Cash Equivalents, & Other Net Assets | 2.36% |

| U.S. Treasury Bond 3.875% 08/15/2034 | 4.64% |
| U.S. Treasury Note 3.75% 08/31/2026 | 4.40% |
| U.S. Treasury Bond 4.125% 08/15/2044 | 3.55% |
| U.S. Treasury Bond 4.25% 08/15/2054 | 3.04% |
| U.S. Treasury Bond 4.625% 05/15/2044 | 2.62% |
| U.S. Treasury Bond 4.625% 05/15/2054 | 2.60% |
| U.S. Treasury Note 3.50% 09/30/2026 | 2.47% |
| U.S. Treasury Note 4.875% 05/31/2026 | 2.25% |
| U.S. Treasury Note 4.125% 10/31/2029 | 1.98% |
| U.S. Treasury Note 3.50% 09/30/2029 | 1.71% |
| Sovereign | 34.52% |
| Mortgage Securities | 24.45% |
| Banks | 5.89% |
| Aerospace/Defense | 3.77% |
| Oil & Gas | 3.12% |
| Pipelines | 3.09% |
| Food | 2.38% |
| Diversified Finan Serv | 2.02% |
| Media | 1.92% |
| Auto Manufacturers | 1.78% |
| Biotechnology | 1.52% |
| Healthcare-Products | 1.30% |
| Other Industries (each less than 1%) | 11.88% |
| Cash, Cash Equivalents, & Other Net Assets | 2.36% |
| |
** | As a percentage of net assets. |
Holdings are subject to change
If you wish to view additional information about the Fund, including but not limited to the Fund's prospectus, financial information, holdings, and proxy voting information, please visit https://www.alpsfunds.com/mutual-funds/smthx.
If you have consented to receive a single annual or semi-annual shareholder report at a shared address you may revoke this consent by calling the Transfer Agent 866-759-5679.
ALPS | Smith Total Return Bond Fund - Class A | FINANCIAL INVESTORS TRUST |
SMAMX | |
This annual shareholder report contains important information about ALPS | Smith Total Return Bond Fund (the "Fund" or "SMAMX") for the period of November 1, 2023 to October 31, 2024 (the "Period"). You can find additional information about the Fund at https://www.alpsfunds.com/mutual-funds/smthx. You can also request this information by contacting us at 866-759-5679.
The ALPS | Smith Total Return Bond Fund returned 11.64% for Class A shares at net asset value (NAV) for the 12 months ended October 31, 2024. The Fund outperformed the Bloomberg US Aggregate Bond Index, which returned 10.55%.
Top contributors to relative performance
Asset allocation, specifically an overweight position in corporate credit—generically including investment grade, high yield, and preferred securities—benefited from tightening risk asset spreads throughout the period.
Security selection across investment grade and high yield credit allocations.
Active portfolio duration positioning throughout market yield fluctuations, during the period. Duration position generally moved higher during relatively higher interest rates and vice versa.
Top detractors from relative performance
Yield curve positioning with U.S. Treasuries, with an overweight to the short and long duration areas of the market and a relative underweight to the belly of the yield curve, which outperformed.
Agency mortgage security selection, with a relative underweight to low-coupon mortgage-backed securities, which outperformed during the period.
Allocations to longer duration AA and A-rated corporates, which underperformed compared to the broader investment grade corporate universe.
The Fund's past performance is not a good predictor of the Fund's future performance. The chart and the table below do not reflect the deduction of taxes that a shareholder would pay on Fund distributions or sale of Fund shares.
| 06/29/2018 | 9452 | 10000 |
| 06/30/2018 | 9452 | 10000 |
| 07/31/2018 | 9518 | 10002 |
| 08/31/2018 | 9606 | 10067 |
| 09/30/2018 | 9587 | 10002 |
| 10/31/2018 | 9550 | 9923 |
| 11/30/2018 | 9589 | 9982 |
| 12/31/2018 | 9760 | 10166 |
| 01/31/2019 | 9876 | 10273 |
| 02/28/2019 | 9916 | 10268 |
| 03/31/2019 | 10101 | 10465 |
| 04/30/2019 | 10132 | 10467 |
| 05/31/2019 | 10287 | 10653 |
| 06/30/2019 | 10399 | 10787 |
| 07/31/2019 | 10436 | 10811 |
| 08/31/2019 | 10693 | 11091 |
| 09/30/2019 | 10651 | 11032 |
| 10/31/2019 | 10676 | 11065 |
| 11/30/2019 | 10671 | 11059 |
| 12/31/2019 | 10673 | 11052 |
| 01/31/2020 | 10853 | 11264 |
| 02/29/2020 | 11016 | 11467 |
| 03/31/2020 | 10676 | 11400 |
| 04/30/2020 | 11014 | 11602 |
| 05/31/2020 | 11148 | 11656 |
| 06/30/2020 | 11284 | 11730 |
| 07/31/2020 | 11570 | 11905 |
| 08/31/2020 | 11497 | 11809 |
| 09/30/2020 | 11473 | 11802 |
| 10/31/2020 | 11419 | 11750 |
| 11/30/2020 | 11624 | 11865 |
| 12/31/2020 | 11682 | 11881 |
| 01/31/2021 | 11595 | 11796 |
| 02/28/2021 | 11466 | 11626 |
| 03/31/2021 | 11361 | 11481 |
| 04/30/2021 | 11446 | 11571 |
| 05/31/2021 | 11484 | 11609 |
| 06/30/2021 | 11580 | 11691 |
| 07/31/2021 | 11687 | 11821 |
| 08/31/2021 | 11673 | 11799 |
| 09/30/2021 | 11586 | 11697 |
| 10/31/2021 | 11564 | 11693 |
| 11/30/2021 | 11563 | 11728 |
| 12/31/2021 | 11570 | 11698 |
| 01/31/2022 | 11316 | 11446 |
| 02/28/2022 | 11184 | 11318 |
| 03/31/2022 | 10932 | 11004 |
| 04/30/2022 | 10580 | 10586 |
| 05/31/2022 | 10594 | 10654 |
| 06/30/2022 | 10363 | 10487 |
| 07/31/2022 | 10629 | 10744 |
| 08/31/2022 | 10379 | 10440 |
| 09/30/2022 | 9991 | 9989 |
| 10/31/2022 | 9872 | 9860 |
| 11/30/2022 | 10182 | 10222 |
| 12/31/2022 | 10135 | 10176 |
| 01/31/2023 | 10484 | 10489 |
| 02/28/2023 | 10263 | 10218 |
| 03/31/2023 | 10411 | 10477 |
| 04/30/2023 | 10474 | 10541 |
| 05/31/2023 | 10368 | 10426 |
| 06/30/2023 | 10381 | 10389 |
| 07/31/2023 | 10385 | 10382 |
| 08/31/2023 | 10333 | 10316 |
| 09/30/2023 | 10075 | 10053 |
| 10/31/2023 | 9883 | 9895 |
| 11/30/2023 | 10346 | 10343 |
| 12/31/2023 | 10745 | 10739 |
| 01/31/2024 | 10737 | 10709 |
| 02/29/2024 | 10631 | 10558 |
| 03/31/2024 | 10726 | 10655 |
| 04/30/2024 | 10486 | 10386 |
| 05/31/2024 | 10660 | 10562 |
| 06/30/2024 | 10744 | 10662 |
| 07/31/2024 | 10975 | 10911 |
| 08/31/2024 | 11116 | 11068 |
| 09/30/2024 | 11267 | 11216 |
| 10/31/2024 | 11033 | 10938 |

| ALPS | Smith Total Return Bond Fund - A - NAV | 11.64% | 0.66% | 2.47% |
| ALPS | Smith Total Return Bond Fund - A - Maximum sales charge (load)*^ | 9.10% | -0.47% | 1.56% |
| Bloomberg US AggregateBond Index# | 10.55% | -0.23% | 1.42% |
For the most current month-end performance data, please call 1-866-759-5679.
| Net Assets | $3,251,025,895 |
| Number of Portfolio Holdings | 1,640 |
| Portfolio Turnover Rate | 135% |
| Total Advisory Fees Paid | $11,583,263 |
| Corporate Bonds | 34.47% |
| Government Bonds | 34.08% |
| Mortgage-Backed Securities | 14.23% |
| Collateralized Mortgage Obligations | 8.51% |
| Bank Loans | 2.08% |
| Commercial Mortgage-Backed Securities | 1.71% |
| Preferred Stock | 2.56% |
| Cash, Cash Equivalents, & Other Net Assets | 2.36% |

| U.S. Treasury Bond 3.875% 08/15/2034 | 4.64% |
| U.S. Treasury Note 3.75% 08/31/2026 | 4.40% |
| U.S. Treasury Bond 4.125% 08/15/2044 | 3.55% |
| U.S. Treasury Bond 4.25% 08/15/2054 | 3.04% |
| U.S. Treasury Bond 4.625% 05/15/2044 | 2.62% |
| U.S. Treasury Bond 4.625% 05/15/2054 | 2.60% |
| U.S. Treasury Note 3.50% 09/30/2026 | 2.47% |
| U.S. Treasury Note 4.875% 05/31/2026 | 2.25% |
| U.S. Treasury Note 4.125% 10/31/2029 | 1.98% |
| U.S. Treasury Note 3.50% 09/30/2029 | 1.71% |
| Sovereign | 34.52% |
| Mortgage Securities | 24.45% |
| Banks | 5.89% |
| Aerospace/Defense | 3.77% |
| Oil & Gas | 3.12% |
| Pipelines | 3.09% |
| Food | 2.38% |
| Diversified Finan Serv | 2.02% |
| Media | 1.92% |
| Auto Manufacturers | 1.78% |
| Biotechnology | 1.52% |
| Healthcare-Products | 1.30% |
| Other Industries (each less than 1%) | 11.88% |
| Cash, Cash Equivalents, & Other Net Assets | 2.36% |
| |
** | As a percentage of net assets. |
Holdings are subject to change
If you wish to view additional information about the Fund, including but not limited to the Fund's prospectus, financial information, holdings, and proxy voting information, please visit https://www.alpsfunds.com/mutual-funds/smthx.
If you have consented to receive a single annual or semi-annual shareholder report at a shared address you may revoke this consent by calling the Transfer Agent 866-759-5679.
ALPS | Smith Total Return Bond Fund - Class C | FINANCIAL INVESTORS TRUST |
SMCHX | |
This annual shareholder report contains important information about ALPS | Smith Total Return Bond Fund (the "Fund" or "SMCHX") for the period of November 1, 2023 to October 31, 2024 (the "Period"). You can find additional information about the Fund at https://www.alpsfunds.com/mutual-funds/smthx. You can also request this information by contacting us at 866-759-5679.
The ALPS | Smith Total Return Bond Fund returned 10.87% for Class C shares at net asset value (NAV) for the 12 months ended October 31, 2024. The Fund outperformed the Bloomberg US Aggregate Bond Index, which returned 10.55%.
Top contributors to relative performance
Asset allocation, specifically an overweight position in corporate credit—generically including investment grade, high yield, and preferred securities—benefited from tightening risk asset spreads throughout the period.
Security selection across investment grade and high yield credit allocations.
Active portfolio duration positioning throughout market yield fluctuations, during the period. Duration position generally moved higher during relatively higher interest rates and vice versa.
Top detractors from relative performance
Yield curve positioning with U.S. Treasuries, with an overweight to the short and long duration areas of the market and a relative underweight to the belly of the yield curve, which outperformed.
Agency mortgage security selection, with a relative underweight to low-coupon mortgage-backed securities, which outperformed during the period.
Allocations to longer duration AA and A-rated corporates, which underperformed compared to the broader investment grade corporate universe.
The Fund's past performance is not a good predictor of the Fund's future performance. The chart and the table below do not reflect the deduction of taxes that a shareholder would pay on Fund distributions or sale of Fund shares.
| 06/29/2018 | 10000 | 10000 |
| 06/30/2018 | 10000 | 10000 |
| 07/31/2018 | 10060 | 10002 |
| 08/31/2018 | 10149 | 10067 |
| 09/30/2018 | 10124 | 10002 |
| 10/31/2018 | 10079 | 9923 |
| 11/30/2018 | 10116 | 9982 |
| 12/31/2018 | 10291 | 10166 |
| 01/31/2019 | 10407 | 10273 |
| 02/28/2019 | 10441 | 10268 |
| 03/31/2019 | 10640 | 10465 |
| 04/30/2019 | 10656 | 10467 |
| 05/31/2019 | 10813 | 10653 |
| 06/30/2019 | 10927 | 10787 |
| 07/31/2019 | 10958 | 10811 |
| 08/31/2019 | 11226 | 11091 |
| 09/30/2019 | 11176 | 11032 |
| 10/31/2019 | 11186 | 11065 |
| 11/30/2019 | 11184 | 11059 |
| 12/31/2019 | 11170 | 11052 |
| 01/31/2020 | 11352 | 11264 |
| 02/29/2020 | 11517 | 11467 |
| 03/31/2020 | 11164 | 11400 |
| 04/30/2020 | 11502 | 11602 |
| 05/31/2020 | 11634 | 11656 |
| 06/30/2020 | 11770 | 11730 |
| 07/31/2020 | 12062 | 11905 |
| 08/31/2020 | 11979 | 11809 |
| 09/30/2020 | 11946 | 11802 |
| 10/31/2020 | 11883 | 11750 |
| 11/30/2020 | 12079 | 11865 |
| 12/31/2020 | 12133 | 11881 |
| 01/31/2021 | 12046 | 11796 |
| 02/28/2021 | 11895 | 11626 |
| 03/31/2021 | 11788 | 11481 |
| 04/30/2021 | 11870 | 11571 |
| 05/31/2021 | 11901 | 11609 |
| 06/30/2021 | 11994 | 11691 |
| 07/31/2021 | 12087 | 11821 |
| 08/31/2021 | 12065 | 11799 |
| 09/30/2021 | 11967 | 11697 |
| 10/31/2021 | 11948 | 11693 |
| 11/30/2021 | 11940 | 11728 |
| 12/31/2021 | 11941 | 11698 |
| 01/31/2022 | 11671 | 11446 |
| 02/28/2022 | 11518 | 11318 |
| 03/31/2022 | 11262 | 11004 |
| 04/30/2022 | 10881 | 10586 |
| 05/31/2022 | 10898 | 10654 |
| 06/30/2022 | 10654 | 10487 |
| 07/31/2022 | 10922 | 10744 |
| 08/31/2022 | 10658 | 10440 |
| 09/30/2022 | 10251 | 9989 |
| 10/31/2022 | 10113 | 9860 |
| 11/30/2022 | 10436 | 10222 |
| 12/31/2022 | 10381 | 10176 |
| 01/31/2023 | 10733 | 10489 |
| 02/28/2023 | 10501 | 10218 |
| 03/31/2023 | 10646 | 10477 |
| 04/30/2023 | 10705 | 10541 |
| 05/31/2023 | 10590 | 10426 |
| 06/30/2023 | 10597 | 10389 |
| 07/31/2023 | 10583 | 10382 |
| 08/31/2023 | 10535 | 10316 |
| 09/30/2023 | 10254 | 10053 |
| 10/31/2023 | 10063 | 9895 |
| 11/30/2023 | 10530 | 10343 |
| 12/31/2023 | 10920 | 10739 |
| 01/31/2024 | 10916 | 10709 |
| 02/29/2024 | 10804 | 10558 |
| 03/31/2024 | 10891 | 10655 |
| 04/30/2024 | 10640 | 10386 |
| 05/31/2024 | 10811 | 10562 |
| 06/30/2024 | 10890 | 10662 |
| 07/31/2024 | 11118 | 10911 |
| 08/31/2024 | 11254 | 11068 |
| 09/30/2024 | 11389 | 11216 |
| 10/31/2024 | 11156 | 10938 |

| ALPS | Smith Total Return Bond Fund - C - NAV | 10.87% | -0.05% | 1.74% |
| ALPS | Smith Total Return Bond Fund - C - Maximim deferred sales charge** | 9.87% | -0.05% | 1.74% |
| Bloomberg US AggregateBond Index# | 10.55% | -0.23% | 1.42% |
For the most current month-end performance data, please call 1-866-759-5679.
| Net Assets | $3,251,025,895 |
| Number of Portfolio Holdings | 1,640 |
| Portfolio Turnover Rate | 135% |
| Total Advisory Fees Paid | $11,583,263 |
| Corporate Bonds | 34.47% |
| Government Bonds | 34.08% |
| Mortgage-Backed Securities | 14.23% |
| Collateralized Mortgage Obligations | 8.51% |
| Bank Loans | 2.08% |
| Commercial Mortgage-Backed Securities | 1.71% |
| Preferred Stock | 2.56% |
| Cash, Cash Equivalents, & Other Net Assets | 2.36% |

| U.S. Treasury Bond 3.875% 08/15/2034 | 4.64% |
| U.S. Treasury Note 3.75% 08/31/2026 | 4.40% |
| U.S. Treasury Bond 4.125% 08/15/2044 | 3.55% |
| U.S. Treasury Bond 4.25% 08/15/2054 | 3.04% |
| U.S. Treasury Bond 4.625% 05/15/2044 | 2.62% |
| U.S. Treasury Bond 4.625% 05/15/2054 | 2.60% |
| U.S. Treasury Note 3.50% 09/30/2026 | 2.47% |
| U.S. Treasury Note 4.875% 05/31/2026 | 2.25% |
| U.S. Treasury Note 4.125% 10/31/2029 | 1.98% |
| U.S. Treasury Note 3.50% 09/30/2029 | 1.71% |
| Sovereign | 34.52% |
| Mortgage Securities | 24.45% |
| Banks | 5.89% |
| Aerospace/Defense | 3.77% |
| Oil & Gas | 3.12% |
| Pipelines | 3.09% |
| Food | 2.38% |
| Diversified Finan Serv | 2.02% |
| Media | 1.92% |
| Auto Manufacturers | 1.78% |
| Biotechnology | 1.52% |
| Healthcare-Products | 1.30% |
| Other Industries (each less than 1%) | 11.88% |
| Cash, Cash Equivalents, & Other Net Assets | 2.36% |
| |
** | As a percentage of net assets. |
Holdings are subject to change
If you wish to view additional information about the Fund, including but not limited to the Fund's prospectus, financial information, holdings, and proxy voting information, please visit https://www.alpsfunds.com/mutual-funds/smthx.
If you have consented to receive a single annual or semi-annual shareholder report at a shared address you may revoke this consent by calling the Transfer Agent 866-759-5679.
ALPS | Smith Total Return Bond Fund - Class I | FINANCIAL INVESTORS TRUST |
SMTHX | |
This annual shareholder report contains important information about ALPS | Smith Total Return Bond Fund (the "Fund" or "SMTHX") for the period of November 1, 2023 to October 31, 2024 (the "Period"). You can find additional information about the Fund at https://www.alpsfunds.com/mutual-funds/smthx. You can also request this information by contacting us at 866-759-5679.
The ALPS | Smith Total Return Bond Fund returned 11.97% for Class I shares at net asset value (NAV) for the 12 months ended October 31, 2024. The Fund outperformed the Bloomberg US Aggregate Bond Index, which returned 10.55%.
Top contributors to relative performance
Asset allocation, specifically an overweight position in corporate credit—generically including investment grade, high yield, and preferred securities—benefited from tightening risk asset spreads throughout the period.
Security selection across investment grade and high yield credit allocations.
Active portfolio duration positioning throughout market yield fluctuations, during the period. Duration position generally moved higher during relatively higher interest rates and vice versa.
Top detractors from relative performance
Yield curve positioning with U.S. Treasuries, with an overweight to the short and long duration areas of the market and a relative underweight to the belly of the yield curve, which outperformed.
Agency mortgage security selection, with a relative underweight to low-coupon mortgage-backed securities, which outperformed during the period.
Allocations to longer duration AA and A-rated corporates, which underperformed compared to the broader investment grade corporate universe.
The Fund's past performance is not a good predictor of the Fund's future performance. The chart and the table below do not reflect the deduction of taxes that a shareholder would pay on Fund distributions or sale of Fund shares.
| 06/29/2018 | 100000 | 100000 |
| 06/30/2018 | 100000 | 100000 |
| 07/31/2018 | 100700 | 100024 |
| 08/31/2018 | 101626 | 100668 |
| 09/30/2018 | 101453 | 100019 |
| 10/31/2018 | 101088 | 99229 |
| 11/30/2018 | 101541 | 99821 |
| 12/31/2018 | 103368 | 101655 |
| 01/31/2019 | 104626 | 102735 |
| 02/28/2019 | 105049 | 102675 |
| 03/31/2019 | 107142 | 104647 |
| 04/30/2019 | 107385 | 104673 |
| 05/31/2019 | 109154 | 106532 |
| 06/30/2019 | 110270 | 107869 |
| 07/31/2019 | 110681 | 108107 |
| 08/31/2019 | 113547 | 110908 |
| 09/30/2019 | 113112 | 110317 |
| 10/31/2019 | 113410 | 110650 |
| 11/30/2019 | 113382 | 110593 |
| 12/31/2019 | 113434 | 110516 |
| 01/31/2020 | 115375 | 112643 |
| 02/29/2020 | 117135 | 114671 |
| 03/31/2020 | 113548 | 113996 |
| 04/30/2020 | 117069 | 116022 |
| 05/31/2020 | 118514 | 116562 |
| 06/30/2020 | 119995 | 117297 |
| 07/31/2020 | 123063 | 119049 |
| 08/31/2020 | 122422 | 118087 |
| 09/30/2020 | 122084 | 118023 |
| 10/31/2020 | 121643 | 117496 |
| 11/30/2020 | 123750 | 118649 |
| 12/31/2020 | 124401 | 118812 |
| 01/31/2021 | 123620 | 117960 |
| 02/28/2021 | 122163 | 116257 |
| 03/31/2021 | 121065 | 114805 |
| 04/30/2021 | 122115 | 115712 |
| 05/31/2021 | 122429 | 116090 |
| 06/30/2021 | 123485 | 116906 |
| 07/31/2021 | 124658 | 118213 |
| 08/31/2021 | 124538 | 117988 |
| 09/30/2021 | 123630 | 116966 |
| 10/31/2021 | 123426 | 116934 |
| 11/30/2021 | 123446 | 117280 |
| 12/31/2021 | 123564 | 116980 |
| 01/31/2022 | 120875 | 114460 |
| 02/28/2022 | 119494 | 113183 |
| 03/31/2022 | 116832 | 110038 |
| 04/30/2022 | 113090 | 105863 |
| 05/31/2022 | 113254 | 106545 |
| 06/30/2022 | 110814 | 104874 |
| 07/31/2022 | 113692 | 107436 |
| 08/31/2022 | 111036 | 104401 |
| 09/30/2022 | 106895 | 99890 |
| 10/31/2022 | 105656 | 98596 |
| 11/30/2022 | 109000 | 102222 |
| 12/31/2022 | 108524 | 101761 |
| 01/31/2023 | 112288 | 104892 |
| 02/28/2023 | 109947 | 102180 |
| 03/31/2023 | 111674 | 104775 |
| 04/30/2023 | 112383 | 105410 |
| 05/31/2023 | 111155 | 104262 |
| 06/30/2023 | 111325 | 103890 |
| 07/31/2023 | 111389 | 103818 |
| 08/31/2023 | 110858 | 103155 |
| 09/30/2023 | 108117 | 100533 |
| 10/31/2023 | 106074 | 98947 |
| 11/30/2023 | 111201 | 103428 |
| 12/31/2023 | 115404 | 107387 |
| 01/31/2024 | 115351 | 107092 |
| 02/29/2024 | 114231 | 105579 |
| 03/31/2024 | 115269 | 106554 |
| 04/30/2024 | 112716 | 103862 |
| 05/31/2024 | 114620 | 105623 |
| 06/30/2024 | 115668 | 106624 |
| 07/31/2024 | 118191 | 109114 |
| 08/31/2024 | 119611 | 110682 |
| 09/30/2024 | 121264 | 112164 |
| 10/31/2024 | 118772 | 109382 |
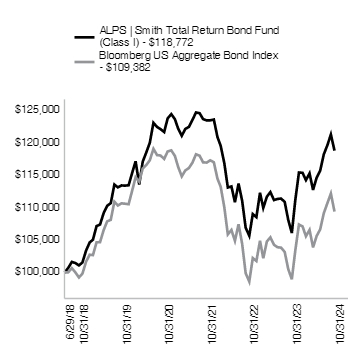
| ALPS | Smith Total Return Bond Fund - I - NAV | 11.97% | 0.93% | 2.75% |
| Bloomberg US AggregateBond Index# | 10.55% | -0.23% | 1.42% |
For the most current month-end performance data, please call 1-866-759-5679.
| Net Assets | $3,251,025,895 |
| Number of Portfolio Holdings | 1,640 |
| Portfolio Turnover Rate | 135% |
| Total Advisory Fees Paid | $11,583,263 |
| Corporate Bonds | 34.47% |
| Government Bonds | 34.08% |
| Mortgage-Backed Securities | 14.23% |
| Collateralized Mortgage Obligations | 8.51% |
| Bank Loans | 2.08% |
| Commercial Mortgage-Backed Securities | 1.71% |
| Preferred Stock | 2.56% |
| Cash, Cash Equivalents, & Other Net Assets | 2.36% |
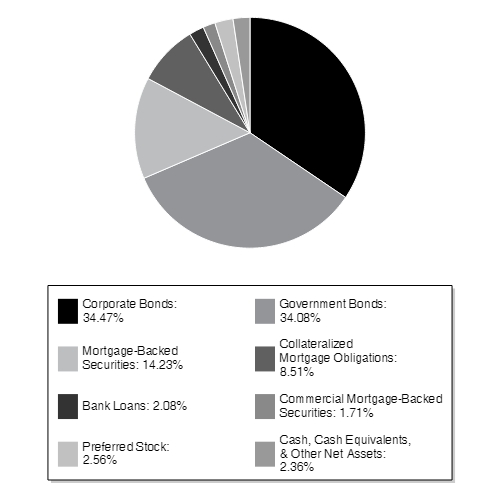
| U.S. Treasury Bond 3.875% 08/15/2034 | 4.64% |
| U.S. Treasury Note 3.75% 08/31/2026 | 4.40% |
| U.S. Treasury Bond 4.125% 08/15/2044 | 3.55% |
| U.S. Treasury Bond 4.25% 08/15/2054 | 3.04% |
| U.S. Treasury Bond 4.625% 05/15/2044 | 2.62% |
| U.S. Treasury Bond 4.625% 05/15/2054 | 2.60% |
| U.S. Treasury Note 3.50% 09/30/2026 | 2.47% |
| U.S. Treasury Note 4.875% 05/31/2026 | 2.25% |
| U.S. Treasury Note 4.125% 10/31/2029 | 1.98% |
| U.S. Treasury Note 3.50% 09/30/2029 | 1.71% |
| Sovereign | 34.52% |
| Mortgage Securities | 24.45% |
| Banks | 5.89% |
| Aerospace/Defense | 3.77% |
| Oil & Gas | 3.12% |
| Pipelines | 3.09% |
| Food | 2.38% |
| Diversified Finan Serv | 2.02% |
| Media | 1.92% |
| Auto Manufacturers | 1.78% |
| Biotechnology | 1.52% |
| Healthcare-Products | 1.30% |
| Other Industries (each less than 1%) | 11.88% |
| Cash, Cash Equivalents, & Other Net Assets | 2.36% |
| |
** | As a percentage of net assets. |
Holdings are subject to change
If you wish to view additional information about the Fund, including but not limited to the Fund's prospectus, financial information, holdings, and proxy voting information, please visit https://www.alpsfunds.com/mutual-funds/smthx.
If you have consented to receive a single annual or semi-annual shareholder report at a shared address you may revoke this consent by calling the Transfer Agent 866-759-5679.
ALPS | Smith Credit Opportunities Fund - Investor Class | FINANCIAL INVESTORS TRUST |
SMCVX | |
This annual shareholder report contains important information about ALPS | Smith Credit Opportunities Fund (the "Fund" or "SMCVX") for the period of November 1, 2023 to October 31, 2024 (the "Period"). You can find additional information about the Fund at https://www.alpsfunds.com/mutual-funds/smcrx. You can also request this information by contacting us at 866-759-5679.
The ALPS | Smith Credit Opportunities Fund returned 14.78% for Investor Class shares at net asset value (NAV) for the 12 months ended October 31, 2024. The Fund outperformed the blended benchmark of 50% Bloomberg U.S. Aggregate Bond Index and 50% Bloomberg U.S. Corporate HY Bond Index, which returned 13.49%.
Top contributors to relative performance
Asset allocation across investment grade, high yield, and preferred corporate securities, all of which benefited from tightening risk asset spreads over the period.
Corporate credit security selection.
Top detractors from relative performance
Yield curve positioning with U.S. Treasuries.
Agency mortgage security selection, with a relative underweight to low coupon MBS, which outperformed during the period.
An underweight to the lowest quality sections of the high yield market, where during the period, these bands saw outsized risk compression.
The Fund's past performance is not a good predictor of the Fund's future performance. The chart and the table below do not reflect the deduction of taxes that a shareholder would pay on Fund distributions or sale of Fund shares.
| 09/15/2020 | 10000 | 10000 | 10000 | 10000 |
| 09/30/2020 | 9940 | 9951 | 9980 | 9921 |
| 10/31/2020 | 9977 | 9954 | 9935 | 9972 |
| 11/30/2020 | 10307 | 10199 | 10033 | 10366 |
| 12/31/2020 | 10480 | 10302 | 10047 | 10561 |
| 01/31/2021 | 10478 | 10283 | 9975 | 10596 |
| 02/28/2021 | 10451 | 10227 | 9831 | 10635 |
| 03/31/2021 | 10415 | 10171 | 9708 | 10651 |
| 04/30/2021 | 10546 | 10266 | 9785 | 10767 |
| 05/31/2021 | 10591 | 10298 | 9817 | 10799 |
| 06/30/2021 | 10701 | 10404 | 9886 | 10943 |
| 07/31/2021 | 10765 | 10482 | 9996 | 10985 |
| 08/31/2021 | 10789 | 10498 | 9977 | 11041 |
| 09/30/2021 | 10758 | 10452 | 9891 | 11040 |
| 10/31/2021 | 10738 | 10442 | 9888 | 11021 |
| 11/30/2021 | 10659 | 10407 | 9917 | 10914 |
| 12/31/2021 | 10796 | 10491 | 9892 | 11119 |
| 01/31/2022 | 10524 | 10235 | 9679 | 10815 |
| 02/28/2022 | 10374 | 10125 | 9571 | 10704 |
| 03/31/2022 | 10231 | 9926 | 9305 | 10581 |
| 04/30/2022 | 9875 | 9561 | 8952 | 10205 |
| 05/31/2022 | 9883 | 9604 | 9009 | 10230 |
| 06/30/2022 | 9383 | 9205 | 8868 | 9541 |
| 07/31/2022 | 9774 | 9589 | 9085 | 10104 |
| 08/31/2022 | 9616 | 9343 | 8828 | 9871 |
| 09/30/2022 | 9272 | 8956 | 8447 | 9479 |
| 10/31/2022 | 9419 | 9014 | 8337 | 9726 |
| 11/30/2022 | 9593 | 9278 | 8644 | 9937 |
| 12/31/2022 | 9561 | 9228 | 8605 | 9875 |
| 01/31/2023 | 9908 | 9546 | 8870 | 10251 |
| 02/28/2023 | 9722 | 9361 | 8640 | 10119 |
| 03/31/2023 | 9681 | 9530 | 8860 | 10227 |
| 04/30/2023 | 9740 | 9606 | 8914 | 10329 |
| 05/31/2023 | 9650 | 9510 | 8816 | 10234 |
| 06/30/2023 | 9735 | 9573 | 8785 | 10406 |
| 07/31/2023 | 9865 | 9635 | 8779 | 10549 |
| 08/31/2023 | 9843 | 9618 | 8723 | 10579 |
| 09/30/2023 | 9686 | 9439 | 8501 | 10453 |
| 10/31/2023 | 9541 | 9309 | 8367 | 10332 |
| 11/30/2023 | 10012 | 9731 | 8746 | 10800 |
| 12/31/2023 | 10352 | 10099 | 9081 | 11202 |
| 01/31/2024 | 10464 | 10085 | 9056 | 11202 |
| 02/29/2024 | 10414 | 10028 | 8928 | 11235 |
| 03/31/2024 | 10543 | 10134 | 9010 | 11368 |
| 04/30/2024 | 10398 | 9958 | 8783 | 11261 |
| 05/31/2024 | 10529 | 10097 | 8932 | 11384 |
| 06/30/2024 | 10599 | 10193 | 9016 | 11492 |
| 07/31/2024 | 10800 | 10411 | 9227 | 11715 |
| 08/31/2024 | 10924 | 10571 | 9359 | 11906 |
| 09/30/2024 | 11051 | 10727 | 9485 | 12099 |
| 10/31/2024 | 10951 | 10565 | 9249 | 12034 |
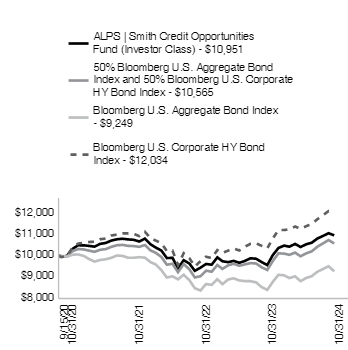
| ALPS | Smith Credit Opportunities Fund - Investor - NAV* | 14.78% | 2.23% |
| 50% Bloomberg U.S. Aggregate Bond Index and 50% Bloomberg U.S. Corporate HY Bond Index | 13.49% | 1.34% |
| Bloomberg U.S. Aggregate Bond Index# | 10.55% | -1.87% |
| Bloomberg U.S. Corporate HY Bond Index | 16.47% | 4.59% |
For the most current month-end performance data, please call 1-866-759-5679.
| Net Assets | $210,517,517 |
| Number of Portfolio Holdings | 325 |
| Portfolio Turnover Rate | 181% |
| Total Advisory Fees Paid | $1,468,024 |
| Corporate Bonds | 74.02% |
| Bank Loans | 8.54% |
| Government Bonds | 4.14% |
| Collateralized Mortgage Obligations | 3.67% |
| Mortgage-Backed Securities | 1.73% |
| Preferred Stock | 3.40% |
| Commercial Mortgage-Backed Securities | 1.34% |
| Cash, Cash Equivalents, & Other Net Assets | 3.16% |

| U.S. Treasury Bond 3.875% 08/15/2034 | 1.83% |
| U.S. Treasury Bond 4.25% 08/15/2054 | 1.48% |
| UBS Group AG 1D US SOFR + 3.92% 08/12/2033 | 1.32% |
| National Rural Utilities Cooperative Finance Corp. 3M US SOFR + 3.17% 04/30/2043 | 1.28% |
| Six Flags Entertainment Corp. 7.25% 05/15/2031 | 1.27% |
| Fortrea Holdings, Inc. 7.50% 07/01/2030 | 1.20% |
| Penn Entertainment, Inc. 5.63% 01/15/2027 | 1.16% |
| Chobani LLC 1M US SOFR + 3.75% 10/25/2027 | 1.14% |
| Discover Bank 5Y US TI + 1.73% 08/09/2028 | 1.13% |
| Kennedy-Wilson, Inc. 4.75% 02/01/2030 | 1.09% |
| Oil&Gas | 10.63% |
| Banks | 8.47% |
| Pipelines | 8.00% |
| Mortgage Securities | 6.73% |
| Media | 5.03% |
| Entertainment | 4.79% |
| Sovereign | 4.14% |
| Aerospace/Defense | 3.87% |
| Leisure Time | 3.74% |
| Diversified Finan Serv | 2.99% |
| Commercial Services | 2.92% |
| Healthcare-Services | 2.83% |
| Airlines | 2.83% |
| Auto Manufacturers | 2.61% |
| Food | 2.50% |
| Retail | 2.48% |
| Electric | 1.90% |
| Real Estate | 1.87% |
| Advertising | 1.55% |
| Software | 1.53% |
| Pharmaceuticals | 1.52% |
| Environmental Control | 1.47% |
| Home Builders | 1.40% |
| Apparel | 1.35% |
| Healthcare-Products | 1.21% |
| Food - Dairy Products | 1.14% |
| Other Industries (each less than 1%) | 7.34% |
| Cash, Cash Equivalents, & Other Net Assets | 3.16% |
| |
** | As a percentage of net assets. |
Holdings are subject to change
If you wish to view additional information about the Fund, including but not limited to the Fund's prospectus, financial information, holdings, and proxy voting information, please visit https://www.alpsfunds.com/mutual-funds/smcrx.
If you have consented to receive a single annual or semi-annual shareholder report at a shared address you may revoke this consent by calling the Transfer Agent 866-759-5679.
ALPS | Smith Credit Opportunities Fund - Class A | FINANCIAL INVESTORS TRUST |
SMCAX | |
This annual shareholder report contains important information about ALPS | Smith Credit Opportunities Fund (the "Fund" or "SMCAX") for the period of November 1, 2023 to October 31, 2024 (the "Period"). You can find additional information about the Fund at https://www.alpsfunds.com/mutual-funds/smcrx. You can also request this information by contacting us at 866-759-5679.
The ALPS | Smith Credit Opportunities Fund returned 14.04% for Class A shares at net asset value (NAV) for the 12 months ended October 31, 2024. The Fund outperformed the blended benchmark of 50% Bloomberg U.S. Aggregate Bond Index and 50% Bloomberg U.S. Corporate HY Bond Index, which returned 13.49%.
Top contributors to relative performance
Asset allocation across investment grade, high yield, and preferred corporate securities, all of which benefited from tightening risk asset spreads over the period.
Corporate credit security selection.
Top detractors from relative performance
Yield curve positioning with U.S. Treasuries.
Agency mortgage security selection, with a relative underweight to low coupon MBS, which outperformed during the period.
An underweight to the lowest quality sections of the high yield market, where during the period, these bands saw outsized risk compression.
The Fund's past performance is not a good predictor of the Fund's future performance. The chart and the table below do not reflect the deduction of taxes that a shareholder would pay on Fund distributions or sale of Fund shares.
| 09/15/2020 | 9775 | 10000 | 10000 | 10000 |
| 09/30/2020 | 9717 | 9951 | 9980 | 9921 |
| 10/31/2020 | 9753 | 9954 | 9935 | 9972 |
| 11/30/2020 | 10075 | 10199 | 10033 | 10366 |
| 12/31/2020 | 10245 | 10302 | 10047 | 10561 |
| 01/31/2021 | 10243 | 10283 | 9975 | 10596 |
| 02/28/2021 | 10217 | 10227 | 9831 | 10635 |
| 03/31/2021 | 10181 | 10171 | 9708 | 10651 |
| 04/30/2021 | 10309 | 10266 | 9785 | 10767 |
| 05/31/2021 | 10354 | 10298 | 9817 | 10799 |
| 06/30/2021 | 10462 | 10404 | 9886 | 10943 |
| 07/31/2021 | 10525 | 10482 | 9996 | 10985 |
| 08/31/2021 | 10549 | 10498 | 9977 | 11041 |
| 09/30/2021 | 10519 | 10452 | 9891 | 11040 |
| 10/31/2021 | 10499 | 10442 | 9888 | 11021 |
| 11/30/2021 | 10422 | 10407 | 9917 | 10914 |
| 12/31/2021 | 10566 | 10491 | 9892 | 11119 |
| 01/31/2022 | 10300 | 10235 | 9679 | 10815 |
| 02/28/2022 | 10143 | 10125 | 9571 | 10704 |
| 03/31/2022 | 10003 | 9926 | 9305 | 10581 |
| 04/30/2022 | 9656 | 9561 | 8952 | 10205 |
| 05/31/2022 | 9663 | 9604 | 9009 | 10230 |
| 06/30/2022 | 9175 | 9205 | 8868 | 9541 |
| 07/31/2022 | 9556 | 9589 | 9085 | 10104 |
| 08/31/2022 | 9402 | 9343 | 8828 | 9871 |
| 09/30/2022 | 9076 | 8956 | 8447 | 9479 |
| 10/31/2022 | 9221 | 9014 | 8337 | 9726 |
| 11/30/2022 | 9381 | 9278 | 8644 | 9937 |
| 12/31/2022 | 9351 | 9228 | 8605 | 9875 |
| 01/31/2023 | 9680 | 9546 | 8870 | 10251 |
| 02/28/2023 | 9508 | 9361 | 8640 | 10119 |
| 03/31/2023 | 9468 | 9530 | 8860 | 10227 |
| 04/30/2023 | 9526 | 9606 | 8914 | 10329 |
| 05/31/2023 | 9436 | 9510 | 8816 | 10234 |
| 06/30/2023 | 9519 | 9573 | 8785 | 10406 |
| 07/31/2023 | 9646 | 9635 | 8779 | 10549 |
| 08/31/2023 | 9624 | 9618 | 8723 | 10579 |
| 09/30/2023 | 9470 | 9439 | 8501 | 10453 |
| 10/31/2023 | 9339 | 9309 | 8367 | 10332 |
| 11/30/2023 | 9788 | 9731 | 8746 | 10800 |
| 12/31/2023 | 10120 | 10099 | 9081 | 11202 |
| 01/31/2024 | 10174 | 10085 | 9056 | 11202 |
| 02/29/2024 | 10125 | 10028 | 8928 | 11235 |
| 03/31/2024 | 10251 | 10134 | 9010 | 11368 |
| 04/30/2024 | 10109 | 9958 | 8783 | 11261 |
| 05/31/2024 | 10249 | 10097 | 8932 | 11384 |
| 06/30/2024 | 10303 | 10193 | 9016 | 11492 |
| 07/31/2024 | 10490 | 10411 | 9227 | 11715 |
| 08/31/2024 | 10624 | 10571 | 9359 | 11906 |
| 09/30/2024 | 10736 | 10727 | 9485 | 12099 |
| 10/31/2024 | 10650 | 10565 | 9249 | 12034 |
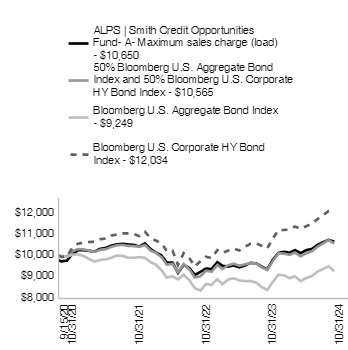
| ALPS | Smith Credit Opportunities Fund - A - NAV | 14.04% | 2.10% |
| ALPS | Smith Credit Opportunities Fund - A - Maximum sales charge (load)*^ | 11.42% | 1.54% |
| 50% Bloomberg U.S. Aggregate Bond Index and 50% Bloomberg U.S. Corporate HY Bond Index | 13.49% | 1.34% |
| Bloomberg U.S. Aggregate Bond Index# | 10.55% | -1.87% |
| Bloomberg U.S. Corporate HY Bond Index | 16.47% | 4.59% |
For the most current month-end performance data, please call 1-866-759-5679.
| Net Assets | $210,517,517 |
| Number of Portfolio Holdings | 325 |
| Portfolio Turnover Rate | 181% |
| Total Advisory Fees Paid | $1,468,024 |
| Corporate Bonds | 74.02% |
| Bank Loans | 8.54% |
| Government Bonds | 4.14% |
| Collateralized Mortgage Obligations | 3.67% |
| Mortgage-Backed Securities | 1.73% |
| Preferred Stock | 3.40% |
| Commercial Mortgage-Backed Securities | 1.34% |
| Cash, Cash Equivalents, & Other Net Assets | 3.16% |

| U.S. Treasury Bond 3.875% 08/15/2034 | 1.83% |
| U.S. Treasury Bond 4.25% 08/15/2054 | 1.48% |
| UBS Group AG 1D US SOFR + 3.92% 08/12/2033 | 1.32% |
| National Rural Utilities Cooperative Finance Corp. 3M US SOFR + 3.17% 04/30/2043 | 1.28% |
| Six Flags Entertainment Corp. 7.25% 05/15/2031 | 1.27% |
| Fortrea Holdings, Inc. 7.50% 07/01/2030 | 1.20% |
| Penn Entertainment, Inc. 5.63% 01/15/2027 | 1.16% |
| Chobani LLC 1M US SOFR + 3.75% 10/25/2027 | 1.14% |
| Discover Bank 5Y US TI + 1.73% 08/09/2028 | 1.13% |
| Kennedy-Wilson, Inc. 4.75% 02/01/2030 | 1.09% |
| Oil&Gas | 10.63% |
| Banks | 8.47% |
| Pipelines | 8.00% |
| Mortgage Securities | 6.73% |
| Media | 5.03% |
| Entertainment | 4.79% |
| Sovereign | 4.14% |
| Aerospace/Defense | 3.87% |
| Leisure Time | 3.74% |
| Diversified Finan Serv | 2.99% |
| Commercial Services | 2.92% |
| Healthcare-Services | 2.83% |
| Airlines | 2.83% |
| Auto Manufacturers | 2.61% |
| Food | 2.50% |
| Retail | 2.48% |
| Electric | 1.90% |
| Real Estate | 1.87% |
| Advertising | 1.55% |
| Software | 1.53% |
| Pharmaceuticals | 1.52% |
| Environmental Control | 1.47% |
| Home Builders | 1.40% |
| Apparel | 1.35% |
| Healthcare-Products | 1.21% |
| Food - Dairy Products | 1.14% |
| Other Industries (each less than 1%) | 7.34% |
| Cash, Cash Equivalents, & Other Net Assets | 3.16% |
| |
** | As a percentage of net assets. |
Holdings are subject to change
If you wish to view additional information about the Fund, including but not limited to the Fund's prospectus, financial information, holdings, and proxy voting information, please visit https://www.alpsfunds.com/mutual-funds/smcrx.
If you have consented to receive a single annual or semi-annual shareholder report at a shared address you may revoke this consent by calling the Transfer Agent 866-759-5679.
ALPS | Smith Credit Opportunities Fund - Class C | FINANCIAL INVESTORS TRUST |
SMCCX | |
This annual shareholder report contains important information about ALPS | Smith Credit Opportunities Fund (the "Fund" or "SMCCX") for the period of November 1, 2023 to October 31, 2024 (the "Period"). You can find additional information about the Fund at https://www.alpsfunds.com/mutual-funds/smcrx. You can also request this information by contacting us at 866-759-5679.
The ALPS | Smith Credit Opportunities Fund returned 12.86% for Class C shares at net asset value (NAV) for the 12 months ended October 31, 2024. The Fund underperformed the blended benchmark of 50% Bloomberg U.S. Aggregate Bond Index and 50% Bloomberg U.S. Corporate HY Bond Index, which returned 13.49%.
Top contributors to relative performance
Asset allocation across investment grade, high yield, and preferred corporate securities, all of which benefited from tightening risk asset spreads over the period.
Corporate credit security selection.
Top detractors from relative performance
Yield curve positioning with U.S. Treasuries.
Agency mortgage security selection, with a relative underweight to low coupon MBS, which outperformed during the period.
An underweight to the lowest quality sections of the high yield market, where during the period, these bands saw outsized risk compression.
The Fund's past performance is not a good predictor of the Fund's future performance. The chart and the table below do not reflect the deduction of taxes that a shareholder would pay on Fund distributions or sale of Fund shares.
| 09/15/2020 | 10000 | 10000 | 10000 | 10000 |
| 09/30/2020 | 9940 | 9951 | 9980 | 9921 |
| 10/31/2020 | 9969 | 9954 | 9935 | 9972 |
| 11/30/2020 | 10292 | 10199 | 10033 | 10366 |
| 12/31/2020 | 10459 | 10302 | 10047 | 10561 |
| 01/31/2021 | 10451 | 10283 | 9975 | 10596 |
| 02/28/2021 | 10419 | 10227 | 9831 | 10635 |
| 03/31/2021 | 10376 | 10171 | 9708 | 10651 |
| 04/30/2021 | 10500 | 10266 | 9785 | 10767 |
| 05/31/2021 | 10539 | 10298 | 9817 | 10799 |
| 06/30/2021 | 10645 | 10404 | 9886 | 10943 |
| 07/31/2021 | 10702 | 10482 | 9996 | 10985 |
| 08/31/2021 | 10719 | 10498 | 9977 | 11041 |
| 09/30/2021 | 10681 | 10452 | 9891 | 11040 |
| 10/31/2021 | 10655 | 10442 | 9888 | 11021 |
| 11/30/2021 | 10571 | 10407 | 9917 | 10914 |
| 12/31/2021 | 10700 | 10491 | 9892 | 11119 |
| 01/31/2022 | 10424 | 10235 | 9679 | 10815 |
| 02/28/2022 | 10270 | 10125 | 9571 | 10704 |
| 03/31/2022 | 10122 | 9926 | 9305 | 10581 |
| 04/30/2022 | 9765 | 9561 | 8952 | 10205 |
| 05/31/2022 | 9766 | 9604 | 9009 | 10230 |
| 06/30/2022 | 9266 | 9205 | 8868 | 9541 |
| 07/31/2022 | 9646 | 9589 | 9085 | 10104 |
| 08/31/2022 | 9485 | 9343 | 8828 | 9871 |
| 09/30/2022 | 9150 | 8956 | 8447 | 9479 |
| 10/31/2022 | 9279 | 9014 | 8337 | 9726 |
| 11/30/2022 | 9445 | 9278 | 8644 | 9937 |
| 12/31/2022 | 9411 | 9228 | 8605 | 9875 |
| 01/31/2023 | 9736 | 9546 | 8870 | 10251 |
| 02/28/2023 | 9547 | 9361 | 8640 | 10119 |
| 03/31/2023 | 9509 | 9530 | 8860 | 10227 |
| 04/30/2023 | 9562 | 9606 | 8914 | 10329 |
| 05/31/2023 | 9466 | 9510 | 8816 | 10234 |
| 06/30/2023 | 9543 | 9573 | 8785 | 10406 |
| 07/31/2023 | 9654 | 9635 | 8779 | 10549 |
| 08/31/2023 | 9637 | 9618 | 8723 | 10579 |
| 09/30/2023 | 9467 | 9439 | 8501 | 10453 |
| 10/31/2023 | 9329 | 9309 | 8367 | 10332 |
| 11/30/2023 | 9772 | 9731 | 8746 | 10800 |
| 12/31/2023 | 10099 | 10099 | 9081 | 11202 |
| 01/31/2024 | 10158 | 10085 | 9056 | 11202 |
| 02/29/2024 | 10103 | 10028 | 8928 | 11235 |
| 03/31/2024 | 10211 | 10134 | 9010 | 11368 |
| 04/30/2024 | 10064 | 9958 | 8783 | 11261 |
| 05/31/2024 | 10185 | 10097 | 8932 | 11384 |
| 06/30/2024 | 10246 | 10193 | 9016 | 11492 |
| 07/31/2024 | 10435 | 10411 | 9227 | 11715 |
| 08/31/2024 | 10549 | 10571 | 9359 | 11906 |
| 09/30/2024 | 10666 | 10727 | 9485 | 12099 |
| 10/31/2024 | 10529 | 10565 | 9249 | 12034 |

| ALPS | Smith Credit Opportunities Fund - C - NAV* | 12.86% | 1.26% |
| ALPS | Smith Credit Opportunities Fund - C - Maximim deferred sales charge** | 11.86% | 1.26% |
| 50% Bloomberg U.S. Aggregate Bond Index and 50% Bloomberg U.S. Corporate HY Bond Index | 13.49% | 1.34% |
| Bloomberg U.S. Aggregate Bond Index# | 10.55% | -1.87% |
| Bloomberg U.S. Corporate HY Bond Index | 16.47% | 4.59% |
For the most current month-end performance data, please call 1-866-759-5679.
| Net Assets | $210,517,517 |
| Number of Portfolio Holdings | 325 |
| Portfolio Turnover Rate | 181% |
| Total Advisory Fees Paid | $1,468,024 |
| Corporate Bonds | 74.02% |
| Bank Loans | 8.54% |
| Government Bonds | 4.14% |
| Collateralized Mortgage Obligations | 3.67% |
| Mortgage-Backed Securities | 1.73% |
| Preferred Stock | 3.40% |
| Commercial Mortgage-Backed Securities | 1.34% |
| Cash, Cash Equivalents, & Other Net Assets | 3.16% |
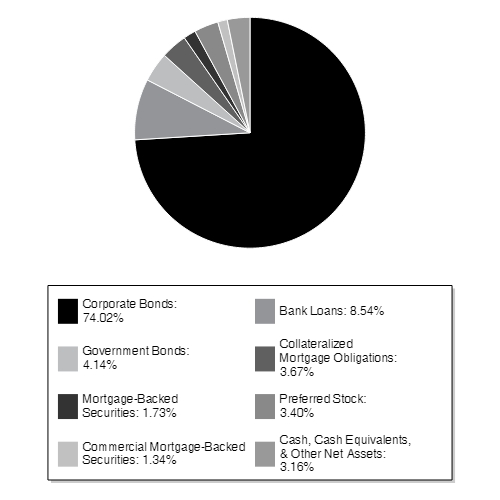
| U.S. Treasury Bond 3.875% 08/15/2034 | 1.83% |
| U.S. Treasury Bond 4.25% 08/15/2054 | 1.48% |
| UBS Group AG 1D US SOFR + 3.92% 08/12/2033 | 1.32% |
| National Rural Utilities Cooperative Finance Corp. 3M US SOFR + 3.17% 04/30/2043 | 1.28% |
| Six Flags Entertainment Corp. 7.25% 05/15/2031 | 1.27% |
| Fortrea Holdings, Inc. 7.50% 07/01/2030 | 1.20% |
| Penn Entertainment, Inc. 5.63% 01/15/2027 | 1.16% |
| Chobani LLC 1M US SOFR + 3.75% 10/25/2027 | 1.14% |
| Discover Bank 5Y US TI + 1.73% 08/09/2028 | 1.13% |
| Kennedy-Wilson, Inc. 4.75% 02/01/2030 | 1.09% |
| Oil&Gas | 10.63% |
| Banks | 8.47% |
| Pipelines | 8.00% |
| Mortgage Securities | 6.73% |
| Media | 5.03% |
| Entertainment | 4.79% |
| Sovereign | 4.14% |
| Aerospace/Defense | 3.87% |
| Leisure Time | 3.74% |
| Diversified Finan Serv | 2.99% |
| Commercial Services | 2.92% |
| Healthcare-Services | 2.83% |
| Airlines | 2.83% |
| Auto Manufacturers | 2.61% |
| Food | 2.50% |
| Retail | 2.48% |
| Electric | 1.90% |
| Real Estate | 1.87% |
| Advertising | 1.55% |
| Software | 1.53% |
| Pharmaceuticals | 1.52% |
| Environmental Control | 1.47% |
| Home Builders | 1.40% |
| Apparel | 1.35% |
| Healthcare-Products | 1.21% |
| Food - Dairy Products | 1.14% |
| Other Industries (each less than 1%) | 7.34% |
| Cash, Cash Equivalents, & Other Net Assets | 3.16% |
| |
** | As a percentage of net assets. |
Holdings are subject to change
If you wish to view additional information about the Fund, including but not limited to the Fund's prospectus, financial information, holdings, and proxy voting information, please visit https://www.alpsfunds.com/mutual-funds/smcrx.
If you have consented to receive a single annual or semi-annual shareholder report at a shared address you may revoke this consent by calling the Transfer Agent 866-759-5679.
ALPS | Smith Credit Opportunities Fund - Class I | FINANCIAL INVESTORS TRUST |
SMCRX | |
This annual shareholder report contains important information about ALPS | Smith Credit Opportunities Fund (the "Fund" or "SMCRX") for the period of November 1, 2023 to October 31, 2024 (the "Period"). You can find additional information about the Fund at https://www.alpsfunds.com/mutual-funds/smcrx. You can also request this information by contacting us at 866-759-5679.
The ALPS | Smith Credit Opportunities Fund returned 13.98% for Class I shares at net asset value (NAV) for the 12 months ended October 31, 2024. The Fund outperformed the blended benchmark of 50% Bloomberg U.S. Aggregate Bond Index and 50% Bloomberg U.S. Corporate HY Bond Index, which returned 13.49%.
Top contributors to relative performance
Asset allocation across investment grade, high yield, and preferred corporate securities, all of which benefited from tightening risk asset spreads over the period.
Corporate credit security selection.
Top detractors from relative performance
Yield curve positioning with U.S. Treasuries.
Agency mortgage security selection, with a relative underweight to low coupon MBS, which outperformed during the period.
An underweight to the lowest quality sections of the high yield market, where during the period, these bands saw outsized risk compression.
The Fund's past performance is not a good predictor of the Fund's future performance. The chart and the table below do not reflect the deduction of taxes that a shareholder would pay on Fund distributions or sale of Fund shares.
| 09/15/2020 | 100000 | 100000 | 100000 | 100000 |
| 09/30/2020 | 99400 | 99507 | 99800 | 99214 |
| 10/31/2020 | 99852 | 99537 | 99354 | 99718 |
| 11/30/2020 | 103170 | 101995 | 100329 | 103663 |
| 12/31/2020 | 104931 | 103025 | 100467 | 105614 |
| 01/31/2021 | 104939 | 102826 | 99747 | 105963 |
| 02/28/2021 | 104690 | 102272 | 98307 | 106353 |
| 03/31/2021 | 104350 | 101710 | 97079 | 106512 |
| 04/30/2021 | 105689 | 102664 | 97846 | 107668 |
| 05/31/2021 | 106167 | 102984 | 98166 | 107987 |
| 06/30/2021 | 107299 | 104035 | 98855 | 109433 |
| 07/31/2021 | 107969 | 104815 | 99961 | 109850 |
| 08/31/2021 | 108232 | 104985 | 99771 | 110414 |
| 09/30/2021 | 107945 | 104525 | 98907 | 110403 |
| 10/31/2021 | 107669 | 104421 | 98879 | 110213 |
| 11/30/2021 | 106904 | 104067 | 99172 | 109141 |
| 12/31/2021 | 108407 | 104910 | 98918 | 111187 |
| 01/31/2022 | 105703 | 102345 | 96787 | 108147 |
| 02/28/2022 | 104226 | 101249 | 95707 | 107037 |
| 03/31/2022 | 102813 | 99262 | 93048 | 105810 |
| 04/30/2022 | 99269 | 95614 | 89517 | 102047 |
| 05/31/2022 | 99360 | 96039 | 90094 | 102297 |
| 06/30/2022 | 94259 | 92053 | 88681 | 95410 |
| 07/31/2022 | 98205 | 95894 | 90848 | 101042 |
| 08/31/2022 | 96645 | 93435 | 88281 | 98714 |
| 09/30/2022 | 93306 | 89561 | 84467 | 94793 |
| 10/31/2022 | 94814 | 90144 | 83373 | 97256 |
| 11/30/2022 | 96587 | 92780 | 86439 | 99367 |
| 12/31/2022 | 96204 | 92281 | 86049 | 98747 |
| 01/31/2023 | 99719 | 95458 | 88696 | 102507 |
| 02/28/2023 | 97863 | 93610 | 86403 | 101189 |
| 03/31/2023 | 97560 | 95299 | 88598 | 102270 |
| 04/30/2023 | 98179 | 96064 | 89135 | 103292 |
| 05/31/2023 | 97168 | 95101 | 88164 | 102345 |
| 06/30/2023 | 98040 | 95727 | 87850 | 104058 |
| 07/31/2023 | 99373 | 96354 | 87789 | 105493 |
| 08/31/2023 | 99289 | 96180 | 87228 | 105786 |
| 09/30/2023 | 97613 | 94389 | 85011 | 104534 |
| 10/31/2023 | 96286 | 93094 | 83670 | 103317 |
| 11/30/2023 | 100942 | 97311 | 87458 | 107998 |
| 12/31/2023 | 104394 | 100987 | 90806 | 112024 |
| 01/31/2024 | 104977 | 100847 | 90557 | 112019 |
| 02/29/2024 | 104491 | 100281 | 89278 | 112346 |
| 03/31/2024 | 105814 | 101338 | 90102 | 113676 |
| 04/30/2024 | 104378 | 99582 | 87826 | 112607 |
| 05/31/2024 | 105718 | 100973 | 89315 | 113844 |
| 06/30/2024 | 106443 | 101928 | 90161 | 114919 |
| 07/31/2024 | 108498 | 104109 | 92267 | 117154 |
| 08/31/2024 | 109771 | 105706 | 93592 | 119064 |
| 09/30/2024 | 111079 | 107269 | 94846 | 120991 |
| 10/31/2024 | 109742 | 105649 | 92494 | 120337 |

| ALPS | Smith Credit Opportunities Fund - I - NAV | 13.98% | 2.28% |
| 50% Bloomberg U.S. Aggregate Bond Index and 50% Bloomberg U.S. Corporate HY Bond Index | 13.49% | 1.34% |
| Bloomberg U.S. Aggregate Bond Index# | 10.55% | -1.87% |
| Bloomberg U.S. Corporate HY Bond Index | 16.47% | 4.59% |
For the most current month-end performance data, please call 1-866-759-5679.
| Net Assets | $210,517,517 |
| Number of Portfolio Holdings | 325 |
| Portfolio Turnover Rate | 181% |
| Total Advisory Fees Paid | $1,468,024 |
| Corporate Bonds | 74.02% |
| Bank Loans | 8.54% |
| Government Bonds | 4.14% |
| Collateralized Mortgage Obligations | 3.67% |
| Mortgage-Backed Securities | 1.73% |
| Preferred Stock | 3.40% |
| Commercial Mortgage-Backed Securities | 1.34% |
| Cash, Cash Equivalents, & Other Net Assets | 3.16% |

| U.S. Treasury Bond 3.875% 08/15/2034 | 1.83% |
| U.S. Treasury Bond 4.25% 08/15/2054 | 1.48% |
| UBS Group AG 1D US SOFR + 3.92% 08/12/2033 | 1.32% |
| National Rural Utilities Cooperative Finance Corp. 3M US SOFR + 3.17% 04/30/2043 | 1.28% |
| Six Flags Entertainment Corp. 7.25% 05/15/2031 | 1.27% |
| Fortrea Holdings, Inc. 7.50% 07/01/2030 | 1.20% |
| Penn Entertainment, Inc. 5.63% 01/15/2027 | 1.16% |
| Chobani LLC 1M US SOFR + 3.75% 10/25/2027 | 1.14% |
| Discover Bank 5Y US TI + 1.73% 08/09/2028 | 1.13% |
| Kennedy-Wilson, Inc. 4.75% 02/01/2030 | 1.09% |
| Oil&Gas | 10.63% |
| Banks | 8.47% |
| Pipelines | 8.00% |
| Mortgage Securities | 6.73% |
| Media | 5.03% |
| Entertainment | 4.79% |
| Sovereign | 4.14% |
| Aerospace/Defense | 3.87% |
| Leisure Time | 3.74% |
| Diversified Finan Serv | 2.99% |
| Commercial Services | 2.92% |
| Healthcare-Services | 2.83% |
| Airlines | 2.83% |
| Auto Manufacturers | 2.61% |
| Food | 2.50% |
| Retail | 2.48% |
| Electric | 1.90% |
| Real Estate | 1.87% |
| Advertising | 1.55% |
| Software | 1.53% |
| Pharmaceuticals | 1.52% |
| Environmental Control | 1.47% |
| Home Builders | 1.40% |
| Apparel | 1.35% |
| Healthcare-Products | 1.21% |
| Food - Dairy Products | 1.14% |
| Other Industries (each less than 1%) | 7.34% |
| Cash, Cash Equivalents, & Other Net Assets | 3.16% |
| |
** | As a percentage of net assets. |
Holdings are subject to change
If you wish to view additional information about the Fund, including but not limited to the Fund's prospectus, financial information, holdings, and proxy voting information, please visit https://www.alpsfunds.com/mutual-funds/smcrx.
If you have consented to receive a single annual or semi-annual shareholder report at a shared address you may revoke this consent by calling the Transfer Agent 866-759-5679.
ALPS | CoreCommodity Natural Resources ETF | FINANCIAL INVESTORS TRUST |
NASDAQ: CCNR | |
This annual shareholder report contains important information about ALPS | CoreCommodity Natural Resources ETF (the "Fund" or "CCNR") for the period of July 10, 2024 (Fund inception) to October 31, 2024 (the "Period"). You can find additional information about the Fund at https://www.alpsfunds.com/exchange-traded-funds/ccnr. You can also request this information by contacting us at 866-759-5679.
| ALPS | CoreCommodity Natural Resources ETF | $12* | 0.39% |
The ALPS | CoreCommodity Natural Resources ETF (the "Fund") returned -1.04% at net asset value (NAV) for the period from July 10, 2024 (Fund inception) through October 31, 2024. The Fund slightly underperformed the Bloomberg Commodity Total Return Index (the "BCOM"), which returned -0.83% over the same period.
Top contributors to relative performance:
Within the energy sector, the Fund's holdings outperformed the BCOM's energy sector by approximately 5.7%, with investments in renewable energy companies materially contributing to that outperformance. An overweight to the sector was also additive to relative performance.
Within the agriculture sector, the Fund's holdings outperformed the BCOM's agriculture and livestock sector by roughly 5.4%, with nearly all industries outperforming. Despite an underweight, the sector was additive to relative performance.
Top detractors from relative performance:
Within the base metals sector, the Fund's holdings underperformed the BCOM's base metals sector by approximately (3.1%), mainly as a result of underperformance from holdings in copper miners, specialty metals producers, and diversified mining companies. Combined with an overweight to the sector, this was a detractor to relative performance.
Within the precious metals sector, the Fund's holdings outperformed the BCOM's precious metals sector by approximately 12.7%, led by outperformance from gold mining companies. Despite this, an underweight to the sector was a net detractor to relative performance.
The Fund's past performance is not a good predictor of the Fund's future performance. The chart and the table below do not reflect the deduction of taxes that a shareholder would pay on Fund distributions or sale of Fund shares.
| 07/10/2024 | 10000 | 10000 | 10000 |
| 07/31/2024 | 10208 | 9632 | 9849 |
| 08/31/2024 | 10056 | 9636 | 10075 |
| 09/30/2024 | 10232 | 10105 | 10288 |
| 10/31/2024 | 9896 | 9917 | 10210 |
| ALPS | CoreCommodity Natural Resources ETF - NAV | -1.04% |
| Bloomberg Commodity Total Return Index | -0.83% |
| Bloomberg US 1000 Total Return Index# | 2.10% |
For the most current month-end performance data, please call 1-866-759-5679.
| Net Assets | $284,676,505 |
| Number of Portfolio Holdings | 251 |
| Portfolio Turnover Rate# | 61% |
| Total Advisory Fees Paid# | $358,638 |
| CNH Industrial NV | 1.66% |
| FMC Corp. | 1.56% |
| Lundin Mining Corp. | 1.44% |
| Cal-Maine Foods, Inc. | 1.39% |
| Boliden AB | 1.37% |
| Hudbay Minerals, Inc. | 1.33% |
| Hormel Foods Corp. | 1.30% |
| B2Gold Corp. | 1.29% |
| Ingredion, Inc. | 1.17% |
| Archer-Daniels-Midland Co. | 1.14% |
| Materials | 35.59% |
| Energy | 35.47% |
| Consumer Staples | 13.59% |
| Industrials | 7.60% |
| Utilities | 5.73% |
| Technology | 0.63% |
| Consumer Discretionary | 0.52% |
| Real Estate | 0.27% |
| Financials | 0.24% |
| Cash, Cash Equivalents, & Other Net Assets | 0.36% |
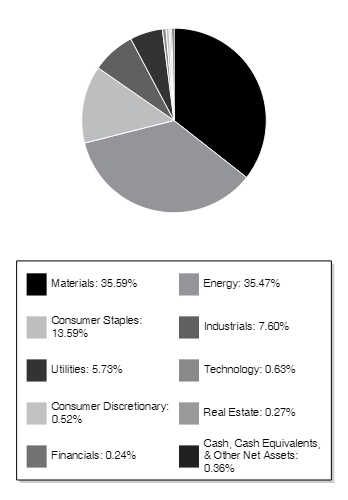
| |
** | As a percentage of net assets. |
Holdings are subject to change
If you wish to view additional information about the Fund, including but not limited to the Fund's prospectus, financial information, holdings, and proxy voting information, please visit https://www.alpsfunds.com/exchange-traded-funds/ccnr.
If you have consented to receive a single annual or semi-annual shareholder report at a shared address you may revoke this consent by calling the Transfer Agent 866-759-5679.
Item 2. Code of Ethics.
| (a) | The Registrant, as of the end of the period covered by this report, has adopted a code of ethics that applies to the Registrant’s principal executive officer, principal financial officer, principal accounting officer or controller or any persons performing similar functions on behalf of the Registrant. |
| (c) | During the period covered by this report, no amendments to the provisions of the code of ethics described in Item 2(a) above were made. |
| (d) | During the period covered by this report, no implicit or explicit waivers to the provisions of the code of ethics described in Item 2(a) above were granted. |
| (f) | The Registrant’s Code of Ethics is attached as an Exhibit to this report. |
Item 3. Audit Committee Financial Expert.
The Board of Trustees of the Registrant has determined that the Registrant has at least one Audit Committee Financial Expert serving on its audit committee. The Board of Trustees of the Registrant has designated Jeremy W. Deems as the Registrant’s “Audit Committee Financial Expert.” Mr. Deems is “independent” as defined in paragraph (a)(2) of Item 3 to Form N-CSR.
Item 4. Principal Accountant Fees and Services.
| (a) | Audit Fees: For the Registrant’s fiscal years ended October 31, 2024 and October 31, 2023, the aggregate fees billed for professional services rendered by the principal accountant for the audit of the Registrant’s annual financial statements were $141,000 and $127,000, respectively. |
| (b) | Audit-Related Fees: For the Registrant’s fiscal years ended October 31, 2024 and October 31, 2023, the aggregate fees billed for assurance and related services by the principal accountant that were reasonably related to the performance of the audit |
of the Registrant’s financial statements and are not reported under paragraph (a) of this Item were $1,000 and $0, respectively.
| (c) | Tax Fees: For the Registrant’s fiscal years ended October 31, 2024 and October 31, 2023, the aggregate fees billed for professional services rendered by the principal accountant for tax compliance, tax advice and tax planning were $37,000 and $33,500, respectively. The fiscal year 2024 and 2023 tax fees were for services for dividend calculation, excise tax preparation and tax return preparation. |
| (d) | All Other Fees: For the Registrant’s fiscal years ended October 31, 2024 and October 31, 2023, no fees were billed to Registrant by the principal accountant for services other than the services reported in paragraphs (a) through (c) of this Item. |
| (e)(1) | Audit Committee Pre-Approval Policies and Procedures: All services to be performed by the Registrant’s principal accountant must be pre-approved by the Registrant’s audit committee. The Chairman of the Audit Committee may pre-approve non-audit services to be performed by the Registrant’s principal accountant on an interim basis, subject to ratification by the Audit Committee at its next regularly scheduled meeting. |
| (e)(2) | No services described in paragraphs (b) through (d) of this Item were approved by the Registrant’s audit committee pursuant to paragraph (c)(7)(i)(C) of Rule 2-01 of Regulation S-X. |
| (g) | The aggregate non-audit fees billed by the Registrant’s accountant for services rendered to the Registrant, and rendered to the Registrant’s investment adviser (not including any sub-adviser whose role is primarily portfolio management and is subcontracted with or overseen by another investment adviser), and any entity controlling, controlled by, or under common control with the adviser that provides ongoing services to the Registrant, were $37,000 in the fiscal year ended October 31, 2024 and $33,500 in the fiscal year ended October 31, 2023. These fees consisted of non-audit fees billed to (i) the Registrant of $37,000 in the fiscal year ended October 31, 2024 and $33,500 in the fiscal year ended October 31, 2023 as described in response to paragraph (c) above and (ii) to ALPS Fund Services, Inc. (“AFS”), an entity under common control with ALPS Advisors, Inc., the Registrant’s investment adviser, of $0 in the fiscal year ended October 31, 2024 and $0 in the fiscal year ended October 31, 2023. The non-audit fees billed to AFS related to SSAE 16 services and other compliance-related matters. |
| (h) | The Registrant’s audit committee has considered whether the provision of non-audit services that were rendered to the Registrant’s investment adviser (not including any sub-adviser whose role is primarily portfolio management and is subcontracted with or overseen by another investment adviser), and any entity controlling, controlled by, or under common control with the investment adviser |
that provides ongoing services to the Registrant that were not pre-approved pursuant to paragraph (c)(7)(ii) of Rule 2-01 of Regulation S-X, is compatible with maintaining the principal accountant’s independence. The Registrant’s audit committee determined that the provision of such non-audit services is compatible with maintaining the principal accountant’s independence.
Item 5. Audit Committee of Listed Registrants.
Not applicable.
Item 6. Investments.
| (a) | Schedule of Investments is included as part of the Reports to Stockholders filed under Item 7 of this Form N-CSR. |
Item 7. Financial Statements and Financial Highlights for Open-End Management Investment Companies.
Table of Contents
| ALPS | CoreCommodity Management CompleteCommodities® Strategy Fund | |
| | |
| Consolidated Statement of Investments | 1 |
| Consolidated Statement of Assets and Liabilities | 4 |
| Consolidated Statement of Operations | 5 |
| Consolidated Statements of Changes in Net Assets | 6 |
| Consolidated Financial Highlights | 7 |
| | |
| ALPS | Kotak India ESG Fund | |
| | |
| Statement of Investments | 11 |
| Statement of Assets and Liabilities | 13 |
| Statement of Operations | 14 |
| Statements of Changes in Net Assets | 15 |
| Financial Highlights | 16 |
| | |
| ALPS Global Opportunity Fund | |
| | |
| Statement of Investments | 21 |
| Statement of Assets and Liabilities | 24 |
| Statement of Operations | 25 |
| Statements of Changes in Net Assets | 26 |
| Financial Highlights | 27 |
| | |
| ALPS Balanced Opportunity Fund | |
| | |
| Statement of Investments | 32 |
| Statement of Assets and Liabilities | 35 |
| Statement of Operations | 36 |
| Statements of Changes in Net Assets | 37 |
| Financial Highlights | 38 |
| RiverFront Asset Allocation Growth & Income | |
| | |
| Statement of Investments | 42 |
| Statement of Assets and Liabilities | 43 |
| Statement of Operations | 44 |
| Statements of Changes in Net Assets | 45 |
| Financial Highlights | 46 |
| | |
| Notes to Financial Statements and Financial Highlights | 50 |
| | |
| Report of Independent Registered Public Accounting Firm | 72 |
| | |
| Additional Information | 73 |
| | |
| Changes in and Disagreements with Accountants for Open-End Management Investment Companies | 74 |
| | |
| Proxy Disclosures for Open-End Management Investment Companies | 75 |
| | |
| Remuneration Paid to Directors, Officers, and Others of Open-End Management Investment Companies | 76 |
| | |
| Statement Regarding Basis for Approval of Investment Advisory Contract | 77 |
alpsfunds.com
ALPS | CoreCommodity Management
CompleteCommodities® Strategy Fund
| Consolidated Statement of Investments | October 31, 2024 |
| | | Shares | | Value
(Note 2) |
| COMMON STOCKS (0.00%) | | | | |
| Great Britain (0.00%)(a) | | | | |
| Evraz PLC(b)(c)(d)(e) | | | 91,946 | | | $ | 1,186 | |
| | | | | | | | | |
| TOTAL COMMON STOCKS | | | | | | | | |
| (Cost $681,663) | | | | | | | 1,186 | |
| | | | | | | | | |
| EXCHANGE TRADED FUNDS (30.12%) | | | | | | | | |
| United States (30.12%) | | | | | | | | |
| ALPS | CoreCommodity Natural Resources ETF(b)(f) | | | 11,455,594 | | | | 283,263,618 | |
| | | | | | | | | |
| TOTAL EXCHANGE TRADED FUNDS | | | | | | | | |
| (Cost $250,318,618) | | | | | | | 283,263,618 | |
| | | Principal Amount | | | Value (Note 2) | |
| GOVERNMENT BONDS (64.31%) | | | | | | |
| U.S. Treasury Bonds (64.31%) | | | | | | |
| United States Treasury Bill | | | | | | |
| 5.160%, 11/14/24(g) | | $ | 25,900,000 | | | $ | 25,856,683 | |
| 5.135%, 12/5/24 | | | 5,000,000 | | | | 4,978,312 | |
| 5.085%, 1/2/25(g) | | | 20,700,000 | | | | 20,539,263 | |
| 4.627%, 1/23/25(g) | | | 15,400,000 | | | | 15,242,689 | |
| 4.360%, 2/6/25 | | | 46,100,000 | | | | 45,549,298 | |
| 4.390%, 2/20/25(g) | | | 151,000,000 | | | | 148,944,450 | |
| 4.370%, 3/6/25(g) | | | 63,150,000 | | | | 62,191,238 | |
| 4.224%, 3/20/25 | | | 74,700,000 | | | | 73,439,703 | |
| United States Treasury Inflation Indexed Bonds | |
| 0.125%, 4/15/26 | | | 112,700,000 | | | | 131,420,562 | |
| 0.125%, 7/15/26 | | | 60,100,000 | | | | 76,741,177 | |
| | | | | | | | 604,903,375 | |
| TOTAL GOVERNMENT BONDS | | | | | | | | |
| (Cost $603,668,588) | | | | | | | 604,903,375 | |
| | | 7-Day Yield | | | Shares | | | Value (Note 2) | |
| SHORT TERM INVESTMENTS (6.76%) | | | | | | | | | |
| Money Market Fund (6.76%) | | | | | | | | | |
| BlackRock Liquidity Funds Treasury Trust Fund Portfolio | | | 4.661 | % | | | 63,583,424 | | | | 63,583,424 | |
| | | | | | | | | | | | | |
| TOTAL SHORT TERM INVESTMENTS | | | | | | | | | | | | |
| (Cost $63,583,424) | | | | | | | | | | | 63,583,424 | |
| | | Value (Note 2) | |
| TOTAL INVESTMENTS (101.19%) | | | | |
| (Cost $918,252,293) | | $ | 951,751,603 | |
| | | | | |
| Liabilities in Excess of Other Assets (-1.19%) | | | (11,222,954 | ) |
| NET ASSETS - 100.00% | | $ | 940,528,649 | |
| (b) | Non-Income Producing Security. |
| (c) | Security deemed to be illiquid under the procedures utilized by the Valuation Designee. As of October 31, 2024, the fair value of illiquid securities in the aggregate was $1,186, representing less than 0.005% of the Fund's net assets. |
| (d) | Fair valued security; valued by the valuation designee in accordance with the procedures utilized by the valuation designee. As of October 31, 2024, these securities had a total value of $1,186 or less than 0.005% of total net assets. |
| (e) | As a result of the use of significant unobservable inputs to determine fair value, these investments have been classified as level 3 assets. See also Note 2 to the financial statements for additional information. |
| (f) | Affiliated Company. See Note 7 in Notes to Financial Statements and Financial Highlights. Financials for the affiliated company can be found at www.alpsfunds.com/exchange-traded-funds/ccnr |
| (g) | Security, or portion of security, is being held as collateral for total return swap contracts and futures contracts aggregating a total market value of $89,297,911. |
For Fund compliance purposes, the Fund's industry and geographical classifications refer to any one or more of the industry sub-classifications used by one or more widely recognized market indexes or ratings group indexes, and/or as defined by Fund management. This definition may not apply for purposes of this report, which may combine sub-classifications for reporting ease. Industries and regions are shown as a percent of net assets.
See Notes to Financial Statements and Financial Highlights.
ALPS | CoreCommodity Management
CompleteCommodities® Strategy Fund
| Consolidated Statement of Investments | October 31, 2024 |
FUTURES CONTRACTS
| Description | | Counterparty | | Position | | Contracts | | | Expiration Date | | Notional Value (Note 2) | | | Unrealized Appreciation | |
| Cocoa Future | | Morgan Stanley | | Long | | 19 | | | 03/14/25 | | $ | 1,309,100 | | | $ | 41,231 | |
| Coffee Robusta Future | | Morgan Stanley | | Short | | (215) | | | 03/25/25 | | | (9,204,150 | ) | | | 773,252 | |
| Copper Future | | Morgan Stanley | | Long | | 30 | | | 12/27/24 | | | 3,255,000 | | | | 6,765 | |
| Corn Future | | Morgan Stanley | | Short | | (76) | | | 03/14/25 | | | (1,618,800 | ) | | | 30,139 | |
| Frzn Concentrated OJ Future | | Morgan Stanley | | Long | | 3 | | | 03/11/25 | | | 214,695 | | | | 9,509 | |
| Gasoline RBOB Future | | Morgan Stanley | | Long | | 49 | | | 03/28/25 | | | 4,062,698 | | | | 35,415 | |
| Gold 100 Oz. Future | | Morgan Stanley | | Long | | 108 | | | 04/28/25 | | | 30,180,600 | | | | 858,092 | |
| Lean Hogs Future | | Morgan Stanley | | Long | | 91 | | | 04/14/25 | | | 3,206,840 | | | | 144,476 | |
| LME Aluminum Future | | Morgan Stanley | | Long | | 77 | | | 12/16/24 | | | 5,019,033 | | | | 169,702 | |
| LME Aluminum Future | | Morgan Stanley | | Short | | (2) | | | 03/17/25 | | | (131,282 | ) | | | 429 | |
| LME Zinc Future | | Morgan Stanley | | Short | | (1) | | | 03/17/25 | | | (75,750 | ) | | | 2,029 | |
| Low Su Gasoil G Future | | Morgan Stanley | | Long | | 49 | | | 03/12/25 | | | 3,268,300 | | | | 61,182 | |
| NY Harbor ULSD Future | | Morgan Stanley | | Long | | 40 | | | 03/28/25 | | | 3,750,096 | | | | 50,975 | |
| Silver Future | | Morgan Stanley | | Long | | 90 | | | 03/27/25 | | | 14,957,550 | | | | 224,811 | |
| Soybean Oil Future | | Morgan Stanley | | Long | | 150 | | | 03/14/25 | | | 4,063,500 | | | | 163,455 | |
| WTI Crude Future | | Morgan Stanley | | Long | | 218 | | | 03/20/25 | | | 14,865,420 | | | | 18,716 | |
| | | | | | | | | | | | $ | 77,122,850 | | | $ | 2,590,178 | |
| Description | | Counterparty | | Position | | Contracts | | | Expiration Date | | Notional Value (Note 2) | | | Unrealized Depreciation | |
| Brent Crude Future | | Morgan Stanley | | Long | | 43 | | | 01/29/25 | | $ | 3,130,830 | | | $ | (251,786 | ) |
| Brent Crude Future | | Morgan Stanley | | Long | | 130 | | | 05/31/25 | | | 9,349,600 | | | | (511,463 | ) |
| Coffee 'C' Future | | Morgan Stanley | | Long | | 160 | | | 03/19/25 | | | 14,730,000 | | | | (1,578,180 | ) |
| Copper Future | | Morgan Stanley | | Long | | 84 | | | 03/27/25 | | | 9,213,750 | | | | (582,932 | ) |
| Cotton No.2 Future | | Morgan Stanley | | Short | | (92) | | | 03/07/25 | | | (3,304,180 | ) | | | (93,142 | ) |
| Hard Red Winter Wheat Future | | Morgan Stanley | | Long | | 75 | | | 03/14/25 | | | 2,186,250 | | | | (41,454 | ) |
| Live Cattle Future | | Morgan Stanley | | Long | | 86 | | | 04/30/25 | | | 6,444,840 | | | | (31,148 | ) |
| LME Aluminum Future | | Morgan Stanley | | Short | | (77) | | | 12/16/24 | | | (5,019,033 | ) | | | (489,241 | ) |
| LME Aluminum Future | | Morgan Stanley | | Long | | 171 | | | 03/17/25 | | | 11,224,611 | | | | (44,807 | ) |
| LME Lead Future | | Morgan Stanley | | Long | | 22 | | | 03/17/25 | | | 1,122,479 | | | | (72,446 | ) |
| LME Nickel Future | | Morgan Stanley | | Long | | 37 | | | 03/17/25 | | | 3,516,387 | | | | (248,996 | ) |
| LME Zinc Future | | Morgan Stanley | | Long | | 51 | | | 03/17/25 | | | 3,863,250 | | | | (104,258 | ) |
| Low Su Gasoil G Future | | Morgan Stanley | | Long | | 24 | | | 01/10/25 | | | 1,600,800 | | | | (97,952 | ) |
| Natural Gas Future | | Morgan Stanley | | Long | | 220 | | | 01/27/25 | | | 6,529,600 | | | | (262,932 | ) |
| Natural Gas Future | | Morgan Stanley | | Long | | 439 | | | 03/26/25 | | | 11,738,860 | | | | (1,819,154 | ) |
| Soybean Future | | Morgan Stanley | | Long | | 148 | | | 03/14/25 | | | 7,470,300 | | | | (472,079 | ) |
| Soybean Meal Future | | Morgan Stanley | | Long | | 124 | | | 03/14/25 | | | 3,769,600 | | | | (325,217 | ) |
| Sugar #11 (World) Future | | Morgan Stanley | | Long | | 210 | | | 03/28/25 | | | 5,348,448 | | | | (117,627 | ) |
| Wheat (CBT) Future | | Morgan Stanley | | Long | | 69 | | | 03/14/25 | | | 2,036,362 | | | | (49,351 | ) |
| | | | | | | | | | | | $ | 94,952,754 | | | $ | (7,194,165 | ) |
See Notes to Financial Statements and Financial Highlights.
ALPS | CoreCommodity Management
CompleteCommodities® Strategy Fund
| Consolidated Statement of Investments | October 31, 2024 |
TOTAL RETURN SWAP CONTRACTS(a)
Swap
Counterparty | | Reference Obligation | | Notional Amount | | | Floating Rate/Fixed Amount Paid by Fund* | | Termination Date | | Value | | | Unrealized Appreciation | |
| UBS Group AG | | CRB 3m Fwd TR Index** | | $ | 43,378,280 | | | USB3MTA + 25 bps | | 11/29/2024 | | $ | 43,378,489 | | | $ | 209 | |
| Citigroup | | CRB 3m Fwd TR Index** | | | 15,261,424 | | | USB3MTA + 24 bps | | 10/31/2025 | | | 15,261,498 | | | | 74 | |
| Bank of America - Merrill Lynch | | CRB 3m Fwd TR Index** | | | 13,841,470 | | | USB3MTA + 25 bps | | 7/1/2025 | | | 13,841,538 | | | | 68 | |
| Citigroup | | BCOM 3m Fwd TR Index*** | | | 188,525,233 | | | USB3MTA + 11 bps | | 10/31/2025 | | | 188,525,262 | | | | 29 | |
| RBC | | BCOM 3m Fwd TR Index*** | | | 92,659,557 | | | USB3MTA + 12 bps | | 10/31/2025 | | | 92,659,571 | | | | 14 | |
| Bank of America - Merrill Lynch | | BCOM 3m Fwd TR Index*** | | | 77,985,762 | | | USB3MTA + 12 bps | | 10/31/2025 | | | 77,985,775 | | | | 13 | |
| Goldman Sachs | | BCOM 3m Fwd TR Index*** | | | 27,728,789 | | | USB3MTA + 11 bps | | 10/31/2025 | | | 27,728,793 | | | | 4 | |
| Societe Generale | | BCOM 3m Fwd TR Index*** | | | 25,656,530 | | | USB3MTA + 12 bps | | 10/31/2025 | | | 25,656,534 | | | | 4 | |
| | | | | $ | 485,037,045 | | | | | | | $ | 485,037,460 | | | $ | 415 | |
| (a) | For long positions in the total return swap, the Fund receives payments based on any positive return of the Reference Obligation less the rate paid by the Fund. The Fund makes payments on any negative return of such Reference Obligations plus the rate paid by the Fund. For short positions in the total return swap, the Fund makes payments based on any positive return of the Reference Obligation less the rate paid by the Fund. The Fund receives payments on any negative return of such Reference Obligations plus the rate paid by the Fund. |
| * | United States Auction Results 3 Month Treasury Bill High Discount. Total return swap resets monthly. |
| ** | CRB - Commodity Research Bureau |
| *** | BCOM – Bloomberg Commodity Index |
See Notes to Financial Statements and Financial Highlights.
ALPS | CoreCommodity Management
CompleteCommodities® Strategy Fund
| Consolidated Statement of Assets and Liabilities | October 31, 2024 |
| ASSETS | | | |
| Investments, at value | | $ | 668,487,985 | |
| Investments in affiliates, at value | | | 283,263,618 | |
| Cash | | | 1,077,366 | |
| Unrealized appreciation on total return swap contracts | | | 415 | |
| Receivable for shares sold | | | 1,038,816 | |
| Dividends and interest receivable | | | 490,413 | |
| Prepaid expenses and other assets | | | 47,956 | |
| Total Assets | | | 954,406,569 | |
| LIABILITIES | | | | |
| Payable for variation margin on futures contracts | | | 1,344,935 | |
| Payable for interest expense on total return swap contracts | | | 2,193,903 | |
| Payable for total return swap contract resets | | | 6,045,035 | |
| Payable due to broker for futures contracts (Note 3) | | | 771,780 | |
| Payable for shares redeemed | | | 2,457,585 | |
| Investment advisory fees payable | | | 726,317 | |
| Administration and transfer agency fees payable | | | 246,521 | |
| Distribution and services fees payable | | | 13,652 | |
| Trustees' fees and expenses payable | | | 5,795 | |
| Professional fees payable | | | 28,677 | |
| Accrued expenses and other liabilities | | | 43,720 | |
| Total Liabilities | | | 13,877,920 | |
| NET ASSETS | | $ | 940,528,649 | |
| NET ASSETS CONSIST OF | | | | |
| Paid-in capital | | $ | 904,919,921 | |
| Total distributable earnings/(accumulated losses) | | | 35,608,728 | |
| NET ASSETS | | $ | 940,528,649 | |
| INVESTMENTS, AT COST | | $ | 667,933,675 | |
| INVESTMENTS IN AFFILIATES, AT COST | | $ | 250,318,618 | |
| | | | |
| PRICING OF SHARES | | | |
| Investor Class: | | | |
| Net Asset Value, offering and redemption price per share | | $ | 7.29 | |
| Net Assets | | $ | 17,849,116 | |
| Shares of beneficial interest outstanding (unlimited number of shares, no par value common stock authorized) | | | 2,447,223 | |
| Class A: | | | | |
| Net Asset Value, offering and redemption price per share | | $ | 7.32 | |
| Net Assets | | $ | 6,726,337 | |
| Shares of beneficial interest outstanding (unlimited number of shares, no par value common stock authorized) | | | 918,983 | |
| Maximum offering price per share ((NAV/0.9450), based on maximum sales charge of 5.50% of the offering price) | | $ | 7.75 | |
| Class C: | | | | |
| Net Asset Value, offering and redemption price per share(a) | | $ | 6.58 | |
| Net Assets | | $ | 9,574,200 | |
| Shares of beneficial interest outstanding (unlimited number of shares, no par value common stock authorized) | | | 1,455,405 | |
| Class I: | | | | |
| Net Asset Value, offering and redemption price per share | | $ | 7.45 | |
| Net Assets | | $ | 906,378,996 | |
| Shares of beneficial interest outstanding (unlimited number of shares, no par value common stock authorized) | | | 121,719,194 | |
| (a) | Redemption price per share may be reduced for any applicable contingent deferred sales charge. For a description of a possible sales charge, please see the Fund's Prospectus. |
See Notes to Financial Statements and Financial Highlights.
ALPS | CoreCommodity Management
CompleteCommodities® Strategy Fund
| Consolidated Statement of Operations | For the Year Ended October 31, 2024 |
| INVESTMENT INCOME | | | |
| Dividends | | $ | 7,108,594 | |
| Foreign taxes withheld on dividends | | | (634,793 | ) |
| Interest and other income, net of premium amortization and accretion of discount | | | 41,102,522 | |
| Total Investment Income | | | 47,576,323 | |
| | | | | |
| EXPENSES | | | | |
| Investment advisory fees | | | 10,030,637 | |
| Investment advisory fees - subsidiary (Note 8) | | | 2,069,206 | |
| Administrative fees | | | 1,458,472 | |
| Delegated transfer agent equivalent services fees | | | 1,634,832 | |
| Distribution and service fees | | | | |
| Investor Class | | | 61,741 | |
| Class A | | | 18,025 | |
| Class C | | | 122,151 | |
| Professional fees | | | 60,604 | |
| Reports to shareholders and printing fees | | | 93,370 | |
| State registration fees | | | 155,720 | |
| Insurance fees | | | 24,718 | |
| Custody fees | | | 108,150 | |
| Trustees' fees and expenses | | | 135,624 | |
| Repayment of previously waived fees | | | | |
| Class I | | | 210,903 | |
| Miscellaneous expenses | | | 49,106 | |
| Total Expenses | | | 16,233,259 | |
| Less fees waived/reimbursed by investment advisor (Note 8) | | | | |
| Waiver of investment advisory fees - subsidiary | | | (2,069,206 | ) |
| Class C | | | (6,857 | ) |
| Class I | | | (451,573 | ) |
| Less fees waived from investments in affiliated securities | | | (356,841 | ) |
| Net Expenses | | | 13,348,782 | |
| Net Investment Income | | | 34,227,541 | |
| Net realized gain on investments | | | 6,323,585 | |
| Net realized loss on investments - affiliated securities(a) | | | (16,994,749 | ) |
| Net realized loss on futures contracts | | | (87,025,216 | ) |
| Net realized loss on total return swap contracts | | | (12,945,511 | ) |
| Net realized loss on foreign currency transactions | | | (375,255 | ) |
| Net Realized Loss | | | (111,017,146 | ) |
| Net change in unrealized appreciation on investments | | | 1,656,156 | |
| Net change in unrealized appreciation on affiliate investments | | | 32,945,000 | |
| Net change in unrealized appreciation on futures contracts | | | 26,383,223 | |
| Net change in unrealized appreciation on total return swap contracts | | | 387 | |
| Net change in unrealized appreciation on translation of assets and liabilities denominated in foreign currencies | | | 6,544 | |
| Net Change in Unrealized Appreciation | | | 60,991,310 | |
| NET REALIZED AND UNREALIZED LOSS ON INVESTMENTS | | | (50,025,836 | ) |
| NET DECREASE IN NET ASSETS RESULTING FROM OPERATIONS | | $ | (15,798,295 | ) |
| (a) | Includes realized gain or loss as a result of in-kind transactions (See Note 5 in Notes to Financial Statements). |
See Notes to Financial Statements and Financial Highlights.
ALPS | CoreCommodity Management
CompleteCommodities® Strategy Fund
Consolidated Statements of Changes in Net Assets
| | | For the Year Ended October 31, 2024 | | | For the Year Ended October 31, 2023 | |
| OPERATIONS | | | | | | |
| Net investment income | | $ | 34,227,541 | | | $ | 54,020,452 | |
| Net realized loss | | | (111,017,146 | ) | | | (39,551,997 | ) |
| Net change in unrealized appreciation/(depreciation) | | | 60,991,310 | | | | (84,133,655 | ) |
| Net Decrease in Net Assets Resulting from Operations | | | (15,798,295 | ) | | | (69,665,200 | ) |
| | | | | | | | | |
| TOTAL DISTRIBUTIONS | | | | | | | | |
| From distributable earnings | | | | | | | | |
| Investor Class | | | (628,729 | ) | | | (5,853,087 | ) |
| Class A | | | (321,104 | ) | | | (1,025,116 | ) |
| Class C | | | (556,037 | ) | | | (1,863,383 | ) |
| Class I | | | (48,168,669 | ) | | | (104,122,024 | ) |
| Net Decrease in Net Assets from Distributions | | | (49,674,539 | ) | | | (112,863,610 | ) |
| | | | | | | | | |
| BENEFICIAL INTEREST TRANSACTIONS (NOTE 6) | | | | | |
| Shares sold | | | | | | | | |
| Investor Class | | | 6,405,379 | | | | 24,927,696 | |
| Class A | | | 718,516 | | | | 2,221,315 | |
| Class C | | | 708,915 | | | | 3,485,981 | |
| Class I | | | 289,585,856 | | | | 998,720,942 | |
| Dividends reinvested | | | | | | | | |
| Investor Class | | | 504,697 | | | | 4,625,429 | |
| Class A | | | 233,759 | | | | 732,350 | |
| Class C | | | 319,589 | | | | 984,573 | |
| Class I | | | 38,805,976 | | | | 72,055,995 | |
| Shares redeemed, net of redemption fees | | | | | | | | |
| Investor Class | | | (10,658,023 | ) | | | (87,608,141 | ) |
| Class A | | | (5,258,139 | ) | | | (6,069,300 | ) |
| Class C | | | (8,628,856 | ) | | | (11,166,968 | ) |
| Class I | | | (960,357,350 | ) | | | (913,800,802 | ) |
| Net Increase/(Decrease) in Net Assets Derived from Beneficial Interest Transactions | | | (647,619,681 | ) | | | 89,109,070 | |
| | | | | | | | | |
| Net decrease in net assets | | | (713,092,515 | ) | | | (93,419,740 | ) |
| | | | | | | | | |
| NET ASSETS | | | | | | | | |
| Beginning of year | | | 1,653,621,164 | | | | 1,747,040,904 | |
| End of year | | $ | 940,528,649 | | | $ | 1,653,621,164 | |
See Notes to Financial Statements and Financial Highlights.
ALPS | CoreCommodity Management
CompleteCommodities® Strategy Fund – Investor Class
Consolidated Financial Highlights
Selected data for a share of beneficial interest outstanding throughout the periods indicated:
| | | For the Year Ended October 31, 2024 | | | For the Year Ended October 31, 2023 | | | For the Year Ended October 31, 2022 | | | For the Year Ended October 31, 2021 | | | For the Year Ended October 31, 2020 | |
| Net asset value, beginning of period(a) | | $ | 7.51 | | | $ | 8.47 | | | $ | 9.50 | | | $ | 6.06 | | | $ | 6.68 | |
| INCOME/(LOSS) FROM INVESTMENT OPERATIONS: | | | | | | | | | | | | | | | | | | | | |
| Net investment income(b) | | | 0.20 | | | | 0.21 | | | | 0.05 | | | | 0.11 | | | | 0.02 | |
| Net realized and unrealized gain/(loss) | | | (0.19 | ) | | | (0.61 | ) | | | 0.62 | | | | 3.35 | | | | (0.58 | ) |
| Total from investment operations | | | 0.01 | | | | (0.40 | ) | | | 0.67 | | | | 3.46 | | | | (0.56 | ) |
| DISTRIBUTIONS: | | | | | | | | | | | | | | | | | | | | |
| From net investment income | | | (0.20 | ) | | | (0.56 | ) | | | (1.70 | ) | | | (0.02 | ) | | | (0.06 | ) |
| From net realized gains | | | (0.03 | ) | | | – | | | | – | | | | – | | | | – | |
| Total distributions | | | (0.23 | ) | | | (0.56 | ) | | | (1.70 | ) | | | (0.02 | ) | | | (0.06 | ) |
| REDEMPTION FEES ADDED TO PAID-IN CAPITAL (NOTE 6) | | | 0.00 | (c) | | | – | | | | – | | | | 0.00 | (c) | | | 0.00 | (c) |
| Net increase/(decrease) in net asset value | | | (0.22 | ) | | | (0.96 | ) | | | (1.03 | ) | | | 3.44 | | | | (0.62 | ) |
| Net asset value, end of year | | $ | 7.29 | | | $ | 7.51 | | | $ | 8.47 | | | $ | 9.50 | | | $ | 6.06 | |
| TOTAL RETURN(d) | | | 0.36 | % | | | (5.01 | )% | | | 9.65 | % | | | 57.25 | % | | | (8.44 | )% |
| RATIOS/SUPPLEMENTAL DATA: | | | | | | | | | | | | | | | | | | | | |
| Net assets, end of year (000s) | | $ | 17,849 | | | $ | 22,202 | | | $ | 89,645 | | | $ | 89,300 | | | $ | 49,060 | |
| Ratio of expenses to average net assets excluding fee waivers and reimbursements | | | 1.36 | %(e) | | | 1.34 | %(e) | | | 1.36 | %(e) | | | 1.37 | %(e) | | | 1.40 | %(e) |
| Ratio of expenses to average net assets including fee waivers and reimbursements | | | 1.32 | % | | | 1.34 | % | | | 1.36 | % | | | 1.37 | % | | | 1.40 | % |
| Ratio of net investment income to average net assets | | | 2.79 | % | | | 2.66 | % | | | 0.55 | % | | | 1.36 | % | | | 0.40 | % |
| Portfolio turnover rate(f) | | | 72 | % | | | 59 | % | | | 54 | % | | | 54 | % | | | 98 | % |
| (a) | Per share amounts and ratios to average net assets include income and expenses of the CoreCommodity Management Cayman Commodity Fund Ltd. (wholly-owned subsidiary). |
| (b) | Calculated using the average shares method. |
| (c) | Less than $0.005 or ($0.005) per share. |
| (d) | Total returns are for the period indicated. Total returns would have been lower had certain expenses not been waived during the period. Returns shown do not reflect the deduction of taxes that a shareholder would pay on Fund distributions or the redemption of Fund shares. |
| (e) | The ratio of operating expenses excluding fee waiver/reimbursements to average net assets is calculated excluding the waived Subsidiary management fee (see Note 8 for additional detail).The ratio inclusive of that fee would be for the years ended October 31, 2024, October 31, 2023, October 31, 2022, October 31, 2021 and October 31, 2020, respectively, 1.50%, 1.52%, 1.53%, 1.55% and 1.58%. |
| (f) | Portfolio turnover does not include securities received or delivered in-kind. |
See Notes to Financial Statements and Financial Highlights.
ALPS | CoreCommodity Management
CompleteCommodities® Strategy Fund – Class A
Consolidated Financial Highlights
Selected data for a share of beneficial interest outstanding throughout the periods indicated:
| | | For the Year Ended October 31, 2024 | | | For the Year Ended October 31, 2023 | | | For the Year Ended October 31, 2022 | | | For the Year Ended October 31, 2021 | | | For the Year Ended October 31, 2020 | |
| Net asset value, beginning of period(a) | | $ | 7.53 | | | $ | 8.48 | | | $ | 9.52 | | | $ | 6.07 | | | $ | 6.68 | |
| | | | | | | | | | | | | | | | | | | | | |
| INCOME FROM INVESTMENT OPERATIONS: | | | | | | | | | | | | | | | | | | | | |
| Net investment income(b) | | | 0.21 | | | | 0.22 | | | | 0.06 | | | | 0.13 | | | | 0.04 | |
| Net realized and unrealized gain/(loss) | | | (0.19 | ) | | | (0.61 | ) | | | 0.60 | | | | 3.34 | | | | (0.59 | ) |
| Total from investment operations | | | 0.02 | | | | (0.39 | ) | | | 0.66 | | | | 3.47 | | | | (0.55 | ) |
| | | | | | | | | | | | | | | | | | | | | |
| DISTRIBUTIONS: | | | | | | | | | | | | | | | | | | | | |
| From net investment income | | | (0.20 | ) | | | (0.56 | ) | | | (1.70 | ) | | | (0.02 | ) | | | (0.06 | ) |
| From net realized gains | | | (0.03 | ) | | | – | | | | – | | | | – | | | | – | |
| Total distributions | | | (0.23 | ) | | | (0.56 | ) | | | (1.70 | ) | | | (0.02 | ) | | | (0.06 | ) |
| | | | | | | | | | | | | | | | | | | | | |
| REDEMPTION FEES ADDED TO PAID-IN CAPITAL (NOTE 6) | | | – | | | | – | | | | – | | | | – | | | | 0.00 | (c) |
| Net increase/(decrease) in net asset value | | | (0.21 | ) | | | (0.95 | ) | | | (1.04 | ) | | | 3.45 | | | | (0.61 | ) |
| Net asset value, end of year | | $ | 7.32 | | | $ | 7.53 | | | $ | 8.48 | | | $ | 9.52 | | | $ | 6.07 | |
| TOTAL RETURN(d) | | | 0.49 | % | | | (4.88 | )% | | | 9.52 | % | | | 57.33 | % | | | (8.29 | )% |
| | | | | | | | | | | | | | | | | | | | | |
| RATIOS/SUPPLEMENTAL DATA: | | | | | | | | | | | | | | | | | | | | |
| Net assets, end of year (000s) | | $ | 6,726 | | | $ | 11,362 | | | $ | 16,246 | | | $ | 7,349 | | | $ | 1,254 | |
| Ratio of expenses to average net assets excluding fee waivers and reimbursements | | | 1.25 | %(e) | | | 1.25 | %(e) | | | 1.30 | %(e) | | | 1.32 | %(e) | | | 1.34 | %(e) |
| Ratio of expenses to average net assets including fee waivers and reimbursements | | | 1.22 | % | | | 1.25 | % | | | 1.30 | % | | | 1.32 | % | | | 1.34 | % |
| Ratio of net investment income to average net assets | | | 2.90 | % | | | 2.83 | % | | | 0.64 | % | | | 1.56 | % | | | 0.62 | % |
| Portfolio turnover rate(f) | | | 72 | % | | | 59 | % | | | 54 | % | | | 54 | % | | | 98 | % |
| (a) | Per share amounts and ratios to average net assets include income and expenses of the CoreCommodity Management Cayman Commodity Fund Ltd. (wholly-owned subsidiary). |
| (b) | Calculated using the average shares method. |
| (c) | Less than $0.005 or ($0.005) per share. |
| (d) | Total returns are for the period indicated. Total returns would have been lower had certain expenses not been waived during the period. Returns shown do not reflect the deduction of taxes that a shareholder would pay on Fund distributions or the redemption of Fund shares. Returns shown exclude any applicable sales charges. |
| (e) | The ratio of operating expenses excluding fee waiver/reimbursements to average net assets is calculated excluding the waived Subsidiary management fee (see Note 8 for additional detail).The ratio inclusive of that fee would be for the years ended October 31, 2024, October 31, 2023, October 31, 2022, October 31, 2021 and October 31, 2020, respectively, 1.39%, 1.43%, 1.47%, 1.50% and 1.52%. |
| (f) | Portfolio turnover does not include securities received or delivered in-kind. |
See Notes to Financial Statements and Financial Highlights.
ALPS | CoreCommodity Management
CompleteCommodities® Strategy Fund – Class C
Consolidated Financial Highlights
Selected data for a share of beneficial interest outstanding throughout the periods indicated:
| | | For the Year Ended October 31, 2024 | | | For the Year Ended October 31,
2023 | | | For the Year Ended October 31, 2022 | | | For the Year Ended October 31, 2021 | | | For the Year Ended October 31, 2020 | |
| Net asset value, beginning of period(a) | | $ | 6.84 | | | $ | 7.80 | | | $ | 8.94 | | | $ | 5.73 | | | $ | 6.35 | |
| INCOME/(LOSS) FROM INVESTMENT OPERATIONS: | | | | | | | | | | | | | | | | | | | | |
| Net investment income/(loss)(b) | | | 0.14 | | | | 0.14 | | | | (0.01 | )(c) | | | 0.07 | | | | (0.02 | )(c) |
| Net realized and unrealized gain/(loss) | | | (0.17 | ) | | | (0.54 | ) | | | 0.56 | | | | 3.14 | | | | (0.54 | ) |
| Total from investment operations | | | (0.03 | ) | | | (0.40 | ) | | | 0.55 | | | | 3.21 | | | | (0.56 | ) |
| DISTRIBUTIONS: | | | | | | | | | | | | | | | | | | | | |
| From net investment income | | | (0.20 | ) | | | (0.56 | ) | | | (1.69 | ) | | | (0.01 | ) | | | (0.06 | ) |
| From net realized gains | | | (0.03 | ) | | | – | | | | – | | | | – | | | | – | |
| Total distributions | | | (0.23 | ) | | | (0.56 | ) | | | (1.69 | ) | | | (0.01 | ) | | | (0.06 | ) |
| REDEMPTION FEES ADDED TO PAID-IN CAPITAL (NOTE 6) | | | – | | | | – | | | | – | | | | 0.01 | | | | – | |
| Net increase/(decrease) in net asset value | | | (0.26 | ) | | | (0.96 | ) | | | (1.14 | ) | | | 3.21 | | | | (0.62 | ) |
| Net asset value, end of year | | $ | 6.58 | | | $ | 6.84 | | | $ | 7.80 | | | $ | 8.94 | | | $ | 5.73 | |
| TOTAL RETURN(d) | | | (0.31 | )% | | | (5.58 | )% | | | 8.78 | % | | | 56.37 | % | | | (8.97 | )% |
| RATIOS/SUPPLEMENTAL DATA: | | | | | | | | | | | | | | | | | | | | |
| Net assets, end of year (000s) | | $ | 9,574 | | | $ | 17,910 | | | $ | 27,856 | | | $ | 13,789 | | | $ | 2,354 | |
| Ratio of expenses to average net assets excluding fee waivers and reimbursements | | | 2.11 | %(e) | | | 2.01 | %(e) | | | 2.00 | %(e) | | | 2.00 | %(e) | | | 2.05 | %(e) |
| Ratio of expenses to average net assets including fee waivers and reimbursements | | | 2.02 | % | | | 2.01 | % | | | 2.00 | % | | | 2.00 | % | | | 2.05 | % |
| Ratio of net investment income/(loss) to average net assets | | | 2.08 | % | | | 2.03 | % | | | (0.08 | )% | | | 0.84 | % | | | (0.28 | )% |
| Portfolio turnover rate(f) | | | 72 | % | | | 59 | % | | | 54 | % | | | 54 | % | | | 98 | % |
| (a) | Per share amounts and ratios to average net assets include income and expenses of the CoreCommodity Management Cayman Commodity Fund Ltd. (wholly-owned subsidiary). |
| (b) | Calculated using the average shares method. |
| (c) | The per share amount does not correspond to activity reflected in the Statement of Operations due to class specific expenses during the period. |
| (d) | Total returns are for the period indicated. Total returns would have been lower had certain expenses not been waived during the period. Returns shown do not reflect the deduction of taxes that a shareholder would pay on Fund distributions or the redemption of Fund shares. Returns shown exclude any applicable sales charges. |
| (e) | The ratio of operating expenses excluding fee waiver/reimbursements to average net assets is calculated excluding the waived Subsidiary management fee (see Note 8 for additional detail).The ratio inclusive of that fee would be for the years ended October 31, 2024, October 31, 2023, October 31, 2022, October 31, 2021 and October 31, 2020, respectively, 2.25%, 2.19%, 2.18%, 2.18% and 2.23%. |
| (f) | Portfolio turnover does not include securities received or delivered in-kind. |
See Notes to Financial Statements and Financial Highlights.
ALPS | CoreCommodity Management
CompleteCommodities® Strategy Fund – Class I
Consolidated Financial Highlights
Selected data for a share of beneficial interest outstanding throughout the periods indicated:
| | | For the Year Ended October 31, 2024 | | | For the Year Ended October 31, 2023 | | | For the Year Ended October 31, 2022 | | | For the Year Ended October 31,
2021 | | | For the Year Ended October 31, 2020 | |
| Net asset value, beginning of period(a) | | $ | 7.65 | | | $ | 8.61 | | | $ | 9.62 | | | $ | 6.12 | | | $ | 6.73 | |
| INCOME/(LOSS) FROM INVESTMENT OPERATIONS: | | | | | | | | | | | | | | | | | | | | |
| Net investment income(b) | | | 0.22 | | | | 0.24 | | | | 0.08 | | | | 0.14 | | | | 0.04 | |
| Net realized and unrealized gain/(loss) | | | (0.18 | ) | | | (0.63 | ) | | | 0.61 | | | | 3.38 | | | | (0.58 | ) |
| Total from investment operations | | | 0.04 | | | | (0.39 | ) | | | 0.69 | | | | 3.52 | | | | (0.54 | ) |
| DISTRIBUTIONS: | | | | | | | | | | | | | | | | | | | | |
| From net investment income | | | (0.21 | ) | | | (0.57 | ) | | | (1.70 | ) | | | (0.02 | ) | | | (0.07 | ) |
| From net realized gains | | | (0.03 | ) | | | – | | | | – | | | | – | | | | – | |
| Total distributions | | | (0.24 | ) | | | (0.57 | ) | | | (1.70 | ) | | | (0.02 | ) | | | (0.07 | ) |
| REDEMPTION FEES ADDED TO PAID-IN CAPITAL (NOTE 6) | | | – | | | | – | | | | (0.00 | )(c) | | | 0.00 | (c) | | | 0.00 | (c) |
| Net increase/(decrease) in net asset value | | | (0.20 | ) | | | (0.96 | ) | | | (1.01 | ) | | | 3.50 | | | | (0.61 | ) |
| Net asset value, end of year | | $ | 7.45 | | | $ | 7.65 | | | $ | 8.61 | | | $ | 9.62 | | | $ | 6.12 | |
| TOTAL RETURN(d) | | | 0.67 | % | | | (4.87 | )% | | | 9.85 | % | | | 57.74 | % | | | (8.18 | )% |
| RATIOS/SUPPLEMENTAL DATA: | | | | | | | | | | | | | | | | | | | | |
| Net assets, end of year (000s) | | $ | 906,379 | | | $ | 1,602,146 | | | $ | 1,613,293 | | | $ | 1,154,123 | | | $ | 439,254 | |
| Ratio of expenses to average net assets excluding fee waivers and reimbursements | | | 1.17 | %(e) | | | 1.16 | %(e) | | | 1.08 | %(e) | | | 1.09 | %(e) | | | 1.15 | %(e) |
| Ratio of expenses to average net assets including fee waivers and reimbursements | | | 1.12 | % | | | 1.15 | % | | | 1.08 | % | | | 1.09 | % | | | 1.15 | % |
| Ratio of net investment income to average net assets | | | 2.92 | % | | | 3.02 | % | | | 0.84 | % | | | 1.68 | % | | | 0.64 | % |
| Portfolio turnover rate(f) | | | 72 | % | | | 59 | % | | | 54 | % | | | 54 | % | | | 98 | % |
| (a) | Per share amounts and ratios to average net assets include income and expenses of the CoreCommodity Management Cayman Commodity Fund Ltd. (wholly-owned subsidiary). |
| (b) | Calculated using the average shares method. |
| (c) | Less than $0.005 or ($0.005) per share. |
| (d) | Total returns are for the period indicated. Total returns would have been lower had certain expenses not been waived during the period. Returns shown do not reflect the deduction of taxes that a shareholder would pay on Fund distributions or the redemption of Fund shares. |
| (e) | The ratio of operating expenses excluding fee waiver/reimbursements to average net assets is calculated excluding the waived Subsidiary management fee (see Note 8 for additional detail).The ratio inclusive of that fee would be for the years ended October 31, 2024, October 31, 2023, October 31, 2022, October 31, 2021 and October 31, 2020, respectively, 1.32%, 1.34%, 1.26%, 1.27% and 1.33%. |
| (f) | Portfolio turnover does not include securities received or delivered in-kind. |
See Notes to Financial Statements and Financial Highlights.
ALPS | Kotak India ESG Fund
| Statement of Investments | October 31, 2024 |
| | | Shares | | | Value (Note 2) | |
| COMMON STOCKS (100.43%) | | | | | | | | |
| Communication Services (7.63%) | | | | | | | | |
| Diversified Telecommunication Services (1.78%) | |
| Indus Towers, Ltd.(a) | | | 1,751,179 | | | $ | 7,065,891 | |
| | | | | | | | | |
| Entertainment (1.37%) | | | | | | | | |
| PVR Inox, Ltd.(a) | | | 292,388 | | | | 5,436,589 | |
| | | | | | | | | |
| Wireless Telecommunication Services (4.48%) | |
| Bharti Airtel, Ltd. | | | 868,727 | | | | 16,627,859 | |
| Bharti Airtel, Ltd. partly paid | | | 78,914 | | | | 1,128,816 | |
| | | | | | | | 17,756,675 | |
| | | | | | | | | |
| TOTAL COMMUNICATION SERVICES | | | | | | | 30,259,155 | |
| | | | | | | | | |
| Consumer Discretionary (9.19%) | | | | | | | | |
| Automobile Components (4.35%) | | | | | | | | |
| Apollo Tyres, Ltd. | | | 1,362,962 | | | | 8,148,178 | |
| UNO Minda, Ltd. | | | 780,321 | | | | 9,088,981 | |
| | | | | | | | 17,237,159 | |
| | | | | | | | | |
| Automobiles (0.98%) | | | | | | | | |
| Hyundai Motor India, Ltd.(a) | | | 178,642 | | | | 3,872,024 | |
| | | | | | | | | |
| Hotels, Restaurants & Leisure (2.85%) | | | | | | | | |
| Zomato, Ltd.(a) | | | 3,946,985 | | | | 11,323,928 | |
| | | | | | | | | |
| Specialty Retail (1.01%) | | | | | | | | |
| BrainBees Solutions, Ltd.(a) | | | 536,605 | | | | 4,007,008 | |
| | | | | | | | | |
| TOTAL CONSUMER DISCRETIONARY | | | | | | | 36,440,119 | |
| | | | | | | | | |
| Consumer Staples (5.63%) | | | | | | | | |
| Food Products (1.43%) | | | | | | | | |
| Nestle India, Ltd. | | | 212,012 | | | | 5,701,662 | |
| | | | | | | | | |
| Personal Care Products (4.20%) | | | | | | | | |
| Dabur India, Ltd. | | | 1,216,970 | | | | 7,803,632 | |
| Godrej Consumer Products, Ltd. | | | 580,469 | | | | 8,844,495 | |
| | | | | | | | 16,648,127 | |
| | | | | | | | | |
| TOTAL CONSUMER STAPLES | | | | | | | 22,349,789 | |
| | | | | | | | | |
| Energy (6.61%) | | | | | | | | |
| Oil, Gas & Consumable Fuels (6.61%) | | | | | | | | |
| Reliance Industries, Ltd. | | | 1,657,310 | | | | 26,205,345 | |
| | | | | | | | | |
| TOTAL ENERGY | | | | | | | 26,205,345 | |
| | | | | | | | | |
| Financials (25.43%) | | | | | | | | |
| Banks (22.37%) | | | | | | | | |
| Axis Bank, Ltd. | | | 1,770,305 | | | | 24,318,965 | |
| HDFC Bank, Ltd., ADR | | | 62,825 | | | | 3,959,860 | |
| HDFC Bank, Ltd. | | | 745,000 | | | | 15,313,261 | |
| | | Shares | | | Value (Note 2) | |
| Banks (continued) | | | | | | |
| ICICI Bank, Ltd., Sponsored ADR | | | 800,000 | | | $ | 24,328,000 | |
| ICICI Bank, Ltd. | | | 679,743 | | | | 10,426,955 | |
| IndusInd Bank, Ltd. | | | 828,031 | | | | 10,359,142 | |
| | | | | | | | 88,706,183 | |
| | | | | | | | | |
| Financial Services (0.29%) | | | | | | | | |
| Bajaj Housing Finance, Ltd.(a) | | | 728,664 | | | | 1,162,153 | |
| | | | | | | | | |
| Insurance (2.77%) | | | | | | | | |
| Max Financial Services, Ltd.(a) | | | 721,572 | | | | 10,994,521 | |
| | | | | | | | | |
| TOTAL FINANCIALS | | | | | | | 100,862,857 | |
| | | | | | | | | |
| Health Care (8.34%) | | | | | | | | |
| Health Care Providers & Services (5.75%) | | | | | | | | |
| Fortis Healthcare, Ltd. | | | 1,739,937 | | | | 12,917,400 | |
| Max Healthcare Institute, Ltd. | | | 820,056 | | | | 9,899,202 | |
| | | | | | | | 22,816,602 | |
| | | | | | | | | |
| Pharmaceuticals (2.59%) | | | | | | | | |
| Sun Pharmaceutical Industries, Ltd. | | | 466,852 | | | | 10,245,191 | |
| | | | | | | | | |
| TOTAL HEALTH CARE | | | | | | | 33,061,793 | |
| | | | | | | | | |
| Industrials (15.42%) | | | | | | | | |
| Aerospace & Defense (1.30%) | | | | | | | | |
| Bharat Electronics, Ltd. | | | 1,533,706 | | | | 5,177,175 | |
| | | | | | | | | |
| Building Products (0.90%) | | | | | | | | |
| Apollo Pipes, Ltd. | | | 567,537 | | | | 3,571,196 | |
| | | | | | | | | |
| Construction & Engineering (4.72%) | | | | | | | | |
| Larsen & Toubro, Ltd. | | | 435,716 | | | | 18,716,930 | |
| | | | | | | | | |
| Electrical Equipment (1.30%) | | | | | | | | |
| GE Vernova T&D India Ltd(a) | | | 245,809 | | | | 5,173,415 | |
| | | | | | | | | |
| Machinery (4.53%) | | | | | | | | |
| Ashok Leyland, Ltd. | | | 3,450,524 | | | | 8,523,385 | |
| Kross, Ltd.(a) | | | 395,158 | | | | 788,425 | |
| Thermax, Ltd. | | | 147,796 | | | | 8,650,303 | |
| | | | | | | | 17,962,113 | |
| | | | | | | | | |
| Passenger Airlines (2.67%) | | | | | | | | |
| InterGlobe Aviation, Ltd.(a)(b)(c) | | | 220,139 | | | | 10,575,362 | |
| | | | | | | | | |
| TOTAL INDUSTRIALS | | | | | | | 61,176,191 | |
| | | | | | | | | |
| Information Technology (9.80%) | | | | | | | | |
| IT Services (9.80%) | | | | | | | | |
| Cognizant Technology Solutions Corp., Class A | | | 201,336 | | | | 15,017,652 | |
| Infosys, Ltd., Sponsored ADR | | | 609,984 | | | | 12,754,766 | |
See Notes to Financial Statements and Financial Highlights.
ALPS | Kotak India ESG Fund
| Statement of Investments | October 31, 2024 |
| | | Shares | | | Value (Note 2) | |
| IT Services (continued) | | | | | | |
| Tech Mahindra, Ltd. | | | 581,974 | | | $ | 11,077,303 | |
| | | | | | | | 38,849,721 | |
| | | | | | | | | |
| TOTAL INFORMATION TECHNOLOGY | | | | | | | 38,849,721 | |
| | | | | | | | | |
| Materials (6.49%) | | | | | | | | |
| Chemicals (2.05%) | | | | | | | | |
| Carborundum Universal, Ltd. | | | 497,294 | | | | 8,135,853 | |
| | | | | | | | | |
| Construction Materials (3.05%) | | | | | | | | |
| UltraTech Cement, Ltd. | | | 92,080 | | | | 12,091,566 | |
| | | | | | | | | |
| Paper & Forest Products (1.39%) | | | | | | | | |
| Century Plyboards India, Ltd. | | | 547,415 | | | | 5,510,133 | |
| | | | | | | | | |
| TOTAL MATERIALS | | | | | | | 25,737,552 | |
| | | | | | | | | |
| Real Estate (3.98%) | | | | | | | | |
| Real Estate Management & Development (3.98%) | | | | | | | | |
| Brigade Enterprises, Ltd. | | | 664,637 | | | | 9,278,229 | |
| Sobha Developers, Ltd. | | | 326,401 | | | | 6,148,793 | |
| Sobha, Ltd. | | | 40,728 | | | | 363,778 | |
| | | | | | | | 15,790,800 | |
| | | | | | | | | |
| TOTAL REAL ESTATE | | | | | | | 15,790,800 | |
| | | | | | | | | |
| Utilities (1.91%) | | | | | | | | |
| Electric Utilities (1.91%) | | | | | | | | |
| Power Grid Corp. of India, Ltd. | | | 1,989,305 | | | | 7,567,277 | |
| | | | | | | | | |
| TOTAL UTILITIES | | | | | | | 7,567,277 | |
| | | | | | | | | |
| TOTAL COMMON STOCKS | | | | | | | | |
| (Cost $316,413,664) | | | | | | | 398,300,599 | |
| | | 7-Day Yield | | | Shares | | | Value (Note 2) | |
| SHORT TERM INVESTMENTS (1.06%) | | | | | | | | | |
| Money Market Funds (1.06%) | | | | | | | | | |
| Goldman Sachs Financial Square Government Fund - Institutional Class | | | 4.778 | % | | | 4,189,000 | | | | 4,189,000 | |
| | | | | | | | | | | | | |
| TOTAL MONEY MARKET FUNDS | | | | | | | | | | | 4,189,000 | |
| | | | | | | | | | | | | |
| TOTAL SHORT TERM INVESTMENTS | | | | | | | | | | | | |
| (Cost $4,189,000) | | | | | | | | | | | 4,189,000 | |
| | | Value (Note 2) | |
| TOTAL INVESTMENTS (101.49%) | | | |
| (Cost $320,602,664) | | $ | 402,489,599 | |
| | | | | |
| Liabilities In Excess Of Other Assets (-1.49%) | | | (5,912,698 | ) |
| | | | | |
| NET ASSETS (100.00%) | | $ | 396,576,901 | |
| (a) | Non-Income Producing Security. |
| (b) | Securities exempt from registration under Rule 144A of the Securities Act of 1933. These securities may be resold in transactions exempt from registration, normally to qualified institutional buyers. As of October 31, 2024, the aggregate market value of those securities was $10,575,362, representing 2.67% of net assets. |
| (c) | Securities were purchased pursuant to Regulation S under the Securities Act of 1933, which exempts securities offered and sold outside of the United States from registration. Such securities cannot be sold in the United States without either an effective registration statement filed pursuant to the Securities Act of 1933, or pursuant to an exemption from registration. These securities have been deemed liquid under guidelines utilized by the Valuation Designee. As of October 31, 2024 the aggregate market value of those securities was $10,575,362, representing 2.67% of net assets. |
For Fund compliance purposes, the Fund's industry classifications refer to any one or more of the industry sub-classifications used by one or more widely recognized market indexes or ratings group indexes, and/or as defined by Fund management. This definition may not apply for purposes of this report, which may combine industry sub-classifications for reporting ease. Industries are shown as a percent of net assets.
See Notes to Financial Statements and Financial Highlights.
ALPS | Kotak India ESG Fund
| Statement of Assets and Liabilities | October 31, 2024 |
| ASSETS | | | |
| Investments, at value | | $ | 402,489,599 | |
| Cash | | | 1,963,640 | |
| Foreign currency, at value (Cost $5,563,678) | | | 4,819,303 | |
| Receivable for investments sold | | | 43,797 | |
| Receivable for shares sold | | | 2,332 | |
| Dividends and interest receivable | | | 246,084 | |
| Prepaid expenses and other assets | | | 26,017 | |
| Total Assets | | | 409,590,772 | |
| LIABILITIES | | | | |
| Payable for shares redeemed | | | 45,560 | |
| Payable for foreign capital gains tax | | | 12,658,937 | |
| Investment advisory fees payable | | | 194,490 | |
| Administration and transfer agency fees payable | | | 59,249 | |
| Distribution and services fees payable | | | 6,000 | |
| Trustees' fees and expenses payable | | | 737 | |
| Professional fees payable | | | 25,092 | |
| Accrued expenses and other liabilities | | | 23,806 | |
| Total Liabilities | | | 13,013,871 | |
| NET ASSETS | | $ | 396,576,901 | |
| NET ASSETS CONSIST OF | | | | |
| Paid-in capital | | $ | 279,395,083 | |
| Total distributable earnings/(accumulated losses) | | | 117,181,818 | |
| NET ASSETS | | $ | 396,576,901 | |
| INVESTMENTS, AT COST | | $ | 320,602,664 | |
| PRICING OF SHARES | | | | |
| Investor Class: | | | | |
| Net Asset Value, offering and redemption price per share | | $ | 19.34 | |
| Net Assets | | $ | 5,302,616 | |
| Shares of beneficial interest outstanding (unlimited number of shares, no par value common stock authorized) | | | 274,213 | |
| Class A: | | | | |
| Net Asset Value, offering and redemption price per share | | $ | 19.30 | |
| Net Assets | | $ | 2,589,843 | |
| Shares of beneficial interest outstanding (unlimited number of shares, no par value common stock authorized) | | | 134,159 | |
| Maximum offering price per share ((NAV/0.9450), based on maximum sales charge of 5.50% of the offering price) | | $ | 20.43 | |
| Class C: | | | | |
| Net Asset Value, offering and redemption price per share(a) | | $ | 17.20 | |
| Net Assets | | $ | 2,351,013 | |
| Shares of beneficial interest outstanding (unlimited number of shares, no par value common stock authorized) | | | 136,655 | |
| Class I: | | | | |
| Net Asset Value, offering and redemption price per share | | $ | 20.27 | |
| Net Assets | | $ | 35,065,504 | |
| Shares of beneficial interest outstanding (unlimited number of shares, no par value common stock authorized) | | | 1,730,069 | |
| Class II: | | | | |
| Net Asset Value, offering and redemption price per share | | $ | 20.51 | |
| Net Assets | | $ | 351,267,925 | |
| Shares of beneficial interest outstanding (unlimited number of shares, no par value common stock authorized) | | | 17,123,586 | |
| (a) | Redemption price per share may be reduced for any applicable contingent deferred sales charge. For a description of a possible sales charge, please see the Fund's Prospectus. |
See Notes to Financial Statements and Financial Highlights.
ALPS | Kotak India ESG Fund
| Statement of Operations | For the Year Ended October 31, 2024 |
| INVESTMENT INCOME | | | |
| Dividends | | $ | 3,215,135 | |
| Foreign taxes withheld on dividends | | | (534,422 | ) |
| Interest and other income | | | 575,812 | |
| Total Investment Income | | | 3,256,525 | |
| | | | | |
| EXPENSES | | | | |
| Investment advisory fees | | | 2,476,675 | |
| Administrative fees | | | 600,800 | |
| Delegated transfer agent equivalent services fees | | | 17,832 | |
| Distribution and service fees | | | | |
| Investor Class | | | 17,296 | |
| Class A | | | 6,290 | |
| Class C | | | 18,320 | |
| Professional fees | | | 35,831 | |
| Reports to shareholders and printing fees | | | 11,182 | |
| State registration fees | | | 79,043 | |
| Custody fees | | | 55,905 | |
| Trustees' fees and expenses | | | 32,427 | |
| Repayment of previously waived fees | | | | |
| Investor Class | | | 28 | |
| Class C | | | 157 | |
| Class I | | | 641 | |
| Miscellaneous expenses | | | 37,909 | |
| Total Expenses | | | 3,390,336 | |
| Less fees waived/reimbursed by investment advisor (Note 8) | | | | |
| Class II | | | (420,514 | ) |
| Net Expenses | | | 2,969,822 | |
| Net Investment Income | | | 286,703 | |
| Net realized gain on investments | | | 66,813,502 | |
| Net realized loss on foreign currency transactions | | | (63,407 | ) |
| Net realized loss on foreign capital gains tax | | | (11,277,291 | ) |
| Net Realized Gain | | | 55,472,804 | |
| Net change in unrealized appreciation on investments | | | 25,589,391 | |
| Net change in unrealized depreciation on translation of assets and liabilities denominated in foreign currencies | | | (41,214 | ) |
| Net change in unrealized depreciation on foreign capital gains tax | | | (3,905,986 | ) |
| Net Change in Unrealized Appreciation | | | 21,642,191 | |
| NET REALIZED AND UNREALIZED GAIN ON INVESTMENTS | | | 77,114,995 | |
| NET INCREASE IN NET ASSETS RESULTING FROM OPERATIONS | | $ | 77,401,698 | |
See Notes to Financial Statements and Financial Highlights.
ALPS | Kotak India ESG Fund
Statements of Changes in Net Assets
| | | For the Year Ended October 31, 2024 | | | For the Year Ended October 31, 2023 | |
| OPERATIONS | | | | | | |
| Net investment income | | $ | 286,703 | | | $ | 526,318 | |
| Net realized gain | | | 55,472,804 | | | | 18,596,925 | |
| Net change in unrealized appreciation | | | 21,642,191 | | | | 2,624,176 | |
| Net Increase in Net Assets Resulting from Operations | | | 77,401,698 | | | | 21,747,419 | |
| | | | | | | | | |
| TOTAL DISTRIBUTIONS | | | | | | | | |
| From distributable earnings | | | | | | | | |
| Investor Class | | | (214,130 | ) | | | (59,404 | ) |
| Class A | | | (68,855 | ) | | | (14,494 | ) |
| Class C | | | (66,560 | ) | | | (17,218 | ) |
| Class I | | | (1,081,718 | ) | | | (235,995 | ) |
| Class II | | | (12,029,229 | ) | | | (5,145,390 | ) |
| Net Decrease in Net Assets from Distributions | | | (13,460,492 | ) | | | (5,472,501 | ) |
| | | | | | | | | |
| BENEFICIAL INTEREST TRANSACTIONS (NOTE 6) | | | | | | | | |
| Shares sold | | | | | | | | |
| Investor Class | | | 2,929,288 | | | | 1,656,774 | |
| Class A | | | 931,483 | | | | 654,565 | |
| Class C | | | 946,442 | | | | 485,951 | |
| Class I | | | 8,395,129 | | | | 10,278,948 | |
| Class II | | | 35,000,000 | | | | 10,000,000 | |
| Dividends reinvested | | | | | | | | |
| Investor Class | | | 179,515 | | | | 48,934 | |
| Class A | | | 60,735 | | | | 12,562 | |
| Class C | | | 66,069 | | | | 17,218 | |
| Class I | | | 1,045,519 | | | | 233,078 | |
| Class II | | | 12,029,229 | | | | 5,145,390 | |
| Shares redeemed, net of redemption fees | | | | | | | | |
| Investor Class | | | (3,237,236 | ) | | | (962,391 | ) |
| Class A | | | (229,770 | ) | | | (60,747 | ) |
| Class C | | | (121,084 | ) | | | (393,111 | ) |
| Class I | | | (3,506,538 | ) | | | (3,062,056 | ) |
| Class II | | | (45,000,000 | ) | | | (75,000,000 | ) |
| Net Increase/(Decrease) in Net Assets Derived from Beneficial Interest Transactions | | | 9,488,781 | | | | (50,944,885 | ) |
| | | | | | | | | |
| Net increase/(decrease) in net assets | | | 73,429,987 | | | | (34,669,967 | ) |
| | | | | | | | | |
| NET ASSETS | | | | | | | | |
| Beginning of year | | | 323,146,914 | | | | 357,816,881 | |
| End of year | | $ | 396,576,901 | | | $ | 323,146,914 | |
See Notes to Financial Statements and Financial Highlights.
ALPS | Kotak India ESG Fund – Investor Class
Financial Highlights
Selected data for a share of beneficial interest outstanding throughout the periods indicated:
| | | For the Year Ended October 31, 2024 | | | For the Year Ended October 31, 2023 | | | For the Year Ended October 31, 2022 | | | For the Year Ended October 31, 2021 | | | For the Year Ended October 31, 2020 | |
| Net asset value, beginning of period | | $ | 16.32 | | | $ | 15.78 | | | $ | 18.70 | | | $ | 12.66 | | | $ | 13.02 | (a) |
| INCOME/(LOSS) FROM INVESTMENT OPERATIONS: | | | | | | | | | | |
| Net investment loss(b) | | | (0.07 | )(c) | | | (0.07 | )(c) | | | (0.12 | ) | | | (0.12 | ) | | | (0.07 | )(c) |
| Net realized and unrealized gain/(loss) | | | 3.85 | | | | 0.85 | | | | (1.82 | ) | | | 6.16 | | | | (0.93 | ) |
| Total from investment operations | | | 3.78 | | | | 0.78 | | | | (1.94 | ) | | | 6.04 | | | | (1.00 | ) |
| DISTRIBUTIONS: | | | | | | | | | | | | | | | | | | | | |
| From net investment income | | | – | | | | – | | | | (0.44 | ) | | | – | | | | – | |
| From net realized gains | | | (0.76 | ) | | | (0.25 | ) | | | (0.54 | ) | | | – | | | | (0.17 | ) |
| Total distributions | | | (0.76 | ) | | | (0.25 | ) | | | (0.98 | ) | | | – | | | | (0.17 | ) |
| REDEMPTION FEES ADDED TO PAID-IN CAPITAL (NOTE 6) | | | 0.00 | (d) | | | 0.01 | | | | 0.00 | (d) | | | 0.00 | (d) | | | 0.81 | |
| Net increase/(decrease) in net asset value | | | 3.02 | | | | 0.54 | | | | (2.92 | ) | | | 6.04 | | | | (0.36 | ) |
| Net asset value, end of year | | $ | 19.34 | | | $ | 16.32 | | | $ | 15.78 | | | $ | 18.70 | | | $ | 12.66 | |
| TOTAL RETURN(e) | | | 23.87 | % | | | 5.06 | % | | | (10.90 | )% | | | 47.71 | % | | | (1.48 | )% |
| RATIOS/SUPPLEMENTAL DATA: | | | | | | | | | | | | | | | | | | | | |
| Net assets, end of year (000s) | | $ | 5,303 | | | $ | 4,596 | | | $ | 3,711 | | | $ | 3,814 | | | $ | 2,704 | |
| Ratio of expenses to average net assets excluding fee waivers and reimbursements | | | 1.22 | % | | | 1.37 | % | | | 1.33 | % | | | 1.35 | % | | | 1.72 | % |
| Ratio of expenses to average net assets including fee waivers and reimbursements | | | 1.22 | % | | | 1.37 | % | | | 1.33 | % | | | 1.35 | % | | | 1.40 | %(f) |
| Ratio of net investment loss to average net assets | | | (0.37 | )% | | | (0.43 | )% | | | (0.74 | )% | | | (0.73 | )% | | | (0.64 | )% |
| Portfolio turnover rate | | | 75 | % | | | 24 | % | | | 18 | % | | | 29 | % | | | 90 | % |
| (a) | Per share amounts and ratios to average net assets include income and expenses of the Kotak Mauritius Portfolio (wholly-owned subsidiary). |
| (b) | Calculated using the average shares method. |
| (c) | The per share amount does not correspond to activity reflected in the Statement of Operations due to class specific expenses during the period. |
| (d) | Less than $0.005 or ($0.005) per share. |
| (e) | Total returns are for the period indicated. Total returns would have been lower had certain expenses not been waived during the period. Returns shown do not reflect the deduction of taxes that a shareholder would pay on Fund distributions or the redemption of Fund shares. |
| (f) | Effective December 2, 2019, the net expense limitation agreement changed from 1.60% to 1.00%, excluding, among other fees and expenses, 12b-1 fees and shareholder service fees. Refer to Note 8. |
See Notes to Financial Statements and Financial Highlights.
ALPS | Kotak India ESG Fund – Class A
Financial Highlights
Selected data for a share of beneficial interest outstanding throughout the periods indicated:
| | | For the Year Ended October 31, 2024 | | | For the Year Ended October 31, 2023 | | | For the Year Ended October 31, 2022 | | | For the Year Ended October 31, 2021 | | | For the Year Ended October 31, 2020 | |
| Net asset value, beginning of period | | $ | 16.29 | | | $ | 15.74 | | | $ | 18.62 | | | $ | 12.59 | | | $ | 12.99 | (a) |
| | | | | | | | | | | | | | | | | | | | | |
| INCOME FROM INVESTMENT OPERATIONS: | | | | | | | | | | | | | | | | | | | | |
| Net investment loss(b) | | | (0.06 | )(c) | | | (0.04 | )(c) | | | (0.08 | ) | | | (0.11 | ) | | | (0.07 | )(c) |
| Net realized and unrealized gain/(loss) | | | 3.83 | | | | 0.84 | | | | (1.82 | ) | | | 6.14 | | | | (0.16 | ) |
| Total from investment operations | | | 3.77 | | | | 0.80 | | | | (1.90 | ) | | | 6.03 | | | | (0.23 | ) |
| | | | | | | | | | | | | | | | | | | | | |
| DISTRIBUTIONS: | | | | | | | | | | | | | | | | | | | | |
| From net investment income | | | – | | | | – | | | | (0.44 | ) | | | – | | | | – | |
| From net realized gains | | | (0.76 | ) | | | (0.25 | ) | | | (0.54 | ) | | | – | | | | (0.17 | ) |
| Total distributions | | | (0.76 | ) | | | (0.25 | ) | | | (0.98 | ) | | | – | | | | (0.17 | ) |
| | | | | | | | | | | | | | | | | | | | | |
| REDEMPTION FEES ADDED TO PAID-IN CAPITAL (NOTE 6) | | | – | | | | 0.00 | (d) | | | – | | | | 0.00 | (d) | | | – | |
| Net increase/(decrease) in net asset value | | | 3.01 | | | | 0.55 | | | | (2.88 | ) | | | 6.03 | | | | (0.40 | ) |
| Net asset value, end of year | | $ | 19.30 | | | $ | 16.29 | | | $ | 15.74 | | | $ | 18.62 | | | $ | 12.59 | |
| TOTAL RETURN(e) | | | 23.85 | % | | | 5.14 | % | | | (10.70 | )% | | | 47.90 | % | | | (1.80 | )% |
| | | | | | | | | | | | | | | | | | | | | |
| RATIOS/SUPPLEMENTAL DATA: | | | | | | | | | | | | | | | | | | | | |
| Net assets, end of year (000s) | | $ | 2,590 | | | $ | 1,499 | | | $ | 847 | | | $ | 762 | | | $ | 89 | |
| Ratio of expenses to average net assets excluding fee waivers and reimbursements | | | 1.17 | % | | | 1.23 | % | | | 1.10 | % | | | 1.30 | % | | | 1.62 | % |
| Ratio of expenses to average net assets including fee waivers and reimbursements | | | 1.17 | % | | | 1.23 | % | | | 1.10 | % | | | 1.30 | % | | | 1.31 | %(f) |
| Ratio of net investment loss to average net assets | | | (0.30 | )% | | | (0.26 | )% | | | (0.51 | )% | | | (0.68 | )% | | | (0.56 | )% |
| Portfolio turnover rate | | | 75 | % | | | 24 | % | | | 18 | % | | | 29 | % | | | 90 | % |
| (a) | Per share amounts and ratios to average net assets include income and expenses of the Kotak Mauritius Portfolio (wholly-owned subsidiary). |
| (b) | Calculated using the average shares method. |
| (c) | The per share amount does not correspond to activity reflected in the Statement of Operations due to class specific expenses during the period. |
| (d) | Less than $0.005 or ($0.005) per share. |
| (e) | Total returns are for the period indicated. Total returns would have been lower had certain expenses not been waived during the period. Returns shown do not reflect the deduction of taxes that a shareholder would pay on Fund distributions or the redemption of Fund shares. Returns shown exclude any applicable sales charges. |
| (f) | Effective December 2, 2019, the net expense limitation agreement changed from 1.60% to 1.00%, excluding, among other fees and expenses, 12b-1 fees and shareholder service fees. Refer to Note 8. |
See Notes to Financial Statements and Financial Highlights.
ALPS | Kotak India ESG Fund – Class C
Financial Highlights
Selected data for a share of beneficial interest outstanding throughout the periods indicated:
| | | For the Year Ended October 31, 2024 | | | For the Year Ended October 31, 2023 | | | For the Year Ended October 31, 2022 | | | For the Year Ended October 31, 2021 | | | For the Year Ended October 31, 2020 | |
| Net asset value, beginning of period | | $ | 14.71 | | | $ | 14.34 | | | $ | 17.18 | | | $ | 11.70 | | | $ | 12.18 | (a) |
| INCOME/(LOSS) FROM INVESTMENT OPERATIONS: | | | | | | | | | | | | | | | | | | | | |
| Net investment loss(b) | | | (0.18 | )(c) | | | (0.15 | )(c) | | | (0.21 | ) | | | (0.21 | ) | | | (0.14 | )(c) |
| Net realized and unrealized gain/(loss) | | | 3.43 | | | | 0.77 | | | | (1.67 | ) | | | 5.69 | | | | (0.17 | ) |
| Total from investment operations | | | 3.25 | | | | 0.62 | | | | (1.88 | ) | | | 5.48 | | | | (0.31 | ) |
| DISTRIBUTIONS: | | | | | | | | | | | | | | | | | | | | |
| From net investment income | | | – | | | | – | | | | (0.42 | ) | | | – | | | | – | |
| From net realized gains | | | (0.76 | ) | | | (0.25 | ) | | | (0.54 | ) | | | – | | | | (0.17 | ) |
| Total distributions | | | (0.76 | ) | | | (0.25 | ) | | | (0.96 | ) | | | – | | | | (0.17 | ) |
| Net increase/(decrease) in net asset value | | | 2.49 | | | | 0.37 | | | | (2.84 | ) | | | 5.48 | | | | (0.48 | ) |
| Net asset value, end of year | | $ | 17.20 | | | $ | 14.71 | | | $ | 14.34 | | | $ | 17.18 | | | $ | 11.70 | |
| TOTAL RETURN(d) | | | 22.83 | % | | | 4.38 | % | | | (11.52 | )% | | | 46.84 | % | | | (2.58 | )% |
| RATIOS/SUPPLEMENTAL DATA: | | | | | | | | | | | | | | | | | | | | |
| Net assets, end of year (000s) | | $ | 2,351 | | | $ | 1,210 | | | $ | 1,060 | | | $ | 1,598 | | | $ | 1,868 | |
| Ratio of expenses to average net assets excluding fee waivers and reimbursements | | | 1.97 | % | | | 2.00 | % | | | 2.00 | % | | | 2.00 | % | | | 2.37 | % |
| Ratio of expenses to average net assets including fee waivers and reimbursements | | | 1.97 | % | | | 2.00 | % | | | 2.00 | % | | | 2.00 | % | | | 2.06 | %(e) |
| Ratio of net investment loss to average net assets | | | (1.10 | )% | | | (1.02 | )% | | | (1.42 | )% | | | (1.37 | )% | | | (1.29 | )% |
| Portfolio turnover rate | | | 75 | % | | | 24 | % | | | 18 | % | | | 29 | % | | | 90 | % |
| (a) | Per share amounts and ratios to average net assets include income and expenses of the Kotak Mauritius Portfolio (wholly-owned subsidiary). |
| (b) | Calculated using the average shares method. |
| (c) | The per share amount does not correspond to activity reflected in the Statement of Operations due to class specific expenses during the period. |
| (d) | Total returns are for the period indicated. Total returns would have been lower had certain expenses not been waived during the period. Returns shown do not reflect the deduction of taxes that a shareholder would pay on Fund distributions or the redemption of Fund shares. Returns shown exclude any applicable sales charges. |
| (e) | Effective December 2, 2019, the net expense limitation agreement changed from 1.60% to 1.00%, excluding, among other fees and expenses, 12b-1 fees and shareholder service fees. Refer to Note 8. |
See Notes to Financial Statements and Financial Highlights.
ALPS | Kotak India ESG Fund – Class I
Financial Highlights
Selected data for a share of beneficial interest outstanding throughout the periods indicated:
| | | For the Year Ended October 31, 2024 | | | For the Year Ended October 31, 2023 | | | For the Year Ended October 31, 2022 | | | For the Year Ended October 31, 2021 | | | For the Year Ended October 31, 2020 | |
| Net asset value, beginning of period | | $ | 17.03 | | | $ | 16.40 | | | $ | 19.35 | | | $ | 13.05 | | | $ | 13.43 | (a) |
| INCOME/(LOSS) FROM INVESTMENT OPERATIONS: | | | | | | | | | | | | | | | | | | | | |
| Net investment loss(b) | | | (0.01 | )(c) | | | (0.00 | )(c)(d) | | | (0.07 | ) | | | (0.07 | ) | | | (0.03 | )(c) |
| Net realized and unrealized gain/(loss) | | | 4.01 | | | | 0.88 | | | | (1.89 | ) | | | 6.37 | | | | (0.18 | ) |
| Total from investment operations | | | 4.00 | | | | 0.88 | | | | (1.96 | ) | | | 6.30 | | | | (0.21 | ) |
| DISTRIBUTIONS: | | | | | | | | | | | | | | | | | | | | |
| From net investment income | | | – | | | | – | | | | (0.45 | ) | | | – | | | | – | |
| From net realized gains | | | (0.76 | ) | | | (0.25 | ) | | | (0.54 | ) | | | – | | | | (0.17 | ) |
| Total distributions | | | (0.76 | ) | | | (0.25 | ) | | | (0.99 | ) | | | – | | | | (0.17 | ) |
| REDEMPTION FEES ADDED TO PAID-IN CAPITAL (NOTE 6) | | | 0.00 | (d) | | | 0.00 | (d) | | | 0.00 | (d) | | | 0.00 | (d) | | | 0.00 | (d) |
| Net increase/(decrease) in net asset value | | | 3.24 | | | | 0.63 | | | | (2.95 | ) | | | 6.30 | | | | (0.38 | ) |
| Net asset value, end of year | | $ | 20.27 | | | $ | 17.03 | | | $ | 16.40 | | | $ | 19.35 | | | $ | 13.05 | |
| TOTAL RETURN(e) | | | 24.18 | % | | | 5.43 | % | | | (10.62 | )% | | | 48.28 | % | | | (1.59 | )% |
| RATIOS/SUPPLEMENTAL DATA: | | | | | | | | | | | | | | | | | | | | |
| Net assets, end of year (000s) | | $ | 35,066 | | | $ | 24,026 | | | $ | 15,664 | | | $ | 16,053 | | | $ | 21,861 | |
| Ratio of expenses to average net assets excluding fee waivers and reimbursements | | | 0.93 | % | | | 1.00 | % | | | 1.00 | % | | | 1.00 | % | | | 1.36 | % |
| Ratio of expenses to average net assets including fee waivers and reimbursements | | | 0.93 | % | | | 1.00 | % | | | 1.00 | % | | | 1.00 | % | | | 1.06 | %(f) |
| Ratio of net investment loss to average net assets | | | (0.06 | )% | | | (0.02 | )% | | | (0.41 | )% | | | (0.45 | )% | | | (0.28 | )% |
| Portfolio turnover rate | | | 75 | % | | | 24 | % | | | 18 | % | | | 29 | % | | | 90 | % |
| (a) | Per share amounts and ratios to average net assets include income and expenses of the Kotak Mauritius Portfolio (wholly-owned subsidiary). |
| (b) | Calculated using the average shares method. |
| (c) | The per share amount does not correspond to activity reflected in the Statement of Operations due to class specific expenses during the period. |
| (d) | Less than $0.005 or ($0.005) per share. |
| (e) | Total returns are for the period indicated. Total returns would have been lower had certain expenses not been waived during the period. Returns shown do not reflect the deduction of taxes that a shareholder would pay on Fund distributions or the redemption of Fund shares. |
| (f) | Effective December 2, 2019, the net expense limitation agreement changed from 1.60% to 1.00%, excluding, among other fees and expenses, 12b-1 fees and shareholder service fees. Refer to Note 8. |
See Notes to Financial Statements and Financial Highlights.
ALPS | Kotak India ESG Fund – Class II
Financial Highlights
Selected data for a share of beneficial interest outstanding throughout the periods indicated:
| | | For the Year Ended October 31, 2024 | | | For the Year Ended October 31, 2023 | | | For the Year Ended October 31, 2022 | | | For the Year Ended October 31, 2021 | | | For the Period
December 19, 2019 (Commencement of Operations) to October 31, 2020 | |
| Net asset value, beginning of period | | $ | 17.20 | | | $ | 16.52 | | | $ | 19.45 | | | $ | 13.08 | | | $ | 13.50 | (a) |
| | | | | | | | | | | | | | | | | | | | | |
| INCOME FROM INVESTMENT OPERATIONS: | | | | | | | | | | | | | | | | | | | | |
| Net investment income/(loss)(b) | | | 0.02 | | | | 0.03 | | | | (0.03 | ) | | | (0.02 | ) | | | 0.02 | |
| Net realized and unrealized gain/(loss) | | | 4.05 | | | | 0.90 | | | | (1.90 | ) | | | 6.39 | | | | (0.44 | ) |
| Total from investment operations | | | 4.07 | | | | 0.93 | | | | (1.93 | ) | | | 6.37 | | | | (0.42 | ) |
| | | | | | | | | | | | | | | | | | | | | |
| DISTRIBUTIONS: | | | | | | | | | | | | | | | | | | | | |
| From net investment income | | | – | | | | – | | | | (0.46 | ) | | | – | | | | – | |
| From net realized gains | | | (0.76 | ) | | | (0.25 | ) | | | (0.54 | ) | | | – | | | | – | |
| Total distributions | | | (0.76 | ) | | | (0.25 | ) | | | (1.00 | ) | | | – | | | | – | |
| | | | | | | | | | | | | | | | | | | | | |
| Net increase/(decrease) in net asset value | | | 3.31 | | | | 0.68 | | | | (2.93 | ) | | | 6.37 | | | | (0.42 | ) |
| Net asset value, end of year | | $ | 20.51 | | | $ | 17.20 | | | $ | 16.52 | | | $ | 19.45 | | | $ | 13.08 | |
| TOTAL RETURN(c) | | | 24.35 | % | | | 5.69 | % | | | (10.42 | )% | | | 48.70 | % | | | (3.11 | )% |
| RATIOS/SUPPLEMENTAL DATA: | | | | | | | | | | | | | | | | | | | | |
| Net assets, end of year (000s) | | $ | 351,268 | | | $ | 291,815 | | | $ | 336,535 | | | $ | 375,605 | | | $ | 136,115 | |
| Ratio of expenses to average net assets excluding fee waivers and reimbursements | | | 0.87 | % | | | 0.88 | % | | | 0.88 | % | | | 0.91 | % | | | 1.18 | %(d) |
| Ratio of expenses to average net assets including fee waivers and reimbursements | | | 0.75 | % | | | 0.75 | % | | | 0.75 | % | | | 0.75 | % | | | 0.75 | %(d) |
| Ratio of net investment income/(loss) to average net assets | | | 0.10 | % | | | 0.16 | % | | | (0.16 | )% | | | (0.11 | )% | | | 0.24 | %(d) |
| Portfolio turnover rate(e) | | | 75 | % | | | 24 | % | | | 18 | % | | | 29 | % | | | 90 | % |
| (a) | Per share amounts and ratios to average net assets include income and expenses of the Kotak Mauritius Portfolio (wholly-owned subsidiary). |
| (b) | Calculated using the average shares method. |
| (c) | Total returns are for the period indicated and have not been annualized. Total returns would have been lower had certain expenses not been waived during the period. Returns shown do not reflect the deduction of taxes that a shareholder would pay on Fund distributions or the redemption of Fund shares. |
| (e) | Portfolio turnover rate for periods less than one full year have not been annualized. |
See Notes to Financial Statements and Financial Highlights.
ALPS Global Opportunity Fund
| Statement of Investments | October 31, 2024 |
| | | Shares | | | Value
(Note 2) | |
| CLOSED-END FUNDS (16.37%) | | | | | | |
| Abrdn Private Equity Opportunities Trust PLC | | | 140,251 | | | $ | 944,025 | |
| HarbourVest Global Private Equity, Ltd.(a) | | | 70,138 | | | | 2,022,471 | |
| HBM Healthcare Investments AG, Class A | | | 3,148 | | | | 683,880 | |
| HgCapital Trust PLC | | | 437,969 | | | | 2,896,974 | |
| NB Private Equity Partners, Ltd. | | | 52,090 | | | | 1,046,475 | |
| Oakley Capital Investments, Ltd. | | | 306,830 | | | | 1,954,482 | |
| Pantheon International PLC Fund(a) | | | 272,520 | | | | 1,103,405 | |
| | | | | | | | | |
| TOTAL CLOSED-END FUNDS | | | | | | | | |
| (Cost $8,237,170) | | | | | | | 10,651,712 | |
| | | | | | | | | |
| COMMON STOCKS (76.47%) | | | | | | | | |
| Communications (2.23%) | | | | | | | | |
| Internet (2.23%) | | | | | | | | |
| Amazon.com, Inc.(a) | | | 3,400 | | | | 633,760 | |
| GoDaddy, Inc.(a) | | | 4,895 | | | | 816,486 | |
| | | | | | | | 1,450,246 | |
| | | | | | | | | |
| TOTAL COMMUNICATIONS | | | | | | | 1,450,246 | |
| | | | | | | | | |
| Consumer Discretionary (1.51%) | | | | | | | | |
| Retail (1.51%) | | | | | | | | |
| Wesfarmers, Ltd. | | | 22,395 | | | | 985,178 | |
| | | | | | | | | |
| TOTAL CONSUMER DISCRETIONARY | | | | | | | 985,178 | |
| | | | | | | | | |
| Consumer Staples (2.79%) | | | | | | | | |
| Retail (2.79%) | | | | | | | | |
| Costco Wholesale Corp. | | | 2,075 | | | | 1,813,924 | |
| | | | | | | | | |
| TOTAL CONSUMER STAPLES | | | | | | | 1,813,924 | |
| | | | | | | | | |
| Financials (54.26%) | | | | | | | | |
| Diversified Financial Services (29.92%) | | | | | | | | |
| Apollo Global Management, Inc. | | | 14,425 | | | | 2,066,526 | |
| Ares Management LP, Class A | | | 18,455 | | | | 3,094,534 | |
| Berkshire Hathaway, Inc., Class B(a) | | | 4,450 | | | | 2,006,594 | |
| Blackstone, Inc., Class A | | | 15,715 | | | | 2,636,191 | |
| Blue Owl Capital, Inc. | | | 21,195 | | | | 473,920 | |
| Houlihan Lokey, Inc. | | | 6,105 | | | | 1,054,761 | |
| KKR & Co., Inc., Class A | | | 28,405 | | | | 3,926,707 | |
| Mastercard, Inc., Class A | | | 1,355 | | | | 676,944 | |
| Partners Group Holding AG | | | 1,556 | | | | 2,140,790 | |
| StepStone Group, Inc., Class A | | | 14,535 | | | | 873,990 | |
| TPG, Inc. | | | 7,605 | | | | 514,706 | |
| | | | | | | | 19,465,663 | |
| | | | | | | | | |
| Investment Companies (9.95%) | | | | | | | | |
| 3i Group PLC | | | 75,850 | | | | 3,110,453 | |
| Eurazeo SE | | | 6,657 | | | | 507,748 | |
| | | Shares | | | Value
(Note 2) | |
| Investment Companies (continued) | | | | | | |
| Investor AB, B Shares | | | 48,375 | | | $ | 1,369,209 | |
| Italmobiliare SpA | | | 20,740 | | | | 623,781 | |
| Mutares SE & Co. KGaA | | | 32,155 | | | | 861,650 | |
| | | | | | | | 6,472,841 | |
| | | | | | | | | |
| Private Equity (14.39%) | | | | | | | | |
| Altamir | | | 38,218 | | | | 935,361 | |
| Brederode SA | | | 18,169 | | | | 2,114,385 | |
| Bridgepoint Group PLC(b)(c) | | | 209,705 | | | | 842,584 | |
| Clairvest Group, Inc. | | | 12,085 | | | | 603,230 | |
| CVC Capital Partners PLC(a)(b)(c) | | | 51,840 | | | | 1,087,742 | |
| EQT AB | | | 29,405 | | | | 853,128 | |
| Intermediate Capital Group PLC | | | 78,687 | | | | 2,090,286 | |
| Petershill Partners PLC(b)(c) | | | 298,802 | | | | 835,275 | |
| | | | | | | | 9,361,991 | |
| | | | | | | | | |
| TOTAL FINANCIALS | | | | | | | 35,300,495 | |
| | | | | | | | | |
| Health Care (1.43%) | | | | | | | | |
| Healthcare-Services (1.43%) | | | | | | | | |
| Chemed Corp. | | | 1,720 | | | | 929,213 | |
| | | | | | | | | |
| TOTAL HEALTH CARE | | | | | | | 929,213 | |
| | | | | | | | | |
| Industrials (6.09%) | | | | | | | | |
| Aerospace/Defense (1.11%) | | | | | | | | |
| Lockheed Martin Corp. | | | 1,325 | | | | 723,516 | |
| | | | | | | | | |
| Electronics (1.71%) | | | | | | | | |
| Atmus Filtration Technologies, Inc. | | | 12,530 | | | | 487,918 | |
| OEM International AB, Class B | | | 53,460 | | | | 624,862 | |
| | | | | | | | 1,112,780 | |
| Machinery-Diversified (3.27%) | | | | | | | | |
| Carlisle Cos., Inc. | | | 1,585 | | | | 669,235 | |
| CSW Industrials, Inc. | | | 2,215 | | | | 782,116 | |
| Dover Corp. | | | 3,560 | | | | 674,015 | |
| | | | | | | | 2,125,366 | |
| | | | | | | | | |
| TOTAL INDUSTRIALS | | | | | | | 3,961,662 | |
| | | | | | | | | |
| Technology (8.16%) | | | | | | | | |
| Computers (2.06%) | | | | | | | | |
| Accenture PLC, Class A | | | 1,955 | | | | 674,123 | |
| Dell Technologies, Inc. | | | 5,375 | | | | 664,512 | |
| | | | | | | | 1,338,635 | |
| | | | | | | | | |
| Software (6.10%) | | | | | | | | |
| Constellation Software, Inc. | | | 649 | | | | 1,957,250 | |
| Fiserv, Inc.(a) | | | 3,820 | | | | 755,978 | |
| Microsoft Corp. | | | 1,420 | | | | 577,017 | |
See Notes to Financial Statements and Financial Highlights.
ALPS Global Opportunity Fund
| Statement of Investments | October 31, 2024 |
| | | Shares | | | Value
(Note 2) | |
| Software (continued) | | | | | | |
| Paychex, Inc. | | | 4,895 | | | $ | 682,020 | |
| | | | | | | | 3,972,265 | |
| | | | | | | | | |
| TOTAL TECHNOLOGY | | | | | | | 5,310,900 | |
| | | | | | | | | |
| TOTAL COMMON STOCKS | | | | | | | | |
| (Cost $33,371,221) | | | | | | | 49,751,618 | |
| | | | | | | | | |
| BUSINESS DEVELOPMENT COMPANIES (4.80%) | | | | | | | | |
| Financials (4.80%) | | | | | | | | |
| Investment Companies (3.62%) | | | | | | | | |
| Ares Capital Corp. | | | 57,535 | | | | 1,216,290 | |
| FS KKR Capital Corp. | | | 56,340 | | | | 1,140,322 | |
| | | | | | | | 2,356,612 | |
| Private Equity (1.18%) | | | | | | | | |
| Hercules Capital, Inc. | | | 38,945 | | | | 769,553 | |
| | | | | | | | | |
| TOTAL FINANCIALS | | | | | | | 3,126,165 | |
| | | | | | | | | |
| TOTAL BUSINESS DEVELOPMENT COMPANIES | | | | | | | | |
| (Cost $2,955,479) | | | | | | | 3,126,165 | |
| | | | | | | | | |
| PREFERRED STOCK (1.56%) | | | | | | | | |
| Financials (1.05%) | | | | | | | | |
| Investment Companies (1.05%) | | | | | | | | |
| Compass Diversified Holdings, Series C, 7.875%(d) | | | 27,876 | | | | 684,634 | |
| | | | | | | | | |
| TOTAL FINANCIALS | | | | | | | 684,634 | |
| | | | | | | | | |
| Industrials (0.51%) | | | | | | | | |
| Metal Fabricate/Hardware (0.51%) | | | | | | | | |
| Steel Partners Holdings LP, 6.00% | | | 13,442 | | | | 329,329 | |
| | | | | | | | | |
| TOTAL INDUSTRIALS | | | | | | | 329,329 | |
| | | | | | | | | |
| TOTAL PREFERRED STOCK | | | | | | | | |
| (Cost $1,013,401) | | | | | | | 1,013,963 | |
| | | 7-Day
Yield | | | Shares | | | Value
(Note 2) | |
| SHORT-TERM INVESTMENTS (0.65%) | | | | | | | | | | | | |
| Money Market Fund (0.65%) | | | | | | | | | | | | |
| State Street Institutional Treasury Plus Money Market Fund - Premier Class | | | 4.823 | % | | | 419,903 | | | $ | 419,903 | |
| | | | | | | | | | | | | |
| TOTAL MONEY MARKET FUND | | | | | | | | | | | 419,903 | |
| | | | | | | | | | | | | |
| TOTAL SHORT-TERM INVESTMENTS | | | | | | | | | | | | |
| (Cost $419,903) | | | | | | | | | | | 419,903 | |
| | | | | | | | | | | | | |
| TOTAL INVESTMENTS (99.85%) | | | | | | | | | | | | |
| (Cost $45,997,174) | | | | | | | | | | $ | 64,963,361 | |
| | | | | | | | | | | | | |
| Assets In Excess Of Other Liabilities (0.15%) | | | | | | | | | | | 97,182 | |
| | | | | | | | | | | | | |
| NET ASSETS (100.00%) | | | | | | | | | | $ | 65,060,543 | |
| (a) | Non-Income Producing Security. |
| (b) | Security exempt from registration under Rule 144A of the Securities Act of 1933. These securities may be resold in transactions exempt from registration, normally to qualified institutional buyers. As of October 31, 2024, the aggregate market value of those securities was $2,765,601, representing 4.25% of net assets. |
| (c) | Securities were purchased pursuant to Regulation S under the Securities Act of 1933, which exempts securities offered and sold outside of the United States from registration. Such securities cannot be sold in the United States without either an effective registration statement filed pursuant to the Securities Act of 1933, or pursuant to an exemption from registration. These securities have been deemed liquid under guidelines utilized by the Valuation Designee. As of October 31, 2024 the aggregate market value of those securities was $2,765,601, representing 4.25% of net assets. |
| (d) | Perpetual maturity. This security has no contractual maturity date, is not redeemable and contractually pays an indefinite stream of interest. |
For Fund compliance purposes, the Fund's industry classifications refer to any one or more of the industry sub-classifications used by one or more widely recognized market indexes or ratings group indexes, and/or as defined by Fund management. This definition may not apply for purposes of this report, which may combine industry sub-classifications for reporting ease. Industries are shown as a percent of net assets.
See Notes to Financial Statements and Financial Highlights.
ALPS Global Opportunity Fund
| Statement of Investments | October 31, 2024 |
OUTSTANDING FORWARD FOREIGN CURRENCY CONTRACTS
| Counterparty | | Settlement Date | | Fund Receiving | | U.S. $ Value at October
31, 2024 | | | Fund Delivering | | U.S. $ Value at October
31, 2024 | | | Unrealized Appreciation | |
| State Street Bank & Trust Company | | 11/22/24 | | USD | | $ | 2,625,520 | | | GBP | | $ | 2,617,516 | | | $ | 8,004 | |
| State Street Bank & Trust Company | | 01/24/25 | | USD | | $ | 2,661,634 | | | GBP | | $ | 2,597,607 | | | | 64,027 | |
| | | | | | | | | | | | | | | | | $ | 72,031 | |
See Notes to Financial Statements and Financial Highlights.
ALPS Global Opportunity Fund
| Statement of Assets and Liabilities | October 31, 2024 |
| ASSETS | | | |
| Investments, at value | | $ | 64,963,361 | |
| Foreign currency, at value (Cost $2) | | | 2 | |
| Unrealized appreciation on forward foreign currency contracts | | | 72,031 | |
| Receivable for shares sold | | | 7,077 | |
| Dividends and interest receivable | | | 127,615 | |
| Prepaid expenses and other assets | | | 25,415 | |
| Total Assets | | | 65,195,501 | |
| LIABILITIES | | | | |
| Payable for investments purchased | | | 5,455 | |
| Payable for shares redeemed | | | 354 | |
| Investment advisory fees payable | | | 44,585 | |
| Administration and transfer agency fees payable | | | 11,328 | |
| Distribution and services fees payable | | | 24,557 | |
| Trustees' fees and expenses payable | | | 1,217 | |
| Professional fees payable | | | 20,891 | |
| Custody fees payable | | | 19,151 | |
| Accrued expenses and other liabilities | | | 7,420 | |
| Total Liabilities | | | 134,958 | |
| NET ASSETS | | $ | 65,060,543 | |
| NET ASSETS CONSIST OF | | | | |
| Paid-in capital | | $ | 43,640,944 | |
| Total distributable earnings/(accumulated losses) | | | 21,419,599 | |
| NET ASSETS | | $ | 65,060,543 | |
| INVESTMENTS, AT COST | | $ | 45,997,174 | |
| PRICING OF SHARES | | | | |
| Investor Class: | | | | |
| Net Asset Value, offering and redemption price per share | | $ | 7.32 | |
| Net Assets | | $ | 10,665,404 | |
| Shares of beneficial interest outstanding (unlimited number of shares, no par value common stock authorized) | | | 1,456,763 | |
| Class A: | | | | |
| Net Asset Value, offering and redemption price per share | | $ | 7.27 | |
| Net Assets | | $ | 10,873,511 | |
| Shares of beneficial interest outstanding (unlimited number of shares, no par value common stock authorized) | | | 1,495,035 | |
| Maximum offering price per share ((NAV/0.9450), based on maximum sales charge of 5.50% of the offering price) | | $ | 7.70 | |
| Class C: | | | | |
| Net Asset Value, offering and redemption price per share(a) | | $ | 6.35 | |
| Net Assets | | $ | 1,523,206 | |
| Shares of beneficial interest outstanding (unlimited number of shares, no par value common stock authorized) | | | 239,812 | |
| Class I: | | | | |
| Net Asset Value, offering and redemption price per share | | $ | 7.62 | |
| Net Assets | | $ | 37,731,791 | |
| Shares of beneficial interest outstanding (unlimited number of shares, no par value common stock authorized) | | | 4,951,661 | |
| Class R: | | | | |
| Net Asset Value, offering and redemption price per share | | $ | 5.31 | |
| Net Assets | | $ | 4,266,631 | |
| Shares of beneficial interest outstanding (unlimited number of shares, no par value common stock authorized) | | | 804,249 | |
| (a) | Redemption price per share may be reduced for any applicable contingent deferred sales charge. For a description of a possible sales charge, please see the Fund's Prospectus. |
See Notes to Financial Statements and Financial Highlights.
ALPS Global Opportunity Fund
| Statement of Operations | For the Year Ended October 31, 2024 |
| INVESTMENT INCOME | | | |
| Dividends | | $ | 1,773,413 | |
| Foreign taxes withheld on dividends | | | (35,281 | ) |
| Total Investment Income | | | 1,738,132 | |
| | | | | |
| EXPENSES | | | | |
| Investment advisory fees | | | 529,283 | |
| Administrative fees | | | 85,661 | |
| Delegated transfer agent equivalent services fees | | | 28,992 | |
| Distribution and service fees | | | | |
| Investor Class | | | 35,509 | |
| Class A | | | 28,431 | |
| Class C | | | 18,864 | |
| Class R | | | 22,310 | |
| Professional fees | | | 23,062 | |
| Reports to shareholders and printing fees | | | 9,597 | |
| State registration fees | | | 90,738 | |
| Insurance fees | | | 784 | |
| Custody fees | | | 12,690 | |
| Trustees' fees and expenses | | | 4,974 | |
| Repayment of previously waived fees | | | | |
| Investor Class | | | 423 | |
| Class A | | | 181 | |
| Class C | | | 253 | |
| Class R | | | 535 | |
| Miscellaneous expenses | | | 18,528 | |
| Total Expenses | | | 910,815 | |
| Less fees waived/reimbursed by investment advisor (Note 8) | | | | |
| Investor Class | | | (104 | ) |
| Class C | | | (1,640 | ) |
| Class I | | | (24,606 | ) |
| Class R | | | (723 | ) |
| Net Expenses | | | 883,742 | |
| Net Investment Income | | | 854,390 | |
| Net realized gain on investments | | | 6,354,443 | |
| Net realized loss on foreign currency transactions | | | (8,747 | ) |
| Net realized loss on forward contracts | | | (216,380 | ) |
| Net Realized Gain | | | 6,129,316 | |
| Net change in unrealized appreciation on investments | | | 11,868,240 | |
| Net change in unrealized appreciation on forward contract | | | 62,634 | |
| Net change in unrealized appreciation on translation of assets and liabilities denominated in foreign currencies | | | 2,192 | |
| Net Change in Unrealized Appreciation | | | 11,933,066 | |
| NET REALIZED AND UNREALIZED GAIN ON INVESTMENTS | | | 18,062,382 | |
| NET INCREASE IN NET ASSETS RESULTING FROM OPERATIONS | | $ | 18,916,772 | |
See Notes to Financial Statements and Financial Highlights.
ALPS Global Opportunity Fund
Statements of Changes in Net Assets
| | | For the Year Ended October 31, 2024 | | | For the Year Ended October 31, 2023(a) | |
| OPERATIONS | | | | | | |
| Net investment income | | $ | 854,390 | | | $ | 769,160 | |
| Net realized gain | | | 6,129,316 | | | | 818,981 | |
| Net change in unrealized appreciation | | | 11,933,066 | | | | 5,072,477 | |
| Net Increase in Net Assets Resulting from Operations | | | 18,916,772 | | | | 6,660,618 | |
| | | | | | | | | |
| TOTAL DISTRIBUTIONS | | | | | | | | |
| From distributable earnings | | | | | | | | |
| Investor Class | | | (569,724 | ) | | | – | |
| Class A | | | (315,706 | ) | | | – | |
| Class C | | | (136,355 | ) | | | – | |
| Class I | | | (1,810,004 | ) | | | – | |
| Class R | | | (339,038 | ) | | | – | |
| Net Decrease in Net Assets from Distributions | | | (3,170,827 | ) | | | – | |
| | | | | | | | | |
| BENEFICIAL INTEREST TRANSACTIONS (NOTE 6) | | | | | | | | |
| Shares sold | | | | | | | | |
| Investor Class | | | 578,558 | | | | 188,818 | |
| Class A | | | 9,406,025 | | | | 2,103,737 | |
| Class C | | | 101,738 | | | | – | |
| Class I | | | 4,907,533 | | | | 8,125,624 | |
| Class R | | | 115,518 | | | | 301,435 | |
| Dividends reinvested | | | | | | | | |
| Investor Class | | | 486,607 | | | | – | |
| Class A | | | 289,805 | | | | – | |
| Class C | | | 122,517 | | | | – | |
| Class I | | | 1,706,420 | | | | – | |
| Class R | | | 339,038 | | | | – | |
| Shares redeemed, net of redemption fees | | | | | | | | |
| Investor Class | | | (2,520,970 | ) | | | (2,152,999 | ) |
| Class A | | | (6,446,342 | ) | | | (1,914,379 | ) |
| Class C | | | (1,291,869 | ) | | | (2,892,700 | ) |
| Class I | | | (8,262,125 | ) | | | (18,427,379 | ) |
| Class R | | | (1,270,444 | ) | | | (873,064 | ) |
| Net Decrease in Net Assets Derived from Beneficial Interest Transactions | | | (1,737,991 | ) | | | (15,540,907 | ) |
| | | | | | | | | |
| Net increase/(decrease) in net assets | | | 14,007,954 | | | | (8,880,289 | ) |
| | | | | | | | | |
| NET ASSETS | | | | | | | | |
| Beginning of year | | | 51,052,589 | | | | 59,932,878 | |
| End of year | | $ | 65,060,543 | | | $ | 51,052,589 | |
| (a) | Prior to January 24, 2023, the ALPS Global Opportunity Fund was known as the ALPS/Red Rocks Global Opportunity Fund. |
See Notes to Financial Statements and Financial Highlights.
ALPS Global Opportunity Fund – Investor Class
Financial Highlights
Selected data for a share of beneficial interest outstanding throughout the periods indicated:
| | | For the Year Ended October 31, 2024 | | | For the Year Ended October 31, 2023(a) | | | For the Year Ended October 31, 2022 | | | For the Year Ended October 31, 2021 | | | For the Year Ended October 31, 2020(a) | |
| Net asset value, beginning of period | | $ | 5.64 | | | $ | 5.09 | | | $ | 9.39 | | | $ | 6.47 | | | $ | 7.71 | |
| INCOME/(LOSS) FROM INVESTMENT OPERATIONS: | | | | | | | | | | | | | | | | | | | | |
| Net investment income(b) | | | 0.08 | | | | 0.07 | | | | 0.05 | | | | 0.00 | (c) | | | 0.06 | |
| Net realized and unrealized gain/(loss) | | | 1.95 | | | | 0.48 | | | | (2.37 | ) | | | 3.22 | | | | (0.23 | ) |
| Total from investment operations | | | 2.03 | | | | 0.55 | | | | (2.32 | ) | | | 3.22 | | | | (0.17 | ) |
| DISTRIBUTIONS: | | | | | | | | | | | | | | | | | | | | |
| From net investment income | | | (0.35 | ) | | | – | | | | (1.25 | ) | | | – | | | | (0.60 | ) |
| From net realized gains | | | – | | | | – | | | | (0.73 | ) | | | (0.30 | ) | | | (0.47 | ) |
| Total distributions | | | (0.35 | ) | | | – | | | | (1.98 | ) | | | (0.30 | ) | | | (1.07 | ) |
| REDEMPTION FEES ADDED TO PAID-IN CAPITAL (NOTE 6) | | | – | | | | – | | | | – | | | | 0.00 | (c) | | | 0.00 | (c) |
| Net increase/(decrease) in net asset value | | | 1.68 | | | | 0.55 | | | | (4.30 | ) | | | 2.92 | | | | (1.24 | ) |
| Net asset value, end of year | | $ | 7.32 | | | $ | 5.64 | | | $ | 5.09 | | | $ | 9.39 | | | $ | 6.47 | |
| TOTAL RETURN(d) | | | 37.47 | % | | | 10.81 | % | | | (30.83 | )% | | | 51.18 | % | | | (3.20 | )% |
| RATIOS/SUPPLEMENTAL DATA: | | | | | | | | | | | | | | | | | | | | |
| Net assets, end of year (000s) | | $ | 10,665 | | | $ | 9,379 | | | $ | 10,256 | | | $ | 20,967 | | | $ | 15,580 | |
| Ratio of expenses to average net assets excluding fee waivers and reimbursements(e) | | | 1.58 | % | | | 1.59 | % | | | 1.46 | % | | | 1.49 | % | | | 1.47 | % |
| Ratio of expenses to average net assets including fee waivers and reimbursements(e) | | | 1.58 | % | | | 1.59 | % | | | 1.46 | % | | | 1.49 | % | | | 1.47 | % |
| Ratio of net investment income to average net assets(e) | | | 1.20 | % | | | 1.20 | % | | | 0.81 | % | | | 0.01 | % | | | 0.86 | % |
| Portfolio turnover rate | | | 37 | % | | | 21 | % | | | 27 | % | | | 43 | % | | | 41 | % |
| (a) | Prior to January 24, 2023, the ALPS Global Opportunity Fund was known as the ALPS/Red Rocks Global Opportunity Fund. Prior to March 31, 2020, the ALPS/Red Rocks Global Opportunity Fund was known as the ALPS/Red Rocks Listed Private Equity Fund. |
| (b) | Calculated using the average shares method. |
| (c) | Less than $0.005 or ($0.005) per share. |
| (d) | Total returns are for the period indicated. Total returns would have been lower had certain expenses not been waived during the period. Returns shown do not reflect the deduction of taxes that a shareholder would pay on Fund distributions or the redemption of Fund shares. |
| (e) | The ratios exclude the impact of expenses of the underlying funds in which the Fund invests as represented in the Statement of Investments. |
See Notes to Financial Statements and Financial Highlights.
ALPS Global Opportunity Fund – Class A
Financial Highlights
Selected data for a share of beneficial interest outstanding throughout the periods indicated:
| | | For the Year Ended October 31, 2024 | | | For the Year Ended October 31, 2023(a) | | | For the Year Ended October 31, 2022 | | | For the Year Ended October 31, 2021 | | | For the Year Ended October 31, 2020(a) | |
| Net asset value, beginning of period | | $ | 5.61 | | | $ | 5.06 | | | $ | 9.35 | | | $ | 6.45 | | | $ | 7.67 | |
| | | | | | | | | | | | | | | | | | | | | |
| INCOME FROM INVESTMENT OPERATIONS: | | | | | | | | | | | | | | | | | | | | |
| Net investment income(b) | | | 0.09 | | | | 0.07 | | | | 0.05 | | | | 0.00 | (c) | | | 0.04 | |
| Net realized and unrealized gain/(loss) | | | 1.92 | | | | 0.48 | | | | (2.36 | ) | | | 3.20 | | | | (0.20 | ) |
| Total from investment operations | | | 2.01 | | | | 0.55 | | | | (2.31 | ) | | | 3.20 | | | | (0.16 | ) |
| | | | | | | | | | | | | | | | | | | | | |
| DISTRIBUTIONS: | | | | | | | | | | | | | | | | | | | | |
| From net investment income | | | (0.35 | ) | | | – | | | | (1.25 | ) | | | – | | | | (0.60 | ) |
| From net realized gains | | | – | | | | – | | | | (0.73 | ) | | | (0.30 | ) | | | (0.47 | ) |
| Total distributions | | | (0.35 | ) | | | – | | | | (1.98 | ) | | | (0.30 | ) | | | (1.07 | ) |
| | | | | | | | | | | | | | | | | | | | | |
| REDEMPTION FEES ADDED TO PAID-IN CAPITAL (NOTE 6) | | | – | | | | – | | | | – | | | | 0.00 | (c) | | | 0.01 | |
| Net increase/(decrease) in net asset value | | | 1.66 | | | | 0.55 | | | | (4.29 | ) | | | 2.90 | | | | (1.22 | ) |
| Net asset value, end of year | | $ | 7.27 | | | $ | 5.61 | | | $ | 5.06 | | | $ | 9.35 | | | $ | 6.45 | |
| TOTAL RETURN(d) | | | 37.31 | % | | | 10.87 | % | | | (30.85 | )% | | | 51.02 | % | | | (2.92 | )% |
| | | | | | | | | | | | | | | | | | | | | |
| RATIOS/SUPPLEMENTAL DATA: | | | | | | | | | | | | | | | | | | | | |
| Net assets, end of year (000s) | | $ | 10,874 | | | $ | 5,379 | | | $ | 4,710 | | | $ | 4,188 | | | $ | 2,544 | |
| Ratio of expenses to average net assets excluding fee waivers and reimbursements(e) | | | 1.56 | % | | | 1.57 | % | | | 1.49 | % | | | 1.47 | % | | | 1.51 | % |
| Ratio of expenses to average net assets including fee waivers and reimbursements(e) | | | 1.56 | % | | | 1.57 | % | | | 1.49 | % | | | 1.47 | % | | | 1.51 | % |
| Ratio of net investment income to average net assets(e) | | | 1.27 | % | | | 1.24 | % | | | 0.88 | % | | | 0.05 | % | | | 0.62 | % |
| Portfolio turnover rate | | | 37 | % | | | 21 | % | | | 27 | % | | | 43 | % | | | 41 | % |
| (a) | Prior to January 24, 2023, the ALPS Global Opportunity Fund was known as the ALPS/Red Rocks Global Opportunity Fund. Prior to March 31, 2020, the ALPS/Red Rocks Global Opportunity Fund was known as the ALPS/Red Rocks Listed Private Equity Fund. |
| (b) | Calculated using the average shares method. |
| (c) | Less than $0.005 or ($0.005) per share. |
| (d) | Total returns are for the period indicated. Total returns would have been lower had certain expenses not been waived during the period. Returns shown do not reflect the deduction of taxes that a shareholder would pay on Fund distributions or the redemption of Fund shares. Returns shown exclude any applicable sales charges. |
| (e) | The ratios exclude the impact of expenses of the underlying funds in which the Fund invests as represented in the Statement of Investments. |
See Notes to Financial Statements and Financial Highlights.
ALPS Global Opportunity Fund – Class C
Financial Highlights
Selected data for a share of beneficial interest outstanding throughout the periods indicated:
| | | For the Year Ended October 31, 2024 | | | For the Year Ended October 31, 2023(a) | | | For the Year Ended October 31, 2022 | | | For the Year Ended October 31, 2021 | | | For the Year Ended October 31, 2020(a) | |
| Net asset value, beginning of period | | $ | 4.96 | | | $ | 4.50 | | | $ | 8.59 | | | $ | 5.98 | | | $ | 7.25 | |
| INCOME/(LOSS) FROM INVESTMENT OPERATIONS: | | | | | | | | | | | | | | | | | | | | |
| Net investment income/(loss)(b) | | | 0.03 | | | | 0.03 | | | | 0.00 | (c) | | | (0.06 | ) | | | 0.01 | |
| Net realized and unrealized gain/(loss) | | | 1.71 | | | | 0.43 | | | | (2.12 | ) | | | 2.97 | | | | (0.22 | ) |
| Total from investment operations | | | 1.74 | | | | 0.46 | | | | (2.12 | ) | | | 2.91 | | | | (0.21 | ) |
| DISTRIBUTIONS: | | | | | | | | | | | | | | | | | | | | |
| From net investment income | | | (0.35 | ) | | | – | | | | (1.24 | ) | | | – | | | | (0.59 | ) |
| From net realized gains | | | – | | | | – | | | | (0.73 | ) | | | (0.30 | ) | | | (0.47 | ) |
| Total distributions | | | (0.35 | ) | | | – | | | | (1.97 | ) | | | (0.30 | ) | | | (1.06 | ) |
| REDEMPTION FEES ADDED TO PAID-IN CAPITAL (NOTE 6) | | | – | | | | – | | | | – | | | | – | | | | 0.00 | (c) |
| Net increase/(decrease) in net asset value | | | 1.39 | | | | 0.46 | | | | (4.09 | ) | | | 2.61 | | | | (1.27 | ) |
| Net asset value, end of year | | $ | 6.35 | | | $ | 4.96 | | | $ | 4.50 | | | $ | 8.59 | | | $ | 5.98 | |
| TOTAL RETURN(d) | | | 36.58 | % | | | 10.22 | % | | | (31.48 | )% | | | 50.14 | % | | | (4.01 | )% |
| RATIOS/SUPPLEMENTAL DATA: | | | | | | | | | | | | | | | | | | | | |
| Net assets, end of year (000s) | | $ | 1,523 | | | $ | 2,098 | | | $ | 4,507 | | | $ | 10,883 | | | $ | 9,061 | |
| Ratio of expenses to average net assets excluding fee waivers and reimbursements(e) | | | 2.34 | % | | | 2.32 | % | | | 2.23 | % | | | 2.20 | % | | | 2.22 | % |
| Ratio of expenses to average net assets including fee waivers and reimbursements(e) | | | 2.25 | % | | | 2.25 | % | | | 2.23 | % | | | 2.20 | % | | | 2.22 | % |
| Ratio of net investment income/(loss) to average net assets(e) | | | 0.53 | % | | | 0.52 | % | | | 0.03 | % | | | (0.73 | )% | | | 0.12 | % |
| Portfolio turnover rate | | | 37 | % | | | 21 | % | | | 27 | % | | | 43 | % | | | 41 | % |
| (a) | Prior to January 24, 2023, the ALPS Global Opportunity Fund was known as the ALPS/Red Rocks Global Opportunity Fund. Prior to March 31, 2020, the ALPS/Red Rocks Global Opportunity Fund was known as the ALPS/Red Rocks Listed Private Equity Fund. |
| (b) | Calculated using the average shares method. |
| (c) | Less than $0.005 or ($0.005) per share. |
| (d) | Total returns are for the period indicated. Total returns would have been lower had certain expenses not been waived during the period. Returns shown do not reflect the deduction of taxes that a shareholder would pay on Fund distributions or the redemption of Fund shares. Returns shown exclude any applicable sales charges. |
| (e) | The ratios exclude the impact of expenses of the underlying funds in which the Fund invests as represented in the Statement of Investments. |
See Notes to Financial Statements and Financial Highlights.
ALPS Global Opportunity Fund – Class I
Financial Highlights
Selected data for a share of beneficial interest outstanding throughout the periods indicated:
| | | For the Year Ended October 31, 2024 | | | For the Year Ended October 31, 2023(a) | | | For the Year Ended October 31, 2022 | | | For the Year Ended October 31, 2021 | | | For the Year Ended October 31, 2020(a) | |
| Net asset value, beginning of period | | $ | 5.85 | | | $ | 5.25 | | | $ | 9.61 | | | $ | 6.61 | | | $ | 7.84 | |
| INCOME/(LOSS) FROM INVESTMENT OPERATIONS: | | | | | | | | | | | | | | | | | | | | |
| Net investment income(b) | | | 0.11 | | | | 0.09 | | | | 0.07 | | | | 0.02 | | | | 0.07 | |
| Net realized and unrealized gain/(loss) | | | 2.02 | | | | 0.51 | | | | (2.44 | ) | | | 3.28 | | | | (0.23 | ) |
| Total from investment operations | | | 2.13 | | | | 0.60 | | | | (2.37 | ) | | | 3.30 | | | | (0.16 | ) |
| DISTRIBUTIONS: | | | | | | | | | | | | | | | | | | | | |
| From net investment income | | | (0.36 | ) | | | – | | | | (1.26 | ) | | | – | | | | (0.60 | ) |
| From net realized gains | | | – | | | | – | | | | (0.73 | ) | | | (0.30 | ) | | | (0.47 | ) |
| Total distributions | | | (0.36 | ) | | | – | | | | (1.99 | ) | | | (0.30 | ) | | | (1.07 | ) |
| REDEMPTION FEES ADDED TO PAID-IN CAPITAL (NOTE 6) | | | – | | | | – | | | | – | | | | 0.00 | (c) | | | 0.00 | (c) |
| Net increase/(decrease) in net asset value | | | 1.77 | | | | 0.60 | | | | (4.36 | ) | | | 3.00 | | | | (1.23 | ) |
| Net asset value, end of year | | $ | 7.62 | | | $ | 5.85 | | | $ | 5.25 | | | $ | 9.61 | | | $ | 6.61 | |
| TOTAL RETURN(d) | | | 37.77 | % | | | 11.43 | % | | | (30.69 | )% | | | 51.31 | % | | | (2.93 | )% |
| RATIOS/SUPPLEMENTAL DATA: | | | | | | | | | | | | | | | | | | | | |
| Net assets, end of year (000s) | | $ | 37,732 | | | $ | 30,176 | | | $ | 36,321 | | | $ | 69,176 | | | $ | 55,950 | |
| Ratio of expenses to average net assets excluding fee waivers and reimbursements(e) | | | 1.32 | % | | | 1.31 | % | | | 1.22 | % | | | 1.20 | % | | | 1.22 | % |
| Ratio of expenses to average net assets including fee waivers and reimbursements(e) | | | 1.25 | % | | | 1.25 | % | | | 1.22 | % | | | 1.20 | % | | | 1.22 | % |
| Ratio of net investment income to average net assets(e) | | | 1.53 | % | | | 1.55 | % | | | 1.07 | % | | | 0.29 | % | | | 1.08 | % |
| Portfolio turnover rate | | | 37 | % | | | 21 | % | | | 27 | % | | | 43 | % | | | 41 | % |
| (a) | Prior to January 24, 2023, the ALPS Global Opportunity Fund was known as the ALPS/Red Rocks Global Opportunity Fund. Prior to March 31, 2020, the ALPS/Red Rocks Global Opportunity Fund was known as the ALPS/Red Rocks Listed Private Equity Fund. |
| (b) | Calculated using the average shares method. |
| (c) | Less than $0.005 or ($0.005) per share. |
| (d) | Total returns are for the period indicated. Total returns would have been lower had certain expenses not been waived during the period. Returns shown do not reflect the deduction of taxes that a shareholder would pay on Fund distributions or the redemption of Fund shares. Returns shown exclude any applicable sales charges. |
| (e) | The ratios exclude the impact of expenses of the underlying funds in which the Fund invests as represented in the Statement of Investments. |
See Notes to Financial Statements and Financial Highlights.
ALPS Global Opportunity Fund – Class R
Financial Highlights
Selected data for a share of beneficial interest outstanding throughout the periods indicated:
| | | For the Year Ended October 31, 2024 | | | For the Year Ended October 31, 2023(a) | | | For the Year Ended October 31, 2022 | | | For the Year Ended October 31, 2021 | | | For the Year Ended October 31, 2020(a) | |
| Net asset value, beginning of period | | $ | 4.18 | | | $ | 3.78 | | | $ | 7.50 | | | $ | 5.23 | | | $ | 6.45 | |
| INCOME/(LOSS) FROM INVESTMENT OPERATIONS: | | | | | | | | | | | | | | | | | | | | |
| Net investment income/(loss)(b) | | | 0.05 | | | | 0.04 | | | | 0.03 | | | | (0.01 | ) | | | 0.03 | |
| Net realized and unrealized gain/(loss) | | | 1.43 | | | | 0.36 | | | | (1.77 | ) | | | 2.58 | | | | (0.18 | ) |
| Total from investment operations | | | 1.48 | | | | 0.40 | | | | (1.74 | ) | | | 2.57 | | | | (0.15 | ) |
| DISTRIBUTIONS: | | | | | | | | | | | | | | | | | | | | |
| From net investment income | | | (0.35 | ) | | | – | | | | (1.25 | ) | | | – | | | | (0.60 | ) |
| From net realized gains | | | – | | | | – | | | | (0.73 | ) | | | (0.30 | ) | | | (0.47 | ) |
| Total distributions | | | (0.35 | ) | | | – | | | | (1.98 | ) | | | (0.30 | ) | | | (1.07 | ) |
| Net increase/(decrease) in net asset value | | | 1.13 | | | | 0.40 | | | | (3.72 | ) | | | 2.27 | | | | (1.22 | ) |
| Net asset value, end of year | | $ | 5.31 | | | $ | 4.18 | | | $ | 3.78 | | | $ | 7.50 | | | $ | 5.23 | |
| TOTAL RETURN(c) | | | 37.41 | % | | | 10.58 | % | | | (30.92 | )% | | | 50.86 | % | | | (3.56 | )% |
| RATIOS/SUPPLEMENTAL DATA: | | | | | | | | | | | | | | | | | | | | |
| Net assets, end of year (000s) | | $ | 4,267 | | | $ | 4,021 | | | $ | 4,140 | | | $ | 6,987 | | | $ | 5,231 | |
| Ratio of expenses to average net assets excluding fee waivers and reimbursements(d) | | | 1.77 | % | | | 1.76 | % | | | 1.68 | % | | | 1.65 | % | | | 1.68 | % |
| Ratio of expenses to average net assets including fee waivers and reimbursements(d) | | | 1.75 | % | | | 1.75 | % | | | 1.68 | % | | | 1.65 | % | | | 1.68 | % |
| Ratio of net investment income/(loss) to average net assets(d) | | | 1.03 | % | | | 1.04 | % | | | 0.61 | % | | | (0.17 | )% | | | 0.61 | % |
| Portfolio turnover rate | | | 37 | % | | | 21 | % | | | 27 | % | | | 43 | % | | | 41 | % |
| (a) | Prior to January 24, 2023, the ALPS Global Opportunity Fund was known as the ALPS/Red Rocks Global Opportunity Fund. Prior to March 31, 2020, the ALPS/Red Rocks Global Opportunity Fund was known as the ALPS/Red Rocks Listed Private Equity Fund. |
| (b) | Calculated using the average shares method. |
| (c) | Total returns are for the period indicated. Total returns would have been lower had certain expenses not been waived during the period. Returns shown do not reflect the deduction of taxes that a shareholder would pay on Fund distributions or the redemption of Fund shares. Returns shown exclude any applicable sales charges. |
| (d) | The ratios exclude the impact of expenses of the underlying funds in which the Fund invests as represented in the Statement of Investments. |
See Notes to Financial Statements and Financial Highlights.
ALPS Balanced Opportunity Fund
| Statement of Investments | October 31, 2024 |
| | | Shares | | | Value (Note 2) | |
| COMMON STOCKS (71.98%) | | | | | | | | |
| Communications (5.97%) | | | | | | | | |
| Entertainment Content (0.86%) | | | | | | | | |
| Walt Disney Co. | | | 1,134 | | | $ | 109,091 | |
| | | | | | | | | |
| Internet Media & Services (3.90%) | | | | | | | | |
| Alphabet, Inc., Class A | | | 1,645 | | | | 281,476 | |
| Meta Platforms, Inc., Class A | | | 372 | | | | 211,140 | |
| | | | | | | | 492,616 | |
| | | | | | | | | |
| Telecommunications (1.21%) | | | | | | | | |
| AT&T, Inc. | | | 6,755 | | | | 152,258 | |
| | | | | | | | | |
| TOTAL COMMUNICATIONS | | | | | | | 753,965 | |
| | | | | | | | | |
| Consumer Discretionary (6.79%) | | | | | | | | |
| Apparel & Textile Products (0.74%) | | | | | | | | |
| NIKE, Inc., Class B | | | 1,215 | | | | 93,713 | |
| | | | | | | | | |
| E-Commerce Discretionary (2.47%) | | | | | | | | |
| Amazon.com, Inc.(a) | | | 1,670 | | | | 311,288 | |
| | | | | | | | | |
| Leisure Facilities & Services (1.74%) | | | | | | | | |
| Marriott International, Inc., Class A | | | 364 | | | | 94,647 | |
| McDonald's Corp. | | | 427 | | | | 124,731 | |
| | | | | | | | 219,378 | |
| | | | | | | | | |
| Retail - Discretionary (1.84%) | | | | | | | | |
| Lowe's Cos., Inc. | | | 511 | | | | 133,795 | |
| O'Reilly Automotive, Inc.(a) | | | 85 | | | | 98,017 | |
| | | | | | | | 231,812 | |
| | | | | | | | | |
| TOTAL CONSUMER DISCRETIONARY | | | | | | | 856,191 | |
| | | | | | | | | |
| Consumer Staples (5.55%) | | | | | | | | |
| Food (0.76%) | | | | | | | | |
| Campbell Soup Co. | | | 2,065 | | | | 96,332 | |
| | | | | | | | | |
| Household Products (0.66%) | | | | | | | | |
| Procter & Gamble Co. | | | 505 | | | | 83,416 | |
| | | | | | | | | |
| Retail - Consumer Staples (3.57%) | | | | | | | | |
| Costco Wholesale Corp. | | | 199 | | | | 173,962 | |
| Target Corp. | | | 401 | | | | 60,166 | |
| Walmart, Inc. | | | 2,635 | | | | 215,938 | |
| | | | | | | | 450,066 | |
| | | | | | | | | |
| Wholesale - Consumer Staples (0.56%) | | | | | | | | |
| ITOCHU Corp., ADR | | | 715 | | | | 70,785 | |
| | | | | | | | | |
| TOTAL CONSUMER STAPLES | | | | | | | 700,599 | |
| | | Shares | | | Value (Note 2) | |
| Energy (3.21%) | | | | | | |
| Oil & Gas Producers (2.57%) | | | | | | |
| ConocoPhillips | | | 1,575 | | | $ | 172,526 | |
| Enbridge, Inc. | | | 3,742 | | | | 151,177 | |
| | | | | | | | 323,703 | |
| | | | | | | | | |
| Oil & Gas Services & Equipment (0.64%) | | | | | | | | |
| Baker Hughes Co. | | | 2,135 | | | | 81,301 | |
| | | | | | | | | |
| TOTAL ENERGY | | | | | | | 405,004 | |
| | | | | | | | | |
| Financials (9.56%) | | | | | | | | |
| Asset Management (0.86%) | | | | | | | | |
| Blackstone, Inc. | | | 645 | | | | 108,199 | |
| | | | | | | | | |
| Banking (3.47%) | | | | | | | | |
| JPMorgan Chase & Co. | | | 1,180 | | | | 261,866 | |
| M&T Bank Corp. | | | 340 | | | | 66,191 | |
| Wells Fargo & Co. | | | 1,695 | | | | 110,039 | |
| | | | | | | | 438,096 | |
| | | | | | | | | |
| Institutional Financial Svcs (2.31%) | | | | | | | | |
| Goldman Sachs Group, Inc. | | | 235 | | | | 121,681 | |
| Intercontinental Exchange, Inc. | | | 1,088 | | | | 169,586 | |
| | | | | | | | 291,267 | |
| | | | | | | | | |
| Specialty Finance (2.92%) | | | | | | | | |
| American Express Co. | | | 695 | | | | 187,706 | |
| Mastercard, Inc., Class A | | | 361 | | | | 180,352 | |
| | | | | | | | 368,058 | |
| | | | | | | | | |
| TOTAL FINANCIALS | | | | | | | 1,205,620 | |
| | | | | | | | | |
| Health Care (8.25%) | | | | | | | | |
| Biotech & Pharma (1.95%) | | | | | | | | |
| Amgen, Inc. | | | 430 | | | | 137,669 | |
| Vertex Pharmaceuticals, Inc.(a) | | | 227 | | | | 108,047 | |
| | | | | | | | 245,716 | |
| | | | | | | | | |
| Health Care Facilities & Svcs (4.02%) | | | | | | | | |
| HCA Healthcare, Inc. | | | 506 | | | | 181,522 | |
| IQVIA Holdings, Inc.(a) | | | 485 | | | | 99,823 | |
| UnitedHealth Group, Inc. | | | 399 | | | | 225,236 | |
| | | | | | | | 506,581 | |
| | | | | | | | | |
| Medical Equipment & Devices (2.28%) | | | | | | | | |
| Boston Scientific Corp.(a) | | | 1,670 | | | | 140,313 | |
| Thermo Fisher Scientific, Inc. | | | 269 | | | | 146,960 | |
| | | | | | | | 287,273 | |
| | | | | | | | | |
| TOTAL HEALTH CARE | | | | | | | 1,039,570 | |
See Notes to Financial Statements and Financial Highlights.
ALPS Balanced Opportunity Fund
| Statement of Investments | October 31, 2024 |
| | | Shares | | | Value (Note 2) | |
| Industrials (9.17%) | | | | | | |
| Aerospace & Defense (1.20%) | | | | | | |
| Lockheed Martin Corp. | | | 278 | | | $ | 151,802 | |
| | | | | | | | | |
| Commercial Support Services (1.05%) | | | | | | | | |
| Waste Management, Inc. | | | 615 | | | | 132,748 | |
| | | | | | | | | |
| Electrical Equipment (3.46%) | | | | | | | | |
| Amphenol Corp., Class A | | | 985 | | | | 66,015 | |
| Schneider Electric SE, ADR | | | 2,780 | | | | 143,698 | |
| TE Connectivity PLC | | | 625 | | | | 92,138 | |
| Trane Technologies PLC | | | 365 | | | | 135,108 | |
| | | | | | | | 436,959 | |
| | | | | | | | | |
| Machinery (2.37%) | | | | | | | | |
| Caterpillar, Inc. | | | 509 | | | | 191,486 | |
| Deere & Co. | | | 265 | | | | 107,243 | |
| | | | | | | | 298,729 | |
| Transportation & Logistics (1.09%) | | | | | | | | |
| Old Dominion Freight Line, Inc. | | | 683 | | | | 137,502 | |
| | | | | | | | | |
| TOTAL INDUSTRIALS | | | | | | | 1,157,740 | |
| | | | | | | | | |
| Materials (1.76%) | | | | | | | | |
| Chemicals (0.89%) | | | | | | | | |
| Linde PLC | | | 245 | | | | 111,757 | |
| | | | | | | | | |
| Metals & Mining (0.87%) | | | | | | | | |
| Freeport-McMoRan, Inc. | | | 1,455 | | | | 65,504 | |
| Norsk Hydro ASA, ADR | | | 7,165 | | | | 43,707 | |
| | | | | | | | 109,211 | |
| | | | | | | | | |
| TOTAL MATERIALS | | | | | | | 220,968 | |
| | | | | | | | | |
| Real Estate (1.42%) | | | | | | | | |
| REIT (1.42%) | | | | | | | | |
| Equity LifeStyle Properties, Inc. | | | 1,521 | | | | 106,652 | |
| Prologis, Inc. | | | 640 | | | | 72,282 | |
| | | | | | | | 178,934 | |
| | | | | | | | | |
| TOTAL REAL ESTATE | | | | | | | 178,934 | |
| | | | | | | | | |
| Technology (18.56%) | | | | | | | | |
| Semiconductors (6.32%) | | | | | | | | |
| Lam Research Corp. | | | 1,670 | | | | 124,164 | |
| NVIDIA Corp. | | | 3,210 | | | | 426,159 | |
| Taiwan Semiconductor | | | | | | | | |
| Manufacturing Co., Ltd., | | | | | | | | |
| Sponsored ADR | | | 1,301 | | | | 247,893 | |
| | | | | | | | 798,216 | |
| | | Shares | | | Value (Note 2) | |
| Software (5.05%) | | | | | | |
| Adobe, Inc.(a) | | | 107 | | | $ | 51,155 | |
| Microsoft Corp. | | | 797 | | | | 323,860 | |
| Salesforce, Inc. | | | 400 | | | | 116,548 | |
| Synopsys, Inc.(a) | | | 283 | | | | 145,351 | |
| | | | | | | | 636,914 | |
| | | | | | | | | |
| Technology Hardware (6.19%) | | | | | | | | |
| Apple, Inc. | | | 2,482 | | | | 560,707 | |
| Dell Technologies, Inc. | | | 810 | | | | 100,140 | |
| Motorola Solutions, Inc. | | | 270 | | | | 121,324 | |
| | | | | | | | 782,171 | |
| | | | | | | | | |
| Technology Services (1.00%) | | | | | | | | |
| International Business Machines Corp. | | | 610 | | | | 126,099 | |
| | | | | | | | | |
| TOTAL TECHNOLOGY | | | | | | | 2,343,400 | |
| | | | | | | | | |
| Utilities (1.74%) | | | | | | | | |
| Electric Utilities (1.74%) | | | | | | | | |
| Duke Energy Corp. | | | 770 | | | | 88,758 | |
| PPL Corp. | | | 4,030 | | | | 131,217 | |
| | | | | | | | 219,975 | |
| | | | | | | | | |
| TOTAL UTILITIES | | | | | | | 219,975 | |
| | | | | | | | | |
| TOTAL COMMON STOCKS | | | | | | | | |
| (Cost $5,702,099) | | | | | | | 9,081,966 | |
| | | | | | | | |
| EXCHANGE TRADED FUNDS (30.71%) | | | | | | | | |
| ALPS Smith Core Plus Bond ETF(b) | | | 150,000 | | | | 3,874,500 | |
| | | | | | | | | |
| TOTAL EXCHANGE TRADED FUNDS | | | | | | | | |
| (Cost $3,946,625) | | | | | | | 3,874,500 | |
| | | Principal Amount | | | Value (Note 2) | |
| COLLATERALIZED MORTGAGE OBLIGATIONS (0.01%) |
| Mortgage Securities (0.01%) | | | | | | |
| | | | | | |
| Fannie Mae REMICS, Series 2012-64 3.000%, 08/25/2041 | | $ | 185 | | | | 184 | |
| Freddie Mac REMICS, Series 1996-1843 7.000%, 04/15/2026 | | | 25 | | | | 25 | |
| Government National Mortgage Association, Series 2009-104 4.500%, 08/16/2039 | | | 314 | | | | 314 | |
| Government National Mortgage Association, Series 2013-98 3.500%, 07/20/2042 | | | 1,093 | | | | 1,088 | |
| | | | | | | | | |
| Total Mortgage Securities | | | | | | | 1,611 | |
See Notes to Financial Statements and Financial Highlights.
ALPS Balanced Opportunity Fund
| Statement of Investments | October 31, 2024 |
| | | Principal Amount | | | Value (Note 2) | |
TOTAL COLLATERALIZED MORTGAGE OBLIGATIONS |
|
|
|
|
|
|
| (Cost $1,645) | | | | | | $ | 1,611 | |
| | | 7-Day Yield | | | Shares | | | Value (Note 2) | |
| SHORT TERM INVESTMENTS (2.98%) | | | | | | | | | |
| Money Market Fund (2.98%) | | | | | | | | | |
| Morgan Stanley Institutional Liquidity Funds - Government Portfolio | | | 4.779 | % | | | 46,489 | | | | 46,489 | |
| State Street Institutional Treasury Plus Money Market Fund - Premier Class | | | 4.823 | % | | | 329,294 | | | | 329,294 | |
| | | | | | | | | | | | | |
| TOTAL SHORT TERM INVESTMENTS | | | | | | | | | | | | |
| (Cost $375,783) | | | | | | | | | | | 375,783 | |
| | | | | | | | | | | | | |
| TOTAL INVESTMENTS (105.68%) | | | | | | | | | | | | |
| (Cost $10,026,152) | | | | | | | | | | $ | 13,333,860 | |
| | | | | | | | | | | | | |
| Liabilities In Excess Of Other Assets (-5.68%) | | | | | | | | | | | (716,964 | ) |
| | | | | | | | | | | | | |
| NET ASSETS (100.00%) | | | | | | | | | | $ | 12,616,896 | |
| (a) | Non-Income Producing Security. |
| (b) | Affiliated Company. See Note 7 in Notes to Financial Statements and Financial Highlights. Financials for the affiliated company can be found at www.alpsfunds.com/exchange-traded-funds/smth |
See Notes to Financial Statements and Financial Highlights.
ALPS Balanced Opportunity Fund
| Statement of Assets and Liabilities | October 31, 2024 |
| ASSETS | | | |
| Investments, at value | | $ | 9,459,360 | |
| Investments in affiliates, at value | | | 3,874,500 | |
| Dividends and interest receivable | | | 25,053 | |
| Receivable due from advisor | | | 71,013 | |
| Prepaid expenses and other assets | | | 7,298 | |
| Total Assets | | | 13,437,224 | |
| LIABILITIES | | | | |
| Payable for shares redeemed | | | 692,684 | |
| Payable due to custodian - overdraft | | | 1,267 | |
| Administration and transfer agency fees payable | | | 34,435 | |
| Distribution and services fees payable | | | 1,627 | |
| Trustees' fees and expenses payable | | | 7 | |
| Professional fees payable | | | 64,122 | |
| Accrued expenses and other liabilities | | | 26,186 | |
| Total Liabilities | | | 820,328 | |
| NET ASSETS | | $ | 12,616,896 | |
| NET ASSETS CONSIST OF | | | | |
| Paid-in capital | | $ | 8,287,352 | |
| Total distributable earnings/(accumulated losses) | | | 4,329,544 | |
| NET ASSETS | | $ | 12,616,896 | |
| INVESTMENTS, AT COST | | $ | 6,079,527 | |
| INVESTMENTS IN AFFILIATES, AT COST | | $ | 3,946,625 | |
| PRICING OF SHARES | | | | |
| Investor Class: | | | | |
| Net Asset Value, offering and redemption price per share | | $ | 13.24 | |
| Net Assets | | $ | 738,893 | |
| Shares of beneficial interest outstanding (unlimited number of shares, no par value common stock authorized) | | | 55,791 | |
| Class A: | | | | |
| Net Asset Value, offering and redemption price per share | | $ | 13.24 | |
| Net Assets | | $ | 1,324,451 | |
| Shares of beneficial interest outstanding (unlimited number of shares, no par value common stock authorized) | | | 100,003 | |
| Maximum offering price per share ((NAV/0.9675), based on maximum sales charge of 3.25% of the offering price) | | $ | 13.69 | |
| Class C: | | | | |
| Net Asset Value, offering and redemption price per share(a) | | $ | 13.13 | |
| Net Assets | | $ | 656,735 | |
| Shares of beneficial interest outstanding (unlimited number of shares, no par value common stock authorized) | | | 50,000 | |
| Class I: | | | | |
| Net Asset Value, offering and redemption price per share | | $ | 13.20 | |
| Net Assets | | $ | 9,896,817 | |
| Shares of beneficial interest outstanding (unlimited number of shares, no par value common stock authorized) | | | 749,893 | |
| (a) | Redemption price per share may be reduced for any applicable contingent deferred sales charge. For a description of a possible sales charge, please see the Fund's Prospectus. |
See Notes to Financial Statements and Financial Highlights.
ALPS Balanced Opportunity Fund
| Statement of Operations | For the Year Ended October 31, 2024 |
| INVESTMENT INCOME | | | |
| Dividends | | $ | 240,025 | |
| Dividends from affiliated securities | | | 13,766 | |
| Foreign taxes withheld on dividends | | | (7,082 | ) |
| Interest | | | 316,232 | |
| Total Investment Income | | | 562,941 | |
| | | | | |
| EXPENSES | | | | |
| Investment advisory fees | | | 145,150 | |
| Administrative fees | | | 99,981 | |
| Delegated transfer agent equivalent services fees | | | 25,064 | |
| Distribution and service fees | | | | |
| Investor Class | | | 4,192 | |
| Class A | | | 7,766 | |
| Class C | | | 6,177 | |
| Professional fees | | | 67,335 | |
| Reports to shareholders and printing fees | | | 7,630 | |
| State registration fees | | | 62,023 | |
| Insurance fees | | | 309 | |
| Custody fees | | | 11,901 | |
| Trustees' fees and expenses | | | 1,764 | |
| Miscellaneous expenses | | | 10,986 | |
| Total Expenses | | | 450,278 | |
| Less fees waived/reimbursed by investment advisor (Note 8) | | | | |
| Investor Class | | | (14,090 | ) |
| Class A | | | (25,663 | ) |
| Class C | | | (8,564 | ) |
| Class I | | | (220,718 | ) |
| Less fees waived from investments in affiliated securities (Note 8) | | | (1,510 | ) |
| Net Expenses | | | 179,733 | |
| Net Investment Income | | | 383,208 | |
| Net realized gain on investments | | | 2,708,902 | |
| Net realized gain on foreign currency transactions | | | 989 | |
| Net Realized Gain | | | 2,709,891 | |
| Net change in unrealized appreciation on investments | | | 2,153,011 | |
| Net change in unrealized depreciation on investments - affiliated securities | | | (72,125 | ) |
| Net change in unrealized appreciation on translation of assets and liabilities denominated in foreign currencies | | | 51 | |
| Net Change in Unrealized Appreciation | | | 2,080,937 | |
| NET REALIZED AND UNREALIZED GAIN ON INVESTMENTS | | | 4,790,828 | |
| NET INCREASE IN NET ASSETS RESULTING FROM OPERATIONS | | $ | 5,174,036 | |
See Notes to Financial Statements and Financial Highlights.
ALPS Balanced Opportunity Fund
Statements of Changes in Net Assets
| | | For the Year Ended October 31, 2024 | | | For the Year Ended October 31, 2023 | |
| OPERATIONS | | | | | | |
| Net investment income | | $ | 383,208 | | | $ | 415,777 | |
| Net realized gain/(loss) | | | 2,709,891 | | | | (142,874 | ) |
| Net change in unrealized appreciation | | | 2,080,937 | | | | 1,143,221 | |
| Net Increase in Net Assets Resulting from Operations | | | 5,174,036 | | | | 1,416,124 | |
| | | | | | | | | |
| DISTRIBUTIONS | | | | | | | | |
| From distributable earnings | | | | | | | | |
| Investor Class | | | (10,981 | ) | | | (11,437 | ) |
| Class A | | | (19,827 | ) | | | (17,999 | ) |
| Class C | | | (5,448 | ) | | | (5,145 | ) |
| Class I | | | (349,404 | ) | | | (398,778 | ) |
| Net Decrease in Net Assets from Distributions | | | (385,660 | ) | | | (433,359 | ) |
| | | | | | | | | |
| BENEFICIAL INTEREST TRANSACTIONS (NOTE 5) | | | | | | | | |
| Shares sold | | | | | | | | |
| Investor Class | | | 15,660 | | | | 20,506 | |
| Class A | | | – | | | | 6,422 | |
| Class I | | | 4,892,899 | | | | 6,444,319 | |
| Dividends reinvested | | | | | | | | |
| Investor Class | | | 1,002 | | | | 2,260 | |
| Class A | | | – | | | | 103 | |
| Class C | | | 14 | | | | 84 | |
| Class I | | | 311,292 | | | | 346,445 | |
| Shares redeemed | | | | | | | | |
| Investor Class | | | (7,273 | ) | | | (115,047 | ) |
| Class A | | | (1 | ) | | | (47,835 | ) |
| Class C | | | (3,145 | ) | | | (14,000 | ) |
| Class I | | | (17,537,750 | ) | | | (13,884,987 | ) |
| Net Decrease in Net Assets Derived from Beneficial Interest Transactions | | | (12,327,302 | ) | | | (7,241,730 | ) |
| | | | | | | | | |
| Net decrease in net assets | | | (7,538,926 | ) | | | (6,258,965 | ) |
| | | | | | | | | |
| NET ASSETS | | | | | | | | |
| Beginning of year | | | 20,155,822 | | | | 26,414,787 | |
| End of year | | $ | 12,616,896 | | | $ | 20,155,822 | |
See Notes to Financial Statements and Financial Highlights.
ALPS Balanced Opportunity Fund – Investor Class
Financial Highlights
Selected data for a share of beneficial interest outstanding throughout the periods indicated:
| | | For the Year Ended October 31, 2024(a) | | | For the Year Ended October 31, 2023 | | | For the Year Ended October 31, 2022 | | | For the Year Ended October 31, 2021 | | | For the Period September 16, 2020 (Commencement of Operations) to October 31, 2020 | |
| Net asset value, beginning of period | | $ | 10.56 | | | $ | 10.22 | | | $ | 12.19 | | | $ | 9.88 | | | $ | 10.00 | |
| | | | | | | | | | | | | | | | | | | | | |
| INCOME FROM INVESTMENT OPERATIONS: | | | | | | | | | | | | | | | | | | | | |
| Net investment income(b) | | | 0.23 | | | | 0.17 | | | | 0.10 | | | | 0.04 | | | | 0.00 | (c) |
| Net realized and unrealized gain/(loss) | | | 2.65 | | | | 0.35 | | | | (1.94 | ) | | | 2.32 | | | | (0.12 | ) |
| Total from investment operations | | | 2.88 | | | | 0.52 | | | | (1.84 | ) | | | 2.36 | | | | (0.12 | ) |
| | | | | | | | | | | | | | | | | | | | | |
| DISTRIBUTIONS: | | | | | | | | | | | | | | | | | | | | |
| From net investment income | | | (0.20 | ) | | | (0.18 | ) | | | (0.11 | ) | | | (0.05 | ) | | | (0.00 | )(c) |
| From net realized gains | | | – | | | | – | | | | (0.02 | ) | | | – | | | | – | |
| From tax return of capital | | | – | | | | – | | | | (0.00 | )(c) | | | – | | | | – | |
| Total distributions | | | (0.20 | ) | | | (0.18 | ) | | | (0.13 | ) | | | (0.05 | ) | | | (0.00 | )(c) |
| | | | | | | | | | | | | | | | | | | | | |
| Net increase/(decrease) in net asset value | | | 2.68 | | | | 0.34 | | | | (1.97 | ) | | | 2.31 | | | | (0.12 | ) |
| Net asset value, end of year | | $ | 13.24 | | | $ | 10.56 | | | $ | 10.22 | | | $ | 12.19 | | | $ | 9.88 | |
| TOTAL RETURN(d) | | | 27.42 | % | | | 5.09 | % | | | (15.17 | )% | | | 23.95 | % | | | (1.18 | )% |
| | | | | | | | | | | | | | | | | | | | | |
| RATIOS/SUPPLEMENTAL DATA: | | | | | | | | | | | | | | | | | | | | |
| Net assets, end of year (000s) | | $ | 739 | | | $ | 582 | | | $ | 651 | | | $ | 784 | | | $ | 601 | |
| Ratio of expenses to average net assets excluding fee waivers and reimbursements | | | 2.20 | %(e) | | | 1.82 | % | | | 1.56 | % | | | 1.67 | % | | | 3.00 | %(f) |
| Ratio of expenses to average net assets including fee waivers and reimbursements | | | 0.79 | %(e) | | | 1.09 | % | | | 1.12 | % | | | 1.12 | % | | | 1.15 | %(f) |
| Ratio of net investment income to average net assets | | | 1.89 | % | | | 1.60 | % | | | 0.86 | % | | | 0.38 | % | | | 0.25 | %(f) |
| Portfolio turnover rate(g) | | | 131 | % | | | 74 | % | | | 108 | % | | | 126 | % | | | 26 | % |
| (a) | Prior to October 3, 2024, the ALPS Balanced Opportunity Fund was known as the ALPS | Smith Balanced Opportunity Fund. |
| (b) | Calculated using the average shares method. |
| (c) | Less than $0.005 or ($0.005) per share. |
| (d) | Total returns are for the period indicated and have not been annualized. Total returns would have been lower had certain expenses not been waived during the period. Returns shown do not reflect the deduction of taxes that a shareholder would pay on Fund distributions or the redemption of Fund shares. |
| (e) | According to the Fund's shareholder services plan with respect to the Fund's Investor Class shares, any amount of fees accrued according to the plan, but not paid during the Fund's fiscal year for such service activities shall be reimbursed to the Fund as soon as practical. Ratios may be lower than the expense cap due to the amounts reimbursed to the Fund. |
| (g) | Portfolio turnover rate for periods less than one full year have not been annualized. |
See Notes to Financial Statements and Financial Highlights.
ALPS Balanced Opportunity Fund – Class A
Financial Highlights
Selected data for a share of beneficial interest outstanding throughout the periods indicated:
| | | For the Year Ended October 31, 2024(a) | | | For the Year Ended October 31, 2023 | | | For the Year Ended October 31, 2022 | | | For the Year Ended October 31, 2021 | | | For the Period September 16, 2020 (Commencement of Operations) to October 31, 2020 | |
| Net asset value, beginning of period | | $ | 10.56 | | | $ | 10.22 | | | $ | 12.19 | | | $ | 9.88 | | | $ | 10.00 | |
| | | | | | | | | | | | | | | | | | | | | |
| INCOME FROM INVESTMENT OPERATIONS: | | | | | | | | | | | | | | | | | | | | |
| Net investment income(b) | | | 0.24 | | | | 0.17 | | | | 0.10 | | | | 0.04 | | | | 0.00 | (c) |
| Net realized and unrealized gain/(loss) | | | 2.64 | | | | 0.35 | | | | (1.94 | ) | | | 2.32 | | | | (0.12 | ) |
| Total from investment operations | | | 2.88 | | | | 0.52 | | | | (1.84 | ) | | | 2.36 | | | | (0.12 | ) |
| | | | | | | | | | | | | | | | | | | | | |
| DISTRIBUTIONS: | | | | | | | | | | | | | | | | | | | | |
| From net investment income | | | (0.20 | ) | | | (0.18 | ) | | | (0.11 | ) | | | (0.05 | ) | | | (0.00 | )(c) |
| From net realized gains | | | – | | | | – | | | | (0.02 | ) | | | – | | | | – | |
| From tax return of capital | | | – | | | | – | | | | (0.00 | )(c) | | | – | | | | – | |
| Total distributions | | | (0.20 | ) | | | (0.18 | ) | | | (0.13 | ) | | | (0.05 | ) | | | (0.00 | )(c) |
| | | | | | | | | | | | | | | | | | | | | |
| Net increase/(decrease) in net asset value | | | 2.68 | | | | 0.34 | | | | (1.97 | ) | | | 2.31 | | | | (0.12 | ) |
| Net asset value, end of year | | $ | 13.24 | | | $ | 10.56 | | | $ | 10.22 | | | $ | 12.19 | | | $ | 9.88 | |
| TOTAL RETURN(d) | | | 27.40 | % | | | 5.06 | % | | | (15.16 | )% | | | 23.96 | % | | | (1.16 | )% |
| | | | | | | | | | | | | | | | | | | | | |
| RATIOS/SUPPLEMENTAL DATA: | | | | | | | | | | | | | | | | | | | | |
| Net assets, end of year (000s) | | $ | 1,324 | | | $ | 1,056 | | | $ | 1,063 | | | $ | 1,219 | | | $ | 988 | |
| Ratio of expenses to average net assets excluding fee waivers and reimbursements | | | 2.18 | %(e) | | | 1.87 | % | | | 1.56 | % | | | 1.66 | % | | | 3.03 | %(f) |
| Ratio of expenses to average net assets including fee waivers and reimbursements | | | 0.78 | %(e) | | | 1.12 | % | | | 1.11 | % | | | 1.11 | % | | | 1.15 | %(f) |
| Ratio of net investment income to average net assets | | | 1.90 | % | | | 1.57 | % | | | 0.87 | % | | | 0.39 | % | | | 0.26 | %(f) |
| Portfolio turnover rate(g) | | | 131 | % | | | 74 | % | | | 108 | % | | | 126 | % | | | 26 | % |
| (a) | Prior to October 3, 2024, the ALPS Balanced Opportunity Fund was known as the ALPS | Smith Balanced Opportunity Fund. |
| (b) | Calculated using the average shares method. |
| (c) | Less than $0.005 or ($0.005) per share. |
| (d) | Total returns are for the period indicated and have not been annualized. Total returns would have been lower had certain expenses not been waived during the period. Returns shown do not reflect the deduction of taxes that a shareholder would pay on Fund distributions or the redemption of Fund shares. Returns shown exclude any applicable sales charges. |
| (e) | According to the Fund's shareholder services plan with respect to the Fund's Class A shares, any amount of fees accrued according to the plan, but not paid during the Fund's fiscal year for such service activities shall be reimbursed to the Fund as soon as practical. Ratios may be lower than the expense cap due to the amounts reimbursed to the Fund. |
| (g) | Portfolio turnover rate for periods less than one full year have not been annualized. |
See Notes to Financial Statements and Financial Highlights.
ALPS Balanced Opportunity Fund – Class C
Financial Highlights
Selected data for a share of beneficial interest outstanding throughout the periods indicated:
| | | For the Year Ended October 31, 2024(a) | | | For the Year Ended October 31, 2023 | | | For the Year Ended October 31, 2022 | | | For the Year Ended October 31, 2021 | | | For the Period September 16, 2020 (Commencement of Operations) to October 31, 2020 | |
| Net asset value, beginning of period | | $ | 10.51 | | | $ | 10.17 | | | $ | 12.14 | | | $ | 9.88 | | | $ | 10.00 | |
| | | | | | | | | | | | | | | | | | | | | |
| INCOME FROM INVESTMENT OPERATIONS: | | | | | | | | | | | | | | | | | | | | |
| Net investment income/(loss)(b) | | | 0.10 | | | | 0.09 | | | | 0.01 | | | | (0.04 | ) | | | (0.01 | ) |
| Net realized and unrealized gain/(loss) | | | 2.63 | | | | 0.35 | | | | (1.92 | ) | | | 2.31 | | | | (0.11 | ) |
| Total from investment operations | | | 2.73 | | | | 0.44 | | | | (1.91 | ) | | | 2.27 | | | | (0.12 | ) |
| | | | | | | | | | | | | | | | | | | | | |
| DISTRIBUTIONS: | | | | | | | | | | | | | | | | | | | | |
| From net investment income | | | (0.11 | ) | | | (0.10 | ) | | | (0.04 | ) | | | (0.01 | ) | | | — | |
| From net realized gains | | | – | | | | – | | | | (0.02 | ) | | | – | | | | – | |
| From tax return of capital | | | – | | | | – | | | | (0.00 | )(c) | | | – | | | | – | |
| Total distributions | | | (0.11 | ) | | | (0.10 | ) | | | (0.06 | ) | | | (0.01 | ) | | | – | |
| | | | | | | | | | | | | | | | | | | | | |
| Net increase/(decrease) in net asset value | | | 2.62 | | | | 0.34 | | | | (1.97 | ) | | | 2.26 | | | | (0.12 | ) |
| Net asset value, end of year | | $ | 13.13 | | | $ | 10.51 | | | $ | 10.17 | | | $ | 12.14 | | | $ | 9.88 | |
| TOTAL RETURN(d) | | | 26.04 | % | | | 4.32 | % | | | (15.81 | )% | | | 22.93 | % | | | (1.20 | )% |
| | | | | | | | | | | | | | | | | | | | | |
| RATIOS/SUPPLEMENTAL DATA: | | | | | | | | | | | | | | | | | | | | |
| Net assets, end of year (000s) | | $ | 657 | | | $ | 528 | | | $ | 524 | | | $ | 607 | | | $ | 494 | |
| Ratio of expenses to average net assets excluding fee waivers and reimbursements | | | 3.22 | % | | | 2.60 | % | | | 2.30 | % | | | 2.40 | % | | | 3.73 | %(e) |
| Ratio of expenses to average net assets including fee waivers and reimbursements | | | 1.85 | % | | | 1.85 | % | | | 1.85 | % | | | 1.85 | % | | | 1.85 | %(e) |
| Ratio of net investment income/(loss) to average net assets | | | 0.84 | % | | | 0.84 | % | | | 0.13 | % | | | (0.35 | )% | | | (0.44 | )%(e) |
| Portfolio turnover rate(f) | | | 131 | % | | | 74 | % | | | 108 | % | | | 126 | % | | | 26 | % |
| (a) | Prior to October 3, 2024, the ALPS Balanced Opportunity Fund was known as the ALPS | Smith Balanced Opportunity Fund. |
| (b) | Calculated using the average shares method. |
| (c) | Less than $0.005 or ($0.005) per share. |
| (d) | Total returns are for the period indicated and have not been annualized. Total returns would have been lower had certain expenses not been waived during the period. Returns shown do not reflect the deduction of taxes that a shareholder would pay on Fund distributions or the redemption of Fund shares. Returns shown exclude any applicable sales charges. |
| (f) | Portfolio turnover rate for periods less than one full year have not been annualized. |
See Notes to Financial Statements and Financial Highlights.
ALPS Balanced Opportunity Fund – Class I
Financial Highlights
Selected data for a share of beneficial interest outstanding throughout the periods indicated:
| | | For the Year Ended October 31, 2024(a) | | | For the Year Ended October 31, 2023 | | | For the Year Ended October 31, 2022 | | | For the Year Ended October 31, 2021 | | | For the Period September 16, 2020 (Commencement of Operations) to October 31, 2020 | |
| Net asset value, beginning of period | | $ | 10.56 | | | $ | 10.22 | | | $ | 12.19 | | | $ | 9.88 | | | $ | 10.00 | |
| | | | | | | | | | | | | | | | | | | | | |
| INCOME FROM INVESTMENT OPERATIONS: | | | | | | | | | | | | | | | | | | | | |
| Net investment income(b) | | | 0.23 | | | | 0.20 | | | | 0.12 | | | | 0.08 | | | | 0.01 | |
| Net realized and unrealized gain/(loss) | | | 2.64 | | | | 0.35 | | | | (1.93 | ) | | | 2.31 | | | | (0.12 | ) |
| Total from investment operations | | | 2.87 | | | | 0.55 | | | | (1.81 | ) | | | 2.39 | | | | (0.11 | ) |
| | | | | | | | | | | | | | | | | | | | | |
| DISTRIBUTIONS: | | | | | | | | | | | | | | | | | | | | |
| From net investment income | | | (0.23 | ) | | | (0.21 | ) | | | (0.14 | ) | | | (0.08 | ) | | | (0.01 | ) |
| From net realized gains | | | – | | | | – | | | | (0.02 | ) | | | – | | | | – | |
| From tax return of capital | | | – | | | | – | | | | (0.00 | )(c) | | | – | | | | – | |
| Total distributions | | | (0.23 | ) | | | (0.21 | ) | | | (0.16 | ) | | | (0.08 | ) | | | (0.01 | ) |
| | | | | | | | | | | | | | | | | | | | | |
| Net increase/(decrease) in net asset value | | | 2.64 | | | | 0.34 | | | | (1.97 | ) | | | 2.31 | | | | (0.12 | ) |
| Net asset value, end of year | | $ | 13.20 | | | $ | 10.56 | | | $ | 10.22 | | | $ | 12.19 | | | $ | 9.88 | |
| TOTAL RETURN(d) | | | 27.38 | % | | | 5.37 | % | | | (14.93 | )% | | | 24.28 | % | | | (1.15 | )% |
| | | | | | | | | | | | | | | | | | | | | |
| RATIOS/SUPPLEMENTAL DATA: | | | | | | | | | | | | | | | | | | | | |
| Net assets, end of year (000s) | | $ | 9,897 | | | $ | 17,990 | | | $ | 24,176 | | | $ | 37,410 | | | $ | 12,289 | |
| Ratio of expenses to average net assets excluding fee waivers and reimbursements | | | 2.06 | % | | | 1.72 | % | | | 1.41 | % | | | 1.39 | % | | | 2.69 | %(e) |
| Ratio of expenses to average net assets including fee waivers and reimbursements | | | 0.85 | % | | | 0.85 | % | | | 0.85 | % | | | 0.85 | % | | | 0.85 | %(e) |
| Ratio of net investment income to average net assets | | | 1.88 | % | | | 1.83 | % | | | 1.10 | % | | | 0.67 | % | | | 0.57 | %(e) |
| Portfolio turnover rate(f) | | | 131 | % | | | 74 | % | | | 108 | % | | | 126 | % | | | 26 | % |
| (a) | Prior to October 3, 2024, the ALPS Balanced Opportunity Fund was known as the ALPS | Smith Balanced Opportunity Fund. |
| (b) | Calculated using the average shares method. |
| (c) | Less than $0.005 or ($0.005) per share. |
| (d) | Total returns are for the period indicated and have not been annualized. Total returns would have been lower had certain expenses not been waived during the period. Returns shown do not reflect the deduction of taxes that a shareholder would pay on Fund distributions or the redemption of Fund shares. |
| (f) | Portfolio turnover rate for periods less than one full year have not been annualized. |
See Notes to Financial Statements and Financial Highlights.
RiverFront Asset Allocation Growth & Income
| Statement of Investments | October 31, 2024 |
| | | Shares | | | Value (Note 2) | |
| EXCHANGE TRADED FUNDS (98.89%) | | | | | | |
| Debt (27.28%) | | | | | | |
| Invesco BulletShares 2029 Corporate Bond ETF | | | 40,062 | | | $ | 737,942 | |
| iShares® 7-10 Year Treasury Bond ETF | | | 18,197 | | | | 1,719,980 | |
| JPMorgan USD Emerging Markets Sovereign Bond ETF | | | 14,183 | | | | 556,582 | |
| PIMCO 25+ Year Zero Coupon U.S. Treasury Index ETF | | | 15,415 | | | | 1,164,912 | |
| RiverFront Dynamic Core Income ETF(a) | | | 227,112 | | | | 5,094,281 | |
| Riverfront Strategic Income Fund(a) | | | 116,542 | | | | 2,677,482 | |
| VanEck Fallen Angel High Yield Bond ETF | | | 62,049 | | | | 1,791,355 | |
| Vanguard® Long-Term Corporate Bond ETF | | | 95,827 | | | | 7,413,177 | |
| | | | | | | | 21,155,711 | |
| Equity (71.61%) | | | | | | | | |
| ALPS Active Equity Opportunity ETF(a) | | | 53,896 | | | | 3,078,000 | |
| Energy Select Sector SPDR® Fund | | | 8,941 | | | | 792,083 | |
| First Trust RiverFront Dynamic Developed International ETF(a) | | | 165,359 | | | | 10,632,584 | |
| First Trust RiverFront Dynamic Emerging Markets ETF(a) | | | 42,789 | | | | 2,782,025 | |
| iShares® Core S&P 500® ETF | | | 9,819 | | | | 5,609,006 | |
| iShares® MSCI Europe Financials ETF | | | 33,635 | | | | 807,240 | |
| iShares® U.S. Technology ETF | | | 27,162 | | | | 4,093,042 | |
| JPMorgan Equity Premium Income ETF | | | 148,245 | | | | 8,700,499 | |
| JPMorgan Nasdaq Equity Premium Income ETF | | | 35,640 | | | | 1,945,231 | |
| RiverFront Dynamic US Dividend Advantage ETF(a) | | | 286,978 | | | | 15,680,105 | |
| VanEck Semiconductor ETF | | | 2,723 | | | | 658,095 | |
| WisdomTree® Europe Hedged Equity Fund | | | 17,282 | | | | 747,101 | |
| | | | | | | | 55,525,011 | |
| | | | | | | | | |
| TOTAL EXCHANGE TRADED FUNDS | | | | | | | | |
| (Cost $63,332,638) | | | | | | | 76,680,722 | |
| | | 7-Day Yield | | | Shares | | | Value (Note 2) | |
| SHORT-TERM INVESTMENTS (1.15%) | | | | | | | | | |
| Money Market Fund (1.15%) | | | | | | | | | |
| State Street Institutional Treasury Plus Money Market Fund- Premier Class | | | 4.823 | % | | | 895,170 | | | | 895,170 | |
| | | | | | | | | | | | | |
| TOTAL MONEY MARKET FUND | | | | | | | | | | | 895,170 | |
| | | | | | | | | | | | | |
| TOTAL SHORT-TERM INVESTMENTS | | | | | | | | | | | | |
| (Cost $895,170) | | | | | | | | | | | 895,170 | |
| | | Value (Note 2) | |
| TOTAL INVESTMENTS (100.04%) | | | | |
| (Cost $64,227,808) | | $ | 77,575,892 | |
| | | | | |
| Liabilities In Excess Of Other Assets (-0.04%) | | | (31,660 | ) |
| | | | | |
| NET ASSETS (100.00%) | | $ | 77,544,232 | |
| (a) | Affiliated Company. See Note 7 in Notes to Financial Statements and Financial Highlights. |
For Fund compliance purposes, the Fund's industry classifications refer to any one or more of the industry sub-classifications used by one or more widely recognized market indexes or ratings group indexes, and/or as defined by Fund management. This definition may not apply for purposes of this report, which may combine industry sub-classifications for reporting ease. Industries are shown as a percent of net assets.
See Notes to Financial Statements and Financial Highlights.
RiverFront Asset Allocation Growth & Income
| Statement of Assets and Liabilities | October 31, 2024 |
| | | RiverFront Asset Allocation Growth & Income | |
| ASSETS | | | |
| Investments, at value | | $ | 37,631,415 | |
| Investments in affiliates, at value | | | 39,944,477 | |
| Receivable for shares sold | | | 8,905 | |
| Dividends and interest receivable | | | 4,763 | |
| Total Assets | | | 77,589,560 | |
| LIABILITIES | | | | |
| Payable for shares redeemed | | | 1,725 | |
| Unitary administrative fees payable | | | 32,946 | |
| Distribution and services fees payable | | | 10,657 | |
| Total Liabilities | | | 45,328 | |
| NET ASSETS | | $ | 77,544,232 | |
| NET ASSETS CONSIST OF | | | | |
| Paid-in capital | | $ | 65,516,169 | |
| Total distributable earnings/(accumulated losses) | | | 12,028,063 | |
| NET ASSETS | | $ | 77,544,232 | |
| INVESTMENTS, AT COST | | $ | 34,456,137 | |
| INVESTMENTS IN AFFILIATES, AT COST | | $ | 29,771,671 | |
| | | | | |
| PRICING OF SHARES | | | | |
| Investor Class: | | | | |
| Net Asset Value, offering and redemption price per share | | $ | 13.98 | |
| Net Assets | | $ | 8,380,148 | |
| Shares of beneficial interest outstanding (unlimited number of shares, no par value common stock authorized) | | | 599,394 | |
| Class A: | | | | |
| Net Asset Value, offering and redemption price per share | | $ | 13.96 | |
| Net Assets | | $ | 21,604,262 | |
| Shares of beneficial interest outstanding (unlimited number of shares, no par value common stock authorized) | | | 1,547,331 | |
| Maximum offering price per share ((NAV/0.9450), based on maximum sales charge of 5.50% of the offering price) | | $ | 14.77 | |
| Class C: | | | | |
| Net Asset Value, offering and redemption price per share(a) | | $ | 13.41 | |
| Net Assets | | $ | 4,819,682 | |
| Shares of beneficial interest outstanding (unlimited number of shares, no par value common stock authorized) | | | 359,484 | |
| Class I: | | | | |
| Net Asset Value, offering and redemption price per share | | $ | 13.93 | |
| Net Assets | | $ | 42,740,140 | |
| Shares of beneficial interest outstanding (unlimited number of shares, no par value common stock authorized) | | | 3,067,969 | |
| (a) | Redemption price per share may be reduced for any applicable contingent deferred sales charge. For a description of a possible sales charge, please see the Fund's Prospectus. |
See Notes to Financial Statements and Financial Highlights.
RiverFront Asset Allocation Growth & Income
| Statement of Operations | For the Year Ended October 31, 2024 |
| | | RiverFront Asset Allocation Growth & Income | |
| INVESTMENT INCOME | | | |
| Dividends | | $ | 1,483,481 | |
| Dividends from affiliated securities | | | 1,257,850 | |
| Total Investment Income | | | 2,741,331 | |
| | | | | |
| EXPENSES | | | | |
| Unitary administrative fees | | | 195,775 | |
| Distribution and service fees | | | | |
| Investor Class | | | 20,698 | |
| Class A | | | 53,205 | |
| Class C | | | 60,427 | |
| Total Expenses | | | 330,105 | |
| Net Expenses | | | 330,105 | |
| Net Investment Income | | | 2,411,226 | |
| Net realized loss on investments | | | (861,524 | ) |
| Net realized gain on investments - affiliated securities | | | 1,115,840 | |
| Net realized gain | | | 254,316 | |
| Net change in unrealized appreciation on investments | | | 7,120,740 | |
| Net change in unrealized appreciation on investments - affiliated securities | | | 6,708,903 | |
| Net change in unrealized appreciation | | | 13,829,643 | |
| NET REALIZED AND UNREALIZED GAIN ON INVESTMENTS | | | 14,083,959 | |
| NET INCREASE IN NET ASSETS RESULTING FROM OPERATIONS | | $ | 16,495,185 | |
See Notes to Financial Statements and Financial Highlights.
RiverFront Asset Allocation Growth & Income
Statements of Changes in Net Assets
| | | For the Year Ended October 31, 2024 | | | For the Year Ended October 31, 2023 | |
| OPERATIONS | | | | | | | | |
| Net investment income | | $ | 2,411,226 | | | $ | 2,785,844 | |
| Net realized gain/(loss) | | | 254,316 | | | | (726,577 | ) |
| Net change in unrealized appreciation | | | 13,829,643 | | | | 2,228,140 | |
| Net Increase in Net Assets Resulting from Operations | | | 16,495,185 | | | | 4,287,407 | |
| TOTAL DISTRIBUTIONS | | | | | | | | |
| From distributable earnings | | | | | | | | |
| Investor Class | | | (260,033 | ) | | | (647,846 | ) |
| Class A | | | (669,037 | ) | | | (1,384,895 | ) |
| Class C | | | (146,313 | ) | | | (779,705 | ) |
| Class I | | | (1,435,407 | ) | | | (3,343,761 | ) |
| Net Decrease in Net Assets from Distributions | | | (2,510,790 | ) | | | (6,156,207 | ) |
| BENEFICIAL INTEREST TRANSACTIONS (NOTE 6) | | | | | | | | |
| Shares sold | | | | | | | | |
| Investor Class | | | 54,187 | | | | 78,472 | |
| Class A | | | 2,588,064 | | | | 3,733,571 | |
| Class C | | | 361,187 | | | | 205,272 | |
| Class I | | | 3,713,854 | | | | 3,084,085 | |
| Dividends reinvested | | | | | | | | |
| Investor Class | | | 254,438 | | | | 636,855 | |
| Class A | | | 649,196 | | | | 1,366,683 | |
| Class C | | | 141,151 | | | | 756,170 | |
| Class I | | | 1,413,318 | | | | 3,255,904 | |
| Shares redeemed | | | | | | | | |
| Investor Class | | | (1,078,857 | ) | | | (2,105,984 | ) |
| Class A | | | (4,478,867 | ) | | | (4,238,648 | ) |
| Class C | | | (3,996,604 | ) | | | (7,143,443 | ) |
| Class I | | | (10,033,679 | ) | | | (12,937,619 | ) |
| Net Decrease in Net Assets Derived from Beneficial Interest Transactions | | | (10,412,612 | ) | | | (13,308,682 | ) |
| Net increase/(decrease) in net assets | | | 3,571,783 | | | | (15,177,482 | ) |
| NET ASSETS | | | | | | | | |
| Beginning of year | | | 73,972,449 | | | | 89,149,931 | |
| End of year | | $ | 77,544,232 | | | $ | 73,972,449 | |
See Notes to Financial Statements and Financial Highlights.
RiverFront Asset Allocation Growth & Income – Investor Class
Financial Highlights
Selected data for a share of beneficial interest outstanding throughout the periods indicated:
| | | For the Year Ended October 31, 2024 | | | For the Year Ended October 31, 2023 | | | For the Year Ended October 31, 2022 | | | For the Year Ended October 31, 2021 | | | For the Year Ended October 31, 2020 | |
| Net asset value, beginning of period | | $ | 11.66 | | | $ | 12.00 | | | $ | 14.45 | | | $ | 11.84 | | | $ | 12.02 | |
| INCOME/(LOSS) FROM INVESTMENT OPERATIONS: | | | | | | | | | | | | | | | | | | | | |
| Net investment income(a) | | | 0.40 | | | | 0.40 | | | | 0.37 | | | | 0.14 | | | | 0.18 | |
| Net realized and unrealized gain/(loss) | | | 2.35 | | | | 0.14 | | | | (2.49 | ) | | | 2.62 | | | | (0.16 | ) |
| Total from investment operations | | | 2.75 | | | | 0.54 | | | | (2.12 | ) | | | 2.76 | | | | 0.02 | |
| DISTRIBUTIONS: | | | | | | | | | | | | | | | | | | | | |
| From net investment income | | | (0.43 | ) | | | (0.42 | ) | | | (0.33 | ) | | | (0.14 | ) | | | (0.20 | ) |
| From net realized gains | | | – | | | | (0.46 | ) | | | – | | | | – | | | | – | |
| Tax return of capital | | | – | | | | – | | | | – | | | | (0.01 | ) | | | – | |
| Total distributions | | | (0.43 | ) | | | (0.88 | ) | | | (0.33 | ) | | | (0.15 | ) | | | (0.20 | ) |
| Net increase/(decrease) in net asset value | | | 2.32 | | | | (0.34 | ) | | | (2.45 | ) | | | 2.61 | | | | (0.18 | ) |
| Net asset value, end of year | | $ | 13.98 | | | $ | 11.66 | | | $ | 12.00 | | | $ | 14.45 | | | $ | 11.84 | |
| TOTAL RETURN(b) | | | 23.67 | % | | | 4.53 | % | | | (14.82 | )% | | | 23.40 | % | | | 0.27 | % |
| RATIOS/SUPPLEMENTAL DATA: | | | | | | | | | | | | | | | | | | | | |
| Net assets, end of year (000s) | | $ | 8,380 | | | $ | 7,687 | | | $ | 9,269 | | | $ | 6,921 | | | $ | 6,802 | |
| Ratio of expenses to average net assets excluding fee waivers and reimbursements(c) | | | 0.50 | % | | | 0.50 | % | | | 0.50 | % | | | 0.50 | % | | | 0.50 | % |
| Ratio of expenses to average net assets including fee waivers and reimbursements(c) | | | 0.50 | % | | | 0.50 | % | | | 0.50 | % | | | 0.50 | % | | | 0.50 | % |
| Ratio of net investment income to average net assets(c)(d) | | | 3.01 | % | | | 3.29 | % | | | 2.84 | % | | | 1.04 | % | | | 1.57 | % |
| Portfolio turnover rate | | | 36 | % | | | 13 | % | | | 127 | % | | | 13 | % | | | 33 | % |
| (a) | Calculated using the average shares method. |
| (b) | Total returns are for the period indicated. Total returns would have been lower had certain expenses not been waived during the period. Returns shown do not reflect the deduction of taxes that a shareholder would pay on Fund distributions or the redemption of Fund shares. |
| (c) | Does not include expenses of the investment companies in which the Fund invests. |
| (d) | The recognition of net investment income is affected by the timing and declaration of dividends by the investment companies in which the Fund invests. |
See Notes to Financial Statements and Financial Highlights.
RiverFront Asset Allocation Growth & Income – Class A
Financial Highlights
Selected data for a share of beneficial interest outstanding throughout the periods indicated:
| | | For the Year Ended October 31, 2024 | | | For the Year Ended October 31, 2023 | | | For the Year Ended October 31, 2022 | | | For the Year Ended October 31, 2021 | | | For the Year Ended October 31, 2020 | |
| Net asset value, beginning of period | | $ | 11.65 | | | $ | 11.99 | | | $ | 14.43 | | | $ | 11.83 | | | $ | 12.01 | |
| | | | | | | | | | | | | | | | | | | | | |
| INCOME FROM INVESTMENT OPERATIONS: | | | | | | | | | | | | | | | | | | | | |
| Net investment income(a) | | | 0.40 | | | | 0.40 | | | | 0.37 | | | | 0.14 | | | | 0.18 | |
| Net realized and unrealized gain/(loss) | | | 2.34 | | | | 0.14 | | | | (2.48 | ) | | | 2.61 | | | | (0.16 | ) |
| Total from investment operations | | | 2.74 | | | | 0.54 | | | | (2.11 | ) | | | 2.75 | | | | 0.02 | |
| | | | | | | | | | | | | | | | | | | | | |
| DISTRIBUTIONS: | | | | | | | | | | | | | | | | | | | | |
| From net investment income | | | (0.43 | ) | | | (0.42 | ) | | | (0.33 | ) | | | (0.14 | ) | | | (0.20 | ) |
| From net realized gains | | | – | | | | (0.46 | ) | | | – | | | | – | | | | – | |
| From tax return of capital | | | – | | | | – | | | | – | | | | (0.01 | ) | | | – | |
| Total distributions | | | (0.43 | ) | | | (0.88 | ) | | | (0.33 | ) | | | (0.15 | ) | | | (0.20 | ) |
| | | | | | | | | | | | | | | | | | | | | |
| Net increase/(decrease) in net asset value | | | 2.31 | | | | (0.34 | ) | | | (2.44 | ) | | | 2.60 | | | | (0.18 | ) |
| Net asset value, end of year | | $ | 13.96 | | | $ | 11.65 | | | $ | 11.99 | | | $ | 14.43 | | | $ | 11.83 | |
| TOTAL RETURN(b) | | | 23.60 | % | | | 4.54 | % | | | (14.76 | )% | | | 23.34 | % | | | 0.28 | % |
| | | | | | | | | | | | | | | | | | | | | |
| RATIOS/SUPPLEMENTAL DATA: | | | | | | | | | | | | | | | | | | | | |
| Net assets, end of year (000s) | | $ | 21,604 | | | $ | 19,110 | | | $ | 18,794 | | | $ | 6,139 | | | $ | 4,489 | |
| Ratio of expenses to average net assets excluding fee waivers and reimbursements(c) | | | 0.50 | % | | | 0.50 | % | | | 0.50 | % | | | 0.50 | % | | | 0.50 | % |
| Ratio of expenses to average net assets including fee waivers and reimbursements(c) | | | 0.50 | % | | | 0.50 | % | | | 0.50 | % | | | 0.50 | % | | | 0.50 | % |
| Ratio of net investment income to average net assets(c)(d) | | | 3.00 | % | | | 3.26 | % | | | 2.89 | % | | | 1.05 | % | | | 1.52 | % |
| Portfolio turnover rate | | | 36 | % | | | 13 | % | | | 127 | % | | | 13 | % | | | 33 | % |
| (a) | Calculated using the average shares method. |
| (b) | Total returns are for the period indicated. Total returns would have been lower had certain expenses not been waived during the period. Returns shown do not reflect the deduction of taxes that a shareholder would pay on Fund distributions or the redemption of Fund shares. Returns shown exclude any applicable sales charges. |
| (c) | Does not include expenses of the investment companies in which the Fund invests. |
| (d) | The recognition of net investment income is affected by the timing and declaration of dividends by the investment companies in which the Fund invests. |
See Notes to Financial Statements and Financial Highlights.
RiverFront Asset Allocation Growth & Income – Class C
Financial Highlights
Selected data for a share of beneficial interest outstanding throughout the periods indicated:
| | | For the Year Ended October 31, 2024 | | | For the Year Ended October 31, 2023 | | | For the Year Ended October 31, 2022 | | | For the Year Ended October 31, 2021 | | | For the Year Ended October 31, 2020 | |
| Net asset value, beginning of period | | $ | 11.20 | | | $ | 11.57 | | | $ | 13.94 | | | $ | 11.45 | | | $ | 11.65 | |
| INCOME/(LOSS) FROM INVESTMENT OPERATIONS: | | | | | | | | | | | | | | | | | | | | |
| Net investment income(a) | | | 0.29 | | | | 0.31 | | | | 0.26 | | | | 0.04 | | | | 0.09 | |
| Net realized and unrealized gain/(loss) | | | 2.25 | | | | 0.11 | | | | (2.39 | ) | | | 2.52 | | | | (0.15 | ) |
| Total from investment operations | | | 2.54 | | | | 0.42 | | | | (2.13 | ) | | | 2.56 | | | | (0.06 | ) |
| DISTRIBUTIONS: | | | | | | | | | | | | | | | | | | | | |
| From net investment income | | | (0.33 | ) | | | (0.33 | ) | | | (0.24 | ) | | | (0.06 | ) | | | (0.14 | ) |
| From net realized gains | | | – | | | | (0.46 | ) | | | – | | | | – | | | | – | |
| Tax return of capital | | | – | | | | – | | | | – | | | | (0.01 | ) | | | – | |
| Total distributions | | | (0.33 | ) | | | (0.79 | ) | | | (0.24 | ) | | | (0.07 | ) | | | (0.14 | ) |
| Net increase/(decrease) in net asset value | | | 2.21 | | | | (0.37 | ) | | | (2.37 | ) | | | 2.49 | | | | (0.20 | ) |
| Net asset value, end of year | | $ | 13.41 | | | $ | 11.20 | | | $ | 11.57 | | | $ | 13.94 | | | $ | 11.45 | |
| TOTAL RETURN(b) | | | 22.77 | % | | | 3.68 | % | | | (15.39 | )% | | | 22.44 | % | | | (0.44 | )% |
| RATIOS/SUPPLEMENTAL DATA: | | | | | | | | | | | | | | | | | | | | |
| Net assets, end of year (000s) | | $ | 4,820 | | | $ | 7,118 | | | $ | 13,432 | | | $ | 11,049 | | | $ | 13,642 | |
| Ratio of expenses to average net assets excluding fee waivers and reimbursements(c) | | | 1.25 | % | | | 1.25 | % | | | 1.25 | % | | | 1.25 | % | | | 1.25 | % |
| Ratio of expenses to average net assets including fee waivers and reimbursements(c) | | | 1.25 | % | | | 1.25 | % | | | 1.25 | % | | | 1.25 | % | | | 1.25 | % |
| Ratio of net investment income to average net assets(c)(d) | | | 2.24 | % | | | 2.60 | % | | | 2.03 | % | | | 0.29 | % | | | 0.82 | % |
| Portfolio turnover rate | | | 36 | % | | | 13 | % | | | 127 | % | | | 13 | % | | | 33 | % |
| (a) | Calculated using the average shares method. |
| (b) | Total returns are for the period indicated. Total returns would have been lower had certain expenses not been waived during the period. Returns shown do not reflect the deduction of taxes that a shareholder would pay on Fund distributions or the redemption of Fund shares. Returns shown exclude any applicable sales charges. |
| (c) | Does not include expenses of the investment companies in which the Fund invests. |
| (d) | The recognition of net investment income is affected by the timing and declaration of dividends by the investment companies in which the Fund invests. |
See Notes to Financial Statements and Financial Highlights.
RiverFront Asset Allocation Growth & Income – Class I
Financial Highlights
Selected data for a share of beneficial interest outstanding throughout the periods indicated:
| | | For the Year Ended October 31, 2024 | | | For the Year Ended October 31, 2023 | | | For the Year Ended October 31, 2022 | | | For the Year Ended October 31, 2021 | | | For the Year Ended October 31, 2020 | |
| Net asset value, beginning of period | | $ | 11.62 | | | $ | 11.96 | | | $ | 14.40 | | | $ | 11.79 | | | $ | 11.97 | |
| INCOME/(LOSS) FROM INVESTMENT OPERATIONS: | | | | | | | | | | | | | | | | | | | | |
| Net investment income(a) | | | 0.43 | | | | 0.43 | | | | 0.40 | | | | 0.18 | | | | 0.22 | |
| Net realized and unrealized gain/(loss) | | | 2.34 | | | | 0.14 | | | | (2.48 | ) | | | 2.61 | | | | (0.18 | ) |
| Total from investment operations | | | 2.77 | | | | 0.57 | | | | (2.08 | ) | | | 2.79 | | | | 0.04 | |
| DISTRIBUTIONS: | | | | | | | | | | | | | | | | | | | | |
| From net investment income | | | (0.46 | ) | | | (0.45 | ) | | | (0.36 | ) | | | (0.16 | ) | | | (0.22 | ) |
| From net realized gains | | | – | | | | (0.46 | ) | | | – | | | | – | | | | – | |
| Tax return of capital | | | – | | | | – | | | | – | | | | (0.02 | ) | | | – | |
| Total distributions | | | (0.46 | ) | | | (0.91 | ) | | | (0.36 | ) | | | (0.18 | ) | | | (0.22 | ) |
| Net increase/(decrease) in net asset value | | | 2.31 | | | | (0.34 | ) | | | (2.44 | ) | | | 2.61 | | | | (0.18 | ) |
| Net asset value, end of year | | $ | 13.93 | | | $ | 11.62 | | | $ | 11.96 | | | $ | 14.40 | | | $ | 11.79 | |
| TOTAL RETURN(b) | | | 23.94 | % | | | 4.80 | % | | | (14.60 | )% | | | 23.79 | % | | | 0.46 | % |
| RATIOS/SUPPLEMENTAL DATA: | | | | | | | | | | | | | | | | | | | | |
| Net assets, end of year (000s) | | $ | 42,740 | | | $ | 40,057 | | | $ | 47,655 | | | $ | 40,106 | | | $ | 34,529 | |
| Ratio of expenses to average net assets excluding fee waivers and reimbursements(c) | | | 0.25 | % | | | 0.25 | % | | | 0.25 | % | | | 0.25 | % | | | 0.25 | % |
| Ratio of expenses to average net assets including fee waivers and reimbursements(c) | | | 0.25 | % | | | 0.25 | % | | | 0.25 | % | | | 0.25 | % | | | 0.25 | % |
| Ratio of net investment income to average net assets(c)(d) | | | 3.25 | % | | | 3.54 | % | | | 3.06 | % | | | 1.29 | % | | | 1.83 | % |
| Portfolio turnover rate | | | 36 | % | | | 13 | % | | | 127 | % | | | 13 | % | | | 33 | % |
| (a) | Calculated using the average shares method. |
| (b) | Total returns are for the period indicated. Total returns would have been lower had certain expenses not been waived during the period. Returns shown do not reflect the deduction of taxes that a shareholder would pay on Fund distributions or the redemption of Fund shares. |
| (c) | Does not include expenses of the investment companies in which the Fund invests. |
| (d) | The recognition of net investment income is affected by the timing and declaration of dividends by the investment companies in which the Fund invests. |
See Notes to Financial Statements and Financial Highlights.
Notes to Financial Statements and Financial Highlights
October 31, 2024
1. ORGANIZATION
Financial Investors Trust (the “Trust”), a Delaware statutory trust, is an open-end management investment company registered under the Investment Company Act of 1940, as amended (“1940 Act”). The Trust consists of multiple separate portfolios or series. This annual report includes the financial statements and financial highlights of the following five funds: ALPS | CoreCommodity Management CompleteCommodities® Strategy Fund, ALPS | Kotak India ESG Fund, ALPS Global Opportunity Fund, ALPS Balanced Opportunity Fund (formerly ALPS | Smith Balanced Opportunity Fund) and RiverFront Asset Allocation Growth & Income (each, a “Fund” and collectively, the “Funds”).
The ALPS | CoreCommodity Management CompleteCommodities® Strategy Fund seeks to maximize real returns, consistent with prudent investment management. ALPS | Kotak India ESG Fund seeks to achieve long-term capital appreciation. The ALPS Global Opportunity Fund seeks to maximize total return, which consists of appreciation on its investments and a variable income stream. The ALPS Balanced Opportunity Fund seeks long-term capital growth, consistent with preservation of capital and balanced by current income. RiverFront Asset Allocation Growth & Income seeks to achieve long-term growth and income.
The classes of each Fund differ principally in the applicable distribution and shareholder service fees. Shareholders of each class also bear certain expenses that pertain to that particular class. All shareholders bear the common expenses of the Fund and earn income and realized gains/losses from the Fund pro rata based on the average daily net assets of each class, without distinction between share classes. Dividends to shareholders are determined separately for each class based on income and expenses allocable to each class. Realized gain distributions to shareholders are allocated to each class pro rata based on the shares outstanding of each class on the date of distribution. Differences in per share dividend rates generally result from differences in separate class expenses, including distribution and shareholder service fees, if applicable.
Basis of Consolidation for the ALPS | CoreCommodity Management CompleteCommodities® Strategy Fund
CoreCommodity Management Cayman Commodity Fund Ltd. (the “Subsidiary”), a Cayman Islands exempted company, was incorporated on April 23, 2010 and is a wholly owned subsidiary of the ALPS | CoreCommodity Management CompleteCommodities® Strategy Fund (the “CoreCommodity Fund”). All intercompany transactions have been eliminated upon consolidation. The Subsidiary acts as an investment vehicle for the CoreCommodity Fund in order to effect certain commodity-related investments on behalf of the CoreCommodity Fund. CoreCommodity Fund is the sole shareholder of the Subsidiary pursuant to a subscription agreement dated as of June 14, 2010, and it is intended that the CoreCommodity Fund will remain the sole shareholder and will continue to wholly own and control the Subsidiary. Under the Articles of Association of the Subsidiary, shares issued by the Subsidiary confer upon a shareholder the right to vote at general meetings of the Subsidiary and certain rights in connection with any winding-up or repayment of capital, as well as the right to participate in the profits or assets of the Subsidiary. The CoreCommodity Fund may invest up to 25% of its total assets in shares of the Subsidiary. As a wholly owned subsidiary of the CoreCommodity Fund, the financial statements of the Subsidiary are included in the consolidated financial statements and financial highlights of the CoreCommodity Fund. All investments held by the Subsidiary are disclosed in the accounts of the CoreCommodity Fund. As of October 31, 2024, net assets of the CoreCommodity Fund were $940,528,649 of which $188,494,740 or 20.04%, represented the CoreCommodity Fund’s ownership of all issued shares and voting rights of the Subsidiary.
2. SIGNIFICANT ACCOUNTING POLICIES
The following is a summary of significant accounting policies consistently followed by each Fund in the preparation of its financial statements. Each Fund is considered an investment company for financial reporting purposes, and follows accounting policies in conformity with accounting principles generally accepted in the United States of America (“U.S. GAAP”), including policies specific to investment companies. The preparation of financial statements in conformity with U.S. GAAP requires management to make certain estimates and assumptions that affect the reported amounts of assets and liabilities and disclosures of contingent assets and liabilities at the date of the financial statements and the reported amounts of increases and decreases in net assets during the reporting period. Actual results could differ from those estimates. The following is a summary of significant accounting policies consistently followed by the Funds and subsidiaries, as applicable, in preparation of their financial statements. The Funds are an investment company and accordingly follows the investment company accounting and reporting guidance of the Financial Accounting Standards Board ("FASB") Accounting Standard Codification ("ASC") Topic 946 "Financial Services – Investment Companies”.
Investment Valuation: The Funds generally value their securities based on market prices determined at the close of regular trading on the New York Stock Exchange (“NYSE”), normally 4:00 p.m. Eastern Time, on each day the NYSE is open for trading. For equity securities and mutual funds that are traded on an exchange, the market price is usually the closing sale or official closing price on that exchange.
The market price for debt obligations is generally the price supplied by an independent third-party pricing service utilized by ALPS Advisors, Inc. (the "Adviser") as the the valuation designee (the "Valuation Designee"), which may use a matrix, formula or other objective method that takes into consideration quotations from dealers, market transactions in comparable investments, market indices and yield curves. If vendors are unable to supply a price, or if the price supplied is deemed to be unreliable, the market price may be determined using quotations received from one or more brokers-dealers that make a market in the security. Investments in non-exchange traded funds are fair valued at their respective net asset values.
Notes to Financial Statements and Financial Highlights
October 31, 2024
Futures contracts that are listed or traded on a national securities exchange, commodities exchange, contract market or comparable over the counter market, and that are freely transferable, are valued at their closing settlement price on the exchange on which they are primarily traded or based upon the current settlement price for a like instrument acquired on the day on which the instrument is being valued. A settlement price may not be used if the market makes a limited move with respect to a particular commodity. Over-the-counter swap contracts are valued based on quotes received from independent pricing services or one or more dealers that make markets in such investments.
Option contracts are valued using the National Best Bid and Offer price (“NBBO”). In the event there is no NBBO price available, option contracts are valued at the mean between the last bid and ask.
For ALPS | Kotak India ESG Fund and ALPS Global Opportunity Fund, who hold equity securities that are primarily traded on foreign securities exchanges, such securities are valued at the closing values of such securities on their respective foreign exchanges, except when an event occurs subsequent to the close of the foreign exchange and the close of the NYSE that was likely to have changed such value. In such an event, the fair value of those securities are determined in good faith through consideration of other factors in accordance with procedures established by the Valuation Designee. The Funds will use a fair valuation model provided by an independent pricing service, which is intended to reflect fair value when a security’s value or a meaningful portion of the Funds' portfolio is believed to have been materially affected by a valuation event that has occurred between the close of the exchange or market on which the security is traded and the close of the regular trading day on the NYSE.
Forward currency exchange contracts have a value determined by the current foreign currency exchange forward rates. The foreign currency exchange forward rates are calculated using an automated system that estimates rates on the basis of the current day foreign currency exchange rates and forward foreign currency exchange rates supplied by a pricing service. Foreign exchange rates and forward foreign currency exchange rates may generally be obtained at the close of the NYSE, normally 4:00 p.m. Eastern Time.
Pursuant to Rule 2a-5 under the Investment Company Act of 1940, the Trust’s Board of Trustees (the “Board” or "Trustees") has appointed the Adviser to serve as the Valuation Designee to perform fair value determinations for investments in the Funds. When such prices or quotations are not available, or when the Valuation Designee appointed by the Board believes that they are unreliable, securities may be priced using fair value procedures utilized by the Valuation Designee. The fair valuation policies and procedures (“FV Procedures”) are utilized by the Valuation Designee for the fair valuation of portfolio assets held by the Funds in the event that (1) market quotations for the current price of a portfolio security or asset are not readily available, or (2) available market quotations that would otherwise be used to value a portfolio security or asset in accordance with the Fund’s Pricing Procedures appear to be unreliable. The Pricing Procedures reflect certain pricing methodologies (or “logics”) that are not “readily available market quotations” and thus are viewed and treated as fair valuations. The Valuation Designee routinely meets to discuss fair valuations of portfolio securities and other instruments held by the Funds.
Fair Value Measurements: The Funds disclose the classification of their fair value measurements following a three-tier hierarchy based on the inputs used to measure fair value. Inputs refer broadly to the assumptions that market participants would use in pricing the asset or liability, including assumptions about risk. Inputs may be observable or unobservable. Observable inputs reflect the assumptions market participants would use in pricing the asset or liability that are developed based on market data obtained from sources independent of the reporting entity. Unobservable inputs reflect the reporting entity’s own assumptions about the assumptions market participants would use in pricing the asset or liability that are developed based on the best information available.
Various inputs are used in determining the value of each Fund’s investments as of the end of the reporting period. When inputs used fall into different levels of the fair value hierarchy, the level in the hierarchy within which the fair value measurement falls is determined based on the lowest level input that is significant to the fair value measurement in its entirety. The designated input levels are not necessarily an indication of the risk or liquidity associated with these investments. These inputs are categorized in the following hierarchy under applicable financial accounting standards:
| Level 1 – | Unadjusted quoted prices in active markets for identical investments, unrestricted assets or liabilities that a Fund has the ability to access at the measurement date; |
| | |
| Level 2 – | Quoted prices which are not active, quoted prices for similar assets or liabilities in active markets or inputs other than quoted prices that are observable (either directly or indirectly) for substantially the full term of the asset or liability; and |
| | |
| Level 3 – | Significant unobservable prices or inputs (including the Fund’s own assumptions in determining the fair value of investments) where there is little or no market activity for the asset or liability at the measurement date. |
Notes to Financial Statements and Financial Highlights
October 31, 2024
The following is a summary of each Fund’s investments/financial instruments in the fair value hierarchy as of October 31, 2024:
| Investments in Securities at Value | | Level 1 – Unadjusted Quoted Prices | | | Level 2 - Other Significant Observable Inputs | | | Level 3 - Significant Unobservable Inputs | | | Total | |
| ALPS | CoreCommodity Management CompleteCommodities® Strategy Fund | | | | | |
| Common Stocks(a) | | $ | – | | | $ | – | | | $ | 1,186 | | | $ | 1,186 | |
| Exchange Traded Funds | | | 283,263,618 | | | | – | | | | – | | | | 283,263,618 | |
| Government Bonds | | | – | | | | 604,903,375 | | | | – | | | | 604,903,375 | |
| Short Term Investments | | | 63,583,424 | | | | – | | | | – | | | | 63,583,424 | |
| Total | | $ | 346,847,042 | | | $ | 604,903,375 | | | $ | 1,186 | | | $ | 951,751,603 | |
| Other Financial Instruments | | | | | | | | | | | | | | | | |
| Assets | | | | | | | | | | | | | | | | |
| Total Return Swap Contracts | | $ | – | | | $ | 415 | | | $ | – | | | $ | 415 | |
| Futures Contracts | | | 2,590,178 | | | | – | | | | – | | | | 2,590,178 | |
| Liabilities | | | | | | | | | | | | | | | | |
| Futures Contracts | | | (7,194,165 | ) | | | – | | | | – | | | | (7,194,165 | ) |
| Total | | $ | (4,603,987 | ) | | $ | 415 | | | $ | – | | | $ | (4,603,572 | ) |
| Investments in Securities at Value | | Level 1 – Unadjusted Quoted Prices | | | Level 2 - Other Significant Observable Inputs | | | Level 3 - Significant Unobservable Inputs | | | Total | |
| ALPS | Kotak India ESG Fund | | | | | | | |
| Common Stocks | | | | | | | | | | | | |
| Communication Services | | $ | – | | | $ | 30,259,155 | | | $ | – | | | $ | 30,259,155 | |
| Consumer Discretionary | | | 7,879,032 | | | | 28,561,087 | | | | – | | | | 36,440,119 | |
| Consumer Staples | | | – | | | | 22,349,789 | | | | – | | | | 22,349,789 | |
| Energy | | | – | | | | 26,205,345 | | | | – | | | | 26,205,345 | |
| Financials | | | 29,450,013 | | | | 71,412,844 | | | | – | | | | 100,862,857 | |
| Health Care | | | – | | | | 33,061,793 | | | | – | | | | 33,061,793 | |
| Industrials | | | 788,425 | | | | 60,387,766 | | | | – | | | | 61,176,191 | |
| Information Technology | | | 27,772,418 | | | | 11,077,303 | | | | – | | | | 38,849,721 | |
| Materials | | | – | | | | 25,737,552 | | | | – | | | | 25,737,552 | |
| Real Estate | | | 363,778 | | | | 15,427,022 | | | | – | | | | 15,790,800 | |
| Utilities | | | – | | | | 7,567,277 | | | | – | | | | 7,567,277 | |
| Short Term Investments | | | 4,189,000 | | | | – | | | | – | | | | 4,189,000 | |
| Total | | $ | 70,442,666 | | | $ | 332,046,933 | | | $ | – | | | $ | 402,489,599 | |
| Investments in Securities at Value | | Level 1 - Unadjusted Quoted Prices | | | Level 2 - Other Significant Observable Inputs | | | Level 3 - Significant Unobservable Inputs | | | Total | |
| ALPS Global Opportunity Fund | | | | | | | |
| Closed-End Funds | | $ | 5,732,267 | | | $ | 4,919,445 | | | $ | – | | | $ | 10,651,712 | |
| Common Stocks | | | | | | | | | | | | | | | | |
| Communications | | | 1,450,246 | | | | – | | | | – | | | | 1,450,246 | |
| Consumer Discretionary | | | – | | | | 985,178 | | | | – | | | | 985,178 | |
| Consumer Staples | | | 1,813,924 | | | | – | | | | – | | | | 1,813,924 | |
| Financials | | | 21,417,571 | | | | 13,882,924 | | | | – | | | | 35,300,495 | |
| Health Care | | | 929,213 | | | | – | | | | – | | | | 929,213 | |
| Industrials | | | 3,336,800 | | | | 624,862 | | | | – | | | | 3,961,662 | |
| Technology | | | 5,310,900 | | | | – | | | | – | | | | 5,310,900 | |
| Business Development Companies(a) | | | 3,126,165 | | | | – | | | | – | | | | 3,126,165 | |
| Preferred Stock | | | 1,013,963 | | | | – | | | | – | | | | 1,013,963 | |
| Short-Term Investments | | | 419,903 | | | | – | | | | – | | | | 419,903 | |
| Total | | $ | 44,550,952 | | | $ | 20,412,409 | | | $ | – | | | $ | 64,963,361 | |
| Other Financial Instruments | | | | | | | | | | | | | | | | |
| Assets: | | | | | | | | | | | | | | | | |
| Forward Contract | | $ | – | | | $ | 72,031 | | | $ | – | | | $ | 72,031 | |
| Total | | $ | – | | | $ | 72,031 | | | $ | – | | | $ | 72,031 | |
Notes to Financial Statements and Financial Highlights
October 31, 2024
| Investments in Securities at Value | | Level 1 - Unadjusted Quoted Prices | | | Level 2 - Other Significant Observable Inputs | | | Level 3 - Significant Unobservable Inputs | | | Total | |
| ALPS Balanced Opportunity Fund | | | | | | | | | |
| Common Stocks(a) | | $ | 9,081,966 | | | $ | – | | | $ | – | | | $ | 9,081,966 | |
| Exchange Traded Funds | | | 3,874,500 | | | | – | | | | – | | | | 3,874,500 | |
| Collateralized Mortgage Obligations | | | – | | | | 1,611 | | | | – | | | | 1,611 | |
| Short Term Investments | | | 375,783 | | | | – | | | | – | | | | 375,783 | |
| Total | | $ | 13,332,249 | | | $ | 1,611 | | | $ | – | | | $ | 13,333,860 | |
| Investments in Securities at Value | | Level 1 - Unadjusted Quoted Prices | | | Level 2 - Other Significant Observable Inputs | | | Level 3 - Significant Unobservable Inputs | | | Total | |
| RiverFront Asset Allocation Growth & Income | | | | | | | | | |
| Exchange Traded Funds | | $ | 76,680,722 | | | $ | – | | | $ | – | | | $ | 76,680,722 | |
| Short-Term Investments | | | 895,170 | | | | – | | | | – | | | | 895,170 | |
| Total | | $ | 77,575,892 | | | $ | – | | | $ | – | | | $ | 77,575,892 | |
| (a) | For detailed descriptions of country, sector and/or industry, see the accompanying Consolidated Statement of Investments or Statements of Investments. |
The Funds, except for the ALPS | CoreCommodity Management CompleteCommodities® Strategy Fund, did not have any securities that used significant unobservable inputs (Level 3) in determining fair value and there were no transfers into or out of Level 3 during the year ended October 31, 2024. As of October 31, 2024, the ALPS | CoreCommodity Management CompleteCommodities® Strategy Fund held securities classified as Level 3 in the fair value hierarchy valued at $1,186, which represents less than 0.005% of net assets.
Fund and Class Expenses: Some expenses of the Trust can be directly attributed to a Fund or a specific share class of a Fund. Expenses which cannot be directly attributed are apportioned among all Funds in the Trust based on average net assets of each share class within a Fund.
Federal Income Taxes: The Funds comply with the requirements under Subchapter M of the Internal Revenue Code of 1986, as amended (the “Code”) applicable to regulated investment companies and intend to distribute substantially all of their net taxable income and net capital gains, if any, each year. The Funds are not subject to income taxes to the extent such distributions are made.
As of and during the year ended October 31, 2024, the Funds did not have a liability for any unrecognized tax benefits. The Funds recognize interest and penalties, if any, related to tax liabilities as income tax expense in the Statements of Operations or Consolidated Statement of Operation. The Funds file U.S. federal, state, and local tax returns as required. The Funds’ tax returns are subject to examination by the relevant tax authorities until expiration of the applicable statute of limitations which is generally three years after the filing of the tax return, but may extend to four years in certain jurisdictions. Tax returns for open years have incorporated no uncertain tax positions that require a provision for income taxes. For tax purposes, the Subsidiary is an exempt Cayman Islands investment company and has received an undertaking from the Government of the Cayman Islands exempting it from all local income, profits, and capital gains taxes. No such taxes are levied in the Cayman Islands at the present time. For U.S. income tax purposes, the Subsidiary is a controlled foreign corporation ("CFC") and as such is not subject to U.S. income tax. However, as a wholly-owned CFC, the net income and capital gain of the CFC, to the extent of its earnings and profits, will be included each year in the ALPS | CoreCommodity Management CompleteCommodities® Strategy Fund's taxable income.
Distributions to Shareholders: Each Fund, except ALPS Balanced Opportunity Fund and RiverFront Asset Allocation Growth & Income, normally pays dividends and distributes capital gains, if any, on an annual basis. ALPS Balanced Opportunity Fund normally pays dividends, if any, on a monthly basis and distributes capital gains, if any, annually. RiverFront Asset Allocation Growth & Income normally pays dividends, if any, on a quarterly basis and distributes capital gains, if any, annually. Income dividend distributions are derived from interest, dividends, and other income a Fund receives from its investments, including distributions of short-term capital gains, if any. Capital gain distributions are derived from gains realized when a Fund sells a security it has owned for more than a year or from long-term capital gain distributions from underlying investments. Each Fund may make additional distributions and dividends at other times if its portfolio manager or managers believe doing so may be necessary for the Fund to avoid or reduce taxes.
Commodity-Linked Notes: The ALPS | CoreCommodity Management CompleteCommodities® Strategy Fund may invest in commodity-linked notes which are derivative instruments that have characteristics of a debt security and of a commodity-linked derivative. A commodity-linked note typically provides for interest payments and a principal payment at maturity linked to the price movement of the underlying commodity, commodity index or
Notes to Financial Statements and Financial Highlights
October 31, 2024
commodity futures or option contract. Commodity-linked notes may be principal protected, partially protected, or offer no principal protection. The value of these notes will rise and fall in response to changes in the underlying commodity or related index or investment. These notes are often leveraged, increasing the volatility of each note’s value relative to the change in the underlying linked index. Commodity index-linked investments may be more volatile and less liquid than the underlying index and their value may be affected by the performance of the commodities as well as other factors, including liquidity, quality, maturity and other economic variables. Commodity-linked notes are typically issued by a bank or other financial institution and are sometimes referred to as structured notes because the terms of the notes may be structured by the issuer and the purchaser of the notes to accommodate the specific investment requirements of the purchaser.
Exchange Traded Funds (ETFs): Each Fund may invest in shares of ETFs and other similar instruments if the investment manager chooses to adjust a Fund’s exposure to the general market or industry sectors and to manage a Fund’s risk exposure. ETFs differ from traditional index funds in that their shares are listed on a securities exchange and can be traded intraday. ETF shares are shares of exchange traded investment companies that are registered under the 1940 Act and hold a portfolio of common stocks designed to track the performance of a particular index. Limitations of the 1940 Act may prohibit a Fund from acquiring more than 3% of the outstanding shares of certain ETFs. Instruments that are similar to ETFs represent beneficial ownership interests in specific “baskets” of stocks of companies within a particular industry sector or group. These securities may also be exchange traded, but unlike ETFs, the issuers of these securities are not registered as investment companies.
The portfolio manager may decide to purchase or sell short ETF shares or options on ETF shares for the same reasons it would purchase or sell (and as an alternative to purchasing or selling) futures contracts – to obtain exposure to the stock market or a particular segment of the stock market, or to hedge a Fund’s portfolio against such exposures. Depending on the market, the holding period and other factors, the use of ETF shares and options thereon can be less costly than the use of index options or stock index futures. In addition, ETF shares and options thereon can typically be purchased in smaller amounts than are available for futures contracts and can offer exposure to market sectors and styles for which there is no suitable or liquid futures contract.
Investment Transactions and Investment Income: Investment transactions are accounted for on the date the investments are purchased or sold (trade date basis). Net realized gains and losses from investment transactions are reported on an identified cost basis. Interest income, which includes accretion of discounts and amortization of premiums, is accrued and recorded as earned. Dividend income is recognized on the ex-dividend date or for withholding taxes or certain foreign securities, as soon as information is available to each Fund. Withholding taxes on foreign dividends are paid (a portion of which may be reclaimable) or provided for in accordance with the applicable country's tax rules and rates and are disclosed in the Statement of Operations or Consolidated Statement of Operations.
Cash Management Transactions: ALPS | Kotak India ESG Fund subscribes to the Brown Brothers Harriman & Co. (“BBH”) Cash Management Service (“CMS”), whereby cash balances are automatically swept into overnight offshore demand deposits with either the BBH Grand Cayman branch or a branch of a pre-approved commercial bank. This fully automated program allows the Fund to earn interest on cash balances. Excess cash with deposit institutions domiciled outside of the U.S. are subject to sovereign actions in the jurisdiction of the deposit institution including, but not limited to, freeze, seizure or diminution. Cash balances in the BBH CMS are included on the Statement of Assets and Liabilities under Cash and Foreign currency, at value. As of October 31, 2024, the ALPS | Kotak India ESG Fund had $1,963,640 cash balance participating in the BBH CMS. As of October 31, 2024, the ALPS | Kotak India ESG Fund did not have any foreign cash balances participating in the BBH CMS.
Foreign Securities: Each Fund may directly purchase securities of foreign issuers. Investing in securities of foreign issuers involves special risks not typically associated with investing in securities of U.S. issuers. The risks include possible reevaluation of currencies, the inability to repatriate foreign currency, less complete financial information about companies and possible future adverse political and economic developments.
Moreover, securities of many foreign issuers and their markets may be less liquid and their prices more volatile than those of securities of comparable U.S. issuers.
Foreign Currency Translation: Values of investments denominated in foreign currencies are converted into U.S. dollars using the current exchange rates each business day (generally 4:00 p.m. Eastern Time). Purchases and sales of investments and dividend income are translated into U.S. dollars using the current prevailing exchange rate on the transaction date. The effect of changes in foreign exchange rates on realized and unrealized gains or losses on securities is reflected as a component of such gains or losses. Transactions in foreign denominated assets may involve greater risks than domestic transactions. The Fund does not isolate that portion of the results of operations resulting from changes in foreign exchange rates on investments from the fluctuations arising from changes in market prices of securities held. Such fluctuations are included with the net realized and unrealized gain or loss from investments. Reported net realized foreign exchange gains or losses arise from sales of foreign currencies, currency gains or losses realized between the trade and settlement dates on securities transactions, and the difference between the amounts of dividends, interest, and foreign withholding taxes recorded on the Fund's books and the U.S. dollar equivalent of the amounts actually received or paid. Net unrealized foreign exchange gains and losses arise from changes in the fair values of assets and liabilities, other than investments in securities at fiscal period end, resulting from changes in exchange rates.
Notes to Financial Statements and Financial Highlights
October 31, 2024
Foreign Currency Spot Contracts: The Funds may enter into foreign currency spot contracts to facilitate transactions in foreign securities or to convert foreign currency receipts into U.S. dollars. A foreign currency spot contract is an agreement between two parties to buy and sell currencies at the current market rate, for settlement generally within two business days. The U.S. dollar value of the contracts is determined using current currency exchange rates supplied by a pricing service. The contract is marked-to-market daily for settlements beyond one day and any change in market value is recorded as an unrealized gain or loss. When the contract is closed, the Fund records a realized gain or loss equal to the difference between the value on the open and close date. Losses may arise from changes in the value of the foreign currency, or if the counterparties do not perform under the contract’s terms. The maximum potential loss from such contracts is the aggregate face value in U.S. dollars at the time the contract was opened.
Real Estate Investment Trusts (“REITs”): The Funds may invest a portion of their assets in REITs and are subject to certain risks associated with direct investment in REITs. REITs may be affected by changes in the value of their underlying properties and by defaults by borrowers or tenants. REITs depend generally on their ability to generate cash flow to make distributions to shareowners, and certain REITs have self-liquidation provisions by which mortgages held may be paid in full and distributions of capital returns may be made at any time. In addition, the performance of a REIT may be affected by its failure to qualify for tax-free pass-through of income under the Code, or its failure to maintain exemption from registration under the 1940 Act. Distributions that the Fund receives from REITs can be classified as ordinary income, capital gain income or return of capital by the REITs that make these distributions to the Fund. However, it is not possible for the Fund to characterize distributions received from REITs during interim periods because the REIT issuers do not report their tax characterizations until subsequent to year end. During interim periods, the REIT distributions are accounted for as ordinary income until the re characterizations are made subsequent to year end.
Master Limited Partnerships (“MLPs”): Certain Funds may invest in MLPs, which are publicly traded partnerships engaged in the transportation, storage and processing of minerals and natural resources. By confining their operations to these specific activities, their interests, or units, are able to trade on public securities exchanges exactly like the shares of a corporation, without entity level taxation. To qualify as a MLP and to not be taxed as a corporation, a partnership must receive at least 90% of its income from qualifying sources as set forth in Section 7704(d) of the Code. These qualifying sources include natural resource based activities such as the processing, transportation and storage of mineral or natural resources. MLPs generally have two classes of owners, the general partner and limited partners. The general partner of an MLP is typically owned by a major energy company, an investment fund, the direct management of the MLP, or is an entity owned by one or more of such parties. The general partner may be structured as a private or publicly traded corporation or other entity. The general partner typically controls the operations and management of the MLP through an up to 2% equity interest in the MLP plus, in many cases, ownership of common units and subordinated units. Limited partners typically own the remainder of the partnership, through ownership of common units, and have a limited role in the partnership’s operations and management. MLPs are typically structured such that common units and general partner interests have first priority to receive quarterly cash distributions up to an established minimum amount (“minimum quarterly distributions” or “MQD”). Common and general partner interests also accrue arrearages in distributions to the extent the MQD is not paid. Once common and general partner interests have been paid, subordinated units receive distributions of up to the MQD; however, subordinated units do not accrue arrearages. Distributable cash in excess of the MQD is paid to both common and subordinated units and is distributed to both common and subordinated units generally on a pro rata basis. The general partner is also eligible to receive incentive distributions if the general partner operates the business in a manner which results in distributions paid per common unit surpassing specified target levels. As the general partner increases cash distributions to the limited partners, the general partner receives an increasingly higher percentage of the incremental cash distributions.
3. DERIVATIVE INSTRUMENTS
As a part of their investment strategy, the Funds are permitted to enter in various types of derivatives contracts. In doing so, the Funds employ strategies in differing combinations to permit them to increase, decrease, or change the level or types of exposure to market factors. Central to those strategies are features inherent in derivatives that make them more attractive for this purpose than equity or debt securities; they require little or no initial cash investment, they focus exposure on only certain selected risk factors, and they may not require the ultimate receipt or delivery of the underlying security (or securities) to the contract. This may allow the Funds to pursue their objectives more quickly and efficiently than if they were to make direct purchases or sales of securities capable of affecting a similar response to market factors.
Cash collateral is being pledged to cover derivative obligations of the Funds and cash collateral received from the counterparty, if any, is reported separately on the Statements of Assets and Liabilities as cash pledged as collateral and cash received as collateral, respectively. Non-cash collateral pledged by the Funds, if any, is noted in the Statements of Investments or Consolidated Statement of Investments.
Risk of Investing in Derivatives: The Funds’ use of derivatives can result in losses due to unanticipated changes in the market risk factors and the overall market. In instances where the Funds are using derivatives to decrease, or hedge, exposures to market risk factors for securities held by the Funds, there are also risks that those derivatives may not perform as expected resulting in losses for the combined or hedged positions.
Notes to Financial Statements and Financial Highlights
October 31, 2024
Derivatives may have little or no initial cash investment relative to their market value exposure and therefore can produce significant gains or losses in excess of their cost. This use of embedded leverage allows the Funds to increase their market value exposure relative to their net assets and can substantially increase the volatility of the Funds’ performance.
Additional associated risks from investing in derivatives also exist and potentially could have significant effects on the valuation of the derivative and the Funds. Typically, the associated risks are not the risks that the Funds are attempting to increase or decrease exposure to, per their investment objectives, but are the additional risks from investing in derivatives.
Examples of these associated risks are liquidity risk, which is the risk that the Funds will not be able to sell or close out the derivative in a timely manner, and counterparty credit risk, which is the risk that the counterparty will not fulfill its obligation to the Funds. In addition, use of derivatives may increase or decrease exposure to the following risk factors:
Equity Risk: Equity risk relates to the change in value of equity securities as they relate to increases or decreases in the general market. Associated risks can be different for each type of derivative and are discussed by each derivative type in the notes that follow.
Commodity Risk: Exposure to the commodities markets may subject the Funds to greater volatility than investments in traditional securities. Prices of various commodities may also be affected by factors, such as drought, floods, weather, livestock disease, embargoes, tariffs and other regulatory developments, which are unpredictable. The prices of commodities can also fluctuate widely due to supply and demand disruptions in major producing or consuming regions.
Foreign Currency Risk: Currency trading involves significant risks, including market risk, interest rate risk, country risk, counterparty credit risk and short sale risk. Market risk results from the price movement of foreign currency values in response to shifting market supply and demand. Interest rate risk arises whenever a country changes its stated interest rate target associated with its currency. Country risk arises because virtually every country has interfered with international transactions in its currency.
Interest Rate Risk: Interest rate risk is the risk that fixed income securities will decline in value because of changes in interest rates. As nominal interest rates rise, the value of fixed income securities held by the Funds are likely to decrease. Securities with longer durations tend to be more sensitive to changes in interest rates, and are usually more volatile than securities.
Swap Contracts: Each Fund may enter into swap transactions for hedging purposes or to seek to increase total return. At the present time, the CoreCommodity Fund primarily enters into swap transactions for the purpose of increasing total return. Swap agreements may be executed in a multilateral or other trade facility program, such as a registered exchange (“centrally cleared swaps”) or may be privately negotiated in the over-the counter market. The duration of a swap agreement typically ranges from a few weeks to more than one year. In a centrally cleared swap, immediately following execution of the swap agreement, the swap agreement is novated to a central counterparty (the “CCP”) and the Fund’s counterparty on the swap agreement becomes the CCP. Risks may arise as a result of the failure of the counterparty to the swap contract to comply with the terms of the swap contract. The loss incurred by the failure of a counterparty is generally limited to the net payment to be received by the Funds and/or the termination value at the end of the contract. Therefore, the Funds consider the creditworthiness of each counterparty to a contract in evaluating potential credit risk. Although centrally cleared swaps typically present less counterparty risk than non-centrally cleared swaps, a Fund that has entered into centrally cleared swaps is subject to the risk of the failure of the CCP.
Additionally, risks may arise from unanticipated movements in interest rates or in the value of the underlying reference asset or index. Entering into these agreements involves, to varying degrees, market risk, liquidity risk and elements of credit, legal and documentation risk that are not directly reflected in the amounts recognized in the Statements of Assets and Liabilities or Consolidated Statement of Assets and Liabilities.
The Funds may pay or receive cash as collateral on these contracts which may be recorded as an asset and/or liability. The Funds must set aside liquid assets, or engage in other appropriate measures, to cover its obligations under these contracts. Swaps are marked to market daily using either pricing vendor quotations, counterparty prices or model prices and the change in value, if any, is recorded as an unrealized gain or loss. Upfront payments made and/or received by the Funds are recorded as an asset and/or liability and realized gains or losses are recognized ratably over the contract’s term/event, with the exception of forward starting interest rate swaps, whose realized gains or losses are recognized ratably from the effective start date. Periodic payments received or made on swap contracts are recorded as realized gains or losses. Gains or losses are realized upon termination of a swap contract and are recorded on the Statement of Operations or Consolidated Statement of Operations.
Total return swaps are agreements in which there is an exchange of cash flows whereby one party commits to make payments based on the total return (coupons plus capital gains/losses) of an underlying instrument in exchange for fixed or floating rate interest payments. To the extent the total return of the instrument or index underlying the transaction exceeds or falls short of the offsetting interest rate obligation, the Funds will receive a
Notes to Financial Statements and Financial Highlights
October 31, 2024
payment from or make a payment to the counterparty. Credit default swaps are a type of swap agreement in which the protection “buyer” is generally obligated to pay the protection “seller” an upfront and/ or a periodic stream of payments over the term of the contract provided that no credit event, such as a default, on a reference obligation has occurred. Credit default swaps (“CDS”) are typically two-party financial contracts that transfer credit exposure between the two parties. Under a typical CDS, one party (the “seller”) receives pre-determined periodic payments from the other party (the “buyer”). The seller agrees to make compensating specific payments to the buyer if a negative credit event occurs, such as the bankruptcy or default by the issuer of the underlying debt instrument. Swap agreements held at October 31, 2024 are disclosed after the Statements of Investments or Consolidated Statement of Investments.
The average notional amount of the swap positions held in the ALPS | CoreCommodity Management CompleteCommodities® Strategy Fund for the year ended October 31, 2024 was $750,952,259. Only the ALPS | CoreCommodity Management CompleteCommodities® Strategy Fund held swap positions as of October 31, 2024.
Futures: Each Fund may invest in futures contracts in accordance with their investment objectives. Each Fund does so for a variety of reasons including for cash management, hedging or non-hedging purposes in an attempt to achieve the Fund’s investment objective. A futures contract provides for the future sale by one party and purchase by another party of a specified quantity of the security or other financial instrument at a specified price and time. A futures contract on an index is an agreement pursuant to which two parties agree to take or make delivery of an amount of cash equal to the difference between the value of the index at the close of the last trading day of the contract and the price at which the index contract was originally written. Futures transactions may result in losses in excess of the amount invested in the futures contract. There can be no guarantee that there will be a correlation between price movements in the hedging vehicle and in the portfolio securities being hedged. An incorrect correlation could result in a loss on both the hedged securities in a Fund and the hedging vehicle so that the portfolio return might have been greater had hedging not been attempted. There can be no assurance that a liquid market will exist at a time when a Fund seeks to close out a futures contract or a futures option position. Lack of a liquid market for any reason may prevent a Fund from liquidating an unfavorable position, and the Fund would remain obligated to meet margin requirements until the position is closed. In addition, a Fund could be exposed to risk if the counterparties to the contracts are unable to meet the terms of their contracts. With exchange traded futures, there is minimal counterparty credit risk to the Funds since futures are exchange traded and the exchange’s clearinghouse, as counterparty to all exchange traded futures, guarantees the futures against default. When a purchase or sale of a futures contract is made by a Fund, the Fund is required to deposit with its custodian (or broker, if legally permitted) a specified amount of liquid assets (“initial margin”). The margin required for a futures contract is set by the exchange on which the contract is traded and may be modified during the term of the contract. The initial margin is in the nature of a performance bond or good faith deposit on the futures contract that is returned to a Fund upon termination of the contract, assuming all contractual obligations have been satisfied. These amounts are included in Deposit with broker for futures contracts on the Statement of Assets and Liabilities. Each day a Fund may pay or receive cash, called “variation margin,” equal to the daily change in value of the futures contract. Such payments or receipts are recorded for financial statement purposes as unrealized gains or losses by a Fund. Variation margin does not represent a borrowing or loan by a Fund but is instead a settlement between a Fund and the broker of the amount one would owe the other if the futures contract expired. When the contract is closed, a Fund records a realized gain or loss equal to the difference between the value of the contract at the time it was opened and the value at the time it was closed.
The average value of futures contracts held in the ALPS | CoreCommodity Management CompleteCommodities® Strategy Fund for the year ended October 31, 2024 was $391,620,001 for long futures and $312,328,559 for short futures. Only the ALPS | CoreCommodity Management CompleteCommodities® Strategy Fund invested in futures contracts as of October 31, 2024.
Forward Foreign Currency Contracts: Each Fund may engage in currency transactions with counterparties to hedge the value of portfolio securities denominated in particular currencies against fluctuations in relative value, to gain or reduce exposure to certain currencies, or to generate income or gains. A forward foreign currency contract is an agreement between two parties to buy and sell a currency at a set price on a future date. The contract is marked-to-market daily and the change in value is recorded by the Fund as an unrealized gain or loss. When a forward foreign currency contract is extinguished, through delivery, the Fund records a realized gain or loss equal to the difference between the value of the contract at the time it was opened and the value of the contract at the time it was extinguished. The average value of forward foreign currency contracts held in the ALPS Global Opportunity Fund for the year ended October 31, 2024 was $4,113,278. Only the ALPS Global Opportunity Fund invested in forward foreign currency contracts as of October 31, 2024.
Option Contracts: Each Fund may enter into options transactions for hedging purposes and for non-hedging purposes such as seeking to enhance return. Each Fund may write covered put and call options on any stocks or stock indices, currencies traded on domestic and foreign securities exchanges, or futures contracts on stock indices, interest rates and currencies traded on domestic and, to the extent permitted by the CFTC, foreign exchanges. A call option on an asset written by a Fund obligates the Fund to sell the specified asset to the holder (purchaser) at a stated price (the exercise price) if the option is exercised before a specified date (the expiration date). A put option on an asset written by a Fund obligates the Fund to buy the specified asset from the purchaser at the exercise price if the option is exercised before the expiration date. Premiums received when writing options are recorded as
Notes to Financial Statements and Financial Highlights
October 31, 2024
liabilities and are subsequently adjusted to the current value of the options written. Premiums received from writing options that expire are treated as realized gains. Premiums received from writing options, which are either exercised or closed, are offset against the proceeds received or amount paid on the transaction to determine realized gains or losses which are recorded on the Statement of Operations or Consolidated Statement of Operations. As of October 31, 2024, the Funds were not invested in option contracts.
Derivatives Instruments: The following tables disclose the amounts related to each Fund’s use of derivative instruments.
The effect of derivatives instruments on the Statement of Assets and Liabilities for the fiscal year ended October 31, 2024:
| Risk Exposure | | Asset Location | | Fair Value | | | Liability Location | | Fair Value | |
| ALPS | CoreCommodity Management CompleteCommodities® Strategy Fund(a) | | | |
| Commodity Contracts (Futures Contracts) | | Unrealized appreciation on futures contracts(b) | | $ | 2,590,178 | | | Unrealized depreciation on futures contracts(b) | | $ | (7,194,165 | ) |
| Commodity Contracts (Total Return Swap Contracts) | | Unrealized appreciation on total return swap contracts | | | 415 | | | Unrealized depreciation on total return swap contracts | | | - | |
| Total | | | | $ | 2,590,593 | | | | | $ | (7,194,165 | ) |
| ALPS Global Opportunity Fund | | | | | | | | | | | | |
| Foreign Exchange Rate Contracts (Forward Foreign Currency Contracts) | | Unrealized appreciation on forward foreign currency contracts | | $ | 72,031 | | | Unrealized depreciation on forward foreign currency contracts | | $ | – | |
| Total | | | | $ | 72,031 | | | | | $ | – | |
| (a) | The ALPS | CoreCommodity Management CompleteCommodities® Strategy Fund consolidates the statements of assets and liabilities. |
| (b) | Represents cumulative appreciation (depreciation) of futures contracts as reported in the Consolidated Statement of Investments. Only the current day's net variation margin is reported within the Consolidated Statement of Assets and Liabilities. |
The effect of derivatives instruments on the Statements of Operations for the fiscal year ended October 31, 2024:
Risk Exposure | | Statement of Operations Location | | Realized Gain/(Loss) on Derivatives Recognized in Income | | | Change in Unrealized Appreciation/(Depreciation) on Derivatives Recognized in Income | |
| ALPS | CoreCommodity Management CompleteCommodities® Strategy Fund(a) | |
| Commodity Contracts (Futures Contracts) | | Net realized loss on futures contracts/ Net change in unrealized appreciation on futures contracts | | $ | (87,025,216 | ) | | $ | 26,383,223 | |
| Commodity Contracts (Total Return Swap Contracts) | | Net realized loss on total return swap contracts/ Net change in unrealized appreciation on total return swap contracts | | | (12,945,511 | ) | | | 387 | |
| Total | | | | $ | (99,970,727 | ) | | $ | 26,383,610 | |
| ALPS Global Opportunity Fund | | | | | | |
| Foreign Exchange Rate Contracts (Forward Foreign Currency Contracts) | | Net realized loss on forward foreign currency contracts/Net change in unrealized appreciation on forward foreign currency contracts | | | (216,380 | ) | | | 62,634 | |
| Total | | | | $ | (216,380 | ) | | $ | 62,634 | |
| (a) | The ALPS | CoreCommodity Management CompleteCommodities® Strategy Fund consolidates the statements of operations. |
Certain derivative contracts are executed under either standardized netting agreements or, for exchange-traded derivatives, the relevant contracts for a particular exchange which contain enforceable netting provisions. A derivative netting arrangement creates an enforceable right of set-off that becomes effective, and affects the realization of settlement on individual assets, liabilities and collateral amounts, only following a specified event of default or early termination. Default events may include the failure to make payments or deliver securities timely, material adverse changes in
Notes to Financial Statements and Financial Highlights
October 31, 2024
financial condition or insolvency, the breach of minimum regulatory capital requirements, or loss of license, charter or other legal authorization necessary to perform under the contract.
The following table presents financial instruments that are subject to enforceable netting arrangements or other similar agreements as of October 31, 2024:
Offsetting of Derivatives Asset
October 31, 2024
| | | | | | | | | | | Gross Amounts Not Offset in the Statement of Assets and Liabilities | |
| | | Gross Amounts of Recognized Assets | | | Gross Amounts Offset in the Statement of Assets and Liabilities | | | Net Amounts Presented in the Statement of Assets and Liabilities | | | Financial Instruments | | | Cash Collateral Received(a) | | | Net Amount | |
| ALPS | CoreCommodity Management CompleteCommodities® Strategy Fund | | | | |
| Total Return Swap Contracts | | $ | 415 | | | $ | – | | | $ | 415 | | | $ | – | | | $ | – | | | $ | 415 | |
| Total | | $ | 415 | | | $ | – | | | $ | 415 | | | $ | – | | | $ | – | | | $ | 415 | |
| (a) | These amounts are limited to the derivative asset/liability balance and, accordingly, do not include excess collateral received/pledged. |
4. TAX BASIS INFORMATION
Tax Basis of Distributions to Shareholders: The character of distributions made during the year from net investment income or net realized gains may differ from its ultimate characterization for federal income tax purposes. Also, due to the timing of dividend distributions, the fiscal year in which amounts are distributed may differ from the fiscal year in which the income or realized gain were recorded by a Fund. The amounts and characteristics of tax basis distributions and composition of distributable earnings/ (accumulated losses) are finalized at fiscal year-end.
The tax character of distributions paid by the Funds for the fiscal year ended October 31, 2024 were as follows:
| Fund | | Ordinary Income | | | Long-Term Capital Gain | |
ALPS | CoreCommodity Management CompleteCommodities® Strategy Fund | | $ | 43,887,247 | | | $ | 5,787,292 | |
| ALPS | Kotak India ESG Fund | | | – | | | | 13,460,492 | |
| ALPS Global Opportunity Fund | | | 3,170,827 | | | | – | |
| ALPS Balanced Opportunity Fund | | | 385,660 | | | | – | |
| RiverFront Asset Allocation Growth & Income | | | 2,510,790 | | | | – | |
The tax character of distributions paid by the Funds for the fiscal year ended October 31, 2023 were as follows:
| Fund | | Ordinary Income | | | Long-Term Capital Gain | |
ALPS | CoreCommodity Management CompleteCommodities® Strategy Fund | | $ | 112,863,610 | | | $ | – | |
| ALPS | Kotak India ESG Fund | | | – | | | | 5,472,501 | |
| ALPS Global Opportunity Fund | | | – | | | | – | |
| ALPS Balanced Opportunity Fund | | | 433,359 | | | | – | |
| RiverFront Asset Allocation Growth & Income | | | 2,911,079 | | | | 3,245,128 | |
Components of Distributable Earnings on a Tax Basis: At October 31, 2024, permanent differences in book and tax accounting were reclassified. These differences had no effect on net assets and were primarily attributed to differences in the treatment of commodity related controlled foreign corporations, prior year tax return true ups, in-kind redemptions, partnership basis transfers, and passive foreign investment company (PFICs) transfers.
Notes to Financial Statements and Financial Highlights
October 31, 2024
For the fiscal year ended October 31, 2024, the following reclassifications, which had no impact on results of operations or net assets, were recorded to reflect tax character:
| Fund | | Paid-in Capital | | | Distributable earnings | |
ALPS | CoreCommodity Management CompleteCommodities® Strategy Fund | | $ | (92,012,667 | ) | | $ | 92,012,667 | |
| ALPS Global Opportunity Fund | | | 80,910 | | | | (80,910 | ) |
| ALPS Balanced Opportunity Fund | | | 10 | | | | (10 | ) |
As of October 31, 2024, the components of distributable earnings on a tax basis were as follows:
| | | Undistributed net investment income | | | Accumulated net realized gain/(loss) on investments | | | Other cumulative effect of timing differences | | | Net unrealized appreciation/ (depreciation) on investments | | | Total | |
| ALPS | CoreCommodity Management CompleteCommodities® Strategy Fund | | $ | 18,429,958 | | | $ | (9,211,902 | ) | | $ | – | | | $ | 26,390,672 | | | $ | 35,608,728 | |
| ALPS | Kotak India ESG Fund | | | 1,492,225 | | | | 50,340,248 | | | | – | | | | 65,349,345 | | | | 117,181,818 | |
| ALPS Global Opportunity Fund | | | 6,740,454 | | | | 2,452,787 | | | | – | | | | 12,226,358 | | | | 21,419,599 | |
| ALPS Balanced Opportunity Fund | | | 9,038 | | | | 1,068,767 | | | | – | | | | 3,251,739 | | | | 4,329,544 | |
| RiverFront Asset Allocation Growth & Income | | | 113,517 | | | | (821,959 | ) | | | – | | | | 12,736,505 | | | | 12,028,063 | |
Capital loss carryovers used during the year ended October 31, 2024 for ALPS Global Opportunity Fund, ALPS Balanced Opportunity Fund and RiverFront Asset Allocation Growth & Income were $712,292, $1,552,371 and $67,420, respectively.
Capital Losses: Under current law, capital losses maintain their character as short-term or long-term and are carried forward to the next tax year without expiration. As of October 31, 2024 the following amounts are available as carry forwards to the next tax year:
| Fund | | Short-Term | | | Long-Term | |
ALPS | CoreCommodity Management CompleteCommodities® Strategy Fund | | $ | 162,694 | | | $ | 9,049,208 | |
| RiverFront Asset Allocation Growth & Income | | | 107,350 | | | | 714,609 | |
Unrealized Appreciation and Depreciation on Investments: As of October 31, 2024, the costs of investments for federal income tax purposes and accumulated net unrealized appreciation/(depreciation) on investments were as follows:
| Fund | | Gross Appreciation (excess of value over tax cost) | | | Gross Depreciation (excess of tax cost over value) | | | Net Appreciation/
(Depreciation) of Foreign Currency | | | Net Unrealized Appreciation/ (Depreciation) | | | Cost of Investments for Income Tax Purposes | |
| ALPS | CoreCommodity Management CompleteCommodities® Strategy Fund | | $ | 528,570,227 | | | $ | (502,178,518 | ) | | $ | (1,037 | ) | | $ | 26,390,672 | | | $ | 920,756,323 | |
| ALPS | Kotak India ESG Fund | | | 100,357,870 | | | | (34,264,150 | )* | | | (744,375 | ) | | | 65,349,345 | | | | 323,736,942 | |
| ALPS Global Opportunity Fund | | | 13,065,444 | | | | (824,989 | ) | | | (14,097 | ) | | | 12,226,358 | | | | 52,722,906 | |
| ALPS Balanced Opportunity Fund | | | 3,410,026 | | | | (158,338 | ) | | | 51 | | | | 3,251,739 | | | | 10,082,172 | |
| RiverFront Asset Allocation Growth & Income | | | 13,070,174 | | | | (449,792 | ) | | | 116,123 | | | | 12,736,505 | | | | 64,955,510 | |
* Net of foreign capital gains tax accrual of $12,658,937.
The differences between book cost and tax cost of investments and unrealized appreciation/depreciation are primarily attributed to the tax deferral of losses on wash sales, PFICs, partnership basis adjustments, and C-corp basis adjustments.
Notes to Financial Statements and Financial Highlights
October 31, 2024
5. SECURITIES TRANSACTIONS
Purchases and sales of securities, excluding short-term securities, in-kind transactions and U.S. Government Obligations during the fiscal year ended October 31, 2024 were as follows:
Fund | | Purchases of Securities | | | Proceeds from Sales of Securities | |
| ALPS | CoreCommodity Management CompleteCommodities® Strategy Fund(a) | | $ | 233,107,468 | | | $ | 289,507,199 | |
| ALPS | Kotak India ESG Fund | | | 283,536,387 | | | | 279,634,374 | |
| ALPS Global Opportunity Fund | | | 22,717,273 | | | | 25,451,665 | |
| ALPS Balanced Opportunity Fund | | | 19,481,874 | | | | 28,481,702 | |
| RiverFront Asset Allocation Growth & Income | | | 27,200,968 | | | | 37,354,154 | |
Purchases and sales of U.S. Government Obligations during the fiscal year ended October 31, 2024 were as follows:
Fund | | Purchases of Securities | | | Proceeds from Sales of Securities | |
| ALPS | CoreCommodity Management CompleteCommodities® Strategy Fund(a) | | $ | 205,251,652 | | | $ | 459,056,731 | |
| ALPS Balanced Opportunity Fund | | | 7,075,528 | | | | 9,539,718 | |
Cost of in-kind purchases and proceeds from in-kind sales during the fiscal year ended October 31, 2024 were as follows:
| Fund | | Purchases of Securities | | | Proceeds from Sales of Securities | |
| ALPS | CoreCommodity Management CompleteCommodities® Strategy Fund(a) | | $ | 291,145,392 | | | $ | 291,145,392 | |
| (a) | Purchases and sales for ALPS | CoreCommodity Management CompleteCommodities® Strategy fund are consolidated and include the balances of CoreCommodity Management Cayman Commodity Fund, Ltd. (wholly owned subsidiary). |
For the fiscal year ended October 31, 2024, the ALPS | CoreCommodity Management CompleteCommodities® Strategy Fund had in-kind net realized gain of $0.
Gains on in-kind transactions are not considered taxable for federal income tax purposes and losses on in-kind transactions are also not deductible for tax purposes.
6. BENEFICIAL INTEREST TRANSACTIONS
Shares redeemed within 30 days of purchase for ALPS | Kotak India ESG Fund may incur a 2% short-term redemption fee deducted from the redemption amount.
For the fiscal year ended October 31, 2024, the amounts listed below were retained by the Funds. These amounts are reflected in “Shares redeemed” in the Consolidated Statements of Changes in Net Assets and Statements of Changes in Net Assets.
| | | Redemption Fee Retained | |
| Fund | | For the Year Ended October 31, 2024 | | | For the Year Ended October 31, 2023 | |
| ALPS | CoreCommodity Management CompleteCommodities® Strategy Fund - Investor Class | | $ | 15 | | | $ | – | |
| ALPS | Kotak India ESG Fund - Investor Class | | | 1,034 | | | | 1,876 | |
| ALPS | Kotak India ESG Fund - Class A | | | – | | | | 146 | |
| ALPS | Kotak India ESG Fund - Class I | | | 627 | | | | 485 | |
Notes to Financial Statements and Financial Highlights
October 31, 2024
Transactions in shares of capital stock were as follows:
| | | ALPS | CoreCommodity Management CompleteCommodities® Strategy Fund | |
| | | For the Year Ended October 31, 2024 | | | For the Year Ended October 31, 2023 | |
| Investor Class | | | | | | |
| Shares sold | | | 888,033 | | | | 3,219,600 | |
| Dividends reinvested | | | 72,723 | | | | 585,497 | |
| Shares redeemed | | | (1,470,539 | ) | | | (11,437,658 | ) |
| Net decrease in shares outstanding | | | (509,783 | ) | | | (7,632,561 | ) |
| Class A | | | | | | | | |
| Shares sold | | | 98,246 | | | | 280,034 | |
| Dividends reinvested | | | 33,586 | | | | 92,468 | |
| Shares redeemed | | | (722,582 | ) | | | (778,344 | ) |
| Net decrease in shares outstanding | | | (590,750 | ) | | | (405,842 | ) |
| Class C | | | | | | | | |
| Shares sold | | | 108,607 | | | | 475,768 | |
| Dividends reinvested | | | 50,728 | | | | 135,991 | |
| Shares redeemed | | | (1,324,208 | ) | | | (1,561,645 | ) |
| Net decrease in shares outstanding | | | (1,164,873 | ) | | | (949,886 | ) |
| Class I | | | | | | | | |
| Shares sold | | | 39,402,274 | | | | 129,590,732 | |
| Dividends reinvested | | | 5,488,823 | | | | 8,962,188 | |
| Shares redeemed | | | (132,628,021 | ) | | | (116,512,020 | ) |
| Net increase/(decrease) in shares outstanding | | | (87,736,924 | ) | | | 22,040,900 | |
Notes to Financial Statements and Financial Highlights
October 31, 2024
| | | ALPS | Kotak India ESG Fund | |
| | | For the Year Ended October 31, 2024 | | | For the Year Ended October 31, 2023 | |
| Investor Class | | | | | | |
| Shares sold | | | 162,526 | | | | 104,836 | |
| Dividends reinvested | | | 10,685 | | | | 3,076 | |
| Shares redeemed | | | (180,609 | ) | | | (61,422 | ) |
| Net increase/(decrease) in shares outstanding | | | (7,398 | ) | | | 46,490 | |
| Class A | | | | | | | | |
| Shares sold | | | 50,117 | | | | 41,233 | |
| Dividends reinvested | | | 3,622 | | | | 792 | |
| Shares redeemed | | | (11,623 | ) | | | (3,815 | ) |
| Net increase in shares outstanding | | | 42,116 | | | | 38,210 | |
| Class C | | | | | | | | |
| Shares sold | | | 57,289 | | | | 34,717 | |
| Dividends reinvested | | | 4,390 | | | | 1,194 | |
| Shares redeemed | | | (7,295 | ) | | | (27,529 | ) |
| Net increase in shares outstanding | | | 54,384 | | | | 8,382 | |
| Class I | | | | | | | | |
| Shares sold | | | 442,493 | | | | 627,523 | |
| Dividends reinvested | | | 59,506 | | | | 14,083 | |
| Shares redeemed | | | (182,924 | ) | | | (185,614 | ) |
| Net increase in shares outstanding | | | 319,075 | | | | 455,992 | |
| Class II | | | | | | | | |
| Shares sold | | | 1,956,553 | | | | 572,864 | |
| Dividends reinvested | | | 677,703 | | | | 308,477 | |
| Shares redeemed | | | (2,479,609 | ) | | | (4,281,312 | ) |
| Net increase/(decrease) in shares outstanding | | | 154,647 | | | | (3,399,971 | ) |
Notes to Financial Statements and Financial Highlights
October 31, 2024
| | | ALPS Global Opportunity Fund | |
| | | For the Year Ended October 31, 2024 | | | For the Year Ended October 31, 2023 | |
| Investor Class | | | | | | |
| Shares sold | | | 86,871 | | | | 33,762 | |
| Dividends reinvested | | | 81,372 | | | | – | |
| Shares redeemed | | | (373,297 | ) | | | (388,202 | ) |
| Net decrease in shares outstanding | | | (205,054 | ) | | | (354,440 | ) |
| Class A | | | | | | | | |
| Shares sold | | | 1,455,931 | | | | 369,287 | |
| Dividends reinvested | | | 48,789 | | | | – | |
| Shares redeemed | | | (968,586 | ) | | | (341,974 | ) |
| Net increase in shares outstanding | | | 536,134 | | | | 27,313 | |
| Class C | | | | | | | | |
| Shares sold | | | 18,042 | | | | – | |
| Dividends reinvested | | | 23,471 | | | | – | |
| Shares redeemed | | | (224,245 | ) | | | (578,422 | ) |
| Net decrease in shares outstanding | | | (182,732 | ) | | | (578,422 | ) |
| Class I | | | | | | | | |
| Shares sold | | | 703,860 | | | | 1,373,891 | |
| Dividends reinvested | | | 274,786 | | | | – | |
| Shares redeemed | | | (1,188,494 | ) | | | (3,129,198 | ) |
| Net decrease in shares outstanding | | | (209,848 | ) | | | (1,755,307 | ) |
| Class R | | | | | | | | |
| Shares sold | | | 25,705 | | | | 72,272 | |
| Dividends reinvested | | | 78,119 | | | | – | |
| Shares redeemed | | | (260,862 | ) | | | (207,229 | ) |
| Net decrease in shares outstanding | | | (157,038 | ) | | | (134,957 | ) |
Notes to Financial Statements and Financial Highlights
October 31, 2024
| | | ALPS Balanced Opportunity Fund | |
| | | For the Year Ended October 31, 2024 | | | For the Year Ended October 31, 2023 | |
| Investor Class | | | | | | |
| Shares sold | | | 1,192 | | | | 1,882 | |
| Dividends reinvested | | | 81 | | | | 210 | |
| Shares redeemed | | | (589 | ) | | | (10,672 | ) |
| Net increase/(decrease) in shares outstanding | | | 684 | | | | (8,580 | ) |
| Class A | | | | | | | | |
| Shares sold | | | – | | | | 576 | |
| Dividends reinvested | | | – | | | | 10 | |
| Shares redeemed | | | – | | | | (4,603 | ) |
| Net decrease in shares outstanding | | | – | | | | (4,017 | ) |
| Class C | | | | | | | | |
| Dividends reinvested | | | 1 | | | | 8 | |
| Shares redeemed | | | (254 | ) | | | (1,297 | ) |
| Net decrease in shares outstanding | | | (253 | ) | | | (1,289 | ) |
| Class I | | | | | | | | |
| Shares sold | | | 406,157 | | | | 598,629 | |
| Dividends reinvested | | | 25,388 | | | | 32,248 | |
| Shares redeemed | | | (1,385,290 | ) | | | (1,292,168 | ) |
| Net decrease in shares outstanding | | | (953,745 | ) | | | (661,291 | ) |
Notes to Financial Statements and Financial Highlights
October 31, 2024
| | | RiverFront Asset Allocation Growth & Income | |
| | | For the Year Ended October 31, 2024 | | | For the Year Ended October 31, 2023 | |
| Investor Class | | | | | | |
| Shares sold | | | 4,094 | | | | 6,399 | |
| Dividends reinvested | | | 18,586 | | | | 53,811 | |
| Shares redeemed | | | (82,469 | ) | | | (173,157 | ) |
| Net decrease in shares outstanding | | | (59,789 | ) | | | (112,947 | ) |
| Class A | | | | | | | | |
| Shares sold | | | 195,337 | | | | 305,675 | |
| Dividends reinvested | | | 47,526 | | | | 115,455 | |
| Shares redeemed | | | (336,373 | ) | | | (347,816 | ) |
| Net increase/(decrease) in shares outstanding | | | (93,510 | ) | | | 73,314 | |
| Class C | | | | | | | | |
| Shares sold | | | 28,662 | | | | 17,634 | |
| Dividends reinvested | | | 10,814 | | | | 66,638 | |
| Shares redeemed | | | (315,434 | ) | | | (610,193 | ) |
| Net decrease in shares outstanding | | | (275,958 | ) | | | (525,921 | ) |
| Class I | | | | | | | | |
| Shares sold | | | 278,523 | | | | 255,047 | |
| Dividends reinvested | | | 103,652 | | | | 275,802 | |
| Shares redeemed | | | (761,891 | ) | | | (1,067,572 | ) |
| Net decrease in shares outstanding | | | (379,716 | ) | | | (536,723 | ) |
7. AFFILIATED COMPANIES
Funds may invest in certain securities that are considered securities issued by affiliated companies. As defined by the Investment Company Act of 1940, an affiliated person, including an affiliated company, is one in which a Fund owns 5% or more of the outstanding voting securities, or a company which is under common ownership or control with the Fund.
The purchases, sales, dividend income, realized gains or losses, change in unrealized gains or losses, shares and value of investments in affiliated companies for ALPS | CoreCommodity Management CompleteCommodities® Strategy Fund for the year ended October 31, 2024 were as follows:
Security Name | | Fair Value as of October 31, 2023 | | | Purchases | | | Sales | | | Fair Value as of October 31, 2024 | | | Share Balance as of October 31, 2024 | | | Dividends | | | Change in Unrealized Gain (Loss) | | | Realized Gain/Loss | |
| ALPS | CoreCommodity Natural Resources ETF | | $ | – | | | $ | 291,145,417 | | | $ | (23,832,050 | ) | | $ | 283,263,618 | | | | 11,455,594 | | | $ | – | | | $ | 32,945,000 | | | $ | (16,994,749 | ) |
| | | $ | – | | | $ | 291,145,417 | | | $ | (23,832,050 | ) | | $ | 283,263,618 | | | | 11,455,594 | | | $ | – | | | $ | 32,945,000 | | | $ | (16,994,749 | ) |
The purchases, sales, dividend income, realized gains or losses, change in unrealized gains or losses, shares and value of investments in affiliated companies for ALPS Balanced Opportunity Fund for the year ended October 31, 2024 were as follows:
Security Name | | Fair Value as of October 31, 2023 | | | Purchases | | | Sales | | | Fair Value as of October 31, 2024 | | | Share Balance as of October 31, 2024 | | | Dividends | | | Change in Unrealized Gain (Loss) | | | Realized Gain/Loss | |
| Alps Smith Core Plus Bond ETF | | $ | – | | | $ | 3,946,625 | | | $ | – | | | $ | 3,874,500 | | | | 150,000 | | | $ | 13,766 | | | $ | (72,125 | ) | | $ | – | |
| | | $ | – | | | $ | 3,946,625 | | | $ | – | | | $ | 3,874,500 | | | | 150,000 | | | $ | 13,766 | | | $ | (72,125 | ) | | $ | – | |
Notes to Financial Statements and Financial Highlights
October 31, 2024
The purchases, sales, dividend income, realized gains or losses, change in unrealized gains or losses, shares and value of investments in affiliated companies for RiverFront Asset Allocation Growth & Income for the year ended October 31, 2024 were as follows:
| Security Name | | Fair Value as of October 31, 2023 | | | Purchases | | | Sales | | | Fair Value as of October 31, 2024 | | | Share Balance as of October 31, 2024 | | | Dividends | | | Change in Unrealized Gain (Loss) | | | Realized Gain (Loss) | |
| RiverFront Dynamic Core Income ETF | | $ | 5,034,204 | | | $ | 488,571 | | | $ | (732,160 | ) | | $ | 5,094,281 | | | | 227,112 | | | $ | 221,089 | | | $ | 363,584 | | | $ | (59,918 | ) |
| Riverfront Strategic Income Fund | | | 2,353,789 | | | | 544,977 | | | | (343,244 | ) | | | 2,677,482 | | | | 116,542 | | | | 116,904 | | | | 147,744 | | | | (25,784 | ) |
| First Trust RiverFront Dynamic Developed International ETF | | | 10,198,579 | | | | – | | | | (1,497,105 | ) | | | 10,632,584 | | | | 165,359 | | | | 371,089 | | | | 1,897,490 | | | | 33,620 | |
| First Trust RiverFront Dynamic Emerging Markets ETF | | | 2,592,781 | | | | – | | | | (395,037 | ) | | | 2,782,025 | | | | 42,789 | | | | 74,959 | | | | 590,995 | | | | (6,714 | ) |
| RiverFront Dynamic US Dividend Advantage ETF | | | 14,234,833 | | | | – | | | | (2,248,371 | ) | | | 15,680,105 | | | | 286,978 | | | | 436,382 | | | | 2,835,879 | | | | 857,764 | |
| ALPS Active Equity Opportunity ETF | | | 4,347,880 | | | | – | | | | (2,461,296 | ) | | | 3,078,000 | | | | 53,896 | | | | 37,427 | | | | 873,211 | | | | 316,872 | |
| | | $ | 38,762,066 | | | $ | 1,033,548 | | | $ | (7,677,213 | ) | | $ | 39,944,477 | | | | | | | $ | 1,257,850 | | | $ | 6,708,903 | | | $ | 1,115,840 | |
8. MANAGEMENT AND RELATED-PARTY TRANSACTIONS
ALPS Advisors, Inc. (“AAI”) acts as the Funds’ investment adviser. AAI is an indirect wholly owned subsidiary of DST Systems, Inc. (“DST”). DST is a wholly-owned subsidiary of SS&C Technologies Holdings, Inc. (“SS&C”), a publicly traded company listed on the NASDAQ Global Select Market.
AAI has delegated daily management of the Funds listed below to the corresponding Sub-Advisor(s) listed in the table below. Each Sub-Advisor manages the investments of each Fund in accordance with its investment objective, policies and limitations and investment guidelines established jointly by AAI and the Board.
| Fund | Sub-Advisor(s) |
| ALPS | CoreCommodity Management CompleteCommodities® Strategy Fund | CoreCommodity Management, LLC |
| ALPS | Kotak India ESG Fund | Kotak Mahindra Asset Management (Singapore) Pte. Ltd |
| ALPS Balanced Opportunity Fund | Smith Capital Investors, LLC(a) |
| RiverFront Asset Allocation Growth & Income | RiverFront Investment Group, LLC |
| (a) | Effective October 4, 2024, the ALPS | Smith Balanced Opportunity Fund changed its name to the ALPS Balanced Opportunity Fund. Additionally, Smith Capital Investors, LLC ceased to serve as sub-adviser to the Fund and ALPS Advisors, Inc., the Fund’s investment adviser, assumed all responsibility for selecting the Fund’s investments. |
Pursuant to the Investment Advisory Agreement (the “Advisory Agreement”), the Funds listed below pay AAI an annual management fee which is based on each Fund’s average daily net assets. The management fee is paid on a monthly basis. The following table reflects the Funds’ contractual management fee rates (expressed as an annual rate).
| Fund | Contractual Management Fee |
| ALPS | CoreCommodity Management CompleteCommodities® Strategy Fund | 0.85% |
| ALPS | Kotak India ESG Fund | 0.65% |
| ALPS Global Opportunity Fund | 0.85% |
| ALPS Balanced Opportunity Fund | 0.70% |
Notes to Financial Statements and Financial Highlights
October 31, 2024
Pursuant to the Administrative Services Agreement, the RiverFront Asset Allocation Growth & Income pays an annual unitary administrative fee which is based on each Fund’s average daily net assets. The unitary administrative fee is paid on a monthly basis. The following table reflects the Fund's contractual unitary administrative fee rate (expressed as an annual rate).
| Fund | Contractual Unitary Fee |
| RiverFront Asset Allocation Growth & Income | 0.25% |
Pursuant to an Investment Sub-Advisory Agreement, AAI pays the Sub-Advisors of the Funds listed below an annual sub-advisory management fee which is based on each Fund’s average daily assets. AAI is required to pay all fees due to each Sub-Advisor out of the management fee AAI receives from each Fund listed below. The following table reflects the Funds’ contractual sub-advisory fee rates.
| Fund | Average Daily Net Assets of the Fund | Contractual Sub-Advisory Fee |
| ALPS | CoreCommodity Management CompleteCommodities® Strategy Fund | All Asset Levels | 0.75% |
| ALPS | Kotak India ESG Fund | All Asset Levels | 0.56% |
| ALPS Balanced Opportunity Fund* | All Asset Levels | 0.37% |
| * | Effective October 4, 2024, the ALPS | Smith Balanced Opportunity Fund changed its name to the ALPS Balanced Opportunity Fund. Additionally, Smith Capital Investors, LLC ceased to serve as sub-adviser to the Fund and ALPS Advisors, Inc., the Fund’s investment adviser, assumed all responsibility for selecting the Fund’s investments. |
ALPS | CoreCommodity Management CompleteCommodities® Strategy Fund
AAI and CoreCommodity Management LLC have contractually agreed to limit the amount of the Fund’s total annual expenses, exclusive of distribution and service (12b-1) fees, shareholder services fees, acquired fund fees and expenses, brokerage commissions, interest expense, taxes and extraordinary expenses that exceed the following annual rates below.
ALPS | Kotak India ESG Fund
AAI and Kotak Mahindra Asset Management (Singapore) Pte. Ltd. have contractually agreed to limit the amount of the Fund’s total annual expenses, exclusive of distribution and service (12b-1) fees, shareholder services fees, acquired fund fees and expenses, brokerage expenses, interest expenses, taxes and extraordinary expenses that exceed the following annual rates below.
ALPS Global Opportunity Fund
AAI has contractually agreed to limit the amount of the Fund’s total annual expenses, exclusive of distribution and service (12b-1) fees, acquired fund fees and expenses, shareholder service fees, brokerage expenses, interest expense, taxes and extraordinary expenses that exceed the following annual rates below.
ALPS Balanced Opportunity Fund
AAI has contractually agreed to limit the amount of the Fund’s total annual expenses, exclusive of distribution and service (12b-1) fees, acquired fund fees and expenses, shareholder service fees, brokerage expenses, interest expense, taxes and extraordinary expenses that exceed the following annual rates below.
These agreements are reevaluated on an annual basis. Expense limitation ratios from the current agreements are listed below. Fees waived or reimbursed for the fiscal year ended October 31, 2024 are disclosed on the Statement of Operations or Consolidated Statement of Operations.
| Fund* | Investor Class | Class A | Class C | Class I | Class II | Class R |
| ALPS | CoreCommodity Management CompleteCommodities® Strategy Fund | 1.05% | 1.05% | 1.05% | 1.15% | N/A | N/A |
| ALPS | Kotak India ESG Fund | 1.00% | 1.00% | 1.00% | 1.00% | 0.75% | N/A |
| ALPS Global Opportunity Fund | 1.25% | 1.25% | 1.25% | 1.25% | N/A | 1.25% |
| ALPS Balanced Opportunity Fund | 0.85% | 0.85% | 0.85% | 0.85% | N/A | N/A |
| * | See each Fund’s Prospectus for Expense Limitation agreement expiration dates. |
Notes to Financial Statements and Financial Highlights
October 31, 2024
Pursuant to the Expense Limitation agreement (the “Expense Agreement”), the Adviser has agreed to waive and/or reimburse the ALPS | CoreCommodity Management CompleteCommodities® Strategy Fund Investor Class, Class A, Class C and Class I shares for any acquired fund fees and expenses incurred by the Fund in connection with the Fund’s investment in any exchangetraded funds advised by the Adviser and sub-advised by the Sub-Adviser. The amount of such waived fees shall not be subject to recapture by the Adviser. The Expense Agreement has no termination date. This waiver may not be modified or discontinued without the approval of the Fund's Board of Trustees.
Pursuant to a written agreement (the “AFFE Agreement”), the Adviser has agreed to waive and/or reimburse the ALPS Balanced Opportunity Fund Investor Class, Class A, Class C and Class I shares for any acquired fund fees and expenses incurred by the Fund in connection with the Fund’s investment in any exchange-traded funds advised by the Adviser. The amount of such waived fees shall not be subject to recapture by the Adviser. The AFFE Agreement has no termination date. This waiver may not be modified or discontinued without the approval of the Fund's Board of Trustees.
AAI and each Sub-Advisor are permitted to recover expenses they have waived or reimbursed, on a class-by-class basis, through the agreements described above to the extent that expenses in later periods fall below the annual limits set forth in these agreements. The ALPS | CoreCommodity Management CompleteCommodities® Strategy Fund, ALPS | Kotak India ESG Fund, ALPS Global Opportunity Fund, and ALPS Balanced Opportunity Fund are not obligated to pay any deferred fees and expenses more than thirty-six months after the date on which the fees were waived or expenses were deferred, as calculated on a monthly basis. As of the fiscal year ended October 31, 2024, the Advisor and Sub-Advisor(s) may seek reimbursement of previously waived and reimbursed fees as follows:
Fund | | Expires 10/31/2025 | | | Expires 10/31/2026 | | | Expires 10/31/2027 | | | Total | |
| ALPS | CoreCommodity Management | | | | | | | | | | | | |
| CompleteCommodities® Strategy Fund - Investor Class | | $ | N/A | | | $ | N/A | | | $ | N/A | | | $ | N/A | |
| ALPS | CoreCommodity Management | | | | | | | | | | | | | | | | |
| CompleteCommodities® Strategy Fund - Class A | | | N/A | | | | N/A | | | | N/A | | | | N/A | |
| ALPS | CoreCommodity Management | | | | | | | | | | | | | | | | |
| CompleteCommodities® Strategy Fund - Class C | | | N/A | | | | N/A | | | | 6,857 | | | | 6,857 | |
| ALPS | CoreCommodity Management | | | | | | | | | | | | | | | | |
| CompleteCommodities® Strategy Fund - Class I | | | N/A | | | | N/A | | | | 451,573 | | | | 451,573 | |
| | | | | | | | | | | | | | | | | |
| ALPS | Kotak India ESG Fund - Investor Class | | | N/A | | | | N/A | | | | N/A | | | | N/A | |
| ALPS | Kotak India ESG Fund - Class A | | | N/A | | | | N/A | | | | N/A | | | | N/A | |
| ALPS | Kotak India ESG Fund - Class C | | | N/A | | | | N/A | | | | N/A | | | | N/A | |
| ALPS | Kotak India ESG Fund - Class I | | | N/A | | | | N/A | | | | N/A | | | | N/A | |
| ALPS | Kotak India ESG Fund - Class II | | | 441,782 | | | | 431,570 | | | | 420,514 | | | | 1,293,866 | |
| | | | | | | | | | | | | | | | | |
| ALPS Global Opportunity Fund - Investor Class | | | N/A | | | | N/A | | | | 104 | | | | 104 | |
| ALPS Global Opportunity Fund - Class A | | | N/A | | | | N/A | | | | N/A | | | | N/A | |
| ALPS Global Opportunity Fund - Class C | | | N/A | | | | 2,197 | | | | 1,640 | | | | 3,837 | |
| ALPS Global Opportunity Fund - Class I | | | N/A | | | | 21,039 | | | | 24,606 | | | | 45,645 | |
| ALPS Global Opportunity Fund - Class R | | | N/A | | | | N/A | | | | 723 | | | | 723 | |
| | | | | | | | | | | | | | | | | |
| ALPS Balanced Opportunity Fund - Investor Class | | | 3,187 | | | | 5,043 | | | | 14,090 | | | | 22,320 | |
| ALPS Balanced Opportunity Fund - Class A | | | 5,161 | | | | 8,125 | | | | 25,663 | | | | 38,949 | |
| ALPS Balanced Opportunity Fund - Class C | | | 2,577 | | | | 4,092 | | | | 8,564 | | | | 15,233 | |
| ALPS Balanced Opportunity Fund - Class I | | | 169,876 | | | | 182,588 | | | | 220,718 | | | | 573,182 | |
The ALPS | CoreCommodity Management CompleteCommodities® Strategy Fund recouped $210,903 during the fiscal year ended October 31, 2024.
The ALPS | Kotak India ESG Fund recouped $826 of expenses during the fiscal year ended October 31, 2024.
The ALPS Global Opportunity Fund recouped $1,392 during the fiscal year ended October 31, 2024.
The ALPS Balanced Opportunity Fund did not recoup fees during the fiscal year ended October 31, 2024.
Notes to Financial Statements and Financial Highlights
October 31, 2024
The CoreCommodity Management Cayman Commodity Fund Ltd. (the “Subsidiary”) has entered into a separate advisory agreement (the “Subsidiary Advisory Agreement”) with CoreCommodity Management, LLC for the management of the Subsidiary’s portfolio pursuant to which the Subsidiary is obligated to pay the CoreCommodity Management, LLC a management fee at the same rate that the Fund pays AAI for investment advisory services provided to the Funds. CoreCommodity Management, LLC has agreed to waive the advisory fee it receives from the Fund in an amount equal to the management fee paid by the Subsidiary. This agreement may be terminated based on the terms of the Subsidiary Advisory Agreement. For the year ended October 31, 2024, this amount equaled $2,069,206 and is disclosed in the Consolidated Statement of Operations. These waivers are not subject to reimbursement/recoupment.
RiverFront Asset Allocation Growth & Income does not pay a management fee or have a contractual limitation with respect to the amount of its annual total operating expenses.
Kotak Mahindra Asset Management (Singapore) Pte. Ltd. executed purchase and sale trades in the ALPS | Kotak India ESG Fund with the sub-adviser’s affiliated broker-dealer, Kotak Securities, (the “affiliate broker”). Fund commissions paid to the affiliate broker were $45,468 during the year ended October 31, 2024.
ALPS Portfolio Solutions Distributor, Inc. (the “Distributor”) acts as the distributor of the Funds’ shares pursuant to a Distribution Agreement with the Trust. Shares are sold on a continuous basis by the Distributor, as agent for the Funds, and the Distributor has agreed to use its best efforts to solicit orders for the sale of Funds’ shares, although it is not obliged to sell any particular amount of shares. The Distributor is not entitled to any compensation for its services. The Distributor is registered as a broker -dealer with the Securities and Exchange Commission.
Distribution and Services (12b-1) Plans
Each Fund has adopted Distribution and Services Plans (the “Plans”) pursuant to Rule 12b-1 of the 1940 Act for its Investor Class, Class A, Class C and Class R (ALPS Global Opportunity Fund only) shares. The Plans allow a Fund to use Investor Class, Class A, Class C, and Class R assets to pay fees in connection with the distribution and marketing of Investor Class, Class A, Class C, and Class R shares and/or the provision of shareholder services to Investor Class, Class A, Class C and Class R shareholders. The Plans permit payment for services in connection with the administration of plans or programs that use Investor Class, Class A, Class C, and Class R shares of a Fund, if any, as their funding medium and for related expenses. The Plans permit a Fund to make total payments at an annual rate of up to 0.25% of a Fund’s average daily net assets attributable to its Investor Class and Class A shares, 0.75% of a Fund’s average daily net assets attributable to its Class C shares and 0.50% of the ALPS Global Opportunity Fund’s average daily net assets attributable to its Class R shares.
Under the terms of the Plans, the Trust is authorized to make payments to the Distributor for remittance to financial intermediaries, as compensation for distribution and/or shareholder ongoing services performed by such entities for beneficial shareholders of the Fund. The Distributor is entitled to retain some or all fees payable under the Plans in certain circumstances, including when there is no broker of record or when certain qualification standards have not been met by the broker of record.
Shareholder Services Plans
Each Fund has adopted a shareholder services plan with respect to their Investor Class shares (the “Investor Class Shareholder Services Plan”). Under the Investor Class Shareholder Services Plan, the Funds are authorized to compensate certain financial intermediaries, including broker dealers and Fund affiliates (“Participating Organizations”), an aggregate fee in an amount not to exceed on an annual basis 0.15% of the average daily net asset value of Investor Class shares of the Funds attributable to or held in the name of the Participating Organizations pursuant to an agreement with a such Participating Organizations (the “Agreement”). Each Agreement will set forth the non-distribution related shareholder services to be performed by the Participating Organizations for the benefit of a Fund’s shareholders who have elected to have such Participating Organizations service their accounts. Any amount of such payment not paid to Participating Organizations during a Fund’s fiscal year for such service activities shall be reimbursed to the Fund as soon as practicable. Shareholder Services Plan fees are included with distribution and service fees in the Statements of Operations. Investor Class Shareholder Services Plan fees recaptured pursuant to the Services Plan for the year ended October 31, 2024 are included as an offset to distribution and service fees as disclosed in the Statements of Operations or Consolidated Statement of Operations.
The Funds has adopted a shareholder services plan with respect to their Class A shares (the “Class A Shareholder Services Plan”). Under the Class A Shareholder Services Plan, the Funds are authorized to compensate certain financial intermediaries, including broker dealers and Fund affiliates, an aggregate fee in an amount not to exceed on an annual basis 0.15% of the average daily net asset value of Class A shares of the Funds attributable to or held in the name of the Participating Organizations pursuant to an agreement with a such Participating Organizations. Each Agreement will set forth the non-distribution related shareholder services to be performed by the Participating Organizations for the benefit of a Fund’s shareholders who have elected to have such Participating Organizations service their accounts. Any amount of such payment not paid to Participating Organizations during a Fund’s fiscal year for such service activities shall be reimbursed to the Fund as soon as practicable. Shareholder Services Plan fees are included with distribution and service fees in the Statements of Operations. Class A Shareholder Services Plan fees recaptured pursuant to the Services Plan for the year ended October 31, 2024 are included as an offset to distribution and service fees as disclosed in the Statements of Operations or Consolidated Statement of Operations.
Notes to Financial Statements and Financial Highlights
October 31, 2024
The Funds have adopted a shareholder services plan with respect to their Class C shares (the “Class C Shareholder Services Plan”). Under the Class C Shareholder Services Plan, the Funds are authorized to pay banks and their affiliates and other institutions, including broker-dealers and Fund affiliates (“Participating Organizations”), an aggregate fee in an amount not to exceed on an annual basis 0.25% for Class C shares of the average daily net asset value of the Class C shares attributable to or held in the name of a Participating Organization for its clients as compensation for providing shareholder service activities, which do not include distribution services, pursuant to an agreement with a Participating Organization. Any amount of such payment not paid to Participating Organizations during a Fund’s fiscal year for such service activities shall be reimbursed to the Fund as soon as practicable after the end of the fiscal year. Class C Shareholder Services Plan fees are included with distribution and service fees on the Statements of Operations or Consolidated Statement of Operations.
Certain intermediaries may charge networking, omnibus account or other administrative fees with respect to transactions in shares of each Fund. Transactions may be processed through the National Securities Clearing Corporation or similar systems or processed on a manual basis. These fees generally are paid by the Fund to the Distributor, which uses such fees to reimburse intermediaries. In the event an intermediary receiving payments from the Distributor on behalf of the Fund converts from a networking structure to an omnibus account structure or otherwise experiences increased costs, fees borne by the Fund may increase. Networking fees are shown in the Statements of Operations or Consolidated Statement of Operations, if applicable to the Funds.
Fund Administrator
ALPS Fund Services, Inc. (“ALPS”) serves as administrator to the Funds and the Funds have agreed to pay expenses incurred in connection with their administrative activities. Pursuant to an Administrative Agreement, ALPS provides operational services to the Funds including, but not limited to, fund accounting and fund administration and generally assists in the Funds’ operations. Officers of the Trust are employees of ALPS. The Funds’ administration fee is accrued on a daily basis and paid monthly. Administrative fees paid by the Funds for the fiscal year ended October 31, 2024 are disclosed in the Statements of Operations or Consolidated Statement of Operations.
ALPS is reimbursed by the Funds for certain out-of-pocket expenses.
Transfer Agent
ALPS serves as transfer, dividend paying and shareholder servicing agent for the Funds. ALPS receives an annual minimum fee, a fee based upon the number of shareholder accounts, and is also reimbursed by the Funds for certain out-of-pocket expenses. Transfer agent fees paid by the Funds for the fiscal year ended October 31, 2024, are included in the Administrative fees disclosed in the Statements of Operations or Consolidated Statement of Operations.
Trustees
Effective January 1, 2024, all Trustees receive a quarterly retainer of $31,000, plus $12,500 for each regular quarterly Board meeting attended. Trustees receive $5,000 for each non-quarterly special Board meeting attended. Trustees receive $5,000 for each non-quarterly special Committee meeting attended for which a corresponding non-quarterly special Board meeting is not held. The Chairman of the Board and the Chairman of the Audit Committee also receive an additional quarterly retainer of $7,500 and $6,000, respectively. The Chairman of the Nominating and Governance Committee receives an additional quarterly retainer of $2,000. The Trustees are also reimbursed for all reasonable out-of-pocket expenses relating to attendance at meetings.
The fees and expenses of the independent trustees of the Board are presented in the Statements of Operations or Consolidated Statement of Operations.
9. INDEMNIFICATIONS
Under the Trust’s organizational documents, its officers and Trustees are indemnified against certain liability arising out of the performance of their duties to the Trust. Additionally, in the normal course of business, the Trust enters into contracts with service providers that may contain general indemnification clauses which may permit indemnification to the extent permissible under applicable law. The Trust’s maximum exposure under these arrangements is unknown, as this would involve future claims that may be made against the Trust that have not yet occurred.
10. SUBSEQUENT EVENTS
Subsequent events after the date of the Statements of Assets and Liabilities or Consolidated Statement of Assets and Liabilities have been evaluated through the date the financial statements were issued. Management has determined that there were no subsequent events to report through the issuance of these financial statements.
Report of Independent Registered Public Accounting Firm
To the Shareholders and Board of Trustees of
Financial Investors Trust
Opinion on the Financial Statements
We have audited the accompanying consolidated statement of assets and liabilities, including the consolidated statement of investments, of ALPS | CoreCommodity Management CompleteCommodities® Strategy Fund, and the statements of assets and liabilities, including the statements of investments, of ALPS | Kotak India ESG Fund, ALPS Global Opportunity Fund, ALPS Balanced Opportunity Fund (formerly ALPS | Smith Balanced Opportunity Fund), and RiverFront Asset Allocation Growth & Income (the “Funds”), each a series of Financial Investors Trust, as of October 31, 2024, the related consolidated statement of operations for the year then ended, the consolidated statements of changes in net assets for each of the two years in the period then ended, the consolidated financial highlights for each of the three years in the period then ended, and the related notes, of ALPS | CoreCommodity Management CompleteCommodities® Strategy Fund, and the related statements of operations for the year then ended, the statements of changes in net assets for each of the two years in the period then ended, the financial highlights for each of the three years in the period then ended, and the related notes, of ALPS | Kotak India ESG Fund, ALPS Global Opportunity Fund, ALPS Balanced Opportunity Fund (formerly ALPS | Smith Balanced Opportunity Fund), and RiverFront Asset Allocation Growth & Income (collectively referred to as the “financial statements”). In our opinion, the financial statements present fairly, in all material respects, the financial position of each of the Funds as of October 31, 2024, the results of their operations for the year then ended, the changes in net assets for each of the two years in the period then ended, and the financial highlights for each of the three years in the period then ended, in conformity with accounting principles generally accepted in the United States of America.
The Funds’ financial highlights for the years or periods ended October 31, 2021, and prior, were audited by other auditors whose report dated December 30, 2021, expressed an unqualified opinion on those financial highlights.
Basis for Opinion
These financial statements are the responsibility of the Funds’ management. Our responsibility is to express an opinion on the Funds’ financial statements based on our audits. We are a public accounting firm registered with the Public Company Accounting Oversight Board (United States) (“PCAOB”) and are required to be independent with respect to the Funds in accordance with the U.S. federal securities laws and the applicable rules and regulations of the Securities and Exchange Commission and the PCAOB.
We conducted our audits in accordance with the standards of the PCAOB. Those standards require that we plan and perform the audit to obtain reasonable assurance about whether the financial statements are free of material misstatement whether due to error or fraud.
Our audits included performing procedures to assess the risks of material misstatement of the financial statements, whether due to error or fraud, and performing procedures that respond to those risks. Such procedures included examining, on a test basis, evidence regarding the amounts and disclosures in the financial statements. Our procedures included confirmation of securities owned as of October 31, 2024, by correspondence with the custodians and brokers; when replies were not received from brokers, we performed other auditing procedures. Our audits also included evaluating the accounting principles used and significant estimates made by management, as well as evaluating the overall presentation of the financial statements. We believe that our audits provide a reasonable basis for our opinion.
We have served as the auditor of one or more investment companies advised by ALPS Advisors, Inc. since 2013.
COHEN & COMPANY, LTD.
Cleveland, Ohio
December 27, 2024
Additional Information
October 31, 2024 (Unaudited)
1. TAX INFORMATION (UNAUDITED)
Of the distributions paid by the Funds from ordinary income for the calendar year ended December 31, 2023, the following percentages met the requiremetns to be treated as qualifying for qualified dividend income and the corporate dividends received deduction:
| | | QDI | | | DRD | |
| ALPS|Core Commodity Management Complete Commodities® Strategy Fund | | | 25.19 | % | | | 7.21 | % |
| ALPS|Kotak India ESG Fund | | | – | | | | – | |
| ALPS Global Opportunity Fund | | | 10.59 | % | | | 4.36 | % |
| ALPS Balanced Opportunity Fund | | | 45.58 | % | | | 34.80 | % |
| RiverFront Asset Allocation Growth & Income | | | 48.19 | % | | | 29.99 | % |
In early 2024, if applicable, shareholders of record received this information for the distribution paid to them by the Funds during the calendar year 2023 via Form 1099. The Funds will notify shareholders in early 2025 of amounts paid to them by the Funds, if any, during the calendar year 2024.
Pursuant to Section 852(b)(3) of the Internal Revenue Code the Funds designate the following amounts as long-term capital gain dividends:
| ALPS|Core Commodity Management Complete Commodities® Strategy Fund | | $ | 5,787,292 | |
| ALPS|Kotak India ESG Fund | | $ | 13,460,492 | |
| ALPS Global Opportunity Fund | | $ | – | |
| ALPS Balanced Opportunity Fund | | $ | – | |
| RiverFront Asset Allocation Growth & Income | | $ | – | |
Changes in and Disagreements with Accountants
for Open-End Management Investment Companies
October 31, 2024 (Unaudited)
Not applicable for this reporting period.
Proxy Disclosures
for Open-End Management Investment Companies
October 31, 2024 (Unaudited)
Not applicable for this reporting period.
Remuneration Paid to Directors, Officers, and Others
for Open-End Management Investment Companies
October 31, 2024 (Unaudited)
The following chart provides certain information about the Trustee fees paid by the Trust for the fiscal year ended October 31, 2024:
| | | Aggregate Regular Compensation From the Trust | | | Aggregate Special Compensation From the Trust | | | Total Compensation From the Trust | |
| Mary K. Anstine | | $ | 191,500 | | | $ | – | | | $ | 191,500 | |
| Jeremy W. Deems | | | 200,500 | | | | – | | | | 200,500 | |
| Jerry G. Rutledge | | | 176,500 | | | | – | | | | 176,500 | |
| Michael “Ross” Shell | | | 197,500 | | | | – | | | | 197,500 | |
| Edmund J. Burke | | | 176,500 | | | | – | | | | 176,500 | |
| Total | | $ | 942,500 | | | $ | – | | | $ | 942,500 | |
Officers who are employed by the Adviser receive no compensaton or expense reimbursement from the Trust.
Pursuant to the RiverFront Fund's administrative fee arrangements, the RiverFront Fund does not pay any Trustee fees.
The fees and expenses of the independent trustees of the Board are presented in the Statements of Operations or Consolidated Statement of Operations.
Statement Regarding Basis
for Approval of Investment Advisory Contract
October 31, 2024 (Unaudited)
CoreCommodity Fund
In anticipation of and as part of the process to consider the renewal of the investment advisory agreement with ALPS Advisors, Inc. (“AAI”) with respect to the ALPS | CoreCommodity Management CompleteCommodities Strategy Fund (the “CoreCommodity Fund”) and the sub-advisory agreement with CoreCommodity Management, LLC (the “Sub-Adviser” or “CoreCommodity”) with respect to the CoreCommodity Fund (the “Advisory Agreements”), legal counsel to the Independent Trustees requested certain information from AAI and the Sub-Adviser. In response to these requests, the Board of Trustees (the “Board” or the “Trustees”) received reports from AAI and the Sub-Adviser that addressed specific factors to be considered by the Board. The Board also received from independent legal counsel memoranda regarding the Board’s responsibilities pertaining to the approval of advisory contracts. Further, the Board met on June 11-12, 2024 with representatives of AAI and the Sub-Adviser and discussed the services the firms provided pursuant to the Advisory Agreements, as well as the information they provided.
During the review process, the Board noted certain instances where clarification or follow-up was appropriate and others where the Board determined that further clarification or follow-up was not necessary. In those instances where clarification or follow-up was requested, the Board determined that in each case either information responsive to its requests had been provided, or where any request was outstanding in whole or in part, given the totality of the information provided with respect to the agreements, the Board had received sufficient information to renew and approve the Advisory Agreements.
In approving AAI as the CoreCommodity Fund’s investment adviser and the Sub-Adviser as the CoreCommodity Fund’s sub-adviser, and the fees to be charged under the Advisory Agreements, the Trustees concluded that no single factor reviewed by the Trustees was identified by the Trustees to be determinative as the principal factor in whether to approve such agreements. Further, the Independent Trustees were advised by independent legal counsel throughout the process. The following summary does not identify all the matters considered by the Board, but provides a summary of the principal matters the Board considered.
In renewing and approving the investment advisory agreement with AAI and the investment sub-advisory agreement with the Sub-Adviser, the Trustees, including the Independent Trustees, considered the following factors with respect to the CoreCommodity Fund:
Investment Advisory and Sub-Advisory Fee Rate: The Trustees reviewed and considered the contractual annual advisory fee rate paid by the Trust, on behalf of the CoreCommodity Fund, to AAI, of 0.85% of the CoreCommodity Fund’s daily average net assets, in light of the extent and quality of the advisory services provided by AAI to the CoreCommodity Fund. The Trustees also reviewed and considered the contractual annual sub-advisory fee rate paid by AAI to CoreCommodity of 0.75% of the CoreCommodity Fund’s daily average net assets, in light of the extent and quality of the advisory services provided by CoreCommodity to the CoreCommodity Fund. The Trustees also considered information regarding compensation paid to affiliates of AAI under other agreements, such as the Fund Accounting and Administration Agreement with ALPS.
The Board received and considered information including a comparison of the CoreCommodity Fund’s contractual advisory fee rates with those of funds in the peer group as selected by an independent provider of investment company data (the “Data Provider”). The Trustees noted that the contractual advisory fee rate for each class of the CoreCommodity Fund was higher than the Data Provider peer group median rate.
Total Net Expense Ratios: The Trustees further reviewed and considered the total net expense ratios of 1.25%, 2.01%, 1.15%, and 1.34% for the Class A, Class C, Class I, and Investor Class shares, respectively, of the CoreCommodity Fund. The Trustees noted that the total net expense ratio of each class of the CoreCommodity Fund was higher than the Data Provider peer group median ratio.
Nature, Extent, and Quality of the Services under the Investment Advisory Agreement: The Trustees received and considered information regarding the nature, extent, and quality of services provided to the CoreCommodity Fund under the Investment Advisory and Sub-Advisory Agreements. The Trustees reviewed certain background materials supplied by AAI and CoreCommodity in their presentations, including their Forms ADV.
The Trustees reviewed and considered AAI’s and CoreCommodity’s investment advisory personnel, their history as asset managers, and their performance and the amount of assets currently under management by AAI and CoreCommodity and their affiliated entities. The Trustees also reviewed the research and decision-making processes utilized by AAI and CoreCommodity, including the methods adopted to seek to achieve compliance with the investment objectives, policies, and restrictions of the CoreCommodity Fund.
The Trustees considered the background and experience of AAI’s and CoreCommodity’s management in connection with the CoreCommodity Fund, including reviewing the qualifications, backgrounds, and responsibilities of the management team primarily responsible for the day-to-day portfolio management of the CoreCommodity Fund and the extent of the resources devoted to research and analysis of actual and potential investments.
The Trustees also reviewed, among other things, AAI’s and CoreCommodity’s Codes of Ethics.
Statement Regarding Basis
for Approval of Investment Advisory Contract
October 31, 2024 (Unaudited)
Performance: The Trustees reviewed performance information for the CoreCommodity Fund, which included a comparison of the CoreCommodity Fund’s performance to the performance of a group of comparable funds selected by the Data Provider for the one-year, three-year, five-year, ten-year, and since inception periods ended March 31, 2024, as applicable. The Trustees noted that, for the three-year period, each of the CoreCommodity Fund’s classes underperformed the Data Provider peer group median, except for Class C, which outperformed the Data Provider peer group median; for the one-year period, each of the CoreCommodity Fund’s classes underperformed the Data Provider peer group median; for the five-year and ten-year periods, as applicable, each of the CoreCommodity Fund’s classes outperformed the Data Provider peer group median; and for the since inception period, each of the CoreCommodity Fund’s classes outperformed the Data Provider peer group median, except that Class A underperformed the Data Provider peer group median. The Trustees also considered CoreCommodity’s investment performance and reputation generally and its investment techniques, risk management controls, and decision-making processes.
Comparable Accounts: The Trustees noted certain information provided by CoreCommodity regarding fees charged to its other clients utilizing a strategy similar to that employed by the CoreCommodity Fund. The Trustees also noted that AAI indicated that it had no other clients utilizing a strategy similar to that employed by the CoreCommodity Fund.
Profitability: The Trustees received and considered the profitability analyses prepared by AAI and CoreCommodity based on the fees payable under the Investment Advisory Agreement with AAI and the Investment Sub-Advisory Agreement with CoreCommodity with respect to the CoreCommodity Fund, respectively. The Trustees considered the profits, if any, realized by AAI and CoreCommodity in connection with the operation of the CoreCommodity Fund.
Economies of Scale: The Trustees considered whether economies of scale in the provision of services to the CoreCommodity Fund will be passed along to the shareholders under the Advisory Agreements.
Other Benefits to the Adviser and Sub-Adviser: The Trustees reviewed and considered any other incidental benefits derived or to be derived by AAI and CoreCommodity from their relationship with the CoreCommodity Fund, including whether soft dollar arrangements were used.
The Trustees, including all of the Independent Trustees, concluded that:
| ● | the contractual advisory fee rate payable to AAI for each class of the CoreCommodity Fund was higher than the Data Provider peer group median rate; |
| ● | CoreCommodity’s fees under the Sub-Advisory Agreement is paid directly by AAI; |
| ● | the total net expense ratio of each class of the CoreCommodity Fund was higher than the Data Provider peer group median ratio; |
| ● | the nature, extent, and quality of services rendered by AAI and CoreCommodity under the Investment Advisory and Sub-Advisory Agreements, respectively, with respect to the CoreCommodity Fund were adequate; |
| ● | for the three-year period, each of the CoreCommodity Fund’s classes underperformed the Data Provider peer group median, except for Class C, which outperformed the Data Provider peer group median; for the one-year period, each of the CoreCommodity Fund’s classes underperformed the Data Provider peer group median; for the five-year and ten-year periods, as applicable, each of the CoreCommodity Fund’s classes outperformed the Data Provider peer group median; and for the since inception period, each of the CoreCommodity Fund’s classes outperformed the Data Provider peer group median, except that Class A underperformed the Data Provider peer group median; |
| ● | that (a) AAI had no other clients utilizing a strategy similar to that employed by the CoreCommodity Fund, and (b) bearing in mind the limitations of comparing different types of managed accounts and the different levels of service typically associated with such accounts, the fee structures applicable to CoreCommodity’s other clients employing a comparable strategy to the CoreCommodity Fund was not indicative of any unreasonableness with respect to the advisory and sub-advisory fees proposed to be payable by the CoreCommodity Fund; |
| ● | the profit, if any, realized by AAI and CoreCommodity in connection with the operation of the CoreCommodity Fund is not unreasonable to the CoreCommodity Fund; and |
| ● | at this time, there were no material economies of scale or other incidental benefits accruing to AAI and CoreCommodity in connection with their relationship with the CoreCommodity Fund. |
Statement Regarding Basis
for Approval of Investment Advisory Contract
October 31, 2024 (Unaudited)
Based on the Trustees’ deliberations and their evaluation of the information described above, the Trustees, including all of the Independent Trustees, concluded that AAI’s and CoreCommodity’s compensation for investment advisory and sub-advisory services is consistent with the best interests of the CoreCommodity Fund and its shareholders.
The Trustees applied the same analysis to the advisory arrangements between AAI, CoreCommodity, and the wholly owned Cayman Island subsidiary of the CoreCommodity Fund.
Kotak Fund
In anticipation of and as part of the process to consider the renewal of the investment advisory agreement with ALPS Advisors, Inc. (“AAI”) with respect to the ALPS | Kotak India ESG Fund (the “Kotak Fund”) and the sub-advisory agreement with Kotak Mahindra Asset Management (Singapore) Pte Ltd. (the “Sub-Adviser” or “Kotak”) with respect to the Kotak Fund (the “Advisory Agreements”), legal counsel to the Independent Trustees requested certain information from AAI and the Sub-Adviser. In response to these requests, the Board of Trustees (the “Board” or the “Trustees”) received reports from AAI and the Sub-Adviser that addressed specific factors to be considered by the Board. The Board also received from independent legal counsel memoranda regarding the Board’s responsibilities pertaining to the approval of advisory contracts. Further, the Board met on June 11-12, 2024 with representatives of AAI and the Sub-Adviser and discussed the services the firms provided pursuant to the Advisory Agreements, as well as the information they provided.
During the review process, the Board noted certain instances where clarification or follow-up was appropriate and others where the Board determined that further clarification or follow-up was not necessary. In those instances where clarification or follow-up was requested, the Board determined that in each case either information responsive to its requests had been provided, or where any request was outstanding in whole or in part, given the totality of the information provided with respect to the agreements, the Board had received sufficient information to renew and approve the Advisory Agreements.
In approving AAI as the Kotak Fund’s investment adviser and the Sub-Adviser as the Kotak Fund’s sub-adviser, and the fees to be charged under the Advisory Agreements, the Trustees concluded that no single factor reviewed by the Trustees was identified by the Trustees to be determinative as the principal factor in whether to approve such agreements. Further, the Independent Trustees were advised by independent legal counsel throughout the process. The following summary does not identify all the matters considered by the Board, but provides a summary of the principal matters the Board considered.
In renewing and approving the investment advisory agreement with AAI and the investment sub-advisory agreement with the Sub-Adviser, the Trustees, including the Independent Trustees, considered the following factors with respect to the Kotak Fund:
Investment Advisory and Sub-Advisory Fee Rates: The Trustees reviewed and considered the contractual annual advisory fee rate paid by the Trust, on behalf of the Kotak Fund, to AAI, of 0.65% of the Kotak Fund’s daily average net assets, in light of the extent and quality of the advisory services provided by AAI to the Kotak Fund. The Trustees also reviewed and considered the contractual annual sub-advisory fee rate paid by AAI to Kotak of 0.56% of the Kotak Fund’s daily average net assets, in light of the extent and quality of the advisory services provided by Kotak to the Kotak Fund. The Trustees also considered information regarding compensation to be paid to affiliates of AAI under other agreements, such as the Fund Accounting and Administration Agreement with ALPS.
The Board received and considered information including a comparison of the Kotak Fund’s contractual advisory fee rate with those of funds in the peer group as selected by an independent provider of investment company data (the “Data Provider”). The Trustees noted that the contractual advisory fee rate for each class of the Kotak Fund was lower than the Data Provider peer group median rate.
Total Net Expense Ratios: The Trustees further reviewed and considered the total net expense ratios of 1.23%, 2.00%, 1.00%, 0.75%, and 1.37% for the Class A, Class C, Class I, Class II, and Investor Class shares, respectively, of the Kotak Fund. The Trustees noted that the total net expense ratio of each class of the Kotak Fund was lower than the Data Provider peer group median ratio.
Nature, Extent, and Quality of the Services under the Investment Advisory and Sub- Advisory Agreements: The Trustees received and considered information regarding the nature, extent, and quality of services to be provided to the Kotak Fund under the Investment Advisory and Sub- Advisory Agreements. The Trustees reviewed certain background materials supplied by AAI and Kotak in their presentations, including their Forms ADV.
The Trustees reviewed and considered AAI’s and Kotak’s investment advisory personnel, their history as asset managers and their performance and the amount of assets currently under management by AAI and Kotak and their affiliated entities. The Trustees also reviewed the research and decision-making processes utilized by AAI and Kotak, including the methods adopted to seek to achieve compliance with the investment objectives, policies, and restrictions of the Kotak Fund.
Statement Regarding Basis
for Approval of Investment Advisory Contract
October 31, 2024 (Unaudited)
The Trustees considered the background and experience of AAI’s and Kotak’s management in connection with the Kotak Fund, including reviewing the qualifications, backgrounds, and responsibilities of the management team primarily responsible for the day-to-day portfolio management of the Kotak Fund and the extent of the resources devoted to research and analysis of actual and potential investments.
The Trustees also reviewed, among other things, AAI’s and Kotak’s Codes of Ethics.
Performance: The Trustees reviewed performance information for the Kotak Fund, which included a comparison of the Kotak Fund’s performance to the performance of a group of comparable funds selected by the Data Provider for the one-year, three-year, five-year, ten-year, and since inception periods ended March 31, 2024, as applicable. The Trustees noted that each of the Kotak Fund’s classes underperformed the Data Provider peer group median for each applicable period, except that Class C outperformed the peer group median for the ten-year and since inception periods, Class I had performance equal to the peer group median for the ten-year and since inception periods, and Investor Class had performance equal to the peer group median for the since inception period. The Trustees also considered Kotak’s investment performance and reputation generally and its investment techniques, risk management controls, and decision-making processes.
Comparable Accounts: The Trustees noted certain information provided by Kotak regarding fees charged to its other clients utilizing a strategy similar to that employed by the Kotak Fund. The Trustees also noted that AAI indicated that it had no other clients utilizing a strategy similar to that employed by the Kotak Fund.
Profitability: The Trustees received and considered the profitability analyses prepared by AAI and Kotak based on the fees payable under the Investment Advisory Agreement with AAI and the Investment Sub-Advisory Agreement with Kotak, with respect to the Kotak Fund, respectively. The Trustees considered the profits, if any, realized by AAI and Kotak in connection with the operation of the Kotak Fund.
Economies of Scale: The Trustees considered whether economies of scale in the provision of services to the Kotak Fund will be passed along to the shareholders under the Advisory Agreements.
Other Benefits to the Adviser and Sub-Adviser: The Trustees reviewed and considered any other incidental benefits derived or to be derived by AAI and Kotak from their relationship with the Kotak Fund, including whether soft dollar arrangements were used.
The Trustees, including all of the Independent Trustees, concluded that:
| ● | the contractual advisory fee rate payable to AAI for each class of the Kotak Fund was lower than the Data Provider peer group median rate; |
| ● | Kotak’s fees under its sub-advisory agreements are paid directly by AAI; |
| ● | the total net expense ratio of each class of the Kotak Fund was lower than the Data Provider peer group median ratio; |
| ● | the nature, extent, and quality of services rendered by AAI and Kotak under the Investment Advisory and Sub-Advisory Agreements, respectively, with respect to the Kotak Fund were adequate; |
| ● | for the one-year, three-year, five-year, ten-year, and since inception periods ended March 31, 2024, as applicable, each of the Kotak Fund’s classes underperformed the Data Provider peer group median, except that Class C outperformed the peer group median for the ten-year and since inception periods, Class I had performance equal to the peer group median for the ten-year and since inception periods, and Investor Class had performance equal to the peer group median for the since inception period; |
| ● | that (a) AAI had no other clients utilizing a strategy similar to that employed by the Kotak Fund, and (b) bearing in mind the limitations of comparing different types of managed accounts and the different levels of service typically associated with such accounts, the fee structures applicable to Kotak’s other clients employing a comparable strategy to the Kotak Fund was not indicative of any unreasonableness with respect to the advisory and sub-advisory fees proposed to be payable by the Kotak Fund; |
| ● | the profit, if any, realized by AAI and Kotak in connection with the operation of the Kotak Fund is not unreasonable to the Kotak Fund; and |
| ● | at this time, there were no material economies of scale or other incidental benefits accruing to AAI and Kotak in connection with their relationship with the Kotak Fund. |
Statement Regarding Basis
for Approval of Investment Advisory Contract
October 31, 2024 (Unaudited)
Based on the Trustees’ deliberations and their evaluation of the information described above, the Trustees, including all of the Independent Trustees, concluded that AAI’s and Kotak’s compensation for investment advisory and sub-advisory services is consistent with the best interests of the Kotak Fund and its shareholders.
Global Opportunity Fund
In anticipation of and as part of the process to consider the renewal of the investment advisory agreement with ALPS Advisors, Inc. (“AAI”) with respect to the ALPS Global Opportunity Fund (the “Global Opportunity Fund”) (the “Advisory Agreement”), legal counsel to the Independent Trustees requested certain information from AAI. In response to these requests, the Board of Trustees (the “Board” or the “Trustees”) received reports from AAI that addressed specific factors to be considered by the Board. The Board also received from independent legal counsel memoranda regarding the Board’s responsibilities pertaining to the approval of advisory contracts. Further, the Board met on June 11-12, 2024 with representatives of AAI and discussed the services the firm provided pursuant to the Advisory Agreement, as well as the information they provided.
During the review process, the Board noted certain instances where clarification or follow-up was appropriate and others where the Board determined that further clarification or follow-up was not necessary. In those instances where clarification or follow-up was requested, the Board determined that in each case either information responsive to its requests had been provided, or where any request was outstanding in whole or in part, given the totality of the information provided with respect to the agreements, the Board had received sufficient information to renew and approve the Advisory Agreement.
In approving AAI as the Global Opportunity Fund’s investment adviser, and the fees to be charged under the Advisory Agreement, the Trustees concluded that no single factor reviewed by the Trustees was identified by the Trustees to be determinative as the principal factor in whether to approve such agreements. Further, the Independent Trustees were advised by independent legal counsel throughout the process. The following summary does not identify all the matters considered by the Board, but provides a summary of the principal matters the Board considered.
In renewing and approving the Advisory Agreement with AAI, the Trustees, including the Independent Trustees, considered the following factors with respect to the Global Opportunity Fund:
Investment Advisory Fee Rates: The Trustees reviewed and considered the contractual annual advisory fee rate paid by the Trust, on behalf of the Global Opportunity Fund, to AAI, of 0.85% of the Global Opportunity Fund’s daily average net assets, in light of the extent and quality of the advisory services provided by AAI to the Global Opportunity Fund. The Trustees also considered information regarding compensation paid to affiliates of AAI under other agreements, such as the Fund Accounting and Administration Agreement with ALPS.
The Board received and considered information including a comparison of the Global Opportunity Fund’s contractual advisory fee rate with those of funds in the peer group as selected by an independent provider of investment company data (the “Data Provider”). The Trustees noted that the contractual advisory fee rate for the Global Opportunity Fund was lower than the Data Provider peer group median rate for each class of the Fund, except for Class R, which was higher than the Data Provider peer group median rate.
Total Net Expense Ratios: The Trustees further reviewed and considered the total net expense ratios of 1.57%, 2.25%, 1.25%, 1.59%, and 1.75% for the Class A, Class C, Class I, Investor Class, and Class R shares, respectively, of the Global Opportunity Fund. The Trustees noted that the total net expense ratio for each class of the Global Opportunity Fund was higher than the Data Provider peer group median ratio, except for Class I, which was lower than the Data Provider peer group median ratio.
Nature, Extent, and Quality of the Services under the Investment Advisory Agreement: The Trustees received and considered information regarding the nature, extent, and quality of services provided to the Global Opportunity Fund under the Investment Advisory Agreement. The Trustees reviewed certain background materials supplied by AAI in its presentation, including its Form ADV.
The Trustees reviewed and considered AAI’s investment advisory personnel, its history as an asset manager and its performance and the amount of assets currently under management by AAI and its affiliated entities. The Trustees also reviewed the research and decision-making processes utilized by AAI, including the methods adopted to seek to achieve compliance with the investment objectives, policies, and restrictions of the Global Opportunity Fund.
The Trustees considered the background and experience of AAI’s management in connection with the Global Opportunity Fund, including reviewing the qualifications, backgrounds, and responsibilities of the management team primarily responsible for the day-to-day portfolio management of the Global Opportunity Fund and the extent of the resources devoted to research and analysis of actual and potential investments.
The Trustees also reviewed, among other things, AAI’s Codes of Ethics.
Statement Regarding Basis
for Approval of Investment Advisory Contract
October 31, 2024 (Unaudited)
Performance: The Trustees reviewed performance information for the Global Opportunity Fund, which included a comparison of the Global Opportunity Fund’s performance to the performance of a peer group selected by the Data Provider for the one-year, three-year, five-year, ten-year, and since inception periods ended March 31, 2024, as applicable. The Trustees noted that each class of the Global Opportunity Fund outperformed the Data Provider peer group median for each applicable period, except that Investor Class and Class R underperformed the Data Provider peer group median for the since inception period. The Trustees also considered AAI’s investment performance and reputation generally and its investment techniques, risk management controls, and decision-making processes.
Comparable Accounts: The Trustees noted certain information provided by AAI regarding fees charged to its other clients utilizing a strategy similar to that employed by the Global Opportunity Fund.
Profitability: The Trustees received and considered a profitability analysis prepared by AAI based on the fees payable under the Investment Advisory Agreement with AAI, with respect to the Global Opportunity Fund.
Economies of Scale: The Trustees considered whether economies of scale in the provision of services to the Global Opportunity Fund will be passed along to the shareholders under the Advisory Agreement.
Other Benefits to the Adviser: The Trustees reviewed and considered any other incidental benefits derived or to be derived by AAI from its relationship with the Global Opportunity Fund, including whether soft dollar arrangements were used.
The Trustees, including all of the Independent Trustees, concluded that:
| ● | the contractual advisory fee rate for the Global Opportunity Fund was lower than the Data Provider peer group median rate for each class of the Global Opportunity Fund, except for Class R, which was higher than the Data provider peer group median rate; |
| ● | the total net expense ratio for each class of the Global Opportunity Fund was higher than the Data Provider peer group median ratio, except for Class I, which was lower than the Data Provider peer group median ratio; |
| ● | the nature, extent, and quality of services rendered by AAI under the Investment Advisory Agreement with respect to the Global Opportunity Fund were adequate; |
| ● | for the one-year, three-year, five-year, ten-year, and since inception periods ended March 31, 2024, as applicable, the Trustees noted that each class of the Global Opportunity Fund outperformed the Data Provider peer group median for each period, except that Investor Class and Class R underperformed the Data Provider peer group median for the since inception period; |
| ● | bearing in mind the limitations of comparing different types of managed accounts and the different levels of service typically associated with such accounts, the fee structures applicable to AAI’s other clients employing a comparable strategy to the Global Opportunity Fund was not indicative of any unreasonableness with respect to the advisory fees payable by the Global Opportunity Fund; |
| ● | the profit, if any, realized by AAI in connection with the operation of the Global Opportunity Fund is not unreasonable to the Global Opportunity Fund; and |
| ● | at this time, there were no material economies of scale or other incidental benefits accruing to AAI in connection with its relationship with the Global Opportunity Fund. |
Based on the Trustees’ deliberations and their evaluation of the information described above, the Trustees, including all of the Independent Trustees, concluded that AAI’s compensation for investment advisory services is consistent with the best interests of the Global Opportunity Fund and its shareholders.
Balanced Opportunity Fund
In anticipation of and as part of the process to consider the renewal of the investment advisory agreement with ALPS Advisors, Inc. (“AAI”) with respect to the ALPS Balanced Opportunity Fund (formerly, the ALPS | Smith Balanced Opportunity Fund) and the sub-advisory agreement with Smith Capital Investors, LLC (the “Sub-Adviser” or “Smith Capital”) with respect to the Balanced Opportunity Fund (the “Advisory Agreements”), legal counsel to the Independent Trustees requested certain information from AAI and the Sub-Adviser. In response to these requests, the Board of Trustees (the “Board” or the “Trustees”) received reports from AAI and the Sub-Adviser that addressed specific factors to be considered by the Board. The Board also received from independent legal counsel memoranda regarding the Board’s responsibilities pertaining to the approval of advisory
Statement Regarding Basis
for Approval of Investment Advisory Contract
October 31, 2024 (Unaudited)
contracts. Further, the Board met on June 11-12, 2024 with representatives of AAI and the Sub-Adviser and discussed the services the firms provided pursuant to the Advisory Agreements, as well as the information they provided.
During the review process, the Board noted certain instances where clarification or follow-up was appropriate and others where the Board determined that further clarification or follow-up was not necessary. In those instances where clarification or follow-up was requested, the Board determined that in each case either information responsive to its requests had been provided, or where any request was outstanding in whole or in part, given the totality of the information provided with respect to the agreements, the Board had received sufficient information to renew and approve the Advisory Agreements.
In approving AAI as the Balanced Opportunity Fund’s investment adviser and the Sub-Adviser as the Balanced Opportunity Fund’s sub-adviser, and the fees to be charged under the Advisory Agreements, the Trustees concluded that no single factor reviewed by the Trustees was identified by the Trustees to be determinative as the principal factor in whether to approve such agreements. Further, the Independent Trustees were advised by independent legal counsel throughout the process. The following summary does not identify all the matters considered by the Board, but provides a summary of the principal matters the Board considered.
In renewing and approving the investment advisory agreements with AAI and the investment sub-advisory agreement with the Sub-Adviser, the Trustees, including the Independent Trustees, considered the following factors with respect to the Balanced Opportunity Fund:
Investment Advisory and Sub-Advisory Fee Rates: The Trustees reviewed and considered the contractual annual advisory fee rates paid by the Trust, on behalf of the Balanced Opportunity Fund, to AAI, of 0.70% of the Balanced Opportunity Fund’s average daily net assets, in light of the extent and quality of the advisory services provided by AAI to the Balanced Opportunity Fund. The Trustees also reviewed and considered the contractual annual sub- advisory fee rates paid by AAI to Smith Capital of 0.37% of the Balanced Opportunity Fund’s average daily net assets, in light of the extent and quality of the advisory services provided by Smith Capital to the Balanced Opportunity Fund. The Trustees also considered information regarding compensation to be paid to affiliates of AAI under other agreements, such as the Fund Accounting and Administration Agreement with ALPS.
The Board received and considered information including a comparison of the Balanced Opportunity Fund’s contractual advisory fee rates with those of funds in the peer group as selected by an independent provider of investment company data (the “Data Provider”). The Trustees noted that the contractual advisory fee for Class A and Class C of the Balanced Opportunity Fund was higher than the Data provider peer group median rate; the contractual advisory fee for the Investor Class of the Balanced Opportunity Fund was equal to the Data Provider peer group median rate; and the contractual advisory fees for Class I of the Balanced Opportunity Fund was lower than the Data Provider peer group median rate.
Total Net Expense Ratios: The Trustees further reviewed and considered the total net expense ratios of 1.12%, 1.85%, 0.85%, 1.09% for the Class A, Class C, Class I, and Investor Class shares of the Balanced Opportunity Fund, respectively. The Trustees noted that the total net expense ratio for each class of the Balanced Opportunity Fund was lower than the Data Provider peer group median ratio.
Nature, Extent, and Quality of the Services under the Investment Advisory and Sub- Advisory Agreements: The Trustees received and considered information regarding the nature, extent, and quality of services to be provided to the Balanced Opportunity Fund under the Investment Advisory and Sub-Advisory Agreements. The Trustees reviewed certain background materials supplied by AAI and Smith Capital in their presentations, including their Forms ADV.
The Trustees reviewed and considered AAI’s and Smith Capital’s investment advisory personnel, their history as asset managers and their performance and the amount of assets currently under management by AAI and Smith Capital and their affiliated entities. The Trustees also reviewed the research and decision-making processes utilized by AAI and Smith Capital, including the methods adopted to seek to achieve compliance with the investment objectives, policies and restrictions of the Balanced Opportunity Fund.
The Trustees considered the background and experience of AAI’s and Smith Capital’s management in connection with the Balanced Opportunity Fund, including reviewing the qualifications, backgrounds and responsibilities of the management team primarily responsible for the day-to-day portfolio management of the Balanced Opportunity Fund and the extent of the resources devoted to research and analysis of actual and potential investments.
The Trustees also reviewed, among other things, AAI’s and Smith Capital’s Codes of Ethics.
Performance: The Trustees reviewed performance information for the Balanced Opportunity Fund, which included a comparison of the Balanced Opportunity Fund’s performance to the performance of a group of comparable funds selected by the Data Provider for the one-year, three-year, five-year and since inception periods ended March 31, 2024, as applicable.
Statement Regarding Basis
for Approval of Investment Advisory Contract
October 31, 2024 (Unaudited)
The Trustees noted that for the one-year period, each class of the Balanced Opportunity Fund outperformed the Data Provider peer group median; for the three-year period, Class A and Class I of the Balanced Opportunity Fund underperformed the Data Provider peer group median and Class C and Investor Class of the Balanced Opportunity Fund outperformed the Data Provider peer group median; for the since inception period, Class A and Class I of the Balanced Opportunity Fund underperformed the Data Provider peer group median, Class C of the Balanced Opportunity Fund had performance equal to the Data Provider peer group median, and Investor Class of the Balanced Opportunity Fund outperformed the Data Provider peer group median.
The Trustees also considered Smith Capital’s investment performance and reputation generally and its investment techniques, risk management controls, and decision-making processes.
Comparable Accounts: The Trustees noted that Smith Capital indicated it had no other clients utilizing a strategy similar to that employed by the Balanced Opportunity Fund. The Trustees also noted that AAI indicated that it had no other clients utilizing a strategy similar to that employed by the Balanced Opportunity Fund.
Profitability: The Trustees received and considered the profitability analyses prepared by AAI and Smith Capital based on the fees payable under the Investment Advisory Agreement with AAI and the Investment Sub-Advisory Agreement with Smith Capital, with respect to the Balanced Opportunity Fund, respectively. The Trustees considered the profits, if any, realized by AAI and Smith Capital in connection with the operation of the Balanced Opportunity Fund.
Economies of Scale: The Trustees considered whether economies of scale in the provision of services to the Balanced Opportunity Fund will be passed along to the shareholders under the Advisory Agreements.
Other Benefits to the Adviser and Sub-Adviser: The Trustees reviewed and considered any other incidental benefits derived or to be derived by AAI and Smith Capital from their relationship with the Balanced Opportunity Fund, including whether soft dollar arrangements were used.
The Trustees, including all of the Independent Trustees, concluded that:
| ● | the contractual advisory fee for Class A and Class C of the Balanced Opportunity Fund was higher than the Data provider peer group median rate; the contractual advisory fee for the Investor Class of the Balanced Opportunity Fund was equal to the Data Provider peer group median rate; and the contractual advisory fees for Class I of the Balanced Opportunity Fund was lower than the Data Provider peer group median rate; |
| ● | Smith Capital’s fees under its sub-advisory agreement are paid directly by AAI; |
| ● | the total net expense ratio for each class of the Balanced Opportunity Fund was lower than the Data Provider peer group median ratio; |
| ● | the nature, extent, and quality of services rendered by AAI and Smith Capital under the Investment Advisory and Sub-Advisory Agreements, respectively, with respect to the Balanced Opportunity Fund were adequate; |
| ● | for the one-year period, each class of the Balanced Opportunity Fund outperformed the Data Provider peer group median; for the three-year period, Class A and Class I of the Balanced Opportunity Fund underperformed the Data Provider peer group median and Class C and Investor Class of the Balanced Opportunity Fund outperformed the Data Provider peer group median; for the since inception period, Class A and Class I of the Balanced Opportunity Fund underperformed the Data Provider peer group median, Class C of the Balanced Opportunity Fund had performance equal to the Data Provider peer group median, and Investor Class of the Balanced Opportunity Fund outperformed the Data Provider peer group median; |
| ● | that (a) AAI had no other clients utilizing a strategy similar to that employed by the Balanced Opportunity Fund; and (b) Smith Capital indicated it had no other clients utilizing a strategy similar to that employed by the Balanced Opportunity Fund; |
| ● | the profit, if any, realized by AAI and Smith Capital in connection with the operation of the Smith Funds is not unreasonable to the Balanced Opportunity Fund; and |
| ● | at this time, there were no material economies of scale or other incidental benefits accruing to AAI and Smith Capital in connection with their relationship with the Balanced Opportunity Fund. |
Statement Regarding Basis
for Approval of Investment Advisory Contract
October 31, 2024 (Unaudited)
Based on the Trustees’ deliberations and their evaluation of the information described above, the Trustees, including all of the Independent Trustees, concluded that AAI’s and Smith Capital’s compensation for investment advisory and sub-advisory services is consistent with the best interests of the Balanced Opportunity Fund and its shareholders.
RiverFront Fund
In anticipation of and as part of the process to consider the renewal of the investment advisory agreement with ALPS Advisors, Inc. (“AAI”) with respect to RiverFront Asset Allocation Growth & Income (the “RiverFront Fund”) and the sub-advisory agreement with RiverFront Investment Group, LLC (the “Sub-Adviser” or “RiverFront”) with respect to the RiverFront Fund (the “Advisory Agreements”), legal counsel to the Independent Trustees requested certain information from AAI and the Sub-Adviser. In response to these requests, the Board of Trustees (the “Board” or the “Trustees”) received reports from AAI and the Sub-Adviser that addressed specific factors to be considered by the Board. The Board also received from independent legal counsel memoranda regarding the Board’s responsibilities pertaining to the approval of advisory contracts. Further, the Board met on June 11-12, 2024 with representatives of AAI and the Sub-Adviser and discussed the services the firms provided pursuant to the Advisory Agreements, as well as the information they provided.
During the review process, the Board noted certain instances where clarification or follow-up was appropriate and others where the Board determined that further clarification or follow-up was not necessary. In those instances where clarification or follow-up was requested, the Board determined that in each case either information responsive to its requests had been provided, or where any request was outstanding in whole or in part, given the totality of the information provided with respect to the agreements, the Board had received sufficient information to renew and approve the Advisory Agreements.
In approving AAI as the RiverFront Fund’s investment adviser and the Sub-Adviser as the RiverFront Fund’s sub-adviser, and the fees to be charged under the Advisory Agreements, the Trustees concluded that no single factor reviewed by the Trustees was identified by the Trustees to be determinative as the principal factor in whether to approve such agreements. Further, the Independent Trustees were advised by independent legal counsel throughout the process. The following summary does not identify all the matters considered by the Board, but provides a summary of the principal matters the Board considered.
In renewing and approving the investment advisory agreement with AAI and the investment sub-advisory agreement with the Sub-Adviser, the Trustees, including the Independent Trustees, considered the following factors with respect to the RiverFront Fund:
Investment Advisory and Sub-Advisory Fee Rates: There are no investment advisory or sub-advisory fees paid with respect to the RiverFront Fund. The Trustees also considered information regarding compensation to be paid to affiliates of AAI under other agreements, such as the Fund Accounting and Administration Agreement with ALPS.
Total Net Expense Ratios: The Trustees reviewed and considered the total net expense ratios of 0.50%, 1.25%, 0.25%, and 0.50%, for the Class A, Class C, Class I, and Investor Class shares, respectively, of the RiverFront Fund. The Trustees noted that the total net expense ratio for each Class of the RiverFront Fund was lower than the Data Provider peer group median ratio.
Nature, Extent, and Quality of the Services under the Investment Advisory and Sub- Advisory Agreements: The Trustees received and considered information regarding the nature, extent, and quality of services provided to the RiverFront Fund under the Investment Advisory and Sub- Advisory Agreements. The Trustees reviewed certain background materials supplied by AAI and RiverFront in their presentations, including their Forms ADV.
The Trustees reviewed and considered AAI’s and RiverFront’s investment advisory personnel, their history as asset managers and their performance and the amount of assets currently under management by AAI and RiverFront and their affiliated entities. The Trustees also reviewed the research and decision-making processes utilized by AAI and RiverFront, including the methods adopted to seek to achieve compliance with the investment objectives, policies, and restrictions of the RiverFront Fund.
The Trustees considered the background and experience of AAI’s and RiverFront’s management in connection with the RiverFront Fund, including reviewing the qualifications, backgrounds, and responsibilities of the management team primarily responsible for the day-to-day portfolio management of the RiverFront Fund and the extent of the resources devoted to research and analysis of actual and potential investments.
The Trustees also reviewed, among other things, AAI’s and RiverFront’s Codes of Ethics.
Performance: The Trustees reviewed performance information for the RiverFront Fund, which included a comparison of the RiverFront Fund’s performance to the performance of a group of comparable funds selected by the Data Provider for the one-year, three- year, five-year, ten-year, and since inception periods ended March 31, 2024, as applicable. The Trustees noted that for the one-year and three-year periods, each of the RiverFront Fund’s classes outperformed the Data Provider peer group median; for the five-year period, each of the RiverFront Fund’s classes
Statement Regarding Basis
for Approval of Investment Advisory Contract
October 31, 2024 (Unaudited)
underperformed the Data Provider peer group median; for the ten-year period, Class C outperformed the Data Provider peer group median, Class I had performance equal to the Data Provider peer group median, and Investor Class underperformed the Data Provider peer group median; and for the since inception period, each of the RiverFront Fund’s classes underperformed the Data Provider peer group median, except for Class I, which outperformed the Data Provider peer group median. The Trustees also considered RiverFront’s investment performance and reputation generally and its investment techniques, risk management controls, and decision-making processes.
Comparable Accounts: The Trustees noted certain information provided by RiverFront and AAI regarding fees charged to their other clients utilizing a strategy similar to that employed by the RiverFront Fund.
Profitability: The Trustees received and considered the profitability analyses prepared by AAI and RiverFront based on the fees payable under the Investment Advisory Agreement with AAI and the Investment Sub-Advisory Agreement with RiverFront with respect to the RiverFront Fund, respectively. The Trustees considered the profits, if any, realized by AAI and RiverFront in connection with the operation of the RiverFront Fund.
Economies of Scale: The Trustees considered whether economies of scale in the provision of services to the RiverFront Fund will be passed along to the shareholders under the Advisory Agreements.
Other Benefits to the Adviser and Sub-Adviser: The Trustees reviewed and considered any other incidental benefits derived or to be derived by AAI and RiverFront from their relationship with the RiverFront Fund, including whether soft dollar arrangements were used and that when the RiverFront Fund invests in RiverFront sub-advised ETFs, RiverFront will benefit from growth in assets of the RiverFront sub-advised ETFs, and AAI will benefit from growth in assets of the RiverFront sub-advised ETFs for which AAI serves as the investment adviser.
The Trustees, including all of the Independent Trustees, concluded that:
| ● | there are no investment advisory or sub-advisory fees paid with respect to the RiverFront Fund; |
| ● | the total net expense ratio for each Class of the RiverFront Fund was lower than the Data Provider peer group median ratio; |
| ● | the nature, extent, and quality of services rendered by AAI and RiverFront under the Investment Advisory and Sub-Advisory Agreements, respectively, with respect to the RiverFront Fund were adequate; |
| ● | for the one-year and three-year periods, each of the RiverFront Fund’s classes outperformed the Data Provider peer group median; for the five-year period, each of the RiverFront Fund’s classes underperformed the Data Provider peer group median; for the ten-year period, Class C outperformed the Data Provider peer group median, Class I had performance equal to the Data Provider peer group median, and Investor Class underperformed the Data Provider peer group median; and for the since inception period, each of the RiverFront Fund’s classes underperformed the Data Provider peer group median, except for Class I, which outperformed the Data Provider peer group median; |
| ● | bearing in mind the limitations of comparing different types of managed accounts and the different levels of service typically associated with such accounts, the fee structures applicable to AAI’s and RiverFront’s other clients employing a comparable strategy to one or more of the RiverFront Fund were not indicative of any unreasonableness with respect to the advisory and sub-advisory fees payable by the RiverFront Fund; |
| ● | the profit, if any, realized by AAI and RiverFront in connection with the operation of the RiverFront Fund, as applicable, is not unreasonable to the RiverFront Fund; |
| ● | at this time, there were no material economies of scale accruing to AAI or RiverFront in connection with their relationship with the RiverFront Fund; and |
| ● | at this time, there were no other incidental benefits accruing to AAI or RiverFront in connection with their relationships with the RiverFront Fund, except that when the RiverFront Fund invests in RiverFront sub-advised ETFs, RiverFront will benefit from growth in assets of the RiverFront sub-advised ETFs, and AAI will benefit from growth in assets of the RiverFront sub-advised ETFs for which AAI serves as the investment adviser. |
Based on the Trustees’ deliberations and their evaluation of the information described above, the Trustees, including all of the Independent Trustees, concluded that AAI’s and RiverFront’s compensation for investment advisory and sub-advisory services is consistent with the best interests of the RiverFront Fund and its shareholders.

Table of Contents
Financial Statements and Financial Highlights for Open-End Management Investment Companies
| Statements of Investments | 1 |
| Statements of Assets and Liabilities | 48 |
| Statements of Operations | 50 |
| Statements of Changes in Net Assets | 51 |
| Financial Highlights | 54 |
| Notes to Financial Statements and Financial Highlights | 66 |
| Report of Independent Registered Public Accounting Firm | 75 |
| Additional Information | 76 |
| Changes in and Disagreements with Accountants for Open-End Management Investment Companies | 77 |
| Proxy Disclosures for Open-End Management Investment Companies | 78 |
| Remuneration Paid to Directors, Officers, and Others of Open-End Management Investment Companies | 79 |
| Statement Regarding Basis for Approval of Investment Advisory Contract | 80 |
alpsfunds.com
ALPS | Smith Short Duration Bond Fund
| Statement of Investments | October 31, 2024 |
| | | Principal
Amount | | Value
(Note 2) |
| BANK LOANS (0.26%) | | | | | | | | |
| Pipeline (0.26%) | | | | | | | | |
| Buckeye Partners LP | | | | | | | | |
| 1M US SOFR + 2.00%, 11/22/2030(a) | | $ | 1,492,509 | | | $ | 1,491,241 | |
| | | | | | | | | |
| TOTAL BANK LOANS | | | | | | | | |
| (Cost $1,492,509) | | | | | | | 1,491,241 | |
| | | Principal
Amount | | Value
(Note 2) |
| COLLATERALIZED MORTGAGE OBLIGATIONS (0.04%) |
| | | | | |
| Fannie Mae | | | | | | | | |
| Series 1997-12, Class FA, 30D US SOFR + 1.11%, 04/18/2027(a) | | $ | 6,055 | | | $ | 6,077 | |
| Series 1997-49, Class F, 30D US SOFR + 0.61%, 06/17/2027(a) | | | 7,791 | | | | 7,785 | |
| Series 2004-95, Class AK, 5.500%, 01/25/2025 | | | 6 | | | | 6 | |
| Series 2005-121, Class DY, 5.500%, 01/25/2026 | | | 270 | | | | 269 | |
| Series 2011-40, Class KA, 3.500%, 03/25/2026 | | | 18,026 | | | | 17,838 | |
| Series 2011-44, Class EB, 3.000%, 05/25/2026 | | | 4,251 | | | | 4,201 | |
| Series 2011-61, Class B, 3.000%, 07/25/2026 | | | 8,271 | | | | 8,166 | |
| Series 2011-80, Class KB, 3.500%, 08/25/2026 | | | 5,891 | | | | 5,831 | |
| Series 2012-47, Class HA, 1.500%, 05/25/2027 | | | 12,173 | | | | 11,843 | |
| Series 2013-5, Class DB, 2.000%, 02/25/2028 | | | 35,652 | | | | 34,545 | |
| Series 2015-96, Class EA, 3.000%, 12/25/2026 | | | 94,218 | | | | 92,278 | |
| | | | | | | | 188,839 | |
| Freddie Mac | | | | | | | | |
| Series 1996-1810, Class D, 6.000%, 02/15/2026 | | | 4,182 | | | | 4,155 | |
| Series 1996-1885, Class FA, 30D US SOFR + 0.56%, 09/15/2026(a) | | | 1,397 | | | | 1,396 | |
| Series 2001-2332, Class FB, 30D US SOFR + 0.56%, 01/15/2028(a) | | | 30,682 | | | | 30,640 | |
| Series 2005-3005, Class ED, 5.000%, 07/15/2025 | | | 3,661 | | | | 3,650 | |
| Series 2006-3104, Class DH, 5.000%, 01/15/2026 | | | 3,782 | | | | 3,770 | |
| Series 2010-3661, Class B, 4.000%, 04/15/2025 | | | 328 | | | | 327 | |
| | | Principal
Amount | | Value
(Note 2) |
| Series 2010-3710, Class MG, 4.000%, 08/15/2025(b) | | $ | 4,889 | | | $ | 4,867 | |
| Series 2011-3829, Class BE, 3.500%, 03/15/2026 | | | 2,929 | | | | 2,902 | |
| Series 2013-4177, Class NB, 1.500%, 03/15/2028 | | | 8,427 | | | | 8,086 | |
| | | | | | | | 59,793 | |
| Ginnie Mae | | | | | | | | |
| Series 2010-101, Class GU, 4.000%, 08/20/2025(b) | | | 1,653 | | | | 1,643 | |
| Series 2013-53, Class KN, 1.500%, 08/20/2025 | | | 1,227 | | | | 1,214 | |
| | | | | | | | 2,857 | |
| TOTAL COLLATERALIZED MORTGAGE OBLIGATIONS | | | | | | | | |
| (Cost $257,482) | | | | | | | 251,489 | |
| | | Principal
Amount | | Value
(Note 2) |
| COMMERCIAL MORTGAGE-BACKED SECURITIES (0.05%) |
| | | | | |
| Freddie Mac Multifamily Structured Pass Through Certificates | | | | | | | | |
| Series 2015-KF07, Class A, 30D US SOFR + 0.40%, 02/25/2025(a) | | | 8,618 | | | | 8,616 | |
| Series 2015-KPLB, Class A, 2.770%, 05/25/2025 | | | 195,000 | | | | 192,484 | |
| Series 2017-KL1P, Class A1P, 2.544%, 10/25/2025 | | | 63,343 | | | | 62,531 | |
| | | | | | | | 263,631 | |
| TOTAL COMMERCIAL MORTGAGE-BACKED SECURITIES | | | | | | | | |
| (Cost $263,194) | | | | | | | 263,631 | |
| | | Principal
Amount | | Value
(Note 2) |
| MORTGAGE-BACKED SECURITIES (1.08%) | | | | |
| | | | | |
| Fannie Mae Pool | | | | |
| Series 2011-, | | | | | | | | |
| 3.500%, 12/01/2026 | | | 83,149 | | | | 82,116 | |
| 5.270%, 07/01/2028 | | | 475,974 | | | | 474,641 | |
| Series 2011-MA0717, 3.500%, 04/01/2026 | | | 73,591 | | | | 72,780 | |
| Series 2014-AM7158, 3.150%, 11/01/2024 | | | 175,000 | | | | 174,420 | |
| Series 2015-, 2.680%, 05/01/2025 | | | 122,168 | | | | 120,592 | |
| Series 2015-AM9288, 2.930%, 07/01/2025 | | | 3,613,048 | | | | 3,563,051 | |
| Series 2016-AL9448, 2.935%, 07/01/2026 | | | 178,060 | | | | 173,475 | |
See Notes to Financial Statements and Financial Highlights.
ALPS | Smith Short Duration Bond Fund
| Statement of Investments | October 31, 2024 |
| | | Principal
Amount | | Value
(Note 2) |
| Series 2016-AN2079, 2.910%, 07/01/2026 | | $ | 33,815 | | | $ | 32,786 | |
| Series 2017-, 3.030%, 07/01/2029 | | | 118,939 | | | | 111,291 | |
| Series 2021-, 1.580%, 12/01/2028 | | | 110,000 | | | | 97,973 | |
| Series 2023-, 4.550%, 03/01/2028 | | | 200,000 | | | | 197,808 | |
| 4.900%, 03/01/2028 | | | 750,000 | | | | 751,242 | |
| | | | | | | | 5,852,175 | |
| Freddie Mac Gold Pool | | | | | | | | |
| Series 2011-, | | | | | | | | |
| 3.500%, 02/01/2026 | | | 86,316 | | | | 85,379 | |
| Series 2012-T40090, | | | | | | | | |
| 3.000%, 05/01/2027 | | | 29,848 | | | | 29,293 | |
| | | | | | | | 114,672 | |
| Freddie Mac Pool | | | | | | | | |
| Series 2018-, | | | | | | | | |
| 3.500%, 04/01/2028 | | | 78,997 | | | | 77,655 | |
| Series 2023-, | | | | | | | | |
| 4.170%, 04/01/2028 | | | 113,000 | | | | 110,539 | |
| | | | | | | | 188,194 | |
| Ginnie Mae I Pool | | | | | | | | |
| Series 2010-745222, | | | | | | | | |
| 4.500%, 07/15/2025 | | | 14,534 | | | | 14,488 | |
| Series 2013-AF1057, | | | | | | | | |
| 2.000%, 07/15/2028 | | | 46,087 | | | | 44,393 | |
| | | | | | | | 58,881 | |
| Ginnie Mae II Pool | | | | | | | | |
| Series 2010-4898, | | | | | | | | |
| 3.000%, 12/20/2025 | | | 13,374 | | | | 13,221 | |
| Series 2011-4954, | | | | | | | | |
| 3.000%, 02/20/2026 | | | 9,753 | | | | 9,635 | |
| | | | | | | | 22,856 | |
| TOTAL MORTGAGE-BACKED SECURITIES | | | | | | | | |
| (Cost $6,269,956) | | | | | | | 6,236,778 | |
| | | Principal
Amount | | Value
(Note 2) |
| CORPORATE BONDS (68.04%) | | | | |
| | | | | |
| Aerospace & Defense (3.13%) | | | | |
| BAE Systems PLC | | | | |
| 5.00%, 03/26/2027(c) | | | 4,500,000 | | | | 4,530,245 | |
| Boeing Co. | | | | | | | | |
| 2.20%, 02/04/2026 | | | 5,000,000 | | | | 4,816,778 | |
| L3Harris Technologies, Inc. | | | | | | | | |
| 5.40%, 01/15/2027 | | | 6,500,000 | | | | 6,606,659 | |
| RTX Corp. | | | | | | | | |
| 5.75%, 11/08/2026 | | | 2,000,000 | | | | 2,043,169 | |
| Total Aerospace & Defense | | | | | | | 17,996,851 | |
| Airlines (0.51%) | | | | | | | | |
| AS Mileage Plan IP, Ltd. | | | | | | | | |
| 5.02%, 10/20/2029(c) | | | 3,000,000 | | | | 2,915,071 | |
| | | Principal
Amount | | Value
(Note 2) |
| Automobiles Manufacturing (4.88%) | | | | |
| Ford Motor Credit Co. LLC | | | | | | | | |
| 3.38%, 11/13/2025 | | $ | 6,465,000 | | | $ | 6,342,764 | |
| 6.95%, 03/06/2026 | | | 3,750,000 | | | | 3,824,949 | |
| General Motors Financial Co., Inc. | | | | | | | | |
| 5.40%, 05/08/2027 | | | 1,500,000 | | | | 1,516,894 | |
| 6.05%, 10/10/2025 | | | 7,000,000 | | | | 7,072,603 | |
| SOFRINDX + 1.30%, 04/07/2025(a)(d) | | | 2,000,000 | | | | 2,007,654 | |
| Hyundai Capital America | | | | | | | | |
| 5.45%, 06/24/2026(c) | | | 3,000,000 | | | | 3,028,041 | |
| Volkswagen Group of America Finance LLC | | | | | | | | |
| 5.40%, 03/20/2026(c) | | | 4,400,000 | | | | 4,417,588 | |
| Total Automobiles Manufacturing | | | | | | | 28,210,493 | |
| Banks (9.05%) | | | | | | | | |
| Associated Bank NA/Green Bay WI | | | | | | | | |
| 4.25%, 01/15/2025 | | | 4,330,000 | | | | 4,314,686 | |
| Bank of Ireland Group PLC | | | | | | | | |
| 1Y US TI + 2.65%, 09/16/2026(a)(c) | | | 4,000,000 | | | | 4,036,263 | |
| Bank of New York Mellon | | | | | | | | |
| 1D US SOFR + 0.80%, 11/21/2025(a) | | | 5,000,000 | | | | 4,999,089 | |
| Danske Bank A/S | | | | | | | | |
| 1Y US TI + 2.10%, 01/09/2026(a)(c) | | | 8,535,000 | | | | 8,550,368 | |
| Discover Bank | | | | | | | | |
| 5Y US TI + 1.73%, 08/09/2028(a) | | | 2,711,000 | | | | 2,768,668 | |
| Goldman Sachs Bank USA | | | | | | | | |
| 1D US SOFR + 0.777%, 03/18/2027(a) | | | 6,000,000 | | | | 6,039,945 | |
| KeyCorp | | | | | | | | |
| SOFRINDX + 1.25%, 05/23/2025(a)(d) | | | 1,000,000 | | | | 1,003,041 | |
| Morgan Stanley Bank NA | | | | | | | | |
| 1D US SOFR + 1.08%, 01/14/2028(a) | | | 3,500,000 | | | | 3,514,985 | |
| Synovus Financial Corp. | | | | | | | | |
| 5.20%, 08/11/2025 | | | 3,450,000 | | | | 3,449,243 | |
| Truist Bank | | | | | | | | |
| 3.30%, 05/15/2026 | | | 3,500,000 | | | | 3,419,121 | |
| Wells Fargo & Co. | | | | | | | | |
| 1D US SOFR + 1.07%, 04/22/2028(a) | | | 5,000,000 | | | | 5,097,874 | |
| Wells Fargo Bank NA | | | | | | | | |
| 4.81%, 01/15/2026 | | | 5,000,000 | | | | 5,014,074 | |
| Total Banks | | | | | | | 52,207,357 | |
| Biotechnology (1.10%) | | | | | | | | |
| Amgen, Inc. | | | | | | | | |
| 5.15%, 03/02/2028 | | | 3,300,000 | | | | 3,345,872 | |
| 5.51%, 03/02/2026 | | | 3,000,000 | | | | 3,000,720 | |
| Total Biotechnology | | | | | | | 6,346,592 | |
| Cable & Satellite (0.68%) | | | | | | | | |
| CCO Holdings LLC / CCO Holdings Capital Corp. | | | | | | | | |
| 5.50%, 05/01/2026(c) | | | 2,900,000 | | | | 2,892,568 | |
See Notes to Financial Statements and Financial Highlights.
ALPS | Smith Short Duration Bond Fund
| Statement of Investments | October 31, 2024 |
| | | Principal
Amount | | Value
(Note 2) |
| Cox Communications, Inc. | | | | | | | | |
| 5.45%, 09/15/2028(c) | | $ | 1,000,000 | | | $ | 1,017,506 | |
| Total Cable & Satellite | | | | | | | 3,910,074 | |
| Casinos & Gaming (0.53%) | | | | | | | | |
| Las Vegas Sands Corp. | | | | | | | | |
| 5.90%, 06/01/2027 | | | 3,000,000 | | | | 3,048,344 | |
| Chemicals (0.78%) | | | | | | | | |
| LG Chem, Ltd. | | | | | | | | |
| 4.38%, 07/14/2025(c) | | | 1,500,000 | | | | 1,491,394 | |
| Sherwin-Williams Co. | | | | | | | | |
| 4.25%, 08/08/2025 | | | 3,000,000 | | | | 2,990,678 | |
| Total Chemicals | | | | | | | 4,482,072 | |
| Commercial Finance (1.12%) | | | | | | | | |
| AerCap Ireland Capital DAC / AerCap Global Aviation Trust | | | | | | | | |
| 6.50%, 07/15/2025 | | | 3,400,000 | | | | 3,430,794 | |
| Penske Truck Leasing Co. Lp / PTL Finance Corp. | | | | | | | | |
| 5.75%, 05/24/2026(c) | | | 3,000,000 | | | | 3,035,156 | |
| Total Commercial Finance | | | | | | | 6,465,950 | |
| Consumer Finance (2.45%) | | | | | | | | |
| American Express Co. | | | | | | | | |
| 2.25%, 03/04/2025 | | | 3,000,000 | | | | 2,973,572 | |
| 1D US SOFR + 0.93%, 07/26/2028(a) | | | 3,000,000 | | | | 3,021,067 | |
| SOFRINDX + 0.75%, 04/23/2027(a)(d) | | | 5,000,000 | | | | 5,063,790 | |
| SOFRINDX + 1.28%, 07/27/2029(a)(d) | | | 3,000,000 | | | | 3,049,303 | |
| Total Consumer Finance | | | | | | | 14,107,732 | |
| Consumer Products (0.69%) | | | | | | | | |
| Haleon UK Capital PLC | | | | | | | | |
| 3.13%, 03/24/2025 | | | 4,000,000 | | | | 3,973,009 | |
| Containers & Packaging (0.85%) | | | | | | | | |
| Sonoco Products Co. | | | | | | | | |
| 4.45%, 09/01/2026 | | | 3,000,000 | | | | 2,981,154 | |
| 4.60%, 09/01/2029 | | | 2,000,000 | | | | 1,951,539 | |
| Total Containers & Packaging | | | | | | | 4,932,693 | |
| Diversified Banks (2.41%) | | | | | | | | |
| Bank of America Corp. | | | | | | | | |
| 1D US SOFR + 1.29%, 01/20/2027(a) | | | 4,000,000 | | | | 4,011,028 | |
| JPMorgan Chase & Co. | | | | | | | | |
| 1D US SOFR + 1.07%, 12/15/2025(a) | | | 3,875,000 | | | | 3,876,207 | |
| 1D US SOFR + 1.19%, 01/23/2028(a) | | | 3,000,000 | | | | 3,016,482 | |
| Toronto-Dominion Bank | | | | | | | | |
| Series GMTN | | | | | | | | |
| 4.98%, 04/05/2027 | | | 3,000,000 | | | | 3,023,110 | |
| Total Diversified Banks | | | | | | | 13,926,827 | |
| | | Principal
Amount | | Value
(Note 2) |
| Electrical Equipment Manufacturing (0.55%) | | |
| Vontier Corp. | | | | |
| 1.80%, 04/01/2026 | | $ | 3,350,000 | | | $ | 3,200,520 | |
| | | | | | | | | |
| Entertainment Content (1.36%) | | | | | | | | |
| Paramount Global | | | | | | | | |
| 3.70%, 06/01/2028 | | | 1,500,000 | | | | 1,403,449 | |
| Warnermedia Holdings, Inc. | | | | | | | | |
| 6.41%, 03/15/2026 | | | 6,500,000 | | | | 6,500,286 | |
| Total Entertainment Content | | | | | | | 7,903,735 | |
| Exploration & Production (3.73%) | | | | | | | | |
| Diamondback Energy, Inc. | | | | | | | | |
| 5.20%, 04/18/2027 | | | 1,000,000 | | | | 1,010,411 | |
| Occidental Petroleum Corp. | | | | | | | | |
| 5.00%, 08/01/2027 | | | 7,000,000 | | | | 6,996,354 | |
| 5.20%, 08/01/2029 | | | 4,000,000 | | | | 3,993,053 | |
| Permian Resources Operating LLC | | | | | | | | |
| 5.38%, 01/15/2026(c) | | | 5,081,000 | | | | 5,060,308 | |
| Range Resources Corp. | | | | | | | | |
| 4.88%, 05/15/2025 | | | 4,483,000 | | | | 4,471,400 | |
| Total Exploration & Production | | | | | | | 21,531,526 | |
| Financial Services (9.74%) | | | | | | | | |
| Charles Schwab Corp. | | | | | | | | |
| 5.88%, 08/24/2026 | | | 5,000,000 | | | | 5,105,478 | |
| SOFRINDX + 1.05%, 03/03/2027(a)(d) | | | 2,471,000 | | | | 2,492,185 | |
| Goldman Sachs Group, Inc. | | | | | | | | |
| 1D US SOFR + 1.075%, 08/10/2026(a) | | | 7,000,000 | | | | 7,044,719 | |
| LPL Holdings, Inc. | | | | | | | | |
| 5.70%, 05/20/2027 | | | 2,900,000 | | | | 2,944,972 | |
| Lseg US Fin Corp. | | | | | | | | |
| 4.88%, 03/28/2027(c) | | | 2,500,000 | | | | 2,509,730 | |
| Morgan Stanley | | | | | | | | |
| 1D US SOFR + 1.295%, 01/28/2027(a) | | | 2,000,000 | | | | 2,006,041 | |
| 1D US SOFR + 1.59%, 04/20/2029(a) | | | 3,000,000 | | | | 3,026,245 | |
| Nasdaq, Inc. | | | | | | | | |
| 5.65%, 06/28/2025 | | | 500,000 | | | | 502,306 | |
| National Securities Clearing Corp. | | | | | | | | |
| 4.90%, 06/26/2029(c) | | | 5,000,000 | | | | 5,055,835 | |
| 5.05%, 11/21/2024(c) | | | 7,000,000 | | | | 7,000,619 | |
| 5.15%, 06/26/2026(c) | | | 5,000,000 | | | | 5,047,966 | |
| State Street Corp. | | | | | | | | |
| 1D US SOFR + 1.353%, 11/04/2026(a) | | | 3,250,000 | | | | 3,282,194 | |
| UBS Group AG | | | | | | | | |
| 1Y US TI + 1.60%, 12/22/2027(a)(c) | | | 7,000,000 | | | | 7,205,899 | |
| USAA Capital Corp. | | | | | | | | |
| 3.38%, 05/01/2025(c) | | | 3,000,000 | | | | 2,983,688 | |
| Total Financial Services | | | | | | | 56,207,877 | |
See Notes to Financial Statements and Financial Highlights.
ALPS | Smith Short Duration Bond Fund
| Statement of Investments | October 31, 2024 |
| | | Principal
Amount | | Value
(Note 2) |
| Food & Beverage (1.22%) | | | | | | | | |
| Campbell Soup Co. | | | | | | | | |
| 5.20%, 03/19/2027 | | $ | 3,000,000 | | | $ | 3,044,819 | |
| 5.30%, 03/20/2026 | | | 1,000,000 | | | | 1,008,174 | |
| Mondelez International Holdings Netherlands BV | | | | | | | | |
| 4.25%, 09/15/2025(c) | | | 3,000,000 | | | | 2,988,701 | |
| Total Food & Beverage | | | | | | | 7,041,694 | |
| Hardware (0.35%) | | | | | | | | |
| Hewlett Packard Enterprise Co. | | | | | | | | |
| 4.45%, 09/25/2026 | | | 2,000,000 | | | | 1,991,557 | |
| | | | | | | | | |
| Health Care Facilities & Services (1.34%) | | | | | | | | |
| HCA, Inc. | | | | | | | | |
| 5.20%, 06/01/2028 | | | 2,000,000 | | | | 2,018,844 | |
| 5.38%, 02/01/2025 | | | 5,700,000 | | | | 5,700,717 | |
| Total Health Care Facilities & Services | | | | | | | 7,719,561 | |
| | | | | | | | | |
| Industrial Other (1.57%) | | | | | | | | |
| Element Fleet Management Corp. | | | | | | | | |
| 6.27%, 06/26/2026(c) | | | 4,000,000 | | | | 4,080,361 | |
| Quanta Services, Inc. | | | | | | | | |
| 4.75%, 08/09/2027 | | | 5,000,000 | | | | 4,993,065 | |
| Total Industrial Other | | | | | | | 9,073,426 | |
| Medical Equipment & Devices Manufacturing (4.82%) | | | | | | | | |
| Alcon Finance Corp. | | | | | | | | |
| 2.75%, 09/23/2026(c) | | | 6,150,000 | | | | 5,924,024 | |
| GE HealthCare Technologies, Inc. | | | | | | | | |
| 4.80%, 08/14/2029 | | | 5,800,000 | | | | 5,791,882 | |
| 5.55%, 11/15/2024 | | | 2,000,000 | | | | 2,000,291 | |
| 5.60%, 11/15/2025 | | | 3,000,000 | | | | 3,025,268 | |
| Illumina, Inc. | | | | | | | | |
| 4.65%, 09/09/2026 | | | 2,000,000 | | | | 1,995,858 | |
| Solventum Corp. | | | | | | | | |
| 5.40%, 03/01/2029(c) | | | 2,000,000 | | | | 2,026,352 | |
| 5.45%, 02/25/2027(c) | | | 5,000,000 | | | | 5,066,694 | |
| Zimmer Biomet Holdings, Inc. | | | | | | | | |
| 1.45%, 11/22/2024 | | | 2,000,000 | | | | 1,995,517 | |
| Total Medical Equipment & Devices Manufacturing | | | | | | | 27,825,886 | |
| Metals & Mining (1.14%) | | | | | | | | |
| Steel Dynamics, Inc. | | | | | | | | |
| 5.00%, 12/15/2026 | | | 6,592,000 | | | | 6,584,868 | |
| | | | | | | | | |
| Pharmaceuticals (0.52%) | | | | | | | | |
| Bristol-Myers Squibb Co. | | | | | | | | |
| 4.95%, 02/20/2026 | | | 3,000,000 | | | | 3,020,035 | |
| | | | | | | | | |
| Pipeline (2.96%) | | | | | | | | |
| Buckeye Partners LP | | | | | | | | |
| 4.13%, 03/01/2025(c) | | | 604,000 | | | | 600,177 | |
| Columbia Pipelines Holding Co. LLC | | | | | | | | |
| 6.04%, 08/15/2028(c) | | | 1,000,000 | | | | 1,029,810 | |
| 6.06%, 08/15/2026(c) | | | 1,500,000 | | | | 1,524,838 | |
| | | Principal
Amount | | Value
(Note 2) |
| EnLink Midstream LLC | | | | | | | | |
| 5.63%, 01/15/2028(c) | | $ | 660,000 | | | $ | 668,521 | |
| Gray Oak Pipeline LLC | | | | | | | | |
| 2.60%, 10/15/2025(c) | | | 7,604,000 | | | | 7,425,671 | |
| Targa Resources Partners LP / Targa Resources Partners Finance Corp. | | | | | | | | |
| 6.50%, 07/15/2027 | | | 5,786,000 | | | | 5,838,728 | |
| Total Pipeline | | | | | | | 17,087,745 | |
| | | | | | | | | |
| Power Generation (0.66%) | | | | | | | | |
| Vistra Operations Co. LLC | | | | | | | | |
| 5.13%, 05/13/2025(c) | | | 3,787,000 | | | | 3,786,617 | |
| | | | | | | | | |
| Property & Casualty Insurance (0.87%) | | | | | | | | |
| Chubb INA Holdings LLC | | | | | | | | |
| 4.65%, 08/15/2029 | | | 5,000,000 | | | | 5,007,297 | |
| | | | | | | | | |
| Real Estate (1.04%) | | | | | | | | |
| VICI Properties LP | | | | | | | | |
| 4.38%, 05/15/2025 | | | 6,000,000 | | | | 5,975,312 | |
| | | | | | | | | |
| Refining & Marketing (0.18%) | | | | | | | | |
| HF Sinclair Corp. | | | | | | | | |
| 6.38%, 04/15/2027 | | | 1,000,000 | | | | 1,012,868 | |
| | | | | | | | | |
| Retail - Consumer Discretionary (0.35%) | | | | | | | | |
| Home Depot, Inc. | | | | | | | | |
| 5.15%, 06/25/2026 | | | 2,000,000 | | | | 2,025,606 | |
| | | | | | | | | |
| Semiconductors (0.70%) | | | | | | | | |
| Broadcom, Inc. | | | | | | | | |
| 5.05%, 07/12/2027 | | | 4,000,000 | | | | 4,040,818 | |
| | | | | | | | | |
| Software & Services (0.26%) | | | | | | | | |
| VMware LLC | | | | | | | | |
| 4.65%, 05/15/2027 | | | 1,500,000 | | | | 1,498,317 | |
| | | | | | | | | |
| Supermarkets & Pharmacies (1.99%) | | | | | | | | |
| Albertsons Cos. Inc / Safeway, Inc. / New Albertsons LP / Albertsons LLC | | | | | | | | |
| 6.50%, 02/15/2028(c) | | | 5,330,000 | | | | 5,459,237 | |
| Kroger Co. | | | | | | | | |
| 4.70%, 08/15/2026 | | | 6,000,000 | | | | 6,020,996 | |
| Total Supermarkets & Pharmacies | | | | | | | 11,480,233 | |
| Transportation & Logistics (0.35%) | | | | | | | | |
| Daimler Truck Finance North America LLC | | | | | | | | |
| 5.60%, 08/08/2025(c) | | | 2,000,000 | | | | 2,013,434 | |
| | | | | | | | | |
| Utilities (2.78%) | | | | | | | | |
| American Electric Power Co., Inc. | | | | | | | | |
| 5.70%, 08/15/2025 | | | 3,000,000 | | | | 3,016,825 | |
See Notes to Financial Statements and Financial Highlights.
ALPS | Smith Short Duration Bond Fund
| Statement of Investments | October 31, 2024 |
| | | Principal
Amount | | Value
(Note 2) |
| DTE Energy Co. | | | | | | | | |
| 4.95%, 07/01/2027 | | $ | 2,000,000 | | | $ | 2,011,475 | |
| Duke Energy Corp. | | | | | | | | |
| 5.00%, 12/08/2025 | | | 6,000,000 | | | | 6,016,113 | |
| NextEra Energy Capital Holdings, Inc. | | | | | | | | |
| 6.05%, 03/01/2025 | | | 3,000,000 | | | | 3,010,061 | |
| Sempra | | | | | | | | |
| 5.40%, 08/01/2026 | | | 2,000,000 | | | | 2,021,279 | |
| Total Utilities | | | | | | | 16,075,753 | |
| | | | | | | | | |
| Waste & Environment Services & Equipment (0.51%) | | | | | | | | |
| GFL Environmental, Inc. | | | | | | | | |
| 5.13%, 12/15/2026(c) | | | 2,971,000 | | | | 2,943,987 | |
| | | | | | | | | |
| Wireless Telecommunications Services (0.87%) | | | | | | | | |
| T-Mobile USA, Inc. | | | | | | | | |
| 4.80%, 07/15/2028 | | | 5,000,000 | | | | 5,004,242 | |
| | | | | | | | | |
| TOTAL CORPORATE BONDS | | | | | | | | |
| (Cost $390,799,504) | | | | | | | 392,575,979 | |
| | | Principal
Amount | | Value
(Note 2) |
| GOVERNMENT BONDS (29.13%) | | | | |
| | | | | |
| U.S. Treasury Bonds (29.13%) | | | | |
| United States Treasury Notes | | | | |
| 3.50%, 09/30/2026 | | | 26,563,000 | | | | 26,241,339 | |
| 3.50%, 09/30/2029 | | | 18,043,000 | | | | 17,525,673 | |
| 3.75%, 08/31/2026 | | | 23,773,000 | | | | 23,594,703 | |
| 4.25%, 03/15/2027 | | | 23,494,000 | | | | 23,558,700 | |
| 4.38%, 07/31/2026 | | | 24,898,000 | | | | 24,973,861 | |
| 4.50%, 04/15/2027 | | | 22,386,000 | | | | 22,576,194 | |
| 4.50%, 05/15/2027 | | | 19,696,000 | | | | 19,867,186 | |
| 4.88%, 05/31/2026 | | | 9,632,000 | | | | 9,727,756 | |
| Total U.S. Treasury Bonds | | | | | | | 168,065,412 | |
| | | | | | | | | |
| TOTAL GOVERNMENT BONDS | | | | | | | | |
| (Cost $167,894,532) | | | | | | | 168,065,412 | |
| | | 7-Day Yield | | Shares | | Value (Note 2) |
| SHORT TERM INVESTMENTS (0.26%) | | | | | | |
| | | | | | | |
| Money Market Fund (0.26%) | | | | | | | | | | | | |
| Morgan Stanley Institutional Liquidity Funds - Government Portfolio | | | 4.78 | % | | | 1,527,965 | | | | 1,527,965 | |
| | | | | | | | | | | | | |
| TOTAL SHORT TERM INVESTMENTS | | | | | | | | | | | | |
| (Cost $1,527,965) | | | | | | | | | | | 1,527,965 | |
| | | Value
(Note 2) |
| TOTAL INVESTMENTS (98.86%) | | |
| (Cost $568,505,142) | | $ | 570,412,495 | |
| | | | | |
| Other Assets In Excess Of Liabilities (1.14%) | | | 6,604,533 | |
| | | | | |
| NET ASSETS (100.00%) | | $ | 577,017,028 | |
Investment Abbreviations:
SOFR - Secured Overnight Financing Rate
SOFRINDX - Secured Overnight Financing Rate Index
TI - Treasury Index
Reference Rates:
1M US SOFR- 1 Month SOFR as of October 31, 2024 was 4.66% 30D US SOFR - 30 Day SOFR as of October 31, 2024 was 4.66% 1D US SOFR - 1 Day SOFR as of October 31, 2024 was 4.90% 1Y US TI - 1 Year US TI as of October 31, 2024 was 4.27%
| (a) | Floating or variable rate security. The reference rate is described above. The rate in effect as of October 31, 2024 is based on the reference rate plus the displayed spread as of the security's last reset date. |
| (b) | Step bond. Coupon changes periodically based upon a predetermined schedule. Interest rate disclosed is that which is in effect as of October 31, 2024. |
| (c) | Security exempt from registration under Rule 144A of the Securities Act of 1933. These securities may be resold in transactions exempt from registration, normally to qualified institutional buyers. As of October 31, 2024, the aggregate market value of those securities was $116,316,669, representing 20.16% of net assets. |
| (d) | The SOFRINDX is a compounded average of the daily Secured Overnight Financing Rate determined by reference to the SOFR Index for any interest period. |
See Notes to Financial Statements and Financial Highlights.
ALPS | Smith Total Return Bond Fund
| Statement of Investments | October 31, 2024 |
| | | Principal Amount | | Value (Note 2) |
| BANK LOANS (2.08%) | | | | |
| | | | | |
| Aerospace & Defense (0.51%) | | | | |
| TransDigm, Inc. | | | | | | | | |
| 3M US SOFR + 3.25%, 02/28/2031(a) | | $ | 16,080,276 | | | $ | 16,113,563 | |
| | | | | | | | | |
| Casinos & Gaming (0.22%) | | | | | | | | |
| Caesars Entertainment, Inc. | | | | | | | | |
| 1M US SOFR + 2.75%, 02/06/2031(a) | | | 7,412,750 | | | | 7,428,391 | |
| | | | | | | | | |
| Consumer Finance (0.47%) | | | | | | | | |
| Boost Newco Borrower LLC | | | | | | | | |
| 3M US SOFR + 2.50%, 01/31/2031(a) | | | 15,240,000 | | | | 15,301,950 | |
| | | | | | | | | |
| Financial Services (0.07%) | | | | | | | | |
| Jane Street Group LLC | | | | | | | | |
| 3M US SOFR + 2.50%, 01/26/2028(a) | | | 2,284,134 | | | | 2,284,329 | |
| | | | | | | | | |
| Industrials (0.15%) | | | | | | | | |
| GFL Environmental 6/24 | | | | | | | | |
| 3M US SOFR + 2.00%, 06/27/2031 | | | 4,944,000 | | | | 4,942,467 | |
| | | | | | | | | |
| Manufactured Goods (0.22%) | | | | | | | | |
| Chart Industries, Inc. | | | | | | | | |
| 3M US SOFR + 2.50%, 03/18/2030(a) | | | 7,076,211 | | | | 7,098,359 | |
| | | | | | | | | |
| Pipeline (0.28%) | | | | | | | | |
| Buckeye Partners LP | | | | | | | | |
| 1M US SOFR + 2.00%, 11/22/2030(a) | | | 9,253,423 | | | | 9,245,558 | |
| | | | | | | | | |
| Travel & Lodging (0.16%) | | | | | | | | |
| Carnival Corp. | | | | | | | | |
| 1M US SOFR + 2.75%, 08/09/2027(a) | | | 5,027,426 | | | | 5,048,642 | |
| | | | | | | | | |
| TOTAL BANK LOANS | | | | | | | | |
| (Cost $67,467,110) | | | | | | | 67,463,259 | |
| | | Principal Amount | | Value (Note 2) |
| COLLATERALIZED MORTGAGE OBLIGATIONS (8.51%) | | | | | | | | |
| | | | | | | | | |
| Fannie Mae | | | | | | | | |
| Series 1997-76, Class FO, 30D US SOFR + 0.61%, 09/17/2027(a) | | $ | 5,402 | | | $ | 5,331 | |
| Series 1999-58, Class F, 30D US SOFR + 0.51%, 11/18/2029(a) | | | 22,197 | | | | 22,120 | |
| Series 2000-40, Class FA, 30D US SOFR + 0.61%, 07/25/2030(a) | | | 8,169 | | | | 8,170 | |
| Series 2000-45, Class F, 30D US SOFR + 0.56%, 12/25/2030(a) | | | 6,325 | | | | 6,306 | |
| Series 2001-27, Class F, 30D US SOFR + 0.61%, 06/25/2031(a) | | | 4,962 | | | | 4,900 | |
| Series 2001-29, Class Z, 6.500%, 07/25/2031 | | | 39,399 | | | | 40,199 | |
| Series 2001-51, Class OD, 6.500%, 10/25/2031 | | | 321 | | | | 322 | |
| Series 2001-52, Class XZ, 6.500%, 10/25/2031 | | | 15,410 | | | | 15,898 | |
| Series 2001-59, Class F, 30D US SOFR + 0.71%, 11/25/2031(a) | | | 67,700 | | | | 67,710 | |
| Series 2001-60, Class OF, 30D US SOFR + 1.06%, 10/25/2031(a) | | | 109,373 | | | | 110,567 | |
| Series 2001-63, Class FD, 30D US SOFR + 0.71%, 12/18/2031(a) | | | 6,845 | | | | 6,861 | |
| Series 2001-63, Class TC, 6.000%, 12/25/2031 | | | 13,091 | | | | 13,446 | |
| Series 2001-68, Class PH, 6.000%, 12/25/2031 | | | 11,331 | | | | 11,644 | |
| Series 2001-71, Class FS, 30D US SOFR + 0.71%, 11/25/2031(a) | | | 39,842 | | | | 39,853 | |
| Series 2001-71, Class FE, 30D US SOFR + 0.76%, 11/25/2031(a) | | | 48,718 | | | | 48,795 | |
| Series 2001-81, Class GE, 6.000%, 01/25/2032 | | | 9,285 | | | | 9,544 | |
| Series 2002-11, Class JF, 30D US SOFR + 0.84%, 03/25/2032(a) | | | 30,461 | | | | 30,560 | |
| Series 2002-12, Class FH, 30D US SOFR + 1.16%, 01/25/2032(a) | | | 32,198 | | | | 32,484 | |
| Series 2002-13, Class FE, 30D US SOFR + 1.01%, 03/25/2032(a) | | | 26,929 | | | | 27,089 | |
| Series 2002-16, Class TM, 7.000%, 04/25/2032 | | | 7,828 | | | | 8,068 | |
See Notes to Financial Statements and Financial Highlights.
ALPS | Smith Total Return Bond Fund
| Statement of Investments | October 31, 2024 |
| | | Principal Amount | | Value (Note 2) |
| Series 2002-17, Class JF, 30D US SOFR + 1.11%, 04/25/2032(a) | | $ | 17,388 | | | $ | 17,571 | |
| Series 2002-18, Class FD, 30D US SOFR + 0.91%, 02/25/2032(a) | | | 31,926 | | | | 32,033 | |
| Series 2002-23, Class FA, 30D US SOFR + 1.01%, 04/25/2032(a) | | | 25,770 | | | | 26,016 | |
| Series 2002-34, Class EO, -%, 05/18/2032(b) | | | 16,791 | | | | 16,046 | |
| Series 2002-36, Class FS, 30D US SOFR + 0.61%, 06/25/2032(a) | | | 4,966 | | | | 4,968 | |
| Series 2002-44, Class FJ, 30D US SOFR + 1.11%, 04/25/2032(a) | | | 44,879 | | | | 44,703 | |
| Series 2002-47, Class FC, 30D US SOFR + 0.71%, 11/25/2031(a) | | | 9,285 | | | | 9,270 | |
| Series 2002-48, Class F, 30D US SOFR + 1.11%, 07/25/2032(a) | | | 27,390 | | | | 27,629 | |
| Series 2002-49, Class FC, 30D US SOFR + 1.11%, 11/18/2031(a) | | | 26,195 | | | | 26,432 | |
| Series 2002-60, Class FV, 30D US SOFR + 1.11%, 04/25/2032(a) | | | 64,543 | | | | 65,221 | |
| Series 2002-63, Class EZ, 6.000%, 10/25/2032 | | | 5,458 | | | | 5,622 | |
| Series 2002-64, Class PG, 5.500%, 10/25/2032 | | | 36,310 | | | | 37,019 | |
| Series 2002-68, Class AF, 30D US SOFR + 1.11%, 10/25/2032(a) | | | 12,067 | | | | 12,193 | |
| Series 2002-7, Class FC, 30D US SOFR + 0.86%, 01/25/2032(a) | | | 38,022 | | | | 38,172 | |
| Series 2002-71, Class AQ, 4.000%, 11/25/2032 | | | 24,725 | | | | 24,111 | |
| Series 2002-8, Class FA, 30D US SOFR + 0.86%, 03/18/2032(a) | | | 18,837 | | | | 18,945 | |
| Series 2002-80, Class CZ, 4.500%, 09/25/2032 | | | 107,450 | | | | 100,839 | |
| Series 2002-9, Class FW, 30D US SOFR + 0.66%, 03/25/2032(a) | | | 9,671 | | | | 9,548 | |
| Series 2002-91, Class F, 30D US SOFR + 0.66%, 01/25/2033(a) | | | 13,615 | | | | 13,590 | |
| Series 2003-107, Class FD, 30D US SOFR + 0.61%, 11/25/2033(a) | | | 8,968 | | | | 8,953 | |
| | | Principal Amount | | Value (Note 2) |
| Series 2003-110, Class CK, 3.000%, 11/25/2033 | | $ | 14,808 | | | $ | 14,308 | |
| Series 2003-116, Class FA, 30D US SOFR + 0.51%, 11/25/2033(a) | | | 17,751 | | | | 17,690 | |
| Series 2003-119, Class ZP, 4.000%, 12/25/2033 | | | 43,496 | | | | 41,712 | |
| Series 2003-119, Class FH, 30D US SOFR + 0.61%, 12/25/2033(a) | | | 27,325 | | | | 27,278 | |
| Series 2003-128, Class MF, 30D US SOFR + 0.71%, 01/25/2034(a) | | | 37,135 | | | | 37,190 | |
| Series 2003-131, Class CH, 5.500%, 01/25/2034 | | | 59,017 | | | | 60,558 | |
| Series 2003-134, Class FC, 30D US SOFR + 0.71%, 12/25/2032(a) | | | 20,794 | | | | 20,825 | |
| Series 2003-14, Class AP, 4.000%, 03/25/2033 | | | 22,818 | | | | 22,612 | |
| Series 2003-14, Class AN, 3.500%, 03/25/2033 | | | 15,212 | | | | 15,058 | |
| Series 2003-19, Class MB, 4.000%, 05/25/2031 | | | 23,098 | | | | 22,287 | |
| Series 2003-21, Class OG, 4.000%, 01/25/2033 | | | 11,222 | | | | 11,019 | |
| Series 2003-22, Class BZ, 6.000%, 04/25/2033 | | | 19,486 | | | | 19,951 | |
| Series 2003-27, Class EK, 5.000%, 04/25/2033 | | | 18,471 | | | | 18,595 | |
| Series 2003-30, Class JQ, 5.500%, 04/25/2033 | | | 18,396 | | | | 18,805 | |
| Series 2003-32, Class UJ, 5.500%, 05/25/2033 | | | 32,856 | | | | 33,614 | |
| Series 2003-41, Class OZ, 3.750%, 05/25/2033 | | | 173,343 | | | | 161,248 | |
| Series 2003-41, Class OB, 4.000%, 05/25/2033 | | | 100,571 | | | | 95,516 | |
| Series 2003-42, Class JH, 5.500%, 05/25/2033 | | | 43,711 | | | | 44,677 | |
| Series 2003-46, Class PJ, 5.500%, 06/25/2033 | | | 24,584 | | | | 25,155 | |
| Series 2003-47, Class PE, 5.750%, 06/25/2033 | | | 33,733 | | | | 34,664 | |
| Series 2003-64, Class JK, 3.500%, 07/25/2033 | | | 33,478 | | | | 32,328 | |
| Series 2003-64, Class ZC, 5.000%, 07/25/2033 | | | 19,677 | | | | 19,818 | |
| Series 2003-71, Class HD, 5.500%, 08/25/2033 | | | 79,739 | | | | 80,748 | |
| Series 2003-76, Class EZ, 5.000%, 08/25/2033 | | | 101,713 | | | | 102,790 | |
| Series 2003-94, Class CE, 5.000%, 10/25/2033 | | | 3,139 | | | | 3,112 | |
| Series 2004-10, Class ZB, 6.000%, 02/25/2034 | | | 142,629 | | | | 147,282 | |
See Notes to Financial Statements and Financial Highlights.
ALPS | Smith Total Return Bond Fund
| Statement of Investments | October 31, 2024 |
| | | Principal Amount | | Value (Note 2) |
| Series 2004-101, Class TB, 5.500%, 01/25/2035 | | $ | 84,710 | | | $ | 86,636 | |
| Series 2004-14, Class QB, 5.250%, 03/25/2034 | | | 116,841 | | | | 118,677 | |
| Series 2004-17, Class DZ, 5.500%, 04/25/2034 | | | 9,979 | | | | 10,103 | |
| Series 2004-17, Class BA, 6.000%, 04/25/2034 | | | 118,388 | | | | 120,168 | |
| Series 2004-36, Class FA, 30D US SOFR + 0.51%, 05/25/2034(a) | | | 17,673 | | | | 17,565 | |
| Series 2004-36, Class CB, 5.000%, 05/25/2034 | | | 64,680 | | | | 65,193 | |
| Series 2004-53, Class FC, 30D US SOFR + 0.56%, 07/25/2034(a) | | | 139,969 | | | | 139,465 | |
| Series 2004-54, Class FL, 30D US SOFR + 0.51%, 07/25/2034(a) | | | 84,888 | | | | 84,723 | |
| Series 2004-60, Class AC, 5.500%, 04/25/2034 | | | 58,575 | | | | 58,219 | |
| Series 2004-68, Class LC, 5.000%, 09/25/2029 | | | 23,847 | | | | 23,968 | |
| Series 2004-77, Class AY, 4.500%, 10/25/2034 | | | 12,720 | | | | 12,594 | |
| Series 2004-82, Class HK, 5.500%, 11/25/2034 | | | 35,590 | | | | 36,549 | |
| Series 2004-92, Class TB, 5.500%, 12/25/2034 | | | 59,778 | | | | 61,428 | |
| Series 2005-110, Class MP, 5.500%, 12/25/2035 | | | 10,931 | | | | 11,118 | |
| Series 2005-120, Class FE, 30D US SOFR + 0.63%, 01/25/2036(a) | | | 15,953 | | | | 15,826 | |
| Series 2005-122, Class PY, 6.000%, 01/25/2036 | | | 221,261 | | | | 228,119 | |
| Series 2005-17, Class EZ, 4.500%, 03/25/2035 | | | 169,328 | | | | 166,951 | |
| Series 2005-17, Class EX, 5.250%, 03/25/2035 | | | 25,000 | | | | 24,677 | |
| Series 2005-29, Class ZA, 5.500%, 04/25/2035 | | | 895,821 | | | | 921,845 | |
| Series 2005-3, Class CH, 5.250%, 02/25/2035 | | | 62,533 | | | | 63,445 | |
| Series 2005-35, Class DZ, 5.000%, 04/25/2035 | | | 100,813 | | | | 101,570 | |
| Series 2005-48, Class TD, 5.500%, 06/25/2035 | | | 93,910 | | | | 96,654 | |
| Series 2005-52, Class FE, 30D US SOFR + 1.91%, 05/25/2035(a) | | | 82,242 | | | | 83,835 | |
| Series 2005-62, Class GZ, 5.750%, 07/25/2035 | | | 318,855 | | | | 328,159 | |
| Series 2005-64, Class PL, 5.500%, 07/25/2035 | | | 44,967 | | | | 45,772 | |
| | | Principal Amount | | Value (Note 2) |
| Series 2005-68, Class PG, 5.500%, 08/25/2035 | | $ | 20,229 | | | $ | 20,503 | |
| Series 2005-68, Class BE, 5.250%, 08/25/2035 | | | 51,120 | | | | 51,551 | |
| Series 2005-68, Class CZ, 5.500%, 08/25/2035 | | | 227,269 | | | | 232,551 | |
| Series 2005-69, Class GZ, 4.500%, 08/25/2035 | | | 11,326 | | | | 10,977 | |
| Series 2005-7, Class MZ, 4.750%, 02/25/2035 | | | 17,961 | | | | 17,610 | |
| Series 2005-70, Class NA, 5.500%, 08/25/2035 | | | 8,632 | | | | 8,794 | |
| Series 2005-70, Class KP, 5.000%, 06/25/2035 | | | 39,899 | | | | 40,146 | |
| Series 2005-72, Class FB, 30D US SOFR + 0.36%, 08/25/2035(a) | | | 7,716 | | | | 7,658 | |
| Series 2005-79, Class DB, 5.500%, 09/25/2035 | | | 61,649 | | | | 63,193 | |
| Series 2005-84, Class XM, 5.750%, 10/25/2035 | | | 40,406 | | | | 41,283 | |
| Series 2005-89, Class F, 30D US SOFR + 0.41%, 10/25/2035(a) | | | 14,895 | | | | 14,749 | |
| Series 2005-99, Class AC, 5.500%, 12/25/2035 | | | 541,000 | | | | 536,345 | |
| Series 2005-99, Class FA, 30D US SOFR + 0.41%, 11/25/2035(a) | | | 8,919 | | | | 8,905 | |
| Series 2005-99, Class ZA, 5.500%, 12/25/2035 | | | 127,065 | | | | 127,729 | |
| Series 2006-112, Class QC, 5.500%, 11/25/2036 | | | 15,970 | | | | 16,428 | |
| Series 2006-114, Class HE, 5.500%, 12/25/2036 | | | 71,574 | | | | 73,034 | |
| Series 2006-115, Class EF, 30D US SOFR + 0.47%, 12/25/2036(a) | | | 12,161 | | | | 12,011 | |
| Series 2006-16, Class HZ, 5.500%, 03/25/2036 | | | 193,021 | | | | 198,765 | |
| Series 2006-39, Class EF, 30D US SOFR + 0.51%, 05/25/2036(a) | | | 11,815 | | | | 11,710 | |
| Series 2006-46, Class UD, 5.500%, 06/25/2036 | | | 30,158 | | | | 30,834 | |
| Series 2006-48, Class TF, 30D US SOFR + 0.51%, 06/25/2036(a) | | | 30,847 | | | | 30,517 | |
| Series 2006-48, Class DZ, 6.000%, 06/25/2036 | | | 177,720 | | | | 181,609 | |
| Series 2006-56, Class F, 30D US SOFR + 0.41%, 07/25/2036(a) | | | 8,336 | | | | 8,261 | |
| Series 2006-62, Class FX, 30D US SOFR + 1.86%, 07/25/2036(a) | | | 153,247 | | | | 152,386 | |
See Notes to Financial Statements and Financial Highlights.
ALPS | Smith Total Return Bond Fund
| Statement of Investments | October 31, 2024 |
| | | Principal Amount | | Value (Note 2) |
| Series 2006-63, Class QH, 5.500%, 07/25/2036 | | $ | 26,062 | | | $ | 26,819 | |
| Series 2006-70, Class AF, 30D US SOFR + 0.51%, 08/25/2036(a) | | | 62,419 | | | | 61,715 | |
| Series 2006-71, Class ZH, 6.000%, 07/25/2036 | | | 31,955 | | | | 33,296 | |
| Series 2006-95, Class FH, 30D US SOFR + 0.56%, 10/25/2036(a) | | | 59,753 | | | | 59,215 | |
| Series 2007-100, Class YF, 30D US SOFR + 0.66%, 10/25/2037(a) | | | 12,877 | | | | 12,799 | |
| Series 2007-109, Class GF, 30D US SOFR + 0.79%, 12/25/2037(a) | | | 36,958 | | | | 36,920 | |
| Series 2007-111, Class FC, 30D US SOFR + 0.71%, 12/25/2037(a) | | | 24,910 | | | | 24,860 | |
| Series 2007-117, Class FM, 30D US SOFR + 0.81%, 01/25/2038(a) | | | 148,233 | | | | 147,374 | |
| Series 2007-12, Class BZ, 6.000%, 03/25/2037 | | | 481,711 | | | | 479,817 | |
| Series 2007-12, Class ZA, 6.000%, 03/25/2037 | | | 138,501 | | | | 134,385 | |
| Series 2007-14, Class GZ, 5.500%, 03/25/2037 | | | 129,528 | | | | 133,823 | |
| Series 2007-18, Class MZ, 6.000%, 03/25/2037 | | | 122,049 | | | | 126,870 | |
| Series 2007-22, Class FC, 30D US SOFR + 0.53%, 03/25/2037(a) | | | 66,452 | | | | 65,591 | |
| Series 2007-26, Class ZB, 5.500%, 04/25/2037 | | | 214,276 | | | | 213,098 | |
| Series 2007-30, Class MB, 4.250%, 04/25/2037 | | | 45,431 | | | | 44,861 | |
| Series 2007-33, Class HE, 5.500%, 04/25/2037 | | | 32,449 | | | | 33,516 | |
| Series 2007-34, Class F, 30D US SOFR + 0.50%, 04/25/2037(a) | | | 18,813 | | | | 18,578 | |
| Series 2007-41, Class FA, 30D US SOFR + 0.51%, 05/25/2037(a) | | | 6,502 | | | | 6,417 | |
| Series 2007-51, Class PB, 5.500%, 06/25/2037 | | | 21,541 | | | | 21,084 | |
| Series 2007-51, Class CP, 5.500%, 06/25/2037 | | | 22,123 | | | | 22,281 | |
| Series 2007-55, Class PH, 6.000%, 06/25/2047 | | | 254,781 | | | | 265,663 | |
| Series 2007-57, Class FA, 30D US SOFR + 0.34%, 06/25/2037(a) | | | 16,494 | | | | 16,292 | |
| | | Principal Amount | | Value (Note 2) |
| Series 2007-6, Class FC, 30D US SOFR + 0.53%, 02/25/2037(a) | | $ | 33,486 | | | $ | 33,072 | |
| Series 2007-63, Class FC, 30D US SOFR + 0.46%, 07/25/2037(a) | | | 16,734 | | | | 16,496 | |
| Series 2007-63, Class VZ, 5.500%, 07/25/2037 | | | 150,601 | | | | 150,164 | |
| Series 2007-65, Class ZE, 5.500%, 07/25/2037 | | | 542,692 | | | | 539,496 | |
| Series 2007-65, Class KF, 30D US SOFR + 0.49%, 07/25/2037(a) | | | 48,286 | | | | 47,646 | |
| Series 2007-70, Class FA, 30D US SOFR + 0.46%, 07/25/2037(a) | | | 19,123 | | | | 18,869 | |
| Series 2007-77, Class JE, 6.000%, 08/25/2037 | | | 276,193 | | | | 282,793 | |
| Series 2007-85, Class FC, 30D US SOFR + 0.65%, 09/25/2037(a) | | | 81,713 | | | | 81,380 | |
| Series 2007-85, Class FL, 30D US SOFR + 0.65%, 09/25/2037(a) | | | 27,716 | | | | 27,543 | |
| Series 2007-86, Class FA, 30D US SOFR + 0.56%, 09/25/2037(a) | | | 23,078 | | | | 22,911 | |
| Series 2007-9, Class FB, 30D US SOFR + 0.46%, 03/25/2037(a) | | | 19,031 | | | | 18,756 | |
| Series 2008-18, Class FA, 30D US SOFR + 1.01%, 03/25/2038(a) | | | 131,230 | | | | 132,265 | |
| Series 2008-24, Class WD, 5.500%, 02/25/2038 | | | 153,997 | | | | 153,098 | |
| Series 2008-25, Class EF, 30D US SOFR + 1.06%, 04/25/2038(a) | | | 33,178 | | | | 33,514 | |
| Series 2008-27, Class B, 5.500%, 04/25/2038 | | | 629,285 | | | | 648,151 | |
| Series 2008-46, Class LA, 5.500%, 06/25/2038 | | | 9,167 | | | | 9,118 | |
| Series 2008-66, Class FT, 30D US SOFR + 1.06%, 08/25/2038(a) | | | 18,997 | | | | 19,076 | |
| Series 2008-86, Class FC, 30D US SOFR + 1.21%, 12/25/2038(a) | | | 136,223 | | | | 137,881 | |
| Series 2009-103, Class FM, 30D US SOFR + 0.81%, 11/25/2039(a) | | | 26,471 | | | | 26,510 | |
| Series 2009-104, Class FA, 30D US SOFR + 0.91%, 12/25/2039(a) | | | 32,613 | | | | 32,756 | |
| Series 2009-11, Class MP, 7.000%, 03/25/2049 | | | 98,179 | | | | 104,332 | |
See Notes to Financial Statements and Financial Highlights.
ALPS | Smith Total Return Bond Fund
| Statement of Investments | October 31, 2024 |
| | | Principal Amount | | Value (Note 2) |
| Series 2009-110, Class FG, 30D US SOFR + 0.86%, 01/25/2040(a) | | $ | 66,950 | | | $ | 67,111 | |
| Series 2009-111, Class CY, 5.000%, 03/25/2038 | | | 131,832 | | | | 131,920 | |
| Series 2009-12, Class LA, 15.018%, 03/25/2039(a) | | | 244,459 | | | | 294,492 | |
| Series 2009-12, Class LD, 16.661%, 03/25/2039(a) | | | 334,697 | | | | 451,234 | |
| Series 2009-19, Class ZA, 6.500%, 04/25/2039 | | | 403,790 | | | | 418,358 | |
| Series 2009-36, Class MX, 5.000%, 06/25/2039 | | | 58,000 | | | | 57,299 | |
| Series 2009-39, Class Z, 6.000%, 06/25/2039 | | | 1,730,036 | | | | 1,752,169 | |
| Series 2009-42, Class TZ, 4.500%, 03/25/2039 | | | 218,036 | | | | 207,451 | |
| Series 2009-47, Class BN, 4.500%, 07/25/2039 | | | 27,464 | | | | 27,180 | |
| Series 2009-62, Class WA, 5.590%, 08/25/2039(a) | | | 79,986 | | | | 80,144 | |
| Series 2009-68, Class FD, 30D US SOFR + 1.36%, 09/25/2039(a) | | | 40,580 | | | | 41,484 | |
| Series 2009-70, Class CO, -%, 01/25/2037(b) | | | 61,267 | | | | 51,180 | |
| Series 2009-70, Class FA, 30D US SOFR + 1.31%, 09/25/2039(a) | | | 20,425 | | | | 20,420 | |
| Series 2009-86, Class OT, -%, 10/25/2037(b) | | | 25,288 | | | | 21,146 | |
| Series 2009-87, Class FG, 30D US SOFR + 0.86%, 11/25/2039(a) | | | 43,325 | | | | 43,509 | |
| Series 2009-90, Class UZ, 4.500%, 11/25/2039 | | | 686,544 | | | | 650,479 | |
| Series 2010-1, Class WA, 6.277%, 02/25/2040(a) | | | 12,264 | | | | 12,463 | |
| Series 2010-1, Class EL, 4.500%, 02/25/2040 | | | 234,018 | | | | 226,112 | |
| Series 2010-102, Class B, 4.500%, 07/25/2040 | | | 210,541 | | | | 203,543 | |
| Series 2010-102, Class HA, 4.000%, 09/25/2050 | | | 52,286 | | | | 48,753 | |
| Series 2010-103, Class DZ, 4.500%, 09/25/2040 | | | 230,518 | | | | 222,664 | |
| Series 2010-103, Class PJ, 4.500%, 09/25/2040 | | | 26,493 | | | | 26,127 | |
| Series 2010-111, Class FC, 30D US SOFR + 0.63%, 10/25/2040(a) | | | 38,656 | | | | 38,339 | |
| Series 2010-118, Class LZ, 4.750%, 10/25/2040 | | | 32,110 | | | | 31,328 | |
| Series 2010-122, Class JA, 7.000%, 07/25/2040 | | | 13,589 | | | | 13,762 | |
| | | Principal Amount | | Value (Note 2) |
| Series 2010-123, Class FL, 30D US SOFR + 0.54%, 11/25/2040(a) | | $ | 14,749 | | | $ | 14,629 | |
| Series 2010-123, Class KU, 4.500%, 11/25/2040 | | | 163,486 | | | | 155,015 | |
| Series 2010-129, Class PZ, 4.500%, 11/25/2040 | | | 36,196 | | | | 33,103 | |
| Series 2010-130, Class BZ, 4.500%, 11/25/2040 | | | 1,158,307 | | | | 1,126,742 | |
| Series 2010-14, Class FJ, 30D US SOFR + 0.71%, 03/25/2040(a) | | | 64,395 | | | | 64,416 | |
| Series 2010-141, Class LZ, 4.500%, 12/25/2040 | | | 728,447 | | | | 688,592 | |
| Series 2010-141, Class MN, 4.000%, 12/25/2040 | | | 90,000 | | | | 84,653 | |
| Series 2010-141, Class FB, 30D US SOFR + 0.58%, 12/25/2040(a) | | | 37,304 | | | | 36,921 | |
| Series 2010-141, Class AL, 4.000%, 12/25/2040 | | | 267,844 | | | | 257,965 | |
| Series 2010-142, Class FM, 30D US SOFR + 0.58%, 12/25/2040(a) | | | 13,515 | | | | 13,367 | |
| Series 2010-154, Class JA, 3.000%, 11/25/2040 | | | 247,707 | | | | 234,386 | |
| Series 2010-16, Class PL, 5.000%, 03/25/2040 | | | 71,000 | | | | 70,057 | |
| Series 2010-19, Class PY, 5.000%, 03/25/2040 | | | 220,856 | | | | 222,295 | |
| Series 2010-33, Class KN, 4.500%, 03/25/2040 | | | 24,410 | | | | 24,200 | |
| Series 2010-37, Class CY, 5.000%, 04/25/2040 | | | 28,110 | | | | 28,341 | |
| Series 2010-39, Class EF, 30D US SOFR + 0.63%, 06/25/2037(a) | | | 29,692 | | | | 29,555 | |
| Series 2010-45, Class WD, 5.000%, 05/25/2040 | | | 180,000 | | | | 171,320 | |
| Series 2010-54, Class LX, 5.000%, 06/25/2040 | | | 272,000 | | | | 269,566 | |
| Series 2010-57, Class HA, 3.500%, 02/25/2040 | | | 910 | | | | 906 | |
| Series 2010-58, Class FY, 30D US SOFR + 0.84%, 06/25/2040(a) | | | 39,033 | | | | 39,047 | |
| Series 2010-64, Class DM, 5.000%, 06/25/2040 | | | 23,870 | | | | 23,878 | |
| Series 2010-67, Class BD, 4.500%, 06/25/2040 | | | 538,323 | | | | 530,632 | |
| Series 2010-68, Class WB, 4.500%, 07/25/2040 | | | 85,000 | | | | 78,820 | |
| Series 2010-82, Class WZ, 5.000%, 08/25/2040 | | | 270,661 | | | | 272,709 | |
| Series 2010-9, Class ME, 5.000%, 02/25/2040 | | | 825,483 | | | | 826,575 | |
See Notes to Financial Statements and Financial Highlights.
ALPS | Smith Total Return Bond Fund
| Statement of Investments | October 31, 2024 |
| | | Principal Amount | | Value (Note 2) |
| Series 2011-114, Class B, 3.500%, 11/25/2041 | | $ | 138,737 | | | $ | 129,460 | |
| Series 2011-118, Class KL, 3.250%, 07/25/2040 | | | 71,041 | | | | 68,796 | |
| Series 2011-121, Class JP, 4.500%, 12/25/2041 | | | 102,432 | | | | 98,655 | |
| Series 2011-128, Class KB, 4.500%, 12/25/2041 | | | 800,000 | | | | 774,421 | |
| Series 2011-130, Class KB, 4.000%, 12/25/2041 | | | 30,193 | | | | 28,307 | |
| Series 2011-132, Class PE, 4.500%, 12/25/2041 | | | 112,671 | | | | 110,096 | |
| Series 2011-145, Class JA, 4.500%, 12/25/2041 | | | 5,709 | | | | 5,624 | |
| Series 2011-148, Class PL, 4.000%, 01/25/2042 | | | 425,000 | | | | 383,990 | |
| Series 2011-15, Class AF, 30D US SOFR + 0.62%, 03/25/2041(a) | | | 21,418 | | | | 21,248 | |
| Series 2011-17, Class PD, 4.000%, 03/25/2041 | | | 5,446 | | | | 5,260 | |
| Series 2011-26, Class PA, 4.500%, 04/25/2041 | | | 82,764 | | | | 81,888 | |
| Series 2011-27, Class ZD, 2.500%, 09/25/2040 | | | 171,272 | | | | 151,769 | |
| Series 2011-3, Class FA, 30D US SOFR + 0.79%, 02/25/2041(a) | | | 128,677 | | | | 128,345 | |
| Series 2011-30, Class ZA, 5.000%, 04/25/2041 | | | 837,556 | | | | 812,831 | |
| Series 2011-43, Class B, 3.500%, 05/25/2031 | | | 15,050 | | | | 14,601 | |
| Series 2011-45, Class ZA, 4.000%, 05/25/2031 | | | 13,019 | | | | 12,806 | |
| Series 2011-47, Class GF, 30D US SOFR + 0.68%, 06/25/2041(a) | | | 86,471 | | | | 86,123 | |
| Series 2011-5, Class PO, -%, 09/25/2040(b) | | | 7,502 | | | | 5,457 | |
| Series 2011-55, Class BZ, 3.500%, 06/25/2041 | | | 407,185 | | | | 379,730 | |
| Series 2011-74, Class UB, 4.000%, 07/25/2040 | | | 129,352 | | | | 117,940 | |
| Series 2011-86, Class NF, 30D US SOFR + 0.66%, 09/25/2041(a) | | | 76,944 | | | | 76,543 | |
| Series 2011-86, Class AF, 30D US SOFR + 0.61%, 02/25/2040(a) | | | 19,637 | | | | 19,566 | |
| Series 2011-93, Class ST, 4.000%, 09/25/2041 | | | 16,116 | | | | 15,208 | |
| Series 2011-93, Class GA, 4.000%, 04/25/2039 | | | 13,020 | | | | 12,623 | |
| Series 2012-100, Class DB, 3.000%, 09/25/2042 | | | 929,486 | | | | 826,804 | |
| | | Principal Amount | | Value (Note 2) |
| Series 2012-103, Class PY, 3.000%, 09/25/2042 | | $ | 180,000 | | | $ | 150,665 | |
| Series 2012-106, Class QN, 3.500%, 10/25/2042 | | | 55,646 | | | | 51,230 | |
| Series 2012-108, Class PL, 3.000%, 10/25/2042 | | | 539,827 | | | | 485,488 | |
| Series 2012-110, Class JB, 2.500%, 10/25/2042 | | | 204,000 | | | | 152,852 | |
| Series 2012-111, Class B, 7.000%, 10/25/2042 | | | 67,912 | | | | 72,483 | |
| Series 2012-112, Class DA, 3.000%, 10/25/2042 | | | 155,456 | | | | 139,869 | |
| Series 2012-115, Class DY, 2.500%, 10/25/2042 | | | 225,000 | | | | 175,356 | |
| Series 2012-120, Class AH, 2.500%, 02/25/2032 | | | 15,123 | | | | 14,820 | |
| Series 2012-125, Class GY, 2.000%, 11/25/2042 | | | 621,000 | | | | 480,466 | |
| Series 2012-126, Class TA, 3.000%, 10/25/2042 | | | 156,804 | | | | 140,927 | |
| Series 2012-128, Class NP, 2.500%, 11/25/2042 | | | 8,143 | | | | 5,335 | |
| Series 2012-129, Class HT, 2.000%, 12/25/2032 | | | 28,713 | | | | 25,088 | |
| Series 2012-13, Class JP, 4.500%, 02/25/2042 | | | 411,199 | | | | 396,177 | |
| Series 2012-131, Class FG, 30D US SOFR + 0.46%, 09/25/2042(a) | | | 38,068 | | | | 37,504 | |
| Series 2012-137, Class CF, 30D US SOFR + 0.41%, 08/25/2041(a) | | | 8,509 | | | | 8,492 | |
| Series 2012-139, Class CY, 2.000%, 12/25/2042 | | | 235,000 | | | | 173,175 | |
| Series 2012-139, Class GB, 2.500%, 12/25/2042 | | | 210,538 | | | | 144,025 | |
| Series 2012-14, Class FL, 30D US SOFR + 0.56%, 12/25/2040(a) | | | 1,379 | | | | 1,378 | |
| Series 2012-141, Class PD, 1.750%, 10/25/2041 | | | 77,304 | | | | 72,042 | |
| Series 2012-149, Class KB, 3.000%, 01/25/2043 | | | 117,001 | | | | 111,296 | |
| Series 2012-149, Class DA, 1.750%, 01/25/2043 | | | 20,799 | | | | 19,169 | |
| Series 2012-149, Class ZA, 3.000%, 01/25/2041 | | | 58,077 | | | | 56,114 | |
| Series 2012-151, Class NX, 1.500%, 01/25/2043 | | | 308,280 | | | | 258,894 | |
| Series 2012-151, Class WC, 2.500%, 01/25/2043 | | | 249,000 | | | | 180,919 | |
| Series 2012-152, Class PB, 3.500%, 01/25/2043 | | | 55,000 | | | | 52,563 | |
| Series 2012-153, Class B, 7.000%, 07/25/2042 | | | 23,049 | | | | 24,872 | |
See Notes to Financial Statements and Financial Highlights.
ALPS | Smith Total Return Bond Fund
| Statement of Investments | October 31, 2024 |
| | | Principal Amount | | Value (Note 2) |
| Series 2012-17, Class JB, 3.500%, 03/25/2042 | | $ | 200,000 | | | $ | 168,083 | |
| Series 2012-17, Class JA, 3.500%, 12/25/2041 | | | 221,457 | | | | 205,543 | |
| Series 2012-19, Class CB, 3.500%, 03/25/2042 | | | 197,000 | | | | 179,845 | |
| Series 2012-20, Class TD, 4.500%, 02/25/2042 | | | 23,882 | | | | 23,676 | |
| Series 2012-26, Class MA, 3.500%, 03/25/2042 | | | 112,806 | | | | 104,763 | |
| Series 2012-27, Class KB, 2.000%, 03/25/2042 | | | 150,407 | | | | 116,411 | |
| Series 2012-33, Class F, 30D US SOFR + 0.63%, 04/25/2042(a) | | | 23,354 | | | | 23,167 | |
| Series 2012-37, Class BF, 30D US SOFR + 0.61%, 12/25/2035(a) | | | 41,636 | | | | 41,385 | |
| Series 2012-38, Class MC, 3.000%, 04/25/2042 | | | 147,000 | | | | 119,461 | |
| Series 2012-46, Class YB, 3.500%, 05/25/2042 | | | 61,440 | | | | 55,458 | |
| Series 2012-46, Class CD, 2.500%, 04/25/2041 | | | 36,040 | | | | 35,447 | |
| Series 2012-47, Class JM, 3.500%, 05/25/2042 | | | 140,340 | | | | 118,067 | |
| Series 2012-47, Class HF, 30D US SOFR + 0.51%, 05/25/2027(a) | | | 25,808 | | | | 25,810 | |
| Series 2012-49, Class TG, 2.000%, 07/25/2041 | | | 17,296 | | | | 16,967 | |
| Series 2012-50, Class HC, 2.000%, 03/25/2042 | | | 95,157 | | | | 87,412 | |
| Series 2012-51, Class ZX, 3.500%, 05/25/2042 | | | 2,087,217 | | | | 1,638,060 | |
| Series 2012-51, Class HJ, 3.500%, 05/25/2042 | | | 364,384 | | | | 309,549 | |
| Series 2012-52, Class BM, 4.500%, 01/25/2042 | | | 491,058 | | | | 484,228 | |
| Series 2012-53, Class AP, 2.000%, 04/25/2041 | | | 21,243 | | | | 20,947 | |
| Series 2012-56, Class WB, 3.500%, 05/25/2042 | | | 65,500 | | | | 60,805 | |
| Series 2012-56, Class UB, 4.000%, 06/25/2042 | | | 416,000 | | | | 384,456 | |
| Series 2012-64, Class NA, 3.000%, 08/25/2041 | | | 2,362 | | | | 2,352 | |
| Series 2012-69, Class PL, 3.000%, 01/25/2042 | | | 71,217 | | | | 69,293 | |
| Series 2012-70, Class WC, 3.000%, 07/25/2042 | | | 172,000 | | | | 139,456 | |
| Series 2012-80, Class GZ, 3.000%, 08/25/2042 | | | 366,213 | | | | 329,746 | |
| Series 2012-82, Class E, 2.000%, 04/25/2042 | | | 20,209 | | | | 19,014 | |
| | | Principal Amount | | Value (Note 2) |
| Series 2012-83, Class AC, 3.000%, 08/25/2042 | | $ | 85,000 | | | $ | 72,571 | |
| Series 2012-90, Class PH, 3.000%, 01/25/2042 | | | 55,466 | | | | 53,387 | |
| Series 2012-90, Class PB, 2.500%, 01/25/2042 | | | 249,595 | | | | 236,517 | |
| Series 2012-93, Class TL, 3.000%, 09/25/2042 | | | 420,000 | | | | 344,433 | |
| Series 2012-98, Class ZP, 6.000%, 09/25/2042 | | | 724,958 | | | | 770,548 | |
| Series 2012-99, Class DC, 2.000%, 08/25/2041 | | | 102,014 | | | | 95,600 | |
| Series 2013-104, Class CY, 5.000%, 10/25/2043 | | | 50,000 | | | | 47,796 | |
| Series 2013-108, Class GU, 3.000%, 10/25/2033 | | | 33,169 | | | | 31,576 | |
| Series 2013-114, Class LM, 4.000%, 03/25/2042 | | | 201,436 | | | | 193,350 | |
| Series 2013-130, Class FB, 30D US SOFR + 0.56%, 01/25/2044(a) | | | 30,331 | | | | 29,949 | |
| Series 2013-136, Class QB, 3.500%, 03/25/2042 | | | 153,807 | | | | 142,840 | |
| Series 2013-17, Class YM, 4.000%, 03/25/2033 | | | 10,943 | | | | 10,743 | |
| Series 2013-2, Class QF, 30D US SOFR + 0.61%, 02/25/2043(a) | | | 11,137 | | | | 11,071 | |
| Series 2013-20, Class CA, 2.500%, 01/25/2043 | | | 164,004 | | | | 144,057 | |
| Series 2013-35, Class CV, 3.000%, 02/25/2043 | | | 200,000 | | | | 182,419 | |
| Series 2013-4, Class PL, 2.000%, 02/25/2043 | | | 120,000 | | | | 87,204 | |
| Series 2013-52, Class GM, 5.000%, 06/25/2043 | | | 89,000 | | | | 85,335 | |
| Series 2013-53, Class CV, 3.500%, 05/25/2030 | | | 37,415 | | | | 37,174 | |
| Series 2013-68, Class P, 3.500%, 10/25/2042 | | | 99,509 | | | | 95,553 | |
| Series 2013-68, Class LE, 2.000%, 04/25/2043 | | | 65,889 | | | | 59,562 | |
| Series 2013-70, Class CE, 2.500%, 01/25/2043 | | | 146,410 | | | | 135,116 | |
| Series 2013-72, Class YA, 3.000%, 06/25/2033 | | | 2,612 | | | | 2,387 | |
| Series 2013-72, Class AF, 30D US SOFR + 0.36%, 11/25/2042(a) | | | 3,633 | | | | 3,626 | |
| Series 2013-81, Class YK, 4.000%, 08/25/2043 | | | 200,000 | | | | 181,704 | |
| Series 2013-9, Class BC, 6.500%, 07/25/2042 | | | 190,389 | | | | 199,243 | |
| Series 2013-9, Class CB, 5.500%, 04/25/2042 | | | 426,713 | | | | 433,743 | |
See Notes to Financial Statements and Financial Highlights.
ALPS | Smith Total Return Bond Fund
| Statement of Investments | October 31, 2024 |
| | | Principal Amount | | Value (Note 2) |
| Series 2013-91, Class PB, 4.000%, 09/25/2043 | | $ | 140,000 | | | $ | 125,207 | |
| Series 2014-10, Class BA, 5.330%, 03/25/2054(a) | | | 257,423 | | | | 262,821 | |
| Series 2014-20, Class AC, 3.000%, 08/25/2036 | | | 24,355 | | | | 24,099 | |
| Series 2014-21, Class MA, 2.000%, 09/25/2041 | | | 54,807 | | | | 51,699 | |
| Series 2014-23, Class Z, 3.500%, 05/25/2044 | | | 463,366 | | | | 426,937 | |
| Series 2014-23, Class A, 3.000%, 05/25/2044 | | | 724,445 | | | | 649,676 | |
| Series 2014-26, Class YW, 3.500%, 04/25/2044 | | | 50,538 | | | | 48,038 | |
| Series 2014-3, Class BM, 2.500%, 06/25/2043 | | | 48,297 | | | | 44,554 | |
| Series 2014-43, Class PZ, 3.000%, 07/25/2043 | | | 249,037 | | | | 203,734 | |
| Series 2014-49, Class CA, 3.000%, 08/25/2044 | | | 68,288 | | | | 65,295 | |
| Series 2014-52, Class LM, 3.500%, 09/25/2044 | | | 1,089,776 | | | | 915,759 | |
| Series 2014-6, Class Z, 2.500%, 02/25/2044 | | | 130,796 | | | | 112,316 | |
| Series 2014-63, Class LN, 3.000%, 10/25/2044 | | | 125,000 | | | | 97,874 | |
| Series 2014-67, Class PL, 3.000%, 04/25/2043 | | | 143,252 | | | | 136,046 | |
| Series 2014-73, Class FA, 30D US SOFR + 0.46%, 11/25/2044(a) | | | 12,020 | | | | 11,798 | |
| Series 2014-80, Class DZ, 3.000%, 12/25/2044 | | | 3,139,143 | | | | 2,798,211 | |
| Series 2014-81, Class GC, 3.000%, 03/25/2038 | | | 19,824 | | | | 19,417 | |
| Series 2014-86, Class PA, 2.000%, 12/25/2044 | | | 846,093 | | | | 737,088 | |
| Series 2014-88, Class ER, 2.500%, 02/25/2036 | | | 17,996 | | | | 17,217 | |
| Series 2015-16, Class ZY, 2.500%, 04/25/2045 | | | 10,752,690 | | | | 8,910,686 | |
| Series 2015-2, Class CD, 3.500%, 02/25/2045 | | | 162,467 | | | | 134,012 | |
| Series 2015-51, Class CD, 3.000%, 07/25/2044 | | | 89,845 | | | | 86,028 | |
| Series 2015-53, Class KB, 3.000%, 01/25/2045 | | | 733,574 | | | | 653,440 | |
| Series 2015-56, Class MH, 3.500%, 08/25/2045 | | | 945,415 | | | | 852,148 | |
| Series 2015-65, Class CZ, 3.500%, 09/25/2045 | | | 137,763 | | | | 116,574 | |
| Series 2015-75, Class LB, 3.000%, 10/25/2045 | | | 125,000 | | | | 93,722 | |
| Series 2015-96, Class EA, 3.000%, 12/25/2026 | | | 94,218 | | | | 92,278 | |
| | | Principal Amount | | Value (Note 2) |
| Series 2016-14, Class NC, 2.500%, 03/25/2046 | | $ | 115,424 | | | $ | 109,454 | |
| Series 2016-2, Class BH, 2.700%, 07/25/2045 | | | 169,531 | | | | 156,036 | |
| Series 2016-23, Class PL, 3.000%, 11/25/2045 | | | 298,685 | | | | 242,518 | |
| Series 2016-27, Class HK, 3.000%, 01/25/2041 | | | 234,719 | | | | 221,786 | |
| Series 2016-31, Class TM, 3.000%, 12/25/2045 | | | 360,000 | | | | 309,727 | |
| Series 2016-33, Class JA, 3.000%, 07/25/2045 | | | 124,776 | | | | 116,001 | |
| Series 2016-33, Class LE, 2.500%, 11/25/2033 | | | 31,655 | | | | 29,314 | |
| Series 2016-48, Class UF, 30D US SOFR + 0.51%, 08/25/2046(a) | | | 57,650 | | | | 57,109 | |
| Series 2016-52, Class MZ, 3.000%, 08/25/2046 | | | 256,085 | | | | 192,496 | |
| Series 2016-55, Class EA, 1.750%, 07/25/2043 | | | 754,206 | | | | 628,281 | |
| Series 2016-57, Class PC, 1.750%, 06/25/2046 | | | 221,912 | | | | 185,714 | |
| Series 2016-75, Class FC, 30D US SOFR + 0.51%, 10/25/2046(a) | | | 29,265 | | | | 28,962 | |
| Series 2016-8, Class CB, 3.500%, 03/25/2046 | | | 893,000 | | | | 810,943 | |
| Series 2016-83, Class KL, 2.500%, 11/25/2046 | | | 132,408 | | | | 84,155 | |
| Series 2016-85, Class BA, 2.500%, 11/25/2046 | | | 5,543 | | | | 3,703 | |
| Series 2016-9, Class D, 3.000%, 03/25/2046 | | | 27,741 | | | | 25,018 | |
| Series 2016-9, Class PA, 2.500%, 06/25/2045 | | | 138,456 | | | | 128,828 | |
| Series 2017-1, Class JP, 3.500%, 04/25/2045 | | | 76,792 | | | | 74,774 | |
| Series 2017-10, Class FA, 30D US SOFR + 0.51%, 03/25/2047(a) | | | 22,148 | | | | 21,893 | |
| Series 2017-100, Class ZE, 3.500%, 12/25/2047 | | | 125,137 | | | | 112,567 | |
| Series 2017-110, Class PB, 3.000%, 02/25/2057 | | | 140,000 | | | | 109,370 | |
| Series 2017-15, Class PE, 3.500%, 04/25/2046 | | | 41,019 | | | | 38,953 | |
| Series 2017-19, Class B, 3.000%, 01/25/2047 | | | 205,413 | | | | 186,646 | |
| Series 2017-24, Class H, 3.000%, 08/25/2043 | | | 21,709 | | | | 21,521 | |
| Series 2017-25, Class QE, 2.500%, 04/25/2047 | | | 149,905 | | | | 127,301 | |
| Series 2017-35, Class AH, 3.500%, 04/25/2053 | | | 8,124 | | | | 8,016 | |
See Notes to Financial Statements and Financial Highlights.
ALPS | Smith Total Return Bond Fund
| Statement of Investments | October 31, 2024 |
| | | Principal Amount | | Value (Note 2) |
| Series 2017-38, Class JA, 3.000%, 03/25/2047 | | $ | 107,335 | | | $ | 95,401 | |
| Series 2017-46, Class P, 3.500%, 06/25/2047 | | | 2,412,286 | | | | 2,165,532 | |
| Series 2017-56, Class BY, 3.000%, 07/25/2047 | | | 128,765 | | | | 105,429 | |
| Series 2017-56, Class BA, 3.000%, 03/25/2045 | | | 70,293 | | | | 67,884 | |
| Series 2017-68, Class HQ, 3.000%, 07/25/2046 | | | 714,163 | | | | 662,626 | |
| Series 2017-84, Class JP, 2.750%, 10/25/2047 | | | 113,215 | | | | 98,618 | |
| Series 2017-90, Class WB, 3.000%, 11/25/2047 | | | 1,119,992 | | | | 889,441 | |
| Series 2017-96, Class PA, 3.000%, 12/25/2054 | | | 103,007 | | | | 99,129 | |
| Series 2017-99, Class DZ, 3.500%, 12/25/2047 | | | 133,442 | | | | 119,999 | |
| Series 2018-15, Class KG, 2.500%, 01/25/2048 | | | 99,492 | | | | 83,736 | |
| Series 2018-19, Class KB, 3.000%, 04/25/2046 | | | 38,055 | | | | 36,640 | |
| Series 2018-2, Class HD, 3.000%, 02/25/2047 | | | 18,430 | | | | 17,754 | |
| Series 2018-25, Class AL, 3.500%, 04/25/2048 | | | 187,296 | | | | 162,585 | |
| Series 2018-38, Class PA, 3.500%, 06/25/2047 | | | 59,009 | | | | 57,175 | |
| Series 2018-39, Class FG,30D US SOFR + 0.36%, 11/25/2033(a) | | | 78,192 | | | | 77,104 | |
| Series 2018-41, Class PZ, 4.000%, 06/25/2048 | | | 1,009,101 | | | | 816,051 | |
| Series 2018-43, Class FE,30D US SOFR + 0.36%, 09/25/2038(a) | | | 81,001 | | | | 79,691 | |
| Series 2018-45, Class GA, 3.000%, 06/25/2048 | | | 33,711 | | | | 29,656 | |
| Series 2018-5, Class JP, 3.000%, 09/25/2047 | | | 39,086 | | | | 35,969 | |
| Series 2018-50, Class DY, 3.000%, 10/25/2047 | | | 467,604 | | | | 424,569 | |
| Series 2018-56, Class CH, 3.000%, 08/25/2048 | | | 27,677 | | | | 24,350 | |
| Series 2018-6, Class PA, 3.000%, 02/25/2048 | | | 174,920 | | | | 151,930 | |
| Series 2018-60, Class KL, 4.000%, 08/25/2048 | | | 96,000 | | | | 83,543 | |
| Series 2018-67, Class DY, 4.000%, 09/25/2048 | | | 304,029 | | | | 259,060 | |
| Series 2018-70, Class HB, 3.500%, 10/25/2058 | | | 314,994 | | | | 266,932 | |
| Series 2018-74, Class AB, 3.500%, 10/25/2048 | | | 303,753 | | | | 277,299 | |
| Series 2018-8, Class KL, 2.500%, 03/25/2047 | | | 259,581 | | | | 228,639 | |
| | | Principal
Amount | | Value
(Note 2) |
| Series 2018-83, Class LH, 4.000%, 11/25/2048 | | $ | 17,751 | | | $ | 16,585 | |
| Series 2018-83, Class AC, 3.500%, 11/25/2048 | | | 141,708 | | | | 126,356 | |
| Series 2018-9, Class PL, 3.500%, 02/25/2048 | | | 395,045 | | | | 347,586 | |
| Series 2018-94, Class KZ, 4.500%, 01/25/2049 | | | 198,829 | | | | 153,890 | |
| Series 2018-94, Class KD, 3.500%, 12/25/2048 | | | 42,687 | | | | 39,084 | |
| Series 2019-10, Class MA, 3.000%, 03/25/2049 | | | 65,221 | | | | 57,773 | |
| Series 2019-11, Class EA, 3.000%, 05/25/2048 | | | 198,966 | | | | 184,628 | |
| Series 2019-12, Class HA, 3.500%, 11/25/2057 | | | 236,277 | | | | 223,778 | |
| Series 2019-13, Class MH, 3.000%, 03/25/2049 | | | 274,603 | | | | 245,892 | |
| Series 2019-34, Class PZ, 3.000%, 07/25/2049 | | | 118,347 | | | | 60,543 | |
| Series 2019-45, Class PT, 3.000%, 08/25/2049 | | | 218,650 | | | | 195,287 | |
| Series 2019-50, Class CZ, 2.750%, 09/25/2049 | | | 179,973 | | | | 82,580 | |
| Series 2019-55, Class MQ, 3.500%, 10/25/2049 | | | 567,562 | | | | 506,787 | |
| Series 2019-60, Class BF, 30D US SOFR + 0.56%, 10/25/2049(a) | | | 10,613 | | | | 10,407 | |
| Series 2019-65, Class HA, 2.500%, 11/25/2049 | | | 144,202 | | | | 122,435 | |
| Series 2019-75, Class PA, 3.000%, 10/25/2049 | | | 484,415 | | | | 427,295 | |
| Series 2019-81, Class LB, 1.500%, 12/25/2049 | | | 485,680 | | | | 387,778 | |
| Series 2019-82, Class HZ, 3.000%, 01/25/2050 | | | 395,244 | | | | 332,180 | |
| Series 2020-10, Class B, 3.000%, 03/25/2050 | | | 226,812 | | | | 194,961 | |
| Series 2020-11, Class JW, 3.000%, 03/25/2050 | | | 237,000 | | | | 178,365 | |
| Series 2020-36, Class GD, 2.000%, 12/25/2037 | | | 115,148 | | | | 103,909 | |
| Series 2020-45, Class NB, 1.500%, 07/25/2050 | | | 259,992 | | | | 110,668 | |
| Series 2020-47, Class GZ, 2.000%, 07/25/2050 | | | 218,091 | | | | 127,809 | |
| Series 2020-73, Class ED, 0.827%, 11/25/2049(a) | | | 753,544 | | | | 556,126 | |
| Series 2021-12, Class GA, 1.000%, 07/25/2050 | | | 124,787 | | | | 90,434 | |
| Series 2021-15, Class JB, 1.250%, 04/25/2051 | | | 120,361 | | | | 47,305 | |
| Series 2021-17, Class ZA, 1.500%, 04/25/2051 | | | 162,499 | | | | 65,476 | |
See Notes to Financial Statements and Financial Highlights.
ALPS | Smith Total Return Bond Fund
| Statement of Investments | October 31, 2024 |
| | | Principal Amount | | Value
(Note 2) |
| Series 2021-43, Class JC, 2.000%, 05/25/2051 | | $ | 120,393 | | | $ | 96,568 | |
| Series 2021-47, Class PD, 1.500%, 07/25/2051 | | | 759,616 | | | | 578,749 | |
| Series 2021-47, Class PE, 1.750%, 07/25/2051 | | | 759,616 | | | | 591,315 | |
| Series 2021-59, Class H, 2.000%, 06/25/2048 | | | 213,238 | | | | 171,099 | |
| Series 2021-6, Class KU, 1.500%, 02/25/2051 | | | 181,291 | | | | 102,292 | |
| Series 2021-66, Class HU, 1.500%, 10/25/2051 | | | 259,998 | | | | 124,524 | |
| Series 2021-66, Class JG, 1.000%, 10/25/2051 | | | 505,657 | | | | 398,989 | |
| Series 2021-68, Class A, 2.000%, 07/25/2049 | | | 2,402,825 | | | | 1,893,935 | |
| Series 2021-69, Class WA, 2.000%, 04/25/2049 | | | 302,677 | | | | 246,935 | |
| Series 2021-72, Class NL, 1.500%, 10/25/2051 | | | 316,302 | | | | 194,893 | |
| Series 2021-72, Class NB, 1.500%, 10/25/2051 | | | 140,000 | | | | 59,127 | |
| Series 2021-8, Class HZ, 2.000%, 03/25/2051 | | | 473,175 | | | | 237,774 | |
| Series 2021-80, Class KE, 2.000%, 11/25/2051 | | | 208,106 | | | | 169,890 | |
| Series 2022-17, Class GV, 2.500%, 01/25/2052 | | | 3,569,000 | | | | 2,631,085 | |
| Series 2022-37, Class QL, 4.000%, 07/25/2052 | | | 1,683,000 | | | | 1,591,828 | |
| Series 2022-4, Class CK, 1.500%, 04/25/2051 | | | 103,750 | | | | 55,430 | |
| Series 2022-43, Class AN, 4.250%, 07/25/2052 | | | 240,932 | | | | 197,666 | |
| Series 2022-43, Class ZA, 4.500%, 07/25/2052 | | | 248,750 | | | | 236,286 | |
| Series 2022-64, Class GM, 4.500%, 10/25/2052 | | | 3,161,000 | | | | 2,803,880 | |
| Series 2022-68, Class Z, 5.000%, 10/25/2052 | | | 626,044 | | | | 615,542 | |
| Series 2022-81, Class DO, -%, 11/25/2052(b) | | | 1,474,485 | | | | 674,269 | |
| Series 2022-88, Class EZ, 6.000%, 12/25/2052 | | | 4,407,699 | | | | 4,476,669 | |
| Series 2022-90, Class AY, 4.500%, 12/25/2041 | | | 180,000 | | | | 170,850 | |
| Series 2023-19, Class BZ, 5.000%, 05/25/2053 | | | 5,823,247 | | | | 5,870,361 | |
| | | | | | | | 96,542,424 | |
| Fannie Mae Grantor Trust 2002-T12 | | | | | | | | |
| Series 2002-T12, Class A1, 6.500%, 05/25/2042 | | | 122,794 | | | | 126,357 | |
| | | Principal
Amount | | Value
(Note 2) |
| Freddie Mac | | | | |
| Series 1996-1863, Class Z, 6.500%, 07/15/2026 | | $ | 25 | | | $ | 25 | |
| Series 1997-1935, Class FK, 30D US SOFR + 0.81%, 02/15/2027(a) | | | 3,817 | | | | 3,820 | |
| Series 1997-1980, Class Z, 7.000%, 07/15/2027 | | | 13,447 | | | | 13,514 | |
| Series 1998-2034, Class Z, 6.500%, 02/15/2028 | | | 8,361 | | | | 8,493 | |
| Series 1998-2035, Class PC, 6.950%, 03/15/2028 | | | 2,106 | | | | 2,126 | |
| Series 1998-2053, Class Z, 6.500%, 04/15/2028 | | | 7,239 | | | | 7,283 | |
| Series 1998-2060, Class Z, 6.500%, 05/15/2028 | | | 3,691 | | | | 3,743 | |
| Series 1998-2079, Class FA, 30D US SOFR + 0.61%, 07/17/2028(a) | | | 3 | | | | 3 | |
| Series 1998-2095, Class PE, 6.000%, 11/15/2028 | | | 7,846 | | | | 7,918 | |
| Series 1998-2102, Class Z, 6.000%, 12/15/2028 | | | 23,992 | | | | 24,239 | |
| Series 1999-2115, Class FB, 30D US SOFR + 0.56%, 01/15/2029(a) | | | 8,670 | | | | 8,660 | |
| Series 1999-2126, Class CB, 6.250%, 02/15/2029 | | | 8,771 | | | | 8,855 | |
| Series 1999-2137, Class TH, 6.500%, 03/15/2029 | | | 2,767 | | | | 2,808 | |
| Series 1999-2154, Class PL, 6.500%, 05/15/2029 | | | 75,270 | | | | 75,687 | |
| Series 2000-2224, Class CB, 8.000%, 03/15/2030 | | | 7,244 | | | | 7,557 | |
| Series 2001-2274, Class ZM, 6.500%, 01/15/2031 | | | 5,422 | | | | 5,474 | |
| Series 2001-2279, Class Z, 6.000%, 01/15/2031 | | | 5,426 | | | | 5,450 | |
| Series 2001-2320, Class FI, 30D US SOFR + 0.61%, 09/15/2029(a) | | | 15,614 | | | | 15,593 | |
| Series 2001-2322, Class FV, 30D US SOFR + 0.61%, 06/15/2030(a) | | | 15,980 | | | | 15,728 | |
| Series 2001-2324, Class PZ, 6.500%, 06/15/2031 | | | 87,125 | | | | 90,108 | |
| Series 2001-2334, Class KB, 6.500%, 05/15/2028 | | | 36,402 | | | | 36,764 | |
| Series 2001-2341, Class FP, 30D US SOFR + 1.01%, 07/15/2031(a) | | | 16,790 | | | | 16,898 | |
| Series 2001-2367, Class FA, 30D US SOFR + 0.63%, 06/15/2031(a) | | | 16,518 | | | | 16,469 | |
See Notes to Financial Statements and Financial Highlights.
ALPS | Smith Total Return Bond Fund
| Statement of Investments | October 31, 2024 |
| | | Principal
Amount | | Value
(Note 2) |
| Series 2001-2372, Class F, 30D US SOFR + 0.61%, 10/15/2031(a) | | $ | 10,471 | | | $ | 10,460 | |
| Series 2001-2388, Class FR, 30D US SOFR + 0.76%, 06/15/2031(a) | | | 14,147 | | | | 14,146 | |
| Series 2001-2388, Class FB, 30D US SOFR + 0.71%, 01/15/2029(a) | | | 12,326 | | | | 12,331 | |
| Series 2001-2391, Class HF, 30D US SOFR + 0.66%, 06/15/2031(a) | | | 5,668 | | | | 5,655 | |
| Series 2001-2396, Class FM, 30D US SOFR + 0.56%, 12/15/2031(a) | | | 12,367 | | | | 12,366 | |
| Series 2001-2396, Class FN, 30D US SOFR + 0.76%, 12/15/2031(a) | | | 92,602 | | | | 92,871 | |
| Series 2002-2411, Class F, 30D US SOFR + 0.66%, 02/15/2032(a) | | | 11,428 | | | | 11,442 | |
| Series 2002-2412, Class OF, 30D US SOFR + 1.06%, 12/15/2031(a) | | | 18,938 | | | | 19,144 | |
| Series 2002-2417, Class FY, 30D US SOFR + 0.71%, 12/15/2031(a) | | | 5,893 | | | | 5,878 | |
| Series 2002-2424, Class FY, 30D US SOFR + 0.56%, 03/15/2032(a) | | | 30,434 | | | | 29,873 | |
| Series 2002-2430, Class WF, 6.500%, 03/15/2032 | | | 5,486 | | | | 5,698 | |
| Series 2002-2433, Class FA, 30D US SOFR + 1.06%, 02/15/2032(a) | | | 24,534 | | | | 24,801 | |
| Series 2002-2460, Class FA, 30D US SOFR + 1.11%, 03/15/2032(a) | | | 42,431 | | | | 42,742 | |
| Series 2002-2466, Class FV, 30D US SOFR + 0.66%, 03/15/2032(a) | | | 36,875 | | | | 36,830 | |
| Series 2002-2470, Class EF, 30D US SOFR + 1.11%, 03/15/2032(a) | | | 45,488 | | | | 45,964 | |
| Series 2002-2478, Class FD, 30D US SOFR + 1.11%, 02/15/2032(a) | | | 13,221 | | | | 13,120 | |
| Series 2002-2481, Class FE, 30D US SOFR + 1.11%, 03/15/2032(a) | | | 12,853 | | | | 12,988 | |
| Series 2002-2488, Class FU, 30D US SOFR + 0.71%, 03/15/2032(a) | | | 43,515 | | | | 43,428 | |
| Series 2002-2494, Class F, 30D US SOFR + 1.16%, 06/15/2031(a) | | | 21,944 | | | | 22,138 | |
| | | Principal
Amount | | Value
(Note 2) |
| Series 2002-2495, Class ZB, 4.500%, 09/15/2032 | | $ | 24,583 | | | $ | 23,814 | |
| Series 2002-2510, Class FE, 30D US SOFR + 0.51%, 10/15/2032(a) | | | 3,871 | | | | 3,850 | |
| Series 2002-2513, Class AF, 30D US SOFR + 1.11%, 02/15/2032(a) | | | 35,340 | | | | 34,130 | |
| Series 2002-2516, Class FD, 30D US SOFR + 1.11%, 02/15/2032(a) | | | 33,584 | | | | 33,937 | |
| Series 2002-2517, Class FR, 30D US SOFR + 0.46%, 10/15/2032(a) | | | 26,306 | | | | 26,105 | |
| Series 2002-2524, Class DH, 6.000%, 11/15/2032 | | | 25,652 | | | | 26,486 | |
| Series 2002-2525, Class NU, 5.000%, 04/15/2032 | | | 53,671 | | | | 52,824 | |
| Series 2002-2535, Class AW, 5.500%, 12/15/2032 | | | 6,970 | | | | 7,133 | |
| Series 2002-2538, Class F, 30D US SOFR + 0.71%, 12/15/2032(a) | | | 97,391 | | | | 97,534 | |
| Series 2002-2541, Class BL, 5.500%, 12/15/2032 | | | 28,664 | | | | 29,209 | |
| Series 2003-2554, Class MN, 5.500%, 01/15/2033 | | | 31,999 | | | | 32,596 | |
| Series 2003-2557, Class HL, 5.300%, 01/15/2033 | | | 111,496 | | | | 111,226 | |
| Series 2003-2557, Class NU, 5.250%, 03/15/2032 | | | 35,963 | | | | 35,859 | |
| Series 2003-2557, Class WF, 30D US SOFR + 0.51%, 01/15/2033(a) | | | 27,777 | | | | 27,636 | |
| Series 2003-2568, Class D, 5.500%, 02/15/2033 | | | 26,292 | | | | 26,812 | |
| Series 2003-2571, Class FY, 30D US SOFR + 0.86%, 12/15/2032(a) | | | 14,550 | | | | 14,634 | |
| Series 2003-2577, Class FC, 30D US SOFR + 0.61%, 02/15/2033(a) | | | 64,062 | | | | 63,683 | |
| Series 2003-2587, Class FW, 30D US SOFR + 0.58%, 03/15/2033(a) | | | 26,403 | | | | 26,286 | |
| Series 2003-2590, Class OZ, 4.000%, 03/15/2033 | | | 169,132 | | | | 162,856 | |
| Series 2003-2614, Class FV, 30D US SOFR + 1.61%, 05/15/2033(a) | | | 159,328 | | | | 162,914 | |
| Series 2003-2624, Class QH, 5.000%, 06/15/2033 | | | 9,124 | | | | 9,203 | |
| Series 2003-2626, Class ZX, 5.000%, 06/15/2033 | | | 218,902 | | | | 209,592 | |
| Series 2003-2627, Class CN, 5.000%, 06/15/2033 | | | 26,970 | | | | 27,203 | |
See Notes to Financial Statements and Financial Highlights.
ALPS | Smith Total Return Bond Fund
| Statement of Investments | October 31, 2024 |
| | | Principal Amount | | Value
(Note 2) |
| Series 2003-2631, Class DB, 5.000%, 06/15/2033 | | $ | 148,000 | | | $ | 143,949 | |
| Series 2003-2647, Class A, 3.250%, 04/15/2032 | | | 47,349 | | | | 45,844 | |
| Series 2003-2648, Class WZ, 5.000%, 07/15/2033 | | | 288,722 | | | | 281,524 | |
| Series 2003-2668, Class LH, 5.000%, 09/15/2033 | | | 17,149 | | | | 17,301 | |
| Series 2003-2707, Class FH, 30D US SOFR + 0.76%, 04/15/2032(a) | | | 51,937 | | | | 52,125 | |
| Series 2003-2711, Class FA, 30D US SOFR + 1.11%, 11/15/2033(a) | | | 101,701 | | | | 103,097 | |
| Series 2003-2717, Class LH, 5.500%, 12/15/2033 | | | 4,415 | | | | 4,536 | |
| Series 2003-2725, Class TA, 4.500%, 12/15/2033 | | | 141,963 | | | | 140,762 | |
| Series 2004-2750, Class TC, 5.250%, 02/15/2034 | | | 3,010 | | | | 3,038 | |
| Series 2004-2768, Class PW, 4.250%, 03/15/2034 | | | 123,336 | | | | 120,717 | |
| Series 2004-2802, Class OH, 6.000%, 05/15/2034 | | | 7,877 | | | | 8,046 | |
| Series 2004-2835, Class KZ, 5.500%, 08/15/2034 | | | 27,246 | | | | 28,003 | |
| Series 2004-2835, Class TB, 4.500%, 08/15/2034 | | | 277,675 | | | | 271,652 | |
| Series 2004-2896, Class BZ, 5.000%, 11/15/2034 | | | 53,264 | | | | 53,768 | |
| Series 2004-2901, Class KB, 5.000%, 12/15/2034 | | | 74,659 | | | | 75,392 | |
| Series 2005-2916, Class MY, 5.500%, 01/15/2035 | | | 117,175 | | | | 120,457 | |
| Series 2005-2927, Class EZ, 5.500%, 02/15/2035 | | | 7,250 | | | | 7,131 | |
| Series 2005-2929, Class PG, 5.000%, 02/15/2035 | | | 28,187 | | | | 28,460 | |
| Series 2005-2933, Class HD, 5.500%, 02/15/2035 | | | 15,271 | | | | 15,544 | |
| Series 2005-2942, Class ZN, 5.500%, 03/15/2035 | | | 544,628 | | | | 540,350 | |
| Series 2005-2953, Class PG, 5.500%, 03/15/2035 | | | 13,375 | | | | 13,686 | |
| Series 2005-2962, Class KF, 30D US SOFR + 0.31%, 04/15/2035(a) | | | 7,957 | | | | 7,898 | |
| Series 2005-2973, Class GE, 5.500%, 05/15/2035 | | | 243,000 | | | | 244,041 | |
| Series 2005-2980, Class QA, 6.000%, 05/15/2035 | | | 25,011 | | | | 26,033 | |
| Series 2005-2996, Class GX, 5.500%, 06/15/2035 | | | 72,000 | | | | 71,322 | |
| Series 2005-3012, Class WZ, 5.500%, 08/15/2035 | | | 255,010 | | | | 251,998 | |
| | | Principal
Amount | | Value (Note 2) |
| Series 2005-3012, Class ZE, 5.750%, 08/15/2035 | | $ | 53,797 | | | $ | 55,737 | |
| Series 2005-3028, Class FM, 30D US SOFR + 0.36%, 09/15/2035(a) | | | 6,916 | | | | 6,865 | |
| Series 2005-3028, Class PG, 5.500%, 09/15/2035 | | | 32,933 | | | | 33,504 | |
| Series 2005-3028, Class ZE, 5.500%, 09/15/2035 | | | 941,435 | | | | 935,403 | |
| Series 2005-3033, Class WY, 5.500%, 09/15/2035 | | | 60,815 | | | | 62,526 | |
| Series 2005-3036, Class NE, 5.000%, 09/15/2035 | | | 73,837 | | | | 74,731 | |
| Series 2005-3042, Class PZ, 5.750%, 09/15/2035 | | | 170,327 | | | | 174,428 | |
| Series 2005-3052, Class WH, 5.500%, 10/15/2035 | | | 14,662 | | | | 15,032 | |
| Series 2005-3059, Class ZM, 5.000%, 02/15/2035 | | | 68,241 | | | | 68,878 | |
| Series 2005-3062, Class DE, 5.500%, 11/15/2035 | | | 97,823 | | | | 100,657 | |
| Series 2005-3068, Class Z, 5.500%, 11/15/2035 | | | 120,330 | | | | 123,326 | |
| Series 2005-3070, Class FT, 30D US SOFR + 0.46%, 11/15/2035(a) | | | 10,878 | | | | 10,838 | |
| Series 2005-3072, Class NF, 30D US SOFR + 0.61%, 11/15/2035(a) | | | 27,518 | | | | 27,343 | |
| Series 2005-3085, Class FE, 30D US SOFR + 0.91%, 08/15/2035(a) | | | 32,494 | | | | 32,679 | |
| Series 2006-3098, Class PG, 5.000%, 01/15/2036 | | | 49,381 | | | | 49,982 | |
| Series 2006-3122, Class OH, -%, 03/15/2036(b) | | | 16,729 | | | | 14,437 | |
| Series 2006-3123, Class HT, 5.000%, 03/15/2026 | | | 3,753 | | | | 3,742 | |
| Series 2006-3136, Class KF, 30D US SOFR + 0.41%, 04/15/2036(a) | | | 10,375 | | | | 10,309 | |
| Series 2006-3137, Class XP, 6.000%, 04/15/2036 | | | 16,253 | | | | 16,961 | |
| Series 2006-3143, Class BC, 5.500%, 02/15/2036 | | | 72,368 | | | | 74,661 | |
| Series 2006-3145, Class FN, 30D US SOFR + 0.54%, 04/15/2036(a) | | | 10,435 | | | | 10,336 | |
| Series 2006-3148, Class CY, 6.000%, 04/15/2036 | | | 14,920 | | | | 15,492 | |
| Series 2006-3153, Class UG, 30D US SOFR + 0.56%, 05/15/2036(a) | | | 16,966 | | | | 16,893 | |
| Series 2006-3154, Class PN, 5.500%, 05/15/2036 | | | 51,599 | | | | 53,244 | |
See Notes to Financial Statements and Financial Highlights.
ALPS | Smith Total Return Bond Fund
| Statement of Investments | October 31, 2024 |
| | | Principal Amount | | | Value (Note 2) | |
| Series 2006-3201, Class FL, 30D US SOFR + 0.71%, 08/15/2036(a) | | $ | 73,793 | | | $ | 73,540 | |
| Series 2006-3202, Class HF, 30D US SOFR + 0.46%, 08/15/2036(a) | | | 29,966 | | | | 29,662 | |
| Series 2006-3203, Class ZM, 5.000%, 08/15/2036 | | | 154,323 | | | | 156,167 | |
| Series 2006-3204, Class ZM, 5.000%, 08/15/2034 | | | 71,136 | | | | 71,801 | |
| Series 2006-3206, Class FE, 30D US SOFR + 0.51%, 08/15/2036(a) | | | 33,486 | | | | 33,040 | |
| Series 2006-3235, Class Z, 6.500%, 11/15/2036 | | | 658,955 | | | | 695,252 | |
| Series 2006-3236, Class EF, 30D US SOFR + 0.41%, 11/15/2036(a) | | | 9,406 | | | | 9,271 | |
| Series 2006-3237, Class CD, 5.500%, 09/15/2036 | | | 57,317 | | | | 57,247 | |
| Series 2006-3237, Class CE, 5.500%, 11/15/2036 | | | 122,000 | | | | 122,901 | |
| Series 2006-3240, Class FG, 30D US SOFR + 1.22%, 11/15/2036(a) | | | 151,194 | | | | 149,097 | |
| Series 2006-3249, Class CB, 4.250%, 12/15/2036 | | | 266,812 | | | | 260,887 | |
| Series 2007-3279, Class FB, 30D US SOFR + 0.43%, 02/15/2037(a) | | | 57,984 | | | | 57,091 | |
| Series 2007-3284, Class AZ, 4.500%, 03/15/2037 | | | 20,725 | | | | 20,091 | |
| Series 2007-3301, Class FY, 30D US SOFR + 0.53%, 04/15/2037(a) | | | 13,079 | | | | 12,929 | |
| Series 2007-3311, Class DF, 30D US SOFR + 0.45%, 05/15/2037(a) | | | 79,483 | | | | 78,698 | |
| Series 2007-3312, Class PA, 5.500%, 05/15/2037 | | | 12,005 | | | | 12,417 | |
| Series 2007-3316, Class FB, 30D US SOFR + 0.41%, 08/15/2035(a) | | | 23,042 | | | | 22,762 | |
| Series 2007-3349, Class HG, 5.500%, 07/15/2037 | | | 13,740 | | | | 14,074 | |
| Series 2007-3361, Class AF, 30D US SOFR + 0.46%, 11/15/2036(a) | | | 51,901 | | | | 51,245 | |
| Series 2007-3367, Class YF, 30D US SOFR + 0.66%, 09/15/2037(a) | | | 13,850 | | | | 13,767 | |
| Series 2007-3368, Class AF, 30D US SOFR + 0.83%, 09/15/2037(a) | | | 49,252 | | | | 49,285 | |
| | | Principal Amount | | Value (Note 2) |
| Series 2007-3378, Class FA, 30D US SOFR + 0.69%, 06/15/2037(a) | | $ | 24,842 | | | $ | 24,755 | |
| Series 2007-3380, Class FM, 30D US SOFR + 0.70%, 10/15/2037(a) | | | 61,670 | | | | 61,424 | |
| Series 2007-3382, Class FG, 30D US SOFR + 0.71%, 11/15/2037(a) | | | 31,312 | | | | 31,205 | |
| Series 2007-3382, Class FL, 30D US SOFR + 0.81%, 11/15/2037(a) | | | 57,522 | | | | 57,549 | |
| Series 2007-3387, Class PF, 30D US SOFR + 0.53%, 11/15/2037(a) | | | 20,137 | | | | 19,937 | |
| Series 2007-3388, Class FJ, 30D US SOFR + 0.81%, 11/15/2037(a) | | | 96,605 | | | | 96,583 | |
| Series 2008-3404, Class DC, 5.500%, 01/15/2038 | | | 285,000 | | | | 289,675 | |
| Series 2008-3405, Class PE, 5.000%, 01/15/2038 | | | 36,074 | | | | 36,363 | |
| Series 2008-3409, Class DB, 6.000%, 01/15/2038 | | | 147,216 | | | | 152,888 | |
| Series 2008-3411, Class FL, 30D US SOFR + 0.81%, 02/15/2038(a) | | | 14,293 | | | | 14,295 | |
| Series 2008-3415, Class DF, 30D US SOFR + 0.81%, 08/15/2035(a) | | | 67,450 | | | | 67,513 | |
| Series 2008-3415, Class PC, 5.000%, 12/15/2037 | | | 25,243 | | | | 25,395 | |
| Series 2008-3415, Class TF, 30D US SOFR + 0.85%, 08/15/2035(a) | | | 33,408 | | | | 33,486 | |
| Series 2008-3450, Class PE, 5.000%, 05/15/2038 | | | 46,069 | | | | 46,675 | |
| Series 2008-3469, Class CF, 30D US SOFR + 0.90%, 07/15/2038(a) | | | 17,353 | | | | 15,945 | |
| Series 2009-3536, Class FM, 30D US SOFR + 1.11%, 05/15/2039(a) | | | 16,236 | | | | 16,331 | |
| Series 2009-3539, Class B, 4.500%, 06/15/2029 | | | 44,000 | | | | 43,879 | |
| Series 2009-3545, Class FA, 30D US SOFR + 0.96%, 06/15/2039(a) | | | 46,201 | | | | 46,211 | |
| Series 2009-3548, Class ZE, 5.500%, 12/15/2032 | | | 104,236 | | | | 105,633 | |
| Series 2009-3549, Class FA, 30D US SOFR + 1.31%, 07/15/2039(a) | | | 16,449 | | | | 16,457 | |
| Series 2009-3564, Class NB, 5.000%, 08/15/2039 | | | 280,399 | | | | 283,723 | |
See Notes to Financial Statements and Financial Highlights.
ALPS | Smith Total Return Bond Fund
| Statement of Investments | October 31, 2024 |
| | | Principal Amount | | | Value
(Note 2) | |
| Series 2009-3574, Class D, 5.000%, 09/15/2039 | | $ | 56,254 | | | $ | 56,990 | |
| Series 2009-3584, Class FA, 30D US SOFR + 0.81%, 12/15/2036(a) | | | 20,214 | | | | 20,244 | |
| Series 2009-3587, Class DA, 4.500%, 10/15/2039 | | | 90,491 | | | | 89,045 | |
| Series 2009-3588, Class CW, 7.645%, 10/15/2037(a) | | | 263,111 | | | | 273,210 | |
| Series 2009-3604, Class PO, -%, 05/15/2036(b) | | | 50,281 | | | | 41,784 | |
| Series 2009-3605, Class BF, 30D US SOFR + 0.97%, 11/15/2039(a) | | | 97,485 | | | | 98,168 | |
| Series 2009-3606, Class ZC, 5.000%, 04/15/2036 | | | 663,811 | | | | 669,368 | |
| Series 2009-3611, Class FH, 30D US SOFR + 0.86%, 07/15/2034(a) | | | 8,720 | | | | 8,743 | |
| Series 2010-3620, Class EL, 4.000%, 01/15/2030 | | | 13,190 | | | | 13,065 | |
| Series 2010-3622, Class PB, 5.000%, 01/15/2040 | | | 322,359 | | | | 326,388 | |
| Series 2010-3626, Class ME, 5.000%, 01/15/2040 | | | 415,896 | | | | 420,776 | |
| Series 2010-3631, Class PA, 4.000%, 02/15/2040 | | | 138,154 | | | | 133,818 | |
| Series 2010-3653, Class B, 4.500%, 04/15/2030 | | | 40,759 | | | | 40,645 | |
| Series 2010-3656, Class PM, 5.000%, 04/15/2040 | | | 116,487 | | | | 117,950 | |
| Series 2010-3662, Class PJ, 5.000%, 04/15/2040 | | | 145,553 | | | | 147,324 | |
| Series 2010-3664, Class DA, 4.000%, 11/15/2037 | | | 58,824 | | | | 58,130 | |
| Series 2010-3747, Class PY, 4.000%, 10/15/2040 | | | 282,069 | | | | 272,231 | |
| Series 2010-3747, Class CY, 4.500%, 10/15/2040 | | | 211,272 | | | | 208,068 | |
| Series 2010-3770, Class GA, 4.500%, 10/15/2040 | | | 322,662 | | | | 317,102 | |
| Series 2010-3770, Class JZ, 4.000%, 12/15/2040 | | | 7,398,599 | | | | 7,112,764 | |
| Series 2010-3778, Class JA, 3.500%, 04/15/2040 | | | 62,294 | | | | 61,424 | |
| Series 2011-3798, Class PJ, 4.000%, 01/15/2041 | | | 44,850 | | | | 43,347 | |
| Series 2011-3800, Class AF, 30D US SOFR + 0.61%, 02/15/2041(a) | | | 16,478 | | | | 16,354 | |
| Series 2011-3819, Class ZQ, 6.000%, 04/15/2036 | | | 11,929 | | | | 12,447 | |
| Series 2011-3822, Class FY, 30D US SOFR + 0.51%, 02/15/2033(a) | | | 17,649 | | | | 17,588 | |
| | | Principal Amount | | | Value (Note 2) | |
| Series 2011-3825, Class BP, 4.000%, 03/15/2041 | | $ | 67,802 | | | $ | 64,467 | |
| Series 2011-3843, Class PZ, 5.000%, 04/15/2041 | | | 499,149 | | | | 500,152 | |
| Series 2011-3843, Class FE, 30D US SOFR + 0.66%, 04/15/2041(a) | | | 35,645 | | | | 35,378 | |
| Series 2011-3844, Class PC, 5.000%, 04/15/2041 | | | 195,000 | | | | 192,658 | |
| Series 2011-3852, Class TP, 27.08% - 30D US SOFR, 05/15/2041(a) | | | 19,785 | | | | 19,904 | |
| Series 2011-3852, Class QN, 26.79% - 30D US SOFR, 05/15/2041(a) | | | 31,800 | | | | 30,403 | |
| Series 2011-3857, Class ZP, 5.000%, 05/15/2041 | | | 1,271,700 | | | | 1,273,443 | |
| Series 2011-3862, Class MA, 5.000%, 04/15/2041 | | | 61,962 | | | | 62,513 | |
| Series 2011-3891, Class BF, 30D US SOFR + 0.66%, 07/15/2041(a) | | | 32,638 | | | | 32,379 | |
| Series 2011-3894, Class ZA, 4.500%, 07/15/2041 | | | 334,497 | | | | 325,293 | |
| Series 2011-3905, Class BZ, 3.000%, 08/15/2041 | | | 178,038 | | | | 138,003 | |
| Series 2011-3919, Class DL, 4.000%, 08/15/2030 | | | 298,000 | | | | 288,466 | |
| Series 2011-3934, Class KB, 5.000%, 10/15/2041 | | | 495,806 | | | | 500,620 | |
| Series 2011-3935, Class JZ, 4.500%, 10/15/2041 | | | 1,145,745 | | | | 1,095,906 | |
| Series 2011-3939, Class AZ, 4.000%, 03/15/2041 | | | 320,951 | | | | 305,061 | |
| Series 2011-3939, Class BZ, 4.500%, 06/15/2041 | | | 676,495 | | | | 658,165 | |
| Series 2011-3940, Class MY, 4.000%, 10/15/2041 | | | 246,756 | | | | 234,252 | |
| Series 2011-3957, Class HZ, 4.000%, 11/15/2041 | | | 582,072 | | | | 550,796 | |
| Series 2011-3958, Class PJ, 4.500%, 09/15/2041 | | | 137,788 | | | | 135,150 | |
| Series 2011-3959, Class MB, 4.500%, 11/15/2041 | | | 44,199 | | | | 39,373 | |
| Series 2011-3963, Class JB, 4.500%, 11/15/2041 | | | 83,375 | | | | 82,190 | |
| Series 2011-3968, Class LA, 4.500%, 12/15/2041 | | | 256,711 | | | | 247,600 | |
| Series 2011-3969, Class JP, 4.500%, 09/15/2041 | | | 13,162 | | | | 13,038 | |
| Series 2011-3978, Class CZ, 3.500%, 12/15/2041 | | | 2,123,344 | | | | 1,959,635 | |
| Series 2012-3984, Class DF, 30D US SOFR + 0.66%, 01/15/2042(a) | | | 26,782 | | | | 26,575 | |
See Notes to Financial Statements and Financial Highlights.
ALPS | Smith Total Return Bond Fund
| Statement of Investments | October 31, 2024 |
| | | Principal Amount | | | Value (Note 2) | |
| Series 2012-3989, Class JW, 3.500%, 01/15/2042 | | $ | 165,786 | | | $ | 154,286 | |
| Series 2012-3994, Class JZ, 3.500%, 02/15/2042 | | | 887,425 | | | | 817,789 | |
| Series 2012-3997, Class EC, 3.500%, 02/15/2042 | | | 59,120 | | | | 49,941 | |
| Series 2012-3997, Class FQ, 30D US SOFR + 0.61%, 02/15/2042(a) | | | 34,305 | | | | 33,939 | |
| Series 2012-4001, Class FM, 30D US SOFR + 0.61%, 02/15/2042(a) | | | 22,904 | | | | 22,626 | |
| Series 2012-4010, Class FC, 30D US SOFR + 1.11%, 03/15/2042(a) | | | 239,601 | | | | 231,519 | |
| Series 2012-4011, Class DC, 4.000%, 09/15/2041 | | | 174,495 | | | | 167,475 | |
| Series 2012-4011, Class DB, 4.000%, 09/15/2041 | | | 170,486 | | | | 163,632 | |
| Series 2012-4012, Class GC, 3.500%, 06/15/2040 | | | 13,525 | | | | 13,405 | |
| Series 2012-4020, Class PG, 2.500%, 03/15/2027 | | | 9,180 | | | | 9,021 | |
| Series 2012-4037, Class CA, 3.000%, 04/15/2027 | | | 42,576 | | | | 41,755 | |
| Series 2012-4039, Class LT, 3.500%, 05/15/2042 | | | 113,000 | | | | 95,605 | |
| Series 2012-4048, Class CE, 4.000%, 05/15/2042 | | | 611,000 | | | | 567,426 | |
| Series 2012-4050, Class ND, 2.500%, 09/15/2041 | | | 8,461 | | | | 8,283 | |
| Series 2012-4062, Class MZ, 3.500%, 06/15/2042 | | | 436,677 | | | | 404,807 | |
| Series 2012-4064, Class AY, 3.000%, 06/15/2027 | | | 37,508 | | | | 36,904 | |
| Series 2012-4068, Class PE, 3.000%, 06/15/2042 | | | 327,000 | | | | 292,884 | |
| Series 2012-4075, Class PB, 3.000%, 07/15/2042 | | | 83,344 | | | | 75,005 | |
| Series 2012-4076, Class MV, 3.000%, 04/15/2031 | | | 43,305 | | | | 42,775 | |
| Series 2012-4077, Class BE, 4.000%, 07/15/2042 | | | 130,000 | | | | 116,543 | |
| Series 2012-4088, Class PB, 3.000%, 08/15/2042 | | | 116,972 | | | | 103,769 | |
| Series 2012-4094, Class CW, 2.000%, 08/15/2042 | | | 147,169 | | | | 125,070 | |
| Series 2012-4097, Class CU, 1.500%, 08/15/2027 | | | 25,000 | | | | 23,589 | |
| Series 2012-4097, Class UF, 30D US SOFR + 0.46%, 08/15/2032(a) | | | 40,490 | | | | 40,444 | |
| Series 2012-4101, Class QN, 3.500%, 09/15/2042 | | | 342,234 | | | | 315,225 | |
| Series 2012-4102, Class CB, 2.000%, 09/15/2042 | | | 150,000 | | | | 129,148 | |
| | | Principal Amount | | | Value (Note 2) | |
| Series 2012-4104, Class AJ, 1.500%, 09/15/2027 | | $ | 8,348 | | | $ | 8,062 | |
| Series 2012-4116, Class YB, 2.500%, 05/15/2042 | | | 132,000 | | | | 107,107 | |
| Series 2012-4120, Class TC, 1.500%, 10/15/2027 | | | 3,902 | | | | 3,756 | |
| Series 2012-4122, Class BA, 2.772%, 05/15/2040(a)(c) | | | 123,571 | | | | 114,486 | |
| Series 2012-4133, Class TA, 3.000%, 11/15/2042 | | | 308,106 | | | | 248,821 | |
| Series 2012-4141, Class PL, 2.500%, 12/15/2042 | | | 274,000 | | | | 191,443 | |
| Series 2013-4160, Class HB, 2.500%, 12/15/2032 | | | 14,094 | | | | 13,035 | |
| Series 2013-4161, Class LT, 2.500%, 08/15/2042 | | | 294,957 | | | | 266,591 | |
| Series 2013-4170, Class FW, 30D US SOFR + 1.06%, 01/15/2033(a) | | | 11,934 | | | | 11,869 | |
| Series 2013-4171, Class MN, 3.000%, 02/15/2043 | | | 144,000 | | | | 107,533 | |
| Series 2013-4176, Class YD, 3.000%, 03/15/2043 | | | 50,000 | | | | 41,127 | |
| Series 2013-4183, Class ME, 2.000%, 02/15/2042 | | | 306,226 | | | | 290,186 | |
| Series 2013-4185, Class PB, 3.000%, 03/15/2043 | | | 447,134 | | | | 414,403 | |
| Series 2013-4203, Class DJ, 2.500%, 04/15/2033 | | | 25,574 | | | | 24,668 | |
| Series 2013-4204, Class QP, 3.000%, 05/15/2043 | | | 153,000 | | | | 126,399 | |
| Series 2013-4218, Class DG, 2.500%, 07/15/2042 | | | 94,268 | | | | 86,491 | |
| Series 2013-4220, Class EH, 2.500%, 06/15/2028 | | | 9,166 | | | | 8,995 | |
| Series 2013-4231, Class FD, 30D US SOFR + 0.46%, 10/15/2032(a) | | | 8,227 | | | | 8,223 | |
| Series 2013-4246, Class PB, 4.000%, 09/15/2043 | | | 493,003 | | | | 427,519 | |
| Series 2013-4265, Class FD, 30D US SOFR + 0.51%, 01/15/2035(a) | | | 41,945 | | | | 41,564 | |
| Series 2013-4283, Class EW, 4.500%, 12/15/2043(a) | | | 171,297 | | | | 167,409 | |
| Series 2014-4293, Class NM, 4.500%, 06/15/2043 | | | 18,581 | | | | 18,142 | |
| Series 2014-4294, Class PF, 30D US SOFR + 0.51%, 01/15/2044(a) | | | 11,072 | | | | 10,898 | |
| Series 2014-4319, Class PM, 3.000%, 03/15/2043 | | | 41,565 | | | | 40,496 | |
| Series 2014-4320, Class AP, 3.500%, 07/15/2039 | | | 107,684 | | | | 104,542 | |
| Series 2014-4324, Class AY, 3.000%, 04/15/2029 | | | 568,738 | | | | 550,044 | |
See Notes to Financial Statements and Financial Highlights.
ALPS | Smith Total Return Bond Fund
| Statement of Investments | October 31, 2024 |
| | | Principal Amount | | | Value (Note 2) | |
| Series 2014-4368, Class GZ, 4.125%, 06/15/2041(d) | | $ | 1,306,451 | | | $ | 1,277,579 | |
| Series 2014-4370, Class PC, 2.500%, 09/15/2041 | | | 10,862 | | | | 10,634 | |
| Series 2014-4403, Class CZ, 3.000%, 10/15/2044 | | | 155,462 | | | | 88,545 | |
| Series 2014-4419, Class DC, 3.000%, 12/15/2044 | | | 240,000 | | | | 194,167 | |
| Series 2015-4457, Class KZ, 3.000%, 04/15/2045 | | | 72,925 | | | | 63,756 | |
| Series 2015-4459, Class CA, 5.000%, 12/15/2034 | | | 9,824 | | | | 9,874 | |
| Series 2015-4461, Class EA, 2.000%, 07/15/2037 | | | 55,732 | | | | 54,282 | |
| Series 2015-4498, Class JA, 2.500%, 04/15/2037 | | | 93,384 | | | | 81,169 | |
| Series 2015-4508, Class UZ, 3.000%, 07/15/2043 | | | 55,545 | | | | 43,156 | |
| Series 2016-4555, Class CP, 3.000%, 04/15/2045 | | | 312,354 | | | | 300,002 | |
| Series 2016-4564, Class QA, 3.000%, 07/15/2029 | | | 11,362 | | | | 11,310 | |
| Series 2016-4582, Class PA, 3.000%, 11/15/2045 | | | 103,438 | | | | 94,965 | |
| Series 2016-4583, Class UP, 3.000%, 07/15/2045 | | | 132,994 | | | | 121,943 | |
| Series 2016-4590, Class AK, 3.500%, 08/15/2027 | | | 32,159 | | | | 31,935 | |
| Series 2016-4601, Class CZ, 3.000%, 12/15/2045 | | | 113,958 | | | | 70,627 | |
| Series 2016-4613, Class AF, 30D US SOFR + 1.21%, 11/15/2037(a) | | | 78,167 | | | | 76,573 | |
| Series 2016-4629, Class KB, 3.000%, 11/15/2046 | | | 1,000,000 | | | | 813,621 | |
| Series 2016-4639, Class HZ, 3.250%, 04/15/2053(d) | | | 1,129,119 | | | | 896,653 | |
| Series 2017-4656, Class EZ, 4.000%, 02/15/2047 | | | 339,549 | | | | 317,777 | |
| Series 2017-4661, Class HA, 3.000%, 05/15/2043 | | | 20,781 | | | | 20,684 | |
| Series 2017-4670, Class TY, 3.000%, 03/15/2047 | | | 346,000 | | | | 278,003 | |
| Series 2017-4672, Class QD, 3.000%, 08/15/2045 | | | 25,854 | | | | 25,286 | |
| Series 2017-4680, Class PA, 3.000%, 03/15/2046 | | | 88,062 | | | | 83,705 | |
| Series 2017-4707, Class Z, 4.000%, 08/15/2047 | | | 127,809 | | | | 79,589 | |
| Series 2017-4710, Class PA, 3.000%, 04/15/2045 | | | 85,139 | | | | 82,245 | |
| Series 2017-4714, Class MY, 3.500%, 08/15/2047 | | | 1,000,000 | | | | 904,222 | |
| Series 2017-4736, Class CL, 3.000%, 12/15/2047 | | | 154,734 | | | | 130,905 | |
| | | Principal Amount | | | Value (Note 2) | |
| Series 2017-4748, Class GA, 3.000%, 01/15/2045 | | $ | 22,865 | | | $ | 22,479 | |
| Series 2018-4767, Class Z, 3.000%, 12/15/2047 | | | 37,854 | | | | 21,566 | |
| Series 2018-4773, Class DZ, 4.000%, 04/15/2048 | | | 158,294 | | | | 148,043 | |
| Series 2018-4787, Class PY, 4.000%, 05/15/2048 | | | 40,401 | | | | 37,739 | |
| Series 2018-4808, Class DG, 3.500%, 09/15/2045 | | | 521,552 | | | | 512,821 | |
| Series 2018-4813, Class CJ, 3.000%, 08/15/2048 | | | 182,617 | | | | 157,630 | |
| Series 2018-4818, Class CA, 3.000%, 04/15/2048 | | | 371,143 | | | | 326,843 | |
| Series 2018-4821, Class ZM, 3.500%, 05/15/2048 | | | 336,939 | | | | 297,175 | |
| Series 2018-4821, Class YZ, 4.000%, 02/15/2042 | | | 1,662,996 | | | | 1,449,687 | |
| Series 2018-4839, Class AE, 4.000%, 04/15/2051 | | | 215,471 | | | | 206,002 | |
| Series 2018-4846, Class PA, 4.000%, 06/15/2047 | | | 3,227 | | | | 3,204 | |
| Series 2018-4857, Class HM, 3.500%, 11/15/2046 | | | 40,509 | | | | 39,947 | |
| Series 2019-4863, Class AJ, 3.500%, 07/15/2038 | | | 39,297 | | | | 37,571 | |
| Series 2019-4863, Class H, 7.000%, 03/15/2049 | | | 125,402 | | | | 132,757 | |
| Series 2019-4896, Class BD, 3.500%, 07/25/2049 | | | 1,062,753 | | | | 908,157 | |
| Series 2019-4911, Class HG, 2.250%, 04/15/2049 | | | 1,633,889 | | | | 1,361,372 | |
| Series 2019-4926, Class BP, 3.000%, 10/25/2049 | | | 524,824 | | | | 451,787 | |
| Series 2019-4942, Class A, 3.000%, 01/25/2049 | | | 93,333 | | | | 85,908 | |
| Series 2020-4954, Class LZ, 2.500%, 02/25/2050 | | | 125,216 | | | | 56,401 | |
| Series 2020-4961, Class JB, 2.500%, 12/15/2042 | | | 123,930 | | | | 111,875 | |
| Series 2020-4989, Class FA, 30D US SOFR + 0.46%, 08/15/2040(a) | | | 109,486 | | | | 107,605 | |
| Series 2020-4989, Class FB, 30D US SOFR + 0.46%, 10/15/2040(a) | | | 104,163 | | | | 102,363 | |
| Series 2020-5000, Class HZ, 1.500%, 08/25/2050 | | | 251,525 | | | | 125,716 | |
| Series 2020-5007, Class PY, 1.500%, 08/25/2050 | | | 218,000 | | | | 89,035 | |
| Series 2020-5013, Class NH, 1.000%, 09/25/2050 | | | 173,579 | | | | 86,359 | |
| Series 2020-5014, Class BP, 1.250%, 09/25/2040 | | | 214,828 | | | | 185,462 | |
| Series 2020-5039, Class ZK, 2.500%, 11/25/2050 | | | 153,603 | | | | 73,214 | |
See Notes to Financial Statements and Financial Highlights.
ALPS | Smith Total Return Bond Fund
| Statement of Investments | October 31, 2024 |
| | | Principal Amount | | | Value (Note 2) | |
| Series 2020-5049, Class JZ, 2.000%, 11/25/2050 | | $ | 142,843 | | | $ | 64,236 | |
| Series 2020-5049, Class WB, 0.750%, 12/25/2050 | | | 336,378 | | | | 253,987 | |
| Series 2020-5068, Class UB, 0.500%, 01/25/2051 | | | 109,000 | | | | 57,473 | |
| Series 2021-5080, Class CA, 2.000%, 02/25/2051 | | | 864,862 | | | | 482,318 | |
| Series 2021-5083, Class MA, 2.000%, 03/25/2051 | | | 612,856 | | | | 358,780 | |
| Series 2021-5085, Class HA, 1.500%, 03/25/2051 | | | 147,216 | | | | 78,975 | |
| Series 2021-5092, Class BC, 2.500%, 06/25/2036 | | | 13,711 | | | | 13,544 | |
| Series 2021-5103, Class LM, 1.500%, 05/25/2041 | | | 119,098 | | | | 64,973 | |
| Series 2021-5103, Class LQ, 1.500%, 04/25/2050 | | | 199,863 | | | | 102,200 | |
| Series 2021-5119, Class LM, 1.500%, 05/25/2041 | | | 202,779 | | | | 106,965 | |
| Series 2021-5121, Class KE, 1.500%, 06/25/2051 | | | 301,427 | | | | 147,114 | |
| Series 2021-5129, Class KC, 1.500%, 11/25/2049 | | | 140,553 | | | | 121,591 | |
| Series 2021-5144, Class PC, 1.500%, 09/25/2051 | | | 358,650 | | | | 297,063 | |
| Series 2021-5156, Class EC, 1.500%, 10/25/2051 | | | 434,989 | | | | 215,337 | |
| Series 2021-5171, Class KY, 1.750%, 12/25/2051 | | | 172,000 | | | | 90,995 | |
| Series 2021-5174, Class TQ, 2.000%, 08/25/2051 | | | 480,253 | | | | 398,754 | |
| Series 2021-5178, Class LY, 1.500%, 12/25/2051 | | | 178,029 | | | | 84,363 | |
| Series 2021-5182, Class M, 2.500%, 05/25/2049 | | | 319,660 | | | | 280,923 | |
| Series 2022-5189, Class PG, 2.500%, 09/25/2051 | | | 87,000 | | | | 78,189 | |
| Series 2022-5198, Class ZM, 3.000%, 02/25/2052 | | | 643,388 | | | | 496,512 | |
| Series 2022-5200, Class WK, 2.500%, 03/25/2052 | | | 217,000 | | | | 138,673 | |
| Series 2022-5201, Class CA, 2.500%, 07/25/2048 | | | 604,585 | | | | 542,353 | |
| Series 2022-5207, Class CZ, 3.500%, 03/25/2052 | | | 378,793 | | | | 235,802 | |
| Series 2022-5208, Class AL, 2.500%, 04/25/2042 | | | 1,386,302 | | | | 1,019,083 | |
| Series 2022-5224, Class HL, 4.000%, 04/25/2052 | | | 1,700,000 | | | | 1,526,212 | |
| Series 2022-5230, Class PE, 2.000%, 12/25/2051 | | | 600,000 | | | | 473,224 | |
| Series 2022-5234, Class PH, 3.500%, 04/25/2051 | | | 758,748 | | | | 722,923 | |
| | | Principal
Amount | | | Value (Note 2) | |
| Series 2024-5407, Class LB, 6.000%, 05/25/2054 | | $ | 6,901,530 | | | $ | 6,989,842 | |
| | | | | | | | 65,875,832 | |
| Freddie Mac Strips | | | | | | | | |
| Series 2013-299, Class 300, 3.000%, 01/15/2043 | | | 148,874 | | | | 135,395 | |
| Series 2013-300, Class 300, 3.000%, 01/15/2043 | | | 122,367 | | | | 110,326 | |
| | | | | | | | 245,721 | |
| Freddie Mac Structured Pass-Through Certificates | | | | | | | | |
| Series 2001-32, Class A1, 1M US SOFR + 0.37%, 08/25/2031(a) | | | 61,082 | | | | 63,695 | |
| Series 2002-41, Class 3A, 4.348%, 07/25/2032(a) | | | 1,841,032 | | | | 1,682,413 | |
| Series 2003-55, Class 1A3A, 30D US SOFR + 0.51%, 03/25/2043(a) | | | 229,125 | | | | 228,246 | |
| | | | | | | | 1,974,354 | |
| Ginnie Mae | | | | | | | | |
| Series 2003-76, Class TG, 5.500%, 09/20/2033 | | | 121,413 | | | | 121,047 | |
| Series 2003-98, Class FY, 1M US SOFR + 0.46%, 09/20/2033(a) | | | 4,161 | | | | 4,159 | |
| Series 2004-1, Class TE, 5.000%, 06/20/2033 | | | 18,609 | | | | 18,478 | |
| Series 2004-15, Class AY, 5.500%, 02/20/2034 | | | 132,215 | | | | 133,603 | |
| Series 2004-22, Class AZ, 5.500%, 04/20/2034 | | | 175,559 | | | | 177,816 | |
| Series 2004-26, Class ED, 5.500%, 04/16/2034 | | | 54,054 | | | | 54,660 | |
| Series 2004-34, Class QL, 5.500%, 05/16/2034 | | | 135,625 | | | | 136,714 | |
| Series 2004-55, Class MC, 5.500%, 07/20/2034 | | | 33,658 | | | | 34,084 | |
| Series 2004-7, Class Z, 5.500%, 01/16/2034 | | | 1,561,263 | | | | 1,570,215 | |
| Series 2004-87, Class BC, 4.500%, 10/20/2034 | | | 10,323 | | | | 10,280 | |
| Series 2005-11, Class PL, 5.000%, 02/20/2035 | | | 25,909 | | | | 25,865 | |
| Series 2005-13, Class NB, 5.000%, 02/20/2035 | | | 9,257 | | | | 9,239 | |
| Series 2005-13, Class BG, 5.000%, 02/20/2035 | | | 145,633 | | | | 145,974 | |
| Series 2005-3, Class JL, 5.000%, 12/16/2034 | | | 55,647 | | | | 55,647 | |
| Series 2005-3, Class JM, 4.750%, 01/20/2035 | | | 39,853 | | | | 39,333 | |
| Series 2005-3, Class OC, 5.000%, 01/20/2035 | | | 135,953 | | | | 136,001 | |
| Series 2005-3, Class QB, 5.000%, 01/16/2035 | | | 43,672 | | | | 43,687 | |
See Notes to Financial Statements and Financial Highlights.
ALPS | Smith Total Return Bond Fund
| Statement of Investments | October 31, 2024 |
| | | Principal
Amount | | | Value (Note 2) | |
| Series 2005-44, Class GZ, 5.000%, 07/20/2035 | | $ | 93,113 | | | $ | 92,993 | |
| Series 2005-45, Class BF, 1M US SOFR + 0.41%, 06/20/2035(a) | | | 27,943 | | | | 27,682 | |
| Series 2005-49, Class B, 5.500%, 06/20/2035 | | | 64,156 | | | | 65,114 | |
| Series 2005-51, Class DC, 5.000%, 07/20/2035 | | | 98,199 | | | | 98,445 | |
| Series 2005-56, Class JA, 5.000%, 05/17/2035 | | | 10,399 | | | | 10,399 | |
| Series 2005-56, Class BD, 5.000%, 07/20/2035 | | | 33,554 | | | | 33,599 | |
| Series 2005-69, Class WD, 5.000%, 05/18/2035 | | | 35,403 | | | | 35,401 | |
| Series 2005-73, Class PH, 5.000%, 09/20/2035 | | | 93,632 | | | | 93,507 | |
| Series 2005-92, Class PB, 6.000%, 12/20/2035 | | | 126,872 | | | | 130,847 | |
| Series 2006-10, Class PB, 5.500%, 03/20/2036 | | | 213,443 | | | | 216,921 | |
| Series 2006-38, Class OH, 6.500%, 08/20/2036 | | | 23,249 | | | | 23,178 | |
| Series 2007-18, Class PH, 5.500%, 03/20/2035 | | | 137,000 | | | | 139,281 | |
| Series 2007-18, Class B, 5.500%, 05/20/2035 | | | 60,587 | | | | 61,344 | |
| Series 2007-35, Class TE, 6.000%, 06/20/2037 | | | 86,886 | | | | 89,283 | |
| Series 2007-35, Class NE, 6.000%, 06/16/2037 | | | 38,738 | | | | 39,764 | |
| Series 2007-40, Class FY, 1M US SOFR + 0.44%, 07/16/2037(a) | | | 27,253 | | | | 27,113 | |
| Series 2007-44, Class PH, 6.000%, 07/20/2037 | | | 99,196 | | | | 102,170 | |
| Series 2007-57, Class Z, 5.500%, 10/20/2037 | | | 862,778 | | | | 875,614 | |
| Series 2007-6, Class LE, 5.500%, 02/20/2037 | | | 221,122 | | | | 223,382 | |
| Series 2007-7, Class PG, 5.000%, 02/16/2037 | | | 20,503 | | | | 20,514 | |
| Series 2007-79, Class FC, 1M US SOFR + 0.55%, 12/20/2037(a) | | | 100,594 | | | | 100,547 | |
| Series 2008-13, Class FB, 1M US SOFR + 0.61%, 02/20/2038(a) | | | 20,118 | | | | 20,077 | |
| Series 2008-20, Class CE, 5.500%, 06/16/2037 | | | 192,325 | | | | 195,541 | |
| Series 2008-21, Class PZ, 5.500%, 11/20/2037 | | | 356,038 | | | | 355,335 | |
| Series 2008-31, Class PC, 5.500%, 04/20/2038 | | | 40,677 | | | | 41,183 | |
| Series 2008-33, Class PB, 5.500%, 04/20/2038 | | | 116,834 | | | | 118,289 | |
| | | Principal Amount | | | Value (Note 2) | |
| Series 2008-37, Class L, 6.000%, 04/20/2038 | | $ | 33,914 | | | $ | 34,432 | |
| Series 2008-38, Class BG, 5.000%, 05/16/2038 | | | 64,962 | | | | 64,877 | |
| Series 2008-38, Class PL, 5.500%, 05/20/2038 | | | 178,578 | | | | 181,773 | |
| Series 2008-38, Class PN, 5.500%, 05/20/2038 | | | 34,344 | | | | 34,959 | |
| Series 2008-40, Class PL, 5.250%, 05/16/2038 | | | 118,000 | | | | 119,836 | |
| Series 2008-41, Class PE, 5.500%, 05/20/2038 | | | 58,644 | | | | 59,754 | |
| Series 2008-43, Class NB, 5.500%, 05/20/2038 | | | 113,432 | | | | 113,988 | |
| Series 2008-47, Class ML, 5.250%, 06/16/2038 | | | 21,952 | | | | 22,197 | |
| Series 2008-49, Class PB, 4.750%, 06/20/2038 | | | 23,968 | | | | 23,762 | |
| Series 2008-50, Class KB, 6.000%, 06/20/2038 | | | 188,985 | | | | 193,797 | |
| Series 2008-51, Class PH, 5.250%, 06/20/2038 | | | 33,674 | | | | 34,053 | |
| Series 2008-51, Class FG, 1M US SOFR + 0.88%, 06/16/2038(a) | | | 67,032 | | | | 67,316 | |
| Series 2008-55, Class PL, 5.500%, 06/20/2038 | | | 26,495 | | | | 26,711 | |
| Series 2008-58, Class PE, 5.500%, 07/16/2038 | | | 67,200 | | | | 68,258 | |
| Series 2008-60, Class JP, 5.500%, 07/20/2038 | | | 199,233 | | | | 200,820 | |
| Series 2008-60, Class JN, 5.500%, 07/20/2038 | | | 100,328 | | | | 101,192 | |
| Series 2008-65, Class PG, 6.000%, 08/20/2038 | | | 179,179 | | | | 180,387 | |
| Series 2008-66, Class FN, 1M US SOFR + 1.06%, 08/20/2038(a) | | | 71,114 | | | | 71,627 | |
| Series 2008-7, Class PQ, 5.000%, 02/20/2038 | | | 78,982 | | | | 78,543 | |
| Series 2008-76, Class QE, 5.750%, 09/20/2038 | | | 58,000 | | | | 58,360 | |
| Series 2008-77, Class FC, 1M US SOFR + 0.81%, 09/20/2038(a) | | | 48,335 | | | | 48,363 | |
| Series 2008-85, Class PG, 5.250%, 10/20/2038 | | | 28,431 | | | | 28,346 | |
| Series 2008-89, Class JC, 5.500%, 08/20/2038 | | | 33,434 | | | | 33,327 | |
| Series 2008-89, Class JD, 6.000%, 08/20/2038 | | | 38,835 | | | | 38,706 | |
| Series 2008-9, Class FA, 1M US SOFR + 0.61%, 02/20/2038(a) | | | 13,913 | | | | 13,915 | |
See Notes to Financial Statements and Financial Highlights.
ALPS | Smith Total Return Bond Fund
| Statement of Investments | October 31, 2024 |
| | | Principal
Amount | | | Value (Note 2) | |
| Series 2009-1, Class FA, 1M US SOFR + 1.16%, 01/20/2039(a) | | $ | 58,293 | | | $ | 58,919 | |
| Series 2009-10, Class PH, 4.500%, 02/20/2039 | | | 24,466 | | | | 24,052 | |
| Series 2009-10, Class NB, 5.000%, 02/16/2039 | | | 64,499 | | | | 64,459 | |
| Series 2009-118, Class PY, 5.000%, 12/16/2039 | | | 15,398 | | | | 15,326 | |
| Series 2009-12, Class NB, 5.000%, 03/20/2039 | | | 45,006 | | | | 44,711 | |
| Series 2009-13, Class E, 4.500%, 03/16/2039 | | | 81,759 | | | | 80,401 | |
| Series 2009-15, Class FM, 1M US SOFR + 1.15%, 03/20/2039(a) | | | 55,008 | | | | 55,208 | |
| Series 2009-24, Class WB, 5.000%, 03/20/2039 | | | 183,721 | | | | 182,466 | |
| Series 2009-32, Class ZA, 5.500%, 05/20/2039 | | | 337,056 | | | | 346,814 | |
| Series 2009-40, Class AD, 4.500%, 06/20/2039 | | | 309,000 | | | | 301,434 | |
| Series 2009-47, Class LT, 5.000%, 06/20/2039 | | | 95,460 | | | | 95,277 | |
| Series 2009-55, Class FN, 1M US SOFR + 1.11%, 07/20/2039(a) | | | 20,236 | | | | 20,429 | |
| Series 2009-58, Class PA, 4.500%, 07/20/2039 | | | 62,695 | | | | 61,014 | |
| Series 2009-61, Class MP, 5.000%, 08/20/2039 | | | 27,315 | | | | 27,293 | |
| Series 2009-61, Class AP, 4.000%, 08/20/2039 | | | 30,013 | | | | 29,141 | |
| Series 2009-69, Class PH, 5.500%, 08/16/2039 | | | 92,000 | | | | 91,579 | |
| Series 2009-75, Class GZ, 4.500%, 09/20/2039 | | | 79,827 | | | | 78,884 | |
| Series 2009-76, Class JB, 4.500%, 07/20/2039 | | | 15,527 | | | | 15,479 | |
| Series 2009-76, Class XA, 5.500%, 09/16/2039 | | | 425,664 | | | | 427,064 | |
| Series 2009-77, Class KJ, 5.000%, 09/20/2039 | | | 95,333 | | | | 96,067 | |
| Series 2009-83, Class TF, 1M US SOFR + 1.01%, 08/20/2039(a) | | | 32,738 | | | | 32,968 | |
| Series 2009-94, Class FA, 1M US SOFR + 0.81%, 10/16/2039(a) | | | 66,570 | | | | 66,682 | |
| Series 2010-103, Class WA, 5.662%, 08/20/2034(a) | | | 186,167 | | | | 188,912 | |
| Series 2010-105, Class BH, 3.000%, 01/16/2040 | | | 57,756 | | | | 55,594 | |
| Series 2010-111, Class FA, 1M US SOFR + 0.46%, 09/20/2040(a) | | | 38,581 | | | | 38,184 | |
| | | Principal Amount | | | Value (Note 2) | |
| Series 2010-134, Class YL, 4.500%, 10/20/2040 | | $ | 101,000 | | | $ | 97,425 | |
| Series 2010-14, Class HA, 4.500%, 02/16/2040 | | | 104,821 | | | | 104,005 | |
| Series 2010-147, Class PG, 3.500%, 05/20/2040 | | | 35,092 | | | | 34,549 | |
| Series 2010-157, Class OP, -%, 12/20/2040(b) | | | 8,095 | | | | 6,842 | |
| Series 2010-167, Class WL, 4.500%, 09/20/2040 | | | 738,957 | | | | 719,745 | |
| Series 2010-169, Class JZ, 4.000%, 12/20/2040 | | | 185,475 | | | | 175,684 | |
| Series 2010-19, Class GW, 4.750%, 02/20/2040 | | | 108,305 | | | | 99,853 | |
| Series 2010-62, Class AF, 1M US SOFR + 0.56%, 04/16/2034(a) | | | 12,134 | | | | 12,132 | |
| Series 2010-76, Class NC, 4.500%, 06/20/2040 | | | 113,194 | | | | 106,802 | |
| Series 2010-84, Class YB, 4.000%, 07/20/2040 | | | 18,150 | | | | 17,334 | |
| Series 2010-H01, Class FA, 1M US SOFR + 0.93%, 01/20/2060(a) | | | 10,466 | | | | 10,490 | |
| Series 2010-H10, Class FC, 1M US SOFR + 1.11%, 05/20/2060(a) | | | 54,207 | | | | 54,456 | |
| Series 2010-H20, Class AF, 1M US SOFR + 0.44%, 10/20/2060(a) | | | 57,386 | | | | 57,141 | |
| Series 2010-H22, Class FE, 1M US SOFR + 0.46%, 05/20/2059(a) | | | 709 | | | | 704 | |
| Series 2010-H27, Class FA, 1M US SOFR + 0.49%, 12/20/2060(a) | | | 19,413 | | | | 19,336 | |
| Series 2011-100, Class MY, 4.000%, 07/20/2041 | | | 170,743 | | | | 164,192 | |
| Series 2011-128, Class MD, 4.000%, 10/20/2040 | | | 87,630 | | | | 86,747 | |
| Series 2011-137, Class WA, 5.591%, 07/20/2040(a) | | | 178,382 | | | | 181,203 | |
| Series 2011-18, Class PA, 4.000%, 08/20/2040 | | | 8,422 | | | | 8,375 | |
| Series 2011-59, Class QC, 4.000%, 12/20/2040 | | | 191,081 | | | | 186,193 | |
| Series 2011-66, Class UA, 4.000%, 05/16/2041 | | | 148,383 | | | | 137,734 | |
| Series 2011-71, Class ZC, 5.500%, 07/16/2034 | | | 150,247 | | | | 151,702 | |
| Series 2011-97, Class WA, 6.087%, 11/20/2038(a) | | | 26,288 | | | | 26,977 | |
| Series 2011-H01, Class AF, 1M US SOFR + 0.56%, 11/20/2060(a) | | | 43,832 | | | | 43,739 | |
See Notes to Financial Statements and Financial Highlights.
ALPS | Smith Total Return Bond Fund
| Statement of Investments | October 31, 2024 |
| | | Principal Amount | | | Value
(Note 2) | |
| Series 2011-H11, Class FB, 1M US SOFR + 0.61%, 04/20/2061(a) | | $ | 24,042 | | | $ | 23,987 | |
| Series 2011-H11, Class FA, 1M US SOFR + 0.61%, 03/20/2061(a) | | | 66,988 | | | | 66,886 | |
| Series 2011-H15, Class FA, 1M US SOFR + 0.56%, 06/20/2061(a) | | | 15,996 | | | | 15,955 | |
| Series 2012-108, Class CB, 2.500%, 09/20/2042 | | | 149,000 | | | | 118,202 | |
| Series 2012-116, Class BY, 3.000%, 09/16/2042 | | | 267,000 | | | | 212,324 | |
| Series 2012-127, Class PG, 1.750%, 09/16/2042 | | | 125,039 | | | | 112,756 | |
| Series 2012-32, Class PE, 3.500%, 03/16/2042 | | | 117,000 | | | | 104,837 | |
| Series 2012-38, Class PL, 3.250%, 01/20/2041 | | | 17,894 | | | | 17,685 | |
| Series 2012-39, Class GA, 3.000%, 10/16/2040 | | | 22,797 | | | | 22,000 | |
| Series 2012-51, Class VM, 3.500%, 04/16/2025 | | | 14,070 | | | | 13,974 | |
| Series 2012-56, Class HZ, 3.500%, 06/20/2040 | | | 1,341,594 | | | | 1,194,636 | |
| Series 2012-68, Class GE, 3.000%, 05/20/2042 | | | 4,247 | | | | 3,317 | |
| Series 2012-76, Class GF, 1M US SOFR + 0.41%, 06/16/2042(a) | | | 19,431 | | | | 19,254 | |
| Series 2012-84, Class TB, 2.500%, 07/20/2042 | | | 390,245 | | | | 320,795 | |
| Series 2012-H08, Class FC, 1M US SOFR + 0.68%, 04/20/2062(a) | | | 163,242 | | | | 163,106 | |
| Series 2012-H14, Class FK, 1M US SOFR + 0.69%, 07/20/2062(a) | | | 82,731 | | | | 82,615 | |
| Series 2012-H20, Class PT, 5.648%, 07/20/2062(a) | | | 10,663 | | | | 10,630 | |
| Series 2012-H24, Class FE, 1M US SOFR + 0.71%, 10/20/2062(a) | | | 935 | | | | 932 | |
| Series 2013-100, Class MA, 3.500%, 02/20/2043 | | | 26,957 | | | | 26,426 | |
| Series 2013-115, Class PM, 4.000%, 08/20/2043 | | | 390,178 | | | | 360,357 | |
| Series 2013-169, Class EZ, 3.250%, 11/16/2043 | | | 114,016 | | | | 98,573 | |
| Series 2013-22, Class GB, 2.500%, 08/20/2042 | | | 115,781 | | | | 101,857 | |
| Series 2013-41, Class MY, 3.000%, 03/20/2043 | | | 263,698 | | | | 235,043 | |
| Series 2013-54, Class WA, 4.897%, 11/20/2042(a) | | | 359,788 | | | | 360,871 | |
| | | Principal Amount | | | Value
(Note 2) | |
| Series 2013-6, Class BE, 3.000%, 01/20/2043 | | $ | 104,000 | | | $ | 78,149 | |
| Series 2013-69, Class NA, 2.000%, 09/20/2042 | | | 168,581 | | | | 148,348 | |
| Series 2013-70, Class LA, 1.000%, 05/20/2043 | | | 101,453 | | | | 83,061 | |
| Series 2013-93, Class CA, 6.000%, 06/20/2043 | | | 898,775 | | | | 925,322 | |
| Series 2013-98, Class KF, 1M US SOFR + 0.41%, 11/20/2041(a) | | | 5,085 | | | | 5,073 | |
| Series 2013-99, Class MF, 1M US SOFR + 0.41%, 07/20/2043(a) | | | 52,805 | | | | 51,886 | |
| Series 2013-H01, Class FA, 1.650%, 01/20/2063 | | | 2 | | | | 2 | |
| Series 2013-H04, Class BA, 1.650%, 02/20/2063 | | | 1,569 | | | | 1,441 | |
| Series 2013-H07, Class GA, 1M US SOFR + 0.58%, 03/20/2063(a) | | | 44,710 | | | | 44,588 | |
| Series 2013-H09, Class HA, 1.650%, 04/20/2063 | | | 5,035 | | | | 4,737 | |
| Series 2013-H18, Class EA, 1M US SOFR + 0.61%, 07/20/2063(a) | | | 4,056 | | | | 4,046 | |
| Series 2014-118, Class ZP, 4.000%, 08/20/2044 | | | 428,896 | | | | 402,302 | |
| Series 2014-119, Class ZK, 3.500%, 08/16/2044 | | | 1,141,293 | | | | 1,045,386 | |
| Series 2014-32, Class DA, 3.500%, 02/20/2044 | | | 101,590 | | | | 86,112 | |
| Series 2014-53, Class JM, 6.976%, 04/20/2039(a) | | | 130,676 | | | | 137,320 | |
| Series 2014-98, Class HE, 3.000%, 07/20/2044 | | | 53,984 | | | | 43,033 | |
| Series 2014-98, Class ZP, 3.000%, 07/16/2044 | | | 244,159 | | | | 185,422 | |
| Series 2014-H10, Class TA, 1M US SOFR + 0.71%, 04/20/2064(a) | | | 238,703 | | | | 238,606 | |
| Series 2014-H15, Class FA, 1M US SOFR + 0.61%, 07/20/2064(a) | | | 16,183 | | | | 16,157 | |
| Series 2014-H16, Class FL, 1M US SOFR + 0.58%, 07/20/2064(a) | | | 271,858 | | | | 270,837 | |
| Series 2014-H19, Class HA, 3.000%, 09/20/2064 | | | 24,804 | | | | 24,196 | |
| Series 2015-100, Class PD, 3.000%, 07/20/2045 | | | 190,263 | | | | 172,704 | |
| Series 2015-190, Class LE, 3.500%, 06/20/2045 | | | 3,595 | | | | 3,571 | |
| Series 2015-63, Class KA, 3.000%, 04/20/2040 | | | 33,494 | | | | 27,693 | |
See Notes to Financial Statements and Financial Highlights.
ALPS | Smith Total Return Bond Fund
| Statement of Investments | October 31, 2024 |
| | | Principal
Amount | | | Value (Note 2) | |
| Series 2015-84, Class QA, 3.500%, 06/20/2045 | | $ | 221,586 | | | $ | 198,650 | |
| Series 2015-91, Class QA, 2.908%, 05/20/2045(a) | | | 1,391,248 | | | | 1,212,416 | |
| Series 2015-H09, Class FA, 1M US SOFR + 0.73%, 04/20/2065(a) | | | 197,290 | | | | 196,926 | |
| Series 2015-H12, Class FB, 1M US SOFR + 0.71%, 05/20/2065(a) | | | 46,745 | | | | 46,657 | |
| Series 2015-H15, Class FC, 1M US SOFR + 0.69%, 06/20/2065(a) | | | 78,565 | | | | 78,357 | |
| Series 2015-H22, Class FC, 1M US SOFR + 0.71%, 09/20/2065(a) | | | 32,923 | | | | 32,852 | |
| Series 2015-H26, Class FA, 1M US SOFR + 0.63%, 10/20/2065(a) | | | 36,784 | | | | 36,739 | |
| Series 2015-H26, Class FG, 1M US SOFR + 0.63%, 10/20/2065(a) | | | 169,342 | | | | 168,789 | |
| Series 2015-H27, Class FA, 1M US SOFR + 0.86%, 09/20/2065(a) | | | 1,535,706 | | | | 1,535,281 | |
| Series 2015-H29, Class FA, 1M US SOFR + 0.81%, 10/20/2065(a) | | | 959 | | | | 958 | |
| Series 2015-H30, Class FE, 1M US SOFR + 0.71%, 11/20/2065(a) | | | 35,862 | | | | 35,853 | |
| Series 2015-H31, Class FT, 1M US SOFR + 0.76%, 11/20/2065(a) | | | 8,945 | | | | 8,942 | |
| Series 2015-H32, Class FH, 1M US SOFR + 0.77%, 12/20/2065(a) | | | 118,351 | | | | 118,399 | |
| Series 2016-116, Class GV, 3.000%, 05/20/2026 | | | 17,864 | | | | 17,494 | |
| Series 2016-120, Class KA, 2.000%, 09/20/2046 | | | 4,738 | | | | 3,683 | |
| Series 2016-136, Class PJ, 3.500%, 01/20/2046 | | | 190,662 | | | | 160,788 | |
| Series 2016-136, Class MY, 2.500%, 10/20/2046 | | | 100,000 | | | | 63,812 | |
| Series 2016-163, Class B, 3.000%, 10/20/2046 | | | 119,000 | | | | 88,329 | |
| Series 2016-19, Class AC, 3.000%, 02/20/2046 | | | 259,000 | | | | 214,030 | |
| Series 2016-46, Class Z, 3.000%, 04/20/2046 | | | 125,135 | | | | 82,473 | |
| Series 2016-82, Class BA, 3.000%, 09/20/2045 | | | 28,207 | | | | 27,731 | |
| Series 2016-H06, Class FC, 1M US SOFR + 1.03%, 02/20/2066(a) | | | 93,301 | | | | 93,464 | |
| | | Principal Amount | | | Value (Note 2) | |
| Series 2016-H08, Class FT, 1M US SOFR + 0.83%, 02/20/2066(a) | | $ | 36,158 | | | $ | 36,148 | |
| Series 2016-H11, Class F, 1M US SOFR + 0.91%, 05/20/2066(a) | | | 2,469,337 | | | | 2,470,116 | |
| Series 2016-H13, Class FT, 1M US SOFR + 0.69%, 05/20/2066(a) | | | 3,997 | | | | 3,995 | |
| Series 2016-H14, Class FA, 1M US SOFR + 0.91%, 06/20/2066(a) | | | 404,145 | | | | 404,241 | |
| Series 2016-H15, Class FA, 1M US SOFR + 0.91%, 07/20/2066(a) | | | 863,373 | | | | 863,588 | |
| Series 2016-H17, Class FC, 1M US SOFR + 0.94%, 08/20/2066(a) | | | 144,480 | | | | 144,582 | |
| Series 2016-H17, Class FK, 1M US SOFR + 0.96%, 07/20/2066(a) | | | 43,931 | | | | 43,974 | |
| Series 2016-H17, Class HA, 2.250%, 03/20/2066 | | | 115,638 | | | | 112,810 | |
| Series 2016-H20, Class PT, 7.955%, 09/20/2066(a) | | | 387,972 | | | | 397,102 | |
| Series 2016-H23, Class PT, 7.752%, 09/20/2066(a) | | | 505,773 | | | | 514,511 | |
| Series 2016-H23, Class F, 1M US SOFR + 0.86%, 10/20/2066(a) | | | 124,475 | | | | 124,633 | |
| Series 2016-H24, Class FG, 1M US SOFR + 0.86%, 10/20/2066(a) | | | 367,914 | | | | 367,794 | |
| Series 2016-H26, Class FC, 1M US SOFR + 1.11%, 12/20/2066(a) | | | 80,528 | | | | 80,776 | |
| Series 2017-150, Class JE, 3.000%, 07/20/2047 | | | 55,239 | | | | 51,053 | |
| Series 2017-170, Class MC, 2.500%, 10/20/2047 | | | 50,509 | | | | 44,579 | |
| Series 2017-36, Class MJ, 3.000%, 03/20/2047 | | | 32,460 | | | | 28,017 | |
| Series 2017-56, Class AZ, 3.000%, 04/20/2047 | | | 119,605 | | | | 97,210 | |
| Series 2017-80, Class BJ, 3.000%, 03/20/2047 | | | 79,126 | | | | 71,602 | |
| Series 2017-80, Class LO, -%, 05/20/2047(b) | | | 98,373 | | | | 73,665 | |
| Series 2017-H06, Class FE, 1M US SOFR + 0.66%, 02/20/2067(a) | | | 49,592 | | | | 49,542 | |
| Series 2017-H14, Class FD, 1M US SOFR + 0.58%, 06/20/2067(a) | | | 76,509 | | | | 76,153 | |
See Notes to Financial Statements and Financial Highlights.
ALPS | Smith Total Return Bond Fund
| Statement of Investments | October 31, 2024 |
| | | Principal
Amount | | | Value (Note 2) | |
| Series 2017-H15, Class FC, 1M US SOFR + 0.58%, 06/20/2067(a) | | $ | 150,338 | | | $ | 150,068 | |
| Series 2017-H16, Class PT, 4.690%, 05/20/2066(a) | | | 10,453 | | | | 10,327 | |
| Series 2017-H17, Class FG, 1M US SOFR + 0.61%, 08/20/2067(a) | | | 14,170 | | | | 14,145 | |
| Series 2017-H22, Class FH, 1Y US SOFR + 0.94%, 11/20/2067(a) | | | 216,439 | | | | 215,908 | |
| Series 2018-131, Class QA, 3.000%, 12/20/2047 | | | 238,906 | | | | 217,073 | |
| Series 2018-160, Class AD, 3.500%, 02/20/2048 | | | 200,813 | | | | 189,015 | |
| Series 2018-36, Class CZ, 4.000%, 03/20/2048 | | | 289,034 | | | | 248,400 | |
| Series 2018-37, Class C, 2.500%, 01/20/2046 | | | 127,141 | | | | 117,575 | |
| Series 2018-H07, Class FD, 1M US SOFR + 0.41%, 05/20/2068(a) | | | 78,150 | | | | 78,197 | |
| Series 2018-H09, Class FA, 1Y US SOFR + 1.22%, 04/20/2068(a) | | | 383,770 | | | | 389,438 | |
| Series 2019-1, Class EY, 4.000%, 10/20/2048 | | | 1,066,499 | | | | 960,867 | |
| Series 2019-103, Class EK, 4.000%, 04/20/2049 | | | 2,921,162 | | | | 2,684,676 | |
| Series 2019-111, Class TE, 2.000%, 09/20/2049 | | | 38,093 | | | | 31,503 | |
| Series 2019-128, Class AL, 2.500%, 10/20/2049 | | | 300,000 | | | | 204,519 | |
| Series 2019-15, Class A, -%, 07/20/2048(b) | | | 300,226 | | | | 182,438 | |
| Series 2019-18, Class HD, 3.500%, 02/20/2049 | | | 165,000 | | | | 145,470 | |
| Series 2019-36, Class PD, 3.000%, 02/20/2049 | | | 226,477 | | | | 202,563 | |
| Series 2019-H01, Class FT, 1M US SOFR + 0.51%, 10/20/2068(a) | | | 19,561 | | | | 19,500 | |
| Series 2019-H04, Class BA, 3.000%, 01/20/2069 | | | 67,735 | | | | 66,610 | |
| Series 2019-H05, Class FT, 1Y US TI + 0.43%, 04/20/2069(a) | | | 17,311 | | | | 17,306 | |
| Series 2019-H08, Class FM, 1M US SOFR + 0.76%, 05/20/2069(a) | | | 1,796,256 | | | | 1,785,684 | |
| Series 2020-122, Class GZ, 3.000%, 08/20/2050 | | | 265,115 | | | | 169,646 | |
| Series 2020-125, Class GC, 2.500%, 08/20/2050 | | | 21,055 | | | | 17,456 | |
| Series 2020-125, Class GA, 2.500%, 03/20/2050 | | | 312,674 | | | | 275,989 | |
| | | Principal Amount | | | Value
(Note 2) | |
| Series 2020-127, Class LZ, 1.500%, 08/20/2050 | | $ | 569,482 | | | $ | 230,312 | |
| Series 2020-134, Class ZU, 3.000%, 09/20/2050 | | | 114,664 | | | | 66,207 | |
| Series 2020-148, Class ZP, 2.000%, 10/20/2050 | | | 230,725 | | | | 92,860 | |
| Series 2020-149, Class LU, 1.000%, 10/20/2050 | | | 199,996 | | | | 88,458 | |
| Series 2020-153, Class MP, 2.500%, 10/20/2050 | | | 292,545 | | | | 253,496 | |
| Series 2020-153, Class ML, 2.500%, 10/20/2050 | | | 275,384 | | | | 230,071 | |
| Series 2020-187, Class KZ, 2.000%, 12/20/2050 | | | 167,340 | | | | 62,722 | |
| Series 2020-32, Class UM, 2.500%, 03/20/2050 | | | 1,137,694 | | | | 1,003,037 | |
| Series 2020-5, Class LC, 3.500%, 10/20/2049 | | | 122,617 | | | | 113,157 | |
| Series 2020-61, Class AB, 3.000%, 05/20/2048 | | | 43,785 | | | | 43,066 | |
| Series 2020-62, Class WD, 0.466%, 05/20/2050(a) | | | 488,945 | | | | 278,808 | |
| Series 2020-62, Class PD, 3.000%, 05/20/2050 | | | 439,311 | | | | 378,849 | |
| Series 2020-83, Class ML, 3.000%, 06/20/2050 | | | 113,602 | | | | 100,914 | |
| Series 2020-98, Class CE, 3.000%, 07/20/2050 | | | 1,129,115 | | | | 993,104 | |
| Series 2020-H01, Class FT, 1Y US TI + 0.50%, 01/20/2070(a) | | | 20,468 | | | | 20,362 | |
| Series 2020-H02, Class DA, 2.250%, 12/20/2069 | | | 86,137 | | | | 84,075 | |
| Series 2020-H04, Class FP, 1M US SOFR + 0.61%, 06/20/2069(a) | | | 188,471 | | | | 188,057 | |
| Series 2020-H12, Class FE, 1M US SOFR + 1.21%, 06/20/2070(a) | | | 958,804 | | | | 974,382 | |
| Series 2020-H13, Class FA, 1M US SOFR + 0.56%, 07/20/2070(a) | | | 184,651 | | | | 182,096 | |
| Series 2021-104, Class AL, 1.500%, 06/20/2051 | | | 120,000 | | | | 54,820 | |
| Series 2021-116, Class WZ, 2.000%, 07/20/2051 | | | 381,892 | | | | 198,937 | |
| Series 2021-116, Class LZ, 2.500%, 07/20/2051 | | | 340,916 | | | | 210,712 | |
| Series 2021-142, Class PZ, 0.750%, 08/20/2051 | | | 307,208 | | | | 166,891 | |
| Series 2021-146, Class PO, -%, 07/20/2051(b) | | | 338,715 | | | | 115,452 | |
| Series 2021-146, Class DE, 1.750%, 08/20/2051 | | | 376,993 | | | | 332,320 | |
| Series 2021-158, Class GK, 2.000%, 09/20/2051 | | | 150,493 | | | | 92,597 | |
See Notes to Financial Statements and Financial Highlights.
ALPS | Smith Total Return Bond Fund
| Statement of Investments | October 31, 2024 |
| | | Principal Amount | | Value
(Note 2) |
| Series 2021-205, Class NK, 1.500%, 11/20/2051 | | $ | 215,000 | | | $ | 131,945 | |
| Series 2021-25, Class HA, 2.000%, 02/20/2051 | | | 721,563 | | | | 589,690 | |
| Series 2021-8, Class KZ, 2.000%, 01/20/2051 | | | 157,361 | | | | 59,028 | |
| Series 2021-8, Class AQ, 5.000%, 01/20/2051 | | | 137,735 | | | | 135,533 | |
| Series 2021-H01, Class FA, 1M US SOFR + 1.36%, 11/20/2070(a) | | | 2,799,136 | | | | 2,844,212 | |
| Series 2021-H12, Class GA, 4.567%, 07/20/2071(a) | | | 85,286 | | | | 84,451 | |
| Series 2022-100, Class EB, 3.000%, 06/20/2052 | | | 1,729,475 | | | | 1,318,710 | |
| Series 2022-104, Class KY, 4.500%, 06/20/2052 | | | 383,627 | | | | 342,101 | |
| Series 2022-112, Class BM, 3.000%, 06/20/2052 | | | 344,718 | | | | 257,006 | |
| Series 2022-126, Class BY, 3.000%, 07/20/2052 | | | 960,094 | | | | 605,561 | |
| Series 2022-127, Class WC, 3.500%, 07/20/2052 | | | 329,622 | | | | 217,072 | |
| Series 2022-127, Class UL, 2.000%, 07/20/2052 | | | 309,557 | | | | 152,575 | |
| Series 2022-137, Class PL, 4.000%, 08/20/2052 | | | 288,633 | | | | 224,456 | |
| Series 2022-20, Class KZ, 2.500%, 01/20/2052 | | | 111,394 | | | | 46,748 | |
| Series 2022-212, Class DZ, 5.500%, 12/20/2052 | | | 2,727,919 | | | | 2,744,190 | |
| Series 2022-44, Class KZ, 4.500%, 03/20/2052 | | | 603,028 | | | | 518,753 | |
| Series 2022-51, Class HZ, 3.000%, 03/20/2052 | | | 305,961 | | | | 177,340 | |
| Series 2022-68, Class MD, 3.500%, 04/20/2052 | | | 223,000 | | | | 163,171 | |
| Series 2022-76, Class PA, 4.000%, 04/20/2052 | | | 755,342 | | | | 725,970 | |
| Series 2022-78, Class YX, 4.500%, 01/20/2051 | | | 759,860 | | | | 750,077 | |
| Series 2022-H06, Class AB, 3.783%, 07/20/2067 | | | 104,570 | | | | 102,968 | |
| Series 2023-150, Class JD, 6.000%, 10/20/2053 | | | 407,200 | | | | 421,831 | |
| Series 2023-173, Class DX, 6.000%, 11/20/2053 | | | 2,720,000 | | | | 2,799,198 | |
| Series 2023-47, Class HZ, 5.500%, 03/20/2053 | | | 1,358,737 | | | | 1,347,455 | |
| Series 2023-55, Class HB, 6.500%, 04/20/2053 | | | 3,822,002 | | | | 3,930,225 | |
| Series 2023-55, Class EB, 6.000%, 04/20/2053 | | | 23,483,111 | | | | 23,483,164 | |
| Series 2023-57, Class CV, 5.000%, 04/20/2034 | | | 1,933,747 | | | | 1,945,986 | |
| | | Principal Amount | | Value (Note 2) |
| Series 2023-59, Class GL, 6.000%, 04/20/2053 | | $ | 7,761,342 | | | $ | 7,790,679 | |
| Series 2023-68, Class HB, 6.500%, 05/20/2053 | | | 10,712,834 | | | | 11,184,239 | |
| | | | | | | | 111,065,534 | |
| Vendee Mortgage Trust 2011-2 | | | | | | | | |
| Series 2011-2, Class DZ, 3.750%, 10/15/2041 | | | 867,446 | | | | 803,199 | |
| TOTAL COLLATERALIZED MORTGAGE OBLIGATIONS | | |
| (Cost $285,623,318) | | | 276,633,421 | |
| | | Principal Amount | | | Value (Note 2) | |
| COMMERCIAL MORTGAGE-BACKED SECURITIES (1.71%) | | | | | | | | |
| | | | | | | | | |
| Fannie Mae-Aces | | | | | | | | |
| Series 2001-M1, Class D, 6.460%, 02/25/2031(a) | | | 82,277 | | | | 82,255 | |
| Series 2006-M2, Class A3F, 5.345%, 09/25/2031(a) | | | 139,929 | | | | 140,325 | |
| Series 2013-M6, Class 1AC, 3.388%, 02/25/2043(a) | | | 9,846,008 | | | | 9,316,667 | |
| Series 2016-M11, Class AL, 2.944%, 07/25/2039 | | | 413,200 | | | | 368,455 | |
| Series 2018-M12, Class A1, 3.546%, 08/25/2030 | | | 626,432 | | | | 620,451 | |
| Series 2018-M15, Class 1A2, 3.700%, 01/25/2036 | | | 470,000 | | | | 437,120 | |
| Series 2019-M10, Class A1, 2.000%, 04/25/2030 | | | 154,085 | | | | 151,894 | |
| Series 2019-M14, Class A1, 2.304%, 06/25/2029 | | | 7,064 | | | | 7,018 | |
| Series 2019-M24, Class 2XA, 1.143%, 03/25/2031(a)(c) | | | 4,208,187 | | | | 211,781 | |
| Series 2020-M1, Class A2, 2.444%, 10/25/2029 | | | 300,000 | | | | 270,813 | |
| Series 2020-M10, Class X1, 1.771%, 12/25/2030(a)(c) | | | 754,112 | | | | 49,425 | |
| Series 2020-M10, Class X4, 0.885%, 07/25/2032(a)(c) | | | 46,531,821 | | | | 1,874,709 | |
| Series 2020-M12, Class IO, 1.285%, 07/25/2029(a)(c) | | | 54,170,198 | | | | 2,183,408 | |
| Series 2020-M13, Class X2, 1.227%, 09/25/2030(a)(c) | | | 7,252,652 | | | | 304,818 | |
| Series 2022-M5, Class A1, 2.353%, 01/01/2034(a) | | | 281,493 | | | | 257,615 | |
| Series 2022-M5, Class A3, 2.353%, 01/01/2034(a) | | | 1,495,000 | | | | 1,235,558 | |
| Series 2022-M8, Class A2, 1.936%, 12/25/2031(a) | | | 100,000 | | | | 83,477 | |
| | | | | | | | 17,595,789 | |
See Notes to Financial Statements and Financial Highlights.
ALPS | Smith Total Return Bond Fund
| Statement of Investments | October 31, 2024 |
| | | Principal
Amount | | | Value
(Note 2) | |
| Freddie Mac Multiclass Certificates Series 2020-P003 | | | | | | |
| Series 2020-P003, Class A3, 1.956%, 09/25/2046 | | $ | 1,600,000 | | | $ | 1,195,840 | |
| | | | | | | | | |
| Freddie Mac Multifamily Structured Pass Through Certificates | | | | | | | | |
| Series 2016-KS07, Class A1, 2.018%, 09/25/2025 | | | 924,993 | | | | 912,876 | |
| Series 2016-KS07, Class X, 0.600%, 09/25/2025(a)(c) | | | 64,111,411 | | | | 322,301 | |
| Series 2017-K153, Class X1, 0.271%, 10/25/2031(a)(c) | | | 98,917,153 | | | | 1,173,068 | |
| Series 2017-Q006, Class A2, 3.734%, 04/25/2028(a) | | | 3,990,672 | | | | 3,780,902 | |
| Series 2018-K154, Class X1, 0.291%, 11/25/2032(a)(c) | | | 134,511,391 | | | | 2,220,030 | |
| Series 2018-K156, Class X1, 0.069%, 06/25/2033(a)(c) | | | 621,468,480 | | | | 3,904,251 | |
| Series 2018-K158, Class X1, 0.071%, 10/25/2033(a)(c) | | | 348,985,362 | | | | 2,601,860 | |
| Series 2019-KLU2, Class X1, 0.956%, 08/25/2029(a)(c) | | | 84,806,262 | | | | 2,926,774 | |
| Series 2020-Q013, | | | | | | | | |
| Class APT2, 1.165%, 04/25/2027(a) | | | 3,308,593 | | | | 3,067,801 | |
| Series 2021-1521, Class X1, 0.979%, 08/25/2036(a)(c) | | | 15,573,521 | | | | 1,227,914 | |
| Series 2021-KLU3, Class X1, 1.932%, 01/25/2031(a)(c) | | | 174,100,269 | | | | 14,616,990 | |
| | | | | | | | 36,754,767 | |
| TOTAL COMMERCIAL MORTGAGE-BACKED SECURITIES | | | | | | | | |
| (Cost $59,500,123) | | | | | | | 55,546,396 | |
| | | Principal Amount | | | Value (Note 2) | |
| MORTGAGE-BACKED SECURITIES (14.23%) | | | | | | | | |
| | | | | | | | | |
| Fannie Mae Pool | | | | | | | | |
| Series 2003-386375, 4.790%, 08/01/2028 | | | 515,920 | | | | 514,204 | |
| Series 2005-843080, 6.000%, 12/01/2034 | | | 103,241 | | | | 104,217 | |
| Series 2006-, 6.000%, 02/01/2036 | | | 91,829 | | | | 92,771 | |
| Series 2007-943003, 5.500%, 08/01/2047 | | | 75,114 | | | | 74,339 | |
| Series 2009-, 4.500%, 06/01/2039 | | | 286,190 | | | | 279,270 | |
| Series 2009-463331, 5.250%, 08/01/2029 | | | 432,241 | | | | 439,326 | |
| Series 2009-930895, 4.500%, 03/01/2039 | | | 140,327 | | | | 137,420 | |
| | | Principal
Amount | | | Value (Note 2) | |
| Series 2009-931707, 4.500%, 08/01/2039 | | $ | 86,407 | | | $ | 83,945 | |
| Series 2009-958348, 5.440%, 04/01/2027 | | | 124,381 | | | | 123,974 | |
| Series 2009-958878, 5.750%, 07/01/2027 | | | 1,235,906 | | | | 1,231,867 | |
| Series 2010-, 3.500%, 10/01/2040 | | | 282,255 | | | | 264,121 | |
| Series 2011-, 6.210%, 12/01/2029 | | | 215,915 | | | | 222,088 | |
| Series 2011-468477, 4.590%, 08/01/2026 | | | 374,350 | | | | 374,376 | |
| Series 2011-469013, 5.470%, 08/01/2026 | | | 956,447 | | | | 970,534 | |
| Series 2011-AH9290, 4.000%, 04/01/2041 | | | 18,941 | | | | 17,733 | |
| Series 2012-, 3.000%, 12/01/2042 | | | 93,624 | | | | 82,626 | |
| 3.000%, 01/01/2043 | | | 117,527 | | | | 105,527 | |
| 3.040%, 12/01/2030 | | | 1,128,839 | | | | 1,046,822 | |
| 3.500%, 04/01/2042 | | | 51,046 | | | | 46,484 | |
| Series 2012-470020, 4.200%, 01/01/2030 | | | 1,504,027 | | | | 1,471,586 | |
| Series 2012-AM0279, 3.210%, 08/01/2027 | | | 274,647 | | | | 264,856 | |
| Series 2012-AM1387, 3.260%, 11/01/2032 | | | 93,543 | | | | 88,756 | |
| Series 2012-MA1214, 3.000%, 10/01/2042 | | | 534,104 | | | | 471,409 | |
| Series 2013-, 3.000%, 01/01/2043 | | | 263,217 | | | | 236,347 | |
| 3.000%, 02/01/2043 | | | 335,089 | | | | 295,736 | |
| 3.000%, 04/01/2043 | | | 207,482 | | | | 183,111 | |
| 3.000%, 07/01/2043 | | | 226,570 | | | | 196,607 | |
| 3.000%, 08/01/2043 | | | 63,244 | | | | 56,252 | |
| 3.380%, 05/01/2028 | | | 244,469 | | | | 236,374 | |
| 4.370%, 07/01/2028 | | | 809,855 | | | | 805,780 | |
| 4.410%, 09/01/2028 | | | 82,553 | | | | 81,972 | |
| Series 2013-AM4329, 3.870%, 10/01/2025 | | | 184,421 | | | | 182,846 | |
| Series 2013-AM4781, 4.180%, 11/01/2028 | | | 1,148,047 | | | | 1,132,565 | |
| Series 2013-AM4991, 3.970%, 12/01/2025 | | | 151,684 | | | | 150,449 | |
| Series 2013-AR2289, 3.000%, 02/01/2033 | | | 166,594 | | | | 157,499 | |
| Series 2013-AT9663, 2.500%, 07/01/2043 | | | 398,689 | | | | 336,825 | |
| Series 2013-MA1586, 3.000%, 08/01/2043 | | | 148,877 | | | | 133,677 | |
| Series 2014-, 3.000%, 06/01/2053 | | | 1,035,945 | | | | 895,148 | |
| 3.300%, 11/01/2026 | | | 251,425 | | | | 245,664 | |
| 3.730%, 07/01/2034 | | | 548,280 | | | | 524,186 | |
| 4.060%, 03/01/2030 | | | 445,620 | | | | 435,304 | |
| | | | | | | | | | |
See Notes to Financial Statements and Financial Highlights.
ALPS | Smith Total Return Bond Fund
| Statement of Investments | October 31, 2024 |
| | | Principal Amount | | | Value (Note 2) | |
| Series 2015-, 3.180%, 07/01/2035 | | $ | 650,004 | | | $ | 576,424 | |
| 3.390%, 07/01/2035 | | | 189,185 | | | | 171,550 | |
| 3.500%, 10/01/2045 | | | 1,427,501 | | | | 1,306,927 | |
| 3.600%, 02/01/2040 | | | 223,409 | | | | 206,902 | |
| 3.610%, 08/01/2030 | | | 300,000 | | | | 285,053 | |
| 4.000%, 01/01/2041 | | | 113,824 | | | | 108,516 | |
| 4.500%, 06/01/2045 | | | 125,260 | | | | 121,666 | |
| Series 2015-AM8666, 2.960%, 06/01/2030 | | | 165,931 | | | | 153,893 | |
| Series 2015-AM8918, 3.250%, 09/01/2030 | | | 731,000 | | | | 680,472 | |
| Series 2015-AM9173, 3.110%, 06/01/2027 | | | 226,757 | | | | 218,654 | |
| Series 2015-AM9288, 2.930%, 07/01/2025 | | | 5,419,572 | | | | 5,344,579 | |
| Series 2016-, 3.159%, 07/01/2036(a) | | | 1,628,539 | | | | 1,432,225 | |
| 6.000%, 07/01/2039 | | | 98,320 | | | | 100,789 | |
| Series 2016-AL8405, 4.500%, 05/01/2041 | | | 119,537 | | | | 116,617 | |
| Series 2016-AN0665, 3.070%, 02/01/2026 | | | 186,904 | | | | 183,259 | |
| Series 2016-AN2228, 2.520%, 08/01/2026 | | | 179,281 | | | | 172,585 | |
| Series 2016-AN3542, 3.410%, 11/01/2046 | | | 341,023 | | | | 295,197 | |
| Series 2016-AN3749, 2.520%, 12/01/2026 | | | 432,889 | | | | 416,283 | |
| Series 2016-BC0943, 3.500%, 05/01/2046 | | | 253,728 | | | | 232,279 | |
| Series 2017-, 2.000%, 01/01/2032 | | | 100,098 | | | | 92,803 | |
| 2.880%, 09/01/2027 | | | 4,646,321 | | | | 4,439,903 | |
| 3.000%, 10/01/2027 | | | 1,225,175 | | | | 1,176,325 | |
| 3.010%, 07/01/2027 | | | 252,693 | | | | 242,751 | |
| 3.160%, 07/01/2027 | | | 144,901 | | | | 140,007 | |
| 3.170%, 01/01/2029 | | | 190,311 | | | | 179,224 | |
| 3.200%, 01/01/2029 | | | 142,136 | | | | 135,112 | |
| 3.210%, 11/01/2032 | | | 100,000 | | | | 89,392 | |
| 3.235%, 02/01/2032 | | | 134,642 | | | | 123,579 | |
| 3.350%, 01/01/2029 | | | 189,025 | | | | 181,449 | |
| 3.450%, 03/01/2029 | | | 296,412 | | | | 284,274 | |
| 3.500%, 06/01/2047 | | | 279,272 | | | | 251,153 | |
| Series 2017-AN4431, 3.220%, 01/01/2027 | | | 85,000 | | | | 82,681 | |
| Series 2017-AN4469, 3.640%, 01/01/2029 | | | 653,906 | | | | 630,756 | |
| Series 2017-AN4529, 3.620%, 01/01/2027 | | | 784,713 | | | | 770,799 | |
| Series 2017-AN4833, 3.320%, 04/01/2027 | | | 95,000 | | | | 92,350 | |
| Series 2017-AN5279, 3.340%, 04/01/2029 | | | 433,640 | | | | 411,802 | |
| Series 2017-AN5742, 3.190%, 05/01/2030 | | | 131,131 | | | | 122,536 | |
| | | Principal
Amount | | | Value
(Note 2) | |
| Series 2017-AN5796, 3.030%, 06/01/2027 | | $ | 260,051 | | | $ | 250,697 | |
| Series 2017-AN6670, 3.210%, 09/01/2027 | | | 1,838,555 | | | | 1,764,190 | |
| Series 2017-AN7060, 2.930%, 10/01/2027 | | | 1,780,000 | | | | 1,695,839 | |
| Series 2017-AN7234, 3.010%, 12/01/2027 | | | 969,626 | | | | 929,011 | |
| Series 2017-AN7384, 2.880%, 12/01/2027 | | | 46,552 | | | | 44,429 | |
| Series 2017-AN7547, 3.370%, 11/01/2027 | | | 1,045,853 | | | | 1,006,536 | |
| Series 2017-AN7823, 2.890%, 12/01/2027 | | | 235,000 | | | | 224,241 | |
| Series 2017-CA0522, 3.000%, 10/01/2047 | | | 191,463 | | | | 165,883 | |
| Series 2018-, 3.000%, 02/01/2033 | | | 42,007 | | | | 40,051 | |
| 3.000%, 04/01/2048 | | | 890,346 | | | | 791,752 | |
| 3.320%, 04/01/2028 | | | 550,000 | | | | 529,476 | |
| 3.430%, 03/01/2033 | | | 974,130 | | | | 888,172 | |
| 3.485%, 04/01/2028 | | | 6,350,000 | | | | 6,144,593 | |
| 3.500%, 09/01/2028 | | | 130,000 | | | | 124,887 | |
| 3.500%, 05/01/2048 | | | 181,446 | | | | 173,052 | |
| 3.545%, 04/01/2028 | | | 636,030 | | | | 617,400 | |
| 3.660%, 05/01/2033 | | | 700,000 | | | | 645,403 | |
| 3.740%, 07/01/2028 | | | 175,000 | | | | 169,971 | |
| 3.940%, 10/01/2036 | | | 316,503 | | | | 292,025 | |
| 4.010%, 12/01/2030 | | | 296,795 | | | | 288,042 | |
| 4.500%, 09/01/2040 | | | 104,804 | | | | 100,656 | |
| 4.500%, 07/01/2041 | | | 247,177 | | | | 239,503 | |
| 4.500%, 08/01/2041 | | | 266,420 | | | | 262,058 | |
| 5.500%, 08/01/2048 | | | 479,278 | | | | 481,875 | |
| 6.000%, 08/01/2048 | | | 101,650 | | | | 103,066 | |
| Series 2018-109435, 3.890%, 08/01/2028 | | | 1,813,895 | | | | 1,771,991 | |
| Series 2018-387770, 3.625%, 07/01/2028 | | | 2,570,000 | | | | 2,486,079 | |
| Series 2018-387853, 3.455%, 08/01/2025 | | | 225,000 | | | | 222,340 | |
| Series 2018-387983, 3.630%, 08/01/2028 | | | 1,964,976 | | | | 1,878,396 | |
| Series 2018-AN8272, 3.170%, 02/01/2028 | | | 100,000 | | | | 95,978 | |
| Series 2018-AN8493, 3.300%, 02/01/2030 | | | 406,619 | | | | 378,453 | |
| Series 2018-AN8982, 3.440%, 05/01/2028 | | | 994,915 | | | | 959,069 | |
| Series 2018-AN9038, 3.460%, 05/01/2028 | | | 135,000 | | | | 130,555 | |
| Series 2018-AN924, 4.210%, 05/01/2033 | | | 490,745 | | | | 482,526 | |
| Series 2018-AN9976, 3.960%, 02/01/2030 | | | 470,000 | | | | 453,986 | |
| Series 2019-, 2.520%, 11/01/2029 | | | 139,313 | | | | 126,961 | |
See Notes to Financial Statements and Financial Highlights.
ALPS | Smith Total Return Bond Fund
| Statement of Investments | October 31, 2024 |
| | | Principal Amount | | | Value (Note 2) | |
| 2.820%, 10/01/2039 | | $ | 919,279 | | | $ | 743,335 | |
| 3.000%, 08/01/2049 | | | 69,916 | | | | 62,238 | |
| 3.490%, 03/01/2029 | | | 189,000 | | | | 180,831 | |
| 3.500%, 08/01/2048 | | | 114,740 | | | | 105,047 | |
| 3.940%, 06/01/2035 | | | 2,600,000 | | | | 2,393,498 | |
| 4.000%, 07/01/2048 | | | 589,093 | | | | 556,869 | |
| 4.070%, 11/01/2026 | | | 129,885 | | | | 127,965 | |
| 4.500%, 08/01/2058 | | | 404,221 | | | | 387,852 | |
| 5.500%, 06/01/2049 | | | 164,765 | | | | 167,677 | |
| 6.000%, 05/01/2049 | | | 1,743,735 | | | | 1,790,013 | |
| Series 2019-BI2928, 3.410%, 07/01/2027 | | | 791,148 | | | | 769,171 | |
| Series 2019-BL1188, 3.480%, 02/01/2026 | | | 191,301 | | | | 188,452 | |
| Series 2019-BL1300, 4.200%, 01/01/2029 | | | 1,375,000 | | | | 1,350,593 | |
| Series 2019-BL1451, 3.760%, 02/01/2029 | | | 678,412 | | | | 655,116 | |
| Series 2019-BL1567, 3.590%, 02/01/2029 | | | 2,746,199 | | | | 2,629,641 | |
| Series 2019-BL1596, 3.480%, 03/01/2029 | | | 158,367 | | | | 151,861 | |
| Series 2019-BL2356, 3.020%, 05/01/2026 | | | 165,000 | | | | 161,478 | |
| Series 2019-BL2460, 3.400%, 05/01/2029 | | | 556,831 | | | | 531,226 | |
| Series 2019-BL3182, 2.980%, 07/01/2029 | | | 240,215 | | | | 224,471 | |
| Series 2019-BM6011, 3.283%, 11/01/2026(a) | | | 57,539 | | | | 56,497 | |
| Series 2019-BM6152, 3.500%, 06/01/2044 | | | 926,476 | | | | 849,369 | |
| Series 2019-MA3784, 3.500%, 09/01/2049 | | | 2,101,847 | | | | 1,861,639 | |
| Series 2020-, 1.400%, 11/01/2032 | | | 7,945,000 | | | | 6,228,370 | |
| 1.500%, 01/01/2036 | | | 648,237 | | | | 557,379 | |
| 2.150%, 09/01/2029 | | | 500,000 | | | | 446,291 | |
| 3.000%, 03/01/2050 | | | 221,532 | | | | 187,808 | |
| 3.500%, 04/01/2050 | | | 172,058 | | | | 151,541 | |
| Series 2021-, 1.710%, 08/01/2031 | | | 751,000 | | | | 622,399 | |
| 3.500%, 11/01/2051 | | | 711,849 | | | | 626,520 | |
| Series 2022-, 2.030%, 12/01/2028 | | | 100,000 | | | | 90,697 | |
| 2.150%, 03/01/2029 | | | 150,000 | | | | 136,210 | |
| 2.400%, 03/01/2029 | | | 143,383 | | | | 131,735 | |
| 3.130%, 01/01/2029 | | | 145,652 | | | | 137,779 | |
| 3.790%, 05/01/2032 | | | 2,148,000 | | | | 1,990,505 | |
| 3.890%, 07/01/2032 | | | 690,000 | | | | 652,846 | |
| 3.910%, 06/01/2032 | | | 1,181,000 | | | | 1,106,877 | |
| 3.980%, 10/01/2032 | | | 700,000 | | | | 664,563 | |
| 4.110%, 09/01/2032 | | | 1,815,000 | | | | 1,721,593 | |
| 4.140%, 08/01/2032 | | | 2,038,000 | | | | 1,932,947 | |
| 4.240%, 07/01/2032 | | | 1,681,304 | | | | 1,613,467 | |
| 4.520%, 10/01/2032 | | | 1,209,000 | | | | 1,175,773 | |
| 5.080%, 10/01/2029 | | | 950,000 | | | | 968,356 | |
| | | Principal
Amount | | | Value
(Note 2) | |
| 5.120%, 11/01/2032 | | $ | 2,979,000 | | | $ | 2,986,343 | |
| 5.250%, 10/01/2032 | | | 7,898,000 | | | | 7,941,692 | |
| 5.300%, 10/01/2032 | | | 8,632,000 | | | | 8,626,100 | |
| 5.440%, 12/01/2032 | | | 7,633,000 | | | | 7,676,977 | |
| 5.500%, 07/01/2042 | | | 1,110,887 | | | | 1,117,442 | |
| 5.500%, 11/01/2052 | | | 10,477,702 | | | | 10,492,897 | |
| 5.620%, 11/01/2032 | | | 2,901,983 | | | | 2,917,748 | |
| 5.730%, 11/01/2032 | | | 16,500,000 | | | | 16,596,520 | |
| 6.120%, 11/01/2032 | | | 1,662,312 | | | | 1,675,008 | |
| 6.500%, 11/01/2052 | | | 1,963,108 | | | | 1,986,784 | |
| Series 2023-, 1.500%, 01/01/2042 | | | 4,073,706 | | | | 3,317,942 | |
| 4.885%, 03/01/2033 | | | 750,000 | | | | 756,099 | |
| 5.030%, 04/01/2028 | | | 4,957,000 | | | | 4,963,162 | |
| 5.090%, 01/01/2029 | | | 816,000 | | | | 828,994 | |
| 5.470%, 11/01/2033 | | | 1,010,190 | | | | 1,014,357 | |
| 5.500%, 02/01/2053 | | | 8,399,791 | | | | 8,384,351 | |
| 5.555%, 01/01/2030 | | | 8,933,000 | | | | 9,122,982 | |
| 6.000%, 02/01/2053 | | | 957,965 | | | | 969,100 | |
| 6.500%, 06/01/2043 | | | 3,046,164 | | | | 3,110,291 | |
| 6.500%, 04/01/2053 | | | 1,597,031 | | | | 1,646,306 | |
| 6.500%, 05/01/2053 | | | 3,999,166 | | | | 4,168,824 | |
| 6.500%, 08/01/2053 | | | 8,594,107 | | | | 8,815,752 | |
| 7.000%, 04/01/2053 | | | 1,254,927 | | | | 1,287,890 | |
| 7.500%, 01/01/2054 | | | 520,973 | | | | 548,654 | |
| Series 2024-, 5.340%, 07/01/2029 | | | 10,000,000 | | | | 10,109,168 | |
| 7.000%, 02/01/2054 | | | 1,551,241 | | | | 1,628,359 | |
| 7.000%, 05/01/2054 | | | 1,967,190 | | | | 2,050,012 | |
| 7.500%, 01/01/2054 | | | 1,693,794 | | | | 1,747,926 | |
| | | | | | | | 226,900,676 | |
| Freddie Mac | | | | | | | | |
| Series 2005-2936, Class FC, 30D US SOFR + 0.51%, 03/15/2029(a) | | | 11,084 | | | | 11,059 | |
| Freddie Mac Gold Pool | | | | | | | | |
| Series 2005-, 5.500%, 12/01/2035 | | | 157,067 | | | | 153,566 | |
| Series 2006-, 6.000%, 01/01/2036 | | | 28,095 | | | | 28,392 | |
| Series 2007-, 5.500%, 11/01/2037 | | | 55,639 | | | | 55,019 | |
| Series 2012-, 3.500%, 08/01/2042 | | | 96,844 | | | | 88,044 | |
| Series 2013-G80393, 5.000%, 08/20/2036 | | | 113,084 | | | | 112,124 | |
| Series 2013-T65180, 3.000%, 11/01/2043 | | | 95,260 | | | | 84,167 | |
| Series 2015-, 3.000%, 08/01/2045 | | | 1,888,133 | | | | 1,666,342 | |
| Series 2015-U49046, 4.000%, 02/01/2029 | | | 19,612 | | | | 19,309 | |
| Series 2016-, 3.500%, 06/01/2046 | | | 314,764 | | | | 288,522 | |
| | | | | | | | 2,495,485 | |
See Notes to Financial Statements and Financial Highlights.
ALPS | Smith Total Return Bond Fund
| Statement of Investments | October 31, 2024 |
| | | Principal
Amount | | | Value
(Note 2) | |
| Freddie Mac Pool | | | | | | |
| Series 2018-, 3.000%, 05/01/2045 | | $ | 245,433 | | | $ | 217,993 | |
| 3.000%, 09/01/2045 | | | 677,271 | | | | 597,585 | |
| 3.000%, 12/01/2045 | | | 357,967 | | | | 310,070 | |
| 3.500%, 12/01/2045 | | | 53,467 | | | | 48,350 | |
| 4.500%, 09/01/2044 | | | 452,411 | | | | 428,787 | |
| 6.000%, 07/01/2048 | | | 229,271 | | | | 232,444 | |
| Series 2020-, 2.000%, 06/01/2050 | | | 805,091 | | | | 623,521 | |
| Series 2021-, 2.190%, 06/01/2034 | | | 144,913 | | | | 118,023 | |
| Series 2022-, 3.000%, 02/01/2046 | | | 3,512,144 | | | | 3,043,119 | |
| Series 2023-, 4.600%, 01/01/2033 | | | 6,743,000 | | | | 6,562,589 | |
| 4.750%, 01/01/2033 | | | 16,673,950 | | | | 16,391,373 | |
| 4.900%, 01/01/2033 | | | 5,000,000 | | | | 4,932,244 | |
| 5.500%, 02/01/2053 | | | 9,143,492 | | | | 9,103,579 | |
| 6.500%, 04/01/2053 | | | 22,655,347 | | | | 23,216,739 | |
| 6.500%, 05/01/2053 | | | 12,467,526 | | | | 12,885,951 | |
| 7.000%, 01/01/2053 | | | 3,355,583 | | | | 3,530,643 | |
| Series 2024-, 5.030%, 02/01/2029 | | | 5,000,000 | | | | 4,980,807 | |
| | | | | | | | 87,223,817 | |
| | | | | | | | | |
| Ginnie Mae I Pool | | | | | | | | |
| Series 2010-, 4.500%, 08/15/2040 | | | 298,383 | | | | 285,753 | |
| Series 2013-, 3.000%, 03/15/2043 | | | 319,771 | | | | 287,860 | |
| | | | | | | | 573,613 | |
| | | | | | | | | |
| Ginnie Mae II Pool | | | | | | | | |
| Series 2010-, 4.000%, 09/20/2040 | | | 76,673 | | | | 71,871 | |
| 4.000%, 11/20/2040 | | | 75,527 | | | | 70,798 | |
| 4.000%, 12/20/2040 | | | 148,424 | | | | 140,111 | |
| 4.500%, 08/20/2040 | | | 247,101 | | | | 237,743 | |
| 4.875%, 01/20/2035 | | | 121,172 | | | | 118,362 | |
| 1M US SOFR + 2.071%, 08/20/2060(a) | | | 130,147 | | | | 133,558 | |
| Series 2011-, 4.000%, 09/20/2041 | | | 227,207 | | | | 215,890 | |
| 4.500%, 07/20/2041 | | | 73,836 | | | | 72,179 | |
| Series 2012-, 3.500%, 03/20/2042 | | | 313,399 | | | | 281,391 | |
| 3.500%, 04/20/2042 | | | 67,004 | | | | 60,160 | |
| 3.500%, 05/20/2042 | | | 115,340 | | | | 103,612 | |
| 3.500%, 06/20/2042 | | | 70,407 | | | | 63,247 | |
| 3.500%, 08/20/2042 | | | 75,254 | | | | 67,599 | |
| 3.500%, 09/20/2042 | | | 61,505 | | | | 55,222 | |
| 3.500%, 10/20/2042 | | | 72,804 | | | | 65,366 | |
| 3.500%, 12/20/2042 | | | 202,023 | | | | 181,383 | |
| 4.000%, 02/20/2042 | | | 21,969 | | | | 20,593 | |
| 4.000%, 04/20/2042 | | | 85,847 | | | | 80,469 | |
| 4.000%, 09/20/2042 | | | 88,873 | | | | 84,099 | |
| | | Principal Amount | | | Value
(Note 2) | |
| Series 2012-5302, 3.500%, 02/20/2042 | | $ | 186,324 | | | $ | 167,290 | |
| Series 2013-, 2.500%, 02/20/2043 | | | 114,529 | | | | 97,208 | |
| 3.000%, 06/20/2043 | | | 177,859 | | | | 156,170 | |
| 3.000%, 08/20/2043 | | | 383,675 | | | | 343,460 | |
| 3.250%, 04/20/2033 | | | 241,435 | | | | 229,733 | |
| 3.500%, 04/20/2043 | | | 195,611 | | | | 175,644 | |
| 3.500%, 05/20/2043 | | | 90,872 | | | | 82,578 | |
| 3.500%, 06/20/2043 | | | 89,819 | | | | 81,743 | |
| 4.000%, 09/20/2043 | | | 253,740 | | | | 238,795 | |
| Series 2013-MA1149, 3.000%, 07/20/2043 | | | 11,270 | | | | 9,830 | |
| Series 2014-, 4.500%, 02/20/2034 | | | 246,443 | | | | 243,304 | |
| 4.500%, 06/20/2034 | | | 502,736 | | | | 496,601 | |
| 4.500%, 02/20/2044 | | | 242,712 | | | | 241,103 | |
| 4.500%, 05/20/2044 | | | 910,573 | | | | 879,236 | |
| 1M US SOFR + 2.295%, 02/20/2064(a) | | | 480,012 | | | | 491,598 | |
| Series 2015-, 3.000%, 01/20/2040 | | | 203,900 | | | | 178,979 | |
| 3.500%, 06/20/2035 | | | 221,076 | | | | 211,121 | |
| 3.750%, 05/20/2045 | | | 95,623 | | | | 88,716 | |
| 4.500%, 08/20/2045 | | | 501,479 | | | | 485,158 | |
| Series 2016-, 2.500%, 05/20/2031 | | | 183,313 | | | | 174,387 | |
| 3.000%, 06/20/2046 | | | 212,609 | | | | 187,875 | |
| 3.000%, 07/20/2046 | | | 207,015 | | | | 181,688 | |
| 3.500%, 06/20/2046 | | | 349,166 | | | | 318,205 | |
| 4.500%, 09/20/2045 | | | 217,873 | | | | 210,386 | |
| 4.500%, 03/20/2046 | | | 145,083 | | | | 144,122 | |
| Series 2016-MA3588, 3.500%, 04/20/2046 | | | 238,330 | | | | 213,959 | |
| Series 2016-MA3793, 3.500%, 07/20/2046 | | | 653,651 | | | | 586,806 | |
| Series 2016-MA3865, 3.500%, 08/20/2046 | | | 406,407 | | | | 364,877 | |
| Series 2017-, 2.500%, 01/20/2032 | | | 208,154 | | | | 197,639 | |
| 3.000%, 11/20/2032 | | | 193,287 | | | | 184,366 | |
| 3.500%, 10/20/2047 | | | 157,669 | | | | 143,833 | |
| 3.500%, 12/20/2047 | | | 599,560 | | | | 542,229 | |
| 4.490%, 01/20/2067(a) | | | 113,485 | | | | 111,131 | |
| Series 2018-, 3.500%, 02/20/2036 | | | 2,191,881 | | | | 2,051,628 | |
| 3.500%, 08/20/2047 | | | 107,084 | | | | 98,199 | |
| 3.500%, 01/20/2048 | | | 59,894 | | | | 54,655 | |
| 3.500%, 04/20/2048 | | | 414,916 | | | | 379,938 | |
| 4.000%, 05/20/2048 | | | 2,470,964 | | | | 2,307,191 | |
| 4.000%, 09/20/2048 | | | 2,150,620 | | | | 2,008,748 | |
| 4.500%, 07/20/2048 | | | 573,236 | | | | 542,680 | |
| 4.500%, 09/20/2048 | | | 265,102 | | | | 256,240 | |
| 5.500%, 10/20/2048 | | | 362,636 | | | | 367,901 | |
| Series 2019-, 3.500%, 12/20/2047 | | | 384,403 | | | | 351,159 | |
| 3.500%, 08/20/2049 | | | 352,158 | | | | 320,902 | |
See Notes to Financial Statements and Financial Highlights.
ALPS | Smith Total Return Bond Fund
| Statement of Investments | October 31, 2024 |
| | | Principal
Amount | | | Value
(Note 2) | |
| 3.500%, 12/20/2049 | | $ | 131,790 | | | $ | 116,676 | |
| 4.000%, 04/20/2049 | | | 100,329 | | | | 92,545 | |
| 4.500%, 09/20/2049 | | | 348,210 | | | | 334,726 | |
| 4.500%, 11/20/2049 | | | 724,117 | | | | 691,609 | |
| 5.500%, 06/20/2049 | | | 98,195 | | | | 99,258 | |
| 6.000%, 01/20/2049 | | | 301,084 | | | | 311,477 | |
| Series 2019-784688, 5.000%, 02/20/2049 | | | 605,538 | | | | 594,285 | |
| Series 2019-MA5864, 3.000%, 04/20/2049 | | | 20,794 | | | | 18,322 | |
| Series 2019-MA5920, 3.000%, 05/20/2049 | | | 13,208 | | | | 11,518 | |
| Series 2019-MA5936, 6.500%, 05/20/2049 | | | 34,095 | | | | 35,563 | |
| Series 2020-, 2.000%, 11/20/2050 | | | 2,734,577 | | | | 2,197,171 | |
| 2.500%, 01/20/2050 | | | 167,519 | | | | 140,492 | |
| 3.000%, 11/20/2050 | | | 148,160 | | | | 127,185 | |
| 3.500%, 12/20/2049 | | | 1,679,387 | | | | 1,483,746 | |
| 3.500%, 10/20/2050 | | | 188,846 | | | | 168,243 | |
| 4.000%, 02/20/2050 | | | 330,702 | | | | 308,911 | |
| 4.000%, 04/20/2050 | | | 523,052 | | | | 481,174 | |
| 4.000%, 05/20/2050 | | | 161,324 | | | | 148,407 | |
| 4.000%, 11/20/2050 | | | 675,282 | | | | 617,020 | |
| Series 2021-, 2.000%, 09/20/2051 | | | 2,157,511 | | | | 1,702,503 | |
| 3.000%, 08/20/2051 | | | 876,778 | | | | 779,073 | |
| 4.000%, 02/20/2051 | | | 200,201 | | | | 184,169 | |
| 4.000%, 03/20/2051 | | | 1,541,251 | | | | 1,441,480 | |
| Series 2022-, 3.000%, 12/20/2044 | | | 2,506,590 | | | | 2,181,036 | |
| 3.000%, 05/20/2052 | | | 3,097,210 | | | | 2,656,520 | |
| 4.000%, 08/20/2052 | | | 1,825,144 | | | | 1,699,978 | |
| 4.000%, 09/20/2052 | | | 13,925,716 | | | | 12,957,519 | |
| 5.000%, 05/20/2052 | | | 982,277 | | | | 950,444 | |
| 5.000%, 06/20/2052 | | | 612,781 | | | | 599,757 | |
| 6.000%, 12/20/2052 | | | 1,907,145 | | | | 1,957,333 | |
| Series 2023-, 5.500%, 05/20/2053 | | | 6,068,367 | | | | 6,116,285 | |
| 6.000%, 08/20/2053 | | | 15,657,843 | | | | 16,078,424 | |
| 6.500%, 04/20/2053 | | | 10,389,062 | | | | 10,739,715 | |
| 6.500%, 10/20/2053 | | | 13,657,949 | | | | 14,074,257 | |
| 6.500%, 11/20/2053 | | | 2,697,706 | | | | 2,775,874 | |
| 7.000%, 10/20/2053 | | | 3,274,586 | | | | 3,409,524 | |
| 8.000%, 12/20/2063 | | | 4,466,054 | | | | 4,641,435 | |
| Series 2024-, 3.000%, 10/20/2050 | | | 4,600,170 | | | | 3,971,471 | |
| 6.000%, 06/20/2054 | | | 2,269,195 | | | | 2,297,925 | |
| 6.500%, 08/20/2054 | | | 2,241,961 | | | | 2,306,578 | |
| 6.500%, 04/20/2064 | | | 2,453,559 | | | | 2,483,780 | |
| 6.500%, 05/20/2064 | | | 3,663,942 | | | | 3,718,565 | |
| 6.500%, 10/20/2064 | | | 8,427,000 | | | | 8,530,795 | |
| 8.000%, 12/20/2053 | | | 1,192,017 | | | | 1,229,631 | |
| 8.000%, 08/20/2054 | | | 3,806,877 | | | | 3,998,117 | |
| | | Principal
Amount | | | Value
(Note 2) | |
| 8.000%, 12/20/2063 | | $ | 4,572,472 | | | $ | 4,722,297 | |
| | | | | | | | 145,505,477 | |
| TOTAL MORTGAGE-BACKED SECURITIES | | | | | | | | |
| (Cost $467,977,721) | | | | | | | 462,710,127 | |
| | | Principal
Amount | | | Value
(Note 2) | |
| CORPORATE BONDS (34.47%) | | | | | | |
| | | | | | | |
| Aerospace & Defense (3.28%) | | | | | | |
| BOEING CO BA | | | | | | | | |
| 6.53%, 05/01/2034(e) | | | 15,220,000 | | | | 16,053,807 | |
| Boeing Co. | | | | | | | | |
| 2.20%, 02/04/2026 | | | 10,030,000 | | | | 9,662,456 | |
| 7.01%, 05/01/2064(e) | | | 11,986,000 | | | | 12,913,364 | |
| Howmet Aerospace, Inc. | | | | | | | | |
| 3.00%, 01/15/2029 | | | 7,684,000 | | | | 7,170,896 | |
| L3Harris Technologies, Inc. | | | | | | | | |
| 5.35%, 06/01/2034 | | | 21,890,000 | | | | 22,157,102 | |
| 5.40%, 07/31/2033 | | | 7,533,000 | | | | 7,646,456 | |
| RTX Corp. | | | | | | | | |
| 6.10%, 03/15/2034 | | | 28,913,000 | | | | 30,986,382 | |
| Total Aerospace & Defense | | | | | | | 106,590,463 | |
| | | | | | | | | |
| Airlines (1.20%) | | | | | | | | |
| Alaska Airlines 2020-1 Class A Pass Through Trust | | | | | | | | |
| 4.80%, 08/15/2027(e) | | | 5,538,817 | | | | 5,495,061 | |
| Alaska Airlines 2020-1 Class B Pass Through Trust | | | | | | | | |
| 8.00%, 08/15/2025(e) | | | 2,029,053 | | | | 2,052,790 | |
| AS Mileage Plan IP, Ltd. | | | | | | | | |
| 5.02%, 10/20/2029(e) | | | 11,250,000 | | | | 10,931,515 | |
| 5.31%, 10/20/2031(e) | | | 8,000,000 | | | | 7,724,221 | |
| British Airways 2020-1 Class A Pass Through Trust | | | | | | | | |
| 4.25%, 11/15/2032(e) | | | 1,058,344 | | | | 1,010,679 | |
| Southwest Airlines Co. | | | | | | | | |
| 5.25%, 05/04/2025 | | | 7,540,000 | | | | 7,547,289 | |
| United Airlines 2020-1 Class A Pass Through Trust | | | | | | | | |
| Series 20-1 5.88%, 10/15/2027 | | | 4,278,648 | | | | 4,378,932 | |
| Total Airlines | | | | | | | 39,140,487 | |
| | | | | | | | | |
| Automobiles Manufacturing (1.77%) | | | | | | | | |
| Ford Motor Credit Co. LLC | | | | | | | | |
| 3.38%, 11/13/2025 | | | 6,500,000 | | | | 6,377,102 | |
| 6.80%, 05/12/2028 | | | 9,919,000 | | | | 10,278,965 | |
| 7.35%, 03/06/2030 | | | 10,487,000 | | | | 11,128,664 | |
| General Motors Financial Co., Inc. | | | | | | | | |
| SOFRINDX + 1.30%, 04/07/2025(a)(f) | | | 14,667,000 | | | | 14,723,130 | |
| Hyundai Capital America | | | | | | | | |
| 5.45%, 06/24/2026(e) | | | 5,541,000 | | | | 5,592,792 | |
| Nissan Motor Acceptance Co. LLC | | | | | | | | |
| 7.05%, 09/15/2028(e) | | | 6,378,000 | | | | 6,624,993 | |
See Notes to Financial Statements and Financial Highlights.
ALPS | Smith Total Return Bond Fund
| Statement of Investments | October 31, 2024 |
| | | Principal Amount | | | Value
(Note 2) | |
| Volkswagen Group of America Finance LLC | | | | | | |
| 3.95%, 06/06/2025(e) | | $ | 3,000,000 | | | $ | 2,982,106 | |
| Total Automobiles Manufacturing | | | | | | | 57,707,752 | |
| | | | | | | | | |
| Banks (2.33%) | | | | | | | | |
| Citizens Financial Group, Inc. | | | | | | | | |
| 1D US SOFR + 1.91%, 07/23/2032(a) | | | 7,500,000 | | | | 7,574,496 | |
| Cooperatieve Rabobank UA | | | | | | | | |
| 3.75%, 07/21/2026 | | | 4,500,000 | | | | 4,404,808 | |
| Danske Bank A/S | | | | | | | | |
| 1Y US TI + 0.95%, 03/01/2028(a)(e) | | | 6,412,000 | | | | 6,493,717 | |
| 1Y US TI + 1.35%, 09/11/2026(a)(e) | | | 6,500,000 | | | | 6,304,149 | |
| 1Y US TI + 1.40%, 03/01/2030(a)(e) | | | 4,580,000 | | | | 4,675,943 | |
| Discover Bank | | | | | | | | |
| 5Y US TI + 1.73%, 08/09/2028(a) | | | 1,503,000 | | | | 1,534,971 | |
| Goldman Sachs Bank USA | | | | | | | | |
| 1D US SOFR + 0.777%, 03/18/2027(a) | | | 3,297,000 | | | | 3,318,950 | |
| Intesa Sanpaolo SpA | | | | | | | | |
| 1Y US TI + 3.90%, 06/20/2054(a)(e) | | | 5,160,000 | | | | 5,686,068 | |
| Regions Financial Corp. | | | | | | | | |
| 1D US SOFR + 2.06%, 09/06/2035(a) | | | 7,890,000 | | | | 7,821,386 | |
| Synovus Financial Corp. | | | | | | | | |
| 1D US SOFR + 2.347%, 11/01/2030(a) | | | 3,350,000 | | | | 3,350,594 | |
| Truist Bank | | | | | | | | |
| 3.30%, 05/15/2026 | | | 4,316,000 | | | | 4,216,265 | |
| Truist Financial Corp. | | | | | | | | |
| 1D US SOFR + 1.571%, 08/05/2032(a) | | | 788,000 | | | | 782,531 | |
| 1D US SOFR + 2.361%, 06/08/2034(a) | | | 6,897,000 | | | | 7,094,964 | |
| Wells Fargo & Co. | | | | | | | | |
| 1D US SOFR + 2.02%, 04/24/2034(a) | | | 12,653,000 | | | | 12,743,343 | |
| Total Banks | | | | | | | 76,002,185 | |
| Biotechnology (1.52%) | | | | | | | | |
| Amgen, Inc. | | | | | | | | |
| 5.25%, 03/02/2033 | | | 14,778,000 | | | | 14,935,947 | |
| 5.51%, 03/02/2026 | | | 8,959,000 | | | | 8,961,152 | |
| 5.75%, 03/02/2063 | | | 14,472,000 | | | | 14,504,090 | |
| Royalty Pharma PLC | | | | | | | | |
| 5.40%, 09/02/2034 | | | 11,100,000 | | | | 11,026,512 | |
| Total Biotechnology | | | | | | | 49,427,701 | |
| | | Principal Amount | | | Value (Note 2) | |
| Cable & Satellite (0.94%) | | | | | | |
| CCO Holdings LLC / CCO Holdings Capital Corp. | | | | | | |
| 4.50%, 05/01/2032 | | $ | 4,000,000 | | | $ | 3,406,589 | |
| 4.50%, 06/01/2033(e) | | | 5,978,000 | | | | 4,977,307 | |
| 6.38%, 09/01/2029(e) | | | 4,850,000 | | | | 4,805,785 | |
| Cox Communications, Inc. | | | | | | | | |
| 5.45%, 09/01/2034(e) | | | 5,490,000 | | | | 5,353,079 | |
| 5.95%, 09/01/2054(e) | | | 5,490,000 | | | | 5,237,185 | |
| Sirius XM Radio, Inc. | | | | | | | | |
| 5.00%, 08/01/2027(e) | | | 7,421,000 | | | | 7,277,242 | |
| Total Cable & Satellite | | | | | | | 31,057,187 | |
| Casinos & Gaming (0.08%) | | | | | | | | |
| Caesars Entertainment, Inc. | | | | | | | | |
| 8.13%, 07/01/2027(e) | | | 2,655,000 | | | | 2,708,748 | |
| | | | | | | | | |
| Commercial Finance (0.43%) | | | | | | | | |
| AerCap Ireland Capital DAC / | | | | | | | | |
| AerCap Global Aviation Trust | | | | | | | | |
| 6.50%, 07/15/2025 | | | 13,642,000 | | | | 13,765,555 | |
| | | | | | | | | |
| Consumer Finance (1.24%) | | | | | | | | |
| American Express Co. | | | | | | | | |
| 1D US SOFR + 1.42%, 07/26/2035(a) | | | 3,162,000 | | | | 3,170,340 | |
| Boost Newco Borrower LLC | | | | | | | | |
| 7.50%, 01/15/2031(e) | | | 5,915,000 | | | | 6,241,388 | |
| Discover Financial Services | | | | | | | | |
| SOFRINDX + 3.37%, 11/02/2034(a)(f) | | | 20,606,000 | | | | 23,685,288 | |
| Fiserv, Inc. | | | | | | | | |
| 5.60%, 03/02/2033 | | | 3,982,000 | | | | 4,095,086 | |
| Synchrony Financial | | | | | | | | |
| 3.70%, 08/04/2026 | | | 3,192,000 | | | | 3,115,659 | |
| Total Consumer Finance | | | | | | | 40,307,761 | |
| Containers & Packaging (0.24%) | | | | | | | | |
| Sonoco Products Co. | | | | | | | | |
| 5.00%, 09/01/2034 | | | 8,084,000 | | | | 7,749,395 | |
| Diversified Banks (0.96%) | | | | | | | | |
| Bank of America Corp. | | | | | | | | |
| 1D US SOFR + 1.91%, 04/25/2034(a) | | | 7,638,000 | | | | 7,675,327 | |
| JPMorgan Chase & Co. | | | | | | | | |
| 1D US SOFR + 0.93%, 04/22/2028(a) | | | 4,054,000 | | | | 4,127,128 | |
| 1D US SOFR + 1.07%, 12/15/2025(a) | | | 8,581,000 | | | | 8,583,672 | |
| 1D US SOFR + 1.62%, 01/23/2035(a) | | | 10,386,000 | | | | 10,479,306 | |
| Total Diversified Banks | | | | | | | 30,865,433 | |
See Notes to Financial Statements and Financial Highlights.
ALPS | Smith Total Return Bond Fund
| Statement of Investments | October 31, 2024 |
| | | Principal
Amount | | | Value
(Note 2) | |
| Electrical Equipment Manufacturing (0.10%) | | | | | | |
| Trimble, Inc. | | | | | | | | |
| 4.75%, 12/01/2024 | | $ | 3,254,000 | | | $ | 3,251,929 | |
| Entertainment Content (0.69%) | | | | | | | | |
| Paramount Global | | | | | | | | |
| 4.20%, 05/19/2032 | | | 17,571,000 | | | | 15,316,908 | |
| Warnermedia Holdings, Inc. | | | | | | | | |
| 4.28%, 03/15/2032 | | | 7,800,000 | | | | 6,838,079 | |
| Total Entertainment Content | | | | | | | 22,154,987 | |
| | | | | | | | | |
| Entertainment Resources (0.12%) | | | | | | | | |
| Six Flags Entertainment Corp. / Six Flags Theme Parks, Inc. | | | | | | | | |
| 6.63%, 05/01/2032(e) | | | 3,651,000 | | | | 3,722,742 | |
| | | | | | | | | |
| Exploration & Production (2.37%) | | | | | | | | |
| Coterra Energy, Inc. | | | | | | | | |
| 5.60%, 03/15/2034 | | | 6,212,000 | | | | 6,213,419 | |
| Devon Energy Corp. | | | | | | | | |
| 5.20%, 09/15/2034 | | | 3,914,000 | | | | 3,769,526 | |
| 5.75%, 09/15/2054 | | | 5,480,000 | | | | 5,103,235 | |
| Hilcorp Energy I LP / Hilcorp Finance Co. | | | | | | | | |
| 6.00%, 04/15/2030(e) | | | 1,682,000 | | | | 1,605,757 | |
| 6.25%, 11/01/2028(e) | | | 5,537,000 | | | | 5,407,006 | |
| 6.25%, 04/15/2032(e) | | | 1,682,000 | | | | 1,579,640 | |
| 7.25%, 02/15/2035(e) | | | 10,955,000 | | | | 10,754,528 | |
| Occidental Petroleum Corp. | | | | | | | | |
| 5.55%, 10/01/2034 | | | 3,815,000 | | | | 3,758,198 | |
| 6.20%, 03/15/2040 | | | 7,155,000 | | | | 7,146,955 | |
| 7.88%, 09/15/2031 | | | 25,079,000 | | | | 28,129,207 | |
| Permian Resources Operating LLC | | | | | | | | |
| 9.88%, 07/15/2031(e) | | | 1,465,000 | | | | 1,619,813 | |
| Range Resources Corp. | | | | | | | | |
| 4.88%, 05/15/2025 | | | 2,000,000 | | | | 1,994,825 | |
| Total Exploration & Production | | | | | | | 77,082,109 | |
| | | | | | | | | |
| Financial Services (2.76%) | | | | | | | | |
| Charles Schwab Corp. | | | | | | | | |
| 1D US SOFR + 2.01%, 08/24/2034(a) | | | 12,000,000 | | | | 12,738,840 | |
| SOFRINDX + 1.05%, 03/03/2027(a)(f) | | | 9,431,000 | | | | 9,511,855 | |
| Goldman Sachs Group, Inc. | | | | | | | | |
| 1D US SOFR + 1.552%, 04/25/2035(a) | | | 3,245,000 | | | | 3,363,500 | |
| Jane Street Group / JSG Finance, Inc. | | | | | | | | |
| 6.13%, 11/01/2032(e) | | | 5,091,000 | | | | 5,097,477 | |
| 7.13%, 04/30/2031(e) | | | 1,400,000 | | | | 1,452,276 | |
| Morgan Stanley | | | | | | | | |
| 1D US SOFR + 2.05%, 11/01/2034(a) | | | 8,443,000 | | | | 9,259,643 | |
| 5Y US TI + 1.80%, 02/07/2039(a) | | | 7,463,000 | | | | 7,574,791 | |
| | | Principal
Amount | | | Value
(Note 2) | |
| UBS Group AG | | | | | | |
| 1D US SOFR + 1.73%, 05/14/2032(a)(e) | | $ | 8,750,000 | | | $ | 7,717,234 | |
| 1D US SOFR + 3.92%, 08/12/2033(a)(e) | | | 25,938,000 | | | | 27,870,829 | |
| 1Y US TI + 1.80%, 09/22/2029(a)(e) | | | 4,893,000 | | | | 5,111,047 | |
| Total Financial Services | | | | | | | 89,697,492 | |
| | | | | | | | | |
| Food & Beverage (0.96%) | | | | | | | | |
| J M Smucker Co. | | | | | | | | |
| 6.20%, 11/15/2033 | | | 6,976,000 | | | | 7,452,981 | |
| Pilgrim's Pride Corp. | | | | | | | | |
| 6.25%, 07/01/2033 | | | 10,000,000 | | | | 10,393,130 | |
| 6.88%, 05/15/2034 | | | 12,266,000 | | | | 13,342,759 | |
| Total Food & Beverage | | | | | | | 31,188,870 | |
| Government Agencies (0.07%) | | | | | | | | |
| Tennessee Valley Authority | | | | | | | | |
| 2.22%, 05/01/2029 | | | 109,037 | | | | 2,436,977 | |
| | | | | | | | | |
| Health Care Facilities & Services (0.62%) | | | | | | | | |
| HCA, Inc. | | | | | | | | |
| 2.38%, 07/15/2031 | | | 11,927,000 | | | | 10,050,856 | |
| 5.38%, 02/01/2025 | | | 3,000,000 | | | | 3,000,377 | |
| 5.50%, 06/01/2033 | | | 6,970,000 | | | | 7,003,829 | |
| Total Health Care Facilities & Services | | | | | | | 20,055,062 | |
| | | | | | | | | |
| Industrial Other (0.66%) | | | | | | | | |
| Honeywell International, Inc. | | | | | | | | |
| 5.00%, 03/01/2035 | | | 14,633,000 | | | | 14,707,243 | |
| Jacobs Engineering Group, Inc. | | | | | | | | |
| 5.90%, 03/01/2033 | | | 6,765,000 | | | | 6,942,323 | |
| Total Industrial Other | | | | | | | 21,649,566 | |
| | | | | | | | | |
| Integrated Oils (0.25%) | | | | | | | | |
| TotalEnergies Capital SA | | | | | | | | |
| 5.49%, 04/05/2054 | | | 8,235,000 | | | | 8,188,467 | |
| | | | | | | | | |
| Machinery Manufacturing (0.22%) | | | | | | | | |
| Nordson Corp. | | | | | | | | |
| 4.50%, 12/15/2029 | | | 7,400,000 | | | | 7,253,261 | |
| | | | | | | | | |
| Manufactured Goods (0.14%) | | | | | | | | |
| Chart Industries, Inc. | | | | | | | | |
| 7.50%, 01/01/2030(e) | | | 4,228,000 | | | | 4,402,747 | |
| Medical Equipment & Devices Manufacturing (1.30%) | | | | | | | | |
| Alcon Finance Corp. | | | | | | | | |
| 5.38%, 12/06/2032(e) | | | 14,770,000 | | | | 15,045,210 | |
| Solventum Corp. | | | | | | | | |
| 5.45%, 03/13/2031(e) | | | 7,429,000 | | | | 7,493,481 | |
| 5.60%, 03/23/2034(e) | | | 12,179,000 | | | | 12,278,124 | |
| 5.90%, 04/30/2054(e) | | | 7,423,000 | | | | 7,441,663 | |
| Total Medical Equipment & Devices Manufacturing | | | | | | | 42,258,478 | |
See Notes to Financial Statements and Financial Highlights.
ALPS | Smith Total Return Bond Fund
| Statement of Investments | October 31, 2024 |
| | | Principal
Amount | | | Value (Note 2) | |
| Metals & Mining (0.33%) | | | | | | |
| Steel Dynamics, Inc. | | | | | | | | |
| 5.00%, 12/15/2026 | | $ | 10,905,000 | | | $ | 10,893,202 | |
| Oil & Gas Services & Equipment (0.07%) | | | | | | | | |
| Transocean Poseidon, Ltd. | | | | | | | | |
| 6.88%, 02/01/2027(e) | | | 2,151,600 | | | | 2,151,999 | |
| Pharmaceuticals (0.98%) | | | | | | | | |
| AbbVie, Inc. | | | | | | | | |
| 5.05%, 03/15/2034 | | | 5,760,000 | | | | 5,804,906 | |
| Bristol-Myers Squibb Co. | | | | | | | | |
| 5.20%, 02/22/2034 | | | 6,525,000 | | | | 6,644,197 | |
| 5.55%, 02/22/2054 | | | 13,582,000 | | | | 13,748,443 | |
| Pfizer Investment Enterprises Pte, Ltd. | | | | | | | | |
| 4.75%, 05/19/2033 | | | 5,779,000 | | | | 5,695,462 | |
| Total Pharmaceuticals | | | | | | | 31,893,008 | |
| Pipeline (2.71%) | | | | | | | | |
| Buckeye Partners LP | | | | | | | | |
| 4.50%, 03/01/2028(e) | | | 8,958,000 | | | | 8,539,955 | |
| 6.88%, 07/01/2029(e) | | | 9,749,000 | | | | 9,917,200 | |
| Energy Transfer LP | | | | | | | | |
| 7.38%, 02/01/2031(e) | | | 7,123,000 | | | | 7,501,246 | |
| EnLink Midstream LLC | | | | | | | | |
| 5.63%, 01/15/2028(e) | | | 3,366,000 | | | | 3,409,455 | |
| Flex Intermediate Holdco LLC | | | | | | | | |
| 3.36%, 06/30/2031(e) | | | 12,936,000 | | | | 11,201,655 | |
| 4.32%, 12/30/2039(e) | | | 9,061,000 | | | | 7,074,123 | |
| Gray Oak Pipeline LLC | | | | | | | | |
| 2.60%, 10/15/2025(e) | | | 10,171,000 | | | | 9,932,471 | |
| Targa Resources Partners LP / | | | | | | | | |
| Targa Resources Partners Finance Corp. | | | | | | | | |
| 6.50%, 07/15/2027 | | | 16,103,000 | | | | 16,249,746 | |
| 6.88%, 01/15/2029 | | | 8,740,000 | | | | 8,945,973 | |
| Western Midstream Operating LP | | | | | | | | |
| 5.45%, 11/15/2034 | | | 5,490,000 | | | | 5,357,995 | |
| Total Pipeline | | | | | | | 88,129,819 | |
| Power Generation (0.52%) | | | | | | | | |
| Vistra Operations Co. LLC | | | | | | | | |
| 5.13%, 05/13/2025(e) | | | 6,961,000 | | | | 6,960,296 | |
| 5.50%, 09/01/2026(e) | | | 9,846,000 | | | | 9,822,444 | |
| Total Power Generation | | | | | | | 16,782,740 | |
| Publishing & Broadcasting (0.50%) | | | | | | | | |
| Gray Television, Inc. | | | | | | | | |
| 7.00%, 05/15/2027(e) | | | 4,200,000 | | | | 4,090,430 | |
| Nexstar Media, Inc. | | | | | | | | |
| 4.75%, 11/01/2028(e) | | | 8,000,000 | | | | 7,527,414 | |
| 5.63%, 07/15/2027(e) | | | 4,376,000 | | | | 4,304,019 | |
| Total Publishing & Broadcasting | | | | | | | 15,921,863 | |
| | | Principal
Amount | | | Value
(Note 2) | |
| Real Estate (0.78%) | | | | | | |
| CoStar Group, Inc. | | | | | | | | |
| 2.80%, 07/15/2030(e) | | $ | 9,317,000 | | | $ | 8,139,080 | |
| VICI Properties LP | | | | | | | | |
| 5.13%, 05/15/2032 | | | 9,134,000 | | | | 8,952,813 | |
| VICI Properties LP / VICI Note Co., Inc. | | | | | | | | |
| 4.63%, 06/15/2025(e) | | | 8,185,000 | | | | 8,147,586 | |
| Total Real Estate | | | | | | | 25,239,479 | |
| Refining & Marketing (0.43%) | | | | | | | | |
| HF Sinclair Corp. | | | | | | | | |
| 4.50%, 10/01/2030 | | | 8,654,000 | | | | 8,288,352 | |
| 5.00%, 02/01/2028 | | | 2,667,000 | | | | 2,641,292 | |
| 5.88%, 04/01/2026 | | | 3,177,000 | | | | 3,208,117 | |
| Total Refining & Marketing | | | | | | | 14,137,761 | |
| Retail - Consumer Discretionary (0.14%) | | | | | | | | |
| ERAC USA Finance LLC | | | | | | | | |
| 5.20%, 10/30/2034(e) | | | 4,403,000 | | | | 4,442,287 | |
| Software & Services (0.76%) | | | | | | | | |
| Accenture Capital, Inc. | | | | | | | | |
| 4.50%, 10/04/2034 | | | 3,850,000 | | | | 3,722,962 | |
| Leidos, Inc. | | | | | | | | |
| 5.75%, 03/15/2033 | | | 6,942,000 | | | | 7,194,672 | |
| VMware LLC | | | | | | | | |
| 2.20%, 08/15/2031 | | | 4,979,000 | | | | 4,160,208 | |
| 4.70%, 05/15/2030 | | | 9,961,000 | | | | 9,788,476 | |
| Total Software & Services | | | | | | | 24,866,318 | |
| Supermarkets & Pharmacies (1.42%) | | | | | | | | |
| Albertsons Cos. Inc / Safeway, Inc. / New Albertsons LP / Albertsons LLC | | | | | | | | |
| 6.50%, 02/15/2028(e) | | | 14,670,000 | | | | 15,025,703 | |
| Kroger Co. | | | | | | | | |
| 5.00%, 09/15/2034 | | | 23,800,000 | | | | 23,418,956 | |
| 5.50%, 09/15/2054 | | | 7,935,000 | | | | 7,711,741 | |
| Total Supermarkets & Pharmacies | | | | | | | 46,156,400 | |
| Travel & Lodging (0.55%) | | | | | | | | |
| Carnival Corp. | | | | | | | | |
| 10.50%, 06/01/2030(e) | | | 9,707,000 | | | | 10,479,667 | |
Royal Caribbean Cruises, Ltd. 6.25%, 03/15/2032(e) | | | 7,169,000 | | | | 7,313,427 | |
| Total Travel & Lodging | | | | | | | 17,793,094 | |
| Utilities (0.22%) | | | | | | | | |
| American Water Capital Corp. | | | | | | | | |
| 5.15%, 03/01/2034 | | | 7,142,000 | | | | 7,185,986 | |
| | | | | | | | | |
| Waste & Environment Services & Equipment (0.46%) | | | | | | | | |
| GFL Environmental, Inc. | | | | | | | | |
| 5.13%, 12/15/2026(e) | | | 10,756,000 | | | | 10,658,205 | |
| 6.75%, 01/15/2031(e) | | | 4,064,000 | | | | 4,189,443 | |
| Total Waste & Environment Services & Equipment | | | | | | | 14,847,648 | |
See Notes to Financial Statements and Financial Highlights.
ALPS | Smith Total Return Bond Fund
| Statement of Investments | October 31, 2024 |
| | | Principal Amount | | | Value (Note 2) | |
| Wireless Telecommunications Services (0.35%) | | | | | | |
| AT&T, Inc. | | | | | | | | |
| 5.54%, 02/20/2026 | | $ | 3,982,000 | | | $ | 3,981,660 | |
| Verizon Communications, Inc. | | | | | | | | |
| 4.78%, 02/15/2035(e) | | | 7,815,000 | | | | 7,530,020 | |
| Total Wireless Telecommunications Services | | | | | | | 11,511,680 | |
| TOTAL CORPORATE BONDS | | | | | | | | |
| (Cost $1,120,064,456) | | | | | | | 1,120,618,638 | |
| | | Principal Amount | | | Value (Note 2) | |
| GOVERNMENT BONDS (34.08%) | | | | | | |
| U.S. Treasury Bonds (34.08%) | | | | | | |
| United States Treasury Bonds | | | | | | |
| 3.88%, 08/15/2034 | | | 155,803,000 | | | | 150,763,747 | |
| 4.13%, 10/31/2029 | | | 64,402,000 | | | | 64,334,076 | |
| 4.13%, 08/15/2044 | | | 122,996,000 | | | | 115,520,149 | |
| 4.25%, 08/15/2054 | | | 102,828,000 | | | | 98,963,917 | |
| 4.63%, 05/15/2044 | | | 84,713,000 | | | | 85,163,038 | |
| 4.63%, 05/15/2054 | | | 82,694,000 | | | | 84,645,062 | |
| United States Treasury Notes | | | | | | | | |
| 3.50%, 09/30/2026 | | | 81,353,000 | | | | 80,367,866 | |
| 3.50%, 09/30/2029 | | | 57,149,000 | | | | 55,510,431 | |
| 3.75%, 08/31/2026 | | | 144,085,000 | | | | 143,004,363 | |
| 4.13%, 10/31/2026 | | | 32,190,000 | | | | 32,168,624 | |
| 4.38%, 07/31/2026 | | | 30,567,000 | | | | 30,660,134 | |
| 4.50%, 05/15/2027 | | | 42,165,000 | | | | 42,531,473 | |
| 4.88%, 05/31/2026 | | | 72,268,000 | | | | 72,986,446 | |
| 5.00%, 10/31/2025 | | | 50,903,000 | | | | 51,234,436 | |
| Total U.S. Treasury Bonds | | | | | | | 1,107,853,762 | |
| TOTAL GOVERNMENT BONDS | | | | | | | | |
| (Cost $1,112,378,426) | | | | | | | 1,107,853,762 | |
| | | Shares | | | Value
(Note 2) | |
| PREFERRED STOCK (2.56%) | | | | | | |
| Energy (0.17%) | | | | | | |
| Pipeline (0.17%) | | | | | | |
| Energy Transfer LP, Series B, 6.625%(g) | | | 2,506,000 | | | | 2,462,467 | |
| Energy Transfer LP, Series F, 6.750%(g) | | | 2,985,000 | | | | 2,980,378 | |
| Total Energy | | | | | | | 5,442,845 | |
| | | | | | | | | |
| Financials (1.54%) | | | | | | | | |
| Banks (0.29%) | | | | | | | | |
| Bank of Hawaii., 8.000%(g) | | | 149,327 | | | | 3,995,991 | |
| Huntington Bancshares, Inc., | | | | | | | | |
| Series J, 6.875%(g) | | | 36,271 | | | | 942,321 | |
| | | Shares | | | Value (Note 2) | |
| Wells Fargo & Co., Series U, 5.875%(g) | | | | | | | | |
| | | | 4,710,000 | | | $ | 4,710,753 | |
| | | | | | | | 9,649,065 | |
| Consumer Finance (0.19%) | | | | | | | | |
| Ally Financial, Inc., Series C, 4.700%(g) | | | 2,982,000 | | | | 2,426,871 | |
| | | | | | | | | |
| American Express Co., 3.550%(g) | | | 4,021,000 | | | | 3,816,118 | |
| | | | | | | | 6,242,989 | |
| Diversified Banks (0.24%) | | | | | | | | |
| HSBC Holdings PLC, 5Y US TI + 3.298%(a)(g) | | | 3,911,000 | | | | 3,937,352 | |
| HSBC Holdings PLC, 5Y US TI + 3.191%(a)(g) | | | 3,911,000 | | | | 3,904,406 | |
| | | | | | | | | |
| Financial Services (0.54%) | | | | | | | | |
| Charles Schwab Corp., Series G, 5Y US TI + 4.971%(a)(g) | | | 11,298,000 | | | | 11,267,861 | |
| Goldman Sachs Group, Inc., Series Y, 10Y US TI + 2.40%(a)(g) | | | 2,330,000 | | | | 2,316,849 | |
| Goldman Sachs Group, Inc., Series X, 5Y US TI + 2.809%(a)(g) | | | 3,724,000 | | | | 3,914,105 | |
| | | | | | | | 17,498,815 | |
| Life Insurance (0.28%) | | | | | | | | |
| Jackson Financial, Inc., 8.000%(g) | | | 98,305 | | | | 2,664,066 | |
| Prudential Financial, Inc., 3M US SOFR + 3.031%(a)(g) | | | 6,543,000 | | | | 6,511,536 | |
| | | | | | | | 9,175,602 | |
| Total Financials | | | | | | | 50,408,229 | |
| | | | | | | | | |
| Government (0.37%) | | | | | | | | |
| Government Agencies (0.37%) | | | | | | | | |
| Farm Credit Bank of Texas, Series 4, | | | | | | | | |
| 5Y US TI + 5.415%(a)(e)(g) | | | 7,900,000 | | | | 7,860,187 | |
| Farm Credit Bank of Texas, 5Y | | | | | | | | |
| US TI + 3.291%(a)(g) | | | 3,980,000 | | | | 4,176,771 | |
| Total Government | | | | | | | 12,036,958 | |
| | | | | | | | | |
| Utilities (0.48%) | | | | | | | | |
| Utilities (0.48%) | | | | | | | | |
| Entergy Corp., 5Y US TI + 2.67%(a)(g) | | | 3,980,000 | | | | 4,079,018 | |
| National Rural Utilities Cooperative Finance Corp., | | | | | | | | |
| 3M US SOFR + 3.17%(a)(g) | | | 3,386,000 | | | | 3,386,477 | |
See Notes to Financial Statements and Financial Highlights.
ALPS | Smith Total Return Bond Fund
| Statement of Investments | October 31, 2024 |
| | | Shares | | | Value
(Note 2) | |
| National Rural Utilities | | | | | | | | |
| Cooperative Finance Corp., 5Y US TI + 3.533%(a)(g) | | | 3,775,000 | | | $ | 3,933,391 | |
| Sempra, 5Y US TI + 2.868%(a)(g) | | | 4,268,000 | | | | 4,069,594 | |
| | | | | | | | 15,468,480 | |
| | | | | | | | | |
| Total Utilities | | | | | | | 15,468,480 | |
| | | | | | | | | |
| TOTAL PREFERRED STOCK | | | | | | | | |
| (Cost $81,896,318) | | | | | | | 83,356,512 | |
| | | 7-Day
Yield | | | Shares | | | Value (Note 2) | |
| SHORT TERM INVESTMENTS (1.45%) | | | | |
| Money Market Fund (1.45%) | | | | | | | | | | | | |
| Morgan Stanley Institutional Liquidity Funds – Government Portfolio | | | 4.78 | % | | | 47,248,215 | | | | 47,248,215 | |
| TOTAL SHORT TERM INVESTMENTS | | | | | | |
| (Cost $47,248,215) | | | | | | | | | | | 47,248,215 | |
| | | Value
(Note 2) | |
| TOTAL INVESTMENTS (99.09%) | | | |
| (Cost $3,242,155,687) | | $ | 3,221,430,330 | |
| | | | | |
| Other Assets In Excess Of Liabilities (0.91%) | | | 29,595,565 | |
| | | | | |
| NET ASSETS (100.00%) | | $ | 3,251,025,895 | |
Investment Abbreviations:
SOFR - Secured Overnight Financing Rate
SOFRINDX - Secured Overnight Financing Rate Index
TI - Treasury Index
Reference Rates:
3M US SOFR - 3 Month SOFR as of October 31, 2024 was 4.56%
30D US SOFR - 30 Day SOFR as of October 31, 2024 was 4.66%
1D US SOFR - 1 Day SOFR as of October 31, 2024 was 4.90%
1Y US SOFR- 1 Year SOFR as of October 31, 2024 was 4.17%
1M US SOFR- 1 Month SOFR as of October 31, 2024 was 4.66%
1Y US TI - 1 Year US TI as of October 31, 2024 was 4.27%
5Y US TI - 5 Year US TI as of October 31, 2024 was 4.15%
10Y US TI - 10 Year US TI as of October 31, 2024 was 4.28%
| (a) | Floating or variable rate security. The reference rate is described above. The rate in effect as of October 31, 2024 is based on the reference rate plus the displayed spread as of the security's last reset date. |
| (b) | Issued with zero coupon. |
| (c) | Interest only security. |
| (d) | Step bond. Coupon changes periodically based upon a predetermined schedule. Interest rate disclosed is that which is in effect as of October 31, 2024. |
| (e) | Security exempt from registration under Rule 144A of the Securities Act of 1933. These securities may be resold in transactions exempt from registration, normally to qualified institutional buyers. As of October 31, 2024, the aggregate market value of those securities was $425,959,825, representing 13.10% of net assets. |
| (f) | The SOFRINDX is a compounded average of the daily Secured Overnight Financing Rate determined by reference to the SOFR Index for any interest period. |
| (g) | Perpetual maturity. This security has no contractual maturity date, is not redeemable and contractually pays an indefinite stream of interest. |
See Notes to Financial Statements and Financial Highlights.
ALPS | Smith Credit Opportunities Fund
| Statement of Investments | October 31, 2024 |
| | | Principal Amount | | | Value (Note 2) | |
| BANK LOANS (8.54%) | | | | | | |
| | | | | | | |
| Aerospace & Defense (1.04%) | | | | | | |
| TransDigm, Inc. | | | | | | |
| 3M US SOFR + 3.25%, 02/28/2031(a) | | $ | 2,194,500 | | | $ | 2,199,043 | |
| | | | | | | | | |
| Apparel & Textile Products (1.08%) | | | | | | | | |
| ABG Intermediate Holdings 2 LLC | | | | | | | | |
| 1M US SOFR + 2.75%, 12/21/2028(a) | | | 2,280,179 | | | | 2,287,452 | |
| | | | | | | | | |
| Casinos & Gaming (1.39%) | | | | | | | | |
| Caesars Entertainment, Inc. | | | | | | | | |
| 1M US SOFR + 2.75%, 02/06/2031(a) | | | 1,741,250 | | | | 1,744,924 | |
| Light & Wonder International, Inc. | | | | | | | | |
| 1M US SOFR + 2.25%, 04/15/2029(a) | | | 1,194,000 | | | | 1,195,301 | |
| Total Casinos & Gaming | | | | | | | 2,940,225 | |
| Consumer Finance (0.58%) | | | | | | | | |
| Boost Newco Borrower LLC | | | | | | | | |
| 3M US SOFR + 2.50%, 01/31/2031(a) | | | 1,200,000 | | | | 1,204,878 | |
| | | | | | | | | |
| Financial Services (0.08%) | | | | | | | | |
| Jane Street Group LLC | | | | | | | | |
| 1M US SOFR + 2.50%, 01/26/2028(a) | | | 176,085 | | | | 176,100 | |
| | | | | | | | | |
| Food & Beverage (1.14%) | | | | | | | | |
| Chobani LLC | | | | | | | | |
| 1M US SOFR + 3.75%, 10/25/2027(a) | | | 2,382,000 | | | | 2,396,637 | |
| | | | | | | | | |
| Health Care Facilities & Services (0.14%) | | | | | | | | |
| Fortrea Holdings, Inc. | | | | | | | | |
| 1M US SOFR + 3.75%, 07/01/2030(a) | | | 293,213 | | | | 293,456 | |
| | | | | | | | | |
| Industrials (0.36%) | | | | | | | | |
| GFL Environmental 6/24 | | | | | | | | |
| 3M US SOFR + 2.00%, 06/27/2031 | | | 757,000 | | | | 756,765 | |
| | | | | | | | | |
| Manufactured Goods (0.51%) | | | | | | | | |
| Chart Industries, Inc. | | | | | | | | |
| 3M US SOFR + 2.50%, 03/18/2030(a) | | | 1,066,278 | | | | 1,069,616 | |
| | | Principal Amount | | | Value (Note 2) | |
| Medical Equipment & Devices Manufacturing (0.52%) |
| Medline Borrower LP |
| 1M US SOFR + 2.50%, 10/23/2028(a) | | $ | 1,094,500 | | | $ | 1,096,750 | |
| | | | | | | | | |
| Pipeline (0.57%) | | | | | | | | |
| Buckeye Partners LP | | | | | | | | |
| 1M US SOFR + 2.00%, 11/22/2030(a) | | | 1,194,008 | | | | 1,192,993 | |
| | | | | | | | | |
| Publishing & Broadcasting (0.27%) | | | | | | | | |
| Nexstar Media, Inc. | | | | | | | | |
| 1M US SOFR + 2.50%, 09/18/2026(a) | | | 570,205 | | | | 570,820 | |
| | | | | | | | | |
| Restaurants (0.24%) | | | | | | | | |
| Raising Cane's Restaurants LLC TLB 1L | | | | | | | | |
| 1M US SOFR + 2.00%, 09/10/2031 | | | 500,000 | | | | 500,103 | |
| | | | | | | | | |
| Travel & Lodging (0.62%) | | | | | | | | |
| Carnival Corp. | | | | | | | | |
| 1M US SOFR + 2.75%, 08/09/2027(a) | | | 1,294,498 | | | | 1,299,960 | |
| | | | | | | | | |
| TOTAL BANK LOANS | | | | | | | | |
| (Cost $17,970,298) | | | | | | | 17,984,798 | |
| | | Principal Amount | | | Value (Note 2) | |
| COLLATERALIZED MORTGAGE OBLIGATIONS (3.67%) | | | | | | |
| Fannie Mae | | | | | | |
| Series 2002-71, Class AP, 5.000%, 11/25/2032 | | $ | 8,778 | | | $ | 8,653 | |
| Series 2002-90, Class A1, 6.500%, 06/25/2042 | | | 46,277 | | | | 47,321 | |
| Series 2008-8, Class FB, 30D US SOFR + 0.93%, 02/25/2038(a) | | | 89,231 | | | | 89,694 | |
| Series 2010-114, Class TC, 2.250%, 03/25/2037 | | | 287,312 | | | | 259,592 | |
| Series 2011-110, Class BX, 4.000%, 10/25/2041 | | | 278,511 | | | | 268,187 | |
| Series 2012-110, Class CA, 3.000%, 10/25/2042 | | | 95,151 | | | | 85,739 | |
| Series 2012-39, Class NB, 4.000%, 04/25/2042 | | | 175,000 | | | | 156,092 | |
| Series 2013-29, Class JE, 1.250%, 04/25/2043 | | | 162,670 | | | | 136,362 | |
| Series 2015-27, Class ME, 3.500%, 10/25/2044 | | | 128,000 | | | | 118,360 | |
| Series 2019-14, Class CA, 3.500%, 04/25/2049 | | | 121,394 | | | | 115,093 | |
See Notes to Financial Statements and Financial Highlights.
ALPS | Smith Credit Opportunities Fund
| Statement of Investments | October 31, 2024 |
| | | Principal Amount | | | Value (Note 2) | |
| Series 2019-7, Class JA, 3.500%, 03/25/2049 | | $ | 102,162 | | | $ | 97,104 | |
| Series 2019-74, Class LB, 3.000%, 10/25/2049 | | | 123,876 | | | | 112,058 | |
| Series 2021-94, Class KU, 2.000%, 12/25/2051 | | | 148,252 | | | | 89,279 | |
| | | | | | | | 1,583,534 | |
| Freddie Mac | | | | | | | | |
| Series 2002-2455, Class GK, 6.500%, 05/15/2032 | | | 10,897 | | | | 11,327 | |
| Series 2002-2505, Class D, 5.500%, 09/15/2032 | | | 22,629 | | | | 23,016 | |
| Series 2005-2990, Class GO, -%, 02/15/2035(b) | | | 25,643 | | | | 22,058 | |
| Series 2011-3965, Class ZA, 4.000%, 11/15/2041 | | | 269,041 | | | | 256,609 | |
| Series 2012-4096, Class BY, 2.000%, 08/15/2042 | | | 85,000 | | | | 65,470 | |
| Series 2012-4116, Class UC, 2.500%, 10/15/2042 | | | 103,000 | | | | 73,802 | |
| Series 2012-4140, Class BW, 2.500%, 12/15/2042 | | | 100,000 | | | | 76,576 | |
| Series 2015-4537, Class AZ, 3.000%, 12/15/2045 | | | 20,971 | | | | 18,310 | |
| Series 2016-4579, Class W, 6.806%, 01/15/2038(a) | | | 58,172 | | | | 60,939 | |
| Series 2016-4614, Class PB, 3.000%, 01/15/2046 | | | 216,212 | | | | 197,512 | |
| Series 2018-4839, Class PZ, 4.000%, 11/15/2048 | | | 127,074 | | | | 108,283 | |
| Series 2021-5142, Class PN, 1.000%, 09/25/2051 | | | 67,165 | | | | 49,500 | |
| Series 2021-5151, Class LV, 1.500%, 09/25/2051 | | | 262,895 | | | | 142,566 | |
| | | | | | | | 1,105,968 | |
| Ginnie Mae | | | | | | | | |
| Series 2009-93, Class HG, 4.000%, 09/16/2039 | | | 9,166 | | | | 9,021 | |
| Series 2011-139, Class KZ, 2.500%, 10/20/2041 | | | 48,425 | | | | 42,260 | |
| Series 2011-141, Class GH, 3.000%, 10/16/2041 | | | 150,000 | | | | 112,839 | |
| Series 2011-H05, Class FB, 1M US SOFR + 0.61%, 12/20/2060(a) | | | 14,881 | | | | 14,858 | |
| Series 2011-H14, Class FC, 1M US SOFR + 0.61%, 05/20/2061(a) | | | 19,465 | | | | 19,435 | |
| Series 2012-137, Class EB, 2.000%, 11/20/2042 | | | 100,000 | | | | 62,106 | |
| Series 2012-16, Class ND, 2.000%, 05/20/2039 | | | 151,623 | | | | 141,502 | |
| Series 2012-41, Class TJ, 4.000%, 03/20/2042 | | | 187,933 | | | | 168,917 | |
| | | Principal Amount | | | Value (Note 2) | |
| Series 2012-H20, Class BA, | | | | | | |
| 1M US SOFR + 0.67%, 09/20/2062(a) | | $ | 9,304 | | | $ | 9,174 | |
| Series 2012-H29, Class SA, 1M US SOFR + 0.62%, 10/20/2062(a) | | | 20,498 | | | | 20,452 | |
| Series 2013-28, Class DB, 3.000%, 02/20/2043 | | | 170,000 | | | | 143,356 | |
| Series 2013-44, Class CE, 2.500%, 03/16/2043 | | | 105,656 | | | | 81,330 | |
| Series 2013-9, Class KY, 3.000%, 01/20/2043 | | | 324,000 | | | | 282,006 | |
| Series 2013-H07, Class GA, 1M US SOFR + 0.58%, 03/20/2063(a) | | | 10,318 | | | | 10,290 | |
| Series 2013-H10, Class FA, 1M US SOFR + 0.51%, 03/20/2063(a) | | | 6,768 | | | | 6,749 | |
| Series 2013-H22, Class FT, 1Y US TI + 0.65%, 04/20/2063(a) | | | 2,479 | | | | 2,473 | |
| Series 2013-H23, Class FA, 1M US SOFR + 1.41%, 09/20/2063(a) | | | 3,711 | | | | 3,742 | |
| Series 2014-21, Class PB, 4.000%, 02/16/2044 | | | 150,000 | | | | 132,596 | |
| Series 2014-H03, Class FA, 1M US SOFR + 0.71%, 01/20/2064(a) | | | 4,582 | | | | 4,580 | |
| Series 2015-3, Class ZD, 4.000%, 01/20/2045 | | | 184,503 | | | | 171,611 | |
| Series 2015-31, Class B, 3.000%, 02/20/2045 | | | 100,000 | | | | 88,151 | |
| Series 2015-43, Class DM, 2.500%, 03/20/2045 | | | 72,053 | | | | 63,323 | |
| Series 2015-H10, Class JA, 2.250%, 04/20/2065 | | | 80,188 | | | | 77,934 | |
| Series 2015-H29, Class FL, 1M US SOFR + 0.71%, 11/20/2065(a) | | | 36,590 | | | | 36,515 | |
| Series 2016-167, Class AD, 2.500%, 03/20/2039 | | | 233,714 | | | | 218,345 | |
| Series 2016-H09, Class FA, 1M US SOFR + 0.76%, 03/20/2066(a) | | | 31,626 | | | | 31,636 | |
| Series 2017-31, Class BY, 3.500%, 02/20/2047 | | | 131,000 | | | | 93,960 | |
| Series 2017-H10, Class GZ, 4.492%, 04/20/2067(a) | | | 248,490 | | | | 228,171 | |
| Series 2017-H11, Class HZ, 4.508%, 04/20/2067(a) | | | 140,101 | | | | 127,465 | |
| Series 2017-H11, Class GZ, 4.587%, 04/20/2067(a) | | | 140,828 | | | | 128,546 | |
| Series 2017-H18, Class PZ, 2.000%, 04/20/2066 | | | 130,182 | | | | 107,294 | |
| Series 2018-H01, Class JZ, 4.575%, 01/20/2068(a) | | | 136,188 | | | | 134,514 | |
See Notes to Financial Statements and Financial Highlights.
ALPS | Smith Credit Opportunities Fund
| Statement of Investments | October 31, 2024 |
| | | Principal Amount | | | Value (Note 2) | |
| Series 2018-H01, Class HZ, 4.616%, 01/20/2068(a) | | $ | 136,461 | | | $ | 131,820 | |
| Series 2018-H03, Class HZ, 4.519%, 01/20/2068(a) | | | 135,284 | | | | 118,037 | |
| Series 2018-H07, Class FE, 1M US SOFR + 0.46%, 02/20/2068(a) | | | 11,996 | | | | 11,950 | |
| Series 2018-H07, Class JZ, 4.570%, 04/20/2068(a) | | | 99,033 | | | | 97,829 | |
| Series 2018-H07, Class HZ, 4.617%, 04/20/2068(a) | | | 134,242 | | | | 128,317 | |
| Series 2019-103, Class HY, 3.000%, 08/20/2049 | | | 104,493 | | | | 71,435 | |
| Series 2019-31, Class JC, 3.500%, 03/20/2049 | | | 86,990 | | | | 80,407 | |
| Series 2020-134, Class XB, 1.000%, 07/20/2048 | | | 125,000 | | | | 69,529 | |
| Series 2020-153, Class GP, 0.500%, 10/20/2050 | | | 184,688 | | | | 164,863 | |
| Series 2020-160, Class QD, 1.000%, 10/20/2050 | | | 162,034 | | | | 78,277 | |
| Series 2020-H09, Class NF, 1M US SOFR + 1.36%, 04/20/2070(a) | | | 41,914 | | | | 42,391 | |
| Series 2020-H11, Class JZ, 4.161%, 05/20/2069(a) | | | 172,203 | | | | 136,780 | |
| Series 2020-H12, Class JZ, 4.174%, 08/20/2069(a) | | | 119,439 | | | | 97,517 | |
| Series 2020-H17, Class KZ, 3.612%, 09/20/2070(a) | | | 454,669 | | | | 336,351 | |
| Series 2020-H18, Class EY, 3.702%, 09/20/2070(a) | | | 108,913 | | | | 79,200 | |
| Series 2021-146, Class EH, 2.000%, 08/20/2051 | | | 113,536 | | | | 64,471 | |
| Series 2021-159, Class AL, 1.000%, 09/20/2051 | | | 118,000 | | | | 53,970 | |
| Series 2021-215, Class TZ, 5.000%, 12/20/2051 | | | 140,947 | | | | 118,268 | |
| Series 2021-225, Class EU, 2.000%, 12/20/2051 | | | 119,733 | | | | 70,688 | |
| Series 2021-86, Class ML, 1.000%, 05/20/2051 | | | 136,000 | | | | 55,772 | |
| Series 2021-H02, Class KB, 3.031%, 01/20/2071(a) | | | 107,782 | | | | 74,393 | |
| Series 2021-H02, Class PB, 4.635%, 05/20/2070(a) | | | 101,992 | | | | 95,297 | |
| Series 2021-H03, Class NY, 3.207%, 01/20/2071(a) | | | 109,865 | | | | 76,150 | |
| | | | | | | | 5,028,863 | |
| TOTAL COLLATERALIZED MORTGAGE OBLIGATIONS | | | | | | | | |
| (Cost $7,444,455) | | | | | | | 7,718,365 | |
| | | Principal Amount | | | Value (Note 2) | |
| COMMERCIAL MORTGAGE-BACKED SECURITIES (1.34%) | | | | | | | | |
| | | | | | | | | |
| Fannie Mae-Aces | | | | | | | | |
| Series 2019-M17, Class X, 0.319%, 08/25/2034(a)(c) | | $ | 22,972,439 | | | $ | 311,617 | |
| | | | | | | | | |
| Freddie Mac Multifamily Structured Pass Through Certificates | | | | | | | | |
| Series 2016-K056, Class X3, 2.117%, 06/25/2044(a)(c) | | | 591,680 | | | | 18,949 | |
| Series 2016-K059, Class X1, 0.293%, 09/25/2026(a)(c) | | | 6,000,944 | | | | 24,273 | |
| Series 2017-KW03, Class X1, 0.774%, 06/25/2027(a)(c) | | | 27,725,939 | | | | 438,554 | |
| Series 2019-K087, Class X1, 0.359%, 12/25/2028(a)(c) | | | 28,925,558 | | | | 371,890 | |
| Series 2019-K092, Class X1, 0.710%, 04/25/2029(a)(c) | | | 16,395,021 | | | | 437,343 | |
| Series 2019-K093, Class X1, 0.941%, 05/25/2029(a)(c) | | | 6,010,633 | | | | 207,108 | |
| Series 2019-K094, Class X1, 0.876%, 06/25/2029(a)(c) | | | 14,296,175 | | | | 484,716 | |
| Series 2020-K121, Class X1, 1.019%, 10/25/2030(a)(c) | | | 2,447,348 | | | | 115,469 | |
| Series 2020-K738, Class X1, 1.505%, 01/25/2027(a)(c) | | | 12,384,374 | | | | 308,460 | |
| Series 2021-Q016, Class APT2, 1.473%, 05/25/2051(a) | | | 101,229 | | | | 92,045 | |
| | | | | | | | 2,498,807 | |
| TOTAL COMMERCIAL MORTGAGE-BACKED SECURITIES | | | | | | | | |
| (Cost $2,724,432) | | | | | | | 2,810,424 | |
| | | Principal Amount | | | Value (Note 2) | |
| MORTGAGE-BACKED SECURITIES (1.73%) | | | | | | | | |
| Fannie Mae Pool | | | | | | | | |
| Series 1998-, | | | | | | | | |
| 6.500%, 08/01/2028 | | | 17,237 | | | | 17,777 | |
| 7.500%, 08/01/2028 | | | 17,876 | | | | 17,847 | |
| 8.500%, 06/01/2027 | | | 489 | | | | 488 | |
| Series 1999-, | | | | | | | | |
| 8.000%, 04/01/2029 | | | 15,502 | | | | 15,473 | |
| Series 2001-, | | | | | | | | |
| 12.000%, 11/01/2030 | | | 48,919 | | | | 50,296 | |
| Series 2002-, | | | | | | | | |
| 6.000%, 12/01/2032 | | | 33,018 | | | | 33,431 | |
| Series 2003-, | | | | | | | | |
| 4.500%, 09/01/2028 | | | 24,069 | | | | 23,916 | |
| 4.750%, 09/01/2033 | | | 36,497 | | | | 35,524 | |
| 5.500%, 10/01/2033 | | | 18,013 | | | | 17,872 | |
| 5.500%, 12/01/2033 | | | 30,848 | | | | 31,619 | |
See Notes to Financial Statements and Financial Highlights.
ALPS | Smith Credit Opportunities Fund
| Statement of Investments | October 31, 2024 |
| | | Principal Amount | | | Value (Note 2) | |
| Series 2005-, | | | | | | | | |
| 4.500%, 05/01/2035 | | $ | 17,570 | | | $ | 17,146 | |
| 6.500%, 01/01/2036 | | | 25,668 | | | | 26,465 | |
| Series 2006-, | | | | | | | | |
| 4.500%, 01/01/2036 | | | 26,928 | | | | 26,583 | |
| 6.000%, 03/01/2036 | | | 30,436 | | | | 31,144 | |
| Series 2007-, | | | | | | | | |
| 5.500%, 07/01/2037 | | | 10,054 | | | | 10,110 | |
| 6.000%, 07/01/2037 | | | 29,259 | | | | 29,580 | |
| 6.000%, 09/01/2037 | | | 25,879 | | | | 26,372 | |
| 6.500%, 11/01/2037 | | | 41,998 | | | | 43,279 | |
| Series 2008-, | | | | | | | | |
| 5.000%, 06/01/2037 | | | 16,062 | | | | 15,506 | |
| 5.500%, 04/01/2038 | | | 10,303 | | | | 10,313 | |
| 5.500%, 08/01/2038 | | | 20,138 | | | | 19,825 | |
| 6.500%, 07/01/2038 | | | 43,006 | | | | 44,317 | |
| Series 2009-, | | | | | | | | |
| 5.000%, 04/01/2039 | | | 37,641 | | | | 37,182 | |
| Series 2010-, | | | | | | | | |
| 4.000%, 05/01/2040 | | | 3,306 | | | | 3,261 | |
| 5.500%, 02/01/2038 | | | 40,131 | | | | 40,053 | |
| Series 2011-, | | | | | | | | |
| 4.500%, 05/01/2041 | | | 45,848 | | | | 44,728 | |
| Series 2013-, | | | | | | | | |
| 3.000%, 04/01/2043 | | | 83,908 | | | | 75,947 | |
| Series 2015-, | | | | | | | | |
| 3.500%, 06/01/2045 | | | 49,138 | | | | 46,582 | |
| 5.000%, 07/01/2044 | | | 108,426 | | | | 108,528 | |
| Series 2018-, | | | | | | | | |
| 3.796%, 02/01/2048(a) | | | 28,090 | | | | 25,238 | |
| Series 2022-, | | | | | | | | |
| 5.730%, 11/01/2032 | | | 1,500,000 | | | | 1,508,775 | |
| | | | | | | | 2,435,177 | |
| Freddie Mac Gold Pool | | | | | | | | |
| Series 2004-, | | | | | | | | |
| 5.500%, 01/01/2034 | | | 25,665 | | | | 25,646 | |
| Series 2005-, | | | | | | | | |
| 5.500%, 05/01/2035 | | | 14,368 | | | | 14,278 | |
| Series 2006-, | | | | | | | | |
| 4.500%, 01/01/2036 | | | 10,439 | | | | 10,023 | |
| 5.500%, 12/01/2034 | | | 22,180 | | | | 22,233 | |
| 6.000%, 05/01/2036 | | | 48,872 | | | | 49,660 | |
| Series 2008-, | | | | | | | | |
| 4.500%, 05/01/2038 | | | 53,015 | | | | 52,397 | |
| 6.000%, 08/01/2038 | | | 26,866 | | | | 27,833 | |
| Series 2013-, | | | | | | | | |
| 3.000%, 01/01/2033 | | | 40,760 | | | | 38,793 | |
| Series 2014-, | | | | | | | | |
| 3.500%, 10/01/2044 | | | 34,327 | | | | 31,227 | |
| Series 2015-, | | | | | | | | |
| 4.000%, 03/01/2044 | | | 26,957 | | | | 25,599 | |
| | | | | | | | 297,689 | |
| Freddie Mac Pool | | | | | | | | |
| Series 2018-, | | | | | | | | |
| 3.500%, 08/01/2042 | | | 41,757 | | | | 38,281 | |
| | | Principal Amount | | | Value (Note 2) | |
| 4.500%, 01/01/2036 | | $ | 63,246 | | | $ | 62,029 | |
| | | | | | | | 100,310 | |
| Ginnie Mae I Pool | | | | | | | | |
| Series 2003-, | | | | | | | | |
| 5.500%, 10/15/2033 | | | 42,126 | | | | 42,919 | |
| Series 2010-, | | | | | | | | |
| 5.000%, 05/15/2040 | | | 38,537 | | | | 38,462 | |
| | | | | | | | 81,381 | |
| Ginnie Mae II Pool | | | | | | | | |
| Series 2009-, | | | | | | | | |
| 4.000%, 11/20/2039 | | | 38,895 | | | | 37,018 | |
| 6.000%, 11/20/2039 | | | 55,327 | | | | 57,541 | |
| Series 2011-, | | | | | | | | |
| 4.000%, 02/20/2041 | | | 30,548 | | | | 28,635 | |
| 4.000%, 05/20/2041 | | | 29,018 | | | | 27,200 | |
| 4.000%, 10/20/2041 | | | 13,158 | | | | 12,334 | |
| Series 2012-, | | | | | | | | |
| 3.500%, 01/20/2042 | | | 89,081 | | | | 80,968 | |
| 3.500%, 05/20/2042 | | | 89,061 | | | | 80,937 | |
| Series 2013-, | | | | | | | | |
| 3.500%, 03/20/2043 | | | 65,345 | | | | 59,106 | |
| 5.500%, 11/20/2035 | | | 69,913 | | | | 71,284 | |
| Series 2014-, | | | | | | | | |
| 3.750%, 04/20/2044 | | | 66,212 | | | | 61,059 | |
| 4.000%, 05/20/2044 | | | 65,276 | | | | 61,457 | |
| Series 2016-, | | | | | | | | |
| 3.500%, 09/20/2046 | | | 16,135 | | | | 14,424 | |
| Series 2021-, | | | | | | | | |
| 4.000%, 05/20/2051 | | | 137,338 | | | | 126,342 | |
| | | | | | | | 718,305 | |
| TOTAL MORTGAGE-BACKED SECURITIES | | | | | | | | |
| (Cost $3,790,317) | | | | | | | 3,632,862 | |
| | | Principal Amount | | | Value (Note 2) | |
| CORPORATE BONDS (74.02%) | | | | | | | | |
| | | | | | | | | |
| Advertising & Marketing (1.55%) | | | | | | | | |
| Neptune Bidco US, Inc. | | | | | | | | |
| 9.29%, 04/15/2029(d) | | | 2,100,000 | | | | 1,963,990 | |
| Outfront Media Capital LLC / Outfront | | | | | | | | |
| Media Capital Corp. | | | | | | | | |
| 5.00%, 08/15/2027(d) | | | 1,200,000 | | | | 1,182,918 | |
| 7.38%, 02/15/2031(d) | | | 100,000 | | | | 105,696 | |
| Total Advertising & Marketing | | | | | | | 3,252,604 | |
| Aerospace & Defense (2.83%) | | | | | | | | |
| Boeing Co. | | | | | | | | |
| 6.53%, 05/01/2034(d) | | | 1,100,000 | | | | 1,160,262 | |
| 7.01%, 05/01/2064(d) | | | 881,000 | | | | 949,163 | |
| Bombardier, Inc. | | | | | | | | |
| 7.00%, 06/01/2032(d) | | | 1,000,000 | | | | 1,025,050 | |
| L3Harris Technologies, Inc. | | | | | | | | |
| 5.35%, 06/01/2034 | | | 560,000 | | | | 566,833 | |
| RTX Corp. | | | | | | | | |
| 6.10%, 03/15/2034 | | | 1,057,000 | | | | 1,132,799 | |
See Notes to Financial Statements and Financial Highlights.
ALPS | Smith Credit Opportunities Fund
| Statement of Investments | October 31, 2024 |
| | | Principal Amount | | | Value (Note 2) | |
| Spirit AeroSystems, Inc. | | | | | | | | |
| 9.75%, 11/15/2030(d) | | $ | 1,000,000 | | | $ | 1,111,323 | |
| Total Aerospace & Defense | | | | | | | 5,945,430 | |
| Airlines (2.82%) | | | | | | | | |
| Alaska Airlines 2020-1 Class A Pass Through Trust | | | | | | | | |
| 4.80%, 08/15/2027(d) | | | 560,827 | | | | 556,397 | |
| Alaska Airlines 2020-1 Class B Pass Through Trust | | | | | | | | |
| 8.00%, 08/15/2025(d) | | | 771,273 | | | | 780,295 | |
| AS Mileage Plan IP, Ltd. | | | | | | | | |
| 5.31%, 10/20/2031(d) | | | 1,200,000 | | | | 1,158,633 | |
| British Airways 2020-1 Class A Pass Through Trust | | | | | | | | |
| 4.25%, 11/15/2032(d) | | | 1,167,486 | | | | 1,114,906 | |
| United Airlines 2020-1 Class A Pass Through Trust | | | | | | | | |
| Series 20-1 5.88%, 10/15/2027 | | | 1,706,000 | | | | 1,745,986 | |
| VistaJet Malta Finance PLC / Vista Management Holding, Inc. | | | | | | | | |
| 9.50%, 06/01/2028(d) | | | 600,000 | | | | 590,071 | |
| Total Airlines | | | | | | | 5,946,288 | |
| Apparel & Textile Products (0.27%) | | | | | | | | |
| Tapestry, Inc. | | | | | | | | |
| 7.85%, 11/27/2033 | | | 550,000 | | | | 562,188 | |
| | | | | | | | | |
| Auto Parts Manufacturing (0.24%) | | | | | | | | |
| Adient Global Holdings, Ltd. | | | | | | | | |
| 7.00%, 04/15/2028(d) | | | 500,000 | | | | 508,742 | |
| | | | | | | | | |
| Automobiles Manufacturing (2.61%) | | | | | | | | |
| Ford Motor Credit Co. LLC | | | | | | | | |
| 3.38%, 11/13/2025 | | | 1,000,000 | | | | 981,093 | |
| 5.85%, 05/17/2027 | | | 1,000,000 | | | | 1,009,740 | |
| 7.35%, 03/06/2030 | | | 513,000 | | | | 544,389 | |
| General Motors Financial Co., Inc. | | | | | | | | |
| SOFRINDX + 1.30%, 04/07/2025(a)(e) | | | 1,300,000 | | | | 1,304,975 | |
| Nissan Motor Acceptance Co. LLC | | | | | | | | |
| 7.05%, 09/15/2028(d) | | | 1,600,000 | | | | 1,661,960 | |
| Total Automobiles Manufacturing | | | | | | | 5,502,157 | |
| Banks (6.83%) | | | | | | | | |
| Associated Banc-Corp | | | | | | | | |
| 1D US SOFR + 3.03%, 08/29/2030(a) | | | 1,050,000 | | | | 1,068,521 | |
| Associated Bank NA/Green Bay WI | | | | | | | | |
| 4.25%, 01/15/2025 | | | 1,000,000 | | | | 996,463 | |
| Citizens Financial Group, Inc. | | | | | | | | |
| 1D US SOFR + 1.91%, 07/23/2032(a) | | | 570,000 | | | | 575,662 | |
| 1D US SOFR + 2.325%,04/25/2035(a) | | | 540,000 | | | | 576,594 | |
| | | Principal Amount | | | Value (Note 2) | |
| Comerica, Inc. | | | | | | | | |
| 1D US SOFR + 2.155%, 01/30/2030(a) | | $ | 500,000 | | | $ | 506,753 | |
| Discover Bank | | | | | | | | |
| 5Y US TI + 1.73%, 08/09/2028(a) | | | 2,330,000 | | | | 2,379,563 | |
| Fifth Third Bancorp | | | | | | | | |
| 1D US SOFR + 1.66%, 04/25/2033(a) | | | 550,000 | | | | 514,886 | |
| Huntington National Bank | | | | | | | | |
| 5.65%, 01/10/2030 | | | 560,000 | | | | 572,186 | |
| Intesa Sanpaolo SpA | | | | | | | | |
| 1Y US TI + 3.90%, 06/20/2054(a)(d) | | | 575,000 | | | | 633,622 | |
| M&T Bank Corp. | | | | | | | | |
| 1D US SOFR + 2.80%, 10/30/2029(a) | | | 1,075,000 | | | | 1,157,670 | |
| Regions Financial Corp. | | | | | | | | |
| 1D US SOFR + 2.06%, 09/06/2035(a) | | | 1,137,000 | | | | 1,127,112 | |
| Synovus Bank/Columbus GA | | | | | | | | |
| 5Y US TI + 3.63%, 10/29/2030(a) | | | 2,424,000 | | | | 2,280,147 | |
| Synovus Financial Corp. | | | | | | | | |
| 1D US SOFR + 2.347%, 11/01/2030(a) | | | 500,000 | | | | 500,089 | |
| Truist Financial Corp. | | | | | | | | |
| 1D US SOFR + 1.571%, 08/05/2032(a) | | | 1,000,000 | | | | 993,060 | |
| 1D US SOFR + 2.361%, 06/08/2034(a) | | | 500,000 | | | | 514,351 | |
| Total Banks | | | | | | | 14,396,679 | |
| Biotechnology (0.52%) | | | | | | | | |
| Amgen, Inc. | | | | | | | | |
| 5.25%, 03/02/2033 | | | 550,000 | | | | 555,879 | |
| 5.75%, 03/02/2063 | | | 535,000 | | | | 536,186 | |
| Total Biotechnology | | | | | | | 1,092,065 | |
| Cable & Satellite (1.83%) | | | | | | | | |
| CCO Holdings LLC / CCO Holdings Capital Corp. | | | | | | | | |
| 6.38%, 09/01/2029(d) | | | 1,195,000 | | | | 1,184,106 | |
| Cox Communications, Inc. | | | | | | | | |
| 5.70%, 06/15/2033(d) | | | 1,000,000 | | | | 1,002,420 | |
| Sirius XM Radio, Inc. | | | | | | | | |
| 5.00%, 08/01/2027(d) | | | 1,700,000 | | | | 1,667,068 | |
| Total Cable & Satellite | | | | | | | 3,853,594 | |
| Casinos & Gaming (2.46%) | | | | | | | | |
| Caesars Entertainment, Inc. | | | | | | | | |
| 7.00%, 02/15/2030(d) | | | 1,500,000 | | | | 1,538,756 | |
| MGM Resorts International | | | | | | | | |
| 6.13%, 09/15/2029 | | | 100,000 | | | | 99,721 | |
| Penn Entertainment, Inc. | | | | | | | | |
| 5.63%, 01/15/2027(d) | | | 2,484,000 | | | | 2,438,632 | |
| Station Casinos LLC | | | | | | | | |
| 6.63%, 03/15/2032(d) | | | 1,100,000 | | | | 1,106,232 | |
| Total Casinos & Gaming | | | | | | | 5,183,341 | |
See Notes to Financial Statements and Financial Highlights.
ALPS | Smith Credit Opportunities Fund
| Statement of Investments | October 31, 2024 |
| | | Principal Amount | | | Value (Note 2) | |
| Consumer Finance (1.40%) | | | | | | | | |
| Boost Newco Borrower LLC | | | | | | | | |
| 7.50%, 01/15/2031(d) | | $ | 1,066,000 | | | $ | 1,124,822 | |
| Discover Financial Services | | | | | | | | |
| SOFRINDX + 3.37%, 11/02/2034(a)(e) | | | 565,000 | | | | 649,432 | |
| Shift4 Payments LLC / Shift4 Payments Finance Sub, Inc. | | | | | | | | |
| 6.75%, 08/15/2032(d) | | | 1,130,000 | | | | 1,160,215 | |
| Total Consumer Finance | | | | | | | 2,934,469 | |
| | | | | | | | | |
| Consumer Products (0.54%) | | | | | | | | |
| Perrigo Finance Unlimited Co. | | | | | | | | |
| Series USD 6.13%, 09/30/2032 | | | 1,150,000 | | | | 1,136,499 | |
| | | | | | | | | |
| Consumer Services (1.08%) | | | | | | | | |
| Brink's Co. | | | | | | | | |
| 6.50%, 06/15/2029(d) | | | 1,100,000 | | | | 1,122,806 | |
| WASH Multifamily Acquisition, Inc. | | | | | | | | |
| 5.75%, 04/15/2026(d) | | | 1,150,000 | | | | 1,148,357 | |
| Total Consumer Services | | | | | | | 2,271,163 | |
| | | | | | | | | |
| Containers & Packaging (0.68%) | | | | | | | | |
| Owens-Brockway Glass Container, Inc. | | | | | | | | |
| 6.63%, 05/13/2027(d) | | | 1,000,000 | | | | 996,048 | |
| 7.25%, 05/15/2031(d) | | | 450,000 | | | | 443,149 | |
| Total Containers & Packaging | | | | | | | 1,439,197 | |
| | | | | | | | | |
| Department Stores (1.20%) | | | | | | | | |
| Macy's Retail Holdings LLC | | | | | | | | |
| 6.13%, 03/15/2032(d) | | | 1,200,000 | | | | 1,148,126 | |
| NMG Holding Co. Inc / Neiman Marcus Group LLC | | | | | | | | |
| 8.50%, 10/01/2028(d) | | | 1,350,000 | | | | 1,373,770 | |
| Total Department Stores | | | | | | | 2,521,896 | |
| | | | | | | | | |
| Electrical Equipment Manufacturing (0.56%) | | | | | | | | |
| Vontier Corp. | | | | | | | | |
| 2.40%, 04/01/2028 | | | 1,300,000 | | | | 1,178,799 | |
| | | | | | | | | |
| Entertainment Content (0.78%) | | | | | | | | |
| Paramount Global | | | | | | | | |
| 4.20%, 05/19/2032 | | | 1,293,000 | | | | 1,127,128 | |
| Warnermedia Holdings, Inc. | | | | | | | | |
| 4.28%, 03/15/2032 | | | 565,000 | | | | 495,322 | |
| Total Entertainment Content | | | | | | | 1,622,450 | |
| | | | | | | | | |
| Entertainment Resources (1.27%) | | | | | | | | |
| Six Flags Entertainment Corp. | | | | | | | | |
| 7.25%, 05/15/2031(d) | | | 2,600,000 | | | | 2,667,359 | |
| | | | | | | | | |
| Exploration & Production (6.85%) | | | | | | | | |
| Ascent Resources Utica Holdings LLC /ARU Finance Corp. | | | | | | | | |
| 6.63%, 10/15/2032(d) | | | 1,000,000 | | | | 991,267 | |
| | | Principal Amount | | | Value (Note 2) | |
| Baytex Energy Corp. | | | | | | | | |
| 7.38%, 03/15/2032(d) | | $ | 100,000 | | | $ | 97,165 | |
| 8.50%, 04/30/2030(d) | | | 1,000,000 | | | | 1,018,276 | |
| Civitas Resources, Inc. | | | | | | | | |
| 8.75%, 07/01/2031(d) | | | 1,600,000 | | | | 1,677,775 | |
| Coterra Energy, Inc. | | | | | | | | |
| 5.60%, 03/15/2034 | | | 472,000 | | | | 472,108 | |
| | | | | | | | | |
| Hilcorp Energy I LP / Hilcorp Finance Co. | | | | | | | | |
| 6.25%, 11/01/2028(d) | | | 1,506,000 | | | | 1,470,643 | |
| 7.25%, 02/15/2035(d) | | | 798,000 | | | | 783,397 | |
| Murphy Oil Corp. | | | | | | | | |
| 6.00%, 10/01/2032 | | | 1,175,000 | | | | 1,131,752 | |
| Occidental Petroleum Corp. | | | | | | | | |
| 5.55%, 10/01/2034 | | | 171,000 | | | | 168,454 | |
| 6.20%, 03/15/2040 | | | 550,000 | | | | 549,382 | |
| 7.88%, 09/15/2031 | | | 1,800,000 | | | | 2,018,922 | |
| Permian Resources Operating LLC | | | | | | | | |
| 6.25%, 02/01/2033(d) | | | 500,000 | | | | 496,737 | |
| 9.88%, 07/15/2031(d) | | | 107,000 | | | | 118,307 | |
| Range Resources Corp. | | | | | | | | |
| 8.25%, 01/15/2029 | | | 1,400,000 | | | | 1,443,452 | |
| SM Energy Co. | | | | | | | | |
| 6.75%, 08/01/2029(d) | | | 1,000,000 | | | | 994,616 | |
| 7.00%, 08/01/2032(d) | | | 1,000,000 | | | | 992,532 | |
| Total Exploration & Production | | | | | | | 14,424,785 | |
| | | | | | | | | |
| Financial Services (3.07%) | | | | | | | | |
| Charles Schwab Corp. | | | | | | | | |
| 1D US SOFR + 2.50%,05/19/2034(a) | | | 500,000 | | | | 520,552 | |
| SOFRINDX + 1.05%,03/03/2027(a)(e) | | | 1,727,000 | | | | 1,741,806 | |
| Jane Street Group / JSG Finance, Inc. | | | | | | | | |
| 6.13%, 11/01/2032(d) | | | 365,000 | | | | 365,464 | |
| 7.13%, 04/30/2031(d) | | | 1,000,000 | | | | 1,037,340 | |
| UBS Group AG | | | | | | | | |
| 1D US SOFR + 3.92%,08/12/2033(a)(d) | | | 2,591,000 | | | | 2,784,074 | |
| Total Financial Services | | | | | | | 6,449,236 | |
| | | | | | | | | |
| Food & Beverage (1.09%) | | | | | | | | |
| Chobani Holdco II LLC | | | | | | | | |
| 8.75%, 10/01/2029(d) | | | 100,000 | | | | 103,415 | |
| Pilgrim's Pride Corp. | | | | | | | | |
| 6.25%, 07/01/2033 | | | 1,050,000 | | | | 1,091,279 | |
| 6.88%, 05/15/2034 | | | 1,001,000 | | | | 1,088,872 | |
| Total Food & Beverage | | | | | | | 2,283,566 | |
| | | | | | | | | |
| Hardware (0.55%) | | | | | | | | |
| NCR Atleos Corp. | | | | | | | | |
| 9.50%, 04/01/2029(d) | | | 1,050,000 | | | | 1,156,529 | |
| | | | | | | | | |
| Health Care Facilities & Services (2.68%) | | | | | | | | |
| Fortrea Holdings, Inc. | | | | | | | | |
| 7.50%, 07/01/2030(d) | | | 2,575,000 | | | | 2,535,364 | |
See Notes to Financial Statements and Financial Highlights.
ALPS | Smith Credit Opportunities Fund
| Statement of Investments | October 31, 2024 |
| | | Principal Amount | | | Value (Note 2) | |
| HCA, Inc. | | | | | | | | |
| 5.45%, 09/15/2034 | | $ | 2,100,000 | | | $ | 2,085,881 | |
| Star Parent, Inc. | | | | | | | | |
| 9.00%, 10/01/2030(d) | | | 1,000,000 | | | | 1,041,252 | |
| Total Health Care Facilities & Services | | | | | | | 5,662,497 | |
| | | | | | | | | |
| Home & Office Products Manufacturing (0.48%) | | | | | | | | |
| Newell Brands, Inc. | | | | | | | | |
| 6.38%, 05/15/2030 | | | 250,000 | | | | 251,768 | |
| 6.63%, 05/15/2032 | | | 750,000 | | | | 754,040 | |
| Total Home & Office Products Manufacturing | | | | | | | 1,005,808 | |
| | | | | | | | | |
| Home Improvement (0.49%) | | | | | | | | |
| Masterbrand, Inc. | | | | | | | | |
| 7.00%, 07/15/2032(d) | | | 1,000,000 | | | | 1,025,389 | |
| | | | | | | | | |
| Homebuilders (1.40%) | | | | | | | | |
| Beazer Homes USA, Inc. | | | | | | | | |
| 7.50%, 03/15/2031(d) | | | 1,100,000 | | | | 1,132,205 | |
| Forestar Group, Inc. | | | | | | | | |
| 3.85%, 05/15/2026(d) | | | 1,850,000 | | | | 1,804,738 | |
| Total Homebuilders | | | | | | | 2,936,943 | |
| | | | | | | | | |
| Industrial Other (0.25%) | | | | | | | | |
| Brand Industrial Services, Inc. | | | | | | | | |
| 10.38%, 08/01/2030(d) | | | 500,000 | | | | 530,699 | |
| | | | | | | | | |
| Leisure Products Manufacturing (0.53%) | | | | | | | | |
| Amer Sports Co. | | | | | | | | |
| 6.75%, 02/16/2031(d) | | | 1,100,000 | | | | 1,118,389 | |
| | | | | | | | | |
| Machinery Manufacturing (0.25%) | | | | | | | | |
| Nordson Corp. | | | | | | | | |
| 4.50%, 12/15/2029 | | | 534,000 | | | | 523,411 | |
| | | | | | | | | |
| Medical Equipment & Devices Manufacturing (0.69%) | | | | | | | | |
| Solventum Corp. | | | | | | | | |
| 5.90%, 04/30/2054(d) | | | 321,000 | | | | 321,807 | |
| 6.00%, 05/15/2064(d) | | | 1,120,000 | | | | 1,123,520 | |
| Total Medical Equipment & Devices Manufacturing | | | | | | | 1,445,327 | |
| | | | | | | | | |
| Oil & Gas Services & Equipment (3.04%) | | | | | | | | |
| Diamond Foreign Asset Co. / Diamond Finance LLC | | | | | | | | |
| 8.50%, 10/01/2030(d) | | | 1,000,000 | | | | 1,033,328 | |
| Noble Finance II LLC | | | | | | | | |
| 8.00%, 04/15/2030(d) | | | 1,350,000 | | | | 1,369,301 | |
| Seadrill Finance, Ltd. | | | | | | | | |
| 8.38%, 08/01/2030(d) | | | 1,000,000 | | | | 1,022,027 | |
| Shelf Drilling Holdings, Ltd. | | | | | | | | |
| 9.63%, 04/15/2029(d) | | | 625,000 | | | | 566,028 | |
| Transocean Titan Financing, Ltd. | | | | | | | | |
| 8.38%, 02/01/2028(d) | | | 1,350,000 | | | | 1,390,254 | |
| Transocean, Inc. | | | | | | | | |
| 8.50%, 05/15/2031(d) | | | 1,000,000 | | | | 1,008,352 | |
| Total Oil & Gas Services & Equipment | | | | | | | 6,389,290 | |
| | | Principal Amount | | | Value (Note 2) | |
| Pharmaceuticals (1.52%) | | | | | | |
| Organon & Co. / Organon Foreign Debt Co-Issuer BV | | | | | | | | |
| 5.13%, 04/30/2031(d) | | $ | 1,629,000 | | | $ | 1,486,889 | |
| 7.88%, 05/15/2034(d) | | | 1,650,000 | | | | 1,705,265 | |
| Total Pharmaceuticals | | | | | | | 3,192,154 | |
| | | | | | | | | |
| Pipeline (6.96%) | | | | | | | | |
| Blue Racer Midstream LLC / Blue Racer Finance Corp. | | | | | | | | |
| 7.00%, 07/15/2029(d) | | | 1,100,000 | | | | 1,129,213 | |
| Buckeye Partners LP | | | | | | | | |
| 4.50%, 03/01/2028(d) | | | 1,698,000 | | | | 1,618,759 | |
| 6.88%, 07/01/2029(d) | | | 746,000 | | | | 758,871 | |
| EnLink Midstream LLC | | | | | | | | |
| 5.63%, 01/15/2028(d) | | | 252,000 | | | | 255,253 | |
| Flex Intermediate Holdco LLC | | | | | | | | |
| 3.36%, 06/30/2031(d) | | | 2,321,000 | | | | 2,009,822 | |
| 4.32%, 12/30/2039(d) | | | 1,733,000 | | | | 1,352,991 | |
| Genesis Energy LP / Genesis Energy Finance Corp. | | | | | | | | |
| 7.88%, 05/15/2032 | | | 550,000 | | | | 550,069 | |
| 8.00%, 01/15/2027 | | | 1,075,000 | | | | 1,094,772 | |
| 8.25%, 01/15/2029 | | | 1,750,000 | | | | 1,788,736 | |
| Global Partners LP / GLP Finance Corp. | | | | | | | | |
| 8.25%, 01/15/2032(d) | | | 1,570,000 | | | | 1,603,223 | |
| Targa Resources Partners LP / Targa Resources Partners Finance Corp. | | | | | | | | |
| 6.88%, 01/15/2029 | | | 1,800,000 | | | | 1,842,420 | |
| Venture Global LNG, Inc. | | | | | | | | |
| 7.00%, 01/15/2030(d) | | | 100,000 | | | | 100,686 | |
| 9.88%, 02/01/2032(d) | | | 500,000 | | | | 546,076 | |
| Total Pipeline | | | | | | | 14,650,891 | |
| | | | | | | | | |
| Power Generation (0.63%) | | | | | | | | |
| Vistra Operations Co. LLC | | | | | | | | |
| 5.50%, 09/01/2026(d) | | | 1,325,000 | | | | 1,321,830 | |
| | | | | | | | | |
| Publishing & Broadcasting (2.38%) | | | | | | | | |
| Gray Television, Inc. | | | | | | | | |
| 5.38%, 11/15/2031(d) | | | 1,050,000 | | | | 634,363 | |
| 7.00%, 05/15/2027(d) | | | 850,000 | | | | 827,825 | |
| 10.50%, 07/15/2029(d) | | | 1,550,000 | | | | 1,611,419 | |
| Nexstar Media, Inc. | | | | | | | | |
| 5.63%, 07/15/2027(d) | | | 2,000,000 | | | | 1,967,102 | |
| Total Publishing & Broadcasting | | | | | | | 5,040,709 | |
| | | | | | | | | |
| Real Estate (2.18%) | | | | | | | | |
| Cushman & Wakefield US Borrower LLC | | | | | | | | |
| 6.75%, 05/15/2028(d) | | | 1,374,000 | | | | 1,382,669 | |
| 8.88%, 09/01/2031(d) | | | 250,000 | | | | 269,580 | |
| Kennedy-Wilson, Inc. | | | | | | | | |
| 4.75%, 02/01/2030 | | | 2,559,000 | | | | 2,291,514 | |
See Notes to Financial Statements and Financial Highlights.
ALPS | Smith Credit Opportunities Fund
| Statement of Investments | October 31, 2024 |
| | | Principal Amount | | | Value (Note 2) | |
| VICI Properties LP / VICI Note Co., Inc. | | | | | | | | |
| 4.63%, 06/15/2025(d) | | $ | 656,000 | | | $ | 653,001 | |
| Total Real Estate | | | | | | | 4,596,764 | |
| | | | | | | | | |
| Refining & Marketing (0.74%) | | | | | | | | |
| Sunoco LP | | | | | | | | |
| 7.00%, 05/01/2029(d) | | | 1,000,000 | | | | 1,032,379 | |
| 7.25%, 05/01/2032(d) | | | 500,000 | | | | 520,916 | |
| Total Refining & Marketing | | | | | | | 1,553,295 | |
| | | | | | | | | |
| Restaurants (1.04%) | | | | | | | | |
| Brinker International, Inc. | | | | | | | | |
| 8.25%, 07/15/2030(d) | | | 1,050,000 | | | | 1,118,551 | |
| Raising Cane's Restaurants LLC | | | | | | | | |
| 9.38%, 05/01/2029(d) | | | 1,000,000 | | | | 1,076,128 | |
| Total Restaurants | | | | | | | 2,194,679 | |
| | | | | | | | | |
| Retail - Consumer Discretionary (0.18%) | | | | | | | | |
| ERAC USA Finance LLC | | | | | | | | |
| 5.20%, 10/30/2034(d) | | | 379,000 | | | | 382,382 | |
| | | | | | | | | |
| Software & Services (1.53%) | | | | | | | | |
| Cloud Software Group, Inc. | | | | | | | | |
| 6.50%, 03/31/2029(d) | | | 2,250,000 | | | | 2,199,214 | |
| 8.25%, 06/30/2032(d) | | | 1,000,000 | | | | 1,028,543 | |
| Total Software & Services | | | | | | | 3,227,757 | |
| | | | | | | | | |
| Supermarkets & Pharmacies (1.41%) | | | | | | | | |
| Albertsons Cos. Inc / Safeway, Inc. / New Albertsons LP / Albertsons LLC | | | | | | | | |
| 6.50%, 02/15/2028(d) | | | 2,100,000 | | | | 2,150,918 | |
| Kroger Co. | | | | | | | | |
| 5.00%, 09/15/2034 | | | 850,000 | | | | 836,391 | |
| Total Supermarkets & Pharmacies | | | | | | | 2,987,309 | |
| | | | | | | | | |
| Travel & Lodging (2.60%) | | | | | | | | |
| Carnival Corp. | | | | | | | | |
| 7.00%, 08/15/2029(d) | | | 500,000 | | | | 523,305 | |
| NCL Corp., Ltd. | | | | | | | | |
| 8.13%, 01/15/2029(d) | | | 1,000,000 | | | | 1,060,826 | |
| Royal Caribbean Cruises, Ltd. | | | | | | | | |
| 6.00%, 02/01/2033(d) | | | 500,000 | | | | 503,383 | |
| 6.25%, 03/15/2032(d) | | | 1,089,000 | | | | 1,110,939 | |
| Viking Cruises, Ltd. | | | | | | | | |
| 9.13%, 07/15/2031(d) | | | 1,000,000 | | | | 1,080,637 | |
| Viking Ocean Cruises Ship VII, Ltd. | | | | | | | | |
| 5.63%, 02/15/2029(d) | | | 1,200,000 | | | | 1,184,381 | |
| Total Travel & Lodging | | | | | | | 5,463,471 | |
| | | | | | | | | |
| Utilities (0.90%) | | | | | | | | |
| AmeriGas Partners LP / AmeriGas Finance Corp. | | | | | | | | |
| 9.38%, 06/01/2028(d) | | | 800,000 | | | | 823,829 | |
| Talen Energy | | | | | | | | |
| 8.63%, 06/01/2030(d) | | | 1,000,000 | | | | 1,079,500 | |
| Total Utilities | | | | | | | 1,903,329 | |
| | | Principal Amount | | | Value (Note 2) | |
| Waste & Environment Services & Equipment (1.11%) | | | | | | | | |
| GFL Environmental, Inc. | | | | | | | | |
| 6.75%, 01/15/2031(d) | | $ | 293,000 | | | $ | 302,044 | |
| Wrangler Holdco Corp. | | | | | | | | |
| 6.63%, 04/01/2032(d) | | | 2,000,000 | | | | 2,044,296 | |
| Total Waste & Environment Services & Equipment | | | | | | | 2,346,340 | |
| | | | | | | | | |
| TOTAL CORPORATE BONDS | | | | | | | | |
| (Cost $154,486,850) | | | | | | | 155,827,699 | |
| | | Principal Amount | | | Value (Note 2) | |
| GOVERNMENT BONDS (4.14%) | | | | | | | | |
| | | | | | | | | |
| U.S. Treasury Bonds (4.14%) | | | | | | | | |
| United States Treasury Bonds | | | | | | | | |
| 3.88%, 08/15/2034 | | | 3,987,000 | | | | 3,858,045 | |
| 4.13%, 08/15/2044 | | | 1,199,000 | | | | 1,126,123 | |
| 4.25%, 08/15/2054 | | | 3,238,000 | | | | 3,116,322 | |
| 4.63%, 05/15/2054 | | | 609,000 | | | | 623,369 | |
| Total U.S. Treasury Bonds | | | | | | | 8,723,859 | |
| TOTAL GOVERNMENT BONDS | | | | | | | | |
| (Cost $8,822,232) | | | | | | | 8,723,859 | |
| | | Shares | | | Value (Note 2) | |
| PREFERRED STOCK (3.40%) | | | | | | | | |
| | | | | | | | | |
| Energy (0.48%) | | | | | | | | |
| Pipeline (0.48%) | | | | | | | | |
| Venture Global LNG, Inc., 5Y US TI + 5.44%(a)(d)(f) | | | 1,000,000 | | | | 1,000,565 | |
| Total Energy | | | | | | | 1,000,565 | |
| | | | | | | | | |
| Financials (1.64%) | | | | | | | | |
| Banks (0.30%) | | | | | | | | |
| Bank of Hawaii., 8.000%(f) | | | 11,359 | | | | 303,967 | |
| Wells Fargo & Co., Series U, 5.875%(f) | | | 341,000 | | | | 341,054 | |
| | | | | | | | 645,021 | |
| Consumer Finance (0.58%) | | | | | | | | |
| American Express Co., 3.550%(f) | | | 1,290,000 | | | | 1,224,271 | |
| | | | | | | | | |
| Financial Services (0.58%) | | | | | | | | |
| Charles Schwab Corp., Series G, 5Y | | | | | | | | |
| US TI + 4.971%(a)(f) | | | 1,238,000 | | | | 1,234,698 | |
| | | | | | | | | |
| Life Insurance (0.18%) | | | | | | | | |
| Jackson Financial, Inc., 8.000%(f) | | | 13,669 | | | | 370,430 | |
| | | | | | | | | |
| Total Financials | | | | | | | 3,474,420 | |
See Notes to Financial Statements and Financial Highlights.
ALPS | Smith Credit Opportunities Fund
| Statement of Investments | October 31, 2024 |
| | | Shares | | | Value (Note 2) | |
| Utilities (1.28%) | | | | | | |
| Utilities (1.28%) | | | | | | |
| National Rural Utilities Cooperative Finance Corp., | | | | | | | | |
| 3M US SOFR + 3.17%(a)(f) | | | 2,687,000 | | | $ | 2,687,378 | |
| Total Utilities | | | | | | | 2,687,378 | |
| | | | | | | | | |
| TOTAL PREFERRED STOCK | | | | | | | | |
| (Cost $6,908,333) | | | | | | | 7,162,363 | |
| | | 7-Day Yield | | | Shares | | | Value (Note 2) | |
| SHORT TERM INVESTMENTS (1.31%) | | | | | | | | | |
| | | | | | |
| Money Market Fund (1.31%) | | | | | | | | | | | | |
| Morgan Stanley | | | | | | | | | | | | |
| Institutional Liquidity Funds – Government Portfolio | | | 4.78 | % | | | 2,764,002 | | | | 2,764,002 | |
| TOTAL SHORT TERM INVESTMENTS | | | | | | |
| (Cost $2,764,002) | | | | | | | | | 2,764,002 | |
| | | | | | | | | | | | | |
| TOTAL INVESTMENTS (98.15%) | | | | | | |
| (Cost $204,910,919) | | | | | | | | $ | 206,624,372 | |
| | | | | | | | | | | | | |
| Other Assets In Excess Of Liabilities (1.85%) | | | | | 3,893,145 | |
| | | | | | | | | | | | | |
| NET ASSETS (100.00%) | | | | | | | | $ | 210,517,517 | |
Investment Abbreviations:
SOFR - Secured Overnight Financing Rate
SOFRINDX - Secured Overnight Financing Rate Index
TI - Treasury Index
Reference Rates:
3M US SOFR - 3 Month SOFR as of October 31, 2024 was 4.56% 30D US SOFR - 30 Day SOFR as of October 31, 2024 was 4.66% 1D US SOFR - 1 Day SOFR as of October 31, 2024 was 4.90% 1M US SOFR- 1 Month SOFR as of October 31, 2024 was 4.66% 1Y US TI - 1 Year US TI as of October 31, 2024 was 4.27% 5Y US TI - 5 Year US TI as of October 31, 2024 was 4.15%
| (a) | Floating or variable rate security. The reference rate is described above. The rate in effect as of October 31, 2024 is based on the reference rate plus the displayed spread as of the security's last reset date. |
| (b) | Issued with zero coupon. |
| (c) | Interest only security. |
| (d) | Security exempt from registration under Rule 144A of the Securities Act of 1933. These securities may be resold in transactions exempt from registration, normally to qualified institutional buyers. As of October 31, 2024, the aggregate market value of those securities was $107,192,658, representing 50.92% of net assets. |
| (e) | The SOFRINDX is a compounded average of the daily Secured Overnight Financing Rate determined by reference to the SOFR Index for any interest period. |
| (f) | Perpetual maturity. This security has no contractual maturity date, is not redeemable and contractually pays an indefinite stream of interest. |
See Notes to Financial Statements and Financial Highlights.
ALPS | Smith Funds
| Statements of Assets and Liabilities | October 31, 2024 |
| | | ALPS | Smith Short Duration Bond Fund | | | ALPS | Smith Total Return Bond Fund | | | ALPS | Smith Credit Opportunities Fund | |
| ASSETS | | | | | | | | | | | | |
| Investments, at value | | $ | 570,412,495 | | | $ | 3,221,430,330 | | | $ | 206,624,372 | |
| Cash | | | – | | | | 139,771 | | | | 59,021 | |
| Receivable for investments sold | | | 5,024,325 | | | | 131,871,376 | | | | 5,532,601 | |
| Receivable for shares sold | | | 664,236 | | | | 6,828,654 | | | | 11,152 | |
| Interest receivable | | | 6,575,170 | | | | 35,893,064 | | | | 3,166,823 | |
| Prepaid expenses and other assets | | | 41,390 | | | | 83,885 | | | | 2,779 | |
| Total Assets | | | 582,717,616 | | | | 3,396,247,080 | | | | 215,396,748 | |
| LIABILITIES | | | | | | | | | | | | |
| Payable for investments purchased | | | 5,051,736 | | | | 139,900,268 | | | | 4,654,679 | |
| Payable for shares redeemed | | | 304,653 | | | | 3,250,514 | | | | 5,347 | |
| Investment advisory fees payable | | | 138,335 | | | | 1,031,659 | | | | 100,051 | |
| Administration and transfer agency fees payable | | | 144,917 | | | | 835,991 | | | | 86,715 | |
| Distribution and services fees payable | | | 11,342 | | | | 23,832 | | | | 190 | |
| Trustees' fees and expenses payable | | | 807 | | | | 5,169 | | | | 308 | |
| Professional fees payable | | | 25,017 | | | | 50,530 | | | | 21,345 | |
| Custody fees payable | | | 7,278 | | | | 31,001 | | | | 5,029 | |
| Accrued expenses and other liabilities | | | 16,503 | | | | 92,221 | | | | 5,567 | |
| Total Liabilities | | | 5,700,588 | | | | 145,221,185 | | | | 4,879,231 | |
| NET ASSETS | | $ | 577,017,028 | | | $ | 3,251,025,895 | | | $ | 210,517,517 | |
| NET ASSETS CONSIST OF | | | | | | | | | | | | |
| Paid-in capital | | $ | 598,250,412 | | | $ | 3,496,551,071 | | | $ | 248,985,472 | |
| Total distributable earnings/(accumulated losses) | | | (21,233,384 | ) | | | (245,525,176 | ) | | | (38,467,955 | ) |
| NET ASSETS | | $ | 577,017,028 | | | $ | 3,251,025,895 | | | $ | 210,517,517 | |
| INVESTMENTS, AT COST | | $ | 568,505,142 | | | $ | 3,242,155,687 | | | $ | 204,910,919 | |
| PRICING OF SHARES | | | | | | | | | |
| Investor Class: | | | | | | | | | | | | |
| Net Asset Value, offering and redemption price per share | | $ | 10.23 | | | $ | 9.65 | | | $ | 9.22 | |
| Net Assets | | $ | 21,454,089 | | | $ | 23,457,680 | | | $ | 329,577 | |
| Shares of beneficial interest outstanding (unlimited number of shares, no par value common stock authorized) | | | 2,098,025 | | | | 2,430,102 | | | | 35,750 | |
| Class A: | | | | | | | | | | | | |
| Net Asset Value, offering and redemption price per share | | $ | 10.23 | | | $ | 9.65 | | | $ | 9.18 | |
| Net Assets | | $ | 10,427,440 | | | $ | 36,552,503 | | | $ | 1,174,375 | |
| Shares of beneficial interest outstanding (unlimited number of shares, no par value common stock authorized) | | | 1,019,653 | | | | 3,786,555 | | | | 127,948 | |
| Maximum offering price per share | | $ | 10.46 | (a) | | $ | 9.88 | (a) | | $ | 9.39 | (a) |
| Class C: | | | | | | | | | | | | |
| Net Asset Value, offering and redemption price per share(b) | | $ | 10.18 | | | $ | 9.63 | | | $ | 9.14 | |
| Net Assets | | $ | 2,290,233 | | | $ | 4,142,660 | | | $ | 472,664 | |
| Shares of beneficial interest outstanding (unlimited number of shares, no par value common stock authorized) | | | 225,037 | | | | 430,217 | | | | 51,699 | |
| Class I: | | | | | | | | | | | | |
| Net Asset Value, offering and redemption price per share | | $ | 10.23 | | | $ | 9.64 | | | $ | 9.15 | |
| Net Assets | | $ | 542,845,266 | | | $ | 3,186,873,052 | | | $ | 208,540,901 | |
| Shares of beneficial interest outstanding (unlimited number of shares, no par value common stock authorized) | | | 53,064,773 | | | | 330,447,787 | | | | 22,790,222 | |
See Notes to Financial Statements and Financial Highlights.
ALPS | Smith Funds
| Statements of Assets and Liabilities | October 31, 2024 |
| (a) | (NAV/0.9775), based on maximum sales charge of 2.25% of the offering price. |
| (b) | Redemption price per share may be reduced for any applicable contingent deferred sales charge. For a description of a possible sales charge, please see the Fund's Prospectus. |
See Notes to Financial Statements and Financial Highlights.
ALPS | Smith Funds
| Statements of Operations | For the Year Ended October 31, 2024 |
| | | ALPS | Smith Short Duration Bond Fund | | | ALPS | Smith Total Return Bond Fund | | | ALPS | Smith Credit Opportunities Fund | |
| INVESTMENT INCOME | | | | | | | | | | | | |
| Dividends | | $ | 639,913 | | | $ | 2,988,004 | | | $ | 367,156 | |
| Interest | | | 27,943,241 | | | | 146,085,900 | | | | 14,667,412 | |
| Total Investment Income | | | 28,583,154 | | | | 149,073,904 | | | | 15,034,568 | |
| | | | | | | | | | | | | |
| EXPENSES | | | | | | | | | | | | |
| Investment advisory fees | | | 2,145,759 | | | | 15,950,861 | | | | 1,712,191 | |
| Administrative fees | | | 511,865 | | | | 2,669,399 | | | | 282,044 | |
| Delegated transfer agent equivalent services fees | | | 436,545 | | | | 2,294,487 | | | | 162,683 | |
| Distribution and service fees | | | | | | | | | | | | |
| Investor Class | | | 57,051 | | | | 83,978 | | | | 975 | |
| Class A | | | 30,138 | | | | 93,598 | | | | 3,502 | |
| Class C | | | 23,563 | | | | 44,923 | | | | 4,613 | |
| Professional fees | | | 30,771 | | | | 70,929 | | | | 23,409 | |
| Reports to shareholders and printing fees | | | 22,752 | | | | 99,539 | | | | 6,503 | |
| State registration fees | | | 83,386 | | | | 144,741 | | | | 63,005 | |
| Insurance fees | | | 6,923 | | | | 42,054 | | | | 2,561 | |
| Custody fees | | | 26,805 | | | | 98,725 | | | | 15,707 | |
| Trustees' fees and expenses | | | 48,547 | | | | 235,537 | | | | 18,547 | |
| Repayment of previously waived fees | | | | | | | | | | | | |
| Investor Class | | | 462 | | | | – | | | | – | |
| Class A | | | 203 | | | | – | | | | – | |
| Miscellaneous expenses | | | 16,717 | | | | 44,935 | | | | 6,773 | |
| Total Expenses | | | 3,441,487 | | | | 21,873,706 | | | | 2,302,513 | |
| Less fees waived/reimbursed by investment advisor (Note 6) | | | | | | | | | | | | |
| Investor Class | | | (5,631 | ) | | | (24,232 | ) | | | (210 | ) |
| Class A | | | (1,092 | ) | | | (27,162 | ) | | | (591 | ) |
| Class C | | | (909 | ) | | | (6,076 | ) | | | (174 | ) |
| Class I | | | (442,793 | ) | | | (4,310,128 | ) | | | (243,192 | ) |
| Net Expenses | | | 2,991,062 | | | | 17,506,108 | | | | 2,058,346 | |
| Net Investment Income | | | 25,592,092 | | | | 131,567,796 | | | | 12,976,222 | |
| Net realized gain on investments | | | 1,999,799 | | | | 1,936,067 | | | | 1,050,803 | |
| Net Realized Gain | | | 1,999,799 | | | | 1,936,067 | | | | 1,050,803 | |
| Net change in unrealized appreciation on investments | | | 12,102,690 | | | | 164,518,816 | | | | 15,203,954 | |
| Net Change in Unrealized Appreciation | | | 12,102,690 | | | | 164,518,816 | | | | 15,203,954 | |
| NET REALIZED AND UNREALIZED GAIN ON INVESTMENTS | | | 14,102,489 | | | | 166,454,883 | | | | 16,254,757 | |
| NET INCREASE IN NET ASSETS RESULTING FROM OPERATIONS | | $ | 39,694,581 | | | $ | 298,022,679 | | | $ | 29,230,979 | |
See Notes to Financial Statements and Financial Highlights.
ALPS | Smith Short Duration Bond Fund
Statements of Changes in Net Assets
| | | For the Year Ended October 31, 2024 | | | For the Year Ended October 31, 2023 | |
| OPERATIONS | | | | | | | | |
| Net investment income | | $ | 25,592,092 | | | $ | 25,402,606 | |
| Net realized gain/(loss) | | | 1,999,799 | | | | (16,316,787 | ) |
| Net change in unrealized appreciation | | | 12,102,690 | | | | 17,314,947 | |
| Net Increase in Net Assets Resulting from Operations | | | 39,694,581 | | | | 26,400,766 | |
| | | | | | | | | |
| DISTRIBUTIONS | | | | | | | | |
| From distributable earnings | | | | | | | | |
| Investor Class | | | (790,319 | ) | | | (614,727 | ) |
| Class A | | | (485,413 | ) | | | (394,923 | ) |
| Class C | | | (80,323 | ) | | | (81,323 | ) |
| Class I | | | (24,295,800 | ) | | | (24,615,362 | ) |
| Net Decrease in Net Assets from Distributions | | | (25,651,855 | ) | | | (25,706,335 | ) |
| | | | | | | | | |
| BENEFICIAL INTEREST TRANSACTIONS (NOTE 5) | | | | | | | | |
| Shares sold | | | | | | | | |
| Investor Class | | | 7,495,967 | | | | 9,842,783 | |
| Class A | | | 12,933,214 | | | | 10,699,745 | |
| Class C | | | 479,319 | | | | 778,411 | |
| Class I | | | 274,793,069 | | | | 377,223,916 | |
| Dividends reinvested | | | | | | | | |
| Investor Class | | | 729,042 | | | | 532,979 | |
| Class A | | | 394,449 | | | | 295,928 | |
| Class C | | | 43,695 | | | | 52,561 | |
| Class I | | | 17,033,030 | | | | 15,189,435 | |
| Shares redeemed, net of redemption fees | | | | | | | | |
| Investor Class | | | (4,699,507 | ) | | | (12,149,072 | ) |
| Class A | | | (13,885,383 | ) | | | (15,687,648 | ) |
| Class C | | | (612,006 | ) | | | (2,306,778 | ) |
| Class I | | | (338,153,242 | ) | | | (542,271,611 | ) |
| Net Decrease in Net Assets Derived from Beneficial Interest Transactions | | | (43,448,353 | ) | | | (157,799,351 | ) |
| | | | | | | | | |
| Net decrease in net assets | | | (29,405,627 | ) | | | (157,104,920 | ) |
| | | | | | | | | |
| NET ASSETS | | | | | | | | |
| Beginning of year | | | 606,422,655 | | | | 763,527,575 | |
| End of year | | $ | 577,017,028 | | | $ | 606,422,655 | |
See Notes to Financial Statements and Financial Highlights.
ALPS | Smith Total Return Bond Fund
Statements of Changes in Net Assets
| | | For the Year Ended October 31, 2024 | | | For the Year Ended October 31, 2023 | |
| OPERATIONS | | | | | | |
| Net investment income | | $ | 131,567,796 | | | $ | 80,836,198 | |
| Net realized gain/(loss) | | | 1,936,067 | | | | (110,434,356 | ) |
| Net change in unrealized appreciation | | | 164,518,816 | | | | 9,159,506 | |
| Net Increase/(Decrease) in Net Assets Resulting from Operations | | | 298,022,679 | | | | (20,438,652 | ) |
| | | | | | | | | |
| DISTRIBUTIONS | | | | | | | | |
| From distributable earnings | | | | | | | | |
| Investor Class | | | (1,212,511 | ) | | | (603,888 | ) |
| Class A | | | (1,414,699 | ) | | | (791,155 | ) |
| Class C | | | (158,784 | ) | | | (141,367 | ) |
| Class I | | | (130,619,629 | ) | | | (80,857,579 | ) |
| Net Decrease in Net Assets from Distributions | | | (133,405,623 | ) | | | (82,393,989 | ) |
| | | | | | | | | |
| BENEFICIAL INTEREST TRANSACTIONS (NOTE 5) | | | | | | | | |
| Shares sold | | | | | | | | |
| Investor Class | | | 16,574,425 | | | | 23,600,092 | |
| Class A | | | 29,968,730 | | | | 13,727,289 | |
| Class C | | | 873,671 | | | | 1,634,038 | |
| Class I | | | 1,656,278,430 | | | | 1,373,671,577 | |
| Dividends reinvested | | | | | | | | |
| Investor Class | | | 1,194,922 | | | | 595,288 | |
| Class A | | | 1,260,635 | | | | 723,544 | |
| Class C | | | 130,766 | | | | 117,024 | |
| Class I | | | 102,185,872 | | | | 60,335,657 | |
| Shares redeemed, net of redemption fees | | | | | | | | |
| Investor Class | | | (18,066,597 | ) | | | (5,013,925 | ) |
| Class A | | | (18,623,509 | ) | | | (7,262,227 | ) |
| Class C | | | (1,622,177 | ) | | | (1,351,913 | ) |
| Class I | | | (1,013,141,297 | ) | | | (666,482,352 | ) |
| Net Increase in Net Assets Derived from Beneficial Interest Transactions | | | 757,013,871 | | | | 794,294,092 | |
| | | | | | | | | |
| Net increase in net assets | | | 921,630,927 | | | | 691,461,451 | |
| | | | | | | | | |
| NET ASSETS | | | | | | | | |
| Beginning of year | | | 2,329,394,968 | | | | 1,637,933,517 | |
| End of year | | $ | 3,251,025,895 | | | $ | 2,329,394,968 | |
See Notes to Financial Statements and Financial Highlights.
ALPS | Smith Credit Opportunities Fund
Statements of Changes in Net Assets
| | | For the Year Ended October 31, 2024 | | | For the Year Ended October 31, 2023 | |
| OPERATIONS | | | | | | | | |
| Net investment income | | $ | 12,976,222 | | | $ | 12,080,326 | |
| Net realized gain/(loss) | | | 1,050,803 | | | | (22,017,161 | ) |
| Net change in unrealized appreciation | | | 15,203,954 | | | | 15,894,744 | |
| Net Increase in Net Assets Resulting from Operations | | | 29,230,979 | | | | 5,957,909 | |
| | | | | | | | | |
| DISTRIBUTIONS | | | | | | | | |
| From distributable earnings | | | | | | | | |
| Investor Class | | | (17,955 | ) | | | (40,695 | ) |
| Class A | | | (64,848 | ) | | | (57,183 | ) |
| Class C | | | (22,372 | ) | | | (23,390 | ) |
| Class I | | | (13,005,148 | ) | | | (12,004,465 | ) |
| Net Decrease in Net Assets from Distributions | | | (13,110,323 | ) | | | (12,125,733 | ) |
| | | | | | | | | |
| BENEFICIAL INTEREST TRANSACTIONS (NOTE 5) | | | | | | | | |
| Shares sold | | | | | | | | |
| Investor Class | | | 104 | | | | 63,719 | |
| Class A | | | 239,123 | | | | 258,892 | |
| Class C | | | 15,413 | | | | 26,647 | |
| Class I | | | 60,154,679 | | | | 60,166,070 | |
| Dividends reinvested | | | | | | | | |
| Investor Class | | | 17,955 | | | | 40,695 | |
| Class A | | | 8,937 | | | | 11,528 | |
| Class I | | | 10,465,283 | | | | 9,192,659 | |
| Shares redeemed | | | | | | | | |
| Investor Class | | | (29,413 | ) | | | (5,955,982 | ) |
| Class A | | | (359,830 | ) | | | (113,345 | ) |
| Class C | | | – | | | | (201,093 | ) |
| Class I | | | (91,761,632 | ) | | | (133,782,469 | ) |
| Net Decrease in Net Assets Derived from Beneficial Interest Transactions | | | (21,249,381 | ) | | | (70,292,679 | ) |
| | | | | | | | | |
| Net decrease in net assets | | | (5,128,725 | ) | | | (76,460,503 | ) |
| | | | | | | | | |
| NET ASSETS | | | | | | | | |
| Beginning of year | | | 215,646,242 | | | | 292,106,745 | |
| End of year | | $ | 210,517,517 | | | $ | 215,646,242 | |
See Notes to Financial Statements and Financial Highlights.
ALPS | Smith Short Duration Bond Fund - Investor Class
Financial Highlights
Selected data for a share of beneficial interest outstanding throughout the periods indicated:
| | | For the Year Ended October 31, 2024 | | | For the Year Ended October 31, 2023 | | | For the Year Ended October 31, 2022 | | | For the Year Ended October 31, 2021 | | | For the Year Ended October 31, 2020 | |
| Net asset value, beginning of period | | $ | 9.98 | | | $ | 9.98 | | | $ | 10.57 | | | $ | 10.62 | | | $ | 10.25 | |
| | | | | | | | | | | | | | | | | | | | | |
| INCOME FROM INVESTMENT OPERATIONS: | | | | | | | | | | | | | | | | | | | | |
| Net investment income(a) | | | 0.41 | | | | 0.33 | | | | 0.14 | | | | 0.05 | | | | 0.11 | |
| Net realized and unrealized gain/(loss) | | | 0.26 | | | | – | | | | (0.59 | ) | | | 0.03 | | | | 0.48 | |
| Total from investment operations | | | 0.67 | | | | 0.33 | | | | (0.45 | ) | | | 0.08 | | | | 0.59 | |
| | | | | | | | | | | | | | | | | | | | | |
| DISTRIBUTIONS: | | | | | | | | | | | | | | | | | | | | |
| From net investment income | | | (0.42 | ) | | | (0.33 | ) | | | (0.11 | ) | | | (0.05 | ) | | | (0.14 | ) |
| From net realized gains | | | – | | | | – | | | | (0.03 | ) | | | (0.08 | ) | | | (0.08 | ) |
| Total distributions | | | (0.42 | ) | | | (0.33 | ) | | | (0.14 | ) | | | (0.13 | ) | | | (0.22 | ) |
| | | | | | | | | | | | | | | | | | | | | |
| Net increase/(decrease) in net asset value | | | 0.25 | | | | – | | | | (0.59 | ) | | | (0.05 | ) | | | 0.37 | |
| Net asset value, end of year | | $ | 10.23 | | | $ | 9.98 | | | $ | 9.98 | | | $ | 10.57 | | | $ | 10.62 | |
| TOTAL RETURN(b) | | | 6.79 | % | | | 3.39 | % | | | (4.31 | )% | | | 0.77 | % | | | 5.85 | % |
| | | | | | | | | | | | | | | | | | | | | |
| RATIOS/SUPPLEMENTAL DATA: | | | | | | | | | | | | | | | | | | | | |
| Net assets, end of year (000s) | | $ | 21,454 | | | $ | 17,484 | | | $ | 19,227 | | | $ | 10,194 | | | $ | 9,100 | |
| Ratio of expenses to average net assets excluding fee waivers and reimbursements | | | 0.82 | % | | | 0.83 | % | | | 0.84 | % | | | 0.90 | % | | | 0.95 | % |
| Ratio of expenses to average net assets including fee waivers and reimbursements | | | 0.79 | % | | | 0.78 | % | | | 0.78 | % | | | 0.76 | % | | | 0.78 | % |
| Ratio of net investment income to average net assets | | | 4.07 | % | | | 3.23 | % | | | 1.41 | % | | | 0.51 | % | | | 1.02 | % |
| Portfolio turnover rate | | | 157 | % | | | 134 | % | | | 99 | % | | | 165 | % | | | 457 | % |
| (a) | Calculated using the average shares method. |
| (b) | Total returns are for the period indicated. Total returns would have been lower had certain expenses not been waived during the period. Returns shown do not reflect the deduction of taxes that a shareholder would pay on Fund distributions or the redemption of Fund shares. |
See Notes to Financial Statements and Financial Highlights.
ALPS | Smith Short Duration Bond Fund - Class A
Financial Highlights
Selected data for a share of beneficial interest outstanding throughout the periods indicated:
| | | For the Year Ended October 31, 2024 | | | For the Year Ended October 31, 2023 | | | For the Year Ended October 31, 2022 | | | For the Year Ended October 31, 2021 | | | For the Year Ended October 31, 2020 | |
| Net asset value, beginning of period | | $ | 9.98 | | | $ | 9.98 | | | $ | 10.56 | | | $ | 10.61 | | | $ | 10.24 | |
| | | | | | | | | | | | | | | | | | | | | |
| INCOME FROM INVESTMENT OPERATIONS: | | | | | | | | | | | | | | | | | | | | |
| Net investment income(a) | | | 0.42 | | | | 0.32 | | | | 0.11 | | | | 0.05 | | | | 0.12 | |
| Net realized and unrealized gain/(loss) | | | 0.25 | | | | 0.02 | | | | (0.55 | ) | | | 0.03 | | | | 0.47 | |
| Total from investment operations | | | 0.67 | | | | 0.34 | | | | (0.44 | ) | | | 0.08 | | | | 0.59 | |
| | | | | | | | | | | | | | | | | | | | | |
| DISTRIBUTIONS: | | | | | | | | | | | | | | | | | | | | |
| From net investment income | | | (0.42 | ) | | | (0.34 | ) | | | (0.11 | ) | | | (0.05 | ) | | | (0.14 | ) |
| From net realized gains | | | – | | | | – | | | | (0.03 | ) | | | (0.08 | ) | | | (0.08 | ) |
| Total distributions | | | (0.42 | ) | | | (0.34 | ) | | | (0.14 | ) | | | (0.13 | ) | | | (0.22 | ) |
| Net increase/(decrease) in net asset value | | | 0.25 | | | | – | | | | (0.58 | ) | | | (0.05 | ) | | | 0.37 | |
| Net asset value, end of year | | $ | 10.23 | | | $ | 9.98 | | | $ | 9.98 | | | $ | 10.56 | | | $ | 10.61 | |
| TOTAL RETURN(b) | | | 6.82 | % | | | 3.42 | % | | | (4.19 | )% | | | 0.77 | % | | | 5.84 | % |
| | | | | | | | | | | | | | | | | | | | | |
| RATIOS/SUPPLEMENTAL DATA: | | | | | | | | | | | | | | | | | | | | |
| Net assets, end of year (000s) | | $ | 10,427 | | | $ | 10,778 | | | $ | 15,429 | | | $ | 16,868 | | | $ | 3,702 | |
| Ratio of expenses to average net assets excluding fee waivers and reimbursements | | | 0.76 | % | | | 0.75 | % | | | 0.79 | % | | | 0.84 | % | | | 0.94 | % |
| Ratio of expenses to average net assets including fee waivers and reimbursements | | | 0.75 | % | | | 0.75 | % | | | 0.74 | % | | | 0.76 | % | | | 0.77 | % |
| Ratio of net investment income to average net assets | | | 4.13 | % | | | 3.22 | % | | | 1.08 | % | | | 0.51 | % | | | 1.10 | % |
| Portfolio turnover rate | | | 157 | % | | | 134 | % | | | 99 | % | | | 165 | % | | | 457 | % |
| (a) | Calculated using the average shares method. |
| (b) | Total returns are for the period indicated. Total returns would have been lower had certain expenses not been waived during the period. Returns shown do not reflect the deduction of taxes that a shareholder would pay on Fund distributions or the redemption of Fund shares. Returns shown exclude any applicable sales charges. |
See Notes to Financial Statements and Financial Highlights.
ALPS | Smith Short Duration Bond Fund - Class C
Financial Highlights
Selected data for a share of beneficial interest outstanding throughout the periods indicated:
| | | For the Year Ended October 31, 2024 | | | For the Year Ended October 31, 2023 | | | For the Year Ended October 31, 2022 | | | For the Year Ended October 31, 2021 | | | For the Year Ended October 31, 2020 | |
| Net asset value, beginning of period | | $ | 9.94 | | | $ | 9.93 | | | $ | 10.53 | | | $ | 10.61 | | | $ | 10.24 | |
| | | | | | | | | | | | | | | | | | | | | |
| INCOME FROM INVESTMENT OPERATIONS: | | | | | | | | | | | | | | | | | | | | |
| Net investment income/(loss)(a) | | | 0.34 | | | | 0.25 | | | | 0.04 | | | | (0.02 | ) | | | 0.05 | |
| Net realized and unrealized gain/(loss) | | | 0.25 | | | | 0.02 | | | | (0.56 | ) | | | 0.02 | | | | 0.47 | |
| Total from investment operations | | | 0.59 | | | | 0.27 | | | | (0.52 | ) | | | – | | | | 0.52 | |
| | | | | | | | | | | | | | | | | | | | | |
| DISTRIBUTIONS: | | | | | | | | | | | | | | | | | | | | |
| From net investment income | | | (0.35 | ) | | | (0.26 | ) | | | (0.05 | ) | | | (0.00 | )(b) | | | (0.07 | ) |
| From net realized gains | | | – | | | | – | | | | (0.03 | ) | | | (0.08 | ) | | | (0.08 | ) |
| Total distributions | | | (0.35 | ) | | | (0.26 | ) | | | (0.08 | ) | | | (0.08 | ) | | | (0.15 | ) |
| | | | | | | | | | | | | | | | | | | | | |
| Net increase/(decrease) in net asset value | | | 0.24 | | | | 0.01 | | | | (0.60 | ) | | | (0.08 | ) | | | 0.37 | |
| Net asset value, end of year | | $ | 10.18 | | | $ | 9.94 | | | $ | 9.93 | | | $ | 10.53 | | | $ | 10.61 | |
| TOTAL RETURN(c) | | | 5.97 | % | | | 2.77 | % | | | (5.01 | )% | | | (0.01 | )% | | | 5.10 | % |
| | | | | | | | | | | | | | | | | | | | | |
| RATIOS/SUPPLEMENTAL DATA: | | | | | | | | | | | | | | | | | | | | |
| Net assets, end of year (000s) | | $ | 2,290 | | | $ | 2,321 | | | $ | 3,784 | | | $ | 3,472 | | | $ | 2,193 | |
| Ratio of expenses to average net assets excluding fee waivers and reimbursements | | | 1.53 | % | | | 1.53 | % | | | 1.53 | % | | | 1.55 | % | | | 1.67 | % |
| Ratio of expenses to average net assets including fee waivers and reimbursements | | | 1.49 | % | | | 1.49 | % | | | 1.49 | % | | | 1.49 | % | | | 1.49 | % |
| Ratio of net investment income/(loss) to average net assets | | | 3.37 | % | | | 2.46 | % | | | 0.43 | % | | | (0.22 | )% | | | 0.46 | % |
| Portfolio turnover rate | | | 157 | % | | | 134 | % | | | 99 | % | | | 165 | % | | | 457 | % |
| (a) | Calculated using the average shares method. |
| (b) | Less than $0.005 or ($0.005) per share. |
| (c) | Total returns are for the period indicated. Total returns would have been lower had certain expenses not been waived during the period. Returns shown do not reflect the deduction of taxes that a shareholder would pay on Fund distributions or the redemption of Fund shares. Returns shown exclude any applicable sales charges. |
See Notes to Financial Statements and Financial Highlights.
ALPS | Smith Short Duration Bond Fund - Class I
Financial Highlights
Selected data for a share of beneficial interest outstanding throughout the periods indicated:
| | | For the Year Ended October 31, 2024 | | | For the Year Ended October 31, 2023 | | | For the Year Ended October 31, 2022 | | | For the Year Ended October 31, 2021 | | | For the Year Ended October 31, 2020 | |
| Net asset value, beginning of period | | $ | 9.98 | | | $ | 9.98 | | | $ | 10.57 | | | $ | 10.62 | | | $ | 10.25 | |
| | | | | | | | | | | | | | | | | | | | | |
| INCOME FROM INVESTMENT OPERATIONS: | | | | | | | | | | | | | | | | | | | | |
| Net investment income(a) | | | 0.45 | | | | 0.35 | | | | 0.15 | | | | 0.08 | | | | 0.16 | |
| Net realized and unrealized gain/(loss) | | | 0.25 | | | | 0.01 | | | | (0.57 | ) | | | 0.03 | | | | 0.46 | |
| Total from investment operations | | | 0.70 | | | | 0.36 | | | | (0.42 | ) | | | 0.11 | | | | 0.62 | |
| | | | | | | | | | | | | | | | | | | | | |
| DISTRIBUTIONS: | | | | | | | | | | | | | | | | | | | | |
| From net investment income | | | (0.45 | ) | | | (0.36 | ) | | | (0.14 | ) | | | (0.08 | ) | | | (0.17 | ) |
| From net realized gains | | | – | | | | – | | | | (0.03 | ) | | | (0.08 | ) | | | (0.08 | ) |
| Total distributions | | | (0.45 | ) | | | (0.36 | ) | | | (0.17 | ) | | | (0.16 | ) | | | (0.25 | ) |
| | | | | | | | | | | | | | | | | | | | | |
| REDEMPTION FEES ADDED TO PAID-IN | | | | | | | | | | | | | | | | | | | | |
| CAPITAL (NOTE 5) | | | – | | | | – | | | | – | | | | – | | | | 0.00 | (b) |
| Net increase/(decrease) in net asset value | | | 0.25 | | | | – | | | | (0.59 | ) | | | (0.05 | ) | | | 0.37 | |
| Net asset value, end of year | | $ | 10.23 | | | $ | 9.98 | | | $ | 9.98 | | | $ | 10.57 | | | $ | 10.62 | |
| TOTAL RETURN(c) | | | 7.10 | % | | | 3.69 | % | | | (4.03 | )% | | | 1.05 | % | | | 6.12 | % |
| | | | | | | | | | | | | | | | | | | | | |
| RATIOS/SUPPLEMENTAL DATA: | | | | | | | | | | | | | | | | | | | | |
| Net assets, end of year (000s) | | $ | 542,845 | | | $ | 575,840 | | | $ | 725,087 | | | $ | 492,215 | | | $ | 166,817 | |
| Ratio of expenses to average net assets excluding fee waivers and reimbursements | | | 0.57 | % | | | 0.56 | % | | | 0.56 | % | | | 0.58 | % | | | 0.70 | % |
| Ratio of expenses to average net assets including fee waivers and reimbursements | | | 0.49 | % | | | 0.49 | % | | | 0.49 | % | | | 0.49 | % | | | 0.49 | % |
| Ratio of net investment income to average net assets | | | 4.37 | % | | | 3.52 | % | | | 1.47 | % | | | 0.77 | % | | | 1.52 | % |
| Portfolio turnover rate | | | 157 | % | | | 134 | % | | | 99 | % | | | 165 | % | | | 457 | % |
| (a) | Calculated using the average shares method. |
| (b) | Less than $0.005 or ($0.005) per share. |
| (c) | Total returns are for the period indicated. Total returns would have been lower had certain expenses not been waived during the period. Returns shown do not reflect the deduction of taxes that a shareholder would pay on Fund distributions or the redemption of Fund shares. |
See Notes to Financial Statements and Financial Highlights.
ALPS | Smith Total Return Bond Fund - Investor Class
Financial Highlights
Selected data for a share of beneficial interest outstanding throughout the periods indicated:
| | | For the Year Ended October 31, 2024 | | | For the Year Ended October 31, 2023 | | | For the Year Ended October 31, 2022 | | | For the Year Ended October 31, 2021 | | | For the Year Ended October 31, 2020 | |
| Net asset value, beginning of period | | $ | 9.02 | | | $ | 9.34 | | | $ | 11.23 | | | $ | 11.46 | | | $ | 10.99 | |
| | | | | | | | | | | | | | | | | | | | | |
| INCOME FROM INVESTMENT OPERATIONS: | | | | | | | | | | | | | | | | | | | | |
| Net investment income(a) | | | 0.41 | | | | 0.36 | | | | 0.22 | | | | 0.18 | | | | 0.19 | |
| Net realized and unrealized gain/(loss) | | | 0.63 | | | | (0.33 | ) | | | (1.85 | ) | | | (0.03 | ) | | | 0.57 | |
| Total from investment operations | | | 1.04 | | | | 0.03 | | | | (1.63 | ) | | | 0.15 | | | | 0.76 | |
| | | | | | | | | | | | | | | | | | | | | |
| DISTRIBUTIONS: | | | | | | | | | | | | | | | | | | | | |
| From net investment income | | | (0.41 | ) | | | (0.35 | ) | | | (0.26 | ) | | | (0.19 | ) | | | (0.19 | ) |
| From net realized gains | | | – | | | | – | | | | – | | | | (0.19 | ) | | | (0.10 | ) |
| From tax return of capital | | | – | | | | – | | | | (0.00 | )(b) | | | – | | | | – | |
| Total distributions | | | (0.41 | ) | | | (0.35 | ) | | | (0.26 | ) | | | (0.38 | ) | | | (0.29 | ) |
| | | | | | | | | | | | | | | | | | | | | |
| REDEMPTION FEES ADDED TO PAID-IN | | | | | | | | | | | | | | | | | | | | |
| CAPITAL (NOTE 5) | | | – | | | | – | | | | – | | | | – | | | | 0.00 | (b) |
| Net increase/(decrease) in net asset value | | | 0.63 | | | | (0.32 | ) | | | (1.89 | ) | | | (0.23 | ) | | | 0.47 | |
| Net asset value, end of year | | $ | 9.65 | | | $ | 9.02 | | | $ | 9.34 | | | $ | 11.23 | | | $ | 11.46 | |
| TOTAL RETURN(c) | | | 11.63 | % | | | 0.23 | % | | | (14.73 | )% | | | 1.26 | % | | | 6.95 | % |
| | | | | | | | | | | | | | | | | | | | | |
| RATIOS/SUPPLEMENTAL DATA: | | | | | | | | | | | | | | | | | | | | |
| Net assets, end of year (000s) | | $ | 23,458 | | | $ | 22,228 | | | $ | 4,252 | | | $ | 9,605 | | | $ | 10,109 | |
| Ratio of expenses to average net assets excluding fee waivers and reimbursements | | | 0.97 | % | | | 0.96 | % | | | 0.97 | % | | | 0.98 | % | | | 1.01 | % |
| Ratio of expenses to average net assets including fee waivers and reimbursements(d) | | | 0.89 | % | | | 0.90 | % | | | 0.93 | % | | | 0.95 | % | | | 0.96 | % |
| Ratio of net investment income to average net assets | | | 4.22 | % | | | 3.78 | % | | | 2.14 | % | | | 1.55 | % | | | 1.66 | % |
| Portfolio turnover rate | | | 135 | % | | | 133 | % | | | 179 | % | | | 178 | % | | | 360 | % |
| (a) | Calculated using the average shares method. |
| (b) | Less than $0.005 or ($0.005) per share. |
| (c) | Total returns are for the period indicated. Total returns would have been lower had certain expenses not been waived during the period. Returns shown do not reflect the deduction of taxes that a shareholder would pay on Fund distributions or the redemption of Fund shares. |
| (d) | Effective September 1, 2023, the Adviser agreed to limit expenses to 0.59%. Prior to September 1, 2023, the Adviser agreed to limit expenses to 0.64%. |
See Notes to Financial Statements and Financial Highlights.
ALPS | Smith Total Return Bond Fund - Class A
Financial Highlights
Selected data for a share of beneficial interest outstanding throughout the periods indicated:
| | | For the Year Ended October 31, 2024 | | | For the Year Ended October 31, 2023 | | | For the Year Ended October 31, 2022 | | | For the Year Ended October 31, 2021 | | | For the Year Ended October 31, 2020 | |
| Net asset value, beginning of period | | $ | 9.02 | | | $ | 9.34 | | | $ | 11.23 | | | $ | 11.46 | | | $ | 10.99 | |
| | | | | | | | | | | | | | | | | | | | | |
| INCOME FROM INVESTMENT OPERATIONS: | | | | | | | | | | | | | | | | | | | | |
| Net investment income(a) | | | 0.41 | | | | 0.35 | | | | 0.22 | | | | 0.18 | | | | 0.19 | |
| Net realized and unrealized gain/(loss) | | | 0.63 | | | | (0.32 | ) | | | (1.85 | ) | | | (0.03 | ) | | | 0.57 | |
| Total from investment operations | | | 1.04 | | | | 0.03 | | | | (1.63 | ) | | | 0.15 | | | | 0.76 | |
| | | | | | | | | | | | | | | | | | | | | |
| DISTRIBUTIONS: | | | | | | | | | | | | | | | | | | | | |
| From net investment income | | | (0.41 | ) | | | (0.35 | ) | | | (0.26 | ) | | | (0.19 | ) | | | (0.19 | ) |
| From net realized gains | | | – | | | | – | | | | – | | | | (0.19 | ) | | | (0.10 | ) |
| From tax return of capital | | | – | | | | – | | | | (0.00 | )(b) | | | – | | | | – | |
| Total distributions | | | (0.41 | ) | | | (0.35 | ) | | | (0.26 | ) | | | (0.38 | ) | | | (0.29 | ) |
| | | | | | | | | | | | | | | | | | | | | |
| REDEMPTION FEES ADDED TO PAID-IN | | | | | | | | | | | | | | | | | | | | |
| CAPITAL (NOTE 5) | | | – | | | | – | | | | – | | | | – | | | | 0.00 | (b) |
| Net increase/(decrease) in net asset value | | | 0.63 | | | | (0.32 | ) | | | (1.89 | ) | | | (0.23 | ) | | | 0.47 | |
| Net asset value, end of year | | $ | 9.65 | | | $ | 9.02 | | | $ | 9.34 | | | $ | 11.23 | | | $ | 11.46 | |
| TOTAL RETURN(c) | | | 11.64 | % | | | 0.21 | % | | | (14.62 | )% | | | 1.27 | % | | | 6.96 | % |
| | | | | | | | | | | | | | | | | | | | | |
| RATIOS/SUPPLEMENTAL DATA: | | | | | | | | | | | | | | | | | | | | |
| Net assets, end of year (000s) | | $ | 36,553 | | | $ | 22,153 | | | $ | 16,024 | | | $ | 27,342 | | | $ | 15,016 | |
| Ratio of expenses to average net assets excluding fee waivers and reimbursements | | | 0.96 | % | | | 0.97 | % | | | 0.96 | % | | | 0.97 | % | | | 0.99 | % |
| Ratio of expenses to average net assets including fee waivers and reimbursements(d) | | | 0.88 | % | | | 0.92 | % | | | 0.92 | % | | | 0.94 | % | | | 0.95 | % |
| Ratio of net investment income to average net assets | | | 4.22 | % | | | 3.69 | % | | | 2.14 | % | | | 1.57 | % | | | 1.66 | % |
| Portfolio turnover rate | | | 135 | % | | | 133 | % | | | 179 | % | | | 178 | % | | | 360 | % |
| (a) | Calculated using the average shares method. |
| (b) | Less than $0.005 or ($0.005) per share. |
| (c) | Total returns are for the period indicated. Total returns would have been lower had certain expenses not been waived during the period. Returns shown do not reflect the deduction of taxes that a shareholder would pay on Fund distributions or the redemption of Fund shares. Returns shown exclude any applicable sales charges. |
| (d) | Effective September 1, 2023, the Adviser agreed to limit expenses to 0.59%. Prior to September 1, 2023, the Adviser agreed to limit expenses to 0.64%. |
See Notes to Financial Statements and Financial Highlights.
ALPS | Smith Total Return Bond Fund - Class C
Financial Highlights
Selected data for a share of beneficial interest outstanding throughout the periods indicated:
| | | For the Year Ended October 31, 2024 | | | For the Year Ended October 31, 2023 | | | For the Year Ended October 31, 2022 | | | For the Year Ended October 31, 2021 | | | For the Year Ended October 31, 2020 | |
| Net asset value, beginning of period | | $ | 9.00 | | | $ | 9.32 | | | $ | 11.21 | | | $ | 11.44 | | | $ | 10.97 | |
| | | | | | | | | | | | | | | | | | | | | |
| INCOME FROM INVESTMENT OPERATIONS: | | | | | | | | | | | | | | | | | | | | |
| Net investment income(a) | | | 0.34 | | | | 0.28 | | | | 0.15 | | | | 0.09 | | | | 0.11 | |
| Net realized and unrealized gain/(loss) | | | 0.63 | | | | (0.32 | ) | | | (1.86 | ) | | | (0.02 | ) | | | 0.57 | |
| Total from investment operations | | | 0.97 | | | | (0.04 | ) | | | (1.71 | ) | | | 0.07 | | | | 0.68 | |
| | | | | | | | | | | | | | | | | | | | | |
| DISTRIBUTIONS: | | | | | | | | | | | | | | | | | | | | |
| From net investment income | | | (0.34 | ) | | | (0.28 | ) | | | (0.18 | ) | | | (0.11 | ) | | | (0.11 | ) |
| From net realized gains | | | – | | | | – | | | | – | | | | (0.19 | ) | | | (0.10 | ) |
| From tax return of capital | | | – | | | | – | | | | (0.00 | )(b) | | | – | | | | – | |
| Total distributions | | | (0.34 | ) | | | (0.28 | ) | | | (0.18 | ) | | | (0.30 | ) | | | (0.21 | ) |
| | | | | | | | | | | | | | | | | | | | | |
| Net increase/(decrease) in net asset value | | | 0.63 | | | | (0.32 | ) | | | (1.89 | ) | | | (0.23 | ) | | | 0.47 | |
| Net asset value, end of year | | $ | 9.63 | | | $ | 9.00 | | | $ | 9.32 | | | $ | 11.21 | | | $ | 11.44 | |
| TOTAL RETURN(c) | | | 10.87 | % | | | (0.49 | )% | | | (15.36 | )% | | | 0.55 | % | | | 6.23 | % |
| | | | | | | | | | | | | | | | | | | | | |
| RATIOS/SUPPLEMENTAL DATA: | | | | | | | | | | | | | | | | | | | | |
| Net assets, end of year (000s) | | $ | 4,143 | | | $ | 4,451 | | | $ | 4,223 | | | $ | 7,184 | | | $ | 6,508 | |
| Ratio of expenses to average net assets excluding fee waivers and reimbursements | | | 1.73 | % | | | 1.70 | % | | | 1.71 | % | | | 1.71 | % | | | 1.72 | % |
| Ratio of expenses to average net assets including fee waivers and reimbursements(d) | | | 1.59 | % | | | 1.63 | % | | | 1.64 | % | | | 1.66 | % | | | 1.67 | % |
| Ratio of net investment income to average net assets | | | 3.50 | % | | | 2.93 | % | | | 1.42 | % | | | 0.83 | % | | | 0.94 | % |
| Portfolio turnover rate | | | 135 | % | | | 133 | % | | | 179 | % | | | 178 | % | | | 360 | % |
| (a) | Calculated using the average shares method. |
| (b) | Less than $0.005 or ($0.005) per share. |
| (c) | Total returns are for the period indicated. Total returns would have been lower had certain expenses not been waived during the period. Returns shown do not reflect the deduction of taxes that a shareholder would pay on Fund distributions or the redemption of Fund shares. Returns shown exclude any applicable sales charges. |
| (d) | Effective September 1, 2023, the Adviser agreed to limit expenses to 0.59%. Prior to September 1, 2023, the Adviser agreed to limit expenses to 0.64%. |
See Notes to Financial Statements and Financial Highlights.
ALPS | Smith Total Return Bond Fund - Class I
Financial Highlights
Selected data for a share of beneficial interest outstanding throughout the periods indicated:
| | | For the Year Ended October 31, 2024 | | | For the Year Ended October 31, 2023 | | | For the Year Ended October 31, 2022 | | | For the Year Ended October 31, 2021 | | | For the Year Ended October 31, 2020 | |
| Net asset value, beginning of period | | $ | 9.01 | | | $ | 9.34 | | | $ | 11.22 | | | $ | 11.46 | | | $ | 10.99 | |
| | | | | | | | | | | | | | | | | | | | | |
| INCOME FROM INVESTMENT OPERATIONS: | | | | | | | | | | | | | | | | | | | | |
| Net investment income(a) | | | 0.43 | | | | 0.38 | | | | 0.25 | | | | 0.21 | | | | 0.22 | |
| Net realized and unrealized gain/(loss) | | | 0.64 | | | | (0.33 | ) | | | (1.84 | ) | | | (0.04 | ) | | | 0.57 | |
| Total from investment operations | | | 1.07 | | | | 0.05 | | | | (1.59 | ) | | | 0.17 | | | | 0.79 | |
| | | | | | | | | | | | | | | | | | | | | |
| DISTRIBUTIONS: | | | | | | | | | | | | | | | | | | | | |
| From net investment income | | | (0.44 | ) | | | (0.38 | ) | | | (0.29 | ) | | | (0.22 | ) | | | (0.22 | ) |
| From net realized gains | | | – | | | | – | | | | – | | | | (0.19 | ) | | | (0.10 | ) |
| From tax return of capital | | | – | | | | – | | | | (0.00 | )(b) | | | – | | | | – | |
| Total distributions | | | (0.44 | ) | | | (0.38 | ) | | | (0.29 | ) | | | (0.41 | ) | | | (0.32 | ) |
| | | | | | | | | | | | | | | | | | | | | |
| REDEMPTION FEES ADDED TO PAID-IN | | | | | | | | | | | | | | | | | | | | |
| CAPITAL (NOTE 5) | | | – | | | | – | | | | – | | | | – | | | | 0.00 | (b) |
| Net increase/(decrease) in net asset value | | | 0.63 | | | | (0.33 | ) | | | (1.88 | ) | | | (0.24 | ) | | | 0.47 | |
| Net asset value, end of year | | $ | 9.64 | | | $ | 9.01 | | | $ | 9.34 | | | $ | 11.22 | | | $ | 11.46 | |
| TOTAL RETURN(c) | | | 11.97 | % | | | 0.40 | % | | | (14.40 | )% | | | 1.47 | % | | | 7.26 | % |
| | | | | | | | | | | | | | | | | | | | | |
| RATIOS/SUPPLEMENTAL DATA: | | | | | | | | | | | | | | | | | | | | |
| Net assets, end of year (000s) | | $ | 3,186,873 | | | $ | 2,280,563 | | | $ | 1,613,435 | | | $ | 1,738,746 | | | $ | 1,331,786 | |
| Ratio of expenses to average net assets excluding fee waivers and reimbursements | | | 0.74 | % | | | 0.74 | % | | | 0.73 | % | | | 0.73 | % | | | 0.72 | % |
| Ratio of expenses to average net assets including fee waivers and reimbursements(d) | | | 0.59 | % | | | 0.63 | % | | | 0.64 | % | | | 0.66 | % | | | 0.67 | % |
| Ratio of net investment income to average net assets | | | 4.50 | % | | | 3.98 | % | | | 2.46 | % | | | 1.84 | % | | | 1.94 | % |
| Portfolio turnover rate | | | 135 | % | | | 133 | % | | | 179 | % | | | 178 | % | | | 360 | % |
| (a) | Calculated using the average shares method. |
| (b) | Less than $0.005 or ($0.005) per share. |
| (c) | Total returns are for the period indicated. Total returns would have been lower had certain expenses not been waived during the period. Returns shown do not reflect the deduction of taxes that a shareholder would pay on Fund distributions or the redemption of Fund shares. |
| (d) | Effective September 1, 2023, the Adviser agreed to limit expenses to 0.59%. Prior to September 1, 2023, the Adviser agreed to limit expenses to 0.64%. |
See Notes to Financial Statements and Financial Highlights.
ALPS | Smith Credit Opportunities Fund - Investor Class
Financial Highlights
Selected data for a share of beneficial interest outstanding throughout the periods indicated:
| | | For the Year Ended October 31, 2024 | | For the Year Ended October 31, 2023 | | For the Year Ended October 31, 2022 | | For the Year Ended October 31, 2021 | | For the Period September 16, 2020 (Commencement of
Operations) to October 31, 2020 |
| Net asset value, beginning of period | | $ | 8.55 | | | $ | 8.82 | | | $ | 10.45 | | | $ | 9.96 | | | $ | 10.00 | |
| | | | | | | | | | | | | | | | | | | | | |
| INCOME FROM INVESTMENT OPERATIONS: | | | | | | | | | | | | | | | | | | | | |
| Net investment income(a) | | | 0.52 | | | | 0.44 | | | | 0.33 | | | | 0.25 | | | | 0.02 | |
| Net realized and unrealized gain/(loss) | | | 0.66 | | | | (0.26 | ) | | | (1.59 | ) | | | 0.51 | | | | (0.04 | ) |
| Total from investment operations | | | 1.18 | | | | 0.18 | | | | (1.26 | ) | | | 0.76 | | | | (0.02 | ) |
| | | | | | | | | | | | | | | | | | | | | |
| DISTRIBUTIONS: | | | | | | | | | | | | | | | | | | | | |
| From net investment income | | | (0.51 | ) | | | (0.45 | ) | | | (0.33 | ) | | | (0.25 | ) | | | (0.02 | ) |
| From net realized gains | | | – | | | | – | | | | (0.04 | ) | | | (0.02 | ) | | | – | |
| From tax return of capital | | | – | | | | – | | | | (0.00 | )(b) | | | – | | | | – | |
| Total distributions | | | (0.51 | ) | | | (0.45 | ) | | | (0.37 | ) | | | (0.27 | ) | | | (0.02 | ) |
| | | | | | | | | | | | | | | | | | | | | |
| Net increase/(decrease) in net asset value | | | 0.67 | | | | 0.27 | | | | (1.63 | ) | | | 0.49 | | | | (0.04 | ) |
| Net asset value, end of year | | $ | 9.22 | | | $ | 8.55 | | | $ | 8.82 | | | $ | 10.45 | | | $ | 9.96 | |
| TOTAL RETURN(c) | | | 13.97 | % | | | 2.01 | % | | | (12.28 | )% | | | 7.63 | % | | | (0.23 | )% |
| | | | | | | | | | | | | | | | | | | | | |
| RATIOS/SUPPLEMENTAL DATA: | | | | | | | | | | | | | | | | | | | | |
| Net assets, end of year (000s) | | $ | 330 | | | $ | 316 | | | $ | 6,155 | | | $ | 6,869 | | | $ | 699 | |
| Ratio of expenses to average net assets excluding fee waivers and reimbursements | | | 0.93 | %(d) | | | 0.90 | %(d) | | | 1.17 | % | | | 1.25 | % | | | 2.36 | %(e) |
| Ratio of expenses to average net assets including fee waivers and reimbursements | | | 0.87 | %(d) | | | 0.89 | % | | | 1.17 | % | | | 1.19 | % | | | 1.20 | %(e) |
| Ratio of net investment income to average net assets | | | 5.72 | % | | | 4.93 | % | | | 3.44 | % | | | 2.35 | % | | | 1.37 | %(e) |
| Portfolio turnover rate(f) | | | 181 | % | | | 176 | % | | | 187 | % | | | 211 | % | | | 66 | % |
| (a) | Calculated using the average shares method. |
| (b) | Less than $0.005 or ($0.005) per share. |
| (c) | Total returns are for the period indicated and have not been annualized. Total returns would have been lower had certain expenses not been waived during the period. Returns shown do not reflect the deduction of taxes that a shareholder would pay on Fund distributions or the redemption of Fund shares. |
| (d) | According to the Fund's shareholder services plan with respect to the Fund's Investor Class shares, any amount of fees accrued according to the plan, but not paid during the Fund's fiscal year for such service activities shall be reimbursed to the Fund as soon as practical. Ratios may be lower than the expense cap due to the amounts reimbursed to the Fund. |
| (f) | Portfolio turnover rate for periods less than one full year have not been annualized. |
See Notes to Financial Statements and Financial Highlights.
ALPS | Smith Credit Opportunities Fund - Class A
Financial Highlights
Selected data for a share of beneficial interest outstanding throughout the periods indicated:
| | | For the Year Ended
October 31, 2024 | | | For the Year Ended
October 31, 2023 | | | For the Year Ended
October 31, 2022 | | | For the Year Ended
October 31, 2021 | | | For the Period
September 16, 2020
(Commencement of
Operations) to
October 31, 2020 | |
| Net asset value, beginning of period | | $ | 8.51 | | | $ | 8.83 | | | $ | 10.45 | | | $ | 9.96 | | | $ | 10.00 | |
| | | | | | | | | | | | | | | | | | | | | |
| INCOME FROM INVESTMENT OPERATIONS: | | | | | | | | | | | | | | | | | | | | |
| Net investment income(a) | | | 0.52 | | | | 0.44 | | | | 0.33 | | | | 0.25 | | | | 0.02 | |
| Net realized and unrealized gain/(loss) | | | 0.66 | | | | (0.32 | ) | | | (1.58 | ) | | | 0.51 | | | | (0.04 | ) |
| Total from investment operations | | | 1.18 | | | | 0.12 | | | | (1.25 | ) | | | 0.76 | | | | (0.02 | ) |
| | | | | | | | | | | | | | | | | | | | | |
| DISTRIBUTIONS: | | | | | | | | | | | | | | | | | | | | |
| From net investment income | | | (0.51 | ) | | | (0.44 | ) | | | (0.33 | ) | | | (0.25 | ) | | | (0.02 | ) |
| From net realized gains | | | – | | | | – | | | | (0.04 | ) | | | (0.02 | ) | | | – | |
| From tax return of capital | | | – | | | | – | | | | (0.00 | )(b) | | | – | | | | – | |
| Total distributions | | | (0.51 | ) | | | (0.44 | ) | | | (0.37 | ) | | | (0.27 | ) | | | (0.02 | ) |
| | | | | | | | | | | | | | | | | | | | | |
| Net increase/(decrease) in net asset value | | | 0.67 | | | | (0.32 | ) | | | (1.62 | ) | | | 0.49 | | | | (0.04 | ) |
| Net asset value, end of year | | $ | 9.18 | | | $ | 8.51 | | | $ | 8.83 | | | $ | 10.45 | | | $ | 9.96 | |
| TOTAL RETURN(c) | | | 14.04 | % | | | 1.28 | % | | | (12.18 | )% | | | 7.65 | % | | | (0.22 | )% |
| | | | | | | | | | | | | | | | | | | | | |
| RATIOS/SUPPLEMENTAL DATA: | | | | | | | | | | | | | | | | | | | | |
| Net assets, end of year (000s) | | $ | 1,174 | | | $ | 1,200 | | | $ | 1,088 | | | $ | 1,217 | | | $ | 996 | |
| Ratio of expenses to average net assets excluding fee waivers and reimbursements | | | 0.89 | %(d) | | | 1.16 | % | | | 1.16 | % | | | 1.26 | % | | | 2.38 | %(e) |
| Ratio of expenses to average net assets including fee waivers and reimbursements | | | 0.83 | %(d) | | | 1.13 | % | | | 1.16 | % | | | 1.16 | % | | | 1.20 | %(e) |
| Ratio of net investment income to average net assets | | | 5.76 | % | | | 4.96 | % | | | 3.45 | % | | | 2.41 | % | | | 1.33 | %(e) |
| Portfolio turnover rate(f) | | | 181 | % | | | 176 | % | | | 187 | % | | | 211 | % | | | 66 | % |
| (a) | Calculated using the average shares method. |
| (b) | Less than $0.005 or ($0.005) per share. |
| (c) | Total returns are for the period indicated and have not been annualized. Total returns would have been lower had certain expenses not been waived during the period. Returns shown do not reflect the deduction of taxes that a shareholder would pay on Fund distributions or the redemption of Fund shares. Returns shown exclude any applicable sales charges. |
| (d) | According to the Fund's shareholder services plan with respect to the Fund's Class A shares, any amount of fees accrued according to the plan, but not paid during the Fund's fiscal year for such service activities shall be reimbursed to the Fund as soon as practical. Ratios may be lower than the expense cap due to the amounts reimbursed to the Fund. |
| (e) | Annualized. |
| (f) | Portfolio turnover rate for periods less than one full year have not been annualized. |
See Notes to Financial Statements and Financial Highlights.
ALPS | Smith Credit Opportunities Fund - Class C
Financial Highlights
Selected data for a share of beneficial interest outstanding throughout the periods indicated:
| | | For the Year Ended
October 31, 2024 | | | For the Year Ended
October 31, 2023 | | | For the Year Ended
October 31, 2022 | | | For the Year Ended
October 31, 2021 | | | For the Period September 16, 2020
(Commencement of
Operations) to
October 31, 2020 | |
| Net asset value, beginning of period | | $ | 8.51 | | | $ | 8.82 | | | $ | 10.45 | | | $ | 9.96 | | | $ | 10.00 | |
| | | | | | | | | | | | | | | | | | | | | |
| INCOME FROM INVESTMENT OPERATIONS: | | | | | | | | | | | | | | | | | | | | |
| Net investment income(a) | | | 0.43 | | | | 0.37 | | | | 0.26 | | | | 0.17 | | | | 0.01 | |
| Net realized and unrealized gain/(loss) | | | 0.64 | | | | (0.31 | ) | | | (1.59 | ) | | | 0.52 | | | | (0.04 | ) |
| Total from investment operations | | | 1.07 | | | | 0.06 | | | | (1.33 | ) | | | 0.69 | | | | (0.03 | ) |
| | | | | | | | | | | | | | | | | | | | | |
| DISTRIBUTIONS: | | | | | | | | | | | | | | | | | | | | |
| From net investment income | | | (0.44 | ) | | | (0.37 | ) | | | (0.26 | ) | | | (0.18 | ) | | | (0.01 | ) |
| From net realized gains | | | – | | | | – | | | | (0.04 | ) | | | (0.02 | ) | | | – | |
| From tax return of capital | | | – | | | | – | | | | (0.00 | )(b) | | | – | | | | – | |
| Total distributions | | | (0.44 | ) | | | (0.37 | ) | | | (0.30 | ) | | | (0.19 | ) | | | (0.01 | ) |
| | | | | | | | | | | | | | | | | | | | | |
| Net increase/(decrease) in net asset value | | | 0.63 | | | | (0.31 | ) | | | (1.63 | ) | | | 0.49 | | | | (0.04 | ) |
| Net asset value, end of year | | $ | 9.14 | | | $ | 8.51 | | | $ | 8.82 | | | $ | 10.45 | | | $ | 9.96 | |
| TOTAL RETURN(c) | | | 12.73 | % | | | 0.65 | % | | | (12.91 | )% | | | 6.88 | % | | | (0.31 | )% |
| | | | | | | | | | | | | | | | | | | | | |
| RATIOS/SUPPLEMENTAL DATA: | | | | | | | | | | | | | | | | | | | | |
| Net assets, end of year (000s) | | $ | 473 | | | $ | 425 | | | $ | 617 | | | $ | 682 | | | $ | 498 | |
| Ratio of expenses to average net assets excluding fee waivers and reimbursements | | | 1.94 | % | | | 1.93 | % | | | 1.90 | % | | | 2.00 | % | | | 3.09 | %(d) |
| Ratio of expenses to average net assets including fee waivers and reimbursements | | | 1.90 | % | | | 1.90 | % | | | 1.90 | % | | | 1.90 | % | | | 1.90 | %(d) |
| Ratio of net investment income to average net assets | | | 4.69 | % | | | 4.17 | % | | | 2.71 | % | | | 1.67 | % | | | 0.63 | %(d) |
| Portfolio turnover rate(e) | | | 181 | % | | | 176 | % | | | 187 | % | | | 211 | % | | | 66 | % |
| (a) | Calculated using the average shares method. |
| (b) | Less than $0.005 or ($0.005) per share. |
| (c) | Total returns are for the period indicated and have not been annualized. Total returns would have been lower had certain expenses not been waived during the period. Returns shown do not reflect the deduction of taxes that a shareholder would pay on Fund distributions or the redemption of Fund shares. Returns shown exclude any applicable sales charges. |
| (d) | Annualized. |
| (e) | Portfolio turnover rate for periods less than one full year have not been annualized. |
See Notes to Financial Statements and Financial Highlights.
ALPS | Smith Credit Opportunities Fund - Class I
Financial Highlights
Selected data for a share of beneficial interest outstanding throughout the periods indicated:
| | | For the Year Ended
October 31, 2024 | | | For the Year Ended
October 31, 2023 | | | For the Year Ended
October 31, 2022 | | | For the Year Ended
October 31, 2021 | | | For the Period September 16, 2020
(Commencement of
Operations) to
October 31, 2020 | |
| Net asset value, beginning of period | | $ | 8.51 | | | $ | 8.83 | | | $ | 10.45 | | | $ | 9.97 | | | $ | 10.00 | |
| | | | | | | | | | | | | | | | | | | | | |
| INCOME FROM INVESTMENT OPERATIONS: | | | | | | | | | | | | | | | | | | | | |
| Net investment income(a) | | | 0.52 | | | | 0.46 | | | | 0.35 | | | | 0.28 | | | | 0.02 | |
| Net realized and unrealized gain/(loss) | | | 0.65 | | | | (0.32 | ) | | | (1.57 | ) | | | 0.50 | | | | (0.03 | ) |
| Total from investment operations | | | 1.17 | | | | 0.14 | | | | (1.22 | ) | | | 0.78 | | | | (0.01 | ) |
| | | | | | | | | | | | | | | | | | | | | |
| DISTRIBUTIONS: | | | | | | | | | | | | | | | | | | | | |
| From net investment income | | | (0.53 | ) | | | (0.46 | ) | | | (0.36 | ) | | | (0.28 | ) | | | (0.02 | ) |
| From net realized gains | | | – | | | | – | | | | (0.04 | ) | | | (0.02 | ) | | | – | |
| From tax return of capital | | | – | | | | – | | | | (0.00 | )(b) | | | – | | | | – | |
| Total distributions | | | (0.53 | ) | | | (0.46 | ) | | | (0.40 | ) | | | (0.30 | ) | | | (0.02 | ) |
| | | | | | | | | | | | | | | | | | | | | |
| Net increase/(decrease) in net asset value | | | 0.64 | | | | (0.32 | ) | | | (1.62 | ) | | | 0.48 | | | | (0.03 | ) |
| Net asset value, end of year | | $ | 9.15 | | | $ | 8.51 | | | $ | 8.83 | | | $ | 10.45 | | | $ | 9.97 | |
| TOTAL RETURN(c) | | | 13.98 | % | | | 1.55 | % | | | (11.94 | )% | | | 7.83 | % | | | (0.15 | )% |
| | | | | | | | | | | | | | | | | | | | | |
| RATIOS/SUPPLEMENTAL DATA: | | | | | | | | | | | | | | | | | | | | |
| Net assets, end of year (000s) | | $ | 208,541 | | | $ | 213,705 | | | $ | 284,247 | | | $ | 298,535 | | | $ | 25,051 | |
| Ratio of expenses to average net assets excluding fee waivers and reimbursements | | | 1.01 | % | | | 0.96 | % | | | 0.93 | % | | | 1.03 | % | | | 1.86 | %(d) |
| Ratio of expenses to average net assets including fee waivers and reimbursements | | | 0.90 | % | | | 0.90 | % | | | 0.90 | % | | | 0.90 | % | | | 0.90 | %(d) |
| Ratio of net investment income to average net assets | | | 5.69 | % | | | 5.17 | % | | | 3.70 | % | | | 2.66 | % | | | 1.79 | %(d) |
| Portfolio turnover rate(e) | | | 181 | % | | | 176 | % | | | 187 | % | | | 211 | % | | | 66 | % |
| (a) | Calculated using the average shares method. |
| (b) | Less than $0.005 or ($0.005) per share. |
| (c) | Total returns are for the period indicated and have not been annualized. Total returns would have been lower had certain expenses not been waived during the period. Returns shown do not reflect the deduction of taxes that a shareholder would pay on Fund distributions or the redemption of Fund shares. |
| (d) | Annualized. |
| (e) | Portfolio turnover rate for periods less than one full year have not been annualized. |
See Notes to Financial Statements and Financial Highlights.
Notes to Financial Statements and Financial Highlights
October 31, 2024
1. ORGANIZATION
Financial Investors Trust (the “Trust”), a Delaware statutory trust, is an open-end management investment company registered under the Investment Company Act of 1940, as amended (“1940 Act”). The Trust consists of multiple separate portfolios or series. This annual report includes the financial statements and financial highlights of the ALPS | Smith Short Duration Bond Fund, ALPS | Smith Total Return Bond Fund and ALPS | Smith Credit Opportunities Fund (each, a “Fund” and collectively, the “Funds”).
The ALPS | Smith Short Duration Bond Fund seeks as high a level of current income as is consistent with preservation of capital. The ALPS | Smith Total Return Bond Fund seeks to obtain maximum total return, consistent with preservation of capital. The ALPS | Smith Credit Opportunities Fund seeks to obtain maximum risk-adjusted return with a secondary focus on high current income.
The classes of each Fund differ principally in the applicable distribution and shareholder service fees. Shareholders of each class also bear certain expenses that pertain to that particular class. All shareholders bear the common expenses of the Fund and earn income and realized gains/losses from the Fund pro rata based on the average daily net assets of each class, without distinction between share classes. Dividends to shareholders are determined separately for each class based on income and expenses allocable to each class. Realized gain distributions to shareholders are allocated to each class pro rata based on the shares outstanding of each class on the date of distribution. Differences in per share dividend rates generally result from differences in separate class expenses, including distribution and shareholder service fees, if applicable.
2. SIGNIFICANT ACCOUNTING POLICIES
The following is a summary of significant accounting policies consistently followed by each Fund in the preparation of its financial statements. Each Fund is considered an investment company for financial reporting purposes, and follows accounting policies in conformity with accounting principles generally accepted in the United States of America (“U.S. GAAP”), including policies specific to investment companies. The preparation of financial statements in conformity with U.S. GAAP requires management to make certain estimates and assumptions that affect the reported amounts of assets and liabilities and disclosures of contingent assets and liabilities at the date of the financial statements and the reported amounts of increases and decreases in net assets from operations during the reporting period. Actual results could differ from those estimates. The following is a summary of significant accounting policies consistently followed by the Funds and subsidiaries, as applicable, in preparation of their financial statements. The Funds are considered investment companies under U.S. GAAP and follow the accounting and reporting guidance applicable to investment companies in the Financial Accounting Standards Board Accounting Standards Codification Topic 946 "Financial Services -Investment Companies".
Investment Valuation: The Funds generally value their securities based on market prices determined at the close of regular trading on the New York Stock Exchange (“NYSE”), normally 4:00 p.m. Eastern Time, on each day the NYSE is open for trading. For equity securities and mutual funds that are traded on an exchange, the market price is usually the closing sale or official closing price on that exchange.
The market price for debt obligations is generally the price supplied by an independent third-party pricing service utilized by ALPS Advisors, Inc. (the "Adviser") as the valuation designee (the "Valuation Designee"), which may use a matrix, formula or other objective method that takes into consideration quotations from dealers, market transactions in comparable investments, market indices and yield curves. If vendors are unable to supply a price, or if the price supplied is deemed to be unreliable, the market price may be determined using quotations received from one or more brokers-dealers that make a market in the security. Investments in non-exchange traded funds are fair valued at their respective net asset values. Bonds may be purchased and held as odd lots. Pricing vendors generally value securities assuming orderly transactions of institutional round lot sizes, but a Fund may hold or transact in such securities in smaller, odd lot sizes. Special valuation considerations may apply with respect to a Fund's oddlot positions, as the Fund may receive different prices when it sells such positions than it would receive for sales of institutional round lot positions. The Funds have odd lot pricing policies they employ to value odd lot securities.
Pursuant to Rule 2a-5 under the Investment Company Act of 1940, the Trust's Board of Trustees (the “Board” or "Trustees") has appointed the Adviser to serve as the Valuation Designee to perform fair value determinations for investments in the Funds. When such prices or quotations are not available, or when the Valuation Designee believes that they are unreliable, securities may be priced using fair value procedures utilized by the Valuation Designee. The fair valuation policies and procedures (“FV Procedures”) are utilized by the Valuation Designee for the fair valuation of portfolio assets held by the Funds in the event that (1) market quotations for the current price of a portfolio security or asset are not readily available, or (2) available market quotations that would otherwise be used to value a portfolio security or asset in accordance with the Funds' Pricing Procedures appear to be unreliable. The Pricing Procedures reflect certain pricing methodologies (or “logics”) that are not “readily available market quotations” and thus are viewed and treated as fair valuations. The Valuation Designee routinely meets to discuss fair valuations of portfolio securities and other instruments held by the Funds.
Notes to Financial Statements and Financial Highlights
October 31, 2024
Fair Value Measurements: The Funds disclose the classification of their fair value measurements following a three-tier hierarchy based on the inputs used to measure fair value. Inputs refer broadly to the assumptions that market participants would use in pricing the asset or liability, including assumptions about risk. Inputs may be observable or unobservable. Observable inputs reflect the assumptions market participants would use in pricing the asset or liability that are developed based on market data obtained from sources independent of the reporting entity. Unobservable inputs reflect the reporting entity's own assumptions about the assumptions market participants would use in pricing the asset or liability that are developed based on the best information available.
Various inputs are used in determining the value of each Fund's investments as of the end of the reporting period. When inputs used fall into different levels of the fair value hierarchy, the level in the hierarchy within which the fair value measurement falls is determined based on the lowest level input that is significant to the fair value measurement in its entirety. The designated input levels are not necessarily an indication of the risk or liquidity associated with these investments. These inputs are categorized in the following hierarchy under applicable financial accounting standards:
Level 1 - | Unadjusted quoted prices in active markets for identical investments, unrestricted assets or liabilities that a Fund has the ability to access at the measurement date; |
| | |
| Level 2 - | Quoted prices which are not active, quoted prices for similar assets or liabilities in active markets or inputs other than quoted prices that are observable (either directly or indirectly) for substantially the full term of the asset or liability; and |
| | |
| Level 3 - | Significant unobservable prices or inputs (including the Fund's own assumptions in determining the fair value of investments) where there is little or no market activity for the asset or liability at the measurement date. |
The following is a summary of each Fund's investments/financial instruments in the fair value hierarchy as of October 31, 2024:
Investments in Securities at Value | | Level 1 - Unadjusted
Quoted Prices | | | Level 2 - Other Significant
Observable Inputs | | | Level 3 - Significant
Unobservable Inputs | | | Total | |
| ALPS | Smith Short Duration Bond Fund | | | | | | | | | | | | | | | | |
| Bank Loans | | $ | – | | | $ | 1,491,241 | | | $ | – | | | $ | 1,491,241 | |
| Collateralized Mortgage Obligations | | | – | | | | 251,489 | | | | – | | | | 251,489 | |
| Commercial Mortgage-Backed Securities | | | – | | | | 263,631 | | | | – | | | | 263,631 | |
| Mortgage-Backed Securities | | | – | | | | 6,236,778 | | | | – | | | | 6,236,778 | |
| Corporate Bonds | | | – | | | | 392,575,979 | | | | – | | | | 392,575,979 | |
| Government Bonds | | | – | | | | 168,065,412 | | | | – | | | | 168,065,412 | |
| Short Term Investments | | | 1,527,965 | | | | – | | | | – | | | | 1,527,965 | |
| Total | | $ | 1,527,965 | | | $ | 568,884,530 | | | $ | – | | | $ | 570,412,495 | |
| Investments in Securities at Value | | Level 1 - Unadjusted
Quoted Prices | | | Level 2 - Other Significant
Observable Inputs | | | Level 3 - Significant Unobservable Inputs | | | Total | |
| ALPS | Smith Total Return Bond Fund | | | | | | | | | | | | | | | | |
| Bank Loans | | $ | – | | | $ | 67,463,259 | | | $ | – | | | $ | 67,463,259 | |
| Collateralized Mortgage Obligations | | | – | | | | 276,633,421 | | | | – | | | | 276,633,421 | |
| Commercial Mortgage-Backed Securities | | | – | | | | 55,546,396 | | | | – | | | | 55,546,396 | |
| Mortgage-Backed Securities | | | – | | | | 462,710,127 | | | | – | | | | 462,710,127 | |
| Corporate Bonds | | | 2,436,977 | | | | 1,118,181,661 | | | | – | | | | 1,120,618,638 | |
| Government Bonds | | | – | | | | 1,107,853,762 | | | | – | | | | 1,107,853,762 | |
| Preferred Stock | | | 7,602,378 | | | | 75,754,134 | | | | – | | | | 83,356,512 | |
| Short Term Investments | | | 47,248,215 | | | | – | | | | – | | | | 47,248,215 | |
| Total | | $ | 57,287,570 | | | $ | 3,164,142,760 | | | $ | – | | | $ | 3,221,430,330 | |
Notes to Financial Statements and Financial Highlights
October 31, 2024
| Investments in Securities at Value | | Level 1 - Unadjusted
Quoted Prices | | | Level 2 - Other Significant
Observable Inputs | | | Level 3 - Significant
Unobservable Inputs | | | Total | |
| ALPS | Smith Credit Opportunities Fund | | | | | | | | | | | | | | | | |
| Bank Loans | | $ | – | | | $ | 17,984,798 | | | $ | – | | | $ | 17,984,798 | |
| Collateralized Mortgage Obligations | | | – | | | | 7,718,365 | | | | – | | | | 7,718,365 | |
| Commercial Mortgage-Backed Securities | | | – | | | | 2,810,424 | | | | – | | | | 2,810,424 | |
| Mortgage-Backed Securities | | | – | | | | 3,632,862 | | | | – | | | | 3,632,862 | |
| Corporate Bonds | | | – | | | | 155,827,699 | | | | – | | | | 155,827,699 | |
| Government Bonds | | | – | | | | 8,723,859 | | | | – | | | | 8,723,859 | |
| Preferred Stock | | | 674,397 | | | | 6,487,966 | | | | – | | | | 7,162,363 | |
| Short Term Investments | | | 2,764,002 | | | | – | | | | – | | | | 2,764,002 | |
| Total | | $ | 3,438,399 | | | $ | 203,185,973 | | | $ | – | | | $ | 206,624,372 | |
For the year ended October 31, 2024, the Funds did not have any securities that used significant unobservable inputs (Level 3) in determining fair value.
Fund and Class Expenses: Some expenses of the Trust can be directly attributed to a Fund or a specific share class of a Fund. Expenses which cannot be directly attributed are apportioned among all Funds in the Trust based on average net assets of each share class within a Fund.
Federal Income Taxes: The Funds comply with the requirements under Subchapter M of the Internal Revenue Code of 1986, as amended (the “Code”) applicable to regulated investment companies and intend to distribute substantially all of their net taxable income and net capital gains, if any, each year. The Funds are not subject to income taxes to the extent such distributions are made.
As of and during the fiscal year ended October 31, 2024, the Funds did not have a liability for any unrecognized tax benefits. The Funds recognize interest and penalties, if any, related to tax liabilities as income tax expense in the Statements of Operations. The Funds file U.S. federal, state, and local tax returns as required. The Funds' tax returns are subject to examination by the relevant tax authorities until expiration of the applicable statute of limitations which is generally three years after the filing of the tax return, but may extend to four years in certain jurisdictions. Tax returns for open years have incorporated no uncertain tax positions that require a provision for income taxes.
Distributions to Shareholders: Each Fund normally pays dividends, if any, on a monthly basis and distributes capital gains, if any, annually. Income dividend distributions are derived from interest, dividends, and other income a Fund receives from its investments, including distributions of shortterm capital gains. Capital gain distributions are derived from gains realized when a Fund sells a security it has owned for more than a year or from long-term capital gain distributions from underlying investments. Each Fund may make additional distributions and dividends at other times if its portfolio manager or managers believe doing so may be necessary for the Fund to avoid or reduce taxes.
Investment Transactions and Investment Income: Investment transactions are accounted for on the date the investments are purchased or sold (trade date basis). Net realized gains and losses from investment transactions are reported on an identified cost basis. Interest income, which includes accretion of discounts and amortization of premiums, is accrued and recorded as earned. Dividend income is recognized on the ex-dividend date or for certain foreign securities, as soon as information is available to each Fund. Withholding taxes on foreign dividends are paid (a portion of which may be reclaimable) or provided for in accordance with the applicable country's tax rules and rates and are disclosed in the Statements of Operations.
Real Estate Investment Trusts (“REITs”): The Funds may invest a portion of their assets in REITs and are subject to certain risks associated with direct investment in REITs. REITs may be affected by changes in the value of their underlying properties and by defaults by borrowers or tenants. REITs depend generally on their ability to generate cash flow to make distributions to shareowners, and certain REITs have self-liquidation provisions by which mortgages held may be paid in full and distributions of capital returns may be made at any time. In addition, the performance of a REIT may be affected by its failure to qualify for tax-free pass-through of income under the Code, or its failure to maintain exemption from registration under the 1940 Act. Distributions that the Fund receives from REITs can be classified as ordinary income, capital gain income or return of capital by the REITs that make these distributions to the Fund. However, it is not possible for the Fund to characterize distributions received from REITs during interim periods because the REIT issuers do not report their tax characterizations until subsequent to year end. During interim periods, the REIT distributions are accounted for as ordinary income until the re characterizations are made subsequent to year end.
Treasury Inflation Protected-Securities (“TIPS”): The Funds may invest in TIPS, including structured bonds in which the principal amount is adjusted daily to keep pace with inflation, as measured by the U.S. Consumer Pricing Index for Urban Consumers. The adjustments to principal due to inflation/deflation are reflected as increases/decreases to interest income with a corresponding adjustment to cost. Such adjustments may have
Notes to Financial Statements and Financial Highlights
October 31, 2024
a significant impact on a Fund's distributions and may result in a return of capital to shareholders. The repayment of the original bond principal upon maturity is guaranteed by the full faith and credit of the U.S. Government.
Loan Participations and Assignments: Certain Funds may invest in loan participations and assignments. A Fund considers loan participations and assignments to be investments in debt securities. Loan participations typically will result in a Fund having a contractual relationship only with the lender, not with the borrower. A Fund will have the right to receive payments of principal, interest and any fees to which it is entitled only from the lender selling the participation and only upon receipt by the lender of the payments from the borrower. Under a loan participation, a Fund generally will have no right to enforce compliance by the borrower with the terms of the loan agreement relating to the loan, nor any rights of set-off against the borrower, and a Fund may not benefit directly from any collateral supporting the loan in which it has purchased the participation. As a result, a Fund will assume the credit risk of both the borrower and the lender that is selling the participation. In the event of the insolvency of the lender selling a participation, a Fund may be treated as a general creditor of the lender and may not benefit from any set-off between the lender and the borrower. When a Fund purchases assignments of loans from lenders, such Fund will acquire direct rights against the borrower on the loan, except that under certain circumstances such rights may be more limited than those held by the assigning lender.
3. TAX BASIS INFORMATION
Tax Basis of Distributions to Shareholders: The character of distributions made during the year from net investment income or net realized gains may differ from its ultimate characterization for federal income tax purposes. Also, due to the timing of dividend distributions, the fiscal year in which amounts are distributed may differ from the fiscal year in which the income or realized gain were recorded by a Fund. The amounts and characteristics of tax basis distributions and composition of distributable earnings/(accumulated losses) are finalized at fiscal year-end.
The tax character of distributions paid by the Funds for the fiscal year ended October 31, 2024 were as follows:
| Fund | | Ordinary Income | | | Long-Term Capital Gain | |
| ALPS | Smith Short Duration Bond Fund | | $ | 25,651,855 | | | $ | – | |
| ALPS | Smith Total Return Bond Fund | | | 133,405,623 | | | | – | |
| ALPS | Smith Credit Opportunities Fund | | | 13,110,323 | | | | – | |
The tax character of distributions paid by the Funds for the fiscal year ended October 31, 2023 were as follows:
| Fund | | Ordinary Income | | | Long-Term Capital Gain | |
| ALPS | Smith Short Duration Bond Fund | | $ | 25,706,335 | | | $ | – | |
| ALPS | Smith Total Return Bond Fund | | | 82,393,989 | | | | – | |
| ALPS | Smith Credit Opportunities Fund | | | 12,125,733 | | | | – | |
Components of Distributable Earnings on a Tax Basis: At October 31, 2024, permanent differences in book and tax accounting were reclassified. These differences had no effect on net assets and were primarily attributed to taxable overdistributions.
For the fiscal year ended October 31, 2024, the following reclassifications, which had no impact on results of operations or net assets, were recorded to reflect tax character:
| Fund | | Paid-in Capital | | | Distributable earnings | |
| ALPS | Smith Short Duration Bond Fund | | $ | (53,623 | ) | | $ | 53,623 | |
| ALPS | Smith Credit Opportunities Fund | | | (16,369 | ) | | | 16,369 | |
As of October 31, 2024, the components of distributable earnings/(accumulated losses) on a tax basis were as follows:
| | | Undistributed net investment income | | | Accumulated net realized gain/(loss) on investments | | | Other cumulative effect of timing differences | | | Net unrealized appreciation/ (depreciation) on investments | | | Total | |
| ALPS | Smith Short Duration Bond Fund | | $ | – | | | $ | (23,129,420 | ) | | $ | – | | | $ | 1,896,036 | $ | | $ | (21,233,384 | ) |
| ALPS | Smith Total Return Bond Fund | | | 37,683 | | | | (217,284,112 | ) | | | – | | | | (28,278,747 | ) | | | (245,525,176 | ) |
| ALPS | Smith Credit Opportunities Fund | | | – | | | | (39,826,662 | ) | | | – | | | | 1,358,707 | | | | (38,467,955 | ) |
Notes to Financial Statements and Financial Highlights
October 31, 2024
Capital loss carryovers used during the year ended October 31, 2024 for ALPS | Smith Short Duration Bond Fund and ALPS | Smith Credit Opportunities Fund, were $1,846,807 and $1,200,220, respectively.
Capital Losses: Under current law, capital losses maintain their character as short-term or long-term and are carried forward to the next tax year without expiration. As of October 31, 2024 the following amounts are available as carry forwards to the next tax year:
| Fund | | Short-Term | | | Long-Term | |
| ALPS | Smith Short Duration Bond Fund | | $ | 16,662,857 | | | $ | 6,466,563 | |
| ALPS | Smith Total Return Bond Fund | | | 122,604,591 | | | | 94,679,521 | |
| ALPS | Smith Credit Opportunities Fund | | | 17,963,199 | | | | 21,863,463 | |
Unrealized Appreciation and Depreciation on Investments: As of October 31, 2024, the costs of investments for federal income tax purposes and accumulated net unrealized appreciation/(depreciation) on investments were as follows:
| Fund | | Gross Appreciation (excess of value over tax cost) | | | Gross Depreciation (excess of tax cost over value) | | | Net Unrealized Appreciation/ (Depreciation) | | | Cost of Investments for Income Tax Purposes | |
| ALPS | Smith Short Duration Bond Fund | | $ | 3,337,980 | | | $ | (1,441,944 | ) | | $ | 1,896,036 | | | $ | 568,516,459 | |
| ALPS | Smith Total Return Bond Fund | | | 22,843,654 | | | | (51,122,401 | ) | | | (28,278,747 | ) | | | 3,249,709,077 | |
| ALPS | Smith Credit Opportunities Fund | | | 3,915,591 | | | | (2,556,884 | ) | | | 1,358,707 | | | | 205,265,665 | |
The differences between book cost and tax cost of investments and unrealized appreciation/depreciation are primarily attributed to the tax deferral of losses on wash sales and trust preferred basis adjustments.
4. SECURITIES TRANSACTIONS
Purchases and sales of securities, excluding short-term securities and U.S. Government Obligations during the fiscal year ended October 31, 2024 were as follows:
| Fund | | Purchases of Securities | | | Proceeds from Sales of Securities | |
| ALPS | Smith Short Duration Bond Fund | | $ | 472,387,675 | | | $ | 515,479,293 | |
| ALPS | Smith Total Return Bond Fund | | | 1,538,973,498 | | | | 1,223,655,270 | |
| ALPS | Smith Credit Opportunities Fund | | | 254,092,305 | | | | 261,655,164 | |
Purchases and sales of U.S. Government Obligations during the fiscal year ended October 31, 2024 were as follows:
| Fund | | Purchases of Securities | | | Proceeds from Sales of Securities | |
| ALPS | Smith Short Duration Bond Fund | | $ | 454,240,043 | | | $ | 410,791,585 | |
| ALPS | Smith Total Return Bond Fund | | | 3,012,471,295 | | | | 2,536,125,068 | |
| ALPS | Smith Credit Opportunities Fund | | | 153,852,148 | | | | 157,489,438 | |
Notes to Financial Statements and Financial Highlights
October 31, 2024
5. BENEFICIAL INTEREST TRANSACTIONS
Transactions in shares of capital stock were as follows:
| | | ALPS | Smith Short Duration Bond Fund | |
| | | For the
Year Ended
October 31, 2024 | | | For the
Year Ended
October 31, 2023 | |
| Investor Class | | | | | | |
| Shares sold | | | 736,898 | | | | 977,756 | |
| Dividends reinvested | | | 71,743 | | | | 53,117 | |
| Shares redeemed | | | (462,303 | ) | | | (1,205,712 | ) |
| Net increase/(decrease) in shares outstanding | | | 346,338 | | | | (174,839 | ) |
| Class A | | | | | | | | |
| Shares sold | | | 1,271,414 | | | | 1,063,977 | |
| Dividends reinvested | | | 38,836 | | | | 29,516 | |
| Shares redeemed | | | (1,370,771 | ) | | | (1,559,645 | ) |
| Net decrease in shares outstanding | | | (60,521 | ) | | | (466,152 | ) |
| Class C | | | | | | | | |
| Shares sold | | | 47,618 | | | | 77,686 | |
| Dividends reinvested | | | 4,320 | | | | 5,259 | |
| Shares redeemed | | | (60,490 | ) | | | (230,204 | ) |
| Net decrease in shares outstanding | | | (8,552 | ) | | | (147,259 | ) |
| Class I | | | | | | | | |
| Shares sold | | | 26,951,147 | | | | 37,464,088 | |
| Dividends reinvested | | | 1,675,797 | | | | 1,513,481 | |
| Shares redeemed | | | (33,238,038 | ) | | | (53,924,320 | ) |
| Net decrease in shares outstanding | | | (4,611,094 | ) | | | (14,946,751 | ) |
| | | ALPS | Smith Total Return Bond Fund | |
| | | For the
Year Ended
October 31, 2024 | | | For the
Year Ended
October 31, 2023 | |
| Investor Class | | | | | | |
| Shares sold | | | 1,721,733 | | | | 2,470,424 | |
| Dividends reinvested | | | 124,876 | | | | 62,940 | |
| Shares redeemed | | | (1,881,622 | ) | | | (523,399 | ) |
| Net increase/(decrease) in shares outstanding | | | (35,013 | ) | | | 2,009,965 | |
| Class A | | | | | | | | |
| Shares sold | | | 3,115,132 | | | | 1,426,220 | |
| Dividends reinvested | | | 131,450 | | | | 76,177 | |
| Shares redeemed | | | (1,916,329 | ) | | | (760,795 | ) |
| Net increase in shares outstanding | | | 1,330,253 | | | | 741,602 | |
| Class C | | | | | | | | |
| Shares sold | | | 91,504 | | | | 170,859 | |
| Dividends reinvested | | | 13,679 | | | | 12,339 | |
| Shares redeemed | | | (169,663 | ) | | | (141,433 | ) |
| Net increase/(decrease) in shares outstanding | | | (64,480 | ) | | | 41,765 | |
| Class I | | | | | | | | |
| Shares sold | | | 172,574,925 | | | | 143,800,894 | |
| Dividends reinvested | | | 10,664,099 | | | | 6,365,794 | |
| Shares redeemed | | | (105,892,520 | ) | | | (69,853,996 | ) |
| Net increase in shares outstanding | | | 77,346,504 | | | | 80,312,692 | |
Notes to Financial Statements and Financial Highlights
October 31, 2024
| | | ALPS | Smith Credit Opportunities Fund | |
| | | For the
Year Ended
October 31,
2024 | | | For the
Year Ended
October 31,
2023 | |
| Investor Class | | | | | | |
| Shares sold | | | 11 | | | | 7,241 | |
| Dividends reinvested | | | 1,972 | | | | 4,600 | |
| Shares redeemed | | | (3,248 | ) | | | (672,281 | ) |
| Net decrease in shares outstanding | | | (1,265 | ) | | | (660,440 | ) |
| Class A | | | | | | | | |
| Shares sold | | | 26,173 | | | | 29,265 | |
| Dividends reinvested | | | 985 | | | | 1,306 | |
| Shares redeemed | | | (40,185 | ) | | | (12,827 | ) |
| Net increase/(decrease) in shares outstanding | | | (13,027 | ) | | | 17,744 | |
| Class C | | | | | | | | |
| Shares sold | | | 1,699 | | | | 2,964 | |
| Shares redeemed | | | – | | | | (22,883 | ) |
| Net increase/(decrease) in shares outstanding | | | 1,699 | | | | (19,919 | ) |
| Class I | | | | | | | | |
| Shares sold | | | 6,589,512 | | | | 6,774,870 | |
| Dividends reinvested | | | 1,152,634 | | | | 1,041,005 | |
| Shares redeemed | | | (10,059,443 | ) | | | (14,896,353 | ) |
| Net decrease in shares outstanding | | | (2,317,297 | ) | | | (7,080,478 | ) |
6. MANAGEMENT AND RELATED-PARTY TRANSACTIONS
The Adviser is an indirect wholly owned subsidiary of DST Systems, Inc. (“DST”). DST is a wholly-owned subsidiary of SS&C Technologies Holdings, Inc. (“SS&C”), a publicly traded company listed on the NASDAQ Global Select Market.
The Adviser has delegated daily management of the Funds listed below to Smith Capital Investors, LLC (the "Sub-Adviser"). The Sub-Adviser manages the investments of the Funds in accordance with its investment objective, policies and limitations and investment guidelines established jointly by the Adviser and the Board.
Pursuant to the Investment Advisory Agreement (the “Advisory Agreement”), the Funds listed below pay the Adviser an annual management fee which is based on each Fund's average daily net assets. The management fee is paid on a monthly basis. The following table reflects the Funds' contractual management fee rates (expressed as an annual rate).
| Fund | Contractual Management Fee |
| ALPS | Smith Short Duration Bond Fund | 0.365% |
| ALPS | Smith Total Return Bond Fund | 0.545% |
| ALPS | Smith Credit Opportunities Fund | 0.75% |
Pursuant to an Investment Sub-Advisory Agreement, the Adviser pays the Sub-Adviser of the Funds listed below an annual sub-advisory management fee which is based on each Fund's average daily assets. The Adviser is required to pay all fees due to each Sub-Adviser out of the management fee the Adviser receives from each Fund listed below. The following table reflects the Funds' contractual sub-advisory fee rates.
| Fund | Average Daily Net Assets
of the Fund | | Contractual Sub-Advisory Fee |
| ALPS | Smith Short Duration Bond Fund | All Asset Levels | | 0.29% |
| ALPS | Smith Total Return Bond Fund | All Asset Levels | | 0.42% |
| ALPS | Smith Credit Opportunities Fund | All Asset Levels | | 0.50% |
The Adviser and Sub-Adviser have agreed contractually to limit the amount of the Fund's total annual expenses, exclusive of distribution and service (12b-1) fees, shareholder service fees, acquired fund fees and expenses, brokerage expenses, interest expenses, taxes and extraordinary expenses that exceed the following annual rates below.
Notes to Financial Statements and Financial Highlights
October 31, 2024
These agreements are reevaluated on an annual basis. Expense limitation ratios from the current agreements are listed below. Fees waived or reimbursed for the fiscal year ended October 31, 2024 are disclosed on the Statements of Operations.
| Fund* | Investor Class | Class A | Class C | Class I |
| ALPS | Smith Short Duration Bond Fund | 0.49% | 0.49% | 0.49% | 0.49% |
| ALPS | Smith Total Return Bond Fund | 0.59% | 0.59% | 0.59% | 0.59% |
| ALPS | Smith Credit Opportunities Fund | 0.90% | 0.90% | 0.90% | 0.90% |
* See each Fund’s Prospectus for Expense Limitation agreement expiration dates.
The Adviser and the Sub-Adviser are permitted to recover expenses they have waived or reimbursed, on a class-by-class basis, through the agreements described above to the extent that expenses in later periods fall below the annual limits set forth in these agreements. The Funds are not obligated to pay any deferred fees and expenses more than thirty-six months after the date on which the fees were waived or expenses were deferred, as calculated on a monthly basis. As of the fiscal year ended October 31, 2024, the Adviser and the Sub-Adviser may seek reimbursement of previously waived and reimbursed fees as follows:
| Fund | | Expires
10/31/2025 | | | Expires 10/31/2026 | | | Expires
10/31/2027 | | | Total | |
| ALPS | Smith Short Duration Bond Fund - Investor Class | | $ | 4,469 | | | $ | 10,424 | | | $ | 5,631 | | | $ | 20,524 | |
| ALPS | Smith Short Duration Bond Fund - Class A | | | 8,598 | | | | 3,016 | | | | 1,092 | | | | 12,706 | |
| ALPS | Smith Short Duration Bond Fund - Class C | | | 1,495 | | | | 1,520 | | | | 909 | | | | 3,924 | |
| ALPS | Smith Short Duration Bond Fund - Class I | | | 407,457 | | | | 457,964 | | | | 442,793 | | | | 1,308,214 | |
| | | | | | | | | | | | | | | | | |
ALPS | Smith Total Return Bond Fund - Investor Class | | | 3,056 | | | | 8,817 | | | | 24,232 | | | | 36,105 | |
| ALPS | Smith Total Return Bond Fund - Class A | | | 8,987 | | | | 11,874 | | | | 27,162 | | | | 48,023 | |
| ALPS | Smith Total Return Bond Fund - Class C | | | 3,783 | | | | 3,350 | | | | 6,076 | | | | 13,209 | |
| ALPS | Smith Total Return Bond Fund - Class I | | | 1,505,281 | | | | 2,107,663 | | | | 4,310,128 | | | | 7,923,072 | |
| | | | | | | | | | | | | | | | | |
| ALPS | Smith Credit Opportunities Fund - Investor Class | | | N/A | | | | 131 | | | | 210 | | | | 341 | |
| ALPS | Smith Credit Opportunities Fund - Class A | | | N/A | | | | 398 | | | | 591 | | | | 989 | |
| ALPS | Smith Credit Opportunities Fund - Class C | | | N/A | | | | 185 | | | | 174 | | | | 359 | |
| ALPS | Smith Credit Opportunities Fund - Class I | | | 91,465 | | | | 139,197 | | | | 243,192 | | | | 473,854 | |
ALPS | Smith Short Duration Bond Fund recouped fees of $462 (Investor Class) and $203 (Class A) during the fiscal year ended October 31, 2024.
ALPS Portfolio Solutions Distributor, Inc. (the "Distributor”) acts as the distributor of the Funds' shares pursuant to a Distribution Agreement with the Trust. Shares are sold on a continuous basis by the Distributor, as agent for the Funds, and the Distributor has agreed to use its best efforts to solicit orders for the sale of Funds' shares, although it is not obliged to sell any particular amount of shares. The Distributor is not entitled to any compensation for its services. The Distributor is registered as a broker -dealer with the Securities and Exchange Commission.
Distribution and Services (12b-1) Plans
The Funds have adopted Distribution and Services Plans (the "Plans”) pursuant to Rule 12b-1 of the 1940 Act for the Investor Class, Class A and Class C shares. The Plans allows each Fund to use Investor Class, Class A and Class C assets to pay fees in connection with the distribution and marketing of Investor Class, Class A and Class C shares and/or the provision of shareholder services to Investor Class, Class A and Class C shareholders. The Plans permit payment for services in connection with the administration of plans or programs that use Investor Class, Class A and Class C shares of a Fund, if any, as their funding medium and for related expenses. The Plans permit a Fund to make total payments at an annual rate of up to 0.25% of a Fund's average daily net assets attributable to its Investor Class and Class A shares and 0.75% of a Fund's average daily net assets attributable to its Class C shares.
Under the terms of the Plans, the Trust is authorized to make payments to the Distributor for remittance to financial intermediaries, as compensation for distribution and/or shareholder ongoing services performed by such entities for beneficial shareholders of the Fund. The Distributor is entitled to retain some or all fees payable under the Plans in certain circumstances, including when there is no broker of record or when certain qualification standards have not been met by the broker of record.
Notes to Financial Statements and Financial Highlights
October 31, 2024
Shareholder Services Plans
The Funds have adopted a shareholder services plan with respect to the Investor Class shares and Class A shares (the “Investor Class Shareholder Services Plan” and the “Class A Shareholder Services Plan”). Under the Investor Class Shareholder Services Plan and Class A Shareholder Services Plan, the Funds are authorized to compensate certain financial intermediaries, including broker dealers and Fund affiliates (“Participating Organizations”), an aggregate fee in an amount not to exceed on an annual basis 0.15% of the average daily net asset value of Investor Class and Class A shares of the Funds attributable to or held in the name of the Participating Organizations pursuant to an agreement with a such Participating Organizations (the “Agreement”). Each Agreement will set forth the non-distribution related shareholder services to be performed by the Participating Organizations for the benefit of a Fund's shareholders who have elected to have such Participating Organizations service their accounts. Any amount of such payment not paid to Participating Organizations during a Fund's fiscal year for such service activities shall be reimbursed to the Fund as soon as practicable. Shareholder Services Plan fees are included with distribution and service fees in the Statements of Operations. Investor Class Shareholder Services Plan fees recaptured pursuant to the Services Plan for the year ended October 31, 2024 are included as an offset to distribution and service fees as disclosed in the Statements of Operations.
The Funds have adopted a shareholder services plan with respect to their Class C shares (the “Class C Shareholder Services Plan”). Under the Class C Shareholder Services Plan, the Funds are authorized to pay banks and their affiliates and other institutions, including broker-dealers and Fund affiliates (“Participating Organizations”), an aggregate fee in an amount not to exceed on an annual basis 0.25% for Class C shares of the average daily net asset value of the Class C shares attributable to or held in the name of a Participating Organization for its clients as compensation for providing shareholder service activities, which do not include distribution services, pursuant to an agreement with a Participating Organization. Any amount of such payment not paid to Participating Organizations during a Fund's fiscal year for such service activities shall be reimbursed to the Fund as soon as practicable after the end of the fiscal year. Class C Shareholder Services Plan fees are included with distribution and service fees on the Statements of Operations.
Certain intermediaries may charge networking, omnibus account or other administrative fees with respect to transactions in shares of each Fund. Transactions may be processed through the National Securities Clearing Corporation or similar systems or processed on a manual basis. These fees generally are paid by the Fund to the Distributor, which uses such fees to reimburse intermediaries. In the event an intermediary receiving payments from the Distributor on behalf of the Fund converts from a networking structure to an omnibus account structure or otherwise experiences increased costs, fees borne by the Fund may increase. Networking fees are shown in the Statements of Operations, if applicable to the Funds.
Fund Administrator
ALPS Fund Services, Inc. (“ALPS”) serves as administrator to the Funds and the Funds have agreed to pay expenses incurred in connection with their administrative activities. Pursuant to an Administrative Agreement, ALPS provides operational services to the Funds including, but not limited to, fund accounting and fund administration and generally assists in the Funds' operations. Officers of the Trust are employees of ALPS. The Funds' administration fee is accrued on a daily basis and paid monthly. Administrative fees paid by the Funds for the fiscal year ended October 31, 2024 are disclosed in the Statements of Operations.
ALPS is reimbursed by the Funds for certain out-of-pocket expenses.
Transfer Agent
ALPS serves as transfer, dividend paying and shareholder servicing agent for the Funds. ALPS receives an annual minimum fee, a fee based upon the number of shareholder accounts, and is also reimbursed by the Funds for certain out-of-pocket expenses. Transfer agent fees paid by the Funds for the fiscal year ended October 31, 2024, are included in the Administrative fees disclosed in the Statements of Operations.
Trustees
Effective January 1, 2024, all Trustees receive a quarterly retainer of $31,000, plus $12,500 for each regular quarterly Board meeting attended. Trustees receive $5,000 for each non-quarterly special Board meeting attended. Trustees receive $5,000 for each non-quarterly special Committee meeting attended for which a corresponding non-quarterly special Board meeting is not held. The Chairman of the Board and the Chairman of the Audit Committee also receive an additional quarterly retainer of $7,500 and $6,000, respectively. The Chairman of the Nominating and Governance Committee receives an additional quarterly retainer of $2,000. The Trustees are also reimbursed for all reasonable out-of-pocket expenses relating to attendance at meetings.
The fees and expenses of the independent trustees of the Board are presented in the Statements of Operations.
7. INDEMNIFICATIONS
Under the Trust's organizational documents, its officers and Trustees are indemnified against certain liability arising out of the performance of their duties to the Trust. Additionally, in the normal course of business, the Trust enters into contracts with service providers that may contain general indemnification clauses which may permit indemnification to the extent permissible under applicable law. The Trust's maximum exposure under these arrangements is unknown, as this would involve future claims that may be made against the Trust that have not yet occurred.
8. SUBSEQUENT EVENTS
Subsequent events after the date of the Statements of Assets and Liabilities have been evaluated through the date the financial statements were issued. Management has determined that there were no subsequent events to report through the issuance of these financial statements
Report of Independent Registered Public Accounting Firm
To the Shareholders and Board of Trustees of
Financial Investors Trust
Opinion on the Financial Statements
We have audited the accompanying statements of assets and liabilities, including the statements of investments, of ALPS | Smith Short Duration Bond Fund, ALPS | Smith Total Return Bond Fund, and ALPS | Smith Credit Opportunities Fund (the "Funds”), each a series of Financial Investors Trust, as of October 31, 2024, and the related statements of operations for the year then ended, the statements of changes in net assets for each of the two years in the period then ended, the financial highlights for each of the three years in the period then ended, and the related notes (collectively referred to as the "financial statements”). In our opinion, the financial statements present fairly, in all material respects, the financial position of each of the Funds as of October 31, 2024, the results of their operations for the year then ended, the changes in net assets for each of the two years in the period then ended, and the financial highlights for each of the three years in the period then ended, in conformity with accounting principles generally accepted in the United States of America.
The Funds' financial highlights for the years or periods ended October 31, 2021, and prior, were audited by other auditors whose report dated December 30, 2021, expressed an unqualified opinion on those financial highlights.
Basis for Opinion
These financial statements are the responsibility of the Funds' management. Our responsibility is to express an opinion on the Funds' financial statements based on our audits. We are a public accounting firm registered with the Public Company Accounting Oversight Board (United States) ("PCAOB”) and are required to be independent with respect to the Funds in accordance with the U.S. federal securities laws and the applicable rules and regulations of the Securities and Exchange Commission and the PCAOB.
We conducted our audits in accordance with the standards of the PCAOB. Those standards require that we plan and perform the audit to obtain reasonable assurance about whether the financial statements are free of material misstatement whether due to error or fraud.
Our audits included performing procedures to assess the risks of material misstatement of the financial statements, whether due to error or fraud, and performing procedures that respond to those risks. Such procedures included examining, on a test basis, evidence regarding the amounts and disclosures in the financial statements. Our procedures included confirmation of securities owned as of October 31, 2024, by correspondence with the custodian, agent banks, and brokers; when replies were not received from brokers and agent banks, we performed other auditing procedures. Our audits also included evaluating the accounting principles used and significant estimates made by management, as well as evaluating the overall presentation of the financial statements. We believe that our audits provide a reasonable basis for our opinion.
We have served as the auditor of one or more investment companies advised by ALPS Advisors, Inc. since 2013.

COHEN & COMPANY, LTD.
Cleveland, Ohio
December 27, 2024
Additional Information
October 31, 2024 (Unaudited)
1. TAX INFORMATION (UNAUDITED)
Qualified Dividend Income
The percentage of ordinary income dividends distributed during the calendar year ended December 31, 2023 are designated as qualified dividend income (QDI) in the following percentages:
| | Amount |
| ALPS Smith Total Return Bond Fund | 0.70% |
| ALPS Smith Credit Opportunities Fund | 0.65% |
Dividends Received Deduction
For corporate shareholders, the following ordinary dividends paid during the calendar year ended December 31, 2023 qualify for the corporate dividends received deduction:
| | Amount |
| ALPS Smith Total Return Bond Fund | 0.70% |
| ALPS Smith Credit Opportunities Fund | 0.76% |
In early 2024, if applicable, shareholders of record received this information for the distribution paid to them by the Funds during the calendar year 2023 via Form 1099. The Funds will notify shareholders in early 2025 of amounts paid to them by the Funds, if any, during the calendar year 2024.
Changes in and Disagreements with Accountants
for Open-End Management Investment Companies
October 31, 2024 (Unaudited)
Not applicable for this reporting period.
Proxy Disclosures for Open-End
Management Investment Companies
October 31, 2024 (Unaudited)
Not applicable for this reporting period.
Remuneration Paid to Directors, Officers, and Others
of Open-End Management Investment Companies
October 31, 2024 (Unaudited)
The following chart provides certain information about the Trustee fees paid by the Trust for the fiscal year ended October 31, 2024:
| | | Aggregate Regular
Compensation From the Trust | | | Aggregate Special Compensation from the Trust | | | Total Compensation from the Trust | |
| Mary K. Anstine | | $ | 191,500 | | | $ | – | | | $ | 191,500 | |
| Jeremy W. Deems | | | 200,500 | | | | – | | | | 200,500 | |
| Jerry G. Rutledge | | | 176,500 | | | | – | | | | 176,500 | |
| Michael “Ross” Shell | | | 197,500 | | | | – | | | | 197,500 | |
| Edmund J. Burke | | | 176,500 | | | | – | | | | 176,500 | |
| Total | | $ | 942,500 | | | $ | – | | | $ | 942,500 | |
Officers who are employed by the Adviser receive no compensaton or expense reimbursement from the Trust.
The fees and expenses of the independent trustees of the Board are presented in the Statements of Operations.
Statement Regarding Basis
for Approval of Investment Advisory Contract
October 31, 2024 (Unaudited)
In anticipation of and as part of the process to consider the renewal of the investment advisory agreement with ALPS Advisors, Inc. (“AAI”) with respect to each of the ALPS | Smith Short Duration Bond Fund (the “Short Duration Bond Fund”), the ALPS | Smith Total Return Bond Fund (the “Total Return Bond Fund”), and the ALPS | Smith Credit Opportunities Fund (the “Credit Opportunities Fund” and, collectively with the Short Duration Bond Fund and Total Return Bond Fund, the “Smith Funds”) and the sub-advisory agreement with Smith Capital Investors, LLC (the “Sub-Adviser” or “Smith Capital”) with respect to each of the Smith Funds (the “Advisory Agreements”), legal counsel to the Independent Trustees requested certain information from AAI and the Sub-Adviser. In response to these requests, the Board of Trustees (the “Board” or the “Trustees”) received reports from AAI and the Sub-Adviser that addressed specific factors to be considered by the Board. The Board also received from independent legal counsel memoranda regarding the Board's responsibilities pertaining to the approval of advisory contracts. Further, the Board met on June 11-12, 2024 with representatives of AAI and the Sub-Adviser and discussed the services the firms provided pursuant to the Advisory Agreements, as well as the information they provided.
During the review process, the Board noted certain instances where clarification or follow-up was appropriate and others where the Board determined that further clarification or follow-up was not necessary. In those instances where clarification or follow-up was requested, the Board determined that in each case either information responsive to its requests had been provided, or where any request was outstanding in whole or in part, given the totality of the information provided with respect to the agreements, the Board had received sufficient information to renew and approve the Advisory Agreements.
In approving AAI as the Smith Funds' investment adviser and the Sub-Adviser as the Smith Funds' sub-adviser, and the fees to be charged under the Advisory Agreements, the Trustees concluded that no single factor reviewed by the Trustees was identified by the Trustees to be determinative as the principal factor in whether to approve such agreements. Further, the Independent Trustees were advised by independent legal counsel throughout the process. The following summary does not identify all the matters considered by the Board, but provides a summary of the principal matters the Board considered.
In renewing and approving the investment advisory agreements with AAI and the investment sub-advisory agreements with the Sub-Adviser, the Trustees, including the Independent Trustees, considered the following factors with respect to the Smith Funds:
Investment Advisory and Sub-Advisory Fee Rates: The Trustees reviewed and considered the contractual annual advisory fee rates paid by the Trust, on behalf of the Smith Funds, to AAI, of 0.365% of the Short Duration Bond Fund's daily average net assets, 0.545% of the Total Return Bond Fund's daily average daily net assets, and 0.75% of the Credit Opportunities Fund's average daily net assets, in light of the extent and quality of the advisory services provided by AAI to the Smith Funds. The Trustees also reviewed and considered the contractual annual sub-advisory fee rates paid by AAI to Smith Capital of 0.29% of the Short Duration Bond Fund's daily average net assets, 0.42% of the Total Return Bond Fund's daily average daily net assets, and 0.50% of the Credit Opportunities Fund average daily net assets, in light of the extent and quality of the advisory services provided by Smith Capital to the Smith Funds. The Trustees also considered information regarding compensation to be paid to affiliates of AAI under other agreements, such as the Fund Accounting and Administration Agreement with ALPS.
The Board received and considered information including a comparison of each Smith Fund's contractual advisory fee rates with those of funds in the peer group as selected by an independent provider of investment company data (the “Data Provider”). The Trustees noted that the contractual advisory fee for each class of the Total Return Bond Fund and Credit Opportunities Fund was higher than the Data Provider peer group median rate; and the contractual advisory fee for each class of the Short Duration Bond Fund was equal to the Data Provider peer group median rate, except for Class C, which was higher than the Data Provider peer group median rate.
Total Net Expense Ratios: The Trustees further reviewed and considered the total net expense ratios of 0.89%, 1.59%, 0.59%, and 0.89% for the Class A, Class C, Class I, and Investor Class shares, respectively, of the Total Return Bond Fund; 0.75%, 1.49%, 0.49%, and 0.78% for the Class A, Class C, Class I, and Investor Class shares, respectively, of the Short Duration Bond Fund; and 1.13%, 1.90%, 0.90%, and 1.20% for the Class A, Class C, Class I, and Investor Class shares of the Credit Opportunities Fund, respectively. The Trustees noted that the total net expense ratio of each class of Total Return Bond Fund, Short Duration Bond Fund, and Credit Opportunities Fund was higher than the Data Provider peer group median ratio.
Nature, Extent, and Quality of the Services under the Investment Advisory and Sub- Advisory Agreements: The Trustees received and considered information regarding the nature, extent, and quality of services to be provided to the Smith Funds under the Investment Advisory and Sub-Advisory Agreements. The Trustees reviewed certain background materials supplied by AAI and Smith Capital in their presentations, including their Forms ADV.
The Trustees reviewed and considered AAI's and Smith Capital's investment advisory personnel, their history as asset managers and their performance and the amount of assets currently under management by AAI and Smith Capital and their affiliated entities. The Trustees also
Statement Regarding Basis
for Approval of Investment Advisory Contract
October 31, 2024 (Unaudited)
reviewed the research and decision-making processes utilized by AAI and Smith Capital, including the methods adopted to seek to achieve compliance with the investment objectives, policies and restrictions of the Smith Funds.
The Trustees considered the background and experience of AAI's and Smith Capital's management in connection with the Smith Funds, including reviewing the qualifications, backgrounds and responsibilities of the management team primarily responsible for the day-to-day portfolio management of the Funds and the extent of the resources devoted to research and analysis of actual and potential investments.
The Trustees also reviewed, among other things, AAI's and Smith Capital's Codes of Ethics.
Performance: The Trustees reviewed performance information for the Smith Funds, which included a comparison of each Fund's performance to the performance of a group of comparable funds selected by the Data Provider for the one-year, three-year, five-year and since inception periods ended March 31, 2024, as applicable.
The Trustees noted that for the one-year period, each class of the Short Duration Fund underperformed the Data Provider peer group median; for the three-year period, each class of the Short Duration Fund outperformed the Data Provider peer group median, except for Class I of the Short Duration Fund, which had performance equal to the Data Provider peer group median; for the five-year and since inception periods, each class of the Short Duration Fund outperformed the Data Provider peer group median.
The Trustees noted that for the one-year period, Class A and Class I of the Credit Opportunities Fund had performance equal to the Data Provider peer group median and Class C and Investor Class of the Credit Opportunities Fund outperformed the Data Provider peer group median; and for the three-year and since inception periods, each class of the Credit Opportunities Fund underperformed the Data Provider peer group median.
The Trustees noted that for the one-year period, each class of the Total Return Fund had performance equal to the Data Provider peer group median, except for Class C of the Total Return Fund, which underperformed the Data Provider peer group median; for the three-year, five-year, and since inception periods, each class of the Total Return Fund outperformed the Data Provider peer group median.
The Trustees also considered Smith Capital's investment performance and reputation generally and its investment techniques, risk management controls, and decision-making processes.
Comparable Accounts: The Trustees noted certain information provided by Smith Capital regarding fees charged to its other clients utilizing a strategy similar to that employed by the Total Return Fund, but that Smith Capital indicated it had no other clients utilizing a strategy similar to that employed by the other Smith Funds. The Trustees also noted that AAI indicated that it had no other clients utilizing a strategy similar to that employed by a Smith Fund.
Profitability: The Trustees received and considered the profitability analyses prepared by AAI and Smith Capital based on the fees payable under the Investment Advisory Agreement with AAI and the Investment Sub-Advisory Agreement with Smith Capital, with respect to the Smith Funds, respectively. The Trustees considered the profits, if any, realized by AAI and Smith Capital in connection with the operation of the Smith Funds.
Economies of Scale: The Trustees considered whether economies of scale in the provision of services to the Smith Funds will be passed along to the shareholders under the Advisory Agreements.
Other Benefits to the Adviser and Sub-Adviser: The Trustees reviewed and considered any other incidental benefits derived or to be derived by AAI and Smith Capital from their relationship with the Smith Funds, including whether soft dollar arrangements were used.
The Trustees, including all of the Independent Trustees, concluded that:
| · | the contractual advisory fee for each class of the Total Return Bond Fund and Credit Opportunities Fund was higher than the Data Provider peer group median rate; the contractual advisory fee for each class of the Short Duration Bond Fund was equal to the Data Provider peer group median rate, except for Class C, which was higher than the Data Provider peer group median rate; |
| · | Smith Capital's fees under its sub-advisory agreement are paid directly by AAI; |
| · | the total net expense ratio of each class of Total Return Bond Fund, Short Duration Bond Fund, and Credit Opportunities Fund was higher than the Data Provider peer group median ratio; |
Statement Regarding Basis
for Approval of Investment Advisory Contract
October 31, 2024 (Unaudited)
| · | the nature, extent, and quality of services rendered by AAI and Smith Capital under the Investment Advisory and Sub-Advisory Agreements, respectively, with respect to the Smith Funds were adequate; |
| · | for the one-year period, each class of the Short Duration Fund underperformed the Data Provider peer group median; for the three-year period, each class of the Short Duration Fund outperformed the Data Provider peer group median, except for Class I of the Short Duration Fund, which had performance equal to the Data Provider peer group median; for the five-year and since inception periods, each class of the Short Duration Fund outperformed the Data Provider peer group median; |
| · | for the one-year period, Class A and Class I of the Credit Opportunities Fund had performance equal to the Data Provider peer group median and Class C and Investor Class of the Credit Opportunities Fund outperformed the Data Provider peer group median; and for the three-year and since inception periods, each class of the Credit Opportunities Fund underperformed the Data Provider peer group median; |
| · | for the one-year period, each class of the Total Return Fund had performance equal to the Data Provider peer group median, except for Class C of the Total Return Fund, which underperformed the Data Provider peer group median; for the three-year, five-year, and since inception periods, each class of the Total Return Fund outperformed the Data Provider peer group median; |
| · | that (a) AAI had no other clients utilizing a strategy similar to that employed by the Smith Funds; (b) bearing in mind the limitations of comparing different types of managed accounts and the different levels of service typically associated with such accounts, the fee structures applicable to Smith Capital's other clients employing a comparable strategy to the Total Return Fund was not indicative of any unreasonableness with respect to the advisory and sub-advisory fees proposed to be payable by the Total Return Fund; and (c) Smith Capital indicated it had no other clients utilizing a strategy similar to that employed by the other Smith Funds; |
| · | the profit, if any, realized by AAI and Smith Capital in connection with the operation of the Smith Funds is not unreasonable to the Smith Funds; and |
| · | at this time, there were no material economies of scale or other incidental benefits accruing to AAI and Smith Capital in connection with their relationship with the Smith Funds. |
Based on the Trustees' deliberations and their evaluation of the information described above, the Trustees, including all of the Independent Trustees, concluded that AAI's and Smith Capital's compensation for investment advisory and sub-advisory services is consistent with the best interests of each of the Smith Funds and its shareholders.

Table of Contents
| Financial Statements and Financial Highlights for Open-End Management Investment Companies | |
| Schedule of Investments | 1 |
| Statement of Assets and Liabilities | 5 |
| Statement of Operations | 6 |
| Statement of Changes in Net Assets | 7 |
| Financial Highlights | 8 |
| Notes to Financial Statements and Financial Highlights | 9 |
| Report of Independent Registered Public Accounting Firm | 15 |
| Additional Information | 16 |
| Changes in and Disagreements with Accountants for Open-End Management Investment Companies | 17 |
| Proxy Disclosures for Open-End Management Investment Companies | 18 |
| Remuneration Paid to Directors, Officers, and Others of Open-End Management Investment Companies | 19 |
| Statement Regarding Basis for Approval of Investment Advisory Contract | 20 |
alpsfunds.com
ALPS | CoreCommodity Natural Resources ETF
| Schedule of Investments | October 31, 2024 |
| | | Shares | | | Value
(Note 2) | |
| COMMON STOCKS (99.58%) | | | | | | |
| Consumer Discretionary (0.52%) | | | | | | |
| Home Construction (0.52%) | | | | | | |
| Sumitomo Forestry Co., Ltd. | | | 38,139 | | | $ | 1,493,531 | |
| | | | | | | | | |
| TOTAL CONSUMER DISCRETIONARY | | | | | | | 1,493,531 | |
| | | | | | | | | |
| Consumer Staples (13.59%) | | | | | | | | |
| Agricultural Producers (0.24%) | | | | | | | | |
| Adecoagro SA | | | 59,840 | | | | 688,160 | |
| | | | | | | | | |
| Food (11.34%) | | | | | | | | |
| AAK AB | | | 15,866 | | | | 454,184 | |
| Cal-Maine Foods, Inc. | | | 45,136 | | | | 3,962,038 | |
| China Mengniu Dairy Co., Ltd. | | | 936,402 | | | | 2,095,856 | |
| Darling Ingredients, Inc.(a) | | | 59,559 | | | | 2,329,352 | |
| Dole PLC | | | 40,064 | | | | 647,034 | |
| Hormel Foods Corp. | | | 121,109 | | | | 3,699,880 | |
| Inghams Group, Ltd. | | | 1,016,830 | | | | 1,920,529 | |
| Ingredion, Inc. | | | 25,125 | | | | 3,335,595 | |
| MEIJI Holdings Co., Ltd. | | | 43,344 | | | | 1,012,711 | |
| Morinaga Milk Industry Co., Ltd. | | | 3,424 | | | | 79,842 | |
| Mowi ASA | | | 101,387 | | | | 1,742,442 | |
| NH Foods, Ltd. | | | 27,231 | | | | 948,622 | |
| Nisshin Seifun Group, Inc. | | | 80,148 | | | | 942,111 | |
| Nissui Corp. | | | 146,080 | | | | 896,824 | |
| Pilgrim's Pride Corp.(a) | | | 42,474 | | | | 2,057,441 | |
| Salmar ASA | | | 17,059 | | | | 865,341 | |
| Suedzucker AG | | | 144,920 | | | | 1,738,731 | |
| Tyson Foods, Inc., Class A | | | 40,774 | | | | 2,388,949 | |
| WH Group, Ltd.(b) | | | 1,514,775 | | | | 1,180,785 | |
| | | | | | | | 32,298,267 | |
| | | | | | | | | |
| Wholesale - Consumer Staples (2.01%) | | | | | | | | |
| Archer-Daniels-Midland Co. | | | 58,933 | | | | 3,253,691 | |
| Bunge Global SA | | | 29,346 | | | | 2,465,651 | |
| | | | | | | | 5,719,342 | |
| | | | | | | | | |
| TOTAL CONSUMER STAPLES | | | | | | | 38,705,769 | |
| | | | | | | | | |
| Energy (35.41%) | | | | | | | | |
| Oil & Gas Producers (22.10%) | | | | | | | | |
| Advantage Energy, Ltd.(a) | | | 82,812 | | | | 518,040 | |
| Aker BP ASA | | | 122,614 | | | | 2,614,975 | |
| Antero Resources Corp.(a) | | | 2,516 | | | | 65,114 | |
| APA Corp. | | | 8,681 | | | | 204,872 | |
| ARC Resources, Ltd. | | | 44,662 | | | | 739,689 | |
| Athabasca Oil Corp.(a) | | | 114,511 | | | | 425,196 | |
| Baytex Energy Corp. | | | 131,467 | | | | 371,074 | |
| Beach Energy, Ltd. | | | 596,177 | | | | 490,429 | |
| Birchcliff Energy, Ltd. | | | 50,213 | | | | 187,170 | |
| Canadian Natural Resources, Ltd. | | | 18,226 | | | | 619,816 | |
| Cenovus Energy, Inc. | | | 197,712 | | | | 3,179,352 | |
| | | Shares | | | Value
(Note 2) | |
| Oil & Gas Producers (continued) | | | | | | | | |
| Chevron Corp. | | | 1,752 | | | $ | 260,733 | |
| Chord Energy Corp. | | | 7,157 | | | | 895,341 | |
| Civitas Resources, Inc. | | | 19,524 | | | | 952,576 | |
| CNX Resources Corp.(a) | | | 2,050 | | | | 69,762 | |
| ConocoPhillips | | | 24,118 | | | | 2,641,886 | |
| Coterra Energy, Inc. | | | 81,047 | | | | 1,938,644 | |
| Crescent Energy Co. | | | 55,043 | | | | 684,184 | |
| Devon Energy Corp. | | | 74,581 | | | | 2,884,792 | |
| Diamondback Energy, Inc. | | | 1,553 | | | | 274,524 | |
| Eni SpA, Sponsored Sponsored ADR | | | 541 | | | | 16,463 | |
| Eni SpA | | | 145,070 | | | | 2,211,089 | |
| EOG Resources, Inc. | | | 2,756 | | | | 336,122 | |
| EQT Corp. | | | 2,807 | | | | 102,568 | |
| Equinor ASA | | | 122,872 | | | | 2,949,434 | |
| Exxon Mobil Corp. | | | 3,163 | | | | 369,375 | |
| Geopark, Ltd. | | | 184,960 | | | | 1,450,086 | |
| Harbour Energy PLC | | | 212,745 | | | | 758,236 | |
| Hess Corp. | | | 1,142 | | | | 153,576 | |
| HighPeak Energy, Inc. | | | 51,348 | | | | 657,254 | |
| Inpex Corp. | | | 209,872 | | | | 2,781,212 | |
| Japan Petroleum Exploration Co., Ltd. | | | 192,025 | | | | 1,454,658 | |
| Karoon Energy, Ltd. | | | 667,340 | | | | 610,454 | |
| Kosmos Energy, Ltd.(a) | | | 42,725 | | | | 160,646 | |
| Magnolia Oil & Gas Corp., Class A | | | 52,417 | | | | 1,325,102 | |
| Matador Resources Co. | | | 31,994 | | | | 1,667,207 | |
| MEG Energy Corp. | | | 85,820 | | | | 1,568,657 | |
| Murphy Oil Corp. | | | 86,716 | | | | 2,729,819 | |
| NuVista Energy, Ltd.(a) | | | 100,809 | | | | 809,455 | |
| Occidental Petroleum Corp. | | | 38,950 | | | | 1,951,785 | |
| OMV AG | | | 2,682 | | | | 111,151 | |
| Parex Resources, Inc. | | | 342,032 | | | | 3,176,266 | |
| Permian Resources Corp. | | | 27,258 | | | | 371,527 | |
| Petroleo Brasileiro SA, Sponsored ADR | | | 23,354 | | | | 314,111 | |
| Peyto Exploration & Development Corp. | | | 89,763 | | | | 978,635 | |
| Range Resources Corp. | | | 3,193 | | | | 95,886 | |
| Repsol SA | | | 10,804 | | | | 134,561 | |
| SandRidge Energy, Inc. | | | 126,826 | | | | 1,406,500 | |
| SM Energy Co. | | | 47,692 | | | | 2,001,633 | |
| Suncor Energy, Inc. | | | 7,459 | | | | 281,571 | |
| Tamarack Valley Energy, Ltd. | | | 295,260 | | | | 880,044 | |
| Topaz Energy Corp. | | | 19,475 | | | | 373,597 | |
| TotalEnergies SE | | | 15,350 | | | | 958,404 | |
| Tourmaline Oil Corp. | | | 29,821 | | | | 1,374,805 | |
| VAALCO Energy, Inc. | | | 104,572 | | | | 558,414 | |
| Var Energi ASA | | | 661,669 | | | | 2,078,204 | |
| Veren, Inc. | | | 133,073 | | | | 685,268 | |
| Vermilion Energy, Inc. | | | 260,612 | | | | 2,429,521 | |
See Notes to Financial Statements and Financial Highlights.
ALPS | CoreCommodity Natural Resources ETF
| Schedule of Investments | October 31, 2024 |
| | | Shares | | | Value
(Note 2) | |
| Oil & Gas Producers (continued) | | | | | | |
| Woodside Energy Group, Ltd. | | | 42,912 | | | $ | 671,554 | |
| | | | | | | | 62,963,019 | |
| | | | | | | | | |
| Oil & Gas Services & Equipment (9.08%) | | | | | | | | |
| Aker Solutions ASA | | | 154,500 | | | | 733,862 | |
| Archrock, Inc. | | | 22,138 | | | | 443,203 | |
| Baker Hughes Co. | | | 21,169 | | | | 806,116 | |
| ChampionX Corp. | | | 56,609 | | | | 1,597,506 | |
| Core Laboratories, Inc. | | | 32,354 | | | | 611,491 | |
| Expro Group Holdings NV(a) | | | 43,035 | | | | 548,696 | |
| Halliburton Co. | | | 59,617 | | | | 1,653,775 | |
| Helix Energy Solutions Group, Inc.(a) | | | 58,175 | | | | 538,119 | |
| Helmerich & Payne, Inc. | | | 60,574 | | | | 2,035,285 | |
| Liberty Energy, Inc., Class A | | | 69,700 | | | | 1,189,779 | |
| Nabors Industries, Ltd.(a) | | | 13,632 | | | | 1,014,357 | |
| National Oilwell Varco, Inc. | | | 49,072 | | | | 761,107 | |
| Noble Corp. PLC | | | 40,264 | | | | 1,287,643 | |
| NOW, Inc.(a) | | | 56,994 | | | | 674,239 | |
| Oceaneering International, Inc.(a) | | | 33,336 | | | | 813,398 | |
| Patterson-UTI Energy, Inc. | | | 159,711 | | | | 1,224,983 | |
| ProPetro Holding Corp.(a) | | | 229,591 | | | | 1,586,474 | |
| RPC, Inc. | | | 263,716 | | | | 1,497,907 | |
| Saipem SpA(a) | | | 288,966 | | | | 686,480 | |
| Schlumberger NV | | | 29,618 | | | | 1,186,793 | |
| Secure Energy Services, Inc. | | | 84,829 | | | | 944,948 | |
| Select Water Solutions, Inc. | | | 64,638 | | | | 685,163 | |
| Subsea 7 SA | | | 36,734 | | | | 562,020 | |
| TGS ASA | | | 159,706 | | | | 1,450,394 | |
| Tidewater, Inc.(a) | | | 1,208 | | | | 72,565 | |
| Transocean, Ltd.(a) | | | 30,033 | | | | 130,343 | |
| Vital Energy, Inc.(a) | | | 41,055 | | | | 1,119,570 | |
| | | | | | | | 25,856,216 | |
| | | | | | | | | |
| Renewable Energy (4.23%) | | | | | | | | |
| Array Technologies, Inc.(a) | | | 73,270 | | | | 478,453 | |
| Corp ACCIONA Energias Renovables SA | | | 17,143 | | | | 353,552 | |
| Daqo New Energy Corp., ADR(a) | | | 83,240 | | | | 1,879,559 | |
| Encavis AG(a) | | | 35,770 | | | | 668,842 | |
| Enphase Energy, Inc.(a) | | | 3,095 | | | | 257,009 | |
| First Solar, Inc.(a) | | | 4,303 | | | | 836,847 | |
| Flat Glass Group Co., Ltd. | | | 509,504 | | | | 1,038,132 | |
| Fluence Energy, Inc.(a) | | | 34,796 | | | | 756,813 | |
| GS Yuasa Corp. | | | 23,070 | | | | 415,955 | |
| JinkoSolar Holding Co., Ltd., ADR | | | 40,007 | | | | 1,062,586 | |
| Shoals Technologies Group, Inc., Class A(a) | | | 268,396 | | | | 1,452,023 | |
| SMA Solar Technology AG | | | 79,773 | | | | 1,390,971 | |
| | | Shares | | | Value (Note 2) | |
| Renewable Energy (continued) | | | | | | |
| Xinyi Solar Holdings, Ltd. | | | 2,828,032 | | | $ | 1,451,467 | |
| | | | | | | | 12,042,209 | |
| | | | | | | | | |
| TOTAL ENERGY | | | | | | | 100,861,444 | |
| | | | | | | | | |
| Financials (0.24%) | | | | | | | | |
| Asset Management (0.24%) | | | | | | | | |
| Remgro, Ltd. | | | 79,039 | | | | 688,442 | |
| | | | | | | | | |
| TOTAL FINANCIALS | | | | | | | 688,442 | |
| | | | | | | | | |
| Industrials (7.60%) | | | | | | | | |
| Engineering & Construction (0.62%) | | | | | | | | |
| Technip Energies NV | | | 70,551 | | | | 1,752,782 | |
| | | | | | | | | |
| Machinery (6.75%) | | | | | | | | |
| AGCO Corp. | | | 25,358 | | | | 2,531,743 | |
| Bucher Industries AG | | | 1,013 | | | | 394,736 | |
| CNH Industrial NV | | | 420,688 | | | | 4,724,325 | |
| Deere & Co. | | | 7,929 | | | | 3,208,787 | |
| Epiroc AB | | | 47,475 | | | | 924,142 | |
| FLSmidth & Co. A/S | | | 8,240 | | | | 429,438 | |
| Fluidra SA | | | 9,569 | | | | 257,302 | |
| Kubota Corp. | | | 164,659 | | | | 2,136,535 | |
| Kurita Water Industries, Ltd. | | | 37,727 | | | | 1,436,675 | |
| Organo Corp. | | | 18,825 | | | | 900,735 | |
| Sany Heavy Equipment International Holdings Co., Ltd. |
|
|
1,002,544 |
|
|
|
656,404 |
|
| Veralto Corp. | | | 15,586 | | | | 1,592,733 | |
| | | | | | | | 19,193,555 | |
| | | | | | | | | |
| Transportation & Logistics (0.23%) | | | | | | | | |
| FLEX LNG, Ltd. | | | 26,883 | | | | 658,634 | |
| | | | | | | | | |
| TOTAL INDUSTRIALS | | | | | | | 21,604,971 | |
| | | | | | | | | |
| Materials (35.59%) | | | | | | | | |
| Agricultural Chemicals (1.09%) | | | | | | | | |
| Mosaic Co. | | | 24,865 | | | | 665,387 | |
| Nutrien, Ltd. | | | 51,530 | | | | 2,456,950 | |
| | | | | | | | 3,122,337 | |
| | | | | | | | | |
| Base Metal (1.33%) | | | | | | | | |
| Hudbay Minerals, Inc. | | | 422,927 | | | | 3,793,844 | |
| | | | | | | | | |
| Chemicals (5.21%) | | | | | | | | |
| Albemarle Corp. | | | 1,928 | | | | 182,639 | |
| CF Industries Holdings, Inc. | | | 2,716 | | | | 223,337 | |
| Corteva, Inc. | | | 51,974 | | | | 3,166,256 | |
| FMC Corp. | | | 68,329 | | | | 4,440,702 | |
| ICL Group, Ltd. | | | 585,356 | | | | 2,421,060 | |
| ICL Group, Ltd. | | | 64,572 | | | | 266,037 | |
See Notes to Financial Statements and Financial Highlights.
ALPS | CoreCommodity Natural Resources ETF
| Schedule of Investments | October 31, 2024 |
| | | Shares | | | Value
(Note 2) | |
| Chemicals (continued) | | | | | | |
| Incitec Pivot, Ltd. | | | 64,914 | | | $ | 128,587 | |
| K+S AG | | | 254,801 | | | | 3,088,941 | |
| Nutrien, Ltd. | | | 9,268 | | | | 441,917 | |
| OCI N.V. | | | 2,852 | | | | 34,637 | |
| Yara International ASA | | | 13,735 | | | | 413,041 | |
| | | | | | | | 14,807,154 | |
| | | | | | | | | |
| Forestry, Paper & Wood Products (0.77%) | | | | | | | | |
| Canfor Corp.(a) | | | 52,591 | | | | 627,383 | |
| Svenska Cellulosa AB SCA | | | 57,385 | | | | 758,613 | |
| West Fraser Timber Co., Ltd. | | | 8,819 | | | | 796,487 | |
| | | | | | | | 2,182,483 | |
| | | | | | | | | |
| Metals & Mining (25.14%) | | | | | | | | |
| African Rainbow Minerals, Ltd. | | | 41,932 | | | | 422,388 | |
| Agnico Eagle Mines, Ltd. | | | 12,656 | | | | 1,092,086 | |
| Agnico-Eagle Mines, Ltd. | | | 15,065 | | | | 1,300,328 | |
| Alamos Gold, Inc., Class A | | | 34,317 | | | | 692,517 | |
| Alcoa Corp. | | | 44,408 | | | | 1,780,317 | |
| Anglo American PLC | | | 11,659 | | | | 360,811 | |
| Antofagasta PLC | | | 10,606 | | | | 236,868 | |
| Aurubis AG | | | 23,046 | | | | 1,808,675 | |
| B2Gold Corp. | | | 1,104,030 | | | | 3,665,380 | |
| BHP Group, Ltd. | | | 65,091 | | | | 1,826,539 | |
| Boliden AB | | | 125,342 | | | | 3,891,590 | |
| Capricorn Metals, Ltd.(a) | | | 164,660 | | | | 683,767 | |
| Capstone Copper Corp.(a) | | | 22,970 | | | | 158,869 | |
| Centerra Gold, Inc. | | | 210,486 | | | | 1,487,544 | |
| Century Aluminum Co.(a) | | | 54,559 | | | | 962,966 | |
| Champion Iron, Ltd. | | | 198,793 | | | | 766,636 | |
| China Hongqiao Group, Ltd. | | | 487,163 | | | | 785,818 | |
| Cia de Minas Buenaventura SAA, ADR | | | 84,834 | | | | 1,107,932 | |
| Coronado Global Resources, Inc.(b)(c) | | | 532,417 | | | | 355,638 | |
| Deterra Royalties, Ltd. | | | 334,638 | | | | 814,831 | |
| Dowa Holdings Co., Ltd. | | | 40,988 | | | | 1,417,072 | |
| Dundee Precious Metals, Inc. | | | 131,608 | | | | 1,338,435 | |
| Eldorado Gold Corp.(a) | | | 49,704 | | | | 863,358 | |
| Endeavour Mining PLC | | | 72,805 | | | | 1,612,079 | |
| Eramet SA | | | 15,042 | | | | 884,362 | |
| Evolution Mining, Ltd. | | | 552,822 | | | | 1,906,371 | |
| Fortescue, Ltd. | | | 165,922 | | | | 2,093,230 | |
| Franco-Nevada Corp. | | | 2,684 | | | | 356,059 | |
| Freeport-McMoRan, Inc. | | | 48,946 | | | | 2,203,549 | |
| Gold Fields, Ltd., Sponsored ADR | | | 45,794 | | | | 754,685 | |
| Grupo Mexico SAB de CV, Series B | | | 339,784 | | | | 1,782,850 | |
| Iluka Resources, Ltd. | | | 483,509 | | | | 1,867,813 | |
| Impala Platinum Holdings, Ltd. | | | 48,191 | | | | 315,333 | |
| Industrias Penoles SAB de CV(a) | | | 41,558 | | | | 654,622 | |
| Kumba Iron Ore, Ltd. | | | 62,652 | | | | 1,179,833 | |
| Labrador Iron Ore Royalty Corp. | | | 43,533 | | | | 952,358 | |
| | | Shares | | | Value
(Note 2) | |
| Metals & Mining (continued) | | | | | | |
| Liontown Resources, Ltd.(a) | | | 119,163 | | | $ | 64,697 | |
| Lundin Mining Corp. | | | 420,167 | | | | 4,085,942 | |
| Metso Corporation | | | 121,201 | | | | 1,147,766 | |
| Mineral Resources, Ltd. | | | 9,625 | | | | 249,567 | |
| Mitsubishi Materials Corp. | | | 48,657 | | | | 811,324 | |
| MP Materials Corp.(a) | | | 12,919 | | | | 232,413 | |
| Newmont Corp. - CDI | | | 4,048 | | | | 189,036 | |
| NexGen Energy, Ltd.(a) | | | 15,177 | | | | 111,619 | |
| Norsk Hydro ASA | | | 290,309 | | | | 1,786,687 | |
| Northern Star Resources, Ltd. | | | 255,960 | | | | 2,986,563 | |
| OceanaGold Corp. | | | 588,780 | | | | 1,670,328 | |
| Pan American Silver Corp. | | | 9,901 | | | | 231,782 | |
| Perseus Mining, Ltd. | | | 477,465 | | | | 901,808 | |
| Pilbara Minerals, Ltd. | | | 159,804 | | | | 299,725 | |
| Ramelius Resources, Ltd. | | | 1,145,390 | | | | 1,801,532 | |
| Sandfire Resources NL(a) | | | 9,260 | | | | 63,195 | |
| South32, Ltd. | | | 788,087 | | | | 1,908,590 | |
| Southern Copper Corp. | | | 16,863 | | | | 1,847,342 | |
| Sumitomo Metal Mining Co., Ltd. | | | 15,180 | | | | 428,705 | |
| SunCoke Energy, Inc. | | | 44,206 | | | | 455,764 | |
| Teck Resources, Ltd., Class B | | | 49,921 | | | | 2,320,827 | |
| Torex Gold Resources, Inc.(a) | | | 47,971 | | | | 1,034,631 | |
| Warrior Met Coal, Inc. | | | 24,362 | | | | 1,537,973 | |
| Wheaton Precious Metals Corp. | | | 1,508 | | | | 99,543 | |
| Zhaojin Mining Industry Co., Ltd. | | | 493,192 | | | | 869,133 | |
| | | | | | | | 71,520,001 | |
| | | | | | | | | |
| Steel (2.05%) | | | | | | | | |
| Acerinox SA | | | 40,973 | | | | 374,597 | |
| ArcelorMittal SA - NY Reg | | | 13,827 | | | | 340,421 | |
| ATI, Inc.(a) | | | 18,996 | | | | 1,001,279 | |
| Cleveland-Cliffs, Inc.(a) | | | 10,358 | | | | 134,447 | |
| Daido Steel Co., Ltd. | | | 24,109 | | | | 188,981 | |
| Metallus, Inc.(a) | | | 9,887 | | | | 139,308 | |
| Nippon Steel Corp. | | | 21,576 | | | | 435,809 | |
| OSAKA Titanium Technologies Co., Ltd. | | | 71,766 | | | | 1,025,904 | |
| Outokumpu Oyj | | | 55,245 | | | | 197,825 | |
| SSAB AB, Class A | | | 83,291 | | | | 399,313 | |
| Steel Dynamics, Inc. | | | 1,456 | | | | 190,008 | |
| thyssenkrupp AG | | | 142,307 | | | | 495,806 | |
| United States Steel Corp. | | | 5,600 | | | | 217,560 | |
| voestalpine AG | | | 29,417 | | | | 609,567 | |
| Yamato Kogyo Co., Ltd. | | | 2,517 | | | | 121,559 | |
| | | | | | | | 5,872,384 | |
| | | | | | | | | |
| TOTAL MATERIALS | | | | | | | 101,298,203 | |
See Notes to Financial Statements and Financial Highlights.
ALPS | CoreCommodity Natural Resources ETF
| Schedule of Investments | October 31, 2024 |
| | | Shares | | | Value
(Note 2) | |
| Real Estate (0.27%) | | | | | | |
| REIT (0.27%) | | | | | | | | |
| PotlatchDeltic Corp. | | | 18,470 | | | $ | 767,798 | |
| | | | | | | | | |
| TOTAL REAL ESTATE | | | | | | | 767,798 | |
| | | | | | | | | |
| Technology (0.63%) | | | | | | | | |
| Semiconductors (0.63%) | | | | | | | | |
| SUMCO Corp. | | | 181,699 | | | | 1,785,419 | |
| | | | | | | | | |
| TOTAL TECHNOLOGY | | | | | | | 1,785,419 | |
| | | | | | | | | |
| Utilities (5.73%) | | | | | | | | |
| Electric Utilities (2.93%) | | | | | | | | |
| Boralex, Inc., Class A | | | 12,446 | | | | 299,183 | |
| China Longyuan Power Group Corp., Ltd. | | | 1,929,976 | | | | 1,715,457 | |
| Drax Group PLC | | | 107,946 | | | | 867,165 | |
| Enlight Renewable Energy, Ltd.(a) | | | 38,628 | | | | 615,285 | |
| ERG SpA | | | 4,942 | | | | 110,954 | |
| Iberdrola SA | | | 6,906 | | | | 102,501 | |
| Innergex Renewable Energy, Inc. | | | 73,956 | | | | 484,418 | |
| Neoen SA(b)(c) | | | 21,324 | | | | 915,049 | |
| Northland Power, Inc. | | | 94,047 | | | | 1,429,263 | |
| RENOVA, Inc.(a) | | | 123,596 | | | | 708,517 | |
| Scatec ASA(b)(c) | | | 150,391 | | | | 1,088,264 | |
| | | | | | | | 8,336,056 | |
| | | | | | | | | |
| Gas & Water Utilities (2.80%) | | | | | | | | |
| California Water Service Group | | | 20,560 | | | | 1,068,298 | |
Cia de Saneamento Basico do
Estado de Sao Paulo SABESP, ADR |
|
|
69,216 |
|
|
|
1,099,843 |
|
| Guangdong Investment, Ltd. | | | 1,735,847 | | | | 1,105,265 | |
| National Fuel Gas Co. | | | 2,910 | | | | 176,142 | |
| Severn Trent PLC | | | 40,767 | | | | 1,349,929 | |
| United Utilities Group PLC | | | 9,069 | | | | 119,572 | |
| Veolia Environnement SA | | | 95,303 | | | | 3,023,928 | |
| | | | | | | | 7,942,977 | |
| | | | | | | | | |
| TOTAL UTILITIES | | | | | | | 16,279,033 | |
| | | | | | | | | |
| TOTAL COMMON STOCKS | | | | | | | | |
| (Cost $276,057,061) | | | | | | | 283,484,610 | |
| | | Shares | | | Value
(Note 2) | |
| MASTER LIMITED PARTNERSHIPS (0.06%) | | | | | | |
| Energy (0.06%) | | | | | | |
| Oil & Gas Producers (0.06%) | | | | | | | | |
| Black Stone Minerals LP | | | 11,524 | | | $ | 170,094 | |
| | | | | | | | | |
| TOTAL ENERGY | | | | | | | 170,094 | |
| | | | | | | | | |
| TOTAL MASTER LIMITED PARTNERSHIPS | | | | | | | | |
| (Cost $175,713) | | | | | | | 170,094 | |
| | | 7-Day | | | | | | Value | |
| | | Yield | | | Shares | | | (Note 2) | |
| SHORT-TERM INVESTMENTS (0.23%) | | | | | | | | | |
| Money Market Fund (0.23%) | | | | | | | | | |
| Money Market Fund (0.23%) | | | | | | | | | |
| State Street Institutional Treasury Plus Money Market Fund - Premier Class | | | 4.823 | % | | | 649,530 | | | | 649,530 | |
| | | | | | | | | | | | | |
| TOTAL MONEY MARKET FUND | | | | | | | | | | | 649,530 | |
| | | | | | | | | | | | | |
| TOTAL SHORT-TERM INVESTMENTS | | | | | | | | | | | | |
| (Cost $649,530) | | | | | | | | | | | 649,530 | |
| | | | | | | | | | | | | |
| TOTAL INVESTMENTS (99.87%) | | | | | | | | | | | | |
| (Cost $276,882,304) | | | | | | | | | | $ | 284,304,234 | |
| | | | | | | | | | | | | |
| Assets In Excess Of Other Liabilities (0.13%) | | | | | | | | | | | 372,271 | |
| | | | | | | | | | | | | |
| NET ASSETS (100.00%) | | | | | | | | | | $ | 284,676,505 | |
| (a) | Non-Income Producing Security. |
| (b) | Securities were purchased pursuant to Regulation S under the Securities Act of 1933, which exempts securities offered and sold outside of the United States from registration. Such securities cannot be sold in the United States without either an effective registration statement filed pursuant to the Securities Act of 1933, or pursuant to an exemption from registration. These securities have been deemed liquid under guidelines utilized by the Valuation Designee. As of October 31, 2024 the aggregate market value of those securities was $3,539,736, representing 1.24% of net assets. |
| (c) | Securities exempt from registration under Rule 144A of the Securities Act of 1933. These securities may be resold in transactions exempt from registration, normally to qualified institutional buyers. As of October 31, 2024, the aggregate market value of those securities was $2,358,951, representing 0.83% of net assets. |
See Notes to Financial Statements and Financial Highlights.
ALPS | CoreCommodity Natural Resources ETF
| Statement of Assets and Liabilities | October 31, 2024 |
| ASSETS | | | |
| Investments, at value | | $ | 284,304,234 | |
| Cash | | | 38,568 | |
| Foreign currency, at value (Cost $218) | | | 218 | |
| Dividends and interest receivable | | | 427,114 | |
| Prepaid expenses and other assets | | | 4,019 | |
| Total Assets | | | 284,774,153 | |
| LIABILITIES | | | | |
| Investment advisory fees payable | | | 97,648 | |
| Total Liabilities | | | 97,648 | |
| NET ASSETS | | $ | 284,676,505 | |
| NET ASSETS CONSIST OF | | | | |
| Paid-in capital | | $ | 289,883,821 | |
| Total distributable earnings/(accumulated losses) | | | (5,207,316 | ) |
| NET ASSETS | | $ | 284,676,505 | |
| INVESTMENTS, AT COST | | $ | 276,882,304 | |
| | | | | |
| PRICING OF SHARES | | | | |
| | | | | |
| Net Asset Value, offering and redemption price per share | | $ | 24.74 | |
| Net Assets | | $ | 284,676,505 | |
| Shares of beneficial interest outstanding (unlimited number of shares, no par value common stock authorized) | | | 11,504,881 | |
See Notes to Financial Statements and Financial Highlights.
ALPS | CoreCommodity Natural Resources ETF
| Statement of Operations | For the Period Ended October 31, 2024(a) |
| INVESTMENT INCOME | | | |
| Dividends | | $ | 2,656,765 | |
| Foreign taxes withheld on dividends | | | (221,065 | ) |
| Interest and other income | | | 11,015 | |
| Total Investment Income | | | 2,446,715 | |
| | | | | |
| EXPENSES | | | | |
| Investment advisory fees | | | 358,638 | |
| Total Expenses | | | 358,638 | |
| Net Investment Income | | | 2,088,077 | |
| Net realized gain on investments(b) | | | 6,415,648 | |
| Net realized loss on foreign currency transactions | | | (6,648 | ) |
| Net Realized Gain | | | 6,409,000 | |
| Net change in unrealized depreciation on investments | | | (11,929,705 | ) |
| Net change in unrealized depreciation on translation of assets and liabilities denominated in foreign currencies | | | (6,894 | ) |
| Net Change in Unrealized Depreciation | | | (11,936,599 | ) |
| NET REALIZED AND UNREALIZED LOSS ON INVESTMENTS | | | (5,527,599 | ) |
| NET DECREASE IN NET ASSETS RESULTING FROM OPERATIONS | | $ | (3,439,522 | ) |
| (a) | The ALPS | CoreCommodity Natural Resources ETF commenced operations on July 11, 2024. |
| (b) | Includes realized gain or loss as a result of in-kind transactions (See Note 4 in Notes to Financial Statements) |
See Notes to Financial Statements and Financial Highlights.
ALPS | CoreCommodity Natural Resources ETF
Statement of Changes in Net Assets
| | | For the Period
July 11, 2024
(Commencement)
to
October 31, 2024 | |
| OPERATIONS | | | |
| Net investment income | | $ | 2,088,077 | |
| Net realized gain | | | 6,409,000 | |
| Net change in unrealized depreciation | | | (11,936,599 | ) |
| Net Decrease in Net Assets Resulting from Operations | | | (3,439,522 | ) |
| | | | | |
| BENEFICIAL INTEREST TRANSACTIONS (NOTE 5) | | | | |
| Shares sold * | | | 397,234,695 | |
| Shares redeemed | | | (109,118,668 | ) |
| Net Increase in Net Assets Derived from Beneficial Interest Transactions | | | 288,116,027 | |
| | | | | |
| Net increase in net assets | | | 284,676,505 | |
| | | | | |
| NET ASSETS | | | | |
| Beginning of period | | | – | |
| End of period | | $ | 284,676,505 | |
| * | On July 10, 2024, the Fund received securities in connection with an in-kind subscription transaction - see Note 1 in Notes to Financial Statements and Financial Highlights. |
See Notes to Financial Statements and Financial Highlights.
ALPS | CoreCommodity Natural Resources ETF
| Financial Highlights | For a Share Outstanding Throughout the Periods Presented |
| | | For the Period
July 11, 2024
(Commencement)
to
October 31, 2024 | |
| Net asset value, beginning of period | | $ | 25.00 | |
| | | | | |
| INCOME FROM INVESTMENT OPERATIONS: | | | | |
| Net investment income(a) | | | 0.18 | |
| Net realized and unrealized loss | | | (0.44 | ) |
| Total from investment operations | | | (0.26 | ) |
| | | | | |
| Net (decrease) in net asset value | | | (0.26 | ) |
| Net asset value, end of year | | $ | 24.74 | |
| TOTAL RETURN(b) | | | (1.04 | )% |
| TOTAL RETURN - MARKET VALUE(c) | | | (1.12 | )% |
| | | | | |
| RATIOS/SUPPLEMENTAL DATA: | | | | |
| Net assets, end of year (000s) | | $ | 284,677 | |
| Ratio of expenses to average net assets | | | 0.39 | %(d) |
| Ratio of net investment income to average net assets | | | 2.27 | %(d) |
| Portfolio turnover rate(e) | | | 61 | % |
| (a) | Calculated using the average shares method. |
| (b) | Total returns are for the period indicated and have not been annualized. Total returns would have been lower had certain expenses not been waived during the period. Returns shown do not reflect the deduction of taxes that a shareholder would pay on Fund distributions or the redemption of Fund shares. |
| (c) | Market value total return is calculated assuming an initial investment made at market value at the beginning of the period, reinvestment of all dividends and distributions at the reinvestment prices (lower or market or NAV on ex-date) during the period, if any, and redemptions on the last day of the period at market value. Market value is determined by the composite closing price as defined as the last reported sales price on Nasdaq. The composite closing price is the last reported sale, regardless of volume, and not an average price, and may have occured on a date prior to the close of the reporting period. |
| (e) | Portfolio turnover rate for periods less than one full year have not been annualized and does not include securities received or delivered from processing creations or redemptions in-kind. |
See Notes to Financial Statements and Financial Highlights.
ALPS | CoreCommodity Natural Resources ETF
| Notes to Financial Statements and Financial Highlights | October 31, 2024 |
1. ORGANIZATION
Financial Investors Trust (the “Trust”), a Delaware statutory trust, is an open-end management investment company registered under the Investment Company Act of 1940, as amended (“1940 Act”). The Trust consists of multiple separate portfolios or series. This annual report includes the financial statements and financial highlights of the ALPS | CoreCommodity Natural Resources ETF (the “Fund”), which commenced operations on July 11, 2024. The Fund seeks to maximize real returns, consistent with prudent investment management.
The Fund’s Shares (“Shares”) are listed on the Nasdaq Stock Market LLC (“Nasdaq Exchange”). The Fund issues and redeems Shares, at net asset value (“NAV”) in blocks of 15,000 Shares, each of which is called a “Creation Unit”. Creation Units are issued and redeemed principally in-kind for securities. Except when aggregated in Creation Units, Shares are not redeemable securities of the Fund.
The Adviser manages separately the ALPS | CoreCommodity Management CompleteCommodities Strategy Fund that contributed specific assets to the Fund (the “Contribution”). The Adviser and Sub-Adviser paid all costs surrounding the Contribution. The Contribution received on July 10, 2024, was tax free, and the cost basis of the assets were carried forward to the Fund for tax and financial reporting purposes. The Contribution resulted in seed shares totaling 12,419,881 with a Net Asset Value of $25. The details of the Contribution are shown below:
| Net Assets | Market Value of Investments | Cost of Investments | Unrealized Appreciation |
| $ 310,497,027 | $ 310,497,027 | $ 291,145,392 | $ 19,351,635 |
2. SIGNIFICANT ACCOUNTING POLICIES
The following is a summary of significant accounting policies consistently followed by the Fund in the preparation of its financial statements. The Fund is considered an investment company for financial reporting purposes, and follows accounting policies in conformity with accounting principles generally accepted in the United States of America (“U.S. GAAP”), including policies specific to investment companies. The preparation of financial statements in conformity with U.S. GAAP requires management to make certain estimates and assumptions that affect the reported amounts of assets and liabilities and disclosures of contingent assets and liabilities at the date of the financial statements and the reported amounts of increases and decreases in net assets during the reporting period. Actual results could differ from those estimates. The following is a summary of significant accounting policies consistently followed by the Fund, as applicable, in preparation of their financial statements. The Fund is an investment company and accordingly follows the investment company accounting and reporting guidance of the Financial Accounting Standards Board ("FASB") Accounting Standard Codification ("ASC") Topic 946 "Financial Services – Investment Companies”.
Investment Valuation: The Fund generally values its securities based on market prices determined at the close of regular trading on the NYSE, normally 4:00 p.m. Eastern Time, on each day the NYSE is open for trading. For equity securities and mutual funds that are traded on an exchange, the market price is usually the closing sale or official closing price on that exchange.
Pursuant to Rule 2a-5 under the Investment Company Act of 1940, the Trust’s Board of Trustees (the “Board” or "Trustees") has appointed ALPS Advisors, Inc. (the “Adviser”) to serve as the valuation designee (the "Valuation Designee") to perform fair value determinations for investments in the Fund. When such prices or quotations are not available, or when the Valuation Designee appointed by the Board believes that they are unreliable, securities may be priced using fair value procedures utilized by the Valuation Designee. The fair valuation policies and procedures (“FV Procedures”) are utilized by the Valuation Designee for the fair valuation of portfolio assets held by the Fund in the event that (1) market quotations for the current price of a portfolio security or asset are not readily available, or (2) available market quotations that would otherwise be used to value a portfolio security or asset in accordance with the Fund’s Pricing Procedures appear to be unreliable. The Pricing Procedures reflect certain pricing methodologies (or “logics”) that are not “readily available market quotations” and thus are viewed and treated as fair valuations. The Valuation Designee routinely meets to discuss fair valuations of portfolio securities and other instruments held by the Fund.
Fair Value Measurements: The Fund discloses the classification of its fair value measurements following a three-tier hierarchy based on the inputs used to measure fair value. Inputs refer broadly to the assumptions that market participants would use in pricing the asset or liability, including assumptions about risk. Inputs may be observable or unobservable. Observable inputs reflect the assumptions market participants would use in pricing the asset or liability that are developed based on market data obtained from sources independent of the reporting entity. Unobservable inputs reflect the reporting entity’s own assumptions about the assumptions market participants would use in pricing the asset or liability that are developed based on the best information available.
ALPS | CoreCommodity Natural Resources ETF
| Notes to Financial Statements and Financial Highlights | October 31, 2024 |
Various inputs are used in determining the value of the Fund’s investments as of the end of the reporting period. When inputs used fall into different levels of the fair value hierarchy, the level in the hierarchy within which the fair value measurement falls is determined based on the lowest level input that is significant to the fair value measurement in its entirety. The designated input levels are not necessarily an indication of the risk or liquidity associated with these investments. These inputs are categorized in the following hierarchy under applicable financial accounting standards:
| Level 1 – | Unadjusted quoted prices in active markets for identical investments, unrestricted assets or liabilities that the Fund has the ability to access at the measurement date; |
| Level 2 – | Quoted prices which are not active, quoted prices for similar assets or liabilities in active markets or inputs other than quoted prices that are observable (either directly or indirectly) for substantially the full term of the asset or liability; and |
| Level 3 – | Significant unobservable prices or inputs (including the Fund’s own assumptions in determining the fair value of investments) where there is little or no market activity for the asset or liability at the measurement date. |
The following is a summary of the Fund’s investments/financial instruments in the fair value hierarchy as of October 31, 2024:
| Investments in Securities at Value | | Level 1 - Unadjusted
Quoted Prices | | | Level 2 - Other Significant
Observable Inputs | | | Level 3 – Significant
Unobservable Inputs | | | Total | |
| ALPS | CoreCommodity Natural Resources ETF | | | | | | | | | | |
| Common Stocks(a) | | $ | 282,800,843 | | | $ | 683,767 | | | $ | – | | | $ | 283,484,610 | |
| Master Limited Partnerships(a) | | | 170,094 | | | | – | | | | – | | | | 170,094 | |
| Short-Term Investments | | | 649,530 | | | | – | | | | – | | | | 649,530 | |
| Total | | $ | 283,620,467 | | | $ | 683,767 | | | $ | – | | | $ | 284,304,234 | |
| (a) | For detailed descriptions of sectors, see the accompanying Schedule of Investments. |
The Fund did not have any securities that used significant unobservable inputs (Level 3) in determining fair value and there were no transfers into or out of Level 3 during the period ended October 31, 2024.
Federal Income Taxes: The Fund complies with the requirements under Subchapter M of the Internal Revenue Code of 1986, as amended (the “Code”) applicable to regulated investment companies and intends to distribute substantially all of its net taxable income and net capital gains, if any, each year. The Fund is not subject to income taxes to the extent such distributions are made.
As of and during the period ended October 31, 2024, the Fund did not have a liability for any unrecognized tax benefits. The Fund recognizes interest and penalties, if any, related to tax liabilities as income tax expense in the Statement of Operations. The Fund files U.S. federal, state, and local tax returns as required. The Fund’s tax returns are subject to examination by the relevant tax authorities until expiration of the applicable statute of limitations which is generally three years after the filing of the tax return, but may extend to four years in certain jurisdictions. Tax returns for open years have incorporated no uncertain tax positions that require a provision for income taxes.
Distributions to Shareholders: The Fund normally pays dividends and distributes capital gains, if any, on an annual basis. Income dividend distributions are derived from interest, dividends, and other income the Fund receives from its investments, including distributions of short-term capital gains, if any. Capital gain distributions are derived from gains realized when the Fund sells a security it has owned for more than a year or from long- term capital gain distributions from underlying investments. The Fund may make additional distributions and dividends at other times if its portfolio manager or managers believe doing so may be necessary for the Fund to avoid or reduce taxes.
Investment Transactions and Investment Income: Investment transactions are accounted for on the date the investments are purchased or sold (trade date basis). Net realized gains and losses from investment transactions are reported on an identified cost basis. Interest income is accrued and recorded as earned. Dividend income is recognized on the ex-dividend date or for withholding taxes or certain foreign securities, as soon as information is available to the Fund. Withholding taxes on foreign dividends are paid (a portion of which may be reclaimable) or provided for in accordance with the applicable country's tax rules and rates and are disclosed in the Statement of Operations.
Foreign Securities: The Fund may directly purchase securities of foreign issuers. Investing in securities of foreign issuers involves special risks not typically associated with investing in securities of U.S. issuers. The risks include possible reevaluation of currencies, the inability to repatriate foreign currency, less complete financial information about companies and possible future adverse political and economic developments.
ALPS | CoreCommodity Natural Resources ETF
| Notes to Financial Statements and Financial Highlights | October 31, 2024 |
Moreover, securities of many foreign issuers and their markets may be less liquid and their prices more volatile than those of securities of comparable U.S. issuers.
Foreign Currency Translation: Values of investments denominated in foreign currencies are converted into U.S. dollars using the current exchange rates each business day (generally 4:00 p.m. Eastern Time). Purchases and sales of investments and dividend income are translated into U.S. dollars using the current prevailing exchange rate on the transaction date. The effect of changes in foreign exchange rates on realized and unrealized gains or losses on securities is reflected as a component of such gains or losses. Transactions in foreign denominated assets may involve greater risks than domestic transactions. The Fund does not isolate that portion of the results of operations resulting from changes in foreign exchange rates on investments from the fluctuations arising from changes in market prices of securities held. Such fluctuations are included with the net realized and unrealized gain or loss from investments. Reported net realized foreign exchange gains or losses arise from sales of foreign currencies, currency gains or losses realized between the trade and settlement dates on securities transactions, and the difference between the amounts of dividends, interest, and foreign withholding taxes recorded on the Fund's books and the U.S. dollar equivalent of the amounts actually received or paid. Net unrealized foreign exchange gains and losses arise from changes in the fair values of assets and liabilities, other than investments in securities at fiscal period end, resulting from changes in exchange rates.
Foreign Currency Spot Contracts: The Fund may enter into foreign currency spot contracts to facilitate transactions in foreign securities or to convert foreign currency receipts into U.S. dollars. A foreign currency spot contract is an agreement between two parties to buy and sell currencies at the current market rate, for settlement generally within two business days. The U.S. dollar value of the contracts is determined using current currency exchange rates supplied by a pricing service. The contract is marked-to-market daily for settlements beyond one day and any change in market value is recorded as an unrealized gain or loss. When the contract is closed, the Fund records a realized gain or loss equal to the difference between the value on the open and close date. Losses may arise from changes in the value of the foreign currency, or if the counterparties do not perform under the contract’s terms. The maximum potential loss from such contracts is the aggregate face value in U.S. dollars at the time the contract was opened.
Master Limited Partnerships (“MLPs”): The Fund may invest in MLPs, which are publicly traded partnerships engaged in the transportation, storage and processing of minerals and natural resources. By confining their operations to these specific activities, their interests, or units, are able to trade on public securities exchanges exactly like the shares of a corporation, without entity level taxation. To qualify as a MLP and to not be taxed as a corporation, a partnership must receive at least 90% of its income from qualifying sources as set forth in Section 7704(d) of the Code. These qualifying sources include natural resource based activities such as the processing, transportation and storage of mineral or natural resources. MLPs generally have two classes of owners, the general partner and limited partners. The general partner of an MLP is typically owned by a major energy company, an investment fund, the direct management of the MLP, or is an entity owned by one or more of such parties. The general partner may be structured as a private or publicly traded corporation or other entity. The general partner typically controls the operations and management of the MLP through an up to 2% equity interest in the MLP plus, in many cases, ownership of common units and subordinated units. Limited partners typically own the remainder of the partnership, through ownership of common units, and have a limited role in the partnership’s operations and management. MLPs are typically structured such that common units and general partner interests have first priority to receive quarterly cash distributions up to an established minimum amount (“minimum quarterly distributions” or “MQD”). Common and general partner interests also accrue arrearages in distributions to the extent the MQD is not paid. Once common and general partner interests have been paid, subordinated units receive distributions of up to the MQD; however, subordinated units do not accrue arrearages. Distributable cash in excess of the MQD is paid to both common and subordinated units and is distributed to both common and subordinated units generally on a pro rata basis. The general partner is also eligible to receive incentive distributions if the general partner operates the business in a manner which results in distributions paid per common unit surpassing specified target levels. As the general partner increases cash distributions to the limited partners, the general partner receives an increasingly higher percentage of the incremental cash distributions.
Lending of Portfolio Securities: The Fund has entered into a securities lending agreement with State Street Bank & Trust Co. (“SSB”), the Fund’s lending agent. The Fund may lend its portfolio securities only to borrowers that are approved by SSB. The Fund will limit such lending to not more than 33 1/3% of the value of its total assets. The Fund’s securities held at SSB as custodian shall be available to be lent except those securities the Fund or ALPS Advisors, Inc. specifically identifies in writing as not being available for lending. The borrower pledges and maintains with the Fund collateral consisting of cash (U.S. Dollars only), securities issued or guaranteed by the U.S. government or its agencies or instrumentalities, and cash equivalents (including irrevocable bank letters of credit) issued by a person other than the borrower or an affiliate of the borrower. The initial collateral received by the Fund is required to have a value of no less than 102% of the market value of the loaned securities for U.S equity securities and a value of no less than 105% of the market value for non-U.S. equity securities. The collateral is maintained thereafter, at a market value equal to not less than 102% of the current value of the U.S. equity securities on loan and not less than 105% of the current value of the non-U.S. equity securities on loan. The market value of the loaned securities is determined at the close of each business day and any additional required collateral is delivered to the Fund on the next business day. During the term of the loan, the Fund is entitled to all distributions made on or in respect of the
ALPS | CoreCommodity Natural Resources ETF
| Notes to Financial Statements and Financial Highlights | October 31, 2024 |
loaned securities. Loans of securities are terminable at any time and the borrower, after notice, is required to return borrowed securities within the customary time period for settlement of securities transactions.
Any cash collateral received is reinvested in a money market fund managed by SSB as disclosed in the Fund’s Schedule of Investments and is reflected in the Statement of Assets and Liabilities as a payable for collateral upon return of securities loaned. Non-cash collateral, in the form of securities issued or guaranteed by the U.S. government or its agencies or instrumentalities, is not disclosed in the Fund’s Statement of Assets and Liabilities or the contractual maturity table below as it is held by the lending agent on behalf of the Fund, and the Fund does not have the ability to re-hypothecate these securities. Income earned by the Fund from securities lending activity is disclosed in the Statement of Operations. As of October 31, 2024, the Fund did not have any securities on loan.
The risks of securities lending include the risk that the borrower may not provide additional collateral when required or may not return the securities when due. To mitigate these risks, the Fund benefits from a borrower default indemnity provided by SSB. SSB’s indemnity allows for full replacement of securities lent wherein SSB will purchase the unreturned loaned securities on the open market by applying the proceeds of the collateral, or to the extent such proceeds are insufficient or the collateral is unavailable, SSB will purchase the unreturned loan securities at SSB’s expense. However, the Fund could suffer a loss if the value of the investments purchased with cash collateral falls below the value of the cash collateral received.
3. TAX BASIS INFORMATION
Tax Basis of Distributions to Shareholders: The character of distributions made during the year from net investment income or net realized gains may differ from its ultimate characterization for federal income tax purposes. Also, due to the timing of dividend distributions, the fiscal year in which amounts are distributed may differ from the fiscal year in which the income or realized gain were recorded by a Fund.
There were no distributions made by the Fund for the fiscal period ending October 31, 2024.
Components of Distributable Earnings on a Tax Basis: At October 31, 2024, permanent differences in book and tax accounting were reclassified. These differences had no effect on net assets and were primarily attributed to differences in in-kind redemptions, partnership basis transfers, and passive foreign investment companies (PFICs) transfers.
For the fiscal period ended October 31, 2024, the following reclassifications, which had no impact on results of operations or net assets, were recorded to reflect tax character:
| Fund | | Paid-in Capital | | | Distributable earnings | |
| ALPS | CoreCommodity Natural Resources ETF | | $ | 21,119,429 | | | $ | (21,119,429 | ) |
As of October 31, 2024, the components of distributable earnings on a tax basis were as follows:
| | | Undistributed net investment income | | | Accumulated net realized gain/(loss) on investments | | | Other cumulative effect of timing differences | | | Net unrealized appreciation/ (depreciation) on investments | | | Total | |
| ALPS | CoreCommodity Natural Resources ETF | | $ | 2,269,567 | | | $ | (10,898,585 | ) | | $ | – | | | $ | 3,421,702 | | | $ | (5,207,316 | ) |
Capital Losses: Under current law, capital losses maintain their character as short-term or long-term and are carried forward to the next tax year without expiration. As of October 31, 2024 the following amounts are available as carry forwards to the next tax year:
| Fund | | Short-Term | | | Long-Term | |
| ALPS | CoreCommodity Natural Resources ETF | | $ | 5,097,187 | | | $ | 5,801,398 | |
ALPS | CoreCommodity Natural Resources ETF
| Notes to Financial Statements and Financial Highlights | October 31, 2024 |
Unrealized Appreciation and Depreciation on Investments: As of October 31, 2024, the costs of investments for federal income tax purposes and accumulated net unrealized appreciation/(depreciation) on investments were as follows:
| Fund | | Gross Appreciation (excess of value over tax cost) | | | Gross Depreciation (excess of tax cost over value) | | | Net Appreciation/ (Depreciation) of Foreign Currency | | | Net Unrealized Appreciation/ (Depreciation) | | | Cost of Investments for Income Tax Purposes | |
| ALPS | CoreCommodity Natural Resources ETF | | $ | 22,341,482 | | | $ | (18,912,886 | ) | | $ | (6,894 | ) | | $ | 3,421,702 | | | $ | 280,875,638 | |
The differences between book cost and tax cost of investments and unrealized appreciation/depreciation are primarily attributed to the tax deferral of losses on wash sales, PFICs, partnership basis adjustments, and C-corp basis adjustments.
4. SECURITIES TRANSACTIONS
Purchases and sales of securities, excluding short-term securities and in-kind transactions during the fiscal period ended October 31, 2024 were as follows:
| Fund | | Purchases | | | Sales | |
| ALPS | CoreCommodity Natural Resources ETF | | $ | 186,581,679 | | | $ | 180,494,690 | |
For fiscal period ended October 31, 2024, the cost of in-kind purchases and proceeds from in-kind sales were as follows:
| Fund | | Purchases | | | Sales | |
| ALPS | CoreCommodity Natural Resources ETF | | $ | 373,350,204 | | | $ | 108,240,835 | |
For the fiscal period ended October 31, 2024, the Fund had in-kind net realized gains of $19,871,925.
Gains on in-kind transactions are not considered taxable for federal income tax purposes and losses on in-kind transactions are also not deductible for tax purposes.
5. BENEFICIAL INTEREST TRANSACTIONS
Transactions in shares of capital stock were as follows:
| | | ALPS |
CoreCommodity
Natural Resources
ETF | |
| | | For the Period July 11, 2024
(Commencement) to
October 31, 2024 | |
| Shares sold | | | 15,839,881 | |
| Shares redeemed | | | (4,335,000 | ) |
| Net increase in shares outstanding | | | 11,504,881 | |
ALPS | CoreCommodity Natural Resources ETF
| Notes to Financial Statements and Financial Highlights | October 31, 2024 |
6. MANAGEMENT AND RELATED-PARTY TRANSACTIONS
ALPS Advisors, Inc. (“AAI” or "Adviser") acts as the Fund’s investment adviser. AAI is an indirect wholly owned subsidiary of DST Systems, Inc. (“DST”). DST is a wholly-owned subsidiary of SS&C Technologies Holdings, Inc. (“SS&C”), a publicly traded company listed on the NASDAQ Global Select Market.
AAI has delegated daily management of the Fund to CoreCommodity Management, LLC (the “Sub-Advisor”). The Sub-Advisor manages the investments of the Fund in accordance with its investment objective, policies and limitations and investment guidelines established jointly by AAI and the Board.
Pursuant to the Investment Advisory Agreement (the “Advisory Agreement”), the Fund will pay AAI an annual management fee of 0.39% based on the Fund’s average daily net assets. The management fee is paid on a monthly basis.
The Adviser pays the Sub-Adviser an annual sub-advisory management fee pursuant to the Sub-Advisory Agreement as follows: The Adviser will pay the Sub-Adviser an annual management fee of 0.25% based on the Fund’s average daily net assets. The sub-advisory management fee is paid on a monthly basis. The Adviser is required to pay all fees due to the Sub-Adviser out of the management fee the Adviser receives from the Fund.
Under the terms of the Advisory Agreement, the Adviser pays all of the fees and expenses of the Fund, except that the Fund will be required to pay brokerage and other expenses of executing Fund transactions, taxes or governmental fees, interest charges and other costs of borrowing funds, litigation and indemnification expenses and other extraordinary expenses not incurred in the ordinary course of the Fund’s business.
ALPS Fund Services, Inc., an affiliate of the Adviser, is the administrator of the Fund. Pursuant to the Administrative Services Agreement, the administrative fee of 0.03% is accrued daily and paid monthly based on the Fund's average daily net assets. The administrative fee is paid from the unitary fee. Officers of the Trust are employees of ALPS and are not paid from the unitary fee.
Effective January 1, 2024, all Trustees receive a quarterly retainer of $31,000, plus $12,500 for each regular quarterly Board meeting attended. Trustees receive $5,000 for each non-quarterly special Board meeting attended. Trustees receive $5,000 for each non-quarterly special Committee meeting attended for which a corresponding non-quarterly special Board meeting is not held. The Chairman of the Board and the Chairman of the Audit Committee also receive an additional quarterly retainer of $7,500 and $6,000, respectively. The Chairman of the Nominating and Governance Committee receives an additional quarterly retainer of $2,000. The Trustees are also reimbursed for all reasonable out-of-pocket expenses relating to attendance at meetings.
7. INDEMNIFICATIONS
Under the Trust’s organizational documents, its officers and Trustees are indemnified against certain liability arising out of the performance of their duties to the Trust. Additionally, in the normal course of business, the Trust enters into contracts with service providers that may contain general indemnification clauses which may permit indemnification to the extent permissible under applicable law. The Trust’s maximum exposure under these arrangements is unknown, as this would involve future claims that may be made against the Trust that have not yet occurred.
8. SUBSEQUENT EVENTS
Subsequent events after the date of the Statement of Assets and Liabilities or Consolidated Statement of Assets and Liabilities have been evaluated through the date the financial statements were issued. Management has determined that there were no subsequent events to report through the issuance of these financial statements.
ALPS | CoreCommodity Natural Resources ETF
Report of Independent Registered Public Accounting Firm
To the Shareholders and Board of Trustees of
Financial Investors Trust
Opinion on the Financial Statements
We have audited the accompanying statement of assets and liabilities, including the schedule of investments, of ALPS | CoreCommodity Natural Resources ETF (the “Fund”), a series of Financial Investors Trust, as of October 31, 2024, and the related statements of operations and changes in net assets, and the financial highlights for the period July 11, 2024 (commencement of operations) through October 31, 2024, and the related notes (collectively referred to as the “financial statements”). In our opinion, the financial statements present fairly, in all material respects, the financial position of the Fund as of October 31, 2024, the results of its operations, the changes in net assets, and the financial highlights for the period July 11, 2024 (commencement of operations) through October 31, 2024, in conformity with accounting principles generally accepted in the United States of America.
Basis for Opinion
These financial statements are the responsibility of the Fund’s management. Our responsibility is to express an opinion on the Fund’s financial statements based on our audit. We are a public accounting firm registered with the Public Company Accounting Oversight Board (United States) (“PCAOB”) and are required to be independent with respect to the Fund in accordance with the U.S. federal securities laws and the applicable rules and regulations of the Securities and Exchange Commission and the PCAOB.
We conducted our audit in accordance with the standards of the PCAOB. Those standards require that we plan and perform the audit to obtain reasonable assurance about whether the financial statements are free of material misstatement whether due to error or fraud.
Our audit included performing procedures to assess the risks of material misstatement of the financial statements, whether due to error or fraud, and performing procedures that respond to those risks. Such procedures included examining, on a test basis, evidence regarding the amounts and disclosures in the financial statements. Our procedures included confirmation of securities owned as of October 31, 2024, by correspondence with the custodian. Our audit also included evaluating the accounting principles used and significant estimates made by management, as well as evaluating the overall presentation of the financial statements. We believe that our audit provides a reasonable basis for our opinion.
We have served as the auditor of one or more investment companies advised by ALPS Advisors, Inc. since 2013.
COHEN & COMPANY, LTD.
Cleveland, Ohio
December 27, 2024
ALPS | CoreCommodity Natural Resources ETF
| Additional Information | October 31, 2024 (Unaudited) |
1. TAX INFORMATION (UNAUDITED)
The Fund will notify shareholders in early 2025 of amounts paid to them by the Fund, if any, during the calendar year 2024.
ALPS | CoreCommodity Natural Resources ETF
Changes in and Disagreements with Accountants for Open-End Management Investment Companies | October 31, 2024 (Unaudited) |
Not applicable for this reporting period.
ALPS | CoreCommodity Natural Resources ETF
Proxy Disclosures for Open-End Management Investment Companies | October 31, 2024 (Unaudited) |
Not applicable for this reporting period.
ALPS | CoreCommodity Natural Resources ETF
Remuneration Paid to Directors, Officers, and Others of Open-End Management Investment Companies | October 31, 2024 (Unaudited) |
The following chart provides certain information about the Trustee fees paid by the Trust for the fiscal year ended October 31, 2024:
| | | Aggregate Regular
Compensation From the Trust | | | Aggregate Special Compensation
from the Trust | | | Total Compensation from the Trust | |
| Mary K. Anstine | | $ | 191,500 | | | $ | – | | | $ | 191,500 | |
| Jeremy W. Deems | | | 200,500 | | | | – | | | | 200,500 | |
| Jerry G. Rutledge | | | 176,500 | | | | – | | | | 176,500 | |
| Michael “Ross” Shell | | | 197,500 | | | | – | | | | 197,500 | |
| Edmund J. Burke | | | 176,500 | | | | – | | | | 176,500 | |
| Total | | $ | 942,500 | | | $ | – | | | $ | 942,500 | |
Officers who are employed by the Adviser receive no compensaton or expense reimbursement from the Trust.
Pursuant to the Fund's unitary fee arrangements, the Fund does not pay any Trustee fees.
ALPS | CoreCommodity Natural Resources ETF
Statement Regarding Basis for
Approval of Investment Advisory Contract | October 31, 2024 (Unaudited) |
In anticipation of and as part of the process to consider the approval of the investment advisory agreement with ALPS Advisors, Inc. (“AAI”) with respect to the ALPS | CoreCommodity Natural Resources ETF (the “CoreCommodity ETF”) and the sub-advisory agreement with CoreCommodity Management, LLC (the “Sub-Adviser” or “CoreCommodity”) with respect to the CoreCommodity ETF (the “Advisory Agreements”), legal counsel to the Independent Trustees requested certain information from AAI and the Sub-Adviser. In response to these requests, the Board of Trustees (the “Board” or the “Trustees”) received reports from AAI and the Sub-Adviser that addressed specific factors to be considered by the Board. The Board also received from independent legal counsel memoranda regarding the Board’s responsibilities pertaining to the approval of advisory contracts. Further, the Board met on March 12, 2024 with representatives of AAI and the Sub-Adviser and discussed the services the firms provided pursuant to the Advisory Agreements, as well as the information they provided.
During the review process, the Board noted certain instances where clarification or follow-up was appropriate and others where the Board determined that further clarification or follow-up was not necessary. In those instances where clarification or follow-up was requested, the Board determined that in each case either information responsive to its requests had been provided, or where any request was outstanding in whole or in part, given the totality of the information provided with respect to the agreements, the Board had received sufficient information to renew and approve the Advisory Agreements.
In approving AAI as the CoreCommodity ETF’s investment adviser and the Sub-Adviser as the CoreCommodity ETF’s sub-adviser, and the fees to be charged under the Advisory Agreements, the Trustees concluded that no single factor reviewed by the Trustees was identified by the Trustees to be determinative as the principal factor in whether to approve such agreements. Further, the Independent Trustees were advised by independent legal counsel throughout the process. The following summary does not identify all the matters considered by the Board, but provides a summary of the principal matters the Board considered.
In renewing and approving the investment advisory agreement with AAI and the investment sub-advisory agreement with the Sub-Adviser, the Trustees, including the Independent Trustees, considered the following factors with respect to the CoreCommodity ETF:
Investment Advisory and Sub-Advisory Fee Rate: The Trustees reviewed and considered the contractual annual advisory fee rate to be paid by the Trust, on behalf of the CoreCommodity ETF, of 0.39% of such Fund’s daily average net assets, to AAI, in light of the extent and quality of the advisory services to be provided by AAI to the CoreCommodity ETF. The Trustees also considered information regarding compensation paid to affiliates of AAI under other agreements, such as the Fund Accounting and Administration Agreement with ALPS. The Trustees also considered the contractual annual sub-advisory fees to be paid by AAI to CoreCommodity of 0.25% of the CoreCommodity ETF’s daily average net assets allocated to CoreCommodity, in light of the extent and quality of the sub-advisory services to be provided by CoreCommodity to the CoreCommodity ETF. The Board also received and considered information provided by CoreCommodity with respect to its operating expense structure.
The Board received and considered information including a comparison of the CoreCommodity ETF’s contractual advisory fee rate with those of funds in the peer group as selected by an independent provider of investment company data (the “Data Provider”). The Trustees noted that the proposed contractual advisory fee rate of the CoreCommodity ETF was below the Data Provider peer group median rate.
Total Net Expense Ratios: The Trustees further reviewed and considered the proposed total net expense ratio of 0.39% of the CoreCommodity ETF. The Trustees noted that the total net expense ratio of the CoreCommodity ETF was below than the Data Provider peer group median ratio.
Nature, Extent, and Quality of the Services under the Investment Advisory Agreement: The Trustees received and considered information regarding the nature, extent, and quality of services to be provided to the CoreCommodity ETF under the CoreCommodity ETF Agreements. The Trustees reviewed certain background materials supplied by AAI and CoreCommodity in their presentations, including their Forms ADV.
The Trustees reviewed and considered AAI’s and CoreCommodity’s investment advisory personnel, their history as asset managers and their performance, and the amount of assets currently under management by AAI and CoreCommodity and their affiliated entities. The Trustees also reviewed the research and decision-making processes utilized by AAI and CoreCommodity, including the proposed methods adopted to seek to achieve compliance with the proposed investment objective, policies, and restrictions of the CoreCommodity ETF.
The Trustees considered the background and experience of AAI’s and CoreCommodity’s management in connection with the CoreCommodity ETF, including reviewing the qualifications, backgrounds, and responsibilities of the management team that would be primarily responsible for the day-to-day portfolio management of the CoreCommodity ETF and the extent of the resources that would be devoted to research and analysis of actual and potential investments.
The Trustees also reviewed, among other things, AAI’s and CoreCommodity’s Codes of Ethics.
ALPS | CoreCommodity Natural Resources ETF
Statement Regarding Basis for
Approval of Investment Advisory Contract | October 31, 2024 (Unaudited) |
Performance: The Trustees noted that since the CoreCommodity ETF has not yet begun operations, there is no performance to be reviewed or analyzed at this time. The Trustees further considered the reputation of CoreCommodity’s personnel generally and its investment techniques, risk management controls, and decision-making processes.
Comparable Accounts: The Trustees noted that neither AAI nor CoreCommodity currently manages other accounts with a similar investment strategy to the CoreCommodity ETF.
Profitability: The Trustees received and considered the projected profitability analyses prepared by AAI and CoreCommodity based on the fees to be paid under the Investment Advisory Agreement with AAI, with respect to the CoreCommodity ETF. The Trustees considered the profits, if any, anticipated to be realized by AAI in connection with the operation of the CoreCommodity ETF.
Economies of Scale: The Trustees considered whether economies of scale in the provision of services to the CoreCommodity ETF would be passed along to the shareholders under the agreement.
Other Benefits to the Adviser and Sub-Adviser: The Trustees reviewed and considered any other incidental benefits to be derived by AAI and CoreCommodity from their relationships with the CoreCommodity ETF, including whether soft dollar arrangements would be used.
The Trustees, including all of the Independent Trustees, concluded that:
| · | the contractual advisory fee rate of the CoreCommodity ETF was below the Data Provider peer group median; |
| · | the total net expense ratio of the CoreCommodity ETF was below the Data Provider peer group median; |
| · | the nature, extent, and quality of services to be rendered by AAI and CoreCommodity under the Investment Advisory Agreement with respect to the CoreCommodity ETF were adequate; |
| · | since the CoreCommodity ETF has not yet begun operations, there was no performance to be reviewed or analyzed at this time; |
| · | that neither AAI nor CoreCommodity currently manages other accounts with a similar investment strategy to the CoreCommodity ETF; |
| · | since the CoreCommodity ETF was not yet in existence, no profit had been realized by AAI or CoreCommodity in connection with the operation of the CoreCommodity ETF; and |
| · | there were no material economies of scale or other incidental benefits accruing to AAI or CoreCommodity in connection with their relationships with the CoreCommodity ETF. |
Based on the Trustees’ deliberations and their evaluation of the information described above, the Trustees, including all of the Independent Trustees, concluded that AAI’s and CoreCommodity’s compensation for investment advisory and sub-advisory services is consistent with the best interests of the CoreCommodity ETF and its shareholders.

Item 8. Changes in and Disagreements with Accountants for Open-End Management Investment Companies.
Any changes in and disagreements with accountants are filed under Item 7 of this Form.
Item 9. Proxy Disclosures for Open-End Management Investment Companies.
Not applicable.
Item 10. Remuneration Paid to Directors, Officers, and Others of Open-End Management Investment Companies.
Any remunerations paid are filed under Item 7 of this Form.
Item 11. Statement Regarding Basis for Approval of Investment Advisory Contract.
Statement Regarding Basis for Approval of Investment Advisory Contract is included as part of the Financial Statements and Financial Highlights filed under Item 7 of this Report.
Item 12. Disclosure of Proxy Voting Policies and Procedures for Closed-End Management Investment Companies.
Not applicable.
Item 13. Portfolio Managers of Closed-End Management Investment Companies.
Item 14. Purchases of Equity Securities by Closed-End Management Investment Company and Affiliated Purchasers.
Not applicable.
Item 15. Submission of Matters to a Vote of Security Holders.
There have been no material changes to the procedures by which shareholders may recommend nominees to the Registrant’s Board of Trustees, where those changes were implemented after the Registrant last provided disclosure in response to the requirements of Item 407(c)(2)(iv) of Regulation S-K, or this Item.
Item 16. Controls and Procedures.
| (a) | The Registrant’s principal executive officer and principal financial officer have concluded that the Registrant’s disclosure controls and procedures (as defined in Rule 30a-3(c) under the Investment Company Act of 1940, as amended) are effective based on their evaluation of these controls and procedures as of a date within 90 days of the filing date of this report. |
| (b) | There was no change in the Registrant’s internal control over financial reporting (as defined in Rule 30a-3(d) under the Investment Company Act of 1940, as amended) during the period covered by this report that has materially affected, or is reasonably likely to materially affect, the Registrant’s internal control over financial reporting. |
Item 17. Disclosure of Securities Lending Activities for Closed-End Management Investment Companies.
Not applicable.
Item 18. Recovery of Erroneously Awarded Compensation.
Item 19. Exhibits.
SIGNATURES
Pursuant to the requirements of the Securities Exchange Act of 1934 and the Investment Company Act of 1940, the Registrant has duly caused this report to be signed on its behalf by the undersigned, thereunto duly authorized.
FINANCIAL INVESTORS TRUST
| By: | /s/ Lucas Foss | |
| Lucas Foss (Principal Executive Officer) | |
| President | |
| | | |
| Date: | January 7, 2025 | |
Pursuant to the requirements of the Securities Exchange Act of 1934 and the Investment Company Act of 1940, this report has been signed below by the following persons on behalf of the Registrant and in the capacities and on the dates indicated.
FINANCIAL INVESTORS TRUST
| By: | /s/ Lucas Foss | |
| Lucas Foss (Principal Executive Officer) | |
| President | |
| | | |
| Date: | January 7, 2025 | |
| By: | /s/ Jennell Panella | |
| Jennell Panella (Principal Financial Officer) | |
| Treasurer | |
| | | |
| Date: | January 7, 2025 | |
7