UNITED STATES
SECURITIES AND EXCHANGE COMMISSION
Washington, D.C. 20549
FORM N-CSR
CERTIFIED SHAREHOLDER REPORT OF REGISTERED
MANAGEMENT INVESTMENT COMPANIES
Investment Company Act file number: 811-08194
FINANCIAL INVESTORS TRUST
(Exact name of registrant as specified in charter)
1290 Broadway, Suite 1000, Denver, Colorado 80203
(Address of principal executive offices) (Zip code)
Michael Lawlor, Esq., Secretary
Financial Investors Trust
1290 Broadway, Suite 1000
Denver, Colorado 80203
(Name and address of agent for service)
Registrant’s telephone number, including area code: 303-623-2577
Date of fiscal year end: October 31
Date of reporting period: November 1, 2022 - October 31, 2023
Item 1. Reports to Stockholders.
| (a) | Report of Shareholders. |
Table of Contents
| Disclosure of Fund Expenses | 1 |
ALPS | CoreCommodity Management CompleteCommodities® Strategy Fund | |
| Management Commentary | 4 |
| Performance Update | 6 |
| Consolidated Statement of Investments | 8 |
| Consolidated Statement of Assets and Liabilities | 14 |
| Consolidated Statement of Operations | 15 |
| Consolidated Statements of Changes in Net Assets | 16 |
| Consolidated Financial Highlights | 17 |
| ALPS | Kotak India ESG Fund | |
| Management Commentary | 21 |
| Performance Update | 23 |
| Statement of Investments | 25 |
| Statement of Assets and Liabilities | 27 |
| Statement of Operations | 28 |
| Statements of Changes in Net Assets | 29 |
| Financial Highlights | 30 |
| ALPS Global Opportunity Fund | |
| Management Commentary | 35 |
| Performance Update | 37 |
| Statement of Investments | 40 |
| Statement of Assets and Liabilities | 43 |
| Statement of Operations | 44 |
| Statements of Changes in Net Assets | 45 |
| Financial Highlights | 46 |
| RiverFront Asset Allocation Growth & Income | |
| Management Commentary | 51 |
| Performance Update | 52 |
| Statement of Investments | 54 |
| Statement of Assets and Liabilities | 55 |
| Statement of Operations | 56 |
| Statements of Changes in Net Assets | 57 |
| Financial Highlights | 58 |
| Notes to Financial Statements | 62 |
| Report of Independent Registered Public Accounting Firm | 82 |
| Additional Information | 83 |
| Board Considerations Regarding Approval of Investment Advisory Agreement and Investment Sub-Advisory Agreements | 84 |
| Liquidity Risk Management Program | 91 |
| Trustees and Officers | 92 |
| Privacy Policy | 95 |
alpsfunds.com
Disclosure of Fund Expenses
October 31, 2023 (Unaudited)
Example. As a shareholder of the Funds, you incur two types of costs: (1) transaction costs, including applicable sales charges (loads) and redemption fees; and (2) ongoing costs, including management fees, distribution and service (12b-1) fees, shareholder service fees and other Fund expenses. The following examples are intended to help you understand your ongoing costs (in dollars) of investing in the Funds and to compare these costs with the ongoing costs of investing in other mutual funds. The examples are based on an investment of $1,000 invested on May 1, 2023 and held until October 31, 2023.
Actual Expenses. The first line under each class in the table below provides information about actual account values and actual expenses. You may use the information in this line, together with the amount you invested, to estimate the expenses that you paid over the period. Simply divide your account value by $1,000 (for example, an $8,600 account value divided by $1,000 = 8.6), then multiply the result by the number in the first line under the heading “Expenses Paid During Period May 1, 2023 - October 31, 2023” to estimate the expenses you paid on your account during this period.
Hypothetical Example for Comparison Purposes. The second line under each class in the table below provides information about hypothetical account values and hypothetical expenses based on the Funds’ actual expense ratio and an assumed rate of return of 5% per year before expenses, which is not the Funds’ actual return. The hypothetical account values and expenses may not be used to estimate the actual ending account balance or expenses you paid for the period. You may use this information to compare the ongoing costs of investing in the Funds and other mutual funds. To do so, compare these 5% hypothetical examples with the 5% hypothetical examples that appear in the shareholder reports of the other funds.
Please note that the expenses shown in the table are meant to highlight your ongoing costs only and do not reflect any transactional costs, such as sales charges or redemption fees. Therefore, the second line under each class in the table below is useful in comparing ongoing costs only, and will not help you determine the relative total costs of owning different funds. In addition, if these transactional costs were included, your costs would have been higher.
Disclosure of Fund Expenses
October 31, 2023 (Unaudited)
| | | Beginning Account Value
May 1, 2023 | | | Ending Account Value
October 31, 2023 | | | Expense Ratio(a) | | | Expenses Paid
During Period
May 1, 2023 -
October 31, 2023(b) | |
| ALPS | CoreCommodity Management CompleteCommodities® Strategy Fund(c) | | | | | | | | | | | | | | | | |
| Investor Class | | | | | | | | | | | | | | | | |
| Actual | | $ | 1,000.00 | | | $ | 1,002.70 | | | | 1.29 | % | | $ | 6.51 | |
| Hypothetical (5% return before expenses) | | $ | 1,000.00 | | | $ | 1,018.70 | | | | 1.29 | % | | $ | 6.56 | |
| Class A | | | | | | | | | | | | | | | | |
| Actual | | $ | 1,000.00 | | | $ | 1,002.70 | | | | 1.17 | % | | $ | 5.91 | |
| Hypothetical (5% return before expenses) | | $ | 1,000.00 | | | $ | 1,019.31 | | | | 1.17 | % | | $ | 5.96 | |
| Class C | | | | | | | | | | | | | | | | |
| Actual | | $ | 1,000.00 | | | $ | 998.50 | | | | 2.02 | % | | $ | 10.18 | |
| Hypothetical (5% return before expenses) | | $ | 1,000.00 | | | $ | 1,015.02 | | | | 2.02 | % | | $ | 10.26 | |
| Class I | | | | | | | | | | | | | | | | |
| Actual | | $ | 1,000.00 | | | $ | 1,002.60 | | | | 1.21 | % | | $ | 6.11 | |
| Hypothetical (5% return before expenses) | | $ | 1,000.00 | | | $ | 1,019.11 | | | | 1.21 | % | | $ | 6.16 | |
| ALPS | Kotak India ESG Fund | | | | | | | | | | | | | | | | |
| Investor Class | | | | | | | | | | | | | | | | |
| Actual | | $ | 1,000.00 | | | $ | 1,064.60 | | | | 1.40 | % | | $ | 7.29 | |
| Hypothetical (5% return before expenses) | | $ | 1,000.00 | | | $ | 1,018.15 | | | | 1.40 | % | | $ | 7.12 | |
| Class A | | | | | | | | | | | | | | | | |
| Actual | | $ | 1,000.00 | | | $ | 1,064.70 | | | | 1.28 | % | | $ | 6.66 | |
| Hypothetical (5% return before expenses) | | $ | 1,000.00 | | | $ | 1,018.75 | | | | 1.28 | % | | $ | 6.51 | |
| Class C | | | | | | | | | | | | | | | | |
| Actual | | $ | 1,000.00 | | | $ | 1,061.30 | | | | 2.00 | % | | $ | 10.39 | |
| Hypothetical (5% return before expenses) | | $ | 1,000.00 | | | $ | 1,015.12 | | | | 2.00 | % | | $ | 10.16 | |
| Class I | | | | | | | | | | | | | | | | |
| Actual | | $ | 1,000.00 | | | $ | 1,066.40 | | | | 1.00 | % | | $ | 5.21 | |
| Hypothetical (5% return before expenses) | | $ | 1,000.00 | | | $ | 1,020.16 | | | | 1.00 | % | | $ | 5.09 | |
| Class II | | | | | | | | | | | | | | | | |
| Actual | | $ | 1,000.00 | | | $ | 1,067.70 | | | | 0.75 | % | | $ | 3.91 | |
| Hypothetical (5% return before expenses) | | $ | 1,000.00 | | | $ | 1,021.42 | | | | 0.75 | % | | $ | 3.82 | |
| ALPS Global Opportunity Fund | | | | | | | | | | | | | | | | |
| Investor Class | | | | | | | | | | | | | | | | |
| Actual | | $ | 1,000.00 | | | $ | 1,003.60 | | | | 1.61 | % | | $ | 8.13 | |
| Hypothetical (5% return before expenses) | | $ | 1,000.00 | | | $ | 1,017.09 | | | | 1.61 | % | | $ | 8.19 | |
| Class A | | | | | | | | | | | | | | | | |
| Actual | | $ | 1,000.00 | | | $ | 1,003.60 | | | | 1.60 | % | | $ | 8.08 | |
| Hypothetical (5% return before expenses) | | $ | 1,000.00 | | | $ | 1,017.14 | | | | 1.60 | % | | $ | 8.13 | |
| Class C | | | | | | | | | | | | | | | | |
| Actual | | $ | 1,000.00 | | | $ | 1,000.00 | | | | 2.25 | % | | $ | 11.34 | |
| Hypothetical (5% return before expenses) | | $ | 1,000.00 | | | $ | 1,013.86 | | | | 2.25 | % | | $ | 11.42 | |
| Class I | | | | | | | | | | | | | | | | |
| Actual | | $ | 1,000.00 | | | $ | 1,006.90 | | | | 1.25 | % | | $ | 6.32 | |
| Hypothetical (5% return before expenses) | | $ | 1,000.00 | | | $ | 1,018.90 | | | | 1.25 | % | | $ | 6.36 | |
| Class R | | | | | | | | | | | | | | | | |
| Actual | | $ | 1,000.00 | | | $ | 1,002.40 | | | | 1.75 | % | | $ | 8.83 | |
| Hypothetical (5% return before expenses) | | $ | 1,000.00 | | | $ | 1,016.38 | | | | 1.75 | % | | $ | 8.89 | |
Disclosure of Fund Expenses
October 31, 2023 (Unaudited)
| | | Beginning Account Value
May 1, 2023 | | | Ending Account Value
October 31, 2023 | | | Expense
Ratio(a) | | | Expenses Paid
During Period
May 1, 2023 -
October 31, 2023(b) | |
| RiverFront Asset Allocation Growth & Income | | | | | | | | | | | | | | | | |
| Investor Class | | | | | | | | | | | | | | | | |
| Actual | | $ | 1,000.00 | | | $ | 967.40 | | | | 0.50 | % | | $ | 2.48 | |
| Hypothetical (5% return before expenses) | | $ | 1,000.00 | | | $ | 1,022.68 | | | | 0.50 | % | | $ | 2.55 | |
| Class A | | | | | | | | | | | | | | | | |
| Actual | | $ | 1,000.00 | | | $ | 968.20 | | | | 0.50 | % | | $ | 2.48 | |
| Hypothetical (5% return before expenses) | | $ | 1,000.00 | | | $ | 1,022.68 | | | | 0.50 | % | | $ | 2.55 | |
| Class C | | | | | | | | | | | | | | | | |
| Actual | | $ | 1,000.00 | | | $ | 964.00 | | | | 1.25 | % | | $ | 6.19 | |
| Hypothetical (5% return before expenses) | | $ | 1,000.00 | | | $ | 1,018.90 | | | | 1.25 | % | | $ | 6.36 | |
| Class I | | | | | | | | | | | | | | | | |
| Actual | | $ | 1,000.00 | | | $ | 969.30 | | | | 0.25 | % | | $ | 1.24 | |
| Hypothetical (5% return before expenses) | | $ | 1,000.00 | | | $ | 1,023.95 | | | | 0.25 | % | | $ | 1.28 | |
| (a) | Annualized, based on the Fund's most recent fiscal half year expenses. |
| (b) | Expenses are equal to the Fund's annualized expense ratio multiplied by the average account value over the period, multiplied by the number of days in the most recent fiscal half year (184), divided by 365. |
| (c) | Includes expenses of the CoreCommodity Management Cayman Commodity Fund Ltd. (wholly-owned subsidiary), exclusive of the subsidiary's management fee. |
ALPS | CoreCommodity Management
CompleteCommodities® Strategy Fund
| Management Commentary | October 31, 2023 (Unaudited) |
The twelve-month period ending on October 31, 2023 produced negative returns for commodities as measured by the diversified Bloomberg Commodity Total Return Index (“BCOM”), down 2.97%. The ALPS|CoreCommodity Management Complete Commodities® Strategy Fund (“I” Shares – “JCRIX” or the “Fund”) delivered a net negative return of -4.87% (JCRAX was down 5.01%, JCCSX was down 10.08% at MOP, and JCRCX was down 6.45% with CDSC).
The Fund underperformed its benchmark, the Bloomberg Commodity Total Return Index, by 190 basis points during the period. The Fund employs a strategy that combines an actively managed portfolio of commodity futures (collateralized by nominal and inflation-adjusted Treasuries), commodity equities, and physical commodity ETFs. On average, for the past twelve months, the Fund allocated approximately 79% of its assets toward commodity futures-related investments and approximately 21% of its assets toward commodity equities. The Fund was more than 99% invested at the end of the period.
The past twelve months ending in October 2023 was a period of two distinct halves for commodity prices. The first seven months or so through the end of May witnessed a significant retracement. Prices were led lower by a lackluster Chinese reopening, a banking crisis in the U.S., resilient energy supplies, and broad calls for a U.S. recession. The last several months however experienced a modest recovery, bolstered by falling inflation, severe weather, ongoing supply challenges among key commodity producers, and steady Chinese stimulus. From a geopolitical standpoint, the environment was tense for most of the year, only to get worse with the Israel- Hamas conflict in October 2023. In general, poor performance in the first half of the period seems to have stabilized. Certain macroeconomic factors that posed serious headwinds in the past are now shifting towards a more neutral or supportive phase for commodity prices.
During the timeframe under review, the Fund was underweight agriculture relative to the BCOM by 2.0% on average. The Fund’s agriculture sector underperformed the respective BCOM sub-index by 1.5%, -2.1% versus -0.6%. A higher concentration of certain soft commodities such as orange juice, which advanced 108.3%, cocoa, which advanced 81.8%, and cotton, which advanced 24.1%, added to performance. Equatorial crops benefited the most from extreme weather and the advent of a new El Nino weather pattern. In contrast, certain staple crops including wheat, down 40.7%, and corn, down 16.2%, were brought lower as concerns over disruption in the Black Sea dissipated and U.S. exports became less competitive in a high-dollar environment. The inclusion of agriculture equities was detractive, underperforming the BCOM sub-index by more than 12%. On a weighted basis, the sector detracted 0.5% from alpha, gross of fees.
The Fund was underweight livestock relative to the BCOM by -1.5% on average. The Fund’s livestock holdings underperformed the respective BCOM sub-index by 9.7%, -1.0% versus 8.7%. Livestock producers were down -10.8%, constrained by rising production costs and extreme heat. Deferred positioning was negative in cattle
futures but proved beneficial in hog futures. On a weighted basis, the sector detracted 0.5% from alpha, gross of fees.
The Fund was overweight energy relative to the BCOM by 4.0% on average during the period. The Fund’s energy holdings outperformed the respective BCOM sub-index by 4.2%, -14.7% versus -18.9%. The inclusion of energy equities was beneficial, outpacing the benchmark by nearly 20%. The Fund’s energy futures also managed to outpace the benchmark, largely due to curve positioning in WTI Crude Oil, which advanced 3.5%. High levels of backwardation within the petroleum complex contributed to total return, as did self-imposed supply restrictions by the OPEC+ cartel. Natural gas, down 63.3% for the period, was a leading detractor. Gas prices were damaged by an unusually warm winter season, resilient associated gas production out of the Permian basin, and poor European industrial demand. On a weighted basis, the sector as a whole contributed 0.6% to alpha, gross of fees.
The Fund was overweight industrial metals relative to the BCOM by 2.2% on average. The Fund’s industrial metal holdings outperformed the respective BCOM sub-index by 2.4%, 4.3% versus 1.9%. Despite an initial surge on the back of relaxed Chinese zero-Covid restrictions, the sector faced a number of severe headwinds over the past year including rampant dollar appreciation and a widescale inventory destocking campaign. Higher interest rates and their impact on construction/manufacturing activity were also detrimental. Nonetheless, the inclusion of industrial metal equities was particularly beneficial, rising 13.7%. Curve positioning in lead, down 4.4% for the period, and an overweight to copper, up 12.2% for the period, were also supportive. On a weighted basis, the sector contributed 0.5% to alpha, gross of fees.
The Fund was underweight precious metals relative to the BCOM by 2.8% on average. The Fund’s precious metal holdings underperformed the respective BCOM sub-index by 0.7%, 20.2% versus 20.9%. An underweight to gold, which advanced 20.9% for the period, detracted from performance; however, overweights to silver, up 20.2% for the period, and platinum, up 3.9% for the period, helped to offset any negative effect. Despite a general rise in real interest rates, gold benefitted from safe-haven demand as well as near-record central bank purchases. Silver was lifted by deficit conditions and growing end-use from various renewable applications. Precious metal equities reduced overall performance, underperforming the BCOM sub-index by 6.6%. On a weighted basis, the sector detracted 1.0% from alpha, gross of fees.
The Fund’s top equity holdings at the end of October 2023 included Cal-Maine Foods Inc (CALM US) -9.6% YTD, Archer-Daniels-Midland Co (ADM US) -21.6% YTD, Gold Fields Ltd (GFI US) 30.4% YTD, Northern Star Resources Ltd (NST AU) 9.7% YTD, K+S AG (SDF GR) -8.5% YTD, Ingredion Inc (INGR US) -2.3% YTD, Kinross Gold Corp (KGC US) 30.1% YTD, B2Gold Corp (BTG US) -6.3% YTD, Alamos Gold Inc (AGI US) 23.2% YTD, West Fraser Timber Co Ltd (WFG CN) -3.1% YTD.
ALPS | CoreCommodity Management
CompleteCommodities® Strategy Fund
| Management Commentary | October 31, 2023 (Unaudited) |
U.S. Treasury Inflation Protected Securities (“TIPS”) and nominal U.S. Treasuries are held by the Fund to invest excess cash and are used as collateral for commodity futures-related investments held in the Cayman Island subsidiary. Over the previous year, rates rose significantly to combat widespread inflation. The yield on U.S. 10- year notes rose from roughly 4.0% to 4.9% in twelve months’ time. At the end of the period, the average maturity of the Fund’s collateral was approximately 0.3 years.
The previous year marked what we believe to be a brief pause within a larger multi-year uptrend for the commodity asset class. These gyrations are normal (at times, healthy) within the context of a longer capital cycle which usually takes many years to transition between shortage and abundance. As it stands, shortages are pervasive at a time when demand for everything from natural gas to corn to copper is growing rapidly. Unfortunately, supplies are failing to catch up, partially due to a decade of underinvestment and partially due to other market forces that are making the production environment so difficult (i.e., higher costs of production, labor tightness, regulatory and environmental restrictions, etc.). Altogether, we believe the fundamental data is relaying several important truths: production costs have risen alongside general inflation, suppliers are prevented or unwilling to invest the capital that is needed, and price has retraced to attractive valuations.
Bob Hyman
Portfolio Manager
CoreCommodity Management, LLC
Past performance if not indicative of future results. “Bloomberg®” and “Bloomberg Commodity IndexSM” are service marks of Bloomberg L.P. (“Bloomberg”) as the case may be. Source for all Index data: Bloomberg L.P. Global. Commodity Sectors and individual commodities are represented by the respective Bloomberg Commodity Sub-Index. This document does not constitute an offer of any commodities, securities or investment advisory services. Any such offer may be made only by means of a disclosure document or similar materials which contain a description of material terms and risks. All expressions of opinion are subject to change without notice in reaction to shifting market conditions. Data contained herein from third-party providers is obtained from what are considered reliable sources. However, its accuracy, completeness or reliability cannot be guaranteed. The economic statistics presented herein are subject to revision by the agencies that issue them. CoreCommodity Management assumes no obligation to provide this information in the future or to advise of changes in this information. Any indices and other financial benchmarks shown are provided for illustrative purposes only, are unmanaged, reflect reinvestment of income and do not reflect the impact of advisory fees. Investors cannot invest directly in an index. All investments are subject to risk.
The views of the authors and information discussed in this commentary are as of the date of publication, are subject to change, and may not reflect the writer's current views. The views expressed are those of the authors only, and represent an assessment of market conditions at a specific point in time, are opinions only and should not be relied upon as investment advice regarding a particular investment or markets in
general. Such information does not constitute a recommendation to buy or sell specific securities or investment vehicles. It should not be assumed that any investment will be profitable or will equal the performance of the fund(s) or any securities or any sectors mentioned in this letter. The subject matter contained in this letter has been derived from several sources believed to be reliable and accurate at the time of compilation. Neither ALPS, Advisors, Inc., CoreCommodity Management, LLC, nor the Fund accepts any liability for losses either direct or consequential caused by the use of this information.
Indices do not reflect deductions for fees, expenses, or taxes.
An investor may not invest directly in an index.
Diversification cannot guarantee gain or prevent losses.
Bob Hyman is a registered representative of ALPS Distributors, Inc.
ALPS Portfolio Solutions Distributor, Inc., ALPS Distributors, Inc. and ALPS Advisors Inc. are affiliated.
ALPS | CoreCommodity Management
CompleteCommodities® Strategy Fund
| Performance Update | October 31, 2023 (Unaudited) |
Performance of $10,000 Initial Investment (as of October 31, 2023)
Comparison of change in value of a $10,000 investment

The chart above represents historical performance of a hypothetical investment of $10,000 in the Fund over the past 10 years. Past performance does not guarantee future results. This chart does not reflect the deduction of taxes that a shareholder would pay on Fund distributions or the redemption of Fund shares.
Average Annual Total Returns (as of October 31, 2023)
| | 1 Year | 3 Year | 5 Year | 10 Year | Since Inception^ | Total Expense Ratio* | What You Pay* |
| Investor# (NAV) | -5.01% | 17.88% | 6.48% | 0.45% | 1.47% | 1.40% | 1.40% |
| Class A (NAV) | -4.88% | 17.90% | 6.53% | 0.47% | 1.49% | 1.40% | 1.40% |
| Class A (LOAD) | -10.08% | 15.72% | 5.33% | -0.10% | 1.06% |
| Class C (NAV) | -5.58% | 17.11% | 5.79% | -0.20% | 0.84% | 2.00% | 2.00% |
| Class C (LOAD) | -6.45% | 17.11% | 5.79% | -0.20% | 0.84% |
| Class I | -4.87% | 18.13% | 6.74% | 0.70% | 1.74% | 1.08% | 1.08% |
| Refinitiv/CoreCommodity CRB Commodity Total Return Index1 | 7.83% | 27.46% | 10.07% | 1.35% | 1.65% | | |
| Bloomberg Commodity TR Index2 | -2.97% | 15.79% | 6.65% | -0.57% | -0.35% | | |
Performance data quoted represents past performance. Past performance does not guarantee future results. Investment return and principal value of an investment will fluctuate so that an investor's shares, when sold or redeemed, may be worth more or less than the original cost. Current performance data may be higher or lower than actual data quoted. For the most current month-end performance data, please call 1-866-759-5679.
Maximum Offering Price (MOP) for Class A shares includes the Fund’s maximum sales charge of 5.50%. Performance shown at NAV does not include these sales charges and would have been lower had it been taken into account. If you invest $ 1 million or more, either as a lump sum or through the Fund’s accumulation or letter of intent programs, you can purchase Class A shares without an initial sales charge (load). A Contingent Deferred Sales Charge (“CDSC”) of 1.00% may apply to Class C shares redeemed within the first 12 months after a purchase, and on Class A shares redeemed within the first 18 months after a purchase in excess of $1 million.
ALPS | CoreCommodity Management
CompleteCommodities® Strategy Fund
| Performance Update | October 31, 2023 (Unaudited) |
Performance shown for Class A shares prior to June 12, 2018 reflects the historical performance of the Fund’s Investor shares, calculated using the fees and expenses of Class A shares.
| 1 | Refinitiv / CoreCommodity CRB Index: a basket of 19 commodities, including energy contracts, agriculture, precious metals, and industrial metals, the Index acts as a representative indicator of commodity markets. An investor may not invest directly in the index. |
| 2 | Bloomberg Commodity Index: an unmanaged index used as a measurement of change in commodity market conditions based on the performance of a basket of different commodities. An investor may not invest directly in the index. |
| ^ | Fund Inception date of June 29, 2010 for Investor Class and Classes C and I; Fund Inception date of June 12, 2018 for Class A. |
| * | Please see the prospectus dated February 28, 2023 for additional information. Pursuant to a written agreement (the “Expense Agreement”), the Sub-Adviser has agreed to waive and/or reimburse fees or expenses in order to limit Total Annual Fund operating expenses after fee waiver/expense reimbursements (excluding Distribution and Service (12b-1) Fees, Shareholder Services Fees, Acquired Fund Fees and Expenses, brokerage expenses, interest expenses, taxes, and extraordinary expenses) to 1.05% (for Investor Class, Class A shares and Class C shares) and 1.15% (for Class I shares) of average daily net assets through February 28, 2024. |
| # | Prior to December 1, 2017, Investor Class was known as Class A. |
Investments in securities of Master Limited Partnerships (MLPs) involve risks that differ from an investment in common stock. MLPs are controlled by their general partners, which generally have conflicts of interest and limited fiduciary duties to the MLP, which may permit the general partner to favor its own interests over the MLPs. The benefit you are expected to derive from the Fund’s investment in MLPs depends largely on the MLPs being treated as partnerships for federal income tax purposes. As a partnership, an MLP has no federal income tax liability at the entity level. Therefore, treatment of one or more MLPs as a corporation for federal income tax purposes could affect the Fund’s ability to meet its investment objective and would reduce the amount of cash available to pay or distribute to you. Legislative, judicial, or administrative changes and differing interpretations, possibly on a retroactive basis, could negatively impact the value of an investment in MLPs and therefore the value of your investment in the Fund.
Investing in commodity-related securities involves risk and considerations not present when investing in more conventional securities. The Fund may be more susceptible to high volatility of commodity markets.
Derivatives generally are more sensitive to changes in economic or market conditions than other types of investments; this could result in losses that significantly exceed the Fund's original investment.
The table does not reflect the deduction of taxes that a shareholder would pay on Fund distributions or the redemption of Fund shares.
This Fund is not suitable for all investors, and is subject to investment risks, including possible loss of the principal amount invested.
There is no guarantee that the Fund will continue to hold any one particular security or stay invested in any one particular company. The composition of the Fund's top holdings is subject to change. Performance figures are historical and reflect the change in share price, reinvested distributions, changes in net asset value, sales charges and capital gains distributions, if any.
Not FDIC Insured – No Bank Guarantee – May Lose Value
Asset Type Allocation (as a % of Net Assets) †
| Government Bonds | 74.27% |
| Common Stocks | 19.29% |
| Master Limited Partnerships | 0.17% |
| Cash, Cash Equivalents, & Other Net Assets | 6.27% |
| Total | 100.00% |
| † | Holdings are subject to change, and may not reflect the current or future position of the portfolio. Table presents approximate values only. |
Industry Sector Allocation (as a % of Net Assets) ^
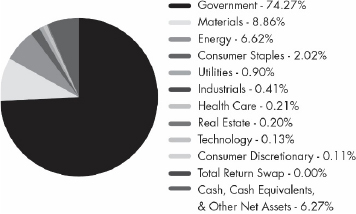
| ^ | Notional Value of Derivative Exposure included |
ALPS | CoreCommodity Management
CompleteCommodities® Strategy Fund
| Consolidated Statement of Investments | October 31, 2023 |
| | | Shares | | | Value
(Note 2) | |
| COMMON STOCKS (19.29%) | | | | | | | | |
| Australia (1.41%) | | | | | | | | |
| Allkem, Ltd.(a) | | | 259,065 | | | $ | 1,567,780 | |
| Beach Energy, Ltd. | | | 937,818 | | | | 919,126 | |
| BHP Group, Ltd. | | | 101,958 | | | | 2,878,123 | |
| BlueScope Steel, Ltd. | | | 182,448 | | | | 2,175,829 | |
| Champion Iron, Ltd. | | | 271,301 | | | | 1,225,348 | |
| Coronado Global Resources, Inc.(b)(c) | | | 888,401 | | | | 972,134 | |
| Evolution Mining, Ltd. | | | 212,323 | | | | 480,832 | |
| Fortescue Metals Group, Ltd. | | | 69,875 | | | | 988,450 | |
| IGO, Ltd. | | | 41,981 | | | | 253,257 | |
| Iluka Resources, Ltd. | | | 229,089 | | | | 1,052,134 | |
| Incitec Pivot, Ltd. | | | 460,296 | | | | 800,048 | |
| Liontown Resources, Ltd.(a) | | | 128,618 | | | | 131,358 | |
| Newcrest Mining, Ltd. | | | 73,188 | | | | 1,084,064 | |
| Nickel Industries, Ltd. | | | 987,973 | | | | 466,906 | |
| Northern Star Resources, Ltd. | | | 612,730 | | | | 4,543,722 | |
| Perseus Mining, Ltd. | | | 326,829 | | | | 353,487 | |
| Sandfire Resources NL(a) | | | 186,337 | | | | 705,670 | |
| South32, Ltd. | | | 1,248,951 | | | | 2,630,338 | |
| Woodside Energy Group, Ltd. | | | 17,900 | | | | 389,017 | |
| | | | | | | | 23,617,623 | |
| Austria (0.07%) | | | | | | | | |
| OMV AG | | | 15,850 | | | | 693,644 | |
| voestalpine AG | | | 18,655 | | | | 465,048 | |
| | | | | | | | 1,158,692 | |
| Brazil (0.08%) | | | | | | | | |
| Cia de Saneamento Basico do Estado | | | | | | | | |
| de Sao Paulo SABESP, ADR | | | 19,683 | | | | 227,142 | |
| Petroleo Brasileiro SA, Sponsored ADR | | | 23,698 | | | | 355,470 | |
| Vale SA, Sponsored ADR | | | 57,226 | | | | 784,568 | |
| | | | | | | | 1,367,180 | |
| Canada (3.82%) | | | | | | | | |
| Advantage Energy, Ltd.(a) | | | 125,100 | | | | 908,424 | |
| Agnico Eagle Mines, Ltd. | | | 10,337 | | | | 484,909 | |
| Agnico-Eagle Mines, Ltd. | | | 42,494 | | | | 1,993,012 | |
| Alamos Gold, Inc., Class A | | | 313,565 | | | | 3,881,935 | |
| Algoma Steel Group, Inc. | | | 187,216 | | | | 1,312,384 | |
| ARC Resources, Ltd. | | | 48,200 | | | | 775,440 | |
| B2Gold Corp. | | | 1,251,669 | | | | 4,042,891 | |
| Barrick Gold Corp. | | | 130,020 | | | | 2,077,719 | |
| Baytex Energy Corp. | | | 551,200 | | | | 2,384,857 | |
| Birchcliff Energy, Ltd. | | | 34,100 | | | | 188,358 | |
| Boralex, Inc., Class A | | | 35,100 | | | | 653,276 | |
| Canadian Natural Resources, Ltd. | | | 9,100 | | | | 577,859 | |
| Canadian Solar, Inc.(a) | | | 56,327 | | | | 1,125,413 | |
| Canfor Corp.(a) | | | 73,700 | | | | 753,608 | |
| Capstone Copper Corp.(a) | | | 228,000 | | | | 776,030 | |
| Cenovus Energy, Inc. | | | 56,400 | | | | 1,074,518 | |
| Centerra Gold, Inc. | | | 227,200 | | | | 1,155,046 | |
| Crescent Point Energy Corp. | | | 90,300 | | | | 724,093 | |
| Dundee Precious Metals, Inc. | | | 156,900 | | | | 1,028,463 | |
| Eldorado Gold Corp.(a) | | | 137,826 | | | | 1,489,899 | |
| | | Shares | | | Value
(Note 2) | |
| Canada (continued) | | | | | | | | |
| Equinox Gold Corp.(a) | | | 256,686 | | | $ | 1,129,418 | |
| First Majestic Silver Corp. | | | 70,099 | | | | 361,010 | |
| First Quantum Minerals, Ltd. | | | 6,300 | | | | 73,006 | |
| Franco-Nevada Corp. | | | 16,439 | | | | 1,998,160 | |
| Hudbay Minerals, Inc. | | | 315,200 | | | | 1,375,129 | |
| Imperial Oil, Ltd. | | | 1,800 | | | | 102,581 | |
| Innergex Renewable Energy, Inc. | | | 67,100 | | | | 413,221 | |
| Ivanhoe Mines, Ltd., Class A(a) | | | 39,800 | | | | 293,316 | |
| Kinross Gold Corp. | | | 789,404 | | | | 4,112,795 | |
| MEG Energy Corp.(a) | | | 43,500 | | | | 859,492 | |
| NexGen Energy, Ltd.(a) | | | 217,300 | | | | 1,311,557 | |
| Northland Power, Inc. | | | 127,800 | | | | 1,796,158 | |
| Nutrien, Ltd. | | | 29,800 | | | | 1,600,508 | |
| NuVista Energy, Ltd.(a) | | | 132,900 | | | | 1,288,989 | |
| Pan American Silver Corp. | | | 22,096 | | | | 322,823 | |
| Parex Resources, Inc. | | | 62,700 | | | | 1,201,778 | |
| Peyto Exploration & Development Corp. | | | 96,900 | | | | 1,020,184 | |
| PrairieSky Royalty, Ltd. | | | 56,500 | | | | 992,086 | |
| Sandstorm Gold, Ltd. | | | 195,495 | | | | 891,457 | |
| Suncor Energy, Inc. | | | 34,200 | | | | 1,107,570 | |
| Teck Resources, Ltd., Class B | | | 54,965 | | | | 1,942,463 | |
| Topaz Energy Corp. | | | 21,000 | | | | 321,038 | |
| Torex Gold Resources, Inc.(a) | | | 77,300 | | | | 745,268 | |
| Tourmaline Oil Corp. | | | 13,200 | | | | 698,003 | |
| Vermilion Energy, Inc. | | | 220,100 | | | | 3,175,916 | |
| West Fraser Timber Co., Ltd. | | | 56,100 | | | | 3,786,118 | |
| Wheaton Precious Metals Corp. | | | 46,801 | | | | 1,977,342 | |
| Whitecap Resources, Inc. | | | 122,100 | | | | 942,990 | |
| | | | | | | | 63,248,510 | |
| Chile (0.03%) | | | | | | | | |
| Sociedad Quimica y Minera de Chile SA, Sponsored ADR | | | 8,858 | | | | 428,727 | |
| | | | | | | | | |
| Denmark (0.27%) | | | | | | | | |
| FLSmidth & Co. A/S | | | 21,846 | | | | 818,247 | |
| Orsted AS(b)(c) | | | 37,606 | | | | 1,811,592 | |
| Vestas Wind Systems A/S | | | 83,683 | | | | 1,806,356 | |
| | | | | | | | 4,436,195 | |
| Finland (0.14%) | | | | | | | | |
| Metso Outotec Oyj | | | 159,987 | | | | 1,406,059 | |
| Outokumpu Oyj | | | 190,862 | | | | 782,157 | |
| | | | | | | | 2,188,216 | |
| France (0.06%) | | | | | | | | |
| TotalEnergies SE, ADR | | | 14,149 | | | | 942,323 | |
| | | | | | | | | |
| Germany (0.62%) | | | | | | | | |
| Bayer AG | | | 79,364 | | | | 3,414,426 | |
| Encavis AG | | | 44,088 | | | | 574,022 | |
| K+S AG | | | 270,074 | | | | 4,535,096 | |
| Nordex SE(a) | | | 73,304 | | | | 769,890 | |
| Salzgitter AG | | | 10,429 | | | | 259,542 | |
| SMA Solar Technology AG(a) | | | 7,899 | | | | 482,671 | |
See Notes to Financial Statements.
ALPS | CoreCommodity Management
CompleteCommodities® Strategy Fund
| Consolidated Statement of Investments | October 31, 2023 |
| | | | | | Value | |
| | | Shares | | | (Note 2) | |
| Germany (continued) | | | | | | | | |
| Suedzucker AG | | | 11,836 | | | $ | 179,089 | |
| thyssenkrupp AG | | | 17,747 | | | | 123,147 | |
| | | | | | | | 10,337,883 | |
| Great Britain (0.99%) | | | | | | | | |
| Anglo American PLC | | | 117,623 | | | | 2,997,261 | |
| Anglogold Ashanti PLC Sponsored | | | 105,457 | | | | 1,881,353 | |
| Atlantica Sustainable Infrastructure PLC | | | 66,880 | | | | 1,211,197 | |
| BP PLC, Sponsored ADR | | | 9,194 | | | | 336,317 | |
| CNH Industrial N.V. | | | 28,290 | | | | 310,624 | |
| Drax Group PLC | | | 98,601 | | | | 506,464 | |
| Endeavour Mining PLC | | | 98,900 | | | | 2,023,287 | |
| Evraz PLC(a)(d)(e)(f) | | | 91,946 | | | | 1,118 | |
| Harbour Energy PLC | | | 325,039 | | | | 1,002,685 | |
| Pennon Group PLC | | | 37,908 | | | | 334,737 | |
| Rio Tinto PLC, Sponsored ADR | | | 39,558 | | | | 2,545,162 | |
| Subsea 7 SA | | | 62,311 | | | | 816,612 | |
| United Utilities Group PLC | | | 152,136 | | | | 1,965,634 | |
| Weir Group PLC | | | 28,885 | | | | 599,299 | |
| | | | | | | | 16,531,750 | |
| India (0.02%) | | | | | | | | |
| ReNew Energy Global PLC(a) | | | 58,125 | | | | 313,875 | |
| | | | | | | | | |
| Israel (0.06%) | | | | | | | | |
| ICL Group, Ltd. | | | 210,944 | | | | 1,018,860 | |
| | | | | | | | | |
| Italy (0.22%) | | | | | | | | |
| Eni SpA, ADR | | | 123,897 | | | | 2,032,314 | |
| ERG SpA | | | 13,743 | | | | 337,362 | |
| Saipem SpA(a) | | | 901,560 | | | | 1,370,336 | |
| | | | | | | | 3,740,012 | |
| Japan (1.01%) | | | | | | | | |
| Daido Steel Co., Ltd. | | | 5,200 | | | | 200,967 | |
| Dowa Holdings Co., Ltd. | | | 29,400 | | | | 887,964 | |
| Inpex Corp. | | | 148,833 | | | | 2,143,018 | |
| Japan Petroleum Exploration Co., Ltd. | | | 33,200 | | | | 1,128,022 | |
| Kurita Water Industries, Ltd. | | | 49,416 | | | | 1,479,464 | |
| MEIJI Holdings Co., Ltd. | | | 21,900 | | | | 537,188 | |
| Mitsubishi Materials Corp. | | | 36,700 | | | | 582,793 | |
| Morinaga Milk Industry Co., Ltd. | | | 23,000 | | | | 895,115 | |
| NH Foods, Ltd. | | | 40,500 | | | | 1,210,391 | |
| Nisshin Seifun Group, Inc. | | | 83,800 | | | | 1,258,866 | |
| OSAKA Titanium Technologies Co., Ltd. | | | 49,700 | | | | 1,042,692 | |
| SUMCO Corp.(a) | | | 164,600 | | | | 2,101,277 | |
| Sumitomo Forestry Co., Ltd. | | | 86,559 | | | | 2,018,140 | |
| Sumitomo Metal Mining Co., Ltd. | | | 16,400 | | | | 456,160 | |
| Tokyo Steel Manufacturing Co., Ltd. | | | 76,200 | | | | 870,714 | |
| | | | | | | | 16,812,771 | |
| Luxembourg (0.12%) | | | | | | | | |
| Aperam SA | | | 14,100 | | | | 390,137 | |
| | | Shares | | | Value
(Note 2) | |
| Luxembourg (continued) | | | | | | | | |
| ArcelorMittal | | | 14,925 | | | $ | 328,649 | |
| ArcelorMittal SA | | | 48,939 | | | | 1,081,216 | |
| Ternium SA, Sponsored ADR | | | 3,742 | | | | 140,288 | |
| | | | | | | | 1,940,290 | |
| Malaysia (0.02%) | | | | | | | | |
| Lynas Rare Earths, Ltd.(a) | | | 73,542 | | | | 328,891 | |
| | | | | | | | | |
| Mexico (0.07%) | | | | | | | | |
| Fresnillo PLC | | | 21,852 | | | | 147,089 | |
| Grupo Mexico SAB de CV, Series B | | | 250,500 | | | | 1,040,265 | |
| | | | | | | | 1,187,354 | |
| Netherlands (0.25%) | | | | | | | | |
| AMG Critical Materials NV | | | 23,373 | | | | 607,887 | |
| Fugro N.V.(a) | | | 70,271 | | | | 1,159,175 | |
| OCI N.V. | | | 69,943 | | | | 1,628,888 | |
| SBM Offshore N.V. | | | 47,369 | | | | 588,924 | |
| | | | | | | | 3,984,874 | |
| Norway (1.17%) | | | | | | | | |
| Aker BP ASA | | | 109,594 | | | | 3,150,192 | |
| Equinor ASA | | | 103,588 | | | | 3,472,267 | |
| Mowi ASA | | | 96,453 | | | | 1,565,393 | |
| NEL ASA(a) | | | 476,921 | | | | 312,513 | |
| Norsk Hydro ASA | | | 398,216 | | | | 2,270,030 | |
| PGS ASA(a) | | | 1,791,047 | | | | 1,617,737 | |
| Salmar ASA | | | 31,650 | | | | 1,498,218 | |
| Scatec ASA(b)(c) | | | 126,055 | | | | 635,299 | |
| Var Energi ASA | | | 321,406 | | | | 1,082,675 | |
| Yara International ASA | | | 107,982 | | | | 3,528,207 | |
| | | | | | | | 19,132,531 | |
| Peru (0.05%) | | | | | | | | |
| Cia de Minas Buenaventura SAA, ADR | | | 108,938 | | | | 882,398 | |
| | | | | | | | | |
| South Africa (0.73%) | | | | | | | | |
| African Rainbow Minerals, Ltd. | | | 69,024 | | | | 568,784 | |
| Anglo Platinum, Ltd. | | | 55,327 | | | | 1,852,397 | |
| Gold Fields, Ltd., Sponsored ADR | | | 405,621 | | | | 5,281,185 | |
| Impala Platinum Holdings, Ltd. | | | 516,786 | | | | 2,153,934 | |
| Kumba Iron Ore, Ltd. | | | 51,422 | | | | 1,362,480 | |
| Northam Platinum Holdings, Ltd. | | | 129,130 | | | | 779,387 | |
| | | | | | | | 11,998,167 | |
| Spain (0.23%) | | | | | | | | |
| Acerinox SA | | | 44,206 | | | | 430,231 | |
| Corp ACCIONA Energias Renovables SA | | | 22,353 | | | | 605,011 | |
| Fluidra SA | | | 57,731 | | | | 1,015,236 | |
| Iberdrola SA | | | 93,414 | | | | 1,037,834 | |
| Repsol SA | | | 22,896 | | | | 334,928 | |
| Solaria Energia y Medio Ambiente SA | | | 18,123 | | | | 271,340 | |
| | | | | | | | 3,694,580 | |
See Notes to Financial Statements.
ALPS | CoreCommodity Management
CompleteCommodities® Strategy Fund
| Consolidated Statement of Investments | October 31, 2023 |
| | | | | | Value | |
| | | Shares | | | (Note 2) | |
| Sweden (0.53%) | | | | | | | | |
| AAK AB | | | 17,147 | | | $ | 325,660 | |
| Boliden AB | | | 147,697 | | | | 3,780,928 | |
| Epiroc AB, Class A | | | 44,264 | | | | 727,658 | |
| Holmen AB, B Shares | | | 32,420 | | | | 1,221,873 | |
| OX2 AB(a) | | | 28,026 | | | | 113,134 | |
| SSAB AB, A Shares | | | 190,388 | | | | 1,140,031 | |
| Svenska Cellulosa AB SCA, Class B | | | 112,748 | | | | 1,544,894 | |
| | | | | | | | 8,854,178 | |
| Switzerland (0.03%) | | | | | | | | |
| Bucher Industries AG | | | 799 | | | | 284,062 | |
| Meyer Burger Technology AG(a) | | | 487,627 | | | | 130,477 | |
| | | | | | | | 414,539 | |
| United States (7.29%) | | | | | | | | |
| AGCO Corp. | | | 1,501 | | | | 172,105 | |
| Albemarle Corp. | | | 2,999 | | | | 380,213 | |
| Alcoa Corp. | | | 45,608 | | | | 1,169,389 | |
| American States Water Co. | | | 17,034 | | | | 1,329,504 | |
| American Water Works Co., Inc. | | | 3,196 | | | | 376,009 | |
| Antero Resources Corp.(a) | | | 3,650 | | | | 107,456 | |
| Archer-Daniels-Midland Co. | | | 75,096 | | | | 5,374,621 | |
| Archrock, Inc. | | | 8,771 | | | | 111,129 | |
| ATI, Inc.(a) | | | 5,191 | | | | 196,064 | |
| Baker Hughes Co. | | | 40,293 | | | | 1,386,885 | |
| Brookfield Renewable Corp. | | | 5,902 | | | | 134,330 | |
| Bunge Ltd | | | 33,222 | | | | 3,520,868 | |
| California Water Service Group | | | 26,453 | | | | 1,287,732 | |
| Callon Petroleum Co.(a) | | | 53,150 | | | | 1,985,152 | |
| Cal-Maine Foods, Inc. | | | 119,609 | | | | 5,419,483 | |
| CF Industries Holdings, Inc. | | | 30,244 | | | | 2,412,866 | |
| ChampionX Corp. | | | 40,758 | | | | 1,255,346 | |
| Chevron Corp. | | | 10,365 | | | | 1,510,491 | |
| Chord Energy Corp. | | | 10,903 | | | | 1,802,484 | |
| Civitas Resources, Inc. | | | 4,309 | | | | 325,028 | |
| Cleveland-Cliffs, Inc.(a) | | | 21,936 | | | | 368,086 | |
| CNX Resources Corp.(a) | | | 16,086 | | | | 349,388 | |
| Commercial Metals Co. | | | 20,281 | | | | 857,683 | |
| Compass Minerals International, Inc. | | | 42,010 | | | | 1,035,126 | |
| Comstock Resources, Inc. | | | 69,631 | | | | 877,351 | |
| ConocoPhillips | | | 2,628 | | | | 312,206 | |
| Corteva, Inc. | | | 70,365 | | | | 3,387,371 | |
| Coterra Energy, Inc. | | | 49,341 | | | | 1,356,878 | |
| Darling Ingredients, Inc.(a) | | | 48,889 | | | | 2,165,294 | |
| Deere & Co. | | | 2,387 | | | | 872,114 | |
| Devon Energy Corp. | | | 75,716 | | | | 3,526,093 | |
| Diamondback Energy, Inc. | | | 17,955 | | | | 2,878,545 | |
| Earthstone Energy, Inc., Class A | | | 78,931 | | | | 1,670,969 | |
| EOG Resources, Inc. | | | 14,389 | | | | 1,816,611 | |
| EQT Corp. | | | 25,149 | | | | 1,065,815 | |
| Expro Group Holdings NV(a) | | | 37,837 | | | | 595,933 | |
| Exxon Mobil Corp. | | | 9,112 | | | | 964,505 | |
| FMC Corp. | | | 45,308 | | | | 2,410,386 | |
| Freeport-McMoRan, Inc. | | | 77,795 | | | | 2,627,915 | |
| Green Plains, Inc.(a) | | | 29,880 | | | | 877,874 | |
| Halliburton Co. | | | 38,715 | | | | 1,523,048 | |
| | | | | | Value | |
| | | Shares | | | (Note 2) | |
| United States (continued) | | | | | | | | |
| Hecla Mining Co. | | | 49,078 | | | $ | 199,747 | |
| Helmerich & Payne, Inc. | | | 42,272 | | | | 1,672,703 | |
| Hess Corp. | | | 4,107 | | | | 593,051 | |
| Hormel Foods Corp. | | | 77,021 | | | | 2,507,034 | |
| Ingredion, Inc. | | | 47,900 | | | | 4,482,481 | |
| Kosmos Energy, Ltd.(a) | | | 13,654 | | | | 98,855 | |
| Liberty Energy, Inc., Class A | | | 127,415 | | | | 2,510,076 | |
| Magnolia Oil & Gas Corp., Class A | | | 133,976 | | | | 3,007,761 | |
| Marathon Oil Corp. | | | 41,802 | | | | 1,141,613 | |
| Matador Resources Co. | | | 4,124 | | | | 254,410 | |
| Mosaic Co. | | | 8,373 | | | | 271,955 | |
| MP Materials Corp.(a) | | | 15,486 | | | | 253,970 | |
| Murphy Oil Corp. | | | 66,664 | | | | 2,991,214 | |
| National Fuel Gas Co. | | | 3,154 | | | | 160,696 | |
| National Oilwell Varco, Inc. | | | 18,715 | | | | 373,551 | |
| Newcrest Mining, Ltd. | | | 3,067 | | | | 46,005 | |
| Newmont Corp. | | | 56,723 | | | | 2,125,411 | |
| Noble Corp. PLC | | | 23,147 | | | | 1,080,733 | |
| Northern Oil and Gas, Inc. | | | 6,053 | | | | 232,072 | |
| Nucor Corp | | | 8,627 | | | | 1,274,984 | |
| Occidental Petroleum Corp. | | | 26,216 | | | | 1,620,411 | |
| Oceaneering International, Inc.(a) | | | 35,959 | | | | 790,738 | |
| Patterson-UTI Energy, Inc. | | | 166,794 | | | | 2,118,285 | |
| Permian Resources Corp. | | | 55,131 | | | | 803,259 | |
| Pilgrim's Pride Corp.(a) | | | 2,948 | | | | 75,174 | |
| Pioneer Natural Resources Co. | | | 9,018 | | | | 2,155,302 | |
| Plug Power, Inc.(a) | | | 4,791 | | | | 28,219 | |
| PotlatchDeltic Corp., REIT | | | 50,379 | | | | 2,158,740 | |
| Range Resources Corp. | | | 22,102 | | | | 792,136 | |
| Rayonier, Inc., REIT | | | 42,782 | | | | 1,079,818 | |
| REC Silicon ASA(a) | | | 596,207 | | | | 774,149 | |
| Royal Gold, Inc. | | | 2,822 | | | | 294,419 | |
| Schlumberger NV | | | 25,372 | | | | 1,412,206 | |
| Shoals Technologies Group, Inc., Class A(a) | | | 36,675 | | | | 563,328 | |
| SM Energy Co. | | | 41,257 | | | | 1,663,482 | |
| Southern Copper Corp. | | | 22,678 | | | | 1,607,870 | |
| Southwestern Energy Co.(a) | | | 218,644 | | | | 1,558,932 | |
| SSR Mining, Inc. | | | 37,055 | | | | 514,252 | |
| Steel Dynamics, Inc. | | | 10,989 | | | | 1,170,438 | |
| SunCoke Energy, Inc. | | | 35,317 | | | | 335,865 | |
| Sunnova Energy International, Inc.(a) | | | 18,148 | | | | 165,691 | |
| SunPower Corp.(a) | | | 118,005 | | | | 503,881 | |
| Talos Energy, Inc.(a) | | | 6,851 | | | | 106,191 | |
| Tidewater, Inc.(a) | | | 4,541 | | | | 310,377 | |
| TimkenSteel Corp.(a) | | | 53,046 | | | | 1,078,425 | |
| Tronox Holdings PLC, Class A | | | 29,466 | | | | 314,992 | |
| Tyson Foods, Inc., Class A | | | 53,103 | | | | 2,461,324 | |
| United States Steel Corp. | | | 55,695 | | | | 1,887,503 | |
| US Silica Holdings, Inc.(a) | | | 105,682 | | | | 1,275,582 | |
| Vital Energy, Inc.(a) | | | 19,892 | | | | 995,396 | |
| W&T Offshore, Inc.(a) | | | 331,440 | | | | 1,375,476 | |
See Notes to Financial Statements.
ALPS | CoreCommodity Management
CompleteCommodities® Strategy Fund
| Consolidated Statement of Investments | October 31, 2023 |
| | | | | | Value | |
| | | Shares | | | (Note 2) | |
| United States (continued) | | | | | | | | |
| Warrior Met Coal, Inc. | | | 26,167 | | | $ | 1,275,118 | |
| | | | | | | | 120,341,647 | |
| TOTAL COMMON STOCKS | | | | | | | | |
| (Cost $317,786,719) | | | | | | | 318,902,066 | |
| | | | | | | | | |
| MASTER LIMITED PARTNERSHIPS (0.17%) | | | | | | | | |
| United States (0.17%) | | | | | | | | |
| Black Stone Minerals LP | | | 71,159 | | | | 1,280,862 | |
| Viper Energy Partners LP | | | 53,519 | | | | 1,524,221 | |
| | | | | | | | 2,805,083 | |
| TOTAL MASTER LIMITED PARTNERSHIPS | | | | | | | | |
| (Cost $2,524,574) | | | | | | | 2,805,083 | |
| | | Principal | | | Value | |
| | | Amount | | | (Note 2) | |
| GOVERNMENT BONDS (74.27%) | | | | | | | | |
| U.S. Treasury Bonds (74.27%) | | | | | | | | |
| United States Treasury Bill | | | | | | | | |
| 5.265%, 11/21/23(g) | | $ | 105,000,000 | | | $ | 104,691,490 | |
| 5.285%, 11/28/23(g) | | | 190,100,000 | | | | 189,346,491 | |
| 5.290%, 12/12/23(g) | | | 29,500,000 | | | | 29,322,439 | |
| 5.295%, 12/19/23(g) | | | 210,800,000 | | | | 209,308,449 | |
| 5.260%, 2/1/24(g) | | | 27,500,000 | | | | 27,126,474 | |
| 5.305%, 3/7/24(g) | | | 105,000,000 | | | | 103,034,014 | |
| 5.309%, 3/14/24(g) | | | 105,800,000 | | | | 103,709,453 | |
| 5.315%, 4/11/24(g) | | | 15,950,000 | | | | 15,569,305 | |
| United States Treasury Inflation Indexed Bonds | | | | | | | | |
| 0.500%, 4/15/24(g) | | | 298,400,000 | | | | 357,100,390 | |
| 0.125%, 7/15/24(g) | | | 70,450,000 | | | | 88,979,997 | |
| | | | | | | | 1,228,188,502 | |
| TOTAL GOVERNMENT BONDS | | | | | | | | |
| (Cost $1,230,686,204) | | | | | | | 1,228,188,502 | |
| | | 7-Day | | | | | | Value | |
| | | Yield | | | Shares | | | (Note 2) | |
| SHORT TERM INVESTMENTS (6.72%) | | | | | | | | | | | | |
| Money Market Fund (6.72%) | | | | | | | | | | | | |
| BlackRock Liquidity Funds Treasury Trust Fund Portfolio | | | 5.270 | % | | | 111,196,510 | | | | 111,196,510 | |
| | | | | | | | | | | | | |
| TOTAL SHORT TERM INVESTMENTS | | | | | | | | | | | | |
| (Cost $111,196,510) | | | | | | | | | | | 111,196,510 | |
| | | Value | |
| | | (Note 2) | |
| TOTAL INVESTMENTS (100.45%) | | | | |
| (Cost $1,662,194,007) | | $ | 1,661,092,161 | |
| | | | | |
| Liabilities in Excess of Other Assets (-0.45%) | | | (7,470,997 | ) |
| NET ASSETS - 100.00% | | $ | 1,653,621,164 | |
| (a) | Non-Income Producing Security. |
| (b) | Securities exempt from registration under rule 144A of the securities act of 1933. These Securities may be resold in transactions exempt from registration, normally to qualified institutional buyers. As of October 31, 2023, the market value of those securities was $3,419,025, representing 0.21% of the Fund's net assets. |
| (c) | Securities were purchased pursuant to Regulation S under the Securities Act of 1933, which exempts securities offered and sold outside of the United States from registration. Such securities cannot be sold in the United States without either an effective registration statement filed pursuant to the Securities Act of 1933, or pursuant to an exemption from registration. These securities have been deemed liquid under guidelines approved by the Fund's Board of Trustees. As of October 31, 2023 the aggregate market value of those securities was $3,419,025, representing 0.21% of net assets. |
| (d) | Security deemed to be illiquid under the procedures approved by the Fund's Board of Trustees. As of October 31, 2023, the fair value of illiquid securities in the aggregate was $1,118, representing less than 0.005% of the Fund's net assets. |
| (e) | As a result of the use of significant unobservable inputs to determine fair value, these investments have been classified as level 3 assets. See also Note 2 to the financial statements for additional information. |
| (f) | Fair valued security; valued by the valuation designee in accordance with the procedures utilized by the valuation designee. As of October 31, 2023, these securities had a total value of $1,118 or less than 0.005% of total net assets. |
| (g) | Security, or portion of security, is being held as collateral for total return swap contracts and futures contracts aggregating a total market value of $247,091,116. |
For Fund compliance purposes, the Fund's industry and geographical classifications refer to any one or more of the industry sub-classifications used by one or more widely recognized market indexes or ratings group indexes, and/or as defined by Fund management. This definition may not apply for purposes of this report, which may combine sub-classifications for reporting ease. Industries and regions are shown as a percent of net assets.
See Notes to Financial Statements.
ALPS | CoreCommodity Management
CompleteCommodities® Strategy Fund
| Consolidated Statement of Investments | October 31, 2023 |
FUTURES CONTRACTS
| Description | | Counterparty | | Position | | Contracts | | Expiration Date | | Notional Value (Note 2) | | | Unrealized Appreciation | |
| Corn Future | | Morgan Stanley | | Short | | (732) | | 12/15/23 | | $ | (17,522,250 | ) | | $ | 736,651 | |
| Cotton No.2 Future | | Morgan Stanley | | Short | | (478) | | 03/07/24 | | | (19,958,890 | ) | | | 416,923 | |
| Gasoline RBOB Future | | Morgan Stanley | | Short | | (6) | | 12/30/23 | | | (558,760 | ) | | | 23,750 | |
| Gasoline RBOB Future | | Morgan Stanley | | Short | | (332) | | 03/29/24 | | | (31,065,838 | ) | | | 421,039 | |
| Live Cattle Future | | Morgan Stanley | | Short | | (239) | | 12/01/23 | | | (17,547,380 | ) | | | 162,184 | |
| Live Cattle Future | | Morgan Stanley | | Short | | (407) | | 02/01/24 | | | (30,056,950 | ) | | | 1,239,776 | |
| LME Aluminum Future | | Morgan Stanley | | Long | | 22 | | 12/19/23 | | | 1,235,933 | | | | 42,923 | |
| LME Lead Future | | Morgan Stanley | | Short | | (5) | | 11/13/23 | | | (259,406 | ) | | | 2,643 | |
| LME Nickel Future | | Morgan Stanley | | Short | | (50) | | 11/13/23 | | | (5,377,800 | ) | | | 18,314 | |
| LME Zinc Future | | Morgan Stanley | | Short | | (140) | | 11/13/23 | | | (8,480,500 | ) | | | 18,805 | |
| Natural Gas Future | | Morgan Stanley | | Long | | 1,794 | | 12/28/23 | | | 64,135,500 | | | | 2,655,192 | |
| NY Harbor ULSD | | Morgan Stanley | | Short | | (314) | | 03/29/24 | | | (36,491,196 | ) | | | 52,012 | |
| Platinum Future | | Morgan Stanley | | Long | | 415 | | 01/29/24 | | | 19,606,675 | | | | 18,765 | |
| Soybean Meal Future | | Morgan Stanley | | Long | | 1,161 | | 12/15/23 | | | 50,039,100 | | | | 2,493,617 | |
| WTI Crude Future | | Morgan Stanley | | Short | | (242) | | 04/21/24 | | | (19,101,060 | ) | | | 1,099 | |
| | | | | | | | | | | $ | (51,402,822 | ) | | $ | 8,303,693 | |
| Description | | Counterparty | | Position | | Contracts | | Expiration Date | | Notional Value (Note 2) | | | Unrealized Depreciation | |
| Brent Crude Future | | Morgan Stanley | | Long | | 1,513 | | 01/30/24 | | $ | 128,635,260 | | | $ | (6,935,388 | ) |
| Cocoa Future | | Morgan Stanley | | Short | | (303) | | 12/14/23 | | | (11,565,510 | ) | | | (1,951,662 | ) |
| Cocoa Future | | Morgan Stanley | | Short | | (1,301) | | 03/14/24 | | | (50,049,470 | ) | | | (4,821,563 | ) |
| Coffee 'C' Future | | Morgan Stanley | | Short | | (300) | | 12/19/23 | | | (18,821,250 | ) | | | (551,957 | ) |
| Copper Future | | Morgan Stanley | | Short | | (8) | | 12/28/23 | | | (729,800 | ) | | | (12,618 | ) |
| Cotton No.2 Future | | Morgan Stanley | | Short | | (204) | | 12/07/23 | | | (8,284,440 | ) | | | (112,744 | ) |
| Frzn Concentrated OJ | | Morgan Stanley | | Short | | (96) | | 01/11/24 | | | (5,525,280 | ) | | | (1,766,053 | ) |
| Frzn Concentrated OJ | | Morgan Stanley | | Short | | (78) | | 03/08/24 | | | (4,364,685 | ) | | | (127,787 | ) |
| Gasoline RBOB Future | | Morgan Stanley | | Long | | 96 | | 01/01/24 | | | 8,917,574 | | | | (1,168,258 | ) |
| Gold 100 Oz Future | | Morgan Stanley | | Long | | 586 | | 12/28/23 | | | 116,865,980 | | | | (1,157,940 | ) |
| Hard Red Winter Wheat Future | | Morgan Stanley | | Long | | 490 | | 12/15/23 | | | 15,416,625 | | | | (1,541,525 | ) |
| Heating Oil Future | | Morgan Stanley | | Long | | 60 | | 01/01/24 | | | 7,197,372 | | | | (596,370 | ) |
| Lean Hogs Future | | Morgan Stanley | | Long | | 193 | | 12/14/23 | | | 5,537,170 | | | | (65,406 | ) |
| LME Aluminum Future | | Morgan Stanley | | Short | | (242) | | 12/19/23 | | | (13,595,258 | ) | | | (325,244 | ) |
| LME Lead Future | | Morgan Stanley | | Long | | 101 | | 11/13/23 | | | 5,240,006 | | | | (42,498 | ) |
| LME Nickel Future | | Morgan Stanley | | Long | | 139 | | 11/13/23 | | | 14,950,284 | | | | (488,179 | ) |
| LME Zinc Future | | Morgan Stanley | | Long | | 685 | | 11/13/23 | | | 41,493,875 | | | | (626,446 | ) |
| Low Su Gasoil G Future | | Morgan Stanley | | Long | | 156 | | 11/10/23 | | | 13,767,000 | | | | (1,302,819 | ) |
| Low Su Gasoil G Future | | Morgan Stanley | | Long | | 294 | | 12/13/23 | | | 25,012,050 | | | | (15,485 | ) |
| Natural Gas Future | | Morgan Stanley | | Short | | (581) | | 03/27/24 | | | (20,149,080 | ) | | | (860,782 | ) |
| Silver Future | | Morgan Stanley | | Long | | 557 | | 12/28/23 | | | 63,921,320 | | | | (1,200,875 | ) |
| Soybean Future | | Morgan Stanley | | Long | | 1,118 | | 12/15/23 | | | 34,492,536 | | | | (6,185,971 | ) |
| Soybean Future | | Morgan Stanley | | Short | | (257) | | 01/12/24 | | | (16,839,925 | ) | | | (119,217 | ) |
| Sugar #11 (World) | | Morgan Stanley | | Short | | (1,072) | | 03/01/24 | | | (32,525,338 | ) | | | (1,749,787 | ) |
| Wheat (CBT) | | Morgan Stanley | | Long | | 774 | | 12/15/23 | | | 21,526,875 | | | | (2,821,204 | ) |
| WTI Crude Future | | Morgan Stanley | | Long | | 411 | | 12/20/23 | | | 33,299,220 | | | | (2,578,551 | ) |
| WTI Crude Future | | Morgan Stanley | | Short | | (1,959) | | 03/20/24 | | | (155,583,780 | ) | | | (164,574 | ) |
| | | | | | | | | | | $ | 198,239,331 | | | $ | (39,290,903 | ) |
See Notes to Financial Statements.
ALPS | CoreCommodity Management
CompleteCommodities® Strategy Fund
| Consolidated Statement of Investments | October 31, 2023 |
TOTAL RETURN SWAP CONTRACTS(a)
Swap Counterparty | | Reference Obligation | | Notional Amount | | | Floating Rate/Fixed Amount Paid by Fund* | | Termination Date | | Value | | | Unrealized Appreciation | |
| UBS Group AG | | CRB 3m Fwd TR Index** | | $ | 153,344,448 | | | USB3MTA + 25 bps | | 11/30/2023 | | $ | 153,344,457 | | | $ | 9 | |
| Goldman Sachs | | CRB 3m Fwd TR Index** | | | 154,047,067 | | | USB3MTA + 25 bps | | 9/30/2024 | | | 154,047,073 | | | | 6 | |
| Citigroup | | CRB 3m Fwd TR Index** | | | 36,015,587 | | | USB3MTA + 24 bps | | 9/30/2024 | | | 36,015,591 | | | | 4 | |
| Citigroup | | CRB TR Index** | | | 278,311,094 | | | USB3MTA + 21 bps | | 9/30/2024 | | | 278,311,095 | | | | 1 | |
| RBC | | CRB TR Index** | | | 29,983,716 | | | USB3MTA + 21 bps | | 10/31/2024 | | | 29,983,719 | | | | 3 | |
| Societe Generale | | CRB 3m Fwd TR Index** | | | 159,559,877 | | | USB3MTA + 24 bps | | 11/30/2023 | | | 159,559,880 | | | | 3 | |
| Bank Of America - Merrill Lynch | | CRB TR Index** | | | 204,597,614 | | | USB3MTA + 21 bps | | 6/28/2024 | | | 204,597,616 | | | | 2 | |
| Bank of America - Merrill Lynch | | CRB 3m Fwd TR Index** | | | 88,025,957 | | | USB3MTA + 25 bps | | 6/28/2024 | | | 88,025,957 | | | | 0 | |
| Goldman Sachs | | CRB TR Index** | | | 79,384,323 | | | USB3MTA + 20 bps | | 9/30/2024 | | | 79,384,323 | | | | 0 | |
| | | | | $ | 1,183,269,683 | | | | | | | $ | 1,183,269,711 | | | $ | 28 | |
| (a) | For long positions in the total return swap, the Fund receives payments based on any positive return of the Reference Obligation less the rate paid by the Fund. The Fund makes payments on any negative return of such Reference Obligations plus the rate paid by the Fund. For short positions in the total return swap, the Fund makes payments based on any positive return of the Reference Obligation less the rate paid by the Fund. The Fund receives payments on any negative return of such Reference Obligations plus the rate paid by the Fund. |
| * | United States Auction Results 3 Month Treasury Bill High Discount. Total return swap resets monthly. |
| ** | CRB - Commodity Research Bureau |
See Notes to Financial Statements.
ALPS | CoreCommodity Management
CompleteCommodities® Strategy Fund
| Consolidated Statement of Assets and Liabilities | October 31, 2023 |
| ASSETS | | | |
| Investments, at value | | $ | 1,661,092,161 | |
| Cash | | | 2,241,360 | |
| Foreign currency, at value (Cost $488,691) | | | 486,198 | |
| Unrealized appreciation on total return swap contracts | | | 28 | |
| Receivable for investments sold | | | 3,036,413 | |
| Receivable for shares sold | | | 1,627,409 | |
| Deposit with broker for futures contracts (Note 3) | | | 44,986 | |
| Dividends and interest receivable | | | 493,885 | |
| Prepaid expenses and other assets | | | 101,659 | |
| Total Assets | | | 1,669,124,099 | |
| LIABILITIES | | | | |
| Payable for investments purchased | | | 198,295 | |
| Payable for variation margin on futures contracts | | | 1,424,686 | |
| Payable for interest expense on total return swap contracts | | | 4,872,516 | |
| Payable for total return swap contract resets | | | 3,792,818 | |
| Payable for shares redeemed | | | 3,249,821 | |
| Investment advisory fees payable | | | 997,528 | |
| Administration and transfer agency fees payable | | | 717,778 | |
| Distribution and services fees payable | | | 37,922 | |
| Professional fees payable | | | 32,198 | |
| Accrued expenses and other liabilities | | | 179,373 | |
| Total Liabilities | | | 15,502,935 | |
| NET ASSETS | | $ | 1,653,621,164 | |
| NET ASSETS CONSIST OF | | | | |
| Paid-in capital | | $ | 1,644,552,269 | |
| Total distributable earnings/(accumulated losses) | | | 9,068,895 | |
| NET ASSETS | | $ | 1,653,621,164 | |
| INVESTMENTS, AT COST | | $ | 1,662,194,007 | |
| | | | | |
| PRICING OF SHARES | | | | |
| Investor Class: | | | | |
| Net Asset Value, offering and redemption price per share | | $ | 7.51 | |
| Net Assets | | $ | 22,202,490 | |
| Shares of beneficial interest outstanding (unlimited number of shares, no par value common stock authorized) | | | 2,957,006 | |
| Class A: | | | | |
| Net Asset Value, offering and redemption price per share | | $ | 7.53 | |
| Net Assets | | $ | 11,362,174 | |
| Shares of beneficial interest outstanding (unlimited number of shares, no par value common stock authorized) | | | 1,509,733 | |
| Maximum offering price per share ((NAV/0.9450), based on maximum sales charge of 5.50% of the offering price) | | $ | 7.96 | |
| Class C: | | | | |
| Net Asset Value, offering and redemption price per share(a) | | $ | 6.84 | |
| Net Assets | | $ | 17,910,194 | |
| Shares of beneficial interest outstanding (unlimited number of shares, no par value common stock authorized) | | | 2,620,278 | |
| Class I: | | | | |
| Net Asset Value, offering and redemption price per share | | $ | 7.65 | |
| Net Assets | | $ | 1,602,146,306 | |
| Shares of beneficial interest outstanding (unlimited number of shares, no par value common stock authorized) | | | 209,456,118 | |
| (a) | Redemption price per share may be reduced for any applicable contingent deferred sales charge. For a description of a possible sales charge, please see the Fund's Prospectus. |
See Notes to Financial Statements.
ALPS | CoreCommodity Management
CompleteCommodities® Strategy Fund
| Consolidated Statement of Operations | For the Year Ended October 31, 2023 |
| INVESTMENT INCOME | | | |
| Dividends | | $ | 15,573,676 | |
| Foreign taxes withheld on dividends | | | (1,306,141 | ) |
| Interest and other income, net of premium amortization and accretion of discount | | | 60,847,357 | |
| Total Investment Income | | | 75,114,892 | |
| | | | | |
| EXPENSES | | | | |
| Investment advisory fees | | | 15,341,286 | |
| Investment advisory fees - subsidiary (Note 8) | | | 3,251,416 | |
| Administrative fees | | | 1,887,843 | |
| Transfer agency fees | | | 2,679,625 | |
| Distribution and service fees | | | | |
| Investor Class | | | 235,965 | |
| Class A | | | 34,824 | |
| Class C | | | 223,571 | |
| Professional fees | | | 50,785 | |
| Reports to shareholders and printing fees | | | 179,323 | |
| State registration fees | | | 287,293 | |
| Insurance fees | | | 24,726 | |
| Custody fees | | | 174,202 | |
| Trustees' fees and expenses | | | 134,943 | |
| Miscellaneous expenses | | | 50,957 | |
| Total Expenses | | | 24,556,759 | |
| Less fees waived/reimbursed by investment advisor (Note 8) | | | | |
| Waiver of investment advisory fees - subsidiary | | | (3,251,416 | ) |
| Class I | | | (210,903 | ) |
| Net Expenses | | | 21,094,440 | |
| Net Investment Income | | | 54,020,452 | |
| Net realized gain on investments | | | 39,698,228 | |
| Net realized loss on futures contracts | | | (143,008,457 | ) |
| Net realized gain on total return swap contracts | | | 64,086,199 | |
| Net realized loss on foreign currency transactions | | | (327,967 | ) |
| Net Realized Loss | | | (39,551,997 | ) |
| Net change in unrealized depreciation on investments | | | (28,549,406 | ) |
| Net change in unrealized depreciation on futures contracts | | | (55,582,291 | ) |
| Net change in unrealized depreciation on total return swap contracts | | | (70 | ) |
| Net change in unrealized depreciation on translation of assets and liabilities denominated in foreign currencies | | | (1,888 | ) |
| Net Change in Unrealized Depreciation | | | (84,133,655 | ) |
| NET REALIZED AND UNREALIZED LOSS ON INVESTMENTS | | | (123,685,652 | ) |
| NET DECREASE IN NET ASSETS RESULTING FROM OPERATIONS | | $ | (69,665,200 | ) |
See Notes to Financial Statements.
ALPS | CoreCommodity Management
CompleteCommodities® Strategy Fund
Consolidated Statements of Changes in Net Assets
| | | For the Year
Ended
October 31, 2023 | | | For the Year
Ended
October 31, 2022 | |
| OPERATIONS | | | | | | |
| Net investment income | | $ | 54,020,452 | | | $ | 13,381,579 | |
| Net realized gain/(loss) | | | (39,551,997 | ) | | | 96,030,396 | |
| Net change in unrealized depreciation | | | (84,133,655 | ) | | | (7,081,327 | ) |
| Net Increase/(Decrease) in Net Assets Resulting from Operations | | | (69,665,200 | ) | | | 102,330,648 | |
| | | | | | | | | |
| TOTAL DISTRIBUTIONS | | | | | | | | |
| From distributable earnings | | | | | | | | |
| Investor Class | | | (5,853,087 | ) | | | (15,456,243 | ) |
| Class A | | | (1,025,116 | ) | | | (1,363,415 | ) |
| Class C | | | (1,863,383 | ) | | | (2,848,568 | ) |
| Class I | | | (104,122,024 | ) | | | (201,615,631 | ) |
| Net Decrease in Net Assets from Distributions | | | (112,863,610 | ) | | | (221,283,857 | ) |
| | | | | | | | | |
| BENEFICIAL INTEREST TRANSACTIONS (NOTE 6) | | | | | | | | |
| Shares sold | | | | | | | | |
| Investor Class | | | 24,927,696 | | | | 41,853,019 | |
| Class A | | | 2,221,315 | | | | 11,230,606 | |
| Class C | | | 3,485,981 | | | | 18,872,221 | |
| Class I | | | 998,720,942 | | | | 1,128,168,065 | |
| Dividends reinvested | | | | | | | | |
| Investor Class | | | 4,625,429 | | | | 14,698,816 | |
| Class A | | | 732,350 | | | | 871,533 | |
| Class C | | | 984,573 | | | | 1,419,872 | |
| Class I | | | 72,055,995 | | | | 141,806,630 | |
| Shares redeemed, net of redemption fees | | | | | | | | |
| Investor Class | | | (87,608,141 | ) | | | (50,064,058 | ) |
| Class A | | | (6,069,300 | ) | | | (1,848,093 | ) |
| Class C | | | (11,166,968 | ) | | | (4,302,809 | ) |
| Class I | | | (913,800,802 | ) | | | (701,272,116 | ) |
| Net Increase in Net Assets Derived from Beneficial Interest Transactions | | | 89,109,070 | | | | 601,433,686 | |
| | | | | | | | | |
| Net increase/(decrease) in net assets | | | (93,419,740 | ) | | | 482,480,477 | |
| | | | | | | | | |
| NET ASSETS | | | | | | | | |
| Beginning of year | | | 1,747,040,904 | | | | 1,264,560,427 | |
| End of year | | $ | 1,653,621,164 | | | $ | 1,747,040,904 | |
See Notes to Financial Statements.
ALPS | CoreCommodity Management
CompleteCommodities® Strategy Fund – Investor Class
Consolidated Financial Highlights
Selected data for a share of beneficial interest outstanding throughout the periods indicated:
| | | For the Year
Ended
October 31,
2023 | | | For the Year
Ended
October 31,
2022 | | | For the Year
Ended
October 31,
2021 | | | For the Year
Ended
October 31,
2020 | | | For the Year
Ended
October 31,
2019 | |
| Net asset value, beginning of period(a) | | $ | 8.47 | | | $ | 9.50 | | | $ | 6.06 | | | $ | 6.68 | | | $ | 7.54 | |
| INCOME/(LOSS) FROM INVESTMENT OPERATIONS: | | | | | | | | | | | | | | | | | | | | |
| Net investment income(b) | | | 0.21 | | | | 0.05 | | | | 0.11 | | | | 0.02 | | | | 0.06 | |
| Net realized and unrealized gain/(loss) | | | (0.61 | ) | | | 0.62 | | | | 3.35 | | | | (0.58 | ) | | | (0.71 | ) |
| Total from investment operations | | | (0.40 | ) | | | 0.67 | | | | 3.46 | | | | (0.56 | ) | | | (0.65 | ) |
| DISTRIBUTIONS: | | | | | | | | | | | | | | | | | | | | |
| From net investment income | | | (0.56 | ) | | | (1.70 | ) | | | (0.02 | ) | | | (0.06 | ) | | | (0.21 | ) |
| Total distributions | | | (0.56 | ) | | | (1.70 | ) | | | (0.02 | ) | | | (0.06 | ) | | | (0.21 | ) |
| REDEMPTION FEES ADDED TO PAID-IN CAPITAL (NOTE 6) | | | – | | | | – | | | | 0.00 | (c) | | | 0.00 | (c) | | | 0.00 | (c) |
| Net increase/(decrease) in net asset value | | | (0.96 | ) | | | (1.03 | ) | | | 3.44 | | | | (0.62 | ) | | | (0.86 | ) |
| Net asset value, end of year | | $ | 7.51 | | | $ | 8.47 | | | $ | 9.50 | | | $ | 6.06 | | | $ | 6.68 | |
| TOTAL RETURN(d) | | | (5.01 | )% | | | 9.65 | % | | | 57.25 | % | | | (8.44 | )% | | | (8.71 | )% |
| RATIOS/SUPPLEMENTAL DATA: | | | | | | | | | | | | | | | | | | | | |
| Net assets, end of year (000s) | | $ | 22,202 | | | $ | 89,645 | | | $ | 89,300 | | | $ | 49,060 | | | $ | 39,226 | |
| Ratio of expenses to average net assets excluding fee waivers and reimbursements | | | 1.34 | %(e) | | | 1.36 | %(e) | | | 1.37 | %(e) | | | 1.40 | %(e) | | | 1.39 | %(e) |
| Ratio of expenses to average net assets including fee waivers and reimbursements | | | 1.34 | % | | | 1.36 | % | | | 1.37 | % | | | 1.40 | % | | | 1.39 | % |
| Ratio of net investment income to average net assets | | | 2.66 | % | | | 0.55 | % | | | 1.36 | % | | | 0.40 | % | | | 0.82 | % |
| Portfolio turnover rate | | | 59 | % | | | 54 | % | | | 54 | % | | | 98 | % | | | 81 | % |
| (a) | Per share amounts and ratios to average net assets include income and expenses of the CoreCommodity Management Cayman Commodity Fund Ltd. (wholly-owned subsidiary). |
| (b) | Calculated using the average shares method. |
| (c) | Less than $0.005 or ($0.005) per share. |
| (d) | Total returns are for the period indicated and have not been annualized. Total returns would have been lower had certain expenses not been waived during the period. Returns shown do not reflect the deduction of taxes that a shareholder would pay on Fund distributions or the redemption of Fund shares. |
| (e) | The ratio of operating expenses excluding fee waiver/reimbursements to average net assets is calculated excluding the waived Subsidiary management fee (see Note 8 for additional detail). The ratio inclusive of that fee would be for the years ended October 31, 2023, October 31, 2022, October 31, 2021, October 31, 2020 and October 31, 2019, respectively, 1.52%, 1.53%, 1.55%, 1.58% and 1.54%. |
See Notes to Financial Statements.
ALPS | CoreCommodity Management
CompleteCommodities® Strategy Fund – Class A
Consolidated Financial Highlights
Selected data for a share of beneficial interest outstanding throughout the periods indicated:
| | | For the Year
Ended
October 31,
2023 | | | For the Year
Ended
October 31,
2022 | | | For the Year
Ended
October 31,
2021 | | | For the Year
Ended
October 31,
2020 | | | For the Year
Ended
October 31,
2019 | |
| Net asset value, beginning of period(a) | | $ | 8.48 | | | $ | 9.52 | | | $ | 6.07 | | | $ | 6.68 | | | $ | 7.54 | |
| INCOME FROM INVESTMENT OPERATIONS: | | | | | | | | | | | | | | | | | | | | |
| Net investment income(b) | | | 0.22 | | | | 0.06 | | | | 0.13 | | | | 0.04 | | | | 0.07 | |
| Net realized and unrealized gain/(loss) | | | (0.61 | ) | | | 0.60 | | | | 3.34 | | | | (0.59 | ) | | | (0.72 | ) |
| Total from investment operations | | | (0.39 | ) | | | 0.66 | | | | 3.47 | | | | (0.55 | ) | | | (0.65 | ) |
| DISTRIBUTIONS: | | | | | | | | | | | | | | | | | | | | |
| From net investment income | | | (0.56 | ) | | | (1.70 | ) | | | (0.02 | ) | | | (0.06 | ) | | | (0.21 | ) |
| Total distributions | | | (0.56 | ) | | | (1.70 | ) | | | (0.02 | ) | | | (0.06 | ) | | | (0.21 | ) |
| REDEMPTION FEES ADDED TO PAID-IN CAPITAL (NOTE 6) | | | – | | | | – | | | | – | | | | 0.00 | (c) | | | – | |
| Net increase/(decrease) in net asset value | | | (0.95 | ) | | | (1.04 | ) | | | 3.45 | | | | (0.61 | ) | | | (0.86 | ) |
| Net asset value, end of year | | $ | 7.53 | | | $ | 8.48 | | | $ | 9.52 | | | $ | 6.07 | | | $ | 6.68 | |
| TOTAL RETURN(d) | | | (4.88 | )% | | | 9.52 | % | | | 57.33 | % | | | (8.29 | )% | | | (8.71 | )% |
| RATIOS/SUPPLEMENTAL DATA: | | | | | | | | | | | | | | | | | | | | |
| Net assets, end of year (000s) | | $ | 11,362 | | | $ | 16,246 | | | $ | 7,349 | | | $ | 1,254 | | | $ | 751 | |
| Ratio of expenses to average net assets excluding fee waivers and reimbursements | | | 1.25 | %(e) | | | 1.30 | %(e) | | | 1.32 | %(e) | | | 1.34 | %(e) | | | 1.40 | %(e) |
| Ratio of expenses to average net assets including fee waivers and reimbursements | | | 1.25 | % | | | 1.30 | % | | | 1.32 | % | | | 1.34 | % | | | 1.40 | % |
| Ratio of net investment income to average net assets | | | 2.83 | % | | | 0.64 | % | | | 1.56 | % | | | 0.62 | % | | | 0.99 | % |
| Portfolio turnover rate | | | 59 | % | | | 54 | % | | | 54 | % | | | 98 | % | | | 81 | % |
| (a) | Per share amounts and ratios to average net assets include income and expenses of the CoreCommodity Management Cayman Commodity Fund Ltd. (wholly-owned subsidiary). |
| (b) | Calculated using the average shares method. |
| (c) | Less than $0.005 or ($0.005) per share. |
| (d) | Total returns are for the period indicated and have not been annualized. Total returns would have been lower had certain expenses not been waived during the period. Returns shown do not reflect the deduction of taxes that a shareholder would pay on Fund distributions or the redemption of Fund shares. Returns shown exclude any applicable sales charges. |
| (e) | The ratio of operating expenses excluding fee waiver/reimbursements to average net assets is calculated excluding the waived Subsidiary management fee (see Note 8 for additional detail). The ratio inclusive of that fee would be for the years ended October 31, 2023, October 31, 2022, October 31, 2021, October 31, 2020 and October 31, 2019, respectively, 1.43%, 1.47%, 1.50%, 1.52% and 1.55%. |
See Notes to Financial Statements.
ALPS | CoreCommodity Management
CompleteCommodities® Strategy Fund – Class C
Consolidated Financial Highlights
Selected data for a share of beneficial interest outstanding throughout the periods indicated:
| | | For the Year
Ended
October 31,
2023 | | | For the Year
Ended
October 31,
2022 | | | For the Year
Ended
October 31,
2021 | | | For the Year
Ended
October 31,
2020 | | | For the Year
Ended
October 31,
2019 | |
| Net asset value, beginning of period(a) | | $ | 7.80 | | | $ | 8.94 | | | $ | 5.73 | | | $ | 6.35 | | | $ | 7.22 | |
| INCOME/(LOSS) FROM INVESTMENT OPERATIONS: | | | | | | | | | | | | | | | | | | | | |
| Net investment income/(loss)(b) | | | 0.14 | | | | (0.01 | )(c) | | | 0.07 | | | | (0.02 | )(c) | | | 0.01 | |
| Net realized and unrealized gain/(loss) | | | (0.54 | ) | | | 0.56 | | | | 3.14 | | | | (0.54 | ) | | | (0.68 | ) |
| Total from investment operations | | | (0.40 | ) | | | 0.55 | | | | 3.21 | | | | (0.56 | ) | | | (0.67 | ) |
| DISTRIBUTIONS: | | | | | | | | | | | | | | | | | | | | |
| From net investment income | | | (0.56 | ) | | | (1.69 | ) | | | (0.01 | ) | | | (0.06 | ) | | | (0.20 | ) |
| Total distributions | | | (0.56 | ) | | | (1.69 | ) | | | (0.01 | ) | | | (0.06 | ) | | | (0.20 | ) |
| REDEMPTION FEES ADDED TO PAID-IN CAPITAL (NOTE 6) | | | – | | | | – | | | | 0.01 | | | | – | | | | 0.00 | (d) |
| Net increase/(decrease) in net asset value | | | (0.96 | ) | | | (1.14 | ) | | | 3.21 | | | | (0.62 | ) | | | (0.87 | ) |
| Net asset value, end of year | | $ | 6.84 | | | $ | 7.80 | | | $ | 8.94 | | | $ | 5.73 | | | $ | 6.35 | |
| TOTAL RETURN(e) | | | (5.58 | )% | | | 8.78 | % | | | 56.37 | % | | | (8.97 | )% | | | (9.35 | )% |
| RATIOS/SUPPLEMENTAL DATA: | | | | | | | | | | | | | | | | | | | | |
| Net assets, end of year (000s) | | $ | 17,910 | | | $ | 27,856 | | | $ | 13,789 | | | $ | 2,354 | | | $ | 6,702 | |
| Ratio of expenses to average net assets excluding fee waivers and reimbursements | | | 2.01 | %(f) | | | 2.00 | %(f) | | | 2.00 | %(f) | | | 2.05 | %(f) | | | 2.05 | %(f) |
| Ratio of expenses to average net assets including fee waivers and reimbursements | | | 2.01 | % | | | 2.00 | % | | | 2.00 | % | | | 2.05 | % | | | 2.05 | % |
| Ratio of net investment income/(loss) to average net assets | | | 2.03 | % | | | (0.08 | )% | | | 0.84 | % | | | (0.28 | )% | | | 0.17 | % |
| Portfolio turnover rate | | | 59 | % | | | 54 | % | | | 54 | % | | | 98 | % | | | 81 | % |
| (a) | Per share amounts and ratios to average net assets include income and expenses of the CoreCommodity Management Cayman Commodity Fund Ltd. (wholly-owned subsidiary). |
| (b) | Calculated using the average shares method. |
| (c) | The per share amount does not correspond to activity reflected in the Statement of Operations due to class specific expenses during the period. |
| (d) | Less than $0.005 or ($0.005) per share. |
| (e) | Total returns are for the period indicated and have not been annualized. Total returns would have been lower had certain expenses not been waived during the period. Returns shown do not reflect the deduction of taxes that a shareholder would pay on Fund distributions or the redemption of Fund shares. Returns shown exclude any applicable sales charges. |
| (f) | The ratio of operating expenses excluding fee waiver/reimbursements to average net assets is calculated excluding the waived Subsidiary management fee (see Note 8 for additional detail). The ratio inclusive of that fee would be for the years ended October 31, 2023, October 31, 2022, October 31, 2021, October 31, 2020 and October 31, 2019, respectively, 2.19%, 2.18%, 2.18%, 2.23% and 2.20%. |
See Notes to Financial Statements.
ALPS | CoreCommodity Management
CompleteCommodities® Strategy Fund – Class I
Consolidated Financial Highlights
Selected data for a share of beneficial interest outstanding throughout the periods indicated:
| | | For the Year
Ended
October 31,
2023 | | | For the Year
Ended
October 31,
2022 | | | For the Year
Ended
October 31,
2021 | | | For the Year
Ended
October 31,
2020 | | | For the Year
Ended
October 31,
2019 | |
| Net asset value, beginning of period(a) | | $ | 8.61 | | | $ | 9.62 | | | $ | 6.12 | | | $ | 6.73 | | | $ | 7.58 | |
| INCOME/(LOSS) FROM INVESTMENT OPERATIONS: | | | | | | | | | | | | | | | | | | | | |
| Net investment income(b) | | | 0.24 | | | | 0.08 | | | | 0.14 | | | | 0.04 | | | | 0.08 | |
| Net realized and unrealized gain/(loss) | | | (0.63 | ) | | | 0.61 | | | | 3.38 | | | | (0.58 | ) | | | (0.72 | ) |
| Total from investment operations | | | (0.39 | ) | | | 0.69 | | | | 3.52 | | | | (0.54 | ) | | | (0.64 | ) |
| DISTRIBUTIONS: | | | | | | | | | | | | | | | | | | | | |
| From net investment income | | | (0.57 | ) | | | (1.70 | ) | | | (0.02 | ) | | | (0.07 | ) | | | (0.21 | ) |
| Total distributions | | | (0.57 | ) | | | (1.70 | ) | | | (0.02 | ) | | | (0.07 | ) | | | (0.21 | ) |
| REDEMPTION FEES ADDED TO PAID-IN CAPITAL (NOTE 6) | | | – | | | | (0.00 | )(c) | | | 0.00 | (c) | | | 0.00 | (c) | | | 0.00 | (c) |
| Net increase/(decrease) in net asset value | | | (0.96 | ) | | | (1.01 | ) | | | 3.50 | | | | (0.61 | ) | | | (0.85 | ) |
| Net asset value, end of year | | $ | 7.65 | | | $ | 8.61 | | | $ | 9.62 | | | $ | 6.12 | | | $ | 6.73 | |
| TOTAL RETURN(d) | | | (4.87 | )% | | | 9.85 | % | | | 57.74 | % | | | (8.18 | )% | | | (8.48 | )% |
| RATIOS/SUPPLEMENTAL DATA: | | | | | | | | | | | | | | | | | | | | |
| Net assets, end of year (000s) | | $ | 1,602,146 | | | $ | 1,613,293 | | | $ | 1,154,123 | | | $ | 439,254 | | | $ | 500,305 | |
| Ratio of expenses to average net assets excluding fee waivers and reimbursements | | | 1.16 | %(e) | | | 1.08 | %(e) | | | 1.09 | %(e) | | | 1.15 | %(e) | | | 1.14 | %(e) |
| Ratio of expenses to average net assets including fee waivers and reimbursements | | | 1.15 | % | | | 1.08 | % | | | 1.09 | % | | | 1.15 | % | | | 1.14 | % |
| Ratio of net investment income to average net assets | | | 3.02 | % | | | 0.84 | % | | | 1.68 | % | | | 0.64 | % | | | 1.09 | % |
| Portfolio turnover rate | | | 59 | % | | | 54 | % | | | 54 | % | | | 98 | % | | | 81 | % |
| (a) | Per share amounts and ratios to average net assets include income and expenses of the CoreCommodity Management Cayman Commodity Fund Ltd. (wholly-owned subsidiary). |
| (b) | Calculated using the average shares method. |
| (c) | Less than $0.005 or ($0.005) per share. |
| (d) | Total returns are for the period indicated and have not been annualized. Total returns would have been lower had certain expenses not been waived during the period. Returns shown do not reflect the deduction of taxes that a shareholder would pay on Fund distributions or the redemption of Fund shares. |
| (e) | The ratio of operating expenses excluding fee waiver/reimbursements to average net assets is calculated excluding the waived Subsidiary management fee (see Note 8 for additional detail). The ratio inclusive of that fee would be for the years ended October 31, 2023, October 31, 2022, October 31, 2021, October 31, 2020 and October 31, 2019, respectively, 1.34%, 1.26%, 1.27%, 1.33% and 1.29%. |
See Notes to Financial Statements.
ALPS | Kotak India ESG Fund
| Management Commentary | October 31, 2023 (Unaudited) |
Performance
For the 1-year period ending October 31, 2023, the ALPS/Kotak India ESG Fund returned 5.43% for Class I compared to its benchmark, the Nifty 500 Index, which returned 9.88% over the same period (total return, all in USD terms).
The past fiscal year was a year of uncertainties and heightened risk, the failure of a few regional US banks and the Credit Suisse merger with UBS at the start of the year to the recent Israel-Hamas conflict. The Indian market has done fairly well amidst these challenges though the markets have been very polarized. The Indian market is concurrently in the bear, bull and bubble phase. Several top large-cap stocks (and quality mid-cap stocks) have hardly given any returns in the past 2-3 years, other large- and mid-cap stocks have delivered decent returns, while several mid- and small-cap stocks have given fantastic returns in the past 6-9 months. INR remained fairly resilient amidst headwinds due to the dollar strength, high crude prices and uncertainty on global growth and rates.
While the frontline Nifty 50 Index returned 6.94% during the period, the Nifty Midcap 100 Index returned 24.59% during the period (total return, all in USD terms as per Bloomberg reference rate).
Looking at some of the global policies: The US Federal Reserve hiked the Fed Funds Rate by 6 times for the past one year by a total of 225bps to bring the Federal Funds Rate to 5.50%, while maintaining status quo with the policy rate target range at 5.25-5.5%. The Federal Open Markets Committee (FOMC) noted the strong pace of economic growth in 3QCY23, moderating but strong job gains, low unemployment rate, and elevated inflation. They also pointed to tighter financial and credit conditions likely to weigh on economic activity, hiring, and inflation. The Bank of England (BOE) had been hiking rates since December 2021, the last hike by 25 bps to 5.25% in August 2023. BOE’s latest projections show CY2023 real GDP growth at 0.5% (unchanged), 0% in CY2024 (0.5% earlier), and 0.25% in CY2025 (unchanged). The BOE projects inflation moderating from 4.75% in CY2023 to 2% in CY2025. The Bank of Japan (BOJ), in line with expectations, maintained status quo on its policy rate at -0.1%. However, it tweaked its yield curve control policy, setting an upper bound of +1% for the 10-year bond yield. The BOJ projects real GDP growth at 2% in FY2023 (1.3% earlier), 1% in FY2024 (1.2% earlier), and 1% in FY2025 (unchanged).
Looking back at India, the FY2024 Union Budget in Feb 2023, did a fine balancing act between (1) fiscal consolidation, (2) increasing attractiveness of the new personal income tax regime and (3) continued higher capital expenditure. The government has rationalized the high subsidies on food and fertilizer and the elevated rural spending seen during the pandemic. Gross borrowing has been maintained at a comfortable level, which we believe should keep interest rates in check.
On the macro side, the World Bank maintained its FY2024 GDP growth forecast for India at 6.3% and IMF raised India's FY24 GDP growth forecast to 6.3% from 6.1% earlier due to stronger demand.
The Reserve Bank of India (RBI) MPC in total had hiked the repo rate by a total of 250bps to 6.5% since May 2020 while continuing to remain focused on the withdrawal of accommodation. Business momentum in India’s manufacturing activity indicated a slowdown in growth - Manufacturing Purchase Money Index (PMI) softened to 55.5 in October vs 57.5 in September but still above the 50-mark (A PMI index greater than 50 represents growth or expansion while reading below 50 indicates contraction). PMI has remained in expansion zone for the entire year.
There was a favorable mix of sound macro and microeconomic conditions, including moderating inflation, declining commodity prices, expectations of peaking global interest rates, for example. Also, JP Morgan announced that it will include Indian government bonds in its emerging market debt index, which is a positive for India in the coming near term. Investment stocks delivered strong returns over the past 6- 12 months on expectations of strong recovery in the domestic capex cycle. Strong government capex for the period April to August 2023 supported this narrative. However, we note two potential risks with this narrative—(1) possible front-loading of government capex in FY2024 and (2) financing of capital expenditure by large fiscal deficits, which may not be sustainable given high fiscal deficit. In our view, private corporate capex appears to be sluggish given (1) weakening GFCF/GDP, despite strong government and household capex, and (2) tepid recovery in sanctioning of long-term loans for projects.
All in all, risks to India’s macro-economic outlook increased within the last few months of the fiscal year compared to a sufficiently comfortable position a few months back. Exiting the fiscal year, growth remains stable but some weakness in the formal jobs segment could add to the recent consumption headwinds. Inflation, while coming off recent highs, is likely to remain well above the 4% mark for the foreseeable future. Amid the cheers of India being included in the JP Morgan emerging market debt index, the fiscal situation remains under some stress at fiscal year end, especially given the uncertainty regarding spending needs over the next few months as well as consolidation pressures over the medium-term. In our view, the larger worry will be from the external sector. We believe that elevated crude oil prices, coupled with sustained high global rates, will impinge on the external balance. A cautious RBI would likely prefer to keep rates elevated for longer and keep liquidity close to neutral.
Market Outlook and Valuation
We believe political risk, geo-political and local elections, are the near term headwinds for the otherwise reasonably strong Indian economy and corporate earnings cycle in a troubled world.
The unfortunate situation in Israel – Gaza is still evolving and has a risk to blow up into a full blown Middle Eastern crisis. Ukraine-Russia war continues to wage on and troubles on US China relations continue to simmer. We hope that we see resolutions on these sooner rather than
ALPS | Kotak India ESG Fund
| Management Commentary | October 31, 2023 (Unaudited) |
later. Global growth is clearly impacted by these ongoing geo-political risk and if the Middle East situation worsens, there is a serious chance of one more energy crisis as happened in 2022 led by Ukraine-Russia conflict.
Locally, India has elections in 5 states in the month of November, the results of which will be announced in the first week of December. While the outcome of these elections is no indicator of the big federal elections in May 2024 when Prime Minister Modi will seek a third term, it may create some volatility and uncertainty.
One interesting facet of Indian economy is the de-risking of the Indian macro risk in the past one decade. We ran into a year of high oil prices last year and our current account deficit was less than 2% of GDP and inflation though above the central bank target range was still manageable. Currency reserves were adequate to manage the widening current account deficit and in 2023 YTD, INR has been a resilient currency when global currencies have seen large volatility. We believe that the corporate balance sheet and profitability cycle is in good shape, and bank balance sheet on asset quality as well as Tier 1 capital and profitability are strong. In our view, the overall capex story continues on a strong foot driven by governments and import substitution and there are some initial signs of revival of general corporate capex.
We believe the recent inclusion of India in JPM Emerging Market Bond Index will further blunt the macro risk as this will likely bring in large passive and active flows, and if other index providers also include India, the flows might be meaningful. In our view, the only macro risk which has increased is the size of government’s balance sheet which expanded during Covid, but we see a trajectory of consolidation on the back of fiscal prudence and rising taxes.
In the near term, despite a strong earnings delivery, we see markets moving in a narrow range as they absorb political risks. We see some risks from the continued weakness in the rural economy of the aggregate demand but, in our view this was already factored in by the market to a large extent. The festive season may hopefully bring in some cheer and with soft raw material basket (WPI Inflation still in negative territory), we believe we would likely see another round of strong earnings in the Oct – Dec quarter. Entering fiscal year 2024, we expect the mid-market to report even stronger earnings as these businesses are mostly domestically oriented, and as they are mostly commodity consumers, earnings are more leveraged to soft commodity inflation barring oil. Oil also has moderated a bit after a swift move almost to 3 digits and does not seem to be settling in the mid-80s.
In our view, the market seems to have now taken a view that the Fed Cycle has come to an end and we witnessed swift correction in bond yields post the recent pause by the Fed. Whether this could fuel a rally in risk assets is a bit uncertain as higher for longer and the risk of bond supply will keep the yields elevated. On the domestic flow side, the monthly retail Systematic Investment Plans (SIP) flows touched an all-time high of ~$2bn in the month of September 2023, translating into an annualised run rate of around 3% of gross household savings. On the back of sustained inflows in mutual funds in the past few years, the nature of institutional holding of Indian markets have seen a big shift.
After the recent correction in the markets, Nifty valuations have moderated to 17.8X, a 12% discount to the last 10 year market multiples of 20.1X (source: Motilal Oswal). It is also worth noting that contrary to popular perception, Indian markets have seen negative aggregate flows ($0.9bn outflow) in the last three calendar years, with inflows of $3.76bn in CY21, outflows of $17.02bn in CY22 and inflows of $12.36bn in CY23 YTD as of October 31, 2023. While we do expect the consolidation phase to continue, any further correction from here may be seen as an opportunity for investors to add exposure to India.
Mr. Nitin Tejpal Jain
Fund Manager
Kotak Mahindra Asset Management (Singapore) Pte Ltd.
The views above are based on publicly available data, Kotak Group internal estimates and are based on the views of the research team at Kotak group.
The views of the author and information discussed in this commentary are as of the date of publication, are subject to change, and may not reflect the writer's current views. The views expressed are those of the author only, and represent an assessment of market conditions at a specific point in time, are opinions only and should not be relied upon as investment advice regarding a particular investment or markets in general. Such information does not constitute a recommendation to buy or sell specific securities or investment vehicles. It should not be assumed that any investment will be profitable or will equal the performance of the fund or any securities or any sectors mentioned in this letter. The subject matter contained in this letter has been derived from several sources believed to be reliable and accurate at the time of compilation. Neither ALPS Advisors, Inc., Kotak Mahindra Asset Management (Singapore) Pte Ltd., nor the Fund accepts any liability for losses either direct or consequential caused by the use of this information.
Diversification cannot guarantee gain or prevent losses.
Past performance is no guarantee of future results. Dividends are not guaranteed and are subject to change or elimination. Investments in international and emerging markets securities include exposure to risks such as currency fluctuations, foreign taxes and regulations, and the potential for illiquid markets and political instability.
ALPS Portfolio Solutions Distributor, Inc., ALPS Distributors, Inc. and ALPS Advisors Inc. are affiliated.
ALPS | Kotak India ESG Fund
| Performance Update | October 31, 2023 (Unaudited) |
Performance of $10, 000 Initial Investment (as of October 31, 2023)
Comparison of change in value of a $10,000 investment
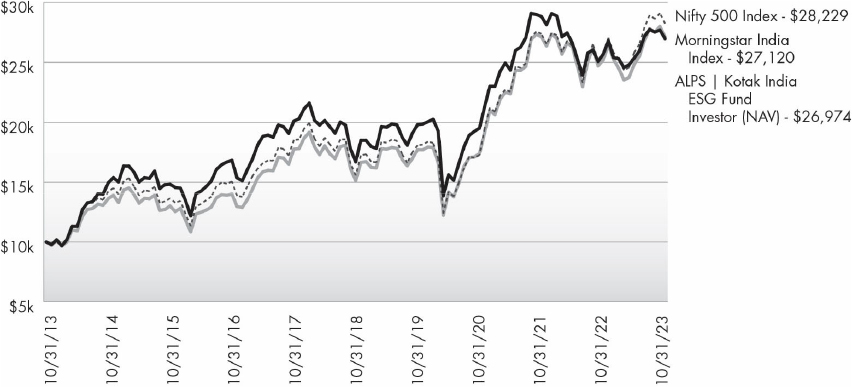
The chart above represents historical performance of a hypothetical investment of $10,000 in the Fund over the past ten years. Past performance does not guarantee future results. This chart does not reflect the deduction of taxes that a shareholder would pay on Fund distributions or the redemption of Fund shares.
Average Annual Total Returns (as of October 31, 2023)
| | 1 Year | 3 Year | 5 Year | 10 Year | Since
Inception^ | Total
Expense
Ratio* | What You
Pay* |
| Investor# (NAV) | 5.06% | 11.41% | 10.06% | 10.43% | 7.07% | 1.40% | 1.40% |
| Class A (NAV) | 5.14% | 11.56% | 10.06% | 10.42% | 7.06% | 1.28% | 1.28% |
| Class A (LOAD) | -0.66% | 9.49% | 8.82% | 9.80% | 6.59% |
| Class C (NAV) | 4.38% | 10.69% | 9.23% | 9.62% | 6.31% | 2.00% | 2.00% |
| Class C (LOAD) | 3.38% | 10.69% | 9.23% | 9.62% | 6.31% |
| Class I | 5.43% | 11.79% | 10.32% | 10.74% | 7.38% | 1.00% | 1.00% |
| Class II | 5.69% | 12.08% | 10.54% | 10.85% | 7.47% | 0.88% | 0.75% |
| Nifty 500 Index1 | 9.88% | 17.81% | 12.62% | 10.94% | 7.11% | | |
| Morningstar India Index2 | 7.64% | 15.98% | 12.39% | 10.49% | 6.95% | | |
Performance data quoted represents past performance. Past performance does not guarantee future results. Investment return and principal value of an investment will fluctuate so that an investor’s shares, when sold or redeemed, may be worth more or less than the original cost. Current performance data may be higher or lower than actual data quoted. For the most current month-end performance data, please call 1-866-759-5679.
Maximum Offering Price (MOP) for Class A shares includes the Fund’s maximum sales charge of 5.50%. Performance shown at NAV does not include these sales charges and would have been lower had it been taken into account. If you invest $ 1 million or more, either as a lump sum or through the Fund’s accumulation or letter of intent programs, you can purchase Class A shares without an initial sales charge (load). A Contingent Deferred Sales Charge (“CDSC”) of 1.00% may apply to Class C shares redeemed within the first 12 months after a purchase, and on Class A shares redeemed within the first 18 months after a purchase in excess of $1 million. The Fund imposes a 2.00% redemption fee on shares held for less than 30 days.
ALPS | Kotak India ESG Fund
| Performance Update | October 31, 2023 (Unaudited) |
Performance shown for Class A shares prior to June 12, 2018 reflects the historical performance of the Fund’s Investor shares, calculated using the fees and expenses of Class A shares. Performance shown for Class II shares prior to December 19, 2019 reflects the historical performance of the Fund’s Class I shares, calculated using the fees and expenses of Class II shares.
| 1 | Nifty 500 Index (formerly the CNX 500 Index) - India's first broad based benchmark of the Indian capital market. The Nifty 500 companies are disaggregated into 72 industry indices. Industry weightages in the index reflect the industry weightages in the market. The index is not actively managed and does not reflect any deduction for fees, expenses or taxes. An investor may not invest directly in an index. |
| 2 | Morningstar India NR Index: measures the performance of India's equity markets targeting the top 97% of stocks by market capitalization. |
| ^ | Fund Inception date of February 14, 2011 for Investor Class and Classes C and I; Fund Inception date of June 12, 2018 for Class A; Fund Inception date of December 19, 2019 for Class II. |
| * | Please see the prospectus dated February 28, 2023 for additional information. ALPS Advisors, Inc. (the “Adviser”) and Kotak Mahindra Asset Management (Singapore) Pte. Ltd. (the “Sub-Adviser”) have agreed to waive and/or reimburse fees or expenses in order to limit Total annual Fund operating expenses after fee waiver/expense reimbursements (excluding Distribution and Service (12b-1) Fees, Shareholder Services Fees, Acquired Fund Fees and Expenses, brokerage expenses, interest expenses, taxes, and extraordinary expenses) to 1.00% of Investor Class, Class A, Class C, and Class I shares and 0.75% for Class II shares of the Fund’s average daily net assets. This agreement (the “Expense Agreement”) is in effect through February 28, 2024. |
| # | Prior to December 1, 2017, Investor Class was known as Class A. |
The table does not reflect the deduction of taxes that a shareholder would pay on Fund distributions or the redemption of Fund shares.
This Fund is not suitable for all investors and is subject to investment risks, including possible loss of the principal amount invested.
There is no guarantee that the Fund will continue to hold any one particular security or stay invested in any one particular company. The composition of the Fund's top holdings is subject to change. Performance figures are historical and reflect the change in share price, reinvested distributions, changes in net asset value, sales charges and capital gains distributions, if any.
Not FDIC Insured – No Bank Guarantee – May Lose Value
Investing in India involves risk and considerations not present when investing in more established securities markets. The Fund may be more susceptible to economic, market, political and local risks of the region than a fund that is more geographically diversified. Investments in India are subject to a number of risks including, but not limited to, risk of losing some or all of the capital invested, high market volatility, variable market liquidity, geopolitical risks (including political instability), exchange rate fluctuations (between the currency of the fund’s share class and the Indian Rupee), changes in tax regime and restrictions on investment activities of foreign investors.
Top Ten Holdings (as a % of Net Assets) †
| ICICI Bank, Ltd. | 8.96% |
| Infosys, Ltd. | 7.07% |
| Reliance Industries, Ltd. | 5.96% |
| HDFC Bank, Ltd. | 5.16% |
| Axis Bank, Ltd. | 4.75% |
| Larsen & Toubro, Ltd. | 3.78% |
| Bharti Airtel, Ltd. | 3.56% |
| IndusInd Bank, Ltd. | 3.05% |
| Hindustan Unilever, Ltd. | 3.05% |
| Persistent Systems, Ltd. | 2.72% |
| Top Ten Holdings | 48.06% |
| † | Holdings are subject to change, and may not reflect the current or future position of the portfolio. Table presents approximate values only. |
Industry Sector Allocation (as a % of Net Assets)
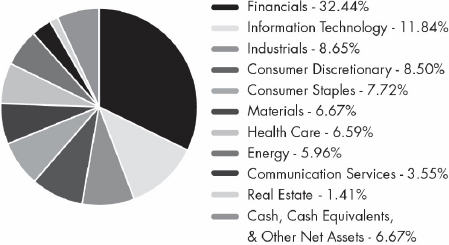
ALPS | Kotak India ESG Fund
| Statement of Investments | October 31, 2023 |
| | |
Shares | | | Value
(Note 2) | |
| COMMON STOCKS (93.33%) | | | | | | |
| Communication Services (3.55%) | | | | | | |
| Wireless Telecommunication Services (3.55%) | | | | | | | | |
| Bharti Airtel, Ltd. | | | 1,000,000 | | | $ | 10,982,616 | |
| Bharti Airtel, Ltd. partly paid | | | 78,914 | | | | 508,419 | |
| | | | | | | | 11,491,035 | |
| | | | | | | | | |
| TOTAL COMMUNICATION SERVICES | | | | | | | 11,491,035 | |
| | | | | | | | | |
| Consumer Discretionary (8.50%) | | | | | | | | |
| Automobile Components (1.40%) | | | | | | | | |
| Apollo Tyres, Ltd. | | | 509,156 | | | | 2,331,945 | |
| Sansera Engineering, Ltd.(a)(b) | | | 211,107 | | | | 2,171,789 | |
| | | | | | | | 4,503,734 | |
| Automobiles (3.89%) | | | | | | | | |
| Mahindra & Mahindra, Ltd. | | | 242,351 | | | | 4,247,270 | |
| Maruti Suzuki India, Ltd. | | | 66,729 | | | | 8,332,898 | |
| | | | | | | | 12,580,168 | |
| Hotels, Restaurants & Leisure (2.37%) | | | | | | | | |
| Jubilant Foodworks, Ltd. | | | 300,430 | | | | 1,807,716 | |
| Zomato, Ltd.(c) | | | 4,630,995 | | | | 5,857,399 | |
| | | | | | | | 7,665,115 | |
| Household Durables (0.25%) | | | | | | | | |
| Crompton Greaves Consumer Electricals, Ltd. | | | 234,233 | | | | 793,344 | |
| | | | | | | | | |
| Textiles, Apparel & Luxury Goods (0.59%) | | | | | | | | |
| Titan Co., Ltd. | | | 50,000 | | | | 1,916,788 | |
| | | | | | | | | |
| TOTAL CONSUMER DISCRETIONARY | | | | | | | 27,459,149 | |
| | | | | | | | | |
| Consumer Staples (7.72%) | | | | | | | | |
| Food Products (1.23%) | | | | | | | | |
| Bikaji Foods International, Ltd. | | | 700,849 | | | | 3,983,486 | |
| | | | | | | | | |
| Personal Care Products (6.49%) | | | | | | | | |
| Dabur India, Ltd. | | | 316,694 | | | | 2,011,837 | |
| Emami, Ltd. | | | 611,218 | | | | 3,744,338 | |
| Godrej Consumer Products, Ltd.(c) | | | 449,102 | | | | 5,351,068 | |
| Hindustan Unilever, Ltd. | | | 330,000 | | | | 9,848,318 | |
| | | | | | | | 20,955,561 | |
| | | | | | | | | |
| TOTAL CONSUMER STAPLES | | | | | | | 24,939,047 | |
| | | | | | | | | |
| Energy (5.96%) | | | | | | | | |
| Oil, Gas & Consumable Fuels (5.96%) | | | | | | | | |
| Reliance Industries, Ltd. | | | 700,000 | | | | 19,248,452 | |
| | | | | | | | | |
| TOTAL ENERGY | | | | | | | 19,248,452 | |
| | |
Shares | | | Value
(Note 2) | |
| Financials (32.44%) | | | | | | |
| Banks (23.89%) | | | | | | |
| AU Small Finance Bank, Ltd.(a)(b) | | | 646,798 | | | $ | 5,198,528 | |
| Axis Bank, Ltd. | | | 1,300,000 | | | | 15,339,758 | |
| Bandhan Bank, Ltd.(a)(b) | | | 457,317 | | | | 1,177,580 | |
| HDFC Bank, Ltd., ADR | | | 62,825 | | | | 3,552,754 | |
| HDFC Bank, Ltd. | | | 739,579 | | | | 13,123,488 | |
| ICICI Bank, Ltd., Sponsored ADR | | | 591,286 | | | | 13,120,636 | |
| ICICI Bank, Ltd. | | | 1,438,002 | | | | 15,820,614 | |
| IndusInd Bank, Ltd. | | | 569,699 | | | | 9,869,199 | |
| | | | | | | | 77,202,557 | |
| Consumer Finance (2.96%) | | | | | | | | |
| Bajaj Finance, Ltd. | | | 74,944 | | | | 6,746,420 | |
| Mahindra & Mahindra Financial Services, Ltd. | | | 958,689 | | | | 2,826,149 | |
| | | | | | | | 9,572,569 | |
| Financial Services (0.79%) | | | | | | | | |
| Aavas Financiers, Ltd.(c) | | | 150,000 | | | | 2,537,590 | |
| | | | | | | | | |
| Insurance (4.80%) | | | | | | | | |
| HDFC Life Insurance Co., Ltd.(a)(b) | | | 735,000 | | | | 5,460,074 | |
| Max Financial Services, Ltd.(c) | | | 550,000 | | | | 6,040,804 | |
| PB Fintech, Ltd.(c) | | | 475,923 | | | | 4,004,691 | |
| | | | | | | | 15,505,569 | |
| | | | | | | | | |
| TOTAL FINANCIALS | | | | | | | 104,818,285 | |
| | | | | | | | | |
| Health Care (6.59%) | | | | | | | | |
| Health Care Providers & Services (4.02%) | | | | | | | | |
| Fortis Healthcare, Ltd. | | | 1,311,094 | | | | 5,086,013 | |
| Max Healthcare Institute, Ltd. | | | 1,150,000 | | | | 7,924,843 | |
| | | | | | | | 13,010,856 | |
| Pharmaceuticals (2.57%) | | | | | | | | |
| Cipla, Ltd. | | | 276,334 | | | | 3,983,390 | |
| Sun Pharmaceutical Industries, Ltd. | | | 330,316 | | | | 4,318,603 | |
| | | | | | | | 8,301,993 | |
| | | | | | | | | |
| TOTAL HEALTH CARE | | | | | | | 21,312,849 | |
| | | | | | | | | |
| Industrials (8.65%) | | | | | | | | |
| Building Products (2.21%) | | | | | | | | |
| Apollo Pipes, Ltd. | | | 385,987 | | | | 3,058,891 | |
| Kajaria Ceramics, Ltd. | | | 270,550 | | | | 4,098,768 | |
| | | | | | | | 7,157,659 | |
| Construction & Engineering (4.82%) | | | | | | | | |
| Kalpataru Projects International, Ltd. | | | 422,285 | | | | 3,360,093 | |
See Notes to Financial Statements.
ALPS | Kotak India ESG Fund
| Statement of Investments | October 31, 2023 |
| | |
Shares | | | Value
(Note 2) | |
| Construction & Engineering (continued) | | | | | | | | |
| Larsen & Toubro, Ltd. | | | 347,000 | | | $ | 12,211,244 | |
| | | | | | | | 15,571,337 | |
| Passenger Airlines (1.62%) | | | | | | | | |
| InterGlobe Aviation, Ltd.(a)(b)(c) | | | 177,355 | | | | 5,227,109 | |
| | | | | | | | | |
| TOTAL INDUSTRIALS | | | | | | | 27,956,105 | |
| | | | | | | | | |
| Information Technology (11.84%) | | | | | | | | |
| IT Services (11.84%) | | | | | | | | |
| Infosys, Ltd., Sponsored ADR | | | 590,839 | | | | 9,701,576 | |
| Infosys, Ltd. | | | 800,000 | | | | 13,156,614 | |
| Persistent Systems, Ltd. | | | 118,650 | | | | 8,788,285 | |
| Tech Mahindra, Ltd. | | | 485,711 | | | | 6,619,332 | |
| | | | | | | | 38,265,807 | |
| | | | | | | | | |
| TOTAL INFORMATION TECHNOLOGY | | | | | | | 38,265,807 | |
| | | | | | | | | |
| Materials (6.67%) | | | | | | | | |
| Chemicals (0.34%) | | | | | | | | |
| Carborundum Universal, Ltd. | | | 85,000 | | | | 1,094,529 | |
| | | | | | | | | |
| Construction Materials (3.95%) | | | | | | | | |
| JK Cement, Ltd. | | | 83,214 | | | | 3,154,596 | |
| Odisha Cement, Ltd. | | | 175,731 | | | | 4,443,127 | |
| Ramco Cements, Ltd. | | | 432,930 | | | | 5,158,432 | |
| | | | | | | | 12,756,155 | |
| Containers & Packaging (0.74%) | | | | | | | | |
| Mold-Tek Packaging, Ltd. | | | 223,731 | | | | 2,395,107 | |
| | | | | | | | | |
| Metals & Mining (1.64%) | | | | | | | | |
| Hindalco Industries, Ltd. | | | 962,338 | | | | 5,311,867 | |
| | | | | | | | | |
| TOTAL MATERIALS | | | | | | | 21,557,658 | |
| | | | | | | | | |
| Real Estate (1.41%) | | | | | | | | |
| Real Estate Management & Development (1.41%) | | | | | | | | |
| Brigade Enterprises, Ltd. | | | 614,948 | | | | 4,544,305 | |
| | | | | | | | | |
| TOTAL REAL ESTATE | | | | | | | 4,544,305 | |
| | | | | | | | | |
| TOTAL COMMON STOCKS | | | | | | | | |
| (Cost $245,295,148) | | | | | | | 301,592,692 | |
| | | 7-Day
Yield | | | Shares | | | Value
(Note 2) | |
| SHORT TERM INVESTMENTS (2.32%) | | | |
| Money Market Funds (2.32%) | | | | | | | | | | | | |
| Goldman Sachs Financial Square Government Fund - Institutional Class | | | 5.253 | % | | | 7,500,000 | | | $ | 7,500,000 | |
| | | | | | | | | | | | | |
| TOTAL MONEY MARKET FUNDS | | | | | | | | | | | 7,500,000 | |
| | | | | | | | | | | | | |
| TOTAL SHORT TERM INVESTMENTS | | | | | | | | | | | | |
| (Cost $7,500,000) | | | | | | | | | | | 7,500,000 | |
| | | | | | | | | | | | | |
| TOTAL INVESTMENTS (95.65%) | | | | | | | | | | | | |
| (Cost $252,795,148) | | | | | | | | | | $ | 309,092,692 | |
| | | | | | | | | | | | | |
| Assets In Excess Of Other Liabilities (4.35%) | | | | | | | | | | | 14,054,222 | |
| | | | | | | | | | | | | |
| NET ASSETS (100.00%) | | | | | | | | | | $ | 323,146,914 | |
| (a) | Securities exempt from registration under Rule 144A of the Securities Act of 1933. These Securities may be resold in transactions exempt from registration, normally to qualified institutional buyers. As of October 31, 2023, the aggregate market value of those securities was $19,235,080, representing 5.95% of net assets. |
| (b) | Securities were purchased pursuant to Regulation S under the Securities Act of 1933, which exempts securities offered and sold outside of the United States from registration. Such securities cannot be sold in the United States without either an effective registration statement filed pursuant to the Securities Act of 1933, or pursuant to an exemption from registration. These securities have been deemed liquid under guidelines approved by the Fund's Board of Trustees. As of October 31, 2023 the aggregate market value of those securities was $19,235,080, representing 5.95% of net assets. |
| (c) | Non-Income Producing Security. |
For Fund compliance purposes, the Fund's industry classifications refer to any one or more of the industry sub-classifications used by one or more widely recognized market indexes or ratings group indexes, and/or as defined by Fund management. This definition may not apply for purposes of this report, which may combine industry sub-classifications for reporting ease. Industries are shown as a percent of net assets.
See Notes to Financial Statements.
ALPS | Kotak India ESG Fund
| Statement of Assets and Liabilities | October 31, 2023 |
| ASSETS | | | |
| Investments, at value | | $ | 309,092,692 | |
| Cash | | | 2,721,930 | |
| Foreign currency, at value (Cost $12,635,093) | | | 11,932,069 | |
| Receivable for investments sold | | | 3,690,201 | |
| Receivable for shares sold | | | 5,161,543 | |
| Dividends and interest receivable | | | 264,822 | |
| Prepaid expenses and other assets | | | 16,046 | |
| Total Assets | | | 332,879,303 | |
| LIABILITIES | | | | |
| Payable for investments purchased | | | 655,105 | |
| Payable for foreign capital gains tax | | | 8,752,951 | |
| Investment advisory fees payable | | | 150,557 | |
| Administration and transfer agency fees payable | | | 110,750 | |
| Distribution and services fees payable | | | 5,534 | |
| Trustees' fees and expenses payable | | | 6,320 | |
| Professional fees payable | | | 23,538 | |
| Accrued expenses and other liabilities | | | 27,634 | |
| Total Liabilities | | | 9,732,389 | |
| NET ASSETS | | $ | 323,146,914 | |
| NET ASSETS CONSIST OF | | | | |
| Paid-in capital | | $ | 269,906,302 | |
| Total distributable earnings/(accumulated losses) | | | 53,240,612 | |
| NET ASSETS | | $ | 323,146,914 | |
| INVESTMENTS, AT COST | | $ | 252,795,148 | |
| PRICING OF SHARES | | | | |
| Investor Class: | | | | |
| Net Asset Value, offering and redemption price per share | | $ | 16.32 | |
| Net Assets | | $ | 4,596,447 | |
| Shares of beneficial interest outstanding (unlimited number of shares, no par value common stock authorized) | | | 281,611 | |
| Class A: | | | | |
| Net Asset Value, offering and redemption price per share | | $ | 16.29 | |
| Net Assets | | $ | 1,499,475 | |
| Shares of beneficial interest outstanding (unlimited number of shares, no par value common stock authorized) | | | 92,043 | |
| Maximum offering price per share ((NAV/0.9450), based on maximum sales charge of 5.50% of the offering price) | | $ | 17.24 | |
| Class C: | | | | |
| Net Asset Value, offering and redemption price per share(a) | | $ | 14.71 | |
| Net Assets | | $ | 1,209,937 | |
| Shares of beneficial interest outstanding (unlimited number of shares, no par value common stock authorized) | | | 82,271 | |
| Class I: | | | | |
| Net Asset Value, offering and redemption price per share | | $ | 17.03 | |
| Net Assets | | $ | 24,025,558 | |
| Shares of beneficial interest outstanding (unlimited number of shares, no par value common stock authorized) | | | 1,410,994 | |
| Class II: | | | | |
| Net Asset Value, offering and redemption price per share | | $ | 17.20 | |
| Net Assets | | $ | 291,815,497 | |
| Shares of beneficial interest outstanding (unlimited number of shares, no par value common stock authorized) | | | 16,968,939 | |
| (a) | Redemption price per share may be reduced for any applicable contingent deferred sales charge. For a description of a possible sales charge, please see the Fund's Prospectus. |
See Notes to Financial Statements.
ALPS | Kotak India ESG Fund
| Statement of Operations | For the Year Ended October 31, 2023 |
| INVESTMENT INCOME | | | |
| Dividends | | $ | 3,647,817 | |
| Foreign taxes withheld on dividends | | | (812,532 | ) |
| Interest and other income | | | 532,920 | |
| Total Investment Income | | | 3,368,205 | |
| | | | | |
| EXPENSES | | | | |
| Investment advisory fees | | | 2,384,228 | |
| Administrative fees | | | 570,995 | |
| Transfer agency fees | | | 3,995 | |
| Distribution and service fees | | | | |
| Investor Class | | | 15,093 | |
| Class A | | | 3,893 | |
| Class C | | | 10,720 | |
| Professional fees | | | 41,114 | |
| Reports to shareholders and printing fees | | | 2,037 | |
| State registration fees | | | 85,993 | |
| Insurance fees | | | 4,649 | |
| Custody fees | | | 64,305 | |
| Trustees' fees and expenses | | | 24,326 | |
| Repayment of previously waived fees | | | | |
| Investor Class | | | 4,970 | |
| Class C | | | 926 | |
| Class I | | | 20,843 | |
| Miscellaneous expenses | | | 35,370 | |
| Total Expenses | | | 3,273,457 | |
| Less fees waived/reimbursed by investment advisor (Note 8) | | | | |
| Class II | | | (431,570 | ) |
| Net Expenses | | | 2,841,887 | |
| Net Investment Income | | | 526,318 | |
| Net realized gain on investments | | | 22,637,740 | |
| Net realized loss on foreign currency transactions | | | (149,992 | ) |
| Net realized loss on foreign capital gains tax | | | (3,890,823 | ) |
| Net Realized Gain | | | 18,596,925 | |
| Net change in unrealized appreciation on investments | | | 2,716,391 | |
| Net change in unrealized appreciation on translation of assets and liabilities denominated in foreign currencies | | | 82,116 | |
| Net change in unrealized depreciation on foreign capital gains tax | | | (174,331 | ) |
| Net Change in Unrealized Appreciation | | | 2,624,176 | |
| NET REALIZED AND UNREALIZED GAIN ON INVESTMENTS | | | 21,221,101 | |
| NET INCREASE IN NET ASSETS RESULTING FROM OPERATIONS | | $ | 21,747,419 | |
See Notes to Financial Statements.
ALPS | Kotak India ESG Fund
Statements of Changes in Net Assets
| | | For the Year
Ended
October 31, 2023 | | | For the Year
Ended
October 31, 2022 | |
| OPERATIONS | | | | | | |
| Net investment income/(loss) | | $ | 526,318 | | | $ | (664,107 | ) |
| Net realized gain | | | 18,596,925 | | | | 6,603,214 | |
| Net change in unrealized appreciation/(depreciation) | | | 2,624,176 | | | | (47,501,737 | ) |
| Net Increase/(Decrease) in Net Assets Resulting from Operations | | | 21,747,419 | | | | (41,562,630 | ) |
| | | | | | | | | |
| TOTAL DISTRIBUTIONS | | | | | | | | |
| From distributable earnings | | | | | | | | |
| Investor Class | | | (59,404 | ) | | | (203,811 | ) |
| Class A | | | (14,494 | ) | | | (41,456 | ) |
| Class C | | | (17,218 | ) | | | (88,461 | ) |
| Class I | | | (235,995 | ) | | | (829,227 | ) |
| Class II | | | (5,145,390 | ) | | | (19,311,883 | ) |
| Net Decrease in Net Assets from Distributions | | | (5,472,501 | ) | | | (20,474,838 | ) |
| | | | | | | | | |
| BENEFICIAL INTEREST TRANSACTIONS (NOTE 6) | | | | | | | | |
| Shares sold | | | | | | | | |
| Investor Class | | | 1,656,774 | | | | 1,318,289 | |
| Class A | | | 654,565 | | | | 296,777 | |
| Class C | | | 485,951 | | | | 12,000 | |
| Class I | | | 10,278,948 | | | | 4,226,736 | |
| Class II | | | 10,000,000 | | | | – | |
| Dividends reinvested | | | | | | | | |
| Investor Class | | | 48,934 | | | | 176,973 | |
| Class A | | | 12,562 | | | | 39,052 | |
| Class C | | | 17,218 | | | | 88,461 | |
| Class I | | | 233,078 | | | | 790,535 | |
| Class II | | | 5,145,390 | | | | 19,311,883 | |
| Shares redeemed, net of redemption fees | | | | | | | | |
| Investor Class | | | (962,391 | ) | | | (931,483 | ) |
| Class A | | | (60,747 | ) | | | (120,501 | ) |
| Class C | | | (393,111 | ) | | | (372,795 | ) |
| Class I | | | (3,062,056 | ) | | | (2,814,302 | ) |
| Class II | | | (75,000,000 | ) | | | – | |
| Net Increase/(Decrease) in Net Assets Derived from Beneficial Interest Transactions | | | (50,944,885 | ) | | | 22,021,625 | |
| | | | | | | | | |
| Net decrease in net assets | | | (34,669,967 | ) | | | (40,015,843 | ) |
| | | | | | | | | |
| NET ASSETS | | | | | | | | |
| Beginning of year | | | 357,816,881 | | | | 397,832,724 | |
| End of year | | $ | 323,146,914 | | | $ | 357,816,881 | |
See Notes to Financial Statements.
ALPS | Kotak India ESG Fund – Investor Class
Financial Highlights
Selected data for a share of beneficial interest outstanding throughout the periods indicated:
| | | For the Year
Ended
October 31,
2023 | | | For the Year
Ended
October 31,
2022 | | | For the Year
Ended
October 31,
2021 | | | For the Year
Ended
October 31,
2020 | | | For the Year
Ended
October 31,
2019 | |
| Net asset value, beginning of period | | $ | 15.78 | | | $ | 18.70 | | | $ | 12.66 | | | $ | 13.02 | (a) | | $ | 11.73 | (a) |
| INCOME/(LOSS) FROM INVESTMENT OPERATIONS: | | | | | | | | | | | | | | | | | | | | |
| Net investment loss(b) | | | (0.07 | )(c) | | | (0.12 | ) | | | (0.12 | ) | | | (0.07 | )(c) | | | (0.10 | ) |
| Net realized and unrealized gain/(loss) | | | 0.85 | | | | (1.82 | ) | | | 6.16 | | | | (0.93 | ) | | | 2.19 | |
| Total from investment operations | | | 0.78 | | | | (1.94 | ) | | | 6.04 | | | | (1.00 | ) | | | 2.09 | |
| DISTRIBUTIONS: | | | | | | | | | | | | | | | | | | | | |
| From net investment income | | | – | | | | (0.44 | ) | | | – | | | | – | | | | – | |
| From net realized gains | | | (0.25 | ) | | | (0.54 | ) | | | – | | | | (0.17 | ) | | | (0.80 | ) |
| Total distributions | | | (0.25 | ) | | | (0.98 | ) | | | – | | | | (0.17 | ) | | | (0.80 | ) |
| REDEMPTION FEES ADDED TO PAID-IN CAPITAL (NOTE 6) | | | 0.01 | | | | 0.00 | (d) | | | 0.00 | (d) | | | 0.81 | | | | 0.00 | (d) |
| Net increase/(decrease) in net asset value | | | 0.54 | | | | (2.92 | ) | | | 6.04 | | | | (0.36 | ) | | | 1.29 | |
| Net asset value, end of year | | $ | 16.32 | | | $ | 15.78 | | | $ | 18.70 | | | $ | 12.66 | | | $ | 13.02 | |
| TOTAL RETURN(e) | | | 5.06 | % | | | (10.90 | )% | | | 47.71 | % | | | (1.48 | )% | | | 18.58 | % |
| RATIOS/SUPPLEMENTAL DATA: | | | | | | | | | | | | | | | | | | | | |
| Net assets, end of year (000s) | | $ | 4,596 | | | $ | 3,711 | | | $ | 3,814 | | | $ | 2,704 | | | $ | 4,604 | |
| Ratio of expenses to average net assets excluding fee waivers and reimbursements | | | 1.37 | % | | | 1.33 | % | | | 1.35 | % | | | 1.72 | % | | | 3.27 | % |
| Ratio of expenses to average net assets including fee waivers and reimbursements | | | 1.37 | % | | | 1.33 | % | | | 1.35 | % | | | 1.40 | %(f) | | | 1.91 | % |
| Ratio of net investment loss to average net assets | | | (0.43 | )% | | | (0.74 | )% | | | (0.73 | )% | | | (0.64 | )% | | | (0.79 | )% |
| Portfolio turnover rate | | | 24 | % | | | 18 | % | | | 29 | % | | | 90 | % | | | 56 | % |
| (a) | Per share amounts and ratios to average net assets include income and expenses of the Kotak Mauritius Portfolio (wholly-owned subsidiary). |
| (b) | Calculated using the average shares method. |
| (c) | The per share amount does not correspond to activity reflected in the Statement of Operations due to class specific expenses during the period. |
| (d) | Less than $0.005 or ($0.005) per share. |
| (e) | Total returns are for the period indicated and have not been annualized. Total returns would have been lower had certain expenses not been waived during the period. Returns shown do not reflect the deduction of taxes that a shareholder would pay on Fund distributions or the redemption of Fund shares. |
| (f) | Effective December 2, 2019, the net expense limitation agreement changed from 1.60% to 1.00%, excluding, among other fees and expenses, 12b-1 fees and shareholder service fees. Refer to Note 8. |
See Notes to Financial Statements.
ALPS | Kotak India ESG Fund – Class A
Financial Highlights
Selected data for a share of beneficial interest outstanding throughout the periods indicated:
| | | For the Year
Ended
October 31,
2023 | | | For the Year
Ended
October 31,
2022 | | | For the Year
Ended
October 31,
2021 | | | For the Year
Ended
October 31,
2020 | | | For the Year
Ended
October 31,
2019 | |
| Net asset value, beginning of period | | $ | 15.74 | | | $ | 18.62 | | | $ | 12.59 | | | $ | 12.99 | (a) | | $ | 11.72 | (a) |
| INCOME FROM INVESTMENT OPERATIONS: | | | | | | | | | | | | | | | | | | | | |
| Net investment loss(b) | | | (0.04 | )(c) | | | (0.08 | ) | | | (0.11 | ) | | | (0.07 | )(c) | | | (0.06 | ) |
| Net realized and unrealized gain/(loss) | | | 0.84 | | | | (1.82 | ) | | | 6.14 | | | | (0.16 | ) | | | 2.13 | |
| Total from investment operations | | | 0.80 | | | | (1.90 | ) | | | 6.03 | | | | (0.23 | ) | | | 2.07 | |
| DISTRIBUTIONS: | | | | | | | | | | | | | | | | | | | | |
| From net investment income | | | – | | | | (0.44 | ) | | | – | | | | – | | | | – | |
| From net realized gains | | | (0.25 | ) | | | (0.54 | ) | | | – | | | | (0.17 | ) | | | (0.80 | ) |
| Total distributions | | | (0.25 | ) | | | (0.98 | ) | | | – | | | | (0.17 | ) | | | (0.80 | ) |
| REDEMPTION FEES ADDED TO PAID-IN CAPITAL (NOTE 6) | | | 0.00 | (d) | | | – | | | | 0.00 | (d) | | | – | | | | – | |
| Net increase/(decrease) in net asset value | | | 0.55 | | | | (2.88 | ) | | | 6.03 | | | | (0.40 | ) | | | 1.27 | |
| Net asset value, end of year | | $ | 16.29 | | | $ | 15.74 | | | $ | 18.62 | | | $ | 12.59 | | | $ | 12.99 | |
| TOTAL RETURN(e) | | | 5.14 | % | | | (10.70 | )% | | | 47.90 | % | | | (1.80 | )% | | | 18.41 | % |
| | | | | | | | | | | | | | | | | | | | | |
| RATIOS/SUPPLEMENTAL DATA: | | | | | | | | | | | | | | | | | | | | |
| Net assets, end of year (000s) | | $ | 1,499 | | | $ | 847 | | | $ | 762 | | | $ | 89 | | | $ | 96 | |
| Ratio of expenses to average net assets excluding fee waivers and reimbursements | | | 1.23 | % | | | 1.10 | % | | | 1.30 | % | | | 1.62 | % | | | 3.24 | % |
| Ratio of expenses to average net assets including fee waivers and reimbursements | | | 1.23 | % | | | 1.10 | % | | | 1.30 | % | | | 1.31 | %(f) | | | 1.94 | % |
| Ratio of net investment loss to average net assets | | | (0.26 | )% | | | (0.51 | )% | | | (0.68 | )% | | | (0.56 | )% | | | (0.52 | )% |
| Portfolio turnover rate | | | 24 | % | | | 18 | % | | | 29 | % | | | 90 | % | | | 56 | % |
| (a) | Per share amounts and ratios to average net assets include income and expenses of the Kotak Mauritius Portfolio (wholly-owned subsidiary). |
| (b) | Calculated using the average shares method. |
| (c) | The per share amount does not correspond to activity reflected in the Statement of Operations due to class specific expenses during the period. |
| (d) | Less than $0.005 or ($0.005) per share. |
| (e) | Total returns are for the period indicated and have not been annualized. Total returns would have been lower had certain expenses not been waived during the period. Returns shown do not reflect the deduction of taxes that a shareholder would pay on Fund distributions or the redemption of Fund shares. Returns shown exclude any applicable sales charges. |
| (f) | Effective December 2, 2019, the net expense limitation agreement changed from 1.60% to 1.00%, excluding, among other fees and expenses, 12b-1 fees and shareholder service fees. Refer to Note 8. |
See Notes to Financial Statements.
ALPS | Kotak India ESG Fund – Class C
Financial Highlights
Selected data for a share of beneficial interest outstanding throughout the periods indicated:
| | | For the Year
Ended
October 31,
2023 | | | For the Year
Ended
October 31,
2022 | | | For the Year
Ended
October 31,
2021 | | | For the Year
Ended
October 31,
2020 | | | For the Year
Ended
October 31,
2019 | |
| Net asset value, beginning of period | | $ | 14.34 | | | $ | 17.18 | | | $ | 11.70 | | | $ | 12.18 | (a) | | $ | 11.10 | (a) |
| INCOME/(LOSS) FROM INVESTMENT OPERATIONS: | | | | | | | | | | | | | | | | | | | | |
| Net investment loss(b) | | | (0.15 | )(c) | | | (0.21 | ) | | | (0.21 | ) | | | (0.14 | )(c) | | | (0.17 | ) |
| Net realized and unrealized gain/(loss) | | | 0.77 | | | | (1.67 | ) | | | 5.69 | | | | (0.17 | ) | | | 2.05 | |
| Total from investment operations | | | 0.62 | | | | (1.88 | ) | | | 5.48 | | | | (0.31 | ) | | | 1.88 | |
| DISTRIBUTIONS: | | | | | | | | | | | | | | | | | | | | |
| From net investment income | | | – | | | | (0.42 | ) | | | – | | | | – | | | | – | |
| From net realized gains | | | (0.25 | ) | | | (0.54 | ) | | | – | | | | (0.17 | ) | | | (0.80 | ) |
| Total distributions | | | (0.25 | ) | | | (0.96 | ) | | | – | | | | (0.17 | ) | | | (0.80 | ) |
| REDEMPTION FEES ADDED TO PAID-IN CAPITAL (NOTE 6) | | | – | | | | – | | | | – | | | | – | | | | 0.00 | (d) |
| Net increase/(decrease) in net asset value | | | 0.37 | | | | (2.84 | ) | | | 5.48 | | | | (0.48 | ) | | | 1.08 | |
| Net asset value, end of year | | $ | 14.71 | | | $ | 14.34 | | | $ | 17.18 | | | $ | 11.70 | | | $ | 12.18 | |
| TOTAL RETURN(e) | | | 4.38 | % | | | (11.52 | )% | | | 46.84 | % | | | (2.58 | )% | | | 17.69 | % |
| RATIOS/SUPPLEMENTAL DATA: | | | | | | | | | | | | | | | | | | | | |
| Net assets, end of year (000s) | | $ | 1,210 | | | $ | 1,060 | | | $ | 1,598 | | | $ | 1,868 | | | $ | 2,195 | |
| Ratio of expenses to average net assets excluding fee waivers and reimbursements | | | 2.00 | % | | | 2.00 | % | | | 2.00 | % | | | 2.37 | % | | | 3.97 | % |
| Ratio of expenses to average net assets including fee waivers and reimbursements | | | 2.00 | % | | | 2.00 | % | | | 2.00 | % | | | 2.06 | %(f) | | | 2.60 | % |
| Ratio of net investment loss to average net assets | | | (1.02 | )% | | | (1.42 | )% | | | (1.37 | )% | | | (1.29 | )% | | | (1.47 | )% |
| Portfolio turnover rate | | | 24 | % | | | 18 | % | | | 29 | % | | | 90 | % | | | 56 | % |
| (a) | Per share amounts and ratios to average net assets include income and expenses of the Kotak Mauritius Portfolio (wholly-owned subsidiary). |
| (b) | Calculated using the average shares method. |
| (c) | The per share amount does not correspond to activity reflected in the Statement of Operations due to class specific expenses during the period. |
| (d) | Less than $0.005 or ($0.005) per share. |
| (e) | Total returns are for the period indicated and have not been annualized. Total returns would have been lower had certain expenses not been waived during the period. Returns shown do not reflect the deduction of taxes that a shareholder would pay on Fund distributions or the redemption of Fund shares. Returns shown exclude any applicable sales charges. |
| (f) | Effective December 2, 2019, the net expense limitation agreement changed from 1.60% to 1.00%, excluding, among other fees and expenses, 12b-1 fees and shareholder service fees. Refer to Note 8. |
See Notes to Financial Statements.
ALPS | Kotak India ESG Fund – Class I
Financial Highlights
Selected data for a share of beneficial interest outstanding throughout the periods indicated:
| | | For the Year
Ended
October 31,
2023 | | | For the Year
Ended
October 31,
2022 | | | For the Year
Ended
October 31,
2021 | | | For the Year
Ended
October 31,
2020 | | | For the Year
Ended
October 31,
2019 | |
| Net asset value, beginning of period | | $ | 16.40 | | | $ | 19.35 | | | $ | 13.05 | | | $ | 13.43 | (a) | | $ | 12.05 | (a) |
| INCOME/(LOSS) FROM INVESTMENT OPERATIONS: | | | | | | | | | | | | | | | | | | | | |
| Net investment loss(b) | | | (0.00 | )(c)(d) | | | (0.07 | ) | | | (0.07 | ) | | | (0.03 | )(d) | | | (0.05 | ) |
| Net realized and unrealized gain/(loss) | | | 0.88 | | | | (1.89 | ) | | | 6.37 | | | | (0.18 | ) | | | 2.23 | |
| Total from investment operations | | | 0.88 | | | | (1.96 | ) | | | 6.30 | | | | (0.21 | ) | | | 2.18 | |
| DISTRIBUTIONS: | | | | | | | | | | | | | | | | | | | | |
| From net investment income | | | – | | | | (0.45 | ) | | | – | | | | – | | | | – | |
| From net realized gains | | | (0.25 | ) | | | (0.54 | ) | | | – | | | | (0.17 | ) | | | (0.80 | ) |
| Total distributions | | | (0.25 | ) | | | (0.99 | ) | | | – | | | | (0.17 | ) | | | (0.80 | ) |
| REDEMPTION FEES ADDED TO PAID-IN CAPITAL (NOTE 6) | | | 0.00 | (c) | | | 0.00 | (c) | | | 0.00 | (c) | | | 0.00 | (c) | | | – | |
| Net increase/(decrease) in net asset value | | | 0.63 | | | | (2.95 | ) | | | 6.30 | | | | (0.38 | ) | | | 1.38 | |
| Net asset value, end of year | | $ | 17.03 | | | $ | 16.40 | | | $ | 19.35 | | | $ | 13.05 | | | $ | 13.43 | |
| TOTAL RETURN(e) | | | 5.43 | % | | | (10.62 | )% | | | 48.28 | % | | | (1.59 | )% | | | 18.85 | % |
| RATIOS/SUPPLEMENTAL DATA: | | | | | | | | | | | | | | | | | | | | |
| Net assets, end of year (000s) | | $ | 24,026 | | | $ | 15,664 | | | $ | 16,053 | | | $ | 21,861 | | | $ | 21,989 | |
| Ratio of expenses to average net assets excluding fee waivers and reimbursements | | | 1.00 | % | | | 1.00 | % | | | 1.00 | % | | | 1.36 | % | | | 2.93 | % |
| Ratio of expenses to average net assets including fee waivers and reimbursements | | | 1.00 | % | | | 1.00 | % | | | 1.00 | % | | | 1.06 | %(f) | | | 1.60 | % |
| Ratio of net investment loss to average net assets | | | (0.02 | )% | | | (0.41 | )% | | | (0.45 | )% | | | (0.28 | )% | | | (0.39 | )% |
| Portfolio turnover rate | | | 24 | % | | | 18 | % | | | 29 | % | | | 90 | % | | | 56 | % |
| (a) | Per share amounts and ratios to average net assets include income and expenses of the Kotak Mauritius Portfolio (wholly-owned subsidiary). |
| (b) | Calculated using the average shares method. |
| (c) | Less than $0.005 or ($0.005) per share. |
| (d) | The per share amount does not correspond to activity reflected in the Statement of Operations due to class specific expenses during the period. |
| (e) | Total returns are for the period indicated and have not been annualized. Total returns would have been lower had certain expenses not been waived during the period. Returns shown do not reflect the deduction of taxes that a shareholder would pay on Fund distributions or the redemption of Fund shares. |
| (f) | Effective December 2, 2019, the net expense limitation agreement changed from 1.60% to 1.00%, excluding, among other fees and expenses, 12b-1 fees and shareholder service fees. Refer to Note 8. |
See Notes to Financial Statements.
ALPS | Kotak India ESG Fund – Class II
Financial Highlights
Selected data for a share of beneficial interest outstanding throughout the periods indicated:
| | | For the Year Ended October 31, 2023 | | | For the Year Ended October 31, 2022 | | | For the Year Ended October 31, 2021 | | | For the Period December 19, 2019
(Commencement of
Operations) to
October 31, 2020 | |
| Net asset value, beginning of period | | $ | 16.52 | | | $ | 19.45 | | | $ | 13.08 | | | $ | 13.50 | (a) |
| INCOME FROM INVESTMENT OPERATIONS: | | | | | | | | | | | | | | | | |
| Net investment income/(loss)(b) | | | 0.03 | | | | (0.03 | ) | | | (0.02 | ) | | | 0.02 | |
| Net realized and unrealized gain/(loss) | | | 0.90 | | | | (1.90 | ) | | | 6.39 | | | | (0.44 | ) |
| Total from investment operations | | | 0.93 | | | | (1.93 | ) | | | 6.37 | | | | (0.42 | ) |
| DISTRIBUTIONS: | | | | | | | | | | | | | | | | |
| From net investment income | | | – | | | | (0.46 | ) | | | – | | | | – | |
| From net realized gains | | | (0.25 | ) | | | (0.54 | ) | | | – | | | | – | |
| Total distributions | | | (0.25 | ) | | | (1.00 | ) | | | – | | | | – | |
| Net increase/(decrease) in net asset value | | | 0.68 | | | | (2.93 | ) | | | 6.37 | | | | (0.42 | ) |
| Net asset value, end of year | | $ | 17.20 | | | $ | 16.52 | | | $ | 19.45 | | | $ | 13.08 | |
| TOTAL RETURN(c) | | | 5.69 | % | | | (10.42 | )% | | | 48.70 | % | | | (3.11 | )% |
| RATIOS/SUPPLEMENTAL DATA: | | | | | | | | | | | | | | | | |
| Net assets, end of year (000s) | | $ | 291,815 | | | $ | 336,535 | | | $ | 375,605 | | | $ | 136,115 | |
| Ratio of expenses to average net assets excluding fee waivers and reimbursements | | | 0.88 | % | | | 0.88 | % | | | 0.91 | % | | | 1.18 | %(d) |
| Ratio of expenses to average net assets including fee waivers and reimbursements | | | 0.75 | % | | | 0.75 | % | | | 0.75 | % | | | 0.75 | %(d) |
| Ratio of net investment income/(loss) to average net assets | | | 0.16 | % | | | (0.16 | )% | | | (0.11 | )% | | | 0.24 | %(d) |
| Portfolio turnover rate(e) | | | 24 | % | | | 18 | % | | | 29 | % | | | 90 | % |
| (a) | Per share amounts and ratios to average net assets include income and expenses of the Kotak Mauritius Portfolio (wholly-owned subsidiary). |
| (b) | Calculated using the average shares method. |
| (c) | Total returns are for the period indicated and have not been annualized. Total returns would have been lower had certain expenses not been waived during the period. Returns shown do not reflect the deduction of taxes that a shareholder would pay on Fund distributions or the redemption of Fund shares. |
| (e) | Portfolio turnover rate for periods less than one full year have not been annualized. |
See Notes to Financial Statements.
ALPS Global Opportunity Fund
| Management Commentary | October 31, 2023 (Unaudited) |
Annual Commentary and Outlook
Stocks were surprisingly calm during the fiscal year despite ominous headwinds building. We believe that inflation, interest rates, corporate profitability, geopolitical tensions, impending market liquidity strains and credit cycle are all trending the wrong direction. These stress points have been looming for several quarters. However, not all is doom and gloom. At fiscal year-end, massive spending by the U.S. government seems to be the glue holding everything together. The positive result is a slow and orderly downward pressure on valuations with the passage of time.
At fiscal year-end, inflation remains stubborn which has led to longer dated interest rates rising to levels not seen since 2007. The ten year treasury is approaching 5%. The Consumer Price Index (CPI) bottomed at 3% then bounced to 3.7% for two months. Leading indicators suggest the future CPI trend is flat to higher from here.
Entering fiscal year 2024, consensus has been firming around the concept of an end to monetary tightening around the globe. In our view, the Federal Reserve is in a bind as market interest rates are becoming restrictive as they rise to a point of concern. We believe that returning to tightening would send a bleak message that inflation cannot be controlled without serious damage to financial markets.
Stocks were resilient over the past year to the end of October despite persistent inflation. The S&P 500 Index was higher 10.1%, primarily driven by large capitalization technology companies. The S&P 500 Technology Index increased 31% from strong earnings. However, small companies represented by the Russell 2000 Index were down 8.6%. S&P 500 Financial stocks were hurt 2.7% from the looming credit cycle and weak earnings from an inverted yield curve.
Portfolio Review
For the fiscal year ending October 31, 2023, the ALPS Global Opportunity Fund (LPEFX) increased 10.8%. The fund’s primary benchmark index of Morningstar Developed Markets Index-net of fees finished up 9.7% for the same period.
The benchmark return was driven by strength in bellwether names such as Microsoft, Nvidia, Meta, and Alphabet. Whereas, the fund benefited from a relatively high exposure to financial services stocks. Also, currency contributed 1% more than the benchmark from the relatively high exposure to foreign stocks as the U.S. dollar declined 4.4% from a year ago.
Strong performance by positions in 3i Group and Mutares helped absorb the loss in the spring from a small position in SVB Financial.
Net contributors to performance included:
Net detractors from performance included:
Exiting the fiscal year, positioning continues to favor broadening diversification with a higher number of positions. During the fiscal year through October 2023 the fund added fourteen new positions and sold twelve names, ending the period with 50 positions.
Outlook (as of October 31, 2023)
Focus remains on inflation and interest rates. The Federal Reserve (Fed) will likely keep rates high as inflation persists from exceptional fiscal spending. We believe that volatile markets are likely as the political mess continued through the end of the fiscal year in Washington D.C., which is delaying fiscal restraint. Deficit spending over 6% of the annual budget is forecast for the next several years, according to the Congressional Budget Office. This level of spending is traditionally temporary following times of crisis like 2008-2009. We believe this spending is not sustainable and will likely to lead to ratings downgrades and subsequent bond liquidity risk if spending is not controlled.
The stock market outlook isn’t as bleak at the moment with strong corporate earnings due in part to government spending. Also, in our view, valuations have come off to appropriate levels given long-term interest rates. Forward price to earnings (P/E) within the S&P 500 have gradually declined from 2020 to levels last seen in 2007 when 10-year treasuries were also around 5%. Pandemic stimulus catapulted valuations to over 25x. Forward P/E estimates are now more modest around 15x.
Given expected volatility, we believe a conservative approach with high diversification and relatively stable earnings streams will be favored. Our view is that growth companies with high valuations will be avoided along with potential credit cycle victims and those firms desperate for investors such as venture capital.
Thank you for your continued support.
Andrew Drummond
Portfolio Manager
ALPS Global Opportunity Fund
| Management Commentary | October 31, 2023 (Unaudited) |
The views of the authors and information discussed in this commentary are as of the date of publication, are subject to change, and may not reflect the writer's current views. The views expressed are those of the authors only, and represent an assessment of market conditions at a specific point in time, are opinions only and should not be relied upon as investment advice regarding a particular investment or markets in general. Such information does not constitute a recommendation to buy or sell specific securities or investment vehicles. It should not be assumed that any investment will be profitable or will equal the performance of the fund(s) or any securities or any sectors mentioned in this letter. The subject matter contained in this letter has been derived from several sources believed to be reliable and accurate at the time of compilation. Neither ALPS, Advisors, Inc., nor the Fund accepts any liability for losses either direct or consequential caused by the use of this information.
Diversification cannot guarantee gain or prevent losses.
Past performance is no guarantee of future results. Dividends are not guaranteed and are subject to change or elimination. Investments in international and emerging markets securities include exposure to risks such as currency fluctuations, foreign taxes and regulations, and the potential for illiquid markets and political instability.
ALPS Portfolio Solutions Distributor, Inc., ALPS Distributors, Inc. and ALPS Advisors Inc. are affiliated.
ALPS Global Opportunity Fund
| Performance Update | October 31, 2023 (Unaudited) |
Performance of $10,000 Initial Investment (as of October 31, 2023)
Comparison of change in value of a $10,000 investment
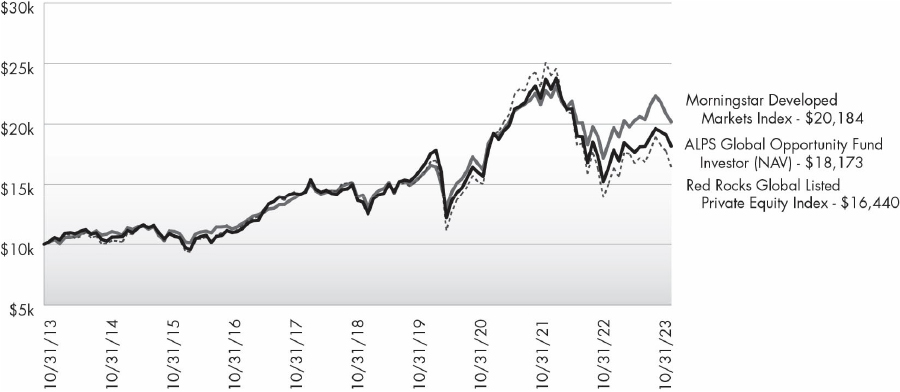
The chart above represents historical performance of a hypothetical investment of $10,000 in the Fund over the past ten years. Past performance does not guarantee future results. This chart does not reflect the deduction of taxes that a shareholder would pay on Fund distributions or the redemption of Fund shares.
Average Annual Total Returns (as of October 31, 2023)
| | 1 Year | 3 Year | 5 Year | 10 Year | Total
Expense
Ratio* | What You
Pay* |
| Investor# (NAV) | 10.81% | 5.03% | 5.91% | 6.16% | 2.22% | 2.22% |
| Class A (NAV) | 10.87% | 5.00% | 5.93% | 6.17% | 2.24% | 2.24% |
| Class A (LOAD) | 4.86% | 3.02% | 4.72% | 5.57% |
| Class C (NAV) | 10.22% | 4.28% | 5.10% | 5.40% | 2.89% | 2.89% |
| Class C (LOAD) | 9.22% | 4.28% | 5.10% | 5.40% |
| Class I | 11.43% | 5.33% | 6.18% | 6.46% | 1.88% | 1.88% |
| Class R | 10.58% | 4.78% | 5.66% | 5.97% | 2.34% | 2.34% |
| Morningstar Developed Markets Index1 | 9.69% | 7.50% | 7.67% | 7.28% | | |
| Red Rocks Global Listed Private Equity Index2 | 9.33% | 3.00% | 3.75% | 5.10% | | |
Performance data quoted represents past performance. Past performance does not guarantee future results. Investment return and principal value of an investment will fluctuate so that an investor’s shares, when sold or redeemed, may be worth more or less than the original cost. Current performance data may be higher or lower than actual data quoted. For the most current month-end performance data, please call 1-866-759-5679.
Maximum Offering Price (MOP) for Class A shares includes the Fund’s maximum sales charge of 5.50%. Performance shown at NAV does not include these sales charges and would have been lower had it been taken into account. If you invest $ 1 million or more, either as a lump sum or through the Fund’s accumulation or letter of intent programs, you can purchase Class A shares without an initial sales charge (load). A Contingent Deferred Sales Charge (“CDSC”) of 1.00% may apply to Class C shares redeemed within the first 12 months after a purchase, and on Class A shares redeemed within the first 18 months after a purchase in excess of $1 million.
ALPS Global Opportunity Fund
| Performance Update | October 31, 2023 (Unaudited) |
Performance shown for Class A shares prior to June 12, 2018 reflects the historical performance of the Fund’s Investor shares, calculated using the fees and expenses of Class A shares.
Fund Inception date of December 31, 2007 for Investor Class, Class I, and Class R; Fund Inception date June 30, 2010 for Class C; Fund Inception date June 12, 2018 for Class A.
| 1 | The Morningstar Developed Market Index measures the performance of developed regional markets targeting the top 97% of stocks by market capitalization. The index is not actively managed and does not reflect any deduction for fees, expenses or taxes. An investor may not invest directly in an index. |
| 2 | The Red Rocks Global Listed Private Equity Index includes securities, ADRs and GDRs of 40 to 75 private equity companies, including business development companies, master limited partnerships and other vehicles whose principal business is to invest in, lend capital to or provide services to privately held companies. The Red Rocks Global Listed Private Equity Index is managed by the Fund’s Advisor. An investor may not invest directly in an index. |
| * | Please see the prospectus dated February 28, 2023 for additional information. ALPS Advisors, Inc. (the “Adviser”) has agreed contractually to limit the amount of the Fund’s total annual expenses, exclusive of Distribution and Service (12b-1) Fees, Acquired Fund Fees and Expenses, Shareholder Service Fees, brokerage expenses, interest expenses, taxes and extraordinary expenses, to 1.25% of the Fund’s average daily net assets. This agreement (the “Expense Agreement”) is in effect through February 28, 2024. |
| # | Prior to December 1, 2017, Investor Class was known as Class A. |
The table does not reflect the deduction of taxes that a shareholder would pay on Fund distributions or the redemption of Fund shares.
This Fund is not suitable for all investors and is subject to investment risks, including possible loss of the principal amount invested.
Listed Private Equity Companies are subject to various risks depending on their underlying investments, which could include, but are not limited to, additional liquidity risk, industry risk, non-U.S. security risk, currency risk, credit risk, managed portfolio risk and derivatives risk (derivatives risk is the risk that the value of the Listed Private Equity Companies’ derivative investments will fall because of pricing difficulties or lack of correlation with the underlying investment).
There are inherent risks in investing in private equity companies, which encompass financial institutions or vehicles whose principal business is to invest in and lend capital to privately held companies. Generally, little public information exists for private and thinly traded companies, and there is a risk that investors may not be able to make a fully informed investment decision.
Listed Private Equity Companies may have relatively concentrated investment portfolios, consisting of a relatively small number of holdings. A consequence of this limited number of investments is that the aggregate returns realized may be adversely impacted by the poor performance of a small number of investments, or even a single investment, particularly if a company experiences the need to write down the value of an investment.
Certain of the Fund’s investments may be exposed to liquidity risk due to low trading volume, lack of a market maker or legal restrictions limiting the ability of the Fund to sell particular securities at an advantageous price and/or time. As a result, these securities may be more difficult to value. Foreign investing involves special risks, such as currency fluctuations and political uncertainty. The Fund invests in derivatives and is subject to the risk that the value of those derivative investments will fall because of pricing difficulties or lack of correlation with the underlying investment.
There is no guarantee that the Fund will continue to hold any one particular security or stay invested in any one particular company. The composition of the Fund's top holdings is subject to change. Performance figures are historical and reflect the change in share price, reinvested distributions, changes in net asset value, sales charges and capital gains distributions, if any.
Not FDIC Insured – No Bank Guarantee – May Lose Value
ALPS Global Opportunity Fund
| Performance Update | October 31, 2023 (Unaudited) |
Top Ten Holdings (as a % of Net Assets) †
| 3i Group PLC | 4.83% |
| HarbourVest Global Private Equity, Ltd. | 4.68% |
| Ares Management LP | 4.31% |
| HgCapital Trust PLC | 3.92% |
| KKR & Co., Inc. | 3.91% |
| Partners Group Holding AG | 3.53% |
| Brederode SA | 3.41% |
| Blackstone, Inc. | 3.36% |
| Oakley Capital Investments, Ltd. | 3.11% |
| Berkshire Hathaway, Inc. | 3.04% |
| Top Ten Holdings | 38.10% |
| † | Holdings are subject to change and my not reflect the current or future position of the portfolio. Table presents indicative values only. |
Industry Sector Allocation (as a % of Net Assets)

ALPS Global Opportunity Fund
| Statement of Investments | October 31, 2023 |
| | | Shares | | | Value
(Note 2) | |
| CLOSED-END FUNDS (22.19%) | | | | | | | | |
| HarbourVest Global Private Equity, Ltd.(a) | | | 91,000 | | | $ | 2,387,112 | |
| HBM Healthcare Investments AG, Class A | | | 3,457 | | | | 601,977 | |
| HgCapital Trust PLC | | | 447,000 | | | | 1,999,491 | |
| NB Private Equity Partners, Ltd. | | | 39,960 | | | | 763,511 | |
| Oakley Capital Investments, Ltd. | | | 311,000 | | | | 1,587,622 | |
| Pantheon International PLC Fund(a) | | | 325,000 | | | | 1,121,412 | |
| VinaCapital Vietnam Opportunity Fund, Ltd. | | | 66,700 | | | | 356,711 | |
| ICG Enterprise Trust PLC | | | 78,442 | | | | 1,039,232 | |
| Abrdn Private Equity Opportunities Trust Plc | | | 168,777 | | | | 886,206 | |
| 3i Infrastructure PLC | | | 160,551 | | | | 583,949 | |
| | | | | | | | | |
| TOTAL CLOSED-END FUNDS | | | | | | | | |
| (Cost $10,049,469) | | | | | | | 11,327,223 | |
| | | | | | | | | |
| COMMON STOCKS (69.32%) | | | | | | | | |
| Communications (1.27%) | | | | | | | | |
| Media (1.27%) IAC, Inc.(a) | | | 7,750 | | | | 329,763 | |
| Liberty Media Corp.-Liberty SiriusXM, Class A(a) | | | 13,000 | | | | 318,370 | |
| | | | | | | | 648,133 | |
| | | | | | | | | |
| TOTAL COMMUNICATIONS | | | | | | | 648,133 | |
| | | | | | | | | |
| Consumer Discretionary (1.66%) | | | | | | | | |
| Retail (1.66%) | | | | | | | | |
| Wesfarmers, Ltd. | | | 26,400 | | | | 849,387 | |
| | | | | | | | | |
| TOTAL CONSUMER DISCRETIONARY | | | | | | | 849,387 | |
| | | | | | | | | |
| Consumer Staples (2.47%) | | | | | | | | |
| Retail (2.47%) | | | | | | | | |
| Costco Wholesale Corp. | | | 2,280 | | | | 1,259,563 | |
| | | | | | | | | |
| TOTAL CONSUMER STAPLES | | | | | | | 1,259,563 | |
| | | | | | | | | |
| Consumer, Non-Cyclical (2.69%) | | | | | | | | |
| Commercial Services (1.27%) | | | | | | | | |
| Ashtead Group PLC | | | 11,300 | | | | 648,084 | |
| | | | | | | | | |
| Healthcare-Services (1.42%) | | | | | | | | |
| UnitedHealth Group, Inc. | | | 1,350 | | | | 723,006 | |
| | | | | | | | | |
| TOTAL CONSUMER, NON-CYCLICAL | | | | | | | 1,371,090 | |
| | | | | | | | | |
| Financials (49.07%) | | | | | | | | |
| Diversified Financial Services (26.06%) | | | | | | | | |
| Apollo Global Management, Inc. | | | 10,800 | | | | 836,352 | |
| Ares Management LP, Class A | | | 22,300 | | | | 2,198,557 | |
| | | Shares | | | Value
(Note 2) | |
| Diversified Financial Services (continued) | | | | | | | | |
| Berkshire Hathaway, Inc., Class B(a) | | | 4,550 | | | $ | 1,553,051 | |
| Blackstone, Inc., Class A | | | 18,600 | | | | 1,717,710 | |
| Carlyle Group, Inc. | | | 17,000 | | | | 468,180 | |
| Intermediate Capital Group PLC | | | 89,500 | | | | 1,424,931 | |
| KKR & Co., Inc., Class A | | | 36,000 | | | | 1,994,400 | |
| Mastercard, Inc., Class A | | | 2,310 | | | | 869,369 | |
| Partners Group Holding AG | | | 1,700 | | | | 1,800,068 | |
| StepStone Group, Inc., Class A | | | 15,700 | | | | 444,310 | |
| | | | | | | | 13,306,928 | |
| Investment Companies (13.63%) | | | | | | | | |
| 3i Group PLC | | | 104,500 | | | | 2,463,860 | |
| Ares Capital Corp. | | | 53,400 | | | | 1,012,464 | |
| Blue Owl Capital Corp. | | | 47,500 | | | | 628,900 | |
| Carlyle Secured Lending, Inc. | | | 36,700 | | | | 499,120 | |
| Investor AB, B Shares | | | 56,000 | | | | 1,027,998 | |
| Italmobiliare SpA | | | 12,400 | | | | 313,503 | |
| Mutares SE & Co. KGaA | | | 33,600 | | | | 1,012,285 | |
| | | | | | | | 6,958,130 | |
| Private Equity (9.38%) | | | | | | | | |
| Altamir | | | 41,168 | | | | 1,102,065 | |
| Brederode SA | | | 19,545 | | | | 1,740,024 | |
| Clairvest Group, Inc. | | | 12,700 | | | | 659,383 | |
| Deutsche Beteiligungs AG | | | 10,600 | | | | 314,697 | |
| Hercules Capital, Inc. | | | 26,000 | | | | 400,400 | |
| Onex Corp. | | | 10,200 | | | | 571,656 | |
| | | | | | | | 4,788,225 | |
| | | | | | | | | |
| TOTAL FINANCIALS | | | | | | | 25,053,283 | |
| | | | | | | | | |
| Health Care (2.42%) | | | | | | | | |
| Healthcare-Services (2.42%) | | | | | | | | |
| Chemed Corp. | | | 2,200 | | | | 1,237,830 | |
| | | | | | | | | |
| TOTAL HEALTH CARE | | | | | | | 1,237,830 | |
| | | | | | | | | |
| Industrials (4.48%) | | | | | | | | |
| Aerospace/Defense (1.43%) | | | | | | | | |
| Lockheed Martin Corp. | | | 1,600 | | | | 727,424 | |
| | | | | | | | | |
| Electrical Equipment (0.90%) | | | | | | | | |
| Melrose Industries PLC | | | 81,000 | | | | 461,196 | |
| | | | | | | | | |
| Machinery-Diversified (2.15%) | | | | | | | | |
| Dover Corp. | | | 4,700 | | | | 610,765 | |
| Nordson Corp. | | | 2,300 | | | | 488,957 | |
| | | | | | | | 1,099,722 | |
| | | | | | | | | |
| TOTAL INDUSTRIALS | | | | | | | 2,288,342 | |
See Notes to Financial Statements.
ALPS Global Opportunity Fund
| Statement of Investments | October 31, 2023 |
| | | Shares | | | Value
(Note 2) | |
| Technology (5.26%) | | | | | | |
| Computers (1.60%) | | | | | | |
| Accenture PLC, Class A | | | 2,750 | | | $ | 816,997 | |
| | | | | | | | | |
| Software (3.66%) | | | | | | | | |
| Constellation Software, Inc. | | | 610 | | | | 1,222,864 | |
| Paychex, Inc. | | | 5,800 | | | | 644,090 | |
| | | | | | | | 1,866,954 | |
| | | | | | | | | |
| TOTAL TECHNOLOGY | | | | | | | 2,683,951 | |
| | | | | | | | | |
| TOTAL COMMON STOCKS | | | | | | | | |
| (Cost $29,397,643) | | | | | | | 35,391,579 | |
| | | | | | | | | |
| BUSINESS DEVELOPMENT COMPANIES (2.50%) | | | | | | | | |
| Financials (2.50%) | | | | | | | | |
| Investment Companies (2.50%) | | | | | | | | |
| FS KKR Capital Corp. | | | 67,500 | | | | 1,279,125 | |
| | | | | | | | | |
| TOTAL FINANCIALS | | | | | | | 1,279,125 | |
| | | | | | | | | |
| TOTAL BUSINESS DEVELOPMENT COMPANIES | | | | | | | | |
| (Cost $1,498,952) | | | | | | | 1,279,125 | |
| | | | | | | | | |
| PREFERRED STOCK (2.05%) | | | | | | | | |
| Financials (2.05%) | | | | | | | | |
| Investment Companies (2.05%) | | | | | | | | |
| Compass Diversified Holdings, Series C, 7.875%(b) | | | 43,781 | | | | 1,046,366 | |
| | | | | | | | | |
| TOTAL FINANCIALS | | | | | | | 1,046,366 | |
| | | | | | | | | |
| TOTAL PREFERRED STOCK | | | | | | | | |
| (Cost $1,000,282) | | | | | | | 1,046,366 | |
| | | 7-Day
Yield | | | Shares | | | Value
(Note 2) | |
| SHORT-TERM INVESTMENTS (3.91%) | | | | | | | | | | | | |
| Money Market Fund (3.91%) | | | | | | | | | | | | |
| Money Market Fund (3.91%) | | | | | | | | | | | | |
| State Street Institutional Treasury Plus Money Market Fund - Premier Class | | | 5.300 | % | | | 1,994,149 | | | | 1,994,149 | |
| | | | | | | | | | | | | |
| TOTAL MONEY MARKET FUND | | | | | | | | | | | 1,994,149 | |
| | | | | | | | | | | | | |
| TOTAL SHORT-TERM INVESTMENTS | | | | | | | | | | | | |
| (Cost $1,994,149) | | | | | | | | | | | 1,994,149 | |
| | | | | | | | | | | | | |
| TOTAL INVESTMENTS (99.97%) | | | | | | | | | | | | |
| (Cost $43,940,495) | | | | | | | | | | $ | 51,038,442 | |
| | | | | | | | | | | | | |
| Assets In Excess Of Other Liabilities (0.03%) | | | | | | | | | | | 14,147 | |
| | | | | | | | | | | | | |
| NET ASSETS (100.00%) | | | | | | | | | | $ | 51,052,589 | |
| (a) | Non-Income Producing Security. |
| (b) | Perpetual maturity. This security has no contractual maturity date, is not redeemable and contractually pays an indefinite stream of interest. |
For Fund compliance purposes, the Fund's industry classifications refer to any one or more of the industry sub-classifications used by one or more widely recognized market indexes or ratings group indexes, and/or as defined by Fund management. This definition may not apply for purposes of this report, which may combine industry sub-classifications for reporting ease. Industries are shown as a percent of net assets.
See Notes to Financial Statements.
ALPS Global Opportunity Fund
| Statement of Investments | October 31, 2023 |
OUTSTANDING FORWARD FOREIGN CURRENCY CONTRACTS
| Counterparty | | Settlement Date | | Fund Receiving | | U.S. $ Value at October 31, 2023 | | | Fund Delivering | | U.S. $ Value at October 31, 2023 | | | Unrealized Appreciation | |
| | | | | | | | | | | | | | | | |
| State Street Bank & Trust Company | | 12/15/23 | | USD | | $ | 2,137,149 | | | GBP | | $ | 2,127,752 | | | $ | 9,397 | |
| | | | | | | | | | | | | | | | | $ | 9,397 | |
See Notes to Financial Statements.
ALPS Global Opportunity Fund
| Statement of Assets and Liabilities | October 31, 2023 |
| ASSETS | | | |
| Investments, at value | | $ | 51,038,442 | |
| Unrealized appreciation on forward foreign currency contracts | | | 9,397 | |
| Receivable for investments sold | | | 624 | |
| Receivable for shares sold | | | 173 | |
| Dividends receivable | | | 148,042 | |
| Prepaid expenses and other assets | | | 13,960 | |
| Total Assets | | | 51,210,638 | |
| LIABILITIES | | | | |
| Payable for investments purchased | | | 625 | |
| Payable for shares redeemed | | | 9,394 | |
| Investment advisory fees payable | | | 36,588 | |
| Administration and transfer agency fees payable | | | 22,956 | |
| Distribution and services fees payable | | | 21,930 | |
| Trustees' fees and expenses payable | | | 880 | |
| Professional fees payable | | | 19,754 | |
| Custody fees payable | | | 37,665 | |
| Accrued expenses and other liabilities | | | 8,257 | |
| Total Liabilities | | | 158,049 | |
| NET ASSETS | | $ | 51,052,589 | |
| NET ASSETS CONSIST OF | | | | |
| Paid-in capital | | $ | 45,298,025 | |
| Total distributable earnings/(accumulated losses) | | | 5,754,564 | |
| NET ASSETS | | $ | 51,052,589 | |
| INVESTMENTS, AT COST | | $ | 43,940,495 | |
| PRICING OF SHARES | | | | |
| Investor Class: | | | | |
| Net Asset Value, offering and redemption price per share | | $ | 5.64 | |
| Net Assets | | $ | 9,378,886 | |
| Shares of beneficial interest outstanding (unlimited number of shares, no par value common stock authorized) | | | 1,661,817 | |
| Class A: | | | | |
| Net Asset Value, offering and redemption price per share | | $ | 5.61 | |
| Net Assets | | $ | 5,378,844 | |
| Shares of beneficial interest outstanding (unlimited number of shares, no par value common stock authorized) | | | 958,901 | |
| Maximum offering price per share ((NAV/0.9450), based on maximum sales charge of 5.50% of the offering price) | | $ | 5.94 | |
| Class C: | | | | |
| Net Asset Value, offering and redemption price per share(a) | | $ | 4.96 | |
| Net Assets | | $ | 2,097,862 | |
| Shares of beneficial interest outstanding (unlimited number of shares, no par value common stock authorized) | | | 422,544 | |
| Class I: | | | | |
| Net Asset Value, offering and redemption price per share | | $ | 5.85 | |
| Net Assets | | $ | 30,175,825 | |
| Shares of beneficial interest outstanding (unlimited number of shares, no par value common stock authorized) | | | 5,161,509 | |
| Class R: | | | | |
| Net Asset Value, offering and redemption price per share | | $ | 4.18 | |
| Net Assets | | $ | 4,021,172 | |
| Shares of beneficial interest outstanding (unlimited number of shares, no par value common stock authorized) | | | 961,287 | |
| (a) | Redemption price per share may be reduced for any applicable contingent deferred sales charge. For a description of a possible sales charge, please see the Fund's Prospectus. |
See Notes to Financial Statements.
ALPS Global Opportunity Fund
| Statement of Operations | For the Year Ended October 31, 2023 |
| INVESTMENT INCOME | | | |
| Dividends | | $ | 1,621,980 | |
| Foreign taxes withheld on dividends | | | (39,790 | ) |
| Total Investment Income | | | 1,582,190 | |
| | | | | |
| EXPENSES | | | | |
| Investment advisory fees | | | 481,071 | |
| Administrative fees | | | 61,511 | |
| Transfer agency fees | | | 48,297 | |
| Distribution and service fees | | | | |
| Investor Class | | | 34,394 | |
| Class A | | | 17,272 | |
| Class C | | | 33,371 | |
| Class R | | | 20,907 | |
| Professional fees | | | 22,388 | |
| Reports to shareholders and printing fees | | | 8,679 | |
| State registration fees | | | 70,587 | |
| Insurance fees | | | 812 | |
| Custody fees | | | 16,390 | |
| Trustees' fees and expenses | | | 4,307 | |
| Miscellaneous expenses | | | 17,672 | |
| Total Expenses | | | 837,658 | |
| Less fees waived/reimbursed by investment advisor (Note 8) | | | | |
| Investor Class | | | (423 | ) |
| Class A | | | (181 | ) |
| Class C | | | (2,450 | ) |
| Class I | | | (21,039 | ) |
| Class R | | | (535 | ) |
| Net Expenses | | | 813,030 | |
| Net Investment Income | | | 769,160 | |
| Net realized gain on investments | | | 969,968 | |
| Net realized loss on foreign currency transactions | | | (6,638 | ) |
| Net realized loss on forward contracts | | | (144,349 | ) |
| Net Realized Gain | | | 818,981 | |
| Net change in unrealized appreciation on investments | | | 4,985,975 | |
| Net change in unrealized appreciation on forward contracts | | | 68,561 | |
| Net change in unrealized appreciation on translation of assets and liabilities denominated in foreign currencies | | | 17,941 | |
| Net Change in Unrealized Appreciation | | | 5,072,477 | |
| NET REALIZED AND UNREALIZED GAIN ON INVESTMENTS | | | 5,891,458 | |
| NET INCREASE IN NET ASSETS RESULTING FROM OPERATIONS | | $ | 6,660,618 | |
See Notes to Financial Statements.
ALPS Global Opportunity Fund
Statements of Changes in Net Assets
| | | For the Year
Ended
October 31, 2023 | | | For the Year
Ended
October 31, 2022 | |
| OPERATIONS | | | | | | | | |
| Net investment income | | $ | 769,160 | | | $ | 745,383 | |
| Net realized gain | | | 818,981 | | | | 3,622,644 | |
| Net change in unrealized appreciation/(depreciation) | | | 5,072,477 | | | | (36,111,244 | ) |
| Net Increase/(Decrease) in Net Assets Resulting from Operations | | | 6,660,618 | | | | (31,743,217 | ) |
| | | | | | | | | |
| TOTAL DISTRIBUTIONS | | | | | | | | |
| From distributable earnings | | | | | | | | |
| Investor Class | | | – | | | | (4,401,059 | ) |
| Class A | | | – | | | | (913,115 | ) |
| Class C | | | – | | | | (2,483,588 | ) |
| Class I | | | – | | | | (14,277,811 | ) |
| Class R | | | – | | | | (1,815,477 | ) |
| Net Decrease in Net Assets from Distributions | | | – | | | | (23,891,050 | ) |
| | | | | | | | | |
| BENEFICIAL INTEREST TRANSACTIONS (NOTE 6) | | | | | | | | |
| Shares sold | | | | | | | | |
| Investor Class | | | 188,818 | | | | 1,022,008 | |
| Class A | | | 2,103,737 | | | | 2,831,090 | |
| Class C | | | – | | | | 135,214 | |
| Class I | | | 8,125,624 | | | | 8,276,457 | |
| Class R | | | 301,435 | | | | 310,647 | |
| Dividends reinvested | | | | | | | | |
| Investor Class | | | – | | | | 3,571,315 | |
| Class A | | | – | | | | 749,895 | |
| Class C | | | – | | | | 1,998,640 | |
| Class I | | | – | | | | 12,833,066 | |
| Class R | | | – | | | | 1,815,477 | |
| Shares redeemed, net of redemption fees | | | | | | | | |
| Investor Class | | | (2,152,999 | ) | | | (5,006,596 | ) |
| Class A | | | (1,914,379 | ) | | | (585,501 | ) |
| Class C | | | (2,892,700 | ) | | | (3,158,729 | ) |
| Class I | | | (18,427,379 | ) | | | (20,286,450 | ) |
| Class R | | | (873,064 | ) | | | (1,141,432 | ) |
| Net Increase/(Decrease) in Net Assets Derived from Beneficial Interest Transactions | | | (15,540,907 | ) | | | 3,365,101 | |
| | | | | | | | | |
| Net decrease in net assets | | | (8,880,289 | ) | | | (52,269,166 | ) |
| | | | | | | | | |
| NET ASSETS | | | | | | | | |
| Beginning of year | | | 59,932,878 | | | | 112,202,044 | |
| End of year | | $ | 51,052,589 | | | $ | 59,932,878 | |
See Notes to Financial Statements.
ALPS Global Opportunity Fund – Investor Class
Financial Highlights
Selected data for a share of beneficial interest outstanding throughout the periods indicated:
| | | For the Year
Ended
October 31,
2023(a) | | | For the Year
Ended
October 31,
2022 | | | For the Year
Ended
October 31,
2021 | | | For the Year
Ended
October 31,
2020(a) | | | For the Year
Ended
October 31,
2019 | |
| Net asset value, beginning of period | | $ | 5.09 | | | $ | 9.39 | | | $ | 6.47 | | | $ | 7.71 | | | $ | 6.79 | |
| INCOME/(LOSS) FROM INVESTMENT OPERATIONS: | | | | | | | | | | | | | | | | | | | | |
| Net investment income(b) | | | 0.07 | | | | 0.05 | | | | 0.00 | (c) | | | 0.06 | | | | 0.12 | |
| Net realized and unrealized gain/(loss) | | | 0.48 | | | | (2.37 | ) | | | 3.22 | | | | (0.23 | ) | | | 1.09 | |
| Total from investment operations | | | 0.55 | | | | (2.32 | ) | | | 3.22 | | | | (0.17 | ) | | | 1.21 | |
| DISTRIBUTIONS: | | | | | | | | | | | | | | | | | | | | |
| From net investment income | | | – | | | | (1.25 | ) | | | – | | | | (0.60 | ) | | | (0.06 | ) |
| From net realized gains | | | – | | | | (0.73 | ) | | | (0.30 | ) | | | (0.47 | ) | | | (0.23 | ) |
| Total distributions | | | – | | | | (1.98 | ) | | | (0.30 | ) | | | (1.07 | ) | | | (0.29 | ) |
| REDEMPTION FEES ADDED TO PAID-IN CAPITAL (NOTE 6) | | | – | | | | – | | | | 0.00 | (c) | | | 0.00 | (c) | | | 0.00 | (c) |
| Net increase/(decrease) in net asset value | | | 0.55 | | | | (4.30 | ) | | | 2.92 | | | | (1.24 | ) | | | 0.92 | |
| Net asset value, end of year | | $ | 5.64 | | | $ | 5.09 | | | $ | 9.39 | | | $ | 6.47 | | | $ | 7.71 | |
| TOTAL RETURN(d) | | | 10.81 | % | | | (30.83 | )% | | | 51.18 | % | | | (3.20 | )% | | | 18.77 | % |
| RATIOS/SUPPLEMENTAL DATA: | | | | | | | | | | | | | | | | | | | | |
| Net assets, end of year (000s) | | $ | 9,379 | | | $ | 10,256 | | | $ | 20,967 | | | $ | 15,580 | | | $ | 25,061 | |
| Ratio of expenses to average net assets excluding fee waivers and reimbursements(e) | | | 1.59 | % | | | 1.46 | % | | | 1.49 | % | | | 1.47 | % | | | 1.44 | % |
| Ratio of expenses to average net assets including fee waivers and reimbursements(e) | | | 1.59 | % | | | 1.46 | % | | | 1.49 | % | | | 1.47 | % | | | 1.44 | % |
| Ratio of net investment income to average net assets(e) | | | 1.20 | % | | | 0.81 | % | | | 0.01 | % | | | 0.86 | % | | | 1.71 | % |
| Portfolio turnover rate | | | 21 | % | | | 27 | % | | | 43 | % | | | 41 | % | | | 28 | % |
| (a) | Prior to January 24, 2023, the ALPS Global Opportunity Fund was known as the ALPS/Red Rocks Global Opportunity Fund. Prior to March 31, 2020, the ALPS/Red Rocks Global Opportunity Fund was known as the ALPS/Red Rocks Listed Private Equity Fund. |
| (b) | Calculated using the average shares method. |
| (c) | Less than $0.005 or ($0.005) per share. |
| (d) | Total returns are for the period indicated and have not been annualized. Total returns would have been lower had certain expenses not been waived during the period. Returns shown do not reflect the deduction of taxes that a shareholder would pay on Fund distributions or the redemption of Fund shares. |
| (e) | The ratios exclude the impact of expenses of the underlying funds in which the Fund invests as represented in the Statement of Investments. |
See Notes to Financial Statements.
ALPS Global Opportunity Fund – Class A
Financial Highlights
Selected data for a share of beneficial interest outstanding throughout the periods indicated:
| | | For the Year
Ended
October 31,
2023(a) | | | For the Year
Ended
October 31,
2022 | | | For the Year
Ended
October 31,
2021 | | | For the Year
Ended
October 31,
2020(a) | | | For the Year
Ended
October 31,
2019 | |
| Net asset value, beginning of period | | $ | 5.06 | | | $ | 9.35 | | | $ | 6.45 | | | $ | 7.67 | | | $ | 6.79 | |
| INCOME FROM INVESTMENT OPERATIONS: | | | | | | | | | | | | | | | | | | | | |
| Net investment income(b) | | | 0.07 | | | | 0.05 | | | | 0.00 | (c) | | | 0.04 | | | | 0.20 | |
| Net realized and unrealized gain/(loss) | | | 0.48 | | | | (2.36 | ) | | | 3.20 | | | | (0.20 | ) | | | 0.99 | |
| Total from investment operations | | | 0.55 | | | | (2.31 | ) | | | 3.20 | | | | (0.16 | ) | | | 1.19 | |
| DISTRIBUTIONS: | | | | | | | | | | | | | | | | | | | | |
| From net investment income | | | – | | | | (1.25 | ) | | | – | | | | (0.60 | ) | | | (0.08 | ) |
| From net realized gains | | | – | | | | (0.73 | ) | | | (0.30 | ) | | | (0.47 | ) | | | (0.23 | ) |
| Total distributions | | | – | | | | (1.98 | ) | | | (0.30 | ) | | | (1.07 | ) | | | (0.31 | ) |
| REDEMPTION FEES ADDED TO PAID-IN CAPITAL (NOTE 6) | | | – | | | | – | | | | 0.00 | (c) | | | 0.01 | | | | – | |
| Net increase/(decrease) in net asset value | | | 0.55 | | | | (4.29 | ) | | | 2.90 | | | | (1.22 | ) | | | 0.88 | |
| Net asset value, end of year | | $ | 5.61 | | | $ | 5.06 | | | $ | 9.35 | | | $ | 6.45 | | | $ | 7.67 | |
| TOTAL RETURN(d) | | | 10.87 | % | | | (30.85 | )% | | | 51.02 | % | | | (2.92 | )% | | | 18.64 | % |
| RATIOS/SUPPLEMENTAL DATA: | | | | | | | | | | | | | | | | | | | | |
| Net assets, end of year (000s) | | $ | 5,379 | | | $ | 4,710 | | | $ | 4,188 | | | $ | 2,544 | | | $ | 790 | |
| Ratio of expenses to average net assets excluding fee waivers and reimbursements(e) | | | 1.57 | % | | | 1.49 | % | | | 1.47 | % | | | 1.51 | % | | | 1.48 | % |
| Ratio of expenses to average net assets including fee waivers and reimbursements(e) | | | 1.57 | % | | | 1.49 | % | | | 1.47 | % | | | 1.51 | % | | | 1.48 | % |
| Ratio of net investment income to average net assets(e) | | | 1.24 | % | | | 0.88 | % | | | 0.05 | % | | | 0.62 | % | | | 2.74 | % |
| Portfolio turnover rate | | | 21 | % | | | 27 | % | | | 43 | % | | | 41 | % | | | 28 | % |
| (a) | Prior to January 24, 2023, the ALPS Global Opportunity Fund was known as the ALPS/Red Rocks Global Opportunity Fund. Prior to March 31, 2020, the ALPS/Red Rocks Global Opportunity Fund was known as the ALPS/Red Rocks Listed Private Equity Fund. |
| (b) | Calculated using the average shares method. |
| (c) | Less than $0.005 or ($0.005) per share. |
| (d) | Total returns are for the period indicated and have not been annualized. Total returns would have been lower had certain expenses not been waived during the period. Returns shown do not reflect the deduction of taxes that a shareholder would pay on Fund distributions or the redemption of Fund shares. Returns shown exclude any applicable sales charges. |
| (e) | The ratios exclude the impact of expenses of the underlying funds in which the Fund invests as represented in the Statement of Investments. |
See Notes to Financial Statements.
ALPS Global Opportunity Fund – Class C
Financial Highlights
Selected data for a share of beneficial interest outstanding throughout the periods indicated:
| | | For the Year
Ended
October 31,
2023(a) | | | For the Year
Ended
October 31,
2022 | | | For the Year
Ended
October 31,
2021 | | | For the Year
Ended
October 31,
2020(a) | | | For the Year
Ended
October 31,
2019 | |
| Net asset value, beginning of period | | $ | 4.50 | | | $ | 8.59 | | | $ | 5.98 | | | $ | 7.25 | | | $ | 6.41 | |
| INCOME/(LOSS) FROM INVESTMENT OPERATIONS: | | | | | | | | | | | | | | | | | | | | |
| Net investment income/(loss)(b) | | | 0.03 | | | | 0.00 | (c) | | | (0.06 | ) | | | 0.01 | | | | 0.06 | |
| Net realized and unrealized gain/(loss) | | | 0.43 | | | | (2.12 | ) | | | 2.97 | | | | (0.22 | ) | | | 1.03 | |
| Total from investment operations | | | 0.46 | | | | (2.12 | ) | | | 2.91 | | | | (0.21 | ) | | | 1.09 | |
| DISTRIBUTIONS: | | | | | | | | | | | | | | | | | | | | |
| From net investment income | | | – | | | | (1.24 | ) | | | – | | | | (0.59 | ) | | | (0.02 | ) |
| From net realized gains | | | – | | | | (0.73 | ) | | | (0.30 | ) | | | (0.47 | ) | | | (0.23 | ) |
| Total distributions | | | – | | | | (1.97 | ) | | | (0.30 | ) | | | (1.06 | ) | | | (0.25 | ) |
| REDEMPTION FEES ADDED TO PAID-IN CAPITAL (NOTE 6) | | | – | | | | – | | | | – | | | | 0.00 | (c) | | | 0.00 | (c) |
| Net increase/(decrease) in net asset value | | | 0.46 | | | | (4.09 | ) | | | 2.61 | | | | (1.27 | ) | | | 0.84 | |
| Net asset value, end of year | | $ | 4.96 | | | $ | 4.50 | | | $ | 8.59 | | | $ | 5.98 | | | $ | 7.25 | |
| TOTAL RETURN(d) | | | 10.22 | % | | | (31.48 | )% | | | 50.14 | % | | | (4.01 | )% | | | 17.83 | % |
| RATIOS/SUPPLEMENTAL DATA: | | | | | | | | | | | | | | | | | | | | |
| Net assets, end of year (000s) | | $ | 2,098 | | | $ | 4,507 | | | $ | 10,883 | | | $ | 9,061 | | | $ | 16,256 | |
| Ratio of expenses to average net assets excluding fee waivers and reimbursements(e) | | | 2.32 | % | | | 2.23 | % | | | 2.20 | % | | | 2.22 | % | | | 2.16 | % |
| Ratio of expenses to average net assets including fee waivers and reimbursements(e) | | | 2.25 | % | | | 2.23 | % | | | 2.20 | % | | | 2.22 | % | | | 2.16 | % |
| Ratio of net investment income/(loss) to average net assets(e) | | | 0.52 | % | | | 0.03 | % | | | (0.73 | )% | | | 0.12 | % | | | 0.86 | % |
| Portfolio turnover rate | | | 21 | % | | | 27 | % | | | 43 | % | | | 41 | % | | | 28 | % |
| (a) | Prior to January 24, 2023, the ALPS Global Opportunity Fund was known as the ALPS/Red Rocks Global Opportunity Fund. Prior to March 31, 2020, the ALPS/Red Rocks Global Opportunity Fund was known as the ALPS/Red Rocks Listed Private Equity Fund. |
| (b) | Calculated using the average shares method. |
| (c) | Less than $0.005 or ($0.005) per share. |
| (d) | Total returns are for the period indicated and have not been annualized. Total returns would have been lower had certain expenses not been waived during the period. Returns shown do not reflect the deduction of taxes that a shareholder would pay on Fund distributions or the redemption of Fund shares. Returns shown exclude any applicable sales charges. |
| (e) | The ratios exclude the impact of expenses of the underlying funds in which the Fund invests as represented in the Statement of Investments. |
See Notes to Financial Statements.
ALPS Global Opportunity Fund – Class I
Financial Highlights
Selected data for a share of beneficial interest outstanding throughout the periods indicated:
| | | For the Year
Ended
October 31,
2023(a) | | | For the Year
Ended
October 31,
2022 | | | For the Year
Ended
October 31,
2021 | | | For the Year
Ended
October 31,
2020(a) | | | For the Year
Ended
October 31,
2019 | |
| Net asset value, beginning of period | | $ | 5.25 | | | $ | 9.61 | | | $ | 6.61 | | | $ | 7.84 | | | $ | 6.92 | |
| INCOME/(LOSS) FROM INVESTMENT OPERATIONS: | | | | | | | | | | | | | | | | | | | | |
| Net investment income(b) | | | 0.09 | | | | 0.07 | | | | 0.02 | | | | 0.07 | | | | 0.13 | |
| Net realized and unrealized gain/(loss) | | | 0.51 | | | | (2.44 | ) | | | 3.28 | | | | (0.23 | ) | | | 1.10 | |
| Total from investment operations | | | 0.60 | | | | (2.37 | ) | | | 3.30 | | | | (0.16 | ) | | | 1.23 | |
| DISTRIBUTIONS: | | | | | | | | | | | | | | | | | | | | |
| From net investment income | | | – | | | | (1.26 | ) | | | – | | | | (0.60 | ) | | | (0.08 | ) |
| From net realized gains | | | – | | | | (0.73 | ) | | | (0.30 | ) | | | (0.47 | ) | | | (0.23 | ) |
| Total distributions | | | – | | | | (1.99 | ) | | | (0.30 | ) | | | (1.07 | ) | | | (0.31 | ) |
| REDEMPTION FEES ADDED TO PAID-IN CAPITAL (NOTE 6) | | | – | | | | – | | | | 0.00 | (c) | | | 0.00 | (c) | | | 0.00 | (c) |
| Net increase/(decrease) in net asset value | | | 0.60 | | | | (4.36 | ) | | | 3.00 | | | | (1.23 | ) | | | 0.92 | |
| Net asset value, end of year | | $ | 5.85 | | | $ | 5.25 | | | $ | 9.61 | | | $ | 6.61 | | | $ | 7.84 | |
| TOTAL RETURN(d) | | | 11.43 | % | | | (30.69 | )% | | | 51.31 | % | | | (2.93 | )% | | | 18.98 | % |
| RATIOS/SUPPLEMENTAL DATA: | | | | | | | | | | | | | | | | | | | | |
| Net assets, end of year (000s) | | $ | 30,176 | | | $ | 36,321 | | | $ | 69,176 | | | $ | 55,950 | | | $ | 141,286 | |
| Ratio of expenses to average net assets excluding fee waivers and reimbursements(e) | | | 1.31 | % | | | 1.22 | % | | | 1.20 | % | | | 1.22 | % | | | 1.19 | % |
| Ratio of expenses to average net assets including fee waivers and reimbursements(e) | | | 1.25 | % | | | 1.22 | % | | | 1.20 | % | | | 1.22 | % | | | 1.19 | % |
| Ratio of net investment income to average net assets(e) | | | 1.55 | % | | | 1.07 | % | | | 0.29 | % | | | 1.08 | % | | | 1.80 | % |
| Portfolio turnover rate | | | 21 | % | | | 27 | % | | | 43 | % | | | 41 | % | | | 28 | % |
| (a) | Prior to January 24, 2023, the ALPS Global Opportunity Fund was known as the ALPS/Red Rocks Global Opportunity Fund. Prior to March 31, 2020, the ALPS/Red Rocks Global Opportunity Fund was known as the ALPS/Red Rocks Listed Private Equity Fund. |
| (b) | Calculated using the average shares method. |
| (c) | Less than $0.005 or ($0.005) per share. |
| (d) | Total returns are for the period indicated and have not been annualized. Total returns would have been lower had certain expenses not been waived during the period. Returns shown do not reflect the deduction of taxes that a shareholder would pay on Fund distributions or the redemption of Fund shares. Returns shown exclude any applicable sales charges. |
| (e) | The ratios exclude the impact of expenses of the underlying funds in which the Fund invests as represented in the Statement of Investments. |
See Notes to Financial Statements.
ALPS Global Opportunity Fund – Class R
Financial Highlights
Selected data for a share of beneficial interest outstanding throughout the periods indicated:
| | | For the Year
Ended
October 31,
2023(a) | | | For the Year
Ended
October 31,
2022 | | | For the Year
Ended
October 31,
2021 | | | For the Year
Ended
October 31,
2020(a) | | | For the Year
Ended
October 31,
2019 | |
| Net asset value, beginning of period | | $ | 3.78 | | | $ | 7.50 | | | $ | 5.23 | | | $ | 6.45 | | | $ | 5.75 | |
| INCOME/(LOSS) FROM INVESTMENT OPERATIONS: | | | | | | | | | | | | | | | | | | | | |
| Net investment income/(loss)(b) | | | 0.04 | | | | 0.03 | | | | (0.01 | ) | | | 0.03 | | | | 0.09 | |
| Net realized and unrealized gain/(loss) | | | 0.36 | | | | (1.77 | ) | | | 2.58 | | | | (0.18 | ) | | | 0.90 | |
| Total from investment operations | | | 0.40 | | | | (1.74 | ) | | | 2.57 | | | | (0.15 | ) | | | 0.99 | |
| DISTRIBUTIONS: | | | | | | | | | | | | | | | | | | | | |
| From net investment income | | | – | | | | (1.25 | ) | | | – | | | | (0.60 | ) | | | (0.06 | ) |
| From net realized gains | | | – | | | | (0.73 | ) | | | (0.30 | ) | | | (0.47 | ) | | | (0.23 | ) |
| Total distributions | | | – | | | | (1.98 | ) | | | (0.30 | ) | | | (1.07 | ) | | | (0.29 | ) |
| Net increase/(decrease) in net asset value | | | 0.40 | | | | (3.72 | ) | | | 2.27 | | | | (1.22 | ) | | | 0.70 | |
| Net asset value, end of year | | $ | 4.18 | | | $ | 3.78 | | | $ | 7.50 | | | $ | 5.23 | | | $ | 6.45 | |
| TOTAL RETURN(c) | | | 10.58 | % | | | (30.92 | )% | | | 50.86 | % | | | (3.56 | )% | | | 18.47 | % |
| RATIOS/SUPPLEMENTAL DATA: | | | | | | | | | | | | | | | | | | | | |
| Net assets, end of year (000s) | | $ | 4,021 | | | $ | 4,140 | | | $ | 6,987 | | | $ | 5,231 | | | $ | 5,782 | |
| Ratio of expenses to average net assets excluding fee waivers and reimbursements(d) | | | 1.76 | % | | | 1.68 | % | | | 1.65 | % | | | 1.68 | % | | | 1.61 | % |
| Ratio of expenses to average net assets including fee waivers and reimbursements(d) | | | 1.75 | % | | | 1.68 | % | | | 1.65 | % | | | 1.68 | % | | | 1.61 | % |
| Ratio of net investment income/(loss) to average net assets(d) | | | 1.04 | % | | | 0.61 | % | | | (0.17 | )% | | | 0.61 | % | | | 1.51 | % |
| Portfolio turnover rate | | | 21 | % | | | 27 | % | | | 43 | % | | | 41 | % | | | 28 | % |
| (a) | Prior to January 24, 2023, the ALPS Global Opportunity Fund was known as the ALPS/Red Rocks Global Opportunity Fund. Prior to March 31, 2020, the ALPS/Red Rocks Global Opportunity Fund was known as the ALPS/Red Rocks Listed Private Equity Fund. |
| (b) | Calculated using the average shares method. |
| (c) | Total returns are for the period indicated and have not been annualized. Total returns would have been lower had certain expenses not been waived during the period. Returns shown do not reflect the deduction of taxes that a shareholder would pay on Fund distributions or the redemption of Fund shares. Returns shown exclude any applicable sales charges. |
| (d) | The ratios exclude the impact of expenses of the underlying funds in which the Fund invests as represented in the Statement of Investments. |
See Notes to Financial Statements.
RiverFront Asset Allocation Growth & Income
| Management Commentary | October 31, 2023 (Unaudited) |
Year in Review (November 2022 – October 2023):
The fiscal year from 11/01/2022 to 10/31/2023 presented an environment where broad equity indices generally outperformed broad bond indices with the Bloomberg US Aggregate Index being about flat over the period and with both the All-Country World Index (ACWI) and the S&P 500 Index up approximately 10% for the period. Inflation abated during the period but remains elevated at fiscal year end as year over year CPI in November 2022 was 7.1% vs. 3.7% in September 2023. The Fed Funds rate went from 3.08% at the beginning of the period to 5.33% at the end of the period with the Fed leaning towards pausing rather than raising interest rates moving forward. As one would expect, 10-year treasury rates also increased substantially over the period. The VIX index (an index designed to measure constant, 30- day expected volatility of the U.S. stock market) moved down during the period from the mid-twenties to the mid-teens with some intra-period volatility, but no major spikes.
This market dynamic contributed to a moderate absolute performance year for balanced portfolios in general. Portfolios with more equity risk were generally rewarded given that broad fixed income markets were flat. Moreover, long-duration fixed income assets faired relatively poorly over the period. Developed international equities generally outperformed their US counterparts (by about 5%) with emerging international equities performing in line with US equities during this period.
Outlook:
As we begin to look at the next twelve months, we believe that there will be an asset allocation shift between equities and fixed income. Now that the equity risk premium has eroded to near zero, the bond market is getting to levels where investors must begin to rethink the equity/fixed income asset allocation decision, as fixed income is becoming more attractive than equities. With the 10-year Treasury yielding 4.56% and the S&P500’s dividend yield at 1.58%, the spread differential is compelling. Additionally, with yields this high, even the earnings yield on stocks is less compelling when compared to high quality corporate bonds yields. At fiscal year end, the equity risk premium is currently -138 basis points (4.93 earnings yield – 6.31 BBB corporate bond yield).
In lieu of the market performance over the last year, investors have begun to add exposure to international markets. However, we believe that the economic headwinds internationally such as war, inflation, and recession will continue a US bias in the fund as it has a stronger economic backdrop.
FUND LEVEL ATTRIBUTION
RiverFront Asset Allocation Growth & Income
The RiverFront Asset Allocation Growth & Income mutual fund posted NAV returns below the benchmark during the fiscal year. The top themes that contributed to and detracted from performance over the last twelve months are listed below:
Contributors:
| • | Underweight allocation to broad fixed income |
| • | Selection within emerging market equities |
Detractors:
| • | Selection within US equities |
| • | Selection within broad fixed income |
| • | Selection within international equities |
Kevin Nicholson, CFA
Adam Grossman, CFA
Past performance is no guarantee of future results. Dividends are not guaranteed and are subject to change or elimination. Investments in international and emerging markets securities include exposure to risks such as currency fluctuations, foreign taxes and regulations, and the potential for illiquid markets and political instability.
The views of the author and information discussed in this commentary are as of the date of publication, are subject to change, and may not reflect the writer's current views. The views expressed are those of the author only, and represent an assessment of market conditions at a specific point in time, are opinions only and should not be relied upon as investment advice regarding a particular investment or markets in general. Such information does not constitute a recommendation to buy or sell specific securities or investment vehicles. It should not be assumed that any investment will be profitable or will equal the performance of the fund(s) or any securities or any sectors mentioned in this letter. The subject matter contained in this letter has been derived from several sources believed to be reliable and accurate at the time of compilation. Neither ALPS Advisors, Inc., RiverFront Investment Group, LLC, nor the Fund accepts any liability for losses either direct or consequential caused by the use of this information.
Indices do not reflect deductions for fees, expenses, or taxes.
An investor may not invest directly in an index.
Diversification cannot guarantee gain or prevent losses.
ALPS Portfolio Solutions Distributor, Inc., ALPS Distributors, Inc. and ALPS Advisors Inc. are affiliated.
RiverFront Asset Allocation Growth & Income
| Performance Update | October 31, 2023 (Unaudited) |
Performance of $10,000 Initial Investment (as of October 31, 2023)
Comparison of change in value of a $10,000 investment

The chart above represents historical performance of a hypothetical investment of $10,000 in the Fund over the past ten years. Past performance does not guarantee future results. This chart does not reflect the deduction of taxes that a shareholder would pay on Fund distributions or the redemption of Fund shares.
Average Annual Total Returns (as of October 31, 2023)
| | 1 Year | 3 Years | 5 Years | 10 Years | Since
Inception^ | Total
Expense
Ratio* | What You
Pay* |
| Investor# (NAV) | 4.53% | 3.19% | 3.29% | 3.90% | 5.34% | 0.93% | 0.93% |
| Class A (NAV) | 4.54% | 3.20% | 3.31% | 3.91% | 5.34% | 0.93% | 0.93% |
| Class A (LOAD) | -1.23% | 1.27% | 2.14% | 3.32% | 4.89% |
| Class C (NAV) | 3.68% | 2.41% | 2.52% | 3.13% | 4.55% | 1.68% | 1.68% |
| Class C (LOAD) | 2.71% | 2.41% | 2.52% | 3.13% | 4.55% |
| Class I (NAV) | 4.80% | 3.47% | 3.57% | 4.17% | 5.60% | 0.68% | 0.68% |
| Morningstar Global Markets Index1 | 9.81% | 6.35% | 7.07% | 6.62% | 7.97% | | |
| Bloomberg US Aggregate Bond Index2 | 0.36% | -5.57% | -0.06% | 0.88% | 1.49% | | |
| 60% Morningstar Global Markets Index / 40% Bloomberg US Aggregate Bond Index1,2 | 6.05% | 1.64% | 4.50% | 4.53% | 5.60% | | |
Performance data quoted represents past performance. Past performance does not guarantee future results. Investment return and principal value of an investment will fluctuate so that an investor's shares, when sold or redeemed, may be worth more or less than the original cost. Current performance data may be higher or lower than actual data quoted. For the most current month-end performance data, please call 1-866-759-5679.
Maximum Offering Price (MOP) for Class A shares includes the Fund’s maximum sales charge of 5.50%. Performance shown at NAV does not include these sales charges and would have been lower had it been taken into account. If you invest $ 1 million or more, either as a lump sum or through the Fund’s accumulation or letter of intent programs, you can purchase Class A shares without an initial sales charge (load). A Contingent Deferred Sales Charge (“CDSC”) of 1.00% may apply to Class C shares redeemed within the first 12 months after a purchase, and on Class A shares redeemed within the first 18 months after a purchase in excess of $1 million.
RiverFront Asset Allocation Growth & Income
| Performance Update | October 31, 2023 (Unaudited) |
Performance shown for Class A shares prior to June 12, 2018 reflects the historical performance of the Fund’s Investor shares, calculated using the fees and expenses of Class A shares.
| 1 | The Morningstar Global Markets Index measures the performance of performance of the stocks located in the developed and emerging countries across the world. Stocks in the index are weighted by their float capital, which removes corporate cross ownership, government holdings and other locked-in shares. The index is not actively managed and does not reflect any deduction for fees, expenses or taxes. An investor may not invest directly in an index. |
| 2 | The Bloomberg U.S. Aggregate Bond Index is a broad-based benchmark that measures the investment grade, U.S. dollar-denominated, fixed-rate taxable bond market, including Treasuries, government-related and corporate securities, MBS (agency fixed-rate and hybrid ARM passthroughs), ABS, and CMBS. The index is not actively managed and does not reflect any deductions for fees, expenses or taxes. An investor may not invest directly in an index. |
| ^ | Fund Inception date of August 2, 2010 for Investor Class and Classes C and I; Fund Inception date of June 12, 2018 for Class A. |
| * | Please see the prospectus dated February 28, 2023 for additional information. |
| # | Prior to December 1, 2017, Investor Class was known as Class A. |
The table does not reflect the deduction of taxes that a shareholder would pay on Fund distributions or the redemption of Fund shares.
This Fund is not suitable for all investors and is subject to investment risks, including possible loss of the principal amount invested.
There is no guarantee that the Fund will continue to hold any one particular security or stay invested in any one particular company. The composition of the Fund's top holdings is subject to change. Performance figures are historical and reflect the change in share price, reinvested distributions, changes in net asset value, sales charges and capital gains distributions, if any.
Not FDIC Insured – No Bank Guarantee – May Lose Value
Top Ten Holdings (as a % of Net Assets) †
| RiverFront Dynamic US Dividend Advantage ETF | 19.24% |
| First Trust RiverFront Dynamic Developed International ETF | 13.79% |
| iShares Core U.S. Aggregate Bond ETF | 11.95% |
| iShares® Core S&P 500® ETF | 8.44% |
| RiverFront Dynamic Core Income ETF | 6.81% |
| FTHI/First Trust Exchange-Traded Fund VI FirstTrust BuyWrite Income ETF | 6.14% |
| ALPS Active Equity Opportunity ETF | 5.88% |
| JPMorgan Equity Premium Income ETF | 4.98% |
| First Trust RiverFront Dynamic Emerging Markets ETF | 3.51% |
| Vanguard Long-Term Corporate Bond ETF | 3.32% |
| Top Ten Holdings | 84.06% |
| † | Holdings are subject to change, and may not reflect the current or future position of the portfolio. Table presents indicative values only. Excludes cash & cash equivalents. |
Portfolio Composition (as a % of Net Assets)
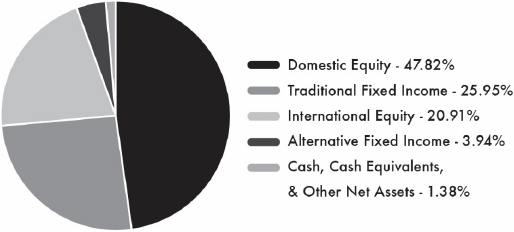
RiverFront Asset Allocation Growth & Income
| Statement of Investments | October 31, 2023 |
| | | Shares | | | Value
(Note 2) | |
| EXCHANGE TRADED FUNDS (98.62%) | | | | | | | | |
| Debt (29.89%) | | | | | | | | |
| iShares® 7-10 Year Treasury Bond ETF | | | 21,231 | | | $ | 1,902,085 | |
| iShares® Core U.S. Aggregate Bond ETF | | | 95,769 | | | | 8,840,436 | |
| iShares® Preferred & Income Securities ETF | | | 19,785 | | | | 565,455 | |
| PIMCO 25+ Year Zero Coupon U.S. Treasury Index ETF | | | 14,719 | | | | 962,917 | |
| RiverFront Dynamic Core Income ETF(a) | | | 238,485 | | | | 5,034,204 | |
| Riverfront Strategic Income Fund(a) | | | 107,873 | | | | 2,353,789 | |
| Vanguard® Long-Term Corporate Bond ETF | | | 35,904 | | | | 2,454,039 | |
| | | | | | | | 22,112,925 | |
| Equity (68.73%) | | | | | | | | |
| ALPS Active Equity Opportunity ETF(a) | | | 103,970 | | | | 4,347,880 | |
| First Trust Nasdaq Artificial Intelligence and Robotics ETF | | | 35,938 | | | | 1,330,425 | |
| First Trust RiverFront Dynamic Developed International ETF(a) | | | 189,741 | | | | 10,198,579 | |
| First Trust RiverFront Dynamic Emerging Markets ETF(a) | | | 49,490 | | | | 2,592,781 | |
| FirstTrust BuyWrite Income ETF | | | 227,858 | | | | 4,541,210 | |
| iShares® Genomics Immunology and Healthcare ETF | | | 16,892 | | | | 306,083 | |
| iShares® MSCI Europe Financials ETF | | | 38,327 | | | | 696,785 | |
| iShares® US Technology ETF | | | 6,613 | | | | 685,900 | |
| iShares® Core S&P® 500® ETF | | | 14,865 | | | | 6,242,408 | |
| iShares® MSCI Germany Index Fund | | | 48,741 | | | | 1,227,298 | |
| JPMorgan Equity Premium Income ETF | | | 70,048 | | | | 3,685,926 | |
| RiverFront Dynamic US Dividend Advantage ETF(a) | | | 333,674 | | | | 14,234,833 | |
| WisdomTree® Europe Hedged Equity Fund | | | 19,683 | | | | 753,662 | |
| | | | | | | | 50,843,770 | |
| TOTAL EXCHANGE TRADED FUNDS | | | | | | | | |
| (Cost $73,438,254) | | | | | | | 72,956,695 | |
| | | 7-Day
Yield | | | Shares | | | Value
(Note 2) | |
| SHORT-TERM INVESTMENTS (1.47%) | | | | | | | | | | | | |
| Money Market Fund (1.47%) | | | | | | | | | | | | |
| State Street Institutional Treasury Plus Money Market Fund-Premier Class | | | 5.300 | % | | | 1,085,252 | | | | 1,085,252 | |
| | | | | | | | | | | | | |
| TOTAL MONEY MARKET FUND | | | | | | | | | | | 1,085,252 | |
| | | | | | | | | | | | | |
| TOTAL SHORT-TERM INVESTMENTS | | | | | | | | | | | | |
| (Cost $1,085,252) | | | | | | | | | | | 1,085,252 | |
| | | | | | | | | | | | | |
| TOTAL INVESTMENTS (100.09%) | | | | | | | | | | | | |
| (Cost $74,523,506) | | | | | | | | | | $ | 74,041,947 | |
| | | | | | | | | | | | | |
| Liabilities In Excess Of Other Assets (-0.09%) | | | | | | | | | | | (69,498 | ) |
| | | | | | | | | | | | | |
| NET ASSETS (100.00%) | | | | | | | | | | $ | 73,972,449 | |
| (a) | Affiliated Company. See Note 7 in Notes to Financial Statements. |
For Fund compliance purposes, the Fund's industry classifications refer to any one or more of the industry sub-classifications used by one or more widely recognized market indexes or ratings group indexes, and/or as defined by Fund management. This definition may not apply for purposes of this report, which may combine industry sub-classifications for reporting ease. Industries are shown as a percent of net assets.
See Notes to Financial Statements.
RiverFront Asset Allocation Growth & Income
| Statement of Assets and Liabilities | October 31, 2023 |
| | | RiverFront Asset
Allocation
Growth &
Income | |
| ASSETS | | | |
| Investments, at value | | $ | 35,279,881 | |
| Investments in affiliates, at value | | | 38,762,066 | |
| Receivable for shares sold | | | 945 | |
| Dividends and interest receivable | | | 6,090 | |
| Total Assets | | | 74,048,982 | |
| LIABILITIES | | | | |
| Payable for shares redeemed | | | 31,926 | |
| Unitary administrative fees payable | | | 32,576 | |
| Distribution and services fees payable | | | 12,031 | |
| Total Liabilities | | | 76,533 | |
| NET ASSETS | | $ | 73,972,449 | |
| NET ASSETS CONSIST OF | | | | |
| Paid-in capital | | $ | 75,928,781 | |
| Total distributable earnings/(accumulated losses) | | | (1,956,332 | ) |
| NET ASSETS | | $ | 73,972,449 | |
| INVESTMENTS, AT COST | | $ | 39,225,343 | |
| INVESTMENTS IN AFFILIATES, AT COST | | $ | 35,298,163 | |
| | | | | |
| PRICING OF SHARES | | | | |
| Investor Class: | | | | |
| Net Asset Value, offering and redemption price per share | | $ | 11.66 | |
| Net Assets | | $ | 7,687,197 | |
| Shares of beneficial interest outstanding (unlimited number of shares, no par value common stock authorized) | | | 659,183 | |
| Class A: | | | | |
| Net Asset Value, offering and redemption price per share | | $ | 11.65 | |
| Net Assets | | $ | 19,110,171 | |
| Shares of beneficial interest outstanding (unlimited number of shares, no par value common stock authorized) | | | 1,640,841 | |
| Maximum offering price per share ((NAV/0.9450), based on maximum sales charge of 5.50% of the offering price) | | $ | 12.32 | |
| Class C: | | | | |
| Net Asset Value, offering and redemption price per share(a) | | $ | 11.20 | |
| Net Assets | | $ | 7,118,083 | |
| Shares of beneficial interest outstanding (unlimited number of shares, no par value common stock authorized) | | | 635,442 | |
| Class I: | | | | |
| Net Asset Value, offering and redemption price per share | | $ | 11.62 | |
| Net Assets | | $ | 40,056,998 | |
| Shares of beneficial interest outstanding (unlimited number of shares, no par value common stock authorized) | | | 3,447,685 | |
| (a) | Redemption price per share may be reduced for any applicable contingent deferred sales charge. For a description of a possible sales charge, please see the Fund's Prospectus. |
See Notes to Financial Statements.
RiverFront Asset Allocation Growth & Income
| Statement of Operations | For the Year Ended October 31, 2023 |
| | | RiverFront Asset
Allocation
Growth &
Income | |
| INVESTMENT INCOME | | | | |
| Dividends | | $ | 1,816,087 | |
| Dividends from affiliated securities | | | 1,351,645 | |
| Total Investment Income | | | 3,167,732 | |
| | | | | |
| EXPENSES | | | | |
| Unitary administrative fees | | | 208,900 | |
| Distribution and service fees | | | | |
| Investor Class | | | 21,869 | |
| Class A | | | 49,383 | |
| Class C | | | 101,736 | |
| Total Expenses | | | 381,888 | |
| Net Expenses | | | 381,888 | |
| Net Investment Income | | | 2,785,844 | |
| Net realized loss on investments | | | (1,350,962 | ) |
| Net realized gain on investments - affiliated securities | | | 624,385 | |
| Net realized loss | | | (726,577 | ) |
| Net change in unrealized appreciation on investments | | | 1,123,196 | |
| Net change in unrealized appreciation on investments - affiliated securities | | | 1,104,944 | |
| Net change in unrealized appreciation | | | 2,228,140 | |
| NET REALIZED AND UNREALIZED GAIN ON INVESTMENTS | | | 1,501,563 | |
| NET INCREASE IN NET ASSETS RESULTING FROM OPERATIONS | | $ | 4,287,407 | |
See Notes to Financial Statements.
RiverFront Asset Allocation Growth & Income
Statements of Changes in Net Assets
| | | For the Year
Ended
October 31, 2023 | | | For the Year
Ended
October 31, 2022 | |
| OPERATIONS | | | | | | |
| Net investment income | | $ | 2,785,844 | | | $ | 2,754,468 | |
| Net realized gain/(loss) | | | (726,577 | ) | | | 10,647,554 | |
| Net change in unrealized appreciation/(depreciation) | | | 2,228,140 | | | | (29,528,960 | ) |
| Net Increase/(Decrease) in Net Assets Resulting from Operations | | | 4,287,407 | | | | (16,126,938 | ) |
| TOTAL DISTRIBUTIONS | | | | | | | | |
| From distributable earnings | | | | | | | | |
| Investor Class | | | (647,846 | ) | | | (242,774 | ) |
| Class A | | | (1,384,895 | ) | | | (414,994 | ) |
| Class C | | | (779,705 | ) | | | (298,284 | ) |
| Class I | | | (3,343,761 | ) | | | (1,462,305 | ) |
| Net Decrease in Net Assets from Distributions | | | (6,156,207 | ) | | | (2,418,357 | ) |
| BENEFICIAL INTEREST TRANSACTIONS (NOTE 6) | | | | | | | | |
| Shares sold | | | | | | | | |
| Investor Class | | | 78,472 | | | | 20,378 | |
| Class A | | | 3,733,571 | | | | 5,636,445 | |
| Class C | | | 205,272 | | | | 651,120 | |
| Class I | | | 3,084,085 | | | | 6,549,965 | |
| Dividends reinvested | | | | | | | | |
| Investor Class | | | 636,855 | | | | 238,111 | |
| Class A | | | 1,366,683 | | | | 410,017 | |
| Class C | | | 756,170 | | | | 287,621 | |
| Class I | | | 3,255,904 | | | | 1,425,826 | |
| Shares redeemed | | | | | | | | |
| Investor Class | | | (2,105,984 | ) | | | (2,770,082 | ) |
| Class A | | | (4,238,648 | ) | | | (2,866,815 | ) |
| Class C | | | (7,143,443 | ) | | | (7,994,232 | ) |
| Class I | | | (12,937,619 | ) | | | (28,480,269 | ) |
| Acquisition (Note 10) | | | | | | | | |
| Investor Class | | | – | | | | 6,729,577 | |
| Class A | | | – | | | | 12,590,186 | |
| Class C | | | – | | | | 12,592,263 | |
| Class I | | | – | | | | 38,460,379 | |
| Net Increase/(Decrease) in Net Assets Derived from Beneficial Interest Transactions | | | (13,308,682 | ) | | | 43,480,490 | |
| Net increase/(decrease) in net assets | | | (15,177,482 | ) | | | 24,935,195 | |
| NET ASSETS | | | | | | | | |
| Beginning of year | | | 89,149,931 | | | | 64,214,736 | |
| End of year | | $ | 73,972,449 | | | $ | 89,149,931 | |
See Notes to Financial Statements.
RiverFront Asset Allocation Growth & Income – Investor Class
Financial Highlights
Selected data for a share of beneficial interest outstanding throughout the periods indicated:
| | | For the Year
Ended
October 31,
2023 | | | For the Year
Ended
October 31,
2022 | | | For the Year
Ended
October 31,
2021 | | | For the Year
Ended
October 31,
2020 | | | For the Year
Ended
October 31,
2019 | |
| Net asset value, beginning of period | | $ | 12.00 | | | $ | 14.45 | | | $ | 11.84 | | | $ | 12.02 | | | $ | 13.37 | |
| INCOME/(LOSS) FROM INVESTMENT OPERATIONS: | | | | | | | | | | | | | | | | | | | | |
| Net investment income(a) | | | 0.40 | | | | 0.37 | | | | 0.14 | | | | 0.18 | | | | 0.23 | |
| Net realized and unrealized gain/(loss) | | | 0.14 | | | | (2.49 | ) | | | 2.62 | | | | (0.16 | ) | | | 0.41 | |
| Total from investment operations | | | 0.54 | | | | (2.12 | ) | | | 2.76 | | | | 0.02 | | | | 0.64 | |
| DISTRIBUTIONS: | | | | | | | | | | | | | | | | | | | | |
| From net investment income | | | (0.42 | ) | | | (0.33 | ) | | | (0.14 | ) | | | (0.20 | ) | | | (0.21 | ) |
| From net realized gains | | | (0.46 | ) | | | – | | | | – | | | | – | | | | (1.78 | ) |
| Tax return of capital | | | – | | | | – | | | | (0.01 | ) | | | – | | | | – | |
| Total distributions | | | (0.88 | ) | | | (0.33 | ) | | | (0.15 | ) | | | (0.20 | ) | | | (1.99 | ) |
| Net increase/(decrease) in net asset value | | | (0.34 | ) | | | (2.45 | ) | | | 2.61 | | | | (0.18 | ) | | | (1.35 | ) |
| Net asset value, end of year | | $ | 11.66 | | | $ | 12.00 | | | $ | 14.45 | | | $ | 11.84 | | | $ | 12.02 | |
| TOTAL RETURN(b) | | | 4.53 | % | | | (14.82 | )% | | | 23.40 | % | | | 0.27 | % | | | 6.71 | % |
| RATIOS/SUPPLEMENTAL DATA: | | | | | | | | | | | | | | | | | | | | |
| Net assets, end of year (000s) | | $ | 7,687 | | | $ | 9,269 | | | $ | 6,921 | | | $ | 6,802 | | | $ | 8,864 | |
| Ratio of expenses to average net assets excluding fee waivers and reimbursements(c) | | | 0.50 | % | | | 0.50 | % | | | 0.50 | % | | | 0.50 | % | | | 0.50 | % |
| Ratio of expenses to average net assets including fee waivers and reimbursements(c) | | | 0.50 | % | | | 0.50 | % | | | 0.50 | % | | | 0.50 | % | | | 0.50 | % |
| Ratio of net investment income to average net assets(c)(d) | | | 3.29 | % | | | 2.84 | % | | | 1.04 | % | | | 1.57 | % | | | 1.91 | % |
| Portfolio turnover rate | | | 13 | % | | | 127 | % | | | 13 | % | | | 33 | % | | | 62 | % |
| (a) | Calculated using the average shares method. |
| (b) | Total returns are for the period indicated and have not been annualized. Total returns would have been lower had certain expenses not been waived during the period. Returns shown do not reflect the deduction of taxes that a shareholder would pay on Fund distributions or the redemption of Fund shares. |
| (c) | Does not include expenses of the investment companies in which the Fund invests. |
| (d) | The recognition of net investment income is affected by the timing and declaration of dividends by the investment companies in which the Fund invests. |
See Notes to Financial Statements.
RiverFront Asset Allocation Growth & Income – Class A
Financial Highlights
Selected data for a share of beneficial interest outstanding throughout the periods indicated:
| | | For the Year
Ended
October 31,
2023 | | | For the Year
Ended
October 31,
2022 | | | For the Year
Ended
October 31,
2021 | | | For the Year
Ended
October 31,
2020 | | | For the Year
Ended
October 31,
2019 | |
| Net asset value, beginning of period | | $ | 11.99 | | | $ | 14.43 | | | $ | 11.83 | | | $ | 12.01 | | | $ | 13.36 | |
| INCOME FROM INVESTMENT OPERATIONS: | | | | | | | | | | | | | | | | | | | | |
| Net investment income(a) | | | 0.40 | | | | 0.37 | | | | 0.14 | | | | 0.18 | | | | 0.25 | |
| Net realized and unrealized gain/(loss) | | | 0.14 | | | | (2.48 | ) | | | 2.61 | | | | (0.16 | ) | | | 0.39 | |
| Total from investment operations | | | 0.54 | | | | (2.11 | ) | | | 2.75 | | | | 0.02 | | | | 0.64 | |
| DISTRIBUTIONS: | | | | | | | | | | | | | | | | | | | | |
| From net investment income | | | (0.42 | ) | | | (0.33 | ) | | | (0.14 | ) | | | (0.20 | ) | | | (0.21 | ) |
| From net realized gains | | | (0.46 | ) | | | – | | | | – | | | | – | | | | (1.78 | ) |
| From tax return of capital | | | – | | | | – | | | | (0.01 | ) | | | – | | | | – | |
| Total distributions | | | (0.88 | ) | | | (0.33 | ) | | | (0.15 | ) | | | (0.20 | ) | | | (1.99 | ) |
| Net increase/(decrease) in net asset value | | | (0.34 | ) | | | (2.44 | ) | | | 2.60 | | | | (0.18 | ) | | | (1.35 | ) |
| Net asset value, end of year | | $ | 11.65 | | | $ | 11.99 | | | $ | 14.43 | | | $ | 11.83 | | | $ | 12.01 | |
| TOTAL RETURN(b) | | | 4.54 | % | | | (14.76 | )% | | | 23.34 | % | | | 0.28 | % | | | 6.78 | % |
| RATIOS/SUPPLEMENTAL DATA: | | | | | | | | | | | | | | | | | | | | |
| Net assets, end of year (000s) | | $ | 19,110 | | | $ | 18,794 | | | $ | 6,139 | | | $ | 4,489 | | | $ | 3,839 | |
| Ratio of expenses to average net assets excluding fee waivers and reimbursements(c) | | | 0.50 | % | | | 0.50 | % | | | 0.50 | % | | | 0.50 | % | | | 0.50 | % |
| Ratio of expenses to average net assets including fee waivers and reimbursements(c) | | | 0.50 | % | | | 0.50 | % | | | 0.50 | % | | | 0.50 | % | | | 0.50 | % |
| Ratio of net investment income to average net assets(c)(d) | | | 3.26 | % | | | 2.89 | % | | | 1.05 | % | | | 1.52 | % | | | 2.13 | % |
| Portfolio turnover rate | | | 13 | % | | | 127 | % | | | 13 | % | | | 33 | % | | | 62 | % |
| (a) | Calculated using the average shares method. |
| (b) | Total returns are for the period indicated and have not been annualized. Total returns would have been lower had certain expenses not been waived during the period. Returns shown do not reflect the deduction of taxes that a shareholder would pay on Fund distributions or the redemption of Fund shares. Returns shown exclude any applicable sales charges. |
| (c) | Does not include expenses of the investment companies in which the Fund invests. |
| (d) | The recognition of net investment income is affected by the timing and declaration of dividends by the investment companies in which the Fund invests. |
See Notes to Financial Statements.
RiverFront Asset Allocation Growth & Income – Class C
Financial Highlights
Selected data for a share of beneficial interest outstanding throughout the periods indicated:
| | | For the Year
Ended
October 31,
2023 | | | For the Year
Ended
October 31,
2022 | | | For the Year
Ended
October 31,
2021 | | | For the Year
Ended
October 31,
2020 | | | For the Year
Ended
October 31,
2019 | |
| Net asset value, beginning of period | | $ | 11.57 | | | $ | 13.94 | | | $ | 11.45 | | | $ | 11.65 | | | $ | 13.03 | |
| INCOME/(LOSS) FROM INVESTMENT OPERATIONS: | | | | | | | | | | | | | | | | | | | | |
| Net investment income(a) | | | 0.31 | | | | 0.26 | | | | 0.04 | | | | 0.09 | | | | 0.13 | |
| Net realized and unrealized gain/(loss) | | | 0.11 | | | | (2.39 | ) | | | 2.52 | | | | (0.15 | ) | | | 0.40 | |
| Total from investment operations | | | 0.42 | | | | (2.13 | ) | | | 2.56 | | | | (0.06 | ) | | | 0.53 | |
| DISTRIBUTIONS: | | | | | | | | | | | | | | | | | | | | |
| From net investment income | | | (0.33 | ) | | | (0.24 | ) | | | (0.06 | ) | | | (0.14 | ) | | | (0.13 | ) |
| From net realized gains | | | (0.46 | ) | | | – | | | | – | | | | – | | | | (1.78 | ) |
| Tax return of capital | | | – | | | | – | | | | (0.01 | ) | | | – | | | | – | |
| Total distributions | | | (0.79 | ) | | | (0.24 | ) | | | (0.07 | ) | | | (0.14 | ) | | | (1.91 | ) |
| Net increase/(decrease) in net asset value | | | (0.37 | ) | | | (2.37 | ) | | | 2.49 | | | | (0.20 | ) | | | (1.38 | ) |
| Net asset value, end of year | | $ | 11.20 | | | $ | 11.57 | | | $ | 13.94 | | | $ | 11.45 | | | $ | 11.65 | |
| TOTAL RETURN(b) | | | 3.68 | % | | | (15.39 | )% | | | 22.44 | % | | | (0.44 | )% | | | 5.91 | % |
| RATIOS/SUPPLEMENTAL DATA: | | | | | | | | | | | | | | | | | | | | |
| Net assets, end of year (000s) | | $ | 7,118 | | | $ | 13,432 | | | $ | 11,049 | | | $ | 13,642 | | | $ | 19,798 | |
| Ratio of expenses to average net assets excluding fee waivers and reimbursements(c) | | | 1.25 | % | | | 1.25 | % | | | 1.25 | % | | | 1.25 | % | | | 1.25 | % |
| Ratio of expenses to average net assets including fee waivers and reimbursements(c) | | | 1.25 | % | | | 1.25 | % | | | 1.25 | % | | | 1.25 | % | | | 1.25 | % |
| Ratio of net investment income to average net assets(c)(d) | | | 2.60 | % | | | 2.03 | % | | | 0.29 | % | | | 0.82 | % | | | 1.15 | % |
| Portfolio turnover rate | | | 13 | % | | | 127 | % | | | 13 | % | | | 33 | % | | | 62 | % |
| (a) | Calculated using the average shares method. |
| (b) | Total returns are for the period indicated and have not been annualized. Total returns would have been lower had certain expenses not been waived during the period. Returns shown do not reflect the deduction of taxes that a shareholder would pay on Fund distributions or the redemption of Fund shares. Returns shown exclude any applicable sales charges. |
| (c) | Does not include expenses of the investment companies in which the Fund invests. |
| (d) | The recognition of net investment income is affected by the timing and declaration of dividends by the investment companies in which the Fund invests. |
See Notes to Financial Statements.
RiverFront Asset Allocation Growth & Income – Class I
Financial Highlights
Selected data for a share of beneficial interest outstanding throughout the periods indicated:
| | | For the Year
Ended
October 31,
2023 | | | For the Year
Ended
October 31,
2022 | | | For the Year
Ended
October 31,
2021 | | | For the Year
Ended
October 31,
2020 | | | For the Year
Ended
October 31,
2019 | |
| Net asset value, beginning of period | | $ | 11.96 | | | $ | 14.40 | | | $ | 11.79 | | | $ | 11.97 | | | $ | 13.31 | |
| INCOME/(LOSS) FROM INVESTMENT OPERATIONS: | | | | | | | | | | | | | | | | | | | | |
| Net investment income(a) | | | 0.43 | | | | 0.40 | | | | 0.18 | | | | 0.22 | | | | 0.26 | |
| Net realized and unrealized gain/(loss) | | | 0.14 | | | | (2.48 | ) | | | 2.61 | | | | (0.18 | ) | | | 0.41 | |
| Total from investment operations | | | 0.57 | | | | (2.08 | ) | | | 2.79 | | | | 0.04 | | | | 0.67 | |
| DISTRIBUTIONS: | | | | | | | | | | | | | | | | | | | | |
| From net investment income | | | (0.45 | ) | | | (0.36 | ) | | | (0.16 | ) | | | (0.22 | ) | | | (0.23 | ) |
| From net realized gains | | | (0.46 | ) | | | – | | | | – | | | | – | | | | (1.78 | ) |
| Tax return of capital | | | – | | | | – | | | | (0.02 | ) | | | – | | | | – | |
| Total distributions | | | (0.91 | ) | | | (0.36 | ) | | | (0.18 | ) | | | (0.22 | ) | | | (2.01 | ) |
| Net increase/(decrease) in net asset value | | | (0.34 | ) | | | (2.44 | ) | | | 2.61 | | | | (0.18 | ) | | | (1.34 | ) |
| Net asset value, end of year | | $ | 11.62 | | | $ | 11.96 | | | $ | 14.40 | | | $ | 11.79 | | | $ | 11.97 | |
| TOTAL RETURN(b) | | | 4.80 | % | | | (14.60 | )% | | | 23.79 | % | | | 0.46 | % | | | 7.07 | % |
| RATIOS/SUPPLEMENTAL DATA: | | | | | | | | | | | | | | | | | | | | |
| Net assets, end of year (000s) | | $ | 40,057 | | | $ | 47,655 | | | $ | 40,106 | | | $ | 34,529 | | | $ | 49,610 | |
| Ratio of expenses to average net assets excluding fee waivers and reimbursements(c) | | | 0.25 | % | | | 0.25 | % | | | 0.25 | % | | | 0.25 | % | | | 0.25 | % |
| Ratio of expenses to average net assets including fee waivers and reimbursements(c) | | | 0.25 | % | | | 0.25 | % | | | 0.25 | % | | | 0.25 | % | | | 0.25 | % |
| Ratio of net investment income to average net assets(c)(d) | | | 3.54 | % | | | 3.06 | % | | | 1.29 | % | | | 1.83 | % | | | 2.17 | % |
| Portfolio turnover rate | | | 13 | % | | | 127 | % | | | 13 | % | | | 33 | % | | | 62 | % |
| (a) | Calculated using the average shares method. |
| (b) | Total returns are for the period indicated and have not been annualized. Total returns would have been lower had certain expenses not been waived during the period. Returns shown do not reflect the deduction of taxes that a shareholder would pay on Fund distributions or the redemption of Fund shares. |
| (c) | Does not include expenses of the investment companies in which the Fund invests. |
| (d) | The recognition of net investment income is affected by the timing and declaration of dividends by the investment companies in which the Fund invests. |
See Notes to Financial Statements.
Notes to Financial Statements
October 31, 2023
1. ORGANIZATION
Financial Investors Trust (the “Trust”), a Delaware statutory trust, is an open-end management investment company registered under the Investment Company Act of 1940, as amended (“1940 Act”). The Trust consists of multiple separate portfolios or series. This annual report includes the financial statements and financial highlights of the following 4 funds: ALPS | CoreCommodity Management CompleteCommodities® Strategy Fund, ALPS | Kotak India ESG Fund (formerly ALPS | Kotak India Growth Fund), ALPS Global Opportunity Fund (formerly ALPS | Red Rocks Global Opportunity Fund), and RiverFront Asset Allocation Growth & Income (each, a “Fund” and collectively, the “Funds”).
The ALPS | CoreCommodity Management CompleteCommodities® Strategy Fund seeks to maximize real returns, consistent with prudent investment management. ALPS | Kotak India ESG Fund seeks to achieve long-term capital appreciation. The ALPS Global Opportunity Fund seeks to maximize total return, which consists of appreciation on its investments and a variable income stream. RiverFront Asset Allocation Growth & Income seeks to achieve long-term growth and income.
The classes of each Fund differ principally in the applicable distribution and shareholder service fees. Shareholders of each class also bear certain expenses that pertain to that particular class. All shareholders bear the common expenses of the Fund and earn income and realized gains/losses from the Fund pro rata based on the average daily net assets of each class, without distinction between share classes. Dividends to shareholders are determined separately for each class based on income and expenses allocable to each class. Realized gain distributions to shareholders are allocated to each class pro rata based on the shares outstanding of each class on the date of distribution. Differences in per share dividend rates generally result from differences in separate class expenses, including distribution and shareholder service fees, if applicable.
Basis of Consolidation for the ALPS | CoreCommodity Management CompleteCommodities® Strategy Fund
CoreCommodity Management Cayman Commodity Fund Ltd. (the “Subsidiary”), a Cayman Islands exempted company, was incorporated on April 23, 2010 and is a wholly owned subsidiary of the ALPS | CoreCommodity Management CompleteCommodities® Strategy Fund (the “CoreCommodity Fund”). All intercompany transactions have been eliminated upon consolidation. The Subsidiary acts as an investment vehicle for the CoreCommodity Fund in order to effect certain commodity-related investments on behalf of the CoreCommodity Fund. CoreCommodity Fund is the sole shareholder of the Subsidiary pursuant to a subscription agreement dated as of June 14, 2010, and it is intended that the CoreCommodity Fund will remain the sole shareholder and will continue to wholly own and control the Subsidiary. Under the Articles of Association of the Subsidiary, shares issued by the Subsidiary confer upon a shareholder the right to vote at general meetings of the Subsidiary and certain rights in connection with any winding-up or repayment of capital, as well as the right to participate in the profits or assets of the Subsidiary. The CoreCommodity Fund may invest up to 25% of its total assets in shares of the Subsidiary. As a wholly owned subsidiary of the CoreCommodity Fund, the financial statements of the Subsidiary are included in the consolidated financial statements and financial highlights of the CoreCommodity Fund. All investments held by the Subsidiary are disclosed in the accounts of the CoreCommodity Fund. As of October 31, 2023, net assets of the CoreCommodity Fund were $1,653,621,164 of which $344,329,509 or 20.82%, represented the CoreCommodity Fund’s ownership of all issued shares and voting rights of the Subsidiary.
2. SIGNIFICANT ACCOUNTING POLICIES
The following is a summary of significant accounting policies consistently followed by each Fund in the preparation of its financial statements. Each Fund is considered an investment company for financial reporting purposes, and follows accounting policies in conformity with accounting principles generally accepted in the United States of America (“U.S. GAAP”), including policies specific to investment companies. The preparation of financial statements in conformity with U.S. GAAP requires management to make certain estimates and assumptions that affect the reported amounts of assets and liabilities and disclosures of contingent assets and liabilities at the date of the financial statements and the reported amounts of increases and decreases in net assets during the reporting period. Actual results could differ from those estimates. The following is a summary of significant accounting policies consistently followed by the Funds and subsidiaries, as applicable, in preparation of their financial statements. The Funds are an investment company and accordingly follows the investment company accounting and reporting guidance of the Financial Accounting Standards Board ("FASB") Accounting Standard Codification ("ASC") Topic 946 "Financial Services – Investment Companies”.
Investment Valuation: The Funds generally value their securities based on market prices determined at the close of regular trading on the New York Stock Exchange (“NYSE”), normally 4:00 p.m. Eastern Time, on each day the NYSE is open for trading. For equity securities and mutual funds that are traded on an exchange, the market price is usually the closing sale or official closing price on that exchange.
The market price for debt obligations is generally the price supplied by an independent third-party pricing service utilized by ALPS Advisors, Inc. (the "Adviser") as the the valuation designee (the "Valuation Designee"), which may use a matrix, formula or other objective method that takes into consideration quotations from dealers, market transactions in comparable investments, market indices and yield curves. If vendors are unable to supply a price, or if the price supplied is deemed to be unreliable, the market price may be determined using quotations received from one or more brokers-dealers that make a market in the security. Investments in non-exchange traded funds are fair valued at their respective net asset values.
Notes to Financial Statements
October 31, 2023
Futures contracts that are listed or traded on a national securities exchange, commodities exchange, contract market or comparable over the counter market, and that are freely transferable, are valued at their closing settlement price on the exchange on which they are primarily traded or based upon the current settlement price for a like instrument acquired on the day on which the instrument is being valued. A settlement price may not be used if the market makes a limited move with respect to a particular commodity. Over-the-counter swap contracts are valued based on quotes received from independent pricing services or one or more dealers that make markets in such investments.
Option contracts are valued using the National Best Bid and Offer price (“NBBO”). In the event there is no NBBO price available, option contracts are valued at the mean between the last bid and ask.
For ALPS | Kotak India ESG Fund and ALPS Global Opportunity Fund, who hold equity securities that are primarily traded on foreign securities exchanges, such securities are valued at the closing values of such securities on their respective foreign exchanges, except when an event occurs subsequent to the close of the foreign exchange and the close of the NYSE that was likely to have changed such value. In such an event, the fair value of those securities are determined in good faith through consideration of other factors in accordance with procedures established by the Valuation Designee. The Funds will use a fair valuation model provided by an independent pricing service, which is intended to reflect fair value when a security’s value or a meaningful portion of the Funds' portfolio is believed to have been materially affected by a valuation event that has occurred between the close of the exchange or market on which the security is traded and the close of the regular trading day on the NYSE.
Forward currency exchange contracts have a value determined by the current foreign currency exchange forward rates. The foreign currency exchange forward rates are calculated using an automated system that estimates rates on the basis of the current day foreign currency exchange rates and forward foreign currency exchange rates supplied by a pricing service. Foreign exchange rates and forward foreign currency exchange rates may generally be obtained at the close of the NYSE, normally 4:00 p.m. Eastern Time.
Pursuant to Rule 2a-5 under the Investment Company Act of 1940, the Trust’s Board of Trustees (the “Board” or "Trustees") has appointed the Adviser to serve as the Valuation Designee to perform fair value determinations for investments in the Funds. When such prices or quotations are not available, or when the Valuation Designee appointed by the Board believes that they are unreliable, securities may be priced using fair value procedures approved by the Board. The fair valuation policies and procedures (“FV Procedures”) have been adopted by the Board for the fair valuation of portfolio assets held by the Funds in the event that (1) market quotations for the current price of a portfolio security or asset are not readily available, or (2) available market quotations that would otherwise be used to value a portfolio security or asset in accordance with the Fund’s Pricing Procedures appear to be unreliable. The Pricing Procedures reflect certain pricing methodologies (or “logics”) that are not “readily available market quotations” and thus are viewed and treated as fair valuations. The Valuation Designee routinely meets to discuss fair valuations of portfolio securities and other instruments held by the Funds.
Fair Value Measurements: The Funds disclose the classification of their fair value measurements following a three-tier hierarchy based on the inputs used to measure fair value. Inputs refer broadly to the assumptions that market participants would use in pricing the asset or liability, including assumptions about risk. Inputs may be observable or unobservable. Observable inputs reflect the assumptions market participants would use in pricing the asset or liability that are developed based on market data obtained from sources independent of the reporting entity. Unobservable inputs reflect the reporting entity’s own assumptions about the assumptions market participants would use in pricing the asset or liability that are developed based on the best information available.
Various inputs are used in determining the value of each Fund’s investments as of the end of the reporting period. When inputs used fall into different levels of the fair value hierarchy, the level in the hierarchy within which the fair value measurement falls is determined based on the lowest level input that is significant to the fair value measurement in its entirety. The designated input levels are not necessarily an indication of the risk or liquidity associated with these investments. These inputs are categorized in the following hierarchy under applicable financial accounting standards:
| Level 1 – | Unadjusted quoted prices in active markets for identical investments, unrestricted assets or liabilities that a Fund has the ability to access at the measurement date; |
| | |
| Level 2 – | Quoted prices which are not active, quoted prices for similar assets or liabilities in active markets or inputs other than quoted prices that are observable (either directly or indirectly) for substantially the full term of the asset or liability; and |
| | |
| Level 3 – | Significant unobservable prices or inputs (including the Fund’s own assumptions in determining the fair value of investments) where there is little or no market activity for the asset or liability at the measurement date. |
Notes to Financial Statements
October 31, 2023
The following is a summary of each Fund’s investments/financial instruments in the fair value hierarchy as of October 31, 2023:
| Investments in Securities at Value | | Level 1 - Unadjusted Quoted Prices | | | Level 2 - Other Significant Observable Inputs | | | Level 3 - Significant Unobservable Inputs | | | Total | |
| ALPS | CoreCommodity Management CompleteCommodities® Strategy Fund | | | | | | | | | | | | | |
| Common Stocks(a) | | $ | 317,816,884 | | | $ | 1,084,064 | | | $ | 1,118 | | | $ | 318,902,066 | |
| Master Limited Partnerships(a) | | | 2,805,083 | | | | – | | | | – | | | | 2,805,083 | |
| Government Bonds | | | – | | | | 1,228,188,502 | | | | – | | | | 1,228,188,502 | |
| Short Term Investments | | | 111,196,510 | | | | – | | | | – | | | | 111,196,510 | |
| Total | | $ | 431,818,477 | | | $ | 1,229,272,566 | | | $ | 1,118 | | | $ | 1,661,092,161 | |
| Other Financial Instruments | | | | | | | | | | | | | | | | |
| Assets | | | | | | | | | | | | | | | | |
| Futures Contracts | | $ | 8,303,693 | | | $ | – | | | $ | – | | | $ | 8,303,693 | |
| Total Return Swap Contracts | | | – | | | | 28 | | | | – | | | | 28 | |
| Liabilities | | | | | | | | | | | | | | | | |
| Futures Contracts | | $ | (39,290,903 | ) | | $ | – | | | $ | – | | | $ | (39,290,903 | ) |
| Total | | $ | (30,987,210 | ) | | $ | 28 | | | $ | – | | | $ | (30,987,182 | ) |
| Investments in Securities at Value | | Level 1 - Unadjusted Quoted Prices | | | Level 2 - Other Significant Observable Inputs | | | Level 3 - Significant Unobservable Inputs | | | Total | |
| ALPS | Kotak India ESG Fund | | | | | | | | | | | | | | | | |
| Common Stocks | | | | | | | | | | | | | | | | |
| Communication Services | | $ | – | | | $ | 11,491,035 | | | $ | – | | | $ | 11,491,035 | |
| Consumer Discretionary | | | – | | | | 27,459,149 | | | | – | | | | 27,459,149 | |
| Consumer Staples | | | – | | | | 24,939,047 | | | | – | | | | 24,939,047 | |
| Energy | | | – | | | | 19,248,452 | | | | – | | | | 19,248,452 | |
| Financials | | | 16,673,390 | | | | 88,144,895 | | | | – | | | | 104,818,285 | |
| Health Care | | | 7,924,843 | | | | 13,388,006 | | | | – | | | | 21,312,849 | |
| Industrials | | | 9,325,877 | | | | 18,630,228 | | | | – | | | | 27,956,105 | |
| Information Technology | | | 9,701,576 | | | | 28,564,231 | | | | – | | | | 38,265,807 | |
| Materials | | | – | | | | 21,557,658 | | | | – | | | | 21,557,658 | |
| Real Estate | | | – | | | | 4,544,305 | | | | – | | | | 4,544,305 | |
| Short Term Investments | | | 7,500,000 | | | | – | | | | – | | | | 7,500,000 | |
| Total | | $ | 51,125,686 | | | $ | 257,967,006 | | | $ | – | | | $ | 309,092,692 | |
| Investments in Securities at Value | | Level 1 - Unadjusted Quoted Prices | | | Level 2 - Other Significant Observable Inputs | | | Level 3 - Significant Unobservable Inputs | | | Total | |
| ALPS Global Opportunity Fund | | | | | | | | | | | | | | | | |
| Closed-End Funds | | $ | 5,235,259 | | | $ | 6,091,964 | | | $ | – | | | $ | 11,327,223 | |
| Common Stocks | | | | | | | | | | | | | | | | |
| Communications | | | 648,133 | | | | – | | | | – | | | | 648,133 | |
| Consumer Discretionary | | | – | | | | 849,387 | | | | – | | | | 849,387 | |
| Consumer Staples | | | 1,259,563 | | | | – | | | | – | | | | 1,259,563 | |
| Consumer, Non-cyclical | | | 723,006 | | | | 648,084 | | | | – | | | | 1,371,090 | |
| Financials | | | 14,955,917 | | | | 10,097,366 | | | | – | | | | 25,053,283 | |
| Health Care | | | 1,237,830 | | | | – | | | | – | | | | 1,237,830 | |
| Industrials | | | 1,827,146 | | | | 461,196 | | | | – | | | | 2,288,342 | |
| Technology | | | 2,683,951 | | | | – | | | | – | | | | 2,683,951 | |
| Business Development Companies | | | 1,279,125 | | | | – | | | | – | | | | 1,279,125 | |
| Preferred Stock | | | 1,046,366 | | | | – | | | | – | | | | 1,046,366 | |
| Short-Term Investments | | | 1,994,149 | | | | – | | | | – | | | | 1,994,149 | |
| Total | | $ | 32,890,445 | | | $ | 18,147,997 | | | $ | – | | | $ | 51,038,442 | |
| Other Financial Instruments | | | | | | | | | | | | | | | | |
| Assets: | | | | | | | | | | | | | | | | |
| Forward Contract | | $ | – | | | $ | 9,397 | | | $ | – | | | $ | 9,397 | |
| Total | | $ | – | | | $ | 9,397 | | | $ | – | | | $ | 9,397 | |
Notes to Financial Statements
October 31, 2023
| Investments in Securities at Value | | Level 1 - Unadjusted Quoted Prices | | | Level 2 - Other Significant Observable Inputs | | | Level 3 - Significant Unobservable Inputs | | | Total | |
| RiverFront Asset Allocation Growth & Income | | | | | | | | | | | | | | | | |
| Exchange Traded Funds | | $ | 72,956,695 | | | $ | – | | | $ | – | | | $ | 72,956,695 | |
| Short-Term Investments | | | 1,085,252 | | | | – | | | | – | | | | 1,085,252 | |
| Total | | $ | 74,041,947 | | | $ | – | | | $ | – | | | $ | 74,041,947 | |
| (a) | For detailed descriptions of country, sector and/or industry, see the accompanying Consolidated Statement of Investments. |
The Funds, except for the ALPS | CoreCommodity Management CompleteCommodities® Strategy, did not have any securities that used significant unobservable inputs (Level 3) in determining fair value and there were no transfers into or out of Level 3 during the year ended October 31, 2023. As of October 31, 2023, ALPS | CoreCommodity Management CompleteCommodities® Strategy held securities classified as Level 3 in the fair value hierarchy valued at $1,118, which represents less than 0.005% of net assets.
Fund and Class Expenses: Some expenses of the Trust can be directly attributed to a Fund or a specific share class of a Fund. Expenses which cannot be directly attributed are apportioned among all Funds in the Trust based on average net assets of each share class within a Fund.
Federal Income Taxes: The Funds comply with the requirements under Subchapter M of the Internal Revenue Code of 1986, as amended (the “Code”) applicable to regulated investment companies and intend to distribute substantially all of their net taxable income and net capital gains, if any, each year. The Funds are not subject to income taxes to the extent such distributions are made.
As of and during the year ended October 31, 2023, the Funds did not have a liability for any unrecognized tax benefits. The Funds recognize interest and penalties, if any, related to tax liabilities as income tax expense in the Statements of Operations or Consolidated Statement of Operation. The Funds file U.S. federal, state, and local tax returns as required. The Funds’ tax returns are subject to examination by the relevant tax authorities until expiration of the applicable statute of limitations which is generally three years after the filing of the tax return, but may extend to four years in certain jurisdictions. Tax returns for open years have incorporated no uncertain tax positions that require a provision for income taxes. For tax purposes, the Subsidiary is an exempt Cayman Islands investment company and has received an undertaking from the Government of the Cayman Islands exempting it from all local income, profits, and capital gains taxes. No such taxes are levied in the Cayman Islands at the present time. For U.S. income tax purposes, the Subsidiary is a controlled foreign corporation ("CFC") and as such is not subject to U.S. income tax. However, as a wholly-owned CFC, the net income and capital gain of the CFC, to the extent of its earnings and profits, will be included each year in the ALPS | CoreCommodity Management CompleteCommodities® Strategy Fund's taxable income.
Distributions to Shareholders: Each Fund, except RiverFront Asset Allocation Growth & Income, normally pays dividends and distributes capital gains, if any, on an annual basis. RiverFront Asset Allocation Growth & Income normally pays dividends, if any, on a quarterly basis and distributes capital gains, if any, annually. Income dividend distributions are derived from interest, dividends, and other income a Fund receives from its investments, including distributions of short-term capital gains, if any. Capital gain distributions are derived from gains realized when a Fund sells a security it has owned for more than a year or from long-term capital gain distributions from underlying investments. Each Fund may make additional distributions and dividends at other times if its portfolio manager or managers believe doing so may be necessary for the Fund to avoid or reduce taxes.
Commodity-Linked Notes: The ALPS | CoreCommodity Management CompleteCommodities® Strategy Fund may invest in commodity-linked notes which are derivative instruments that have characteristics of a debt security and of a commodity-linked derivative. A commodity-linked note typically provides for interest payments and a principal payment at maturity linked to the price movement of the underlying commodity, commodity index or commodity futures or option contract. Commodity-linked notes may be principal protected, partially protected, or offer no principal protection. The value of these notes will rise and fall in response to changes in the underlying commodity or related index or investment. These notes are often leveraged, increasing the volatility of each note’s value relative to the change in the underlying linked index. Commodity index-linked investments may be more volatile and less liquid than the underlying index and their value may be affected by the performance of the commodities as well as other factors, including liquidity, quality, maturity and other economic variables. Commodity-linked notes are typically issued by a bank or other financial institution and are sometimes referred to as structured notes because the terms of the notes may be structured by the issuer and the purchaser of the notes to accommodate the specific investment requirements of the purchaser.
Notes to Financial Statements
October 31, 2023
Exchange Traded Funds (ETFs): Each Fund may invest in shares of ETFs and other similar instruments if the investment manager chooses to adjust a Fund’s exposure to the general market or industry sectors and to manage a Fund’s risk exposure. ETFs differ from traditional index funds in that their shares are listed on a securities exchange and can be traded intraday. ETF shares are shares of exchange traded investment companies that are registered under the 1940 Act and hold a portfolio of common stocks designed to track the performance of a particular index. Limitations of the 1940 Act may prohibit a Fund from acquiring more than 3% of the outstanding shares of certain ETFs. Instruments that are similar to ETFs represent beneficial ownership interests in specific “baskets” of stocks of companies within a particular industry sector or group. These securities may also be exchange traded, but unlike ETFs, the issuers of these securities are not registered as investment companies.
The portfolio manager may decide to purchase or sell short ETF shares or options on ETF shares for the same reasons it would purchase or sell (and as an alternative to purchasing or selling) futures contracts – to obtain exposure to the stock market or a particular segment of the stock market, or to hedge a Fund’s portfolio against such exposures. Depending on the market, the holding period and other factors, the use of ETF shares and options thereon can be less costly than the use of index options or stock index futures. In addition, ETF shares and options thereon can typically be purchased in smaller amounts than are available for futures contracts and can offer exposure to market sectors and styles for which there is no suitable or liquid futures contract.
Investment Transactions and Investment Income: Investment transactions are accounted for on the date the investments are purchased or sold (trade date basis). Net realized gains and losses from investment transactions are reported on an identified cost basis. Interest income, which includes accretion of discounts and amortization of premiums, is accrued and recorded as earned. Dividend income is recognized on the ex-dividend date or for withholding taxes or certain foreign securities, as soon as information is available to each Fund. Withholding taxes on foreign dividends are paid (a portion of which may be reclaimable) or provided for in accordance with the applicable country's tax rules and rates and are disclosed in the Statement of Operations or Consolidated Statement of Operations.
Cash Management Transactions: ALPS/ Kotak India ESG Fund subscribes to the Brown Brothers Harriman & Co. (“BBH”) Cash Management Service (“CMS”), whereby cash balances are automatically swept into overnight offshore demand deposits with either the BBH Grand Cayman branch or a branch of a pre-approved commercial bank. This fully automated program allows the Fund to earn interest on cash balances. Excess cash with deposit institutions domiciled outside of the U.S. are subject to sovereign actions in the jurisdiction of the deposit institution including, but not limited to, freeze, seizure or diminution. Cash balances in the BBH CMS are included on the Statement of Assets and Liabilities under Cash and Foreign currency, at value. As of October 31, 2023, the ALPS/ Kotak India ESG Fund had $2,721,930 cash balance participating in the BBH CMS. As of October 31, 2023, the ALPS/ Kotak India ESG Fund did not have any foreign cash balances participating in the BBH CMS.
Foreign Securities: Each Fund may directly purchase securities of foreign issuers. Investing in securities of foreign issuers involves special risks not typically associated with investing in securities of U.S. issuers. The risks include possible reevaluation of currencies, the inability to repatriate foreign currency, less complete financial information about companies and possible future adverse political and economic developments.
Moreover, securities of many foreign issuers and their markets may be less liquid and their prices more volatile than those of securities of comparable U.S. issuers.
Foreign Currency Translation: Values of investments denominated in foreign currencies are converted into U.S. dollars using the current exchange rates each business day (generally 4:00 p.m. Eastern Time). Purchases and sales of investments and dividend income are translated into U.S. dollars using the current prevailing exchange rate on the transaction date. The effect of changes in foreign exchange rates on realized and unrealized gains or losses on securities is reflected as a component of such gains or losses. Transactions in foreign denominated assets may involve greater risks than domestic transactions. The Fund does not isolate that portion of the results of operations resulting from changes in foreign exchange rates on investments from the fluctuations arising from changes in market prices of securities held. Such fluctuations are included with the net realized and unrealized gain or loss from investments. Reported net realized foreign exchange gains or losses arise from sales of foreign currencies, currency gains or losses realized between the trade and settlement dates on securities transactions, and the difference between the amounts of dividends, interest, and foreign withholding taxes recorded on the Fund's books and the U.S. dollar equivalent of the amounts actually received or paid. Net unrealized foreign exchange gains and losses arise from changes in the fair values of assets and liabilities, other than investments in securities at fiscal period end, resulting from changes in exchange rates.
Foreign Currency Spot Contracts: The Funds may enter into foreign currency spot contracts to facilitate transactions in foreign securities or to convert foreign currency receipts into U.S. dollars. A foreign currency spot contract is an agreement between two parties to buy and sell currencies at the current market rate, for settlement generally within two business days. The U.S. dollar value of the contracts is determined using current currency exchange rates supplied by a pricing service. The contract is marked-to-market daily for settlements beyond one day and any change in market value is recorded as an unrealized gain or loss. When the contract is closed, the Fund records a realized gain or loss equal to the difference between the value on the open and close date. Losses may arise from changes in the value of the foreign currency, or if the counterparties do not
Notes to Financial Statements
October 31, 2023
perform under the contract’s terms. The maximum potential loss from such contracts is the aggregate face value in U.S. dollars at the time the contract was opened.
Real Estate Investment Trusts (“REITs”): The Funds may invest a portion of their assets in REITs and are subject to certain risks associated with direct investment in REITs. REITs may be affected by changes in the value of their underlying properties and by defaults by borrowers or tenants. REITs depend generally on their ability to generate cash flow to make distributions to shareowners, and certain REITs have self-liquidation provisions by which mortgages held may be paid in full and distributions of capital returns may be made at any time. In addition, the performance of a REIT may be affected by its failure to qualify for tax-free pass-through of income under the Code, or its failure to maintain exemption from registration under the 1940 Act. Distributions that the Fund receives from REITs can be classified as ordinary income, capital gain income or return of capital by the REITs that make these distributions to the Fund. However, it is not possible for the Fund to characterize distributions received from REITs during interim periods because the REIT issuers do not report their tax characterizations until subsequent to year end. During interim periods, the REIT distributions are accounted for as ordinary income until the re characterizations are made subsequent to year end.
Master Limited Partnerships (“MLPs”): Certain Funds may invest in MLPs, which are publicly traded partnerships engaged in the transportation, storage and processing of minerals and natural resources. By confining their operations to these specific activities, their interests, or units, are able to trade on public securities exchanges exactly like the shares of a corporation, without entity level taxation. To qualify as a MLP and to not be taxed as a corporation, a partnership must receive at least 90% of its income from qualifying sources as set forth in Section 7704(d) of the Code. These qualifying sources include natural resource based activities such as the processing, transportation and storage of mineral or natural resources. MLPs generally have two classes of owners, the general partner and limited partners. The general partner of an MLP is typically owned by a major energy company, an investment fund, the direct management of the MLP, or is an entity owned by one or more of such parties. The general partner may be structured as a private or publicly traded corporation or other entity. The general partner typically controls the operations and management of the MLP through an up to 2% equity interest in the MLP plus, in many cases, ownership of common units and subordinated units. Limited partners typically own the remainder of the partnership, through ownership of common units, and have a limited role in the partnership’s operations and management. MLPs are typically structured such that common units and general partner interests have first priority to receive quarterly cash distributions up to an established minimum amount (“minimum quarterly distributions” or “MQD”). Common and general partner interests also accrue arrearages in distributions to the extent the MQD is not paid. Once common and general partner interests have been paid, subordinated units receive distributions of up to the MQD; however, subordinated units do not accrue arrearages. Distributable cash in excess of the MQD is paid to both common and subordinated units and is distributed to both common and subordinated units generally on a pro rata basis. The general partner is also eligible to receive incentive distributions if the general partner operates the business in a manner which results in distributions paid per common unit surpassing specified target levels. As the general partner increases cash distributions to the limited partners, the general partner receives an increasingly higher percentage of the incremental cash distributions.
3. DERIVATIVE INSTRUMENTS
As a part of their investment strategy, the Funds are permitted to enter in various types of derivatives contracts. In doing so, the Funds employ strategies in differing combinations to permit them to increase, decrease, or change the level or types of exposure to market factors. Central to those strategies are features inherent in derivatives that make them more attractive for this purpose than equity or debt securities; they require little or no initial cash investment, they focus exposure on only certain selected risk factors, and they may not require the ultimate receipt or delivery of the underlying security (or securities) to the contract. This may allow the Funds to pursue their objectives more quickly and efficiently than if they were to make direct purchases or sales of securities capable of affecting a similar response to market factors.
Cash collateral is being pledged to cover derivative obligations of the Funds and cash collateral received from the counterparty, if any, is reported separately on the Statements of Assets and Liabilities as cash pledged as collateral and cash received as collateral, respectively. Non-cash collateral pledged by the Funds, if any, is noted in the Statements of Investments or Consolidated Statement of Investments.
Risk of Investing in Derivatives: The Funds’ use of derivatives can result in losses due to unanticipated changes in the market risk factors and the overall market. In instances where the Funds are using derivatives to decrease, or hedge, exposures to market risk factors for securities held by the Funds, there are also risks that those derivatives may not perform as expected resulting in losses for the combined or hedged positions.
Derivatives may have little or no initial cash investment relative to their market value exposure and therefore can produce significant gains or losses in excess of their cost. This use of embedded leverage allows the Funds to increase their market value exposure relative to their net assets and can substantially increase the volatility of the Funds’ performance.
Additional associated risks from investing in derivatives also exist and potentially could have significant effects on the valuation of the derivative and the Funds. Typically, the associated risks are not the risks that the Funds are attempting to increase or decrease exposure to, per their investment objectives, but are the additional risks from investing in derivatives.
Notes to Financial Statements
October 31, 2023
Examples of these associated risks are liquidity risk, which is the risk that the Funds will not be able to sell or close out the derivative in a timely manner, and counterparty credit risk, which is the risk that the counterparty will not fulfill its obligation to the Funds. In addition, use of derivatives may increase or decrease exposure to the following risk factors:
Equity Risk: Equity risk relates to the change in value of equity securities as they relate to increases or decreases in the general market. Associated risks can be different for each type of derivative and are discussed by each derivative type in the notes that follow.
Commodity Risk: Exposure to the commodities markets may subject the Funds to greater volatility than investments in traditional securities. Prices of various commodities may also be affected by factors, such as drought, floods, weather, livestock disease, embargoes, tariffs and other regulatory developments, which are unpredictable. The prices of commodities can also fluctuate widely due to supply and demand disruptions in major producing or consuming regions.
Foreign Currency Risk: Currency trading involves significant risks, including market risk, interest rate risk, country risk, counterparty credit risk and short sale risk. Market risk results from the price movement of foreign currency values in response to shifting market supply and demand. Interest rate risk arises whenever a country changes its stated interest rate target associated with its currency. Country risk arises because virtually every country has interfered with international transactions in its currency.
Interest Rate Risk: Interest rate risk is the risk that fixed income securities will decline in value because of changes in interest rates. As nominal interest rates rise, the value of fixed income securities held by the Funds are likely to decrease. Securities with longer durations tend to be more sensitive to changes in interest rates, and are usually more volatile than securities.
Swap Contracts: Each Fund may enter into swap transactions for hedging purposes or to seek to increase total return. At the present time, the CoreCommodity Fund primarily enters into swap transactions for the purpose of increasing total return. Swap agreements may be executed in a multilateral or other trade facility program, such as a registered exchange (“centrally cleared swaps”) or may be privately negotiated in the over-the counter market. The duration of a swap agreement typically ranges from a few weeks to more than one year. In a centrally cleared swap, immediately following execution of the swap agreement, the swap agreement is novated to a central counterparty (the “CCP”) and the Fund’s counterparty on the swap agreement becomes the CCP. Risks may arise as a result of the failure of the counterparty to the swap contract to comply with the terms of the swap contract. The loss incurred by the failure of a counterparty is generally limited to the net payment to be received by the Funds and/or the termination value at the end of the contract. Therefore, the Funds consider the creditworthiness of each counterparty to a contract in evaluating potential credit risk. Although centrally cleared swaps typically present less counterparty risk than non-centrally cleared swaps, a Fund that has entered into centrally cleared swaps is subject to the risk of the failure of the CCP.
Additionally, risks may arise from unanticipated movements in interest rates or in the value of the underlying reference asset or index. Entering into these agreements involves, to varying degrees, market risk, liquidity risk and elements of credit, legal and documentation risk that are not directly reflected in the amounts recognized in the Statements of Assets and Liabilities or Consolidated Statement of Assets and Liabilities.
The Funds may pay or receive cash as collateral on these contracts which may be recorded as an asset and/or liability. The Funds must set aside liquid assets, or engage in other appropriate measures, to cover its obligations under these contracts. Swaps are marked to market daily using either pricing vendor quotations, counterparty prices or model prices and the change in value, if any, is recorded as an unrealized gain or loss. Upfront payments made and/or received by the Funds are recorded as an asset and/or liability and realized gains or losses are recognized ratably over the contract’s term/event, with the exception of forward starting interest rate swaps, whose realized gains or losses are recognized ratably from the effective start date. Periodic payments received or made on swap contracts are recorded as realized gains or losses. Gains or losses are realized upon termination of a swap contract and are recorded on the Statement of Operations or Consolidated Statement of Operations.
Total return swaps are agreements in which there is an exchange of cash flows whereby one party commits to make payments based on the total return (coupons plus capital gains/losses) of an underlying instrument in exchange for fixed or floating rate interest payments. To the extent the total return of the instrument or index underlying the transaction exceeds or falls short of the offsetting interest rate obligation, the Funds will receive a payment from or make a payment to the counterparty. Credit default swaps are a type of swap agreement in which the protection “buyer” is generally obligated to pay the protection “seller” an upfront and/ or a periodic stream of payments over the term of the contract provided that no credit event, such as a default, on a reference obligation has occurred. Credit default swaps (“CDS”) are typically two-party financial contracts that transfer credit exposure between the two parties. Under a typical CDS, one party (the “seller”) receives pre-determined periodic payments from the other party (the “buyer”). The seller agrees to make compensating specific payments to the buyer if a negative credit event occurs, such as the bankruptcy or default by the issuer of the underlying debt instrument. Swap agreements held at October 31, 2023 are disclosed after the Statement of Investments or Consolidated Statement of Investments.
Notes to Financial Statements
October 31, 2023
The average notional amount of the swap positions held in the ALPS | CoreCommodity Management CompleteCommodities® Strategy Fund for the year ended October 31, 2023 was $1,246,268,590. Only the ALPS | CoreCommodity Management CompleteCommodities® Strategy Fund held swap positions as of October 31, 2023.
Futures: Each Fund may invest in futures contracts in accordance with their investment objectives. Each Fund does so for a variety of reasons including for cash management, hedging or non-hedging purposes in an attempt to achieve the Fund’s investment objective. A futures contract provides for the future sale by one party and purchase by another party of a specified quantity of the security or other financial instrument at a specified price and time. A futures contract on an index is an agreement pursuant to which two parties agree to take or make delivery of an amount of cash equal to the difference between the value of the index at the close of the last trading day of the contract and the price at which the index contract was originally written. Futures transactions may result in losses in excess of the amount invested in the futures contract. There can be no guarantee that there will be a correlation between price movements in the hedging vehicle and in the portfolio securities being hedged. An incorrect correlation could result in a loss on both the hedged securities in a Fund and the hedging vehicle so that the portfolio return might have been greater had hedging not been attempted. There can be no assurance that a liquid market will exist at a time when a Fund seeks to close out a futures contract or a futures option position. Lack of a liquid market for any reason may prevent a Fund from liquidating an unfavorable position, and the Fund would remain obligated to meet margin requirements until the position is closed. In addition, a Fund could be exposed to risk if the counterparties to the contracts are unable to meet the terms of their contracts. With exchange traded futures, there is minimal counterparty credit risk to the Funds since futures are exchange traded and the exchange’s clearinghouse, as counterparty to all exchange traded futures, guarantees the futures against default. When a purchase or sale of a futures contract is made by a Fund, the Fund is required to deposit with its custodian (or broker, if legally permitted) a specified amount of liquid assets (“initial margin”). The margin required for a futures contract is set by the exchange on which the contract is traded and may be modified during the term of the contract. The initial margin is in the nature of a performance bond or good faith deposit on the futures contract that is returned to a Fund upon termination of the contract, assuming all contractual obligations have been satisfied. These amounts are included in Deposit with broker for futures contracts on the Statement of Assets and Liabilities. Each day a Fund may pay or receive cash, called “variation margin,” equal to the daily change in value of the futures contract. Such payments or receipts are recorded for financial statement purposes as unrealized gains or losses by a Fund. Variation margin does not represent a borrowing or loan by a Fund but is instead a settlement between a Fund and the broker of the amount one would owe the other if the futures contract expired. When the contract is closed, a Fund records a realized gain or loss equal to the difference between the value of the contract at the time it was opened and the value at the time it was closed.
The average value of futures contracts held in the ALPS | CoreCommodity Management CompleteCommodities® Strategy Fund for the year ended October 31, 2023 was $745,645,220 for long futures and $572,907,800 for short futures. Only the ALPS | CoreCommodity Management CompleteCommodities® Strategy Fund invested in futures contracts as of October 31, 2023.
Forward Foreign Currency Contracts: Each Fund may engage in currency transactions with counterparties to hedge the value of portfolio securities denominated in particular currencies against fluctuations in relative value, to gain or reduce exposure to certain currencies, or to generate income or gains. A forward foreign currency contract is an agreement between two parties to buy and sell a currency at a set price on a future date. The contract is marked-to-market daily and the change in value is recorded by the Fund as an unrealized gain or loss. When a forward foreign currency contract is extinguished, through delivery, the Fund records a realized gain or loss equal to the difference between the value of the contract at the time it was opened and the value of the contract at the time it was extinguished. The average value of forward foreign currency contracts held in the ALPS Global Opportunity Fund for the year ended October 31, 2023 was $2,105,720. Only the ALPS Global Opportunity Fund invested in forward foreign currency contracts as of October 31, 2023.
Option Contracts: Each Fund may enter into options transactions for hedging purposes and for non-hedging purposes such as seeking to enhance return. Each Fund may write covered put and call options on any stocks or stock indices, currencies traded on domestic and foreign securities exchanges, or futures contracts on stock indices, interest rates and currencies traded on domestic and, to the extent permitted by the CFTC, foreign exchanges. A call option on an asset written by a Fund obligates the Fund to sell the specified asset to the holder (purchaser) at a stated price (the exercise price) if the option is exercised before a specified date (the expiration date). A put option on an asset written by a Fund obligates the Fund to buy the specified asset from the purchaser at the exercise price if the option is exercised before the expiration date. Premiums received when writing options are recorded as liabilities and are subsequently adjusted to the current value of the options written. Premiums received from writing options that expire are treated as realized gains. Premiums received from writing options, which are either exercised or closed, are offset against the proceeds received or amount paid on the transaction to determine realized gains or losses which are recorded on the Statement of Operations or Consolidated Statement of Operations. As of October 31, 2023, the Funds were not invested in option contracts.
Notes to Financial Statements
October 31, 2023
Derivatives Instruments: The following tables disclose the amounts related to each Fund’s use of derivative instruments.
The effect of derivatives instruments on the Statement of Assets and Liabilities for the fiscal year ended October 31, 2023:
| Risk Exposure | | Asset Location | | Fair Value | | | Liability Location | | Fair Value | |
| ALPS | CoreCommodity Management CompleteCommodities® Strategy Fund(a) | | | | |
| Commodity Contracts (Futures Contracts) | | Unrealized appreciation on futures contracts(b) | | $ | 8,303,693 | | | Unrealized depreciation on futures contracts(b) | | $ | (39,290,903 | ) |
| Commodity Contracts (Total Return Swap Contracts) | | Unrealized appreciation on total return swap contracts | | | 28 | | | Unrealized depreciation on total return swap contracts | | | - | |
| Total | | | | $ | 8,303,721 | | | | | $ | (39,290,903 | ) |
| ALPS Global Opportunity Fund | | | | | | | | | | | | |
| Foreign Exchange Rate Contracts (Forward Foreign Currency Contracts) | | Unrealized appreciation on forward foreign currency contracts | | $ | 9,397 | | | Unrealized depreciation on forward foreign currency contracts | | $ | – | |
| Total | | | | $ | 9,397 | | | | | $ | – | |
| (a) | The ALPS | CoreCommodity Management CompleteCommodities® Strategy Fund consolidates the statements of assets and liabilities. |
| (b) | Represents cumulative appreciation (depreciation) of futures contracts as reported in the Consolidated Statement of Investments. Only the current day's net variation margin is reported within the Consolidated Statement of Assets and Liabilities. |
The effect of derivatives instruments on the Statements of Operations for the fiscal year ended October 31, 2023:
| Risk Exposure | | Statement of Operations Location | | Realized Gain/(Loss) on Derivatives Recognized in Income | | | Change in Unrealized Appreciation/(Depreciation) on Derivatives Recognized in Income | |
| ALPS | CoreCommodity Management CompleteCommodities® Strategy Fund(a) |
| Commodity Contracts (Futures Contracts) | | Net realized loss on futures contracts/ Net change in unrealized depreciation on futures contracts | | $ | (143,008,457 | ) | | $ | (55,582,291 | ) |
| Commodity Contracts (Total Return Swap Contracts) | | Net realized gain on total return swap contracts/ Net change in unrealized depreciation on total return swap contracts | | | 64,086,199 | | | | (70 | ) |
| Total | | | | $ | (78,922,258 | ) | | $ | (55,582,361 | ) |
| Risk Exposure | | Statement of Operations Location | | Realized Gain/(Loss) on Derivatives Recognized in Income | | | Change in Unrealized Appreciation/(Depreciation) on Derivatives Recognized in Income | |
| ALPS Global Opportunity Fund | | | | | | | | |
| Foreign Exchange Rate Contracts (Forward Foreign Currency Contracts) | | Net realized loss on forward foreign currency contracts/Net change in unrealized appreciation on forward foreign currency contracts | | | (144,349 | ) | | | 68,561 | |
| Total | | | | $ | (144,349 | ) | | $ | 68,561 | |
| (a) | The ALPS | CoreCommodity Management CompleteCommodities® Strategy Fund consolidates the statement of operations. |
Certain derivative contracts are executed under either standardized netting agreements or, for exchange-traded derivatives, the relevant contracts for a particular exchange which contain enforceable netting provisions. A derivative netting arrangement creates an enforceable right of set-off that
Notes to Financial Statements
October 31, 2023
becomes effective, and affects the realization of settlement on individual assets, liabilities and collateral amounts, only following a specified event of default or early termination. Default events may include the failure to make payments or deliver securities timely, material adverse changes in financial condition or insolvency, the breach of minimum regulatory capital requirements, or loss of license, charter or other legal authorization necessary to perform under the contract.
The following table presents financial instruments that are subject to enforceable netting arrangements or other similar agreements as of October 31, 2023:
Offsetting of Derivatives Asset
October 31, 2023
| | | | | | | | | | | | Gross Amounts Not Offset in the Statement of Assets and Liabilities | |
| | | Gross Amounts of Recognized Assets | | | Gross Amounts Offset in the Statement of Assets and Liabilities | | | Net Amounts Presented in the Statement of Assets and Liabilities | | | Financial Instruments | | | Cash Collateral Received(a) | | | Net Amount | |
| ALPS | CoreCommodity Management CompleteCommodities® Strategy Fund | | | | | | | | | | | | |
| Total Return Swap Contracts | | $ | 28 | | | $ | – | | | $ | 28 | | | $ | – | | | $ | – | | | $ | 28 | |
| Total | | $ | 28 | | | $ | – | | | $ | 28 | | | $ | – | | | $ | – | | | $ | 28 | |
| (a) | These amounts are limited to the derivative asset/liability balance and, accordingly, do not include excess collateral received/pledged. |
4. TAX BASIS INFORMATION
Tax Basis of Distributions to Shareholders: The character of distributions made during the year from net investment income or net realized gains may differ from its ultimate characterization for federal income tax purposes. Also, due to the timing of dividend distributions, the fiscal year in which amounts are distributed may differ from the fiscal year in which the income or realized gain were recorded by a Fund. The amounts and characteristics of tax basis distributions and composition of distributable earnings/ (accumulated losses) are finalized at fiscal year-end.
The tax character of distributions paid by the Funds for the fiscal year ended October 31, 2023 were as follows:
| Fund | | Ordinary Income | | | Long-Term Capital Gain | |
| ALPS | CoreCommodity Management CompleteCommodities® Strategy Fund | | $ | 112,863,610 | | | $ | – | |
| ALPS | Kotak India ESG Fund | | | – | | | | 5,472,501 | |
| ALPS Global Opportunity Fund | | | – | | | | – | |
| RiverFront Asset Allocation Growth & Income | | | 2,911,079 | | | | 3,245,128 | |
The tax character of distributions paid by the Funds for the fiscal year ended October 31, 2022 were as follows:
| Fund | | Ordinary Income | | | Long-Term Capital Gain | |
| ALPS | CoreCommodity Management CompleteCommodities® Strategy Fund | | $ | 221,283,857 | | | $ | – | |
| ALPS | Kotak India ESG Fund | | | 12,591,343 | | | | 7,883,495 | |
| ALPS Global Opportunity Fund | | | 17,420,756 | | | | 6,470,294 | |
| RiverFront Asset Allocation Growth & Income | | | 2,418,357 | | | | – | |
Notes to Financial Statements
October 31, 2023
Components of Distributable Earnings on a Tax Basis: At October 31, 2023, permanent differences in book and tax accounting were reclassified. These differences had no effect on net assets and were primarily attributed to differences in the treatment of commodity related controlled foreign corporations, net operating losses, and prior year tax return true ups.
For the fiscal year ended October 31, 2023, the following reclassifications, which had no impact on results of operations or net assets, were recorded to reflect tax character:
| Fund | | Paid-in Capital | | | Distributable earnings | |
| ALPS | CoreCommodity Management CompleteCommodities® Strategy Fund | | $ | (65,759,544 | ) | | $ | 65,759,544 | |
| ALPS | Kotak India ESG Fund | | | (830,692 | ) | | | 830,692 | |
| ALPS Global Opportunity Fund | | | (21,950 | ) | | | 21,950 | |
As of October 31, 2023, the components of distributable earnings on a tax basis were as follows:
| | | Undistributed net investment income | | | Accumulated net realized gain/(loss) on investments | | | Other cumulative effect of timing differences | | | Net unrealized appreciation/(depreciation) on investments | | | Total | |
| ALPS | CoreCommodity Management CompleteCommodities® Strategy Fund | | $ | 36,987,364 | | | $ | 6,309,874 | | | $ | – | | | $ | (34,228,343 | ) | | $ | 9,068,895 | |
| ALPS | Kotak India ESG Fund | | | – | | | | 13,459,098 | | | | – | | | | 39,781,514 | | | | 53,240,612 | |
| ALPS Global Opportunity Fund | | | 3,155,676 | | | | (686,384 | ) | | | – | | | | 3,285,272 | | | | 5,754,564 | |
| RiverFront Asset Allocation Growth & Income | | | 213,081 | | | | (898,244 | ) | | | – | | | | (1,271,169 | ) | | | (1,956,332 | ) |
Capital loss carryovers used during the year ended October 31, 2023 for ALPS | CoreCommodity Management CompleteCommodities® Strategy Fund were $40,368,737.
Capital Losses: Under current law, capital losses maintain their character as short-term or long-term and are carried forward to the next tax year without expiration. As of October 31, 2023 the following amounts are available as carry forwards to the next tax year:
| Fund | | Short-Term | | | Long-Term | |
| ALPS Global Opportunity Fund | | $ | 566,621 | | | $ | 119,763 | |
| RiverFront Asset Allocation Growth & Income | | | 178,911 | | | | 719,333 | |
Unrealized Appreciation and Depreciation on Investments: As of October 31, 2023, the costs of investments for federal income tax purposes and accumulated net unrealized appreciation/(depreciation) on investments were as follows:
| Fund | | Gross Appreciation (excess of value over tax cost) | | | Gross Depreciation (excess of tax cost over value) | | | Net Appreciation/(Depreciation) of Foreign Currency | | | Net Unrealized Appreciation/ (Depreciation) | | | Cost of Investments for Income Tax Purposes | |
| ALPS | CoreCommodity Management CompleteCommodities® Strategy Fund | | $ | 1,233,998,876 | | | $ | (1,268,219,636 | ) | | $ | (7,583 | ) | | $ | (34,228,343 | ) | | $ | 1,664,325,742 | |
| ALPS | Kotak India ESG Fund | | | 59,580,750 | | | | (19,096,075 | )* | | | (703,161 | ) | | | 39,781,514 | | | | 259,855,066 | |
| ALPS Global Opportunity Fund | | | 5,227,644 | | | | (1,926,083 | ) | | | (16,289 | ) | | | 3,285,272 | | | | 47,736,881 | |
| RiverFront Asset Allocation Growth & Income | | | 4,190,024 | | | | (5,577,316 | ) | | | 116,123 | | | | (1,271,169 | ) | | | 75,429,239 | |
| * | Net of foreign capital gains tax accrual of $8,752,951. |
The differences between book cost and tax cost of investments and unrealized appreciation/depreciation are primarily attributed to the tax deferral of losses on wash sales, passive foreign investment companies (PFICs), and C-corp basis adjustments.
Notes to Financial Statements
October 31, 2023
5. SECURITIES TRANSACTIONS
Purchases and sales of securities, excluding short-term securities and U.S. Government Obligations during the fiscal year ended October 31, 2023 were as follows:
| Fund | | Purchases of Securities | | | Proceeds from Sales of Securities | |
| ALPS | CoreCommodity Management CompleteCommodities® Strategy Fund(a) | | $ | 344,362,953 | | | $ | 392,968,684 | |
| ALPS | Kotak India ESG Fund | | | 84,133,843 | | | | 155,257,590 | |
| ALPS Global Opportunity Fund | | | 11,394,569 | | | | 26,316,807 | |
| RiverFront Asset Allocation Growth & Income | | | 10,463,574 | | | | 26,959,234 | |
Purchases and sales of U.S. Government Obligations during the fiscal year ended October 31, 2023 were as follows:
| Fund | | Purchases of Securities | | | Proceeds from Sales of Securities | |
| ALPS | CoreCommodity Management CompleteCommodities® Strategy Fund(a) | | $ | 434,537,964 | | | $ | 123,172,140 | |
| (a) | Purchases and sales for ALPS | CoreCommodity Management CompleteCommodities® Strategy Fund are consolidated and include the balances of CoreCommodity Management Cayman Commodity Fund, Ltd. (wholly owned subsidiary). |
6. BENEFICIAL INTEREST TRANSACTIONS
Shares redeemed within 30 days of purchase for ALPS | Kotak India ESG Fund may incur a 2% short-term redemption fee deducted from the redemption amount.
For the fiscal year ended October 31, 2023, the amounts listed below were retained by the Funds. These amounts are reflected in “Shares redeemed” in the Statements of Changes in Net Assets.
| | | Redemption Fee Retained | |
| Fund | | For the
Year Ended
October 31, 2023 | | | For the
Year Ended
October 31, 2022 | |
| ALPS | Kotak India ESG Fund - Investor Class | | $ | 1,876 | | | $ | 752 | |
| ALPS | Kotak India ESG Fund - Class A | | | 146 | | | | – | |
| ALPS | Kotak India ESG Fund - Class I | | | 485 | | | | 797 | |
Notes to Financial Statements
October 31, 2023
Transactions in shares of capital stock were as follows:
| | | ALPS | CoreCommodity Management CompleteCommodities® Strategy Fund | |
| | | For the
Year Ended
October 31, 2023 | | | For the
Year Ended
October 31, 2022 | |
| Investor Class | | | | | | | | |
| Shares sold | | | 3,219,600 | | | | 4,705,184 | |
| Dividends reinvested | | | 585,497 | | | | 1,989,014 | |
| Shares redeemed | | | (11,437,658 | ) | | | (5,500,570 | ) |
| Net increase/(decrease) in shares outstanding | | | (7,632,561 | ) | | | 1,193,628 | |
| Class A | | | | | | | | |
| Shares sold | | | 280,034 | | | | 1,235,120 | |
| Dividends reinvested | | | 92,468 | | | | 117,775 | |
| Shares redeemed | | | (778,344 | ) | | | (209,539 | ) |
| Net increase/(decrease) in shares outstanding | | | (405,842 | ) | | | 1,143,356 | |
| Class C | | | | | | | | |
| Shares sold | | | 475,768 | | | | 2,350,237 | |
| Dividends reinvested | | | 135,991 | | | | 207,281 | |
| Shares redeemed | | | (1,561,645 | ) | | | (530,046 | ) |
| Net increase/(decrease) in shares outstanding | | | (949,886 | ) | | | 2,027,472 | |
| Class I | | | | | | | | |
| Shares sold | | | 129,590,732 | | | | 126,922,726 | |
| Dividends reinvested | | | 8,962,188 | | | | 18,932,794 | |
| Shares redeemed | | | (116,512,020 | ) | | | (78,421,798 | ) |
| Net increase in shares outstanding | | | 22,040,900 | | | | 67,433,722 | |
| | | ALPS | Kotak India ESG Fund | |
| | | For the
Year Ended
October 31, 2023 | | | For the
Year Ended
October 31, 2022 | |
| Investor Class | | | | | | | | |
| Shares sold | | | 104,836 | | | | 75,932 | |
| Dividends reinvested | | | 3,076 | | | | 10,090 | |
| Shares redeemed | | | (61,422 | ) | | | (54,831 | ) |
| Net increase in shares outstanding | | | 46,490 | | | | 31,191 | |
| Class A | | | | | | | | |
| Shares sold | | | 41,233 | | | | 18,193 | |
| Dividends reinvested | | | 792 | | | | 2,238 | |
| Shares redeemed | | | (3,815 | ) | | | (7,553 | ) |
| Net increase in shares outstanding | | | 38,210 | | | | 12,878 | |
| Class C | | | | | | | | |
| Shares sold | | | 34,717 | | | | 767 | |
| Dividends reinvested | | | 1,194 | | | | 5,515 | |
| Shares redeemed | | | (27,529 | ) | | | (25,379 | ) |
| Net increase/(decrease) in shares outstanding | | | 8,382 | | | | (19,097 | ) |
| Class I | | | | | | | | |
| Shares sold | | | 627,523 | | | | 249,038 | |
| Dividends reinvested | | | 14,083 | | | | 43,484 | |
| Shares redeemed | | | (185,614 | ) | | | (167,032 | ) |
| Net increase in shares outstanding | | | 455,992 | | | | 125,490 | |
| Class II | | | | | | | | |
| Shares sold | | | 572,864 | | | | – | |
| Dividends reinvested | | | 308,477 | | | | 1,057,027 | |
| Shares redeemed | | | (4,281,312 | ) | | | – | |
| Net increase/(decrease) in shares outstanding | | | (3,399,971 | ) | | | 1,057,027 | |
Notes to Financial Statements
October 31, 2023
| | | ALPS Global Opportunity Fund | |
| | | For the
Year Ended
October 31, 2023 | | | For the
Year Ended
October 31, 2022 | |
| Investor Class | | | | | | | | |
| Shares sold | | | 33,762 | | | | 154,271 | |
| Dividends reinvested | | | – | | | | 498,091 | |
| Shares redeemed | | | (388,202 | ) | | | (870,220 | ) |
| Net decrease in shares outstanding | | | (354,440 | ) | | | (217,858 | ) |
| Class A | | | | | | | | |
| Shares sold | | | 369,287 | | | | 469,037 | |
| Dividends reinvested | | | – | | | | 105,175 | |
| Shares redeemed | | | (341,974 | ) | | | (90,819 | ) |
| Net increase in shares outstanding | | | 27,313 | | | | 483,393 | |
| Class C | | | | | | | | |
| Shares sold | | | – | | | | 21,208 | |
| Dividends reinvested | | | – | | | | 312,287 | |
| Shares redeemed | | | (578,422 | ) | | | (600,094 | ) |
| Net decrease in shares outstanding | | | (578,422 | ) | | | (266,599 | ) |
| Class I | | | | | | | | |
| Shares sold | | | 1,373,891 | | | | 1,295,966 | |
| Dividends reinvested | | | – | | | | 1,736,545 | |
| Shares redeemed | | | (3,129,198 | ) | | | (3,311,639 | ) |
| Net decrease in shares outstanding | | | (1,755,307 | ) | | | (279,128 | ) |
| Class R | | | | | | | | |
| Shares sold | | | 72,272 | | | | 69,028 | |
| Dividends reinvested | | | – | | | | 339,977 | |
| Shares redeemed | | | (207,229 | ) | | | (244,082 | ) |
| Net increase/(decrease) in shares outstanding | | | (134,957 | ) | | | 164,923 | |
Notes to Financial Statements
October 31, 2023
| | | RiverFront Asset Allocation Growth & Income | |
| | | For the
Year Ended
October 31, 2023 | | | For the
Year Ended
October 31, 2022 | |
| Investor Class | | | | | | | | |
| Shares sold | | | 6,399 | | | | 1,433 | |
| Dividends reinvested | | | 53,811 | | | | 18,511 | |
| Shares redeemed | | | (173,157 | ) | | | (204,822 | ) |
| Acquisition (Note 10) | | | – | | | | 478,017 | |
| Net increase/(decrease) in shares outstanding | | | (112,947 | ) | | | 293,139 | |
| Class A | | | | | | | | |
| Shares sold | | | 305,675 | | | | 430,952 | |
| Dividends reinvested | | | 115,455 | | | | 32,350 | |
| Shares redeemed | | | (347,816 | ) | | | (216,376 | ) |
| Acquisition (Note 10) | | | – | | | | 895,264 | |
| Net increase in shares outstanding | | | 73,314 | | | | 1,142,190 | |
| Class C | | | | | | | | |
| Shares sold | | | 17,634 | | | | 50,107 | |
| Dividends reinvested | | | 66,638 | | | | 23,041 | |
| Shares redeemed | | | (610,193 | ) | | | (632,037 | ) |
| Acquisition (Note 10) | | | – | | | | 927,668 | |
| Net increase/(decrease) in shares outstanding | | | (525,921 | ) | | | 368,779 | |
| Class I | | | | | | | | |
| Shares sold | | | 255,047 | | | | 470,646 | |
| Dividends reinvested | | | 275,802 | | | | 110,769 | |
| Shares redeemed | | | (1,067,572 | ) | | | (2,124,553 | ) |
| Acquisition (Note 10) | | | – | | | | 2,741,648 | |
| Net increase/(decrease) in shares outstanding | | | (536,723 | ) | | | 1,198,510 | |
7. AFFILIATED COMPANIES
Funds may invest in certain securities that are considered securities issued by affiliated companies. As defined by the Investment Company Act of 1940, an affiliated person, including an affiliated company, is one in which a Fund owns 5% or more of the outstanding voting securities, or a company which is under common ownership or control with the Fund. The purchases, sales, dividend income, realized gains or losses, change in unrealized gains or losses, shares and value of investments in affiliated companies for RiverFront Asset Allocation Growth & Income for the year ended October 31, 2023 were as follows:
| Security Name | | Market Value as of October 31, 2022 | | | Purchases | | | Sales | | | Market Value as of October 31, 2023 | | | Share Balance as of October 31, 2023 | | | Dividends | | | Change in Unrealized Gain (Loss) | | | Realized Gain/Loss | |
| RiverFront Dynamic Core Income ETF | | $ | 6,509,874 | | | $ | – | | | $ | (1,363,827 | ) | | $ | 5,034,204 | | | | 238,485 | | | $ | 194,504 | | | $ | (11,972 | ) | | $ | (99,871 | ) |
| Riverfront Strategic Income Fund | | | 3,034,538 | | | | – | | | | (641,003 | ) | | | 2,353,789 | | | | 107,873 | | | | 89,837 | | | | 12,848 | | | | (52,594 | ) |
| First Trust RiverFront Dynamic Developed International ETF | | | 11,883,550 | | | | – | | | | (2,907,406 | ) | | | 10,198,579 | | | | 189,741 | | | | 386,106 | | | | 1,491,992 | | | | (269,557 | ) |
| First Trust RiverFront Dynamic Emerging Markets ETF | | | 2,969,977 | | | | – | | | | (696,154 | ) | | | 2,592,781 | | | | 49,490 | | | | 150,309 | | | | 392,566 | | | | (73,608 | ) |
| RiverFront Dynamic US Dividend Advantage ETF | | | 17,787,732 | | | | – | | | | (3,722,267 | ) | | | 14,234,833 | | | | 333,674 | | | | 452,226 | | | | (978,729 | ) | | | 1,148,097 | |
| ALPS Active Equity Opportunity ETF* | | | 5,294,793 | | | | – | | | | (1,117,070 | ) | | | 4,347,880 | | | | 103,970 | | | | 78,663 | | | | 198,239 | | | | (28,082 | ) |
| | | $ | 47,480,464 | | | $ | – | | | $ | (10,447,727 | ) | | $ | 38,762,066 | | | | | | | $ | 1,351,645 | | | $ | 1,104,944 | | | $ | 624,385 | |
| * | formerly RiverFront Dynamic US Flex-Cap ETF |
Notes to Financial Statements
October 31, 2023
8. MANAGEMENT AND RELATED-PARTY TRANSACTIONS
ALPS Advisors, Inc. (“AAI”) acts as the Funds’ investment adviser. AAI is an indirect wholly owned subsidiary of DST Systems, Inc. (“DST”). DST is a wholly-owned subsidiary of SS&C Technologies Holdings, Inc. (“SS&C”), a publicly traded company listed on the NASDAQ Global Select Market.
AAI has delegated daily management of the Funds listed below to the corresponding Sub-Advisor(s) listed in the table below. Each Sub-Advisor manages the investments of each Fund in accordance with its investment objective, policies and limitations and investment guidelines established jointly by AAI and the Board.
| Fund | Sub-Advisor(s) |
| ALPS | CoreCommodity Management CompleteCommodities® Strategy Fund | CoreCommodity Management, LLC |
| ALPS | Kotak India ESG Fund | Kotak Mahindra Asset Management (Singapore) Pte. Ltd |
| ALPS Global Opportunity Fund | Red Rocks Capital, LLC(a) |
| RiverFront Asset Allocation Growth & Income | RiverFront Investment Group, LLC |
| (a) | Red Rocks Capital, LLC was acquired by AAI on January 3, 2023 and after this date AAI no longer employed a sub-advisor for the ALPS Global Opportunity Fund. |
Pursuant to the Investment Advisory Agreement (the “Advisory Agreement”), the Funds listed below pay AAI an annual management fee which is based on each Fund’s average daily net assets. The management fee is paid on a monthly basis. The following table reflects the Funds’ contractual management fee rates (expressed as an annual rate).
| Fund | Contractual Management Fee |
| ALPS | CoreCommodity Management CompleteCommodities® Strategy Fund | 0.85% |
| ALPS | Kotak India ESG Fund | 0.65% |
| ALPS Global Opportunity Fund | 0.85% |
Pursuant to the Administrative Services Agreement, the RiverFront Asset Allocation Growth & Income pays an annual unitary administrative fee which is based on each Fund’s average daily net assets. The unitary administrative fee is paid on a monthly basis. The following table reflects the Fund's contractual unitary administrative fee rate (expressed as an annual rate).
| Fund | Contractual Unitary Fee |
| RiverFront Asset Allocation Growth & Income | 0.25% |
Pursuant to an Investment Sub-Advisory Agreement, AAI pays the Sub-Advisors of the Funds listed below an annual sub-advisory management fee which is based on each Fund’s average daily assets. AAI is required to pay all fees due to each Sub-Advisor out of the management fee AAI receives from each Fund listed below. The following table reflects the Funds’ contractual sub-advisory fee rates.
| Fund | Average Daily Net Assets
of the Fund | Contractual Sub-Advisory Fee |
| ALPS | CoreCommodity Management CompleteCommodities® Strategy Fund | All Asset Levels | 0.75% |
| ALPS | Kotak India ESG Fund | All Asset Levels | 0.56% |
| ALPS | Global Opportunity Fund* | All Asset Levels | 0.57% |
| * | Red Rocks Capital, LLC was acquired by AAI on January 3, 2023 and after this date AAI no longer employed a sub-advisor for the ALPS Global Opportunity Fund. |
ALPS | CoreCommodity Management CompleteCommodities® Strategy Fund
AAI and CoreCommodity Management LLC have contractually agreed to limit the amount of the Fund’s total annual expenses, exclusive of distribution and service (12b-1) fees, shareholder services fees, acquired fund fees and expenses, brokerage commissions, interest expense, taxes and extraordinary expenses that exceed the following annual rates below.
Notes to Financial Statements
October 31, 2023
ALPS | Kotak India ESG Fund
AAI and Kotak Mahindra Asset Management (Singapore) Pte. Ltd. have contractually agreed to limit the amount of the Fund’s total annual expenses, exclusive of distribution and service (12b-1) fees, shareholder services fees, acquired fund fees and expenses, brokerage expenses, interest expenses, taxes and extraordinary expenses that exceed the following annual rates below.
ALPS Global Opportunity Fund
AAI has contractually agreed to limit the amount of the Fund’s total annual expenses, exclusive of distribution and service (12b-1) fees, acquired fund fees and expenses, shareholder service fees, brokerage expenses, interest expense, taxes and extraordinary expenses that exceed the following annual rates below.
These agreements are reevaluated on an annual basis. Expense limitation ratios from the current agreements are listed below. Fees waived or reimbursed for the fiscal year ended October 31, 2023 are disclosed on the Statement of Operations or Consolidated Statement of Operations.
| Fund* | Investor Class | Class A | Class C | Class I | Class II | Class R |
| ALPS | CoreCommodity Management CompleteCommodities® Strategy Fund | 1.05% | 1.05% | 1.05% | 1.15% | N/A | N/A |
| ALPS | Kotak India ESG Fund | 1.00% | 1.00% | 1.00% | 1.00% | 0.75% | N/A |
| ALPS Global Opportunity Fund | 1.25% | 1.25% | 1.25% | 1.25% | N/A | 1.25% |
| * | See each Fund’s Performance Update section for Expense Limitation agreement expiration dates |
AAI and each Sub-Advisor are permitted to recover expenses they have waived or reimbursed, on a class-by-class basis, through the agreements described above to the extent that expenses in later periods fall below the annual limits set forth in these agreements. The ALPS | CoreCommodity Management CompleteCommodities® Strategy Fund, ALPS | Kotak India ESG Fund, and ALPS Global Opportunity Fund are not obligated to pay any deferred fees and expenses more than thirty-six months after the date on which the fees were waived or expenses were deferred, as calculated on a monthly basis. As of the fiscal year ended October 31, 2023, the Advisor and Sub-Advisor(s) may seek reimbursement of previously waived and reimbursed fees as follows:
| Fund | | Expires 10/31/2024 | | | Expires 10/31/2025 | | | Expires 10/31/2026 | | | Total | |
| ALPS | CoreCommodity Management CompleteCommodities® Strategy Fund - Investor Class | | $ | N/A | | | $ | N/A | | | $ | N/A | | | $ | N/A | |
| ALPS | CoreCommodity Management CompleteCommodities® Strategy Fund - Class A | | | N/A | | | | N/A | | | | N/A | | | | N/A | |
| ALPS | CoreCommodity Management CompleteCommodities® Strategy Fund - Class C | | | N/A | | | | N/A | | | | N/A | | | | N/A | |
| ALPS | CoreCommodity Management CompleteCommodities® Strategy Fund - Class I | | | N/A | | | | N/A | | | | 210,903 | | | | 210,903 | |
| | | | | | | | | | | | | | | | | |
| ALPS | Kotak India ESG Fund - Investor Class | | | 28 | | | | N/A | | | | N/A | | | | 28 | |
| ALPS | Kotak India ESG Fund - Class A | | | N/A | | | | N/A | | | | N/A | | | | N/A | |
| ALPS | Kotak India ESG Fund - Class C | | | 67 | | | | N/A | | | | N/A | | | | 67 | |
| ALPS | Kotak India ESG Fund - Class I | | | 641 | | | | N/A | | | | N/A | | | | 641 | |
| ALPS | Kotak India ESG Fund - Class II | | | 465,777 | | | | 441,782 | | | | 431,570 | | | | 1,339,129 | |
| | | | | | | | | | | | | | | | | |
| ALPS Global Opportunity Fund - Investor Class | | | N/A | | | | N/A | | | | 423 | | | | 423 | |
| ALPS Global Opportunity Fund - Class A | | | N/A | | | | N/A | | | | 181 | | | | 181 | |
| ALPS Global Opportunity Fund - Class C | | | N/A | | | | N/A | | | | 2,450 | | | | 2,450 | |
| ALPS Global Opportunity Fund - Class I | | | N/A | | | | N/A | | | | 21,039 | | | | 21,039 | |
| ALPS Global Opportunity Fund - Class R | | | N/A | | | | N/A | | | | 535 | | | | 535 | |
The CoreCommodity Management Cayman Commodity Fund Ltd. (the “Subsidiary”) has entered into a separate advisory agreement (the “Subsidiary Advisory Agreement”) with CoreCommodity Management, LLC for the management of the Subsidiary’s portfolio pursuant to which the Subsidiary is obligated to pay the CoreCommodity Management, LLC a management fee at the same rate that the Fund pays AAI for investment advisory services provided to the Funds. CoreCommodity Management, LLC has agreed to waive the advisory fee it receives from the Fund in an amount equal to the
Notes to Financial Statements
October 31, 2023
management fee paid by the Subsidiary. This agreement may be terminated based on the terms of the Subsidiary Advisory Agreement. For the year ended October 31, 2023, this amount equaled $3,251,416 and is disclosed in the Consolidated Statement of Operations. These waivers are not subject to reimbursement/recoupment.
ALPS | Kotak India ESG Fund recouped $26,739 of expenses during the year ended October 31, 2023.
RiverFront Asset Allocation Growth & Income does not pay a management fee or have a contractual limitation with respect to the amount of its annual total operating expenses.
Kotak Mahindra Asset Management (Singapore) Pte. Ltd. executed purchase and sale trades in the ALPS | Kotak India ESG Fund with the sub-adviser’s affiliated broker-dealer, Kotak Securities, (the “affiliate broker”). Fund commissions paid to the affiliate broker were $28,279 during the year ended October 31, 2023.
ALPS Portfolio Solutions Distributor, Inc. (the “Distributor”) acts as the distributor of the Funds’ shares pursuant to a Distribution Agreement with the Trust. Shares are sold on a continuous basis by the Distributor, as agent for the Funds, and the Distributor has agreed to use its best efforts to solicit orders for the sale of Funds’ shares, although it is not obliged to sell any particular amount of shares. The Distributor is not entitled to any compensation for its services. The Distributor is registered as a broker -dealer with the Securities and Exchange Commission.
Distribution and Services (12b-1) Plans
Each Fund has adopted Distribution and Services Plans (the “Plans”) pursuant to Rule 12b-1 of the 1940 Act for its Investor Class, Class A, Class C and Class R (ALPS Global Opportunity Fund only) and shares. The Plans allow a Fund to use Investor Class, Class A, Class C, and Class R assets to pay fees in connection with the distribution and marketing of Investor Class, Class A, Class C, and Class R shares and/or the provision of shareholder services to Investor Class, Class A, Class C and Class R shareholders. The Plans permit payment for services in connection with the administration of plans or programs that use Investor Class, Class A, Class C, and Class R shares of a Fund, if any, as their funding medium and for related expenses. The Plans permit a Fund to make total payments at an annual rate of up to 0.25% of a Fund’s average daily net assets attributable to its Investor Class and Class A shares, 0.75% of a Fund’s average daily net assets attributable to its Class C shares and 0.50% of the ALPS Global Opportunity Fund’s average daily net assets attributable to its Class R shares.
Under the terms of the Plans, the Trust is authorized to make payments to the Distributor for remittance to financial intermediaries, as compensation for distribution and/or shareholder ongoing services performed by such entities for beneficial shareholders of the Fund. The Distributor is entitled to retain some or all fees payable under the Plans in certain circumstances, including when there is no broker of record or when certain qualification standards have not been met by the broker of record.
Shareholder Services Plans
Each Fund has adopted a shareholder services plan with respect to their Investor Class shares (the “Investor Class Shareholder Services Plan”). Under the Investor Class Shareholder Services Plan, the Funds are authorized to compensate certain financial intermediaries, including broker dealers and Fund affiliates (“Participating Organizations”), an aggregate fee in an amount not to exceed on an annual basis 0.15% of the average daily net asset value of Investor Class shares of the Funds attributable to or held in the name of the Participating Organizations pursuant to an agreement with a such Participating Organizations (the “Agreement”). Each Agreement will set forth the non-distribution related shareholder services to be performed by the Participating Organizations for the benefit of a Fund’s shareholders who have elected to have such Participating Organizations service their accounts. Any amount of such payment not paid to Participating Organizations during a Fund’s fiscal year for such service activities shall be reimbursed to the Fund as soon as practicable. Shareholder Services Plan fees are included with distribution and service fees in the Statements of Operations. Investor Class Shareholder Services Plan fees recaptured pursuant to the Services Plan for the year ended October 31, 2023 are included as an offset to distribution and service fees as disclosed in the Statements of Operations or Consolidated Statement of Operations.
The Funds has adopted a shareholder services plan with respect to their Class A shares (the “Class A Shareholder Services Plan”). Under the Class A Shareholder Services Plan, the Funds are authorized to compensate certain financial intermediaries, including broker dealers and Fund affiliates, an aggregate fee in an amount not to exceed on an annual basis 0.15% of the average daily net asset value of Class A shares of the Funds attributable to or held in the name of the Participating Organizations pursuant to an agreement with a such Participating Organizations. Each Agreement will set forth the non-distribution related shareholder services to be performed by the Participating Organizations for the benefit of a Fund’s shareholders who have elected to have such Participating Organizations service their accounts. Any amount of such payment not paid to Participating Organizations during a Fund’s fiscal year for such service activities shall be reimbursed to the Fund as soon as practicable. Shareholder Services Plan fees are included with distribution and service fees in the Statements of Operations. Class A Shareholder Services Plan fees recaptured pursuant to the Services Plan for the year ended October 31, 2023 are included as an offset to distribution and service fees as disclosed in the Statements of Operations or Consolidated Statement of Operations.
Notes to Financial Statements
October 31, 2023
The Funds have adopted a shareholder services plan with respect to their Class C shares (the “Class C Shareholder Services Plan”). Under the Class C Shareholder Services Plan, the Funds are authorized to pay banks and their affiliates and other institutions, including broker-dealers and Fund affiliates (“Participating Organizations”), an aggregate fee in an amount not to exceed on an annual basis 0.25% for Class C shares of the average daily net asset value of the Class C shares attributable to or held in the name of a Participating Organization for its clients as compensation for providing shareholder service activities, which do not include distribution services, pursuant to an agreement with a Participating Organization. Any amount of such payment not paid to Participating Organizations during a Fund’s fiscal year for such service activities shall be reimbursed to the Fund as soon as practicable after the end of the fiscal year. Class C Shareholder Services Plan fees are included with distribution and service fees on the Statements of Operations or Consolidated Statement of Operations.
Certain intermediaries may charge networking, omnibus account or other administrative fees with respect to transactions in shares of each Fund. Transactions may be processed through the National Securities Clearing Corporation or similar systems or processed on a manual basis. These fees generally are paid by the Fund to the Distributor, which uses such fees to reimburse intermediaries. In the event an intermediary receiving payments from the Distributor on behalf of the Fund converts from a networking structure to an omnibus account structure or otherwise experiences increased costs, fees borne by the Fund may increase. Networking fees are shown in the Statements of Operations or Consolidated Statement of Operations, if applicable to the Funds.
ALPS Fund Services, Inc. (“ALPS”) serves as administrator to the Funds and the Funds have agreed to pay expenses incurred in connection with their administrative activities. Pursuant to an Administrative Agreement, ALPS provides operational services to the Funds including, but not limited to, fund accounting and fund administration and generally assists in the Funds’ operations. Officers of the Trust are employees of ALPS. The Funds’ administration fee is accrued on a daily basis and paid monthly. Administrative fees paid by the Funds for the fiscal year ended October 31, 2023 are disclosed in the Statements of Operations or Consolidated Statement of Operations.
ALPS is reimbursed by the Funds for certain out-of-pocket expenses.
Transfer Agent
ALPS serves as transfer, dividend paying and shareholder servicing agent for the Funds. ALPS receives an annual minimum fee, a fee based upon the number of shareholder accounts, and is also reimbursed by the Funds for certain out-of-pocket expenses. Transfer agent fees paid by the Funds for the fiscal year ended October 31, 2023, are disclosed in the Statements of Operations or Consolidated Statement of Operations.
Trustees
The fees and expenses of the independent trustees of the Board are presented in the Statements of Operations or Consolidated Statement of Operations.
9. INDEMNIFICATIONS
Under the Trust’s organizational documents, its officers and Trustees are indemnified against certain liability arising out of the performance of their duties to the Trust. Additionally, in the normal course of business, the Trust enters into contracts with service providers that may contain general indemnification clauses which may permit indemnification to the extent permissible under applicable law. The Trust’s maximum exposure under these arrangements is unknown, as this would involve future claims that may be made against the Trust that have not yet occurred.
10. FUND REORGANIZATION
At a regular meeting of the Board of Trustees held on September 29, 2021, the Trustees of RiverFront Asset Allocation Aggressive and RiverFront Asset Allocation Moderate (the “Acquired Funds”), a former series of the Trust, approved the reorganization, pursuant to an Agreement and Plan of Reorganization (the “Plan”), of the Acquired Funds into the RiverFront Asset Allocation Growth & Income (“Acquiring Fund”). For accounting and financial reporting purposes, the Acquiring Fund is the accounting survivor and as a result, the financial statements and financial highlights do not reflect the operations of the Acquired Funds.
The purpose of the Reorganization was to combine three funds with substantially identical investment objectives and similar principal investment strategies and policies.
Following the completion of the reorganization on January 24, 2022, and pursuant to the terms of the Plan, shareholders of the Acquired Funds became shareholders of the Acquiring Fund and received their respective class shares. Revenue Code of 1986, as amended (the “Code”) for U.S. federal income tax purposes. The Acquired Fund's securities were recorded at fair value, however, the cost basis of the investments received from the Aggressive Fund and Moderate Fund were carried forward to align ongoing reporting of the Growth & Income Fund’s realized and unrealized gains and losses with amounts distributable for tax purposes.
Notes to Financial Statements
October 31, 2023
As of the close of business on January 21, 2022, assets of the Acquired Funds were acquired by the Acquiring Fund in exchange for shares of the Acquiring Fund and the assumption by the Acquiring Fund of the liabilities of the Acquired Funds. On the Reorganization date, the Acquiring Fund and the Acquired Funds reported the following financial information:
| Acquiring Fund | | Shares Outstanding of Acquiring Fund | | | Net Assets of Acquiring Fund | | | Acquired Fund | | Acquired Fund Shares Exchanged | | | Net Assets of Acquired Fund Exchanged | |
| Growth & Income | | | 4,423,781 | | | $ | 61,761,680 | | | Aggressive Fund | | | 1,704,592 | | | $ | 24,687,921 | |
| Acquiring Fund | | Shares Outstanding of Acquiring Fund | | | Net Assets of Acquiring Fund | | | Acquired Fund | | Acquired Fund Shares Exchanged | | | Net Assets of Acquired Fund Exchanged | |
| Growth & Income | | | 4,423,781 | | | $ | 61,761,680 | | | Moderate Fund | | | 3,908,462 | | | $ | 45,690,615 | |
The investment portfolio value and unrealized appreciation/(depreciation) as of the Reorganization Date of the Acquired Fund was as follows:
| Acquired Fund | | Portfolio Value | | | Unrealized Appreciation of Acquired Fund | |
| Aggressive Fund | | $ | 24,684,519 | | | $ | 6,067,004 | |
| Acquired Fund | | Portfolio Value | | | Unrealized Appreciation of Acquired Fund | |
| Moderate Fund | | $ | 45,660,335 | | | $ | 7,174,726 | |
Immediately following the Reorganizations the net assets of the Riverfront Asset Allocation Growth & Income was $132,134,117
As a result of the Reorganization, 5,042,597 Shares were issued in the Riverfront Asset Allocation Growth & Income.
11. SUBSEQUENT EVENTS
Subsequent events after the date of the Statements of Assets and Liabilities or Consolidated Statement of Assets and Liabilities have been evaluated through the date the financial statements were issued. Management has determined that there were no subsequent events to report through the issuance of these financial statements.
Report of Independent Registered Public Accounting Firm
To the Shareholders and Board of Trustees of Financial Investors Trust
Opinion on the Financial Statements
We have audited the accompanying consolidated statement of assets and liabilities, including the consolidated statement of investments, of ALPS | CoreCommodity Management CompleteCommodities Strategy Fund, and the statements of assets and liabilities, including the statements of investments, of ALPS | Kotak India ESG Fund, ALPS Global Opportunity Fund (formerly ALPS | Red Rocks Global Opportunity Fund), and RiverFront Asset Allocation Growth & Income (the “Funds”), each a series of Financial Investors Trust, as of October 31, 2023, and the related consolidated statement of operations for the year then ended, and the consolidated statements of changes in net assets, the related notes, and the consolidated financial highlights for each of the two years in the period then ended, of ALPS | CoreCommodity Management CompleteCommodities Strategy Fund, and the related statements of operations for the year then ended, and the statements of changes in net assets, the related notes, and the financial highlights for each of the two years in the period then ended, of ALPS | Kotak India ESG Fund, ALPS Global Opportunity Fund (formerly ALPS | Red Rocks Global Opportunity Fund), and RiverFront Asset Allocation Growth & Income (collectively referred to as the “financial statements”). In our opinion, the financial statements present fairly, in all material respects, the financial position of each of the Funds as of October 31, 2023, the results of their operations for the year then ended, and the changes in net assets and the financial highlights for each of the two years in the period then ended, in conformity with accounting principles generally accepted in the United States of America.
The Funds’ financial highlights for the years or periods ended October 31, 2021, and prior, were audited by other auditors whose report dated December 30, 2021, expressed an unqualified opinion on those financial highlights.
Basis for Opinion
These financial statements are the responsibility of the Funds’ management. Our responsibility is to express an opinion on the Funds’ financial statements based on our audits. We are a public accounting firm registered with the Public Company Accounting Oversight Board (United States) (“PCAOB”) and are required to be independent with respect to the Funds in accordance with the U.S. federal securities laws and the applicable rules and regulations of the Securities and Exchange Commission and the PCAOB.
We conducted our audits in accordance with the standards of the PCAOB. Those standards require that we plan and perform the audit to obtain reasonable assurance about whether the financial statements are free of material misstatement whether due to error or fraud.
Our audits included performing procedures to assess the risks of material misstatement of the financial statements, whether due to error or fraud, and performing procedures that respond to those risks. Such procedures included examining, on a test basis, evidence regarding the amounts and disclosures in the financial statements. Our procedures included confirmation of securities owned as of October 31, 2023, by correspondence with the custodians and brokers; when replies were not received from brokers, we performed other auditing procedures. Our audits also included evaluating the accounting principles used and significant estimates made by management, as well as evaluating the overall presentation of the financial statements. We believe that our audits provide a reasonable basis for our opinion.
We have served as the auditor of one or more investment companies advised by ALPS Advisors, Inc. since 2013.

COHEN & COMPANY, LTD.
Cleveland, Ohio
December 29, 2023
Additional Information
October 31, 2023 (Unaudited)
1. FUND HOLDINGS
The Funds’ portfolio holdings are made available semi-annually in shareholder reports within 60 days after the close of the period for which the report is being made, as required by federal securities laws. The Funds also file monthly portfolio holdings on Form N-PORT on a quarterly basis, with the schedule of portfolio holdings filed on Form N-PORT for the third month of each Fund’s fiscal quarter made publicly available 60 days after the end of the Funds’ fiscal quarter.
2. FUND PROXY VOTING POLICIES, PROCEDURES AND SUMMARIES
Fund policies and procedures used in determining how to vote proxies and information regarding how each of the Funds voted proxies relating to portfolio securities during the most recent prior 12-month period ending June 30 are available without charge, (1) upon request, by calling (toll-free) (866) 759-5679 and (2) on the SEC’s website at http://www.sec.gov.
3. TAX INFORMATION (UNAUDITED)
Of the distributions paid by the Funds from ordinary income for the calendar year ended December 31, 2022, the following percentages met the requirements to be treated as qualifying for qualified dividend income and the corporate dividends received deduction:
| | | QDI | | | DRD | |
| ALPS|Core Commodity Management Complete Commodities® Strategy Fund | | | 10.36 | % | | | 2.77 | % |
| ALPS|Kotak India ESG Fund | | | – | | | | – | |
| ALPS Global Opportunity Fund | | | – | | | | – | |
| RiverFront Asset Allocation Growth & Income Fund | | | 68.60 | % | | | 47.25 | % |
In early 2023, if applicable, shareholders of record received this information for the distribution paid to them by the Funds during the calendar year 2022 via Form 1099. The Funds will notify shareholders in early 2024 of amounts paid to them by the Funds, if any, during the calendar year 2023.
Pursuant to Section 852(b)(3) of the Internal Revenue Code the Funds designate the following amounts as long-term capital gain dividends:
| ALPS|Core Commodity Management Complete Commodities® Strategy Fund | | $ | – | |
| ALPS|Kotak India ESG Fund | | $ | 5,472,501 | |
| ALPS Global Opportunity Fund | | $ | – | |
| RiverFront Asset Allocation Growth & Income Fund | | $ | 3,245,164 | |
Board Considerations Regarding Approval of Investment
Advisory Agreement and Investment Sub-Advisory Agreements
October 31, 2023 (Unaudited)
In anticipation of and as part of the process to consider the renewal of the investment advisory agreement with AAI with respect to each Fund and the sub-advisory agreements with each Sub- Adviser with respect to the applicable Fund (the “Advisory Agreements”), legal counsel to the Independent Trustees requested certain information from AAI and each Sub-Adviser. In response to these requests, the Trustees received reports from AAI and each Sub-Adviser that addressed specific factors to be considered by the Board. The Board also received from independent legal counsel memoranda regarding the Board’s responsibilities pertaining to the approval of advisory contracts. Further, the Board met on June 13, 2023 with representatives of AAI and each Sub-Adviser and discussed the services the firms provided pursuant to the agreements, as well as the information they provided.
During the review process, the Board noted certain instances where clarification or follow-up was appropriate and others where the Board determined that further clarification or follow-up was not necessary. In those instances where clarification or follow-up was requested, the Board determined that in each case either information responsive to its requests had been provided, or where any request was outstanding in whole or in part, given the totality of the information provided with respect to the agreements, the Board had received sufficient information to renew and approve the agreements.
In approving AAI as the Funds’ investment adviser and each Sub-Adviser as the relevant Fund’s sub-adviser, and the fees to be charged under the Advisory Agreements, the Trustees concluded that no single factor reviewed by the Trustees was identified by the Trustees to be determinative as the principal factor in whether to approve such agreements. Further, the Independent Trustees were advised by independent legal counsel throughout the process. The following summary does not identify all the matters considered by the Board, but provides a summary of the principal matters the Board considered.
Global Opportunity Fund
In renewing and approving the Investment Advisory Agreement with AAI, the Trustees, including the Independent Trustees, considered the following factors with respect to the Global Opportunity Fund:
Investment Advisory Fee Rates: The Trustees reviewed and considered the contractual annual advisory fee rate paid by the Trust, on behalf of the Global Opportunity Fund, to AAI, of 0.85% of the Global Opportunity Fund’s daily average net assets, in light of the extent and quality of the advisory services provided by AAI to the Global Opportunity Fund. The Trustees also considered information regarding compensation paid to affiliates of AAI under other agreements, such as the Fund Accounting and Administration Agreement with ALPS.
The Board received and considered information including a comparison of the Global Opportunity Fund’s contractual advisory fee rate with those of funds in the peer group as selected by an independent provider of investment company data (the “Data Provider”). The Trustees noted that the contractual advisory fee rate for the Global Opportunity Fund was lower than the Data Provider peer group median rate for each class of the Fund, except for Class R, which was higher than the Data Provider peer group median rate.
Total Net Expense Ratios: The Trustees further reviewed and considered the total net expense ratios of 1.49%, 2.23%, 1.22%, 1.46%, and 1.68% for the Class A, Class C, Class I, Investor Class, and Class R shares, respectively, of the Global Opportunity Fund. The Trustees noted that the total net expense ratio for each class of the Global Opportunity Fund was higher than the Data Provider peer group median ratio.
Nature, Extent, and Quality of the Services under the Investment Advisory and Sub- Advisory Agreements: The Trustees received and considered information regarding the nature, extent, and quality of services provided to the Global Opportunity Fund under the Investment Advisory Agreement. The Trustees reviewed certain background materials supplied by AAI in its presentation, including its Form ADV.
The Trustees reviewed and considered AAI’s investment advisory personnel, its history as an asset manager and its performance and the amount of assets currently under management by AAI and its affiliated entities. The Trustees also reviewed the research and decision-making processes utilized by AAI, including the methods adopted to seek to achieve compliance with the investment objectives, policies, and restrictions of the Global Opportunity Fund.
The Trustees considered the background and experience of AAI’s management in connection with the Global Opportunity Fund, including reviewing the qualifications, backgrounds, and responsibilities of the management team primarily responsible for the day-to-day portfolio management of the Global Opportunity Fund and the extent of the resources devoted to research and analysis of actual and potential investments.
The Trustees also reviewed, among other things, AAI’s Codes of Ethics.
Performance: The Trustees reviewed performance information for the Global Opportunity Fund, which included a comparison of the Global Opportunity Fund’s performance to the performance of a peer group selected by the Data Provider for the three-month, one-year, three-year, five-
Board Considerations Regarding Approval of Investment
Advisory Agreement and Investment Sub-Advisory Agreements
October 31, 2023 (Unaudited)
year, ten-year, and since inception periods ended March 31, 2023, as applicable. The Trustees noted that for the three-month and one-year periods, each class of the Fund underperformed the peer group median; for the three-year period, Class C and Class R had performance equal to the peer group median and each other class underperformed the peer group median; for the five year period, Investor Class had performance equal to the peer group median, Class R underperformed the peer group median, and Class C and Class I outperformed the peer group median; for the ten-year period, Class R had performance equal to the peer group median, and Class C, Class I, and Investor Class outperformed the peer group median; and for the since inception period, each class outperformed the peer group median except for Investor Class and Class R, which underperformed the peer group median. The Trustees also considered AAI’s investment performance and reputation generally and its investment techniques, risk management controls, and decision-making processes.
Comparable Accounts: The Trustees noted certain information provided by AAI regarding fees charged to its other clients utilizing a strategy similar to that employed by the Global Opportunity Fund.
Profitability: The Trustees received and considered a combined profitability analysis prepared by AAI based on the fees payable under the Investment Advisory Agreement with AAI, with respect to the Global Opportunity Fund.
Economies of Scale: The Trustees considered whether economies of scale in the provision of services to the Global Opportunity Fund will be passed along to the shareholders under the agreements.
Other Benefits to the Adviser and Sub-Adviser: The Trustees reviewed and considered any other incidental benefits derived or to be derived by AAI and Red Rocks from their relationship with the Global Opportunity Fund, including whether soft dollar arrangements were used.
The Trustees, including all of the Independent Trustees, concluded that:
| ● | the contractual advisory fee rate for the Global Opportunity Fund was lower than the Data Provider peer group median rate for each class of the Global Opportunity Fund, except for Class R, which was higher than the Data provider peer group median rate; |
| ● | the total net expense ratio for each class of the Global Opportunity Fund was higher than the Data Provider peer group median ratio; |
| ● | the nature, extent, and quality of services rendered by AAI under the Investment Advisory Agreement with respect to the Global Opportunity Fund were adequate; |
| ● | for the three-month, one-year, three-year, five-year, ten-year, and since inception periods ended March 31, 2023, as applicable, the Trustees noted that for the three- month and one-year periods, each class of the Fund underperformed the peer group median; for the three-year period, Class C and Class R had performance equal to the peer group median and each other class underperformed the peer group median; for the five year period, Investor Class had performance equal to the peer group median, Class R underperformed the peer group median, and Class C and Class I outperformed the peer group median; for the ten-year period, Class R had performance equal to the peer group median, and Class C, Class I, and Investor Class outperformed the peer group median; and for the since inception period, each class outperformed the peer group median except for Investor Class and Class R, which underperformed the peer group median. ; |
| ● | bearing in mind the limitations of comparing different types of managed accounts and the different levels of service typically associated with such accounts, the fee structures applicable to AAI’s other clients employing a comparable strategy to the Global Opportunity Fund was not indicative of any unreasonableness with respect to the advisory fees payable by the Global Opportunity Fund; |
| ● | the profit, if any, realized by AAI in connection with the operation of the Global Opportunity Fund is not unreasonable to the Global Opportunity Fund; and |
| ● | at this time, there were no material economies of scale or other incidental benefits accruing to AAI in connection with their relationship with the Global Opportunity Fund. |
Based on the Trustees’ deliberations and their evaluation of the information described above, the Trustees, including all of the Independent Trustees, concluded that AAI’s compensation for investment advisory services is consistent with the best interests of the Global Opportunity Fund and its shareholders.
Board Considerations Regarding Approval of Investment
Advisory Agreement and Investment Sub-Advisory Agreements
October 31, 2023 (Unaudited)
CoreCommodity Fund
In renewing and approving the Investment Advisory Agreement with AAI and the Investment Sub- Advisory Agreement with CoreCommodity, the Trustees, including the Independent Trustees, considered the following factors with respect to the CoreCommodity Fund:
Investment Advisory and Sub-Advisory Fee Rates: The Trustees reviewed and considered the contractual annual advisory fee rate paid by the Trust, on behalf of the CoreCommodity Fund, to AAI, of 0.85% of the CoreCommodity Fund’s daily average net assets, in light of the extent and quality of the advisory services provided by AAI to the CoreCommodity Fund. The Trustees also reviewed and considered the contractual annual sub-advisory fee rate paid by AAI to CoreCommodity of 0.75% of the CoreCommodity Fund’s daily average net assets, in light of the extent and quality of the advisory services provided by CoreCommodity to the CoreCommodity Fund. The Trustees also considered information regarding compensation paid to affiliates of AAI under other agreements, such as the Fund Accounting and Administration Agreement with ALPS.
The Board received and considered information including a comparison of the CoreCommodity Fund’s contractual advisory fee rates with those of funds in the peer group as selected by an independent provider of investment company data (the “Data Provider”). The Trustees noted that the contractual advisory fee rate for each class of the CoreCommodity Fund was higher than the Data Provider peer group median rate.
Total Net Expense Ratios: The Trustees further reviewed and considered the total net expense ratios of 1.30%, 2.00%, 1.08%, and 1.36% for the Class A, Class C, Class I, and Investor Class shares, respectively, of the CoreCommodity Fund. The Trustees noted that the total net expense ratio of each class of the CoreCommodity Fund was higher than the Data Provider peer group median ratio.
Nature, Extent, and Quality of the Services under the Investment Advisory and Sub- Advisory Agreements: The Trustees received and considered information regarding the nature, extent, and quality of services provided to the CoreCommodity Fund under the Investment Advisory and Sub-Advisory Agreements. The Trustees reviewed certain background materials supplied by AAI and CoreCommodity in their presentations, including their Forms ADV.
The Trustees reviewed and considered AAI’s and CoreCommodity’s investment advisory personnel, their history as asset managers, and their performance and the amount of assets currently under management by AAI and CoreCommodity and their affiliated entities. The Trustees also reviewed the research and decision-making processes utilized by AAI and CoreCommodity, including the methods adopted to seek to achieve compliance with the investment objectives, policies, and restrictions of the CoreCommodity Fund.
The Trustees considered the background and experience of AAI’s and CoreCommodity’s management in connection with the CoreCommodity Fund, including reviewing the qualifications, backgrounds, and responsibilities of the management team primarily responsible for the day-to-day portfolio management of the CoreCommodity Fund and the extent of the resources devoted to research and analysis of actual and potential investments.
The Trustees also reviewed, among other things, AAI’s and CoreCommodity’s Codes of Ethics.
Performance: The Trustees reviewed performance information for the CoreCommodity Fund, which included a comparison of the CoreCommodity Fund’s performance to the performance of a group of comparable funds selected by the Data Provider for the three- month, one-year, three-year, five-year, ten-year, and since inception periods ended March 31, 2023, as applicable. The Trustees noted that each class of the CoreCommodity Fund underperformed the peer group median for the three-month and one-year periods, and each class outperformed the peer group median for each other applicable period, except that Class I and Investor Class had performance equal to the peer group median for the ten-year period. The Trustees also considered CoreCommodity’s investment performance and reputation generally and its investment techniques, risk management controls, and decision-making processes.
Comparable Accounts: The Trustees noted certain information provided by CoreCommodity regarding fees charged to its other clients utilizing a strategy similar to that employed by the CoreCommodity Fund. The Trustees also noted that AAI indicated that it had no other clients utilizing a strategy similar to that employed by the CoreCommodity Fund.
Profitability: The Trustees received and considered the profitability analyses prepared by AAI and CoreCommodity based on the fees payable under the Investment Advisory Agreement with AAI and the Investment Sub-Advisory Agreement with CoreCommodity with respect to the CoreCommodity Fund, respectively. The Trustees considered the profits, if any, realized by AAI and CoreCommodity in connection with the operation of the CoreCommodity Fund.
Economies of Scale: The Trustees considered whether economies of scale in the provision of services to the CoreCommodity Fund will be passed along to the shareholders under the agreements.
Board Considerations Regarding Approval of Investment
Advisory Agreement and Investment Sub-Advisory Agreements
October 31, 2023 (Unaudited)
Other Benefits to the Adviser and Sub-Adviser: The Trustees reviewed and considered any other incidental benefits derived or to be derived by AAI and CoreCommodity from their relationship with the CoreCommodity Fund, including whether soft dollar arrangements were used.
The Trustees, including all of the Independent Trustees, concluded that:
| ● | the contractual advisory fee rate for each class of the CoreCommodity Fund was higher than the Data Provider peer group median rate; |
| ● | CoreCommodity’s fees under its sub-advisory agreements are paid directly by AAI; |
| ● | the total net expense ratio of each class of the CoreCommodity Fund was higher than the Data Provider peer group median ratio; |
| ● | the nature, extent, and quality of services rendered by AAI and CoreCommodity under the Investment Advisory and Sub-Advisory Agreements, respectively, with respect to the CoreCommodity Fund were adequate; |
| ● | for the three-month, one-year, three-year, five-year, ten-year, and since inception periods ended March 31, 2023, as applicable, each class of the CoreCommodity Fund underperformed the peer group median for the three-month and one-year periods, and each class outperformed the peer group median for each other applicable period, except that Class I and Investor Class had performance equal to the peer group median for the ten-year period; |
| ● | that (a) AAI had no other clients utilizing a strategy similar to that employed by the CoreCommodity Fund, and (b) bearing in mind the limitations of comparing different types of managed accounts and the different levels of service typically associated with such accounts, the fee structures applicable to CoreCommodity’s other clients employing a comparable strategy to the CoreCommodity Fund was not indicative of any unreasonableness with respect to the advisory and sub-advisory fees proposed to be payable by the CoreCommodity Fund; |
| ● | the profit, if any, realized by AAI and CoreCommodity in connection with the operation of the CoreCommodity Fund is not unreasonable to the CoreCommodity Fund; and |
| ● | at this time, there were no material economies of scale or other incidental benefits accruing to AAI and CoreCommodity in connection with their relationship with the CoreCommodity Fund. |
Based on the Trustees’ deliberations and their evaluation of the information described above, the Trustees, including all of the Independent Trustees, concluded that AAI’s and CoreCommodity’s compensation for investment advisory and sub-advisory services is consistent with the best interests of the CoreCommodity Fund and its shareholders.
The Trustees applied the same analysis to the advisory arrangements between AAI, CoreCommodity, and the wholly owned Cayman Island subsidiary of the CoreCommodity Fund.
RiverFront Fund
In renewing and approving the Investment Advisory Agreement with AAI and the Investment Sub- Advisory Agreement with RiverFront, the Trustees, including the Independent Trustees, considered the following factors with respect to the RiverFront Fund:
Investment Advisory and Sub-Advisory Fee Rates: There are no investment advisory or sub-advisory fees paid with respect to the RiverFront Fund. The Trustees also considered information regarding compensation to be paid to affiliates of AAI under other agreements, such as the Fund Accounting and Administration Agreement with ALPS.
Total Net Expense Ratios: The Trustees reviewed and considered the total net expense ratios of 0.50%, 1.25%, 0.25%, and 0.50%, for the Class A, Class C, Class I, and Investor Class shares, respectively, of the RiverFront Fund. The Trustees noted that the total net expense ratio for each Class of the RiverFront Fund was equal to the peer group median, except for Class C, which was lower than the peer group median.
Nature, Extent, and Quality of the Services under the Investment Advisory and Sub- Advisory Agreements: The Trustees received and considered information regarding the nature, extent, and quality of services provided to the RiverFront Fund under the Investment Advisory and Sub- Advisory Agreements. The Trustees reviewed certain background materials supplied by AAI and RiverFront in their presentations, including their Forms ADV.
Board Considerations Regarding Approval of Investment
Advisory Agreement and Investment Sub-Advisory Agreements
October 31, 2023 (Unaudited)
The Trustees reviewed and considered AAI’s and RiverFront’s investment advisory personnel, their history as asset managers and their performance and the amount of assets currently under management by AAI and RiverFront and their affiliated entities. The Trustees also reviewed the research and decision-making processes utilized by AAI and RiverFront, including the methods adopted to seek to achieve compliance with the investment objectives, policies, and restrictions of the RiverFront Fund.
The Trustees considered the background and experience of AAI’s and RiverFront’s management in connection with the RiverFront Fund, including reviewing the qualifications, backgrounds, and responsibilities of the management team primarily responsible for the day-to-day portfolio management of the RiverFront Fund and the extent of the resources devoted to research and analysis of actual and potential investments.
The Trustees also reviewed, among other things, AAI’s and RiverFront’s Codes of Ethics.
Performance: The Trustees reviewed performance information for the RiverFront Fund, which included a comparison of each Fund’s performance to the performance of a group of comparable funds selected by the Data Provider for the three-month, one-year, three- year, five-year, ten-year, and since inception periods ended March 31, 2023, as applicable. The Trustees noted that for the three-month period, Class C outperformed the peer group median, Investor Class had performance equal to the peer group median, and Class A and Class I underperformed the peer group median; for the one-year period, each class of the Fund outperformed the peer group median, except for Class I, which had performance equal to the peer group median; for the three-year period, each class outperformed the peer group median, except for Class I, which underperformed the peer group median; for the five-year period, each applicable class underperformed the peer group median; for the ten-year period, each applicable class outperformed the peer group median, except for Investor Class, which had performance equal to the peer group median; and for the since inception period, Class C and Class I outperformed the peer group median, Investor Class had performance equal to the peer group median, and Class A underperformed the peer group median. The Trustees also considered RiverFront’s investment performance and reputation generally and its investment techniques, risk management controls, and decision-making processes.
Comparable Accounts: The Trustees noted certain information provided by RiverFront and AAI regarding fees charged to their other clients utilizing a strategy similar to that employed by the RiverFront Fund.
Profitability: The Trustees received and considered the profitability analyses prepared by AAI and RiverFront based on the fees payable under the Investment Advisory Agreement with AAI and the Investment Sub-Advisory Agreement with RiverFront with respect to the RiverFront Fund, respectively. The Trustees considered the profits, if any, realized by AAI and RiverFront in connection with the operation of the RiverFront Fund.
Economies of Scale: The Trustees considered whether economies of scale in the provision of services to the RiverFront Fund will be passed along to the shareholders under the agreements.
Other Benefits to the Adviser and Sub-Adviser: The Trustees reviewed and considered any other incidental benefits derived or to be derived by AAI and RiverFront from their relationship with the RiverFront Fund, including whether soft dollar arrangements were used and that when the RiverFront Fund invests in RiverFront sub-advised ETFs, RiverFront will benefit from growth in assets of the RiverFront sub-advised ETFs, and AAI will benefit from growth in assets of the RiverFront sub-advised ETFs for which AAI serves as the investment adviser.
The Trustees, including all of the Independent Trustees, concluded that:
| ● | there are no investment advisory or sub-advisory fees paid with respect to the RiverFront Fund; |
| ● | the total net expense ratio for each Class of the RiverFront Fund was equal to the Data Provider peer group median, except for Class C, which was lower than the Data Provider peer group median; |
| ● | the nature, extent, and quality of services rendered by AAI and RiverFront under the Investment Advisory and Sub-Advisory Agreements, respectively, with respect to the RiverFront Fund were adequate; |
| ● | for the three-month, one-year, three-year, five-year, ten-year, and since inception periods ended March 31, 2023, as applicable, with respect to the three-month period, Class C outperformed the peer group median, Investor Class had performance equal to the peer group median, and Class A and Class I underperformed the peer group median; for the one-year period, each class of the Fund outperformed the peer group median, except for Class I, which had performance equal to the peer group median; for the three- year period, each class outperformed the peer group median, except for Class I, which underperformed the peer group median; for the five-year period, each applicable class underperformed the peer group median; for the ten-year period, each applicable class outperformed the peer group median, except for Investor Class, which had performance equal to the peer group median; and for the since inception period; Class C and |
Board Considerations Regarding Approval of Investment
Advisory Agreement and Investment Sub-Advisory Agreements
October 31, 2023 (Unaudited)
Class I outperformed the peer group median, Investor Class had performance equal to the peer group median, and Class A underperformed the peer group median;
| ● | bearing in mind the limitations of comparing different types of managed accounts and the different levels of service typically associated with such accounts, the fee structures applicable to AAI’s and RiverFront’s other clients employing a comparable strategy to one or more of the RiverFront Fund were not indicative of any unreasonableness with respect to the advisory and sub-advisory fees proposed to be payable by the RiverFront Fund; |
| ● | the profit, if any, realized by AAI and RiverFront in connection with the operation of the RiverFront Fund, as applicable, is not unreasonable to the RiverFront Fund; |
| ● | at this time, there were no material economies of scale accruing to AAI or RiverFront in connection with their relationship with the RiverFront Fund; and |
| ● | at this time, there were no other incidental benefits accruing to AAI or RiverFront in connection with their relationships with the RiverFront Fund, except that when the RiverFront Fund invests in RiverFront sub-advised ETFs, RiverFront will benefit from growth in assets of the RiverFront sub-advised ETFs, and AAI will benefit from growth in assets of the RiverFront sub-advised ETFs for which AAI serves as the investment adviser. |
Based on the Trustees’ deliberations and their evaluation of the information described above, the Trustees, including all of the Independent Trustees, concluded that AAI’s and RiverFront’s compensation for investment advisory and sub-advisory services is consistent with the best interests of the RiverFront Fund and its shareholders.
Kotak Fund
In renewing and approving the Investment Advisory Agreement with AAI and the Investment Sub- Advisory Agreement with Kotak, the Trustees, including the Independent Trustees, considered the following factors with respect to the Kotak Fund:
Investment Advisory and Sub-Advisory Fee Rates: The Trustees reviewed and considered the contractual annual advisory fee rate paid by the Trust, on behalf of the Kotak Fund, to AAI, of 0.65% of the Kotak Fund’s daily average net assets, in light of the extent and quality of the advisory services provided by AAI to the Kotak Fund. The Trustees also reviewed and considered the contractual annual sub-advisory fee rate paid by AAI to Kotak of 0.56% of the Kotak Fund’s daily average net assets, in light of the extent and quality of the advisory services provided by Kotak to the Kotak Fund. The Trustees also considered information regarding compensation to be paid to affiliates of AAI under other agreements, such as the Fund Accounting and Administration Agreement with ALPS.
The Board received and considered information including a comparison of the Kotak Fund’s contractual advisory fee rate with those of funds in the peer group as selected by an independent provider of investment company data (the “Data Provider”). The Trustees noted that the contractual advisory fee rate for each class of the Kotak Fund was lower than the Data Provider peer group median rate.
Total Net Expense Ratios: The Trustees further reviewed and considered the total net expense ratios of 1.10%, 2.00%, 1.00%, 0.75%, and 1.33% for the Class A, Class C, Class I, Class II, and Investor Class shares, respectively, of the Kotak Fund. The Trustees noted that the total net expense ratio of each class of the Kotak Fund was lower than the Data Provider peer group median ratio.
Nature, Extent, and Quality of the Services under the Investment Advisory and Sub- Advisory Agreements: The Trustees received and considered information regarding the nature, extent, and quality of services to be provided to the Kotak Fund under the Investment Advisory and Sub-Advisory Agreements. The Trustees reviewed certain background materials supplied by AAI and Kotak in their presentations, including their Forms ADV.
The Trustees reviewed and considered AAI’s and Kotak’s investment advisory personnel, their history as asset managers and their performance and the amount of assets currently under management by AAI and Kotak and their affiliated entities. The Trustees also reviewed the research and decision-making processes utilized by AAI and Kotak, including the methods adopted to seek to achieve compliance with the investment objectives, policies, and restrictions of the Kotak Fund.
The Trustees considered the background and experience of AAI’s and Kotak’s management in connection with the Kotak Fund, including reviewing the qualifications, backgrounds, and responsibilities of the management team primarily responsible for the day-to-day portfolio management of the Kotak Fund and the extent of the resources devoted to research and analysis of actual and potential investments.
Board Considerations Regarding Approval of Investment
Advisory Agreement and Investment Sub-Advisory Agreements
October 31, 2023 (Unaudited)
The Trustees also reviewed, among other things, AAI’s and Kotak’s Codes of Ethics.
Performance: The Trustees reviewed performance information for the Kotak Fund, which included a comparison of the Kotak Fund’s performance to the performance of a group of comparable funds selected by the Data Provider for the three-month, one-year, three-year, five-year, ten-year, and since inception periods ended March 31, 2023, as applicable. The Trustees noted that each class of the Fund outperformed the Data Provider peer group median for each applicable period. The Trustees also considered Kotak’s investment performance and reputation generally and its investment techniques, risk management controls, and decision-making processes.
Comparable Accounts: The Trustees noted certain information provided by Kotak regarding fees charged to its other clients utilizing a strategy similar to that employed by the Kotak Fund. The Trustees also noted that AAI indicated that it had no other clients utilizing a strategy similar to that employed by the Kotak Fund.
Profitability: The Trustees received and considered the profitability analyses prepared by AAI and Kotak based on the fees payable under the Investment Advisory Agreement with AAI and the Investment Sub-Advisory Agreement with Kotak, with respect to the Kotak Fund, respectively. The Trustees considered the profits, if any, realized by AAI and Kotak in connection with the operation of the Kotak Fund.
Economies of Scale: The Trustees considered whether economies of scale in the provision of services to the Kotak Fund will be passed along to the shareholders under the agreements.
Other Benefits to the Adviser and Sub-Adviser: The Trustees reviewed and considered any other incidental benefits derived or to be derived by AAI and Kotak from their relationship with the Kotak Fund, including whether soft dollar arrangements were used.
The Trustees, including all of the Independent Trustees, concluded that:
| ● | the contractual and gross advisory fee rate for each class of the Kotak Fund was lower than the Data Provider peer group median rate; |
| ● | Kotak’s fees under its sub-advisory agreements are paid directly by AAI; |
| ● | the total net expense ratio of each class of the Kotak Fund was lower than the Data Provider peer group median ratio; |
| ● | the nature, extent, and quality of services rendered by AAI and Kotak under the Investment Advisory and Sub-Advisory Agreements, respectively, with respect to the Kotak Fund were adequate; |
| ● | for the three-month, one-year, three-year, five-year, ten-year, and since inception periods ended March 31, 2022, as applicable, each class of the Fund outperformed the Data Provider peer group median; |
| ● | that (a) AAI had no other clients utilizing a strategy similar to that employed by the Kotak Fund, and (b) bearing in mind the limitations of comparing different types of managed accounts and the different levels of service typically associated with such accounts, the fee structures applicable to Kotak’s other clients employing a comparable strategy to the Kotak Fund was not indicative of any unreasonableness with respect to the advisory and sub-advisory fees proposed to be payable by the Kotak Fund; |
| ● | the profit, if any, realized by AAI and Kotak in connection with the operation of the Kotak Fund is not unreasonable to the Kotak Fund; and |
| ● | at this time, there were no material economies of scale or other incidental benefits accruing to AAI and Kotak in connection with their relationship with the Kotak Fund. |
Based on the Trustees’ deliberations and their evaluation of the information described above, the Trustees, including all of the Independent Trustees, concluded that AAI’s and Kotak’s compensation for investment advisory and sub-advisory services is consistent with the best interests of the Kotak Fund and its shareholders.
Liquidity Risk Management Program
October 31, 2023 (Unaudited)
The Financial Investors Trust (the “Trust”) has established a liquidity risk management program (the “Program”) to govern the Trust’s approach to managing liquidity risk for each fund in the Trust (each a “Fund”). The Program is overseen by the Liquidity Committee (the “Committee”), a committee comprised of representatives of the Trust’s investment advisers, sub-advisers, and Officers of the Trust. The Trust’s Board of Trustees (the “Board”) has approved the designation of the Committee to oversee the Program.
The Program’s principal objectives include supporting each Fund’s compliance with limits on investments in illiquid assets and mitigating the risk that a Fund will be unable to meet its redemption obligations in a timely manner. The Program also includes a number of elements that support the management and assessment of liquidity risk, including a periodic assessment of factors that influence a Fund’s liquidity and the periodic classification and re-classification of the Fund’s investments into groupings that reflect the Committee’s assessment of their relative liquidity under current market conditions.
At a meeting of the Board held on June 13, 2023, the Trustees received a report from the Committee regarding the design and operational effectiveness of the Program during the calendar year 2022. The Committee determined, and reported to the Board, that the Program is reasonably designed to assess and manage each Fund’s liquidity risk and has operated adequately and effectively to manage each Fund’s liquidity risk since implementation.
The Committee reported that during the period covered by the report, there were no liquidity events that impacted the Funds or their ability to timely meet redemptions without dilution to existing shareholders. Among other things, the Board noted that the Funds are not required to have a highly liquid investment minimum based on their liquidity classifications. The Board further noted that no material changes have been made to the Program since its implementation.
Trustees and Officers
October 31, 2023 (Unaudited)
The business and affairs of each Fund are managed under the direction of its Board. The Board approves all significant agreements between a Fund and the persons or companies that furnish services to the Fund, including agreements with its distributor, Adviser, Sub-Adviser, administrator, custodian and transfer agent. The day-to-day operations of each Fund are delegated to the Fund’s Adviser, Sub-Adviser and administrator.
The name, address, age and principal occupations for the past five years of the Trustees and officers of the Trust are listed below, along with the number of portfolios in the Fund complex overseen by and the other directorships held by each Trustee.
INDEPENDENT TRUSTEES
Name,
Address* &
Year of Birth | Position(s)
Held with
Fund | Term of Office**
and Length of
Time Served | Principal Occupation(s)
During Past 5 Years*** | Number of Funds
in Fund Complex
Overseen by
Trustee **** | Other Directorships
Held by
Trustee During
Past 5 Years*** |
Mary K. Anstine, 1940 | Trustee and Chairman | Since 1997 | Ms. Anstine is Trustee/Director of AV Hunter Trust and Colorado Uplift Board. | 46 | Ms. Anstine is a Trustee of ALPS ETF Trust (23 funds); ALPS Variable Investment Trust (7 funds); Reaves Utility Income Fund (1 fund); and Segall Bryant & Hamill Trust through December 2020 (14 funds). |
Jeremy W. Deems, 1976 | Trustee | Since 2009 | Mr. Deems is the Co-Founder and Chief Financial Officer of Green Alpha Advisors, LLC, a registered investment advisor, and Co- Portfolio Manager of the Shelton Green Alpha Fund. | 46 | Mr. Deems is a Trustee of ALPS ETF Trust (23 funds); ALPS Variable Investment Trust (7 funds); Reaves Utility Income Fund (1 Fund); and Clough Funds Trust (1 fund). |
Jerry G. Rutledge, 1944 | Trustee | Since 2009 | Mr. Rutledge is the President and owner of Rutledge’s Inc., a retail clothing business. | 17 | Mr. Rutledge is a Trustee of Clough Global Dividend and Income Fund (1 fund); Clough Global Equity Fund (1 fund); Clough Global Opportunities Fund (1 fund); and Principal Real Estate Income Fund (1 fund). |
| * | All communications to Officers may be directed to Financial Investors Trust c/o 1290 Broadway, Suite 1000, Denver, CO 80203. |
| ** | This is the period for which the Officer began serving the Trust. Officers are appointed on an annual basis. |
| *** | Except as otherwise indicated, each individual has held the office shown or other offices in the same company for the last five years. Because of their respective positions with ALPS, each officer is considered an affiliated person of the Trust as defined under the 1940 Act. |
| **** | The Fund Complex includes all series of the Trust and any other investment companies for which the following list of investment advisers provides investment advisory services: SS&C ALPS Advisors, Inc., CoreCommodity Management, LLC, Kotak Mahindra Asset Management (Singapore) Pte. Ltd., RiverFront Investment Group, LLC and Smith Capital Investors, LLC. |
Trustees and Officers
October 31, 2023 (Unaudited)
INDEPENDENT TRUSTEES (continued)
Name,
Address* &
Year of Birth | Position(s)
Held with
Fund | Term of Office**
and Length of
Time Served | Principal Occupation(s)
During Past 5 Years*** | Number of Funds
in Fund Complex
Overseen by
Trustee **** | Other Directorships
Held by
Trustee During
Past 5 Years*** |
Michael “Ross” Shell, 1970 | Trustee | Since 2009 | Mr. Shell is Founder and CEO of Red Idea, LLC, a strategic consulting/early stage venture firm (since June 2008). Mr. Shell serves on the Board of Directors of TalkBox, a phone/privacy booth company (since 2018) and DLVR, a package security company (since 2018). Mr. Shell served on the Advisory Board, St. Vrain School District Innovation Center (from 2015-2018). Mr. Shell graduated with honors from Stanford University with a degree in Political Science. | 16 | None. |
Edmund J. Burke, 1961 | Trustee | Since 2009 | Mr. Burke joined ALPS in 1991 and served as the President and Director of ALPS Holdings, Inc., and ALPS Advisors, Inc., and Director of ALPS Distributors, Inc., ALPS Fund Services, Inc. (“ALPS”), and ALPS Portfolio Solutions Distributor, Inc. (collectively, the “ALPS Companies”). Mr. Burke retired from the ALPS Companies in June 2019. Mr. Burke is currently a partner at ETF Action, a web-based system that provides data and analytics to registered investment advisers, (since 2020) and a Director of Alliance Bioenergy Plus, Inc., a technology company focused on emerging technologies in the renewable energy, biofuels, and bioplastics technology sectors (since 2020). | 39 | Mr. Burke is a Trustee of ALPS ETF Trust (23 funds); Clough Global Dividend and Income Fund (1 fund); Clough Global Equity Fund (1 fund); Clough Global Opportunities Fund (1 fund); Clough Funds Trust (1 fund); Liberty All-Star Equity Fund (1 fund); and Director of the Liberty All-Star Growth Fund, Inc. (1 fund). |
| * | All communications to Officers may be directed to Financial Investors Trust c/o 1290 Broadway, Suite 1000, Denver, CO 80203. |
| ** | This is the period for which the Officer began serving the Trust. Officers are appointed on an annual basis. |
| *** | Except as otherwise indicated, each individual has held the office shown or other offices in the same company for the last five years. Because of their respective positions with ALPS, each officer is considered an affiliated person of the Trust as defined under the 1940 Act. |
| **** | The Fund Complex includes all series of the Trust and any other investment companies for which the following list of investment advisers provides investment advisory services: SS&C ALPS Advisors, Inc., CoreCommodity Management, LLC, Kotak Mahindra Asset Management (Singapore) Pte. Ltd., RiverFront Investment Group, LLC and Smith Capital Investors, LLC. |
Trustees and Officers
October 31, 2023 (Unaudited)
| OFFICERS | | | |
Name, Address*
& Year of Birth | Position(s)
Held with
Fund | Term of Office** and
Length of Time Served | Principal Occupation(s)
During Past 5 Years*** |
Lucas Foss, 1977 | President | Since 2022 | Mr. Foss rejoined ALPS in November 2017 and is currently Senior Director and Fund Chief Compliance Officer. Prior to his current role, Mr. Foss served as the Director of Compliance at Transamerica Asset Management (2015-2017) and Deputy Chief Compliance Officer at ALPS (2012-2015). Mr. Foss is President of ALPS Series Trust and Chief Compliance Officer of Clough Global Funds; Clough Funds Trust; MVP Private Markets Funds; Bluerock Total Income + Real Estate Fund; Bluerock High Income Institutional Credit Fund; SPDR® S&P 500® ETF Trust, SPDR® Dow Jones® Industrial Average ETF Trust, SPDR® S&P MIDCAP 400® ETF Trust. |
Jennell Panella, 1974 | Treasurer | Since 2020 | Ms. Panella joined ALPS in June 2012 and is currently Fund Controller of ALPS Fund Services, Inc. Prior to joining ALPS, Ms. Panella served as Financial Reporting Manager for Parker Global Strategies, LLC (2009-2012). |
Ted Uhl, 1974 | Chief Compliance Officer (“CCO”) | Since 2010 | Mr. Uhl joined ALPS in October 2006, and is currently Deputy Compliance Officer of ALPS. Prior to his current role, Mr. Uhl served as Senior Risk Manager for ALPS from October 2006 until June 2010. Before joining ALPS, Mr. Uhl served a Sr. Analyst with Enenbach and Associates (RIA), and a Sr. Financial Analyst at Sprint. Because of his position with ALPS, Mr. Uhl is deemed an affiliate of the Trust as defined under the 1940 Act. Mr. Uhl is also CCO of Alpha Alternative Asset Fund, Centre Funds, GraniteShares ETF Trust, Reaves Utility Income Fund and XAI Octagon Floating Rate & Alternative Income Term Trust. Mr. Uhl formerly served as CCO of the Boulder Growth & Income Fund, Inc., Index Funds and Reality Shares ETF Trust. |
Michael P. Lawlor, 1969 | Secretary | Since 2022 | Mr. Lawlor joined ALPS in January 2022, and is currently Vice President and Principal Legal Counsel. Prior to joining ALPS, Mr. Lawlor was Lead Fund Counsel at Brighthouse Financial (insurance company) (January 2007-April 2021). Mr. Lawlor also serves as Secretary of ALPS ETF Trust and ALPS Variable Investment Trust. |
Brenda Haskell, 1981 | Assistant Secretary | Since 2023 | Ms. Haskell joined ALPS in October 2022 and is currently a Senior Paralegal of ALPS Fund Services, Inc. and is the Assistant Secretary of ALPS Variable Investment Trust. Prior to joining ALPS Ms. Haskell worked at Ironhorse Funding LLC (November 2021 – September 2022) and Fidelity Investments (June 2000 – October 2021). |
Sheri Zetterower, 1963 | Assistant Secretary | Since 2023 | Ms. Zetterower rejoined ALPS in August 2022 and is currently a Senior Paralegal of ALPS Fund Services, Inc. Prior to her current role, Ms. Zetterower worked at Ultimus Fund Solutions, Inc. (November 2020 – August 2022) and ALPS Fund Services, Inc. (April 2013 – October 2020). |
| * | All communications to Officers may be directed to Financial Investors Trust c/o 1290 Broadway, Suite 1000, Denver, CO 80203. |
| ** | This is the period for which the Officer began serving the Trust. Officers are appointed on an annual basis. |
| *** | Except as otherwise indicated, each individual has held the office shown or other offices in the same company for the last five years. Because of their respective positions with ALPS, each officer is considered an affiliated person of the Trust as defined under the 1940 Act. |
| **** | The Fund Complex includes all series of the Trust and any other investment companies for which the following list of investment advisers provides investment advisory services: SS&C ALPS Advisors, Inc., CoreCommodity Management, LLC, Kotak Mahindra Asset Management (Singapore) Pte. Ltd., RiverFront Investment Group, LLC and Smith Capital Investors, LLC. |
Privacy Policy
October 31, 2023 (Unaudited)
| FACTS | WHAT DO THE FUNDS DO WITH YOUR PERSONAL INFORMATION? |
| WHY? | Financial companies choose how they share your personal information. Federal law gives consumers the right to limit some but not all sharing. Federal law also requires us to tell you how we collect, share, and protect your personal information. Please read this notice carefully to understand what we do. |
| WHAT? | The types of personal information we collect and share depend on the product or service you have with us. This information can include: |
| | ● Social Security number and account transactions ● Account balances and transaction history ● Wire transfer instructions |
| HOW? | All financial companies need to share customers’ personal information to run their everyday business. In the section below, we list the reasons financial companies can share their customers’ personal information; the reasons the Funds choose to share; and whether you can limit this sharing. |
| REASONS WE CAN SHARE YOUR PERSONAL INFORMATION | DO THE FUNDS SHARE: | CAN YOU LIMIT
THIS SHARING? |
For our everyday business purposes –
such as to process your transactions, maintain your account(s), respond to court orders and legal investigations, or report to credit bureaus | Yes | No |
For our marketing purposes –
to offer our products and services to you | No | We do not share. |
| For joint marketing with other financial companies | No | We do not share. |
For our affiliates’ everyday business purposes –
information about your transactions and experiences | Yes | No |
For our affiliates’ everyday business purposes –
information about your creditworthiness | No | We do not share. |
| For non-affiliates to market to you | No | We do not share. |
Privacy Policy
October 31, 2023 (Unaudited)
| WHO WE ARE | |
| Who is providing this notice? | Financial Investors Trust |
| WHAT WE DO | |
| How do the Funds protect my personal information? | To protect your personal information from unauthorized access and use, we use security measures that comply with federal law. These measures include computer safeguards and secured files and buildings. |
How do the Funds collect my personal information? | We collect your personal information, for example, when you ● open an account ● provide account information or give us your contact information ● make a wire transfer or deposit money |
Why can’t I limit all sharing? | Federal law gives you the right to limit only ● sharing for affiliates’ everyday business purposes-information about your creditworthiness ● affiliates from using your information to market to you ● sharing for non-affiliates to market to you State laws and individual companies may give you additional rights to limit sharing. |
| DEFINITIONS | |
| Affiliates | Companies related by common ownership or control. They can be financial and nonfinancial companies. |
| Non-affiliates | Companies not related by common ownership or control. They can be financial and nonfinancial companies. ● The Funds do not share with non-affiliates so they can market to you. |
| Joint marketing | A formal agreement between non-affiliated financial companies that together market financial products or services to you. ● The Funds do not jointly market. |
| OTHER IMPORTANT INFORMATION | |
| California Residents | If your account has a California home address, your personal information will not be disclosed to nonaffiliated third parties except as permitted by applicable California law, and we will limit sharing such personal information with our affiliates to comply with California privacy laws that apply to us. |
| Vermont Residents | The State of Vermont requires financial institutions to obtain your consent prior to sharing personal information that they collect about you with affiliated companies and nonaffiliated third parties other than in certain limited circumstances. Except as permitted by law, we will not share personal information we collect about you with nonaffiliated third parties or other affiliated companies unless you provide us with your written consent to share such information. |
| QUESTIONS? | Call 1-866-759-5679 or go to www.alpsfunds.com |


Table of Contents
| Disclosure of Fund Expenses | 1 |
| Management Commentary | 4 |
| Performance Update | 10 |
| Statements of Investments | 18 |
| Statements of Assets and Liabilities | 74 |
| Statements of Operations | 76 |
| Statements of Changes in Net Assets | 77 |
| Financial Highlights | 81 |
| Notes to Financial Statements | 97 |
| Report of Independent Registered Public Accounting Firm | 108 |
| Additional Information | 109 |
| Board Considerations Regarding Approval of Investment Advisory Agreement and Investment Sub-Advisory Agreements | 110 |
| Liquidity Risk Management Program | 113 |
| Trustees and Officers | 114 |
| Privacy Policy | 117 |
alpsfunds.com
Disclosure of Fund Expenses
October 31, 2023 (Unaudited)
Example. As a shareholder of the Funds, you incur two types of costs: (1) transaction costs, including applicable sales charges (loads) and redemption fees; and (2) ongoing costs, including management fees, distribution and service (12b-1) fees, shareholder service fees and other Fund expenses. The following examples are intended to help you understand your ongoing costs (in dollars) of investing in the Funds and to compare these costs with the ongoing costs of investing in other mutual funds. The examples are based on an investment of $1,000 invested on May 1, 2023 and held until October 31, 2023.
Actual Expenses. The first line under each class in the table below provides information about actual account values and actual expenses. You may use the information in this line, together with the amount you invested, to estimate the expenses that you paid over the period. Simply divide your account value by $1,000 (for example, an $8,600 account value divided by $1,000 = 8.6), then multiply the result by the number in the first line under the heading “Expenses Paid During Period May 1, 2023 – October 31, 2023” to estimate the expenses you paid on your account during this period.
Hypothetical Example for Comparison Purposes. The second line under each class in the table below provides information about hypothetical account values and hypothetical expenses based on the Fund’s actual expense ratio and an assumed rate of return of 5% per year before expenses, which is not the Fund’s actual return. The hypothetical account values and expenses may not be used to estimate the actual ending account balance or expenses you paid for the period. You may use this information to compare the ongoing costs of investing in the Funds and other mutual funds. To do so, compare these 5% hypothetical examples with the 5% hypothetical examples that appear in the shareholder reports of the other funds.
Please note that the expenses shown in the table are meant to highlight your ongoing costs only and do not reflect any transactional costs, such as sales charges or redemption fees. Therefore, the second line under each class in the table below is useful in comparing ongoing costs only, and will not help you determine the relative total costs of owning different funds. In addition, if these transactional costs were included, your costs would have been higher.
Disclosure of Fund Expenses
October 31, 2023 (Unaudited)
| | | Beginning Account Value May 1, 2023 | | | Ending Account Value October 31, 2023 | | | Expense Ratio(a) | | | Expenses Paid During Period May 1, 2023 - October 31, 2023(b) | |
| ALPS | Smith Short Duration Bond Fund | | | | | | | | | | | | | | | | |
| Investor Class | | | | | | | | | | | | | | | | |
| Actual | | $ | 1,000.00 | | | $ | 1,007.90 | | | | 0.79 | % | | $ | 4.00 | |
| Hypothetical (5% return before expenses) | | $ | 1,000.00 | | | $ | 1,021.22 | | | | 0.79 | % | | $ | 4.02 | |
| Class A | | | | | | | | | | | | | | | | |
| Actual | | $ | 1,000.00 | | | $ | 1,008.30 | | | | 0.70 | % | | $ | 3.54 | |
| Hypothetical (5% return before expenses) | | $ | 1,000.00 | | | $ | 1,021.68 | | | | 0.70 | % | | $ | 3.57 | |
| Class C | | | | | | | | | | | | | | | | |
| Actual | | $ | 1,000.00 | | | $ | 1,005.30 | | | | 1.49 | % | | $ | 7.53 | |
| Hypothetical (5% return before expenses) | | $ | 1,000.00 | | | $ | 1,017.69 | | | | 1.49 | % | | $ | 7.58 | |
| Class I | | | | | | | | | | | | | | | | |
| Actual | | $ | 1,000.00 | | | $ | 1,009.40 | | | | 0.49 | % | | $ | 2.48 | |
| Hypothetical (5% return before expenses) | | $ | 1,000.00 | | | $ | 1,022.74 | | | | 0.49 | % | | $ | 2.50 | |
| ALPS | Smith Total Return Bond Fund | | | | | | | | | | | | | | | | |
| Investor Class | | | | | | | | | | | | | | | | |
| Actual | | $ | 1,000.00 | | | $ | 943.60 | | | | 0.89 | % | | $ | 4.36 | |
| Hypothetical (5% return before expenses) | | $ | 1,000.00 | | | $ | 1,020.72 | | | | 0.89 | % | | $ | 4.53 | |
| Class A | | | | | | | | | | | | | | | | |
| Actual | | $ | 1,000.00 | | | $ | 943.50 | | | | 0.90 | % | | $ | 4.41 | |
| Hypothetical (5% return before expenses) | | $ | 1,000.00 | | | $ | 1,020.67 | | | | 0.90 | % | | $ | 4.58 | |
| Class C | | | | | | | | | | | | | | | | |
| Actual | | $ | 1,000.00 | | | $ | 940.00 | | | | 1.62 | % | | $ | 7.92 | |
| Hypothetical (5% return before expenses) | | $ | 1,000.00 | | | $ | 1,017.04 | | | | 1.62 | % | | $ | 8.24 | |
| Class I | | | | | | | | | | | | | | | | |
| Actual | | $ | 1,000.00 | | | $ | 943.90 | | | | 0.62 | % | | $ | 3.04 | |
| Hypothetical (5% return before expenses) | | $ | 1,000.00 | | | $ | 1,022.08 | | | | 0.62 | % | | $ | 3.16 | |
Disclosure of Fund Expenses
October 31, 2023 (Unaudited)
| | | Beginning Account Value May 1, 2023 | | | Ending Account Value October 31, 2023 | | | Expense Ratio(a) | | | Expenses Paid During Period May 1, 2023 - October 31, 2023(b) | |
| ALPS | Smith Credit Opportunities Fund | | | | | | | | | | | | | | | | |
| Investor Class | | | | | | | | | | | | | | | | |
| Actual | | $ | 1,000.00 | | | $ | 980.70 | | | | 1.10 | % | | $ | 5.49 | |
| Hypothetical (5% return before expenses) | | $ | 1,000.00 | | | $ | 1,019.66 | | | | 1.10 | % | | $ | 5.60 | |
| Class A | | | | | | | | | | | | | | | | |
| Actual | | $ | 1,000.00 | | | $ | 980.40 | | | | 1.12 | % | | $ | 5.59 | |
| Hypothetical (5% return before expenses) | | $ | 1,000.00 | | | $ | 1,019.56 | | | | 1.12 | % | | $ | 5.70 | |
| Class C | | | | | | | | | | | | | | | | |
| Actual | | $ | 1,000.00 | | | $ | 976.80 | | | | 1.90 | % | | $ | 9.47 | |
| Hypothetical (5% return before expenses) | | $ | 1,000.00 | | | $ | 1,015.63 | | | | 1.90 | % | | $ | 9.65 | |
| Class I | | | | | | | | | | | | | | | | |
| Actual | | $ | 1,000.00 | | | $ | 980.70 | | | | 0.90 | % | | $ | 4.49 | |
| Hypothetical (5% return before expenses) | | $ | 1,000.00 | | | $ | 1,020.67 | | | | 0.90 | % | | $ | 4.58 | |
| ALPS | Smith Balanced Opportunity Fund | | | | | | | | | | | | | | | | |
| Investor Class | | | | | | | | | | | | | | | | |
| Actual | | $ | 1,000.00 | | | $ | 983.20 | | | | 1.07 | % | | $ | 5.35 | |
| Hypothetical (5% return before expenses) | | $ | 1,000.00 | | | $ | 1,019.81 | | | | 1.07 | % | | $ | 5.45 | |
| Class A | | | | | | | | | | | | | | | | |
| Actual | | $ | 1,000.00 | | | $ | 983.00 | | | | 1.11 | % | | $ | 5.55 | |
| Hypothetical (5% return before expenses) | | $ | 1,000.00 | | | $ | 1,019.61 | | | | 1.11 | % | | $ | 5.65 | |
| Class C | | | | | | | | | | | | | | | | |
| Actual | | $ | 1,000.00 | | | $ | 979.30 | | | | 1.85 | % | | $ | 9.23 | |
| Hypothetical (5% return before expenses) | | $ | 1,000.00 | | | $ | 1,015.88 | | | | 1.85 | % | | $ | 9.40 | |
| Class I | | | | | | | | | | | | | | | | |
| Actual | | $ | 1,000.00 | | | $ | 984.40 | | | | 0.85 | % | | $ | 4.25 | |
| Hypothetical (5% return before expenses) | | $ | 1,000.00 | | | $ | 1,020.92 | | | | 0.85 | % | | $ | 4.33 | |
| (a) | Annualized, based on the Fund's most recent fiscal half year expenses. |
| (b) | Expenses are equal to the Fund's annualized expense ratio multiplied by the average account value over the period, multiplied by the number of days in the most recent fiscal half year (184), divided by 365. |
ALPS | Smith Funds
| Management Commentary | October 31, 2023 (Unaudited) |
Dear Shareholder,
The ALPS | Smith Total Return Bond Fund and ALPS | Smith Short Duration Bond Fund were launched on June 29, 2018. We followed with the launch of the ALPS | Smith Balanced Opportunity Fund and ALPS | Smith Credit Opportunities Fund on September 15, 2020. We welcome you as a shareholder to the Funds and thank you for your trust. Our process is centered on performance, relationships and investing excellence. Our goal is to provide shareholders with consistent, risk-adjusted returns with a keen focus on capital preservation.
Total Return
The ALPS | Smith Total Return Bond Fund Class I marked a positive return of 40 basis points (bps) in the twelve months ending October 31, 2023, while outperforming its benchmark, the Bloomberg US Aggregate Index, by 4 bps. The Fund outperformed the benchmark index by 712 bps since the inception of the Fund on June 29, 2018. The outperformance during the twelve-month period ending October 31, 2023, was attributed to security selection; primarily within corporate credit but also from the mortgage allocation in the Fund as the Fund’s positioning was less sensitive to the impact of increased interest rate volatility on mortgage-backed securities (MBS) performance. Sector allocation also contributed to the Fund’s outperformance for the period to a smaller extent. Yield curve positioning was a slight detractor to Fund performance for the period as the Fund’s US Treasury allocation and curve positioning were driven by risk management focused on offsetting some of the risk, yield curve and durations contribution impacts resulting for the MBS, and corporate positioning. The Fund’s overall performance since inception through October 31, 2023, was achieved by focusing on active sector rotation, duration management, security selection, and bottom-up fundamental credit analysis.
Short Duration
The ALPS | Smith Short Duration Bond Fund Class I marked a positive return of 369 bps in the twelve months ending October 31, 2023, outperforming its benchmark, the Bloomberg 1-3 Year US Government/Credit Index, by 46 bps. The Fund outperformed the benchmark index by 592 bps since the inception of the Fund on June 29, 2018. As a continuing theme, the Fund’s allocation to corporate bonds and a much smaller allocation to securitized assets allowed the Fund to out-yield the benchmark index during the period. The Fund’s allocation to floating rate securities helped performance on a calendar year-to-date (YTD) basis as rates trended higher. Additionally, individual security selection within corporate credit was a large component of the excess returns generated in the period. Duration management was an important contributor to performance for the period given the volatile moves in the front end. It was also important due to the cross currents resulting from the regional banking crisis earlier in the year, combined with the continued adjustment of the market to reflect a longer and higher than expected interest rate policy communicated by the Federal Reserve (Fed). The Fund continued to maintain its focus on capital preservation. While being overweight credit on a percentage basis vs. the benchmark, the Fund maintained a shorter credit duration positioning as valuations continued to compress and aimed to shield
investors from losses given moves higher in US Treasury (UST) yields and widening credit spreads.
Credit Opportunities
The ALPS | Smith Credit Opportunities Fund Class I marked a positive return of 155 bps in the twelve-month period ending October 31, 2023, underperforming its benchmark, a 50/50 blend of the Bloomberg US Aggregate Index and the Bloomberg US Corporate High Yield Index, by 172 bps. The Fund outperformed the Index by 320 bps since the inception of the Fund on September 15, 2020. The underperformance of the Fund over this annual period was predominately driven by security selection and duration/yield curve, partially offset by active asset allocation. Since inception, a dynamic several years, positive security selection along with asset allocation and active duration/yield curve management have aided the overall outperformance of the Fund. These pillars of returns, over a multi-year period, are the backbones from which the Fund seeks to generate its outperformance for fundholders.
Balanced Opportunity
The ALPS | Smith Balanced Opportunity Fund Class I marked a positive return of 537 bps in the twelve months ending October 31, 2023, while underperforming its benchmark, a blend of 55% Bloomberg 1000 / 45% Bloomberg Barclays US Aggregate Bond Index, by 3 bps. The Fund outperformed the Index by 419 bps since the inception of the Fund on September 15, 2020. The performance within the Fixed Income sleeve during the period was attributed to the Fund’s relative defensive duration positioning and an overweight in corporate credit assets, as well as corporate and securitized security selection. The Equity sleeve outperformed the Bloomberg 1000 equity index with broadly positive stock selection during the period. Overweights in strong performing industries like Software & Services, Semiconductors, and Media drove performance. Overall performance was also aided by the active asset reallocations between Equities and Fixed Income positions within the Fund’s portfolio. The Fund’s overall performance since inception was achieved by focusing on active portfolio positioning, duration management, security selection, bottom-up fundamental credit analysis and active asset allocation between the Fixed Income and Equity sleeves.
Macro Commentary
Throughout the twelve-month period, the market moved through three stages: 1) fear that the Federal Reserve was not slowing demand fast enough and the market pushing rate hike expectations materially higher. This quickly flipped to 2) pricing in well over 100 bps of rate cuts and an imminent recession due to the banking crisis. And finally, 3) accepting that the Fed may be able to facilitate a soft landing and adjusting the market to the Fed’s view of reaching the terminal level and pausing for an extended period. As the dust settled on what was a volatile twelve-month period, we saw the Fed raise rates to a range of 5.25-5.5% and pause, indicating that they are potentially nearing the terminal level while the data supports continued growth, albeit at a slower pace going forward. While the banking crisis unearthed the unintended consequences of tightening policy at a rapid pace, we can acknowledge both that the economy continues to have a strong foundation, yet event risk is likely in our future. As we ended the reporting period, views within the market
ALPS | Smith Funds
| Management Commentary | October 31, 2023 (Unaudited) |
started to converge and accept the Fed’s stance and the underlying strength of the economy. This unfortunately did not ease the market volatility from both risk and risk-free assets.
The overall theme for this period was a disconnect between the Fed and the market. The Fed held constant in its messaging and action, the economy—much to the market’s surprise—continued to show resilience and the market flipped between extremes before finally accepting both the Fed’s stance and the economy’s strong foundation.
We’ve sounded like a broken record for the past twelve months, but once again the consumer proved to remain resilient. Throughout the reporting period, we saw an average of 249k jobs created, over 9M jobs were still available and wages reported above 4% year-over-year (YoY) throughout the entire reporting period. Gross domestic product (GDP) for the reporting period marked 2.9% YoY and a pace of 4.9% seasonally adjusted annual rate (SAAR) in 3Q2023 with consumption reporting 2.4% YoY at the end of the reporting period. Confidence remains weak, reminding us that the consumer may not “feel” as healthy as the data suggests plus the consumer still believes inflation remains too high. While we believe there is a higher likelihood of event driven risk in the future, the consumer’s resilience remains a source of strength and continues to be underpinned by a strong foundation.
Housing and manufacturing continued to have a difficult time recovering from the recent low levels as noted within the economic data. As a reminder, the COVID-19 pandemic and recovery created massive imbalances for both sectors, and this was further disrupted by the Fed’s rapid rate hikes. Housing was aided in the initial stages of the pandemic by work- from-home and low-interest rates. As rates moved up, affordability became out of reach for many, and the pace of sales declined. The next stage of recovery saw limited supply hindering home sales. After rising nearly 45% YoY during the height of the crises, existing home sales are now down 15% YoY. Manufacturing was negatively impacted by supply chain disruptions as well as labor issues and pricing throughout the pandemic and recovery. As time passed, the tightening of financial conditions due to higher rates as well as shifting consumer trends weighed on the manufacturing sector. The ISM Manufacturing index remained below 50 - the point of expansion vs. contraction – for the entire reporting period. Comments continued to point to slowing demand, soaring borrowing costs and ongoing labor issues. Employment within the ISM report started to shift from a labor shortage issue to layoffs over the reporting period and after pricing fell for most of 2022, prices paid within the ISM report hovered around the recent low levels.
GDP came in at 2.9% YoY as of 3Q2023 vs. 1.7% YoY in the previous twelve-month reporting period. Final sales to domestic purchasers marked a 2.5% YoY pace at the end of the reporting period vs. 1.3% in the previous period. As mentioned above, the consumer registered 2.4% YoY at the end of the reporting period vs. 1.9% YoY previously and continued to remain a pillar of strength. Gross Private Investment marked 1.8% YoY and Government Consumption rose 4.5% YoY. The strong foundation of the economy and robust labor market undermined the Fed’s attempt to slow demand.
Inflation moved lower but still not as quickly as the Fed preferred and started to show possible signs of stickiness towards the end of
the reporting period. The Fed continued to have the luxury of focusing on the inflation side of the mandate as employment remained stable throughout the period. Core Consumer Price Index (CPI) reported a high of 6.6% YoY in September 2022 and is now down to 4.1% YoY. Core personal consumption expenditures (PCE) rose to 5.4% YoY in February 2022 and now sits at 3.7% YoY.
The Fed increased rates from a range of 3-3.25% to a range of 5.25- 5.5% over the twelve-month period. They paused at the current level and are willing to hold rates for an extended period or resume hiking if necessary to ensure that inflation moves back to their 2% mandate over time. As previously mentioned, the overall theme for this period was a disconnect between the Fed’s projections and the market’s desires for rate policy. We started 2023 with the market believing the Fed was behind the curve. Post the banking crisis in March, the market narrative flipped to an expectation that the Fed would cut rates well over 100 bps by January 2024. As of the end of October 2023, the market expected the terminal level to hold near 5.4% before easing to 4.56% by January 2025.
Exiting the fiscal year, the Issues that have plagued us for the past year remain - high inflation but a strong foundation and a resilient consumer. The Fed is fiercely focused on fighting inflation at the expense of growth and a recovery that is walking a very fine line between sub-potential and event driven risk. We believe there are many unintended consequences that have yet to be uncovered due to the Fed’s aggressive tightening policy and the ability to weather future events is wearing thin. In the meantime, volatility likely will remain with us for some time.
Portfolio Positioning (as of October 31, 2023)
Throughout the annual period ending October 2023, Smith Capital Investors (SCI) remained more defensive across most major Fixed Income asset classes. The market has undergone a substantial period of repricing as monetary policy turned restrictive in response to higher inflation.
Total Return: Asset allocation changes throughout the period were more nuanced than previous years given a focus on gradually increasing the MBS weighting of the Fund and skewing the corporate sector allocation towards more defensive sectors. As part of this, both the High Yield and Preferred security allocations within the Fund were near the lows since the Fund’s inception. Additionally, the Fund’s duration contribution across investment grade and high-yield credit continues to remain towards the lower end of the historical range at fiscal year end given moves in valuations and further increased uncertainty in the future macroeconomic environment. The Fed’s continued rate hikes and “Quantitative Tightening” (QT) served to reverse the “crowding out” effect the Fed targeted, post the Great Financial Crisis. We believe that this drain of liquidity across the investing universe will continue to increase the volatility of asset prices as markets seek to adjust to this new dynamic. Elevated volatility, combined with increased geopolitical uncertainty and concerns about corporate fundamentals, made us less constructive on corporate credit exiting the fiscal year. However, we have been encouraged by the resiliency of both the domestic consumer and corporate fundamentals through October 31, 2023. Meanwhile, there is a continued generic theme from management teams focusing on proactively addressing underlying
ALPS | Smith Funds
| Management Commentary | October 31, 2023 (Unaudited) |
business weaknesses and fortifying capital structures. Within the Fund’s corporate credit exposure, there has been a focus on utilizing the significant move higher in both short-duration interest rates and credit spreads to add to higher-yielding opportunities with short maturities. On the flip side, longer duration positioning within the Fund’s corporate credit exposure during the period was focused on what we see as more defensive, higher quality, less economically sensitive sectors that demonstrate less fundamental cyclicality in the event of an economic slowdown. At a high level, the Fund’s lower corporate credit duration profile helped reduce the Fund’s realized volatility from changing credit valuations during the fiscal year.
Exiting the period, we continue to seek investments in companies whose management interests are aligned with debtholders, either via reducing leverage or outright debt levels. Additionally, we look for a focus on managing through a variety of scenarios as we believe this provides optionality and downside protection. As mentioned previously, corporate fundamentals remained resilient during the period despite the economic weakness that has transpired due to the quantitative tightening cycle. Entering the next fiscal year, we intend to seek to maintain a close focus on how this impacts earnings reports going forward; however, thus far through October 31, 2023 the declines in earnings and forecasts have been much more impactful to equity valuations vs. the underlying creditworthiness of corporations.
As during most market conditions, short-duration high yield remains a focus for us. This area of the market historically has less forecasting error embedded in its analysis as it is a liquidity evaluation over a short period vs. a longer-term projection of industries, commodity prices and competitive dynamics facing a sector/company. We believe that positioning here allows the Fund to realize higher yield profiles vs. recent years while doing so at a more limited risk addition to the overall portfolio.
In addition, we are watching the market transition from a negative real rate environment (driven by Fed policy) to a positive real rate environment (more conscious of inflation). While this transition has created great volatility and significant markdowns on Fixed Income securities, we view this as healthy. In a world of negative real yields, and in some cases, negative absolute yields, valuations can exhibit a lack of common sense. We believe the transition back to a positive real rate will provide new and more attractive opportunities for investors within the Fixed Income space. At fiscal year end, duration and yield curve management continue to be of critical importance as we work through the next cycle.
Short Duration: While the Fund’s overall elevated credit exposure was maintained during the period, as of October 31, 2023, the exposure remains short with a focus on seeking to generate enhanced yield for shareholders due to the inverted shape of the interest rate curve. We believe this is a key part of the portfolio construction process as this high amount of “roll-off” allows for natural portfolio repositioning as economic and market conditions change. While corporate fundamentals have remained resilient, and the yield pickup is material vs. other asset classes, the increased uncertainty of the macro and corporate outlooks have argued for these proceeds to largely be reinvested in other asset classes, primarily US Treasuries. Given the material change in short-duration
US Treasury yields over the course of the Fed’s tightening, there was a shift in the Fund during the period towards allocating some exposure to more duration within the US Treasury bucket, which we believe would benefit from an economic slowdown and a pause or reversal in Fed policy direction.
Credit Opportunities: This annual period has been hallmarked by resilient consumer and corporate fundamentals which despite rates continuing to move higher has contributed to spreads tightening across both investment grade and high-yield bonds. With the move higher in rates and coupons resetting higher as companies come to the market to refinance existing bonds, or otherwise issue new financing, we believe the argument regarding the attractiveness of yield profiles (particularly current yield) and therefore income potential has become stronger.
Building into this yield environment, the Fund incrementally increased its exposure to corporate credit during the period, particularly seeking to take advantage of companies coming to the market and doing so with historically elevated coupons. Additionally, the Fund added to its securitized exposure as opportunities surfaced through the period, though the total exposure to this sleeve remains modest at fiscal year end.
Unique to this environment has been the shape of both the yield and the spread curves of corporate credit; both being historically flat. In this vein we have sought to take advantage of the presented opportunity to add the yield of high-quality companies and move in on the curve while sacrificing little to no give in yield to do so. We find that shorter maturity credit provides higher transparency and fewer required assumptions around future cash flows of the business, and when funds have the option to rely on fewer assumptions and receive similar yield that is an investment, we often find this attractive.
At fiscal year end, the Fund continues to maintain and actively manage around holding an elevated allocation to more liquid securities such as treasuries and low-volatility, shorter duration securities. We believe this allocation decision allows the Fund optionality around new opportunities as well as any future volatility and/or dislocations across asset classes that may develop in the future.
As always, the Fund continues to be built from the bottom-up, seeking to take advantage of predominately fundamentally improving businesses, capital structures and credit profiles. Understanding a company’s entire capital structure and how its management team is driving value creation across that structure continues to be a decisive focus of the Fund. Opportunities, like the broad flatness in yield and spread curves, as well as elevated new issue coupons are executed within the context of our fundamental view on an individual credit and the risk-adjusted return potential of the security targeted within its capital structure.
Balanced: The Fixed Income sleeve was run largely in line with the Total Return Fund, reallocating the Fund’s credit exposure throughout the period—most notably reducing the Fund’s high yield and preferred exposure and shifting the Fund’s investment grade exposure towards more defensive sectors and issuers. Overall
ALPS | Smith Funds
| Management Commentary | October 31, 2023 (Unaudited) |
portfolio duration was actively managed with continued market fears around sticky inflation and the potential forward path of the Fed. Notably, compared to the Total Return Fund, at period end the Fund continues to run a lower relative credit risk profile given the current asset allocation between Fixed Income and Equities. The Fund was ~67% invested in the Equity sleeve and ~33% in the Fixed Income sleeve due to the market opportunity at the end of the period. Most of the active risk in the Fund is attributable to stock selection.
The Equity sleeve maintained a balanced style approach through the period. As Growth outperformed in the first half of the period the fund gradually too profits and reallocated to more Value exposed sectors such as Financials and Industrials. Throughout, the fund maintained it’s preference for higher Quality businesses with lower leverage and higer Return on Invested Capital than the index. At the end of the period the Equity Sleeve’s largest overweights versus the Bloomberg 1000 Index were Energy and Industrials, reflecting a belief that equity markets begin to look toward cyclical reacceleration over the next 12 to 18 months. The Equity Sleeve is underweight Technolgy and Utilities reflecting generally high valuations in those two sectors. Most of the active risk in the Fund is attributable to stock selection.
Within the Funds’ US Treasury allocations, we remained active in duration management throughout the period given the disconnect between the Fed and the market but ended the period near duration neutral to the Funds’ respective indices, specifically in Total Return. The Short Duration Fund mostly remained underweight vs. each of its benchmark indices due to the repricing of Fed expectations throughout the period. The market swung from believing the Fed was behind the curve, to pricing in a 100 bps cut during the banking crisis, to finally accepting the Fed’s view as we ended the period. The economic foundation remained stable throughout, and the Fed reconfirmed their commitment to the 2% inflation mandate. The 2- yr moved in a range of 3.77-5.22% over the year. February reacted to expectations that the Fed was behind the curve, while the lows were reached in March with the banking crisis. As we moved into October, new yield highs were set as the market accepted the strength of the economy. During the same period, the 30-yr moved between 3.43-5.11%, shifting between a flight to quality move and reacting to strong growth and sticky inflation. Attractive outright yield levels at the end of the period, coupled with geopolitical fears and the unintended risk associated with the Fed’s tightening policy, allowed the Fund to utilize Treasuries when the opportunity presented itself. Additionally, we remained proactive in using the longer duration US Treasury position as an insurance policy and believe that we are nearing peak yields for this cycle as the Fed is close to the terminal level and inflation is showing signs of easing.
Within the Funds’ securitized allocations, we continued to increase the Funds’ allocations to Agency-backed mortgage-backed securities via specific mortgage pools, collateralized mortgage obligations (CMOs) and Agency guaranteed commercial mortgage-backed securities (CMBS). Valuations for these asset classes had been very repressed following the direct Fed investment in this area of the market as part of its COVID-19 Quantitative Easing (QE) response. Overall, elevated interest rate volatility, the increase in mortgage
rates, slowdown in prepayments and the ongoing reduction in the Federal Reserve’s MBS holdings were headwinds for this area of the market during the period. Over the previous year, valuations adjusted to these new realities to a point that we believe mortgages are now offered, finally, at an attractive risk-adjusted return profile to compete with other major asset classes. As such, we continued to add to the space while acknowledging that the headwinds for the asset class are unlikely to abate. At fiscal year end, we continue to believe that select CMOs and Agency CMBS provide better convexity, exhibit less change in duration given changes in interest rates and prepayment speeds, and provide higher option-adjusted spreads and yield compared to the broader market. Throughout the year, we were aided in navigating volatility by our continued focus on seeking to select securities that perform well through a wide band of underlying economic and interest rate assumptions rather than a specific directional view.
Fixed Income Themes
Credit – The collapse of Silicon Valley Bank (SVB) brought the market to grips with the lagged effects of much tighter rate policy in the US and across the globe. While the extremity and perceived speed is not the same as that during in the whirlwind period around the downfall of SVB, at fiscal year end we are still seeing the effects of tightening on both corporates (particularly those with high amounts of floating rate debt) and consumers.
One thing we certainly walked away with was that income is back in fixed income, which we believe to be important for several reasons. Namely, where yields are the contractual return (interest income), absent a default (importance of security selection), yields acts as both a tailwind for forward return profiles as well as a buffer against downside volatility. Said another way, yields act as both a sail and ballast for fixed income returns, giving the structural propensity for positive forward returns and acting as the protection or absorption mechanism by which to weather stormy seas.
With this in mind, we do not put a lot of emphasis on precisely forecasting what tomorrow will look like, rather we have found focusing on things that are likely to prevail important and steadfast in numerous, though uncertain, economic environments to be more fruitful over a longer period for security selection. Some of these factors include resiliency of free cash flow profiles, defensible capital allocation favoring creditors and management intentions towards balance sheet positioning.
On management intentions, this year we saw many company management teams be proactive in addressing and strengthening capital structures with calls, tenders and outright debt reduction. We find this type of behavior encouraging and often exemplary of actions we want to allocate capital alongside.
Lastly, given the likely widening range of outcomes on the horizon at fiscal year end, we fall back on not only the above but also place elevated prominence on the following:
Security Selection – No matter the inning of the credit cycle or the outlook, there will always be differences in performance created by changing corporate credit risk profiles and influencing catalysts. In addition to focusing on securities with strong risk-adjusted returns,
ALPS | Smith Funds
| Management Commentary | October 31, 2023 (Unaudited) |
we look to overweight issuers that we believe display higher probabilities for improving credit strength, regardless of the macroeconomic backdrop.
Security Avoidance – Active management can purposefully choose to avoid owning certain credits or securities and should do so. In our view, a credit that has a higher probability of going through a phase of deteriorating credit strength would be a prime example of a name to avoid. On the security side, there may be fundamental, structural, or technical factors that create a lower estimated ratio of potential upside relative to the downside.
Risk-Adjusted Carry – Highlighted above, carry (yield income) is of elevated importance. This said, not all carry is the same. Fundamental analysis can unearth risk profiles that may be viewed more or less favorably when compared to their commensurate carry profiles. We believe the amplifying nature of duration and the continued general flatness of all-in-yield credit curves only increase the importance of focusing on risk-adjusted return profiles.
MBS – After the poor relative performance the previous year, despite the continued headwinds for the asset class, MBS marginally outperformed during this fiscal year. As of October 31, 2023, the Bloomberg US MBS Index (MBS Index) had nominal returns of positive 22 bps for the last fiscal year driven largely by the improved yield profile of these securities post the massive change in valuations marked in 2022. Year to date through the end of the period, despite intra-period volatility, nominal MBS spreads finished the last fiscal year essentially unchanged at 178 bps compared to 174 bps as of October 31, 2022. However, this does not tell the entire story as the option adjusted spread (OAS) of the MBS Index ranged between 35 and 85 bps for the period. From an excess return perspective, which adjusts for duration differentials, the MBS Index outperformed the Bloomberg US Aggregate Bond Index by 20 bps. Looking forward, we believe there is real potential for MBS outperformance on the horizon. At fiscal year end, MBS nominal spreads and option-adjusted spreads remain elevated compared to historical ranges and yield profiles of securities are vastly improved compared to the last ten years. We believe this should help to offset some of the impacts of the Fed’s MBS runoff, making the risk-adjusted return outlook from MBS much more balanced than it has been for the last couple of years.
Interest Rates – The Treasury landscape changed dramatically throughout the period. Volatility was high, marking both extremes. After believing the Fed was behind the curve, markets flipped to event driven risks, specifically the collapse of SVB and Signature Bank followed by First Republic Bank. The front-end moved up rapidly in February, reaching a recent high yield of 5.07 as Fed expectations repriced on fears of sticky inflation. This quickly reversed, falling to 3.77 due to fears that the Fed’s ~500 bps of rate hikes would have unintended consequences for the economy. Both the 10-yr and 30-yr moved within ~90 bps range throughout as the market flipped between the sticky inflation narrative and a flight-to-quality rally. After the economy marked strength after strength, the market finally came around to the view that the Fed would be able to facilitate a soft landing. The period ended with 2’s and 30’s flat to each other at 5.09% as the market expected the Fed to hold at the
terminal level while growth continued, and inflation slowly moving back towards the Fed’s target.
The Fed continued the rate hiking path through the market volatility, raising rates from 3.25 to 5.5% (upper bound range) over the reporting period, clearly stating that they had more work to do to bring inflation down. The 10 year-3 month curve inverted further, suggesting impending recession before starting to unwind the extreme inversions midway through the period. The 2 year/30 year, 5 year/10 year, 5 year/30 year and 10 year/30 year curves moved back to a positive curve relationship. As of the end of the reporting period, markets expect the Fed to pause rates at the 5.25-5.5% level before cutting rates to 4.56% by January 2025. We were once again reminded throughout the market volatility that the long-end remains a safe haven asset in a flight-to-quality move.
The Fed appears to be nearing the end of the aggressive rate hiking cycle, but they remain committed to slowing demand to bring inflation back to the 2% mandate. This suggests that the Fed will be on hold at the terminal level, likely 5.5%, for longer than the market desires. Given the strong data we received at the end of the reporting period, the market’s hand was forced to concede to the Fed’s soft-landing narrative. While we are happy with the strength of the economy, specifically the consumer, we are closely watching for the next event driven risk. Additionally, inflation data is showing early signs of stickiness after the vast improvement we made this past year. The first quarter of the calendar year reminded us that warning signs are flashing, and recession probability was elevated. The second quarter proved why we remain productive on the strength of the labor market and the resilience of the consumer. And the third quarter reinforced that this is a new era and both businesses and consumers have adjusted to higher rates relatively well. We are very much still in an adjustment phase which is and will continue to be painful, but if the COVID-19 pandemic has taught us anything, it is to expect the unexpected. There will be winners and losers, similar to the heart of the pandemic. Given the strong foundation of both businesses and consumers, we believe there is a reasonable chance that the economy can continue to grow at sub-potential levels, but the margin of error is increasing. The Fed is walking a thin line between making sure that inflation is completely under control and creating a recession. Thus far, even with the market risk and volatility we registered in 2023, the Fed is committed to fighting inflation. The push/pull between the market’s view and the Fed’s desires has been a consistent theme for many years and will continue going forward.
At fiscal year end, we are opportunistic in this market both in credit and US Treasury exposure given the recent large-scale moves in valuations. At a high level, we expect that Treasuries will become more appreciated by the market as we get closer to the end of the Fed’s hiking cycle, allowing Treasuries to once again be utilized as an off set in a risk off market as a flight-to-quality move.
Conclusion
We have once again been reminded that cycles are shorter, and the market reprices much faster than in previous periods. While we spent the annual period living between extreme market events and opposing views, when we cut through the short-term noise, we remain constructive on the foundation of the economy.
ALPS | Smith Funds
| Management Commentary | October 31, 2023 (Unaudited) |
We continue to live in a push/pull between the Fed and the market and while it briefly looked like the market won the first round in 2023, the Fed is still in the game and ended 2023 strong. With the increased market volatility, we believe in defensiveness and incrementalism and remain excited for the market opportunities ahead in Fixed Income. Exiting the period, we not only have heightened levels of liquidity across the Funds’ portfolios, but we are also focused on seeking to make smart but aggressive moves while leaning on the math behind the market as our keys to success.
In our view, the risks are rising, and the outlook is less straight-forward as we near the end of the current cycle. While the Fed will continue to fight inflation, in our view they are closer to the terminal level than previous periods. We are encouraged by both consumers and businesses but recognize that the economy remains uneven. We believe there is still a small chance that the Fed can facilitate a soft landing, maintain the terminal level, and allow the economy to grow at sub-potential levels. As time progresses, this view is becoming more likely, and a range bound market may be ahead of us in 2024.
It is our view as of fiscal year end that the Funds’ portfolios over the next six- to-twelve months may look different as we enter the next phase in the cycle. Our job is to seek to recognize changes in sentiment and direction in markets. With current outright levels on yields, at fiscal year end our view is that the market looks more attractive—even considering the uncertainty on the horizon - than at many points over the last five years. To say we are excited about the opportunity in the Fixed Income space is an understatement. It is our belief that portfolios should change and evolve as we move through cycles is reinforced in this environment. There will be a time in the future when opportunistic positioning will be rewarded.
At our core, we are active managers, and both security selection and avoidance are always at the front of our mind. Our three pillars continue to drive our actions—Investment Excellence, Relationships/ People, and Intentional Culture.
With great appreciation and gratitude,
 |  |
| R. Gibson Smith | Eric C. Bernum, CFA |
| Portfolio Manager | Portfolio Manager |
| | |
 |  |
| Jonathan Aal | Garrett Olson, CFA |
| Portfolio Manager | Portfolio Manager |
| | |
 |  |
| Laton Spahr, CFA | Eric Hewitt |
| Portfolio Manager (ALPS Advisors) | Portfolio Manager (ALPS Advisors) |
Past performance is no guarantee of future results. Dividends are not guaranteed and are subject to change or elimination. Investments in international and emerging markets securities include exposure to risks such as currency fluctuations, foreign taxes and regulations, and the potential for illiquid markets and political instability.
The views of the author and information discussed in this commentary are as of the date of publication, are subject to change, and may not reflect the writer's current views. The views expressed are those of the author only, and represent an assessment of market conditions at a specific point in time, are opinions only and should not be relied upon as investment advice regarding a particular investment or markets in general. Such information does not constitute a recommendation to buy or sell specific securities or investment vehicles. It should not be assumed that any investment will be profitable or will equal the performance of the fund(s) or any securities or any sectors mentioned in this letter. The subject matter contained in this letter has been derived from several sources believed to be reliable and accurate at the time of compilation. Neither ALPS Advisors, Inc., Smith Capital Investors, LLC, nor the Funds accepts any liability for losses either direct or consequential caused by the use of this information.
Indices do not reflect deductions for fees, expenses, or taxes.
An investor may not invest directly in an index.
Diversification cannot guarantee gain or prevent losses.
Gibson Smith is a registered representative of ALPS Distributors, Inc.
Eric Bernum is a registered representative of ALPS Distributors, Inc.
The Fund’s investments in fixed-income securities and positions in fixed-income derivatives may decline in value because of changes in interest rates. As nominal interest rates rise, the value of fixed-income securities and any long positions in fixed-income derivatives held by the Fund are likely to decrease, whereas the value of its short positions in fixed-income derivatives is likely to increase.
ALPS Advisors, Inc. is the investment adviser to the Fund and Smith Capital Investors, LLC is the investment sub-adviser to the Fund. ALPS Advisors, Inc., ALPS Distributors, Inc. and ALPS Portfolio Solutions Distributor, Inc., affiliated entities, are unaffiliated with Smith Capital Investors, LLC. ALPS Portfolio Solutions Distributor, Inc. is the distributor for the Fund.
ALPS | Smith Short Duration Bond Fund
| Performance Update | October 31, 2023 (Unaudited) |
Performance of $100,000 Initial Investment (as of October 31, 2023)
Comparison of change in value of a $100,000 investment
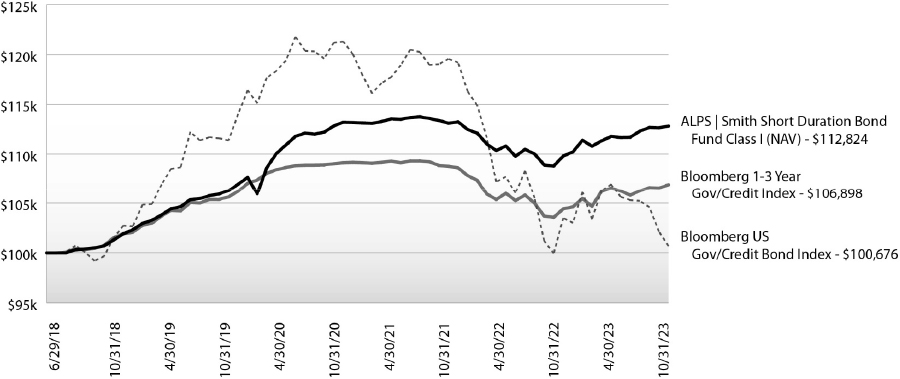
The chart above represents historical performance of a hypothetical investment of $100,000 in the Fund since inception. Past performance does not guarantee future results. This chart does not reflect the deduction of taxes that a shareholder would pay on Fund distributions or the redemption of Fund shares.
Average Annual Total Returns (as of October 31, 2023)
| | 1 Year | 3 Year | 5 Year | Since Inception^ | Total Expense Ratio* | What You Pay* |
| Class I | 3.69% | 0.18% | 2.34% | 2.29% | 0.56% | 0.49% |
| Investor (NAV) | 3.39% | -0.11% | 2.08% | 1.99% | 0.85% | 0.79% |
| Class A (NAV) | 3.42% | -0.05% | 2.09% | 2.01% | 0.84% | 0.79% |
| Class A (MOP) | 1.09% | -0.79% | 0.95% | 0.94% |
| Class C (NAV) | 2.66%+ | -0.84% | 1.32% | 1.25% | 1.53% | 1.49% |
| Class C (CDSC) | 1.66% | -0.84% | 1.32% | 1.25% |
| Bloomberg U.S. Government/Credit Bond Index¹ | 0.74% | -5.58% | 0.30% | 0.13% | | |
| Bloomberg 1-3 Year Government/Credit Bond Index² | 3.23% | -0.62% | 1.25% | 1.26% | | |
Performance data quoted represents past performance. Past performance does not guarantee future results. Investment return and principal value of an investment will fluctuate so that an investor's shares, when sold or redeemed, may be worth more or less than the original cost. Current performance data may be higher or lower than actual data quoted. For the most current month-end performance data, please call 1-866-759-5679.
Effective September 1, 2020 the Maximum Offering Price (MOP) for Class A shares includes the Fund’s maximum sales charge of 2.25%. Prior to September 1, 2020 the sales charge was 5.50%. Performance shown at NAV does not include these sales charges and would have been lower had it been taken into account. If you invest $500 thousand or more, either as a lump sum or through the Fund’s accumulation or letter of intent programs, you can purchase Class A shares without an initial sales charge (load). A Contingent Deferred Sales Charge (“CDSC”) of 1.00% may apply to Class C shares redeemed within the first 12 months after a purchase, and on Class A shares redeemed within the first 18 months after a purchase in excess of $1 million.
ALPS | Smith Short Duration Bond Fund
| Performance Update | October 31, 2023 (Unaudited) |
| 1 | Bloomberg US Government/Credit Index: a broad-based benchmark that measures the non-securitized component of the US Aggregate Index. It includes investment grade, US dollar-denominated, fixed-rate Treasuries, government-related and corporate securities. One may not invest directly in an index. |
| 2 | Bloomberg 1-3 Year US Government/Credit Index: includes all medium and larger issues of US government, investment-grade corporate, and investment-grade international dollar-denominated bonds that have maturities of between 1 and 3 years and are publicly issued. One may not invest directly in an index. |
| ^ | Fund Inception date of June 29, 2018. |
| * | Please see the prospectus dated February 28, 2023 for additional information. ALPS Advisors, Inc. (the “Adviser”) and Smith Capital Investors, LLC (the “Sub-Adviser”) have agreed contractually to limit the amount of the Fund’s total annual expenses, exclusive of Distribution and Service (12b-1) Fees, Shareholder Service Fees, Acquired Fund Fees and Expenses, brokerage expenses, interest expenses, taxes and extraordinary expenses, to 0.49% of the Fund’s average daily net assets. This agreement (the “Expense Agreement”) is in effect through February 28, 2024. |
| + | Excludes adjustments in accordance with accounting principles generally accepted in the United States of America and as such, the net asset value and total return for shareholder transactions reported to the market may differ from the net asset value for financial reporting purposes. |
The table does not reflect the deduction of taxes that a shareholder would pay on Fund distributions or the redemption of Fund shares.
This Fund is not suitable for all investors, and is subject to investment risks, including possible loss of the principal amount invested.
There is no guarantee that the Fund will continue to hold any one particular security or stay invested in any one particular company. The composition of the Fund's top holdings is subject to change. Performance figures are historical and reflect the change in share price, reinvested distributions, changes in net asset value, sales charges and capital gains distributions, if any.
Not FDIC Insured – No Bank Guarantee – May Lose Value
Asset Type Allocation (as a % of Net Assets) †
| Corporate Bonds | 77.75% |
| Government Bonds | 20.18% |
| Mortgage-Backed Securities | 0.88% |
| Collateralized Mortgage Obligations | 0.09% |
| Commercial Mortgage-Backed Securities | 0.04% |
| Cash, Cash Equivalents, & Other Net Assets | 1.06% |
| Total | 100.00% |
| † | Holdings are subject to change, and may not reflect the current or future position of the portfolio. Table presents approximate values only. |
Top Ten Holdings (as a % of Net Assets) †
| U.S. Treasury Note 3.125% 8/15/2025 | 4.26% |
| U.S. Treasury Note 5.00% 9/30/2025 | 3.10% |
| U.S. Treasury Note 4.625% 3/15/2026 | 2.94% |
| U.S. Treasury Note 4.625% 6/30/2025 | 2.77% |
| U.S. Treasury Note 4.75% 7/31/2025 | 2.35% |
| VICI Properties LP 4.375% 5/15/2025 | 1.68% |
| Midwest Connector Capital Co. LLC 3.9% 4/1/2024 | 1.59% |
| U.S. Treasury Note 4.625% 9/30/2028 | 1.59% |
| Vistra Operations Co. LLC 4.875% 5/13/2024 | 1.26% |
| General Motors Financial Co., Inc. 6.05% 10/10/2025 | 1.15% |
| Top Ten Holdings | 22.69% |
| † | Holdings are subject to change, and may not reflect the current or future position of the portfolio. Table presents approximate values only. |
Industry Sector Allocation (as a % of Net Assets)
| Sovereign | 20.18% |
| Banks | 19.87% |
| Auto Manufacturers | 8.31% |
| Electric | 8.29% |
| Diversified Financial Services | 4.10% |
| Pipelines | 3.55% |
| Chemicals | 3.37% |
| Aerospace/Defense | 2.81% |
| Food | 2.35% |
| Retail | 2.16% |
| REITs | 2.00% |
| Software | 1.68% |
| Biotechnology | 1.52% |
| Telecommunications | 1.44% |
| Entertainment | 1.40% |
| Healthcare-Products | 1.30% |
| Healthcare-Services | 1.30% |
| Electronics | 1.29% |
| Commercial Services | 1.06% |
| Mortgage Securities | 1.01% |
| Other Industries (each less than 1%) | 9.95%* |
| Cash, Cash Equivalents, & Other Net Assets | 1.06% |
| Total | 100.00% |
* See Statement of Investments for detailed breakout of other industries.
ALPS | Smith Total Return Bond Fund
| Performance Update | October 31, 2023 (Unaudited) |
Performance of $100,000 Initial Investment (as of October 31, 2023)
Comparison of change in value of a $100,000 investment

The chart above represents historical performance of a hypothetical investment of $100,000 in the Fund since inception. Past performance does not guarantee future results. This chart does not reflect the deduction of taxes that a shareholder would pay on Fund distributions or the redemption of Fund shares.
Average Annual Total Returns (as of October 31, 2023)
| | 1 Year | 3 Year | 5 Year | Since Inception^ | Total Expense Ratio* | What You Pay* |
| Class I | 0.40% | -4.46% | 0.97% | 1.11% | 0.73% | 0.59% |
| Investor (NAV) | 0.23% | -4.70% | 0.68% | 0.83% | 0.98% | 0.89% |
| Class A (NAV) | 0.10%+ | -4.70% | 0.69% | 0.84% | 0.98% | 0.89% |
| Class A (MOP) | -2.20% | -5.41% | -0.44% | -0.22% |
| Class C (NAV) | -0.49% | -5.39% | -0.03% | 0.12% | 1.71% | 1.59% |
| Class C (CDSC) | -1.46% | -5.39% | -0.03% | 0.12% |
| Bloomberg US Aggregate Bond Index1 | 0.36% | -5.57% | -0.06% | -0.20% | | |
Performance data quoted represents past performance. Past performance does not guarantee future results. Investment return and principal value of an investment will fluctuate so that an investor's shares, when sold or redeemed, may be worth more or less than the original cost. Current performance data may be higher or lower than actual data quoted. For the most current month-end performance data, please call 1-866-759-5679.
Effective September 1, 2020 the Maximum Offering Price (MOP) for Class A shares includes the Fund’s maximum sales charge of 2.25%. Prior to September 1, 2020 the sales charge was 5.50%. Performance shown at NAV does not include these sales charges and would have been lower had it been taken into account. If you invest $500 thousand or more, either as a lump sum or through the Fund’s accumulation or letter of intent programs, you can purchase Class A shares without an initial sales charge (load). A Contingent Deferred Sales Charge (“CDSC”) of 1.00% may apply to Class C shares redeemed within the first 12 months after a purchase, and on Class A shares redeemed within the first 18 months after a purchase in excess of $1 million.
ALPS | Smith Total Return Bond Fund
| Performance Update | October 31, 2023 (Unaudited) |
| 1 | Bloomberg US Aggregate Bond Index: a broad-based benchmark that measures the investment grade, US dollar-denominated, fixed-rate taxable bond market. The index includes Treasuries, government-related and corporate securities, fixed-rate agency MBS, ABS and CMBS (agency and non-agency). One may not invest directly in an index. |
| ^ | Fund Inception date of June 29, 2018. |
| * | Please see the prospectus supplement dated August 25, 2023 for additional information. ALPS Advisors, Inc. (the “Adviser”) and Smith Capital Investors, LLC (the “Sub-Adviser”) have agreed contractually to limit the amount of the Fund’s total annual expenses, exclusive of Distribution and Service (12b-1) Fees, Shareholder Service Fees, Acquired Fund Fees and Expenses, brokerage expenses, interest expenses, taxes and extraordinary expenses, to 0.59% of the Fund’s average daily net assets. This agreement (the “Expense Agreement”) is in effect through February 28, 2025. |
| + | Excludes adjustments in accordance with accounting principles generally accepted in the United States of America and as such, the net asset value and total return for shareholder transactions reported to the market may differ from the net asset value for financial reporting purposes. |
The table does not reflect the deduction of taxes that a shareholder would pay on Fund distributions or the redemption of Fund shares.
This Fund is not suitable for all investors, and is subject to investment risks, including possible loss of the principal amount invested.
There is no guarantee that the Fund will continue to hold any one particular security or stay invested in any one particular company. The composition of the Fund's top holdings is subject to change. Performance figures are historical and reflect the change in share price, reinvested distributions, changes in net asset value, sales charges and capital gains distributions, if any.
Not FDIC Insured – No Bank Guarantee – May Lose Value
Asset Type Allocation (as a % of Net Assets) †
| Corporate Bonds | 38.62% |
| Government Bonds | 25.88% |
| Mortgage-Backed Securities | 17.23% |
| Collateralized Mortgage Obligations | 11.29% |
| Commercial Mortgage-Backed Securities | 2.69% |
| Preferred Stock | 2.40% |
| Bank Loans | 0.17% |
| Cash, Cash Equivalents, & Other Net Assets | 1.72% |
| Total | 100.00% |
| † | Holdings are subject to change, and may not reflect the current or future position of the portfolio. Table presents approximate values only. |
Top Ten Holdings (as a % of Net Assets) †
| U.S. Treasury Bond 4.125% 8/15/2053 | 4.21% |
| U.S. Treasury Note 5% 9/30/2025 | 4.10% |
| U.S. Treasury Note 5% 8/31/2025 | 3.38% |
| U.S. Treasury Bond 3.875% 5/15/2043 | 2.47% |
| U.S. Treasury Bond 3.625% 5/15/2053 | 2.26% |
| U.S. Treasury Bond 3.375% 8/15/2042 | 1.37% |
| U.S. Treasury Bond 3.625% 2/15/2053 | 1.25% |
| U.S. Treasury Bond 4% 11/15/2042 | 1.25% |
| U.S. Treasury Note 4.75% 7/31/2025 | 1.24% |
PNC Financial Services Group, Inc. 3M US SOFR + 3.94% 12/31/2049 | 1.14% |
| Top Ten Holdings | 22.67% |
| † | Holdings are subject to change, and may not reflect the current or future position of the portfolio. Table presents approximate values only. |
Industry Sector Allocation (as a % of Net Assets)
| Mortgage Securities | 31.17% |
| Sovereign | 25.98% |
| Banks | 7.81% |
| Pipelines | 3.93% |
| Electric | 2.94% |
| Diversified Financial Services | 2.91% |
| Auto Manufacturers | 2.45% |
| Media | 1.79% |
| Food | 1.76% |
| Aerospace/Defense | 1.54% |
| Oil & Gas | 1.43% |
| Pharmaceuticals | 1.28% |
| Biotechnology | 1.25% |
| Other Industries (each less than 1%) | 12.04%* |
| Cash, Cash Equivalents, & Other Net Assets | 1.72% |
| Total | 100.00% |
* See Statement of Investments for detailed breakout of other industries.
ALPS | Smith Credit Opportunities Fund
| Performance Update | October 31, 2023 (Unaudited) |
Performance of $100,000 Initial Investment (as of October 31, 2023)
Comparison of change in value of a $100,000 investment

The chart above represents historical performance of a hypothetical investment of $100,000 in the Fund since inception. Past performance does not guarantee future results. This chart does not reflect the deduction of taxes that a shareholder would pay on Fund distributions or the redemption of Fund shares.
Average Annual Total Returns (as of October 31, 2023)
| | 1 Year | 3 Year | Since Inception^ | Total Expense Ratio* | What You Pay* |
| Class I | 1.55% | -1.21% | -1.20% | 0.94% | 0.91% |
| Investor (NAV) | 1.29%+ | -1.48% | -1.49% | 1.21% | 1.21% |
| Class A (NAV) | 1.28% | -1.44% | -1.45% | 1.21% | 1.21% |
| Class A (MOP) | -0.96% | -2.18% | -2.16% |
| Class C (NAV) | 0.53%+ | -2.19% | -2.20% | 1.91% | 1.91% |
| Class C (CDSC) | -0.43% | -2.19% | -2.20% |
| 50% Bloomberg US Aggregate Bond Index / 50% Bloomberg US Corporate High Yield Bond Index1,2 | 3.27% | -2.21% | -2.26% | | |
| Bloomberg US Aggregate Bond Index | 0.36% | -5.57% | -5.54% | | |
| Bloomberg US Corporate High Yield Bond Index | 6.23% | 1.19% | 1.05% | | |
Performance data quoted represents past performance. Past performance does not guarantee future results. Investment return and principal value of an investment will fluctuate so that an investor's shares, when sold or redeemed, may be worth more or less than the original cost. Current performance data may be higher or lower than actual data quoted. For the most current month-end performance data, please call 1-866-759-5679.
Maximum Offering Price (MOP) for Class A shares includes the Fund’s maximum sales charge of 2.25%. Performance shown at NAV does not include these sales charges and would have been lower had it been taken into account. If you invest $500 thousand or more, either as a lump sum or through the Fund’s accumulation or letter of intent programs, you can purchase Class A shares without an initial sales charge (load). A Contingent Deferred Sales Charge (“CDSC”) of 1.00% may apply to Class C shares redeemed within the first 12 months after a purchase, and on Class A shares redeemed within the first 18 months after a purchase in excess of $1 million.
ALPS | Smith Credit Opportunities Fund
| Performance Update | October 31, 2023 (Unaudited) |
| 1 | Bloomberg US Aggregate Bond Index: a broad-based benchmark that measures the investment grade, US dollar-denominated, fixed-rate taxable bond market. The index includes Treasuries, government-related and corporate securities, fixed-rate agency MBS, ABS and CMBS (agency and non-agency). One may not invest directly in the index. |
| 2 | Bloomberg US Corporate High Yield Bond Index: measures the USD-denominated, high yield, fixed-rate corporate bond market. One may not invest directly in the index. |
| ^ | Fund Inception date of September 15, 2020. |
| * | Please see the prospectus dated February 28, 2023 for additional information. ALPS Advisors, Inc. (“ALPS Advisors,” or the “Adviser”) and Smith Capital Investors, LLC (the “Sub-Adviser”) have agreed contractually to limit the amount of the Fund’s total annual expenses, exclusive of Distribution and Service (12b-1) Fees, Shareholder Service Fees, Acquired Fund Fees and Expenses, brokerage expenses, interest expenses, taxes and extraordinary expenses, to 0.90% of the Fund’s average daily net assets. This agreement (the “Expense Agreement”) is in effect through February 28, 2024. |
| + | Excludes adjustments in accordance with accounting principles generally accepted in the United States of America and as such, the net asset value and total return for shareholder transactions reported to the market may differ from the net asset value for financial reporting purposes. |
The table does not reflect the deduction of taxes that a shareholder would pay on Fund distributions or the redemption of Fund shares.
This Fund is not suitable for all investors, and is subject to investment risks, including possible loss of the principal amount invested.
There is no guarantee that the Fund will continue to hold any one particular security or stay invested in any one particular company. The composition of the Fund's top holdings is subject to change. Performance figures are historical and reflect the change in share price, reinvested distributions, changes in net asset value, sales charges and capital gains distributions, if any.
Not FDIC Insured – No Bank Guarantee – May Lose Value
Asset Type Allocation (as a % of Net Assets) †
| Corporate Bonds | 82.45% |
| Government Bonds | 5.28% |
| Collateralized Mortgage Obligations | 3.56% |
| Preferred Stock | 3.54% |
| Mortgage-Backed Securities | 1.75% |
| Commercial Mortgage-Backed Securities | 1.43% |
| Bank Loans | 0.27% |
| Cash, Cash Equivalents, & Other Net Assets | 1.72% |
| Total | 100.00% |
| † | Holdings are subject to change, and may not reflect the current or future position of the portfolio. Table presents approximate values only. |
Top Ten Holdings (as a % of Net Assets) †
| U.S. Treasury Bond 4.125% 8/15/2053 | 4.07% |
PNC Financial Services Group, Inc. 3M US SOFR + 3.94% 12/31/2049 | 1.76% |
| Midwest Connector Capital Co. LLC 3.9% 4/1/2024 | 1.68% |
| Cloud Software Group, Inc. 6.5% 3/31/2029 | 1.63% |
| Penn Entertainment, Inc. 5.625% 1/15/2027 | 1.56% |
Genesis Energy LP / Genesis Energy Finance Corp. 8% 1/15/2027 | 1.46% |
| Danske Bank A/S 1Y US TI + 1.35% 9/11/2026 | 1.44% |
Targa Resources Partners LP / Targa Resources Partners Finance Corp. 6.875% 1/15/2029 | 1.37% |
| Cushman & Wakefield US Borrower LLC 6.75% 5/15/2028 | 1.26% |
Outfront Media Capital LLC / Outfront Media Capital Corp. 5% 8/15/2027 | 1.26% |
| Top Ten Holdings | 17.49% |
| † | Holdings are subject to change, and may not reflect the current or future position of the portfolio. Table presents approximate values only. |
Industry Sector Allocation (as a % of Net Assets)
| Banks | 11.14% |
| Pipelines | 7.37% |
| Mortgage Securities | 6.74% |
| Oil & Gas | 6.27% |
| Media | 6.18% |
| Electric | 5.43% |
| Sovereign | 5.28% |
| Diversified Financial Services | 4.54% |
| Entertainment | 4.33% |
| Retail | 4.25% |
| Commercial Services | 3.86% |
| Auto Manufacturers | 3.57% |
| Real Estate | 2.97% |
| Food | 2.72% |
| Airlines | 2.67% |
| Software | 2.56% |
| Aerospace/Defense | 2.45% |
| Leisure Time | 2.12% |
| Machinery-Diversified | 1.39% |
| Packaging & Containers | 1.34% |
| Chemicals | 1.27% |
| Advertising | 1.26% |
| Home Builders | 1.25% |
| REITs | 1.21% |
| Environmental Control | 1.06% |
| Other Industries (each less than 1%) | 5.05%* |
| Cash, Cash Equivalents, & Other Net Assets | 1.72% |
| Total | 100.00% |
* See Statement of Investments for detailed breakout of other industries.
ALPS | Smith Balanced Opportunity Fund
| Performance Update | October 31, 2023 (Unaudited) |
Performance of $100,000 Initial Investment (as of October 31, 2023)
Comparison of change in value of a $100,000 investment

The chart above represents historical performance of a hypothetical investment of $100,000 in the Fund since inception. Past performance does not guarantee future results. This chart does not reflect the deduction of taxes that a shareholder would pay on Fund distributions or the redemption of Fund shares.
Average Annual Total Returns (as of October 31, 2023)
| | 1 Year | 3 Year | Since Inception^ | Total Expense Ratio* | What You Pay* |
| Class I | 5.37% | 3.66% | 3.13% | 1.41% | 0.85% |
| Investor (NAV) | 5.09% | 3.39% | 2.86% | 1.59% | 1.15% |
| Class A (NAV) | 5.06% | 3.38% | 2.86% | 1.60% | 1.15% |
| Class A (MOP) | 1.68% | 2.25% | 1.76% |
| Class C (NAV) | 4.32% | 2.65% | 2.12% | 2.30% | 1.85% |
| Class C (CDSC) | 3.32% | 2.65% | 2.12% |
55% Bloomberg U.S. 1000 TR Index / 45% Bloomberg U.S. Aggregate Bond Index1,2 | 5.40% | 2.65% | 1.86% | | |
| Bloomberg U.S. Aggregate Bond Index2 | 0.36% | -5.57% | -5.54% | | |
| Bloomberg U.S. 1000 TR Index1 | 9.44% | 9.34% | 7.81% | | |
Performance data quoted represents past performance. Past performance does not guarantee future results. Investment return and principal value of an investment will fluctuate so that an investor's shares, when sold or redeemed, may be worth more or less than the original cost. Current performance data may be higher or lower than actual data quoted. For the most current month-end performance data, please call 1-866-759-5679.
Maximum Offering Price (MOP) for Class A shares includes the Fund’s maximum sales charge of 3.25%. Performance shown at NAV does not include these sales charges and would have been lower had it been taken into account. If you invest $500 thousand or more, either as a lump sum or through the Fund’s accumulation or letter of intent programs, you can purchase Class A shares without an initial sales charge (load). A Contingent Deferred Sales Charge (“CDSC”) of 1.00% may apply to Class C shares redeemed within the first 12 months after a purchase, and on Class A shares redeemed within the first 18 months after a purchase in excess of $1 million.
ALPS | Smith Balanced Opportunity Fund
| Performance Update | October 31, 2023 (Unaudited) |
| 1 | Bloomberg US 1000 TR Index: a float market-cap-weighted benchmark of the 1000 most highly capitalized US companies. One may not invest directly in the index. |
| 2 | Bloomberg US Aggregate Bond Index: a broad-based benchmark that measures the investment grade, US dollar-denominated, fixed-rate taxable bond market. The index includes Treasuries, government-related and corporate securities, fixed-rate agency MBS, ABS and CMBS (agency and non-agency). One may not invest directly in the index. |
| ^ | Fund Inception date of September 15, 2020. |
| * | Please see the prospectus dated February 28, 2023 for additional information. ALPS Advisors, Inc. (“ALPS Advisors,” or the “Adviser”) and Smith Capital Investors, LLC (the “Sub-Adviser”) have agreed contractually to limit the amount of the Fund’s total annual expenses, exclusive of Distribution and Service (12b-1) Fees, Shareholder Service Fees, Acquired Fund Fees and Expenses, brokerage expenses, interest expenses, taxes and extraordinary expenses, to 0.85% of the Fund’s average daily net assets. This agreement (the “Expense Agreement”) is in effect through February 28, 2024. |
The table does not reflect the deduction of taxes that a shareholder would pay on Fund distributions or the redemption of Fund shares.
This Fund is not suitable for all investors, and is subject to investment risks, including possible loss of the principal amount invested.
There is no guarantee that the Fund will continue to hold any one particular security or stay invested in any one particular company. The composition of the Fund's top holdings is subject to change. Performance figures are historical and reflect the change in share price, reinvested distributions, changes in net asset value, sales charges and capital gains distributions, if any.
Not FDIC Insured – No Bank Guarantee – May Lose Value
Asset Type Allocation (as a % of Net Assets) †
| Common Stock | 61.21% |
| Corporate Bonds | 15.81% |
| Government Bonds | 11.33% |
| Collateralized Mortgage Obligations | 4.80% |
| Mortgage-Backed Securities | 4.49% |
| Preferred Stock | 1.21% |
| Commercial Mortgage-Backed Securities | 0.23% |
| Cash, Cash Equivalents, & Other Net Assets | 0.92% |
| Total | 100.00% |
| † | Holdings are subject to change, and may not reflect the current or future position of the portfolio. Table presents approximate values only. |
Top Ten Holdings (as a % of Net Assets) †
| Microsoft Corp. | 3.15% |
| ConocoPhillips | 2.25% |
| JPMorgan Chase & Co. | 2.08% |
| Apple, Inc. | 2.07% |
| UnitedHealth Group, Inc. | 2.04% |
| Alphabet, Inc. | 1.95% |
| Meta Platforms, Inc. | 1.89% |
| NVIDIA Corp. | 1.79% |
| U.S. Treasury Bond 4.125% 8/15/2053 | 1.74% |
| Amazon.com, Inc. | 1.56% |
| Top Ten Holdings | 20.52% |
| † | Holdings are subject to change, and may not reflect the current or future position of the portfolio. Table presents approximate values only. |
Industry Sector Allocation (as a % of Net Assets)
| Sovereign | 11.36% |
| Mortgage Securities | 9.51% |
| Software | 6.68% |
| Semiconductors | 4.54% |
| Oil & Gas Producers | 4.42% |
| Internet Media & Services | 3.85% |
| Health Care Facilities & Services | 3.66% |
| Banks | 6.35% |
| Retail - Consumer Staples | 3.14% |
| Technology Hardware | 2.90% |
| Electrical Equipment | 2.45% |
| Leisure Facilities & Services | 2.28% |
| Biotech & Pharma | 2.14% |
| Pipelines | 2.12% |
| Machinery | 2.10% |
| Medical Equipment & Devices | 2.01% |
| Technology Services | 1.91% |
| Retail - Discretionary | 1.88% |
| E-Commerce Discretionary | 1.56% |
| Electric | 1.54% |
| REITs | 1.34% |
| Aerospace/Defense | 1.27% |
| Chemicals | 1.15% |
| Institutional Financial Services | 1.12% |
| Food | 1.06% |
| Commercial Support Services | 1.04% |
| Other Industries (each less than 1%) | 15.70%* |
| Cash, Cash Equivalents, & Other Net Assets | 0.92% |
| Total | 100.00% |
| * | See Statement of Investments for detailed breakout of other industries |
ALPS | Smith Short Duration Bond Fund
| Statement of Investments | October 31, 2023 |
| | | Principal Value | | | Amount (Note 2) | |
| COLLATERALIZED MORTGAGE OBLIGATIONS (0.09%) | | | | | | | | |
| | | | | | | | | |
| Fannie Mae | | | | | | | | |
| Series 1993-230, Class FA, 30D US SOFR + 0.71%, 12/25/2023(a) | | $ | 280 | | | $ | 280 | |
| Series 1993-255, Class E, 7.100%, 12/25/2023 | | | 346 | | | | 345 | |
| Series 1994-18, Class FA, 30D US SOFR + 0.71%, 02/25/2024(a) | | | 459 | | | | 459 | |
| Series 1994-22, Class F, 30D US SOFR + 1.31%, 01/25/2024(a) | | | 868 | | | | 869 | |
| Series 1994-3, Class FB, 30D US SOFR + 0.76%, 01/25/2024(a) | | | 680 | | | | 680 | |
| Series 1994-3, Class FA, 30D US SOFR + 0.76%, 03/25/2024(a) | | | 58 | | | | 58 | |
| Series 1994-61, Class E, 7.500%, 04/25/2024 | | | 1,162 | | | | 1,158 | |
| Series 1994-75, Class K, 7.000%, 04/25/2024 | | | 1,549 | | | | 1,542 | |
| Series 1994-77, Class FB, 30D US SOFR + 1.61%, 04/25/2024(a) | | | 3,991 | | | | 3,998 | |
| Series 1997-12, Class FA, 30D US SOFR + 1.11%, 04/18/2027(a) | | | 9,703 | | | | 9,735 | |
| Series 1997-49, Class F, 30D US SOFR + 0.61%, 06/17/2027(a) | | | 16,640 | | | | 16,588 | |
| Series 2004-53, Class NC, 5.500%, 07/25/2024 | | | 253 | | | | 251 | |
| Series 2004-95, Class AK, 5.500%, 01/25/2025 | | | 2,751 | | | | 2,723 | |
| Series 2005-121, Class DY, 5.500%, 01/25/2026 | | | 4,279 | | | | 4,227 | |
| Series 2011-40, Class KA, 3.500%, 03/25/2026 | | | 35,990 | | | | 34,915 | |
| Series 2011-44, Class EB, 3.000%, 05/25/2026 | | | 10,231 | | | | 9,944 | |
| Series 2011-61, Class B, 3.000%, 07/25/2026 | | | 18,792 | | | | 18,238 | |
| Series 2011-80, Class KB, 3.500%, 08/25/2026 | | | 16,842 | | | | 16,413 | |
| Series 2012-22, Class ND, 2.000%, 12/25/2026 | | | 7,263 | | | | 7,201 | |
| Series 2012-47, Class HA, 1.500%, 05/25/2027 | | | 24,829 | | | | 23,528 | |
| Series 2013-5, Class DB, 2.000%, 02/25/2028 | | | 57,006 | | | | 53,805 | |
| | | Principal
Amount | | | Value
(Note 2) | |
| Series 2015-96, Class EA, 3.000%, 12/25/2026 | | $ | 138,245 | | | $ | 131,604 | |
| | | | | | | | 338,561 | |
| Freddie Mac | | | | | | | | |
| Series 1993-1611, Class Z, 6.500%, 11/15/2023 | | | 113 | | | | 113 | |
| Series 1993-1628, Class LZ, 6.500%, 12/15/2023 | | | 107 | | | | 107 | |
| Series 1993-1630, Class PK, 6.000%, 11/15/2023 | | | 152 | | | | 151 | |
| Series 1993-1636, Class F, 30D US SOFR + 0.76%, 11/15/2023(a) | | | 23 | | | | 23 | |
| Series 1993-24, Class FJ, 30D US SOFR + 0.61%, 11/25/2023(a) | | | 86 | | | | 85 | |
| Series 1994-1673, Class FB, 10Y US TI + -0.50%, 02/15/2024(a) | | | 148 | | | | 147 | |
| Series 1994-1699, Class FB, 30D US SOFR + 1.11%, 03/15/2024(a) | | | 229 | | | | 229 | |
| Series 1994-1707, Class F, 30D US SOFR + 0.81%, 03/15/2024(a) | | | 528 | | | | 528 | |
| Series 1994-1730, Class Z, 7.000%, 05/15/2024 | | | 3,291 | | | | 3,277 | |
| Series 1994-1744, Class FD, 30D US SOFR + 2.09%, 08/15/2024(a) | | | 5,131 | | | | 5,148 | |
| Series 1994-32, Class PN, 7.500%, 04/25/2024 | | | 4,471 | | | | 4,449 | |
| Series 1994-43, Class PH, 6.500%, 10/17/2024 | | | 560 | | | | 558 | |
| Series 1996-1810, Class D, 6.000%, 02/15/2026 | | | 8,344 | | | | 8,180 | |
| Series 1996-1885, Class FA, 30D US SOFR + 0.56%, 09/15/2026(a) | | | 2,549 | | | | 2,541 | |
| Series 1997-1983, Class Z, 6.500%, 12/15/2023 | | | 640 | | | | 638 | |
| Series 2001-2332, Class FB, 30D US SOFR + 0.56%, 01/15/2028(a) | | | 51,794 | | | | 51,584 | |
| Series 2004-2877, Class AL, 5.000%, 10/15/2024 | | | 157 | | | | 156 | |
| Series 2005-3005, Class ED, 5.000%, 07/15/2025 | | | 16,046 | | | | 15,812 | |
| Series 2006-3104, Class DH, 5.000%, 01/15/2026 | | | 11,325 | | | | 11,128 | |
| Series 2009-3575, Class EB, 4.000%, 09/15/2024 | | | 4,898 | | | | 4,855 | |
| Series 2010-3661, Class B, 4.000%, 04/15/2025 | | | 5,425 | | | | 5,355 | |
| Series 2010-3710, Class MG, 4.000%, 08/15/2025(b) | | | 17,064 | | | | 16,760 | |
See Notes to Financial Statements.
ALPS | Smith Short Duration Bond Fund
| Statement of Investments | October 31, 2023 |
| | | Principal
Amount | | | Value
(Note 2) | |
| Series 2010-3779, Class KJ, 2.750%, 11/15/2025 | | $ | 2,775 | | | $ | 2,757 | |
| Series 2011-3829, Class BE, 3.500%, 03/15/2026 | | | 7,421 | | | | 7,237 | |
| Series 2011-3907, Class FM, 30D US SOFR + 0.46%, 05/15/2026(a) | | | 77 | | | | 77 | |
| Series 2012-4003, Class BG, 2.000%, 10/15/2026 | | | 10,904 | | | | 10,726 | |
| Series 2013-4177, Class NB, 1.500%, 03/15/2028 | | | 13,236 | | | | 12,347 | |
| | | | | | | | 164,968 | |
| Ginnie Mae | | | | | | | | |
| Series 2010-101, Class GU, 4.000%, 08/20/2025(b) | | | 6,970 | | | | 6,838 | |
| Series 2013-53, Class KN, 1.500%, 08/20/2025 | | | 6,942 | | | | 6,726 | |
| | | | | | | | 13,564 | |
| | | | | | | | | |
| TOTAL COLLATERALIZED MORTGAGE OBLIGATIONS | | | | | | | | |
| (Cost $538,638) | | | | | | | 517,093 | |
| | | Principal
Amount | | | Value
(Note 2) | |
| COMMERCIAL MORTGAGE-BACKED SECURITIES (0.04%) |
| |
| Freddie Mac Multifamily Structured Pass Through Certificates | | | | | | | | |
| Series 2015-KF07, Class A, 30D US SOFR + 0.40%, 02/25/2025(a) | | | 8,773 | | | | 8,735 | |
| Series 2017-K069, Class A1, 2.892%, 06/25/2027 | | | 38,200 | | | | 37,578 | |
| Series 2017-K728, Class A2, 3.064%, 08/25/2024(a) | | | 99,598 | | | | 97,466 | |
| Series 2017-KL1P, Class A1P, 2.544%, 10/25/2025 | | | 124,975 | | | | 120,627 | |
| | | | | | | | 264,406 | |
| TOTAL COMMERCIAL MORTGAGE-BACKED SECURITIES | | | | | | | | |
| (Cost $268,323) | | | | | | | 264,406 | |
| | | Principal
Amount | | | Value
(Note 2) | |
| MORTGAGE-BACKED SECURITIES (0.88%) | | | | | | | | |
| | | | | | | | | |
| Fannie Mae Pool | | | | | | | | |
| Series 2011-, 3.500%, 12/01/2026 | | | 141,631 | | | | 134,528 | |
| Series 2011-MA0717, 3.500%, 04/01/2026 | | | 129,443 | | | | 118,674 | |
| Series 2012-AM1076, 2.920%, 10/01/2024 | | | 221,354 | | | | 214,981 | |
| | | Principal
Amount | | | Value
(Note 2) | |
| Series 2014-AM7158, 3.150%, 11/01/2024 | | $ | 175,000 | | | $ | 169,751 | |
| Series 2015-AM9288, 2.930%, 07/01/2025 | | | 3,693,121 | | | | 3,525,081 | |
| Series 2016-AL8941, 2.970%, 01/01/2024(a) | | | 4,775 | | | | 4,734 | |
| Series 2016-AL9448, 2.935%, 07/01/2026(a) | | | 182,486 | | | | 170,693 | |
| Series 2016-AN1413, 2.490%, 05/01/2026 | | | 138,042 | | | | 128,479 | |
| Series 2016-AN2079, 2.910%, 07/01/2026 | | | 34,688 | | | | 32,201 | |
| Series 2018-AN8096, 3.020%, 06/01/2024 | | | 305,000 | | | | 298,783 | |
| Series 2021-, 1.580%, 12/01/2028 | | | 110,000 | | | | 90,935 | |
| | | | | | | | 4,888,840 | |
| Freddie Mac Gold Pool | | | | | | | | |
| Series 2011-, 3.500%, 02/01/2026 | | | 168,254 | | | | 160,155 | |
| Series 2012-T40090, 3.000%, 05/01/2027 | | | 46,456 | | | | 44,001 | |
| | | | | | | | 204,156 | |
| Freddie Mac Pool | | | | | | | | |
| Series 2018-, 3.500%, 04/01/2028 | | | 106,496 | | | | 102,268 | |
| | | | | | | | | |
| Ginnie Mae I Pool | | | | | | | | |
| Series 2010-745222, 4.500%, 07/15/2025 | | | 37,956 | | | | 37,135 | |
| Series 2013-AF1057, 2.000%, 07/15/2028 | | | 62,314 | | | | 58,534 | |
| | | | | | | | 95,669 | |
| Ginnie Mae II Pool | | | | | | | | |
| Series 2009-4377, 4.500%, 03/20/2024 | | | 14,710 | | | | 14,430 | |
| Series 2010-4898, 3.000%, 12/20/2025 | | | 30,865 | | | | 30,030 | |
| Series 2011-4954, 3.000%, 02/20/2026 | | | 24,082 | | | | 23,463 | |
| | | | | | | | 67,923 | |
| TOTAL MORTGAGE-BACKED SECURITIES | | | | | | | | |
| (Cost $5,543,134) | | | | | | | 5,358,856 | |
| | | Principal
Amount | | | Value
(Note 2) | |
| CORPORATE BONDS (77.75%) | | | | | | | | |
| | | | | | | | | |
| Aerospace & Defense (2.80%) | | | | | | | | |
| Boeing Co. | | | | | | | | |
| 1.43%, 02/04/2024 | | | 6,130,000 | | | | 6,052,621 | |
| 2.20%, 02/04/2026 | | | 5,000,000 | | | | 4,595,373 | |
| L3Harris Technologies, Inc. | | | | | | | | |
| 5.40%, 01/15/2027 | | | 6,500,000 | | | | 6,386,185 | |
| Total Aerospace & Defense | | | | | | | 17,034,179 | |
See Notes to Financial Statements.
ALPS | Smith Short Duration Bond Fund
| Statement of Investments | October 31, 2023 |
| | | Principal
Amount | | | Value
(Note 2) | |
| Auto Parts Manufacturing (0.16%) | | | | | | | | |
| Aptiv PLC / Aptiv Corp. 2.40%, 02/18/2025 | | $ | 1,000,000 | | | $ | 954,089 | |
| | | | | | | | | |
| Automobiles Manufacturing (7.67%) | | | | | | | | |
| Ford Motor Credit Co. LLC | | | | | | | | |
| 2.30%, 02/10/2025 | | | 2,000,000 | | | | 1,890,799 | |
| 3.38%, 11/13/2025 | | | 6,465,000 | | | | 6,039,329 | |
| 6.95%, 03/06/2026 | | | 3,750,000 | | | | 3,760,392 | |
| General Motors Financial Co., Inc. | | | | | | | | |
| 5.80%, 06/23/2028 | | | 2,000,000 | | | | 1,938,457 | |
| 6.05%, 10/10/2025 | | | 7,000,000 | | | | 6,973,904 | |
| SOFRINDX + 1.30%, 04/07/2025(a)(c) | | | 4,000,000 | | | | 4,006,464 | |
| Hyundai Capital America 5.80%, 06/26/2025(d) | | | 2,000,000 | | | | 1,988,842 | |
| Kia Corp. 1.00%, 04/16/2024(d) | | | 2,850,000 | | | | 2,784,294 | |
| Mercedes-Benz Finance North America LLC 5.38%, 08/01/2025(d) | | | 4,000,000 | | | | 3,986,580 | |
| Nissan Motor Acceptance Co. LLC 6.95%, 09/15/2026(d) | | | 5,600,000 | | | | 5,617,045 | |
| Volkswagen Group of America Finance LLC 0.88%, 11/22/2023(d) | | | 2,500,000 | | | | 2,493,118 | |
| 1D US SOFR + 0.95%, 06/07/2024(a)(d) | | | 5,000,000 | | | | 5,009,877 | |
| Total Automobiles Manufacturing | | | | | | | 46,489,101 | |
| | | | | | | | | |
| Banks (8.04%) | | | | | | | | |
| Bank of Ireland Group PLC 1Y US TI + 2.65%, 09/16/2026(a)(d) | | | 4,000,000 | | | | 3,966,661 | |
| Bank of New York Mellon 1D US SOFR + 0.80%, 11/21/2025(a) | | | 5,000,000 | | | | 4,961,155 | |
| Citizens Bank NA 1D US SOFR + 1.45%, 10/24/2025(a) | | | 4,810,000 | | | | 4,600,417 | |
| Danske Bank A/S | | | | | | | | |
| 5.38%, 01/12/2024(d) | | | 250,000 | | | | 249,286 | |
| 1Y US TI + 1.18%, 09/22/2026(a)(d) | | | 3,000,000 | | | | 2,992,988 | |
| 1Y US TI + 2.10%, 01/09/2026(a)(d) | | | 3,850,000 | | | | 3,835,037 | |
| Discover Bank 2.45%, 09/12/2024 | | | 3,029,000 | | | | 2,914,117 | |
| Fifth Third Bank NA SOFRINDX + 1.23%, 10/27/2025(a)(c) | | | 2,000,000 | | | | 1,948,709 | |
| KeyCorp SOFRINDX + 1.25%, 05/23/2025(a)(c) | | | 1,000,000 | | | | 957,380 | |
| Morgan Stanley Bank NA 5.48%, 07/16/2025 | | | 4,000,000 | | | | 3,983,775 | |
| National Bank of Canada 1Y US TI + 0.40%, 11/15/2024(a) | | | 3,000,000 | | | | 2,993,139 | |
| | | Principal
Amount | | | Value
(Note 2) | |
| NatWest Markets PLC 0.80%, 08/12/2024(d) | | $ | 1,000,000 | | | $ | 959,426 | |
| Swedbank AB 6.14%, 09/12/2026(d) | | | 2,260,000 | | | | 2,238,865 | |
| Synovus Financial Corp. 5.20%, 08/11/2025 | | | 3,450,000 | | | | 3,248,991 | |
| Truist Bank 3.30%, 05/15/2026 | | | 3,500,000 | | | | 3,205,848 | |
| Truist Financial Corp. 1D US SOFR + 0.40%, 06/09/2025(a) | | | 2,000,000 | | | | 1,957,827 | |
| UniCredit SpA 7.83%, 12/04/2023(d) | | | 3,775,000 | | | | 3,780,195 | |
| Total Banks | | | | | | | 48,793,816 | |
| | | | | | | | | |
| Biotechnology (1.51%) | | | | | | | | |
| Amgen, Inc. | | | | | | | | |
| 5.15%, 03/02/2028 | | | 3,300,000 | | | | 3,222,043 | |
| 5.51%, 03/02/2026 | | | 6,000,000 | | | | 5,969,612 | |
| Total Biotechnology | | | | | | | 9,191,655 | |
| | | | | | | | | |
| Cable & Satellite (0.74%) | | | | | | | | |
| Charter Communications Operating LLC / Charter Communications Operating Capital 3M US SOFR + 1.9124%, 02/01/2024(a) | | | 3,530,000 | | | | 3,537,141 | |
| Cox Communications, Inc. 5.45%, 09/15/2028(d) | | | 1,000,000 | | | | 974,477 | |
| Total Cable & Satellite | | | | | | | 4,511,618 | |
| | | | | | | | | |
| Casinos & Gaming (0.46%) | | | | | | | | |
| MGM Resorts International | | | | | | | | |
| 6.75%, 05/01/2025 | | | 2,843,000 | | | | 2,830,166 | |
| | | | | | | | | |
| Chemicals (3.37%) | | | | | | | | |
| Avient Corp. 5.75%, 05/15/2025(d) | | | 3,826,000 | | | | 3,752,814 | |
| EIDP, Inc. 4.50%, 05/15/2026 | | | 5,000,000 | | | | 4,856,374 | |
| LG Chem, Ltd. 4.38%, 07/14/2025(d) | | | 1,500,000 | | | | 1,457,490 | |
| Nutrien, Ltd. 5.90%, 11/07/2024 | | | 4,000,000 | | | | 3,992,317 | |
| Sherwin-Williams Co. | | | | | | | | |
| 4.05%, 08/08/2024 | | | 3,000,000 | | | | 2,955,881 | |
| 4.25%, 08/08/2025 | | | 3,000,000 | | | | 2,917,106 | |
| Westlake Corp. 0.88%, 08/15/2024 | | | 500,000 | | | | 479,675 | |
| Total Chemicals | | | | | | | 20,411,657 | |
| | | | | | | | | |
| Commercial Finance (1.28%) | | | | | | | | |
| AerCap Ireland Capital DAC / AerCap Global Aviation Trust | | | | | | | | |
| 6.50%, 07/15/2025 | | | 4,800,000 | | | | 4,790,605 | |
| Penske Truck Leasing Co. Lp / PTL Finance Corp. | | | | | | | | |
| 5.75%, 05/24/2026(d) | | | 3,000,000 | | | | 2,951,995 | |
See Notes to Financial Statements.
ALPS | Smith Short Duration Bond Fund
| Statement of Investments | October 31, 2023 |
| | | Principal
Amount | | | Value
(Note 2) | |
| Total Commercial Finance | | | | | | | 7,742,600 | |
| | | | | | | | | |
| Consumer Finance (2.90%) | | | | | | | | |
| American Express Co. | | | | | | | | |
| 2.25%, 03/04/2025 | | $ | 3,000,000 | | | $ | 2,853,971 | |
| 3.38%, 05/03/2024 | | | 3,000,000 | | | | 2,963,264 | |
| 1D US SOFR + 1.28%, 07/27/2029(a) | | | 3,000,000 | | | | 2,880,794 | |
| SOFRINDX + 0.23%, 11/03/2023(a)(c) | | | 2,000,000 | | | | 1,999,994 | |
| Fiserv, Inc. 5.38%, 08/21/2028 | | | 7,000,000 | | | | 6,849,307 | |
| Total Consumer Finance | | | | | | | 17,547,330 | |
| | | | | | | | | |
| Consumer Products (0.63%) | | | | | | | | |
| Haleon UK Capital PLC 3.13%, 03/24/2025 | | | 4,000,000 | | | | 3,846,079 | |
| | | | | | | | | |
| Department Stores (0.81%) | | | | | | | | |
| Nordstrom, Inc. Series WI 2.30%, 04/08/2024 | | | 5,000,000 | | | | 4,896,225 | |
| | | | | | | | | |
| Design, Manufacturing & Distribution (0.47%) | | | | | | | | |
| TD SYNNEX Corp. 1.25%, 08/09/2024 | | | 3,000,000 | | | | 2,878,556 | |
| | | | | | | | | |
| Diversified Banks (4.49%) | | | | | | | | |
| Banco Santander SA 1Y US TI + 0.45%, 06/30/2024(a) | | | 1,000,000 | | | | 996,874 | |
| Bank of America Corp. 1D US SOFR + 1.29%, 01/20/2027(a) | | | 4,000,000 | | | | 3,894,819 | |
| 1D US SOFR + 1.63%, 04/25/2029(a) | | | 7,000,000 | | | | 6,657,462 | |
| Citigroup, Inc. 1D US SOFR + 0.669%, 05/01/2025(a) | | | 3,000,000 | | | | 2,912,280 | |
| JPMorgan Chase & Co. Series FRN | | | | | | | | |
| 1D US SOFR + 0.58%, 06/23/2025(a) | | | 2,000,000 | | | | 1,993,427 | |
| 1D US SOFR + 1.07%, 12/15/2025(a) | | | 3,875,000 | | | | 3,846,648 | |
| Mitsubishi UFJ Financial Group, Inc. 1Y US TI + 1.70%, 07/18/2025(a) | | | 3,000,000 | | | | 2,966,225 | |
| Standard Chartered PLC 1D US SOFR + 0.93%, 11/23/2025(a)(d) | | | 4,000,000 | | | | 3,976,319 | |
| Total Diversified Banks | | | | | | | 27,244,054 | |
| | | | | | | | | |
| Entertainment Content (1.07%) | | | | | | | | |
| Warnermedia Holdings, Inc. | | | | | | | | |
| 6.41%, 03/15/2026 | | | 6,500,000 | | | | 6,487,945 | |
| | | Principal
Amount | | | Value
(Note 2) | |
| Entertainment Resources (0.33%) | | | | | | | | |
| Vail Resorts, Inc. 6.25%, 05/15/2025(d) | | $ | 2,000,000 | | | $ | 1,989,390 | |
| | | | | | | | | |
| Exploration & Production (0.62%) | | | | | | | | |
| Occidental Petroleum Corp. 8.50%, 07/15/2027 | | | 3,500,000 | | | | 3,732,348 | |
| | | | | | | | | |
| Financial Services (8.90%) | | | | | | | | |
| Charles Schwab Corp. 5.88%, 08/24/2026 | | | 5,000,000 | | | | 4,967,105 | |
| SOFRINDX + 1.05%, 03/03/2027(a)(c) | | | 1,015,000 | | | | 1,001,830 | |
| Goldman Sachs Group, Inc. | | | | | | | | |
| 1D US SOFR + 0.70%, 01/24/2025(a) | | | 3,000,000 | | | | 2,993,014 | |
| 1D US SOFR + 1.075%, 08/10/2026(a) | | | 7,000,000 | | | | 6,930,382 | |
| Morgan Stanley | | | | | | | | |
| 1D US SOFR + 0.525%, 05/30/2025(a) | | | 3,000,000 | | | | 2,893,924 | |
| 1D US SOFR + 1.295%, 01/28/2027(a) | | | 2,000,000 | | | | 1,953,728 | |
| 1D US SOFR + 1.59%, 04/20/2029(a) | | | 3,000,000 | | | | 2,855,042 | |
| 1D US SOFR + 1.63%, 07/20/2029(a) | | | 2,000,000 | | | | 1,923,998 | |
| Nasdaq, Inc. | | | | | | | | |
| 5.65%, 06/28/2025 | | | 500,000 | | | | 498,341 | |
| National Securities Clearing Corp. | | | | | | | | |
| 5.05%, 11/21/2024(d) | | | 7,000,000 | | | | 6,947,032 | |
| 5.15%, 05/30/2025(d) | | | 3,000,000 | | | | 2,979,140 | |
| State Street Corp. | | | | | | | | |
| 1D US SOFR + 1.353%, 11/04/2026(a) | | | 3,250,000 | | | | 3,232,280 | |
| UBS Group AG | | | | | | | | |
| 1Y US TI + 1.55%, 01/12/2027(a)(d) | | | 4,000,000 | | | | 3,935,637 | |
| 1Y US TI + 1.60%, 08/05/2025(a)(d) | | | 5,000,000 | | | | 4,919,089 | |
| 1Y US TI + 1.60%, 12/22/2027(a)(d) | | | 3,000,000 | | | | 2,970,626 | |
| USAA Capital Corp. 3.38%, 05/01/2025(d) | | | 3,000,000 | | | | 2,890,363 | |
| Total Financial Services | | | | | | | 53,891,531 | |
| | | | | | | | | |
| Food & Beverage (2.84%) | | | | | | | | |
| Cargill, Inc. 4.50%, 06/24/2026(d) | | | 3,000,000 | | | | 2,927,355 | |
| Constellation Brands, Inc. 3.60%, 05/09/2024 | | | 3,000,000 | | | | 2,961,297 | |
| JDE Peet's NV 0.80%, 09/24/2024(d) | | | 1,000,000 | | | | 953,187 | |
| Mondelez International Holdings Netherlands BV 4.25%, 09/15/2025(d) | | | 3,000,000 | | | | 2,917,929 | |
| Mondelez International, Inc. 2.13%, 03/17/2024 | | | 3,000,000 | | | | 2,957,152 | |
See Notes to Financial Statements.
ALPS | Smith Short Duration Bond Fund
| Statement of Investments | October 31, 2023 |
| | | Principal
Amount | | | Value
(Note 2) | |
| Nestle Holdings, Inc. 4.00%, 09/12/2025(d) | | $ | 4,627,000 | | | $ | 4,528,973 | |
| Total Food & Beverage | | | | | | | 17,245,893 | |
| | | | | | | | | |
| Hardware (0.48%) | | | | | | | | |
| Teledyne Technologies, Inc. 0.95%, 04/01/2024 | | | 3,000,000 | | | | 2,934,876 | |
| | | | | | | | | |
| Health Care Facilities & Services (1.30%) | | | | | | | | |
| HCA, Inc. | | | | | | | | |
| 5.00%, 03/15/2024 | | | 5,974,000 | | | | 5,950,803 | |
| 5.20%, 06/01/2028 | | | 2,000,000 | | | | 1,904,987 | |
| Total Health Care Facilities & Services | | | | | | | 7,855,790 | |
| | | | | | | | | |
| Industrial Other (2.04%) | | | | | | | | |
| Element Fleet Management Corp. 6.27%, 06/26/2026(d) | | | 4,300,000 | | | | 4,277,412 | |
| Honeywell International, Inc. 4.85%, 11/01/2024 | | | 5,000,000 | | | | 4,965,022 | |
| Parker-Hannifin Corp. 3.65%, 06/15/2024 | | | 1,000,000 | | | | 985,482 | |
| Quanta Services, Inc. 0.95%, 10/01/2024 | | | 2,250,000 | | | | 2,144,004 | |
| Total Industrial Other | | | | | | | 12,371,920 | |
| | | | | | | | | |
| Leisure Products Manufacturing (0.31%) | | | | | | | | |
| Brunswick Corp. 0.85%, 08/18/2024 | | | 2,000,000 | | | | 1,909,265 | |
| | | | | | | | | |
| Life Insurance (0.16%) | | | | | | | | |
| Security Benefit Global Funding 1.25%, 05/17/2024(d) | | | 1,000,000 | | | | 969,394 | |
| | | | | | | | | |
| Machinery Manufacturing (0.65%) | | | | | | | | |
| Ingersoll Rand, Inc. 5.40%, 08/14/2028 | | | 2,000,000 | | | | 1,949,758 | |
| Nordson Corp. 5.60%, 09/15/2028 | | | 2,000,000 | | | | 1,964,307 | |
| Total Machinery Manufacturing | | | | | | | 3,914,065 | |
| | | | | | | | | |
| Mass Merchants (0.32%) | | | | | | | | |
| Dollar General Corp. 4.25%, 09/20/2024 | | | 2,000,000 | | | | 1,967,441 | |
| | | | | | | | | |
| Medical Equipment & Devices Manufacturing (1.30%) | | | | | | | | |
| Baxter International, Inc. SOFRINDX + 0.26%, 12/01/2023(a)(c) | | | 2,000,000 | | | | 1,999,270 | |
| GE HealthCare Technologies, Inc. | | | | | | | | |
| 5.55%, 11/15/2024 | | | 2,000,000 | | | | 1,990,786 | |
| 5.60%, 11/15/2025 | | | 2,000,000 | | | | 1,989,455 | |
| Zimmer Biomet Holdings, Inc. 1.45%, 11/22/2024 | | | 2,000,000 | | | | 1,904,865 | |
| Total Medical Equipment & Devices Manufacturing | | | | | | | 7,884,376 | |
| | | Principal
Amount | | | Value
(Note 2) | |
| Metals & Mining (1.38%) | | | | | | | | |
| BHP Billiton Finance USA, Ltd. 5.25%, 09/08/2026 | | $ | 3,000,000 | | | $ | 2,975,311 | |
| Steel Dynamics, Inc. 5.00%, 12/15/2026 | | | 5,592,000 | | | | 5,401,554 | |
| Total Metals & Mining | | | | | | | 8,376,865 | |
| | | | | | | | | |
| Pharmaceuticals (0.82%) | | | | | | | | |
| Mylan, Inc. 4.20%, 11/29/2023 | | | 5,000,000 | | | | 4,992,155 | |
| Pipeline (3.54%) | | | | | | | | |
| Buckeye Partners LP 4.35%, 10/15/2024 | | | 2,471,000 | | | | 2,374,433 | |
| Columbia Pipelines Holding Co. LLC | | | | | | | | |
| 6.04%, 08/15/2028(d) | | | 1,000,000 | | | | 983,091 | |
| 6.06%, 08/15/2026(d) | | | 1,500,000 | | | | 1,498,323 | |
| Energy Transfer LP 4.50%, 04/15/2024 | | | 900,000 | | | | 893,129 | |
| Gray Oak Pipeline LLC 2.60%, 10/15/2025(d) | | | 400,000 | | | | 370,335 | |
| Midwest Connector Capital Co. LLC 3.90%, 04/01/2024(d) | | | 9,784,000 | | | | 9,664,727 | |
| Targa Resources Partners LP / Targa Resources Partners Finance Corp. 6.50%, 07/15/2027 | | | 5,786,000 | | | | 5,723,656 | |
| Total Pipeline | | | | | | | 21,507,694 | |
| | | | | | | | | |
| Power Generation (2.15%) | | | | | | | | |
| Alexander Funding Trust 1.84%, 11/15/2023(d) | | | 5,345,000 | | | | 5,334,462 | |
| Vistra Operations Co. LLC 4.88%, 05/13/2024(d) | | | 7,735,000 | | | | 7,657,164 | |
| Total Power Generation | | | | | | | 12,991,626 | |
| | | | | | | | | |
| Real Estate (2.00%) | | | | | | | | |
| VICI Properties LP 4.38%, 05/15/2025 | | | 10,500,000 | | | | 10,169,250 | |
| VICI Properties LP / VICI Note Co., Inc. 5.63%, 05/01/2024(d) | | | 2,000,000 | | | | 1,988,198 | |
| Total Real Estate | | | | | | | 12,157,448 | |
| | | | | | | | | |
| Retail - Consumer Discretionary (0.48%) | | | | | | | | |
| Lowe's Cos., Inc. 4.80%, 04/01/2026 | | | 3,000,000 | | | | 2,939,102 | |
| | | | | | | | | |
| Semiconductors (0.49%) | | | | | | | | |
| Analog Devices, Inc. SOFRINDX + 0.25%, 10/01/2024(a)(c) | | | 2,000,000 | | | | 1,999,430 | |
| Microchip Technology, Inc. 0.97%, 02/15/2024 | | | 1,000,000 | | | | 984,642 | |
| Total Semiconductors | | | | | | | 2,984,072 | |
See Notes to Financial Statements.
ALPS | Smith Short Duration Bond Fund
| Statement of Investments | October 31, 2023 |
| | | Principal
Amount | | | Value
(Note 2) | |
| Software & Services (0.56%) | | | | | | | | |
| Concentrix Corp. 6.65%, 08/02/2026 | | $ | 3,350,000 | | | $ | 3,330,550 | |
| | | | | | | | | |
| Supermarkets & Pharmacies (1.19%) | | | | | | | | |
| 7-Eleven, Inc. 0.80%, 02/10/2024(d) | | | 3,350,000 | | | | 3,300,425 | |
| Albertsons Cos. Inc / Safeway, Inc. / New Albertsons LP / Albertsons LLC 6.50%, 02/15/2028(d) | | | 3,924,000 | | | | 3,856,714 | |
| Total Supermarkets & Pharmacies | | | | | | | 7,157,139 | |
| | | | | | | | | |
| Transportation & Logistics (0.65%) | | | | | | | | |
| Daimler Truck Finance North America LLC | | | | | | | | |
| 5.40%, 09/20/2028(d) | | | 2,000,000 | | | | 1,939,271 | |
| 5.60%, 08/08/2025(d) | | | 2,000,000 | | | | 1,986,822 | |
| Total Transportation & Logistics | | | | | | | 3,926,093 | |
| | | | | | | | | |
| Travel & Lodging (0.33%) | | | | | | | | |
| Marriott International, Inc. 5.45%, 09/15/2026 | | | 2,000,000 | | | | 1,975,204 | |
| Utilities (6.70%) | | | | | | | | |
| American Electric Power Co., Inc. | | | | | | | | |
| 2.03%, 03/15/2024 | | | 3,969,000 | | | | 3,902,471 | |
| 5.70%, 08/15/2025 | | | 3,000,000 | | | | 2,976,471 | |
| Black Hills Corp. 1.04%, 08/23/2024 | | | 3,000,000 | | | | 2,876,309 | |
| DTE Energy Co. 4.22%, 11/01/2024(b) | | | 2,000,000 | | | | 1,961,421 | |
| Duke Energy Corp. 5.00%, 12/08/2025 | | | 6,000,000 | | | | 5,905,168 | |
| NextEra Energy Capital Holdings, Inc. 6.05%, 03/01/2025 | | | 3,000,000 | | | | 2,999,173 | |
| ONE Gas, Inc. 1.10%, 03/11/2024 | | | 3,439,000 | | | | 3,378,921 | |
| Pacific Gas and Electric Co. 3.25%, 02/16/2024 | | | 5,900,000 | | | | 5,848,756 | |
| Sempra 5.40%, 08/01/2026 | | | 2,000,000 | | | | 1,972,374 | |
| Southern Co. 4.48%, 08/01/2024(b) | | | 3,000,000 | | | | 2,960,542 | |
| WEC Energy Group, Inc. | | | | | | | | |
| 0.80%, 03/15/2024 | | | 3,000,000 | | | | 2,944,880 | |
| 4.75%, 01/09/2026 | | | 3,000,000 | | | | 2,927,761 | |
| Total Utilities | | | | | | | 40,654,247 | |
| | | | | | | | | |
| Waste & Environment Services & Equipment (0.37%) | | | | | | | | |
| GFL Environmental, Inc. 5.13%, 12/15/2026(d) | | | 2,340,000 | | | | 2,222,999 | |
| | | | | | | | | |
| Wireless Telecommunications Services (1.44%) | | | | | | | | |
| AT&T, Inc. 5.54%, 02/20/2026 | | | 4,000,000 | | | | 3,968,529 | |
| | | Principal
Amount | | | Value
(Note 2) | |
| T-Mobile USA, Inc. 4.80%, 07/15/2028 | | $ | 5,000,000 | | | $ | 4,759,063 | |
| Total Wireless Telecommunications Services | | | | | | | 8,727,592 | |
| | | | | | | | | |
| TOTAL CORPORATE BONDS | | | | | | | | |
| (Cost $480,252,542) | | | | | | | 471,468,145 | |
| | | Principal
Amount | | | Value
(Note 2) | |
| GOVERNMENT BONDS (20.18%) | | | | | | | | |
| | | | | | | | | |
| U.S. Treasury Bonds (20.18%) | | | | | | | | |
| United States Treasury Notes | | | | | | | | |
| 3.13%, 08/15/2025 | | | 26,725,000 | | | | 25,815,201 | |
| 4.13%, 06/15/2026 | | | 6,789,000 | | | | 6,654,281 | |
| 4.63%, 06/30/2025 | | | 16,949,000 | | | | 16,805,993 | |
| 4.63%, 03/15/2026 | | | 17,945,000 | | | | 17,799,197 | |
| 4.63%, 09/30/2028 | | | 9,724,000 | | | | 9,636,636 | |
| 4.75%, 07/31/2025 | | | 14,335,000 | | | | 14,242,606 | |
| 5.00%, 08/31/2025 | | | 6,607,000 | | | | 6,593,580 | |
| 5.00%, 09/30/2025 | | | 18,826,000 | | | | 18,792,907 | |
| 5.00%, 10/31/2025 | | | 6,050,000 | | | | 6,042,674 | |
| Total U.S. Treasury Bonds | | | | | | | 122,383,075 | |
| | | | | | | | | |
| TOTAL GOVERNMENT BONDS | | | | | | | | |
| (Cost $123,584,275) | | | | | | | 122,383,075 | |
| | | 7-Day Yield | | | Shares | | | Value (Note 2) | |
| SHORT TERM INVESTMENTS (0.03%) | | | | | | | | | | | | |
| | | | | | | | | | | | | |
| Money Market Fund (0.03%) | | | | | | | | | | | | |
| Morgan Stanley Institutional Liquidity Funds - Government Portfolio | | | 5.25 | % | | | 191,552 | | | | 191,552 | |
| | | | | | | | | | | | | |
| TOTAL SHORT TERM INVESTMENTS | | | | | | | | | | | | |
| (Cost $191,552) | | | | | | | | | | | 191,552 | |
| | | | | | | | | | | | | |
| TOTAL INVESTMENTS (98.97%) | | | | | | | | | | | | |
| (Cost $610,378,464) | | | | | | | | | | $ | 600,183,127 | |
| | | | | | | | | | | | | |
| Other Assets In Excess Of Liabilities (1.03%) | | | | | | | | | | | 6,239,528 | |
| | | | | | | | | | | | | |
| NET ASSETS (100.00%) | | | | | | | | | | $ | 606,422,655 | |
Investment Abbreviations:
SOFR - Secured Overnight Financing Rate
SOFRINDX - Secured Overnight Financing Rate Index
TI – Treasury Index
Reference Rates:
30D US SOFR - 30 Day SOFR as of October 31, 2023 was 5.32%
See Notes to Financial Statements.
ALPS | Smith Short Duration Bond Fund
| Statement of Investments | October 31, 2023 |
1D US SOFR - 1 Day SOFR as of October 31, 2023 was 5.35%
3M US SOFR - 3 Month SOFR as of October 31, 2023 was 5.38%
1Y US TI - 1 Year US TI as of October 31, 2023 was 5.44%
10Y US TI - 10 Year US TI as of October 31, 2023 was 4.88%
| (a) | Floating or variable rate security. The reference rate is described above. The rate in effect as of October 31, 2023 is based on the reference rate plus the displayed spread as of the security's last reset date. |
| (b) | Step bond. Coupon changes periodically based upon a predetermined schedule. Interest rate disclosed is that which is in effect as of October 31, 2023. |
| (c) | The SOFRINDX is a compounded average of the daily Secured Overnight Financing Rate determined by reference to the SOFR Index for any interest period. |
| (d) | Security exempt from registration under Rule 144A of the Securities Act of 1933. This security may be resold in transactions exempt from registration, normally to qualified institutional buyers. As of October 31, 2023, the aggregate market value of those securities was $137,023,370, representing 22.60% of net assets. |
See Notes to Financial Statements.
ALPS | Smith Total Return Bond Fund
| Statement of Investments | October 31, 2023 |
| | | Principal
Amount | | | Value
(Note 2) | |
| BANK LOANS (0.17%) | | | | | | | | |
| | | | | | | | | |
| Apparel & Textile Products (0.17%) | | | | | | | | |
| Hanesbrands, Inc. 1M US SOFR + 3.75%, 03/08/2030(a) | | $ | 3,980,000 | | | $ | 3,935,225 | |
| | | | | | | | | |
| TOTAL BANK LOANS | | | | | | | | |
| (Cost $3,942,911) | | | | | | | 3,935,225 | |
| | | Principal
Amount | | | Value
(Note 2) | |
| COLLATERALIZED MORTGAGE OBLIGATIONS (11.29%) | | | | | | | | |
| Fannie Mae | | | | | | | | |
| Series 1997-76, Class FO, 30D US SOFR + 0.61%, 09/17/2027(a) | | $ | 8,826 | | | $ | 8,811 | |
| Series 1999-58, Class F, 30D US SOFR + 0.51%, 11/18/2029(a) | | | 29,167 | | | | 28,934 | |
| Series 2000-40, Class FA, 30D US SOFR + 0.61%, 07/25/2030(a) | | | 12,166 | | | | 12,122 | |
| Series 2000-45, Class F, 30D US SOFR + 0.56%, 12/25/2030(a) | | | 10,505 | | | | 10,429 | |
| Series 2001-27, Class F, 30D US SOFR + 0.61%, 06/25/2031(a) | | | 7,515 | | | | 7,372 | |
| Series 2001-29, Class Z, 6.500%, 07/25/2031 | | | 50,167 | | | | 50,337 | |
| Series 2001-51, Class OD, 6.500%, 10/25/2031 | | | 2,386 | | | | 2,373 | |
| Series 2001-52, Class XZ, 6.500%, 10/25/2031 | | | 18,800 | | | | 18,929 | |
| Series 2001-59, Class F, 30D US SOFR + 0.71%, 11/25/2031(a) | | | 82,198 | | | | 82,023 | |
| Series 2001-60, Class OF, 30D US SOFR + 1.06%, 10/25/2031(a) | | | 134,128 | | | | 135,442 | |
| Series 2001-63, Class FD, 30D US SOFR + 0.71%, 12/18/2031(a) | | | 9,393 | | | | 9,386 | |
| Series 2001-63, Class TC, 6.000%, 12/25/2031 | | | 16,331 | | | | 16,235 | |
| Series 2001-68, Class PH, 6.000%, 12/25/2031 | | | 13,559 | | | | 13,480 | |
| Series 2001-71, Class FE, 30D US SOFR + 0.76%, 11/25/2031(a) | | | 58,297 | | | | 58,262 | |
| Series 2001-71, Class FS, 30D US SOFR + 0.71%, 11/25/2031(a) | | | 47,675 | | | | 47,577 | |
| | | Principal
Amount | | | Value
(Note 2) | |
| Series 2001-81, Class GE, 6.000%, 01/25/2032 | | $ | 11,418 | | | $ | 11,351 | |
| Series 2002-11, Class JF, 30D US SOFR + 0.84%, 03/25/2032(a) | | | 36,129 | | | | 36,190 | |
| Series 2002-12, Class FH, 30D US SOFR + 1.164%, 01/25/2032(a) | | | 40,029 | | | | 40,331 | |
| Series 2002-13, Class FE, 30D US SOFR + 1.01%, 03/25/2032(a) | | | 37,637 | | | | 37,780 | |
| Series 2002-16, Class TM, 7.000%, 04/25/2032 | | | 10,559 | | | | 10,744 | |
| Series 2002-17, Class JF, 30D US SOFR + 1.11%, 04/25/2032(a) | | | 22,138 | | | | 22,357 | |
| Series 2002-18, Class FD, 30D US SOFR + 0.91%, 02/25/2032(a) | | | 37,867 | | | | 37,936 | |
| Series 2002-23, Class FA, 30D US SOFR + 1.01%, 04/25/2032(a) | | | 32,019 | | | | 32,302 | |
| Series 2002-34, Class EO, –%, 05/18/2032(b) | | | 27,341 | | | | 25,403 | |
| Series 2002-36, Class FS, 30D US SOFR + 0.61%, 06/25/2032(a) | | | 13,183 | | | | 13,164 | |
| Series 2002-44, Class FJ, 30D US SOFR + 1.11%, 04/25/2032(a) | | | 55,462 | | | | 55,904 | |
| Series 2002-47, Class FC, 30D US SOFR + 0.71%, 11/25/2031(a) | | | 11,429 | | | | 11,376 | |
| Series 2002-48, Class F, 30D US SOFR + 1.11%, 07/25/2032(a) | | | 34,973 | | | | 35,250 | |
| Series 2002-49, Class FC, 30D US SOFR + 1.11%, 11/18/2031(a) | | | 32,244 | | | | 32,488 | |
| Series 2002-60, Class FV, 30D US SOFR + 1.11%, 04/25/2032(a) | | | 82,174 | | | | 82,986 | |
| Series 2002-63, Class EZ, 6.000%, 10/25/2032 | | | 6,046 | | | | 5,990 | |
| Series 2002-64, Class PG, 5.500%, 10/25/2032 | | | 45,106 | | | | 44,191 | |
| Series 2002-68, Class AF, 30D US SOFR + 1.11%, 10/25/2032(a) | | | 15,408 | | | | 15,561 | |
| Series 2002-7, Class FC, 30D US SOFR + 0.86%, 01/25/2032(a) | | | 46,105 | | | | 46,211 | |
| Series 2002-71, Class AQ, 4.000%, 11/25/2032 | | | 31,210 | | | | 29,763 | |
See Notes to Financial Statements.
ALPS | Smith Total Return Bond Fund
| Statement of Investments | October 31, 2023 |
| | | Principal
Amount | | | Value
(Note 2) | |
| Series 2002-8, Class FA, 30D US SOFR + 0.86%, 03/18/2032(a) | | $ | 22,871 | | | $ | 22,967 | |
| Series 2002-80, Class CZ, 4.500%, 09/25/2032 | | | 102,731 | | | | 91,309 | |
| Series 2002-9, Class FW, 30D US SOFR + 0.66%, 03/25/2032(a) | | | 11,471 | | | | 11,283 | |
| Series 2002-91, Class F, 30D US SOFR + 0.66%, 01/25/2033(a) | | | 16,987 | | | | 16,916 | |
| Series 2003-107, Class FD, 30D US SOFR + 0.61%, 11/25/2033(a) | | | 10,927 | | | | 10,881 | |
| Series 2003-110, Class CK, 3.000%, 11/25/2033 | | | 18,434 | | | | 16,962 | |
| Series 2003-116, Class FA, 30D US SOFR + 0.51%, 11/25/2033(a) | | | 22,405 | | | | 22,268 | |
| Series 2003-119, Class FH, 30D US SOFR + 0.61%, 12/25/2033(a) | | | 32,689 | | | | 32,552 | |
| Series 2003-119, Class ZP, 4.000%, 12/25/2033 | | | 53,102 | | | | 48,644 | |
| Series 2003-128, Class MF, 30D US SOFR + 0.71%, 01/25/2034(a) | | | 45,256 | | | | 45,233 | |
| Series 2003-131, Class CH, 5.500%, 01/25/2034 | | | 67,448 | | | | 65,993 | |
| Series 2003-134, Class FC, 30D US SOFR + 0.71%, 12/25/2032(a) | | | 25,699 | | | | 25,688 | |
| Series 2003-14, Class AN, 3.500%, 03/25/2033 | | | 31,865 | | | | 30,993 | |
| Series 2003-14, Class AP, 4.000%, 03/25/2033 | | | 47,797 | | | | 46,623 | |
| Series 2003-19, Class MB, 4.000%, 05/25/2031 | | | 29,493 | | | | 27,609 | |
| Series 2003-21, Class OG, 4.000%, 01/25/2033 | | | 19,254 | | | | 18,487 | |
| Series 2003-22, Class BZ, 6.000%, 04/25/2033 | | | 22,495 | | | | 22,203 | |
| Series 2003-27, Class EK, 5.000%, 04/25/2033 | | | 24,387 | | | | 23,474 | |
| Series 2003-30, Class JQ, 5.500%, 04/25/2033 | | | 22,448 | | | | 21,976 | |
| Series 2003-32, Class UJ, 5.500%, 05/25/2033 | | | 37,747 | | | | 36,943 | |
| Series 2003-41, Class OZ, 3.750%, 05/25/2033 | | | 134,655 | | | | 115,842 | |
| Series 2003-41, Class OB, 4.000%, 05/25/2033 | | | 100,571 | | | | 91,263 | |
| Series 2003-42, Class JH, 5.500%, 05/25/2033 | | | 55,156 | | | | 53,265 | |
| Series 2003-46, Class PJ, 5.500%, 06/25/2033 | | | 29,435 | | | | 28,807 | |
| | | Principal
Amount | | | Value
(Note 2) | |
| Series 2003-47, Class PE, 5.750%, 06/25/2033 | | $ | 39,718 | | | $ | 39,204 | |
| Series 2003-64, Class JK, 3.500%, 07/25/2033 | | | 45,745 | | | | 42,218 | |
| Series 2003-64, Class ZC, 5.000%, 07/25/2033 | | | 25,099 | | | | 24,029 | |
| Series 2003-71, Class HD, 5.500%, 08/25/2033 | | | 109,934 | | | | 107,326 | |
| Series 2003-76, Class EZ, 5.000%, 08/25/2033 | | | 123,587 | | | | 118,272 | |
| Series 2003-94, Class CE, 5.000%, 10/25/2033 | | | 6,014 | | | | 5,871 | |
| Series 2004-101, Class TB, 5.500%, 01/25/2035 | | | 109,082 | | | | 106,772 | |
| Series 2004-14, Class QB, 5.250%, 03/25/2034 | | | 143,661 | | | | 139,324 | |
| Series 2004-17, Class BA, 6.000%, 04/25/2034 | | | 118,388 | | | | 119,934 | |
| Series 2004-17, Class DZ, 5.500%, 04/25/2034 | | | 14,958 | | | | 14,684 | |
| Series 2004-26, Class CG, 4.500%, 08/25/2033 | | | 1,083 | | | | 1,069 | |
| Series 2004-36, Class CB, 5.000%, 05/25/2034 | | | 78,619 | | | | 75,963 | |
| Series 2004-36, Class FA, 30D US SOFR + 0.51%, 05/25/2034(a) | | | 22,927 | | | | 22,681 | |
| Series 2004-53, Class FC, 30D US SOFR + 0.56%, 07/25/2034(a) | | | 169,049 | | | | 167,946 | |
| Series 2004-54, Class FL, 30D US SOFR + 0.51%, 07/25/2034(a) | | | 120,488 | | | | 119,578 | |
| Series 2004-60, Class AC, 5.500%, 04/25/2034 | | | 106,091 | | | | 103,949 | |
| Series 2004-68, Class LC, 5.000%, 09/25/2029 | | | 32,177 | | | | 31,221 | |
| Series 2004-77, Class AY, 4.500%, 10/25/2034 | | | 14,986 | | | | 14,223 | |
| Series 2004-82, Class HK, 5.500%, 11/25/2034 | | | 42,991 | | | | 42,061 | |
| Series 2004-92, Class TB, 5.500%, 12/25/2034 | | | 74,975 | | | | 73,204 | |
| Series 2004-92, Class FD, 30D US SOFR + 0.46%, 05/25/2034(a) | | | 123,909 | | | | 123,556 | |
| Series 2005-110, Class MP, 5.500%, 12/25/2035 | | | 15,335 | | | | 15,268 | |
| Series 2005-120, Class FE, 30D US SOFR + 0.63%, 01/25/2036(a) | | | 18,658 | | | | 18,259 | |
| Series 2005-122, Class PY, 6.000%, 01/25/2036 | | | 288,847 | | | | 286,815 | |
| Series 2005-17, Class EZ, 4.500%, 03/25/2035 | | | 161,891 | | | | 153,191 | |
See Notes to Financial Statements.
ALPS | Smith Total Return Bond Fund
| Statement of Investments | October 31, 2023 |
| | | Principal
Amount | | | Value
(Note 2) | |
| Series 2005-17, Class EX, 5.250%, 03/25/2035 | | $ | 25,000 | | | $ | 24,082 | |
| Series 2005-29, Class ZA, 5.500%, 04/25/2035 | | | 989,611 | | | | 995,070 | |
| Series 2005-3, Class CH, 5.250%, 02/25/2035 | | | 71,406 | | | | 69,975 | |
| Series 2005-35, Class DZ, 5.000%, 04/25/2035 | | | 118,441 | | | | 114,476 | |
| Series 2005-48, Class TD, 5.500%, 06/25/2035 | | | 112,314 | | | | 109,575 | |
| Series 2005-52, Class FE, 30D US SOFR + 1.91%, 05/25/2035(a) | | | 97,565 | | | | 101,503 | |
| Series 2005-62, Class GZ, 5.750%, 07/25/2035 | | | 357,938 | | | | 349,082 | |
| Series 2005-64, Class PL, 5.500%, 07/25/2035 | | | 61,950 | | | | 60,793 | |
| Series 2005-68, Class PG, 5.500%, 08/25/2035 | | | 25,309 | | | | 24,786 | |
| Series 2005-68, Class BE, 5.250%, 08/25/2035 | | | 69,714 | | | | 67,571 | |
| Series 2005-68, Class CZ, 5.500%, 08/25/2035 | | | 269,513 | | | | 259,310 | |
| Series 2005-69, Class GZ, 4.500%, 08/25/2035 | | | 19,135 | | | | 18,231 | |
| Series 2005-7, Class MZ, 4.750%, 02/25/2035 | | | 29,522 | | | | 28,455 | |
| Series 2005-70, Class NA, 5.500%, 08/25/2035 | | | 10,631 | | | | 10,416 | |
| Series 2005-70, Class KP, 5.000%, 06/25/2035 | | | 47,719 | | | | 45,736 | |
| Series 2005-72, Class FB, 30D US SOFR + 0.36%, 08/25/2035(a) | | | 11,043 | | | | 10,854 | |
| Series 2005-79, Class DB, 5.500%, 09/25/2035 | | | 69,758 | | | | 68,490 | |
| Series 2005-83, Class QP, 17.09% - 30D US SOFR, 11/25/2034(a) | | | 42,616 | | | | 42,113 | |
| Series 2005-84, Class XM, 5.750%, 10/25/2035 | | | 55,694 | | | | 54,726 | |
| Series 2005-89, Class F, 30D US SOFR + 0.41%, 10/25/2035(a) | | | 18,454 | | | | 18,078 | |
| Series 2005-99, Class AC, 5.500%, 12/25/2035 | | | 541,000 | | | | 528,636 | |
| Series 2005-99, Class FA, 30D US SOFR + 0.41%, 11/25/2035(a) | | | 17,579 | | | | 17,463 | |
| Series 2005-99, Class ZA, 5.500%, 12/25/2035 | | | 120,281 | | | | 117,670 | |
| Series 2006-112, Class QC, 5.500%, 11/25/2036 | | | 18,246 | | | | 17,817 | |
| Series 2006-114, Class HE, 5.500%, 12/25/2036 | | | 81,682 | | | | 79,916 | |
| | | Principal
Amount | | | Value
(Note 2) | |
| Series 2006-115, Class EF, 30D US SOFR + 0.47%, 12/25/2036(a) | | $ | 14,288 | | | $ | 13,905 | |
| Series 2006-16, Class HZ, 5.500%, 03/25/2036 | | | 215,169 | | | | 205,842 | |
| Series 2006-39, Class EF, 30D US SOFR + 0.51%, 05/25/2036(a) | | | 13,777 | | | | 13,481 | |
| Series 2006-46, Class UD, 5.500%, 06/25/2036 | | | 33,000 | | | | 31,872 | |
| Series 2006-48, Class TF, 30D US SOFR + 0.51%, 06/25/2036(a) | | | 33,721 | | | | 32,883 | |
| Series 2006-48, Class DZ, 6.000%, 06/25/2036 | | | 167,395 | | | | 161,203 | |
| Series 2006-56, Class F, 30D US SOFR + 0.41%, 07/25/2036(a) | | | 10,424 | | | | 10,275 | |
| Series 2006-62, Class FX, 30D US SOFR + 1.86%, 07/25/2036(a) | | | 183,610 | | | | 184,770 | |
| Series 2006-63, Class QH, 5.500%, 07/25/2036 | | | 30,142 | | | | 29,429 | |
| Series 2006-70, Class AF, 30D US SOFR + 0.51%, 08/25/2036(a) | | | 78,095 | | | | 76,330 | |
| Series 2006-71, Class ZH, 6.000%, 07/25/2036 | | | 36,976 | | | | 36,659 | |
| Series 2006-95, Class FH, 30D US SOFR + 0.56%, 10/25/2036(a) | | | 73,314 | | | | 71,595 | |
| Series 2007-100, Class YF, 30D US SOFR + 0.66%, 10/25/2037(a) | | | 14,710 | | | | 14,397 | |
| Series 2007-109, Class GF, 30D US SOFR + 0.79%, 12/25/2037(a) | | | 42,522 | | | | 41,652 | |
| Series 2007-111, Class FC, 30D US SOFR + 0.71%, 12/25/2037(a) | | | 29,485 | | | | 29,104 | |
| Series 2007-117, Class FM, 30D US SOFR + 0.81%, 01/25/2038(a) | | | 172,226 | | | | 169,767 | |
| Series 2007-12, Class BZ, 6.000%, 03/25/2037 | | | 453,726 | | | | 431,581 | |
| Series 2007-12, Class ZA, 6.000%, 03/25/2037 | | | 164,500 | | | | 152,593 | |
| Series 2007-14, Class GZ, 5.500%, 03/25/2037 | | | 160,415 | | | | 154,618 | |
| Series 2007-18, Class MZ, 6.000%, 03/25/2037 | | | 128,593 | | | | 122,814 | |
| Series 2007-22, Class FC, 30D US SOFR + 0.53%, 03/25/2037(a) | | | 69,946 | | | | 66,927 | |
| Series 2007-26, Class ZB, 5.500%, 04/25/2037 | | | 242,055 | | | | 231,518 | |
See Notes to Financial Statements.
ALPS | Smith Total Return Bond Fund
| Statement of Investments | October 31, 2023 |
| | | Principal
Amount | | | Value
(Note 2) | |
| Series 2007-30, Class MB, 4.250%, 04/25/2037 | | $ | 56,683 | | | $ | 54,482 | |
| Series 2007-33, Class HE, 5.500%, 04/25/2037 | | | 36,550 | | | | 35,719 | |
| Series 2007-34, Class F, 30D US SOFR + 0.50%, 04/25/2037(a) | | | 22,154 | | | | 21,350 | |
| Series 2007-41, Class FA, 30D US SOFR + 0.51%, 05/25/2037(a) | | | 7,173 | | | | 6,976 | |
| Series 2007-51, Class CP, 5.500%, 06/25/2037 | | | 25,425 | | | | 24,966 | |
| Series 2007-51, Class PB, 5.500%, 06/25/2037 | | | 31,054 | | | | 29,784 | |
| Series 2007-55, Class PH, 6.000%, 06/25/2047 | | | 260,536 | | | | 259,395 | |
| Series 2007-57, Class FA, 30D US SOFR + 0.34%, 06/25/2037(a) | | | 20,614 | | | | 20,130 | |
| Series 2007-6, Class FC, 30D US SOFR + 0.53%, 02/25/2037(a) | | | 37,465 | | | | 36,068 | |
| Series 2007-63, Class FC, 30D US SOFR + 0.46%, 07/25/2037(a) | | | 18,470 | | | | 17,952 | |
| Series 2007-63, Class VZ, 5.500%, 07/25/2037 | | | 183,092 | | | | 176,126 | |
| Series 2007-65, Class ZE, 5.500%, 07/25/2037 | | | 598,412 | | | | 570,698 | |
| Series 2007-65, Class KF, 30D US SOFR + 0.49%, 07/25/2037(a) | | | 55,962 | | | | 54,339 | |
| Series 2007-70, Class FA, 30D US SOFR + 0.46%, 07/25/2037(a) | | | 25,723 | | | | 24,896 | |
| Series 2007-77, Class JE, 6.000%, 08/25/2037 | | | 292,683 | | | | 275,435 | |
| Series 2007-85, Class FC, 30D US SOFR + 0.65%, 09/25/2037(a) | | | 99,302 | | | | 97,755 | |
| Series 2007-85, Class FL, 30D US SOFR + 0.65%, 09/25/2037(a) | | | 29,989 | | | | 29,349 | |
| Series 2007-86, Class FA, 30D US SOFR + 0.56%, 09/25/2037(a) | | | 27,434 | | | | 26,891 | |
| Series 2007-9, Class FB, 30D US SOFR + 0.46%, 03/25/2037(a) | | | 20,057 | | | | 19,446 | |
| Series 2008-18, Class FA, 30D US SOFR + 1.01%, 03/25/2038(a) | | | 153,091 | | | | 151,538 | |
| Series 2008-24, Class WD, 5.500%, 02/25/2038 | | | 153,997 | | | | 148,156 | |
| | | Principal
Amount | | | Value
(Note 2) | |
| Series 2008-25, Class EF, 30D US SOFR + 1.06%, 04/25/2038(a) | | $ | 38,659 | | | $ | 38,575 | |
| Series 2008-27, Class B, 5.500%, 04/25/2038 | | | 665,048 | | | | 649,418 | |
| Series 2008-46, Class LA, 5.500%, 06/25/2038 | | | 11,204 | | | | 10,730 | |
| Series 2008-66, Class FT, 30D US SOFR + 1.06%, 08/25/2038(a) | | | 21,663 | | | | 21,468 | |
| Series 2008-86, Class FC, 30D US SOFR + 1.21%, 12/25/2038(a) | | | 155,071 | | | | 156,432 | |
| Series 2009-103, Class FM, 30D US SOFR + 0.81%, 11/25/2039(a) | | | 34,193 | | | | 33,895 | |
| Series 2009-104, Class FA, 30D US SOFR + 0.91%, 12/25/2039(a) | | | 36,435 | | | | 36,060 | |
| Series 2009-11, Class MP, 7.000%, 03/25/2049 | | | 101,768 | | | | 102,039 | |
| Series 2009-110, Class FG, 30D US SOFR + 0.86%, 01/25/2040(a) | | | 84,224 | | | | 83,647 | |
| Series 2009-111, Class CY, 5.000%, 03/25/2038 | | | 133,000 | | | | 125,956 | |
| Series 2009-12, Class LA, 15.645%, 03/25/2039(a) | | | 273,005 | | | | 327,243 | |
| Series 2009-12, Class LD, 17.384%, 03/25/2039(a) | | | 370,107 | | | | 500,085 | |
| Series 2009-36, Class MX, 5.000%, 06/25/2039 | | | 58,000 | | | | 54,336 | |
| Series 2009-39, Class Z, 6.000%, 06/25/2039 | | | 1,830,365 | | | | 1,819,625 | |
| Series 2009-42, Class TZ, 4.500%, 03/25/2039 | | | 240,158 | | | | 218,045 | |
| Series 2009-47, Class BN, 4.500%, 07/25/2039 | | | 33,007 | | | | 31,278 | |
| Series 2009-62, Class WA, 5.582%, 08/25/2039(a) | | | 112,705 | | | | 110,919 | |
| Series 2009-68, Class FD, 30D US SOFR + 1.36%, 09/25/2039(a) | | | 46,329 | | | | 45,650 | |
| Series 2009-70, Class FA, 30D US SOFR + 1.31%, 09/25/2039(a) | | | 22,722 | | | | 22,379 | |
| Series 2009-70, Class CO, –%, 01/25/2037(b) | | | 69,464 | | | | 57,326 | |
| Series 2009-86, Class OT, –%, 10/25/2037(b) | | | 29,633 | | | | 23,323 | |
| Series 2009-87, Class FG, 30D US SOFR + 0.86%, 11/25/2039(a) | | | 59,261 | | | | 58,994 | |
| Series 2009-90, Class UZ, 4.500%, 11/25/2039 | | | 656,390 | | | | 588,247 | |
See Notes to Financial Statements.
ALPS | Smith Total Return Bond Fund
| Statement of Investments | | | | October 31, 2023 |
| | | Principal
Amount | | | Value
(Note 2) | |
| Series 2010-1, Class EL, 4.500%, 02/25/2040 | | $ | 262,643 | | | $ | 244,912 | |
| Series 2010-1, Class WA, 6.236%, 02/25/2040(a) | | | 16,179 | | | | 16,150 | |
| Series 2010-102, Class B, 4.500%, 07/25/2040 | | | 241,086 | | | | 225,271 | |
| Series 2010-102, Class HA, 4.000%, 09/25/2050 | | | 58,670 | | | | 52,056 | |
| Series 2010-103, Class DZ, 4.500%, 09/25/2040 | | | 220,393 | | | | 201,547 | |
| Series 2010-103, Class PJ, 4.500%, 09/25/2040 | | | 31,055 | | | | 28,981 | |
| Series 2010-111, Class FC, 30D US SOFR + 0.63%, 10/25/2040(a) | | | 44,343 | | | | 42,898 | |
| Series 2010-118, Class LZ, 4.750%, 10/25/2040 | | | 34,566 | | | | 31,928 | |
| Series 2010-122, Class JA, 7.000%, 07/25/2040 | | | 15,291 | | | | 15,252 | |
| Series 2010-123, Class FL, 30D US SOFR + 0.54%, 11/25/2040(a) | | | 17,971 | | | | 17,492 | |
| Series 2010-123, Class KU, 4.500%, 11/25/2040 | | | 163,486 | | | | 148,332 | |
| Series 2010-129, Class PZ, 4.500%, 11/25/2040 | | | 34,606 | | | | 27,637 | |
| Series 2010-130, Class BZ, 4.500%, 11/25/2040 | | | 1,220,903 | | | | 1,136,675 | |
| Series 2010-14, Class FJ, 30D US SOFR + 0.71%, 03/25/2040(a) | | | 100,925 | | | | 100,290 | |
| Series 2010-141, Class AL, 4.000%, 12/25/2040 | | | 318,342 | | | | 288,863 | |
| Series 2010-141, Class LZ, 4.500%, 12/25/2040 | | | 696,452 | | | | 606,278 | |
| Series 2010-141, Class MN, 4.000%, 12/25/2040 | | | 90,000 | | | | 79,790 | |
| Series 2010-141, Class FB, 30D US SOFR + 0.58%, 12/25/2040(a) | | | 42,130 | | | | 40,667 | |
| Series 2010-142, Class FM, 30D US SOFR + 0.58%, 12/25/2040(a) | | | 15,811 | | | | 15,237 | |
| Series 2010-154, Class JA, 3.000%, 11/25/2040 | | | 292,212 | | | | 266,916 | |
| Series 2010-16, Class PL, 5.000%, 03/25/2040 | | | 71,000 | | | | 66,563 | |
| Series 2010-19, Class PY, 5.000%, 03/25/2040 | | | 312,170 | | | | 298,516 | |
| Series 2010-33, Class KN, 4.500%, 03/25/2040 | | | 34,494 | | | | 32,948 | |
| Series 2010-37, Class CY, 5.000%, 04/25/2040 | | | 32,982 | | | | 31,856 | |
| Series 2010-38, Class KD, 4.500%, 09/25/2039 | | | 27 | | | | 27 | |
| | | Principal
Amount | | | Value
(Note 2) | |
| Series 2010-39, Class EF, 30D US SOFR + 0.63%, 06/25/2037(a) | | $ | 34,565 | | | $ | 34,082 | |
| Series 2010-45, Class WD, 5.000%, 05/25/2040 | | | 180,000 | | | | 163,246 | |
| Series 2010-54, Class LX, 5.000%, 06/25/2040 | | | 272,000 | | | | 258,114 | |
| Series 2010-57, Class HA, 3.500%, 02/25/2040 | | | 20,836 | | | | 20,434 | |
| Series 2010-58, Class FY, 30D US SOFR + 0.84%, 06/25/2040(a) | | | 45,859 | | | | 44,791 | |
| Series 2010-64, Class DM, 5.000%, 06/25/2040 | | | 33,121 | | | | 32,343 | |
| Series 2010-67, Class BD, 4.500%, 06/25/2040 | | | 546,273 | | | | 507,377 | |
| Series 2010-68, Class WB, 4.500%, 07/25/2040 | | | 85,000 | | | | 75,290 | |
| Series 2010-82, Class WZ, 5.000%, 08/25/2040 | | | 356,552 | | | | 344,724 | |
| Series 2010-9, Class ME, 5.000%, 02/25/2040 | | | 962,226 | | | | 923,638 | |
| Series 2011-114, Class B, 3.500%, 11/25/2041 | | | 155,048 | | | | 136,774 | |
| Series 2011-118, Class KL, 3.250%, 07/25/2040 | | | 105,063 | | | | 98,391 | |
| Series 2011-121, Class JP, 4.500%, 12/25/2041 | | | 112,132 | | | | 104,084 | |
| Series 2011-128, Class KB, 4.500%, 12/25/2041 | | | 800,000 | | | | 706,596 | |
| Series 2011-130, Class KB, 4.000%, 12/25/2041 | | | 33,818 | | | | 30,118 | |
| Series 2011-132, Class PE, 4.500%, 12/25/2041 | | | 122,818 | | | | 115,477 | |
| Series 2011-145, Class JA, 4.500%, 12/25/2041 | | | 8,427 | | | | 8,130 | |
| Series 2011-148, Class PL, 4.000%, 01/25/2042 | | | 425,000 | | | | 352,581 | |
| Series 2011-15, Class AF, 30D US SOFR + 0.62%, 03/25/2041(a) | | | 23,002 | | | | 22,461 | |
| Series 2011-17, Class PD, 4.000%, 03/25/2041 | | | 6,365 | | | | 5,956 | |
| Series 2011-26, Class PA, 4.500%, 04/25/2041 | | | 95,336 | | | | 90,526 | |
| Series 2011-27, Class ZD, 2.500%, 09/25/2040 | | | 167,047 | | | | 138,350 | |
| Series 2011-3, Class FA, 30D US SOFR + 0.79%, 02/25/2041(a) | | | 145,491 | | | | 141,361 | |
| Series 2011-30, Class ZA, 5.000%, 04/25/2041 | | | 538,810 | | | | 507,881 | |
| Series 2011-43, Class B, 3.500%, 05/25/2031 | | | 18,698 | | | | 17,577 | |
| Series 2011-45, Class ZA, 4.000%, 05/25/2031 | | | 17,021 | | | | 15,946 | |
See Notes to Financial Statements.
ALPS | Smith Total Return Bond Fund
| Statement of Investments | October 31, 2023 |
| | | Principal
Amount | | | Value
(Note 2) | |
| Series 2011-47, Class GF, 30D US SOFR + 0.68%, 06/25/2041(a) | | $ | 102,724 | | | $ | 100,414 | |
| Series 2011-5, Class PO, –%, 09/25/2040(b) | | | 8,588 | | | | 5,890 | |
| Series 2011-55, Class BZ, 3.500%, 06/25/2041 | | | 469,281 | | | | 418,191 | |
| Series 2011-74, Class UB, 4.000%, 07/25/2040 | | | 135,981 | | | | 123,546 | |
| Series 2011-86, Class NF, 30D US SOFR + 0.66%, 09/25/2041(a) | | | 91,588 | | | | 89,236 | |
| Series 2011-86, Class AF, 30D US SOFR + 0.61%, 02/25/2040(a) | | | 23,998 | | | | 23,645 | |
| Series 2011-93, Class GA, 4.000%, 04/25/2039 | | | 21,081 | | | | 19,803 | |
| Series 2011-93, Class ST, 4.000%, 09/25/2041 | | | 18,461 | | | | 16,918 | |
| Series 2012-100, Class DB, 3.000%, 09/25/2042 | | | 972,331 | | | | 811,136 | |
| Series 2012-103, Class PY, 3.000%, 09/25/2042 | | | 109,000 | | | | 82,875 | |
| Series 2012-106, Class QN, 3.500%, 10/25/2042 | | | 54,438 | | | | 46,870 | |
| Series 2012-108, Class PL, 3.000%, 10/25/2042 | | | 541,668 | | | | 451,390 | |
| Series 2012-110, Class JB, 2.500%, 10/25/2042 | | | 204,000 | | | | 132,806 | |
| Series 2012-111, Class B, 7.000%, 10/25/2042 | | | 76,766 | | | | 78,941 | |
| Series 2012-112, Class DA, 3.000%, 10/25/2042 | | | 172,913 | | | | 146,612 | |
| Series 2012-115, Class DY, 2.500%, 10/25/2042 | | | 225,000 | | | | 157,917 | |
| Series 2012-120, Class AH, 2.500%, 02/25/2032 | | | 24,170 | | | | 23,193 | |
| Series 2012-125, Class GY, 2.000%, 11/25/2042 | | | 621,000 | | | | 435,351 | |
| Series 2012-126, Class TA, 3.000%, 10/25/2042 | | | 177,279 | | | | 151,077 | |
| Series 2012-128, Class NP, 2.500%, 11/25/2042 | | | 8,144 | | | | 5,222 | |
| Series 2012-129, Class HT, 2.000%, 12/25/2032 | | | 28,713 | | | | 24,446 | |
| Series 2012-13, Class JP, 4.500%, 02/25/2042 | | | 427,478 | | | | 396,461 | |
| Series 2012-131, Class FG, 30D US SOFR + 0.46%, 09/25/2042(a) | | | 11,883 | | | | 11,390 | |
| Series 2012-137, Class CF, 30D US SOFR + 0.41%, 08/25/2041(a) | | | 13,433 | | | | 13,273 | |
| Series 2012-139, Class CY, 2.000%, 12/25/2042 | | | 235,000 | | | | 147,117 | |
| | | Principal
Amount | | | Value
(Note 2) | |
| Series 2012-139, Class GB, 2.500%, 12/25/2042 | | $ | 210,538 | | | $ | 127,594 | |
| Series 2012-14, Class FL, 30D US SOFR + 0.56%, 12/25/2040(a) | | | 3,376 | | | | 3,357 | |
| Series 2012-141, Class PD, 1.750%, 10/25/2041 | | | 95,750 | | | | 84,363 | |
| Series 2012-149, Class KB, 3.000%, 01/25/2043 | | | 144,000 | | | | 132,856 | |
| Series 2012-149, Class DA, 1.750%, 01/25/2043 | | | 26,930 | | | | 23,787 | |
| Series 2012-149, Class ZA, 3.000%, 01/25/2041 | | | 59,108 | | | | 54,433 | |
| Series 2012-151, Class NX, 1.500%, 01/25/2043 | | | 346,485 | | | | 275,954 | |
| Series 2012-151, Class WC, 2.500%, 01/25/2043 | | | 249,000 | | | | 161,472 | |
| Series 2012-152, Class PB, 3.500%, 01/25/2043 | | | 55,000 | | | | 50,860 | |
| Series 2012-153, Class B, 7.000%, 07/25/2042 | | | 25,930 | | | | 26,392 | |
| Series 2012-17, Class JB, 3.500%, 03/25/2042 | | | 135,000 | | | | 91,002 | |
| Series 2012-17, Class JA, 3.500%, 12/25/2041 | | | 231,701 | | | | 201,662 | |
| Series 2012-19, Class CB, 3.500%, 03/25/2042 | | | 153,000 | | | | 130,424 | |
| Series 2012-20, Class TD, 4.500%, 02/25/2042 | | | 34,939 | | | | 34,106 | |
| Series 2012-26, Class MA, 3.500%, 03/25/2042 | | | 122,354 | | | | 106,164 | |
| Series 2012-27, Class KB, 2.000%, 03/25/2042 | | | 150,407 | | | | 101,065 | |
| Series 2012-33, Class F, 30D US SOFR + 0.63%, 04/25/2042(a) | | | 27,505 | | | | 26,851 | |
| Series 2012-37, Class BF, 30D US SOFR + 0.61%, 12/25/2035(a) | | | 48,640 | | | | 47,722 | |
| Series 2012-38, Class MC, 3.000%, 04/25/2042 | | | 147,000 | | | | 108,315 | |
| Series 2012-46, Class YB, 3.500%, 05/25/2042 | | | 61,440 | | | | 51,236 | |
| Series 2012-46, Class CD, 2.500%, 04/25/2041 | | | 75,146 | | | | 71,911 | |
| Series 2012-47, Class JM, 3.500%, 05/25/2042 | | | 140,340 | | | | 107,799 | |
| Series 2012-47, Class HF, 30D US SOFR + 0.51%, 05/25/2027(a) | | | 52,637 | | | | 52,647 | |
| Series 2012-49, Class TG, 2.000%, 07/25/2041 | | | 31,790 | | | | 30,600 | |
| Series 2012-50, Class HC, 2.000%, 03/25/2042 | | | 120,367 | | | | 104,896 | |
| Series 2012-51, Class HJ, 3.500%, 05/25/2042 | | | 364,384 | | | | 280,680 | |
See Notes to Financial Statements.
ALPS | Smith Total Return Bond Fund
| Statement of Investments | October 31, 2023 |
| | | Principal
Amount | | | Value
(Note 2) | |
| Series 2012-51, Class ZX, 3.500%, 05/25/2042 | | $ | 2,015,530 | | | $ | 1,270,056 | |
| Series 2012-52, 4.500%, 01/25/2042 | | | 611,505 | | | | 592,301 | |
| Series 2012-53, Class AP, 2.000%, 04/25/2041 | | | 43,799 | | | | 42,110 | |
| Series 2012-56, Class WB, 3.500%, 05/25/2042 | | | 65,852 | | | | 56,201 | |
| Series 2012-56, Class UB, 4.000%, 06/25/2042 | | | 416,000 | | | | 364,720 | |
| Series 2012-64, Class NA, 3.000%, 08/25/2041 | | | 23,811 | | | | 23,310 | |
| Series 2012-69, Class PL, 3.000%, 01/25/2042 | | | 106,881 | | | | 100,288 | |
| Series 2012-70, Class WC, 3.000%, 07/25/2042 | | | 172,000 | | | | 119,962 | |
| Series 2012-80, Class GZ, 3.000%, 08/25/2042 | | | 396,524 | | | | 339,631 | |
| Series 2012-82, Class E, 2.000%, 04/25/2042 | | | 23,877 | | | | 21,488 | |
| Series 2012-83, Class AC, 3.000%, 08/25/2042 | | | 85,000 | | | | 66,742 | |
| Series 2012-90, Class PH, 3.000%, 01/25/2042 | | | 66,076 | | | | 61,258 | |
| Series 2012-90, Class PB, 2.500%, 01/25/2042 | | | 198,229 | | | | 181,391 | |
| Series 2012-93, Class TL, 3.000%, 09/25/2042 | | | 420,000 | | | | 309,455 | |
| Series 2012-98, Class ZP, 6.000%, 09/25/2042 | | | 682,842 | | | | 699,703 | |
| Series 2012-99, Class DC, 2.000%, 08/25/2041 | | | 125,494 | | | | 111,297 | |
| Series 2013-100, Class DH, 3.000%, 09/25/2031 | | | 8,755 | | | | 8,664 | |
| Series 2013-104, Class CY, 5.000%, 10/25/2043 | | | 50,000 | | | | 44,728 | |
| Series 2013-108, Class GU, 3.000%, 10/25/2033 | | | 39,779 | | | | 36,459 | |
| Series 2013-114, Class LM, 4.000%, 03/25/2042 | �� | | 214,110 | | | | 191,897 | |
| Series 2013-130, Class FB, 30D US SOFR + 0.56%, 01/25/2044(a) | | | 34,351 | | | | 33,037 | |
| Series 2013-136, Class QB, 3.500%, 03/25/2042 | | | 166,825 | | | | 144,751 | |
| Series 2013-17, Class YM, 4.000%, 03/25/2033 | | | 13,284 | | | | 12,504 | |
| Series 2013-2, Class QF, 30D US SOFR + 0.61%, 02/25/2043(a) | | | 13,126 | | | | 12,518 | |
| Series 2013-20, Class CA, 2.500%, 01/25/2043 | | | 177,596 | | | | 147,889 | |
| Series 2013-35, Class CV, 3.000%, 02/25/2043 | | | 200,000 | | | | 172,585 | |
| Series 2013-4, Class PL, 2.000%, 02/25/2043 | | | 120,000 | | | | 79,151 | |
| | | Principal
Amount | | | Value
(Note 2) | |
| Series 2013-52, Class GM, 5.000%, 06/25/2043 | | $ | 89,000 | | | $ | 79,059 | |
| Series 2013-53, Class CV, 3.500%, 05/25/2030 | | | 93,757 | | | | 91,480 | |
| Series 2013-68, Class P, 3.500%, 10/25/2042 | | | 133,149 | | | | 125,031 | |
| Series 2013-68, Class LE, 2.000%, 04/25/2043 | | | 80,566 | | | | 69,351 | |
| Series 2013-70, Class CE, 2.500%, 01/25/2043 | | | 167,504 | | | | 149,105 | |
| Series 2013-72, Class YA, 3.000%, 06/25/2033 | | | 2,612 | | | | 2,201 | |
| Series 2013-72, Class AF, 30D US SOFR + 0.36%, 11/25/2042(a) | | | 6,810 | | | | 6,739 | |
| Series 2013-81, Class YK, 4.000%, 08/25/2043 | | | 200,000 | | | | 168,748 | |
| Series 2013-9, Class CB, 5.500%, 04/25/2042 | | | 509,433 | | | | 504,599 | |
| Series 2013-9, Class BC, 6.500%, 07/25/2042 | | | 220,090 | | | | 224,869 | |
| Series 2013-91, Class PB, 4.000%, 09/25/2043 | | | 140,000 | | | | 115,326 | |
| Series 2014-10, Class BA, 5.349%, 03/25/2054(a) | | | 296,665 | | | | 289,763 | |
| Series 2014-20, Class AC, 3.000%, 08/25/2036 | | | 54,625 | | | | 53,094 | |
| Series 2014-21, Class MA, 2.000%, 09/25/2041 | | | 69,347 | | | | 63,401 | |
| Series 2014-23, Class Z, 3.500%, 05/25/2044 | | | 503,532 | | | | 433,119 | |
| Series 2014-23, Class A, 3.000%, 05/25/2044 | | | 786,956 | | | | 663,265 | |
| Series 2014-26, Class YW, 3.500%, 04/25/2044 | | | 50,538 | | | | 45,148 | |
| Series 2014-3, Class BM, 2.500%, 06/25/2043 | | | 50,000 | | | | 42,889 | |
| Series 2014-43, Class PZ, 3.000%, 07/25/2043 | | | 249,037 | | | | 183,976 | |
| Series 2014-49, Class CA, 3.000%, 08/25/2044 | | | 84,896 | | | | 77,692 | |
| Series 2014-52, Class LM, 3.500%, 09/25/2044 | | | 1,089,776 | | | | 836,225 | |
| Series 2014-6, Class Z, 2.500%, 02/25/2044 | | | 127,570 | | | | 100,812 | |
| Series 2014-63, Class LN, 3.000%, 10/25/2044 | | | 125,000 | | | | 79,427 | |
| Series 2014-67, Class PL, 3.000%, 04/25/2043 | | | 169,891 | | | | 153,560 | |
| Series 2014-73, Class FA, 30D US SOFR + 0.46%, 11/25/2044(a) | | | 13,254 | | | | 12,657 | |
| Series 2014-80, Class DZ, 3.000%, 12/25/2044 | | | 3,046,481 | | | | 2,504,912 | |
| Series 2014-81, Class GC, 3.000%, 03/25/2038 | | | 27,162 | | | | 26,007 | |
See Notes to Financial Statements.
ALPS | Smith Total Return Bond Fund
| Statement of Investments | October 31, 2023 |
| | | Principal
Amount | | | Value
(Note 2) | |
| Series 2014-86, Class PA, 2.000%, 12/25/2044 | | $ | 908,589 | | | $ | 762,220 | |
| Series 2014-88, Class ER, 2.500%, 02/25/2036 | | | 24,333 | | | | 22,559 | |
| Series 2015-16, Class ZY, 2.500%, 04/25/2045 | | | 10,487,478 | | | | 7,963,436 | |
| Series 2015-51, Class CD, 3.000%, 07/25/2044 | | | 112,389 | | | | 102,772 | |
| Series 2015-53, Class KB, 3.000%, 01/25/2045 | | | 828,230 | | | | 678,364 | |
| Series 2015-56, Class MH, 3.500%, 08/25/2045 | | | 998,369 | | | | 842,544 | |
| Series 2015-65, Class CZ, 3.500%, 09/25/2045 | | | 133,032 | | | | 99,697 | |
| Series 2015-75, Class LB, 3.000%, 10/25/2045 | | | 125,000 | | | | 76,997 | |
| Series 2016-14, Class NC, 2.500%, 03/25/2046 | | | 220,078 | | | | 201,133 | |
| Series 2016-2, Class BH, 2.700%, 07/25/2045 | | | 190,823 | | | | 166,852 | |
| Series 2016-23, Class PL, 3.000%, 11/25/2045 | | | 298,685 | | | | 207,484 | |
| Series 2016-27, Class HK, 3.000%, 01/25/2041 | | | 272,843 | | | | 246,441 | |
| Series 2016-31, Class TM, 3.000%, 12/25/2045 | | | 360,000 | | | | 278,017 | |
| Series 2016-33, Class JA, 3.000%, 07/25/2045 | | | 149,926 | | | | 132,162 | |
| Series 2016-33, Class LE, 2.500%, 11/25/2033 | | | 38,172 | | | | 34,122 | |
| Series 2016-48, Class UF, 30D US SOFR + 0.51%, 08/25/2046(a) | | | 69,536 | | | | 67,556 | |
| Series 2016-52, Class MZ, 3.000%, 08/25/2046 | | | 248,526 | | | | 154,342 | |
| Series 2016-55, Class EA, 1.750%, 07/25/2043 | | | 806,301 | | | | 614,090 | |
| Series 2016-57, Class PC, 1.750%, 06/25/2046 | | | 248,879 | | | | 194,338 | |
| Series 2016-75, Class FC, 30D US SOFR + 0.51%, 10/25/2046(a) | | | 34,691 | | | | 33,609 | |
| Series 2016-8, Class CB, 3.500%, 03/25/2046 | | | 893,000 | | | | 759,448 | |
| Series 2016-83, Class KL, 2.500%, 11/25/2046 | | | 132,413 | | | | 75,230 | |
| Series 2016-85, Class BA, 2.500%, 11/25/2046 | | | 5,543 | | | | 3,530 | |
| Series 2016-9, Class D, 3.000%, 03/25/2046 | | | 30,738 | | | | 25,985 | |
| Series 2016-9, Class PA, 2.500%, 06/25/2045 | | | 167,651 | | | | 149,513 | |
| Series 2017-1, Class JP, 3.500%, 04/25/2045 | | | 99,241 | | | | 92,467 | |
| | | Principal
Amount | | | Value
(Note 2) | |
| Series 2017-10, Class FA, 30D US SOFR + 0.51%, 03/25/2047(a) | | $ | 25,700 | | | $ | 24,825 | |
| Series 2017-100, Class ZE, 3.500%, 12/25/2047 | | | 133,792 | | | | 112,350 | |
| Series 2017-110, Class PB, 3.000%, 02/25/2057 | | | 140,000 | | | | 95,455 | |
| Series 2017-15, Class PE, 3.500%, 04/25/2046 | | | 46,280 | | | | 41,651 | |
| Series 2017-19, Class B, 3.000%, 01/25/2047 | | | 238,334 | | | | 202,520 | |
| Series 2017-22, Class DA, 4.000%, 08/25/2044 | | | 3,255 | | | | 3,223 | |
| Series 2017-24, Class H, 3.000%, 08/25/2043 | | | 71,346 | | | | 69,062 | |
| Series 2017-25, Class QE, 2.500%, 04/25/2047 | | | 163,827 | | | | 131,726 | |
| Series 2017-35, Class AH, 3.500%, 04/25/2053 | | | 11,115 | | | | 10,681 | |
| Series 2017-38, Class JA, 3.000%, 03/25/2047 | | | 111,687 | | | | 94,528 | |
| Series 2017-40, Class GL, 3.500%, 03/25/2043 | | | 872 | | | | 863 | |
| Series 2017-46, Class P, 3.500%, 06/25/2047 | | | 2,626,206 | | | | 2,210,977 | |
| Series 2017-56, Class BY, 3.000%, 07/25/2047 | | | 128,765 | | | | 93,686 | |
| Series 2017-56, Class BA, 3.000%, 03/25/2045 | | | 86,280 | | | | 78,984 | |
| Series 2017-68, Class HQ, 3.000%, 07/25/2046 | | | 785,073 | | | | 691,625 | |
| Series 2017-84, Class JP, 2.750%, 10/25/2047 | | | 121,178 | | | | 100,354 | |
| Series 2017-90, Class WB, 3.000%, 11/25/2047 | | | 1,119,992 | | | | 780,925 | |
| Series 2017-96, Class PA, 3.000%, 12/25/2054 | | | 120,721 | | | | 111,038 | |
| Series 2017-99, Class DZ, 3.500%, 12/25/2047 | | | 149,091 | | | | 125,150 | |
| Series 2018-15, Class KG, 2.500%, 01/25/2048 | | | 107,229 | | | | 85,951 | |
| Series 2018-19, Class KB, 3.000%, 04/25/2046 | | | 63,169 | | | | 58,339 | |
| Series 2018-2, Class HD, 3.000%, 02/25/2047 | | | 23,518 | | | | 21,990 | |
| Series 2018-24, Class BA, 3.500%, 09/25/2045 | | | 4,669 | | | | 4,637 | |
| Series 2018-25, Class AL, 3.500%, 04/25/2048 | | | 187,296 | | | | 148,991 | |
| Series 2018-38, Class PA, 3.500%, 06/25/2047 | | | 55,392 | | | | 50,993 | |
| Series 2018-39, Class FG, 30D US SOFR + 0.36%, 11/25/2033(a) | | | 92,475 | | | | 89,380 | |
| Series 2018-41, Class PZ, 4.000%, 06/25/2048 | | | 969,598 | | | | 696,566 | |
See Notes to Financial Statements.
ALPS | Smith Total Return Bond Fund
| Statement of Investments | October 31, 2023 |
| | | Principal
Amount | | | Value
(Note 2) | |
| Series 2018-43, Class FE, 30D US SOFR + 0.36%, 09/25/2038(a) | | $ | 95,291 | | | $ | 91,640 | |
| Series 2018-45, Class GA, 3.000%, 06/25/2048 | | | 37,101 | | | | 31,090 | |
| Series 2018-5, Class JP, 3.000%, 09/25/2047 | | | 44,289 | | | | 38,116 | |
| Series 2018-50, Class DY, 3.000%, 10/25/2047 | | | 573,651 | | | | 487,551 | |
| Series 2018-56, Class CH, 3.000%, 08/25/2048 | | | 30,369 | | | | 25,458 | |
| Series 2018-6, Class PA, 3.000%, 02/25/2048 | | | 192,350 | | | | 161,513 | |
| Series 2018-60, Class KL, 4.000%, 08/25/2048 | | | 96,000 | | | | 76,274 | |
| Series 2018-67, Class DY, 4.000%, 09/25/2048 | | | 304,029 | | | | 237,992 | |
| Series 2018-70, Class HB, 3.500%, 10/25/2058 | | | 314,994 | | | | 245,558 | |
| Series 2018-74, Class AB, 3.500%, 10/25/2048 | | | 331,905 | | | | 282,392 | |
| Series 2018-8, Class KL, 2.500%, 03/25/2047 | | | 287,311 | | | | 235,903 | |
| Series 2018-83, Class AC, 3.500%, 11/25/2048 | | | 145,406 | | | | 123,720 | |
| Series 2018-83, Class LH, 4.000%, 11/25/2048 | | | 20,423 | | | | 18,244 | |
| Series 2018-9, Class PL, 3.500%, 02/25/2048 | | | 395,045 | | | | 320,210 | |
| Series 2018-94, Class KD, 3.500%, 12/25/2048 | | | 48,291 | | | | 41,362 | |
| Series 2018-94, Class KZ, 4.500%, 01/25/2049 | | | 190,096 | | | | 124,086 | |
| Series 2019-10, Class MA, 3.000%, 03/25/2049 | | | 75,208 | | | | 63,294 | |
| Series 2019-11, Class EA, 3.000%, 05/25/2048 | | | 223,086 | | | | 194,746 | |
| Series 2019-12, Class HA, 3.500%, 11/25/2057 | | | 261,384 | | | | 234,745 | |
| Series 2019-13, Class MH, 3.000%, 03/25/2049 | | | 287,422 | | | | 245,058 | |
| Series 2019-34, Class PZ, 3.000%, 07/25/2049 | | | 114,854 | | | | 48,488 | |
| Series 2019-45, Class PT, 3.000%, 08/25/2049 | | | 248,865 | | | | 211,158 | |
| Series 2019-50, Class CZ, 2.750%, 09/25/2049 | | | 175,097 | | | | 65,370 | |
| Series 2019-55, Class MQ, 3.500%, 10/25/2049 | | | 581,078 | | | | 490,764 | |
| Series 2019-60, Class BF, 30D US SOFR + 0.564%, 10/25/2049(a) | | | 11,548 | | | | 10,994 | |
| Series 2019-65, Class HA, 2.500%, 11/25/2049 | | | 165,514 | | | | 133,732 | |
| Series 2019-81, Class LB, 1.500%, 12/25/2049 | | | 536,464 | | | | 405,277 | |
| | | Principal
Amount | | | Value
(Note 2) | |
| Series 2019-82, Class HZ, 3.000%, 01/25/2050 | | $ | 428,980 | | | $ | 339,959 | |
| Series 2020-10, Class B, 3.000%, 03/25/2050 | | | 233,272 | | | | 191,957 | |
| Series 2020-11, Class JW, 3.000%, 03/25/2050 | | | 237,000 | | | | 161,954 | |
| Series 2020-36, Class GD, 2.000%, 12/25/2037 | | | 132,273 | | | | 113,918 | |
| Series 2020-45, Class NB, 1.500%, 07/25/2050 | | | 259,992 | | | | 96,081 | |
| Series 2020-47, Class GZ, 2.000%, 07/25/2050 | | | 213,776 | | | | 106,210 | |
| Series 2020-73, Class ED, 0.836%, 11/25/2049(a) | | | 810,342 | | | | 560,102 | |
| Series 2021-12, Class GA, 1.000%, 07/25/2050 | | | 132,782 | | | | 91,058 | |
| Series 2021-15, Class JB, 1.250%, 04/25/2051 | | | 120,361 | | | | 40,600 | |
| Series 2021-17, Class ZA, 1.500%, 04/25/2051 | | | 160,081 | | | | 53,475 | |
| Series 2021-43, Class JC, 2.000%, 05/25/2051 | | | 127,816 | | | | 97,099 | |
| Series 2021-47, Class PE, 1.750%, 07/25/2051 | | | 820,564 | | | | 593,732 | |
| Series 2021-47, Class PD, 1.500%, 07/25/2051 | | | 820,564 | | | | 583,971 | |
| Series 2021-59, Class H, 2.000%, 06/25/2048 | | | 227,885 | | | | 171,762 | |
| Series 2021-6, Class KU, 1.500%, 02/25/2051 | | | 181,291 | | | | 89,407 | |
| Series 2021-66, Class HU, 1.500%, 10/25/2051 | | | 259,998 | | | | 107,619 | |
| Series 2021-66, Class JG, 1.000%, 10/25/2051 | | | 545,187 | | | | 408,518 | |
| Series 2021-68, Class A, 2.000%, 07/25/2049 | | | 2,524,865 | | | | 1,918,457 | |
| Series 2021-69, Class WA, 2.000%, 04/25/2049 | | | 323,754 | | | | 250,512 | |
| Series 2021-72, Class NL, 1.500%, 10/25/2051 | | | 316,302 | | | | 167,856 | |
| Series 2021-72, Class NB, 1.500%, 10/25/2051 | | | 140,000 | | | | 45,009 | |
| Series 2021-8, Class HZ, 2.000%, 03/25/2051 | | | 463,813 | | | | 170,312 | |
| Series 2021-80, Class KE, 2.000%, 11/25/2051 | | | 231,221 | | | | 181,617 | |
| Series 2022-17, Class GV, 2.500%, 01/25/2052 | | | 3,569,000 | | | | 2,346,418 | |
| Series 2022-37, Class QL, 4.000%, 07/25/2052 | | | 1,683,000 | | | | 1,489,172 | |
| Series 2022-4, Class CK, 1.500%, 04/25/2051 | | | 103,750 | | | | 48,346 | |
| Series 2022-43, Class ZA, 4.500%, 07/25/2052 | | | 237,825 | | | | 209,176 | |
| Series 2022-43, Class AN, 4.250%, 07/25/2052 | | | 240,932 | | | | 178,783 | |
See Notes to Financial Statements.
ALPS | Smith Total Return Bond Fund
| Statement of Investments | October 31, 2023 |
| | | Principal
Amount | | | Value
(Note 2) | |
| Series 2022-64, Class GM, 4.500%, 10/25/2052 | | $ | 3,161,000 | | | $ | 2,579,755 | |
| Series 2022-68, Class Z, 5.000%, 10/25/2052 | | | 738,367 | | | | 735,177 | |
| Series 2022-81, Class DO, –%, 11/25/2052(b) | | | 1,474,638 | | | | 572,513 | |
| Series 2022-88, Class EZ, 6.000%, 12/25/2052 | | | 4,151,636 | | | | 3,706,151 | |
| Series 2022-90, Class AY, 4.500%, 12/25/2041 | | | 180,000 | | | | 161,580 | |
| Series 2023-19, Class BZ, 5.000%, 05/25/2053 | | | 5,539,819 | | | | 4,711,658 | |
| | | | | | | | 92,446,725 | |
| Fannie Mae Grantor Trust 2002-T12 | | | | | | | | |
| Series 2002-T12, Class A1, 6.500%, 05/25/2042 | | | 135,242 | | | | 131,191 | |
| | | | | | | | | |
| Freddie Mac | | | | | | | | |
| Series 1994-1665, Class KZ, 6.500%, 01/15/2024 | | | 161 | | | | 160 | |
| Series 1996-1863, Class Z, 6.500%, 07/15/2026 | | | 246 | | | | 245 | |
| Series 1997-1935, Class FK, 30D US SOFR + 0.81%, 02/15/2027(a) | | | 7,400 | | | | 7,397 | |
| Series 1997-1980, Class Z, 7.000%, 07/15/2027 | | | 22,367 | | | | 22,255 | |
| Series 1998-2034, Class Z, 6.500%, 02/15/2028 | | | 13,464 | | | | 13,519 | |
| Series 1998-2035, Class PC, 6.950%, 03/15/2028 | | | 3,173 | | | | 3,172 | |
| Series 1998-2053, Class Z, 6.500%, 04/15/2028 | | | 10,283 | | | | 10,203 | |
| Series 1998-2060, Class Z, 6.500%, 05/15/2028 | | | 5,617 | | | | 5,626 | |
| Series 1998-2079, Class FA, 30D US SOFR + 0.61%, 07/17/2028(a) | | | 212 | | | | 212 | |
| Series 1998-2095, Class PE, 6.000%, 11/15/2028 | | | 11,203 | | | | 11,102 | |
| Series 1998-2102, Class Z, 6.000%, 12/15/2028 | | | 33,264 | | | | 33,001 | |
| Series 1999-2115, Class FB, 30D US SOFR + 0.56%, 01/15/2029(a) | | | 16,613 | | | | 16,555 | |
| Series 1999-2126, Class CB, 6.250%, 02/15/2029 | | | 14,468 | | | | 14,410 | |
| Series 1999-2137, Class TH, 6.500%, 03/15/2029 | | | 3,940 | | | | 3,941 | |
| Series 1999-2154, Class PL, 6.500%, 05/15/2029 | | | 112,246 | | | | 110,896 | |
| Series 2000-2224, Class CB, 8.000%, 03/15/2030 | | | 9,303 | | | | 9,645 | |
| Series 2001-2274, Class ZM, 6.500%, 01/15/2031 | | | 7,599 | | | | 7,561 | |
| | | Principal
Amount | | | Value
(Note 2) | |
| Series 2001-2279, Class Z, 6.000%, 01/15/2031 | | $ | 8,354 | | | $ | 8,233 | |
| Series 2001-2320, Class FI, 30D US SOFR + 0.61%, 09/15/2029(a) | | | 23,075 | | | | 22,952 | |
| Series 2001-2322, Class FV, 30D US SOFR + 0.61%, 06/15/2030(a) | | | 20,284 | | | | 19,835 | |
| Series 2001-2324, Class PZ, 6.500%, 06/15/2031 | | | 104,949 | | | | 105,928 | |
| Series 2001-2334, Class KB, 6.500%, 05/15/2028 | | | 49,364 | | | | 49,203 | |
| Series 2001-2341, Class FP, 30D US SOFR + 1.01%, 07/15/2031(a) | | | 23,399 | | | | 23,507 | |
| Series 2001-2367, Class FA, 30D US SOFR + 0.64%, 06/15/2031(a) | | | 20,613 | | | | 20,479 | |
| Series 2001-2372, Class F, 30D US SOFR + 0.61%, 10/15/2031(a) | | | 15,012 | | | | 14,947 | |
| Series 2001-2388, Class FR, 30D US SOFR + 0.76%, 06/15/2031(a) | | | 17,654 | | | | 17,599 | |
| Series 2001-2388, Class FB, 30D US SOFR + 0.71%, 01/15/2029(a) | | | 17,092 | | | | 17,044 | |
| Series 2001-2391, Class HF, 30D US SOFR + 0.66%, 06/15/2031(a) | | | 7,073 | | | | 7,032 | |
| Series 2001-2396, Class FM, 30D US SOFR + 0.56%, 12/15/2031(a) | | | 20,215 | | | | 20,171 | |
| Series 2001-2396, Class FN, 30D US SOFR + 0.76%, 12/15/2031(a) | | | 108,091 | | | | 108,224 | |
| Series 2002-2411, Class F, 30D US SOFR + 0.66%, 02/15/2032(a) | | | 16,790 | | | | 16,766 | |
| Series 2002-2412, Class OF, 30D US SOFR + 1.06%, 12/15/2031(a) | | | 24,035 | | | | 24,281 | |
| Series 2002-2417, Class FY, 30D US SOFR + 0.71%, 12/15/2031(a) | | | 7,237 | | | | 7,201 | |
| Series 2002-2424, Class FY, 30D US SOFR + 0.56%, 03/15/2032(a) | | | 39,097 | | | | 38,802 | |
| Series 2002-2430, Class WF, 6.500%, 03/15/2032 | | | 6,687 | | | | 6,743 | |
| Series 2002-2433, Class FA, 30D US SOFR + 1.06%, 02/15/2032(a) | | | 29,285 | | | | 29,587 | |
| Series 2002-2460, Class FA, 30D US SOFR + 1.11%, 03/15/2032(a) | | | 54,708 | | | | 55,055 | |
See Notes to Financial Statements.
ALPS | Smith Total Return Bond Fund
| Statement of Investments | October 31, 2023 |
| | | Principal
Amount | | | Value
(Note 2) | |
| Series 2002-2466, Class FV, 30D US SOFR + 0.66%, 03/15/2032(a) | | $ | 47,891 | | | $ | 47,713 | |
| Series 2002-2470, Class EF, 30D US SOFR + 1.11%, 03/15/2032(a) | | | 58,650 | | | | 59,229 | |
| Series 2002-2478, Class FD, 30D US SOFR + 1.11%, 02/15/2032(a) | | | 16,589 | | | | 16,411 | |
| Series 2002-2481, Class FE, 30D US SOFR + 1.11%, 03/15/2032(a) | | | 16,572 | | | | 16,736 | |
| Series 2002-2488, Class FU, 30D US SOFR + 0.71%, 03/15/2032(a) | | | 56,106 | | | | 55,868 | |
| Series 2002-2494, Class F, 30D US SOFR + 1.16%, 06/15/2031(a) | | | 27,384 | | | | 27,579 | |
| Series 2002-2495, Class ZB, 4.500%, 09/15/2032 | | | 31,926 | | | | 30,032 | |
| Series 2002-2510, Class FE, 30D US SOFR + 0.51%, 10/15/2032(a) | | | 9,481 | | | | 9,396 | |
| Series 2002-2513, Class AF, 30D US SOFR + 1.11%, 02/15/2032(a) | | | 44,343 | | | | 42,534 | |
| Series 2002-2516, Class FD, 30D US SOFR + 1.11%, 02/15/2032(a) | | | 42,140 | | | | 42,554 | |
| Series 2002-2517, Class FR, 30D US SOFR + 0.46%, 10/15/2032(a) | | | 11,227 | | | | 11,098 | |
| Series 2002-2524, Class DH, 6.000%, 11/15/2032 | | | 28,828 | | | | 28,361 | |
| Series 2002-2525, Class NU, 5.000%, 04/15/2032 | | | 65,119 | | | | 62,489 | |
| Series 2002-2535, Class AW, 5.500%, 12/15/2032 | | | 8,552 | | | | 8,300 | |
| Series 2002-2538, Class F, 30D US SOFR + 0.71%, 12/15/2032(a) | | | 117,291 | | | | 117,227 | |
| Series 2002-2541, Class BL, 5.500%, 12/15/2032 | | | 35,592 | | | | 34,898 | |
| Series 2003-2554, Class MN, 5.500%, 01/15/2033 | | | 39,177 | | | | 38,416 | |
| Series 2003-2557, Class HL, 5.300%, 01/15/2033 | | | 135,580 | | | | 132,118 | |
| Series 2003-2557, Class NU, 5.250%, 03/15/2032 | | | 47,247 | | | | 46,015 | |
| Series 2003-2557, Class WF, 30D US SOFR + 0.51%, 01/15/2033(a) | | | 31,080 | | | | 30,825 | |
| Series 2003-2568, Class D, 5.500%, 02/15/2033 | | | 29,912 | | | | 29,322 | |
| | | Principal
Amount | | | Value
(Note 2) | |
| Series 2003-2571, Class FY, 30D US SOFR + 0.86%, 12/15/2032(a) | | $ | 17,688 | | | $ | 17,765 | |
| Series 2003-2577, Class FC, 30D US SOFR + 0.61%, 02/15/2033(a) | | | 77,569 | | | | 76,886 | |
| Series 2003-2587, Class FW, 30D US SOFR + 0.58%, 03/15/2033(a) | | | 30,172 | | | | 29,954 | |
| Series 2003-2590, Class OZ, 4.000%, 03/15/2033 | | | 201,959 | | | | 188,403 | |
| Series 2003-2590, Class QY, 3.750%, 04/15/2028 | | | 3,228 | | | | 3,176 | |
| Series 2003-2614, Class FV, 30D US SOFR + 1.61%, 05/15/2033(a) | | | 190,920 | | | | 190,493 | |
| Series 2003-2624, Class QH, 5.000%, 06/15/2033 | | | 10,848 | | | | 10,501 | |
| Series 2003-2626, Class ZX, 5.000%, 06/15/2033 | | | 208,247 | | | | 177,221 | |
| Series 2003-2627, Class CN, 5.000%, 06/15/2033 | | | 31,393 | | | | 30,244 | |
| Series 2003-2631, Class DB, 5.000%, 06/15/2033 | | | 148,000 | | | | 139,059 | |
| Series 2003-2647, Class A, 3.250%, 04/15/2032 | | | 61,588 | | | | 57,453 | |
| Series 2003-2648, Class WZ, 5.000%, 07/15/2033 | | | 274,669 | | | | 251,350 | |
| Series 2003-2668, Class LH, 5.000%, 09/15/2033 | | | 20,975 | | | | 20,303 | |
| Series 2003-2707, Class FH, 30D US SOFR + 0.76%, 04/15/2032(a) | | | 32,424 | | | | 32,466 | |
| Series 2003-2711, Class FA, 30D US SOFR + 1.11%, 11/15/2033(a) | | | 130,163 | | | | 131,860 | |
| Series 2003-2717, Class LH, 5.500%, 12/15/2033 | | | 5,139 | | | | 5,037 | |
| Series 2003-2725, Class TA, 4.500%, 12/15/2033 | | | 159,000 | | | | 150,585 | |
| Series 2004-2750, Class TC, 5.250%, 02/15/2034 | | | 4,645 | | | | 4,555 | |
| Series 2004-2768, Class PW, 4.250%, 03/15/2034 | | | 135,051 | | | | 127,324 | |
| Series 2004-2802, Class OH, 6.000%, 05/15/2034 | | | 12,988 | | | | 12,940 | |
| Series 2004-2835, Class KZ, 5.500%, 08/15/2034 | | | 31,387 | | | | 30,572 | |
| Series 2004-2835, Class TB, 4.500%, 08/15/2034 | | | 311,905 | | | | 296,209 | |
| Series 2004-2893, Class PE, 5.000%, 11/15/2034 | | | 207,572 | | | | 200,770 | |
| Series 2004-2896, Class BZ, 5.000%, 11/15/2034 | | | 68,605 | | | | 66,325 | |
| Series 2004-2901, Class KB, 5.000%, 12/15/2034 | | | 32,522 | | | | 31,433 | |
See Notes to Financial Statements.
ALPS | Smith Total Return Bond Fund
| Statement of Investments | October 31, 2023 |
| | | Principal
Amount | | | Value
(Note 2) | |
| Series 2005-2916, Class MY, 5.500%, 01/15/2035 | | $ | 136,732 | | | $ | 131,349 | |
| Series 2005-2927, Class EZ, 5.500%, 02/15/2035 | | | 12,274 | | | | 11,876 | |
| Series 2005-2929, Class PG, 5.000%, 02/15/2035 | | | 32,772 | | | | 31,682 | |
| Series 2005-2933, Class HD, 5.500%, 02/15/2035 | | | 21,528 | | | | 21,174 | |
| Series 2005-2942, Class ZN, 5.500%, 03/15/2035 | | | 544,628 | | | | 516,795 | |
| Series 2005-2953, Class PG, 5.500%, 03/15/2035 | | | 15,280 | | | | 14,973 | |
| Series 2005-2962, Class KF, 30D US SOFR + 0.31%, 04/15/2035(a) | | | 11,285 | | | | 11,119 | |
| Series 2005-2973, Class GE, 5.500%, 05/15/2035 | | | 243,000 | | | | 232,929 | |
| Series 2005-2980, Class QA, 6.000%, 05/15/2035 | | | 35,640 | | | | 35,564 | |
| Series 2005-2996, Class GX, 5.500%, 06/15/2035 | | | 72,000 | | | | 68,976 | |
| Series 2005-3012, Class ZE, 5.750%, 08/15/2035 | | | 51,940 | | | | 51,770 | |
| Series 2005-3012, Class WZ, 5.500%, 08/15/2035 | | | 241,394 | | | | 224,353 | |
| Series 2005-3028, Class FM, 30D US SOFR + 0.36%, 09/15/2035(a) | | | 9,277 | | | | 9,123 | |
| Series 2005-3028, Class PG, 5.500%, 09/15/2035 | | | 44,181 | | | | 43,279 | |
| Series 2005-3028, Class ZE, 5.500%, 09/15/2035 | | | 891,166 | | | | 841,951 | |
| Series 2005-3033, Class WY, 5.500%, 09/15/2035 | | | 73,505 | | | | 71,851 | |
| Series 2005-3036, Class NE, 5.000%, 09/15/2035 | | | 86,596 | | | | 83,631 | |
| Series 2005-3042, Class PZ, 5.750%, 09/15/2035 | | | 160,832 | | | | 156,177 | |
| Series 2005-3052, Class WH, 5.500%, 10/15/2035 | | | 18,233 | | | | 17,865 | |
| Series 2005-3059, Class ZM, 5.000%, 02/15/2035 | | | 80,665 | | | | 77,812 | |
| Series 2005-3062, Class DE, 5.500%, 11/15/2035 | | | 115,801 | | | | 113,467 | |
| Series 2005-3068, Class Z, 5.500%, 11/15/2035 | | | 143,872 | | | | 141,706 | |
| Series 2005-3070, Class FT, 30D US SOFR + 0.46%, 11/15/2035(a) | | | 14,056 | | | | 13,865 | |
| Series 2005-3072, Class NF, 30D US SOFR + 0.61%, 11/15/2035(a) | | | 32,825 | | | | 32,177 | |
| Series 2005-3085, Class FE, 30D US SOFR + 0.91%, 08/15/2035(a) | | | 38,014 | | | | 38,030 | |
| | | Principal
Amount | | | Value
(Note 2) | |
| Series 2006-3098, Class PG, 5.000%, 01/15/2036 | | $ | 56,442 | | | $ | 54,505 | |
| Series 2006-3122, Class OH, –%, 03/15/2036(b) | | | 23,320 | | | | 19,671 | |
| Series 2006-3123, Class HT, 5.000%, 03/15/2026 | | | 12,233 | | | | 12,037 | |
| Series 2006-3136, Class KF, 30D US SOFR + 0.41%, 04/15/2036(a) | | | 14,899 | | | | 14,683 | |
| Series 2006-3137, Class XP, 6.000%, 04/15/2036 | | | 18,708 | | | | 18,696 | |
| Series 2006-3143, Class BC, 5.500%, 02/15/2036 | | | 83,390 | | | | 81,093 | |
| Series 2006-3145, Class FN, 30D US SOFR + 0.54%, 04/15/2036(a) | | | 11,275 | | | | 10,963 | |
| Series 2006-3148, Class CY, 6.000%, 04/15/2036 | | | 19,048 | | | | 18,703 | |
| Series 2006-3153, Class UG, 30D US SOFR + 0.56%, 05/15/2036(a) | | | 19,727 | | | | 19,328 | |
| Series 2006-3154, Class PN, 5.500%, 05/15/2036 | | | 57,866 | | | | 56,622 | |
| Series 2006-3201, Class FL, 30D US SOFR + 0.71%, 08/15/2036(a) | | | 78,054 | | | | 76,660 | |
| Series 2006-3202, Class HF, 30D US SOFR + 0.46%, 08/15/2036(a) | | | 36,248 | | | | 35,437 | |
| Series 2006-3203, Class ZM, 5.000%, 08/15/2036 | | | 177,496 | | | | 171,436 | |
| Series 2006-3204, Class ZM, 5.000%, 08/15/2034 | | | 83,913 | | | | 81,161 | |
| Series 2006-3206, Class FE, 30D US SOFR + 0.51%, 08/15/2036(a) | | | 37,684 | | | | 35,886 | |
| Series 2006-3235, Class Z, 6.500%, 11/15/2036 | | | 617,594 | | | | 618,939 | |
| Series 2006-3236, Class EF, 30D US SOFR + 0.41%, 11/15/2036(a) | | | 10,739 | | | | 10,428 | |
| Series 2006-3237, Class CD, 5.500%, 09/15/2036 | | | 108,807 | | | | 107,515 | |
| Series 2006-3237, Class CE, 5.500%, 11/15/2036 | | | 122,000 | | | | 119,973 | |
| Series 2006-3240, Class FG, 30D US SOFR + 1.22%, 11/15/2036(a) | | | 190,655 | | | | 190,007 | |
| Series 2006-3249, Class CB, 4.250%, 12/15/2036 | | | 337,780 | | | | 309,964 | |
| Series 2007-3279, Class FB, 30D US SOFR + 0.43%, 02/15/2037(a) | | | 72,541 | | | | 69,973 | |
| Series 2007-3284, Class AZ, 4.500%, 03/15/2037 | | | 23,285 | | | | 21,639 | |
See Notes to Financial Statements.
ALPS | Smith Total Return Bond Fund
| Statement of Investments | October 31, 2023 |
| | | Principal
Amount | | | Value
(Note 2) | |
| Series 2007-3301, Class FY, 30D US SOFR + 0.53%, 04/15/2037(a) | | $ | 13,984 | | | $ | 13,451 | |
| Series 2007-3311, Class DF, 30D US SOFR + 0.45%, 05/15/2037(a) | | | 92,227 | | | | 89,108 | |
| Series 2007-3312, Class PA, 5.500%, 05/15/2037 | | | 14,635 | | | | 14,326 | |
| Series 2007-3316, Class FB, 30D US SOFR + 0.41%, 08/15/2035(a) | | | 26,957 | | | | 26,438 | |
| Series 2007-3349, Class HG, 5.500%, 07/15/2037 | | | 15,769 | | | | 15,413 | |
| Series 2007-3361, Class AF, 30D US SOFR + 0.46%, 11/15/2036(a) | | | 61,032 | | | | 59,372 | |
| Series 2007-3367, Class YF, 30D US SOFR + 0.66%, 09/15/2037(a) | | | 16,081 | | | | 15,740 | |
| Series 2007-3368, Class AF, 30D US SOFR + 0.83%, 09/15/2037(a) | | | 56,715 | | | | 55,686 | |
| Series 2007-3378, Class FA, 30D US SOFR + 0.69%, 06/15/2037(a) | | | 32,045 | | | | 31,515 | |
| Series 2007-3380, Class FM, 30D US SOFR + 0.70%, 10/15/2037(a) | | | 73,510 | | | | 72,126 | |
| Series 2007-3382, Class FG, 30D US SOFR + 0.71%, 11/15/2037(a) | | | 36,392 | | | | 35,746 | |
| Series 2007-3382, Class FL, 30D US SOFR + 0.81%, 11/15/2037(a) | | | 67,352 | | | | 66,410 | |
| Series 2007-3387, Class PF, 30D US SOFR + 0.53%, 11/15/2037(a) | | | 23,217 | | | | 22,649 | |
| Series 2007-3388, Class FJ, 30D US SOFR + 0.81%, 11/15/2037(a) | | | 103,320 | | | | 101,303 | |
| Series 2008-3404, Class DC, 5.500%, 01/15/2038 | | | 285,000 | | | | 279,082 | |
| Series 2008-3405, Class PE, 5.000%, 01/15/2038 | | | 41,489 | | | | 39,847 | |
| Series 2008-3409, Class DB, 6.000%, 01/15/2038 | | | 155,822 | | | | 155,275 | |
| Series 2008-3411, Class FL, 30D US SOFR + 0.81%, 02/15/2038(a) | | | 16,722 | | | | 16,431 | |
| Series 2008-3415, Class DF, 30D US SOFR + 0.81%, 08/15/2035(a) | | | 78,910 | | | | 77,989 | |
| Series 2008-3415, Class PC, 5.000%, 12/15/2037 | | | 29,986 | | | | 28,377 | |
| | | Principal
Amount | | | Value
(Note 2) | |
| Series 2008-3415, Class TF, 30D US SOFR + 0.85%, 08/15/2035(a) | | $ | 39,083 | | | $ | 38,688 | |
| Series 2008-3450, Class PE, 5.000%, 05/15/2038 | | | 49,177 | | | | 47,474 | |
| Series 2008-3469, Class CF, 30D US SOFR + 0.90%, 07/15/2038(a) | | | 18,716 | | | | 18,575 | |
| Series 2009-3536, Class FM, 30D US SOFR + 1.11%, 05/15/2039(a) | | | 17,111 | | | | 16,967 | |
| Series 2009-3539, Class B, 4.500%, 06/15/2029 | | | 44,000 | | | | 41,804 | |
| Series 2009-3545, Class FA, 30D US SOFR + 0.96%, 06/15/2039(a) | | | 49,109 | | | | 48,393 | |
| Series 2009-3548, Class ZE, 5.500%, 12/15/2032 | | | 126,402 | | | | 124,719 | |
| Series 2009-3549, Class FA, 30D US SOFR + 1.31%, 07/15/2039(a) | | | 17,485 | | | | 17,237 | |
| Series 2009-3564, Class NB, 5.000%, 08/15/2039 | | | 323,250 | | | | 312,260 | |
| Series 2009-3574, Class D, 5.000%, 09/15/2039 | | | 63,749 | | | | 61,113 | |
| Series 2009-3584, Class FA, 30D US SOFR + 0.81%, 12/15/2036(a) | | | 23,385 | | | | 23,206 | |
| Series 2009-3587, Class DA, 4.500%, 10/15/2039 | | | 104,448 | | | | 96,558 | |
| Series 2009-3588, Class CW, 6.145%, 10/15/2037(a) | | | 352,093 | | | | 360,495 | |
| Series 2009-3604, Class PO, –%, 05/15/2036(b) | | | 59,477 | | | | 47,066 | |
| Series 2009-3605, Class BF, 30D US SOFR + 0.97%, 11/15/2039(a) | | | 109,809 | | | | 109,033 | |
| Series 2009-3606, Class ZC, 5.000%, 04/15/2036 | | | 738,627 | | | | 696,545 | |
| Series 2009-3611, Class FH, 30D US SOFR + 0.86%, 07/15/2034(a) | | | 10,400 | | | | 10,312 | |
| Series 2010-3620, Class EL, 4.000%, 01/15/2030 | | | 18,888 | | | | 18,198 | |
| Series 2010-3622, Class PB, 5.000%, 01/15/2040 | | | 380,018 | | | | 366,825 | |
| Series 2010-3626, Class ME, 5.000%, 01/15/2040 | | | 472,133 | | | | 451,998 | |
| Series 2010-3631, Class PA, 4.000%, 02/15/2040 | | | 164,531 | | | | 152,872 | |
| Series 2010-3653, Class B, 4.500%, 04/15/2030 | | | 55,506 | | | | 53,824 | |
| Series 2010-3656, Class PM, 5.000%, 04/15/2040 | | | 131,237 | | | | 126,710 | |
| Series 2010-3662, Class PJ, 5.000%, 04/15/2040 | | | 168,673 | | | | 162,891 | |
See Notes to Financial Statements.
ALPS | Smith Total Return Bond Fund
| Statement of Investments | October 31, 2023 |
| | | Principal
Amount | | | Value
(Note 2) | |
| Series 2010-3664, Class DA, 4.000%, 11/15/2037 | | $ | 76,839 | | | $ | 74,019 | |
| Series 2010-3704, Class DC, 4.000%, 11/15/2036 | | | 14,638 | | | | 14,550 | |
| Series 2010-3747, Class PY, 4.000%, 10/15/2040 | | | 344,722 | | | | 313,899 | |
| Series 2010-3747, Class CY, 4.500%, 10/15/2040 | | | 267,569 | | | | 249,629 | |
| Series 2010-3762, Class WP, 4.000%, 12/15/2039 | | | 12,426 | | | | 11,998 | |
| Series 2010-3770, Class GA, 4.500%, 10/15/2040 | | | 329,723 | | | | 304,354 | |
| Series 2010-3770, Class JZ, 4.000%, 12/15/2040 | | | 8,178,677 | | | | 7,422,623 | |
| Series 2010-3778, Class JA, 3.500%, 04/15/2040 | | | 94,633 | | | | 91,310 | |
| Series 2011-3792, Class DF, 30D US SOFR + 0.51%, 11/15/2040(a) | | | 1,178 | | | | 1,178 | |
| Series 2011-3798, Class PJ, 4.000%, 01/15/2041 | | | 51,016 | | | | 46,821 | |
| Series 2011-3800, Class AF, 30D US SOFR + 0.61%, 02/15/2041(a) | | | 19,166 | | | | 18,733 | |
| Series 2011-3819, Class ZQ, 6.000%, 04/15/2036 | | | 13,635 | | | | 13,530 | |
| Series 2011-3822, Class FY, 30D US SOFR + 0.51%, 02/15/2033(a) | | | 21,855 | | | | 21,720 | |
| Series 2011-3825, Class BP, 4.000%, 03/15/2041 | | | 71,216 | | | | 64,483 | |
| Series 2011-3830, Class NB, 4.500%, 02/15/2039 | | | 1,062 | | | | 1,059 | |
| Series 2011-3843, Class PZ, 5.000%, 04/15/2041 | | | 573,759 | | | | 549,547 | |
| Series 2011-3843, Class FE, 30D US SOFR + 0.66%, 04/15/2041(a) | | | 40,069 | | | | 38,768 | |
| Series 2011-3844, Class PC, 5.000%, 04/15/2041 | | | 195,000 | | | | 183,301 | |
| Series 2011-3852, Class TP, 27.08% - 30D US SOFR, 05/15/2041(a) | | | 21,721 | | | | 20,980 | |
| Series 2011-3852, Class QN, 26.79% - 30D US SOFR, 05/15/2041(a) | | | 37,314 | | | | 34,191 | |
| Series 2011-3857, Class ZP, 5.000%, 05/15/2041 | | | 1,268,961 | | | | 1,210,545 | |
| Series 2011-3862, Class MA, 5.000%, 04/15/2041 | | | 79,889 | | | | 77,059 | |
| Series 2011-3891, Class BF, 30D US SOFR + 0.66%, 07/15/2041(a) | | | 37,905 | | | | 36,628 | |
| Series 2011-3894, Class ZA, 4.500%, 07/15/2041 | | | 348,115 | | | | 323,520 | |
| | | Principal
Amount | | | Value
(Note 2) | |
| Series 2011-3905, Class BZ, 3.000%, 08/15/2041 | | $ | 172,783 | | | $ | 109,331 | |
| Series 2011-3919, Class DL, 4.000%, 08/15/2030 | | | 298,000 | | | | 268,276 | |
| Series 2011-3934, Class KB, 5.000%, 10/15/2041 | | | 549,388 | | | | 519,611 | |
| Series 2011-3935, Class JZ, 4.500%, 10/15/2041 | | | 1,095,421 | | | | 1,000,544 | |
| Series 2011-3939, Class AZ, 4.000%, 03/15/2041 | | | 340,085 | | | | 308,262 | |
| Series 2011-3939, Class BZ, 4.500%, 06/15/2041 | | | 707,679 | | | | 658,262 | |
| Series 2011-3940, Class MY, 4.000%, 10/15/2041 | | | 261,808 | | | | 231,916 | |
| Series 2011-3957, Class HZ, 4.000%, 11/15/2041 | | | 604,008 | | | | 545,706 | |
| Series 2011-3958, Class PJ, 4.500%, 09/15/2041 | | | 145,996 | | | | 136,990 | |
| Series 2011-3959, Class MB, 4.500%, 11/15/2041 | | | 44,199 | | | | 36,571 | |
| Series 2011-3963, Class JB, 4.500%, 11/15/2041 | | | 96,809 | | | | 90,046 | |
| Series 2011-3968, Class LA, 4.500%, 12/15/2041 | | | 409,343 | | | | 379,239 | |
| Series 2011-3969, Class JP, 4.500%, 09/15/2041 | | | 15,185 | | | | 14,805 | |
| Series 2011-3978, Class CZ, 3.500%, 12/15/2041 | | | 2,216,135 | | | | 1,909,916 | |
| Series 2012-3984, Class DF, 30D US SOFR + 0.66%, 01/15/2042(a) | | | 30,936 | | | | 29,914 | |
| Series 2012-3989, Class JW, 3.500%, 01/15/2042 | | | 188,521 | | | | 165,661 | |
| Series 2012-3994, Class JZ, 3.500%, 02/15/2042 | | | 856,946 | | | | 747,949 | |
| Series 2012-3997, Class EC, 3.500%, 02/15/2042 | | | 59,120 | | | | 43,089 | |
| Series 2012-3997, Class FQ, 30D US SOFR + 0.61%, 02/15/2042(a) | | | 37,529 | | | | 36,128 | |
| Series 2012-3998, Class KG, 2.000%, 11/15/2026 | | | 18,020 | | | | 17,792 | |
| Series 2012-4001, Class FM, 30D US SOFR + 0.61%, 02/15/2042(a) | | | 25,701 | | | | 24,696 | |
| Series 2012-4010, Class FC, 30D US SOFR + 1.11%, 03/15/2042(a) | | | 239,601 | | | | 226,701 | |
| Series 2012-4011, Class DB, 4.000%, 09/15/2041 | | | 188,612 | | | | 170,904 | |
| Series 2012-4011, Class DC, 4.000%, 09/15/2041 | | | 193,043 | | | | 174,915 | |
| Series 2012-4012, Class GC, 3.500%, 06/15/2040 | | | 24,655 | | | | 23,807 | |
| Series 2012-4020, Class PG, 2.500%, 03/15/2027 | | | 5,005 | | | | 4,807 | |
See Notes to Financial Statements.
ALPS | Smith Total Return Bond Fund
| Statement of Investments | October 31, 2023 |
| | | Principal
Amount | | | Value
(Note 2) | |
| Series 2012-4037, Class CA, 3.000%, 04/15/2027 | | $ | 42,576 | | | $ | 39,803 | |
| Series 2012-4039, Class LT, 3.500%, 05/15/2042 | | | 113,000 | | | | 88,061 | |
| Series 2012-4048, Class CE, 4.000%, 05/15/2042 | | | 611,000 | | | | 525,112 | |
| Series 2012-4050, Class ND, 2.500%, 09/15/2041 | | | 12,717 | | | | 12,204 | |
| Series 2012-4062, Class MZ, 3.500%, 06/15/2042 | | | 456,371 | | | | 387,034 | |
| Series 2012-4064, Class AY, 3.000%, 06/15/2027 | | | 64,000 | | | | 61,314 | |
| Series 2012-4068, Class PE, 3.000%, 06/15/2042 | | | 327,000 | | | | 272,047 | |
| Series 2012-4075, Class PB, 3.000%, 07/15/2042 | | | 35,513 | | | | 30,321 | |
| Series 2012-4076, Class MV, 3.000%, 04/15/2031 | | | 69,000 | | | | 66,216 | |
| Series 2012-4077, Class BE, 4.000%, 07/15/2042 | | | 130,000 | | | | 106,969 | |
| Series 2012-4077, Class MA, 2.000%, 08/15/2040 | | | 35,207 | | | | 34,640 | |
| Series 2012-4088, Class PB, 3.000%, 08/15/2042 | | | 129,906 | | | | 109,876 | |
| Series 2012-4094, Class CW, 2.000%, 08/15/2042 | | | 180,676 | | | | 138,456 | |
| Series 2012-4097, Class CU, 1.500%, 08/15/2027 | | | 25,000 | | | | 22,077 | |
| Series 2012-4097, Class UF, 30D US SOFR + 0.46%, 08/15/2032(a) | | | 47,519 | | | | 47,444 | |
| Series 2012-4101, Class QN, 3.500%, 09/15/2042 | | | 378,577 | | | | 326,514 | |
| Series 2012-4102, Class CB, 2.000%, 09/15/2042 | | | 150,000 | | | | 119,712 | |
| Series 2012-4104, Class AJ, 1.500%, 09/15/2027 | | | 14,771 | | | | 13,877 | |
| Series 2012-4116, Class YB, 2.500%, 05/15/2042 | | | 132,000 | | | | 99,867 | |
| Series 2012-4120, Class TC, 1.500%, 10/15/2027 | | | 6,181 | | | | 5,790 | |
| Series 2012-4122, Class BA, 2.747%, 05/15/2040(a)(c) | | | 140,591 | | | | 122,443 | |
| Series 2012-4133, Class TA, 3.000%, 11/15/2042 | | | 308,106 | | | | 226,871 | |
| Series 2012-4141, Class PL, 2.500%, 12/15/2042 | | | 219,000 | | | | 129,480 | |
| Series 2013-4160, Class HB, 2.500%, 12/15/2032 | | | 14,094 | | | | 12,164 | |
| Series 2013-4161, Class LT, 2.500%, 08/15/2042 | | | 301,350 | | | | 251,190 | |
| Series 2013-4170, Class FW, 30D US SOFR + 1.06%, 01/15/2033(a) | | | 15,541 | | | | 14,836 | |
| Series 2013-4171, Class MN, 3.000%, 02/15/2043 | | | 103,000 | | | | 69,563 | |
| | | Principal
Amount | | | Value
(Note 2) | |
| Series 2013-4176, Class YD, 3.000%, 03/15/2043 | | $ | 50,000 | | | $ | 37,196 | |
| Series 2013-4183, Class ME, 2.000%, 02/15/2042 | | | 380,756 | | | | 350,236 | |
| Series 2013-4185, Class PB, 3.000%, 03/15/2043 | | | 450,000 | | | | 394,156 | |
| Series 2013-4203, Class DJ, 2.500%, 04/15/2033 | | | 37,380 | | | | 35,257 | |
| Series 2013-4204, Class QP, 3.000%, 05/15/2043 | | | 113,000 | | | | 83,699 | |
| Series 2013-4218, Class DG, 2.500%, 07/15/2042 | | | 114,974 | | | | 99,310 | |
| Series 2013-4220, Class EH, 2.500%, 06/15/2028 | | | 19,616 | | | | 18,848 | |
| Series 2013-4231, Class FD, 30D US SOFR + 0.46%, 10/15/2032(a) | | | 10,393 | | | | 10,371 | |
| Series 2013-4246, Class PB, 4.000%, 09/15/2043 | | | 493,003 | | | | 396,661 | |
| Series 2013-4265, Class FD, 30D US SOFR + 0.51%, 01/15/2035(a) | | | 50,742 | | | | 49,341 | |
| Series 2013-4283, Class EW, 4.500%, 12/15/2043(a) | | | 188,419 | | | | 176,025 | |
| Series 2014-4293, Class NM, 4.500%, 06/15/2043 | | | 22,358 | | | | 21,344 | |
| Series 2014-4294, Class PF, 30D US SOFR + 0.51%, 01/15/2044(a) | | | 11,483 | | | | 10,923 | |
| Series 2014-4319, Class PM, 3.000%, 03/15/2043 | | | 55,123 | | | | 51,946 | |
| Series 2014-4320, Class AP, 3.500%, 07/15/2039 | | | 131,789 | | | | 124,438 | |
| Series 2014-4324, Class AY, 3.000%, 04/15/2029 | | | 568,738 | | | | 517,068 | |
| Series 2014-4368, Class GZ, 4.125%, 06/15/2041(d) | | | 1,552,314 | | | | 1,461,909 | |
| Series 2014-4370, Class PC, 2.500%, 09/15/2041 | | | 16,326 | | | | 15,667 | |
| Series 2014-4403, Class CZ, 3.000%, 10/15/2044 | | | 150,873 | | | | 72,381 | |
| Series 2014-4419, Class DC, 3.000%, 12/15/2044 | | | 240,000 | | | | 172,584 | |
| Series 2015-4457, Class KZ, 3.000%, 04/15/2045 | | | 76,132 | | | | 63,644 | |
| Series 2015-4459, Class CA, 5.000%, 12/15/2034 | | | 14,663 | | | | 14,301 | |
| Series 2015-4461, Class EA, 2.000%, 07/15/2037 | | | 77,112 | | | | 72,621 | |
| Series 2015-4498, Class JA, 2.500%, 04/15/2037 | | | 105,180 | | | | 90,682 | |
| Series 2015-4508, Class UZ, 3.000%, 07/15/2043 | | | 53,906 | | | | 38,783 | |
| Series 2015-4531, Class PA, 3.500%, 05/15/2043 | | | 9,841 | | | | 9,670 | |
See Notes to Financial Statements.
ALPS | Smith Total Return Bond Fund
| Statement of Investments | October 31, 2023 |
| | | Principal
Amount | | | Value
(Note 2) | |
| Series 2016-4555, Class CP, 3.000%, 04/15/2045 | | $ | 387,466 | | | $ | 350,019 | |
| Series 2016-4564, Class QA, 3.000%, 07/15/2029 | | | 34,898 | | | | 34,073 | |
| Series 2016-4582, Class PA, 3.000%, 11/15/2045 | | | 118,172 | | | | 103,290 | |
| Series 2016-4583, Class UP, 3.000%, 07/15/2045 | | | 149,068 | | | | 130,218 | |
| Series 2016-4590, Class AK, 3.500%, 08/15/2027 | | | 68,374 | | | | 66,494 | |
| Series 2016-4601, Class CZ, 3.000%, 12/15/2045 | | | 110,594 | | | | 57,685 | |
| Series 2016-4613, Class AF, 30D US SOFR + 1.21%, 11/15/2037(a) | | | 86,643 | | | | 85,583 | |
| Series 2016-4629, Class KB, 3.000%, 11/15/2046 | | | 1,000,000 | | | | 766,032 | |
| Series 2016-4639, Class HZ, 3.250%, 04/15/2053(d) | | | 1,093,061 | | | | 758,892 | |
| Series 2017-4656, Class EZ, 4.000%, 02/15/2047 | | | 326,257 | | | | 282,429 | |
| Series 2017-4661, Class HA, 3.000%, 05/15/2043 | | | 92,670 | | | | 90,637 | |
| Series 2017-4664, Class UE, 3.000%, 05/15/2043 | | | 20,520 | | | | 20,301 | |
| Series 2017-4670, Class TY, 3.000%, 03/15/2047 | | | 346,000 | | | | 248,867 | |
| Series 2017-4672, Class QD, 3.000%, 08/15/2045 | | | 31,163 | | | | 29,780 | |
| Series 2017-4680, Class PA, 3.000%, 03/15/2046 | | | 103,143 | | | | 91,433 | |
| Series 2017-4680, Class YE, 2.500%, 12/15/2041 | | | 137,426 | | | | 135,813 | |
| Series 2017-4707, Class Z, 4.000%, 08/15/2047 | | | 122,806 | | | | 64,150 | |
| Series 2017-4710, Class PA, 3.000%, 04/15/2045 | | | 108,908 | | | | 100,472 | |
| Series 2017-4714, Class MY, 3.500%, 08/15/2047 | | | 1,000,000 | | | | 842,162 | |
| Series 2017-4736, Class CL, 3.000%, 12/15/2047 | | | 154,734 | | | | 116,376 | |
| Series 2017-4748, Class GA, 3.000%, 01/15/2045 | | | 48,538 | | | | 46,032 | |
| Series 2018-4767, Class Z, 3.000%, 12/15/2047 | | | 36,737 | | | | 17,442 | |
| Series 2018-4773, Class DZ, 4.000%, 04/15/2048 | | | 173,579 | | | | 155,104 | |
| Series 2018-4787, Class PY, 4.000%, 05/15/2048 | | | 44,531 | | | | 39,103 | |
| Series 2018-4808, Class DG, 3.500%, 09/15/2045 | | | 807,421 | | | | 778,959 | |
| Series 2018-4813, Class CJ, 3.000%, 08/15/2048 | | | 194,046 | | | | 160,635 | |
| Series 2018-4818, Class CA, 3.000%, 04/15/2048 | | | 363,782 | | | | 305,281 | |
| | | Principal
Amount | | | Value
(Note 2) | |
| Series 2018-4821, Class VA, 4.000%, 10/15/2029 | | $ | 76,293 | | | $ | 74,884 | |
| Series 2018-4821, Class YZ, 4.000%, 02/15/2042 | | | 1,597,895 | | | | 1,266,471 | |
| Series 2018-4821, Class ZM, 3.500%, 05/15/2048 | | | 359,681 | | | | 299,812 | |
| Series 2018-4839, Class AE, 4.000%, 04/15/2051 | | | 237,943 | | | | 215,942 | |
| Series 2018-4846, Class PA, 4.000%, 06/15/2047 | | | 5,888 | | | | 5,716 | |
| Series 2018-4857, Class HM, 3.500%, 11/15/2046 | | | 88,958 | | | | 85,447 | |
| Series 2019-4863, Class AJ, 3.500%, 07/15/2038 | | | 46,256 | | | | 41,648 | |
| Series 2019-4863, Class H, 7.000%, 03/15/2049 | | | 128,199 | | | | 130,366 | |
| Series 2019-4896, Class BD, 3.500%, 07/25/2049 | | | 1,062,753 | | | | 810,398 | |
| Series 2019-4911, Class HG, 2.250%, 04/15/2049 | | | 1,776,408 | | | | 1,405,871 | |
| Series 2019-4926, Class BP, 3.000%, 10/25/2049 | | | 555,574 | | | | 448,562 | |
| Series 2019-4942, Class A, 3.000%, 01/25/2049 | | | 100,645 | | | | 88,952 | |
| Series 2020-4954, Class LZ, 2.500%, 02/25/2050 | | | 122,127 | | | | 44,841 | |
| Series 2020-4961, Class JB, 2.500%, 12/15/2042 | | | 140,829 | | | | 120,324 | |
| Series 2020-4989, Class FA, 30D US SOFR + 0.46%, 08/15/2040(a) | | | 129,043 | | | | 123,846 | |
| Series 2020-4989, Class FB, 30D US SOFR + 0.46%, 10/15/2040(a) | | | 123,684 | | | | 118,343 | |
| Series 2020-5000, Class HZ, 1.500%, 08/25/2050 | | | 247,783 | | | | 92,016 | |
| Series 2020-5007, Class PY, 1.500%, 08/25/2050 | | | 218,000 | | | | 77,171 | |
| Series 2020-5013, Class NH, 1.000%, 09/25/2050 | | | 173,580 | | | | 74,890 | |
| Series 2020-5014, Class BP, 1.250%, 09/25/2040 | | | 241,095 | | | | 197,110 | |
| Series 2020-5039, Class ZK, 2.500%, 11/25/2050 | | | 149,814 | | | | 59,600 | |
| Series 2020-5049, Class JZ, 2.000%, 11/25/2050 | | | 140,017 | | | | 46,017 | |
| Series 2020-5049, Class WB, 0.750%, 12/25/2050 | | | 368,865 | | | | 263,664 | |
| Series 2020-5068, Class UB, 0.500%, 01/25/2051 | | | 109,000 | | | | 50,548 | |
| Series 2021-5080, Class CA, 2.000%, 02/25/2051 | | | 864,862 | | | | 422,104 | |
| Series 2021-5083, Class MA, 2.000%, 03/25/2051 | | | 612,856 | | | | 289,895 | |
| Series 2021-5085, Class HA, 1.500%, 03/25/2051 | | | 147,217 | | | | 68,837 | |
See Notes to Financial Statements.
ALPS | Smith Total Return Bond Fund
| Statement of Investments | October 31, 2023 |
| | | Principal
Amount | | | Value
(Note 2) | |
| Series 2021-5092, Class BC, 2.500%, 06/25/2036 | | $ | 32,359 | | | $ | 31,307 | |
| Series 2021-5103, Class LQ, 1.500%, 04/25/2050 | | | 199,879 | | | | 89,530 | |
| Series 2021-5103, Class LM, 1.500%, 05/25/2041 | | | 119,098 | | | | 56,776 | |
| Series 2021-5119, Class LM, 1.500%, 05/25/2041 | | | 202,779 | | | | 93,445 | |
| Series 2021-5121, Class KE, 1.500%, 06/25/2051 | | | 301,427 | | | | 127,587 | |
| Series 2021-5129, Class KC, 1.500%, 11/25/2049 | | | 153,543 | | | | 126,891 | |
| Series 2021-5144, Class PC, 1.500%, 09/25/2051 | | | 392,260 | | | | 308,789 | |
| Series 2021-5156, Class EC, 1.500%, 10/25/2051 | | | 434,993 | | | | 165,620 | |
| Series 2021-5171, Class KY, 1.750%, 12/25/2051 | | | 172,000 | | | | 71,441 | |
| Series 2021-5174, Class TQ, 2.000%, 08/25/2051 | | | 517,545 | | | | 407,902 | |
| Series 2021-5178, Class LY, 1.500%, 12/25/2051 | | | 178,029 | | | | 61,884 | |
| Series 2021-5182, Class M, 2.500%, 05/25/2049 | | | 371,756 | | | | 305,394 | |
| Series 2022-5189, Class PG, 2.500%, 09/25/2051 | | | 100,974 | | | | 84,996 | |
| Series 2022-5198, Class ZM, 3.000%, 02/25/2052 | | | 624,396 | | | | 427,173 | |
| Series 2022-5200, Class WK, 2.500%, 03/25/2052 | | | 217,000 | | | | 123,816 | |
| Series 2022-5201, Class CA, 2.500%, 07/25/2048 | | | 710,094 | | | | 598,194 | |
| Series 2022-5207, Class CZ, 3.500%, 03/25/2052 | | | 365,783 | | | | 173,302 | |
| Series 2022-5208, Class AL, 2.500%, 04/25/2042 | | | 1,386,302 | | | | 899,450 | |
| Series 2022-5224, Class HL, 4.000%, 04/25/2052 | | | 1,700,000 | | | | 1,393,266 | |
| Series 2022-5230, Class PE, 2.000%, 12/25/2051 | | | 600,000 | | | | 427,345 | |
| Series 2022-5234, Class PH, 3.500%, 04/25/2051 | | | 892,613 | | | | 815,743 | |
| | | | | | | | 60,135,967 | |
| Freddie Mac Strips | | | | | | | | |
| Series 2013-299, Class 300, 3.000%, 01/15/2043 | | | 168,260 | | | | 145,529 | |
| Series 2013-300, Class 300, 3.000%, 01/15/2043 | | | 134,108 | | | | 114,808 | |
| | | | | | | | 260,337 | |
| Freddie Mac Structured Pass-Through Certificates | | | | | | | | |
| Series 2001-32, Class A1, 1M US SOFR + 0.37%, 08/25/2031(a) | | | 82,407 | | | | 83,008 | |
| Series 2002-41, Class 3A, 4.381%, 07/25/2032(a) | | | 2,016,669 | | | | 1,832,812 | |
| | | Principal
Amount | | | Value
(Note 2) | |
| Series 2003-55, Class 1A3A, 30D US SOFR + 0.51%, 03/25/2043(a) | | $ | 270,346 | | | $ | 268,926 | |
| | | | | | | | 2,184,746 | |
| Ginnie Mae | | | | | | | | |
| Series 2003-76, Class TG, 5.500%, 09/20/2033 | | | 145,113 | | | | 144,076 | |
| Series 2003-98, Class FY, 1M US SOFR + 0.46%, 09/20/2033(a) | | | 17,087 | | | | 17,042 | |
| Series 2004-1, Class TE, 5.000%, 06/20/2033 | | | 22,385 | | | | 21,854 | |
| Series 2004-15, Class AY, 5.500%, 02/20/2034 | | | 156,941 | | | | 155,166 | |
| Series 2004-22, Class AZ, 5.500%, 04/20/2034 | | | 166,185 | | | | 164,277 | |
| Series 2004-26, Class ED, 5.500%, 04/16/2034 | | | 63,192 | | | | 62,497 | |
| Series 2004-34, Class QL, 5.500%, 05/16/2034 | | | 135,625 | | | | 134,481 | |
| Series 2004-55, Class MC, 5.500%, 07/20/2034 | | | 39,329 | | | | 38,900 | |
| Series 2004-7, Class Z, 5.500%, 01/16/2034 | | | 1,477,898 | | | | 1,446,944 | |
| Series 2004-87, Class BC, 4.500%, 10/20/2034 | | | 12,544 | | | | 12,275 | |
| Series 2005-11, Class PL, 5.000%, 02/20/2035 | | | 29,995 | | | | 29,286 | |
| Series 2005-13, Class NB, 5.000%, 02/20/2035 | | | 10,994 | | | | 10,711 | |
| Series 2005-13, Class BG, 5.000%, 02/20/2035 | | | 172,189 | | | | 167,780 | |
| Series 2005-3, Class QB, 5.000%, 01/16/2035 | | | 59,781 | | | | 58,706 | |
| Series 2005-3, Class OC, 5.000%, 01/20/2035 | | | 159,698 | | | | 156,024 | |
| Series 2005-3, Class JM, 4.750%, 01/20/2035 | | | 48,947 | | | | 47,336 | |
| Series 2005-3, Class JL, 5.000%, 12/16/2034 | | | 73,230 | | | | 71,069 | |
| Series 2005-44, Class GZ, 5.000%, 07/20/2035 | | | 109,655 | | | | 107,219 | |
| Series 2005-45, Class BF, 1M US SOFR + 0.41%, 06/20/2035(a) | | | 33,983 | | | | 33,120 | |
| Series 2005-49, Class B, 5.500%, 06/20/2035 | | | 73,529 | | | | 72,562 | |
| Series 2005-51, Class DC, 5.000%, 07/20/2035 | | | 113,407 | | | | 113,280 | |
| Series 2005-56, Class BD, 5.000%, 07/20/2035 | | | 39,043 | | | | 37,706 | |
| Series 2005-56, Class JA, 5.000%, 05/17/2035 | | | 12,029 | | | | 11,700 | |
| Series 2005-69, Class WD, 5.000%, 05/18/2035 | | | 40,949 | | | | 39,918 | |
See Notes to Financial Statements.
ALPS | Smith Total Return Bond Fund
| Statement of Investments | October 31, 2023 |
| | | Principal
Amount | | | Value
(Note 2) | |
| Series 2005-73, Class PH, 5.000%, 09/20/2035 | | $ | 107,981 | | | $ | 105,679 | |
| Series 2005-92, Class PB, 6.000%, 12/20/2035 | | | 149,398 | | | | 149,651 | |
| Series 2006-10, Class PB, 5.500%, 03/20/2036 | | | 247,821 | | | | 244,076 | |
| Series 2006-38, Class OH, 6.500%, 08/20/2036 | | | 26,625 | | | | 26,553 | |
| Series 2007-18, Class B, 5.500%, 05/20/2035 | | | 72,163 | | | | 70,859 | |
| Series 2007-18, Class PH, 5.500%, 03/20/2035 | | | 137,000 | | | | 135,245 | |
| Series 2007-35, Class TE, 6.000%, 06/20/2037 | | | 98,458 | | | | 98,423 | |
| Series 2007-35, Class NE, 6.000%, 06/16/2037 | | | 46,441 | | | | 46,296 | |
| Series 2007-40, Class FY, 1M US SOFR + 0.44%, 07/16/2037(a) | | | 32,572 | | | | 31,969 | |
| Series 2007-44, Class PH, 6.000%, 07/20/2037 | | | 114,846 | | | | 114,918 | |
| Series 2007-57, Class Z, 5.500%, 10/20/2037 | | | 818,060 | | | | 819,313 | |
| Series 2007-6, Class LE, 5.500%, 02/20/2037 | | | 248,325 | | | | 245,325 | |
| Series 2007-7, Class PG, 5.000%, 02/16/2037 | | | 24,152 | | | | 23,296 | |
| Series 2007-79, Class FC, 1M US SOFR + 0.55%, 12/20/2037(a) | | | 116,652 | | | | 115,814 | |
| Series 2008-13, Class FB, 1M US SOFR + 0.61%, 02/20/2038(a) | | | 22,729 | | | | 22,431 | |
| Series 2008-20, Class CE, 5.500%, 06/16/2037 | | | 214,480 | | | | 212,732 | |
| Series 2008-31, Class PC, 5.500%, 04/20/2038 | | | 46,083 | | | | 45,422 | |
| Series 2008-33, Class PB, 5.500%, 04/20/2038 | | | 132,678 | | | | 131,555 | |
| Series 2008-37, Class L, 6.000%, 04/20/2038 | | | 38,153 | | | | 38,026 | |
| Series 2008-38, Class PN, 5.500%, 05/20/2038 | | | 39,306 | | | | 38,887 | |
| Series 2008-38, Class PL, 5.500%, 05/20/2038 | | | 204,376 | | | | 200,339 | |
| Series 2008-38, Class BG, 5.000%, 05/16/2038 | | | 76,164 | | | | 74,338 | |
| Series 2008-40, Class PL, 5.250%, 05/16/2038 | | | 118,000 | | | | 115,225 | |
| Series 2008-41, Class PE, 5.500%, 05/20/2038 | | | 66,491 | | | | 65,088 | |
| Series 2008-43, Class NB, 5.500%, 05/20/2038 | | | 130,121 | | | | 128,449 | |
| Series 2008-47, Class ML, 5.250%, 06/16/2038 | | | 25,476 | | | | 24,795 | |
| | | Principal
Amount | | | Value
(Note 2) | |
| Series 2008-49, Class PB, 4.750%, 06/20/2038 | | $ | 27,017 | | | $ | 26,322 | |
| Series 2008-50, Class KB, 6.000%, 06/20/2038 | | | 214,633 | | | | 212,712 | |
| Series 2008-51, Class PH, 5.250%, 06/20/2038 | | | 40,012 | | | | 38,728 | |
| Series 2008-51, Class FG, 1M US SOFR + 0.88%, 06/16/2038(a) | | | 75,551 | | | | 75,148 | |
| Series 2008-55, Class PL, 5.500%, 06/20/2038 | | | 29,978 | | | | 29,742 | |
| Series 2008-58, Class PE, 5.500%, 07/16/2038 | | | 78,898 | | | | 77,435 | |
| Series 2008-60, Class JP, 5.500%, 07/20/2038 | | | 220,000 | | | | 216,540 | |
| Series 2008-60, Class JN, 5.500%, 07/20/2038 | | | 112,593 | | | | 111,167 | |
| Series 2008-65, Class PG, 6.000%, 08/20/2038 | | | 204,612 | | | | 202,616 | |
| Series 2008-66, Class FN, 1M US SOFR + 1.06%, 08/20/2038(a) | | | 49,974 | | | | 50,015 | |
| Series 2008-7, Class PQ, 5.000%, 02/20/2038 | | | 89,585 | | | | 87,229 | |
| Series 2008-76, Class QE, 5.750%, 09/20/2038 | | | 58,000 | | | | 57,284 | |
| Series 2008-77, Class FC, 1M US SOFR + 0.81%, 09/20/2038(a) | | | 57,015 | | | | 56,685 | |
| Series 2008-85, Class PG, 5.250%, 10/20/2038 | | | 31,692 | | | | 31,584 | |
| Series 2008-89, Class JD, 6.000%, 08/20/2038 | | | 44,381 | | | | 43,964 | |
| Series 2008-89, Class JC, 5.500%, 08/20/2038 | | | 38,209 | | | | 37,771 | |
| Series 2008-9, Class FA, 1M US SOFR + 0.61%, 02/20/2038(a) | | | 15,619 | | | | 15,482 | |
| Series 2009-1, Class FA, 1M US SOFR + 1.16%, 01/20/2039(a) | | | 65,713 | | | | 65,915 | |
| Series 2009-10, Class PH, 4.500%, 02/20/2039 | | | 27,757 | | | | 26,286 | |
| Series 2009-10, Class NB, 5.000%, 02/16/2039 | | | 72,484 | | | | 69,837 | |
| Series 2009-118, Class PY, 5.000%, 12/16/2039 | | | 18,255 | | | | 17,498 | |
| Series 2009-12, Class NB, 5.000%, 03/20/2039 | | | 51,433 | | | | 50,167 | |
| Series 2009-13, Class E, 4.500%, 03/16/2039 | | | 90,620 | | | | 85,957 | |
| Series 2009-15, Class FM, 1M US SOFR + 1.15%, 03/20/2039(a) | | | 62,863 | | | | 62,994 | |
| Series 2009-24, Class WB, 5.000%, 03/20/2039 | | | 209,956 | | | | 205,872 | |
See Notes to Financial Statements.
ALPS | Smith Total Return Bond Fund
| Statement of Investments | October 31, 2023 |
| | | Principal
Amount | | | Value
(Note 2) | |
| Series 2009-32, Class ZA, 5.500%, 05/20/2039 | | $ | 319,058 | | | $ | 313,076 | |
| Series 2009-40, Class AD, 4.500%, 06/20/2039 | | | 309,000 | | | | 282,589 | |
| Series 2009-47, Class LT, 5.000%, 06/20/2039 | | | 108,114 | | | | 105,222 | |
| Series 2009-55, Class FN, 1M US SOFR + 1.11%, 07/20/2039(a) | | | 22,720 | | | | 22,761 | |
| Series 2009-58, Class PA, 4.500%, 07/20/2039 | | | 73,822 | | | | 69,465 | |
| Series 2009-61, Class AP, 4.000%, 08/20/2039 | | | 35,386 | | | | 33,479 | |
| Series 2009-61, Class MP, 5.000%, 08/20/2039 | | | 32,204 | | | | 31,148 | |
| Series 2009-69, Class PH, 5.500%, 08/16/2039 | | | 92,000 | | | | 88,298 | |
| Series 2009-75, Class GZ, 4.500%, 09/20/2039 | | | 89,856 | | | | 85,717 | |
| Series 2009-76, Class XA, 5.500%, 09/16/2039 | | | 425,664 | | | | 413,206 | |
| Series 2009-76, Class JB, 4.500%, 07/20/2039 | | | 20,998 | | | | 20,651 | |
| Series 2009-77, Class KJ, 5.000%, 09/20/2039 | | | 108,292 | | | | 103,795 | |
| Series 2009-83, Class TF, 1M US SOFR + 1.01%, 08/20/2039(a) | | | 38,000 | | | | 37,947 | |
| Series 2009-94, Class FA, 1M US SOFR + 0.81%, 10/16/2039(a) | | | 70,016 | | | | 69,371 | |
| Series 2010-103, Class WA, 5.677%, 08/20/2034(a) | | | 231,724 | | | | 229,895 | |
| Series 2010-105, Class BH, 3.000%, 01/16/2040 | | | 70,884 | | | | 65,620 | |
| Series 2010-111, Class FA, 1M US SOFR + 0.46%, 09/20/2040(a) | | | 42,897 | | | | 41,867 | |
| Series 2010-134, Class YL, 4.500%, 10/20/2040 | | | 101,000 | | | | 90,913 | |
| Series 2010-14, Class A, 4.500%, 06/16/2039 | | | 13,394 | | | | 13,278 | |
| Series 2010-14, Class HA, 4.500%, 02/16/2040 | | | 126,167 | | | | 121,066 | |
| Series 2010-147, Class PG, 3.500%, 05/20/2040 | | | 49,719 | | | | 47,686 | |
| Series 2010-157, Class OP, –%, 12/20/2040(b) | | | 9,001 | | | | 7,246 | |
| Series 2010-167, Class WL, 4.500%, 09/20/2040 | | | 764,000 | | | | 713,787 | |
| Series 2010-169, Class JZ, 4.000%, 12/20/2040 | | | 200,306 | | | | 179,821 | |
| Series 2010-19, Class GW, 4.750%, 02/20/2040 | | | 108,305 | | | | 94,285 | |
| | | Principal
Amount | | | Value
(Note 2) | |
| Series 2010-62, Class AF, 1M US SOFR + 0.56%, 04/16/2034(a) | | $ | 15,915 | | | $ | 15,894 | |
| Series 2010-76, Class NC, 4.500%, 06/20/2040 | | | 113,194 | | | | 102,776 | |
| Series 2010-84, Class YB, 4.000%, 07/20/2040 | | | 19,993 | | | | 18,337 | |
| Series 2010-H01, Class FA, 1M US SOFR + 0.93%, 01/20/2060(a) | | | 18,784 | | | | 18,776 | |
| Series 2010-H10, Class FC, 1M US SOFR + 1.11%, 05/20/2060(a) | | | 109,661 | | | | 109,834 | |
| Series 2010-H20, Class AF, 1M US SOFR + 0.44%, 10/20/2060(a) | | | 124,920 | | | | 124,148 | |
| Series 2010-H22, Class FE, 1M US SOFR + 0.46%, 05/20/2059(a) | | | 1,467 | | | | 1,457 | |
| Series 2010-H27, Class FA, 1M US SOFR + 0.49%, 12/20/2060(a) | | | 39,841 | | | | 39,606 | |
| Series 2011-100, Class MY, 4.000%, 07/20/2041 | | | 151,143 | | | | 140,097 | |
| Series 2011-128, Class MD, 4.000%, 10/20/2040 | | | 123,886 | | | | 120,100 | |
| Series 2011-137, Class WA, 5.592%, 07/20/2040(a) | | | 101,376 | | | | 100,445 | |
| Series 2011-18, Class PA, 4.000%, 08/20/2040 | | | 25,234 | | | | 24,780 | |
| Series 2011-59, Class QC, 4.000%, 12/20/2040 | | | 201,246 | | | | 191,039 | |
| Series 2011-66, Class UA, 4.000%, 05/16/2041 | | | 148,383 | | | | 128,438 | |
| Series 2011-71, Class ZC, 5.500%, 07/16/2034 | | | 178,194 | | | | 175,563 | |
| Series 2011-97, Class WA, 6.110%, 11/20/2038(a) | | | 33,352 | | | | 33,492 | |
| Series 2011-H01, Class AF, 1M US SOFR + 0.56%, 11/20/2060(a) | | | 113,579 | | | | 113,125 | |
| Series 2011-H11, Class FA, 1M US SOFR + 0.61%, 03/20/2061(a) | | | 125,014 | | | | 124,490 | |
| Series 2011-H11, Class FB, 1M US SOFR + 0.61%, 04/20/2061(a) | | | 57,675 | | | | 57,431 | |
| Series 2011-H15, Class FA, 1M US SOFR + 0.56%, 06/20/2061(a) | | | 31,272 | | | | 31,112 | |
| Series 2012-108, 2.500%, 09/20/2042 | | | 149,000 | | | | 108,292 | |
| Series 2012-116, Class BY, 3.000%, 09/16/2042 | | | 242,000 | | | | 176,402 | |
| Series 2012-127, Class PG, 1.750%, 09/16/2042 | | | 142,166 | | | | 121,371 | |
See Notes to Financial Statements.
ALPS | Smith Total Return Bond Fund
| Statement of Investments | October 31, 2023 |
| | | Principal
Amount | | | Value
(Note 2) | |
| Series 2012-32, Class PE, 3.500%, 03/16/2042 | | $ | 117,000 | | | $ | 97,018 | |
| Series 2012-38, Class PL, 3.250%, 01/20/2041 | | | 39,032 | | | | 37,903 | |
| Series 2012-39, Class GA, 3.000%, 10/16/2040 | | | 12,692 | | | | 11,816 | |
| Series 2012-51, Class VM, 3.500%, 04/16/2025 | | | 41,816 | | | | 40,788 | |
| Series 2012-56, Class HZ, 3.500%, 06/20/2040 | | | 1,295,517 | | | | 1,082,860 | |
| Series 2012-68, Class GE, 3.000%, 05/20/2042 | | | 4,247 | | | | 3,037 | |
| Series 2012-76, Class GF, 1M US SOFR + 0.41%, 06/16/2042(a) | | | 22,983 | | | | 22,505 | |
| Series 2012-84, Class TB, 2.500%, 07/20/2042 | | | 390,245 | | | | 290,839 | |
| Series 2012-H08, Class FC, 1M US SOFR + 0.68%, 04/20/2062(a) | | | 287,624 | | | | 286,544 | |
| Series 2012-H14, Class FK, 1M US SOFR + 0.69%, 07/20/2062(a) | | | 60,779 | | | | 60,519 | |
| Series 2012-H20, Class PT, 6.180%, 07/20/2062(a) | | | 39,264 | | | | 39,119 | |
| Series 2012-H24, Class FE, 1M US SOFR + 0.71%, 10/20/2062(a) | | | 1,465 | | | | 1,430 | |
| Series 2013-100, Class MA, 3.500%, 02/20/2043 | | | 34,333 | | | | 32,660 | |
| Series 2013-115, Class PM, 4.000%, 08/20/2043 | | | 400,000 | | | | 353,118 | |
| Series 2013-169, Class EZ, 3.250%, 11/16/2043 | | | 110,375 | | | | 87,074 | |
| Series 2013-22, Class GB, 2.500%, 08/20/2042 | | | 115,781 | | | �� | 98,521 | |
| Series 2013-41, Class MY, 3.000%, 03/20/2043 | | | 275,000 | | | | 233,236 | |
| Series 2013-54, Class WA, 4.907%, 11/20/2042(a) | | | 389,597 | | | | 367,338 | |
| Series 2013-6, 3.000%, 01/20/2043 | | | 104,000 | | | | 79,996 | |
| Series 2013-69, Class NA, 2.000%, 09/20/2042 | | | 171,915 | | | | 141,043 | |
| Series 2013-70, Class LA, 1.000%, 05/20/2043 | | | 107,070 | | | | 83,897 | |
| Series 2013-93, Class CA, 6.000%, 06/20/2043 | | | 1,025,900 | | | | 1,026,314 | |
| Series 2013-98, Class KF, 1M US SOFR + 0.41%, 11/20/2041(a) | | | 9,358 | | | | 9,260 | |
| Series 2013-99, Class MF, 1M US SOFR + 0.41%, 07/20/2043(a) | | | 62,470 | | | | 60,044 | |
| Series 2013-H01, Class FA, 1.650%, 01/20/2063 | | | 85 | | | | 74 | |
| | | Principal
Amount | | | Value
(Note 2) | |
| Series 2013-H04, Class BA, 1.650%, 02/20/2063 | | $ | 1,579 | | | $ | 1,408 | |
| Series 2013-H07, Class GA, 1M US SOFR + 0.58%, 03/20/2063(a) | | | 62,003 | | | | 61,616 | |
| Series 2013-H09, Class HA, 1.650%, 04/20/2063 | | | 5,100 | | | | 4,690 | |
| Series 2013-H18, Class EA, 1M US SOFR + 0.61%, 07/20/2063(a) | | | 19,473 | | | | 19,404 | |
| Series 2014-118, 4.000%, 08/20/2044 | | | 484,791 | | | | 433,015 | |
| Series 2014-119, Class ZK, 3.500%, 08/16/2044 | | | 1,102,095 | | | | 917,445 | |
| Series 2014-32, Class DA, 3.500%, 02/20/2044 | | | 101,590 | | | | 79,028 | |
| Series 2014-53, Class JM, 6.994%, 04/20/2039(a) | | | 168,323 | | | | 171,310 | |
| Series 2014-98, Class HE, 3.000%, 07/20/2044 | | | 53,984 | | | | 39,121 | |
| Series 2014-98, Class ZP, 3.000%, 07/16/2044 | | | 236,952 | | | | 160,559 | |
| Series 2014-H10, Class TA, 1M US SOFR + 0.71%, 04/20/2064(a) | | | 309,927 | | | | 308,614 | |
| Series 2014-H15, Class FA, 1M US SOFR + 0.61%, 07/20/2064(a) | | | 20,067 | | | | 19,949 | |
| Series 2014-H16, Class FL, 1M US SOFR + 0.58%, 07/20/2064(a) | | | 363,712 | | | | 359,580 | |
| Series 2014-H19, Class HA, 3.000%, 09/20/2064 | | | 170,916 | | | | 167,459 | |
| Series 2015-100, Class PD, 3.000%, 07/20/2045 | | | 208,200 | | | | 180,942 | |
| Series 2015-190, Class LE, 3.500%, 06/20/2045 | | | 8,638 | | | | 8,416 | |
| Series 2015-56, Class LB, 1.500%, 04/16/2040 | | | 39,116 | | | | 38,842 | |
| Series 2015-63, Class KA, 3.000%, 04/20/2040 | | | 33,494 | | | | 25,477 | |
| Series 2015-84, Class QA, 3.500%, 06/20/2045 | | | 230,551 | | | | 204,049 | |
| Series 2015-91, Class QA, 2.954%, 05/20/2045(a) | | | 1,441,529 | | | | 1,144,397 | |
| Series 2015-H09, Class FA, 1M US SOFR + 0.73%, 04/20/2065(a) | | | 217,204 | | | | 214,490 | |
| Series 2015-H12, Class FB, 1M US SOFR + 0.71%, 05/20/2065(a) | | | 69,756 | | | | 69,159 | |
| Series 2015-H15, Class FC, 1M US SOFR + 0.69%, 06/20/2065(a) | | | 103,784 | | | | 102,731 | |
See Notes to Financial Statements.
ALPS | Smith Total Return Bond Fund
| Statement of Investments | October 31, 2023 |
| | | Principal
Amount | | | Value
(Note 2) | |
| Series 2015-H22, Class FC, 1M US SOFR + 0.71%, 09/20/2065(a) | | $ | 41,235 | | | $ | 40,827 | |
| Series 2015-H26, Class FA, 1M US SOFR + 0.63%, 10/20/2065(a) | | | 47,413 | | | | 47,163 | |
| Series 2015-H26, Class FG, 1M US SOFR + 0.63%, 10/20/2065(a) | | | 233,621 | | | | 231,096 | |
| Series 2015-H27, Class FA, 1M US SOFR + 0.86%, 09/20/2065(a) | | | 2,169,086 | | | | 2,155,137 | |
| Series 2015-H29, Class FA, 1M US SOFR + 0.81%, 10/20/2065(a) | | | 2,528 | | | | 2,504 | |
| Series 2015-H30, Class FE, 1M US SOFR + 0.71%, 11/20/2065(a) | | | 46,995 | | | | 46,812 | |
| Series 2015-H31, Class FT, 1M US SOFR + 0.76%, 11/20/2065(a) | | | 26,465 | | | | 26,421 | |
| Series 2015-H32, Class FH, 1M US SOFR + 0.77%, 12/20/2065(a) | | | 160,932 | | | | 160,464 | |
| Series 2016-116, Class GV, 3.000%, 05/20/2026 | | | 29,135 | | | | 27,804 | |
| Series 2016-120, Class KA, 2.000%, 09/20/2046 | | | 4,738 | | | | 3,594 | |
| Series 2016-136, Class PJ, 3.500%, 01/20/2046 | | | 192,214 | | | | 147,491 | |
| Series 2016-136, Class MY, 2.500%, 10/20/2046 | | | 100,000 | | | | 57,417 | |
| Series 2016-163, Class B, 3.000%, 10/20/2046 | | | 119,000 | | | | 80,094 | |
| Series 2016-19, Class AC, 3.000%, 02/20/2046 | | | 259,000 | | | | 193,639 | |
| Series 2016-46, Class Z, 3.000%, 04/20/2046 | | | 121,441 | | | | 74,338 | |
| Series 2016-82, Class BA, 3.000%, 09/20/2045 | | | 43,450 | | | | 41,397 | |
| Series 2016-H06, Class FC, 1M US SOFR + 1.03%, 02/20/2066(a) | | | 125,595 | | | | 124,878 | |
| Series 2016-H08, Class FT, 1M US SOFR + 0.83%, 02/20/2066(a) | | | 104,427 | | | | 104,304 | |
| Series 2016-H11, Class F, 1M US SOFR + 0.91%, 05/20/2066(a) | | | 3,452,261 | | | | 3,425,094 | |
| Series 2016-H13, Class FT, 1M US SOFR + 0.69%, 05/20/2066(a) | | | 10,799 | | | | 10,770 | |
| Series 2016-H14, Class FA, 1M US SOFR + 0.91%, 06/20/2066(a) | | | 542,119 | | | | 538,921 | |
| | | Principal
Amount | | | Value
(Note 2) | |
| Series 2016-H15, Class FA, 1M US SOFR + 0.91%, 07/20/2066(a) | | $ | 1,521,758 | | | $ | 1,513,508 | |
| Series 2016-H17, Class FK, 1M US SOFR + 0.96%, 07/20/2066(a) | | | 59,091 | | | | 58,734 | |
| Series 2016-H17, Class FC, 1M US SOFR + 0.94%, 08/20/2066(a) | | | 196,597 | | | | 195,417 | |
| Series 2016-H17, Class HA, 2.250%, 03/20/2066 | | | 196,183 | | | | 187,977 | |
| Series 2016-H20, Class PT, 6.323%, 09/20/2066(a) | | | 483,016 | | | | 492,557 | |
| Series 2016-H23, Class F, 1M US SOFR + 0.86%, 10/20/2066(a) | | | 169,252 | | | | 169,080 | |
| Series 2016-H23, Class PT, 6.012%, 09/20/2066(a) | | | 330,916 | | | | 335,452 | |
| Series 2016-H24, Class FG, 1M US SOFR + 0.86%, 10/20/2066(a) | | | 504,344 | | | | 500,644 | |
| Series 2016-H26, Class FC, 1M US SOFR + 1.11%, 12/20/2066(a) | | | 106,239 | | | | 105,793 | |
| Series 2017-150, Class JE, 3.000%, 07/20/2047 | | | 58,166 | | | | 51,478 | |
| Series 2017-170, Class MC, 2.500%, 10/20/2047 | | | 55,345 | | | | 46,646 | |
| Series 2017-36, Class MJ, 3.000%, 03/20/2047 | | | 35,111 | | | | 28,918 | |
| Series 2017-56, Class AZ, 3.000%, 04/20/2047 | | | 116,074 | | | | 85,746 | |
| Series 2017-73, Class JT, 2.750%, 09/20/2046 | | | 805 | | | | 800 | |
| Series 2017-80, Class LO, –%, 05/20/2047(b) | | | 116,774 | | | | 80,601 | |
| Series 2017-80, Class BJ, 3.000%, 03/20/2047 | | | 87,787 | | | | 76,214 | |
| Series 2017-H06, Class FE, 1M US SOFR + 0.66%, 02/20/2067(a) | | | 71,770 | | | | 71,441 | |
| Series 2017-H14, Class FD, 1M US SOFR + 0.58%, 06/20/2067(a) | | | 101,987 | | | | 100,713 | |
| Series 2017-H15, Class FC, 1M US SOFR + 0.58%, 06/20/2067(a) | | | 208,725 | | | | 207,558 | |
| Series 2017-H16, Class PT, 4.884%, 05/20/2066(a) | | | 18,998 | | | | 18,628 | |
| Series 2017-H17, Class FG, 1M US SOFR + 0.61%, 08/20/2067(a) | | | 23,623 | | | | 23,506 | |
| Series 2017-H22, Class FH, 1Y US SOFR + 0.94%, 11/20/2067(a) | | | 249,179 | | | | 247,303 | |
See Notes to Financial Statements.
ALPS | Smith Total Return Bond Fund
| Statement of Investments | October 31, 2023 |
| | | Principal
Amount | | | Value
(Note 2) | |
| Series 2018-131, Class QA, 3.000%, 12/20/2047 | | $ | 261,489 | | | $ | 226,011 | |
| Series 2018-160, Class AD, 3.500%, 02/20/2048 | | | 235,487 | | | | 210,429 | |
| Series 2018-36, Class CZ, 4.000%, 03/20/2048 | | | 277,720 | | | | 214,057 | |
| Series 2018-37, Class C, 2.500%, 01/20/2046 | | | 146,540 | | | | 130,414 | |
| Series 2018-H07, Class FD, 1M US SOFR + 0.41%, 05/20/2068(a) | | | 130,798 | | | | 130,477 | |
| Series 2018-H09, Class FA, 1Y US SOFR + 1.22%, 04/20/2068(a) | | | 423,207 | | | | 415,802 | |
| Series 2019-1, Class EY, 4.000%, 10/20/2048 | | | 1,066,499 | | | | 879,994 | |
| Series 2019-103, Class EK, 4.000%, 04/20/2049 | | | 2,921,162 | | | | 2,563,106 | |
| Series 2019-111, Class TE, 2.000%, 09/20/2049 | | | 43,705 | | | | 34,074 | |
| Series 2019-128, Class AL, 2.500%, 10/20/2049 | | | 300,000 | | | | 180,743 | |
| Series 2019-15, Class A, –%, 07/20/2048(a)(b) | | | 300,226 | | | | 161,655 | |
| Series 2019-18, Class HD, 3.500%, 02/20/2049 | | | 165,000 | | | | 134,664 | |
| Series 2019-36, Class PD, 3.000%, 02/20/2049 | | | 259,011 | | | | 218,124 | |
| Series 2019-61, Class K, 3.500%, 07/20/2048 | | | 4,669 | | | | 4,633 | |
| Series 2019-H01, Class FT, 1M US SOFR + 0.51%, 10/20/2068(a) | | | 83,663 | | | | 83,385 | |
| Series 2019-H04, Class BA, 3.000%, 01/20/2069 | | | 110,667 | | | | 106,989 | |
| Series 2019-H05, Class FT, 1Y US TI + 0.43%, 04/20/2069(a) | | | 58,480 | | | | 58,463 | |
| Series 2019-H08, Class FM, 1M US SOFR + 0.76%, 05/20/2069(a) | | | 1,810,056 | | | | 1,758,687 | |
| Series 2020-122, Class GZ, 3.000%, 08/20/2050 | | | 257,290 | | | | 118,770 | |
| Series 2020-125, Class GC, 2.500%, 08/20/2050 | | | 21,629 | | | | 17,075 | |
| Series 2020-125, Class GA, 2.500%, 03/20/2050 | | | 341,560 | | | | 277,644 | |
| Series 2020-127, Class LZ, 1.500%, 08/20/2050 | | | 561,009 | | | | 169,074 | |
| Series 2020-134, Class ZU, 3.000%, 09/20/2050 | | | 111,279 | | | | 45,945 | |
| Series 2020-148, Class ZP, 2.000%, 10/20/2050 | | | 226,160 | | | | 74,017 | |
| Series 2020-149, Class LU, 1.000%, 10/20/2050 | | | 199,997 | | | | 75,007 | |
| | | Principal
Amount | | | Value
(Note 2) | |
| Series 2020-153, Class MP, 2.500%, 10/20/2050 | | $ | 322,386 | | | $ | 252,655 | |
| Series 2020-153, Class ML, 2.500%, 10/20/2050 | | | 303,201 | | | | 239,973 | |
| Series 2020-187, Class KZ, 2.000%, 12/20/2050 | | | 164,029 | | | | 50,113 | |
| Series 2020-32, Class UM, 2.500%, 03/20/2050 | | | 1,242,799 | | | | 1,009,545 | |
| Series 2020-5, Class LC, 3.500%, 10/20/2049 | | | 137,174 | | | | 121,133 | |
| Series 2020-61, Class AB, 3.000%, 05/20/2048 | | | 62,471 | | | | 60,275 | |
| Series 2020-62, Class PD, 3.000%, 05/20/2050 | | | 460,550 | | | | 379,046 | |
| Series 2020-62, Class WD, 0.517%, 05/20/2050(a) | | | 488,945 | | | | 244,166 | |
| Series 2020-83, Class ML, 3.000%, 06/20/2050 | | | 134,343 | | | | 113,541 | |
| Series 2020-98, Class CE, 3.000%, 07/20/2050 | | | 1,235,948 | | | | 1,041,050 | |
| Series 2020-H01, Class FT, 1Y US TI + 0.50%, 01/20/2070(a) | | | 50,806 | | | | 50,592 | |
| Series 2020-H02, Class DA, 2.250%, 12/20/2069 | | | 138,434 | | | | 132,683 | |
| Series 2020-H04, Class FP, 1M US SOFR + 0.61%, 06/20/2069(a) | | | 224,505 | | | | 222,825 | |
| Series 2020-H12, Class FE, 1M US SOFR + 1.21%, 06/20/2070(a) | | | 961,507 | | | | 967,234 | |
| Series 2020-H13, Class FA, 1M US SOFR + 0.56%, 07/20/2070(a) | | | 189,642 | | | | 183,352 | |
| Series 2021-104, Class AL, 1.500%, 06/20/2051 | | | 120,000 | | | | 47,839 | |
| Series 2021-116, Class WZ, 2.000%, 07/20/2051 | | | 374,337 | | | | 188,255 | |
| Series 2021-116, Class LZ, 2.500%, 07/20/2051 | | | 332,508 | | | | 164,139 | |
| Series 2021-142, Class PZ, 0.750%, 08/20/2051 | | | 304,913 | | | | 144,120 | |
| Series 2021-146, Class PO, –%, 07/20/2051(b) | | | 338,715 | | | | 96,803 | |
| Series 2021-146, Class DE, 1.750%, 08/20/2051 | | | 415,662 | | | | 346,776 | |
| Series 2021-158, Class GK, 2.000%, 09/20/2051 | | | 152,966 | | | | 85,611 | |
| Series 2021-205, Class NK, 1.500%, 11/20/2051 | | | 215,000 | | | | 140,885 | |
| Series 2021-25, Class HA, 2.000%, 02/20/2051 | | | 786,655 | | | | 595,163 | |
| Series 2021-8, Class KZ, 2.000%, 01/20/2051 | | | 154,248 | | | | 47,173 | |
| Series 2021-8, Class AQ, 5.000%, 01/20/2051 | | | 148,126 | | | | 141,220 | |
See Notes to Financial Statements.
ALPS | Smith Total Return Bond Fund
| Statement of Investments | October 31, 2023 |
| | | Principal
Amount | | | Value
(Note 2) | |
| Series 2021-H01, Class FA, 1M US SOFR + 1.36%, 11/20/2070(a) | | $ | 2,870,420 | | | $ | 2,872,799 | |
| Series 2021-H12, Class GA, 4.599%, 07/20/2071(a) | | | 202,613 | | | | 199,009 | |
| Series 2022-100, Class EB, 3.000%, 06/20/2052 | | | 1,729,475 | | | | 1,198,777 | |
| Series 2022-104, Class KY, 4.500%, 06/20/2052 | | | 383,627 | | | | 296,810 | |
| Series 2022-112, Class BM, 3.000%, 06/20/2052 | | | 344,718 | | | | 228,853 | |
| Series 2022-126, Class BY, 3.000%, 07/20/2052 | | | 960,094 | | | | 542,142 | |
| Series 2022-127, Class WC, 3.500%, 07/20/2052 | | | 329,622 | | | | 195,157 | |
| Series 2022-127, Class UL, 2.000%, 07/20/2052 | | | 309,557 | | | | 133,420 | |
| Series 2022-137, Class PL, 4.000%, 08/20/2052 | | | 288,633 | | | | 202,131 | |
| Series 2022-20, Class KZ, 2.500%, 01/20/2052 | | | 108,646 | | | | 37,451 | |
| Series 2022-212, Class DZ, 5.500%, 12/20/2052 | | | 2,582,259 | | | | 2,284,785 | |
| Series 2022-44, Class KZ, 4.500%, 03/20/2052 | | | 576,542 | | | | 447,398 | |
| Series 2022-51, Class HZ, 3.000%, 03/20/2052 | | | 296,930 | | | | 115,787 | |
| Series 2022-68, Class MD, 3.500%, 04/20/2052 | | | 223,000 | | | | 148,412 | |
| Series 2022-76, Class PA, 4.000%, 04/20/2052 | | | 878,320 | | | | 814,891 | |
| Series 2022-78, Class YX, 4.500%, 01/20/2051 | | | 887,040 | | | | 846,029 | |
| Series 2022-H06, Class AB, 3.719%, 07/20/2067 | | | 299,381 | | | | 292,594 | |
| Series 2023-150, 6.000%, 10/20/2053 | | | 407,200 | | | | 384,422 | |
| Series 2023-47, Class HZ, 5.500%, 03/20/2053 | | | 1,286,186 | | | | 1,056,149 | |
| Series 2023-55, Class HB, 6.500%, 04/20/2053 | | | 3,822,002 | | | | 3,644,117 | |
| Series 2023-55, Class EB, 6.000%, 04/20/2053 | | | 23,483,111 | | | | 21,268,686 | |
| Series 2023-57, Class CV, 5.000%, 04/20/2034 | | | 2,089,861 | | | | 1,990,467 | |
| Series 2023-59, Class GL, 6.000%, 04/20/2053 | | | 7,761,342 | | | | 7,034,227 | |
| Series 2023-68, Class HB, 6.500%, 05/20/2053 | | | 10,712,834 | | | | 10,274,817 | |
| | | | | | | | 107,075,046 | |
| | | Principal
Amount | | | Value
(Note 2) | |
| Vendee Mortgage Trust 2011-2 | | | | | | | | |
| Series 2011-2, Class DZ, 3.750%, 10/15/2041 | | $ | 957,240 | | | $ | 853,739 | |
| | | | | | | | | |
| TOTAL COLLATERALIZED MORTGAGE OBLIGATIONS | | | | | | | | |
| (Cost $290,605,490) | | | | | | | 263,087,751 | |
| | | Principal
Amount | | | Value
(Note 2) | |
| COMMERCIAL MORTGAGE-BACKED SECURITIES (2.69%) |
| |
| Fannie Mae-Aces | | | | | | | | |
| Series 2001-M1, Class D, 6.460%, 02/25/2031(a) | | | 95,518 | | | | 94,810 | |
| Series 2006-M2, Class A3F, 5.345%, 09/25/2031(a) | | | 220,992 | | | | 216,523 | |
| Series 2013-M6, Class 1AC, 3.389%, 02/25/2043(a) | | | 10,239,975 | | | | 9,215,261 | |
| Series 2016-M11, Class AL, 2.944%, 07/25/2039 | | | 435,042 | | | | 369,032 | |
| Series 2018-M12, Class A1, 3.546%, 08/25/2030 | | | 1,868,663 | | | | 1,801,065 | |
| Series 2018-M15, Class 1A2, 3.700%, 01/25/2036 | | | 470,000 | | | | 402,408 | |
| Series 2019-M10, Class A1, 2.000%, 04/25/2030 | | | 541,664 | | | | 510,160 | |
| Series 2019-M14, Class A1, 2.304%, 06/25/2029 | | | 27,005 | | | | 26,248 | |
| Series 2019-M24, Class 2XA, 1.143%, 03/25/2031(a)(c) | | | 4,221,174 | | | | 234,093 | |
| Series 2020-M1, Class A2, 2.444%, 10/25/2029 | | | 300,000 | | | | 255,076 | |
| Series 2020-M10, Class X1, 1.771%, 12/25/2030(a)(c) | | | 756,521 | | | | 56,121 | |
| Series 2020-M10, Class X4, 0.885%, 07/25/2032(a)(c) | | | 46,837,071 | | | | 2,030,380 | |
| Series 2020-M12, Class IO, 1.285%, 07/25/2029(a)(c) | | | 54,561,864 | | | | 2,607,168 | |
| Series 2020-M13, Class X2, 1.225%, 09/25/2030(a)(c) | | | 7,345,275 | | | | 340,305 | |
| Series 2022-M5, Class A1, 2.358%, 01/01/2034(a) | | | 292,437 | | | | 251,764 | |
| Series 2022-M5, Class A3, 2.358%, 01/01/2034(a) | | | 1,495,000 | | | | 1,125,463 | |
| Series 2022-M8, Class A2, 1.937%, 12/25/2031(a) | | | 100,000 | | | | 76,340 | |
| | | | | | | | 19,612,217 | |
| Freddie Mac Multiclass Certificates Series 2020-P003 | | | | | | | | |
| Series 2020-P003, Class A3, 1.956%, 09/25/2046 | | | 1,600,000 | | | | 1,049,821 | |
See Notes to Financial Statements.
ALPS | Smith Total Return Bond Fund
| Statement of Investments | October 31, 2023 |
| | | Principal
Amount | | | Value
(Note 2) | |
| Freddie Mac Multifamily Structured Pass Through Certificates | | | | | | | | |
| Series 2016-KS07, Class A1, 2.018%, 09/25/2025 | | $ | 1,984,518 | | | $ | 1,914,340 | |
| Series 2016-KS07, Class X, 0.615%, 09/25/2025(a)(c) | | | 65,385,072 | | | | 697,897 | |
| Series 2017-K153, Class X1, 0.275%, 10/25/2031(a)(c) | | | 100,327,415 | | | | 1,396,538 | |
| Series 2017-Q006, Class A2, 4.107%, 04/25/2028(a) | | | 3,994,544 | | | | 3,532,307 | |
| Series 2018-K154, Class X1, 0.295%, 11/25/2032(a)(c) | | | 136,170,816 | | | | 2,489,359 | |
| Series 2018-K156, Class X1, 0.070%, 06/25/2033(a)(c) | | | 623,829,507 | | | | 4,328,815 | |
| Series 2018-K158, Class X1, 0.071%, 10/25/2033(a)(c) | | | 350,684,755 | | | | 2,811,299 | |
| Series 2019-KL4F, Class A2AS, 3.683%, 10/25/2025(a) | | | 256,000 | | | | 246,110 | |
| Series 2019-KLU2, Class X1, 0.956%, 08/25/2029(a)(c) | | | 86,135,796 | | | | 3,472,199 | |
| Series 2020-Q013, Class APT2, 1.167%, 04/25/2027(a) | | | 3,367,251 | | | | 2,964,363 | |
| Series 2021-1521, Class X1, 0.980%, 08/25/2036(a)(c) | | | 15,630,562 | | | | 1,224,037 | |
| Series 2021-KLU3, Class X1, 1.936%, 01/25/2031(a)(c) | | | 176,473,334 | | | | 16,864,276 | |
| | | | | | | | 41,941,540 | |
| TOTAL COMMERCIAL MORTGAGE-BACKED SECURITIES | | | | | | | | |
| (Cost $69,377,560) | | | | | | | 62,603,578 | |
| | | Principal
Amount | | | Value
(Note 2) | |
| MORTGAGE-BACKED SECURITIES (17.23%) | | | |
| | | | |
| Fannie Mae Pool | | | | | | | | |
| Series 2003-386375, 4.790%, 08/01/2028 | | | 633,040 | | | | 630,559 | |
| Series 2005-843080, 6.000%, 12/01/2034 | | | 112,431 | | | | 111,108 | |
| Series 2006-, 6.000%, 02/01/2036 | | | 112,658 | | | | 112,377 | |
| Series 2007-943003, 5.500%, 08/01/2047 | | | 76,632 | | | | 72,658 | |
| Series 2009-, 4.500%, 06/01/2039 | | | 340,980 | | | | 322,341 | |
| Series 2009-463331, 5.250%, 08/01/2029 | | | 501,178 | | | | 498,948 | |
| Series 2009-930895, 4.500%, 03/01/2039 | | | 154,024 | | | | 146,881 | |
| Series 2009-931707, 4.500%, 08/01/2039 | | | 100,109 | | | | 93,778 | |
| | | Principal
Amount | | | Value
(Note 2) | |
| Series 2009-958348, 5.440%, 04/01/2027 | | $ | 129,390 | | | $ | 127,730 | |
| Series 2009-958878, 5.750%, 07/01/2027 | | | 1,283,092 | | | | 1,277,018 | |
| Series 2010-, 3.500%, 10/01/2040 | | | 307,120 | | | | 259,051 | |
| Series 2011-, 6.210%, 12/01/2029 | | | 219,812 | | | | 217,737 | |
| Series 2011-468477, 4.590%, 08/01/2026 | | | 387,432 | | | | 379,055 | |
| Series 2011-469013, 5.470%, 08/01/2026 | | | 981,165 | | | | 982,834 | |
| Series 2011-AH9290, 4.000%, 04/01/2041 | | | 31,077 | | | | 27,264 | |
| Series 2012-, | | | | | | | | |
| 3.000%, 12/01/2042 | | | 101,051 | | | | 83,094 | |
| 3.000%, 01/01/2043 | | | 125,103 | | | | 103,770 | |
| 3.040%, 12/01/2030 | | | 1,167,777 | | | | 1,024,620 | |
| 3.500%, 04/01/2042 | | | 56,977 | | | | 48,145 | |
| Series 2012-470020, 4.200%, 01/01/2030 | | | 1,535,161 | | | | 1,435,933 | |
| Series 2012-AM0279, 3.210%, 08/01/2027 | | | 283,676 | | | | 261,028 | |
| Series 2012-AM1387, 3.260%, 11/01/2032 | | | 102,818 | | | | 93,366 | |
| Series 2012-MA1214, 3.000%, 10/01/2042 | | | 596,393 | | | | 490,266 | |
| Series 2013-, | | | | | | | | |
| 3.000%, 01/01/2043 | | | 283,805 | | | | 235,418 | |
| 3.000%, 02/01/2043 | | | 361,284 | | | | 297,039 | |
| 3.000%, 04/01/2043 | | | 221,278 | | | | 181,902 | |
| 3.000%, 07/01/2043 | | | 248,578 | | | | 204,338 | |
| 3.000%, 08/01/2043 | | | 68,541 | | | | 56,384 | |
| 3.380%, 05/01/2028 | | | 256,646 | | | | 237,678 | |
| 4.370%, 07/01/2028 | | | 831,166 | | | | 801,067 | |
| 4.410%, 09/01/2028 | | | 84,641 | | | | 81,325 | |
| Series 2013-AM3154, 3.250%, 05/01/2028 | | | 346,940 | | | | 315,680 | |
| Series 2013-AM4329, 3.870%, 10/01/2025 | | | 189,695 | | | | 183,906 | |
| Series 2013-AM4781, 4.180%, 11/01/2028 | | | 1,178,096 | | | | 1,122,257 | |
| Series 2013-AM4991, 3.970%, 12/01/2025 | | | 156,030 | | | | 151,361 | |
| Series 2013-AR2289, 3.000%, 02/01/2033 | | | 197,740 | | | | 180,870 | |
| Series 2013-AT9663, 2.500%, 07/01/2043 | | | 446,164 | | | | 345,999 | |
| Series 2013-MA1586, 3.000%, 08/01/2043 | | | 177,879 | | | | 147,552 | |
| Series 2014-, | | | | | | | | |
| 3.000%, 06/01/2053 | | | 1,131,186 | | | | 909,225 | |
| 3.300%, 11/01/2026 | | | 256,238 | | | | 241,364 | |
| 3.730%, 07/01/2034 | | | 590,106 | | | | 539,566 | |
| 4.060%, 03/01/2030 | | | 452,706 | | | | 421,801 | |
See Notes to Financial Statements.
ALPS | Smith Total Return Bond Fund
| Statement of Investments | October 31, 2023 |
| | | Principal
Amount | | | Value
(Note 2) | |
| Series 2014-AM4198, 3.550%, 03/01/2024 | | $ | 92,444 | | | $ | 91,385 | |
| Series 2014-AM7274, 3.000%, 12/01/2024 | | | 6,300,000 | | | | 6,086,664 | |
| Series 2015-, | | | | | | | | |
| 3.100%, 09/01/2025 | | | 153,145 | | | | 146,159 | |
| 3.180%, 07/01/2035 | | | 669,004 | | | | 547,466 | |
| 3.390%, 07/01/2035 | | | 197,028 | | | | 167,895 | |
| 3.500%, 10/01/2045 | | | 1,597,860 | | | | 1,413,310 | |
| 3.600%, 02/01/2040 | | | 232,960 | | | | 200,906 | |
| 3.610%, 08/01/2030 | | | 300,000 | | | | 267,443 | |
| 4.000%, 01/01/2041 | | | 123,371 | | | | 109,181 | |
| 4.500%, 06/01/2045 | | | 139,395 | | | | 127,423 | |
| Series 2015-AM8666, 2.960%, 06/01/2030 | | | 171,031 | | | | 150,144 | |
| Series 2015-AM8918, 3.250%, 09/01/2030 | | | 731,000 | | | | 635,677 | |
| Series 2015-AM9173, 3.110%, 06/01/2027 | | | 232,945 | | | | 215,564 | |
| Series 2015-AM9288, 2.930%, 07/01/2025 | | | 5,539,681 | | | | 5,287,620 | |
| Series 2016-, | | | | | | | | |
| 3.160%, 07/01/2036(a) | | | 1,662,203 | | | | 1,337,592 | |
| 6.000%, 07/01/2039 | | | 111,828 | | | | 111,997 | |
| Series 2016-AL8405, 4.500%, 05/01/2041 | | | 135,112 | | | | 120,761 | |
| Series 2016-AN0665, 3.070%, 02/01/2026 | | | 190,275 | | | | 180,700 | |
| Series 2016-AN0774, 3.210%, 01/01/2026 | | | 169,936 | | | | 162,150 | |
| Series 2016-AN2228, 2.520%, 08/01/2026 | | | 182,803 | | | | 168,621 | |
| Series 2016-AN3542, 3.410%, 11/01/2046 | | | 349,713 | | | | 272,737 | |
| Series 2016-AN3749, 2.520%, 12/01/2026 | | | 443,829 | | | | 407,990 | |
| Series 2016-BC0943, 3.500%, 05/01/2046 | | | 262,288 | | | | 226,188 | |
| Series 2017-, | | | | | | | | |
| 2.000%, 01/01/2032 | | | 112,629 | | | | 105,992 | |
| 2.880%, 09/01/2027 | | | 4,738,303 | | | | 4,305,242 | |
| 3.010%, 07/01/2027 | | | 258,295 | | | | 237,821 | |
| 3.160%, 07/01/2027 | | | 147,231 | | | | 136,064 | |
| 3.170%, 01/01/2029 | | | 190,311 | | | | 169,319 | |
| 3.200%, 01/01/2029 | | | 145,614 | | | | 131,704 | |
| 3.210%, 11/01/2032 | | | 100,000 | | | | 81,638 | |
| 3.235%, 02/01/2032 | | | 136,967 | | | | 117,642 | |
| 3.350%, 01/01/2029 | | | 192,155 | | | | 178,419 | |
| 3.450%, 03/01/2029 | | | 301,989 | | | | 275,283 | |
| 3.500%, 06/01/2047 | | | 309,036 | | | | 256,448 | |
| Series 2017-AN4431, 3.220%, 01/01/2027 | | | 85,000 | | | | 79,510 | |
| Series 2017-AN4469, 3.640%, 01/01/2029 | | | 668,477 | | | | 615,559 | |
| Series 2017-AN4529, 3.620%, 01/01/2027 | | | 802,451 | | | | 761,463 | |
| | | Principal
Amount | | | Value
(Note 2) | |
| Series 2017-AN4606, 3.510%, 02/01/2027 | | $ | 766,999 | | | $ | 724,190 | |
| Series 2017-AN4833, 3.320%, 04/01/2027 | | | 95,000 | | | | 88,773 | |
| Series 2017-AN5279, 3.340%, 04/01/2029 | | | 443,849 | | | | 398,895 | |
| Series 2017-AN5742, 3.190%, 05/01/2030 | | | 134,125 | | | | 117,919 | |
| Series 2017-AN5796, 3.030%, 06/01/2027 | | | 264,757 | | | | 244,409 | |
| Series 2017-AN6304, 3.100%, 10/01/2027 | | | 275,000 | | | | 251,976 | |
| Series 2017-AN6670, 3.210%, 09/01/2027 | | | 1,872,884 | | | | 1,704,536 | |
| Series 2017-AN7060, 2.930%, 10/01/2027 | | | 1,780,000 | | | | 1,614,874 | |
| Series 2017-AN7234, 3.010%, 12/01/2027 | | | 986,425 | | | | 901,717 | |
| Series 2017-AN7384, 2.880%, 12/01/2027 | | | 47,500 | | | | 43,179 | |
| Series 2017-AN7547, 3.370%, 11/01/2027 | | | 1,070,957 | | | | 978,338 | |
| Series 2017-AN7823, 2.890%, 12/01/2027 | | | 235,000 | | | | 213,196 | |
| Series 2017-CA0522, 3.000%, 10/01/2047 | | | 214,453 | | | | 172,731 | |
| Series 2018-, | | | | | | | | |
| 3.000%, 02/01/2033 | | | 46,283 | | | | 41,224 | |
| 3.000%, 04/01/2048 | | | 1,026,335 | | | | 843,964 | |
| 3.320%, 04/01/2028 | | | 200,000 | | | | 183,177 | |
| 3.430%, 03/01/2033 | | | 990,710 | | | | 837,431 | |
| 3.500%, 09/01/2028 | | | 130,000 | | | | 119,133 | |
| 3.500%, 05/01/2048 | | | 349,077 | | | | 299,203 | |
| 3.660%, 05/01/2033 | | | 700,000 | | | | 592,127 | |
| 3.740%, 07/01/2028 | | | 175,000 | | | | 161,667 | |
| 3.940%, 10/01/2036 | | | 322,786 | | | | 275,225 | |
| 4.010%, 12/01/2030 | | | 300,000 | | | | 273,758 | |
| 4.130%, 12/01/2030 | | | 2,000,000 | | | | 1,826,596 | |
| 4.500%, 09/01/2040 | | | 115,326 | | | | 102,176 | |
| 4.500%, 07/01/2041 | | | 260,558 | | | | 243,342 | |
| 4.500%, 08/01/2041 | | | 313,381 | | | | 290,738 | |
| 5.500%, 08/01/2048 | | | 510,164 | | | | 491,058 | |
| 6.000%, 08/01/2048 | | | 111,745 | | | | 110,154 | |
| Series 2018-109435, 3.890%, 08/01/2028 | | | 1,848,268 | | | | 1,722,780 | |
| Series 2018-387770, 3.625%, 07/01/2028 | | | 2,570,000 | | | | 2,366,940 | |
| Series 2018-387853, 3.455%, 08/01/2025 | | | 225,000 | | | | 215,247 | |
| Series 2018-387983, 3.630%, 08/01/2028 | | | 1,995,114 | | | | 1,837,438 | |
| Series 2018-AN8272, 3.170%, 02/01/2028 | | | 100,000 | | | | 91,269 | |
| Series 2018-AN8493, 3.300%, 02/01/2030 | | | 415,079 | | | | 363,570 | |
See Notes to Financial Statements.
ALPS | Smith Total Return Bond Fund
| Statement of Investments | October 31, 2023 |
| | | Principal
Amount | | | Value
(Note 2) | |
| Series 2018-AN8982, 3.440%, 05/01/2028 | | $ | 1,000,000 | | | $ | 921,423 | |
| Series 2018-AN9038, 3.460%, 05/01/2028 | | | 135,000 | | | | 124,380 | |
| Series 2018-AN924, 4.210%, 05/01/2033 | | | 536,337 | | | | 507,800 | |
| Series 2018-AN9976, 3.960%, 02/01/2030 | | | 470,000 | | | | 428,962 | |
| Series 2019-, | | | | | | | | |
| 2.520%, 11/01/2029 | | | 142,190 | | | | 121,661 | |
| 2.820%, 10/01/2039 | | | 936,950 | | | | 673,419 | |
| 3.000%, 08/01/2049 | | | 71,803 | | | | 59,187 | |
| 3.490%, 03/01/2029 | | | 189,000 | | | | 171,061 | |
| 3.500%, 08/01/2048 | | | 127,363 | | | | 107,734 | |
| 3.710%, 04/01/2031 | | | 1,885,991 | | | | 1,674,039 | |
| 3.940%, 06/01/2035 | | | 2,600,000 | | | | 2,187,585 | |
| 4.000%, 07/01/2048 | | | 656,031 | | | | 580,954 | |
| 4.070%, 11/01/2026 | | | 131,901 | | | | 125,812 | |
| 4.500%, 08/01/2058 | | | 450,476 | | | | 405,248 | |
| 5.500%, 06/01/2049 | | | 186,628 | | | | 179,987 | |
| 6.000%, 05/01/2049 | | | 1,972,252 | | | | 1,956,947 | |
| Series 2019-BI2928, 3.410%, 07/01/2027 | | | 804,571 | | | | 750,205 | |
| Series 2019-BL1188, 3.480%, 02/01/2026 | | | 194,658 | | | | 185,660 | |
| Series 2019-BL1300, 4.200%, 01/01/2029 | | | 1,375,000 | | | | 1,289,821 | |
| Series 2019-BL1451, 3.760%, 02/01/2029 | | | 685,000 | | | | 630,242 | |
| Series 2019-BL1567, 3.590%, 02/01/2029 | | | 1,775,000 | | | | 1,612,850 | |
| Series 2019-BL1596, 3.480%, 03/01/2029 | | | 161,661 | | | | 147,660 | |
| Series 2019-BL2356, 3.020%, 05/01/2026 | | | 165,000 | | | | 154,180 | |
| Series 2019-BL2460, 3.400%, 05/01/2029 | | | 567,708 | | | | 515,726 | |
| Series 2019-BL3182, 2.980%, 07/01/2029 | | | 245,364 | | | | 217,163 | |
| Series 2019-BM6011, 3.284%, 11/01/2026(a) | | | 58,155 | | | | 55,323 | |
| Series 2019-BM6152, 3.500%, 06/01/2044 | | | 1,031,242 | | | | 896,594 | |
| Series 2019-MA3784, 3.500%, 09/01/2049 | | | 2,437,819 | | | | 1,998,655 | |
| Series 2020-, | | | | | | | | |
| 1.400%, 11/01/2032 | | | 7,945,000 | | | | 5,559,394 | |
| 1.500%, 01/01/2036 | | | 707,902 | | | | 589,726 | |
| 2.150%, 09/01/2029 | | | 500,000 | | | | 414,562 | |
| 3.000%, 03/01/2050 | | | 237,926 | | | | 187,346 | |
| 3.500%, 04/01/2050 | | | 176,676 | | | | 144,737 | |
| Series 2021-, | | | | | | | | |
| 1.710%, 08/01/2031 | | | 751,000 | | | | 564,188 | |
| 3.500%, 11/01/2051 | | | 731,252 | | | | 595,880 | |
| Series 2022-, | | | | | | | | |
| 2.030%, 12/01/2028 | | | 100,000 | | | | 84,153 | |
| | | Principal
Amount | | | Value
(Note 2) | |
| 2.150%, 03/01/2029 | | $ | 150,000 | | | $ | 126,834 | |
| 2.400%, 03/01/2029 | | | 146,027 | | | | 125,940 | |
| 3.130%, 01/01/2029 | | | 147,463 | | | | 132,387 | |
| 3.790%, 05/01/2032 | | | 2,148,000 | | | | 1,819,113 | |
| 3.890%, 07/01/2032 | | | 300,000 | | | | 260,806 | |
| 3.910%, 06/01/2032 | | | 1,181,000 | | | | 1,032,836 | |
| 3.980%, 10/01/2032 | | | 700,000 | | | | 608,260 | |
| 4.110%, 09/01/2032 | | | 1,815,000 | | | | 1,577,899 | |
| 4.140%, 08/01/2032 | | | 2,038,000 | | | | 1,770,577 | |
| 4.240%, 07/01/2032 | | | 1,687,000 | | | | 1,493,400 | |
| 4.520%, 10/01/2032 | | | 1,209,000 | | | | 1,070,182 | |
| 5.080%, 10/01/2029 | | | 950,000 | | | | 928,233 | |
| 5.120%, 11/01/2032 | | | 2,979,000 | | | | 2,764,870 | |
| 5.250%, 10/01/2032 | | | 7,898,000 | | | | 7,461,880 | |
| 5.300%, 10/01/2032 | | | 8,632,000 | | | | 8,184,659 | |
| 5.440%, 12/01/2032 | | | 7,633,000 | | | | 7,310,067 | |
| 5.500%, 07/01/2042 | | | 1,153,462 | | | | 1,095,242 | |
| 5.500%, 11/01/2052 | | | 11,899,656 | | | | 11,324,935 | |
| 5.620%, 11/01/2032 | | | 2,901,983 | | | | 2,813,715 | |
| 5.730%, 11/01/2032 | | | 16,500,000 | | | | 15,780,365 | |
| 6.120%, 11/01/2032 | | | 1,678,048 | | | | 1,676,201 | |
| 6.500%, 11/01/2052 | | | 1,985,482 | | | | 1,946,965 | |
| Series 2023-, | | | | | | | | |
| 1.500%, 01/01/2042 | | | 4,419,816 | | | | 3,311,578 | |
| 4.885%, 03/01/2033 | | | 750,000 | | | | 709,269 | |
| 5.030%, 04/01/2028 | | | 4,957,000 | | | | 4,788,985 | |
| 5.500%, 02/01/2053 | | | 8,909,382 | | | | 8,486,563 | |
| 6.000%, 02/01/2053 | | | 1,209,192 | | | | 1,180,545 | |
| 6.500%, 06/01/2043 | | | 3,452,709 | | | | 3,459,619 | |
| 6.500%, 04/01/2053 | | | 2,158,802 | | | | 2,149,715 | |
| 6.500%, 05/01/2053 | | | 4,705,498 | | | | 4,726,159 | |
| 6.500%, 08/01/2053 | | | 10,169,302 | | | | 10,176,538 | |
| | | | | | | | 199,199,521 | |
| Freddie Mac | | | | | | | | |
| Series 2005-2936, Class FC, 30D US SOFR + 0.51%, 03/15/2029(a) | | | 15,529 | | | | 15,284 | |
| | | | | | | | | |
| Freddie Mac Gold Pool | | | | | | | | |
| Series 2005-, 5.500%, 12/01/2035 | | | 166,841 | | | | 161,125 | |
| Series 2006-, 6.000%, 01/01/2036 | | | 29,966 | | | | 29,883 | |
| Series 2007-, 5.500%, 11/01/2037 | | | 58,335 | | | | 55,776 | |
| Series 2012-, 3.500%, 08/01/2042 | | | 100,474 | | | | 84,004 | |
| Series 2013-G80393, 5.000%, 08/20/2036 | | | 128,060 | | | | 124,027 | |
| Series 2013-T65180, 3.000%, 11/01/2043 | | | 107,871 | | | | 89,350 | |
| Series 2015-U49046, 4.000%, 02/01/2029 | | | 30,108 | | | | 28,285 | |
| Series 2016-, 3.500%, 06/01/2046 | | | 356,534 | | | | 305,136 | |
| | | | | | | | 877,586 | |
See Notes to Financial Statements.
ALPS | Smith Total Return Bond Fund
| Statement of Investments | October 31, 2023 |
| | | Principal
Amount | | | Value
(Note 2) | |
| Freddie Mac Pool | | | | | | | | |
| Series 2018-, | | | | | | | | |
| 3.000%, 05/01/2045 | | $ | 279,410 | | | $ | 232,636 | |
| 3.000%, 09/01/2045 | | | 701,794 | | | | 576,829 | |
| 3.000%, 12/01/2045 | | | 503,740 | | | | 405,584 | |
| 3.500%, 12/01/2045 | | | 55,478 | | | | 46,023 | |
| 4.500%, 09/01/2044 | | | 465,514 | | | | 414,995 | |
| 6.000%, 07/01/2048 | | | 233,299 | | | | 228,593 | |
| Series 2021-, 2.190%, 06/01/2034 | | | 146,463 | | | | 107,838 | |
| Series 2022-, 3.000%, 02/01/2046 | | | 3,960,415 | | | | 3,245,307 | |
| Series 2023-, | | | | | | | | |
| 4.600%, 01/01/2033 | | | 6,743,000 | | | | 6,026,545 | |
| 4.750%, 01/01/2033 | | | 16,673,950 | | | | 15,288,008 | |
| 4.900%, 01/01/2033 | | | 5,000,000 | | | | 4,552,178 | |
| 5.500%, 02/01/2053 | | | 10,948,292 | | | | 10,396,767 | |
| 6.500%, 04/01/2053 | | | 27,750,880 | | | | 27,638,344 | |
| 6.500%, 05/01/2053 | | | 15,113,645 | | | | 15,109,078 | |
| 7.000%, 01/01/2053 | | | 4,209,475 | | | | 4,276,297 | |
| | | | | | | | 88,545,022 | |
| Ginnie Mae I Pool | | | | | | | | |
| Series 2010-, 4.500%, 08/15/2040 | | | 321,145 | | | | 297,268 | |
| Series 2013-, 3.000%, 03/15/2043 | | | 338,472 | | | | 290,935 | |
| | | | | | | | 588,203 | |
| Ginnie Mae II Pool | | | | | | | | |
| Series 2010-, | | | | | | | | |
| 4.000%, 09/20/2040 | | | 80,107 | | | | 70,957 | |
| 4.000%, 11/20/2040 | | | 88,042 | | | | 77,988 | |
| 4.000%, 12/20/2040 | | | 155,461 | | | | 139,046 | |
| 4.500%, 08/20/2040 | | | 261,096 | | | | 238,008 | |
| 4.875%, 01/20/2035 | | | 130,075 | | | | 120,967 | |
| 1M US SOFR + 2.145%, 08/20/2060(a) | | | 348,143 | | | | 353,610 | |
| Series 2011-, | | | | | | | | |
| 4.000%, 09/20/2041 | | | 244,748 | | | | 220,649 | |
| 4.000%, 10/20/2041 | | | 118,680 | | | | 106,340 | |
| 4.500%, 07/20/2041 | | | 93,546 | | | | 85,100 | |
| Series 2012-, | | | | | | | | |
| 3.500%, 03/20/2042 | | | 330,311 | | | | 279,702 | |
| 3.500%, 04/20/2042 | | | 73,111 | | | | 61,909 | |
| 3.500%, 05/20/2042 | | | 127,455 | | | | 107,935 | |
| 3.500%, 06/20/2042 | | | 77,781 | | | | 65,884 | |
| 3.500%, 08/20/2042 | | | 85,410 | | | | 72,334 | |
| 3.500%, 09/20/2042 | | | 69,385 | | | | 58,753 | |
| 3.500%, 10/20/2042 | | | 81,062 | | | | 68,662 | |
| 3.500%, 12/20/2042 | | | 211,784 | | | | 179,362 | |
| 4.000%, 02/20/2042 | | | 23,002 | | | | 20,406 | |
| 4.000%, 04/20/2042 | | | 90,749 | | | | 80,508 | |
| 4.000%, 09/20/2042 | | | 92,138 | | | | 82,434 | |
| Series 2012-5302, 3.500%, 02/20/2042 | | | 211,879 | | | | 179,413 | |
| Series 2013-, | | | | | | | | |
| 2.500%, 02/20/2043 | | | 125,033 | | | | 99,902 | |
| | | Principal
Amount | | | Value
(Note 2) | |
| 3.000%, 06/20/2043 | | $ | 203,699 | | | $ | 168,880 | |
| 3.000%, 08/20/2043 | | | 424,191 | | | | 357,301 | |
| 3.250%, 04/20/2033 | | | 287,284 | | | | 246,931 | |
| 3.500%, 04/20/2043 | | | 214,392 | | | | 181,557 | |
| 3.500%, 05/20/2043 | | | 95,887 | | | | 82,470 | |
| 3.500%, 06/20/2043 | | | 99,606 | | | | 85,646 | |
| 4.000%, 09/20/2043 | | | 262,795 | | | | 234,363 | |
| Series 2013-MA1149, 3.000%, 07/20/2043 | | | 12,299 | | | | 10,084 | |
| Series 2014-, | | | | | | | | |
| 4.500%, 02/20/2034 | | | 267,423 | | | | 244,903 | |
| 4.500%, 06/20/2034 | | | 620,953 | | | | 562,693 | |
| 4.500%, 02/20/2044 | | | 267,259 | | | | 245,761 | |
| 4.500%, 05/20/2044 | | | 940,849 | | | | 861,064 | |
| 1M US SOFR + 2.290%, 02/20/2064(a) | | | 560,250 | | | | 573,096 | |
| Series 2015-, | | | | | | | | |
| 3.000%, 01/20/2040 | | | 216,674 | | | | 179,720 | |
| 3.500%, 06/20/2035 | | | 244,174 | | | | 215,181 | |
| 3.750%, 05/20/2045 | | | 98,605 | | | | 86,835 | |
| 4.500%, 08/20/2045 | | | 516,729 | | | | 473,849 | |
| Series 2016-, | | | | | | | | |
| 2.500%, 05/20/2031 | | | 215,376 | | | | 185,600 | |
| 3.000%, 06/20/2046 | | | 220,251 | | | | 184,147 | |
| 3.000%, 07/20/2046 | | | 237,800 | | | | 196,288 | |
| 3.500%, 06/20/2046 | | | 412,417 | | | | 355,461 | |
| 4.500%, 09/20/2045 | | | 223,954 | | | | 204,958 | |
| 4.500%, 03/20/2046 | | | 152,978 | | | | 140,369 | |
| Series 2016-MA3588, 3.500%, 04/20/2046 | | | 255,865 | | | | 216,620 | |
| Series 2016-MA3793, 3.500%, 07/20/2046 | | | 730,787 | | | | 618,690 | |
| Series 2016-MA3865, 3.500%, 08/20/2046 | | | 428,441 | | | | 363,022 | |
| Series 2017-, | | | | | | | | |
| 2.500%, 01/20/2032 | | | 246,345 | | | | 212,288 | |
| 3.000%, 11/20/2032 | | | 213,938 | | | | 191,213 | |
| 3.500%, 10/20/2047 | | | 339,527 | | | | 293,937 | |
| 3.500%, 12/20/2047 | | | 768,376 | | | | 655,703 | |
| 4.526%, 01/20/2067(a) | | | 133,903 | | | | 128,821 | |
| Series 2018-, | | | | | | | | |
| 3.500%, 02/20/2036 | | | 2,698,370 | | | | 2,390,093 | |
| 3.500%, 08/20/2047 | | | 122,302 | | | | 106,110 | |
| 3.500%, 01/20/2048 | | | 64,450 | | | | 55,804 | |
| 3.500%, 04/20/2048 | | | 459,069 | | | | 397,493 | |
| 4.000%, 05/20/2048 | | | 2,717,137 | | | | 2,403,511 | |
| 4.000%, 09/20/2048 | | | 2,604,563 | | | | 2,305,369 | |
| 4.500%, 07/20/2048 | | | 590,945 | | | | 534,594 | |
| 4.500%, 09/20/2048 | | | 274,027 | | | | 251,306 | |
| 5.500%, 10/20/2048 | | | 370,642 | | | | 358,449 | |
| Series 2019-, | | | | | | | | |
| 3.500%, 12/20/2047 | | | 426,812 | | | | 370,252 | |
| 3.500%, 08/20/2049 | | | 360,739 | | | | 310,065 | |
| 3.500%, 12/20/2049 | | | 141,194 | | | | 119,078 | |
| 4.000%, 04/20/2049 | | | 103,009 | | | | 89,139 | |
| 4.500%, 09/20/2049 | | | 390,639 | | | | 355,609 | |
| 4.500%, 11/20/2049 | | | 782,822 | | | | 708,157 | |
See Notes to Financial Statements.
ALPS | Smith Total Return Bond Fund
| Statement of Investments | October 31, 2023 |
| | | Principal
Amount | | | Value
(Note 2) | |
| 5.500%, 06/20/2049 | | $ | 147,787 | | | $ | 142,174 | |
| 6.000%, 01/20/2049 | | | 310,951 | | | | 309,657 | |
| Series 2019-784688, 5.000%, 02/20/2049 | | | 842,403 | | | | 794,702 | |
| Series 2019-MA5864, 3.000%, 04/20/2049 | | | 21,480 | | | | 17,801 | |
| Series 2019-MA5920, 3.000%, 05/20/2049 | | | 15,546 | | | | 12,742 | |
| Series 2019-MA5936, 6.500%, 05/20/2049 | | | 44,982 | | | | 46,715 | |
| Series 2020-, | | | | | | | | |
| 2.000%, 11/20/2050 | | | 3,119,062 | | | | 2,384,823 | |
| 2.500%, 01/20/2050 | | | 185,627 | | | | 145,390 | |
| 3.000%, 11/20/2050 | | | 154,323 | | | | 123,629 | |
| 3.500%, 12/20/2049 | | | 788,553 | | | | 657,290 | |
| 3.500%, 10/20/2050 | | | 215,862 | | | | 182,218 | |
| 4.000%, 02/20/2050 | | | 338,193 | | | | 298,394 | |
| 4.000%, 04/20/2050 | | | 731,720 | | | | 633,180 | |
| 4.000%, 05/20/2050 | | | 164,638 | | | | 142,974 | |
| 4.000%, 11/20/2050 | | | 845,362 | | | | 732,084 | |
| Series 2021-, | | | | | | | | |
| 3.000%, 08/20/2051 | | | 945,536 | | | | 791,005 | |
| 4.000%, 02/20/2051 | | | 204,142 | | | | 176,647 | |
| 4.000%, 03/20/2051 | | | 1,572,079 | | | | 1,389,765 | |
| Series 2022-, | | | | | | | | |
| 3.000%, 12/20/2044 | | | 2,703,663 | | | | 2,231,929 | |
| 3.000%, 05/20/2052 | | | 3,164,949 | | | | 2,545,560 | |
| 4.000%, 08/20/2052 | | | 1,861,296 | | | | 1,637,896 | |
| 4.000%, 09/20/2052 | | | 16,007,059 | | | | 14,066,634 | |
| 5.000%, 05/20/2052 | | | 1,061,646 | | | | 972,587 | |
| 5.000%, 06/20/2052 | | | 626,729 | | | | 584,677 | |
| 6.000%, 12/20/2052 | | | 1,932,062 | | | | 1,919,525 | |
| Series 2023-, | | | | | | | | |
| 5.500%, 05/20/2053 | | | 8,028,747 | | | | 7,793,963 | |
| 6.000%, 08/20/2053 | | | 18,696,070 | | | | 18,579,422 | |
| 6.500%, 04/20/2053 | | | 11,051,522 | | | | 11,075,329 | |
| 6.500%, 10/20/2053 | | | 15,190,243 | | | | 15,265,187 | |
| 7.000%, 10/20/2053 | | | 4,151,388 | | | | 4,251,642 | |
| | | | | | | | 112,187,890 | |
| TOTAL MORTGAGE-BACKED SECURITIES | | | | | | | | |
| (Cost $426,662,523) | | | | | | | 401,413,506 | |
| | | Principal
Amount | | | Value
(Note 2) | |
| CORPORATE BONDS (38.62%) | | | | | | | | |
| | | | | | | | | |
| Aerospace & Defense (1.55%) | | | | | | | | |
| Boeing Co. | | | | | | | | |
| 1.43%, 02/04/2024 | | | 9,669,000 | | | | 9,546,947 | |
| 2.20%, 02/04/2026 | | | 10,030,000 | | | | 9,218,318 | |
| 3.95%, 08/01/2059 | | | 7,777,000 | | | | 4,795,286 | |
| 5.93%, 05/01/2060 | | | 3,986,000 | | | | 3,356,954 | |
| L3Harris Technologies, Inc. | | | | | | | | |
| 5.40%, 07/31/2033 | | | 4,543,000 | | | | 4,247,631 | |
| 5.60%, 07/31/2053 | | | 5,450,000 | | | | 4,821,230 | |
| Total Aerospace & Defense | | | | | | | 35,986,366 | |
| | | Principal
Amount | | | Value
(Note 2) | |
| Airlines (0.98%) | | | | | | |
| Alaska Airlines 2020-1 Class A Pass Through Trust | | | | | | | | |
| 4.80%, 08/15/2027(e) | | $ | 5,581,767 | | | $ | 5,325,267 | |
| Alaska Airlines 2020-1 Class B Pass Through Trust | | | | | | | | |
| 8.00%, 08/15/2025(e) | | | 3,235,708 | | | | 3,233,363 | |
| British Airways 2020-1 Class A Pass Through Trust | | | | | | | | |
| 4.25%, 11/15/2032(e) | | | 1,141,194 | | | | 1,023,309 | |
| Southwest Airlines Co. | | | | | | | | |
| 5.25%, 05/04/2025 | | | 7,540,000 | | | | 7,437,738 | |
| United Airlines 2020-1 Class A Pass Through Trust Series 20-1 | | | | | | | | |
| 5.88%, 10/15/2027 | | | 5,923,132 | | | | 5,838,616 | |
| Total Airlines | | | | | | | 22,858,293 | |
| | | | | | | | | |
| Apparel & Textile Products (0.13%) | | | | | | | | |
| Hanesbrands, Inc. | | | | | | | | |
| 9.00%, 02/15/2031(e) | | | 3,303,000 | | | | 3,069,594 | |
| | | | | | | | | |
| Automobiles Manufacturing (2.45%) | | | | | | | | |
| Ford Motor Co. | | | | | | | | |
| 5.29%, 12/08/2046 | | | 7,850,000 | | | | 5,703,055 | |
| Ford Motor Credit Co. LLC | | | | | | | | |
| 3.38%, 11/13/2025 | | | 6,500,000 | | | | 6,072,024 | |
| 6.80%, 05/12/2028 | | | 9,919,000 | | | | 9,900,278 | |
| 7.35%, 03/06/2030 | | | 10,487,000 | | | | 10,544,174 | |
| General Motors Financial Co., Inc. | | | | | | | | |
| SOFRINDX + 1.30%, 04/07/2025(a)(f) | | | 14,607,000 | | | | 14,630,604 | |
| Nissan Motor Acceptance Co. LLC | | | | | | | | |
| 7.05%, 09/15/2028(e) | | | 6,378,000 | | | | 6,302,098 | |
| Volkswagen Group of America Finance LLC | | | | | | | | |
| 0.88%, 11/22/2023(e) | | | 995,000 | | | | 992,261 | |
| 3.95%, 06/06/2025(e) | | | 3,000,000 | | | | 2,906,276 | |
| Total Automobiles Manufacturing | | | | | | | 57,050,770 | |
| | | | | | | | | |
| Banks (2.53%) | | | | | | | | |
| Associated Bank NA/Green Bay WI | | | | | | | | |
| 4.25%, 01/15/2025 | | | 934,000 | | | | 895,559 | |
| Citibank NA | | | | | | | | |
| 5.80%, 09/29/2028 | | | 9,965,000 | | | | 9,845,439 | |
| Citizens Bank NA 1D US SOFR + 1.45%, 10/24/2025(a) | | | 5,154,000 | | | | 4,929,428 | |
| Cooperatieve Rabobank UA | | | | | | | | |
| 3.75%, 07/21/2026 | | | 4,500,000 | | | | 4,182,287 | |
| Danske Bank A/S | | | | | | | | |
| 5.38%, 01/12/2024(e) | | | 1,000,000 | | | | 997,142 | |
| 1Y US TI + 1.35%, 09/11/2026(a)(e) | | | 6,500,000 | | | | 5,923,848 | |
See Notes to Financial Statements.
ALPS | Smith Total Return Bond Fund
| Statement of Investments | October 31, 2023 |
| | | Principal
Amount | | | Value
(Note 2) | |
| Intesa Sanpaolo SpA 6.63%, 06/20/2033(e) | | $ | 2,989,000 | | | $ | 2,743,723 | |
| 1Y US TI + 2.75%, 06/01/2042(a)(e) | | | 1,800,000 | | | | 1,057,056 | |
| 1Y US TI + 3.90%, 06/20/2054(a)(e) | | | 3,985,000 | | | | 3,459,269 | |
| Truist Bank 3.30%, 05/15/2026 | | | 4,316,000 | | | | 3,953,269 | |
| Truist Financial Corp. 1D US SOFR + 2.361%, 06/08/2034(a) | | | 5,580,000 | | | | 5,078,438 | |
| US Bancorp 1D US SOFR + 1.60%, 02/01/2034(a) | | | 9,000,000 | | | | 7,693,214 | |
| Wells Fargo & Co. 1D US SOFR + 2.02%, 04/24/2034(a) | | | 9,019,000 | | | | 8,168,635 | |
| Total Banks | | | | | | | 58,927,307 | |
| | | | | | | | | |
| Biotechnology (1.25%) | | | | | | | | |
| Amgen, Inc. | | | | | | | | |
| 5.25%, 03/02/2033 | | | 10,628,000 | | | | 9,916,807 | |
| 5.51%, 03/02/2026 | | | 8,959,000 | | | | 8,913,627 | |
| 5.75%, 03/02/2063 | | | 11,957,000 | | | | 10,364,513 | |
| Total Biotechnology | | | | | | | 29,194,947 | |
| | | | | | | | | |
| Cable & Satellite (0.84%) | | | | | | | | |
| CCO Holdings LLC / CCO Holdings Capital Corp. | | | | | | | | |
| 4.50%, 05/01/2032 | | | 4,000,000 | | | | 3,065,207 | |
| 4.50%, 06/01/2033(e) | | | 5,978,000 | | | | 4,463,626 | |
| 4.75%, 02/01/2032(e) | | | 5,300,000 | | | | 4,142,109 | |
| Charter Communications Operating LLC / Charter Communications Operating Capital 3.85%, 04/01/2061 | | | 6,363,000 | | | | 3,363,964 | |
| Sirius XM Radio, Inc. 5.00%, 08/01/2027(e) | | | 5,127,000 | | | | 4,705,561 | |
| Total Cable & Satellite | | | | | | | 19,740,467 | |
| | | | | | | | | |
| Casinos & Gaming (0.85%) | | | | | | | | |
| MGM Resorts International 6.75%, 05/01/2025 | | | 12,855,000 | | | | 12,796,971 | |
| Penn Entertainment, Inc. 5.63%, 01/15/2027(e) | | | 7,595,000 | | | | 6,934,744 | |
| Total Casinos & Gaming | | | | | | | 19,731,715 | |
| | | | | | | | | |
| Chemicals (0.42%) | | | | | | | | |
| Avient Corp. 5.75%, 05/15/2025(e) | | | 4,130,000 | | | | 4,050,999 | |
| Celanese US Holdings LLC 6.38%, 07/15/2032 | | | 6,175,000 | | | | 5,798,854 | |
| Total Chemicals | | | | | | | 9,849,853 | |
| | | Principal
Amount | | | Value
(Note 2) | |
| Commercial Finance (0.37%) | | | | | | | | |
| AerCap Ireland Capital DAC / AerCap Global Aviation Trust 6.50%, 07/15/2025 | | $ | 8,623,000 | | | $ | 8,606,122 | |
| | | | | | | | | |
| Consumer Finance (2.16%) | | | | | | | | |
| Ally Financial, Inc. 8.00%, 11/01/2031 | | | 4,000,000 | | | | 3,905,845 | |
| Capital One Financial Corp. 1D US SOFR + 2.60%, 02/01/2034(a) | | | 8,680,000 | | | | 7,594,120 | |
| Discover Financial Services 6.70%, 11/29/2032 | | | 12,930,000 | | | | 11,983,601 | |
| SOFRINDX + 3.37%, 11/02/2034(a)(f) | | | 1,993,000 | | | | 1,981,140 | |
| Fiserv, Inc. 5.60%, 03/02/2033 | | | 3,982,000 | | | | 3,749,077 | |
| GTCR W-2 Merger Sub LLC 7.50%, 01/15/2031(e) | | | 10,073,000 | | | | 9,954,642 | |
| Synchrony Financial | | | | | | | | |
| 3.70%, 08/04/2026 | | | 3,192,000 | | | | 2,832,388 | |
| 4.25%, 08/15/2024 | | | 1,700,000 | | | | 1,664,696 | |
| 7.25%, 02/02/2033 | | | 7,950,000 | | | | 6,746,049 | |
| Total Consumer Finance | | | | | | | 50,411,558 | |
| | | | | | | | | |
| Consumer Products (0.19%) | | | | | | | | |
| Church & Dwight Co., Inc. 5.60%, 11/15/2032 | | | 4,500,000 | | | | 4,406,507 | |
| | | | | | | | | |
| Department Stores (0.17%) | | | | | | | | |
| Nordstrom, Inc. Series WI 2.30%, 04/08/2024 | | | 4,000,000 | | | | 3,916,980 | |
| | | | | | | | | |
| Diversified Banks (1.86%) | | | | | | | | |
| Banco Santander SA 6.94%, 11/07/2033 | | | 4,983,000 | | | | 5,001,800 | |
| Bank of America Corp. | | | | | | | | |
| 1D US SOFR + 1.84%, 09/15/2034(a) | | | 4,982,000 | | | | 4,693,368 | |
| 1D US SOFR + 1.91%, 04/25/2034(a) | | | 9,018,000 | | | | 8,148,473 | |
| 5Y US TI + 1.20%, 09/21/2036(a) | | | 12,241,000 | | | | 8,728,757 | |
| Citigroup, Inc. 4.30%, 11/20/2026 | | | 8,949,000 | | | | 8,412,108 | |
| JPMorgan Chase & Co. | | | | | | | | |
| 1D US SOFR + 1.07%, 12/15/2025(a) | | | 8,581,000 | | | | 8,518,216 | |
| Total Diversified Banks | | | | | | | 43,502,722 | |
| | | | | | | | | |
| Electrical Equipment Manufacturing (0.42%) | | | | | | | | |
| Trimble, Inc. | | | | | | | | |
| 4.75%, 12/01/2024 | | | 3,254,000 | | | | 3,204,657 | |
| 6.10%, 03/15/2033 | | | 6,969,000 | | | | 6,655,663 | |
| Total Electrical Equipment Manufacturing | | | | | | | 9,860,320 | |
See Notes to Financial Statements.
ALPS | Smith Total Return Bond Fund
| Statement of Investments | October 31, 2023 |
| | | Principal | | | Value | |
| | | Amount | | | (Note 2) | |
| Entertainment Content (0.54%) | | | | | | | | |
| Discovery Communications LLC 4.00%, 09/15/2055 | | $ | 2,709,000 | | | $ | 1,557,202 | |
| Warnermedia Holdings, Inc. | | | | | | | | |
| 4.28%, 03/15/2032 | | | 5,300,000 | | | | 4,396,429 | |
| 5.14%, 03/15/2052 | | | 9,240,000 | | | | 6,543,270 | |
| Total Entertainment Content | | | | | | | 12,496,901 | |
| | | | | | | | | |
| Entertainment Resources (0.13%) | | | | | | | | |
| Vail Resorts, Inc. 6.25%, 05/15/2025(e) | | | 2,983,000 | | | | 2,967,175 | |
| | | | | | | | | |
| Exploration & Production (0.95%) | | | | | | | | |
| Hilcorp Energy I LP / Hilcorp Finance Co. | | | | | | | | |
| 6.00%, 04/15/2030(e) | | | 1,682,000 | | | | 1,495,214 | |
| 6.25%, 11/01/2028(e) | | | 5,537,000 | | | | 5,182,343 | |
| 6.25%, 04/15/2032(e) | | | 1,682,000 | | | | 1,470,886 | |
| Occidental Petroleum Corp. 7.88%, 09/15/2031 | | | 12,968,000 | | | | 13,896,509 | |
| Total Exploration & Production | | | | | | | 22,044,952 | |
| | | | | | | | | |
| Financial Services (2.47%) | | | | | | | | |
| Ameriprise Financial, Inc. 5.15%, 05/15/2033 | | | 2,986,000 | | | | 2,757,785 | |
| Charles Schwab Corp. | | | | | | | | |
| 1D US SOFR + 2.01%, 08/24/2034(a) | | | 4,982,000 | | | | 4,669,017 | |
| 1D US SOFR + 2.50%, 05/19/2034(a) | | | 5,500,000 | | | | 5,047,161 | |
| Goldman Sachs Group, Inc. | | | | | | | | |
| 1D US SOFR + 0.50%, 09/10/2024(a) | | | 3,976,000 | | | | 3,965,951 | |
| Morgan Stanley | | | | | | | | |
| 1D US SOFR + 1.36%, 09/16/2036(a) | | | 12,446,000 | | | | 8,809,353 | |
| 1D US SOFR + 2.05%, 11/01/2034(a) | | | 2,990,000 | | | | 2,988,755 | |
| 5Y US TI + 2.43%, 01/19/2038(a) | | | 4,945,000 | | | | 4,486,301 | |
| UBS Group AG | | | | | | | | |
| 1D US SOFR + 3.92%, 08/12/2033(a)(e) | | | 14,468,000 | | | | 13,909,866 | |
| 1Y US TI + 1.75%, 05/12/2028(a)(e) | | | 2,983,000 | | | | 2,803,241 | |
| 1Y US TI + 1.80%, 09/22/2029(a)(e) | | | 1,993,000 | | | | 1,953,452 | |
| 1Y US TI + 2.00%, 09/22/2034(a)(e) | | | 1,445,000 | | | | 1,369,270 | |
| 1Y US TI + 2.20%, 01/12/2034(a)(e) | | | 5,000,000 | | | | 4,663,537 | |
| Total Financial Services | | | | | | | 57,423,689 | |
| | | | | | | | | |
| Food & Beverage (1.38%) | | | | | | | | |
| J M Smucker Co. 6.20%, 11/15/2033 | | | 6,976,000 | | | | 6,783,919 | |
| | | Principal
Amount | | | Value
(Note 2) | |
| JBS USA LUX SA / JBS USA Food Co. / JBS Luxembourg SARL | | | | | | | | |
| 6.75%, 03/15/2034(e) | | $ | 2,728,000 | | | $ | 2,558,264 | |
| 7.25%, 11/15/2053(e) | | | 8,290,000 | | | | 7,411,332 | |
| JDE Peet's NV 0.80%, 09/24/2024(e) | | | 1,984,000 | | | | 1,891,123 | |
| Pilgrim's Pride Corp. | | | | | | | | |
| 6.25%, 07/01/2033 | | | 10,000,000 | | | | 9,202,469 | |
| 6.88%, 05/15/2034 | | | 4,548,000 | | | | 4,308,994 | |
| Total Food & Beverage | | | | | | | 32,156,101 | |
| | | | | | | | | |
| Health Care Facilities & Services (0.78%) | | | | | | | | |
| HCA, Inc. | | | | | | | | |
| 2.38%, 07/15/2031 | | | 11,927,000 | | | | 8,873,674 | |
| 5.38%, 02/01/2025 | | | 3,000,000 | | | | 2,968,840 | |
| 5.50%, 06/01/2033 | | | 6,970,000 | | | | 6,361,955 | |
| Total Health Care Facilities & Services | | | | | | | 18,204,469 | |
| | | | | | | | | |
| Industrial Other (0.49%) | | | | | | | | |
| Jacobs Engineering Group, Inc. 5.90%, 03/01/2033 | | | 9,458,000 | | | | 8,766,389 | |
| Quanta Services, Inc. 0.95%, 10/01/2024 | | | 2,581,000 | | | | 2,459,411 | |
| Total Industrial Other | | | | | | | 11,225,800 | |
| | | | | | | | | |
| Internet Media (0.27%) | | | | | | | | |
| Meta Platforms, Inc. | | | | | | | | |
| 5.60%, 05/15/2053 | | | 1,992,000 | | | | 1,802,974 | |
| 5.75%, 05/15/2063 | | | 4,979,000 | | | | 4,470,281 | |
| Total Internet Media | | | | | | | 6,273,255 | |
| | | | | | | | | |
| Life Insurance (0.20%) | | | | | | | | |
| Five Corners Funding Trust III | | | | | | | | |
| 5.79%, 02/15/2033(e) | | | 4,978,000 | | | | 4,710,327 | |
| | | | | | | | | |
| Machinery Manufacturing (0.20%) | | | | | | | | |
| Nordson Corp. | | | | | | | | |
| 5.80%, 09/15/2033 | | | 4,982,000 | | | | 4,745,287 | |
| |
| Medical Equipment & Devices Manufacturing (0.47%) |
| Alcon Finance Corp. 5.38%, 12/06/2032(e) | | | 8,670,000 | | | | 8,128,073 | |
| Revvity, Inc. 0.85%, 09/15/2024 | | | 2,977,000 | | | | 2,839,539 | |
| Total Medical Equipment & Devices Manufacturing | | | | | | | 10,967,612 | |
| | | | | | | | | |
| Metals & Mining (0.41%) | | | | | | | | |
| Steel Dynamics, Inc. 5.00%, 12/15/2026 | | | 9,805,000 | | | | 9,471,073 | |
| | | | | | | | | |
| Pharmaceuticals (1.28%) | | | | | | | | |
| Bristol-Myers Squibb Co. 6.25%, 11/15/2053 | | | 1,993,000 | | | | 1,976,304 | |
| Merck & Co., Inc. | | | | | | | | |
| 4.50%, 05/17/2033 | | | 2,988,000 | | | | 2,717,646 | |
| 5.00%, 05/17/2053 | | | 6,971,000 | | | | 5,958,365 | |
See Notes to Financial Statements.
ALPS | Smith Total Return Bond Fund
| Statement of Investments | October 31, 2023 |
| | | Principal
Amount | | | Value
(Note 2) | |
| Pfizer Investment Enterprises Pte, Ltd. | | | | | | | | |
| 4.75%, 05/19/2033 | | $ | 5,779,000 | | | $ | 5,314,115 | |
| 5.11%, 05/19/2043 | | | 7,968,000 | | | | 6,998,828 | |
| 5.30%, 05/19/2053 | | | 7,693,000 | | | | 6,736,040 | |
| Total Pharmaceuticals | | | | | | | 29,701,298 | |
| | | | | | | | | |
| Pipeline (3.72%) | | | | | | | | |
| Buckeye Partners LP 4.50%, 03/01/2028(e) | | | 8,958,000 | | | | 7,803,314 | |
| Cheniere Energy Partners LP 3.25%, 01/31/2032 | | | 8,000,000 | | | | 6,211,382 | |
| Enbridge, Inc. 5Y US TI + 4.431%, 01/15/2084(a) | | | 1,993,000 | | | | 1,910,237 | |
| Flex Intermediate Holdco LLC | | | | | | | | |
| 3.36%, 06/30/2031(e) | | | 12,936,000 | | | | 9,770,071 | |
| 4.32%, 12/30/2039(e) | | | 9,061,000 | | | | 5,961,159 | |
| Midwest Connector Capital Co. LLC | | | | | | | | |
| 3.90%, 04/01/2024(e) | | | 15,478,000 | | | | 15,289,315 | |
| 4.63%, 04/01/2029(e) | | | 6,974,000 | | | | 6,281,721 | |
| Targa Resources Partners LP / Targa Resources Partners Finance Corp. | | | | | | | | |
| 6.50%, 07/15/2027 | | | 16,103,000 | | | | 15,929,489 | |
| 6.88%, 01/15/2029 | | | 8,740,000 | | | | 8,705,694 | |
| TransCanada PipeLines, Ltd. 6.20%, 03/09/2026 | | | 8,962,000 | | | | 8,958,758 | |
| Total Pipeline | | | | | | | 86,821,140 | |
| | | | | | | | | |
| Power Generation (1.14%) | | | | | | | | |
| Alexander Funding Trust 1.84%, 11/15/2023(e) | | | 6,118,000 | | | | 6,105,938 | |
| Alexander Funding Trust II 7.47%, 07/31/2028(e) | | | 4,547,000 | | | | 4,516,782 | |
| Vistra Operations Co. LLC | | | | | | | | |
| 5.13%, 05/13/2025(e) | | | 6,961,000 | | | | 6,808,581 | |
| 5.50%, 09/01/2026(e) | | | 8,626,000 | | | | 8,214,648 | |
| 6.95%, 10/15/2033(e) | | | 997,000 | | | | 950,736 | |
| Total Power Generation | | | | | | | 26,596,685 | |
| | | | | | | | | |
| Property & Casualty Insurance (0.45%) | | | | | | | | |
| Allstate Corp. 5.25%, 03/30/2033 | | | 5,974,000 | | | | 5,520,897 | |
| Arthur J Gallagher & Co. 6.50%, 02/15/2034 | | | 2,990,000 | | | | 2,970,937 | |
| Fairfax US, Inc. 4.88%, 08/13/2024(e) | | | 2,000,000 | | | | 1,975,791 | |
| Total Property & Casualty Insurance | | | | | | | 10,467,625 | |
| | | | | | | | | |
| Publishing & Broadcasting (0.88%) | | | | | | | | |
| Gray Escrow II, Inc. 5.38%, 11/15/2031(e) | | | 6,377,000 | | | | 4,024,597 | |
| Gray Television, Inc. 7.00%, 05/15/2027(e) | | | 4,200,000 | | | | 3,565,632 | |
| | | Principal
Amount | | | Value
(Note 2) | |
| Nexstar Media, Inc. | | | | | | | | |
| 4.75%, 11/01/2028(e) | | $ | 8,000,000 | | | $ | 6,727,197 | |
| 5.63%, 07/15/2027(e) | | | 4,376,000 | | | | 3,941,465 | |
| Scripps Escrow II, Inc. 3.88%, 01/15/2029(e) | | | 2,888,000 | | | | 2,195,443 | |
| Total Publishing & Broadcasting | | | | | | | 20,454,334 | |
| | | | | | | | | |
| Real Estate (0.81%) | | | | | | | | |
| Cushman & Wakefield US Borrower LLC 6.75%, 05/15/2028(e) | | | 3,033,000 | | | | 2,768,856 | |
| VICI Properties LP / VICI Note Co., Inc. | | | | | | | | |
| 4.63%, 06/15/2025(e) | | | 6,300,000 | | | | 6,057,104 | |
| 5.63%, 05/01/2024(e) | | | 10,165,000 | | | | 10,105,014 | |
| Total Real Estate | | | | | | | 18,930,974 | |
| | | | | | | | | |
| Refining & Marketing (0.48%) | | | | | | | | |
| HF Sinclair Corp. | | | | | | | | |
| 4.50%, 10/01/2030 | | | 9,494,000 | | | | 8,076,315 | |
| 5.88%, 04/01/2026 | | | 3,177,000 | | | | 3,133,666 | |
| Total Refining & Marketing | | | | | | | 11,209,981 | |
| | | | | | | | | |
| Restaurants (0.20%) | | | | | | | | |
| Brinker International, Inc. 8.25%, 07/15/2030(e) | | | 4,832,000 | | | | 4,677,086 | |
| | | | | | | | | |
| Semiconductors (0.39%) | | | | | | | | |
| Broadcom, Inc. 3.47%, 04/15/2034(e) | | | 6,885,000 | | | | 5,248,151 | |
| Microchip Technology, Inc. 0.97%, 02/15/2024 | | | 3,985,000 | | | | 3,923,800 | |
| Total Semiconductors | | | | | | | 9,171,951 | |
| | | | | | | | | |
| Software & Services (1.13%) | | | | | | | | |
| Concentrix Corp. | | | | | | | | |
| 6.60%, 08/02/2028 | | | 5,813,000 | | | | 5,583,546 | |
| 6.85%, 08/02/2033 | | | 6,043,000 | | | | 5,461,623 | |
| CoStar Group, Inc. 2.80%, 07/15/2030(e) | | | 9,060,000 | | | | 7,039,630 | |
| Leidos, Inc. 5.75%, 03/15/2033 | | | 4,779,000 | | | | 4,444,743 | |
| VMware, Inc. 2.20%, 08/15/2031 | | | 4,979,000 | | | | 3,682,339 | |
| Total Software & Services | | | | | | | 26,211,881 | |
| | | | | | | | | |
| Supermarkets & Pharmacies (0.47%) | | | | | | | | |
| Albertsons Cos. Inc / Safeway, Inc. / New Albertsons LP / Albertsons LLC 6.50%, 02/15/2028(e) | | | 11,035,000 | | | | 10,845,781 | |
| | | | | | | | | |
| Transportation & Logistics (0.22%) | | | | | | | | |
| FedEx Corp. 2020-1 Class AA Pass Through Trust 1.88%, 02/20/2034 | | | 6,637,736 | | | | 5,224,790 | |
See Notes to Financial Statements.
ALPS | Smith Total Return Bond Fund
| Statement of Investments | October 31, 2023 |
| | | Principal
Amount | | | Value
(Note 2) | |
| Utilities (2.11%) | | | | | | | | |
| Dominion Energy, Inc. 3.07%, 08/15/2024(d) | | $ | 1,500,000 | | | $ | 1,464,534 | |
| National Rural Utilities Cooperative Finance Corp. | | | | | | | | |
| 3M US SOFR + 3.17%, 04/30/2043(a) | | | 3,248,000 | | | | 3,184,403 | |
| 5Y US TI + 3.533%, 09/15/2053(a) | | | 5,478,000 | | | | 5,444,869 | |
| ONE Gas, Inc. 1.10%, 03/11/2024 | | | 7,521,000 | | | | 7,389,609 | |
| Pacific Gas and Electric Co. 3.25%, 02/16/2024 | | | 12,005,000 | | | | 11,900,731 | |
| Public Service Enterprise Group, Inc. | | | | | | | | |
| 5.88%, 10/15/2028 | | | 1,993,000 | | | | 1,973,447 | |
| 6.13%, 10/15/2033 | | | 1,993,000 | | | | 1,946,350 | |
| Sempra 5Y US TI + 2.868%, 04/01/2052(a) | | | 4,268,000 | | | | 3,292,706 | |
| Southern California Edison Co. | | | | | | | | |
| 1.10%, 04/01/2024 | | | 2,899,000 | | | | 2,841,481 | |
| 5.65%, 10/01/2028 | | | 4,982,000 | | | | 4,935,747 | |
| Southern Co. 5.11%, 08/01/2027 | | | 4,972,000 | | | | 4,798,055 | |
| Total Utilities | | | | | | | 49,171,932 | |
| |
| Waste & Environment Services & Equipment (0.27%) |
| GFL Environmental, Inc. 5.13%, 12/15/2026(e) | | | 6,644,000 | | | | 6,311,796 | |
| | | | | | | | | |
| Wireless Telecommunications Services (0.61%) | | | | | | | | |
| AT&T, Inc. | | | | | | | | |
| 5.35%, 11/01/2066 | | | 132,530 | | | | 2,776,504 | |
| 5.54%, 02/20/2026 | | | 3,982,000 | | | | 3,950,671 | |
| T-Mobile USA, Inc. | | | | | | | | |
| 4.80%, 07/15/2028 | | | 4,979,000 | | | | 4,739,074 | |
| 6.00%, 06/15/2054 | | | 2,989,000 | | | | 2,715,698 | |
| Total Wireless Telecommunications Services | | | | | | | 14,181,947 | |
| | | | | | | | | |
| TOTAL CORPORATE BONDS | | | | | | | | |
| (Cost $973,068,706) | | | | | | | 899,779,363 | |
| | | Principal
Amount | | | Value
(Note 2) | |
| GOVERNMENT BONDS (25.88%) | | | | | | | | |
| | | | | | | | | |
| U.S. Treasury Bonds (25.88%) | | | | | | | | |
| United States Treasury Bonds | | | | | | | | |
| 3.38%, 08/15/2042 | | $ | 41,237,000 | | | $ | 31,919,210 | |
| 3.63%, 02/15/2053 | | | 37,416,000 | | | | 29,161,095 | |
| 3.63%, 05/15/2053 | | | 67,433,000 | | | | 52,576,667 | |
| 3.88%, 02/15/2043 | | | 24,944,000 | | | | 20,744,444 | |
| 3.88%, 05/15/2043 | | | 69,138,000 | | | | 57,433,153 | |
| 4.00%, 11/15/2042 | | | 34,367,000 | | | | 29,144,156 | |
| 4.00%, 11/15/2052 | | | 28,182,000 | | | | 23,558,391 | |
| 4.13%, 08/15/2053 | | | 114,506,000 | | | | 97,974,195 | |
| 4.38%, 08/15/2043 | | | 12,068,000 | | | | 10,765,033 | |
| United States Treasury Notes | | | | | | | | |
| 4.63%, 06/30/2025 | | | 23,656,000 | | | | 23,456,403 | |
| 4.75%, 07/31/2025 | | | 29,131,000 | | | | 28,943,242 | |
| 5.00%, 08/31/2025 | | | 78,829,000 | | | | 78,668,879 | |
| 5.00%, 09/30/2025 | | | 95,627,000 | | | | 95,458,906 | |
| 5.00%, 10/31/2025 | | | 23,028,000 | | | | 23,000,114 | |
| Total U.S. Treasury Bonds | | | | | | | 602,803,888 | |
| | | | | | | | | |
| TOTAL GOVERNMENT BONDS | | | | | | | | |
| (Cost $651,555,501) | | | | | | | 602,803,888 | |
| | | Shares | | | Value
(Note 2) | |
| PREFERRED STOCK (2.40%) | | | | | | | | |
| | | | | | | | | |
| Energy (0.20%) | | | | | | | | |
| Pipeline (0.20%) | | | | | | | | |
| Energy Transfer LP, Series B, 6.625%(g) | | | 2,506,000 | | | | 1,945,283 | |
| Energy Transfer LP, Series F, 6.750%(g) | | | 2,985,000 | | | | 2,706,095 | |
| Total Energy | | | | | | | 4,651,378 | |
| | | | | | | | | |
| Financials (2.10%) | | | | | | | | |
| Banks (1.48%) | | | | | | | | |
| Huntington Bancshares, Inc., Series J, 6.875%(g) | | | 236,800 | | | | 5,245,120 | |
| Lloyds Banking Group PLC, 5Y US TI + 3.913%(a)(g) | | | 3,000,000 | | | | 2,641,821 | |
| PNC Financial Services Group, Inc., Series O, 3M US SOFR + 3.939%(a)(g) | | | 26,627,000 | | | | 26,627,001 | |
| | | | | | | | 34,513,942 | |
| Consumer Finance (0.43%) | | | | | | | | |
| Ally Financial, Inc., Series C, 4.700%(g) | | | 2,982,000 | | | | 1,748,376 | |
| American Express Co., 3.550%(g) | | | 4,674,000 | | | | 3,680,775 | |
See Notes to Financial Statements.
ALPS | Smith Total Return Bond Fund
| Statement of Investments | October 31, 2023 |
| | | Shares | | | Value
(Note 2) | |
| Discover Financial Services, Series D, 6.125%(g) | | | 5,000,000 | | | | 4,629,567 | |
| | | | | | | | 10,058,718 | |
| Life Insurance (0.19%) | | | | | | | | |
| Jackson Financial, Inc., 8.000%(g) | | | 178,800 | | | $ | 4,378,812 | |
| | | | | | | | | |
| Total Financials | | | | | | | 48,951,472 | |
| | | | | | | | | |
| Government (0.10%) | | | | | | | | |
| Government Agencies (0.10%) | | | | | | | | |
| Tennessee Valley Authority, 2.216% | | | 109,615 | | | | 2,330,415 | |
| | | | | | | | | |
| Total Government | | | | | | | 2,330,415 | |
| | | | | | | | | |
| TOTAL PREFERRED STOCK | | | | | | | | |
| (Cost $59,588,058) | | | | | | | 55,933,265 | |
| | | 7-Day Yield | | | Shares | | | Value
(Note 2) | |
| SHORT TERM INVESTMENTS (1.77%) | | | | | | | | | | | | |
| | | | | | | | | | | | | |
| Money Market Fund (1.77%) | | | | | | | | | | | | |
| Morgan Stanley Institutional Liquidity Funds - Government Portfolio | | | 5.25 | % | | | 41,115,689 | | | | 41,115,689 | |
| | | | | | | | | | | | | |
| TOTAL SHORT TERM INVESTMENTS | | | | | | | | | | | | |
| (Cost $41,115,689) | | | | | | | | | | | 41,115,689 | |
| | | Value
(Note 2) | |
| TOTAL INVESTMENTS (100.05%) | | | | |
| (Cost $2,515,916,438) | | $ | 2,330,672,265 | |
| | | | | |
| Liabilities In Excess Of Other Assets (-0.05%) | | | (1,277,297 | ) |
| | | | | |
| NET ASSETS (100.00%) | | $ | 2,329,394,968 | |
Investment Abbreviations:
SOFR - Secured Overnight Financing Rate
SOFRINDX - Secured Overnight Financing Rate Index
TI – Treasury Index
Reference Rates:
30D US SOFR - 30 Day SOFR as of October 31, 2023 was 5.32%
1D US SOFR - 1 Day SOFR as of October 31, 2023 was 5.35%
1M US SOFR- 1 Month SOFR as of October 31, 2023 was 5.32%
3M US SOFR - 3 Month SOFR as of October 31, 2023 was 5.38%
1Y US TI - 1 Year US TI as of October 31, 2023 was 5.44%
5Y US TI - 5 Year US TI as of October 31, 2023 was 4.82%
| (a) | Floating or variable rate security. The reference rate is described above. The rate in effect as of October 31, 2023 is based on the reference rate plus the displayed spread as of the security's last reset date. |
| (b) | Issued with zero coupon. |
| (c) | Interest only security. |
| (d) | Step bond. Coupon changes periodically based upon a predetermined schedule. Interest rate disclosed is that which is in effect as of October 31, 2023. |
| (e) | Security exempt from registration under Rule 144A of the Securities Act of 1933. This security may be resold in transactions exempt from registration, normally to qualified institutional buyers. As of October 31, 2023, the aggregate market value of those securities was $278,984,799, representing 11.98% of net assets. |
| (f) | The SOFRINDX is a compounded average of the daily Secured Overnight Financing Rate determined by reference to the SOFR Index for any interest period. |
| (g) | Perpetual maturity. This security has no contractual maturity date, is not redeemable and contractually pays an indefinite stream of interest. |
See Notes to Financial Statements.
ALPS | Smith Credit Opportunities Fund
| Statement of Investments | October 31, 2023 |
| | | Principal
Amount | | | Value
(Note 2) | |
| BANK LOANS (0.27%) | | | | | | | | |
| | | | | | | | | |
| Publishing & Broadcasting (0.27%) | | | | | | | | |
| Nexstar Media, Inc. 09/18/2026(a) | | $ | 590,437 | | | $ | 590,968 | |
| | | | | | | | | |
| TOTAL BANK LOANS | | | | | | | | |
| (Cost $590,437) | | | | | | | 590,968 | |
| | | Principal
Amount | | | Value
(Note 2) | |
| COLLATERALIZED MORTGAGE OBLIGATIONS (3.56%) | | | | | | | | |
| | | | | | | | | |
| Fannie Mae | | | | | | | | |
| Series 2002-71, Class AP, 5.000%, 11/25/2032 | | $ | 11,080 | | | $ | 10,727 | |
| Series 2002-90, Class A1, 6.500%, 06/25/2042 | | | 53,400 | | | | 53,768 | |
| Series 2008-8, Class FB, 30D US SOFR + 0.93%, 02/25/2038(a) | | | 96,252 | | | | 95,303 | |
| Series 2010-114, Class TC, 2.250%, 03/25/2037 | | | 364,869 | | | | 315,298 | |
| Series 2011-110, Class BX, 4.000%, 10/25/2041 | | | 362,569 | | | | 336,072 | |
| Series 2012-110, Class CA, 3.000%, 10/25/2042 | | | 103,756 | | | | 87,758 | |
| Series 2012-39, Class NB, 4.000%, 04/25/2042 | | | 175,000 | | | | 136,966 | |
| Series 2013-29, Class JE, 1.250%, 04/25/2043 | | | 170,655 | | | | 135,538 | |
| Series 2015-27, Class ME, 3.500%, 10/25/2044 | | | 128,000 | | | | 112,461 | |
| Series 2019-14, Class CA, 3.500%, 04/25/2049 | | | 145,130 | | | | 131,570 | |
| Series 2019-7, Class JA, 3.500%, 03/25/2049 | | | 113,690 | | | | 102,215 | |
| Series 2019-74, Class LB, 3.000%, 10/25/2049 | | | 137,565 | | | | 117,979 | |
| Series 2021-94, Class KU, 2.000%, 12/25/2051 | | | 148,254 | | | | 106,132 | |
| | | | | | | | 1,741,787 | |
| Freddie Mac | | | | | | | | |
| Series 2002-2455, Class GK, 6.500%, 05/15/2032 | | | 13,475 | | | | 13,256 | |
| Series 2002-2505, Class D, 5.500%, 09/15/2032 | | | 27,054 | | | | 26,542 | |
| Series 2005-2990, Class GO, –%, 02/15/2035(b) | | | 30,336 | | | | 24,950 | |
| Series 2011-3965, Class ZA, 4.000%, 11/15/2041 | | | 296,147 | | | | 260,898 | |
| Series 2012-4096, Class BY, 2.000%, 08/15/2042 | | | 85,000 | | | | 59,202 | |
| Series 2012-4116, Class UC, 2.500%, 10/15/2042 | | | 103,000 | | | | 66,520 | |
| | | Principal
Amount | | | Value
(Note 2) | |
| Series 2015-4537, Class AZ, 3.000%, 12/15/2045 | | $ | 22,352 | | | $ | 18,703 | |
| Series 2016-4579, Class W, 5.001%, 01/15/2038(a) | | | 71,140 | | | | 73,046 | |
| Series 2016-4614, Class PB, 3.000%, 01/15/2046 | | | 233,555 | | | | 202,342 | |
| Series 2018-4839, Class PZ, 4.000%, 11/15/2048 | | | 122,100 | | | | 89,817 | |
| Series 2021-5142, Class PN, 1.000%, 09/25/2051 | | | 72,793 | | | | 50,181 | |
| Series 2021-5151, Class LV, 1.500%, 09/25/2051 | | | 262,896 | | | | 124,578 | |
| | | | | | | | 1,010,035 | |
| Ginnie Mae | | | | | | | | |
| Series 2009-93, Class HG, 4.000%, 09/16/2039 | | | 12,193 | | | | 11,696 | |
| Series 2011-139, Class KZ, 2.500%, 10/20/2041 | | | 47,230 | | | | 37,790 | |
| Series 2011-141, Class GH, 3.000%, 10/16/2041 | | | 150,000 | | | | 104,873 | |
| Series 2011-H05, Class FB, 1M US SOFR + 0.61%, 12/20/2060(a) | | | 21,461 | | | | 21,359 | |
| Series 2011-H14, Class FC, 1M US SOFR + 0.61%, 05/20/2061(a) | | | 36,901 | | | | 36,751 | |
| Series 2012-137, Class EB, 2.000%, 11/20/2042 | | | 100,000 | | | | 55,665 | |
| Series 2012-16, Class ND, 2.000%, 05/20/2039 | | | 174,560 | | | | 156,085 | |
| Series 2012-41, Class TJ, 4.000%, 03/20/2042 | | | 155,737 | | | | 131,313 | |
| Series 2012-H20, Class BA, 1M US SOFR + 0.67%, 09/20/2062(a) | | | 17,060 | | | | 16,986 | |
| Series 2012-H29, Class SA, 1M US SOFR + 0.62%, 10/20/2062(a) | | | 43,797 | | | | 43,600 | |
| Series 2013-28, Class DB, 3.000%, 02/20/2043 | | | 100,000 | | | | 68,415 | |
| Series 2013-44, Class CE, 2.500%, 03/16/2043 | | | 105,656 | | | | 79,496 | |
| Series 2013-9, Class KY, 3.000%, 01/20/2043 | | | 312,000 | | | | 253,044 | |
| Series 2013-H07, Class GA, 1M US SOFR + 0.58%, 03/20/2063(a) | | | 14,308 | | | | 14,219 | |
| Series 2013-H10, Class FA, 1M US SOFR + 0.51%, 03/20/2063(a) | | | 12,699 | | | | 12,631 | |
| Series 2013-H22, Class FT, 1Y US TI + 0.65%, 04/20/2063(a) | | | 9,147 | | | | 9,133 | |
| Series 2013-H23, Class FA, 1M US SOFR + 1.41%, 09/20/2063(a) | | | 7,766 | | | | 7,805 | |
See Notes to Financial Statements.
ALPS | Smith Credit Opportunities Fund
| Statement of Investments | October 31, 2023 |
| | | Principal
Amount | | | Value
(Note 2) | |
| Series 2014-21, Class PB, 4.000%, 02/16/2044 | | $ | 150,000 | | | $ | 122,425 | |
| Series 2014-H03, Class FA, 1M US SOFR + 0.71%, 01/20/2064(a) | | | 9,100 | | | | 9,071 | |
| Series 2015-3, Class ZD, 4.000%, 01/20/2045 | | | 177,280 | | | | 149,847 | |
| Series 2015-31, Class B, 3.000%, 02/20/2045 | | | 100,000 | | | | 81,512 | |
| Series 2015-43, Class DM, 2.500%, 03/20/2045 | | | 80,526 | | | | 67,683 | |
| Series 2015-H10, Class JA, 2.250%, 04/20/2065 | | | 185,290 | | | | 178,609 | |
| Series 2015-H29, Class FL, 1M US SOFR + 0.71%, 11/20/2065(a) | | | 51,230 | | | | 50,774 | |
| Series 2016-167, Class AD, 2.500%, 03/20/2039 | | | 273,426 | | | | 246,897 | |
| Series 2016-H09, Class FA, 1M US SOFR + 0.76%, 03/20/2066(a) | | | 39,095 | | | | 38,965 | |
| Series 2017-31, Class BY, 3.500%, 02/20/2047 | | | 131,000 | | | | 85,929 | |
| Series 2017-H10, Class GZ, 4.519%, 04/20/2067(a) | | | 237,559 | | | | 218,244 | |
| Series 2017-H11, Class HZ, 4.517%, 04/20/2067(a) | | | 133,930 | | | | 122,304 | |
| Series 2017-H11, Class GZ, 4.596%, 04/20/2067(a) | | | 134,521 | | | | 122,841 | |
| Series 2017-H18, Class PZ, 2.000%, 04/20/2066 | | | 127,607 | | | | 98,697 | |
| Series 2018-H01, Class JZ, 4.614%, 01/20/2068(a) | | | 130,064 | | | | 125,681 | |
| Series 2018-H01, Class HZ, 4.621%, 01/20/2068(a) | | | 130,317 | | | | 118,728 | |
| Series 2018-H03, Class HZ, 4.546%, 01/20/2068(a) | | | 129,297 | | | | 114,388 | |
| Series 2018-H07, Class FE, 1M US SOFR + 0.46%, 02/20/2068(a) | | | 32,925 | | | | 32,762 | |
| Series 2018-H07, Class HZ, 4.609%, 04/20/2068(a) | | | 128,210 | | | | 115,695 | |
| Series 2018-H07, Class JZ, 4.673%, 04/20/2068(a) | | | 127,307 | | | | 123,958 | |
| Series 2019-103, Class HY, 3.000%, 08/20/2049 | | | 104,493 | | | | 59,870 | |
| Series 2019-31, Class JC, 3.500%, 03/20/2049 | | | 99,800 | | | | 86,146 | |
| Series 2020-134, Class XB, 1.000%, 07/20/2048 | | | 125,000 | | | | 62,698 | |
| Series 2020-153, Class GP, 0.500%, 10/20/2050 | | | 224,063 | | | | 192,594 | |
| Series 2020-160, Class QD, 1.000%, 10/20/2050 | | | 162,035 | | | | 68,360 | |
| | | Principal
Amount | | | Value
(Note 2) | |
| Series 2020-H09, Class NF, 1M US SOFR + 1.36%, 04/20/2070(a) | | $ | 52,627 | | | $ | 53,072 | |
| Series 2020-H11, Class JZ, 4.164%, 05/20/2069(a) | | | 165,194 | | | | 132,957 | |
| Series 2020-H12, Class JZ, 4.181%, 08/20/2069(a) | | | 114,561 | | | | 94,483 | |
| Series 2020-H17, Class KZ, 3.628%, 09/20/2070(a) | | | 438,547 | | | | 328,057 | |
| Series 2020-H18, Class EY, 3.724%, 09/20/2070(a) | | | 106,095 | | | | 77,870 | |
| Series 2021-146, Class EH, 2.000%, 08/20/2051 | | | 113,536 | | | | 57,734 | |
| Series 2021-159, Class AL, 1.000%, 09/20/2051 | | | 118,000 | | | | 40,465 | |
| Series 2021-215, Class TZ, 5.000%, 12/20/2051 | | | 134,087 | | | | 100,245 | |
| Series 2021-86, Class ML, 1.000%, 05/20/2051 | | | 136,000 | | | | 40,616 | |
| Series 2021-H02, Class KB, 3.030%, 01/20/2071(a) | | | 104,990 | | | | 72,550 | |
| Series 2021-H02, Class PB, 4.641%, 05/20/2070(a) | | | 101,628 | | | | 95,387 | |
| Series 2021-H03, Class NY, 3.263%, 01/20/2071(a) | | | 108,093 | | | | 75,186 | |
| | | | | | | | 4,924,161 | |
| TOTAL COLLATERALIZED MORTGAGE OBLIGATIONS | | | | | |
| (Cost $7,734,515) | | | | | | | 7,675,983 | |
| | | Principal
Amount | | | Value
(Note 2) | |
| COMMERCIAL MORTGAGE-BACKED SECURITIES (1.43%) |
| | | | | | | | | |
| Fannie Mae-Aces | | | | | | | | |
| Series 2019-M17, Class X, 0.318%, 09/25/2034(a)(c) | | | 23,112,317 | | | | 369,922 | |
| | | | | | | | | |
| Freddie Mac Multifamily Structured Pass Through Certificates | | | | | | | | |
| Series 2016-K056, Class X3, 2.116%, 06/25/2026(a)(c) | | | 591,680 | | | | 29,518 | |
| Series 2016-K059, Class X1, 0.300%, 09/25/2026(a)(c) | | | 6,130,015 | | | | 41,915 | |
| Series 2017-KW03, Class X1, 0.829%, 06/25/2027(a)(c) | | | 6,975,657 | | | | 137,995 | |
| Series 2019-K087, Class X1, 0.363%, 12/25/2028(a)(c) | | | 29,562,591 | | | | 466,023 | |
| Series 2019-K092, Class X1, 0.712%, 04/25/2029(a)(c) | | | 16,547,517 | | | | 521,032 | |
| Series 2019-K093, Class X1, 0.943%, 05/25/2029(a)(c) | | | 6,058,929 | | | | 249,755 | |
| Series 2019-K094, Class X1, 0.878%, 06/25/2029(a)(c) | | | 14,412,648 | | | | 568,637 | |
See Notes to Financial Statements.
ALPS | Smith Credit Opportunities Fund
| Statement of Investments | October 31, 2023 |
| | | Principal
Amount | | | Value
(Note 2) | |
| Series 2020-K121, Class X1, 1.022%, 10/25/2030(a)(c) | | $ | 2,467,279 | | | $ | 130,061 | |
| Series 2020-K738, Class X1, 1.510%, 01/25/2027(a)(c) | | | 12,501,257 | | | | 477,252 | |
| Series 2021-Q016, Class APT2, 1.480%, 05/25/2028(a) | | | 106,696 | | | | 92,393 | |
| | | | | | | | 2,714,581 | |
| | | | | | | | | |
| TOTAL COMMERCIAL MORTGAGE-BACKED SECURITIES | | | | | | | | |
| (Cost $3,063,063) | | | | | | | 3,084,503 | |
| | | Principal
Amount | | | Value
(Note 2) | |
| MORTGAGE-BACKED SECURITIES (1.75%) | | | | | | | | |
| | | | | | | | | |
| Fannie Mae Pool | | | | | | | | |
| Series 1998-, | | | | | | | | |
| 6.500%, 08/01/2028 | | | 21,710 | | | | 21,861 | |
| 7.500%, 08/01/2028 | | | 22,114 | | | | 22,044 | |
| 8.500%, 06/01/2027 | | | 6,028 | | | | 6,013 | |
| Series 1999-, 8.000%, 04/01/2029 | | | 20,571 | | | | 20,500 | |
| Series 2001-, 12.000%, 11/01/2030 | | | 54,194 | | | | 54,491 | |
| Series 2002-, 6.000%, 12/01/2032 | | | 36,381 | | | | 36,271 | |
| Series 2003-, | | | | | | | | |
| 4.500%, 09/01/2028 | | | 32,097 | | | | 31,582 | |
| 4.750%, 09/01/2033 | | | 39,769 | | | | 37,256 | |
| 5.500%, 10/01/2033 | | | 20,339 | | | | 19,778 | |
| 5.500%, 12/01/2033 | | | 35,108 | | | | 34,432 | |
| Series 2005-, | | | | | | | | |
| 4.500%, 05/01/2035 | | | 18,941 | | | | 16,879 | |
| 6.500%, 01/01/2036 | | | 27,542 | | | | 27,946 | |
| Series 2006-, | | | | | | | | |
| 4.500%, 01/01/2036 | | | 28,741 | | | | 28,016 | |
| 6.000%, 03/01/2036 | | | 36,457 | | | | 36,676 | |
| Series 2007-, | | | | | | | | |
| 5.500%, 07/01/2037 | | | 13,113 | | | | 13,033 | |
| 6.000%, 07/01/2037 | | | 32,770 | | | | 32,613 | |
| 6.000%, 09/01/2037 | | | 29,508 | | | | 29,639 | |
| 6.500%, 11/01/2037 | | | 43,920 | | | | 44,241 | |
| Series 2008-, | | | | | | | | |
| 5.000%, 06/01/2037 | | | 24,709 | | | | 22,659 | |
| 5.500%, 04/01/2038 | | | 20,873 | | | | 20,652 | |
| 5.500%, 08/01/2038 | | | 23,335 | | | | 22,010 | |
| 6.500%, 07/01/2038 | | | 45,021 | | | | 45,352 | |
| Series 2009-, 5.000%, 04/01/2039 | | | 41,324 | | | | 39,875 | |
| Series 2010-, | | | | | | | | |
| 4.000%, 05/01/2040 | | | 4,316 | | | | 3,997 | |
| 5.500%, 02/01/2038 | | | 42,449 | | | | 41,631 | |
| Series 2011-, 4.500%, 05/01/2041 | | | 51,627 | | | | 46,150 | |
| Series 2013-, 3.000%, 04/01/2043 | | | 92,021 | | | | 75,669 | |
| | | Principal
Amount | | | Value
(Note 2) | |
| Series 2015-, | | | | | | | | |
| 3.500%, 06/01/2045 | | $ | 52,520 | | | $ | 48,333 | |
| 5.000%, 07/01/2044 | | | 121,824 | | | | 115,916 | |
| Series 2016-, 3.500%, 06/01/2046 | | | 34,843 | | | | 28,918 | |
| Series 2018-, 3.734%, 02/01/2048(a) | | | 50,016 | | | | 40,152 | |
| Series 2022-, 5.730%, 11/01/2032 | | | 1,500,000 | | | | 1,434,580 | |
| | | | | | | | 2,499,165 | |
| Freddie Mac Gold Pool | | | | | | | | |
| Series 2004-, 5.500%, 01/01/2034 | | | 27,729 | | | | 27,404 | |
| Series 2005-, 5.500%, 05/01/2035 | | | 20,311 | | | | 19,934 | |
| Series 2006-, | | | | | | | | |
| 4.500%, 01/01/2036 | | | 11,234 | | | | 10,237 | |
| 5.500%, 12/01/2034 | | | 24,170 | | | | 23,759 | |
| 6.000%, 05/01/2036 | | | 53,156 | | | | 52,573 | |
| Series 2008-, | | | | | | | | |
| 4.500%, 05/01/2038 | | | 57,780 | | | | 56,390 | |
| 6.000%, 08/01/2038 | | | 28,860 | | | | 28,962 | |
| Series 2010-, 6.000%, 04/01/2040 | | | 23,287 | | | | 22,972 | |
| Series 2013-, 3.000%, 01/01/2033 | | | 52,249 | | | | 47,899 | |
| Series 2014-, 3.500%, 10/01/2044 | | | 38,002 | | | | 31,578 | |
| Series 2015-, 4.000%, 03/01/2044 | | | 30,742 | | | | 27,664 | |
| | | | | | | | 349,372 | |
| Freddie Mac Pool | | | | | | | | |
| Series 2018-, | | | | | | | | |
| 3.500%, 08/01/2042 | | | 46,953 | | | | 40,824 | |
| 4.500%, 01/01/2036 | | | 69,378 | | | | 63,844 | |
| | | | | | | | 104,668 | |
| Ginnie Mae I Pool | | | | | | | | |
| Series 2003-, 5.500%, 10/15/2033 | | | 49,928 | | | | 48,873 | |
| Series 2010-, 5.000%, 05/15/2040 | | | 40,184 | | | | 38,683 | |
| | | | | | | | 87,556 | |
| Ginnie Mae II Pool | | | | | | | | |
| Series 2009-, | | | | | | | | |
| 4.000%, 11/20/2039 | | | 41,089 | | | | 36,983 | |
| 6.000%, 11/20/2039 | | | 63,174 | | | | 64,449 | |
| Series 2011-, | | | | | | | | |
| 4.000%, 02/20/2041 | | | 32,311 | | | | 28,620 | |
| 4.000%, 05/20/2041 | | | 30,216 | | | | 26,764 | |
| 4.000%, 10/20/2041 | | | 13,855 | | | | 12,272 | |
| Series 2012-, | | | | | | | | |
| 3.500%, 01/20/2042 | | | 92,795 | | | | 79,776 | |
| 3.500%, 05/20/2042 | | | 93,551 | | | | 80,241 | |
| Series 2013-, | | | | | | | | |
| 3.500%, 03/20/2043 | | | 70,836 | | | | 60,506 | |
| 5.500%, 11/20/2035 | | | 87,716 | | | | 86,446 | |
See Notes to Financial Statements.
ALPS | Smith Credit Opportunities Fund
| Statement of Investments | October 31, 2023 |
| | | Principal
Amount | | | Value
(Note 2) | |
| Series 2014-, | | | | | | | | |
| 3.750%, 04/20/2044 | | $ | 76,429 | | | $ | 67,309 | |
| 4.000%, 05/20/2044 | | | 67,353 | | | | 60,042 | |
| Series 2016-, 3.500%, 09/20/2046 | | | 16,589 | | | | 13,982 | |
| Series 2021-, 4.000%, 05/20/2051 | | | 140,324 | | | | 121,654 | |
| | | | | | | | 739,044 | |
| | | | | | | | | |
| TOTAL MORTGAGE-BACKED SECURITIES | | | | | | | | |
| (Cost $4,144,752) | | | | | | | 3,779,805 | |
| | | Principal
Amount | | | Value
(Note 2) | |
| CORPORATE BONDS (82.45%) | | | | | | | | |
| | | | | | | | | |
| Advertising & Marketing (1.26%) | | | | | | | | |
| Outfront Media Capital LLC / Outfront Media Capital Corp. 5.00%, 08/15/2027(d) | | | 3,052,000 | | | | 2,713,655 | |
| | | | | | | | | |
| Aerospace & Defense (2.46%) | | | | | | | | |
| Boeing Co. | | | | | | | | |
| 3.95%, 08/01/2059 | | | 2,170,000 | | | | 1,338,018 | |
| 5.93%, 05/01/2060 | | | 550,000 | | | | 463,202 | |
| L3Harris Technologies, Inc. | | | | | | | | |
| 5.40%, 07/31/2033 | | | 441,000 | | | | 412,328 | |
| 5.60%, 07/31/2053 | | | 530,000 | | | | 468,854 | |
| Spirit AeroSystems, Inc. | | | | | | | | |
| 4.60%, 06/15/2028 | | | 675,000 | | | | 534,665 | |
| 7.50%, 04/15/2025(d) | | | 1,100,000 | | | | 1,098,518 | |
| TransDigm, Inc. 6.75%, 08/15/2028(d) | | | 1,000,000 | | | | 972,233 | |
| Total Aerospace & Defense | | | | | | | 5,287,818 | |
| | | | | | | | | |
| Airlines (2.67%) | | | | | | | | |
| Alaska Airlines 2020-1 Class A Pass Through Trust 4.80%, 08/15/2027(d) | | | 573,626 | | | | 547,266 | |
| Alaska Airlines 2020-1 Class B Pass Through Trust 8.00%, 08/15/2025(d) | | | 1,229,940 | | | | 1,229,048 | |
| British Airways 2020-1 Class A Pass Through Trust 4.25%, 11/15/2032(d) | | | 1,258,880 | | | | 1,128,838 | |
| United Airlines 2020-1 Class A Pass Through Trust Series 20-1 5.88%, 10/15/2027 | | | 2,426,188 | | | | 2,391,569 | |
| VistaJet Malta Finance PLC / Vista Management Holding, Inc. 9.50%, 06/01/2028(d) | | | 600,000 | | | | 460,354 | |
| Total Airlines | | | | | | | 5,757,075 | |
| | | | | | | | | |
| Apparel & Textile Products (0.30%) | | | | | | | | |
| Hanesbrands, Inc. 9.00%, 02/15/2031(d) | | | 697,000 | | | | 647,747 | |
| | | Principal
Amount | | | Value
(Note 2) | |
| Auto Parts Manufacturing (0.57%) | | | | | | | | |
| Adient Global Holdings, Ltd. | | | | | | | | |
| 7.00%, 04/15/2028(d) | | $ | 500,000 | | | $ | 492,698 | |
| 8.25%, 04/15/2031(d) | | | 750,000 | | | | 730,615 | |
| Total Auto Parts Manufacturing | | | | | | | 1,223,313 | |
| | | | | | | | | |
| Automobiles Manufacturing (3.57%) | | | | | | | | |
| Ford Motor Co. 5.29%, 12/08/2046 | | | 725,000 | | | | 526,715 | |
| Ford Motor Credit Co. LLC | | | | | | | | |
| 3.38%, 11/13/2025 | | | 1,000,000 | | | | 934,158 | |
| 3.66%, 09/08/2024 | | | 1,100,000 | | | | 1,071,882 | |
| 7.35%, 11/04/2027 | | | 1,500,000 | | | | 1,522,009 | |
| 7.35%, 03/06/2030 | | | 513,000 | | | | 515,797 | |
| General Motors Financial Co., Inc. SOFRINDX + 1.30%, 04/07/2025(a)(e) | | | 1,300,000 | | | | 1,302,101 | |
| Nissan Motor Acceptance Co. LLC | | | | | | | | |
| 1.05%, 03/08/2024(d) | | | 250,000 | | | | 245,286 | |
| 7.05%, 09/15/2028(d) | | | 1,600,000 | | | | 1,580,959 | |
| Total Automobiles Manufacturing | | | | | | | 7,698,907 | |
| | | | | | | | | |
| Banks (6.78%) | | | | | | | | |
| Citizens Bank NA | | | | | | | | |
| 1D US SOFR + 1.45%, 10/24/2025(a) | | | 1,050,000 | | | | 1,004,249 | |
| Danske Bank A/S | | | | | | | | |
| 1Y US TI + 1.35%, 09/11/2026(a)(d) | | | 3,400,000 | | | | 3,098,628 | |
| Discover Bank | | | | | | | | |
| 2.45%, 09/12/2024 | | | 971,000 | | | | 934,172 | |
| 5Y US S + 1.73%, 08/09/2028(a) | | | 1,150,000 | | | | 1,036,031 | |
| Fifth Third Bancorp | | | | | | | | |
| 1D US SOFR + 1.66%, 04/25/2033(a) | | | 1,150,000 | | | | 937,279 | |
| Huntington National Bank 5.65%, 01/10/2030 | | | 560,000 | | | | 513,289 | |
| Intesa Sanpaolo SpA | | | | | | | | |
| 1Y US TI + 4.40%, 11/21/2033(a)(d) | | | 1,000,000 | | | | 976,245 | |
| KeyBank NA/Cleveland OH | | | | | | | | |
| 5.00%, 01/26/2033 | | | 1,200,000 | | | | 966,568 | |
| M&T Bank Corp. | | | | | | | | |
| 1D US SOFR + 2.80%, 10/30/2029(a) | | | 500,000 | | | | 501,402 | |
| Swedbank AB 6.14%, 09/12/2026(d) | | | 740,000 | | | | 733,080 | |
| Synovus Bank/Columbus GA 5Y US TI + 3.63%, 10/29/2030(a) | | | 2,424,000 | | | | 1,971,162 | |
| Truist Financial Corp. 1D US SOFR + 2.361%, 06/08/2034(a) | | | 500,000 | | | | 455,057 | |
| UniCredit SpA 7.83%, 12/04/2023(d) | | | 1,500,000 | | | | 1,502,064 | |
| Total Banks | | | | | | | 14,629,226 | |
See Notes to Financial Statements.
ALPS | Smith Credit Opportunities Fund
| Statement of Investments | October 31, 2023 |
| | | Principal
Amount | | | Value
(Note 2) | |
| Cable & Satellite (2.28%) | | | | | | | | |
| CCO Holdings LLC / CCO Holdings Capital Corp. | | | | | | | | |
| 6.38%, 09/01/2029(d) | | $ | 1,600,000 | | | $ | 1,465,853 | |
| 7.38%, 03/01/2031(d) | | | 1,000,000 | | | | 945,646 | |
| Cox Communications, Inc. | | | | | | | | |
| 5.70%, 06/15/2033(d) | | | 1,000,000 | | | | 940,904 | |
| Sirius XM Radio, Inc. | | | | | | | | |
| 5.00%, 08/01/2027(d) | | | 1,700,000 | | | | 1,560,260 | |
| Total Cable & Satellite | | | | | | | 4,912,663 | |
| | | | | | | | | |
| Casinos & Gaming (3.02%) | | | | | | | | |
| Caesars Entertainment, Inc. | | | | | | | | |
| 7.00%, 02/15/2030(d) | | | 1,500,000 | | | | 1,449,027 | |
| Light & Wonder International, Inc. | | | | | | | | |
| 7.50%, 09/01/2031(d) | | | 500,000 | | | | 488,777 | |
| MGM Resorts International | | | | | | | | |
| 6.75%, 05/01/2025 | | | 1,233,000 | | | | 1,227,434 | |
| Penn Entertainment, Inc. | | | | | | | | |
| 5.63%, 01/15/2027(d) | | | 3,674,000 | | | | 3,354,608 | |
| Total Casinos & Gaming | | | | | | | 6,519,846 | |
| | | | | | | | | |
| Chemicals (1.27%) | | | | | | | | |
| Avient Corp. | | | | | | | | |
| 5.75%, 05/15/2025(d) | | | 1,525,000 | | | | 1,495,828 | |
| WR Grace Holdings LLC | | | | | | | | |
| 7.38%, 03/01/2031(d) | | | 1,350,000 | | | | 1,252,652 | |
| Total Chemicals | | | | | | | 2,748,480 | |
| | | | | | | | | |
| Consumer Finance (3.76%) | | | | | | | | |
| Ally Financial, Inc. | | | | | | | | |
| 6.70%, 02/14/2033 | | | 1,000,000 | | | | 840,997 | |
| 8.00%, 11/01/2031 | | | 1,250,000 | | | | 1,220,577 | |
| GTCR W-2 Merger Sub LLC | | | | | | | | |
| 7.50%, 01/15/2031(d) | | | 1,891,000 | | | | 1,868,781 | |
| OneMain Finance Corp. | | | | | | | | |
| 6.88%, 03/15/2025 | | | 1,650,000 | | | | 1,629,662 | |
| Synchrony Financial | | | | | | | | |
| 7.25%, 02/02/2033 | | | 3,000,000 | | | | 2,545,678 | |
| Total Consumer Finance | | | | | | | 8,105,695 | |
| | | | | | | | | |
| Consumer Services (0.94%) | | | | | | | | |
| WASH Multifamily Acquisition, Inc. | | | | | | | | |
| 5.75%, 04/15/2026(d) | | | 1,125,000 | | | | 1,041,649 | |
| Williams Scotsman, Inc. | | | | | | | | |
| 7.38%, 10/01/2031(d) | | | 1,000,000 | | | | 984,245 | |
| Total Consumer Services | | | | | | | 2,025,894 | |
| | | | | | | | | |
| Containers & Packaging (1.34%) | | | | | | | | |
| Canpack SA / Canpack US LLC | | | | | | | | |
| 3.88%, 11/15/2029(d) | | | 1,300,000 | | | | 1,022,216 | |
| Owens-Brockway Glass Container, Inc. | | | | | | | | |
| 6.63%, 05/13/2027(d) | | | 1,000,000 | | | | 951,070 | |
| 7.25%, 05/15/2031(d) | | | 1,000,000 | | | | 916,250 | |
| Total Containers & Packaging | | | | | | | 2,889,536 | |
| | | Principal
Amount | | | Value
(Note 2) | |
| Department Stores (1.86%) | | | | | | |
| NMG Holding Co. Inc / Neiman Marcus Group LLC | | | | | | | | |
| 7.13%, 04/01/2026(d) | | $ | 2,700,000 | | | $ | 2,528,061 | |
| Nordstrom, Inc. Series WI | | | | | | | | |
| 2.30%, 04/08/2024 | | | 1,500,000 | | | | 1,468,868 | |
| Total Department Stores | | | | | | | 3,996,929 | |
| | | | | | | | | |
| Diversified Banks (0.23%) | | | | | | | | |
| Bank of America Corp. 5Y US TI + 1.20%, 09/21/2036(a) | | | 690,000 | | | | 492,022 | |
| | | | | | | | | |
| Entertainment Content (0.99%) | | | | | | | | |
| Discovery Communications LLC 4.00%, 09/15/2055 | | | 833,000 | | | | 478,829 | |
| Warnermedia Holdings, Inc. 5.14%, 03/15/2052 | | | 2,345,000 | | | | 1,660,603 | |
| Total Entertainment Content | | | | | | | 2,139,432 | |
| | | | | | | | | |
| Entertainment Resources (1.11%) | | | | | | | | |
| Six Flags Entertainment Corp. 7.25%, 05/15/2031(d) | | | 2,600,000 | | | | 2,394,899 | |
| | | | | | | | | |
| Exploration & Production (4.13%) | | | | | | | | |
| Baytex Energy Corp. 8.50%, 04/30/2030(d) | | | 1,000,000 | | | | 991,382 | |
| Civitas Resources, Inc. 8.75%, 07/01/2031(d) | | | 1,600,000 | | | | 1,616,827 | |
| Hilcorp Energy I LP / Hilcorp Finance Co. | | | | | | | | |
| 5.75%, 02/01/2029(d) | | | 675,000 | | | | 608,425 | |
| 6.25%, 11/01/2028(d) | | | 1,506,000 | | | | 1,409,537 | |
| Occidental Petroleum Corp. 7.88%, 09/15/2031 | | | 1,800,000 | | | | 1,928,880 | |
| Ovintiv, Inc. 7.10%, 07/15/2053 | | | 1,000,000 | | | | 952,530 | |
| Range Resources Corp. 8.25%, 01/15/2029 | | | 1,400,000 | | | | 1,431,134 | |
| Total Exploration & Production | | | | | | | 8,938,715 | |
| | | | | | | | | |
| Financial Services (2.93%) | | | | | | | | |
| Charles Schwab Corp. | | | | | | | | |
| 1D US SOFR + 2.50%, 05/19/2034(a) | | | 1,580,000 | | | | 1,449,912 | |
| Compass Group Diversified Holdings LLC | | | | | | | | |
| 5.00%, 01/15/2032(d) | | | 1,300,000 | | | | 1,024,596 | |
| Morgan Stanley | | | | | | | | |
| 5Y US TI + 2.43%, 01/19/2038(a) | | | 1,050,000 | | | | 952,602 | |
See Notes to Financial Statements.
ALPS | Smith Credit Opportunities Fund
| Statement of Investments | October 31, 2023 |
| | | Principal
Amount | | | Value
(Note 2) | |
| UBS Group AG | | | | | | | | |
| 1D US SOFR + 3.92%, 08/12/2033(a)(d) | | $ | 1,005,000 | | | $ | 966,230 | |
| 1Y US TI + 2.00%, 09/22/2034(a)(d) | | | 550,000 | | | | 521,175 | |
| 1Y US TI + 2.20%, 01/12/2034(a)(d) | | | 1,500,000 | | | | 1,399,061 | |
| Total Financial Services | | | | | | | 6,313,576 | |
| | | | | | | | | |
| Food & Beverage (1.52%) | | | | | | | | |
| B&G Foods, Inc. | | | | | | | | |
| 8.00%, 09/15/2028(d) | | | 1,000,000 | | | | 975,742 | |
| JBS USA LUX SA / JBS USA Food Co. / JBS Luxembourg SARL | | | | | | | | |
| 6.75%, 03/15/2034(d) | | | 262,000 | | | | 245,698 | |
| 7.25%, 11/15/2053(d) | | | 780,000 | | | | 697,327 | |
| Pilgrim's Pride Corp. | | | | | | | | |
| 6.25%, 07/01/2033 | | | 1,050,000 | | | | 966,259 | |
| 6.88%, 05/15/2034 | | | 436,000 | | | | 413,087 | |
| Total Food & Beverage | | | | | | | 3,298,113 | |
| | | | | | | | | |
| Health Care Facilities & Services (0.95%) | | | | | | | | |
| Fortrea Holdings, Inc. | | | | | | | | |
| 7.50%, 07/01/2030(d) | | | 1,100,000 | | | | 1,062,875 | |
| Star Parent, Inc. | | | | | | | | |
| 9.00%, 10/01/2030(d) | | | 1,000,000 | | | | 993,634 | |
| Total Health Care Facilities & Services | | | | | | | 2,056,509 | |
| | | | | | | | | |
| Homebuilders (1.25%) | | | | | | | | |
| Forestar Group, Inc. | | | | | | | | |
| 3.85%, 05/15/2026(d) | | | 1,850,000 | | | | 1,648,631 | |
| Shea Homes LP | | | | | | | | |
| 4.75%, 02/15/2028 | | | 1,200,000 | | | | 1,056,188 | |
| Total Homebuilders | | | | | | | 2,704,819 | |
| | | | | | | | | |
| Industrial Other (1.01%) | | | | | | | | |
| Brand Industrial Services, Inc. | | | | | | | | |
| 10.38%, 08/01/2030(d) | | | 1,000,000 | | | | 993,750 | |
| Element Fleet Management Corp. | | | | | | | | |
| 6.27%, 06/26/2026(d) | | | 1,200,000 | | | | 1,193,697 | |
| Total Industrial Other | | | | | | | 2,187,447 | |
| | | | | | | | | |
| Machinery Manufacturing (0.44%) | | | | | | | | |
| GrafTech Global Enterprises, Inc. | | | | | | | | |
| 9.88%, 12/15/2028(d) | | | 1,050,000 | | | | 941,575 | |
| | | | | | | | | |
| Manufactured Goods (0.95%) | | | | | | | | |
| Chart Industries, Inc. | | | | | | | | |
| 9.50%, 01/01/2031(d) | | | 2,000,000 | | | | 2,062,350 | |
| | | | | | | | | |
| Oil & Gas Services & Equipment (2.14%) | | | | | | | | |
| Diamond Foreign Asset Co. / Diamond Finance LLC | | | | | | | | |
| 8.50%, 10/01/2030(d) | | | 1,000,000 | | | | 975,629 | |
| Noble Finance II LLC | | | | | | | | |
| 8.00%, 04/15/2030(d) | | | 250,000 | | | | 250,111 | |
| Seadrill Finance, Ltd. | | | | | | | | |
| 8.38%, 08/01/2030(d) | | | 2,000,000 | | | | 2,002,820 | |
| | | Principal
Amount | | | Value
(Note 2) | |
| Transocean Titan Financing, Ltd. | | | | | | | | |
| 8.38%, 02/01/2028(d) | | $ | 1,350,000 | | | $ | 1,356,804 | |
| Total Oil & Gas Services & Equipment | | | | | | | 4,585,364 | |
| | | | | | | | | |
| Pharmaceuticals (0.71%) | | | | | | | | |
| Organon & Co. / Organon Foreign Debt Co-Issuer BV | | | | | | | | |
| 5.13%, 04/30/2031(d) | | | 1,950,000 | | | | 1,524,787 | |
| | | | | | | | | |
| Pipeline (7.37%) | | | | | | | | |
| Buckeye Partners LP | | | | | | | | |
| 4.35%, 10/15/2024 | | | 232,000 | | | | 222,933 | |
| 4.50%, 03/01/2028(d) | | | 1,698,000 | | | | 1,479,128 | |
| Flex Intermediate Holdco LLC | | | | | | | | |
| 3.36%, 06/30/2031(d) | | | 2,321,000 | | | | 1,752,963 | |
| 4.32%, 12/30/2039(d) | | | 1,733,000 | | | | 1,140,127 | |
| Genesis Energy LP / Genesis Energy Finance Corp. | | | | | | | | |
| 8.00%, 01/15/2027 | | | 3,285,000 | | | | 3,157,417 | |
| Midwest Connector Capital Co. LLC | | | | | | | | |
| 3.90%, 04/01/2024(d) | | | 3,675,000 | | | | 3,630,200 | |
| 4.63%, 04/01/2029(d) | | | 1,734,000 | | | | 1,561,873 | |
| Targa Resources Partners LP / Targa Resources Partners Finance Corp. | | | | | | | | |
| 6.88%, 01/15/2029 | | | 2,957,000 | | | | 2,945,393 | |
| Total Pipeline | | | | | | | 15,890,034 | |
| | | | | | | | | |
| Power Generation (2.44%) | | | | | | | | |
| Alexander Funding Trust | | | | | | | | |
| 1.84%, 11/15/2023(d) | | | 1,624,000 | | | | 1,620,798 | |
| Alexander Funding Trust II | | | | | | | | |
| 7.47%, 07/31/2028(d) | | | 437,000 | | | | 434,096 | |
| Vistra Operations Co. LLC | | | | | | | | |
| 5.50%, 09/01/2026(d) | | | 1,325,000 | | | | 1,261,814 | |
| 7.75%, 10/15/2031(d) | | | 2,000,000 | | | | 1,932,850 | |
| Total Power Generation | | | | | | | 5,249,558 | |
| | | | | | | | | |
| Publishing & Broadcasting (3.41%) | | | | | | | | |
| Gray Escrow II, Inc. | | | | | | | | |
| 5.38%, 11/15/2031(d) | | | 4,200,000 | | | | 2,650,668 | |
| Gray Television, Inc. | | | | | | | | |
| 7.00%, 05/15/2027(d) | | | 850,000 | | | | 721,616 | |
| Nexstar Media, Inc. | | | | | | | | |
| 5.63%, 07/15/2027(d) | | | 2,000,000 | | | | 1,801,401 | |
| Scripps Escrow, Inc. | | | | | | | | |
| 5.88%, 07/15/2027(d) | | | 2,900,000 | | | | 2,170,389 | |
| Total Publishing & Broadcasting | | | | | | | 7,344,074 | |
| | | | | | | | | |
| Real Estate (4.18%) | | | | | | | | |
| Cushman & Wakefield US Borrower LLC | | | | | | | | |
| 6.75%, 05/15/2028(d) | | | 2,975,000 | | | | 2,715,908 | |
| 8.88%, 09/01/2031(d) | | | 250,000 | | | | 237,261 | |
| Howard Hughes Corp. | | | | | | | | |
| 5.38%, 08/01/2028(d) | | | 1,150,000 | | | | 1,012,207 | |
| Kennedy-Wilson, Inc. | | | | | | | | |
| 4.75%, 02/01/2030 | | | 3,334,000 | | | | 2,437,354 | |
See Notes to Financial Statements.
ALPS | Smith Credit Opportunities Fund
| Statement of Investments | October 31, 2023 |
| | | Principal
Amount | | | Value
(Note 2) | |
| VICI Properties LP / VICI Note Co., Inc. | | | | | | | | |
| 4.63%, 06/15/2025(d) | | $ | 656,000 | | | $ | 630,708 | |
| 5.63%, 05/01/2024(d) | | | 2,000,000 | | | | 1,988,198 | |
| Total Real Estate | | | | | | | 9,021,636 | |
| | | | | | | | | |
| Restaurants (0.97%) | | | | | | | | |
| Brinker International, Inc. | | | | | | | | |
| 8.25%, 07/15/2030(d) | | | 2,150,000 | | | | 2,081,070 | |
| | | | | | | | | |
| Retail - Consumer Discretionary (0.76%) | | | | | | | | |
| Victoria's Secret & Co. | | | | | | | | |
| 4.63%, 07/15/2029(d) | | | 2,225,000 | | | | 1,638,304 | |
| | | | | | | | | |
| Retail - Consumer Staples (0.49%) | | | | | | | | |
| US Foods, Inc. | | | | | | | | |
| 4.75%, 02/15/2029(d) | | | 1,200,000 | | | | 1,059,723 | |
| | | | | | | | | |
| Semiconductors (0.24%) | | | | | | | | |
| Broadcom, Inc. | | | | | | | | |
| 3.47%, 04/15/2034(d) | | | 665,000 | | | | 506,902 | |
| | | | | | | | | |
| Software & Services (4.05%) | | | | | | | | |
| Cloud Software Group, Inc. | | | | | | | | |
| 6.50%, 03/31/2029(d) | | | 4,000,000 | | | | 3,515,631 | |
| Concentrix Corp. | | | | | | | | |
| 6.60%, 08/02/2028 | | | 555,000 | | | | 533,093 | |
| 6.85%, 08/02/2033 | | | 575,000 | | | | 519,681 | |
| CoStar Group, Inc. | | | | | | | | |
| 2.80%, 07/15/2030(d) | | | 2,446,000 | | | | 1,900,545 | |
| Neptune Bidco US, Inc. | | | | | | | | |
| 9.29%, 04/15/2029(d) | | | 1,500,000 | | | | 1,325,233 | |
| RingCentral, Inc. | | | | | | | | |
| 8.50%, 08/15/2030(d) | | | 1,000,000 | | | | 951,130 | |
| Total Software & Services | | | | | | | 8,745,313 | |
| | | | | | | | | |
| Supermarkets & Pharmacies (0.71%) | | | | | | | | |
| Albertsons Cos. Inc / Safeway, Inc. / New Albertsons LP / Albertsons LLC | | | | | | | | |
| 6.50%, 02/15/2028(d) | | | 1,541,000 | | | | 1,514,576 | |
| | | | | | | | | |
| Travel & Lodging (2.12%) | | | | | | | | |
| Carnival Corp. | | | | | | | | |
| 6.00%, 05/01/2029(d) | | | 1,200,000 | | | | 1,014,740 | |
| 7.00%, 08/15/2029(d) | | | 500,000 | | | | 490,735 | |
| NCL Corp., Ltd. | | | | | | | | |
| 8.13%, 01/15/2029(d) | | | 1,000,000 | | | | 978,064 | |
| Royal Caribbean Cruises, Ltd. | | | | | | | | |
| 5.50%, 04/01/2028(d) | | | 1,200,000 | | | | 1,095,290 | |
| Viking Cruises, Ltd. | | | | | | | | |
| 9.13%, 07/15/2031(d) | | | 1,000,000 | | | | 983,400 | |
| Total Travel & Lodging | | | | | | | 4,562,229 | |
| | | Principal
Amount | | | Value
(Note 2) | |
| Utilities (4.12%) | | | | | | |
| AmeriGas Partners LP / AmeriGas Finance Corp. | | | | | | | | |
| 9.38%, 06/01/2028(d) | | $ | 1,000,000 | | | $ | 989,173 | |
| National Rural Utilities Cooperative Finance Corp. | | | | | | | | |
| 3M US SOFR + 3.17%, 04/30/2043(a) | | | 1,387,000 | | | | 1,359,842 | |
| Pacific Gas and Electric Co. | | | | | | | | |
| 3.25%, 02/16/2024 | | | 2,000,000 | | | | 1,982,629 | |
| Sempra | | | | | | | | |
| 5Y US TI + 2.868%, 04/01/2052(a) | | | 2,725,000 | | | | 2,102,301 | |
| Suburban Propane Partners LP/Suburban Energy Finance Corp. | | | | | | | | |
| 5.00%, 06/01/2031(d) | | | 1,750,000 | | | | 1,451,360 | |
| Talen Energy | | | | | | | | |
| 8.63%, 06/01/2030(d) | | | 1,000,000 | | | | 1,017,109 | |
| Total Utilities | | | | | | | 8,902,414 | |
| | | | | | | | | |
| Waste & Environment Services & Equipment (1.06%) | | | | | | | | |
| GFL Environmental, Inc. | | | | | | | | |
| 5.13%, 12/15/2026(d) | | | 2,399,000 | | | | 2,279,049 | |
| | | | | | | | | |
| Wireless Telecommunications Services (0.09%) | | | | | | | | |
| AT&T, Inc. | | | | | | | | |
| 5.35%, 11/01/2066 | | | 9,345 | | | | 195,778 | |
| | | | | | | | | |
| TOTAL CORPORATE BONDS | | | | | | | | |
| (Cost $189,888,943) | | | | | | | 177,787,052 | |
| | | Principal
Amount | | | Value
(Note 2) | |
| GOVERNMENT BONDS (5.28%) | | | | | | | | |
| | | | | | | | | |
| U.S. Treasury Bonds (5.28%) | | | | | | | | |
| United States Treasury Bonds | | | | | | | | |
| 3.88%, 05/15/2043 | | | 3,150,000 | | | | 2,616,715 | |
| 4.13%, 08/15/2053 | | | 10,252,000 | | | | 8,771,867 | |
| Total U.S. Treasury Bonds | | | | | | | 11,388,582 | |
| | | | | | | | | |
| TOTAL GOVERNMENT BONDS | | | | | | | | |
| (Cost $12,087,243) | | | | | | | 11,388,582 | |
| | | Shares | | | Value
(Note 2) | |
| PREFERRED STOCK (3.54%) | | | | | | | | |
| | | | | | | | | |
| Financials (3.54%) | | | | | | | | |
| Banks (2.33%) PNC Financial Services Group, Inc., Series O, 3M US SOFR + 3.939%(a)(f) | | | 3,802,000 | | | | 3,801,999 | |
See Notes to Financial Statements.
ALPS | Smith Credit Opportunities Fund
| Statement of Investments | October 31, 2023 |
| | | Shares | | | Value
(Note 2) | |
| Truist Financial Corp., Series N, 4.800%(f) | | | 1,500,000 | | | $ | 1,233,019 | |
| | | | | | | | 5,035,018 | |
| | | | | | | | | |
| Consumer Finance (0.98%) | | | | | | | | |
| American Express Co., 3.550%(f) | | | 1,500,000 | | | | 1,181,250 | |
| Discover Financial Services, Series D, 6.125%(f) | | | 1,000,000 | | | | 925,914 | |
| | | | | | | | 2,107,164 | |
| Life Insurance (0.23%) | | | | | | | | |
| Jackson Financial, Inc., 8.000%(f) | | | 20,400 | | | | 499,596 | |
| | | | | | | | | |
| Total Financials | | | | | | | 7,641,778 | |
| | | | | | | | | |
| TOTAL PREFERRED STOCK | | | | | | | | |
| (Cost $7,930,219) | | | | | | | 7,641,778 | |
| | | 7-Day
Yield | | | Shares | | | Value
(Note 2) | |
| SHORT TERM INVESTMENTS (0.47%) | | | | | | | | | | | | |
| | | | | | | | | | | | | |
| Money Market Fund (0.47%) | | | | | | | | | | | | |
| Morgan Stanley Institutional Liquidity Funds - Government Portfolio | | | 5.25 | % | | | 1,010,279 | | | | 1,010,279 | |
| | | | | | | | | | | | | |
| TOTAL SHORT TERM INVESTMENTS | | | | | | | | | | | | |
| (Cost $1,010,279) | | | | | | | | | | | 1,010,279 | |
| | | | | | | | | | | | | |
| TOTAL INVESTMENTS (98.75%) | | | | | | | | | | | | |
| (Cost $226,449,451) | | | | | | | | | | $ | 212,958,950 | |
| | | | | | | | | | | | | |
| Other Assets In Excess Of Liabilities (1.25%) | | | | | | | | | | | 2,687,292 | |
| | | | | | | | | | | | | |
| NET ASSETS (100.00%) | | | | | | | | | | $ | 215,646,242 | |
Investment Abbreviations:
SOFR - Secured Overnight Financing Rate
SOFRINDX - Secured Overnight Financing Rate Index
TI – Treasury Index
Reference Rates:
30D US SOFR - 30 Day SOFR as of October 31, 2023 was 5.32%
1D US SOFR - 1 Day SOFR as of October 31, 2023 was 5.35%
1M US SOFR- 1 Month SOFR as of October 31, 2023 was 5.32%
3M US SOFR - 3 Month SOFR as of October 31, 2023 was 5.38%
1Y US TI - 1 Year US TI as of October 31, 2023 was 5.44%
5Y US TI - 5 Year US TI as of October 31, 2023 was 4.82%
| (a) | Floating or variable rate security. The reference rate is described above. The rate in effect as of October 31, 2023 is based on the reference rate plus the displayed spread as of the security's last reset date. |
| (b) | Issued with zero coupon. |
| (c) | Interest only security. |
| (d) | Security exempt from registration under Rule 144A of the Securities Act of 1933. This security may be resold in transactions exempt from registration, normally to qualified institutional buyers. As of October 31, 2023, the aggregate market value of those securities was $121,814,860, representing 56.49% of net assets. |
| (e) | The SOFRINDX is a compounded average of the daily Secured Overnight Financing Rate determined by reference to the SOFR Index for any interest period. |
| (f) | Perpetual maturity. This security has no contractual maturity date, is not redeemable and contractually pays an indefinite stream of interest. |
See Notes to Financial Statements.
ALPS | Smith Balanced Opportunity Fund
| Statement of Investments | October 31, 2023 |
| | | Shares | | | Value
(Note 2) | |
| COMMON STOCKS (61.21%) | | | | | | | | |
| | | | | | | | | |
| Communications (5.34%) | | | | | | | | |
| Media (4.76%) | | | | | | | | |
| Alphabet, Inc., Class A(a) | | | 3,170 | | | $ | 393,334 | |
| Meta Platforms, Inc., Class A(a) | | | 1,267 | | | | 381,709 | |
| Walt Disney Co.(a) | | | 2,259 | | | | 184,312 | |
| | | | | | | | 959,355 | |
| Telecommunications (0.58%) | | | | | | | | |
| AT&T, Inc. | | | 7,530 | | | | 115,962 | |
| | | | | | | | | |
| Total Communications | | | | | | | 1,075,317 | |
| | | | | | | | | |
| Consumer Discretionary (6.51%) | | | | | | | | |
| Consumer Discretionary Products (0.79%) | | | | | | | | |
| NIKE, Inc., Class B | | | 1,545 | | | | 158,780 | |
| | | | | | | | | |
| Consumer Discretionary Services (2.28%) | | | | | | | | |
| Marriott International, Inc., Class A | | | 1,159 | | | | 218,541 | |
| McDonald's Corp. | | | 917 | | | | 240,410 | |
| | | | | | | | 458,951 | |
| Retail & Whsle - Discretionary (3.44%) | | | | | | | | |
| Amazon.com, Inc.(a) | | | 2,370 | | | | 315,423 | |
| Lowe's Cos., Inc. | | | 1,206 | | | | 229,828 | |
| O'Reilly Automotive, Inc.(a) | | | 160 | | | | 148,870 | |
| | | | | | | | 694,121 | |
| | | | | | | | | |
| Total Consumer Discretionary | | | | | | | 1,311,852 | |
| | | | | | | | | |
| Consumer Staples (3.88%) | | | | | | | | |
| Consumer Staple Products (0.74%) | | | | | | | | |
| Campbell Soup Co. | | | 2,455 | | | | 99,207 | |
| Estee Lauder Cos., Inc., Class A | | | 392 | | | | 50,517 | |
| | | | | | | | 149,724 | |
| Retail & Wholesale - Staples (3.14%) | | | | | | | | |
| Costco Wholesale Corp. | | | 489 | | | | 270,143 | |
| Target Corp. | | | 671 | | | | 74,340 | |
| Walmart, Inc. | | | 1,765 | | | | 288,419 | |
| | | | | | | | 632,902 | |
| | | | | | | | | |
| Total Consumer Staples | | | | | | | 782,626 | |
| | | | | | | | | |
| Energy (5.27%) | | | | | | | | |
| Oil & Gas (5.27%) | | | | | | | | |
| Baker Hughes Co. | | | 4,960 | | | | 170,723 | |
| BP PLC, Sponsored ADR | | | 5,620 | | | | 205,579 | |
| ConocoPhillips | | | 3,825 | | | | 454,410 | |
| Enbridge, Inc. | | | 7,207 | | | | 230,912 | |
| | | | | | | | 1,061,624 | |
| | | Shares | | | Value
(Note 2) | |
| Total Energy | | | | | | | 1,061,624 | |
| | | | | | | | | |
| Financials (5.78%) | | | | | | | | |
| Banking (3.20%) | | | | | | | | |
| JPMorgan Chase & Co. | | | 3,010 | | | $ | 418,570 | |
| Wells Fargo & Co. | | | 5,715 | | | | 227,286 | |
| | | | | | | | 645,856 | |
| Financial Services (2.58%) | | | | | | | | |
| American Express Co. | | | 1,280 | | | | 186,918 | |
| Intercontinental Exchange, Inc. | | | 2,098 | | | | 225,409 | |
| LPL Financial Holdings, Inc. | | | 479 | | | | 107,545 | |
| | | | | | | | 519,872 | |
| | | | | | | | | |
| Total Financials | | | | | | | 1,165,728 | |
| | | | | | | | | |
| Health Care (7.81%) | | | | | | | | |
| Health Care (7.81%) | | | | | | | | |
| Boston Scientific Corp.(a) | | | 3,760 | | | | 192,474 | |
| Bristol-Myers Squibb Co. | | | 2,002 | | | | 103,163 | |
| HCA Healthcare, Inc. | | | 745 | | | | 168,474 | |
| IQVIA Holdings, Inc.(a) | | | 865 | | | | 156,418 | |
| Pfizer, Inc. | | | 3,175 | | | | 97,028 | |
| Thermo Fisher Scientific, Inc. | | | 477 | | | | 212,156 | |
| UnitedHealth Group, Inc. | | | 769 | | | | 411,846 | |
| Vertex Pharmaceuticals, Inc.(a) | | | 637 | | | | 230,664 | |
| | | | | | | | 1,572,223 | |
| | | | | | | | | |
| Total Health Care | | | | | | | 1,572,223 | |
| | | | | | | | | |
| Industrials (7.65%) | | | | | | | | |
| Industrial Products (5.81%) | | | | | | | | |
| Caterpillar, Inc. | | | 919 | | | | 207,740 | |
| Deere & Co. | | | 590 | | | | 215,562 | |
| Lockheed Martin Corp. | | | 563 | | | | 255,962 | |
| Schneider Electric SE, ADR | | | 6,425 | | | | 196,798 | |
| TE Connectivity, Ltd. | | | 1,325 | | | | 156,151 | |
| Trane Technologies PLC | | | 735 | | | | 139,878 | |
| | | | | | | | 1,172,091 | |
| Industrial Services (1.84%) | | | | | | | | |
| Old Dominion Freight Line, Inc. | | | 429 | | | | 161,587 | |
| Waste Management, Inc. | | | 1,270 | | | | 208,699 | |
| | | | | | | | 370,286 | |
| | | | | | | | | |
| Total Industrials | | | | | | | 1,542,377 | |
| | | | | | | | | |
| Materials (2.13%) | | | | | | | | |
| Materials (2.13%) | | | | | | | | |
| Anglo American PLC, ADR | | | 6,170 | | | | 78,236 | |
| Freeport-McMoRan, Inc. | | | 2,880 | | | | 97,286 | |
| Linde PLC | | | 460 | | | | 175,794 | |
See Notes to Financial Statements.
ALPS | Smith Balanced Opportunity Fund
| Statement of Investments | October 31, 2023 |
| | | Shares | | | Value
(Note 2) | |
| Norsk Hydro ASA, ADR | | | 13,815 | | | $ | 78,193 | |
| | | | | | | | 429,509 | |
| | | | | | | | | |
| Total Materials | | | | | | | 429,509 | |
| | | | | | | | | |
| Real Estate (1.34%) | | | | | | | | |
| Real Estate (1.34%) | | | | | | | | |
| Equity LifeStyle Properties, Inc. | | | 2,556 | | | | 168,185 | |
| Prologis, Inc. | | | 1,015 | | | | 102,261 | |
| | | | | | | | 270,446 | |
| | | | | | | | | |
| Total Real Estate | | | | | | | 270,446 | |
| | | | | | | | | |
| Technology (15.50%) | | | | | | | | |
| Software & Tech Services (8.23%) | | | | | | | | |
| Adobe, Inc.(a) | | | 455 | | | | 242,087 | |
| DocuSign, Inc.(a) | | | 1,765 | | | | 68,623 | |
| International Business Machines Corp. | | | 910 | | | | 131,622 | |
| Mastercard, Inc., Class A | | | 671 | | | | 252,532 | |
| Microsoft Corp. | | | 1,879 | | | | 635,309 | |
| Nice, Ltd., ADR | | | 425 | | | | 65,599 | |
| Synopsys, Inc.(a) | | | 558 | | | | 261,948 | |
| | | | | | | | 1,657,720 | |
| Tech Hardware & Semiconductors (7.27%) | | | | | | | | |
| Apple, Inc. | | | 2,442 | | | | 417,020 | |
| Lam Research Corp. | | | 207 | | | | 121,762 | |
| Motorola Solutions, Inc. | | | 600 | | | | 167,076 | |
| NVIDIA Corp. | | | 885 | | | | 360,903 | |
| Taiwan Semiconductor Manufacturing Co., Ltd., ADR | | | 2,291 | | | | 197,736 | |
| Texas Instruments, Inc. | | | 1,413 | | | | 200,660 | |
| | | | | | | | 1,465,157 | |
| | | | | | | | | |
| Total Technology | | | | | | | 3,122,877 | |
| | | | | | | | | |
| TOTAL COMMON STOCKS | | | | | | | | |
| (Cost $10,348,012) | | | | | | | 12,334,579 | |
| | | Principal
Amount | | | Value
(Note 2) | |
| COLLATERALIZED MORTGAGE OBLIGATIONS (4.80%) | | | | | | | | |
| | | | | | | | | |
| Fannie Mae | | | | | | | | |
| Series 1997-10, Class FA, 30D US SOFR + 0.71%, 03/18/2027(b) | | $ | 3,529 | | | $ | 3,524 | |
| Series 1997-42, Class PK, 4.500%, 07/18/2027 | | | 5,141 | | | | 4,972 | |
| Series 2002-21, Class FD, 30D US SOFR + 1.01%, 04/25/2032(b) | | | 5,728 | | | | 5,750 | |
| | | Principal
Amount | | | Value
(Note 2) | |
| Series 2002-22, Class GC, 6.500%, 04/25/2032 | | $ | 6,366 | | | $ | 6,393 | |
| Series 2002-58, Class PG, 6.000%, 09/25/2032 | | | 15,455 | | | | 15,335 | |
| Series 2002-58, Class FG, 30D US SOFR + 1.11%, 08/25/2032(b) | | | 5,793 | | | | 5,851 | |
| Series 2003-117, Class KB, 6.000%, 12/25/2033 | | | 13,394 | | | | 13,304 | |
| Series 2003-87, Class SL, 8.98% - 30D US SOFR, 07/25/2033(b) | | | 31,344 | | | | 29,229 | |
| Series 2004-60, Class JC, 5.500%, 04/25/2034 | | | 15,234 | | | | 15,040 | |
| Series 2005-27, Class GH, 5.500%, 04/25/2035 | | | 90,000 | | | | 88,100 | |
| Series 2007-104, Class ZE, 6.000%, 08/25/2037 | | | 14,743 | | | | 14,308 | |
| Series 2007-22, Class A, 5.500%, 03/25/2037 | | | 7,232 | | | | 7,152 | |
| Series 2007-55, Class PH, 6.000%, 06/25/2047 | | | 17,876 | | | | 17,797 | |
| Series 2007-76, Class ZG, 6.000%, 08/25/2037 | | | 132,739 | | | | 127,490 | |
| Series 2008-1, Class LF, 30D US SOFR + 0.81%, 05/25/2037(b) | | | 15,706 | | | | 15,530 | |
| Series 2008-22, Class DB, 5.000%, 04/25/2048 | | | 13,458 | | | | 12,525 | |
| Series 2009-12, Class LC, 8.167%, 06/25/2037(b) | | | 12,840 | | | | 13,266 | |
| Series 2009-51, Class BZ, 4.500%, 07/25/2039 | | | 19,502 | | | | 18,180 | |
| Series 2010-61, Class WA, 5.993%, 06/25/2040(b) | | | 13,894 | | | | 13,854 | |
| Series 2010-98, Class BH, 5.500%, 09/25/2040 | | | 15,204 | | | | 14,838 | |
| Series 2012-153, Class B, 7.000%, 07/25/2042 | | | 6,483 | | | | 6,598 | |
| Series 2012-64, Class NA, 3.000%, 08/25/2041 | | | 1,356 | | | | 1,327 | |
| Series 2013-18, Class MY, 3.000%, 03/25/2033 | | | 15,000 | | | | 12,706 | |
| Series 2013-61, Class NY, 3.000%, 06/25/2033 | | | 35,000 | | | | 29,344 | |
| Series 2014-21, Class MA, 2.000%, 09/25/2041 | | | 9,767 | | | | 8,930 | |
| | | | | | | | 501,343 | |
| | | | | | | | | |
| Freddie Mac | | | | | | | | |
| Series 1996-1843, Class Z, 7.000%, 04/15/2026 | | | 356 | | | | 355 | |
| Series 1999-2123, Class L, 6.500%, 01/15/2029 | | | 16,144 | | | | 16,130 | |
| Series 2002-2538, Class FB, 30D US SOFR + 0.51%, 12/15/2032(b) | | | 2,553 | | | | 2,546 | |
See Notes to Financial Statements.
ALPS | Smith Balanced Opportunity Fund
| Statement of Investments | October 31, 2023 |
| | | Principal
Amount | | | Value
(Note 2) | |
| Series 2003-2696, Class DG, 5.500%, 10/15/2033 | | $ | 9,552 | | | $ | 9,363 | |
| Series 2005-2977, Class AT, 4.500%, 05/15/2025 | | | 2,600 | | | | 2,563 | |
| Series 2005-2990, Class LB, 16.65% - 30D US SOFR, 06/15/2034(b) | | | 285 | | | | 284 | |
| Series 2005-2993, Class TF, 30D US SOFR + 0.46%, 06/15/2025(b) | | | 2,425 | | | | 2,425 | |
| Series 2006-3174, Class LF, 30D US SOFR + 0.46%, 05/15/2036(b) | | | 6,169 | | | | 6,081 | |
| Series 2006-3239, Class EF, 30D US SOFR + 0.46%, 11/15/2036(b) | | | 8,000 | | | | 7,777 | |
| Series 2007-3298, Class Z, 6.000%, 04/15/2037 | | | 23,110 | | | | 22,673 | |
| Series 2008-3409, Class DB, 6.000%, 01/15/2038 | | | 15,292 | | | | 15,238 | |
| Series 2009-3572, Class KT, 4.500%, 09/15/2039 | | | 14,027 | | | | 13,395 | |
| Series 2010-3645, Class WD, 4.500%, 02/15/2040 | | | 26,000 | | | | 24,034 | |
| Series 2010-3699, Class LC, 4.000%, 03/15/2040 | | | 9,817 | | | | 9,384 | |
| Series 2010-3721, Class FB, 30D US SOFR + 0.61%, 09/15/2040(b) | | | 9,770 | | | | 9,489 | |
| Series 2010-3759, Class PY, 4.000%, 11/15/2040 | | | 25,000 | | | | 22,814 | |
| Series 2010-3770, Class JZ, 4.000%, 12/15/2040 | | | 23,435 | | | | 21,268 | |
| Series 2011-3954, Class PG, 2.500%, 07/15/2041 | | | 19,810 | | | | 17,796 | |
| Series 2012-3987, Class LP, 3.500%, 01/15/2042 | | | 26,000 | | | | 22,059 | |
| Series 2012-4032, Class AD, 2.000%, 10/15/2041 | | | 8,653 | | | | 8,030 | |
| Series 2012-4043, Class PB, 1.500%, 05/15/2027 | | | 8,281 | | | | 7,797 | |
| Series 2013-4226, Class GZ, 3.000%, 07/15/2043 | | | 12,362 | | | | 10,504 | |
| Series 2015-4498, Class JA, 2.500%, 04/15/2037 | | | 27,667 | | | | 23,853 | |
| | | | | | | | 275,858 | |
| | | | | | | | | |
| Ginnie Mae | | | | | | | | |
| Series 2003-52, Class AP, –%, 06/16/2033(c) | | | 10,553 | | | | 9,563 | |
| Series 2004-86, Class C, 5.500%, 10/20/2034 | | | 14,288 | | | | 14,146 | |
| Series 2005-91, Class PD, 5.500%, 12/20/2035 | | | 9,175 | | | | 9,066 | |
| Series 2007-70, Class FC, 1M US SOFR + 0.58%, 11/20/2037(b) | | | 14,558 | | | | 14,407 | |
| | | Principal
Amount | | | Value
(Note 2) | |
| Series 2008-2, Class PC, 4.750%, 01/20/2038 | | $ | 6,647 | | | $ | 6,347 | |
| Series 2008-46, Class FA, 1M US SOFR + 0.714%, 05/20/2038(b) | | | 6,468 | | | | 6,465 | |
| Series 2008-60, Class JP, 5.500%, 07/20/2038 | | | 46,000 | | | | 45,278 | |
| Series 2009-104, Class KA, 4.500%, 08/16/2039 | | | 3,513 | | | | 3,469 | |
| Series 2011-H23, Class HA, 3.000%, 12/20/2061 | | | 6,085 | | | | 5,647 | |
| Series 2012-39, Class GA, 3.000%, 10/16/2040 | | | 5,698 | | | | 5,305 | |
| Series 2013-149, Class BP, 3.500%, 10/20/2043 | | | 50,000 | | | | 39,301 | |
| Series 2013-98, Class DM, 3.500%, 07/20/2042 | | | 3,875 | | | | 3,804 | |
| Series 2015-91, Class NE, 3.000%, 10/20/2044 | | | 2,442 | | | | 2,376 | |
| Series 2019-152, Class LC, 3.500%, 10/20/2049 | | | 2,385 | | | | 2,092 | |
| Series 2019-162, Class GA, 3.000%, 10/20/2049 | | | 3,252 | | | | 2,964 | |
| Series 2020-167, Class EC, 1.000%, 02/20/2049 | | | 6,955 | | | | 5,142 | |
| Series 2020-5, Class LC, 3.500%, 10/20/2049 | | | 2,799 | | | | 2,472 | |
| Series 2021-76, Class ND, 1.250%, 08/20/2050 | | | 8,089 | | | | 5,964 | |
| Series 2023-57, Class CV, 5.000%, 04/20/2034 | | | 7,538 | | | | 7,179 | |
| | | | | | | | 190,987 | |
| | | | | | | | | |
| TOTAL COLLATERALIZED MORTGAGE OBLIGATIONS | | | | | | | | |
| (Cost $1,110,301) | | | | | | | 968,188 | |
| | | Principal
Amount | | | Value
(Note 2) | |
| COMMERCIAL MORTGAGE-BACKED SECURITIES (0.23%) |
| Fannie Mae-Aces | | | | | | | | |
| Series 2014-M9, Class A2, 3.103%, 07/25/2024(b) | | | 21,330 | | | | 20,917 | |
| | | | | | | | | |
| Freddie Mac Multifamily Structured Pass Through Certificates | | | | | | | | |
| Series 2018-K074, Class A2, 3.600%, 01/25/2028 | | | 28,000 | | | | 26,146 | |
| | | | | | | | | |
| TOTAL COMMERCIAL MORTGAGE-BACKED SECURITIES | | | | | | | | |
| (Cost $46,544) | | | | | | | 47,063 | |
See Notes to Financial Statements.
ALPS | Smith Balanced Opportunity Fund
| Statement of Investments | October 31, 2023 |
| | | Principal
Amount | | | Value
(Note 2) | |
| MORTGAGE-BACKED SECURITIES (4.49%) | | | | | | | | |
| | | | | | | | | |
| Fannie Mae Pool | | | | | | | | |
| Series 2004-, | | | | | | | | |
| 5.500%, 08/01/2034 | | $ | 25,951 | | | $ | 25,559 | |
| 5.500%, 11/01/2034 | | | 37,575 | | | | 36,496 | |
| Series 2005-, 7.715%, 06/15/2034 | | | 11,328 | | | | 11,693 | |
| Series 2007-, | | | | | | | | |
| 5.500%, 08/01/2037 | | | 27,767 | | | | 26,208 | |
| 1Y US TI + 2.41%, 10/01/2035(b) | | | 17,436 | | | | 17,168 | |
| Series 2008-, | | | | | | | | |
| 5.500%, 03/01/2038 | | | 34,279 | | | | 33,950 | |
| 5.500%, 05/01/2038 | | | 27,531 | | | | 27,239 | |
| Series 2009-, 5.500%, 11/01/2039 | | | 27,347 | | | | 25,663 | |
| Series 2012-AM0762, 3.290%, 09/01/2032 | | | 7,906 | | | | 6,841 | |
| Series 2012-AM1671, 2.100%, 12/01/2027 | | | 23,419 | | | | 21,888 | |
| Series 2014-, 3.500%, 11/01/2033 | | | 25,446 | | | | 23,830 | |
| Series 2015-AM8645, 2.690%, 05/01/2027 | | | 20,466 | | | | 18,772 | |
| Series 2015-AM8674, 2.810%, 04/01/2025 | | | 60,000 | | | | 57,593 | |
| Series 2016-, 2.390%, 06/01/2025 | | | 72,061 | | | | 68,402 | |
| Series 2017-AN6670, 3.210%, 09/01/2027 | | | 28,521 | | | | 25,957 | |
| Series 2019-, 3.340%, 05/01/2031 | | | 23,986 | | | | 20,922 | |
| Series 2020-, 1.400%, 11/01/2032 | | | 55,000 | | | | 38,485 | |
| | | | | | | | 486,666 | |
| | | | | | | | | |
| Freddie Mac Gold Pool | | | | | | | | |
| Series 2012-, 3.000%, 05/01/2032 | | | 27,940 | | | | 23,313 | |
| | | | | | | | | |
| Freddie Mac Pool | | | | | | | | |
| Series 2023-, 4.750%, 01/01/2033 | | | 69,050 | | | | 63,311 | |
| | | | | | | | | |
| Ginnie Mae II Pool | | | | | | | | |
| Series 2009-, | | | | | | | | |
| 5.000%, 10/20/2039 | | | 11,067 | | | | 10,447 | |
| 5.500%, 02/20/2039 | | | 20,755 | | | | 19,920 | |
| Series 2010-, | | | | | | | | |
| 4.000%, 12/20/2040 | | | 22,993 | | | | 20,370 | |
| 4.500%, 04/20/2040 | | | 100,798 | | | | 91,881 | |
| 4.500%, 08/20/2040 | | | 20,651 | | | | 18,865 | |
| Series 2011-, 5.000%, 04/20/2041 | | | 25,346 | | | | 23,891 | |
| Series 2012-, | | | | | | | | |
| 3.500%, 05/20/2042 | | | 36,692 | | | | 31,072 | |
| | | Principal
Amount | | | Value
(Note 2) | |
| 4.000%, 08/20/2042 | | $ | 60,222 | | | $ | 53,229 | |
| Series 2022-, 3.000%, 12/20/2044 | | | 9,468 | | | | 7,816 | |
| Series 2023-, 6.500%, 10/20/2053 | | | 53,260 | | | | 53,523 | |
| | | | | | | | 331,014 | |
| | | | | | | | | |
| TOTAL MORTGAGE-BACKED SECURITIES | | | | | | | | |
| (Cost $993,208) | | | | | | | 904,304 | |
| | | Principal
Amount | | | Value
(Note 2) | |
| CORPORATE BONDS (15.81%) | | | | | | | | |
| | | | | | | | | |
| Aerospace & Defense (0.92%) | | | | | | | | |
| Boeing Co. | | | | | | | | |
| 1.43%, 02/04/2024 | | | 45,000 | | | | 44,432 | |
| 2.20%, 02/04/2026 | | | 70,000 | | | | 64,334 | |
| 3.95%, 08/01/2059 | | | 53,000 | | | | 32,680 | |
| 5.93%, 05/01/2060 | | | 14,000 | | | | 11,791 | |
| L3Harris Technologies, Inc. | | | | | | | | |
| 5.40%, 07/31/2033 | | | 16,000 | | | | 14,960 | |
| 5.60%, 07/31/2053 | | | 20,000 | | | | 17,693 | |
| Total Aerospace & Defense | | | | | | | 185,890 | |
| | | | | | | | | |
| Airlines (0.46%) | | | | | | | | |
| Alaska Airlines 2020-1 Class A Pass Through Trust | | | | | | | | |
| 4.80%, 08/15/2027(d) | | | 39,771 | | | | 37,944 | |
| Alaska Airlines 2020-1 Class B Pass Through Trust | | | | | | | | |
| 8.00%, 08/15/2025(d) | | | 16,202 | | | | 16,190 | |
| British Airways 2020-1 Class A Pass Through Trust | | | | | | | | |
| 4.25%, 11/15/2032(d) | | | 5,095 | | | | 4,568 | |
| United Airlines 2020-1 Class A Pass Through Trust | | | | | | | | |
| Series 20-1 5.88%, 10/15/2027 | | | 35,584 | | | | 35,076 | |
| Total Airlines | | | | | | | 93,778 | |
| | | | | | | | | |
| Automobiles Manufacturing (0.59%) | | | | | | | | |
| Ford Motor Co. | | | | | | | | |
| 5.29%, 12/08/2046 | | | 25,000 | | | | 18,163 | |
| Ford Motor Credit Co. LLC | | | | | | | | |
| 3.38%, 11/13/2025 | | | 35,000 | | | | 32,696 | |
| 6.80%, 05/12/2028 | | | 42,000 | | | | 41,920 | |
| Nissan Motor Acceptance Co. LLC | | | | | | | | |
| 7.05%, 09/15/2028(d) | | | 22,000 | | | | 21,738 | |
| Volkswagen Group of America Finance LLC | | | | | | | | |
| 0.88%, 11/22/2023(d) | | | 5,000 | | | | 4,986 | |
| Total Automobiles Manufacturing | | | | | | | 119,503 | |
| | | | | | | | | |
| Banks (0.71%) | | | | | | | | |
| Citibank NA | | | | | | | | |
| 5.80%, 09/29/2028 | | | 35,000 | | | | 34,580 | |
See Notes to Financial Statements.
ALPS | Smith Balanced Opportunity Fund
| Statement of Investments | October 31, 2023 |
| | | Principal
Amount | | | Value
(Note 2) | |
| Citizens Bank NA | | | | | | | | |
| 1D US SOFR + 1.45%, 10/24/2025(b) | | $ | 36,000 | | | $ | 34,431 | |
| Intesa Sanpaolo SpA | | | | | | | | |
| 6.63%, 06/20/2033(d) | | | 11,000 | | | | 10,097 | |
| 1Y US TI + 3.90%, 06/20/2054(b)(d) | | | 15,000 | | | | 13,021 | |
| Truist Financial Corp. | | | | | | | | |
| 1D US SOFR + 2.36%, 06/08/2034(b) | | | 20,000 | | | | 18,202 | |
| Wells Fargo & Co. | | | | | | | | |
| 1D US SOFR + 2.02%, 04/24/2034(b) | | | 38,000 | | | | 34,417 | |
| Total Banks | | | | | | | 144,748 | |
| | | | | | | | | |
| Biotechnology (0.58%) | | | | | | | | |
| Amgen, Inc. | | | | | | | | |
| 5.25%, 03/02/2033 | | | 42,000 | | | | 39,189 | |
| 5.51%, 03/02/2026 | | | 41,000 | | | | 40,793 | |
| 5.75%, 03/02/2063 | | | 43,000 | | | | 37,273 | |
| Total Biotechnology | | | | | | | 117,255 | |
| | | | | | | | | |
| Cable & Satellite (0.40%) | | | | | | | | |
| CCO Holdings LLC / CCO Holdings Capital Corp. | | | | | | | | |
| 4.50%, 06/01/2033(d) | | | 22,000 | | | | 16,427 | |
| 4.75%, 02/01/2032(d) | | | 27,000 | | | | 21,101 | |
| Charter Communications Operating LLC / Charter Communications Operating Capital | | | | | | | | |
| 3.85%, 04/01/2061 | | | 41,000 | | | | 21,676 | |
| Sirius XM Radio, Inc. | | | | | | | | |
| 5.00%, 08/01/2027(d) | | | 23,000 | | | | 21,109 | |
| Total Cable & Satellite | | | | | | | 80,313 | |
| | | | | | | | | |
| Casinos & Gaming (0.58%) | | | | | | | | |
| MGM Resorts International | | | | | | | | |
| 6.75%, 05/01/2025 | | | 60,000 | | | | 59,729 | |
| Penn Entertainment, Inc. | | | | | | | | |
| 5.63%, 01/15/2027(d) | | | 61,000 | | | | 55,696 | |
| Total Casinos & Gaming | | | | | | | 115,425 | |
| | | | | | | | | |
| Chemicals (0.28%) | | | | | | | | |
| Avient Corp. | | | | | | | | |
| 5.75%, 05/15/2025(d) | | | 24,000 | | | | 23,541 | |
| Celanese US Holdings LLC | | | | | | | | |
| 6.38%, 07/15/2032 | | | 34,000 | | | | 31,929 | |
| Total Chemicals | | | | | | | 55,470 | |
| | | | | | | | | |
| Commercial Finance (0.27%) | | | | | | | | |
| AerCap Ireland Capital DAC / AerCap Global Aviation Trust | | | | | | | | |
| 6.50%, 07/15/2025 | | | 55,000 | | | | 54,892 | |
| | | | | | | | | |
| Consumer Finance (0.29%) | | | | | | | | |
| Discover Financial Services SOFRINDX + 3.37%, 11/02/2034(b)(e) | | | 7,000 | | | | 6,958 | |
| | | Principal
Amount | | | Value
(Note 2) | |
| Fiserv, Inc. | | | | | | | | |
| 5.60%, 03/02/2033 | | $ | 18,000 | | | $ | 16,947 | |
| GTCR W-2 Merger Sub LLC | | | | | | | | |
| 7.50%, 01/15/2031(d) | | | 36,000 | | | | 35,577 | |
| Total Consumer Finance | | | | | | | 59,482 | |
| | | | | | | | | |
| Diversified Banks (0.80%) | | | | | | | | |
| Banco Santander SA | | | | | | | | |
| 6.94%, 11/07/2033 | | | 17,000 | | | | 17,064 | |
| Bank of America Corp. | | | | | | | | |
| 1D US SOFR + 1.84%, 09/15/2034(b) | | | 18,000 | | | | 16,957 | |
| 1D US SOFR + 1.91%, 04/25/2034(b) | | | 38,000 | | | | 34,336 | |
| Citigroup, Inc. | | | | | | | | |
| 4.30%, 11/20/2026 | | | 51,000 | | | | 47,941 | |
| JPMorgan Chase & Co. | | | | | | | | |
| 1D US SOFR + 1.07%, 12/15/2025(b) | | | 44,000 | | | | 43,679 | |
| Total Diversified Banks | | | | | | | 159,977 | |
| | | | | | | | | |
| Electrical Equipment Manufacturing (0.15%) | | | | | | | | |
| Trimble, Inc. | | | | | | | | |
| 6.10%, 03/15/2033 | | | 31,000 | | | | 29,606 | |
| | | | | | | | | |
| Entertainment Content (0.15%) | | | | | | | | |
| Warnermedia Holdings, Inc. | | | | | | | | |
| 4.28%, 03/15/2032 | | | 15,000 | | | | 12,443 | |
| 5.14%, 03/15/2052 | | | 25,000 | | | | 17,704 | |
| Total Entertainment Content | | | | | | | 30,147 | |
| | | | | | | | | |
| Entertainment Resources (0.08%) | | | | | | | | |
| Vail Resorts, Inc. | | | | | | | | |
| 6.25%, 05/15/2025(d) | | | 17,000 | | | | 16,910 | |
| | | | | | | | | |
| Exploration & Production (0.37%) | | | | | | | | |
| Hilcorp Energy I LP / Hilcorp Finance Co. | | | | | | | | |
| 6.25%, 11/01/2028(d) | | | 42,000 | | | | 39,310 | |
| Occidental Petroleum Corp. | | | | | | | | |
| 7.88%, 09/15/2031 | | | 32,000 | | | | 34,291 | |
| Total Exploration & Production | | | | | | | 73,601 | |
| | | | | | | | | |
| Financial Services (1.09%) | | | | | | | | |
| Ameriprise Financial, Inc. | | | | | | | | |
| 5.15%, 05/15/2033 | | | 14,000 | | | | 12,930 | |
| Charles Schwab Corp. | | | | | | | | |
| 1D US SOFR + 2.01%, 08/24/2034(b) | | | 18,000 | | | | 16,869 | |
| 1D US SOFR + 2.50%, 05/19/2034(b) | | | 20,000 | | | | 18,354 | |
| Goldman Sachs Group, Inc. | | | | | | | | |
| 1D US SOFR + 0.50%, 09/10/2024(b) | | | 24,000 | | | | 23,939 | |
See Notes to Financial Statements.
ALPS | Smith Balanced Opportunity Fund
| Statement of Investments | October 31, 2023 |
| | | Principal
Amount | | | Value
(Note 2) | |
| Morgan Stanley | | | | | | | | |
| 1D US SOFR + 1.36%, 09/16/2036(b) | | $ | 61,000 | | | $ | 43,177 | |
| 1D US SOFR + 2.05%, 11/01/2034(b) | | | 10,000 | | | | 9,996 | |
| 5Y US TI + 2.43%, 01/19/2038(b) | | | 21,000 | | | | 19,052 | |
| UBS Group AG | | | | | | | | |
| 1D US SOFR + 3.92%, 08/12/2033(b)(d) | | | 52,000 | | | | 49,994 | |
| 1Y US TI + 1.75%, 05/12/2028(b)(d) | | | 17,000 | | | | 15,976 | |
| 1Y US TI + 1.80%, 09/22/2029(b)(d) | | | 7,000 | | | | 6,861 | |
| 1Y US TI + 2.00%, 09/22/2034(b)(d) | | | 5,000 | | | | 4,738 | |
| Total Financial Services | | | | | | | 221,886 | |
| | | | | | | | | |
| Food & Beverage (0.65%) | | | | | | | | |
| J M Smucker Co. | | | | | | | | |
| 6.20%, 11/15/2033 | | | 24,000 | | | | 23,339 | |
| JBS USA LUX SA / JBS USA Food Co. / JBS Luxembourg SARL | | | | | | | | |
| 6.75%, 03/15/2034(d) | | | 10,000 | | | | 9,378 | |
| 7.25%, 11/15/2053(d) | | | 30,000 | | | | 26,820 | |
| JDE Peet's NV | | | | | | | | |
| 0.80%, 09/24/2024(d) | | | 16,000 | | | | 15,251 | |
| Pilgrim's Pride Corp. | | | | | | | | |
| 6.25%, 07/01/2033 | | | 43,000 | | | | 39,571 | |
| 6.88%, 05/15/2034 | | | 16,000 | | | | 15,159 | |
| Total Food & Beverage | | | | | | | 129,518 | |
| | | | | | | | | |
| Health Care Facilities & Services (0.14%) | | | | | | | | |
| HCA, Inc. | | | | | | | | |
| 5.50%, 06/01/2033 | | | 30,000 | | | | 27,383 | |
| | | | | | | | | |
| Industrial Other (0.28%) | | | | | | | | |
| Jacobs Engineering Group, Inc. | | | | | | | | |
| 5.90%, 03/01/2033 | | | 42,000 | | | | 38,929 | |
| Quanta Services, Inc. | | | | | | | | |
| 0.95%, 10/01/2024 | | | 19,000 | | | | 18,105 | |
| Total Industrial Other | | | | | | | 57,034 | |
| | | | | | | | | |
| Internet Media (0.13%) | | | | | | | | |
| Meta Platforms, Inc. | | | | | | | | |
| 5.60%, 05/15/2053 | | | 8,000 | | | | 7,241 | |
| 5.75%, 05/15/2063 | | | 21,000 | | | | 18,854 | |
| Total Internet Media | | | | | | | 26,095 | |
| | | | | | | | | |
| Life Insurance (0.10%) | | | | | | | | |
| Five Corners Funding Trust III | | | | | | | | |
| 5.79%, 02/15/2033(d) | | | 22,000 | | | | 20,817 | |
| | | | | | | | | |
| Machinery Manufacturing (0.09%) | | | | | | | | |
| Nordson Corp. | | | | | | | | |
| 5.80%, 09/15/2033 | | | 18,000 | | | | 17,145 | |
| | | Principal
Amount | | | Value
(Note 2) | |
| Medical Equipment & Devices Manufacturing (0.11%) | | | | | | | | |
| Revvity, Inc. | | | | | | | | |
| 0.85%, 09/15/2024 | | $ | 23,000 | | | $ | 21,938 | |
| | | | | | | | | |
| Pharmaceuticals (0.57%) | | | | | | | | |
| Bristol-Myers Squibb Co. | | | | | | | | |
| 6.25%, 11/15/2053 | | | 7,000 | | | | 6,941 | |
| Merck & Co., Inc. | | | | | | | | |
| 4.50%, 05/17/2033 | | | 12,000 | | | | 10,914 | |
| 5.00%, 05/17/2053 | | | 29,000 | | | | 24,788 | |
| Pfizer Investment Enterprises Pte, Ltd. | | | | | | | | |
| 4.75%, 05/19/2033 | | | 21,000 | | | | 19,311 | |
| 5.11%, 05/19/2043 | | | 32,000 | | | | 28,107 | |
| 5.30%, 05/19/2053 | | | 28,000 | | | | 24,517 | |
| Total Pharmaceuticals | | | | | | | 114,578 | |
| | | | | | | | | |
| Pipeline (2.05%) | | | | | | | | |
| Buckeye Partners LP | | | | | | | | |
| 4.50%, 03/01/2028(d) | | | 50,000 | | | | 43,555 | |
| Enbridge, Inc. | | | | | | | | |
| 5Y US TI + 4.431%, 01/15/2084(b) | | | 7,000 | | | | 6,709 | |
| Flex Intermediate Holdco LLC | | | | | | | | |
| 3.36%, 06/30/2031(d) | | | 63,000 | | | | 47,582 | |
| 4.32%, 12/30/2039(d) | | | 62,000 | | | | 40,789 | |
| Midwest Connector Capital Co. LLC | | | | | | | | |
| 3.90%, 04/01/2024(d) | | | 74,000 | | | | 73,098 | |
| 4.63%, 04/01/2029(d) | | | 32,000 | | | | 28,824 | |
| Targa Resources Partners LP / Targa Resources Partners Finance Corp. | | | | | | | | |
| 6.50%, 07/15/2027 | | | 91,000 | | | | 90,020 | |
| 6.88%, 01/15/2029 | | | 46,000 | | | | 45,819 | |
| TransCanada PipeLines, Ltd. | | | | | | | | |
| 6.20%, 03/09/2026 | | | 38,000 | | | | 37,987 | |
| Total Pipeline | | | | | | | 414,383 | |
| | | | | | | | | |
| Power Generation (0.62%) | | | | | | | | |
| Alexander Funding Trust | | | | | | | | |
| 1.84%, 11/15/2023(d) | | | 40,000 | | | | 39,921 | |
| Alexander Funding Trust II | | | | | | | | |
| 7.47%, 07/31/2028(d) | | | 16,000 | | | | 15,894 | |
| Vistra Operations Co. LLC | | | | | | | | |
| 5.13%, 05/13/2025(d) | | | 39,000 | | | | 38,146 | |
| 5.50%, 09/01/2026(d) | | | 29,000 | | | | 27,617 | |
| 6.95%, 10/15/2033(d) | | | 3,000 | | | | 2,861 | |
| Total Power Generation | | | | | | | 124,439 | |
| | | | | | | | | |
| Property & Casualty Insurance (0.17%) | | | | | | | | |
| Allstate Corp. | | | | | | | | |
| 5.25%, 03/30/2033 | | | 26,000 | | | | 24,028 | |
| Arthur J Gallagher & Co. | | | | | | | | |
| 6.50%, 02/15/2034 | | | 10,000 | | | | 9,936 | |
| Total Property & Casualty Insurance | | | | | | | 33,964 | |
| | | | | | | | | |
| Publishing & Broadcasting (0.33%) | | | | | | | | |
| Gray Escrow II, Inc. | | | | | | | | |
| 5.38%, 11/15/2031(d) | | | 23,000 | | | | 14,516 | |
See Notes to Financial Statements.
ALPS | Smith Balanced Opportunity Fund
| Statement of Investments | October 31, 2023 |
| | | Principal
Amount | | | Value
(Note 2) | |
| Nexstar Media, Inc. | | | | | | | | |
| 4.75%, 11/01/2028(d) | | $ | 25,000 | | | $ | 21,022 | |
| 5.63%, 07/15/2027(d) | | | 24,000 | | | | 21,617 | |
| Scripps Escrow II, Inc. | | | | | | | | |
| 3.88%, 01/15/2029(d) | | | 12,000 | | | | 9,122 | |
| Total Publishing & Broadcasting | | | | | | | 66,277 | |
| | | | | | | | | |
| Real Estate (0.22%) | | | | | | | | |
| Cushman & Wakefield US Borrower LLC | | | | | | | | |
| 6.75%, 05/15/2028(d) | | | 13,000 | | | | 11,868 | |
| VICI Properties LP / VICI Note Co., Inc. | | | | | | | | |
| 5.63%, 05/01/2024(d) | | | 33,000 | | | | 32,805 | |
| Total Real Estate | | | | | | | 44,673 | |
| | | | | | | | | |
| Refining & Marketing (0.30%) | | | | | | | | |
| HF Sinclair Corp. | | | | | | | | |
| 4.50%, 10/01/2030 | | | 46,000 | | | | 39,131 | |
| 5.88%, 04/01/2026 | | | 22,000 | | | | 21,700 | |
| Total Refining & Marketing | | | | | | | 60,831 | |
| | | | | | | | | |
| Restaurants (0.09%) | | | | | | | | |
| Brinker International, Inc. | | | | | | | | |
| 8.25%, 07/15/2030(d) | | | 18,000 | | | | 17,423 | |
| | | | | | | | | |
| Semiconductors (0.17%) | | | | | | | | |
| Broadcom, Inc. | | | | | | | | |
| 3.47%, 04/15/2034(d) | | | 25,000 | | | | 19,056 | |
| Microchip Technology, Inc. | | | | | | | | |
| 0.97%, 02/15/2024 | | | 15,000 | | | | 14,770 | |
| Total Semiconductors | | | | | | | 33,826 | |
| | | | | | | | | |
| Software & Services (0.58%) | | | | | | | | |
| Concentrix Corp. | | | | | | | | |
| 6.60%, 08/02/2028 | | | 22,000 | | | | 21,132 | |
| 6.85%, 08/02/2033 | | | 22,000 | | | | 19,883 | |
| CoStar Group, Inc. | | | | | | | | |
| 2.80%, 07/15/2030(d) | | | 54,000 | | | | 41,958 | |
| Leidos, Inc. | | | | | | | | |
| 5.75%, 03/15/2033 | | | 21,000 | | | | 19,531 | |
| VMware, Inc. | | | | | | | | |
| 2.20%, 08/15/2031 | | | 21,000 | | | | 15,531 | |
| Total Software & Services | | | | | | | 118,035 | |
| | | | | | | | | |
| Transportation & Logistics (0.16%) | | | | | | | | |
| FedEx Corp. 2020-1 Class AA Pass Through Trust | | | | | | | | |
| 1.88%, 02/20/2034 | | | 41,979 | | | | 33,043 | |
| | | | | | | | | |
| Utilities (0.92%) | | | | | | | | |
| National Rural Utilities Cooperative Finance Corp. | | | | | | | | |
| 3M US SOFR + 3.171%, 04/30/2043(b) | | | 23,000 | | | | 22,550 | |
| 5Y US TI + 3.533%, 09/15/2053(b) | | | 22,000 | | | | 21,867 | |
| Pacific Gas and Electric Co. | | | | | | | | |
| 3.25%, 02/16/2024 | | | 48,000 | | | | 47,582 | |
| | | Principal
Amount | | | Value
(Note 2) | |
| Public Service Enterprise Group, Inc. | | | | | | | | |
| 5.88%, 10/15/2028 | | $ | 7,000 | | | $ | 6,931 | |
| 6.13%, 10/15/2033 | | | 7,000 | | | | 6,836 | |
| Sempra | | | | | | | | |
| 5Y US TI + 2.868%, 04/01/2052(b) | | | 32,000 | | | | 24,688 | |
| Southern California Edison Co. | | | | | | | | |
| 1.10%, 04/01/2024 | | | 10,000 | | | | 9,802 | |
| 5.65%, 10/01/2028 | | | 18,000 | | | | 17,833 | |
| Southern Co. | | | | | | | | |
| 5.11%, 08/01/2027 | | | 28,000 | | | | 27,020 | |
| Total Utilities | | | | | | | 185,109 | |
| | | | | | | | | |
| Waste & Environment Services & Equipment (0.17%) | | | | | | | | |
| GFL Environmental, Inc. | | | | | | | | |
| 5.13%, 12/15/2026(d) | | | 36,000 | | | | 34,200 | |
| | | | | | | | | |
| Wireless Telecommunications Services (0.24%) | | | | | | | | |
| AT&T, Inc. | | | | | | | | |
| 5.54%, 02/20/2026 | | | 18,000 | | | | 17,858 | |
| T-Mobile USA, Inc. | | | | | | | | |
| 4.80%, 07/15/2028 | | | 21,000 | | | | 19,989 | |
| 6.00%, 06/15/2054 | | | 11,000 | | | | 9,994 | |
| Total Wireless Telecommunications Services | | | | | | | 47,841 | |
| | | | | | | | | |
| TOTAL CORPORATE BONDS | | | | | | | | |
| (Cost $3,468,020) | | | | | | | 3,187,435 | |
| | | Principal | | | Value | |
| | | Amount | | | (Note 2) | |
| GOVERNMENT BONDS (11.33%) | | | | | | | | |
| | | | | | | | | |
| U.S. Treasury Bonds (11.33%) | | | | | | | | |
| United States Treasury Bonds | | | | | | | | |
| 3.38%, 08/15/2042 | | | 222,000 | | | | 171,838 | |
| 3.50%, 02/15/2033 | | | 184,000 | | | | 164,738 | |
| 3.63%, 02/15/2053 | | | 158,000 | | | | 123,141 | |
| 3.63%, 05/15/2053 | | | 132,000 | | | | 102,919 | |
| 3.88%, 02/15/2043 | | | 124,000 | | | | 103,123 | |
| 3.88%, 05/15/2043 | | | 178,000 | | | | 147,865 | |
| 4.00%, 11/15/2042 | | | 293,000 | | | | 248,472 | |
| 4.00%, 11/15/2052 | | | 193,000 | | | | 161,336 | |
| 4.13%, 08/15/2053 | | | 409,000 | | | | 349,951 | |
| 4.38%, 08/15/2043 | | | 43,000 | | | | 38,357 | |
| United States Treasury Notes | | | | | | | | |
| 4.75%, 07/31/2025 | | | 270,000 | | | | 268,260 | |
| 5.00%, 08/31/2025 | | | 160,000 | | | | 159,675 | |
| 5.00%, 09/30/2025 | | | 245,000 | | | | 244,569 | |
| Total U.S. Treasury Bonds | | | | | | | 2,284,244 | |
| | | | | | | | | |
| TOTAL GOVERNMENT BONDS | | | | | | | | |
| (Cost $2,515,669) | | | | | | | 2,284,244 | |
See Notes to Financial Statements.
ALPS | Smith Balanced Opportunity Fund
| Statement of Investments | October 31, 2023 |
| | | Shares | | | Value
(Note 2) | |
| PREFERRED STOCK (1.21%) | | | | | | | | |
| | | | | | | | | |
| Energy (0.07%) | | | | | | | | |
| Pipeline (0.07%) | | | | | | | | |
| Energy Transfer LP, Series F, 6.750%(f) | | | 15,000 | | | $ | 13,598 | |
| | | | | | | | | |
| Total Energy | | | | | | | 13,598 | |
| | | | | | | | | |
| Financials (1.10%) | | | | | | | | |
| Banks (0.78%) | | | | | | | | |
| Huntington Bancshares, Inc., Series J, 6.875%(f) | | | 1,100 | | | | 24,365 | |
| PNC Financial Services Group, Inc., | | | | | | | | |
| Series O, 3M US SOFR + 3.939%(b)(f) | | | 133,000 | | | | 133,001 | |
| | | | | | | | 157,366 | |
| Consumer Finance (0.22%) | | | | | | | | |
| Ally Financial, Inc., Series C, 4.700%(f) | | | 18,000 | | | | 10,554 | |
| American Express Co., 3.550%(f) | | | 26,000 | | | | 20,474 | |
| Discover Financial Services, Series D, 6.125%(f) | | | 15,000 | | | | 13,889 | |
| | | | | | | | 44,917 | |
| Life Insurance (0.10%) | | | | | | | | |
| Jackson Financial, Inc., 8.000%(f) | | | 800 | | | | 19,592 | |
| Total Financials | | | | | | | 221,875 | |
| | | | | | | | | |
| Government (0.04%) | | | | | | | | |
| Government Agencies (0.04%) | | | | | | | | |
| Tennessee Valley Authority, 2.216% | | | 385 | | | | 8,185 | |
| | | | | | | | | |
| Total Government | | | | | | | 8,185 | |
| | | | | | | | | |
| TOTAL PREFERRED STOCK | | | | | | | | |
| (Cost $260,895) | | | | | | | 243,658 | |
| | | 7-Day
Yield | | | Shares | | | Value
(Note 2) | |
| SHORT TERM INVESTMENTS (0.82%) | | | | | | | | | | | | |
| | | | | | | | | | | | | |
| Money Market Fund (0.82%) | | | | | | | | | | | | |
| Morgan Stanley Institutional Liquidity Funds - Government Portfolio | | | 5.25 | % | | | 10,772 | | | | 10,772 | |
| | | 7-Day
Yield | | | Shares | | | Value
(Note 2) | |
| State Street Institutional Treasury Plus Money Market Fund - Premier Class | | | 5.30 | % | | | 154,577 | | | | 154,577 | |
| | | | | | | | | | | | | |
| TOTAL SHORT TERM INVESTMENTS | | | | | | | | | | | | |
| (Cost $165,349) | | | | | | | | | | $ | 165,349 | |
| | | | | | | | | | | | | |
| TOTAL INVESTMENTS (99.90%) | | | | | | | | | | | | |
| (Cost $18,907,998) | | | | | | | | | | $ | 20,134,820 | |
| | | | | | | | | | | | | |
| Other Assets In Excess Of Liabilities (0.10%) | | | | | | | | | | | 21,002 | |
| | | | | | | | | | | | | |
| NET ASSETS (100.00%) | | | | | | | | | | $ | 20,155,822 | |
Investment Abbreviations:
SOFR - Secured Overnight Financing Rate
SOFRINDX - Secured Overnight Financing Rate Index
TI – Treasury Index
Reference Rates:
30D US SOFR - 30 Day SOFR as of October 31, 2023 was 5.32%
1D US SOFR - 1 Day SOFR as of October 31, 2023 was 5.35%
1M US SOFR- 1 Month SOFR as of October 31, 2023 was 5.32%
3M US SOFR - 3 Month SOFR as of October 31, 2023 was 5.38%
1Y US TI - 1 Year US TI as of October 31, 2023 was 5.44%
5Y US TI - 5 Year US TI as of October 31, 2023 was 4.82%
| (a) | Non-Income Producing Security. |
| (b) | Floating or variable rate security. The reference rate is described above. The rate in effect as of October 31, 2023 is based on the reference rate plus the displayed spread as of the security's last reset date. |
| (c) | Issued with zero coupon. |
| (d) | Security exempt from registration under Rule 144A of the Securities Act of 1933. This security may be resold in transactions exempt from registration, normally to qualified institutional buyers. As of October 31, 2023, the aggregate market value of those securities was $1,069,926, representing 5.31% of net assets. |
| (e) | The SOFRINDX is a compounded average of the daily Secured Overnight Financing Rate determined by reference to the SOFR Index for any interest period. |
| (f) | Perpetual maturity. This security has no contractual maturity date, is not redeemable and contractually pays an indefinite stream of interest. |
See Notes to Financial Statements.
ALPS | Smith Funds
| Statements of Assets and Liabilities | October 31, 2023 |
| | | ALPS | Smith
Short Duration
Bond Fund | | | ALPS | Smith
Total Return
Bond Fund | | | ALPS | Smith
Credit
Opportunities
Fund | | | ALPS | Smith
Balanced
Opportunity
Fund | |
| ASSETS | | | | | | | | | | | | |
| Investments, at value | | $ | 600,183,127 | | | $ | 2,330,672,265 | | | $ | 212,958,950 | | | $ | 20,134,820 | |
| Receivable for investments sold | | | 21,242,681 | | | | 12,824,358 | | | | 4,179,728 | | | | 40,939 | |
| Receivable for shares sold | | | 744,750 | | | | 12,660,774 | | | | 100,497 | | | | 12,612 | |
| Interest receivable | | | 6,963,769 | | | | 24,891,968 | | | | 3,363,062 | | | | 98,394 | |
| Receivable due from advisor | | | – | | | | – | | | | – | | | | 17,270 | |
| Prepaid expenses and other assets | | | 22,454 | | | | 36,159 | | | | 31,297 | | | | 30,606 | |
| Total Assets | | | 629,156,781 | | | | 2,381,085,524 | | | | 220,633,534 | | | | 20,334,641 | |
| LIABILITIES | | | | | | | | | | | | | | | | |
| Payable for investments purchased | | | 18,242,273 | | | | 47,450,062 | | | | 4,668,453 | | | | 76,590 | |
| Payable for shares redeemed | | | 3,993,720 | | | | 2,512,593 | | | | 86,012 | | | | 6,050 | |
| Investment advisory fees payable | | | 205,277 | | | | 635,163 | | | | 99,357 | | | | – | |
| Administration and transfer agency fees payable | | | 210,585 | | | | 799,358 | | | | 87,797 | | | | 61,322 | |
| Distribution and services fees payable | | | 11,205 | | | | 19,969 | | | | 925 | | | | 1,429 | |
| Trustees' fees and expenses payable | | | 10,882 | | | | 36,814 | | | | 3,565 | | | | 361 | |
| Professional fees payable | | | 21,906 | | | | 32,043 | | | | 19,963 | | | | 19,095 | |
| Custody fees payable | | | 20,620 | | | | 73,380 | | | | 15,081 | | | | 10,150 | |
| Accrued expenses and other liabilities | | | 17,658 | | | | 131,174 | | | | 6,139 | | | | 3,822 | |
| Total Liabilities | | | 22,734,126 | | | | 51,690,556 | | | | 4,987,292 | | | | 178,819 | |
| NET ASSETS | | $ | 606,422,655 | | | $ | 2,329,394,968 | | | $ | 215,646,242 | | | $ | 20,155,822 | |
| NET ASSETS CONSIST OF | | | | | | | | | | | | | | | | |
| Paid-in capital | | $ | 641,752,388 | | | $ | 2,739,537,200 | | | $ | 270,251,222 | | | $ | 20,614,644 | |
| Total distributable earnings/(accumulated losses) | | | (35,329,733 | ) | | | (410,142,232 | ) | | | (54,604,980 | ) | | | (458,822 | ) |
| NET ASSETS | | $ | 606,422,655 | | | $ | 2,329,394,968 | | | $ | 215,646,242 | | | $ | 20,155,822 | |
| INVESTMENTS, AT COST | | $ | 610,378,464 | | | $ | 2,515,916,438 | | | $ | 226,449,451 | | | $ | 18,907,998 | |
| | | | | | | | | | | | | | | | | |
| PRICING OF SHARES | | | | | | | | | | | | | | | | |
| Investor Class: | | | | | | | | | | | | | | | | |
| Net Asset Value, offering and redemption price per share | | $ | 9.98 | | | $ | 9.02 | | | $ | 8.55 | | | $ | 10.56 | |
| Net Assets | | $ | 17,483,814 | | | $ | 22,228,006 | | | $ | 316,426 | | | $ | 582,092 | |
| Shares of beneficial interest outstanding (unlimited number of shares, no par value common stock authorized) | | | 1,751,687 | | | | 2,465,115 | | | | 37,015 | | | | 55,107 | |
| Class A: | | | | | | | | | | | | | | | | |
| Net Asset Value, offering and redemption price per share | | $ | 9.98 | | | $ | 9.02 | | | $ | 8.51 | | | $ | 10.56 | |
| Net Assets | | $ | 10,777,863 | | | $ | 22,153,028 | | | $ | 1,199,570 | | | $ | 1,056,172 | |
| Shares of beneficial interest outstanding (unlimited number of shares, no par value common stock authorized) | | | 1,080,174 | | | | 2,456,302 | | | | 140,975 | | | | 100,003 | |
| Maximum offering price per share | | $ | 10.21 | (a) | | $ | 9.23 | (a) | | $ | 8.70 | (a) | | $ | 10.92 | (b) |
| Class C: | | | | | | | | | | | | | | | | |
| Net Asset Value, offering and redemption price per share(c) | | $ | 9.94 | | | $ | 9.00 | | | $ | 8.51 | | | $ | 10.51 | |
| Net Assets | | $ | 2,320,726 | | | $ | 4,450,638 | | | $ | 425,252 | | | $ | 528,045 | |
| Shares of beneficial interest outstanding (unlimited number of shares, no par value common stock authorized) | | | 233,589 | | | | 494,697 | | | | 50,000 | | | | 50,253 | |
| Class I: | | | | | | | | | | | | | | | | |
| Net Asset Value, offering and redemption price per share | | $ | 9.98 | | | $ | 9.01 | | | $ | 8.51 | | | $ | 10.56 | |
| Net Assets | | $ | 575,840,252 | | | $ | 2,280,563,296 | | | $ | 213,704,994 | | | $ | 17,989,513 | |
| Shares of beneficial interest outstanding (unlimited number of shares, no par value common stock authorized) | | | 57,675,867 | | | | 253,101,283 | | | | 25,107,519 | | | | 1,703,638 | |
See Notes to Financial Statements.
ALPS | Smith Funds
| Statements of Assets and Liabilities | October 31, 2023 |
| (a) | (NAV/0.9775), based on maximum sales charge of 2.25% of the offering price. |
| (b) | (NAV/0.9675), based on maximum sales charge of 3.25% of the offering price. |
| (c) | Redemption price per share may be reduced for any applicable contingent deferred sales charge. For a description of a possible sales charge, please see the Fund's Prospectus. |
See Notes to Financial Statements.
ALPS | Smith Funds
| Statements of Operations | For the Year Ended October 31, 2023 |
|
|
ALPS | Smith
Short Duration
Bond Fund |
|
|
ALPS | Smith
Total Return
Bond Fund |
|
| ALPS | Smith
Credit
Opportunities
Fund |
|
| ALPS | Smith
Balanced
Opportunity
Fund |
|
| INVESTMENT INCOME | | | | | | | | | | | | | | | | |
| Dividends | | $ | 385,237 | | | $ | 2,036,691 | | | $ | 546,760 | | | $ | 242,042 | |
| Foreign taxes withheld on dividends | | | – | | | | – | | | | – | | | | (7,122 | ) |
| Interest | | | 28,692,816 | | | | 91,792,346 | | | | 13,644,946 | | | | 388,355 | |
| Total Investment Income | | | 29,078,053 | | | | 93,829,037 | | | | 14,191,706 | | | | 623,275 | |
| | | | | | | | | | | | | | | | | |
| EXPENSES | | | | | | | | | | | | | | | | |
| Investment advisory fees | | | 2,651,930 | | | | 11,088,340 | | | | 1,754,094 | | | | 162,747 | |
| Administrative fees | | | 628,495 | | | | 2,042,040 | | | | 246,207 | | | | 87,837 | |
| Transfer agency fees | | | 437,359 | | | | 1,189,153 | | | | 85,218 | | | | 38,597 | |
| Distribution and service fees | | | | | | | | | | | | | | | | |
| Investor Class | | | 54,080 | | | | 41,875 | | | | – | | | | 1,615 | |
| Class A | | | 30,779 | | | | 60,402 | | | | 2,665 | | | | 2,943 | |
| Class C | | | 32,476 | | | | 47,277 | | | | 5,618 | | | | 5,461 | |
| Professional fees | | | 26,912 | | | | 39,696 | | | | 21,198 | | | | 18,875 | |
| Reports to shareholders and printing fees | | | 35,249 | | | | 88,671 | | | | 9,700 | | | | 3,105 | |
| State registration fees | | | 113,029 | | | | 228,643 | | | | 62,992 | | | | 59,529 | |
| Insurance fees | | | 11,910 | | | | 22,227 | | | | 4,585 | | | | 386 | |
| Custody fees | | | 41,813 | | | | 115,817 | | | | 31,164 | | | | 18,096 | |
| Trustees' fees and expenses | | | 47,314 | | | | 132,186 | | | | 15,182 | | | | 1,648 | |
| Repayment of previously waived fees | | | | | | | | | | | | | | | | |
| Investor Class | | | 759 | | | | – | | | | 19 | | | | – | |
| Class A | | | 2,304 | | | | – | | | | 27 | | | | – | |
| Class C | | | 222 | | | | – | | | | 16 | | | | – | |
| Class I | | | 7,453 | | | | – | | | | – | | | | – | |
| Miscellaneous expenses | | | 26,287 | | | | 28,216 | | | | 12,606 | | | | 6,507 | |
| Total Expenses | | | 4,148,371 | | | | 15,124,543 | | | | 2,251,291 | | | | 407,346 | |
| Less fees waived/reimbursed by investment advisor (Note 6) | | | | | | | | | | | | | | | | |
| Investor Class | | | (10,424 | ) | | | (8,817 | ) | | | (131 | ) | | | (5,043 | ) |
| Class A | | | (3,016 | ) | | | (11,874 | ) | | | (398 | ) | | | (8,125 | ) |
| Class C | | | (1,520 | ) | | | (3,350 | ) | | | (185 | ) | | | (4,092 | ) |
| Class I | | | (457,964 | ) | | | (2,107,663 | ) | | | (139,197 | ) | | | (182,588 | ) |
| Net Expenses | | | 3,675,447 | | | | 12,992,839 | | | | 2,111,380 | | | | 207,498 | |
| Net Investment Income | | | 25,402,606 | | | | 80,836,198 | | | | 12,080,326 | | | | 415,777 | |
| Net realized loss on investments | | | (16,316,787 | ) | | | (110,434,356 | ) | | | (22,017,161 | ) | | | (142,705 | ) |
| Net realized loss on foreign currency transactions | | | – | | | | – | | | | – | | | | (169 | ) |
| Net Realized Loss | | | (16,316,787 | ) | | | (110,434,356 | ) | | | (22,017,161 | ) | | | (142,874 | ) |
| Net change in unrealized appreciation on investments | | | 17,314,947 | | | | 9,159,506 | | | | 15,894,744 | | | | 1,143,221 | |
| Net Change in Unrealized Appreciation | | | 17,314,947 | | | | 9,159,506 | | | | 15,894,744 | | | | 1,143,221 | |
| NET REALIZED AND UNREALIZED GAIN/(LOSS) ON INVESTMENTS | | | 998,160 | | | | (101,274,850 | ) | | | (6,122,417 | ) | | | 1,000,347 | |
| NET INCREASE/(DECREASE) IN NET ASSETS RESULTING | | | | | | | | | | | | | | | | |
| FROM OPERATIONS | | $ | 26,400,766 | | | $ | (20,438,652 | ) | | $ | 5,957,909 | | | $ | 1,416,124 | |
See Notes to Financial Statements.
ALPS | Smith Short Duration Bond Fund
Statements of Changes in Net Assets
|
| For the Year
Ended
October 31, 2023 |
|
| For the Year
Ended
October 31, 2022 |
|
| OPERATIONS | | | | | | | | |
| Net investment income | | $ | 25,402,606 | | | $ | 9,479,942 | |
| Net realized loss | | | (16,316,787 | ) | | | (8,526,807 | ) |
| Net change in unrealized appreciation/(depreciation) | | | 17,314,947 | | | | (27,717,066 | ) |
| Net Increase/(Decrease) in Net Assets Resulting from Operations | | | 26,400,766 | | | | (26,763,931 | ) |
| | | | | | | | | |
| DISTRIBUTIONS | | | | | | | | |
| From distributable earnings | | | | | | | | |
| Investor Class | | | (614,727 | ) | | | (135,980 | ) |
| Class A | | | (394,923 | ) | | | (223,388 | ) |
| Class C | | | (81,323 | ) | | | (27,527 | ) |
| Class I | | | (24,615,362 | ) | | | (10,393,894 | ) |
| Net Decrease in Net Assets from Distributions | | | (25,706,335 | ) | | | (10,780,789 | ) |
| | | | | | | | | |
| BENEFICIAL INTEREST TRANSACTIONS (NOTE 5) | | | | | | | | |
| Shares sold | | | | | | | | |
| Investor Class | | | 9,842,783 | | | | 20,293,360 | |
| Class A | | | 10,699,745 | | | | 8,110,025 | |
| Class C | | | 778,411 | | | | 2,785,267 | |
| Class I | | | 377,223,916 | | | | 657,729,701 | |
| Dividends reinvested | | | | | | | | |
| Investor Class | | | 532,979 | | | | 117,679 | |
| Class A | | | 295,928 | | | | 145,571 | |
| Class C | | | 52,561 | | | | 20,508 | |
| Class I | | | 15,189,435 | | | | 5,293,045 | |
| Shares redeemed, net of redemption fees | | | | | | | | |
| Investor Class | | | (12,149,072 | ) | | | (10,816,386 | ) |
| Class A | | | (15,687,648 | ) | | | (8,700,902 | ) |
| Class C | | | (2,306,778 | ) | | | (2,298,424 | ) |
| Class I | | | (542,271,611 | ) | | | (394,356,061 | ) |
| Net Increase/(Decrease) in Net Assets Derived from Beneficial Interest Transactions | | | (157,799,351 | ) | | | 278,323,383 | |
| | | | | | | | | |
| Net increase/(decrease) in net assets | | | (157,104,920 | ) | | | 240,778,663 | |
| | | | | | | | | |
| NET ASSETS | | | | | | | | |
| Beginning of year | | | 763,527,575 | | | | 522,748,912 | |
| End of year | | $ | 606,422,655 | | | $ | 763,527,575 | |
See Notes to Financial Statements.
ALPS | Smith Total Return Bond Fund
Statements of Changes in Net Assets
|
| For the Year
Ended
October 31, 2023 |
|
| For the Year
Ended
October 31, 2022 |
|
| OPERATIONS | | | | | | | | |
| Net investment income | | $ | 80,836,198 | | | $ | 42,971,311 | |
| Net realized loss | | | (110,434,356 | ) | | | (104,815,742 | ) |
| Net change in unrealized appreciation/(depreciation) | | | 9,159,506 | | | | (212,897,549 | ) |
| Net Decrease in Net Assets Resulting from Operations | | | (20,438,652 | ) | | | (274,741,980 | ) |
| | | | | | | | | |
| DISTRIBUTIONS | | | | | | | | |
| From distributable earnings | | | | | | | | |
| Investor Class | | | (603,888 | ) | | | (169,630 | ) |
| Class A | | | (791,155 | ) | | | (472,869 | ) |
| Class C | | | (141,367 | ) | | | (93,247 | ) |
| Class I | | | (80,857,579 | ) | | | (47,659,641 | ) |
| Dividends to shareholders from tax return of capital | | | | | | | | |
| Investor Class | | | – | | | | (575 | ) |
| Class A | | | – | | | | (1,607 | ) |
| Class C | | | – | | | | (318 | ) |
| Class I | | | – | | | | (162,036 | ) |
| Net Decrease in Net Assets from Distributions | | | (82,393,989 | ) | | | (48,559,923 | ) |
| | | | | | | | | |
| BENEFICIAL INTEREST TRANSACTIONS (NOTE 5) | | | | | | | | |
| Shares sold | | | | | | | | |
| Investor Class | | | 23,600,092 | | | | 2,107,435 | |
| Class A | | | 13,727,289 | | | | 6,858,178 | |
| Class C | | | 1,634,038 | | | | 1,341,168 | |
| Class I | | | 1,373,671,577 | | | | 972,091,838 | |
| Dividends reinvested | | | | | | | | |
| Investor Class | | | 595,288 | | | | 158,015 | |
| Class A | | | 723,544 | | | | 425,759 | |
| Class C | | | 117,024 | | | | 74,386 | |
| Class I | | | 60,335,657 | | | | 32,775,183 | |
| Shares redeemed, net of redemption fees | | | | | | | | |
| Investor Class | | | (5,013,925 | ) | | | (6,384,019 | ) |
| Class A | | | (7,262,227 | ) | | | (15,232,506 | ) |
| Class C | | | (1,351,913 | ) | | | (3,381,657 | ) |
| Class I | | | (666,482,352 | ) | | | (812,475,284 | ) |
| Net Increase in Net Assets Derived from Beneficial Interest Transactions | | | 794,294,092 | | | | 178,358,496 | |
| | | | | | | | | |
| Net increase/(decrease) in net assets | | | 691,461,451 | | | | (144,943,407 | ) |
| | | | | | | | | |
| NET ASSETS | | | | | | | | |
| Beginning of year | | | 1,637,933,517 | | | | 1,782,876,924 | |
| End of year | | $ | 2,329,394,968 | | | $ | 1,637,933,517 | |
See Notes to Financial Statements.
ALPS | Smith Credit Opportunities Fund
Statements of Changes in Net Assets
|
| For the Year
Ended
October 31,
2023 |
|
| For the Year
Ended
October 31,
2022 |
|
| OPERATIONS | | | | | | | | |
| Net investment income | | $ | 12,080,326 | | | $ | 10,794,595 | |
| Net realized loss | | | (22,017,161 | ) | | | (18,956,826 | ) |
| Net change in unrealized appreciation/(depreciation) | | | 15,894,744 | | | | (30,273,340 | ) |
| Net Increase/(Decrease) in Net Assets Resulting from Operations | | | 5,957,909 | | | | (38,435,571 | ) |
| | | | | | | | | |
| DISTRIBUTIONS | | | | | | | | |
| From distributable earnings | | | | | | | | |
| Investor Class | | | (40,695 | ) | | | (243,907 | ) |
| Class A | | | (57,183 | ) | | | (43,048 | ) |
| Class C | | | (23,390 | ) | | | (19,336 | ) |
| Class I | | | (12,004,465 | ) | | | (11,494,833 | ) |
| Dividends to shareholders from tax return of capital | | | | | | | | |
| Investor Class | | | – | | | | (3,082 | ) |
| Class A | | | – | | | | (543 | ) |
| Class C | | | – | | | | (238 | ) |
| Class I | | | – | | | | (146,533 | ) |
| Net Decrease in Net Assets from Distributions | | | (12,125,733 | ) | | | (11,951,520 | ) |
| | | | | | | | | |
| BENEFICIAL INTEREST TRANSACTIONS (NOTE 5) | | | | | | | | |
| Shares sold | | | | | | | | |
| Investor Class | | | 63,719 | | | | 1,453,017 | |
| Class A | | | 258,892 | | | | 54,211 | |
| Class C | | | 26,647 | | | | 50,288 | |
| Class I | | | 60,166,070 | | | | 163,129,209 | |
| Dividends reinvested | | | | | | | | |
| Investor Class | | | 40,695 | | | | 246,758 | |
| Class A | | | 11,528 | | | | 6,716 | |
| Class C | | | – | | | | 567 | |
| Class I | | | 9,192,659 | | | | 9,479,983 | |
| Shares redeemed | | | | | | | | |
| Investor Class | | | (5,955,982 | ) | | | (1,322,489 | ) |
| Class A | | | (113,345 | ) | | | – | |
| Class C | | | (201,093 | ) | | | (9,912 | ) |
| Class I | | | (133,782,469 | ) | | | (137,896,810 | ) |
| Net Increase/(Decrease) in Net Assets Derived from Beneficial Interest Transactions | | | (70,292,679 | ) | | | 35,191,538 | |
| | | | | | | | | |
| Net decrease in net assets | | | (76,460,503 | ) | | | (15,195,553 | ) |
| | | | | | | | | |
| NET ASSETS | | | | | | | | |
| Beginning of year | | | 292,106,745 | | | | 307,302,298 | |
| End of year | | $ | 215,646,242 | | | $ | 292,106,745 | |
See Notes to Financial Statements.
ALPS | Smith Balanced Opportunity Fund
Statements of Changes in Net Assets
|
| For the Year
Ended
October 31,
2023 |
|
| For the Year
Ended
October 31,
2022 |
|
| OPERATIONS | | | | | | | | |
| Net investment income | | $ | 415,777 | | | $ | 348,017 | |
| Net realized loss | | | (142,874 | ) | | | (1,347,578 | ) |
| Net change in unrealized appreciation/(depreciation) | | | 1,143,221 | | | | (4,243,201 | ) |
| Net Increase/(Decrease) in Net Assets Resulting from Operations | | | 1,416,124 | | | | (5,242,762 | ) |
| | | | | | | | | |
| DISTRIBUTIONS | | | | | | | | |
| From distributable earnings | | | | | | | | |
| Investor Class | | | (11,437 | ) | | | (8,311 | ) |
| Class A | | | (17,999 | ) | | | (13,485 | ) |
| Class C | | | (5,145 | ) | | | (3,314 | ) |
| Class I | | | (398,778 | ) | | | (435,324 | ) |
| Dividends to shareholders from tax return of capital | | | | | | | | |
| Investor Class | | | – | | | | (16 | ) |
| Class A | | | – | | | | (26 | ) |
| Class C | | | – | | | | (5 | ) |
| Class I | | | – | | | | (855 | ) |
| Net Decrease in Net Assets from Distributions | | | (433,359 | ) | | | (461,336 | ) |
| | | | | | | | | |
| BENEFICIAL INTEREST TRANSACTIONS (NOTE 5) | | | | | | | | |
| Shares sold | | | | | | | | |
| Investor Class | | | 20,506 | | | | 2,810 | |
| Class A | | | 6,422 | | | | 48,757 | |
| Class C | | | – | | | | 18,793 | |
| Class I | | | 6,444,319 | | | | 11,772,497 | |
| Dividends reinvested | | | | | | | | |
| Investor Class | | | 2,260 | | | | 1,769 | |
| Class A | | | 103 | | | | 430 | |
| Class C | | | 84 | | | | 99 | |
| Class I | | | 346,445 | | | | 313,630 | |
| Shares redeemed | | | | | | | | |
| Investor Class | | | (115,047 | ) | | | (11,772 | ) |
| Class A | | | (47,835 | ) | | | (862 | ) |
| Class C | | | (14,000 | ) | | | – | |
| Class I | | | (13,884,987 | ) | | | (20,047,598 | ) |
| Net Decrease in Net Assets Derived from Beneficial Interest Transactions | | | (7,241,730 | ) | | | (7,901,447 | ) |
| | | | | | | | | |
| Net decrease in net assets | | | (6,258,965 | ) | | | (13,605,545 | ) |
| | | | | | | | | |
| NET ASSETS | | | | | | | | |
| Beginning of year | | | 26,414,787 | | | | 40,020,332 | |
| End of year | | $ | 20,155,822 | | | $ | 26,414,787 | |
See Notes to Financial Statements.
ALPS | Smith Short Duration Bond Fund – Investor Class
Financial Highlights
Selected data for a share of beneficial interest outstanding throughout the periods indicated:
| |
| For the Year
Ended
October 31,
2023 |
|
| For the Year
Ended
October 31,
2022 |
|
| For the Year
Ended
October 31,
2021 |
|
| For the Year
Ended
October 31,
2020 |
|
| For the Year
Ended
October 31,
2019 |
|
| Net asset value, beginning of period | | $ | 9.98 | | | $ | 10.57 | | | $ | 10.62 | | | $ | 10.25 | | | $ | 9.98 | |
| | | | | | | | | | | | | | | | | | | | | |
| INCOME FROM INVESTMENT OPERATIONS: | | | | | | | | | | | | | | | | | | | | |
| Net investment income(a) | | | 0.33 | | | | 0.14 | | | | 0.05 | | | | 0.11 | | | | 0.23 | |
| Net realized and unrealized gain/(loss) | | | – | | | | (0.59 | ) | | | 0.03 | | | | 0.48 | | | | 0.27 | |
| Total from investment operations | | | 0.33 | | | | (0.45 | ) | | | 0.08 | | | | 0.59 | | | | 0.50 | |
| | | | | | | | | | | | | | | | | | | | | |
| DISTRIBUTIONS: | | | | | | | | | | | | | | | | | | | | |
| From net investment income | | | (0.33 | ) | | | (0.11 | ) | | | (0.05 | ) | | | (0.14 | ) | | | (0.22 | ) |
| From net realized gains | | | – | | | | (0.03 | ) | | | (0.08 | ) | | | (0.08 | ) | | | (0.01 | ) |
| Total distributions | | | (0.33 | ) | | | (0.14 | ) | | | (0.13 | ) | | | (0.22 | ) | | | (0.23 | ) |
| | | | | | | | | | | | | | | | | | | | | |
| Net increase/(decrease) in net asset value | | | – | | | | (0.59 | ) | | | (0.05 | ) | | | 0.37 | | | | 0.27 | |
| Net asset value, end of year | | $ | 9.98 | | | $ | 9.98 | | | $ | 10.57 | | | $ | 10.62 | | | $ | 10.25 | |
| TOTAL RETURN(b) | | | 3.39 | % | | | (4.31 | )% | | | 0.77 | % | | | 5.85 | % | | | 5.04 | % |
| | | | | | | | | | | | | | | | | | | | | |
| RATIOS/SUPPLEMENTAL DATA: | | | | | | | | | | | | | | | | | | | | |
| Net assets, end of year (000s) | | $ | 17,484 | | | $ | 19,227 | | | $ | 10,194 | | | $ | 9,100 | | | $ | 519 | |
| Ratio of expenses to average net assets excluding fee waivers and reimbursements | | | 0.83 | % | | | 0.84 | % | | | 0.90 | % | | | 0.95 | % | | | 1.10 | % |
| Ratio of expenses to average net assets including fee waivers and reimbursements | | | 0.78 | % | | | 0.78 | % | | | 0.76 | % | | | 0.78 | % | | | 0.76 | % |
| Ratio of net investment income to average net assets | | | 3.23 | % | | | 1.41 | % | | | 0.51 | % | | | 1.02 | % | | | 2.22 | % |
| Portfolio turnover rate | | | 134 | % | | | 99 | % | | | 165 | % | | | 457 | % | | | 639 | % |
| (a) | Calculated using the average shares method. |
| (b) | Total returns are for the period indicated and have not been annualized. Total returns would have been lower had certain expenses not been waived during the period. Returns shown do not reflect the deduction of taxes that a shareholder would pay on Fund distributions or the redemption of Fund shares. |
See Notes to Financial Statements.
ALPS | Smith Short Duration Bond Fund – Class A
Financial Highlights
Selected data for a share of beneficial interest outstanding throughout the periods indicated:
| |
| For the Year
Ended
October 31,
2023 |
|
| For the Year
Ended
October 31,
2022 |
|
| For the Year
Ended
October 31,
2021 |
|
| For the Year
Ended
October 31,
2020 |
|
| For the Year
Ended
October 31,
2019 |
|
| Net asset value, beginning of period | | $ | 9.98 | | | $ | 10.56 | | | $ | 10.61 | | | $ | 10.24 | | | $ | 9.98 | |
| | | | | | | | | | | | | | | | | | | | | |
| INCOME FROM INVESTMENT OPERATIONS: | | | | | | | | | | | | | | | | | | | | |
| Net investment income(a) | | | 0.32 | | | | 0.11 | | | | 0.05 | | | | 0.12 | | | | 0.22 | |
| Net realized and unrealized gain/(loss) | | | 0.02 | | | | (0.55 | ) | | | 0.03 | | | | 0.47 | | | | 0.27 | |
| Total from investment operations | | | 0.34 | | | | (0.44 | ) | | | 0.08 | | | | 0.59 | | | | 0.49 | |
| | | | | | | | | | | | | | | | | | | | | |
| DISTRIBUTIONS: | | | | | | | | | | | | | | | | | | | | |
| From net investment income | | | (0.34 | ) | | | (0.11 | ) | | | (0.05 | ) | | | (0.14 | ) | | | (0.22 | ) |
| From net realized gains | | | – | | | | (0.03 | ) | | | (0.08 | ) | | | (0.08 | ) | | | (0.01 | ) |
| Total distributions | | | (0.34 | ) | | | (0.14 | ) | | | (0.13 | ) | | | (0.22 | ) | | | (0.23 | ) |
| | | | | | | | | | | | | | | | | | | | | |
| REDEMPTION FEES ADDED TO PAID-IN CAPITAL (NOTE 5) | | | – | | | | – | | | | – | | | | – | | | | 0.00 | (b) |
| Net increase/(decrease) in net asset value | | | – | | | | (0.58 | ) | | | (0.05 | ) | | | 0.37 | | | | 0.26 | |
| Net asset value, end of year | | $ | 9.98 | | | $ | 9.98 | | | $ | 10.56 | | | $ | 10.61 | | | $ | 10.24 | |
| TOTAL RETURN(c) | | | 3.42 | % | | | (4.19 | )% | | | 0.77 | % | | | 5.84 | % | | | 4.96 | % |
| | | | | | | | | | | | | | | | | | | | | |
| RATIOS/SUPPLEMENTAL DATA: | | | | | | | | | | | | | | | | | | | | |
| Net assets, end of year (000s) | | $ | 10,778 | | | $ | 15,429 | | | $ | 16,868 | | | $ | 3,702 | | | $ | 471 | |
| Ratio of expenses to average net assets excluding fee waivers and reimbursements | | | 0.75 | % | | | 0.79 | % | | | 0.84 | % | | | 0.94 | % | | | 1.09 | % |
| Ratio of expenses to average net assets including fee waivers and reimbursements | | | 0.75 | % | | | 0.74 | % | | | 0.76 | % | | | 0.77 | % | | | 0.74 | % |
| Ratio of net investment income to average net assets | | | 3.22 | % | | | 1.08 | % | | | 0.51 | % | | | 1.10 | % | | | 2.17 | % |
| Portfolio turnover rate | | | 134 | % | | | 99 | % | | | 165 | % | | | 457 | % | | | 639 | % |
| (a) | Calculated using the average shares method. |
| (b) | Less than $0.005 or ($0.005) per share. |
| (c) | Total returns are for the period indicated and have not been annualized. Total returns would have been lower had certain expenses not been waived during the period. Returns shown do not reflect the deduction of taxes that a shareholder would pay on Fund distributions or the redemption of Fund shares. Returns shown exclude any applicable sales charges. |
See Notes to Financial Statements.
ALPS | Smith Short Duration Bond Fund – Class C
Financial Highlights
Selected data for a share of beneficial interest outstanding throughout the periods indicated:
| |
| For the Year
Ended
October 31,
2023 |
|
| For the Year
Ended
October 31,
2022 |
|
| For the Year
Ended
October 31,
2021 |
|
| For the Year
Ended
October 31,
2020 |
|
| For the Year
Ended
October 31,
2019 |
|
| Net asset value, beginning of period | | $ | 9.93 | | | $ | 10.53 | | | $ | 10.61 | | | $ | 10.24 | | | $ | 9.98 | |
| | | | | | | | | | | | | | | | | | | | | |
| INCOME FROM INVESTMENT OPERATIONS: | | | | | | | | | | | | | | | | | | | | |
| Net investment income/(loss)(a) | | | 0.25 | | | | 0.04 | | | | (0.02 | ) | | | 0.05 | | | | 0.15 | |
| Net realized and unrealized gain/(loss) | | | 0.02 | | | | (0.56 | ) | | | 0.02 | | | | 0.47 | | | | 0.27 | |
| Total from investment operations | | | 0.27 | | | | (0.52 | ) | | | – | | | | 0.52 | | | | 0.42 | |
| | | | | | | | | | | | | | | | | | | | | |
| DISTRIBUTIONS: | | | | | | | | | | | | | | | | | | | | |
| From net investment income | | | (0.26 | ) | | | (0.05 | ) | | | (0.00 | )(b) | | | (0.07 | ) | | | (0.15 | ) |
| From net realized gains | | | – | | | | (0.03 | ) | | | (0.08 | ) | | | (0.08 | ) | | | (0.01 | ) |
| Total distributions | | | (0.26 | ) | | | (0.08 | ) | | | (0.08 | ) | | | (0.15 | ) | | | (0.16 | ) |
| | | | | | | | | | | | | | | | | | | | | |
| Net increase/(decrease) in net asset value | | | 0.01 | | | | (0.60 | ) | | | (0.08 | ) | | | 0.37 | | | | 0.26 | |
| Net asset value, end of year | | $ | 9.94 | | | $ | 9.93 | | | $ | 10.53 | | | $ | 10.61 | | | $ | 10.24 | |
| TOTAL RETURN(c) | | | 2.77 | % | | | (5.01 | )% | | | (0.01 | )% | | | 5.10 | % | | | 4.19 | % |
| | | | | | | | | | | | | | | | | | | | | |
| RATIOS/SUPPLEMENTAL DATA: | | | | | | | | | | | | | | | | | | | | |
| Net assets, end of year (000s) | | $ | 2,321 | | | $ | 3,784 | | | $ | 3,472 | | | $ | 2,193 | | | $ | 497 | |
| Ratio of expenses to average net assets excluding fee waivers and reimbursements | | | 1.53 | % | | | 1.53 | % | | | 1.55 | % | | | 1.67 | % | | | 1.83 | % |
| Ratio of expenses to average net assets including fee waivers and reimbursements | | | 1.49 | % | | | 1.49 | % | | | 1.49 | % | | | 1.49 | % | | | 1.49 | % |
| Ratio of net investment income/(loss) to average net assets | | | 2.46 | % | | | 0.43 | % | | | (0.22 | )% | | | 0.46 | % | | | 1.48 | % |
| Portfolio turnover rate | | | 134 | % | | | 99 | % | | | 165 | % | | | 457 | % | | | 639 | % |
| (a) | Calculated using the average shares method. |
| (b) | Less than $0.005 or ($0.005) per share. |
| (c) | Total returns are for the period indicated and have not been annualized. Total returns would have been lower had certain expenses not been waived during the period. Returns shown do not reflect the deduction of taxes that a shareholder would pay on Fund distributions or the redemption of Fund shares. Returns shown exclude any applicable sales charges. |
See Notes to Financial Statements.
ALPS | Smith Short Duration Bond Fund – Class I
Financial Highlights
Selected data for a share of beneficial interest outstanding throughout the periods indicated:
| |
| For the Year
Ended
October 31,
2023 |
|
| For the Year
Ended
October 31,
2022 |
|
| For the Year
Ended
October 31,
2021 |
|
| For the Year
Ended
October 31,
2020 |
|
| For the Year
Ended
October 31,
2019 |
|
| Net asset value, beginning of period | | $ | 9.98 | | | $ | 10.57 | | | $ | 10.62 | | | $ | 10.25 | | | $ | 9.99 | |
| | | | | | | | | | | | | | | | | | | | | |
| INCOME FROM INVESTMENT OPERATIONS: | | | | | | | | | | | | | | | | | | | | |
| Net investment income(a) | | | 0.35 | | | | 0.15 | | | | 0.08 | | | | 0.16 | | | | 0.25 | |
| Net realized and unrealized gain/(loss) | | | 0.01 | | | | (0.57 | ) | | | 0.03 | | | | 0.46 | | | | 0.26 | |
| Total from investment operations | | | 0.36 | | | | (0.42 | ) | | | 0.11 | | | | 0.62 | | | | 0.51 | |
| | | | | | | | | | | | | | | | | | | | | |
| DISTRIBUTIONS: | | | | | | | | | | | | | | | | | | | | |
| From net investment income | | | (0.36 | ) | | | (0.14 | ) | | | (0.08 | ) | | | (0.17 | ) | | | (0.25 | ) |
| From net realized gains | | | – | | | | (0.03 | ) | | | (0.08 | ) | | | (0.08 | ) | | | (0.01 | ) |
| Total distributions | | | (0.36 | ) | | | (0.17 | ) | | | (0.16 | ) | | | (0.25 | ) | | | (0.26 | ) |
| | | | | | | | | | | | | | | | | | | | | |
| REDEMPTION FEES ADDED TO PAID-IN CAPITAL (NOTE 5) | | | – | | | | – | | | | – | | | | 0.00 | (b) | | | 0.01 | |
| Net increase/(decrease) in net asset value | | | – | | | | (0.59 | ) | | | (0.05 | ) | | | 0.37 | | | | 0.26 | |
| Net asset value, end of year | | $ | 9.98 | | | $ | 9.98 | | | $ | 10.57 | | | $ | 10.62 | | | $ | 10.25 | |
| TOTAL RETURN(c) | | | 3.69 | % | | | (4.03 | )% | | | 1.05 | % | | | 6.12 | % | | | 5.21 | % |
| | | | | | | | | | | | | | | | | | | | | |
| RATIOS/SUPPLEMENTAL DATA: | | | | | | | | | | | | | | | | | | | | |
| Net assets, end of year (000s) | | $ | 575,840 | | | $ | 725,087 | | | $ | 492,215 | | | $ | 166,817 | | | $ | 44,916 | |
| Ratio of expenses to average net assets excluding fee waivers and reimbursements | | | 0.56 | % | | | 0.56 | % | | | 0.58 | % | | | 0.70 | % | | | 0.82 | % |
| Ratio of expenses to average net assets including fee waivers and reimbursements | | | 0.49 | % | | | 0.49 | % | | | 0.49 | % | | | 0.49 | % | | | 0.49 | % |
| Ratio of net investment income to average net assets | | | 3.52 | % | | | 1.47 | % | | | 0.77 | % | | | 1.52 | % | | | 2.46 | % |
| Portfolio turnover rate | | | 134 | % | | | 99 | % | | | 165 | % | | | 457 | % | | | 639 | % |
| (a) | Calculated using the average shares method. |
| (b) | Less than $0.005 or ($0.005) per share. |
| (c) | Total returns are for the period indicated and have not been annualized. Total returns would have been lower had certain expenses not been waived during the period. Returns shown do not reflect the deduction of taxes that a shareholder would pay on Fund distributions or the redemption of Fund shares. |
See Notes to Financial Statements.
ALPS | Smith Total Return Bond Fund – Investor Class
Financial Highlights
Selected data for a share of beneficial interest outstanding throughout the periods indicated:
| |
| For the Year
Ended
October 31,
2023 |
|
| For the Year
Ended
October 31,
2022 |
|
| For the Year
Ended
October 31,
2021 |
|
| For the Year
Ended
October 31,
2020 |
|
| For the Year
Ended
October 31,
2019 |
|
| Net asset value, beginning of period | | $ | 9.34 | | | $ | 11.23 | | | $ | 11.46 | | | $ | 10.99 | | | $ | 10.05 | |
| | | | | | | | | | | | | | | | | | | | | |
| INCOME FROM INVESTMENT OPERATIONS: | | | | | | | | | | | | | | | | | | | | |
| Net investment income(a) | | | 0.36 | | | | 0.22 | | | | 0.18 | | | | 0.19 | | | | 0.22 | |
| Net realized and unrealized gain/(loss) | | | (0.33 | ) | | | (1.85 | ) | | | (0.03 | ) | | | 0.57 | | | | 0.95 | |
| Total from investment operations | | | 0.03 | | | | (1.63 | ) | | | 0.15 | | | | 0.76 | | | | 1.17 | |
| | | | | | | | | | | | | | | | | | | | | |
| DISTRIBUTIONS: | | | | | | | | | | | | | | | | | | | | |
| From net investment income | | | (0.35 | ) | | | (0.26 | ) | | | (0.19 | ) | | | (0.19 | ) | | | (0.21 | ) |
| From net realized gains | | | – | | | | – | | | | (0.19 | ) | | | (0.10 | ) | | | (0.02 | ) |
| From tax return of capital | | | – | | | | (0.00 | )(b) | | | – | | | | – | | | | – | |
| Total distributions | | | (0.35 | ) | | | (0.26 | ) | | | (0.38 | ) | | | (0.29 | ) | | | (0.23 | ) |
| | | | | | | | | | | | | | | | | | | | | |
| REDEMPTION FEES ADDED TO PAID-IN CAPITAL (NOTE 5) | | | – | | | | – | | | | – | | | | 0.00 | (b) | | | 0.00 | (b) |
| Net increase/(decrease) in net asset value | | | (0.32 | ) | | | (1.89 | ) | | | (0.23 | ) | | | 0.47 | | | | 0.94 | |
| Net asset value, end of year | | $ | 9.02 | | | $ | 9.34 | | | $ | 11.23 | | | $ | 11.46 | | | $ | 10.99 | |
| TOTAL RETURN(c) | | | 0.23 | % | | | (14.73 | )% | | | 1.26 | % | | | 6.95 | % | | | 11.77 | % |
| | | | | | | | | | | | | | | | | | | | | |
| RATIOS/SUPPLEMENTAL DATA: | | | | | | | | | | | | | | | | | | | | |
| Net assets, end of year (000s) | | $ | 22,228 | | | $ | 4,252 | | | $ | 9,605 | | | $ | 10,109 | | | $ | 4,121 | |
| Ratio of expenses to average net assets excluding fee waivers and reimbursements | | | 0.96 | % | | | 0.97 | % | | | 0.98 | % | | | 1.01 | % | | | 1.07 | % |
| Ratio of expenses to average net assets including fee waivers and reimbursements(d) | | | 0.90 | % | | | 0.93 | % | | | 0.95 | % | | | 0.96 | % | | | 0.96 | % |
| Ratio of net investment income to average net assets | | | 3.78 | % | | | 2.14 | % | | | 1.55 | % | | | 1.66 | % | | | 2.05 | % |
| Portfolio turnover rate | | | 133 | % | | | 179 | % | | | 178 | % | | | 360 | % | | | 489 | % |
| (a) | Calculated using the average shares method. |
| (b) | Less than $0.005 or ($0.005) per share. |
| (c) | Total returns are for the period indicated and have not been annualized. Total returns would have been lower had certain expenses not been waived during the period. Returns shown do not reflect the deduction of taxes that a shareholder would pay on Fund distributions or the redemption of Fund shares. |
| (d) | Effective September 1, 2023, the Adviser agreed to limit expenses to 0.59%. Prior to September 1, 2023, the Adviser agreed to limit expenses to 0.64%. |
See Notes to Financial Statements.
ALPS | Smith Total Return Bond Fund – Class A
Financial Highlights
Selected data for a share of beneficial interest outstanding throughout the periods indicated:
| |
| For the Year
Ended
October 31,
2023 |
|
| For the Year
Ended
October 31,
2022 |
|
| For the Year
Ended
October 31,
2021 |
|
| For the Year
Ended
October 31,
2020 |
|
| For the Year
Ended
October 31,
2019 |
|
| Net asset value, beginning of period | | $ | 9.34 | | | $ | 11.23 | | | $ | 11.46 | | | $ | 10.99 | | | $ | 10.05 | |
| | | | | | | | | | | | | | | | | | | | | |
| INCOME FROM INVESTMENT OPERATIONS: | | | | | | | | | | | | | | | | | | | | |
| Net investment income(a) | | | 0.35 | | | | 0.22 | | | | 0.18 | | | | 0.19 | | | | 0.21 | |
| Net realized and unrealized gain/(loss) | | | (0.32 | ) | | | (1.85 | ) | | | (0.03 | ) | | | 0.57 | | | | 0.97 | |
| Total from investment operations | | | 0.03 | | | | (1.63 | ) | | | 0.15 | | | | 0.76 | | | | 1.18 | |
| | | | | | | | | | | | | | | | | | | | | |
| DISTRIBUTIONS: | | | | | | | | | | | | | | | | | | | | |
| From net investment income | | | (0.35 | ) | | | (0.26 | ) | | | (0.19 | ) | | | (0.19 | ) | | | (0.22 | ) |
| From net realized gains | | | – | | | | – | | | | (0.19 | ) | | | (0.10 | ) | | | (0.02 | ) |
| From tax return of capital | | | – | | | | (0.00 | )(b) | | | – | | | | – | | | | – | |
| Total distributions | | | (0.35 | ) | | | (0.26 | ) | | | (0.38 | ) | | | (0.29 | ) | | | (0.24 | ) |
| | | | | | | | | | | | | | | | | | | | | |
| REDEMPTION FEES ADDED TO PAID-IN CAPITAL (NOTE 5) | | | – | | | | – | | | | – | | | | 0.00 | (b) | | | 0.00 | (b) |
| Net increase/(decrease) in net asset value | | | (0.32 | ) | | | (1.89 | ) | | | (0.23 | ) | | | 0.47 | | | | 0.94 | |
| Net asset value, end of year | | $ | 9.02 | | | $ | 9.34 | | | $ | 11.23 | | | $ | 11.46 | | | $ | 10.99 | |
| TOTAL RETURN(c) | | | 0.21 | % | | | (14.62 | )% | | | 1.27 | % | | | 6.96 | % | | | 11.79 | % |
| | | | | | | | | | | | | | | | | | | | | |
| RATIOS/SUPPLEMENTAL DATA: | | | | | | | | | | | | | | | | | | | | |
| Net assets, end of year (000s) | | $ | 22,153 | | | $ | 16,024 | | | $ | 27,342 | | | $ | 15,016 | | | $ | 7,929 | |
| Ratio of expenses to average net assets excluding fee waivers and reimbursements | | | 0.97 | % | | | 0.96 | % | | | 0.97 | % | | | 0.99 | % | | | 1.05 | % |
| Ratio of expenses to average net assets including fee waivers and reimbursements(d) | | | 0.92 | % | | | 0.92 | % | | | 0.94 | % | | | 0.95 | % | | | 0.95 | % |
| Ratio of net investment income to average net assets | | | 3.69 | % | | | 2.14 | % | | | 1.57 | % | | | 1.66 | % | | | 1.91 | % |
| Portfolio turnover rate | | | 133 | % | | | 179 | % | | | 178 | % | | | 360 | % | | | 489 | % |
| (a) | Calculated using the average shares method. |
| (b) | Less than $0.005 or ($0.005) per share. |
| (c) | Total returns are for the period indicated and have not been annualized. Total returns would have been lower had certain expenses not been waived during the period. Returns shown do not reflect the deduction of taxes that a shareholder would pay on Fund distributions or the redemption of Fund shares. Returns shown exclude any applicable sales charges. |
| (d) | Effective September 1, 2023, the Adviser agreed to limit expenses to 0.59%. Prior to September 1, 2023, the Adviser agreed to limit expenses to 0.64%. |
See Notes to Financial Statements.
ALPS | Smith Total Return Bond Fund – Class C
Financial Highlights
Selected data for a share of beneficial interest outstanding throughout the periods indicated:
| |
| For the Year
Ended
October 31,
2023 |
|
| For the Year
Ended
October 31,
2022 |
|
| For the Year
Ended
October 31,
2021 |
|
| For the Year
Ended
October 31,
2020 |
|
| For the Year
Ended
October 31,
2019 |
|
| Net asset value, beginning of period | | $ | 9.32 | | | $ | 11.21 | | | $ | 11.44 | | | $ | 10.97 | | | $ | 10.04 | |
| | | | | | | | | | | | | | | | | | | | | |
| INCOME FROM INVESTMENT OPERATIONS: | | | | | | | | | | | | | | | | | | | | |
| Net investment income(a) | | | 0.28 | | | | 0.15 | | | | 0.09 | | | | 0.11 | | | | 0.13 | |
| Net realized and unrealized gain/(loss) | | | (0.32 | ) | | | (1.86 | ) | | | (0.02 | ) | | | 0.57 | | | | 0.97 | |
| Total from investment operations | | | (0.04 | ) | | | (1.71 | ) | | | 0.07 | | | | 0.68 | | | | 1.10 | |
| | | | | | | | | | | | | | | | | | | | | |
| DISTRIBUTIONS: | | | | | | | | | | | | | | | | | | | | |
| From net investment income | | | (0.28 | ) | | | (0.18 | ) | | | (0.11 | ) | | | (0.11 | ) | | | (0.15 | ) |
| From net realized gains | | | – | | | | – | | | | (0.19 | ) | | | (0.10 | ) | | | (0.02 | ) |
| From tax return of capital | | | – | | | | (0.00 | )(b) | | | – | | | | – | | | | – | |
| Total distributions | | | (0.28 | ) | | | (0.18 | ) | | | (0.30 | ) | | | (0.21 | ) | | | (0.17 | ) |
| | | | | | | | | | | | | | | | | | | | | |
| Net increase/(decrease) in net asset value | | | (0.32 | ) | | | (1.89 | ) | | | (0.23 | ) | | | 0.47 | | | | 0.93 | |
| Net asset value, end of year | | $ | 9.00 | | | $ | 9.32 | | | $ | 11.21 | | | $ | 11.44 | | | $ | 10.97 | |
| TOTAL RETURN(c) | | | (0.49 | )% | | | (15.36 | )% | | | 0.55 | % | | | 6.23 | % | | | 10.98 | % |
| | | | | | | | | | | | | | | | | | | | | |
| RATIOS/SUPPLEMENTAL DATA: | | | | | | | | | | | | | | | | | | | | |
| Net assets, end of year (000s) | | $ | 4,451 | | | $ | 4,223 | | | $ | 7,184 | | | $ | 6,508 | | | $ | 1,727 | |
| Ratio of expenses to average net assets excluding fee waivers and reimbursements | | | 1.70 | % | | | 1.71 | % | | | 1.71 | % | | | 1.72 | % | | | 1.79 | % |
| Ratio of expenses to average net assets including fee waivers and reimbursements(d) | | | 1.63 | % | | | 1.64 | % | | | 1.66 | % | | | 1.67 | % | | | 1.67 | % |
| Ratio of net investment income to average net assets | | | 2.93 | % | | | 1.42 | % | | | 0.83 | % | | | 0.94 | % | | | 1.20 | % |
| Portfolio turnover rate | | | 133 | % | | | 179 | % | | | 178 | % | | | 360 | % | | | 489 | % |
| (a) | Calculated using the average shares method. |
| (b) | Less than $0.005 or ($0.005) per share. |
| (c) | Total returns are for the period indicated and have not been annualized. Total returns would have been lower had certain expenses not been waived during the period. Returns shown do not reflect the deduction of taxes that a shareholder would pay on Fund distributions or the redemption of Fund shares. Returns shown exclude any applicable sales charges. |
| (d) | Effective September 1, 2023, the Adviser agreed to limit expenses to 0.59%. Prior to September 1, 2023, the Adviser agreed to limit expenses to 0.64%. |
See Notes to Financial Statements.
ALPS | Smith Total Return Bond Fund – Class I
Financial Highlights
Selected data for a share of beneficial interest outstanding throughout the periods indicated:
| |
| For the Year
Ended
October 31,
2023 |
|
| For the Year
Ended
October 31,
2022 |
|
| For the Year
Ended
October 31,
2021 |
|
| For the Year
Ended
October 31,
2020 |
|
| For the Year
Ended
October 31,
2019 |
|
| Net asset value, beginning of period | | $ | 9.34 | | | $ | 11.22 | | | $ | 11.46 | | | $ | 10.99 | | | $ | 10.04 | |
| | | | | | | | | | | | | | | | | | | | | |
| INCOME FROM INVESTMENT OPERATIONS: | | | | | | | | | | | | | | | | | | | | |
| Net investment income(a) | | | 0.38 | | | | 0.25 | | | | 0.21 | | | | 0.22 | | | | 0.24 | |
| Net realized and unrealized gain/(loss) | | | (0.33 | ) | | | (1.84 | ) | | | (0.04 | ) | | | 0.57 | | | | 0.97 | |
| Total from investment operations | | | 0.05 | | | | (1.59 | ) | | | 0.17 | | | | 0.79 | | | | 1.21 | |
| | | | | | | | | | | | | | | | | | | | | |
| DISTRIBUTIONS: | | | | | | | | | | | | | | | | | | | | |
| From net investment income | | | (0.38 | ) | | | (0.29 | ) | | | (0.22 | ) | | | (0.22 | ) | | | (0.24 | ) |
| From net realized gains | | | – | | | | – | | | | (0.19 | ) | | | (0.10 | ) | | | (0.02 | ) |
| From tax return of capital | | | – | | | | (0.00 | )(b) | | | – | | | | – | | | | – | |
| Total distributions | | | (0.38 | ) | | | (0.29 | ) | | | (0.41 | ) | | | (0.32 | ) | | | (0.26 | ) |
| | | | | | | | | | | | | | | | | | | | | |
| REDEMPTION FEES ADDED TO PAID-IN CAPITAL (NOTE 5) | | | – | | | | – | | | | – | | | | 0.00 | (b) | | | 0.00 | (b) |
| Net increase/(decrease) in net asset value | | | (0.33 | ) | | | (1.88 | ) | | | (0.24 | ) | | | 0.47 | | | | 0.95 | |
| Net asset value, end of year | | $ | 9.01 | | | $ | 9.34 | | | $ | 11.22 | | | $ | 11.46 | | | $ | 10.99 | |
| TOTAL RETURN(c) | | | 0.40 | % | | | (14.40 | )% | | | 1.47 | % | | | 7.26 | % | | | 12.19 | % |
| | | | | | | | | | | | | | | | | | | | | |
| RATIOS/SUPPLEMENTAL DATA: | | | | | | | | | | | | | | | | | | | | |
| Net assets, end of year (000s) | | $ | 2,280,563 | | | $ | 1,613,435 | | | $ | 1,738,746 | | | $ | 1,331,786 | | | $ | 365,930 | |
| Ratio of expenses to average net assets excluding fee waivers and reimbursements | | | 0.74 | % | | | 0.73 | % | | | 0.73 | % | | | 0.72 | % | | | 0.76 | % |
| Ratio of expenses to average net assets including fee waivers and reimbursements(d) | | | 0.63 | % | | | 0.64 | % | | | 0.66 | % | | | 0.67 | % | | | 0.67 | % |
| Ratio of net investment income to average net assets | | | 3.98 | % | | | 2.46 | % | | | 1.84 | % | | | 1.94 | % | | | 2.22 | % |
| Portfolio turnover rate | | | 133 | % | | | 179 | % | | | 178 | % | | | 360 | % | | | 489 | % |
| (a) | Calculated using the average shares method. |
| (b) | Less than $0.005 or ($0.005) per share. |
| (c) | Total returns are for the period indicated and have not been annualized. Total returns would have been lower had certain expenses not been waived during the period. Returns shown do not reflect the deduction of taxes that a shareholder would pay on Fund distributions or the redemption of Fund shares. |
| (d) | Effective September 1, 2023, the Adviser agreed to limit expenses to 0.59%. Prior to September 1, 2023, the Adviser agreed to limit expenses to 0.64%. |
See Notes to Financial Statements.
ALPS | Smith Credit Opportunities Fund – Investor Class
Financial Highlights
Selected data for a share of beneficial interest outstanding throughout the periods indicated:
| | | For the Year Ended October 31, 2023 | | | For the Year Ended October 31, 2022 | | | For the Year Ended October 31, 2021 | | | For the Period September 16, 2020 (Commencement of Operations) to October 31, 2020 | |
| Net asset value, beginning of period | | $ | 8.82 | | | $ | 10.45 | | | $ | 9.96 | | | $ | 10.00 | |
| | | | | | | | | | | | | | | | | |
| INCOME FROM INVESTMENT OPERATIONS: | | | | | | | | | | | | | | | | |
| Net investment income(a) | | | 0.44 | | | | 0.33 | | | | 0.25 | | | | 0.02 | |
| Net realized and unrealized gain/(loss) | | | (0.26 | ) | | | (1.59 | ) | | | 0.51 | | | | (0.04 | ) |
| Total from investment operations | | | 0.18 | | | | (1.26 | ) | | | 0.76 | | | | (0.02 | ) |
| | | | | | | | | | | | | | | | | |
| DISTRIBUTIONS: | | | | | | | | | | | | | | | | |
| From net investment income | | | (0.45 | ) | | | (0.33 | ) | | | (0.25 | ) | | | (0.02 | ) |
| From net realized gains | | | – | | | | (0.04 | ) | | | (0.02 | ) | | | – | |
| From tax return of capital | | | – | | | | (0.00 | )(b) | | | – | | | | – | |
| Total distributions | | | (0.45 | ) | | | (0.37 | ) | | | (0.27 | ) | | | (0.02 | ) |
| | | | | | | | | | | | | | | | | |
| Net increase/(decrease) in net asset value | | | (0.27 | ) | | | (1.63 | ) | | | 0.49 | | | | (0.04 | ) |
| Net asset value, end of year | | $ | 8.55 | | | $ | 8.82 | | | $ | 10.45 | | | $ | 9.96 | |
| TOTAL RETURN(c) | | | 2.01 | % | | | (12.28 | )% | | | 7.63 | % | | | (0.23 | )% |
| | | | | | | | | | | | | | | | | |
| RATIOS/SUPPLEMENTAL DATA: | | | | | | | | | | | | | | | | |
| Net assets, end of year (000s) | | $ | 316 | | | $ | 6,155 | | | $ | 6,869 | | | $ | 699 | |
| Ratio of expenses to average net assets excluding fee waivers and reimbursements | | | 0.90 | %(d) | | | 1.17 | % | | | 1.25 | % | | | 2.36 | %(e) |
| Ratio of expenses to average net assets including fee waivers and reimbursements | | | 0.89 | % | | | 1.17 | % | | | 1.19 | % | | | 1.20 | %(e) |
| Ratio of net investment income to average net assets | | | 4.93 | % | | | 3.44 | % | | | 2.35 | % | | | 1.37 | %(e) |
| Portfolio turnover rate(f) | | | 176 | % | | | 187 | % | | | 211 | % | | | 66 | % |
| (a) | Calculated using the average shares method. |
| (b) | Less than $0.005 or ($0.005) per share. |
| (c) | Total returns are for the period indicated and have not been annualized. Total returns would have been lower had certain expenses not been waived during the period. Returns shown do not reflect the deduction of taxes that a shareholder would pay on Fund distributions or the redemption of Fund shares. |
| (d) | According to the Fund's shareholder services plan with respect to the Fund's Investor Class shares, any amount of fees accrued according to the plan, but not paid during the Fund's fiscal year for such service activities shall be reimbursed to the Fund as soon as practical. |
| (f) | Portfolio turnover rate for periods less than one full year have not been annualized. |
See Notes to Financial Statements.
ALPS | Smith Credit Opportunities Fund – Class A
Financial Highlights
Selected data for a share of beneficial interest outstanding throughout the periods indicated:
| | | For the Year Ended October 31, 2023 | | | For the Year Ended October 31, 2022 | | | For the Year Ended October 31, 2021 | | | For the Period September 16, 2020 (Commencement of Operations) to October 31, 2020 | |
| Net asset value, beginning of period | | $ | 8.83 | | | $ | 10.45 | | | $ | 9.96 | | | $ | 10.00 | |
| | | | | | | | | | | | | | | | | |
| INCOME FROM INVESTMENT OPERATIONS: | | | | | | | | | | | | | | | | |
| Net investment income(a) | | | 0.44 | | | | 0.33 | | | | 0.25 | | | | 0.02 | |
| Net realized and unrealized gain/(loss) | | | (0.32 | ) | | | (1.58 | ) | | | 0.51 | | | | (0.04 | ) |
| Total from investment operations | | | 0.12 | | | | (1.25 | ) | | | 0.76 | | | | (0.02 | ) |
| | | | | | | | | | | | | | | | | |
| DISTRIBUTIONS: | | | | | | | | | | | | | | | | |
| From net investment income | | | (0.44 | ) | | | (0.33 | ) | | | (0.25 | ) | | | (0.02 | ) |
| From net realized gains | | | – | | | | (0.04 | ) | | | (0.02 | ) | | | – | |
| From tax return of capital | | | – | | | | (0.00 | )(b) | | | – | | | | – | |
| Total distributions | | | (0.44 | ) | | | (0.37 | ) | | | (0.27 | ) | | | (0.02 | ) |
| | | | | | | | | | | | | | | | | |
| Net increase/(decrease) in net asset value | | | (0.32 | ) | | | (1.62 | ) | | | 0.49 | | | | (0.04 | ) |
| Net asset value, end of year | | $ | 8.51 | | | $ | 8.83 | | | $ | 10.45 | | | $ | 9.96 | |
| TOTAL RETURN(c) | | | 1.28 | % | | | (12.18 | )% | | | 7.65 | % | | | (0.22 | )% |
| | | | | | | | | | | | | | | | | |
| RATIOS/SUPPLEMENTAL DATA: | | | | | | | | | | | | | | | | |
| Net assets, end of year (000s) | | $ | 1,200 | | | $ | 1,088 | | | $ | 1,217 | | | $ | 996 | |
| Ratio of expenses to average net assets excluding fee waivers and reimbursements | | | 1.16 | % | | | 1.16 | % | | | 1.26 | % | | | 2.38 | %(d) |
| Ratio of expenses to average net assets including fee waivers and reimbursements | | | 1.13 | % | | | 1.16 | % | | | 1.16 | % | | | 1.20 | %(d) |
| Ratio of net investment income to average net assets | | | 4.96 | % | | | 3.45 | % | | | 2.41 | % | | | 1.33 | %(d) |
| Portfolio turnover rate(e) | | | 176 | % | | | 187 | % | | | 211 | % | | | 66 | % |
| (a) | Calculated using the average shares method. |
| (b) | Less than $0.005 or ($0.005) per share. |
| (c) | Total returns are for the period indicated and have not been annualized. Total returns would have been lower had certain expenses not been waived during the period. Returns shown do not reflect the deduction of taxes that a shareholder would pay on Fund distributions or the redemption of Fund shares. Returns shown exclude any applicable sales charges. |
| (e) | Portfolio turnover rate for periods less than one full year have not been annualized. |
See Notes to Financial Statements.
ALPS | Smith Credit Opportunities Fund – Class C
Financial Highlights
Selected data for a share of beneficial interest outstanding throughout the periods indicated:
| | | For the Year Ended October 31, 2023 | | | For the Year Ended October 31, 2022 | | | For the Year Ended October 31, 2021 | | | For the Period September 16, 2020 (Commencement of Operations) to October 31, 2020 | |
| Net asset value, beginning of period | | $ | 8.82 | | | $ | 10.45 | | | $ | 9.96 | | | $ | 10.00 | |
| | | | | | | | | | | | | | | | | |
| INCOME FROM INVESTMENT OPERATIONS: | | | | | | | | | | | | | | | | |
| Net investment income(a) | | | 0.37 | | | | 0.26 | | | | 0.17 | | | | 0.01 | |
| Net realized and unrealized gain/(loss) | | | (0.31 | ) | | | (1.59 | ) | | | 0.52 | | | | (0.04 | ) |
| Total from investment operations | | | 0.06 | | | | (1.33 | ) | | | 0.69 | | | | (0.03 | ) |
| | | | | | | | | | | | | | | | | |
| DISTRIBUTIONS: | | | | | | | | | | | | | | | | |
| From net investment income | | | (0.37 | ) | | | (0.26 | ) | | | (0.18 | ) | | | (0.01 | ) |
| From net realized gains | | | – | | | | (0.04 | ) | | | (0.02 | ) | | | – | |
| From tax return of capital | | | – | | | | (0.00 | )(b) | | | – | | | | – | |
| Total distributions | | | (0.37 | ) | | | (0.30 | ) | | | (0.19 | ) | | | (0.01 | ) |
| | | | | | | | | | | | | | | | | |
| Net increase/(decrease) in net asset value | | | (0.31 | ) | | | (1.63 | ) | | | 0.49 | | | | (0.04 | ) |
| Net asset value, end of year | | $ | 8.51 | | | $ | 8.82 | | | $ | 10.45 | | | $ | 9.96 | |
| TOTAL RETURN(c) | | | 0.65 | % | | | (12.91 | )% | | | 6.88 | % | | | (0.31 | )% |
| | | | | | | | | | | | | | | | | |
| RATIOS/SUPPLEMENTAL DATA: | | | | | | | | | | | | | | | | |
| Net assets, end of year (000s) | | $ | 425 | | | $ | 617 | | | $ | 682 | | | $ | 498 | |
| Ratio of expenses to average net assets excluding fee waivers and reimbursements | | | 1.93 | % | | | 1.90 | % | | | 2.00 | % | | | 3.09 | %(d) |
| Ratio of expenses to average net assets including fee waivers and reimbursements | | | 1.90 | % | | | 1.90 | % | | | 1.90 | % | | | 1.90 | %(d) |
| Ratio of net investment income to average net assets | | | 4.17 | % | | | 2.71 | % | | | 1.67 | % | | | 0.63 | %(d) |
| Portfolio turnover rate(e) | | | 176 | % | | | 187 | % | | | 211 | % | | | 66 | % |
| (a) | Calculated using the average shares method. |
| (b) | Less than $0.005 or ($0.005) per share. |
| (c) | Total returns are for the period indicated and have not been annualized. Total returns would have been lower had certain expenses not been waived during the period. Returns shown do not reflect the deduction of taxes that a shareholder would pay on Fund distributions or the redemption of Fund shares. Returns shown exclude any applicable sales charges. |
| (e) | Portfolio turnover rate for periods less than one full year have not been annualized. |
See Notes to Financial Statements.
ALPS | Smith Credit Opportunities Fund – Class I
Financial Highlights
Selected data for a share of beneficial interest outstanding throughout the periods indicated:
| | | For the Year Ended October 31, 2023 | | | For the Year Ended October 31, 2022 | | | For the Year Ended October 31, 2021 | | | For the Period September 16, 2020 (Commencement of Operations) to October 31, 2020 | |
| Net asset value, beginning of period | | $ | 8.83 | | | $ | 10.45 | | | $ | 9.97 | | | $ | 10.00 | |
| | | | | | | | | | | | | | | | | |
| INCOME FROM INVESTMENT OPERATIONS: | | | | | | | | | | | | | | | | |
| Net investment income(a) | | | 0.46 | | | | 0.35 | | | | 0.28 | | | | 0.02 | |
| Net realized and unrealized gain/(loss) | | | (0.32 | ) | | | (1.57 | ) | | | 0.50 | | | | (0.03 | ) |
| Total from investment operations | | | 0.14 | | | | (1.22 | ) | | | 0.78 | | | | (0.01 | ) |
| | | | | | | | | | | | | | | | | |
| DISTRIBUTIONS: | | | | | | | | | | | | | | | | |
| From net investment income | | | (0.46 | ) | | | (0.36 | ) | | | (0.28 | ) | | | (0.02 | ) |
| From net realized gains | | | – | | | | (0.04 | ) | | | (0.02 | ) | | | – | |
| From tax return of capital | | | – | | | | (0.00 | )(b) | | | – | | | | – | |
| Total distributions | | | (0.46 | ) | | | (0.40 | ) | | | (0.30 | ) | | | (0.02 | ) |
| | | | | | | | | | | | | | | | | |
| Net increase/(decrease) in net asset value | | | (0.32 | ) | | | (1.62 | ) | | | 0.48 | | | | (0.03 | ) |
| Net asset value, end of year | | $ | 8.51 | | | $ | 8.83 | | | $ | 10.45 | | | $ | 9.97 | |
| TOTAL RETURN(c) | | | 1.55 | % | | | (11.94 | )% | | | 7.83 | % | | | (0.15 | )% |
| | | | | | | | | | | | | | | | | |
| RATIOS/SUPPLEMENTAL DATA: | | | | | | | | | | | | | | | | |
| Net assets, end of year (000s) | | $ | 213,705 | | | $ | 284,247 | | | $ | 298,535 | | | $ | 25,051 | |
| Ratio of expenses to average net assets excluding fee waivers and reimbursements | | | 0.96 | % | | | 0.93 | % | | | 1.03 | % | | | 1.86 | %(d) |
| Ratio of expenses to average net assets including fee waivers and reimbursements | | | 0.90 | % | | | 0.90 | % | | | 0.90 | % | | | 0.90 | %(d) |
| Ratio of net investment income to average net assets | | | 5.17 | % | | | 3.70 | % | | | 2.66 | % | | | 1.79 | %(d) |
| Portfolio turnover rate(e) | | | 176 | % | | | 187 | % | | | 211 | % | | | 66 | % |
| (a) | Calculated using the average shares method. |
| (b) | Less than $0.005 or ($0.005) per share. |
| (c) | Total returns are for the period indicated and have not been annualized. Total returns would have been lower had certain expenses not been waived during the period. Returns shown do not reflect the deduction of taxes that a shareholder would pay on Fund distributions or the redemption of Fund shares. |
| (e) | Portfolio turnover rate for periods less than one full year have not been annualized. |
See Notes to Financial Statements.
ALPS | Smith Balanced Opportunity Fund – Investor Class
Financial Highlights
Selected data for a share of beneficial interest outstanding throughout the periods indicated:
| | | For the Year Ended October 31, 2023 | | | For the Year Ended October 31, 2022 | | | For the Year Ended October 31, 2021 | | | For the Period September 16, 2020 (Commencement of Operations) to October 31, 2020 | |
| Net asset value, beginning of period | | $ | 10.22 | | | $ | 12.19 | | | $ | 9.88 | | | $ | 10.00 | |
| | | | | | | | | | | | | | | | | |
| INCOME FROM INVESTMENT OPERATIONS: | | | | | | | | | | | | | | | | |
| Net investment income(a) | | | 0.17 | | | | 0.10 | | | | 0.04 | | | | 0.00 | (b) |
| Net realized and unrealized gain/(loss) | | | 0.35 | | | | (1.94 | ) | | | 2.32 | | | | (0.12 | ) |
| Total from investment operations | | | 0.52 | | | | (1.84 | ) | | | 2.36 | | | | (0.12 | ) |
| | | | | | | | | | | | | | | | | |
| DISTRIBUTIONS: | | | | | | | | | | | | | | | | |
| From net investment income | | | (0.18 | ) | | | (0.11 | ) | | | (0.05 | ) | | | (0.00 | )(b) |
| From net realized gains | | | – | | | | (0.02 | ) | | | – | | | | – | |
| From tax return of capital | | | – | | | | (0.00 | )(b) | | | – | | | | – | |
| Total distributions | | | (0.18 | ) | | | (0.13 | ) | | | (0.05 | ) | | | (0.00 | )(b) |
| | | | | | | | | | | | | | | | | |
| Net increase/(decrease) in net asset value | | | 0.34 | | | | (1.97 | ) | | | 2.31 | | | | (0.12 | ) |
| Net asset value, end of year | | $ | 10.56 | | | $ | 10.22 | | | $ | 12.19 | | | $ | 9.88 | |
| TOTAL RETURN(c) | | | 5.09 | % | | | (15.17 | )% | | | 23.95 | % | | | (1.18 | )% |
| | | | | | | | | | | | | | | | | |
| RATIOS/SUPPLEMENTAL DATA: | | | | | | | | | | | | | | | | |
| Net assets, end of year (000s) | | $ | 582 | | | $ | 651 | | | $ | 784 | | | $ | 601 | |
| Ratio of expenses to average net assets excluding fee waivers and reimbursements | | | 1.82 | % | | | 1.56 | % | | | 1.67 | % | | | 3.00 | %(d) |
| Ratio of expenses to average net assets including fee waivers and reimbursements | | | 1.09 | % | | | 1.12 | % | | | 1.12 | % | | | 1.15 | %(d) |
| Ratio of net investment income to average net assets | | | 1.60 | % | | | 0.86 | % | | | 0.38 | % | | | 0.25 | %(d) |
| Portfolio turnover rate(e) | | | 74 | % | | | 108 | % | | | 126 | % | | | 26 | % |
| (a) | Calculated using the average shares method. |
| (b) | Less than $0.005 or ($0.005) per share. |
| (c) | Total returns are for the period indicated and have not been annualized. Total returns would have been lower had certain expenses not been waived during the period. Returns shown do not reflect the deduction of taxes that a shareholder would pay on Fund distributions or the redemption of Fund shares. |
| (e) | Portfolio turnover rate for periods less than one full year have not been annualized. |
See Notes to Financial Statements.
ALPS | Smith Balanced Opportunity Fund – Class A
Financial Highlights
Selected data for a share of beneficial interest outstanding throughout the periods indicated:
| | | For the Year Ended October 31, 2023 | | | For the Year Ended October 31, 2022 | | | For the Year Ended October 31, 2021 | | | For the Period September 16, 2020 (Commencement of Operations) to October 31, 2020 | |
| Net asset value, beginning of period | | $ | 10.22 | | | $ | 12.19 | | | $ | 9.88 | | | $ | 10.00 | |
| | | | | | | | | | | | | | | | | |
| INCOME FROM INVESTMENT OPERATIONS: | | | | | | | | | | | | | | | | |
| Net investment income(a) | | | 0.17 | | | | 0.10 | | | | 0.04 | | | | 0.00 | (b) |
| Net realized and unrealized gain/(loss) | | | 0.35 | | | | (1.94 | ) | | | 2.32 | | | | (0.12 | ) |
| Total from investment operations | | | 0.52 | | | | (1.84 | ) | | | 2.36 | | | | (0.12 | ) |
| | | | | | | | | | | | | | | | | |
| DISTRIBUTIONS: | | | | | | | | | | | | | | | | |
| From net investment income | | | (0.18 | ) | | | (0.11 | ) | | | (0.05 | ) | | | (0.00 | )(b) |
| From net realized gains | | | – | | | | (0.02 | ) | | | – | | | | – | |
| From tax return of capital | | | – | | | | (0.00 | )(b) | | | – | | | | – | |
| Total distributions | | | (0.18 | ) | | | (0.13 | ) | | | (0.05 | ) | | | (0.00 | )(b) |
| | | | | | | | | | | | | | | | | |
| Net increase/(decrease) in net asset value | | | 0.34 | | | | (1.97 | ) | | | 2.31 | | | | (0.12 | ) |
| Net asset value, end of year | | $ | 10.56 | | | $ | 10.22 | | | $ | 12.19 | | | $ | 9.88 | |
| TOTAL RETURN(c) | | | 5.06 | % | | | (15.16 | )% | | | 23.96 | % | | | (1.16 | )% |
| | | | | | | | | | | | | | | | | |
| RATIOS/SUPPLEMENTAL DATA: | | | | | | | | | | | | | | | | |
| Net assets, end of year (000s) | | $ | 1,056 | | | $ | 1,063 | | | $ | 1,219 | | | $ | 988 | |
| Ratio of expenses to average net assets excluding fee waivers and reimbursements | | | 1.87 | % | | | 1.56 | % | | | 1.66 | % | | | 3.03 | %(d) |
| Ratio of expenses to average net assets including fee waivers and reimbursements | | | 1.12 | % | | | 1.11 | % | | | 1.11 | % | | | 1.15 | %(d) |
| Ratio of net investment income to average net assets | | | 1.57 | % | | | 0.87 | % | | | 0.39 | % | | | 0.26 | %(d) |
| Portfolio turnover rate(e) | | | 74 | % | | | 108 | % | | | 126 | % | | | 26 | % |
| (a) | Calculated using the average shares method. |
| (b) | Less than $0.005 or ($0.005) per share. |
| (c) | Total returns are for the period indicated and have not been annualized. Total returns would have been lower had certain expenses not been waived during the period. Returns shown do not reflect the deduction of taxes that a shareholder would pay on Fund distributions or the redemption of Fund shares. Returns shown exclude any applicable sales charges. |
| (e) | Portfolio turnover rate for periods less than one full year have not been annualized. |
See Notes to Financial Statements.
ALPS | Smith Balanced Opportunity Fund – Class C
Financial Highlights
Selected data for a share of beneficial interest outstanding throughout the periods indicated:
| | | For the Year Ended October 31, 2023 | | | For the Year Ended October 31, 2022 | | | For the Year Ended October 31, 2021 | | | For the Period September 16, 2020 (Commencement of Operations) to October 31, 2020 | |
| Net asset value, beginning of period | | $ | 10.17 | | | $ | 12.14 | | | $ | 9.88 | | | $ | 10.00 | |
| | | | | | | | | | | | | | | | | |
| INCOME FROM INVESTMENT OPERATIONS: | | | | | | | | | | | | | | | | |
| Net investment income/(loss)(a) | | | 0.09 | | | | 0.01 | | | | (0.04 | ) | | | (0.01 | ) |
| Net realized and unrealized gain/(loss) | | | 0.35 | | | | (1.92 | ) | | | 2.31 | | | | (0.11 | ) |
| Total from investment operations | | | 0.44 | | | | (1.91 | ) | | | 2.27 | | | | (0.12 | ) |
| | | | | | | | | | | | | | | | | |
| DISTRIBUTIONS: | | | | | | | | | | | | | | | | |
| From net investment income | | | (0.10 | ) | | | (0.04 | ) | | | (0.01 | ) | | | – | |
| From net realized gains | | | – | | | | (0.02 | ) | | | – | | | | – | |
| From tax return of capital | | | – | | | | (0.00 | )(b) | | | – | | | | – | |
| Total distributions | | | (0.10 | ) | | | (0.06 | ) | | | (0.01 | ) | | | – | |
| | | | | | | | | | | | | | | | | |
| Net increase/(decrease) in net asset value | | | 0.34 | | | | (1.97 | ) | | | 2.26 | | | | (0.12 | ) |
| Net asset value, end of year | | $ | 10.51 | | | $ | 10.17 | | | $ | 12.14 | | | $ | 9.88 | |
| TOTAL RETURN(c) | | | 4.32 | % | | | (15.81 | )% | | | 22.93 | % | | | (1.20 | )% |
| | | | | | | | | | | | | | | | | |
| RATIOS/SUPPLEMENTAL DATA: | | | | | | | | | | | | | | | | |
| Net assets, end of year (000s) | | $ | 528 | | | $ | 524 | | | $ | 607 | | | $ | 494 | |
| Ratio of expenses to average net assets excluding fee waivers and reimbursements | | | 2.60 | % | | | 2.30 | % | | | 2.40 | % | | | 3.73 | %(d) |
| Ratio of expenses to average net assets including fee waivers and reimbursements | | | 1.85 | % | | | 1.85 | % | | | 1.85 | % | | | 1.85 | %(d) |
| Ratio of net investment income/(loss) to average net assets | | | 0.84 | % | | | 0.13 | % | | | (0.35 | )% | | | (0.44 | )%(d) |
| Portfolio turnover rate(e) | | | 74 | % | | | 108 | % | | | 126 | % | | | 26 | % |
| (a) | Calculated using the average shares method. |
| (b) | Less than $0.005 or ($0.005) per share. |
| (c) | Total returns are for the period indicated and have not been annualized. Total returns would have been lower had certain expenses not been waived during the period. Returns shown do not reflect the deduction of taxes that a shareholder would pay on Fund distributions or the redemption of Fund shares. Returns shown exclude any applicable sales charges. |
| (e) | Portfolio turnover rate for periods less than one full year have not been annualized. |
See Notes to Financial Statements.
ALPS | Smith Balanced Opportunity Fund – Class I
Financial Highlights
Selected data for a share of beneficial interest outstanding throughout the periods indicated:
| | | For the Year Ended October 31, 2023 | | | For the Year Ended October 31, 2022 | | | For the Year Ended October 31, 2021 | | | For the Period September 16, 2020 (Commencement of Operations) to October 31, 2020 | |
| Net asset value, beginning of period | | $ | 10.22 | | | $ | 12.19 | | | $ | 9.88 | | | $ | 10.00 | |
| | | | | | | | | | | | | | | | | |
| INCOME FROM INVESTMENT OPERATIONS: | | | | | | | | | | | | | | | | |
| Net investment income(a) | | | 0.20 | | | | 0.12 | | | | 0.08 | | | | 0.01 | |
| Net realized and unrealized gain/(loss) | | | 0.35 | | | | (1.93 | ) | | | 2.31 | | | | (0.12 | ) |
| Total from investment operations | | | 0.55 | | | | (1.81 | ) | | | 2.39 | | | | (0.11 | ) |
| | | | | | | | | | | | | | | | | |
| DISTRIBUTIONS: | | | | | | | | | | | | | | | | |
| From net investment income | | | (0.21 | ) | | | (0.14 | ) | | | (0.08 | ) | | | (0.01 | ) |
| From net realized gains | | | – | | | | (0.02 | ) | | | – | | | | – | |
| From tax return of capital | | | – | | | | (0.00 | )(b) | | | – | | | | – | |
| Total distributions | | | (0.21 | ) | | | (0.16 | ) | | | (0.08 | ) | | | (0.01 | ) |
| | | | | | | | | | | | | | | | | |
| Net increase/(decrease) in net asset value | | | 0.34 | | | | (1.97 | ) | | | 2.31 | | | | (0.12 | ) |
| Net asset value, end of year | | $ | 10.56 | | | $ | 10.22 | | | $ | 12.19 | | | $ | 9.88 | |
| TOTAL RETURN(c) | | | 5.37 | % | | | (14.93 | )% | | | 24.28 | % | | | (1.15 | )% |
| | | | | | | | | | | | | | | | | |
| RATIOS/SUPPLEMENTAL DATA: | | | | | | | | | | | | | | | | |
| Net assets, end of year (000s) | | $ | 17,990 | | | $ | 24,176 | | | $ | 37,410 | | | $ | 12,289 | |
| Ratio of expenses to average net assets excluding fee waivers and reimbursements | | | 1.72 | % | | | 1.41 | % | | | 1.39 | % | | | 2.69 | %(d) |
| Ratio of expenses to average net assets including fee waivers and reimbursements | | | 0.85 | % | | | 0.85 | % | | | 0.85 | % | | | 0.85 | %(d) |
| Ratio of net investment income to average net assets | | | 1.83 | % | | | 1.10 | % | | | 0.67 | % | | | 0.57 | %(d) |
| Portfolio turnover rate(e) | | | 74 | % | | | 108 | % | | | 126 | % | | | 26 | % |
| (a) | Calculated using the average shares method. |
| (b) | Less than $0.005 or ($0.005) per share. |
| (c) | Total returns are for the period indicated and have not been annualized. Total returns would have been lower had certain expenses not been waived during the period. Returns shown do not reflect the deduction of taxes that a shareholder would pay on Fund distributions or the redemption of Fund shares. |
| (e) | Portfolio turnover rate for periods less than one full year have not been annualized. |
See Notes to Financial Statements.
Notes to Financial Statements
October 31, 2023
1. ORGANIZATION
Financial Investors Trust (the “Trust”), a Delaware statutory trust, is an open-end management investment company registered under the Investment Company Act of 1940, as amended (“1940 Act”). The Trust consists of multiple separate portfolios or series. This annual report includes the financial statements and financial highlights of the ALPS | Smith Short Duration Bond Fund, ALPS | Smith Total Return Bond Fund, ALPS | Smith Credit Opportunities Fund and ALPS |Smith Balanced Opportunity Fund (each, a “Fund” and collectively, the “Funds”).
The ALPS | Smith Total Return Bond Fund seeks to obtain maximum total return, consistent with preservation of capital. The ALPS | Smith Short Duration Bond Fund seeks as high a level of current income as is consistent with preservation of capital. The ALPS | Smith Balanced Opportunity Fund seeks long-term capital growth, consistent with preservation of capital and balanced by current income. The ALPS | Smith Credit Opportunities Fund seeks to obtain maximum risk-adjusted return with a secondary focus on high current income.
The classes of each Fund differ principally in the applicable distribution and shareholder service fees. Shareholders of each class also bear certain expenses that pertain to that particular class. All shareholders bear the common expenses of the Fund and earn income and realized gains/losses from the Fund pro rata based on the average daily net assets of each class, without distinction between share classes. Dividends to shareholders are determined separately for each class based on income and expenses allocable to each class. Realized gain distributions to shareholders are allocated to each class pro rata based on the shares outstanding of each class on the date of distribution. Differences in per share dividend rates generally result from differences in separate class expenses, including distribution and shareholder service fees, if applicable.
2. SIGNIFICANT ACCOUNTING POLICIES
The following is a summary of significant accounting policies consistently followed by each Fund in the preparation of its financial statements. Each Fund is considered an investment company for financial reporting purposes, and follows accounting policies in conformity with accounting principles generally accepted in the United States of America (“U.S. GAAP”), including policies specific to investment companies. The preparation of financial statements in conformity with U.S. GAAP requires management to make certain estimates and assumptions that affect the reported amounts of assets and liabilities and disclosures of contingent assets and liabilities at the date of the financial statements and the reported amounts of increases and decreases in net assets from operations during the reporting period. Actual results could differ from those estimates. The following is a summary of significant accounting policies consistently followed by the Funds and subsidiaries, as applicable, in preparation of their financial statements. The Funds are considered investment companies under U.S. GAAP and follow the accounting and reporting guidance applicable to investment companies in the Financial Accounting Standards Board Accounting Standards Codification Topic 946 "Financial Services -Investment Companies".
Investment Valuation: The Funds generally value their securities based on market prices determined at the close of regular trading on the New York Stock Exchange (“NYSE”), normally 4:00 p.m. Eastern Time, on each day the NYSE is open for trading. For equity securities and mutual funds that are traded on an exchange, the market price is usually the closing sale or official closing price on that exchange.
The market price for debt obligations is generally the price supplied by an independent third-party pricing service utilized by ALPS Advisors, Inc. (the "Adviser") as the valuation designee (the "Valuation Designee"), which may use a matrix, formula or other objective method that takes into consideration quotations from dealers, market transactions in comparable investments, market indices and yield curves. If vendors are unable to supply a price, or if the price supplied is deemed to be unreliable, the market price may be determined using quotations received from one or more brokers-dealers that make a market in the security. Investments in non-exchange traded funds are fair valued at their respective net asset values. Bonds may be purchased and held as odd lots. Pricing vendors generally value securities assuming orderly transactions of institutional round lot sizes, but a Fund may hold or transact in such securities in smaller, odd lot sizes. Special valuation considerations may apply with respect to a Fund’s odd-lot positions, as the Fund may receive different prices when it sells such positions than it would receive for sales of institutional round lot positions. The Funds have odd lot pricing policies they employ to value odd lot securities.
Pursuant to Rule 2a-5 under the Investment Company Act of 1940, the Trust’s Board of Trustees (the “Board” or "Trustees") has appointed the Adviser to serve as the Valuation Designee to perform fair value determinations for investments in the Funds. When such prices or quotations are not available, or when the Valuation Designee believes that they are unreliable, securities may be priced using fair value procedures approved by the Board. The fair valuation policies and procedures (“FV Procedures”) have been adopted by the Board for the fair valuation of portfolio assets held by the Funds in the event that (1) market quotations for the current price of a portfolio security or asset are not readily available, or (2) available market quotations that would otherwise be used to value a portfolio security or asset in accordance with the Funds' Pricing Procedures appear to be unreliable. The Pricing Procedures reflect certain pricing methodologies (or “logics”) that are not “readily available market quotations” and thus are viewed and treated as fair valuations. The Valuation Designee routinely meets to discuss fair valuations of portfolio securities and other instruments held by the Funds.
Notes to Financial Statements
October 31, 2023
Fair Value Measurements: The Funds disclose the classification of their fair value measurements following a three-tier hierarchy based on the inputs used to measure fair value. Inputs refer broadly to the assumptions that market participants would use in pricing the asset or liability, including assumptions about risk. Inputs may be observable or unobservable. Observable inputs reflect the assumptions market participants would use in pricing the asset or liability that are developed based on market data obtained from sources independent of the reporting entity. Unobservable inputs reflect the reporting entity’s own assumptions about the assumptions market participants would use in pricing the asset or liability that are developed based on the best information available.
Various inputs are used in determining the value of each Fund’s investments as of the end of the reporting period. When inputs used fall into different levels of the fair value hierarchy, the level in the hierarchy within which the fair value measurement falls is determined based on the lowest level input that is significant to the fair value measurement in its entirety. The designated input levels are not necessarily an indication of the risk or liquidity associated with these investments. These inputs are categorized in the following hierarchy under applicable financial accounting standards:
| Level 1 – | Unadjusted quoted prices in active markets for identical investments, unrestricted assets or liabilities that a Fund has the ability to access at the measurement date; |
| | |
| Level 2 – | Quoted prices which are not active, quoted prices for similar assets or liabilities in active markets or inputs other than quoted prices that are observable (either directly or indirectly) for substantially the full term of the asset or liability; and |
| | |
| Level 3 – | Significant unobservable prices or inputs (including the Fund’s own assumptions in determining the fair value of investments) where there is little or no market activity for the asset or liability at the measurement date. |
The following is a summary of each Fund’s investments/financial instruments in the fair value hierarchy as of October 31, 2023:
| Investments in Securities at Value | | Level 1 - Unadjusted Quoted Prices | | | Level 2 - Other Significant Observable Inputs | | | Level 3 - Significant Unobservable Inputs | | | Total | |
| ALPS | Smith Short Duration Bond Fund | | | | | | | | | | | | | | | | |
| Collateralized Mortgage Obligations | | $ | – | | | $ | 517,093 | | | $ | – | | | $ | 517,093 | |
| Commercial Mortgage-Backed Securities | | | – | | | | 264,406 | | | | – | | | | 264,406 | |
| Mortgage-Backed Securities | | | – | | | | 5,358,856 | | | | – | | | | 5,358,856 | |
| Corporate Bonds | | | – | | | | 471,468,145 | | | | – | | | | 471,468,145 | |
| Government Bonds | | | – | | | | 122,383,075 | | | | – | | | | 122,383,075 | |
| Short Term Investments | | | 191,552 | | | | – | | | | – | | | | 191,552 | |
| Total | | $ | 191,552 | | | $ | 599,991,575 | | | $ | – | | | $ | 600,183,127 | |
| Investments in Securities at Value | | Level 1 - Unadjusted Quoted Prices | | | Level 2 - Other Significant Observable Inputs | | | Level 3 - Significant Unobservable Inputs | | | Total | |
| ALPS | Smith Total Return Bond Fund | | | | | | | | | | | | | | | | |
| Bank Loans | | $ | – | | | $ | 3,935,225 | | | $ | – | | | $ | 3,935,225 | |
| Collateralized Mortgage Obligations | | | – | | | | 263,087,751 | | | | – | | | | 263,087,751 | |
| Commercial Mortgage-Backed Securities | | | – | | | | 62,603,578 | | | | – | | | | 62,603,578 | |
| Mortgage-Backed Securities | | | – | | | | 401,413,506 | | | | – | | | | 401,413,506 | |
| Corporate Bonds | | | 2,776,504 | | | | 897,002,859 | | | | – | | | | 899,779,363 | |
| Government Bonds | | | – | | | | 602,803,888 | | | | – | | | | 602,803,888 | |
| Preferred Stock | | | 11,954,347 | | | | 43,978,918 | | | | – | | | | 55,933,265 | |
| Short Term Investments | | | 41,115,689 | | | | – | | | | – | | | | 41,115,689 | |
| Total | | $ | 55,846,540 | | | $ | 2,274,825,725 | | | $ | – | | | $ | 2,330,672,265 | |
Notes to Financial Statements
October 31, 2023
| Investments in Securities at Value | | Level 1 - Unadjusted Quoted Prices | | | Level 2 - Other Significant Observable Inputs | | | Level 3 - Significant Unobservable Inputs | | | Total | |
| ALPS | Smith Credit Opportunities Fund | | | | | | | | | | | | | | | | |
| Bank Loans | | $ | – | | | $ | 590,968 | | | $ | – | | | $ | 590,968 | |
| Collateralized Mortgage Obligations | | | – | | | | 7,675,983 | | | | – | | | | 7,675,983 | |
| Commercial Mortgage-Backed Securities | | | – | | | | 3,084,503 | | | | – | | | | 3,084,503 | |
| Mortgage-Backed Securities | | | – | | | | 3,779,805 | | | | – | | | | 3,779,805 | |
| Corporate Bonds | | | 195,778 | | | | 177,591,274 | | | | – | | | | 177,787,052 | |
| Government Bonds | | | – | | | | 11,388,582 | | | | – | | | | 11,388,582 | |
| Preferred Stock | | | 499,596 | | | | 7,142,182 | | | | – | | | | 7,641,778 | |
| Short Term Investments | | | 1,010,279 | | | | – | | | | – | | | | 1,010,279 | |
| Total | | $ | 1,705,653 | | | $ | 211,253,297 | | | $ | – | | | $ | 212,958,950 | |
| Investments in Securities at Value | | Level 1 - Unadjusted Quoted Prices | | | Level 2 - Other Significant Observable Inputs | | | Level 3 - Significant Unobservable Inputs | | | Total | |
| ALPS | Smith Balanced Opportunity Fund | | | | | | | | | | | | | | | | |
| Common Stocks(a) | | $ | 12,334,579 | | | $ | – | | | $ | – | | | $ | 12,334,579 | |
| Collateralized Mortgage Obligations | | | – | | | | 968,188 | | | | – | | | | 968,188 | |
| Commercial Mortgage-Backed Securities | | | – | | | | 47,063 | | | | – | | | | 47,063 | |
| Mortgage-Backed Securities | | | – | | | | 904,304 | | | | – | | | | 904,304 | |
| Corporate Bonds | | | – | | | | 3,187,435 | | | | – | | | | 3,187,435 | |
| Government Bonds | | | – | | | | 2,284,244 | | | | – | | | | 2,284,244 | |
| Preferred Stock | | | 52,142 | | | | 191,516 | | | | – | | | | 243,658 | |
| Short Term Investments | | | 165,349 | | | | – | | | | – | | | | 165,349 | |
| Total | | $ | 12,552,070 | | | $ | 7,582,750 | | | $ | – | | | $ | 20,134,820 | |
| (a) | For detailed descriptions of sector and/or industry, see the accompanying Statement of Investments. |
For the year ended October 31, 2023, the Funds did not have any securities that used significant unobservable inputs (Level 3) in determining fair value.
Fund and Class Expenses: Some expenses of the Trust can be directly attributed to a Fund or a specific share class of a Fund. Expenses which cannot be directly attributed are apportioned among all Funds in the Trust based on average net assets of each share class within a Fund.
Federal Income Taxes: The Funds comply with the requirements under Subchapter M of the Internal Revenue Code of 1986, as amended (the “Code”) applicable to regulated investment companies and intend to distribute substantially all of their net taxable income and net capital gains, if any, each year. The Funds are not subject to income taxes to the extent such distributions are made.
As of and during the fiscal year ended October 31, 2023, the Funds did not have a liability for any unrecognized tax benefits. The Funds recognize interest and penalties, if any, related to tax liabilities as income tax expense in the Statements of Operations. The Funds file U.S. federal, state, and local tax returns as required. The Funds’ tax returns are subject to examination by the relevant tax authorities until expiration of the applicable statute of limitations which is generally three years after the filing of the tax return, but may extend to four years in certain jurisdictions. Tax returns for open years have incorporated no uncertain tax positions that require a provision for income taxes.
Distributions to Shareholders: Each Fund normally pays dividends, if any, on a monthly basis and distributes capital gains, if any, annually. Income dividend distributions are derived from interest, dividends, and other income a Fund receives from its investments, including distributions of short-term capital gains. Capital gain distributions are derived from gains realized when a Fund sells a security it has owned for more than a year or from long-term capital gain distributions from underlying investments. Each Fund may make additional distributions and dividends at other times if its portfolio manager or managers believe doing so may be necessary for the Fund to avoid or reduce taxes.
Investment Transactions and Investment Income: Investment transactions are accounted for on the date the investments are purchased or sold (trade date basis). Net realized gains and losses from investment transactions are reported on an identified cost basis. Interest income, which includes accretion of discounts and amortization of premiums, is accrued and recorded as earned. Dividend income is recognized on the ex-dividend date or for certain foreign securities, as soon as information is available to each Fund. Withholding taxes on foreign dividends are paid (a
Notes to Financial Statements
October 31, 2023
portion of which may be reclaimable) or provided for in accordance with the applicable country's tax rules and rates and are disclosed in the Statements of Operations.
Real Estate Investment Trusts (“REITs”): The Funds may invest a portion of their assets in REITs and are subject to certain risks associated with direct investment in REITs. REITs may be affected by changes in the value of their underlying properties and by defaults by borrowers or tenants. REITs depend generally on their ability to generate cash flow to make distributions to shareowners, and certain REITs have self-liquidation provisions by which mortgages held may be paid in full and distributions of capital returns may be made at any time. In addition, the performance of a REIT may be affected by its failure to qualify for tax-free pass-through of income under the Code, or its failure to maintain exemption from registration under the 1940 Act. Distributions that the Fund receives from REITs can be classified as ordinary income, capital gain income or return of capital by the REITs that make these distributions to the Fund. However, it is not possible for the Fund to characterize distributions received from REITs during interim periods because the REIT issuers do not report their tax characterizations until subsequent to year end. During interim periods, the REIT distributions are accounted for as ordinary income until the re characterizations are made subsequent to year end.
Treasury Inflation Protected-Securities (“TIPS”): The Funds may invest in TIPS, including structured bonds in which the principal amount is adjusted daily to keep pace with inflation, as measured by the U.S. Consumer Pricing Index for Urban Consumers. The adjustments to principal due to inflation/deflation are reflected as increases/decreases to interest income with a corresponding adjustment to cost. Such adjustments may have a significant impact on a Fund’s distributions and may result in a return of capital to shareholders. The repayment of the original bond principal upon maturity is guaranteed by the full faith and credit of the U.S. Government.
Loan Participations and Assignments: Certain Funds may invest in loan participations and assignments. The Fund considers loan participations and assignments to be investments in debt securities. Loan participations typically will result in the Fund having a contractual relationship only with the lender, not with the borrower. The Fund will have the right to receive payments of principal, interest and any fees to which it is entitled only from the lender selling the participation and only upon receipt by the lender of the payments from the borrower. Under a loan participation, the Fund generally will have no right to enforce compliance by the borrower with the terms of the loan agreement relating to the loan, nor any rights of set-off against the borrower, and the Fund may not benefit directly from any collateral supporting the loan in which it has purchased the participation. As a result, the Fund will assume the credit risk of both the borrower and the lender that is selling the participation. In the event of the insolvency of the lender selling a participation, the Fund may be treated as a general creditor of the lender and may not benefit from any set-off between the lender and the borrower. When the Fund purchases assignments of loans from lenders, the Fund will acquire direct rights against the borrower on the loan, except that under certain circumstances such rights may be more limited than those held by the assigning lender.
3. TAX BASIS INFORMATION
Tax Basis of Distributions to Shareholders: The character of distributions made during the year from net investment income or net realized gains may differ from its ultimate characterization for federal income tax purposes. Also, due to the timing of dividend distributions, the fiscal year in which amounts are distributed may differ from the fiscal year in which the income or realized gain were recorded by a Fund. The amounts and characteristics of tax basis distributions and composition of distributable earnings/(accumulated losses) are finalized at fiscal year-end.
The tax character of distributions paid by the Funds for the fiscal year ended October 31, 2023 were as follows:
| Fund | | Ordinary Income | | | Long-Term Capital Gain | |
| ALPS | Smith Short Duration Bond Fund | | $ | 25,706,335 | | | $ | – | |
| ALPS | Smith Total Return Bond Fund | | | 82,393,989 | | | | – | |
| ALPS | Smith Credit Opportunities Fund | | | 12,125,733 | | | | – | |
| ALPS | Smith Balanced Opportunity Fund | | | 433,359 | | | | – | |
The tax character of distributions paid by the Funds for the fiscal year ended October 31, 2022 were as follows:
| Fund | | Ordinary Income | | | Long-Term Capital Gain | | | Return of Capital | |
| ALPS | Smith Short Duration Bond Fund | | $ | 10,319,191 | | | $ | 461,598 | | | | – | |
| ALPS | Smith Total Return Bond Fund | | | 48,395,387 | | | | – | | | | 164,536 | |
| ALPS | Smith Credit Opportunities Fund | | | 11,785,660 | | | | 15,464 | | | | 150,396 | |
| ALPS | Smith Balanced Opportunity Fund | | | 446,229 | | | | 14,205 | | | | 902 | |
Notes to Financial Statements
October 31, 2023
Components of Distributable Earnings on a Tax Basis: At October 31, 2023, permanent differences in book and tax accounting were reclassified. These differences had no effect on net assets and were primarily attributed to net operating losses and taxable overdistributions.
For the fiscal year ended October 31, 2023, the following reclassifications, which had no impact on results of operations or net assets, were recorded to reflect tax character:
| Fund | | Paid-in Capital | | | Distributable earnings | |
| ALPS | Smith Short Duration Bond Fund | | $ | (1,026 | ) | | $ | 1,026 | |
| ALPS | Smith Total Return Bond Fund | | | (111,540 | ) | | | 111,540 | |
| ALPS | Smith Credit Opportunities Fund | | | 97,354 | | | | (97,354 | ) |
| ALPS | Smith Balanced Opportunity Fund | | | (1,103 | ) | | | 1,103 | |
As of October 31, 2023, the components of distributable earnings/(accumulated losses) on a tax basis were as follows:
| | | Undistributed net investment income | | | Accumulated net realized gain/(loss) on investments | | | Other cumulative effect of timing differences | | | Net unrealized appreciation/ (depreciation) on investments | | | Total | |
| ALPS | Smith Short Duration Bond Fund | | $ | – | | | $ | (24,976,227 | ) | | $ | – | | | $ | (10,353,506 | ) | | $ | (35,329,733 | ) |
| ALPS | Smith Total Return Bond Fund | | | – | | | | (216,815,567 | ) | | | – | | | | (193,326,665 | ) | | | (410,142,232 | ) |
| ALPS | Smith Credit Opportunities Fund | | | 18,104 | | | | (40,988,901 | ) | | | – | | | | (13,634,183 | ) | | | (54,604,980 | ) |
| ALPS | Smith Balanced Opportunity Fund | | | – | | | | (1,552,321 | ) | | | – | | | | 1,093,499 | | | | (458,822 | ) |
Capital Losses: Under current law, capital losses maintain their character as short-term or long-term and are carried forward to the next tax year without expiration. As of October 31, 2023 the following amounts are available as carry forwards to the next tax year:
| Fund | | Short-Term | | | Long-Term | |
| ALPS | Smith Short Duration Bond Fund | | $ | 19,265,259 | | | $ | 5,710,968 | |
| ALPS | Smith Total Return Bond Fund | | | 136,969,631 | | | | 79,845,937 | |
| ALPS | Smith Credit Opportunities Fund | | | 20,672,760 | | | | 20,316,141 | |
| ALPS | Smith Balanced Opportunity Fund | | | 1,345,611 | | | | 206,710 | |
Unrealized Appreciation and Depreciation on Investments: As of October 31, 2023, the costs of investments for federal income tax purposes and accumulated net unrealized appreciation/(depreciation) on investments were as follows:
| Fund | | Gross Appreciation (excess of value over tax cost) | | | Gross Depreciation (excess of tax cost over value) | | | Net Unrealized Appreciation/ (Depreciation) | | | Cost of Investments for Income Tax Purposes | |
| ALPS | Smith Short Duration Bond Fund | | $ | 96,390 | | | $ | (10,449,896 | ) | | $ | (10,353,506 | ) | | $ | 610,536,633 | |
| ALPS | Smith Total Return Bond Fund | | | 1,621,634 | | | | (194,948,299 | ) | | | (193,326,665 | ) | | | 2,523,998,930 | |
| ALPS | Smith Credit Opportunities Fund | | | 430,470 | | | | (14,064,653 | ) | | | (13,634,183 | ) | | | 226,593,133 | |
| ALPS | Smith Balanced Opportunity Fund | | | 2,488,052 | | | | (1,394,553 | ) | | | 1,093,499 | | | | 19,041,321 | |
The differences between book cost and tax cost of investments and unrealized appreciation/depreciation are primarily attributed to the tax deferral of losses on wash sales and trust preferred basis adjustments.
4. SECURITIES TRANSACTIONS
Purchases and sales of securities, excluding short-term securities and U.S. Government Obligations during the fiscal year ended October 31, 2023 were as follows:
| Fund | | Purchases of Securities | | | Proceeds from Sales of Securities | |
| ALPS | Smith Short Duration Bond Fund | | $ | 482,356,286 | | | $ | 481,427,668 | |
| ALPS | Smith Total Return Bond Fund | | | 1,654,875,692 | | | | 965,798,781 | |
| ALPS | Smith Credit Opportunities Fund | | | 265,626,723 | | | | 289,475,043 | |
| ALPS | Smith Balanced Opportunity Fund | | | 8,669,387 | | | | 13,277,867 | |
Notes to Financial Statements
October 31, 2023
Purchases and sales of U.S. Government Obligations during the fiscal year ended October 31, 2023 were as follows:
| Fund | | Purchases of Securities | | | Proceeds from Sales of Securities | |
| ALPS | Smith Short Duration Bond Fund | | $ | 475,970,672 | | | $ | 565,702,135 | |
| ALPS | Smith Total Return Bond Fund | | | 1,856,292,541 | | | | 1,703,966,534 | |
| ALPS | Smith Credit Opportunities Fund | | | 140,902,181 | | | | 165,748,554 | |
| ALPS | Smith Balanced Opportunity Fund | | | 7,749,915 | | | | 8,505,161 | |
5. BENEFICIAL INTEREST TRANSACTIONS
Effective December 20, 2019, the ALPS | Smith Total Return Bond Fund and ALPS | Smith Short Duration Bond Fund do not incur redemption fees.
Transactions in shares of capital stock were as follows:
| | | ALPS | Smith Short Duration Bond Fund | |
| | | For the Year Ended October 31, 2023 | | | For the Year Ended October 31, 2022 | |
| Investor Class | | | | | | | | |
| Shares sold | | | 977,756 | | | | 1,996,935 | |
| Dividends reinvested | | | 53,117 | | | | 11,629 | |
| Shares redeemed | | | (1,205,712 | ) | | | (1,046,758 | ) |
| Net increase/(decrease) in shares outstanding | | | (174,839 | ) | | | 961,806 | |
| Class A | | | | | | | | |
| Shares sold | | | 1,063,977 | | | | 783,697 | |
| Dividends reinvested | | | 29,516 | | | | 14,251 | |
| Shares redeemed | | | (1,559,645 | ) | | | (848,353 | ) |
| Net decrease in shares outstanding | | | (466,152 | ) | | | (50,405 | ) |
| Class C | | | | | | | | |
| Shares sold | | | 77,686 | | | | 272,552 | |
| Dividends reinvested | | | 5,259 | | | | 2,012 | |
| Shares redeemed | | | (230,204 | ) | | | (223,444 | ) |
| Net increase/(decrease) in shares outstanding | | | (147,259 | ) | | | 51,120 | |
| Class I | | | | | | | | |
| Shares sold | | | 37,464,088 | | | | 64,107,769 | |
| Dividends reinvested | | | 1,513,481 | | | | 518,966 | |
| Shares redeemed | | | (53,924,320 | ) | | | (38,561,384 | ) |
| Net increase/(decrease) in shares outstanding | | | (14,946,751 | ) | | | 26,065,351 | |
Notes to Financial Statements
October 31, 2023
| | | ALPS | Smith Total Return Bond Fund | |
| | | For the Year Ended October 31, 2023 | | | For the Year Ended October 31, 2022 | |
| Investor Class | | | | | | | | |
| Shares sold | | | 2,470,424 | | | | 203,649 | |
| Dividends reinvested | | | 62,940 | | | | 15,365 | |
| Shares redeemed | | | (523,399 | ) | | | (619,330 | ) |
| Net increase/(decrease) in shares outstanding | | | 2,009,965 | | | | (400,316 | ) |
| Class A | | | | | | | | |
| Shares sold | | | 1,426,220 | | | | 669,487 | |
| Dividends reinvested | | | 76,177 | | | | 41,260 | |
| Shares redeemed | | | (760,795 | ) | | | (1,430,441 | ) |
| Net increase/(decrease) in shares outstanding | | | 741,602 | | | | (719,694 | ) |
| Class C | | | | | | | | |
| Shares sold | | | 170,859 | | | | 127,814 | |
| Dividends reinvested | | | 12,339 | | | | 7,235 | |
| Shares redeemed | | | (141,433 | ) | | | (323,157 | ) |
| Net increase/(decrease) in shares outstanding | | | 41,765 | | | | (188,108 | ) |
| Class I | | | | | | | | |
| Shares sold | | | 143,800,894 | | | | 93,542,912 | |
| Dividends reinvested | | | 6,365,794 | | | | 3,207,527 | |
| Shares redeemed | | | (69,853,996 | ) | | | (78,872,704 | ) |
| Net increase in shares outstanding | | | 80,312,692 | | | | 17,877,735 | |
| | | ALPS | Smith Credit Opportunities Fund | |
| | | For the Year Ended October 31, 2023 | | | For the Year Ended October 31, 2022 | |
| Investor Class | | | | | | | | |
| Shares sold | | | 7,241 | | | | 152,120 | |
| Dividends reinvested | | | 4,600 | | | | 25,921 | |
| Shares redeemed | | | (672,281 | ) | | | (138,138 | ) |
| Net increase/(decrease) in shares outstanding | | | (660,440 | ) | | | 39,903 | |
| Class A | | | | | | | | |
| Shares sold | | | 29,265 | | | | 6,027 | |
| Dividends reinvested | | | 1,306 | | | | 709 | |
| Shares redeemed | | | (12,827 | ) | | | – | |
| Net increase in shares outstanding | | | 17,744 | | | | 6,736 | |
| Class C | | | | | | | | |
| Shares sold | | | 2,964 | | | | 5,539 | |
| Dividends reinvested | | | – | | | | 55 | |
| Shares redeemed | | | (22,883 | ) | | | (956 | ) |
| Net increase/(decrease) in shares outstanding | | | (19,919 | ) | | | 4,638 | |
| Class I | | | | | | | | |
| Shares sold | | | 6,774,870 | | | | 17,229,379 | |
| Dividends reinvested | | | 1,041,005 | | | | 993,931 | |
| Shares redeemed | | | (14,896,353 | ) | | | (14,591,058 | ) |
| Net increase/(decrease) in shares outstanding | | | (7,080,478 | ) | | | 3,632,252 | |
Notes to Financial Statements
October 31, 2023
| | | ALPS | Smith Balanced Opportunity Fund | |
| | | For the Year Ended October 31, 2023 | | | For the Year Ended October 31, 2022 | |
| Investor Class | | | | | | | | |
| Shares sold | | | 1,882 | | | | 253 | |
| Dividends reinvested | | | 210 | | | | 160 | |
| Shares redeemed | | | (10,672 | ) | | | (1,034 | ) |
| Net decrease in shares outstanding | | | (8,580 | ) | | | (621 | ) |
| Class A | | | | | | | | |
| Shares sold | | | 576 | | | | 4,054 | |
| Dividends reinvested | | | 10 | | | | 38 | |
| Shares redeemed | | | (4,603 | ) | | | (72 | ) |
| Net increase/(decrease) in shares outstanding | | | (4,017 | ) | | | 4,020 | |
| Class C | | | | | | | | |
| Shares sold | | | – | | | | 1,534 | |
| Dividends reinvested | | | 8 | | | | 8 | |
| Shares redeemed | | | (1,297 | ) | | | – | |
| Net increase/(decrease) in shares outstanding | | | (1,289 | ) | | | 1,542 | |
| Class I | | | | | | | | |
| Shares sold | | | 598,629 | | | | 1,022,032 | |
| Dividends reinvested | | | 32,248 | | | | 28,336 | |
| Shares redeemed | | | (1,292,168 | ) | | | (1,754,374 | ) |
| Net decrease in shares outstanding | | | (661,291 | ) | | | (704,006 | ) |
6. MANAGEMENT AND RELATED-PARTY TRANSACTIONS
The Adviser is an indirect wholly owned subsidiary of DST Systems, Inc. (“DST”). DST is a wholly-owned subsidiary of SS&C Technologies Holdings, Inc. (“SS&C”), a publicly traded company listed on the NASDAQ Global Select Market.
The Adviser has delegated daily management of the Funds listed below to Smith Capital Investors, LLC (the "Sub-Adviser"). The Sub-Adviser manages the investments of the Funds in accordance with its investment objective, policies and limitations and investment guidelines established jointly by the Adviser and the Board.
Pursuant to the Investment Advisory Agreement (the “Advisory Agreement”), the Funds listed below pay the Adviser an annual management fee which is based on each Fund’s average daily net assets. The management fee is paid on a monthly basis. The following table reflects the Funds’ contractual management fee rates (expressed as an annual rate).
| Fund | Contractual Management Fee |
| ALPS | Smith Short Duration Bond Fund | 0.365% |
| ALPS | Smith Total Return Bond Fund | 0.545% |
| ALPS | Smith Credit Opportunities Fund | 0.75% |
| ALPS | Smith Balanced Opportunity Fund | 0.70% |
Pursuant to an Investment Sub-Advisory Agreement, the Adviser pays the Sub-Adviser of the Funds listed below an annual sub-advisory management fee which is based on each Fund’s average daily assets. The Adviser is required to pay all fees due to each Sub-Adviser out of the management fee the Adviser receives from each Fund listed below. The following table reflects the Funds’ contractual sub-advisory fee rates.
| Fund | Average Daily Net Assets of the Fund | Contractual Sub-Advisory Fee |
| ALPS | Smith Short Duration Bond Fund | All Asset Levels | 0.29% |
| ALPS | Smith Total Return Bond Fund | All Asset Levels | 0.42% |
| ALPS | Smith Credit Opportunities Fund | All Asset Levels | 0.50% |
| ALPS | Smith Balanced Opportunity Fund | All Asset Levels | 0.37% |
Notes to Financial Statements
October 31, 2023
The Adviser and Sub-Adviser have agreed contractually to limit the amount of the Fund’s total annual expenses, exclusive of distribution and service (12b-1) fees, shareholder service fees, acquired fund fees and expenses, brokerage expenses, interest expenses, taxes and extraordinary expenses that exceed the following annual rates below.
These agreements are reevaluated on an annual basis. Expense limitation ratios from the current agreements are listed below. Fees waived or reimbursed for the fiscal year ended October 31, 2023 are disclosed on the Statements of Operations.
| Fund* | Investor Class | Class A | Class C | Class I |
| ALPS | Smith Short Duration Bond Fund | 0.49% | 0.49% | 0.49% | 0.49% |
| ALPS | Smith Total Return Bond Fund** | 0.59% | 0.59% | 0.59% | 0.59% |
| ALPS | Smith Credit Opportunities Fund | 0.90% | 0.90% | 0.90% | 0.90% |
| ALPS | Smith Balanced Opportunity Fund | 0.85% | 0.85% | 0.85% | 0.85% |
| * | See each Fund’s Performance Update section for Expense Limitation agreement expiration dates. |
| ** | Effective September 1, 2023, the Adviser agreed to limit expenses to 0.59%. Prior to September 1, 2023, the Adviser agreed to limit expenses to 0.64%. |
The Adviser and the Sub-Adviser are permitted to recover expenses they have waived or reimbursed, on a class-by-class basis, through the agreements described above to the extent that expenses in later periods fall below the annual limits set forth in these agreements. The Funds are not obligated to pay any deferred fees and expenses more than thirty-six months after the date on which the fees was waived or expenses were deferred, as calculated on a monthly basis. As of the fiscal year ended October 31, 2023, the Adviser and the Sub-Advisor may seek reimbursement of previously waived and reimbursed fees as follows:
| Fund | | Expires 10/31/2024 | | | Expires 10/31/2025 | | | Expires 10/31/2026 | | | Total | |
| ALPS | Smith Short Duration Bond Fund - Investor Class | | | 16,881 | | | | 4,469 | | | | 10,424 | | | | 31,774 | |
| ALPS | Smith Short Duration Bond Fund - Class A | | | 7,868 | | | | 8,598 | | | | 3,016 | | | | 19,482 | |
| ALPS | Smith Short Duration Bond Fund - Class C | | | 1,817 | | | | 1,495 | | | | 1,520 | | | | 4,832 | |
| ALPS | Smith Short Duration Bond Fund - Class I | | | 320,901 | | | | 407,457 | | | | 457,964 | | | | 1,186,322 | |
| | | | | | | | | | | | | | | | | |
| ALPS | Smith Total Return Bond Fund - Investor Class | | | 2,940 | | | | 3,056 | | | | 8,817 | | | | 14,813 | |
| ALPS | Smith Total Return Bond Fund - Class A | | | 5,556 | | | | 8,987 | | | | 11,874 | | | | 26,417 | |
| ALPS | Smith Total Return Bond Fund - Class C | | | 4,192 | | | | 3,783 | | | | 3,350 | | | | 11,325 | |
| ALPS | Smith Total Return Bond Fund - Class I | | | 1,175,366 | | | | 1,505,281 | | | | 2,107,663 | | | | 4,788,310 | |
| | | | | | | | | | | | | | | | | |
| ALPS | Smith Credit Opportunities Fund - Investor Class | | | 3,188 | | | | - | | | | 131 | | | | 3,319 | |
| ALPS | Smith Credit Opportunities Fund - Class A | | | 1,196 | | | | - | | | | 398 | | | | 1,594 | |
| ALPS | Smith Credit Opportunities Fund - Class C | | | 594 | | | | - | | | | 185 | | | | 779 | |
| ALPS | Smith Credit Opportunities Fund - Class I | | | 158,423 | | | | 91,465 | | | | 139,197 | | | | 389,085 | |
| | | | | | | | | | | | | | | | | |
| ALPS | Smith Balanced Opportunity Fund - Investor Class | | | 3,910 | | | | 3,187 | | | | 5,043 | | | | 12,140 | |
| ALPS | Smith Balanced Opportunity Fund - Class A | | | 6,318 | | | | 5,161 | | | | 8,125 | | | | 19,604 | |
| ALPS | Smith Balanced Opportunity Fund - Class C | | | 3,152 | | | | 2,577 | | | | 4,092 | | | | 9,821 | |
| ALPS | Smith Balanced Opportunity Fund - Class I | | | 134,501 | | | | 169,876 | | | | 182,588 | | | | 486,965 | |
ALPS | Smith Short Duration Bond Fund recouped fees of $759 (Investor Class), $2,304 (Class A), $222 (Class C) and $7,453 (Class I) during the fiscal year ended October 31, 2023. ALPS | Smith Credit Opportunities Fund recouped fees of $19 (Investor Class), $27 (Class A), and $16 (Class C) during the fiscal year ended October 31, 2023.
ALPS Portfolio Solutions Distributor, Inc. (the “Distributor”) acts as the distributor of the Funds’ shares pursuant to a Distribution Agreement with the Trust. Shares are sold on a continuous basis by the Distributor, as agent for the Funds, and the Distributor has agreed to use its best efforts to solicit orders for the sale of Funds’ shares, although it is not obliged to sell any particular amount of shares. The Distributor is not entitled to any compensation for its services. The Distributor is registered as a broker -dealer with the Securities and Exchange Commission.
Notes to Financial Statements
October 31, 2023
Distribution and Services (12b-1) Plans
The Funds have adopted Distribution and Services Plans (the “Plans”) pursuant to Rule 12b-1 of the 1940 Act for the Investor Class, Class A and Class C shares. The Plans allows each Fund to use Investor Class, Class A and Class C assets to pay fees in connection with the distribution and marketing of Investor Class, Class A and Class C shares and/or the provision of shareholder services to Investor Class, Class A and Class C shareholders. The Plans permit payment for services in connection with the administration of plans or programs that use Investor Class, Class A and Class C shares of a Fund, if any, as their funding medium and for related expenses. The Plans permit a Fund to make total payments at an annual rate of up to 0.25% of a Fund’s average daily net assets attributable to its Investor Class and Class A shares and 0.75% of a Fund’s average daily net assets attributable to its Class C shares.
Under the terms of the Plans, the Trust is authorized to make payments to the Distributor for remittance to financial intermediaries, as compensation for distribution and/or shareholder ongoing services performed by such entities for beneficial shareholders of the Fund. The Distributor is entitled to retain some or all fees payable under the Plans in certain circumstances, including when there is no broker of record or when certain qualification standards have not been met by the broker of record.
Shareholder Services Plans
The Funds have adopted a shareholder services plan with respect to the Investor Class shares and Class A shares (the “Investor Class Shareholder Services Plan” and the “Class A Shareholder Services Plan”). Under the Investor Class Shareholder Services Plan and Class A Shareholder Services Plan, the Funds are authorized to compensate certain financial intermediaries, including broker dealers and Fund affiliates (“Participating Organizations”), an aggregate fee in an amount not to exceed on an annual basis 0.15% of the average daily net asset value of Investor Class and Class A shares of the Funds attributable to or held in the name of the Participating Organizations pursuant to an agreement with a such Participating Organizations (the “Agreement”). Each Agreement will set forth the non-distribution related shareholder services to be performed by the Participating Organizations for the benefit of a Fund’s shareholders who have elected to have such Participating Organizations service their accounts. Any amount of such payment not paid to Participating Organizations during a Fund’s fiscal year for such service activities shall be reimbursed to the Fund as soon as practicable. Shareholder Services Plan fees are included with distribution and service fees in the Statements of Operations. Investor Class Shareholder Services Plan fees recaptured pursuant to the Services Plan for the year ended October 31, 2023 are included as an offset to distribution and service fees as disclosed in the Statements of Operations.
The Funds have adopted a shareholder services plan with respect to their Class C shares (the “Class C Shareholder Services Plan”). Under the Class C Shareholder Services Plan, the Funds are authorized to pay banks and their affiliates and other institutions, including broker-dealers and Fund affiliates (“Participating Organizations”), an aggregate fee in an amount not to exceed on an annual basis 0.25% for Class C shares of the average daily net asset value of the Class C shares attributable to or held in the name of a Participating Organization for its clients as compensation for providing shareholder service activities, which do not include distribution services, pursuant to an agreement with a Participating Organization. Any amount of such payment not paid to Participating Organizations during a Fund’s fiscal year for such service activities shall be reimbursed to the Fund as soon as practicable after the end of the fiscal year. Class C Shareholder Services Plan fees are included with distribution and service fees on the Statements of Operations.
Certain intermediaries may charge networking, omnibus account or other administrative fees with respect to transactions in shares of each Fund. Transactions may be processed through the National Securities Clearing Corporation or similar systems or processed on a manual basis. These fees generally are paid by the Fund to the Distributor, which uses such fees to reimburse intermediaries. In the event an intermediary receiving payments from the Distributor on behalf of the Fund converts from a networking structure to an omnibus account structure or otherwise experiences increased costs, fees borne by the Fund may increase. Networking fees are shown in the Statements of Operations, if applicable to the Funds.
Fund Administrator
ALPS Fund Services, Inc. (“ALPS”) serves as administrator to the Funds and the Funds have agreed to pay expenses incurred in connection with their administrative activities. Pursuant to an Administrative Agreement, ALPS provides operational services to the Funds including, but not limited to, fund accounting and fund administration and generally assists in the Funds’ operations. Officers of the Trust are employees of ALPS. The Funds’ administration fee is accrued on a daily basis and paid monthly. Administrative fees paid by the Funds for the fiscal year ended October 31, 2023 are disclosed in the Statements of Operations.
ALPS is reimbursed by the Funds for certain out-of-pocket expenses.
Transfer Agent
ALPS serves as transfer, dividend paying and shareholder servicing agent for the Funds. ALPS receives an annual minimum fee, a fee based upon the number of shareholder accounts, and is also reimbursed by the Funds for certain out-of-pocket expenses. Transfer agent fees paid by the Funds for the fiscal year ended October 31, 2023, are disclosed in the Statements of Operations.
Trustees
The fees and expenses of the independent trustees of the Board are presented in the Statements of Operations.
Notes to Financial Statements
October 31, 2023
7. INDEMNIFICATIONS
Under the Trust’s organizational documents, its officers and Trustees are indemnified against certain liability arising out of the performance of their duties to the Trust. Additionally, in the normal course of business, the Trust enters into contracts with service providers that may contain general indemnification clauses which may permit indemnification to the extent permissible under applicable law. The Trust’s maximum exposure under these arrangements is unknown, as this would involve future claims that may be made against the Trust that have not yet occurred.
8. SUBSEQUENT EVENTS
Subsequent events after the date of the Statements of Assets and Liabilities have been evaluated through the date the financial statements were issued. Management has determined that there were no subsequent events to report through the issuance of these financial statements.
Report of Independent Registered Public Accounting Firm
To the Shareholders and Board of Trustees of Financial Investors Trust
Opinion on the Financial Statements
We have audited the accompanying statements of assets and liabilities, including the statements of investments, of ALPS | Smith Short Duration Bond Fund, ALPS | Smith Total Return Bond Fund, ALPS | Smith Credit Opportunities Fund, and ALPS | Smith Balanced Opportunity Fund (the “Funds”), each a series of Financial Investors Trust, as of October 31, 2023, the related statements of operations for the year then ended, and the statements of changes in net assets, the related notes, and the financial highlights for each of the two years in the period then ended (collectively referred to as the “financial statements”). In our opinion, the financial statements present fairly, in all material respects, the financial position of each of the Funds as of October 31, 2023, the results of their operations for the year then ended, and the changes in net assets and the financial highlights for each of the two years in the period then ended, in conformity with accounting principles generally accepted in the United States of America.
The Funds’ financial highlights for the years or periods ended October 31, 2021, and prior, were audited by other auditors whose report dated December 30, 2021, expressed an unqualified opinion on those financial highlights.
Basis for Opinion
These financial statements are the responsibility of the Funds’ management. Our responsibility is to express an opinion on the Funds’ financial statements based on our audits. We are a public accounting firm registered with the Public Company Accounting Oversight Board (United States) (“PCAOB”) and are required to be independent with respect to the Funds in accordance with the U.S. federal securities laws and the applicable rules and regulations of the Securities and Exchange Commission and the PCAOB.
We conducted our audits in accordance with the standards of the PCAOB. Those standards require that we plan and perform the audit to obtain reasonable assurance about whether the financial statements are free of material misstatement whether due to error or fraud.
Our audits included performing procedures to assess the risks of material misstatement of the financial statements, whether due to error or fraud, and performing procedures that respond to those risks. Such procedures included examining, on a test basis, evidence regarding the amounts and disclosures in the financial statements. Our procedures included confirmation of securities owned as of October 31, 2023, by correspondence with the custodian, agent banks and brokers; when replies were not received from brokers, we performed other auditing procedures. Our audits also included evaluating the accounting principles used and significant estimates made by management, as well as evaluating the overall presentation of the financial statements. We believe that our audits provide a reasonable basis for our opinion.
We have served as the auditor of one or more investment companies advised by ALPS Advisors, Inc. since 2013.

COHEN & COMPANY, LTD.
Cleveland, Ohio
December 29, 2023
Additional Information
October 31, 2023 (Unaudited)
1. FUND HOLDINGS
The Funds’ portfolio holdings are made available semi-annually in shareholder reports within 60 days after the close of the period for which the report is being made, as required by federal securities laws. The Funds also file monthly portfolio holdings on Form N-PORT on a quarterly basis, with the schedule of portfolio holdings filed on Form N-PORT for the third month of each Fund’s fiscal quarter made publicly available 60 days after the end of the Funds’ fiscal quarter.
2. FUND PROXY VOTING POLICIES, PROCEDURES AND SUMMARIES
Fund policies and procedures used in determining how to vote proxies and information regarding how each of the Funds voted proxies relating to portfolio securities during the most recent prior 12-month period ending June 30 are available without charge, (1) upon request, by calling (toll-free) (866) 759-5679 and (2) on the SEC’s website at http://www.sec.gov.
3. TAX INFORMATION (UNAUDITED)
Qualified Dividend Income
The percentage of ordinary income dividends distributed during the calendar year ended December 31, 2022 are designated as qualified dividend income (QDI) in the following percentages:
| | Amount |
| ALPS Smith Total Return Bond Fund | 2.30% |
| ALPS Smith Credit Opportunities Fund | 6.21% |
| ALPS Smith Balanced Opportunity Fund | 72.71% |
Dividends Received Deduction
For corporate shareholders, the following ordinary dividends paid during the calendar year ended December 31, 2022 qualify for the corporate dividends received deduction:
| | Amount |
| ALPS Smith Total Return Bond Fund | 2.30% |
| ALPS Smith Credit Opportunities Fund | 6.21% |
| ALPS Smith Balanced Opportunity Fund | 54.92% |
In early 2023, if applicable, shareholders of record received this information for the distribution paid to them by the Funds during the calendar year 2022 via Form 1099. The Funds will notify shareholders in early 2024 of amounts paid to them by the Funds, if any, during the calendar year 2023.
Board Considerations Regarding Approval of Investment
Advisory Agreement and Investment Sub-Advisory Agreements
October 31, 2023 (Unaudited)
In anticipation of and as part of the process to consider the renewal of the investment advisory agreement with AAI with respect to each Fund and the sub-advisory agreement with the Sub- Adviser with respect to the applicable Fund (the “Advisory Agreements”), legal counsel to the Independent Trustees requested certain information from AAI and the Sub-Adviser. In response to these requests, the Trustees received reports from AAI and the Sub-Adviser that addressed specific factors to be considered by the Board. The Board also received from independent legal counsel memoranda regarding the Board’s responsibilities pertaining to the approval of advisory contracts. Further, the Board met on June 13, 2023 with representatives of AAI and the Sub-Adviser and discussed the services the firms provided pursuant to the agreements, as well as the information they provided.
During the review process, the Board noted certain instances where clarification or follow-up was appropriate and others where the Board determined that further clarification or follow-up was not necessary. In those instances where clarification or follow-up was requested, the Board determined that in each case either information responsive to its requests had been provided, or where any request was outstanding in whole or in part, given the totality of the information provided with respect to the agreements, the Board had received sufficient information to renew and approve the agreements.
In approving AAI as the Funds’ investment adviser and the Sub-Adviser as the Fund’s sub-adviser, and the fees to be charged under the Advisory Agreements, the Trustees concluded that no single factor reviewed by the Trustees was identified by the Trustees to be determinative as the principal factor in whether to approve such agreements. Further, the Independent Trustees were advised by independent legal counsel throughout the process. The following summary does not identify all the matters considered by the Board, but provides a summary of the principal matters the Board considered.
In renewing and approving the Investment Advisory Agreement with AAI and the Investment Sub- Advisory Agreement with Smith Capital Investors, LLC, the Trustees, including the Independent Trustees, considered the following factors with respect to the Smith Funds:
Investment Advisory and Sub-Advisory Fee Rates: The Trustees reviewed and considered the contractual annual advisory fee rates paid by the Trust, on behalf of the Funds, to AAI, of 0.365% of the Short Duration Bond Fund’s daily average net assets, 0.545% of the Total Return Bond Fund’s daily average daily net assets, 0.75% of the Credit Opportunities Fund’s average daily net assets, and 0.70% of the Balanced Opportunity Fund’s average daily net assets, in light of the extent and quality of the advisory services provided by AAI to the Funds. The Trustees also reviewed and considered the contractual annual sub- advisory fee rates paid by AAI to Smith Capital Investors, LLC of 0.29% of the Short Duration Bond Fund’s daily average net assets, 0.42% of the Total Return Bond Fund’s daily average daily net assets, 0.50% of the Credit Opportunities Fund average daily net assets, and 0.37% of the Balanced Opportunity Fund’s average daily net assets, in light of the extent and quality of the advisory services provided by Smith Capital Investors, LLC to the Smith Funds. The Trustees also considered information regarding compensation to be paid to affiliates of AAI under other agreements, such as the Fund Accounting and Administration Agreement with ALPS.
The Board received and considered information including a comparison of each Smith Fund’s contractual and gross advisory fee rates with those of funds in the peer group as selected by an independent provider of investment company data (the “Data Provider”). The Trustees noted that the contractual advisory fee for each class of the Total Return Bond Fund and Credit Opportunities Fund was higher than the Data Provider peer group median; the contractual advisory fee for each class of the Short Duration Bond Fund was lower than the Data Provider peer group median; the contractual advisory fee for Class A of the Balanced Opportunities Fund was higher than the Data provider peer group median; the contractual advisory fee for the Investor Class of the Balanced Opportunities Fund was equal to the Data Provider peer group median; and the contractual advisory fees for the Class C and Class I of the Balanced Opportunities Fund were each lower than their Data Provider peer group median.
Total Net Expense Ratios: The Trustees further reviewed and considered the total net expense ratios of 0.92%, 1.64%, 0.64%, and 0.93% for the Class A, Class C, Class I, and Investor Class shares, respectively, of the Total Return Bond Fund; 0.74%, 1.49%, 0.49%, and 0.78% for the Class A, Class C, Class I, and Investor Class shares, respectively, of the Short Duration Bond Fund; 1.16%, 1.90%, 0.90%, and 1.17% for the Class A, Class C, Class I, and Investor Class shares of the Credit Opportunities Fund, respectively; and 1.11%, 1.85%, 0.85%, 1.12% for the Class A, Class C, Class I, and Investor Class shares of the Balanced Opportunity Fund, respectively. The Trustees noted that the total net expense ratio of each class of Total Return Bond Fund and Credit Opportunities Fund was higher than the Data Provider peer group median ratio; the total net expense ratio for each class of the Balanced Opportunities Fund was lower than the Data Provider peer group median ratio; the total net expense ratio of Class A and Class I of the Short Duration Bond Fund was lower than the Data Provider peer group median; and the total net expense ratio for each other class of the Short Duration Bond Fund was higher than the Data Provider peer group median.
Nature, Extent, and Quality of the Services under the Investment Advisory and Sub-Advisory Agreements: The Trustees received and considered information regarding the nature, extent, and quality of services to be provided to the Smith Funds under the Investment Advisory and Sub-Advisory Agreements. The Trustees reviewed certain background materials supplied by AAI and Smith Capital Investors, LLC in their presentations, including their Forms ADV.
The Trustees reviewed and considered AAI’s and Smith Capital Investors, LLC's investment advisory personnel, their history as asset managers and their performance and the amount of assets currently under management by AAI and Smith Capital Investors, LLC and their affiliated entities. The Trustees also reviewed the research and decision-making processes utilized by AAI and Smith Capital Investors, LLC, including the methods adopted to seek to achieve compliance with the investment objectives, policies and restrictions of the Smith Funds.
Board Considerations Regarding Approval of Investment
Advisory Agreement and Investment Sub-Advisory Agreements
October 31, 2023 (Unaudited)
The Trustees considered the background and experience of AAI’s and Smith Capital Investors, LLC's management in connection with the Smith Funds, including reviewing the qualifications, backgrounds and responsibilities of the management team primarily responsible for the day-to-day portfolio management of the Funds and the extent of the resources devoted to research and analysis of actual and potential investments.
The Trustees also reviewed, among other things, AAI’s and Smith Capital Investors, LLC's Codes of Ethics.
Performance: The Trustees reviewed performance information for the Smith Funds, which included a comparison of each Fund’s performance to the performance of a group of comparable funds selected by the Data Provider for the three-month, one-year, three-year, and since inception periods ended March 31, 2023, as applicable. The Trustees noted that for the three month period, each class of the Balanced Opportunity Fund outperformed the Data Provider peer group median and each class of each other Fund underperformed the Data Provider peer group median; for the one-year period, each class of the Short Duration Fund and Total Return Fund outperformed the Data Provider peer group median and each class of the Credit Opportunities Fund and Balanced Opportunity Fund underperformed the Data Provider peer group median; for the three-year period, each class of the Short Duration Fund outperformed the Data Provider peer group median and each Class of the Total Return Fund underperformed the Data Provider peer group median; and for the since inception period, each class of the Short Duration Fund and Total Return Fund outperformed the Data Provider peer group median and each class of the Credit Opportunities Fund and Balanced Opportunity Fund underperformed the Data Provider peer group median. The Trustees also considered Smith Capital Investors, LLC's investment performance and reputation generally and its investment techniques, risk management controls, and decision-making processes.
Comparable Accounts: The Trustees noted that neither Smith Capital Investors, LLC nor AAI currently manages any other accounts with similar strategies to the Smith Funds.
Profitability: The Trustees received and considered the profitability analyses prepared by AAI and Smith Capital Investors, LLC based on the fees payable under the Investment Advisory Agreement with AAI and the Investment Sub-Advisory Agreement with Smith Capital Investors, LLC, with respect to the Smith Funds, respectively. The Trustees considered the profits, if any, realized by AAI and Smith Capital Investors, LLC in connection with the operation of the Smith Funds.
Economies of Scale: The Trustees considered whether economies of scale in the provision of services to the Smith Funds will be passed along to the shareholders under the agreements.
Other Benefits to the Adviser and Sub-Adviser: The Trustees reviewed and considered any other incidental benefits derived or to be derived by AAI and Smith Capital Investors, LLC from their relationship with the Smith Funds, including whether soft dollar arrangements were used.
The Trustees, including all of the Independent Trustees, concluded that:
| · | the contractual advisory fee for each class of the Total Return Bond Fund and Credit Opportunities Fund was higher than the Data Provider peer group median; the contractual advisory fee for each class of the Short Duration Bond Fund was lower than the Data Provider peer group median; the contractual advisory fee for Class A of the Balanced Opportunities Fund was higher than the Data provider peer group median; the contractual advisory fee for the Investor Class of the Balanced Opportunities Fund was equal to the Data Provider peer group median; and the contractual advisory fees for the Class C and Class I of the Balanced Opportunities Fund were each lower than their Data Provider peer group median; |
| · | Smith Capital Investors, LLC's fees under its sub-advisory agreement are paid directly by AAI; |
| · | the total net expense ratio of each class of Total Return Bond Fund and Credit Opportunities Fund was higher than the Data Provider peer group median ratio; the total net expense ratio for each class of the Balanced Opportunities Fund was lower than the Data Provider peer group median ratio; the total net expense ratio of Class A and Class I of the Short Duration Bond Fund was lower than the Data Provider peer group median; and the total net expense ratio for each other class of the Short Duration Bond Fund was higher than the Data Provider peer group median; |
| · | the nature, extent, and quality of services rendered by AAI and Smith Capital Investors, LLC under the Investment Advisory and Sub-Advisory Agreements, respectively, with respect to the Smith Funds were adequate; |
| · | for the three-month, one-year, three-year, and since inception periods ended March 31, 2023, as applicable, with respect to the three month period, each class of the Balanced Opportunity Fund outperformed the Data Provider peer group median and each class of each other Fund underperformed the Data Provider peer group median; for the one- year period, each class of the Short Duration Fund and Total Return Fund outperformed the Data Provider peer group median and each class of the Credit Opportunities Fund and Balanced Opportunity Fund underperformed the Data Provider peer group median; for the three-year period, each class of the Short Duration Fund outperformed the Data Provider peer group median and each Class of the Total Return Fund underperformed the Data Provider peer group median; and for the since inception period, each class of the Short Duration Fund and Total Return Fund outperformed the Data Provider peer group median and each class of the Credit Opportunities Fund and Balanced Opportunity Fund underperformed the Data Provider peer group median.; |
Board Considerations Regarding Approval of Investment
Advisory Agreement and Investment Sub-Advisory Agreements
October 31, 2023 (Unaudited)
| · | that neither AAI nor Smith Capital Investors, LLC currently manages any other accounts with similar investment strategies to the Smith Funds; |
| · | the profit, if any, realized by AAI and Smith Capital Investors, LLC in connection with the operation of the Smith Funds is not unreasonable to the Smith Funds; and |
| · | at this time, there were no material economies of scale or other incidental benefits accruing to AAI and Smith Capital Investors, LLC in connection with their relationship with the Smith Funds. |
Based on the Trustees’ deliberations and their evaluation of the information described above, the Trustees, including all of the Independent Trustees, concluded that AAI’s and Smith Capital Investors, LLC's compensation for investment advisory and sub-advisory services is consistent with the best interests of each of the Smith Funds and its shareholders.
Liquidity Risk Management Program
October 31, 2023 (Unaudited)
The Financial Investors Trust (the “Trust”) has established a liquidity risk management program (the “Program”) to govern the Trust’s approach to managing liquidity risk for each fund in the Trust (each a “Fund”). The Program is overseen by the Liquidity Committee (the “Committee”), a committee comprised of representatives of the Trust’s investment advisers, sub-advisers, and Officers of the Trust. The Trust’s Board of Trustees (the “Board”) has approved the designation of the Committee to oversee the Program.
The Program’s principal objectives include supporting each Fund’s compliance with limits on investments in illiquid assets and mitigating the risk that a Fund will be unable to meet its redemption obligations in a timely manner. The Program also includes a number of elements that support the management and assessment of liquidity risk, including a periodic assessment of factors that influence a Fund’s liquidity and the periodic classification and re-classification of the Fund’s investments into groupings that reflect the Committee’s assessment of their relative liquidity under current market conditions.
At a meeting of the Board held on June 13, 2023, the Trustees received a report from the Committee regarding the design and operational effectiveness of the Program during the calendar year 2022. The Committee determined, and reported to the Board, that the Program is reasonably designed to assess and manage each Fund’s liquidity risk and has operated adequately and effectively to manage each Fund’s liquidity risk since implementation.
The Committee reported that during the period covered by the report, there were no liquidity events that impacted the Funds or their ability to timely meet redemptions without dilution to existing shareholders. Among other things, the Board noted that the Funds are not required to have a highly liquid investment minimum based on their liquidity classifications. The Board further noted that no material changes have been made to the Program since its implementation.
Trustees and Officers
October 31, 2023 (Unaudited)
The business and affairs of each Fund are managed under the direction of its Board. The Board approves all significant agreements between the Trust on behalf of a Fund and the persons or companies that furnish services to the Fund, including agreements with its distributor, Adviser, administrator, custodian and transfer agent. The day-to-day operations of each Fund are delegated to the Fund’s Adviser and administrator.
The name, address, year of birth and principal occupations for the past five years of the Trustees and officers of the Trust are listed below, along with the number of portfolios in the Fund complex overseen by and the other directorships held by each Trustee.
INDEPENDENT TRUSTEES
Name, Address* & Year of Birth | Position(s) Held with Fund | Term of Office** and Length of Time Served | Principal Occupation(s) During Past 5 Years*** | Number of Funds in Fund Complex Overseen by Trustee **** | Other Directorships Held by Trustee During Past 5 Years*** |
Mary K. Anstine, 1940 | Trustee and Chairman | Since 1997 | Ms. Anstine is Trustee/Director of AV Hunter Trust and Colorado Uplift Board. | 46 | Ms. Anstine is a Trustee of ALPS ETF Trust (23 funds); ALPS Variable Investment Trust (7 funds); Reaves Utility Income Fund (1 fund); and Segall Bryant & Hamill Trust through December 2020 (14 funds). |
Jeremy W. Deems, 1976 | Trustee | Since 2009 | Mr. Deems is the Co-Founder and Chief Financial Officer of Green Alpha Advisors, LLC, a registered investment advisor, and Co-Portfolio Manager of the Shelton Green Alpha Fund. | 46 | Mr. Deems is a Trustee of ALPS ETF Trust (23 funds); ALPS Variable Investment Trust (7 funds); Reaves Utility Income Fund (1 Fund); and Clough Funds Trust (1 fund). |
Jerry G. Rutledge, 1944 | Trustee | Since 2009 | Mr. Rutledge is the President and owner of Rutledge’s Inc., a retail clothing business. | 17 | Mr. Rutledge is a Trustee of Clough Global Dividend and Income Fund (1 fund); Clough Global Equity Fund (1 fund); Clough Global Opportunities Fund (1 fund); and Principal Real Estate Income Fund (1 fund). |
| * | All communications to Officers may be directed to Financial Investors Trust c/o 1290 Broadway, Suite 1000, Denver, CO 80203. |
| ** | This is the period for which the Officer began serving the Trust. Officers are appointed on an annual basis. |
| *** | Except as otherwise indicated, each individual has held the office shown or other offices in the same company for the last five years. Because of their respective positions with ALPS, each officer is considered an affiliated person of the Trust as defined under the 1940 Act. |
| **** | The Fund Complex includes all series of the Trust and any other investment companies for which the following list of investment advisers provides investment advisory services: SS&C ALPS Advisors, Inc., CoreCommodity Management, LLC, Kotak Mahindra Asset Management (Singapore) Pte. Ltd., RiverFront Investment Group, LLC and Smith Capital Investors, LLC. |
Trustees and Officers
October 31, 2023 (Unaudited)
INDEPENDENT TRUSTEES (continued)
Name, Address* & Year of Birth | Position(s) Held with Fund | Term of Office** and Length of Time Served | Principal Occupation(s) During Past 5 Years*** | Number of Funds in Fund Complex Overseen by Trustee **** | Other Directorships Held by Trustee During Past 5 Years*** |
Michael “Ross” Shell, 1970 | Trustee | Since 2009 | Mr. Shell is Founder and CEO of Red Idea, LLC, a strategic consulting/early stage venture firm (since June 2008). Mr. Shell serves on the Board of Directors of TalkBox, a phone/privacy booth company (since 2018) and DLVR, a package security company (since 2018). Mr. Shell served on the Advisory Board, St. Vrain School District Innovation Center (from 2015-2018). Mr. Shell graduated with honors from Stanford University with a degree in Political Science. | 16 | None. |
Edmund J. Burke, 1961 | Trustee | Since 2009 | Mr. Burke joined ALPS in 1991 and served as the President and Director of ALPS Holdings, Inc., and ALPS Advisors, Inc., and Director of ALPS Distributors, Inc., ALPS Fund Services, Inc. (“ALPS”), and ALPS Portfolio Solutions Distributor, Inc. (collectively, the “ALPS Companies”). Mr. Burke retired from the ALPS Companies in June 2019. Mr. Burke is currently a partner at ETF Action, a web-based system that provides data and analytics to registered investment advisers, (since 2020) and a Director of Alliance Bioenergy Plus, Inc., a technology company focused on emerging technologies in the renewable energy, biofuels, and bioplastics technology sectors (since 2020). | 39 | Mr. Burke is a Trustee of ALPS ETF Trust (23 funds); Clough Global Dividend and Income Fund (1 fund); Clough Global Equity Fund (1 fund); Clough Global Opportunities Fund (1 fund); Clough Funds Trust (1 fund); Liberty All-Star Equity Fund (1 fund); and Director of the Liberty All-Star Growth Fund, Inc. (1 fund). |
| * | All communications to Officers may be directed to Financial Investors Trust c/o 1290 Broadway, Suite 1000, Denver, CO 80203. |
| ** | This is the period for which the Officer began serving the Trust. Officers are appointed on an annual basis. |
| *** | Except as otherwise indicated, each individual has held the office shown or other offices in the same company for the last five years. Because of their respective positions with ALPS, each officer is considered an affiliated person of the Trust as defined under the 1940 Act. |
| **** | The Fund Complex includes all series of the Trust and any other investment companies for which the following list of investment advisers provides investment advisory services: SS&C ALPS Advisors, Inc., CoreCommodity Management, LLC, Kotak Mahindra Asset Management (Singapore) Pte. Ltd., RiverFront Investment Group, LLC and Smith Capital Investors, LLC. |
Trustees and Officers
October 31, 2023 (Unaudited)
OFFICERS
Name, Address*
& Year of Birth | Position(s) Held with Fund | Term of Office** and Length of Time Served | Principal Occupation(s) During Past 5 Years*** |
Lucas Foss, 1977 | President | Since 2022 | Mr. Foss rejoined ALPS in November 2017 and is currently Senior Director and Fund Chief Compliance Officer. Prior to his current role, Mr. Foss served as the Director of Compliance at Transamerica Asset Management (2015-2017) and Deputy Chief Compliance Officer at ALPS (2012-2015). Mr. Foss is President of ALPS Series Trust and Chief Compliance Officer of Clough Global Funds; Clough Funds Trust; MVP Private Markets Funds; Bluerock Total Income + Real Estate Fund; Bluerock High Income Institutional Credit Fund; SPDR® S&P 500® ETF Trust, SPDR® Dow Jones® Industrial Average ETF Trust, SPDR® S&P MIDCAP 400® ETF Trust. |
Jennell Panella, 1974 | Treasurer | Since 2020 | Ms. Panella joined ALPS in June 2012 and is currently Fund Controller of ALPS Fund Services, Inc. Prior to joining ALPS, Ms. Panella served as Financial Reporting Manager for Parker Global Strategies, LLC (2009-2012). |
Ted Uhl, 1974 | Chief Compliance Officer (“CCO”) | Since 2010 | Mr. Uhl joined ALPS in October 2006, and is currently Deputy Compliance Officer of ALPS. Prior to his current role, Mr. Uhl served as Senior Risk Manager for ALPS from October 2006 until June 2010. Before joining ALPS, Mr. Uhl served a Sr. Analyst with Enenbach and Associates (RIA), and a Sr. Financial Analyst at Sprint. Because of his position with ALPS, Mr. Uhl is deemed an affiliate of the Trust as defined under the 1940 Act. Mr. Uhl is also CCO of Alpha Alternative Asset Fund, Centre Funds, GraniteShares ETF Trust, Reaves Utility Income Fund and XAI Octagon Floating Rate & Alternative Income Term Trust. Mr. Uhl formerly served as CCO of the Boulder Growth & Income Fund, Inc., Index Funds and Reality Shares ETF Trust. |
Michael P. Lawlor, 1969 | Secretary | Since 2022 | Mr. Lawlor joined ALPS in January 2022, and is currently Vice President and Principal Legal Counsel. Prior to joining ALPS, Mr. Lawlor was Lead Fund Counsel at Brighthouse Financial (insurance company) (January 2007-April 2021). Mr. Lawlor also serves as Secretary of ALPS ETF Trust and ALPS Variable Investment Trust. |
Brenda Haskell, 1981 | Assistant Secretary | Since 2023 | Ms. Haskell joined ALPS in October 2022 and is currently a Senior Paralegal of ALPS Fund Services, Inc. and is the Assistant Secretary of ALPS Variable Investment Trust. Prior to joining ALPS Ms. Haskell worked at Ironhorse Funding LLC (November 2021 – September 2022) and Fidelity Investments (June 2000 – October 2021). |
Sheri Zetterower, 1963 | Assistant Secretary | Since 2023 | Ms. Zetterower rejoined ALPS in August 2022 and is currently a Senior Paralegal of ALPS Fund Services, Inc. Prior to her current role, Ms. Zetterower worked at Ultimus Fund Solutions, Inc. (November 2020 – August 2022) and ALPS Fund Services, Inc. (April 2013 – October 2020). |
| * | All communications to Officers may be directed to Financial Investors Trust c/o 1290 Broadway, Suite 1000, Denver, CO 80203. |
| ** | This is the period for which the Officer began serving the Trust. Officers are appointed on an annual basis. |
| *** | Except as otherwise indicated, each individual has held the office shown or other offices in the same company for the last five years. Because of their respective positions with ALPS, each officer is considered an affiliated person of the Trust as defined under the 1940 Act. |
Privacy Policy
October 31, 2023 (Unaudited)
| FACTS | WHAT DO THE FUNDS DO WITH YOUR PERSONAL INFORMATION? |
| WHY? | Financial companies choose how they share your personal information. Federal law gives consumers the right to limit some but not all sharing. Federal law also requires us to tell you how we collect, share, and protect your personal information. Please read this notice carefully to understand what we do. |
| WHAT? | The types of personal information we collect and share depend on the product or service you have with us. This information can include: · Social Security number and account transactions · Account balances and transaction history · Wire transfer instructions |
| HOW? | All financial companies need to share customers’ personal information to run their everyday business. In the section below, we list the reasons financial companies can share their customers’ personal information; the reasons the Funds choose to share; and whether you can limit this sharing. |
| REASONS WE CAN SHARE YOUR PERSONAL INFORMATION | DO THE FUNDS SHARE: | CAN YOU LIMIT THIS SHARING? |
For our everyday business purposes –
such as to process your transactions, maintain your account(s), respond to court orders and legal investigations, or report to credit bureaus | Yes | No |
For our marketing purposes –
to offer our products and services to you | No | We do not share. |
| For joint marketing with other financial companies | No | We do not share. |
For our affiliates’ everyday business purposes –
information about your transactions and experiences | Yes | No |
For our affiliates’ everyday business purposes –
information about your creditworthiness | No | We do not share. |
| For non-affiliates to market to you | No | We do not share. |
Privacy Policy
October 31, 2023 (Unaudited)
| WHO WE ARE | |
| Who is providing this notice? | Financial Investors Trust |
| WHAT WE DO | |
| How do the Funds protect my personal information? | To protect your personal information from unauthorized access and use, we use security measures that comply with federal law. These measures include computer safeguards and secured files and buildings. |
| How do the Funds collect my personal information? | We collect your personal information, for example, when you · open an account · provide account information or give us your contact information · make a wire transfer or deposit money |
| Why can’t I limit all sharing? | Federal law gives you the right to limit only · sharing for affiliates’ everyday business purposes-information about your creditworthiness · affiliates from using your information to market to you · sharing for non-affiliates to market to you State laws and individual companies may give you additional rights to limit sharing. |
| DEFINITIONS | |
| Affiliates | Companies related by common ownership or control. They can be financial and nonfinancial companies. |
| Non-affiliates | Companies not related by common ownership or control. They can be financial and nonfinancial companies. · The Funds do not share with non-affiliates so they can market to you. |
| Joint marketing | A formal agreement between non-affiliated financial companies that together market financial products or services to you. · The Funds do not jointly market. |
| OTHER IMPORTANT INFORMATION | |
| California Residents | If your account has a California home address, your personal information will not be disclosed to nonaffiliated third parties except as permitted by applicable California law, and we will limit sharing such personal information with our affiliates to comply with California privacy laws that apply to us. |
| Vermont Residents | The State of Vermont requires financial institutions to obtain your consent prior to sharing personal information that they collect about you with affiliated companies and nonaffiliated third parties other than in certain limited circumstances. Except as permitted by law, we will not share personal information we collect about you with nonaffiliated third parties or other affiliated companies unless you provide us with your written consent to share such information. |
| | |
| QUESTIONS? | Call 1-866-759-5679 or go to www.alpsfunds.com |
Intentionally Left Blank

Item 2. Code of Ethics.
| (a) | The Registrant, as of the end of the period covered by this report, has adopted a code of ethics that applies to the Registrant’s principal executive officer, principal financial officer, principal accounting officer or controller or any persons performing similar functions on behalf of the Registrant. |
| (c) | During the period covered by this report, no amendments to the provisions of the code of ethics described in Item 2(a) above were made. |
| (d) | During the period covered by this report, no implicit or explicit waivers to the provisions of the code of ethics described in Item 2(a) above were granted. |
| (f) | The Registrant’s Code of Ethics is attached as an Exhibit to this report. |
Item 3. Audit Committee Financial Expert.
The Board of Trustees of the Registrant has determined that the Registrant has at least one Audit Committee Financial Expert serving on its audit committee. The Board of Trustees of the Registrant has designated Jeremy W. Deems as the Registrant’s “Audit Committee Financial Expert.” Mr. Deems is “independent” as defined in paragraph (a)(2) of Item 3 to Form N-CSR.
Item 4. Principal Accountant Fees and Services.
| (a) | Audit Fees: For the Registrant’s fiscal years ended October 31, 2023 and October 31, 2022, the aggregate fees billed for professional services rendered by the principal accountant for the audit of the Registrant’s annual financial statements were $127,000 and $127,000, respectively. |
| (b) | Audit-Related Fees: For the Registrant’s fiscal years ended October 31, 2023 and October 31, 2022, the aggregate fees billed for assurance and related services by the principal accountant that were reasonably related to the performance of the audit of the Registrant’s financial statements and are not reported under paragraph (a) of this Item were $0 and $0, respectively. |
| (c) | Tax Fees: For the Registrant’s fiscal years ended October 31, 2023 and October 31, 2022, the aggregate fees billed for professional services rendered by the principal accountant for tax compliance, tax advice and tax planning were $33,500 and $45,500, respectively. The fiscal year 2023 and 2022 tax fees were for services for dividend calculation, excise tax preparation and tax return preparation. |
| (d) | All Other Fees: For the Registrant’s fiscal years ended October 31, 2023 and October 31, 2022, no fees were billed to Registrant by the principal accountant for services other than the services reported in paragraphs (a) through (c) of this Item. |
| (e)(1) | Audit Committee Pre-Approval Policies and Procedures: All services to be performed by the Registrant’s principal accountant must be pre-approved by the Registrant’s audit committee. The Chairman of the Audit Committee may pre-approve non-audit services to be performed by the Registrant’s principal accountant on an interim basis, subject to ratification by the Audit Committee at its next regularly scheduled meeting. |
| (e)(2) | No services described in paragraphs (b) through (d) of this Item were approved by the Registrant’s audit committee pursuant to paragraph (c)(7)(i)(C) of Rule 2-01 of Regulation S-X. |
| (g) | The aggregate non-audit fees billed by the Registrant’s accountant for services rendered to the Registrant, and rendered to the Registrant’s investment adviser (not including any sub-adviser whose role is primarily portfolio management and is subcontracted with or overseen by another investment adviser), and any entity controlling, controlled by, or under common control with the adviser that provides ongoing services to the Registrant, were $33,500 in the fiscal year ended October 31, 2023 and $45,500 in the fiscal year ended October 31, 2022. These fees consisted of non-audit fees billed to (i) the Registrant of $33,500 in the fiscal year ended October 31, 2023 and $45,500 in the fiscal year ended October 31, 2022 as described in response to paragraph (c) above and (ii) to ALPS Fund Services, Inc. (“AFS”), an entity under common control with ALPS Advisors, Inc., the Registrant’s investment adviser, of $0 in the fiscal year ended October 31, 2023 and $0 in the fiscal year ended October 31, 2022. The non-audit fees billed to AFS related to SSAE 16 services and other compliance-related matters. |
| (h) | The Registrant’s audit committee has considered whether the provision of non-audit services that were rendered to the Registrant’s investment adviser (not including any sub-adviser whose role is primarily portfolio management and is subcontracted with or overseen by another investment adviser), and any entity controlling, controlled by, or under common control with the investment adviser that provides ongoing services to the Registrant that were not pre-approved pursuant to paragraph (c)(7)(ii) of Rule 2-01 of Regulation S-X, is compatible with maintaining the principal accountant’s independence. The Registrant’s audit committee determined that the provision of such non-audit services is compatible with maintaining the principal accountant’s independence. |
Item 5. Audit Committee of Listed Registrants.
Not applicable to the Registrant.
Item 6. Investments.
| (a) | Schedule of Investments is included as part of the Reports to Stockholders filed under Item 1 of this Form N-CSR. |
Item 7. Disclosure of Proxy Voting Policies and Procedures for Closed-End Management Investment Companies.
Not applicable to the Registrant.
Item 8. Portfolio Managers of Closed-End Management Investment Companies.
Not applicable to the Registrant.
Item 9. Purchases of Equity Securities by Closed-End Management Investment Company and Affiliated Purchasers.
Not applicable to the Registrant.
Item 10. Submission of Matters to a Vote of Security Holders.
There have been no material changes to the procedures by which shareholders may recommend nominees to the Registrant’s Board of Trustees, where those changes were implemented after the Registrant last provided disclosure in response to the requirements of Item 407(c)(2)(iv) of Regulation S-K, or this Item.
Item 11. Controls and Procedures.
| (a) | The Registrant’s principal executive officer and principal financial officer have concluded that the Registrant’s disclosure controls and procedures (as defined in Rule 30a-3(c) under the Investment Company Act of 1940, as amended) are effective based on their evaluation of these controls and procedures as of a date within 90 days of the filing date of this report. |
| (b) | There was no change in the Registrant’s internal control over financial reporting (as defined in Rule 30a-3(d) under the Investment Company Act of 1940, as amended) during the period covered by this report that has materially affected, or is reasonably likely to materially affect, the Registrant’s internal control over financial reporting. |
Item 12. Disclosure of Securities Lending Activities for Closed-End Management Investment Companies.
Not applicable to the Registrant.
Item 13. Exhibits.
| (a)(4) | Not applicable to the Registrant. |
SIGNATURES
Pursuant to the requirements of the Securities Exchange Act of 1934 and the Investment Company Act of 1940, the Registrant has duly caused this report to be signed on its behalf by the undersigned, thereunto duly authorized.
FINANCIAL INVESTORS TRUST
| By: | /s/ Lucas Foss | |
| | Lucas Foss (Principal Executive Officer) | |
| | President | |
| | | |
| Date: | January 5, 2024 | |
Pursuant to the requirements of the Securities Exchange Act of 1934 and the Investment Company Act of 1940, this report has been signed below by the following persons on behalf of the Registrant and in the capacities and on the dates indicated.
FINANCIAL INVESTORS TRUST
| By: | /s/ Lucas Foss | |
| | Lucas Foss (Principal Executive Officer) | |
| | President | |
| | | |
| Date: | January 5, 2024 | |
| | | |
| By: | /s/ Jennell Panella | |
| | Jennell Panella (Principal Financial Officer) | |
| | Treasurer | |
| | | |
| Date: | January 5, 2024 | |