UNITED STATES
SECURITIES AND EXCHANGE COMMISSION
Washington, D.C. 20549
FORM N-CSR
CERTIFIED SHAREHOLDER REPORT OF REGISTERED
MANAGEMENT INVESTMENT COMPANIES
| | |
Investment Company Act file number | | 811-08200 |
BRIDGEWAY FUNDS, INC.
|
| (Exact name of registrant as specified in charter) |
| | |
5615 Kirby Drive, Suite 518 Houston, Texas | | 77005-2448 |
| (Address of principal executive offices) | | (Zip code) |
Bridgeway Funds, Inc.
5615 Kirby Drive, Suite 518
Houston, Texas 77005-2448
|
| (Name and address of agent for service) |
Registrant’s telephone number, including area code: (713) 661-3500
Date of fiscal year end: June 30
Date of reporting period: June 30, 2008
| Item 1. | Reports to Stockholders. |

| | |
| | A no-load mutual fund family of domestic funds |
| | |
| |
| | Annual Report June 30, 2008 |
| | | | |
| | |
| | AGGRESSIVE INVESTORS 1 | | BRAGX |
| | (Closed to New Investors) | | |
| | |
| | AGGRESSIVE INVESTORS 2 | | BRAIX |
| | |
| | ULTRA-SMALL COMPANY | | BRUSX |
| | (Closed) | | |
| | |
| | ULTRA-SMALL COMPANY MARKET | | BRSIX |
| | |
| | MICRO-CAP LIMITED | | BRMCX |
| | (Closed to New Investors) | | |
| | |
| | SMALL-CAP GROWTH | | BRSGX |
| | |
| | SMALL-CAP VALUE | | BRSVX |
| | |
| | LARGE-CAP GROWTH | | BRLGX |
| | |
| | LARGE-CAP VALUE | | BRLVX |
| | |
| | BLUE CHIP 35 INDEX | | BRLIX |
| | |
| | BALANCED | | BRBPX |

TABLE OF CONTENTS
Bridgeway Funds Standardized Returns as of June 30, 2008*
| | | | | | | | | | | | | | | |
| | | | | Annualized | | | | | |
| | | June Qtr. | | 1 Year | | 5 Years | | 10 Years | | Inception to Date | | Inception
Date | | Gross
Expense
Ratio | |
| Fund | | 4/1/08
to 6/30/08 | | | | | | |
Aggressive Investors 1 | | 7.73% | | 3.51% | | 14.63% | | 17.11% | | 19.41% | | 8/5/1994 | | 1.69% | |
Aggressive Investors 2 | | 11.61% | | 5.88% | | 16.57% | | | | 12.66% | | 10/31/2001 | | 1.19% | |
Ultra-Small Company | | -1.84% | | -24.59% | | 10.93% | | 14.93% | | 18.08% | | 8/5/1994 | | 1.06% | |
Ultra-Small Co Market | | -1.67% | | -21.72% | | 9.18% | | 11.68% | | 11.97% | | 7/31/1997 | | 0.65% | |
Micro-Cap Limited | | 2.32% | | -17.58% | | 6.93% | | 12.84% | | 12.84% | | 6/30/1998 | | 0.79% | |
Small-Cap Growth | | 3.26% | | -12.87% | | | | | | 7.40% | | 10/31/2003 | | 0.88% | |
Small-Cap Value | | 2.65% | | -15.37% | | | | | | 10.39% | | 10/31/2003 | | 0.84% | |
Large-Cap Growth | | 3.54% | | -2.50% | | | | | | 7.17% | | 10/31/2003 | | 0.73% | |
Large-Cap Value | | -4.22% | | -16.46% | | | | | | 8.55% | | 10/31/2003 | | 0.74% | |
Blue Chip 35 Index | | -6.85% | | -14.28% | | 4.63% | | 2.88% | | 4.53% | | 7/31/1997 | | 0.30% | 1 |
Balanced | | 1.62% | | -1.57% | | 6.37% | | | | 4.77% | | 6/30/2001 | | 0.93% | |
1 Some of the Fund’s fees were waived or expenses reimbursed otherwise returns would have been lower. The Adviser has contractually agreed to waive fees and/or reimburse expenses such that the total operating expenses of the Fund do not exceed 0.15%. Any material change to this Fund policy would require a vote by shareholders.
Bridgeway Funds Returns for Calendar Years 1995 through 2007*
| | | | | | | | | | | | | | | | | | | | | | | | | | |
| | | 1995 | | 1996 | | 1997 | | 1998 | | 1999 | | 2000 | | 2001 | | 2002 | | 2003 | | 2004 | | 2005 | | 2006 | | 2007 |
Aggressive Investors 1 | | 27.10% | | 32.20% | | 18.27% | | 19.28% | | 120.62% | | 13.58% | | -11.20% | | -18.01% | | 53.97% | | 12.21% | | 14.93% | | 7.11% | | 25.80% |
Aggressive Investors 2 | | | | | | | | | | | | | | | | -19.02% | | 44.01% | | 16.23% | | 18.59% | | 5.43% | | 32.19% |
Ultra-Small Company | | 39.84% | | 29.74% | | 37.99% | | -13.11% | | 40.41% | | 4.75% | | 34.00% | | 3.98% | | 88.57% | | 23.33% | | 2.99% | | 21.55% | | -2.77% |
Ultra-Small Co Market | | | | | | | | -1.81% | | 31.49% | | 0.67% | | 23.98% | | 4.90% | | 79.43% | | 20.12% | | 4.08% | | 11.48% | | -5.40% |
Micro-Cap Limited | | | | | | | | | | 49.55% | | 6.02% | | 30.20% | | -16.61% | | 66.97% | | 9.46% | | 22.55% | | -2.34% | | -4.97% |
Small-Cap Growth | | | | | | | | | | | | | | | | | | | | 11.59% | | 18.24% | | 5.31% | | 6.87% |
Small-Cap Value | | | | | | | | | | | | | | | | | | | | 17.33% | | 18.92% | | 12.77% | | 6.93% |
Large-Cap Growth | | | | | | | | | | | | | | | | | | | | 6.77% | | 9.33% | | 4.99% | | 19.01% |
Large-Cap Value | | | | | | | | | | | | | | | | | | | | 15.15% | | 11.62% | | 18.52% | | 4.49% |
Blue Chip 35 Index | | | | | | | | 39.11% | | 30.34% | | -15.12% | | -9.06% | | -18.02% | | 28.87% | | 4.79% | | 0.05% | | 15.42% | | 6.07% |
Balanced | | | | | | | | | | | | | | | | -3.51% | | 17.82% | | 7.61% | | 6.96% | | 6.65% | | 6.58% |
Performance figures quoted represent past performance and are no guarantee of future results. Current performance may be lower or higher than the performance data quoted. Investment return and principal value will fluctuate so that an investor’s shares, when redeemed, may be worth more or less than original cost. To obtain performance current to the most recent month-end, please visit our website at www.bridgeway.com or call 1-800-661-3550. Total return figures include the reimbursement of dividends and capital gains.
This report is submitted for the general information of the shareholders of each Fund. It is not authorized for distribution to prospective investors unless preceded or accompanied by an effective prospectus, which includes information regarding a Fund’s risks, objectives, fees and expenses, experience of its management, and other information. Investors should read the prospectus carefully before investing in a Fund. For questions or other Fund information, call 1-800-661-3550 or visit the Funds’ website www.bridgeway.com. Funds are available for purchase by residents of the United States, Puerto Rico, U.S. Virgin Islands and Guam only. Foreside Fund Services, LLC, Distributor.
The views expressed here are exclusively those of Fund management. These views including those relating to the market, sectors or individual stocks are not meant as investment advice and should be not considered predictive in nature.
| * | Numbers with green highlight indicate periods when the Fund outperformed its primary benchmark. |
LETTER FROM THE INVESTMENT MANAGEMENT TEAM
June 30, 2008
Dear Fellow Shareholders,
Fighting the trend of the broader market averages, seven of our eleven Funds ended the June 2008 quarter with positive returns. Nine Funds beat their primary market benchmarks as detailed on the facing page (market beating returns are in green). For the full fiscal year ending in June, the same nine Funds beat their primary market benchmark, although only Aggressive Investors 1 Fund and Aggressive Investors 2 Fund had a positive one-year return as the market tumbled in the environment of a credit crisis, inflation, and economic pull-back. While negative returns don’t feel good, we aim to be fully invested for the long haul, so we are generally pleased when and where we are able to provide some “cushion” in a downturn.
More details of the market in the June quarter are provided in the section following this letter. On page 2 we also provide an overview of Bridgeway’s “hot button” issue: ways investors can “destroy value” even while being generally invested in market-beating mutual funds. We’re especially impressed with two communications from a shareholder on what she learned by investing in our Funds during the current decade (page 3). As part of a section covering the current fad (ok, it could be with us for some time to come) of “target date funds,” Bridgeway discloses what we think about when we come to market with a new fund. If you’re interested in how we think and what goes on behind the scenes at Bridgeway, you probably won’t want to miss this section starting on page 4. One of our shareholders asked a handful of insightful questions about our quantitative models, and we share our answers on page 5. (No, we’re not disclosing the “secret sauce,” but we are trying to provide some insight for how our investment management team does what it does.) An icon of investing and model of integrity in business, Sir John Templeton, died last quarter at age 95. John’s tribute to Sir John is on page 6. Recent news articles have reported very basic statistics on fund ownership by portfolio managers. Mike Mulcahy, President of Bridgeway Funds, conducted a much more detailed study for Bridgeway staff and reports the impressive results on page 6. Each fiscal year we report the worst thing that happened at Bridgeway. You are our owner and boss, and we think you have the right to know the good (everybody discloses) and the bad (most firms sweep this under the carpet). If the worst thing is not clear, our staff votes on it. This year has an interesting twist. See page 8. The Adviser to our Funds celebrated 15 years along with John’s 15 years at Bridgeway on July 1, 2008. On page 8 Mike wrote a tribute to John and his vision (but didn’t give him a vote on whether to include this section in Bridgeway’s report.)
As always, we appreciate your feedback. We take your comments very seriously and regularly discuss them internally to help in managing our Funds and this company. Please keep your ideas coming—both favorable and critical. They provide us with a vital tool helping us serve you better.
Sincerely,
Your investment team
LETTER FROM THE INVESTMENT MANAGEMENT TEAM (continued)
Market Review
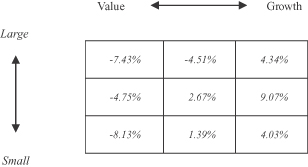
The Short Version: In the midst of a decline for the broader market averages, value companies (those that are cheaper on the basis of certain economic measures) were hardest hit across the board of all size companies. The stocks of growth companies (those growing at a faster rate) actually had a positive return for the quarter ending June 30, 2008.
It seems that each area of the “style box” eventually gets its day in the sun. Growth stocks, which had lagged the market every calendar year from 2000 through 2006, actually had a significant positive quarterly return, even as most stocks declined. Many of the companies hardest hit in the credit crisis “hailed’ from the value end of the spectrum, and this contributed to the style box results below. (Data from Morningstar for the quarter ended June 30, 2008):
Staying Put
The Short Version: For those of you who read each of our shareholder letters, you may have recognized a common theme around several related issues. In particular, we consistently encourage our investors: a) not to “chase hot returns” (buy funds that look strong recently and dump ones that have done poorly), b) not to try to time the market, c) not to base long-term investment decisions on short-term events. In this letter we thought we’d pull these together, given unusually strong opportunities in this market environment to get off track.
One of the saddest things we see some of our shareholders do is appropriately pick a given Bridgeway Fund to meet their investment objectives, but to time the entry and exit of our Funds so as to “destroy value” by buying after a market and/or Fund run up, and selling after a decline. This drives us nuts. Here is some hard data evidence about why.
Not chasing hot returns. Page i of our annual report gives all the details on performance of our Funds over various time periods. One would then think that individual investors in those Funds have also done as well. While anyone who has invested, with dividend reinvested, over the full time period reported has actually achieved these audited results—in aggregate these returns are frequently over-inflated! These are the actual returns, and over the long haul they have been very attractive. One would think that, since individual investors in those Funds have done as well. While anyone who has invested over the full time period reported and who has reinvested Fund dividends has actually achieved these audited results—in aggregate these returns are frequently overinflated! Did you read that correctly? Bridgeway, which prides itself on straightforward, blunt, and honest communications, is inflating its returns? Let’s dig a little deeper.
This over-inflation has to do with the timing of actual shareholder returns. Let’s say 100 shareholders invest $10,000 each in a fictitious “Skyrocket Fund” at the beginning of year one. Let’s also assume that the total return that first year is 50%, or 25% more than the market. Skyrocket Fund appears in performance tables and is written up as a “top performer.” There’s a nice story in Buy this Fund magazine about a hot shot portfolio manager who is very articulate about why he or she chose such great stocks. The adviser to Skyrocket Fund knows a marketing opportunity when they see it and takes out advertising, which rather conspicuously reports year one returns. (Fund companies as a whole have actually gotten better about this practice, but there are still many versions of it.) Furthermore, they ante up large fees to ensure “shelf space” with a brokerage firm that assures Skyrocket Fund will get some much needed exposure. On the basis of this performance, press coverage, advertisements, and new “distribution channel,” 1,000 new investors each buy $20,000 (they are more confident than the earlier investors, because the fund now has a track record) at the beginning of year two. That year, the market declines 10%, but Skyrocket Fund declines 20%. Frustrated and disappointed, the 1,000 new investors realize they made the wrong decision and sell at the end of the second year. The Fund is no longer in performance charts and no journalist wants to write about it, so there are no new investors at the beginning of year three. This is the year the market recovers 11% (the long term historical average) and Skyrocket Fund does the same.
| | |
| 2 | | Annual Report | June 30, 2008 |
LETTER FROM THE INVESTMENT MANAGEMENT TEAM (continued)
Under this scenario, the first investors enjoyed a 33% total return, not too shabby for a three-year period. The second round of investors suffered a 20% loss (and missed the third year recovery). Skyrocket Fund reports three-year returns of 33% cumulative (or 10.03% per year)—beating the 25% return of the market—but the average shareholder still suffered a significant decline. The only way to ensure the full three-year period returns is to stay invested for the full three-year period. (To be fair, if Skyrocket Fund had declined three years in a row, the second year shareholders would have suffered less; so mathematically, staying in longer doesn’t necessarily mean better returns, just the actual returns for the fund for the period). Sound far fetched? Let’s look at some actual numbers from Bridgeway.
For the last five-year period from June 2003 to June 2008, Bridgeway Aggressive Investors 2 Fund appreciated 16.57% per year, much better than the S&P 500 Index, which appreciated 7.58% per year. However, according to Morningstar, the average shareholder return was only 11.39% per year—more than 5% poorer than the record of this Fund itself. Unfortunately, this statistic is predictable. In a more aggressive fund that does well over the long haul, way too many investors will squander a big portion of the fund’s return by buying and selling, rather than staying put. By comparison, people are much less likely to sell a closed fund when performance is off. Our sister Fund, Aggressive Investors 1 (which is closed to new investors) returned 14.63% over the same five-year time period (not quite as high as Aggressive Investors 2 Fund). Nevertheless, because the investors mostly stayed put, the average investor’s return was actually higher than those in the “better performing” sister Fund, and was within one percentage point of the actual, reported Fund returns. We can’t tell you the best time to buy (or sell) our Funds. We never know returns before the fact. But we do know that human emotion tends to work against you, and our most successful investors tend to be the ones who have been with us over the long haul.
Not timing the market. Bridgeway got a wonderful letter from a shareholder, Denise Di Salvo, about lessons learned by “market timing:”
| | | This is just to let you know that I learned my lesson in 2000, when I bailed & shouldn’t have. Been there, done that, so now I leave it to you to make the great decisions & look for buying opportunities. I’m not really that worried. |
I, John, have my own “lessons learned,” which cost me money at the time, but now seem like cheap lessons. I wrote Denise back for more details. Here’s what she said:
| | | In 2000 I did not understand how much of the market is based on emotion. All of these waves rolling around on top. Underneath all the froth are some things that are going to remain unaffected, like good companies with solid business plans & a need & ability to pay for that particular product or service in the marketplace. The rest is all hysteria. |
| | | This was a painful & expensive lesson. I yanked my money out of Bridgeway Aggressive Investors 1 Fund at the bottom & proceeded to watch the NAV recover over the next few years. This was far more painful than any 300-point drop in the Dow. It is far and away the stupidest thing I have ever done, but it earned me the dubious title of “seasoned investor.” |
| | | I did not understand that at biddy-bottom it feels as though prices have nowhere to go but down. Just like at tippy-top, it feels like they have nowhere to go but up. To my mind, this might be more definitive of a top and bottom than any other measure. It makes me think that when projections are being made for another precipitous drop in, say, the housing market, we are by definition closer to the bottom than one may think. |
| | | Anyway, I hope some of these thoughts can help other investors relax & stay focused on the number of shares they have rather than the NAV. |
Not basing long-term decision on short-term events. Matching up your investment needs with the investment objective of your fund (and especially the investment time horizon) is crucial. Stock market instruments are by definition long-term investments. If you use our stock market-based Funds, our assumption is that you are investing for the long haul. Our prospectus says in eleven places that our Funds are not appropriate investments for short-term investors, those trying to time the market, or those who would panic during a major market or Fund correction. Likewise with events: as one investor recently said that with all the talk of credit crises, soaring energy costs, deficits, and inflation, isn’t it clear that the stock market direction is down?
Of course, We’d love to use recent events to predict the direction of the stock market. We’ve even spent some time in prior years trying to model this, and the modeling is fraught with problems. Our conclusion: don’t time our Funds, don’t time the
LETTER FROM THE INVESTMENT MANAGEMENT TEAM (continued)
market, and don’t think—even if you did know the direction of the economy (and your name is Ben Bernanke)—that you could productively predict the direction of the market. In short, you could adopt John’s sister’s investment philosophy, the “Rip Van Winkle” principle: “Get a long-term plan, put it in place for the long term, then fall asleep until something changes or it’s getting closer to time to spend the money.”
Opportunities and Problems of Target Date Funds
The Short Version: Target date funds seem like an attractive way to simplify the decision of how to allocate investment funds among the major alternatives (e.g., stocks, bonds, and cash) within a mutual fund structure. Unfortunately, used at “face value,” they are an oversimplification that may get an investor off the best track for the long haul due to their simplified “one size fits all” approach.
Target date funds (ones with asset allocations designed around the date that a person is targeted to retire) currently attract the largest inflows of new money of any mutual fund segment. You might be interested to know then, why Bridgeway isn’t planning to offer a target date fund.
As background, it’s helpful to know what we think about when designing a new fund. Bridgeway never offers a fund simply because there is a “market,” and our advisory firm can make money by offering it. Our high standards for a new fund include the following five factors:
| | 1) | it must meet a legitimate investing need (such as diversification, or attractive asset class returns, or favorable risk characteristics), |
| | 2) | it must be an attractive way (or part of a statistically “optimal” way) to achieve that legitimate investing need, |
| | 3) | it must be “in sync” with our four business values (integrity, performance, cost efficiency, and service), |
| | 4) | we must be able to look at a lot of historical data, so we can model what returns might look like in a downturn, and |
| | 5) | we must believe we have a “leg up” on the competition. |
While we think we are up to the task of competition among target date funds (the fifth criterion), our current analysis of the second criterion indicates target date funds pose significant limitations at the individual investor level.
To understand why this is so, it is helpful to understand how target date funds got started and became so popular. The answer, according to a recent article in the New York Times (“You’re on Autopilot,” July 13, 2008), concerns company liability in corporate retirement plans. It turns out that one of the biggest investing mistakes we investors make is not getting around to saving and investing. To address that problem, companies have looked for ways within defined contribution retirement plans to automatically enroll their employees. But then the question is, “could a company be sued for the investment choices they make on behalf of their employees, especially if those investments did poorly?” According to the article,
| | | The Labor Department’s effort to answer [this] question set off the current boom in target-date funds. The department issued a regulation last year saying that employers could not be held liable for 401(k) [retirement plan] losses if they had taken care to enroll their workers in investment funds that had diversified portfolios and reflected the number of years before the employees would retire. |
We believe companies’ push to get employees’ funds invested quickly is a noble one and that diversification is an extremely important part of any investment program. We disagree, however, with the interpretation that target date funds are in all cases the best solution for both the employer and retirement plan participant. The defining element of how risky a person’s investments should be allocated (i.e., how much is invested in stocks, bonds, and cash—the defining focus of the various target date funds) is not the date of their retirement, but rather a combination of a) when they will actually need to spend that money (the investment time horizon), b) their withdrawal rate (what percentage of their investment nest egg they will need to spend each year) at that time and c) their tolerance for short term risk (swings in account valuation). Thus, a 60 year old employee, who through a combination, let’s say, of relatively modest lifestyle and alternative resources, only plans to spend 2% of their 401(k) plan assets each year in retirement, can afford to be in the same target date fund (with respect to risk and investment allocation) as a 25 year old. The target date fund concept is a way around the conundrum of how a company can invest a large number of employees’ retirement funds with the only information at hand (age), but it generally doesn’t address the real underlying investment needs and risks of the individual investor. (One size doesn’t fit all!)
| | |
| 4 | | Annual Report | June 30, 2008 |
LETTER FROM THE INVESTMENT MANAGEMENT TEAM (continued)
In our next letter, we’ll propose two alternative ways to approach a plan for investment allocation in a retirement fund—considering the three (admittedly more complex) criteria of investment horizon, withdrawal rate, and risk tolerance.
Conversation with a Shareholder on our “Quant” models
The Short Version: Bridgeway uses quantitative models to pick stocks in our actively managed Funds. Since these models focus on longer timeframes, they tend to be more stable than strategies you may read about in the press. Thus, our investment process looks the same in radically different market environments, which is just one more way we can keep emotions out. Another “upside” to our process is that we’re not dependent on any one person for the operation or implementation of our models.
The following are questions asked recently by a shareholder: (along with our replies):
| | 1) | Do you ever revise the quantitative models on the basis of which you manage the funds? In other words, are you using the same model today as you did 1, 2, 5 or more years ago? We don’t use just one model, and yes, we do revise them. However, they are relatively stable, due to the modeling process we use. Last year we added two models to our library and now use 17 at Bridgeway across the sum total of our funds. We recently “reengineered” two of the early Bridgeway models and made only minor changes. |
| | 2) | If you do not revise the models, then do you believe that the market does not “fundamentally” change. ever? There are different modeling strategies; ours are designed for use in divergent market environments. Our process looks exactly the same in a bull or bear market. We view the markets from the standpoint of risk. The kinds of risk may change, e.g., the risk of nuclear war did not exist eight decades ago (higher risk now). The Federal Reserve is more successful with economic interventions (lower risk now). Bank insurance was not as prevalent eight decades ago (higher risk then). Derivative instruments were largely absent (lower risk then). Risk principles of diversification and stress testing are just as relevant in any time period. We say the economy and the market may significantly change over time, but not the principles of risk on which our models are based. Therefore, we count on their working over the long haul in many different (even “new”) market environments. Some of our Funds are old enough to get some picture of our success along these lines, at least historically. |
| | 3) | Is it possible that certain forces (e.g., electronic trading, more widespread dissemination of information) might actually cause fundamental changes? Yes. |
| | 4) | If so, do you worry that the models might need tweaking? We’re continually doing research to “stay ahead of the curve.” But we think we have less to worry about than, say, many hedge funds which rely on fewer models, short-term trends, and leverage (debt). |
| | 5) | If you do revise the models, then how do I, as a shareholder, find out about it? Generally, you won’t, at least not on a “real time” basis. It’s our intention to report some major changes in shareholder letters, as long as we feel it won’t damage our future returns by divulging too much to competitors—we’re always trying to protect our investors’ returns in this regard. Recent changes (but I would say these are much more incremental than major) are: a) we’ve added to our resources (both human and data) to expand our investment research capabilities, b) we’ve begun a methodical process to reengineer the earlier models, and c) we’re focusing some current research on looking for ways to dampen short-term risk without giving up expected returns. |
| | 6) | Conventional advice says that fund shareholders should monitor changes in fund management. I would certainly sit up and take notice if John Montgomery were no longer fund manager. A change from using Bridgeway Capital Management as the adviser for Bridgeway Funds would require the approval of shareholders, so you would know if the advisory firm changed (or John’s majority ownership of it). However, if John (or any other member of the investment team) were suddenly “out of the loop” for whatever reason, nothing about the operation of the models would change as a result. As a matter of fact, we think much less would change at Bridgeway than at most “fundamental” shops, where managers are given more leeway to implement their personal investment views. We have a formal backup plan for each member of the investment management team, and our models are well documented, we intentionally rotate roles and we operate without members to assure more continuity. |
LETTER FROM THE INVESTMENT MANAGEMENT TEAM (continued)
| | | To put it bluntly, we think that much more so than most other fund companies, nothing would change about the investment management process of your funds. Four people are trained on the operation of our models, and we expect the remaining three would keep cranking as they currently are. |
| | 7) | But since a ‘quant’ fund is managed largely by the model, shouldn’t I be concerned if the model is substantially revised? We don’t expect dramatic, wholesale changes. Our team’s confidence is in the modeling process, however, so any new model has to meet the same standards of “vetting” that our old ones do. As a matter of fact, with increased resources for data, tools, and staff, we hope there is reason for increased confidence. Of course, each shareholder will have to decide for him- or herself. |
| | 8) | Don’t get me wrong, I am very happy with being a Bridgeway shareholder for the last 5+ years, but these questions have been nagging me for a while. Great that you’re a long term shareholder! These are the shareholders who have done the best with Bridgeway, keeping cool and holding through downturns with money they have invested for the long haul. We can make no representations about the future, but we don’t see any current structural change that would cause us to modify our own investing strategy, personally or corporately. |
Fund Founder and Philanthropist John Templeton Dies at Age 95 in early July
It’s unusual that we would highlight the founder of a competing fund company, but John Templeton was an extraordinary man. John Montgomery had the privilege of meeting him in his office a little over four years ago. Here are some notes from that meeting:
| | ¡ | | I was struck by a graph of total returns of his fund for the two plus decades he was portfolio manager; it was an encouragement to aim for long-term results. |
| | ¡ | | At age 91, he was terribly sharp and said he was the busiest he had ever been. |
| | ¡ | | He demonstrated self awareness, broad perspective, and humility. |
| | ¡ | | He noted instances in his life and career where strength was born out of severe adversity. |
| | ¡ | | For every dollar he spent on himself or his family, he donated nine (a “reverse tithe”). |
| | ¡ | | He had already accomplished two of my life goals: celebrating a 50th wedding anniversary and giving away $100 million annually. |
Our condolences go to his family members and colleagues. He was truly a gifted, generous, and extraordinary man, leaving a very important and significant footprint behind in our industry and through the work of Templeton Foundation.
Fund Managers “Eating Their Own Cooking” (the next three sections by Mike Mulcahy)
The Short Version: While it is good that shareholders consider whether their fund manager is investing alongside their own shareholders, a simple absolute number of dollars invested per fund may not be the best metric and certainly shouldn’t be the only one. In this section, we help you “look under the hood” at Bridgeway.
In this past quarter, Morningstar, the mutual fund rating and investment research company, released their study on how much managers invest in their own funds. A requirement of the Securities & Exchange Commission is that managers must disclose their holdings in each fund annually. This report is typically done in the Statement of Additional Information, (Bridgeway’s most recent SAI is available on our website www.bridgeway.com) and displays holdings in a range of values.
What looks like a rather shocking statistic, Morningstar discovered 46% of domestic stock fund managers were not invested in their own funds! That certainly is not “eating their own cooking.” But, is that good or bad? Probably mostly bad, but an accurate judgment requires more information. (In fairness, Morningstar acknowledges this is not a one size fits all statistic, any more than the magnitude of an expense ratio taken out of context.)
Here are several things you may want to consider as you review this metric against any funds you may hold:
| | ¡ | | What is the investment style of the fund, and is it an appropriate investment for the managers to have a large part of their investable assets in it? For example, if the fund is a municipal bond fund, it may not make sense for the manager |
| | to be invested, particularly if he or she doesn’t live in that state. Or an aggressive fund may not be appropriate for someone who has near-term cash needs. |
| | |
| 6 | | Annual Report | June 30, 2008 |
LETTER FROM THE INVESTMENT MANAGEMENT TEAM (continued)
| | ¡ | | How many funds does the person manage? If the manager works on multiple funds, is it possible for the manager to make significant investments in each? |
| | ¡ | | Is the amount invested increasing or decreasing? This information is possible to get but requires some digging. This trend could give an idea of what the manager is thinking. |
| | ¡ | | How much of the manager’s investable assets are in the funds he or she manages? Unfortunately, this metric is not available. But THAT would be more telling than just how much money is invested. Someone with $10s of millions of dollars in net worth who only has $100,000 in the fund doesn’t seem to have his or her interests aligned with yours. But a manager with $200,000 in net worth probably does. |
What you probably don’t want to see as an investor are token investments. Instead, you want a manager who “feels your pain” and is interested in success of the fund—and you.
Why do I bring this up? Well, Bridgeway did not score as well as we would have liked on the Morningstar study (see www.morningstar.com for details), and we did get a question from a shareholder as a result. So, like Paul Harvey would say, I am here to tell you the “rest of the story.”
We recently surveyed the partners at Bridgeway Capital Management (that is, all full-time staff members) to measure their commitment to the Funds. There are 26 partners. (The results below reflect 23 data points as we excluded 3 partners who had been here less than 3 months). So, we are looking at a pool larger than just the investment management team. What did we find?
| | — | Average number of funds invested: 4.9 per partner |
| | — | Most popular funds: Aggressive Investors 2 with 96% of partners invested, Aggressive Investor 1 (78%) and Ultra-Small Company (74%). |
| | — | Least popular funds: Small-Cap Growth (17%), Small Cap-Value (17%) and Large-Cap Growth (22%). |
Clearly there is a bent toward “aggressive” in our partner pool.
We also asked: “What percentage of your estimated investable assets is in Bridgeway Funds?”—This is an important metric, and one we really believe reflects commitment.
| | — | All 23 partners invested in at least 1 Bridgeway Fund. |
| | — | On average, partners reported that 66% of their investable assets were in Bridgeway Funds. |
| | — | For partners that have been here more than 5 years, that number increases to 75%. |
| | — | For partners on the investment management team…69% |
| | — | For partners that are officers and directors…. 76% |
We don’t have any industry data to compare but believe this IS a strong commitment.
Finally, we asked “Are you committed to further investments in the Bridgeway Funds?” The answer was not surprising: 100% are planning more investment.
In regards to the portfolio managers specifically and the Morningstar study results, here are some points for you to ponder about Bridgeway:
| | ¡ | | We subscribe to a 7 to 1 total compensation cap with Bridgeway Capital Management. That means no one makes more than 7x the lowest compensated full-time person at Bridgeway. So unlike some firms who have outrageously high salaries for their “top” people, Bridgeway’s are much more conservative. In fact, salaries and trends are disclosed in the SAI annually. |
| | ¡ | | Three of our investment management team members (Rasool, Elena and Michael)—being very candid—are not in the stage of life to have large investable assets. Each is in the 30-40 age range and is supporting young and growing families. They are committed and are building positions. This is where following trend is important. |
| | ¡ | | Our investment team members are involved with up to 11 funds. Unlike fundamental shops that typically align a manager with 1 or 2 funds, our team works on up to 11. For the team to make significant investment in a large number of funds will take time. |
[GRAPHIC]
LETTER FROM THE INVESTMENT MANAGEMENT TEAM (continued)
| | ¡ | | Bridgeway Capital Management and our Bridgeway Foundation both maintain significant positions in the funds, which do not get captured in these surveys. The Adviser’s investments are disclosed in the SAI. |
We are proud of our commitment to the Funds by the entire staff of Bridgeway. Maybe it doesn’t show up in the numbers captured by the Morningstar study, but it is there.
The Worst Thing of the Year
The Short Version: Micro-Cap Limited Fund continues to lag its market benchmark over a three-year period (by 2.65% per year) and over a five-year period (by 0.70% per year). At most fund companies we suspect beating a market benchmark by 7.39% in the last year and by 5.25% per year for the last ten years would be enough to put it in the “outright winner” column. At Bridgeway, our standards are a bit different. We designed Micro-cap Limited Fund to keep up with our Aggressive Investors Fund(s) over the long haul (and with “diversifying” timing) but it hasn’t come close to doing so in the Fund’s first decade. We’re also not satisfied with our consistency of relative performance with this Fund. Thus, the performance record of Micro-cap Limited Fund got the most votes for “worst thing in fiscal year 2008” among our staff at a recent full-staff meeting, and we’re presenting the case here to you.
In each annual report, Bridgeway reveals its “worst thing of the year.” This section has become an important Bridgeway tradition within each annual report. As a shareholder, you are the owner and “boss,” and we think you have a right to know the negatives as well as the positives. In previous years we have discussed company turnover, trading errors, and compliance issues, among other things. This year we selected our three- and five-year track record for Micro-Cap Limited Fund as the worst thing.
Bluntly, Micro-Cap Limited Fund’s three-year record lags its market benchmark, and by our standards, that stinks, and ditto for our five-year record. This puts more than a dent in our excitement of celebrating the ten year anniversary of our Fund on June 30, 2008. The Adviser seeks to beat each Fund’s market and peer benchmarks over the long term—periods of three years and more. Informally, we want to be in the top 5% of our peer group over the long haul—but even in the ten year timeframe Micro-Cap Limited Fund falls out of this range. (see page 50 for more details.)
For seven quarters in a row from December 2005 until June 2007, this Fund underperformed its market benchmark, which contributed to the lagging five-year period. Since the fall of 2006, the investment management team has evaluated the nine models used for this Fund with renewed vigor. These models span the spectrum in orientation from value to growth to technical. The conclusion: we found no reason to change course. In spite of seven quarters lagging the market, perhaps the thing we are most proud of is that we stuck to the discipline of our process and didn’t succumb to the strong human tendency to change direction when things didn’t look good. This (changing course when something current feels bad) works in some other areas of life (picture sticking your hand in a fire), but it can lead to a travesty in investing. Without this kind of discipline, it is unlikely that your investment management team could have delivered a “cushion” of 7.39% (on a relative basis) in the most recently completed fiscal year, a time corresponding to the first bear market since 2002.
We do take long-term underperformance seriously. So far, periods of extended underperformance haven’t happened too often. (Past performance is no guarantee of future returns, however.) No actively-managed Bridgeway Fund has lagged its benchmark at any quarter end over a five-year period since our first Funds hit their five-year anniversary. While we cannot know the future of Micro-Cap Limited Fund, we do know that we are not making any major changes, except through our disciplined modeling process—and this is where we want to focus significant energy. And the “worst” part is that it has had such an extended period of underperformance—but it’s not a “dud” because at one point, it was the “bomb”.
15 Years in the Making (and Many More to Go)
The Short Version: In July, Bridgeway celebrated the founding of Bridgeway Capital Management, the investment adviser to Bridgeway Funds. This section was written by Mike Mulcahy, a Bridgeway partner, and is a celebration of John Montgomery, the founder of Bridgeway, and the vision he created.
In 1991, an unassuming, spectacle-wearing, flute-playing man running budgets and operations for Houston’s transportation company (METRO) was tossed the proverbial once-in-a-lifetime offer by his legal and tax firm. After Glenn H. Johnson
| | |
| 8 | | Annual Report | June 30, 2008 |
LETTER FROM THE INVESTMENT MANAGEMENT TEAM (continued)
reviewed John’s personal investment track record and returns, he unknowingly started John on the journey of founding Bridgeway Capital Management, the adviser to the Bridgeway Funds, by making the comment “We do a lot of tax returns, and I’ve never seen returns like these; if you ever consider investing professionally, I will be your client and bring you others.” Some years later in 1993 after intensive research (as is John’s unrelenting nature) Bridgeway Capital Management was formed and the idea for Bridgeway Funds was firmly planted.
John founded Bridgeway on a set of ideals, which not only haven’t wavered but have grown stronger through the years, and have been essential to our growth and success to date.
| | • | | He wanted to build a firm based on integrity. Not just in name but visible in all that we do. The so-called markers or flags that investors see regularly are reminders that we really take integrity seriously. |
| | • | | He wanted to create funds with long-term performance that would be among the top 5% of their peers. No fund would be launched that wasn’t diligently scrutinized, back-tested, and scrubbed for the potential of long-term performance. |
| | • | | He wanted service that reflected a commitment to and respect of people. Friendly, honest and open. |
| | • | | He wanted us to be cost efficient as reflected in our expense ratios, so that more money remains in the hands of investors. |
Aside from these four pillars of Bridgeway’s mission statement (which you can read more about at www.bridgeway.com) there were some incredible ideals in the founding of Bridgeway that have come to life in amazing ways over the first 15 years. These include such visions as:
| | • | | Building an organization that was highly participative, empowering, relatively flat, and intensely respectful and loving of each other and our community around us. An organization committed to the development and success of “partners” where everyone is an owner and acts like an owner of the company. No titles. Salary caps. Equity participation. Everyone leads, everyone follows. Not dependent on any one person. A new kind of—rather, a better—organization. |
| | • | | Committing an amazing 50% of after-tax profits of the Adviser to charitable causes. As John jokingly says, “It’s more fun to give away money while you are alive than dead.” (A truism we wish everyone would adopt.) It’s a great ideal that has truly been transformational to the partners of Bridgeway and, more importantly, organizations and people around the world addressing some of the world’s most depressing, repressive and daunting challenges and where we have been able to come along side with our time, talent and treasures. (See our foundation website for more information, www.bridgewayfoundation.com). |
This is Bridgeway. Who we are and who we are becoming is a reflection of one man’s unpolished, raw vision which time, our partners, friends, investors and the markets are helping to refine, shape and shine into something of emerging beauty that is truly a different and better place to work.
Thank you, John, for the vision, the willingness to take a chance and for never giving up the dream. Happy 15!
Aggressive Investors 1 Fund
MANAGER’S COMMENTARY
June 30, 2008
Dear Fellow Aggressive Investors 1 Fund Shareholder,
Our Fund bounced back strongly in the June quarter, outperforming all our market and peer benchmarks. Aggressive Investors 1 increased by an impressive 7.73%, trouncing our primary market index (the S&P 500 Index—down 2.73%), our peer benchmark (the Lipper Capital Appreciation Funds Index—up 4.54%), and the Russell 2000 Index of small companies (up 0.58%) for the three-month period. This was our best quarter relative to our primary market benchmark in five years and our fifth best quarter since inception 14 years ago. We are quite pleased.
Likewise, our Fund performed well for the full fiscal year on both an absolute and relative return basis, outperforming each of its benchmarks. For the 12-months ending June 30, 2008, the Fund rose by 3.51% while each of the indexes closed in negative territory: S&P 500 (-13.12%), Lipper Capital Appreciation Funds Index (-0.16%), and Russell 2000 Index (-16.19%). While we welcome such strong results during these shorter-term quarterly and 12-month time horizons, we strive to achieve excellent consistent returns over the long term. We are pleased to report that Aggressive Investors 1 Fund has rewarded our shareholders with double-digit returns and outperformed each of its benchmarks over the past five and ten years as well as since inception in August 1994 (where we have ranked first among our peers according to Lipper research as detailed below). Our strategies stay constant and consistent in both good times and bad, in both strong and weak markets, during both “the sky is the limit” and “the sky is falling” investor environments. Such long-term results always will remain the key objective of our firm. The information below bears out our historical success in these areas.
The table below presents our June quarter, one-year, five-year, ten-year and life-to-date financial results according to the formula required by the SEC. See the next page for a graph of performance from inception to June 30, 2008.
| | | | | | | | | | |
| | | June Qtr. 4/1/08
to 6/30/08 | | 1 Year 7/1/07
to 6/30/08 | | 5 Year 7/1/03
to 6/30/08 | | 10 Year 7/1/98
to 6/30/08 | | Life-to-Date 8/5/94 to 6/30/08 |
| | | | | |
Aggressive Investors 1 Fund | | 7.73% | | 3.51% | | 14.63% | | 17.11% | | 19.41% |
S&P 500 Index (large companies) | | -2.73% | | -13.12% | | 7.58% | | 2.88% | | 9.61% |
Lipper Capital Appreciation Funds Index | | 4.54% | | -0.16% | | 11.19% | | 4.53% | | 9.06% |
Russell 2000 Index (small companies) | | 0.58% | | -16.19% | | 10.29% | | 5.53% | | 9.19% |
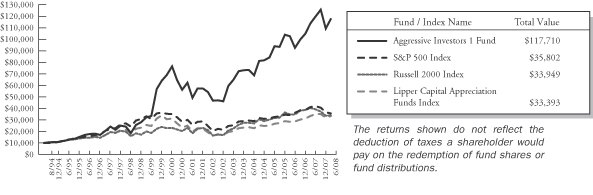
Performance figures quoted in the table above and graph below represent past performance and are no guarantee of future results. The table above and the graph below do not reflect the deduction of taxes that a shareholder would pay on Fund distributions or the redemption of Fund shares.
The S&P 500 Index is a broad-based, unmanaged measurement of changes in stock market conditions based on the average of 500 widely held common stocks with dividends reinvested, while the Russell 2000 Index is an unmanaged, market value weighted index, that measures performance of the 2,000 companies that are between the 1,000th and 3,000th largest in the market with dividends reinvested. The Lipper Capital Appreciation Funds Index reflects the record of the 30 largest funds in this category, comprised of more aggressive domestic growth mutual funds, as reported by Lipper, Inc. It is not possible to invest directly in an index. Periods longer than one year are annualized.
According to data from Lipper, Inc. as of June 30, 2008, Aggressive Investors 1 Fund ranked 33rd of 296 capital appreciation funds for the twelve months ending June 30, 2008, 28th of 218 over the last five years, 3rd of 120 over the last ten years, and 1st of 59 since inception in August, 1994. These long-term numbers and the following graph give two snapshots of our long-term success. Lipper, Inc. is an independent mutual fund rating service that ranks funds in various fund categories by making comparative calculations using total returns
| | |
| 10 | | Annual Report | June 30, 2008 |
Aggressive Investors 1 Fund
MANAGER’S COMMENTARY (continued)
Aggressive Investors 1 Fund vs. S&P 500 Index & Lipper Capital Appreciation Funds Index & Russell 2000 Index Inception (8/5/94) to 6/30/08
Detailed Explanation of Quarterly Performance—What Worked Well
The Short Version: These days, a lump of coal in the old holiday stocking actually would be a pretty good thing (ok, its 97 degrees in August in Bridgeway’s hometown of Houston). Commodities like coal continued to surge during the past quarter, and companies within industries that deal with natural resources and related products performed best over the three-month period. Our top performer list is comprised entirely of energy, basic materials, and industrial companies, most of which engage in some commodities-driven operations. These ten performers contributed over 13% to the return of the Fund over the three-month period.
These are the ten best performers for the quarter ended June 30, 2008:
| | | | | | |
| Rank | | Description | | Industry | | % Gain |
| 1 | | Alpha Natural Resources Inc | | Coal | | 74.2% |
| 2 | | National Oilwell Varco Inc | | Oil & Gas Services | | 52.0% |
| 3 | | CF Industries Holdings Inc | | Chemicals | | 47.5% |
| 4 | | Potash Corp of Saskatchewan | | Chemicals | | 47.3% |
| 5 | | Bucyrus International Inc | | Machinery-Construction & Mining | | 43.7% |
| 6 | | Mosaic Co | | Chemicals | | 41.0% |
| 7 | | Terra Industries Inc | | Chemicals | | 38.9% |
| 8 | | Petroleo Brasileiro SA ADR | | Oil & Gas | | 38.7% |
| 9 | | Flir Systems Inc | | Electronics | | 34.8% |
| 10 | | Flowserve Corp | | Machinery-Diversified | | 31.0% |
| | | | | | | |
Alpha Natural Resources was the Fund’s top performer and contributed over three percent to the overall return of the Fund. The company is the leading domestic exporter of metallurgical coal, which is used in the production of steel. With demand for coal (and steel) skyrocketing in emerging markets like China and India, Alpha Resources reported that its earnings tripled in the first-quarter, and some analysts predict soaring profitability through at least 2010. High natural gas prices and the weak dollar contributed to the strong global demand, which helped push the company’s stock price to an all-time high in late June.
Bucyrus International manufactures mining equipment used to extract resources like coal, copper, iron, and other minerals. Coal and copper mining companies represent its two largest customer bases. A consistent story during the quarter, higher commodities prices derived from growing international demand escalated the need for such specialized equipment; replacement parts and repairs accounted for over half of the company’s sales in the most recent quarter. In May, Lehman Brothers initiated coverage at “overweight,” and the stock price hit a 52-week high shortly thereafter. However, our own “overweighting” (See the top ten holdings on page 14) resulted from following our models’ analysis, not any broker’s recommendation. For the quarter, Bucyrus contributed over a percentage point to the overall return of the Fund.
Aggressive Investors 1 Fund
MANAGER’S COMMENTARY (continued)
Detailed Explanation of Quarterly Performance—What Didn’t Work
The Short Version: While the Fund did not suffer much from the ill-effects of the downturn in financial-related companies this past quarter, four consumer-oriented firms were among those on the list of worst performers. Of note, food companies struggled from the rising costs of grains and other commodities; additionally, retailers recognized less traffic (both in stores and online), as consumers grew more cautious given the weaker domestic economic environment. Combined, the four consumer companies lost two and a half percent during the three-month period.
These are the ten stocks that performed the worst in the quarter ended June 30, 2008:
| | | | | | |
| Rank | | Description | | Industry | | % Loss |
| 1 | | Chiquita Brands International Inc | | Food | | -32.6% |
| 2 | | Turkcell Iletisim Hizmet AS ADR | | Telecommunications | | -29.9% |
| 3 | | Owens-Illinois Inc | | Packaging & Containers | | -26.1% |
| 4 | | NewMarket Corp | | Chemicals | | -23.5% |
| 5 | | Garmin Ltd | | Electronics | | -23.5% |
| 6 | | Amtrust Financial Services Inc | | Insurance | | -22.3% |
| 7 | | Fresh Del Monte Produce Inc | | Food | | -21.4% |
| 8 | | GameStop Corp | | Retail | | -20.8% |
| 9 | | Sigma Designs Inc | | Semiconductors | | -19.5% |
| 10 | | Intuitive Surgical Inc | | Healthcare-Products | | -16.9% |
| | | | | | | |
Chiquita Brands distributes bananas and other produce across the U.S. and abroad. Late in the quarter, blaming bad weather in Central America and Ecuador, management warned that higher costs will lead to a significant loss in the third quarter. The company has not been able to pass along these escalating costs to consumers and previously strong markets in Europe have been slowing as of late. (Apparently, as banana prices rise, healthy eaters seek out alternative sources for their potassium!) After the warning, its stock price plummeted by 28% in one day, which represents the majority of the loss for the quarter. Chiquita was the Fund’s poorest performer for the three-months, and we sold it after quarter end.
Owens-Illinois is the largest glass manufacturer in the world and sells containers and related products throughout North and South America, Asia, and Europe. The company produced excellent fundamental results as of late, including four straight quarters of better than expected earnings reports. Indeed, our Fund had a sizable gain in the stock coming into the June quarter. However, after hitting an all-time high in April, Owens-Illinois took a step back and lost over 25% of its value during the quarter. While the company has benefited from strong international demand (70% of its revenue comes from overseas), management warned about the effects that rising energy and raw material costs may have on future sales. The company cost the Fund just less than two percent for the three-month period.
Detailed Explanation of Fiscal Year Performance—What Worked Well
The Short Version: The four top performers during the fiscal year are all chemical-related stocks, further proof that companies engaged in commodities-driven industries have reaped tremendous benefits during the run-up in prices over the past twelve months. In fact, our three best performers each doubled in value during the period and contributed over 10% to the return of the Fund.
| | |
| 12 | | Annual Report | June 30, 2008 |
Aggressive Investors 1 Fund
MANAGER’S COMMENTARY (continued)
These are the ten best performers for the fiscal year ended June 30, 2008:
| | | | | | |
| Rank | | Description | | Industry | | % Gain |
| 1 | | Potash Corp of Saskatchewan | | Chemicals | | 193.2% |
| 2 | | Mosaic Co | | Chemicals | | 140.1% |
| 3 | | CF Industries Holdings Inc | | Chemicals | | 106.7% |
| 4 | | Terra Industries Inc | | Chemicals | | 92.4% |
| 5 | | Research In Motion Ltd | | Computers | | 85.2% |
| 6 | | Alpha Natural Resources Inc | | Coal | | 74.2% |
| 7 | | National Oilwell Varco Inc | | Oil & Gas Services | | 70.2% |
| 8 | | priceline.com Inc | | Internet | | 68.0% |
| 9 | | Mobile Telesystems OJSC ADR | | Telecommunications | | 55.5% |
| 10 | | Bucyrus International Inc | | Machinery-Construction & Mining | | 52.4% |
| | | | | | | |
Our top performing stock, Potash Corp. of Saskatchewan, nearly tripled in price during the past twelve months and represented almost four percent of the Fund’s return. The Canadian-based company produces and markets fertilizer and related products across the globe. As the population in many emerging markets become more affluent, demand for different foods and other materials has increased dramatically, thus, enhancing the farmers’ needs for fertilizer. Additionally, natural disasters like the floods that devastated the Midwest earlier in the year also contributed to the shrinking supply (and rising demand) for grains, foods, and other products—all benefiting our Fund’s performance.
Three other top performers (Mosaic, CF Industries, and Terra Industries) are also chemical-related, and their stories have some similarities to Potash Corp. Outside of that industry, priceline.com was another excellent performer. The online travel company actually benefited from the ailing economy, as travelers sought out any and all discounts and promotions for their trips. When Captain Kirk…aka William Shatner…talks, people listen (though a few Bridgeway traders are more partial to Captain Picard in The Next Generation). The company’s tag line “name your own price” attracted consumers and business travelers alike to its sight in search of discounted flights, hotels, rental cars, and full packages, as priceline.com outperformed its key competitors: Orbitz and Expedia. For the summer, its management initiated a new creative promotion called “Sunshine Guaranteed.” Travelers who book through the website can get refunds should poor weather conditions ruin vacation plans.
Detailed Explanation of Fiscal Year Performance—What Didn’t Work
The Short Version: While financials received much of the negative headlines over the past twelve months, the weaker economy impacted companies within other (non-commodities-related) sectors as well, including technology and consumer non-cyclicals. The five poorest performing stocks declined at least 50%, and together they cost the Fund over 4% in return.
These are the ten stocks that performed the worst for the fiscal year ended June 30, 2008:
| | | | | | |
| Rank | | Description | | Industry | | % Loss |
| 1 | | WellCare Health Plans Inc | | Healthcare-Services | | -77.5% |
| 2 | | Sigma Designs Inc | | Semiconductors | | -63.3% |
| 3 | | Garmin Ltd | | Electronics | | -54.7% |
| 4 | | Synaptics Inc | | Computers | | -52.2% |
| 5 | | Perini Corp | | Engineering & Construction | | -51.5% |
| 6 | | Apollo Group Inc | | Commercial Services | | -44.3% |
| 7 | | Sunpower Corp | | Energy-Alternate Sources | | -43.1% |
| 8 | | Onyx Pharmaceuticals Inc | | Pharmaceuticals | | -41.4% |
| 9 | | Turkcell Iletisim Hizmet AS ADR | | Telecommunications | | -40.5% |
| 10 | | Sun Microsystems Inc | | Computers | | -38.4% |
| | | | | | | |
Aggressive Investors 1 Fund
MANAGER’S COMMENTARY (continued)
WellCare Health Plans was our Fund’s worst performer for the fiscal year. This managed care provider offers government-sponsored healthcare and prescription drug programs through Medicare and Medicaid. In late October 2007, federal officials began investigating the company for fraud-related claims. The company’s stock price plummeted over 70% in one day on the news of the investigation. Additionally, reports surfaced that corporate execs had sold a sizable number of shares in advance of the decline, prompting concerns about insider trading and other illegal activities. We had only owned this stock a brief period when this news came out, and we sold shortly thereafter. Fortunately, as a smaller diversifying position, it cost the Fund less than a percentage point of return.
Chip-maker Sigma Designs is a leading manufacturer of digital solutions for home entertainment products, particularly high definition (HD) televisions and DVDs. The company holds a considerable market share advantage in providing chips for Sony’s Blu-Ray devices. During the year, management disclosed a significant error in its ordering system that resulted in its shipping products in excess of actual demand. As a result, the problem prompted the company to reduce its future sales forecasts, and several analysts lowered their price targets. Sigma Designs was the second worst-performing holding and cost the Fund just over a percentage point during the fiscal year.
Top Ten Holdings as of June 30, 2008
Commodities were a consistent theme among the Fund’s top holdings, as companies related to chemicals, coal, energy, and mining highlighted the list. Six of our largest positions at fiscal year end were also among our top quarterly performers: Mosaic, Alpha Natural Resources, Potash Corp., CF Industries, Bucyrus International, and National Oilwell Varco. The top ten holdings represented just under half of the overall net assets of the Fund, which represents more concentration in a smaller number of stocks and in more related industries than we have seen in quite a while.
| | | | | | |
| Rank | | Description | | Industry | | Percent of
Net Assets |
| 1 | | Mosaic Co | | Chemicals | | 8.0% |
| 2 | | Alpha Natural Resources Inc | | Coal | | 7.3% |
| 3 | | Potash Corp of Saskatchewan | | Chemicals | | 6.5% |
| 4 | | Owens-Illinois Inc | | Packaging & Containers | | 5.1% |
| 5 | | CF Industries Holdings Inc | | Chemicals | | 4.2% |
| 6 | | Bucyrus International Inc | | Machinery-Construction & Mining | | 4.1% |
| 7 | | Intuitive Surgical Inc | | Healthcare-Products | | 3.8% |
| 8 | | Compass Minerals International Inc | | Mining | | 3.7% |
| 9 | | Invitrogen Corp | | Biotechnology | | 3.1% |
| 10 | | National Oilwell Varco Inc | | Oil & Gas Services | | 2.6% |
| | | | | | | |
| | | | | | 48.4% |
| | |
| 14 | | Annual Report | June 30, 2008 |
Aggressive Investors 1 Fund
MANAGER’S COMMENTARY (continued)
Industry Sector Representation as of June 30, 2008
Our Fund’s concentration in basic materials greatly contributed to the June quarter success. This overweighting along with good stock selection in the sector added over seven percent to the return. Conversely, we were underweighted in financials and avoided much of the hardships faced by companies engaged in subprime lending, mortgage-related securities investing, and other ramifications of the ongoing credit crisis, which saved the Fund more than two percentage points relative to our primary market benchmark.
| | | | | | |
| | | % of Portfolio | | % S&P 500 Index | | Difference |
Basic Materials | | 30.0% | | 3.9% | | 26.1% |
Communications | | 3.1% | | 11.0% | | -7.9% |
Consumer, Cyclical | | 4.6% | | 7.1% | | -2.5% |
Consumer, Non-cyclical | | 13.6% | | 20.6% | | -7.0% |
Energy | | 17.0% | | 16.3% | | 0.7% |
Financial | | 1.6% | | 14.0% | | -12.4% |
Industrial | | 19.9% | | 11.5% | | 8.4% |
Technology | | 6.7% | | 11.6% | | -4.9% |
Utilities | | 0.0% | | 3.9% | | -3.9% |
Diversified | | 0.0% | | 0.1% | | -0.1% |
Cash | | 3.5% | | 0.0% | | 3.5% |
| | | | | | | |
Total | | 100.0% | | 100.0% | | |
Disclaimer
The following is a reminder from the friendly folks at your Fund who worry about liability. The views expressed here are exclusively those of Fund management. These views, including those of market sectors or individual stocks, are not meant as investment advice and should not be considered predictive in nature. Any favorable (or unfavorable) description of a holding applies only as of the quarter end, June 30, 2008, unless otherwise stated. Security positions can and do change thereafter. Discussions of historical performance do not guarantee and may not be indicative of future performance.
Market volatility can significantly affect short-term performance. The Fund is not an appropriate investment for short-term investors. Investments in the small companies within this multi-cap fund generally carry greater risk than is customarily associated with larger companies. This additional risk is attributable to a number of factors, including the relatively limited financial resources that are typically available to small companies, and the fact that small companies often have comparatively limited product lines. In addition, the stock of small companies tends to be more volatile than the stock of large companies, particularly in the short term and particularly in the early stages of an economic or market downturn. The Fund’s use of options, futures, and leverage can magnify the risk of loss in an unfavorable market, and the Fund’s use of short-sale positions can, in theory, expose shareholders to unlimited loss. Finally, the Fund exposes shareholders to “focus risk” which may add to Fund volatility through the possibility that a single company could significantly affect total return. Shareholders of the Fund, therefore, are taking on more risk than they would if they invested in the stock market as a whole.
Conclusion
Thank you for your continued investment in Aggressive Investors 1 Fund. We encourage your feedback; your reactions and concerns are important to us.
Sincerely,
Your Investment Management Team
Bridgeway Aggressive Investors 1 Fund
SCHEDULE OF INVESTMENTS
Showing percentage of net assets as of June 30, 2008
| | | | | | | |
| Industry | | Company | | Shares | | Value |
|
COMMON STOCKS - 96.48% |
Aerospace/Defense - 0.88% |
| | Lockheed Martin Corp. | | 30,100 | | $ | 2,969,666 |
|
Apparel - 1.32% |
| | Warnaco Group, Inc.* | | 101,200 | | | 4,459,884 |
|
Banks - 0.85% |
| | US Bancorp+ | | 103,800 | | | 2,894,982 |
|
Biotechnology - 5.22% |
| | Invitrogen Corp.* | | 259,700 | | | 10,195,822 |
| | OSI Pharmaceuticals, Inc.* | | 181,700 | | | 7,507,844 |
| | | | | | | |
| | | | | | | 17,703,666 |
|
Chemicals - 24.15% |
| | CF Industries Holdings, Inc.+ | | 91,600 | | | 13,996,480 |
| | Dow Chemical Co. | | 82,300 | | | 2,873,093 |
| | Monsanto Co. | | 28,000 | | | 3,540,320 |
| | Mosaic Co.* | | 184,000 | | | 26,624,800 |
| | NewMarket Corp. | | 50,500 | | | 3,344,615 |
| | Potash Corp. of Saskatchewan, Inc. | | 95,100 | | | 21,737,007 |
| | Syngenta AG - ADR | | 37,900 | | | 2,452,130 |
| | Terra Industries, Inc.+ | | 146,370 | | | 7,223,359 |
| | | | | | | |
| | | | | | | 81,791,804 |
|
Coal - 7.22% |
| | Alpha Natural Resources, Inc.*+ | | 234,400 | | | 24,445,576 |
|
Computers - 3.78% |
| | Apple, Inc.* | | 21,300 | | | 3,566,472 |
| | Research In Motion, Ltd.* | | 26,800 | | | 3,132,920 |
| | Western Digital Corp.* | | 176,500 | | | 6,094,545 |
| | | | | | | |
| | | | | | | 12,793,937 |
|
Electrical Components & Equipment - 1.24% |
| | GrafTech International, Ltd.* | | 156,400 | | | 4,196,212 |
|
Electronics - 1.23% |
| | FLIR Systems, Inc.* | | 103,200 | | | 4,186,824 |
|
Engineering & Construction - 1.20% |
| | ABB, Ltd. - ADR* | | 143,400 | | | 4,061,088 |
|
Food - 0.04% |
| | Chiquita Brands International, Inc.*+ | | 8,600 | | | 130,462 |
| | | | | | | |
| Industry | | Company | | Shares | | Value |
|
|
Healthcare - Products - 4.65% |
| | Intuitive Surgical, Inc.* | | 46,800 | | $ | 12,607,920 |
| | St. Jude Medical, Inc.* | | 76,700 | | | 3,135,496 |
| | | | | | | |
| | | | | | | 15,743,416 |
|
Insurance - 0.78% |
| | AmTrust Financial Services, Inc. | | 209,400 | | | 2,638,440 |
|
Internet - 2.18% |
| | Priceline.com, Inc.*+ | | 64,000 | | | 7,389,440 |
|
Iron/Steel - 2.28% |
| | AK Steel Holding Corp. | | 50,600 | | | 3,491,400 |
| | Mechel Open Joint Stock Co. - ADR+ | | 85,300 | | | 4,225,762 |
| | | | | | | |
| | | | | | | 7,717,162 |
|
Machinery - Construction & Mining - 4.08% |
| | Bucyrus International, Inc., Class A+ | | 189,200 | | | 13,815,384 |
|
Machinery - Diversified - 3.34% |
| | AGCO Corp.*+ | | 57,300 | | | 3,003,093 |
| | Flowserve Corp. | | 33,100 | | | 4,524,770 |
| | Gardner Denver, Inc.* | | 66,600 | | | 3,782,880 |
| | | | | | | |
| | | | | | | 11,310,743 |
|
Media - 0.93% |
| | Walt Disney Co. | | 101,100 | | | 3,154,320 |
|
Mining - 3.61% |
| | Compass Minerals International, Inc. | | 152,000 | | | 12,245,120 |
|
Office Furnishing - 1.00% |
| | Herman Miller, Inc. | | 136,100 | | | 3,387,529 |
|
Oil & Gas - 5.00% |
| | CNOOC, Ltd. - ADR | | 13,100 | | | 2,273,374 |
| | ConocoPhillips | | 36,700 | | | 3,464,113 |
| | EOG Resources, Inc. | | 23,500 | | | 3,083,200 |
| | Petroleo Brasileiro S.A. - ADR | | 68,400 | | | 4,844,772 |
| | Transocean, Inc. | | 21,400 | | | 3,261,146 |
| | | | | | | |
| | | | | | | 16,926,605 |
|
Oil & Gas Services - 3.72% |
| | FMC Technologies, Inc.* | | 51,600 | | | 3,969,588 |
| | National Oilwell Varco, Inc.* | | 97,200 | | | 8,623,584 |
| | | | | | | |
| | | | | | | 12,593,172 |
| | |
| 16 | | Annual Report | June 30, 2008 |
Bridgeway Aggressive Investors 1 Fund
SCHEDULE OF INVESTMENTS (continued)
Showing percentage of net assets as of June 30, 2008
| | | | | | | |
| Industry | | Company | | Shares | | Value |
|
Common Stocks (continued) |
Packaging & Containers - 5.04% |
| | Owens-Illinois, Inc.* | | 409,600 | | $ | 17,076,224 |
|
Pharmaceuticals - 3.65% |
| | Bristol-Myers Squibb Co. | | 174,300 | | | 3,578,379 |
| | Express Scripts, Inc.* | | 50,600 | | | 3,173,632 |
| | Medco Health Solutions, Inc.* | | 68,200 | | | 3,219,040 |
| | Novo Nordisk A/S - Sponsored ADR | | 36,200 | | | 2,389,200 |
| | | | | | | |
| | | | | | | 12,360,251 |
|
Pipelines - 1.07% |
| | The Williams Cos., Inc. | | 89,700 | | | 3,615,807 |
|
Retail - 2.25% |
| | Aeropostale, Inc.* | | 91,600 | | | 2,869,828 |
| | Costco Wholesale Corp.+ | | 33,200 | | | 2,328,648 |
| | Tiffany & Co. | | 60,000 | | | 2,445,000 |
| | | | | | | |
| | | | | | | 7,643,476 |
|
Semiconductors - 0.99% |
| | Amkor Technology, Inc.* | | 321,500 | | | 3,346,815 |
|
Software - 1.92% |
| | Microsoft Corp. | | 115,900 | | | 3,188,409 |
| | Oracle Corp.* | | 157,500 | | | 3,307,500 |
| | | | | | | |
| | | | | | | 6,495,909 |
|
Transportation - 2.86% |
| | CH Robinson Worldwide, Inc. | | 53,900 | | | 2,955,876 |
| | CSX Corp. | | 49,700 | | | 3,121,657 |
| | Kirby Corp.* | | 20 | | | 960 |
| | Ryder System, Inc. | | 52,600 | | | 3,623,088 |
| | | | | | | |
| | | | | | | 9,701,581 |
| | | | | | | |
| |
TOTAL COMMON STOCKS - 96.48% | | | 326,795,496 |
| | | | | | | |
(Cost $250,679,171) | | | |
| | | | | |
| |
PURCHASED CALL OPTIONS - 0.18% | | | |
| | |
| Company | | Number
of Contracts | | Value |
Southwestern Energy Co.
Expiring September, 2008 at $42.50 | | 800 | | $ | 624,000 |
| | | | | |
| |
TOTAL PURCHASED CALL OPTIONS - 0.18% | | | 624,000 |
| | | | | |
(Cost $480,679) | | | | | |
| | | | | | | |
|
MONEY MARKET FUNDS - 0.35% |
| | | |
| | | Rate^ | | Shares | | Value |
BlackRock Temp Cash Liquidity Fund Institutional Shares #21 | | 2.61% | | 1,170,513 | | $ | 1,170,513 |
| | | | | | | |
| |
TOTAL MONEY MARKET FUNDS - 0.35% | | | 1,170,513 |
| | | | | | | |
(Cost $1,170,513) | | | |
| |
TOTAL INVESTMENTS - 97.01% | | $ | 328,590,009 |
(Cost $252,330,363) | | | |
Other Assets in Excess of Liabilities - 2.99% | | | 10,124,881 |
| | | | | | | |
NET ASSETS - 100.00% | | $ | 338,714,890 |
| | | | | | | |
| * | Non Income Producing Security. |
| + | This security or a portion of the security is out on loan at June 30, 2008. Total loaned securities had a market value of $53,026,296 at June 30, 2008. |
| ^ | Rate disclosed is as of June 30, 2008. |
| ADR | - American Depositary Receipt |
See Notes to Financial Statements.
Aggressive Investors 2 Fund
MANAGER’S COMMENTARY
June 30, 2008
Dear Fellow Aggressive Investors 2 Fund Shareholder,
Our Fund bounced back strongly in the June quarter, outperforming all our market and peer benchmarks. Aggressive Investors 2 increased by an impressive 11.61%, trouncing our primary market index (the S&P 500 Index—down 2.73%), our peer benchmark (the Lipper Capital Appreciation Funds Index—up 4.54%), and the Russell 2000 Index of small companies (up 0.58%) for the three-month period. This was our best quarter relative to our primary market benchmark in five years and our second best quarter relative to our primary market benchmark since inception six and a half years ago. We are quite pleased.
Likewise, our Fund outperformed all of its benchmarks for the full fiscal year on both an absolute and relative return basis. For the twelve months ending June 30, 2008, the Fund appreciated 5.88%, while each of the indexes closed in negative territory: S&P 500 (-13.12%), Lipper Capital Appreciation Funds Index (-0.16%), and Russell 2000 Index (-16.19%). While we welcome such strong results during these shorter-term quarterly and twelve month time horizons, we strive to achieve excellent consistent returns over the long term. We are pleased to report that Aggressive Investors 2 Fund has rewarded our shareholders with double-digit returns and outperformed each of its benchmarks over the past five years as well as since inception in October, 2001. Our strategies stay constant and consistent in both good times and bad, in both strong and weak markets, during both “the sky is the limit” and “the sky is falling” investor environments. Such long-term results always will remain the key objective of our firm. The information below bears out our longer term success in these areas.
The table below presents our June quarter, one-year, five-year and life-to-date financial results, according to the formula required by the SEC. See the next page for a graph of performance from inception to June 30, 2008.
| | | | | | | | |
| | | June Qtr.
4/1/08
to 6/30/08 | | 1 Year
7/1/07
to 6/30/08 | | 5 Year
7/1/03
to 6/30/08 | | Life-to-Date
10/31/01 to 6/30/08 |
| | | | |
Aggressive Investors 2 Fund | | 11.61% | | 5.88% | | 16.57% | | 12.66% |
S&P 500 Index (large companies) | | -2.73% | | -13.12% | | 7.58% | | 4.75% |
Lipper Capital Appreciation Funds Index | | 4.54% | | -0.16% | | 11.19% | | 7.41% |
Russell 2000 Index (small companies) | | 0.58% | | -16.19% | | 10.29% | | 8.76% |
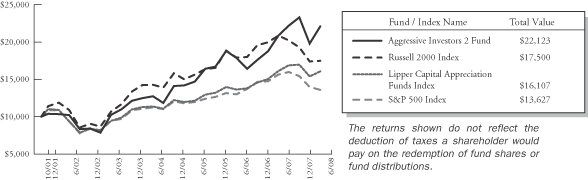
Performance figures quoted in the table above and graph below represent past performance and are no guarantee of future results. The table above and the graph below do not reflect the deduction of taxes that a shareholder would pay on Fund distributions or the redemption of Fund shares.
The S&P 500 Index is a broad-based, unmanaged measurement of changes in stock market conditions based on the average of 500 widely held common stocks with dividends reinvested, while the Russell 2000 Index is an unmanaged, market value weighted index, that measures performance of the 2,000 companies that are between the 1,000th and 3,000th largest in the market with dividends reinvested. The Lipper Capital Appreciation Funds Index reflects the record of the 30 largest funds in this category, comprised of more aggressive domestic growth mutual funds, as reported by Lipper, Inc. It is not possible to invest directly in an index. Periods longer than one year are annualized.
According to data from Lipper, Inc. as of June 30, 2008, Aggressive Investors 2 Fund ranked 23rd of 296 capital appreciation funds for the twelve months ending June 30, 2008, 15th of 218 over the last five years, and 12th of 198 since inception in October, 2001. Lipper, Inc. is an independent mutual fund rating service that ranks funds in various fund categories by making comparative calculations using total returns.
| | |
| 18 | | Annual Report | June 30, 2008 |
Aggressive Investors 2 Fund
MANAGER’S COMMENTARY (continued)
Aggressive Investors 2 Fund vs. S&P 500 Index & Lipper Capital Appreciation Funds Index & Russell 2000 Index 10/31/01 to 6/30/08
Detailed Explanation of Quarterly Performance—What Worked Well
The Short Version: These days, a lump of coal in the old holiday stocking actually would be a pretty good thing (ok, its 97 degrees in August in Bridgeway’s hometown of Houston). Commodities like coal continued to surge during the past quarter, and companies within industries that deal with natural resources and related products performed best over the three-month period. Our top performer list is comprised entirely of energy, basic materials, and industrial companies, most of which engage in some commodities-driven operations. These ten performers contributed over 13% to the return of the Fund over the three-month period.
These are the ten best performers for the quarter ended June 30, 2008:
| | | | | | |
| Rank | | Description | | Industry | | % Gain |
| 1 | | Alpha Natural Resources Inc | | Coal | | 68.0% |
| 2 | | GrafTech International Ltd | | Electrical Components & Equipment | | 65.5% |
| 3 | | National Oilwell Varco Inc | | Oil & Gas Services | | 52.0% |
| 4 | | CF Industries Holdings Inc | | Chemicals | | 47.5% |
| 5 | | Potash Corp of Saskatchewan | | Chemicals | | 47.3% |
| 6 | | Bucyrus International Inc | | Machinery-Construction & Mining | | 43.7% |
| 7 | | Mosaic Co/The | | Chemicals | | 41.0% |
| 8 | | Terra Industries Inc | | Chemicals | | 38.9% |
| 9 | | Petroleo Brasileiro SA ADR | | Oil & Gas | | 38.7% |
| 10 | | Flir Systems Inc | | Electronics | | 34.8% |
| | | | | | | |
Alpha Natural Resources was the Fund’s top performer and contributed over three percent to the overall return of the Fund. The company is the leading domestic exporter of metallurgical coal, which is used in the production of steel. With demand for coal (and steel) skyrocketing in emerging markets like China and India, Alpha Resources reported that its earnings tripled in the first-quarter, and some analysts predict soaring profitability through at least 2010. High natural gas prices and the weak dollar contributed to the strong global demand, which helped push the company’s stock price to an all-time high in late June.
Bucyrus International manufactures mining equipment used to extract resources like coal, copper, iron, and other minerals. Coal and copper mining companies represent its two largest customer bases. A consistent story during the quarter, higher commodities prices derived from growing international demand escalated the need for such specialized equipment; replacement parts and repairs accounted for over half of the company’s sales in the most recent quarter. In May, Lehman Brothers initiated coverage at “overweight,” and the stock price hit a 52-week high shortly thereafter. However, our own “overweighting” (See the top ten holdings on page 22) resulted from following our models’ analysis, not any broker’s recommendation. For the quarter, Bucyrus contributed over a percentage point to the overall return of the Fund.
Aggressive Investors 2 Fund
MANAGER’S COMMENTARY (continued)
Detailed Explanation of Quarterly Performance—What Didn’t Work
The Short Version: While the Fund did not suffer much from the ill-effects of the downturn in financial-related companies this past quarter, five consumer-oriented firms are among those on the list of worst performers. Of note, food companies struggled from the rising costs of grains and other commodities; additionally, retailers recognized less traffic (both in stores and online), as consumers grew more cautious given the weaker domestic economic environment. Combined, the five consumer companies lost about a percent and a half during the three-month period.
These are the ten stocks that performed the worst in the quarter ended June 30, 2008:
| | | | | | |
| Rank | | Description | | Industry | | % Loss |
| 1 | | Goodyear Tire & Rubber Co | | Auto Parts & Equipment | | -38.3% |
| 2 | | Chiquita Brands International Inc | | Food | | -34.8% |
| 3 | | Turkcell Iletisim Hizmet AS ADR | | Telecommunications | | -30.4% |
| 4 | | Owens-Illinois Inc | | Packaging & Containers | | -26.1% |
| 5 | | LKQ Corp | | Distribution/Wholesale | | -24.7% |
| 6 | | Garmin Ltd | | Electronics | | -23.5% |
| 7 | | GameStop Corp | | Retail | | -20.8% |
| 8 | | Sigma Designs Inc | | Semiconductors | | -19.7% |
| 9 | | NewMarket Corp | | Chemicals | | -19.1% |
| 10 | | Perrigo Co | | Pharmaceuticals | | -18.2% |
| | | | | | | |
Chiquita Brands distributes bananas and other produce across the U.S. and abroad. Late in the quarter, blaming bad weather in Central America and Ecuador, management warned that higher costs will lead to a significant loss in the third quarter. The company has not been able to pass along these escalating costs to consumers and previously strong markets in Europe have been slowing as of late. (Apparently, as banana prices rise, healthy eaters seek out alternative sources for their potassium!) After the warning, its stock price plummeted by 28% in one day, which represents the majority of the loss for the quarter. Chiquita was the Fund’s second poorest performer for the three-months, and we sold it after quarter end.
Owens-Illinois is the largest glass manufacturer in the world and sells containers and related products throughout North and South America, Asia, and Europe. The company has produced excellent fundamental results as of late, including four straight quarters of better than expected earnings reports. Indeed, our Fund had a sizable gain in the stock coming into the June quarter. However, after hitting an all-time high in April, Owens-Illinois took a step back and lost over 25% of its value during the quarter. While the company has benefited from strong international demand (70% of its revenue comes from overseas), management warned about the effects that rising energy and raw material costs may have on future sales. The company cost the Fund about a percent and a half for the three-month period.
Detailed Explanation of Fiscal Year Performance—What Worked Well
The Short Version: Four of the Fund’s top five performers during the fiscal year are chemical-related stocks, further proof that companies engaged in commodities-driven industries have reaped tremendous benefits during the run-up in prices over the past twelve months. In fact, our three best performers each doubled in value during the period and contributed over 11% to the return of the Fund.
| | |
| 20 | | Annual Report | June 30, 2008 |
Aggressive Investors 2 Fund
MANAGER’S COMMENTARY (continued)
These are the ten best performers for the fiscal year ended June 30, 2008:
| | | | | | |
| Rank | | Description | | Industry | | % Gain |
| 1 | | Potash Corp of Saskatchewan | | Chemicals | | 182.2% |
| 2 | | Mosaic Co | | Chemicals | | 138.9% |
| 3 | | CF Industries Holdings Inc | | Chemicals | | 104.4% |
| 4 | | Research In Motion Ltd | | Computers | | 82.1% |
| 5 | | Terra Industries Inc | | Chemicals | | 75.0% |
| 6 | | GrafTech International Ltd | | Electrical Components & Equipment | | 74.2% |
| 7 | | National Oilwell Varco Inc | | Oil & Gas Services | | 70.2% |
| 8 | | Alpha Natural Resources Inc | | Coal | | 68.0% |
| 9 | | Vimpel-Communications ADR | | Telecommunications | | 53.3% |
| 10 | | Bucyrus International Inc | | Machinery-Construction & Mining | | 51.6% |
Our top performing stock, Potash Corp. of Saskatchewan, nearly tripled in price during the past twelve months and represented almost four percent of the Fund’s return. The Canadian-based company produces and markets fertilizer and related products across the globe. As the population in many emerging markets become more affluent, demand for different foods and other materials has increased dramatically, thus, enhancing the farmers’ needs for fertilizer. Additionally, natural disasters like the floods that devastated the Midwest earlier in the year also contributed to the shrinking supply (and rising demand) for grains, foods, and other products—all benefiting our Fund’s performance.
Three other top performers (Mosaic, CF Industries, and Terra Industries) are also chemical-related and have some similar “commodities” success stories as Potash Corp. Combined, these companies contributed over 8% to the Fund’s return during the fiscal year.
Detailed Explanation of Fiscal Year Performance—What Didn’t Work
The Short Version: While financials received much of the negative headlines over the past 12 twelve months, the weaker economy impacted companies within other (non-commodities-related) sectors as well, including five consumer-related companies (two cyclical and three non-cyclical) represented on the list. Each of the ten worst performers lost over 40% in value during the fiscal year.
These are the ten stocks that performed the worst for the fiscal year ended June 30, 2008:
| | | | | | |
| Rank | | Description | | Industry | | % Loss |
| 1 | | WellCare Health Plans Inc | | Healthcare-Services | | -77.5% |
| 2 | | Sigma Designs Inc | | Semiconductors | | -63.4% |
| 3 | | Garmin Ltd | | Electronics | | -59.5% |
| 4 | | China Southern Airlines Co Ltd ADR | | Airlines | | -58.4% |
| 5 | | Synaptics Inc | | Computers | | -52.7% |
| 6 | | Perini Corp | | Engineering & Construction | | -49.9% |
| 7 | | Apollo Group Inc | | Commercial Services | | -45.7% |
| 8 | | Turkcell Iletisim Hizmet AS ADR | | Telecommunications | | -44.3% |
| 9 | | Cooper Tire & Rubber Co | | Auto Parts & Equipment | | -42.9% |
| 10 | | Onyx Pharmaceuticals Inc | | Pharmaceuticals | | -41.8% |
| | | | | | | |
WellCare Health Plans was our Fund’s worst performer for the fiscal year. This managed care provider offers government-sponsored healthcare and prescription drug programs through Medicare and Medicaid. In late October 2007, federal officials began investigating the company for fraud-related claims. The company’s stock price plummeted over 70% in one day on the news of the investigation. Additionally, reports surfaced that corporate execs had sold a sizable number of shares in advance of the decline, prompting concerns about insider trading and other illegal activities. We had only owned this stock a brief
Aggressive Investors 2 Fund
MANAGER’S COMMENTARY (continued)
period when this news came out, and we sold shortly thereafter. Fortunately, as a smaller diversifying position, it cost the Fund less than a percentage point of return.
Chip-maker Sigma Designs is a leading manufacturer of digital solutions for home entertainment products, particularly high definition (HD) televisions and DVDs. The company holds a considerable market share advantage in providing chips for Sony’s Blu-Ray devices. During the year, management disclosed a significant error in its ordering system that resulted in its shipping products in excess of actual demand. As a result, the problem prompted the company to reduce its future sales forecasts, and several analysts lowered their price targets. Sigma Designs was the second worst-performing holding and cost the Fund roughly a percent and a half return during the fiscal year.
Top Ten Holdings as of June 30, 2008
Commodities were a consistent theme among the Fund’s top holdings, as companies related to chemicals, coal, energy, and mining highlighted the list. Five of our largest positions at fiscal year end were also among our top quarterly performers: Alpha Natural Resources, Mosaic, Potash Corp., Bucyrus International, and CF Industries. Each is engaged in some form of commodities-driven operations. The top 10 holdings represented a strong 40% of the overall Fund net assets.
| | | | | | |
| Rank | | Description | | Industry | | Percent of
Net Assets |
| 1 | | Alpha Natural Resources Inc | | Coal | | 7.0% |
| 2 | | Mosaic Co | | Chemicals | | 6.3% |
| 3 | | Potash Corp of Saskatchewan | | Chemicals | | 4.7% |
| 4 | | Bucyrus International Inc | | Machinery-Construction & Mining | | 3.7% |
| 5 | | Owens-Illinois Inc | | Packaging & Containers | | 3.6% |
| 6 | | Compass Minerals International Inc | | Mining | | 3.4% |
| 7 | | CF Industries Holdings Inc | | Chemicals | | 3.2% |
| 8 | | Invitrogen Corp | | Biotechnology | | 3.0% |
| 9 | | Monsanto Co | | Chemicals | | 2.8% |
| 10 | | Southwestern Energy Co | | Oil & Gas | | 2.4% |
| | | | | | | |
| Total | | | | | | 40.1% |
Industry Sector Representation as of June 30, 2008
Our Fund’s concentration in basic materials greatly contributed to the June quarter success. This overweighting along with good stock selection in the sector added over seven percent to the return. Conversely, we were underweighted in financials and avoided much of the hardships faced by companies engaged in subprime lending, mortgage-related securities investing, and other ramifications of the ongoing credit crisis, which saved the Fund more than two percentage points relative to our primary market benchmark.
| | | | | | |
| | | % of Portfolio | | % S&P 500 Index | | Difference |
Basic Materials | | 29.1% | | 3.9% | | 25.2% |
Communications | | 2.4% | | 11.0% | | -8.6% |
Consumer, Cyclical | | 4.9% | | 7.1% | | -2.2% |
Consumer, Non-cyclical | | 14.3% | | 20.6% | | -6.3% |
Energy | | 19.1% | | 16.3% | | 2.8% |
Financial | | 0.9% | | 14.0% | | -13.1% |
Industrial | | 20.0% | | 11.5% | | 8.5% |
Technology | | 7.9% | | 11.6% | | -3.8% |
Utilities | | 0.0% | | 3.9% | | -3.9% |
Diversified | | 0.0% | | 0.1% | | -0.1% |
Cash | | 1.4% | | 0.0% | | 1.5% |
| | | | | | | |
Total | | 100.0% | | 100.0% | | |
| | |
| 22 | | Annual Report | June 30, 2008 |
Aggressive Investors 2 Fund
MANAGER’S COMMENTARY (continued)
Disclaimer
The following is a reminder from the friendly folks at your Fund who worry about liability. The views expressed here are exclusively those of Fund management. These views, including those of market sectors or individual stocks, are not meant as investment advice and should not be considered predictive in nature. Any favorable (or unfavorable) description of a holding applies only as of the quarter end, June 30, 2008, unless otherwise stated. Security positions can and do change thereafter. Discussions of historical performance do not guarantee and are not indicative of future performance.
Market volatility can significantly affect short-term performance. The Fund is not an appropriate investment for short-term investors. Investments in the small companies within this multi-cap fund generally carry greater risk than is customarily associated with larger companies. This additional risk is attributable to a number of factors, including the relatively limited financial resources that are typically available to small companies, and the fact that small companies often have comparatively limited product lines. In addition, the stock of small companies tends to be more volatile than the stock of large companies, particularly in the short term and particularly in the early stages of an economic or market downturn. The Fund’s use of options, futures, and leverage can magnify the risk of loss in an unfavorable market, and the Fund’s use of short-sale positions can, in theory, expose shareholders to unlimited loss. Finally, the Fund exposes shareholders to “focus risk” which may add to Fund volatility through the possibility that a single company could significantly affect total return. Shareholders of the Fund, therefore, are taking on more risk than they would if they invested in the stock market as a whole.
Conclusion
Thank you for your continued investment in Aggressive Investors 2 Fund. We encourage your feedback; your reactions and concerns are important to us.
Sincerely,
Your Investment Management Team
Bridgeway Aggressive Investors 2 Fund
SCHEDULE OF INVESTMENTS
Showing percentage of net assets as of June 30, 2008
| | | | | | | |
| Industry | | Company | | Shares | | Value |
|
COMMON STOCKS - 98.64% |
Apparel - 0.94% |
| | Warnaco Group, Inc.* | | 188,700 | | $ | 8,316,009 |
|
Auto Parts & Equipment - 0.58% |
| | Goodyear Tire & Rubber Co.*+ | | 287,600 | | | 5,127,908 |
|
Banks - 0.25% |
| | US Bancorp+ | | 79,000 | | | 2,203,310 |
|
Biotechnology - 5.40% |
| | Gilead Sciences, Inc.* | | 182,000 | | | 9,636,900 |
| | Invitrogen Corp.* | | 675,400 | | | 26,516,204 |
| | OSI Pharmaceuticals, Inc.* | | 282,700 | | | 11,681,164 |
| | | | | | | |
| | | | | | | 47,834,268 |
|
Chemicals - 20.93% |
| | CF Industries Holdings, Inc. | | 184,400 | | | 28,176,320 |
| | Dow Chemical Co. | | 201,000 | | | 7,016,910 |
| | Monsanto Co. | | 197,200 | | | 24,933,968 |
| | Mosaic Co.* | | 381,600 | | | 55,217,520 |
| | NewMarket Corp. | | 100,300 | | | 6,642,869 |
| | Potash Corp. of Saskatchewan, Inc. | | 181,299 | | | 41,439,512 |
| | Syngenta AG - ADR | | 97,200 | | | 6,288,840 |
| | Terra Industries, Inc.+ | | 313,800 | | | 15,486,030 |
| | | | | | | |
| | | | | | | 185,201,969 |
|
Coal - 8.02% |
| | Alpha Natural Resources, Inc.*+ | | 593,100 | | | 61,854,399 |
| | Massey Energy Co. | | 97,000 | | | 9,093,750 |
| | | | | | | |
| | | | | | | 70,948,149 |
|
Commercial Services - 1.00% |
| | ITT Educational Services, Inc.*+ | | 107,400 | | | 8,874,462 |
|
Computers - 5.06% |
| | Apple, Inc.* | | 52,000 | | | 8,706,880 |
| | EMC Corp.* | | 470,700 | | | 6,914,583 |
| | Hewlett-Packard Co. | | 138,900 | | | 6,140,769 |
| | Research In Motion, Ltd.* | | 69,500 | | | 8,124,550 |
| | Western Digital Corp.*+ | | 431,700 | | | 14,906,601 |
| | | | | | | |
| | | | | | | 44,793,383 |
|
Electrical Components & Equipment - 1.69% |
| | GrafTech International, Ltd.* | | 557,500 | | | 14,957,725 |
|
Electronics - 1.12% |
| | FLIR Systems, Inc.*+ | | 244,100 | | | 9,903,137 |
| | | | | | | |
| Industry | | Company | | Shares | | Value |
|
|
Engineering & Construction - 2.76% |
| | ABB, Ltd. - ADR* | | 334,400 | | $ | 9,470,208 |
| | EMCOR Group, Inc.* | | 325,100 | | | 9,275,103 |
| | Foster Wheeler, Ltd.* | | 77,800 | | | 5,691,070 |
| | | | | | | |
| | | | | | | 24,436,381 |
|
Environmental Control - 1.08% |
| | Darling International, Inc.* | | 579,400 | | | 9,571,688 |
|
Food - 0.68% |
| | Chiquita Brands International, Inc.*+ | | 394,000 | | | 5,976,980 |
|
Healthcare - Products - 2.74% |
| | Intuitive Surgical, Inc.* | | 64,000 | | | 17,241,600 |
| | St. Jude Medical, Inc.* | | 172,100 | | | 7,035,448 |
| | | | | | | |
| | | | | | | 24,277,048 |
|
Insurance - 0.68% |
| | MetLife, Inc.+ | | 114,300 | | | 6,031,611 |
|
Internet - 2.06% |
| | Priceline.Com, Inc.*+ | | 158,100 | | | 18,254,226 |
|
Iron/Steel - 3.22% |
| | AK Steel Holding Corp. | | 128,500 | | | 8,866,500 |
| | Mechel Open Joint Stock Co. - ADR+ | | 222,600 | | | 11,027,604 |
| | Steel Dynamics, Inc. | | 220,100 | | | 8,599,307 |
| | | | | | | |
| | | | | | | 28,493,411 |
|
Machinery - Construction & Mining - 3.69% |
| | Bucyrus International, Inc., Class A+ | | 447,600 | | | 32,683,752 |
|
Machinery - Diversified - 3.16% |
| | AGCO Corp.*+ | | 147,000 | | | 7,704,270 |
| | Flowserve Corp. | | 77,300 | | | 10,566,910 |
| | Gardner Denver, Inc.* | | 170,976 | | | 9,711,437 |
| | | | | | | |
| | | | | | | 27,982,617 |
|
Mining - 5.00% |
| | Compania de Minas Buenaventura S.A. - ADR | | 91,700 | | | 5,994,429 |
| | Compass Minerals International, Inc. | | 370,500 | | | 29,847,480 |
| | Goldcorp., Inc.+ | | 181,200 | | | 8,366,004 |
| | | | | | | |
| | | | | | | 44,207,913 |
|
Miscellaneous Manufacturing - 0.85% |
| | Parker Hannifin Corp. | | 104,900 | | | 7,481,468 |
| | |
| 24 | | Annual Report | June 30, 2008 |
Bridgeway Aggressive Investors 2 Fund
SCHEDULE OF INVESTMENTS (continued)
Showing percentage of net assets as of June 30, 2008
| | | | | | | |
| Industry | | Company | | Shares | | Value |
|
Common Stocks (continued) |
Oil & Gas - 7.93% |
| | Canadian Natural Resources, Ltd. | | 25,450 | | $ | 2,551,363 |
| | CNOOC, Ltd. - ADR+ | | 33,600 | | | 5,830,944 |
| | ConocoPhillips | | 95,400 | | | 9,004,806 |
| | EOG Resources, Inc. | | 62,600 | | | 8,213,120 |
| | Petroleo Brasileiro S.A. - ADR | | 216,200 | | | 15,313,446 |
| | Southwestern Energy Co.* | | 443,800 | | | 21,129,318 |
| | Transocean, Inc. | | 53,700 | | | 8,183,343 |
| | | | | | | |
| | | | | | | 70,226,340 |
|
Oil & Gas Services - 3.13% |
| | FMC Technologies, Inc.* | | 125,800 | | | 9,677,794 |
| | National Oilwell Varco, Inc.* | | 202,800 | | | 17,992,416 |
| | | | | | | |
| | | | | | | 27,670,210 |
|
Packaging & Containers - 3.59% |
| | Owens-Illinois, Inc.* | | 762,300 | | | 31,780,287 |
|
Pharmaceuticals - 4.50% |
| | Bristol-Myers Squibb Co. | | 465,500 | | | 9,556,715 |
| | Express Scripts, Inc.* | | 126,800 | | | 7,952,896 |
| | Medco Health Solutions, Inc.* | | 162,200 | | | 7,655,840 |
| | Novo Nordisk A/S - Sponsored ADR | | 92,900 | | | 6,131,400 |
| | Pfizer, Inc. | | 490,800 | | | 8,574,276 |
| | | | | | | |
| | | | | | | 39,871,127 |
|
Retail - 3.40% |
| | Aeropostale, Inc.* | | 250,900 | | | 7,860,697 |
| | Costco Wholesale Corp.+ | | 85,200 | | | 5,975,928 |
| | Gymboree Corp.* | | 198,400 | | | 7,949,888 |
| | Tiffany & Co. | | 204,400 | | | 8,329,300 |
| | | | | | | |
| | | | | | | 30,115,813 |
|
Semiconductors - 0.88% |
| | Amkor Technology, Inc.* | | 746,900 | | | 7,775,229 |
|
Software - 1.90% |
| | Microsoft Corp. | | 278,700 | | | 7,667,037 |
| | Open Text Corp.*+ | | 17,300 | | | 555,330 |
| | Oracle Corp.* | | 408,300 | | | 8,574,300 |
| | | | | | | |
| | | | | | | 16,796,667 |
|
Telecommunications - 0.36% |
| | Turkcell Iletisim Hizmetleri AS - ADR+ | | 219,100 | | | 3,187,905 |
| | | | | | | |
| Industry | | Company | | Shares | | Value |
|
|
Transportation - 2.04% |
| | CSX Corp. | | 150,100 | | $ | 9,427,781 |
| | Ryder System, Inc. | | 125,300 | | | 8,630,664 |
| | | | | | | |
| | | | | | | 18,058,445 |
| |
TOTAL COMMON STOCKS - 98.64% | | | 873,039,438 |
| | | | | | | |
(Cost $700,183,122) | | | | | |
| | | | | | | |
| |
MONEY MARKET FUNDS - 0.42% | | | |
| | | |
| | | Rate^ | | Shares | | Value |
BlackRock Temp Cash Liquidity Fund Institutional Shares #21 | | 2.61% | | 3,702,144 | | | 3,702,144 |
| | | | | | | |
| |
TOTAL MONEY MARKET FUNDS - 0.42% | | | 3,702,144 |
| | | | | | | |
(Cost $3,702,144) | | | | | |
| | |
TOTAL INVESTMENTS - 99.06% | | | | $ | 876,741,582 |
(Cost $703,885,266) | | | |
Other Assets in Excess of Liabilities - 0.94% | | | 8,334,468 |
| | | | | | | |
NET ASSETS - 100.00% | | | | $ | 885,076,050 |
| | | | | | | |
| * | Non Income Producing Security. |
| + | This security or a portion of the security is out on loan at June 30, 2008. Total loaned securities had a market value of $129,946,137 at June 30, 2008. |
| ^ | Rate disclosed is as of June 30, 2008. |
| ADR | - American Depositary Receipt |
See Notes to Financial Statements.
Ultra-Small Company Fund
MANAGER’S COMMENTARY
June 30, 2008
Dear Fellow Ultra-Small Company Fund Shareholder,
In the environment of the ongoing credit crisis and market downturn, Ultra-Small Company Fund declined 1.84% for the quarter ended June 30, 2008, providing a nice “cushion” of 3.69% against the decline of our primary market benchmark, the CRSP Cap Based Portfolio 10 Index, which was down 5.53%. The smallest companies were the hardest hit during this period, as reflected in our unfavorable performance versus our other benchmarks that invest in “larger” small companies. The Russell 2000 Index of small companies increased 0.58% while the Lipper Small-Cap Stock Funds Index increased 1.78%. Given our focus on ultra-small companies, it was a good quarter and exactly what we hope to do in a down market. However, on an absolute return basis, and relative to some broader exposure small company indexes, it was not a good quarter.
For the same reasons above, our Fund’s fiscal year performance was in “bear market” territory. The Fund declined a significant 24.59%; however, it provided a cushion of 2.72% relative to the CRSP 10 Index of ultra-small companies. Nevertheless, we significantly underperformed our peer and small-cap market indexes. The Lipper Small-Cap Stock Funds Index dropped 12.67%, and the Russell 2000 Index declined 16.19% over the same one-year period ending June 30, 2008. On a more positive note, and in line with the long-term focus of our Fund, Ultra-Small-Company Fund has rewarded our shareholders with double-digit returns and outperformed our primary benchmark (CRSP Cap-Based Portfolio 10 Index) by 5.50% per year since inception. The shorter time frames have been—and we expect will continue to be—very bumpy along the way. This is the nature of ultra-small stocks: strong appreciation potential over the long term, strong diversification for larger-company dominated portfolios, and frequently bigger (and unpredictable) market moves both up and down.
The table below presents our June quarter, one-year, five-year, ten-year and life-to-date financial results according to the formula required by the SEC. See the next page for a graph of performance from inception.
| | | | | | | | | | |
| | | June Qtr.
4/1/08
to 6/30/08 | | 1 Year
7/1/07
to 6/30/08 | | 5 Year
7/1/03
to 6/30/08 | | 10 Year
7/1/98
to 6/30/08 | | Life-to-Date
8/5/94
to 6/30/08 |
| | | | | |
Ultra-Small Company Fund | | -1.84% | | -24.59% | | 10.93% | | 14.93% | | 18.08% |
CRSP Cap-Based Port. 10 Index | | -5.53% | | -27.31% | | 10.04% | | 10.35% | | 12.58% |
Lipper Small-Cap Stock Funds Index | | 1.78% | | -12.67% | | 11.22% | | 5.59% | | 9.21% |
Russell 2000 Index (small companies) | | 0.58% | | -16.19% | | 10.29% | | 5.53% | | 9.19% |
Performance figures quoted in the table above and graph below represent past performance and are no guarantee of future results. The table above and the graph below do not reflect the deduction of taxes that a shareholder would pay on Fund distributions or the redemption of Fund shares.
The Lipper Small-Cap Stock Funds Index is an index of small-company funds compiled by Lipper, Inc. The Russell 2000 Index is an unmanaged, market value weighted index, which measures performance of the 2,000 companies that are between the 1,000th and 3,000th largest in the market with dividends reinvested. The CRSP Cap-Based Portfolio 10 Index is an unmanaged index of 1,780 of the smallest publicly traded U.S. stocks (with dividends reinvested), as reported by the Center for Research on Security Prices. It is not possible to invest directly in an index. Periods longer than one year are annualized.
According to data from Lipper, Inc. as of June 30, 2008, Ultra-Small Company Fund ranked 66th of 97 micro-cap funds for the twelve months ending June 30, 2008, 15th of 66 over the last five years, 3rd of 38 over the last ten years, and 1st of 9 since inception in August, 1994. These long-term numbers and the graph below give two snapshots of our long-term success. Lipper, Inc. is an independent mutual fund rating service that ranks funds in various fund categories by making comparative calculations using total returns.
| | |
| 26 | | Annual Report | June 30, 2008 |
Ultra-Small Company Fund
MANAGER’S COMMENTARY (continued)
Ultra-Small Company Fund vs. CRSP 10 Index & Lipper Small Company Funds Index & Russell 2000 Index Inception (8/5/94) to 6/30/08
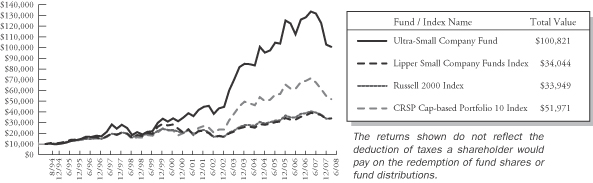
Detailed Explanation of Quarterly Performance—What Worked Well
The Short Version: Five industrial companies highlighted the list of top performers during the quarter, as some of these companies benefited from international business (where a weak dollar proved helpful). Combined, the five holdings contributed over two percent to the Fund’s return. While many ultra-small-cap companies struggled during the quarter, thirteen of our holdings increased by over 25% for the three-month period.
These are the ten best performers for the quarter ended June 30, 2008:
| | | | | | |
| Rank | | Description | | Industry | | % Gain |
| 1 | | Graham Corp | | Electrical Components & Equipment | | 108.1% |
| 2 | | Crimson Exploration Inc | | Oil & Gas | | 65.3% |
| 3 | | Crawford & Co | | Insurance | | 44.5% |
| 4 | | Natural Gas Services Group Inc | | Oil & Gas Services | | 39.6% |
| 5 | | Advanced Battery Technologies Inc | | Electrical Components & Equipment | | 32.5% |
| 6 | | Integral Systems Inc | | Computers | | 32.4% |
| 7 | | Peerless Manufacturing Co | | Miscellaneous Manufacturing | | 30.8% |
| 8 | | FreeSeas Inc | | Transportation | | 29.3% |
| 9 | | PC Mall Inc | | Retail | | 27.6% |
| 10 | | LSB Industries Inc | | Miscellaneous Manufacturing | | 26.9% |
| | | | | | | |
Graham Corporate was the Fund’s top performer during the quarter and an example of a company that benefited from surging commodities (energy) prices, the weak dollar, and its growing global footprint. The industrial company produces and markets vacuums and heat transfer equipment that is used by petrochemical, fertilizer, and liquefied natural gas plants (among others). In April, it announced a 32% surge in fourth quarter orders on strong international demand from Saudi Arabia, China, and Canada. In June, Graham expanded its international business even further by receiving significant contracts from oil refineries in South Korea, China, Malaysia, and Russia. Its stock price doubled over the quarter and contributed over one percent to the return of the Fund.
Detailed Explanation of Quarterly Performance—What Didn’t Work
The Short Version: Much of the economic news continued to revolve around financial companies, and in spite of owning relatively few of these companies, our Fund was not immune. Four of the poorest performers came from that sector and cost the Fund just under half a percent in return. Six different sectors were represented in the list of worst performers, indicating that the losses were more widespread than just financials. Thirteen holdings lost over 25% during the past three months.
Ultra-Small Company Fund
MANAGER’S COMMENTARY (continued)
These are the ten stocks that performed the worst in the quarter ended June 30, 2008:
| | | | | | |
| Rank | | Description | | Industry | | % Loss |
| 1 | | WSI Industries Inc | | Hand/Machine Tools | | -46.9% |
| 2 | | Chindex International Inc | | Distribution/Wholesale | | -40.3% |
| 3 | | BluePhoenix Solutions Ltd | | Computers | | -37.0% |
| 4 | | 21st Century Holding Co | | Insurance | | -36.2% |
| 5 | | Centrue Financial Corp | | Banks | | -35.9% |
| 6 | | Dayton Superior Corp | | Building Materials | | -35.5% |
| 7 | | Dollar Financial Corp | | Commercial Services | | -34.3% |
| 8 | | Penford Corp | | Chemicals | | -31.5% |
| 9 | | Rainier Pacific Financial Group Inc | | Savings & Loans | | -31.3% |
| 10 | | Farmers Capital Bank Corp | | Banks | | -30.5% |
| | | | | | | |
Chindex International is a provider of healthcare services (under the United Family Healthcare brand) and also sells medical equipment and related products. The company operates the only foreign-owned private hospitals in China and has plans for future expansion in this rapidly-growing market. In its recent earnings report, Chindex announced a 40% increase in sales from last year’s levels. So, what happened? As proof that small companies have no room for error (especially in tough markets), the company suffered a fourth quarter loss as a result of a non-recurring interest expense. Its results came in below Wall Street expectations, investors sold on the news, and its price plunged about 30% in one trading session. For the quarter, Chindex cost the Fund over one percent in performance. The models gave it a poor bill of health late in the fiscal year, and we sold out of the position.
Detailed Explanation of Fiscal Year Performance—What Worked Well
The Short Version: Three consumer-related companies highlighted our list of top performers for the fiscal year. Combined, these companies contributed about three percent to the Fund’s overall performance. In addition, despite the widespread negativity that hurt small-cap companies over the past twelve months, two of our holdings actually doubled in value and another three increased at least 50%.
These are the ten best performers for the fiscal year ended June 30, 2008:
| | | | | | |
| Rank | | Description | | Industry | | % Gain |
| 1 | | Natural Gas Services Group Inc | | Oil & Gas Services | | 102.2% |
| 2 | | Cal-Maine Foods Inc | | Food | | 101.6% |
| 3 | | Integral Systems Inc/MD | | Computers | | 69.8% |
| 4 | | Ebix Inc | | Software | | 51.3% |
| 5 | | Jinpan International Ltd | | Electronics | | 51.3% |
| 6 | | Graham Corp | | Electrical Components & Equipment | | 44.6% |
| 7 | | HQ Sustainable Maritime Industries Inc | | Food | | 44.6% |
| 8 | | Crawford & Co | | Insurance | | 44.5% |
| 9 | | Crimson Exploration Inc | | Oil & Gas | | 43.8% |
| 10 | | Vnus Medical Technologies Inc | | Healthcare-Products | | 41.5% |
| | | | | | | |
Hard boiled? Scrambled? Over easy? However you like them, eggs are in hot demand these days. Cal-Maine Food is the largest domestic egg producer and was the second best Fund performer of the fiscal year. In January, the company announced that revenues had skyrocketed by over 60%, with strong exports contributing to another solid quarter. In April, it announced another strong quarter, and demand continued to grow worldwide, despite the record high prices of eggs. The company also announced a lucrative (for shareholders) variable dividend policy and will pay out a third of its income each quarter. In June, the egg giant got even bigger as it acquired a majority interest in Zephyr Eggs, a regional company with a stronghold on the Florida market. For the twelve month period, Cal-Maine doubled in value and contributed over two and a half percent to the Fund’s return.
| | |
| 28 | | Annual Report | June 30, 2008 |
Ultra-Small Company Fund
MANAGER’S COMMENTARY (continued)
Detailed Explanation of Fiscal Year Performance—What Didn’t Work
The Short Version: The good news: The Fund managed to avoid the worst of the crisis among financials, as no related company made the list of poor performers. The bad news: The negativity moved into other sectors of the economy as well. Four different sectors were represented in the list of poor performers, with four industrials highlighting the list. Seven holdings lost over half their value during the twelve-month period as investors shied away (to put it mildly) from the smallest of small-cap companies.
These are the ten stocks that performed the worst for the fiscal year ended June 30, 2008:
| | | | | | |
| Rank | | Description | | Industry | | % Loss |
| 1 | | CPI Corp | | Commercial Services | | -69.6% |
| 2 | | BluePhoenix Solutions Ltd | | Computers | | -60.9% |
| 3 | | Transcend Services Inc | | Commercial Services | | -58.7% |
| 4 | | Clean Diesel Technologies Inc | | Chemicals | | -53.6% |
| 5 | | Hardinge Inc | | Hand/Machine Tools | | -53.1% |
| 6 | | Landec Corp | | Chemicals | | -51.7% |
| 7 | | Dayton Superior Corp | | Building Materials | | -51.4% |
| 8 | | Twin Disc Inc | | Machinery-Diversified | | -49.7% |
| 9 | | Trio Tech International | | Semiconductors | | -49.5% |
| 10 | | Silicom Ltd | | Electronics | | -49.2% |
| | | | | | | |
BluePhoenix Solutions is an Israeli-based software company that develops enterprise information technologies serving to modernize or update preexisting products (before they become antiquated). In January, its stock plunged when its quarterly revenue missed analysts’ expectations. In June, the troubles continued when two investment firms reduced their earnings estimates on concerns that Israel’s strong currency (as opposed to operations) was having too great an effect on company earnings. BluePhoenix stock moved to a 52-week low in late June, and its performance cost the Fund about three-quarters of a percent of returns. Our models gave us a sell signal soon after.
Top Ten Holdings as of June 30, 2008
Three of the Fund’s top holdings at the end of the fiscal year were also on our list of top performers for the quarter: Natural Gas Services Group, Graham Corp., and Integrated Systems Inc. While our top holding accounted for over six percent of the net assets, no other stock represented greater than three percent of the Fund.
| | | | | | |
| Rank | | Description | | Industry | | Percent of
Net Assets |
| 1 | | Cal-Maine Foods Inc | | Food | | 6.3% |
| 2 | | American Physicians Capital Inc | | Insurance | | 3.0% |
| 3 | | AZZ Inc | | Miscellaneous Manufacturing | | 3.0% |
| 4 | | Natural Gas Services Group Inc | | Oil & Gas Services | | 2.7% |
| 5 | | Graham Corp | | Electrical Components & Equipment | | 2.2% |
| 6 | | Penford Corp | | Chemicals | | 2.1% |
| 7 | | Ezcorp Inc | | Retail | | 2.0% |
| 8 | | Integral Systems Inc/MD | | Computers | | 1.9% |
| 9 | | Lydall Inc | | Miscellaneous Manufacturing | | 1.9% |
| 10 | | Bolt Technology Corp | | Oil & Gas Services | | 1.9% |
| | | | | | | |
| Total | | | | | | 27.0% |
Ultra-Small Company Fund
MANAGER’S COMMENTARY (continued)
Industry Sector Representation as of June 30, 2008
Fortunately, we were underweighted in financial stocks and avoided some of the hardships faced by companies engaged in subprime lending, mortgage-related securities investing, and other ramifications of the ongoing credit crisis. Likewise, our models’ direction to overweight industrials proved beneficial during the quarter.
| | | | | | |
| | | % of Portfolio | | % of CRSP 10 Index | | Difference |
Basic Materials | | 2.8% | | 2.7% | | 0.1% |
Communications | | 5.0% | | 8.2% | | -3.2% |
Consumer, Cyclical | | 11.0% | | 10.8% | | 0.2% |
Consumer, Non-cyclical | | 19.9% | | 24.9% | | -5% |
Energy | | 11.9% | | 8.8% | | 3.1% |
Financial | | 9.1% | | 21.1% | | -12% |
Industrial | | 27.2% | | 11.2% | | 16% |
Technology | | 5.6% | | 8.7% | | -3.1% |
Utilities | | 0.0% | | 1.5% | | -1.5% |
Diversified | | 0.0% | | 2.1% | | -2.1% |
Cash | | 7.5% | | 0.0% | | 7.5% |
| | | | | | | |
Total | | 100.0% | | 100.0% | | |
Disclaimer
The following is a reminder from the friendly folks at your Fund who worry about liability. The views expressed here are exclusively those of Fund management. These views are not meant as investment advice and should not be considered predictive in nature. Any favorable (or unfavorable) description of a holding applies only as of June 30, 2008, unless otherwise stated. Security positions can and do change thereafter. Discussions of historical performance do not guarantee and are not indicative of future performance.
The Fund is subject to very high, above market risk (volatility) and is not an appropriate investment for short-term investors. Investments in ultra-small companies generally carry greater risk than is customarily associated with larger companies and even “small companies” for various reasons such as narrower markets (fewer investors), limited financial resources and greater trading difficulty.
Conclusion
Ultra-Small Company Fund remains closed to investors. We encourage your feedback; your reactions and concerns are important to us.
Sincerely,
Your Investment Management Team
| | |
| 30 | | Annual Report | June 30, 2008 |
THIS PAGE INTENTIONALLY LEFT BLANK
Bridgeway Ultra-Small Company Fund
SCHEDULE OF INVESTMENTS
Showing percentage of net assets as of June 30, 2008
| | | | | | | |
| Industry | | Company | | Shares | | Value |
|
COMMON STOCKS - 92.53% |
Aerospace/Defense - 0.92% |
| | LMI Aerospace, Inc.* | | 50,000 | | $ | 878,500 |
|
Airlines - 0.78% |
| | Hawaiian Holdings, Inc.* | | 106,000 | | | 736,700 |
|
Apparel - 0.82% |
| | G-III Apparel Group, Ltd.* | | 63,200 | | | 779,888 |
|
Auto Parts & Equipment - 0.63% |
| | China Automotive Systems, Inc.*+ | | 101,570 | | | 594,185 |
|
Banks - 0.68% |
| | Centrue Financial Corp. | | 10,000 | | | 109,000 |
| | Farmers Capital Bank Corp.+ | | 4,500 | | | 79,290 |
| | Pennsylvania Commerce Bancorp, Inc.* | | 11,900 | | | 286,195 |
| | Southcoast Financial Corp.* | | 12,500 | | | 170,750 |
| | | | | | | |
| | | | | | | 645,235 |
|
Biotechnology - 0.31% |
| | CombiMatrix Corp.*+ | | 29,400 | | | 293,706 |
|
Chemicals - 2.83% |
| | Landec Corp.* | | 107,800 | | | 697,466 |
| | Penford Corp. | | 133,400 | | | 1,984,992 |
| | | | | | | |
| | | | | | | 2,682,458 |
|
Commercial Services - 6.07% |
| | Carriage Services, Inc.* | | 62,500 | | | 412,500 |
| | Dollar Financial Corp.*+ | | 107,200 | | | 1,619,792 |
| | ICF International, Inc.* | | 88,250 | | | 1,466,715 |
| | Princeton Review, Inc.* | | 47,800 | | | 323,128 |
| | QC Holdings, Inc. | | 35,434 | | | 276,031 |
| | The Hackett Group, Inc.* | | 168,900 | | | 969,486 |
| | Transcend Services, Inc.* | | 77,600 | | | 692,192 |
| | | | | | | |
| | | | | | | 5,759,844 |
|
Computers - 2.62% |
| | Adept Technology, Inc.*+ | | 25,000 | | | 244,250 |
| | Computer Task Group, Inc.* | | 33,000 | | | 168,960 |
| | Integral Systems, Inc. | | 47,700 | | | 1,845,990 |
| | TechTeam Global, Inc.* | | 21,600 | | | 230,904 |
| | | | | | | |
| | | | | | | 2,490,104 |
|
Distribution/Wholesale - 0.24% |
| | Chindex International, Inc.* | | 15,600 | | | 228,852 |
| | | | | | | |
| Industry | | Company | | Shares | | Value |
|
|
Diversified Financial Services - 0.67% |
| | Westwood Holdings Group, Inc. | | 15,900 | | $ | 632,820 |
|
Electrical Components & Equipment - 3.70% |
| | Advanced Battery Technologies, Inc.*+ | | 229,200 | | | 1,322,484 |
| | Espey Manufacturing & Electronics Corp. | | 6,000 | | | 113,940 |
| | Graham Corp. | | 28,000 | | | 2,075,080 |
| | | | | | | |
| | | | | | | 3,511,504 |
|
Electronics - 6.71% |
| | Aehr Test Systems* | | 50,000 | | | 386,500 |
| | Chyron International Corp.* | | 24,000 | | | 141,120 |
| | Digital Ally, Inc.*+ | | 115,500 | | | 984,060 |
| | Eagle Test Systems, Inc.* | | 77,000 | | | 862,400 |
| | IntriCon Corp.* | | 30,500 | | | 256,200 |
| | Iteris, Inc.* | | 62,600 | | | 158,378 |
| | Jinpan International, Ltd.+ | | 36,400 | | | 1,346,800 |
| | LaBarge, Inc.* | | 35,000 | | | 455,000 |
| | NVE Corp.*+ | | 56,100 | | | 1,776,126 |
| | | | | | | |
| | | | | | | 6,366,584 |
|
Engineering & Construction - 1.56% |
| | Argan, Inc.* | | 14,000 | | | 193,760 |
| | VSE Corp. | | 46,700 | | | 1,284,250 |
| | | | | | | |
| | | | | | | 1,478,010 |
|
Environmental Control - 0.40% |
| | Industrial Services of America, Inc.+ | | 24,123 | | | 384,279 |
|
Food - 6.35% |
| | Cal-Maine Foods, Inc.+ | | 182,000 | | | 6,004,180 |
| | Overhill Farms, Inc.* | | 2,900 | | | 20,155 |
| | | | | | | |
| | | | | | | 6,024,335 |
|
Hand/Machine Tools - 1.18% |
| | K-Tron International, Inc.* | | 4,300 | | | 557,280 |
| | WSI Industries, Inc. | | 82,800 | | | 568,008 |
| | | | | | | |
| | | | | | | 1,125,288 |
|
Healthcare - Products - 3.68% |
| | Cynosure, Inc., Class A* | | 39,600 | | | 784,872 |
| | Exactech, Inc.* | | 13,200 | | | 339,372 |
| | Northstar Neuroscience, Inc.*+ | | 400,000 | | | 636,000 |
| | Vnus Medical Technologies, Inc.* | | 86,800 | | | 1,736,868 |
| | | | | | | |
| | | | | | | 3,497,112 |
| | |
| 32 | | Annual Report | June 30, 2008 |
Bridgeway Ultra-Small Company Fund
SCHEDULE OF INVESTMENTS (continued)
Showing percentage of net assets as of June 30, 2008
| | | | | | | |
| Industry | | Company | | Shares | | Value |
|
Common Stocks (continued) |
Healthcare - Services - 2.31% |
| | Advocat, Inc.* | | 30,000 | | $ | 323,400 |
| | Almost Family, Inc.* | | 47,400 | | | 1,260,840 |
| | Dynacq Healthcare, Inc.*+ | | 27,100 | | | 173,440 |
| | Life Sciences Research, Inc.* | | 15,500 | | | 437,720 |
| | | | | | | |
| | | | | | | 2,195,400 |
|
Household Products/Wares - 0.19% |
| | A.T. Cross Co., Class A* | | 21,800 | | | 181,594 |
|
Insurance - 6.08% |
| | 21st Century Holding Co. | | 55,300 | | | 451,801 |
| | American Physicians Capital, Inc. | | 59,550 | | | 2,884,602 |
| | American Physicians Service Group, Inc. | | 31,000 | | | 683,240 |
| | Crawford & Co., Class B* | | 31,200 | | | 249,288 |
| | Hallmark Financial Services* | | 55,000 | | | 531,850 |
| | Navigators Group, Inc.* | | 18,000 | | | 972,900 |
| | | | | | | |
| | | | | | | 5,773,681 |
|
Internet - 2.94% |
| | A.D.A.M., Inc.* | | 37,200 | | | 276,954 |
| | Bidz.com, Inc.*+ | | 100,600 | | | 876,226 |
| | InsWeb Corp.* | | 10,800 | | | 101,088 |
| | TeleCommunication Systems, Inc., Class A* | | 203,800 | | | 943,594 |
| | Zix Corp.*+ | | 213,200 | | | 592,696 |
| | | | | | | |
| | | | | | | 2,790,558 |
|
Investment Companies - 0.35% |
| | Medallion Financial Corp. | | 35,000 | | | 329,700 |
|
Machinery - Diversified - 2.62% |
| | Alamo Group, Inc. | | 45,100 | | | 928,609 |
| | Art’s-Way Manufacturing Co., Inc. | | 8,000 | | | 158,000 |
| | Key Technology, Inc.* | | 43,900 | | | 1,396,459 |
| | | | | | | |
| | | | | | | 2,483,068 |
|
Metal Fabrication - Hardware - 1.51% |
| | Hawk Corp., Class A* | | 35,700 | | | 664,020 |
| | NN, Inc. | | 54,950 | | | 766,003 |
| | | | | | | |
| | | | | | | 1,430,023 |
|
Miscellaneous Manufacturing - 7.16% |
| | AZZ, Inc.* | | 71,300 | | | 2,844,870 |
| | Chase Corp. | | 57,000 | | | 1,068,180 |
| | LSB Industries, Inc.*+ | | 53,000 | | | 1,049,400 |
| | Lydall, Inc.* | | 146,200 | | | 1,834,810 |
| | | | | | | |
| | | | | | | 6,797,260 |
| | | | | | | |
| Industry | | Company | | Shares | | Value |
|
|
Oil & Gas - 3.20% |
| | Adams Resources & Energy, Inc. | | 12,583 | | $ | 426,564 |
| | BMB Munai, Inc.*+ | | 219,900 | | | 1,306,206 |
| | Crimson Exploration, Inc.* | | 20,000 | | | 324,000 |
| | Double Eagle Petroleum Co.*+ | | 54,000 | | | 984,420 |
| | | | | | | |
| | | | | | | 3,041,190 |
|
Oil & Gas Services - 8.69% |
| | Bolt Technology Corp.*+ | | 80,025 | | | 1,806,164 |
| | Boots & Coots International Well Control, Inc.* | | 586,810 | | | 1,396,608 |
| | Dawson Geophysical Co.* | | 26,400 | | | 1,569,744 |
| | Mitcham Industries, Inc.* | | 52,300 | | | 893,284 |
| | Natural Gas Services Group, Inc.* | | 84,800 | | | 2,584,704 |
| | | | | | | |
| | | | | | | 8,250,504 |
|
Packaging & Containers - 1.11% |
| | UFP Technologies, Inc.* | | 105,100 | | | 1,052,051 |
|
Pharmaceuticals - 1.03% |
| | Omega Protein Corp.* | | 65,500 | | | 979,225 |
|
Retail - 8.55% |
| | Allion Healthcare, Inc.* | | 66,000 | | | 376,200 |
| | America’s Car-Mart, Inc.* | | 39,700 | | | 711,424 |
| | Einstein Noah Restaurant Group, Inc.* | | 96,800 | | | 1,071,576 |
| | EZCORP, Inc., Class A* | | 151,418 | | | 1,930,579 |
| | Hastings Entertainment, Inc.* | | 29,300 | | | 234,693 |
| | PC Connection, Inc.* | | 136,527 | | | 1,271,066 |
| | PC Mall, Inc.* | | 73,800 | | | 1,000,728 |
| | PetMed Express, Inc.* | | 34,538 | | | 423,091 |
| | Sport Supply Group, Inc. | | 95,800 | | | 983,866 |
| | Winmark Corp.* | | 6,608 | | | 114,054 |
| | | | | | | |
| | | | | | | 8,117,277 |
|
Savings & Loans - 1.32% |
| | OceanFirst Financial Corp. | | 63,500 | | | 1,146,175 |
| | Rainier Pacific Financial Group, Inc. | | 11,100 | | | 106,005 |
| | | | | | | |
| | | | | | | 1,252,180 |
|
Semiconductors - 0.89% |
| | CEVA, Inc.* | | 58,400 | | | 465,448 |
| | Ramtron International Corp.* | | 91,300 | | | 384,373 |
| | | | | | | |
| | | | | | | 849,821 |
|
Shipbuilding - 0.17% |
| | Todd Shipyards Corp. | | 11,600 | | | 164,836 |
Bridgeway Ultra-Small Company Fund
SCHEDULE OF INVESTMENTS (continued)
Showing percentage of net assets as of June 30, 2008
| | | | | | | |
| Industry | | Company | | Shares | | Value |
|
Common Stocks (continued) |
Software - 1.97% |
| | BSQUARE Corp.* | | 135,000 | | $ | 652,050 |
| | CAM Commerce Solutions, Inc. | | 11,500 | | | 456,665 |
| | Ebix, Inc.*+ | | 9,800 | | | 761,656 |
| | | | | | | |
| | | | | | | 1,870,371 |
|
Telecommunications - 2.09% |
| | Communications Systems, Inc. | | 8,900 | | | 95,675 |
| | Fibernet Telecom Group, Inc.*+ | | 55,211 | | | 466,533 |
| | Globecomm Systems, Inc.* | | 172,100 | | | 1,421,546 |
| | | | | | | |
| | | | | | | 1,983,754 |
|
Trucking & Leasing - 0.20% |
| | Willis Lease Finance Corp.* | | 17,900 | | | 191,172 |
| | | | | | | |
| |
TOTAL COMMON STOCKS - 92.53% | | | 87,843,069 |
| | | | | | | |
(Cost $83,056,717) | | | |
| | | | | | | |
|
MONEY MARKET FUNDS - 4.66% |
| | | |
| | | Rate^ | | Shares | | Value |
BlackRock Temp Cash Liquidity Fund Institutional Shares #21 | | 2.61% | | 4,424,623 | | | 4,424,623 |
| | | | | | | |
| |
TOTAL MONEY MARKET FUNDS - 4.66% | | | 4,424,623 |
| | | | | | | |
(Cost $4,424,623) | | | | | | | |
| |
TOTAL INVESTMENTS - 97.19% | | $ | 92,267,692 |
(Cost $87,481,340) | | | |
Other Assets in Excess of Liabilities - 2.81% | | | 2,664,902 |
| | | | | | | |
NET ASSETS - 100.00% | | $ | 94,932,594 |
| | | | | | | |
| * | Non Income Producing Security. |
| + | This security or a portion of the security is out on loan at June 30, 2008. Total loaned securities had a market value of $18,095,257 at June 30, 2008. |
| ^ | Rate disclosed is as of June 30, 2008. |
See Notes to Financial Statements.
| | |
| 34 | | Annual Report | June 30, 2008 |
THIS PAGE INTENTIONALLY LEFT BLANK
Ultra-Small Company Market Fund
MANAGER’S COMMENTARY
June 30, 2008
Dear Fellow Ultra-Small Company Market Fund Shareholder,
In the environment of the ongoing credit crisis and market downturn, our passively-managed Ultra-Small Company Market Fund declined 1.67% for the quarter ended June 30, 2008, providing a “cushion” of 3.86% against the decline of our primary market benchmark, the CRSP Cap Based Portfolio 10 Index, which declined 5.53%. The smallest companies were the hardest hit during this period, and this fact is reflected in our unfavorable performance versus our other benchmarks that invest in “larger” small companies. The Russell 2000 Index of small companies increased 0.58%, and the Lipper Small-Cap Stock Funds Index increased 1.78%. Given our primary investment strategy seeking to approximate the return of the CRSP 10 Index of ultra-small companies, it was a good quarter. Of course, on an absolute return basis, it was not.
For the same reasons above and due partly to strong CRSP 10 Index exposure to financial companies (there are a large number of very small banks), our Fund’s fiscal year performance was in “bear market” territory. The Fund declined a significant 21.72%; however, it provided a cushion of 5.59% relative to the CRSP 10 Index of ultra-small companies. Nevertheless, we underperformed our peer and small cap market indexes. The Lipper Small-Cap Stock Funds dropped 12.67%, and the Russell 2000 Index declined 16.19% over the same one-year period ending June 30, 2008. On a more positive note, and in line with the strategy of our Fund, Ultra-Small-Company Market Fund has rewarded our shareholders with double-digit returns and outperformed our primary benchmark (CRSP Cap-Based Portfolio 10 Index) over the past ten years as well as since inception in July 1997. Such long-term results always will remain the key objective of our firm. The shorter time frames have been—and we expect will continue to be—very bumpy along the way. This is the nature of ultra-small stocks: strong appreciation potential over the long term, strong diversification for larger-company dominated portfolios, and frequently bigger (and unpredictable) market moves both up and down.
Ultra-Small Company Market Fund is (generally) passively managed to track the CRSP 10 Index, though it holds many fewer stocks and considers turnover, costs, and tax efficiency in trade decisions. Therefore, the Fund may lag or exceed the return of its benchmark over any given period. The table below presents our June quarter, one-year, five-year, ten-year and life-to-date financial results according to the formula required by the SEC. See the next page for a graph of performance from inception.
| | | | | | | | | | |
| | | June Qtr.
4/1/08
to 6/30/08 | | 1 Year
7/1/07
to 6/30/08 | | 5 Year
7/1/03
to 6/30/08 | | 10 Year
7/1/98
to 6/30/08 | | Life-to-Date
7/31/97
to 6/30/08 |
| | | | | |
Ultra-Small Company Market Fund | | -1.67% | | -21.72% | | 9.18% | | 11.68% | | 11.97% |
CRSP Cap-Based Port. 10 Index | | -5.53% | | -27.31% | | 10.04% | | 10.35% | | 10.60% |
Lipper Small-Cap Stock Funds Index | | 1.78% | | -12.67% | | 11.22% | | 5.59% | | 6.51% |
Russell 2000 Index (small companies) | | 0.58% | | -16.19% | | 10.29% | | 5.53% | | 6.09% |
Performance figures quoted in the table above and graph below represent past performance and are no guarantee of future results. The table above and the graph below do not reflect the deduction of taxes that a shareholder would pay on Fund distributions or the redemption of Fund shares.
The Lipper Small-Cap Stock Funds Index is an index of small-company funds compiled by Lipper, Inc. The Russell 2000 Index is an unmanaged, market value weighted index, which measures performance of the 2,000 companies that are between the 1,000th and 3,000th largest in the market with dividends reinvested. The CRSP Cap-Based Portfolio 10 Index is an unmanaged index of 1,780 of the smallest publicly traded U.S. stocks (with dividends reinvested), as reported by the Center for Research on Security Prices. It is not possible to invest directly in an index. Periods longer than one year are annualized.
According to data from Lipper, Inc. as of June 30, 2008, Ultra-Small Company Market Fund ranked 44th of 97 micro-cap funds for the twelve months ended June 30, 2008, 31st of 66 over the last five years, 11th of 38 over the last ten years, and 7th of 30 since inception in July 1997. These long-term numbers and the graph below give two snapshots of our long-term success. Lipper, Inc. is an independent mutual fund rating service that ranks funds in various fund categories by making comparative calculations using total returns.
| | |
| 36 | | Annual Report | June 30, 2008 |
Ultra-Small Company Market Fund
MANAGER’S COMMENTARY (continued)
Ultra-Small Company Market Fund vs. CRSP 10 Index & Lipper Small Company Funds Index & Russell 2000 Index Inception (7/31/97) to 6/30/08

Detailed Explanation of Quarterly Performance—What Worked Well
The Short Version: As commodity prices continued to increase, six of the Fund’s top ten holdings came from the energy sector and combined to contribute over two percent to the overall return during the quarter. Five of our holdings, four of which were energy-related, actually doubled in value (and in some cases, much better), and a total of fifteen stocks increased by over 50% over the prior three months.
These are the ten best performers for the quarter ended June 30, 2008:
| | | | | | |
| Rank | | Description | | Industry | | % Gain |
| 1 | | Royale Energy Inc | | Oil & Gas | | 332.1% |
| 2 | | James River Coal Co | | Coal | | 235.7% |
| 3 | | Fuel Systems Solutions Inc | | Auto Parts & Equipment | | 188.8% |
| 4 | | Brigham Exploration Co | | Oil & Gas | | 160.8% |
| 5 | | Clayton Williams Energy Inc | | Oil & Gas | | 109.5% |
| 6 | | Finish Line | | Retail | | 82.8% |
| 7 | | IXYS Corp | | Semiconductors | | 74.8% |
| 8 | | Cano Petroleum Inc | | Oil & Gas | | 71.7% |
| 9 | | Vaalco Energy Inc | | Oil & Gas | | 70.4% |
| 10 | | American Superconductor Corp | | Electrical Components & Equipment | | 67.4% |
| | | | | | | |
These days, a lump of coal in the old holiday stocking actually would be a pretty good thing (ok, its 97 degrees in August in Bridgeway’s hometown of Houston). James River Coal Co. was the Fund’s second top performer, as its stock price soared over 200% during the quarter. With demand for coal increasing across the globe (particularly in developing nations), producers have benefited from a commodity shortage that in turn allows them to sell at the rapidly escalating prices. Supply issues have even prompted European utilities to turn to domestic coal producers to keep up with demand. Since James River Coal had very few long-term contracts, management was best able to accommodate some of these growing needs and effectively took advantage of the higher commodity prices. For the quarter, the company contributed just less than one percent to the return of the Fund.
Detailed Explanation of Quarterly Performance—What Didn’t Work
The Short Version: Much of the negative economic news revolved around financial companies, and our Fund was not immune this quarter. Five of the poorest performers came from that sector and cost the Fund about half a percent in return. Consumers felt the strain of the ongoing economic weakness, and three related companies (cyclical and noncyclical) also made the worst performing list. Six of our holdings lost over 50% in value during the three-month period.
Ultra-Small Company Market Fund
MANAGER’S COMMENTARY (continued)
These are the ten stocks that performed the worst in the quarter ended June 30, 2008:
| | | | | | |
| Rank | | Description | | Industry | | % Loss |
| 1 | | Indevus Pharmaceuticals Inc | | Pharmaceuticals | | -67.1% |
| 2 | | First Regional Bancorp/Los Angeles CA | | Banks | | -59.5% |
| 3 | | Superior Bancorp | | Banks | | -57.3% |
| 4 | | Harrington West Financial Group Inc | | Savings & Loans | | -53.1% |
| 5 | | I-many Inc | | Internet | | -51.9% |
| 6 | | Independent Bank Corp/MI | | Banks | | -51.1% |
| 7 | | Aldila Inc | | Leisure Time | | -49.7% |
| 8 | | Consumer Portfolio Services | | Diversified Financial Services | | -48.2% |
| 9 | | Introgen Therapeutics Inc | | Pharmaceuticals | | -47.7% |
| 10 | | Soapstone Networks Inc | | Telecommunications | | -46.5% |
| | | | | | | |
Two pharmaceutical companies were among the Fund’s worst performers, including Indevus, which topped the list. The company is engaged in developing products that treat urology and endocrinology issues. In June, the FDA failed to approve a widely anticipated testosterone drug due to safety concerns and instead requested additional data that is expected to take the company another eighteen months to complete. The stock price plunged to a 52-week low on the disappointing news and cost the Fund just under a quarter of a percent in return.
Detailed Explanation of Fiscal Year Performance—What Worked Well
The Short Version: Five energy-related companies highlighted the list of top performers and contributed almost two percent to the return of the Fund during the past 12-months. Such news was not surprising considering the rapid increase in commodities prices. However, what was most surprising was that three consumer-related companies also made the list including one each from the struggling retail and auto parts industries. Sometimes you can have a great company in a downtrodden industry.
Altogether, our top ten companies added about two and a half percentage points to our annual return. These are the ten best performers for the fiscal year ended June 30, 2008:
| | | | | | |
| Rank | | Description | | Industry | | % Gain |
| 1 | | James River Coal Co | | Coal | | 464.0% |
| 2 | | Clayton Williams Energy Inc | | Oil & Gas | | 315.4% |
| 3 | | Finish Line | | Retail | | 234.9% |
| 4 | | Royale Energy Inc | | Oil & Gas | | 226.3% |
| 5 | | Brigham Exploration Co | | Oil & Gas | | 169.7% |
| 6 | | Contango Oil & Gas Co | | Oil & Gas | | 155.9% |
| 7 | | Rigel Pharmaceuticals Inc | | Pharmaceuticals | | 154.3% |
| 8 | | Axsys Technologies Inc | | Electronics | | 143.3% |
| 9 | | Fuel Systems Solutions Inc | | Auto Parts & Equipment | | 132.2% |
| 10 | | Document Sciences Corp | | Software | | 131.9% |
| | | | | | | |
Finish Line, the country’s second largest athletic footwear retailer, operates about 700 stores in malls across the country. The company’s stock price had been on a steady decline after it announced its intent to acquire retailer Genesco in a joint deal with UBS last summer 2007. Soon after, management decided that such a transaction was not in the best interest of Finish Line, especially during the current sluggish retail environment. After some legal challenges, the company finally was able to abandon the deal in March, much to the delight of analysts and shareholders. The stock began rising immediately after news that the acquisition could be halted. In May, the company entered into an agreement with athletic attire giant Nike and opened a co-branded store. A month later, Finish Line announced earnings that beat analysts’ expectations. Finish Line rose over 200% during the fiscal year.
| | |
| 38 | | Annual Report | June 30, 2008 |
Ultra-Small Company Market Fund
MANAGER’S COMMENTARY (continued)
Detailed Explanation of Fiscal Year Performance—What Didn’t Work
The Short Version: Financial services companies and bio-techs highlighted the list of poor performers for the fiscal year, and the results were definitely not very pretty. In fact, a couple of our ultra small-cap holdings were virtually worthless once the period came to a close. All ten of these poor performers plummeted by over 80% and, combined; they cost the Fund about one-and-a-half percent over the prior twelve months.
In spite of how negative the list of stocks below looks, it is noteworthy among the dynamics of ultra-small companies that the maximum theoretical decline is 100%, but the maximum increase is much higher. In fact, all ten of our top performing companies increased more than 100%, more than offsetting the carnage below. Or from another perspective, even as bad as they were, our worst ten stocks cost the Fund a percent and a half, but our best stocks (above) more than offset these (with more than a two and half percent return contribution).
These are the ten stocks that performed the worst for the fiscal year ended June 30, 2008:
| | | | | | |
| Rank | | Description | | Industry | | % Loss |
| 1 | | Delta Financial Corp | | Diversified Financial Services | | -99.7% |
| 2 | | Keryx Biopharmaceuticals Inc | | Biotechnology | | -94.0% |
| 3 | | Federal Trust Corp | | Savings & Loans | | -89.2% |
| 4 | | Sonus Pharmaceuticals Inc | | Biotechnology | | -89.0% |
| 5 | | Neose Technologies Inc | | Biotechnology | | -84.7% |
| 6 | | LodgeNet Interactive Corp | | Media | | -82.2% |
| 7 | | Tarragon Corp | | Real Estate | | -80.8% |
| 8 | | Fremont General Corp | | Banks | | -80.8% |
| 9 | | Jupitermedia Corp | | Internet | | -80.8% |
| 10 | | Spectrum Pharmaceuticals Inc | | Pharmaceuticals | | -80.6% |
| | | | | | | |
Even the most optimistic of investors and financial professionals will rarely make the claim that a 99.7% decline in value creates a “buying opportunity.” Delta Financial was a subprime mortgage lender (say no more) that filed for Chapter 11 bankruptcy protection in December 2007, suspended all new mortgage originations, and let go its 1,300 employees (some of whom followed up with lawsuits). Of note, the company had originated about $7 billion in mortgage loans between January 2006 and September 2007, but severely suffered when the subprime debacle surfaced and its entire business operations all but evaporated (along with its capital). Nevertheless, since we take many small positions, Delta Financial cost the Fund less than a quarter-of-a-percent in return for the full fiscal year.
Top Ten Holdings as of June 30, 2008
Two of the Fund’s top holdings at the end of the fiscal year were also among the best performers over the past quarter: Clayton Williams Energy and Brigham Exploration Co. Predictably, both companies operate within the energy sector. Because this passively managed fund is designed to model the ultra-small-cap index (CRSP 10), no one company comprises too great a percentage of its assets. In fact, the top ten holdings represent a meager ten and a half percent of Fund net assets. Since the maximum we typically invest in a new company is 0.2% of net assets, all of these companies made the list due to appreciation, not because we like them any better than another among our Fund’s holdings.
| | | | | | |
| Rank | | Description | | Industry | | Percent of
Net Assets |
| 1 | | Cal-Maine Foods Inc | | Food | | 1.4% |
| 2 | | Clayton Williams Energy Inc | | Oil & Gas | | 1.3% |
| 3 | | HUB Group Inc | | Transportation | | 1.2% |
| 4 | | Lufkin Industries Inc | | Oil & Gas Services | | 1.1% |
| 5 | | Spartan Stores Inc | | Food | | 1.1% |
| 6 | | Layne Christensen Co | | Engineering & Construction | | 1.0% |
| 7 | | Bolt Technology Corp | | Oil & Gas Services | | 1.0% |
| 8 | | Darling International Inc | | Environmental Control | | 1.0% |
| 9 | | Amedisys Inc | | Healthcare-Services | | 0.9% |
| 10 | | Brigham Exploration Co | | Oil & Gas | | 0.9% |
| | | | | | | |
| | | | | | 10.9% |
Ultra-Small Company Market Fund
MANAGER’S COMMENTARY (continued)
Industry Sector Representation as of June 30, 2008
Typically, any differences in the sector weightings between the Fund and the Index will be slight, as we are always trying to bring the Fund weightings back in line with the CRSP 10 Index. Occasional variances occur due to decisions that take into account the timing of cash flows, upcoming or recent Index quarterly rebalancing, Fund turnover, costs, and tax efficiency in this (generally) passively managed fund.
| | | | | | |
| | | % of Portfolio | | % CRSP 10 Index | | Difference |
Basic Materials | | 2.6% | | 2.7% | | -0.1% |
Communications | | 8.6% | | 8.2% | | 0.4% |
Consumer, Cyclical | | 11.9% | | 10.8% | | 1.1% |
Consumer, Non-cyclical | | 23.7% | | 24.9% | | -1.2% |
Energy | | 7.9% | | 8.8% | | -0.9% |
Financial | | 16.8% | | 21.1% | | -4.3% |
Industrial | | 11.6% | | 11.2% | | 0.4% |
Technology | | 8.6% | | 8.7% | | -0.1% |
Utilities | | 1.4% | | 1.5% | | -0.1% |
Diversified | | 0.4% | | 2.1% | | -1.7% |
Cash | | 6.5% | | 0.0% | | 6.5% |
| | | | | | | |
Total | | 100.0% | | 100.0% | | |
Disclaimer
The following is a reminder from the friendly folks at your Fund who worry about liability. The views expressed here are exclusively those of Fund management. These views are not meant as investment advice and should not be considered predictive in nature. Any favorable (or unfavorable) description of a holding applies only as of June 30, 2008, unless otherwise stated. Security positions can and do change thereafter. Discussions of historical performance do not guarantee and are not indicative of future performance.
The Fund is subject to very high, above market risk (volatility) and is not an appropriate investment for short-term investors. Investments in ultra-small companies generally carry greater risk than is customarily associated with larger companies and even “small companies” for various reasons such as narrower markets (fewer investors), limited financial resources and greater trading difficulty.
Conclusion
Thank you for your continued investment in Ultra-Small Company Market Fund. We encourage your feedback; your reactions and concerns are important to us.
Sincerely,
Your Investment Management Team
| | |
| 40 | | Annual Report | June 30, 2008 |
THIS PAGE INTENTIONALLY LEFT BLANK
Bridgeway Ultra-Small Company Market Fund
SCHEDULE OF INVESTMENTS
Showing percentage of net assets as of June 30, 2008
| | | | | | | |
| Industry | | Company | | Shares | | Value |
|
COMMON STOCKS - 93.53% |
Advertising - 0.43% |
| | inVentiv Health, Inc.* | | 110,400 | | $ | 3,068,016 |
|
Aerospace/Defense - 0.40% |
| | CPI Aerostructures, Inc.* | | 31,400 | | | 243,978 |
| | Ducommun, Inc.* | | 94,700 | | | 2,174,312 |
| | LMI Aerospace, Inc.* | | 27,626 | | | 485,389 |
| | | | | | | |
| | | | | | | 2,903,679 |
|
Agriculture - 0.80% |
| | Andersons, Inc.+ | | 129,002 | | | 5,251,671 |
| | Maui Land & Pineapple Co., Inc.*+ | | 17,155 | | | 505,215 |
| | | | | | | |
| | | | | | | 5,756,886 |
|
Airlines - 0.34% |
| | Hawaiian Holdings, Inc.*+ | | 348,000 | | | 2,418,600 |
|
Apparel - 1.16% |
| | Cherokee, Inc.+ | | 52,400 | | | 1,055,860 |
| | G-III Apparel Group, Ltd.* | | 143,400 | | | 1,769,556 |
| | Perry Ellis International, Inc.* | | 121,600 | | | 2,580,352 |
| | Sport-Haley, Inc.* | | 104,900 | | | 208,751 |
| | Tandy Brands Accessories, Inc. | | 65,009 | | | 358,199 |
| | Unifi, Inc.* | | 441,900 | | | 1,113,588 |
| | Weyco Group, Inc.+ | | 46,875 | | | 1,243,594 |
| | | | | | | |
| | | | | | | 8,329,900 |
|
Auto Parts & Equipment - 1.40% |
| | Fuel Systems Solutions, Inc.*+ | | 81,750 | | | 3,147,375 |
| | Spartan Motors, Inc.+ | | 242,470 | | | 1,811,251 |
| | Titan International, Inc. | | 144,000 | | | 5,129,280 |
| | | | | | | |
| | | | | | | 10,087,906 |
|
Banks - 8.85% |
| | Abigail Adams National Bancorp | | 22,220 | | | 207,757 |
| | American River Bankshares | | 42,000 | | | 414,120 |
| | Arrow Financial Corp. | | 109,545 | | | 1,986,051 |
| | Bancorp Rhode Island, Inc. | | 70,800 | | | 2,022,756 |
| | Beach First National Bancshares, Inc.* | | 28,900 | | | 225,998 |
| | Beverly Hills Bancorp, Inc. | | 147,900 | | | 248,472 |
| | Cadence Financial Corp.+ | | 7,830 | | | 84,799 |
| | Camden National Corp. | | 52,400 | | | 1,219,872 |
| | Capitol Bancorp, Ltd.+ | | 53,392 | | | 478,926 |
| | Cardinal Financial Corp. | | 287,700 | | | 1,801,002 |
| | Cass Information Systems, Inc.+ | | 101,070 | | | 3,237,272 |
| | Center Bancorp, Inc. | | 68,342 | | | 597,993 |
| | | | | | | |
| Industry | | Company | | Shares | | Value |
|
|
Banks (continued) |
| | Central Bancorp, Inc. | | 12,300 | | $ | 135,300 |
| | Centrue Financial Corp. | | 31,200 | | | 340,080 |
| | Community Bancorp* | | 61,944 | | | 310,339 |
| | Enterprise Financial Services Corp.+ | | 83,600 | | | 1,575,860 |
| | Financial Institutions, Inc. | | 78,000 | | | 1,252,680 |
| | First Bancorp | | 109,500 | | | 1,384,080 |
| | First Community Bancshares, Inc. | | 35,796 | | | 1,009,447 |
| | First Regional Bancorp* | | 60,400 | | | 338,844 |
| | First Security Group, Inc. | | 106,900 | | | 596,502 |
| | First South Bancorp, Inc.+ | | 43,306 | | | 557,781 |
| | Gateway Financial Holdings, Inc.+ | | 87,654 | | | 672,306 |
| | Green Bankshares, Inc.+ | | 119,919 | | | 1,681,264 |
| | Guaranty Federal Bancshares, Inc. | | 62,556 | | | 1,266,759 |
| | Integra Bank Corp. | | 78,402 | | | 613,888 |
| | Intervest Bancshares Corp., Class A | | 62,565 | | | 320,333 |
| | Irwin Financial Corp. | | 99,359 | | | 267,276 |
| | Lakeland BanCorp, Inc. | | 200,304 | | | 2,439,703 |
| | Lakeland Financial Corp. | | 77,388 | | | 1,476,563 |
| | MainSource Financial Group, Inc. | | 143,600 | | | 2,225,800 |
| | Mercantile Bank Corp. | | 89,372 | | | 641,691 |
| | Merchants Bancshares, Inc. | | 933 | | | 20,946 |
| | MidWestOne Financial Group, Inc. | | 36,681 | | | 474,652 |
| | NewBridge Bancorp | | 47,313 | | | 326,460 |
| | Nexity Financial Corp.* | | 225,600 | | | 1,049,040 |
| | Northeast Bancorp | | 4,700 | | | 52,170 |
| | Oriental Financial Group+ | | 239,900 | | | 3,420,974 |
| | PAB Bankshares, Inc.+ | | 71,400 | | | 586,194 |
| | Pacific Mercantile Bancorp | | 71,000 | | | 543,150 |
| | Pacific State Bancorp*+ | | 26,386 | | | 214,518 |
| | Pennsylvania Commerce Bancorp, Inc.* | | 27,751 | | | 667,412 |
| | Peoples Bancorp, Inc. | | 75,600 | | | 1,434,888 |
| | Pinnacle Financial Partners, Inc.*+ | | 127,700 | | | 2,565,493 |
| | Republic First Bancorp, Inc.* | | 75,971 | | | 551,549 |
| | SCBT Financial Corp. | | 33,883 | | | 967,698 |
| | Seacoast Banking Corp.+ | | 195,369 | | | 1,516,063 |
| | Shore Bancshares, Inc.+ | | 95,455 | | | 1,786,918 |
| | Sierra Bancorp+ | | 75,000 | | | 1,237,500 |
| | Smithtown Bancorp, Inc.+ | | 70,730 | | | 1,149,362 |
| | Southcoast Financial Corp.* | | 5,059 | | | 69,106 |
| | Southern Community Financial Corp. | | 66,700 | | | 410,205 |
| | Southside Bancshares, Inc.+ | | 107,670 | | | 1,985,435 |
| | State Bancorp, Inc. | | 34,500 | | | 431,250 |
| | Sterling Bancorp | | 183,400 | | | 2,191,630 |
| | |
| 42 | | Annual Report | June 30, 2008 |
Bridgeway Ultra-Small Company Market Fund
SCHEDULE OF INVESTMENTS (continued)
Showing percentage of net assets as of June 30, 2008
| | | | | | | |
| Industry | | Company | | Shares | | Value |
|
Common Stocks (continued) |
Banks (continued) |
| | Suffolk Bancorp | | 42,800 | | $ | 1,257,464 |
| | Sun Bancorp, Inc.* | | 62,967 | | | 639,115 |
| | Superior Bancorp*+ | | 109,025 | | | 925,622 |
| | Tennessee Commerce Bancorp, Inc.*+ | | 46,300 | | | 766,265 |
| | Union Bankshares Corp. | | 8,099 | | | 120,594 |
| | United Security Bancshares+ | | 100,700 | | | 1,464,178 |
| | Univest Corp. of Pennsylvania+ | | 57,865 | | | 1,149,199 |
| | Washington Trust Bancorp, Inc. | | 54,577 | | | 1,075,167 |
| | West Bancorporation, Inc.+ | | 131,378 | | | 1,142,989 |
| | | | | | | |
| | | | | | | 63,824,720 |
|
Beverages - 0.45% |
| | Central European Distribution Corp.*+ | | 9,900 | | | 734,085 |
| | Green Mountain Coffee Roasters, Inc.*+ | | 55,400 | | | 2,081,378 |
| | Peet’s Coffee & Tea, Inc.*+ | | 17,400 | | | 344,868 |
| | Craft Brewers Alliance, Inc. | | 23,000 | | | 106,030 |
| | | | | | | |
| | | | | | | 3,266,361 |
|
Biotechnology - 3.13% |
| | Affymax, Inc.*+ | | 29,303 | | | 466,211 |
| | Anesiva, Inc.*+ | | 150,464 | | | 443,869 |
| | Avigen, Inc.* | | 298,900 | | | 863,821 |
| | Dendreon Corp.*+ | | 185,100 | | | 823,695 |
| | Discovery Laboratories, Inc.*+ | | 1,083,000 | | | 1,786,950 |
| | Dynavax Technologies Corp.* | | 115,719 | | | 168,950 |
| | Entremed, Inc.* | | 207,612 | | | 114,187 |
| | Exact Sciences Corp.* | | 595,200 | | | 1,071,360 |
| | Immunogen, Inc.*+ | | 423,217 | | | 1,295,044 |
| | Immunomedics, Inc.*+ | | 416,148 | | | 886,395 |
| | Maxygen, Inc.* | | 214,876 | | | 728,430 |
| | Repligen Corp.* | | 41,134 | | | 194,152 |
| | Sangamo Biosciences, Inc.*+ | | 370,100 | | | 3,682,495 |
| | Seattle Genetics, Inc.*+ | | 373,255 | | | 3,157,737 |
| | StemCells, Inc.*+ | | 602,800 | | | 735,416 |
| | Third Wave Technologies, Inc.* | | 449,000 | | | 5,010,840 |
| | Vical, Inc.*+ | | 337,600 | | | 1,137,712 |
| | | | | | | |
| | | | | | | 22,567,264 |
| | | | | | | |
| Industry | | Company | | Shares | | Value |
|
|
Building Materials - 0.24% |
| | AAON, Inc. | | 28,100 | | $ | 541,206 |
| | Comfort Systems USA, Inc. | | 43,900 | | | 590,016 |
| | US Home Systems, Inc.* | | 145,600 | | | 572,208 |
| | | | | | | |
| | | | | | | 1,703,430 |
|
Chemicals - 1.71% |
| | Aceto Corp. | | 128,044 | | | 978,256 |
| | American Pacific Corp.* | | 35,524 | | | 612,434 |
| | American Vanguard Corp.+ | | 152,000 | | | 1,869,600 |
| | Balchem Corp. | | 89,975 | | | 2,081,122 |
| | Landec Corp.* | | 205,000 | | | 1,326,350 |
| | NewMarket Corp. | | 29,200 | | | 1,933,916 |
| | Penford Corp. | | 11,592 | | | 172,489 |
| | Quaker Chemical Corp. | | 99,700 | | | 2,658,002 |
| | Symyx Technologies, Inc.* | | 96,894 | | | 676,320 |
| | Tronox, Inc., Class A | | 16,600 | | | 52,456 |
| | | | | | | |
| | | | | | | 12,360,945 |
|
Coal - 0.43% |
| | James River Coal Co.*+ | | 52,374 | | | 3,073,830 |
|
Commercial Services - 4.52% |
| | Bankrate, Inc.*+ | | 83,885 | | | 3,277,387 |
| | Carriage Services, Inc.* | | 134,500 | | | 887,700 |
| | Corvel Corp.* | | 75,433 | | | 2,554,916 |
| | Edgewater Technology, Inc.* | | 100,000 | | | 481,000 |
| | Franklin Covey Co.* | | 192,400 | | | 1,670,032 |
| | Geo Group, Inc.* | | 48,863 | | | 1,099,417 |
| | Healthcare Services Group+ | | 53,325 | | | 811,073 |
| | Hill International, Inc.* | | 75,000 | | | 1,233,000 |
| | HMS Holdings Corp.* | | 218,000 | | | 4,680,460 |
| | Intersections, Inc.* | | 178,900 | | | 1,955,377 |
| | Kendle International, Inc.* | | 22,390 | | | 813,429 |
| | Learning Tree International, Inc.* | | 10,737 | | | 183,603 |
| | Multi-Color Corp. | | 88,704 | | | 1,861,897 |
| | National Research Corp.+ | | 40,300 | | | 1,066,741 |
| | On Assignment, Inc.* | | 173,500 | | | 1,391,470 |
| | PRG-Schultz International, Inc.* | | 6,770 | | | 63,706 |
| | RCM Technologies, Inc.* | | 170,459 | | | 734,678 |
| | Standard Parking Corp.* | | 162,200 | | | 2,952,040 |
| | Team, Inc.* | | 131,200 | | | 4,502,784 |
| | The Hackett Group, Inc.* | | 65,614 | | | 376,624 |
| | | | | | | |
| | | | | | | 32,597,334 |
|
Computers - 2.68% |
| | Cogo Group, Inc.* | | 36,492 | | | 332,442 |
| | Dot Hill Systems Corp.* | | 516,068 | | | 1,305,652 |
| | Immersion Corp.*+ | | 273,226 | | | 1,860,669 |
| | Integral Systems, Inc.+ | | 62,056 | | | 2,401,567 |
Bridgeway Ultra-Small Company Market Fund
SCHEDULE OF INVESTMENTS (continued)
Showing percentage of net assets as of June 30, 2008
| | | | | | | |
| Industry | | Company | | Shares | | Value |
|
Common Stocks (continued) |
Computers (continued) |
| | InterVoice, Inc.* | | 268,300 | | $ | 1,529,310 |
| | LaserCard Corp.*+ | | 146,775 | | | 700,117 |
| | Magma Design Automation, Inc.* | | 220,300 | | | 1,337,221 |
| | Netscout Systems, Inc.* | | 236,500 | | | 2,525,820 |
| | Radiant Systems, Inc.* | | 141,800 | | | 1,521,514 |
| | RadiSys Corp.* | | 187,900 | | | 1,702,374 |
| | SI International, Inc.* | | 76,700 | | | 1,606,098 |
| | TechTeam Global, Inc.* | | 190,370 | | | 2,035,055 |
| | Tier Technologies, Inc., Class B* | | 54,700 | | | 438,147 |
| | | | | | | |
| | | | | | | 19,295,986 |
|
Distribution/Wholesale - 0.52% |
| | Building Material Holding Corp. | | 67,150 | | | 118,856 |
| | Chindex International, Inc.*+ | | 80,550 | | | 1,181,668 |
| | DEI Holdings, Inc.*+ | | 336,700 | | | 572,390 |
| | Infosonics Corp.* | | 430,900 | | | 323,175 |
| | Navarre Corp.* | | 223,644 | | | 366,776 |
| | Rentrak Corp.* | | 83,800 | | | 1,179,904 |
| | | | | | | |
| | | | | | | 3,742,769 |
|
Diversified Financial Services - 1.30% |
| | AeroCentury Corp.*+(a) | | 85,700 | | | 934,987 |
| | Consumer Portfolio Services*+ | | 332,800 | | | 489,216 |
| | Cowen Group, Inc.* | | 32,158 | | | 248,260 |
| | Encore Capital Group, Inc.* | | 85,986 | | | 759,256 |
| | Federal Agricultural Mortgage Corp., Class C+ | | 83,900 | | | 2,079,042 |
| | International Assets Holding Corp.* | | 11,886 | | | 357,293 |
| | TradeStation Group, Inc.* | | 245,974 | | | 2,496,636 |
| | Westwood Holdings Group, Inc. | | 51,200 | | | 2,037,760 |
| | | | | | | |
| | | | | | | 9,402,450 |
|
Electric Utilities - 0.25% |
| | Central Vermont Public Service Corp. | | 81,600 | | | 1,580,592 |
| | Unitil Corp. | | 9,400 | | | 254,834 |
| | | | | | | |
| | | | | | | 1,835,426 |
|
Electrical Components & Equipment - 0.32% |
| | American Superconductor Corp.*+ | | 62,300 | | | 2,233,455 |
| | TII Network Technologies, Inc.* | | 59,599 | | | 95,358 |
| | | | | | | |
| | | | | | | 2,328,813 |
| | | | | | | |
| Industry | | Company | | Shares | | Value |
|
|
Electronics - 1.93% |
| | Advanced Photonix, Inc., Class A*+ | | 156,350 | | $ | 267,359 |
| | Axsys Technologies, Inc.* | | 86,887 | | | 4,521,599 |
| | Frequency Electronics, Inc. | | 14,600 | | | 96,214 |
| | Measurement Specialties, Inc.* | | 104,500 | | | 1,838,155 |
| | Napco Security Systems, Inc.* | | 113,934 | | | 516,121 |
| | OYO Geospace Corp.* | | 13,700 | | | 807,478 |
| | Stoneridge, Inc.* | | 199,200 | | | 3,398,352 |
| | UQM Technologies, Inc.*+ | | 191,100 | | | 420,420 |
| | Vicon Industries, Inc.* | | 132,800 | | | 694,544 |
| | Zygo Corp.* | | 135,646 | | | 1,333,400 |
| | | | | | | |
| | | | | | | 13,893,642 |
|
Energy-Alternative Sources - 0.32% |
| | Evergreen Solar, Inc.*+ | | 56,090 | | | 543,512 |
| | Plug Power, Inc.*+ | | 736,900 | | | 1,731,715 |
| | | | | | | |
| | | | | | | 2,275,227 |
|
Engineering & Construction - 1.14% |
| | Layne Christensen Co.* | | 161,900 | | | 7,089,601 |
| | Michael Baker Corp.* | | 51,700 | | | 1,131,196 |
| | | | | | | |
| | | | | | | 8,220,797 |
|
Entertainment - 0.73% |
| | Canterbury Park Holding Corp. | | 59,400 | | | 540,540 |
| | Dover Motorsports, Inc. | | 159,500 | | | 811,855 |
| | Elixir Gaming Technologies, Inc.*+ | | 375,500 | | | 450,600 |
| | Great Wolf Resorts, Inc.* | | 337,900 | | | 1,476,623 |
| | Progressive Gaming International Corp.* | | 498,500 | | | 623,125 |
| | Silverleaf Resorts, Inc.* | | 388,800 | | | 874,800 |
| | Steinway Musical Instruments* | | 18,314 | | | 483,490 |
| | | | | | | |
| | | | | | | 5,261,033 |
|
Environmental Control - 1.02% |
| | CECO Environmental Corp.* | | 60,575 | | | 356,787 |
| | Darling International, Inc.* | | 424,600 | | | 7,014,392 |
| | | | | | | |
| | | | | | | 7,371,179 |
|
Food - 3.96% |
| | Cal-Maine Foods, Inc.+ | | 312,700 | | | 10,315,973 |
| | Imperial Sugar Co.+ | | 121,316 | | | 1,884,038 |
| | Lifeway Foods, Inc.*+ | | 156,302 | | | 1,858,431 |
| | M&F Worldwide Corp.*+ | | 106,598 | | | 4,190,367 |
| | Rocky Mountain Chocolate Factory, Inc. | | 113,543 | | | 1,093,419 |
| | |
| 44 | | Annual Report | June 30, 2008 |
Bridgeway Ultra-Small Company Market Fund
SCHEDULE OF INVESTMENTS (continued)
Showing percentage of net assets as of June 30, 2008
| | | | | | | |
| Industry | | Company | | Shares | | Value |
|
Common Stocks (continued) |
Food (continued) |
| | Spartan Stores, Inc. | | 343,650 | | $ | 7,903,950 |
| | Village Super Market, Class A | | 24,600 | | | 949,068 |
| | Zapata Corp.* | | 57,600 | | | 402,624 |
| | | | | | | |
| | | | | | | 28,597,870 |
|
Forest Products & Paper - 0.03% |
| | Xerium Technologies, Inc. | | 62,373 | | | 246,997 |
|
Gas - 0.42% |
| | Chesapeake Utilities Corp. | | 33,988 | | | 874,171 |
| | EnergySouth, Inc.+ | | 44,232 | | | 2,170,022 |
| | | | | | | |
| | | | | | | 3,044,193 |
|
Hand/Machine Tools - 0.29% |
| | K-Tron International, Inc.* | | 10,600 | | | 1,373,760 |
| | LS Starrett Co., Class A | | 29,200 | | | 690,288 |
| | | | | | | |
| | | | | | | 2,064,048 |
|
Healthcare - Products - 4.85% |
| | Abaxis, Inc.* | | 80,400 | | | 1,940,052 |
| | Arrhythmia Research Technology* | | 109,100 | | | 640,417 |
| | Atrion Corp. | | 39,148 | | | 3,751,161 |
| | BioLase Technology, Inc.* | | 89,621 | | | 306,504 |
| | Bovie Medical Corp.* | | 286,900 | | | 2,051,335 |
| | Cantel Medical Corp.* | | 64,599 | | | 653,742 |
| | Cardiac Science Corp.* | | 6,607 | | | 54,178 |
| | Cerus Corp.* | | 181,815 | | | 743,623 |
| | CryoLife, Inc.* | | 356,000 | | | 4,072,640 |
| | Endologix, Inc.*+ | | 589,800 | | | 1,362,438 |
| | Hanger Orthopedic Group, Inc.* | | 146,317 | | | 2,412,767 |
| | Merit Medical Systems, Inc.* | | 17,500 | | | 257,250 |
| | Natus Medical, Inc.* | | 138,600 | | | 2,902,284 |
| | NMT Medical, Inc.* | | 171,100 | | | 799,037 |
| | NxStage Medical, Inc.*+ | | 110,591 | | | 424,670 |
| | Orthologic Corp.* | | 441,899 | | | 441,899 |
| | Osteotech, Inc.* | | 10,215 | | | 58,123 |
| | Palomar Medical Technologies, Inc.* | | 74,000 | | | 738,520 |
| | Rochester Medical Corp.*+ | | 128,000 | | | 1,333,760 |
| | Span-America Medical Systems, Inc. | | 96,900 | | | 1,085,280 |
| | Utah Medical Products, Inc. | | 49,900 | | | 1,426,641 |
| | Vnus Medical Technologies, Inc.* | | 106,000 | | | 2,121,060 |
| | Zoll Medical Corp.* | | 160,200 | | | 5,393,934 |
| | | | | | | |
| | | | | | | 34,971,315 |
|
Healthcare - Services - 2.06% |
| | Alliance Imaging, Inc.* | | 335,992 | | | 2,913,051 |
| | Almost Family, Inc.* | | 11,600 | | | 308,560 |
| | | | | | | |
| Industry | | Company | | Shares | | Value |
|
|
Healthcare - Services (continued) |
| | Amedisys, Inc.* | | 133,460 | | $ | 6,729,053 |
| | America Service Group, Inc.* | | 93,000 | | | 850,950 |
| | Five Star Quality Care, Inc.* | | 171,900 | | | 813,087 |
| | NovaMed, Inc.*+ | | 194,400 | | | 732,888 |
| | Psychiatric Solutions, Inc.* | | 67,000 | | | 2,535,280 |
| | | | | | | |
| | | | | | | 14,882,869 |
|
Holding Companies - Diversified - 0.37% |
| | GSC Acquisition Co.* | | 122,592 | | | 1,151,139 |
| | Resource America, Inc., Class A | | 164,800 | | | 1,535,936 |
| | | | | | | |
| | | | | | | 2,687,075 |
|
Home Builders - 0.55% |
| | Amrep Corp.+ | | 17,100 | | | 813,789 |
| | M/I Homes, Inc. | | 75,909 | | | 1,194,049 |
| | Nobility Homes, Inc. | | 16,300 | | | 259,985 |
| | Skyline Corp. | | 72,600 | | | 1,706,100 |
| | | | | | | |
| | | | | | | 3,973,923 |
|
Home Furnishings - 0.70% |
| | Audiovox Corp., Class A* | | 103,227 | | | 1,013,689 |
| | Cobra Electronics Corp. | | 170,300 | | | 464,919 |
| | DTS, Inc.* | | 112,000 | | | 3,507,840 |
| | Koss Corp. | | 4,138 | | | 64,636 |
| | | | | | | |
| | | | | | | 5,051,084 |
|
Household Products/Wares - 0.15% |
| | Nashua Corp.* | | 38,600 | | | 386,000 |
| | Russ Berrie & Co., Inc.* | | 90,400 | | | 720,488 |
| | | | | | | |
| | | | | | | 1,106,488 |
|
Housewares - 0.35% |
| | National Presto Industries, Inc. | | 38,804 | | | 2,490,441 |
|
Insurance - 1.98% |
| | 21st Century Holding Co. | | 150,500 | | | 1,229,585 |
| | American Independence Corp.* | | 45,135 | | | 288,864 |
| | Amerisafe, Inc.* | | 108,900 | | | 1,735,866 |
| | Donegal Group, Inc., Class A | | 53,750 | | | 853,013 |
| | Investors Title Co. | | 56,432 | | | 2,744,852 |
| | Meadowbrook Insurance Group, Inc. | | 370,400 | | | 1,963,120 |
| | Mercer Insurance Group, Inc. | | 144,257 | | | 2,510,072 |
| | Penn Treaty American Corp.* | | 162,300 | | | 785,532 |
| | SeaBright Insurance Holdings, Inc.* | | 150,350 | | | 2,177,068 |
| | | | | | | |
| | | | | | | 14,287,972 |
Bridgeway Ultra-Small Company Market Fund
SCHEDULE OF INVESTMENTS (continued)
Showing percentage of net assets as of June 30, 2008
| | | | | | | |
| Industry | | Company | | Shares | | Value |
|
Common Stocks (continued) |
Internet - 4.04% |
| | 1-800-FLOWERS.COM, Inc.* | | 247,000 | | $ | 1,593,150 |
| | A.D.A.M., Inc.* | | 125,700 | | | 935,837 |
| | ActivIdentity Corp.* | | 453,900 | | | 1,239,147 |
| | Aladdin Knowledge Systems, Ltd.* | | 51,974 | | | 701,649 |
| | Art Technology Group, Inc.* | | 586,137 | | | 1,875,638 |
| | Cybersource Corp.* | | 103,452 | | | 1,730,752 |
| | Drugstore.Com* | | 819,834 | | | 1,557,685 |
| | I-many, Inc.* | | 184,475 | | | 184,475 |
| | Insure.com, Inc.* | | 30,400 | | | 100,320 |
| | Jupitermedia Corp.* | | 164,000 | | | 229,600 |
| | Keynote Systems, Inc.* | | 147,400 | | | 1,898,512 |
| | Knot, Inc.*+ | | 186,800 | | | 1,826,904 |
| | Lionbridge Technologies, Inc.* | | 516,595 | | | 1,332,815 |
| | LookSmart, Ltd.* | | 515,000 | | | 2,070,300 |
| | Napster, Inc.* | | 1,118,900 | | | 1,588,838 |
| | Network Engines, Inc.* | | 850,400 | | | 994,968 |
| | New Motion, Inc.*+ | | 168,139 | | | 699,458 |
| | Online Resources Corp.* | | 165,400 | | | 1,381,090 |
| | Perficient, Inc.* | | 186,138 | | | 1,798,093 |
| | SumTotal Systems, Inc.* | | 429,730 | | | 2,011,136 |
| | TheStreet.com, Inc. | | 335,500 | | | 2,184,105 |
| | Zix Corp.*+ | | 437,600 | | | 1,216,528 |
| | | | | | | |
| | | | | | | 29,151,000 |
|
Iron/Steel - 0.30% |
| | Friedman Industries | | 98,300 | | | 786,400 |
| | Great Northern Iron Ore Property+ | | 12,000 | | | 1,349,040 |
| | | | | | | |
| | | | | | | 2,135,440 |
|
Leisure Time - 0.58% |
| | Aldila, Inc. | | 97,779 | | | 560,274 |
| | Cybex International, Inc.*+ | | 162,100 | | | 552,761 |
| | GameTech International, Inc.* | | 222,600 | | | 1,057,350 |
| | Town Sports International Holdings, Inc.*+ | | 216,900 | | | 2,025,846 |
| | | | | | | |
| | | | | | | 4,196,231 |
|
Lodging - 0.32% |
| | Interstate Hotels & Resorts, Inc.* | | 372,266 | | | 964,169 |
| | Monarch Casino & Resort, Inc.* | | 2,185 | | | 25,783 |
| | Red Lion Hotels Corp.* | | 166,600 | | | 1,327,802 |
| | | | | | | |
| | | | | | | 2,317,754 |
| | | | | | | |
| Industry | | Company | | Shares | | Value |
|
|
Machinery - Diversified - 1.67% |
| | Gehl Co.* | | 165,150 | | $ | 2,442,569 |
| | Hurco Cos, Inc.*+ | | 126,434 | | | 3,905,546 |
| | Twin Disc, Inc. | | 272,800 | | | 5,709,704 |
| | | | | | | |
| | | | | | | 12,057,819 |
|
Media - 0.91% |
| | Acacia Research Corp. | | 9,500 | | | 42,560 |
| | ADDvantage Technologies Group, Inc.* | | 194,100 | | | 593,946 |
| | DG FastChannel, Inc.*+ | | 126,484 | | | 2,181,849 |
| | Global Traffic Network, Inc.* | | 65,316 | | | 583,925 |
| | Gray Television, Inc. | | 76,066 | | | 218,309 |
| | Martha Stewart Living Omnimedia, Inc., Class A*+ | | 115,752 | | | 856,565 |
| | Nexstar Broadcasting Group, Inc., Class A*+ | | 154,307 | | | 631,116 |
| | Outdoor Channel Holdings, Inc.*+ | | 91,431 | | | 638,188 |
| | PRIMEDIA, Inc. | | 179,866 | | | 838,176 |
| | | | | | | |
| | | | | | | 6,584,634 |
|
Metal Fabrication - Hardware - 1.49% |
| | Ampco-Pittsburgh Corp. | | 89,800 | | | 3,994,304 |
| | Furmanite Corp.* | | 151,200 | | | 1,206,576 |
| | Ladish Co., Inc.* | | 20,132 | | | 414,518 |
| | LB Foster Co. Class A* | | 95,300 | | | 3,163,960 |
| | Northwest Pipe Co.* | | 11,347 | | | 633,163 |
| | Sun Hydraulics Corp. | | 41,349 | | | 1,334,332 |
| | | | | | | |
| | | | | | | 10,746,853 |
|
Mining - 0.62% |
| | United States Lime & Minerals, Inc.* | | 53,700 | | | 2,124,909 |
| | Uranerz Energy Corp.*+ | | 686,100 | | | 2,291,574 |
| | Vista Gold Corp.*+ | | 11,300 | | | 41,245 |
| | | | | | | |
| | | | | | | 4,457,728 |
|
Miscellaneous Manufacturing - 1.33% |
| | AZZ, Inc.*+ | | 68,000 | | | 2,713,200 |
| | Ceradyne, Inc.* | | 54,025 | | | 1,853,057 |
| | EnPro Industries, Inc.* | | 13,600 | | | 507,824 |
| | Flanders Corp.* | | 85,183 | | | 515,357 |
| | Park-Ohio Holdings Corp.* | | 98,597 | | | 1,455,292 |
| | Raven Industries, Inc. | | 35,600 | | | 1,166,968 |
| | Spire Corp.*+ | | 111,400 | | | 1,390,272 |
| | | | | | | |
| | | | | | | 9,601,970 |
|
Oil & Gas - 4.34% |
| | American Oil & Gas, Inc.* | | 192,550 | | | 754,796 |
| | ATP Oil & Gas Corp.*+ | | 29,600 | | | 1,168,312 |
| | |
| 46 | | Annual Report | June 30, 2008 |
Bridgeway Ultra-Small Company Market Fund
SCHEDULE OF INVESTMENTS (continued)
Showing percentage of net assets as of June 30, 2008
| | | | | | | |
| Industry | | Company | | Shares | | Value |
|
Common Stocks (continued) |
Oil & Gas (continued) |
| | Brigham Exploration Co.* | | 388,500 | | $ | 6,149,955 |
| | Callon Petroleum Co.* | | 156,600 | | | 4,284,576 |
| | Cano Petroleum, Inc.* | | 327,800 | | | 2,602,732 |
| | Clayton Williams Energy, Inc.*+ | | 82,500 | | | 9,070,875 |
| | Contango Oil & Gas Co.* | | 10,000 | | | 929,200 |
| | Royale Energy, Inc.*+ | | 93,856 | | | 1,176,016 |
| | Teton Energy Corp.*+ | | 234,500 | | | 1,170,155 |
| | Vaalco Energy, Inc.* | | 473,100 | | | 4,007,157 |
| | | | | | | |
| | | | | | | 31,313,774 |
|
Oil & Gas Services - 2.77% |
| | Bolt Technology Corp.*+ | | 311,263 | | | 7,025,206 |
| | Dawson Geophysical Co.* | | 15,799 | | | 939,409 |
| | Lufkin Industries, Inc. | | 95,742 | | | 7,973,394 |
| | Matrix Service Co.* | | 65,232 | | | 1,504,250 |
| | Omni Energy Services Corp.*+ | | 266,105 | | | 1,705,733 |
| | TGC Industries, Inc.* | | 96,027 | | | 854,640 |
| | | | | | | |
| | | | | | | 20,002,632 |
|
Packaging & Containers - 0.15% |
| | AEP Industries, Inc.* | | 63,000 | | | 1,094,310 |
|
Pharmaceuticals - 3.75% |
| | Adolor Corp.* | | 157,918 | | | 865,391 |
| | Anika Therapeutics, Inc.* | | 197,639 | | | 1,697,719 |
| | Array Biopharma, Inc.* | | 83,514 | | | 392,516 |
| | Auxilium Pharmaceuticals, Inc.*+ | | 98,855 | | | 3,323,505 |
| | Caraco Pharmaceutical Laboratories, Ltd.* | | 42,300 | | | 558,360 |
| | EPIX Pharmaceuticals, Inc.*+ | | 210,060 | | | 363,404 |
| | Indevus Pharmaceuticals, Inc.*+ | | 480,300 | | | 754,071 |
| | Inspire Pharmaceuticals, Inc.* | | 334,070 | | | 1,429,820 |
| | Integrated Biopharma, Inc.* | | 54,100 | | | 134,709 |
| | Introgen Therapeutics, Inc.*+ | | 98,980 | | | 153,419 |
| | Mannatech, Inc.+ | | 90,680 | | | 493,299 |
| | Matrixx Initiatives, Inc.* | | 41,319 | | | 688,374 |
| | MiddleBrook Pharmaceuticals, Inc.*+ | | 242,982 | | | 821,279 |
| | Omega Protein Corp.* | | 14,960 | | | 223,652 |
| | Pain Therapeutics, Inc.*+ | | 114,000 | | | 900,600 |
| | Quigley Corp.*+ | | 124,000 | | | 638,600 |
| | Reliv International, Inc.+ | | 206,200 | | | 1,127,914 |
| | Rigel Pharmaceuticals, Inc.*+ | | 220,562 | | | 4,997,935 |
| | Sciclone Pharmaceuticals, Inc.*+ | | 677,800 | | | 1,037,034 |
| | Sciele Pharma, Inc.+ | | 212,800 | | | 4,117,680 |
| | Spectrum Pharmaceuticals, Inc.*+ | | 463,400 | | | 644,126 |
| | Theragenics Corp.* | | 459,131 | | | 1,666,645 |
| | | | | | | |
| | | | | | | 27,030,052 |
| | | | | | | |
| Industry | | Company | | Shares | | Value |
|
|
Real Estate - 0.34% |
| | Consolidated-Tomoka Land Co.+ | | 43,800 | | $ | 1,842,228 |
| | Meruelo Maddux Properties, Inc.* | | 18,401 | | | 40,114 |
| | Stratus Properties, Inc.*+ | | 32,300 | | | 561,697 |
| | | | | | | |
| | | | | | | 2,444,039 |
|
Retail - 5.19% |
| | Allion Healthcare, Inc.* | | 314,500 | | | 1,792,650 |
| | America’s Car-Mart, Inc.*+ | | 154,500 | | | 2,768,640 |
| | Buffalo Wild Wings, Inc.*+ | | 95,000 | | | 2,358,850 |
| | Build-A-Bear Workshop, Inc.* | | 48,400 | | | 351,868 |
| | EZCORP, Inc., Class A* | | 294,600 | | | 3,756,150 |
| | Famous Dave’s of America, Inc.* | | 172,400 | | | 1,327,480 |
| | Frisch’s Restaurants, Inc. | | 47,800 | | | 1,100,834 |
| | GTSI Corp.* | | 17,086 | | | 129,341 |
| | Hastings Entertainment, Inc.* | | 79,800 | | | 639,198 |
| | Haverty Furniture Cos., Inc.+ | | 26,500 | | | 266,060 |
| | Hot Topic, Inc.* | | 375,258 | | | 2,030,146 |
| | Krispy Kreme Doughnuts, Inc.*+ | | 555,700 | | | 2,772,943 |
| | Luby’s, Inc.* | | 252,700 | | | 1,541,470 |
| | O’ Charley’s, Inc. | | 26,998 | | | 271,600 |
| | PC Connection, Inc.* | | 152,438 | | | 1,419,198 |
| | PC Mall, Inc.* | | 182,200 | | | 2,470,632 |
| | PetMed Express, Inc.*+ | | 211,999 | | | 2,596,988 |
| | Pricesmart, Inc.+ | | 126,200 | | | 2,496,236 |
| | Rush Enterprises, Inc., Class A* | | 65,400 | | | 785,454 |
| | Rush Enterprises, Inc., Class B* | | 65,400 | | | 710,244 |
| | Sport Supply Group, Inc., Class A | | 178,000 | | | 1,828,060 |
| | The Finish Line, Inc. Class A* | | 240,324 | | | 2,090,819 |
| | The Walking Co. Holdings, Inc.*+ | | 147,000 | | | 826,140 |
| | Zones, Inc.* | | 136,767 | | | 1,070,885 |
| | | | | | | |
| | | | | | | 37,401,886 |
|
Savings & Loans - 4.31% |
| | Abington Bancorp, Inc. | | 251,680 | | | 2,295,322 |
| | American Bancorp of New Jersey | | 183,800 | | | 1,891,302 |
| | Berkshire Hills Bancorp, Inc. | | 57,500 | | | 1,359,875 |
| | Citizens Community Bancorp, Inc. | | 90,400 | | | 723,200 |
| | Citizens First Bancorp, Inc. | | 157,300 | | | 943,800 |
| | Clifton Savings Bancorp, Inc.+ | | 127,300 | | | 1,239,902 |
| | ESSA Bancorp, Inc. | | 4,138 | | | 51,808 |
| | Fidelity Bancorp, Inc. | | 47,512 | | | 592,000 |
Bridgeway Ultra-Small Company Market Fund
SCHEDULE OF INVESTMENTS (continued)
Showing percentage of net assets as of June 30, 2008
| | | | | | | |
| Industry | | Company | | Shares | | Value |
|
Common Stocks (continued) |
Savings & Loans (continued) |
| | First Financial Holdings, Inc. | | 73,072 | | $ | 1,255,377 |
| | First Financial Northwest, Inc. | | 34,723 | | | 344,799 |
| | First Pactrust Bancorp, Inc. | | 53,800 | | | 694,020 |
| | First Place Financial Corp. | | 134,000 | | | 1,259,600 |
| | Harrington West Financial Group, Inc. | | 86,320 | | | 330,606 |
| | HMN Financial, Inc. | | 36,213 | | | 559,491 |
| | Home Federal Bancorp, Inc. | | 90,425 | | | 891,590 |
| | Indiana Community Bancorp | | 14,076 | | | 230,846 |
| | Legacy Bancorp, Inc. | | 81,700 | | | 942,001 |
| | LSB Corp. | | 76,350 | | | 1,117,000 |
| | OceanFirst Financial Corp. | | 159,400 | | | 2,877,170 |
| | Pacific Premier Bancorp, Inc.* | | 28,400 | | | 146,260 |
| | Provident Financial Holdings, Inc. | | 41,100 | | | 387,984 |
| | Pulaski Financial Corp. | | 113,193 | | | 1,075,333 |
| | Rainier Pacific Financial Group, Inc. | | 61,400 | | | 586,370 |
| | Rockville Financial, Inc. | | 78,200 | | | 982,192 |
| | Rome Bancorp, Inc. | | 36,219 | | | 402,031 |
| | Teche Holding Co. | | 11,400 | | | 418,038 |
| | Timberland Bancorp, Inc. | | 120,609 | | | 967,284 |
| | United Community Financial Corp.+ | | 478,704 | | | 1,795,140 |
| | United Financial Bancorp, Inc. | | 86,641 | | | 967,780 |
| | United Western Bancorp, Inc. | | 59,600 | | | 748,576 |
| | Westfield Financial, Inc. | | 279,800 | | | 2,532,190 |
| | Willow Financial Bancorp, Inc. | | 900 | | | 7,335 |
| | WSB Holdings, Inc. | | 95,850 | | | 503,213 |
| | | | | | | |
| | | | | | | 31,119,435 |
|
Semiconductors - 3.15% |
| | Amtech Systems, Inc.* | | 22,546 | | | 242,144 |
| | Anadigics, Inc.*+ | | 255,258 | | | 2,514,291 |
| | AXT, Inc.* | | 354,800 | | | 1,486,612 |
| | Bookham, Inc.*+ | | 967,100 | | | 1,634,399 |
| | Catalyst Semiconductor, Inc.* | | 240,100 | | | 1,042,034 |
| | CEVA, Inc.* | | 186,900 | | | 1,489,593 |
| | Diodes, Inc.*+ | | 47,237 | | | 1,305,631 |
| | Integrated Silicon Solution, Inc.* | | 297,741 | | | 1,655,440 |
| | IXYS Corp.* | | 45,110 | | | 538,613 |
| | Kopin Corp.* | | 445,000 | | | 1,277,150 |
| | Leadis Technology, Inc.* | | 403,300 | | | 645,280 |
| | Microtune, Inc.* | | 289,700 | | | 1,002,362 |
| | Pericom Semiconductor Corp.* | | 249,600 | | | 3,704,064 |
| | | | | | | |
| Industry | | Company | | Shares | | Value |
|
|
Semiconductors (continued) |
| | QuickLogic Corp.* | | 352,900 | | $ | 589,343 |
| | Ramtron International Corp.* | | 410,000 | | | 1,726,100 |
| | Techwell, Inc.* | | 154,000 | | | 1,897,280 |
| | | | | | | |
| | | | | | | 22,750,336 |
|
Software - 2.79% |
| | Actuate Corp.* | | 652,030 | | | 2,549,437 |
| | American Software, Inc., Class A | | 236,538 | | | 1,334,074 |
| | Bottomline Technologies, Inc.* | | 227,800 | | | 2,216,494 |
| | Callidus Software, Inc.* | | 250,100 | | | 1,250,500 |
| | CAM Commerce Solutions, Inc. | | 35,649 | | | 1,415,622 |
| | Captaris, Inc.* | | 337,052 | | | 1,365,060 |
| | Concur Technologies, Inc.* | | 56,900 | | | 1,890,787 |
| | Digi International, Inc.* | | 112,936 | | | 886,548 |
| | Double-Take Software, Inc.*+ | | 82,231 | | | 1,129,854 |
| | Ebix, Inc.*+ | | 7,287 | | | 566,346 |
| | Innodata Isogen, Inc.* | | 191,306 | | | 535,657 |
| | Interactive Intelligence, Inc.* | | 168,700 | | | 1,963,668 |
| | Quality Systems, Inc.+ | | 46,100 | | | 1,349,808 |
| | SeaChange International, Inc.* | | 237,200 | | | 1,698,352 |
| | | | | | | |
| | | | | | | 20,152,207 |
|
Telecommunications - 3.20% |
| | Anaren, Inc.* | | 55,312 | | | 584,648 |
| | Applied Signal Technology, Inc. | | 12,673 | | | 173,113 |
| | Avanex Corp.* | | 123,730 | | | 139,815 |
| | Aware, Inc.* | | 193,310 | | | 583,796 |
| | Comarco, Inc.*+ | | 12,100 | | | 44,044 |
| | Communications Systems, Inc. | | 7,000 | | | 75,250 |
| | Globecomm Systems, Inc.* | | 256,800 | | | 2,121,168 |
| | HickoryTech Corp. | | 5,895 | | | 48,752 |
| | Hypercom Corp.* | | 420,200 | | | 1,848,880 |
| | Knology, Inc.* | | 229,700 | | | 2,524,403 |
| | KVH Industries, Inc.* | | 208,100 | | | 1,733,473 |
| | MRV Communications, Inc.* | | 924,835 | | | 1,100,553 |
| | Oplink Communications, Inc.* | | 188,600 | | | 1,810,560 |
| | Orbcomm, Inc.*+ | | 287,000 | | | 1,635,900 |
| | Parkervision, Inc.*+ | | 208,100 | | | 2,066,433 |
| | Soapstone Networks, Inc.* | | 345,601 | | | 1,323,652 |
| | SureWest Communications | | 64,503 | | | 543,760 |
| | Telular Corp.*+ | | 240,200 | | | 917,564 |
| | Tessco Technologies, Inc.* | | 111,500 | | | 1,525,320 |
| | USA Mobility, Inc. | | 96,034 | | | 725,057 |
| | Warwick Valley Telephone Co. | | 4,400 | | | 46,464 |
| | |
| 48 | | Annual Report | June 30, 2008 |
Bridgeway Ultra-Small Company Market Fund
SCHEDULE OF INVESTMENTS (continued)
Showing percentage of net assets as of June 30, 2008
| | | | | | | |
| Industry | | Company | | Shares | | Value |
|
Common Stocks (continued) |
Telecommunications (continued) |
| | Westell Technologies, Inc., Class A* | | 544,900 | | $ | 735,615 |
| | WPCS International, Inc.*+ | | 139,000 | | | 785,350 |
| | | | | | | |
| | | | | | | 23,093,570 |
|
Textiles - 0.09% |
| | Culp, Inc.* | | 94,400 | | | 662,688 |
| | |
Transportation - 1.72% | | | | | |
| | Celadon Group, Inc.* | | 256,275 | | | 2,560,187 |
| | HUB Group, Inc., Class A* | | 253,600 | | | 8,655,368 |
| | Patriot Transportation Holding, Inc.* | | 15,300 | | | 1,224,000 |
| | | | | | | |
| | | | | | | 12,439,555 |
| | |
Water - 0.69% | | | | | |
| | Connecticut Water Service, Inc. | | 48,900 | | | 1,095,360 |
| | Middlesex Water Co. | | 64,957 | | | 1,077,637 |
| | Southwest Water Co.+ | | 183,500 | | | 1,838,670 |
| | York Water Co. | | 68,550 | | | 998,773 |
| | | | | | | |
| | | | | | | 5,010,440 |
| | | | | | | |
| |
TOTAL COMMON STOCKS - 93.53% | | | 674,754,821 |
| | | | | | | |
(Cost $549,714,368) | | | |
| | | | | | | |
|
MONEY MARKET FUNDS - 4.91% |
| | | |
| | | Rate^ | | Shares | | Value |
BlackRock Temp Cash Liquidity Fund Institutional Shares #21 | | 2.61% | | 35,432,293 | | | 35,432,293 |
| | | | | | | |
| |
TOTAL MONEY MARKET FUNDS - 4.91% | | | 35,432,293 |
| | | | | | | |
(Cost $35,432,293) | | | | | | | |
| |
TOTAL INVESTMENTS - 98.44% | | $ | 710,187,114 |
(Cost $585,146,661) | | | | | | | |
Other Assets in Excess of Liabilities - 1.56% | | | 11,224,487 |
| | | | | | | |
NET ASSETS - 100.00% | | | | $ | 721,411,601 |
| | | | | | | |
| * | Non Income Producing Security. |
| + | This security or a portion of the security is out on loan at June 30, 2008. Total loaned securities had a market value of $156,993,337 at June 30, 2008. |
| ^ | Rate disclosed is as of June 30, 2008. |
| (a) | Affiliated Company. An affiliated company is a company in which the Fund has ownership of at least 5% of the voting securities. Transactions during the year with companies which are or were affiliates are as follows: |
| | | | | | | | | | | | | | | | |
Name of
Issuer | | Shares
Held
as of
Beginning
of Year | | Gross
Additions | | Gross
Reductions | | Income | | Shares
Held as
of End
of Year | | Value
as of
End of
Year |
| AeroCentury Corp. | | 143,800 | | $ | - | | $ | 647,329 | | $ | - | | 85,700 | | $ | 934,987 |
| | | | | | | | | | | | | | | | |
| | 143,800 | | $ | - | | $ | 647,329 | | $ | - | | 85,700 | | $ | 934,987 |
| | | | | | | | | | | | | | | | |
See Notes to Financial Statements.
Micro-Cap Limited Fund
MANAGER’S COMMENTARY
June 30, 2008
Dear Fellow Micro-Cap Limited Fund Shareholder,
For the quarter ending June 30, 2008, our Fund increased by 2.32% and outperformed our primary benchmark, the CRSP Cap-Based Portfolio 9 Index, which actually lost 2.79% for the quarter. We beat our other two performance benchmarks as well: the Russell 2000 Index of small companies climbed 0.58% and the Lipper Small-Cap Stock Funds Index rose 1.78%. Our Fund withstood the onslaught of negative news surrounding the economy, the financial services sector, and threats of inflation from the continued increases in food and energy prices. We have now outperformed our primary market benchmark three quarters out of the last four, and we are quite pleased.
For the full fiscal year ending June 30, 2008, Micro-Cap Limited Fund declined a significant 17.58%, as the economic news was especially hard on some of the markets’ micro-cap stocks. Nevertheless, we provided a cushion of more than seven percentage points relative to our primary market benchmark of micro-cap companies, the CRSP 9 Index—exactly what we hope to do in a bear market decline. Smaller and mid-size companies as a whole were not hit as hard; consequently, our performance lagged the Russell 2000 Index of small companies (down 16.19%) as well as the Lipper Small-Cap Stock Funds (down 12.67%).
Stepping back from the short-term performance picture, we still lag the five-year record of our primary market benchmark by 0.7% per year, but lead it since inception by more than five percent per year. Market and peer-beating returns over the long haul remain one of our firms’ top goals. The table below presents our June quarter, one-year, five-year, ten-year and life-to-date financial results according to the formula required by the SEC. See the next page for a graph of performance since inception.
| | | | | | | | | | |
| | | June Qtr. 4/1/08 to 6/30/08 | | 1 Year 7/1/07 to 6/30/08 | | 5 Year 7/1/03 to 6/30/08 | | 10 Year 7/1/98 to 6/30/08 | | Life-to-Date 6/30/98
to 6/30/08 |
| | | | | |
Micro-Cap Limited Fund | | 2.32% | | -17.58% | | 6.93% | | 12.84% | | 12.84% |
CRSP Cap-Based Portfolio 9 Index | | -2.79% | | -24.97% | | 7.63% | | 7.59% | | 7.59% |
Lipper Small-Cap Stock Funds Index | | 1.78% | | -12.67% | | 11.22% | | 5.59% | | 5.59% |
Russell 2000 Index (small stocks) | | 0.58% | | -16.19% | | 10.29% | | 5.53% | | 5.53% |
Performance figures quoted in the table above and graph below represent past performance and are no guarantee of future results. The table above and the graph below do not reflect the deduction of taxes that a shareholder would pay on Fund distributions or the redemption of Fund shares.
The Lipper Small-Cap Stock Funds Index is an index of small-company funds compiled by Lipper, Inc. The Russell 2000 Index is an unmanaged, market value weighted index, which measures performance of the 2,000 companies that are between the 1,000th and 3,000th largest in the market with dividends reinvested. The CRSP Cap-Based Portfolio 9 Index is an unmanaged index of 644 publicly traded U.S. micro-cap stocks (with dividends reinvested), as reported by the Center for Research on Security Prices. It is not possible to invest directly in an index. Periods longer than one year are annualized.
According to data from Lipper, Inc., for the period ended June 30, 2008, the Micro-Cap Limited Fund ranked 21st of 97 micro-cap funds for the last twelve months ended June 30, 2008, 53rd of 66 such funds for the last five years, 5th of 38 funds for the last 10 years and 5th of 40 funds since inception in June, 1998. Lipper, Inc. is an independent mutual fund rating service that ranks funds in various fund categories by making comparative calculations using total returns.
| | |
| 50 | | Annual Report | June 30, 2008 |
Micro-Cap Limited Fund
MANAGER’S COMMENTARY (continued)
Micro-Cap Limited Fund vs. CRSP 9 Index & Lipper Small Company Funds Index & Russell 2000 Index 6/30/98 to 6/30/08
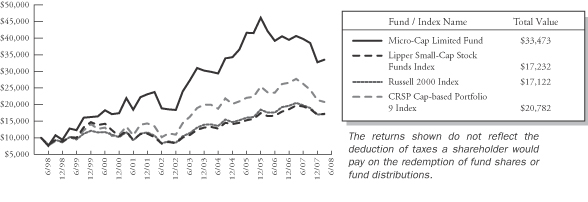
Detailed Explanation of Quarterly Performance—What Worked Well
The Short Version: With eight industries in six sectors represented in the list of top performers, the Fund found winners in a variety of places during the quarter. The share prices of four holdings actually increased greater than 50% during the three-month period and contributed over three percent to the return of the Fund.
These are the ten best-performing stocks for the quarter ended June 30, 2008:
| | | | | | |
| Rank | | Description | | Industry | | % Gain |
| 1 | | T-3 Energy Services Inc | | Oil & Gas Services | | 86.7% |
| 2 | | General Steel Holdings Inc | | Iron/Steel | | 67.8% |
| 3 | | Superior Essex Inc | | Electrical Components & Equipment | | 59.0% |
| 4 | | Fushi Copperweld Inc | | Electrical Components & Equipment | | 57.8% |
| 5 | | Systemax Inc | | Retail | | 46.4% |
| 6 | | Chart Industries Inc | | Machinery-Diversified | | 43.7% |
| 7 | | Olympic Steel Inc | | Iron/Steel | | 41.0% |
| 8 | | eResearchTechnology Inc | | Internet | | 40.4% |
| 9 | | Darwin Professional Underwriters Inc | | Insurance | | 36.9% |
| 10 | | Arena Resources Inc | | Oil & Gas | | 36.5% |
| | | | | | | |
There’s no place like home. While we seek out quality companies all across the U.S. (and some international companies trading on U.S. exchanges), it’s always nice to find good ones right in our own backyard. Houston, Texas-based T-3 Energy Services was the Fund’s top performer of the quarter and contributed over one percent to the overall return. The company provides products and services to energy-related firms engaged in the drilling and completion of oil and gas wells. As energy prices continued to soar during the period, exploration and production companies began investing additional capital in drilling opportunities, and T-3 reaped the rewards of additional demand for its products. In May, the company reported higher than expected earnings and credited two recent acquisitions (Energy Equipment Corp. and HP&T Products) as major contributors. T-3 has also been expanding it global footprint by bringing in new business from Russia and the Middle East. Its stock price moved to a new 52-week high at the end of the quarter.
Detailed Explanation of Quarterly Performance—What Didn’t Work
The Short Version: Much of the negative economic news revolved around financial companies, and two of the poorest performers came from that sector. These cost the Fund just under half a percent in return. Six different sectors were represented in the list of worst performers, and all ten of these holdings lost over 20% during the past three months.
Micro-Cap Limited Fund
MANAGER’S COMMENTARY (continued)
These are the ten worst-performing stocks for the quarter ended June 30, 2008:
| | | | | | |
| Rank | | Description | | Industry | | % Loss |
| 1 | | BioScrip Inc | | Pharmaceuticals | | -61.7% |
| 2 | | Pier 1 Imports Inc | | Retail | | -53.0% |
| 3 | | Bidz.com Inc | | Internet | | -34.1% |
| 4 | | Administradora de Fondos de Pensiones Prov | | Investment Companies | | -31.1% |
| 5 | | Providence Service Corp/The | | Commercial Services | | -29.6% |
| 6 | | Pricesmart Inc | | Retail | | -28.6% |
| 7 | | 1-800-FLOWERS.COM Inc | | Internet | | -28.3% |
| 8 | | Epicor Software Corp | | Software | | -28.1% |
| 9 | | Columbus McKinnon Corp/NY | | Machinery-Diversified | | -22.3% |
| 10 | | Oriental Financial Group Inc | | Banks | | -21.4% |
| | | | | | | |
Pier 1 Imports is a home furnishing retailer that has been affected both by the weakness in housing and the ongoing nervousness among consumers leading to reduced buying activity. Its stock was the Fund’s second poorest performer for the quarter and lost over 50% of its value during the three-month period. In June, the company made an $88 million dollar bid for specialty retailer Cost Plus, which management felt would offer a nice complement to its existing product lines. However, a few days later, Pier 1 announced quarterly earnings that were well below Wall Street’s (and its own) projections. The company also reported declining sales in May. By late June, it withdrew its offer for Cost Plus, and many analysts agreed the timing of such a move would not prove beneficial. For the quarter, Pier 1 cost the Fund over half a percent in return, but we are still holding this one. (or…”our models have not yet signaled a sell” but let’s not say that we’re “sitting on it”)
Detailed Explanation of Fiscal Year Performance—What Worked Well
The Short Version: Four industrial companies highlighted the list of top performers during the twelve-month period. Some of these companies benefited from international business (where a weak dollar proved helpful). Combined, the five holdings contributed over two percent to the Fund’s return. While many micro-cap companies struggled during the fiscal year, nine of our holdings increased by over 50% for the three-month period.
These are the ten best performers for the fiscal year ended June 30, 2008:
| | | | | | |
| Rank | | Description | | Industry | | % Gain |
| 1 | | T-3 Energy Services Inc | | Oil & Gas Services | | 102.4% |
| 2 | | Chart Industries Inc | | Machinery-Diversified | | 82.5% |
| 3 | | Darling International Inc | | Environmental Control | | 80.7% |
| 4 | | EDO Corp | | Aerospace/Defense | | 71.1% |
| 5 | | Cal-Maine Foods Inc | | Food | | 68.5% |
| 6 | | General Steel Holdings Inc | | Iron/Steel | | 63.2% |
| 7 | | eResearchTechnology Inc | | Internet | | 59.3% |
| 8 | | Arena Resources Inc | | Oil & Gas | | 52.8% |
| 9 | | Open Text Corp | | Software | | 52.2% |
| 10 | | Fushi Copperweld Inc | | Electrical Components & Equipment | | 47.4% |
| | | | | | | |
Judging by the number of breakfast burrito wrappers (we’re in Texas) left on the Bridgeway trading floor, it is obvious that eggs are in hot demand these days. (Just kidding; we on the portfolio management side are going to pay for that comment!) Cal-Maine Foods is the largest domestic egg producer and was among the Fund’s best performers of the fiscal year. In January, the company announced that revenues had skyrocketed by over 60%, with strong exports contributing to another solid quarter. In April, it announced another strong quarter, and demand continued to grow worldwide, despite the record high prices of eggs. The company also announced a lucrative (for shareholders) variable dividend policy and will pay out a
| | |
| 52 | | Annual Report | June 30, 2008 |
Micro-Cap Limited Fund
MANAGER’S COMMENTARY (continued)
third of its income each quarter. In June, the egg giant got even bigger as it acquired a majority interest in Zephyr Eggs, a regional company with a stronghold on the Florida market. For the twelve-month period, Cal-Maine rose almost 70% and contributed about three-quarters of a percent to the Fund’s return.
Detailed Explanation of Fiscal Year Performance—What Didn’t Work
The Short Version: The good news: The Fund managed to avoid the worst of the financial crisis, as no related company made the list of poor performers. The bad news: The negativity prompted caution among consumers and five related companies (cyclical and noncyclical) made the list of poor performers for the fiscal year. Combined, these five holdings cost the Fund over three percent in return. Further, other industries have been impacted by the slowdown in activity. All told, seven firms owned by the Fund during the twelve-month period lost over 50% in value.
These are the ten stocks that performed the worst in the fiscal year ended June 30, 2008:
| | | | | | |
| Rank | | Description | | Industry | | % Loss |
| 1 | | China Fire & Security Group Inc | | Miscellaneous Manufacturing | | -71.8% |
| 2 | | BioScrip Inc | | Pharmaceuticals | | -68.8% |
| 3 | | Novatel Wireless Inc | | Telecommunications | | -55.2% |
| 4 | | Hardinge Inc | | Hand/Machine Tools | | -53.0% |
| 5 | | Pier 1 Imports Inc | | Retail | | -53.0% |
| 6 | | Astronics Corp | | Aerospace/Defense | | -51.8% |
| 7 | | Kforce Inc | | Commercial Services | | -50.1% |
| 8 | | Spartan Stores Inc | | Food | | -47.6% |
| 9 | | Perry Ellis International Inc | | Apparel | | -47.0% |
| 10 | | Shutterfly Inc | | Internet | | -46.9% |
| | | | | | | |
Broadband provider Novatel Wireless was one such holding that dropped over 50% during the fiscal year and cost the Fund about one percent in return. Throughout much of 2007, the demand for wireless services skyrocketed, and the firm benefited from escalating sales. However, in more recent months, the weaker economy and lackluster consumer activity have prompted a slowdown in the growth of the wireless market. In February, the company warned that first quarter results may be weaker than expected. The stock price took it on the chin and we KO’d it out of the Fund.
Top Ten Holdings as of June 30, 2008
Only two of the Fund’s top holdings at the end of the fiscal year were also on our list of top performers for the quarter: T-3 Energy Services and Chart Industries. While our top holding accounted for over four and one-half percent of the net assets, no other stock represented greater than three percent of the Fund.
| | | | | | |
| Rank | | Description | | Industry | | % of Net Assets |
| 1 | | Axsys Technologies, Inc. | | Electronics | | 4.7% |
| 2 | | Darling International, Inc. | | Environmental Control | | 3.0% |
| 3 | | Cal-Maine Foods, Inc. | | Food | | 2.9% |
| 4 | | Gulfmark Offshore, Inc. | | Transportation | | 2.6% |
| 5 | | Hill International, Inc. | | Commercial Services | | 2.6% |
| 6 | | T-3 Energy Services, Inc. | | Oil & Gas Services | | 2.3% |
| 7 | | Life Sciences Research, Inc. | | Healthcare-Services | | 2.0% |
| 8 | | PriceSmart, Inc. | | Retail | | 2.0% |
| 9 | | Hawaiian Holdings, Inc. | | Airlines | | 1.9% |
| 10 | | Chart Industries, Inc. | | Machinery-Diversified | | 1.8% |
| | | | | | | |
| | | | | | 25.8% |
Micro-Cap Limited Fund
MANAGER’S COMMENTARY (continued)
Industry Sector Representation as of June 30, 2008
Our Fund’s concentration in industrial stocks (as well as their superior performance) contributed nicely to the June quarter success. Similarly, dramatic underweighting among financial stocks helped our relative performance, as these were a significant drag in performance of our benchmarks. Major changes since last quarter were an increase in industrial stocks and a decrease in both technology and consumer non-cyclicals.
| | | | | | |
| | | % of Net Assets | | % S&P
Small-Cap Index | | Difference |
Basic Materials | | 7.8% | | 3.0% | | 4.8% |
Communications | | 6.6% | | 3.7% | | 2.9% |
Consumer, Cyclical | | 10.5% | | 13.6% | | -3.1% |
Consumer, Non-cyclical | | 17.9% | | 18.4% | | -0.5% |
Energy | | 6.4% | | 11.1% | | -4.7% |
Financial | | 4.7% | | 15.3% | | -10.6% |
Industrial | | 37.1% | | 19.3% | | 17.8% |
Technology | | 6.3% | | 10.3% | | -4.0% |
Utilities | | 1.0% | | 5.3% | | -4.3% |
Cash | | 1.7% | | 0.0% | | 1.7% |
| | | | | | | |
Total | | 100.0% | | 100.0% | | |
Disclaimer
The following is a reminder from the friendly folks at your Fund who worry about liability. The views expressed here are exclusively those of Fund management. These views are not meant as investment advice and should not be considered predictive in nature. Any favorable (or unfavorable) description of a holding applies only as of June 30, 2008, unless otherwise stated. Security positions can and do change thereafter. Discussions of historical performance do not guarantee and are not indicative of future performance.
The Fund is subject to very high, above market risk (volatility) and is not an appropriate investment for short-term investors. Investments in micro-cap companies generally carry greater risk than is customarily associated with larger companies and even “small companies” for various reasons such as narrower markets (fewer investors), limited financial resources and greater trading difficulty.
Conclusion
Micro-Cap Limited Fund remains closed to new shareholders, but is open to your additional investments. We encourage your feedback; your reactions and concerns are important to us.
Sincerely,
Your Investment Management Team
| | |
| 54 | | Annual Report | June 30, 2008 |
THIS PAGE INTENTIONALLY LEFT BLANK
Bridgeway Micro-Cap Limited Fund
SCHEDULE OF INVESTMENTS
Showing percentage of net assets as of June 30, 2008
| | | | | | | |
| Industry | | Company | | Shares | | Value |
|
COMMON STOCKS - 98.29% |
Airlines - 1.87% |
| | Hawaiian Holdings, Inc.* | | 102,800 | | $ | 714,460 |
|
Banks - 1.89% |
| | Oriental Financial Group | | 10,900 | | | 155,434 |
| | Park National Corp.+ | | 6,600 | | | 355,740 |
| | Republic Bancorp, Inc., Class A | | 8,495 | | | 208,977 |
| | | | | | | |
| | | | | | | 720,151 |
|
Building Materials - 1.03% |
| | NCI Building Systems, Inc.* | | 10,700 | | | 393,011 |
|
Chemicals - 4.23% |
| | Innophos Holdings, Inc.+ | | 9,200 | | | 293,940 |
| | NewMarket Corp. | | 4,700 | | | 311,281 |
| | Quaker Chemical Corp. | | 24,000 | | | 639,840 |
| | Stepan Co. | | 8,100 | | | 369,522 |
| | | | | | | |
| | | | | | | 1,614,583 |
|
Commercial Services - 7.61% |
| | CBIZ, Inc.* | | 32,200 | | | 255,990 |
| | Corvel Corp.* | | 12,500 | | | 423,375 |
| | Exponent, Inc.* | | 12,300 | | | 386,343 |
| | Hill International, Inc.* | | 59,200 | | | 973,248 |
| | ICF International, Inc.* | | 31,400 | | | 521,868 |
| | Providence Service Corp.* | | 7,100 | | | 149,881 |
| | TNS, Inc.* | | 8,000 | | | 191,680 |
| | | | | | | |
| | | | | | | 2,902,385 |
|
Computers - 1.01% |
| | Manhattan Associates, Inc.* | | 16,200 | | | 384,426 |
|
Electrical Components & Equipment - 3.77% |
| | Capstone Turbine Corp.* | | 111,700 | | | 468,023 |
| | Fushi Copperweld, Inc.*+ | | 13,500 | | | 320,355 |
| | Graham Corp. | | 6,200 | | | 459,482 |
| | Insteel Industries, Inc. | | 10,300 | | | 188,593 |
| | | | | | | |
| | | | | | | 1,436,453 |
|
Electronics - 6.96% |
| | Axsys Technologies, Inc.* | | 34,300 | | | 1,784,972 |
| | Badger Meter, Inc. | | 4,200 | | | 212,226 |
| | OSI Systems, Inc.* | | 8,300 | | | 177,786 |
| | Stoneridge, Inc.* | | 28,100 | | | 479,386 |
| | | | | | | |
| | | | | | | 2,654,370 |
|
Engineering & Construction - 1.87% |
| | Layne Christensen Co.* | | 4,400 | | | 192,676 |
| | Stanley, Inc.* | | 15,500 | | | 519,560 |
| | | | | | | |
| | | | | | | 712,236 |
| | | | | | | |
| Industry | | Company | | Shares | | Value |
|
|
Environmental Control - 4.27% |
| | Calgon Carbon Corp.*+ | | 30,000 | | $ | 463,800 |
| | Darling International, Inc.* | | 70,400 | | | 1,163,008 |
| | | | | | | |
| | | | | | | 1,626,808 |
|
Food - 2.89% |
| | Cal-Maine Foods, Inc.+ | | 33,400 | | | 1,101,866 |
|
Forest Products & Paper - 0.94% |
| | Glatfelter | | 26,500 | | | 358,015 |
|
Gas - 1.04% |
| | The Laclede Group, Inc. | | 9,800 | | | 395,626 |
|
Hand/Machine Tools - 1.26% |
| | K-Tron International, Inc.* | | 3,700 | | | 479,520 |
|
Healthcare - Products - 1.09% |
| | Hanger Orthopedic Group, Inc.* | | 600 | | | 9,894 |
| | Somanetics Corp.* | | 19,200 | | | 407,040 |
| | | | | | | |
| | | | | | | 416,934 |
|
Healthcare - Services - 2.04% |
| | Life Sciences Research, Inc.* | | 27,600 | | | 779,424 |
|
Insurance - 2.16% |
| | Navigators Group, Inc.* | | 8,000 | | | 432,400 |
| | Tower Group, Inc. | | 18,400 | | | 389,896 |
| | | | | | | |
| | | | | | | 822,296 |
|
Internet - 3.97% |
| | 1-800-FLOWERS.COM, Inc., Class A* | | 46,619 | | | 300,693 |
| | Bidz.com, Inc.*+ | | 31,400 | | | 273,494 |
| | EarthLink, Inc.*+ | | 48,600 | | | 420,390 |
| | eResearchTechnology, Inc.* | | 29,900 | | | 521,456 |
| | | | | | | |
| | | | | | | 1,516,033 |
|
Investment Companies - 0.65% |
| | Administradora de Fondos de Pensiones Provida SA - Sponsored ADR | | 9,700 | | | 247,641 |
|
Iron/Steel - 2.66% |
| | General Steel Holdings, Inc.*+ | | 29,800 | | | 468,456 |
| | Olympic Steel, Inc. | | 7,200 | | | 546,624 |
| | | | | | | |
| | | | | | | 1,015,080 |
|
Machinery - Diversified - 4.04% |
| | Altra Holdings, Inc.* | | 11,400 | | | 191,634 |
| | Chart Industries, Inc.* | | 14,000 | | | 680,960 |
| | |
| 56 | | Annual Report | June 30, 2008 |
Bridgeway Micro-Cap Limited Fund
SCHEDULE OF INVESTMENTS (continued)
Showing percentage of net assets as of June 30, 2008
| | | | | | | |
| Industry | | Company | | Shares | | Value |
|
Common Stocks (continued) |
Machinery - Diversified (continued) |
| | Columbus McKinnon Corp.* | | 6,900 | | $ | 166,152 |
| | Gerber Scientific, Inc.* | | 7,100 | | | 80,798 |
| | Tecumseh Products Co., Class A* | | 12,800 | | | 419,584 |
| | | | | | | |
| | | | | | | 1,539,128 |
|
Metal Fabrication - Hardware - 3.95% |
| | Ampco-Pittsburgh Corp. | | 6,800 | | | 302,464 |
| | CIRCOR International, Inc. | | 3,700 | | | 181,263 |
| | Furmanite Corp.* | | 57,225 | | | 456,655 |
| | Northwest Pipe Co.* | | 4,100 | | | 228,780 |
| | Sun Hydraulics Corp. | | 10,400 | | | 335,608 |
| | | | | | | |
| | | | | | | 1,504,770 |
|
Miscellaneous Manufacturing - 4.23% |
| | AZZ, Inc.* | | 10,200 | | | 406,980 |
| | Koppers Holdings, Inc. | | 13,400 | | | 561,058 |
| | LSB Industries, Inc.*+ | | 32,600 | | | 645,480 |
| | | | | | | |
| | | | | | | 1,613,518 |
|
Oil & Gas - 1.33% |
| | Arena Resources, Inc.* | | 9,600 | | | 507,072 |
|
Oil & Gas Services - 5.11% |
| | Dawson Geophysical Co.* | | 5,500 | | | 327,030 |
| | Gulf Island Fabrication, Inc. | | 9,400 | | | 459,942 |
| | North American Energy Partners, Inc.* | | 13,700 | | | 297,016 |
| | T-3 Energy Services, Inc.* | | 10,900 | | | 866,223 |
| | | | | | | |
| | | | | | | 1,950,211 |
|
Pharmaceuticals - 4.17% |
| | BioScrip, Inc.* | | 117,800 | | | 305,102 |
| | Neogen Corp.* | | 16,462 | | | 376,815 |
| | Omega Protein Corp.* | | 25,700 | | | 384,215 |
| | Questcor Pharmaceuticals, Inc.* | | 112,700 | | | 522,928 |
| | | | | | | |
| | | | | | | 1,589,060 |
|
Retail - 8.64% |
| | EZCORP, Inc., Class A* | | 52,382 | | | 667,870 |
| | PC Connection, Inc.* | | 49,400 | | | 459,914 |
| | PetMed Express, Inc.* | | 40,400 | | | 494,900 |
| | Pier 1 Imports, Inc.*+ | | 52,900 | | | 181,976 |
| | Pricesmart, Inc. | | 38,000 | | | 751,640 |
| | Systemax, Inc.+ | | 31,800 | | | 561,270 |
| | The Wet Seal, Inc., Class A* | | 37,500 | | | 178,875 |
| | | | | | | |
| | | | | | | 3,296,445 |
|
Semiconductors - 0.37% |
| | Pericom Semiconductor Corp.* | | 9,500 | | | 140,980 |
| | | | | | | |
| Industry | | Company | | Shares | | Value |
|
|
Software - 4.92% |
| | CSG Systems International, Inc.* | | 15,900 | | $ | 175,218 |
| | Ebix, Inc.* | | 6,000 | | | 466,320 |
| | JDA Software Group, Inc.* | | 27,600 | | | 499,560 |
| | Open Text Corp.*+ | | 10,500 | | | 337,050 |
| | Tyler Technologies, Inc.* | | 29,500 | | | 400,315 |
| | | | | | | |
| | | | | | | 1,878,463 |
|
Telecommunications - 2.61% |
| | Harmonic, Inc.* | | 47,200 | | | 448,872 |
| | Sierra Wireless, Inc.*+ | | 24,000 | | | 350,400 |
| | UTStarcom, Inc.* | | 35,600 | | | 194,732 |
| | | | | | | |
| | | | | | | 994,004 |
|
Transportation - 5.29% |
| | Gulfmark Offshore, Inc.* | | 17,298 | | | 1,006,398 |
| | Pacer International, Inc. | | 20,300 | | | 436,653 |
| | Ultrapetrol (Bahamas) Ltd.* | | 30,200 | | | 380,822 |
| | Universal Truckload Services, Inc.* | | 8,800 | | | 193,776 |
| | | | | | | |
| | | | | | | 2,017,649 |
|
Trucking & Leasing - 0.42% |
| | TAL International Group, Inc. | | 7,100 | | | 161,454 |
| | | | | | | |
| |
TOTAL COMMON STOCKS - 98.29% | | | 37,484,072 |
| | | | | | | |
(Cost $34,538,200) | | | |
| | | | | | | |
|
MONEY MARKET FUNDS - 0.63% |
| | | |
| | | Rate^ | | Shares | | Value |
BlackRock Temp Cash Liquidity Fund Institutional Shares #21 | | 2.61% | | 238,444 | | | 238,444 |
| | | | | | | |
| |
TOTAL MONEY MARKET FUNDS - 0.63% | | | 238,444 |
| | | | | | | |
(Cost $238,444) | | | |
| |
TOTAL INVESTMENTS - 98.92% | | $ | 37,722,516 |
(Cost $34,776,644) | | | |
Other Assets in Excess of Liabilities - 1.08% | | | 412,991 |
| | | | | | | |
NET ASSETS - 100.00% | | | | | | $ | 38,135,507 |
| | | | | | | |
| * | Non Income Producing Security. |
| + | This security or a portion of the security is out on loan at June 30, 2008. Total loaned securities had a market value of $6,074,877 at June 30, 2008. |
| ^ | Rate disclosed is as of June 30, 2008. |
| ADR | - American Depositary Receipt |
See Notes to Financial Statements.
Small-Cap Growth Fund
MANAGER’S COMMENTARY
June 30, 2008
Dear Fellow Small-Cap Growth Fund Shareholder,
For the quarter ending June 30, 2008, our Fund increased by 3.26%, outperforming our peer benchmark, the Lipper Small-Cap Growth Funds Index (up 2.50%), but underperforming our primary market benchmark, the Russell 2000 Growth Index (up 4.47%). Small-cap growth stocks held up better than most corners of the market in the midst of an onslaught of negative economic news. It was a decent quarter on an absolute basis, but a “mixed” (mediocre) quarter overall.
For the full fiscal year ending June 30, 2008, Small-Cap Growth Fund declined a significant 12.87% as the economic news took its toll on small-cap stocks. Similar to the quarter, we outperformed the Lipper Small-Cap Growth Funds Index (down 13.60%), but underperformed the Russell 2000 Growth Index (down 10.83%).
As we approach the five-year anniversary of the Fund, we continue to apply our quantitative strategies with discipline and diligence. Focusing on the long term will remain a key objective of our firm. We look forward to reporting our first five-year returns later this year.
The table presents our June quarter, one-year, and life-to-date financial results according to the formula required by the SEC. See the next page for a graph of performance since inception.
| | | | | | |
| | | June Qtr. 4/1/08 to 6/30/08 | | 1 Year 7/1/07 to 6/30/08 | | Life-to-Date 10/31/03 to 6/30/08 |
| | | |
Small-Cap Growth Fund | | 3.26% | | -12.87% | | 7.40% |
Russell 2000 Growth Index | | 4.47% | | -10.83% | | 6.89% |
Lipper Small-Cap Growth Funds Index | | 2.50% | | -13.60% | | 5.31% |
Performance figures quoted in the table above and graph below represent past performance and are no guarantee of future results. The table above and the graph below do not reflect the deduction of taxes that a shareholder would pay on Fund distributions or the redemption of Fund shares.
The Russell 2000 Growth Index is an unmanaged index which consists of stocks in the Russell 2000 Index with higher price-to-book ratios and higher forecasted growth values with dividends reinvested. The Lipper Small-Cap Growth Funds Index is an index of small-company, growth-oriented funds compiled by Lipper, Inc. It is not possible to invest directly in an index. Periods longer than one year are annualized.
According to data from Lipper, Inc. as of June 30, 2008, Small-Cap Growth Fund ranked 270th of 604 small cap growth funds for the twelve-month period ended June 30, 2008 and 114th of 412 such funds since inception in October, 2003. Lipper, Inc. is an independent mutual fund rating service that ranks funds in various fund categories by making comparative calculations using total returns.
| | |
| 58 | | Annual Report | June 30, 2008 |
Small-Cap Growth Fund
MANAGER’S COMMENTARY (continued)
Small-Cap Growth Fund vs. Russell 2000 Growth Index & Lipper Small-Cap Growth Funds Index 10/31/03 to 6/30/08
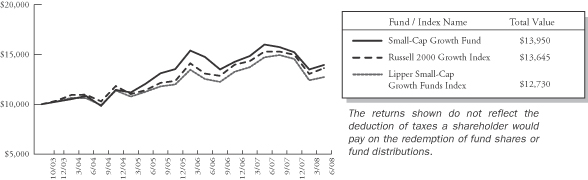
Detailed Explanation of Quarterly Performance—What Worked Well
The Short Version: The Fund enjoyed the almost-daily rise in share prices of commodity-related securities. Five energy-related companies were included in the list of top performers over the quarter, together contributing over two-and-a-half percent to the return of the Fund. For the three-month period, 22 companies experienced returns of greater than 20%, with the two top performers gaining over 50%.
These are the ten best-performing stocks for the quarter ended June 30, 2008:
| | | | | | |
| Rank | | Description | | Industry | | % Gain |
| 1 | | GrafTech International Ltd | | Electrical Components & Equipment | | 65.5% |
| 2 | | Gardner Denver Inc | | Machinery-Diversified | | 53.1% |
| 3 | | Fuel Systems Solutions Inc | | Auto Parts & Equipment | | 47.5% |
| 4 | | Alpha Natural Resources Inc | | Coal | | 42.6% |
| 5 | | Natural Gas Services Group Inc | | Oil & Gas Services | | 39.5% |
| 6 | | Superior Energy Services | | Oil & Gas Services | | 39.2% |
| 7 | | Strayer Education Inc | | Commercial Services | | 37.1% |
| 8 | | CommScope Inc | | Telecommunications | | 35.8% |
| 9 | | FMC Technologies Inc | | Oil & Gas Services | | 35.2% |
| 10 | | Arena Resources Inc | | Oil & Gas | | 33.0% |
| | | | | | | |
How about a little high priced coal in that holiday stocking? Alpha Natural Resources was the Fund’s fourth best performer. The company is the leading domestic exporter of metallurgical coal, which is used in the production of steel. With demand for coal (and steel) skyrocketing in emerging markets like China and India, Alpha Resources reported that its earnings tripled in the first-quarter, and some analysts predict soaring profitability through at least 2010. High natural gas prices and the weak dollar contributed to the strong global demand, which helped push the company’s stock price to an all-time high in late-June. For the quarter, the company contributed about three-quarters of a percent to the overall return of the Fund.
Detailed Explanation of Quarterly Performance—What Didn’t Work
The Short Version: Industrial companies highlighted the Fund’s poor performers during the quarter. While financials continue to get most of the economic news, the negative ramifications of a slowing economy have moved into the manufacturing sector as well. Likewise, consumers have grown more cautious during the sluggish times, and five related companies (cyclical and noncyclical) were among the worst performers for the quarter.
Small-Cap Growth Fund
MANAGER’S COMMENTARY (continued)
These are the ten worst-performing stocks for the quarter ended June 30, 2008:
| | | | | | |
| Rank | | Description | | Industry | | % Loss |
| 1 | | AAR Corp | | Aerospace/Defense | | -50.4% |
| 2 | | CROCS Inc | | Apparel | | -40.3% |
| 3 | | Fresh Del Monte Produce Inc | | Food | | -35.3% |
| 4 | | Infinera Corp | | Telecommunications | | -35.2% |
| 5 | | Middleby Corp | | Machinery-Diversified | | -29.6% |
| 6 | | Pricesmart Inc | | Retail | | -28.6% |
| 7 | | Owens-Illinois Inc | | Packaging & Containers | | -26.1% |
| 8 | | Air Methods Corp | | Healthcare-Services | | -25.9% |
| 9 | | Iconix Brand Group Inc | | Apparel | | -24.6% |
| 10 | | Dynamic Materials Corp | | Metal Fabricate/Hardware | | -23.7% |
| | | | | | | |
The skies aren’t quite so friendly for flying these days. AAR Corp. sells new and used parts, primarily to commercial airlines and defense companies. Early in the year, American Airlines, Delta and others were forced to cancel hundreds of scheduled flights because of safety concerns over aircraft wiring and other maintenance issues. In April, the Federal Aviation Administration (FAA) issued a warning to AAR about landing gear that the agency believed had been improperly maintained. Despite a track record of good earnings since 2004, the company’s stock price hit a three-year low in June, as analysts grew concerned about the overall airline industry. Others contend that AAR is primed to benefit from the need for repairs and maintenance of the aging airlines’ fleets, even if the industry continues to struggle in this high fuel price environment. Fortunately, we had sold about eighty percent of our position earlier in the year; we are in a holding pattern on the remaining shares.
Detailed Explanation of Fiscal Year Performance—What Worked Well
The Short Version: Despite its poor performance for the fiscal year, the Fund had several success stories as twelve holdings increased by over 40% during the period, including the top seven that climbed by more than 50%. As has become the norm these days, energy companies highlighted the list, and three oil and gas holdings contributed about one and one-quarter percent to the Fund’s return.
These are the ten best performers for the fiscal year ended June 30, 2008:
| | | | | | |
| Rank | | Description | | Industry | | % Gain |
| 1 | | FMC Technologies Inc | | Oil & Gas Services | | 94.2% |
| 2 | | EDO Corp | | Aerospace/Defense | | 73.9% |
| 3 | | Arena Resources Inc | | Oil & Gas | | 70.3% |
| 4 | | priceline.com Inc | | Internet | | 68.0% |
| 5 | | GrafTech International Ltd | | Electrical Components & Equipment | | 66.4% |
| 6 | | Lifecell Corp | | Biotechnology | | 65.5% |
| 7 | | Strayer Education Inc | | Commercial Services | | 57.8% |
| 8 | | Integral Systems Inc/MD | | Computers | | 48.5% |
| 9 | | Fuel Systems Solutions Inc | | Auto Parts & Equipment | | 47.5% |
| 10 | | Natural Gas Services Group Inc | | Oil & Gas Services | | 43.4% |
| | | | | | | |
The rise in energy prices is well-documented, and the Fund’s oil and gas holdings certainly benefited from the run-up. Outside of that industry, priceline.com was another excellent performer and contributed over one-quarter of a percent to the Fund’s performance. The online travel company actually benefited from the ailing economy, as travelers sought out any and all discounts and promotions for their trips. When Star Trek’s Captain Kirk…aka William Shatner…talks, people listen (though a few Bridgeway traders are more partial to Captain Picard in The Next Generation). The company’s tag line “name your own price” attracted consumers and business travelers alike to its site in search of discounted flights, hotels, rental cars, and full packages as priceline.com outperformed its key competitors: Orbitz and Expedia. For the summer, priceline.com’s management initiated a new creative promotion called “Sunshine Guaranteed” in which travelers who book through the website can get refunds should poor weather conditions ruin vacation plans.
| | |
| 60 | | Annual Report | June 30, 2008 |
Small-Cap Growth Fund
MANAGER’S COMMENTARY (continued)
Detailed Explanation of Fiscal Year Performance—What Didn’t Work
The Short Version: Nine companies lost over 50% during the fiscal year. They represented five different sectors, as the credit crisis spread from housing to financials to other areas of the economy. Combined, the worst ten holdings cost the Fund about four percent in return.
These are the ten stocks that performed the worst in the fiscal year ended June 30, 2008:
| | | | | | |
| Rank | | Description | | Industry | | % Gain |
| 1 | | CROCS Inc | | Apparel | | -75.7% |
| 2 | | Ceradyne Inc | | Miscellaneous Manufacturing | | -60.8% |
| 3 | | Novatel Wireless Inc | | Telecommunications | | -58.7% |
| 4 | | Flotek Industries Inc | | Oil & Gas Services | | -56.1% |
| 5 | | Sigma Designs Inc | | Semiconductors | | -54.0% |
| 6 | | Zoran Corp | | Semiconductors | | -52.0% |
| 7 | | NutriSystem Inc | | Internet | | -51.1% |
| 8 | | RF Micro Devices Inc | | Telecommunications | | -50.4% |
| 9 | | JOS A Bank Clothiers Inc | | Retail | | -50.4% |
| 10 | | LSB Industries Inc | | Miscellaneous Manufacturing | | -47.4% |
| | | | | | | |
Long-term shareholders and readers of these reports know that the Fund has ridden the popularity of CROCS footwear. In fact, most of our “trendy” partners have sported a pair of these comfortable, colorful shoes at one time or another. While the company started the fiscal year strong with a gain of about 60% in the September 2007 quarter, it all went downhill from there. In October, management reported another strong quarter and even issued favorable guidance for the rest of the year. However, analysts were looking for an even better outlook, and investors sold on the news with the stock plunging over 36% in one day. Some naysayers believed CROCS to be a passing fad and took the opportunity to sell at the first sign of anything but outstanding news. In April, the company found itself caught up in the economic downturn that was impacting consumer activity, and management cut its estimates for the quarter. Recently CROCS announced some cost-cutting measures and is consolidating its production facilities. For the twelve-month period, the company cost the Fund about a third of a percent in return.
Top Ten Holdings as of June 30, 2008
Three energy companies were among our top holdings at fiscal year-end and also were on the Fund’s list of top performers for the quarter: Superior Energy, Arena Resources, and Alpha Natural Resources. Those holdings represented about 7.5% of the assets of the Fund. The top 10 holdings accounted for just less than 25% of the Fund’s net assets with no one holding making up over four percent.
| | | | | | |
| Rank | | Description | | Industry | | % of Net Assets |
| 1 | | Guess ?, Inc. | | Retail | | 3.4% |
| 2 | | OSI Pharmaceuticals, Inc. | | Pharmaceuticals | | 3.0% |
| 3 | | Superior Energy Services | | Oil & Gas Services | | 2.6% |
| 4 | | Arena Resources, Inc. | | Oil & Gas Services | | 2.5% |
| 5 | | Alpha Natural Resources, Inc. | | Coal | | 2.3% |
| 6 | | BMC Software, Inc. | | Software | | 2.3% |
| 7 | | Compass Minerals International, Inc. | | Mining | | 2.3% |
| 8 | | General Cable Corp. | | Electrical Components & Equipment | | 1.9% |
| 9 | | Axsys Technologies, Inc. | | Electronics | | 1.9% |
| 10 | | Baldor Electric Co. | | Hand/Machine Tools | | 1.9% |
| | | | | | | |
| Total | | | | | | 24.1% |
Small-Cap Growth Fund
MANAGER’S COMMENTARY (continued)
Industry Sector Representation as of June 30, 2008
Two allocation decisions contributed to the positive return of the Fund during the past quarter. We were overweight basic materials and benefited from the run-up in energy and other commodities prices. We were significantly underweight in financials and avoided some of the hardships faced by companies engaged in subprime lending, mortgage-related securities investing, and other ramifications of the ongoing credit crisis. We were also overweight in industrials, and unfortunately some of those holdings were among our worst performers for the quarter.
| | | | | | |
| | | % of Net Assets | | % of S&P
Small Cap Index | | Difference |
Basic Materials | | 5.3% | | 3.0% | | 2.3% |
Communications | | 6.4% | | 3.7% | | 2.7% |
Consumer, Cyclical | | 10.4% | | 13.6% | | -3.2% |
Consumer, Non-cyclical | | 23.2% | | 18.4% | | 4.8% |
Energy | | 17.5% | | 11.1% | | 6.4% |
Financial | | 0.4% | | 15.3% | | -14.9% |
Industrial | | 24.7% | | 19.3% | | 5.4% |
Technology | | 10.4% | | 10.3% | | 0.1% |
Utilities | | 0.0% | | 5.3% | | -5.3% |
Cash | | 1.7% | | 0.0% | | 1.7% |
| | | | | | | |
Total | | 100.0% | | 100.0% | | |
Disclaimer
The following is a reminder from the friendly folks at your Fund who worry about liability. The views expressed here are exclusively those of Fund management. These views are not meant as investment advice and should not be considered predictive in nature. Any favorable (or unfavorable) description of a holding applies only as of June 30, 2008, unless otherwise stated. Security positions can and do change thereafter. Discussions of historical performance do not guarantee and are not indicative of future performance.
Market volatility can significantly impact short-term performance. The Fund is not an appropriate investment for short-term investors. Investments in small companies generally carry greater risk than is customarily associated with larger companies. This additional risk is attributable to a number of factors, including the relatively limited financial resources that are typically available to small companies, and the fact that small companies often have comparatively limited product lines. In addition, the stock of small companies tends to be more volatile than the stock of large companies, particularly in the short term and particularly in the early stages of an economic or market downturn. Shareholders of the Fund, therefore, are taking on more risk than they would if they invested in the stock market as a whole.
Conclusion
Thank you for your continued investment in Small-Cap Growth Fund. We encourage your feedback; your reactions and concerns are important to us.
Sincerely,
Your Investment Management Team
| | |
| 62 | | Annual Report | June 30, 2008 |
THIS PAGE INTENTIONALLY LEFT BLANK
Bridgeway Small-Cap Growth Fund
SCHEDULE OF INVESTMENTS
Showing percentage of net assets as of June 30, 2008
| | | | | | | |
| Industry | | Company | | Shares | | Value |
|
COMMON STOCKS - 98.30% |
Aerospace/Defense - 0.11% |
| | AAR Corp.* | | 11,629 | | $ | 157,340 |
|
Auto Parts & Equipment - 1.54% |
| | Fuel Systems Solutions, Inc.*+ | | 57,700 | | | 2,221,450 |
|
Beverages - 0.45% |
| | Boston Beer Co., Inc.* | | 16,000 | | | 650,880 |
|
Biotechnology - 3.91% |
| | Invitrogen Corp.* | | 32,800 | | | 1,287,728 |
| | OSI Pharmaceuticals, Inc.* | | 105,800 | | | 4,371,656 |
| | | | | | | |
| | | | | | | 5,659,384 |
|
Chemicals - 2.98% |
| | Albemarle Corp. | | 18,000 | | | 718,380 |
| | Lubrizol Corp. | | 6,000 | | | 277,980 |
| | NewMarket Corp. | | 31,500 | | | 2,086,245 |
| | Quaker Chemical Corp. | | 46,200 | | | 1,231,692 |
| | | | | | | |
| | | | | | | 4,314,297 |
|
Coal - 3.63% |
| | Alpha Natural Resources, Inc.*+ | | 32,400 | | | 3,378,996 |
| | Penn Virginia GP Holdings LP | | 57,200 | | | 1,876,160 |
| | | | | | | |
| | | | | | | 5,255,156 |
|
Commercial Services - 8.54% |
| | FTI Consulting, Inc.* | | 6,065 | | | 415,210 |
| | Geo Group, Inc.* | | 109,000 | | | 2,452,500 |
| | Hill International, Inc.* | | 100,000 | | | 1,644,000 |
| | ICF International, Inc.* | | 33,000 | | | 548,460 |
| | MPS Group, Inc.* | | 109,500 | | | 1,163,985 |
| | PAREXEL International Corp.* | | 51,200 | | | 1,347,072 |
| | Strayer Education, Inc. | | 6,227 | | | 1,301,879 |
| | TeleTech Holdings, Inc.* | | 135,300 | | | 2,700,588 |
| | Transcend Services, Inc.* | | 10,000 | | | 89,200 |
| | Watson Wyatt Worldwide, Inc., Class A | | 13,000 | | | 687,570 |
| | | | | | | |
| | | | | | | 12,350,464 |
|
Computers - 4.69% |
| | Cognizant Technology Solutions Corp., Class A* | | 72,880 | | | 2,369,329 |
| | Integral Systems, Inc. | | 59,400 | | | 2,298,780 |
| | Manhattan Associates, Inc.* | | 89,490 | | | 2,123,597 |
| | | | | | | |
| | | | | | | 6,791,706 |
| | | | | | | |
| Industry | | Company | | Shares | | Value |
|
|
Distribution/Wholesale - 1.05% |
| | LKQ Corp.*+ | | 83,900 | | $ | 1,516,073 |
|
Diversified Financial Services - 0.44% |
| | IntercontinentalExchange, Inc.* | | 5,600 | | | 638,400 |
|
Electrical Components & Equipment - 3.66% |
| | General Cable Corp.*+ | | 46,200 | | | 2,811,270 |
| | GrafTech International, Ltd.* | | 92,322 | | | 2,476,999 |
| | | | | | | |
| | | | | | | 5,288,269 |
|
Electronics - 1.92% |
| | Axsys Technologies, Inc.* | | 53,500 | | | 2,784,140 |
|
Engineering & Construction - 1.04% |
| | Layne Christensen Co.* | | 6,200 | | | 271,498 |
| | VSE Corp. | | 44,900 | | | 1,234,750 |
| | | | | | | |
| | | | | | | 1,506,248 |
|
Environmental Control - 2.79% |
| | Calgon Carbon Corp.*+ | | 84,300 | | | 1,303,278 |
| | Metalico, Inc.*+ | | 156,400 | | | 2,740,128 |
| | | | | | | |
| | | | | | | 4,043,406 |
|
Food - 3.46% |
| | Cal-Maine Foods, Inc.+ | | 74,560 | | | 2,459,734 |
| | Fresh Del Monte Produce, Inc.* | | 107,900 | | | 2,543,203 |
| | | | | | | |
| | | | | | | 5,002,937 |
|
Hand/Machine Tools - 1.90% |
| | Baldor Electric Co.+ | | 78,400 | | | 2,742,432 |
|
Healthcare - Products - 3.19% |
| | CryoLife, Inc.* | | 53,663 | | | 613,905 |
| | Hologic, Inc.*+ | | 60,000 | | | 1,308,000 |
| | Intuitive Surgical, Inc.* | | 4,200 | | | 1,131,480 |
| | Qiagen NV*+ | | 77,256 | | | 1,555,163 |
| | | | | | | |
| | | | | | | 4,608,548 |
|
Healthcare - Services - 1.53% |
| | Almost Family, Inc.* | | 66,800 | | | 1,776,880 |
| | Life Sciences Research, Inc.* | | 15,386 | | | 434,501 |
| | | | | | | |
| | | | | | | 2,211,381 |
|
Internet - 3.45% |
| | eResearchTechnology, Inc.* | | 92,000 | | | 1,604,480 |
| | Interwoven, Inc.* | | 181,300 | | | 2,177,413 |
| | Priceline.Com, Inc.*+ | | 10,500 | | | 1,212,330 |
| | | | | | | |
| | | | | | | 4,994,223 |
| | |
| 64 | | Annual Report | June 30, 2008 |
Bridgeway Small-Cap Growth Fund
SCHEDULE OF INVESTMENTS (continued)
Showing percentage of net assets as of June 30, 2008
| | | | | | | |
| Industry | | Company | | Shares | | Value |
|
Common Stocks (continued) |
Iron/Steel - 0.01% |
| | Schnitzer Steel Industries, Inc., Class A | | 100 | | $ | 11,460 |
|
Machinery - Diversified - 3.39% |
| | Gardner Denver, Inc.* | | 40,000 | | | 2,272,000 |
| | Key Technology, Inc.* | | 34,000 | | | 1,081,540 |
| | Middleby Corp.*+ | | 35,200 | | | 1,545,632 |
| | | | | | | |
| | | | | | | 4,899,172 |
|
Metal Fabrication - Hardware - 3.60% |
| | Dynamic Materials Corp.+ | | 58,100 | | | 1,914,395 |
| | LB Foster Co., Class A* | | 31,600 | | | 1,049,120 |
| | Valmont Industries, Inc.+ | | 21,500 | | | 2,242,235 |
| | | | | | | |
| | | | | | | 5,205,750 |
|
Mining - 2.28% |
| | Compass Minerals International, Inc. | | 40,900 | | | 3,294,904 |
|
Miscellaneous Manufacturing - 2.10% |
| | AZZ, Inc.* | | 15,303 | | | 610,590 |
| | Trinity Industries, Inc. | | 70,050 | | | 2,430,034 |
| | | | | | | |
| | | | | | | 3,040,624 |
|
Oil & Gas - 4.04% |
| | Arena Resources, Inc.* | | 67,400 | | | 3,560,068 |
| | GeoResources, Inc.*+ | | 118,000 | | | 2,173,560 |
| | Gulfport Energy Corp.* | | 6,965 | | | 114,714 |
| | | | | | | |
| | | | | | | 5,848,342 |
|
Oil & Gas Services - 9.72% |
| | Bolt Technology Corp.*+ | | 119,277 | | | 2,692,082 |
| | Dawson Geophysical Co.* | | 12,000 | | | 713,520 |
| | Dril-Quip, Inc.* | | 18,300 | | | 1,152,900 |
| | FMC Technologies, Inc.* | | 14,030 | | | 1,079,328 |
| | Gulf Island Fabrication, Inc. | | 34,500 | | | 1,688,085 |
| | Mitcham Industries, Inc.* | | 77,800 | | | 1,328,824 |
| | Natural Gas Services Group, Inc.* | | 20,300 | | | 618,744 |
| | Oceaneering International, Inc.* | | 13,000 | | | 1,001,650 |
| | Superior Energy Services* | | 68,600 | | | 3,782,604 |
| | | | | | | |
| | | | | | | 14,057,737 |
|
Packaging & Containers - 0.46% |
| | Owens-Illinois, Inc.* | | 16,100 | | | 671,209 |
|
Pharmaceuticals - 2.09% |
| | Omega Protein Corp.* | | 97,600 | | | 1,459,120 |
| | Questcor Pharmaceuticals, Inc.* | | 337,700 | | | 1,566,928 |
| | | | | | | |
| | | | | | | 3,026,048 |
| | | | | | | |
| Industry | | Company | | Shares | | Value |
|
|
Pipelines - 0.09% |
| | Enbridge Energy Management LLC* | | 2,536 | | $ | 129,716 |
|
Retail - 7.80% |
| | Aeropostale, Inc.* | | 15,900 | | | 498,147 |
| | Cash America International, Inc. | | 49,800 | | | 1,543,800 |
| | EZCORP, Inc., Class A* | | 5,000 | | | 63,750 |
| | Guess?, Inc.+ | | 132,600 | | | 4,965,870 |
| | Gymboree Corp.* | | 43,100 | | | 1,727,017 |
| | MSC Industrial Direct Co., Class A+ | | 30,200 | | | 1,332,122 |
| | Pricesmart, Inc. | | 58,500 | | | 1,157,130 |
| | | | | | | |
| | | | | | | 11,287,836 |
|
Semiconductors - 2.29% |
| | Amkor Technology, Inc.* | | 177,550 | | | 1,848,296 |
| | NVIDIA Corp.* | | 78,600 | | | 1,471,392 |
| | | | | | | |
| | | | | | | 3,319,688 |
|
Software - 3.42% |
| | BMC Software, Inc.* | | 92,500 | | | 3,330,000 |
| | Informatica Corp.* | | 101,900 | | | 1,532,576 |
| | SkillSoft PLC - ADR* | | 9,679 | | | 87,498 |
| | | | | | | |
| | | | | | | 4,950,074 |
|
Telecommunications - 2.99% |
| | Comtech Telecommunications Corp.* | | 16,687 | | | 817,663 |
| | Infinera Corp.*+ | | 135,500 | | | 1,195,110 |
| | JDS Uniphase Corp.*+ | | 98,900 | | | 1,123,504 |
| | Knology, Inc.* | | 31,053 | | | 341,273 |
| | Tekelec* | | 57,720 | | | 849,061 |
| | | | | | | |
| | | | | | | 4,326,611 |
|
Transportation - 3.64% |
| | Gulfmark Offshore, Inc.* | | 15,050 | | | 875,609 |
| | Kirby Corp.*+ | | 44,000 | | | 2,112,000 |
| | Tidewater, Inc.+ | | 35,000 | | | 2,276,050 |
| | | | | | | |
| | | | | | | 5,263,659 |
|
Trucking & Leasing - 0.10% |
| | TAL International Group, Inc. | | 6,325 | | | 143,831 |
| | | | | | | |
| |
TOTAL COMMON STOCKS - 98.30% | | | 142,213,395 |
| | | | | | | |
(Cost $119,896,749) | | | |
Bridgeway Small-Cap Growth Fund
SCHEDULE OF INVESTMENTS (continued)
Showing percentage of net assets as of June 30, 2008
| | | | | | | |
| | | Rate^ | | Shares | | Value |
|
MONEY MARKET FUNDS - 0.01% |
BlackRock Temp Cash Liquidity Fund Institutional Shares #21 | | 2.61% | | 9,413 | | $ | 9,413 |
| | | | | | | |
| |
TOTAL MONEY MARKET FUNDS - 0.01% | | | 9,413 |
| | | | | | | |
(Cost $9,413) | | | |
| |
TOTAL INVESTMENTS - 98.31% | | $ | 142,222,808 |
(Cost $119,906,162) | | | |
Other Assets in Excess of Liabilities - 1.69% | | | 2,444,946 |
| | | | | | | |
NET ASSETS - 100.00% | | $ | 144,667,754 |
| | | | | | | |
| * | Non Income Producing Security. |
| + | This security or a portion of the security is out on loan at June 30, 2008. Total loaned securities had a market value of $42,471,034 at June 30, 2008. |
| ^ | Rate disclosed is as of June 30, 2008. |
| LLC | - Limited Liability Co. |
| PLC | - Public Liability Co. |
| ADR | - American Depositary Receipt |
See Notes to Financial Statements.
| | |
| 66 | | Annual Report | June 30, 2008 |
THIS PAGE INTENTIONALLY LEFT BLANK
Small-Cap Value Fund
MANAGER’S COMMENTARY
June 30, 2008
Dear Fellow Small-Cap Value Fund Shareholder,
For the quarter ending June 30, 2008, our Fund increased by 2.65% and outperformed our performance benchmarks by significant margins. The Russell 2000 Value Index declined 3.55%, and the Lipper Small-Cap Stock Funds Index declined 1.89%. Posting a positive return in a down market is quite pleasing to us.
For the full fiscal year ending June 30, 2008, Small-Cap Value Fund declined a significant 15.37%, as the economic news took its toll on small-cap stocks. Nevertheless, we provided a cushion of more than 6% relative to our primary market benchmark and more than 4% relative to our peer benchmark, the Lipper Small-Cap Value Funds Index. As we approach the five-year anniversary of the Fund, we continue to apply our quantitative strategies with discipline and diligence. Focusing on the long term will remain a key objective of our firm. We look forward to reporting our first five-year returns later this year.
The table below presents our June quarter, one-year, and life-to-date financial results according to the formula required by the SEC. See the next page for a graph of performance since inception.
| | | | | | |
| | | June Qtr. 4/1/08 to 6/30/08 | | 1 Year 7/1/07 to 6/30/08 | | Life-to-Date 10/31/03 to 6/30/08 |
| | | |
Small-Cap Value Fund | | 2.65% | | -15.37% | | 10.39% |
Russell 2000 Value Index | | -3.55% | | -21.63% | | 7.20% |
Lipper Small-Cap Value Funds Index | | -1.89% | | -19.38% | | 8.10% |
Performance figures quoted in the table above and graph below represent past performance and are no guarantee of future results. The table above and the graph below do not reflect the deduction of taxes that a shareholder would pay on Fund distributions or the redemption of Fund shares.
The Russell 2000 Value Index is an unmanaged index which consists of stocks in the Russell 2000 Index with higher price-to-book ratios and higher forecasted growth values with dividends reinvested. The Lipper Small-Cap Value Funds Index is an index of small-company, value-oriented funds compiled by Lipper, Inc. It is not possible to invest directly in an index. Periods longer than one year are annualized.
According to data from Lipper, Inc. as of June 30, 2008, Small-Cap Value Fund ranked 72nd of 314 small-cap value funds for the twelve-month period ended June 30, 2008 and 33rd of 211 such funds since inception in October, 2003. Lipper, Inc. is an independent mutual fund rating service that ranks funds in various fund categories by making comparative calculations using total returns.
| | |
| 68 | | Annual Report | June 30, 2008 |
Small-Cap Value Fund
MANAGER’S COMMENTARY (continued)
Small-Cap Value Fund vs. Russell 2000 Value Index & Lipper Small-Cap Value Funds Index 10/31/03 to 6/30/08
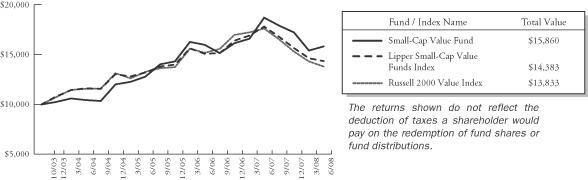
Detailed Explanation of Quarterly Performance—What Worked Well
The Short Version: Five industrial companies highlighted the list of top performers for the quarter, contributing over three and a half percent to the return of the Fund. Two retailers made the positive list, revealing that while consumer activity may be down in the weak economy, certain related companies are still performing well for their shareholders (and our models are finding them). Five stocks rose by more than 50% for the three-month period.
These are the ten best-performing stocks for the quarter ended June 30, 2008:
| | | | | | |
| Rank | | Description | | Industry | | % Gain |
| 1 | | Cleveland-Cliffs Inc | | Iron/Steel | | 91.1% |
| 2 | | Metalico Inc | | Environmental Control | | 79.0% |
| 3 | | Superior Essex Inc | | Electrical Components & Equipment | | 58.7% |
| 4 | | Gardner Denver Inc | | Machinery-Diversified | | 53.1% |
| 5 | | Robbins & Myers Inc | | Machinery-Diversified | | 52.7% |
| 6 | | Multi-Fineline Electronix Inc | | Electronics | | 47.4% |
| 7 | | Systemax Inc | | Retail | | 46.4% |
| 8 | | Big Lots Inc | | Retail | | 40.1% |
| 9 | | Terra Industries Inc | | Chemicals | | 38.9% |
| 10 | | Dril-Quip Inc | | Oil & Gas Services | | 32.6% |
| | | | | | | |
Cleveland-Cliffs was the Fund’s best performer and nearly doubled in value during the quarter. The company has long been among the leading iron ore miners in the country and recently made significant inroads into the coal industry as well. Last year, it acquired PinnOak Resources and has been able to take advantage of the escalating price of coal ever since. The company has also expanded its reach internationally and is engaged in mining activity in both Brazil and Australia. The company’s stock price moved to an all-time high late in the quarter.
Detailed Explanation of Quarterly Performance—What Didn’t Work
The Short Version: While financials continue to get most of the bad economic news, the negative ramifications of a slowing economy have moved into other areas as well, as six different sectors were represented in the list of poor performers during the quarter. Likewise, consumers have grown more cautious during the sluggish times, and five related companies (cyclical and noncyclical) were among the worst performers for the quarter.
Small-Cap Value Fund
MANAGER’S COMMENTARY (continued)
These are the ten worst-performing stocks for the quarter ended June 30, 2008:
| | | | | | |
| Rank | | Description | | Industry | | % Loss |
| 1 | | Pier 1 Imports Inc | | Retail | | -52.4% |
| 2 | | AAR Corp | | Aerospace/Defense | | -50.4% |
| 3 | | OM Group Inc | | Chemicals | | -42.9% |
| 4 | | Chindex International Inc | | Distribution/Wholesale | | -41.7% |
| 5 | | BioScrip Inc | | Pharmaceuticals | | -40.5% |
| 6 | | Chiquita Brands International Inc | | Food | | -35.1% |
| 7 | | SureWest Communications | | Telecommunications | | -31.8% |
| 8 | | Penford Corp | | Chemicals | | -31.5% |
| 9 | | Nasdaq OMX Group | | Diversified Financial Services | | -31.3% |
| 10 | | Goodyear Tire & Rubber Co | | Auto Parts & Equipment | | -30.9% |
| | | | | | | |
Pier 1 Imports is a home furnishing retailer that has been affected both by the weakness in housing and the ongoing nervousness among consumers, leading to reduced buying activity. Its stock was the Fund’s poorest performer for the quarter and lost over 50% of its value during the three-month period. In June, the company made an $88 million dollar bid for specialty retailer Cost Plus, which management felt would offer a nice complement to its existing product lines. However, a few days later, Pier 1 announced quarterly earnings that were well below Wall Street’s (and its own) projections. The company also reported declining sales in May. By late June, it withdrew its offer for Cost Plus, and many analysts agreed the timing of such a move would not prove beneficial. For the quarter, Pier 1 cost the Fund over half a percent in return, but our models have not yet signaled a sell.
Detailed Explanation of Fiscal Year Performance—What Worked Well
The Short Version: Commodities continued to surge during the twelve-month period, and companies within industries that deal with natural resources and related products performed best. Our top- performer list was comprised entirely of energy, basic materials, and industrial companies, many of which engage in some commodities-driven operations. Despite the overall negative performance of the Fund, these ten performers contributed over ten percent to the return over the fiscal year, providing a nice cushion in a bear market.
These are the ten best performers for the fiscal year ended June 30, 2008:
| | | | | | |
| Rank | | Description | | Industry | | % Gain |
| 1 | | Cleveland-Cliffs Inc | | Iron/Steel | | 102.1% |
| 2 | | Terra Industries Inc | | Chemicals | | 94.1% |
| 3 | | Robbins & Myers Inc | | Machinery-Diversified | | 87.7% |
| 4 | | Steel Dynamics Inc | | Iron/Steel | | 86.5% |
| 5 | | AK Steel Holding Corp | | Iron/Steel | | 84.6% |
| 6 | | Metalico Inc | | Environmental Control | | 73.6% |
| 7 | | Superior Essex Inc | | Electrical Components & Equipment | | 59.2% |
| 8 | | Stone Energy Corp | | Oil & Gas | | 51.4% |
| 9 | | Hornbeck Offshore Services Inc | | Oil & Gas Services | | 39.2% |
| 10 | | Dril-Quip Inc | | Oil & Gas Services | | 37.0% |
| | | | | | | |
The industry may not be glamorous, but it’s working these days. Terra Industries is a fertilizer manufacturer that has benefited greatly from the rising prices in agricultural goods like wheat and grains. The need for fertilizer among farmers escalated further when the floods in the Midwest damaged crops and brought an even greater imbalance between supply and demand. Institutional investors such as hedge funds have begun buying related firms, and analysts continue to increase earnings expectations. While Terra Industries has benefited from the industry-wide trends, management also has engaged in cost-cutting measures that have helped boast profits dramatically over the past year. Though its stock price almost doubled during the fiscal year, some analysts claim that the stock price is still cheap relative to its surging earnings. Time will tell.
| | |
| 70 | | Annual Report | June 30, 2008 |
Small-Cap Value Fund
MANAGER’S COMMENTARY (continued)
Detailed Explanation of Fiscal Year Performance—What Didn’t Work
The Short Version: The good news: The Fund managed to avoid the worst of the crisis among financials, as no related company made the list of poor performers. The bad news: The negativity moved into other sectors of the economy as well. Four industrial and five consumer-related (cyclical and non-cyclical) companies highlighted the list of worst performers. These nine companies combined to cost the Fund over seven and one-half percent in return. In fact, all ten companies on the list lost over 50% in value during the twelve-month period.
These are the ten stocks that performed the worst in the fiscal year ended June 30, 2008:
| | | | | | |
| Rank | | Description | | Industry | | % Gain |
| 1 | | WellCare Health Plans Inc | | Healthcare-Services | | -75.6% |
| 2 | | Hardinge Inc | | Hand/Machine Tools | | -63.0% |
| 3 | | Ceradyne Inc | | Miscellaneous Manufacturing | | -60.8% |
| 4 | | AAR Corp | | Aerospace/Defense | | -59.0% |
| 5 | | Michael Baker Corp | | Engineering & Construction | | -58.4% |
| 6 | | Penford Corp | | Chemicals | | -56.6% |
| 7 | | Pier 1 Imports Inc | | Retail | | -52.4% |
| 8 | | Cooper Tire & Rubber Co | | Auto Parts & Equipment | | -52.2% |
| 9 | | Onyx Pharmaceuticals Inc | | Pharmaceuticals | | -50.6% |
| 10 | | Imperial Sugar Co | | Food | | -50.4% |
| | | | | | | |
WellCare Health Plans was our Fund’s worst performer for the fiscal year. This managed care provider offers government-sponsored healthcare and prescription drug programs through Medicare and Medicaid. In late October 2007, federal officials began investigating the company for fraud-related claims. The company’s stock price plummeted over 70% in one day on the news of the investigation. Additionally, reports surfaced that corporate executives had sold a sizable number of shares in advance of the decline, prompting concerns about insider trading and other illegal activities. Fortunately, as a smaller diversifying position, it cost the Fund less than a percentage point of return.
Top Ten Holdings as of June 30, 2008
Four of the Fund’s top holdings at fiscal year end were also among the best performers for the quarter: Robbins & Myers, Cleveland-Cliff, Terra Industries, and Gardner Denver. Diversification is evident, with the top ten holdings representing just over 20% of the Fund’s net assets and no one company accounting for more than 3.2%.
| | | | | | |
| Rank | | Description | | Industry | | % of Net Assets |
| 1 | | Robbins & Myers, Inc. | | Machinery-Diversified | | 3.2% |
| 2 | | Cleveland-Cliffs, Inc. | | Iron/Steel | | 3.1% |
| 3 | | Amkor Technology, Inc. | | Semiconductors | | 2.4% |
| 4 | | Hornbeck Offshore Services, Inc. | | Oil & Gas Services | | 2.4% |
| 5 | | General Cable Corp. | | Electrical Components & Equipment | | 2.1% |
| 6 | | Terra Industries, Inc. | | Chemicals | | 2.0% |
| 7 | | Gardner Denver, Inc. | | Machinery-Diversified | | 1.9% |
| 8 | | AK Steel Holding Corp. | | Iron/Steel | | 1.8% |
| 9 | | Warnaco Group, Inc. | | Apparel | | 1.7% |
| 10 | | McMoRan Exploration Co. | | Oil & Gas | | 1.6% |
| | | | | | | |
| Total | | | | | | 22.2% |
Small-Cap Value Fund
MANAGER’S COMMENTARY (continued)
Industry Sector Representation as of June 30, 2008
Major changes since last quarter in the industry sector representation of our Fund were an increase in energy and industrial stocks and a decrease in consumer non-cyclicals. Our strong weighting in basic materials (relative to the S&P Small Cap Index) was particularly effective, as it added more than five percentage points of return on a relative basis. Being “light” on financials was also helpful.
| | | | | | |
| | | % of Net Assets | | % of S&P
Small Cap Index | | Difference |
Basic Materials | | 12.7% | | 3.0% | | 9.7% |
Communications | | 2.4% | | 3.7% | | -1.3% |
Consumer, Cyclical | | 13.7% | | 13.6% | | 0.1% |
Consumer, Non-cyclical | | 13.6% | | 18.4% | | -4.8% |
Energy | | 11.4% | | 11.1% | | 0.3% |
Financial | | 7.3% | | 15.3% | | -8.0% |
Industrial | | 29.1% | | 19.3% | | 9.8% |
Technology | | 4.4% | | 10.3% | | -5.9% |
Utilities | | 4.5% | | 5.3% | | -0.8% |
Cash | | 0.9% | | 0.0% | | 0.9% |
| | | | | | | |
Total | | 100.0% | | 100.0% | | |
Disclaimer
The following is a reminder from the friendly folks at your Fund who worry about liability. The views expressed here are exclusively those of Fund management. These views are not meant as investment advice and should not be considered predictive in nature. Any favorable (or unfavorable) description of a holding applies only as of June 30, 2008, unless otherwise stated. Security positions can and do change thereafter. Discussions of historical performance do not guarantee and are not indicative of future performance.
Market volatility can significantly impact short-term performance. The Fund is not an appropriate investment for short-term investors. Investments in small companies generally carry greater risk than is customarily associated with larger companies. This additional risk is attributable to a number of factors, including the relatively limited financial resources that are typically available to small companies, and the fact that small companies often have comparatively limited product lines. In addition, the stock of small companies tends to be more volatile than the stock of large companies, particularly in the short term and particularly in the early stages of an economic or market downturn. Shareholders of the Fund, therefore, are taking on more risk than they would if they invested in the stock market as a whole.
Conclusion
Thank you for your continued investment in Small-Cap Value Fund. We encourage your feedback; your reactions and concerns are important to us.
Sincerely,
Your Investment Management Team
| | |
| 72 | | Annual Report | June 30, 2008 |
THIS PAGE INTENTIONALLY LEFT BLANK
Bridgeway Small-Cap Value Fund
SCHEDULE OF INVESTMENTS
Showing percentage of net assets as of June 30, 2008
| | | | | | | |
| Industry | | Company | | Shares | | Value |
|
COMMON STOCKS - 99.07% |
Aerospace/Defense - 0.82% |
| | AAR Corp.* | | 186,600 | | $ | 2,524,698 |
| | SIFCO Industries, Inc.* | | 20,500 | | | 207,050 |
| | | | | | | |
| | | | | | | 2,731,748 |
|
Airlines - 0.81% |
| | Hawaiian Holdings, Inc.* | | 386,500 | | | 2,686,175 |
|
Apparel - 2.79% |
| | G-III Apparel Group, Ltd.* | | 17,420 | | | 214,963 |
| | Quiksilver, Inc.* | | 341,300 | | | 3,351,566 |
| | Warnaco Group, Inc.* | | 129,100 | | | 5,689,437 |
| | | | | | | |
| | | | | | | 9,255,966 |
|
Auto Parts & Equipment - 0.75% |
| | ATC Technology Corp.* | | 105,000 | | | 2,444,400 |
| | Goodyear Tire & Rubber Co.*+ | | 2,100 | | | 37,443 |
| | | | | | | |
| | | | | | | 2,481,843 |
|
Biotechnology - 2.09% |
| | Applera Corp. - Celera Group* | | 338,300 | | | 3,843,088 |
| | Invitrogen Corp.* | | 78,600 | | | 3,085,836 |
| | | | | | | |
| | | | | | | 6,928,924 |
|
Building Materials - 1.69% |
| | Comfort Systems USA, Inc. | | 178,780 | | | 2,402,803 |
| | NCI Building Systems, Inc.* | | 87,100 | | | 3,199,183 |
| | | | | | | |
| | | | | | | 5,601,986 |
|
Chemicals - 4.27% |
| | A. Schulman, Inc. | | 141,600 | | | 3,261,048 |
| | Hercules, Inc. | | 70,000 | | | 1,185,100 |
| | OM Group, Inc.* | | 55,700 | | | 1,826,403 |
| | Penford Corp. | | 95,497 | | | 1,420,995 |
| | Terra Industries, Inc.+ | | 131,300 | | | 6,479,655 |
| | | | | | | |
| | | | | | | 14,173,201 |
|
Commercial Services - 3.01% |
| | HealthSpring, Inc.* | | 196,000 | | | 3,308,480 |
| | ICF International, Inc.* | | 115,846 | | | 1,925,361 |
| | MAXIMUS, Inc.+ | | 61,000 | | | 2,124,020 |
| | MPS Group, Inc.* | | 246,500 | | | 2,620,295 |
| | | | | | | |
| | | | | | | 9,978,156 |
|
Distribution/Wholesale - 0.00% |
| | Chindex International, Inc.* | | 1,057 | | | 15,506 |
| | | | | | | |
| Industry | | Company | | Shares | | Value |
|
|
Diversified Financial Services - 2.80% |
| | Knight Capital Group, Inc., Class A* | | 165,600 | | $ | 2,977,488 |
| | LaBranche & Co., Inc.* | | 705,200 | | | 4,992,816 |
| | NASDAQ OMX Group, Inc.* | | 49,660 | | | 1,318,473 |
| | | | | | | |
| | | | | | | 9,288,777 |
|
Electric Utilities - 3.47% |
| | Central Vermont Public Service Corp. | | 117,010 | | | 2,266,484 |
| | El Paso Electric Co.* | | 130,500 | | | 2,583,900 |
| | Hawaiian Electric Industries, Inc.+ | | 126,100 | | | 3,118,453 |
| | MGE Energy, Inc. | | 96,300 | | | 3,141,306 |
| | Portland General Electric Co. | | 17,284 | | | 389,235 |
| | | | | | | |
| | | | | | | 11,499,378 |
|
Electrical Components & Equipment - 6.23% |
| | Belden, Inc. | | 50,000 | | | 1,694,000 |
| | Capstone Turbine Corp.* | | 801,000 | | | 3,356,190 |
| | Encore Wire Corp.+ | | 185,100 | | | 3,922,269 |
| | General Cable Corp.*+ | | 112,200 | | | 6,827,370 |
| | Superior Essex, Inc.* | | 108,600 | | | 4,846,818 |
| | | | | | | |
| | | | | | | 20,646,647 |
|
Electronics - 2.16% |
| | Multi-Fineline Electronix, Inc.*+ | | 157,600 | | | 4,360,792 |
| | Stoneridge, Inc.* | | 165,200 | | | 2,818,312 |
| | | | | | | |
| | | | | | | 7,179,104 |
|
Engineering & Construction - 2.15% |
| | EMCOR Group, Inc.* | | 161,000 | | | 4,593,330 |
| | Perini Corp.*+ | | 76,400 | | | 2,525,020 |
| | | | | | | |
| | | | | | | 7,118,350 |
|
Environmental Control - 1.06% |
| | Metalico, Inc.*+ | | 200,000 | | | 3,504,000 |
|
Food - 4.54% |
| | Cal-Maine Foods, Inc.+ | | 147,900 | | | 4,879,221 |
| | Chiquita Brands International, Inc.*+ | | 133,900 | | | 2,031,263 |
| | Corn Products International, Inc. | | 75,000 | | | 3,683,250 |
| | Spartan Stores, Inc. | | 193,300 | | | 4,445,900 |
| | | | | | | |
| | | | | | | 15,039,634 |
|
Forest Products & Paper - 1.42% |
| | Glatfelter | | 212,300 | | | 2,868,173 |
| | Rock-Tenn Co., Class A | | 61,797 | | | 1,853,292 |
| | | | | | | |
| | | | | | | 4,721,465 |
| | |
| 74 | | Annual Report | June 30, 2008 |
Bridgeway Small-Cap Value Fund
SCHEDULE OF INVESTMENTS (continued)
Showing percentage of net assets as of June 30, 2008
| | | | | | | |
| Industry | | Company | | Shares | | Value |
|
Common Stocks (continued) |
Gas - 0.96% |
| | The Laclede Group, Inc. | | 79,000 | | $ | 3,189,230 |
|
Hand/Machine Tools - 0.67% |
| | Regal-Beloit Corp. | | 52,500 | | | 2,218,125 |
|
Healthcare - Services - 2.58% |
| | AMERIGROUP Corp.* | | 115,700 | | | 2,406,560 |
| | Kindred Healthcare, Inc.* | | 125,900 | | | 3,620,884 |
| | Triple-S Management Corp., Class B*+ | | 155,600 | | | 2,544,060 |
| | | | | | | |
| | | | | | | 8,571,504 |
|
Insurance - 4.53% |
| | American Physicians Capital, Inc. | | 88,500 | | | 4,286,940 |
| | Amerisafe, Inc.* | | 109,701 | | | 1,748,634 |
| | AmTrust Financial Services, Inc. | | 176,600 | | | 2,225,160 |
| | Navigators Group, Inc.* | | 81,700 | | | 4,415,885 |
| | Tower Group, Inc. | | 110,000 | | | 2,330,900 |
| | | | | | | |
| | | | | | | 15,007,519 |
|
Internet - 1.15% |
| | FTD Group, Inc. | | 285,800 | | | 3,809,714 |
|
Iron/Steel - 6.98% |
| | AK Steel Holding Corp. | | 85,000 | | | 5,865,000 |
| | Cleveland-Cliffs, Inc. | | 87,200 | | | 10,393,368 |
| | Olympic Steel, Inc. | | 52,300 | | | 3,970,616 |
| | Steel Dynamics, Inc. | | 74,800 | | | 2,922,436 |
| | | | | | | |
| | | | | | | 23,151,420 |
|
Leisure Time - 0.76% |
| | Callaway Golf Co.+ | | 213,300 | | | 2,523,339 |
|
Machinery - Diversified - 6.90% |
| | Columbus McKinnon Corp.* | | 111,100 | | | 2,675,288 |
| | Gardner Denver, Inc.* | | 112,400 | | | 6,384,320 |
| | Robbins & Myers, Inc. | | 214,000 | | | 10,672,180 |
| | Tecumseh Products Co., Class A* | | 96,500 | | | 3,163,270 |
| | | | | | | |
| | | | | | | 22,895,058 |
|
Miscellaneous Manufacturing - 1.21% |
| | Koppers Holdings, Inc. | | 74,000 | | | 3,098,380 |
| | LSB Industries, Inc.* | | 47,000 | | | 930,600 |
| | | | | | | |
| | | | | | | 4,028,980 |
| | | | | | | |
| Industry | | Company | | Shares | | Value |
|
|
Oil & Gas - 5.75% |
| | Callon Petroleum Co.* | | 75,040 | | $ | 2,053,094 |
| | McMoRan Exploration Co.*+ | | 193,400 | | | 5,322,368 |
| | Rosetta Resources, Inc.* | | 114,900 | | | 3,274,650 |
| | Stone Energy Corp.* | | 77,100 | | | 5,081,661 |
| | Swift Energy Co.* | | 50,700 | | | 3,349,242 |
| | | | | | | |
| | | | | | | 19,081,015 |
|
Oil & Gas Services - 5.65% |
| | Dril-Quip, Inc.* | | 76,000 | | | 4,788,000 |
| | Hornbeck Offshore Services, Inc.* | | 138,200 | | | 7,809,682 |
| | Oil States International, Inc.* | | 53,300 | | | 3,381,352 |
| | Trico Marine Services, Inc.*+ | | 75,500 | | | 2,749,710 |
| | | | | | | |
| | | | | | | 18,728,744 |
|
Packaging & Containers - 1.01% |
| | Greif, Inc., Class A+ | | 52,200 | | | 3,342,366 |
|
Pharmaceuticals - 1.40% |
| | Perrigo Co.+ | | 146,000 | | | 4,638,420 |
|
Retail - 5.42% |
| | Big Lots, Inc.* | | 128,500 | | | 4,014,340 |
| | EZCORP, Inc., Class A* | | 396,000 | | | 5,049,000 |
| | Pier 1 Imports, Inc.*+ | | 416,800 | | | 1,433,792 |
| | Systemax, Inc.+ | | 199,650 | | | 3,523,823 |
| | The Children’s Place Retail Stores, Inc.* | | 109,600 | | | 3,956,560 |
| | | | | | | |
| | | | | | | 17,977,515 |
|
Semiconductors - 2.39% |
| | Amkor Technology, Inc.*+ | | 760,700 | | | 7,918,887 |
|
Software - 2.04% |
| | Compuware Corp.* | | 375,100 | | | 3,578,454 |
| | SYNNEX Corp.* | | 126,500 | | | 3,173,885 |
| | | | | | | |
| | | | | | | 6,752,339 |
|
Telecommunications - 1.30% |
| | Anixter International, Inc.*+ | | 18,000 | | | 1,070,820 |
| | iPCS, Inc.* | | 109,100 | | | 3,232,633 |
| | | | | | | |
| | | | | | | 4,303,453 |
|
Textiles - 1.46% |
| | UniFirst Corp. | | 108,300 | | | 4,836,678 |
|
Toys/Games/Hobbies - 1.73% |
| | Hasbro, Inc. | | 95,900 | | | 3,425,548 |
| | JAKKS Pacific, Inc.* | | 105,300 | | | 2,300,805 |
| | | | | | | |
| | | | | | | 5,726,353 |
Bridgeway Small-Cap Value Fund
SCHEDULE OF INVESTMENTS (continued)
Showing percentage of net assets as of June 30, 2008
| | | | | | | |
| Industry | | Company | | Shares | | Value |
|
Common Stocks (continued) |
Transportation - 5.12% |
| | Gulfmark Offshore, Inc.* | | 64,945 | | $ | 3,778,500 |
| | HUB Group, Inc., Class A* | | 107,400 | | | 3,665,562 |
| | Kirby Corp.*+ | | 110,200 | | | 5,289,600 |
| | Ryder System, Inc. | | 43,000 | | | 2,961,840 |
| | Tidewater, Inc.+ | | 20,000 | | | 1,300,600 |
| | | | | | | |
| | | | | | | 16,996,102 |
| | | | | | | |
| |
TOTAL COMMON STOCKS - 99.07% | | | 328,547,621 |
| | | | | | | |
(Cost $287,921,168) | | | |
| | | | | | | | |
|
MONEY MARKET FUNDS - 9.44% | |
| | | |
| | | Rate^ | | Shares | | Value | |
BlackRock Liquidity Funds TempFund Portfolio #24 | | 2.57% | | 14,724,596 | | | 14,724,596 | |
BlackRock Temp Cash Liquidity Fund Institutional Shares #21 | | 2.61% | | 16,594,017 | | | 16,594,017 | |
| | | | | | | | |
| |
TOTAL MONEY MARKET FUNDS - 9.44% | | | 31,318,613 | |
| | | | | | | | |
(Cost $31,318,613) | | | | | | | | |
| |
TOTAL INVESTMENTS - 108.51% | | $ | 359,866,234 | |
(Cost $319,239,781) | | | | |
Liabilities in Excess of Other Assets - (8.51)% | | | (28,217,968 | ) |
| | | | | | | | |
NET ASSETS - 100.00% | | | | | | $ | 331,648,266 | |
| | | | | | | | |
| * | Non Income Producing Security. |
| + | This security or a portion of the security is out on loan at June 30, 2008. Total loaned securities had a market value of $67,236,125 at June 30, 2008. |
| ^ | Rate disclosed is as of June 30, 2008. |
See Notes to Financial Statements.
| | |
| 76 | | Annual Report | June 30, 2008 |
THIS PAGE INTENTIONALLY LEFT BLANK
Large-Cap Growth Fund
MANAGER’S COMMENTARY
June 30, 2008
Dear Fellow Large-Cap Growth Fund Shareholder,
For the quarter ending June 30, 2008, our Fund increased 3.54%, exceeding the returns of both our performance benchmarks. The Russell 1000 Growth Index appreciated 1.25% and the Lipper Large-Cap Growth Funds Index appreciated 1.04%. It was a very good quarter overall.
Likewise, our Fund outperformed its benchmarks for the full fiscal year, though it ended the twelve-month period in negative territory. Our Fund declined by 2.50%, while the Russell 1000 Growth Index fell by 5.96% and the Lipper Large-Cap Growth Funds Index dropped by 4.21%. Providing a nice “cushion” in a market downturn is a favorable result as we remain roughly fully invested—ready for a future market upturn.
We apply our quantitative strategies in a disciplined manner in both good times and bad, both strong and weak markets. Focusing on the long term will remain a key objective of our firm. The information below bears out our historical success as we approach our five-year anniversary.
The table below presents our June quarter, one-year, and life-to-date financial results according to the formula required by the SEC. See the next page for a graph of performance since inception.
| | | | | | |
| | | June Qtr. 4/1/08 to 6/30/08 | | 1 Year 7/1/07 to 6/30/08 | | Life-to-Date
10/31/03
to 6/30/08 |
| | | |
Large-Cap Growth Fund | | 3.54% | | -2.50% | | 7.17% |
Russell 1000 Growth Index | | 1.25% | | -5.96% | | 5.74% |
Lipper Large-Cap Growth Funds Index | | 1.04% | | -4.21% | | 5.71% |
Performance figures quoted in the table above and graph below represent past performance and are no guarantee of future results. The table above and the graph below do not reflect the deduction of taxes that a shareholder would pay on Fund distributions or the redemption of Fund shares.
The Russell 1000 Growth Index is an unmanaged index which consists of stocks in the Russell 1000 Index with higher price-to-book ratios and higher forecasted growth values with dividends reinvested. The Lipper Large-Cap Growth Funds Index is an index of large-company, growth-oriented funds compiled by Lipper, Inc. It is not possible to invest directly in an index. Periods longer than one year are annualized.
According to data from Lipper, Inc. as of June 30, 2008, Large-Cap Growth Fund ranked 125th of 493 multi-cap growth funds for the twelve-month period ended June 30, 2008 and 153rd of 331 such funds since inception in October, 2003. Lipper, Inc. is an independent mutual fund rating service that ranks funds in various fund categories by making comparative calculations using total returns.
| | |
| 78 | | Annual Report | June 30, 2008 |
Large-Cap Growth Fund
MANAGER’S COMMENTARY (continued)
Large-Cap Growth Fund vs. Russell 1000 Growth Index & Lipper Large-Cap Growth Funds Index 10/31/03 to 6/30/08
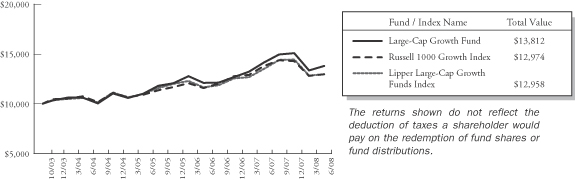
Detailed Explanation of Quarterly Performance—What Worked Well
The Short Version: Oil, that is…Black Gold…Texas Tea. With oil prices surging to new record highs through quarter end, the Fund enjoyed the rise in share prices of related securities. Seven oil and gas companies were included in the list of top performers over the quarter and combined to contribute over 2.5% to the return of the Fund. Two chemical companies that are engaged in the fertilizer business also made the list.
These are the ten best-performing stocks for the quarter ended June 30, 2008:
| | | | | | |
| Rank | | Description | | Industry | | % Gain |
| 1 | | National Oilwell Varco Inc | | Oil & Gas Services | | 52.0% |
| 2 | | Potash Corp of Saskatchewan | | Chemicals | | 47.3% |
| 3 | | Mosaic Co | | Chemicals | | 41.0% |
| 4 | | Noble Energy Inc | | Oil & Gas | | 38.1% |
| 5 | | Schering-Plough Corp | | Pharmaceuticals | | 36.6% |
| 6 | | FMC Technologies Inc | | Oil & Gas Services | | 35.2% |
| 7 | | Cameron International Corp | | Oil & Gas Services | | 32.9% |
| 8 | | Noble Corp | | Oil & Gas | | 30.8% |
| 9 | | Smith International Inc | | Oil & Gas Services | | 29.4% |
| 10 | | Baker Hughes Inc | | Oil & Gas Services | | 27.5% |
| | | | | | | |
National Oilwell Varco was the Fund’s top performer and the only stock that rose in excess of 50% during the three-month period. The company is the largest global provider of drilling rig equipment and got even bigger this quarter with the completion of its $7 billion acquisition of Grant Prideco. In April, the company announced earnings that beat expectations and its stock price rose to an all-time high in June. National Oilwell contributed over half a percent to the return of the Fund.
Detailed Explanation of Quarterly Performance—What Didn’t Work
The Short Version: Industrial companies highlighted the Fund’s poor performers during the quarter, as five related holdings made the list. While financials continue to get most of the bad economic news, the negative ramifications of a slowing economy have moved into the manufacturing sector as well. The five industrial companies cost the Fund almost 3% in performance during the three-month period.
`
Large-Cap Growth Fund
MANAGER’S COMMENTARY (continued)
These are the ten worst-performing stocks for the quarter ended June 30, 2008:
| | | | | | |
| Rank | | Description | | Industry | | % Loss |
| 1 | | Bank of America Corp | | Banks | | -37.0% |
| 2 | | Owens-Illinois Inc | | Packaging & Containers | | -26.1% |
| 3 | | AGCO Corp | | Machinery-Diversified | | -24.1% |
| 4 | | GameStop Corp | | Retail | | -21.9% |
| 5 | | State Street Corp | | Banks | | -19.0% |
| 6 | | Rockwell Automation Inc/DE | | Machinery-Diversified | | -18.9% |
| 7 | | Intuitive Surgical Inc | | Healthcare-Products | | -16.9% |
| 8 | | L-3 Communications Holdings Inc | | Aerospace/Defense | | -16.9% |
| 9 | | Pfizer Inc | | Pharmaceuticals | | -16.5% |
| 10 | | General Electric Co | | Miscellaneous Manufacturing | | -16.1% |
| | | | | | | |
Owens-Illinois is the largest glass manufacturer in the world and sells containers and related products throughout North and South America, Asia, and Europe. The company has produced excellent fundamental results including four straight quarters of better than expected earnings reports. However, after hitting an all-time high in April, Owens-Illinois took a step back and lost over 25% of its value during the quarter. What’s a “step back?” While the company has benefited from strong international demand (70% of its revenue come from overseas), management warned about the effects that rising energy and raw materials costs may have on future sales. The company cost the Fund about 0.6% for the three-month period, but our models have not yet given the sell signal.
Detailed Explanation of Fiscal Year Performance—What Worked Well
The Short Version: Five energy-related and three other commodities-related (chemicals) companies in the top ten added significantly to the Fund’s return, as oil and other commodities continued to soar over the past twelve months. These eight companies contributed over 9% to the performance of the Fund. Six top performers each climbed over 50% during the past twelve months.
These are the ten best performers for the fiscal year ended June 30, 2008:
| | | | | | |
| Rank | | Description | | Industry | | % Gain |
| 1 | | Mosaic Co | | Chemicals | | 150.9% |
| 2 | | Potash Corp of Saskatchewan | | Chemicals | | 90.8% |
| 3 | | Monsanto Co | | Chemicals | | 75.4% |
| 4 | | National Oilwell Varco Inc | | Oil & Gas Services | | 70.2% |
| 5 | | Noble Energy Inc | | Oil & Gas | | 61.2% |
| 6 | | Cameron International Corp | | Oil & Gas Services | | 54.9% |
| 7 | | XTO Energy Inc | | Oil & Gas | | 42.5% |
| 8 | | Smith International Inc | | Oil & Gas Services | | 39.7% |
| 9 | | Gilead Sciences Inc | | Biotechnology | | 36.5% |
| 10 | | Apple Inc | | Computers | | 35.9% |
| | | | | | | |
Potash Corp. of Saskatchewan nearly doubled in price during the past twelve months and represented almost 2% of the Fund’s return. The Canadian-based company produces and markets fertilizer and related products across the globe. As the population in many emerging markets becomes more affluent, demand for different foods and other materials has increased dramatically, thus, enhancing the farmers’ needs for fertilizer. Additionally, natural disasters like the floods that devastated the Midwest earlier in the year also contributed to the shrinking supply (and rising demand) for grains, foods, and other products. Two other top performers (Mosaic, Monsanto) are also chemical-related, and their stories are similar to that of Potash Corp.
| | |
| 80 | | Annual Report | June 30, 2008 |
Large-Cap Growth Fund
MANAGER’S COMMENTARY (continued)
Detailed Explanation of Fiscal Year Performance—What Didn’t Work
The Short Version: While financials received much of the negative economic news over the past twelve months, the weaker economy impacted companies within other sectors as well. Five distinct industries were represented in our list of worst performers for the fiscal year with consumer-related companies (both cyclical and non-cyclical) placing four on the list. The three lowest performing stocks each declined by half, and combined they cost the Fund just under 2% in return.
These are the ten stocks that performed the worst in the fiscal year ended June 30, 2008:
| | | | | | |
| Rank | | Description | | Industry | | % Gain |
| 1 | | SanDisk Corp | | Computers | | -54.0% |
| 2 | | Bank of America Corp | | Banks | | -51.2% |
| 3 | | CB Richard Ellis Group Inc | | Real Estate | | -51.1% |
| 4 | | Sunpower Corp | | Energy-Alternate Sources | | -43.1% |
| 5 | | Wynn Resorts Ltd | | Lodging | | -41.1% |
| 6 | | Coach Inc | | Apparel | | -39.1% |
| 7 | | Sun Microsystems Inc | | Computers | | -37.3% |
| 8 | | E*Trade Financial Corp | | Diversified Financial Services | | -35.4% |
| 9 | | Schering-Plough Corp | | Pharmaceuticals | | -35.2% |
| 10 | | UnitedHealth Group Inc | | Healthcare-Services | | -34.9% |
| | | | | | | |
Bank of America, the giant Charlotte, North Carolina-based financial holding company, lost over 50% of its value during the past twelve months and cost the Fund just under half a percent in performance. As the credit crisis continued to worsen, Bank of America played “white knight” and agreed to purchase Countrywide Financial for an estimated $4 billion. Once the country’s largest mortgage lender, Countrywide had become the poster child for the subprime debacle, and investors became leery that the acquisition would hurt Bank of America’s future earnings and ongoing operations. Countrywide’s shareholders approved the purchase in June, though the value had declined to about $2.6 billion because of the drop in stock price. The transaction was completed on July 1 (just after the end of the fiscal year) and Bank of America is now the country’s largest mortgage lender and servicer (a title that doesn’t bring great bragging rights these days) and we are still holding.
Top Ten Holdings as of June 30, 2008
The top two holdings of the Fund, Mosaic and Potash Corp, were also the top two performers for the fiscal year (and numbers two and three in terms of returns for the quarter). Both companies are involved in the fertilizer business and have reaped the benefits of the rise in commodities prices. The Fund remains well-diversified with none of its holdings representing greater than 4% of its assets. In fact, the top 10 holdings account for less than 25% of the net assets of the Fund.
| | | | | | |
| Rank | | Description | | Industry | | Percent of
Net Assets |
| 1 | | Mosaic Co. | | Chemicals | | 3.9% |
| 2 | | Potash Corp. of Saskatchewan, Inc. | | Chemicals | | 3.2% |
| 3 | | Apple, Inc. | | Computers | | 2.4% |
| 4 | | Monsanto Co. | | Chemicals | | 2.4% |
| 5 | | Gilead Sciences, Inc. | | Pharmaceuticals | | 2.1% |
| 6 | | Oracle Corp. | | Software | | 2.0% |
| 7 | | Intuitive Surgical, Inc. | | Healthcare-Products | | 2.0% |
| 8 | | EOG Resources, Inc. | | Oil & Gas | | 2.0% |
| 9 | | Bristol-Myers Squibb Co. | | Pharmaceuticals | | 1.9% |
| 10 | | Microsoft Corp. | | Software | | 1.8% |
| | | | | | | |
| Total | | | | | | 23.7% |
Large-Cap Growth Fund
MANAGER’S COMMENTARY (continued)
Industry Sector Representation as of June 30, 2008
Two significant allocation decisions greatly contributed to the success of the Fund during the past quarter. We were overweight in basic materials and benefited from the run-up in commodities prices. We were underweight financials and avoided some of the hardships faced by companies engaged in subprime lending, mortgage-related securities investing, and other ramifications of the ongoing credit crisis.
| | | | | | |
| | | % of Net Assets | | % of S&P 500 Index | | Difference |
Basic Materials | | 12.0% | | 3.9% | | 8.1% |
Communications | | 10.8% | | 11.0% | | -0.2% |
Consumer, Cyclical | | 2.9% | | 7.1% | | -4.2% |
Consumer, Non-cyclical | | 22.7% | | 20.6% | | 2.1% |
Energy | | 16.4% | | 16.3% | | 0.1% |
Financial | | 5.3% | | 14.0% | | -8.7% |
Industrial | | 10.7% | | 11.5% | | -0.8% |
Technology | | 16.1% | | 11.6% | | 4.5% |
Utilities | | 0.7% | | 3.9% | | -3.2% |
Diversified | | 0.0% | | 0.1% | | -0.1% |
Cash | | 2.4% | | 0.0% | | 2.4% |
| | | | | | | |
Total | | 100.0% | | 100.0% | | |
Disclaimer
The following is a reminder from the friendly folks at your Fund who worry about liability. The views expressed here are exclusively those of Fund management. These views are not meant as investment advice and should not be considered predictive in nature. Any favorable (or unfavorable) description of a holding applies only as of June 30, 2008, unless otherwise stated. Security positions can and do change thereafter. Discussions of historical performance do not guarantee and may not be indicative of future performance.
The Fund is subject to market risk (volatility) and is not an appropriate investment for short-term investors.
Conclusion
Thank you for your continued investment in Large-Cap Growth Fund. We encourage your feedback; your reactions and concerns are important to us.
Sincerely,
Your Investment Management Team
| | |
| 82 | | Annual Report | June 30, 2008 |
THIS PAGE INTENTIONALLY LEFT BLANK
Bridgeway Large-Cap Growth Fund
SCHEDULE OF INVESTMENTS
Showing percentage of net assets as of June 30, 2008
| | | | | | | |
| Industry | | Company | | Shares | | Value |
|
COMMON STOCKS - 97.64% |
Aerospace/Defense - 0.61% |
| | L-3 Communications Holdings, Inc. | | 2,000 | | $ | 181,740 |
| | Rockwell Collins, Inc. | | 18,300 | | | 877,668 |
| | | | | | | |
| | | | | | | 1,059,408 |
|
Apparel - 0.58% |
| | Coach, Inc.* | | 35,320 | | | 1,020,042 |
|
Banks - 2.45% |
| | Bank of America Corp. | | 23,700 | | | 565,719 |
| | State Street Corp. | | 22,700 | | | 1,452,573 |
| | US Bancorp | | 81,000 | | | 2,259,090 |
| | | | | | | |
| | | | | | | 4,277,382 |
|
Beverages - 2.38% |
| | Coca-Cola Co. | | 59,300 | | | 3,082,414 |
| | PepsiCo., Inc. | | 16,900 | | | 1,074,671 |
| | | | | | | |
| | | | | | | 4,157,085 |
|
Biotechnology - 5.54% |
| | Biogen Idec, Inc.* | | 50,200 | | | 2,805,678 |
| | Celgene Corp.* | | 24,900 | | | 1,590,363 |
| | Genentech, Inc.* | | 21,400 | | | 1,624,260 |
| | Gilead Sciences, Inc.* | | 69,240 | | | 3,666,258 |
| | | | | | | |
| | | | | | | 9,686,559 |
|
Chemicals - 11.22% |
| | CF Industries Holdings, Inc. | | 20,500 | | | 3,132,400 |
| | Monsanto Co. | | 32,700 | | | 4,134,588 |
| | Mosaic Co.* | | 47,300 | | | 6,844,310 |
| | Potash Corp. of Saskatchewan, Inc. | | 24,100 | | | 5,508,537 |
| | | | | | | |
| | | | | | | 19,619,835 |
|
Commercial Services - 2.73% |
| | MasterCard, Inc., Class A+ | | 10,000 | | | 2,655,200 |
| | Paychex, Inc.+ | | 68,000 | | | 2,127,040 |
| | | | | | | |
| | | | | | | 4,782,240 |
|
Computers - 8.75% |
| | Apple, Inc.* | | 25,200 | | | 4,219,488 |
| | EMC Corp.* | | 178,400 | | | 2,620,696 |
| | Hewlett-Packard Co. | | 68,600 | | | 3,032,806 |
| | International Business Machines Corp. | | 24,000 | | | 2,844,720 |
| | Research In Motion, Ltd.* | | 22,000 | | | 2,571,800 |
| | | | | | | |
| | | | | | | 15,289,510 |
| | | | | | | |
| Industry | | Company | | Shares | | Value |
|
|
Cosmetics/Personal Care - 0.63% |
| | Procter & Gamble Co. | | 18,232 | | $ | 1,108,688 |
|
Diversified Financial Services - 2.83% |
| | Charles Schwab Corp. | | 136,400 | | | 2,801,656 |
| | Interactive Brokers Group, Inc., Class A* | | 63,000 | | | 2,024,190 |
| | IntercontinentalExchange, Inc.* | | 1,000 | | | 114,000 |
| | | | | | | |
| | | | | | | 4,939,846 |
|
Electric Utilities - 0.66% |
| | Allegheny Energy, Inc. | | 22,900 | | | 1,147,519 |
|
Electronics - 0.55% |
| | Waters Corp.* | | 14,900 | | | 961,050 |
|
Engineering & Construction - 1.00% |
| | Jacobs Engineering Group, Inc.* | | 21,600 | | | 1,743,120 |
|
Healthcare - Products - 5.73% |
| | CR Bard, Inc. | | 1,800 | | | 158,310 |
| | Intuitive Surgical, Inc.* | | 12,900 | | | 3,475,260 |
| | Johnson & Johnson | | 27,300 | | | 1,756,482 |
| | Medtronic, Inc. | | 4,400 | | | 227,700 |
| | St. Jude Medical, Inc.* | | 48,100 | | | 1,966,328 |
| | Stryker Corp. | | 38,800 | | | 2,439,744 |
| | | | | | | |
| | | | | | | 10,023,824 |
|
Internet - 4.86% |
| | Amazon.com, Inc.*+ | | 41,900 | | | 3,072,527 |
| | eBay, Inc.* | | 100,200 | | | 2,738,466 |
| | Google, Inc., Class A* | | 5,100 | | | 2,684,742 |
| | | | | | | |
| | | | | | | 8,495,735 |
|
Machinery - Diversified - 3.33% |
| | AGCO Corp.*+ | | 41,100 | | | 2,154,051 |
| | Deere & Co. | | 22,700 | | | 1,637,351 |
| | Flowserve Corp. | | 14,800 | | | 2,023,160 |
| | | | | | | |
| | | | | | | 5,814,562 |
|
Media - 0.59% |
| | Walt Disney Co. | | 33,200 | | | 1,035,840 |
|
Metal Fabrication - Hardware - 1.31% |
| | Precision Castparts Corp. | | 23,700 | | | 2,283,969 |
|
Mining - 0.85% |
| | Southern Copper Corp.+ | | 14,000 | | | 1,492,820 |
| | |
| 84 | | Annual Report | June 30, 2008 |
Bridgeway Large-Cap Growth Fund
SCHEDULE OF INVESTMENTS (continued)
Showing percentage of net assets as of June 30, 2008
| | | | | | | |
| Industry | | Company | | Shares | | Value |
|
Common Stocks (continued) |
Miscellaneous Manufacturing - 1.60% |
| | Danaher Corp. | | 14,800 | | $ | 1,144,040 |
| | Dover Corp. | | 15,700 | | | 759,409 |
| | Illinois Tool Works, Inc. | | 19,000 | | | 902,690 |
| | | | | | | |
| | | | | | | 2,806,139 |
|
Oil & Gas - 9.70% |
| | ConocoPhillips | | 3,607 | | | 340,465 |
| | EOG Resources, Inc. | | 26,100 | | | 3,424,320 |
| | Exxon Mobil Corp. | | 33,800 | | | 2,978,794 |
| | Noble Corp.+ | | 39,700 | | | 2,578,912 |
| | Noble Energy, Inc. | | 17,900 | | | 1,800,024 |
| | Plains Exploration & Production Co.* | | 37,300 | | | 2,721,781 |
| | XTO Energy, Inc. | | 45,332 | | | 3,105,695 |
| | | | | | | |
| | | | | | | 16,949,991 |
|
Oil & Gas Services - 6.80% |
| | Baker Hughes, Inc. | | 22,700 | | | 1,982,618 |
| | Cameron International Corp.* | | 41,800 | | | 2,313,630 |
| | FMC Technologies, Inc.* | | 30,900 | | | 2,377,137 |
| | National Oilwell Varco, Inc.* | | 30,400 | | | 2,697,088 |
| | Smith International, Inc. | | 30,200 | | | 2,510,828 |
| | | | | | | |
| | | | | | | 11,881,301 |
|
Packaging & Containers - 1.61% |
| | Owens-Illinois, Inc.* | | 67,400 | | | 2,809,906 |
|
Pharmaceuticals - 5.68% |
| | Bristol-Myers Squibb Co. | | 162,700 | | | 3,340,231 |
| | Express Scripts, Inc.* | | 35,900 | | | 2,251,648 |
| | Merck & Co., Inc. | | 50,800 | | | 1,914,652 |
| | Pfizer, Inc. | | 7,200 | | | 125,784 |
| | Schering-Plough Corp. | | 116,800 | | | 2,299,792 |
| | | | | | | |
| | | | | | | 9,932,107 |
|
Retail - 2.34% |
| | CVS Caremark Corp. | | 3,340 | | | 132,164 |
| | GameStop Corp., Class A* | | 41,400 | | | 1,672,560 |
| | Staples, Inc.+ | | 25,890 | | | 614,887 |
| | Tiffany & Co. | | 41,200 | | | 1,678,900 |
| | | | | | | |
| | | | | | | 4,098,511 |
|
Semiconductors - 2.66% |
| | MEMC Electronic Materials, Inc.* | | 29,100 | | | 1,790,814 |
| | Texas Instruments, Inc.+ | | 101,790 | | | 2,866,406 |
| | | | | | | |
| | | | | | | 4,657,220 |
| | | | | | | |
| Industry | | Company | | Shares | | Value |
|
|
Software - 4.65% |
| | Adobe Systems, Inc.* | | 10,000 | | $ | 393,900 |
| | BMC Software, Inc.* | | 5,000 | | | 180,000 |
| | CA, Inc. | | 35,000 | | | 808,150 |
| | Microsoft Corp. | | 116,200 | | | 3,196,662 |
| | Oracle Corp.* | | 169,200 | | | 3,553,200 |
| | | | | | | |
| | | | | | | 8,131,912 |
|
Telecommunications - 5.30% |
| | AT&T, Inc. | | 83,800 | | | 2,823,222 |
| | Cisco Systems, Inc.* | | 119,200 | | | 2,772,592 |
| | Corning, Inc. | | 59,300 | | | 1,366,865 |
| | Harris Corp. | | 22,100 | | | 1,115,829 |
| | Juniper Networks, Inc.* | | 53,900 | | | 1,195,502 |
| | | | | | | |
| | | | | | | 9,274,010 |
|
Transportation - 0.70% |
| | CH Robinson Worldwide, Inc. | | 22,200 | | | 1,217,448 |
| | | | | | | |
| |
TOTAL COMMON STOCKS - 97.64% | | | 170,697,579 |
| | | | | | | |
(Cost $147,839,015) | | | |
| | | | | | | |
|
MONEY MARKET FUNDS - 2.23% |
| | | |
| | | Rate^ | | Shares | | Value |
BlackRock Temp Cash Liquidity Fund Institutional Shares #21 | | 2.61% | | 3,892,546 | | | 3,892,546 |
| | | | | | | |
| |
TOTAL MONEY MARKET FUNDS - 2.23% | | | 3,892,546 |
| | | | | | | |
(Cost $3,892,546) | | | |
| |
TOTAL INVESTMENTS - 99.87% | | $ | 174,590,125 |
(Cost $151,731,561) | | | |
Other Assets in Excess of Liabilities - 0.13% | | | 222,478 |
| | | | | | | |
NET ASSETS - 100.00% | | $ | 174,812,603 |
| | | | | | | |
| * | Non Income Producing Security. |
| + | This security or a portion of the security is out on loan at June 30, 2008. Total loaned securities had a market value of $14,534,265 at June 30, 2008. |
| ^ | Rate disclosed is as of June 30, 2008. |
See Notes to Financial Statements.
Large-Cap Value Fund
MANAGER’S COMMENTARY
June 30, 2008
Dear Fellow Large-Cap Value Fund Shareholder,
Along with the large-cap value segment of the stock market, our Fund continued to suffer the ill-effects of the ongoing credit crisis and economic downturn. For the quarter ending June 30, 2008, the Fund declined 4.22%, beating its primary benchmark, the Russell 1000 Value Index, which fell 5.31%. Our peer benchmark, however, dropped by a smaller 3.40%. While certain growth stocks experienced a bit of a rebound during the period, investors avoided value-oriented companies. It was a mixed (mediocre to poor) quarter on a relative return basis.
For the full fiscal year ended June 30, 2008, Large-Cap Value Fund declined a significant 16.46%, as the economic news took its toll on value stocks. Nevertheless, we did provide some “cushion” against the downturn, outperforming both our benchmarks. The Russell 1000 Value Index declined 18.78% and the Lipper Large-Cap Value Funds Index dropped 16.53% during the period.
As presented in the table below, we are pleased to report that Large-Cap Value Fund has also outperformed each of its benchmarks since inception in October 2003. We apply our quantitative strategies in a disciplined manner in both good times and bad, both strong and weak markets. Focusing on the long term will remain a key objective of our firm. The information below bears out our historical success as we approach our five year anniversary.
The table below presents our June quarter, one-year, and life-to-date financial results according to the formula required by the SEC. See the next page for a graph of performance since inception.
| | | | | | |
| | | June Qtr.
4/1/08
to 6/30/08 | | 1 Year
7/1/07
to 6/30/08 | | Life-to-Date
10/31/03
to 6/30/08 |
| | | |
Large-Cap Value Fund | | -4.22% | | -16.46% | | 8.55% |
Russell 1000 Value Index | | -5.31% | | -18.78% | | 7.73% |
Lipper Large-Cap Value Funds Index | | -3.40% | | -16.53% | | 6.71% |
Performance figures quoted in the table above and graph below represent past performance and are no guarantee of future results. The table above and the graph below do not reflect the deduction of taxes that a shareholder would pay on Fund distributions or the redemption of Fund shares.
The Russell 1000 Value Index is an unmanaged index which consists of stocks in the Russell 1000 Index with higher price-to-book ratios and higher forecasted growth values with dividends reinvested. The Lipper Large-Cap Value Funds Index is an index of large-company, value-oriented funds compiled by Lipper, Inc. It is not possible to invest directly in an index. Periods longer than one year are annualized.
According to data from Lipper, Inc. as of June 30, 2008, Large-Cap Value Fund ranked 173rd of 431 multi-cap value funds for the twelve-month period ended June 30, 2008 and 58th of 262 such funds since inception in October, 2003. Lipper, Inc. is an independent mutual fund rating service that ranks funds in various fund categories by making comparative calculations using total returns.
| | |
| 86 | | Annual Report | June 30, 2008 |
Large-Cap Value Fund
MANAGER’S COMMENTARY (continued)
Large-Cap Value Fund vs. Russell 1000 Value Index & Lipper Large-Cap Value Funds Index 10/31/03 to 6/30/08
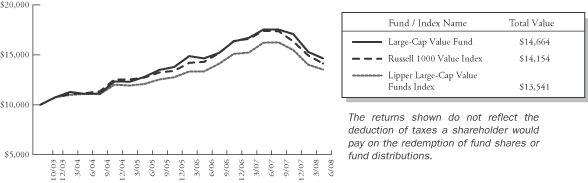
Detailed Explanation of Quarterly Performance—What Worked Well
The Short Version: Energy companies were the saving grace for the Fund over the past three months, as five oil and gas holdings headlined our list of top performers. Combined these stocks contributed about 2% to the Fund’s return. However, only one holding climbed by more than 30% during the quarter, and four of our top performing stocks earned single-digit returns.
These are the ten best-performing stocks for the quarter ended June 30, 2008:
| | | | | | |
| Rank | | Description | | Industry | | % Gain |
| 1 | | Chesapeake Energy Corp | | Oil & Gas | | 42.9% |
| 2 | | Western Digital Corp | | Computers | | 27.7% |
| 3 | | ConocoPhillips | | Oil & Gas | | 23.9% |
| 4 | | Freeport-McMoRan Copper & Gold Inc | | Mining | | 21.8% |
| 5 | | Chevron Corp | | Oil & Gas | | 16.1% |
| 6 | | Marathon Oil Corp | | Oil & Gas | | 13.8% |
| 7 | | Medco Health Solutions Inc | | Pharmaceuticals | | 7.8% |
| 8 | | Time Warner Inc | | Media | | 5.6% |
| 9 | | Goldman Sachs Group Inc | | Diversified Financial Services | | 4.4% |
| 10 | | Exxon Mobil Corp | | Oil & Gas | | 4.2% |
| | | | | | | |
Exploration and production company Chesapeake Energy was the Fund’s top performer over the three-month period. During the quarter, the company engaged in a series of transactions, as management positioned it to take advantage of the continued rise in energy prices. In May, Chesapeake announced the sale of several producing properties, including some older gas reserves for over $600 million. It also advanced its position in the shale market by partnering on some developing properties with Goodrich Petroleum in Louisiana. The company announced a first quarter loss; however, once hedging costs were removed from the equation, its adjusted earnings far exceeded Wall Street expectations. For the quarter, the company contributed about 0.7% to the return of the Fund.
Detailed Explanation of Quarterly Performance—What Didn’t Work
The Short Version: The financial services industry continued to struggle through the credit crisis. Banks and investment firms wrote-down significant assets and sought out capital infusions from various sources to shore up their balance sheets. Four of our lowest performing companies of the quarter (including the two worst performers) were in that industry. Combined, they cost the Fund slightly less than 1.8% in terms of performance.
Large-Cap Value Fund
MANAGER’S COMMENTARY (continued)
These are the ten worst-performing stocks for the quarter ended June 30, 2008:
| | | | | | |
| Rank | | Description | | Industry | | % Loss |
| 1 | | Wachovia Corp | | Banks | | -42.5% |
| 2 | | Bank of America Corp | | Banks | | -37.0% |
| 3 | | Goodyear Tire & Rubber Co | | Auto Parts & Equipment | | -30.9% |
| 4 | | Owens-Illinois Inc | | Packaging & Containers | | -26.1% |
| 5 | | JPMorgan Chase & Co | | Diversified Financial Services | | -20.1% |
| 6 | | Avnet Inc | | Electronics | | -18.9% |
| 7 | | Pepsi Bottling Group Inc | | Beverages | | -17.7% |
| 8 | | Pfizer Inc | | Pharmaceuticals | | -16.1% |
| 9 | | Expedia Inc | | Internet | | -16.0% |
| 10 | | US Bancorp | | Banks | | -13.8% |
| | | | | | | |
North Carolina-based Wachovia is the nation’s fourth largest bank. Unfortunately, management’s decision to purchase Golden West Financial, a California-based mortgage company, in 2006 contributed greatly to many of the financial hardships the bank has incurred. In May, Wachovia reported a loss of $708 million in the first quarter and was forced to cut its dividend and seek additional capital through the issuance of new common and preferred stock. The company also became the target of an SEC investigation and related class-action lawsuits over its role in misrepresenting certain auction-rate securities. In June, CEO Ken Thompson became the latest financial executive victim as he “chose” to step down, just a few weeks after he relinquished his Chairman title. We continue to hold this stock for now.
Detailed Explanation of Fiscal Year Performance—What Worked Well
The Short Version: One look at the Fund’s numbers for the fiscal year reveals that not much worked during the period. However, some of our energy and commodities (mining) companies performed quite well for the Fund. Additionally, some good picks from outside of these two hot industries also resulted in strong returns for certain stocks, and six different sectors were represented in the list of top performers.
These are the ten best performers for the fiscal year ended June 30, 2008:
| | | | | | |
| Rank | | Description | | Industry | | % Gain |
| 1 | | Chesapeake Energy Corp | | Oil & Gas | | 90.6% |
| 2 | | Western Digital Corp | | Computers | | 29.8% |
| 3 | | Freeport-McMoRan Copper & Gold Inc | | Mining | | 27.4% |
| 4 | | Express Scripts Inc | | Pharmaceuticals | | 22.3% |
| 5 | | Medco Health Solutions Inc | | Pharmaceuticals | | 20.7% |
| 6 | | ConocoPhillips | | Oil & Gas | | 20.2% |
| 7 | | Chevron Corp | | Oil & Gas | | 17.7% |
| 8 | | Southern Copper Corp | | Mining | | 13.1% |
| 9 | | Berkshire Hathaway Inc | | Insurance | | 11.3% |
| 10 | | Parker Hannifin Corp | | Miscellaneous Manufacturing | | 9.3% |
| | | | | | | |
Western Digital Corp. was the Fund’s number two performer during the fiscal year and contributed over 0.2% to the overall return. During the year, the hard-drive manufacturer reported consecutive quarters of positive earnings surprises, and revenues jumped over 50% in its most recent report. While computer makers have struggled given the sluggish economy, the demand for digital storage has been expanding, and some analysts claim that such content is more important than the hardware it resides on. Our models gave us the buy signal for this stock in late January, and it has paid off so far.
| | |
| 88 | | Annual Report | June 30, 2008 |
Large-Cap Value Fund
MANAGER’S COMMENTARY (continued)
Detailed Explanation of Fiscal Year Performance—What Didn’t Work
The Short Version: Financials and consumer-related companies highlighted the list of the Fund’s worst performers for the fiscal year. As the credit crisis pushes forward, the losses, write-downs, and general negativity are starting to impact other sectors of the economy, particularly those reliant on consumer activity. Three financial companies and four consumer-oriented (cyclical and non-cyclical) holdings comprise this list and cost the Fund about 4% in returns. The two biggest losers were major banks, and both declined in excess of 50% during the fiscal year.
These are the ten stocks that performed the worst in the fiscal year ended June 30, 2008:
| | | | | | |
| Rank | | Description | | Industry | | % Gain |
| 1 | | Wachovia Corp | | Banks | | -60.4% |
| 2 | | Bank of America Corp | | Banks | | -50.6% |
| 3 | | CNA Financial Corp | | Insurance | | -40.6% |
| 4 | | Qwest Communications International Inc | | Telecommunications | | -38.4% |
| 5 | | Expedia Inc | | Internet | | -37.6% |
| 6 | | Bristol-Myers Squibb Co | | Pharmaceuticals | | -34.7% |
| 7 | | Kla-Tencor Corp | | Semiconductors | | -33.4% |
| 8 | | Goodyear Tire & Rubber Co/The | | Auto Parts & Equipment | | -33.1% |
| 9 | | Cigna Corp | | Healthcare-Services | | -32.2% |
| 10 | | Pepsi Bottling Group Inc | | Beverages | | -31.9% |
| | | | | | | |
Bank of America, the giant Charlotte, North Carolina-based financial holding company, lost over 50% of its value during the past twelve months and cost the Fund over three-quarters of a percent in performance. As the credit crisis continued to worsen, Bank of America played “white knight” and agreed to purchase Countrywide Financial for an estimated $4 billion. Once the country’s largest mortgage lender, Countrywide had become the poster child for the subprime debacle, and investors became leery that the acquisition would hurt Bank of America’s future earnings and ongoing operations. Countrywide’s shareholders approved the purchase in June, though the value had declined to about $2.6 billion because of the drop in stock price. The transaction was completed on July 1 (just after the end of the fiscal year) and Bank of America is now the country’s largest mortgage lender and servicer (not such a desired position to be in these days). We are still in a holding pattern with Bank of America.
Top Ten Holdings as of June 30, 2008
Four of the Fund’s largest positions at the end of the fiscal year were also among the top performers for the quarter; it’s not surprising that three of those holdings were oil and gas companies: ConocoPhillips, Exxon Mobil, and Chevron. No single position accounted for over 5% of the net assets and, as a whole, the top 10 holdings made up less than 40% of the Fund.
| | | | | | |
| Rank | | Description | | Industry | | Percent of
Net Assets |
| 1 | | Hewlett-Packard Co. | | Computers | | 4.9% |
| 2 | | AT&T, Inc. | | Telecommunications | | 4.1% |
| 3 | | Berkshire Hathaway, Inc. | | Insurance | | 3.8% |
| 4 | | ConocoPhillips | | Oil & Gas | | 3.8% |
| 5 | | Exxon Mobil Corp. | | Oil & Gas | | 3.5% |
| 6 | | Medco Health Solutions, Inc. | | Pharmaceuticals | | 3.5% |
| 7 | | Verizon Communications, Inc. | | Telecommunications | | 3.5% |
| 8 | | Chevron Corp. | | Oil & Gas | | 3.4% |
| 9 | | Lockheed Martin Corp. | | Aerospace/Defense | | 3.3% |
| 10 | | International Business Machines Corp. | | Computers | | 3.2% |
| | | | | | | |
| Total | | | | | | 37.0% |
Large-Cap Value Fund
MANAGER’S COMMENTARY (continued)
Industry Sector Representation as of June 30, 2008
The underweighting in the consumer sectors (both cyclical and non-cyclical) proved to be a successful strategy as the sluggish economy continued to hinder consumer activity. However, the Fund was overweight financials which, as the media reminds us about daily, remains the hardest hit sector.
| | | | | | |
| | | % of Net Assets | | % of S&P 500 Index | | Difference |
Basic Materials | | 8.1% | | 3.9% | | 4.2% |
Communications | | 12.8% | | 11.0% | | 1.8% |
Consumer, Cyclical | | 1.7% | | 7.1% | | -5.4% |
Consumer, Non-cyclical | | 16.2% | | 20.6% | | -4.4% |
Energy | | 18.1% | | 16.3% | | 1.8% |
Financial | | 16.8% | | 14.0% | | 2.8% |
Industrial | | 11.7% | | 11.5% | | 0.2% |
Technology | | 9.7% | | 11.6% | | -1.9% |
Utilities | | 4.9% | | 3.9% | | 1.0% |
Cash | | 0.0% | | 0.1% | | -0.1% |
| | | | | | | |
Total | | 100.0% | | 100.0% | | |
Disclaimer
The following is a reminder from the friendly folks at your Fund who worry about liability. The views expressed here are exclusively those of Fund management. These views are not meant as investment advice and should not be considered predictive in nature. Any favorable (or unfavorable) description of a holding applies only as of June 30, 2008, unless otherwise stated. Security positions can and do change thereafter. Discussions of historical performance do not guarantee and are not indicative of future performance.
The Fund is subject to market risk (volatility) and is not an appropriate investment for short-term investors.
Conclusion
Thank you for your continued investment in Large-Cap Value Fund. We encourage your feedback; your reactions and concerns are important to us.
Sincerely,
Your Investment Management Team
| | |
| 90 | | Annual Report | June 30, 2008 |
THIS PAGE INTENTIONALLY LEFT BLANK
Bridgeway Large-Cap Value Fund
SCHEDULE OF INVESTMENTS
Showing percentage of net assets as of June 30, 2008
| | | | | | | |
| Industry | | Company | | Shares | | Value |
|
COMMON STOCKS - 100.00% |
Aerospace/Defense - 5.41% |
| | Lockheed Martin Corp. | | 18,300 | | $ | 1,805,478 |
| | Raytheon Co. | | 20,000 | | | 1,125,600 |
| | | | | | | |
| | | | | | | 2,931,078 |
|
Auto Parts & Equipment - 0.88% |
| | Goodyear Tire & Rubber Co.* | | 26,800 | | | 477,844 |
|
Banks - 3.18% |
| | Bank of America Corp. | | 27,508 | | | 656,616 |
| | US Bancorp | | 27,000 | | | 753,030 |
| | Wachovia Corp.+ | | 20,000 | | | 310,600 |
| | | | | | | |
| | | | | | | 1,720,246 |
|
Beverages - 0.92% |
| | Pepsi Bottling Group, Inc. | | 17,900 | | | 499,768 |
|
Chemicals - 3.77% |
| | Dow Chemical Co. | | 12,400 | | | 432,884 |
| | EI Du Pont de Nemours & Co. | | 37,500 | | | 1,608,375 |
| | | | | | | |
| | | | | | | 2,041,259 |
|
Commercial Services - 1.64% |
| | RR Donnelley & Sons Co. | | 30,000 | | | 890,700 |
|
Computers - 9.72% |
| | Hewlett-Packard Co. | | 60,000 | | | 2,652,600 |
| | International Business Machines Corp. | | 14,800 | | | 1,754,244 |
| | Western Digital Corp.*+ | | 24,800 | | | 856,344 |
| | | | | | | |
| | | | | | | 5,263,188 |
|
Diversified Financial Services - 2.79% |
| | Goldman Sachs Group, Inc. | | 1,000 | | | 174,900 |
| | JPMorgan Chase & Co. | | 38,950 | | | 1,336,374 |
| | | | | | | |
| | | | | | | 1,511,274 |
|
Electric Utilities - 4.91% |
| | American Electric Power Co., Inc. | | 24,000 | | | 965,520 |
| | Duke Energy Corp. | | 26,100 | | | 453,618 |
| | Reliant Energy, Inc.* | | 33,600 | | | 714,672 |
| | Southern Co. | | 15,050 | | | 525,546 |
| | | | | | | |
| | | | | | | 2,659,356 |
|
Healthcare - Services - 3.06% |
| | Aetna, Inc. | | 22,600 | | | 915,978 |
| | CIGNA Corp. | | 21,000 | | | 743,190 |
| | | | | | | |
| | | | | | | 1,659,168 |
| | | | | | | |
| Industry | | Company | | Shares | | Value |
|
|
Insurance - 10.82% |
| | Aflac, Inc. | | 15,000 | | $ | 942,000 |
| | Berkshire Hathaway, Inc., Class B* | | 510 | | | 2,046,120 |
| | Chubb Corp. | | 25,100 | | | 1,230,151 |
| | MetLife, Inc. | | 31,100 | | | 1,641,147 |
| | | | | | | |
| | | | | | | 5,859,418 |
|
Internet - 1.07% |
| | Expedia, Inc.* | | 31,500 | | | 578,970 |
|
Machinery - Diversified - 1.02% |
| | AGCO Corp.*+ | | 10,500 | | | 550,305 |
|
Media - 3.26% |
| | Time Warner, Inc. | | 20,400 | | | 301,920 |
| | Walt Disney Co. | | 46,900 | | | 1,463,280 |
| | | | | | | |
| | | | | | | 1,765,200 |
|
Mining - 4.33% |
| | Freeport-McMoRan Copper & Gold, Inc., Class B | | 8,156 | | | 955,802 |
| | Southern Copper Corp.+ | | 13,000 | | | 1,386,190 |
| | | | | | | |
| | | | | | | 2,341,992 |
|
Miscellaneous Manufacturing - 4.27% |
| | Honeywell International, Inc. | | 20,000 | | | 1,005,600 |
| | Parker Hannifin Corp. | | 5,250 | | | 374,430 |
| | Textron, Inc. | | 19,400 | | | 929,842 |
| | | | | | | |
| | | | | | | 2,309,872 |
|
Oil & Gas - 18.09% |
| | Chesapeake Energy Corp.+ | | 22,000 | | | 1,451,120 |
| | Chevron Corp. | | 18,514 | | | 1,835,293 |
| | ConocoPhillips | | 21,600 | | | 2,038,824 |
| | Exxon Mobil Corp. | | 21,600 | | | 1,903,608 |
| | Hess Corp.+ | | 6,900 | | | 870,711 |
| | Marathon Oil Corp. | | 21,200 | | | 1,099,644 |
| | Noble Energy, Inc. | | 5,900 | | | 593,304 |
| | | | | | | |
| | | | | | | 9,792,504 |
|
Packaging & Containers - 1.00% |
| | Owens-Illinois, Inc.* | | 13,000 | | | 541,970 |
|
Pharmaceuticals - 10.53% |
| | Bristol-Myers Squibb Co. | | 75,000 | | | 1,539,750 |
| | Express Scripts, Inc.* | | 15,000 | | | 940,800 |
| | Medco Health Solutions, Inc.* | | 40,000 | | | 1,888,000 |
| | Pfizer, Inc. | | 76,200 | | | 1,331,214 |
| | | | | | | |
| | | | | | | 5,699,764 |
| | |
| 92 | | Annual Report | June 30, 2008 |
Bridgeway Large-Cap Value Fund
SCHEDULE OF INVESTMENTS (continued)
Showing percentage of net assets as of June 30, 2008
| | | | | | | | |
| Industry | | Company | | Shares | | Value | |
|
Common Stocks (continued) | |
Retail - 0.84% | |
| | CVS Caremark Corp. | | 11,480 | | $ | 454,264 | |
|
Telecommunications - 8.49% | |
| | AT&T, Inc. | | 65,292 | | | 2,199,687 | |
| | Corning, Inc. | | 22,600 | | | 520,930 | |
| | Verizon Communications, Inc.+ | | 53,030 | | | 1,877,262 | |
| | | | | | | | |
| | | | | | | 4,597,879 | |
| | | | | | | | |
| |
TOTAL COMMON STOCKS - 100.00% | | | 54,146,019 | |
| | | | | | | | |
(Cost $46,947,038) | | | | |
| |
TOTAL INVESTMENTS - 100.00% | | $ | 54,146,019 | |
(Cost $46,947,038) | | | | |
Liabilities in Excess of Other Assets - 0.00% | | | (2,431 | ) |
| | | | | | | | |
NET ASSETS - 100.00% | | $ | 54,143,588 | |
| | | | | | | | |
| * | Non Income Producing Security. |
| + | This security or a portion of the security is out on loan at June 30, 2008. Total loaned securities had a market value of $6,750,451 at June 30, 2008. |
See Notes to Financial Statements.
Blue Chip 35 Index Fund
MANAGER’S COMMENTARY
June 30, 2008
Dear Fellow Blue Chip 35 Index Fund Shareholder,
For the six months ending June 30, 2008, our Fund declined sharply, 14.57%, a steeper decline than either our primary market or peer benchmark. By comparison, the S&P 500 Index was down 11.91%, and the Lipper Large-Cap Core Funds Index was down 10.80%. Our own proprietary index, the Bridgeway Ultra-Large 35 Index, declined 14.89% during the past six months, slightly more than our Fund (even after considering our expense ratio). Accounting for the benchmark-lagging performance were the facts that a) mid-size companies strongly outperformed our ultra-large ones during the period, and b) we had slightly stronger representation among financial stocks, some of which were among those particularly hard hit in the credit crisis. Except for the favorable operational execution against our own index, this was a poor six-month period.
Based on the negative performance drag of the recent six-month period, our Fund declined a similar 14.28% for the fiscal year ending June 30, 2008, underperforming the S&P 500 Index by 1.16% and the Lipper Large-Cap Core Funds Index by 2.90%.
The table below presents our six month, one-year, five-year, ten-year and life-to-date financial results according to the formula required by the SEC. See the next page for a graph of performance from inception. We are now “dead even” with the S&P 500 Index over the last ten years and lead by a bit since inception.
| | | | | | | | | | |
| | | Six Months
1/1/08
to 6/30/08 | | 1 Year
7/1/07
to 6/30/08 | | 5 Year
7/1/03
to 6/30/08 | | 10 Year
7/1/98
to 6/30/08 | | Life-to-Date
7/31/97
to 6/30/08 |
| | | | | |
Blue Chip 35 Index Fund | | -14.57% | | -14.28% | | 4.63% | | 2.88% | | 4.53% |
S&P 500 Index | | -11.91% | | -13.12% | | 7.58% | | 2.88% | | 4.40% |
Bridgeway Ultra-Large 35 Index | | -14.89% | | -14.59% | | 4.55% | | 2.97% | | 4.61% |
Lipper Large-Cap Core Funds Index | | -10.80% | | -11.38% | | 6.94% | | 2.32% | | 3.85% |
Performance figures quoted in the table above and graph below represent past performance and are no guarantee of future results. The table above and the graph below do not reflect the deduction of taxes that a shareholder would pay on Fund distributions or the redemption of Fund shares.
The S&P 500 Index is a broad-based, unmanaged measurement of changes in stock market conditions based on the average of 500 widely held common stocks with dividends reinvested. The Bridgeway Ultra-Large 35 Index is an index comprised of very large, “blue chip” U.S. stocks, excluding tobacco; it is compiled by the adviser of the Fund. The Lipper Large-Cap Core Funds Index reflects the aggregate record of domestic large-cap core mutual funds as reported by Lipper, Inc. It is not possible to invest directly in an index. Periods longer than one year are annualized.
According to data from Lipper, Inc. as of June 30, 2008, Blue-Chip 35 Index Fund ranked 565th of 817 large-cap core funds for the twelve months ending June 30, 2008, 497th of 574 over the last five years, 137th of 323 over the last ten years, and 83rd of 270 since inception in July 1997. Lipper, Inc. is an independent mutual fund rating service that ranks funds in various fund categories by making comparative calculations using total returns.
| | |
| 94 | | Annual Report | June 30, 2008 |
Blue Chip 35 Index Fund
MANAGER’S COMMENTARY (continued)
Blue Chip 35 Index Fund vs. S&P 500 Index & Bridgeway Ultra-Large 35 Index & Lipper Large-Cap Core Funds Index Inception (7/31/97) to 6/30/08
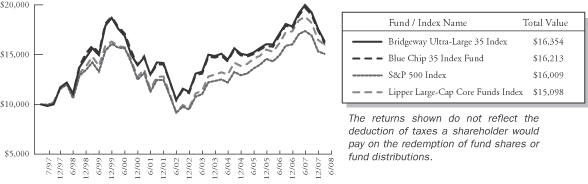
Six-Month Performance
The Short Version: Being pure “ultra-large,” that is, focusing on the market’s largest companies, did not help in the last six-month period. Our financial stocks also hurt performance.
As reported in our December 2007 report, “The shift toward larger company stocks is clearly evident during the one-year timeframe and shorter. The most recent quarter [December 2007] indicates things could be shifting back in the “bulls-eye” of our Fund.” We were certainly off the mark on this last statement. (One more reason we don’t take action to time the market with our funds at Bridgeway; it’s nearly impossible to predict short-term market movements with accuracy. Not only did things shift back in favor of mid-cap companies (absent from our Fund but present in our primary market and peer benchmarks), but it happened in a strongly down-trending market—rather unusual based on a study of the last eight decades of stock market data. The second column in the table below shows statistically that we had a “size disadvantage” relative to our performance benchmarks that have some exposure to the companies in size deciles 2-5, which our Fund does not.
| | | | | | |
| CRSP Decile1 | | Six-months
to 6/30/08 | | Fiscal Year
to 6/30/08 | | (82 years)
12/31/1925
to 6/30/08 |
(ultra-large) 1 | | -12.1% | | -11.0% | | 9.4% |
2 | | -11.2% | | -13.2% | | 10.7% |
3 | | -6.8% | | -13.0% | | 11.1% |
4 | | -7.0% | | -13.9% | | 10.9% |
5 | | -6.2% | | -13.1% | | 11.5% |
6 | | -10.6% | | -15.3% | | 11.5% |
7 | | -12.8% | | -20.3% | | 11.3% |
8 | | -11.5% | | -21.1% | | 11.5% |
9 | | -15.0% | | -25.0% | | 11.6% |
10 | | -15.1% | | -27.3% | | 13.2% |
1 | The CRSP Cap-Based Portfolio Indexes are unmanaged indexes of the publicly traded U.S. stocks with dividends reinvested, grouped by the market capitalization, as reported by the Center for Research in Security Prices. Past performance is no guarantee of future results. |
In addition to the size disadvantage for the six-month period, financial stocks were a major part of our performance problem, as detailed more fully in the next section.
Fiscal Year Performance
The Short Version: Relative to the S&P 500 Index, our blue chip fund has a higher concentration of finance stocks and too many of the ones that did particularly poorly. We were a bit under concentrated in energy, basic materials, and utility companies.
Blue Chip 35 Index Fund
MANAGER’S COMMENTARY (continued)
Unlike the last six-month period described above, the six-month period from July through December 2007 was quite favorable to our staple of ultra-large companies. Indeed, according to the table above, the CRSP 1 group of ultra-large companies outperformed the next smaller group by more than two percentage points for the full fiscal year ending June 30, 2008. Alas, this favorable factor was swamped by the other unfavorable factors below.
The table below tells much of the story behind our negative (and benchmark-lagging) returns over the twelve months of fiscal year 2008. First of all, two companies declined by more than 50%. We wondered if this had ever happened before, and we checked through our Fund’s history. It has. In fiscal year 2001, the second year of the worst bear market since the Great Depression, seven Fund companies declined more than 50%. While interesting, somehow that fact doesn’t seem to provide much comfort.
Second, while our Fund was only overweight by one percentage point in financial companies relative to the S&P 500 Index at the end of the fiscal year, the largest financial companies in the marketplace were particularly hard hit. Indeed, all four of the worst-performing companies on the list below hailed from the financial sector. In aggregate, these four companies accounted for about half of our negative performance for the fiscal year—seven percentage points of return. Ouch.
Third, our “roughly equal weighting strategy,” (we generally seek to own equal amounts of each of our index stocks), worked against us over the last few quarters. Our analysis indicates that, over time, equal weighting helps manage Fund risk, but it doesn’t work as well in environments where there are major market trends, such as the technology boom of the late nineties or the financial debacle over the last year.
Fourth, the three sectors of the economy that actually had positive returns over the last year were basic materials (especially chemical companies), utilities, and energy—areas where our Index of the largest companies was absent or “light.” For example, on average during the June quarter our Fund held about nine and a half percent of net assets in energy companies, but the S&P 500 Index held fourteen and a half percent in this sector. Since this has been a “boom” part of the economy—with double digit positive returns—our underweighting cost about two percentage points of returns on a relative basis.
In total, a lot was working against us. Our informal internal goal is to outperform the market about three of every four years.
Total Return for Blue Chip 35 Index Fund Stocks for the Fiscal Year Ended June 30, 2008
| | | | | | |
| Rank | | Company | | Industry | | % Change |
| 1 | | ConocoPhillips | | Oil & Gas | | 18.0% |
| 2 | | Wal-Mart Stores Inc | | Retail | | 14.1% |
| 3 | | Chevron Corp | | Oil & Gas | | 13.3% |
| 4 | | International Business Machines Corp | | Computers | | 8.2% |
| 5 | | Genentech Inc | | Biotechnology | | 3.3% |
| 6 | | Oracle Corp | | Software | | 2.7% |
| 7 | | Exxon Mobil Corp | | Oil & Gas | | 1.8% |
| 8 | | Berkshire Hathaway Inc | | Insurance | | 0.8% |
| 9 | | Johnson & Johnson | | Healthcare-Products | | 0.1% |
| 10 | | Google Inc | | Internet | | -0.4% |
| 11 | | Applied Materials Inc | | Semiconductors | | -1.2% |
| 12 | | Coca-Cola Co | | Beverages | | -3.8% |
| 13 | | Procter & Gamble Co | | Cosmetics/Personal Care | | -5.9% |
| 14 | | PepsiCo Inc | | Beverages | | -6.2% |
| 15 | | Intel Corp | | Semiconductors | | -7.2% |
| 16 | | Microsoft Corp | | Software | | -8.5% |
| 17 | | Dell Inc | | Computers | | -9.2% |
| 18 | | United Parcel Service Inc | | Transportation | | -11.0% |
| 19 | | AT&T Inc | | Telecommunications | | -11.5% |
| | |
| 96 | | Annual Report | June 30, 2008 |
Blue Chip 35 Index Fund
MANAGER’S COMMENTARY (continued)
| | | | | | |
| Rank | | Company | | Industry | | % Change |
| 20 | | Verizon Communications Inc | | Telecommunications | | -11.6% |
| 21 | | Eli Lilly & Co | | Pharmaceuticals | | -14.3% |
| 22 | | United Technologies Corp | | Aerospace/Defense | | -14.8% |
| 23 | | Cisco Systems Inc | | Telecommunications | | -14.8% |
| 24 | | Texas Instruments Inc | | Semiconductors | | -14.9% |
| 25 | | 3M Co | | Miscellaneous Manufacturing | | -15.6% |
| 26 | | Time Warner Inc | | Media | | -15.8% |
| 27 | | Merck & Co Inc | | Pharmaceuticals | | -16.7% |
| 28 | | JPMorgan Chase & Co | | Diversified Financial Services | | -20.7% |
| 29 | | General Electric Co | | Miscellaneous Manufacturing | | -22.9% |
| 30 | | Wells Fargo & Co | | Banks | | -24.2% |
| 31 | | Pfizer Inc | | Pharmaceuticals | | -24.4% |
| 32 | | Home Depot Inc | | Retail | | -26.5% |
| 33 | | Bank of America Corp | | Banks | | -42.8% |
| 34 | | Citigroup Inc | | Diversified Financial Services | | -47.7% |
| 35 | | Wachovia Corp | | Banks | | -52.7% |
| 36 | | American International Group Inc | | Insurance | | -54.0% |
| | | | | | | |
Rebalancing Bridgeway Ultra-Large 35 Index
Our most significant restructuring of the Ultra-Large 35 Index takes place every two to three years, at which point we add and remove between five and ten stocks to stay in line with the Index strategy of investing in the largest “blue chip” U.S. stocks. Changing the constituents is not done in a straightforward way: by simply ranking stocks by their market capitalization. We also implement a number of restrictions and rules looking for diversification at the industry and sector level. Our last rebalancing was three years ago. We made the following changes to the Index on June 30, 2008 (and consequently made the same changes to the Fund):
| | |
| Added to the Index | | Industry |
| Apple Inc | | Computers |
| Abbott Laboratories | | Pharmaceuticals |
| CVS/Caremark Corp | | Retail |
| Halliburton Co | | Oil & Gas Services |
| Hewlett-Packard Co | | Computers |
| Monsanto Co | | Chemicals |
| Occidental Petroleum Corp | | Oil & Gas |
| Visa Inc | | Commercial Services |
| | |
| Dropped from the Index | | Industry |
| Applied Materials Inc | | Semiconductors |
| Dell Inc | | Computers |
| Home Depot Inc | | Retail |
| Eli Lilly & Co | | Pharmaceuticals |
| 3M Co | | Miscellaneous Manufacturers |
| Time Warner Inc | | Media |
| Texas Instruments Inc | | Semiconductors |
| Wachovia Corp | | Banks |
Not Destroying Value in the Recomposition Process
One of the studies that had an impact on John Montgomery’s (and later, Bridgeway’s) overall investment philosophy (or “contrarian leanings”) had to do with the investment industry’s first index fund. This fund was constructed for a pension fund with the idea that what you give up (performance) with active management, you save in lower transaction costs and operating
[GRAPHIC]
Blue Chip 35 Index Fund
MANAGER’S COMMENTARY (continued)
costs. It was a really good idea except for, as it turns out on the margin, human intervention. Ah, you may have thought human intervention was completely taken out of the investment process with indexing. Almost, but not quite.
One of the principles applied to this first index fund was the “prudent man rule.” This rule directs trustees to “observe how men of prudence, discretion and intelligence manage their own affairs, not in regard to speculation, but . . . also considering the safety of the capital to be invested.” The first implementers of index investing decided that even in indexing, a prudent man should eliminate the dozen or so companies that a . . . prudent man (apparently women didn’t invest in 1830 when this rule was born) would avoid, i.e. those that are probably going out of business. So, more than a dozen companies were “skipped” in the construction of the fund. Some years later, a researcher came up with the idea of checking how these “dogs” of the index actually did in the ensuing years. Indeed, not all the companies survived, but those that did carry the day and the group as a whole actually outperformed the index. A classical contrarian result.
When designing our own proprietary index, we at Bridgeway wanted to make sure that nothing we did would destroy value by picking stocks we simply thought were particularly good (or avoiding ones we thought were particularly bad), lest we end up with returns somewhat less that the universe of stocks from which we were sampling. Unless you are on your guard, emotion creeps into the process in difficult to detect and insidious ways.
Since it’s now been more than ten years since the construction of Bridgeway Ultra-Large 35 Index, and since this is the fourth time we have recomposed our Index, we thought it would be appropriate to evaluate how well we’ve done. Elena Khoziaeva, a member of Bridgeway’s Investment Management Team recently compiled the list of all the stocks coming out of the Index and all the ones going in. (drum roll please)
We’re happy to report that, in aggregate, our new companies moving into the Index have outperformed the ones coming out. We have a well constructed process to identify the stocks coming in and out. My favorite example is Google, which came in three and a half years ago. Elena’s reaction when we added it was, “This stock is way too expensive. I can’t believe we’re adding it to a blue chip fund. So, now we have to buy it anyway.”
Oh, we almost forgot the punch line. In the fiscal years since adding it, Google has ranked, among all 35+ Index companies: first, twelfth, and (above) tenth. This makes it our second best performing company since adding it to the Fund.
Industry Sector Representation as of June 30, 2008
Technology represented the largest sector allocation dispersion (+9.6%) between our Fund and the S&P 500 Index. Energy was next (-5.7%), as reported below. Both of these “gaps” closed some with our “recomposed” Ultra-Large 35 Index (see “recomposition” above.) The second column below reflects actual Fund holdings, which approximate the weights in Bridgeway’s Ultra-Large 35 Index before recomposition. The second column reflects the Index post recomposition; these weights became the target for our Fund beginning July 1, 2008.
| | | | | | |
| | | % of Fund | | % Newly
Recomposed Index | | % S&P 500 |
Basic Materials | | 0.0% | | 2.7% | | 3.9% |
Communications | | 15.3% | | 11.1% | | 11% |
Consumer, Cyclical | | 5.4% | | 5.5% | | 7.1% |
Consumer, Non-cyclical | | 22.2% | | 25.1% | | 20.6% |
Energy | | 10.6% | | 14.0% | | 16.3% |
Financial | | 14.9% | | 16.7% | | 14% |
Industrial | | 10.0% | | 8.2% | | 11.5% |
Technology | | 21.2% | | 16.7% | | 11.6% |
Utilities | | 0.0% | | 0.0% | | 3.9% |
Diversified | | 0.0% | | 0.0% | | 0.1% |
Cash | | 0.4% | | 0.0% | | 0.0% |
| | | | | | | |
Total | | 100.0% | | 100.0% | | 100.0% |
| | |
| 98 | | Annual Report | June 30, 2008 |
Blue Chip 35 Index Fund
MANAGER’S COMMENTARY (continued)
Disclaimer
The following is a reminder from the friendly folks at your Fund who worry about liability. The views expressed here are exclusively those of Fund management. These views, including those of market sectors or individual stocks, are not meant as investment advice and should not be considered predictive in nature. Any favorable (or unfavorable) description of a holding applies only as of the quarter end, June 30, 2008, unless otherwise stated. Security positions can and do change thereafter. Discussions of historical performance do not guarantee and are not indicative of future performance.
The Fund is subject to above average market risk (volatility) and is not an appropriate investment for short-term investors.
Conclusion
Thank you for your continued investment in Blue Chip 35 Index Fund. This Fund remains open to both current and new investors. As always, we appreciate your feedback.
Sincerely,
Your Investment Management Team
Bridgeway Blue Chip 35 Index Fund
SCHEDULE OF INVESTMENTS
Showing percentage of net assets as of June 30, 2008
| | | | | | | |
| Industry | | Company | | Shares | | Value |
|
COMMON STOCKS - 99.59% |
Aerospace/Defense - 2.91% |
| | United Technologies Corp. | | 118,480 | | $ | 7,310,216 |
|
Banks - 5.56% |
| | Bank of America Corp. | | 185,008 | | | 4,416,141 |
| | Wachovia Corp.+ | | 260,135 | | | 4,039,897 |
| | Wells Fargo & Co.+ | | 231,559 | | | 5,499,526 |
| | | | | | | |
| | | | | | | 13,955,564 |
|
Beverages - 5.19% |
| | Coca-Cola Co. | | 121,257 | | | 6,302,939 |
| | PepsiCo., Inc. | | 105,650 | | | 6,718,283 |
| | | | | | | |
| | | | | | | 13,021,222 |
|
Biotechnology - 2.80% |
| | Genentech, Inc.* | | 92,515 | | | 7,021,888 |
|
Computers - 5.79% |
| | Dell, Inc.*+ | | 342,944 | | | 7,503,615 |
| | International Business Machines Corp. | | 59,342 | | | 7,033,807 |
| | | | | | | |
| | | | | | | 14,537,422 |
|
Cosmetics/Personal Care - 2.83% |
| | Procter & Gamble Co. | | 116,826 | | | 7,104,189 |
|
Diversified Financial Services - 4.64% |
| | Citigroup, Inc.+ | | 348,049 | | | 5,833,301 |
| | JPMorgan Chase & Co. | | 169,695 | | | 5,822,236 |
| | | | | | | |
| | | | | | | 11,655,537 |
|
Healthcare - Products - 3.18% |
| | Johnson & Johnson | | 123,952 | | | 7,975,072 |
|
Insurance - 4.73% |
| | American International Group, Inc. | | 164,036 | | | 4,340,393 |
| | Berkshire Hathaway, Inc., Class B* | | 1,880 | | | 7,542,560 |
| | | | | | | |
| | | | | | | 11,882,953 |
|
Internet - 3.52% |
| | Google, Inc., Class A* | | 16,770 | | | 8,828,063 |
|
Media - 3.03% |
| | Time Warner, Inc.+ | | 513,630 | | | 7,601,724 |
|
Miscellaneous Manufacturing - 5.07% |
| | 3M Co. | | 94,328 | �� | | 6,564,285 |
| | General Electric Co. | | 230,443 | | | 6,150,524 |
| | | | | | | |
| | | | | | | 12,714,809 |
| | | | | | | |
| Industry | | Company | | Shares | | Value |
|
|
Oil & Gas - 10.60% |
| | Chevron Corp. | | 89,895 | | $ | 8,911,291 |
| | ConocoPhillips | | 100,915 | | | 9,525,367 |
| | Exxon Mobil Corp. | | 92,787 | | | 8,177,318 |
| | | | | | | |
| | | | | | | 26,613,976 |
|
Pharmaceuticals - 8.24% |
| | Eli Lilly & Co.+ | | 151,395 | | | 6,988,393 |
| | Merck & Co., Inc. | | 204,835 | | | 7,720,231 |
| | Pfizer, Inc. | | 342,644 | | | 5,985,991 |
| | | | | | | |
| | | | | | | 20,694,615 |
|
Retail - 5.36% |
| | Home Depot, Inc. | | 211,030 | | | 4,942,322 |
| | Wal-Mart Stores, Inc. | | 151,319 | | | 8,504,128 |
| | | | | | | |
| | | | | | | 13,446,450 |
|
Semiconductors - 8.84% |
| | Applied Materials, Inc.+ | | 373,965 | | | 7,138,992 |
| | Intel Corp. | | 390,443 | | | 8,386,716 |
| | Texas Instruments, Inc.+ | | 236,690 | | | 6,665,190 |
| | | | | | | |
| | | | | | | 22,190,898 |
|
Software - 6.53% |
| | Microsoft Corp. | | 282,345 | | | 7,767,311 |
| | Oracle Corp.* | | 410,613 | | | 8,622,873 |
| | | | | | | |
| | | | | | | 16,390,184 |
|
Telecommunications - 8.78% |
| | AT&T, Inc. | | 232,025 | | | 7,816,922 |
| | Cisco Systems, Inc.* | | 301,804 | | | 7,019,961 |
| | FairPoint Communications, Inc.+ | | 2,823 | | | 20,354 |
| | Verizon Communications, Inc.+ | | 202,889 | | | 7,182,271 |
| | | | | | | |
| | | | | | | 22,039,508 |
|
Transportation - 1.99% |
| | United Parcel Service, Inc., Class B | | 81,163 | | | 4,989,090 |
| | | | | | | |
| |
TOTAL COMMON STOCKS - 99.59% | | | 249,973,380 |
| | | | | | | |
(Cost $274,333,161) | | | |
| | |
| 100 | | Annual Report | June 30, 2008 |
Bridgeway Blue Chip 35 Index Fund
SCHEDULE OF INVESTMENTS (continued)
Showing percentage of net assets as of June 30, 2008
| | | | | | | |
| | | Rate^ | | Shares | | Value |
|
MONEY MARKET FUNDS - 0.23% |
BlackRock Temp Cash Liquidity Fund Institutional Shares #21 | | 2.61% | | 573,927 | | $ | 573,927 |
| | | | | | | |
| |
TOTAL MONEY MARKET FUNDS - 0.23% | | | 573,927 |
| | | | | | | |
(Cost $573,927) | | | |
| |
TOTAL INVESTMENTS - 99.82% | | $ | 250,547,307 |
(Cost $274,907,088) | | | |
Other Assets in Excess of Liabilities - 0.18% | | | 440,545 |
| | | | | | | |
NET ASSETS - 100.00% | | $ | 250,987,852 |
| | | | | | | |
| + | This security or a portion of the security is out on loan at June 30, 2008. Total loaned securities had a market value of $37,211,798 at June 30, 2008. |
| * | Non Income Producing Security. |
| ^ | Rate disclosed is as of June 30, 2008. |
See Notes to Financial Statements.
Balanced Fund
MANAGER’S COMMENTARY
June 30, 2008
Dear Fellow Balanced Fund Shareholder:
For the quarter ending June 30, 2008, Balanced Fund bounced back from a rough first quarter ended March 31, 2008, to increase by 1.62% and outperform each of its benchmarks, which declined over the three-month period: Balanced Benchmark (-1.69%), S&P 500 (-2.73%), Bloomberg/EFFAS US Government 1-3 year Total Return Bond (-0.99%), and Lipper Balanced Funds Index (-1.07%). Our Fund ended in positive territory, despite the onslaught of negative news surrounding the economy, the financial services sector, and threats of inflation. We are generally pleased with the turnaround quarter and our absolute and relative performance. As always, our investment objective is to manage a conservative, low risk balanced portfolio with less than or equal to 40% of the volatility of the S&P index (i.e., 60% less risk).
Unfortunately the results were not quite as favorable for the full fiscal year ending June 30, 2008. The Fund dropped in value by 1.57% and slightly trailed the Balanced Benchmark, which declined by 0.87%. The Fund also underperformed the Bloomberg/EFFAS US Government 1-3 Year Total Return Bond Index, which rose by 7.29% during the 12-month period. Bond-only funds and indexes benefited during the period as economic and stock market concerns led to a flight-to-quality from certain equities into fixed income. On the other hand, Balanced Fund handily beat the equity-only S&P 500 Index (-13.12%) and the Lipper Balanced Funds Index (-5.59%). From a longer-term perspective, we are pleased to report that the Fund has rewarded our shareholders by outperforming each of the benchmarks since inception in July 2001; such long-term results will remain a key objective of our firm.
Our hybrid total-return Fund invests in both equity and fixed income securities, while incorporating an options strategy designed to produce a conservative, lower volatility balanced portfolio. During very favorable equity market conditions, the Fund often under-performs many of the more aggressive benchmarks. On the other hand, when stocks struggle and investors seek the safe haven of more conservative bonds, Balanced Fund tends to perform better than the equity-only indexes.
The table below presents our June quarter, one-year, five-year and life-to-date financial results according to the formula required by the SEC. A graph of quarterly performance since inception appears on the following page.
| | | | | | | | |
| | | June Qtr. 4/1/08
to 6/30/08 | | 1 Year 7/1/07
to 6/30/08 | | 5 Year
7/1/03
to 6/30/08 | | Life-to-Date 6/30/01
to 6/30/08 |
| | | | |
Balanced Fund | | 1.62% | | -1.57% | | 6.37% | | 4.77% |
Bloomberg/ EFFAS U.S. Government 1-3 Year Total Return Bond Index | | -0.99% | | 7.29% | | 3.20% | | 3.94% |
Balanced Benchmark | | -1.69% | | -0.87% | | 5.04% | | 3.36% |
S&P 500 Index | | -2.73% | | -13.12% | | 7.58% | | 2.45% |
Lipper Balanced Funds Index | | -1.07% | | -5.59% | | 7.07% | | 4.34% |
Performance figures quoted in the table above and graph on the next page represent past performance and are no guarantee of future results. The table above and graph below do not reflect the deduction of taxes that a shareholder would pay on Fund distributions or the redemption of Fund shares.
The Lipper Balanced Funds Index is an index of balanced funds compiled by Lipper, Inc. Balanced Benchmark is a combined index of which 40% reflects the S&P 500 Index (an unmanaged index of large companies with dividends reinvested) and 60% reflects the Bloomberg/ EFFAS U.S. Government 1-3 year Total Return Bond Index (transparent benchmark for the total return of the 1-3 year U.S. Government bond market).
According to data from Lipper, Inc. as of June 30, 2008, the Balanced Fund ranked 55th of 462 Mixed-Asset Moderate funds for the calendar year ended June 30, 2008, 123rd of 239 for the past five years and 58th of 180 funds since inception on June 30, 2001. Lipper, Inc. is an independent mutual fund rating service that ranks funds in various fund categories by making comparative calculations using total returns.
According to data from Morningstar as of June 30, 2008, the Balanced Fund ranked 204th of 637 Conservative Allocation funds for the calendar year ended June 30, 2008 and 39th out of 278 funds for five years. Morningstar ranks funds in various fund categories by making comparative calculations using total returns.
| | |
| 102 | | Annual Report | June 30, 2008 |
Balanced Fund
MANAGER’S COMMENTARY (continued)
Balanced Fund vs. S&P 500 Index & Bloomberg/EFFAS Bond Index & Lipper Balanced Funds Index & Balanced Benchmark 6/30/01 to 6/30/08
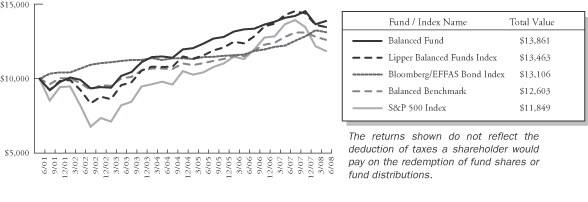
Detailed Explanation of Quarterly Performance—What Worked Well
The Short Version: Energy stocks highlighted our list of top performers for the quarter, as the continued surge in oil, gas, and other commodity prices prompted an increase in many related securities. A total of five energy companies made the list and, combined, they contributed just under three-quarters of a percent to the Fund’s return. Three holdings, two of which were energy-related, climbed over 50% during the three-month period.
These are the ten best-performing stocks for the quarter ended June 30, 2008:
| | | | | | |
| Rank | | Description | | Industry | | % Gain |
| 1 | | Peabody Energy Corp | | Coal | | 72.7% |
| 2 | | Safeco Corp | | Insurance | | 53.1% |
| 3 | | National Oilwell Varco Inc | | Oil & Gas Services | | 52.0% |
| 4 | | United States Steel Corp | | Iron/Steel | | 45.7% |
| 5 | | Hess Corp | | Oil & Gas | | 43.1% |
| 6 | | Sprint Nextel Corp | | Telecommunications | | 42.0% |
| 7 | | Nabors Industries Ltd | | Oil & Gas | | 38.2% |
| 8 | | Halliburton Co | | Oil & Gas Services | | 34.9% |
| 9 | | Fluor Corp | | Engineering & Construction | | 31.8% |
| 10 | | Anheuser-Busch Cos Inc | | Beverages | | 30.9% |
| | | | | | | |
These days, a lump of coal in the old holiday stocking actually would be a pretty good thing. Peabody Energy Corp, whose stock price surged by over 70% in the June quarter, was the Fund’s top performer. The company is among the world’s largest coal producers and continued to benefit from soaring commodity prices that have been driven by the increased demand in emerging markets like China and India. In April, Peabody increased its earnings targets for the fiscal year while high natural gas prices and the weak dollar contributed to the strong global demand. By late-June, the company’s stock price had climbed to an all-time high.
Detailed Explanation of Quarterly Performance—What Didn’t Work
The Short Version: Much of the negative economic news revolved around financial companies, and our Fund was not immune this quarter. Five of the poorest performers came from that sector (including four banks) and cost the Fund about one and a quarter percent in return. Consumers also felt the strain of the ongoing economic weakness, and three-related companies (all consumer cyclicals) also made the worst-performing list.
Balanced Fund
MANAGER’S COMMENTARY (continued)
These are the ten worst-performing stocks for the quarter ended June 30, 2008:
| | | | | | |
| Rank | | Description | | Industry | | % Loss |
| 1 | | Keycorp | | Banks | | -50.0% |
| 2 | | Wachovia Corp | | Banks | | -42.5% |
| 3 | | International Game Technology | | Entertainment | | -37.9% |
| 4 | | Bank of America Corp | | Banks | | -36.6% |
| 5 | | SunTrust Banks Inc | | Banks | | -34.3% |
| 6 | | Whirlpool Corp | | Home Furnishings | | -28.9% |
| 7 | | General Electric Co | | Miscellaneous Manufacturing | | -27.9% |
| 8 | | Sears Holdings Corp | | Retail | | -27.9% |
| 9 | | Ciena Corp | | Telecommunications | | -24.9% |
| 10 | | Principal Financial Group Inc | | Insurance | | -24.7% |
| | | | | | | |
Bank of America, the giant Charlotte, North Carolina-based bank holding company, was one such financial services company that cost the Fund during the past three months and lost over 35% of its value. As the credit crisis continued to worsen, Bank of America played “white knight” and agreed to purchase Countrywide Financial for an estimated $4 billion. Once the country’s largest mortgage lender, Countrywide had become one of the poster children for the subprime debacle, and some investors became leery that the acquisition would hurt Bank of America’s future earnings and ongoing operations. Despite speculation that the deal may not go through, Countrywide’s shareholders approved it in June, though the value had declined to about $2.6 billion because of the drop in stock price. The transaction was completed on July 1 (just after the end of the fiscal year) and Bank of America is now the country’s largest mortgage lender and servicer.
Detailed Explanation of Fiscal Year Performance—What Worked Well
The Short Version: Commodities continued to surge during the fiscal year, and companies within industries that deal with natural resources and related products performed best. Many of these holdings derive income from international sources and benefited from the weak dollar. Our top performer list was comprised entirely of energy, basic materials, and industrial companies, many of which engage in some commodities-driven operations. These ten performers contributed about two percent to the return over the fiscal year.
Here are the ten best-performing companies for the fiscal year ended June 30, 2008:
| | | | | | |
| Rank | | Description | | Industry | | % Gain |
| 1 | | Hess Corp | | Oil & Gas | | 96.1% |
| 2 | | Monsanto Co | | Chemicals | | 87.2% |
| 3 | | EOG Resources Inc | | Oil & Gas | | 79.6% |
| 4 | | United States Steel Corp | | Iron/Steel | | 69.9% |
| 5 | | Fluor Corp | | Engineering & Construction | | 67.1% |
| 6 | | Mosaic Co/The | | Chemicals | | 59.6% |
| 7 | | Potash Corp of Saskatchewan | | Chemicals | | 57.7% |
| 8 | | Occidental Petroleum Corp | | Oil & Gas | | 56.4% |
| 9 | | Apache Corp | | Oil & Gas | | 54.6% |
| 10 | | Peabody Energy Corp | | Coal | | 54.1% |
| | | | | | | |
Potash Corp. of Saskatchewan is one of our chemical holdings that performed quite well for our Fund, as its stock price increased by over 50% during the fiscal year. The Canadian-based company produces and markets fertilizer and related products across the globe. As the population in many emerging markets become more affluent, demand for food and other materials has increased dramatically, thus, enhancing the farmers’ needs for fertilizer. Additionally, natural disasters like the floods that devastated the Midwest earlier in the year also contributed to the shrinking supply (and rising demand) for grains, foods, and other products. In June, one noted analyst increased his long-term price target to $340 (its stock closed the fiscal year at $228), claiming that market fundamentals look strong for the next five years and beyond. Monsanto and Mosaic were two other related chemical holdings with similar performance stories as Potash Corp’s. Combined, these three holdings contributed over three-quarters of a percent to the Fund’s performance.
| | |
| 104 | | Annual Report | June 30, 2008 |
Balanced Fund
MANAGER’S COMMENTARY (continued)
Detailed Explanation of Fiscal Year Performance—What Didn’t Work
The Short Version: Seven financial services companies were among the Fund’s worst performers, and another three consumer-related stocks (all retailers) also made the list. Each of these holdings declined in value by over 50% and, combined, they cost the Fund over two percent in return.
These are the ten worst-performing stocks for the fiscal year ended June 30, 2008:
| | | | | | |
| Rank | | Description | | Industry | | % Loss |
| 1 | | E*Trade Financial Corp | | Diversified Financial Services | | -85.8% |
| 2 | | Wachovia Corp | | Banks | | -68.7% |
| 3 | | Keycorp | | Banks | | -68.0% |
| 4 | | SLM Corp | | Diversified Financial Services | | -66.4% |
| 5 | | OfficeMax Inc | | Retail | | -64.6% |
| 6 | | Office Depot Inc | | Retail | | -63.9% |
| 7 | | Merrill Lynch & Co Inc | | Diversified Financial Services | | -62.1% |
| 8 | | Circuit City Stores Inc | | Retail | | -60.4% |
| 9 | | CIT Group Inc | | Diversified Financial Services | | -60.0% |
| 10 | | Lehman Brothers Holdings Inc | | Diversified Financial Services | | -59.9% |
| | | | | | | |
North Carolina-based Wachovia is the nation’s fourth largest bank and the Fund’s second worst performer for the fiscal year. Unfortunately, management’s decision to purchase Golden West Financial, a California-based mortgage company, in 2006 contributed greatly to the financial hardships the bank has incurred over the past 12 months. In May, Wachovia reported a loss of $708 million in the first quarter and was forced to cut its dividend and seek additional capital through the issuance of new common and preferred stock. The company also became the target of an SEC investigation and related class-action lawsuits over its role in misrepresenting certain auction-rate securities.
Background on Fixed Income Securities Strategy
This fiscal year saw a flight-to-quality from equities and other investments into fixed-income securities. We see this clearly as the Bloomberg/EFFAS U.S. Government 1-3 Year Total Return Bond Index rose a very strong 7.29%. Our fixed income holdings remain largely in short term U.S. Treasury Bills and Notes and as such, the Fund did not participate in this significant rally. While that may be disappointing in the short run, our fixed income positions are very much in line with our desire to not take on significant credit and interest rate risk. This strategy is dictated by the quantitative work we did during the creation of this fund where we learned that fixed income needed to be the anchor of the fund and not the sail. This has served us well on a long term basis as we have out performed the Bloomberg/EFFAS U.S. Government 1-3 Year Total Return Bond Index for 5 years (6.37% to 3.20%) and since inception (4.77% to 3.94%).
Top Ten Equity Holdings as of June 30, 2008
Diversification remains a key objective of the Balanced Fund. In fact, our top ten holdings combined to account for only around 12.5% of the Fund. Banks, pharmaceuticals, and chemical companies contributed two stocks each to our top equity holdings list.
| | | | | | |
| Rank | | Description | | Industry | | % of Net Assets |
| 1 | | Bristol-Myers Squibb Co. | | Pharmaceuticals | | 2.0% |
| 2 | | US Bancorp | | Banks | | 1.5% |
| 3 | | AT&T, Inc. | | Telecommunications | | 1.5% |
| 4 | | Dow Chemical Co. | | Chemicals | | 1.4% |
| 5 | | Bank of America Corp. | | Banks | | 1.2% |
| 6 | | Apple, Inc. | | Computers | | 1.2% |
| 7 | | AGCO Corp. | | Machinery-Diversified | | 1.0% |
| 8 | | CF Industries Holdings, Inc. | | Chemicals | | 1.0% |
| 9 | | CBS Corp. | | Media | | 0.9% |
| 10 | | OSI Pharmaceuticals, Inc. | | Pharmaceuticals | | 0.8% |
| | | | | | | |
| | | | | | 12.5% |
Balanced Fund
MANAGER’S COMMENTARY (continued)
Industry Sector Representation as of June 30, 2008
As of June 30, 2008, equities comprised about 57% of the Fund’s allocation, while U.S. government obligations made up just over 35% of its net assets. Financials and consumer non-cyclicals represented the two largest equity allocations within the Fund. Both sectors struggled as the subprime debacle became a full-fledged credit crisis. While non-cyclical stocks often fare better than their cyclical counterparts, consumer-related companies in general suffered over the past three (and twelve) months. These factors prompted some losses during both the quarterly and annual time frames and cost us in terms of absolute performance. Still, the models generated some excellent stock picks that propelled the Fund’s return into positive territory last quarter, while each of the benchmarks lagged behind.
| | |
Common Stock | | 57.4% |
Basic Materials | | 4.4% |
Communications | | 7.3% |
Consumer, Cyclical | | 3.2% |
Consumer, Non-cyclical | | 12.1% |
Energy | | 7.4% |
Financial | | 10.3% |
Industrial | | 6.4% |
Technology | | 4.5% |
Utilities | | 1.8% |
U.S. Government Obligations | | 35.8% |
Corporate Notes | | 2.7% |
Covered Call Options Written | | -0.1% |
Put Options Written | | -0.1% |
Money Market Funds | | 5.2% |
Liabilities in Excess of Other Assets | | -0.9% |
| | | |
Total | | 100.0% |
Disclaimer
The following is a reminder from the friendly folks at your Fund who worry about liability. The views expressed here are exclusively those of Fund management. These views, including those of market sectors or individual stocks, are not meant as investment advice and should not be considered predictive in nature. Any favorable (or unfavorable) description of a holding applies only as of the quarter end, June 30, 2008, unless otherwise stated. Security positions can and do change thereafter. Discussions of historical performance do not guarantee and are not indicative of future performance.
Market volatility can significantly affect short-term performance. The Fund is not an appropriate investment for short-term investors. Investments in the small companies within this multi-cap fund generally carry greater risk than is customarily associated with larger companies. This additional risk is attributable to a number of factors, including the relatively limited financial resources that are typically available to small companies, and the fact that small companies often have comparatively limited product lines. In addition, the stock of small companies tends to be more volatile than the stock of large companies, particularly in the short term and particularly in the early stages of an economic or market downturn. The Fund’s use of options, futures, and leverage can magnify the risk of loss in an unfavorable market, and the Fund’s use of short-sale positions can, in theory, expose shareholders to unlimited loss. Shareholders of the Fund, therefore, are taking on more risk than they would if they invested in the stock market as a whole. The Fund uses an option writing strategy in which the Fund may sell covered calls or secured put options. Up to 75% of Fund assets may be invested in options. Options are subject to special risks and may not fully protect the Fund against declines in the value of its stocks. In addition, an option writing strategy limits the upside profit potential normally associated with stocks. Finally, the Fund’s fixed-income holdings are subject to three types of risk. Interest rate risk is the chance that bond prices overall will decline as interest rates rise. Credit risk is the chance a bond issuer will fail to pay interest and principal. Prepayment risk is the chance a mortgage-backed bond issuer will repay a higher yielding bond, resulting in a lower paying yield.
| | |
| 106 | | Annual Report | June 30, 2008 |
Balanced Fund
MANAGER’S COMMENTARY (continued)
Conclusion
In closing, we would like to thank you for your continued investment in Balanced Fund. We appreciate your feedback, so please call or write us with any questions or comments. We work for you and value your input.
Sincerely,
Your Investment Management Team
Bridgeway Balanced Fund
SCHEDULE OF INVESTMENTS
Showing percentage of net assets as of June 30, 2008
| | | | | | | |
| Industry | | Company | | Shares | | Value |
|
COMMON STOCKS - 57.36% |
Advertising - 0.12% |
| | Omnicom Group, Inc.# | | 2,000 | | $ | 89,760 |
|
Aerospace/Defense - 1.06% |
| | General Dynamics Corp. | | 1,400 | | | 117,880 |
| | Goodrich Corp. | | 1,800 | | | 85,428 |
| | Lockheed Martin Corp.# | | 3,470 | | | 342,350 |
| | Northrop Grumman Corp. | | 2,200 | | | 147,180 |
| | United Technologies Corp. | | 1,740 | | | 107,358 |
| | | | | | | |
| | | | | | | 800,196 |
|
Agriculture - 0.70% |
| | Archer-Daniels-Midland Co. | | 15,600 | | | 526,500 |
|
Apparel - 0.30% |
| | Coach, Inc.*+ | | 4,600 | | | 132,848 |
| | NIKE, Inc., Class B | | 1,600 | | | 95,376 |
| | | | | | | |
| | | | | | | 228,224 |
|
Auto Parts & Equipment - 0.13% |
| | Johnson Controls, Inc.# | | 2,340 | | | 67,111 |
| | WABCO Holdings, Inc. | | 600 | | | 27,876 |
| | | | | | | |
| | | | | | | 94,987 |
|
Banks - 4.73% |
| | Bank of America Corp.# | | 39,100 | | | 933,317 |
| | Bank of New York Mellon
Corp. | | 8,032 | | | 303,851 |
| | KeyCorp. | | 5,400 | | | 59,292 |
| | Northern Trust Corp. | | 2,900 | | | 198,853 |
| | State Street Corp. | | 3,300 | | | 211,167 |
| | SunTrust Banks, Inc.# | | 3,200 | | | 115,904 |
| | US Bancorp#+ | | 40,300 | | | 1,123,967 |
| | Wachovia Corp.#+ | | 27,389 | | | 425,351 |
| | Wells Fargo & Co.#+ | | 8,200 | | | 194,750 |
| | | | | | | |
| | | | | | | 3,566,452 |
|
Beverages - 1.10% |
| | Anheuser-Busch Cos., Inc. | | 2,000 | | | 124,240 |
| | Brown-Forman Corp., Class B | | 1,800 | | | 136,026 |
| | Coca-Cola Co. | | 3,900 | | | 202,722 |
| | Pepsi Bottling Group, Inc. | | 4,400 | | | 122,848 |
| | PepsiCo., Inc. | | 3,800 | | | 241,642 |
| | | | | | | |
| | | | | | | 827,478 |
|
Biotechnology - 1.83% |
| | Biogen Idec, Inc.*# | | 2,200 | | | 122,958 |
| | Genzyme Corp.* | | 1,800 | | | 129,636 |
| | Gilead Sciences, Inc.* | | 9,800 | | | 518,910 |
| | OSI Pharmaceuticals, Inc.*# | | 14,700 | | | 607,404 |
| | | | | | | |
| | | | | | | 1,378,908 |
| | | | | | | |
| Industry | | Company | | Shares | | Value |
|
|
Chemicals - 3.83% |
| | CF Industries Holdings, Inc.# | | 5,000 | | $ | 764,000 |
| | Dow Chemical Co.# | | 30,000 | | | 1,047,300 |
| | Monsanto Co.# | | 4,700 | | | 594,268 |
| | NewMarket Corp.# | | 2,500 | | | 165,575 |
| | Sherwin-Williams Co.# | | 3,500 | | | 160,755 |
| | Sigma-Aldrich Corp. | | 2,900 | | | 156,194 |
| | | | | | | |
| | | | | | | 2,888,092 |
|
Coal - 0.20% |
| | Peabody Energy Corp.+ | | 1,700 | | | 149,685 |
|
Commercial Services - 0.57% |
| | Automatic Data Processing, Inc.# | | 3,700 | | | 155,030 |
| | Equifax, Inc. | | 2,600 | | | 87,412 |
| | Moody’s Corp.+ | | 800 | | | 27,552 |
| | Paychex, Inc.+ | | 2,200 | | | 68,816 |
| | Robert Half International, Inc. | | 600 | | | 14,382 |
| | Western Union Co. | | 3,000 | | | 74,160 |
| | | | | | | |
| | | | | | | 427,352 |
|
Computers - 2.34% |
| | Apple, Inc.*# | | 5,200 | | | 870,688 |
| | Hewlett-Packard Co.# | | 7,800 | | | 344,838 |
| | International Business Machines Corp. | | 1,000 | | | 118,530 |
| | NCR Corp.* | | 6,300 | | | 158,760 |
| | NetApp, Inc.* | | 5,800 | | | 125,628 |
| | Teradata Corp.*#+ | | 6,300 | | | 145,782 |
| | | | | | | |
| | | | | | | 1,764,226 |
|
Cosmetics/Personal Care - 0.82% |
| | Colgate-Palmolive Co. | | 4,400 | | | 304,040 |
| | Estee Lauder Cos., Inc., Class A | | 1,600 | | | 74,320 |
| | Procter & Gamble Co.# | | 4,000 | | | 243,240 |
| | | | | | | |
| | | | | | | 621,600 |
|
Distribution/Wholesale - 0.05% |
| | WW Grainger, Inc. | | 500 | | | 40,900 |
|
Diversified Financial Services - 2.65% |
| | Ameriprise Financial, Inc. | | 2,780 | | | 113,063 |
| | Charles Schwab Corp.# | | 16,300 | | | 334,802 |
| | Citigroup, Inc.# | | 35,100 | | | 588,276 |
| | Discover Financial Services | | 1,550 | | | 20,413 |
| | E*Trade Financial Corp.*+ | | 11,400 | | | 35,796 |
| | Franklin Resources, Inc.# | | 2,800 | | | 256,620 |
| | Goldman Sachs Group, Inc.# | | 1,100 | | | 192,390 |
| | Merrill Lynch & Co., Inc.# | | 1,600 | | | 50,736 |
| | Morgan Stanley#+ | | 3,000 | | | 108,210 |
| | |
| 108 | | Annual Report | June 30, 2008 |
Bridgeway Balanced Fund
SCHEDULE OF INVESTMENTS (continued)
Showing percentage of net assets as of June 30, 2008
| | | | | | | |
| Industry | | Company | | Shares | | Value |
|
Common Stocks (continued) |
Diversified Financial Services (continued) |
| | SLM Corp.*# | | 810 | | $ | 15,674 |
| | T Rowe Price Group, Inc. | | 5,000 | | | 282,350 |
| | | | | | | |
| | | | | | | 1,998,330 |
|
Electric Utilities - 1.31% |
| | AES Corp.*# | | 14,100 | | | 270,861 |
| | Allegheny Energy, Inc. | | 2,300 | | | 115,253 |
| | Dominion Resources, Inc. | | 5,620 | | | 266,894 |
| | Exelon Corp. | | 1,100 | | | 98,956 |
| | Public Service Enterprise Group, Inc.# | | 5,100 | | | 234,243 |
| | | | | | | |
| | | | | | | 986,207 |
|
Electrical Components & Equipment - 0.24% |
| | Emerson Electric Co. | | 3,600 | | | 178,020 |
|
Electronics - 0.38% |
| | Agilent Technologies, Inc.*# | | 4,500 | | | 159,930 |
| | Thermo Fisher Scientific, Inc.*+ | | 2,300 | | | 128,179 |
| | | | | | | |
| | | | | | | 288,109 |
|
Engineering & Construction - 0.20% |
| | Fluor Corp.+ | | 800 | | | 148,864 |
|
Entertainment - 0.04% |
| | International Game Technology# | | 1,200 | | | 29,976 |
|
Environmental Control - 0.09% |
| | Allied Waste Industries, Inc.*# | | 5,200 | | | 65,624 |
|
Food - 0.75% |
| | Campbell Soup Co.+ | | 3,200 | | | 107,072 |
| | Kraft Foods, Inc., Class A | | 3,400 | | | 96,730 |
| | Kroger Co. | | 3,800 | | | 109,706 |
| | Safeway, Inc. | | 8,700 | | | 248,385 |
| | | | | | | |
| | | | | | | 561,893 |
|
Forest Products & Paper - 0.14% |
| | International Paper Co. | | 4,500 | | | 104,850 |
|
Gas - 0.52% |
| | Nicor, Inc. | | 1,200 | | | 51,108 |
| | Sempra Energy#+ | | 6,000 | | | 338,700 |
| | | | | | | |
| | | | | | | 389,808 |
|
Healthcare - Products - 1.79% |
| | Baxter International, Inc.#+ | | 6,500 | | | 415,610 |
| | Becton Dickinson & Co. | | 3,420 | | | 278,046 |
| | CR Bard, Inc. | | 2,600 | | | 228,670 |
| | | | | | | |
| Industry | | Company | | Shares | | Value |
|
|
Healthcare - Products (continued) |
| | Medtronic, Inc. | | 1,000 | | $ | 51,750 |
| | St. Jude Medical, Inc.* | | 1,080 | | | 44,150 |
| | Stryker Corp. | | 5,260 | | | 330,749 |
| | | | | | | |
| | | | | | | 1,348,975 |
|
Healthcare - Services - 0.57% |
| | Aetna, Inc. | | 1,800 | | | 72,954 |
| | CIGNA Corp. | | 2,700 | | | 95,553 |
| | Humana, Inc.* | | 1,000 | | | 39,770 |
| | Laboratory Corp. of America Holdings* | | 800 | | | 55,704 |
| | Quest Diagnostics, Inc. | | 1,500 | | | 72,705 |
| | UnitedHealth Group, Inc.# | | 3,600 | | | 94,500 |
| | | | | | | |
| | | | | | | 431,186 |
|
Home Furnishings - 0.05% |
| | Whirlpool Corp.# | | 600 | | | 37,038 |
| | |
Household Products/Wares - 0.32% | | | | | |
| | Clorox Co. | | 1,530 | | | 79,866 |
| | Kimberly-Clark Corp. | | 2,700 | | | 161,406 |
| | | | | | | |
| | | | | | | 241,272 |
|
Insurance - 2.89% |
| | ACE, Ltd. | | 1,400 | | | 77,126 |
| | Aflac, Inc. | | 800 | | | 50,240 |
| | Allstate Corp.# | | 1,000 | | | 45,590 |
| | AON Corp.# | | 3,500 | | | 160,790 |
| | Berkshire Hathaway, Inc., Class B* | | 120 | | | 481,440 |
| | Chubb Corp. | | 4,500 | | | 220,545 |
| | Genworth Financial, Inc., Class A | | 2,600 | | | 46,306 |
| | Hartford Financial Services Group, Inc. | | 900 | | | 58,113 |
| | MetLife, Inc.+ | | 4,600 | | | 242,742 |
| | Principal Financial Group, Inc.# | | 4,700 | | | 197,259 |
| | Progressive Corp.# | | 5,520 | | | 103,335 |
| | Prudential Financial, Inc. | | 1,200 | | | 71,688 |
| | Safeco Corp. | | 3,420 | | | 229,687 |
| | Travelers Cos., Inc.# | | 4,500 | | | 195,300 |
| | | | | | | |
| | | | | | | 2,180,161 |
|
Internet - 1.00% |
| | Amazon.com, Inc.*+ | | 3,100 | | | 227,323 |
| | eBay, Inc.*# | | 6,900 | | | 188,577 |
| | Google, Inc., Class A* | | 600 | | | 315,852 |
| | Yahoo!, Inc.* | | 1,000 | | | 20,660 |
| | | | | | | |
| | | | | | | 752,412 |
|
Iron/Steel - 0.34% |
| | United States Steel Corp. | | 1,400 | | | 258,692 |
Bridgeway Balanced Fund
SCHEDULE OF INVESTMENTS (continued)
Showing percentage of net assets as of June 30, 2008
| | | | | | | |
| Industry | | Company | | Shares | | Value |
|
Common Stocks (continued) |
Leisure Time - 0.14% |
| | Harley-Davidson, Inc.# | | 2,900 | | $ | 105,154 |
|
Lodging - 0.16% |
| | Marriott International, Inc., Class A# | | 4,500 | | | 118,080 |
|
Machinery - Construction & Mining - 0.18% |
| | Terex Corp.*# | | 2,700 | | | 138,699 |
|
Machinery - Diversified - 1.24% |
| | AGCO Corp.*# | | 15,000 | | | 786,150 |
| | Deere & Co. | | 2,100 | | | 151,473 |
| | | | | | | |
| | | | | | | 937,623 |
|
Media - 2.21% |
| | CBS Corp., Class B# | | 33,200 | | | 647,068 |
| | Comcast Corp., Class A# | | 10,950 | | | 207,721 |
| | McGraw-Hill Cos., Inc.+ | | 4,000 | | | 160,480 |
| | News Corp., Class A | | 14,000 | | | 210,560 |
| | Time Warner, Inc. | | 15,900 | | | 235,320 |
| | Walt Disney Co.# | | 6,700 | | | 209,040 |
| | | | | | | |
| | | | | | | 1,670,189 |
|
Mining - 0.08% |
| | Alcoa, Inc.# | | 1,600 | | | 56,992 |
|
Miscellaneous Manufacturing - 1.98% |
| | Cooper Industries, Ltd., Class A | | 5,200 | | | 205,400 |
| | Danaher Corp. | | 2,400 | | | 185,520 |
| | Eaton Corp. | | 2,200 | | | 186,934 |
| | General Electric Co. | | 6,000 | | | 160,140 |
| | Honeywell International, Inc. | | 3,900 | | | 196,092 |
| | Illinois Tool Works, Inc. | | 2,000 | | | 95,020 |
| | Parker Hannifin Corp.# | | 4,350 | | | 310,242 |
| | Textron, Inc. | | 3,200 | | | 153,376 |
| | | | | | | |
| | | | | | | 1,492,724 |
|
Office/Business Equipment - 0.07% |
| | Pitney Bowes, Inc. | | 1,600 | | | 54,560 |
|
Oil & Gas - 5.49% |
| | Anadarko Petroleum Corp.# | | 5,300 | | | 396,652 |
| | Apache Corp. | | 1,700 | | | 236,300 |
| | Chevron Corp.# | | 5,478 | | | 543,034 |
| | ConocoPhillips# | | 5,987 | | | 565,113 |
| | EOG Resources, Inc. | | 2,400 | | | 314,880 |
| | Exxon Mobil Corp.# | | 6,500 | | | 572,845 |
| | Hess Corp.#+ | | 3,660 | | | 461,855 |
| | Marathon Oil Corp. | | 4,000 | | | 207,480 |
| | Nabors Industries, Ltd.* | | 4,400 | | | 216,612 |
| | | | | | | |
| Industry | | Company | | Shares | | Value |
|
|
Oil & Gas (continued) |
| | Occidental Petroleum Corp.#+ | | 5,300 | | $ | 476,258 |
| | Valero Energy Corp. | | 3,700 | | | 152,366 |
| | | | | | | |
| | | | | | | 4,143,395 |
|
Oil & Gas Services - 1.38% |
| | Baker Hughes, Inc.# | | 1,200 | | | 104,808 |
| | Halliburton Co.# | | 11,000 | | | 583,770 |
| | National Oilwell Varco, Inc.* | | 4,000 | | | 354,880 |
| | | | | | | |
| | | | | | | 1,043,458 |
|
Packaging & Containers - 0.06% |
| | Pactiv Corp.*# | | 2,100 | | | 44,583 |
|
Pharmaceuticals - 3.70% |
| | Allergan, Inc.+ | | 1,900 | | | 98,895 |
| | Bristol-Myers Squibb Co.# | | 72,400 | | | 1,486,372 |
| | Cardinal Health, Inc. | | 2,100 | | | 108,318 |
| | Express Scripts, Inc.* | | 3,000 | | | 188,160 |
| | Hospira, Inc.*# | | 7,700 | | | 308,847 |
| | Medco Health Solutions, Inc.*# | | 7,000 | | | 330,400 |
| | Merck & Co., Inc. | | 3,700 | | | 139,453 |
| | Pfizer, Inc. | | 7,600 | | | 132,772 |
| | | | | | | |
| | | | | | | 2,793,217 |
|
Pipelines - 0.34% |
| | El Paso Corp. | | 5,000 | | | 108,700 |
| | Spectra Energy Corp. | | 5,250 | | | 150,885 |
| | | | | | | |
| | | | | | | 259,585 |
|
Retail - 2.19% |
| | Autozone, Inc.* | | 1,700 | | | 205,717 |
| | Costco Wholesale Corp.+ | | 1,000 | | | 70,140 |
| | CVS Caremark Corp.# | | 9,600 | | | 379,872 |
| | Dillard’s, Inc., Class A# | | 1,500 | | | 17,355 |
| | JC Penney Co., Inc.# | | 1,000 | | | 36,290 |
| | Limited Brands, Inc. | | 2,000 | | | 33,700 |
| | Nordstrom, Inc. | | 5,000 | | | 151,500 |
| | Office Depot, Inc.*# | | 4,300 | | | 47,042 |
| | OfficeMax, Inc.# | | 1,500 | | | 20,850 |
| | Sears Holdings Corp.*#+ | | 1,200 | | | 88,392 |
| | Staples, Inc.+ | | 3,950 | | | 93,813 |
| | Starbucks Corp.*# | | 3,700 | | | 58,238 |
| | Wal-Mart Stores, Inc. | | 6,600 | | | 370,920 |
| | Walgreen Co.#+ | | 2,500 | | | 81,275 |
| | | | | | | |
| | | | | | | 1,655,104 |
|
Semiconductors - 0.70% |
| | Applied Materials, Inc.#+ | | 10,700 | | | 204,263 |
| | NVIDIA Corp.* | | 5,000 | | | 93,600 |
| | Texas Instruments, Inc. | | 8,070 | | | 227,251 |
| | | | | | | |
| | | | | | | 525,114 |
| | |
| 110 | | Annual Report | June 30, 2008 |
Bridgeway Balanced Fund
SCHEDULE OF INVESTMENTS (continued)
Showing percentage of net assets as of June 30, 2008
| | | | | | | |
| Industry | | Company | | Shares | |
Value |
|
Common Stocks (continued) |
Software - 1.43% |
| | Adobe Systems, Inc.*# | | 7,000 | | $ | 275,730 |
| | BMC Software, Inc.*# | | 3,920 | | | 141,120 |
| | Citrix Systems, Inc.* | | 4,300 | | | 126,463 |
| | IMS Health, Inc. | | 2,800 | | | 65,240 |
| | Intuit, Inc.*# | | 5,600 | | | 154,392 |
| | Novell, Inc.* | | 5,400 | | | 31,806 |
| | Oracle Corp.* | | 13,660 | | | 286,860 |
| | | | | | | |
| | | | | | | 1,081,611 |
|
Telecommunications - 3.93% |
| | AT&T, Inc.# | | 32,700 | | | 1,101,663 |
| | Ciena Corp.*#+ | | 5,942 | | | 137,676 |
| | Cisco Systems, Inc.*+ | | 14,900 | | | 346,574 |
| | Corning, Inc.+ | | 7,500 | | | 172,875 |
| | Motorola, Inc.#+ | | 5,300 | | | 38,902 |
| | QUALCOMM, Inc.# | | 11,800 | | | 523,566 |
| | Sprint Nextel Corp.#+ | | 12,800 | | | 121,600 |
| | Verizon Communications, Inc.#+ | | 14,700 | | | 520,380 |
| | | | | | | |
| | | | | | | 2,963,236 |
|
Toys/Games/Hobbies - 0.05% |
| | Mattel, Inc.# | | 2,200 | | | 37,664 |
|
Transportation - 0.97% |
| | CSX Corp.# | | 5,400 | | | 339,174 |
| | Norfolk Southern Corp. | | 1,900 | | | 119,073 |
| | Union Pacific Corp.# | | 2,800 | | | 211,400 |
| | United Parcel Service, Inc., Class B | | 1,000 | | | 61,470 |
| | | | | | | |
| | | | | | | 731,117 |
| | | | | | | |
| |
TOTAL COMMON STOCKS - 57.36% | | | 43,257,882 |
| | | | | | | |
(Cost $38,560,489) | | | |
| | | | | | | | |
|
CORPORATE NOTES - 2.65% |
| | | |
| Due Date | | Discount Rate
or Coupon Rate | | Principal
Amount | | Value |
|
Holding Companies - Diversified - 2.65% |
Leucadia National Corp. | | | | | | |
8/15/2013 | | 7.750% | | $ | 2,000,000 | | $ | 2,000,000 |
| | | | | | | | |
| |
TOTAL CORPORATE NOTES - 2.65% | | | 2,000,000 |
| | | | | | | | |
(Cost $2,058,123) | | | |
|
U.S. GOVERNMENT OBLIGATIONS - 35.78% |
| | | |
| Due Date | | Discount Rate
or Coupon Rate | | Principal
Amount | | Value |
U.S. Treasury Bills - 20.44% | | | |
7/10/2008 | | 3.222% | | | 2,500,000 | | | 2,499,495 |
7/31/2008 | | 1.425% | | | 3,000,000 | | | 2,995,839 |
| | | | | | | | |
| Maturity Date | | Discount Rate
or Coupon Rate | | Principal
Amount | | Value |
|
|
U.S. Treasury Bills (continued) | | | |
9/18/2008 | | 2.061% | | $ | 2,000,000 | | $ | 1,992,130 |
10/30/2008 | | 1.715% | | | 3,000,000 | | | 2,981,346 |
11/20/2008 | | 1.903% | | | 3,000,000 | | | 2,976,096 |
12/26/2008 | | 2.281% | | | 2,000,000 | | | 1,979,036 |
| | | | | | | | |
| | | | | | | | 15,423,942 |
|
U.S. Treasury Notes - 15.34% |
8/31/2008 | | 4.875% | | | 300,000 | | | 301,453 |
10/15/2008 | | 3.125% | | | 200,000 | | | 200,781 |
11/15/2008 | | 3.375% | | | 200,000 | | | 200,953 |
4/15/2009 | | 3.125% | | | 300,000 | | | 301,805 |
4/30/2009 | | 4.500% | | | 300,000 | | | 305,320 |
6/15/2009 | | 4.000% | | | 300,000 | | | 304,570 |
8/15/2009 | | 3.500% | | | 200,000 | | | 202,547 |
10/15/2009 | | 3.375% | | | 300,000 | | | 304,055 |
11/15/2009 | | 3.500% | | | 200,000 | | | 203,125 |
11/30/2009 | | 3.125% | | | 300,000 | | | 303,117 |
12/31/2009 | | 3.250% | | | 200,000 | | | 202,391 |
2/15/2010 | | 3.500% | | | 300,000 | | | 305,063 |
4/15/2010 | | 4.000% | | | 300,000 | | | 307,641 |
6/15/2010 | | 3.625% | | | 500,000 | | | 510,078 |
7/15/2010 | | 3.875% | | | 500,000 | | | 512,578 |
10/15/2010 | | 4.250% | | | 500,000 | | | 517,695 |
3/31/2011 | | 4.750% | | | 1,000,000 | | | 1,049,297 |
4/30/2011 | | 4.875% | | | 2,000,000 | | | 2,108,282 |
7/31/2011 | | 4.875% | | | 1,000,000 | | | 1,056,484 |
8/31/2011 | | 4.625% | | | 300,000 | | | 314,531 |
4/30/2012 | | 4.500% | | | 300,000 | | | 314,484 |
11/30/2012 | | 3.375% | | | 300,000 | | | 301,313 |
12/31/2012 | | 3.625% | | | 200,000 | | | 203,047 |
6/30/2013 | | 3.375% | | | 500,000 | | | 500,898 |
11/15/2013 | | 4.250% | | | 200,000 | | | 208,719 |
2/15/2015 | | 4.000% | | | 200,000 | | | 205,578 |
5/15/2017 | | 4.500% | | | 300,000 | | | 312,469 |
| | | | | | | | |
| | | | | | | | 11,558,274 |
| | | | | | | | |
| |
TOTAL U.S. GOVERNMENT OBLIGATIONS - 35.78% | | | 26,982,216 |
| | | | | | | | |
(Cost $26,589,890) | | | |
| | | | | |
|
PURCHASED CALL OPTIONS - 0.08% |
| | |
| Company | | Number
of Contracts | | Value |
Pfizer, Inc.
Expiring January, 2010 at $20.00 | | 550 | | $ | 61,875 |
| | | | | |
| |
TOTAL PURCHASED CALL OPTIONS - 0.08% | | | 61,875 |
| | | | | |
(Cost $115,234) | | | | | |
Bridgeway Balanced Fund
SCHEDULE OF INVESTMENTS (continued)
Showing percentage of net assets as of June 30, 2008
| | | | | | | | |
| | | Rate^ | | Shares | | Value | |
|
MONEY MARKET FUNDS - 5.22% | |
BlackRock Liquidity Funds TempFund Portfolio #24 | | 2.57% | | 1,228,474 | | $ | 1,228,474 | |
BlackRock Temp Cash Liquidity Fund Institutional Shares #21 | | 2.61% | | 2,712,092 | | | 2,712,092 | |
| | | | | | | | |
| |
TOTAL MONEY MARKET FUNDS - 5.22% | | | 3,940,566 | |
| | | | | | | | |
(Cost $3,940,566) | | | | |
| |
TOTAL INVESTMENTS - 101.09% | | $ | 76,242,539 | |
(Cost $71,264,302) | | | | |
Liabilities in Excess of Other Assets - (1.09)% | | | (825,262 | ) |
| | | | | | | | |
NET ASSETS - 100.00% | | $ | 75,417,277 | |
| | | | | | | | |
| # | Security subject to call option written by the Fund. |
| * | Non Income Producing Security. |
| + | This security or a portion of the security is out on loan at June 30, 2008. Total loaned securities had a market value of $5,634,924 at June 30, 2008. |
| ^ | Rate disclosed is as of June 30, 2008. |
See Notes to Financial Statements.
| | |
| 112 | | Annual Report | June 30, 2008 |
Bridgeway Balanced Fund
SCHEDULE OF OPTIONS WRITTEN
Showing percentage of net assets as of June 30, 2008
| | | | | | |
| Company | | Number
of Contracts | | Value | |
|
COVERED CALL OPTIONS WRITTEN - (.69)% | |
Adobe Systems, Inc. | |
Expiring July, 2008 at $40.00 | | 40 | | $ | (3,400 | ) |
AES Corp. | |
Expiring August, 2008 at $20.00 | | 65 | | | (4,063 | ) |
AGCO Corp. | |
Expiring July, 2008 at $60.00 | | 150 | | | (5,625 | ) |
Agilent Technologies, Inc. | |
Expiring August, 2008 at $32.50 | | 15 | | | (5,588 | ) |
Agilent Technologies, Inc. | |
Expiring August, 2008 at $35.00 | | 15 | | | (2,978 | ) |
Alcoa, Inc. | |
Expiring July, 2008 at $37.50 | | 8 | | | (736 | ) |
Allied Waste Industries, Inc. | |
Expiring September, 2008 at $15.00 | | 18 | | | (360 | ) |
Allstate Corp. | |
Expiring July, 2008 at $50.00 | | 5 | | | (62 | ) |
Anadarko Petroleum Corp. | |
Expiring August, 2008 at $80.00 | | 15 | | | (3,788 | ) |
Aon Corp. | |
Expiring July, 2008 at $47.50 | | 15 | | | (750 | ) |
Apple, Inc. | |
Expiring July, 2008 at $130.00 | | 15 | | | (56,738 | ) |
Applied Materials, Inc. | |
Expiring July, 2008 at $22.50 | | 25 | | | (188 | ) |
AT&T, Inc. | |
Expiring July, 2008 at $40.00 | | 182 | | | (455 | ) |
Expiring October, 2008 at $42.50 | | 80 | | | (800 | ) |
Automatic Data Processing, Inc. | |
Expiring August, 2008 at $45.00 | | 10 | | | (425 | ) |
Baker Hughes, Inc. | |
Expiring July, 2008 at $75.00 | | 6 | | | (7,530 | ) |
Bank of America Corp. | |
Expiring August, 2008 at $27.50 | | 70 | | | (5,915 | ) |
Expiring August, 2008 at $37.50 | | 200 | | | (900 | ) |
Expiring August, 2008 at $35.00 | | 71 | | | (497 | ) |
Expiring November, 2008 at $35.00 | | 50 | | | (1,500 | ) |
Baxter International, Inc. | |
Expiring August, 2008 at $65.00 | | 15 | | | (2,513 | ) |
Biogen Idec, Inc. | |
Expiring July, 2008 at $70.00 | | 11 | | | (27 | ) |
BMC Software, Inc. | |
Expiring August, 2008 at $40.00 | | 9 | | | (540 | ) |
Bristol-Myers Squibb Co. | |
Expiring September, 2008 at $20.00 | | 200 | | | (27,600 | ) |
Expiring September, 2008 at $22.50 | | 300 | | | (13,050 | ) |
| | | | | | |
| Company | | Number
of Contracts | | Value | |
|
| |
CBS Corp. Class B | |
Expiring September, 2008 at $20.00 | | 232 | | $ | (22,040 | ) |
Expiring September, 2008 at $22.50 | | 50 | | | (1,125 | ) |
CF Industries Holdings, Inc. | |
Expiring July, 2008 at $140.00 | | 50 | | | (81,000 | ) |
Charles Schwab Corp. | |
Expiring September, 2008 at $25.00 | | 80 | | | (2,800 | ) |
Chevron Corp. | |
Expiring September, 2008 at $100.00 | | 20 | | | (8,800 | ) |
Ciena Corp. | |
Expiring July, 2008 at $35.00 | | 20 | | | (50 | ) |
Citigroup, Inc. | |
Expiring August, 2008 at $20.00 | | 150 | | | (6,375 | ) |
Expiring September, 2008 at $22.50 | | 150 | | | (4,650 | ) |
Comcast Corp. | |
Expiring July, 2008 at $22.50 | | 76 | | | (190 | ) |
ConocoPhillips | |
Expiring August, 2008 at $95.00 | | 15 | | | (5,738 | ) |
CSX Corp. | |
Expiring August, 2008 at $70.00 | | 10 | | | (1,175 | ) |
CVS Caremark Corp. | |
Expiring August, 2008 at $45.00 | | 20 | | | (450 | ) |
Dillard’s, Inc., Class A | |
Expiring August, 2008 at $22.50 | | 15 | | | (75 | ) |
Dow Chemical Co. | |
Expiring September, 2008 at $40.00 | | 76 | | | (3,040 | ) |
eBay, Inc. | |
Expiring July, 2008 at $32.50 | | 20 | | | (170 | ) |
Exxon Mobil Corp. | |
Expiring July, 2008 at $100.00 | | 15 | | | (37 | ) |
Franklin Resources, Inc. | |
Expiring July, 2008 at $100.00 | | 28 | | | (2,380 | ) |
Goldman Sachs Group, Inc. | |
Expiring July, 2008 at $200.00 | | 5 | | | (122 | ) |
Halliburton Co. | |
Expiring July, 2008 at $42.50 | | 25 | | | (26,750 | ) |
Expiring July, 2008 at $50.00 | | 30 | | | (11,100 | ) |
Harley-Davidson, Inc. | |
Expiring August, 2008 at $40.00 | | 10 | | | (875 | ) |
Hess Corp. | |
Expiring August, 2008 at $120.00 | | 9 | | | (11,835 | ) |
Hewlett-Packard Co. | |
Expiring August, 2008 at $50.00 | | 18 | | | (405 | ) |
Bridgeway Balanced Fund
SCHEDULE OF OPTIONS WRITTEN (continued)
Showing percentage of net assets as of June 30, 2008
| | | | | | |
| Company | | Number
of Contracts | | Value | |
|
Covered Call Options Written (continued) | |
Hospira, Inc. | |
Expiring August, 2008 at $45.00 | | 20 | | $ | (900 | ) |
International Game Technology | |
Expiring August, 2008 at $30.00 | | 12 | | | (390 | ) |
International Paper Co. | |
Expiring July, 2008 at $27.50 | | 45 | | | (112 | ) |
Intuit, Inc. | |
Expiring July, 2008 at $30.00 | | 25 | | | (250 | ) |
JC Penney Co., Inc. | |
Expiring August, 2008 at $40.00 | | 5 | | | (575 | ) |
Johnson Controls, Inc. | |
Expiring August, 2008 at $35.00 | | 10 | | | (175 | ) |
Lockheed Martin Corp. | |
Expiring September, 2008 at $115.00 | | 8 | | | (480 | ) |
Marriott International, Inc. | |
Expiring July, 2008 at $40.00 | | 15 | | | (37 | ) |
Mattel, Inc. | |
Expiring July, 2008 at $20.00 | | 22 | | | (220 | ) |
Medco Health Solutions, Inc. | |
Expiring July, 2008 at $45.00 | | 15 | | | (4,125 | ) |
Merrill Lynch & Co., Inc. | |
Expiring July, 2008 at $50.00 | | 16 | | | (24 | ) |
Monsanto Co. | |
Expiring July, 2008 at $135.00 | | 15 | | | (3,113 | ) |
Morgan Stanley | |
Expiring July, 2008 at $45.00 | | 15 | | | (37 | ) |
Motorola, Inc. | |
Expiring July, 2008 at $10.00 | | 25 | | | (62 | ) |
NewMarket Corp. | |
Expiring July, 2008 at $75.00 | | 25 | | | (1,500 | ) |
Occidental Petroleum Corp. | |
Expiring August, 2008 at $80.00 | | 12 | | | (14,340 | ) |
Office Depot, Inc. | |
Expiring July, 2008 at $12.50 | | 43 | | | (645 | ) |
OfficeMax, Inc. | |
Expiring August, 2008 at $20.00 | | 7 | | | (35 | ) |
Omnicom Group, Inc. | |
Expiring July, 2008 at $50.00 | | 10 | | | (25 | ) |
OSI Pharmaceuticals, Inc. | |
Expiring July, 2008 at $35.00 | | 147 | | | (94,815 | ) |
Pactiv Corp. | |
Expiring August, 2008 at $25.00 | | 21 | | | (473 | ) |
Parker Hannifin Corp. | |
Expiring August, 2008 at $80.00 | | 10 | | | (1,075 | ) |
Principal Financial Group, Inc. | |
Expiring July, 2008 at $55.00 | | 22 | | | (110 | ) |
Procter & Gamble Co. | |
Expiring July, 2008 at $72.50 | | 20 | | | (50 | ) |
| | | | | | |
| Company | | Number
of Contracts | | Value | |
|
| |
Progressive Corp. | |
Expiring August, 2008 at $17.50 | | 25 | | $ | (4,500 | ) |
Public Service Enterprise Group | |
Expiring September, 2008 at $50.00 | | 20 | | | (1,750 | ) |
QUALCOMM, Inc. | |
Expiring July, 2008 at $45.00 | | 30 | | | (3,540 | ) |
Sears Holdings Corp. | |
Expiring August, 2008 at $80.00 | | 12 | | | (3,030 | ) |
Sempra Energy | |
Expiring July, 2008 at $60.00 | | 15 | | | (188 | ) |
Sherwin-Williams Co. | |
Expiring September, 2008 at $55.00 | | 10 | | | (550 | ) |
SLM Corp. | |
Expiring July, 2008 at $22.50 | | 8 | | | (360 | ) |
Sprint Nextel Corp. | |
Expiring August, 2008 at $8.00 | | 60 | | | (10,500 | ) |
Starbucks Corp. | |
Expiring October, 2008 at $17.00 | | 37 | | | (3,663 | ) |
SunTrust Banks, Inc. | |
Expiring August, 2008 at $45.00 | | 32 | | | (3,040 | ) |
Teradata Corp. | |
Expiring July, 2008 at $22.50 | | 30 | | | (3,225 | ) |
Terex Corp. | |
Expiring July, 2008 at $75.00 | | 8 | | | (20 | ) |
The Travelers Cos, Inc. | |
Expiring July, 2008 at $50.00 | | 15 | | | (112 | ) |
U.S. Bancorp | |
Expiring August, 2008 at $30.00 | | 75 | | | (6,563 | ) |
Expiring December, 2008 at $32.50 | | 75 | | | (7,500 | ) |
Union Pacific Corp. | |
Expiring August, 2008 at $77.50 | | 10 | | | (3,400 | ) |
UnitedHealth Group, Inc. | |
Expiring September, 2008 at $35.00 | | 36 | | | (810 | ) |
Verizon Communications, Inc. | |
Expiring July, 2008 at $37.50 | | 50 | | | (800 | ) |
Expiring July, 2008 at $40.00 | | 25 | | | (62 | ) |
Wachovia Corp. | |
Expiring July, 2008 at $27.50 | | 100 | | | (250 | ) |
Expiring July, 2008 at $32.50 | | 73 | | | (182 | ) |
Expiring October, 2008 at $30.00 | | 100 | | | (1,750 | ) |
Walgreen Co. | |
Expiring August, 2008 at $35.00 | | 10 | | | (400 | ) |
Walt Disney Co. (The) | |
Expiring July, 2008 at $32.50 | | 20 | | | (650 | ) |
Wells Fargo & Co. | |
Expiring July, 2008 at $32.50 | | 62 | | | (155 | ) |
| | |
| 114 | | Annual Report | June 30, 2008 |
Bridgeway Balanced Fund
SCHEDULE OF OPTIONS WRITTEN (continued)
Showing percentage of net assets as of June 30, 2008
| | | | | | |
| Company | | Number
of Contracts | | Value | |
|
Covered Call Options Written (continued) | |
Whirlpool Corp. | |
Expiring September, 2008 at $75.00 | | 6 | | $ | (690 | ) |
| | | | | | |
| |
TOTAL COVERED CALL OPTIONS WRITTEN | | | (518,468 | ) |
| | | | | | |
(Premiums received $(729,973)) | | | | | | |
| | |
PUT OPTIONS WRITTEN - (.74)% | | | | | | |
Alpha Natural Resources, Inc. | |
Expiring July, 2008 at $65.00 | | 120 | | | (900 | ) |
Expiring July, 2008 at $85.00 | | 25 | | | (1,937 | ) |
Expiring August, 2008 at $90.00 | | 50 | | | (20,250 | ) |
Bristol-Myers Squibb Co. | |
Expiring September, 2008 at $20.00 | | 200 | | | (21,100 | ) |
Bucyrus International, Inc. | |
Expiring July, 2008 at $70.00 | | 50 | | | (9,375 | ) |
Expiring August, 2008 at $70.00 | | 100 | | | (46,500 | ) |
CF Industries Holdings, Inc. | |
Expiring July, 2008 at $130.00 | | 20 | | | (2,550 | ) |
Compass Minerals International, Inc. | |
Expiring July, 2008 at $70.00 | | 40 | | | (2,100 | ) |
Expiring August, 2008 at $75.00 | | 100 | | | (34,500 | ) |
Dow Chemical Co. | |
Expiring September, 2008 at $35.00 | | 100 | | | (19,000 | ) |
Massey Energy Co. | |
Expiring July, 2008 at $85.00 | | 25 | | | (5,688 | ) |
Expiring August, 2008 at $80.00 | | 75 | | | (28,500 | ) |
Expiring August, 2008 at $85.00 | | 75 | | | (40,500 | ) |
| | | | | | |
| Company | | Number
of Contracts | | Value | |
|
| |
Owens-Illinois, Inc. | |
Expiring July, 2008 at $50.00 | | 100 | | $ | (82,500 | ) |
Expiring August, 2008 at $50.00 | | 100 | | | (86,500 | ) |
Pfizer, Inc. | |
Expiring December, 2008 at $20.00 | | 250 | | | (82,500 | ) |
Potash Corp. of Saskatchewan | |
Expiring July, 2008 at $180.00 | | 80 | | | (1,800 | ) |
Expiring July, 2008 at $210.00 | | 10 | | | (3,025 | ) |
Southwestern Energy Co. | |
Expiring July, 2008 at $40.00 | | 60 | | | (900 | ) |
The Mosaic Co. | |
Expiring July, 2008 at $115.00 | | 40 | | | (1,900 | ) |
Expiring July, 2008 at $140.00 | | 25 | | | (13,000 | ) |
Expiring August, 2008 at $140.00 | | 50 | | | (54,250 | ) |
| | | | | | |
| | |
TOTAL PUT OPTIONS WRITTEN | | | | | (559,275 | ) |
| | | | | | |
(Premiums received $(594,878)) | | | | | | |
| | |
TOTAL OPTIONS WRITTEN | | | | $ | (1,077,743 | ) |
| | | | | | |
(Premiums received $(1,324,851)) | | | | | | |
See Notes to Financial Statements
STATEMENTS OF ASSETS AND LIABILITIES
June 30, 2008
| | | | | | | | | | | | | | | |
| ASSETS | | Aggressive
Investors 1 | | | Aggressive
Investors 2 | | | Ultra-Small
Company | | | Ultra-Small
Company Market |
| | | | |
Unaffiliated investments at value | | $ | 328,590,009 | | | $ | 876,741,582 | | | $ | 92,267,692 | | | $ | 709,252,127 |
Affiliated investments at value | | | - | | | | - | | | | - | | | | 934,987 |
| | | | | | | | | | | | | | | | |
Total Investments at value | | | 328,590,009 | | | | 876,741,582 | | | | 92,267,692 | | | | 710,187,114 |
| | | | | | | | | | | | | | | | |
Cash | | | 9 | | | | 17 | | | | - | | | | 3,990 |
Receivables: | | | | | | | | | | | | | | | |
Portfolio securities sold | | | 23,835,258 | | | | 27,413,184 | | | | 4,859,970 | | | | 21,545,026 |
Fund shares sold | | | 59,290 | | | | 2,756,635 | | | | - | | | | 731,202 |
Dividends and interest | | | 186,253 | | | | 276,829 | | | | 171,344 | | | | 968,089 |
Reclaims receivable | | | 1,406 | | | | 2,113 | | | | - | | | | - |
Deposits with Brokers | | | - | | | | - | | | | - | | | | - |
Total return swap | | | 50,624 | | | | - | | | | - | | | | - |
Prepaid expenses | | | 35,144 | | | | 68,235 | | | | 8,600 | | | | 62,949 |
| | | | | | | | | | | | | | | | |
Total assets | | | 352,757,993 | | | | 907,258,595 | | | | 97,307,606 | | | | 733,498,370 |
| | | | | | | | | | | | | | | | |
| | | | |
LIABILITIES | | | | | | | | | | | | | | | |
Payables: | | | | | | | | | | | | | | | |
Portfolio securities purchased | | | 12,810,522 | | | | 20,411,269 | | | | 2,133,837 | | | | 9,824,576 |
Fund shares redeemed | | | 227,408 | | | | 575,230 | | | | 136,430 | | | | 1,603,275 |
Total return swap | | | - | | | | - | | | | - | | | | - |
Due to Custodian | | | - | | | | - | | | | - | | | | - |
Accrued Liabilities: | | | | | | | | | | | | | | | |
Investment advisor fees | | | 897,033 | | | | 922,080 | | | | 73,258 | | | | 337,753 |
Administration fees | | | 5,298 | | | | 13,745 | | | | 1,506 | | | | 12,447 |
Directors’ fees and expenses | | | 1,452 | | | | 2,734 | | | | 517 | | | | 4,078 |
Other | | | 101,390 | | | | 257,487 | | | | 29,464 | | | | 304,640 |
Covered call options written at value | | | - | | | | - | | | | - | | | | - |
Put options written at value | | | - | | | | - | | | | - | | | | - |
| | | | | | | | | | | | | | | | |
Total liabilities | | | 14,043,103 | | | | 22,182,545 | | | | 2,375,012 | | | | 12,086,769 |
| | | | | | | | | | | | | | | | |
NET ASSETS | | $ | 338,714,890 | | | $ | 885,076,050 | | | $ | 94,932,594 | | | $ | 721,411,601 |
| | | | | | | | | | | | | | | | |
| | | | |
NET ASSETS REPRESENT | | | | | | | | | | | | | | | |
Paid-in capital | | $ | 260,613,805 | | | $ | 727,534,759 | | | $ | 97,823,937 | | | $ | 560,863,805 |
Accumulated net investment income (loss) | | | (50,624 | ) | | | - | | | | 113,772 | | | | 6,894,753 |
Accumulated net realized gain (loss) on investments | | | 1,841,439 | | | | (15,315,025 | ) | | | (7,791,467 | ) | | | 28,612,590 |
Net unrealized appreciation (depreciation) on investments | | | 76,310,270 | | | | 172,856,316 | | | | 4,786,352 | | | | 125,040,453 |
| | | | | | | | | | | | | | | | |
NET ASSETS | | $ | 338,714,890 | | | $ | 885,076,050 | | | $ | 94,932,594 | | | $ | 721,411,601 |
| | | | | | | | | | | | | | | | |
| | | | |
Shares of common stock outstanding of $.001 par value* | | | 6,277,383 | | | | 42,809,467 | | | | 3,860,501 | | | | 47,050,553 |
| | | | | | | | | | | | | | | | |
Net asset value per share | | $ | 53.96 | | | $ | 20.67 | | | $ | 24.59 | | | $ | 15.33 |
| | | | | | | | | | | | | | | | |
Unaffiliated investments at cost | | $ | 252,330,363 | | | $ | 703,885,266 | | | $ | 87,481,340 | | | $ | 583,934,030 |
Affiliated investments at cost | | $ | - | | | $ | - | | | $ | - | | | $ | 1,212,631 |
| | | | | | | | | | | | | | | | |
Total investments at cost | | $ | 252,330,363 | | | $ | 703,885,266 | | | $ | 87,481,340 | | | $ | 585,146,661 |
Premiums received on covered call options written | | $ | - | | | $ | - | | | $ | - | | | $ | - |
Premiums received on put options written | | $ | - | | | $ | - | | | $ | - | | | $ | - |
| * | See Note 1 - Organization in the Notes to Financial Statements for shares authorized for each Fund. |
See Notes to Financial Statements
| | |
| 116 | | Annual Report | June 30, 2008 |
| | | | | | | | | | | | | | | | | | | | | | | | | | |
Micro-Cap
Limited | | | Small-Cap
Growth | | | Small-Cap
Value | | | Large-Cap
Growth | | | Large-Cap
Value | | | Blue Chip 35
Index | | | Balanced | |
| | | | | | |
| $ | 37,722,516 | | | $ | 142,222,808 | | | $ | 359,866,234 | | | $ | 174,590,125 | | | $ | 54,146,019 | | | $ | 250,547,307 | | | $ | 76,242,539 | |
| | - | | | | - | | | | - | | | | - | | | | - | | | | - | | | | - | |
| | | | | | | | | | | | | | | | | | | | | | | | | | | |
| | 37,722,516 | | | | 142,222,808 | | | | 359,866,234 | | | | 174,590,125 | | | | 54,146,019 | | | | 250,547,307 | | | | 76,242,539 | |
| | | | | | | | | | | | | | | | | | | | | | | | | | | |
| | - | | | | - | | | | - | | | | 1 | | | | - | | | | - | | | | 1,375 | |
| | | | | | | | | | | | | | | | | | | | | | | | | | |
| | 2,227,398 | | | | 3,269,232 | | | | 3,648,524 | | | | - | | | | 243,900 | | | | 269,162 | | | | - | |
| | 562 | | | | 207,058 | | | | 380,827 | | | | 1,608,701 | | | | 10,207 | | | | 637,872 | | | | 105,562 | |
| | 49,191 | | | | 106,494 | | | | 365,047 | | | | 131,046 | | | | 42,152 | | | | 206,654 | | | | 233,781 | |
| | - | | | | - | | | | - | | | | - | | | | - | | | | - | | | | - | |
| | - | | | | - | | | | - | | | | - | | | | - | | | | - | | | | 11,263 | |
| | - | | | | - | | | | 70,547 | | | | - | | | | - | | | | - | | | | - | |
| | 11,620 | | | | 16,377 | | | | 31,913 | | | | 20,400 | | | | 10,140 | | | | 29,842 | | | | 16,129 | |
| | | | | | | | | | | | | | | | | | | | | | | | | | | |
| | 40,011,287 | | | | 145,821,969 | | | | 364,363,092 | | | | 176,350,273 | | | | 54,452,418 | | | | 251,690,837 | | | | 76,610,649 | |
| | | | | | | | | | | | | | | | | | | | | | | | | | | |
| | | | | | |
| | | | | | | | | | | | | | | | | | | | | | | | | | |
| | | | | | | | | | | | | | | | | | | | | | | | | | |
| | 1,727,667 | | | | 852,766 | | | | 31,651,849 | | | | 1,330,210 | | | | - | | | | 448,009 | | | | - | |
| | 51,536 | | | | 66,594 | | | | 761,892 | | | | 59,470 | | | | 97,376 | | | | 199,991 | | | | 39,100 | |
| | - | | | | 85,602 | | | | - | | | | - | | | | - | | | | - | | | | - | |
| | - | | | | - | | | | - | | | | - | | | | 152,938 | | | | - | | | | - | |
| | | | | | | | | | | | | | | | | | | | | | | | | | |
| | 71,175 | | | | 78,083 | | | | 175,914 | | | | 78,858 | | | | 25,804 | | | | 5,282 | | | | 37,916 | |
| | 587 | | | | 2,301 | | | | 4,904 | | | | 2,748 | | | | 870 | | | | 4,007 | | | | 1,173 | |
| | 214 | | | | 578 | | | | 1,171 | | | | 701 | | | | 365 | | | | 537 | | | | 454 | |
| | 24,601 | | | | 68,291 | | | | 119,096 | | | | 65,683 | | | | 31,477 | | | | 45,159 | | | | 36,986 | |
| | - | | | | - | | | | - | | | | - | | | | - | | | | - | | | | 518,468 | |
| | - | | | | - | | | | - | | | | - | | | | - | | | | - | | | | 559,275 | |
| | | | | | | | | | | | | | | | | | | | | | | | | | | |
| | 1,875,780 | | | | 1,154,215 | | | | 32,714,826 | | | | 1,537,670 | | | | 308,830 | | | | 702,985 | | | | 1,193,372 | |
| | | | | | | | | | | | | | | | | | | | | | | | | | | |
| $ | 38,135,507 | | | $ | 144,667,754 | | | $ | 331,648,266 | | | $ | 174,812,603 | | | $ | 54,143,588 | | | $ | 250,987,852 | | | $ | 75,417,277 | |
| | | | | | | | | | | | | | | | | | | | | | | | | | | |
| | | | | | |
| | | | | | | | | | | | | | | | | | | | | | | | | | |
| $ | 41,066,492 | | | $ | 132,260,865 | | | $ | 301,164,628 | | | $ | 159,843,700 | | | $ | 47,808,999 | | | $ | 276,463,698 | | | $ | 69,039,041 | |
| | 76,496 | | | | 85,256 | | | | 223,087 | | | | 288,948 | | | | 364,938 | | | | 2,911,094 | | | | 1,415,470 | |
| | (5,953,353 | ) | | | (9,909,411 | ) | | | (10,436,449 | ) | | | (8,178,609 | ) | | | (1,229,330 | ) | | | (4,027,159 | ) | | | (262,579 | ) |
| | 2,945,872 | | | | 22,231,044 | | | | 40,697,000 | | | | 22,858,564 | | | | 7,198,981 | | | | (24,359,781 | ) | | | 5,225,345 | |
| | | | | | | | | | | | | | | | | | | | | | | | | | | |
| $ | 38,135,507 | | | $ | 144,667,754 | | | $ | 331,648,266 | | | $ | 174,812,603 | | | $ | 54,143,588 | | | $ | 250,987,852 | | | $ | 75,417,277 | |
| | | | | | | | | | | | | | | | | | | | | | | | | | | |
| | | | | | |
| | 5,411,246 | | | | 10,369,726 | | | | 20,912,812 | | | | 12,734,962 | | | | 3,971,053 | | | | 34,819,731 | | | | 5,994,007 | |
| | | | | | | | | | | | | | | | | | | | | | | | | | | |
| $ | 7.05 | | | $ | 13.95 | | | $ | 15.86 | | | $ | 13.73 | | | $ | 13.63 | | | $ | 7.21 | | | $ | 12.58 | |
| | | | | | | | | | | | | | | | | | | | | | | | | | | |
| $ | 34,776,644 | | | $ | 119,906,162 | | | $ | 319,239,781 | | | $ | 151,731,561 | | | $ | 46,947,038 | | | $ | 274,907,088 | | | $ | 71,264,302 | |
| $ | - | | | $ | - | | | $ | - | | | $ | - | | | $ | - | | | $ | - | | | | - | |
| | | | | | | | | | | | | | | | | | | | | | | | | | | |
| $ | 34,776,644 | | | $ | 119,906,162 | | | $ | 319,239,781 | | | $ | 151,731,561 | | | $ | 46,947,038 | | | $ | 274,907,088 | | | $ | 71,264,302 | |
| $ | - | | | $ | - | | | $ | - | | | $ | - | | | $ | - | | | $ | - | | | $ | 729,973 | |
| $ | - | | | $ | - | | | $ | - | | | $ | - | | | $ | - | | | $ | - | | | $ | 594,878 | |
STATEMENTS OF OPERATIONS
Year Ended June 30, 2008
| | | | | | | | | | | | | | | | |
| | | Aggressive
Investors 1 | | | Aggressive
Investors 2 | | | Ultra-Small
Company | | | Ultra-Small
Company Market | |
| | | | |
INVESTMENT INCOME | | | | | | | | | | | | | | | | |
Dividends from unaffiliated issuers | | $ | 2,230,927 | | | $ | 4,963,537 | | | $ | 678,947 | | | $ | 9,314,285 | |
Less: foreign taxes withheld | | | (30,644 | ) | | | (50,806 | ) | | | - | | | | (10,536 | ) |
Interest | | | - | | | | - | | | | - | | | | - | |
Securities lending | | | 445,819 | | | | 1,003,647 | | | | 669,660 | | | | 4,735,309 | |
| | | | | | | | | | | | | | | | | |
Total Investment Income | | | 2,646,102 | | | | 5,916,378 | | | | 1,348,607 | | | | 14,039,058 | |
| | | �� | | | | | | | | | | | | | | |
| | | | |
EXPENSES | | | | | | | | | | | | | | | | |
Investment advisory fees - Base fees | | | 3,144,607 | | | | 6,717,896 | | | | 1,041,253 | | | | 4,851,695 | |
Investment advisor fees - Performance adjustment | | | 2,529,670 | | | | 955,798 | | | | - | | | | - | |
Administration fees | | | 65,612 | | | | 144,952 | | | | 21,442 | | | | 179,019 | |
Accounting fees | | | 37,812 | | | | 40,667 | | | | 38,145 | | | | 41,640 | |
Transfer Agent fees | | | 73,799 | | | | 210,033 | | | | 32,285 | | | | 196,009 | |
Professional fees | | | 53,416 | | | | 103,767 | | | | 21,478 | | | | 139,371 | |
Custody fees | | | 16,898 | | | | 49,669 | | | | 16,483 | | | | 87,591 | |
Blue sky fees | | | 18,752 | | | | 26,433 | | | | 2,055 | | | | 30,281 | |
Directors’ and officers’ fees and expenses | | | 21,860 | | | | 43,863 | | | | 7,668 | | | | 62,667 | |
Shareholder servicing fees | | | 130,758 | | | | 381,245 | | | | 14,738 | | | | 279,221 | |
Reports to shareholders | | | 71,996 | | | | 190,971 | | | | 24,844 | | | | 391,853 | |
Interest expense | | | 51,289 | | | | 27,232 | | | | 1,050 | | | | 1,364 | |
Miscellaneous expenses | | | 47,118 | | | | 84,614 | | | | 17,454 | | | | 134,031 | |
| | | | | | | | | | | | | | | | | |
Total expenses | | | 6,263,587 | | | | 8,977,140 | | | | 1,238,895 | | | | 6,394,742 | |
| | | | | | | | | | | | | | | | | |
Less investment advisory fees waived | | | - | | | | - | | | | - | | | | - | |
Less other expense reimbursements | | | (9,245 | ) | | | (25,957 | ) | | | (4,079 | ) | | | (30,787 | ) |
| | | | | | | | | | | | | | | | | |
Net Expenses | | | 6,254,342 | | | | 8,951,183 | | | | 1,234,816 | | | | 6,363,955 | |
| | | | | | | | | | | | | | | | | |
| | | | |
NET INVESTMENT INCOME (LOSS) | | | (3,608,240 | ) | | | (3,034,805 | ) | | | 113,791 | | | | 7,675,103 | |
| | | | | | | | | | | | | | | | | |
NET REALIZED AND UNREALIZED GAIN
(LOSS) ON INVESTMENTS | | | | | | | | | | | | | | | | |
Realized Gain (Loss) on: | | | | | | | | | | | | | | | | |
Unaffiliated investments | | | 8,510,418 | | | | 3,780,613 | | | | (7,791,457 | ) | | | 40,256,880 | |
Affiliated investments | | | - | | | | - | | | | - | | | | (701,078 | ) |
Written options | | | (298,848 | ) | | | 655,897 | | | | - | | | | - | |
Futures contracts | | | 4,036,783 | | | | 8,068,727 | | | | - | | | | (1,469,435 | ) |
Swaps | | | (145,540 | ) | | | - | | | | - | | | | - | |
| | | | | | | | | | | | | | | | | |
Net realized gain (loss) | | | 12,102,813 | | | | 12,505,237 | | | | (7,791,457 | ) | | | 38,086,367 | |
| | | | | | | | | | | | | | | | | |
Change in Unrealized Appreciation (Depreciation) on: | | | | | | | | | | | | | | | | |
Investments in unaffiliated companies | | | 4,441,155 | | | | 30,649,595 | | | | (24,568,770 | ) | | | (279,292,385 | ) |
Investments in affiliated companies | | | - | | | | - | | | | - | | | | 1,289,957 | |
Written options | | | - | | | | - | | | | - | | | | - | |
Futures contracts | | | - | | | | - | | | | - | | | | (850,120 | ) |
Swaps | | | 57,916 | | | | - | | | | - | | | | - | |
| | | | | | | | | | | | | | | | | |
Net change in unrealized appreciation (depreciation) | | | 4,499,071 | | | | 30,649,595 | | | | (24,568,770 | ) | | | (278,852,548 | ) |
| | | | | | | | | | | | | | | | | |
Net realized and unrealized gain (loss) on investments | | | 16,601,884 | | | | 43,154,832 | | | | (32,360,227 | ) | | | (240,766,181 | ) |
| | | | | | | | | | | | | | | | | |
INCREASE (DECREASE) IN NET ASSETS
RESULTING FROM OPERATIONS | | $ | 12,993,644 | | | $ | 40,120,027 | | | $ | (32,246,436 | ) | | $ | (233,091,078 | ) |
| | | | | | | | | | | | | | | | | |
See Notes to Financial Statements
| | |
| 118 | | Annual Report | June 30, 2008 |
| | | | | | | | | | | | | | | | | | | | | | | | | | |
Micro-Cap
Limited | | | Small-Cap
Growth | | | Small-Cap
Value | | | Large-Cap
Growth | | | Large-Cap
Value | | | Blue Chip 35
Index | | | Balanced | |
| | | | | | |
| | | | | | | | | | | | | | | | | | | | | | | | | | |
| $ | 308,652 | | | $ | 564,363 | | | $ | 2,400,002 | | | $ | 1,765,496 | | | $ | 1,479,168 | | | $ | 4,490,013 | | | $ | 1,068,336 | |
| | (247 | ) | | | - | | | | - | | | | (723 | ) | | | - | | | | - | | | | (45 | ) |
| | - | | | | - | | | | - | | | | - | | | | - | | | | - | | | | 1,503,914 | |
| | 234,204 | | | | 457,975 | | | | 623,755 | | | | 114,312 | | | | 51,180 | | | | 109,285 | | | | 44,763 | |
| | | | | | | | | | | | | | | | | | | | | | | | | | | |
| | 542,609 | | | | 1,022,338 | | | | 3,023,757 | | | | 1,879,085 | | | | 1,530,348 | | | | 4,599,298 | | | | 2,616,968 | |
| | | | | | | | | | | | | | | | | | | | | | | | | | | |
| | | | | | |
| | | | | | | | | | | | | | | | | | | | | | | | | | |
| | 506,261 | | | | 922,526 | | | | 1,805,935 | | | | 856,079 | | | | 353,825 | | | | 147,081 | | | | 506,941 | |
| | (282,254 | ) | | | 16,084 | | | | 81,195 | | | | 18,202 | | | | 5,960 | | | | - | | | | - | |
| | 9,074 | | | | 28,523 | | | | 56,482 | | | | 32,552 | | | | 12,960 | | | | 34,899 | | | | 15,768 | |
| | 37,817 | | | | 39,003 | | | | 41,467 | | | | 41,973 | | | | 39,475 | | | | 37,776 | | | | 46,792 | |
| | 19,617 | | | | 104,660 | | | | 125,577 | | | | 50,718 | | | | 22,925 | | | | 28,975 | | | | 36,183 | |
| | 15,008 | | | | 26,873 | | | | 44,697 | | | | 33,813 | | | | 15,201 | | | | 34,254 | | | | 18,606 | |
| | 8,375 | | | | 20,125 | | | | 27,098 | | | | 9,712 | | | | 10,275 | | | | 8,868 | | | | 28,222 | |
| | 14,474 | | | | 19,456 | | | | 22,051 | | | | 21,850 | | | | 18,986 | | | | 18,127 | | | | 14,714 | |
| | 3,523 | | | | 10,698 | | | | 21,048 | | | | 12,023 | | | | 4,583 | | | | 12,367 | | | | 5,988 | |
| | 13,113 | | | | 79,301 | | | | 135,313 | | | | 78,055 | | | | 26,753 | | | | 27,076 | | | | 19,920 | |
| | 11,707 | | | | 45,060 | | | | 71,777 | | | | 37,773 | | | | 18,319 | | | | 30,864 | | | | 19,128 | |
| | 2,400 | | | | 5,223 | | | | 12,430 | | | | 5,104 | | | | 20,233 | | | | 4,260 | | | | 10,562 | |
| | 8,300 | | | | 21,598 | | | | 56,581 | | | | 18,183 | | | | 11,570 | | | | 15,416 | | | | 21,680 | |
| | | | | | | | | | | | | | | | | | | | | | | | | | | |
| | 367,415 | | | | 1,339,130 | | | | 2,501,651 | | | | 1,216,037 | | | | 561,065 | | | | 399,963 | | | | 744,504 | |
| | | | | | | | | | | | | | | | | | | | | | | | | | | |
| | - | | | | - | | | | - | | | | - | | | | - | | | | (119,915 | ) | | | - | |
| | (1,176 | ) | | | (4,485 | ) | | | (14,517 | ) | | | (4,800 | ) | | | (2,434 | ) | | | (3,775 | ) | | | (5,442 | ) |
| | | | | | | | | | | | | | | | | | | | | | | | | | | |
| | 366,239 | | | | 1,334,645 | | | | 2,487,134 | | | | 1,211,237 | | | | 558,631 | | | | 276,273 | | | | 739,062 | |
| | | | | | | | | | | | | | | | | | | | | | | | | | | |
| | | | | | |
| | 176,370 | | | | (312,307 | ) | | | 536,623 | | | | 667,848 | | | | 971,717 | | | | 4,323,025 | | | | 1,877,906 | |
| | | | | | | | | | | | | | | | | | | | | | | | | | | |
| | | | | | |
| | | | | | | | | | | | | | | | | | | | | | | | | | |
| | | | | | | | | | | | | | | | | | | | | | | | | | |
| | (4,043,124 | ) | | | 5,435,393 | | | | (9,454,165 | ) | | | (3,357,393 | ) | | | (660,976 | ) | | | (1,205,950 | ) | | | (1,736,340 | ) |
| | - | | | | - | | | | - | | | | - | | | | - | | | | - | | | | - | |
| | - | | | | - | | | | - | | | | - | | | | - | | | | - | | | | 3,875,766 | |
| | - | | | | - | | | | - | | | | - | | | | - | | | | - | | | | 1,419,600 | |
| | - | | | | (395,445 | ) | | | (394,632 | ) | | | - | | | | - | | | | - | | | | - | |
| | | | | | | | | | | | | | | | | | | | | | | | | | | |
| | (4,043,124 | ) | | | 5,039,948 | | | | (9,848,797 | ) | | | (3,357,393 | ) | | | (660,976 | ) | | | (1,205,950 | ) | | | 3,559,026 | |
| | | | | | | | | | | | | | | | | | | | | | | | | | | |
| | | | | | | | | | | | | | | | | | | | | | | | | | |
| | (6,420,717 | ) | | | (26,428,783 | ) | | | (42,566,978 | ) | | | (3,367,261 | ) | | | (12,527,611 | ) | | | (39,474,739 | ) | | | (6,777,109 | ) |
| | - | | | | - | | | | - | | | | - | | | | - | | | | - | | | | - | |
| | | | | - | | | | - | | | | - | | | | - | | | | - | | | | 103,357 | |
| | - | | | | - | | | | - | | | | - | | | | - | | | | - | | | | - | |
| | - | | | | (87,081 | ) | | | 142,849 | | | | - | | | | - | | | | - | | | | - | |
| | | | | | | | | | | | | | | | | | | | | | | | | | | |
| | (6,420,717 | ) | | | (26,515,864 | ) | | | (42,424,129 | ) | | | (3,367,261 | ) | | | (12,527,611 | ) | | | (39,474,739 | ) | | | (6,673,752 | ) |
| | | | | | | | | | | | | | | | | | | | | | | | | | | |
| | (10,463,841 | ) | | | (21,475,916 | ) | | | (52,272,926 | ) | | | (6,724,654 | ) | | | (13,188,587 | ) | | | (40,680,689 | ) | | | (3,114,726 | ) |
| | | | | | | | | | | | | | | | | | | | | | | | | | | |
| | | | | | |
| $ | (10,287,471 | ) | | $ | (21,788,223 | ) | | $ | (51,736,303 | ) | | $ | (6,056,806 | ) | | $ | (12,216,870 | ) | | $ | (36,357,664 | ) | | $ | (1,236,820 | ) |
| | | | | | | | | | | | | | | | | | | | | | | | | | | |
STATEMENTS OF CHANGES IN NET ASSETS
| | | | | | | | | | | | | | | | |
| | | Aggressive Investors 1 | | | Aggressive Investors 2 | |
| | | Year Ended
June 30, | | | Year Ended
June 30, | |
| | | 2008 | | | 2007 | | | 2008 | | | 2007 | |
| | | | |
OPERATIONS: | | | | | | | | | | | | | | | | |
Net investment income/(loss) | | $ | (3,608,240 | ) | | $ | (2,879,612 | ) | | $ | (3,034,805 | ) | | $ | (2,250,598 | ) |
Net realized gain/(loss) on investments | | | 12,102,813 | | | | 63,389,624 | | | | 12,505,237 | | | | (7,746,640 | ) |
Net change in unrealized appreciation/(depreciation) on investments | | | 4,499,071 | | | | (25,083,021 | ) | | | 30,649,595 | | | | 100,819,182 | |
| | | | | | | | | | | | | | | | | |
Net increase/(decrease) in net assets resulting from operations | | | 12,993,644 | | | | 35,426,991 | | | | 40,120,027 | | | | 90,821,944 | |
| | | | | | | | | | | | | | | | | |
| | | | |
DISTRIBUTIONS: | | | | | | | | | | | | | | | | |
From net investment income | | | - | | | | - | | | | - | | | | - | |
From net realized gains | | | (59,135,745 | ) | | | (38,922,847 | ) | | | (21,016,161 | ) | | | (12,277,639 | ) |
| | | | | | | | | | | | | | | | | |
Net decrease in net assets from distributions | | | (59,135,745 | ) | | | (38,922,847 | ) | | | (21,016,161 | ) | | | (12,277,639 | ) |
| | | | | | | | | | | | | | | | | |
| | | | |
SHARE TRANSACTIONS: | | | | | | | | | | | | | | | | |
Proceeds from sale of shares | | | 22,693,076 | | | | 25,500,417 | | | | 373,518,838 | | | | 257,748,964 | |
Reinvestment of distributions | | | 52,129,569 | | | | 33,935,405 | | | | 19,724,944 | | | | 11,193,522 | |
Cost of shares redeemed | | | (57,923,516 | ) | | | (126,574,282 | ) | | | (178,210,882 | ) | | | (281,809,367 | ) |
Redemption fees | | | - | | | | - | | | | - | | | | - | |
| | | | | | | | | | | | | | | | | |
Net increase/(decrease) in net assets from share transactions | | | 16,899,129 | | | | (67,138,460 | ) | | | 215,032,900 | | | | (12,866,881 | ) |
| | | | | | | | | | | | | | | | | |
| | | | |
Net increase/(decrease) in net assets | | | (29,242,972 | ) | | | (70,634,316 | ) | | | 234,136,766 | | | | 65,677,424 | |
| | | | |
NET ASSETS: | | | | | | | | | | | | | | | | |
Beginning of year | | | 367,957,862 | | | | 438,592,178 | | | | 650,939,284 | | | | 585,261,860 | |
| | | | | | | | | | | | | | | | | |
End of year* | | $ | 338,714,890 | | | $ | 367,957,862 | | | $ | 885,076,050 | | | $ | 650,939,284 | |
| | | | | | | | | | | | | | | | | |
| | | | |
SHARES ISSUED & REDEEMED | | | | | | | | | | | | | | | | |
Issued | | | 404,802 | | | | 449,096 | | | | 18,346,826 | | | | 14,911,236 | |
Distributions reinvested | | | 933,553 | | | | 613,217 | | | | 936,476 | | | | 647,402 | |
Redeemed | | | (1,005,484 | ) | | | (2,202,942 | ) | | | (8,935,188 | ) | | | (16,441,911 | ) |
| | | | | | | | | | | | | | | | | |
Net increase/(decrease) | | | 332,871 | | | | (1,140,629 | ) | | | 10,348,114 | | | | (883,273 | ) |
Outstanding at beginning of year | | | 5,944,512 | | | | 7,085,141 | | | | 32,461,353 | | | | 33,344,626 | |
| | | | | | | | | | | | | | | | | |
Outstanding at end of year | | | 6,277,383 | | | | 5,944,512 | | | | 42,809,467 | | | | 32,461,353 | |
| | | | | | | | | | | | | | | | | |
| | | | |
* Including accumulated net investment income (loss) of: | | $ | (50,624 | ) | | $ | 7,292 | | | $ | - | | | $ | - | |
See Notes to Financial Statements
| | |
| 120 | | Annual Report | June 30, 2008 |
| | | | | | | | | | | | | | | | | | | | | | |
Ultra-Small Company | | | Ultra-Small Company Market | | | Micro-Cap Limited | |
Year Ended
June 30, | | | Year Ended
June 30, | | | Year Ended
June 30, | |
| 2008 | | | 2007 | | | 2008 | | | 2007 | | | 2008 | | | 2007 | |
| | | | | |
| | | | | | | | | | | | | | | | | | | | | | |
| $ | 113,791 | | | $ | 408,100 | | | $ | 7,675,103 | | | $ | 6,105,627 | | | $ | 176,370 | | | $ | (61,758 | ) |
| | (7,791,457 | ) | | | 25,260,501 | | | | 38,086,367 | | | | 51,335,453 | | | | (4,043,124 | ) | | | (1,910,229 | ) |
| | (24,568,770 | ) | | | (14,050,480 | ) | | | (278,852,548 | ) | | | 55,403,853 | | | | (6,420,717 | ) | | | (780,270 | ) |
| | | | | | | | | | | | | | | | | | | | | | | |
| | (32,246,436 | ) | | | 11,618,121 | | | | (233,091,078 | ) | | | 112,844,933 | | | | (10,287,471 | ) | | | (2,752,257 | ) |
| | | | | | | | | | | | | | | | | | | | | | | |
| | | | | |
| | | | | | | | | | | | | | | | | | | | | | |
| | (394,094 | ) | | | - | | | | (2,258,281 | ) | | | (4,933,248 | ) | | | (99,874 | ) | | | - | |
| | (15,085,229 | ) | | | (25,378,384 | ) | | | (34,714,496 | ) | | | (22,318,728 | ) | | | - | | | | (14,955,401 | ) |
| | | | | | | | | | | | | | | | | | | | | | | |
| | (15,479,323 | ) | | | (25,378,384 | ) | | | (36,972,777 | ) | | | (27,251,976 | ) | | | (99,874 | ) | | | (14,955,401 | ) |
| | | | | | | | | | | | | | | | | | | | | | | |
| | | | | |
| | | | | | | | | | | | | | | | | | | | | | |
| | 1,223,204 | | | | 2,892,005 | | | | 256,154,976 | | | | 368,886,509 | | | | 2,320,692 | | | | 2,149,314 | |
| | 14,780,752 | | | | 24,602,886 | | | | 35,539,226 | | | | 25,618,053 | | | | 91,033 | | | | 14,435,520 | |
| | (10,581,496 | ) | | | (8,691,768 | ) | | | (462,864,797 | ) | | | (405,818,662 | ) | | | (16,132,953 | ) | | | (17,343,613 | ) |
| | - | | | | - | | | | 229,578 | | | | 387,659 | | | | - | | | | - | |
| | | | | | | | | | | | | | | | | | | | | | | |
| | 5,422,460 | | | | 18,803,123 | | | | (170,941,017 | ) | | | (10,926,441 | ) | �� | | (13,721,228 | ) | | | (758,779 | ) |
| | | | | | | | | | | | | | | | | | | | | | | |
| | | | | |
| | (42,303,299 | ) | | | 5,042,860 | | | | (441,004,872 | ) | | | 74,666,516 | | | | (24,108,573 | ) | | | (18,466,437 | ) |
| | | | | |
| | | | | | | | | | | | | | | | | | | | | | |
| | 137,235,893 | | | | 132,193,033 | | | | 1,162,416,473 | | | | 1,087,749,957 | | | | 62,244,080 | | | | 80,710,517 | |
| | | | | | | | | | | | | | | | | | | | | | | |
| $ | 94,932,594 | | | $ | 137,235,893 | | | $ | 721,411,601 | | | $ | 1,162,416,473 | | | $ | 38,135,507 | | | $ | 62,244,080 | |
| | | | | | | | | | | | | | | | | | | | | | | |
| | | | | |
| | | | | | | | | | | | | | | | | | | | | | |
| | 44,362 | | | | 76,935 | | | | 14,573,622 | | | | 19,173,707 | | | | 314,887 | | | | 235,605 | |
| | 516,990 | | | | 683,778 | | | | 2,044,835 | | | | 1,315,771 | | | | 11,582 | | | | 1,651,661 | |
| | (346,232 | ) | | | (231,431 | ) | | | (26,658,714 | ) | | | (20,839,119 | ) | | | (2,182,900 | ) | | | (1,892,871 | ) |
| | | | | | | | | | | | | | | | | | | | | | | |
| | 215,120 | | | | 529,282 | | | | (10,040,257 | ) | | | (349,641 | ) | | | (1,856,431 | ) | | | (5,605 | ) |
| | 3,645,381 | | | | 3,116,099 | | | | 57,090,810 | | | | 57,440,451 | | | | 7,267,677 | | | | 7,273,282 | |
| | | | | | | | | | | | | | | | | | | | | | | |
| | 3,860,501 | | | | 3,645,381 | | | | 47,050,553 | | | | 57,090,810 | | | | 5,411,246 | | | | 7,267,677 | |
| | | | | | | | | | | | | | | | | | | | | | | |
| | | | | |
| $ | 113,772 | | | $ | 394,075 | | | $ | 6,894,753 | | | $ | 2,258,267 | | | $ | 76,496 | | | $ | - | |
STATEMENTS OF CHANGES IN NET ASSETS
| | | | | | | | | | | | | | | | |
| | | Small-Cap Growth | | | Small-Cap Value | |
| | | Year Ended
June 30, | | | Year Ended
June 30, | |
| | | 2008 | | | 2007 | | | 2008 | | | 2007 | |
| | | | |
OPERATIONS: | | | | | | | | | | | | | | | | |
Net investment income/(loss) | | $ | (312,307 | ) | | $ | (599,494 | ) | | $ | 536,623 | | | $ | (524,387 | ) |
Net realized gain/(loss) on investments | | | 5,039,948 | | | | (11,045,092 | ) | | | (9,848,797 | ) | | | 4,920,957 | |
Net change in unrealized appreciation/(depreciation) on investments | | | (26,515,864 | ) | | | 18,709,955 | | | | (42,424,129 | ) | | | 29,678,491 | |
| | | | | | | | | | | | | | | | | |
Net increase/(decrease) in net assets resulting from operations | | | (21,788,223 | ) | | | 7,065,369 | | | | (51,736,303 | ) | | | 34,075,061 | |
| | | | | | | | | | | | | | | | | |
| | | | |
DISTRIBUTIONS: | | | | | | | | | | | | | | | | |
From net investment income | | | - | | | | - | | | | - | | | | - | |
From net realized gains | | | - | | | | - | | | | - | | | | - | |
| | | | | | | | | | | | | | | | | |
Net decrease in net assets from distributions | | | - | | | | - | | | | - | | | | - | |
| | | | | | | | | | | | | | | | | |
| | | | |
SHARE TRANSACTIONS: | | | | | | | | | | | | | | | | |
Proceeds from sale of shares | | | 41,766,427 | | | | 48,904,578 | | | | 212,944,988 | | | | 93,045,370 | |
Reinvestment of distributions | | | - | | | | - | | | | - | | | | - | |
Cost of shares redeemed | | | (47,705,114 | ) | | | (158,852,967 | ) | | | (109,736,945 | ) | | | (207,064,202 | ) |
| | | | | | | | | | | | | | | | | |
Net increase/(decrease) in net assets from share transactions | | | (5,938,687 | ) | | | (109,948,389 | ) | | | 103,208,043 | | | | (114,018,832 | ) |
| | | | | | | | | | | | | | | | | |
| | | | |
Net increase/(decrease) in net assets | | | (27,726,910 | ) | | | (102,883,020 | ) | | | 51,471,740 | | | | (79,943,771 | ) |
| | | | |
NET ASSETS: | | | | | | | | | | | | | | | | |
Beginning of year | | | 172,394,664 | | | | 275,277,684 | | | | 280,176,526 | | | | 360,120,297 | |
| | | | | | | | | | | | | | | | | |
End of year* | | $ | 144,667,754 | | | $ | 172,394,664 | | | $ | 331,648,266 | | | $ | 280,176,526 | |
| | | | | | | | | | | | | | | | | |
| | | | |
SHARES ISSUED & REDEEMED | | | | | | | | | | | | | | | | |
Issued | | | 2,834,069 | | | | 3,426,645 | | | | 12,592,357 | | | | 5,710,836 | |
Distributions reinvested | | | - | | | | - | | | | - | | | | - | |
Redeemed | | | (3,230,062 | ) | | | (11,322,443 | ) | | | (6,630,990 | ) | | | (13,240,019 | ) |
| | | | | | | | | | | | | | | | | |
Net increase/(decrease) | | | (395,993 | ) | | | (7,895,798 | ) | | | 5,961,367 | | | | (7,529,183 | ) |
Outstanding at beginning of year | | | 10,765,719 | | | | 18,661,517 | | | | 14,951,445 | | | | 22,480,628 | |
| | | | | | | | | | | | | | | | | |
Outstanding at end of year | | | 10,369,726 | | | | 10,765,719 | | | | 20,912,812 | | | | 14,951,445 | |
| | | | | | | | | | | | | | | | | |
| | | | |
* Including accumulated net investment income (loss) of: | | $ | 85,256 | | | $ | (2,867 | ) | | $ | 223,087 | | | $ | 70,914 | |
See Notes to Financial Statements
| | |
| 122 | | Annual Report | June 30, 2008 |
| | | | | | | | | | | | | | | | | | | | | | | | | | | | | | |
Large-Cap Growth | | | Large-Cap Value | | | Blue Chip 35 Index | | | Balanced | |
Year Ended
June 30, | | | Year Ended
June 30, | | | Year Ended
June 30, | | | Year Ended
June 30, | |
| 2008 | | | 2007 | | | 2008 | | | 2007 | | | 2008 | | | 2007 | | | 2008 | | | 2007 | |
| | | | | | | |
| | | | | | | | | | | | | | | | | | | | | | | | | | | | | | |
| $ | 667,848 | | | $ | 271,736 | | | $ | 971,717 | | | $ | 949,079 | | | $ | 4,323,025 | | | $ | 1,363,198 | | | $ | 1,877,906 | | | $ | 1,859,563 | |
| | (3,357,393 | ) | | | 486,313 | | | | (660,976 | ) | | | 2,784,881 | | | | (1,205,950 | ) | | | (232,846 | ) | | | 3,559,026 | | | | (3,724,855 | ) |
| | (3,367,261 | ) | | | 16,911,227 | | | | (12,527,611 | ) | | | 11,542,582 | | | | (39,474,739 | ) | | | 10,307,323 | | | | (6,673,752 | ) | | | 6,819,420 | |
| | | | | | | | | | | | | | | | | | | | | | | | | | | | | | | |
| | (6,056,806 | ) | | | 17,669,276 | | | | (12,216,870 | ) | | | 15,276,542 | | | | (36,357,664 | ) | | | 11,437,675 | | | | (1,236,820 | ) | | | 4,954,128 | |
| | | | | | | | | | | | | | | | | | | | | | | | | | | | | | | |
| | | | | | | |
| | | | | | | | | | | | | | | | | | | | | | | | | | | | | | |
| | (501,206 | ) | | | (357,354 | ) | | | (935,231 | ) | | | (819,616 | ) | | | (2,216,904 | ) | | | (1,021,236 | ) | | | (1,132,035 | ) | | | (1,860,754 | ) |
| | - | | | | - | | | | (2,259,581 | ) | | | - | | | | - | | | | - | | | | - | | | | (1,041,917 | ) |
| | | | | | | | | | | | | | | | | | | | | | | | | | | | | | | |
| | (501,206 | ) | | | (357,354 | ) | | | (3,194,812 | ) | | | (819,616 | ) | | | (2,216,904 | ) | | | (1,021,236 | ) | | | (1,132,035 | ) | | | (2,902,671 | ) |
| | | | | | | | | | | | | | | | | | | | | | | | | | | | | | | |
| | | | | | | |
| | | | | | | | | | | | | | | | | | | | | | | | | | | | | | |
| | 85,463,022 | | | | 53,352,870 | | | | 15,647,493 | | | | 38,671,336 | | | | 223,052,529 | | | | 64,503,705 | | | | 21,256,530 | | | | 26,839,294 | |
| | 403,318 | | | | 304,098 | | | | 3,077,813 | | | | 794,313 | | | | 2,117,136 | | | | 985,385 | | | | 1,075,310 | | | | 2,766,204 | |
| | (42,633,298 | ) | | | (36,692,288 | ) | | | (35,265,212 | ) | | | (55,545,831 | ) | | | (34,689,544 | ) | | | (19,293,804 | ) | | | (31,601,455 | ) | | | (29,941,283 | ) |
| | | | | | | | | | | | | | | | | | | | | | | | | | | | | | | |
| | 43,233,042 | | | | 16,964,680 | | | | (16,539,906 | ) | | | (16,080,182 | ) | | | 190,480,121 | | | | 46,195,286 | | | | (9,269,615 | ) | | | (335,785 | ) |
| | | | | | | | | | | | | | | | | | | | | | | | | | | | | | | |
| | | | | | | |
| | 36,675,030 | | | | 34,276,602 | | | | (31,951,588 | ) | | | (1,623,256 | ) | | | 151,905,553 | | | | 56,611,725 | | | | (11,638,470 | ) | | | 1,715,672 | |
| | | | | | | |
| | | | | | | | | | | | | | | | | | | | | | | | | | | | | | |
| | 138,137,573 | | | | 103,860,971 | | | | 86,095,176 | | | | 87,718,432 | | | | 99,082,299 | | | | 42,470,574 | | | | 87,055,747 | | | | 85,340,075 | |
| | | | | | | | | | | | | | | | | | | | | | | | | | | | | | | |
| $ | 174,812,603 | | | $ | 138,137,573 | | | $ | 54,143,588 | | | $ | 86,095,176 | | | $ | 250,987,852 | | | $ | 99,082,299 | | | $ | 75,417,277 | | | $ | 87,055,747 | |
| | | | | | | | | | | | | | | | | | | | | | | | | | | | | | | |
| | | | | | | |
| | | | | | | | | | | | | | | | | | | | | | | | | | | | | | |
| | 5,974,190 | | | | 4,091,823 | | | | 986,625 | | | | 2,461,638 | | | | 27,202,745 | | | | 8,004,336 | | | | 1,647,886 | | | | 2,108,086 | |
| | 27,587 | | | | 23,573 | | | | 195,790 | | | | 49,771 | | | | 252,040 | | | | 121,644 | | | | 82,336 | | | | 220,590 | |
| | (3,047,431 | ) | | | (2,908,564 | ) | | | (2,255,334 | ) | | | (3,556,554 | ) | | | (4,267,847 | ) | | | (2,381,492 | ) | | | (2,457,847 | ) | | | (2,354,584 | ) |
| | | | | | | | | | | | | | | | | | | | | | | | | | | | | | | |
| | 2,954,346 | | | | 1,206,832 | | | | (1,072,919 | ) | | | (1,045,145 | ) | | | 23,186,938 | | | | 5,744,488 | | | | (727,625 | ) | | | (25,908 | ) |
| | 9,780,616 | | | | 8,573,784 | | | | 5,043,972 | | | | 6,089,117 | | | | 11,632,793 | | | | 5,888,305 | | | | 6,721,632 | | | | 6,747,540 | |
| | | | | | | | | | | | | | | | | | | | | | | | | | | | | | | |
| | 12,734,962 | | | | 9,780,616 | | | | 3,971,053 | | | | 5,043,972 | | | | 34,819,731 | | | | 11,632,793 | | | | 5,994,007 | | | | 6,721,632 | |
| | | | | | | | | | | | | | | | | | | | | | | | | | | | | | | |
| | | | | | | |
| $ | 288,948 | | | $ | 121,549 | | | $ | 364,938 | | | $ | 425,557 | | | $ | 2,911,094 | | | $ | 804,973 | | | $ | 1,415,470 | | | $ | 826,873 | |
FINANCIAL HIGHLIGHTS
(for a share outstanding throughout the year indicated)
| | | | | | | | | | | | | | | |
| | | | | Income from
Investment Operations | |
| | | Net Asset
Value,
Beginning
of Year | | Net
Investment
Income (Loss)(a) | | | Net Realized
and Unrealized
Gain\(Loss) | | | Total from
Investment
Operations | |
| | | | |
| AGGRESSIVE INVESTORS 1 | | | | | | | | | | | | | | | |
| | | | |
Year Ended June 30, 2008 | | $ | 61.90 | | $ | (0.59 | ) | | $ | 3.14 | | | $ | 2.55 | |
Year Ended June 30, 2007 | | | 61.90 | | | (0.43 | ) | | | 6.41 | | | | 5.98 | |
Year Ended June 30, 2006 | | | 56.60 | | | (0.42 | ) | | | 12.23 | | | | 11.81 | |
Year Ended June 30, 2005 | | | 49.43 | | | (0.26 | ) | | | 7.43 | | | | 7.17 | |
Year Ended June 30, 2004 | | | 39.94 | | | (0.58 | ) | | | 10.07 | | | | 9.49 | |
| | | | |
| | | | | | | | | | | | | | | | |
| | | | |
| AGGRESSIVE INVESTORS 2 | | | | | | | | | | | | | | | |
| | | | |
Year Ended June 30, 2008 | | | 20.05 | | | (0.08 | ) | | | 1.27 | | | | 1.19 | |
Year Ended June 30, 2007 | | | 17.55 | | | (0.07 | ) | | | 2.94 | | | | 2.87 | |
Year Ended June 30, 2006 | | | 14.72 | | | (0.05 | ) | | | 3.22 | | | | 3.17 | |
Year Ended June 30, 2005 | | | 12.75 | | | (0.04 | ) | | | 2.01 | | | | 1.97 | |
Year Ended June 30, 2004 | | | 10.28 | | | (0.09 | ) | | | 2.56 | | | | 2.47 | |
| | | | |
| | | | | | | | | | | | | | | | |
| | | | |
| ULTRA-SMALL COMPANY | | | | | | | | | | | | | | | |
| | | | |
Year Ended June 30, 2008 | | | 37.65 | | | 0.03 | | | | (8.67 | ) | | | (8.64 | ) |
Year Ended June 30, 2007 | | | 42.42 | | | 0.12 | | | | 3.37 | | | | 3.49 | |
Year Ended June 30, 2006 | | | 38.44 | | | (0.15 | ) | | | 9.23 | | | | 9.08 | |
Year Ended June 30, 2005 | | | 40.97 | | | (0.10 | ) | | | 6.69 | | | | 6.59 | |
Year Ended June 30, 2004 | | | 32.93 | | | (0.33 | ) | | | 13.66 | | | | 13.33 | |
| | | | |
| | | | | | | | | | | | | | | | |
| | | | |
| ULTRA-SMALL COMPANY MARKET | | | | | | | | | | | | | | | |
| | | | |
Year Ended June 30, 2008 | | | 20.36 | | | 0.14 | | | | (4.49 | ) | | | (4.35 | ) |
Year Ended June 30, 2007 | | | 18.94 | | | 0.10 | | | | 1.76 | | | | 1.86 | |
Year Ended June 30, 2006 | | | 16.96 | | | 0.05 | | | | 2.48 | | | | 2.53 | |
Year Ended June 30, 2005 | | | 16.14 | | | 0.02 | | | | 0.97 | | | | 0.99 | |
Year Ended June 30, 2004 | | | 10.98 | | | 0.02 | | | | 5.16 | | | | 5.18 | |
| | | | |
| | | | | | | | | | | | | | | | |
| | | | |
| MICRO-CAP LIMITED | | | | | | | | | | | | | | | |
| | | | |
Year Ended June 30, 2008 | | | 8.56 | | | 0.03 | | | | (1.53 | ) | | | (1.50 | ) |
Year Ended June 30, 2007 | | | 11.10 | | | (0.01 | ) | | | (0.32 | ) | | | (0.33 | ) |
Year Ended June 30, 2006 | | | 11.09 | | | (0.13 | ) | | | 1.81 | | | | 1.68 | |
Year Ended June 30, 2005 | | | 10.75 | | | (0.13 | ) | | | 2.45 | | | | 2.32 | |
Year Ended June 30, 2004 | | | 9.36 | | | (0.17 | ) | | | 2.49 | | | | 2.32 | |
| | | | |
| | | | | | | | | | | | | | | | |
See Notes to Financial Statements
| | |
| 124 | | Annual Report | June 30, 2008 |
| | | | | | | | | | | | | | | | | | | | | | | | | | | | | | | | | | |
Less Distributions
to Shareholders from: | | | | | | | | | | Ratios & Supplemental Data | |
Net
Realized
Gain | | | Net
Investment
Income | | | Total
Distributions | | | Paid in Capital
from
Redemption
Fees(a) | | Net Asset
Value,
End of
Year | | Total
Return | | | Net Assets
End of Year
(000’s) | | Expenses Before
Waivers and
Reimbursements | | | Expenses After
Waivers and
Reimbursements | | | Net Investment
Income (Loss)
After Waivers and
Reimbursements | | | Portfolio
Turnover
Rate | |
| | | | | | | | | | |
| | | | | | | | | | | | | | | | | | | | | | | | | | | | | | | | | | |
| | | | | | | | | | |
| $ | (10.49 | ) | | $ | - | | | $ | (10.49 | ) | | $ | - | | $ | 53.96 | | 3.54 | %(d) | | $ | 338,715 | | 1.78 | % | | 1.78 | % | | (1.03 | %) | | 142 | % |
| | (5.98 | ) | | | - | | | | (5.98 | ) | | | - | | | 61.90 | | 10.79 | % | | | 367,958 | | 1.72 | % | | 1.72 | % | | (0.75 | %) | | 115 | % |
| | (6.51 | ) | | | - | | | | (6.51 | ) | | | - | | | 61.90 | | 21.79 | % | | | 438,592 | | 1.58 | % | | 1.58 | % | | (0.69 | %) | | 128 | % |
| | - | | | | - | | | | - | | | | - | | | 56.60 | | 14.51 | % | | | 368,886 | | 1.58 | % | | 1.58 | % | | (0.51 | %) | | 155 | % |
| | - | | | | - | | | | - | | | | - | | | 49.43 | | 23.76 | % | | | 353,684 | | 1.74 | % | | 1.74 | % | | (1.24 | %) | | 151 | % |
| | | | | | | | | | |
| | | | | | | | | | | | | | | | | | | | | | | | | | | | | | | | | | | |
| | | | | | | | | | |
| | | | | | | | | | | | | | | | | | | | | | | | | | | | | | | | | | |
| | | | | | | | | | |
| | (0.57 | ) | | | - | | | | (0.57 | ) | | | - | | | 20.67 | | 5.88 | %(d) | | | 885,076 | | 1.17 | % | | 1.17 | % | | (0.40 | %) | | 127 | % |
| | (0.37 | ) | | | - | | | | (0.37 | ) | | | - | | | 20.05 | | 16.68 | % | | | 650,939 | | 1.22 | % | | 1.22 | % | | (0.38 | %) | | 124 | % |
| | (0.34 | ) | | | - | | | | (0.34 | ) | | | - | | | 17.55 | | 21.65 | % | | | 585,262 | | 1.12 | % | | 1.12 | % | | (0.26 | %) | | 89 | % |
| | - | | | | - | | | | - | | | | - | | | 14.72 | | 15.45 | % | | | 156,053 | | 1.37 | % | | 1.37 | % | | (0.33 | %) | | 148 | % |
| | - | | | | - | | | | - | | | | - | | | 12.75 | | 24.03 | % | | | 110,395 | | 1.58 | % | | 1.58 | % | | (1.13 | %) | | 152 | % |
| | | | | | | | | | |
| | | | | | | | | | | | | | | | | | | | | | | | | | | | | | | | | | | |
| | | | | | | | | | |
| | | | | | | | | | | | | | | | | | | | | | | | | | | | | | | | | | |
| | | | | | | | | | |
| | (4.31 | ) | | | (0.11 | ) | | | (4.42 | ) | | | - | | | 24.59 | | (24.59 | %)(d) | | | 94,933 | | 1.07 | % | | 1.07 | % | | 0.10 | % | | 102 | % |
| | (8.26 | ) | | | - | | | | (8.26 | ) | | | - | | | 37.65 | | 9.12 | % | | | 137,236 | | 1.09 | % | | 1.09 | % | | 0.31 | % | | 106 | % |
| | (5.10 | ) | | | - | | | | (5.10 | ) | | | - | | | 42.42 | | 25.58 | % | | | 132,193 | | 1.09 | % | | 1.09 | % | | (0.37 | %) | | 101 | % |
| | (9.12 | ) | | | - | | | | (9.12 | ) | | | - | | | 38.44 | | 15.37 | % | | | 110,634 | | 1.12 | % | | 1.12 | % | | (0.25 | %) | | 86 | % |
| | (5.29 | ) | | | - | | | | (5.29 | ) | | | - | | | 40.97 | | 40.88 | % | | | 101,233 | | 1.15 | % | | 1.15 | % | | (0.84 | %) | | 71 | % |
| | | | | | | | | | |
| | | | | | | | | | | | | | | | | | | | | | | | | | | | | | | | | | | |
| | | | | | | | | | |
| | | | | | | | | | | | | | | | | | | | | | | | | | | | | | | | | | |
| | | | | | | | | | |
| | (0.65 | ) | | | (0.04 | ) | | | (0.69 | ) | | | 0.01 | | | 15.33 | | (21.72 | %)(d) | | | 721,412 | | 0.66 | % | | 0.66 | % | | 0.79 | % | | 29 | % |
| | (0.37 | ) | | | (0.08 | ) | | | (0.45 | ) | | | 0.01 | | | 20.36 | | 10.08 | % | | | 1,162,416 | | 0.67 | % | | 0.67 | % | | 0.53 | % | | 34 | % |
| | (0.53 | ) | | | (0.03 | ) | | | (0.56 | ) | | | 0.01 | | | 18.94 | | 15.13 | % | | | 1,087,750 | | 0.65 | % | | 0.65 | % | | 0.27 | % | | 27 | % |
| | (0.15 | ) | | | (0.03 | ) | | | (0.18 | ) | | | 0.01 | | | 16.96 | | 6.12 | % | | | 593,883 | | 0.73 | % | | 0.73 | % | | 0.15 | % | | 13 | % |
| | (0.04 | ) | | | - | | | | (0.04 | ) | | | 0.02 | | | 16.14 | | 47.41 | % | | | 816,748 | | 0.67 | % | | 0.67 | % | | 0.11 | % | | 19 | % |
| | | | | | | | | | |
| | | | | | | | | | | | | | | | | | | | | | | | | | | | | | | | | | | |
| | | | | | | | | | |
| | | | | | | | | | | | | | | | | | | | | | | | | | | | | | | | | | |
| | | | | | | | | | |
| | - | | | | (0.01 | ) | | | (0.01 | ) | | | - | | | 7.05 | | (17.49 | %)(d) | | | 38,136 | | 0.75 | % | | 0.75 | % | | 0.36 | % | | 147 | % |
| | (2.21 | ) | | | - | | | | (2.21 | ) | | | - | | | 8.56 | | (3.37 | %) | | | 62,244 | | 0.84 | % | | 0.84 | % | | (0.09 | %) | | 133 | % |
| | (1.67 | ) | | | - | | | | (1.67 | ) | | | - | | | 11.10 | | 14.72 | % | | | 80,711 | | 1.60 | % | | 1.60 | % | | (1.05 | %) | | 125 | % |
| | (1.98 | ) | | | - | | | | (1.98 | ) | | | - | | | 11.09 | | 22.94 | % | | | 66,637 | | 1.75 | % | | 1.75 | % | | (1.27 | %) | | 87 | % |
| | (0.93 | ) | | | - | | | | (0.93 | ) | | | - | | | 10.75 | | 24.30 | % | | | 57,750 | | 1.79 | % | | 1.79 | % | | (1.50 | %) | | 98 | % |
| | | | | | | | | | |
| | | | | | | | | | | | | | | | | | | | | | | | | | | | | | | | | | | |
FINANCIAL HIGHLIGHTS (continued)
(for a share outstanding throughout the period indicated)
| | | | | | | | | | | | | | | |
| | | | | Income from
Investment Operations | |
| | | Net Asset
Value,
Beginning
of Period | | Net
Investment
Income (Loss)(a) | | | Net Realized
and Unrealized
Gain\(Loss) | | | Total from
Investment
Operations | |
| | | | |
| SMALL-CAP GROWTH | | | | | | | | | | | | | | | |
| | | | |
Year Ended June 30, 2008 | | $ | 16.01 | | $ | (0.03 | ) | | $ | (2.03 | ) | | $ | (2.06 | ) |
Year Ended June 30, 2007 | | | 14.75 | | | (0.04 | ) | | | 1.30 | | | | 1.26 | |
Year Ended June 30, 2006 | | | 12.08 | | | (0.03 | ) | | | 2.70 | | | | 2.67 | |
Year Ended June 30, 2005 | | | 10.84 | | | (0.07 | ) | | | 1.31 | | | | 1.24 | |
Period from October 31, 2003
to June 30, 2004(e) | | | 10.00 | | | (0.05 | ) | | | 0.89 | | | | 0.84 | |
| | | | |
| | | | | | | | | | | | | | | | |
| | | | |
| SMALL-CAP VALUE | | | | | | | | | | | | | | | |
| | | | |
Year Ended June 30, 2008 | | | 18.74 | | | 0.03 | | | | (2.91 | ) | | | (2.88 | ) |
Year Ended June 30, 2007 | | | 16.02 | | | (0.03 | ) | | | 2.75 | | | | 2.72 | |
Year Ended June 30, 2006 | | | 12.78 | | | - | | | | 3.24 | | | | 3.24 | |
Year Ended June 30, 2005 | | | 10.46 | | | (0.02 | ) | | | 2.34 | | | | 2.32 | |
Period from October 31, 2003
to June 30, 2004(e) | | | 10.00 | | | (0.03 | ) | | | 0.49 | | | | 0.46 | |
| | | | |
| | | | | | | | | | | | | | | | |
| | | | |
| LARGE-CAP GROWTH | | | | | | | | | | | | | | | |
| | | | |
Year Ended June 30, 2008 | | | 14.12 | | | 0.06 | | | | (0.41 | ) | | | (0.35 | ) |
Year Ended June 30, 2007 | | | 12.11 | | | 0.03 | | | | 2.02 | | | | 2.05 | |
Year Ended June 30, 2006 | | | 11.00 | | | 0.04 | | | | 1.07 | | | | 1.11 | |
Year Ended June 30, 2005 | | | 10.63 | | | - | | | | 0.37 | | | | 0.37 | |
Period from October 31, 2003
to June 30, 2004(e) | | | 10.00 | | | (0.01 | ) | | | 0.64 | | | | 0.63 | |
| | | | |
| | | | | | | | | | | | | | | | |
| | | | |
| LARGE-CAP VALUE | | | | | | | | | | | | | | | |
| | | | |
Year Ended June 30, 2008 | | | 17.07 | | | 0.22 | | | | (2.94 | ) | | | (2.72 | ) |
Year Ended June 30, 2007 | | | 14.41 | | | 0.17 | | | | 2.64 | | | | 2.81 | |
Year Ended June 30, 2006 | | | 12.70 | | | 0.17 | | | | 1.69 | | | | 1.86 | |
Year Ended June 30, 2005 | | | 11.11 | | | 0.14 | | | | 1.55 | | | | 1.69 | |
Period from October 31, 2003
to June 30, 2004(e) | | | 10.00 | | | 0.03 | | | | 1.08 | | | | 1.11 | |
| | | | |
| | | | | | | | | | | | | | | | |
| | | | |
| BLUE CHIP 35 INDEX | | | | | | | | | | | | | | | |
| | | | |
Year Ended June 30, 2008 | | | 8.52 | | | 0.19 | | | | (1.39 | ) | | | (1.20 | ) |
Year Ended June 30, 2007 | | | 7.21 | | | 0.16 | | | | 1.26 | | | | 1.42 | |
Year Ended June 30, 2006 | | | 6.86 | | | 0.14 | | | | 0.32 | | | | 0.46 | |
Year Ended June 30, 2005 | | | 7.02 | | | 0.14 | | | | (0.18 | ) | | | (0.04 | ) |
Year Ended June 30, 2004 | | | 6.14 | | | 0.10 | | | | 0.83 | | | | 0.93 | |
| | | | |
| | | | | | | | | | | | | | | | |
| | | | |
| BALANCED | | | | | | | | | | | | | | | |
| | | | |
Year Ended June 30, 2008 | | | 12.95 | | | 0.29 | | | | (0.49 | ) | | | (0.20 | ) |
Year Ended June 30, 2007 | | | 12.65 | | | 0.28 | | | | 0.44 | | | | 0.72 | |
Year Ended June 30, 2006 | | | 11.92 | | | 0.22 | | | | 0.73 | | | | 0.95 | |
Year Ended June 30, 2005 | | | 11.30 | | | 0.14 | | | | 0.66 | | | | 0.80 | |
Year Ended June 30, 2004 | | | 10.05 | | | 0.06 | | | | 1.24 | | | | 1.30 | |
| | | | |
| | | | | | | �� | | | | | | | | | |
| (a) | Per share amounts calculated based on the average daily shares outstanding during the period. |
| (c) | Total returns for periods less than one year are not annualized. |
| (d) | Total return may have been lower had various fees not been waived during the period. |
| (e) | Fund commenced operations on October 31, 2003 |
See Notes to Financial Statements
| | |
| 126 | | Annual Report | June 30, 2008 |
| | | | | | | | | | | | | | | | | | | | | | | | | | | | | | | |
Less Distributions
to Shareholders from: | | | | | | | | Ratios & Supplemental Data(b) | |
Net
Realized
Gain | | | Net
Investment
Income | | | Total
Distributions | | | Net Asset
Value,
End of
Period | | Total
Return(c) | | | Net Assets
End of Period
(000’s) | | Expenses Before
Waivers and
Reimbursements | | | Expenses After
Waivers and
Reimbursements | | | Net Investment
Income (Loss)
After Waivers and
Reimbursements | | | Portfolio
Turnover
Rate | |
| | | | | | | | | |
| | | | | | | | | | | | | | | | | | | | | | | | | | | | | | | |
| | | | | | | | | |
| $ | - | | | $ | - | | | $ | - | | | $ | 13.95 | | (12.87 | %)(d) | | $ | 144,668 | | 0.87 | % | | 0.87 | % | | (0.20 | %) | | 63 | % |
| | - | | | | - | | | | - | | | | 16.01 | | 8.54 | % | | | 172,395 | | 0.92 | % | | 0.92 | % | | (0.31 | %) | | 37 | % |
| | - | | | | - | | | | - | | | | 14.75 | | 22.10 | % | | | 275,278 | | 0.81 | % | | 0.81 | % | | (0.19 | %) | | 41 | % |
| | - | | | | - | | | | - | | | | 12.08 | | 11.44 | %(d) | | | 55,704 | | 1.08 | % | | 0.94 | % | | (0.68 | %) | | 51 | % |
|
- |
| | | - | | | | - | | | | 10.84 | | 8.40 | %(d) | | | 37,968 | | 1.25 | %(b) | | 0.94 | %(b) | | (0.74 | %)(b) | | 17 | % |
| | | | | | | | | |
| | | | | | | | | | | | | | | | | | | | | | | | | | | | | | | | |
| | | | | | | | | |
| | | | | | | | | | | | | | | | | | | | | | | | | | | | | | | |
| | | | | | | | | |
| | - | | | | - | | | | - | | | | 15.86 | | (15.37 | %)(d) | | | 331,648 | | 0.83 | % | | 0.83 | % | | 0.18 | % | | 73 | % |
| | - | | | | - | | | | - | | | | 18.74 | | 16.98 | % | | | 280,177 | | 0.88 | % | | 0.88 | % | | (0.19 | %) | | 58 | % |
| | - | | | | - | | | | - | | | | 16.02 | | 25.35 | % | | | 360,120 | | 0.77 | % | | 0.77 | % | | (0.03 | %) | | 49 | % |
| | - | | | | - | | | | - | | | | 12.78 | | 22.18 | %(d) | | | 68,545 | | 1.07 | % | | 0.94 | % | | (0.32 | %) | | 57 | % |
|
- |
| | | - | | | | - | | | | 10.46 | | 4.60 | %(d) | | | 28,193 | | 1.49 | %(b) | | 0.94 | %(b) | | (0.42 | %)(b) | | 21 | % |
| | | | | | | | | |
| | | | | | | | | | | | | | | | | | | | | | | | | | | | | | | | |
| | | | | | | | | |
| | | | | | | | | | | | | | | | | | | | | | | | | | | | | | | |
| | | | | | | | | |
| | - | | | | (0.04 | ) | | | (0.04 | ) | | | 13.73 | | (2.50 | %)(d) | | | 174,813 | | 0.71 | % | | 0.71 | % | | 0.39 | % | | 37 | % |
| | - | | | | (0.04 | ) | | | (0.04 | ) | | | 14.12 | | 16.98 | % | | | 138,138 | | 0.78 | % | | 0.78 | % | | 0.25 | % | | 39 | % |
| | - | | | | - | | | | - | | | | 12.11 | | 10.09 | % | | | 103,861 | | 0.82 | % | | 0.82 | % | | 0.31 | % | | 26 | % |
| | - | | | | - | | | | - | | | | 11.00 | | 3.48 | %(d) | | | 42,988 | | 1.03 | % | | 0.84 | % | | (0.04 | %) | | 20 | % |
|
- |
| | | - | | | | - | | | | 10.63 | | 6.30 | %(d) | | | 39,532 | | 1.13 | %(b) | | 0.84 | %(b) | | (0.09 | %)(b) | | 7 | % |
| | | | | | | | | |
| | | | | | | | | | | | | | | | | | | | | | | | | | | | | | | | |
| | | | | | | | | |
| | | | | | | | | | | | | | | | | | | | | | | | | | | | | | | |
| | | | | | | | | |
| | (0.51 | ) | | | (0.21 | ) | | | (0.72 | ) | | | 13.63 | | (16.46 | %)(d) | | | 54,144 | | 0.80 | % | | 0.79 | % | | 1.38 | % | | 28 | % |
| | - | | | | (0.15 | ) | | | (0.15 | ) | | | 17.07 | | 19.57 | % | | | 86,095 | | 0.79 | % | | 0.79 | % | | 1.08 | % | | 34 | % |
| | - | | | | (0.15 | ) | | | (0.15 | ) | | | 14.41 | | 14.69 | %(d) | | | 87,718 | | 0.86 | % | | 0.84 | % | | 1.18 | % | | 23 | % |
| | - | | | | (0.10 | ) | | | (0.10 | ) | | | 12.70 | | 15.22 | %(d) | | | 27,476 | | 1.10 | % | | 0.84 | % | | 1.24 | % | | 30 | % |
|
- |
| | | - | | | | - | | | | 11.11 | | 11.10 | %(d) | | | 20,598 | | 1.52 | %(b) | | 0.84 | %(b) | | 0.86 | %(b) | | 11 | % |
| | | | | | | | | |
| | | | | | | | | | | | | | | | | | | | | | | | | | | | | | | | |
| | | | | | | | | |
| | | | | | | | | | | | | | | | | | | | | | | | | | | | | | | |
| | | | | | | | | |
| | - | | | | (0.11 | ) | | | (0.11 | ) | | | 7.21 | | (14.28 | %)(d) | | | 250,988 | | 0.22 | % | | 0.15 | % | | 2.35 | % | | 12 | % |
| | - | | | | (0.11 | ) | | | (0.11 | ) | | | 8.52 | | 19.81 | %(d) | | | 99,082 | | 0.35 | % | | 0.15 | % | | 1.98 | % | | 11 | % |
| | - | | | | (0.11 | ) | | | (0.11 | ) | | | 7.21 | | 6.64 | %(d) | | | 42,471 | | 0.47 | % | | 0.15 | % | | 1.90 | % | | 41 | % |
| | - | | | | (0.12 | ) | | | (0.12 | ) | | | 6.86 | | (0.59 | %)(d) | | | 34,612 | | 0.56 | % | | 0.15 | % | | 2.07 | % | | 20 | % |
| | - | | | | (0.05 | ) | | | (0.05 | ) | | | 7.02 | | 15.20 | %(d) | | | 35,960 | | 0.58 | % | | 0.15 | % | | 1.64 | % | | 5 | % |
| | | | | | | | | |
| | | | | | | | | | | | | | | | | | | | | | | | | | | | | | | | |
| | | | | | | | | |
| | | | | | | | | | | | | | | | | | | | | | | | | | | | | | | |
| | | | | | | | | |
| | - | | | | (0.17 | ) | | | (0.17 | ) | | | 12.58 | | (1.57 | %)(d) | | | 75,417 | | 0.88 | % | | 0.88 | % | | 2.23 | % | | 44 | % |
| | (0.15 | ) | | | (0.27 | ) | | | (0.42 | ) | | | 12.95 | | 5.87 | %(d) | | | 87,056 | | 0.98 | % | | 0.94 | % | | 2.16 | % | | 27 | % |
| | (0.11 | ) | | | (0.11 | ) | | | (0.22 | ) | | | 12.65 | | 8.01 | % | | | 85,340 | | 0.94 | % | | 0.94 | % | | 1.81 | % | | 51 | % |
| | (0.10 | ) | | | (0.08 | ) | | | (0.18 | ) | | | 11.92 | | 7.15 | %(d) | | | 42,264 | | 1.19 | % | | 0.94 | % | | 1.20 | % | | 126 | % |
| | - | | | | (0.05 | ) | | | (0.05 | ) | | | 11.30 | | 12.94 | %(d) | | | 23,212 | | 1.51 | % | | 0.94 | % | | 0.60 | % | | 124 | % |
| | | | | | | | | |
| | | | | | | | | | | | | | | | | | | | | | | | | | | | | | | | |
NOTES TO FINANCIAL STATEMENTS
June 30, 2008
1. Organization:
Bridgeway Funds, Inc. (“Bridgeway”) was organized as a Maryland corporation on October 19, 1993, and is registered under the Investment Company Act of 1940, as amended, as an open-end management investment company.
Bridgeway is organized as a series fund, which currently has 11 investment funds (collectively, the “Funds”): Aggressive Investors 1, Aggressive Investors 2, Ultra-Small Company, Ultra-Small Company Market, Micro-Cap Limited, Small-Cap Growth, Small-Cap Value, Large-Cap Growth, Large-Cap Value, Blue Chip 35 Index, and Balanced Funds.
Bridgeway is authorized to issue 1,000,000,000 shares of common stock at $0.001 per share. 15,000,000 shares have been classified into the Aggressive Investors 1 Fund. 130,000,000 shares each have been classified into the Aggressive Investors 2 and Blue Chip 35 Index Funds. 5,000,000 shares have been classified into the Ultra-Small Company Fund. 100,000,000 shares have been classified in the Ultra-Small Company Market Fund. 10,000,000 shares have been classified in the Micro-Cap Limited Fund. 100,000,000 shares each have been classified into the Small-Cap Growth, Small-Cap Value, Large-Cap Growth, and Large-Cap Value Funds. 50,000,000 shares have been classified into the Balanced Fund. All shares outstanding currently represent Class N shares.
The Aggressive Investors 1 Fund and the Micro-Cap Limited Fund are closed to new investors. The Ultra-Small Company Fund is closed to all investors.
All of the Funds are no-load, diversified funds.
The Aggressive Investors 1 and 2 Funds seek to exceed the stock market total return (primarily through capital appreciation) at a level of total risk roughly equal to that of the stock market over longer periods of time (three years or more).
The Ultra-Small Company, Ultra-Small Company Market, Micro-Cap Limited, Small-Cap Growth, Small-Cap Value, and Large-Cap Growth Funds seek to provide a long-term total return of capital, primarily through capital appreciation.
The Blue Chip 35 Index and Large-Cap Value Funds seek to provide long-term total return of capital, primarily through capital appreciation but also some income.
The Balanced Fund seeks to provide a high current return with short-term risk less than or equal to 40% of the stock market.
Bridgeway Capital Management, Inc. (the “Adviser”) is the investment adviser for all of the Funds.
2 . Significant Accounting Policies:
The following summary of significant accounting policies, followed in the preparation of the financial statements of the Funds, are in conformity with accounting principles generally accepted in the United States of America.
Securities, Options, Futures and Other Investments Valuation Other than options, portfolio securities that are principally traded on a national securities exchange are valued at their last sale price on the principal exchange on which they are traded prior to the close of the New York Stock Exchange (“NYSE”), on each day the NYSE is open for business. Portfolio securities other than options that are principally traded on the National Association of Securities Dealers Automated Quotation System (“NASDAQ”) are valued at the NASDAQ Official Closing Price (“NOCP”). In the absence of recorded sales on their home exchange or NOCP in the case of NASDAQ traded securities, the security will be valued as follows: bid prices for long positions and ask prices for short positions.
Short-term fixed income securities having a remaining maturity of 60 days or less are valued at amortized cost, which approximates market value. Options are valued at the average of the best bid and best asked quotations. Other investments for which no sales are reported are valued at the latest bid price in accordance with the pricing policy established by the Board of Directors.
Investments in open-end registered investment companies and closed-end registered investment companies that do not trade on an exchange are valued at the end of day net asset value per share.
| | |
| 128 | | Annual Report | June 30, 2008 |
NOTES TO FINANCIAL STATEMENTS (continued)
June 30, 2008
Investments in closed-end registered investment companies that trade on an exchange are valued at the last sales price as of the close of the customary trading session on the exchange where the security is principally traded.
When market quotations are not readily available or when events occur that make established valuation methods unreliable, securities of the Funds may be valued at fair value as determined in good faith by or under the direction of the Board of Directors. The valuation assigned to fair valued securities for purposes of calculating the Funds’ NAVs may differ from the security’s most recent closing market price and from the prices used by other mutual funds to calculate their NAVs.
Securities Lending Upon lending its securities to third parties, the Fund receives compensation in the form of fees. The Fund also continues to receive dividends on the securities loaned. The loans are secured by collateral at least equal to the fair value of the securities loaned plus accrued interest. Gain or loss in the fair value of the securities loaned that may occur during the term of the loan will be for the account of the Fund. The Fund has the right under the lending agreement to recover the securities from the borrower on demand. Additionally, the Fund does not have the right to sell or repledge collateral received in the form of securities unless the borrower goes into default. The risks to the Fund of securities lending are that the borrower may not provide additional collateral when required or return the securities when due.
As of June 30, 2008, the Funds had securities on loan and related collateral with values shown below:
| | | | | | |
| Bridgeway Fund | | Securities on
Loan Value | | Value of
Securities
Received as
Collateral |
| | | | | | |
Aggressive Investors 1 | | $ | 53,026,296 | | $ | 55,333,498 |
Aggressive Investors 2 | | $ | 129,946,137 | | $ | 134,184,146 |
Ultra-Small Company | | $ | 18,095,257 | | $ | 19,232,590 |
Ultra-Small Company Market | | $ | 156,993,337 | | $ | 168,736,391 |
Micro-Cap Limited | | $ | 6,074,877 | | $ | 6,310,408 |
Small-Cap Growth | | $ | 42,471,034 | | $ | 44,433,424 |
Small-Cap Value | | $ | 67,236,125 | | $ | 70,680,471 |
Large-Cap Growth | | $ | 14,534,265 | | $ | 15,180,866 |
Large-Cap Value | | $ | 6,750,451 | | $ | 6,849,100 |
Blue Chip 35 Index | | $ | 37,211,798 | | $ | 39,144,456 |
Balanced | | $ | 5,634,924 | | $ | 5,803,040 |
It is the Fund’s policy to obtain additional collateral from or return excess collateral to the borrower by the end of the next business day, following the valuation date of the securities loaned. Therefore, the value of the collateral held may be temporarily less than that required under the lending contract.
Federal Income Taxes It is the Funds’ policy to continue to comply with the provisions of the Internal Revenue Code applicable to registered investment companies and to distribute income to the extent necessary so that the Funds are not subject to federal income tax. Therefore, no federal income tax provision is required.
Use of Estimates in Financial Statements In preparing financial statements in conformity with accounting principles generally accepted in the United States of America, management makes estimates and assumptions that affect the reported amounts of assets and liabilities at the date of the financial statements and the disclosure of contingent assets and liabilities at the date of the financial statements as well as the reported amounts of revenue and expenses during the reporting period. Actual results could differ from those estimates.
Risks and Uncertainties The Funds provide for various investment options, including stocks and call and put options. Such investments are exposed to various risks, such as interest rate, market and credit risks. Due to the risks involved, it is at least reasonably possible that changes in risks in the near term would materially affect shareholders’ account values and the amounts reported in the financial statements and financial highlights.
NOTES TO FINANCIAL STATEMENTS (continued)
June 30, 2008
Security Transactions, Expenses, Gains and Losses and Allocations Fund expenses that are not series specific are allocated to each series based upon its relative proportion of net assets to the Funds’ total net assets or other appropriate basis.
Security transactions are accounted for as of the trade date, the date the order to buy or sell is executed. Realized gains and losses are computed on the identified cost basis. Dividend income is recorded on the ex-dividend date, and interest income is recorded on the accrual basis from settlement date. Particularly related to the Balanced Fund, discounts and premiums are accreted/amortized on the effective interest method.
Futures Contracts A futures contract is an agreement between two parties to buy or sell a financial instrument at a set price on a future date. Upon entering into such a contract a Fund is required to pledge to the broker an amount of cash or U.S. government securities equal to the minimum “initial margin” requirements of the exchange on which the futures contract is traded. The contract amount reflects the extent of a Fund’s exposure in these financial instruments. The Fund’s participation in the futures markets involves certain risks, including imperfect correlation between movements in the price of futures contracts and movements in the price of the securities hedged or used for cover. The Fund’s activities in the futures contracts are conducted through regulated exchanges that do not result in counterparty credit risks on a periodic basis. Pursuant to a contract, the Fund agrees to receive from or pay to the broker an amount of cash equal to the fluctuation in value of the contract. Such receipts or payments are known as “variation margin” and are recorded by the Fund as unrealized appreciation or depreciation. When a contract is closed, the Fund records a realized gain or loss equal to the difference between the value of the contract at the time it was opened and the value at the time it was closed. As of June 30, 2008, the Funds had no open futures contracts.
Options An option is a contract conveying a right to buy or sell a financial instrument at a specified price during a stipulated period. The premium paid by a Fund for the purchase of a call or a put option is included in the Fund’s Schedule of Investments as an investment and subsequently marked to market to reflect the current market value of the option. When a Fund writes a call or a put option, an amount equal to the premium received by the Fund is included in the Fund’s Statement of Assets and Liabilities as a liability and is subsequently marked to market to reflect the current market value of the option written. If an option which a Fund has written either expires on its stipulated expiration date, or if the Fund enters into a closing purchase transaction, the Fund realizes a gain (or a loss if the cost of a closing purchase transaction exceeds the premium received when the option was written) without regard to any unrealized gain or loss on the underlying security, and the liability related to such options is extinguished. If a call option that a Fund has written is assigned, the Fund realizes a gain or loss from the sale of the underlying security and the proceeds from such sale are increased by the premium originally received. If a put option that a Fund has written is assigned, the amount of the premium originally received reduces the cost of the security that the Fund purchased upon exercise of the option. Buying calls increases a Fund’s exposure to the underlying security to the extent of any premium paid. Buying puts on a stock market index tends to limit a Fund’s exposure to a stock market decline. All options purchased by the Funds were listed on exchanges and considered liquid positions with readily available market quotes.
Covered Call Options and Secured Puts The Aggressive Investors 1, Aggressive Investors 2, and Balanced Funds may write call options on a covered basis, that is, the Fund will own the underlying security, or the Fund may write secured puts. The principal reason for writing covered calls and secured puts on a security is to attempt to realize income, through the receipt of premiums. The option writer has, in return for the premium, given up the opportunity for profit from a substantial price increase in the underlying security so long as the obligation as a writer continues, but has retained the risk of loss should the price of the security decline. All options were listed on exchanges and considered liquid positions with readily available market quotes. Only the Balanced Fund had outstanding written options as of June 30, 2008.
| | |
| 130 | | Annual Report | June 30, 2008 |
NOTES TO FINANCIAL STATEMENTS (continued)
June 30, 2008
A summary of the options transactions written by each of the Funds is as follows:
| | | | | | | | | | | | | | |
| | | Aggressive Investors 1 Fund | | | Aggressive Investors 2 Fund | |
| | | Written Call Options | | | Written Call Options | |
| | | Contracts | | | Premiums | | | Contracts | | | Premiums | |
| | | | | | | | | | | | | | |
Outstanding, June 30, 2007 | | - | | | $ | - | | | - | | | $ | - | |
Positions Opened | | 3,805 | | | | 1,517,307 | | | 7,087 | | | | 3,017,163 | |
Exercised | | (1,110 | ) | | | (617,126 | ) | | - | | | | - | |
Closed | | (2,695 | ) | | | (900,181 | ) | | (7,087 | ) | | | (3,017,163 | ) |
| | | | | | | | | | | | | | | |
Outstanding, June 30, 2008 | | - | | | $ | - | | | - | | | $ | - | |
| | | | | | | | | | | | | | | |
Market Value, June 30, 2008 | | | | | $ | - | | | | | | $ | - | |
| | | | | | | | | | | | | | | |
| | |
| | | Balanced Fund | | | Balanced Fund | |
| | | Written Call Options | | | Written Put Options | |
| | | Contracts | | | Premiums | | | Contracts | | | Premiums | |
| | | | | | | | | | | | | | |
Outstanding, June 30, 2007 | | 3,906 | | | $ | 515,704 | | | 3,140 | | | $ | 413,618 | |
Positions Opened | | 24,311 | | | | 4,737,869 | | | 16,993 | | | | 4,424,594 | |
Exercised | | (2,314 | ) | | | (955,095 | ) | | (4,395 | ) | | | (797,248 | ) |
Expired | | (9,103 | ) | | | (1,523,105 | ) | | (3,919 | ) | | | (1,168,749 | ) |
Closed | | (12,577 | ) | | | (2,045,400 | ) | | (10,124 | ) | | | (2,277,337 | ) |
| | | | | | | | | | | | | | | |
Outstanding, June 30, 2008 | | 4,223 | | | $ | 729,973 | | | 1,695 | | | $ | 594,878 | |
| | | | | | | | | | | | | | | |
Market Value, June 30, 2008 | | | | | $ | 518,468 | | | | | | $ | 559,275 | |
| | | | | | | | | | | | | | | |
NOTES TO FINANCIAL STATEMENTS (continued)
June 30, 2008
Swaps. Each Fund may enter into total return swaps. Total return swaps are agreements that provide a Fund with a return based on the performance of an underlying asset, in exchange for fee payments to a counterparty based on a specified rate. The difference in the value of these income streams is recorded daily by the Funds, and is settled in cash at the end of each month. The fee paid by a Fund will typically be determined by multiplying the face value of the swap agreement by an agreed upon interest rate. In addition, if the underlying asset declines in value over the term of the swap, the Fund would also be required to pay the dollar value of that decline to the counterparty. Total return swaps could result in losses if the underlying asset does not perform as anticipated by the Adviser. A Fund may use its own net asset value as the underlying asset in a total return swap. This strategy serves to reduce cash drag (the impact of cash on a Fund’s overall return) by replacing it with the impact of market exposure based upon the Fund’s own investment holdings. The following total return swaps were open as of June 30, 2008:
| | | | | | | | | | | |
| Portfolio | | Swap
Counterparty | | Notional
Principal | | Maturity
Date | | Net Unrealized
Gain\(Loss) | |
| | | | | | | | | | | |
Aggressive Investors 1 | | ReFlow Management Co. | | $ | 3,154,606 | | July 1, 2008 | | $ | 50,624 | |
Small-Cap Growth | | ReFlow Management Co. | | | 2,531,074 | | July 1, 2008 | | | (85,602 | ) |
Small-Cap Value | | ReFlow Management Co. | | | 16,620,072 | | July 1, 2008 | | | 70,547 | |
Indemnification Under the Company’s organizational documents, the Funds’ officers, directors, employees and agents are indemnified against certain liabilities that may arise out of the performance of their duties to the Funds. Additionally, in the normal course of business, the Funds enter into contracts that contain a variety of indemnification clauses. The Funds’ maximum exposure under these arrangements is unknown as this would involve future claims that may be made against the Funds that have not yet occurred. However, the Funds have not had prior claims or losses pursuant to these contracts.
| 3. | Management Fees, Other Related Party Transactions and Contingencies: |
The Funds have entered into management agreements with the Adviser. As compensation for the advisory services rendered, facilities furnished, and expenses borne by the Adviser, the Funds pay the Adviser a fee pursuant to each Fund’s management agreement, as described below.
Aggressive Investors 1: A total advisory fee is paid by the Fund to the Adviser that is comprised of a Base Fee and a Performance Adjustment. The Base Fee equals the Base Fee Rate times the average daily net assets of the Fund. The Base Fee Rate is based on the following annual rates: 0.90% of the first $250 million of the Fund’s average daily net assets, 0.875% of the next $250 million and 0.85% of any excess over $500 million.
The Performance Adjustment equals 4.67% times the difference in cumulative total return between the Fund and the Standard and Poor’s 500 Index with dividends reinvested (hereinafter “Index”) over a rolling five-year performance period. The Performance Adjustment Rate varies from a minimum of –0.70% to a maximum of +0.70%. However, the Performance Adjustment Rate is zero if the difference between the cumulative Fund performance and the Index performance is less than or equal to 2%.
Aggressive Investors 2: A total advisory fee is paid by the Fund to the Adviser that is comprised of a Base Fee and a Performance Adjustment. The Base Fee equals the Base Fee Rate times the average daily net assets of the Fund. The Base Fee rate is based on the following annual rates: 0.90% of the first $250 million of the Fund’s average daily net assets, 0.875% of the next $250 million, 0.85% from $500 million to $1 billion, and 0.80% over $1 billion.
The Performance Adjustment equals 2.00% times the difference in cumulative total return between the Fund and the Standard and Poor’s 500 Index with dividends reinvested (hereinafter “Index”) over a rolling five-year performance period. The Performance Adjustment Rate varies from a minimum of -0.30% to a maximum of +0.30%. However, the Performance Adjustment Rate is zero if the difference between the cumulative Fund performance and the Index performance is less than or equal to 2%.
Ultra-Small Company: The Fund pays management fees based on the following annual rates: 0.90% of the first $250 million of the Fund’s average daily net assets, 0.875% of the next $250 million and 0.85% of any excess over $500 million. The
| | |
| 132 | | Annual Report | June 30, 2008 |
NOTES TO FINANCIAL STATEMENTS (continued)
June 30, 2008
management fees are computed daily and are payable monthly. However, during any quarter that the Fund’s net assets range from $27,500,000 to $55,000,000, the advisory fee will be determined as if the Fund had $55,000,000 under management. This is limited to a maximum annualized expense ratio of 1.49% of average net assets.
Ultra-Small Company Market: The Fund’s management fee is a flat 0.50% of the value of the Fund’s average daily net assets, computed daily and payable monthly.
Micro-Cap Limited: A total advisory fee is paid by the Fund to the Adviser that is comprised of a Base Fee and a Performance Adjustment. The Base Fee equals the Base Fee Rate times the average daily net assets of the Fund. The Base Fee Rate is based on the following annual rates: 0.90% of the first $250 million of the Fund’s average daily net assets, 0.875% of the next $250 million and 0.85% of any excess over $500 million. However, during any quarter that the Fund’s net assets range from $27,500,000 to $55,000,000, the advisory fee will be determined as if the Fund had $55,000,000 under management. This is limited to a maximum annualized expense ratio of 1.49% of the net assets in the quarter the advisory fee is determined.
The Performance Adjustment equals 2.87% times the difference in cumulative total return between the Fund and the CRSP Cap-based Portfolio 9 Index with dividends reinvested (hereinafter “Index”) over a rolling five-year performance period. The Performance Adjustment Rate varies from a minimum of –0.70% to a maximum of +0.70%. However, the Performance Adjustment Rate is zero if the difference between the cumulative Fund performance and the Index performance is less than or equal to 2%.
Small-Cap Growth and Small-Cap Value: A total advisory fee is paid by each Fund to the Adviser that is comprised of a Base Fee and a Performance Adjustment. The Base Fee equals the Base Fee Rate times the average daily net assets of the Fund. The Base Fee Rate is based on the annual rate of 0.60% of the value of the Fund’s average daily net assets.
The Performance Adjustment equals 0.33% times the difference in cumulative total return between the Fund and the Russell 2000 Growth Index for Small-Cap Growth Fund and the Russell 2000 Value Index for Small-Cap Value Fund, with dividends reinvested (hereinafter “Index”) over a rolling five-year performance period. Since each Fund does not have a five-year operating history, the Performance Adjustment Rate will be calculated as follows during the initial five-year period: (a) From inception through September 30, 2004, the Performance Adjustment Rate was inoperative thus the Advisory Fee was calculated based on the Base Advisory Fee Rate times the average daily net assets of the Funds only; (b) From September 30, 2004 through September 30, 2008, the Performance Adjustment Rate will be calculated based upon a comparison of the investment performance of the Fund and the Index over the number of quarters that have elapsed since the Fund’s inception. Each time the Performance Adjustment Rate is calculated, it will cover a longer time span, until it can cover a running five-year period as intended. In the meantime, the early months of the transition period will have a disproportionate effect on the performance adjustment of the fee. The Performance Adjustment Rate varies from a minimum of -0.05% to a maximum of +0.05%. However, the Performance Adjustment Rate is zero if the difference between the cumulative Fund’s performance and the Index performance is less than or equal to 2%.
Large-Cap Growth and Large-Cap Value: A total advisory fee is paid by each Fund to the Adviser that is comprised of a Base Fee and a Performance Adjustment. The Base Fee equals the Base Fee Rate times the average daily net assets of the Fund. The Base Fee Rate is based on the annual rate of 0.50% of the value of the Fund’s average daily net assets.
The Performance Adjustment equals 0.33% times the difference in cumulative total return between the Fund and the Russell 1000 Growth Index for Large-Cap Growth Fund and the Russell 1000 Value Index for the Large-Cap Value Fund, with dividends reinvested (hereinafter “Index”) over a rolling five-year performance period. Since each Fund does not have a five-year operating history, the Performance Adjustment Rate will be calculated as follows during the initial five-year period: (a) From inception through September 30, 2004, the Performance Adjustment Rate was inoperative thus the Advisory Fee was calculated based on the Base Advisory Fee Rate times the average daily net assets of the Funds only; (b) From September 30, 2004 through September 30, 2008, the Performance Adjustment Rate will be calculated based upon a comparison of the investment performance of the Fund and the Index over the number of quarters that have elapsed since the Fund’s inception. Each time the Performance Adjustment Rate is calculated, it will cover a longer time span, until it can cover a running five-year period as intended. In the meantime, the early months of the transition period will have a disproportionate effect on the performance adjustment of the fee. The Performance Adjustment Rate varies from a minimum of - -0.05% to a maximum of +0.05%. However, the Performance Adjustment Rate is zero if the difference between the cumulative Fund’s performance and the Index performance is less than or equal to 2%.
NOTES TO FINANCIAL STATEMENTS (continued)
June 30, 2008
Blue Chip 35 Index: The Fund’s management fee is a flat 0.08% of the value of the Fund’s average daily Net Assets, computed daily and payable monthly.
Balanced: The Fund’s management fee is a flat 0.60% of the value of the Funds average daily Net Assets, computed daily and payable monthly.
Expense limitations: At a special meeting on March 31, 2005, shareholders of the Funds approved amendments to the Management Agreements detailing expense limitations. The Adviser agrees to reimburse the Funds for operating expenses and management fees above the expense limitations, which are shown as a ratio of net expenses to average net assets, for each Fund, for the fiscal year ended June 30, 2008. All expense limitations and total reimbursements for the fiscal year ended June 30, 2008, are shown below.
| | | | | | | | | |
| | | | | | Total Waivers and
Reimbursements for
Fiscal Year Ending
06/30/08 |
| Bridgeway Fund | | Expense
Limitation | | | Adviser
Waived and
Reimbursed | | Other*
Reimbursements |
| | | | | | | | | |
Aggressive Investors 1 | | 1.80 | % | | $ | - | | $ | 9,245 |
Aggressive Investors 2 | | 1.75 | % | | | - | | | 25,957 |
Ultra-Small Company | | 2.00 | % | | | - | | | 4,079 |
Ultra-Small Company Market | | 0.75 | % | | | - | | | 30,787 |
Micro-Cap Limited | | 1.85 | % | | | - | | | 1,176 |
Small-Cap Growth | | 0.94 | % | | | - | | | 4,485 |
Small-Cap Value | | 0.94 | % | | | - | | | 14,517 |
Large-Cap Growth | | 0.84 | % | | | - | | | 4,800 |
Larch-Cap Value | | 0.84 | % | | | - | | | 2,434 |
Blue Chip 35 Index | | 0.15 | % | | | 119,915 | | | 3,775 |
Balanced | | 0.94 | % | | | - | | | 5,442 |
| * | The Funds’ accounting agent voluntarily reimbursed certain expenses during the fiscal year ended June 30, 2008. |
Other Related Party Transactions: The Adviser entered into an Administrative Services Agreement with Bridgeway Funds pursuant to which the Adviser provides various administrative services to the Funds including, but not limited to: (i) supervising and managing various aspects of the Funds’ business and affairs; (ii) selecting, overseeing and/or coordinating activities with other service providers to the Funds; (iii) providing reports to the Board as requested from time to time; (iv) assisting and/or reviewing amendments and updates to the Funds’ registration statement and other filings with the SEC; (v) providing certain shareholder services; (vi) providing administrative support in connection with meetings of the Board of Directors; and (vii) providing certain recordkeeping services. For its services to the Funds, the Adviser is paid an aggregate annual fee of $635,000 payable in equal monthly installments.
One director of the Funds, John Montgomery, is an owner and director of the Adviser. Another director of the Fund, Michael Mulcahy, is an executive and director of the Adviser. Under the Investment Company Act of 1940 definitions, each is considered to be an “affiliated person” of the Adviser and an “interested person” of the Adviser and of the Funds. Compensation for Mr. Montgomery and Mr. Mulcahy is borne by the Adviser rather than the Funds.
Board of Directors Compensation Independent Directors are paid an annual retainer of $8,000 with an additional retainer of $2,500 paid to the Independent Chairman of the Board and an additional retainer of $1,000 paid to the Nominating and Corporate Governance Committee Chair. Independent Director meeting fees are $6,000 per meeting.
The Independent Directors receive this compensation in the form of shares of Bridgeway Funds, credited to his or her account. Such Directors are reimbursed for any expenses incurred in attending meetings and conferences and expenses for subscriptions or printed materials. During the fiscal year ended June 30, 2008, total reimbursements made, across all of the Funds, was $3,028. The amount of directors’ fees attributable to each Fund is disclosed in the Statements of Operations.
| | |
| 134 | | Annual Report | June 30, 2008 |
NOTES TO FINANCIAL STATEMENTS (continued)
June 30, 2008
4. Distribution and Shareholder Servicing Fees:
Foreside Fund Services, LLC acts as distributor of the Funds’ shares pursuant to a restated and amended Distribution Agreement dated July 1, 2007. The Adviser pays all costs and expenses associated with distribution of the Funds’ shares pursuant to a protective plan adopted by shareholders pursuant to Rule 12b-1.
5. Purchases and Sales of Investment Securities:
Purchases and sales of investments, other than short-term securities, for each Bridgeway Fund for fiscal year ended June 30, 2008 were as follows:
| | | | | | | | | | | | |
| | | Purchases | | Sales |
| Bridgeway Fund | | U.S. Government | | Other | | U.S. Government | | Other |
| | | | | | | | | | | | |
Aggressive Investors 1 | | | - | | $ | 495,686,577 | | | - | | $ | 545,330,449 |
Aggressive Investors 2 | | | - | | $ | 1,157,120,039 | | | - | | $ | 962,875,354 |
Ultra-Small Company | | | - | | $ | 113,893,599 | | | - | | $ | 126,942,230 |
Ultra-Small Company Market | | | - | | $ | 276,427,193 | | | - | | $ | 489,612,135 |
Micro-Cap Limited | | | - | | $ | 70,114,092 | | | - | | $ | 82,422,920 |
Small-Cap Growth | | | - | | $ | 95,443,763 | | | - | | $ | 103,677,345 |
Small-Cap Value | | | - | | $ | 317,704,107 | | | - | | $ | 216,545,333 |
Large-Cap Growth | | | - | | $ | 101,927,702 | | | - | | $ | 61,448,692 |
Large-Cap Value | | | - | | $ | 19,505,681 | | | - | | $ | 37,469,447 |
Blue Chip 35 Index | | | - | | $ | 213,845,243 | | | - | | $ | 21,325,970 |
Balanced | | $ | 1,497,405 | | $ | 28,653,308 | | $ | 5,386,602 | | $ | 23,346,461 |
6. Federal Income Taxes
Unrealized Appreciation and Depreciation on Investments (Tax Basis) The amount of net unrealized appreciation/depreciation and the cost of investment securities for tax purposes, including short-term securities at June 30, 2008, were as follows:
| | | | | | | | | | | | |
| | | Aggressive Investors 1 | | | Aggressive Investors 2 | | | Ultra-Small Company | |
As of June 30, 2008 | | | | | | | | | | | | |
Gross appreciation (excess of value over tax cost) | | $ | 86,632,389 | | | $ | 206,381,418 | | | $ | 15,821,999 | |
Gross depreciation (excess of tax cost over value) | | | (10,399,388 | ) | | | (33,525,102 | ) | | | (11,789,926 | ) |
| | | | | | | | | | | | | |
Net unrealized appreciation | | $ | 76,233,001 | | | $ | 172,856,316 | | | $ | 4,032,073 | |
| | | | | | | | | | | | | |
Cost of investments for income tax purposes | | $ | 252,357,008 | | | $ | 703,885,266 | | | $ | 88,235,619 | |
| | | | | | | | | | | | | |
| | | | | | | | | | | | | | | | |
| | | Ultra-Small
Company Market | | | Micro-Cap Limited | | | Small-Cap Growth | | | Small-Cap Value | |
As of June 30, 2008 | | | | | | | | | | | | | | | | |
Gross appreciation (excess of value over tax cost) | | $ | 249,405,311 | | | $ | 6,062,439 | | | $ | 29,773,072 | | | $ | 64,991,335 | |
Gross depreciation (excess of tax cost over value) | | | (124,497,660 | ) | | | (3,261,055 | ) | | | (7,456,426 | ) | | | (24,364,882 | ) |
| | | | | | | | | | | | | | | | | |
Net unrealized appreciation | | $ | 124,907,651 | | | $ | 2,801,384 | | | $ | 22,316,646 | | | $ | 40,626,453 | |
| | | | | | | | | | | | | | | | | |
Cost of investments for income tax purposes | | $ | 585,279,463 | | | $ | 34,921,132 | | | $ | 119,906,162 | | | $ | 319,239,781 | |
| | | | | | | | | | | | | | | | | |
NOTES TO FINANCIAL STATEMENTS (continued)
June 30, 2008
| | | | | | | | | | | | | | | | |
| | | Large-Cap Growth | | | Large-Cap Value | | | Blue Chip 35 Index | | | Balanced | |
As of June 30, 2008 | | | | | | | | | | | | | | | | |
Gross appreciation (excess of value over tax cost) | | $ | 33,390,642 | | | $ | 11,105,212 | | | $ | 15,668,685 | | | $ | 10,988,469 | |
Gross depreciation (excess of tax cost over value) | | | (10,617,124 | ) | | | (3,906,231 | ) | | | (41,359,242 | ) | | | (6,003,960 | ) |
| | | | | | | | | | | | | | | | | |
Net unrealized appreciation | | $ | 22,773,518 | | | $ | 7,198,981 | | | $ | (25,690,557 | ) | | $ | 4,984,509 | |
| | | | | | | | | | | | | | | | | |
Cost of investments for income tax purposes | | $ | 151,816,607 | | | $ | 46,947,038 | | | $ | 276,237,864 | | | $ | 70,180,287 | |
| | | | | | | | | | | | | | | | | |
The differences between book and tax net unrealized appreciation are primarily due to wash sale loss deferrals.
Classifications of Distributions Net investment income (loss) and net realized gain (loss) may differ for financial statement and tax purposes. The character of distributions made during the year from net investment income or net realized gains may differ from its ultimate characterization for federal income tax purposes.
The difference between book and tax components of net assets and the resulting reclassifications were primarily a result of the differing book/tax treatment of net operating losses and certain expenses.
The tax character of the distributions paid by the Funds during the last two fiscal years ended June 30, 2008 and June 30, 2007, respectively are as follows:
| | | | | | | | | | | | |
| | | Aggressive Investors 1 | | Aggressive Investors 2 |
| | | Year
Ended
June 30, 2008 | | Year
Ended
June 30, 2007 | | Year
Ended
June 30, 2008 | | Year
Ended
June 30, 2007 |
Distributions paid from: | | | | | | | | | | | | |
Long Term Capital Gain | | $ | 59,135,745 | | $ | 38,922,847 | | $ | 21,016,161 | | $ | 12,277,639 |
| | | | | | | | | | | | | |
Total | | $ | 59,135,745 | | $ | 38,922,847 | | $ | 21,016,161 | | $ | 12,277,639 |
| | | | | | | | | | | | | |
| | |
| | | Ultra-Small Company | | Ultra-Small Company Market |
| | | Year Ended
June 30, 2008 | | Year
Ended
June 30, 2007 | | Year
Ended
June 30, 2008 | | Year
Ended
June 30, 2007 |
Distributions paid from: | | | | | | | | | | | | |
Ordinary income | | $ | 394,104 | | $ | 1,877,630 | | $ | 2,258,281 | | $ | 4,933,248 |
Long Term Capital Gain | | | 15,085,219 | | | 23,500,754 | | | 34,714,496 | | | 22,318,728 |
| | | | | | | | | | | | | |
Total | | $ | 15,479,323 | | $ | 25,378,384 | | $ | 36,972,777 | | $ | 27,251,976 |
| | | | | | | | | | | | | |
| | |
| | | Micro-Cap Limited | | Large-Cap Growth |
| | | Year
Ended
June 30, 2008 | | Year
Ended
June 30, 2007 | | Year
Ended
June 30, 2008 | | Year Ended
June 30, 2007 |
Distributions paid from: | | | | | | | | | | | | |
Ordinary income | | $ | 99,874 | | $ | 1,475 | | $ | 501,206 | | $ | 357,354 |
Long Term Capital Gain | | | - | | | 14,953,926 | | | - | | | - |
| | | | | | | | | | | | | |
Total | | $ | 99,874 | | $ | 14,955,401 | | $ | 501,206 | | $ | 357,354 |
| | | | | | | | | | | | | |
| | |
| 136 | | Annual Report | June 30, 2008 |
[GRAPHIC]
NOTES TO FINANCIAL STATEMENTS (continued)
June 30, 2008
| | | | | | | | | | | | |
| | | Large-Cap Value | | Blue Chip 35 Index |
| | | Year
Ended
June 30, 2008 | | Year
Ended
June 30, 2007 | | Year
Ended
June 30, 2008 | | Year
Ended
June 30, 2007 |
Distributions paid from: | | | | | | | | | | | | |
Ordinary income | | $ | 935,266 | | $ | 819,616 | | $ | 2,216,904 | | $ | 1,021,236 |
Long Term Capital Gain | | | 2,259,546 | | | - | | | - | | | - |
| | | | | | | | | | | | | |
Total | | $ | 3,194,812 | | $ | 819,616 | | $ | 2,216,904 | | $ | 1,021,236 |
| | | | | | | | | | | | | |
| | |
| | | Balanced | | |
| | | Year
Ended
June 30, 2008 | | Year
Ended
June 30, 2007 | | | | |
Distributions paid from: | | | | | | | | | | | | |
Ordinary income | | $ | 1,132,035 | | $ | 2,182,831 | | | | | | |
Long Term Capital Gain | | | - | | | 719,840 | | | | | | |
| | | | | | | | | | | | | |
Total | | $ | 1,132,035 | | $ | 2,902,671 | | | | | | |
| | | | | | | | | | | | | |
At June 30, 2008, the Funds had available for tax purposes, capital loss carryovers as follows:
| | | | | | | | | | | | |
| | | Ultra-Small
Company | | Micro-Cap Limited | | Small-Cap Growth | | Small-Cap Value |
| Expiring 6/30/2013 | | | - | | | - | | | - | | $ | 948,551 |
| 6/30/2015 | | | - | | $ | 1,910,229 | | $ | 9,909,411 | | | - |
| 6/30/2016 | | $ | 3,822,016 | | | 1,720,318 | | | - | | | 1,491,117 |
| | | | | | | | | | | | | |
| | | | | |
| | | Large-Cap Growth | | Blue Chip 35 Index | | Balanced | | | | |
| Expiring 6/30/2009 | | | - | | $ | 100,306 | | | - | | | | |
| 6/30/2010 | | | - | | | 429,064 | | | - | | | | |
| 6/30/2011 | | | - | | | 337,509 | | | - | | | | |
| 6/30/2012 | | | - | | | 327,296 | | | - | | | | |
| 6/30/2013 | | $ | 2,323,531 | | | 282,192 | | | - | | | | |
| 6/30/2014 | | | 2,412,639 | | | 402,963 | | | - | | | | |
| 6/30/2015 | | | - | | | 418,882 | | $ | 21,741 | | | | |
| 6/30/2016 | | | 1,302,044 | | | 31,461 | | | - | | | | |
Components of Net Assets (Tax Basis) As of June 30, 2008, the components of net assets on a tax basis were:
| | | | | | | | | | | |
| | | Aggressive Investors 1 | | Aggressive Investors 2 | | | Ultra-Small Company | |
Accumulated Net Investment Income (Loss) | | $ | - | | $ | - | | | $ | 113,762 | |
Accumulated Net Realized Gain (Loss) on Investments | | | 1,868,083 | | | (15,315,025 | )* | | | (7,037,178 | )* |
Net unrealized appreciation/depreciation of investments | | | 76,233,001 | | | 172,856,316 | | | | 4,032,073 | |
| | | | | | | | | | | | |
Total | | $ | 78,101,084 | | $ | 157,541,291 | | | $ | (2,891,343 | ) |
| | | | | | | | | | | | |
[GRAPHIC]
NOTES TO FINANCIAL STATEMENTS (continued)
June 30, 2008
| | | | | | | | | | | | |
| | | Ultra-Small
Company Market | | | Micro-Cap Limited | | | Small-Cap Growth | |
Accumulated Net Investment Income (Loss) | | $ | 6,894,753 | | | $ | 76,496 | | | $ | - | |
Accumulated Net Realized Gain (Loss) on Investments | | | 28,745,392 | | | | (5,808,865 | )* | | | (9,909,411 | ) |
Net unrealized appreciation/depreciation of investments | | | 124,907,651 | | | | 2,801,384 | | | | 22,316,646 | |
Other Book/Tax Differences | | | - | | | | - | | | | (346 | ) |
| | | | | | | | | | | | | |
Total | | $ | 160,547,796 | | | $ | (2,930,985 | ) | | $ | 12,406,889 | |
| | | | | | | | | | | | | |
| | | |
| | | Small-Cap Value | | | Large-Cap Growth | | | Large-Cap Value | |
Accumulated Net Investment Income (Loss) | | $ | 293,980 | | | $ | 289,288 | | | $ | 365,278 | |
Accumulated Net Realized Gain (Loss) on Investments | | | (10,436,449 | )* | | | (8,093,563 | )* | | | (1,229,330 | )* |
Net unrealized appreciation/depreciation of investments | | | 40,626,453 | | | | 22,773,518 | | | | 7,198,981 | |
Other Book/Tax Differences | | | (346 | ) | | | (340 | ) | | | (340 | ) |
| | | | | | | | | | | | | |
Total | | $ | 30,483,638 | | | $ | 14,968,903 | | | $ | 6,334,589 | |
| | | | | | | | | | | | | |
| | | |
| | | Blue Chip 35 Index | | | Balanced | | | | |
| Accumulated Net Investment Income (Loss) | | $ | 2,911,094 | | | $ | 1,415,470 | | | | | |
| Accumulated Net Realized Gain (Loss) on Investments | | | (2,696,383 | )* | | | (21,743 | ) | | | | |
| Net unrealized appreciation/depreciation of investments | | | (25,690,557 | ) | | | 4,984,509 | | | | | |
| | | | | | | | | | | | | |
| Total | | $ | (25,475,846 | ) | | $ | 6,378,236 | | | | | |
| | | | | | | | | | | | | |
| * | Includes losses incurred in the period November 1, 2007 through June 30, 2008 which the Fund has elected to defer to its fiscal year ending June 30, 2008. Post October Losses - Under current tax law, capital losses realized after October 31 of a Fund’s fiscal year may be deferred and treated as occurring on the first business day of the following fiscal year for tax purposes. The Aggressive Investors 2 Fund, The Ultra-Small Company Fund, The Micro-Cap Limited Fund, The Small-Cap Value Fund, The Large-Cap Growth Fund, The Large-Cap Value Fund and The Blue-Chip 35 Index Fund had deferred post October losses of $15,315,025, $3,215,162, $2,178,318, $7,996,781, $2,055,350, $1,229,330, and $366,710 respectively. |
For the year ended June 30, 2008, the Funds recorded the following reclassifications to the accounts listed below:
| | | | | | | | | | | | |
| | | Increase (Decrease) | |
| | | Aggressive Investors 1 | | | Aggressive Investors 2 | | | Ultra-Small Company | |
Paid-in-Capital | | $ | (1,913,438 | ) | | $ | (3,977,951 | ) | | $ | 1 | |
Accumulated Net Investment Income (Loss) | | | 3,550,324 | | | | 3,034,805 | | | | - | |
Accumulated Net Realized Gain (Loss) | | | (1,636,886 | ) | | | 943,146 | | | | (1 | ) |
| | | | | | | | | | | | | |
| | | |
| | | Ultra-Small
Company Market | | | Micro-Cap Limited | | | Small-Cap Growth | |
Paid-in-Capital | | $ | 10,177,548 | | | $ | - | | | $ | (795,875 | ) |
Accumulated Net Investment Income (Loss) | | | (780,336 | ) | | | - | | | | 400,430 | |
Accumulated Net Realized Gain (Loss) | | | (9,397,212 | ) | | | - | | | | 395,445 | |
| | | | | | | | | | | | | |
| | | |
| | | Small-Cap Value | | | Large-Cap Growth | | | Large-Cap Value | |
Paid-in-Capital | | $ | (10,182 | ) | | $ | (757 | ) | | $ | 97,070 | |
Accumulated Net Investment Income (Loss) | | | (384,450 | ) | | | 757 | | | | (97,105 | ) |
Accumulated Net Realized Gain (Loss) | | | 394,632 | | | | - | | | | 35 | |
| | | | | | | | | | | | | |
| | | |
| | | Blue Chip 35 Index | | | Balanced | | | | |
Paid-in-Capital | | $ | (106,811 | ) | | $ | 157,274 | | | | | |
Accumulated Net Investment Income (Loss) | | | - | | | | (157,274 | ) | | | | |
Accumulated Net Realized Gain (Loss) | | | 106,811 | | | | - | | | | | |
| | | | | | | | | | | | | |
The difference between book and tax components of net assets and the resulting reclassifications were primarily a result of the differing book/tax treatment of net operating losses, the deduction of equalization debits for tax purposes, and certain expenses.
In June 2006, Financial Accounting Standards Board Interpretation No. 48, Accounting for Uncertainty in Income Taxes (FIN 48), was issued. The Funds implemented the provisions of FIN 48, which prescribe a minimum threshold for financial
| | |
| 138 | | Annual Report | June 30, 2008 |
NOTES TO FINANCIAL STATEMENTS (continued)
June 30, 2008
statement recognition of the benefit of a tax position taken in a tax return. As of June 30, 2008, Fund management has determined that the Fund did not have any unrecognized tax benefits as a result of tax positions taken in the current or prior periods that would require reporting under FIN 48.
7. Bank Borrowings
Certain Bridgeway Funds established a line of credit agreement (“Facility”) with PNC Bank, N.A. (the “Bank” or “Lender”) which matures on October 9, 2008 and is renewable annually at the Bank’s option, to be used for temporary or emergency purposes, primarily for financing redemption payments. At a meeting held August 15, 2008 the Board of Directors approved and authorized officers of the Bridgeway Funds to renew this Facility for an additional one year period. Any and all advances under this Facility would be at the sole discretion of the Lender based on the merits of the specific transaction. Advances under the Facility are limited to $5,000,000 in total for all Funds (except Aggressive Investors 1 and Aggressive Investors 2 Funds), or 33 1/3% of a Fund’s net assets. Borrowings under the line of credit bear interest based on the Lender’s Prime Rate. Principal is due fifteen days after each advance and at Maturity. Interest is payable monthly in arrears. No Fund had borrowings under the Facility during the year ended June 30, 2008.
During the fiscal year ended June 30, 2008 each of the Funds engaged in short-term borrowings from PFPC Trust Company, the Funds’ Custodian. Interest on the borrowings was charged at 1.25 times the Federal Fund Rate. The average daily loan balance during the period for which loans were outstanding and the weighted average interest rate was:
| | | | | | | |
| Bridgeway Fund | | Average Borrowing | | | Average Rate | |
| | | | | | | |
Aggressive Investors 1 | | ($ | 2,322,769 | ) | | 4.78 | % |
Aggressive Investors 2 | | | (3,093,110 | ) | | 5.59 | |
Ultra-Small Company | | | (455,088 | ) | | 5.57 | |
Ultra-Small Company Market | | | (1,239,901 | ) | | 5.83 | |
Micro-Cap Limited | | | (180,197 | ) | | 4.21 | |
Small-Cap Growth | | | (650,585 | ) | | 4.97 | |
Small-Cap Value | | | (1,667,508 | ) | | 4.34 | |
Large-Cap Growth | | | (1,160,726 | ) | | 3.60 | |
Large-Cap Value | | | (714,942 | ) | | 4.31 | |
Blue Chip 35 Index | | | (484,952 | ) | | 5.06 | |
Balanced | | | (1,283,390 | ) | | 5.25 | |
8. Redemption Fees:
In Ultra-Small Company Market Fund a 2.00% redemption fee may be charged on shares held less than six months or for redemptions in a down market, subject to a maximum combined redemption fee of 2%. In Blue Chip 35 Index Fund a 1.00% redemption fee may be charged on redemptions in a down market.
At a Board Meeting held on August 15, 2008, the Board of Directors elected to eliminate the redemption fee for redemptions in a down market for both the Ultra-Small Company Fund and Blue Chip 35 Index Fund effective October 31, 2008.
9. New Accounting Pronouncements
In September 2006, the Financial Accounting Standards Board (FASB) issued Statement on Financial Accounting Standards (SFAS No. 157), “Fair Value Measurements.” This standard establishes a single authoritative definition of fair value, sets out a framework for measuring fair value and requires additional disclosures about fair value measurements. SFAS No. 157 applies to fair value measurements already required or permitted by existing standards. SFAS No. 157 is effective for financial statements issued for fiscal years beginning after November 15, 2007 and interim periods within those fiscal years. The changes to current generally accepted accounting principles from the application of SFAS No. 157 relate to the definition of fair value, the methods used to measure fair value, and the expanded disclosures about fair value measurements. As of June 30, 2008, the Funds do not believe the adoption of SFAS No. 157 will impact the financial statement amounts, however, additional disclosures may be required about the inputs used to develop the measurements and the effect of certain of the measurements on changes in net assets for the period.
In March 2008, the Financial Accounting Standards Board issued the Statement of Financial Accounting Standards No. 161, “Disclosures about Derivative Instruments and Hedging Activities” (“SFAS No. 161”). SFAS No. 161 is effective for fiscal years and interim periods beginning after November 15, 2008. SFAS No. 161 requires enhanced disclosures about the Funds’ derivative and hedging activities, including how such activities are accounted for and their effect on the Funds’ financial position, performance and cash flows. Management is currently evaluating the impact the adoption of SFAS No. 161 will have, if any, on the Fund’s financial statements and related disclosures.
REPORT OF INDEPENDENT REGISTERED PUBLIC ACCOUNTING FIRM
To the Shareholders and
Board of Directors of
Bridgeway Funds, Inc.
We have audited the accompanying statements of assets and liabilities of Aggressive Investors 1 Fund, Aggressive Investors 2 Fund, Ultra Small Company Fund, Ultra Small Company Market Fund, Micro-Cap Limited Fund, Small-Cap Growth Fund, Small-Cap Value Fund, Large-Cap Growth Fund, Large-Cap Value Fund, Blue Chip 35 Index Fund, and Balanced Fund, each a series of Bridgeway Funds, Inc., including the schedules of investments, as of June 30, 2008, and the related statements of operations for the year then ended, the statements of changes in net assets for each of the years in the two year period then ended, and the financial highlights for each of the years in the four year period then ended. These financial statements and financial highlights are the responsibility of the Fund’s management. Our responsibility is to express an opinion on these financial statements and financial highlights based on our audits. The financial highlights for the year ended June 30, 2004 were audited by other auditors whose report dated August 30, 2004 expressed an unqualified opinion on such financial highlights.
We conducted our audits in accordance with the standards of the Public Company Accounting Oversight Board (United States). Those standards require that we plan and perform the audits to obtain reasonable assurance about whether the financial statements and financial highlights are free of material misstatement. An audit includes examining, on a test basis, evidence supporting the amounts and disclosures in the financial statements. Our procedures included confirmation of securities owned as of June 30, 2008 by correspondence with the custodian and brokers. An audit also includes assessing the accounting principles used and significant estimates made by management, as well as evaluating the overall financial statement presentation. We believe that our audits provide a reasonable basis for our opinion.
In our opinion, the financial statements and financial highlights referred to above present fairly, in all material respects, the financial position of Aggressive Investors 1 Fund, Aggressive Investors 2 Fund, Ultra Small Company Fund, Ultra Small Company Market Fund, Micro-Cap Limited Fund, Small-Cap Growth Fund, Small-Cap Value Fund, Large-Cap Growth Fund, Large-Cap Value Fund, Blue Chip 35 Index Fund, and Balanced Fund as of June 30, 2008, the results of their operations for the year then ended, and the changes in their net assets for each of the years in the two year period then ended, and financial highlights for each of the years in the four year period then ended, in conformity with accounting principles generally accepted in the United States of America.

BRIGGS, BUNTING & DOUGHERTY, LLP
Philadelphia, Pennsylvania
August 28, 2008
| | |
| 140 | | Annual Report | June 30, 2008 |
OTHER INFORMATION
June 30, 2008 (unaudited)
1. Shareholder Tax Information
Certain tax Information regarding the Funds is required to be provided to shareholders based upon each Fund’s income and distributions for the taxable year ended June 30, 2008. The information and distributions reported herein may differ from information and distributions taxable to the shareholders for the calendar year ended December 31, 2007.
During the fiscal year ended June 30, 2008, the following percentages of dividends paid by each Fund from net investment income qualified for the corporate dividends received deduction and met the requirements regarding qualified dividend income:
| | | | | | | | |
| | | Ultra-Small
Company | | Ultra-Small
Company Market | | Micro-Cap
Limited | | Large-Cap
Growth |
Corporate Dividends Received Deduction | | 24.86% | | 95.14% | | 100.00% | | 100.00% |
Qualified Dividend Income | | 24.66% | | 95.06% | | 100.00% | | 100.00% |
Qualified Interest Related Dividends | | 0.00% | | 4.13% | | 0.00% | | 0.00% |
| | | | |
| | | Large-Cap
Value | | Blue Chip
35 Index | | Balanced | | |
Corporate Dividends Received Deduction | | 96.94% | | 71.65% | | 36.50% | | |
Qualified Dividend Income | | 96.94% | | 71.64% | | 36.56% | | |
Qualified Interest Related Dividends | | 0.73% | | 2.13% | | 69.40% | | |
During the fiscal year ended June 30, 2008, the Funds paid distributions from ordinary income and long-term capital gain which included equalization debits as summarized below:
| | | | | | | | | | | | | | | |
| | | Aggressive
Investors 1 | | Aggressive
Investors 2 | | Ultra-Small
Company | | Ultra-Small
Company Market | | Micro-Cap
Limited |
Ordinary Income Distributions | | $ | - | | $ | - | | $ | 394,104 | | $ | 2,258,281 | | $ | 99,874 |
Equalization Debits Included in Ordinary Income Distributions | | | - | | | - | | | - | | | 766,084 | | | - |
Long-Term Capital Gain Distributions | | | 59,135,745 | | | 21,016,161 | | | 15,085,219 | | | 34,714,496 | | | - |
Equalization Debits Included in Long-Term Capital Gain Distributions | | | - | | | - | | | - | | | 9,411,460 | | | - |
| | | | | |
| | | Large-Cap
Growth | | Large-Cap
Value | | Blue Chip
35 Index | | Balanced | | |
Ordinary Income Distributions | | $ | 501,206 | | $ | 935,266 | | $ | 2,216,904 | | $ | 1,132,035 | | | |
Equalization Debits Included in Ordinary Income Distributions | | | - | | | 97,070 | | | - | | | 157,274 | | | |
Long-Term Capital Gain Distributions | | | - | | | 2,259,546 | | | - | | | - | | | |
See Note 6 of Notes to Financial Statements for distributions paid during the fiscal year.
2. Proxy Voting
Fund policies and procedures used in determining how to vote proxies relating to the Funds’ securities and a summary of proxies voted by the Funds for the period ended June 30, 2008 are available without a charge, upon request, by contacting Bridgeway Funds at 1-800-661-3550 and on the Securities and Exchange Commission’s (“SEC”) website at http://www.sec.gov.
OTHER INFORMATION (continued)
June 30, 2008 (unaudited)
3. Fund Holdings
The complete schedules of the Funds’ holdings for the second and fourth quarters of each fiscal year are contained in the Funds’ Semi-Annual and Annual shareholder reports, respectively.
The Bridgeway Funds file complete schedules of the Funds’ holdings with the SEC for the first and third quarters of each fiscal year on Form N-Q within 60 days after the end of the period. Copies of the Funds’ Form N-Q are available without charge, upon request, by contacting Bridgeway Funds at 1-800-661-3550 and on the SEC’s website at http://www.sec.gov. You may also review and copy Form N-Q at the SEC’s Public Reference Room in Washington, D.C. For more information about the operation of the Public Reference Room, please call 1-800-SEC-0330.
4. Investment Advisory Agreement Approval
At a meeting held on June 13, 2008 (the “Meeting”), the Board of Directors (“Board”), including a majority of the non-interested or independent Directors (hereinafter, “Directors”), approved the renewal of the investment management agreement (the “Advisory Agreement”) between Bridgeway Capital Management, Inc. (the “Adviser”) and each Fund.
In reaching its decisions to approve the continuation of the Advisory Agreement for each Fund, the Board considered information provided specifically in relation to the renewal of the Advisory Agreement for the Meeting. In response to specific requests from the independent Directors in connection with the Meeting, the Adviser furnished, and the Board considered, information including, but not limited to, the following: (1) the nature, extent and quality of services provided by the Adviser to the Funds, including investment advisory and certain administrative services to the Funds; (2) the actual management and other fees paid by each Fund to the Adviser and a comparison of those fees to a comparable group of funds; (3) the performance of each Fund over various time periods and a comparison of that performance to a comparable group of funds; (4) the profitability of the Adviser from the relationship with the Funds; and (5) any “fall out” or ancillary benefits that accrue to the Adviser as a result of the relationship with each Fund. In addition to evaluating, among other things, the written information provided by the Adviser, the Board also evaluated the answers to questions posed by the independent Directors to representatives of the Adviser at the Meeting.
In considering the information and materials described above, the independent Directors received assistance from and met separately with independent legal counsel and were provided with a written description of their statutory responsibilities and the legal standards that are applicable to approvals of advisory agreements. Although the Advisory Agreement for all of the Funds was considered at the same Board Meeting, the Directors addressed each Fund separately during the Meeting.
Based on all of the information presented, the Board, including a majority of its independent Directors, determined on a Fund-by-Fund basis that the fees charged under the Advisory Agreement are reasonable in relation to the services that are provided under the Advisory Agreement. In view of the broad scope and variety of factors and information, the Directors did not find it practicable to, and did not, assign relative weights to the specific factors considered in reaching their conclusions and determinations to approve the continuance of the Advisory Agreement for each Fund. Rather, the approval determinations were made on the basis of each Director’s business judgment after consideration of all of the factors taken in their entirety.
Although not meant to be all-inclusive, the following discusses some of the factors relevant to the Board’s decisions to approve the continuance of the Advisory Agreement for each Fund.
Nature, Extent and Quality of Services. The independent Directors were pleased that the Funds continue to have access to the Adviser’s specialized skills in quantitative analysis and active and passive investment management and trading, and viewed those skills as relatively unique within the investment industry. The Directors were satisfied that staffing levels and plans for growth at the Adviser were adequate and appropriate in view of the Funds’ operations. The Directors noted that the Adviser devotes most of its personnel time to managing the Funds, as they are the largest part of the Adviser’s business operations. There have been no changes in personnel that provide services to the Funds other than the addition of a new partner to the investment management team during the past year. In addition to providing investment management services to the Funds, the Adviser has undertaken extensive responsibility to review and implement policies and procedures to ensure that the Funds comply with regulatory initiatives. Finally, the Directors considered that the Adviser provides certain administrative services under the Administrative Services Agreement approximately at cost to the Funds.
| | |
| 142 | | Annual Report | June 30, 2008 |
OTHER INFORMATION (continued)
June 30, 2008 (unaudited)
Investment Performance. The independent Directors reviewed performance information through March 31, 2008 for each Fund and noted the following. The Aggressive Investors 1 Fund has outperformed its peer funds and benchmark by considerable margins over shorter periods and since inception. The Aggressive Investors 2 Fund has outperformed its peer funds for the past three and five year periods and has outperformed its benchmark index for the past three and five year periods as well as since inception. The Ultra-Small Company Fund and the Ultra-Small Company Market Fund have outperformed peer funds for the past five year period but have lagged their benchmark index during the same period. In addition, the Ultra-Small Company Fund and Ultra-Small Company Market Fund have outperformed their benchmark index for the past ten year period as well as since inception. The Micro-Cap Limited Fund has slightly lagged its peer funds and benchmark for the past 5 years but has outperformed its benchmark since inception. The Blue Chip 35 Index Fund has slightly lagged its peer funds and benchmark for the past 5 years but has outperformed its benchmark over the past ten year period as well as since inception. The Balanced Fund has outperformed its peer funds for the past three and five year periods and has outperformed its benchmark index over the past five year period as well as since inception. The Small-Cap Growth Fund, Small-Cap Value Fund, Large-Cap Growth Fund and Large-Cap Value Fund have each outperformed their respective peer funds and benchmark indexes for the past three year period and since inception each fund has outperformed its benchmark. The independent Directors were satisfied with each Fund’s relative investment performance.
Fees and Expenses. The independent Directors were satisfied with the reasonableness of the management fees and favorable overall expense levels of each of the Funds, and believed that the fee and expense levels were consistent with the Adviser’s long-standing goal of providing low cost funds. The management fees of the Aggressive Investors 1 Fund, Aggressive Investors 2 Fund and Micro-Cap Limited Fund are performance-based fees that adjust higher or lower in a range in response to investment results. As a result of the performance fees and their long-term investment success, the Aggressive Investors 1 Fund and Aggressive Investors 2 Fund paid higher management fees than fees paid by peers. Overall expenses were slightly higher for Aggressive Investors 1 Fund but slightly lower for Aggressive Investors 2 Fund as compared to peers. Due to the fact that the Micro-Cap Limited Fund is currently in a negative performance fee adjustment, the management fees and overall expenses of the Micro-Cap Limited Fund were significantly lower than the fees paid by peers. The Ultra-Small Company Fund has no performance fee and both the management fee and overall expenses were significantly lower than peers.
The Small-Cap Growth Fund, Small-Cap Value Fund, Large-Cap Growth Fund and Large-Cap Value Fund also have performance-based fees, but each Fund’s management fees and overall expenses were significantly lower than its peers.
The passively managed Ultra-Small Company Market Fund’s management fee was higher than the average of other passively-managed funds, but the Board recognized that the fee was warranted because the Fund was relatively unique among index funds based on its ultra small focus. In any event, the overall expenses of the Fund were slightly lower than its peers. The Blue Chip 35 Index Fund has no performance fee and both the management fee and overall expenses were significantly lower than peer funds, primarily due to fee waivers by the Adviser. The Balanced Fund has no performance fee and its management fee is lower than peers and overall expenses were significantly lower than peer funds.
In addition, the Board acknowledged that the Adviser agreed to contractual expense limitation agreements for each of the Funds to ensure that overall expense levels do not increase above certain levels, and noted that each Fund’s non-management expense levels were lower or comparable to peer group expenses.
Profitability and Economies of Scale. The Board reviewed profitability information for the Adviser in the aggregate for each of the past two years as well as profitability information presented by the Adviser at the Meeting comparing the Adviser’s profitability to other investment advisers. The Board noted that, as a business matter, the Adviser was entitled to earn reasonable profits for its services to the Funds.
With regard to economies of scale, the Board noted that the Aggressive Investors 1 and 2 Funds have each reached a size so that they already benefit from a reduced base management fee rate. The Micro-Cap Limited and Ultra-Small Company Funds also had fee breakpoints that had not yet been met. Although the Small-Cap Growth Fund, Small-Cap Value Fund, Large-Cap Growth Fund and Large-Cap Value Fund do not have fee breakpoints, the Adviser indicated that the Funds were priced low relative to peers and ahead of the economies of scale curve at launch. In particular, these Funds’ management fees were aggressively priced from launch as if they had assets of $1 billion (in the case of the Small-Cap Growth and Small-Cap Value Funds) and $5 billion (in the case of the Large-Cap Growth and Large-Cap Value Funds). However, these
OTHER INFORMATION (continued)
June 30, 2008 (unaudited)
four Funds had assets that were significantly below the $1 billion and $5 billion levels, as the case may be, at the time of the Meeting. Although the Ultra-Small Company Market Fund does not have fee breakpoints, the Adviser noted that it believes that the Fund does not exhibit significant economies of scale because it involves intensive and time-consuming portfolio and trading management because trades are small and oftentimes less liquid and may take longer to execute. As a result, the Adviser indicated that an increase in assets does not necessarily lead to economies of scale. With regard to both the Blue Chip 35 Index Fund and Balanced Fund, the Adviser noted that although neither Fund has fee breakpoints, each Fund was priced low relative to peers and ahead of the economies of scale curve at launch. In view of asset sizes and fee structure, the Board was satisfied that shareholders were not missing the opportunity to benefit from economies of scale if they were available.
The Directors also reviewed the fees the Adviser charged to other funds and separate accounts and evaluated the differences.
Ancillary Benefits. In terms of potential ancillary benefits to the Adviser due to its position as manager of the Funds, the Adviser continues to use no soft dollars and its administrative services to the Funds are structured to approximate an at-cost relationship.
Overall, the Directors were pleased to renew the Advisory Agreement with respect to each Fund. The Directors valued access by the Funds to the Adviser’s proprietary quantitative investment management services, excellent investment performance and favorable fee levels and concluded that renewal of the Advisory Agreement was in the best interests of the Funds and their shareholders. They also expressed appreciation for the integrity and level of commitment of the Adviser’s personnel.
| | |
| 144 | | Annual Report | June 30, 2008 |
DISCLOSURE OF FUND EXPENSES
June 30, 2008 (unaudited)
As a shareholder of the Fund, you will not incur sales charges (loads) on purchases, on reinvest dividends, or on other distributions. There are no exchange fees. Shareholders are subject to redemption fees on the Ultra-Small Company Market and Blue Chip 35 Index Funds under certain circumstances. However, as a shareholder of the Fund, you will incur ongoing costs, including management fees and other Fund expenses. The following examples are intended to help you understand your ongoing costs (in dollars) of investing in the Fund and to compare these costs with ongoing costs of investing in other mutual funds. The examples are based on an investment of $1,000 invested on January 1, 2008 and held until June 30, 2008.
Actual Return. The first line of the table below provides information about actual account values and actual expenses. You may use the information in this line, together with the amount you invested, to estimate the expenses that you paid over the period. Simply divide your account value by $1,000 (for example, an $8,600 account value divided by $1,000 = 8.6), then multiply the result by the number in the first line under the heading “Expense Paid During the Period” to estimate the expenses you paid on your account during the period.
Hypothetical 5% Return. The second line of the table below provides information about hypothetical account values and hypothetical expenses based on the Fund’s actual expense ratio and an assumed rate of return of 5% per year before expenses, which is not the Fund’s actual return. The hypothetical account values and expenses may not be used to estimate the actual ending account balance or expenses you paid for the period. You may use this information to compare the ongoing costs of investing in a Fund and other mutual funds. To do so, compare this 5% hypothetical example with the 5% hypothetical examples that appear In the shareholder reports of other funds.
The expenses shown in the table are meant to highlight ongoing Fund costs only. Therefore, the second line of the table Is useful in comparing ongoing costs only, and will not help you determine the relative total costs of owning different funds, because other funds may also have transaction costs, such as sales charges, redemption fees or exchange fees.
| | | | | | | | | | | |
| | | Beginning Account
Value at 1/1/08 | | Ending Account
Value at 6/30/08 | | Expense Ratio During Period
1/1/08 - 6/30/08 | | Expense Paid
During Period*
1/1/08 - 6/30/08 |
| | | | |
| Bridgeway Aggressive Investors 1 | | | | | | | | | | | |
| | | | | | | | | | | | |
Actual Fund Return | | $ | 1,000.00 | | $ | 935.30 | | 1.81% | | $ | 8.71 |
Hypothetical Fund Return | | $ | 1,000.00 | | $ | 1016.00 | | 1.81% | | $ | 9.07 |
| | | | |
| Bridgeway Aggressive Investors 2 | | | | | | | | | | | |
| | | | | | | | | | | | |
Actual Fund Return | | $ | 1,000.00 | | $ | 948.60 | | 1.16% | | $ | 5.62 |
Hypothetical Fund Return | | $ | 1,000.00 | | $ | 1,019.23 | | 1.16% | | $ | 5.82 |
| | | | |
| Bridgeway Ultra Small Company Fund | | | | | | | | | | | |
| | | | | | | | | | | | |
Actual Fund Return | | $ | 1,000.00 | | $ | 821.60 | | 1.07% | | $ | 4.85 |
Hypothetical Fund Return | | $ | 1,000.00 | | $ | 1,019.68 | | 1.07% | | $ | 5.37 |
| | | | |
| Bridgeway Ultra Small Company Market Fund | | | | | | | | | | | |
| | | | | | | | | | | | |
Actual Fund Return | | $ | 1,000.00 | | $ | 862.20 | | 0.66% | | $ | 3.06 |
Hypothetical Fund Return | | $ | 1,000.00 | | $ | 1,021.72 | | 0.66% | | $ | 3.32 |
| | | | |
| Bridgeway Micro-Cap Limited Fund | | | | | | | | | | | |
| | | | | | | | | | | | |
Actual Fund Return | | $ | 1,000.00 | | $ | 869.30 | | 1.07% | | $ | 4.97 |
Hypothetical Fund Return | | $ | 1,000.00 | | $ | 1,019.68 | | 1.07% | | $ | 5.37 |
DISCLOSURE OF FUND EXPENSES (continued)
June 30, 2008 (unaudited)
| | | | | | | | | | | |
| | | Beginning Account
Value at 1/1/08 | | Ending Account
Value at 6/30/08 | | Expense Ratio During Period
1/1/08 - 6/30/08 | | Expense Paid
During Period*
1/1/08 - 6/30/08 |
| | | | |
| Bridgeway Small-Cap Growth Fund | | | | | | | | | | | |
| | | | | | | | | | | | |
Actual Fund Return | | $ | 1,000.00 | | $ | 914.80 | | 0.88% | | $ | 4.19 |
Hypothetical Fund Return | | $ | 1,000.00 | | $ | 1020.62 | | 0.88% | | $ | 4.42 |
| | | | |
| Bridgeway Small-Cap Value Fund | | | | | | | | | | | |
| | | | | | | | | | | | |
Actual Fund Return | | $ | 1,000.00 | | $ | 917.80 | | 0.85% | | $ | 4.05 |
Hypothetical Fund Return | | $ | 1,000.00 | | $ | 1,020.77 | | 0.85% | | $ | 4.27 |
| | | | |
| Bridgeway Large-Cap Growth Fund | | | | | | | | | | | |
| | | | | | | | | | | | |
Actual Fund Return | | $ | 1,000.00 | | $ | 915.90 | | 0.73% | | $ | 3.48 |
Hypothetical Fund Return | | $ | 1,000.00 | | $ | 1021.37 | | 0.73% | | $ | 3.67 |
| | | | |
| Bridgeway Large-Cap Value Fund | | | | | | | | | | | |
| | | | | | | | | | | | |
Actual Fund Return | | $ | 1,000.00 | | $ | 857.80 | | 0.84% | | $ | 3.88 |
Hypothetical Fund Return | | $ | 1,000.00 | | $ | 1,020.82 | | 0.84% | | $ | 4.22 |
| | | | |
| Bridgeway Blue Chip 35 Index Fund | | | | | | | | | | | |
| | | | | | | | | | | | |
Actual Fund Return | | $ | 1,000.00 | | $ | 854.30 | | 0.15% | | $ | 0.69 |
Hypothetical Fund Return | | $ | 1,000.00 | | $ | 1,024.25 | | 0.15% | | $ | 0.75 |
| | | | |
| Bridgeway Balanced Fund | | | | | | | | | | | |
| | | | | | | | | | | | |
Actual Fund Return | | $ | 1,000.00 | | $ | 953.80 | | 0.85% | | $ | 4.13 |
Hypothetical Fund Return | | $ | 1,000.00 | | $ | 1,020.77 | | 0.85% | | $ | 4.27 |
| * | Expenses are equal to the average account value times the Fund’s annualized expense ratio multiplied by the number of days in the most recent fiscal half-year divided by the number of days in the fiscal year. |
| | |
| 146 | | Annual Report | June 30, 2008 |
DIRECTORS & OFFICERS
June 30, 2008 (unaudited)
| | | | | | | | | | |
| Independent Directors |
Name, Address
and Age1 | | Position
Held with
Bridgeway
Funds | | Term of
Office and
Length of
Time Served | | Principal Occupation(s)
During Past Five Years | | No. of Bridgeway
Funds Overseen
by Director | | Other Directorships
Held by Director |
| | | | | |
Kirbyjon Caldwell Age 54 | | Director | | Term: 1 Year Length: 2001 to Present. | | Senior Pastor of Windsor Village United Methodist Church, since 1982. | | Eleven | | Continental Airlines, Inc., American Church Mortgage Company, Reliant Energy, Amegy Bancshares Advisory Board |
| | | | | |
Karen S. Gerstner Age 53 | | Director | | Term: 1 Year Length: 1994 to Present. | | Principal, Karen S. Gerstner & Associates, P.C., 2004 to present. Attorney and Partner, Davis, Ridout, Jones and Gerstner LLP, 1999 to 2003. | | Eleven | | None |
| | | | | |
Miles Douglas Harper, III* Age 45 | | Director | | Term: 1 Year Length: 1994 to Present. | | Partner, 10/1998 to present, Gainer, Donnelly, Desroches, LLP. | | Eleven | | Calvert Social Investment Fund (8 Portfolios) Calvert Social Index Series, Inc. (1 Portfolio) Calvert Impact Fund2 (4 Portfolios) Calvert World Values Fund (3 Portfolios), Founders Bank, SSB |
| | | | | |
Evan Harrel Age 47 | | Director | | Term: 1 Year Length: 2006 to Present. | | Executive Director, Small Steps Nurturing Center, 8/2004 to present. Senior Portfolio Manager, AIM Capital Management, 1998 to 2003. | | Eleven | | None |
DIRECTORS & OFFICERS (continued)
June 30, 2008 (unaudited)
| | | | | | | | | | |
| “Interested” or Affiliated Directors |
Name, Address
and Age1 | | Position(s)
Held with
Bridgeway
Funds | | Term of
Office and
Length of
Time Served | | Principal Occupation(s)
During Past Five Years | | No. of Bridgeway
Funds Overseen
by Director | | Other Directorships
Held by Director |
| | | | | |
Michael D. Mulcahy3 Age 44 | | President and Director | | Term: 1 Year Length: 2003 to Present. | | President, Bridgeway Funds, 6/2005 to present. Director, Secretary and Vice President, Bridgeway Capital Management, Inc., 12/2002 to present. | | Eleven | | None |
| | | | | |
John N. R. Montgomery4 Age 52 | | Vice President and Director | | Term: 1 Year Length: 1993 to Present. | | Vice President, Bridgeway Funds, 6/2005 to present. President, Bridgeway Funds, 11/1993 - 6/2005. President, Bridgeway Capital Management Inc., 7/1993 to present. | | Eleven | | None |
| Officers |
| | | | | |
Richard P. Cancelmo, Jr. Age 50 | | Vice President | | Term: 1 Year Length: 2004 to Present. | | Vice-President, Bridgeway Funds, 11/2004 to present. Staff member, Bridgeway Capital Management, Inc., 2000 to present. | | | | None |
| | | | | |
Linda G. Giuffré Age 46 | | Treasurer and Chief Compliance Officer | | Term: 1 Year Length: 2004 to Present. | | Chief Compliance Officer, Bridgeway Capital Management, Inc., 5/2004 to present. Staff member, Bridgeway Capital Management, Inc., 5/2004 to present. Vice President - Compliance, Capstone Asset Management Company, 1998 - 2004. | | | | None |
| | | | | |
Deborah L. Hanna Age 43 | | Secretary | | Term: 1 Year Length: 2/16/2007 to Present. | | Self-employed, accounting and related projects for various organizations, 2001 - Present. | | | | None |
1 | The address of all of the Directors and Officers of Bridgeway Funds is 5615 Kirby Drive, Suite 518, Houston, Texas, 77005-2448. |
2 | The Calvert Large-Cap Growth Fund is sub-advised by Bridgeway Capital Management, Inc., the Adviser to Bridgeway Funds. |
3 | Michael Mulcahy is a director and officer of Bridgeway Capital Management, Inc., and therefore an interested person of Bridgeway Funds. |
4 | John Montgomery is president, director and majority shareholder of Bridgeway Capital Management, Inc., and therefore an interested person of Bridgeway Funds. |
The overall management of the business and affairs of Bridgeway Funds is vested with its Board of Directors (the “Board”). The Board approves all significant agreements between Bridgeway Funds and persons or companies furnishing services to it, including agreements with its Adviser and Custodian. The day-to-day operations of Bridgeway Funds are delegated to its officers, subject to its investment objectives and policies and general supervision by the Board.
The Funds’ Statement of Additional Information includes additional information about the Funds’ Board and is available, without charge, upon request by calling 1-800-661-3550.
| | |
| 148 | | Annual Report | June 30, 2008 |
BRIDGEWAY FUNDS, INC.
Citi Fund Services, LLC
PO Box 182218
Columbus, OH 43218-2218
(713) 661-3500 (800)-661-3550
CUSTODIAN
PFPC Trust Company
8800 Tinicum Blvd., 4th Floor
Philadelphia, PA 19153
DISTRIBUTOR
Foreside Fund Services, LLC
Three Canal Plaza, Suite 100
Portland, ME 04101
You can review and copy information about our Funds (including the SAI) at the SEC’s Public Reference Room in Washington, D.C. To find out more about this public service, call the SEC at 800-SEC-0330. Reports and other information about the Funds is also available on the SEC’s website at www.sec.gov. You can receive copies of this information, for a fee, by writing the Public Reference Section, Securities and Exchange Commission, Washington, D.C. 20549-0102 or by sending an electronic request to the following email address: publicinfo@sec.gov
(a) The registrant has adopted a code of ethics that applies to the registrant’s principal executive officer, principal financial officer, principal accounting officer or controller, or persons performing similar functions. This code of ethics is included as an Exhibit.
(b) During the period covered by the report, with respect to the registrant’s code of ethics that applies to its principal executive officer, principal financial officer, principal accounting officer or controller, or persons performing similar functions; there have been no amendments to, nor any waivers granted from, a provision that relates to any element of the code of ethics definition enumerated in paragraph (b) of this Item 2.
(c) Amendments were made to state that approvals or waivers sought by the Company’s Chief Compliance Officer with respect to the registrant’s code of ethics that applies to its President and Treasurer would be considered by the Company’s Audit Committee and that the Company’s Audit Committee will be responsible for granting waivers to this code of ethics.
| Item 3. | Audit Committee Financial Expert. |
3(a)(1) The registrant’s board of directors has determined that the registrant has at least one audit committee financial expert serving on its audit committee.
3(a)(2) The audit committee financial expert is Miles Douglas Harper, III, who is “independent” for purposes of this Item 3 of Form N-CSR.
| Item 4. | Principal Accountant Fees and Services. |
| | | | | | |
| | | Current Year | | Previous Year |
Audit Fees | | $ | 224,000 | | $ | 213,000 |
Audit-Related Fees | | | 54,000 | | | 0 |
Tax Fees | | | 23,000 | | | 22,000 |
All Other Fees | | | 0 | | | 0 |
| (e) | (1) Audit Committee Pre-Approval Policies and Procedures: The Registrant’s Audit Committee has adopted an Audit Committee Charter that provides that the Audit Committee shall approve, prior to appointment, the engagement of the auditor to provide audit services to the Registrant and non-audit services to the Registrant, its investment advisor or any entity controlling, controlled by or under common control with the investment adviser that provides on-going services to the Registrant if the engagement relates directly to the operations and financial reporting of the Registrant. |
| (e) | (2) No services described in paragraphs (b) through (d) above were approved pursuant to paragraph (c)(7)(i)(C) of Rule 2-01 of Regulation S-X. |
(f) None.
(g) None
(h) Not applicable.
| Item 5. | Audit Committee of Listed Registrants. |
Not applicable.
| Item 6. | Schedule of Investments. |
Schedule of Investments is included as part of the Report to Stockholders filed under Item 1 of this form.
| Item 7. | Disclosure of Proxy Voting Policies and Procedures for Closed-End Management Investment Companies. |
Not applicable.
| Item 8. | Portfolio Managers of Closed-End Management Investment Companies. |
Not applicable.
| Item 9. | Purchases of Equity Securities by Closed-End Management Investment Company and Affiliated Purchasers. |
Not applicable.
| Item 10. | Submission of Matters to a Vote of Security Holders. |
There has been no material change to the procedures by which shareholders may recommend nominees to the Registrant’s Board of Directors.
| Item 11. | Controls and Procedures. |
(a)The registrant’s principal executive officer and principal financial officer have concluded, based on their evaluation of the registrant’s disclosure controls and procedures as conducted within 90 days of the filing date of this report, that these disclosure controls and procedures are adequately designed and are operating effectively to ensure that information required to be disclosed by the registrant on Form N-CSR is recorded, processed, summarized and reported within the time periods specified in the Securities and Exchange Commission’s rules and forms.
(b)There were no changes in the registrant’s internal control over financial reporting (as defined in Rule 30a-3(d) under the Act (17 CFR 270.30a-3(d)) that occurred during the second fiscal quarter of the period covered by this report that have materially affected or are reasonably likely to materially affect, the registrant’s internal control over financial reporting.
(a)(1) The code of ethics that is the subject of the disclosure required by Item 2 is attached hereto.
(a)(2) Certifications pursuant to Rule 30a-2(a) are attached hereto.
(a)(3) Not applicable.
(b) Certifications pursuant to Rule 30a-2(b) are furnished herewith.
SIGNATURES
Pursuant to the requirements of the Securities Exchange Act of 1934 and the Investment Company Act of 1940, the registrant has duly caused this report to be signed on its behalf by the undersigned, thereunto duly authorized.
(Registrant) Bridgeway Funds, Inc.
| | |
| By (Signature and Title)* | | /s/ Michael D. Mulcahy |
| | Michael D. Mulcahy |
| | President and Principal Executive Officer |
Date 8/28/08
Pursuant to the requirements of the Securities Exchange Act of 1934 and the Investment Company Act of 1940, this report has been signed below by the following persons on behalf of the registrant and in the capacities and on the dates indicated.
| | |
| By (Signature and Title)* | | /s/ Michael D. Mulcahy |
| | Michael D. Mulcahy |
| | President and Principal Executive Officer |
Date 8/28/08
| | |
| By (Signature and Title)* | | /s/ Linda Giuffre |
| | Linda Giuffre |
| | Treasurer and Principal Financial Officer |
Date 8/28/08