UNITED STATES
SECURITIES AND EXCHANGE COMMISSION
Washington, D.C. 20549
FORM N-CSR
CERTIFIED SHAREHOLDER REPORT OF REGISTERED MANAGEMENT
INVESTMENT COMPANIES
Investment Company Act file number 811-08200
Bridgeway Funds, Inc.
(Exact name of registrant as specified in charter)
5615 Kirby Drive, Suite 518
Houston, Texas 77005-2448
(Address of principal executive offices) (Zip code)
Michael D. Mulcahy, President
Bridgeway Funds, Inc.
5615 Kirby Drive, Suite 518
Houston, Texas 77005-2448
(Name and address of agent for service)
Registrant’s telephone number, including area code:(713) 661-3500
Date of fiscal year end: June 30
Date of reporting period: July 1, 2009 through June 30, 2010
Form N-CSR is to be used by management investment companies to file reports with the Commission not later than 10 days after the transmission to stockholders of any report that is required to be transmitted to stockholders under Rule 30e-1 under the Investment Company Act of 1940 (17 CFR 270.30e-1). The Commission may use the information provided on Form N-CSR in its regulatory, disclosure review, inspection, and policymaking roles.
A registrant is required to disclose the information specified by Form N-CSR, and the Commission will make this information public. A registrant is not required to respond to the collection of information contained in Form N-CSR unless the Form displays a currently valid Office of Management and Budget (“OMB”) control number. Please direct comments concerning the accuracy of the information collection burden estimate and any suggestions for reducing the burden to Secretary, Securities and Exchange Commission, 100 F Street, NE, Washington, DC 20549. The OMB has reviewed this collection of information under the clearance requirements of 44 U.S.C. § 3507.
Item 1. Reports to Stockholders.
The Report to Shareholders is attached herewith.
| | |

A no-load mutual fund family of domestic funds |
Annual Report June 30, 2010 |
| | |
AGGRESSIVE INVESTORS 1 | | BRAGX |
(Closed to New Investors) | | |
| |
AGGRESSIVE INVESTORS 2 | | BRAIX |
| |
ULTRA-SMALL COMPANY | | BRUSX |
(Open to Existing Investors — Direct Only) | | |
| |
ULTRA-SMALL COMPANY MARKET | | BRSIX |
| |
MICRO-CAP LIMITED | | BRMCX |
| |
SMALL-CAP MOMENTUM | | BRSMX |
| |
SMALL-CAP GROWTH | | BRSGX |
| |
SMALL-CAP VALUE | | BRSVX |
| |
LARGE-CAP GROWTH | | BRLGX |
| |
LARGE-CAP VALUE | | BRLVX |
| |
BLUE CHIP 35 INDEX | | BRLIX |
| |
MANAGED VOLATILITY | | BRBPX |
(formerly Balanced Fund) | | |
| | |
| TABLE OF CONTENTS | |  |
Bridgeway Funds Standardized Returns as of June 30, 2010*
| | | | | | | | | | | | | | | | |
| | | | | | | | | Annualized | | | | | | |
| Fund | | June Qtr.
4/1/10
to 6/30/10 | | Six Months
1/1/10 to
6/30/10 | | 1 Year | | 5 Years | | 10 Years | | Inception
to Date | | Inception
Date | | Gross
Expense
Ratio2 |
Aggressive Investors 1 | | -13.42% | | -9.84% | | 7.51% | | -6.05% | | -1.11% | | 12.12% | | 8/5/1994 | | 0.34% |
Aggressive Investors 2 | | -13.65% | | -11.53% | | 8.54% | | -3.95% | | NA | | 2.16% | | 10/31/2001 | | 1.20% |
Ultra-Small Company | | -8.46% | | -3.12% | | 17.26% | | -0.49% | | 11.85% | | 15.22% | | 8/5/1994 | | 1.17% |
Ultra-Small Co Market | | -8.08% | | -1.93% | | 13.30% | | -2.98% | | 8.44% | | 8.82% | | 7/31/1997 | | 0.79%1 |
Micro-Cap Limited | | -5.03% | | -0.18% | | 16.44% | | -6.36% | | 4.84% | | 8.41% | | 6/30/1998 | | 0.87% |
Small-Cap Momentum | | NA | | NA | | NA | | NA | | NA | | -6.70%3 | | 5/28/2010 | | 1.29%1 |
Small-Cap Growth | | -11.43% | | -7.49% | | 8.44% | | -5.34% | | NA | | -1.29% | | 10/31/2003 | | 0.94% |
Small-Cap Value | | -7.51% | | -2.80% | | 18.35% | | -1.92% | | NA | | 2.26% | | 10/31/2003 | | 0.92% |
Large-Cap Growth | | -13.00% | | -7.71% | | 12.89% | | -1.15% | | NA | | 0.56% | | 10/31/2003 | | 0.82% |
Large-Cap Value | | -10.42% | | -4.90% | | 19.65% | | 0.04% | | NA | | 3.81% | | 10/31/2003 | | 0.98%1 |
Blue Chip 35 Index | | -12.22% | | -8.58% | | 11.25% | | -0.21% | | -1.91% | | 3.00% | | 7/31/1997 | | 0.25%1 |
Managed Volatility | | -6.66% | | -5.45% | | 1.67% | | 0.19% | | NA | | 2.46% | | 6/30/2001 | | 1.01%1 |
1 Some of the Funds’ fees were waived or expenses reimbursed otherwise returns would have been lower. The Adviser has contractually agreed to waive fees and/or reimburse expenses. Any material change to this Fund policy would require a vote by shareholders.
2 Expense ratios are as stated in the current prospectus. Please see financials for expense ratios as of June 30, 2010.
3 Return is not annualized.
Bridgeway Funds Returns for Calendar Years 1996 through 2009*
| | | | | | | | | | | | | | | | | | | | | | | | | | | | |
| | | 1996 | | 1997 | | 1998 | | 1999 | | 2000 | | 2001 | | 2002 | | 2003 | | 2004 | | 2005 | | 2006 | | 2007 | | 2008 | | 2009 |
Aggressive Investors 1 | | 32.20% | | 18.27% | | 19.28% | | 120.62% | | 13.58% | | -11.20% | | -18.01% | | 53.97% | | 12.21% | | 14.93% | | 7.11% | | 25.80% | | -56.16% | | 23.98% |
Aggressive Investors 2 | | | | | | | | | | | | | | -19.02% | | 44.01% | | 16.23% | | 18.59% | | 5.43% | | 32.19% | | -55.07% | | 29.84% |
Ultra-Small Company | | 29.74% | | 37.99% | | -13.11% | | 40.41% | | 4.75% | | 34.00% | | 3.98% | | 88.57% | | 23.33% | | 2.99% | | 21.55% | | -2.77% | | -46.24% | | 48.93% |
Ultra-Small Co Market | | | | | | -1.81% | | 31.49% | | 0.67% | | 23.98% | | 4.90% | | 79.43% | | 20.12% | | 4.08% | | 11.48% | | -5.40% | | -39.49% | | 25.95% |
Micro-Cap Limited | | | | | | | | 49.55% | | 6.02% | | 30.20% | | -16.61% | | 66.97% | | 9.46% | | 22.55% | | -2.34% | | -4.97% | | -41.74% | | 17.65% |
Small-Cap Growth | | | | | | | | | | | | | | | | | | 11.59% | | 18.24% | | 5.31% | | 6.87% | | -43.48% | | 15.04% |
Small-Cap Value | | | | | | | | | | | | | | | | | | 17.33% | | 18.92% | | 12.77% | | 6.93% | | -45.57% | | 26.98% |
Large-Cap Growth | | | | | | | | | | | | | | | | | | 6.77% | | 9.33% | | 4.99% | | 19.01% | | -45.42% | | 36.66% |
Large-Cap Value | | | | | | | | | | | | | | | | | | 15.15% | | 11.62% | | 18.52% | | 4.49% | | -36.83% | | 24.92% |
Blue Chip 35 Index | | | | | | 39.11% | | 30.34% | | -15.12% | | -9.06% | | -18.02% | | 28.87% | | 4.79% | | 0.05% | | 15.42% | | 6.07% | | -33.30% | | 26.61% |
Managed Volatility | | | | | | | | | | | | | | -3.51% | | 17.82% | | 7.61% | | 6.96% | | 6.65% | | 6.58% | | -19.38% | | 12.39% |
Performance figures quoted represent past performance and are no guarantee of future results. Current performance may be lower or higher than the performance data quoted. Investment return and principal value will fluctuate so that an investor’s shares, when redeemed, may be worth more or less than original cost. To obtain performance current to the most recent month-end, please visit our website at www.bridgeway.com or call 1-800-661-3550. Total return figures include the reimbursement of dividends and capital gains.
This report is submitted for the general information of the shareholders of each Fund. It is not authorized for distribution to prospective investors unless preceded or accompanied by an effective prospectus, which includes information regarding a Fund’s risks, objectives, fees and expenses, experience of its management, and other information. Investors should read the prospectus carefully before investing in a Fund. For questions or other Fund information, call 1-800-661-3550 or visit the Funds’ website www.bridgeway.com. Funds are available for purchase by residents of the United States, Puerto Rico, U.S. Virgin Islands and Guam only. Foreside Fund Services, LLC, Distributor.
The views expressed here are exclusively those of Fund management. These views, including those relating to the market, sectors or individual stocks are not meant as investment advice and should not be considered predictive in nature.
| * | Numbers with green highlight indicate periods when the Fund outperformed its primary benchmark. |
| | |
| LETTER FROM THE INVESTMENT MANAGEMENT TEAM | | |
June 30, 2010
Dear Fellow Shareholders,
Our Funds generally followed the trends of the broader market, which broke a four quarter string of positive returns, retreating by double digits in the June quarter. Only three of our eleven Funds beat their primary market benchmark, although our twelfth and newest Fund beat its market benchmark during the initial partial quarter period. Please also note that we changed the name of Bridgeway Balanced Fund to Bridgeway Managed Volatility Fund to better reflect its investment objective and strategy.
A review of the market environment appears on page 2, while the following section on page 3 presents the current picture on the lack of traction that has hurt our relative performance over the last two year period. An encouraging note there: the junk rally aspect (a price surge of the most financially distressed and beat up companies) of the previous four quarters (April 2009 through March 2010), has abated, though not reversed. Stepping back from the details of the recent market, we put the recent market volatility into the context of the prior several decades on page 3. The results may surprise you.
By way of investor education, Bridgeway has been a strong advocate of not chasing hot returns and of learning how to distinguish this emotional tendency in our investment decisions. Page 4 discusses the latest evidence that investors are continuing to chase hot returns, which in the recent environment means the perceived safety of bonds.
Each fiscal year we commit to reporting to shareholders what we think is the worst thing at Bridgeway during the year. This year it was pretty easy to figure out. Details are on page 5. In a rather long and detailed section on pages 5 to 9, we discuss the “state of the union” among investment managers using quantitative methods — the last two years haven’t been pretty —and talk about where Bridgeway fits in and what we’re doing about it.
As always, we appreciate your feedback. We take your comments very seriously and regularly discuss them internally to help in managing our Funds and this company. Please keep your ideas coming — both favorable and critical. They provide us with a vital tool, helping us serve you better.
Sincerely,
Your Investment Management Team
| | | | | | |
 | | | |  | | |
| John Montgomery | | | | Dick Cancelmo | | |
| | | |
 | | | |  | | |
| Elena Khoziaeva | | | | Michael Whipple | | |
| |  | | | | |
| | Rasool Shaik | | | | |
| | |
| LETTER FROM THE INVESTMENT MANAGEMENT TEAM (continued) | | |
Market Review
The Short Version: The stock market dropped during the quarter as investors struggled with implications of the sovereign debt crisis in Europe and the BP oil disaster in the gulf.
As the second quarter began, the economy continued its trek toward recovery; confidence had returned to corporate boardrooms; and investors were pouring their “cash-on-the sidelines” back into risky assets. Just when all seemed right with the world again, tiny Greece (and huge BP) began dominating the headlines. While market watchers would have expected a collective yawn about an economy whose GDP is smaller than that of Houston’s, soon Spain, Portugal, Ireland, and others across Europe offered similar debt concerns. Threats of sovereign debt defaults rekindled memories of the subprime debacle, and investors feared a new global banking crisis. Meanwhile, the worst oil spill disaster in history unfolded in the Gulf of Mexico. Not even a $20 billion fund for victim compensation could ease the pain caused by the BP oil disaster (which had yet to be plugged at quarter-end). While investors were considering the long-term implications of these critical events, they were greeted by “high frequency flash trades” that prompted the Dow to plunge 1,000 points in less than an hour on May 6, 2010. If sovereign debt and BP were not enough to rattle nerves, the flash crash did the trick.
When the dust settled, the Dow had declined by 10% and suffered its first down quarter since early 2009. The S&P and Nasdaq experienced similar fates, and many global markets fared even worse. Most sectors struggled, commodity-related stocks were among the biggest losers and financials plummeted as well. Gold mining companies reaped the rewards of the new-found bearishness as investors pushed gold to record highs. Oil prices fell steadily during the quarter; traders feared the weakness in Europe would spread and hinder global demand. Shifting to bonds, the benchmark 10-year Treasury dropped 90 bps on flight-to-quality trades, and corporate (and junk) bonds again fell out of favor as companies found new challenges in gaining access to credit.
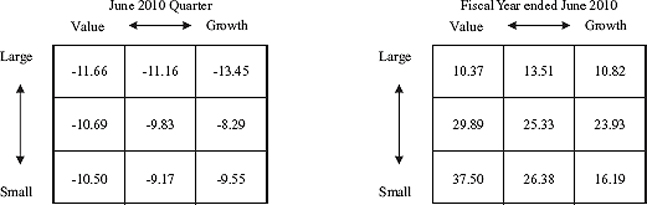
As presented below, each “corner” of the domestic market had more than a nine percent negative return for the quarter ending June 30, 2010. Larger-cap stocks were the weakest market segment, with large-cap growth stocks declining the most, falling 13.45% during the quarter. Mid-cap growth stocks were the “best” performers, dropping only 8.29% during the same period.
Sector returns varied widely during the quarter. Energy, Industrials, and Financial Services were the hardest hit, all declining approximately 12% for the period. Consumer Goods and Telecommunications stocks performed the best, with losses of 4% and 6%, respectively.
| | — | | The tables below are based on stock data from Morningstar. |
| | |
| 2 | | Annual Report | June 30, 2010 |
| | |
| LETTER FROM THE INVESTMENT MANAGEMENT TEAM (continued) | | |
Lack of Traction — Part 5 — the tide has not yet turned, but there are hopeful signs
The Short Version: Our small-, micro-, and ultra-small cap stocks continued to show very significant “lack of traction,” which we see primarily as a disconnect between the underlying fundamental financial health of a company and the relative performance of its stock price.
As explained in each of the shareholder letters this last year, we refer to an unusual market phenomenon whereby the underlying economic health of a company and its stock price diverge. This has not been a favorable environment for a majority of our stock picking models. Long-term, we believe a company’s stock price and its economic results in the marketplace must go hand in hand. We believe this extended period of lack of traction could be due to pumping $700 billion through our economy (the TARP program) in a way that is not driven by normal capital market mechanisms. For example, if the U.S. government rescues companies that would normally suffer severely or go bankrupt, this affects the outcomes of these companies, their stock prices, and their consumers, distributors and suppliers in ways that are much more difficult to predict, based on history.
This phenomenon, which we call a “lack of traction”, was strongest in the June and September quarters of 2009, coming out of the severe bear market. In the December 2009 quarter, we saw some signs that things might be returning to normal, but only among “value” companies (those that are cheap by some financial measures). Similarly, we saw some signs of normality in the March 2010 quarter, but only among the smallest companies in our Funds. This quarter, we also see some positive signs, but as in the December 2009 quarter, only among the companies on the value end of the spectrum.
These are the encouraging signs:
Some of our sidestepping models, ones that tell us to avoid distressed companies that could go bankrupt and those at risk of a precipitous price drop, have stopped working against us — though we would not say that they are actively helping yet. The easiest way to see this is in the performance of our Ultra-Small Company Market Fund, where the sidestepping models are usually (and currently) the primary driver of performance relative to its primary market benchmark.
Unlike the worst relative performance period of 2009, there is now a noticeable difference in the performance between the stock picking models in our most actively managed and higher turnover Funds. Stock picking models on the value end of the spectrum are doing better; those on the growth end are still delivering poorer results.
Not encouraging signs:
Among the companies of the S&P 500 Index, those with the highest levels of debt still outperformed those with the lowest levels of debt, although only by a small margin. At least these are not affecting us like they did in calendar year 2009.
One of the metrics we have followed is the record of companies beating Wall Street estimates. This record still indicates a clear lack of traction. Some of our best performing Funds on a fundamental basis, Funds with the highest percentage of companies beating Wall Street estimates, (e.g. Aggressive Investors 1 and 2 and Small-Cap Value) were among our worst performing Funds relative to their market benchmarks.
The Big Picture on Market Volatility
The Short Version: While it feels as though market volatility is up, historical data indicates we are still within the range of the prior couple of decades over monthly and quarterly periods.
One of the big advantages of Bridgeway’s quantitative investing approach is that it takes emotion out of the stock picking process. As we reflect on how the recent market environment feels to individual investors, however, we realize it could feel as if they are captaining a sailboat adrift in a volatile economic storm. The erratic market winds seem to obscure any investment course that is set. With the crest of each new wave, it’s unclear whether the skies are truly turning blue or we’re merely experiencing false peace as the eye of this economic storm passes. We do know that economic storms come and go; we just don’t know when. And if you can’t stomach this “Dramamine-demanding” volatility by maintaining a long-term perspective, you just might be on the verge of nausea.
We encourage investors in any specific market environment to step back and look at the big picture; and we believe that looking at long-term history is a good way to do that. With respect to longer-term market volatility, it feels as though things have
| | |
| LETTER FROM THE INVESTMENT MANAGEMENT TEAM (continued) | | |
changed; but what does the data actually show? We just completed some research on market volatility since the 1950’s. Here’s what we discovered:
We looked at S&P 500 Index price changes from 1950 to 2009 and computed standard deviations on these returns for daily, monthly and quarterly time periods. What we found was…
| | — | | 2000-2009 was the most volatile decade since 1950 on a daily basis. There is a slight ramp up in the 2005-2009 period as well. |
| | — | | The 80’s were the most volatile decade on a monthly basis, with the 2000-2009 period close behind. |
| | — | | The 70’s were the most volatile decade on a quarterly basis, with the 2000-2009 period close behind. |
Conclusion: There has been an upward trend in volatility since the 50’s and 60’s, yet since the 1970s, volatility over monthly or longer periods is still within range.
While we won’t speculate on why the markets are more volatile today than in the past, we are definitely seeing more volatility. Bridgeway has always encouraged investors to take a longer-term perspective – that is, five years or more – and we still do. Yet, it is difficult for many investors to keep their eyes on that horizon, particularly when their boat is in the trough between waves and visibility is nil.
Balanced Fund renamed to Managed Volatility Fund
This past quarter we changed the name of our Balanced Fund to Managed Volatility Fund. The strategy for the Fund has not changed, but we felt the name obscured its real purpose. The fund is not about “balance” per se, but was designed with the objective of providing stock market-like returns at roughly 40% of the volatility. We launched this fund in 2001 as we entered what has become an increasingly volatile market. And now with nine years of experience, we are pleased that the fund has achieved its objective. The name change is one way for us to provide more clarity about its purpose.
Another Form of Chasing Hot Returns
The Short Version: If an investor has strong exposure to stocks just before the worst bear market in eight decades, but immediately thereafter switches to bonds just before a major bout of inflation, he or she will very likely miss out on both ends of the market. In aggregate, it appears that mutual fund investors in America may be doing just that. Bridgeway recommends appropriate diversification, but a static strategy for the long term to help keep emotions from destroying long-term wealth.
In what looks to us like another form of “chasing hot returns,” or more specifically, looking for conservative investments after the horse has left the barn . . .
“Over the past year and a half, investors have poured a net $390 billion into taxable bond funds while pulling $45 billion from U.S. stock funds, according to Morningstar, which opens its 22nd annual conference [this week] in Chicago. . . .” From an article written by Mark Jewel of the Associated Press, June 22, 2010.
If you read our semi-annual report, you know we think one of the biggest investment risks in the next three to five years is inflation risk. This is because, politically, the most feasible way to “pay down” our nation’s war and TARP debt is to inflate our way out. But inflation hits bond funds disproportionately hard. Bonds typically pay a fixed return, the value of which is potentially eroded hugely by inflation. While inflation is also generally bad for stocks in the short term, historically stocks have provided good long-term protection against inflation, since companies inevitably raise the prices of their goods and services in line with the inflated costs of materials and other resources. The bottom line? Some investors were hit hard in the stock market rout of 2008. But if they switch into bond funds just before a bout of inflation, they may be positioning themselves for two back-to-back “hits.”
The article referenced above goes on to say:
The conference agenda reflects the increasing flexibility money managers are seeking as they worry about becoming too dependent on stocks.
| | |
| 4 | | Annual Report | June 30, 2010 |
| | |
| LETTER FROM THE INVESTMENT MANAGEMENT TEAM (continued) | | |
It seems that many money professionals are also looking for solutions to the last downturn, rather than focusing on an appropriate long-term strategy that takes into consideration all kinds of risks. Stock market risk is one; inflation risk is another —a good argument for diversification, which is an appropriate investing principle in all market environments.
The Worst Thing of the Fiscal Year
The Short Version: Underperforming our primary market benchmark with 10 of 11 Funds in a “bounceback” year following the previous year mega-bear market was the worst thing to happen at Bridgeway over the last year. While absolute returns were attractive, our higher quality stocks performed relatively poorly in the “junk rally” and market environment since March 2009.
For the last dozen fiscal years in each annual report, Bridgeway has revealed its “worst thing of the year.” This section has become an important Bridgeway tradition. As a shareholder, you are the owner and “boss,” and we think you have a right to know the negatives as well as the positives. In previous years we have discussed partner loss, trading errors, compliance issues, and Fund performance. This year’s choice for “worst thing” was pretty easy to identify: underperforming our primary market benchmarks in back-to-back fiscal years 2008-09 and 2009-10. The performance sections above and in the individual Fund letters give the details. We are definitely looking forward to the period when “traction” returns to the market and, as is true in any market environment, our research team is working to improve our returns going forward. (See page 7 for more details.)
A Frank Discussion of Quant Firms and Where Bridgeway Fits In
The Short Version: Many quant styles of investing have been out of favor lately, and some of our quantitative competitors have even “pulled the plug” on using models to buy stocks. Bridgeway’s corporate strategy is a contrarian one: we have continued to invest in our quantitative capabilities and have increased research around risk and methodically and incrementally improving our models, a process that was begun well before the downturn of fiscal year ’08-09.
After two fiscal years of relative underperformance by some of our most actively managed funds, and in Bridgeway’s tradition of blunt communications, it’s appropriate to ask some tough questions about our performance (broad picture), our advisory firm’s use of quantitative models, and where Bridgeway fits in, relative to other quantitatively oriented investment equity firms. Ultimately, do we think we will again enjoy the strong relative returns of the fourteen years before fiscal year 2009? Or is the party over?
First, it’s appropriate not to paint all the Bridgeway Funds with the same brush. Aggressive Investors 1 and 2, Small-Cap Value and Growth, Ultra-Small Company and Micro-Cap Limited are the Funds with the most disappointing records over the last two years. Other Funds did better in one or both years. Ultra-Small Company Market provided a nice “cushion” versus its market benchmark in the ’08-’09 downturn, true to its design, but lagged in the bounceback period. Likewise for Market Volatility Fund (formerly Balanced Fund) and Blue Chip 35 Index Fund. Large Cap Value outperformed in both years. Our new Small-Cap Momentum Fund has come out of the blocks in the right direction, relative to its benchmark, but doesn’t yet have even a quarter of performance history. But let’s focus on the funds most driven by our quantitative stock picking models.
Bridgeway had a much better record in the bear market of 2000-2002 and in the 2003 bounceback year. Why was this one (2008 and 2009) different?
The 2000-2002 bear market was driven much more significantly by valuations. The internet and technology rout of 2000-2001 was largely driven by unrealistic expectations of these companies, and a number of our models had increasingly shied away from them as prices rose to unrealistic levels. Our “top-down risk overlay” process also worked well in this period. Huge appreciation in the technology sector in particular caused us to trim these stocks significantly before the rout in 2000. Finally, certain momentum-related factors and models negotiated some of those years pretty well, adding to returns during the relentless market downturn from mid 2000 to late 2002. The valuation metrics then worked well in reverse in 2003. Our models picked up on some of the companies that had become quite cheap, and some multi-factor models that tend to pick up on quick turnaround in profits also did well.
In contrast, we owned some companies with stellar balance sheets and cash flows (“real profits”) in 2008, especially in the energy and materials sectors. Normally, companies with these characteristics would tend to do better in a recession and bear market. In spite of strong fundamentals, however, these companies’ stock prices were hit very hard in the downturn as Wall
| | |
| LETTER FROM THE INVESTMENT MANAGEMENT TEAM (continued) | | |
Street anticipated that demand for their products would vanish in the recession. Whether that actually happened was irrelevant in the second half of 2008, as Wall Street’s anticipation alone pounded these stocks. Our momentum models, which had performed well in the previous bear market, performed poorly in this one. Some large and heavily leveraged (debt-laden) hedge funds were forced to deleverage, causing huge sales of many of these companies. Selling fever fed on itself, and many of the target companies, including some we owned, were pounded mercilessly. Finally, our large deep value model that tends to do well in a downturn (cheaper, larger, and more mature stocks have tended to do better in previous bear markets, since they are not overvalued and have “staying power”) also disappointed in 2008, as everything at the extremes appeared to do poorly.
At this point (late 2008 and early 2009), two factors actually did help, though not enough to reverse the carnage. One thing we worry about, and that our modeling process anticipates, is that we will get “whipsawed” — in other words, that certain technical or growth factors will give sell signals at the height of the downturn, just as a fast moving market turns around. One aspect of our models that worked pretty well is that if a stock gets too cheap by some proprietary measures, they require that we maintain a hold on that stock. This worked pretty well in the last phase of the downturn and into the June quarter of 2009. The second thing that worked was a new risk overlay that we developed after the 2008 downturn. This new risk model identifies sectors or industries that have become “overheated” and thus unusually risky. It would have identified the energy and materials sectors as such, had we been using them in 2008, which we weren’t. But it did come in handy when it identified consumer non-cyclical stocks, notably food and personal product-related companies as much riskier than normal in early calendar 2009. These are the kind of companies investors would tend to flock to in a recession, and we made sure we didn’t overinvest in them, in spite of the fact that they comprised fully half the stock picks of one model. To be clear, neither of these two parts (holding a stock that had been very cheap, and making sure we didn’t over concentrate in a sector that had become risky) of our investment process helped enough to overcome the most dramatic element of the recent market described in the next paragraph.
As described more fully in the “lack of traction” section on page 3, beat up, financially distressed, and penny stock companies led a truly remarkable rally from March 2009 through March 2010. Our models tend in aggregate to avoid such companies. In spite of the fact that our models continued identifying companies with strong and improving company level economics, we were not rewarded with market beating performance.
That’s a lot of details. Isn’t there some “big picture” reason many of Bridgeway’s stock picking models stopped working in fiscal years 2009 and 2010?
We believe that since our models in aggregate are more driven by company level economics, “event driven” markets are not favorable to us. An example on the upside is the market euphoria following the first couple of days of Operation Desert Storm in 1990 when our models were somewhat left behind. An example on the downside is that the quarter following the terrorist attacks of 9/11 was a poor one for our models. Putting this in the context of 2009, if you manipulate the economy by pouring $700 billion of government bailout money through it in a way not dictated by our capitalist system, we believe these events (artificially low interest rates, government purchase of huge amounts of mortgage securities, bailouts of bank, auto, and insurance companies that otherwise would have gone bankrupt, debt incentive programs, etc.) led to a market environment, one some people call a “sentiment driven market,” that is not favorable to our models.
Most “quant” firms suffered on a relative basis in the middle of calendar 2007. What happened at Bridgeway and why?
Many of the investment firms relying on quantitative methods use very short-term signals to buy stocks based on short-term trends. Bridgeway calibrates its models over longer time periods than most of these firms and has a much lower rate of buying and selling stocks. Combined with the fact that we try to keep some independence from what other firms are doing (or else execute it better), we avoided the pitfalls of other “quant shops” in calendar 2007, which was a relatively strong year for us.
Why would an investor want to continue to hold a mutual fund that has underperformed for two or more years?
Avoiding or selling a well-managed fund after a period of underperformance might result in missing the “bounceback.” This is part of the well documented phenomenon of “chasing hot returns,” which we think is the biggest investor education task we face — in times of underperformance or outperformance. This can be seen historically in the fact that the previous worst
| | |
| 6 | | Annual Report | June 30, 2010 |
| | |
| LETTER FROM THE INVESTMENT MANAGEMENT TEAM (continued) | | |
period for Aggressive Investors 1 Fund (it underperformed its market benchmark in calendar 1995, 1997, and 1998) was followed by seven straight years of outperformance. However, we also believe the timing of any turnaround is impossible to forecast and encourage investors who are appropriate for a particular fund to stay invested through the downturns.
Why would an investor invest with a quant firm even in good times? What are the advantages?
Bridgeway believes emotions are “Public Enemy #1” in investing and that statistical models calibrated over long time periods with high quality data — combined with a disciplined process to implement and execute those models — are the best way to take emotion out of the investing process. Other advantages of quant investing are efficiency and potentially lower expenses, the ability to tap lower liquidity stocks in small cap investing, the ability to design a particular investment style with specific and more predictable risk characteristics, having an historical framework to assess risk, and the lack of dependency on a single portfolio manager.
As assets in quant firms have declined, has Bridgeway had to lay off members of its investment management team?
No. We added a member in 2009, another member in 2010, and are currently searching for a third. Our own corporate financial and human resources strategy since inception in 1994 has been to invest during downturns. We did it in the longest running bear market in two generations (2002-2003), and we’re selectively investing in people and systems again. Downturns can be a great time to hire some very talented people. Of course, you must have planned ahead in order to have the resources to do so. Our advisory firm’s low cost and no-debt strategies have enabled us to have those resources.
Did Bridgeway learn anything in the last two years?
Yes. We created a “macro” model of risk, as discussed above. It would have helped in 2008, and it may help in the next downturn.
We continue to search for new variables and models, and we have just completed two years of re-engineering every model at Bridgeway with the highest quality, most recent data available. We also conduct research on risk, timing of sells, transaction costs, and competitive products. We obviously expect these efforts to yield benefits for shareholders in the future. Although these efforts, as well as past performance, are no guarantee of future returns.
From our specific returns in the last two fiscal years, we are faced with the reality that in a financially led market rout and ensuing government bailout, our stock picking models of disparate styles could come together to underperform at the same time. Seeking out models or processes to further diversify this risk is part of the research task at hand. One area of research is using macro-economic indicators to determine when particular variables or models might go in or out of favor.
Did Bridgeway decide to re-engineer its models as a result of the recession, bear market, and performance?
No. We planned out and started this process before the bear market at the beginning of 2008. We strive continually to improve our models and execution in any market environment.
However, we will not make the classic error that we believe some competitors are making, of designing a whole process around the last couple of years of experience. There will most certainly be future bear markets. They will most certainly not look just like the past one, however.
What trends do others see among quantitative investment firms?
Three trends are highlighted in recent industry literature.
First, firms are searching for methods that can statistically associate certain factors (e.g. growth, value, momentum, etc.) with specific economic or market environmental factors. Bridgeway’s previous research in this area indicates that a long-term static strategy is most effective. The closest thing we have to a “macro indicator” is the risk metric described above. However, there is a relatively new window into macroeconomic indicators that we expect to research in the future.
| | |
| LETTER FROM THE INVESTMENT MANAGEMENT TEAM (continued) | | |
Second, firms are no longer publishing their factor (model variable) insights. This is in order to protect their intellectual property and especially to protect their ability to deliver future market beating returns. The problem with this strategy is that it makes the business development of their products more difficult, since investors understandably want to know what’s “under the hood.” Bridgeway has a long standing policy of disclosing overall process (e.g. what kind of factors we use, that we calibrate models over long timeframes, which Funds practice more stringent tax management strategies, etc.), but never specific factors or coefficients. Sometimes the lack of that disclosure keeps an appropriate potential investor from investing, but our criterion in this conversation is answering the question, “What’s in the best long-term interest of current investors?” Bridgeway is ahead of this industry trend.
Third, a “lesson learned” reported at a recent industry conference was, “we need to pay as much attention to the risk management of our business as we do to the risk of the equity investments we make.” With Bridgeway’s policy of no debt on the advisory firm’s balance sheet and a history of retaining for “a rainy day” the substantial profits that we don’t donate to nonprofit work, Bridgeway is significantly out in front of the industry here.
What’s the big picture on quants in the investment management business? Where does Bridgeway fit in?
Our quantitative competitors fall into four categories: those that are
| | 1. | Exiting the quant or investment management business. Profits are way down among quant firms. Some smaller firms don’t have the financial resources to last it out and are closing down or shifting to a fundamental (non-quant) strategy. Some firms are owned by large parent companies that are more committed to short-term profits than to a long-term strategy of unemotional quantitative investing. Bridgeway is fortunate to be independent and financially strong. |
| | 2. | Giving portfolio managers the flexibility to decide when certain factors are in favor. We were astounded to learn of a firm articulating this strategy. This entails discipline in the first (quantitative) part of the process, then giving it all away at the execution stage. |
| | 3. | Research. Any new market environment provides us with the opportunity for additional, rich data. This is definitely true of the recent environment, and we have been adding to our investment team to be able to take strong advantage of it. |
| | 4. | Hiding one’s head in the sand. Pretending the worst bear market since the 1930’s didn’t happen is not in line with a true statistical, unemotional, quantitative process. |
Bridgeway has definitively chosen category three.
In summary, what is Bridgeway doing about the last two years with the poorer performing of its Funds?
We are adding members to the investment management team, rather than laying them off, in order to further strengthen our quantitative capabilities and efficiency. We are selectively strengthening other resources, such as our software systems (a more advanced trade order management system in ’08 and additional capabilities in the “mid-back office” in ’09). We are continuing to invest in our current team members with additional development opportunities. We are hiring a new head of investment operations and structuring a new team to free up investment management time from some support tasks. And we are applying our additional research capacities toward managing risk, fine tuning our current models, looking for new or improved model variables, analyzing ways to better implement the models we have, and pursuing such activities as the macroeconomic modeling discussed above.
I like Bridgeway, but can’t stomach the volatility of Aggressive Investors. Is there a Fund that has had less volatility, one that doesn’t give me the short-term roller coaster ride?
Yes. Managed Volatility Fund (formerly Bridgeway Balanced Fund) is designed to exhibit about 40% of the market’s volatility on a quarterly basis and has delivered well on this since inception. Also, Blue Chip 35 Index is designed to give S&P 500 Index-like returns over the long haul, which has provided some cushion in the vast majority of downturns. Please see the prospectus for more specific information on strategy, risk, and fees. As with any Fund, please make sure it fits appropriately into a long term investment plan in order to avoid the classic mistake of chasing hot returns or investing inappropriately in a conservative Fund after a bear market.
| | |
| 8 | | Annual Report | June 30, 2010 |
| | |
| LETTER FROM THE INVESTMENT MANAGEMENT TEAM (continued) | | |
What does a perfect market environment look like for our very actively managed funds?
A market environment is one that is driven more by fundamental economics at the company level. But our goal is to out- perform in an array of market environments, so we are always striving to broaden our “library” of stock picking models.
How Does Quantitative Investing Help in an Index Fund
The Short Version: Even in its index fund, Bridgeway applies quantitative methods and discipline of execution to avoid emotions that can destroy value.
Bridgeway’s investment philosophy is built on quantitative methods that minimize the role of emotions. For almost all of our Funds (exceptions are Ultra-Small Company Market and Blue Chip 35 Index), this involves building a “library” of models that pick stocks in one or more market niches and with particular statistical characteristics. We then design a Fund using a subset of these models in order to attain a desired risk and return profile in accordance with a Fund’s investment objective, strategy, and risk characteristics, as disclosed in our prospectus. Then, we implement and monitor our Funds to ensure we are staying true to our intentions. Key to all of these steps is our belief in not destroying value by allowing emotions to creep into our process at any point, from model design to Fund management. When we talk about not destroying value, we often think about prudently managing costs. We believe this is so important for our fellow shareholders that cost efficiency is one of Bridgeway’s four business values. (Integrity, long term investment performance, and service are the other three.) There are additional ways that a firm or a manager can destroy value for shareholders, and even our Blue Chip 35 Index Fund provides another, and very interesting, example of how we have been successful in not letting emotion destroy value at Bridgeway.
Blue Chip 35 Index Fund is designed to provide shareholders with long term total return of capital by investing in the ultra-large, high quality segment of the U.S. stock market, the “bluest” of the blue chips. The strategy is implemented using a proprietary index of such companies. We seek to track this index’s holdings and investment returns closely, while scrupulously managing costs. This is one key design of the Fund, but how does this step avoid destroying value?
The underlying index is recomposed (a handful of companies are added into and taken out of the index) every two to three years (with flexibility for takeovers and spin offs) with two major goals in mind: first, to keep the index market capitalization very large, and second, to adequately diversify the fund within the constraint of 35 or 36 holdings. This design seeks to avoid destroying value through cost efficiency by minimizing portfolio turnover and thus, operating costs and capital gains. Yet there is more to it: the statistical re-composition of the index seeks to avoid the downside of human emotions. And human emotion can come shockingly easily into the decision of which companies make up an index. Let’s consider some history to understand the dynamics of how this works.
The very first index portfolio was designed for pension funds, but there was concern that the management company might be sued for including all 500 index stocks in the portfolio. The “prudent man” theory of law suggested that a reasonable man would not include the very worst of the 500 stocks in an investment portfolio. So the portfolio designers excluded twenty companies they thought bore unusually high risk of bankruptcy. Two decades later, someone thought to go back and analyze the success of the decision to avoid the “worst of the worst.” The results were surprising, however. Although a couple of the outperformed the others. Why? Emotion could be the answer.
Another such story is reported by David Dreman in “Contrarian Investment Strategies-The Next Generation” and cites the Dow Jones Industrial Average (DJIA), one of the most highly quoted indexes in the financial media. Selections for companies coming in and out of this index are chosen by committee. In 1939, the Index decided to drop an office equipment supplier for AT&T, which moved up 6 times until 1979. Who was this office equipment supplier? IBM, which over that four decade period moved up 635.2 times before it was re-admitted in 1979. But a stock had to go, and that stock was Chrysler, which appreciated until 1997 by 1324% to IBM’s 82% appreciation, or sixteen times as much. Even a sophisticated committee of very bright people can make mistakes. In fairness, this example was undoubtedly “cherry picked.” Some of the committee’s selections have been much better timed. However, a study last year indicated that in aggregate they have destroyed, not added value. The thought of systematically destroying value sends shivers down the spine of Bridgeway’s research team, and thirteen-plus years out, we sought a process and discipline to avoid this problem with Bridgeway’s own proprietary index. How has this played out after an almost thirteen year track record?
| | |
| LETTER FROM THE INVESTMENT MANAGEMENT TEAM (continued) | | |
Over the thirteen-year history of our Fund, the process of recomposition has in actuality slightly added to, not detracted from our Fund’s returns. Why? We think statistics trump human emotion when it comes to investing. But some of the actual results are related to the discipline of following the process. Here’s a real world example from our own Fund:
In 2005, during an Index re-composition, Google Inc (GOOG) rose for inclusion in the top 35 stocks selected, based on market capitalization. Looking back, this may seem an obvious choice, but in June 2005, Google’s stock offering was less than a year old, seemed much hyped, and appeared quite overvalued. We remember the look of surprise and concern when the statistical choice for inclusion was presented. How could such a young stock, in business less than ten years, appear in the “bluest” of the blue chips already? Could we represent this as a “blue chip” stock, and at any rate, wasn’t it ripe for a fall? In spite of this natural reaction, the portfolio management team chose to stick with our documented process. The outcome? Over the next year, Google was this Fund’s top performer.
| | |
| 10 | | Annual Report | June 30, 2010 |
THIS PAGE INTENTIONALLY LEFT BLANK
| | |
Aggressive Investors 1 Fund MANAGER’S COMMENTARY | | |
June 30, 2010
Dear Fellow Aggressive Investors 1 Fund Shareholder,
In the June quarter, our Fund declined 13.42%, underperforming our primary market benchmark, the S&P 500 Index (down 11.43%), the Russell 2000 Index of smaller companies (down 9.92%), and our peer benchmark, the Lipper Capital Appreciation Funds Index (down 11.08%). As detailed on page 3, the lack of traction continues to affect our growth leaning models the most severely, while more value leaning models made up some of the difference. This was a poor quarter on an absolute basis and relative basis.
For the fiscal year ended June 30, 2010, our Fund increased 7.51%, trailing the returns of the S&P 500 Index (up 14.43%), the Russell 2000 Index of smaller companies (up 21.48%), and the Lipper Capital Appreciation Funds Index (up 14.86%). Performance details appear below. While we still lead all of our benchmarks since inception, the last two years of returns have taken their toll on performance, including even the five and ten year periods.
The table below presents our June quarter, one-year, five-year, ten-year and life-to-date financial results according to the formula required by the SEC. See the next page for a graph of performance from inception to June 30, 2010.
| | | | | | | | | | | | | | | |
| | | Jun. Qtr.
4/1/10
to 6/30/10 | | | 1 Year
7/1/09
to 6/30/10 | | | 5 Year
7/1/05
to 6/30/10 | | | 10 Year
7/1/00
to 6/30/10 | | | Life-to-Date
8/5/94 to 6/30/10 | |
| | | | | |
Aggressive Investors 1 Fund | | -13.42 | % | | 7.51 | % | | -6.05 | % | | -1.11 | % | | 12.12 | % |
S&P 500 Index (large companies) | | -11.43 | % | | 14.43 | % | | -0.80 | % | | -1.59 | % | | 7.20 | % |
Lipper Capital Appreciation Funds Index | | -11.08 | % | | 14.86 | % | | 1.85 | % | | -1.06 | % | | 6.60 | % |
Russell 2000 Index (small companies) | | -9.92 | % | | 21.48 | % | | 0.37 | % | | 3.00 | % | | 7.36 | % |
Performance figures quoted in the table above and graph below represent past performance and are no guarantee of future results. Total return figures in the table above include the reinvestment of dividends and capital gains. The table above and the graph below do not reflect the deduction of taxes that a shareholder would pay on Fund distributions or the redemption of Fund shares.
The S&P 500 Index is a broad-based, unmanaged measurement of changes in stock market conditions based on the average of 500 widely held common stocks with dividends reinvested, while the Russell 2000 Index is an unmanaged, market value weighted index that measures performance of the 2,000 companies that are between the 1,000th and 3,000th largest in the market with dividends reinvested. The Lipper Capital Appreciation Funds Index reflects the record of the 30 largest funds in this category, comprised of more aggressive domestic growth mutual funds, as reported by Lipper, Inc. It is not possible to invest directly in an index. Periods longer than one year are annualized.
According to data from Lipper, Inc. as of June 30, 2010, Aggressive Investors 1 Fund ranked 246th of 285 capital appreciation funds for the twelve months ending June 30, 2010, 218th of 218 over the last five years, 66th of 140 over the last ten years, and 2nd of 54 since inception in August, 1994. Lipper, Inc. is an independent mutual fund rating service that ranks funds in various fund categories by making comparative calculations using total returns.
| | |
| 12 | | Annual Report | June 30, 2010 |
| | |
Aggressive Investors 1 Fund MANAGER’S COMMENTARY (continued) | | |
Aggressive Investors 1 Fund vs. S&P 500 Index, Lipper Capital Appreciation Funds Index & Russell 2000 Index
from Inception 8/5/94 to 6/30/10

Detailed Explanation of Quarterly Performance — What Worked
The Short Version: In spite of the market decline, some companies in disparate industries overcame the trend. The consumer discretionary and industrial companies helped the most.
Despite the difficulties brought on by such global factors as the European sovereign debt crisis, our models uncovered a number of companies that contributed positive returns to the Fund. Four industrial and three consumer discretionary companies were among the Fund’s best performers list. Combined, these seven stocks returned about three-quarters of a percent to the Fund’s performance, providing some cushion in the quarterly downturn.
These are the ten stocks that performed the best for the Fund during the quarter ended June 30, 2010:
| | | | | | |
| Rank | | Description | | Industry | | % Gain |
1 | | ev3, Inc. | | Health Care Equiptment & Supplies | | 40.2% |
2 | | US Airways Group, Inc. | | Airlines | | 17.1% |
3 | | EMCOR Group, Inc. | | Construction & Engineering | | 16.0% |
4 | | Valassis Communications, Inc. | | Media | | 14.0% |
5 | | Hasbro, Inc. | | Leisure Equipment & Products | | 8.1% |
6 | | EnerNOC, Inc. | | Commercial Services & Supplies | | 5.9% |
7 | | Multi-Fineline Electronix, Inc. | | Electronic Equip., Instruments | | 5.8% |
8 | | Family Dollar Stores, Inc. | | Multiline Retail | | 3.4% |
9 | | Equinix, Inc. | | Internet Software & Services | | 2.4% |
10 | | Acme Packet, Inc. | | Communications Equiptment | | 2.2% |
ev3 manufactures medical devices that allow for small incisions during surgery. In May, its stock reached a 52-week high when the company completed a regulatory filing for a product used in procedures related to cerebral aneurysms. A few weeks later, Covidien PLC, a Dublin, Ireland-based health-care corporation, agreed to acquire ev3 for $2.6 billion, a move aimed at improving global revenue growth. Its share price surged almost 20% in the aftermath of the announcement. Prior to selling the stock in early June, the Fund’s top performer rose over 40% and contributed over 1% to the overall return during the quarter.
Snubbed in the latest airline merger talk (Continental and United Airlines), US Airways claims to be content to go it alone and is not looking for a merger partner at this time. The industry as a whole seems primed for recovery following last year’s
| | |
Aggressive Investors 1 Fund MANAGER’S COMMENTARY (continued) | | |
recessionary period and the oil hikes of 2008. US Airways announced a nice increase in May revenue as business travel continues to pick up and international bookings have risen. In fact, management recently projected a quarterly profit for the first time since 2007. US Airways was the Fund’s second best performer for the June quarter.
Detailed Explanation of Quarterly Performance — What Didn’t Work
The Short Version: Beating Wall Street expectations didn’t help in the quarter, especially among technology and growth companies.
Lack of traction (page 3) continues to take a toll on the growth leaning stock picking models of this Fund. According to data from Bloomberg, a very strong 89% of our companies reported earnings above Wall Street expectations, versus 82% for our primary market benchmark. Yet, this did not translate into market beating returns. Our Fund stocks with higher exposure to market risk hurt the most, combined with an underweighting of classical conservative sectors: utilities and consumer staples.
These are the ten stocks that performed the worst for the Fund during the quarter ended June 30, 2010:
| | | | | | |
| Rank | | Description | | Industry | | % Loss |
| 1 | | Unisys Corp. | | IT Services | | -47.0% |
| 2 | | Corinthian Colleges, Inc. | | Diversified Consumer Services | | -44.0% |
| 3 | | Pilgrim’s Pride Corp. | | Food Products | | -42.1% |
| 4 | | Teck Resources, Ltd. | | Metals & Mining | | -31.7% |
| 5 | | Diamond Offshore Drilling, Inc. | | Energy Equipment & Services | | -28.7% |
| 6 | | Seagate Technology | | Computers & Peripherals | | -28.6% |
| 7 | | Potash Corp. of Saskatchewan, Inc. | | Chemicals | | -27.7% |
| 8 | | Cinemark Holdings, Inc. | | Media | | -27.4% |
| 9 | | Xerox Corp. | | Office Electronics | | -27.2% |
| 10 | | Barclays PLC | | Commercial Banks | | -26.7% |
Sometimes a global presence hinders a firm’s operations, particularly when foreign governments make decisions beyond management’s control. Unisys Corp. provides outsourced IT services to business enterprises and governments across the globe. Early in the year, Venezuelan President Hugo Chavez took actions to devalue the country’s currency, a move that had a dramatic (negative) impact on multinational companies. The SEC later labeled Venezuela’s economy as “hyperinflationary,” and domestic companies that engaged in operations there were forced to incur a charge to earnings. As a result, Unisys took a hit of $20 million in the first quarter, despite strong operating profits. Its stock price dropped almost 50% in the three-month period, and it was the worst performer in the Fund.
Corinthian Colleges, Inc. (CCI) offers for-profit post-secondary programs in the United States and Canada. In recent times, the industry has been criticized for poor oversight as numerous students incurred significant debt that they are unable to repay (and often without a solid education in return). In April, an official at the Department of Education compared the regulatory environment to that of Wall Street, a harsh reprimand in the aftermath of the financial debacle. In May, the company was downgraded by an analyst who forecast a decline in its enrollment as the government tightened aid requirements to help reduce student loan defaults. Its share price fell almost 50% during the quarter in spite of the fact that the company’s financial results continue to improve. Is the company significantly “oversold?” Our model indicates it may well be.
An interesting footnote to the Corinthian Colleges story highlights the degree to which much of a company’s price continues to be driven by events. On May 17 the company’s stock price soared 14% in the last 15 minutes of trading on the news that U.S. Education Deputy Undersecretary Robert Shireman, a for-profit watchdog, was stepping down.
Detailed Explanation of Fiscal Year Performance — What Worked
The Short Version: Some of the market’s most distressed and battered stocks of the bear market bounced back the most over the last year.
| | |
14 | | Annual Report | June 30, 2010 |
| | |
Aggressive Investors 1 Fund MANAGER’S COMMENTARY (continued) | | |
We were significantly underrepresented in distressed stocks over the last year, although these were among the market’s best performers. Nevertheless, we held a handful of these stocks, which showed up on our fiscal year best performers list, e.g. BioMed Realty and Aflac. Others, such as our top performer, Cognizant, did reflect strong underlying economic growth. Winners and losers existed in each sector during the past 12 months. Seven sectors were represented on the list of best performers for the year, and they contributed almost six percent to the Fund’s return. In fact, four holdings enjoyed gains of over 50% during the 12-month period.
These are the ten stocks that performed the best for the Fund during the fiscal year ended June 30, 2010:
| | | | | | |
| Rank | | Description | | Industry | | % Gain |
| 1 | | Cognizant Technololgy Solutions Corp. | | IT Services | | 87.5% |
| 2 | | ev3, Inc. | | Health Care Equipment & Supplies | | 79.8% |
| 3 | | BioMed Realty Trust, Inc. | | Real Estate Investment Trusts | | 62.7% |
| 4 | | Coca-Cola Enterprises, Inc. | | Beverages | | 54.7% |
| 5 | | Fifth Third Bancorp | | Commercial Banks | | 42.1% |
| 6 | | EMCOR Group, Inc. | | Construction & Engineering | | 42.0% |
| 7 | | Jo-Ann Stores, Inc. | | Specialty Retail | | 40.8% |
| 8 | | Aflac, Inc. | | Insurance | | 40.7% |
| 9 | | Weingarten Realty Investors | | Real Estate Investment Trusts | | 38.5% |
| 10 | | Equinix, Inc. | | Internet Software & Services | | 37.0% |
Cognizant Technology provides outsourced technology services worldwide. Much of its operations take place in Asian emerging markets, such as India, and its profits are quite high, as it benefits from the lower labor costs. As global firms look for ways to cut expenses in the aftermath of the economic downturn, many have turned to outsourcing certain technology areas. India’s tech sector has surged, even during these challenging times, boosting Cognizant’s earnings beyond Wall Street expectations over the past few quarters. Since Europe is a major market, some analysts fear that future operations may be impacted by the declining value of the euro. In June, Cognizant continued in growth mode and announced that it was acquiring a Paris-based consulting firm, Galileo Performance. Its stock price recently hit an all-time high, rising over 75% during the 12-month period. It was the fund’s top performer for the fiscal year and contributed just over one percent to the overall return.
Detailed Explanation of Fiscal Year Performance — What Didn’t Work
The Short Version: In spite of an up market over three of the last four quarters, there were also significant decliners in a broad array of industries.
Our ten worst performers over the fiscal year period came from ten different industries, although three were related to the information technology sector that also provided the Fund’s top performer. Altogether, these three cost the Fund over two percentage points in return.
These are the ten stocks that performed the worst for the Fund during fiscal year ended June 30, 2010:
| | | | | | |
| Rank | | Description | | Industry | | % Loss |
| 1 | | Pilgrim’s Pride Corp. | | Food Products | | -42.1% |
| 2 | | Corinthian Colleges, Inc. | | Diversified Consumer Services | | -41.8% |
| 3 | | Fuel Systems Solutions, Inc. | | Auto Components | | -38.5% |
| 4 | | Synaptics, Inc. | | Computers & Peripherals | | -37.4% |
| 5 | | Unisys Corp. | | IT Services | | -36.6% |
| 6 | | Fibria Celulose SA | | Paper & Forest Products | | -34.0% |
| 7 | | Cal Dive International, Inc. | | Energy Equipment & Services | | -32.2% |
| 8 | | Xerox Corp. | | Office Electronics | | -27.2% |
| 9 | | Banco Bilbao Vizcaya Argentaria SA | | Commercial Banks | | -25.6% |
| 10 | | Cabot Corp. | | Chemicals | | -24.8% |
| | |
Aggressive Investors 1 Fund MANAGER’S COMMENTARY (continued) | | |
Overcoming a bankruptcy in the midst of a recession is not an easy task. Pilgrim’s Pride, a producer of processed poultry products, filed for reorganization in late 2008, and Brazil-based JBS acquired a 64% ownership of the company. China indicated that it planned to impose new tariffs on chicken products this past April, a move that was designed to limit US sales of chicken feet, a delicacy in that country. Pilgrim’s Pride reported recent quarterly financials that came in below analysts’ expectations, and its stock price plummeted as a result. Management blamed ongoing restructuring expenses as well as hedging losses incurred during the period. The holding lost over 40% during the period we owned it and cost the fund about a half-percent in return.
Will the country ever become less dependent on the world’s sources of oil? Fuel Systems Solutions certainly hopes so. The company manufactures alternative fuel components and systems that are incorporated in the transportation and industrial industries. While the outlook is bright as carmakers strive to build more fuel efficient vehicles, the company’s share price has declined dramatically since the beginning of the year. In fact, its price decline has followed in step with the European debt crisis that has made headlines over the past few quarters. Italy has long been a key market for Fuel Systems, and some analysts fear a pessimistic outlook for its economy should a “contagion” spread beyond Greece, Spain, and other debt-challenged European markets. Additionally, the Italian government ended an alternative fuel subsidy that had been instrumental in prior revenue gains for Fuel Systems. Its stock price has fallen on these ongoing uncertainties, and the negative returns cost the fund over one percent during the 12-month period.
Top Ten Holdings as of June 30, 2010
The Fund’s top ten holdings comprised six different sectors; only information technology and industrials had more than one company on the list at year-end. The Fund was broadly diversified, and no single holding accounted for greater than 3.4% of net assets. The ten largest positions represented just over 21% of the total assets of the Fund.
| | | | | | |
| Rank | | Description | | Industry | | % of Net
Assets |
| 1 | | Sanmina-SCI Corp. | | Electronic Equip., Instruments & Components | | 3.4% |
| 2 | | DSW, Inc. | | Speciality Retail | | 2.4% |
| 3 | | Veeco Instruments, Inc. | | Semiconductors & Semiconductor | | 2.1% |
| 4 | | Micron Technology, Inc. | | Semiconductors & Semiconductor | | 2.1% |
| 5 | | Align Technology, Inc. | | Health Care Equipment & Supplies | | 2.1% |
| 6 | | W.W. Grainger, Inc. | | Trading Companies & Distributors | | 2.0% |
| 7 | | Cognizant Technology Solutions Corp. | | IT Services | | 1.9% |
| 8 | | Jo-Ann Stores, Inc. | | Speciality Retail | | 1.8% |
| 9 | | Atwood Oceanics, Inc. | | Energy Equipment & Services | | 1.7% |
| 10 | | Cooper Industries PLC | | Electrical Equipment | | 1.6% |
| | Total | | | | 21.1% |
Industry Sector Representation as of June 30, 2010
Information Technology represented almost one-fourth of the Fund’s net assets at the end of the period and comprised the largest allocation disparity within the index. Unfortunately, this volatile sector underperformed during the past three months. Combined, the consumer-related sectors represented in excess of 20% of net assets in both the Fund and the S&P 500 Index. However, we owned more consumer discretionary companies, and the index held more consumer staples.
| | |
16 | | Annual Report | June 30, 2010 |
| | |
Aggressive Investors 1 Fund MANAGER’S COMMENTARY (continued) | | |
| | | | | | |
| | | % of Portfolio | | % of S&P 500 Index | | Difference |
Consumer Discretionary | | 15.9% | | 10.1% | | 5.8% |
Consumer Staples | | 5.5% | | 11.5% | | -6.0% |
Energy | | 9.8% | | 10.8% | | -1.0% |
Financials | | 16.9% | | 16.3% | | 0.6% |
Health Care | | 7.7% | | 12.1% | | -4.4% |
Industrial | | 11.6% | | 10.4% | | 1.2% |
Information Technology | | 24.4% | | 18.7% | | 5.7% |
Materials | | 7.0% | | 3.4% | | 3.6% |
Telecommunication Services | | 0.0% | | 3.0% | | -3.0% |
Utilities | | 0.0% | | 3.7% | | -3.7% |
Cash | | 1.2% | | 0.0% | | 1.2% |
Total | | 100.0% | | 100.0% | | |
Disclaimer
The views expressed here are exclusively those of Fund management. These views, including those related to market sectors or individual stocks, are not meant as investment advice and should not be considered predictive in nature. Any favorable (or unfavorable) description of a holding applies only as of the quarter-end, June 30, 2010, unless otherwise stated. Security positions can and do change thereafter. Discussions of historical performance do not guarantee and may not be indicative of future performance.
Market volatility can significantly affect short-term performance. The Fund is not an appropriate investment for short-term investors. Investments in the small companies within this multi-cap fund generally carry greater risk than is customarily associated with larger companies. This additional risk is attributable to a number of factors, including the relatively limited financial resources that are typically available to small companies, and the fact that small companies often have comparatively limited product lines. In addition, the stock of small companies tends to be more volatile than the stock of large companies, particularly in the short term and particularly in the early stages of an economic or market downturn. The Fund’s use of options, futures, and leverage can magnify the risk of loss in an unfavorable market, and the Fund’s use of short-sale positions can, in theory, expose shareholders to unlimited loss. Finally, the Fund exposes shareholders to “focus risk,” which may add to Fund volatility through the possibility that a single company could significantly affect total return. Shareholders of the Fund, therefore, are taking on more risk than they would if they invested in the stock market as a whole.
Conclusion
Thank you for your continued investment in Aggressive Investors 1 Fund. We encourage your feedback; your reactions and concerns are extremely important to us.
Sincerely,
Your Investment Management Team
| | |
Bridgeway Aggressive Investors 1 Fund SCHEDULE OF INVESTMENTS | | |
Showing percentage of net assets as of June 30, 2010
| | | | | | | |
Industry Company | | Shares | | Value | | |
| | | | | | | |
COMMON STOCKS - 98.95% | | |
Aerospace & Defense - 1.02% | | |
Northrop Grumman Corp. | | 17,400 | | $ | 947,256 | | |
Airlines - 3.53% | | |
Delta Air Lines, Inc.* | | 77,800 | | | 914,150 | | |
UAL Corp.*+ | | 51,900 | | | 1,067,064 | | |
US Airways Group, Inc.*+ | | 150,800 | | | 1,298,388 | | |
| | | | | | | |
| | | | | 3,279,602 | | |
Auto Components - 1.07% | | |
TRW Automotive Holdings Corp.* | | 36,200 | | | 998,034 | | |
Automobiles - 1.27% | | |
Ford Motor Co.* | | 117,600 | | | 1,185,408 | | |
Beverages - 1.29% | | |
Brown-Forman Corp., Class B | | 20,900 | | | 1,196,107 | | |
Building Products - 1.02% | | |
Owens Corning* | | 31,700 | | | 948,147 | | |
Capital Markets - 1.19% | | |
Goldman Sachs Group, Inc. (The) | | 8,400 | | | 1,102,668 | | |
Chemicals - 5.31% | | |
Cabot Corp. | | 35,100 | | | 846,261 | | |
Lubrizol Corp. | | 16,400 | | | 1,317,084 | | |
NewMarket Corp. | | 13,900 | | | 1,213,748 | | |
Potash Corp. of | | | | | | | |
Saskatchewan, Inc. | | 10,000 | | | 862,400 | | |
Sherwin-Williams Co. (The) | | 10,100 | | | 698,819 | | |
| | | | | | | |
| | | | | 4,938,312 | | |
Commercial Banks - 3.19% | | |
Barclays PLC - Sponsored ADR | | 29,100 | | | 462,399 | | |
Lloyds Banking Group PLC - ADR+ | | 215,200 | | | 680,032 | | |
M&T Bank Corp. | | 14,200 | | | 1,206,290 | | |
Regions Financial Corp. | | 94,600 | | | 622,468 | | |
| | | | | | | |
| | | | | 2,971,189 | | |
Commercial Services & Supplies - 1.31% | | |
EnerNOC, Inc.*+ | | 38,700 | | | 1,216,728 | | |
Communications Equipment - 1.27% | | |
Acme Packet, Inc.* | | 43,800 | | | 1,177,344 | | |
Computers & Peripherals - 3.30% | | |
Lexmark International, Inc., Class A* | | 30,200 | | | 997,506 | | |
SanDisk Corp.* | | 27,900 | | | 1,173,753 | | |
| | | | | | | |
Industry Company | | Shares | | Value | | |
| | | | | | | |
Computers & Peripherals (continued) | | |
Seagate Technology* | | 68,600 | | $ | 894,544 | | |
| | | | | | | |
| | | | | 3,065,803 | | |
Consumer Finance - 2.12% | | |
Credit Acceptance Corp.* | | 20,800 | | | 1,014,416 | | |
SLM Corp.* | | 92,000 | | | 955,880 | | |
| | | | | | | |
| | | | | 1,970,296 | | |
Diversified Consumer Services - 0.76% | | |
Corinthian Colleges, Inc.*+ | | 71,500 | | | 704,275 | | |
Electrical Equipment - 1.62% | | |
Cooper Industries PLC | | 34,300 | | | 1,509,200 | | |
Electronic Equipment, Instruments & Components - 6.43% | | |
Arrow Electronics, Inc.* | | 39,000 | | | 871,650 | | |
Ingram Micro, Inc., Class A* | | 66,700 | | | 1,013,173 | | |
Sanmina-SCI Corp.* | | 231,700 | | | 3,153,437 | | |
Tech Data Corp.* | | 26,400 | | | 940,368 | | |
| | | | | | | |
| | | | | 5,978,628 | | |
Energy Equipment & Services - 5.60% | | |
Atwood Oceanics, Inc.* | | 62,700 | | | 1,600,104 | | |
Cal Dive International, Inc.* | | 132,100 | | | 772,785 | | |
Diamond Offshore Drilling, Inc.+ | | 16,300 | | | 1,013,697 | | |
National Oilwell Varco, Inc. | | 26,000 | | | 859,820 | | |
Tetra Technologies, Inc.* | | 106,400 | | | 966,112 | | |
| | | | | | | |
| | | | | 5,212,518 | | |
Food & Staples Retailing - 2.19% | | |
Safeway, Inc. | | 49,200 | | | 967,272 | | |
Whole Foods Market, Inc.*+ | | 29,600 | | | 1,066,192 | | |
| | | | | | | |
| | | | | 2,033,464 | | |
Food Products - 0.74% | | |
Pilgrim’s Pride Corp.* | | 104,800 | | | 688,536 | | |
Health Care Equipment & Supplies - 3.19% | | |
Align Technology, Inc.*+ | | 131,700 | | | 1,958,379 | | |
Sirona Dental Systems, Inc.* | | 28,900 | | | 1,006,876 | | |
| | | | | | | |
| | | | | 2,965,255 | | |
Health Care Providers & Services - 1.03% | | |
Quest Diagnostics, Inc. | | 19,300 | | | 960,561 | | |
Insurance - 6.11% | | |
Aflac, Inc. | | 12,500 | | | 533,375 | | |
Genworth Financial, Inc., Class A* | | 74,900 | | | 978,943 | | |
Prudential Financial, Inc. | | 18,600 | | | 998,076 | | |
Travelers Cos., Inc. (The) | | 23,200 | | | 1,142,600 | | |
| | |
18 | | Annual Report | June 30, 2010 |
| | |
Bridgeway Aggressive Investors 1 Fund SCHEDULE OF INVESTMENTS (continued) | | |
Showing percentage of net assets as of June 30, 2010
| | | | | | | |
Industry Company | | Shares | | Value | | |
Common Stocks (continued) | | |
Insurance (continued) | | |
Unitrin, Inc. | | 47,900 | | $ | 1,226,240 | | |
XL Capital, Ltd., Class A | | 50,400 | | | 806,904 | | |
| | | | | | | |
| | | | | 5,686,138 | | |
Internet Software & Services - 1.00% | | |
United Online, Inc. | | 160,800 | | | 926,208 | | |
IT Services - 3.36% | | |
Cognizant Technology | | | | | | | |
Solutions Corp., Class A* | | 34,800 | | | 1,742,088 | | |
Unisys Corp.* | | 74,883 | | | 1,384,587 | | |
| | | | | | | |
| | | | | 3,126,675 | | |
Leisure Equipment & Products - 1.35% | | |
Hasbro, Inc. | | 30,500 | | | 1,253,550 | | |
Life Sciences Tools & Services - 2.33% | | |
Life Technologies Corp.* | | 24,100 | | | 1,138,725 | | |
Thermo Fisher Scientific, Inc.* | | 20,900 | | | 1,025,145 | | |
| | | | | | | |
| | | | | 2,163,870 | | |
Marine - 0.00% | | |
Kirby Corp.* | | 20 | | | 765 | | |
Media - 2.44% | | |
Cinemark Holdings, Inc. | | 65,200 | | | 857,380 | | |
Valassis Communications, Inc.* | | 44,600 | | | 1,414,712 | | |
| | | | | | | |
| | | | | 2,272,092 | | |
Metals & Mining - 1.71% | | |
Mechel - Sponsored ADR | | 32,600 | | | 591,364 | | |
Teck Resources, Ltd., Class B | | 33,800 | | | 999,804 | | |
| | | | | | | |
| | | | | 1,591,168 | | |
Multiline Retail - 2.35% | | |
Dillard’s, Inc., Class A+ | | 38,600 | | | 829,900 | | |
Family Dollar Stores, Inc. | | 36,100 | | | 1,360,609 | | |
| | | | | | | |
| | | | | 2,190,509 | | |
Office Electronics - 0.94% | | |
Xerox Corp. | | 108,900 | | | 875,556 | | |
Oil, Gas & Consumable Fuels - 4.20% | | |
Comstock Resources, Inc.* | | 36,800 | | | 1,020,096 | | |
ConocoPhillips | | 27,000 | | | 1,325,430 | | |
Exxon Mobil Corp. | | 16,700 | | | 953,069 | | |
Yanzhou Coal Mining Co., Ltd. - Sponsored ADR+ | | 31,900 | | | 610,885 | | |
| | | | | | | |
| | | | | 3,909,480 | | |
| | | | | | | |
Industry Company | | Shares | | Value | | |
| | | | | | | |
Personal Products - 1.31% | | |
Estee Lauder Cos., Inc., Class A (The) | | 21,800 | | $ | 1,214,914 | | |
Pharmaceuticals - 1.15% | | |
Medicis Pharmaceutical Corp., Class A | | 48,800 | | | 1,067,744 | | |
Professional Services - 1.13% | | |
Dun & Bradstreet Corp. | | 15,700 | | | 1,053,784 | | |
Real Estate Investment Trusts (REITs) - 2.07% | | |
BioMed Realty Trust, Inc. | | 64,700 | | | 1,041,023 | | |
Weingarten Realty Investors | | 46,600 | | | 887,730 | | |
| | | | | | | |
| | | | | 1,928,753 | | |
Real Estate Management & Development - 1.07% | | |
Brookfield Properties Corp.+ | | 70,800 | | | 994,032 | | |
Semiconductors & Semiconductor Equipment - 6.54% | | |
Applied Materials, Inc. | | 93,900 | | | 1,128,678 | | |
Cirrus Logic, Inc.* | | 63,000 | | | 996,030 | | |
Micron Technology, Inc.* | | 231,600 | | | 1,966,284 | | |
Veeco Instruments, Inc.* | | 58,200 | | | 1,995,096 | | |
| | | | | | | |
| | | | | 6,086,088 | | |
Software - 1.55% | | |
Longtop Financial Technologies, Ltd. - | | |
Sponsored ADR*+ | | 44,400 | | | 1,438,560 | | |
Specialty Retail - 6.70% | | |
DSW, Inc., Class A*+ | | 100,200 | | | 2,250,492 | | |
Finish Line, Inc., Class A (The) | | 70,000 | | | 975,100 | | |
Jo-Ann Stores, Inc.* | | 44,800 | | | 1,680,448 | | |
Pier 1 Imports, Inc.*# | | 207,400 | | | 1,329,434 | | |
| | | | | | | |
| | | | | 6,235,474 | | |
Thrifts & Mortgage Finance - 1.19% | | |
Hudson City Bancorp, Inc. | | 90,600 | | | 1,108,944 | | |
Trading Companies & Distributors - 2.00% | | |
W.W. Grainger, Inc. | | 18,700 | | | 1,859,715 | | |
| | | | | | | |
TOTAL COMMON STOCKS - 98.95% | | | 92,033,350 | | |
| | | | | | | |
(Cost $93,316,801) | | | | | | | |
| | |
Bridgeway Aggressive Investors 1 Fund SCHEDULE OF INVESTMENTS (continued) | | |
Showing percentage of net assets as of June 30, 2010
| | | | | | | | | | | | | |
| | | | | Rate^ | | | Shares | | Value | | | |
| |
MONEY MARKET FUND - 1.29% | | | |
BlackRock Fed Fund | | 0.04 | % | | 1,199,868 | | $ | 1,199,868 | | | |
| | | | | | | | | | | | | |
TOTAL MONEY MARKET FUND - 1.29% | | | 1,199,868 | | | |
| | | | | | | | | | | | | |
(Cost $1,199,868) | | | | | | |
TOTAL INVESTMENTS - 100.24% | | $ | 93,233,218 | | | |
(Cost $94,516,669) | | | | | | |
Liabilities in Excess of Other Assets - (0.24%) | | | (225,578 | ) | | |
| | | | | | | | | | | | | |
NET ASSETS - 100.00% | | $ | 93,007,640 | | | |
| | | | | | | | | | | | | |
* Non-income producing security. # Securities, or a portion thereof, segregated to cover the Fund’s obligation under swap agreements. The total market value of segregated assets is $1,329,434. ^ Rate disclosed as of June 30, 2010. + This security or a portion of the security is out on loan at June 30, 2010. Total loaned securities had a market value of $10,677,072 at June 30, 2010. ADR- American Depositary Receipt PLC- Public Limited Company Summary of inputs used to value the Fund’s investments as of 06/30/2010 are as follows (See Note 2 in Notes to Financial Statements): | | | |
| | | | | | | | | | | | | |
| | | Valuation Inputs |
| | | Investment in Securities (Market Value) |
| | | Level 1
Quoted
Prices | | Level 2
Significant
Observable
Inputs | | | Level 3
Significant Unobservable Inputs | | Total |
Common Stocks | | $ | 92,033,350 | | $ | — | | | $ | — | | $ | 92,033,350 |
Money Market Fund | | | — | | | 1,199,868 | | | | — | | | 1,199,868 |
| | | | | | | | | | | | | |
TOTAL | | $ | 92,033,350 | | $ | 1,199,868 | | | $ | — | | $ | 93,233,218 |
| | | | | | | | | | | | | |
Other Financial Instruments** | | $ | — | | $ | (82,971 | ) | | $ | — | | $ | (82,971) |
| | | | | | | | | | | | | |
** Other financial instruments are derivative instruments not reflected in the Schedule of Investments, such as futures, forwards and swap contracts, which are valued at the unrealized appreciation/ depreciation on the investment. |
See Notes to Financial Statements. |
| |
| | |
20 | | Annual Report | June 30, 2010 |
| | |
Aggressive Investors 2 Fund MANAGER’S COMMENTARY | | |
June 30, 2010
Dear Fellow Aggressive Investors 2 Fund Shareholder,
In the June quarter, our Fund declined 13.65%, underperforming our primary market benchmark, the S&P 500 Index (down 11.43%), the Russell 2000 Index of smaller companies (down 9.92%), and our peer benchmark, the Lipper Capital Appreciation Funds Index (down 11.08%). As detailed on page 3, the lack of traction continues to affect our growth leaning models the most severely, while more value leaning models made up some of the difference. This was a poor quarter on an absolute basis and relative basis
For the fiscal year ended June 30, 2010, our Fund increased 8.54%, trailing the returns of the S&P 500 Index (up 14.43%), the Russell 2000 Index of smaller companies (up 21.48%), and the Lipper Capital Appreciation Funds Index (up 14.86%). Performance details appear below. While we still lead our primary market benchmark since inception, the last two years of returns have taken their toll on performance, including even the five year period.
The table below presents our June quarter, one-year, five-year, and life-to-date financial results according to the formula required by the SEC. See the next page for a graph of performance from inception to June 30, 2010.
| | | | | | | | | | |
| | | June Qtr.
4/1/10 to 6/30/10 | | | 1 Year
7/1/09
to 6/30/10 | | | 5 Year
7/1/05
to 6/30/10 | | Life-to-Date
10/31/01 to 6/30/10 |
| | | | |
Aggressive Investors 2 Fund | | -13.65 | % | | 8.54 | % | | -3.95% | | 2.16% |
S&P 500 Index (large companies) | | -11.43 | % | | 14.43 | % | | -0.80% | | 1.63% |
Russell 2000 Index (small companies) | | -9.92 | % | | 21.48 | % | | 0.37% | | 5.53% |
Lipper Capital Appreciation Funds Index | | -11.08 | % | | 14.86 | % | | 1.85% | | 3.38% |
Performance figures quoted in the table above and graph below represent past performance and are no guarantee of future results. Total return figures in the table above include the reinvestment of dividends and capital gains. The table above and the graph below do not reflect the deduction of taxes that a shareholder would pay on Fund distributions or the redemption of Fund shares.
The S&P 500 Index is a broad-based, unmanaged measurement of changes in stock market conditions based on the average of 500 widely held common stocks with dividends reinvested. The Russell 2000 Index is an unmanaged, market value weighted index that measures performance of the 2,000 companies that are between the 1,000th and 3,000th largest in the market with dividends reinvested. The Lipper Capital Appreciation Funds Index reflects the record of the 30 largest funds in this category, comprised of more aggressive domestic growth mutual funds, as reported by Lipper, Inc. It is not possible to invest directly in an index. Periods longer than one year are annualized.
According to data from Lipper, Inc. as of June 30, 2010, Aggressive Investors 2 Fund ranked 235th of 285 capital appreciation funds for the twelve months ending June 30, 2010, 213th of 218 over the last five years, and 104th of 173 since inception in October, 2001. Lipper, Inc. is an independent mutual fund rating service that ranks funds in various fund categories by making comparative calculations using total returns.
| | |
Aggressive Investors 2 Fund MANAGER’S COMMENTARY (continued) | | |
Aggressive Investors 2 Fund vs. S&P 500 Index, Lipper Capital Appreciation Funds Index & Russell 2000 Index
from Inception 10/31/01 to 6/30/10
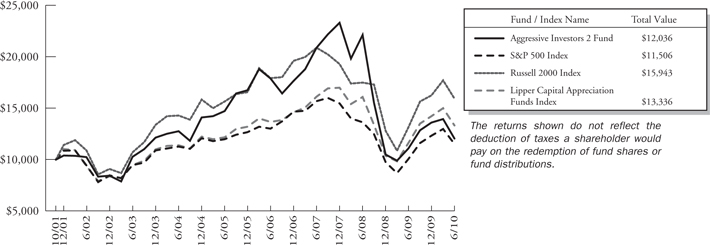
Detailed Explanation of Quarterly Performance — What Worked
The Short Version: In spite of the market decline, some companies in disparate industries overcame the trend. The consumer discretionary and industrial companies helped the most.
Despite the difficulties brought on by such global factors as the European sovereign debt crisis, our models uncovered a number of companies that contributed positive returns to the fund. Four industrial and three consumer discretionary companies were among the best performers list. Combined, these seven stocks returned about three-quarters of a percent to the Fund’s performance, providing some cushion in the quarterly downturn.
These are the ten stocks that performed the best for the Fund during the quarter ended June 30, 2010:
| | | | | | |
| Rank | | Description | | Industry | | % Gain |
1 | | US Airways Group, Inc. | | Airlines | | 17.1% |
2 | | EMCOR Group, Inc. | | Construction & Engineering | | 15.0% |
3 | | Valassis Communications, Inc. | | Media | | 14.0% |
4 | | Home Depot, Inc. | | Specialty Retail | | 9.0% |
5 | | Hasbro, Inc. | | Leisure Equipment & Products | | 8.1% |
6 | | EnerNOC, Inc. | | Commercial Services & Supplies | | 5.9% |
7 | | Microsoft Corp. | | Software | | 5.3% |
8 | | General Electric Co. | | Industrial Conglomerates | | 4.1% |
9 | | Bristol-Myers Squibb Co. | | Pharmaceuticals | | 3.7% |
10 | | AT&T, Inc. | | Diversified Telecommunication Services | | 3.4% |
Snubbed in the latest airline merger talk (Continental and United Airlines), US Airways claims to be content to go it alone and is not looking for a merger partner at this time. The industry as a whole seems primed for recovery following last year’s recessionary period and the oil hikes of 2008. US Airways announced a nice increase in May revenue as business travel continues to pick up and international bookings have risen. In fact, management recently projected a quarterly profit for the first time since 2007. US Airways was the fund’s top performer for the June quarter.
Detailed Explanation of Quarterly Performance — What Didn’t Work
The Short Version: Beating Wall Street expectations didn’t help in the quarter, especially among technology and growth companies.
| | |
22 | | Annual Report | June 30, 2010 |
| | |
Aggressive Investors 2 Fund MANAGER’S COMMENTARY (continued) | | |
Lack of traction (page 3) continues to take a toll on the growth leaning stock picking models of this Fund. For example, according to data from Bloomberg, a very strong 89% of our companies reported earnings above Wall Street expectations, versus 82% for our primary market benchmark. Yet, this did not translate into market beating returns. Our Fund stocks with higher exposure to market risk hurt the most, combined with an underweighting of classical conservative sectors: utilities and consumer staples.
These are the ten stocks that performed the worst for the Fund during the quarter ended June 30, 2010
| | | | | | |
| Rank | | Description | | Industry | | % Loss |
1 | | Unisys Corp. | | IT Services | | -47.0% |
2 | | Corinthian Colleges, Inc. | | Diversified Consumer Services | | -44.0% |
3 | | Fibria Celulose SA | | Paper & Forest Products | | -32.4% |
4 | | Teck Resources, Ltd. | | Metals & Mining | | -28.7% |
5 | | Diamond Offshore Drilling, Inc. | | Energy Equipment & Services | | -28.7% |
6 | | Seagate Technology | | Computers & Peripherals | | -28.6% |
7 | | Potash Corp of Saskatchewan, Inc. | | Chemicals | | -27.7% |
8 | | Xerox Corp. | | Office Electronics | | -27.2% |
9 | | United States Steel Corp. | | Metals & Mining | | -27.2% |
10 | | Barclays PLC | | Commercial Banks | | -26.7% |
Corinthian Colleges, Inc (CCI) offers for-profit post-secondary programs in the United States and Canada. In recent times, the industry has been criticized for poor oversight as numerous students incurred significant debt that they are unable to repay (and often without a solid education in return). In April, an official at the Department of Education compared the regulatory environment to that of Wall Street, a harsh reprimand in the aftermath of the financial debacle. In May, the company was downgraded by an analyst who forecast a decline in its enrollment as the government tightened aid requirements to help reduce student loan defaults. Its share price fell 44% during the quarter in spite of the fact that the company’s financial results continue to improve. Is the company significantly “oversold?” Our model indicates it may well be.
An interesting footnote to the Corinthian Colleges story highlights the degree to which much of a company’s price continues to be driven by events. On May 17 the company’s stock price soared 14% in the last 15 minutes of trading on the news that U.S. Education Deputy Undersecretary Robert Shireman, a for-profit watchdog, was stepping down.
Detailed Explanation of Fiscal Year Performance — What Worked
The Short Version: Some of the market’s most distressed and battered stocks of the bear market bounced back the most over the last year.
We were significantly underrepresented in distressed stocks over the last year, although these were among the market’s best performers. Nevertheless, we held a handful of these stocks, which showed up on our fiscal year best performers list, e.g. General Electric, BioMed Realty, and Aflac. Others, such as our top performer, Cognizant, did reflect strong underlying economic growth. Winners and losers existed in each sector during the past 12 months. Seven sectors were represented on the list of best performers for the year and they contributed almost six percent to the Fund’s return. In fact, five holdings enjoyed gains of over 50% during the 12-month period.
| | |
Aggressive Investors 2 Fund MANAGER’S COMMENTARY (continued) | | |
These are the ten stocks that performed the best for the Fund during the fiscal year ended June 30, 2010:
| | | | | | |
| Rank | | Description | | Industry | | % Gain |
1 | | Cognizant Technology Solutions Corp. | | IT Services | | 87.5% |
2 | | General Electric Co. | | Industrial Conglomerates | | 64.7% |
3 | | BioMed Realty Trust, Inc. | | Real Estate Investment Trusts | | 62.7% |
4 | | Home Depot, Inc. | | Specialty Retail | | 52.9% |
5 | | NewMarket Corp. | | Chemicals | | 50.2% |
6 | | Aflac, Inc. | | Insurance | | 41.1% |
7 | | EMCOR Group, Inc. | | Construction & Engineering | | 40.8% |
8 | | Amedisys, Inc. | | Health Care Providers & Services | | 40.3% |
9 | | Cerner Corp. | | Health Care Technology | | 39.2% |
10 | | FMC Technologies, Inc. | | Energy Equipment & Services | | 39.0% |
Cognizant Technology provides outsourced technology services worldwide. Much of its operations take place in Asian emerging markets, such as India, and its profits are quite high, as it benefits from the lower labor costs. As global firms look for ways to cut expenses in the aftermath of the economic downturn, many have turned to outsourcing certain technology areas. India’s tech sector has surged, even during these challenging times, boosting Cognizant’s earnings beyond Wall Street expectations over the past few quarters. Since Europe is a major market, some analysts fear that future operations may be impacted by the declining value of the euro. In June, Cognizant continued in growth mode and announced that it was acquiring a Paris-based consulting firm, Galileo Performance. Its stock price recently hit an all-time high, rising over 75% during the 12-month period. It was the fund’s top performer for the fiscal year and contributed just over one percent to the overall return.
Detailed Explanation of Fiscal Year Performance — What Didn’t Work
The Short Version: In spite of an up market over three of the last four quarters, there were also significant decliners in a broad array of industries.
Our ten worst performers over the fiscal year period came from nine different industries, although four were related to the information technology sector that also provided the Fund’s top performer. These four combined cost the Fund over two percentage points in return.
These are the ten stocks that performed the worst for the Fund during the fiscal year ended June 30, 2010:
| | | | | | |
| Rank | | Description | | Industry | | % Loss |
1 | | Corinthian Colleges, Inc. | | Diversified Consumer Services | | -41.8% |
2 | | Fuel Systems Solutions, Inc. | | Auto Components | | -40.4% |
3 | | Unisys Corp. | | IT Services | | -36.6% |
4 | | Synaptics, Inc. | | Computers & Peripherals | | -33.4% |
5 | | Teck Resources, Ltd. | | Metals & Mining | | -28.7% |
6 | | Xerox Corp. | | Office Electronics | | -27.2% |
7 | | United States Steel Corp. | | Metals & Mining | | -27.2% |
8 | | Fibria Celulose SA | | Paper & Forest Products | | -25.4% |
9 | | Tetra Tech, Inc. | | Commercial Services & Supplies | | -23.5% |
10 | | Arrow Electronics, Inc. | | Electronic Equip., Instruments & Components | | -23.3% |
Will the country ever become less dependent on the world’s sources of oil? Fuel Systems Solutions certainly hopes so. The company manufactures alternative fuel components and systems that are incorporated in the transportation and industrial industries. While the outlook is bright as carmakers strive to build more fuel efficient vehicles, the company’s share price has declined dramatically since the beginning of the year. In fact, its price decline has followed in step with the European debt crisis that has made headlines over the past few quarters. Italy has long been a key market for Fuel Systems, and some analysts fear a pessimistic outlook for its economy should a “contagion” spread beyond Greece, Spain, and other debt-challenged European markets. Additionally, the Italian government ended an alternative fuel subsidy that had been instrumental in prior
| | |
24 | | Annual Report | June 30, 2010 |
| | |
Aggressive Investors 2 Fund MANAGER’S COMMENTARY (continued) | | |
revenue gains for Fuel Systems. Its stock price has fallen on these ongoing uncertainties, and the negative returns cost the fund over one percent during the 12-month period.
Top Ten Holdings as of June 30, 2010
Seven of the top ten holdings were from the information technology sector, but they were diversified among six different industries. No single holding accounted for greater than 3.2% of net assets. The ten largest positions represented just over 20% of the total assets of the Fund.
| | | | | | |
| Rank | | Description | | Industry | | % of Net
Assets |
1 | | Sanmina-SCI Corp. | | Electronic Equip., Instruments & Components | | 3.2% |
2 | | Acme Packet, Inc. | | Communications Equipment | | 2.5% |
3 | | SanDisk Corp. | | Computers & Peripherals | | 2.5% |
4 | | Cognizant Technology Solutions Corp. | | IT Services | | 2.2% |
5 | | Veeco Instruments, Inc. | | Semiconductors & Semiconductor Equipment | | 2.1% |
6 | | Micron Technology, Inc. | | Semiconductors & Semiconductor Equipment | | 2.0% |
7 | | Lexmark International, Inc. | | Computers & Peripherals | | 1.9% |
8 | | Atwood Oceanics, Inc. | | Energy Equipment & Services | | 1.7% |
9 | | Cooper Industries PLC | | Electrical Equipment | | 1.6% |
10 | | Longtop Financial Technologies, Ltd. | | Software | | 1.6% |
| | | Total | | | | 21.3% |
Industry Sector Representation as of June 30, 2010
Information Technology represented over one-fourth of the Fund’s holdings at the end of the period and comprised the largest allocation disparity within the Index. Unfortunately, this volatile sector underperformed during the past three months. Combined, the consumer-related sectors represented in excess of 20% of net assets in both the Fund and the S&P 500 Index. However, we owned more consumer discretionary companies, and the index held more consumer staples.
| | | | | | |
| | | % of Portfolio | | % of S&P 500 Index | | Difference |
Consumer Discretionary | | 16.1% | | 10.1% | | 6.0% |
Consumer Staples | | 4.9% | | 11.5% | | -6.6% |
Energy | | 10.0% | | 10.8% | | -0.8% |
Financials | | 16.3% | | 16.3% | | 0.0% |
Health Care | | 6.5% | | 12.1% | | -5.6% |
Industrials | | 12.2% | | 10.4% | | 1.8% |
Information Technology | | 27.5% | | 18.7% | | 8.8% |
Materials | | 5.6% | | 3.4% | | 2.2% |
Telecommunication Services | | 0.0% | | 3.0% | | -3.0% |
Utilities | | 0.0% | | 3.7% | | -3.7% |
Cash | | 0.9% | | 0.0% | | 0.9% |
Total | | 100.0% | | 100.0% | | |
Disclaimer
The views expressed here are exclusively those of Fund management. These views, including those related to market sectors or individual stocks, are not meant as investment advice and should not be considered predictive in nature. Any favorable (or unfavorable) description of a holding applies only as of the quarter-end, June 30, 2010, unless otherwise stated. Security positions can and do change thereafter. Discussions of historical performance do not guarantee and may not be indicative of future performance.
Market volatility can significantly affect short-term performance. The Fund is not an appropriate investment for short-term investors. Investments in the small companies within this multi-cap fund generally carry greater risk than is customarily associated
| | |
Aggressive Investors 2 Fund MANAGER’S COMMENTARY (continued) | | |
with larger companies. This additional risk is attributable to a number of factors, including the relatively limited financial resources that are typically available to small companies and the fact that small companies often have comparatively limited product lines. In addition, the stock of small companies tends to be more volatile than the stock of large companies, particularly in the short term and particularly in the early stages of an economic or market downturn. The Fund’s use of options, futures, and leverage can magnify the risk of loss in an unfavorable market, and the Fund’s use of short-sale positions can, in theory, expose shareholders to unlimited loss. Finally, the Fund exposes shareholders to “focus risk,” which may add to Fund volatility through the possibility that a single company could significantly affect total return. Shareholders of the Fund, therefore, are taking on more risk than they would if they invested in the stock market as a whole.
Conclusion
Thank you for your continued investment in Aggressive Investors 2 Fund. We encourage your feedback; your reactions and concerns are extremely important to us.
Sincerely,
Your Investment Management Team
| | |
26 | | Annual Report | June 30, 2010 |
| | |
Bridgeway Aggressive Investors 2 Fund SCHEDULE OF INVESTMENTS | | |
Showing percentage of net assets as of June 30, 2010
| | | | | | | |
Industry Company | | Shares | | Value | | |
COMMON STOCKS - 99.07% | | |
Aerospace & Defense - 2.07% | | |
Northrop Grumman Corp. | | 55,500 | | $ | 3,021,420 | | |
Raytheon Co. | | 67,300 | | | 3,256,647 | | |
| | | | | | | |
| | | | | 6,278,067 | | |
Airlines - 2.44% | | |
UAL Corp.*+ | | 169,800 | | | 3,491,088 | | |
US Airways Group, Inc.*+ | | 454,400 | | | 3,912,384 | | |
| | | | | | | |
| | | | | 7,403,472 | | |
Auto Components - 1.94% | | |
Magna International, Inc., Class A | | 47,000 | | | 3,100,120 | | |
TRW Automotive Holdings Corp.* | | 101,100 | | | 2,787,327 | | |
| | | | | | | |
| | | | | 5,887,447 | | |
Automobiles - 1.38% | | |
Ford Motor Co.* | | 416,700 | | | 4,200,336 | | |
Beverages - 1.08% | | |
Brown-Forman Corp., Class B | | 57,300 | | | 3,279,279 | | |
Building Products - 1.02% | | |
Owens Corning* | | 103,500 | | | 3,095,685 | | |
Capital Markets - 0.92% | | |
Goldman Sachs Group, Inc. (The) | | 21,200 | | | 2,782,924 | | |
Chemicals - 3.39% | | |
Lubrizol Corp. | | 55,000 | | | 4,417,050 | | |
Potash Corp. of Saskatchewan, Inc. | | 29,099 | | | 2,509,498 | | |
Sherwin-Williams Co. (The) | | 48,300 | | | 3,341,877 | | |
| | | | | | | |
| | | | | 10,268,425 | | |
Commercial Banks - 3.66% | | |
Barclays PLC-Sponsored ADR | | 163,700 | | | 2,601,193 | | |
Fifth Third Bancorp | | 238,600 | | | 2,932,394 | | |
Lloyds Banking Group PLC - ADR+ | | 702,400 | | | 2,219,584 | | |
M&T Bank Corp. | | 39,500 | | | 3,355,525 | | |
| | | | | | | |
| | | | | 11,108,696 | | |
Commercial Services & Supplies - 1.32% | | |
EnerNOC, Inc.*+ | | 127,700 | | | 4,014,888 | | |
| | | | | | | |
| | | | | |
Industry Company | | Shares | | Value |
| | | | | |
Communications Equipment - 2.50% |
Acme Packet, Inc.* | | 281,900 | | $ | 7,577,472 |
Computers & Peripherals - 5.36% |
Lexmark International, Inc., Class A* | | 175,100 | | | 5,783,553 |
SanDisk Corp.* | | 179,800 | | | 7,564,186 |
Seagate Technology* | | 222,400 | | | 2,900,096 |
| | | | | |
| | | | | 16,247,835 |
Consumer Finance - 1.99% |
Capital One Financial Corp. | | 73,700 | | | 2,970,110 |
SLM Corp.* | | 294,300 | | | 3,057,777 |
| | | | | |
| | | | | 6,027,887 |
Diversified Consumer Services - 1.60% |
Corinthian Colleges, Inc.*+ | | 192,800 | | | 1,899,080 |
DeVry, Inc. | | 56,400 | | | 2,960,436 |
| | | | | |
| | | | | 4,859,516 |
Electrical Equipment - - 1.64% |
Cooper Industries PLC | | 112,900 | | | 4,967,600 |
Electronic Equipment, Instruments & Components - 6.11% |
Arrow Electronics, Inc.* | | 128,800 | | | 2,878,680 |
Ingram Micro, Inc., Class A* | | 185,200 | | | 2,813,188 |
Sanmina-SCI Corp.* | | 717,500 | | | 9,765,175 |
Tech Data Corp.* | | 86,400 | | | 3,077,568 |
| | | | | |
| | | | | 18,534,611 |
Energy Equipment & Services - 4.74% |
Atwood Oceanics, Inc.* | | 196,700 | | | 5,019,784 |
Diamond Offshore Drilling, Inc.+ | | 51,000 | | | 3,171,690 |
National Oilwell Varco, Inc. | | 89,600 | | | 2,963,072 |
Tetra Technologies, Inc.* | | 355,300 | | | 3,226,124 |
| | | | | |
| | | | | 14,380,670 |
Food & Staples Retailing - 1.04% |
Safeway, Inc. | | 160,700 | | | 3,159,362 |
Health Care Providers & Services - 2.19% |
AmerisourceBergen Corp. | | 120,000 | | | 3,810,000 |
Quest Diagnostics, Inc. | | 56,700 | | | 2,821,959 |
| | | | | |
| | | | | 6,631,959 |
Household Products - 1.50% |
Procter & Gamble Co. (The) | | 75,700 | | | 4,540,486 |
| | |
Bridgeway Aggressive Investors 2 Fund SCHEDULE OF INVESTMENTS (continued) | | |
Showing percentage of net assets as of June 30, 2010
| | | | | | | |
Industry Company | | Shares | | Value | | |
Common Stocks (continued) | | |
Insurance - 5.16% | | | | | | | |
Genworth Financial, Inc., Class A* | | 201,900 | | $ | 2,638,833 | | |
Hartford Financial Services Group, Inc. | | 142,300 | | | 3,149,099 | | |
Prudential Financial, Inc. | | 64,200 | | | 3,444,972 | | |
Travelers Cos., Inc. (The) | | 76,800 | | | 3,782,400 | | |
XL Capital, Ltd., Class A | | 164,700 | | | 2,636,847 | | |
| | | | | | | |
| | | | | 15,652,151 | | |
IT Services - 5.96% | | |
Cognizant Technology Solutions Corp., Class A* | | 132,500 | | | 6,632,950 | | |
International Business Machines Corp. | | 26,800 | | | 3,309,264 | | |
Unisys Corp.* | | 206,900 | | | 3,825,581 | | |
Visa, Inc., Class A | | 61,000 | | | 4,315,750 | | |
| | | | | | | |
| | | | | 18,083,545 | | |
Leisure Equipment & Products - 1.32% | | |
Hasbro, Inc. | | 97,400 | | | 4,003,140 | | |
Life Sciences Tools & Services - 2.16% | | |
Life Technologies Corp.* | | 78,300 | | | 3,699,675 | | |
Thermo Fisher Scientific, Inc.* | | 58,300 | | | 2,859,615 | | |
| | | | | | | |
| | | | | 6,559,290 | | |
Machinery - 0.96% | | |
Mueller Industries, Inc. | | 118,100 | | | 2,905,260 | | |
Media - 2.52% | | |
CBS Corp., Class B Non Voting | | 239,200 | | | 3,092,856 | | |
Valassis Communications, Inc.* | | 143,800 | | | 4,561,336 | | |
| | | | | | | |
| | | | | 7,654,192 | | |
Metals & Mining - 1.55% | | |
Teck Resources, Ltd., Class B | | 79,500 | | | 2,351,610 | | |
United States Steel Corp.+ | | 61,300 | | | 2,363,115 | | |
| | | | | | | |
| | | | | 4,714,725 | | |
Multiline Retail - 3.47% | | |
Dillard’s, Inc., Class A+ | | 125,500 | | | 2,698,250 | | |
Family Dollar Stores, Inc. | | 124,100 | | | 4,677,329 | | |
Target Corp. | | 64,000 | | | 3,146,880 | | |
| | | | | | | |
| | | | | 10,522,459 | | |
| | | | | |
Industry Company | | Shares | | Value |
| | | | | |
Office Electronics - 0.80% |
Xerox Corp. | | 303,200 | | $ | 2,437,728 |
Oil, Gas & Consumable Fuels - 5.27% |
Comstock Resources, Inc.* | | 127,100 | | | 3,523,212 |
ConocoPhillips | | 94,400 | | | 4,634,096 |
Exxon Mobil Corp. | | 54,600 | | | 3,116,022 |
World Fuel Services Corp. | | 182,200 | | | 4,726,268 |
| | | | | |
| | | | | 15,999,598 |
Paper & Forest Products - 1.81% |
Fibria Celulose SA - Sponsored ADR*+ | | 167,100 | | | 2,473,080 |
MeadWestvaco Corp. | | 136,100 | | | 3,021,420 |
| | | | | |
| | | | | 5,494,500 |
Personal Products - 1.30% |
Estee Lauder Cos., Inc., Class A (The) | | 70,700 | | | 3,940,111 |
Pharmaceuticals - 2.13% |
Bristol-Myers Squibb Co. | | 140,200 | | | 3,496,588 |
Medicis Pharmaceutical Corp., Class A | | 135,300 | | | 2,960,364 |
| | | | | |
| | | | | 6,456,952 |
Professional Services - - 0.98% |
Dun & Bradstreet Corp. | | 44,100 | | | 2,959,992 |
Real Estate Investment Trusts (REITs) - 2.36% |
BioMed Realty Trust, Inc. | | 213,600 | | | 3,436,824 |
Weingarten Realty Investors | | 195,300 | | | 3,720,465 |
| | | | | |
| | | | | 7,157,289 |
Real Estate Management & Development - 1.07% |
Brookfield Properties Corp. | | 231,400 | | | 3,248,856 |
Road & Rail - - 0.76% |
Avis Budget Group, Inc.* | | 233,300 | | | 2,291,006 |
Semiconductors & Semiconductor Equipment - 5.17% |
Cirrus Logic, Inc.* | | 204,100 | | | 3,226,821 |
Micron Technology, Inc.* | | 728,700 | | | 6,186,663 |
Veeco Instruments, Inc.*+ | | 182,600 | | | 6,259,528 |
| | | | | |
| | | | | 15,673,012 |
Software - 1.60% |
Longtop Financial Technologies, Ltd. - Sponsored ADR*+ | | 149,400 | | | 4,840,560 |
| | |
28 | | Annual Report | June 30, 2010 |
| | |
Bridgeway Aggressive Investors 2 Fund SCHEDULE OF INVESTMENTS (continued) | | |
Showing percentage of net assets as of June 30, 2010
| | | | | | | | | |
Industry Company | | Shares | | Value | | |
Common Stocks (continued) | | |
Specialty Retail - 2.71% | | |
Pier 1 Imports, Inc.*+ | | 692,000 | | $ | 4,435,720 | | |
Ross Stores, Inc. | | 71,300 | | | 3,799,577 | | |
| | | | | | | | | |
| | | | | | | 8,235,297 | | |
Thrifts & Mortgage Finance - 1.12% | | |
Hudson City Bancorp, Inc. | | 276,600 | | | 3,385,584 | | |
Trading Companies & Distributors - 1.00% | | |
W.W. Grainger, Inc. | | | | 30,400 | | | 3,023,280 | | |
| | | | | | | | | |
TOTAL COMMON STOCKS - 99.07% | | | 300,485,144 | | |
| | | | | | | | | |
(Cost $301,453,337) | | | | | |
| | | Rate^ | | Shares | | Value | | |
MONEY MARKET FUND - 0.84% | | |
BlackRock Fed Fund | | 0.04% | | 2,530,973 | | | 2,530,973 | | |
| | | | | | | | | |
TOTAL MONEY MARKET FUND - - 0.84% | | | 2,530,973 | | |
| | | | | | | | | |
(Cost $2,530,973) | | | | | |
TOTAL INVESTMENTS - 99.91% | | $ | 303,016,117 | | |
(Cost $303,984,310) | | | | | | | |
Other Assets in Excess of Liabilities - 0.09% | | | 276,827 | | |
| | | | | | | | | |
NET ASSETS - 100.00% | | $ | 303,292,944 | | |
| | | | | | | | | |
* Non-income producing security. ^ Rate disclosed as of June 30, 2010. + This security or a portion of the security is out on loan at June 30, 2010. Total loaned securities had a market value of $22,492,054 at June 30, 2010. ADR - American Depositary Receipt PLC- Public Limited Company |
Summary of inputs used to value the Fund’s investments as of 06/30/2010 are as follows (See Note 2 in Notes to Financial Statements):
| | | | | | | | | | |
| | | Valuation Inputs |
| | | Investment in Securities (Market Value) |
| | | Level 1
Quoted Prices | | Level 2
Significant
Observable
Inputs | | Level 3
Significant
Unobservable
Inputs | | Total |
Common Stocks | | $300,485,144 | | $ | — | | $— | | $ | 300,485,144 |
Money Market Fund | | — | | | 2,530,973 | | — | | | 2,530,973 |
| | | | | | | | | | |
TOTAL | | $300,485,144 | | $ | 2,530,973 | | $— | | $ | 303,016,117 |
| | | | | | | | | | |
See Notes to Financial Statements.
| | |
Ultra-Small Company Fund MANAGER’S COMMENTARY | | |
June 30, 2010
Dear Fellow Ultra-Small Company Fund Shareholder,
In the June quarter, our Fund declined 8.46%, trailing the 7.94% loss of our primary market benchmark, the CRSP Cap-Based Portfolio 10 Index, and the 7.67% loss of our peer benchmark, the Lipper Micro-Cap Stock Funds Index, but outperforming the 8.85% decline of the Russell Micro-Cap Index as well as the 9.92% decline of the Russell 2000 Index. It was a mixed quarter on a relative basis.
For the fiscal year ended June 30, 2010, our Fund appreciated 17.26%, trailing the CRSP Cap-Based Portfolio 10 Index (up 33.06%), the Lipper Micro-Cap Stock Funds Index (up 21.65%), the Russell Microcap Index (up 20.45%) and the Russell 2000 Index (up 21.48%). In the environment of a junk rally and lack of traction (page 3), it was a poor fiscal year on a relative basis. We are not pleased.
The table below presents our June quarter, one-year, five-year, ten-year and life-to-date financial results according to the formula required by the SEC. See the next page for a graph of performance from inception to June 30, 2010.
| | | | | | | | | | |
| | | June Qtr.
4/1/10
to 6/30/10 | | 1 Year
7/1/09
to 6/30/10 | | 5 Year
7/1/05
to 6/30/10 | | 10 Year
7/1/00
to 6/30/10 | | Life-to-Date
8/5/94
to 6/30/10 |
| | | | | |
Ultra-Small Company Fund | | -8.46% | | 17.26% | | -0.49% | | 11.85% | | 15.22% |
CRSP Cap-Based Port. 10 Index | | -7.94% | | 33.06% | | 3.26% | | 10.32% | | 11.92% |
Russell Microcap Index | | -8.85% | | 20.45% | | -2.41% | | 3.25% | | N/A |
Russell 2000 Index (small companies) | | -9.92% | | 21.48% | | 0.37% | | 3.00% | | 7.36% |
Lipper Micro-Cap Stock Funds Index | | -7.67% | | 21.65% | | -0.45% | | 1.79% | | N/A |
Performance figures quoted in the table above and graph below represent past performance and are no guarantee of future results. Total return figures in the table above include the reinvestment of dividends and capital gains. The table above and the graph below do not reflect the deduction of taxes that a shareholder would pay on Fund distributions or the redemption of Fund shares.
The CRSP Cap-Based Portfolio 10 Index is an unmanaged index of 1,321 of the smallest publicly traded U.S. stocks (with dividends reinvested), as reported by the Center for Research on Security Prices. The Russell Microcap Index is an unmanaged, market value weighted index that measures the performance of 1000 of the smallest securities in the Russell 2,000 Index. The Russell 2000 Index is an unmanaged, market value weighted index that measures the performance of the 2,000 companies that are between the 1,000th and 3,000th largest in the market with dividends reinvested. The Lipper Micro-Cap Stock Funds Index is an index of small-company funds compiled by Lipper, Inc. It is not possible to invest directly in an index. Periods longer than one year are annualized.
According to data from Lipper, Inc. as of June 30, 2010, Ultra-Small Company Fund ranked 55th of 70 micro-cap funds for the twelve months ending June 30, 2010, 32nd of 59 over the last five years, 1st of 35 over the last ten years, and 1st of 9 since inception in August, 1994. These long-term numbers and the graph below give two snapshots of our long-term success. Lipper, Inc. is an independent mutual fund rating service that ranks funds in various fund categories by making comparative calculations using total returns.
| | |
| 30 | | Annual Report | June 30, 2010 |
| | |
Ultra-Small Company Fund MANAGER’S COMMENTARY (continued) | | |
Ultra-Small Company Fund vs. CRSP 10 Index, Lipper Micro-Cap Stock Funds Index* & Russell 2000 Index & Russell Microcap Index** from Inception 8/5/94 to 6/30/10
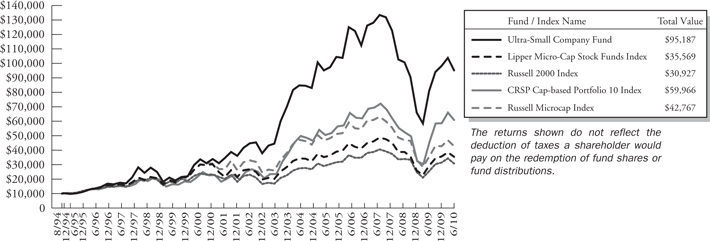
| * | The Lipper Micro-Cap Stock Funds Index began on 12/31/1995, and the line graph for the Index begins at the same value as the Fund on that date. |
| ** | The Russell Microcap Index began on 6/30/2000, and the line graph for the Index begins at the same value as the Fund on that date. |
The Effect of Company Size on Performance:
The Short Version: After strong large-company stock dominant years in 2007 and 2008, small and especially ultra-small stocks came back with a vengeance in the March 2009 through March 2010 timeframe, and then surprisingly provided some cushion in the most recent quarter as well. While this “tailwind” certainly helped, factors relating to lack of traction (page 3) worked against us.
In a majority of strongly declining markets, large companies outperform small ones. Not so over the last quarter, as ultra-small stocks significantly outperformed larger ones, giving our Fund a nice tailwind against benchmarks such as the Russell 2000 Index of small companies. The table below shows an almost four percentage point difference between the market’s smallest and largest companies. Even more dramatic is the performance disparity by size over the last year. Unfortunately, as detailed in our December 2009 report, much of that outperformance came among very risky “penny stocks” and distressed stocks that we tend to avoid; thus, we didn’t get the full benefit of the asset class’s 33.06% fiscal year return
| | | | | | | | | | |
| CRSP Decile1 | | Three Month
4/1/10 to
6/30/10 | | 1 Year
7/1/09 to
6/30/10 | | 5 Years
7/1/05
to 6/30/10 | | 10 Years
7/1/00
to 6/30/10 | | 84.5 Years
1/1/1926
to 6/30/10 |
1 (ultra-large) | | -11.89% | | 11.55% | | -0.83% | | -2.97% | | 8.90% |
2 | | -9.80% | | 20.71% | | 0.78% | | 2.87% | | 10.24% |
3 | | -9.02% | | 27.56% | | 1.14% | | 3.21% | | 10.64% |
4 | | -11.19% | | 22.21% | | 1.82% | | 4.06% | | 10.60% |
5 | | -9.76% | | 26.42% | | 4.62% | | 4.47% | | 11.15% |
6 | | -10.50% | | 24.67% | | 0.99% | | 3.59% | | 11.10% |
7 | | -8.97% | | 27.21% | | 2.41% | | 4.33% | | 11.10% |
8 | | -8.49% | | 27.56% | | 3.25% | | 6.41% | | 11.34% |
9 | | -9.64% | | 22.80% | | 1.55% | | 5.90% | | 11.38% |
10 (ultra-small) | | -7.94% | | 33.06% | | 3.26% | | 10.32% | | 13.06% |
| 1 | The CRSP Cap-Based Portfolio Indexes are unmanaged indexes of the publicly traded U.S. stocks with dividends reinvested, grouped by the market capitalization, as reported by the Center for Research in Security Prices. Past performance is no guarantee of future results. |
| | |
Ultra-Small Company Fund MANAGER’S COMMENTARY (continued) | | |
Detailed Explanation of Quarterly Performance — What Worked
The Short Version: In spite of the quarterly downturn, a number of our holdings performed quite well.
Despite the difficulties brought on by such global factors as the European sovereign debt crisis, our models uncovered a number of companies that contributed strong returns to the Fund. Six different sectors were represented in this list of best performers.
These are the ten stocks that performed the best for the Fund during the quarter ended June 30, 2010:
| | | | | | |
| Rank | | Description | | Industry | | % Gain |
1 | | IDT Corp. | | Diversified Telecommunication Services | | 96.8% |
2 | | Winmark Corp. | | Specialty Retail | | 44.6% |
3 | | Caribou Coffee Co., Inc. | | Hotels Restaurants & Leisure | | 43.1% |
4 | | Vascular Solutions, Inc. | | Health Care Equipment & Supplies | | 39.0% |
5 | | Ballantyne Strong, Inc. | | Media | | 34.1% |
6 | | HealthTronics, Inc. | | Health Care Equipment & Supplies | | 33.8% |
7 | | Diamond Management & Technology Consultants, Inc. | | Professional Services | | 32.5% |
8 | | Lionbridge Technologies, Inc. | | IT Services | | 25.9% |
9 | | Medifast, Inc. | | Personal Products | | 25.7% |
10 | | GSI Technology, Inc. | | Semiconductors & Semiconductor Equipment | | 22.8% |
Late in the quarter, executives from IDT Corp. rang the bell on the New York Stock Exchange as the company achieved a successful turnaround, returned to profitability, and regained compliance status with the exchange’s listing requirements. Its stock had struggled over the past few years with cash flow difficulties, restructuring issues, and management changes. IDT is both a telecommunication and energy company and recently reported a profitable quarter that included stronger cash flow, mainly on revenues from its calling card business. Recently, management looked to the future with its energy services group and entered into a venture with French oil company Total SA to develop a shale production plant in Northwest Colorado. This move looks highly appealing, particularly in light of the recent domestic off-shore drilling problems and potential future bans. The stock doubled in value during the three-month period and recently traded at its highest level since early 2008.
Detailed Explanation of Quarterly Performance — What Didn’t Work
The Short Version: Information technology and consumer discretionary stocks were well represented on the worst performers list.
Despite the fact that the models uncovered some positive consumer stocks as shown in the best performers section above, several other factors negatively affected our performance relative to our primary market benchmark: a) the 18% of our Fund stocks that had appreciated above “ultra-small” status hurt our returns to the tune of about a half percent; b) our Fund’s somewhat conservative positioning with respect to debt hurt by about a quarter of a percentage point, and c) our slight leaning toward market-sensitive stocks hurt as well.
| | |
32 | | Annual Report | June 30, 2010 |
| | |
Ultra-Small Company Fund MANAGER’S COMMENTARY (continued) | | |
Consumer discretionary and IT stocks loomed large on the list of poor performers last quarter as five related companies from these two sectors made the list. Combined, those holdings cost the Fund about one-and-a-half percent in return.
These are the ten stocks that performed the worst for the Fund during the quarter ended June 30, 2010:
| | | | | | |
| Rank | | Description | | Industry | | % Loss |
1 | | Astrotech Corp. | | Aerospace & Defense | | -61.4% |
2 | | Grubb & Ellis Co. | | Real Estate Management & Development | | -55.5% |
3 | | BioFuel Energy Corp. | | Oil, Gas & Consumable Fuels | | -54.8% |
4 | | Valuevision Media, Inc. | | Internet & Catalog Retail | | -47.9% |
5 | | Ikanos Communications, Inc. | | Semiconductors & Semiconductor Equipment | | -46.3% |
6 | | Tongxin International, Ltd. | | Auto Components | | -42.4% |
7 | | Eon Communications Corp. | | Communications Equipment | | -41.4% |
8 | | PRG-Schultz International, Inc. | | Commercial Services & Supplies | | -36.6% |
9 | | MarineMax, Inc. | | Specialty Retail | | -36.0% |
10 | | Insmed, Inc. | | Biotechnology | | -35.7% |
BioFuel Energy manufactures and sells ethanol and related energy products and aims to become the leading producer in the United States. In recent times, its operating performance has been dramatically impacted by shrinking margins as the difference between the cost of corn and the price of ethanol has narrowed substantially. Management believes the company has improved its cost structure in other areas, including capital improvement at its plants, and should be primed to benefit in the upcoming quarters as margins improve and move back to more “normal” spreads. The stock lost 55% during the three month period and cost the Fund about a quarter percent in return.
Detailed Explanation of Fiscal Year Performance — What Worked
The Short Version: Company size and risk were the two biggest determinants of fiscal year performance.
During the market downturn of calendar 2008, large companies outperformed their small-cap (particularly ultra-small cap) counterparts, but that trend shifted dramatically over the past twelve months as the smallest, riskiest, and most downtrodden companies came roaring back. Seven sectors were represented on the list of best performers for the year, and each of the top 10 holdings doubled in value (and then some) during the fiscal year. Altogether they contributed almost eleven percent in return.
These are the ten stocks that performed the best for the Fund during the fiscal year ended June 30, 2010:
| | | | | | |
| Rank | | Description | | Industry | | % Gain |
1 | | Saga Communications, Inc. | | Media | | 410.8% |
2 | | IDT Corp. | | Diversified Telecommuication Services | | 323.6% |
3 | | China Automotive Systems, Inc. | | Auto Components | | 288.9% |
4 | | Telestone Technologies Corp. | | Communications Equipment | | 282.9% |
5 | | One Liberty Properties, Inc. | | Real Estate Investment Trusts | | 182.2% |
6 | | Medifast, Inc. | | Personal Products | | 175.6% |
7 | | Wave Systems Corp. | | Software | | 163.4% |
8 | | Collectors Universe | | Diversified Consumer Services | | 157.7% |
9 | | Hi-Tech Pharmacal Co., Inc. | | Pharmaceuticals | | 157.4% |
10 | | KapStone Paper & Packaging Corp. | | Paper & Forest Products | | 126.7% |
As the US economy experiences a sluggish recovery and Europe fights through sovereign debt issues, China remains among the only primary markets that continue to expand in the post-financial debacle and global recession. Many companies doing business there are truly benefiting. China Automotive Systems produces power steering systems and other parts for Chinese automakers. Most of its customers operate in China, which has seen an industry-wide explosion with the development of a broader middle class. The car industry is expected to continue experiencing rapid growth. With Toyota and other Japanese companies suffering the ill effects of recalls and hindered reputations, Chinese automakers and their suppliers have reaped the
| | |
Ultra-Small Company Fund MANAGER’S COMMENTARY (continued) | | |
rewards of increased sales. China Automotive System’s share price more than tripled in value during the fiscal year and contributed over half-a-percent to the Fund’s return.
Detailed Explanation of Fiscal Year Performance — What Didn’t Work
The Short Version: Our Fund reflects the fact that the worst performers appeared among each of the economy’s sectors.
No sector was spared from the negativity of the last twelve months and especially the last quarter. Five sectors were represented in the list of worst performers. Altogether they cost the Fund about four and a half percent in return. Three holdings from both the consumer discretionary and energy sectors made the worst performers list.
These are the ten stocks that performed the worst for the Fund during the fiscal year ended June 30, 2010:
| | | | | | |
Rank | | Description | | Industry | | % Loss |
1 | | Eon Communications Corp. | | Communications Equipment | | -73.2% |
2 | | BioFuel Energy Corp. | | Oil, Gas & Consumable Fuels | | -62.8% |
3 | | Cornerstone Therapautics, Inc. | | Pharmaceuticals | | -53.4% |
4 | | Tongxin International, Ltd. | | Auto Components | | -49.5% |
5 | | Omni Energy Services Corp. | | Energy Equipment & Services | | -49.5% |
6 | | Spartan Motors, Inc. | | Auto Components | | -48.7% |
7 | | Grubb & Ellis Co. | | Real Estate Management & Development | | -47.9% |
8 | | Trico Marine Services, Inc. | | Energy Equipment & Services | | -47.8% |
9 | | Valuevision Media, Inc. | | Internet & Catalog Retail | | -47.4% |
10 | | Ikanos Communications, Inc. | | Semiconductors & Semiconductor Equipment | | -46.3% |
Eon Communications develops global communication solutions through advanced technologies for small- and mid-sized businesses. Management reported losses during the past two quarters. Though revenue jumped in the January 2010 quarter, much of the increase was due to a recent acquisition that may have served to inflate the true results of the period. The company continues to seek new revenue sources and cost-cutting measures and recently announced the acquisition of a majority interest in Cortelco Systems Puerto Rico to expand its global presence. Eon’s stock price fell over 70% during the fiscal year and cost the Fund about a half a percent in overall return.
Top Ten Equity Holdings as of June 30, 2010
IDT Corp. was the only best performer of the quarter that was also among the ten largest holdings as of June 30. Diversification ruled the day as eight industries were represented among the largest positions and no single stock accounted for greater than 2.5% of the net assets. All told, the ten largest positions represented under 20% of the total assets of the Fund.
| | | | | | |
| Rank | | Description | | Industry | | % of Net
Assets |
1 | | Keithley Instruments, Inc. | | Electronic Equip., Instruments & Components | | 2.2% |
2 | | Culp, Inc. | | Textiles, Apparel & Luxury Goods | | 2.1% |
3 | | FSI International, Inc. | | Semiconductors & Semiconductor Equipment | | 1.9% |
4 | | IDT Corp. | | Diversified Telecommunication | | 1.9% |
5 | | Nanometrics, Inc. | | Semiconductors & Semiconductor Equipment | | 1.8% |
6 | | Callon Petroleum Co. | | Oil, Gas & Consumable Fuels | | 1.7% |
7 | | Integrated Silicon Solution, Inc. | | Semiconductors & Semiconductor Equipment | | 1.7% |
8 | | Hi-Tech Pharmacal Co., Inc. | | Pharmaceuticals | | 1.6% |
9 | | Libbey, Inc. | | Household Durables | | 1.5% |
10 | | KMG Chemicals, Inc. | | Chemicals | | 1.4% |
| | Total | | | | 17.8% |
| | |
34 | | Annual Report | June 30, 2010 |
| | |
Ultra-Small Company Fund MANAGER’S COMMENTARY (continued) | | |
Industry Sector Representation as of June 30, 2010
The Fund held a smaller allocation in health care than the CRSP 10 Index and was rewarded accordingly, as the sector performed poorly during the three month period. However, much of the allocation slack was taken up with information technology stocks, which struggled during the quarter.
| | | | | | |
| | | % of Portfolio | | % of CRSP 10 Index | | Difference |
Consumer Discretionary | | 15.7% | | 15.3% | | 0.4% |
Consumer Staples | | 4.0% | | 3.0% | | 1.0% |
Energy | | 4.7% | | 5.2% | | -0.5% |
Financials | | 18.8% | | 21.4% | | -2.6% |
Health Care | | 11.0% | | 18.0% | | -7.0% |
Industrials | | 9.1% | | 14.4% | | -5.3% |
Information Technology | | 24.7% | | 17.0% | | 7.7% |
Materials | | 4.9% | | 3.2% | | 1.7% |
Telecommunication Services | | 2.3% | | 1.0% | | 1.3% |
Utilities | | 2.0% | | 1.5% | | 0.5% |
Cash | | ��2.8% | | 0.0% | | 2.8% |
Total | | 100.0% | | 100.0% | | |
Disclaimer
The views expressed here are exclusively those of Fund management. These views, including those related to market sectors or individual stocks, are not meant as investment advice and should not be considered predictive in nature. Any favorable (or unfavorable) description of a holding applies only as of the quarter-end, June 30, 2010, unless otherwise stated. Security positions can and do change thereafter. Discussions of historical performance do not guarantee and may not be indicative of future performance.
The Fund is subject to very high, above market risk (volatility) and is not an appropriate investment for short-term investors. Investments in ultra-small companies generally carry greater risk than is customarily associated with larger companies and even “small companies” for various reasons such as narrower markets (fewer investors), limited financial resources and greater trading difficulty.
Conclusion
Ultra-Small Company Fund remains closed to new investors. We encourage your feedback; your reactions and concerns are important to us.
Sincerely,
Your Investment Management Team
| | |
Bridgeway Ultra-Small Company Fund SCHEDULE OF INVESTMENTS | | |
Showing percentage of net assets as of June 30, 2010
| | | | | | | |
Industry Company | | Shares | | Value | | |
COMMON STOCKS - 97.10% | | |
Aerospace & Defense - 0.77% | | |
AeroCentury Corp.*+ | | 9,000 | | $ | 186,930 | | |
Astrotech Corp.*+ | | 30,100 | | | 37,324 | | |
Sparton Corp.* | | 80,000 | | | 402,400 | | |
| | | | | | | |
| | | | | 626,654 | | |
Air Freight & Logistics - 1.16% | | |
Park-Ohio Holdings Corp.* | | 65,700 | | | 945,423 | | |
Auto Components - 2.03% | | |
Hawk Corp., Class A* | | 17,200 | | | 437,740 | | |
Motorcar Parts of America, Inc.* | | 40,000 | | | 255,200 | | |
Shiloh Industries, Inc.*+ | | 14,200 | | | 120,132 | | |
SORL Auto Parts, Inc.*+ | | 41,100 | | | 341,952 | | |
Strattec Security Corp.* | | 5,300 | | | 117,130 | | |
Tongxin International, Ltd.*+ | | 89,500 | | | 383,955 | | |
| | | | | | | |
| | | | | 1,656,109 | | |
Biotechnology - 1.23% | | |
Oncothyreon, Inc.*+ | | 139,400 | | | 462,808 | | |
Sciclone Pharmaceuticals, Inc.*+ | | 125,300 | | | 333,298 | | |
Transcept Pharmaceuticals, Inc.*+ | | 25,400 | | | 211,582 | | |
| | | | | | | |
| | | | | 1,007,688 | | |
Building Products - 1.11% | | |
Insteel Industries, Inc. | | 77,900 | | | 905,198 | | |
Capital Markets - 3.97% | | |
Arlington Asset Investment Corp., Class A+ | | 43,600 | | | 820,988 | | |
Ladenburg Thalmann Financial Services, Inc.*+ | | 353,500 | | | 441,875 | | |
Rodman & Renshaw Capital Group, Inc.*+ | | 100 | | | 286 | | |
TICC Capital Corp. | | 121,500 | | | 1,020,600 | | |
Triangle Capital Corp.+ | | 67,171 | | | 955,172 | | |
| | | | | | | |
| | | | | 3,238,921 | | |
Chemicals - 1.43% | | |
KMG Chemicals, Inc. | | 81,200 | | | 1,166,032 | | |
Commercial Banks - 3.92% | | |
Alliance Financial Corp. | | 16,100 | | | 447,580 | | |
American National Bankshares, Inc.+ | | 9,100 | | | 194,649 | | |
Bancorp Rhode Island, Inc. | | 11,600 | | | 303,920 | | |
Eagle Bancorp, Inc.*+ | | 36,000 | | | 424,080 | | |
Fidelity Southern Corp.*+ | | 20,100 | | | 131,856 | | |
Financial Institutions, Inc. | | 20,000 | | | 355,200 | | |
| | | | | |
Industry Company | | Shares | | Value |
| | | | | |
Commercial Banks (continued) |
MainSource Financial Group, Inc. | | 40,000 | | $ | 286,800 |
MidSouth Bancorp, Inc. | | 6,000 | | | 76,620 |
NewBridge Bancorp* | | 18,900 | | | 66,339 |
Penns Woods Bancorp, Inc. | | 5,500 | | | 167,310 |
State Bancorp, Inc. | | 26,700 | | | 253,650 |
Taylor Capital Group, Inc.*+ | | 37,800 | | | 489,132 |
| | | | | |
| | | | | 3,197,136 |
Commercial Services & Supplies - 1.62% |
APAC Customer Services, Inc.* | | 100,000 | | | 570,000 |
Metalico, Inc.* | | 189,900 | | | 755,802 |
| | | | | |
| | | | | 1,325,802 |
Communications Equipment - 2.92% |
Anaren, Inc.* | | 51,000 | | | 761,940 |
Bel Fuse, Inc., Class A | | 5,200 | | | 86,320 |
Eon Communications Corp.* | | 50,000 | | | 76,500 |
Network Engines, Inc.* | | 325,800 | | | 882,918 |
Westell Technologies, Inc., Class A* | | 367,200 | | | 572,832 |
| | | | | |
| | | | | 2,380,510 |
Computers & Peripherals - 1.26% |
Hypercom Corp.* | | 216,200 | | | 1,003,168 |
TransAct Technologies, Inc.* | | 2,864 | | | 20,907 |
| | | | | |
| | | | | 1,024,075 |
Consumer Finance - 0.12% |
Nicholas Financial, Inc.* | | 12,100 | | | 98,857 |
Containers & Packaging - 1.00% |
UFP Technologies, Inc.* | | 89,000 | | | 817,910 |
Diversified Consumer Services - 0.76% |
Carriage Services, Inc.* | | 18,100 | | | 84,346 |
Collectors Universe | | 40,000 | | | 536,800 |
| | | | | |
| | | | | 621,146 |
Diversified Financial Services - 0.06% |
California First National Bancorp | | 4,000 | | | 49,360 |
Diversified Telecommunication Services - 2.26% |
8X8, Inc.* | | 250,000 | | | 312,500 |
IDT Corp., Class B*+ | | 120,000 | | | 1,530,000 |
| | | | | |
| | | | | 1,842,500 |
| | |
| 36 | | Annual Report | June 30, 2010 |
| | |
Bridgeway Ultra-Small Company Fund SCHEDULE OF INVESTMENTS (continued) | | |
Showing percentage of net assets as of June 30, 2010
| | | | | | | |
Industry Company | | Shares | | Value | | |
Common Stocks (continued) | | |
Electric Utilities - 0.79% | | |
Central Vermont Public Service Corp. | | 32,600 | | $ | 643,524 | | |
Electrical Equipment - - 1.83% | | |
China Sunergy Co., Ltd. - ADR*+ | | 233,400 | | | 835,572 | | |
Espey Manufacturing & Electronics Corp. | | 4,700 | | | 88,736 | | |
LGL Group, Inc.* | | 16,000 | | | 179,840 | | |
Preformed Line Products Co. | | 13,000 | | | 363,350 | | |
SL Industries, Inc.* | | 1,800 | | | 21,600 | | |
| | | | | | | |
| | | | | 1,489,098 | | |
Electronic Equipment, Instruments & Components - 7.33% | | |
DDi Corp. | | 111,000 | | | 835,830 | | |
IEC Electronics Corp.*+ | | 113,300 | | | 517,781 | | |
Keithley Instruments, Inc. | | 200,000 | | | 1,766,000 | | |
Kemet Corp.* | | 86,431 | | | 202,249 | | |
Measurement Specialties, Inc.* | | 62,500 | | | 856,250 | | |
PC Connection, Inc.* | | 27,100 | | | 164,226 | | |
Richardson Electronics, Ltd. | | 85,400 | | | 768,600 | | |
SMTC Corp.*+ | | 100,000 | | | 301,000 | | |
Spectrum Control, Inc.* | | 19,300 | | | 269,814 | | |
TESSCO Technologies, Inc. | | 17,700 | | | 295,590 | | |
| | | | | | | |
| | | | | 5,977,340 | | |
Energy Equipment & Services - 0.26% | | |
Mitcham Industries, Inc.* | | 31,800 | | | 214,650 | | |
Food & Staples Retailing - 0.21% | | |
G. Willi-Food International, Ltd.* | | 30,000 | | | 175,200 | | |
Food Products - 2.34% | | |
Coffee Holding Co., Inc.+ | | 50,000 | | | 253,000 | | |
John B. Sanfilippo & Son, Inc.* | | 25,500 | | | 368,985 | | |
SkyPeople Fruit Juice, Inc.*+ | | 125,000 | | | 631,250 | | |
SunOpta, Inc.* | | 150,000 | | | 657,000 | | |
| | | | | | | |
| | | | | 1,910,235 | | |
Gas Utilities - 0.04% | | |
Energy, Inc. | | 2,826 | | | 30,690 | | |
Health Care Equipment & Supplies - 1.35% | | |
Anika Therapeutics, Inc.* | | 54,000 | | | 318,060 | | |
Shamir Optical Industry, Ltd.+ | | 24,400 | | | 194,956 | | |
| | | | | |
Industry Company | | Shares | | Value |
| | | | | |
Health Care Equipment & Supplies (continued) |
Vascular Solutions, Inc.* | | 47,000 | | $ | 587,500 |
| | | | | |
| | | | | 1,100,516 |
Health Care Providers & Services - 6.71% |
Almost Family, Inc.*+ | | 28,500 | | | 995,505 |
American Dental Partners, Inc.* | | 47,000 | | | 569,170 |
Continucare Corp.* | | 142,000 | | | 475,700 |
Health Grades, Inc.* | | 142,000 | | | 852,000 |
Metropolitan Health Networks, Inc.* | | 216,600 | | | 807,918 |
Prospect Medical Holdings, Inc.*+ | | 100 | | | 605 |
Rural/Metro Corp.*+ | | 117,200 | | | 954,008 |
U.S. Physical Therapy, Inc.* | | 48,700 | | | 822,056 |
| | | | | |
| | | | | 5,476,962 |
Health Care Technology - 0.17% |
HealthStream, Inc.* | | 30,000 | | | 138,000 |
Hotels, Restaurants & Leisure - 1.30% |
Caribou Coffee Co., Inc.*+ | | 111,700 | | | 1,057,799 |
Household Durables - 2.57% |
Libbey, Inc.*+ | | 94,700 | | | 1,229,206 |
Lifetime Brands, Inc.*+ | | 59,400 | | | 868,428 |
| | | | | |
| | | | | 2,097,634 |
Insurance - 2.86% |
American Physicians Capital, Inc. | | 36,633 | | | 1,130,128 |
Hallmark Financial Services, Inc.* | | 48,700 | | | 484,565 |
Meadowbrook Insurance Group, Inc. | | 83,000 | | | 716,290 |
| | | | | |
| | | | | 2,330,983 |
Internet & Catalog Retail - 0.59% |
Gaiam, Inc., Class A+ | | 31,800 | | | 193,026 |
US Auto Parts Network, Inc.* | | 48,500 | | | 291,000 |
| | | | | |
| | | | | 484,026 |
Internet Software & Services - 1.10% |
Local.com Corp.*+ | | 95,900 | | | 655,956 |
Marchex, Inc., Class B | | 62,200 | | | 239,470 |
| | | | | |
| | | | | 895,426 |
| | |
Bridgeway Ultra-Small Company Fund SCHEDULE OF INVESTMENTS (continued) | | |
Showing percentage of net assets as of June 30, 2010
| | | | | | | |
Industry Company | | Shares | | Value | | |
Common Stocks (continued) | | |
IT Services - 1.04% | | |
Lionbridge Technologies, Inc.* | | 167,500 | | $ | 765,475 | | |
Newtek Business Services, Inc. | | 60,900 | | | 80,997 | | |
| | | | | | | |
| | | | | 846,472 | | |
Leisure Equipment & Products - 0.65% | | |
Summer Infant, Inc.*+ | | 81,600 | | | 534,480 | | |
Machinery - 0.23% | | |
Key Technology, Inc.* | | 14,000 | | | 189,000 | | |
Media - 1.67% | | |
Ballantyne Strong, Inc.* | | 108,900 | | | 788,436 | | |
Saga Communications, Inc., Class A* | | 7,500 | | | 179,100 | | |
Salem Communications Corp., Class A* | | 45,000 | | | 166,950 | | |
Spanish Broadcasting System, Inc., Class A* | | 200,000 | | | 228,000 | | |
| | | | | | | |
| | | | | 1,362,486 | | |
Metals & Mining - 1.23% | | |
US Energy Corp.*+ | | 211,700 | | | 1,005,575 | | |
Oil, Gas & Consumable Fuels - 5.18% | | |
BioFuel Energy Corp.*+ | | 175,000 | | | 225,750 | | |
Callon Petroleum Co.*+ | | 223,900 | | | 1,410,570 | | |
REX American Resources Corp.* | | 38,000 | | | 608,000 | | |
Vanguard Natural Resources LLC+ | | 48,500 | | | 1,013,650 | | |
Warren Resources, Inc.* | | 334,100 | | | 968,890 | | |
| | | | | | | |
| | | | | 4,226,860 | | |
Paper & Forest Products - 1.28% | | |
Mercer International, Inc.*+ | | 185,900 | | | 739,882 | | |
Orient Paper, Inc.* | | 45,000 | | | 300,600 | | |
| | | | | | | |
| | | | | 1,040,482 | | |
Personal Products - 1.45% | | |
CCA Industries, Inc. | | 34,000 | | | 181,900 | | |
Female Health Co. (The) | | 73,000 | | | 378,870 | | |
Schiff Nutrition International, Inc. | | 87,000 | | | 619,440 | | |
| | | | | | | |
| | | | | 1,180,210 | | |
Pharmaceuticals - 1.56% | | |
Hi-Tech Pharmacal Co., Inc.* | | 55,500 | | | 1,271,505 | | |
| | | | | |
Industry Company | | Shares | | Value |
| | | | | |
Professional Services - - 1.41% |
Diamond Management & Technology Consultants, Inc.+ | | 111,700 | | $ | 1,151,627 |
Real Estate Investment Trusts (REITs) - 2.79% |
Agree Realty Corp. | | 26,160 | | | 610,051 |
One Liberty Properties, Inc.+ | | 53,500 | | | 797,685 |
Winthrop Realty Trust | | 67,900 | | | 869,799 |
| | | | | |
| | | | | 2,277,535 |
Real Estate Management & Development - 0.48% |
Grubb & Ellis Co.*+ | | 400,000 | | | 392,000 |
Semiconductors & Semiconductor Equipment - 9.47% |
Axcelis Technologies, Inc.*+ | | 472,500 | | | 732,375 |
FSI International, Inc.*+ | | 370,700 | | | 1,553,233 |
GSI Technology, Inc.* | | 40,000 | | | 228,800 |
Ikanos Communications, Inc.* | | 218,000 | | | 350,980 |
Integrated Silicon Solution, Inc.*+ | | 185,900 | | | 1,401,686 |
inTEST Corp.* | | 152,000 | | | 516,800 |
Nanometrics, Inc.* | | 143,100 | | | 1,443,879 |
Tower Semiconductor, Ltd.*+ | | 400,000 | | | 560,000 |
Ultra Clean Holdings, Inc.*+ | | 109,700 | | | 934,644 |
| | | | | |
| | | | | 7,722,397 |
Software - 1.56% |
ClickSoftware Technologies Ltd.* | | 83,500 | | | 444,220 |
Magic Software Enterprises, Ltd. | | 8,858 | | | 18,602 |
Wave Systems Corp., Class A*+ | | 250,000 | | | 810,000 |
| | | | | |
| | | | | 1,272,822 |
Specialty Retail - 1.25% |
America’s Car-Mart, Inc.*+ | | 30,000 | | | 678,900 |
MarineMax, Inc.* | | 27,100 | | | 188,074 |
Winmark Corp.+ | | 4,500 | | | 150,615 |
| | | | | |
| | | | | 1,017,589 |
Textiles, Apparel & Luxury Goods - 4.13% |
Culp, Inc.*+ | | 156,400 | | | 1,714,144 |
Delta Apparel, Inc.*+ | | 23,400 | | | 341,640 |
Heelys, Inc.* | | 85,000 | | | 206,550 |
Joe’s Jeans, Inc.*+ | | 153,600 | | | 304,128 |
| | |
38 | | Annual Report | June 30, 2010 |
| | |
Bridgeway Ultra-Small Company Fund SCHEDULE OF INVESTMENTS (continued) | | |
Showing percentage of net assets as of June 30, 2010
| | | | | | | | | | |
Industry Company | | Shares | | Value | | | |
Common Stocks (continued) | | | |
Textiles, Apparel & Luxury Goods (continued) | | | |
LaCrosse Footwear, Inc.+ | | 12,000 | | $ | 202,080 | | | |
R.G. Barry Corp. | | 37,000 | | | 408,110 | | | |
Unifi, Inc.* | | 50,910 | | | 194,476 | | | |
| | | | | | | | | | |
| | | | | 3,371,128 | | | |
Thrifts & Mortgage Finance - 4.56% | | | |
Abington Bancorp, Inc. | | 57,400 | | | 500,528 | | | |
Bofl Holding, Inc.*+ | | 55,900 | | | 789,308 | | | |
ESSA Bancorp, Inc. | | 50,000 | | | 615,500 | | | |
Federal Agricultural Mortgage Corp., Class C+ | | 11,456 | | | 160,728 | | | |
Louisiana Bancorp, Inc.* | | 18,000 | | | 252,180 | | | |
Meridian Interstate Bancorp, Inc.* | | 35,500 | | | 386,950 | | | |
United Financial Bancorp, Inc. | | 69,300 | | | 945,945 | | | |
Waterstone Financial, Inc.* | | 20,427 | | | 69,656 | | | |
| | | | | | | | | | |
| | | | | 3,720,795 | | | |
Trading Companies & Distributors - 0.96% | | | |
Aceto Corp. | | 136,800 | | | 783,864 | | | |
Water Utilities - 1.13% | | | |
Artesian Resources Corp., Class A | | 25,000 | | | 461,500 | | | |
Connecticut Water Service, Inc. | | 22,000 | | | 462,440 | | | |
| | | | | | | | | | |
| | | | | 923,940 | | | |
| | | | | | | | | | |
TOTAL COMMON STOCKS - 97.10% | | | 79,216,171 | | | |
| | | | | | | | | | |
(Cost $73,451,384) | | | | | | | | | | |
| | | | |
| | | Rate^ | | Shares | | Value | | | |
MONEY MARKET FUND - 4.69% | | | |
BlackRock Fed Fund | | 0.04% | | 3,827,717 | | | 3,827,717 | | | |
| | | | | | | | | | |
TOTAL MONEY MARKET FUND - - 4.69% | | | 3,827,717 | | | |
| | | | | | | | | | |
(Cost $3,827,717) | | | | | | |
TOTAL INVESTMENTS - 101.79% | | | 83,043,888 | | | |
(Cost $77,279,101) | | | | | | | | |
Liabilities in Excess of Other Assets - (1.79%) | | | (1,462,243 | ) | | |
| | | | | | | | | | |
NET ASSETS - 100.00% | | $ | 81,581,645 | | | |
| | | | | | | | | | |
* Non-income producing security. ^ Rate disclosed as of June 30, 2010. + This security or a portion of the security is out on loan at June 30, 2010. Total loaned securities had a market value of $20,214,256 at June 30, 2010. ADR - American Depositary Receipt LLC - Limited Liability Co. |
Summary of inputs used to value the Fund’s investments as of 06/30/2010 are as follows (See Note 2 in Notes to Financial Statements):
| | | | | | | | | | | |
| | | Valuation Inputs |
| | | Investment in Securities (Market Value) |
| | | Level 1
Quoted
Prices | | Level 2
Significant
Observable
Inputs | | Level 3
Significant
Unobservable
Inputs | | Total |
Common Stocks | | $ | 79,216,171 | | $ | — | | $— | | $ | 79,216,171 |
Money Market Fund | | | — | | | 3,827,717 | | — | | | 3,827,717 |
| | | | | | | | | | | |
TOTAL | | $ | 79,216,171 | | $ | 3,827,717 | | $— | | $ | 83,043,888 |
| | | | | | | | | | | |
See Notes to Financial Statements.
| | |
Ultra-Small Company Market Fund MANAGER’S COMMENTARY | | |
June 30, 2010
Dear Fellow Ultra-Small Company Market Fund Shareholder,
Our Fund declined 8.08% in the June quarter, trailing slightly the 7.94% loss of our primary market benchmark, the CRSP Cap-Based Portfolio 10 Index, and the 7.67% loss of our peer benchmark, the Lipper Micro-Cap Stock Funds Index. We outperformed the 8.85% decline of the Russell Microcap Index as well as the 9.92% loss of the Russell 2000 Index. Uncharacteristically for a majority of down quarters, ultra-small stocks as a group declined less that the broader U.S. market indexes. It was a mixed quarter on a relative basis.
For the fiscal year ended June 30, 2010, our Fund appreciated 13.30%, badly trailing the CRSP Cap-Based Portfolio 10 Index (up 33.06%) for reasons highlighted in detail in our December quarter letter and below. We also lagged the Lipper Micro-Cap Stock Funds Index (up 21.65%), the Russell Microcap Index (up 20.45%) and the Russell 2000 Index (up 21.48%). It was a poor fiscal year on a relative basis.
The table below presents our June quarter, one-year, five-year, ten-year and life-to-date financial results according to the formula required by the SEC. See the next page for a graph of performance from inception to June 30, 2010.
| | | | | | | | | | |
| | | June Qtr
4/1/10
to 6/30/10 | | 1 Year
7/1/09
to 6/30/10 | | 5 Year
7/1/05
to 6/30/10 | | 10 Year
7/1/00
to 6/30/10 | | Life-to-Date
7/31/97
to 6/30/10 |
| | | | | |
Ultra-Small Company Market Fund | | -8.08% | | 13.30% | | -2.98% | | 8.44% | | 8.82% |
CRSP Cap-Based Port. 10 Index | | -7.94% | | 33.06% | | 3.26% | | 10.32% | | 10.09% |
Russell Microcap Index | | -8.85% | | 20.45% | | -2.41% | | 3.25% | | N/A |
Lipper Micro-Cap Stock Funds Index | | -7.67% | | 21.65% | | -0.45% | | 1.79% | | 5.08% |
Russell 2000 Index (small companies) | | -9.92% | | 21.48% | | 0.37% | | 3.00% | | 4.37% |
Performance figures quoted in the table above and graph below represent past performance and are no guarantee of future results. Total return figures in the table above include the reinvestment of dividends and capital gains. The table above and the graph below do not reflect the deduction of taxes that a shareholder would pay on Fund distributions or the redemption of Fund shares.
The CRSP Cap-Based Portfolio 10 Index is an unmanaged index of 1,321 of the smallest publicly traded U.S. stocks (with dividends reinvested), as reported by the Center for Research on Security Prices. The Lipper Micro-Cap Stock Funds Index is an index of small-company funds compiled by Lipper, Inc. The Russell Microcap Index is an unmanaged, market value weighted index that measures the performance of 1000 of the smallest securities in the Russell 2000 Index. The Russell 2000 Index is an unmanaged, market value weighted index, which measures performance of the 2,000 companies that are between the 1,000th and 3,000th largest in the market with dividends reinvested. It is not possible to invest directly in an index. Periods longer than one year are annualized.
According to data from Lipper, Inc. as of June 30, 2010, Ultra-Small Company Market Fund ranked 68th of 70 micro-cap funds for the twelve months ending June 30, 2010, 46th of 59 over the last five years, 10th of 35 over the last ten years, and 7th of 24 since inception in July 1997. These long-term numbers and the graph below give two snapshots of our long-term success. Lipper, Inc. is an independent mutual fund rating service that ranks funds in various fund categories by making comparative calculations using total returns.
| | |
| 40 | | Annual Report | June 30, 2010 |
| | |
Ultra-Small Company Market Fund MANAGER’S COMMENTARY (continued) | | |
Ultra-Small Company Market Fund vs. CRSP 10 Index, Lipper Micro-Cap Stock Funds Index & Russell 2000 Index & Russell Microcap Index* from Inception 7/31/97 to 6/30/10
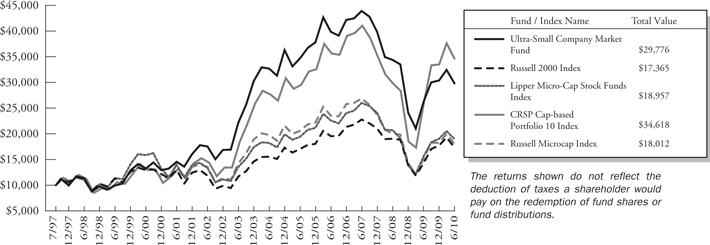
| * | The Russell Microcap Index began on 6/30/2000, and the line graph for the Index begins at the same value as the Fund on that date. |
The Effect of Company Size on Performance:
The Short Version: After strong large-company stock dominant years in 2007 and 2008, small and especially ultra-small stocks came back with a vengeance in the March 2009 through March 2010 timeframe, and then surprisingly provided some cushion against the market decline in the most recent quarter as well. While this “tailwind” certainly helped, our low exposure to penny stocks (risky stocks selling for less than a dollar per share) and a slower rebalancing into ultra-small stocks (as detailed in our December report), worked strongly against us in the first three quarters of the fiscal year.
In a majority of strongly declining markets, large companies outperform small ones. Not so over the last quarter, as ultra-small stocks significantly outperformed larger ones, giving our Fund a nice tailwind against benchmarks such as the Russell 2000 Index of small companies. The table below shows an almost four percentage point difference between the market’s smallest and largest companies. Even more dramatic is the performance disparity by size over the last year. Unfortunately, as detailed in our December 2009 report, much of that outperformance came among very risky “penny stocks” and distressed stocks that we tend to avoid; thus, we didn’t come close to reaping the full benefit of the CRSP 10 Index’s 33.06% fiscal year return. While this is disappointing, we believe avoiding these stocks is the right long term decision, has led to lower risk statistics than all of our market benchmarks (note, for example, that we outperformed our primary market benchmark by nearly eight percentage points in the dramatic bear market of calendar 2008), and may even lead to better overall long-term performance. (See the common section on “Staying the Course” on page 4).
| | | | | | | | | | |
| CRSP Decile1 | | Three Month
4/1/10
to 6/30/10 | | 1 Year
7/1/09
to 6/30/10 | | 5 Years
7/1/05
to 6/30/10 | | 10 Years
7/1/00
to 6/30/10 | | 84.5 Years
1/1/1926
to 6/30/10 |
1 (ultra-large) | | -11.89% | | 11.55% | | -0.83% | | -2.97% | | 8.90% |
2 | | -9.80% | | 20.71% | | 0.78% | | 2.87% | | 10.24% |
3 | | -9.02% | | 27.56% | | 1.14% | | 3.21% | | 10.64% |
4 | | -11.19% | | 22.21% | | 1.82% | | 4.06% | | 10.60% |
5 | | -9.76% | | 26.42% | | 4.62% | | 4.47% | | 11.15% |
6 | | -10.50% | | 24.67% | | 0.99% | | 3.59% | | 11.10% |
7 | | -8.97% | | 27.21% | | 2.41% | | 4.33% | | 11.10% |
8 | | -8.49% | | 27.56% | | 3.25% | | 6.41% | | 11.34% |
| | |
Ultra-Small Company Market Fund MANAGER’S COMMENTARY (continued) | | |
| | | | | | | | | | |
| CRSP Decile1 | | Three Month
4/1/10
to 6/30/10 | | 1 Year
7/1/09
to 6/30/10 | | 5 Years
7/1/05
to 6/30/10 | | 10 Years
7/1/00
to 6/30/10 | | 84.5 Years
1/1/1926
to 6/30/10 |
9 | | -9.64% | | 22.80% | | 1.55% | | 5.90% | | 11.38% |
10 (ultra-small) | | -7.94% | | 33.06% | | 3.26% | | 10.32% | | 13.06% |
| 1 | The CRSP Cap-Based Portfolio Indexes are unmanaged indexes of the publicly traded U.S. stocks with dividends reinvested, grouped by the market capitalization, as reported by the Center for Research in Security Prices. Past performance is no guarantee of future results. |
Detailed Explanation of June Quarter Performance — What Worked
The Short Version: A number of companies performed very well despite the sluggish economy and quarterly market downturn.
Despite the difficulties brought on by such global factors as the European sovereign debt crisis, many companies still performed quite well during the June quarter. Health care companies, in particular, dominated the top performers during the quarter as six holdings made up the best performers list.
These are the ten stocks that performed the best for the Fund during the quarter ended June 30, 2010:
| | | | | | |
| Rank | | Description | | Industry | | % Gain |
| 1 | | Neurocrine Biosciences, Inc. | | Biotechnology | | 119.6% |
| 2 | | IDT Corp. | | Diversified Telecommunication Services | | 96.8% |
| 3 | | Antigenics, Inc. | | Biotechnology | | 78.9% |
| 4 | | Idenix Pharmaceuticals, Inc. | | Biotechnology | | 77.3% |
| 5 | | TriMas Corp. | | Machinery | | 74.3% |
| 6 | | Javelin Pharmaceuticals, Inc. | | Pharmaceuticals | | 69.8% |
| 7 | | Power-One, Inc. | | Electrical Equipment | | 61.5% |
| 8 | | Virage Logic Corp. | | Semiconductors & Semiconductor Equipment | | 51.3% |
| 9 | | STAAR Surgical Co. | | Health Care Equipment & Supplies | | 49.7% |
| 10 | | SenoRx, Inc. | | Health Care Equipment & Supplies | | 48.6% |
Late in the quarter, executives from IDT Corp. rang the bell on the New York Stock Exchange as the company achieved a successful turnaround, returned to profitability, and regained compliance status with the exchange’s listing requirements. Its stock had struggled over the past few years with cash flow difficulties, restructuring issues, and management changes. IDT is both a telecommunication and energy company and recently reported a profitable quarter that included stronger cash flow, mainly from revenues from its calling card business. Recently, management looked to the future with its energy services group and entered into a venture with French oil company Total SA to develop a shale production plant in Northwest Colorado. This move looks highly appealing, particularly in light of the recent domestic off-shore drilling problems and potential future bans. The stock doubled in value during the three-month period and recently traded at its highest level since early 2008.
Detailed Explanation of Quarterly Performance — What Didn’t Work
The Short Version: Health care stocks were especially vulnerable in the June quarter.
While health care holdings were prominent on the top performer list, the sector certainly was not immune to difficulties during the quarter as well. Five related companies dominated the worst performers list as well. Because of the extreme company-level diversification of this Fund, however, they only cost the fund roughly half a percent in return. Each of the ten holdings on the list declined by more than 50% during the three month period.
| | |
42 | | Annual Report | June 30, 2010 |
| | |
Ultra-Small Company Market Fund MANAGER’S COMMENTARY (continued) | | |
These are the ten stocks that performed the worst for the Fund during the quarter ended June 30, 2010:
| | | | | | |
| Rank | | Description | | Industry | | % Loss |
| 1 | | NMT Medical, Inc. | | Health Care Equipment & Supplies | | -88.4% |
| 2 | | Affymax, Inc. | | Biotechnology | | -74.5% |
| 3 | | Pacific Capital Bancorp NA | | Commercial Banks | | -60.2% |
| 4 | | Radio One, Inc. | | Media | | -58.0% |
| 5 | | BioFuel Energy Corp. | | Oil, Gas & Consumable Fuels | | -55.5% |
| 6 | | Grubb & Ellis Co. | | Real Estate Management & Development | | -55.5% |
| 7 | | Curis, Inc. | | Biotechnology | | -54.7% |
| 8 | | Santarus, Inc. | | Pharmaceuticals | | -53.9% |
| 9 | | Cypress Bioscience, Inc. | | Pharmaceuticals | | -53.0% |
| 10 | | FuelCell Energy, Inc. | | Electrical Equipment | | -52.6% |
BioFuel Energy manufactures and sells ethanol and related energy products and has a goal of becoming the leading producer in the United States. In recent times, its operating performance has been dramatically impacted by shrinking margins as the difference between the cost of corn and the price of ethanol has narrowed substantially. Management believes the company has improved its cost structure in other areas, including capital improvement at its plants, and should be primed to benefit in the upcoming quarters as margins improve and move back to more “normal” spreads. The stock lost 56% during the period we owned it and cost the Fund about a quarter percent in return.
Detailed Explanation of Fiscal Year Performance — What Worked
The Short Version: Company size and risk were the two biggest determinants of fiscal year performance.
During the market downturn of calendar 2008, large companies outperformed their small-cap (particularly ultra-small cap) counterparts, but that trend shifted dramatically over the past twelve months as the smallest, riskiest, and most downtrodden companies came roaring back. Each of these top ten holdings rose at least 200% (and then some) during the fiscal year.
These are the ten stocks that performed the best for the Fund during the fiscal year ended June 30, 2010:
| | | | | | |
| Rank | | Description | | Industry | | % Gain |
| 1 | | Entercom Communications Corp. | | Media | | 476.5% |
| 2 | | IDT Corp. | | Diversified Telecommunication Services | | 440.8% |
| 3 | | Media General, Inc. | | Media | | 400.5% |
| 4 | | Power-One, Inc. | | Electrical Equipment | | 353.0% |
| 5 | | Protection One, Inc. | | Commercial Services & Supplies | | 260.8% |
| 6 | | Retail Ventures, Inc. | | Multiline Retail | | 258.7% |
| 7 | | Trimas Corp. | | Machinery | | 235.6% |
| 8 | | American Oil & Gas, Inc. | | Oil, Gas & Consumable Fuels | | 218.8% |
| 9 | | Callon Petroleum Co. | | Oil, Gas & Consumable Fuels | | 218.2% |
| 10 | | Valassis Communications, Inc. | | Media | | 214.7% |
Traditional radio is putting up a strong fight against satellite radio. Entercom Communications owns and operates over 100 radio stations in more than 20 markets across the country. With significant industry consolidations, it is considered one of the five largest operators in what was once forecast to be a dying market. But a funny thing happened on the way to the funeral. Entercom recently posted its third straight quarterly profit, and revenues continue to be solid. While satellite radio (and other media outlets like that Internet fad) were supposed to herald the end for traditional operators, more advertising dollars have been moving into those stations that reach more listeners, particularly in a “sluggish” economy when many consumers are pinching pennies. Ad revenue has increased over 50%, and the company maintains a low debt position. Entercom’s stock soared over 400% during the fiscal year and was the top Fund performer.
| | |
Ultra-Small Company Market Fund MANAGER’S COMMENTARY (continued) | | |
Detailed Explanation of Fiscal Year Performance — What Didn’t Work
The Short Version: Health care and financial stocks were pummeled during the fiscal year.
Shareholders looking for culprits (or performance laggards) during the fiscal year need look no further than health care and financials. Nine related companies from these two sectors made up the list of worst performers during the twelve month period. In some cases, the uncertainty over the industry reform policies for heath care and financial services contributed to these tough times.
These are the ten stocks that performed the worst for the Fund during the fiscal year ended June 30, 2010:
| | | | | | |
| Rank | | Description | | Industry | | % Loss |
| 1 | | Columbia Bancorp | | Commercial Banks | | -97.8% |
| 2 | | Hampton Roads Bankshares, Inc. | | Commercial Banks | | -91.6% |
| 3 | | United Western Bancorp, Inc. | | Thrifts & Mortgage Finance | | -86.3% |
| 4 | | Sterling Financial Corp. | | Commercial Banks | | -81.4% |
| 5 | | Soapstone Networks, Inc. | | Software | | -78.5% |
| 6 | | MiddleBrook Pharmaceuticals, Inc. | | Pharmaceuticals | | -76.7% |
| 7 | | NMT Medical, Inc. | | Health Care Equipment & Supplies | | -76.2% |
| 8 | | Republic First Bancorp, Inc. | | Commercial Banks | | -74.9% |
| 9 | | KV Pharmaceutical Co. | | Pharmaceuticals | | -73.8% |
| 10 | | Molecular Insight Pharmaceuticals, Inc. | | Biotechnology | | -73.7% |
While some of the large financial companies have exhibited strong rebounds over the past year — thanks significantly to the government bailout — smaller regional banks have continued to struggle, and many are hurting for capital. Hampton Roads Bankshares operates community and commercial banks mainly in Virginia and North Carolina. In February, it deferred its dividend payment to the US Treasury on its TARP-related preferred stock and then entered into “definitive agreements” in May to receive significant capital infusions in the future from two private equity firms to meet operating requirements. Columbia Bancorp was even less fortunate as its wholly-owned subsidiary, Columbia River Bank, was shut down by the State of Oregon in January and moved into FDIC receivership. These two holdings were the Fund’s worst performers for the fiscal year.
Top Ten Equity Holdings as of June 30, 2010
Because this Fund is designed to invest broadly in the ultra-small company asset class, no single company comprises too high a percentage of its assets. In fact, the top ten holdings represent less than 7.5% of overall Fund net assets, and no stock accounts for greater than one percent. Bear in mind, any stock with an allocation of greater than three-tenths of one percent has appreciated significantly in value, since we never initiate any positions that large.
| | | | | | |
| Rank | | Description | | Industry | | % of Net
Assets |
| 1 | | America’s Car-Mart, Inc. | | Specialty Retail | | 0.9% |
| 2 | | TESSCO Technologies, Inc. | | Electronic Equip., Instruments & Components | | 0.8% |
| 3 | | Arrow Financial Corp. | | Commercial Banks | | 0.8% |
| 4 | | Mercer Insurance Group, Inc. | | Insurance | | 0.7% |
| 5 | | CEVA, Inc. | | Semiconductors & Semiconductor Equipment | | 0.7% |
| 6 | | Standard Parking Corp. | | Commercial Services & Supplies | | 0.7% |
| 7 | | Providence Service Corp. (The) | | Health Care Providers & Services | | 0.7% |
| 8 | | Hypercom Corp. | | Computers & Peripherals | | 0.7% |
| 9 | | Callon Petroleum Co. | | Oil, Gas & Consumable Fuels | | 0.7% |
| 10 | | Integrated Silicon Solution, Inc. | | Semiconductors & Semiconductor Equipment | | 0.7% |
| | Total | | | | 7.4% |
| | |
44 | | Annual Report | June 30, 2010 |
| | |
Ultra-Small Company Market Fund MANAGER’S COMMENTARY (continued) | | |
Industry Sector Representation as of June 30, 2010
Financials and information technology were the two sectors with the largest allocations at quarter end, and since many related stocks performed so poorly, the Fund was negatively impacted. As a passively-managed fund, the allocations will not vary dramatically from those of the CRSP 10 Index benchmark.
| | | | | | |
| | | % of Portfolio | | % of CRSP 10 Index | | Difference |
Consumer Discretionary | | 14.9% | | 15.3% | | -0.4% |
Consumer Staples | | 2.5% | | 3.0% | | -0.5% |
Energy | | 5.3% | | 5.2% | | 0.1% |
Financials | | 21.3% | | 21.4% | | -0.1% |
Health Care | | 17.7% | | 18.0% | | -0.3% |
Industrials | | 13.5% | | 14.4% | | -0.9% |
Information Technology | | 17.8% | | 17.0% | | 0.8% |
Materials | | 3.3% | | 3.2% | | 0.1% |
Telecommunication Services | | 1.4% | | 1.0% | | 0.4% |
Utilities | | 1.1% | | 1.5% | | -0.4% |
Cash | | 1.2% | | 0.0% | | 1.2% |
Total | | 100.0% | | 100.0% | | |
Disclaimer
The views expressed here are exclusively those of Fund management. These views, including those related to market sectors or individual stocks, are not meant as investment advice and should not be considered predictive in nature. Any favorable (or unfavorable) description of a holding applies only as of quarter-end, June 30, 2010, unless otherwise stated. Security positions can and do change thereafter. Discussions of historical performance do not guarantee and may not be indicative of future performance.
The Fund is subject to very high, above market risk (volatility) and is not an appropriate investment for short-term investors. Investments in ultra-small companies generally carry greater risk than is customarily associated with larger companies and even “small companies” for various reasons such as narrower markets (fewer investors), limited financial resources and greater trading difficulty.
Conclusion
Thank you for your continued investment in Ultra-Small Company Market Fund. We encourage your feedback; your reactions and concerns are important to us.
Sincerely,
Your Investment Management Team
| | |
Bridgeway Ultra-Small Company Market Fund SCHEDULE OF INVESTMENTS | | |
|
Showing percentage of net assets as of June 30, 2010
| | | | | | | |
Industry Company | | Shares | | Value | | |
COMMON STOCKS - 96.97% | | | | | | | |
Aerospace & Defense - 1.73% | | | | | | | |
AeroCentury Corp.* | | 43,400 | | $ | 901,418 | | |
Applied Signal Technology, Inc. | | 77,834 | | | 1,529,438 | | |
Ascent Solar Technologies, Inc.*+ | | 180,700 | | | 493,311 | | |
Astronics Corp.* | | 22,700 | | | 371,372 | | |
GenCorp, Inc.*+ | | 152,600 | | | 668,388 | | |
Herley Industries, Inc.* | | 31,700 | | | 452,042 | | |
Innovative Solutions & Support, Inc.* | | 134,815 | | | 593,186 | | |
Kratos Defense & Security Solutions, Inc.* | | 28,600 | | | 300,300 | | |
LMI Aerospace, Inc.* | | 21,000 | | | 331,170 | | |
Sparton Corp.* | | 63,300 | | | 318,399 | | |
| | | | | | | |
| | | | | 5,959,024 | | |
Air Freight & Logistics - - 0.50% | | | | | | | |
Pacer International, Inc.* | | 188,800 | | | 1,319,712 | | |
Park-Ohio Holdings Corp.* | | 26,700 | | | 384,213 | | |
| | | | | | | |
| | | | | 1,703,925 | | |
Airlines - 0.29% | | | | | | | |
Pinnacle Airlines Corp.* | | 106,600 | | | 579,904 | | |
Republic Airways Holdings, Inc.*+ | | 67,700 | | | 413,647 | | |
| | | | | | | |
| | | | | 993,551 | | |
Auto Components - 1.51% | | | | | | | |
Amerigon, Inc.*+ | | 42,200 | | | 311,436 | | |
Dorman Products, Inc.* | | 41,100 | | | 835,563 | | |
Hawk Corp., Class A* | | 56,600 | | | 1,440,470 | | |
SORL Auto Parts, Inc.*+ | | 54,700 | | | 455,104 | | |
Spartan Motors, Inc. | | 382,600 | | | 1,606,920 | | |
Strattec Security Corp.* | | 24,100 | | | 532,610 | | |
| | | | | | | |
| | | | | 5,182,103 | | |
Beverages - 0.10% | | | | | | | |
MGP Ingredients, Inc.*+ | | 51,800 | | | 343,434 | | |
Biotechnology - 5.65% | | | | | | | |
Acadia Pharmaceuticals, Inc.* | | 253,500 | | | 276,315 | | |
Achillion Pharmaceuticals, Inc.* | | 134,500 | | | 295,900 | | |
Affymax, Inc.* | | 29,303 | | | 175,232 | | |
Amicus Therapeutics, Inc.*+ | | 109,800 | | | 245,952 | | |
Anadys Pharmaceuticals, Inc.* | | 202,300 | | | 388,416 | | |
ARIAD Pharmaceuticals, Inc.*+ | | 222,000 | | | 626,040 | | |
ArQule, Inc.* | | 131,300 | | | 564,590 | | |
Array Biopharma, Inc.* | | 160,100 | | | 488,305 | | |
| | | | | |
Industry Company | | Shares | | Value |
| | | | | |
Biotechnology (continued) | | | | | |
AVI BioPharma, Inc.*+ | | 480,100 | | $ | 772,961 |
BioSante Pharmaceuticals, Inc.*+ | | 212,800 | | | 374,528 |
BioSpecifics Technologies Corp.*+ | | 11,300 | | | 224,644 |
Biotime, Inc.*+ | | 71,800 | | | 442,288 |
Celldex Therapeutics, Inc.*+ | | 71,400 | | | 325,584 |
CombinatoRx, Inc.*+ | | 194,321 | | | 281,765 |
Curis, Inc.*+ | | 219,100 | | | 304,549 |
Cyclacel Pharmaceuticals, Inc.*+ | | 157,300 | | | 270,556 |
Cytokinetics, Inc.* | | 108,900 | | | 258,093 |
Cytori Therapeutics, Inc.*+ | | 96,200 | | | 334,776 |
CytRx Corp.*+ | | 378,895 | | | 291,749 |
Dusa Pharmaceuticals, Inc.* | | 89,600 | | | 192,640 |
GTx, Inc.*+ | | 195,000 | | | 594,750 |
Idenix Pharmaceuticals, Inc.* | | 126,100 | | | 630,500 |
Infinity Pharmaceuticals, Inc.* | | 56,200 | | | 332,142 |
Inovio Pharmaceuticals, Inc.*+ | | 251,600 | | | 256,632 |
Keryx Biopharmaceuticals, Inc.*+ | | 214,400 | | | 784,704 |
Ligand Pharmaceuticals, Inc., Class B* | | 217,100 | | | 316,966 |
Nanosphere, Inc.* | | 71,000 | | | 309,560 |
Neuralstem, Inc.*+ | | 124,800 | | | 312,000 |
Neurocrine Biosciences, Inc.* | | 157,600 | | | 882,560 |
NeurogesX, Inc.*+ | | 43,700 | | | 289,731 |
Novavax, Inc.*+ | | 154,700 | | | 335,699 |
OncoGenex Pharmaceutical, Inc.*+ | | 11,200 | | | 150,640 |
Oncothyreon, Inc.* | | 124,300 | | | 412,676 |
Orexigen Therapeutics, Inc.*+ | | 83,300 | | | 349,860 |
Osiris Therapeutics, Inc.*+ | | 52,000 | | | 302,120 |
Poniard Pharmaceuticals, Inc.*+ | | 182,700 | | | 109,620 |
Progenics Pharmaceuticals, Inc.* | | 72,400 | | | 396,752 |
PROLOR Biotech, Inc.*+ | | 75,700 | | | 521,573 |
Repligen Corp.*+ | | 74,634 | | | 239,575 |
Rexahn Pharmaceuticals, Inc.*+ | | 85,000 | | | 121,550 |
Sangamo Biosciences, Inc.*+ | | 370,100 | | | 1,373,071 |
Sciclone Pharmaceuticals, Inc.*+ | | 104,607 | | | 278,255 |
Spectrum Pharmaceuticals, Inc.*+ | | 86,700 | | | 339,864 |
StemCells, Inc.* | | 328,100 | | | 308,414 |
| | |
Bridgeway Ultra-Small Company Market Fund SCHEDULE OF INVESTMENTS (continued) | | |
Showing percentage of net assets as of June 30, 2010
| | | | | | | |
Industry Company | | Shares | | Value | | |
Common Stocks (continued) | | | | | | | |
Biotechnology (continued) | | |
Synta Pharmaceuticals Corp.* | | 78,100 | | $ | 210,870 | | |
Transcept Pharmaceuticals, Inc.* | | 48,200 | | | 401,506 | | |
Trimeris, Inc.* | | 143,000 | | | 308,880 | | |
Vanda Pharmaceuticals, Inc.*+ | | 54,100 | | | 357,601 | | |
Vical, Inc.*+ | | 337,600 | | | 1,046,560 | | |
| | | | | | | |
| | | | | 19,409,514 | | |
Building Products - 0.23% | | | | | | | |
China Architectural Engineering, Inc.*+ | | 203,500 | | | 168,905 | | |
Insteel Industries, Inc. | | 29,700 | | | 345,114 | | |
PGT, Inc.*+ | | 112,041 | | | 287,945 | | |
| | | | | | | |
| | | | | 801,964 | | |
Capital Markets - 2.90% | | |
Arlington Asset Investment Corp., Class A+ | | 38,700 | | | 728,721 | | |
Calamos Asset Management, Inc., Class A | | 37,000 | | | 343,360 | | |
Cowen Group, Inc., Class A* | | 126,758 | | | 519,708 | | |
Diamond Hill Investment Group, Inc. | | 5,600 | | | 317,464 | | |
Gladstone Capital Corp.+ | | 76,600 | | | 828,046 | | |
Harris & Harris Group, Inc.*+ | | 69,400 | | | 283,846 | | |
HFF, Inc., Class A* | | 56,300 | | | 398,041 | | |
JMP Group, Inc. | | 81,100 | | | 502,009 | | |
Kohlberg Capital Corp.+ | | 59,900 | | | 300,099 | | |
Ladenburg Thalmann | | | | | | | |
Financial Services, Inc.*+ | | 181,700 | | | 227,125 | | |
Main Street Capital Corp.+ | | 27,500 | | | 410,575 | | |
NGP Capital Resources Co. | | 48,600 | | | 348,462 | | |
PennantPark Investment Corp. | | 129,100 | | | 1,232,905 | | |
Rodman & Renshaw Capital Group, Inc.*+ | | 117,800 | | | 336,908 | | |
TICC Capital Corp. | | 82,300 | | | 691,320 | | |
TradeStation Group, Inc.* | | 114,174 | | | 770,674 | | |
Triangle Capital Corp. | | 57,212 | | | 813,555 | | |
Westwood Holdings Group, Inc. | | 25,600 | | | 899,840 | | |
| | | | | | | |
| | | | | 9,952,658 | | |
Chemicals - 0.98% | | |
Chase Corp. | | 27,800 | | | 317,754 | | |
KMG Chemicals, Inc. | | 58,800 | | | 844,368 | | |
Landec Corp.* | | 124,900 | | | 735,661 | | |
| | | | | |
Industry Company | | Shares | | Value |
| | | | | |
Chemicals (continued) |
Omnova Solutions, Inc.* | | 163,700 | | $ | 1,278,497 |
Senomyx, Inc.*+ | | 49,300 | | | 186,847 |
| | | | | |
| | | | | 3,363,127 |
Commercial Banks - 9.05% |
1st United Bancorp, Inc.*+ | | 91,900 | | | 676,384 |
Alliance Financial Corp. | | 25,000 | | | 695,000 |
American National Bankshares, Inc. | | 7,800 | | | 166,842 |
American River Bankshares | | 25,800 | | | 192,726 |
Ameris Bancorp* | | 86,697 | | | 837,490 |
Arrow Financial Corp. | | 112,831 | | | 2,606,396 |
Bancorp Rhode Island, Inc. | | 70,800 | | | 1,854,960 |
Bancorp, Inc.* | | 113,000 | | | 884,790 |
BancTrust Financial Group, Inc.+ | | 69,000 | | | 255,300 |
Bank of Commerce Holdings+ | | 81,100 | | | 384,414 |
Bridge Bancorp, Inc.+ | | 26,800 | | | 650,704 |
Bryn Mawr Bank Corp.+ | | 8,692 | | | 145,852 |
Camden National Corp. | | 11,800 | | | 324,146 |
Capital City Bank Group, Inc.+ | | 23,100 | | | 285,978 |
Center Bancorp, Inc.+ | | 49,917 | | | 378,371 |
Center Financial Corp.*+ | | 152,200 | | | 783,830 |
Central Pacific Financial Corp.* | | 113,556 | | | 170,334 |
Century Bancorp, Inc., Class A | | 16,800 | | | 370,272 |
CNB Financial Corp.+ | | 25,500 | | | 279,990 |
CoBiz Financial, Inc.+ | | 72,100 | | | 475,139 |
Eagle Bancorp, Inc.* | | 5,964 | | | 70,256 |
Encore Bancshares, Inc.*+ | | 24,300 | | | 240,327 |
Enterprise Financial Services Corp.+ | | 41,100 | | | 396,204 |
Farmers Capital Bank Corp. | | 28,592 | | | 144,390 |
Financial Institutions, Inc. | | 50,533 | | | 897,466 |
First Bancorp, Inc. | | 19,800 | | | 259,974 |
First South Bancorp, Inc. | | 57,237 | | | 607,285 |
German American Bancorp, Inc.+ | | 39,500 | | | 604,350 |
Hampden Bancorp, Inc.+ | | 33,000 | | | 313,500 |
Hampton Roads Bankshares, Inc.+ | | 94,705 | | | 71,029 |
Heritage Commerce Corp.*+ | | 74,000 | | | 262,700 |
Heritage Financial Corp.* | | 25,400 | | | 380,238 |
Home Bancorp, Inc.* | | 27,300 | | | 352,443 |
Lakeland Bancorp, Inc.+ | | 93,200 | | | 794,064 |
Lakeland Financial Corp. | | 41,088 | | | 820,938 |
LNB Bancorp, Inc. | | 24,700 | | | 124,488 |
| | |
Bridgeway Ultra-Small Company Market Fund SCHEDULE OF INVESTMENTS (continued) | | |
Showing percentage of net assets as of June 30, 2010
| | | | | | | |
Industry Company | | Shares | | Value | | |
Common Stocks (continued) | | |
Commercial Banks (continued) | | | | | |
Merchants Bancshares, Inc. | | 27,800 | | $ | 617,716 | | |
MidSouth Bancorp, Inc. | | 46,900 | | | 598,913 | | |
MidWestOne Financial Group, Inc.+ | | 11,100 | | | 171,828 | | |
National Bankshares, Inc.+ | | 14,300 | | | 346,489 | | |
Northrim BanCorp, Inc. | | 13,200 | | | 204,336 | | |
Ohio Valley Banc Corp. | | 9,128 | | | 150,338 | | |
Oriental Financial Group, Inc. | | 37,900 | | | 479,814 | | |
Pacific Capital Bancorp*+ | | 132,100 | | | 95,112 | | |
Pacific Continental Corp. | | 41,500 | | | 393,005 | | |
Peapack-Gladstone Financial Corp. | | 27,300 | | | 319,410 | | |
Penns Woods Bancorp, Inc. | | 11,000 | | | 334,620 | | |
QCR Holdings, Inc. | | 4,448 | | | 43,902 | | |
Sandy Spring Bancorp, Inc. | | 27,600 | | | 386,676 | | |
Seacoast Banking Corp. of Florida*+ | | 79,100 | | | 105,203 | | |
Sierra Bancorp+ | | 78,600 | | | 903,900 | | |
Smithtown Bancorp, Inc. | | 2,600 | | | 7,748 | | |
Southcoast Financial Corp.* | | 27,099 | | | 70,457 | | |
Southside Bancshares, Inc. | | 59,067 | | | 1,160,076 | | |
State Bancorp, Inc. | | 74,700 | | | 709,650 | | |
Sterling Bancorp | | 59,509 | | | 535,581 | | |
Sun Bancorp, Inc.*+ | | 69,400 | | | 260,944 | | |
Superior Bancorp*+ | | 102,800 | | | 198,404 | | |
Taylor Capital Group, Inc.*+ | | 93,100 | | | 1,204,714 | | |
Tower Bancorp, Inc. | | 27,241 | | | 596,305 | | |
United Security Bancshares*+ | | 878 | | | 3,196 | | |
Virginia Commerce Bancorp, Inc.* | | 89,159 | | | 557,244 | | |
Washington Banking Co.+ | | 51,700 | | | 661,243 | | |
West Bancorporation, Inc. | | 147,478 | | | 1,004,325 | | |
West Coast Bancorp+ | | 87,917 | | | 224,188 | | |
| | | | | | | |
| | | | | 31,103,907 | | |
Commercial Services & Supplies - 1.92% | | |
APAC Customer Services, Inc.* | | 265,500 | | | 1,513,350 | | |
Casella Waste Systems, Inc., Class A* | | 81,800 | | | 312,476 | | |
Fuel Tech, Inc.*+ | | 32,023 | | | 202,385 | | |
Intersections, Inc.* | | 158,584 | | | 658,124 | | |
M&F Worldwide Corp.* | | 19,798 | | | 536,526 | | |
Metalico, Inc.*+ | | 110,800 | | | 440,984 | | |
Multi-Color Corp. | | 21,800 | | | 223,232 | | |
Standard Parking Corp.* | | 145,900 | | | 2,309,597 | | |
Standard Register Co. (The)+ | | 46,800 | | | 146,952 | | |
Versar, Inc.* | | 81,100 | | | 259,520 | | |
| | | | | | | |
| | | | | 6,603,146 | | |
| | | | | |
Industry Company | | Shares | | Value |
| | | | | |
Communications Equipment - 2.78% |
Cogo Group, Inc.* | | 228,100 | | $ | 1,423,344 |
Communications Systems, Inc.+ | | 29,100 | | | 303,222 |
Globecomm Systems, Inc.* | | 256,800 | | | 2,118,600 |
KVH Industries, Inc.* | | 106,700 | | | 1,325,214 |
Network Equipment Technologies, Inc.*+ | | 73,900 | | | 257,911 |
Occam Networks, Inc.*+ | | 301,900 | | | 1,678,564 |
Oplink Communications, Inc.* | | 92,100 | | | 1,319,793 |
SeaChange International, Inc.* | | 112,000 | | | 921,760 |
Telestone Technologies Corp.*+ | | 26,100 | | | 220,284 |
| | | | | |
| | | | | 9,568,692 |
Computers & Peripherals - 1.68% | | | |
ActivIdentity Corp.*+ | | 255,207 | | | 487,445 |
Cray, Inc.* | | 101,200 | | | 564,696 |
Dot Hill Systems Corp.* | | 683,800 | | | 813,722 |
Hutchinson Technology, Inc.*+ | | 44,700 | | | 193,551 |
Hypercom Corp.* | | 491,300 | | | 2,279,632 |
LaserCard Corp.*+ | | 146,775 | | | 654,617 |
TransAct Technologies, Inc.* | | 105,800 | | | 772,340 |
| | | | | |
| | | | | 5,766,003 |
Construction & Engineering - 0.21% |
Comfort Systems USA, Inc. | | 43,900 | | | 424,074 |
Furmanite Corp.* | | 75,400 | | | 299,338 |
| | | | | |
| | | | | 723,412 |
Consumer Finance - 0.16% | | | |
CompuCredit Holdings Corp. | | 33,143 | | | 131,246 |
First Marblehead Corp. (The)*+ | | 185,600 | | | 436,160 |
| | | | | |
| | | | | 567,406 |
Containers & Packaging - 0.44% | | | |
AEP Industries, Inc.* | | 63,000 | | | 1,504,440 |
Distributors - 0.10% | | | | | |
Audiovox Corp., Class A* | | 47,707 | | | 350,646 |
Diversified Consumer Services - 0.91% |
Carriage Services, Inc.* | | 53,383 | | | 248,765 |
China Education Alliance, Inc.* | | 116,300 | | | 482,645 |
Collectors Universe | | 69,460 | | | 932,153 |
CPI Corp.+ | | 22,000 | | | 493,240 |
Learning Tree International, Inc.* | | 46,800 | | | 507,780 |
| | |
48 | | Annual Report | June 30, 2010 |
| | |
Bridgeway Ultra-Small Company Market Fund SCHEDULE OF INVESTMENTS (continued) | | |
Showing percentage of net assets as of June 30, 2010
| | | | | | | |
Industry Company | | Shares | | Value | | |
Common Stocks (continued) | | |
Diversified Consumer Services (continued) | | |
Mac-Gray Corp. | | 33,300 | | $ | 370,962 | | |
Nobel Learning Communities, Inc.* | | 14,523 | | | 85,686 | | |
| | | | | | | |
| | | | | 3,121,231 | | |
Diversified Financial Services - 0.99% | | |
Asset Acceptance Capital Corp.* | | 31,800 | | | 131,652 | | |
Asta Funding, Inc.+ | | 142,300 | | | 1,404,501 | | |
Encore Capital Group, Inc.* | | 22,114 | | | 455,770 | | |
Marlin Business Services Corp.* | | 28,300 | | | 342,147 | | |
Medallion Financial Corp. | | 161,400 | | | 1,065,240 | | |
| �� | | | | | | |
| | | | | 3,399,310 | | |
Diversified Telecommunication Services - 0.89% | | |
HickoryTech Corp.+ | | 43,495 | | | 293,591 | | |
IDT Corp., Class B*+ | | 116,567 | | | 1,486,230 | | |
Otelco, Inc.+ | | 28,600 | | | 457,600 | | |
SureWest Communications* | | 64,503 | | | 408,949 | | |
Warwick Valley Telephone Co. | | 30,200 | | | 424,914 | | |
| | | | | | | |
| | | | | 3,071,284 | | |
Electric Utilities - 0.47% | | |
Central Vermont Public Service Corp. | | 81,600 | | | 1,610,784 | | |
Electrical Equipment - - 1.70% | | |
China BAK Battery, Inc.*+ | | 144,600 | | | 251,604 | | |
China Ritar Power Corp.*+ | | 71,800 | | | 236,940 | | |
Evergreen Solar, Inc.*+ | | 357,600 | | | 243,883 | | |
FuelCell Energy, Inc.*+ | | 148,100 | | | 174,758 | | |
Fushi Copperweld, Inc.*+ | | 226,000 | | | 1,848,680 | | |
Hoku Corp.*+ | | 122,600 | | | 409,484 | | |
Hong Kong Highpower Technology, Inc.* | | 93,500 | | | 332,860 | | |
LaBarge, Inc.* | | 28,000 | | | 319,480 | | |
Magnetek, Inc.* | | 188,311 | | | 173,246 | | |
Ocean Power Technologies, Inc.*+ | | 84,483 | | | 437,622 | | |
PowerSecure International, Inc.*+ | | 60,900 | | | 553,581 | | |
UQM Technologies, Inc.*+ | | 249,500 | | | 845,805 | | |
| | | | | | | |
| | | | | 5,827,943 | | |
Electronic Equipment, Instruments & Components - 3.34% | | |
Comverge, Inc.*+ | | 85,700 | | | 767,872 | | |
DDi Corp. | | 83,600 | | | 629,508 | | |
Gerber Scientific, Inc.* | | 64,900 | | | 347,215 | | |
| | | | | |
Industry Company | | Shares | | Value |
| | | | | |
Electronic Equipment, Instruments & Components (continued) |
I.D. Systems, Inc.* | | 80,200 | | $ | 212,530 |
IEC Electronics Corp.* | | 64,500 | | | 294,765 |
LoJack Corp.* | | 71,900 | | | 265,311 |
LRAD Corp.*+ | | 213,500 | | | 266,875 |
Measurement Specialties, Inc.* | | 59,552 | | | 815,862 |
Mercury Computer Systems, Inc.* | | 60,600 | | | 710,838 |
Power-One, Inc.*+ | | 231,000 | | | 1,559,250 |
RadiSys Corp.* | | 187,900 | | | 1,788,808 |
Richardson Electronics, Ltd. | | 52,011 | | | 468,099 |
Superconductor Technologies, Inc.*+ | | 117,200 | | | 283,624 |
TESSCO Technologies, Inc. | | 167,250 | | | 2,793,075 |
Vicon Industries, Inc.* | | 64,629 | | | 266,272 |
| | | | | |
| | | | | 11,469,904 |
Energy Equipment & Services - 1.30% |
Allis-Chalmers Energy, Inc.* | | 148,851 | | | 306,633 |
Bolt Technology Corp.*+ | | 155,763 | | | 1,362,926 |
Bronco Drilling Co., Inc.*+ | | 83,900 | | | 281,065 |
Dawson Geophysical Co.* | | 15,799 | | | 336,045 |
Mitcham Industries, Inc.* | | 161,700 | | | 1,091,475 |
Natural Gas Services Group, Inc.* | | 22,400 | | | 338,912 |
OYO Geospace Corp.* | | 15,700 | | | 761,136 |
TGC Industries, Inc.* | | 407 | | | 1,233 |
| | | | | |
| | | | | 4,479,425 |
Food & Staples Retailing - 0.19% |
Village Super Market, Inc., Class A | | 24,600 | | | 645,750 |
Food Products - 1.26% |
AgFeed Industries, Inc.*+ | | 25,001 | | | 73,253 |
Alico, Inc.+ | | 21,000 | | | 482,580 |
Bridgford Foods Corp.+ | | 12,400 | | | 173,600 |
China Marine Food Group, Ltd.*+ | | 133,900 | | | 554,346 |
Griffin Land & Nurseries, Inc. | | 11,500 | | | 292,100 |
Imperial Sugar Co. | | 36,500 | | | 368,650 |
John B. Sanfilippo & Son, Inc.* | | 28,300 | | | 409,501 |
Lifeway Foods, Inc.*+ | | 156,302 | | | 1,522,381 |
Reddy Ice Holdings, Inc.* | | 110,000 | | | 355,300 |
SkyPeople Fruit Juice, Inc.* | | 17,694 | | | 89,355 |
| | | | | |
| | | | | 4,321,066 |
| | |
Bridgeway Ultra-Small Company Market Fund SCHEDULE OF INVESTMENTS (continued) | | |
Showing percentage of net assets as of June 30, 2010
| | | | | | | |
Industry Company | | Shares | | Value | | |
Common Stocks (continued) | | |
Gas Utilities - 0.14% | | |
Chesapeake Utilities Corp. | | 15,906 | | $ | 499,448 | | |
Health Care Equipment & Supplies - 4.54% | | |
Alphatec Holdings, Inc.* | | 112,300 | | | 521,072 | | |
Anika Therapeutics, Inc.* | | 197,639 | | | 1,164,094 | | |
Antares Pharma, Inc.*+ | | 168,374 | | | 296,338 | | |
AtriCure, Inc.* | | 133,200 | | | 885,780 | | |
Atrion Corp. | | 7,848 | | | 1,059,872 | | |
Bovie Medical Corp.*+ | | 145,900 | | | 434,782 | | |
Cerus Corp.*+ | | 244,600 | | | 772,936 | | |
CryoLife, Inc.* | | 356,000 | | | 1,918,840 | | |
Exactech, Inc.* | | 12,587 | | | 214,986 | | |
Kensey Nash Corp.* | | 16,800 | | | 398,328 | | |
Micrus Endovascular Corp.* | | 59,100 | | | 1,228,689 | | |
NMT Medical, Inc.*+ | | 168,200 | | | 88,254 | | |
Orthovita, Inc.* | | 255,300 | | | 518,259 | | |
Palomar Medical Technologies, Inc.* | | 31,600 | | | 353,604 | | |
RTI Biologics, Inc.* | | 125,000 | | | 366,250 | | |
Solta Medical, Inc.*+ | | 151,121 | | | 287,130 | | |
Span-America Medical Systems, Inc. | | 47,900 | | | 837,292 | | |
Spectranetics Corp.* | | 54,948 | | | 284,631 | | |
STAAR Surgical Co.*+ | | 181,200 | | | 1,036,464 | | |
Stereotaxis, Inc.*+ | | 79,081 | | | 261,758 | | |
Synovis Life Technologies, Inc.* | | 40,100 | | | 612,728 | | |
Theragenics Corp.* | | 18,891 | | | 21,725 | | |
TranS1, Inc.* | | 2,885 | | | 7,530 | | |
Utah Medical Products, Inc.+ | | 49,900 | | | 1,244,506 | | |
Vascular Solutions, Inc.* | | 49,300 | | | 616,250 | | |
Young Innovations, Inc. | | 6,015 | | | 169,322 | | |
| | | | | | | |
| | | | | 15,601,420 | | |
Health Care Providers & Services - 3.74% | | |
Allied Healthcare International, Inc.* | | 222,800 | | | 516,896 | | |
Almost Family, Inc.*+ | | 11,600 | | | 405,188 | | |
America Service Group, Inc. | | 47,100 | | | 810,120 | | |
Capital Senior Living Corp.* | | 129,000 | | | 641,130 | | |
CardioNet, Inc.*+ | | 55,054 | | | 301,696 | | |
Chindex International, Inc.* | | 121,200 | | | 1,518,636 | | |
Continucare Corp.* | | 120,100 | | | 402,335 | | |
Corvel Corp.* | | 37,733 | | | 1,274,998 | | |
Emergent Group, Inc. | | 57,500 | | | 391,000 | | |
Health Grades, Inc.* | | 162,679 | | | 976,074 | | |
Medcath Corp.* | | 43,400 | | | 341,124 | | |
Metropolitan Health Networks, Inc.* | | 185,300 | | | 691,169 | | |
| | | | | |
Industry Company | | Shares | | Value |
| | | | | |
Health Care Providers & Services (continued) |
National Research Corp. | | 25,500 | | $ | 614,805 |
Nighthawk Radiology Holdings, Inc.* | | 2,003 | | | 5,188 |
NovaMed, Inc.* | | 7,803 | | | 64,765 |
PDI, Inc.* | | 56,700 | | | 469,476 |
Prospect Medical Holdings, Inc.*+ | | 59,100 | | | 357,555 |
Providence Service Corp. (The)* | | 164,292 | | | 2,300,088 |
Sharps Compliance Corp.* | | 38,300 | | | 176,180 |
Sunrise Senior Living, Inc.*+ | | 85,695 | | | 238,232 |
U.S. Physical Therapy, Inc.* | | 21,400 | | | 361,232 |
| | | | | |
| | | | | 12,857,887 |
Health Care Technology - 0.10% |
Transcend Services, Inc.*+ | | 25,139 | | | 339,377 |
Hotels, Restaurants & Leisure - 2.44% |
AFC Enterprises, Inc.* | | 127,732 | | | 1,162,361 |
Ambassadors Group, Inc. | | 32,800 | | | 370,312 |
Bluegreen Corp.* | | 34,903 | | | 105,058 |
Canterbury Park Holding Corp.* | | 59,400 | | | 451,440 |
Caribou Coffee Co., Inc.* | | 79,600 | | | 753,812 |
Dover Downs Gaming & Entertainment, Inc. | | 2,716 | | | 7,849 |
Einstein Noah Restaurant Group, Inc.* | | 16,178 | | | 174,561 |
Empire Resorts, Inc.*+ | | 142,700 | | | 232,601 |
Famous Dave’s of America, Inc.* | | 172,400 | | | 1,434,368 |
Frisch’s Restaurants, Inc. | | 937 | | | 18,853 |
Full House Resorts, Inc.* | | 49,717 | | | 154,123 |
Great Wolf Resorts, Inc.* | | 85,617 | | | 178,083 |
Jamba, Inc.*+ | | 112,454 | | | 239,527 |
McCormick & Schmick’s Seafood Restaurants, Inc.* | | 39,800 | | | 296,908 |
Monarch Casino & Resort, Inc.* | | 48,685 | | | 493,179 |
Morgans Hotel Group Co.* | | 84,300 | | | 519,288 |
Morton’s Restaurant Group, Inc.* | | 64,200 | | | 332,556 |
Multimedia Games, Inc.* | | 75,700 | | | 340,650 |
Nathan’s Famous, Inc.* | | 12,000 | | | 186,480 |
Premier Exhibitions, Inc.* | | 89,160 | | | 114,125 |
Red Lion Hotels Corp.* | | 110,194 | | | 657,858 |
Town Sports International Holdings, Inc.* | | 76,387 | | | 175,690 |
| | | | | |
| | | | | 8,399,682 |
| | |
50 | | Annual Report | June 30, 2010 |
| | |
Bridgeway Ultra-Small Company Market Fund SCHEDULE OF INVESTMENTS (continued) | | |
Showing percentage of net assets as of June 30, 2010
| | | | | | | |
Industry Company | | Shares | | Value | | |
Common Stocks (continued) | | |
Household Durables - 1.25% | | |
Bassett Furniture Industries, Inc.* | | 58,324 | | $ | 249,627 | | |
Brookfield Homes Corp.* | | 46,400 | | | 312,736 | | |
Cavco Industries, Inc.* | | 10,600 | | | 372,908 | | |
CSS Industries, Inc. | | 19,600 | | | 323,400 | | |
Emerson Radio Corp. | | 95,343 | | | 162,083 | | |
Hooker Furniture Corp. | | 28,500 | | | 303,810 | | |
Kid Brands, Inc.*+ | | 83,400 | | | 586,302 | | |
Libbey, Inc.*+ | | 29,000 | | | 376,420 | | |
Lifetime Brands, Inc.*+ | | 63,300 | | | 925,446 | | |
M/I Homes, Inc.* | | 34,800 | | | 335,472 | | |
NIVS IntelliMedia Technology Group, Inc.* | | 19,500 | | | 44,850 | | |
Skyline Corp. | | 17,300 | | | 311,573 | | |
| | | | | | | |
| | | | | 4,304,627 | | |
Household Products - 0.13% | | |
Oil-Dri Corp. of America | | 19,800 | | | 454,410 | | |
Independent Power Producers & Energy Traders - 0.09% | | |
Synthesis Energy Systems, Inc.* | | 272,471 | | | 299,718 | | |
Insurance - 1.92% | | |
First Mercury Financial Corp. | | 27,551 | | | 291,490 | | |
Hallmark Financial Services, Inc.* | | 40,400 | | | 401,980 | | |
Investors Title Co. | | 7,296 | | | 228,000 | | |
Meadowbrook Insurance Group, Inc. | | 185,200 | | | 1,598,276 | | |
Mercer Insurance Group, Inc.+ | | 144,257 | | | 2,440,828 | | |
NYMAGIC, Inc. | | 62,000 | | | 1,195,980 | | |
SeaBright Holdings, Inc. | | 34,521 | | | 327,259 | | |
Universal Insurance Holdings, Inc. | | 24,677 | | | 103,150 | | |
| | | | | | | |
| | | | | 6,586,963 | | |
Internet & Catalog Retail - 0.38% | | |
Gaiam, Inc., Class A | | 53,500 | | | 324,745 | | |
US Auto Parts Network, Inc.* | | 100,900 | | | 605,400 | | |
ValueVision Media, Inc., Class A* | | 206,986 | | | 366,365 | | |
| | | | | | | |
| | | | | 1,296,510 | | |
Internet Software & Services - 1.83% | | |
Innodata Isogen, Inc.*+ | | 191,306 | | | 491,656 | | |
Keynote Systems, Inc. | | 94,300 | | | 850,586 | | |
KIT Digital, Inc.*+ | | 36,000 | | | 317,520 | | |
| | | | | |
Industry Company | | Shares | | Value |
| | | | | |
Internet Software & Services (continued) |
Local.com Corp.* | | 97,400 | | $ | 666,216 |
Marchex, Inc., Class B | | 70,400 | | | 271,040 |
Saba Software, Inc.*+ | | 165,817 | | | 853,958 |
Stamps.com, Inc.* | | 39,700 | | | 406,925 |
Support.com, Inc.* | | 360,650 | | | 1,500,304 |
Web.Com Group, Inc.* | | 188,852 | | | 677,979 |
Zix Corp.*+ | | 112,782 | | | 254,887 |
| | | | | |
| | | | | 6,291,071 |
IT Services - 2.27% |
Acorn Energy, Inc.*+ | | 46,291 | | | 241,176 |
Cass Information Systems, Inc.+ | | 50,570 | | | 1,732,023 |
Computer Task Group, Inc.* | | 92,400 | | | 596,904 |
Dynamics Research Corp.* | | 24,558 | | | 248,281 |
Hackett Group, Inc. (The)* | | 126,389 | | | 355,153 |
Integral Systems, Inc.* | | 38,500 | | | 244,475 |
Lionbridge Technologies, Inc.* | | 316,595 | | | 1,446,839 |
MoneyGram International, Inc.*+ | | 113,400 | | | 277,830 |
Online Resources Corp.* | | 51,912 | | | 215,435 |
PRGX Global, Inc.* | | 105,000 | | | 435,750 |
TechTeam Global, Inc.* | | 190,370 | | | 1,140,316 |
Tier Technologies, Inc.* | | 39,166 | | | 238,129 |
Virtusa Corp.* | | 43,900 | | | 409,587 |
WPCS International, Inc.* | | 81,192 | | | 219,219 |
| | | | | |
| | | | | 7,801,117 |
Leisure Equipment & Products - 0.66% |
Arctic Cat, Inc.* | | 55,500 | | | 505,605 |
Leapfrog Enterprises, Inc.* | | 151,800 | | | 610,236 |
Nautilus, Inc.* | | 99,141 | | | 150,694 |
Steinway Musical Instruments, Inc.* | | 19,900 | | | 354,021 |
Sturm Ruger & Co., Inc.+ | | 31,400 | | | 449,962 |
Summer Infant, Inc.* | | 32,039 | | | 209,856 |
| | | | | |
| | | | | 2,280,374 |
Life Sciences Tools & Services - 0.83% |
Accelrys, Inc.* | | 34,354 | | | 221,583 |
BioClinica, Inc.* | | 77,100 | | | 316,110 |
BioDelivery Sciences International, Inc.*+ | | 113,100 | | | 260,695 |
Caliper Life Sciences, Inc.* | | 98,100 | | | 418,887 |
Cambrex Corp.* | | 27,945 | | | 88,027 |
Enzo Biochem, Inc.* | | 65,056 | | | 264,778 |
Harvard Bioscience, Inc.*+ | | 162,817 | | | 579,629 |
Kendle International, Inc.* | | 29,500 | | | 339,840 |
| | |
Bridgeway Ultra-Small Company Market Fund SCHEDULE OF INVESTMENTS (continued) | | |
Showing percentage of net assets as of June 30, 2010
| | | | | | | |
Industry Company | | Shares | | Value | | |
Common Stocks (continued) | | |
Life Sciences Tools & Services (continued) | | |
Medtox Scientific, Inc.* | | 29,000 | | $ | 356,700 | | |
| | | | | | | |
| | | | | 2,846,249 | | |
Machinery - 3.80% | | |
Alamo Group, Inc. | | 21,800 | | | 473,060 | | |
Ampco-Pittsburgh Corp. | | 68,387 | | | 1,424,501 | | |
China Wind Systems, Inc.*+ | | 78,600 | | | 353,700 | | |
Commercial Vehicle Group, Inc.* | | 66,900 | | | 683,049 | | |
Dynamic Materials Corp. | | 34,000 | | | 545,360 | | |
Flanders Corp.* | | 85,183 | | | 264,919 | | |
Flow International Corp.*+ | | 114,600 | | | 270,456 | | |
Graham Corp. | | 59,500 | | | 891,905 | | |
Greenbrier Cos., Inc.* | | 43,600 | | | 488,320 | | |
Hurco Cos., Inc.*+ | | 60,234 | | | 894,475 | | |
Kadant, Inc.* | | 37,800 | | | 658,476 | | |
Key Technology, Inc.* | | 17,600 | | | 237,600 | | |
L.S. Starrett Co., Class A | | 29,200 | | | 278,276 | | |
Lydall, Inc.* | | 45,200 | | | 345,328 | | |
Met-Pro Corp. | | 40,200 | | | 432,552 | | |
Miller Industries, Inc. | | 32,600 | | | 439,122 | | |
PMFG, Inc.*+ | | 102,000 | | | 1,545,300 | | |
Portec Rail Products, Inc. | | 16,731 | | | 190,399 | | |
Shengkai Innovations, Inc.*+ | | 43,100 | | | 349,110 | | |
TriMas Corp.* | | 89,000 | | | 1,006,590 | | |
Twin Disc, Inc. | | 29,600 | | | 336,256 | | |
Wabash National Corp.* | | 133,400 | | | 948,474 | | |
| | | | | | | |
| | | | | 13,057,228 | | |
Marine - 0.19% | | |
Horizon Lines, Inc., Class A+ | | 86,560 | | | 366,149 | | |
International Shipholding Corp. | | 12,400 | | | 274,412 | | |
| | | | | | | |
| | | | | 640,561 | | |
Media - 3.24% | | |
A.H. Belo Corp., Class A*+ | | 6,400 | | | 42,496 | | |
Alloy, Inc.* | | 49,254 | | | 462,003 | | |
Ballantyne Strong, Inc.* | | 30,423 | | | 220,262 | | |
Carmike Cinemas, Inc.* | | 45,300 | | | 274,518 | | |
Cumulus Media, Inc., Class A*+ | | 98,700 | | | 263,529 | | |
Entercom Communications Corp., Class A* | | 112,086 | | | 988,599 | | |
Entravision Communications Corp., Class A*+ | | 209,800 | | | 442,678 | | |
Fisher Communications, Inc.* | | 25,200 | | | 424,368 | | |
Global Traffic Network, Inc.* | | 73,874 | | | 397,442 | | |
Gray Television, Inc.*+ | | 128,600 | | | 309,926 | | |
Knology, Inc.* | | 70,053 | | | 765,679 | | |
| | | | | |
Industry Company | | Shares | | Value |
| | | | | |
Media (continued) | | | | | |
Lee Enterprises, Inc.*+ | | 93,200 | | $ | 239,524 |
McClatchy Co., Class A (The)*+ | | 173,000 | | | 629,720 |
Media General, Inc., Class A*+ | | 134,170 | | | 1,309,499 |
Navarre Corp.* | | 275,500 | | | 600,590 |
Nexstar Broadcasting Group, Inc., Class A*+ | | 100,900 | | | 441,942 |
PRIMEDIA, Inc. | | 254,837 | | | 746,672 |
Radio One, Inc., Class D*+ | | 324,765 | | | 415,699 |
Reading International, Inc., Class A* | | 20,672 | | | 82,068 |
Rentrak Corp.* | | 83,800 | | | 2,038,854 |
Saga Communications, Inc., Class A* | | 1,804 | | | 43,080 |
| | | | | |
| | | | | 11,139,148 |
Metals & Mining - 0.99% |
China Direct Industries, Inc.*+ | | 209,610 | | | 234,763 |
Friedman Industries | | 67,000 | | | 373,190 |
General Steel Holdings, Inc.*+ | | 89,771 | | | 210,962 |
Great Northern Iron Ore Properties+ | | 12,000 | | | 1,144,200 |
Mines Management, Inc.*+ | | 98,600 | | | 176,494 |
Paramount Gold & Silver Corp.*+ | | 266,800 | | | 346,840 |
Sutor Technology Group, Ltd.*+ | | 62,500 | | | 124,375 |
Synalloy Corp. | | 19,400 | | | 162,184 |
Universal Stainless & Alloy* | | 38,500 | | | 615,615 |
| | | | | |
| | | | | 3,388,623 |
Multiline Retail - 0.37% |
Bon-Ton Stores, Inc. (The) | | 25,850 | | | 252,038 |
Retail Ventures, Inc.* | | 91,976 | | | 719,252 |
Tuesday Morning Corp.*+ | | 75,227 | | | 300,156 |
| | | | | |
| | | | | 1,271,446 |
Oil, Gas & Consumable Fuels - 3.83% |
Adams Resources & Energy, Inc. | | 22,300 | | | 401,400 |
American Oil & Gas, Inc.* | | 209,600 | | | 1,316,288 |
Approach Resources, Inc.* | | 46,900 | | | 322,672 |
BioFuel Energy Corp.*+ | | 129,900 | | | 167,571 |
Callon Petroleum Co.* | | 359,300 | | | 2,263,590 |
Cheniere Energy, Inc.*+ | | 107,944 | | | 304,402 |
China North East Petroleum Holdings, Ltd.*D | | 81,300 | | | 81,300 |
Crimson Exploration, Inc.*+ | | 123,700 | | | 330,279 |
Crosstex Energy, Inc.*+ | | 143,418 | | | 919,309 |
| | |
52 | | Annual Report | June 30, 2010 |
| | |
Bridgeway Ultra-Small Company Market Fund SCHEDULE OF INVESTMENTS (continued) | | |
Showing percentage of net assets as of June 30, 2010
| | | | | | | |
Industry Company | | Shares | | Value | | |
Common Stocks (continued) | | |
Oil, Gas & Consumable Fuels (continued) | | |
Double Eagle Petroleum Co.* | | 69,700 | | $ | 296,225 | | |
Endeavour International Corp.*+ | | 262,600 | | | 278,356 | | |
Evolution Petroleum Corp.* | | 67,400 | | | 337,674 | | |
FX Energy, Inc.* | | 105,800 | | | 382,996 | | |
GeoMet, Inc.* | | 264,100 | | | 301,074 | | |
GMX Resources, Inc.*+ | | 56,900 | | | 369,281 | | |
Green Plains Renewable Energy, Inc.* | | 3,896 | | | 39,817 | | |
Harvest Natural Resources, Inc.*+ | | 36,473 | | | 268,806 | | |
Magnum Hunter Resources Corp.* | | 103,290 | | | 450,345 | | |
Panhandle Oil & Gas, Inc., Class A | | 16,397 | | | 433,373 | | |
PostRock Energy Corp.* | | 10,619 | | | 50,971 | | |
Pyramid Oil Co.*+ | | 69,800 | | | 321,080 | | |
RAM Energy Resources, Inc.*+ | | 115,900 | | | 239,913 | | |
Rentech, Inc.*+ | | 327,200 | | | 323,928 | | |
REX American Resources Corp.* | | 66,249 | | | 1,059,984 | | |
Rex Energy Corp.* | | 63,381 | | | 640,148 | | |
Uranium Energy Corp.*+ | | 133,100 | | | 314,116 | | |
Warren Resources, Inc.* | | 165,600 | | | 480,240 | | |
Westmoreland Coal Co.*+ | | 59,675 | | | 484,561 | | |
| | | | | | | |
| | | | | 13,179,699 | | |
Paper & Forest Products - 0.80% | | |
KapStone Paper & Packaging Corp.* | | 83,400 | | | 929,076 | | |
Mercer International, Inc.*+ | | 119,400 | | | 475,212 | | |
Neenah Paper, Inc. | | 60,000 | | | 1,098,000 | | |
Verso Paper Corp.*+ | | 103,400 | | | 238,854 | | |
| | | | | | | |
| | | | | 2,741,142 | | |
Personal Products - 0.75% | | |
American Oriental Bioengineering, Inc.* | | 37,347 | | | 94,114 | | |
CCA Industries, Inc. | | 4,292 | | | 22,962 | | |
Female Health Co. (The) | | 87,300 | | | 453,087 | | |
Mannatech, Inc.+ | | 90,680 | | | 180,453 | | |
Medifast, Inc.*+ | | 48,399 | | | 1,254,018 | | |
Natural Alternatives International, Inc.* | | 2,456 | | | 15,596 | | |
Physicians Formula Holdings, Inc.* | | 30,095 | | | 99,314 | | |
Reliv International, Inc. | | 103,100 | | | 249,502 | | |
Schiff Nutrition International, Inc. | | 27,869 | | | 198,427 | | |
| | | | | | | |
| | | | | 2,567,473 | | |
| | | | | |
Industry Company | | Shares | | Value |
| | | | | |
Pharmaceuticals - 2.56% |
Adolor Corp.*+ | | 252,547 | | $ | 275,276 |
Akorn, Inc.* | | 132,502 | | | 393,531 |
Alexza Pharmaceuticals, Inc.*+ | | 131,900 | | | 358,768 |
AVANIR Pharmaceuticals, Inc., Class A* | | 184,800 | | | 474,936 |
Biodel, Inc.*+ | | 70,200 | | | 265,356 |
BMP Sunstone Corp.*+ | | 75,000 | | | 386,250 |
Caraco Pharmaceutical Laboratories, Ltd.*+ | | 72,600 | | | 342,672 |
China Pharma Holdings, Inc.*+ | | 91,000 | | | 250,250 |
Columbia Laboratories, Inc.* | | 254,300 | | | 269,558 |
Cumberland Pharmaceuticals, Inc.*+ | | 39,100 | | | 251,022 |
Cypress Bioscience, Inc.* | | 124,700 | | | 286,810 |
Depomed, Inc.* | | 104,400 | | | 292,320 |
Durect Corp.* | | 164,400 | | | 399,492 |
Hi-Tech Pharmacal Co., Inc.* | | 65,900 | | | 1,509,769 |
ISTA Pharmaceuticals, Inc.*+ | | 200,800 | | | 439,752 |
KV Pharmaceutical Co., Class A*+ | | 45,534 | | | 38,248 |
Lannett Co., Inc.* | | 41,377 | | | 189,093 |
MDRNA, Inc.*+ | | 142,500 | | | 128,392 |
Neostem, Inc.*+ | | 123,500 | | | 226,005 |
Pain Therapeutics, Inc.* | | 5,135 | | | 28,551 |
Penwest Pharmaceuticals Co.*+ | | 120,110 | | | 396,363 |
Pozen, Inc.*+ | | 57,500 | | | 403,075 |
Santarus, Inc.* | | 100,972 | | | 250,411 |
Sucampo Pharmaceuticals, Inc., Class A* | | 104,000 | | | 367,120 |
SuperGen, Inc.* | | 168,600 | | | 340,572 |
Tianyin Pharmaceutical Co., Inc.+ | | 90,900 | | | 250,884 |
| | | | | |
| | | | | 8,814,476 |
Professional Services - - 1.60% |
Barrett Business Services, Inc. | | 31,600 | | | 391,840 |
Diamond Management & Technology Consultants, Inc. | | 87,200 | | | 899,032 |
Dolan Co. (The)* | | 110,200 | | | 1,225,424 |
GP Strategies Corp.* | | 76,500 | | | 555,390 |
Hill International, Inc.* | | 75,000 | | | 304,500 |
Hudson Highland Group, Inc.* | | 70,000 | | | 308,000 |
LECG Corp.* | | 141,800 | | | 368,680 |
On Assignment, Inc.* | | 89,800 | | | 451,694 |
| | |
Bridgeway Ultra-Small Company Market Fund SCHEDULE OF INVESTMENTS (continued) | | |
Showing percentage of net assets as of June 30, 2010
| | | | | | | |
Industry Company | | Shares | | Value | | |
Common Stocks (continued) | | |
Professional Services (continued) | | |
RCM Technologies, Inc.* | | 62,259 | | $ | 278,298 | | |
Volt Information Sciences, Inc.* | | 35,200 | | | 295,680 | | |
VSE Corp. | | 13,300 | | | 423,206 | | |
| | | | | | | |
| | | | | 5,501,744 | | |
Real Estate Management & Development - 0.73% | | |
China Housing & Land Development, Inc.*+ | | 223,400 | | | 518,288 | | |
Consolidated-Tomoka Land Co.+ | | 43,800 | | | 1,248,300 | | |
Grubb & Ellis Co.* | | 241,500 | | | 236,670 | | |
Stratus Properties, Inc.* | | 32,300 | | | 320,093 | | |
Thomas Properties Group, Inc.+ | | 61,200 | | | 202,572 | | |
| | | | | | | |
| | | | | 2,525,923 | | |
Road & Rail - - 0.37% | | |
P.A.M. Transportation Services, Inc.* | | 28,300 | | | 425,349 | | |
Quality Distribution, Inc.* | | 88,000 | | | 454,960 | | |
Saia, Inc.* | | 25,900 | | | 388,500 | | |
| | | | | | | |
| | | | | 1,268,809 | | |
Semiconductors & Semiconductor Equipment - 3.67% | | |
Advanced Analogic Technologies, Inc.* | | 200,000 | | | 638,000 | | |
Amtech Systems, Inc.* | | 80,046 | | | 668,384 | | |
AuthenTec, Inc.*+ | | 533,200 | | | 1,338,332 | | |
CEVA, Inc.* | | 186,900 | | | 2,354,940 | | |
FSI International, Inc.*+ | | 114,600 | | | 480,174 | | |
GSI Technology, Inc.* | | 201,417 | | | 1,152,105 | | |
Ikanos Communications, Inc.* | | 325,000 | | | 523,250 | | |
Integrated Silicon Solution, Inc.* | | 297,741 | | | 2,244,967 | | |
Kopin Corp.* | | 290,443 | | | 984,602 | | |
Microtune, Inc.* | | 176,045 | | | 374,976 | | |
Nanometrics, Inc.* | | 39,200 | | | 395,528 | | |
Photronics, Inc.* | | 157,570 | | | 712,217 | | |
Rudolph Technologies, Inc.* | | 100,600 | | | 759,530 | | |
| | | | | | | |
| | | | | 12,627,005 | | |
Software - 1.93% | | |
Actuate Corp.* | | 326,030 | | | 1,450,834 | | |
American Software, Inc., Class A | | 60,700 | | | 280,434 | | |
China TransInfo Technology Corp.*+ | | 36,000 | | | 195,480 | | |
Digimarc Corp.*+ | | 23,100 | | | 433,125 | | |
ePlus, Inc.* | | 19,559 | | | 342,282 | | |
| | | | | |
Industry Company | | Shares | | Value |
| | | | | |
Software (continued) | | | | | |
Guidance Software, Inc.* | | 63,000 | | $ | 328,860 |
Magma Design Automation, Inc.*+ | | 145,500 | | | 413,220 |
Phoenix Technologies, Ltd.*+ | | 229,200 | | | 662,388 |
QAD, Inc.* | | 77,000 | | | 318,010 |
Sonic Solutions, Inc.*+ | | 104,700 | | | 874,245 |
SRS Labs, Inc.* | | 54,400 | | | 497,760 |
Unica Corp.* | | 35,500 | | | 340,090 |
VirnetX Holding Corp.+ | | 81,400 | | | 481,888 |
| | | | | |
| | | | | 6,618,616 |
Specialty Retail - 2.14% |
America’s Car-Mart, Inc.*+ | | 130,923 | | | 2,962,787 |
Books-A-Million, Inc.+ | | 49,800 | | | 299,796 |
Borders Group, Inc.*+ | | 178,744 | | | 237,729 |
Casual Male Retail Group, Inc.* | | 47,366 | | | 161,992 |
Cost Plus, Inc.* | | 79,800 | | | 284,886 |
Hot Topic, Inc. | | 184,558 | | | 937,555 |
Kirkland’s, Inc.* | | 48,400 | | | 816,750 |
MarineMax, Inc.* | | 65,100 | | | 451,794 |
Midas, Inc.* | | 55,313 | | | 424,251 |
Select Comfort Corp.* | | 33,939 | | | 296,966 |
Shoe Carnival, Inc.* | | 22,400 | | | 459,424 |
Zale Corp.* | | 18,355 | | | 29,001 |
| | | | | |
| | | | | 7,362,931 |
Textiles, Apparel & Luxury Goods - 1.63% |
Alpha PRO Tech, Ltd.*+ | | 175,000 | | | 323,750 |
Charles & Colvard, Ltd.*+ | | 55,311 | | | 154,318 |
Cherokee, Inc.+ | | 35,800 | | | 612,180 |
Culp, Inc.* | | 109,016 | | | 1,194,815 |
Delta Apparel, Inc.*+ | | 23,100 | | | 337,260 |
Ever-Glory International Group, Inc.* | | 45,900 | | | 137,700 |
Hallwood Group, Inc.* | | 9,100 | | | 345,800 |
Kenneth Cole Productions, Inc., Class A* | | 33,600 | | | 369,936 |
LaCrosse Footwear, Inc.+ | | 21,829 | | | 367,600 |
Perry Ellis International, Inc.* | | 40,100 | | | 810,020 |
R.G. Barry Corp. | | 39,600 | | | 436,788 |
Rocky Brands, Inc.* | | 21,100 | | | 134,829 |
Unifi, Inc.* | | 96,000 | | | 366,720 |
| | | | | |
| | | | | 5,591,716 |
Thrifts & Mortgage Finance - 5.19% |
Abington Bancorp, Inc. | | 72,200 | | | 629,584 |
BankAtlantic Bancorp, Inc., Class A* | | 230,641 | | | 322,897 |
| | |
54 | | Annual Report | June 30, 2010 |
| | |
Bridgeway Ultra-Small Company Market Fund SCHEDULE OF INVESTMENTS (continued) | | |
Showing percentage of net assets as of June 30, 2010
| | | | | | | |
Industry Company | | Shares | | Value | | |
Common Stocks (continued) | | | | | | | |
Thrifts & Mortgage Finance (continued) | | | | | |
BankFinancial Corp. | | 79,700 | | $ | 662,307 | | |
Beacon Federal Bancorp, Inc. | | 35,800 | | | 313,608 | | |
Bofl Holding, Inc.* | | 31,300 | | | 441,956 | | |
Brooklyn Federal Bancorp, Inc.+ | | 38,900 | | | 171,549 | | |
Citizens Community Bancorp, Inc. | | 90,400 | | | 343,520 | | |
Clifton Savings Bancorp, Inc.+ | | 127,300 | | | 1,101,145 | | |
ESB Financial Corp.+ | | 25,500 | | | 332,775 | | |
ESSA Bancorp, Inc. | | 99,884 | | | 1,229,572 | | |
Federal Agricultural Mortgage Corp., Class C+ | | 134,300 | | | 1,884,229 | | |
Fidelity Bancorp, Inc. | | 47,512 | | | 281,271 | | |
First Financial Northwest, Inc.+ | | 90,948 | | | 360,154 | | |
First Pactrust Bancorp, Inc.+ | | 53,800 | | | 427,172 | | |
Fox Chase Bancorp, Inc.* | | 36,032 | | | 344,827 | | |
Guaranty Federal Bancshares, Inc.* | | 62,556 | | | 399,107 | | |
HMN Financial, Inc.* | | 36,213 | | | 165,856 | | |
Home Federal Bancorp, Inc. | | 30,600 | | | 386,478 | | |
Louisiana Bancorp, Inc.* | | 18,000 | | | 252,180 | | |
LSB Corp.+ | | 76,350 | | | 927,652 | | |
Meridian Interstate Bancorp, Inc.* | | 39,200 | | | 427,280 | | |
New Hampshire Thrift Bancshares, Inc. | | 18,100 | | | 190,050 | | |
Ocean Shore Holding Co. | | 32,100 | | | 333,198 | | |
OceanFirst Financial Corp. | | 29,200 | | | 352,444 | | |
Provident Financial Holdings, Inc. | | 101,300 | | | 486,240 | | |
Pulaski Financial Corp.+ | | 70,456 | | | 454,441 | | |
Rockville Financial, Inc. | | 72,630 | | | 865,023 | | |
Rome Bancorp, Inc. | | 36,219 | | | 336,475 | | |
Teche Holding Co. | | 30,100 | | | 845,810 | | |
Territorial Bancorp, Inc. | | 21,100 | | | 399,845 | | |
United Community Financial Corp.* | | 130,000 | | | 217,100 | | |
United Financial Bancorp, Inc. | | 86,641 | | | 1,182,650 | | |
WSB Holdings, Inc. | | 95,850 | | | 321,098 | | |
WSFS Financial Corp. | | 12,200 | | | 438,346 | | |
| | | | | | | |
| | | | | 17,827,839 | | |
Trading Companies & Distributors - 0.71% | | |
Aceto Corp. | | 58,500 | | | 335,205 | | |
CAI International, Inc.* | | 23,238 | | | 276,532 | | |
China Armco Metals, Inc.*+ | | 74,900 | | | 217,210 | | |
| | | | | | | | | |
Industry Company | | Shares | | Value |
| | | | | | | | | |
Trading Companies & Distributors (continued) |
DXP Enterprises, Inc.* | | 27,800 | | $ | 435,070 |
Houston Wire & Cable Co. | | 29,400 | | | 318,990 |
Lawson Products, Inc. | | 28,300 | | | 480,534 |
Titan Machinery, Inc.*+ | | 29,100 | | | 382,083 |
| | | | | | | | | |
| | | | | 2,445,624 |
Water Utilities - 0.34% |
Artesian Resources Corp., Class A | | 10,500 | | | 193,830 |
York Water Co. | | 68,550 | | | 973,410 |
| | | | | | | | | |
| | | | | 1,167,240 |
Wireless Telecommunication Services - 0.53% |
FiberTower Corp.*+ | | 31,159 | | | 147,070 |
USA Mobility, Inc. | | 128,593 | | | 1,661,422 |
| | | | | | | | | |
| | | | | 1,808,492 |
| | | | | | | | | |
TOTAL COMMON STOCKS - 96.97% | | | | | 333,248,237 |
| | | | | | | | | |
(Cost $295,404,915) | | | | | |
EXCHANGE TRADED FUND - 1.79% |
iShares Russell Microcap Index Fund+ | | 157,600 | | | 6,168,464 |
| | | | | | | | | |
TOTAL EXCHANGE TRADED FUND - 1.79% | | | 6,168,464 |
| | | | | | | | | |
(Cost $5,123,090) | | | |
RIGHTS - 0.00% | | | |
BankAtlantic Bancorp, Inc.D | | 75,420 | | | 754 |
| | | | | | | | | |
TOTAL RIGHTS - 0.00% | | | | | 754 |
| | | | | | | | | |
(Cost $ — ) | | | | | |
| | | |
| | | Rate^ | | Shares | | Value |
MONEY MARKET FUND - 1.48% | | | | | |
BlackRock Fed Fund | | 0.04% | | 5,078,381 | | | 5,078,381 |
| | | | | | | | | |
TOTAL MONEY MARKET FUND - 1.48% | | | | | 5,078,381 |
| | | | | | | | | |
(Cost $5,078,381) | | | | | |
| | |
Bridgeway Ultra-Small Company Market Fund SCHEDULE OF INVESTMENTS (continued) | | |
Showing percentage of net assets as of June 30, 2010
| | | | | | | | | | | | | | | |
| | | | | Value | | | |
TOTAL INVESTMENTS - 100.24% (Cost $305,606,386) | | | | | $ | 344,495,836 | | | |
Liabilities in Excess of Other Assets - (0.24%) | | | | | | (827,647 | ) | | |
| | | | | | | | | | | | | | | |
NET ASSETS - 100.00% | | | | | $ | 343,668,189 | | | |
| | | | | | | | | | | | | | | |
* Non-income producing security. ^ Rate disclosed as of June 30, 2010. D Security was fair valued under procedures adopted by the Board of Directors (see Note 2). + This security or a portion of the security is out on loan at June 30, 2010. Total loaned securities had a market value of $78,299,203 at June 30, 2010. Summary of inputs used to value the Fund’s investments as of 06/30/2010 are as follows (See Note 2 in Notes to Financial Statements): | | | |
| | | Valuation Inputs | | | |
| | | Investment in Securities (Market Value) | | | |
| | | Level 1
Quoted
Prices | | Level 2
Significant Observable
Inputs | | Level 3 Significant Unobservable Inputs | | Total | | | |
Common Stocks | | $ | 333,166,937 | | $ | — | | $ | 81,300 | | $ | 333,248,237 | | | |
Exchange-Traded Fund | | | 6,168,464 | | | — | | | — | | | 6,168,464 | | | |
Rights | | | — | | | — | | | 754 | | | 754 | | | |
Money Market Fund | | | — | | | 5,078,381 | | | — | | | 5,078,381 | | | |
| | | | | | | | | | | | | | | |
TOTAL | | $ | 339,335,401 | | $ | 5,078,381 | | $ | 82,054 | | $ | 344,495,836 | | | |
| | | | | | | | | | | | | | | |
| | | | | |
| | | | | | | | | | | | | | | |
Following is a reconciliation of Level 3 investments for which significant unobservable inputs were used to determine fair value:
| | | | | | | | | | | |
| | | Investment in Securities (Market Value) | |
| | | Common Stocks | | | Rights | | Total | |
Balance as of 06/30/2009 | | $ | — | | | $ | — | | $ | — | |
Net purchases (sales) | | | — | | | | 754 | | | 754 | |
Change in unrealized appreciation/ (depreciation) | | | (278,132 | ) | | | — | | | (278,132 | ) |
Transfers in/out of Level 31 | | | 359,432 | | | | — | | | 359,432 | |
| | | | | | | | | | | |
Balance as of 06/30/2010 | | $ | 81,300 | | | $ | 754 | | $ | 82,054 | |
| | | | | | | | | | | |
1“Transfers in and/or out” represent the value as of the beginning of the year ended June 30, 2010, for any investment security where significant transfers in the pricing level occurred during the year. The purchase value is used in situations where the investment was not held as of the beginning of the year. The transfer above took place as a result of a trading halt. The securities in the table above were considered Level 3 securities because they were fair valued under procedures adopted by the Board of Directors at June 30, 2010. Such valuation is based on a review of inputs such as, but not limited to, similar securities, company specific financial information and company specific news. See Notes to Financial Statements. | |
| | |
56 | | Annual Report | June 30, 2010 |
| | |
Micro-Cap Limited Fund MANAGER’S COMMENTARY | | |
June 30, 2010
Dear Fellow Micro-Cap Limited Fund Shareholder,
In the June quarter, our Fund declined 5.03%, outperforming our primary market benchmark, the CRSP Cap-Based Portfolio 9 Index (down 9.64%), the Russell Microcap Index (down 8.85%), the Russell 2000 Index (down 9.92%) and our peer benchmark, the Lipper Micro-Cap Stock Funds Index (down 7.67%). It was a strong quarter on a relative basis, and we are pleased, though we still have significant performance ground to make up over the prior recent period.
For the fiscal year ended June 30, 2010, our Fund increased 16.44%, trailing the returns of the CRSP Cap-Based Portfolio 9 Index (up 22.80%), the Russell Microcap Index (up 20.45%), the Russell 2000 Index (up 21.48%) and our peer benchmark, the Lipper Micro-Cap Stock Funds Index (up 21.65%). While we don’t like the fact the Fund continues to lag its benchmarks over the five-year time horizon, we are pleased that we lead all of our benchmarks since inception in June 1998.
The table below presents our June quarter, one-year, five-year, ten-year, and life-to-date financial results according to the formula required by the SEC. See the next page for a graph of performance since inception.
| | | | | | | | | | |
| | | June Qtr.
4/1/10
to 6/30/10 | | 1 Year
7/1/09
to 6/30/10 | | 5 Year
7/1/05
to 6/30/10 | | 10 Year
7/1/00
to 6/30/10 | | Life-to-Date
6/30/98
to 6/30/10 |
| | | | | |
| Micro-Cap Limited Fund | | -5.03% | | 16.44% | | -6.36% | | 4.84% | | 8.41% |
CRSP Cap-Based Portfolio 9 Index | | -9.64% | | 22.80% | | 1.55% | | 5.90% | | 7.00% |
Lipper Micro-Cap Stock Funds Index | | -7.67% | | 21.65% | | -0.45% | | 1.79% | | 4.59% |
Russell 2000 Index (small stocks) | | -9.92% | | 21.48% | | 0.37% | | 3.00% | | 3.77% |
Russell Microcap Index | | -8.85% | | 20.45% | | -2.41% | | 3.25% | | N/A |
Performance figures quoted in the table above and graph below represent past performance and are no guarantee of future results. Total return figures in the table above include the reinvestment of dividends and capital gains. The table above and the graph below do not reflect the deduction of taxes that a shareholder would pay on Fund distributions or the redemption of Fund shares.
The CRSP Cap-Based Portfolio 9 Index is an unmanaged index of 511 publicly traded U.S. micro-cap stocks (with dividends reinvested), as reported by the Center for Research on Security Prices. The Russell Microcap Index is an unmanaged, market value weighted index that measures performance of 1,000 of the smallest securities in the Russell 2000 Index. The Russell 2000 Index is an unmanaged, market value weighted index that measures performance of the 2,000 companies that are between the 1,000th and 3,000th largest in the market with dividends reinvested. The Lipper Micro-Cap Stock Funds Index is an index of Micro-cap funds compiled by Lipper, Inc. It is not possible to invest directly in an index. Periods longer than one year are annualized.
According to data from Lipper, Inc., for the period ended June 30, 2010, the Micro-Cap Limited Fund ranked 57th of 70 micro-cap funds for the last twelve months ended June 30, 2010, 58th of 59 such funds for the last five years, 19th of 35 funds for the last 10 years and 15th of 34 funds since inception in June, 1998. Lipper, Inc. is an independent mutual fund rating service that ranks funds in various fund categories by making comparative calculations using total returns.
| | |
Micro-Cap Limited Fund MANAGER’S COMMENTARY (continued) | | |
Micro-Cap Limited Fund vs. CRSP 9 Index, Lipper Micro-Cap Stock Funds Index, Russell 2000 Index, Russell Microcap Index* from Inception 6/30/98 to 6/30/10
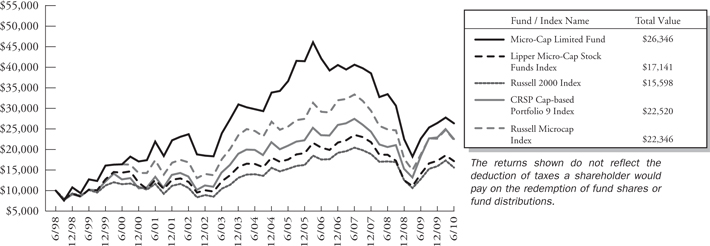
| * | The Russell Microcap Index began on 6/30/2000, and the line graph for the Index begins at the same value as the Fund on that date. |
Detailed Explanation of Quarterly Performance — What Worked
The Short Version: The Fund’s positioning relative to company size and sector had little effect on performance. Individual stocks tell the story.
Despite the difficulties brought on by such global factors as the European sovereign debt crisis, our models uncovered a number of companies with strong performance. Seven different sectors were represented in the list below.
These are the ten stocks that performed the best for the Fund during the quarter ended June 30, 2010:
| | | | | | |
| Rank | | Description | | Industry | | % Gain |
1 | | Cirrus Logic, Inc. | | Semiconductors & Semiconductor Equipment | | 88.4% |
2 | | Vonage Holdings Corp. | | Diversified Telecommunication Services | | 70.4% |
3 | | Power-One, Inc. | | Electrical Equipment | | 61.5% |
4 | | Odyssey HealthCare, Inc. | | Health Care Providers & Services | | 46.4% |
5 | | Protection One, Inc. | | Commercial Services & Supplies | | 35.1% |
6 | | China Information Security Technology, Inc. | | IT Services | | 33.7% |
7 | | Boston Beer Co., Inc. | | Beverages | | 29.1% |
8 | | Encore Capital Group, Inc. | | Diversified Financial Services | | 25.3% |
9 | | Stepan Co. | | Chemicals | | 22.9% |
10 | | Lattice Semiconductor Corp. | | Semiconductors & Semiconductor Equipment | | 18.3% |
Apple’s success gave a boost to a number of its suppliers. Cirrus Logic manufactures and sells audio chips to speaker makers Bose and Sony . . . and another key customer named Apple. So when Apple launched the iPad and ultimately sold upwards of 3 million units, Cirrus was there to benefit. When Apple introduced the next new iPhone this past quarter, Cirrus was there to benefit. In April the company offered revenue projections that beat Wall Street expectations and has even generated a position “shout out” or two on “Mad Money” with Jim Cramer. There’s plenty of Wall Street hype to go with the excellent financial returns. Cirrus has enjoyed living off of Apple’s coattails and has generated new business relationships because of its success with that growing product line. It was the Fund’s best performer over the past three months and contributed over one percent to the overall return.
| | |
| 58 | | Annual Report | June 30, 2010 |
| | |
Micro-Cap Limited Fund MANAGER’S COMMENTARY (continued) | | |
Detailed Explanation of Quarterly Performance — What Didn’t Work
The Short Version: The downturn was broad based. Nine different industries were represented on our list of worst performers.
Consumers stocks suffered dramatically over the last three months, and four related companies made our Fund’s list of worst performers for the quarter (three consumer discretionary and one consumer staple). Those four holdings cost the Fund almost two percent in return.
These are the ten stocks that performed the worst for the Fund during the quarter ended June 30, 2010:
| | | | | | |
| Rank | | Description | | Industry | | % Loss |
1 | | RINO International Corp. | | Commercial Services & Supplies | | -47.3% |
2 | | Sunrise Senior Living, Inc. | | Health Care Providers & Services | | -45.7% |
3 | | Bon-Ton Stores, Inc. (The) | | Multiline Retail | | -45.2% |
4 | | L&L Energy, Inc. | | Oil, Gas & Consumable Fuels | | -39.2% |
5 | | Horsehead Holding Corp. | | Metals & Mining | | -36.2% |
6 | | Smart Balance, Inc. | | Food Products | | -35.4% |
7 | | Infospace, Inc. | | Internet Software & Services | | -32.0% |
8 | | Entercom Communications Corp. | | Media | | -31.5% |
9 | | China Intergrated Energy, Inc. | | Oil, Gas & Comsumable Fuels | | -31.5% |
10 | | La-Z-Boy, Inc. | | Household Durables | | -28.7% |
Department store Bon-Ton struggled along with other retail stores over the past three months as same-store revenues declined in both April and May. However, first quarter losses were reported as narrower-than-expected. Though Moody’s increased Bon-Ton’s credit rating to B3 in May, it still remains non-investment grade status. Nevertheless, balance sheet financial strength, surprisingly, has not been a major driver of stock price in the recent environment. Our investment in Bon-Ton fell almost 50% during the June quarter and cost the Fund about one percent in return.
Detailed Explanation of Fiscal Year Performance — What Worked
The Short Version: In the aftermath of the dramatic 2008 downturn, some of the riskiest and most battered companies came roaring back the most. While our Fund was underrepresented in this category, we nevertheless held three stocks with triple digit returns.
Studying our list of best performers would give one reason to celebrate, except for the fact that our worst performers in the next section took a corresponding (albeit slightly smaller) bite from performance. Seven sectors were represented on our list of best performers for the year. The best performer was also highlighted in our quarterly “top ten” list.
These are the ten stocks that performed the best for the Fund during the fiscal year ended June 30, 2010:
| | | | | | |
| Rank | | Description | | Industry | | % Gain |
1 | | Cirrus Logic, Inc. | | Semiconductors & Semiconductor Equipment | | 228.7% |
2 | | Odyssey HealthCare, Inc. | | Health Care Providers & Services | | 158.0% |
3 | | China Automotive Systems, Inc. | | Auto Components | | 125.9% |
4 | | Gulfport Energy Corp. | | Oil, Gas & Comsumable Fuels | | 83.2% |
5 | | Omnova Solutions, Inc. | | Chemicals | | 77.1% |
6 | | Protection One, Inc. | | Commercial Services & Supplies | | 76.9% |
7 | | Par Pharmaceutical Cos., Inc. | | Pharmaceuticals | | 71.4% |
8 | | Medical Properties Trust, Inc. | | Real Estate Investment Trusts | | 71.3% |
9 | | Vanguard Natural Resouces LLC | | Oil, Gas & Comsumable Fuels | | 70.9% |
10 | | VSE Corp. | | Professional Services | | 70.9% |
| | |
Micro-Cap Limited Fund MANAGER’S COMMENTARY (continued) | | |
As the US economy experiences a sluggish recovery and Europe fights through sovereign debt issues, China remains among the only primary markets that continue to expand in the post-financial debacle and global recession. Many companies doing business there are truly benefiting. China Automotive Systems produces power steering systems and other parts for Chinese automakers. Most of its customers operate in China, which has seen an industry-wide explosion with the development of a broader middle class. The car industry is expected to continue experiencing rapid growth. With Toyota and other Japanese companies suffering the ill-effects of recalls and hindered reputations, Chinese automakers and their suppliers have reaped the rewards of increased sales. China Automotive System’s share price doubled in value during the fiscal year and contributed over half-a-percent to the Fund’s return.
Detailed Explanation of Fiscal Year Performance — What Didn’t Work
The Short Version: Our list of worst performers was equally broad based.
Uncertainty was in the air during the past 12-month period (much of it during the final quarter), and no sector was spared from the negativity. Seven sectors were represented in the list of worst performers, altogether costing the Fund about four and a half percent in return.
These are the ten stocks that performed the worst for the Fund during the fiscal year ended June 30, 2010:
| | | | | | |
| Rank | | Description | | Industry | | % Loss |
1 | | Force Protection, Inc. | | Machinery | | -53.9% |
2 | | Qiao Xing Mobile Communicationi Co., Ltd. | | Communications Equiptment | | -49.3% |
3 | | RINO International Corp. | | Commercial Services & Supplies | | -47.2% |
4 | | Sunrise Senior Living, Inc. | | Health Care Providers & Services | | -47.1% |
5 | | Bon-Ton Stores, Inc. (The) | | Multiline Retail | | -45.2% |
6 | | Fuqi International, Inc. | | Textiles, Apparel & Luxury Goods | | -42.4% |
7 | | L&L Energy, Inc. | | Oil, Gas & Consumable Fuels | | -39.2% |
8 | | Horsehead Holding Corp. | | Metals & Mining | | -36.2% |
9 | | Smart Balance, Inc. | | Food Products | | -35.4% |
10 | | Lannett Co., Inc. | | Pharmaceuticals | | -35.3% |
Force Protection manufactures blast and ballistic protection vehicles for the US military. In mid-2009, a major contract for MRAPs (Mine Resistant Ambush Protected vehicles) was cancelled and, with it a significant percentage of the company’s sales. The news took a one-day 39% bite out of the company’s stock price, and with that, a bite out of our Fund returns.
Top Ten Holdings as of June 30, 2010
Four of the best performers of the quarter were also among the five largest holdings at June 30: Cirrus Logic, Boston Beer, Power-One, and Vonage. Diversification ruled the day as nine industries were represented among the largest positions and no single stock accounted for greater than 3% of the net assets. The ten largest positions represented just over 20% of the total assets of the Fund.
| | |
60 | | Annual Report | June 30, 2010 |
| | |
Micro-Cap Limited Fund MANAGER’S COMMENTARY (continued) | | |
| | | | | | |
| Rank | | Description | | Industry | | % of Net
Assets |
1 | | Cirrus Logic, Inc. | | Semiconductors & Semiconductor Equipment | | 2.9% |
2 | | Boston Beer Co., Inc. | | Beverages | | 2.5% |
3 | | Omnova Solutions, Inc. | | Chemicals | | 2.2% |
4 | | Power-One, Inc. | | Electrical Equiptment | | 2.0% |
5 | | Vonage Holdings, Corp. | | Diversified Telecommunications | | 2.0% |
6 | | Pier 1 Imports, Inc. | | Specialty Retail | | 2.0% |
7 | | L&L Energy, Inc. | | Oil, Gas & Consumable Fuels | | 1.8% |
8 | | Internet Brands, Inc. | | Internet Software & Services | | 1.6% |
9 | | Sanmina-SCI Corp. | | Electronic Equip., Instruments | | 1.6% |
10 | | World Acceptance Corp. | | Consumer Finance | | 1.5% |
| |
| | Total | | | | 20.1% |
Industry Sector Representation as of June 30, 2010
The Fund held a smaller allocation in financial companies than the Russell 2000 Index and was rewarded for that position, as the sector performed quite poorly during the three-month period. However, the overweighting on information technology and materials stocks hurt, as these sectors struggled during the quarter.
| | | | | | | | | | | | | | |
| | | % of Net Assets | | | | | | % of Russell
2000 Index | | | | | | Difference |
Consumer Discretionary | | 13.1% | | | | | | 13.8% | | | | | | -0.7% |
Consumer Staples | | 4.3% | | | | | | 3.3% | | | | | | 1.0% |
Energy | | 6.9% | | | | | | 5.4% | | | | | | 1.5% |
Financials | | 16.2% | | | | | | 21.4% | | | | | | -5.2% |
Health Care | | 10.8% | | | | | | 13.8% | | | | | | -3.0% |
Industrials | | 11.7% | | | | | | 15.4% | | | | | | -3.7% |
Information Technology | | 23.0% | | | | | | 17.9% | | | | | | 5.1% |
Materials | | 9.4% | | | | | | 4.8% | | | | | | 4.6% |
Telecommunication Services | | 3.0% | | | | | | 1.0% | | | | | | 2.0% |
Utilities | | 1.6% | | | | | | 3.2% | | | | | | -1.6% |
Cash | | 0.0% | | | | | | 0.0% | | | | | | 0.0% |
| |
Total | | 100.0% | | | | | | 100.0% | | | | | | |
Disclaimer
The views expressed here are exclusively those of Fund management. These views, including those related to market sectors or individual stocks, are not meant as investment advice and should not be considered predictive in nature. Any favorable (or unfavorable) description of a holding applies only as of the quarter-end, June 30, 2010, unless otherwise stated. Security positions can and do change thereafter. Discussions of historical performance do not guarantee and may not be indicative of future performance.
The Fund is subject to very high, above market risk (volatility) and is not an appropriate investment for short-term investors. Investments in micro-cap companies generally carry greater risk than is customarily associated with larger companies and even “small companies” for various reasons such as narrower markets (fewer investors), limited financial resources and greater trading difficulty.
Conclusion
Thank you for your continued investment in Micro-Cap Limited Fund, which remains open to all investors. We encourage your feedback; your reactions and concerns are important to us.
Sincerely,
Your Investment Management Team
| | |
Bridgeway Micro-Cap Limited Fund SCHEDULE OF INVESTMENTS | | |
Showing percentage of net assets as of June 30, 2010
| | | | | | | |
Industry Company | | Shares | | Value | | |
COMMON STOCKS - 100.49% | | |
Beverages - 2.51% | | |
Boston Beer Co., Inc., Class A* | | 7,700 | | $ | 519,365 | | |
Biotechnology - 1.19% | | |
Martek Biosciences Corp.*+ | | 10,400 | | | 246,584 | | |
Building Products - 0.91% | | |
Quanex Building Products Corp. | | 10,900 | | | 188,461 | | |
Capital Markets - 1.36% | | |
BlackRock Kelso Capital Corp.+ | | 16,300 | | | 160,881 | | |
Prospect Capital Corp.+ | | 12,500 | | | 120,625 | | |
| | | | | | | |
| | | | | 281,506 | | |
Chemicals - 5.96% | | |
Hawkins, Inc.+ | | 11,300 | | | 272,104 | | |
Omnova Solutions, Inc.* | | 57,800 | | | 451,418 | | |
Stepan Co. | | 4,200 | | | 287,406 | | |
TPC Group, Inc.* | | 13,500 | | | 224,100 | | |
| | | | | | | |
| | | | | 1,235,028 | | |
Commercial Banks - 3.12% | | |
Cardinal Financial Corp. | | 25,900 | | | 239,316 | | |
Danvers Bancorp, Inc. | | 14,600 | | | 210,970 | | |
Texas Capital Bancshares, Inc.* | | 12,000 | | | 196,800 | | |
| | | | | | | |
| | | | | 647,086 | | |
Commercial Services & Supplies - 2.00% | | |
APAC Customer Services, Inc.* | | 27,200 | | | 155,040 | | |
M&F Worldwide Corp.* | | 4,200 | | | 113,820 | | |
RINO International Corp.*+ | | 11,600 | | | 145,116 | | |
| | | | | | | |
| | | | | 413,976 | | |
Communications Equipment - 1.32% | | |
Digi International, Inc.* | | 19,700 | | | 162,919 | | |
Ituran Location & Control, Ltd. | | 7,400 | | | 110,926 | | |
| | | | | | | |
| | | | | 273,845 | | |
Computers & Peripherals - 1.21% | | |
ADPT Corp.* | | 86,900 | | | 251,141 | | |
Construction & Engineering - 1.08% | | |
Layne Christensen Co.* | | 9,200 | | | 223,284 | | |
Consumer Finance - 1.52% | | |
World Acceptance Corp.*+ | | 8,200 | | | 314,142 | | |
Containers & Packaging - 0.71% | | |
Boise, Inc.* | | 26,700 | | | 146,583 | | |
| | | | | |
Industry Company | | Shares | | Value |
| | | | | |
Diversified Consumer Services - 2.06% |
Lincoln Educational Services Corp.* | | 12,667 | | $ | 260,814 |
Universal Technical Institute, Inc. | | 7,000 | | | 165,480 |
| | | | | |
| | | | | 426,294 |
Diversified Financial Services - 0.77% |
Encore Capital Group, Inc.* | | 7,700 | | | 158,697 |
Diversified Telecommunication Services - 3.00% |
City Telecom (H.K.), Ltd. - ADR | | 8,912 | | | 101,062 |
Consolidated Communications Holdings, Inc. | | 6,300 | | | 107,163 |
Vonage Holdings Corp.*+ | | 180,100 | | | 414,230 |
| | | | | |
| | | | | 622,455 |
Electric Utilities - 1.05% |
Central Vermont Public Service Corp. | | 11,000 | | | 217,140 |
Electrical Equipment - - 2.18% |
Powell Industries, Inc.* | | 8,700 | | | 237,858 |
Solarfun Power Holdings Co., Ltd. - Sponsored ADR*+ | | 31,600 | | | 213,932 |
| | | | | |
| | | | | 451,790 |
Electronic Equipment, Instruments & Components - 6.74% |
Electro Rent Corp. | | 12,800 | | | 163,712 |
Electro Scientific Industries, Inc.* | | 17,000 | | | 227,120 |
Insight Enterprises, Inc.* | | 19,900 | | | 261,884 |
Power-One, Inc.*+ | | 61,500 | | | 415,125 |
Sanmina-SCI Corp.* | | 24,200 | | | 329,362 |
| | | | | |
| | | | | 1,397,203 |
Energy Equipment & Services - 0.77% |
Superior Well Services, Inc.* | | 9,500 | | | 158,840 |
Food Products - 0.72% |
Smart Balance, Inc.* | | 36,700 | | | 150,103 |
Gas Utilities - 0.51% |
Chesapeake Utilities Corp. | | 3,400 | | | 106,760 |
Health Care Equipment & Supplies - 3.18% |
Analogic Corp. | | 2,300 | | | 104,673 |
Invacare Corp. | | 5,400 | | | 111,996 |
Orthofix International NV* | | 7,300 | | | 233,965 |
Zoll Medical Corp.* | | 7,700 | | | 208,670 |
| | | | | |
| | | | | 659,304 |
| | |
62 | | Annual Report | June 30, 2010 |
| | |
Bridgeway Micro-Cap Limited Fund SCHEDULE OF INVESTMENTS (continued) | | |
Showing percentage of net assets as of June 30, 2010
| | | | | | | |
Industry Company | | Shares | | Value | | |
Common Stocks (continued) | | | | | | | |
Health Care Providers & Services - 3.30% | | |
Corvel Corp.* | | 6,300 | | $ | 212,877 | | |
Ensign Group, Inc. (The) | | 13,400 | | | 221,368 | | |
Gentiva Health Services, Inc.* | | 5,500 | | | 148,555 | | |
Sunrise Senior Living, Inc.*+ | | 36,400 | | | 101,192 | | |
| | | | | | | |
| | | | | 683,992 | | |
Health Care Technology - 0.90% | | |
MedQuist, Inc. | | 23,500 | | | 185,885 | | |
Household Durables - 1.46% | | |
American Greetings Corp., Class A | | 9,200 | | | 172,592 | | |
National Presto Industries, Inc. | | 1,400 | | | 130,004 | | |
| | | | | | | |
| | | | | 302,596 | | |
Industrial Conglomerates - 1.38% | | |
Standex International Corp. | | 11,300 | | | 286,455 | | |
Insurance - 7.57% | | |
American Equity Investment Life Holding Co. | | 22,700 | | | 234,264 | | |
American Physicians Capital, Inc. | | 5,500 | | | 169,675 | | |
Employers Holdings, Inc. | | 10,100 | | | 148,773 | | |
Infinity Property & Casualty Corp. | | 4,700 | | | 217,046 | | |
Kansas City Life Insurance Co. | | 5,500 | | | 162,635 | | |
Meadowbrook Insurance Group, Inc. | | 14,300 | | | 123,409 | | |
Phoenix Cos., Inc. (The)* | | 55,200 | | | 116,472 | | |
Safety Insurance Group, Inc. | | 5,000 | | | 185,100 | | |
United Fire & Casualty Co. | | 10,700 | | | 212,074 | | |
| | | | | | | |
| | | | | 1,569,448 | | |
Internet & Catalog Retail - 0.88% | | |
Overstock.com, Inc.* | | 10,100 | | | 182,507 | | |
Internet Software & Services - 3.36% | | |
Infospace, Inc.* | | 33,200 | | | 249,664 | | |
Internet Brands, Inc., Class A* | | 32,400 | | | 334,692 | | |
Marchex, Inc., Class B | | 29,000 | | | 111,650 | | |
| | | | | | | |
| | | | | 696,006 | | |
Machinery - 3.26% | | | | | | | |
Alamo Group, Inc. | | 10,400 | | | 225,680 | | |
| | | | | |
Industry Company | | Shares | | Value |
| | | | | |
Machinery (continued) |
China Yuchai International, Ltd. | | 15,900 | | $ | 245,019 |
Commercial Vehicle Group, Inc.* | | 20,000 | | | 204,200 |
| | | | | |
| | | | | 674,899 |
Media - 1.84% |
Entercom Communications Corp., Class A* | | 18,600 | | | 164,052 |
Entravision Communications Corp., Class A* | | 59,900 | | | 126,389 |
McClatchy Co., Class A (The)*+ | | 24,891 | | | 90,603 |
| | | | | |
| | | | | 381,044 |
Metals & Mining - 2.25% |
Gulf Resources, Inc.*+ | | 23,300 | | | 200,147 |
Horsehead Holding Corp.* | | 22,000 | | | 166,320 |
Kaiser Aluminum Corp. | | 2,900 | | | 100,543 |
| | | | | |
| | | | | 467,010 |
Multiline Retail - 1.02% |
Bon-Ton Stores, Inc. (The)+ | | 21,800 | | | 212,550 |
Oil, Gas & Consumable Fuels - 6.16% |
China Integrated Energy, Inc.* | | 20,600 | | | 170,980 |
Knightsbridge Tankers, Ltd. | | 9,100 | | | 160,069 |
L&L Energy, Inc.*+ | | 43,000 | | | 369,800 |
Petroleum Development Corp.* | | 10,500 | | | 269,010 |
Vanguard Natural Resources LLC+ | | 10,000 | | | 209,000 |
Warren Resources, Inc.*+ | | 33,500 | | | 97,150 |
| | | | | |
| | | | | 1,276,009 |
Paper & Forest Products - 0.51% |
Neenah Paper, Inc. | | 5,800 | | | 106,140 |
Personal Products - 1.15% |
Medifast, Inc.*+ | | 4,300 | | | 111,413 |
Schiff Nutrition International, Inc. | | 17,700 | | | 126,024 |
| | | | | |
| | | | | 237,437 |
Pharmaceuticals - 2.33% |
Hi-Tech Pharmacal Co., Inc.*+ | | 10,900 | | | 249,719 |
| | |
Bridgeway Micro-Cap Limited Fund SCHEDULE OF INVESTMENTS (continued) | | |
Showing percentage of net assets as of June 30, 2010
| | | | | | | |
Industry Company | | Shares | | Value | | |
Common Stocks (continued) | | |
Pharmaceuticals (continued) | | |
Par Pharmaceutical Cos., Inc.* | | 9,000 | | $ | 233,640 | | |
| | | | | | | |
| | | | | 483,359 | | |
Real Estate Investment Trusts (REITs) - 0.78% | | |
Retail Opportunity Investments Corp. | | 16,800 | | | 162,120 | | |
Real Estate Management & Development - 0.64% | | |
IRSA Inversiones y Representaciones SA - Sponsored ADR | | 12,800 | | | 133,632 | | |
Semiconductors & Semiconductor Equipment - 7.31% | | |
Cirrus Logic, Inc.* | | 38,000 | | | 600,780 | | |
Cohu, Inc. | | 15,900 | | | 192,867 | | |
Kopin Corp.* | | 48,500 | | | 164,415 | | |
Lattice Semiconductor Corp.* | | 45,900 | | | 199,206 | | |
Micrel, Inc. | | 20,600 | | | 209,708 | | |
Tower Semiconductor, Ltd.*+ | | 106,000 | | | 148,400 | | |
| | | | | | | |
| | | | | 1,515,376 | | |
Software - 3.14% | | |
Renaissance Learning, Inc. | | 12,700 | | | 186,563 | | |
Sourcefire, Inc.* | | 6,400 | | | 121,600 | | |
VanceInfo Technologies, Inc. - ADR*+ | | 5,400 | | | 125,712 | | |
Wave Systems Corp., Class A*+ | | 67,000 | | | 217,080 | | |
| | | | | | | |
| | | | | 650,955 | | |
Specialty Retail - 5.25% | | |
America’s Car-Mart, Inc.*+ | | 5,900 | | | 133,517 | | |
Citi Trends, Inc.* | | 6,800 | | | 223,992 | | |
Monro Muffler Brake, Inc. | | 2,900 | | | 114,637 | | |
Pier 1 Imports, Inc.*+ | | 63,500 | | | 407,035 | | |
Select Comfort Corp.* | | 24,000 | | | 210,000 | | |
| | | | | | | |
| | | | | 1,089,181 | | |
Textiles, Apparel & Luxury Goods - 0.68% | | |
Unifi, Inc.* | | 37,000 | | | 141,340 | | |
Thrifts & Mortgage Finance - 0.51% | | |
United Financial Bancorp, Inc. | | 7,700 | | | 105,105 | | |
Trading Companies & Distributors - 0.94% | | |
TAL International Group, Inc. | | 8,700 | | | 195,489 | | |
| | | | | | | |
TOTAL COMMON STOCKS - 100.49% | | | 20,828,122 | | |
| | | | | | | |
(Cost $19,734,647) | | | | | | | |
| | | | |
| | | Value | |
| | | | |
TOTAL INVESTMENTS - 100.49% | | $ | 20,828,122 | |
(Cost $19,734,647) | | | | |
Liabilities in Excess of Other Assets - (0.49%) | | | (102,192 | ) |
| | | | |
NET ASSETS - 100.00% | | $ | 20,725,930 | |
| | | | |
| * | Non-income producing security. |
| + | This security or a portion of the security is out on loan at June 30, 2010. Total loaned securities had a market value of 4,249,539 at June 30, 2010. |
ADR - American Depositary Receipt
LLC - Limited Liability Co.
Summary of inputs used to value the Fund’s investments as of 06/30/2010 are as follows (See Note 2 in Notes to Financial Statements):
| | | | | | | | | | |
| | | Valuation Inputs |
| | | Investment in Securities (Market Value) |
| | | Level 1
Quoted Prices | | Level 2
Significant
Observable
Inputs | | Level 3
Significant
Unobservable
Inputs | | Total |
Common Stocks | | $ | 20,828,122 | | $— | | $— | | $ | 20,828,122 |
| | | | | | | | | | |
TOTAL | | $ | 20,828,122 | | $— | | $— | | $ | 20,828,122 |
| | | | | | | | | | |
See Notes to Financial Statements.
| | |
64 | | Annual Report | June 30, 2010 |
| | |
Small-Cap Momentum Fund MANAGER’S COMMENTARY | | |
June 30, 2010
Dear Fellow Small-Cap Momentum Fund Shareholder,
In the first month since inception, our Fund declined 6.70% compared to a 7.75% decline for our primary market benchmark, the Russell 2000 Index, and a 6.89% decline of our peer benchmark, the Lipper Small-Cap Stock Funds Index. It was a good month of relative performance. The table below presents our one-month financial results according to the formula required by the SEC.
| | |
| | | Life-to-Date
5/28/10 to 6/30/10 |
| |
Small-Cap Momentum Fund | | -6.70% |
Russell 2000 Index | | -7.75% |
Lipper Small-Cap Stock Funds Index | | -6.89% |
Performance figures quoted in the table above represent past performance and are no guarantee of future results. Total return figures in the table above include the reinvestment of dividends and capital gains. The table above does not reflect the deduction of taxes that a shareholder would pay on Fund distributions or the redemption of Fund shares.
The Russell 2000 Index is an unmanaged, market value weighted index that measures performance of the 2,000 companies that are between the 1,000th and 3,000th largest in the market with dividends reinvested. The Lipper Small-Cap Stock Funds Index is an index of Small-cap funds compiled by Lipper, Inc. It is not possible to invest directly in an index.
Small-Cap Momentum Fund was launched May 28, 2010 and is the newest member of our Fund family. The Fund seeks to achieve its investment objective through diversified small-cap exposure with a favorable risk/return profile. The small-cap universe used by the Fund encompasses 2,000 stocks that are ranked by Bridgeway’s proprietary risk-adjusted momentum model. The top-ranked stocks are included in the Fund and are weighted by relative market capitalization. The portfolio is reconstituted each quarter.
The Small-Cap Momentum Fund allows investors to access efficiently a new risk-adjusted approach to capitalizing on opportunities presented by positive price momentum in the small-cap market. Bridgeway’s research indicates this style has been a particularly strong diversifier of value stocks.
One month is really too short a timeframe to comment on performance in a detailed fashion. The top-ten holdings below, the detailed schedule of investments, and the financial statements attached provide some details of our Fund.
Top Ten Holdings as of June 30, 2010
| | | | | | |
| Rank | | Description | | Industry | | % of Net
Assets |
1 | | Deckers Outdoor Corp. | | Textiles, Apparel & Luxury Goods | | 2.3% |
2 | | GSI Commerce, Inc. | | Internet Software & Services | | 2.2% |
3 | | HMS Holdings Corp. | | Health Care Providers & Services | | 2.1% |
4 | | Lufkin Industries, Inc. | | Energy Equipment & Services | | 2.1% |
5 | | Universal American Corp. | | Health Care Providers & Services | | 2.1% |
6 | | South Jersey Industries, Inc. | | Gas Utilities | | 2.0% |
7 | | Equity Lifestyle Properties, Inc. | | Real Estate Investment Trusts | | 2.0% |
8 | | Southwest Gas Corp. | | Gas Utilities | | 2.0% |
9 | | Signature Bank | | Commercial Banks | | 2.0% |
10 | | CVB Financial Corp. | | Commercial Banks | | 1.9% |
| |
| | Total | | | | 20.7% |
| | |
Small-Cap Momentum Fund MANAGER’S COMMENTARY (continued) | | |
Disclaimer
The views expressed here are exclusively those of Fund management. These views, including those related to market sectors or individual stocks, are not meant as investment advice and should not be considered predictive in nature. Any favorable (or unfavorable) description of a holding applies only as of the quarter-end, June 30, 2010, unless otherwise stated. Security positions can and do change thereafter. Discussions of historical performance do not guarantee and may not be indicative of future performance.
Market volatility can significantly impact short-term performance. The Fund is not an appropriate investment for short-term investors. Investments in small companies generally carry greater risk than is customarily associated with larger companies. This additional risk is attributable to a number of factors, including the relatively limited financial resources that are typically available to small companies, and the fact that small companies often have comparatively limited product lines. In addition, the stock of small companies tends to be more volatile than the stock of large companies, particularly in the short term and particularly in the early stages of an economic or market downturn. Shareholders of the Fund, therefore, are taking on more risk than they would if they invested in the stock market as a whole.
Conclusion
Thank you for your continued investment in Small-Cap Momentum Fund. We encourage your feedback; your reactions and concerns are important to us.
Sincerely,
Your Investment Management Team
| | |
66 | | Annual Report | June 30, 2010 |
| | |
Bridgeway Small-Cap Momentum Fund SCHEDULE OF INVESTMENTS | | |
Showing percentage of net assets as of June 30, 2010
| | | | | | | |
Industry Company | | Shares | | Value | | |
| | | | | | | |
COMMON STOCKS - 97.70% | | |
Auto Components - 0.31% | | |
SORL Auto Parts, Inc.* | | 700 | | $ | 5,824 | | |
Biotechnology - 0.67% | | |
Pharmacyclics, Inc.* | | 1,900 | | | 12,654 | | |
Capital Markets - 0.92% | | |
Arlington Asset Investment Corp., Class A+ | | 300 | | | 5,649 | | |
MVC Capital, Inc. | | 900 | | | 11,628 | | |
| | | | | | | |
| | | | | 17,277 | | |
Chemicals - 3.32% | | |
Balchem Corp. | | 1,100 | | | 27,500 | | |
Kronos Worldwide, Inc.* | | 1,800 | | | 35,100 | | |
| | | | | | | |
| | | | | 62,600 | | |
Commercial Banks - 8.16% | | |
1st United Bancorp, Inc.* | | 900 | | | 6,624 | | |
CoBiz Financial, Inc. | | 1,400 | | | 9,226 | | |
Community Bank System, Inc. | | 1,200 | | | 26,436 | | |
CVB Financial Corp.+ | | 3,800 | | | 36,100 | | |
Eagle Bancorp, Inc.* | | 700 | | | 8,246 | | |
Fidelity Southern Corp.* | | 519 | | | 3,404 | | |
S&T Bancorp, Inc. | | 1,000 | | | 19,760 | | |
Signature Bank* | | 1,000 | | | 38,010 | | |
Virginia Commerce Bancorp, Inc.* | | 1,000 | | | 6,250 | | |
| | | | | | | |
| | | | | 154,056 | | |
Commercial Services & Supplies - 1.96% | | |
Healthcare Services Group, Inc. | | 1,600 | | | 30,320 | | |
Metalico, Inc.* | | 1,700 | | | 6,766 | | |
| | | | | | | |
| | | | | 37,086 | | |
Communications Equipment - 3.71% | | |
Black Box Corp. | | 700 | | | 19,523 | | |
EXFO, Inc.* | | 1,900 | | | 9,462 | | |
Gilat Satellite Networks, Ltd.* | | 1,500 | | | 6,930 | | |
Ituran Location & Control, Ltd. | | 800 | | | 11,992 | | |
Oclaro, Inc.* | | 2,000 | | | 22,180 | | |
| | | | | | | |
| | | | | 70,087 | | |
Computers & Peripherals - 0.15% | | |
TransAct Technologies, Inc.* | | 400 | | | 2,920 | | |
Construction & Engineering - 0.57% | | |
Primoris Services Corp. | | 1,700 | | | 10,710 | | |
| | | | | |
Industry Company | | Shares | | Value |
| | | | | |
| | | | | |
Consumer Finance - 0.17% |
Nicholas Financial, Inc.* | | 400 | | $ | 3,268 |
Diversified Consumer Services - 1.43% |
Collectors Universe | | 300 | | | 4,026 |
Steiner Leisure, Ltd.* | | 600 | | | 23,064 |
| | | | | |
| | | | | 27,090 |
Diversified Telecommunication Services - 1.88% |
B Communications, Ltd.* | | 1,100 | | | 25,300 |
IDT Corp., Class B*+ | | 800 | | | 10,200 |
| | | | | |
| | | | | 35,500 |
Electrical Equipment - - 0.29% |
Ocean Power Technologies, Inc.* | | 400 | | | 2,072 |
Orion Energy Systems, Inc.* | | 1,100 | | | 3,465 |
| | | | | |
| | | | | 5,537 |
Electronic Equipment, Instruments & Components - 1.97% |
Coherent, Inc.* | | 900 | | | 30,870 |
Richardson Electronics, Ltd. | | 700 | | | 6,300 |
| | | | | |
| | | | | 37,170 |
Energy Equipment & Services - 3.49% |
Lufkin Industries, Inc. | | 1,000 | | | 38,990 |
OYO Geospace Corp.* | | 200 | | | 9,696 |
Tesco Corp.* | | 1,400 | | | 17,192 |
| | | | | |
| | | | | 65,878 |
Food & Staples Retailing - 1.74% |
Weis Markets, Inc. | | 1,000 | | | 32,910 |
Gas Utilities - 4.08% | | | | | |
South Jersey Industries, Inc. | | 900 | | | 38,664 |
Southwest Gas Corp. | | 1,300 | | | 38,350 |
| | | | | |
| | | | | 77,014 |
Health Care Equipment & Supplies - 4.46% |
Angiodynamics, Inc.* | | 900 | | | 13,275 |
Cantel Medical Corp. | | 600 | | | 10,020 |
HeartWare International, Inc.* | | 500 | | | 35,035 |
MAKO Surgical Corp.*+ | | 1,300 | | | 16,185 |
OraSure Technologies, Inc.* | | 2,100 | | | 9,723 |
| | | | | |
| | | | | 84,238 |
Health Care Providers & Services - 8.91% |
Catalyst Health Solutions, Inc.* | | 1,000 | | | 34,500 |
Ensign Group, Inc. (The) | | 800 | | | 13,216 |
| | |
Bridgeway Small-Cap Momentum Fund SCHEDULE OF INVESTMENTS (continued) | | |
Showing percentage of net assets as of June 30, 2010
| | | | | | | |
Industry Company | | Shares | | Value | | |
| | | | | | | |
Common Stocks (continued) | | |
Health Care Providers & Services (continued) | | |
Healthspring, Inc.* | | 2,200 | | $ | 34,122 | | |
HMS Holdings Corp.* | | 740 | | | 40,123 | | |
Rural/Metro Corp.* | | 900 | | | 7,326 | | |
Universal American Corp.* | | 2,700 | | | 38,880 | | |
| | | | | | | |
| | | | | 168,167 | | |
Hotels, Restaurants & Leisure - 2.53% | | |
CEC Entertainment, Inc.* | | 800 | | | 28,208 | | |
Peet’s Coffee & Tea, Inc.* | | 500 | | | 19,635 | | |
| | | | | | | |
| | | | | 47,843 | | |
Household Durables - 0.60% | | |
Flexsteel Industries | | 200 | | | 2,200 | | |
Libbey, Inc.*+ | | 700 | | | 9,086 | | |
| | | | | | | |
| | | | | 11,286 | | |
Household Products - 1.06% | | |
WD-40 Co. | | 600 | | | 20,040 | | |
Internet Software & Services - 4.08% | | |
GSI Commerce, Inc.* | | 1,450 | | | 41,760 | | |
Internap Network Services Corp.* | | 1,900 | | | 7,923 | | |
Internet Gold-Golden Lines, Ltd.*+ | | 700 | | | 14,791 | | |
Perficient, Inc.* | | 1,100 | | | 9,801 | | |
Subaye, Inc.* | | 300 | | | 2,700 | | |
| | | | | | | |
| | | | | 76,975 | | |
IT Services - 1.71% | | |
Acxiom Corp.* | | 2,200 | | | 32,318 | | |
Machinery - 0.69% | | |
China Valves Technology, Inc.*+ | | 1,400 | | | 13,062 | | |
Media - 4.22% | | |
A.H. Belo Corp., Class A*+ | | 900 | | | 5,976 | | |
China MediaExpress Holdings, Inc.* | | 1,200 | | | 10,524 | | |
Cinemark Holdings, Inc. | | 2,400 | | | 31,560 | | |
McClatchy Co., Class A (The)*+ | | 3,200 | | | 11,648 | | |
Radio One, Inc., Class D*+ | | 2,000 | | | 2,560 | | |
Sinclair Broadcast Group, Inc., Class A* | | 3,000 | | | 17,490 | | |
| | | | | | | |
| | | | | 79,758 | | |
Metals & Mining - 2.52% | | |
Exeter Resource Corp.* | | 2,800 | | | 17,640 | | |
Taseko Mines, Ltd.* | | 7,000 | | | 29,960 | | |
| | | | | | | |
| | | | | 47,600 | | |
| | | | | |
Industry Company | | Shares | | Value |
| | | | | |
| | | | | |
Oil, Gas & Consumable Fuels - 7.74% |
American Oil & Gas, Inc.* | | 2,300 | | $ | 14,444 |
Crosstex Energy, Inc.* | | 1,700 | | | 10,897 |
Enbridge Energy Management LLC* | | 640 | | | 32,640 |
Evolution Petroleum Corp.* | | 1,000 | | | 5,010 |
Gran Tierra Energy, Inc.* | | 7,200 | | | 35,712 |
Northern Oil & Gas, Inc.* | | 1,900 | | | 24,396 |
REX American Resources Corp.* | | 400 | | | 6,400 |
Vanguard Natural Resources LLC+ | | 800 | | | 16,720 |
| | | | | |
| | | | | 146,219 |
Personal Products - 2.84% |
Nu Skin Enterprises, Inc., Class A | | 1,300 | | | 32,409 |
Revlon, Inc., Class A* | | 1,900 | | | 21,204 |
| | | | | |
| | | | | 53,613 |
Pharmaceuticals - 1.82% |
Impax Laboratories, Inc.* | | 1,800 | | | 34,308 |
Real Estate Investment Trusts (REITs) - 5.89% |
Ashford Hospitality Trust, Inc.* | | 2,000 | | | 14,660 |
Cogdell Spencer, Inc. | | 1,800 | | | 12,168 |
Equity Lifestyle Properties, Inc. | | 800 | | | 38,584 |
First Potomac Realty Trust | | 1,400 | | | 20,118 |
Pennsylvania Real Estate Investment Trust | | 2,100 | | | 25,662 |
| | | | | |
| | | | | 111,192 |
Road & Rail - 0.43% | | | | | |
Patriot Transportation Holding, Inc.* | | 100 | | | 8,091 |
Semiconductors & Semiconductor Equipment - 0.48% |
Mindspeed Technologies, Inc.* | | 1,200 | | | 8,988 |
Software - 3.14% |
Epicor Software Corp.* | | 2,400 | | | 19,176 |
Guidance Software, Inc.* | | 900 | | | 4,698 |
SuccessFactors, Inc.*+ | | 1,700 | | | 35,343 |
| | | | | |
| | | | | 59,217 |
Specialty Retail - 5.23% |
AutoChina International, Ltd.*+ | | 700 | | | 18,872 |
Brown Shoe Co., Inc. | | 1,600 | | | 24,288 |
DSW, Inc., Class A* | | 1,300 | | | 29,198 |
| | |
68 | | Annual Report | June 30, 2010 |
| | |
Bridgeway Small-Cap Momentum Fund SCHEDULE OF INVESTMENTS (continued) | | |
Showing percentage of net assets as of June 30, 2010
| | | | | | | |
Industry Company | | Shares | | Value | | |
| | | | | | | |
Common Stocks (continued) | | |
Specialty Retail (continued) | | |
Hibbett Sports, Inc.* | | 1,100 | | $ | 26,356 | | |
| | | | | | | |
| | | | | 98,714 | | |
Textiles, Apparel & Luxury Goods - 4.23% | | |
Deckers Outdoor Corp.* | | 300 | | | 42,861 | | |
Delta Apparel, Inc.* | | 300 | | | 4,380 | | |
Rocky Brands, Inc.* | | 300 | | | 1,917 | | |
Timberland Co., Class A (The)* | | 1,900 | | | 30,685 | | |
| | | | | | | |
| | | | | 79,843 | | |
Thrifts & Mortgage Finance - 0.30% | | |
Bofl Holding, Inc.* | | 400 | | | 5,648 | | |
| | | | | | | |
TOTAL COMMON STOCKS - 97.70% | | | 1,844,701 | | |
| | | | | | | |
(Cost $1,976,537) | | | | | | | |
EXCHANGE TRADED FUND - 2.27% | | |
iShares Russell 2000 Index Fund+ | | 700 | | | 42,756 | | |
| | | | | | | |
TOTAL EXCHANGE TRADED FUND - 2.27% | | | 42,756 | | |
| | | | | | | |
(Cost $46,371) | | | | | | | |
TOTAL INVESTMENTS - 99.97% | | | | $ | 1,887,457 | | |
(Cost $2,022,908) | | | | | | | |
Other Assets in Excess of Liabilities - 0.03% | | | 652 | | |
| | | | | | | |
NET ASSETS - 100.00% | | | | $ | 1,888,109 | | |
| | | | | | | |
* Non-income producing security. + This security or a portion of the security is out on loan at June 30, 2010. Total loaned securities had a market value of $202,346 at June 30, 2010. LLC - Limited Liability Co. |
Summary of inputs used to value the Fund’s investments as of 06/30/2010 are as follows (See Note 2 in Notes to Financial Statements):
| | | | | | | | |
| | | | | Valuation Inputs | | |
| | | Investment in Securities (Market Value) |
| | | Level 1
Quoted
Prices | | Level 2
Significant
Observable
Inputs | | Level 3
Significant
Unobservable
Inputs | | Total |
Common Stocks | | $1,844,701 | | $— | | $— | | $1,844,701 |
Exchange-Traded Fund | | 42,756 | | — | | — | | 42,756 |
| | | | | | | | |
TOTAL | | $1,887,457 | | $— | | $— | | $1,887,457 |
| | | | | | | | |
See Notes to Financial Statements.
| | |
Small-Cap Growth Fund MANAGER’S COMMENTARY | | |
June 30, 2010
Dear Fellow Small-Cap Growth Fund Shareholder,
In the June quarter, our Fund declined 11.43%, underperforming our primary market benchmark, the Russell 2000 Growth Index (down 9.22%) and our peer benchmark, the Lipper Small-Cap Growth Funds Index (down 9.46%). As detailed on page 3, the lack of traction continues to affect our growth leaning models — and thus our growth leaning Funds — the most severely. This was a poor quarter on an absolute basis and relative basis.
For the fiscal year ended June 30, 2010, our Fund increased 8.44%, trailing the returns of the Russell 2000 Growth Index (up 17.96) and the Lipper Small-Cap Growth Funds Index (up 18.22%). Performance details appear below. The Fund continues to trail its benchmarks since inception as the last two years of returns have really taken their toll on performance. As long-term investors, we are disappointed in this track record.
The table below presents our June quarter, one-year, five-year and life-to-date financial results according to the formula required by the SEC. See the next page for a graph of performance from inception to June 30, 2010.
| | | | | | | | |
| | | June Qtr.
4/1/10 to 6/30/10 | | 1 Year
7/1/09
to 6/30/10 | | 5 Year
7/1/05
to 6/30/10 | | Life-to-Date
10/31/03 to 6/30/10 |
| | | | |
Small-Cap Growth Fund | | -11.43% | | 8.44% | | -5.34% | | -1.29% |
Russell 2000 Growth Index | | -9.22% | | 17.96% | | 1.14% | | 2.90% |
Lipper Small-Cap Growth Funds Index | | -9.46% | | 18.22% | | -0.14% | | 1.68% |
Performance figures quoted in the table above and graph below represent past performance and are no guarantee of future results. Total return figures in the table above include the reinvestment of dividends and capital gains. The table above and the graph below do not reflect the deduction of taxes that a shareholder would pay on Fund distributions or the redemption of Fund shares.
The Russell 2000 Growth Index is an unmanaged index that consists of stocks in the Russell 2000 Index with higher price-to-book ratios and higher forecasted growth values with dividends reinvested. The Lipper Small-Cap Growth Funds Index is an index of small-company, growth-oriented funds compiled by Lipper, Inc. It is not possible to invest directly in an index. Periods longer than one year are annualized.
According to data from Lipper, Inc. as of June 30, 2010, Small-Cap Growth Fund ranked 513th of 534 small-cap growth funds for the twelve-month period ended June 30, 2010, 388th of 394 over the last five years and 325th of 339 such funds since inception in October, 2003. Lipper, Inc. is an independent mutual fund rating service that ranks funds in various fund categories by making comparative calculations using total returns.
| | |
| 70 | | Annual Report | June 30, 2010 |
| | |
Small-Cap Growth Fund MANAGER’S COMMENTARY (continued) | | |
Small-Cap Growth Fund vs. Russell 2000 Growth Index & Lipper Small-Cap Growth Funds Index
from Inception 10/31/03 to 6/30/10
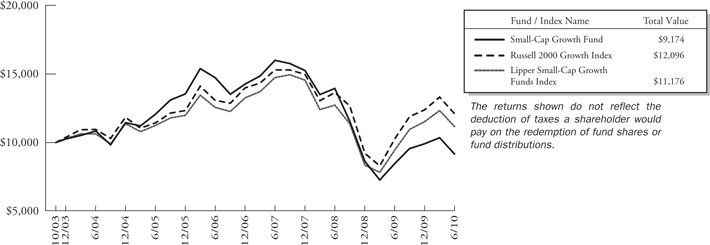
Detailed Explanation of Quarterly Performance — What Worked
The Short Version: Technology stocks were among our best performers.
Despite the difficulties brought on by such global factors as the European sovereign debt crisis, our models uncovered a number of companies with very strong returns. Information Technology companies, in particular, were highlights among the ten best Fund performers as four related holdings comprised the list. Combined, these IT stocks contributed over one-and-a-quarter percent to the overall return.
These are the ten stocks that performed the best for the Fund during the quarter ended June 30, 2010:
| | | | | | |
| Rank | | Description | | Industry | | % Gain |
1 | | Cirrus Logic, Inc. | | Semiconductors & Semiconductor Equipment | | 88.4% |
2 | | Odyssey HealthCare, Inc. | | Health Care Providers & Services | | 46.4% |
3 | | American Italian Pasta Co. | | Food Products | | 35.5% |
4 | | Keryx Biopharmaceuticals, Inc. | | Biotechnology | | 33.6% |
5 | | Boston Beer Co., Inc. | | Beverages | | 29.1% |
6 | | Lionbridge Technologies, Inc. | | IT Services | | 25.9% |
7 | | American Medical Systems Holdings, Inc. | | Health Care Equipment & Supplies | | 19.1% |
8 | | Polypore International, Inc. | | Electrical Equipment | | 13.0% |
9 | | Sapient Corp. | | IT Services | | 10.9% |
10 | | Ceva, Inc. | | Semiconductors & Semiconductor Equipment | | 8.6% |
Apple’s success gave a boost to a number of its suppliers. Cirrus Logic manufactures and sells audio chips to speaker makers Bose and Sony . . . and another key customer named Apple. So when Apple launched the iPad and ultimately sold upwards of 3 million units, Cirrus was there to benefit. When Apple introduced the next new iPhone this past quarter, Cirrus was there to benefit. In April the company offered revenue projections that beat Wall Street expectations and has even generated a position “shout out” or two on “Mad Money” with Jim Cramer. There’s plenty of Wall Street hype to accompany the excellent financial returns. Cirrus has enjoyed living off of Apple’s coattails and has generated new business relationships because of its success with that growing product line. It was the Fund’s best performer over the past three months and contributed under one percent to the overall return.
| | |
Small-Cap Growth Fund MANAGER’S COMMENTARY (continued) | | |
Detailed Explanation of Quarterly Performance — What Didn’t Work
The Short Version: Some technology and consumer discretionary stocks hurt the most.
While information technology holdings were prominent on the top performer list, the sector certainly was not immune to difficulties during the quarter. Three technology related companies appear on the ten worst performers list. Altogether they cost the fund over two percent in return. Additionally, four consumer discretionary holdings were among the worst performers as the depressed labor market continued to take its toll on retail and overall consumer activity.
These are the ten stocks that performed the worst for the Fund during the quarter ended June 30, 2010:
| | | | | | |
| Rank | | Description | | Industry | | % Loss |
1 | | Telestone Technologies Corp. | | Communications Equipment | | -51.8% |
2 | | Unisys Corp. | | IT Services | | -47.0% |
3 | | Corinthian Colleges, Inc. | | Diversified Consumer Services | | -44.0% |
4 | | Bon-Ton Stores, Inc. (The) | | Multiline Retail | | -41.3% |
5 | | Gleacher & Co, Inc. | | Capital Markets | | -39.9% |
6 | | MarineMax, Inc. | | Specialty Retail | | -35.5% |
7 | | priceline.com, Inc. | | Internet & Catalog Retail | | -29.0% |
8 | | Integrated Silicon Solution, Inc. | | Semiconductors & Semiconductor Equipment | | -28.5% |
9 | | Pinnacle Airlines Corp. | | Airlines | | -27.7% |
10 | | Dril-Quip, Inc. | | Energy Equipment & Services | | -27.7% |
Sometimes a global presence hinders a firm’s operations, particularly when foreign governments make decisions beyond management’s control. Unisys Corp. provides outsourced IT services to business enterprises and governments across the globe. Early in the year, Venezuelan President Hugo Chavez took actions to devalue the country’s currency, a move that had a dramatic (negative) impact on multinational companies. The SEC later labeled Venezuela’s economy as “hyperinflationary,” and domestic companies that engaged in operations there were forced to incur a charge to earnings. As a result, Unisys took a hit of $20 million in the first quarter, despite strong operating profits. Its stock price dropped almost 50% in the three-month period, and it was the second worst performer in the Fund.
Detailed Explanation of Fiscal Year Performance — What Worked
The Short Version: In the aftermath of the dramatic 2008 downturn, some of the riskiest and most battered companies came roaring back the most. While our Fund was underrepresented in these two categories, we nevertheless held some strong performers, one with a triple digit return. Five sectors were represented on the list of best performers. The top nine best performers each gained over 50% during the 12-month period. Information technology companies were well-represented during the fiscal year, including three of the top five performers.
These are the ten stocks that performed the best for the Fund during the fiscal year ended June 30, 2010:
| | | | | | |
| Rank | | Description | | Industry | | % Gain |
1 | | Cirrus Logic, Inc. | | Semiconductors & Semiconductor Equipment | | 118.7% |
2 | | Odyssey HealthCare, Inc. | | Health Care Providers & Services | | 90.2% |
3 | | Cognizant Technology Solutions Corp. | | IT Services | | 87.5% |
4 | | American Italian Pasta Co. | | Food Products | | 80.7% |
5 | | Sapient Corp. | | IT Services | | 67.7% |
6 | | priceline.com, Inc. | | Internet & Catalog Retail | | 62.3% |
7 | | CSG Systems International, Inc. | | IT Services | | 60.7% |
8 | | Jos. A. Bank Clothiers, Inc. | | Specialty Retail | | 56.7% |
9 | | Triangle Capital Corp. | | Capital Markets | | 52.8% |
10 | | Tractor Supply Co. | | Specialty Retail | | 48.2% |
| | |
72 | | Annual Report | June 30, 2010 |
| | |
Small-Cap Growth Fund MANAGER’S COMMENTARY (continued) | | |
Cognizant Technology provides outsourced technology services worldwide. Much of its operations take place in Asian emerging markets, such as India, and its profits are quite high, as it benefits from the lower labor costs. As global firms look for ways to cut expenses in the aftermath of the economic downturn, many have turned to outsourcing certain technology areas. India’s tech sector has surged, even during these challenging times, boosting Cognizant’s earnings beyond Wall Street expectations over the past few quarters. Since Europe is a major market, some analysts fear that future operations may be impacted by the declining value of the euro. In June, Cognizant continued in growth mode and announced that it was acquiring a Paris-based consulting firm, Galileo Performance. Its stock price recently hit an all-time high, rising over 75% during the 12-month period. It was the Fund’s third best performer for the fiscal year and contributed over one-and-a-half percent to the overall return.
Detailed Explanation of Fiscal Year Performance — What Didn’t Work
The Short Version: Reflecting some of the same problems with the quarter and in spite of the double digit positive market returns, some stocks fared very poorly for the fiscal year.
As was the case for the quarter, consumer discretionary stocks took a significant bite out of fiscal year returns. Four are on the list below, including retail, consumer services, and textile companies.
These are the ten stocks that performed the worst for the Fund during the fiscal year ended June 30, 2010:
| | | | | | | | |
| Rank | | | | Description | | Industry | | % Loss |
1 | | | | Gleacher & Co., Inc. | | Capital Markets | | -56.9% |
2 | | | | Unisys Corp. | | IT Services | | -52.0% |
3 | | | | Spectrum Pharmaceuticals, Inc. | | Biotechnology | | -42.5% |
4 | | | | Corinthian Colleges, Inc. | | Diversified Consumer Services | | -41.8% |
5 | | | | Bon-Ton Stores, Inc. (The) | | Multiline Retail | | -41.3% |
6 | | | | Force Protection, Inc. | | Machinery | | -40.7% |
7 | | | | MarineMax, Inc. | | Specialty Retail | | -36.9% |
8 | | | | Telestone Technologies Corp. | | Communications Equipment | | -35.2% |
9 | | | | Culp, Inc. | | Textiles, Apparel & Luxury Goods | | -33.2% |
10 | | | | Orient Paper, Inc. | | Paper & Forest Products | | -32.2% |
Corinthian Colleges, Inc (CCI) offers for-profit post-secondary programs in the United States and Canada. In recent times, the industry has been criticized for poor oversight as numerous students incurred significant debt that they are unable to repay (and often without a solid education in return). In April, an official at the Department of Education compared the regulatory environment to that of Wall Street, a harsh reprimand in the aftermath of the financial debacle. In May, the company was downgraded by an analyst who forecast a decline in its enrollment as the government tightened aid requirements to help reduce student loan defaults. Its share price fell almost 50% during the quarter in spite of the fact that the company’s financial results continue to improve. Is the company significantly “oversold?” Our model indicates it may well be.
An interesting footnote to the Corinthian Colleges story highlights the degree to which much of a company’s price continues to be driven by events. On May 17 the company’s stock price soared 14% in the last 15 minutes of trading on the news that U.S. Education Deputy Undersecretary Robert Shireman, a for-profit watchdog, was stepping down.
Top Ten Holdings as of June 30, 2010
Three of the best performers of the quarter were also among the top 10 holdings at June 30: Cirrus Logic, American Medical Systems, and Sapient. Additionally, three health care equipment companies were among the top holdings at the end of the quarter. The Fund was broadly diversified, and no single holding accounted for greater than 2.7% of the net assets. The ten largest positions represented less than 25% of the total assets of the Fund.
| | |
Small-Cap Growth Fund MANAGER’S COMMENTARY (continued) | | |
| | | | | | |
| Rank | | Description | | Industry | | % of Net
Assets |
1 | | Jo-Ann Stores, Inc. | | Specialty Retail | | 2.7% |
2 | | Sirona Dental Systems, Inc. | | Health Care Equipment & Supplies | | 2.5% |
3 | | Align Technology, Inc. | | Health Care Equipment & Supplies | | 2.5% |
4 | | Cirrus Logic, Inc. | | Semiconductors & Semiconductor Equipment | | 2.5% |
5 | | Medicis Pharmaceutical Corp. | | Pharmaceuticals | | 2.4% |
6 | | Sanmina-SCI Corp. | | Electronic Equip., Instruments & Components | | 2.3% |
7 | | American Medical Systems Holdings, Inc. | | Health Care Equipment & Supplies | | 2.1% |
8 | | Southside Bancshares, Inc. | | Commercial Banks | | 2.1% |
9 | | Sapient Corp. | | IT Services | | 2.1% |
10 | | American Superconductor Corp. | | Electrical Equipment | | 2.0% |
| | Total | | | | 23.2% |
Industry Sector Representation as of June 30, 2010
The biggest allocation differences between the Fund and the Russell 2000 Growth Index were found in the consumer-discretionary and health-care sectors. In both cases, the models’ overweighting of these areas hurt the Fund, due to the sectors’ poor performance. The Fund’s largest allocation was in information technology, although it was actually slightly less concentrated than in our primary market benchmark.
| | | | | | | | | | | | | | |
| | | % of Net Assets | | | | | | % of Russell 2000
Growth Index | | | | | | Difference |
Consumer Discretionary | | 21.7% | | | | | | 14.1% | | | | | | 7.6% |
Consumer Staples | | 4.7% | | | | | | 10.1% | | | | | | -5.4% |
Energy | | 2.8% | | | | | | 10.1% | | | | | | -7.3% |
Financials | | 5.0% | | | | | | 4.6% | | | | | | 0.4% |
Health Care | | 20.8% | | | | | | 10.9% | | | | | | 9.9% |
Industrials | | 11.2% | | | | | | 13.0% | | | | | | -1.8% |
Information Technology | | 29.5% | | | | | | 31.5% | | | | | | -2.0% |
Materials | | 3.1% | | | | | | 4.6% | | | | | | -1.5% |
Telecommunication Services | | 0.0% | | | | | | 0.9% | | | | | | -0.9% |
Utilities | | 0.0% | | | | | | 0.2% | | | | | | -0.2% |
Cash | | 1.2% | | | | | | 0.0% | | | | | | 1.2% |
Total | | 100.0% | | | | | | 100.0% | | | | | | |
Disclaimer
The views expressed here are exclusively those of Fund management. These views, including those related to market sectors or individual stocks, are not meant as investment advice and should not be considered predictive in nature. Any favorable (or unfavorable) description of a holding applies only as of the quarter-end, June 30, 2010, unless otherwise stated. Security positions can and do change thereafter. Discussions of historical performance do not guarantee and may not be indicative of future performance.
Market volatility can significantly impact short-term performance. The Fund is not an appropriate investment for short-term investors. Investments in small companies generally carry greater risk than is customarily associated with larger companies. This additional risk is attributable to a number of factors, including the relatively limited financial resources that are typically available to small companies and the fact that small companies often have comparatively limited product lines. In addition, the stock of small companies tends to be more volatile than the stock of large companies, particularly in the short term and particularly in the early stages of an economic or market downturn. Shareholders of the Fund, therefore, are taking on more risk than if they invested in the stock market as a whole.
| | |
74 | | Annual Report | June 30, 2010 |
| | |
Small-Cap Growth Fund MANAGER’S COMMENTARY (continued) | | |
Conclusion
Thank you for your continued investment in Small-Cap Growth Fund. We encourage your feedback; your reactions and concerns are important to us.
Sincerely,
Your Investment Management Team
| | |
Bridgeway Small-Cap Growth Fund SCHEDULE OF INVESTMENTS | | |
Showing percentage of net assets as of June 30, 2010
| | | | | | | |
Industry Company | | Shares | | Value | | |
COMMON STOCKS - 98.82% | | |
Airlines - 1.98% | | |
Pinnacle Airlines Corp.*+ | | 92,600 | | $ | 503,744 | | |
UAL Corp.*+ | | 30,300 | | | 622,968 | | |
| | | | | | | |
| | | | | 1,126,712 | | |
Beverages - 1.74% | | |
Boston Beer Co., Inc., Class A* | | 14,700 | | | 991,515 | | |
Biotechnology - 2.61% | | |
Cubist Pharmaceuticals, Inc.* | | 29,500 | | | 607,700 | | |
Keryx Biopharmaceuticals, Inc.*+ | | 241,200 | | | 882,792 | | |
| | | | | | | |
| | | | | 1,490,492 | | |
Building Products - 1.21% | | |
Quanex Building Products Corp. | | 40,000 | | | 691,600 | | |
Capital Markets - 1.86% | | |
Gleacher & Co., Inc.* | | 194,000 | | | 494,700 | | |
Triangle Capital Corp. | | 39,837 | | | 566,482 | | |
| | | | | | | |
| | | | | 1,061,182 | | |
Chemicals - 2.32% | | |
KMG Chemicals, Inc.# | | 53,600 | | | 769,696 | | |
NewMarket Corp. | | 6,300 | | | 550,116 | | |
| | | | | | | |
| | | | | 1,319,812 | | |
Commercial Banks - 2.11% | | |
Southside Bancshares, Inc. | | 61,357 | | | 1,205,052 | | |
Commercial Services & Supplies - 3.98% | | |
APAC Customer Services, Inc.* | | 175,100 | | | 998,070 | | |
EnerNOC, Inc.*+ | | 20,000 | | | 628,800 | | |
Standard Parking Corp.* | | 40,500 | | | 641,115 | | |
| | | | | | | |
| | | | | 2,267,985 | | |
Communications Equipment - 3.84% | | |
Acme Packet, Inc.* | | 25,300 | | | 680,064 | | |
Digi International, Inc.* | | 62,700 | | | 518,529 | | |
Harmonic, Inc.* | | 109,400 | �� | | 595,136 | | |
Telestone Technologies Corp.*+ | | 46,900 | | | 395,836 | | |
| | | | | | | |
| | | | | 2,189,565 | | |
Computers & Peripherals - 0.94% | | |
Super Micro Computer, Inc.* | | 39,800 | | | 537,300 | | |
| | | | | | | |
Industry Company | | Shares | | Value | | |
| | |
Diversified Consumer Services - 2.78% | | |
Corinthian Colleges, Inc.*+ | | 88,200 | | $ | 868,770 | | |
Lincoln Educational Services Corp.* | | 34,800 | | | 716,532 | | |
| | | | | | | |
| | | | | 1,585,302 | | |
Electrical Equipment - - 3.22% | | |
American Superconductor Corp.*+ | | 43,500 | | | 1,161,015 | | |
Polypore International, Inc.* | | 29,600 | | | 673,104 | | |
| | | | | | | |
| | | | | 1,834,119 | | |
Electronic Equipment, Instruments & Components - 5.14% | | |
Checkpoint Systems, Inc.* | | 29,900 | | | 519,064 | | |
Power-One, Inc.*+ | | 77,800 | | | 525,150 | | |
Richardson Electronics, Ltd. | | 60,900 | | | 548,100 | | |
Sanmina-SCI Corp.* | | 98,400 | | | 1,339,224 | | |
| | | | | | | |
| | | | | 2,931,538 | | |
Energy Equipment & Services - 1.41% | | |
Dril-Quip, Inc.* | | 18,300 | | | 805,566 | | |
Food Products - 2.95% | | | | | | | |
Green Mountain Coffee Roasters, Inc.*+ | | 37,050 | | | 952,185 | | |
Lancaster Colony Corp. | | 13,725 | | | 732,366 | | |
| | | | | | | |
| | | | | 1,684,551 | | |
Health Care Equipment & Supplies - 9.58% | | |
Align Technology, Inc.*+ | | 95,900 | | | 1,426,033 | | |
American Medical Systems Holdings, Inc.* | | 54,800 | | | 1,212,176 | | |
Invacare Corp. | | 36,500 | | | 757,010 | | |
Orthofix International NV* | | 19,600 | | | 628,180 | | |
Sirona Dental Systems, Inc.* | | 41,300 | | | 1,438,892 | | |
| | | | | | | |
| | | | | 5,462,291 | | |
Health Care Providers & Services - 6.28% | | |
Almost Family, Inc.*+ | | 16,500 | | | 576,345 | | |
Amedisys, Inc.*+ | | 14,000 | | | 615,580 | | |
Corvel Corp.* | | 18,500 | | | 625,115 | | |
Emergency Medical Services Corp., Class A* | | 21,100 | | | 1,034,533 | | |
Providence Service Corp. (The)* | | 52,100 | | | 729,400 | | |
| | | | | | | |
| | | | | 3,580,973 | | |
Hotels, Restaurants & Leisure - 2.14% | | |
Peet’s Coffee & Tea, Inc.*+ | | 16,700 | | | 655,809 | | |
| | |
| 76 | | Annual Report | June 30, 2010 |
| | |
Bridgeway Small-Cap Growth Fund SCHEDULE OF INVESTMENTS (continued) | | |
Showing percentage of net assets as of June 30, 2010
| | | | | | | | | |
Industry Company | | | | Shares | | Value | | |
Common Stocks (continued) | | |
Hotels, Restaurants & Leisure (continued) | | |
Texas Roadhouse, Inc.* | | | | 44,633 | | $ | 563,268 | | |
| | | | | | | | | |
| | | | | | | 1,219,077 | | |
Internet Software & Services - 0.95% | | |
Equinix, Inc.*+ | | | | 6,700 | | | 544,174 | | |
IT Services - 7.07% | | |
Cognizant Technology Solutions Corp., Class A* | | | | 22,180 | | | 1,110,331 | | |
Lionbridge Technologies, Inc.* | | | | 199,500 | | | 911,715 | | |
Sapient Corp. | | | | 115,300 | | | 1,169,142 | | |
Unisys Corp.* | | | | 45,300 | | | 837,597 | | |
| | | | | | | | | |
| | | | | | | 4,028,785 | | |
Media - 2.75% | | |
Cinemark Holdings, Inc. | | | | 78,000 | | | 1,025,700 | | |
Entercom Communications Corp., Class A* | | | | 61,300 | | | 540,666 | | |
| | | | | | | | | |
| | | | | | | 1,566,366 | | |
Multiline Retail - 1.74% | | |
99 Cents Only Stores* | | | | 42,000 | | | 621,600 | | |
Bon-Ton Stores, Inc. (The)+ | | | | 37,700 | | | 367,575 | | |
| | | | | | | | | |
| | | | | | | 989,175 | | |
Oil, Gas & Consumable Fuels - 1.37% | | |
L&L Energy, Inc.*+ | | | | 90,500 | | | 778,300 | | |
Paper & Forest Products - 0.78% | | |
Orient Paper, Inc.* | | | | 66,400 | | | 443,552 | | |
Pharmaceuticals - 2.36% | | |
Medicis Pharmaceutical Corp., Class A | | | | 61,600 | | | 1,347,808 | | |
Professional Services - 0.83% | | | | | | | | | |
VSE Corp. | | | | 14,800 | | | 470,936 | | |
Semiconductors & Semiconductor Equipment - 10.42% | | |
Cirrus Logic, Inc.* | | | | 89,700 | | | 1,418,157 | | |
FSI International, Inc.*+ | | | | 136,800 | | | 573,192 | | |
Integrated Silicon Solution, Inc.* | | | | 108,500 | | | 818,090 | | |
Lattice Semiconductor Corp.* | | | | 146,100 | | | 634,074 | | |
Nanometrics, Inc.* | | | | 97,300 | | | 981,757 | | |
Ultra Clean Holdings, Inc.* | | | | 81,000 | | | 690,120 | | |
Veeco Instruments, Inc.* | | | | 24,000 | | | 822,720 | | |
| | | | | | | | | |
| | | | | | | 5,938,110 | | |
Software - 1.14% | | |
Informatica Corp.* | | | | 27,100 | | | 647,148 | | |
| | | | | | | | |
Industry Company | | Shares | | Value | |
| |
Specialty Retail - 10.38% | | | | |
Destination Maternity Corp.* | | 31,600 | | $ | 799,480 | |
Jo-Ann Stores, Inc.* | | 40,700 | | | 1,526,657 | |
Jos. A. Bank Clothiers, Inc.*+ | | 21,000 | | | 1,133,790 | |
Kirkland’s, Inc.* | | 43,800 | | | 739,125 | |
MarineMax, Inc.* | | 63,300 | | | 439,302 | |
Monro Muffler Brake, Inc. | | 16,700 | | | 660,151 | |
Tractor Supply Co. | | 10,200 | | | 621,894 | |
| | | | | | | | |
| | | 5,920,399 | |
Textiles, Apparel & Luxury Goods - 1.94% | | | | |
Culp, Inc.*+ | | 101,000 | | | 1,106,960 | |
Thrifts & Mortgage Finance - 1.00% | | | | |
Bofl Holding, Inc.* | | 40,300 | | | 569,036 | |
| | | | | | | | |
TOTAL COMMON STOCKS - 98.82% | | | 56,335,381 | |
| | | | | | | | |
(Cost $55,151,210) | |
| | | | | | | | | |
| | | |
| | | Rate^ | | | Shares | | Value | |
| |
MONEY MARKET FUND - 1.40% | | | | |
BlackRock Fed Fund | | 0.04 | % | | 800,290 | | | 800,290 | |
| | | | | | | | | |
TOTAL MONEY MARKET FUND - - 1.40% | | | 800,290 | |
| | | | | | | | | |
(Cost $800,290) | | | | |
| |
TOTAL INVESTMENTS - 100.22% | | $ | 57,135,671 | |
(Cost $55,951,500) | | | | |
Liabilities in Excess of Other Assets - (0.22%) | | | (124,286 | ) |
| | | | | | | | | |
NET ASSETS - 100.00% | | $ | 57,011,385 | |
| | | | | | | | | |
| * | Non-income producing security. |
| # | Securities, or a portion thereof, segregated to cover the Fund’s obligation under swap agreements. The total market value of segregated assets is $541,372. |
| ^ | Rate disclosed as of June 30, 2010. |
| + | This security or a portion of the security is out on loan at June 30, 2010. Total loaned securities had a market value of $11,358,969 at June 30, 2010. |
| | |
Bridgeway Small-Cap Growth Fund SCHEDULE OF INVESTMENTS (continued) | | |
| | | | | | | | | | | | | |
Summary of inputs used to value the Fund’s investments as of
06/30/2010 are as follows (See Note 2 in Notes to Financial Statements): | | |
| | | Valuation Inputs | | |
| | | Investment in Securities (Market Value) | | |
| | | Level 1
Quoted
Prices | | Level 2
Significant
Observable
Inputs | | Level 3
Significant
Unobservable
Inputs | | Total | | |
Common Stocks | | $ | 56,335,381 | | $ | — | | $— | | $ | 56,335,381 | | |
Money Market Fund | | | — | | | 800,290 | | — | | | 800,290 | | |
| | | | | | | | | | | | | |
TOTAL | | $ | 56,335,381 | | $ | 800,290 | | $— | | $ | 57,135,671 | | |
| | | | | | | | | | | | | |
Other Financial Instruments** | | $ | — | | $ | (45,207) | | $— | | $ | (45,207) | | |
| | | | | | | | | | | | | |
** Other financial instruments are derivative instruments not reflected in the Schedule of Investments, such as futures, forwards and swap contracts, which are valued at the unrealized appreciation/ depreciation on the investment. See Notes to Financial Statements. | | |
| | |
78 | | Annual Report | June 30, 2010 |
| | |
Small-Cap Value Fund MANAGER’S COMMENTARY | | |
June 30, 2010
Dear Fellow Small-Cap Value Fund Shareholder,
In the June quarter, our Fund declined 7.51%, but outperformed our performance benchmarks by a fair margin. The Russell 2000 Value Index was down 10.60%, while our peer benchmark, the Lipper Small-Cap Value Funds Index, was down 9.86%. We are pleased to have provided some “cushion” against the market’s double digit quarter decline, but still have a ways to go to catch up from our underperformance during several prior quarters.
For the fiscal year ended June 30, 2010, our Fund increased 18.35%, but trailed the returns of the Russell 2000 Value Index (up 25.07%) and the Lipper Small-Cap Value Funds Index (up 25.50%). Performance details appear below and reflect the unusual market environment of the last year (see page 2), which was not favorable to our Fund.
The table below presents our June quarter, one-year, five-year and life-to-date financial results according to the formula required by the SEC. See the next page for a graph of performance from inception to June 30, 2010.
| | | | | | | | |
| | | June Qtr. 4/1/10 to 6/30/10 | | 1 Year
7/1/09
to 6/30/10 | | 5 Year
7/1/05
to 6/30/10 | | Life-to-Date
10/31/03
to 6/30/10 |
| | | | |
Small-Cap Value Fund | | -7.51% | | 18.35% | | -1.92% | | 2.26% |
Russell 2000 Value Index | | -10.60% | | 25.07% | | -0.51% | | 3.94% |
Lipper Small-Cap Value Funds Index | | -9.86% | | 25.50% | | 0.90% | | 4.99% |
Performance figures quoted in the table above and graph below represent past performance and are no guarantee of future results. Total return figures in the table above include the reinvestment of dividends and capital gains. The table above and the graph below do not reflect the deduction of taxes that a shareholder would pay on Fund distributions or the redemption of Fund shares.
The Russell 2000 Value Index is an unmanaged index that consists of stocks in the Russell 2000 Index with higher price-to-book ratios and higher forecasted growth values with dividends reinvested. The Lipper Small-Cap Value Funds Index is an index of small-company, value-oriented funds compiled by Lipper, Inc. It is not possible to invest directly in an index. Periods longer than one year are annualized.
According to data from Lipper, Inc. as of June 30, 2010, Small-Cap Value Fund ranked 574th of 760 small-cap core funds for the twelve-month period ended June 30, 2010, 433rd of 551 over the last five years and 362nd of 458 such funds since inception in October, 2003. Lipper, Inc. is an independent mutual fund rating service that ranks funds in various fund categories by making comparative calculations using total returns.
| | |
Small-Cap Value Fund MANAGER’S COMMENTARY (continued) | | |
Small-Cap Value Fund vs. Russell 2000 Value Index & Lipper Small-Cap Value Funds Index from Inception 10/31/03 to 6/30/10
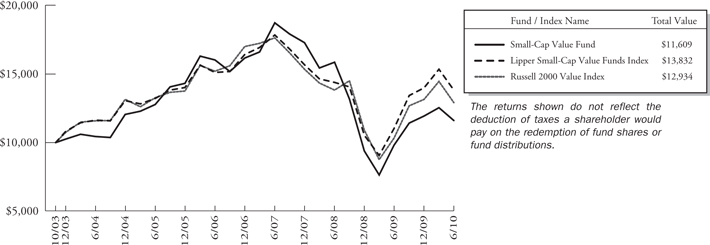
Detailed Explanation of Quarterly Performance — What Worked
The Short Version: Our best stocks reflected the diversity of our holdings. Ten different industries appeared on our ten-best performers list for the quarter.
Despite the difficulties brought on by such global factors as the European sovereign debt crisis, our models uncovered a number of companies with stellar returns. In fact, eight different sectors and ten industries were represented in the ten best performers list for the June quarter, demonstrating that diamonds can be found in the rough.
These are the ten stocks that performed the best for the Fund during the quarter ended June 30, 2010:
| | | | | | |
| Rank | | Description | | Industry | | % Gain |
1 | | US Gold Corp. | | Metals & Mining | | 85.6% |
2 | | Vonage Holdings Corp. | | Diversified Telecommunication Services | | 70.4% |
3 | | ev3, Inc. | | Health Care Equipment & Supplies | | 40.2% |
4 | | Polypore International, Inc. | | Electrical Equipment | | 30.2% |
5 | | Evercore Partners, Inc. | | Capital Markets | | 18.4% |
6 | | Callon Petroleum Co. | | Oil, Gas & Consumable Fuels | | 17.5% |
7 | | PowerSecure International, Inc. | | Electrical Equipment | | 15.4% |
8 | | Carrols Restaurant Group, Inc. | | Hotels Restaurants & Leisure | | 14.3% |
9 | | Valassis Communication, Inc. | | Media | | 14.0% |
10 | | Seneca Foods Corp. | | Food Products | | 10.8% |
The performance of our top stock, US Gold, reflects some stellar drilling results, the continuing increase of gold prices, and the flight to gold as a defensive play in the recent stock market decline.
ev3 manufactures medical devices that allow for small incisions during surgery. In May, its stock reached a 52-week high when the company completed a regulatory filing for a product used in procedures related to cerebral aneurysms. A few weeks later, Covidien PLC, a Dublin, Ireland-based health-care corporation, agreed to acquire ev3 for $2.6 billion, a move aimed at improving global revenue growth. Its share price surged almost 20% in the aftermath of the announcement. ev3 was the Fund’s third top performer (in absolute terms), rising over 40% and contributing over one percent to the overall return during the quarter.
| | |
80 | | Annual Report | June 30, 2010 |
| | |
Small-Cap Value Fund MANAGER’S COMMENTARY (continued) | | |
Detailed Explanation of Quarterly Performance — What Didn’t Work
The Short Version: After three quarters of positive returns, consumer discretionary stocks took more than a “breather” in the June quarter, as did some technology companies. Our worst performer, while a U.S. stock, demonstrates the risk of foreign operations.
Consumer discretionary and information technology stocks loomed large on the list of poor performers in the June quarter as four related companies from each sector made the list. Combined, those eight holdings cost the Fund over five percent in return. All ten of the stocks below lost over 25% during the three-month period as the equity markets took negative cues from the potential debt “contagion” spreading in Europe and the ongoing labor woes at home.
These are the ten stocks that performed the worst for the Fund during the quarter ended June 30, 2010:
| | | | | | |
| Rank | | Description | | Industry | | % Loss |
1 | | Unisys Corp. | | IT Services | | -47.0% |
2 | | La-Z-Boy, Inc. | | Household Durables | | -40.8% |
3 | | Agilysys, Inc. | | Electronic Equip., Instruments & Components | | -40.1% |
4 | | MarineMax, Inc. | | Specialty Retail | | -35.5% |
5 | | Radian Group, Inc. | | Thrifts & Mortgage Finance | | -34.3% |
6 | | Utstarcom, Inc. | | Communications Equipment | | -34.1% |
7 | | Integrated Silicon Solution, Inc. | | Semiconductors & Semiconductor Equipment | | -28.5% |
8 | | Cinemark Holdings, Inc. | | Media | | -27.4% |
9 | | Biglari Holdings, Inc. | | Hotels Restaurants & Leisure | | -27.3% |
10 | | Crosstex Energy, Inc. | | Oil, Gas & Consumable Fuels | | -26.3% |
Sometimes a global presence hinders a firm’s operations, particularly when foreign governments make decisions beyond management’s control. Unisys Corp. provides outsourced IT services to business enterprises and governments across the globe. Early in the year, Venezuelan President Hugo Chavez took actions to devalue the country’s currency, a move that had a dramatic (negative) impact on multinational companies. The SEC later labeled Venezuela’s economy as “hyperinflationary,” and domestic companies that engaged in operations there were forced to incur a charge to earnings. As a result, Unisys took a hit of $20 million in the first quarter, despite strong operating profits. Its stock price dropped almost 50% in the three-month period, and it was the worst performer in the Fund.
Detailed Explanation of Fiscal Year Performance — What Worked
The Short Version: In the aftermath of the dramatic 2008 downturn, some of the riskiest and most battered companies came roaring back the most. While our Fund was underrepresented in this category, we nevertheless held four stocks with triple digit returns.
Six sectors were represented on the list of best performers for the fiscal year, and the ten holdings combined contributed over 11% to the Fund’s return. In fact, four holdings at least doubled in value during the twelve-month period.
| | |
Small-Cap Value Fund MANAGER’S COMMENTARY (continued) | | |
These are the ten stocks that performed the best for the Fund during the fiscal year ended June 30, 2010:
| | | | | | | | |
| Rank | | | | Description | | Industry | | % Gain |
1 | | | | Callon Petroleum Co. | | Oil, Gas & Consumable Fuels | | 218.2% |
2 | | | | Rosetta Resources, Inc. | | Oil, Gas & Consumable Fuels | | 176.5% |
3 | | | | Unitrin, Inc. | | Insurance | | 121.4% |
4 | | | | Polypore International, Inc. | | Electrical Equipment | | 104.5% |
5 | | | | West Marine, Inc. | | Specialty Retail | | 97.5% |
6 | | | | World Accpetance Corp. | | Consumer Finance | | 92.4% |
7 | | | | Kirkland’s, Inc. | | Specialty Retail | | 90.8% |
8 | | | | US Gold Corp. | | Metals & Mining | | 89.8% |
9 | | | | RR Donnelley & Sons Co. | | Commercial Services & Supplies | | 88.8% |
10 | | | | ev3, Inc. | | Health Care Equipment & Supplies | | 75.7% |
Exploration and production companies have benefited from higher oil prices after the commodity plummeted in value in the midst of the economic downturn. Crude began a steady rise from the mid-$30’s in early 2009 to the $80s during the past quarter. Companies such as Callon Petroleum and Rosetta Resources were able to recognize financial windfalls. These two holdings were the Fund’s best performers for the twelve-month period and contributed over two percent to the overall return. While Callon has potential exposure to the current problems in the Gulf of Mexico, the company has also made recent investments in shale and may be making a strategic move into more on-shore exploration.
Detailed Explanation of Fiscal Year Performance — What Didn’t Work
The Short Version: Reflecting some of the same problems with the quarter and in spite of the double digit positive market returns, some stocks fared very poorly for the fiscal year.
As was the case for the quarter, the majority of the holdings in the worst performing list for the fiscal year came from the consumer discretionary (six) and information technology (three) sectors. Despite the economic recovery, consumers and businesses continue to hold off on many discretionary purchases. In total, these stocks cost the Fund just less than five percent in performance. While the fiscal year started off strong and continued strong for the first three quarters, many of the losses occurred during the final three months.
These are the ten stocks that performed the worst for the Fund during the fiscal year ended June 30, 2010:
| | | | | | |
Rank | | Description | | Industry | | % Loss |
1 | | Spartan Motors, Inc. | | Auto Components | | -48.0% |
2 | | Unisys Corp. | | IT Services | | -45.3% |
3 | | Coldwater Creek, Inc. | | Specialty Retail | | -41.1% |
4 | | Agilysys, Inc. | | Electronic Equip., Instruments & Components | | -39.6% |
5 | | MarineMax, Inc. | | Specialty Retail | | -36.2% |
6 | | LSB Industries, Inc. | | Chemicals | | -31.2% |
7 | | Regis Corp. | | Diversified Consumer Services | | -28.9% |
8 | | Fred’s, Inc. | | Multiline Retail | | -26.1% |
9 | | Mediacom Communications Corp. | | Media | | -23.3% |
10 | | Super Micro Computer, Inc. | | Computers & Peripherals | | -22.7% |
Given the weak labor picture, some retailers continue to struggle. Three of the worst performers over the past twelve months were retail companies; combined, they cost the Fund almost one percent in return. While two of the companies focus more on specialty lines (Coldwater Creek – women’s apparel and accessories, and MarineMax – recreational boats), the third operates discount stores, proving that virtually no type of retailer is immune from the economic difficulties.
| | |
| 82 | | Annual Report | June 30, 2010 |
| | |
Small-Cap Value Fund MANAGER’S COMMENTARY (continued) | | |
Top Ten Holdings as of June 30, 2010
Three of the best performers of the quarter were also among the ten largest holdings on June 30: Polypore International, Vonage Holdings, and Valassis Communications. The Fund was broadly diversified across sectors, and no single holding accounted for greater than 3.6% of the net assets. The ten largest positions represented less than 30% of the total assets of the Fund.
| | | | | | |
| Rank | | Description | | Industry | | % of Net
Assets |
1 | | Polypore International, Inc. | | Electrical Equipment | | 3.6% |
2 | | Vonage Holdings Corp. | | Diversified Telecommunication Services | | 3.6% |
3 | | Jo-Ann Stores, Inc. | | Specialty Retail | | 2.9% |
4 | | Vanguard Natural Resources LLC | | Oil, Gas & Consumable Fuels | | 2.6% |
5 | | Select Comfort Corp. | | Specialty Retail | | 2.6% |
6 | | Sanmina-SCI Corp. | | Electronic Equip., Instruments | | 2.5% |
7 | | World Acceptance Corp. | | Consumer Finance | | 2.5% |
8 | | Healthspring, Inc. | | Health Care Providers & Services | | 2.4% |
9 | | Cinemark Holdings, Inc. | | Media | | 2.4% |
10 | | Valassis Communications, Inc. | | Media | | 2.2% |
| | Total | | | | 27.3% |
Industry Sector Representation as of June 30, 2010
The Fund held a much smaller allocation in financial companies than the Russell 2000 Value Index. We were rewarded for that move as related companies struggled amid the ongoing debate over industry reform. However, the Fund was heavily overrepresented with consumer discretionary holdings, and their difficulties pulled down our performance overall.
| | | | | | | | | | | | | | |
| | | % of Net Assets | | | | | | % of
Russell 2000
Value Index | | | | | | Difference |
Consumer Discretionary | | 19.1% | | | | | | 9.7% | | | | | | 9.4% |
Consumer Staples | | 1.5% | | | | | | 3.4% | | | | | | -1.9% |
Energy | | 5.5% | | | | | | 6.8% | | | | | | -1.3% |
Financials | | 28.7% | | | | | | 38.6% | | | | | | -9.9% |
Health Care | | 8.7% | | | | | | 5.8% | | | | | | 2.9% |
Industrials | | 14.7% | | | | | | 14.0% | | | | | | 0.7% |
Information Technology | | 11.8% | | | | | | 9.4% | | | | | | 2.4% |
Materials | | 1.1% | | | | | | 5.2% | | | | | | -4.1% |
Telecommunication Services | | 3.6% | | | | | | 0.6% | | | | | | 3.0% |
Utilities | | 4.2% | | | | | | 6.5% | | | | | | -2.3% |
Cash | | 1.1% | | | | | | 0.0% | | | | | | 1.1% |
Total | | 100.0% | | | | | | 100.0% | | | | | | |
Disclaimer
The views expressed here are exclusively those of Fund management. These views, including those related to market sectors or individual stocks, are not meant as investment advice and should not be considered predictive in nature. Any favorable (or unfavorable) description of a holding applies only as of the quarter-end, June 30, 2010, unless otherwise stated. Security positions can and do change thereafter. Discussions of historical performance do not guarantee and may not be indicative of future performance.
Market volatility can significantly impact short-term performance. The Fund is not an appropriate investment for short-term investors. Investments in small companies generally carry greater risk than is customarily associated with larger companies. This additional risk is attributable to a number of factors, including the relatively limited financial resources that are typically
| | |
Small-Cap Value Fund MANAGER’S COMMENTARY (continued) | | |
available to small companies and the fact that small companies often have comparatively limited product lines. In addition, the stock of small companies tends to be more volatile than the stock of large companies, particularly in the short term and particularly in the early stages of an economic or market downturn. Shareholders of the Fund, therefore, are taking on more risk than if they invested in the stock market as a whole.
Conclusion
Thank you for your continued investment in Small-Cap Value Fund. We encourage your feedback; your reactions and concerns are important to us.
Sincerely,
Your Investment Management Team
| | |
| 84 | | Annual Report | June 30, 2010 |
| | |
Bridgeway Small-Cap Value Fund SCHEDULE OF INVESTMENTS | | |
Showing percentage of net assets as of June 30, 2010
| | | | | | | |
Industry Company | | Shares | | Value | | |
COMMON STOCKS - 99.10% | | |
Airlines - 1.05% | | | | | | | |
US Airways Group, Inc.*+ | | 132,100 | | $ | 1,137,381 | | |
Building Products - 1.15% | | | | | | | |
Quanex Building Products Corp. | | 72,200 | | | 1,248,338 | | |
Capital Markets - 2.36% | | | | | | | |
BlackRock Kelso Capital Corp.+ | | 124,500 | | | 1,228,815 | | |
Prospect Capital Corp.+ | | 138,800 | | | 1,339,420 | | |
| | | | | | | |
| | | | | 2,568,235 | | |
Commercial Banks - 2.67% | | |
Alliance Financial Corp. | | 27,500 | | | 764,500 | | |
Bancorp, Inc.* | | 138,300 | | | 1,082,889 | | |
Southwest Bancorp, Inc. | | 79,800 | | | 1,060,542 | | |
| | | | | | | |
| | | | | 2,907,931 | | |
Commercial Services & Supplies - 1.38% | | |
M&F Worldwide Corp.* | | 55,200 | | | 1,495,920 | | |
Communications Equipment - 0.52% | | |
UTStarcom, Inc.*+ | | 305,800 | | | 562,672 | | |
Computers & Peripherals - 0.97% | | |
Super Micro Computer, Inc.*# | | 78,100 | | | 1,054,350 | | |
Construction & Engineering - 1.61% | | |
EMCOR Group, Inc.* | | 75,700 | | | 1,753,969 | | |
Consumer Finance - 5.70% | | | | | | | |
Dollar Financial Corp.* | | 57,000 | | | 1,128,030 | | |
Nelnet, Inc., Class A | | 120,800 | | | 2,329,024 | | |
World Acceptance Corp.*+ | | 71,400 | | | 2,735,334 | | |
| | | | | | | |
| | | | | 6,192,388 | | |
Diversified Telecommunication Services - 3.57% | | |
Vonage Holdings Corp.*+ | | 1,687,000 | | | 3,880,100 | | |
Electric Utilities - 1.64% | | | | | | | |
Cleco Corp. | | 67,700 | | | 1,787,957 | | |
Electrical Equipment - - 5.03% | | |
Polypore International, Inc.* | | 174,400 | | | 3,965,856 | | |
PowerSecure International, Inc.*+ | | 165,100 | | | 1,500,759 | | |
| | | | | | | |
| | | | | 5,466,615 | | |
Electronic Equipment, Instruments & Components - 5.65% | | |
Agilysys, Inc. | | 183,500 | | | 1,227,615 | | |
Power-One, Inc.*+ | | 160,500 | | | 1,083,375 | | |
| | | | | |
Industry Company | | Shares | | Value |
|
Electronic Equipment, Instruments & Components (continued) |
Richardson Electronics, Ltd. | | 118,600 | | $ | 1,067,400 |
Sanmina-SCI Corp.* | | 202,900 | | | 2,761,469 |
| | | | | |
| | | | | 6,139,859 |
Food Products - 1.54% | | | | | |
Seneca Foods Corp., Class A* | | 52,000 | | | 1,677,520 |
Health Care Providers & Services - 4.16% |
Gentiva Health Services, Inc.* | | 69,300 | | | 1,871,793 |
Healthspring, Inc.* | | 170,600 | | | 2,646,006 |
| | | | | |
| | | | | 4,517,799 |
Household Durables - 4.63% |
American Greetings Corp., Class A | | 115,700 | | | 2,170,532 |
La-Z-Boy, Inc.* | | 219,200 | | | 1,628,656 |
Libbey, Inc.*+ | | 94,800 | | | 1,230,504 |
| | | | | |
| | | | | 5,029,692 |
Insurance - 10.71% | | | | | |
American Physicians Capital, Inc. | | 44,533 | | | 1,373,843 |
AmTrust Financial Services, Inc. | | 113,600 | | | 1,367,744 |
Employers Holdings, Inc. | | 89,900 | | | 1,324,227 |
Horace Mann Educators Corp. | | 87,400 | | | 1,337,220 |
Meadowbrook Insurance Group, Inc. | | 239,800 | | | 2,069,474 |
NYMAGIC, Inc. | | 41,300 | | | 796,677 |
United Fire & Casualty Co. | | 56,800 | | | 1,125,776 |
Unitrin, Inc. | | 87,600 | | | 2,242,560 |
| | | | | |
| | | | | 11,637,521 |
IT Services - 2.01% | | | | | |
Acxiom Corp.* | | 34,100 | | | 500,929 |
Unisys Corp.* | | 90,900 | | | 1,680,741 |
| | | | | |
| | | | | 2,181,670 |
Machinery - 3.07% | | | | | |
Briggs & Stratton Corp. | | 71,500 | | | 1,216,930 |
Commercial Vehicle Group, Inc.* | | 100,900 | | | 1,030,189 |
Mueller Industries, Inc. | | 44,400 | | | 1,092,240 |
| | | | | |
| | | | | 3,339,359 |
| | |
Bridgeway Small-Cap Value Fund SCHEDULE OF INVESTMENTS (continued) | | |
Showing percentage of net assets as of June 30, 2010
| | | | | | | |
Industry Company | | Shares | | Value | | |
Common Stocks (continued) | | | | | | | |
Marine - 1.44% | | | | | | | |
International Shipholding Corp. | | 70,900 | | $ | 1,569,017 | | |
Media - 4.59% | | | | | | | |
Cinemark Holdings, Inc. | | 199,300 | | | 2,620,795 | | |
Valassis Communications, Inc.* | | 74,800 | | | 2,372,656 | | |
| | | | | | | |
| | | | | 4,993,451 | | |
Metals & Mining - 1.15% | | | | | | | |
US Gold Corp.*+ | | 249,100 | | | 1,247,991 | | |
Multiline Retail - 0.57% | | | | | | | |
Big Lots, Inc.* | | 19,300 | | | 619,337 | | |
Multi-Utilities - 1.56% | | | | | | | |
NorthWestern Corp. | | 64,700 | | | 1,695,140 | | |
Oil, Gas & Consumable Fuels - 5.49% | | |
Callon Petroleum Co.*+ | | 226,300 | | | 1,425,690 | | |
Crosstex Energy, Inc.*+ | | 261,400 | | | 1,675,574 | | |
Vanguard Natural Resources LLC+ | | 137,400 | | | 2,871,660 | | |
| | | | | | | |
| | | | | 5,972,924 | | |
Pharmaceuticals - 4.57% | | | | | | | |
Hi-Tech Pharmacal Co., Inc.* | | 41,100 | | | 941,601 | | |
Medicis Pharmaceutical Corp., Class A | | 82,200 | | | 1,798,536 | | |
Par Pharmaceutical Cos., Inc.* | | 85,900 | | | 2,229,964 | | |
| | | | | | | |
| | | | | 4,970,101 | | |
Real Estate Investment Trusts (REITs) - 3.68% | | |
BioMed Realty Trust, Inc. | | 130,400 | | | 2,098,136 | | |
Weingarten Realty Investors | | 99,740 | | | 1,900,047 | | |
| | | | | | | |
| | | | | 3,998,183 | | |
Semiconductors & Semiconductor Equipment - 1.64% | | |
Integrated Silicon Solution, Inc.* | | 236,300 | | | 1,781,702 | | |
Software - 1.07% | | | | | | | |
Wave Systems Corp., Class A*+ | | 358,300 | | | 1,160,892 | | |
Specialty Retail - 7.63% | | | | | | | |
Jo-Ann Stores, Inc.*+ | | 85,100 | | | 3,192,101 | | |
MarineMax, Inc.* | | 124,200 | | | 861,948 | | |
Select Comfort Corp.* | | 323,500 | | | 2,830,625 | | |
West Marine, Inc.*+ | | 129,400 | | | 1,407,872 | | |
| | | | | | | |
| | | | | 8,292,546 | | |
| | | | | | | |
Industry Company | | Shares | | Value |
| | | | | | |
Textiles, Apparel & Luxury Goods - 1.67% |
Joe’s Jeans, Inc.*+ | | 319,200 | | $ | 632,016 |
UniFirst Corp. | | 26,800 | | | 1,179,736 |
| | | | | |
| | | | | 1,811,752 |
Thrifts & Mortgage Finance - 3.59% |
Beneficial Mutual Bancorp, Inc.* | | 192,200 | | | 1,898,936 |
Bofl Holding, Inc.* | | 79,500 | | | 1,122,540 |
Meridian Interstate Bancorp, Inc.* | | 81,300 | | | 886,170 |
| | | | | |
| | | | | 3,907,646 |
Water Utilities - 1.03% | | | | | |
American States Water Co. | | 33,800 | | | 1,120,132 |
| | | | | |
TOTAL COMMON STOCKS - 99.10% | | | 107,720,090 |
| | | | | |
(Cost $97,662,216) | | | | | |
| | | |
| | | Rate^ | | Shares | | Value |
MONEY MARKET FUND - 0.58% |
BlackRock Fed Fund | | 0.04% | | 637,144 | | | 637,144 |
| | | | | | | |
TOTAL MONEY MARKET FUND - - 0.58% | | | 637,144 |
| | | | | |
(Cost $637,144) | | | | | | | |
TOTAL INVESTMENTS - 99.68% | | $ | 108,357,234 |
(Cost $98,299,360) | | | | | | | |
Other Assets in Excess of Liabilities - 0.32% | | | 343,636 |
| | | | | |
NET ASSETS - 100.00% | | | | $ | 108,700,870 |
| | | | | | | |
| * | Non-income producing security. |
| # | Securities, or a portion thereof, segregated to cover the Fund’s obligation under swap agreements. The total market value of segregated assets is $498,150. |
| ^ | Rate disclosed as of June 30, 2010. |
| + | This security or a portion of the security is out on loan at June 30, 2010. Total loaned securities had a market value of $18,192,617 at June 30, 2010. |
LLC - Limited Liability Co.
| | |
| 86 | | Annual Report | June 30, 2010 |
| | |
Bridge Small-Cap Value Fund SCHEDULE OF INVESTMENTS (continued) | | |
| | | | | | | | | | | | | |
Summary of inputs used to value the Fund’s investments as of 06/30/2010
are as follows (See Note 2 in Notes to Financial Statements): |
| | | Valuation Inputs | | | |
| | | Investment in Securities (Market Value) | | | |
| | | Level 1
Quoted
Prices | | Level 2
Significant
Observable
Inputs | | Level 3
Significant
Unobservable
Inputs | | Total | | | |
Common Stocks | | $ | 107,720,090 | | $ — | | $— | | $ | 107,720,090 | | |
Money Market Fund | | | — | | 637,144 | | — | | | 637,144 | | |
| | | | | | | | | | | | |
TOTAL | | $ | 107,720,090 | | $637,144 | | $— | | $ | 108,357,234 | | |
| | | | | | | | | | | | |
Other Financial Instruments** | | $ | — | | $(48,247) | | $— | | $ | (48,247 | ) | |
| | | | | | | | | | | | | |
| |
** Other financial instruments are derivative instruments not reflected in the Schedule of Investments, such as futures, forwards and swap contracts, which are valued at the unrealized appreciation/ depreciation on the investment. |
| |
See Notes to Financial Statements. | | | |
| | |
Large-Cap Growth Fund MANAGER’S COMMENTARY | | |
June 30, 2010
Dear Fellow Large-Cap Growth Fund Shareholder,
In the June quarter, our Fund declined 13.00%, underperforming our primary market benchmark, the Russell 1000 Growth Index (down 11.74%) and our peer benchmark, the Lipper Large-Cap Growth Funds Index (down 12.43%). As detailed on page 3, the lack of traction continues to affect our growth leaning models, and thus our growth Funds, the most severely. This was a poor quarter on an absolute and a relative basis.
For the fiscal year ended June 30, 2010, our Fund had a return of 12.89%, trailing the Russell 1000 Growth Index return of 13.62%, but outperforming the Lipper Large-Cap Growth Funds Index return of 12.59%. Performance details appear below. After lagging the market in the prior bear market fiscal year, we still have some “catch up” to do on our long term relative performance.
The table below presents our June quarter, one-year, five-year and life-to-date financial results according to the formula required by the SEC. See the next page for a graph of performance from inception to June 30, 2010.
| | | | | | | | |
| | | June Qtr.
4/1/10
to 6/30/10 | | 1 Year
7/1/09
to 6/30/10 | | 5 Year
7/1/05
to 6/30/10 | | Life-to-Date
10/31/03 to 6/30/10 |
| | | | |
Large-Cap Growth Fund | | -13.00% | | 12.89% | | -1.15% | | 0.56% |
Russell 1000 Growth Index | | -11.74% | | 13.62% | | 0.38% | | 1.62% |
Lipper Large-Cap Growth Funds Index | | -12.43% | | 12.59% | | -0.56% | | 1.03% |
Performance figures quoted in the table above and graph below represent past performance and are no guarantee of future results. Total return figures in the table above include the reinvestment of dividends and capital gains. The table above and the graph below do not reflect the deduction of taxes that a shareholder would pay on Fund distributions or the redemption of Fund shares.
The Russell 1000 Growth Index is an unmanaged index, which consists of stocks in the Russell 1000 Index with higher price-to-book ratios and higher forecasted growth values with dividends reinvested. The Lipper Large-Cap Growth Funds Index is an index of large-company, growth-oriented funds compiled by Lipper, Inc. It is not possible to invest directly in an index. Periods longer than one year are annualized.
According to data from Lipper, Inc. as of June 30, 2010, Large-Cap Growth Fund ranked 262nd of 845 large-cap growth funds for the twelve-month period ended June 30, 2010, 398th of 615 over the last five years and 344th of 536 such funds since inception in October, 2003. Lipper, Inc. is an independent mutual fund rating service that ranks funds in various fund categories by making comparative calculations using total returns.
| | |
| 88 | | Annual Report | June 30, 2010 |
| | |
Large-Cap Growth Fund MANAGER’S COMMENTARY (continued) | | |
Large-Cap Growth Fund vs. Russell 1000 Growth Index & Lipper Large-Cap Growth Funds Index from Inception 10/31/03 to 6/30/10
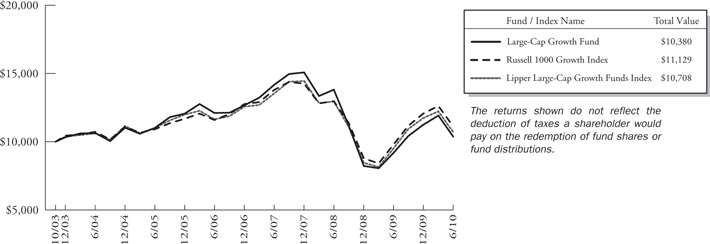
Detailed Explanation of Quarterly Performance — What Worked
The Short Version: It was a tough quarter, especially for large companies.
Despite the difficulties brought on by such global factors as the European sovereign debt crisis, our models uncovered several companies that contributed favorable returns to the Fund. Seven of the top performers came from consumer-related industries, though no single holding returned even 10% during the quarter and two of the “top” performers actually declined in value.
These are the ten stocks that performed the best for the Fund during the quarter ended June 30, 2010:
| | | | | | |
| Rank | | Description | | Industry | | % Gain |
| 1 | | Hasbro, Inc. | | Leisure Equipment & Products | | 8.1% |
| 2 | | Apple, Inc. | | Computers & Peripherals | | 7.0% |
| 3 | | Family Dollar Stores, Inc. | | Multiline Retail | | 3.4% |
| 4 | | State Street Corp. | | Capital Markets | | 2.8% |
| 5 | | Brown-Forman Corp. | | Beverages | | 1.8% |
| 6 | | Oracle Corp. | | Software | | 1.2% |
| 7 | | General Mills, Inc. | | Food Products | | 1.1% |
| 8 | | Starbucks Corp. | | Hotels Restaurants & Leisure | | 0.5% |
| 9 | | Ross Stores, Inc. | | Specialty Retail | | -0.1% |
| 10 | | TJX Cos., Inc. | | Specialty Retail | | -1.0% |
While many consumer goods companies have struggled mightily in the economic downturn (and even the aftermath), toymaker Hasbro has remained relatively immune from the ongoing difficulties. Its stock returned positive gains in both 2008 and 2009 and seems on its way to another successful year. Its classics, such as GI Joe, Monopoly, and Mr. Potato Head, remain hits with kids and adults alike, and the company is teaming up with Discovery to initiate a children’s TV network later in the year. It also has avoided much of the negativity surrounding other toymakers regarding lead poisoning and toxicity and even recently rewarded shareholders with a dividend increase. Though management has denied the rumors, talk has persisted about a potential leveraged buyout by a private equity firm to take the company private. Hasbro was the Fund’s top performer, though it still returned only single digit gains during the three-month period.
| | |
Large-Cap Growth Fund MANAGER’S COMMENTARY (continued) | | |
Detailed Explanation of Quarterly Performance — What Didn’t Work
The Short Version: The worst performers list was well diversified during the June quarter.
Uncertainty was in the air during the quarter, and no sector was spared from the negativity. Retailers struggled from the weak labor market, financial services worried about an enhanced regulatory environment, and global players feared a default contagion. Five sectors were represented on the list of worst performers, and each of the 10 holdings below lost over 20% during the June quarter.
These are the ten stocks that performed the worst for the Fund during the quarter ended June 30, 2010:
| | | | | | |
| Rank | | Description | | Industry | | % Loss |
| 1 | | priceline.com, Inc. | | Internet & Catalog Retail | | -29.0% |
| 2 | | Seagate Technology | | Computers & Peripherals | | -28.6% |
| 3 | | ITT Educational Services, Inc. | | Diversified Consumer Services | | -26.2% |
| 4 | | Juniper Networks, Inc. | | Communications Equipment | | -25.6% |
| 5 | | Gilead Sciences, Inc. | | Biotechnology | | -24.6% |
| 6 | | Expedia, Inc. | | Internet & Catalog Retail | | -24.5% |
| 7 | | Cameron International Corp. | | Energy Equipment & Services | | -24.1% |
| 8 | | Principal Financial Group, Inc. | | Insurance | | -22.5% |
| 9 | | Franklin Resources, Inc. | | Capital Markets | | -22.1% |
| 10 | | Google, Inc. | | Internet Software & Services | | -21.5% |
Franklin Resources, a money management and mutual fund company, lost over 20% during the June quarter and suffered along with numerous other financial services firms due to the uncertainties of the financial reform bill. Despite the political grandstanding, some form of legislation will pass soon, and analysts have lined up to predict the winners and losers. Franklin management worries about how the regulation will impact mutual fund companies and whether fund oversight will fall under the Federal Reserve’s watch as opposed to the SEC. If that happens, fund companies fear stricter guidelines like those that apply to banks. In May, a key analyst cut ratings on several money managers and removed Franklin from its “conviction buy” list.
Detailed Explanation of Fiscal Year Performance — What Worked
The Short Version: Information Technology highlighted a well diversified list of strong performers for the fiscal year.
In the aftermath of the dramatic downturn, investors looked for value across all sectors. Winners and losers existed in each category during the past 12 months. Five sectors were represented on the list of best performers for the year; the three top holdings came from IT. As the economy showed some signs of recovery, certain businesses have begun slowly increasing their budgets for technology upgrades. (That....and consumers love Apple). These three tech holdings combined contributed over three percent to the Fund’s return.
These are the ten stocks that performed the best for the Fund during the fiscal year ended June 30, 2010:
| | | | | | |
| Rank | | Description | | Industry | | % Gain |
| 1 | | Apple, Inc. | | Computers & Peripherals | | 76.6% |
| 2 | | Harris Corp. | | Communications Equipment | | 49.9% |
| 3 | | Cognizant Technology Solutions Corp. | | IT Services | | 49.0% |
| 4 | | Noble Corp. | | Energy Equipment & Services | | 45.2% |
| 5 | | FMC Technologies, Inc. | | Energy Equipment & Services | | 40.1% |
| 6 | | Intuitive Surgical, Inc. | | Health Care Equipment & Supplies | | 39.8% |
| 7 | | Rockwell Collins, Inc. | | Aerospace & Defense | | 38.1% |
| 8 | | Express Scripts, Inc. | | Health Care Providers & Services | | 36.8% |
| 9 | | Union Pacific Corp. | | Road & Rail | | 35.9% |
| 10 | | Family Dollar Stores, Inc. | | Multiline Retail | | 35.6% |
| | |
| 90 | | Annual Report | June 30, 2010 |
| | |
Large-Cap Growth Fund MANAGER’S COMMENTARY (continued) | | |
Though Apple has garnered considerable positive attention over the past 12-months, other IT firms deserve some recognition as well. Cognizant Technology provides outsourced technology services worldwide. Much of its operations take place in Asian emerging markets, such as India, and its margins are quite high as it benefits from the lower labor costs. As global firms look for ways to cut expenses in the aftermath of the economic downturn, many have turned to outsourcing certain technology areas. India’s tech sector has surged, even during these challenging times, boosting Cognizant’s earnings beyond Wall Street expectations over the past few quarters. Since Europe is a major market, some analysts fear that future operations may be impacted by the declining value of the euro. In June, Cognizant continued in growth mode and announced that it was acquiring a Paris-based consulting firm, Galileo Performance. Its stock price recently hit an all-time high, rising over 75% during the 12-month period. It was the fund’s third best performer for the fiscal year and contributed about half a percent to the overall return.
Detailed Explanation of Fiscal Year Performance — What Didn’t Work
The Short Version: Information Technology was the highlight on a well diversified list of poor performers for the fiscal year.
While IT companies were the Fund’s top three performers over the fiscal year, the list of worst holdings reveals that the sector was not immune to certain difficulties as well. Three related technology companies headlined the worst performers list; combined, they cost the Fund about one-and-a-half percent in return.
These are the ten stocks that performed the worst for the Fund during the fiscal year ended June 30, 2010:
| | | | | | |
| Rank | | Description | | Industry | | % Gain |
| 1 | | Seagate Technology | | Computers & Peripherals | | -37.9% |
| 2 | | Myriad Genetics, Inc. | | Biotechnology | | -35.2% |
| 3 | | First Solar, Inc. | | Electrical Equipment | | -29.8% |
| 4 | | Gilead Sciences, Inc. | | Biotechnology | | -26.8% |
| 5 | | Expedia, Inc. | | Internet & Catalog Retail | | -24.3% |
| 6 | | Principal Financial Group, Inc. | | Insurance | | -22.5% |
| 7 | | ITT Educational Services, Inc. | | Diversified Consumer Services | | -17.5% |
| 8 | | Micron Technology, Inc. | | Semiconductors & Semiconductor Equipment | | -17.3% |
| 9 | | Exxon Mobil Corp. | | Oil, Gas & Consumable Fuels | | -16.3% |
| 10 | | Arrow Electronics, Inc. | | Electronic Equip., Instruments | | -14.4% |
Chipmakers and semiconductor companies struggled in the recession as businesses and consumers cut back on spending and hesitated to upgrade to new technologies. Some have started to bounce back in the recovery, but many investors keep a quick trigger on their “sells,” and these stocks remain volatile at the first signs of bad news. In April, memory chipmaker Micron Technology fell victim to a worse-than-expected earnings report by semiconductor company AMD. Additionally, investors remained gun-shy due to ongoing legal matters concerning alleged price fixing activities throughout the industry. In May, the European Commission came down on several firms, and in June, 33 states reached a $173 million settlement with six chipmakers, including Micron. However, some of the recent news about Micron has been quite favorable. As an Apple supplier, the company has benefited from iPad and iPhone successes, and in fact, it just posted its third consecutive quarter of positive earnings. It also recently acquired Numonyx BV and should be better able now to meet the growing demand for certain flash memory chips that are used in MP3 players and digital cameras. Still, during the fiscal year, Micron cost the Fund about half a percent in return.
Top Ten Holdings as of June 30, 2010
Two of the best performers of the quarter were also among the 10 largest holdings at June 30: Apple Inc and Hasbro. In fact, computer companies made up the Fund’s three largest positions. Still, diversification ruled the day as no single holding accounted for greater than 3.8% of the net assets and the ten largest positions represented under 30% of the total assets of the Fund.
| | |
Large-Cap Growth Fund MANAGER’S COMMENTARY (continued) | | |
| | | | | | |
| Rank | | Description | | Industry | | % of Net
Assets |
| 1 | | Apple, Inc. | | Computers & Peripherals | | 3.8% |
| 2 | | International Business Machines Corp. | | Computers & Peripherals | | 3.2% |
| 3 | | Hewlett-Packard Co. | | Computers & Peripherals | | 3.1% |
| 4 | | Estee Lauder Cos, Inc. (The) | | Personal Products | | 2.9% |
| 5 | | Google, Inc. | | Internet Software & Services | | 2.8% |
| 6 | | TRW Automotive Holdings Corp. | | Auto Components | | 2.8% |
| 7 | | FMC Technologies, Inc. | | Energy Equipment & Services | | 2.8% |
| 8 | | Johnson & Johnson | | Pharmaceuticals | | 2.8% |
| 9 | | Hasbro, Inc. | | Leisure Equipment & Products | | 2.7% |
| 10 | | Micron Technology, Inc. | | Semiconductors & Semiconductor Equipment | | 2.5% |
| | Total | | | | 29.4% |
Industry Sector Representation as of June 30, 2010
The Fund was somewhat overweighted in both consumer-discretionary and health-care sectors, both of which were among the market’s poorer performers in this quarter’s declining market. The Fund’s largest allocation was in information technology, right in line with our primary market benchmark.
| | | | | | |
| | | % of Net Assets | | % of Russell 1000
Growth Index | | Difference |
Consumer Discretionary | | 18.0% | | 14.1% | | 3.9% |
Consumer Staples | | 9.8% | | 10.1% | | -0.3% |
Energy | | 7.7% | | 10.1% | | -2.4% |
Financials | | 5.6% | | 4.6% | | 1.0% |
Health Care | | 15.8% | | 10.9% | | 4.9% |
Industrials | | 7.7% | | 13.0% | | -5.3% |
Information Technology | | 31.9% | | 31.5% | | 0.4% |
Materials | | 2.8% | | 4.6% | | -1.8% |
Telecommunication Services | | 0.0% | | 0.9% | | -0.9% |
Utilities | | 0.0% | | 0.2% | | -0.2% |
Cash | | 0.7% | | 0.0% | | 0.7% |
Total | | 100.0% | | 100.0% | | |
Disclaimer
The views expressed here are exclusively those of Fund management. These views, including those related to market sectors or individual stocks, are not meant as investment advice and should not be considered predictive in nature. Any favorable (or unfavorable) description of a holding applies only as of quarter-end, June 30, 2010, unless otherwise stated. Security positions can and do change thereafter. Discussions of historical performance do not guarantee and may not be indicative of future performance.
The Fund is subject to market risk (volatility) and is not an appropriate investment for short-term investors.
Conclusion
Thank you for your continued investment in Large-Cap Growth Fund. We encourage your feedback; your reactions and concerns are important to us.
Sincerely,
Your Investment Management Team
| | |
92 | | Annual Report | June 30, 2010 |
| | |
Bridgeway Large-Cap Growth Fund SCHEDULE OF INVESTMENTS | | |
Showing percentage of net assets as of June 30, 2010
| | | | | | | |
Industry Company | | Shares | | Value | | |
COMMON STOCKS - 99.29% | | | | | | | |
Aerospace & Defense - 1.99% | | |
Lockheed Martin Corp. | | 7,900 | | $ | 588,550 | | |
Northrop Grumman Corp. | | 10,500 | | | 571,620 | | |
| | | | | | | |
| | | | | 1,160,170 | | |
Auto Components - 2.80% | | |
TRW Automotive Holdings Corp.* | | 59,400 | | | 1,637,658 | | |
Beverages - 2.31% | | |
Brown-Forman Corp., Class B | | 12,600 | | | 721,098 | | |
Coca-Cola Co. (The) | | 12,500 | | | 626,500 | | |
| | | | | | | |
| | | | | 1,347,598 | | |
Biotechnology - 4.51% | | |
Biogen Idec, Inc.* | | 28,200 | | | 1,338,090 | | |
Gilead Sciences, Inc.* | | 37,740 | | | 1,293,727 | | |
| | | | | | | |
| | | | | 2,631,817 | | |
Capital Markets - 1.15% | | |
Franklin Resources, Inc. | | 7,800 | | | 672,282 | | |
Chemicals - 3.80% | | |
Lubrizol Corp. | | 10,800 | | | 867,348 | | |
Praxair, Inc. | | 9,800 | | | 744,702 | | |
Sherwin-Williams Co. (The) | | 8,800 | | | 608,872 | | |
| | | | | | | |
| | | | | 2,220,922 | | |
Communications Equipment - 3.98% | | |
Cisco Systems, Inc.* | | 40,600 | | | 865,186 | | |
Harris Corp. | | 22,100 | | | 920,465 | | |
Juniper Networks, Inc.* | | 23,600 | | | 538,552 | | |
| | | | | | | |
| | | | | 2,324,203 | | |
Computers & Peripherals - 9.43% | | |
Apple, Inc.* | | 8,900 | | | 2,238,617 | | |
Hewlett-Packard Co. | | 42,200 | | | 1,826,416 | | |
SanDisk Corp.* | | 13,600 | | | 572,152 | | |
Seagate Technology* | | 66,600 | | | 868,464 | | |
| | | | | | | |
| | | | | 5,505,649 | | |
Diversified Consumer Services - 1.05% | | |
ITT Educational Services, Inc.* | | 7,400 | | | 614,348 | | |
Electrical Equipment - - 1.07% | | |
First Solar, Inc.*+ | | 5,500 | | | 626,065 | �� | |
| | | | | |
Industry Company | | Shares | | Value |
| |
Electronic Equipment, Instruments & Components - 0.85% |
Arrow Electronics, Inc.* | | 22,300 | | $ | 498,405 |
Energy Equipment & Services - 5.11% |
Cameron International Corp.* | | 41,800 | | | 1,359,336 |
FMC Technologies, Inc.* | | 30,900 | | | 1,627,194 |
| | | | | |
| | | | | 2,986,530 |
Food & Staples Retailing - 2.06% |
CVS Caremark Corp. | | 20,440 | | | 599,301 |
Wal-Mart Stores, Inc. | | 12,600 | | | 605,682 |
| | | | | |
| | | | | 1,204,983 |
Food Products - 1.33% | | | | | |
General Mills, Inc. | | 21,800 | | | 774,336 |
Health Care Equipment & Supplies - 2.93% |
Intuitive Surgical, Inc.* | | 3,500 | | | 1,104,670 |
Medtronic, Inc. | | 16,700 | | | 605,709 |
| | | | | |
| | | | | 1,710,379 |
Health Care Providers & Services - 4.07% |
Express Scripts, Inc.* | | 28,800 | | | 1,354,176 |
Medco Health Solutions, Inc.* | | 18,600 | | | 1,024,488 |
| | | | | |
| | | | | 2,378,664 |
Hotels, Restaurants & Leisure - 1.27% |
Starbucks Corp. | | 30,600 | | | 743,580 |
Household Products - 1.17% |
Procter & Gamble Co. (The) | | 11,400 | | | 683,772 |
Insurance - 2.20% |
Aflac, Inc. | | 16,900 | | | 721,123 |
Principal Financial Group, Inc. | | 24,100 | | | 564,904 |
| | | | | |
| | | | | 1,286,027 |
Internet & Catalog Retail - 2.95% |
Amazon.com, Inc.* | | 5,000 | | | 546,300 |
Expedia, Inc. | | 31,400 | | | 589,692 |
NetFlix, Inc.* | | 5,400 | | | 586,710 |
| | | | | |
| | | | | 1,722,702 |
Internet Software & Services - 4.24% |
Equinix, Inc.*+ | | 10,200 | | | 828,444 |
| | |
Bridgeway Large-Cap Growth Fund SCHEDULE OF INVESTMENTS (continued) | | |
Showing percentage of net assets as of June 30, 2010
| | | | | | | |
Industry Company | | Shares | | Value | | |
Common Stocks (continued) | | |
Internet Software & Services (continued) | | |
Google, Inc., Class A* | | 3,700 | | $ | 1,646,315 | | |
| | | | | | | |
| | | | | 2,474,759 | | |
IT Services - 6.70% | | |
Cognizant Technology Solutions Corp., Class A* | | 22,000 | | | 1,101,320 | | |
International Business Machines Corp. | | 15,000 | | | 1,852,200 | | |
Mastercard, Inc., Class A | | 4,800 | | | 957,744 | | |
| | | | | | | |
| | | | | 3,911,264 | | |
Leisure Equipment & Products - 2.74% | | |
Hasbro, Inc. | | 39,000 | | | 1,602,900 | | |
Media - 0.99% | | |
Comcast Corp., Class A | | 33,100 | | | 574,947 | | |
Multiline Retail - 1.49% | | |
Family Dollar Stores, Inc. | | 23,100 | | | 870,639 | | |
Oil, Gas & Consumable Fuels - 2.59% | | |
Exxon Mobil Corp. | | 10,500 | | | 599,235 | | |
Southwestern Energy Co.* | | 23,700 | | | 915,768 | | |
| | | | | | | |
| | | | | 1,515,003 | | |
Personal Products - 2.90% | | |
Estee Lauder Cos., Inc., Class A (The) | | 30,400 | | | 1,694,192 | | |
Pharmaceuticals - 4.33% | | |
Bristol-Myers Squibb Co. | | 36,653 | | | 914,126 | | |
Johnson & Johnson | | 27,300 | | | 1,612,338 | | |
| | | | | | | |
| | | | | 2,526,464 | | |
Road & Rail - - 1.96% | | |
Union Pacific Corp. | | 16,500 | | | 1,146,915 | | |
Semiconductors & Semiconductor Equipment - 4.26% | | |
Intel Corp. | | 54,200 | | | 1,054,190 | | |
Micron Technology, Inc.* | | 169,100 | | | 1,435,659 | | |
| | | | | | | |
| | | | | 2,489,849 | | |
Software - 1.45% | | |
Microsoft Corp. | | 36,800 | | | 846,768 | | |
Specialty Retail - 3.70% | | |
Ross Stores, Inc. | | 16,200 | | | 863,298 | | |
TJX Cos., Inc. | | 30,900 | | | 1,296,255 | | |
| | | | | | | |
| | | | | 2,159,553 | | |
Textiles, Apparel & Luxury Goods - 1.99% | | |
Coach, Inc. | | 15,800 | | | 577,490 | | |
| | | | | |
Industry Company | | Shares | | Value |
| | | | | |
Textiles, Apparel & Luxury Goods (continued) |
VF Corp. | | 8,200 | | $ | 583,676 |
| | | | | |
| | | | | 1,161,166 |
Thrifts & Mortgage Finance - 2.30% |
Hudson City Bancorp, Inc. | | 109,700 | | | 1,342,728 |
Trading Companies & Distributors - 1.62% |
W.W. Grainger, Inc. | | 9,500 | | | 944,775 |
| | | | | |
TOTAL COMMON STOCKS - 99.29% | | | 57,992,012 |
| | | | | |
(Cost $54,914,938) | | | | | |
| | | | | | | | |
| | | Rate^ | | | Shares | | Value |
MONEY MARKET FUND - 0.11% |
BlackRock Fed Fund | | 0.04 | % | | 64,584 | | | 64,584 |
| | | | | | | | |
TOTAL MONEY MARKET FUND - - 0.11% | | | 64,584 |
| | | | | | | | |
(Cost $64,584) | | | | | | | | |
TOTAL INVESTMENTS - 99.40% | | $ | 58,056,596 |
(Cost $54,979,522) | | | | | | | | |
Other Assets in Excess of Liabilities - 0.60% | | | 352,761 |
| | | | | | | | |
NET ASSETS - 100.00% | | $ | 58,409,357 |
| | | | | | | | |
| * | Non-income producing security. |
| ^ | Rate disclosed as of June 30, 2010. |
| + | This security or a portion of the security is out on loan at June 30, 2010. Total loaned securities had a market value of $1,141,489 at June 30, 2010. |
Summary of inputs used to value the Fund’s investments as of 06/30/2010 are as follows (See Note 2 in Notes to Financial Statements):
| | | | | | | | | | | | |
Valuation Inputs |
| Investment in Securities (Market Value) |
| | | Level 1
Quoted
Prices | | Level 2
Significant
Observable
Inputs | | Level 3
Significant
Unobservable
Inputs | | Total |
Common Stocks | | $ | 57,992,012 | | $ | — | | $ | — | | $ | 57,992,012 |
Money Market Fund | | | — | | | 64,584 | | | — | | | 64,584 |
| | | | | | | | | | | | |
TOTAL | | $ | 57,992,012 | | $ | 64,584 | | $ | — | | $ | 58,056,596 |
| | | | | | | | | | | | |
See Notes to Financial Statements.
| | |
| 94 | | Annual Report | June 30, 2010 |
| | |
Large-Cap Value Fund MANAGER’S COMMENTARY | | |
June 30, 2010
Dear Fellow Large-Cap Value Fund Shareholder,
In the June quarter, our Fund declined 10.42%, outperforming our primary market benchmark, the Russell 1000 Value Index (down 11.15%) and our peer benchmark, the Lipper Large-Cap Value Funds Index (down 12.17%). While a short-term double digit decline is always painful, we are pleased to have provided some “cushion” in this down market.
For the fiscal year ended June 30, 2010, our Fund returned 19.65%, outperforming the Russell 1000 Value Index return of 16.92% and the Lipper Large-Cap Value Funds Index return of 13.04%. Performance details appear below. We continue to enjoy strong success with this Fund, beating both benchmarks since inception and over the five-year period. We are very pleased with the short-term and especially long-term performance.
The table below presents our June quarter, one-year, five-year and life-to-date financial results according to the formula required by the SEC. See the next page for a graph of performance from inception to June 30, 2010.
| | | | | | | | |
| | | June Qtr.
4/1/10 to 6/30/10 | | 1 Year
7/1/09
to 6/30/10 | | 5 Year
7/1/05
to 6/30/10 | | Life-to-Date
10/31/03 to
6/30/10 |
| | | | |
Large-Cap Value Fund | | -10.42% | | 19.65% | | 0.04% | | 3.81% |
Russell 1000 Value Index | | -11.15% | | 16.92% | | -1.64% | | 2.44% |
Lipper Large-Cap Value Funds Index | | -12.17% | | 13.04% | | -1.29% | | 1.89% |
Performance figures quoted in the table above and graph below represent past performance and are no guarantee of future results. Total return figures in the table above include the reinvestment of dividends and capital gains. The table above and the graph below do not reflect the deduction of taxes that a shareholder would pay on Fund distributions or the redemption of Fund shares.
The Russell 1000 Value Index is an unmanaged index, which consists of stocks in the Russell 1000 Index with higher price-to-book ratios and higher forecasted growth values with dividends reinvested. The Lipper Large-Cap Value Funds Index is an index of large-company, value-oriented funds compiled by Lipper, Inc. It is not possible to invest directly in an index. Periods longer than one year are annualized.
According to data from Lipper, Inc. as of June 30, 2010, Large-Cap Value Fund ranked 19th of 521arge-cap value funds for the twelve-month period ended June 30, 2010, 52nd of 404 over the last five years and 19th of 347 such funds since inception in October, 2003. Lipper, Inc. is an independent mutual fund rating service that ranks funds in various fund categories by making comparative calculations using total returns.
| | |
Large-Cap Value Fund MANAGER’S COMMENTARY (continued) | | |
Large-Cap Value Fund vs. Russell 1000 Value Index & Lipper Large-Cap Value Funds Index from Inception 10/31/03 to 6/30/10
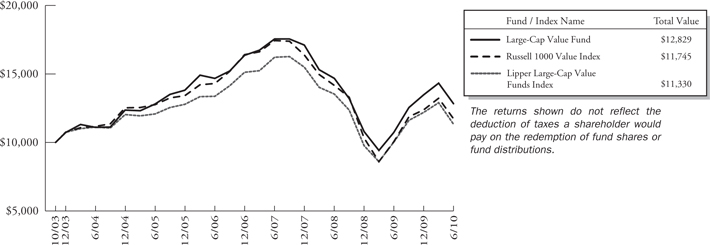
Detailed Explanation of Quarterly Performance — What Worked
The Short Version: Our specific financial and healthcare companies helped the most. Our stock picking models on the value end of the spectrum helped considerably as we started coming out of a “junk rally” and more “macro” or event-driven market.
Despite the difficulties brought on by such global factors as the European sovereign debt crisis, our models uncovered a handful of companies that contributed positive returns to the Fund. Six different sectors were represented in this list of top performers, including four financial holdings. Still, to show just how tough the quarter was for equities, only a single Fund position returned even 10%, and one of the “top” performers actually declined slightly in value.
These are the ten stocks that performed the best for the Fund during the quarter ended June 30, 2010:
| | | | | | |
| Rank | | Description | | Industry | | % Gain |
| 1 | | AmerisourceBergen Corp. | | Health Care Providers & Services | | 10.1% |
| 2 | | AvalonBay Communities, Inc. | | Real Estate Investment Trusts | | 9.1% |
| 3 | | Hasbro, Inc. | | Leisure Equipment & Products | | 8.1% |
| 4 | | State Street Corp. | | Capital Markets | | 4.0% |
| 5 | | Mead Johnson Nutrition Co. | | Personal Products | | 3.0% |
| 6 | | McKesson Corp. | | Health Care Providers & Services | | 2.5% |
| 7 | | American Express Co. | | Consumer Finance | | 2.1% |
| 8 | | Southern Co. | | Electric Utilities | | 1.7% |
| 9 | | Ventas, Inc. | | Real Estate Investment Trusts | | 0.0% |
| 10 | | Unit Corp. | | Energy Equipment & Services | | -0.1% |
While a number of consumer goods companies have struggled mightily in the economic downturn, toymaker Hasbro has remained relatively immune from the ongoing difficulties. Its stock returned positive gains in both 2008 and 2009 and seems on its way for another successful year. Its classics, such as GI Joe, Monopoly, and Mr. Potato Head, remain hits with kids and adults alike, and the company is teaming up with Discovery to initiate a children’s TV network later in the year. It also has avoided much of the negativity surrounding other toymakers regarding lead poisoning and toxicity and recently rewarded shareholders with a dividend increase. Though management has denied the rumors, talk has persisted about a potential leveraged buyout by a private equity firm to take the company private. Hasbro was the Fund’s third best performer.
Detailed Explanation of Quarterly Performance — What Didn’t Work
The Short Version: Negative performers were not scarce in a very weak June quarter.
| | |
96 | | Annual Report | June 30, 2010 |
| | |
Large-Cap Value Fund MANAGER’S COMMENTARY (continued) | | |
Uncertainty was in the air during the quarter, and no sector was spared from the negativity. After a three quarter run, consumer discretionary stocks, especially retailers, took more than a “breather” in the June quarter. Some financial stocks declined amid worries of an enhanced regulatory environment. Global players feared a debt default contagion. Five sectors were represented on the list of worst performers, and nine of the ten holdings below lost over 20% during the June quarter. To show how difficult the quarter was for equity investors, four financial service companies are included in the list of worst performers below, while four others from that same sector were among the top performers described above.
These are the ten stocks that performed the worst for the Fund during the quarter ended June 30, 2010:
| | | | | | |
| Rank | | Description | | Industry | | % Loss |
| 1 | | Noble Corp. | | Energy Equipment & Services | | -26.0% |
| 2 | | General Electric Co. | | Industrial Conglomerates | | -25.6% |
| 3 | | BlackRock, Inc. | | Capital Markets | | -24.3% |
| 4 | | Goldman Sachs Group, Inc. (The) | | Capital Markets | | -22.9% |
| 5 | | Western Digital Corp. | | Computers & Peripherals | | -22.7% |
| 6 | | L-3 Communications Holdings, Inc. | | Aerospace & Defense | | -22.3% |
| 7 | | Franklin Resources, Inc. | | Capital Markets | | -22.1% |
| 8 | | Aflac, Inc. | | Insurance | | -20.9% |
| 9 | | CarMax, Inc. | | Specialty Retail | | -20.8% |
| 10 | | Ford Motor Co. | | Automobiles | | -19.8% |
Franklin Resources, the money management and mutual fund company, lost over 20% during the June quarter and suffered along with numerous other financial services firms, due to the uncertainties of the financial reform bill. Despite the political grandstanding, some form of legislation will pass soon, and analysts have lined up to predict the winners and losers. Franklin management worries about the impact of regulation on mutual fund companies and whether fund oversight will fall under the Federal Reserve’s watch, as opposed to the SEC. If that happens, fund companies fear stricter guidelines, like those that apply to banks. In May, a key analyst cut ratings on several money managers and removed Franklin from its “conviction buy” list.
Detailed Explanation of Fiscal Year Performance — What Worked
The Short Version: Reflecting the “bounce back” among large and battered financial companies, fully half of our best performers came from this category.
Despite the setback over the past quarter, many large financial companies have rebounded nicely from the dramatic slide in late 2008 and early 2009 that was initiated by the subprime crisis. Five related holdings made up the list of top performers and altogether contributed just under four percent to the Fund’s return. Industrial companies were also well-represented during the fiscal year, including two of the top five performers.
These are the ten stocks that performed best for the Fund during the fiscal year ended June 30, 2010:
| | | | | | |
| Rank | | Description | | Industry | | % Gain |
| 1 | | RR Donnelley & Sons Co. | | Commercial Services & Supplies | | 84.1% |
| 2 | | American Express Co. | | Consumer Finance | | 83.7% |
| 3 | | AmerisourceBergen Corp. | | Health Care Providers & Services | | 81.1% |
| 4 | | AvalonBay Communities, Inc. | | Real Estate Investment Trusts | | 74.1% |
| 5 | | Southwest Airlines Co. | | Airlines | | 65.4% |
| 6 | | Ventas, Inc. | | Real Estate Investment Trusts | | 65.0% |
| 7 | | HCP, Inc. | | Real Estate Investment Trusts | | 62.3% |
| 8 | | McKesson Corp | | Health Care Providers & Services | | 54.0% |
| 9 | | New York Community Bancorp, Inc. | | Thrifts & Mortgage Finance | | 48.5% |
| 10 | | CSX Corp. | | Road & Rail | | 47.4% |
| | |
Large-Cap Value Fund MANAGER’S COMMENTARY (continued) | | |
The airline industry has had its challenges over the past decade. From 9-11 (2001) to escalating oil prices (2008) to recessionary times (2009), companies found it hard to recover fully before the next debacle. Somehow, Southwest Airlines seems to fare better than most. In April, management announced that it had moved back into profitability as business travel picked up and many customers were paying full fares again. Likewise, June was shaping up to be another month of strong revenue increases. Its CEO points to Southwest’s “customer-first” attitude and never hesitates to remind the public that “bags fly free.” Over the next few months, the company promises to further enhance the customer’s experience with Internet connectivity and upgrades to its rewards program. Southwest has also successfully integrated social media such as Facebook and Twitter to attract more buyers through these venues. The holding was among the top performers and contributed over half a percent to the Fund’s overall performance during the fiscal year.
Detailed Explanation of Fiscal Year Performance — What Didn’t Work
The Short Version: Three of our worst fiscal year performers were related to finance.
Seven sectors appear on the list of poor performers. The ten worst performing holdings cost the fund over two-and-a-half percent in return. Many of the losses occurred in the most recent quarter as tiny Greece became a top headline and the European sovereign debt crisis sparked market fears around the globe.
These are the ten stocks that performed the worst for the Fund during the fiscal year ended June 30, 2010:
| | | | | | |
| Rank | | Description | | Industry | | % Gain |
| 1 | | BlackRock, Inc. | | Capital Markets | | -27.0% |
| 2 | | Micron Technology, Inc. | | Semiconductors & Semiconductor Equipment | | -18.8% |
| 3 | | Franklin Resources, Inc. | | Capital Markets | | -17.7% |
| 4 | | Goldman Sachs Group, Inc. (The) | | Capital Markets | | -17.5% |
| 5 | | Safeway, Inc. | | Food & Staples Retailing | | -17.5% |
| 6 | | Exxon Mobil Corp. | | Oil, Gas & Comsumable Fuels | | -16.3% |
| 7 | | AES Corp. | | Independent Power Producers | | -14.8% |
| 8 | | Western Digital Corp. | | Computers & Peripherals | | -13.4% |
| 9 | | DIRECTV | | Media | | -10.1% |
| 10 | | Omnicare, Inc. | | Health Care Providers & Services | | -9.0% |
Chipmakers and semiconductor companies struggled in the recession as businesses and consumers cut back on spending and hesitated to upgrade to new technologies. Some have started to bounce back in the recovery, but many investors keep a quick trigger on their “sells,” and these stocks remain volatile at the first signs of bad news. In April, memory chipmaker Micron Technology fell victim to a worse-than-expected earnings report by semiconductor company AMD. Additionally, investors remained gun-shy due to ongoing legal matters concerning alleged price fixing activities throughout the industry. In May, the European Commission came down on several firms, and in June, 33 states reached a $173 million settlement with six chipmakers, including Micron. However, some of the recent news about Micron has been quite favorable. As an Apple supplier, the company has benefited from iPad and iPhone successes, and in fact, it just posted its third consecutive quarter of positive earnings. It also recently acquired Numonyx BV and should be better able now to meet the growing demand for certain flash memory chips that are used in MP3 players and digital cameras. Still, during the fiscal year Micron cost the Fund just under half a percent in return.
Top Ten Holdings as of June 30, 2010
Two of the best performers of the quarter were also among the ten largest holdings at June 30: McKesson and Hasbro. Diversification ruled the day as nine industries were represented among the largest positions and no single stock accounted for greater than 3.2% of the net assets. All told, the ten largest positions represented just over 25% of the total assets of the Fund.
| | |
98 | | Annual Report | June 30, 2010 |
| | |
Large-Cap Value Fund MANAGER’S COMMENTARY (continued) | | |
| | | | | | |
| Rank | | Description | | Industry | | % of Net
Assets |
| 1 | | AT&T, Inc. | | Diversified Telecommunications | | 3.2% |
| 2 | | Berkshire Hathaway, Inc. | | Insurance | | 3.0% |
| 3 | | Verizon Communications, Inc. | | Diversified Telecommunications | | 2.8% |
| 4 | | Raytheon Co. | | Aerospace & Defense | | 2.7% |
| 5 | | Hasbro, Inc. | | Leisure Equipment & Products | | 2.6% |
| 6 | | McKesson Corp. | | Health Care Providers & Services | | 2.4% |
| 7 | | Time Warner, Inc. | | Media | | 2.4% |
| 8 | | Chevron Corp. | | Oil, Gas & Consumable Fuels | | 2.2% |
| 9 | | Pfizer, Inc. | | Pharmaceuticals | | 2.1% |
| 10 | | Noble Corp | | Energy Equipment & Services | | 2.0% |
| | Total | | | | 25.4% |
Industry Sector Representation as of June 30, 2010
The Fund held a smaller allocation in financial companies than the Russell 1000 Value Index and was rewarded for that position, as the sector performed quite poorly during the three month period. However, some of the slack was taken up by the Fund’s overweighting of consumer discretionary companies, which also performed poorly.
| | | | | | |
| | | % of Net Assets | | % of Russell 1000
Value Index | | Difference |
Consumer Discretionary | | 14.7% | | 7.4% | | 7.3% |
Consumer Staples | | 6.8% | | 10.6% | | -3.8% |
Energy | | 12.9% | | 10.7% | | 2.2% |
Financials | | 23.4% | | 28.5% | | -5.1% |
Health Care | | 11.0% | | 13.4% | | -2.4% |
Industrials | | 9.8% | | 8.8% | | 1.0% |
Information Technology | | 6.5% | | 5.5% | | 1.0% |
Materials | | 4.1% | | 2.9% | | 1.2% |
Telecommunication Services | | 7.2% | | 5.0% | | 2.2% |
Utilities | | 3.4% | | 7.2% | �� | -3.8% |
Cash | | 0.2% | | 0.0% | | 0.2% |
Total | | 100.0% | | 100.0% | | |
Disclaimer
The views expressed here are exclusively those of Fund management. These views, including those related to market sectors or individual stocks, are not meant as investment advice and should not be considered predictive in nature. Any favorable (or unfavorable) description of a holding applies only as of the quarter-end, June 30, 2010, unless otherwise stated. Security positions can and do change thereafter. Discussions of historical performance do not guarantee and may not be indicative of future performance.
The Fund is subject to market risk (volatility) and is not an appropriate investment for short-term investors.
Conclusion
Thank you for your continued investment in Large-Cap Value Fund. We encourage your feedback; your reactions and concerns are important to us.
Sincerely,
Your Investment Management Team
| | |
Bridgeway Large-Cap Value Fund SCHEDULE OF INVESTMENTS | | |
Showing percentage of net assets as of June 30, 2010
| | | | | | | |
Industry Company | | Shares | | Value | | |
COMMON STOCKS - 99.94% | | |
Aerospace & Defense - 5.22% | | |
L-3 Communications Holdings, Inc. | | 4,300 | | $ | 304,612 | | |
Northrop Grumman Corp. | | 6,100 | | | 332,084 | | |
Raytheon Co. | | 14,400 | | | 696,816 | | |
| | | | | | | |
| | | | | 1,333,512 | | |
Airlines - 1.63% | | |
Southwest Airlines Co. | | 37,500 | | | 416,625 | | |
Auto Components - 1.42% | | |
TRW Automotive Holdings Corp.* | | 13,200 | | | 363,924 | | |
Automobiles - 1.43% | | |
Ford Motor Co.*+ | | 36,200 | | | 364,896 | | |
Beverages - 2.07% | | |
Brown-Forman Corp., Class B | | 4,600 | | | 263,258 | | |
Dr. Pepper Snapple Group, Inc. | | 7,100 | | | 265,469 | | |
| | | | | | | |
| | | | | 528,727 | | |
Capital Markets - 2.57% | | |
Franklin Resources, Inc. | | 2,900 | | | 249,951 | | |
Goldman Sachs Group, Inc. (The) | | 3,100 | | | 406,937 | | |
| | | | | | | |
| | | | | 656,888 | | |
Chemicals - 4.15% | | |
E.I. du Pont de Nemours & Co. | | 12,600 | | | 435,834 | | |
Lubrizol Corp. | | 4,400 | | | 353,364 | | |
Sherwin-Williams Co. (The) | | 3,900 | | | 269,841 | | |
| | | | | | | |
| | | | | 1,059,039 | | |
Commercial Banks - 3.25% | | |
M&T Bank Corp. | | 3,700 | | | 314,315 | | |
Wells Fargo & Co. | | 20,100 | | | 514,560 | | |
| | | | | | | |
| | | | | 828,875 | | |
Computers & Peripherals - 3.63% | | |
Hewlett-Packard Co. | | 6,000 | | | 259,680 | | |
SanDisk Corp.* | | 5,800 | | | 244,006 | | |
Western Digital Corp.* | | 14,000 | | | 422,240 | | |
| | | | | | | |
| | | | | 925,926 | | |
Diversified Financial Services - 1.17% | | |
NYSE Euronext | | 10,800 | | | 298,404 | | |
Diversified Telecommunication Services - 7.21% | | |
AT&T, Inc. | | 33,449 | | | 809,131 | | |
| | | | | |
Industry Company | | Shares | | Value |
| |
Diversified Telecommunication Services (continued) |
CenturyLink, Inc. | | 9,300 | | $ | 309,783 |
Verizon Communications, Inc. | | 25,730 | | | 720,955 |
| | | | | |
| | | | | 1,839,869 |
Electric Utilities - 3.39% |
American Electric Power Co., Inc. | | 8,100 | | | 261,630 |
Duke Energy Corp. | | 17,400 | | | 278,400 |
Southern Co. | | 9,750 | | | 324,480 |
| | | | | |
| | | | | 864,510 |
Energy Equipment & Services - 4.24% |
National Oilwell Varco, Inc. | | 8,500 | | | 281,095 |
Noble Corp.* | | 16,900 | | | 522,379 |
Unit Corp.* | | 6,900 | | | 280,071 |
| | | | | |
| | | | | 1,083,545 |
Food & Staples Retailing - 2.32% |
CVS Caremark Corp. | | 11,480 | | | 336,594 |
Safeway, Inc. | | 13,000 | | | 255,580 |
| | | | | |
| | | | | 592,174 |
Food Products - 2.41% |
Campbell Soup Co. | | 7,400 | | | 265,142 |
ConAgra Foods, Inc. | | 15,000 | | | 349,800 |
| | | | | |
| | | | | 614,942 |
Health Care Providers & Services - 5.01% |
AmerisourceBergen Corp. | | 15,800 | | | 501,650 |
CIGNA Corp. | | 4,900 | | | 152,194 |
McKesson Corp. | | 9,300 | | | 624,588 |
| | | | | |
| | | | | 1,278,432 |
Industrial Conglomerates - 1.39% |
General Electric Co. | | 24,700 | | | 356,174 |
Insurance - 10.39% |
Aflac, Inc. | | 10,000 | | | 426,700 |
Berkshire Hathaway, Inc., Class B* | | 9,500 | | | 757,055 |
Chubb Corp. | | 8,000 | | | 400,080 |
Loews Corp. | | 10,800 | | | 359,748 |
Prudential Financial, Inc. | | 7,600 | | | 407,816 |
Travelers Cos., Inc. (The) | | 6,100 | | | 300,425 |
| | | | | |
| | | | | 2,651,824 |
IT Services - 0.97% |
Computer Sciences Corp. | | 5,500 | | | 248,875 |
| | |
| 100 | | Annual Report | June 30, 2010 |
| | |
Bridgeway Large-Cap Value Fund SCHEDULE OF INVESTMENTS (continued) | | |
Showing percentage of net assets as of June 30, 2010
| | | | | | | |
Industry Company | | Shares | | Value | | |
Common Stocks (continued) | | |
Leisure Equipment & Products - 2.64% | | |
Hasbro, Inc. | | 16,400 | | $ | 674,040 | | |
Media - 5.89% | | |
DIRECTV, Class A* | | 8,800 | | | 298,496 | | |
News Corp., Class A | | 26,000 | | | 310,960 | | |
Time Warner, Inc.* | | 20,966 | | | 606,127 | | |
Washington Post Co., Class B (The) | | 700 | | | 287,336 | | |
| | | | | | | |
| | | | | 1,502,919 | | |
Oil, Gas & Consumable Fuels - 8.70% | | |
Chesapeake Energy Corp. | | 22,000 | | | 460,900 | | |
Chevron Corp. | | 8,414 | | | 570,974 | | |
Comstock Resources, Inc.* | | 10,100 | | | 279,972 | | |
ConocoPhillips | | 9,100 | | | 446,719 | | |
Exxon Mobil Corp. | | 8,100 | | | 462,267 | | |
| | | | | | | |
| | | | | 2,220,832 | | |
Pharmaceuticals - 5.97% | | |
Bristol-Myers Squibb Co. | | 11,572 | | | 288,606 | | |
Merck & Co., Inc. | | 10,100 | | | 353,197 | | |
Pfizer, Inc. | | 37,800 | | | 539,028 | | |
Watson Pharmaceuticals, Inc.* | | 8,500 | | | 344,845 | | |
| | | | | | | |
| | | | | 1,525,676 | | |
Real Estate Investment Trusts (REITs) - 4.20% | | |
AvalonBay Communities, | | | | | | | |
Inc. | | 3,900 | | | 364,143 | | |
HCP, Inc. | | 10,165 | | | 327,821 | | |
Ventas, Inc. | | 8,100 | | | 380,295 | | |
| | | | | | | |
| | | | | 1,072,259 | | |
Road & Rail - - 1.61% | | |
Union Pacific Corp. | | 5,900 | | | 410,109 | | |
Semiconductors & Semiconductor Equipment - 1.88% | | |
Micron Technology, Inc.* | | 56,400 | | | 478,836 | | |
Specialty Retail - 2.39% | | |
CarMax, Inc.* | | 18,600 | | | 370,140 | | |
Gap, Inc. (The) | | 12,400 | | | 241,304 | | |
| | | | | | | |
| | | | | 611,444 | | |
Textiles, Apparel & Luxury Goods - 0.94% | | |
Polo Ralph Lauren Corp. | | 3,300 | | | 240,768 | | |
Thrifts & Mortgage Finance - 1.85% | | |
New York Community | | | | | | | |
Bancorp, Inc. | | 31,000 | | | 473,370 | | |
| | | | | | | |
TOTAL COMMON STOCKS - 99.94% | | | | | 25,517,414 | | |
| | | | | | | |
(Cost $22,648,419) | | | | | | | |
| | | | | | | | |
| | | Rate^ | | | Shares | | Value | |
| | | | | | | | | |
MONEY MARKET FUND - 1.68% | |
BlackRock Fed Fund | | 0.04 | % | | 429,680 | | $429,680 | |
| | | | | | | | |
TOTAL MONEY MARKET FUND - 1.68% | | 429,680 | |
| | | | | | | | |
(Cost $429,680) | | | | | | | | |
TOTAL INVESTMENTS - 101.62% | | $25,947,094 | |
(Cost $23,078,099) | | | | | | | | |
Liabilities in Excess of Other Assets - (1.62%) | | (412,883 | ) |
| | | | | | | | |
NET ASSETS - 100.00% | | $25,534,211 | |
| | | | | | | | |
| * | Non-income producing security. |
| ^ | Rate disclosed as of June 30, 2010. |
| + | This security or a portion of the security is out on loan at June 30, 2010. Total loaned securities had a market value of $105,225 at June 30, 2010. |
Summary of inputs used to value the Fund’s investments as of 06/30/2010 are as follows (See Note 2 in Notes to Financial Statements):
| | | | | | | | |
Valuation Inputs |
Investment in Securities (Market Value) |
| | | Level 1
Quoted
Prices | | Level 2
Significant
Observable
Inputs | | Level 3
Significant
Unobservable
Inputs | | Total |
Common Stocks | | $25,517,414 | | $ — | | $— | | $25,517,414 |
Money Market Fund | | — | | 429,680 | | — | | 429,680 |
| | | | | | | | |
TOTAL | | $25,517,414 | | $429,680 | | $— | | $25,947,094 |
| | | | | | | | |
See Notes to Financial Statements.
| | |
Blue Chip 35 Index Fund MANAGER’S COMMENTARY | | |
June 30, 2010
Dear Fellow Blue Chip 35 Index Fund Shareholder,
Our Fund declined 12.22% in the June quarter, trailing the S&P 500 Index (down 11.43%) and the Lipper Large-Cap Core Funds Index (down 11.91%), but beating the Russell Top 50 Index (down 12.50%). This is the first time in the twelve-plus year history of our Fund that we did not provide some “cushion” versus our primary market benchmark in a quarterly double-digit declining market. We are not pleased.**
The results were much the same for the fiscal year ending June 30, 2010. Our Fund returned 11.25%, trailing the S&P 500 Index (14.43%) and the Lipper Large-Cap Core Funds Index (12.33%), while beating the Russell Top 50 Index (8.24%). As presented in the section on performance by size below, smaller company stocks had a relative heyday over the last year, creating a market disadvantage for our Fund relative to all of our performance benchmarks except the Russell Top 50, which we beat.
The table below presents our June quarter, six-month, one-year, five-year, ten-year and life-to-date financial results according to the formula required by the SEC. See the next page for a graph of performance from inception.
| | | | | | | | | | | | |
| | | June Qtr.
4/1/10 to 6/30/10 | | Six Months
1/1/10 to 6/30/10 | | 1 Year
7/1/09
to 6/30/10 | | 5 Year
7/1/05 to 6/30/10 | | 10 Year
7/1/00 to 6/30/10 | | Life-to-Date
7/31/97 to 6/30/10 |
| | | | | | |
Blue Chip 35 Index Fund | | -12.22% | | -8.58% | | 11.25% | | -0.21% | | -1.91% | | 3.00% |
S&P 500 Index | | -11.43% | | -6.65% | | 14.43% | | -0.80% | | -1.59% | | 2.36% |
Russell Top 50 Index | | -12.50% | | -9.19% | | 8.24% | | -1.64% | | NA | | NA |
Bridgeway Ultra-Large 35 Index | | -12.15% | | -8.48% | | 11.56% | | 0.00% | | -1.61% | | 3.16% |
Lipper Large-Cap Core Funds Index | | -11.91% | | -7.65% | | 12.33% | | -0.78% | | -2.17% | | 1.81% |
Performance figures quoted in the table above and graph below represent past performance and are no guarantee of future results. Total return figures in the table above include the reinvestment of dividends and capital gains. The table above and the graph below do not reflect the deduction of taxes that a shareholder would pay on Fund distributions or the redemption of Fund shares.
The S&P 500 Index is a broad-based, unmanaged measurement of changes in stock market conditions based on the average of 500 widely held common stocks with dividends reinvested. The Russell Top 50 Index measures the performance of the largest companies in the Russell 3000(r) Index. It includes approximately 50 of the largest securities based on a combination of their market cap and current index membership and represents approximately 40% of the total market capitalization of the Russell 3000. The Bridgeway Ultra-Large 35 Index is an index comprised of very large, “blue chip” U.S. stocks, excluding tobacco; it is compiled by the adviser of the Fund. The Lipper Large-Cap Core Funds Index reflects the aggregate record of domestic large-cap core mutual funds as reported by Lipper, Inc. It is not possible to invest directly in an index. Periods longer than one year are annualized.
**Note: A deeper dive into the quarterly statistics reveals that the Fund did provide slight cushion during the downturn from April 26 through June 30, but lagged more substantially in the up market from April 1 to April 26.
According to data from Lipper, Inc. as of June 30, 2010, Blue-Chip 35 Index Fund ranked 572nd of 986 large-cap core funds for the twelve months ending June 30, 2010, 213th of 716 over the last five years, 266th of 419 over the last ten years, and 71st of 263 since inception in July 1997. Lipper, Inc. is an independent mutual fund rating service that ranks funds in various fund categories by making comparative calculations using total returns.
| | |
| 102 | | Annual Report | June 30, 2010 |
| | |
Blue Chip 35 Index Fund MANAGER’S COMMENTARY (continued) | | |
Blue Chip 35 Index Fund vs. S&P 500 Index, Russell Top 50 Index*, Bridgeway Ultra-Large 35 Index & Lipper Large-Cap Core Funds Index from Inception 7/31/97 to 6/30/10
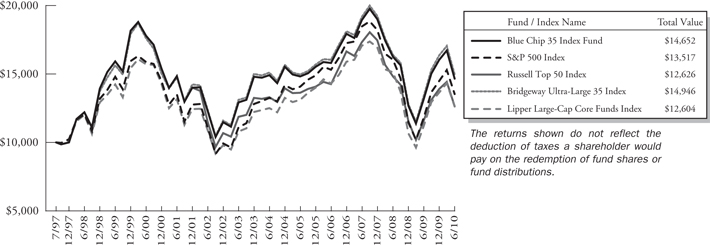
| * | The Russell Top 50 Index began on 12/31/2001, and the line graph for the Index begins at the same value as the Fund on that date. |
Quarter and Fiscal Year Performance:
The Short Version: Smaller company stocks carried the day in the quarter and the fiscal year, presenting a significant “head-wind” for our ultra-large company focused Fund.
In a majority of strongly declining markets, large companies outperform small ones. Not so over the last quarter, as ultra-large stocks, the category our Fund buys, significantly underperformed small ones. The table below shows an almost four percentage point difference between the market’s smallest and largest companies. Even more dramatic is this performance disparity by size over the last year. This is not the market environment within which we would expect to perform well relative to our primary market benchmark or peer benchmark.
| | | | | | | | | | |
| CRSP Decile1 | | Three Month
4/1/10 to 6/30/10 | | 1 Year
7/1/09
to 6/30/10 | | 5 Years
7/1/05
to 6/30/10 | | 10 Years
7/1/00
to 6/30/10 | | 84.5 Years
1/1/1926
to 6/30/10 |
| 1 (ultra-large) | | -11.89% | | 11.55% | | -0.83% | | -2.97% | | 8.90% |
| 2 | | -9.80% | | 20.71% | | 0.78% | | 2.87% | | 10.24% |
| 3 | | -9.02% | | 27.56% | | 1.14% | | 3.21% | | 10.64% |
| 4 | | -11.19% | | 22.21% | | 1.82% | | 4.06% | | 10.60% |
| 5 | | -9.76% | | 26.42% | | 4.62% | | 4.47% | | 11.15% |
| 6 | | -10.50% | | 24.67% | | 0.99% | | 3.59% | | 11.10% |
| 7 | | -8.97% | | 27.21% | | 2.41% | | 4.33% | | 11.10% |
| 8 | | -8.49% | | 27.56% | | 3.25% | | 6.41% | | 11.34% |
| 9 | | -9.64% | | 22.80% | | 1.55% | | 5.90% | | 11.38% |
| 10 (ultra-small) | | -7.94% | | 33.06% | | 3.26% | | 10.32% | | 13.06% |
| 1 | The CRSP Cap-Based Portfolio Indexes are unmanaged indexes of the publicly traded U.S. stocks with dividends reinvested, grouped by the market capitalization, as reported by the Center for Research in Security Prices. Past performance is no guarantee of future results. |
Fiscal Year Performance
The Short Version: Technology stocks and energy stocks populated both ends of our performance spectrum for the Fiscal Year.
| | |
Blue Chip 35 Index Fund MANAGER’S COMMENTARY (continued) | | |
As noted in the preceding section, size was far and away the largest determinant of performance over the last twelve months. Here’s the full list of our companies’ performance:
| | | | | | | |
| Rank Name | | Industry | | Stock
Return | |
1 | | Apple, Inc. | | Computers & Peripherals | | 76.6% | |
2 | | 3M Co. | | Industrial Conglomerates | | 35.0% | |
3 | | Merck & Co., Inc. | | Pharmaceuticals | | 33.4% | |
4 | | United Technologies Corp. | | Aerospace & Defense | | 28.0% | |
5 | | General Electric Co. | | Industrial Conglomerates | | 26.2% | |
6 | | ConocoPhillips | | Oil, Gas & Consumable Fuels | | 21.7% | |
7 | | Intel Corp. | | Semiconductors | | 21.1% | |
8 | | Procter & Gamble Co. (The) | | Household Products | | 21.0% | |
9 | | International Business Machines Corp. Computers & Peripherals | | 20.5% | |
10 | | Berkshire Hathaway, Inc. | | Insurance | | 20.3% | |
11 | | Occidental Petroleum Corp. | | Oil, Gas & Consumable Fuels | | 19.3% | |
12 | | McDonald’s Corp. | | Hotels Restaurants & Leisure | | 18.6% | |
13 | | United Parcel Service, Inc. | | Air Freight & Logistics | | 17.5% | |
14 | | Visa, Inc. | | IT Services | | 16.2% | |
15 | | Cisco Systems, Inc. | | Communications Equipment | | 14.3% | |
16 | | PepsiCo, Inc. | | Beverages | | 14.2% | |
17 | | Hewlett-Packard Co. | | Computers & Peripherals | | 12.7% | |
18 | | Bank of America Corp. | | Diversified Financial Services | | 9.1% | |
19 | | JPMorgan Chase & Co. | | Diversified Financial Services | | 7.9% | |
20 | | Coca-Cola Co. (The) | | Beverages | | 7.8% | |
21 | | Johnson & Johnson | | Pharmaceuticals | | 7.4% | |
22 | | Chevron Corp. | | Oil, Gas & Consumable Fuels | | 6.4% | |
23 | | Wells Fargo & Co. | | Commercial Banks | | 6.3% | |
24 | | Google, Inc. | | Internet Software & Services | | 5.5% | |
25 | | AT&T, Inc. | | Diversified Telecommunication Services | | 3.8% | |
26 | | Schlumberger, Ltd. | | Energy Equipment & Services | | 3.7% | |
27 | | Abbott Laboratories | | Pharmaceuticals | | 2.7% | |
28 | | Wal-Mart Stores, Inc. | | Food & Staples Retailing | | 1.4% | |
29 | | Oracle Corp. | | Software | | 1.1% | |
30 | | Pfizer, Inc. | | Pharmaceuticals | | -1.1% | |
31 | | Microsoft Corp. | | Software | | -1.4% | |
32 | | Verizon Communications, Inc. | | Diversified Telecommunication Services | | -3.0% | |
33 | | CVS Caremark Corp. | | Food & Staples Retailing | | -7.1% | |
34 | | Goldman Sachs Group, Inc. (The) | | Capital Markets | | -10.2% | |
35 | | Exxon Mobil Corp. | | Oil, Gas & Consumable Fuels | | -16.3% | |
36 | | Monsanto Co. | | Chemicals | | -37.2% | |
Steven Jobs doesn’t know there’s a sluggish economy. While many technology and consumer-related companies continue to struggle from lackluster business and consumer activity, Apple Inc., is still flying high. Whether it’s the Mac, iPod, iPhone, or iPad, folks can’t seem to get enough of Apple’s newest new thing. Simply stick “I” in front of almost any word and Apple can sell it. In its most recent earnings report, Apple’s profits soared 90%; the sales of the highly successful iPad tablet were not even included in the data yet. iPad sold over 3 million units in less than three months on the market. In June 2010, iPhone 4 hit the market and, within days of its launch, the company had already sold more than 1.7 million units. In fact, 600,000 advance orders had been taken on the first day it became available. While AT&T has been the lone iPhone provider to date, Verizon Wireless may enter the mix in early 2011. Flush with cash from the huge iPad and iPhone demand, Apple pays no dividends and maintains very little debt. Because of its significant liquidity position, analysts expect new product launches or
| | |
104 | | Annual Report | June 30, 2010 |
| | |
Blue Chip 35 Index Fund MANAGER’S COMMENTARY (continued) | | |
possibly an acquisition or two on the horizon. In fact, early in the year, the company hired a prominent Goldman Sachs investment banker to head up its deal team. Apple is now the largest component in the NASDAQ 100 and accounts for around 20% of the overall index. Its stock price climbed over 75% during the fiscal year and was the top performer in the Fund.
On the other end of the performance spectrum… In prior years, agri-chemical giant Monsanto rode the waves of growth (economic and population) in China as its sales to that country more than doubled since 2003 on enhanced farm production. The more recent global economic downturn and sluggish domestic recovery, however, have definitely taken their toll on the company. Investors have grown tired of missed earnings and overzealous growth projections by management, and a lingering anti-trust lawsuit over monopolistic powers has contributed to ongoing uncertainty. However, competition has hurt the most as struggling farmers fled Monsanto’s leading Roundup herbicide product in favor of less expensive generics. Monsanto management had long felt that loyal customers would continue to pay a premium for its “superior” products, but have experienced a rude awakening as farmers faced a difficult economy and declining commodity prices. The company finally assumed a “can’t beat them, join them” attitude and began slashing Roundup prices, with hopes of regaining market share and “loss leading” these buyers back to other products. Its most recent earnings declined by 45% as sales dropped by over six percent in the prior quarter. Recently, Monsanto received some good news in the form of a Supreme Court ruling over previously banned genetically enhanced alfalfa seeds, but analysts do not expect the company to reap significant financial rewards for a few years. While management has cut costs significantly, it has been careful to keep R&D intact (the expense has even increased) so the “next new thing” to meet the farmers’ ever-changing needs may be on the horizon. For the fiscal year, Monsanto plunged almost 40% and was the Fund’s worst performer of the fiscal year.
Industry Sector Representation as of June 30, 2010
Our Fund continues to be underweighted in consumer discretionary and overweighted in information technology companies relative to our primary market benchmark.
| | | | | | |
| | | % of Fund | | % of S&P 500 | | Difference |
Consumer Discretionary | | 2.7% | | 10.1% | | -7.4% |
Consumer Staples | | 13.5% | | 11.5% | | 2.0% |
Energy | | 13.5% | | 10.8% | | 2.7% |
Financials | | 14.5% | | 16.3% | | -1.8% |
Health Care | | 11.0% | | 12.1% | | -1.1% |
Industrials | | 11.3% | | 10.4% | | 0.9% |
Information Technology | | 25.3% | | 18.7% | | 6.6% |
Materials | | 2.8% | | 3.4% | | -0.6% |
Telecommunication Services | | 5.4% | | 3.0% | | 2.4% |
Utilities | | 0.0% | | 3.7% | | -3.7% |
Cash | | 0.0% | | 0.0% | | 0.0% |
| | | |
Total | | 100.0% | | 100.0% | | |
Disclaimer
The views expressed here are exclusively those of Fund management. These views, including those of market sectors or individual stocks, are not meant as investment advice and should not be considered predictive in nature. Any favorable (or unfavorable) description of a holding applies only as of the quarter end, June 30, 2010, unless otherwise stated. Security positions can and do change thereafter. Discussions of historical performance do not guarantee and may not be indicative of future performance.
The Fund is subject to significant market risk (volatility) and is not an appropriate investment for short-term investors.
| | |
Blue Chip 35 Index Fund MANAGER’S COMMENTARY (continued) | | |
Conclusion
Thank you for your continued investment in Blue Chip 35 Index Fund. We encourage your feedback; your reactions and concerns are extremely important to us.
Sincerely,
Your Investment Management Team
| | |
106 | | Annual Report | June 30, 2010 |
| | |
Bridgeway Blue Chip 35 Index Fund SCHEDULE OF INVESTMENTS | | |
Showing percentage of net assets as of June 30, 2010
| | | | | | | |
Industry Company | | Shares | | Value | | |
COMMON STOCKS - 99.95% | | |
Aerospace & Defense - 2.62% | | |
United Technologies Corp. | | 89,780 | | $ | 5,827,620 | | |
Air Freight & Logistics - 2.69% | | |
United Parcel Service, Inc., Class B | | 105,063 | | | 5,977,034 | | |
Beverages - 5.46% | | |
Coca-Cola Co. (The) | | 120,057 | | | 6,017,257 | | |
PepsiCo, Inc. | | 100,450 | | | 6,122,427 | | |
| | | | | | | |
| | | | | 12,139,684 | | |
Capital Markets - 2.80% | | |
Goldman Sachs Group, Inc. (The) | | 47,500 | | | 6,235,325 | | |
Chemicals - 2.75% | | |
Monsanto Co. | | 132,550 | | | 6,126,461 | | |
Commercial Banks - 2.93% | | |
Wells Fargo & Co. | | 254,859 | | | 6,524,390 | | |
Communications Equipment - 2.58% | | |
Cisco Systems, Inc.* | | 269,108 | | | 5,734,692 | | |
Computers & Peripherals - 6.83% | | |
Apple, Inc.* | | 35,200 | | | 8,853,856 | | |
Hewlett-Packard Co. | | 146,600 | | | 6,344,848 | | |
| | | | | | | |
| | | | | 15,198,704 | | |
Diversified Financial Services - 5.58% | | |
Bank of America Corp. | | 438,908 | | | 6,307,108 | | |
JPMorgan Chase & Co. | | 167,095 | | | 6,117,348 | | |
| | | | | | | |
| | | | | 12,424,456 | | |
Diversified Telecommunication Services - 5.43% | | |
AT&T, Inc. | | 255,125 | | | 6,171,474 | | |
Verizon Communications, Inc. | | 211,389 | | | 5,923,120 | | |
| | | | | | | |
| | | | | 12,094,594 | | |
Energy Equipment & Services - 2.79% | | |
Schlumberger, Ltd. | | 112,100 | | | 6,203,614 | | |
Food & Staples Retailing - 5.23% | | |
CVS Caremark Corp. | | 196,200 | | | 5,752,584 | | |
Wal-Mart Stores, Inc. | | 122,519 | | | 5,889,488 | | |
| | | | | | | |
| | | | | 11,642,072 | | |
Hotels, Restaurants & Leisure - 2.65% | | |
McDonald’s Corp. | | 89,600 | | | 5,901,952 | | |
Household Products - 2.82% | | |
Procter & Gamble Co. (The) | | 104,626 | | | 6,275,467 | | |
| | | | | |
Industry Company | | Shares | | Value |
| | | | | |
Industrial Conglomerates - 5.94% |
3M Co. | | 90,100 | | $ | 7,116,999 |
General Electric Co. | | 423,943 | | | 6,113,258 |
| | | | | |
| | | | | 13,230,257 |
Insurance - 3.21% |
Berkshire Hathaway, Inc., Class B* | | 89,650 | | | 7,144,209 |
Internet Software & Services - 2.73% |
Google, Inc., Class A* | | 13,670 | | | 6,082,467 |
IT Services - 5.33% |
International Business | | | | | |
Machines Corp. | | 48,642 | | | 6,006,314 |
Visa, Inc., Class A | | 82,900 | | | 5,865,175 |
| | | | | |
| | | | | 11,871,489 |
Oil, Gas & Consumable Fuels - 10.72% |
Chevron Corp. | | 84,595 | | | 5,740,617 |
ConocoPhillips | | 128,115 | | | 6,289,165 |
Exxon Mobil Corp. | | 102,887 | | | 5,871,761 |
Occidental Petroleum Corp. | | 77,300 | | | 5,963,695 |
| | | | | |
| | | | | 23,865,238 |
Pharmaceuticals - 11.00% |
Abbott Laboratories | | 137,100 | | | 6,413,538 |
Johnson & Johnson | | 103,752 | | | 6,127,593 |
Merck & Co., Inc. | | 177,135 | | | 6,194,411 |
Pfizer, Inc. | | 402,644 | | | 5,741,704 |
| | | | | |
| | | | | 24,477,246 |
Semiconductors & Semiconductor Equipment - 2.62% |
Intel Corp. | | 299,343 | | | 5,822,221 |
Software - 5.24% |
Microsoft Corp. | | 249,845 | | | 5,748,933 |
Oracle Corp. | | 276,013 | | | 5,923,239 |
| | | | | |
| | | | | 11,672,172 |
| | | | | |
TOTAL COMMON STOCKS - 99.95% | | | 222,471,364 |
| | | | | |
(Cost $212,576,719) | | | | | |
TOTAL INVESTMENTS - 99.95% | | | 222,471,364 |
(Cost $212,576,719) | | | | | |
Other Assets in Excess of Liabilities - 0.05% | | | 114,781 |
| | | | | |
NET ASSETS - 100.00% | | | | $ | 222,586,145 |
| | | | | |
| * | Non-income producing security. |
| | |
Bridgeway Blue Chip 35 Index Fund SCHEDULE OF INVESTMENTS (continued) | | |
| | | | | | | | | | |
Summary of inputs used to value the Fund’s investments as of
06/30/2010 are as follows (See Note 2 in Notes to Financial
Statements): | | |
| | | Valuation Inputs | | |
| | | Investment in Securities (Market Value) | |
| | | Level 1
Quoted
Prices | | Level 2
Significant
Observable
Inputs | | Level 3
Significant
Unobservable
Inputs | | Total | |
Common Stocks | | $222,471,364 | | $— | | $— | | $222,471,364 | |
| | | | | | | | | |
TOTAL | | $222,471,364 | | $— | | $— | | $222,471,364 | |
| | | | | | | | | | |
See Notes to Financial Statements. | | |
| | |
108 | | Annual Report | June 30, 2010 |
| | |
Managed Volatility Fund (formerly, the Balanced Fund) MANAGER’S COMMENTARY | | |
June 30, 2010
Dear Fellow Managed Volatility Fund Shareholder:
Please note the new name! Our Fund board voted to change the name to better reflect our investment strategy.
For the quarter ended June 30, 2010, the Managed Volatility Fund declined 6.66%, trailing the Balanced Benchmark decline of 3.83%, the fixed income only Bloomberg/EFFAS US Government 1-3 Year Total Return Bond Index (BBI) return of 1.23%, and the Lipper Balanced Funds Index decline of 6.26%. We beat the S&P 500 Index decline of 11.43%, but all in all it was not a good quarter.
For the full fiscal year ended June 30, 2010, the Managed Volatility Fund returned 1.67%, trailing the Balanced Benchmark return of 7.45%, the BBI return of 2.79%, the Lipper Balanced Funds Index return of 13.33%, and the S&P 500 Index return of 14.43%. This fiscal year performance is even worse than the quarter, as we only captured 11.57% of the S&P gain.
This fiscal year-end period had the worst relative performance to the S&P 500 and third worst relative to our Balanced Benchmark since we launched the fund 9 years ago. These periods are never fun, but must be put in context. If we look at our annual fiscal year returns since inception, there are only two years out of nine where we significantly failed to achieve our objective of capturing 40% (40% or less in declining markets, 40% or more in up markets) of the returns of the S&P. The other was fiscal year 2007, when we only achieved a “capture ratio” of 29%. Here is a link to our calendar year, fiscal year and quarterly returns relative to the S&P 500 Index to give you a full view of our results (http://www.bridgeway.com/assets/BRBPX vs SP500.pdf). We actually beat the S&P 500 Index in two fiscal years and two calendar years, but never lost more than the S&P in any quarter. The standard deviation of the Fund’s returns since inception is 4.3% versus 9.3% for the S&P 500 Index.
The table below presents our June quarter, one-year, five-year and life-to-date financial results according to the formula required by the SEC. See the next page for a graph of performance since inception.
| | | | | | | | |
| | | June Qtr.
4/1/10
to 6/30/10 | | 1 Year
7/1/09
to 6/30/10 | | 5 Year
7/1/05
to 6/30/10 | | Life-to-Date
6/30/01 to 6/30/10 |
| | | | |
Managed Volatility Fund | | -6.66% | | 1.67% | | 0.19% | | 2.46% |
Balanced Benchmark | | -3.83% | | 7.45% | | 2.36% | | 2.48% |
S&P 500 Index | | -11.43% | | 14.43% | | -0.80% | | 0.01% |
Bloomberg/EFFAS U.S. Government 1-3 Year Total Return Bond Index | | 1.23% | | 2.79% | | 4.27% | | 3.90% |
Lipper Balanced Funds Index | | -6.26% | | 13.33% | | 1.98% | | 2.72% |
Performance figures quoted in the table above and graph below represent past performance and are no guarantee of future results. Total return figures in the table above include the reinvestment of dividends and capital gains. The table above and the graph below do not reflect the deduction of taxes that a shareholder would pay on Fund distributions or the redemption of Fund shares.
Balanced Benchmark is a combined index of which 40% reflects the S&P 500 Index (an unmanaged index of large companies with dividends reinvested) and 60% reflects the Bloomberg/ EFFAS U.S. Government 1-3 year Total Return Bond Index (transparent benchmark for the total return of the 1-3 year U.S. Government bond market). The Lipper Balanced Funds Index is an index of balanced funds compiled by Lipper, Inc.
According to data from Lipper, Inc. as of June 30, 2010, the Managed Volatility Fund ranked 492nd of 492 Mixed-Asset Target Allocation Moderate funds for the calendar year ended June 30, 2010, 316th of 369 for the past five years and 107th of 200 funds since inception on June 30, 2001. Lipper, Inc. is an independent mutual fund rating service that ranks funds in various fund categories by making comparative calculations using total returns.
| | |
Managed Volatility Fund (formerly, the Balanced Fund) MANAGER’S COMMENTARY (continued) | | |
According to data from Morningstar as of June 30, 2010, the Managed Volatility Fund ranked 642nd of 649 Conservative Allocation funds for the fiscal year ended June 30, 2010, and 375th out of 400 funds for five years. Morningstar ranks funds in various fund categories by making comparative calculations using total returns.
Managed Volatility Fund vs. S&P 500 Index, Bloomberg/EFFAS Bond Index, Lipper Balanced Funds Index & Balanced Benchmark from Inception 6/30/01 to 6/30/10
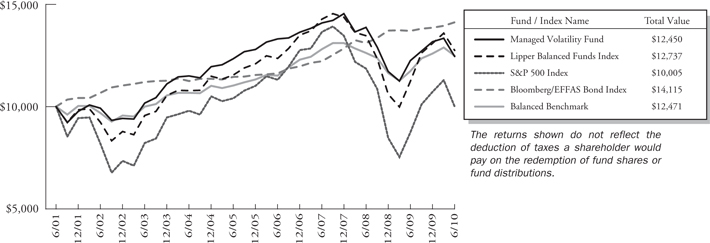
Detailed Explanation of Quarterly Performance — What Worked
The Short Version: Consumer discretionary companies were well represented on the best performers list.
Despite the difficulties brought on by such global factors as the European sovereign debt crisis, our models uncovered several companies that contributed favorable returns to the Fund. While labor woes have kept many consumers away from the malls and strip centers as of late, four consumer discretionary companies headlined the list of best performers of the quarter. Still, no holding returned greater than 15% for the three-month period, and seven of the top stocks only generated single-digit returns.
These are the ten stocks that performed the best for the Fund during the quarter ended June 30, 2010:
| | | | | | |
| Rank | | Description | | Industry | | % Gain |
| 1 | | SanDisk Corp. | | Computers & Peripherals | | 14.7% |
| 2 | | AutoZone, Inc. | | Specialty Retail | | 11.6% |
| 3 | | Sprint Nextel Corp. | | Wireless Telecommunication Services | | 11.6% |
| 4 | | American Greetings Corp. | | Household Durables | | 9.3% |
| 5 | | Fluor Corp. | | Construction & Engineering | | 9.2% |
| 6 | | Hasbro, Inc. | | Leisure Equipment & Products | | 8.1% |
| 7 | | Public Service Enterprise Group, Inc. | | Multi-Utilities | | 7.3% |
| 8 | | Apple, Inc. | | Computers & Peripherals | | 7.0% |
| 9 | | EMC Corp. | | Computers & Peripherals | | 6.7% |
| 10 | | Fuel Systems Solutions, Inc. | | Auto Components | | 6.0% |
While many consumer goods companies have struggled mightily in the economic downturn (and even the aftermath), toymaker Hasbro has remained relatively immune from the ongoing difficulties. Its stock returned positive gains in both 2008 and 2009 and seems on its way to another successful year. Its classics, such as GI Joe, Monopoly, and Mr. Potato Head, remain hits with kids and adults alike, and the company is teaming up with Discovery to initiate a children’s TV network later in the year. It also has avoided much of the negativity surrounding other toymakers regarding lead poisoning and toxicity and even recently
| | |
110 | | Annual Report | June 30, 2010 |
| | |
Managed Volatility Fund (formerly, the Balanced Fund) MANAGER’S COMMENTARY (continued) | | |
rewarded shareholders with a dividend increase. Though management has denied the rumors, talk has persisted about a potential leveraged buyout by a private equity firm to take the company private. Hasbro was the Fund’s sixth best performer during the three-month period.
Detailed Explanation of Quarterly Performance — What Didn’t Work
The Short Version: Every sector had stocks that were hit hard. Our hedging strategy with derivatives did cushion the quarterly downturn, but not as much as we would have expected, hurting our relative performance in both the quarter and fiscal periods.
Uncertainty was in the air during the quarter, and no sector was spared from the negativity. Retailers and IT struggled from the weak labor market and lackluster buying activity; health care and financials worried about enhanced regulatory environments; global players within industrials and materials feared a debt default contagion. Six sectors were represented on the list of worst performers, and each of the 10 holdings below lost over 25% during the June quarter. IT and materials companies headlined the list; three holdings from both sectors were included.
These are the ten stocks that performed the worst for the Fund during the quarter ended June 30, 2010:
| | | | | | |
| Rank | | Description | | Industry | | % Loss |
| 1 | | Anadarko Petroleum Corp. | | Oil, Gas & Consumable Fuels | | -50.4% |
| 2 | | Unisys Corp. | | IT Services | | -49.3% |
| 3 | | Sears Holdings Corp. | | Multiline Retail | | -40.4% |
| 4 | | United States Steel Corp. | | Metals & Mining | | -39.3% |
| 5 | | Monsanto Co. | | Chemicals | | -35.0% |
| 6 | | Baxter International, Inc. | | Health Care Equipment & Supplies | | -29.7% |
| 7 | | Alcoa, Inc. | | Metals & Mining | | -29.2% |
| 8 | | Seagate Technology | | Computers & Peripherals | | -28.6% |
| 9 | | Walgreen Co. | | Food & Staples Retailing | | -27.7% |
| 10 | | eBay, Inc. | | Internet Software & Services | | -27.3% |
Sometimes a global presence hinders a firm’s operations, particularly when foreign governments make decisions beyond management’s control. Unisys Corp. provides outsourced IT services to business enterprises and governments across the globe. Early in the year, Venezuelan President Hugo Chavez took actions to devalue the country’s currency, a move that had a dramatic (negative) impact on multinational companies. The SEC later labeled Venezuela’s economy as “hyperinflationary,” and domestic companies that engaged in operations there were forced to incur a charge to earnings. As a result, Unisys took a hit of $20 million in the first quarter, despite strong operating profits. Its stock price dropped almost 50% while we owned it during the quarter, and it was the second worst performer in the Fund.
Detailed Explanation of Fiscal Year Performance — What Worked
The Short Version: Information technology led the way for the fiscal year.
In the aftermath of the dramatic downturn, investors looked for value across all sectors, and winners (and losers) existed in each during the past 12 months. Four sectors were represented on the list of best performers for the year, with three of the top holdings in the IT sector. As the economy has moved into recovery (somewhat), certain businesses have slowly begun increasing their budgets for technology upgrades. (That…and consumers love Apple). Combined, these three tech holdings contributed about one-and-a-half percent to the Fund’s return. Each of the “best of” holdings soared over 50% for the 12-month period.
| | |
Managed Volatility Fund (formerly, the Balanced Fund) MANAGER’S COMMENTARY (continued) | | |
These are the ten stocks that performed the best for the Fund during the fiscal year ended June 30, 2010:
| | | | | | |
| Rank | | Description | | Industry | | % Gain |
| 1 | | Lexmark International, Inc. | | Computers & Peripherals | | 108.4% |
| 2 | | Apple, Inc. | | Computers & Peripherals | | 76.6% |
| 3 | | Comerica, Inc. | | Commercial Banks | | 75.2% |
| 4 | | Hasbro, Inc. | | Leisure Equipment & Products | | 74.3% |
| 5 | | Terex Corp. | | Machinery | | 59.7% |
| 6 | | Big Lots, Inc. | | Multiline Retail | | 52.6% |
| 7 | | NetApp, Inc. | | Computers & Peripherals | | 52.2% |
| 8 | | CSX Corp. | | Road & Rail | | 51.8% |
| 9 | | Ameriprise Financial, Inc. | | Capital Markets | | 51.8% |
| 10 | | Eaton Corp. | | Machinery | | 51.5% |
Steven Jobs doesn’t know there’s a sluggish economy. While many IT and consumer-related companies continue to struggle from lackluster buying activity (by both individuals and businesses), Apple Inc., is still flying high. Whether it’s the Mac, iPod, iPhone, or iPad, folks can’t seem to get enough of Apple’s newest new thing. Simply stick “I” in front of almost any word, and Apple can sell it. In its most recent earnings report, Apple’s profits soared 90%; sales of the highly successful iPad tablet were not even included in the data yet. (By the way, iPad sold over 3 million units in less than three months on the market.) In June 2010, iPhone 4 hit the market, and within days of its launch, the company had already sold more than 1.7 million units. In fact, 600,000 advance orders had been taken on the first day it became available. Flush with cash from the huge iPad and iPhone demand, Apple pays no dividend and maintains very little debt. Because of its significant liquidity position, analysts expect new product launches or possibly an acquisition or two on the horizon. Its stock price climbed over 75% during the fiscal year and contributed over one percent to the return of the Fund.
Detailed Explanation of Fiscal Year Performance — What Didn’t Work
The Short Version: Information technology also led the way among the worst performers.
While three IT companies were among the Fund’s top performers over the fiscal year, the list of worst holdings reveals that the sector was not immune to certain difficulties as well. Three related technology companies headlined the “worst of” list and combined cost the Fund about one-and-a-half percent in return. In fact, five total sectors were represented, so plenty of “challenges” continued to exist in the aftermath of the economic downturn.
These are the ten stocks that performed the worst for the Fund during the fiscal year ended June 30, 2010:
| | | | | | |
| Rank | | Description | | Industry | | % Loss |
| 1 | | Unisys Corp. | | IT Services | | -49.3% |
| 2 | | Monsanto Co. | | Chemicals | | -37.2% |
| 3 | | Seagate Technology | | Computers & Peripherals | | -33.8% |
| 4 | | State Street Corp. | | Capital Markets | | -28.3% |
| 5 | | Gilead Sciences, Inc. | | Biotechnology | | -26.8% |
| 6 | | Visa, Inc. | | IT Services | | -23.9% |
| 7 | | Dow Chemical Co. (The) | | Chemicals | | -22.5% |
| 8 | | Exelon Corp. | | Electric Utilities | | -22.4% |
| 9 | | Baxter International, Inc. | | Health Care Equipment & Supplies | | -21.6% |
| 10 | | AES Corp. (The) | | Independent Power Producers & Energy Traders | | -20.4% |
The recent global economic downturn and sluggish domestic recovery have definitely taken their toll on Monsanto as of late; its stock price closed near a 52-week low to end the fiscal year. Investors have grown tired of missed earnings and overzealous growth projections by management, and a lingering anti-trust lawsuit over monopolistic powers has contributed to ongoing uncertainty. However, it’s the competition that has hurt the most as struggling farmers fled its leading Roundup herbicide product in favor of less expensive generics. Monsanto management had long felt that loyal customers would continue to pay a
| | |
112 | | Annual Report | June 30, 2010 |
| | |
Managed Volatility Fund (formerly, the Balanced Fund) MANAGER’S COMMENTARY (continued) | | |
premium for its “superior” products, but have been rudely awakened as farmers faced a difficult economy and declining commodity prices. The company finally assumed a “can’t beat them, join them” attitude and began slashing Roundup prices, with hopes of regaining market share and “loss leading” these buyers back to other products. Its most recent earnings declined by 45% as sales dropped by over six percent in the prior quarter. While management has cut costs wherever possible, it has been careful to keep R&D intact (and the expense has even increased) in order to find the “next new thing” that will meet farmers’ ever-changing needs (until a generic is created). For the fiscal year, Monsanto plunged almost 40% and cost the Fund just less than a quarter-of-a-percent in return.
Top Ten Holdings as of June 30, 2010
The Fund remained well-diversified; no one equity position accounted for more than 2.3% of the net assets, and nine diverse industries were represented in the top stock holdings list at fiscal year-end. Combined, the top 10 positions accounted for about 15% of the overall allocation. The top two largest holdings were major oil and gas companies.
| | | | | | |
| Rank | | Description | | Industry | | % of Net
Assets |
| 1 | | Chevron Corp. | | Oil, Gas & Consumable Fuels | | 2.3% |
| 2 | | Exxon Mobil Corp. | | Oil, Gas & Consumable Fuels | | 2.2% |
| 3 | | Travelers Cos, Inc. (The) | | Insurance | | 2.1% |
| 4 | | Veeco Instruments, Inc. | | Semiconductors & Semiconductor Equipment | | 1.6% |
| 5 | | CarMax, Inc. | | Specialty Retail | | 1.5% |
| 6 | | Berkshire Hathaway, Inc. | | Thrifts & Mortgage Finance | | 1.4% |
| 7 | | Sanmina-SCI Corp. | | Electronic Equip., Instruments | | 1.3% |
| 8 | | Archer-Daniels-Midland Co. | | Food Products | | 1.0% |
| 9 | | JPMorgan Chase & Co. | | Diversified Financial Services | | 1.0% |
| 10 | | Cisco Systems, Inc. | | Communications Equipment | | 0.9% |
| | | |
| | Total | | | | 15.3% |
Industry Sector Representation as of June 30, 2010
As of June 30, 2010, equities comprised slightly more than 50% of the Fund’s overall allocation. Information technology and financials represented the largest allocations; both sectors struggled over the past three months amid sluggish consumer activity and the uncertainty of financial reform legislation. While many investors began to shift to more “risky” assets (such as equities), in the aftermath of the recession, the results of the past three months hurt performance as stocks pulled back from the rapid rebound of the prior quarters.
The fixed income portfolio primarily held positions in short-duration US treasuries, though we did increase our exposure to corporate securities, a decision that proved costly, since certain companies found new difficulties gaining access to credit. According to its mandate, the Fund must maintain a healthy allocation to safe-haven securities; the treasury portfolio benefited during the past three months as investors moved away from certain asset classes with a “flight-to-quality” into government securities. Finally, we utilized the options markets to generate additional income by selling puts and calls, a strategy that can be quite effective when premiums are high during volatile equity market environments.
| | |
Managed Volatility Fund (formerly, the Balanced Fund) MANAGER’S COMMENTARY (continued) | | |
| | |
| Asset Type | | % of Net
Assets |
Common Stock | | 56.1% |
Consumer Discretionary | | 6.3% |
Consumer Staples | | 6.4% |
Energy | | 7.2% |
Financials | | 10.1% |
Health Care | | 5.1% |
Industrials | | 4.5% |
Information Technology | | 12.7% |
Materials | | 1.2% |
Telecommunication Services | | 1.0% |
Utilities | | 1.6% |
U.S. Government Obligations | | 38.8% |
Corporate Notes | | 6.2% |
Covered Call Options Written | | -0.3% |
Put Options Written | | -1.8% |
Money Market Funds | | 3.6% |
Liabilities in Excess of Other Assets | | -2.6% |
| |
Total | | 100.0% |
Disclaimer
The views expressed here are exclusively those of Fund management. These views, including those concerning market sectors or individual stocks, are not meant as investment advice and should not be considered predictive in nature. Any favorable (or unfavorable) description of a holding applies only as of the quarter-end, June 30, 2010, unless otherwise stated. Security positions can and do change thereafter. Discussions of historical performance do not guarantee and may not be indicative of future performance.
Market volatility can significantly affect short-term performance. While the volatility of this Fund has historically been significantly less than that of the broader stock market, the Fund is not an appropriate investment for short-term investors. The Fund invests in companies of any size for which exchange-traded options are available. Small companies are more vulnerable to financial and other risks than large companies. The Fund’s use of options, futures, and leverage can magnify the risk of loss in an unfavorable market, and the Fund’s use of short-sale positions can, in theory, expose shareholders to unlimited loss. Shareholders of the Fund, therefore, are taking on more risk than they would if they invested in the stock market as a whole. The Fund uses an option writing strategy in which the Fund may sell covered calls or secured put options. Up to 75% of Fund assets may be invested in common stocks and options. Options are subject to special risks and may not fully protect the Fund against declines in the value of its stocks. In addition, an option writing strategy limits the upside profit potential normally associated with stocks. Finally, the Fund’s fixed-income holdings are subject to three types of risk. Interest rate risk is the chance that bond prices overall will decline as interest rates rise. Credit risk is the chance that a bond issuer will fail to pay interest and principal. Prepayment risk is the chance a mortgage-backed bond issuer will repay a higher yielding bond, resulting in a lower paying yield.
Conclusion
Thank you for your continued investment in Managed Volatility Fund. We encourage your feedback; your reactions and concerns are extremely important to us.
Sincerely,
Your Investment Management Team
| | |
114 | | Annual Report | June 30, 2010 |
| | |
Bridgeway Managed Volatility Fund SCHEDULE OF INVESTMENTS | | |
Showing percentage of net assets as of June 30, 2010
| | | | | | | |
Industry Company | | Shares | | Value | | |
COMMON STOCKS - 56.06% | | |
Aerospace & Defense - 1.57% | | |
General Dynamics Corp. | | 1,400 | | $ | 81,984 | | |
Honeywell International, Inc. | | 2,900 | | | 113,187 | | |
Lockheed Martin Corp. | | 2,470 | | | 184,015 | | |
Northrop Grumman Corp. | | 1,600 | | | 87,104 | | |
United Technologies Corp. | | 940 | | | 61,015 | | |
| | | | | | | |
| | | | | 527,305 | | |
Air Freight & Logistics - 0.25% | | |
FedEx Corp. | | 1,200 | | | 84,132 | | |
Beverages - 1.20% | | | | | | | |
Brown-Forman Corp., Class B | | 2,950 | | | 168,828 | | |
Coca-Cola Co. (The)# | | 3,500 | | | 175,420 | | |
PepsiCo, Inc. | | 1,000 | | | 60,950 | | |
| | | | | | | |
| | | | | 405,198 | | |
Biotechnology - 0.66% | | |
Gilead Sciences, Inc.*# | | 6,500 | | | 222,820 | | |
Capital Markets - 1.22% | | | | | | | |
Ameriprise Financial, Inc.# | | 2,080 | | | 75,150 | | |
Bank of New York Mellon Corp. (The)# | | 1,832 | | | 45,232 | | |
Charles Schwab Corp. (The) | | 5,000 | | | 70,900 | | |
Franklin Resources, Inc. | | 300 | | | 25,857 | | |
Goldman Sachs Group, Inc. (The) | | 700 | | | 91,889 | | |
Morgan Stanley# | | 1,500 | | | 34,815 | | |
State Street Corp.# | | 2,000 | | | 67,640 | | |
| | | | | | | |
| | | | | 411,483 | | |
Chemicals - 0.84% | | |
Dow Chemical Co. (The) | | 5,300 | | | 125,716 | | |
Monsanto Co.# | | 1,000 | | | 46,220 | | |
Sherwin-Williams Co. (The) | | 600 | | | 41,514 | | |
Sigma-Aldrich Corp. | | 1,400 | | | 69,762 | | |
| | | | | | | |
| | | | | 283,212 | | |
Commercial Banks - 1.73% | | |
BB&T Corp. | | 2,300 | | | 60,513 | | |
Comerica, Inc.# | | 2,600 | | | 95,758 | | |
KeyCorp | | 4,900 | | | 37,681 | | |
Marshall & Ilsley Corp. | | 8,200 | | | 58,876 | | |
US Bancorp | | 5,500 | | | 122,925 | | |
Wells Fargo & Co.# | | 8,071 | | | 206,618 | | |
| | | | | | | |
| | | | | 582,371 | | |
Communications Equipment - 1.16% | | |
Ciena Corp.*+ | | 42 | | | 533 | | |
| | | | | |
Industry Company | | Shares | | Value |
| | | | | |
Communications Equipment (continued) |
Cisco Systems, Inc.*# | | 14,100 | | $ | 300,471 |
Juniper Networks, Inc.* | | 3,900 | | | 88,998 |
| | | | | |
| | | | | 390,002 |
Computers & Peripherals - 2.55% |
Apple, Inc.* | | 800 | | | 201,224 |
Lexmark International, Inc., Class A* | | 2,800 | | | 92,484 |
SanDisk Corp.* | | 2,700 | | | 113,589 |
Seagate Technology*# | | 20,000 | | | 260,800 |
Teradata Corp.* | | 6,200 | | | 188,976 |
| | | | | |
| | | | | 857,073 |
Consumer Finance - 0.64% |
American Express Co. | | 2,200 | | | 87,340 |
Capital One Financial Corp.# | | 3,200 | | | 128,960 |
| | | | | |
| | | | | 216,300 |
Diversified Financial Services - 1.47% |
Bank of America Corp.# | | 10,800 | | | 155,196 |
Citigroup, Inc.* | | 5,100 | | | 19,176 |
JPMorgan Chase & Co. | | 8,800 | | | 322,168 |
| | | | | |
| | | | | 496,540 |
Diversified Telecommunication Services - 0.62% |
AT&T, Inc. | | 5,400 | | | 130,626 |
Verizon Communications, Inc.# | | 2,800 | | | 78,456 |
| | | | | |
| | | | | 209,082 |
Electric Utilities - 0.38% |
American Electric Power Co., Inc. | | 1,600 | | | 51,680 |
Exelon Corp. | | 1,100 | | | 41,767 |
Progress Energy, Inc. | | 900 | | | 35,298 |
| | | | | |
| | | | | 128,745 |
Electrical Equipment - - 0.14% |
Emerson Electric Co. | | 1,100 | | | 48,059 |
Electronic Equipment, Instruments & Components - 1.63% |
Corning, Inc. | | 4,500 | | | 72,675 |
FLIR Systems, Inc.* | | 1,200 | | | 34,908 |
Sanmina-SCI Corp.*# | | 32,500 | | | 442,325 |
| | | | | |
| | | | | 549,908 |
Energy Equipment & Services - 0.48% |
Halliburton Co.# | | 5,500 | | | 135,025 |
| | |
Bridgeway Managed Volatility Fund SCHEDULE OF INVESTMENTS (continued) | | |
Showing percentage of net assets as of June 30, 2010
| | | | | | | |
Industry Company | | Shares | | Value | | |
Common Stocks (continued) | | |
Energy Equipment & Services (continued) | | |
National Oilwell Varco, Inc. | | 800 | | $ | 26,456 | | |
| | | | | | | |
| | | | | 161,481 | | |
Food & Staples Retailing - 1.93% | | |
Costco Wholesale Corp. | | 800 | | | 43,864 | | |
CVS Caremark Corp.# | | 6,900 | | | 202,308 | | |
Kroger Co. (The) | | 1,000 | | | 19,690 | | |
Safeway, Inc.# | | 4,700 | | | 92,402 | | |
Walgreen Co.# | | 2,500 | | | 66,750 | | |
Wal-Mart Stores, Inc. | | 4,700 | | | 225,929 | | |
| | | | | | | |
| | | | | 650,943 | | |
Food Products - 1.87% | | |
Archer-Daniels-Midland Co.# | | 13,500 | | | 348,570 | | |
General Mills, Inc.# | | 2,400 | | | 85,248 | | |
Kraft Foods, Inc., Class A | | 3,400 | | | 95,200 | | |
Mead Johnson Nutrition Co. | | 2,016 | | | 101,042 | | |
| | | | | | | |
| | | | | 630,060 | | |
Health Care Equipment & Supplies - 1.32% | | |
Baxter International, Inc.# | | 4,100 | | | 166,624 | | |
Becton Dickinson & Co. | | 720 | | | 48,686 | | |
CR Bard, Inc. | | 1,300 | | | 100,789 | | |
Medtronic, Inc. | | 1,000 | | | 36,270 | | |
Stryker Corp. | | 1,860 | | | 93,112 | | |
| | | | | | | |
| | | | | 445,481 | | |
Health Care Providers & Services - 1.16% | | |
Express Scripts, Inc.*# | | 2,200 | | | 103,444 | | |
Laboratory Corp. of America Holdings* | | 800 | | | 60,280 | | |
Medco Health Solutions, Inc.*# | | 2,100 | | | 115,668 | | |
Quest Diagnostics, Inc. | | 1,500 | | | 74,655 | | |
UnitedHealth Group, Inc. | | 1,300 | | | 36,920 | | |
| | | | | | | |
| | | | | 390,967 | | |
Hotels, Restaurants & Leisure - 0.18% | | |
McDonald’s Corp. | | 900 | | | 59,283 | | |
Household Products - 0.96% | | |
Clorox Co. | | 30 | | | 1,865 | | |
Colgate-Palmolive Co. | | 1,500 | | | 118,140 | | |
Kimberly-Clark Corp. | | 1,000 | | | 60,630 | | |
Procter & Gamble Co. (The)# | | 2,400 | | | 143,952 | | |
| | | | | | | |
| | | | | 324,587 | | |
Independent Power Producers & Energy Traders - 0.31% | | |
AES Corp. (The)*# | | 11,100 | | | 102,564 | | |
| | | | | |
Industry Company | | Shares | | Value |
| | | | | |
Industrial Conglomerates - 0.91% |
3M Co. | | 2,800 | | $ | 221,172 |
General Electric Co. | | 6,000 | | | 86,520 |
| | | | | |
| | | | | 307,692 |
Insurance - 4.84% |
Aflac, Inc. | | 800 | | | 34,136 |
AON Corp.# | | 3,500 | | | 129,920 |
Berkshire Hathaway, Inc., Class B*# | | 6,000 | | | 478,140 |
Chubb Corp.# | | 3,500 | | | 175,035 |
Principal Financial Group, Inc. | | 1,000 | | | 23,440 |
Progressive Corp. (The) | | 4,020 | | | 75,254 |
Travelers Cos., Inc. (The)# | | 14,500 | | | 714,125 |
| | | | | |
| | | | | 1,630,050 |
Internet & Catalog Retail - 0.75% |
Amazon.com, Inc.*# | | 2,300 | | | 251,298 |
Internet Software & Services - 0.53% |
eBay, Inc.*# | | 4,500 | | | 88,245 |
Google, Inc., Class A* | | 200 | | | 88,990 |
| | | | | |
| | | | | 177,235 |
IT Services - 1.81% |
Automatic Data Processing, Inc. | | 3,400 | | | 136,884 |
Cognizant Technology Solutions Corp., Class A* | | 1,000 | | | 50,060 |
International Business Machines Corp.# | | 1,800 | | | 222,264 |
Paychex, Inc. | | 500 | | | 12,985 |
Unisys Corp.*# | | 4,000 | | | 73,960 |
Visa, Inc., Class A | | 1,300 | | | 91,975 |
Western Union Co. (The)# | | 1,500 | | | 22,365 |
| | | | | |
| | | | | 610,493 |
Leisure Equipment & Products - 0.18% |
Hasbro, Inc. | | 1,500 | | | 61,650 |
Life Sciences Tools & Services - 0.18% |
Thermo Fisher Scientific, Inc.* | | 1,200 | | | 58,860 |
Machinery - 0.95% |
Danaher Corp. | | 3,000 | | | 111,360 |
Eaton Corp. | | 2,400 | | | 157,056 |
Flowserve Corp. | | 600 | | | 50,880 |
| | | | | |
| | | | | 319,296 |
| | |
116 | | Annual Report | June 30, 2010 |
| | |
Bridgeway Managed Volatility Fund SCHEDULE OF INVESTMENTS (continued) | | |
Showing percentage of net assets as of June 30, 2010
| | | | | | | |
Industry Company | | Shares | | Value | | |
Common Stocks (continued) | | |
Media - 1.52% | | | | | | | |
Cinemark Holdings, Inc.# | | 5,000 | | $ | 65,750 | | |
Comcast Corp., Class A# | | 10,950 | | | 190,202 | | |
News Corp., Class A | | 11,800 | | | 141,128 | | |
Omnicom Group, Inc. | | 1,000 | | | 34,300 | | |
Time Warner, Inc.*# | | 2,833 | | | 81,902 | | |
| | | | | | | |
| | | | | 513,282 | | |
| |
Metals & Mining - 0.21% | | |
Alcoa, Inc.# | | 1,600 | | | 16,096 | | |
United States Steel Corp.+ | | 1,400 | | | 53,970 | | |
| | | | | | | |
| | | | | 70,066 | | |
| |
Multiline Retail - 0.83% | | |
Big Lots, Inc.* | | 6,300 | | | 202,167 | | |
Sears Holdings Corp.*+ | | 1,200 | | | 77,580 | | |
| | | | | | | |
| | | | | 279,747 | | |
| | | |
Multi-Utilities - 0.93% | | | | | | | |
Dominion Resources, Inc. | | 2,620 | | | 101,499 | | |
Public Service Enterprise Group, Inc. | | 2,600 | | | 81,458 | | |
Sempra Energy# | | 2,800 | | | 131,012 | | |
| | | | | | | |
| | | | | 313,969 | | |
| |
Oil, Gas & Consumable Fuels - 6.68% | | |
Anadarko Petroleum Corp. | | 1,700 | | | 61,353 | | |
Apache Corp.# | | 1,200 | | | 101,028 | | |
Chesapeake Energy Corp. | | 1,000 | | | 20,950 | | |
Chevron Corp.# | | 11,478 | | | 778,897 | | |
ConocoPhillips# | | 3,587 | | | 176,086 | | |
EOG Resources, Inc.# | | 1,500 | | | 147,555 | | |
Exxon Mobil Corp.# | | 13,000 | | | 741,910 | | |
Occidental Petroleum Corp.# | | 1,200 | | | 92,580 | | |
Peabody Energy Corp. | | 1,200 | | | 46,956 | | |
Spectra Energy Corp. | | 4,050 | | | 81,283 | | |
| | | | | | | |
| | | | | 2,248,598 | | |
| | |
Paper & Forest Products - 0.30% | | | | | |
International Paper Co. | | 4,500 | | | 101,835 | | |
| | |
Personal Products - 0.41% | | | | | |
Estee Lauder Cos., Inc., Class A (The)# | | 2,500 | | | 139,325 | | |
| | |
Pharmaceuticals - 1.81% | | | | | |
Allergan, Inc.# | | 2,900 | | | 168,954 | | |
Bristol-Myers Squibb Co. | | 5,579 | | | 139,140 | | |
Merck & Co., Inc. | | 2,800 | | | 97,916 | | |
Mylan, Inc.*+ | | 5,500 | | | 93,720 | | |
Pfizer, Inc. | | 7,600 | | | 108,376 | | |
| | | | | | | |
| | | | | 608,106 | | |
| | | | | |
Industry Company | | Shares | | Value |
| | | | | |
Road & Rail - 0.58% | | | | | |
Union Pacific Corp.# | | 2,800 | | $ | 194,628 |
|
Semiconductors & Semiconductor Equipment - 3.14% |
Broadcom Corp., Class A | | 4,500 | | | 148,365 |
Intel Corp.# | | 7,500 | | | 145,875 |
Micron Technology, Inc.*# | | 10,000 | | | 84,900 |
Texas Instruments, Inc.# | | 6,070 | | | 141,310 |
Veeco Instruments, Inc.*# | | 15,700 | | | 538,196 |
| | | | | |
| | | | | 1,058,646 |
| | |
Software - 1.82% | | | | | |
BMC Software, Inc.*# | | 3,920 | | | 135,750 |
Citrix Systems, Inc.* | | 2,100 | | | 88,683 |
Intuit, Inc.* | | 3,100 | | | 107,787 |
Microsoft Corp. | | 4,400 | | | 101,244 |
Oracle Corp. | | 8,360 | | | 179,405 |
| | | | | |
| | | | | 612,869 |
| |
Specialty Retail - 2.24% | | | |
AutoZone, Inc.* | | 1,200 | | | 231,864 |
CarMax, Inc.*# | | 25,000 | | | 497,500 |
Staples, Inc. | | 1,250 | | | 23,813 |
| | | | | |
| | | | | 753,177 |
|
Textiles, Apparel & Luxury Goods - 0.44% |
NIKE, Inc., Class B# | | 2,200 | | | 148,610 |
|
Thrifts & Mortgage Finance - 0.17% |
Hudson City Bancorp, Inc. | | 4,800 | | | 58,752 |
|
Trading Companies & Distributors - 0.15% |
W.W. Grainger, Inc. | | 500 | | | 49,725 |
|
Wireless Telecommunication Services - 0.41% |
American Tower Corp., Class A*# | | 2,500 | | | 111,250 |
Sprint Nextel Corp.* | | 6,000 | | | 25,440 |
| | | | | |
| | | | | 136,690 |
| | | | | |
TOTAL COMMON STOCKS - 56.06% | | | 18,882,195 |
| | | | | |
(Cost $18,209,084) | | | | | |
| | | | | | | | |
Due Date | | Discount Rate
or Coupon Rate | | | Principal
Amount | | Value |
|
CORPORATE NOTES - 6.17% |
Holding Companies - Diversified - 6.17% |
Leucadia National Corp. 8/15/2013 | | 7.750 | % | | $ | 2,000,000 | | 2,080,000 |
| | | | | | | | |
TOTAL CORPORATE NOTES - 6.17% | | 2,080,000 |
| | | | | | | | |
(Cost $2,037,846) | | | | | | |
| | |
Bridgeway Managed Volatility Fund SCHEDULE OF INVESTMENTS (continued) | | |
Showing percentage of net assets as of June 30, 2010
| | | | | | | | | | |
| Due Date | | Discount Rate
or Coupon Rate | | | Principal
Amount | | Value | |
U.S. GOVERNMENT OBLIGATIONS - 38.81% | |
U.S. Treasury Bills - 26.71% | |
07/01/2010 | | 0.200 | %(a) | | $ | 2,000,000 | | $ | 2,000,000 | |
09/02/2010 | | 0.158 | %(a) | | | 2,000,000 | | | 1,999,450 | |
09/30/2010 | | 0.160 | %(a) | | | 1,000,000 | | | 999,558 | |
10/28/2010 | | 0.240 | %(a) | | | 4,000,000 | | | 3,998,056 | |
| | | | | | | | | | |
| | | | | | | | | 8,997,064 | |
| |
U.S. Treasury Notes - 12.10% | |
10/15/2010 | | 4.250 | % | | | 500,000 | | | 505,821 | |
04/30/2011 | | 4.875 | % | | | 1,200,000 | | | 1,245,000 | |
08/31/2011 | | 4.625 | % | | | 300,000 | | | 314,567 | |
12/31/2011 | | 1.000 | % | | | 200,000 | | | 201,461 | |
04/30/2012 | | 4.500 | % | | | 300,000 | | | 321,715 | |
07/15/2012 | | 1.500 | % | | | 200,000 | | | 203,641 | |
08/15/2012 | | 1.750 | % | | | 300,000 | | | 306,961 | |
11/30/2012 | | 3.375 | % | | | 300,000 | | | 319,125 | |
12/31/2012 | | 3.625 | % | | | 200,000 | | | 214,484 | |
11/15/2013 | | 4.250 | % | | | 200,000 | | | 220,562 | |
02/15/2015 | | 4.000 | % | | | 200,000 | | | 220,734 | |
| | | | | | | | | | |
| | | | | | | | | 4,074,071 | |
| | | | | | | | | | |
TOTAL U.S. GOVERNMENT OBLIGATIONS - 38.81% | | | | | | | 13,071,135 | |
| | | | | | | | | | |
(Cost $12,892,385) | | | | |
| | | |
| | | Rate^ | | | Shares | | Value | |
MONEY MARKET FUND - 3.62% | |
BlackRock Fed Fund | | 0.04 | % | | | 1,219,546 | | | 1,219,546 | |
| | | | | | | | | | |
TOTAL MONEY MARKET FUND — 3.62% | | | 1,219,546 | |
| | | | | | | | | | |
(Cost $1,219,546) | | | | |
TOTAL INVESTMENTS - 104.66% | | | 35,252,876 | |
(Cost $34,358,861) | | | | |
Liabilities in Excess of Other Assets - (4.66%) | | | (1,569,356 | ) |
| | | | | | | | | | |
NET ASSETS - 100.00% | | $ | 33,683,520 | |
| | | | | | | | | | |
* Non-income producing security. # Security subject to call option written by the Fund. ^ Rate disclosed as of June 30, 2010. + This security or a portion of the security is out on loan at June 30, 2010. Total loaned securities had a market value of $225,803 at June 30, 2010. (a) Rate represents the effective yield at purchase. See Notes to Financial Statements. | |
| | | | | | | | | | |
| | | | | | | | | | |
| | | | | | | | | | |
| | | | | | | | | | |
| | | | | | | | | | |
| | |
118 | | Annual Report | June 30, 2010 |
| | |
| Bridgeway Managed Volatility Fund | | |
| SCHEDULE OF OPTIONS WRITTEN | | |
Showing percentage of net assets as of June 30, 2010
| | | | | | | | |
Company | | Numbers
of Contracts | | Value | | | |
CALL OPTIONS WRITTEN - (0.27%) | | | | | | |
AES Corp. (The) | | | | | | | | |
Expiring August, 2010 at $12.50 | | 30 | | $ | (300 | ) | | |
Expiring November, 2010 at $11.00 | | 50 | | | (2,750 | ) | | |
| | | | | | | | |
| | | | | (3,050 | ) | | |
Alcoa, Inc. | | | | | | | | |
Expiring October, 2010 at $12.00 | | 10 | | | (410 | ) | | |
Allergan, Inc. | | | | | | | | |
Expiring July, 2010 at $65.00 | | 12 | | | (60 | ) | | |
Amazon.com, Inc. | | | | | | | | |
Expiring July, 2010 at $155.00 | | 10 | | | (20 | ) | | |
American Tower Corp., Class A | | | | | | | | |
Expiring July, 2010 at $42.50 | | 10 | | | (2,360 | ) | | |
Ameriprise Financial, Inc. | | | | | | | | |
Expiring September, 2010 at $50.00 | | 10 | | | (100 | ) | | |
AON Corp. | | | | | | | | |
Expiring July, 2010 at $45.00 | | 10 | | | (50 | ) | | |
Apache Corp. | | | | | | | | |
Expiring July, 2010 at $120.00 | | 5 | | | (25 | ) | | |
Archer-Daniels-Midland Co. | | | | | | | | |
Expiring September, 2010 at $29.00 | | 35 | | | (1,225 | ) | | |
Bank of America Corp. | | | | | | | | |
Expiring August, 2010 at $17.00 | | 25 | | | (400 | ) | | |
Bank of New York Mellon Corp. (The) | | | | | | | | |
Expiring September, 2010 at $27.00 | | 10 | | | (740 | ) | | |
Baxter International, Inc. | | | | | | | | |
Expiring August, 2010 at $50.00 | | 20 | | | (200 | ) | | |
Expiring August, 2010 at $60.00 | | 10 | | | (50 | ) | | |
| | | | | | | | |
| | | | | (250 | ) | | |
Berkshire Hathaway, Inc., Class B | | | | | | | | |
Expiring September, 2010 at $85.00 | | 60 | | | (12,120 | ) | | |
BMC Software, Inc. | | | | | | | | |
Expiring August, 2010 at $40.00 | | 10 | | | (350 | ) | | |
Capital One Financial Corp. | | | | | | | | |
Expiring September, 2010 at $43.00 | | 10 | | | (2,490 | ) | | |
CarMax, Inc. | | | | | | | | |
Expiring July, 2010 at $20.00 | | 250 | | | (18,750 | ) | | |
Chevron Corp. | | | | | | | | |
Expiring September, 2010 at $75.00 | | 70 | | | (7,070 | ) | | |
Chubb Corp. | | | | | | | | |
Expiring October, 2010 at $55.00 | | 10 | | | (900 | ) | | |
Cinemark Holdings, Inc. | | | | | | | | |
Expiring September, 2010 at $15.00 | | 50 | | | (2,500 | ) | | |
| | | | | | | | |
| | | | | | | | |
| | | | | | | | |
Company | | Number
of Contracts | | Value | | | |
| | | |
Cisco Systems, Inc. | | | | | | | | |
Expiring July, 2010 at $27.00 | | 25 | | $ | (50 | ) | | |
Coca-Cola Co. (The) | | | | | | | | |
Expiring August, 2010 at $57.50 | | 10 | | | (50 | ) | | |
Comcast Corp., Class A | | | | | | | | |
Expiring October, 2010 at $20.00 | | 10 | | | (450 | ) | | |
Comerica, Inc. | | | | | | | | |
Expiring July, 2010 at $50.00 | | 8 | | | (80 | ) | | |
ConocoPhillips | | | | | | | | |
Expiring August, 2010 at $65.00 | | 10 | | | (10 | ) | | |
CVS Caremark Corp. | | | | | | | | |
Expiring August, 2010 at $33.00 | | 15 | | | (615 | ) | | |
eBay, Inc. | | | | | | | | |
Expiring July, 2010 at $27.00 | | 20 | | | (40 | ) | | |
Expiring October, 2010 at $23.00 | | 10 | | | (540 | ) | | |
| | | | | | | | |
| | | | | (580 | ) | | |
EOG Resources, Inc. | | | | | | | | |
Expiring July, 2010 at $125.00 | | 5 | | | (50 | ) | | |
Estee Lauder Cos., Inc., Class A (The) | | | | | | | | |
Expiring July, 2010 at $60.00 | | 25 | | | (875 | ) | | |
Express Scripts, Inc. | | | | | | | | |
Expiring August, 2010 at $60.00 | | 10 | | | (100 | ) | | |
Exxon Mobil Corp. | | | | | | | | |
Expiring July, 2010 at $70.00 | | 65 | | | (260 | ) | | |
Expiring October, 2010 at $67.50 | | 15 | | | (705 | ) | | |
| | | | | | | | |
| | | | | (965) | | | |
General Mills, Inc. | | | | | | | | |
Expiring July, 2010 at $37.50 | | 10 | | | (50 | ) | | |
Gilead Sciences, Inc. | | | | | | | | |
Expiring August, 2010 at $37.00 | | 10 | | | (850 | ) | | |
Expiring August, 2010 at $50.00 | | 15 | | | (45 | ) | | |
| | | | | | | | |
| | | | | (895 | ) | | |
Halliburton Co. | | | | | | | | |
Expiring July, 2010 at $35.00 | | 15 | | | (45 | ) | | |
Expiring October, 2010 at $30.00 | | 20 | | | (1,780 | ) | | |
| | | | | | | | |
| | | | | (1,825 | ) | | |
Intel Corp. | | | | | | | | |
Expiring July, 2010 at $25.00 | | 20 | | | (20 | ) | | |
Expiring October, 2010 at $23.00 | | 20 | | | (680 | ) | | |
| | | | | | | | |
| | | | | (700 | ) | | |
International Business Machines Corp. | | | | | | | | |
Expiring July, 2010 at $140.00 | | 6 | | | (18 | ) | | |
Medco Health Solutions, Inc. | | | | | | | | |
Expiring July, 2010 at $65.00 | | 7 | | | (35 | ) | | |
Micron Techology, Inc. | | | | | | | | |
Expiring July, 2010 at $12.00 | | 100 | | | (100 | ) | | |
| | |
Bridgeway Managed Volatility Fund SCHEDULE OF OPTIONS WRITTEN (continued) | | |
Showing percentage of net assets as of June 30, 2010
| | | | | | | | |
Company | | Number
of Contracts | | Value | | | |
| |
Call Options Written (continued) | | | |
Monsanto Co. | | | | | | | | |
Expiring July, 2010 at $70.00 | | 5 | | $ | (10 | ) | | |
Morgan Stanley | | | | | | | | |
Expiring July, 2010 at $35.00 | | 5 | | | (5 | ) | | |
NIKE, Inc., Class B | | | | | | | | |
Expiring July, 2010 at $85.00 | | 7 | | | (35 | ) | | |
Occidental Petroleum Corp. | | | | | | | | |
Expiring August, 2010 at $100.00 | | 5 | | | (50 | ) | | |
Procter & Gamble Co. (The) | | | | | | | | |
Expiring July, 2010 at $65.00 | | 12 | | | (48 | ) | | |
Safeway, Inc. | | | | | | | | |
Expiring September, 2010 at $22.50 | | 20 | | | (800 | ) | | |
Sanmina-SCI Corp. | | | | | | | | |
Expiring July, 2010 at $15.00 | | 300 | | | (9,000 | ) | | |
Expiring October, 2010 at $15.00 | | 25 | | | (4,000 | ) | | |
| | | | | | | | |
| | | | | (13,000 | ) | | |
Seagate Technology | | | | | | | | |
Expiring July, 2010 at $17.00 | | 200 | | | (400 | ) | | |
Sempra Energy | | | | | | | | |
Expiring July, 2010 at $60.00 | | 12 | | | (60 | ) | | |
State Street Corp. | | | | | | | | |
Expiring August, 2010 at $40.00 | | 10 | | | (290 | ) | | |
Texas Instruments, Inc. | | | | | | | | |
Expiring July, 2010 at $29.00 | | 20 | | | (60 | ) | | |
Time Warner, Inc. | | | | | | | | |
Expiring October, 2010 at $34.00 | | 10 | | | (510 | ) | | |
Travelers Cos., Inc. (The) | | | | | | | | |
Expiring July, 2010 at $55.00 | | 112 | | | (560 | ) | | |
Expiring October, 2010 at $55.00 | | 15 | | | (900 | ) | | |
| | | | | | | | |
| | | | | (1,460 | ) | | |
Union Pacific Corp. | | | | | | | | |
Expiring August, 2010 at $80.00 | | 10 | | | (570 | ) | | |
Unisys Corp. | | | | | | | | |
Expiring July, 2010 at $22.50 | | 40 | | | (400 | ) | | |
Veeco Instruments, Inc. | | | | | | | | |
Expiring July, 2010 at $35.00 | | 23 | | | (4,370 | ) | | |
Expiring July, 2010 at $40.00 | | 72 | | | (3,960 | ) | | |
Expiring July, 2010 at $45.00 | | 62 | | | (930 | ) | | |
| | | | | | | | |
| | | | | (9,260 | ) | | |
Verizon Communications, Inc. | | | | | | | | |
Expiring July, 2010 at $30.00 | | 14 | | | (56 | ) | | |
Walgreen Co. | | | | | | | | |
Expiring July, 2010 at $36.00 | | 10 | | | (30 | ) | | |
| | | | | | |
Company | | Number of Contracts | | Value | |
| | |
Wells Fargo & Co. | | | | | | |
Expiring July, 2010 at $36.00 | | 25 | | $ | (25 | ) |
Expiring October, 2010 at | | | | | | |
$30.00 | | 25 | | | (1,800 | ) |
| | | | | | |
| | | | | (1,825 | ) |
Western Union Co. (The) | | | | | | |
Expiring August, 2010 at $17.50 | | 15 | | | (225 | ) |
| | | | | | |
TOTAL CALL OPTIONS WRITTEN – (0.27%) | | | (89,412 | ) |
| | | | | | |
(Premiums received $(297,023)) | | | | | | |
|
PUT OPTIONS WRITTEN - (1.81%) | |
| | |
Acme Packet, Inc. | | | | | | |
Expiring August, 2010 at $25.00 | | 140 | | | (23,100 | ) |
Expiring July, 2010 at $22.50 | | 75 | | | (1,500 | ) |
Expiring July, 2010 at $25.00 | | 60 | | | (3,000 | ) |
| | | | | | |
| | | | | (27,600 | ) |
AmerisourceBergen Corp. | | | | | | |
Expiring August, 2010 at $30.00 | | 100 | | | (7,000 | ) |
Bristol-Myers Squibb Co. | | | | | | |
Expiring September, 2010 at $25.00 | | 140 | | | (17,920 | ) |
Campbell Soup Co. | | | | | | |
Expiring August, 2010 at $35.00 | | 100 | | | (9,500 | ) |
CBS Corp., Class B Non Voting | | | | | | |
Expiring September, 2010 at $15.00 | | 200 | | | (51,000 | ) |
Chubb Corp. | | | | | | |
Expiring October, 2010 at $45.00 | | 80 | | | (11,200 | ) |
Cirrus Logic, Inc. | | | | | | |
Expiring July, 2010 at $12.50 | | 200 | | | (3,000 | ) |
CVS Caremark Corp. | | | | | | |
Expiring November, 2010 at $32.00 | | 115 | | | (46,575 | ) |
Dillards, Inc., Class A | | | | | | |
Expiring July, 2010 at $25.00 | | 130 | | | (46,800 | ) |
Medicis Pharmaceutical Corp., Class A | | | | | | |
Expiring July, 2010 at $25.00 | | 100 | | | (28,000 | ) |
Micron Technology, Inc. | | | | | | |
Expiring July, 2010 at $10.00 | | 300 | | | (45,900 | ) |
NetFlix, Inc. | | | | | | |
Expiring July, 2010 at $115.00 | | 25 | | | (22,750 | ) |
Northrop Grumman Corp. | | | | | | |
Expiring August, 2010 at $60.00 | | 45 | | | (28,350 | ) |
Pier 1 Imports, Inc. | | | | | | |
Expiring September, 2010 at $7.50 | | 300 | | | (52,500 | ) |
| | |
120 | | Annual Report | June 30, 2010 |
| | |
Bridgeway Managed Volatility Fund SCHEDULE OF OPTIONS WRITTEN (continued) | | |
Showing percentage of net assets as of June 30, 2010
| | | | | | | | | | | |
Company | | Number
of Contracts | | Value | | | |
Put Options Written (continued) | | | | | | | |
Procter & Gamble Co. (The) | | | | | | | |
Expiring July, 2010 at $62.50 | | 66 | | $ (18,546 | ) | | |
Safeway, Inc. | | | | | | | |
Expiring September, 2010 at $25.00 | | 70 | | (39,200 | ) | | |
SanDisk Corp. | | | | | | | |
Expiring July, 2010 at $46.00 | | 75 | | (33,000 | ) | | |
Valassis Communications, Inc. | | | | | | | |
Expiring July, 2010 at $35.00 | | 160 | | (56,000 | ) | | |
Viacom, Inc., Class A | | | | | | | |
Expiring November, 2010 at $40.00 | | 100 | | (65,000 | ) | | |
| | | | | | | | | | | |
TOTAL PUT OPTIONS WRITTEN – (1.81%) | | (609,841 | ) | | |
| | | | | | | | | | | |
(Premiums received $(335,089)) | | | | | | | |
| | | |
TOTAL OPTIONS WRITTEN – (2.08)% | | | | $(699,253 | ) | | |
| | | | | | | | | | | |
(Premiums received $(632,112)) | | | | | | | |
Summary of inputs used to value the Fund’s investments as of 06/30/2010 are as follows (See Note 2 in Notes to Financial Statements): | | | |
| | | | | | | | | | | |
| | |
| | | Assets Table | | |
| | | Valuation Inputs | | |
| | | Investment in Securities (Market Value) | | |
| | | Level 1 Quoted Prices | | Level 2
Significant
Observable
Inputs | | Level 3 Significant Unobservable
Inputs | | Total | | |
Common Stocks | | $18,882,195 | | $ | – | | $– | | $18,882,195 | | |
Corporate Notes | | – | | | 2,080,000 | | – | | 2,080,000 | | |
U.S. Government Obligations | | – | | | 13,071,135 | | – | | 13,071,135 | | |
Money Market Fund | | – | | | 1,219,546 | | – | | 1,219,546 | | |
| | | | | | | | | | | |
TOTAL | | $18,882,195 | | $ | 16,370,681 | | $– | | $35,252,876 | | |
| | | | | | | | | | | |
| | | | | | | | | | | |
| | | | | | | | | | | |
| | | | | | | | | | | |
| | | | | | | | | | | |
| | | | | | | | | | | |
| | | | | | | | | | | |
| | | | | | | | | | | |
| | | | | | | | | | | |
| | | | | | | | | | | |
| | | | | | | | | | | |
| | | | | | | | | | |
| | | Liabilities Table | |
| | | Valuation Inputs | |
| | | Investment in Securities (Market Value) | |
| | | Level 1
Quoted Prices |
| | Level 2
Significant
Observable
Inputs | | Level 3
Significant Unobservable
Inputs | | Total | |
Written Options | | $(699,253 | ) | | $– | | $– | | $(699,253 | ) |
| | | | | | | | | | |
TOTAL | | $(699,253 | ) | | $– | | $– | | $(699,253 | ) |
| | | | | | | | | | |
See Notes to Financial Statements.
STATEMENTS OF ASSETS AND LIABILITIES
June 30, 2010
| | | | | | | | | | | | | | | | | |
| ASSETS | | Aggressive
Investors 1 | | | Aggressive
Investors 2 | | | Ultra-Small
Company | | | Ultra-Small Company Market |
Investments at value | | $ | 93,233,218 | | | $ | 303,016,117 | | | $ | 83,043,888 | | | $344,495,836 | | | |
Receivables: | | | | | | | | | | | | | | | | | |
Portfolio securities sold | | | 2,092,792 | | | | 3,640,879 | | | | 985,184 | | | 2,061,268 | | | |
Fund shares sold | | | 3,010 | | | | 299,245 | | | | - | | | 116,238 | | | |
Dividends and interest | | | 68,202 | | | | 251,291 | | | | 110,166 | | | 442,758 | | | |
Reclaims receivable | | | 1,406 | | | | 2,113 | | | | - | | | - | | | |
Receivable from investment adviser | | | 90,749 | | | | - | | | | - | | | - | | | |
Prepaid expenses | | | 27,548 | | | | 56,007 | | | | 13,138 | | | 57,952 | | | |
Total assets | | | 95,516,925 | | | | 307,265,652 | | | | 84,152,376 | | | 347,174,052 | | | |
| | | | | |
LIABILITIES | | | | | | | | | | | | | | | | | |
Payables: | | | | | | | | | | | | | | | | | |
Portfolio securities purchased | | | 2,185,524 | | | | 3,274,315 | | | | 2,463,778 | | | 2,924,413 | | | |
Fund shares redeemed | | | 163,916 | | | | 342,397 | | | | - | | | 255,135 | | | |
Total Return Swap | | | 82,971 | | | | - | | | | - | | | - | | | |
Due to Custodian | | | - | | | | - | | | | - | | | - | | | |
Accrued Liabilities: | | | | | | | | | | | | | | | | | |
Investment adviser fees | | | - | | | | 101,538 | | | | 63,549 | | | 135,193 | | | |
Administration fees | | | 3,190 | | | | 10,247 | | | | 2,679 | | | 11,181 | | | |
Directors’ fees | | | 2,162 | | | | 6,709 | | | | 1,759 | | | 7,333 | | | |
Other | | | 71,522 | | | | 237,502 | | | | 38,966 | | | 172,608 | | | |
Call options written at value | | | - | | | | - | | | | - | | | - | | | |
Put options written at value | | | - | | | | - | | | | - | | | - | | | |
Total liabilities | | | 2,509,285 | | | | 3,972,708 | | | | 2,570,731 | | | 3,505,863 | | | |
NET ASSETS | | $ | 93,007,640 | | | $ | 303,292,944 | | | $ | 81,581,645 | | | $343,668,189 | | | |
| | | | |
NET ASSETS REPRESENT | | | | | | | | | | | | | | |
Paid-in capital | | $ | 177,617,649 | | | $ | 536,996,074 | | | $ | 91,826,865 | | | $310,252,839 | | | |
Undistributed net investment income | | | 2,264,739 | | | | 874,268 | | | | 680,558 | | | 4,177,591 | | | |
Accumulated net realized loss on investments | | | (85,508,326 | ) | | | (233,609,205 | ) | | | (16,690,565 | ) | | (9,651,691 | ) | | |
Net unrealized appreciation (depreciation) on investments | | | (1,366,422 | ) | | | (968,193 | ) | | | 5,764,787 | | | 38,889,450 | | | |
NET ASSETS | | $ | 93,007,640 | | | $ | 303,292,944 | | | $ | 81,581,645 | | | $343,668,189 | | | |
Shares of common stock outstanding of $.001 par value* | | | 3,361,139 | | | | 27,072,996 | | | | 3,556,581 | | | 29,332,038 | | | |
Net asset value per share | | $ | 27.67 | | | $ | 11.20 | | | $ | 22.94 | | | $11.72 | | | |
Total investments at cost | | $ | 94,516,669 | | | $ | 303,984,310 | | | $ | 77,279,101 | | | $305,606,386 | | | |
Premiums received on call options written | | $ | - | | | $ | - | | | $ | - | | | $ - | | | |
Premiums received on put options written | | $ | - | | | $ | - | | | $ | - | | | $ - | | | |
| * | See Note 1 - Organization in the Notes to Financial Statements for shares authorized for each Fund. |
See Notes to Financial Statements.
| | |
| 122 | | Annual Report | June 30, 2010 |
| | | | | | | | | | | | | | | | | | | | | | | | | | | | | | |
Micro-Cap Limited | | | Small-Cap
Momentum | | | Small-Cap
Growth | | | Small-Cap
Value | | | Large-Cap
Growth | | | Large-Cap
Value | | | Blue Chip 35
Index | | | Managed
Volatility | |
| $ | 20,828,122 | | | $ | 1,887,457 | | | $ | 57,135,671 | | | $ | 108,357,234 | | | $ | 58,056,596 | | | $ | 25,947,094 | | | $ | 222,471,364 | | | $ | 35,252,876 | |
| | | | | | | |
| | | | | | | | | | | | | | | | | | | | | | | | | | | | | | |
| | 722,870 | | | | - | | | | - | | | | 508,451 | | | | 2,811,753 | | | | 681,589 | | | | 3,000,956 | | | | 80,584 | |
| | 100 | | | | - | | | | 20,590 | | | | 3,990 | | | | 187 | | | | 3,418 | | | | 9,549 | | | | 341 | |
| | 30,415 | | | | 1,840 | | | | 41,780 | | | | 125,830 | | | | 58,628 | | | | 25,915 | | | | 222,704 | | | | 111,151 | |
| | - | | | | - | | | | - | | | | - | | | | - | | | | - | | | | - | | | | - | |
| | 12,316 | | | | 10,325 | | | | - | | | | - | | | | - | | | | 656 | | | | 15,747 | | | | - | |
| | 10,592 | | | | 283 | | | | 10,867 | | | | 19,866 | | | | 10,955 | | | | 5,255 | | | | 35,488 | | | | 15,177 | |
| 21,604,415 | | | | 1,899,905 | | | | 57,208,908 | | | | 109,015,371 | | | | 60,938,119 | | | | 26,663,927 | | | | 225,755,808 | | | | 35,460,129 | |
| | | | | | | |
| | | | | | | | | | | | | | | | | | | | | | | | | | | | | | |
| | | | | | | |
| | | | | | | | | | | | | | | | | | | | | | | | | | | | | | |
| | 520,413 | | | | - | | | | - | | | | - | | | | 2,398,816 | | | | 1,073,831 | | | | 2,903,151 | | | | 999,595 | |
| | 30,532 | | | | - | | | | 70,737 | | | | 114,183 | | | | 62,351 | | | | 24,792 | | | | 21,954 | | | | 30,256 | |
| | - | | | | - | | | | 45,207 | | | | 48,247 | | | | - | | | | - | | | | - | | | | - | |
| | 300,601 | | | | 5 | | | | - | | | | - | | | | - | | | | - | | | | 166,277 | | | | - | |
| | | | | | | |
| | | | | | | | | | | | | | | | | | | | | | | | | | | | | | |
| | - | | | | - | | | | 24,178 | | | | 56,669 | | | | 13,427 | | | | - | | | | - | | | | 5,782 | |
| | 696 | | | | 62 | | | | 1,883 | | | | 3,608 | | | | 1,940 | | | | 844 | | | | 7,153 | | | | 1,095 | |
| | 466 | | | | 39 | | | | 1,266 | | | | 2,461 | | | | 1,307 | | | | 562 | | | | 4,184 | | | | 751 | |
| | 25,777 | | | | 11,690 | | | | 54,252 | | | | 89,333 | | | | 50,921 | | | | 29,687 | | | | 66,944 | | | | 39,877 | |
| | - | | | | - | | | | - | | | | - | | | | - | | | | - | | | | - | | | | 89,412 | |
| | - | | | | - | | | | - | | | | - | | | | - | | | | - | | | | - | | | | 609,841 | |
| 878,485 | | | | 11,796 | | | | 197,523 | | | | 314,501 | | | | 2,528,762 | | | | 1,129,716 | | | | 3,169,663 | | | | 1,776,609 | |
$ | 20,725,930 | | | $ | 1,888,109 | | | $ | 57,011,385 | | | $ | 108,700,870 | | | $ | 58,409,357 | | | $ | 25,534,211 | | | $ | 222,586,145 | | | $ | 33,683,520 | |
| | | | | | | |
| | | | | | | | | | | | | | | | | | | | | | | | | | | | | | |
| $ | 31,981,875 | | | $ | 2,022,858 | | | $ | 96,245,923 | | | $ | 184,240,859 | | | $ | 102,058,722 | | | $ | 29,092,718 | | | $ | 280,503,391 | | | $ | 40,692,421 | |
| | 439,547 | | | | 807 | | | | 152,882 | | | | 414,281 | | | | 187,491 | | | | 222,649 | | | | 2,199,352 | | | | 217,769 | |
| | | | | | | |
| | (12,788,967 | ) | | | (105 | ) | | | (40,526,384 | ) | | | (85,963,897 | ) | | | (46,913,930 | ) | | | (6,650,151 | ) | | | (70,011,243 | ) | | | (8,053,544 | ) |
| | | | | | | |
| | 1,093,475 | | | | (135,451 | ) | | | 1,138,964 | | | | 10,009,627 | | | | 3,077,074 | | | | 2,868,995 | | | | 9,894,645 | | | | 826,874 | |
$ | 20,725,930 | | | $ | 1,888,109 | | | $ | 57,011,385 | | | $ | 108,700,870 | | | $ | 58,409,357 | | | $ | 25,534,211 | | | $ | 222,586,145 | | | $ | 33,683,520 | |
| | | | | | | |
| 3,787,482 | | | | 202,374 | | | | 6,234,235 | | | | 9,493,781 | | | | 5,741,293 | | | | 2,232,042 | | | | 36,006,896 | | | | 3,293,852 | |
$ | 5.47 | | | $ | 9.33 | | | $ | 9.14 | | | $ | 11.45 | | | $ | 10.17 | | | $ | 11.44 | | | $ | 6.18 | | | $ | 10.23 | |
$ | 19,734,647 | | | $ | 2,022,908 | | | $ | 55,951,500 | | | $ | 98,299,360 | | | $ | 54,979,522 | | | $ | 23,078,099 | | | $ | 212,576,719 | | | $ | 34,358,861 | |
| $ | - | | | $ | - | | | $ | - | | | $ | - | | | $ | - | | | $ | - | | | $ | - | | | $ | 297,023 | |
| $ | - | | | $ | - | | | $ | - | | | $ | - | | | $ | - | | | $ | - | | | $ | - | | | $ | 335,089 | |
STATEMENTS OF OPERATIONS
Year ended June 30, 2010
| | | | | | | | | | | | | | | | | |
| | | Aggressive
Investors 1 | | | Aggressive
Investors 2 | | | Ultra-Small
Company | | | Ultra-Small
Company Market |
INVESTMENT INCOME | | | | | | | | | | | | | | | | | |
Dividends | | $ | 1,482,456 | | | $ | 5,003,374 | | | $ | 1,231,427 | | | $5,045,757 | | | |
Less: foreign taxes withheld | | | (7,139 | ) | | | (13,475 | ) | | | - | | | (1,612 | ) | | |
Interest | | | - | | | | - | | | | - | | | 6,972 | | | |
Securities lending | | | 184,959 | | | | 750,207 | | | | 484,889 | | | 1,808,484 | | | |
Total Investment Income | | | 1,660,276 | | | | 5,740,106 | | | | 1,716,316 | | | 6,859,601 | | | |
| | | | | |
EXPENSES | | | | | | | | | | | | | | | | | |
Investment advisory fees - Base fees | | | 1,046,653 | | | | 3,304,217 | | | | 770,310 | | | 1,778,233 | | | |
Investment advisory fees - Performance adjustment | | | (1,995,774 | ) | | | (720,356 | ) | | | - | | | - | | | |
Administration fees | | | 39,414 | | | | 132,139 | | | | 31,022 | | | 125,455 | | | |
Accounting fees | | | 49,553 | | | | 60,525 | | | | 51,224 | | | 75,552 | | | |
Transfer agent fees | | | 52,271 | | | | 250,162 | | | | 35,394 | | | 163,934 | | | |
Professional fees | | | 34,735 | | | | 104,588 | | | | 30,763 | | | 99,868 | | | |
Custody fees | | | 3,034 | | | | - | | | | 21,779 | | | 72,098 | | | |
Blue sky fees | | | 15,517 | | | | 41,386 | | | | 13,014 | | | 27,862 | | | |
Directors’ and officers’ fees | | | 16,257 | | | | 55,786 | | | | 13,450 | | | 45,127 | | | |
Shareholder servicing fees | | | 70,442 | | | | 299,496 | | | | 5,358 | | | 182,095 | | | |
Reports to shareholders | | | 21,833 | | | | 88,212 | | | | 3,266 | | | 24,938 | | | |
Miscellaneous expenses | | | 48,338 | | | | 173,017 | | | | 27,456 | | | 135,406 | | | |
Total Expenses | | | (597,727 | ) | | | 3,789,172 | | | | 1,003,036 | | | 2,730,568 | | | |
Less investment advisory fees waived | | | - | | | | - | | | | - | | | (63,055 | ) | | |
Less other fees waived | | | - | | | | - | | | | - | | | - | | | |
Less expense reimbursed by investment adviser | | | - | | | | - | | | | - | | | - | | | |
Net Expenses | | | (597,727 | ) | | | 3,789,172 | | | | 1,003,036 | | | 2,667,513 | | | |
NET INVESTMENT INCOME | | | 2,258,003 | | | | 1,950,934 | | | | 713,280 | | | 4,192,088 | | | |
| | | | |
NET REALIZED AND UNREALIZED GAIN (LOSS) ON INVESTMENTS | | | | | | | | | | | | | | |
Realized Gain (Loss) on: | | | | | | | | | | | | | | | | | |
Investments | | | 11,304,023 | | | | 32,255,391 | | | | 13,701,643 | | | 30,266,479 | | | |
Written options | | | (47,205 | ) | | | 24,954 | | | | - | | | - | | | |
Futures contracts | | | - | | | | - | | | | - | | | - | | | |
Swaps | | | 33,506 | | | | - | | | | - | | | - | | | |
Net Realized Gain (Loss) | | | 11,290,324 | | | | 32,280,345 | | | | 13,701,643 | | | 30,266,479 | | | |
Change in Unrealized Appreciation (Depreciation) on: | | | | | | | | | | | | | | | | | |
Investments | | | (2,284,089 | ) | | | 8,505,578 | | | | (1,347,400 | ) | | 9,608,184 | | | |
Written options | | | - | | | | (58,842 | ) | | | - | | | - | | | |
Swaps | | | (83,031 | ) | | | - | | | | - | | | - | | | |
Net Change in Unrealized Appreciation (Depreciation) | | | (2,367,120 | ) | | | 8,446,736 | | | | (1,347,400 | ) | | 9,608,184 | | | |
Net Realized and Unrealized Gain (Loss) on Investments | | | 8,923,204 | | | | 40,727,081 | | | | 12,354,243 | | | 39,874,663 | | | |
INCREASE (DECREASE) IN NET ASSETS RESULTING FROM OPERATIONS | | $ | 11,181,207 | | | $ | 42,678,015 | | | $ | 13,067,523 | | | $44,066,751 | | | |
| 1 | For the period May 28, 2010 (commencement of operations) thru June 30, 2010. |
See Notes to Financial Statements.
| | |
| 124 | | Annual Report | June 30, 2010 |
| | |
| | |
| | | | | | | | | | | | | | | | | | | | | | |
Micro-Cap
Limited | | | Small-Cap
Momentum1 | | | Small-Cap
Growth | | | Small-Cap
Value | | | Large-Cap
Growth | | | Large-Cap
Value | | | Blue Chip 35
Index | | | Managed
Volatility | |
| | | | | | | |
| $ 339,313 | | | $ 2,130 | | | $ 424,054 | | | $ 1,989,387 | | | $ 968,798 | | | $ 714,562 | | | $ 4,558,878 | | | $ 407,127 | |
| (318 | ) | | - | | | - | | | - | | | (1,061 | ) | | - | | | - | | | (45 | ) |
| - | | | - | | | - | | | - | | | - | | | - | | | - | | | 406,339 | |
| 107,082 | | | 143 | | | 343,572 | | | 110,315 | | | 21,655 | | | 4,591 | | | - | | | 12,731 | |
| 446,077 | | | 2,273 | | | 767,626 | | | 2,099,702 | | | 989,392 | | | 719,153 | | | 4,558,878 | | | 826,152 | |
| | | | | | | |
| 224,240 | | | 896 | | | 403,435 | | | 814,102 | | | 356,072 | | | 148,280 | | | 170,120 | | | 267,867 | |
| (369,459 | ) | | - | | | (66,165 | ) | | (35,004 | ) | | (21,905 | ) | | 16,842 | | | - | | | - | |
| 9,234 | | | 62 | | | 23,680 | | | 46,752 | | | 23,270 | | | 10,594 | | | 78,086 | | | 15,644 | |
| 46,183 | | | 3,236 | | | 46,893 | | | 50,203 | | | 46,957 | | | 45,008 | | | 53,700 | | | 52,653 | |
| 26,592 | | | 2,735 | | | 66,427 | | | 100,129 | | | 55,924 | | | 32,772 | | | 29,099 | | | 22,522 | |
| 14,002 | | | 10,024 | | | 24,168 | | | 39,790 | | | 23,869 | | | 14,609 | | | 65,182 | | | 24,103 | |
| 7,901 | | | 720 | | | 6,440 | | | 9,894 | | | 3,776 | | | 3,484 | | | 7,075 | | | 15,405 | |
| 15,767 | | | 100 | | | 21,126 | | | 26,368 | | | 22,008 | | | 19,784 | | | 27,549 | | | 17,859 | |
| 3,997 | | | 39 | | | 9,993 | | | 22,657 | | | 9,941 | | | 4,442 | | | 32,782 | | | 6,784 | |
| 6,425 | | | - | | | 36,244 | | | 80,204 | | | 39,510 | | | 13,392 | | | 32,469 | | | 21,589 | |
| 3,779 | | | 500 | | | 20,832 | | | 14,984 | | | 17,713 | | | 5,833 | | | 11,441 | | | 5,498 | |
| 11,761 | | | - | | | 34,639 | | | 66,610 | | | 34,000 | | | 13,473 | | | 72,464 | | | 18,565 | |
| 422 | | | 18,312 | | | 627,712 | | | 1,236,689 | | | 611,135 | | | 328,513 | | | 579,967 | | | 468,489 | |
| - | | | (896 | ) | | - | | | - | | | (13,017 | ) | | (79,298 | ) | | (170,120 | ) | | (48,883 | ) |
| - | | | (5,625 | ) | | - | | | - | | | - | | | - | | | - | | | - | |
| - | | | (10,325 | ) | | - | | | - | | | - | | | - | | | (90,542 | ) | | - | |
| 422 | | | 1,466 | | | 627,712 | | | 1,236,689 | | | 598,118 | | | 249,215 | | | 319,305 | | | 419,606 | |
| 445,655 | | | 807 | | | 139,914 | | | 863,013 | | | 391,274 | | | 469,938 | | | 4,239,573 | | | 406,546 | |
| | | | | | | |
| 4,966,984 | | | (105 | ) | | 13,323,677 | | | 16,474,228 | | | 931,464 | | | 2,963,788 | | | (10,168,908 | ) | | 756,741 | |
| - | | | - | | | - | | | - | | | - | | | - | | | - | | | 1,972,319 | |
| - | | | - | | | - | | | - | | | - | | | - | | | - | | | (2,951,015 | ) |
| - | | | - | | | 15,375 | | | (81,352 | ) | | - | | | - | | | - | | | - | |
| 4,966,984 | | | (105 | ) | | 13,339,052 | | | 16,392,876 | | | 931,464 | | | 2,963,788 | | | (10,168,908 | ) | | (221,955 | ) |
| | | | | | | |
| (1,140,437 | ) | | (135,451 | ) | | (6,731,217 | ) | | 8,165,322 | | | 8,818,151 | | | 2,161,925 | | | 26,109,776 | | | 1,610,666 | |
| - | | | - | | | - | | | - | | | - | | | - | | | - | | | (329,673 | ) |
| - | | | - | | | (47,011 | ) | | (48,247 | ) | | - | | | - | | | - | | | - | |
| (1,140,437 | ) | | (135,451 | ) | | (6,778,228 | ) | | 8,117,075 | | | 8,818,151 | | | 2,161,925 | | | 26,109,776 | | | 1,280,993 | |
| | | | | | | | |
| 3,826,547 | | | (135,556 | ) | | 6,560,824 | | | 24,509,951 | | | 9,749,615 | | | 5,125,713 | | | 15,940,868 | | | 1,059,038 | |
| | | | | | | |
| $ 4,272,202 | | | $(134,749 | ) | | $ 6,700,738 | | | $25,372,964 | | | $10,140,889 | | | $5,595,651 | | | $20,180,441 | | | $1,465,584 | |
STATEMENTS OF CHANGES IN NET ASSETS
| | | | | | | | | | | | | | | | |
| | | Aggressive Investors 1 | | | Aggressive Investors 2 | |
| | | Year Ended June 30, | | |
Year Ended June 30, | |
| | | 2010 | | | 2009 | | | 2010 | | | 2009 | |
| | | | |
OPERATIONS | | | | | | | | | | | | | | | | |
Net investment income | | $ | 2,258,003 | | | $ | 1,645,870 | | | $ | 1,950,934 | | | $ | 641,017 | |
Net realized gain (loss) on investments | | | 11,290,324 | | | | (97,430,431 | ) | | | 32,280,345 | | | | (250,672,145 | ) |
Net change in unrealized appreciation/(depreciation) on investments | | | (2,367,120 | ) | | | (75,309,572 | ) | | | 8,446,736 | | | | (182,271,245 | ) |
Net increase/(decrease) in net assets resulting from operations | | | 11,181,207 | | | | (171,094,133 | ) | | | 42,678,015 | | | | (432,302,373 | ) |
| | | | |
DISTRIBUTIONS: | | | | | | | | | | | | | | | | |
From net investment income | | | (930,085 | ) | | | - | | | | (1,620,063 | ) | | | - | |
From net realized gains | | | - | | | | (1,868,083 | ) | | | - | | | | - | |
Net decrease in net assets from distributions | | | (930,085 | ) | | | (1,868,083 | ) | | | (1,620,063 | ) | | | - | |
| | | | |
SHARE TRANSACTIONS: | | | | | | | | | | | | | | | | |
Proceeds from sale of shares | | | 3,655,994 | | | | 16,235,421 | | | | 114,813,049 | | | | 235,932,607 | |
Reinvestment of distributions | | | 881,283 | | | | 1,627,084 | | | | 1,413,787 | | | | - | |
Cost of shares redeemed | | | (37,615,713 | ) | | | (67,780,225 | ) | | | (237,848,301 | ) | | | (304,849,827 | ) |
Redemption fees | | | - | | | | - | | | | - | | | | - | |
Net increase/(decrease) in net assets from share transactions | | | (33,078,436 | ) | | | (49,917,720 | ) | | | (121,621,465 | ) | | | (68,917,220 | ) |
Net increase/(decrease) in net assets | | | (22,827,314 | ) | | | (222,879,936 | ) | | | (80,563,513 | ) | | | (501,219,593 | ) |
| | | | |
NET ASSETS: | | | | | | | | | | | | | | | | |
Beginning of period | | | 115,834,954 | | | | 338,714,890 | | | | 383,856,457 | | | | 885,076,050 | |
End of period* | | $ | 93,007,640 | | | $ | 115,834,954 | | | $ | 303,292,944 | | | $ | 383,856,457 | |
| | | | |
SHARES ISSUED & REDEEMED | | | | | | | | | | | | | | | | |
Issued | | | 119,698 | | | | 546,786 | | | | 9,531,170 | | | | 17,924,723 | |
Distributions reinvested | | | 29,298 | | | | 65,529 | | | | 114,107 | | | | - | |
Redeemed | | | (1,255,542 | ) | | | (2,422,013 | ) | | | (19,605,918 | ) | | | (23,700,553 | ) |
Net increase/(decrease) | | | (1,106,546 | ) | | | (1,809,698 | ) | | | (9,960,641 | ) | | | (5,775,830 | ) |
Outstanding at beginning of period | | | 4,467,685 | | | | 6,277,383 | | | | 37,033,637 | | | | 42,809,467 | |
Outstanding at end of period | | | 3,361,139 | | | | 4,467,685 | | | | 27,072,996 | | | | 37,033,637 | |
| | | | |
* Including undistributed net investment income of: | | $ | 2,264,739 | | | $ | 930,026 | | | $ | 874,268 | | | $ | 641,017 | |
1 Commencement of operations.
See Notes to Financial Statements.
| | |
| 126 | | Annual Report | June 30, 2010 |
| | | | | | | | | | | | | | | | | | | | | | | |
| | | |
| Ultra-Small Company | | | Ultra-Small Company Market | | | Micro-Cap Limited | | | Small-Cap Momentum |
Year Ended June 30, | | | Year Ended June 30, | | | Year Ended June 30, | | | For the Period May 28, 20101 through |
| 2010 | | 2009 | | | 2010 | | | 2009 | | | 2010 | | | 2009 | | | June 30, 2010 |
| | | | | | |
| | | | | | | | | | | | | | | | | | | | | | | |
| $ | 713,280 | | $ | 837,953 | | | $ | 4,192,088 | | | $ | 5,060,416 | | | $ | 445,655 | | | $ | 300,331 | | | $ 807 |
| | 13,701,643 | | | (22,640,935 | ) | | | 30,266,479 | | | | (39,799,867 | ) | | | 4,966,984 | | | | (11,808,703 | ) | | (105) |
| | | | | | |
| | (1,347,400) | | | 2,325,835 | | | | 9,608,184 | | | | (95,759,187 | ) | | | (1,140,437 | ) | | | (711,960 | ) | | (135,451) |
| | | | | | |
| | 13,067,523 | | | (19,477,147 | ) | | | 44,066,751 | | | | (130,498,638 | ) | | | 4,272,202 | | | | (12,220,332 | ) | | (134,749) |
| | | | | | |
| | | | | | | | | | | | | | | | | | | | | | | |
| | (837,589) | | | (114,124 | ) | | | (5,060,400 | ) | | | (6,894,757 | ) | | | (300,332 | ) | | | (76,498 | ) | | - |
| | | | | | |
| | - | | | - | | | | - | | | | (28,745,402 | ) | | | - | | | | - | | | - |
| | (837,589) | | | (114,124 | ) | | | (5,060,400 | ) | | | (35,640,159 | ) | | | (300,332 | ) | | | (76,498 | ) | | - |
| | | | | | |
| | | | | | | | | | | | | | | | | | | | | | | |
| | 2,791,876 | | | 5,115,664 | | | | 83,956,444 | | | | 128,049,216 | | | | 1,581,302 | | | | 3,268,625 | | | 2,022,858 |
| | 783,940 | | | 106,740 | | | | 4,532,570 | | | | 33,435,828 | | | | 292,385 | | | | 74,543 | | | - |
| | (7,932,551) | | | (6,855,281 | ) | | | (126,816,712 | ) | | | (374,017,029 | ) | | | (9,838,747 | ) | | | (4,462,725 | ) | | - |
| | - | | | - | | | | 66,739 | | | | 181,978 | | | | - | | | | - | | | - |
| | | | | | |
| | (4,356,735) | | | (1,632,877 | ) | | | (38,260,959 | ) | | | (212,350,007 | ) | | | (7,965,060 | ) | | | (1,119,557 | ) | | 2,022,858 |
| | 7,873,199 | | | (21,224,148 | ) | | | 745,392 | | | | (378,488,804 | ) | | | (3,993,190 | ) | | | (13,416,387 | ) | | 1,888,109 |
| | | | | | |
| | | | | | | | | | | | | | | | | | | | | | | |
| | 73,708,446 | | | 94,932,594 | | | | 342,922,797 | | | | 721,411,601 | | | | 24,719,120 | | | | 38,135,507 | | | - |
| $ | 81,581,645 | | $ | 73,708,446 | | | $ | 343,668,189 | | | $ | 342,922,797 | | | $ | 20,725,930 | | | $ | 24,719,120 | | | $1,888,109 |
| | | | | | |
| | | | | | | | | | | | | | | | | | | | | | | |
| | 120,490 | | | 285,411 | | | | 6,969,210 | | | | 10,812,597 | | | | 295,049 | | | | 739,781 | | | 202,374 |
| | 34,611 | | | 6,842 | | | | 393,794 | | | | 3,538,183 | | | | 54,448 | | | | 16,602 | | | - |
| | (327,820) | | | (423,454 | ) | | | (10,690,345 | ) | | | (28,741,954 | ) | | | (1,766,430 | ) | | | (963,214 | ) | | - |
| | (172,719) | | | (131,201 | ) | | | (3,327,341 | ) | | | (14,391,174 | ) | | | (1,416,933 | ) | | | (206,831 | ) | | 202,374 |
| | 3,729,300 | | | 3,860,501 | | | | 32,659,379 | | | | 47,050,553 | | | | 5,204,415 | | | | 5,411,246 | | | - |
| | 3,556,581 | | | 3,729,300 | | | | 29,332,038 | | | | 32,659,379 | | | | 3,787,482 | | | | 5,204,415 | | | 202,374 |
| | | | | | |
| $ | 680,558 | | $ | 837,591 | | | $ | 4,177,591 | | | $ | 5,060,402 | | | $ | 439,547 | | | $ | 300,329 | | | $ 807 |
| | |
| STATEMENTS OF CHANGES IN NET ASSETS (continued) | | |
| | | | | | | | | | | | | | | | |
| | | Small-Cap Growth | | | Small-Cap Value | |
| | | Year Ended June 30, | | | Year Ended June 30, | |
| | | 2010 | | | 2009 | | | 2010 | | | 2009 | |
| | | | | |
OPERATIONS | | | | | | | | | | | | | | | | |
Net investment income | | $ | 139,914 | | | $ | 268,053 | | | $ | 863,013 | | | $ | 1,460,190 | |
Net realized gain (loss) on investments | | | 13,339,052 | | | | (44,044,221 | ) | | | 16,392,876 | | | | (91,869,568 | ) |
Net change in unrealized appreciation/(depreciation) on investments | | | (6,778,228 | ) | | | (14,313,852 | ) | | | 8,117,075 | | | | (38,804,448 | ) |
Net increase/(decrease) in net assets resulting from operations | | | 6,700,738 | | | | (58,090,020 | ) | | | 25,372,964 | | | | (129,213,826 | ) |
| | | | |
DISTRIBUTIONS: | | | | | | | | | | | | | | | | |
From net investment income | | | (252,145 | ) | | | - | | | | (806,731 | ) | | | (1,307,246 | ) |
From net realized gains | | | - | | | | - | | | | - | | | | - | |
Net decrease in net assets from distributions | | | (252,145 | ) | | | - | | | | (806,731 | ) | | | (1,307,246 | ) |
| | | | |
SHARE TRANSACTIONS: | | | | | | | | | | | | | | | | |
Proceeds from sale of shares | | | 16,264,411 | | | | 25,366,544 | | | | 14,406,868 | | | | 46,302,721 | |
Reinvestment of distributions | | | 235,833 | | | | - | | | | 705,905 | | | | 1,174,309 | |
Cost of shares redeemed | | | (37,633,988 | ) | | | (40,247,742 | ) | | | (63,207,015 | ) | | | (116,375,345 | ) |
Net increase/(decrease) in net assets from share transactions | | | (21,133,744 | ) | | | (14,881,198 | ) | | | (48,094,242 | ) | | | (68,898,315 | ) |
Net increase/(decrease) in net assets | | | (14,685,151 | ) | | | (72,971,218 | ) | | | (23,528,009 | ) | | | (199,419,387 | ) |
| | | | |
NET ASSETS: | | | | | | | | | | | | | | | | |
Beginning of year | | | 71,696,536 | | | | 144,667,754 | | | | 132,228,879 | | | | 331,648,266 | |
End of year* | | $ | 57,011,385 | | | $ | 71,696,536 | | | $ | 108,700,870 | | | $ | 132,228,879 | |
| | | | |
SHARES ISSUED & REDEEMED | | | | | | | | | | | | | | | | |
Issued | | | 1,683,629 | | | | 2,666,464 | | | | 1,267,266 | | | | 4,471,038 | |
Distributions reinvested | | | 24,464 | | | | - | | | | 61,490 | | | | 129,901 | |
Redeemed | | | (3,944,414 | ) | | | (4,565,634 | ) | | | (5,423,838 | ) | | | (11,924,888 | ) |
Net increase/(decrease) | | | (2,236,321 | ) | | | (1,899,170 | ) | | | (4,095,082 | ) | | | (7,323,949 | ) |
Outstanding at beginning of year | | | 8,470,556 | | | | 10,369,726 | | | | 13,588,863 | | | | 20,912,812 | |
Outstanding at end of year | | | 6,234,235 | | | | 8,470,556 | | | | 9,493,781 | | | | 13,588,863 | |
| | | | |
* Including undistributed net investment income of: | | $ | 152,882 | | | $ | 250,343 | | | $ | 414,281 | | | $ | 492,110 | |
See Notes to Financial Statements.
| | |
| 128 | | Annual Report | June 30, 2010 |
| | |
| | |
| | | | | | | | | | | | | | | | | | | | | | | | | | | | | |
| Large-Cap Growth | | | Large-Cap Value | | | Blue Chip 35 Index | | | Managed Volatility | |
Year Ended June 30, | | | Year Ended June 30, | | | Year Ended June 30, | | | Year Ended June 30, | |
| 2010 | | 2009 | | | 2010 | | | 2009 | | | 2010 | | | 2009 | | | 2010 | | | 2009 | |
| | | | | | | | |
| | | | | | | | | | | | | | | | | | | | | | | | | | | | | |
| $ | 391,274 | | $ | 655,110 | | | $ | 469,938 | | | $ | 784,452 | | | $ | 4,239,573 | | | $ | 4,845,369 | | | $ | 406,546 | | | $ | 971,702 | |
| | 931,464 | | | (39,666,785 | ) | | | 2,963,788 | | | | (8,393,446 | ) | | | (10,168,908 | ) | | | (56,344,546 | ) | | | (221,955 | ) | | | (4,862,969 | ) |
| 8,818,151 | | | (28,599,641 | ) | | | 2,161,925 | | | | (6,491,911 | ) | | | 26,109,776 | | | | 8,144,650 | | | | 1,280,993 | | | | (5,679,464 | ) |
|
10,140,889 | | | (67,611,316 | ) | | | 5,595,651 | | | | (14,100,905 | ) | | | 20,180,441 | | | | (43,354,527 | ) | | | 1,465,584 | | | | (9,570,731 | ) |
| | | | | | | |
| | | | | | | | | | | | | | | | | | | | | | | | | | | | | |
| | (417,231) | | | (732,353 | ) | | | (565,868 | ) | | | (822,272 | ) | | | (4,072,171 | ) | | | (5,724,513 | ) | | | (612,394 | ) | | | (1,894,744 | ) |
| | - | | | - | | | | - | | | | - | | | | - | | | | - | | | | - | | | | (2,727,783 | ) |
| (417,231) | | | (732,353 | ) | | | (565,868 | ) | | | (822,272 | ) | | | (4,072,171 | ) | | | (5,724,513 | ) | | | (612,394 | ) | | | (4,622,527 | ) |
| | | | | | | |
| | | | | | | | | | | | | | | | | | | | | | | | | | | | | |
| | 3,317,409 | | | 31,525,083 | | | | 2,205,061 | | | | 6,440,226 | | | | 75,798,410 | | | | 64,786,199 | | | | 7,408,382 | | | | 9,477,275 | |
| | 393,794 | | | 669,989 | | | | 523,937 | | | | 795,525 | | | | 3,847,889 | | | | 5,416,570 | | | | 599,982 | | | | 4,416,669 | |
| | (25,559,606) | | | (68,129,904 | ) | | | (10,220,486 | ) | | | (18,460,246 | ) | | | (61,180,333 | ) | | | (84,099,672 | ) | | | (22,477,177 | ) | | | (27,818,820 | ) |
|
(21,848,403) | | | (35,934,832 | ) | | | (7,491,488 | ) | | | (11,224,495 | ) | | | 18,465,966 | | | | (13,896,903 | ) | | | (14,468,813 | ) | | | (13,924,876 | ) |
| | (12,124,745) | | | (104,278,501 | ) | | | (2,461,705 | ) | | | (26,147,672 | ) | | | 34,574,236 | | | | (62,975,943 | ) | | | (13,615,623 | ) | | | (28,118,134 | ) |
| | | | | | | |
| | | | | | | | | | | | | | | | | | | | | | | | | | | | | |
| | 70,534,102 | | | 174,812,603 | | | | 27,995,916 | | | | 54,143,588 | | | | 188,011,909 | | | | 250,987,852 | | | | 47,299,143 | | | | 75,417,277 | |
| $ | 58,409,357 | | $ | 70,534,102 | | | $ | 25,534,211 | | | $ | 27,995,916 | | | $ | 222,586,145 | | | $ | 188,011,909 | | | $ | 33,683,520 | | | $ | 47,299,143 | |
| | | | | | | |
| | | | | | | | | | | | | | | | | | | | | | | | | | | | | |
| | 313,191 | | | 2,694,605 | | | | 183,704 | | | | 638,856 | | | | 11,535,727 | | | | 11,769,819 | | | | 697,925 | | | | 900,091 | |
| | 36,161 | | | 80,431 | | | | 43,991 | | | | 80,846 | | | | 574,312 | | | | 983,044 | | | | 55,812 | | | | 456,739 | |
| | (2,394,855) | | | (7,723,202 | ) | | | (869,788 | ) | | | (1,816,620 | ) | | | (9,336,887 | ) | | | (14,338,850 | ) | | | (2,101,935 | ) | | | (2,708,787 | ) |
| | (2,045,503) | | | (4,948,166 | ) | | | (642,093 | ) | | | (1,096,918 | ) | | | 2,773,152 | | | | (1,585,987 | ) | | | (1,348,198 | ) | | | (1,351,957 | ) |
| | 7,786,796 | | | 12,734,962 | | | | 2,874,135 | | | | 3,971,053 | | | | 33,233,744 | | | | 34,819,731 | | | | 4,642,050 | | | | 5,994,007 | |
| | 5,741,293 | | | 7,786,796 | | | | 2,232,042 | | | | 2,874,135 | | | | 36,006,896 | | | | 33,233,744 | | | | 3,293,852 | | | | 4,642,050 | |
| | | | | | | |
| $ | 187,491 | | $ | 211,705 | | | $ | 222,649 | | | $ | 327,118 | | | $ | 2,199,352 | | | $ | 2,031,950 | | | $ | 217,769 | | | $ | 423,617 | |
FINANCIAL HIGHLIGHTS
(for a share outstanding throughout the year indicated)
| | | | | | | | | | |
| | | | | Income from
Investment Operations | | |
| | | Net Asset
Value,
Beginning
of Year | | Net Investment Income (Loss)(a) | | Net Realized
and Unrealized
Gain\(Loss) | | Total from
Investment
Operations | | |
| | | | | |
AGGRESSIVE INVESTORS 1 | | | | | | | | | | |
| | | | | |
Year Ended June 30, 2010 | | $25.93 | | $ 0.58 | | $ 1.40 | | $ 1.98 | | |
Year Ended June 30, 2009 | | 53.96 | | 0.30 | | (28.00) | | (27.70) | | |
Year Ended June 30, 2008 | | 61.90 | | (0.59) | | 3.14 | | 2.55 | | |
Year Ended June 30, 2007 | | 61.90 | | (0.43) | | 6.41 | | 5.98 | | |
Year Ended June 30, 2006 | | 56.60 | | (0.42) | | 12.23 | | 11.81 | | |
| | | | | |
AGGRESSIVE INVESTORS 2 | | | | | | | | | | |
| | | | | |
Year Ended June 30, 2010 | | 10.37 | | 0.06 | | 0.82 | | 0.88 | | |
Year Ended June 30, 2009 | | 20.67 | | 0.02 | | (10.32) | | (10.30) | | |
Year Ended June 30, 2008 | | 20.05 | | (0.08) | | 1.27 | | 1.19 | | |
Year Ended June 30, 2007 | | 17.55 | | (0.07) | | 2.94 | | 2.87 | | |
Year Ended June 30, 2006 | | 14.72 | | (0.05) | | 3.22 | | 3.17 | | |
| | | | | |
ULTRA-SMALL COMPANY | | | | | | | | | | |
| | | | | |
Year Ended June 30, 2010 | | 19.76 | | 0.19 | | 3.22 | | 3.41 | | |
Year Ended June 30, 2009 | | 24.59 | | 0.23 | | (5.03) | | (4.80) | | |
Year Ended June 30, 2008 | | 37.65 | | 0.03 | | (8.67) | | (8.64) | | |
Year Ended June 30, 2007 | | 42.42 | | 0.12 | | 3.37 | | 3.49 | | |
Year Ended June 30, 2006 | | 38.44 | | (0.15) | | 9.23 | | 9.08 | | |
| | | | | |
ULTRA-SMALL COMPANY MARKET | | | | | | | | | | |
| | | | | |
Year Ended June 30, 2010 | | 10.50 | | 0.14 | | 1.25 | | 1.39 | | |
Year Ended June 30, 2009 | | 15.33 | | 0.14 | | (3.88) | | (3.74) | | |
Year Ended June 30, 2008 | | 20.36 | | 0.14 | | (4.49) | | (4.35) | | |
Year Ended June 30, 2007 | | 18.94 | | 0.10 | | 1.76 | | 1.86 | | |
Year Ended June 30, 2006 | | 16.96 | | 0.05 | | 2.48 | | 2.53 | | |
| (a) | Per share amounts calculated based on the average daily shares outstanding during the period. |
| (b) | For the years ended June 30, 2009 and June 30, 2010, the expense ratio was significantly lower than past years due to a negative performance adjustment to the investment advisory fee. Please refer to the Statement of Operations and Note 3 of the Notes to Financial Statements for further information. The rate shown may not be indicative of the rate going forward. |
| (c) | Total return may have been lower had various fees not been waived during the period. |
| (d) | Amount represents less than $0.005. |
See Notes to Financial Statements.
| | |
| 130 | | Annual Report | June 30, 2010 |
| | |
| | |
| | | | | | | | | | | | | | | | | | | | | | | |
| | | Less Distributions
to Shareholders from: | | | | | | | | Ratios & Supplemental Data |
| | | Net
Realized
Gain | | Net
Investment
Income | | Total Distributions | | Paid in Capital
from
Redemption
Fees(a) | | Net Asset
Value,
End of
Year | | Total Return | | Net Assets
End of Year
(000’s) | | Expenses Before
Waivers and
Reimbursements | | Expenses After
Waivers and Reimbursements | | Net Investment Income (Loss)
After Waivers and
Reimbursement | | Portfolio Turnover Rate |
| | | | | | | | | | | |
| | | | | | | | | | | | | | | | | | | | | | | |
| | | | | | | | | | | |
| | $ | - | | $(0.24) | | $ (0.24) | | - | | $27.67 | | 7.56% | | $ 93,008 | | (0.51%)(b) | | (0.51%) | | 1.94% | | 118% |
| | | (0.33) | | - | | (0.33) | | - | | 25.93 | | (51.31%) | | 115,835 | | 0.34%(b) | | 0.34% | | 0.97% | | 134% |
| | | (10.49) | | - | | (10.49) | | - | | 53.96 | | 3.54%(c) | | 338,715 | | 1.78% | | 1.78% | | (1.03%) | | 142% |
| | | (5.98) | | - | | (5.98) | | - | | 61.90 | | 10.79% | | 367,958 | | 1.72% | | 1.72% | | (0.75%) | | 115% |
| | | | (6.51) | | - | | (6.51) | | - | | 61.90 | | 21.79% | | 438,592 | | 1.58% | | 1.58% | | (0.69%) | | 128% |
| | | | | | | | | | | |
| | | | | | | | | | | | | | | | | | | | | | | |
| | | | | | | | | | | |
| | | - | | (0.05) | | (0.05) | | - | | 11.20 | | 8.44% | | 303,293 | | 1.02% | | 1.02% | | 0.52% | | 105% |
| | | - | | - | | - | | - | | 10.37 | | (49.83%) | | 383,856 | | 1.20% | | 1.20% | | 0.14% | | 126% |
| | | (0.57) | | - | | (0.57) | | - | | 20.67 | | 5.88%(c) | | 885,076 | | 1.17% | | 1.17% | | (0.40%) | | 127% |
| | | (0.37) | | - | | (0.37) | | - | | 20.05 | | 16.68% | | 650,939 | | 1.22% | | 1.22% | | (0.38%) | | 124% |
| | | | (0.34) | | - | | (0.34) | | - | | 17.55 | | 21.65% | | 585,262 | | 1.12% | | 1.12% | | (0.26%) | | 89% |
| | | | | | | | | | | |
| | | | | | | | | | | | | | | | | | | | | | | |
| | | | | | | | | | | |
| | | - | | (0.23) | | (0.23) | | - | | 22.94 | | 17.26% | | 81,582 | | 1.17% | | 1.17% | | 0.83% | | 133% |
| | | - | | (0.03) | | (0.03) | | - | | 19.76 | | (19.48%) | | 73,708 | | 1.16% | | 1.16% | | 1.23% | | 90% |
| | | (4.31) | | (0.11) | | (4.42) | | - | | 24.59 | | (24.59%)(c) | | 94,933 | | 1.07% | | 1.07% | | 0.10% | | 102% |
| | | (8.26) | | - | | (8.26) | | - | | 37.65 | | 9.12% | | 137,236 | | 1.09% | | 1.09% | | 0.31% | | 106% |
| | | | (5.10) | | - | | (5.10) | | - | | 42.42 | | 25.58% | | 132,193 | | 1.09% | | 1.09% | | (0.37%) | | 101% |
| | | | | | | | | | | |
| | | | | | | | | | | | | | | | | | | | | | | |
| | | | | | | | | | | |
| | | - | | (0.17) | | (0.17) | | -(d) | | 11.72 | | 13.30%(c) | | 343,668 | | 0.77% | | 0.75% | | 1.18% | | 48% |
| | | (0.89) | | (0.21) | | (1.10) | | $0.01 | | 10.50 | | (23.47%)(c) | | 342,923 | | 0.79% | | 0.75% | | 1.27% | | 42% |
| | | (0.65) | | (0.04) | | (0.69) | | 0.01 | | 15.33 | | (21.72%)(c) | | 721,412 | | 0.66% | | 0.66% | | 0.79% | | 29% |
| | | (0.37) | | (0.08) | | (0.45) | | 0.01 | | 20.36 | | 10.08% | | 1,162,416 | | 0.67% | | 0.67% | | 0.53% | | 34% |
| | | | (0.53) | | (0.03) | | (0.56) | | 0.01 | | 18.94 | | 15.13% | | 1,087,750 | | 0.65% | | 0.65% | | 0.27% | | 27% |
FINANCIAL HIGHLIGHTS (continued)
(for a share outstanding throughout the year or period indicated)
| | | | | | | | | | |
| | | | | Income from
Investment Operations | | |
| | | Net Asset
Value,
Beginning
of Period | | Net Investment
Income (Loss)(a) | | Net Realized
and Unrealized
Gain\(Loss) | | Total from
Investment
Operations | | |
| | | | | |
MICRO-CAP LIMITED | | | | | | | | | | |
| | | | | |
Year Ended June 30, 2010 | | $ 4.75 | | $ 0.09 | | $ 0.69 | | $ 0.78 | | |
Year Ended June 30, 2009 | | 7.05 | | 0.06 | | (2.35) | | (2.29) | | |
Year Ended June 30, 2008 | | 8.56 | | 0.03 | | (1.53) | | (1.50) | | |
Year Ended June 30, 2007 | | 11.10 | | (0.01) | | (0.32) | | (0.33) | | |
Year Ended June 30, 2006 | | 11.09 | | (0.13) | | 1.81 | | 1.68 | | |
| | | | | |
SMALL-CAP MOMENTUM | | | | | | | | | | |
| | | | | |
Period Ended June 30, 2010(e) | | 10.00 | | -(f) | | (0.67) | | (0.67) | | |
| | | | | |
SMALL-CAP GROWTH | | | | | | | | | | |
| | | | | |
Year Ended June 30, 2010 | | 8.46 | | 0.02 | | 0.70 | | 0.72 | | |
Year Ended June 30, 2009 | | 13.95 | | 0.03 | | (5.52) | | (5.49) | | |
Year Ended June 30, 2008 | | 16.01 | | (0.03) | | (2.03) | | (2.06) | | |
Year Ended June 30, 2007 | | 14.75 | | (0.04) | | 1.30 | | 1.26 | | |
Year Ended June 30, 2006 | | 12.08 | | (0.03) | | 2.70 | | 2.67 | | |
| | | | | |
SMALL-CAP VALUE | | | | | | | | | | |
| | | | | |
Year Ended June 30, 2010 | | 9.73 | | 0.07 | | 1.72 | | 1.79 | | |
Year Ended June 30, 2009 | | 15.86 | | 0.08 | | (6.14) | | (6.06) | | |
Year Ended June 30, 2008 | | 18.74 | | 0.03 | | (2.91) | | (2.88) | | |
Year Ended June 30, 2007 | | 16.02 | | (0.03) | | 2.75 | | 2.72 | | |
Year Ended June 30, 2006 | | 12.78 | | -(f) | | 3.24 | | 3.24 | | |
| | | | | |
LARGE-CAP GROWTH | | | | | | | | | | |
| | | | | |
Year Ended June 30, 2010 | | 9.06 | | 0.06 | | 1.11 | | 1.17 | | |
Year Ended June 30, 2009 | | 13.73 | | 0.06 | | (4.66) | | (4.60) | | |
Year Ended June 30, 2008 | | 14.12 | | 0.06 | | (0.41) | | (0.35) | | |
Year Ended June 30, 2007 | | 12.11 | | 0.03 | | 2.02 | | 2.05 | | |
Year Ended June 30, 2006 | | 11.00 | | 0.04 | | 1.07 | | 1.11 | | |
| (a) | Per share amounts calculated based on the average daily shares outstanding during the period. |
| (b) | Annualized for periods less than one year. |
| (c) | For the year ended June 30, 2010, the expense ratio was significantly lower than past years due to a negative performance adjustment to the investment advisory fee. Please refer to the Statement of Operations and Note 3 of the Notes to Financial Statements for further information. The rate shown may not be indicative of the rate going forward. |
| (d) | Total return may have been lower had various fees not been waived during the period. |
| (e) | Commenced operations on May 28, 2010. |
| (f) | Amount represents less than $0.005. |
See Notes to Financial Statements.
| | |
| 132 | | Annual Report | June 30, 2010 |
| | |
| | |
| | | | | | | | | | | | | | | | | | | | |
| | | Less Distributions
to Shareholders from: | | | | | | Ratios & Supplemental Data |
| | | Net
Realized
Gain | | Net
Investment
Income | | Total Distributions | | Net Asset
Value,
End of Period | | Total Return | | Net Assets End of Period (000’s) | | Expenses Before Waivers and Reimbursements(b) | | Expenses After Waivers and Reimbursements(b) | | Net Investment
Income (Loss) After Waivers and Reimbursements(b) | | Portfolio Turnover Rate |
| | | | | | | | | | |
| | | | | | | | | | | | | | | | | | | | |
| | | | | | | | | | |
| | $ - | | $(0.06) | | $(0.06) | | $ 5.47 | | 16.44% | | $ 20,726 | | 0.00%(c) | | 0.00% | | 1.73% | | 123% |
| | - | | (0.01) | | (0.01) | | 4.75 | | (32.41%) | | 24,719 | | 0.87% | | 0.87% | | 1.13% | | 151% |
| | - | | (0.01) | | (0.01) | | 7.05 | | (17.49%)(d) | | 38,136 | | 0.75% | | 0.75% | | 0.36% | | 147% |
| | (2.21) | | - | | (2.21) | | 8.56 | | (3.37%) | | 62,244 | | 0.84% | | 0.84% | | (0.09%) | | 133% |
| | | (1.67) | | - | | (1.67) | | 11.10 | | 14.72% | | 80,711 | | 1.60% | | 1.60% | | (1.05%) | | 125% |
| | | | | | | | | | |
| | | | | | | | | | | | | | | | | | | | |
| | | | | | | | | | |
| | | - | | - | | - | | 9.33 | | (6.70%)(d) | | 1,888 | | 11.24% | | 0.90% | | 0.50% | | 3% |
| | | | | | | | | | |
| | | | | | | | | | | | | | | | | | | | |
| | | | | | | | | | |
| | - | | (0.04) | | (0.04) | | 9.14 | | 8.44% | | 57,011 | | 0.93% | | 0.93% | | 0.21% | | 87% |
| | - | | - | | - | | 8.46 | | (39.35%) | | 71,697 | | 0.94% | | 0.94% | | 0.29% | | 75% |
| | - | | - | | - | | 13.95 | | (12.87%)(d) | | 144,668 | | 0.87% | | 0.87% | | (0.20%) | | 63% |
| | - | | - | | - | | 16.01 | | 8.54% | | 172,395 | | 0.92% | | 0.92% | | (0.31%) | | 37% |
| | | - | | - | | - | | 14.75 | | 22.10% | | 275,278 | | 0.81% | | 0.81% | | (0.19%) | | 41% |
| | | | | | | | | | |
| | | | | | | | | | | | | | | | | | | | |
| | | | | | | | | | |
| | - | | (0.07) | | (0.07) | | 11.45 | | 18.35% | | 108,701 | | 0.91% | | 0.91% | | 0.64% | | 81% |
| | - | | (0.07) | | (0.07) | | 9.73 | | (38.15%) | | 132,229 | | 0.92% | | 0.92% | | 0.75% | | 83% |
| | - | | - | | - | | 15.86 | | (15.37%)(d) | | 331,648 | | 0.83% | | 0.83% | | 0.18% | | 73% |
| | - | | - | | - | | 18.74 | | 16.98% | | 280,177 | | 0.88% | | 0.88% | | (0.19%) | | 58% |
| | | - | | - | | - | | 16.02 | | 25.35% | | 360,120 | | 0.77% | | 0.77% | | (0.03%) | | 49% |
| | | | | | | | | | |
| | | | | | | | | | | | | | | | | | | | |
| | | | | | | | | | |
| | - | | (0.06) | | (0.06) | | 10.17 | | 12.89%(d) | | 58,409 | | 0.86% | | 0.84% | | 0.55% | | 40% |
| | - | | (0.07) | | (0.07) | | 9.06 | | (33.43%) | | 70,534 | | 0.82% | | 0.82% | | 0.63% | | 49% |
| | - | | (0.04) | | (0.04) | | 13.73 | | (2.50%)(d) | | 174,813 | | 0.71% | | 0.71% | | 0.39% | | 37% |
| | - | | (0.04) | | (0.04) | | 14.12 | | 16.98% | | 138,138 | | 0.78% | | 0.78% | | 0.25% | | 39% |
| | | - | | - | | - | | 12.11 | | 10.09% | | 103,861 | | 0.82% | | 0.82% | | 0.31% | | 26% |
FINANCIAL HIGHLIGHTS (continued)
(for a share outstanding throughout the year indicated)
| | | | | | | | | | |
| | | | | Income from
Investment Operations | | |
| | | Net Asset
Value,
Beginning
of Year | | Net
Investment
Income(a) | | Net Realized
and Unrealized
Gain\(Loss) | | Total from
Investment
Operations | | |
| | | | | |
LARGE-CAP VALUE | | | | | | | | | | |
| | | | | |
Year Ended June 30, 2010 | | $ 9.74 | | $0.19 | | $ 1.73 | | $ 1.92 | | |
Year Ended June 30, 2009 | | 13.63 | | 0.23 | | (3.89) | | (3.66) | | |
Year Ended June 30, 2008 | | 17.07 | | 0.22 | | (2.94) | | (2.72) | | |
Year Ended June 30, 2007 | | 14.41 | | 0.17 | | 2.64 | | 2.81 | | |
Year Ended June 30, 2006 | | 12.70 | | 0.17 | | 1.69 | | 1.86 | | |
| | | | | |
BLUE CHIP 35 INDEX | | | | | | | | | | |
| | | | | |
Year Ended June 30, 2010 | | 5.66 | | 0.13 | | 0.52 | | 0.65 | | |
Year Ended June 30, 2009 | | 7.21 | | 0.15 | | (1.51) | | (1.36) | | |
Year Ended June 30, 2008 | | 8.52 | | 0.19 | | (1.39) | | (1.20) | | |
Year Ended June 30, 2007 | | 7.21 | | 0.16 | | 1.26 | | 1.42 | | |
Year Ended June 30, 2006 | | 6.86 | | 0.14 | | 0.32 | | 0.46 | | |
| | | | | |
MANAGED VOLATILITY | | | | | | | | | | |
| | | | | |
Year Ended June 30, 2010 | | 10.19 | | 0.10 | | 0.08 | | 0.18 | | |
Year Ended June 30, 2009 | | 12.58 | | 0.18 | | (1.69) | | (1.51) | | |
Year Ended June 30, 2008 | | 12.95 | | 0.29 | | (0.49) | | (0.20) | | |
Year Ended June 30, 2007 | | 12.65 | | 0.28 | | 0.44 | | 0.72 | | |
Year Ended June 30, 2006 | | 11.92 | | 0.22 | | 0.73 | | 0.95 | | |
| (a) | Per share amounts calculated based on the average daily shares outstanding during the period. |
| (b) | Total return may have been lower had various fees not been waived during the period. |
| (c) | Total return includes the effect of a reimbursement by the Adviser and the accounting agent due to a trading error. See Note 3 (Other Reimbursements) in the Notes to Financial Statements. |
See Notes to Financial Statements.
| | |
| 134 | | Annual Report | June 30, 2010 |
| | |
| | |
| | | | | | | | | | | | | | | | | | | | |
| | | Less Distributions
to Shareholders from | | | | | | Ratios & Supplemental Data |
| | | Net
Realized
Gain | | Net Investment Income | | Total Distributions | | Net Asset Value, End of Year | | Total Return | | Net Assets
End of Year (000’s) | | Expenses Before
Waivers and
Reimbursements | | Expenses After Waivers and Reimbursements | | Net Investment
Income After Waivers and Reimbursements | | Portfolio Turnover Rate |
| | | | | | | | | | |
| | | | | | | | | | | | | | | | | | | | |
| | | | | | | | | | |
| | $ - | | $(0.22) | | $(0.22) | | $11.44 | | 19.65%(b) | | $ 25,534 | | 1.11% | | 0.84% | | 1.58% | | 49% |
| | - | | (0.23) | | (0.23) | | 9.74 | | (26.88%)(b) | | 27,996 | | 0.98% | | 0.84% | | 2.20% | | 65% |
| | (0.51) | | (0.21) | | (0.72) | | 13.63 | | (16.46%)(b) | | 54,144 | | 0.80% | | 0.79% | | 1.38% | | 28% |
| | - | | (0.15) | | (0.15) | | 17.07 | | 19.57% | | 86,095 | | 0.79% | | 0.79% | | 1.08% | | 34% |
| | | - | | (0.15) | | (0.15) | | 14.41 | | 14.69%(b) | | 87,718 | | 0.86% | | 0.84% | | 1.18% | | 23% |
| | | | | | | | | | |
| | | | | | | | | | | | | | | | | | | | |
| | | | | | | | | | |
| | - | | (0.13) | | (0.13) | | 6.18 | | 11.25%(b)(c) | | 222,586 | | 0.27% | | 0.15% | | 1.99% | | 28% |
| | - | | (0.19) | | (0.19) | | 5.66 | | (18.77%)(b) | | 188,012 | | 0.25% | | 0.15% | | 2.58% | | 86% |
| | - | | (0.11) | | (0.11) | | 7.21 | | (14.28%)(b) | | 250,988 | | 0.22% | | 0.15% | | 2.35% | | 12% |
| | - | | (0.11) | | (0.11) | | 8.52 | | 19.81%(b) | | 99,082 | | 0.35% | | 0.15% | | 1.98% | | 11% |
| | | - | | (0.11) | | (0.11) | | 7.21 | | 6.64%(b) | | 42,471 | | 0.47% | | 0.15% | | 1.90% | | 41% |
| | | | | | | | | | |
| | | | | | | | | | | | | | | | | | | | |
| | | | | | | | | | |
| | - | | (0.14) | | (0.14) | | 10.23 | | 1.67%(b) | | 33,684 | | 1.05% | | 0.94% | | 0.91% | | 33% |
| | (0.52) | | (0.36) | | (0.88) | | 10.19 | | (11.66%)(b) | | 47,299 | | 1.01% | | 0.94% | | 1.72% | | 51% |
| | - | | (0.17) | | (0.17) | | 12.58 | | (1.57%)(b) | | 75,417 | | 0.88% | | 0.88% | | 2.23% | | 44% |
| | (0.15) | | (0.27) | | (0.42) | | 12.95 | | 5.87%(b) | | 87,056 | | 0.98% | | 0.94% | | 2.16% | | 27% |
| | | (0.11) | | (0.11) | | (0.22) | | 12.65 | | 8.01% | | 85,340 | | 0.94% | | 0.94% | | 1.81% | | 51% |
| | |
NOTES TO FINANCIAL STATEMENTS | | |
June 30, 2010
1. Organization:
Bridgeway Funds, Inc. (“Bridgeway”) was organized as a Maryland corporation on October 19, 1993, and is registered under the Investment Company Act of 1940, as amended (the “1940 Act”), as an open-end management investment company.
Bridgeway is organized as a series fund, which currently has 12 investment funds (each, a “Fund” and collectively, the “Funds”): Aggressive Investors 1, Aggressive Investors 2, Ultra-Small Company, Ultra-Small Company Market, Micro-Cap Limited, Small-Cap Momentum, Small-Cap Growth, Small-Cap Value, Large-Cap Growth, Large-Cap Value, Blue Chip 35 Index and Managed Volatility Funds. The Small-Cap Momentum Fund commenced operations on May 28, 2010.
Bridgeway is authorized to issue 2,000,000,000 shares of common stock at $0.001 per share. 15,000,000 shares have been classified into the Aggressive Investors 1 Fund. 130,000,000 shares each have been classified into the Aggressive Investors 2 and Blue Chip 35 Index Funds. 5,000,000 shares have been classified into the Ultra-Small Company Fund. 100,000,000 shares have been classified in the Ultra-Small Company Market Fund. 10,000,000 shares have been classified in the Micro-Cap Limited Fund. 100,000,000 shares each have been classified into the Small-Cap Momentum, Small-Cap Growth, Small-Cap Value, Large-Cap Growth, and Large-Cap Value Funds. 50,000,000 shares have been classified into the Managed Volatility Fund. All shares outstanding currently represent Class N shares.
The Aggressive Investors 1 Fund is closed to new investors. The Ultra-Small Company Fund is open to existing investors (direct only).
All of the Funds are no-load, diversified funds.
The Aggressive Investors 1 and 2 Funds seek to exceed the stock market total return (primarily through capital appreciation) at a level of total risk roughly equal to that of the stock market over longer periods of time (three years or more).
The Ultra-Small Company, Ultra-Small Company Market, Micro-Cap Limited, Small-Cap Momentum, Small-Cap Growth, Small-Cap Value and Large-Cap Growth Funds seek to provide a long-term total return of capital, primarily through capital appreciation.
The Blue Chip 35 Index and Large-Cap Value Funds seek to provide long-term total return of capital, primarily through capital appreciation but also some income.
The Managed Volatility Fund seeks to provide a high current return with short-term risk less than or equal to 40% of the stock market.
Bridgeway Capital Management, Inc. (the “Adviser”) is the investment adviser for all of the Funds.
2. Significant Accounting Policies:
The following summary of significant accounting policies, followed in the preparation of the financial statements of the Funds, are in conformity with accounting principles generally accepted in the United States of America (“GAAP”).
Securities, Options, Futures and Other Investments Valuation Other than options, portfolio securities that are principally traded on a national securities exchange are valued at their last sale price on the principal exchange on which they are traded prior to the close of the New York Stock Exchange (“NYSE”), on each day the NYSE is open for business. If there is no closing price on the NYSE, the portfolio security will be valued using a composite price, which is defined as the last price for the security on any exchange. Portfolio securities other than options that are principally traded on the National Association of Securities Dealers Automated Quotation System (“NASDAQ”) are valued at the NASDAQ Official Closing Price (“NOCP”). In the absence of recorded sales on their home exchange or NOCP in the case of NASDAQ traded securities, the security will be valued as follows: bid prices for long positions and ask prices for short positions.
Short-term fixed income securities having a remaining maturity of 60 days or less are valued at amortized cost, which approximates market value. Options are valued at the close if there is trading volume and if there is no trading volume, the bid on long
| | |
| 136 | | Annual Report | June 30, 2010 |
| | |
| NOTES TO FINANCIAL STATEMENTS (continued) | | |
June 30, 2010
positions and ask on the short positions. Other investments for which no sales are reported are valued at the latest bid price in accordance with the pricing policy established by the Board of Directors.
Investments in open-end registered investment companies and closed-end registered investment companies that do not trade on an exchange are valued at the end of day net asset value (“NAV”) per share.
Investments in closed-end registered investment companies that trade on an exchange are valued at the last sales price as of the close of the customary trading session on the exchange where the security is principally traded.
When market quotations are not readily available or when events occur that make established valuation methods unreliable, securities of the Funds may be valued at fair value as determined in good faith by or under the direction of the Board of Directors. The valuation assigned to fair valued securities for purposes of calculating the Funds’ NAVs may differ from the security’s most recent closing market price and from the prices used by other mutual funds to calculate their NAVs.
The inputs and valuation techniques used to determine the value of a Fund’s investments are summarized into three levels as described in the hierarchy below:
| • | Level 1 – quoted prices in active markets for identical assets |
Investments whose values are based on quoted market prices in active markets, and whose values are therefore classified as Level 1 prices, include active listed equity securities. The Funds do not adjust the quoted price for such investments, even in situations where the Funds hold a large position and a sale could reasonably impact the quoted price.
| • | Level 2 – other significant observable inputs (including quoted prices for similar securities, interest rates, prepayments speeds, credit risk, etc.) |
Investments that trade in markets that are not considered to be active, but whose values are based on quoted market prices, dealer quotations or valuations provided by alternative pricing sources supported by observable inputs are classified as Level 2 prices. These generally include certain U.S. government and sovereign obligations, most government agency securities, investment-grade corporate bonds and less liquid listed equity securities. As investments whose values are classified as Level 2 prices include positions that are not traded in active markets and/or are subject to transfer restrictions, valuations may be adjusted to reflect illiquidity and/or non-transferability, which are generally based on available market information.
Money market fund investments consist of mutual funds which invest primarily in securities that are valued at amortized cost, a Level 2 investment. Therefore, the money market funds are classified as Level 2 investments. The Funds’ total return swap values are derived by applying observable inputs to the outstanding notional values.
| • | Level 3 – significant unobservable inputs (including a Fund’s own assumptions in determining the fair value of investments) |
Investments whose values are classified as Level 3 prices have significant unobservable inputs, as they may trade infrequently or not at all. When observable prices are not available for these securities, the Funds use one or more valuation techniques for which sufficient and reliable data is available. The inputs used by the Funds in estimating the value of Level 3 prices may include the original transaction price, quoted prices for similar securities or assets in active markets, completed or pending third-party transactions in the underlying investment or comparable issuers, and changes in financial ratios or cash flows. Level 3 prices may also be adjusted to reflect illiquidity and/or non-transferability, with the amount of such discount estimated by the Funds in the absence of market information. Assumptions used by the Funds due to the lack of observable inputs may significantly impact the resulting value and therefore the Funds’ results of operations.
The inputs or methodology used for valuing investments are not necessarily an indication of the risk associated with investing in those investments. A summary of the inputs used to value the Funds’ investments as of June 30, 2010 is included with each Fund’s Schedule of Investments.
| | |
| NOTES TO FINANCIAL STATEMENTS (continued) | | |
June 30, 2010
In January 2010, the Financial Accounting Standards Board (“FASB”) issued Accounting Standards Update (“ASU”) No. 2010-06 “Improving Disclosures about Fair Value Measurements.” ASU No. 2010-06 amends FASB Accounting Standards Codification Topic 820, Fair Value Measurements and Disclosures, to require additional disclosures regarding fair value measurements. Certain disclosures required by ASU No. 2010-06 are effective for fiscal years beginning after December 15, 2010, and for interim periods within those fiscal years. Management is currently evaluating the impact of ASU No. 2010-06 will have on its financial statement disclosures.
Securities Lending Upon lending its securities to third parties, each Fund receives compensation in the form of fees. A Fund also continues to receive dividends on the securities loaned. The loans are secured by collateral at least equal to the fair value of the securities loaned plus accrued interest. Gain or loss in the fair value of the securities loaned that may occur during the term of the loan will be for the account of a Fund. Each Fund has the right under the lending agreement to recover the securities from the borrower on demand. Additionally, a Fund does not have the right to sell or repledge collateral received in the form of securities unless the borrower goes into default. The risks to a Fund of securities lending are that the borrower may not provide additional collateral when required or return the securities when due.
As of June 30, 2010, the Funds had securities on loan and related collateral with values shown below:
| | | | |
| Bridgeway Fund | | Securities on
Loan Value | | Value of
Collateral |
| | | | |
Aggressive Investors 1 | | $10,677,072 | | $11,273,995 |
Aggressive Investors 2 | | 22,492,054 | | 23,480,550 |
Ultra-Small Company | | 20,214,256 | | 22,501,207 |
Ultra-Small Company Market | | 78,299,203 | | 87,817,537 |
Micro-Cap Limited | | 4,249,539 | | 4,676,858 |
Small-Cap Momentum | | 202,346 | | 213,900 |
Small-Cap Growth | | 11,358,969 | | 12,041,302 |
Small-Cap Value | | 18,192,617 | | 20,081,047 |
Large-Cap Growth | | 1,141,489 | | 1,161,976 |
Large-Cap Value | | 105,225 | | 114,829 |
Managed Volatility | | 225,803 | | 237,188 |
It is each Fund’s policy to obtain additional collateral from or return excess collateral to the borrower by the end of the next business day, following the valuation date of the securities loaned. Therefore, the value of the collateral held may be temporarily less than that required under the lending contract. As of June 30, 2010 the collateral consisted of an institutional money market fund.
Use of Estimates in Financial Statements In preparing financial statements in conformity with GAAP, management makes estimates and assumptions that affect the reported amounts of assets and liabilities at the date of the financial statements and the disclosure of contingent assets and liabilities at the date of the financial statements as well as the reported amounts of revenue and expenses during the reporting period. Actual results could differ from those estimates.
Risks and Uncertainties The Funds provide for various investment options, including stocks and call and put options. Such investments are exposed to various risks, such as interest rate, market and credit risks. Due to the risks involved, it is at least reasonably possible that changes in risks in the near term would materially affect shareholders’ account values and the amounts reported in the financial statements.
Security Transactions, Expenses, Gains and Losses and Allocations Fund expenses that are not series specific are allocated to each series based upon its relative proportion of net assets to the Funds’ total net assets or other appropriate basis.
Security transactions are accounted for as of the trade date, the date the order to buy or sell is executed. Realized gains and losses are computed on the identified cost basis. Dividend income is recorded on the ex-dividend date, and interest income is recorded on the accrual basis from settlement date. Particularly related to the Managed Volatility Fund, discounts and premiums are accreted/amortized on the effective interest method.
| | |
138 | | Annual Report | June 30, 2010 |
| | |
| NOTES TO FINANCIAL STATEMENTS (continued) | | |
June 30, 2010
Derivatives
The Funds’ use of derivatives for the fiscal year ended June 30, 2010 was limited to futures contracts, total return swaps and writing options. The following is a summary of how these derivatives are treated in the financial statements and their impact on the Funds.
| | | | | | | | | | |
| | | Liability Derivatives | |
Fund/Financial Instrument Type | | Location on Statement of Assets and Liabilities | | | | | Fair Value | |
Aggressive Investors 1 | | | | | | | | | | |
Other | | Payable, Total Return Swap | | | | | | $ | 82,971 | |
Small-Cap Growth Fund | | | | | | | | | | |
Other | | Payable, Total Return Swap | | | | | | | 45,207 | |
Small-Cap Value Fund | | | | | | | | | | |
Other | | Payable, Total Return Swap | | | | | | | 48,247 | |
Managed Volatility Fund | | | | | | | | | | |
Equity Contracts | | Call Options Written | | | | | | | 89,412 | |
| | Put Options Written | | | | | | | 609,841 | |
| | | |
Fund/Financial Instrument Type | | Location of Gain (Loss) on Derivatives Recognized in Income | | Amount of
Realized Gain
(Loss) | | | Amount of
Unrealized
Gain
(Loss) | |
Aggressive Investors 1 | | | | | | | | | | |
Equity Contracts | | Realized loss on Written Options | | $ | (47,205 | ) | | | | |
Other | | Realized gain on Swaps | | | 33,506 | | | | | |
| | Change in Unrealized Depreciation on Swaps | | | | | | $ | (83,031 | ) |
Aggressive Investors 2 | | | | | | | | | | |
Equity Contracts | | Realized gain on Written Options | | | 24,954 | | | | | |
| | Change in Unrealized Depreciation on Written Options | | | | | | | (58,842 | ) |
Small-Cap Growth Fund | | | | | | | | | | |
Other | | Realized gain on Swaps | | | 15,375 | | | | | |
| | Change in Unrealized Depreciation on Swaps | | | | | | | (47,011 | ) |
Small-Cap Value Fund | | | | | | | | | | |
Other | | Realized loss on Swaps | | | (81,352 | ) | | | | |
| | Change in Unrealized Depreciation on Swaps | | | | | | | (48,247 | ) |
Managed Volatility Fund | | | | | | | | | | |
Equity Contracts | | Realized gain on Written Options | | | 1,972,319 | | | | | |
| | Change in Unrealized Depreciation on Written Options | | | | | | | (329,673 | ) |
| | Realized loss on Futures Contracts | | | (2,951,015 | ) | | | | |
| | |
| NOTES TO FINANCIAL STATEMENTS (continued) | | |
June 30, 2010
The derivative instruments outstanding as of June 30, 2010 as disclosed in the Notes to the Financial Statements and the amounts of realized and changes in unrealized gains and losses on derivative instruments during the period as disclosed in the Statement of Operations serve as indicators of the volume of derivative activity for the Funds.
Futures Contracts The Funds may purchase or sell financial futures contracts to hedge cash positions, manage market risk and to dampen volatility in line with investment objectives. A futures contract is an agreement between two parties to buy or sell a financial instrument at a set price on a future date. Upon entering into such a contract a Fund is required to pledge to the broker an amount of cash or U.S. government securities equal to the minimum “initial margin” requirements of the exchange on which the futures contract is traded. The contract amount reflects the extent of a Fund’s exposure in these financial instruments. A Fund’s participation in the futures markets involves certain risks, including imperfect correlation between movements in the price of futures contracts and movements in the price of the securities hedged or used for cover. Pursuant to a contract, such Fund agrees to receive from or pay to the broker an amount of cash equal to the fluctuation in value of the contract. Such receipts or payments are known as “variation margin” and are recorded by a Fund as unrealized appreciation or depreciation. When a contract is closed, a Fund records a realized gain or loss equal to the difference between the value of the contract at the time it was opened and the value at the time it was closed. With futures, there is minimal counterparty risk to the Funds since futures are exchange traded and the exchange’s clearinghouse, as counterparty to all exchange traded futures, guarantees the futures against default. As of June 30, 2010, the Funds had no open futures contracts.
Options The Aggressive Investors 1 Fund and Aggressive Investors 2 Fund may buy and sell calls and puts to increase or decrease each Fund’s exposure to stock market risk or for purposes of diversification of risk. The Managed Volatility Fund may buy and sell calls and puts to reduce the Fund’s volatility and provide some cash flow. An option is a contract conveying a right to buy or sell a financial instrument at a specified price during a stipulated period. The premium paid by a Fund for the purchase of a call or a put option is included in a Fund’s Schedule of Investments as an investment and subsequently marked-to-market to reflect the current market value of the option. When a Fund writes a call or a put option, an amount equal to the premium received by such Fund is included in its Statement of Assets and Liabilities as a liability and is subsequently marked-to-market to reflect the current market value of the option written. If an option which a Fund has written either expires on its stipulated expiration date, or if such Fund enters into a closing purchase transaction, that Fund realizes a gain (or a loss if the cost of a closing purchase transaction exceeds the premium received when the option was written) without regard to any unrealized gain or loss on the underlying security, and the liability related to such options is extinguished. If a call option that a Fund has written is assigned, such Fund realizes a gain or loss from the sale of the underlying security and the proceeds from such sale are increased by the premium originally received. If a put option that a Fund has written is assigned, the amount of the premium originally received reduces the cost of the security that such Fund purchased upon exercise of the option. Buying calls increases a Fund’s exposure to the underlying security to the extent of any premium paid. Buying puts on a stock market index tends to limit a Fund’s exposure to a stock market decline. All options purchased by the Funds were listed on exchanges and considered liquid positions with readily available market quotes.
Covered Call Options and Secured Puts The Aggressive Investors 1, Aggressive Investors 2 and Managed Volatility Funds may write call options on a covered basis, that is, a Fund will own the underlying security, or a Fund may write secured puts. The principal reason for writing covered calls and secured puts on a security is to attempt to realize income, through the receipt of premiums. The option writer has, in return for the premium, given up the opportunity for profit from a substantial price increase in the underlying security so long as the obligation as a writer continues, but has retained the risk of loss should the price of the security decline. All options were listed on exchanges and considered liquid positions with readily available market quotes. Transactions in options written during the year ended June 30, 2010 are as follows:
| | |
140 | | Annual Report | June 30, 2010 |
| | |
NOTES TO FINANCIAL STATEMENTS (continued) | | |
June 30, 2010
| | | | | | | | |
| | | Aggressive Investors 1 Fund
Written Call Options | | Aggressive Investors 2 Fund
Written Call Options |
| | | Contracts | | Premiums | | Contracts | | Premiums |
| | | | |
Outstanding, June 30, 2009 | | - | | $ - | | 200 | | $ 128,842 |
Positions Opened | | 298 | | 160,555 | | 1,402 | | 725,354 |
Exercised | | - | | - | | - | | - |
Expired | | (98) | | (4,866) | | (702) | | (153,596) |
Closed | | (200) | | (155,689) | | (900) | | (700,600) |
Outstanding, June 30, 2010 | | - | | $ - | | - | | $ - |
Market Value, June 30, 2010 | | | | $ - | | | | $ - |
| | |
| | | Managed Volatility Fund Written Call Options | | Managed Volatility Fund Written Put Options |
| | | Contracts | | Premiums | | Contracts | | Premiums |
| | | | |
Outstanding, June 30, 2009 | | 2,567 | | $ 392,545 | | 3,420 | | $ 527,678 |
Positions Opened | | 9,036 | | 1,208,546 | | 17,529 | | 2,477,335 |
Exercised | | (2,874) | | (459,800) | | (2,655) | | (372,522) |
Expired | | (4,498) | | (534,397) | | (13,978) | | (2,008,641) |
Closed | | (2,019) | | (309,871) | | (1,735) | | (288,761) |
Outstanding, June 30, 2010 | | 2,212 | | $ 297,023 | | 2,581 | | $ 335,089 |
Market Value, June 30, 2010 | | | | $ 89,412 | | | | $ 609,841 |
Swaps. Each Fund may enter into total return swaps. Total return swaps are agreements that provide a Fund with a return based on the performance of an underlying asset, in exchange for fee payments to a counterparty based on a specified rate. The difference in the value of these income streams is recorded daily by the Funds, and is settled in cash monthly.
The fee paid by a Fund will typically be determined by multiplying the face value of the swap agreement by an agreed upon interest rate. In addition, if the underlying asset declines in value over the term of the swap, a Fund would also be required to pay the dollar value of that decline to the counterparty. Total return swaps could result in losses if the underlying asset does not perform as anticipated by the Adviser. A Fund may use its own net asset value as the underlying asset in a total return swap. This strategy serves to reduce cash drag (the impact of cash on a Fund’s overall return) by replacing it with the impact of market exposure based upon a Fund’s own investment holdings. The following total return swaps were open as of June 30, 2010:
| | | | | | | | |
| Portfolio | | Swap Counterparty | | Notional
Principal | | Maturity
Date | | Net Unrealized
Gain\(Loss) |
| | | | |
Aggressive Investors 1 | | ReFlow Management Co. | | $120,223 | | July 1, 2010 | | $(82,971) |
Small-Cap Growth | | ReFlow Management Co. | | 802,653 | | July 1, 2010 | | (45,207) |
Small-Cap Value | | ReFlow Management Co. | | 414,433 | | July 1, 2010 | | (48,247) |
Indemnification Under the Company’s organizational documents, the Funds’ officers, directors, employees and agents are indemnified against certain liabilities that may arise out of the performance of their duties to the Funds. Additionally, in the normal course of business, the Funds enter into contracts that contain a variety of indemnification clauses. The Funds’ maximum exposure under these arrangements is unknown as this would involve future claims that may be made against the Funds that have not yet occurred. However, the Funds have not had prior claims or losses pursuant to these contracts.
| | |
NOTES TO FINANCIAL STATEMENTS (continued) | | |
June 30, 2010
3. Management Fees, Other Related Party Transactions and Contingencies:
The Funds have entered into management agreements with the Adviser. As compensation for the advisory services rendered, facilities furnished, and expenses borne by the Adviser, the Funds pay the Adviser a fee pursuant to each Fund’s management agreement, as described below.
Aggressive Investors 1: A total advisory fee is paid by the Fund to the Adviser that is comprised of a Base Fee and a Performance Adjustment. The Base Fee equals the Base Fee Rate times the average daily net assets of the Fund. The Base Fee Rate is based on the following annual rates: 0.90% of the first $250 million of the Fund’s average daily net assets, 0.875% of the next $250 million and 0.85% of any excess over $500 million.
The Performance Adjustment equals 4.67% times the difference in cumulative total return between the Fund and the Standard and Poor’s 500 Composite Stock Price Index with dividends reinvested (hereinafter “Index”) over a rolling five-year performance period. The Performance Adjustment Rate varies from a minimum of –0.70% to a maximum of +0.70%. However, the Performance Adjustment Rate is zero if the difference between the cumulative Fund performance and the Index performance is less than or equal to 2%.
Aggressive Investors 2: A total advisory fee is paid by the Fund to the Adviser that is comprised of a Base Fee and a Performance Adjustment. The Base Fee equals the Base Fee Rate times the average daily net assets of the Fund. The Base Fee rate is based on the following annual rates: 0.90% of the first $250 million of the Fund’s average daily net assets, 0.875% of the next $250 million, 0.85% from $500 million to $1 billion, and 0.80% over $1 billion.
The Performance Adjustment equals 2.00% times the difference in cumulative total return between the Fund and the Standard and Poor’s 500 Composite Stock Price Index with dividends reinvested (hereinafter “Index”) over a rolling five-year performance period. The Performance Adjustment Rate varies from a minimum of -0.30% to a maximum of +0.30%. However, the Performance Adjustment Rate is zero if the difference between the cumulative Fund performance and the Index performance is less than or equal to 2%.
Ultra-Small Company: The Fund pays management fees based on the following annual rates: 0.90% of the first $250 million of the Fund’s average daily net assets, 0.875% of the next $250 million and 0.85% of any excess over $500 million. The management fees are computed daily and are payable monthly. However, during any period that the Fund’s net assets range from $27,500,000 to $55,000,000, the advisory fee will be determined as if the Fund had $55,000,000 under management. This is limited to a maximum annualized expense ratio of 1.49% of average net assets.
Ultra-Small Company Market: The Fund’s management fee is a flat 0.50% of the value of the Fund’s average daily net assets, computed daily and payable monthly.
Micro-Cap Limited: A total advisory fee is paid by the Fund to the Adviser that is comprised of a Base Fee and a Performance Adjustment. The Base Fee equals the Base Fee Rate times the average daily net assets of the Fund. The Base Fee Rate is based on the following annual rates: 0.90% of the first $250 million of the Fund’s average daily net assets, 0.875% of the next $250 million and 0.85% of any excess over $500 million. However, during any quarter that the Fund’s net assets range from $27,500,000 to $55,000,000, the advisory fee will be determined as if the Fund had $55,000,000 under management. This is limited to a maximum annualized expense ratio of 1.49% of the net assets in the quarter the advisory fee is determined.
The Performance Adjustment equals 2.87% times the difference in cumulative total return between the Fund and the CRSP Cap-based Portfolio 9 Index with dividends reinvested (hereinafter “Index”) over a rolling five-year performance period. The Performance Adjustment Rate varies from a minimum of –0.70% to a maximum of +0.70%. However, the Performance Adjustment Rate is zero if the difference between the cumulative Fund performance and the Index performance is less than or equal to 2%.
Small-Cap Momentum: The Fund’s management fee is a flat 0.55% of the value of the Fund’s average daily net assets, computed daily and payable monthly.
| | |
142 | | Annual Report | June 30, 2010 |
| | |
NOTES TO FINANCIAL STATEMENTS (continued) | | |
June 30, 2010
Small-Cap Growth and Small-Cap Value: A total advisory fee is paid by each Fund to the Adviser that is comprised of a Base Fee and a Performance Adjustment. The Base Fee equals the Base Fee Rate times the average daily net assets of the Fund. The Base Fee Rate is based on the annual rate of 0.60% of the value of the Fund’s average daily net assets.
The Performance Adjustment equals 0.33% times the difference in cumulative total return between the Fund and the Russell 2000 Growth Index for Small-Cap Growth Fund and the Russell 2000 Value Index for Small-Cap Value Fund, with dividends reinvested (hereinafter “Index”) over a rolling five-year performance period. The Performance Adjustment Rate varies from a minimum of -0.05% to a maximum of +0.05%. However, the Performance Adjustment Rate is zero if the difference between the cumulative Fund’s performance and the Index performance is less than or equal to 2%.
Large-Cap Growth and Large-Cap Value: A total advisory fee is paid by each Fund to the Adviser that is comprised of a Base Fee and a Performance Adjustment. The Base Fee equals the Base Fee Rate times the average daily net assets of the Fund. The Base Fee Rate is based on the annual rate of 0.50% of the value of the Fund’s average daily net assets.
The Performance Adjustment equals 0.33% times the difference in cumulative total return between the Fund and the Russell 1000 Growth Index for Large-Cap Growth Fund and the Russell 1000 Value Index for the Large-Cap Value Fund, with dividends reinvested (hereinafter “Index”) over a rolling five-year performance period. The Performance Adjustment Rate varies from a minimum of -0.05% to a maximum of +0.05%. However, the Performance Adjustment Rate is zero if the difference between the cumulative Fund’s performance and the Index performance is less than or equal to 2%.
Blue Chip 35 Index: The Fund’s management fee is a flat 0.08% of the value of the Fund’s average daily Net Assets, computed daily and payable monthly.
Managed Volatility: The Fund’s management fee is a flat 0.60% of the value of the Fund’s average daily Net Assets, computed daily and payable monthly.
Expense limitations: At a special meeting on March 31, 2005, shareholders of the Funds (except for the Small-Cap Momentum Fund, which was launched on May 28, 2010) approved amendments to the Management Agreements detailing expense limitations. With regard to the Small-Cap Momentum Fund, the Board of Directors and sole initial shareholder approved an expense limitation beginning on May 28, 2010. The Adviser agrees to reimburse the Funds for operating expenses and management fees above the expense limitations, which are shown as a ratio of net expenses to average net assets, for each Fund, for the fiscal year ended June 30, 2010. Such expense limitations and total reimbursements for the fiscal year ended June 30, 2010, are shown below.
| | |
NOTES TO FINANCIAL STATEMENTS (continued) | | |
June 30, 2010
| | | | |
| Bridgeway Fund | | Expense
Limitation | | Total Waivers and Reimbursements for Period Ending 06/30/10 |
| | |
Aggressive Investors 1 | | 1.80% | | $ - |
Aggressive Investors 2 | | 1.75% | | - |
Ultra-Small Company | | 2.00% | | - |
Ultra-Small Company Market | | 0.75% | | 63,055 |
Micro-Cap Limited | | 1.85% | | - |
Small-Cap Momentum* | | 0.90% | | 11,221 |
Small-Cap Growth | | 0.94% | | - |
Small-Cap Value | | 0.94% | | - |
Large-Cap Growth | | 0.84% | | 13,017 |
Large-Cap Value | | 0.84% | | 79,298 |
Blue Chip 35 Index | | 0.15% | | 260,662 |
Managed Volatility | | 0.94% | | 48,883 |
*The Fund is authorized to reimburse the Adviser for management fees previously waived and/or for expenses previously paid by the Adviser, provided, however, that any reimbursements must be paid at a date not more than three years after the fiscal year in which the Adviser waived the fees or reimbursed the expenses and the reimbursements do not cause the Fund to exceed the expense limitation in the agreement. |
Other Waivers and Reimbursements: BNY Mellon Asset Servicing, the Funds’ accounting agent, at its discretion, voluntarily waived a portion of its accounting and transfer agent fees for the Small-Cap Momentum Fund. For the year ended June 30, 2010, BNY Mellon Asset Servicing waived $3,125 in accounting fees and $2,500 in transfer agent fees. During the year ended June 30, 2010, the Adviser and BNY Mellon Asset Servicing reimbursed the Blue Chip 35 Index Fund $5,468 and $35,416, respectively, due to a trading error.
Other Related Party Transactions: On occasion, the Funds will engage in inter-portfolio trades when it is to the benefit of both parties. The Board of Directors reviews these trades quarterly. During the fiscal year ended June 30, 2010, the Large-Cap Growth Fund had inter-portfolio purchases of $720,325 and the Large-Cap Value Fund had inter-portfolio sales of $720,325. The Large-Cap Value Fund had an inter-portfolio purchase of $336,040 and the Large-Cap Growth Fund had an inter-portfolio sale of $336,040. No inter-portfolio purchases or sales were entered into during the fiscal year ended June 30, 2010 by the Aggressive Investors 1, Aggressive Investors 2, Ultra-Small Company, Ultra-Small Company Market, Micro-Cap Limited, Small-Cap Momentum, Small-Cap Growth, Small-Cap Value, Blue Chip 35 Index and Managed Volatility Funds.
The Adviser entered into an Administrative Services Agreement with Bridgeway, pursuant to which the Adviser provides various administrative services to the Funds including, but not limited to: (i) supervising and managing various aspects of the Funds’ business and affairs; (ii) selecting, overseeing and/or coordinating activities with other service providers to the Funds; (iii) providing reports to the Board as requested from time to time; (iv) assisting and/or reviewing amendments and updates to the Funds’ registration statement and other filings with the Securities and Exchange Commission (“SEC”); (v) providing certain shareholder services; (vi) providing administrative support in connection with meetings of the Board of Directors; and (vii) providing certain record-keeping services. For its services to the Funds, the Adviser is paid an aggregate annual fee of $535,000 payable in equal monthly installments.
One director of the Funds, John Montgomery, is an owner and director of the Adviser. Another director of the Funds, Michael Mulcahy, is an executive and director of the Adviser. Under the 1940 Act definitions, each is considered to be an “affiliated person” of the Adviser and an “interested person” of the Adviser and of the Funds. Compensation for Mr. Montgomery and Mr. Mulcahy is borne by the Adviser rather than the Funds.
Board of Directors Compensation Independent Directors are paid an annual retainer of $14,000 with an additional retainer of $2,500 paid to the Independent Chairman of the Board and an additional retainer of $1,000 paid to the Nominating and Corporate Governance Committee Chair. Independent Directors are paid $6,000 per meeting for meeting fees.
| | |
144 | | Annual Report | June 30, 2010 |
| | |
NOTES TO FINANCIAL STATEMENTS (continued) | | |
June 30, 2010
The Independent Directors receive this compensation in the form of shares of the Funds, credited to his or her account. Such Directors are reimbursed for any expenses incurred in attending meetings and conferences and expenses for subscriptions or printed materials. During the fiscal year ended June 30, 2010, no such reimbursements were paid. The amount of directors’ fees attributable to each Fund is disclosed in the Statements of Operations.
4. Distribution and Shareholder Servicing Fees:
Foreside Fund Services, LLC acts as distributor of the Funds’ shares pursuant to a Distribution Agreement dated March, 31 2009. The Adviser pays all costs and expenses associated with distribution of the Funds’ shares pursuant to a protective plan adopted by shareholders pursuant to Rule 12b-1.
5. Purchases and Sales of Investment Securities:
Purchases and sales of investments, other than short-term securities, for each Fund for the fiscal year ended June 30, 2010 were as follows:
| | | | | | | | |
| | | Purchases | | Sales |
| Bridgeway Fund | | U.S. Government | | Other | | U.S. Government | | Other |
| | | | |
Aggressive Investors 1 | | - | | $132,753,638 | | - | | $164,913,532 |
Aggressive Investors 2 | | - | | 378,778,015 | | - | | 498,428,774 |
Ultra-Small Company | | - | | 109,474,132 | | - | | 110,754,604 |
Ultra-Small Company Market | | - | | 164,640,649 | | - | | 207,358,972 |
Micro-Cap Limited | | - | | 30,869,622 | | - | | 38,411,486 |
Small-Cap Momentum | | - | | 2,075,961 | | - | | 52,947 |
Small-Cap Growth | | - | | 57,729,207 | | - | | 83,641,318 |
Small-Cap Value | | - | | 107,794,549 | | - | | 157,010,760 |
Large-Cap Growth | | - | | 27,627,653 | | - | | 50,108,428 |
Large-Cap Value | | - | | 14,106,880 | | - | | 21,709,521 |
Blue Chip 35 Index | | - | | 78,315,377 | | - | | 59,692,830 |
Managed Volatility | | $699,276 | | 9,539,328 | | $3,688,219 | | 19,268,455 |
6. Federal Income Taxes
It is the Funds’ policy to continue to comply with the provisions of the Internal Revenue Code of 1986, as amended applicable to regulated investment companies and distribute income to the extent necessary so that the Funds are not subject to federal income tax. Therefore, no federal income tax provision is required.
Unrealized Appreciation and Depreciation on Investments (Tax Basis) The amount of net unrealized appreciation/ depreciation and the cost of investment securities for tax purposes, including short-term securities at June 30, 2010, were as follows:
| | | | | | | | |
| | | Aggressive Investors 1 | | Aggressive Investors 2 | | Ultra-Small Company | | Ultra-Small Company Market |
As of June 30, 2010 | | | | | | | | |
Gross appreciation (excess of value over tax cost) | | $ 6,979,950 | | $ 24,171,565 | | $11,304,651 | | $ 79,471,752 |
Gross depreciation (excess of tax cost over value) | | (8,249,082) | | (25,101,703) | | (5,565,663) | | (41,492,521) |
Net unrealized appreciation (depreciation) | | $ (1,269,132) | | $ (930,138) | | $ 5,738,988 | | $ 37,979,231 |
Cost of investments for income tax purposes | | $94,502,350 | | $303,946,255 | | $77,304,900 | | $306,516,605 |
| | |
NOTES TO FINANCIAL STATEMENTS (continued) | | |
June 30, 2010
| | | | | | | | |
| | | Micro-Cap Limited | | Small-Cap Momentum | | Small-Cap Growth | | Small-Cap Value |
As of June 30, 2010 | | | | | | | | |
Gross appreciation (excess of value over tax cost) | | $ 2,858,733 | | $ 22,111 | | $ 7,392,051 | | $19,023,444 |
Gross depreciation (excess of tax cost over value) | | (1,729,443) | | (157,628) | | (6,207,880) | | (8,772,097) |
Net unrealized appreciation (depreciation) | | $ 1,129,290 | | $ (135,517) | | $ 1,184,171 | | $10,251,347 |
Cost of investments for income tax purposes | | $19,698,832 | | $2,022,974 | | $55,951,500 | | $98,105,887 |
| | | | |
| | | Large-Cap Growth | | Large-Cap Value | | Blue Chip 35 Index | | Managed Volatility |
As of June 30, 2010 | | | | | | | | |
Gross appreciation (excess of value over tax cost) | | $ 6,796,315 | | $ 4,094,323 | | $ 21,805,572 | | $ 3,365,285 |
Gross depreciation (excess of tax cost over value) | | (3,719,241) | | (1,340,755) | | (14,428,461) | | (2,567,735) |
Net unrealized appreciation | | $ 3,077,074 | | $ 2,753,568 | | $ 7,377,111 | | $ 797,550 |
Cost of investments for income tax purposes | | $54,979,522 | | $23,193,526 | | $215,094,253 | | $33,756,073 |
The differences between book and tax net unrealized appreciation (depreciation) are primarily due to wash sale loss deferrals, and adjustments to basis from investments in real estate investment trusts, business development companies and partnerships.
Classifications of Distributions Net investment income (loss) and net realized gain (loss) may differ for financial statement and tax purposes. The character of distributions made during the year from net investment income or net realized gains may differ from its ultimate characterization for federal income tax purposes.
The tax character of the distributions paid by the Funds during the last two fiscal years ended June 30, 2010 and June 30, 2009, respectively, are as follows:
| | | | | | | | |
| | | Aggressive Investors 1 | | Aggressive Investors 2 |
| | | Year Ended
June 30, 2010 | | Year Ended
June 30, 2009 | | Year Ended
June 30, 2010 | | Year Ended June 30, 2009 |
| Distributions paid from: | | | | | | | | |
Ordinary Income | | $930,085 | | $ - | | $1,620,063 | | $ - |
Long Term Capital Gain | | - | | 1,868,083 | | - | | - |
Total | | $930,085 | | $1,868,083 | | $1,620,063 | | $ - |
| | | Ultra-Small Company | | Ultra-Small Company Market |
| | | Year Ended June 30, 2010 | | Year Ended June 30, 2009 | | Year Ended June 30, 2010 | | Year Ended June 30, 2009 |
Distributions paid from: | | | | | | | | |
Ordinary income | | $837,589 | | $ 114,124 | | $5,060,400 | | $ 6,894,767 |
Long Term Capital Gain | | - | | - | | - | | 28,745,392 |
Total | | $837,589 | | $ 114,124 | | $5,060,400 | | $35,640,159 |
| | |
146 | | Annual Report | June 30, 2010 |
| | |
| NOTES TO FINANCIAL STATEMENTS (continued) | | |
June 30, 2010
| | | | | | | | |
| | | Micro-Cap Limited | | Small-Cap Growth |
| | | Year Ended
June 30, 2010 | | Year Ended
June 30, 2009 | | Year Ended June 30, 2010 | | Year Ended June 30, 2009 |
Distributions paid from: | | | | | | | | |
Ordinary income | | $300,332 | | $ 76,498 | | $ 252,145 | | $ - |
Total | | $300,332 | | $ 76,498 | | $ 252,145 | | $ - |
| | |
| | | Small-Cap Value | | Large-Cap Growth |
| | | Year Ended June 30, 2010 | | Year Ended June 30, 2009 | | Year Ended June 30, 2010 | | Year Ended June 30, 2009 |
Distributions paid from: | | | | | | | | |
Ordinary income | | $806,731 | | $1,307,246 | | $ 417,231 | | $ 732,353 |
Total | | $806,731 | | $1,307,246 | | $ 417,231 | | $ 732,353 |
| | |
| | | Large-Cap Value | | Blue Chip 35 Index |
| | | Year Ended June 30, 2010 | | Year Ended June 30, 2009 | | Year Ended June 30, 2010 | | Year Ended June 30, 2009 |
Distributions paid from: | | | | | | | | |
Ordinary income | | $565,868 | | $ 822,272 | | $4,072,171 | | $5,724,513 |
Total | | $565,868 | | $ 822,272 | | $4,072,171 | | $5,724,513 |
| | |
| | | Managed Volatility | | |
| | | Year Ended
June 30, 2010 | | Year Ended
June 30, 2009 | |
Distributions paid from: | | | | | |
Ordinary income | | $612,394 | | $2,683,137 | |
Long Term Capital Gain | | - | | 1,939,390 | |
Total | | $612,394 | | $4,622,527 | |
There were no distributions paid from Small-Cap Momentum Fund.
At June 30, 2010, the Funds had available for tax purposes, capital loss carryovers as follows:
| | | | | | | | | | |
| | | | | Aggressive Investor 1 | | Aggressive Investor 2 | | Ultra-Small Company | | |
Expiring | | 6/30/2016 | | $ - | | $ - | | $ 3,822,016 | | |
| | 6/30/2017 | | 11,662,159 | | 56,263,750 | | 11,429,146 | | |
| | 6/30/2018 | | 73,846,167 | | 177,345,455 | | 1,365,778 | | |
| | | | | | | | | | | | |
| | | | | Ultra-Small Company Market | | Micro-Cap Limited | | Small-Cap Growth | | Small-Cap Value | | |
Expiring | | 6/30/2013 | | $ - | | $ - | | $ - | | $ 948,551 | | |
| | 6/30/2015 | | - | | 1,910,229 | | 9,909,411 | | - | | |
| | 6/30/2016 | | - | | 1,720,318 | | - | | 1,491,117 | | |
| | 6/30/2017 | | 8,675,110 | | 4,648,974 | | 7,823,854 | | 32,945,776 | | |
| | 6/30/2018 | | - | | 4,507,635 | | 22,793,119 | | 50,552,993 | | |
| | |
| NOTES TO FINANCIAL STATEMENTS (continued) | | |
June 30, 2010
| | | | | | | | | | |
| | | | | Large-Cap Growth | | Large-Cap Value | | Blue Chip 35 Index | | Managed Volatility |
Expiring | | 6/30/2011 | | $ - | | $ - | | $ 337,509 | | $ - |
| | 6/30/2012 | | - | | - | | 327,296 | | - |
| | 6/30/2013 | | 2,323,531 | | - | | 282,192 | | - |
| | 6/30/2014 | | 2,412,639 | | - | | 402,963 | | - |
| | 6/30/2015 | | - | | - | | 418,882 | | - |
| | 6/30/2016 | | 1,302,044 | | - | | 31,461 | | - |
| | 6/30/2017 | | 7,385,621 | | 3,172,735 | | 28,604,419 | | - |
| | 6/30/2018 | | 33,490,095 | | 3,361,989 | | 34,451,339 | | 8,024,220 |
There are no capital loss carryovers for Small-Cap Momentum Fund as of June 30, 2010.
Capital loss carryovers utilized during the fiscal year ended June 30, 2010 were $10,158,128 for Ultra-Small Company Market Fund.
Capital loss carryovers expired during the fiscal year ended June 30, 2010 were $429,064 for Blue Chip 35 Index Fund.
Components of Accumulated Earnings (Deficit) As of June 30, 2010, the components of accumulated earnings (deficit) on a tax basis were:
| | | | | | |
| | | Aggressive Investors 1 | | Aggressive Investors 2 | | Ultra-Small Company |
Accumulated Net Investment Income (Loss) | | $ 2,167,449 | | $ 836,213 | | $ 632,732 |
Accumulated Net Realized Gain (Loss) on Investments* | | (85,508,326) | | (233,609,205) | | (16,616,940) |
Net unrealized appreciation/depreciation of investments | | (1,269,132) | | (930,138) | | 5,738,988 |
Total | | $(84,610,009) | | $(233,703,130) | | $(10,245,220) |
| | | |
| | | Ultra-Small
Company Market | | Micro-Cap Limited | | Small-Cap Momentum |
Accumulated Net Investment Income (Loss) | | $ 4,111,229 | | $ 401,921 | | $ 807 |
Accumulated Net Realized Gain (Loss) on Investments* | | (8,675,110) | | (12,787,156) | | (39) |
Net unrealized appreciation/depreciation of investments | | 37,979,231 | | 1,129,290 | | (135,517) |
Total | | $ 33,415,350 | | $ (11,255,945) | | $ (134,749) |
| | | |
| | | Small-Cap Growth | | Small-Cap Value | | Large-Cap Growth |
Accumulated Net Investment Income (Loss) | | $ 107,675 | | $ 147,101 | | $ 187,491 |
Accumulated Net Realized Gain (Loss) on Investments* | | (40,526,384) | | (85,938,437) | | (46,913,930) |
Net unrealized appreciation/depreciation of investments | | 1,184,171 | | 10,251,347 | | 3,077,074 |
Total | | $(39,234,538) | | $ (75,539,989) | | $(43,649,365) |
| | | |
| | | Large-Cap Value | | Blue Chip 35 Index | | Managed Volatility |
Accumulated Net Investment Income (Loss) | | $ 222,649 | | $ 2,199,352 | | $ 217,769 |
Accumulated Net Realized Gain (Loss) on Investments* | | (6,534,724) | | (67,493,709) | | (8,024,220) |
Net unrealized appreciation/depreciation of investments | | 2,753,568 | | 7,377,111 | | 797,550 |
Total | | $ (3,558,507) | | $ (57,917,246) | | $ (7,008,901) |
| * | Includes losses incurred in the period November 1, 2009 through June 30, 2010 which a Fund has elected to defer to its fiscal year ending June 30, 2011. Post October Losses - Under current tax law, capital losses realized after October 31 of a Fund’s fiscal year may be deferred and treated as occurring on the first business day of the following fiscal year for tax purposes. The Small-Cap Momentum and The Blue-Chip 35 Index Funds have deferred post October losses of $39 and $2,637,648 respectively. |
| | |
| 148 | | Annual Report | June 30, 2010 |
| | |
| NOTES TO FINANCIAL STATEMENTS (continued) | | |
June 30, 2010
For the year ended June 30, 2010, the Funds recorded the following reclassifications to the accounts listed below:
| | | | | | |
| | | Increase (Decrease) |
| | | Aggressive Investors 1 | | Aggressive Investors 2 | | Ultra-Small Company |
Paid-in-Capital | | $ - | | $ - | | $ (7,460) |
Undistributed Net Investment Income | | 6,795 | | (97,620) | | (32,724) |
Accumulated Net Realized Loss | | (6,795) | | 97,620 | | 40,184 |
| | | |
| | | Ultra-Small Company Market | | Micro-Cap Limited | | Small-Cap Momentum |
Paid-in-Capital | | $ - | | $ - | | $ - |
Undistributed Net Investment Income | | (14,499) | | (6,105) | | - |
Accumulated Net Realized Loss | | 14,499 | | 6,105 | | - |
| | | |
| | | Small-Cap Growth | | Small-Cap Value | | Large-Cap Growth |
Paid-in-Capital | | $ - | | $ (1,759) | | $ (1,743) |
Undistributed Net Investment Income | | 14,770 | | (134,111) | | 1,743 |
Accumulated Net Realized Loss | | (14,770) | | 135,870 | | - |
| | | Large-Cap Value | | Blue Chip 35 Index | | Managed Volatility |
Paid-in-Capital | | $ (298) | | $(429,064) | | $ - |
Undistributed Net Investment Income | | (8,539) | | - | | - |
Accumulated Net Realized Loss | | 8,837 | | 429,064 | | - |
The difference between book and tax components of net assets and the resulting reclassifications were primarily a result of the differing book/tax treatment of expired capital loss carryovers, the deduction of certain expenses, and investments in swaps, partnerships, real estate investment trusts and business development companies.
Accounting for Uncertainty in Income Taxes sets forth a minimum threshold for financial statement recognition of the benefit of a tax position taken or expected to be taken in a tax return. Management has analyzed each of the Fund’s tax positions and has concluded that no provision for income tax is required in each of the Fund’s financial statements. The Funds are not aware of any tax position for which it is reasonably possible that the total amounts of unrecognized tax benefits will significantly change in the next twelve months. Each of the Fund’s federal tax returns for the prior three fiscal years remains subject to examination by the Internal Revenue Service.
7. Line of Credit
Bridgeway established a line of credit agreement (“Facility”) with PNC Bank, NA, (the “Bank” or “Lender”) which matures on October 5, 2010 and is renewable annually at the Bank’s option, to be used for temporary or emergency purposes, primarily for financing redemption payments. Any and all advances under this Facility would be at the sole discretion of the Lender based on the merits of the specific transaction. Advances under the Facility are limited to $5,000,000 in total for all Funds (except Aggressive Investors 1, Aggressive Investors 2 and Small-Cap Momentum Funds), or 33 1/3% of a Fund’s net assets. Borrowings under the line of credit bear interest based on the Lender’s Prime Rate. Principal is due fifteen days after each advance and at maturity. Interest is payable monthly in arrears. None of the Funds had borrowings under the Facility during the year ended June 30, 2010.
8. Redemption Fees
In Ultra-Small Company Market and Small-Cap Momentum Funds, a 2% redemption fee may be charged on shares held less than six months. The fee is charged for the benefit of the remaining shareholders and will be paid to the Fund to help offset transaction costs. The fee is accounted for as an addition to paid-in capital.
| | |
| NOTES TO FINANCIAL STATEMENTS (continued) | | |
June 30, 2010
9. Subsequent Events
Management has evaluated the impact of all subsequent events on the Funds and has determined that there were no subsequent events requiring recognition or disclosure in the financial statements.
| | |
150 | | Annual Report | June 30, 2010 |
| | |
| REPORT OF INDEPENDENT REGISTERED PUBLIC ACCOUNTING FIRM | | |
To the Shareholders and Board of Directors of Bridgeway Funds, Inc.
We have audited the accompanying statements of assets and liabilities of Aggressive Investors 1 Fund, Aggressive Investors 2 Fund, Ultra-Small Company Fund, Ultra-Small Company Market Fund, Micro-Cap Limited Fund, Small-Cap Momentum Fund, Small-Cap Growth Fund, Small-Cap Value Fund, Large-Cap Growth Fund, Large-Cap Value Fund, Blue Chip 35 Index Fund, and Managed Volatility Fund (formerly The Balanced Fund), each a series of Bridgeway Funds, Inc., including the schedules of investments, as of June 30, 2010, and the related statements of operations for the year or period then ended, the statements of changes in net assets for each of the years and period presented in the two year period then ended, and the financial highlights for each of the years and period presented in the five year period then ended. These financial statements and financial highlights are the responsibility of the Fund’s management. Our responsibility is to express an opinion on these financial statements and financial highlights based on our audits.
We conducted our audits in accordance with the standards of the Public Company Accounting Oversight Board (United States). Those standards require that we plan and perform the audits to obtain reasonable assurance about whether the financial statements and financial highlights are free of material misstatement. An audit includes examining, on a test basis, evidence supporting the amounts and disclosures in the financial statements. Our procedures included confirmation of securities owned as of June 30, 2010 by correspondence with the custodian and brokers. An audit also includes assessing the accounting principles used and significant estimates made by management, as well as evaluating the overall financial statement presentation. We believe that our audits provide a reasonable basis for our opinion.
In our opinion, the financial statements and financial highlights referred to above present fairly, in all material respects, the financial position of Aggressive Investors 1 Fund, Aggressive Investors 2 Fund, Ultra-Small Company Fund, Ultra-Small Company Market Fund, Micro-Cap Limited Fund, Small-Cap Momentum Fund, Small-Cap Growth Fund, Small-Cap Value Fund, Large-Cap Growth Fund, Large-Cap Value Fund, Blue Chip 35 Index Fund, and Managed Volatility Fund as of June 30, 2010, the results of their operations for the year or period then ended, the changes in their net assets for each of the years or period in the two year period then ended, and financial highlights for each of the years or period in the five year period then ended, in conformity with accounting principles generally accepted in the United States of America.
|
 |
|
| BBD, LLP |
Philadelphia, Pennsylvania
August 25, 2010
| | |
| OTHER INFORMATION | | |
June 30, 2010 (unaudited)
1. Shareholder Tax Information
Certain tax information regarding the Funds is required to be provided to shareholders based upon each Fund’s income and distributions for the taxable year ended June 30, 2010. The information and distributions reported herein may differ from information and distributions taxable to the shareholders for the calendar year ended December 31, 2009.
The Funds designate the following items with regard to distributions paid during the fiscal year ended June 30, 2010. All designations are based on financial information available as of the date of this annual report and, accordingly, are subject to change. For each item, it is the intention of each Fund to designate the maximum amount permitted under the Internal Revenue Code and the regulations thereunder.
During the fiscal year ended June 30, 2010, the following percentages of dividends paid by each Fund from net investment income qualified for the corporate dividends received deduction and met the requirements regarding qualified dividend income:
| | | | | | | | |
| | | Aggressive
Investor 1 | | Aggressive
Investor 2 | | Ultra-Small
Company | | Ultra-Small
Company Market |
Corporate Dividends Received Deduction | | 100.00% | | 100.00% | | 35.55% | | 57.18% |
Qualified Dividend Income | | 100.00% | | 100.00% | | 39.92% | | 53.66% |
Qualified Interest Related Dividends | | 0.00% | | 0.01% | | 0.00% | | 0.00% |
Qualified Short Term Capital Gain Dividends | | 0.00% | | 0.00% | | 0.00% | | 0.00% |
| | | | |
| | | Micro-Cap
Limited | | Small-Cap
Momentum | | Small-Cap
Growth | | Small-Cap Value |
Corporate Dividends Received Deduction | | 39.97% | | 0.00% | | 100.00% | | 96.45% |
Qualified Dividend Income | | 35.05% | | 0.00% | | 100.00% | | 95.50% |
Qualified Interest Related Dividends | | 0.00% | | 0.00% | | 0.00% | | 0.00% |
Qualified Short Term Capital Gain Dividends | | 0.00% | | 0.00% | | 0.00% | | 0.00% |
| | | | |
| | | Large-Cap
Growth | | Large-Cap
Value | | Blue Chip
35 Index | | Managed
Volatility |
Corporate Dividends Received Deduction | | 100.00% | | 95.50% | | 97.11% | | 48.16% |
Qualified Dividend Income | | 100.00% | | 95.43% | | 97.00% | | 48.43% |
Qualified Interest Related Dividends | | 0.00% | | 0.01% | | 0.00% | | 34.08% |
Qualified Short Term Capital Gain Dividends | | 0.00% | | 0.00% | | 0.00% | | 0.00% |
2. Proxy Voting
Fund policies and procedures used in determining how to vote proxies relating to the Funds’ securities and a summary of proxies voted by the Funds for the period ended June 30, 2010 are available without a charge, upon request, by contacting Bridgeway Funds at 1-800-661-3550 and on the SEC website at http://www.sec.gov.
3. Fund Holdings
The complete schedules of the Funds’ holdings for the second and fourth quarters of each fiscal year are contained in the Funds’ Semi-Annual and Annual shareholder reports, respectively.
The Bridgeway Funds file complete schedules of the Funds’ holdings with the SEC for the first and third quarters of each fiscal year on Form N-Q within 60 days after the end of the period. Copies of the Funds’ Form N-Q are available without charge, upon request, by contacting Bridgeway Funds at 1-800-661-3550 and on the SEC’s website at http://www.sec.gov. You may also review and copy Form N-Q at the SEC’s Public Reference Room in Washington, D.C. For more information about the operation of the Public Reference Room, please call 1-800-SEC-0330.
| | |
152 | | Annual Report | June 30, 2010 |
| | |
| OTHER INFORMATION (continued) | | |
June 30, 2010 (unaudited)
4. Investment Advisory Agreement Approval For All Funds Except Small-Cap Momentum Fund
At a meeting held on June 22, 2010 (the “Meeting”), the Board of Directors (“Board”), including a majority of the non-interested or independent Directors (hereinafter, “Directors”), met in person and approved the renewal of the investment management agreement (the “Advisory Agreement”) between Bridgeway Capital Management, Inc. (the “Adviser”) and the following Funds: Aggressive Investors 1 Fund, Aggressive Investors 2 Fund, Ultra-Small Company Fund, Ultra-Small Company Market Fund, Micro-Cap Limited Fund, Small-Cap Growth Fund, Small-Cap Value Fund, Large-Cap Growth Fund, Large-Cap Value Fund, Blue Chip 35 Index Fund and Managed Volatility Fund (each, a “Fund” and collectively, the “Funds”).
In reaching its decisions to approve the continuation of the Advisory Agreement for each Fund, the Board considered information provided specifically in relation to the renewal of the Advisory Agreement for the Meeting. In response to specific requests from the independent Directors in connection with the Meeting, the Adviser furnished, and the Board considered, information including, but not limited to, the following: (1) the investment performance over various time periods and the fees and expenses of each Fund as compared to a comparable group of funds (the “peer funds”); (2) the nature, extent and quality of services provided by the Adviser to the Funds, including investment advisory and administrative services to the Funds; (3) the actual management fees paid by each Fund to the Adviser; (4) the costs of providing services to each Fund and the profitability of the Adviser from the relationship with each Fund; (5) the extent to which economies of scale may be present and if so, whether they would be shared with the Fund’s shareholders; and (6) any “fall out” or ancillary benefits accruing to the Adviser as a result of the relationship with each Fund. In addition to evaluating, among other things, the written information provided by the Adviser, the Board also evaluated the answers to questions posed by the independent Directors to representatives of the Adviser at the Meeting.
In considering the information and materials described above, the independent Directors received assistance from independent legal counsel and were provided with a written description of their statutory responsibilities and the legal standards that are applicable to approvals of advisory agreements. Although the Advisory Agreement for all of the Funds was considered at the same Board meeting, the Directors addressed each Fund separately during the Meeting.
Based on all of the information presented, the Board, including a majority of its independent Directors, determined on a Fund-by-Fund basis that the fees charged under the Advisory Agreement are reasonable in relation to the services that are provided under the Advisory Agreement. In view of the broad scope and variety of factors and information, the Directors did not identify any single factor as being of paramount importance in reaching their conclusions and determinations to approve the continuance of the Advisory Agreement for each Fund. Rather, the approval determinations were made on the basis of each Director’s business judgment after consideration of all of the factors taken in their entirety.
Although not meant to be all-inclusive, the following discusses some of the factors relevant to the Board’s decisions to approve the continuance of the Advisory Agreement for each Fund.
Nature, Extent and Quality of Services. In examining the nature, extent and quality of the services provided by the Adviser, the independent Directors were pleased that the Funds continue to have access to the Adviser’s specialized skills in quantitative analysis and active and passive investment management and trading, and viewed those skills as relatively unique within the investment management industry. The independent Directors were satisfied that staffing levels at the Adviser were adequate and appropriate in view of the Funds’ operations. The independent Directors noted that the Adviser devotes most of its personnel time to managing the Funds, as they represent approximately half of the Adviser’s total assets under management. The independent Directors also noted that there have been no significant changes in personnel that provide services to the Funds other than the addition of a new partner to the investment management team in April 2010. The independent Directors also considered that, in addition to providing investment management services to the Funds, the Adviser is also responsible for developing and maintaining policies and procedures to ensure that the Funds comply with applicable rules and regulations. Finally, the independent Directors considered that the Adviser provides certain administrative services under the Administrative Services Agreement approximately at cost to the Funds. Based on the information considered, the Board concluded that the nature, extent and quality of the Adviser’s services supported approval of the Advisory Agreement.
Investment Performance. The independent Directors reviewed performance information as of March 31, 2010 for each Fund. With regard to the Aggressive Investors 1 Fund, the independent Directors noted that: (i) the Fund has outperformed its benchmark index for the past ten year period as well as since inception; and (ii) the Fund’s performance for the past three
| | |
| OTHER INFORMATION (continued) | | |
June 30, 2010 (unaudited)
and five year periods has lagged both peer funds and its benchmark index primarily due to underperformance in the past six quarters during the recent economic crisis although the Fund was outperforming its peer funds and benchmark index for the three year period, five year period and since inception period as of March 31, 2008. With regard to the Aggressive Investors 2 Fund, the independent Directors noted that: (i) the Fund has outperformed its benchmark index since inception; and (ii) the Fund’s performance for the past three and five year periods has lagged both peer funds and its benchmark index primarily due to underperformance in the past twelve months during the recent economic crisis although the Fund was outperforming its peer funds and benchmark index for the five year period ending March 31, 2009. With regard to the Ultra-Small Company Fund, the independent Directors noted that the Fund has outperformed its benchmark index for the past ten years and since inception, although it has lagged its peer funds and benchmark index for the past three and five year periods. With regard to the Ultra-Small Company Market Fund, the independent Directors noted that the Fund has lagged its peer funds and benchmark index for the past three and five year periods and lagged its benchmark index since inception. However, the independent Directors considered that the Ultra-Small Company Market Fund is a passively managed fund whose peer funds have a significantly higher average market capitalization and that this difference in average capitalization was the primary reason for the difference in performance compared to peer funds. With regard to the Micro-Cap Limited Fund, the independent Directors noted that the Fund has outperformed its benchmark index since inception, although it has underperformed its peer funds and benchmark index for the past three and five year periods and lagged its benchmark index slightly for the past ten year period. With regard to the Small-Cap Growth Fund and Small-Cap Value Fund, the independent Directors noted that each Fund’s performance for the past three and five year periods has lagged both peer funds and its benchmark index and has also lagged its benchmark index since inception and also noted that this lag in performance is primarily due to underperformance in the past twenty four months during the recent economic crisis although each Fund was outperforming its peer funds for the three year period and outperforming its benchmark index for the three year period and since inception period as of March 31, 2008. With regard to the Large-Cap Growth Fund, the independent Directors noted that: (i) the Fund has lagged its peer funds and benchmark index for the past three and five year periods and lagged its primary benchmark index since inception; and (ii) such lag in performance was primarily due to underperformance in 2008 although the Fund was outperforming its peer funds for the three year period and outperforming its benchmark index for the three year period and the since inception period as of March 31, 2008. With regard to the Large-Cap Value Fund, the independent Directors noted that: (i) the Fund has outperformed its peer funds and benchmark index for the past three and five year periods; and (ii) the Fund has outperformed its benchmark index since inception. With regard to the Blue Chip 35 Index Fund, the independent Directors noted that: (i) the Fund has outperformed its peer funds and benchmark index for the past three and five year periods; (ii) the Fund has outperformed its benchmark index since inception; and (iii) the Fund has slightly lagged its benchmark index for the past ten year period. With regard to the Managed Volatility Fund, the independent Directors noted that: (i) the Fund has outperformed its benchmark index since inception; and (ii) the Fund has lagged its peer funds and benchmark index for the past three and five year periods primarily due to poor relative performance in the last twelve months in the recent economic crisis.
Fees and Expenses. The independent Directors were satisfied with the reasonableness of the management fees and favorable overall expense levels of each of the Funds, and believed that the fee and expense levels were consistent with the Adviser’s long-standing goal of providing low cost funds. The management fees of the Aggressive Investors 1 Fund and Aggressive Investors 2 Fund are performance-based fees that adjust higher or lower in a range in response to investment results. As a result of the performance fees and the recent underperformance, the Aggressive Investors 1 Fund’s management fees are significantly lower than peer funds although the base management fee is slightly higher than peer funds. As a result of the performance fees and the recent underperformance, the Aggressive Investors 2 Fund’s management fees are lower than peer funds although the base management fee is slightly higher than peer funds. The total expenses of the Aggressive Investors 1 Fund and Aggressive Investors 2 Fund are significantly lower than peer funds. The Ultra-Small Company Fund has no performance fee and the management fee is lower than peer funds and the total expenses were significantly lower than peer funds. The passively managed Ultra-Small Company Market Fund’s management fee was higher than the average of other passively-managed funds, but the independent Directors recognized that the fee was warranted because of the higher costs to manage and trade stocks in the ultra-small market capitalization and that the Fund was relatively unique among index funds based on its ultra-small focus. The independent Directors also noted that the total expenses of the Ultra-Small Company Market Fund were slightly higher than its peer funds. The management fees of the Micro-Cap Limited Fund also are performance-based fees that adjust higher or lower in a range in response to investment results. As a result of the performance fees and the Fund’s underperformance, the Micro-Cap Limited Fund’s management fees and overall expenses are significantly lower than peer funds and its base management fee is lower than peer funds. The Small-Cap Growth Fund, Small-Cap Value Fund, Large-Cap Growth Fund and Large-Cap Value Fund also have performance fees, but each Fund’s management fees and
| | |
154 | | Annual Report | June 30, 2010 |
| | |
| OTHER INFORMATION (continued) | | |
June 30, 2010 (unaudited)
overall expenses were significantly lower than its peer funds. The Blue Chip 35 Index Fund has no performance fee and both the management fee and total expenses were significantly lower than peer funds, partly due to fee waivers and expense reimbursements by the Adviser. The Managed Volatility Fund has no performance fee and its management fee is slightly lower than peer funds and total expenses were significantly lower than peer funds.
In addition, the independent Directors considered that the Adviser agreed to contractual expense limitation agreements for each of the Funds to ensure that total expense levels do not increase above certain levels. The independent Directors also reviewed the fees the Adviser charged to other funds and separately managed accounts and evaluated the differences in fees and services provided to the Funds and such other separately managed accounts.
The foregoing comparisons assisted the independent Directors by providing them with a basis for evaluating each Fund’s management fee and expense ratio on a relative basis.
Profitability. The independent Directors reviewed the materials it received from the Adviser regarding its revenues and costs in providing investment management and certain administrative services to the Funds. In particular, the independent Directors considered the analysis of the Adviser’s profitability with respect to each Fund, calculated for the years ended December 31, 2007, December 31, 2008 and December 31, 2009. The independent Directors also considered the Adviser’s representations that allocating expenses on a Fund-by-Fund basis to calculate Fund-by-Fund profitability is a subjective, and somewhat arbitrary process, since the Adviser does not track expenses or maintain staff on a Fund-by-Fund basis. The independent Directors also considered the Adviser’s representations that profit margins for certain years can be affected by the seven to one total compensation cap for Adviser employees (i.e., no employee can make more than seven times the total compensation of the lowest paid employee). The independent Directors also considered that the Adviser was operating the Aggressive Investors 1 Fund, Micro-Cap Limited Fund, Small-Cap Growth Fund, Large-Cap Growth Fund, Large-Cap Value Fund, Blue Chip 35 Index Fund and Managed Volatility Fund at a loss. The independent Directors noted that, as a business matter, the Adviser was entitled to earn reasonable profits for its services to the Funds.
Economies of Scale. With regard to economies of scale, the independent Directors noted that the Aggressive Investors 1 Fund, Aggressive Investors 2 Fund, Ultra-Small Company Fund and Micro-Cap Limited Fund each have fee breakpoints in their management fee schedules and that the Aggressive Investors 2 Fund has reached a size so that it already benefits from a reduced base management fee rate. The independent Directors noted that although the Aggressive Investors 1 Fund, Ultra-Small Company Fund and Micro-Cap Limited Fund are not currently at an asset level at which they can take advantage of the breakpoints contained in their fee schedules, the fee schedules are structured so that when the assets of the Funds increase, economies of scale may be shared for the benefit of shareholders. Although the Ultra-Small Company Market Fund does not have fee breakpoints in its management fee schedule, the Adviser noted that it believes that the Fund does not exhibit significant economies of scale because it involves intensive and time-consuming portfolio and trading management because trades are small and oftentimes less liquid so they may take longer to execute. As a result, the Adviser indicated that an increase in assets of the Ultra-Small Company Market Fund does not necessarily lead to economies of scale. Although the Small-Cap Growth Fund, Small-Cap Value Fund, Large-Cap Growth Fund and Large-Cap Value Fund do not have fee breakpoints in their management fee schedules, the Adviser indicated that these Funds were priced low relative to peers and ahead of the economies of scale curve at launch. In particular, these Funds’ management fees were aggressively priced from launch as if they had assets of $1 billion (in the case of the Small-Cap Growth and Small-Cap Value Funds) and $5 billion (in the case of the Large-Cap Growth and Large-Cap Value Funds). However, these four Funds had assets that were significantly below the $1 billion and $5 billion levels, as the case may be, at the time of the Meeting. With regard to both the Blue Chip 35 Index Fund and Managed Volatility Fund, the Adviser noted that, although neither Fund has fee breakpoints in its management fee schedule, each Fund was priced low relative to peers and ahead of the economies of scale curve at launch. In view of asset sizes and fee structures, the independent Directors were satisfied that shareholders were not missing the opportunity to benefit from economies of scale if they were available.
“Fall Out” or Ancillary Benefits. In terms of potential “fall out” or ancillary benefits to the Adviser due to its position as manager of the Funds, the independent Directors noted that the Adviser continues to use no soft dollars and its administrative services to the Funds are structured to approximate an at-cost relationship.
| | |
| OTHER INFORMATION (continued) | | |
June 30, 2010 (unaudited)
Overall, the Directors were pleased to renew the Advisory Agreement with respect to each Fund. The Directors valued access by the Funds to the Adviser’s proprietary quantitative investment management services, relative investment performance and favorable fee levels and concluded that renewal of the Advisory Agreement was in the best interests of the Funds and their shareholders.
5. Investment Advisory Agreement Approval For Small-Cap Momentum Fund
The Board of Directors (“Board”), including a majority of the non-interested or independent Directors (hereinafter, “Directors”), met in person on February 12, 2010 (the “Meeting”) to consider, among other things, the creation of the Small-Cap Momentum Fund (the “Fund”), and to consider whether to approve an investment management agreement (the “Advisory Agreement”) between Bridgeway Capital Management, Inc. (the “Adviser”) and the Fund.
In reaching its decision to approve the new Advisory Agreement for the Fund, the Board considered information provided specifically in relation to the approval of the Advisory Agreement for the Meeting including the following: (1) the proposed management fees and total expenses of the Fund as compared to a comparable group of funds (the “peer funds”); (2) the nature, extent and quality of services to be provided by the Adviser to the Fund, including investment advisory and administrative services to the Fund; (3) the costs of providing services to the Fund; (4) the extent to which economies of scale may be present and if so, whether they would be shared with the Fund’s shareholders; and (5) any “fall out” or ancillary benefits that may accrue to the Adviser as a result of the relationship with the Fund. In addition to evaluating, among other things, the written information provided by the Adviser, the Board also evaluated the answers to questions posed by the independent Directors to representatives of the Adviser at the Meeting. In considering the information and materials described above, the independent Directors received assistance from independent legal counsel.
The Board also considered the Fund’s proposed Morningstar category and benchmark. Because the Fund is new, the Board could not consider comparative information regarding Fund performance or the level of profitability (or lack thereof) that the Adviser would receive for its investment management services to the Fund. The Board considered the Fund’s proposed investment objective and strategy. The Board considered that the proposed management fee for the Fund is lower than 90% of the funds in the peer group and the Fund’s projected total annual operating expenses, after taking into account waivers/ reimbursements, was projected to be in the lowest quartile of peer funds. The Board also noted that the proposed management fee for the Fund is less than or equal to the management fee the Adviser plans to charge for managing a similar mandate for separate accounts. The Board also considered that the Adviser agreed to waive fees and reimburse expenses so that the total operating expenses do not exceed a cap for the Fund. Although the Fund does not have fee breakpoints in its management fee schedule, the Adviser indicated that the Fund was priced low relative to peers and ahead of the economies of scale curve at launch. The Board also considered its satisfactory experience with the nature, extent and quality of the services the Adviser has provided to other funds in the complex and this experience supported approval of the Advisory Agreement with the Fund. In terms of potential “fall out” or ancillary benefits to the Adviser due to its position as manager of the Fund, the Board noted that the Adviser continues to use no soft dollars and its administrative services to the Fund are structured to approximate an at-cost relationship.
Based on all of the information presented, the Board, including a majority of its independent Directors, approved the Advisory Agreement for the Fund and determined that the fees to be charged under the Advisory Agreement are reasonable in relation to the services to be provided under the Advisory Agreement. In view of the broad scope and variety of factors and information, the Directors did not identify any single factor as being of paramount importance in reaching their conclusions and determination to approve the Advisory Agreement for the Fund. Rather, the approval determination was made on the basis of each Director’s business judgment after consideration of all of the factors taken in their entirety.
| | |
156 | | Annual Report | June 30, 2010 |
| | |
| DISCLOSURE OF FUND EXPENSES | | |
June 30, 2010 (unaudited)
As a shareholder of a Fund, you will incur no transaction costs from the Fund, including sales charges (loads) on purchases, on reinvested dividends, or on other distributions. There are no exchange fees. Shareholders are subject to redemption fees on the Ultra-Small Company Market and Small-Cap Momentum Funds under certain circumstances. However, as a shareholder of a Fund, you will incur ongoing costs, including management fees and other Fund expenses. The following examples are intended to help you understand your ongoing costs (in dollars) of investing in a Fund and to compare these costs with ongoing costs of investing in other mutual funds. The examples are based on an investment of $1,000 invested on January 1, 2010 and held until June 30, 2010.
Actual Expenses. The first line of the table below provides information about actual account values and actual expenses. You may use the information in this line, together with the amount you invested, to estimate the expenses that you paid over the period. Simply divide you’re account value by $1,000 (for example, an $8,600 account value divided by $1,000 = 8.6), then multiply the result by the number in the first line under the heading “Expense Paid During the Period” to estimate the expenses you paid on your account during the period.
Hypothetical Example for Comparison Purposes. The second line of the table below provides information about hypothetical account values and hypothetical expenses based on the Fund’s actual expense ratio and an assumed rate of return of 5% per year before expenses, which is not the Fund’s actual return. The hypothetical account values and expenses may not be used to estimate the actual ending account balance or expenses you paid for the period. You may use this information to compare the ongoing costs of investing in a Fund and other mutual funds. To do so, compare this 5% hypothetical example with the 5% hypothetical examples that appear in the shareholder reports of other funds.
The expenses shown in the table are meant to highlight ongoing Fund costs only. Therefore, the second line of the table is useful in comparing ongoing costs only, and will not help you determine the relative total costs of owning different funds, because other funds may also have transaction costs, such as sales charges, redemption fees or exchange fees.
| | | | | | | | | |
| | | Beginning Account
Value at 1/1/10 | | Ending Account
Value at 6/30/10 | | Expense
Ratio | | | Expenses Paid
During Period*
1/1/10 - 6/30/10 |
| | | | |
Bridgeway Aggressive Investors 1 | | | | | | | | | |
Actual Fund Return | | $1,000.00 | | $ 901.60 | | -0.66% | ** | | $(3.11) |
Hypothetical Fund Return | | $1,000.00 | | $1,028.07 | | -0.66% | ** | | $(3.32) |
| | | | |
Bridgeway Aggressive Investors 2 | | | | | | | | | |
Actual Fund Return | | $1,000.00 | | $ 884.70 | | 0.85% | | | $ 3.97 |
Hypothetical Fund Return | | $1,000.00 | | $1,020.58 | | 0.85% | | | $ 4.26 |
| | | | |
Bridgeway Ultra-Small Company Fund | | | | | | | | | |
Actual Fund Return | | $1,000.00 | | $ 968.80 | | 1.19% | | | $ 5.81 |
Hypothetical Fund Return | | $1,000.00 | | $1,018.89 | | 1.19% | | | $ 5.96 |
| | | | |
Bridgeway Ultra-Small Company Market Fund | | | | | | | | | |
Actual Fund Return | | $1,000.00 | | $ 980.70 | | 0.75% | | | $ 3.68 |
Hypothetical Fund Return | | $1,000.00 | | $1,021.08 | | 0.75% | | | $ 3.76 |
| | | | |
Bridgeway Micro-Cap Limited Fund | | | | | | | | | |
Actual Fund Return | | $1,000.00 | | $ 998.20 | | -0.05% | *** | | $(0.25) |
Hypothetical Fund Return | | $1,000.00 | | $1,025.04 | | -0.05% | *** | | $(0.25) |
| | | | |
Bridgeway Small-Cap Momentum Fund**** | | | | | | | | | |
Actual Fund Return | | $1,000.00 | | $ 933.00 | | 0.90% | | | $ 0.71 |
Hypothetical Fund Return | | $1,000.00 | | $1,003.37 | | 0.90% | | | $ 0.74 |
| | |
| DISCLOSURE OF FUND EXPENSES (continued) | | |
June 30, 2010 (unaudited)
| | | | | | | | |
| | | Beginning Account
Value at 1/1/10 | | Ending Account
Value at 6/30/10 | | Expense
Ratio | | Expenses Paid
During Period*
1/1/10 - 6/30/10 |
| | | | |
Bridgeway Small-Cap Growth Fund | | | | | | | | |
Actual Fund Return | | $1,000.00 | | $ 925.10 | | 0.93% | | $4.44 |
Hypothetical Fund Return | | $1,000.00 | | $1,020.18 | | 0.93% | | $4.66 |
| | | | |
Bridgeway Small-Cap Value Fund | | | | | | | | |
Actual Fund Return | | $1,000.00 | | $ 972.00 | | 0.88% | | $4.30 |
Hypothetical Fund Return | | $1,000.00 | | $1,020.43 | | 0.88% | | $4.41 |
| | | | |
Bridgeway Large-Cap Growth Fund | | | | | | | | |
Actual Fund Return | | $1,000.00 | | $ 922.90 | | 0.84% | | $4.00 |
Hypothetical Fund Return | | $1,000.00 | | $1,020.63 | | 0.84% | | $4.21 |
| | | | |
Bridgeway Large-Cap Value Fund | | | | | | | | |
Actual Fund Return | | $1,000.00 | | $ 951.00 | | 0.84% | | $4.06 |
Hypothetical Fund Return | | $1,000.00 | | $1,020.63 | | 0.84% | | $4.21 |
| | | | |
Bridgeway Blue Chip 35 Fund | | | | | | | | |
Actual Fund Return | | $1,000.00 | | $ 914.20 | | 0.15% | | $0.71 |
Hypothetical Fund Return | | $1,000.00 | | $1,024.05 | | 0.15% | | $0.75 |
| | | | |
Bridgeway Managed Volatility | | | | | | | | |
Actual Fund Return | | $1,000.00 | | $ 945.50 | | 0.94% | | $4.53 |
Hypothetical Fund Return | | $1,000.00 | | $1,020.13 | | 0.94% | | $4.71 |
| * | Expenses are equal to the average account value times the Fund’s annualized expense ratio multiplied by the number of days in the most recent half-year divided by the number of days in the fiscal year. |
| ** | The expense ratio for Aggressive Investors 1 Fund is negative due to the negative performance adjustment of the investment advisory fee. The expense ratio for this period excluding the negative performance adjustment was 1.21%. |
| *** | The expense ratio for Micro-Cap Limited is negative due to the negative performance adjustment of the investment advisory fee. The expense ratio for this period excluding the negative performance adjustment was 1.44%. |
| **** | Commenced operations on May 28, 2010. For purposes of the “Hypothetical 5% Return”, the annualized expense ratio was applied to the period January 1, 2010 through June 30, 2010. The “Actual Fund Return” information reflects the performance since inception. |
| | |
158 | | Annual Report | June 30, 2010 |
| | |
| DIRECTORS & OFFICERS | | |
June 30, 2010
| | | | | | | | | | |
| Independent Directors |
| | | | | |
Name, Address and Age1 | | Position Held with
Bridgeway Funds | | Term of Office and
Length of Time Served | | Principal Occupation(s)
During Past Five Years | | No. of Bridgeway
Funds Overseen
by Director | | Other Directorships
Held by Director |
| | | | | |
Kirbyjon Caldwell Age 57 | | Director | | Term: 1 Year Length: 2001 to Present. | | Senior Pastor of Windsor Village United Methodist Church, since 1982. | | Twelve | | Continental Airlines, Inc., American Church Mortgage Company, Reliant Energy, NRG Energy, Inc., Amegy Bancshares Advisory Board |
| | | | | |
Karen S. Gerstner Age 55 | | Director | | Term: 1 Year Length: 1994 to Present. | | Principal, Karen S. Gerstner & Associates, P.C., 2004 to present. | | Twelve | | None |
| | | | | |
Miles Douglas Harper, III* Age 47 | | Director | | Term: 1 Year Length: 1994 to Present. | | Partner, 10/1998 to present, Gainer, Donnelly, Desroches, LLP. | | Twelve | | Calvert Social Investment Fund (8 Portfolios), Calvert Social Index Series, Inc. (1 Portfolio), Calvert Impact Fund2 (5 Portfolios), Calvert World Values Fund (3 Portfolios), Founders Bank, SSB |
| | | | | |
Evan Harrel Age 49 | | Director | | Term: 1 Year Length: 2006 to Present. | | Executive Director, Small Steps Nurturing Center, 8/2004 to present. | | Twelve | | None |
|
| “Interested” or Affiliated Directors and Officers |
| | | | | |
Name, Address and Age1 | | Position(s)
Held with
Bridgeway
Funds | | Term of
Office and
Length of
Time Served | | Principal Occupation(s)
During Past Five Years | | No. of Bridgeway
Funds Overseen
by Director | | Other Directorships
Held by Director |
| | | | | |
Michael D. Mulcahy3 Age 46 | | President and Director | | Term: 1 Year Length: 2003 to Present. | | President, Bridgeway Funds, 6/2005 to present. Director, Secretary and Vice President, Bridgeway Capital Management, Inc., 12/2002 to present. | | Twelve | | None |
| | | | | |
John N. R. Montgomery4 Age 54 | | Vice President and Director | | Term: 1 Year Length: 1993 to Present. | | Vice President, Bridgeway Funds, 6/2005 to present. President, Bridgeway Funds, 11/1993 - 6/2005. President, Bridgeway Capital Management Inc., 7/1993 to present. | | Twelve | | None |
| | |
| DIRECTORS & OFFICERS (continued) | | |
June 30, 2010
| | | | | | | | | | |
| Other Officers |
| | | | | |
Richard P. Cancelmo, Jr. Age 52 | | Vice President | | Term: 1 Year Length: 2004 to Present. | | Vice-President, Bridgeway Funds, 11/2004 to present. Staff member, Bridgeway Capital Management, Inc., since 2000. | | | | None |
| | | | | |
Linda G. Giuffré Age 48 | | Treasurer and Chief Compliance Officer | | Term: 1 Year Length: 2004 to Present. | | Chief Compliance Officer, Bridgeway Capital Management, Inc., 12/2004 to present. Staff member, Bridgeway Capital Management, Inc., 5/2004 to present. | | | | None |
| | | | | |
Deborah L. Hanna Age 45 | | Secretary | | Term: 1 Year Length: 2/16/2007 to Present. | | Self-employed, accounting and related projects for various organizations, 2001 to present. | | | | None |
| 1 | The address of all of the Directors and Officers of Bridgeway Funds is 5615 Kirby Drive, Suite 518, Houston, Texas, 77005-2448. |
| 2 | The Calvert Large-Cap Growth Fund is sub-advised by Bridgeway Capital Management, Inc., the Adviser to Bridgeway Funds. |
| 3 | Michael Mulcahy is a director and officer of Bridgeway Capital Management, Inc., and therefore an interested person of Bridgeway Funds. |
| 4 | John Montgomery is president, director and majority shareholder of Bridgeway Capital Management, Inc., and therefore an interested person of Bridgeway Funds. |
The overall management of the business and affairs of Bridgeway Funds is vested with its Board of Directors (the “Board”). The Board approves all significant agreements between Bridgeway Funds and persons or companies furnishing services to it, including agreements with its Adviser and Custodian. The day-to-day operations of Bridgeway Funds are delegated to its officers, subject to its investment objectives and policies and general supervision by the Board.
The Funds’ Statement of Additional Information includes additional information about the Funds’ Board and is available, without charge, upon request by calling 1-800-661-3550.
| | |
160 | | Annual Report | June 30, 2010 |
BRIDGEWAY FUNDS, INC.
BNY Mellon Investment Servicing (US) Inc.
301 Bellevue Parkway
Wilmington, DE 19809
CUSTODIAN
PFPC Trust Company
8800 Tinicum Blvd., 4th Floor
Philadelphia, PA 19153
DISTRIBUTOR
Foreside Fund Services, LLC
Three Canal Plaza, Suite 100
Portland, ME 04101
| | | | |
| |
You can review and copy information about our Funds (including the SAI) at the SEC’s Public Reference Room in Washington, D.C. To find out more about this public service, call the SEC at 800-SEC-0330. Reports and other information about the Funds is also available on the SEC’s website at www.sec.gov. You can receive copies of this information, for a fee, by writing the Public Reference Section, Securities and Exchange Commission, Washington, D.C. 20549-0102 or by sending an electronic request to the following email address: publicinfo@sec.gov | | |
Item 2. Code of Ethics.
| | (a) | The registrant, as of the end of the period covered by this report, has adopted a code of ethics that applies to the registrant’s principal executive officer, principal financial officer, principal accounting officer or controller, or persons performing similar functions, regardless of whether these individuals are employed by the registrant or a third party. |
| | (c) | There have been no amendments, during the period covered by this report, to a provision of the code of ethics that applies to the registrant’s principal executive officer, principal financial officer, principal accounting officer or controller, or persons performing similar functions, regardless of whether these individuals are employed by the registrant or a third party, and that relates to any element of the code of ethics description. |
| | (d) | The registrant has not granted any waivers, including an implicit waiver, from a provision of the code of ethics that applies to the registrant’s principal executive officer, principal financial officer, principal accounting officer or controller, or persons performing similar functions, regardless of whether these individuals are employed by the registrant or a third party, that relates to one or more of the items set forth in paragraph (b) of this item’s instructions. |
Item 3. Audit Committee Financial Expert.
3(a)(1) The registrant’s board of directors has determined that the registrant has at least one audit committee financial expert serving on its audit committee.
3(a)(2) The audit committee financial expert is Miles Douglas Harper III, who is “independent” for purposes of this Item 3 of Form N-CSR.
Item 4. Principal Accountant Fees and Services.
Audit Fees
| | (a) | The aggregate fees billed for each of the last two fiscal years for professional services rendered by the principal accountant for the audit of the registrant’s annual financial statements or services that are normally provided by the accountant in connection with statutory and regulatory filings or engagements were $240,000 for the fiscal year ended June 30, 2010 and $232,000 for the fiscal year ended June 30, 2009. |
Audit-Related Fees
| | (b) | The aggregate fees billed in each of the last two fiscal years for assurance and related services by the principal accountant that are reasonably related to the performance of the audit of the registrant’s financial statements and are not reported under paragraph (a) of this Item were $0 for the fiscal year ended June 30, 2010 and $0 for the fiscal year ended June 30, 2009. |
Tax Fees
| | (c) | The aggregate fees billed in each of the last two fiscal years for professional services rendered by the principal accountant for tax compliance, tax advice, and tax planning were $24,000 for the fiscal year ended June 30, 2010 and $22,000 for the fiscal year ended June 30, 2009. Tax services include the review of the Funds’ federal income tax returns, the review of the Funds’ federal excise tax returns and the review of required distributions by the Funds. |
All Other Fees
| | (d) | The aggregate fees billed in each of the last two fiscal years for products and services provided by the principal accountant, other than the services reported in paragraphs (a) through (c) of this Item were $0 for the fiscal year ended June 30, 2010 and $0 for the fiscal year ended June 30, 2009. |
| | (e) (1) | Disclose the audit committee’s pre-approval policies and procedures described in paragraph (c)(7) of Rule 2-01 of Regulation S-X. |
The Registrant’s Audit Committee has adopted an Audit Committee Charter that provides that the Audit Committee shall approve, prior to appointment, the engagement of the auditor to provide audit services to the Registrant and non-audit services to the Registrant, its investment advisor or any entity controlling, controlled by or under common control with the investment adviser that provides on-going services to the Registrant if the engagement relates directly to the operations and financial reporting of the Registrant.
| | (e) (2) | No services described in paragraphs (b) through (d) above were approved pursuant to paragraph (c)(7)(i)(C) of Rule 2-01 of Regulation S-X. |
Item 5. Audit Committee of Listed registrants.
Not applicable.
Item 6. Investments.
| (a) | Schedule of Investments in securities of unaffiliated issuers as of the close of the reporting period is included as part of the report to shareholders filed under Item 1 of this form. |
| (b) | The Registrant made no divestments of securities in accordance with section 13(a) of the Investment Company Act of 1940. |
| Item 7. | Disclosure of Proxy Voting Policies and Procedures for Closed-End Management Investment Companies. |
Not applicable.
Item 8. Portfolio Managers of Closed-End Management Investment Companies.
Not applicable.
| Item 9. | Purchases of Equity Securities by Closed-End Management Investment Company and Affiliated Purchasers. |
Not applicable.
Item 10. Submission of Matters to a Vote of Security Holders.
There have been no material changes to the procedures by which the shareholders may recommend nominees to the Registrant’s Board of Directors, where those changes were implemented after the registrant last provided disclosure in response to the requirements of Item 407(c)(2)(iv) of Regulation S-K (17 CFR 229.407) (as required by Item 22(b)(15) of Schedule 14A (17 CFR 240.14a-101)), or this Item.
Item 11. Controls and Procedures.
| | (a) | The registrant’s principal executive officer and principal financial officer, or persons performing similar functions, have concluded that the registrant’s disclosure controls and procedures (as defined in Rule 30a-3(c) under the Investment Company Act of 1940, as amended (the “1940 Act”) (17 CFR 270.30a-3(c))) are effectively designed, as of a date within 90 days of the filing date of the report that includes the disclosure required by this paragraph, based on their evaluation of these controls and procedures required by Rule 30a-3(b) under the 1940 Act (17 CFR 270.30a-3(b)) and Rules 13a-15(b) or 15d-15(b) under the Securities Exchange Act of 1934, as amended (17 CFR 240.13a-15(b) or 240.15d-15(b)). |
| | (b) | There were no changes in the registrant’s internal control over financial reporting (as defined in Rule 30a-3(d) under the Act (17 CFR 270.30a-3(d)) that occurred during the second fiscal quarter of the period covered by this report that have materially affected or are reasonably likely to materially affect, the registrant’s internal control over financial reporting. |
Item 12. Exhibits.
| | |
| |
| (a)(1) | | Code of ethics, or any amendment thereto, that is the subject of disclosure required by Item 2 is attached hereto. |
| |
| (a)(2) | | Certifications pursuant to Rule 30a-2(a) under the 1940 Act and Section 302 of the Sarbanes-Oxley Act of 2002 are attached hereto. |
| |
| (a)(3) | | Not applicable. |
| |
| (b) | | Certifications pursuant to Rule 30a-2(b) under the 1940 Act and Section 906 of the Sarbanes- Oxley Act of 2002 are attached hereto. |
SIGNATURES
Pursuant to the requirements of the Securities Exchange Act of 1934 and the Investment Company Act of 1940, the registrant has duly caused this report to be signed on its behalf by the undersigned, thereunto duly authorized.
| | | | |
| (registrant) | | | | Bridgeway Funds, Inc. |
| | | | |
| | |
| By (Signature and Title)* | | | | /s/ Michael D. Mulcahy |
| | |
| | Michael D. Mulcahy, President and Principal Executive Officer |
| | (principal executive officer) |
Pursuant to the requirements of the Securities Exchange Act of 1934 and the Investment Company Act of 1940, this report has been signed below by the following persons on behalf of the registrant and in the capacities and on the dates indicated.
| | | | |
| | |
| By (Signature and Title)* | | | | /s/ Michael D. Mulcahy |
| | |
| | Michael D. Mulcahy, President and Principal Executive Officer |
| | (principal executive officer) |
| | | | |
| | |
| By (Signature and Title)* | | | | /s/ Linda G. Giuffre |
| | |
| | Linda G. Giuffre, Treasurer and Principal Financial Officer |
| | (principal financial officer) |
| * | Print the name and title of each signing officer under his or her signature. |