UNITED STATES
SECURITIES AND EXCHANGE COMMISSION
Washington, D.C. 20549
FORM N-CSR
CERTIFIED SHAREHOLDER REPORT OF REGISTERED MANAGEMENT
INVESTMENT COMPANIES
Investment Company Act file number 811-08200
Bridgeway Funds, Inc.
(Exact name of registrant as specified in charter)
20 Greenway Plaza, Suite 450
Houston, Texas 77046
(Address of principal executive offices) (Zip code)
Michael D. Mulcahy, President
Bridgeway Funds, Inc.
20 Greenway Plaza, Suite 450
Houston, Texas 77046
(Name and address of agent for service)
Registrant’s telephone number, including area code: (713) 661-3500
Date of fiscal year end: June 30
Date of reporting period: July 1, 2011 through June 30, 2012
Form N-CSR is to be used by management investment companies to file reports with the Commission not later than 10 days after the transmission to stockholders of any report that is required to be transmitted to stockholders under Rule 30e-1 under the Investment Company Act of 1940 (17 CFR 270.30e-1). The Commission may use the information provided on Form N-CSR in its regulatory, disclosure review, inspection, and policymaking roles.
A registrant is required to disclose the information specified by Form N-CSR, and the Commission will make this information public. A registrant is not required to respond to the collection of information contained in Form N-CSR unless the Form displays a currently valid Office of Management and Budget (“OMB”) control number. Please direct comments concerning the accuracy of the information collection burden estimate and any suggestions for reducing the burden to Secretary, Securities and Exchange Commission, 100 F Street, NE, Washington, DC 20549. The OMB has reviewed this collection of information under the clearance requirements of 44 U.S.C. § 3507.
Item 1. Reports to Stockholders.
The Report to Shareholders is attached herewith.

| | | | | | |
| | A no-load mutual fund family of domestic funds | | |
| | Annual Report | | |
| | June 30, 2012 | | |
| | AGGRESSIVE INVESTORS 1 | | BRAGX | | |
| | | |
| | ULTRA-SMALL COMPANY | | BRUSX | | |
| | (Open to Existing Investors — Direct Only) | | | | |
| | | |
| | ULTRA-SMALL COMPANY MARKET | | BRSIX | | |
| | | |
| | SMALL-CAP MOMENTUM | | BRSMX | | |
| | | |
| | SMALL-CAP GROWTH | | BRSGX | | |
| | | |
| | SMALL-CAP VALUE | | BRSVX | | |
| | | |
| | LARGE-CAP GROWTH | | BRLGX | | |
| | | |
| | BLUE CHIP 35 INDEX | | BRLIX | | |
| | | |
| | MANAGED VOLATILITY | | BRBPX | | |
| | | |
| | | | | | |
| | | |
| | | | | | |
| | | |
| | | | | | |
| | | |
| | | | | | |
| | | |
| | | | | | |
| | www.bridgeway.com | | | | |
| | |
| TABLE OF CONTENTS | | 
|
Bridgeway Funds Standardized Returns as of June 30, 2012* (Unaudited)
| | | | | | | | | | | | | | | | |
| | | | | | | Annualized | | | | |
| Fund | | Quarter | | Six Months | | 1 Year | | 5 Years | | 10 Years | | Inception
to Date | | Inception
Date | | Gross
Expense
Ratio2 |
Aggressive Investors 1 | | -4.80% | | 8.62% | | -9.59% | | -7.14% | | 3.74% | | 12.20% | | 8/5/1994 | | 1.25%3 |
Ultra-Small Company | | -6.55% | | 13.06% | | -5.41% | | -2.61% | | 9.93% | | 14.74% | | 8/5/1994 | | 1.31% |
Ultra-Small Co Market | | -1.81% | | 13.90% | | 1.05% | | -1.94% | | 8.53% | | 9.70% | | 7/31/1997 | | 0.92%1 |
Small-Cap Momentum | | -4.26% | | 7.35% | | -1.40% | | NA | | NA | | 11.90% | | 5/28/2010 | | 5.47%1 |
Small-Cap Growth | | -7.40% | | 6.21% | | -6.35% | | -6.08% | | NA | | 1.83% | | 10/31/2003 | | 0.98%1 |
Small-Cap Value | | -2.31% | | 8.89% | | -0.59% | | -3.95% | | NA | | 5.04% | | 10/31/2003 | | 0.87% |
Large-Cap Growth | | -3.96% | | 8.91% | | 0.37% | | -0.54% | | NA | | 3.77% | | 10/31/2003 | | 0.86%1 |
Blue Chip 35 Index | | -2.04% | | 9.97% | | 9.72% | | 1.23% | | 5.04% | | 4.80% | | 7/31/1997 | | 0.27%1 |
Managed Volatility | | 0.00% | | 4.19% | | 3.74% | | 0.92% | | 4.04% | | 3.59% | | 6/30/2001 | | 1.22%1 |
Bridgeway Funds Returns for Calendar Years 1998 through 2011* (Unaudited)
| | | | | | | | | | | | | | | | | | | | | | | | | | | | | | |
| | | 1998 | | 1999 | | 2000 | | 2001 | | 2002 | | 2003 | | 2004 | | 2005 | | 2006 | | 2007 | | 2008 | | 2009 | | 2010 | | 2011 | |
Aggressive Investors 1 | | 19.28% | | 120.62% | | 13.58% | | -11.20% | | -18.01% | | 53.97% | | 12.21% | | 14.93% | | 7.11% | | 25.80% | | -56.16% | | 23.98% | | 17.82% | | | -10.31% | |
Ultra-Small Company | | -13.11% | | 40.41% | | 4.75% | | 34.00% | | 3.98% | | 88.57% | | 23.33% | | 2.99% | | 21.55% | | -2.77% | | -46.24% | | 48.93% | | 23.55% | | | -14.64% | |
Ultra-Small Co Market | | -1.81% | | 31.49% | | 0.67% | | 23.98% | | 4.90% | | 79.43% | | 20.12% | | 4.08% | | 11.48% | | -5.40% | | -39.49% | | 25.95% | | 24.86% | | | -7.86% | |
Small-Cap Momentum | | | | | | | | | | | | | | | | | | | | | | | | | | | | | -0.92% | |
Small-Cap Growth | | | | | | | | | | | | | | 11.59% | | 18.24% | | 5.31% | | 6.87% | | -43.48% | | 15.04% | | 11.77% | | | -0.63% | |
Small-Cap Value | | | | | | | | | | | | | | 17.33% | | 18.92% | | 12.77% | | 6.93% | | -45.57% | | 26.98% | | 16.55% | | | 1.05% | |
Large-Cap Growth | | | | | | | | | | | | | | 6.77% | | 9.33% | | 4.99% | | 19.01% | | -45.42% | | 36.66% | | 13.34% | | | -0.71% | |
Blue Chip 35 Index | | 39.11% | | 30.34% | | -15.12% | | -9.06% | | -18.02% | | 28.87% | | 4.79% | | 0.05% | | 15.42% | | 6.07% | | -33.30% | | 26.61% | | 10.60% | | | 3.17% | |
Managed Volatility | | | | | | | | | | -3.51% | | 17.82% | | 7.61% | | 6.96% | | 6.65% | | 6.58% | | -19.38% | | 12.39% | | 5.41% | | | 1.94% | |
Performance figures quoted represent past performance and are no guarantee of future results. Current performance may be lower or higher than the performance data quoted. Investment return and principal value will fluctuate, so that an investor’s shares, when redeemed, may be worth more or less than original cost. To obtain performance current to the most recent month-end, please visit our website at www.bridgeway.com or call 1-800-661-3550. Total return figures include the reinvestment of dividends and capital gains.
| | |
1 Some of the Funds’ fees were waived or expenses reimbursed; otherwise, returns would have been lower. The Adviser has contractually agreed to waive fees and/or reimburse expenses. Any material change to this Fund policy would require a vote by shareholders. | | |
2 Expense ratios are as stated in the current prospectus. Please see financial highlights for expense ratios as of June 30, 2012. | | |
3 The management fee included in the gross expense ratio for the Aggressive Investors 1 Fund has been restated to reflect only the base management fee payable under the Fund’s performance-based management fee structure. The total actual management fee for the fiscal year ended June 30, 2011 was -0.76%. The actual total management fee for the prior fiscal year was negative due to the negative performance adjustment of the investment management fee under the Fund’s performance-based management fee structure. | | |
* Numbers highlighted in green indicate periods when the Fund outperformed its primary benchmark.
This report is submitted for the general information of the shareholders of each Fund. It is not authorized for distribution to prospective investors unless preceded or accompanied by an effective prospectus, which includes information regarding a Fund’s risks, objectives, fees and expenses, experience of its management, and other information. Investors should read the prospectus carefully before investing in a Fund. For questions or other Fund information, call 1-800-661-3550 or visit the Funds’ website at www.bridgeway.com. Funds are available for purchase by residents of the United States, Puerto Rico, U.S. Virgin Islands and Guam only. Foreside Fund Services, LLC, Distributor.
The views expressed here are exclusively those of Fund management. These views, including those relating to the market, sectors or individual stocks are not meant as investment advice and should not be considered predictive in nature.
THIS PAGE INTENTIONALLY LEFT BLANK
| | |
LETTER FROM THE INVESTMENT MANAGEMENT TEAM | |
|
June 30, 2012
Dear Fellow Shareholders,
The “macro-driven market” environment discussed in the last several shareholder letters, as well as on page 3, continued in full force in the quarter ended June 30, 2012. In fact, this was the first time two high correlation spikes occurred in one year. Not surprisingly, the Bridgeway Funds that had the broadest market exposure (Blue Chip 35 Index, Ultra-Small Company Market, and Small-Cap Momentum Funds) plus our more value oriented Fund (Small-Cap Value Fund) were the ones that beat their market benchmarks in the fiscal year ending June 30, 2012. Those Funds with more exposure to our growth leaning models (Aggressive Investors 1, Ultra-Small Company, Small-Cap Growth and Large-Cap Growth Funds) did not. The quarter did give us our first test of how our Select models performed in a high correlation spike after adding data from the first three high correlation spikes and adjusting our models accordingly; overall, our growth leaning Funds performed in line with expectations: an improvement over the previous three spikes in 2008, 2010, and 2011. A discussion of the factors that affected the market environment, as well as their impact on the different market sectors, appears on page 2.
Each fiscal year we commit to reporting to shareholders what we think is the worst thing at Bridgeway during the year. This year it took a vote from our Partners to help us decide what the worst thing was. Details are on page 4.
Contrary to the advice of most financial advisers, investors below the age of 35 have become more risk averse than 35 to 64 year olds. Will this hurt their chances for a secure retirement? See page 4.
Last quarter we reviewed the case for equities and why it’s so important to have a long-term asset allocation plan and stick with it. This quarter, on page 5, we focus on bonds, the reasons why investors continue to move from stock mutual funds to bond mutual funds, and why we think bonds are unusually risky in the current environment, in spite of their appearance of safety.
One of the strongest parts of our culture is a commitment to community and world change. On page 7, Cindy Griffin and Michele Camp share their experiences on affecting world change by digging a water well during a service trip to El Salvador with five other Partners.
As always, we appreciate your feedback. We take your comments very seriously and regularly discuss them internally to help in managing our Funds and this company. Please keep your ideas coming — both favorable and critical. They provide us with a vital tool, helping us serve you better.
Sincerely,
Your Investment Management Team
|

|
|
| John Montgomery |
|

|
|
| Elena Khoziaeva |
|

|
|
| Christine Liang |
|

|
|
| Dick Cancelmo |
|

|
|
Michael Whipple |
|

|
|
Rasool Shaik |
| | |
1 | | Annual Report | June 30, 2012 |
| | |
LETTER FROM THE INVESTMENT MANAGEMENT TEAM (continued) | |
|
Market Review
The positive momentum that carried the market at the end of 2011 and through the first quarter of 2012 came to an end in the second quarter. Domestic and global fears crept into the market, causing equities to slide as investors retreated from risky, more volatile stocks. A shift to the perceived safety of government bonds sent the yield on the 10-year Treasury note down to 1.56%. The economically sensitive commodity prices declined, oil prices declined 18%, and volatility and high correlations returned to the Dow as investors focused attention on macroeconomic events. The Dow Jones Industrial Average stomached 22 days of triple digit moves, compared to 6 in the first quarter. Companies were not well rewarded for high earnings surprises and were severely beaten down for reporting lower than expected earnings. The “sweet spot” seemed to be large companies in the “middle of the pack.” In other words, investors were looking for stability.
The quarter started with fear in April and May when the European debt crisis reignited. Concern that Greece would exit the euro as a result of the “pro-bailout” New Democracy party failing to win an early election led to scrutiny of all sovereign debt holdings. Government bond yields in Italy and Spain spiked. The quarter ended June 30, 2012 followed the 2010 and 2011 pattern of a mid year correction. The New Democracy prevailed in the second Greek election and calmed fears of a rapid exit. Eurozone leaders relaxed conditions for emergency bank loans, and the potential for additional Fed intervention via quantitative easing (QE3) helped boost the market, but it was not enough to erase the losses from April and May. The S&P 500 Index ended down 2.75% for the quarter.
There was a huge disparity between the returns of large and mid-cap stocks. This is evident in the CRSP (Center for Research in Security Prices) Portfolio Index returns for the fiscal year. The CRSP 1 Index (ultra-large stocks) outperformed all other deciles of market cap, returning 7.66% for the fiscal year. The CRSP 5 Index (mid-cap stocks) was the worst performing decile, falling 6.10%. At the other end of the spectrum, the CRSP 10 Index (ultra-small stocks) declined 0.85%, reflecting higher risk associated with ultra-small stocks (a negative in the fiscal year) but also the advantage in this fiscal year of being “off the radar screen.”
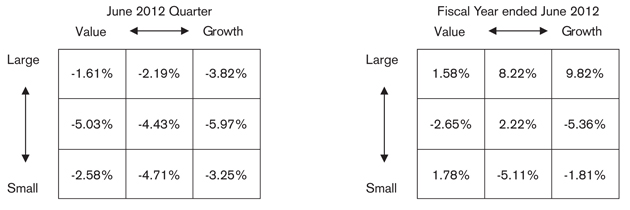
Returns across all style boxes, as defined by Morningstar, were negative for the quarter. Value stocks outpaced growth stocks, and investors generally favored large stocks over small, with large value leading the way, returning -1.61%.
Four of the ten S&P 500 Index sectors posted positive returns, with defensive stocks outperforming cyclicals. The financial sector was hit the hardest amid credit rating agency downgrades of major U.S. and European banks, as well as financial market weakness and slowing global economic growth. Information technology, energy, materials, industrials and consumer discretionary also underperformed the market. Telecommunication services shone, returning 14.15%. Consumer staples, healthcare, and utilities were also positive for the quarter.
Following are the stock market “style box” returns from Morningstar for the quarter and year:
| | |
LETTER FROM THE INVESTMENT MANAGEMENT TEAM (continued) | |
|
Macro Driven Markets — An update
The Short Version: As highlighted in the last several shareholder letters, the primarily macro-driven markets of the last four years have been particularly unfavorable to some of our Select Funds, especially those with a strong growth component (Aggressive Investors 1, Ultra-Small Company, Large-Cap Growth, and Small-Cap Growth Funds). Last quarter we dissected the dynamics of these markets, why they have been less favorable to our growth leaning stock picking models, and why we do not expect our relative performance to be hit as hard should macro driven markets continue. The June quarter gave us our first test of this latter belief, and our performance was indeed in line with expectations for this group of four Funds.
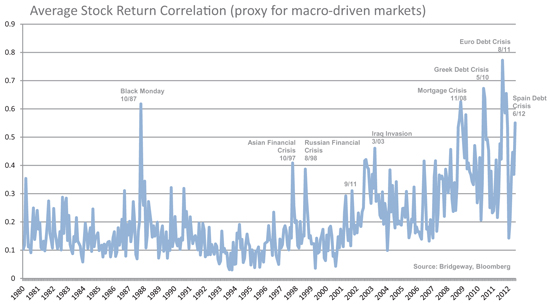
High correlation markets are markets where individual stock prices tend to move proportionally in tandem — statistically, time periods when stock correlations exceed 0.5. We call these “macro-driven markets,” markets within which investors focus on macroeconomic events, such as the European debt crisis, rather than the economic health of individual companies. Thus, in a macro driven market, good news at Company XYZ is less likely to favorably impact its stock price than in most market environments. Macro-driven markets are unfavorable to our more growth leaning stock picking models in particular, since our models focus on data at the company rather than national or world level.
In our December 2011 semi-annual report we “dove deep” to consider the strongly negative effects of macro-driven markets on our Select Funds that use our more growth leaning models. In that report we stated:
Within the context of an unchanged investment process, the adviser has made incremental changes to its stock picking models that we believe would help relative performance in future macro-driven markets without any cost to our performance in micro-driven markets, which historically comprise the vast majority of markets.
The high stock correlations in the last half of calendar year 2011, which characterize market environments unfavorable to some of our stock picking models, dropped back to normal historical levels in January and February. This gave a performance tailwind to some of our Funds. Time will tell what the follow-through looks like and when we will see the next “macro-driven market,” which we hope is not for a few years (or decades).
The last sentence was prescient within the context of the June quarter: it only took a couple of months before we experienced another high correlation spike and had the opportunity to test our incremental stock picking model improvements and extended data that included a number of high correlation spikes. Overall, we passed the test for this quarter. Five of our 11 funds outperformed their primary market benchmark. Our more growth leaning funds (Aggressive Investors 1, Ultra-Small Company, Small-Cap Growth, and Large-Cap Growth Funds) did not beat their market benchmarks, as expected; but even half of these outperformed their peer benchmarks. For the six-month period through June, these four Funds as a group had “OK” performance — doing much better than in the previous three high correlation spikes in spite of being in an unfavorable market environment.
The following graph presents the long term view of macro-driven, high correlation markets, with two spikes in the last fiscal year and four in the last four fiscal years. We continue to believe strongly that the market will return to a micro-driven environment, one in which the market focuses on the economic health of individual companies — an environment that our growth leaning models and funds have historically favored.
| | |
3 | | Annual Report | June 30, 2012 |
| | |
LETTER FROM THE INVESTMENT MANAGEMENT TEAM (continued) | |
|
The Worst Thing of the Fiscal Year
The Short Version: While half of our Funds had strong performance over the fiscal year, four really performed miserably: Aggressive Investors 1, Ultra-Small Company, Large-Cap Growth, and Small-Cap Growth Funds. As highlighted in the previous section, the market delivered two high correlation spikes in one year, the first time this has happened since 1946. This is a market environment generally unfavorable for these Funds, though we think high correlation spikes will not have such a deleterious affect going forward.
In each annual report for the last fourteen fiscal years, Bridgeway has revealed its “worst thing of the year.” This section has become an important Bridgeway tradition. As a shareholder, you are the owner and “boss,” and we think you have a right to know the negatives as well as the positives. In previous years we have discussed company turnover, trading errors, compliance issues, and specific periods of the performance of one or more of our Funds. Part of our firm’s culture is transparency (we’re the only Fund firm we know of that addresses this topic in an annual report), and we work hard to address problems and not repeat mistakes.
This year’s choice for “worst thing” was the performance of our four more growth leaning Select Funds. The dynamics of high correlation markets were discussed in the previous section. It’s easy enough to chalk up this year’s worst thing to factors beyond Bridgeway’s control, and one can make a strong case for it this year. However, by way of continual learning we should also ask, “Is there anything the adviser could have done within the scope of these Funds’ investment objectives, strategies, and investment process to anticipate or dampen the negative effects of these market spikes?” Our answer: we continue to believe that market timing is a loser’s game, so trying to time or anticipate high correlation spikes is not realistic and is likely counterproductive.
Are Young Investors Investing Too Conservatively?
The Short Version: Investors under the age of 35 are taking on less risk than older baby boomers. Most investment advisers recommend the opposite: more risk at a young age, less later in life.
The following graph with data from the Investment Company Institute demonstrates a phenomenon we hear about frequently: investors are more risk-averse than they were a decade ago. What is most surprising to us at Bridgeway, however, is the breakdown by age: elderly investors have not significantly changed their appetite for risk, while younger investors’ risk appetite has plummeted — to the point that it is slightly lower than that of the baby boomer generation. This seems upside down. Financial advisors typically preach that younger investors can afford to take on more risk and should do so. Something to ponder.
| | |
LETTER FROM THE INVESTMENT MANAGEMENT TEAM (continued) | |
|
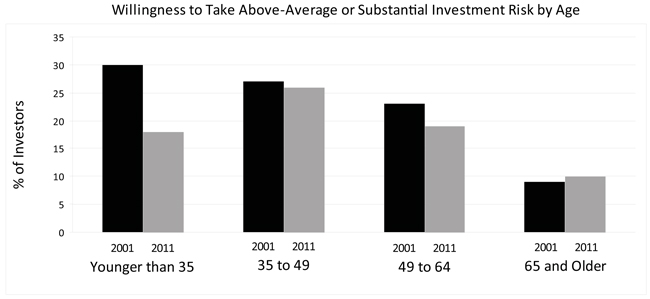
Sources: Investment Company Institute tabulations of Federal Reserve Board survey of consumer finances and
Investment Company Institute annual mutual fund shareholder tracking survey.
What Recent Fund Flows and History Tell Us About the Risk of Bonds — from Bridgeway’s Chief Investment Officer
The Short Version: Last quarter we reviewed the case for equities and why it’s so important to have a long-term asset allocation plan and stick with it. This quarter we focus on bonds, the reasons why investors continue to move from stock mutual funds to bond mutual funds, and why we think bonds are unusually risky in the current environment.
Over the decade of the 2000’s, intermediate-term and long-term government bonds outperformed stocks. As presented in the table below, the S&P 500 Index returned 1.41% for the ten years through December 2010, while intermediate-term Treasuries returned 5.64%/year and long-term Treasuries returned 6.64%. Some people would conclude from this that since government bonds are relatively safe — they are backed by the U.S. Government — as well as less volatile (see the table below), they are a simply a better deal: less risk, more return.
Risk and Returns (the “lost decade,” December 2000 to December 2010)
| | | | | | | | |
| | | | Total Returns/Year | | | | Volatility | |
| | | | | | | | |
Long-term government bonds | | | 6.64% | | | | 12.40 | |
Intermediate-term government bonds | | | 5.64% | | | | 5.20 | |
S&P 500 (stocks) | | | 1.41% | | | | 16.30 | |
What investors don’t see in this equation is that bonds have received a tremendous “tailwind” from declining interest rates over the last decade, one that is very unlikely to be repeated. Why? Ten-year Treasury bonds recently hit an all-time low. Can they go lower? Yes, but while theoretically possible, it is very unlikely that they will go into negative territory. Had interest rates remained flat over the last decade, total returns would have been somewhat lower. But it gets more interesting looking forward. If bond yields only remain at current levels, total return drops to the current yield, 0.59% for intermediate-term government bonds, 2.48% for long-term government bonds. And as interest rates rise significantly, bond prices and total returns fall. So, for example, if interest rates were to rise to the long-term historical average in the next year, the one-year returns for intermediate bonds would be -12.41%, with long-term bonds at -23.60%. Scarier yet is if inflation kicked in. Since our national debt is at the highest level (as a percent of gross domestic product) since World War II, I believe this is a real and serious risk
| | |
5 | | Annual Report | June 30, 2012 |
| | |
LETTER FROM THE INVESTMENT MANAGEMENT TEAM (continued) | |
|
over the two to five year time frame, though perhaps not over the next year, as the Federal Reserve seeks to keep interest rates low. If a drop in interest rates was coupled with inflation increasing to 10% per year (double digit inflation occurred in both 1979 and 1980), the one-year return for intermediate bonds after adjusting for inflation would drop to -20.38% with long-term bonds dropping to -30.55%.
This concept is referred to as interest rate risk related to inflation risk, a very real risk that I believe many investors are ignoring as they shift from stocks to bonds.
The following table shows the extent to which mutual fund investors have been shifting from stocks to bonds over the recent six year period:
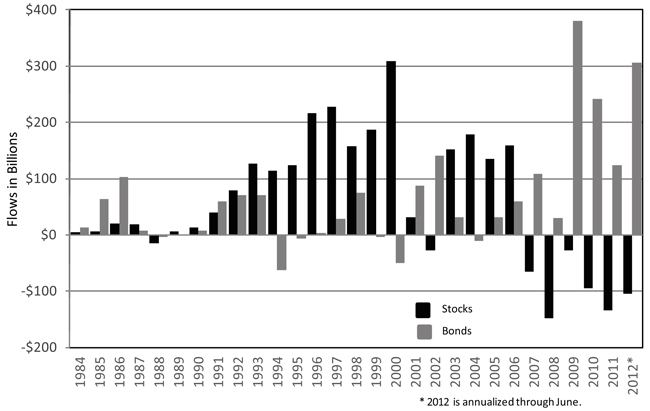
Source: Investment Company Institute. Includes domestic equities only.
Unfortunately, the timing of these flows may be the next prime example of a phenomenon we have discussed previously, the behavior gap. Investors tend to pile into stocks after a bull market, as in the period of the late 1990s internet bubble. This was ill-timed, as 2000 to 2002 was the most extended bear market in the last seven decades. When stocks were relatively cheap during this current period, investors shifted to the perceived safety of bonds. Again, ill-timed in retrospect. What I worry about most now is the possibility that the recent move to bonds portends a “bond bubble.” Specifically, that inflation and rising interest rates could deliver a double whammy to bondholders. This isn’t to say that bonds aren’t an appropriate investment in a well diversified portfolio, just that an overreliance on them carries its own significant risks.
What’s an investor to do? We believe that creating, writing down, and implementing a disciplined asset allocation plan is the best antidote to the behavior gap problem. Right now that might be guarding against an overreliance on bonds, particularly because they’ve done so well over the last one and two decades.
| | |
LETTER FROM THE INVESTMENT MANAGEMENT TEAM (continued) | |
|
Throughout this section we have focused on Treasury bonds to demonstrate the risk to bonds of interest rates and a rise in inflation. Corporate and municipal bonds, especially lower rated ones, carry more default risk, but somewhat muted inflation and interest rate risk. This is perhaps a good reason to diversify, even within one’s bond holdings.
Transformative Change — authored by Cindy Griffin and Michele Camp
Last quarter, we talked about Bridgeway’s mission statement and how our partners were effecting extraordinary change at a local level to support our mission. This quarter, we share a service project with Living Water International (LWI) in El Salvador and highlight how Bridgeway partners are effecting extraordinary change outside of their local communities.
In May, seven Bridgeway partners left the comfort and safety of Houston, Texas for El Salvador. For the two of us, this was the first time on a service trip with our colleagues at Bridgeway; several of whom had completed similar trips in prior years. Our task? To work with LWI to drill a water well for a rural, impoverished community in El Salvador called El Mango. For five days, we were covered in mud, sweat and more mud as we took turns operating the hydraulic well drill, taking dirt samples, assembling PVC pipes, mixing and pouring concrete, and all other various tasks involved in completing a well. We labored side-by-side with the people of El Mango, who offered their own tools, strength, and determination to ensure the success of the project. It was hard work, especially in a tropical climate where it feels like it’s constantly 120 degrees with 100 percent humidity.
Five days flew by, and we were astounded by how much our team was able to accomplish in such a short amount of time. We struck water on the first day at 90 feet, which put us ahead of schedule. In fact, we were so far ahead of schedule in El Mango that we travelled to another community, where we helped complete a 220 foot well. Our final day at the drill site was spent putting the finishing touches on the El Mango well and participating in a dedication ceremony with the community. It was a joyous day of celebration and excitement. We were overwhelmed with happiness at seeing the locals pump fresh, clean water for the first time. They were so grateful and so thankful. When the festivities were over, we loaded up the truck, took a few more pictures, piled in the van and waved goodbye to our new friends one last time.
So why did we go? Why would a firm of only 29 people send seven away for a week to drill a water well? Part of Bridgeway’s vision statement states, “Partners effecting extraordinary community and world change.” It’s who we are and what we’re about – it’s engrained in our culture. For a week in May, a group of seven Bridgeway partners literally lived our vision statement and effected extraordinary community and world change in the little village of El Mango. But it took more than the seven of us to make this happen. We left behind our families and our fellow partners, who gladly and graciously gave of themselves so that we could be gone for a week. Even though they weren’t there physically, their love and support were equally important and such a necessary and vital component to our trip. It was unifying, not just for the people who went to El Salvador, but for everyone involved. As another partner, James McKissick (who has been involved with LWI for a long time), beautifully stated, “Stepping out of yourself brings out a whole new energy.” It does and it did, for everyone at Bridgeway. We came back with a renewed passion for our vision statement, realizing that the higher we performed at our job, the better our company would be, which would lead to more success and very importantly, greater giving. The small community of El Mango is a perfect example of the BIG difference 29 people can make.
| | |
7 | | Annual Report | June 30, 2012 |
| | |
Aggressive Investors 1 Fund MANAGER’S COMMENTARY (Unaudited) | | |
June 30, 2012
Dear Fellow Aggressive Investors 1 Fund Shareholder,
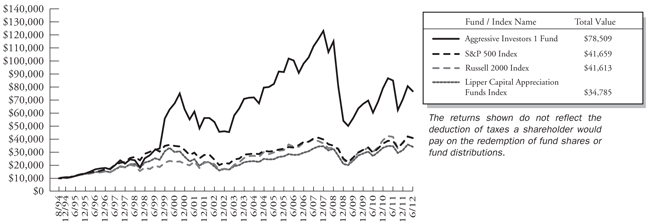
For the quarter ended June 30, 2012, our Fund declined 4.80%, trailing our primary market benchmark, the S&P 500 Index (-2.75%), and the Russell 2000 Index (-3.47%). We did outperform our peer benchmark, the Lipper Capital Appreciation Funds Index (-5.10%). It was the fourth high correlation spike — an historically rare, but unfriendly environment for our Fund. Our Fund navigated this one much better than the previous three, as discussed in detail below. It was a mixed quarter, but we are guardedly pleased in this market context.
For the fiscal year ended June 30, 2012, our Fund declined 9.59%, badly trailing our primary benchmark, the S&P 500 Index (+5.45%), our peer benchmark, the Lipper Capital Appreciation Funds Index (-1.67%) and the Russell 2000 Index (-2.08%). Two market phenomena created a tremendous headwind of performance we have not seen previously in the 17+ year history of our Fund: first, two correlation spikes occurred in the same fiscal year as discussed on page 3 and in the section on annual performance below. Second, there was a huge disparity between the returns of large and mid-cap stocks as discussed in the market overview on page 2; the “size effect” cost our Fund over five percentage points of returns for the fiscal year. We did receive a mild tailwind from one factor: our models’ tilt toward quality (e.g. low debt) stocks helped us to the tune of almost two percentage points.
You may recall that our prior fiscal year 2011 contained no high correlation peaks (what we refer to as “macro-driven markets”) and we outperformed the S&P 500 by just over 10%. This is in stark contrast to the current fiscal year 2012, the first time we have ever experienced two high correlation spikes in the same year (September and June quarters). In spite of two positive quarters (December 2011 and March 2012), the two high correlation spikes (September 2011 and June 2012) of the fiscal year put us strongly “in the red” for the fiscal year. For reasons outlined on page 3, proactive steps on our part make us more optimistic about negotiating high correlation spikes in the future, should they continue.
The table below presents our June quarter, one-year, five-year, ten-year and inception-to-date financial results. See the next page for a graph of performance since inception.
Standardized Returns as of June 30, 2012
| | | | | | | | | | | | |
|
| | | | | | | Annualized |
| | | Quarter | | 1 Year | | 5 Years | | 10 Years | | Since Inception
(8/5/94) | | |
| | |
Aggressive Investors 1 Fund | | -4.80% | | -9.59% | | -7.14% | | 3.74% | | 12.20% | | |
S&P 500 Index | | -2.75% | | 5.45% | | 0.22% | | 5.33% | | 8.29% | | |
Russell 2000 Index | | -3.47% | | -2.08% | | 0.54% | | 7.00% | | 8.29% | | |
Lipper Capital Appreciation Funds Index | | -5.10% | | -1.67% | | 0.79% | | 6.01% | | 7.20% | | |
Performance figures quoted in the table above and graph below represent past performance and are no guarantee of future results. Total return figures in the table above include the reinvestment of dividends and capital gains. The table above and the graph below do not reflect the deduction of taxes that a shareholder would pay on Fund distributions or the redemption of Fund shares.
| | |
Aggressive Investors 1 Fund MANAGER’S COMMENTARY (Unaudited) (continued) | | |
The S&P 500 Index is a broad-based, unmanaged measurement of changes in stock market conditions, based on the average of 500 widely held common stocks with dividends reinvested. The Russell 2000 Index is an unmanaged, market value weighted index that measures performance of the 2,000 companies that are between the 1,000th and 3,000th largest in the market with dividends reinvested. The Lipper Capital Appreciation Funds Index reflects the record of the 30 largest funds in the category of more aggressive domestic growth mutual funds, as reported by Lipper, Inc. It is not possible to invest directly in an index. Periods longer than one year are annualized.
According to data from Lipper, Inc. as of June 30, 2012, Aggressive Investors 1 Fund ranked 262nd of 288 capital appreciation funds for the twelve months ending June 30, 2012, 230th of 231 over the last five years, 137th of 169 over the last ten years, and 3rd of 53 since inception in August, 1994. Lipper, Inc. is an independent mutual fund rating service that ranks funds in various fund categories by making comparative calculations using total returns.
Aggressive Investors 1 Fund vs. S&P 500 Index, Russell 2000 Index & Lipper Capital Appreciation Funds Index
from Inception 8/5/94 to 6/30/12
Detailed Explanation of Quarterly Performance
The Short Version: In a quarter that contained the fourth high correlation spike in the last four years, our newly optimized models handled the spike much better, though we still underperformed our primary market benchmark. Differences in company size between the Fund and our primary market benchmark fully explain our quarterly variance. Our models continued to pick stocks that are strong performers on a fundamental basis (as measured by following quarterly earnings report surprises), but were not rewarded with strong price increases — as expected in a macro-driven market.
We underperformed our primary market benchmark by just over two percent for the quarter ended June 30, 2012. It was a period that showed the fourth high correlation spike since 2008. It was the first spike since we completed the re-optimization of our models, including data from the previous three high correlation spikes. The results, while we still underperformed, were much improved over the last three high correlation spikes.
Our primary market benchmark, the S&P 500 Index is very heavily weighted in ultra-large stocks, those in the largest size decile of the NYSE, with over 75% of the Index in that decile. Since the Aggressive Investors 1 Fund chooses from among a broader range of stocks and does not weight them by size, the Fund has about 25% of net assets in the largest decile. This has given the Fund a slight tailwind over longer historical periods, but it cost the Fund over two and one-half percent of relative performance this quarter.
| | |
9 | | Annual Report | June 30, 2012 |
| | |
Aggressive Investors 1 Fund MANAGER’S COMMENTARY (Unaudited) (continued) | | |
On the bright side, our models continued to pick stocks that were strong performers on a fundamental basis (as measured by following quarter earnings report surprises), but were not rewarded with price increases. This is a pattern we have seen in each of the high correlation spikes.
Detailed Explanation of Fiscal Year Performance
The Short Version: The fiscal year contained two high correlation spikes, the first of which occurred before we completed our model re-optimization. The majority of our underperformance for the fiscal year occurred during the period of that first spike.
We underperformed the S&P 500 Index by 15.0% for the fiscal year ended June 30, 2012. It was a period that contained two high correlation spikes. The first spike occurred in the September quarter of 2011 while we were still in the process of re-optimizing our models to include the most recent data and add some model improvements. Almost 13% of our underperformance was attributable to that high correlation spike. The second spike happened in the June quarter of 2012 after the re-optimization and our underperformance was reduced to only two percent. While this is only one data point for our newly optimized models, we are pleased with the improvement, since high correlation spikes are still the historical exception and we believe we will better navigate them going forward, should they continue.
Similar to the June quarter, company size hurt in the fiscal year, costing the Fund more than fifteen percent of relative return. The Financials sector was the only sector that added significant positive relative return to the Fund, contributing over five percentage points. Information Technology was our worst performing sector, costing the Fund over four percentage points of return relative to the S&P 500 Index. The Fund’s large exposure to high beta stocks cost almost seven percent in relative return, while our “quality tilt” (low debt) helped to the tune of almost two percent.
Top Ten Holdings as of June 30, 2012
| | | | | | | | |
| Rank | | Description | | Industry | | % of Net
Assets | | |
1 | | Apple, Inc. | | Computers & Peripherals | | 3.0% | | |
2 | | Seagate Technology PLC | | Computers & Peripherals | | 2.9% | | |
3 | | Dean Foods Co. | | Food Products | | 2.2% | | |
4 | | Discover Financial Services | | Consumer Finance | | 2.0% | | |
5 | | Dillard’s, Inc. | | Multiline Retail | | 2.0% | | |
6 | | Monster Beverage Corp. | | Beverages | | 1.7% | | |
7 | | United Rentals, Inc. | | Trading Companies & Distributors | | 1.6% | | |
8 | | NeuStar, Inc. | | IT Services | | 1.6% | | |
9 | | Cirrus Logic, Inc. | | Semiconductors & Semiconductor Equipment | | 1.6% | | |
10 | | Halliburton Co. | | Energy Equipment & Services | | 1.4% | | |
| | | Total | | | | 20.0% | | |
| | |
Aggressive Investors 1 Fund MANAGER’S COMMENTARY (Unaudited) (continued) | | |
Industry Sector Representation as of June 30, 2012
| | | | | | | | | | | | | | | |
| | | % of Net Assets | | % of S&P 500 Index | | Difference |
Consumer Discretionary | | | | 22.1% | | | | | 11.0% | | | | | 11.1% | |
Consumer Staples | | | | 7.4% | | | | | 11.3% | | | | | -3.9% | |
Energy | | | | 6.3% | | | | | 10.8% | | | | | -4.5% | |
Financials | | | | 14.2% | | | | | 14.4% | | | | | -0.2% | |
Health Care | | | | 9.9% | | | | | 12.0% | | | | | -2.1% | |
Industrials | | | | 13.0% | | | | | 10.5% | | | | | 2.5% | |
Information Technology | | | | 18.0% | | | | | 19.7% | | | | | -1.7% | |
Materials | | | | 4.6% | | | | | 3.4% | | | | | 1.2% | |
Telecommunication Services | | | | 3.9% | | | | | 3.2% | | | | | 0.7% | |
Utilities | | | | 0.0% | | | | | 3.7% | | | | | -3.7% | |
Cash & Other Assets | | | | 0.6% | | | | | 0.0% | | | | | 0.6% | |
Total | | | | 100.0% | | | | | 100.0% | | | | | | |
Disclaimer
The views expressed here are exclusively those of Fund management. These views, including those related to market sectors or individual stocks, are not meant as investment advice and should not be considered predictive in nature. Any favorable (or unfavorable) description of a holding applies only as of the quarter-end, June 30, 2012, unless otherwise stated. Security positions can and do change thereafter. Discussions of historical performance do not guarantee and may not be indicative of future performance.
Market volatility can significantly affect short-term performance. The Fund is not an appropriate investment for short-term investors. Investments in the small companies within this multi-cap fund generally carry greater risk than is customarily associated with larger companies. This additional risk is attributable to a number of factors, including the relatively limited financial resources that are typically available to small companies and the fact that small companies often have comparatively limited product lines. In addition, the stock of small companies tends to be more volatile than the stock of large companies, particularly in the short term and particularly in the early stages of an economic or market downturn. The Fund’s use of options, futures, and leverage can magnify the risk of loss in an unfavorable market, and the Fund’s use of short-sale positions can, in theory, expose shareholders to unlimited loss. Finally, the Fund exposes shareholders to “focus risk,” which may add to Fund volatility through the possibility that a single company could significantly affect total return. Shareholders of the Fund, therefore, are taking on more risk than they would if they invested in the stock market as a whole.
Conclusion
Thank you for your continued investment in Aggressive Investors 1 Fund. We encourage your feedback; your reactions and concerns are extremely important to us.
Sincerely,
The Investment Management Team
| | |
11 | | Annual Report | June 30, 2012 |
| | |
Bridgeway Aggressive Investors 1 Fund SCHEDULE OF INVESTMENTS | | |
Showing percentage of net assets as of June 30, 2012
| | | | | | | | |
| Industry Company | | Shares | | | Value | |
COMMON STOCKS - 99.40% | |
Aerospace & Defense - 2.50% | |
Textron, Inc. | | | 92,100 | | | | $2,290,527 | |
Triumph Group, Inc. | | | 50,673 | | | | 2,851,370 | |
| | | | | | | | |
| | | | | | | 5,141,897 | |
| |
Auto Components - 0.99% | |
Delphi Automotive PLC* | | | 80,300 | | | | 2,047,650 | |
| |
Beverages - 4.09% | |
Coca-Cola Enterprises, Inc.# | | | 89,200 | | | | 2,501,168 | |
Constellation Brands, Inc., Class A* | | | 89,500 | | | | 2,421,870 | |
Monster Beverage Corp.* | | | 49,300 | | | | 3,510,160 | |
| | | | | | | | |
| | | | | | | 8,433,198 | |
| |
Biotechnology - 1.32% | |
Alexion Pharmaceuticals, Inc,* | | | 27,400 | | | | 2,720,820 | |
| |
Building Products - 1.28% | |
USG Corp.*+ | | | 138,200 | | | | 2,632,710 | |
| |
Capital Markets - 2.11% | |
Bank of New York Mellon Corp. (The) | | | 99,100 | | | | 2,175,245 | |
Northern Trust Corp. | | | 47,200 | | | | 2,172,144 | |
| | | | | | | | |
| | | | | | | 4,347,389 | |
| |
Chemicals - 2.15% | |
CF Industries Holdings, Inc. | | | 12,800 | | | | 2,479,872 | |
H.B. Fuller Co. | | | 63,800 | | | | 1,958,660 | |
| | | | | | | | |
| | | | | | | 4,438,532 | |
| |
Commercial Banks - 1.96% | |
KeyCorp | | | 198,600 | | | | 1,537,164 | |
US Bancorp | | | 78,000 | | | | 2,508,480 | |
| | | | | | | | |
| | | | | | | 4,045,644 | |
| |
Commercial Services & Supplies - 0.36% | |
Consolidated Graphics, Inc.* | | | 17,400 | | | | 505,470 | |
Quad Graphics, Inc. | | | 15,800 | | | | 227,204 | |
| | | | | | | | |
| | | | | | | 732,674 | |
| |
Computers & Peripherals - 7.90% | |
Apple, Inc.* | | | 10,600 | | | | 6,190,400 | |
Dell, Inc.* | | | 165,700 | | | | 2,074,564 | |
Seagate Technology PLC | | | 245,300 | | | | 6,066,269 | |
| | | | | | | | |
| Industry Company | | Shares | | | Value | |
| | | | | | | | |
Computers & Peripherals (continued) | |
Western Digital Corp.* | | | 63,500 | | | | $ 1,935,480 | |
| | | | | | | | |
| | | | | | | 16,266,713 | |
|
Consumer Finance - 3.06% | |
Cash America International, Inc. | | | 48,500 | | | | 2,135,940 | |
Discover Financial Services | | | 120,400 | | | | 4,163,432 | |
| | | | | | | | |
| | | | | | | 6,299,372 | |
|
Diversified Financial Services - 1.25% | |
Interactive Brokers Group, Inc., Class A | | | 174,700 | | | | 2,571,584 | |
|
Diversified Telecommunication Services - 1.93% | |
tw telecom, inc.* | | | 80,800 | | | | 2,073,328 | |
Vonage Holdings Corp.* | | | 948,381 | | | | 1,906,246 | |
| | | | | | | | |
| | | | | | | 3,979,574 | |
|
Electronic Equipment, Instruments & Components - 1.56% | |
Brightpoint, Inc.* | | | 205,600 | | | | 1,112,296 | |
SYNNEX Corp.* | | | 61,000 | | | | 2,103,890 | |
| | | | | | | | |
| | | | | | | 3,216,186 | |
|
Energy Equipment & Services - 1.62% | |
Halliburton Co. | | | 104,700 | | | | 2,972,433 | |
Helix Energy Solutions Group, Inc.* | | | 22,000 | | | | 361,020 | |
| | | | | | | | |
| | | | | | | 3,333,453 | |
|
Food Products - 3.33% | |
Bunge, Ltd. | | | 35,800 | | | | 2,246,092 | |
Dean Foods Co.* | | | 271,200 | | | | 4,618,536 | |
| | | | | | | | |
| | | | | | | 6,864,628 | |
|
Health Care Providers & Services - 8.25% | |
Aetna, Inc. | | | 49,000 | | | | 1,899,730 | |
Cigna Corp. | | | 45,900 | | | | 2,019,600 | |
Community Health Systems, Inc.* | | | 80,400 | | | | 2,253,612 | |
DaVita, Inc.* | | | 26,800 | | | | 2,632,028 | |
HCA Holdings, Inc. | | | 76,800 | | | | 2,337,024 | |
Health Management Associates, Inc., Class A* | | | 165,300 | | | | 1,297,605 | |
Humana, Inc. | | | 26,600 | | | | 2,059,904 | |
McKesson Corp. | | | 26,700 | | | | 2,503,125 | |
| | | | | | | | |
| | | | | | | 17,002,628 | |
| | |
Bridgeway Aggressive Investors 1 Fund SCHEDULE OF INVESTMENTS (continued) | | |
Showing percentage of net assets as of June 30, 2012
| | | | | | | | |
| Industry Company | | Shares | | | Value | |
Common Stocks (continued) | |
Hotels, Restaurants & Leisure - 1.69% | |
Darden Restaurants, Inc. | | | 39,500 | | | | $ 1,999,885 | |
McDonald’s Corp. | | | 16,800 | | | | 1,487,304 | |
| | | | | | | | |
| | | | | | | 3,487,189 | |
| |
Household Durables - 1.03% | |
Ryland Group, Inc. (The) | | | 83,200 | | | | 2,128,256 | |
| |
Insurance - 2.35% | |
MetLife, Inc. | | | 66,000 | | | | 2,036,100 | |
Torchmark Corp. | | | 55,300 | | | | 2,795,415 | |
| | | | | | | | |
| | | | | | | 4,831,515 | |
| |
Internet Software & Services - 1.31% | |
eBay, Inc.* | | | 64,000 | | | | 2,688,640 | |
| |
IT Services - 4.45% | |
Heartland Payment Systems, Inc. | | | 41,400 | | | | 1,245,312 | |
NeuStar, Inc., Class A* | | | 98,200 | | | | 3,279,880 | |
Visa, Inc., Class A | | | 17,300 | | | | 2,138,799 | |
Western Union Co. (The) | | | 148,500 | | | | 2,500,740 | |
| | | | | | | | |
| | | | | | | 9,164,731 | |
| |
Machinery - 2.26% | |
Actuant Corp., Class A | | | 95,800 | | | | 2,601,928 | |
Cummins, Inc. | | | 21,200 | | | | 2,054,492 | |
| | | | | | | | |
| | | | | | | 4,656,420 | |
| |
Marine - 0.81% | |
Kirby Corp.* | | | 35,477 | | | | 1,670,257 | |
| |
Media - 6.23% | |
CBS Corp., Class B Non-Voting | | | 64,300 | | | | 2,107,754 | |
DIRECTV, Class A* | | | 55,500 | | | | 2,709,510 | |
DISH Network Corp., Class A | | | 46,000 | | | | 1,313,300 | |
Sinclair Broadcast Group, Inc., Class A | | | 203,900 | | | | 1,847,334 | |
Time Warner Cable, Inc. | | | 30,000 | | | | 2,463,000 | |
Viacom, Inc., Class B | | | 50,700 | | | | 2,383,914 | |
| | | | | | | | |
| | | | | | | 12,824,812 | |
| |
Metals & Mining - 1.66% | |
Noranda Aluminum Holding Corp. | | | 127,500 | | | | 1,014,900 | |
Southern Copper Corp. | | | 76,100 | | | | 2,397,911 | |
| | | | | | | | |
| | | | | | | 3,412,811 | |
| |
Multiline Retail - 3.17% | |
Dillard’s, Inc., Class A | | | 65,300 | | | | 4,158,304 | |
| | | | | | | | |
| Industry Company | | Shares | | | Value | |
| |
Multiline Retail (continued) | |
Macy’s, Inc. | | | 69,100 | | | | $ 2,373,585 | |
| | | | | | | | |
| | | | | | | 6,531,889 | |
|
Oil, Gas & Consumable Fuels - 5.64% | |
Chevron Corp. | | | 23,300 | | | | 2,458,150 | |
HollyFrontier Corp. | | | 67,600 | | | | 2,395,068 | �� |
Stone Energy Corp.* | | | 81,200 | | | | 2,057,608 | |
Valero Energy Corp. | | | 32,500 | | | | 784,875 | |
Whiting Petroleum Corp.* | | | 45,600 | | | | 1,875,072 | |
Williams Cos., Inc. (The) | | | 71,300 | | | | 2,054,866 | |
| | | | | | | | |
| | | | | | | 11,625,639 | |
|
Paper & Forest Products - 1.30% | |
PH Glatfelter Co. | | | 163,400 | | | | 2,674,858 | |
|
Pharmaceuticals - 0.35% | |
Warner Chilcot PLC, Class A* | | | 40,400 | | | | 723,968 | |
|
Real Estate Investment Trusts (REITs) - 2.49% | |
BioMed Realty Trust, Inc. | | | 130,600 | | | | 2,439,608 | |
Weingarten Realty Investors | | | 101,700 | | | | 2,678,778 | |
| | | | | | | | |
| | | | | | | 5,118,386 | |
|
Road & Rail - 2.61% | |
Amerco, Inc. | | | 8,800 | | | | 791,736 | |
CSX Corp. | | | 110,500 | | | | 2,470,780 | |
RailAmerica, Inc.* | | | 87,417 | | | | 2,115,492 | |
| | | | | | | | |
| | | | | | | 5,378,008 | |
|
Semiconductors & Semiconductor Equipment - 1.56% | |
Cirrus Logic, Inc.* | | | 107,400 | | | | 3,209,112 | |
|
Software - 1.25% | |
Oracle Corp. | | | 86,600 | | | | 2,572,020 | |
|
Specialty Retail - 7.74% | |
Advance Auto Parts, Inc. | | | 33,200 | | | | 2,264,904 | |
Cabela’s, Inc.* | | | 61,500 | | | | 2,325,315 | |
Genesco, Inc.* | | | 40,400 | | | | 2,430,060 | |
GNC Holdings, Inc., Class A | | | 54,100 | | | | 2,120,720 | |
Limited Brands, Inc. | | | 47,300 | | | | 2,011,669 | |
O’Reilly Automotive, Inc.* | | | 28,900 | | | | 2,420,953 | |
Rent-A-Center, Inc. | | | 70,500 | | | | 2,378,670 | |
| | | | | | | | |
| | | | | | | 15,952,291 | |
|
Textiles, Apparel & Luxury Goods - 1.22% | |
VF Corp. | | | 18,900 | | | | 2,522,205 | |
| | |
13 | | Annual Report | June 30, 2012 |
| | |
Bridgeway Aggressive Investors 1 Fund SCHEDULE OF INVESTMENTS (continued) | | |
Showing percentage of net assets as of June 30, 2012
| | | | | | | | |
| Industry Company | | Shares | | Value | |
Common Stocks (continued) | |
Trading Companies & Distributors - 2.69% | |
United Rentals, Inc.* | | 98,959 | | $ | 3,368,564 | |
W.W. Grainger, Inc. | | 11,400 | | | 2,180,136 | |
| | | | | | | | |
| | | | | 5,548,700 | |
| |
Wireless Telecommunication Services - 1.93% | |
Crown Castle International Corp.* | | 34,400 | | | 2,017,904 | |
SK Telecom Co., Ltd. - ADR | | 161,800 | | | 1,957,780 | |
| | | | | | | | |
| | | | | | | 3,975,684 | |
| | | | | | | | |
TOTAL COMMON STOCKS - 99.40% | | | 204,772,043 | |
| | | | | | | | |
(Cost $196,013,698) | |
| | | |
| | | Rate^ | | Shares | | Value | |
| | | |
MONEY MARKET FUND - 2.45% | |
BlackRock FedFund | | 0.01% | | 5,055,748 | | | 5,055,748 | |
| | | | | | | | |
TOTAL MONEY MARKET FUND - 2.45% | | | 5,055,748 | |
| | | | | | | | |
(Cost $5,055,748) | | | | |
| |
TOTAL INVESTMENTS - 101.85% (Cost $201,069,446) | | $ | 209,827,791 | |
Liabilities in Excess of Other Assets - (1.85%) | | | (3,817,906 | ) |
| | | | | | | | |
NET ASSETS - 100.00% | | $ | 206,009,885 | |
| | | | | | | | |
* Non-income producing security. # Securities, or a portion thereof, segregated to cover the Fund’s potential obligation under swap agreements. The total value of segregated assets is $560,800. ^ Rate disclosed as of June 30, 2012. + This security or a portion of the security is out on loan at June 30, 2012. Total loaned securities had a value of $2,632,710 at June 30, 2012. ADR - American Depositary Receipt PLC - Public Limited Company | |
Summary of inputs used to value the Fund’s investments as of 06/30/2012 is as follows (See Note 2 in Notes to Financial Statements):
| | | | | | | | | | | | | | | | |
| | | Valuation Inputs | |
| | | Investment in Securities (Value) | |
| | | Level 1 Quoted Prices | | | Level 2
Significant
Observable
Inputs | | | Level 3
Significant
Unobservable
Inputs | | | Total | |
Common Stocks | | $ | 204,772,043 | | | $ | — | | | $ | — | | | $ | 204,772,043 | |
Money Market Fund | | | — | | | | 5,055,748 | | | | — | | | | 5,055,748 | |
| | | | | | | | | | | | | | | | |
TOTAL | | $ | 204,772,043 | | | $ | 5,055,748 | | | $ | — | | | $ | 209,827,791 | |
| | | | | | | | | | | | | | | | |
See Notes to Financial Statements.
| | |
Ultra-Small Company Fund MANAGER’S COMMENTARY (Unaudited) | | |
June 30, 2012
Dear Fellow Ultra-Small Company Fund Shareholder,
For the quarter ended June 30, 2012, our Fund declined 6.55%, trailing our primary market benchmark, the CRSP Cap-Based Portfolio 10 Index (-2.01%), our peer benchmark, the Lipper Micro-Cap Stock Funds Index (-4.15%), the Russell Microcap Index (-1.98%) and the Russell 2000 Index (-3.47%). It was a quarter that contained the fourth high correlation spike since 2008 (see page 3 for a fuller explanation), an environment generally unfavorable to our Fund’s performance.
For the fiscal year ended June 30, 2012, our Fund declined 5.41%, trailing our primary market benchmark, the CRSP Cap-Based Portfolio 10 Index (-0.85%), our peer benchmark, the Lipper Micro-Cap Stock Funds Index (-2.53%), the Russell Microcap Index (-0.54%) and the Russell 2000 Index (-2.08%). In spite of two strong quarters (December 2011 and March 2012), the two high correlation spikes (September 2011 and June 2012) of the fiscal year put us strongly “in the red” for the period. For reasons outlined on page 3, proactive steps on our part make us more optimistic about negotiating high correlation spikes in the future, should they continue.
The table below presents our June quarter, one-year, five-year, ten-year and inception-to-date financial results. See the next page for a graph of performance since inception.
Standardized Returns as of June 30, 2012
| | | | | | | | | | | | | | | | | | |
| | | | |
| | | | | | | | | Annualized |
| | | Quarter | | | 1 Year | | | 5 Years | | | 10 Years | | | Since Inception
(8/5/94) |
| | | | | |
Ultra-Small Company Fund | | | -6.55% | | | | -5.41% | | | | -2.61% | | | | 9.93% | | | 14.74% |
CRSP Cap-Based Portfolio 10 Index | | | -2.01% | | | | -0.85% | | | | 0.97% | | | | 11.61% | | | 11.86% |
Russell Microcap Index | | | -1.98% | | | | -0.54% | | | | -2.19% | | | | 5.89% | | | N/A |
Russell 2000 Index | | | -3.47% | | | | -2.08% | | | | 0.54% | | | | 7.00% | | | 8.29% |
Lipper Micro-Cap Stock Funds Index | | | -4.15% | | | | -2.53% | | | | -0.78% | | | | 6.47% | | | N/A |
Performance figures quoted in the table above and graph below represent past performance and are no guarantee of future results. Total return figures in the table above include the reinvestment of dividends and capital gains. The table above and the graph below do not reflect the deduction of taxes that a shareholder would pay on Fund distributions or the redemption of Fund shares.
The CRSP Cap-Based Portfolio 10 Index is an unmanaged index of 1,131 of the smallest publicly traded U.S. stocks (with dividends reinvested), as reported by the Center for Research on Security Prices. The Russell Microcap Index is an unmanaged, market value weighted index that measures performance of 1,000 of the smallest securities in the Russell 2000 Index. The Russell 2000 Index is an unmanaged, market value weighted index that measures performance of the 2,000 companies that are between the 1,000th and 3,000th largest in the market with dividends reinvested. The Lipper Micro-Cap Stock Funds Index is an index of micro-cap funds compiled by Lipper, Inc. It is not possible to invest directly in an index. Periods longer than one year are annualized.
According to data from Lipper, Inc. as of June 30, 2012, Ultra-Small Company Fund ranked 60th of 76 micro-cap funds for the twelve months ending June 30, 2012, 49th of 60 over the last five years, 2nd of 42 over the last ten years, and 1st of 9 since inception in August, 1994. Lipper, Inc. is an independent mutual fund rating service that ranks funds in various fund categories by making comparative calculations using total returns.
| | |
15 | | Annual Report | June 30, 2012 |
| | |
Ultra-Small Company Fund MANAGER’S COMMENTARY (Unaudited) (continued) | | |
Ultra-Small Company Fund vs. CRSP Cap-Based Portfolio 10 Index, Russell Microcap Index**, Russell 2000 Index & Lipper Micro-Cap Stock Funds Index* from Inception 8/5/94 to 6/30/12
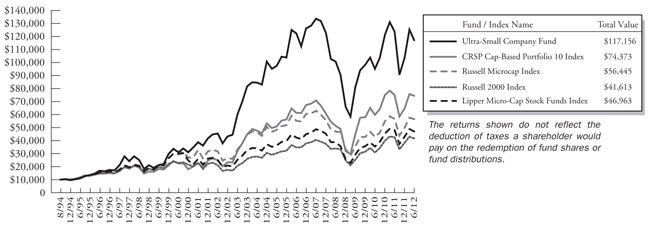
| * | The Lipper Micro-Cap Stock Funds Index began on 12/31/1995, and the line graph for the Index begins at the same value as the Fund on that date. |
| ** | The Russell Microcap Index began on 6/30/2000, and the line graph for the Index begins at the same value as the Fund on that date. |
Detailed Explanation of Quarterly Performance
The Short Version: Our Fund performed poorly in the fourth high correlation spike of the last four years. Note there have only been three other high correlation spikes in the six+ decades preceding.
The table below presents index performance numbers of stocks by size for different time periods. It indicates that even though the returns were negative in all deciles, we had a nice tailwind to ride in the quarter ended June 30, 2012 as the 10th decile outperformed all other size stocks.
| | | | | | | | | | | | | | | | | | | | |
| CRSP Decile1 | | Quarter | | | 1 Year | | | 5 Years | | | 10 Years | | | 86.5 Years | |
1 (ultra-large) | | | -2.27% | | | | 7.66% | | | | 0.49% | | | | 4.81% | | | | 9.09% | |
2 | | | -4.61% | | | | -0.15% | | | | 0.68% | | | | 8.05% | | | | 10.39% | |
3 | | | -6.33% | | | | -4.40% | | | | 0.89% | | | | 8.12% | | | | 10.77% | |
4 | | | -6.85% | | | | -3.88% | | | | 2.02% | | | | 8.92% | | | | 10.73% | |
5 | | | -5.81% | | | | -6.10% | | | | 2.84% | | | | 9.84% | | | | 11.27% | |
6 | | | -5.24% | | | | -1.48% | | | | 1.77% | | | | 8.45% | | | | 11.25% | |
7 | | | -4.02% | | | | -1.88% | | | | 3.09% | | | | 9.34% | | | | 11.25% | |
8 | | | -5.21% | | | | -2.22% | | | | 2.93% | | | | 9.69% | | | | 11.45% | |
9 | | | -4.13% | | | | -2.88% | | | | 1.61% | | | | 8.31% | | | | 11.46% | |
10 (ultra-small) | | | -2.01% | | | | -0.85% | | | | 0.97% | | | | 11.61% | | | | 13.02% | |
| 1 | Performance figures are as of the period ended June 30, 2012. The CRSP Cap-Based Portfolio Indexes are unmanaged indexes of the publicly traded U.S. stocks with dividends reinvested, grouped by market capitalization, as reported by the Center for Research in Security Prices. Past performance is no guarantee of future results. |
Our June quarter underperformance was broad based across sector, model, size, and valuation. The high correlation spike unquestionably affected Fund returns. On an encouraging note, our models continued to pick companies that showed improving corporate level economic health. However, companies that surprised Wall Street to the upside were rewarded little, while those surprising analysts on the downside were relatively hammered. Since we now have four high correlation spikes in our
| | |
Ultra-Small Company Fund MANAGER’S COMMENTARY (Unaudited) (continued) | | |
calibration database, we believe our models will negotiate these better in the future, should they continue. Eventually, however, we believe investors will get back to focusing on individual company health as a driver of stock price, fostering an environment that has been historically much friendlier to our Fund’s returns.
Detailed Explanation of Fiscal Year Performance
The Short Version: Much like the quarter, two high correlation spikes took their toll, in spite of two other strong quarters (December 2011 and March 2012).
As in the latest quarter, poor performing stocks were represented in a broad based fashion across the Information Technology, Industrials, Financials and Energy sectors. Strong stock picking in the Consumer Discretionary sector was not enough to offset the other sectors, however. Generally speaking, our higher risk stocks predictably did the most damage.
Top Ten Holdings as of June 30, 2012
| | | | | | | | |
| Rank | | Description | | Industry | | % of Net
Assets | |
1 | | Smith & Wesson Holding Corp. | | Leisure Equipment & Products | | | 2.0 | % |
2 | | Homeowners Choice, Inc. | | Insurance | | | 1.3 | % |
3 | | Metropolitan Health Networks, Inc. | | Health Care Providers & Services | | | 1.3 | % |
4 | | Fiesta Restaurant Group, Inc. | | Hotels, Restaurants & Leisure | | | 1.3 | % |
5 | | Multimedia Games Holding Co., Inc. | | Hotels, Restaurants & Leisure | | | 1.2 | % |
6 | | TGC Industries, Inc. | | Energy Equipment & Services | | | 1.2 | % |
7 | | Cambrex Corp. | | Life Sciences Tools & Services | | | 1.2 | % |
8 | | Aceto Corp. | | Trading Companies & Distributors | | | 1.1 | % |
9 | | Carmike Cinemas, Inc. | | Media | | | 1.1 | % |
10 | | On Assignment, Inc. | | Professional Services | | | 1.1 | % |
| | Total | | | | | 12.8 | % |
Industry Sector Representation as of June 30, 2012
| | | | | | | | | | | | |
| | | % of Net Assets | | | % of CRSP 10 Index | | | Difference | |
Consumer Discretionary | | | 24.0% | | | | 15.2% | | | | 8.8% | |
Consumer Staples | | | 2.6% | | | | 3.0% | | | | -0.4% | |
Energy | | | 4.7% | | | | 5.7% | | | | -1.0% | |
Financials | | | 21.7% | | | | 25.1% | | | | -3.4% | |
Health Care | | | 8.8% | | | | 18.2% | | | | -9.4% | |
Industrials | | | 15.3% | | | | 11.8% | | | | 3.5% | |
Information Technology | | | 11.7% | | | | 15.3% | | | | -3.6% | |
Materials | | | 4.9% | | | | 2.8% | | | | 2.1% | |
Telecommunication Services | | | 2.0% | | | | 1.4% | | | | 0.6% | |
Utilities | | | 0.0% | | | | 1.5% | | | | -1.5% | |
Cash & Other Assets | | | 4.3% | | | | 0.0% | | | | 4.3% | |
Total | | | 100.0% | | | | 100.0% | | | | | |
Disclaimer
The views expressed here are exclusively those of Fund management. These views, including those related to market sectors or individual stocks, are not meant as investment advice and should not be considered predictive in nature. Any favorable (or
| | |
17 | | Annual Report | June 30, 2012 |
| | |
Ultra-Small Company Fund MANAGER’S COMMENTARY (Unaudited) (continued) | | |
unfavorable) description of a holding applies only as of the quarter-end, June 30, 2012, unless otherwise stated. Security positions can and do change thereafter. Discussions of historical performance do not guarantee and may not be indicative of future performance.
The Fund is subject to very high, above market risk (volatility) and is not an appropriate investment for short-term investors. Investments in ultra-small companies generally carry greater risk than is customarily associated with larger companies and even “small companies” for various reasons, such as narrower markets (fewer investors), limited financial resources and greater trading difficulty.
Conclusion
Ultra-Small Company Fund remains closed to new investors. We encourage your feedback; your reactions and concerns are important to us.
Sincerely,
The Investment Management Team
| | |
Bridgeway Ultra-Small Company Fund SCHEDULE OF INVESTMENTS | | |
Showing percentage of net assets as of June 30, 2012
| | | | | | | | |
| Industry Company | | Shares | | | Value | |
COMMON STOCKS - 95.78% | |
Aerospace & Defense - 1.56% | |
Astronics Corp.* | | | 26,500 | | | $ | 748,360 | |
Astronics Corp., Class B* | | | 2,650 | | | | 70,278 | |
EDAC Technologies Corp.*+ | | | 18,600 | | | | 209,808 | |
GenCorp, Inc.* | | | 37,100 | | | | 241,521 | |
GeoEye, Inc.* | | | 9,400 | | | | 145,512 | |
Sypris Solutions, Inc. | | | 24,900 | | | | 173,553 | |
| | | | | | | | |
| | | | | | | 1,589,032 | |
| |
Air Freight & Logistics - 1.95% | |
Air Transport Services Group, Inc.* | | | 40,900 | | | | 212,680 | |
Echo Global Logistics, Inc.*+ | | | 5,800 | | | | 110,548 | |
Pacer International, Inc.* | | | 135,800 | | | | 736,036 | |
Park-Ohio Holdings Corp.* | | | 49,000 | | | | 932,470 | |
| | | | | | | | |
| | | | | | | 1,991,734 | |
| |
Airlines - 0.74% | |
Hawaiian Holdings, Inc.* | | | 19,900 | | | | 129,549 | |
Republic Airways Holdings, Inc.* | | | 112,500 | | | | 624,375 | |
| | | | | | | | |
| | | | | | | 753,924 | |
| |
Auto Components - 1.45% | |
American Axle & Manufacturing Holdings, Inc.* | | | 17,600 | | | | 184,624 | |
Shiloh Industries, Inc. | | | 9,300 | | | | 106,950 | |
Spartan Motors, Inc. | | | 37,300 | | | | 195,452 | |
Stoneridge, Inc.* | | | 103,900 | | | | 707,559 | |
Tower International, Inc.* | | | 27,200 | | | | 285,600 | |
Williams Controls, Inc. | | | 214 | | | | 2,590 | |
| | | | | | | | |
| | | | | | | 1,482,775 | |
| |
Beverages - 0.07% | |
Reed’s, Inc.* | | | 20,700 | | | | 67,275 | |
| |
Biotechnology - 0.61% | |
China Biologic Products, Inc.* | | | 6,900 | | | | 64,653 | |
Vanda Pharmaceuticals, Inc.* | | | 126,500 | | | | 556,600 | |
| | | | | | | | |
| | | | | | | 621,253 | |
| |
Building Products - 0.71% | |
Patrick Industries, Inc.* | | | 55,752 | | | | 710,838 | |
PGT, Inc.* | | | 6,000 | | | | 18,180 | |
| | | | | | | | |
| | | | | | | 729,018 | |
| |
Capital Markets - 4.11% | |
Arlington Asset Investment Corp., Class A+ | | | 43,600 | | | | 946,556 | |
| | | | | | | | |
| Industry Company | | Shares | | | Value | |
| |
Capital Markets (continued) | |
Calamos Asset | | | | | | | | |
Management, Inc., Class A | | | 80,100 | | | $ | 917,145 | |
Duff & Phelps Corp., Class A | | | 7,300 | | | | 105,850 | |
Fidus Investment Corp. | | | 34,300 | | | | 520,331 | |
Gladstone Capital Corp. | | | 74,600 | | | | 588,594 | |
Gladstone Investment Corp. | | | 52,500 | | | | 387,975 | |
Kohlberg Capital Corp. | | | 100,000 | | | | 726,000 | |
| | | | | | | | |
| | | | | | | 4,192,451 | |
|
Chemicals - 3.13% | |
American Vanguard Corp. | | | 11,000 | | | | 292,490 | |
Arabian American Development Co.*+ | | | 65,100 | | | | 630,819 | |
Core Molding Technologies, Inc.* | | | 14,800 | | | | 121,952 | |
Innospec, Inc.* | | | 9,400 | | | | 278,334 | |
Landec Corp.* | | | 79,800 | | | | 683,088 | |
Material Sciences Corp.* | | | 33,800 | | | | 277,160 | |
Penford Corp.* | | | 6,900 | | | | 61,755 | |
Spartech Corp.* | | | 146,000 | | | | 754,820 | |
TPC Group, Inc.* | | | 2,700 | | | | 99,765 | |
| | | | | | | | |
| | | | | | | 3,200,183 | |
|
Commercial Banks - 6.40% | |
Access National Corp.+ | | | 9,800 | | | | 128,380 | |
American National Bankshares, Inc. | | | 19,000 | | | | 447,640 | |
Ameris Bancorp* | | | 58,800 | | | | 740,880 | |
BancFirst Corp. | | | 4,900 | | | | 205,359 | |
Bancorp, Inc. (The)* | | | 13,300 | | | | 125,685 | |
C&F Financial Corp.+ | | | 4,800 | | | | 192,768 | |
Enterprise Bancorp, Inc.+ | | | 5,900 | | | | 96,701 | |
Enterprise Financial Services Corp. | | | 6,600 | | | | 72,336 | |
Farmers Capital Bank Corp.* | | | 20,000 | | | | 131,400 | |
Fidelity Southern Corp.+ | | | 19,688 | | | | 170,104 | |
German American Bancorp, Inc.+ | | | 18,600 | | | | 381,300 | |
Guaranty Bancorp* | | | 99,500 | | | | 209,945 | |
Heritage Financial Corp. | | | 30,200 | | | | 442,430 | |
Horizon Bancorp+ | | | 8,700 | | | | 228,810 | |
MainSource Financial Group, Inc. | | | 26,600 | | | | 314,678 | |
Mercantile Bank Corp.* | | | 20,900 | | | | 385,605 | |
Metro Bancorp, Inc.* | | | 38,700 | | | | 465,561 | |
MetroCorp Bancshares, Inc.* | | | 16,000 | | | | 170,720 | |
OmniAmerican Bancorp, Inc.* | | | 28,300 | | | | 606,469 | |
| | |
19 | | Annual Report | June 30, 2012 |
| | |
Bridgeway Ultra-Small Company Fund SCHEDULE OF INVESTMENTS (continued) | | |
Showing percentage of net assets as of June 30, 2012
| | | | | | | | |
| Industry Company | | Shares | | | Value | |
Common Stocks (continued) | |
Commercial Banks (continued) | |
Pacific Mercantile Bancorp*+ | | | 25,000 | | | $ | 172,750 | |
Renasant Corp. | | | 13,700 | | | | 215,227 | |
Taylor Capital Group, Inc.*+ | | | 17,500 | | | | 286,825 | |
Trico Bancshares | | | 22,000 | | | | 338,800 | |
| | | | | | | | |
| | | | | | | 6,530,373 | |
| |
Commercial Services & Supplies - 1.73% | |
Asset Acceptance Capital Corp.*+ | | | 40,800 | | | | 277,440 | |
Ceco Environmental Corp. | | | 12,700 | | | | 100,330 | |
Cenveo, Inc.*+ | | | 142,900 | | | | 275,797 | |
Consolidated Graphics, Inc.* | | | 4,700 | | | | 136,535 | |
Courier Corp. | | | 42,700 | | | | 565,775 | |
Intersections, Inc. | | | 11,700 | | | | 185,445 | |
TRC Cos., Inc.* | | | 37,800 | | | | 229,824 | |
| | | | | | | | |
| | | | | | | 1,771,146 | |
| |
Communications Equipment - 3.22% | |
CalAmp Corp.* | | | 115,600 | | | | 847,348 | |
Globecomm Systems, Inc.* | | | 7,500 | | | | 76,050 | |
Ituran Location & Control, Ltd. | | | 14,500 | | | | 159,065 | |
Sierra Wireless, Inc.* | | | 87,600 | | | | 791,028 | |
Tessco Technologies, Inc. | | | 49,100 | | | | 1,082,655 | |
UTStarcom Holdings Corp.* | | | 281,400 | | | | 334,866 | |
| | | | | | | | |
| | | | | | | 3,291,012 | |
| |
Computers & Peripherals - 0.32% | |
Hutchinson Technology, Inc.*+ | | | 126,700 | | | | 184,982 | |
Smart Technologies, Inc., Class A* | | | 76,200 | | | | 138,684 | |
| | | | | | | | |
| | | | | | | 323,666 | |
| |
Construction & Engineering - 1.27% | |
Argan, Inc. | | | 22,800 | | | | 318,744 | |
Dycom Industries, Inc.* | | | 10,800 | | | | 200,988 | |
Goldfield Corp. (The)* | | | 58,600 | | | | 133,608 | |
Michael Baker Corp.* | | | 19,000 | | | | 495,710 | |
Pike Electric Corp.* | | | 19,300 | | | | 148,996 | |
| | | | | | | | |
| | | | | | | 1,298,046 | |
| |
Consumer Finance - 0.71% | |
CompuCredit Holdings Corp.* | | | 200,000 | | | | 724,000 | |
| |
Containers & Packaging - 0.14% | |
Myers Industries, Inc. | | | 8,200 | | | | 140,712 | |
| |
Distributors - 0.33% | |
Core-Mark Holding Co., Inc. | | | 4,300 | | | | 207,002 | |
| | | | | | | | |
| Industry Company | | Shares | | | Value | |
| |
Distributors (continued) | |
VOXX International Corp.* | | | 13,500 | | | | $ 125,820 | |
| | | | | | | | |
| | | | | | | 332,822 | |
|
Diversified Consumer Services - 0.91% | |
Carriage Services, Inc. | | | 36,100 | | | | 300,352 | |
Corinthian Colleges, Inc.* | | | 196,200 | | | | 567,018 | |
Lincoln Educational Services Corp. | | | 10,100 | | | | 65,650 | |
| | | | | | | | |
| | | | | | | 933,020 | |
|
Diversified Financial Services - 0.59% | |
Gain Capital Holdings, Inc.+ | | | 57,000 | | | | 284,430 | |
Interactive Brokers Group, Inc., Class A | | | 10,900 | | | | 160,448 | |
MicroFinancial, Inc. | | | 19,100 | | | | 154,710 | |
| | | | | | | | |
| | | | | | | 599,588 | |
|
Diversified Telecommunication Services - 1.98% | |
Fairpoint Communications, Inc.*+ | | | 175,000 | | | | 1,076,250 | |
Hawaiian Telcom Holdco, Inc.*+ | | | 32,200 | | | | 628,222 | |
IDT Corp., Class B | | | 7,700 | | | | 75,537 | |
Nortel Inversora SA - ADR Preferred B | | | 5,800 | | | | 90,596 | |
Vonage Holdings Corp.* | | | 74,000 | | | | 148,740 | |
| | | | | | | | |
| | | | | | | 2,019,345 | |
|
Electrical Equipment - 0.35% | |
Allied Motion Technologies, Inc. | | | 30,000 | | | | 180,000 | |
Magnetek, Inc.* | | | 11,700 | | | | 180,648 | |
| | | | | | | | |
| | | | | | | 360,648 | |
|
Electronic Equipment, Instruments & Components - 2.83% | |
Brightpoint, Inc.* | | | 29,500 | | | | 159,595 | |
Insight Enterprises, Inc.* | | | 19,900 | | | | 334,917 | |
Key Tronic Corp.* | | | 88,500 | | | | 729,240 | |
LoJack Corp.* | | | 67,305 | | | | 203,261 | |
Netlist, Inc.* | | | 225,700 | | | | 510,082 | |
PAR Technology Corp.* | | | 18,400 | | | | 90,712 | |
PC Connection, Inc. | | | 48,500 | | | | 515,070 | |
SMTC Corp.* | | | 3,300 | | | | 10,791 | |
Viasystems Group, Inc.* | | | 11,200 | | | | 190,400 | |
Zygo Corp.* | | | 7,900 | | | | 141,094 | |
| | | | | | | | |
| | | | | | | 2,885,162 | |
|
Energy Equipment & Services - 1.91% | |
Forbes Energy Services, Ltd.* | | | 46,700 | | | | 219,490 | |
Global Geophysical Services, Inc.* | | | 24,000 | | | | 146,880 | |
| | |
Bridgeway Ultra-Small Company Fund SCHEDULE OF INVESTMENTS (continued) | | |
Showing percentage of net assets as of June 30, 2012
| | | | | | | | |
| Industry Company | | Shares | | | Value | |
Common Stocks (continued) | | | | | |
Energy Equipment & Services (continued) | | | | | |
PHI, Inc.* | | | 5,400 | | | | $ 150,174 | |
Pioneer Drilling Co.* | | | 25,800 | | | | 205,626 | |
TGC Industries, Inc.* | | | 126,780 | | | | 1,231,034 | |
| | | | | | | | |
| | | | | | | 1,953,204 | |
| |
Food & Staples Retailing - 1.04% | | | | | |
Ingles Markets, Inc., Class A | | | 6,200 | | | | 99,386 | |
Pantry, Inc. (The)* | | | 7,000 | | | | 102,900 | |
Spartan Stores, Inc. | | | 6,000 | | | | 108,780 | |
Susser Holdings Corp.* | | | 20,100 | | | | 747,117 | |
| | | | | | | | |
| | | | | | | 1,058,183 | |
| |
Food Products - 1.35% | | | | | |
Alico, Inc. | | | 15,400 | | | | 470,316 | |
Inventure Foods, Inc.* | | | 11,000 | | | | 69,300 | |
John B. Sanfilippo & Son, Inc.* | | | 38,300 | | | | 683,655 | |
Smart Balance, Inc.* | | | 17,000 | | | | 159,630 | |
| | | | | | | | |
| | | | | | | 1,382,901 | |
| |
Health Care Equipment & Supplies - 1.71% | | | | | |
Fonar Corp.*+ | | | 46,600 | | | | 191,526 | |
IRIS International, Inc.* | | | 50,300 | | | | 568,390 | |
Orthofix International NV* | | | 2,700 | | | | 111,375 | |
PhotoMedex, Inc.*+ | | | 72,000 | | | | 874,800 | |
| | | | | | | | |
| | | | | | | 1,746,091 | |
| |
Health Care Providers & Services - 4.61% | | | | | |
Advocat, Inc. | | | 8,300 | | | | 53,120 | |
Ensign Group, Inc. (The) | | | 13,400 | | | | 378,818 | |
Five Star Quality Care, Inc.* | | | 205,400 | | | | 630,578 | |
Kindred Healthcare, Inc.* | | | 17,400 | | | | 171,042 | |
LCA-Vision, Inc.* | | | 195,200 | | | | 839,360 | |
Metropolitan Health Networks, Inc.* | | | 139,600 | | | | 1,335,972 | |
Providence Service Corp. (The)* | | | 62,700 | | | | 859,617 | |
Skilled Healthcare Group, Inc., Class A* | | | 24,900 | | | | 156,372 | |
Sunrise Senior Living, Inc.*+ | | | 21,800 | | | | 158,922 | |
Triple-S Management Corp., Class B* | | | 6,800 | | | | 124,304 | |
| | | | | | | | |
| | | | | | | 4,708,105 | |
| |
Hotels, Restaurants & Leisure - 8.32% | | | | | |
Ameristar Casinos, Inc. | | | 11,100 | | | | 197,247 | |
Caribou Coffee Co., Inc.* | | | 55,800 | | | | 720,378 | |
Carrols Restaurant Group, Inc.* | | | 104,040 | | | �� | 617,998 | |
CEC Entertainment, Inc. | | | 3,300 | | | | 120,021 | |
| | | | | | | | |
| Industry Company | | Shares | | | Value | |
| | | | | |
Hotels, Restaurants & Leisure (continued) | | | | | |
Einstein Noah Restaurant Group, Inc. | | | 14,100 | | | $ | 247,596 | |
Fiesta Restaurant Group, Inc.* | | | 100,000 | | | | 1,323,000 | |
Frisch’s Restaurants, Inc. | | | 10,700 | | | | 303,238 | |
Isle of Capri Casinos, Inc.* | | | 94,400 | | | | 582,448 | |
Kona Grill, Inc.* | | | 20,000 | | | | 180,400 | |
Luby’s, Inc.* | | | 35,700 | | | | 239,190 | |
Marcus Corp. | | | 8,700 | | | | 119,712 | |
MTR Gaming Group, Inc.* | | | 63,900 | | | | 303,525 | |
Multimedia Games Holding Co., Inc.* | | | 88,800 | | | | 1,243,200 | |
Papa John’s International, Inc.* | | | 3,300 | | | | 156,981 | |
Red Robin Gourmet Burgers, Inc.* | | | 3,500 | | | | 106,785 | |
Ruth’s Hospitality Group, Inc.* | | | 134,100 | | | | 885,060 | |
Sonic Corp.* | | | 28,500 | | | | 285,570 | |
Town Sports International Holdings, Inc.*# | | | 64,800 | | | | 861,192 | |
| | | | | | | | |
| | | | | | | 8,493,541 | |
| |
Household Durables - 1.06% | | | | | |
Flexsteel Industries, Inc. | | | 11,800 | | | | 233,404 | |
Libbey, Inc.* | | | 10,600 | | | | 162,922 | |
Lifetime Brands, Inc. | | | 22,900 | | | | 285,563 | |
Sealy Corp.*+ | | | 216,800 | | | | 401,080 | |
| | | | | | | | |
| | | | | | | 1,082,969 | |
| |
Insurance - 2.87% | | | | | |
Eastern Insurance Holdings, Inc.+ | | | 10,300 | | | | 175,100 | |
Flagstone Reinsurance Holdings SA | | | 15,000 | | | | 120,150 | |
Hallmark Financial Services, Inc.* | | | 46,100 | | | | 359,580 | |
Homeowners Choice, Inc. | | | 78,200 | | | | 1,376,320 | |
Independence Holding Co. | | | 9,200 | | | | 90,620 | |
Maiden Holdings, Ltd. | | | 16,400 | | | | 142,352 | |
United Fire Group, Inc. | | | 10,700 | | | | 228,231 | |
Universal Insurance Holdings, Inc. | | | 130,000 | | | | 443,300 | |
| | | | | | | | |
| | | | | | | 2,935,653 | |
| |
Internet & Catalog Retail - 0.74% | | | | | |
1-800-Flowers.com, Inc., Class A* | | | 183,500 | | | | 640,415 | |
Nutrisystem, Inc. | | | 9,600 | | | | 110,976 | |
| | | | | | | | |
| | | | | | | 751,391 | |
| | |
21 | | Annual Report | June 30, 2012 |
| | |
Bridgeway Ultra-Small Company Fund SCHEDULE OF INVESTMENTS (continued) | | |
Showing percentage of net assets as of June 30, 2012
| | | | | | | | |
| Industry Company | | Shares | | | Value | |
Common Stocks (continued) | | | | | | | | |
Internet Software & Services - 0.51% | | | | | |
Internet Initiative Japan, Inc. - Sponsored ADR | | | 9,100 | | | | $ 95,095 | |
Ipass, Inc.* | | | 180,200 | | | | 428,876 | |
| | | | | | | | |
| | | | | | | 523,971 | |
| |
IT Services - 2.36% | | | | | |
Computer Task Group, Inc.* | | | 43,300 | | | | 649,067 | |
Hackett Group, Inc. (The)* | | | 145,700 | | | | 811,549 | |
Heartland Payment Systems, Inc. | | | 7,500 | | | | 225,600 | |
Innodata, Inc.*+ | | | 22,300 | | | | 152,532 | |
LML Payment Systems, Inc.* | | | 56,000 | | | | 106,960 | |
NCI, Inc., Class A* | | | 10,900 | | | | 44,145 | |
Pfsweb, Inc.* | | | 60,200 | | | | 170,968 | |
Unisys Corp.* | | | 12,500 | | | | 244,375 | |
| | | | | | | | |
| | | | | | | 2,405,196 | |
| |
Leisure Equipment & Products - 3.37% | | | | | |
Arctic Cat, Inc.* | | | 3,900 | | | | 142,584 | |
LeapFrog Enterprises, Inc.* | | | 29,600 | | | | 303,696 | |
Nautilus, Inc.* | | | 188,800 | | | | 624,928 | |
Smith & Wesson Holding Corp.* | | | 250,800 | | | | 2,084,148 | |
Sturm Ruger & Co., Inc.+ | | | 7,200 | | | | 289,080 | |
| | | | | | | | |
| | | | | | | 3,444,436 | |
| |
Life Sciences Tools & Services - 1.18% | | | | | |
Cambrex Corp.* | | | 128,000 | | | | 1,204,480 | |
| |
Machinery - 1.18% | | | | | |
Alamo Group, Inc. | | | 10,400 | | | | 326,248 | |
Briggs & Stratton Corp. | | | 8,300 | | | | 145,167 | |
Manitex International, Inc.* | | | 63,200 | | | | 530,880 | |
Trimas Corp.* | | | 9,500 | | | | 190,950 | |
Xerium Technologies, Inc.* | | | 4,200 | | | | 12,180 | |
| | | | | | | | |
| | | | | | | 1,205,425 | |
| |
Marine - 0.09% | | | | | |
Seanergy Maritime Holdings Corp.* | | | 40,000 | | | | 88,400 | |
| |
Media - 4.66% | | | | | |
Ballantyne Strong, Inc.* | | | 67,300 | | | | 401,781 | |
Beasley Broadcasting Group, Inc., Class A* | | | 5,100 | | | | 30,039 | |
Carmike Cinemas, Inc.* | | | 74,600 | | | | 1,092,890 | |
Dex One Corp.* | | | 670,000 | | | | 626,450 | |
Entercom Communications Corp., Class A* | | | 85,100 | | | | 512,302 | |
Lee Enterprises, Inc.* | | | 354,800 | | | | 574,776 | |
LIN TV Corp., Class A* | | | 117,400 | | | | 354,548 | |
| | | | | | | | |
| Industry Company | | Shares | | | Value | |
| | | | | |
Media (continued) | | | | | |
Saga Communications, Inc., Class A* | | | 5,100 | | | $ | 189,261 | |
Salem Communications Corp., Class A | | | 78,700 | | | | 430,489 | |
Sinclair Broadcast Group, Inc., Class A | | | 18,800 | | | | 170,328 | |
Spanish Broadcasting System, Inc., Class A* | | | 27,500 | | | | 111,650 | |
SuperMedia, Inc.*+ | | | 105,000 | | | | 262,500 | |
| | | | | | | | |
| | | | | | | 4,757,014 | |
| |
Metals & Mining - 0.96% | | | | | |
Friedman Industries, Inc. | | | 23,700 | | | | 241,029 | |
Handy & Harman, Ltd.* | | | 55,000 | | | | 741,400 | |
| | | | | | | | |
| | | | | | | 982,429 | |
| |
Multiline Retail - 0.18% | | | | | |
Bon-Ton Stores, Inc. (The) | | | 24,200 | | | | 189,002 | |
| |
Oil, Gas & Consumable Fuels - 2.97% | | | | | |
Adams Resources & Energy, Inc. | | | 25,400 | | | | 1,064,768 | |
Alon USA Energy, Inc. | | | 20,000 | | | | 169,200 | |
ATP Oil & Gas Corp.*+ | | | 16,000 | | | | 54,080 | |
BioFuel Energy Corp.* | | | 1,100 | | | | 3,916 | |
Double Eagle Petroleum Co.* | | | 28,142 | | | | 123,262 | |
Green Plains Renewable Energy, Inc.*+ | | | 87,059 | | | | 543,248 | |
Patriot Coal Corp.* | | | 401,000 | | | | 489,220 | |
REX American Resources Corp.* | | | 7,100 | | | | 138,592 | |
Verenium Corp.* | | | 57,600 | | | | 180,288 | |
Westmoreland Coal Co.* | | | 32,600 | | | | 262,430 | |
| | | | | | | | |
| | | | | | | 3,029,004 | |
| |
Paper & Forest Products - 0.46% | | | | | |
Mercer International, Inc.* | | | 18,000 | | | | 102,780 | |
Neenah Paper, Inc. | | | 7,900 | | | | 210,851 | |
Orient Paper, Inc. | | | 60,400 | | | | 158,248 | |
| | | | | | | | |
| | | | | | | 471,879 | |
| |
Personal Products - 0.15% | | | | | |
Cyanotech Corp.* | | | 4,737 | | | | 32,780 | |
Nature’s Sunshine Products, Inc.+ | | | 8,100 | | | | 122,310 | |
| | | | | | | | |
| | | | | | | 155,090 | |
| | |
Pharmaceuticals - 0.69% | | | | | | | | |
Pozen, Inc.* | | | 112,600 | | | | 702,624 | |
| | |
Bridgeway Ultra-Small Company Fund SCHEDULE OF INVESTMENTS (continued) | | |
Showing percentage of net assets as of June 30, 2012
| | | | | | | | |
| Industry Company | | Shares | | | Value | |
Common Stocks (continued) | | | | | |
Professional Services - 2.23% | |
Barrett Business Services, Inc. | | | 29,300 | | | | $ 619,402 | |
CDI Corp. | | | 11,400 | | | | 186,960 | |
ICF International, Inc.* | | | 8,600 | | | | 205,024 | |
Insperity, Inc. | | | 6,700 | | | | 181,235 | |
On Assignment, Inc.* | | | 68,000 | | | | 1,085,280 | |
| | | | | | | | |
| | | | | | | 2,277,901 | |
| |
Real Estate Investment Trusts (REITs) - 4.38% | |
Agree Realty Corp. | | | 26,160 | | | | 578,921 | |
ARMOUR Residential REIT, Inc.+ | | | 31,300 | | | | 222,543 | |
Capital Trust, Inc., Class A* | | | 110,300 | | | | 317,664 | |
Gramercy Capital Corp.* | | | 268,600 | | | | 671,500 | |
MPG Office Trust, Inc.*+ | | | 283,700 | | | | 570,237 | |
One Liberty Properties, Inc. | | | 41,700 | | | | 785,211 | |
RAIT Financial Trust+ | | | 26,633 | | | | 123,044 | |
Retail Opportunity Investments Corp.+ | | | 21,700 | | | | 261,702 | |
Sabra Health Care REIT, Inc. | | | 6,700 | | | | 114,637 | |
Winthrop Realty Trust | | | 67,900 | | | | 825,664 | |
| | | | | | | | |
| | | | | | | 4,471,123 | |
| |
Real Estate Management & Development - 0.46% | |
AV Homes, Inc.* | | | 25,800 | | | | 376,164 | |
IRSA Inversiones y Representaciones SA - Sponsored ADR | | | 12,800 | | | | 90,752 | |
| | | | | | | | |
| | | | | | | 466,916 | |
| | |
Road & Rail - 1.62% | | | | | | | | |
Celadon Group, Inc. | | | 15,200 | | | | 248,976 | |
Quality Distribution, Inc.* | | | 52,800 | | | | 585,552 | |
Saia, Inc.* | | | 37,300 | | | | 816,497 | |
| | | | | | | | |
| | | | | | | 1,651,025 | |
| |
Semiconductors & Semiconductor Equipment - 1.05% | |
Actions Semiconductor Co., Ltd. - ADR* | | | 58,000 | | | | 98,600 | |
FSI International, Inc.* | | | 28,041 | | | | 100,667 | |
Mattson Technology, Inc.* | | | 394,600 | | | | 690,550 | |
Photronics, Inc.* | | | 29,900 | | | | 182,390 | |
| | | | | | | | |
| | | | | | | 1,072,207 | |
| | |
Software - 1.43% | | | | | | | | |
Cinedigm Digital Cinema Corp., Class A* | | | 50,700 | | | | 76,050 | |
ePlus, Inc.* | | | 15,700 | | | | 507,895 | |
QAD, Inc., Class A | | | 13,400 | | | | 190,548 | |
QAD, Inc., Class B | | | 15,000 | | | | 204,150 | |
| | | | | | | | |
| Industry Company | | Shares | | | Value | |
| | | | | | | | |
Software (continued) | | | | | | | | |
Top Image Systems, Ltd.*+ | | | 110,000 | | | | $ 485,100 | |
| | | | | | | | |
| | | | | | | 1,463,743 | |
| | |
Specialty Retail - 2.38% | | | | | | | | |
America’s Car-Mart, Inc.* | | | 3,200 | | | | 124,320 | |
Conn’s, Inc.*+ | | | 62,000 | | | | 917,600 | |
Haverty Furniture Cos., Inc. | | | 17,400 | | | | 194,358 | |
hhgregg, Inc.*+ | | | 6,700 | | | | 75,777 | |
Lithia Motors, Inc., Class A | | | 5,900 | | | | 135,995 | |
TravelCenters of America LLC* | | | 150,200 | | | | 761,514 | |
West Marine, Inc.* | | | 19,100 | | | | 224,425 | |
| | | | | | | | |
| | | | | | | 2,433,989 | |
|
Textiles, Apparel & Luxury Goods - 0.62% | |
Culp, Inc. | | | 10,400 | | | | 106,600 | |
DGSE Cos., Inc.*D | | | 14,900 | | | | 65,173 | |
Movado Group, Inc. | | | 8,300 | | | | 207,666 | |
Oxford Industries, Inc. | | | 5,600 | | | | 250,320 | |
| | | | | | | | |
| | | | | | | 629,759 | |
|
Thrifts & Mortgage Finance - 2.59% | |
BofI Holding, Inc.* | | | 29,300 | | | | 578,968 | |
Doral Financial Corp.* | | | 529,000 | | | | 793,500 | |
First Defiance Financial Corp. | | | 11,600 | | | | 198,592 | |
First Financial Holdings, Inc. | | | 52,800 | | | | 566,016 | |
Meta Financial Group, Inc. | | | 4,200 | | | | 83,706 | |
Provident Financial Holdings, Inc. | | | 16,400 | | | | 189,092 | |
United Community Financial Corp.* | | | 9,344 | | | | 27,845 | |
ViewPoint Financial Group, Inc. | | | 13,400 | | | | 209,576 | |
| | | | | | | | |
| | | | | | | 2,647,295 | |
|
Trading Companies & Distributors - 1.54% | |
Aceto Corp. | | | 122,000 | | | | 1,101,660 | |
DXP Enterprises, Inc.* | | | 11,400 | | | | 472,986 | |
| | | | | | | | |
| | | | | | | 1,574,646 | |
| | | | | | | | |
TOTAL COMMON STOCKS - 95.78% (Cost $87,672,632) | | | | | | | 97,796,777 | |
| | | | | | | | |
| | | | | | | | |
| | |
23 | | Annual Report | June 30, 2012 |
| | |
Bridgeway Ultra-Small Company Fund SCHEDULE OF INVESTMENTS (continued) | | |
Showing percentage of net assets as of June 30, 2012
| | | | | | | | | | |
| | | | | Rate^ | | Shares | | Value | |
MONEY MARKET FUND - 5.94% | | | | |
BlackRock FedFund | | 0.01% | | 6,064,304 | | | $6,064,304 | |
| | | | | | | | | | |
TOTAL MONEY MARKET FUND - 5.94% | | | 6,064,304 | |
| | | | | | | | | | |
(Cost $6,064,304) | | | | | | |
TOTAL INVESTMENTS - 101.72% | | | $103,861,081 | |
(Cost $93,736,936) | | | | |
Liabilities in Excess of Other Assets - (1.72%) | | | (1,751,470 | ) |
| | | | |
NET ASSETS - 100.00% | | | $102,109,611 | |
| | | | |
* Non-income producing security. | |
# Securities, or a portion thereof, segregated to cover the Fund’s potential obligation under swap agreements. The total value of segregated assets is $398,700. | |
^ Rate disclosed as of June 30, 2012. | |
D Security was fair valued under procedures adopted by the Board of Directors (see Note 2). | |
+ This security or a portion of the security is out on loan at June 30, 2012. Total loaned securities had a value of $9,775,783 at June 30, 2012. | |
| ADR - American Depositary Receipt | |
| LLC - Limited Liability Company | |
Summary of inputs used to value the Fund’s investments as of 06/30/2012 is as follows (See Note 2 in Notes to Financial Statements): | |
| | | Valuation Inputs | |
| | | Investment in Securities (Value) | |
| | | Level 1 Quoted Prices | | Level 2 Significant Observable Inputs | | Level 3 Significant Unobservable Inputs | | Total | |
Common Stocks | | $97,731,604 | | $ — | | $ 65,173 | | | $ 97,796,777 | |
Money Market Fund | | — | | 6,064,304 | | — | | | 6,064,304 | |
| | | | | | | | | | |
TOTAL | | $97,731,604 | | $6,064,304 | | $ 65,173 | | | $103,861,081 | |
| | | | | | | | | | |
| | | | | | | | | | |
| | | | | | | | | | |
| | | | | | | | | | |
| | | | | | | | | | |
| | | | | | | | | | |
|
Following is a reconciliation of Level 3 investments for which significant unobservable inputs were used to determine fair value: |
| | | | | | | | | | |
| | | Investment in Securities (Value) |
| | | Common Stocks | | Total |
Balance as of 06/30/2011 | | | | $ 124,650 | | | | | $ 124,650 | |
Purchases | | | | 102,841 | | | | | 102,841 | |
Sales | | | | (25,506) | | | | | (25,506) | |
Realized gain/(loss)1 | | | | (254,813) | | | | | (254,813) | |
Change in unrealized appreciation/ (depreciation)2 | | | | 109,445 | | | | | 109,445 | |
Transfers in3,4 | | | | 8,556 | | | | | 8,556 | |
Transfers out | | | | — | | | | | — | |
| | | | | | | | | | |
Balance as of 06/30/2012 | | | | $ 65,173 | | | | | $ 65,173 | |
| | | | | | | | | | |
Net change in unrealized appreciation (depreciation) from investments held as of 06/30/20122 | | | | $ (46,194) | | | | | $ (46,194) | |
| | | | | | | | | | |
1Realized gain/(loss) from Level 3 securities is included on the Statement of Operations in the Realized Gain (Loss) on Investments.
2Change in unrealized appreciation/(depreciation) for Level 3 securities is included on the Statement of Operations in the Change in Unrealized Appreciation (Depreciation) on Investments.
3Transfers in represent the value as of the beginning of the reporting period, for any investment security where significant transfers in the pricing level occurred during the period. The purchase value is used in situations where the investment was not held as of the beginning of the period.
4Transfers in took place as a result of trading halts.
The security in the table above was considered a Level 3 security because it was fair valued under procedures adopted by the Board of Directors at June 30, 2012. Such valuation is based on a review of inputs such as, but not limited to, similar securities, company specific financial information and company specific news.
See Notes to Financial Statements.
| | |
Ultra-Small Company Market Fund MANAGER’S COMMENTARY (Unaudited) | | |
June 30, 2012
Dear Fellow Ultra-Small Company Market Fund Shareholder,
For the quarter ended June 30, 2012, our Fund declined 1.81%, outperforming our primary market benchmark, the CRSP Cap-Based Portfolio 10 Index (-2.01%), our peer benchmark, the Lipper Micro-Cap Stock Funds Index (-4.15%), the Russell Microcap Index (-1.98%), and the Russell 2000 Index (-3.47%). It was a clean sweep, and we were pleased to provide some “cushion” in a down market.
For the fiscal year ended June 30, 2012, our Fund appreciated 1.05%, outperforming each of our performance benchmarks, none of which had a positive return: our primary market benchmark, the CRSP Cap-Based Portfolio 10 Index (-0.85%), our peer benchmark, the Lipper Micro-Cap Stock Funds Index (-2.53%), the Russell Microcap Index (-0.54%), and the Russell 2000 Index (-2.08%). Due largely to a single year’s performance in the “junk rally” and penny stock explosion of 2009, we still trail our primary market benchmark for the longer five- and ten-year periods. We trail the “CRSP 10” index since inception by an amount smaller than our expense ratio, which means that we have reasonably captured our asset class return over the nearly fifteen-year life of our Fund, but with less risk.
The table below presents our June quarter, one-year, five-year, ten-year and inception-to-date financial results. See the next page for a graph of performance since inception.
Standardized Returns as of June 30, 2012
| | | | | | | | | | | | | | | | | | |
| | | | |
| | | | | | | | | Annualized |
| | | Quarter | | | 1 Year | | | 5 Years | | | 10 Years | | | Since Inception (7/31/97) |
| | | | | |
Ultra-Small Company Market Fund | | | -1.81% | | | | 1.05% | | | | -1.94% | | | | 8.53% | | | 9.70% |
CRSP Cap-Based Portfolio 10 Index | | | -2.01% | | | | -0.85% | | | | 0.97% | | | | 11.61% | | | 10.27% |
Russell Microcap Index | | | -1.98% | | | | -0.54% | | | | -2.19% | | | | 5.89% | | | N/A |
Russell 2000 Index | | | -3.47% | | | | -2.08% | | | | 0.54% | | | | 7.00% | | | 5.85% |
Lipper Micro-Cap Stock Funds Index | | | -4.15% | | | | -2.53% | | | | -0.78% | | | | 6.47% | | | 6.34% |
Performance figures quoted in the table above and graph below represent past performance and are no guarantee of future results. Total return figures in the table above and the graph below include the reinvestment of dividends and capital gains. The table above and the graph below do not reflect the deduction of taxes that a shareholder would pay on Fund distributions or the redemption of Fund shares.
The CRSP Cap-Based Portfolio 10 Index is an unmanaged index of 1,131 of the smallest publicly traded U.S. stocks (with dividends reinvested), as reported by the Center for Research on Security Prices. The Russell Microcap Index is an unmanaged, market value weighted index that measures performance of 1,000 of the smallest securities in the Russell 2000 Index. The Russell 2000 Index is an unmanaged, market value weighted index that measures performance of the 2,000 companies that are between the 1,000th and 3,000th largest in the market with dividends reinvested. The Lipper Micro-Cap Stock Funds Index is an index of micro-cap funds compiled by Lipper, Inc. It is not possible to invest directly in an index. Periods longer than one year are annualized.
According to data from Lipper, Inc. as of June 30, 2012, Ultra-Small Company Market Fund ranked 18th of 76 micro-cap funds for the twelve months ending June 30, 2012, 41st of 60 over the last five years, 9th of 42 over the last ten years, and 7th of 22 since inception in July, 1997. Lipper, Inc. is an independent mutual fund rating service that ranks funds in various fund categories by making comparative calculations using total returns.
| | |
25 | | Annual Report | June 30, 2012 |
| | |
Ultra-Small Company Market Fund MANAGER’S COMMENTARY (Unaudited) (continued) | | |
Ultra-Small Company Market Fund vs. CRSP Cap-Based Portfolio 10 Index, Russell Microcap Index*,
Russell 2000 Index & Lipper Micro-Cap Stock Funds Index from Inception 7/31/97 to 6/30/12
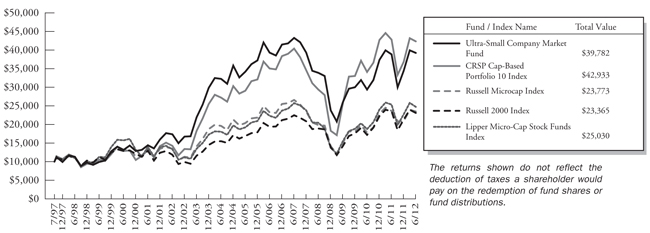
| * | The Russell Microcap Index began on 6/30/2000, and the line graph for the Index begins at the same value as the Fund on that date. |
Detailed Explanation of Quarterly Performance:
The Short Version: Ultra-small stocks performed better than any other size stocks for the quarter, with Consumer Staples and Financial stocks leading the way.
Since we are committed to investing long term in smaller stocks than the vast majority of small-cap mutual funds, a primary determinant of our performance relative to most other funds is the size of the companies in which we invest. Our investment strategy is to approximate the long-term returns of the CRSP Cap-Based Portfolio 10 Index of ultra-small companies by investing in a representative sample of ultra-small stocks. As shown in the table below, even though the returns were negative in all deciles, we had a nice tailwind to ride in the quarter ended June 30, 2012 as the 10th decile outperformed all other size stocks. As would be true in a majority of market declines, and indeed in all six calendar year bear markets for ultra-small stocks since the Fund’s inception, our sidestepping models helped provide some “cushion.”
| | | | | | | | | | | | | | | | | | | | |
| CRSP Decile1 | | Quarter | | | 1 Year | | | 5 Years | | | 10 Years | | | 86.5 Years | |
| |
1 (ultra-large) | | | -2.27% | | | | 7.66% | | | | 0.49% | | | | 4.81% | | | | 9.09% | |
2 | | | -4.61% | | | | -0.15% | | | | 0.68% | | | | 8.05% | | | | 10.39% | |
3 | | | -6.33% | | | | -4.40% | | | | 0.89% | | | | 8.12% | | | | 10.77% | |
4 | | | -6.85% | | | | -3.88% | | | | 2.02% | | | | 8.92% | | | | 10.73% | |
5 | | | -5.81% | | | | -6.10% | | | | 2.84% | | | | 9.84% | | | | 11.27% | |
6 | | | -5.24% | | | | -1.48% | | | | 1.77% | | | | 8.45% | | | | 11.25% | |
7 | | | -4.02% | | | | -1.88% | | | | 3.09% | | | | 9.34% | | | | 11.25% | |
8 | | | -5.21% | | | | -2.22% | | | | 2.93% | | | | 9.96% | | | | 11.45% | |
9 | | | -4.13% | | | | -2.88% | | | | 1.61% | | | | 8.31% | | | | 11.46% | |
10 (ultra-small) | | | -2.01% | | | | -0.85% | | | | 0.97% | | | | 11.61% | | | | 13.02% | |
| 1 | Performance figures are as of the period ended June 30, 2012. The CRSP Cap-Based Portfolio Indexes are unmanaged indexes of the publicly traded U.S. stocks with dividends reinvested, grouped by market capitalization, as reported by the Center for Research in Security Prices. Past performance is no guarantee of future results. |
| | |
Ultra-Small Company Market Fund MANAGER’S COMMENTARY (Unaudited) (continued) | | |
The Fund’s sector allocation was very much in line with the Index for the period, with only two sectors differing as much as one percent. Consumer Staples and Financials were the only sectors that produced positive overall returns in the ultra-small universe for the quarter.
Detailed Explanation of Fiscal Year Performance
The Short Version: Ultra-small stocks showed off their diversifying advantages in the recent fiscal year. The Financials sector comprised 26% of Fund net assets at fiscal year end and added the most to Fund performance for the fiscal year.
For the fiscal year ended June 30, 2012, ultra-small stocks outperformed all deciles, with the exception of the 1st and 2nd deciles — demonstrating some of the nice diversifying characteristics of ultra-small stocks. It’s interesting to think about the dynamics of this. Investors flocked to the perceived safety of ultra-large stocks — no surprise. But why did ultra-small stocks not experience the relative pounding of mid- and small-cap stocks? We believe they are generally “off the radar screen” of large institutions that make big shifts in asset allocation, such as happened significantly during our fiscal year. Generally, ultra-small stocks are more — not less — risky than small- and mid-cap stocks. Yet sometimes they are “left alone” in downturns (declining less), adding significant diversification to a multi-asset class portfolio. This we know well from history. The exact reason for this statistical diversification is harder to pinpoint. In fairness, our diversifying aspects work both ways, sometimes helping, sometimes hurting absolute Fund performance. But our conservative “side-stepping models” have done a great job of providing some cushion for our asset class in downturns.
This size effect in the fiscal year helped our performance a great deal in comparison to other small-cap and mid-cap funds. Much like the quarter, the Fund’s sector allocation was right on target with the index; no sector differed by even one percent. The Financials sector was the strongest performing sector for the fiscal year, adding three percent to the Fund’s return, even though no financial stocks were among our best performers for the year.
Top Ten Holdings as of June 30, 2012
| | | | | | | | |
| Rank Description | | Industry | | % of Net
Assets | |
| |
| 1 | | Federal Agricultural Mortgage Corp. | | Thrifts & Mortgage Finance | | | 0.9% | |
| 2 | | AEP Industries, Inc. | | Containers & Packaging | | | 0.8% | |
| 3 | | Susser Holdings Corp. | | Food & Staples Retailing | | | 0.6% | |
| 4 | | Mitcham Industries, Inc. | | Energy Equipment & Services | | | 0.6% | |
| 5 | | Famous Dave’s of America, Inc. | | Hotels, Restaurants & Leisure | | | 0.6% | |
| 6 | | Spartan Motors, Inc. | | Auto Components | | | 0.6% | |
| 7 | | Metropolitan Health Networks, Inc. | | Health Care Providers & Services | | | 0.6% | |
| 8 | | AuthenTec, Inc. | | Semiconductors & Semiconductor Equipment | | | 0.6% | |
| 9 | | Intersections, Inc. | | Commercial Services & Supplies | | | 0.6% | |
| 10 | | Lifeway Foods, Inc. | | Food Products | | | 0.5% | |
| |
| | Total | | | | | 6.4% | |
| | |
27 | | Annual Report | June 30, 2012 |
| | |
Ultra-Small Company Market Fund MANAGER’S COMMENTARY (Unaudited) (continued) | | |
Industry Sector Representation as of June 30, 2012
| | | | | | | | | | | | |
| | | % of Net Assets | | | % of CRSP 10 Index | | | Difference | |
Consumer Discretionary | | | 15.9% | | | | 15.2% | | | | 0.7% | |
Consumer Staples | | | 3.7% | | | | 3.0% | | | | 0.7% | |
Energy | | | 5.5% | | | | 5.7% | | | | -0.2% | |
Financials | | | 26.0% | | | | 25.1% | | | | 0.9% | |
Health Care | | | 17.6% | | | | 18.2% | | | | -0.6% | |
Industrials | | | 11.7% | | | | 11.8% | | | | -0.1% | |
Information Technology | | | 14.6% | | | | 15.3% | | | | -0.7% | |
Materials | | | 2.9% | | | | 2.8% | | | | 0.1% | |
Telecommunication Services | | | 1.0% | | | | 1.4% | | | | -0.4% | |
Utilities | | | 1.0% | | | | 1.5% | | | | -0.5% | |
Cash & Other Assets | | | 0.1% | | | | 0.0% | | | | 0.1% | |
Total | | | 100.0% | | | | 100.0% | | | | | |
Disclaimer
The views expressed here are exclusively those of Fund management. These views, including those related to market sectors or individual stocks, are not meant as investment advice and should not be considered predictive in nature. Any favorable (or unfavorable) description of a holding applies only as of the quarter-end, June 30, 2012, unless otherwise stated. Security positions can and do change thereafter. Discussions of historical performance do not guarantee and may not be indicative of future performance.
The Fund is subject to very high, above market risk (volatility) and is not an appropriate investment for short-term investors. Investments in ultra-small companies generally carry greater risk than is customarily associated with larger companies and even “small companies” for various reasons, such as narrower markets (fewer investors), limited financial resources and greater trading difficulty.
Conclusion
Thank you for your continued investment in Ultra-Small Company Market Fund. We encourage your feedback; your reactions and concerns are important to us.
Sincerely,
The Investment Management Team
| | |
Bridgeway Ultra-Small Company Market Fund SCHEDULE OF INVESTMENTS | | |
Showing percentage of net assets as of June 30, 2012
| | | | | | | | |
| Industry Company | | Shares | | | Value | |
COMMON STOCKS - 99.34% | |
Aerospace & Defense - 1.03% | |
Astronics Corp.* | | | 22,700 | | | | $ 641,048 | |
Astronics Corp., Class B*+ | | | 2,270 | | | | 60,200 | |
Ducommun, Inc.* | | | 25,300 | | | | 248,193 | |
GenCorp, Inc.* | | | 66,700 | | | | 434,217 | |
Innovative Solutions & Support, Inc.* | | | 63,454 | | | | 208,764 | |
KEYW Holding Corp. (The)*+ | | | 90,100 | | | | 904,604 | |
Sparton Corp.* | | | 63,300 | | | | 626,670 | |
| | | | | | | | |
| | | | | | | 3,123,696 | |
| |
Air Freight & Logistics - 0.54% | |
Park-Ohio Holdings Corp.* | | | 46,000 | | | | 875,380 | |
XPO Logistics, Inc.* | | | 44,800 | | | | 752,640 | |
| | | | | | | | |
| | | | | | | 1,628,020 | |
| |
Airlines - 0.11% | |
Republic Airways Holdings, Inc.* | | | 62,204 | | | | 345,232 | |
| |
Auto Components - 0.99% | |
Shiloh Industries, Inc. | | | 39,600 | | | | 455,400 | |
SORL Auto Parts, Inc.*+ | | | 109,900 | | | | 264,859 | |
Spartan Motors, Inc. | | | 334,600 | | | | 1,753,304 | |
Strattec Security Corp. | | | 24,100 | | | | 507,064 | |
| | | | | | | | |
| | | | | | | 2,980,627 | |
| |
Automobiles - 0.11% | |
Kandi Technolgies Corp.*+ | | | 103,000 | | | | 318,270 | |
| |
Beverages - 0.24% | |
Craft Brew Alliance, Inc.* | | | 89,100 | | | | 728,838 | |
| |
Biotechnology - 6.42% | |
ACADIA Pharmaceuticals, Inc.* | | | 188,000 | | | | 330,880 | |
ADVENTRX Pharmaceuticals, Inc.* | | | 25,000 | | | | 12,750 | |
Affymax, Inc.* | | | 15,140 | | | | 195,003 | |
Amicus Therapeutics, Inc.*+ | | | 115,991 | | | | 637,951 | |
Anacor Pharmaceuticals, Inc.*+ | | | 85,300 | | | | 553,597 | |
ArQule, Inc.* | | | 131,300 | | | | 778,609 | |
Array BioPharma, Inc.* | | | 152,400 | | | | 528,828 | |
Astex Pharmaceuticals* | | | 274,600 | | | | 573,914 | |
BioCryst Pharmaceuticals, Inc.* | | | 155,700 | | | | 619,686 | |
Biosante Pharmaceuticals, Inc.* | | | 20,200 | | | | 51,510 | |
BioSpecifics Technologies Corp.*+ | | | 22,500 | | | | 422,550 | |
Biotime, Inc.*+ | | | 121,100 | | | | 557,060 | |
| | | | | | | | |
| Industry Company | | Shares | | | Value | |
| |
Biotechnology (continued) | |
Celldex Therapeutics, Inc.* | | | 71,400 | | | | $ 370,566 | |
Codexis, Inc.* | | | 140,100 | | | | 523,974 | |
Curis, Inc.*+ | | | 247,600 | | | | 1,337,040 | |
Cytokinetics, Inc.* | | | 321,800 | | | | 206,113 | |
Cytori Therapeutics, Inc.*+ | | | 183,300 | | | | 494,910 | |
Dusa Pharmaceuticals, Inc.* | | | 181,000 | | | | 944,820 | |
Dyax Corp.* | | | 194,000 | | | | 413,220 | |
Geron Corp.* | | | 298,900 | | | | 514,108 | |
Infinity Pharmaceuticals, Inc.*+ | | | 56,200 | | | | 762,072 | |
Maxygen, Inc.* | | | 49,850 | | | | 297,106 | |
Myrexis, Inc.* | | | 98,700 | | | | 257,607 | |
Nabi Biopharmaceuticals* | | | 107,400 | | | | 169,692 | |
Nanosphere, Inc.* | | | 113,300 | | | | 249,260 | |
Novavax, Inc.*+ | | | 315,900 | | | | 492,804 | |
Oncothyreon, Inc.*+ | | | 124,300 | | | | 581,724 | |
Orexigen Therapeutics, Inc.* | | | 75,000 | | | | 415,500 | |
Osiris Therapeutics, Inc.*+ | | | 80,200 | | | | 879,794 | |
PharmAthene, Inc.*+ | | | 153,826 | | | | 213,818 | |
Progenics Pharmaceuticals, Inc.* | | | 72,400 | | | | 708,072 | |
Repligen Corp.* | | | 99,100 | | | | 426,130 | |
Sangamo Biosciences, Inc.*+ | | | 89,158 | | | | 492,152 | |
Sciclone Pharmaceuticals, Inc.* | | | 124,307 | | | | 871,392 | |
SIGA Technologies, Inc.*+ | | | 139,700 | | | | 400,939 | |
Synta Pharmaceuticals Corp.*+ | | | 142,500 | | | | 779,475 | |
Targacept, Inc.* | | | 8,401 | | | | 36,124 | |
Trius Therapeutics, Inc.*+ | | | 46,700 | | | | 268,992 | |
Vanda Pharmaceuticals, Inc.* | | | 70,000 | | | | 308,000 | |
XOMA Corp.* | | | 120,000 | | | | 360,000 | |
Zalicus, Inc.*+ | | | 313,021 | | | | 375,625 | |
| | | | | | | | |
| | | | | | | 19,413,367 | |
|
Building Products - 0.56% | |
American Woodmark Corp.* | | | 26,100 | | | | 446,310 | |
Builders FirstSource, Inc.* | | | 173,300 | | | | 821,442 | |
Insteel Industries, Inc. | | | 25,700 | | | | 286,555 | |
NCI Building Systems, Inc.* | | | 3,608 | | | | 39,074 | |
US Home Systems, Inc. | | | 10,025 | | | | 101,754 | |
| | | | | | | | |
| | | | | | | 1,695,135 | |
|
Capital Markets - 3.59% | |
Arlington Asset Investment Corp., Class A+ | | | 19,800 | | | | 429,858 | |
Calamos Asset Management, Inc., Class A | | | 21,400 | | | | 245,030 | |
| | |
29 | | Annual Report | June 30, 2012 |
| | |
Bridgeway Ultra-Small Company Market Fund SCHEDULE OF INVESTMENTS (continued) | |
|
Showing percentage of net assets as of June 30, 2012
| | | | | | | | |
| Industry Company | | Shares | | | Value | |
Common Stocks (continued) | | | | | |
Capital Markets (continued) | | | | | |
Diamond Hill Investment Group, Inc. | | | 5,600 | | | $ | 438,424 | |
Edelman Financial Group, Inc. | | | 51,000 | | | | 443,700 | |
FBR & Co.* | | | 123,300 | | | | 341,541 | |
Firstcity Financial Corp.* | | | 18,842 | | | | 162,983 | |
Gladstone Capital Corp.+ | | | 76,600 | | | | 604,374 | |
Gladstone Investment Corp. | | | 56,400 | | | | 416,796 | |
Gleacher & Co., Inc.* | | | 98,392 | | | | 78,714 | |
Harris & Harris Group, Inc.* | | | 96,800 | | | | 367,840 | |
HFF, Inc., Class A* | | | 46,300 | | | | 645,422 | |
JMP Group, Inc. | | | 81,100 | | | | 501,198 | |
Kohlberg Capital Corp.+ | | | 93,900 | | | | 681,714 | |
Ladenburg Thalmann Financial Services, Inc.* | | | 493,000 | | | | 759,220 | |
Medallion Financial Corp. | | | 86,711 | | | | 920,871 | |
Medley Capital Corp. | | | 56,800 | | | | 683,872 | |
NGP Capital Resources Co. | | | 70,400 | | | | 498,432 | |
Oppenheimer Holdings, Inc., Class A | | | 19,300 | | | | 303,396 | |
Pzena Investment Management, Inc., Class A | | | 52,800 | | | | 233,904 | |
SWS Group, Inc.* | | | 83,000 | | | | 442,390 | |
TICC Capital Corp. | | | 82,300 | | | | 798,310 | |
Westwood Holdings Group, Inc. | | | 23,025 | | | | 857,911 | |
| | | | | | | | |
| | | | | | | 10,855,900 | |
| |
Chemicals - 0.86% | | | | | |
Chase Corp.+ | | | 27,800 | | | | 366,960 | |
Core Molding Technologies, Inc.* | | | 18,600 | | | | 153,264 | |
KMG Chemicals, Inc. | | | 58,800 | | | | 1,133,664 | |
Landec Corp.* | | | 109,200 | | | | 934,752 | |
| | | | | | | | |
| | | | | | | 2,588,640 | |
| |
Commercial Banks - 12.03% | | | | | |
1st United Bancorp, Inc.* | | | 58,900 | | | | 365,769 | |
Alliance Financial Corp. | | | 25,000 | | | | 858,500 | |
American National Bankshares, Inc. | | | 29,700 | | | | 699,732 | |
American River Bankshares* | | | 37,800 | | | | 275,184 | |
Ameris Bancorp* | | | 82,853 | | | | 1,043,948 | |
Arrow Financial Corp.+ | | | 16,686 | | | | 403,301 | |
Bancorp, Inc. (The)* | | | 36,600 | | | | 345,870 | |
Bank of Commerce Holdings | | | 41,100 | | | | 167,688 | |
Bank of Kentucky Financial Corp. | | | 9,000 | | | | 239,760 | |
Bar Harbor Bankshares | | | 6,000 | | | | 216,000 | |
| | | | | | | | |
| | | | | | | | |
| | | | | | | | |
| Industry Company | | Shares | | | Value | |
| | | | | | | | |
Commercial Banks (continued) | | | | | | | | |
Berkshire Bancorp, Inc.* | | | 34,000 | | | | $299,200 | |
Bridge Bancorp, Inc. | | | 25,400 | | | | 599,186 | |
Bryn Mawr Bank Corp. | | | 41,724 | | | | 879,125 | |
C&F Financial Corp.+ | | | 6,300 | | | | 253,008 | |
Camden National Corp. | | | 11,800 | | | | 432,116 | |
Capital City Bank Group, Inc.+ | | | 33,490 | | | | 246,821 | |
Center Bancorp, Inc.+ | | | 72,217 | | | | 812,441 | |
Centerstate Banks, Inc. | | | 40,866 | | | | 292,192 | |
Century Bancorp, Inc., Class A | | | 23,272 | | | | 691,876 | |
Citizens Holding Co. | | | 20,670 | | | | 387,976 | |
CNB Financial Corp. | | | 40,800 | | | | 665,448 | |
CoBiz Financial, Inc. | | | 155,800 | | | | 975,308 | |
Enterprise Financial Services Corp. | | | 85,700 | | | | 939,272 | |
Farmers Capital Bank Corp.* | | | 67,149 | | | | 441,169 | |
Financial Institutions, Inc. | | | 17,600 | | | | 297,088 | |
First Bancorp | | | 30,000 | | | | 266,700 | |
First Bancorp, Inc. | | | 33,300 | | | | 566,100 | |
First California Financial Group, Inc.* | | | 98,100 | | | | 674,928 | |
First Community Bancshares, Inc. | | | 35,000 | | | | 505,050 | |
First Connecticut Bancorp, Inc.+ | | | 36,400 | | | | 491,400 | |
First Merchants Corp. | | | 36,711 | | | | 457,419 | |
First South Bancorp, Inc.* | | | 14,300 | | | | 57,915 | |
German American Bancorp, Inc.+ | | | 39,500 | | | | 809,750 | |
Great Southern Bancorp, Inc. | | | 17,161 | | | | 473,300 | |
Guaranty Bancorp* | | | 204,200 | | | | 430,862 | |
Hampton Roads Bankshares, Inc.*+ | | | 85,300 | | | | 92,977 | |
Heritage Commerce Corp.*+ | | | 70,000 | | | | 455,000 | |
Heritage Financial Corp. | | | 39,260 | | | | 575,159 | |
Intervest Bancshares Corp., Class A* | | | 78,212 | | | | 299,552 | |
Lakeland Bancorp, Inc. | | | 86,115 | | | | 905,930 | |
LNB Bancorp, Inc. | | | 20,000 | | | | 131,600 | |
Macatawa Bank Corp.* | | | 51,500 | | | | 175,615 | |
MainSource Financial Group, Inc. | | | 40,500 | | | | 479,115 | |
Mercantile Bank Corp.* | | | 25,000 | | | | 461,250 | |
Merchants Bancshares, Inc. | | | 27,800 | | | | 765,890 | |
Metro Bancorp, Inc.* | | | 40,600 | | | | 488,418 | |
MetroCorp Bancshares, Inc.* | | | 16,607 | | | | 177,197 | |
| | |
Bridgeway Ultra-Small Company Market Fund SCHEDULE OF INVESTMENTS (continued) | |
|
Showing percentage of net assets as of June 30, 2012
| | | | | | | | |
| Industry Company | | Shares | | | Value | |
Common Stocks (continued) | | | | | |
Commercial Banks (continued) | | | | | |
MidSouth Bancorp, Inc. | | | 35,900 | | | | $ 505,472 | |
MidWestOne Financial Group, Inc.+ | | | 69,500 | | | | 1,494,250 | |
National Bankshares, Inc.+ | | | 14,300 | | | | 430,716 | |
NewBridge Bancorp* | | | 28,287 | | | | 123,897 | |
Northrim BanCorp, Inc. | | | 33,300 | | | | 715,617 | |
Ohio Valley Banc Corp. | | | 19,500 | | | | 381,225 | |
OmniAmerican Bancorp, Inc.* | | | 26,300 | | | | 563,609 | |
Pacific Continental Corp. | | | 51,611 | | | | 457,790 | |
Park Sterling Corp.* | | | 116,900 | | | | 550,599 | |
Peapack Gladstone Financial Corp.+ | | | 39,130 | | | | 606,906 | |
Penns Woods Bancorp, Inc.+ | | | 16,400 | | | | 652,884 | |
Peoples Bancorp, Inc. | | | 28,400 | | | | 624,232 | |
Preferred Bank*+ | | | 33,120 | | | | 442,483 | |
QCR Holdings, Inc. | | | 13,200 | | | | 172,920 | |
Republic First Bancorp, Inc.* | | | 60,000 | | | | 125,400 | |
Seacoast Banking Corp. of Florida* | | | 194,064 | | | | 293,037 | |
Shore Bancshares, Inc. | | | 42,600 | | | | 253,044 | |
Sierra Bancorp | | | 42,900 | | | | 424,710 | |
Southwest Bancorp, Inc.* | | | 70,900 | | | | 667,169 | |
Sterling Bancorp | | | 10,000 | | | | 99,800 | |
Suffolk Bancorp* | | | 27,000 | | | | 350,190 | |
Taylor Capital Group, Inc.*+ | | | 25,908 | | | | 424,632 | |
Trico Bancshares | | | 21,200 | | | | 326,480 | |
Univest Corp. of Pennsylvania | | | 24,300 | | | | 401,679 | |
Virginia Commerce Bancorp, Inc.* | | | 153,159 | | | | 1,291,130 | |
Washington Banking Co. | | | 71,900 | | | | 999,410 | |
West Bancorporation, Inc. | | | 27,100 | | | | 257,721 | |
Yadkin Valley Financial Corp.* | | | 64,200 | | | | 170,130 | |
| | | | | | | | |
| | | | | | | 36,376,237 | |
| |
Commercial Services & Supplies - 2.21% | | | | | |
A.T. Cross Co., Class A* | | | 26,000 | | | | 256,620 | |
Acorn Energy, Inc.+ | | | 16,600 | | | | 138,112 | |
American Reprographics Co.* | | | 73,300 | | | | 368,699 | |
Asset Acceptance Capital Corp.* | | | 100,000 | | | | 680,000 | |
Asta Funding, Inc. | | | 142,300 | | | | 1,333,351 | |
Casella Waste Systems, Inc., Class A* | �� | | 115,700 | | | | 676,845 | |
Ceco Environmental Corp. | | | 42,600 | | | | 336,540 | |
Courier Corp. | | | 25,000 | | | | 331,250 | |
| | | | | | | | |
| | | | | | | | |
| | | | | | | | |
| Industry Company | | Shares | | | Value | |
| | | | | | | | |
Commercial Services & Supplies (continued) | | | | | |
Intersections, Inc. | | | 106,184 | | | | $1,683,016 | |
Kimball International, Inc., Class B | | | 56,100 | | | | 431,970 | |
Metalico, Inc.* | | | 110,800 | | | | 243,760 | |
TRC Cos., Inc.* | | | 35,000 | | | | 212,800 | |
| | | | | | | | |
| | | | | | | 6,692,963 | |
| |
Communications Equipment - 2.63% | | | | | |
Aviat Networks, Inc.* | | | 221,000 | | | | 618,800 | |
Bel Fuse, Inc., Class B | | | 25,100 | | | | 442,011 | |
CalAmp Corp.* | | | 101,200 | | | | 741,796 | |
Communications Systems, Inc. | | | 51,000 | | | | 569,670 | |
Emcore Corp.*+ | | | 97,127 | | | | 429,301 | |
Globecomm Systems, Inc.* | | | 137,400 | | | | 1,393,236 | |
KVH Industries, Inc.* | | | 60,410 | | | | 755,125 | |
Meru Networks, Inc.* | | | 4,950 | | | | 8,663 | |
Network Engines, Inc.* | | | 55,500 | | | | 78,255 | |
Numerex Corp., Class A*+ | | | 30,000 | | | | 279,000 | |
Opnext, Inc.* | | | 60,000 | | | | 75,600 | |
PC-Tel, Inc. | | | 85,600 | | | | 553,832 | |
Symmetricom, Inc.* | | | 56,300 | | | | 337,237 | |
Telestone Technologies Corp.*+ | | | 94,100 | | | | 160,911 | |
Telular Corp. | | | 57,900 | | | | 534,996 | |
Tessco Technologies, Inc. | | | 23,500 | | | | 518,175 | |
Westell Technologies, Inc., Class A* | | | 198,000 | | | | 471,240 | |
| | | | | | | | |
| | | | | | | 7,967,848 | |
| |
Computers & Peripherals - 0.85% | | | | | |
Concurrent Computer Corp.* | | | 105,300 | | | | 436,995 | |
Datalink Corp.* | | | 54,800 | | | | 523,340 | |
Dot Hill Systems Corp.* | | | 263,300 | | | | 300,162 | |
Immersion Corp.* | | | 87,400 | | | | 492,062 | |
Novatel Wireless, Inc.* | | | 146,800 | | | | 365,532 | |
Rimage Corp. | | | 5,000 | | | | 40,000 | |
Transact Technologies, Inc.* | | | 32,821 | | | | 253,050 | |
USA Technologies, Inc.*+ | | | 111,400 | | | | 160,416 | |
| | | | | | | | |
| | | | | | | 2,571,557 | |
| |
Construction & Engineering - 0.94% | | | | | |
Argan, Inc. | | | 44,700 | | | | 624,906 | |
Furmanite Corp.* | | | 75,400 | | | | 366,444 | |
Michael Baker Corp.* | | | 24,900 | | | | 649,641 | |
Orion Marine Group, Inc.* | | | 63,300 | | | | 440,568 | |
| | |
31 | | Annual Report | June 30, 2012 |
| | |
Bridgeway Ultra-Small Company Market Fund SCHEDULE OF INVESTMENTS (continued) | | |
Showing percentage of net assets as of June 30, 2012
| | | | | | | | |
| Industry Company | | Shares | | | Value | |
Common Stocks (continued) | | | | | | | | |
Construction & Engineering (continued) | | | | | |
Sterling Construction Co., Inc.* | | | 73,300 | | | | $ 749,126 | |
| | | | | | | | |
| | | | | | | 2,830,685 | |
| |
Construction Materials - 0.08% | | | | | |
United States Lime & Minerals, Inc.* | | | 5,300 | | | | 247,351 | |
| | |
Consumer Finance - 0.18% | | | | | | | | |
CompuCredit Holdings Corp.* | | | 65,000 | | | | 235,300 | |
First Marblehead Corp. (The)* | | | 125,600 | | | | 146,952 | |
White River Capital, Inc. | | | 7,000 | | | | 157,710 | |
| | | | | | | | |
| | | | | | | 539,962 | |
| |
Containers & Packaging - 0.85% | | | | | |
AEP Industries, Inc.* | | | 58,800 | | | | 2,560,740 | |
| | |
Distributors - 0.08% | | | | | | | | |
Amcon Distributing Co.+ | | | 1,000 | | | | 55,390 | |
VOXX International Corp.* | | | 20,001 | | | | 186,409 | |
| | | | | | | | |
| | | | | | | 241,799 | |
| |
Diversified Consumer Services - 0.79% | | | | | |
Cambium Learning Group, Inc.* | | | 58,715 | | | | 55,779 | |
Carriage Services, Inc. | | | 81,100 | | | | 674,752 | |
Collectors Universe | | | 69,460 | | | | 1,019,673 | |
Learning Tree International, Inc.* | | | 38,500 | | | | 168,245 | |
Mac-Gray Corp. | | | 33,300 | | | | 469,197 | |
| | | | | | | | |
| | | | | | | 2,387,646 | |
| |
Diversified Financial Services - 0.47% | | | | | |
Gain Capital Holdings, Inc.+ | | | 61,700 | | | | 307,883 | |
Life Partners Holdings, Inc. | | | 8,000 | | | | 17,040 | |
Marlin Business Services Corp. | | | 28,300 | | | | 463,837 | |
Resource America, Inc., Class A | | | 100,700 | | | | 642,466 | |
| | | | | | | | |
| | | | | | | 1,431,226 | |
| |
Diversified Telecommunication Services - 0.96% | |
Hawaiian Telcom Holdco, Inc.*+ | | | 23,686 | | | | 462,114 | |
HickoryTech Corp. | | | 43,495 | | | | 483,230 | |
IDT Corp., Class B | | | 48,667 | | | | 477,423 | |
ORBCOMM, Inc.* | | | 101,000 | | | | 329,260 | |
Otelco, Inc.+ | | | 28,600 | | | | 206,206 | |
| | | | | | | | |
| | | | | | | | |
| | | | | | | | |
| Industry Company | | Shares | | | Value | |
| | | | | | | | |
Diversified Telecommunication Services (continued) | |
Primus Telecommunications Group, Inc.+ | | | 35,000 | | | | $ 544,950 | |
Warwick Valley Telephone Co. | | | 30,200 | | | | 398,036 | |
| | | | | | | | |
| | | | | | | 2,901,219 | |
| |
Electrical Equipment - 0.53% | | | | | |
Coleman Cable, Inc. | | | 77,000 | | | | 669,130 | |
LSI Industries, Inc. | | | 70,500 | | | | 501,960 | |
Magnetek, Inc.* | | | 10,000 | | | | 154,400 | |
Ocean Power Technologies, Inc.*+ | | | 38,000 | | | | 79,040 | |
PowerSecure International, Inc.* | | | 7,100 | | | | 35,358 | |
SL Industries, Inc.* | | | 13,200 | | | | 174,108 | |
| | | | | | | | |
| | | | | | | 1,613,996 | |
|
Electronic Equipment, Instruments & Components - 2.55% | |
Agilysys, Inc.* | | | 60,100 | | | | 521,067 | |
Clearfield, Inc.* | | | 57,000 | | | | 274,170 | |
Document Security Systems, Inc.*+ | | | 51,700 | | | | 207,317 | |
Echelon Corp.* | | | 64,000 | | | | 222,720 | |
eMagin Corp.* | | | 56,300 | | | | 173,967 | |
ID Systems, Inc.* | | | 45,000 | | | | 197,100 | |
Identive Group, Inc.* | | | 366,197 | | | | 342,907 | |
IEC Electronics Corp.*+ | | | 64,500 | | | | 392,160 | |
Iteris, Inc.* | | | 126,700 | | | | 169,778 | |
Key Tronic Corp.* | | | 24,200 | | | | 199,408 | |
LeCroy Corp.* | | | 56,000 | | | | 798,560 | |
LoJack Corp.* | | | 44,100 | | | | 133,182 | |
Mesa Laboratories, Inc.+ | | | 6,200 | | | | 288,238 | |
Netlist, Inc.* | | | 63,100 | | | | 142,606 | |
PAR Technology Corp.* | | | 17,800 | | | | 87,754 | |
PC Connection, Inc. | | | 30,000 | | | | 318,600 | |
PC Mall, Inc.* | | | 74,200 | | | | 401,422 | |
Pulse Electronics Corp. | | | 109,800 | | | | 216,306 | |
RadiSys Corp.* | | | 72,200 | | | | 453,416 | |
Richardson Electronics, Ltd. | | | 52,011 | | | | 641,295 | |
SMTC Corp.*+ | | | 154,300 | | | | 504,561 | |
Vishay Precision Group, Inc.* | | | 23,567 | | | | 328,760 | |
Zygo Corp.* | | | 39,200 | | | | 700,112 | |
| | | | | | | | |
| | | | | | | 7,715,406 | |
| |
Energy Equipment & Services - 2.11% | | | | | |
Bolt Technology Corp. | | | 63,763 | | | | 957,083 | |
Dawson Geophysical Co.* | | | 30,000 | | | | 714,600 | |
ENGlobal Corp.* | | | 118,761 | | | | 178,142 | |
| | |
Bridgeway Ultra-Small Company Market Fund SCHEDULE OF INVESTMENTS (continued) | | |
Showing percentage of net assets as of June 30, 2012
| | | | | | | | |
| Industry Company | | Shares | | | Value | |
Common Stocks (continued) | | | | | | | | |
Energy Equipment & Services (continued) | | | | | |
Forbes Energy Services, Ltd.* | | | 99,000 | | | | $ 465,300 | |
GreenHunter Energy, Inc.*+ | | | 74,000 | | | | 150,960 | |
Mitcham Industries, Inc.* | | | 104,700 | | | | 1,776,759 | |
Natural Gas Services Group, Inc.* | | | 36,400 | | | | 539,448 | |
TGC Industries, Inc.* | | | 122,850 | | | | 1,192,873 | |
Union Drilling, Inc.* | | | 88,300 | | | | 395,584 | |
| | | | | | | | |
| | | | | | | 6,370,749 | |
| |
Food & Staples Retailing - 1.14% | | | | | |
Arden Group, Inc., Class A | | | 5,500 | | | | 479,655 | |
Ingles Markets, Inc., Class A | | | 21,200 | | | | 339,836 | |
Susser Holdings Corp.* | | | 48,900 | | | | 1,817,613 | |
Village Super Market, Inc., | | | | | | | | |
Class A | | | 24,600 | | | | 801,468 | |
| | | | | | | | |
| | | | | | | 3,438,572 | |
| | |
Food Products - 1.54% | | | | | | | | |
Alico, Inc. | | | 21,000 | | | | 641,340 | |
Griffin Land & Nurseries, Inc. | | | 19,300 | | | | 540,207 | |
John B. Sanfilippo & Son, Inc.* | | | 33,900 | | | | 605,115 | |
Lifeway Foods, Inc.+ | | | 156,302 | | | | 1,620,852 | |
Limoneira Co.+ | | | 18,900 | | | | 306,558 | |
Omega Protein Corp.* | | | 72,900 | | | | 536,544 | |
Overhill Farms, Inc.* | | | 102,100 | | | | 400,232 | |
| | | | | | | | |
| | | | | | | 4,650,848 | |
| | |
Gas Utilities - 0.16% | | | | | | | | |
Chesapeake Utilities Corp. | | | 7,600 | | | | 332,272 | |
Gas Natural, Inc. | | | 15,900 | | | | 160,590 | |
| | | | | | | | |
| | | | | | | 492,862 | |
| |
Health Care Equipment & Supplies - 4.10% | | | | | |
Alphatec Holdings, Inc.* | | | 164,740 | | | | 303,122 | |
Anika Therapeutics, Inc.* | | | 98,639 | | | | 1,340,504 | |
Antares Pharma, Inc.*+ | | | 197,000 | | | | 717,080 | |
AtriCure, Inc.* | | | 133,200 | | | | 1,280,052 | |
Bacterin International Holdings, Inc.* | | | 5,601 | | | | 7,505 | |
Cardica, Inc.* | | | 30,000 | | | | 56,400 | |
Cardiovascular Systems, Inc.*+ | | | 33,900 | | | | 331,881 | |
Cerus Corp.*+ | | | 193,304 | | | | 641,769 | |
CryoLife, Inc.* | | | 107,270 | | | | 561,022 | |
Cutera, Inc.* | | | 43,000 | | | | 309,385 | |
DynaVox, Inc., Class A* | | | 28,330 | | | | 31,730 | |
Hansen Medical, Inc.*+ | | | 170,000 | | | | 385,900 | |
IRIS International, Inc.* | | | 44,100 | | | | 498,330 | |
| | | | | | | | |
| | | | | | | | |
| Industry Company | | Shares | | | Value | |
| | | | | | | | |
Health Care Equipment & Supplies (continued) | | | | | |
LeMaitre Vascular, Inc. | | | 50,000 | | | | $ 300,000 | |
Medical Action Industries, Inc.* | | | 47,700 | | | | 165,996 | |
Palomar Medical Technologies, Inc.* | | | 40,600 | | | | 345,100 | |
Rockwell Medical Technologies, Inc.*+ | | | 72,100 | | | | 671,251 | |
RTI Biologics, Inc.* | | | 125,000 | | | | 470,000 | |
Solta Medical, Inc.* | | | 158,400 | | | | 464,112 | |
Spectranetics Corp.* | | | 29,948 | | | | 342,006 | |
Theragenics Corp.* | | | 211,800 | | | | 425,718 | |
TranS1, Inc.* | | | 129,500 | | | | 321,160 | |
Utah Medical Products, Inc. | | | 44,900 | | | | 1,505,497 | |
Vascular Solutions, Inc.* | | | 49,300 | | | | 619,208 | |
Young Innovations, Inc. | | | 9,000 | | | | 310,410 | |
| | | | | | | | |
| | | | | | | 12,405,138 | |
| |
Health Care Providers & Services - 3.56% | | | | | |
Almost Family, Inc.* | | | 11,600 | | | | 259,144 | |
AMN Healthcare Services, Inc.* | | | 72,300 | | | | 428,739 | |
Capital Senior Living Corp.* | | | 96,000 | | | | 1,017,600 | |
CardioNet, Inc.* | | | 131,100 | | | | 266,133 | |
Chindex International, Inc.* | | | 71,200 | | | | 697,760 | |
Cross Country Healthcare, Inc.* | | | 58,700 | | | | 256,519 | |
Five Star Quality Care, Inc.* | | | 121,600 | | | | 373,312 | |
Medcath Corp.* | | | 43,400 | | | | 324,198 | |
Metropolitan Health Networks, Inc.* | | | 179,272 | | | | 1,715,633 | |
National Research Corp. | | | 13,500 | | | | 706,725 | |
PDI, Inc.* | | | 70,200 | | | | 578,448 | |
Providence Service Corp. (The)* | | | 115,200 | | | | 1,579,392 | |
RadNet, Inc.* | | | 246,800 | | | | 656,488 | |
Skilled Healthcare Group, Inc., Class A* | | | 75,300 | | | | 472,884 | |
Sun Healthcare Group, Inc.* | | | 63,400 | | | | 530,658 | |
U.S. Physical Therapy, Inc. | | | 35,483 | | | | 902,333 | |
| | | | | | | | |
| | | | | | | 10,765,966 | |
| |
Hotels, Restaurants & Leisure - 3.80% | | | | | |
Benihana, Inc. | | | 26,200 | | | | 422,082 | |
Bluegreen Corp.*+ | | | 57,203 | | | | 283,727 | |
Caribou Coffee Co., Inc.* | | | 33,600 | | | | 433,776 | |
Carrols Restaurant Group, Inc.* | | | 43,100 | | | | 256,014 | |
Dover Downs Gaming & Entertainment, Inc. | | | 154,617 | | | | 465,397 | |
Einstein Noah Restaurant Group, Inc. | | | 31,550 | | | | 554,018 | |
| | |
33 | | Annual Report | June 30, 2012 |
| | |
Bridgeway Ultra-Small Company Market Fund SCHEDULE OF INVESTMENTS (continued) | | |
Showing percentage of net assets as of June 30, 2012
| | | | | | | | |
| Industry Company | | Shares | | | Value | |
Common Stocks (continued) | | | | | | | | |
Hotels, Restaurants & Leisure (continued) | | | | | |
Famous Dave’s of America, Inc.* | | | 158,800 | | | | $ 1,754,740 | |
Fiesta Restaurant Group, Inc.* | | | 43,100 | | | | 570,213 | |
Frisch’s Restaurants, Inc. | | | 16,000 | | | | 453,440 | |
Full House Resorts, Inc.* | | | 60,700 | | | | 174,209 | |
Gaming Partners International Corp. | | | 56,300 | | | | 345,119 | |
Isle of Capri Casinos, Inc.* | | | 62,500 | | | | 385,625 | |
Jamba, Inc.* | | | 153,314 | | | | 300,496 | |
Kona Grill, Inc.* | | | 67,500 | | | | 608,850 | |
Lakes Entertainment, Inc.* | | | 80,000 | | | | 232,000 | |
Luby’s, Inc.* | | | 73,600 | | | | 493,120 | |
Monarch Casino & Resort, Inc.* | | | 48,685 | | | | 444,981 | |
Morgans Hotel Group Co.* | | | 84,300 | | | | 396,210 | |
MTR Gaming Group, Inc.* | | | 90,700 | | | | 430,825 | |
Multimedia Games Holding Co., Inc.* | | | 57,700 | | | | 807,800 | |
Nathan’s Famous, Inc.*+ | | | 12,000 | | | | 354,000 | |
Nevada Gold & Casinos, Inc.* | | | 120,000 | | | | 138,000 | |
Premier Exhibitions, Inc.*+ | | | 142,500 | | | | 384,750 | |
Town Sports International Holdings, Inc.* | | | 61,087 | | | | 811,846 | |
| | | | | | | | |
| | | | | | | 11,501,238 | |
| | |
Household Durables - 1.63% | | | | | | | | |
Bassett Furniture Industries, Inc. | | | 74,200 | | | | 765,002 | |
CSS Industries, Inc. | | | 15,700 | | | | 322,635 | |
Emerson Radio Corp.* | | | 114,300 | | | | 232,029 | |
Furniture Brands International, Inc.* | | | 284,100 | | | | 352,284 | |
Hooker Furniture Corp. | | | 51,900 | | | | 611,901 | |
Kid Brands, Inc.* | | | 80,300 | | | | 160,600 | |
Lifetime Brands, Inc. | | | 63,300 | | | | 789,351 | |
Sealy Corp.*+ | | | 242,600 | | | | 448,810 | |
Zagg, Inc.*+ | | | 114,300 | | | | 1,247,013 | |
| | | | | | | | |
| | | | | | | 4,929,625 | |
| | |
Household Products - 0.14% | | | | | | | | |
Oil-Dri Corp. of America | | | 19,800 | | | | 433,620 | |
| |
Independent Power Producers & Energy Traders - 0.31% | |
American DG Energy, Inc.*+ | | | 105,800 | | | | 240,166 | |
Genie Energy, Ltd., Class B | | | 48,667 | | | | 378,142 | |
Synthesis Energy Systems, Inc.* | | | 272,471 | | | | 332,415 | |
| | | | | | | | |
| | | | | | | 950,723 | |
| | | | | | | | |
| | | | | | | | |
| | | | | | | | |
| Industry Company | | Shares | | | Value | |
| | | | | | | | |
Insurance - 1.56% | | | | | | | | |
Crawford & Co., Class B | | | 84,600 | | | | $ 346,014 | |
First Acceptance Corp.* | | | 111,700 | | | | 149,678 | |
Hallmark Financial Services, Inc.* | | | 51,800 | | | | 404,040 | |
Homeowners Choice, Inc. | | | 12,000 | | | | 211,200 | |
Independence Holding Co.+ | | | 65,670 | | | | 646,849 | |
Investors Title Co.+ | | | 3,500 | | | | 199,255 | |
Meadowbrook Insurance Group, Inc. | | | 95,200 | | | | 836,808 | |
SeaBright Holdings, Inc. | | | 69,100 | | | | 614,299 | |
Stewart Information Services Corp. | | | 39,594 | | | | 607,768 | |
Universal Insurance Holdings, Inc. | | | 205,200 | | | | 699,732 | |
| | | | | | | | |
| | | | | | | 4,715,643 | |
| | |
Internet & Catalog Retail - 0.56% | | | | | | | | |
1-800-Flowers.com, Inc., Class A* | | | 170,000 | | | | 593,300 | |
Gaiam, Inc., Class A* | | | 38,200 | | | | 148,980 | |
Geeknet, Inc.* | | | 7,408 | | | | 146,826 | |
US Auto Parts Network, Inc.* | | | 100,900 | | | | 421,762 | |
ValueVision Media, Inc., Class A* | | | 176,286 | | | | 366,675 | |
| | | | | | | | |
| | | | | | | 1,677,543 | |
| |
Internet Software & Services - 1.54% | | | | | |
Globalscape, Inc.* | | | 59,700 | | | | 119,400 | |
Ipass, Inc.* | | | 155,000 | | | | 368,900 | |
Keynote Systems, Inc. | | | 44,400 | | | | 659,340 | |
Marchex, Inc., Class B | | | 140,400 | | | | 506,844 | |
MeetMe, Inc.*+ | | | 33,989 | | | | 79,874 | |
Spark Networks, Inc.*+ | | | 64,800 | | | | 334,368 | |
Support.com, Inc.* | | | 336,745 | | | | 1,074,217 | |
TechTarget, Inc.* | | | 96,350 | | | | 485,604 | |
TheStreet, Inc. | | | 149,700 | | | | 224,550 | |
Unwired Planet, Inc.* | | | 223,900 | | | | 514,970 | |
Zix Corp.* | | | 112,782 | | | | 293,233 | |
| | | | | | | | |
| | | | | | | 4,661,300 | |
| | |
IT Services - 1.56% | | | | | | | | |
Analysts International Corp.* | | | 18,500 | | | | 78,070 | |
Computer Task Group, Inc.* | | | 92,400 | | | | 1,385,076 | |
Dynamics Research Corp.* | | | 39,458 | | | | 229,251 | |
Edgewater Technology, Inc.* | | | 39,200 | | | | 152,488 | |
Hackett Group, Inc. (The)* | | | 138,789 | | | | 773,055 | |
Information Services Group, Inc.* | | | 96,600 | | | | 124,614 | |
| | |
Bridgeway Ultra-Small Company Market Fund SCHEDULE OF INVESTMENTS (continued) | | |
Showing percentage of net assets as of June 30, 2012
| | | | | | | | |
| Industry Company | | Shares | | | Value | |
Common Stocks (continued) | | | | | | | | |
IT Services (continued) | | | | | | | | |
Innodata, Inc.*+ | | | 50,000 | | | | $ 342,000 | |
Lionbridge Technologies, Inc.* | | | 116,595 | | | | 367,274 | |
Mattersight Corp.*+ | | | 30,000 | | | | 239,400 | |
ModusLink Global Solutions, Inc.* | | | 105,800 | | | | 316,342 | |
NCI, Inc., Class A* | | | 2,630 | | | | 10,652 | |
Online Resources Corp.* | | | 127,028 | | | | 308,678 | |
PRGX Global, Inc.* | | | 50,000 | | | | 397,500 | |
| | | | | | | | |
| | | | | | | 4,724,400 | |
| |
Leisure Equipment & Products - 1.05% | | | | | |
Arctic Cat, Inc.* | | | 28,900 | | | | 1,056,584 | |
Johnson Outdoors, Inc., Class A* | | | 34,800 | | | | 716,880 | |
LeapFrog Enterprises, Inc.* | | | 97,000 | | | | 995,220 | |
Marine Products Corp.+ | | | 66,400 | | | | 403,712 | |
| | | | | | | | |
| | | | | | | 3,172,396 | |
| |
Life Sciences Tools & Services - 1.45% | | | | | |
Albany Molecular Research, Inc.* | | | 103,100 | | | | 262,905 | |
BioClinica, Inc.* | | | 77,100 | | | | 372,393 | |
Cambrex Corp.* | | | 104,100 | | | | 979,581 | |
Complete Genomics, Inc.*+ | | | 80,381 | | | | 149,509 | |
Enzo Biochem, Inc.* | | | 191,700 | | | | 320,139 | |
Furiex Pharmaceuticals, Inc.* | | | 21,200 | | | | 444,140 | |
Harvard Bioscience, Inc.* | | | 162,817 | | | | 613,820 | |
Medtox Scientific, Inc.* | | | 29,000 | | | | 781,840 | |
Pacific Biosciences of | | | | | | | | |
California, Inc.* | | | 213,800 | | | | 463,946 | |
| | | | | | | | |
| | | | | | | 4,388,273 | |
| | |
Machinery - 3.13% | | | | | | | | |
Alamo Group, Inc. | | | 19,875 | | | | 623,479 | |
Ampco-Pittsburgh Corp. | | | 26,600 | | | | 487,578 | |
Energy Recovery, Inc.* | | | 66,700 | | | | 160,080 | |
Flow International Corp.* | | | 185,551 | | | | 584,485 | |
Graham Corp. | | | 59,500 | | | | 1,107,890 | |
Greenbrier Cos., Inc.* | | | 43,600 | | | | 766,488 | |
Hardinge, Inc. | | | 31,300 | | | | 284,830 | |
Hurco Cos., Inc.* | | | 60,234 | | | | 1,234,195 | |
Key Technology, Inc.* | | | 17,600 | | | | 176,000 | |
L.S. Starrett Co., Class A (The) | | | 29,200 | | | | 337,844 | |
Lydall, Inc.* | | | 74,200 | | | | 1,003,184 | |
Met-Pro Corp. | | | 40,200 | | | | 370,242 | |
Miller Industries, Inc. | | | 28,400 | | | | 452,412 | |
NN, Inc.* | | | 83,800 | | | | 855,598 | |
PMFG, Inc.*+ | | | 30,000 | | | | 234,300 | |
| | | | | | | | |
| | | | | | | | |
| Industry Company | | Shares | | | Value | |
| | | | | | | | |
Machinery (continued) | | | | | | | | |
Tecumseh Products Co., Class A* | | | 7,600 | | | $ | 38,380 | |
Twin Disc, Inc.+ | | | 29,600 | | | | 547,304 | |
Xerium Technologies, Inc.*+ | | | 73,500 | | | | 213,150 | |
| | | | | | | | |
| | | | | | | 9,477,439 | |
| | |
Marine - 0.07% | | | | | | | | |
International Shipholding Corp. | | | 11,103 | | | | 209,403 | |
| | |
Media - 2.56% | | | | | | | | |
AH Belo Corp., Class A | | | 47,100 | | | | 189,342 | |
Ballantyne Strong, Inc.* | | | 45,500 | | | | 271,635 | |
Carmike Cinemas, Inc.* | | | 51,800 | | | | 758,870 | |
Dex One Corp.*+ | | | 222,700 | | | | 208,224 | |
Entercom Communications Corp., Class A* | | | 10,200 | | | | 61,404 | |
Entravision Communications Corp., Class A | | | 297,200 | | | | 359,612 | |
Fisher Communications, Inc.* | | | 25,200 | | | | 753,732 | |
Gray Television, Inc.* | | | 163,600 | | | | 240,492 | |
Journal Communications, Inc., Class A* | | | 127,200 | | | | 656,352 | |
LIN TV Corp., Class A* | | | 103,495 | | | | 312,555 | |
Martha Stewart Living Omnimedia, Class A | | | 90,200 | | | | 306,680 | |
McClatchy Co., Class A (The)* | | | 173,000 | | | | 380,600 | |
Media General, Inc., Class A*+ | | | 130,611 | | | | 602,117 | |
Navarre Corp.* | | | 271,200 | | | | 431,208 | |
Nexstar Broadcasting Group, Inc., Class A* | | | 41,400 | | | | 279,036 | |
Outdoor Channel Holdings, Inc. | | | 67,100 | | | | 490,501 | |
Radio One, Inc., Class D* | | | 100,000 | | | | 93,800 | |
ReachLocal, Inc.* | | | 34,069 | | | | 374,759 | |
Rentrak Corp.* | | | 11,809 | | | | 243,856 | |
Saga Communications, Inc., Class A* | | | 14,604 | | | | 541,954 | |
SuperMedia, Inc.*+ | | | 79,300 | | | | 198,250 | |
| | | | | | | | |
| | | | | | | 7,754,979 | |
| | |
Metals & Mining - 0.64% | | | | | | | | |
Friedman Industries, Inc. | | | 67,000 | | | | 681,390 | |
Great Northern Iron Ore Properties+ | | | 7,700 | | | | 581,889 | |
Mines Management, Inc.* | | | 6,200 | | | | 8,370 | |
Paramount Gold & Silver Corp.*+ | | | 55,840 | | | | 134,016 | |
Synalloy Corp. | | | 19,400 | | | | 221,160 | |
| | | | | | | | |
| | |
35 | | Annual Report | June 30, 2012 |
| | |
Bridgeway Ultra-Small Company Market Fund SCHEDULE OF INVESTMENTS (continued) | | |
Showing percentage of net assets as of June 30, 2012
| | | | | | | | |
| Industry Company | | Shares | | | Value | |
Common Stocks (continued) | | | | | | | | |
Metals & Mining (continued) | | | | | | | | |
Universal Stainless & Alloy* | | | 7,428 | | | | $ 305,291 | |
| | | | | | | | |
| | | | | | | 1,932,116 | |
| | |
Multiline Retail - 0.43% | | | | | | | | |
Bon-Ton Stores, Inc. (The)+ | | | 45,950 | | | | 358,870 | |
Duckwall-ALCO Stores, Inc.* | | | 7,000 | | | | 61,180 | |
Tuesday Morning Corp.* | | | 205,500 | | | | 881,595 | |
| | | | | | | | |
| | | | | | | 1,301,645 | |
| |
Oil, Gas & Consumable Fuels - 3.40% | | | | | |
Adams Resources & Energy, Inc. | | | 22,300 | | | | 934,816 | |
Callon Petroleum Co.* | | | 179,700 | | | | 765,522 | |
CREDO Petroleum Corp.* | | | 13,300 | | | | 192,451 | |
Crimson Exploration, Inc.* | | | 185,300 | | | | 850,527 | |
Double Eagle Petroleum Co.* | | | 77,200 | | | | 338,136 | |
Gevo, Inc.*+ | | | 32,859 | | | | 163,309 | |
Halcon Resources Corp.*+ | | | 94,067 | | | | 887,992 | |
HKN, Inc.* | | | 44,134 | | | | 104,598 | |
Miller Energy Resources, Inc.*+ | | | 193,800 | | | | 969,000 | |
Panhandle Oil & Gas, Inc., Class A | | | 13,797 | | | | 415,842 | |
PostRock Energy Corp.* | | | 73,500 | | | | 116,865 | |
Pyramid Oil Co.* | | | 69,800 | | | | 318,986 | |
REX American Resources Corp.* | | | 66,249 | | | | 1,293,180 | |
Saratoga Resources, Inc.*+ | | | 80,100 | | | | 470,988 | |
Synergy Resources Corp.* | | | 80,000 | | | | 246,400 | |
Uranerz Energy Corp.*+ | | | 74,000 | | | | 107,300 | |
USEC, Inc.*+ | | | 400,000 | | | | 396,000 | |
Verenium Corp.*+ | | | 78,800 | | | | 246,644 | |
Voyager Oil & Gas, Inc.* | | | 141,100 | | | | 248,336 | |
Warren Resources, Inc.* | | | 118,700 | | | | 284,880 | |
Westmoreland Coal Co.*+ | | | 59,675 | | | | 480,384 | |
ZaZa Energy Corp.*+ | | | 71,900 | | | | 324,988 | |
Zion Oil & Gas, Inc.*+ | | | 81,200 | | | | 127,484 | |
| | | | | | | | |
| | | | | | | 10,284,628 | |
| | |
Paper & Forest Products - 0.43% | | | | | | | | |
Mercer International, Inc.* | | | 64,400 | | | | 367,724 | |
Neenah Paper, Inc. | | | 30,000 | | | | 800,700 | |
Orient Paper, Inc.+ | | | 50,500 | | | | 132,310 | |
| | | | | | | | |
| | | | | | | 1,300,734 | |
| | |
Personal Products - 0.62% | | | | | | | | |
CCA Industries, Inc. | | | 14,100 | | | | 54,990 | |
Female Health Co. (The)+ | | | 43,200 | | | | 253,584 | |
| | | | | | | | |
| | | | | | | | |
| Industry Company | | Shares | | | Value | |
| | | | | | | | |
Personal Products (continued) | | | | | | | | |
Natural Alternatives International, Inc.* | | | 17,500 | | | | $ 134,575 | |
Nutraceutical International Corp.* | | | 35,800 | | | | 545,950 | |
Physicians Formula Holdings, Inc.* | | | 93,000 | | | | 324,570 | |
Schiff Nutrition International, Inc.* | | | 31,658 | | | | 568,261 | |
| | | | | | | | |
| | | | | | | 1,881,930 | |
| | |
Pharmaceuticals - 2.01% | | | | | | | | |
Cumberland Pharmaceuticals, Inc.* | | | 81,900 | | | | 529,074 | |
Depomed, Inc.* | | | 93,300 | | | | 530,877 | |
Lannett Co., Inc.* | | | 83,020 | | | | 352,005 | |
Novabay Pharmaceuticals, Inc.*+ | | | 121,500 | | | | 153,090 | |
Obagi Medical Products, Inc.* | | | 56,000 | | | | 855,120 | |
Omeros Corp.*+ | | | 77,400 | | | | 774,000 | |
Pain Therapeutics, Inc.* | | | 120,299 | | | | 564,202 | |
Pernix Therapeutics Holdings* | | | 4,086 | | | | 29,787 | |
Pozen, Inc.* | | | 76,400 | | | | 476,736 | |
Sucampo Pharmaceuticals, Inc., Class A* | | | 104,000 | | | | 731,120 | |
Transcept Pharmaceuticals, Inc.*+ | | | 44,100 | | | | 273,420 | |
XenoPort, Inc.*+ | | | 65,100 | | | | 393,204 | |
Zogenix, Inc.*+ | | | 161,300 | | | | 400,024 | |
| | | | | | | | |
| | | | | | | 6,062,659 | |
| | |
Professional Services - 1.50% | | | | | | | | |
Barrett Business Services, Inc. | | | 31,600 | | | | 668,024 | |
CDI Corp. | | | 41,701 | | | | 683,896 | |
CRA International, Inc.* | | | 27,200 | | | | 399,568 | |
GP Strategies Corp.* | | | 76,500 | | | | 1,412,955 | |
Hill International, Inc.* | | | 94,400 | | | | 302,080 | |
Hudson Global, Inc.* | | | 59,700 | | | | 248,949 | |
On Assignment, Inc.* | | | 34,036 | | | | 543,215 | |
VSE Corp. | | | 11,100 | | | | 264,069 | |
| | | | | | | | |
| | | | | | | 4,522,756 | |
|
Real Estate Management & Development - 1.01% | |
AV Homes, Inc.* | | | 52,800 | | | | 769,824 | |
Consolidated-Tomoka Land Co.+ | | | 30,649 | | | | 882,078 | |
Stratus Properties, Inc.* | | | 32,500 | | | | 292,500 | |
| | |
Bridgeway Ultra-Small Company Market Fund SCHEDULE OF INVESTMENTS (continued) | | |
Showing percentage of net assets as of June 30, 2012
| | | | | | | | |
| Industry Company | | Shares | | | Value | |
Common Stocks (continued) | | | | | |
Real Estate Management & Development (continued) | |
Thomas Properties Group, Inc. | | | 203,400 | | | | $1,106,496 | |
| | | | | | | | |
| | | | | | | 3,050,898 | |
| | |
Road & Rail - 0.30% | | | | | | | | |
Universal Truckload Services, Inc. | | | 30,700 | | | | 464,338 | |
USA Truck, Inc.* | | | 40,061 | | | | 188,687 | |
YRC Worldwide, Inc.*+ | | | 36,800 | | | | 259,072 | |
| | | | | | | | |
| | | | | | | 912,097 | |
| |
Semiconductors & Semiconductor Equipment - 3.24% | |
Amtech Systems, Inc.*+ | | | 57,500 | | | | 216,200 | |
AuthenTec, Inc.*+ | | | 394,200 | | | | 1,706,886 | |
AXT, Inc.* | | | 80,000 | | | | 316,000 | |
DSP Group, Inc.* | | | 81,300 | | | | 515,442 | |
FSI International, Inc.* | | | 125,400 | | | | 450,186 | |
GSI Technology, Inc.* | | | 201,417 | | | | 954,716 | |
Integrated Silicon Solution, Inc.* | | | 77,641 | | | | 783,398 | |
Mattson Technology, Inc.* | | | 125,900 | | | | 220,325 | |
MaxLinear, Inc., Class A* | | | 65,100 | | | | 322,896 | |
PDF Solutions, Inc.* | | | 103,400 | | | | 1,020,558 | |
Pericom Semiconductor Corp.* | | | 50,772 | | | | 456,948 | |
Photronics, Inc.* | | | 81,070 | | | | 494,527 | |
Pixelworks, Inc.* | | | 58,900 | | | | 142,538 | |
PLX Technology, Inc.* | | | 78,900 | | | | 501,015 | |
QuickLogic Corp.*+ | | | 127,100 | | | | 319,021 | |
Ramtron International Corp.* | | | 98,900 | | | | 298,678 | |
Rudolph Technologies, Inc.* | | | 52,600 | | | | 458,672 | |
SemiLEDs Corp.* | | | 90,000 | | | | 278,100 | |
Ultra Clean Holdings* | | | 53,500 | | | | 344,005 | |
| | | | | | | | |
| | | | | | | 9,800,111 | |
| | |
Software - 2.13% | | | | | | | | |
American Software, Inc., Class A | | | 60,700 | | | | 482,565 | |
Callidus Software, Inc.*+ | | | 109,200 | | | | 543,816 | |
Cinedigm Digital Cinema Corp., Class A* | | | 100,000 | | | | 150,000 | |
Digimarc Corp. | | | 23,100 | | | | 592,746 | |
ePlus, Inc.* | | | 19,559 | | | | 632,733 | |
FalconStor Software, Inc.* | | | 132,700 | | | | 346,347 | |
Glu Mobile, Inc.*# | | | 140,500 | | | | 779,775 | |
Guidance Software, Inc.* | | | 63,000 | | | | 599,130 | |
Pervasive Software, Inc.* | | | 40,000 | | | | 299,600 | |
PROS Holdings, Inc.* | | | 26,900 | | | | 452,458 | |
QAD, Inc., Class A | | | 30,800 | | | | 437,976 | |
QAD, Inc., Class B | | | 7,700 | | | | 104,797 | |
Rosetta Stone, Inc.*+ | | | 41,400 | | | | 572,976 | |
| | | | | | | | |
| | | | | | | | |
| Industry Company | | Shares | | | Value | |
| | | | | | | | |
Software (continued) | | | | | | | | |
Smith Micro Software, Inc.* | | | 64,300 | | | | $ 118,312 | |
TeleCommunication Systems, Inc., Class A* | | | 271,434 | | | | 333,864 | |
| | | | | | | | |
| | | | | | | 6,447,095 | |
| | |
Specialty Retail - 2.45% | | | | | | | | |
America’s Car-Mart, Inc.* | | | 22,500 | | | | 874,125 | |
Big 5 Sporting Goods Corp. | | | 43,400 | | | | 328,104 | |
Build-A-Bear Workshop, Inc.* | | | 59,500 | | | | 284,410 | |
Casual Male Retail Group, Inc.* | | | 163,100 | | | | 592,053 | |
Cost Plus, Inc.* | | | 44,800 | | | | 985,600 | |
Haverty Furniture Cos., Inc. | | | 53,219 | | | | 594,456 | |
MarineMax, Inc.* | | | 68,200 | | | | 648,582 | |
New York & Co., Inc.* | | | 156,100 | | | | 543,228 | |
Pacific Sunwear of California, Inc.* | | | 118,249 | | | | 216,396 | |
TravelCenters of America LLC* | | | 76,200 | | | | 386,334 | |
West Marine, Inc.* | | | 72,200 | | | | 848,350 | |
Winmark Corp.+ | | | 10,200 | | | | 597,210 | |
Zale Corp.* | | | 190,200 | | | | 511,638 | |
| | | | | | | | |
| | | | | | | 7,410,486 | |
| |
Textiles, Apparel & Luxury Goods - 1.33% | | | | | |
Alpha PRO Tech, Ltd.* | | | 97,600 | | | | 136,640 | |
Charles & Colvard, Ltd.* | | | 60,900 | | | | 229,593 | |
Cherokee, Inc. | | | 20,100 | | | | 279,993 | |
Culp, Inc. | | | 51,016 | | | | 522,914 | |
Delta Apparel, Inc.* | | | 21,900 | | | | 299,154 | |
DGSE Cos., Inc.*D+ | | | 28,800 | | | | 125,971 | |
K-Swiss, Inc., Class A*+ | | | 108,700 | | | | 334,796 | |
Lacrosse Footwear, Inc. | | | 13,729 | | | | 149,509 | |
Lakeland Industries, Inc.* | | | 10,000 | | | | 70,700 | |
R.G. Barry Corp. | | | 27,600 | | | | 375,084 | |
Rocky Brands, Inc.* | | | 52,200 | | | | 688,518 | |
Unifi, Inc.* | | | 71,000 | | | | 804,430 | |
| | | | | | | | |
| | | | | | | 4,017,302 | |
| |
Thrifts & Mortgage Finance - 6.94% | | | | | |
Bank Mutual Corp. | | | 99,000 | | | | 436,590 | |
BankFinancial Corp. | | | 36,079 | | | | 271,675 | |
Beacon Federal Bancorp, Inc. | | | 17,800 | | | | 352,974 | |
BofI Holding, Inc.* | | | 36,200 | | | | 715,312 | |
Cape Bancorp, Inc.* | | | 42,100 | | | | 349,851 | |
Chicopee Bancorp, Inc.* | | | 26,500 | | | | 383,720 | |
Clifton Savings Bancorp, Inc.+ | | | 64,300 | | | | 669,363 | |
ESB Financial Corp.+ | | | 69,000 | | | | 910,800 | |
| | |
37 | | Annual Report | June 30, 2012 |
| | |
Bridgeway Ultra-Small Company Market Fund SCHEDULE OF INVESTMENTS (continued) | | |
Showing percentage of net assets as of June 30, 2012
| | | | | | | | |
| Industry Company | | Shares | | | Value | |
Common Stocks (continued) | | | | | |
Thrifts & Mortgage Finance (continued) | | | | | |
ESSA Bancorp, Inc. | | | 36,000 | | | | $ 388,800 | |
Federal Agricultural Mortgage Corp., Class C | | | 104,800 | | | | 2,748,904 | |
First Defiance Financial Corp. | | | 58,400 | | | | 999,808 | |
First Financial Holdings, Inc. | | | 53,800 | | | | 576,736 | |
First Financial Northwest, Inc.*+ | | | 61,600 | | | | 500,192 | |
First Pactrust Bancorp, Inc.+ | | | 57,100 | | | | 677,206 | |
Fox Chase Bancorp, Inc. | | | 57,932 | | | | 836,538 | |
Franklin Financial Corp.* | | | 32,800 | | | | 539,560 | |
Guaranty Federal Bancshares, Inc.* | | | 20,856 | | | | 166,848 | |
Hampden Bancorp, Inc. | | | 33,000 | | | | 427,020 | |
Heritage Financial Group, Inc.+ | | | 17,100 | | | | 220,077 | |
Home Bancorp, Inc.*+ | | | 41,600 | | | | 712,608 | |
Home Federal Bancorp, Inc. | | | 32,200 | | | | 338,100 | |
Kaiser Federal Financial Group, Inc. | | | 55,114 | | | | 814,585 | |
Louisiana Bancorp, Inc.* | | | 18,000 | | | | 288,000 | |
Meridian Interstate Bancorp, Inc.* | | | 52,100 | | | | 725,232 | |
Meta Financial Group, Inc. | | | 12,100 | | | | 241,153 | |
New Hampshire Thrift Bancshares, Inc. | | | 18,100 | | | | 224,440 | |
Ocean Shore Holding Co. | | | 32,100 | | | | 406,065 | |
OceanFirst Financial Corp. | | | 29,200 | | | | 419,312 | |
Provident Financial Holdings, Inc.+ | | | 101,300 | | | | 1,167,989 | |
Pulaski Financial Corp.+ | | | 43,500 | | | | 322,335 | |
Riverview Bancorp, Inc.* | | | 17,406 | | | | 21,757 | |
SI Financial Group, Inc.+ | | | 17,276 | | | | 198,674 | |
Territorial Bancorp, Inc. | | | 42,300 | | | | 963,171 | |
Timberland Bancorp, Inc.* | | | 24,222 | | | | 120,141 | |
Tree.com, Inc.* | | | 20,100 | | | | 229,944 | |
United Community Financial Corp.* | | | 130,000 | | | | 387,400 | |
United Financial Bancorp, Inc. | | | 46,641 | | | | 670,698 | |
Waterstone Financial, Inc.* | | | 43,355 | | | | 164,749 | |
Westfield Financial, Inc. | | | 56,179 | | | | 410,107 | |
| | | | | | | | |
| | | | | | | 20,998,434 | |
| |
Trading Companies & Distributors - 0.78% | | | | | |
Aceto Corp. | | | 58,500 | | | | 528,255 | |
BlueLinx Holdings, Inc.* | | | 16,378 | | | | 38,488 | |
DXP Enterprises, Inc.* | | | 22,200 | | | | 921,078 | |
Lawson Products, Inc. | | | 60,700 | | | | 561,475 | |
Willis Lease Finance Corp.* | | | 24,400 | | | | 300,608 | |
| | | | | | | | |
| | | | | | | 2,349,904 | |
| | | | | | | | |
| Industry Company | | Shares | | | Value | |
| | | | | | | | |
Water Utilities - 0.56% | | | | | | | | |
Artesian Resources Corp., Class A | | | 10,500 | | | $ | 226,170 | |
Cadiz, Inc.*+ | | | 31,400 | | | | 226,394 | |
York Water Co. | | | 68,550 | | | | 1,226,360 | |
| | | | | | | | |
| | | | | | | 1,678,924 | |
| | | | | | | | |
TOTAL COMMON STOCKS - 99.34% (Cost $222,018,137) | | | | | | | 300,428,796 | |
| | | | | | | | |
| | | | | | | | |
| |
EXCHANGE TRADED FUND - 0.55% | | | | | |
iShares Russell Microcap Index Fund+ | | | 33,525 | | | | 1,677,591 | |
| | | | | | | | |
TOTAL EXCHANGE TRADED FUND - 0.55% (Cost $920,990) | | | | | | | 1,677,591 | |
| | | | | | | | |
| | | | | | | | |
| | |
RIGHTS - 0.02% | | | | | | | | |
Hampton Roads Bankshares, Inc.*D | | | 85,300 | | | | 61,843 | |
| | | | | | | | |
TOTAL RIGHTS - 0.02% (Cost $132,736) | | | | | | | 61,843 | |
| | | | | | | | |
| | | | | | | | |
| | | | | | | | | | |
| | | Rate^ | | Shares | | | Value | |
| | | |
MONEY MARKET FUND - 0.28% | | | | | |
BlackRock FedFund | | 0.01% | | | 850,013 | | | | 850,013 | |
| | | | | | | | | | |
TOTAL MONEY MARKET FUND - 0.28% (Cost $850,013) | | | | | | | 850,013 | |
| | | | | | | | |
| | | | | | | | |
TOTAL INVESTMENTS - 100.19% (Cost $223,921,876) | | | | | | $ | 303,018,243 | |
| | | | | | | | |
Liabilities in Excess of Other Assets - (0.19%) | | | | (586,205 | ) |
| | | | | | | | | | |
NET ASSETS - 100.00% | | | | | | $ | 302,432,038 | |
| | | | | | | | | | |
| * | Non-income producing security. |
| # | Securities, or a portion thereof, segregated to cover the Fund’s potential obligation under swap agreements. The total value of segregated assets is $779,775. |
| ^ | Rate disclosed as of June 30, 2012. |
| D | Security was fair valued under procedures adopted by the Board of Directors (see Note 2). |
| + | This security or a portion of the security is out on loan at June 30, 2012. Total loaned securities had a value of $40,200,979 at June 30, 2012. |
| LLC | - Limited Liability Company |
| | |
Bridgeway Ultra-Small Company Market Fund SCHEDULE OF INVESTMENTS (continued) | | |
| | | | | | | | | | | | | | |
Summary of inputs used to value the Fund’s investments as of 06/30/2012 is as follows (See Note 2 in Notes to Financial Statements): |
| | | Valuation Inputs |
| | | Investment in Securities (Value) |
| | | Level 1 Quoted Prices | | | Level 2
Significant
Observable
Inputs | | | Level 3
Significant
Unobservable
Inputs | | | Total |
Common Stocks | | $ | 300,302,825 | | | | $ — | | | | $125,971 | | | $300,428,796 |
Exchange-Traded Fund | | | 1,677,591 | | | | — | | | | — | | | 1,677,591 |
Rights | | | — | | | | — | | | | 61,843 | | | 61,843 |
Money Market Fund | | | — | | | | 850,013 | | | | — | | | 850,013 |
| | | | | | | | | | | | | | |
TOTAL | | $ | 301,980,416 | | | | $850,013 | | | | $187,814 | | | $303,018,243 |
| | | | | | | | | | | | | | |
Other Finan-
cial Instru-
ments** | | | | | | | | | | | | | | |
Swaps | | $ | — | | | | $ 11,563 | | | | $ — | | | $ 11,563 |
| | | | | | | | | | | | | | |
TOTAL | | $ | — | | | | $ 11,563 | | | | $ — | | | $ 11,563 |
| | | | | | | | | | | | | | |
** Other financial instruments are derivative instruments not reflected in the Schedule of Investments, such as swap contracts, which are valued at the unrealized appreciation/depreciation on the investment. |
| |
| |
| |
| |
| |
| |
| |
| |
| |
| | | | | | | | | | | | |
Following is a reconciliation of Level 3 investments for which significant
unobservable inputs were used to determine fair value: | |
| | | Investment in Securities (Value) | |
| | | Common Stocks | | | Rights | | | Total | |
Balance as of 06/30/2011 | | | $ 234,354 | | | | $ — | | | | $ 234,354 | |
Purchases | | | 226,250 | | | | 132,736 | | | | 358,986 | |
Sales | | | (21,122) | | | | — | | | | (21,122) | |
Realized gain/(loss)1 | | | (385,489) | | | | — | | | | (385,489) | |
Change in unrealized appreciation/ (depreciation)2 | | | 71,978 | | | | (70,893) | | | | 1,085 | |
Transfers in | | | — | | | | — | | | | — | |
Transfers out | | | — | | | | — | | | | — | |
| | | | | | | | | | | | |
Balance as of 06/30/2012 | | | $ 125,971 | | | | $ 61,843 | | | | $ 187,814 | |
| | | | | | | | | | | | |
Net change in unrealized appreciation (depreciation) from investments held as of 06/30/20122 | | | $(100,279) | | | | $ (70,893) | | | | $(171,172) | |
| | | | | | | | | | | | |
1Realized gain/(loss) from Level 3 securities is included on the Statement of Operations in the Realized Gain (Loss) on Investments.
2Change in unrealized appreciation/(depreciation) for Level 3 securities is included on Statement of Operations in the Change in Unrealized Appreciation (Depreciation) on Investments.
The securities in the table above were considered Level 3 securities because they were fair valued under procedures adopted by the Board of Directors at June 30, 2012. Such valuations are based on a review of inputs such as, but not limited to, similar securities, company specific financial information and company specific news.
See Notes to Financial Statements.
| | |
39 | | Annual Report | June 30, 2012 |
| | |
| Small-Cap Momentum Fund | | |
| MANAGER’S COMMENTARY (Unaudited) | |
June 30, 2012
Dear Fellow Small-Cap Momentum Fund Shareholder,
For the quarter ended June 30, 2012, our Fund declined 4.26%, underperforming our primary market benchmark, the Russell 2000 Index (-3.47%). Although our risk adjustment feature helped, it was not enough to overcome the negative impact of a price momentum strategy in this “choppy” market. It was a poor quarter overall.
For the fiscal year ended June 30, 2012, our Fund declined 1.40%, beating our primary market benchmark, the Russell 2000 Index (-2.08%). We are happier with the “cushion” we provided in the fiscal year. We continue to lead the Index over the life of the Fund.
The table below presents our June quarter, one-year and inception-to-date financial results. See the next page for a graph of performance since inception.
Standardized Returns as of June 30, 2012
| | | | | | | | | | | | |
|
| | | | |
| | | | | | | | | Annualized |
| | | | | | | | | | | | | Since Inception |
| | | Quarter | | | | 1 Year | | | | | | (5/28/10) |
|
Small-Cap Momentum Fund | | -4.26% | | | | -1.40% | | | | | | 11.90% |
Russell 2000 Index | | -3.47% | | | | -2.08% | | | | | | 10.88% |
Performance figures quoted in the table above and graph below represent past performance and are no guarantee of future results. Total return figures in the table above and the graph below include the reinvestment of dividends and capital gains. The table above and the graph below do not reflect the deduction of taxes that a shareholder would pay on Fund distributions or the redemption of Fund shares.
The Russell 2000 Index is an unmanaged, market value weighted index that measures performance of the 2,000 companies that are between the 1,000th and 3,000th largest in the market with dividends reinvested. It is not possible to invest directly in an index. Periods longer than one year are annualized.
According to data from Lipper, Inc. as of June 30, 2012, Small-Cap Momentum Fund ranked 184th of 682 small-cap core funds for the twelve-month period ended June 30, 2012 and 171st of 650 such funds since inception in May, 2010. Lipper, Inc. is an independent mutual fund rating service that ranks funds in various fund categories by making comparative calculations using total returns.
| | |
Small-Cap Momentum Fund MANAGER’S COMMENTARY (Unaudited) (continued) | | |
Small-Cap Momentum Fund vs. Russell 2000 Index from Inception 5/28/10 to 6/30/12
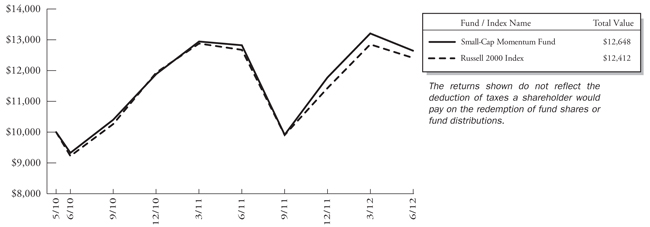
Detailed Explanation of Quarterly Performance
The Short Version: Our price momentum exposure hurt returns in the June quarter.
The Fund performed in line with its design objective for the quarter ended June 30, 2012. Our exposure to price momentum hurt in the “zigzag” market of the January through June 2012 time period. Even though the risk-adjustment overlay did cushion the underperformance somewhat, we weren’t able to overcome the downdraft from price momentum exposure. Lower weighting and strong stock picking in the poor performing Energy sector helped our relative return. Poor stock selection in the Consumer Discretionary and Information Technology sectors hurt the Fund’s relative performance.
Detailed Explanation of Fiscal Year Performance
The Short Version: The Fund’s risk-adjustment overlay did overcome our exposure to price momentum, which allowed the Fund to outperform the index for the full fiscal year.
The Fund performed according to its design during the full fiscal year. Our exposure to price momentum, as expected, hurt the Fund in a choppy market. However, the risk-adjustment overlay helped cushion the fall, resulting in some outperformance versus its Russell 2000 Index benchmark for the fiscal year. Our relative overweighting of smaller companies also added some cushion. Strong stock selection in the Energy sector helped our relative performance, while poor stock selection in the Financials and Information Technology sectors hurt relative performance.
| | |
41 | | Annual Report | June 30, 2012 |
| | |
Small-Cap Momentum Fund MANAGER’S COMMENTARY (Unaudited) (continued) | | |
Top Ten Holdings as of June 30, 2012
| | | | | | | | |
| Rank | | Description | | Industry | | % of Net
Assets | |
1 | | Standard Pacific Corp. | | Household Durables | | | 0.8% | |
2 | | USG Corp. | | Building Products | | | 0.7% | |
3 | | Lancaster Colony Corp. | | Food Products | | | 0.7% | |
4 | | Cirrus Logic, Inc. | | Semiconductors & Semiconductor Equipment | | | 0.7% | |
5 | | Susquehanna Bancshares, Inc. | | Commercial Banks | | | 0.7% | |
6 | | Pool Corp. | | Distributors | | | 0.7% | |
7 | | LifePoint Hospitals, Inc. | | Health Care Providers & Services | | | 0.7% | |
8 | | Huntington Ingalls Industries, Inc. | | Aerospace & Defense | | | 0.7% | |
9 | | Life Time Fitness, Inc. | | Hotels, Restaurants & Leisure | | | 0.7% | |
10 | | Ironwood Pharmaceuticals, Inc. | | Biotechnology | | | 0.7% | |
| | Total | | | | | 7.1% | |
Industry Sector Representation as of June 30, 2012
| | | | | | |
| | | % of Net Assets | | % of
Russell 2000
Index | | Difference |
Consumer Discretionary | | 16.6% | | 13.8% | | 2.8% |
Consumer Staples | | 2.9% | | 3.7% | | -0.8% |
Energy | | 1.6% | | 6.1% | | -4.5% |
Financials | | 25.5% | | 21.3% | | 4.2% |
Health Care | | 9.8% | | 13.5% | | -3.7% |
Industrials | | 16.5% | | 14.9% | | 1.6% |
Information Technology | | 21.1% | | 17.5% | | 3.6% |
Materials | | 4.1% | | 4.7% | | -0.6% |
Telecommunication Services | | 0.1% | | 0.9% | | -0.8% |
Utilities | | 1.5% | | 3.6% | | -2.1% |
Cash & Other Assets | | 0.3% | | 0.0% | | 0.3% |
Total | | 100.0% | | 100.0% | | |
Disclaimer
The views expressed here are exclusively those of Fund management. These views, including those related to market sectors or individual stocks, are not meant as investment advice and should not be considered predictive in nature. Any favorable (or unfavorable) description of a holding applies only as of June 30, 2012, unless otherwise stated. Security positions can and do change thereafter. Discussions of historical performance do not guarantee and are not indicative of future performance.
Market volatility can significantly impact short-term performance. The Fund is not an appropriate investment for short-term investors. Investments in small companies generally carry greater risk than is customarily associated with larger companies. This additional risk is attributable to a number of factors, including the relatively limited financial resources that are typically available to small companies, and the fact that small companies often have comparatively limited product lines. In addition, the stock of small companies tends to be more volatile than the stock of large companies, particularly in the short term and particularly in the early stages of an economic or market downturn. Shareholders of the Fund, therefore, are taking on more risk than they would if they invested in the stock market as a whole.
| | |
Small-Cap Momentum Fund MANAGER’S COMMENTARY (Unaudited) (continued) | | |
Conclusion
Thank you for your continued investment in Small-Cap Momentum Fund. We encourage your feedback; your reactions and concerns are important to us.
Sincerely,
The Investment Management Team
| | |
43 | | Annual Report | June 30, 2012 |
| | |
Bridgeway Small-Cap Momentum Fund SCHEDULE OF INVESTMENTS | | |
Showing percentage of net assets as of June 30, 2012
| | | | | | | | |
| Industry Company | | Shares | | | Value | |
COMMON STOCKS - 99.48% | | | | | |
Aerospace & Defense - 1.21% | | | | | | | | |
Curtiss-Wright Corp. | | | 350 | | | | $10,868 | |
Huntington Ingalls Industries, Inc.* | | | 350 | | | | 14,084 | |
| | | | | | | | |
| | | | | | | 24,952 | |
| | |
Air Freight & Logistics - 0.31% | | | | | | | | |
Forward Air Corp. | | | 200 | | | | 6,454 | |
| | |
Airlines - 1.10% | | | | | | | | |
Allegiant Travel Co.* | | | 150 | | | | 10,452 | |
Hawaiian Holdings, Inc.* | | | 400 | | | | 2,604 | |
Spirit Airlines, Inc.* | | | 500 | | | | 9,730 | |
| | | | | | | | |
| | | | | | | 22,786 | |
| | |
Auto Components - 0.81% | | | | | | | | |
American Axle & Manufacturing Holdings, Inc.* | | | 600 | | | | 6,294 | |
Dorman Products, Inc.* | | | 250 | | | | 6,272 | |
Drew Industries, Inc.* | | | 150 | | | | 4,178 | |
| | | | | | | | |
| | | | | | | 16,744 | |
| | |
Automobiles - 0.50% | | | | | | | | |
Thor Industries, Inc. | | | 375 | | | | 10,279 | |
| | |
Biotechnology - 2.02% | | | | | | | | |
Affymax, Inc.* | | | 250 | | | | 3,220 | |
Array BioPharma, Inc.* | | | 650 | | | | 2,255 | |
Curis, Inc.*+ | | | 700 | | | | 3,780 | |
Ironwood Pharmaceuticals, Inc.* | | | 1,000 | | | | 13,780 | |
Opko Health, Inc.*+ | | | 2,250 | | | | 10,350 | |
Progenics Pharmaceuticals, Inc.* | | | 250 | | | | 2,445 | |
Synageva BioPharma Corp.* | | | 150 | | | | 6,084 | |
| | | | | | | | |
| | | | | | | 41,914 | |
| | |
Building Products - 1.19% | | | | | | | | |
Apogee Enterprises, Inc. | | | 200 | | | | 3,214 | |
Builders FirstSource, Inc.* | | | 800 | | | | 3,792 | |
Insteel Industries, Inc. | | | 150 | | | | 1,672 | |
Patrick Industries, Inc.* | | | 100 | | | | 1,275 | |
USG Corp.*+ | | | 775 | | | | 14,764 | |
| | | | | | | | |
| | | | | | | 24,717 | |
| | |
Capital Markets - 2.56% | | | | | | | | |
Duff & Phelps Corp., Class A | | | 300 | | | | 4,350 | |
Fidus Investment Corp. | | | 50 | | | | 759 | |
GFI Group, Inc. | | | 900 | | | | 3,204 | |
Gladstone Capital Corp. | | | 150 | | | | 1,184 | |
| | | | | | | | |
| | | | | | | | |
| Industry Company | | Shares | | | Value | |
| | | | | | | | |
Capital Markets (continued) | | | | | | | | |
Gladstone Investment Corp. | | | 150 | | | | $ 1,108 | |
Greenhill & Co., Inc. | | | 200 | | | | 7,130 | |
Knight Capital Group, Inc., Class A* | | | 750 | | | | 8,955 | |
Main Street Capital Corp.+ | | | 200 | | | | 4,840 | |
Medallion Financial Corp. | | | 150 | | | | 1,593 | |
Medley Capital Corp. | | | 150 | | | | 1,806 | |
New Mountain Finance Corp. | | | 100 | | | | 1,419 | |
Prospect Capital Corp.+ | | | 900 | | | | 10,251 | |
Triangle Capital Corp. | | | 200 | | | | 4,556 | |
Westwood Holdings Group, Inc. | | | 50 | | | | 1,863 | |
| | | | | | | | |
| | | | | | | 53,018 | |
| | |
Chemicals - 2.02% | | | | | | | | |
American Vanguard Corp. | | | 200 | | | | 5,318 | |
Calgon Carbon Corp.* | | | 450 | | | | 6,399 | |
Flotek Industries, Inc.* | | | 325 | | | | 3,036 | |
H.B. Fuller Co. | | | 375 | | | | 11,512 | |
Olin Corp. | | | 550 | | | | 11,489 | |
Schulman (A.), Inc. | | | 200 | | | | 3,970 | |
| | | | | | | | |
| | | | | | | 41,724 | |
| | |
Commercial Banks - 8.65% | | | | | | | | |
American National Bankshares, Inc. | | | 50 | | | | 1,178 | |
Ames National Corp. | | | 50 | | | | 1,150 | |
Arrow Financial Corp. | | | 100 | | | | 2,417 | |
Banco Latinoamericano de Comercio Exterior SA | | | 250 | | | | 5,358 | |
Banner Corp. | | | 150 | | | | 3,286 | |
BBCN Bancorp, Inc.* | | | 600 | | | | 6,534 | |
C&F Financial Corp. | | | 25 | | | | 1,004 | |
Camden National Corp. | | | 50 | | | | 1,831 | |
Cathay General Bancorp | | | 600 | | | | 9,906 | |
Centerstate Banks, Inc. | | | 250 | | | | 1,788 | |
Chemical Financial Corp. | | | 200 | | | | 4,300 | |
Citizens & Northern Corp. | | | 100 | | | | 1,905 | |
Citizens Republic Bancorp, Inc.* | | | 300 | | | | 5,139 | |
City Holding Co. | | | 100 | | | | 3,369 | |
CNB Financial Corp. | | | 100 | | | | 1,631 | |
Columbia Banking System, Inc. | | | 300 | | | | 5,646 | |
Community Trust Bancorp, Inc. | | | 100 | | | | 3,349 | |
Eagle Bancorp, Inc.* | | | 150 | | | | 2,362 | |
First Bancorp, Inc. | | | 50 | | | | 850 | |
| | |
Bridgeway Small-Cap Momentum Fund SCHEDULE OF INVESTMENTS (continued) | | |
Showing percentage of net assets as of June 30, 2012
| | | | | | | | |
| Industry Company | | Shares | | | Value | |
Common Stocks (continued) | | | | | | | | |
Commercial Banks (continued) | | | | | | | | |
First Connecticut Bancorp, Inc. | | | 150 | | | | $ 2,025 | |
First Interstate Bancsystem, Inc. | | | 350 | | | | 4,984 | |
First Merchants Corp. | | | 200 | | | | 2,492 | |
FNB Corp. | | | 1,025 | | | | 11,142 | |
German American Bancorp, Inc. | | | 100 | | | | 2,050 | |
Great Southern Bancorp, Inc. | | | 100 | | | | 2,758 | |
Heritage Financial Corp. | | | 100 | | | | 1,465 | |
International Bancshares Corp. | | | 475 | | | | 9,272 | |
MainSource Financial Group, Inc. | | | 150 | | | | 1,774 | |
Mercantile Bank Corp.* | | | 50 | | | | 922 | |
MetroCorp Bancshares, Inc.* | | | 150 | | | | 1,600 | |
MidWestOne Financial Group, Inc. | | | 50 | | | | 1,075 | |
National Bankshares, Inc.+ | | | 50 | | | | 1,506 | |
Northrim BanCorp, Inc. | | | 50 | | | | 1,074 | |
Old National Bancorp | | | 675 | | | | 8,107 | |
OmniAmerican Bancorp, Inc.* | | | 100 | | | | 2,143 | |
Pacific Premier Bancorp, Inc.* | | | 100 | | | | 840 | |
Park National Corp.+ | | | 100 | | | | 6,975 | |
Peoples Bancorp, Inc. | | | 100 | | | | 2,198 | |
Pinnacle Financial Partners, Inc.* | | | 250 | | | | 4,878 | |
PrivateBancorp, Inc. | | | 500 | | | | 7,380 | |
Republic Bancorp, Inc., Class A | | | 175 | | | | 3,894 | |
S&T Bancorp, Inc. | | | 225 | | | | 4,156 | |
Simmons First National Corp., Class A | | | 150 | | | | 3,488 | |
Southwest Bancorp, Inc.* | | | 150 | | | | 1,412 | |
Susquehanna Bancshares, Inc. | | | 1,375 | | | | 14,162 | |
Taylor Capital Group, Inc.* | | | 200 | | | | 3,278 | |
Virginia Commerce Bancorp, Inc.* | | | 250 | | | | 2,107 | |
Washington Banking Co. | | | 100 | | | | 1,390 | |
Western Alliance Bancorp* | | | 600 | | | | 5,616 | |
| | | | | | | | |
| | | | | | | 179,166 | |
| |
Commercial Services & Supplies - 1.49% | | | | | |
Acorn Energy, Inc. | | | 150 | | | | 1,248 | |
Deluxe Corp. | | | 400 | | | | 9,976 | |
Healthcare Services Group, Inc. | | | 500 | | | | 9,690 | |
| | | | | | | | |
| | | | | | | | |
| | | | | | | | |
| | | | | | | | |
| | | | | | | | |
| Industry Company | | Shares | | | Value | |
| | | | | | | | |
Commercial Services & Supplies (continued) | |
InnerWorkings, Inc.* | | | 350 | | | | $ 4,736 | |
McGrath RentCorp | | | 200 | | | | 5,300 | |
| | | | | | | | |
| | | | | | | 30,950 | |
| |
Communications Equipment - 2.14% | | | | | |
Bel Fuse, Inc., Class B | | | 100 | | | | 1,761 | |
Black Box Corp. | | | 150 | | | | 4,305 | |
CalAmp Corp.* | | | 200 | | | | 1,466 | |
Ciena Corp.* | | | 725 | | | | 11,868 | |
Comtech Telecommunications Corp. | | | 125 | | | | 3,573 | |
Harmonic, Inc.* | | | 900 | | | | 3,834 | |
NETGEAR, Inc.* | | | 300 | | | | 10,353 | |
Numerex Corp., Class A*+ | | | 100 | | | | 930 | |
Oplink Communications, Inc.* | | | 150 | | | | 2,030 | |
PC-Tel, Inc. | | | 150 | | | | 970 | |
Symmetricom, Inc.* | | | 300 | | | | 1,797 | |
Telular Corp. | | | 150 | | | | 1,386 | |
| | | | | | | | |
| | | | | | | 44,273 | |
| | |
Computers & Peripherals - 1.38% | | | | | | | | |
Cray, Inc.* | | | 300 | | | | 3,624 | |
Electronics for Imaging, Inc.* | | | 350 | | | | 5,687 | |
QLogic Corp.* | | | 700 | | | | 9,583 | |
STEC, Inc.* | | | 350 | | | | 2,730 | |
Super Micro Computer, Inc.* | | | 300 | | | | 4,758 | |
Xyratex, Ltd. | | | 200 | | | | 2,262 | |
| | | | | | | | |
| | | | | | | 28,644 | |
| |
Construction & Engineering - 0.67% | | | | | |
Argan, Inc. | | | 100 | | | | 1,398 | |
Comfort Systems USA, Inc. | | | 300 | | | | 3,006 | |
Dycom Industries, Inc.* | | | 250 | | | | 4,652 | |
Primoris Services Corp. | | | 400 | | | | 4,800 | |
| | | | | | | | |
| | | | | | | 13,856 | |
| | |
Construction Materials - 0.63% | | | | | | | | |
Eagle Materials, Inc. | | | 350 | | | | 13,069 | |
| | |
Consumer Finance - 0.70% | | | | | | | | |
DFC Global Corp.* | | | 350 | | | | 6,450 | |
Nelnet, Inc., Class A | | | 350 | | | | 8,050 | |
| | | | | | | | |
| | | | | | | 14,500 | |
| | |
Containers & Packaging - 0.57% | | | | | | | | |
AEP Industries, Inc.* | | | 50 | | | | 2,178 | |
Boise, Inc. | | | 800 | | | | 5,264 | |
Myers Industries, Inc. | | | 250 | | | | 4,290 | |
| | | | | | | | |
| | | | | | | 11,732 | |
| | |
45 | | Annual Report | June 30, 2012 |
| | |
Bridgeway Small-Cap Momentum Fund SCHEDULE OF INVESTMENTS (continued) | | |
Showing percentage of net assets as of June 30, 2012
| | | | | | | | |
| Industry Company | | Shares | | | Value | |
Common Stocks (continued) | | | | | | | | |
Distributors - 0.75% | | | | | | | | |
Pool Corp. | | | 350 | | | | $14,161 | |
VOXX International Corp.* | | | 150 | | | | 1,398 | |
| | | | | | | | |
| | | | | | | 15,559 | |
| |
Diversified Consumer Services - 0.87% | | | | | |
Capella Education Co.* | | | 100 | | | | 3,476 | |
Grand Canyon Education, Inc.* | | | 350 | | | | 7,329 | |
Regis Corp. | | | 400 | | | | 7,184 | |
| | | | | | | | |
| | | | | | | 17,989 | |
| |
Diversified Financial Services - 0.47% | | | | | |
Gain Capital Holdings, Inc. | | | 250 | | | | 1,247 | |
MarketAxess Holdings, Inc. | | | 275 | | | | 7,326 | |
MicroFinancial, Inc. | | | 150 | | | | 1,215 | |
| | | | | | | | |
| | | | | | | 9,788 | |
| |
Diversified Telecommunication Services - 0.05% | |
HickoryTech Corp. | | | 100 | | | | 1,111 | |
| | |
Electric Utilities - 0.57% | | | | | | | | |
PNM Resources, Inc. | | | 600 | | | | 11,724 | |
| | |
Electrical Equipment - 2.21% | | | | | | | | |
Belden, Inc. | | | 350 | | | | 11,672 | |
Brady Corp., Class A | | | 400 | | | | 11,004 | |
Encore Wire Corp. | | | 175 | | | | 4,687 | |
Generac Holdings, Inc. | | | 475 | | | | 11,428 | |
Preformed Line Products Co. | | | 50 | | | | 2,896 | |
Thermon Group Holdings, Inc.* | | | 200 | | | | 4,142 | |
| | | | | | | | |
| | | | | | | 45,829 | |
| |
Electronic Equipment, Instruments & Components - 5.01% | |
Benchmark Electronics, Inc.* | | | 450 | | | | 6,278 | |
Brightpoint, Inc.* | | | 600 | | | | 3,246 | |
Cognex Corp. | | | 325 | | | | 10,286 | |
Coherent, Inc.* | | | 175 | | | | 7,577 | |
CTS Corp. | | | 250 | | | | 2,355 | |
Daktronics, Inc. | | | 350 | | | | 2,418 | |
FARO Technologies, Inc.* | | | 125 | | | | 5,260 | |
FEI Co.* | | | 275 | | | | 13,156 | |
Key Tronic Corp.* | | | 100 | | | | 824 | |
Mesa Laboratories, Inc. | | | 25 | | | | 1,162 | |
Multi-Fineline Electronix, Inc.* | | | 175 | | | | 4,312 | |
Newport Corp.* | | | 275 | | | | 3,306 | |
OSI Systems, Inc.* | | | 155 | | | | 9,818 | |
PAR Technology Corp.* | | | 150 | | | | 739 | |
Park Electrochemical Corp. | | | 150 | | | | 3,882 | |
| | | | | | | | |
| | | | | | | | |
| Industry Company | | Shares | | | Value | |
| | | | | | | | |
Electronic Equipment, Instruments & Components (continued) | |
Plexus Corp.* | | | 275 | | | | $ 7,755 | |
Rofin-Sinar Technologies, Inc.* | | | 200 | | | | 3,786 | |
Sanmina-SCI Corp.* | | | 650 | | | | 5,324 | |
SYNNEX Corp.* | | | 275 | | | | 9,485 | |
Zygo Corp.* | | | 150 | | | | 2,679 | |
| | | | | | | | |
| | | | | | | 103,648 | |
| |
Energy Equipment & Services - 0.13% | | | | | |
PHI, Inc.* | | | 100 | | | | 2,781 | |
| | |
Food & Staples Retailing - 0.58% | | | | | | | | |
Ingles Markets, Inc., Class A | | | 200 | | | | 3,206 | |
Susser Holdings Corp.* | | | 150 | | | | 5,576 | |
Village Super Market, Inc., Class A | | | 100 | | | | 3,258 | |
| | | | | | | | |
| | | | | | | 12,040 | |
| | |
Food Products - 2.04% | | | | | | | | |
Calavo Growers, Inc. | | | 100 | | | | 2,558 | |
Cal-Maine Foods, Inc. | | | 175 | | | | 6,842 | |
John B. Sanfilippo & Son, Inc.* | | | 100 | | | | 1,785 | |
Lancaster Colony Corp. | | | 200 | | | | 14,242 | |
Smart Balance, Inc.* | | | 450 | | | | 4,226 | |
Snyders-Lance, Inc. | | | 500 | | | | 12,615 | |
| | | | | | | | |
| | | | | | | 42,268 | |
| | |
Gas Utilities - 0.39% | | | | | | | | |
Chesapeake Utilities Corp. | | | 50 | | | | 2,186 | |
Laclede Group, Inc. (The) | | | 150 | | | | 5,972 | |
| | | | | | | | |
| | | | | | | 8,158 | |
|
Health Care Equipment & Supplies - 2.11% | |
Anika Therapeutics, Inc.* | | | 100 | | | | 1,359 | |
Atrion Corp. | | | 15 | | | | 3,075 | |
Cantel Medical Corp. | | | 200 | | | | 5,450 | |
Conceptus, Inc.* | | | 250 | | | | 4,955 | |
CONMED Corp. | | | 200 | | | | 5,534 | |
Cyberonics, Inc.* | | | 200 | | | | 8,988 | |
Cynosure, Inc., Class A* | | | 100 | | | | 2,115 | |
Endologix, Inc.* | | | 450 | | | | 6,948 | |
SurModics, Inc.* | | | 150 | | | | 2,595 | |
Utah Medical Products, Inc. | | | 25 | | | | 838 | |
Young Innovations, Inc. | | | 50 | | | | 1,724 | |
| | | | | | | | |
| | | | | | | 43,581 | |
| |
Health Care Providers & Services - 2.76% | | | | | |
Air Methods Corp.* | | | 100 | | | | 9,825 | |
Centene Corp.* | | | 370 | | | | 11,159 | |
| | |
Bridgeway Small-Cap Momentum Fund SCHEDULE OF INVESTMENTS (continued) | | |
Showing percentage of net assets as of June 30, 2012
| | | | | | | | |
| Industry Company | | Shares | | | Value | |
Common Stocks (continued) | | | | | | | | |
Health Care Providers & Services (continued) | |
Landauer, Inc. | | | 75 | | | | $ 4,300 | |
LifePoint Hospitals, Inc.* | | | 345 | | | | 14,138 | |
National Research Corp. | | | 50 | | | | 2,617 | |
Providence Service Corp. (The)* | | | 100 | | | | 1,371 | |
VCA Antech, Inc.* | | | 625 | | | | 13,738 | |
| | | | | | | | |
| | | | | | | 57,148 | |
| | |
Health Care Technology - 0.81% | | | | | | | | |
HealthStream, Inc.* | | | 200 | | | | 5,200 | |
Quality Systems, Inc. | | | 420 | | | | 11,554 | |
| | | | | | | | |
| | | | | | | 16,754 | |
| |
Hotels, Restaurants & Leisure - 3.20% | | | | | |
BJ’s Restaurants, Inc.* | | | 200 | | | | 7,600 | |
Boyd Gaming Corp.*+ | | | 700 | | | | 5,040 | |
Churchill Downs, Inc. | | | 135 | | | | 7,937 | |
Denny’s Corp.* | | | 850 | | | | 3,774 | |
Life Time Fitness, Inc.* | | | 300 | | | | 13,953 | |
Marcus Corp. | | | 200 | | | | 2,752 | |
Multimedia Games Holding Co., Inc.* | | | 200 | | | | 2,800 | |
Nathan’s Famous, Inc.* | | | 50 | | | | 1,475 | |
Papa John’s International, Inc.* | | | 175 | | | | 8,325 | |
Shuffle Master, Inc.* | | | 425 | | | | 5,865 | |
Speedway Motorsports, Inc. | | | 300 | | | | 5,073 | |
Town Sports International Holdings, Inc.* | | | 125 | | | | 1,661 | |
| | | | | | | | |
| | | | | | | 66,255 | |
| | |
Household Durables - 2.06% | | | | | | | | |
Beazer Homes USA, Inc.* | | | 850 | | | | 2,762 | |
Cavco Industries, Inc.* | | | 50 | | | | 2,564 | |
Hooker Furniture Corp. | | | 100 | | | | 1,179 | |
iRobot Corp.* | | | 200 | | | | 4,430 | |
La-Z-Boy, Inc.* | | | 375 | | | | 4,609 | |
Libbey, Inc.* | | | 150 | | | | 2,306 | |
Ryland Group, Inc. (The) | | | 350 | | | | 8,953 | |
Standard Pacific Corp.* | | | 2,550 | | | | 15,784 | |
| | | | | | | | |
| | | | | | | 42,587 | |
| |
Industrial Conglomerates - 0.63% | | | | | |
Raven Industries, Inc. | | | 125 | | | | 8,699 | |
Standex International Corp. | | | 100 | | | | 4,257 | |
| | | | | | | | |
| | | | | | | 12,956 | |
| | |
Insurance - 4.25% | | | | | | | | |
AMERISAFE, Inc.* | | | 150 | | | | 3,892 | |
Citizens, Inc.* | | | 350 | | | | 3,412 | |
Donegal Group, Inc., Class A | | | 200 | | | | 2,656 | |
| | | | | | | | |
| Industry Company | | Shares | | | Value | |
| | | | | | | | |
Insurance (continued) | | | | | | | | |
eHealth, Inc.* | | | 150 | | | | $ 2,417 | |
EMC Insurance Group, Inc. | | | 100 | | | | 2,020 | |
Flagstone Reinsurance Holdings SA | | | 550 | | | | 4,406 | |
Homeowners Choice, Inc. | | | 50 | | | | 880 | |
Horace Mann Educators Corp. | | | 300 | | | | 5,244 | |
Infinity Property & Casualty Corp. | | | 100 | | | | 5,767 | |
Kansas City Life Insurance Co. | | | 100 | | | | 3,519 | |
National Financial Partners Corp.* | | | 300 | | | | 4,020 | |
National Interstate Corp. | | | 150 | | | | 3,988 | |
OneBeacon Insurance Group, Ltd., Class A | | | 700 | | | | 9,114 | |
Primerica, Inc. | | | 450 | | | | 12,029 | |
RLI Corp. | | | 150 | | | | 10,230 | |
StanCorp Financial Group, Inc. | | | 325 | | | | 12,077 | |
Stewart Information Services Corp. | | | 150 | | | | 2,303 | |
| | | | | | | | |
| | | | | | | 87,974 | |
| | |
Internet & Catalog Retail - 0.16% | | | | | | | | |
PetMed Express, Inc. | | | 150 | | | | 1,824 | |
Vitacost.com, Inc.* | | | 250 | | | | 1,475 | |
| | | | | | | | |
| | | | | | | 3,299 | |
| | |
Internet Software & Services - 2.02% | | | | | | | | |
Bankrate, Inc.* | | | 725 | | | | 13,333 | |
Constant Contact, Inc.* | | | 250 | | | | 4,470 | |
Internap Network Services Corp.* | | | 450 | | | | 2,929 | |
Perficient, Inc.* | | | 250 | | | | 2,808 | |
SPS Commerce, Inc.* | | | 100 | | | | 3,038 | |
VistaPrint NV*+ | | | 275 | | | | 8,882 | |
Web.com Group, Inc.* | | | 350 | | | | 6,412 | |
| | | | | | | | |
| | | | | | | 41,872 | |
| | |
IT Services - 2.17% | | | | | | | | |
Acxiom Corp.* | | | 575 | | | | 8,688 | |
Cass Information Systems, Inc. | | | 75 | | | | 3,019 | |
Computer Task Group, Inc.* | | | 150 | | | | 2,248 | |
Forrester Research, Inc. | | | 150 | | | | 5,079 | |
Global Cash Access Holdings, Inc.* | | | 500 | | | | 3,605 | |
iGATE Corp.* | | | 450 | | | | 7,659 | |
Innodata, Inc.*+ | | | 250 | | | | 1,710 | |
MAXIMUS, Inc. | | | 250 | | | | 12,938 | |
| | | | | | | | |
| | | | | | | 44,946 | |
| | |
47 | | Annual Report | June 30, 2012 |
| | |
Bridgeway Small-Cap Momentum Fund SCHEDULE OF INVESTMENTS (continued) | | |
Showing percentage of net assets as of June 30, 2012
| | | | | | | | |
| Industry Company | | Shares | | | Value | |
Common Stocks (continued) | | | | | | | | |
Leisure Equipment & Products - 1.09% | | | | | |
Arctic Cat, Inc.* | | | 100 | | | | $ 3,656 | |
Callaway Golf Co. | | | 500 | | | | 2,955 | |
LeapFrog Enterprises, Inc.* | | | 475 | | | | 4,874 | |
Nautilus, Inc.* | | | 250 | | | | 828 | |
Smith & Wesson Holding Corp.* | | | 500 | | | | 4,155 | |
Sturm Ruger & Co., Inc.+ | | | 150 | | | | 6,022 | |
| | | | | | | | |
| | | | | | | 22,490 | |
| |
Life Sciences Tools & Services - 0.73% | | | | | |
Cambrex Corp.* | | | 250 | | | | 2,352 | |
PAREXEL International Corp.* | | | 450 | | | | 12,704 | |
| | | | | | | | |
| | | | | | | 15,056 | |
| | |
Machinery - 1.28% | | | | | | | | |
Alamo Group, Inc. | | | 100 | | | | 3,137 | |
Cascade Corp. | | | 75 | | | | 3,529 | |
Columbus McKinnon Corp.* | | | 150 | | | | 2,263 | |
Eastern Co. (The)+ | | | 50 | | | | 808 | |
Manitex International, Inc.* | | | 100 | | | | 840 | |
NACCO Industries, Inc., Class A | | | 65 | | | | 7,556 | |
PMFG, Inc.* | | | 150 | | | | 1,172 | |
RBC Bearings, Inc.* | | | 150 | | | | 7,095 | |
| | | | | | | | |
| | | | | | | 26,400 | |
| | |
Marine - 0.05% | | | | | | | | |
International Shipholding Corp. | | | 50 | | | | 943 | |
| | |
Media - 1.30% | | | | | | | | |
AH Belo Corp., Class A | | | 200 | | | | 804 | |
Belo Corp., Class A | | | 800 | | | | 5,152 | |
Entercom Communications Corp., Class A* | | | 400 | | | | 2,408 | |
Harte-Hanks, Inc. | | | 450 | | | | 4,113 | |
Live Nation Entertainment, Inc.* | | | 1,375 | | | | 12,622 | |
Saga Communications, Inc., Class A* | | | 50 | | | | 1,856 | |
| | | | | | | | |
| | | | | | | 26,955 | |
| | |
Multi-Utilities - 0.50% | | | | | | | | |
Black Hills Corp. | | | 325 | | | | 10,455 | |
| |
Oil, Gas & Consumable Fuels - 1.50% | | | | | |
Adams Resources & Energy, Inc. | | | 50 | | | | 2,096 | |
Enbridge Energy Management LLC* | | | 300 | | | | 9,591 | |
Evolution Petroleum Corp.* | | | 200 | | | | 1,668 | |
Rentech, Inc.* | | | 1,850 | | | | 3,811 | |
| | | | | | | | |
| Industry Company | | Shares | | | Value | |
| | | | | | | | |
Oil, Gas & Consumable Fuels (continued) | | | | | |
REX American Resources Corp.* | | | 50 | | | | $ 976 | |
Targa Resources Corp. | | | 300 | | | | 12,810 | |
| | | | | | | | |
| | | | | | | 30,952 | |
| | |
Paper & Forest Products - 0.90% | | | | | | | | |
Buckeye Technologies, Inc. | | | 300 | | | | 8,547 | |
Deltic Timber Corp. | | | 100 | | | | 6,098 | |
Wausau Paper Corp. | | | 400 | | | | 3,892 | |
| | | | | | | | |
| | | | | | | 18,537 | |
| | |
Personal Products - 0.30% | | | | | | | | |
Female Health Co. (The) | | | 200 | | | | 1,174 | |
United-Guardian, Inc. | | | 50 | | | | 926 | |
USANA Health Sciences, Inc.*+ | | | 100 | | | | 4,112 | |
| | | | | | | | |
| | | | | | | 6,212 | |
| | |
Pharmaceuticals - 1.41% | | | | | | | | |
Akorn, Inc.* | | | 725 | | | | 11,433 | |
Lannett Co., Inc.* | | | 250 | | | | 1,060 | |
Medicines Co. (The)* | | | 400 | | | | 9,176 | |
Omeros Corp.*+ | | | 150 | | | | 1,500 | |
Santarus, Inc.* | | | 500 | | | | 3,545 | |
Sucampo Pharmaceuticals, Inc., Class A* | | | 350 | | | | 2,461 | |
| | | | | | | | |
| | | | | | | 29,175 | |
| | |
Professional Services - 2.71% | | | | | | | | |
Advisory Board Co. (The)* | | | 240 | | | | 11,902 | |
Barrett Business Services, Inc. | | | 50 | | | | 1,057 | |
CDI Corp. | | | 150 | | | | 2,460 | |
Exponent, Inc.* | | | 100 | | | | 5,283 | |
FTI Consulting, Inc.* | | | 325 | | | | 9,344 | |
Huron Consulting Group, Inc.* | | | 150 | | | | 4,747 | |
ICF International, Inc.* | | | 150 | | | | 3,576 | |
Navigant Consulting, Inc.* | | | 400 | | | | 5,056 | |
Odyssey Marine Exploration, Inc.* | | | 550 | | | | 2,057 | |
On Assignment, Inc.* | | | 400 | | | | 6,384 | |
TrueBlue, Inc.* | | | 275 | | | | 4,257 | |
| | | | | | | | |
| | | | | | | 56,123 | |
| |
Real Estate Investment Trusts (REITs) - 7.39% | | | | | |
Agree Realty Corp. | | | 100 | | | | 2,213 | |
CommonWealth REIT | | | 600 | | | | 11,472 | |
Coresite Realty Corp. | | | 150 | | | | 3,873 | |
DCT Industrial Trust, Inc. | | | 1,825 | | | | 11,497 | |
EastGroup Properties, Inc. | | | 200 | | | | 10,660 | |
Education Realty Trust, Inc. | | | 675 | | | | 7,479 | |
| | |
Bridgeway Small-Cap Momentum Fund SCHEDULE OF INVESTMENTS (continued) | | |
Showing percentage of net assets as of June 30, 2012
| | | | | | | | |
| Industry Company | | Shares | | | Value | |
Common Stocks (continued) | | | | | | | | |
Real Estate Investment Trusts (REITs) (continued) | |
Excel Trust, Inc. | | | 250 | | | | $ 2,990 | |
First Potomac Realty Trust | | | 400 | | | | 4,708 | |
Healthcare Realty Trust, Inc. | | | 575 | | | | 13,708 | |
Kite Realty Group Trust | | | 500 | | | | 2,495 | |
Lexington Realty Trust+ | | | 1,200 | | | | 10,164 | |
LTC Properties, Inc. | | | 225 | | | | 8,163 | |
Mission West Properties, Inc. | | | 200 | | | | 1,724 | |
Monmouth Real Estate Investment Corp., Class A | | | 300 | | | | 3,516 | |
National Health Investors, Inc. | | | 200 | | | | 10,184 | |
One Liberty Properties, Inc. | | | 100 | | | | 1,883 | |
Pebblebrook Hotel Trust | | | 400 | | | | 9,324 | |
PS Business Parks, Inc. | | | 170 | | | | 11,512 | |
Sovran Self Storage, Inc. | | | 195 | | | | 9,768 | |
STAG Industrial, Inc. | | | 200 | | | | 2,916 | |
Sun Communities, Inc. | | | 175 | | | | 7,742 | |
UMH Properties, Inc. | | | 100 | | | | 1,073 | |
Urstadt Biddle Properties, Inc., Class A | | | 200 | | | | 3,954 | |
| | | | | | | | |
| | | | | | | 153,018 | |
| |
Real Estate Management & Development - 0.27% | |
Kennedy-Wilson Holdings, Inc. | | | 400 | | | | 5,604 | |
| | |
Road & Rail - 1.79% | | | | | | | | |
Celadon Group, Inc. | | | 150 | | | | 2,457 | |
Knight Transportation, Inc. | | | 575 | | | | 9,194 | |
Saia, Inc.* | | | 100 | | | | 2,189 | |
Swift Transportation Co.* | | | 1,075 | | | | 10,159 | |
Werner Enterprises, Inc. | | | 550 | | | | 13,139 | |
| | | | | | | | |
| | | | | | | 37,138 | |
| |
Semiconductors & Semiconductor Equipment - 5.21% | |
ATMI, Inc.* | | | 225 | | | | 4,628 | |
AuthenTec, Inc.* | | | 350 | | | | 1,516 | |
Axcelis Technologies, Inc.* | | | 1,000 | | | | 1,200 | |
Brooks Automation, Inc. | | | 500 | | | | 4,720 | |
Cabot Microelectronics Corp. | | | 150 | | | | 4,382 | |
Cirrus Logic, Inc.* | | | 475 | | | | 14,193 | |
Cohu, Inc. | | | 200 | | | | 2,032 | |
Cymer, Inc.* | | | 225 | | | | 13,264 | |
Diodes, Inc.* | | | 350 | | | | 6,569 | |
Entropic Communications, Inc.* | | | 700 | | | | 3,948 | |
FSI International, Inc.* | | | 300 | | | | 1,077 | |
Kulicke & Soffa Industries, Inc.* | | | 525 | | | | 4,683 | |
Micrel, Inc. | | | 450 | | | | 4,288 | |
| | | | | | | | |
| | | | | | | | |
| Industry Company | | Shares | | | Value | |
| | | | | | | | |
Semiconductors & Semiconductor Equipment (continued) | |
MKS Instruments, Inc. | | | 400 | | | | $ 11,572 | |
Monolithic Power Systems, Inc.* | | | 250 | | | | 4,968 | |
Nanometrics, Inc.* | | | 200 | | | | 3,072 | |
Semtech Corp.* | | | 475 | | | | 11,552 | |
Ultratech, Inc.* | | | 175 | | | | 5,512 | |
Volterra Semiconductor Corp.* | | | 200 | | | | 4,690 | |
| | | | | | | | |
| | | | | | | 107,866 | |
| | |
Software - 3.17% | | | | | | | | |
Blackbaud, Inc. | | | 350 | | | | 8,984 | |
Bottomline Technologies, Inc.* | | | 275 | | | | 4,964 | |
Callidus Software, Inc.* | | | 250 | | | | 1,245 | |
Deltek, Inc.* | | | 500 | | | | 5,795 | |
Netscout Systems, Inc.* | | | 300 | | | | 6,477 | |
RealPage, Inc.* | | | 550 | | | | 12,738 | |
Synchronoss Technologies, Inc.* | | | 300 | | | | 5,541 | |
Take-Two Interactive Software, Inc.* | | | 625 | | | | 5,912 | |
Tangoe, Inc.* | | | 250 | | | | 5,328 | |
Tyler Technologies, Inc.* | | | 200 | | | | 8,070 | |
Wave Systems Corp., Class A*+ | | | 700 | | | | 483 | |
| | | | | | | | |
| | | | | | | 65,537 | |
| | |
Specialty Retail - 4.45% | | | | | | | | |
bebe stores, inc. | | | 650 | | | | 3,816 | |
Body Central Corp.* | | | 100 | | | | 900 | |
Buckle, Inc. (The)+ | | | 345 | | | | 13,652 | |
Conn’s, Inc.* | | | 250 | | | | 3,700 | |
Destination Maternity Corp. | | | 100 | | | | 2,160 | |
Hibbett Sports, Inc.* | | | 200 | | | | 11,542 | |
Kirkland’s, Inc.* | | | 150 | | | | 1,687 | |
Lumber Liquidators Holdings, Inc.*+ | | | 200 | | | | 6,758 | |
Men’s Wearhouse, Inc. (The) | | | 375 | | | | 10,552 | |
Pep Boys-Manny, Moe & Jack (The) | | | 400 | | | | 3,960 | |
Pier 1 Imports, Inc. | | | 800 | | | | 13,144 | |
Select Comfort Corp.* | | | 400 | | | | 8,368 | |
Winmark Corp. | | | 50 | | | | 2,928 | |
Zumiez, Inc.*+ | | | 225 | | | | 8,910 | |
| | | | | | | | |
| | | | | | | 92,077 | |
| |
Textiles, Apparel & Luxury Goods - 1.39% | | | | | |
Fifth & Pacific Cos., Inc.* | | | 800 | | | | 8,584 | |
Movado Group, Inc. | | | 175 | | | | 4,378 | |
| | |
49 | | Annual Report | June 30, 2012 |
| | |
Bridgeway Small-Cap Momentum Fund SCHEDULE OF INVESTMENTS (continued) | | |
Showing percentage of net assets as of June 30, 2012
| | | | | | | | |
| Industry Company | | Shares | | | Value | |
Common Stocks (continued) | | | | | |
Textiles, Apparel & Luxury Goods (continued) | |
Oxford Industries, Inc. | | | 125 | | | $ | 5,588 | |
Steven Madden, Ltd.* | | | 325 | | | | 10,319 | |
| | | | | | | | |
| | | | | | | 28,869 | |
| |
Thrifts & Mortgage Finance - 0.90% | | | | | |
Bank Mutual Corp. | | | 350 | | | | 1,544 | |
BofI Holding, Inc.* | | | 100 | | | | 1,976 | |
Brookline Bancorp, Inc. | | | 500 | | | | 4,425 | |
Federal Agricultural Mortgage Corp., Class C | | | 100 | | | | 2,623 | |
MutualFirst Financial, Inc. | | | 50 | | | | 525 | |
Provident Financial Holdings, Inc. | | | 100 | | | | 1,153 | |
Provident New York Bancorp | | | 350 | | | | 2,656 | |
TrustCo Bank Corp | | | 700 | | | | 3,822 | |
| | | | | | | | |
| | | | | | | 18,724 | |
| |
Trading Companies & Distributors - 1.88% | |
Aceto Corp. | | | 200 | | | | 1,806 | |
Applied Industrial Technologies, Inc. | | | 325 | | | | 11,976 | |
H&E Equipment Services, Inc.* | | | 250 | | | | 3,758 | |
TAL International Group, Inc. | | | 250 | | | | 8,372 | |
Textainer Group Holdings, Ltd. | | | 350 | | | | 12,915 | |
| | | | | | | | |
| | | | | | | 38,827 | |
| | |
Water Utilities - 0.07% | | | | | | | | |
Connecticut Water Service, Inc. | | | 50 | | | | 1,449 | |
| | | | | | | | |
TOTAL COMMON STOCKS - 99.48% | | | | 2,059,452 | |
| | | | | | | | |
(Cost $1,902,605) | | | | | |
| |
EXCHANGE TRADED FUND - 0.34% | |
iShares Russell 2000 Index Fund+ | | | 88 | | | | 7,009 | |
| | | | | | | | |
TOTAL EXCHANGE TRADED FUND - 0.34% | | | | 7,009 | |
| | | | | | | | |
(Cost $6,807) | | | | | |
| | | | | | | | |
| | | | | | | | |
| | | | | | | | |
| | | | | | | | |
| | | | | | | | |
| | | | | | | | |
| | | | | | | | |
| | | | | | | | |
| Industry Company | | Shares | | | Value | |
WARRANTS - 0.00% | | | | | |
Magnum Hunter Resources Corp. Warrants*D | | | 115 | | | | $— | |
| | | | | | | | |
TOTAL WARRANTS - 0.00% | | | | | | | — | |
| | | | | | | | |
(Cost $ — ) | | | | | | | | |
TOTAL INVESTMENTS - 99.82% | | | | $2,066,461 | |
(Cost $1,909,412) | | | | | | | | |
Other Assets in Excess of Liabilities - 0.18% | | | | 3,733 | |
| | | | | | | | |
NET ASSETS - 100.00% | | | | $2,070,194 | |
| | | | | | | | |
| * | Non-income producing security. |
| D | Security was fair valued under procedures adopted by the Board of Directors (see Note 2). |
| + | This security or a portion of the security is out on loan at June 30, 2012. Total loaned securities had a value of $115,744 at June 30, 2012. |
LLC - Limited Liability Company
Summary of inputs used to value the Fund’s investments as of 06/30/2012 is as follows (See Note 2 in Notes to Financial Statements):
| | | | | | | | | | | | | | | | |
| | | Valuation Inputs | |
| | | Investment in Securities (Value) | |
| | | Level 1
Quoted
Prices | | | Level 2
Significant
Observable
Inputs | | | Level 3
Significant
Unobservable
Inputs | | | Total | |
Common Stocks | | $ | 2,059,452 | | | $ | — | | | $ | — | | | $ | 2,059,452 | |
Exchange Traded Fund | | | 7,009 | | | | — | | | | — | | | | 7,009 | |
Warrants | | | — | | | | — | | | | — | | | | — | |
| | | | | | | | | | | | | | | | |
TOTAL | | $ | 2,066,461 | | | $ | — | | | $ | — | | | $ | 2,066,461 | |
| | | | | | | | | | | | | | | | |
See Notes to Financial Statements.
| | |
Small-Cap Growth Fund MANAGER’S COMMENTARY (Unaudited) | | |
June 30, 2012
Dear Fellow Small-Cap Growth Fund Shareholder,
For the quarter ended June 30, 2012, our Fund declined 7.40%, trailing our primary market benchmark, the Russell 2000 Growth Index (-3.94%) and our peer benchmark, the Lipper Small-Cap Growth Funds Index (-4.56%). The June quarter poor performance corresponds to the fourth high correlation spike since 2008, a market environment unfavorable to our Fund as outlined in the section “Macro-driven Market Update” on page 3.
For the fiscal year ended June 30, 2012, our Fund declined 6.35%, trailing our primary market benchmark, the Russell 2000 Growth Index (-2.71%) and our peer benchmark, the Lipper Small-Cap Growth Funds Index (-3.50%). In spite of two strong quarters (December 2011 and March 2012), the two high correlation spikes (September 2011 and June 2012) of the fiscal year put us strongly “in the red” for the fiscal year. For reasons outlined on page 3, proactive steps on our part make us more optimistic about negotiating high correlation spikes in the future, should they continue.
The table below presents our June quarter, one-year, five-year and inception-to-date financial results. See the next page for a graph of performance since inception.
Standardized Returns as of June 30, 2012
| | | | | | | | | | | | | | |
|
| | | | | | | | | | | Annualized |
| | | Quarter | | | | 1 Year | | | | 5 Years | | | | Since Inception
(10/31/03) |
|
Small-Cap Growth Fund | | -7.40% | | | | -6.35% | | | | -6.08% | | | | 1.83% |
Russell 2000 Growth Index | | -3.94% | | | | -2.71% | | | | 1.99% | | | | 6.23% |
Lipper Small-Cap Growth Funds Index | | -4.56% | | | | -3.50% | | | | 0.76% | | | | 5.03% |
Performance figures quoted in the table above and graph below represent past performance and are no guarantee of future results. Total return figures in the table above include the reinvestment of dividends and capital gains. The table above and the graph below do not reflect the deduction of taxes that a shareholder would pay on Fund distributions or the redemption of Fund shares.
The Russell 2000 Growth Index is an unmanaged index that consists of stocks in the Russell 2000 Index with higher price-to-book ratios and higher forecasted growth values with dividends reinvested. The Lipper Small-Cap Growth Funds Index is an index of small-company, growth-oriented funds compiled by Lipper, Inc. It is not possible to invest directly in an index. Periods longer than one year are annualized.
According to data from Lipper, Inc. as of June 30, 2012, Small-Cap Growth Fund ranked 339th of 513 small-cap growth funds for the twelve-month period ended June 30, 2012, 391st of 394 over the last five years and 282nd of 287 such funds since inception in October, 2003. Lipper, Inc. is an independent mutual fund rating service that ranks funds in various fund categories by making comparative calculations using total returns.
| | |
51 | | Annual Report | June 30, 2012 |
| | |
Small-Cap Growth Fund MANAGER’S COMMENTARY (Unaudited) (continued) | | |
Small-Cap Growth Fund vs. Russell 2000 Growth Index & Lipper Small-Cap Growth Funds Index
from Inception 10/31/03 to 6/30/12
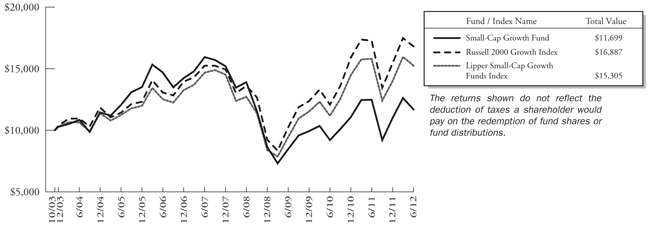
Detailed Explanation of Quarterly and Fiscal Year Performance
The Short Version: The Fund’s poor quarterly performance was broad-based across companies and model styles (e.g. growth and GARP or growth at a reasonable price). The same thing is true for the fiscal year. Looking forward, we now have four high correlation spikes in our model calibration database, which we believe will help our relative performance, should macro-driven market spikes continue. We don’t believe that correlation spikes can continue indefinitely — historically, investors have always returned eventually to focus on company level economic health — but the macro environment could still continue over the coming fiscal year.
While our small-cap growth models continued successfully to identify stocks that show improvement in company economics, this has not translated into market beating performance. This is characteristic of macro-driven markets, as explained in the section by the same name on page 3.
Top Ten Holdings as of June 30, 2012
| | | | | | | | |
| Rank | | Description | | Industry | | % of Net
Assets | |
1 | | Metropolitan Health Networks, Inc. | | Health Care Providers & Services | | | 2.9% | |
2 | | Sinclair Broadcast Group, Inc. | | Media | | | 2.1% | |
3 | | Cirrus Logic, Inc. | | Semiconductors & Semiconductor Equipment | | | 2.1% | |
4 | | OSI Systems, Inc. | | Electronic Equipment, Instruments & Components | | | 2.1% | |
5 | | Trimas Corp. | | Machinery | | | 1.9% | |
6 | | DXP Enterprises, Inc. | | Trading Companies & Distributors | | | 1.9% | |
7 | | Alaska Air Group, Inc. | | Airlines | | | 1.8% | |
8 | | WellCare Health Plans, Inc. | | Health Care Providers & Services | | | 1.7% | |
9 | | Credit Acceptance Corp. | | Consumer Finance | | | 1.7% | |
10 | | Sturm Ruger & Co., Inc. | | Leisure Equipment & Products | | | 1.7% | |
| | Total | | | | | 19.9% | |
| | |
Small-Cap Growth Fund MANAGER’S COMMENTARY (Unaudited) (continued) | | |
Industry Sector Representation as of June 30, 2012
| | | | | | |
| | | % of Net Assets | | % of Russell 2000
Growth Index | | Difference |
Consumer Discretionary | | 24.2% | | 16.2% | | 8.0% |
Consumer Staples | | 3.8% | | 4.8% | | -1.0% |
Energy | | 5.8% | | 5.6% | | 0.2% |
Financials | | 5.1% | | 6.8% | | -1.7% |
Health Care | | 13.4% | | 22.1% | | -8.7% |
Industrials | | 23.9% | | 16.8% | | 7.1% |
Information Technology | | 19.7% | | 22.1% | | -2.4% |
Materials | | 3.4% | | 4.2% | | -0.8% |
Telecommunication Services | | 0.5% | | 1.1% | | -0.6% |
Utilities | | 0.0% | | 0.3% | | -0.3% |
Cash & Other Assets | | 0.2% | | 0.0% | | 0.2% |
Total | | 100.0% | | 100.0% | | |
Disclaimer
The views expressed here are exclusively those of Fund management. These views, including those related to market sectors or individual stocks, are not meant as investment advice and should not be considered predictive in nature. Any favorable (or unfavorable) description of a holding applies only as of the quarter-end, June 30, 2012, unless otherwise stated. Security positions can and do change thereafter. Discussions of historical performance do not guarantee and may not be indicative of future performance.
Market volatility can significantly impact short-term performance. The Fund is not an appropriate investment for short-term investors. Investments in small companies generally carry greater risk than is customarily associated with larger companies. This additional risk is attributable to a number of factors, including the relatively limited financial resources that are typically available to small companies and the fact that small companies often have comparatively limited product lines. In addition, the stock of small companies tends to be more volatile than the stock of large companies, particularly in the short term and particularly in the early stages of an economic or market downturn. Shareholders of the Fund, therefore, are taking on more risk than they would if they invested in the stock market as a whole.
Conclusion
Thank you for your continued investment in Small-Cap Growth Fund. We encourage your feedback; your reactions and concerns are important to us.
Sincerely,
The Investment Management Team
| | |
53 | | Annual Report | June 30, 2012 |
| | |
Bridgeway Small-Cap Growth Fund SCHEDULE OF INVESTMENTS | | |
Showing percentage of net assets as of June 30, 2012
| | | | | | | | |
| Industry Company | | Shares | | | Value | |
COMMON STOCKS - 99.85% | | | | | |
Aerospace & Defense - 2.00% | | | | | | | | |
Astronics Corp.* | | | 9,800 | | | | $ 276,752 | |
Triumph Group, Inc. | | | 6,400 | | | | 360,128 | |
| | | | | | | | |
| | | | | | | 636,880 | |
| | |
Air Freight & Logistics - 2.66% | | | | | | | | |
Echo Global Logistics, Inc.*+ | | | 19,700 | | | | 375,482 | |
Park-Ohio Holdings Corp.* | | | 24,600 | | | | 468,138 | |
| | | | | | | | |
| | | | | | | 843,620 | |
| | |
Airlines - 1.81% | | | | | | | | |
Alaska Air Group, Inc.* | | | 16,000 | | | | 574,400 | |
| | |
Auto Components - 1.56% | | | | | | | | |
American Axle & Manufacturing Holdings, Inc.* | | | 47,100 | | | | 494,079 | |
| | |
Chemicals - 2.37% | | | | | | | | |
Innospec, Inc.* | | | 14,100 | | | | 417,501 | |
TPC Group, Inc.* | | | 9,100 | | | | 336,245 | |
| | | | | | | | |
| | | | | | | 753,746 | |
| | |
Commercial Banks - 1.14% | | | | | | | | |
Taylor Capital Group, Inc.*+ | | | 22,100 | | | | 362,219 | |
| |
Commercial Services & Supplies - 2.68% | | | | | |
Consolidated Graphics, Inc.* | | | 14,500 | | | | 421,225 | |
InnerWorkings, Inc.*+ | | | 31,700 | | | | 428,901 | |
| | | | | | | | |
| | | | | | | 850,126 | |
| |
Communications Equipment - 0.81% | | | | | |
Globecomm Systems, Inc.* | | | 25,300 | | | | 256,542 | |
| |
Construction & Engineering - 0.92% | | | | | |
Dycom Industries, Inc.* | | | 15,700 | | | | 292,177 | |
| | |
Consumer Finance - 3.95% | | | | | | | | |
Cash America International, Inc. | | | 3,200 | | | | 140,928 | |
Credit Acceptance Corp.* | | | 6,400 | | | | 540,352 | |
DFC Global Corp.* | | | 10,500 | | | | 193,515 | |
World Acceptance Corp.* | | | 5,800 | | | | 381,640 | |
| | | | | | | | |
| | | | | | | 1,256,435 | |
| |
Diversified Consumer Services - 2.28% | | | | | |
Coinstar, Inc.*+ | | | 5,600 | | | | 384,496 | |
Grand Canyon Education, Inc.* | | | 16,300 | | | | 341,322 | |
| | | | | | | | |
| | | | | | | 725,818 | |
| | | | | | | | |
| | | | | | | | |
| | | | | | | | |
| Industry Company | | Shares | | | Value | |
| | | | | | | | |
Diversified Telecommunication Services - 0.54% | |
Vonage Holdings Corp.* | | | 85,300 | | | | $ 171,453 | |
|
Electronic Equipment, Instruments & Components - 4.75% | |
Brightpoint, Inc.* | | | 31,600 | | | | 170,956 | |
Insight Enterprises, Inc.* | | | 23,600 | | | | 397,188 | |
OSI Systems, Inc.* | | | 10,600 | | | | 671,404 | |
Viasystems Group, Inc.* | | | 15,900 | | | | 270,300 | |
| | | | | | | | |
| | | | | | | 1,509,848 | |
| |
Energy Equipment & Services - 1.76% | | | | | |
Global Geophysical | | | | | | | | |
Services, Inc.* | | | 41,900 | | | | 256,428 | |
Pioneer Drilling Co.* | | | 38,100 | | | | 303,657 | |
| | | | | | | | |
| | | | | | | 560,085 | |
| |
Food & Staples Retailing - 1.36% | | | | | |
Casey’s General Stores, Inc. | | | 7,300 | | | | 430,627 | |
| |
Food Products - 1.26% | | | | | |
Smart Balance, Inc.* | | | 42,700 | | | | 400,953 | |
| |
Health Care Equipment & Supplies - 2.18% | | | | | |
Align Technology, Inc.* | | | 7,100 | | | | 237,566 | |
Orthofix International NV* | | | 11,000 | | | | 453,750 | |
| | | | | | | | |
| | | | | | | 691,316 | |
| |
Health Care Providers & Services - 10.18% | | | | | |
AMERIGROUP Corp.* | | | 5,300 | | | | 349,323 | |
Bio-Reference Labs, Inc.* | | | 6,600 | | | | 173,448 | |
Ensign Group, Inc. (The) | | | 14,300 | | | | 404,261 | |
Metropolitan Health Networks, Inc.* | | | 96,100 | | | | 919,677 | |
MWI Veterinary Supply, Inc.* | | | 4,800 | | | | 493,296 | |
RadNet, Inc.* | | | 33,499 | | | | 89,107 | |
U.S. Physical Therapy, Inc. | | | 10,200 | | | | 259,386 | |
WellCare Health Plans, Inc.* | | | 10,300 | | | | 545,900 | |
| | | | | | | | |
| | | | | | | 3,234,398 | |
| |
Health Care Technology - 1.08% | | | | | |
HealthStream, Inc.* | | | 13,200 | | | | 343,200 | |
| |
Hotels, Restaurants & Leisure - 4.71% | | | | | |
Caribou Coffee Co., Inc.* | | | 13,300 | | | | 171,703 | |
CEC Entertainment, Inc.# | | | 7,800 | | | | 283,686 | |
Cheesecake Factory, Inc. (The)* | | | 12,600 | | | | 402,696 | |
Krispy Kreme Doughnuts, Inc.* | | | 38,100 | | | | 243,459 | |
Papa John’s International, Inc.* | | | 700 | | | | 33,299 | |
| | |
Bridgeway Small-Cap Growth Fund SCHEDULE OF INVESTMENTS (continued) | | |
Showing percentage of net assets as of June 30, 2012
| | | | | | | | |
| Industry Company | | Shares | | | Value | |
Common Stocks (continued) | | | | | | | | |
Hotels, Restaurants & Leisure (continued) | | | | | |
Town Sports International Holdings, Inc.* | | | 27,300 | | | | $ 362,817 | |
| | | | | | | | |
| | | | | | | 1,497,660 | |
| |
Industrial Conglomerates - 1.15% | | | | | |
Standex International Corp. | | | 8,600 | | | | 366,102 | |
| |
Internet Software & Services - 1.09% | | | | | |
j2 Global, Inc.+ | | | 13,100 | | | | 346,102 | |
| | |
IT Services - 8.09% | | | | | | | | |
CACI International, Inc., | | | | | | | | |
Class A* | | | 7,700 | | | | 423,654 | |
Cardtronics, Inc.* | | | 14,800 | | | | 447,108 | |
Computer Task Group, Inc.* | | | 34,600 | | | | 518,654 | |
Hackett Group, Inc. (The)* | | | 66,100 | | | | 368,177 | |
Heartland Payment Systems, Inc. | | | 14,600 | | | | 439,168 | |
Unisys Corp.* | | | 19,200 | | | | 375,360 | |
| | | | | | | | |
| | | | | | | 2,572,121 | |
| |
Leisure Equipment & Products - 3.65% | | | | | |
LeapFrog Enterprises, Inc.* | | | 22,000 | | | | 225,720 | |
Smith & Wesson Holding Corp.* | | | 49,100 | | | | 408,021 | |
Sturm Ruger & Co., Inc.+ | | | 13,100 | | | | 525,965 | |
| | | | | | | | |
| | | | | | | 1,159,706 | |
| | |
Machinery - 3.94% | | | | | | | | |
Flow International Corp.* | | | 100,816 | | | | 317,571 | |
Sauer-Danfoss, Inc. | | | 9,000 | | | | 314,370 | |
Trimas Corp.* | | | 30,800 | | | | 619,080 | |
| | | | | | | | |
| | | | | | | 1,251,021 | |
| | |
Media - 2.13% | | | | | | | | |
Sinclair Broadcast Group, Inc., Class A | | | 74,800 | | | | 677,688 | |
| |
Oil, Gas & Consumable Fuels - 4.00% | | | | | |
Adams Resources & Energy, Inc. | | | 9,800 | | | | 410,816 | |
Berry Petroleum Co., Class A | | | 7,800 | | | | 309,348 | |
Clayton Williams Energy, Inc.* | | | 3,500 | | | | 169,330 | |
Contango Oil & Gas Co.* | | | 4,500 | | | | 266,400 | |
Westmoreland Coal Co.* | | | 14,400 | | | | 115,920 | |
| | | | | | | | |
| | | | | | | 1,271,814 | |
| | | | | | | | |
| | | | | | | | |
| | | | | | | | |
| Industry Company | | Shares | | | Value | |
| | | | | | | | |
Paper & Forest Products - 1.08% | | | | | |
Neenah Paper, Inc. | | | 12,800 | | | | $ 341,632 | |
| |
Personal Products - 1.06% | | | | | |
USANA Health Sciences, Inc.*+ | | | 8,200 | | | | 337,184 | |
| |
Professional Services - 3.77% | | | | | |
GP Strategies Corp.* | | | 20,800 | | | | 384,176 | |
Insperity, Inc. | | | 17,500 | | | | 473,375 | |
On Assignment, Inc.* | | | 21,400 | | | | 341,544 | |
| | | | | | | | |
| | | | | | | 1,199,095 | |
| | |
Road & Rail - 0.54% | | | | | | | | |
Quality Distribution, Inc.* | | | 15,600 | | | | 173,004 | |
| |
Semiconductors & Semiconductor Equipment - 3.32% | | | | | |
Cirrus Logic, Inc.* | | | 22,600 | | | | 675,288 | |
GT Advanced Technologies, Inc.* | | | 71,700 | | | | 378,576 | |
| | | | | | | | |
| | | | | | | 1,053,864 | |
| | |
Software - 1.65% | | | | | | | | |
ePlus, Inc.* | | | 8,900 | | | | 287,915 | |
QAD, Inc., Class A | | | 16,600 | | | | 236,052 | |
| | | | | | | | |
| | | | | | | 523,967 | |
| |
Specialty Retail - 9.92% | | | | | |
America’s Car-Mart, Inc.* | | | 6,900 | | | | 268,065 | |
Destination Maternity Corp. | | | 10,800 | | | | 233,280 | |
Express, Inc.* | | | 16,500 | | | | 299,805 | |
Genesco, Inc.* | | | 6,200 | | | | 372,930 | |
Lumber Liquidators Holdings, Inc.*+ | | | 11,000 | | | | 371,690 | |
Pier 1 Imports, Inc. | | | 19,200 | | | | 315,456 | |
Sally Beauty Holdings, Inc.* | | | 18,000 | | | | 463,320 | |
Select Comfort Corp.* | | | 22,600 | | | | 472,792 | |
Zumiez, Inc.*+ | | | 9,000 | | | | 356,400 | |
| | | | | | | | |
| | | | | | | 3,153,738 | |
| |
Trading Companies & Distributors - 4.46% | | | | | |
DXP Enterprises, Inc.* | | | 14,900 | | | | 618,201 | |
H&E Equipment Services, Inc.* | | | 18,300 | | | | 275,049 | |
United Rentals, Inc.* | | | 15,400 | | | | 524,216 | |
| | | | | | | | |
| | | | | | | 1,417,466 | |
| | | | | | | | |
TOTAL COMMON STOCKS - 99.85% (Cost $28,930,980) | | | | | | | 31,730,086 | |
| | | | | | | | |
| | | | | | | | |
| | |
55 | | Annual Report | June 30, 2012 |
| | |
Bridgeway Small-Cap Growth Fund SCHEDULE OF INVESTMENTS (continued) | | |
Showing percentage of net assets as of June 30, 2012
| | | | | | | | |
| Rate^ | | Shares | | | Value | |
MONEY MARKET FUND - 0.06% | | | | | |
BlackRock FedFund 0.01% | | | 17,992 | | | | $17,992 | |
| | | | | | | | |
TOTAL MONEY MARKET FUND - 0.06% | | | | 17,992 | |
| | | | | | | | |
(Cost $17,992) | | | | | | | | |
| | |
TOTAL INVESTMENTS - 99.91% | | | | | | $ | 31,748,078 | |
(Cost $28,948,972) | | | | | | | | |
Other Assets in Excess of Liabilities - 0.09% | | | | 30,183 | |
| | | | | | | | |
NET ASSETS - 100.00% | | | | | | $ | 31,778,261 | |
| | | | | | | | |
* Non-income producing security. # Securities, or a portion thereof, segregated to cover the Fund’s potential obligation under swap agreements. The total value of segregated assets is $283,686. ^ Rate disclosed as of June 30, 2012. + This security or a portion of the security is out on loan at June 30, 2012. Total loaned securities had a value of $3,103,705 at June 30, 2012. | |
| | | | | | | | | | | | | | | | |
| Summary of inputs used to value the Fund’s investments as of 06/30/2012 is as follows (See Note 2 in Notes to Financial Statements): | |
| |
| | | Valuation Inputs | |
| | | Investment in Securities (Value) | |
| | | Level 1
Quoted
Prices | | | Level 2
Significant
Observable
Inputs | | | Level 3
Significant
Unobservable
Inputs | | | Total | |
Common Stocks | | $ | 31,730,086 | | | $ | — | | | $ | — | | | $ | 31,730,086 | |
Money Market Fund | | | — | | | | 17,992 | | | | — | | | | 17,992 | |
| | | | | | | | | | | | | | | | |
TOTAL | | $ | 31,730,086 | | | $ | 17,992 | | | $ | — | | | $ | 31,748,078 | |
| | | | | | | | | | | | | | | | |
See Notes to Financial Statements. | |
| | |
Small-Cap Value Fund MANAGER’S COMMENTARY (Unaudited) | | |
June 30, 2012
Dear Fellow Small-Cap Value Fund Shareholder,
For the quarter ended June 30, 2012, our Fund declined 2.31%, outperforming our primary market benchmark, the Russell 2000 Value Index (-3.01%) and our peer benchmark, the Lipper Small-Cap Value Funds Index (-5.37%). We are pleased to have provided some “cushion” in a declining market.
For the fiscal year ended June 30, 2012, our Fund declined 0.59%, outperforming our primary market benchmark, the Russell 2000 Value Index (-1.44%) and our peer benchmark, the Lipper Small-Cap Value Funds Index (-3.37%). We still have more ground to make up for the longer five-year and inception-to-date periods.
The table below presents our June quarter, one-year, five-year and inception-to-date financial results. See the next page for a graph of performance since inception.
Standardized Returns as of June 30, 2012
| | | | | | | | | | | | |
| | | | | | |
| | | | | | | | | | | Annualized |
| | | Quarter | | | | 1 Year | | | | 5 Years | | Since Inception
(10/31/03) |
| | | | | | |
Small-Cap Value Fund | | -2.31% | | | | -0.59% | | | | -3.95% | | 5.04% |
Russell 2000 Value Index | | -3.01% | | | | -1.44% | | | | -1.05% | | 6.13% |
Lipper Small-Cap Value Funds Index | | -5.37% | | | | -3.37% | | | | -0.06% | | 6.87% |
Performance figures quoted in the table above and graph below represent past performance and are no guarantee of future results. Total return figures in the table above include the reinvestment of dividends and capital gains. The table above and the graph below do not reflect the deduction of taxes that a shareholder would pay on Fund distributions or the redemption of Fund shares.
The Russell 2000 Value Index is an unmanaged index that consists of stocks in the Russell 2000 Index with lower price-to-book ratios and lower forecasted growth values with dividends reinvested. The Lipper Small-Cap Value Funds Index is an index of small-company, value-oriented funds compiled by Lipper, Inc. It is not possible to invest directly in an index. Periods longer than one year are annualized.
According to data from Lipper, Inc. as of June 30, 2012, Small-Cap Value Fund ranked 78th of 328 small-cap value funds for the twelve-month period ended June 30, 2012, 223rd of 234 over the last five years and 142nd of 163 such funds since inception in October, 2003. Lipper, Inc. is an independent mutual fund rating service that ranks funds in various fund categories by making comparative calculations using total returns.
| | |
57 | | Annual Report | June 30, 2012 |
| | |
Small-Cap Value Fund MANAGER’S COMMENTARY (Unaudited) (continued) | | |
Small-Cap Value Fund vs. Russell 2000 Value Index & Lipper Small-Cap Value Funds Index
from Inception 10/31/03 to 6/30/12
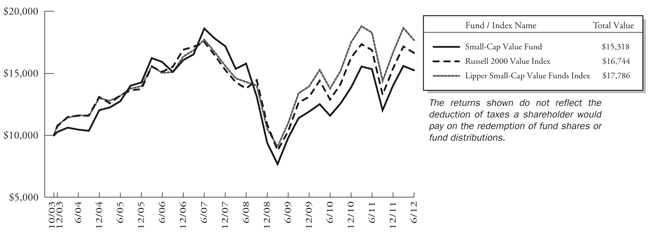
Detailed Explanation of Quarterly Performance
The Short Version: Consumer Staples and Materials stocks helped, while Financials stocks hurt our relative performance.
The largest sector discrepancy between our Fund and the Russell 2000 Value Index was in the Financials sector, which made up a whopping 38% of the Index on average for the quarter. Our underweighting and stock selection in this sector cost us almost three-fourths of a percent in relative return. Fortunately, our strong stock picks in the Consumer Staples and Materials sectors more than made up the difference, adding nearly two percent to our relative return.
Detailed Explanation of Fiscal Year Performance
The Short Version: Stock picking in the Consumer Discretionary and Materials sectors carried the Fund for the fiscal year.
The Fund’s sector allocation was very much in line with the Russell 2000 Value Index for the fiscal year. Solid stock picking in the Consumer Discretionary and Materials sectors helped our relative performance by almost four percent. On the other end of the spectrum, weak stock picks in the heavily weighted Finance sector (35.5% of Fund net assets on average for the fiscal year) cost us about one-half percent in relative returns.
| | |
Small-Cap Value Fund MANAGER’S COMMENTARY (Unaudited) (continued) | | |
Top Ten Holdings as of June 30, 2012
| | | | | | | | |
| Rank | | Description | | Industry | | % of Net
Assets | |
| 1 | | Amerco, Inc. | | Road & Rail | | | 2.1% | |
| 2 | | PH Glatfelter Co. | | Paper & Forest Products | | | 2.1% | |
| 3 | | Sinclair Broadcast Group, Inc. | | Media | | | 2.0% | |
| 4 | | Town Sports International Holdings, Inc. | | Hotels, Restaurants & Leisure | | | 1.8% | |
| 5 | | Insight Enterprises, Inc. | | Electronic Equipment, Instruments & Components | | | 1.7% | |
| 6 | | Genesco, Inc. | | Specialty Retail | | | 1.7% | |
| 7 | | First Industrial Realty Trust, Inc. | | Real Estate Investment Trusts (REITs) | | | 1.7% | |
| 8 | | Retail Opportunity Investments Corp. | | Real Estate Investment Trusts (REITs) | | | 1.6% | |
| 9 | | Dillard’s, Inc. | | Multiline Retail | | | 1.6% | |
| 10 | | El Paso Electric Co. | | Electric Utilities | | | 1.5% | |
| | Total | | | | | 17.8% | |
Industry Sector Representation as of June 30, 2012
| | | | | | | | | | |
| | | % of Net Assets | | | % of
Russell 2000
Value Index | | | Difference |
Consumer Discretionary | | | 12.3% | | | | 11.4% | | | 0.9% |
Consumer Staples | | | 5.3% | | | | 2.7% | | | 2.6% |
Energy | | | 4.7% | | | | 6.7% | | | -2.0% |
Financials | | | 30.7% | | | | 35.8% | | | -5.1% |
Health Care | | | 5.6% | | | | 4.8% | | | 0.8% |
Industrials | | | 17.6% | | | | 12.9% | | | 4.7% |
Information Technology | | | 8.2% | | | | 13.0% | | | -4.8% |
Materials | | | 7.2% | | | | 5.1% | | | 2.1% |
Telecommunication Services | | | 1.2% | | | | 0.6% | | | 0.6% |
Utilities | | | 5.2% | | | | 7.0% | | | -1.8% |
Cash & Other Assets | | | 2.0% | | | | 0.0% | | | 2.0% |
Total | | | 100.0% | | | | 100.0% | | | |
Disclaimer
The views expressed here are exclusively those of Fund management. These views, including those related to market sectors or individual stocks, are not meant as investment advice and should not be considered predictive in nature. Any favorable (or unfavorable) description of a holding applies only as of the quarter-end, June 30, 2012, unless otherwise stated. Security positions can and do change thereafter. Discussions of historical performance do not guarantee and may not be indicative of future performance.
Market volatility can significantly impact short-term performance. The Fund is not an appropriate investment for short-term investors. Investments in small companies generally carry greater risk than is customarily associated with larger companies. This additional risk is attributable to a number of factors, including the relatively limited financial resources that are typically available to small companies and the fact that small companies often have comparatively limited product lines. In addition, the stock of small companies tends to be more volatile than the stock of large companies, particularly in the short term and particularly in the early stages of an economic or market downturn.
Shareholders of the Fund, therefore, are taking on more risk than they would if they invested in the stock market as a whole.
| | |
59 | | Annual Report | June 30, 2012 |
| | |
Small-Cap Value Fund MANAGER’S COMMENTARY (Unaudited) (continued) | | |
Conclusion
Thank you for your continued investment in Small-Cap Value Fund. We encourage your feedback; your reactions and concerns are important to us.
Sincerely,
The Investment Management Team
| | |
Bridgeway Small-Cap Value Fund SCHEDULE OF INVESTMENTS | | |
Showing percentage of net assets as of June 30, 2012
| | | | | | | | |
| Industry Company | | Shares | | | Value | |
COMMON STOCKS - 97.95% | | | | | | | | |
Aerospace & Defense - 1.87% | | | | | | | | |
GenCorp, Inc.* | | | 85,900 | | | $ | 559,209 | |
Triumph Group, Inc. | | | 12,500 | | | | 703,375 | |
| | | | | | | | |
| | | | | | | 1,262,584 | |
| | |
Airlines - 4.39% | | | | | | | | |
Alaska Air Group, Inc.* | | | 27,500 | | | | 987,250 | |
Hawaiian Holdings, Inc.* | | | 122,000 | | | | 794,220 | |
Republic Airways Holdings, Inc.* | | | 93,200 | | | | 517,260 | |
US Airways Group, Inc.* | | | 50,200 | | | | 669,166 | |
| | | | | | | | |
| | | | | | | 2,967,896 | |
| | |
Auto Components - 0.38% | | | | | | | | |
Standard Motor Products, Inc. | | | 18,200 | | | | 256,256 | |
| | |
Biotechnology - 0.40% | | | | | | | | |
Maxygen, Inc.* | | | 8,000 | | | | 47,680 | |
Vanda Pharmaceuticals, Inc.* | | | 51,000 | | | | 224,400 | |
| | | | | | | | |
| | | | | | | 272,080 | |
| | |
Building Products - 0.80% | | | | | | | | |
NCI Building Systems, Inc.* | | | 50,000 | | | | 541,500 | |
| | |
Capital Markets - 1.63% | | | | | | | | |
Arlington Asset Investment Corp., Class A | | | 32,700 | | | | 709,917 | |
Calamos Asset Management, Inc., Class A | | | 34,100 | | | | 390,445 | |
| | | | | | | | |
| | | | | | | 1,100,362 | |
| | |
Chemicals - 2.14% | | | | | | | | |
American Vanguard Corp. | | | 37,100 | | | | 986,489 | |
Quaker Chemical Corp. | | | 9,900 | | | | 457,479 | |
| | | | | | | | |
| | | | | | | 1,443,968 | |
| | |
Commercial Banks - 5.76% | | | | | | | | |
Bancfirst Corp. | | | 11,000 | | | | 461,010 | |
Bancorp, Inc. (The)* | | | 47,200 | | | | 446,040 | |
City Holding Co.+ | | | 16,900 | | | | 569,361 | |
FNB Corp. | | | 33,300 | | | | 361,971 | |
Merchants Bancshares, Inc. | | | 11,500 | | | | 316,825 | |
Renasant Corp. | | | 20,300 | | | | 318,913 | |
Taylor Capital Group, Inc.*+ | | | 30,000 | | | | 491,700 | |
United Community Banks, Inc.* | | | 55,640 | | | | 476,835 | |
Wintrust Financial Corp. | | | 12,800 | | | | 454,400 | |
| | | | | | | | |
| | | | | | | 3,897,055 | |
| | | | | | | | |
| Industry Company | | Shares | | | Value | |
| | | | | | | | |
Commercial Services & Supplies - 0.47% | | | | | |
Cenveo, Inc.*+ | | | 163,400 | | | $ | 315,362 | |
| |
Communications Equipment - 0.41% | | | | | |
Globecomm Systems, Inc.* | | | 27,000 | | | | 273,780 | |
| |
Construction & Engineering - 0.87% | | | | | |
Dycom Industries, Inc.* | | | 31,500 | | | | 586,215 | |
| |
Consumer Finance - 1.11% | | | | | |
Nelnet, Inc., Class A | | | 15,900 | | | | 365,700 | |
World Acceptance Corp.* | | | 5,800 | | | | 381,640 | |
| | | | | | | | |
| | | | | | | 747,340 | |
| |
Containers & Packaging - 1.09% | | | | | |
Myers Industries, Inc. | | | 43,000 | | | | 737,880 | |
| |
Diversified Financial Services - 0.79% | | | | | |
Interactive Brokers Group, Inc., Class A | | | 36,400 | | | | 535,808 | |
|
Diversified Telecommunication Services - 1.16% | |
IDT Corp., Class B | | | 22,800 | | | | 223,668 | |
Vonage Holdings Corp.* | | | 277,700 | | | | 558,177 | |
| | | | | | | | |
| | | | | | | 781,845 | |
| | |
Electric Utilities - 3.41% | | | | | | | | |
Cleco Corp. | | | 21,300 | | | | 890,979 | |
El Paso Electric Co. | | | 31,500 | | | | 1,044,540 | |
Unitil Corp. | | | 13,900 | | | | 368,350 | |
| | | | | | | | |
| | | | | | | 2,303,869 | |
|
Electronic Equipment, Instruments & Components - 3.60% | |
Brightpoint, Inc.* | | | 69,600 | | | | 376,536 | |
Insight Enterprises, Inc.* | | | 67,400 | | | | 1,134,342 | |
OSI Systems, Inc.* | | | 14,600 | | | | 924,764 | |
| | | | | | | | |
| | | | | | | 2,435,642 | |
|
Energy Equipment & Services - 1.93% | |
Helix Energy Solutions | | | | | | | | |
Group, Inc.* | | | 42,900 | | | | 703,989 | |
Pioneer Drilling Co.* | | | 75,100 | | | | 598,547 | |
| | | | | | | | |
| | | | | | | 1,302,536 | |
| |
Food & Staples Retailing - 2.62% | | | | | |
Pantry, Inc. (The)* | | | 31,900 | | | | 468,930 | |
Susser Holdings Corp.* | | | 16,300 | | | | 605,871 | |
Weis Markets, Inc. | | | 15,600 | | | | 694,512 | |
| | | | | | | | |
| | | | | | | 1,769,313 | |
| | |
Food Products - 1.34% | | | | | | | | |
Smart Balance, Inc.* | | | 96,300 | | | | 904,257 | |
| | |
61 | | Annual Report | June 30, 2012 |
| | |
Bridgeway Small-Cap Value Fund SCHEDULE OF INVESTMENTS (continued) | | |
Showing percentage of net assets as of June 30, 2012
| | | | | | | | |
| Industry Company | | Shares | | | Value | |
Common Stocks (continued) | | | | | | | | |
Gas Utilities - 1.01% | | | | | | | | |
Laclede Group, Inc. (The) | | | 17,100 | | | $ | 680,751 | |
Health Care Providers & Services - 3.31% | |
Kindred Healthcare, Inc.* | | | 67,100 | | | | 659,593 | |
Skilled Healthcare Group, Inc., Class A* | | | 90,300 | | | | 567,084 | |
Triple-S Management Corp., Class B* | | | 26,100 | | | | 477,108 | |
U.S. Physical Therapy, Inc. | | | 21,000 | | | | 534,030 | |
| | | | | | | | |
| | | | | | | 2,237,815 | |
Hotels, Restaurants & Leisure - 2.44% | |
Caribou Coffee Co., Inc.* | | | 33,700 | | | | 435,067 | |
Town Sports International Holdings, Inc.* | | | 91,500 | | | | 1,216,035 | |
| | | | | | | | |
| | | | | | | 1,651,102 | |
Household Durables - 1.88% | |
Blyth, Inc. | | | 17,000 | | | | 587,520 | |
Hovnanian Enterprises, Inc., Class A* | | | 235,700 | | | | 683,530 | |
| | | | | | | | |
| | | | | | | 1,271,050 | |
Industrial Conglomerates - 0.74% | |
Standex International Corp. | | | 11,800 | | | | 502,326 | |
Insurance - 7.84% | | | | | | | | |
Argo Group International Holdings, Ltd. | | | 14,900 | | | | 436,123 | |
CNO Financial Group, Inc. | | | 100,600 | | | | 784,680 | |
Employers Holdings, Inc. | | | 21,600 | | | | 389,664 | |
Primerica, Inc. | | | 30,100 | | | | 804,573 | |
ProAssurance Corp. | | | 7,600 | | | | 677,084 | |
RLI Corp. | | | 10,300 | | | | 702,460 | |
Symetra Financial Corp. | | | 61,800 | | | | 779,916 | |
United Fire Group, Inc. | | | 20,200 | | | | 430,866 | |
Universal Insurance | | | | | | | | |
Holdings, Inc. | | | 87,491 | | | | 298,344 | |
| | | | | | | | |
| | | | | | | 5,303,710 | |
IT Services - 2.12% | | | | | | | | |
CACI International, Inc., Class A* | | | 15,800 | | | | 869,316 | |
Unisys Corp.* | | | 29,000 | | | | 566,950 | |
| | | | | | | | |
| | | | | | | 1,436,266 | |
Leisure Equipment & Products - 0.69% | |
Arctic Cat, Inc.* | | | 12,800 | | | | 467,968 | |
Machinery - 1.17% | | | | | | | | |
Lydall, Inc.* | | | 58,500 | | | | 790,920 | |
| | | | | | | | |
| | | | | | | | |
| Industry Company | | Shares | | | Value | |
| | | | | | | | |
Media - 2.02% | | | | | | | | |
Sinclair Broadcast Group, Inc., Class A# | | | 151,100 | | | $ | 1,368,966 | |
Metals & Mining - 1.13% | | | | | | | | |
Kaiser Aluminum Corp. | | | 14,700 | | | | 762,048 | |
Multiline Retail - 1.61% | | | | | | | | |
Dillard’s, Inc., Class A | | | 17,100 | | | | 1,088,928 | |
Oil, Gas & Consumable Fuels - 2.74% | |
Cloud Peak Energy, Inc.* | | | 45,100 | | | | 762,641 | |
Swift Energy Co.* | | | 13,500 | | | | 251,235 | |
Western Refining, Inc. | | | 27,000 | | | | 601,290 | |
Westmoreland Coal Co.* | | | 29,300 | | | | 235,865 | |
| | | | | | | | |
| | | | | | | 1,851,031 | |
Paper & Forest Products - 2.81% | |
Neenah Paper, Inc. | | | 18,800 | | | | 501,772 | |
PH Glatfelter Co. | | | 85,600 | | | | 1,401,272 | |
| | | | | | | | |
| | | | | | | 1,903,044 | |
Personal Products - 1.38% | | | | | | | | |
Elizabeth Arden, Inc.* | | | 24,100 | | | | 935,321 | |
Pharmaceuticals - 1.40% | | | | | | | | |
Medicines Co. (The)* | | | 41,400 | | | | 949,716 | |
Professional Services - 0.05% | |
CBIZ, Inc.* | | | 5,700 | | | | 33,858 | |
Real Estate Investment Trusts (REITs) - 10.79% | |
Agree Realty Corp. | | | 1,703 | | | | 37,687 | |
ARMOUR Residential REIT, Inc.+ | | | 59,300 | | | | 421,623 | |
BioMed Realty Trust, Inc. | | | 53,900 | | | | 1,006,852 | |
First Industrial Realty Trust, Inc.* | | | 89,100 | | | | 1,124,442 | |
Gramercy Capital Corp.* | | | 225,300 | | | | 563,250 | |
iStar Financial, Inc.*+ | | | 81,300 | | | | 524,385 | |
MPG Office Trust, Inc.* | | | 172,700 | | | | 347,127 | |
National Retail Properties, Inc. | | | 25,600 | | | | 724,224 | |
One Liberty Properties, Inc. | | | 11,800 | | | | 222,194 | |
Retail Opportunity Investments Corp.+ | | | 91,000 | | | | 1,097,460 | |
Sabra Health Care REIT, Inc. | | | 27,400 | | | | 468,814 | |
Weingarten Realty Investors | | | 28,840 | | | | 759,646 | |
| | | | | | | | |
| | |
| | | | | | | 7,297,704 | |
Road & Rail - 5.17% | | | | | | | | |
Amerco, Inc. | | | 15,700 | | | | 1,412,529 | |
| | |
Bridgeway Small-Cap Value Fund SCHEDULE OF INVESTMENTS (continued) | | |
Showing percentage of net assets as of June 30, 2012
| | | | | | | | |
Industry Company | | Shares | | | Value | | |
Common Stocks (continued) | | |
Road & Rail (continued) | | | | | | | | |
Arkansas Best Corp. | | | 19,800 | | | $249,480 | | |
Quality Distribution, Inc.* | | | 29,400 | | | 326,046 | | |
RailAmerica, Inc.* | | | 37,700 | | | 912,340 | | |
Saia, Inc.* | | | 27,200 | | | 595,408 | | |
| | | | | | | | |
| | | | | | 3,495,803 | | |
| |
Semiconductors & Semiconductor Equipment - 2.10% | | |
Amkor Technology, Inc.* | | | 143,000 | | | 697,840 | | |
Photronics, Inc.* | | | 118,800 | | | 724,680 | | |
| | | | | | | | |
| | | | | | 1,422,520 | | |
| | | |
Specialty Retail - 4.24% | | | | | | | | |
Cabela’s, Inc.* | | | 19,600 | | | 741,076 | | |
Conn’s, Inc.*+ | | | 27,600 | | | 408,480 | | |
Genesco, Inc.* | | | 18,800 | | | 1,130,820 | | |
Penske Automotive Group, Inc.+ | | | 27,500 | | | 584,100 | | |
| | | | | | | | |
| | | | | | 2,864,476 | | |
| |
Thrifts & Mortgage Finance - 3.21% | | |
Doral Financial Corp.* | | | 243,800 | | | 365,700 | | |
Northwest Bancshares, Inc. | | | 58,200 | | | 681,522 | | |
Ocwen Financial Corp.* | | | 51,100 | | | 959,658 | | |
Oritani Financial Corp. | | | 11,346 | | | 163,269 | | |
| | | | | | | | |
| | | | | | 2,170,149 | | |
| |
Trading Companies & Distributors - 1.12% | | |
United Rentals, Inc.* | | | 22,200 | | | 755,688 | | |
| | | |
Water Utilities - 0.81% | | | | | | | | |
American States Water Co. | | | 13,800 | | | 546,204 | | |
| | | | | | | | |
TOTAL COMMON STOCKS - 97.95% | | | 66,222,912 | | |
| | | | | | | | |
(Cost $59,880,766) | | | | | | | | |
| | | | | | | | |
| | | | | | | | |
| | | | | | | | |
| | | | | | | | |
| | | | | | | | |
| | | | | | | | |
| | | | | | | | |
| | | | | | | | |
| | | | | | | | | | |
| | | Rate^ | | Shares | | | Value | |
MONEY MARKET FUND - 1.90% | |
BlackRock FedFund | | 0.01% | | | 1,282,952 | | | | $1,282,952 | |
| | | | | | | | | | |
TOTAL MONEY MARKET FUND - 1.90% | | | | 1,282,952 | |
| | | | | | | | | | |
(Cost $1,282,952) | | | | | | | | | | |
| | | |
Total Investments - 99.85% | | | | | | | | | $67,505,864 | |
(Cost $61,163,718) | | | | | | | | | | |
Other Assets in Excess of Liabilities - 0.15% | | | | 103,982 | |
| | | | | | | | | | |
NET ASSETS - 100.00% | | | | | | | | | $67,609,846 | |
| | | | | | | | | | |
| * | Non-income producing security. |
| # | Securities, or a portion thereof, segregated to cover the Fund’s potential obligation under swap agreements. The total value of segregated assets is $271,800. |
| ^ | Rate disclosed as of June 30, 2012. |
| + | This security or a portion of the security is out on loan at June 30, 2012. Total loaned securities had a value of $4,232,950 at June 30, 2012. |
Summary of inputs used to value the Fund’s investments as of 06/30/2012 is as follows (See Note 2 in Notes to Financial Statements):
| | | | | | | | | | | | | | | | |
| Valuation Inputs | |
| Investment in Securities (Value) | |
| | | Level 1
Quoted
Prices | | | Level 2
Significant
Observable
Inputs | | | Level 3
Significant
Unobservable
Inputs | | | Total | |
| | | | |
Common Stocks | | $ | 66,222,912 | | | $ | — | | | $ | — | | | $ | 66,222,912 | |
Money Market Fund | | | — | | | | 1,282,952 | | | | — | | | | 1,282,952 | |
| | | | | | | | | | | | | | | | |
TOTAL | | $ | 66,222,912 | | | $ | 1,282,952 | | | $ | — | | | $ | 67,505,864 | |
| | | | | | | | | | | | | | | | |
Other Financial Instruments** | | | | | | | | | | | | | | | | |
Swaps | | $ | — | | | $ | 33,837 | | | $ | — | | | $ | 33,837 | |
| | | | | | | | | | | | | | | | |
TOTAL | | $ | — | | | $ | 33,837 | | | $ | — | | | $ | 33,837 | |
| | | | | | | | | | | | | | | | |
| ** | Other financial instruments are derivative instruments not reflected in the Schedule of Investments, such as swap contracts, which are valued at the unrealized appreciation/depreciation on the investment. |
See Notes to Financial Statements
| | |
63 | | Annual Report | June 30, 2012 |
| | |
Large-Cap Growth Fund MANAGER’S COMMENTARY (Unaudited) | | |
June 30, 2012
Dear Fellow Large-Cap Growth Fund Shareholder,
For the quarter ended June 30, 2012, our Fund declined 3.96%, slightly outperforming our primary market benchmark, the Russell 1000 Growth Index (-4.02%) and beating our peer benchmark, the Lipper Large-Cap Growth Funds Index (-6.32%). In a quarter containing the fourth high correlation spike since 2008 (see page 3), we are pleased with these results.
For the fiscal year ended June 30, 2012, our Fund appreciated 0.37%, trailing our primary market benchmark, the Russell 1000 Growth Index (+5.76%), and our peer benchmark, the Lipper Large-Cap Growth Funds Index (+1.26%). The fiscal year contained two high correlation spikes, conditions in which our growth leaning Funds have generally not fared well. Additionally, compared to our primary benchmark, our more reasonable but still strong weighting of Apple Inc. (3.0% versus 6.4%) cost the Fund 1.6% of relative performance in the fiscal year.
The table below presents our June quarter, one-year, five-year and inception-to-date financial results. See the next page for a graph of performance since inception.
Standardized Returns as of June 30, 2012
| | | | | | | | | | | | | | | | |
| | | | | | | | | Annualized | |
| | | Quarter | | | 1 Year | | | 5 Years | | | Since Inception
(10/31/03) | |
| | | | |
Large-Cap Growth Fund | | | -3.96% | | | | 0.37% | | | | -0.54% | | | | 3.77% | |
Russell 1000 Growth Index | | | -4.02% | | | | 5.76% | | | | 2.87% | | | | 5.49% | |
Lipper Large-Cap Growth Funds Index | | | -6.32% | | | | 1.26% | | | | 1.24% | | | | 4.28% | |
Performance figures quoted in the table above and graph below represent past performance and are no guarantee of future results. The table above and the graph below do not reflect the deduction of taxes that a shareholder would pay on Fund distributions or the redemption of Fund shares.
The Russell 1000 Growth Index is an unmanaged index that consists of stocks in the Russell 1000 Index with higher price-to-book ratios and higher forecasted growth values with dividends reinvested. The Lipper Large-Cap Growth Funds Index is an index of large-company, growth-oriented funds compiled by Lipper, Inc. It is not possible to invest directly in an index. Periods longer than one year are annualized.
According to data from Lipper, Inc. as of June 30, 2012, Large-Cap Growth Fund ranked 204th of 504 large-cap growth funds for the twelve-month period ended June 30, 2012, 251st of 362 over the last five years and 231st of 270 such funds since inception in October, 2003. Lipper, Inc. is an independent mutual fund rating service that ranks funds in various fund categories by making comparative calculations using total returns.
| | |
Large-Cap Growth Fund MANAGER’S COMMENTARY (Unaudited) (continued) | | |
Large-Cap Growth Fund vs. Russell 1000 Growth Index & Lipper Large-Cap Growth Funds Index
from Inception 10/31/03 to 6/30/12
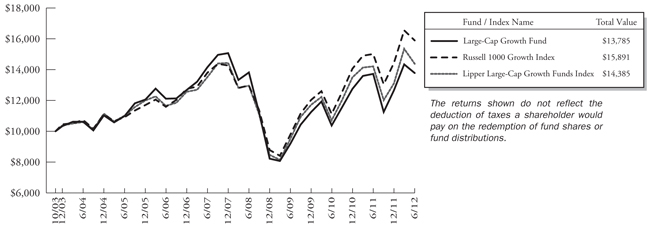
Detailed Explanation of Quarterly Performance
The Short Version: In spite of a company size disadvantage costing the Fund about 0.8% of returns relative to our primary market benchmark, and in spite of the fourth high correlation spike of a macro driven economy, our Fund eked out a slight market-beating return. The Energy sector added the most (about one half percent) to relative returns for the quarter.
In any era where investors move to the largest, most stable stocks, our non-market cap weighting strategy puts our Fund at some disadvantage relative to our market benchmark, which is market cap weighted. A market cap weighted strategy means owning companies in proportion to their size. Over the long haul, our strategy has historically given us a slight tailwind. Not so in this quarter (where we had a 0.8% disadvantage in relative performance) and especially in the fiscal year, as highlighted below. Recent large cap dominance is not unrelated to the macro-driven market environment discussed on page 3.
Strong stock picking combined with our underweighting in the poorly performing Energy sector added over one half percent to our relative returns for the quarter.
Detailed Explanation of Fiscal Year Performance
The Short Version: In the unfavorable market environment of two high correlation spikes (see page 3), investors flocked to the safety of the market’s largest stocks. This cost our Fund 4.4% of returns relative to our primary market benchmark, accounting for most of our fiscal year underperformance.
Company size was the biggest factor in our Fund’s fiscal year underperformance relative to our primary market benchmark. Apple Inc. soared 74% and accounted for over two percentage points of our relative underperformance, since the company comprised approximately 6.4% of the Russell 1000 Growth Index and 3.4% of the Fund during the fiscal year. The Fund’s adviser believes that the index’s 6.4% weighting leads to company specific risk that is not commensurately rewarded with returns over the long haul. This phenomenon was just as true with Microsoft in the late 1990’s. It’s an approach that is great on the way up, but very painful on the way down; at any rate, it does not line up with Bridgeway’s careful management of company, industry, and sector specific risk. Overall, this company size difference between the Fund and the Index accounted for a whopping 4.4% fiscal year performance difference.
| | |
65 | | Annual Report | June 30, 2012 |
| | |
Large-Cap Growth Fund MANAGER’S COMMENTARY (Unaudited) (continued) | | |
From a sector viewpoint, Information Technology and Consumer Discretionary stocks hurt performance the most. Consumer Staples and Industrials helped some, but not nearly enough to make up the difference.
Top Ten Holdings as of June 30, 2012
| | | | | | | | |
| Rank | | Description | | Industry | | % of Net
Assets | |
1 | | Apple, Inc. | | Computers & Peripherals | | | 3.4% | |
2 | | International Business Machines Corp. | | IT Services | | | 2.5% | |
3 | | Viacom, Inc. | | Media | | | 1.7% | |
4 | | Mastercard, Inc. | | IT Services | | | 1.7% | |
5 | | Colgate-Palmolive Co. | | Household Products | | | 1.6% | |
6 | | Biogen Idec, Inc. | | Biotechnology | | | 1.6% | |
7 | | Union Pacific Corp. | | Road & Rail | | | 1.5% | |
8 | | AutoZone, Inc. | | Specialty Retail | | | 1.5% | |
9 | | Sherwin-Williams Co. (The) | | Chemicals | | | 1.5% | |
10 | | Google, Inc. | | Internet Software & Services | | | 1.4% | |
| | Total | | | | | 18.4% | |
Industry Sector Representation as of June 30, 2012
| | | | | | | | | | | | | | | |
| | | % of Net Assets | | % of Russell 1000
Growth Index | | Difference |
Consumer Discretionary | | | | 22.9% | | | | | 16.2% | | | | | 6.7% | |
Consumer Staples | | | | 12.2% | | | | | 13.2% | | | | | -1.0% | |
Energy | | | | 8.1% | | | | | 3.7% | | | | | 4.4% | |
Financials | | | | 3.2% | | | | | 4.5% | | | | | -1.3% | |
Health Care | | | | 9.0% | | | | | 11.9% | | | | | -2.9% | |
Industrials | | | | 12.1% | | | | | 12.4% | | | | | -0.3% | |
Information Technology | | | | 20.2% | | | | | 31.7% | | | | | -11.5% | |
Materials | | | | 8.4% | | | | | 3.9% | | | | | 4.5% | |
Telecommunication Services | | | | 2.5% | | | | | 2.3% | | | | | 0.2% | |
Utilities | | | | 0.0% | | | | | 0.2% | | | | | -0.2% | |
Cash & Other Assets | | | | 1.4% | | | | | 0.0% | | | | | 1.4% | |
Total | | | | 100.0% | | | | | 100.0% | | | | | | |
Disclaimer
The views expressed here are exclusively those of Fund management. These views, including those related to market sectors or individual stocks, are not meant as investment advice and should not be considered predictive in nature. Any favorable (or unfavorable) description of a holding applies only as of the quarter-end, June 30, 2012, unless otherwise stated. Security positions can and do change thereafter. Discussions of historical performance do not guarantee and may not be indicative of future performance.
The Fund is subject to market risk (volatility) and is not an appropriate investment for short-term investors.
| | |
Large-Cap Growth Fund MANAGER’S COMMENTARY (Unaudited) (continued) | | |
Conclusion
Thank you for your continued investment in Large-Cap Growth Fund. We encourage your feedback; your reactions and concerns are important to us.
Sincerely,
The Investment Management Team
| | |
67 | | Annual Report | June 30, 2012 |
| | |
Bridgeway Large-Cap Growth Fund SCHEDULE OF INVESTMENTS | | |
Showing percentage of net assets as of June 30, 2012
| | | | | | | | |
| Industry Company | | Shares | | | Value | |
COMMON STOCKS - 98.55% | | | | | |
Aerospace & Defense - 4.16% | | | | | |
Boeing Co. (The) | | | 5,900 | | | $ | 438,370 | |
Lockheed Martin Corp. | | | 5,800 | | | | 505,064 | |
Precision Castparts Corp. | | | 2,300 | | | | 378,327 | |
Textron, Inc. | | | 27,800 | | | | 691,386 | |
| | | | | | | | |
| | | | | | | 2,013,147 | |
| | |
Airlines - 1.12% | | | | | | | | |
United Continental Holdings, Inc.* | | | 22,300 | | | | 542,559 | |
| | |
Automobiles - 0.83% | | | | | | | | |
Ford Motor Co. | | | 42,100 | | | | 403,739 | |
| | |
Beverages - 3.94% | | | | | | | | |
Brown-Forman Corp., Class B | | | 3,000 | | | | 290,550 | |
Coca-Cola Co. (The) | | | 6,600 | | | | 516,054 | |
Coca-Cola Enterprises, Inc. | | | 20,200 | | | | 566,408 | |
Monster Beverage Corp.* | | | 7,500 | | | | 534,000 | |
| | | | | | | | |
| | | | | | | 1,907,012 | |
| | |
Biotechnology - 2.46% | | | | | | | | |
Biogen Idec, Inc.* | | | 5,400 | | | | 779,652 | |
Celgene Corp.* | | | 6,400 | | | | 410,624 | |
| | | | | | | | |
| | | | | | | 1,190,276 | |
| | |
Chemicals - 4.67% | | | | | | | | |
CF Industries Holdings, Inc. | | | 3,300 | | | | 639,342 | |
Rockwood Holdings, Inc. | | | 10,200 | | | | 452,370 | |
Sherwin-Williams Co. (The) | | | 5,400 | | | | 714,690 | |
Valspar Corp. | | | 8,700 | | | | 456,663 | |
| | | | | | | | |
| | | | | | | 2,263,065 | |
| | |
Commercial Banks - 1.05% | | | | | | | | |
Huntington Bancshares, Inc. | | | 79,900 | | | | 511,360 | |
| |
Communications Equipment - 0.44% | | | | | |
Cisco Systems, Inc. | | | 12,300 | | | | 211,191 | |
| |
Computers & Peripherals - 5.07% | | | | | |
Apple, Inc.*# | | | 2,800 | | | | 1,635,200 | |
Dell, Inc.* | | | 36,700 | | | | 459,484 | |
Western Digital Corp.* | | | 11,900 | | | | 362,712 | |
| | | | | | | | |
| | | | | | | 2,457,396 | |
| | |
Consumer Finance - 1.03% | | | | | | | | |
Discover Financial Services | | | 14,400 | | | | 497,952 | |
| |
Containers & Packaging - 1.00% | | | | | |
Crown Holdings, Inc.* | | | 14,100 | | | | 486,309 | |
| |
Diversified Consumer Services - 0.53% | | | | | |
H&R Block, Inc. | | | 16,100 | | | | 257,278 | |
| | | | | | | | |
| Industry Company | | Shares | | | Value | |
| | | | | | | | |
Diversified Financial Services - 1.10% | | | | | |
Moody’s Corp. | | | 14,600 | | | $ | 533,630 | |
|
Diversified Telecommunication Services - 2.46% | |
tw telecom, inc.* | | | 23,500 | | | | 603,010 | |
Verizon Communications, Inc. | | | 13,200 | | | | 586,608 | |
| | | | | | | | |
| | | | | | | 1,189,618 | |
|
Energy Equipment & Services - 1.79% | |
Diamond Offshore Drilling, Inc. | | | 6,300 | | | | 372,519 | |
Halliburton Co. | | | 17,400 | | | | 493,986 | |
| | | | | | | | |
| | | | | | | 866,505 | |
| |
Food & Staples Retailing - 2.53% | | | | | |
Costco Wholesale Corp. | | | 4,700 | | | | 446,500 | |
Wal-Mart Stores, Inc. | | | 4,900 | | | | 341,628 | |
Whole Foods Market, Inc. | | | 4,600 | | | | 438,472 | |
| | | | | | | | |
| | | | | | | 1,226,600 | |
| | |
Food Products - 0.78% | | | | | | | | |
General Mills, Inc. | | | 9,800 | | | | 377,692 | |
|
Health Care Providers & Services - 3.75% | |
DaVita, Inc.* | | | 6,800 | | | | 667,828 | |
HCA Holdings, Inc. | | | 14,300 | | | | 435,149 | |
Humana, Inc. | | | 2,800 | | | | 216,832 | |
McKesson Corp. | | | 5,300 | | | | 496,875 | |
| | | | | | | | |
| | | | | | | 1,816,684 | |
| |
Hotels, Restaurants & Leisure - 3.52% | | | | | |
Chipotle Mexican Grill, Inc.* | | | 1,200 | | | | 455,940 | |
McDonald’s Corp. | | | 5,000 | | | | 442,650 | |
Starbucks Corp. | | | 8,900 | | | | 474,548 | |
Wynn Resorts, Ltd. | | | 3,200 | | | | 331,904 | |
| | | | | | | | |
| | | | | | | 1,705,042 | |
| |
Household Durables - 0.21% | | | | | |
Tempur-Pedic International, Inc.* | | | 4,400 | | | | 102,916 | |
| |
Household Products - 3.45% | | | | | |
Colgate-Palmolive Co. | | | 7,500 | | | | 780,750 | |
Kimberly-Clark Corp. | | | 5,300 | | | | 443,981 | |
Procter & Gamble Co. (The) | | | 7,300 | | | | 447,125 | |
| | | | | | | | |
| | | | | | | 1,671,856 | |
|
Internet Software & Services - 1.44% | |
Google, Inc., Class A* | | | 1,200 | | | | 696,084 | |
| | |
IT Services - 9.18% | | | | | | | | |
Accenture PLC, Class A | | | 8,800 | | | | 528,792 | |
| | |
Bridgeway Large-Cap Growth Fund SCHEDULE OF INVESTMENTS (continued) | | |
Showing percentage of net assets as of June 30, 2012
| | | | | | | | |
| Industry Company | | Shares | | | Value | |
Common Stocks (continued) | | | | | | | | |
IT Services (continued) | | | | | | | | |
Alliance Data Systems Corp.* | | | 3,800 | | | $ | 513,000 | |
International Business Machines Corp. | | | 6,300 | | | | 1,232,154 | |
Mastercard, Inc., Class A | | | 1,900 | | | | 817,209 | |
NeuStar, Inc., Class A* | | | 10,300 | | | | 344,020 | |
Visa, Inc., Class A | | | 4,100 | | | | 506,883 | |
Western Union Co. (The) | | | 29,900 | | | | 503,516 | |
| | | | | | | | |
| | | | | | | 4,445,574 | |
| |
Leisure Equipment & Products - 0.65% | | | | | |
Polaris Industries, Inc. | | | 4,400 | | | | 314,512 | |
| |
Life Sciences Tools & Services - 0.86% | | | | | |
Agilent Technologies, Inc. | | | 10,600 | | | | 415,944 | |
| | |
Machinery - 0.92% | | | | | | | | |
Cummins, Inc. | | | 4,600 | | | | 445,786 | |
| | |
Marine - 1.41% | | | | | | | | |
Kirby Corp.* | | | 14,500 | | | | 682,660 | |
| | |
Media - 3.89% | | | | | | | | |
Comcast Corp., Class A | | | 20,000 | | | | 639,400 | |
DIRECTV, Class A* | | | 8,600 | | | | 419,852 | |
Viacom, Inc., Class B | | | 17,600 | | | | 827,552 | |
| | | | | | | | |
| | | | | | | 1,886,804 | |
| | |
Metals & Mining - 2.71% | | | | | | | | |
Cliffs Natural Resources, Inc. | | | 5,100 | | | | 251,379 | |
Freeport-McMoRan Copper & Gold, Inc. | | | 16,400 | | | | 558,748 | |
Southern Copper Corp. | | | 15,900 | | | | 501,009 | |
| | | | | | | | |
| | | | | | | 1,311,136 | |
| | |
Multiline Retail - 2.78% | | | | | | | | |
Dollar General Corp.* | | | 8,300 | | | | 451,437 | |
Dollar Tree, Inc.* | | | 6,400 | | | | 344,320 | |
Macy’s, Inc. | | | 16,000 | | | | 549,600 | |
| | | | | | | | |
| | | | | | | 1,345,357 | |
| |
Oil, Gas & Consumable Fuels - 6.34% | | | | | |
Chevron Corp. | | | 3,400 | | | | 358,700 | |
ConocoPhillips | | | 5,900 | | | | 329,692 | |
Denbury Resources, Inc.* | | | 24,300 | | | | 367,173 | |
HollyFrontier Corp. | | | 10,600 | | | | 375,558 | |
Marathon Petroleum Corp. | | | 13,200 | | | | 592,944 | |
Occidental Petroleum Corp. | | | 5,500 | | | | 471,735 | |
Phillips 66* | | | 2,950 | | | | 98,058 | |
Pioneer Natural Resources Co. | | | 5,400 | | | | 476,334 | |
| | | | | | | | |
| | | | | | | 3,070,194 | |
| | | | | | | | |
| Industry Company | | Shares | | | Value | |
| | | | | | | | |
Personal Products - 1.49% | | | | | | | | |
Estee Lauder Cos., Inc., Class A (The) | | | 8,500 | | | $ | 460,020 | |
Herbalife, Ltd. | | | 5,400 | | | | 260,982 | |
| | | | | | | | |
| | | | | | | 721,002 | |
| | |
Pharmaceuticals - 1.91% | | | | | | | | |
Abbott Laboratories | | | 6,900 | | | | 444,843 | |
Allergan, Inc. | | | 5,200 | | | | 481,364 | |
| | | | | | | | |
| | | | | | | 926,207 | |
| | |
Road & Rail - 2.55% | | | | | | | | |
CSX Corp. | | | 22,200 | | | | 496,392 | |
Union Pacific Corp. | | | 6,200 | | | | 739,722 | |
| | | | | | | | |
| | | | | | | 1,236,114 | |
|
Semiconductors & Semiconductor Equipment - 2.23% | |
Intel Corp. | | | 9,100 | | | | 242,515 | |
Lam Research Corp.* | | | 9,000 | | | | 339,660 | |
Xilinx, Inc. | | | 14,900 | | | | 500,193 | |
| | | | | | | | |
| | | | | | | 1,082,368 | |
| | |
Software - 1.87% | | | | | | | | |
Microsoft Corp. | | | 7,700 | | | | 235,543 | |
Oracle Corp. | | | 22,600 | | | | 671,220 | |
| | | | | | | | |
| | | | | | | 906,763 | |
| | |
Specialty Retail - 9.74% | | | | | | | | |
Advance Auto Parts, Inc. | | | 7,100 | | | | 484,362 | |
AutoZone, Inc.* | | | 2,000 | | | | 734,340 | |
Bed Bath & Beyond, Inc.* | | | 3,900 | | | | 241,020 | |
Home Depot, Inc. (The) | | | 11,000 | | | | 582,890 | |
Limited Brands, Inc. | | | 6,900 | | | | 293,457 | |
PetSmart, Inc. | | | 3,700 | | | | 252,266 | |
Ross Stores, Inc. | | | 7,800 | | | | 487,266 | |
Sally Beauty Holdings, Inc.* | | | 15,900 | | | | 409,266 | |
TJX Cos., Inc. | | | 11,400 | | | | 489,402 | |
Tractor Supply Co. | | | 3,800 | | | | 315,628 | |
Ulta Salon Cosmetics & Fragrance, Inc. | | | 4,600 | | | | 429,548 | |
| | | | | | | | |
| | | | | | | 4,719,445 | |
|
Textiles, Apparel & Luxury Goods - 0.71% | |
PVH Corp. | | | 4,400 | | | | 342,276 | |
|
Trading Companies & Distributors - 1.98% | |
Fastenal Co. | | | 7,200 | | | | 290,232 | |
W.W. Grainger, Inc. | | | 3,500 | | | | 669,340 | |
| | | | | | | | |
| | | | | | | 959,572 | |
| | | | | | | | |
TOTAL COMMON STOCKS - 98.55% (Cost $42,589,867) | | | | 47,739,625 | |
| | | | |
| | | | |
| | |
69 | | Annual Report | June 30, 2012 |
| | |
Bridgeway Large-Cap Growth Fund SCHEDULE OF INVESTMENTS (continued) | | |
Showing percentage of net assets as of June 30, 2012
| | | | | | | | | | | | |
| | | Rate^ | | | Shares | | | Value | |
MONEY MARKET FUND - 0.71% | | | | | |
BlackRock FedFund | | | 0.01 | % | | | 346,004 | | | | $346,004 | |
| | | | | | | | | | | | |
| | | | | | | | | | | | |
TOTAL MONEY MARKET FUND - 0.71% | | | | | | | | 346,004 | |
| | | | | | | | | | | | |
(Cost $346,004) | | | | | | | | | | | | |
| | |
TOTAL INVESTMENTS - 99.26% | | | | | | | | $48,085,629 | |
(Cost $42,935,871) | | | | | | | | | | | | |
Other Assets in Excess of Liabilities - 0.74% | | | | 357,886 | |
| | | | | | | | | | | | |
NET ASSETS - 100.00% | | | | | | | | | | | $48,443,515 | |
| | | | | | | | | | | | |
| | |
* Non-income producing security. # Securities, or a portion thereof, segregated to cover the Fund’s potential obligation under swap agreements. The total value of segregated assets is $467,200. ^ Rate disclosed as of June 30, 2012. PLC - Public Limited Company Summary of inputs used to value the Fund’s investments as of 06/30/2012 is as follows (See Note 2 in Notes to Financial Statements): | | |
| | | | | | | | | | | | | | | | | | |
| | | Valuation Inputs | | | |
| | | Investment in Securities (Value) | | | |
| | | Level 1
Quoted
Prices | | | Level 2
Significant
Observable
Inputs | | | Level 3
Significant
Unobservable
Inputs | | | Total | | | |
Common Stocks | | $ | 47,739,625 | | | $ | — | | | $ | — | | | $ | 47,739,625 | | |
Money Market Fund | | | — | | | | 346,004 | | | | — | | |
| 346,004
|
| |
| | | | | | | | | | | | | | | | | |
TOTAL | | $ | 47,739,625 | | | $ | 346,004 | | | $ | — | | | $ | 48,085,629 | | |
| | | | | | | | | | | | | | | | | |
Other Financial Instru-
ments** | | | | | | | | | | | | | | | | | |
Swaps | | $ | — | | | $ | 17,951 | | | $ | — | | | $ | 17,951 | | |
| | | | | | | | | | | | | | | | | |
TOTAL | | $ | — | | | $ | 17,951 | | | $ | — | | | $ | 17,951 | | |
| | | | | | | | | | | | | | | | | |
| | |
** Other financial instruments are derivative instruments not reflected in the Schedule of Investments, such as swap contracts, which are valued at the unrealized appreciation/depreciation on the investment. See Notes to Financial Statements. | | |
| |
| | |
| |
| | |
| | |
Blue Chip 35 Index Fund MANAGER’S COMMENTARY (Unaudited) | | |
June 30, 2012
Dear Fellow Blue Chip 35 Index Fund Shareholder,
For the quarter ended June 30, 2012, our Fund declined 2.04%, outperforming our primary market benchmark, the S&P 500 Index (-2.75%), our peer benchmark, the Lipper Large-Cap Core Funds Index (-3.39%), but trailing the Russell Top 50 Index (-1.93%). We performed as expected in a period where the very largest caps had the highest returns.
For the fiscal year ending June 30, 2012, the Fund appreciated 9.72%, outperforming our primary market benchmark, the S&P 500 Index (+5.45%) and our peer benchmark, the Lipper Large-Cap Core Funds Index (+2.65%), but trailing the Russell Top 50 Index (+11.44%). In line with our Fund’s design, we outperformed our primary market benchmark in a period where large companies dominated performance. Apple Inc.’s whopping 7.4% representation in the Russell Top 50 Index, almost twice Apple’s (still large) representation in our Fund, caused a “headwind” of approximately 1.4%. This accounts for most of our underperformance relative to the more concentrated and riskier Russell Top 50 Index.
The table below presents our June quarter, one-year, five-year, ten-year and inception-to-date financial results. See the next page for a graph of performance from inception.
Standardized Returns as of June 30, 2012
| | | | | | | | | | | | | | | | | | |
|
| | | |
| | | | | | | | | Annualized |
| | | Quarter | | | 1 Year | | | 5 Years | | | 10 Years | | | Since Inception
(7/31/97) |
|
Blue Chip 35 Index Fund | | | -2.04% | | | | 9.72% | | | | 1.23% | | | | 5.04% | | | 4.80% |
S&P 500 Index | | | -2.75% | | | | 5.45% | | | | 0.22% | | | | 5.33% | | | 4.26% |
Russell Top 50 Index | | | -1.93% | | | | 11.44% | | | | 0.44% | | | | 4.39% | | | 3.22% |
Bridgeway Ultra-Large 35 Index | | | -1.99% | | | | 10.26% | | | | 1.53% | | | | 5.27% | | | 4.98% |
Lipper Large-Cap Core Funds Index | | | -3.39% | | | | 2.65% | | | | -0.47% | | | | 4.32% | | | 3.47% |
Performance figures quoted in the table above and graph below represent past performance and are no guarantee of future results. Total return figures in the table above include the reinvestment of dividends and capital gains. The table above and the graph below do not reflect the deduction of taxes that a shareholder would pay on Fund distributions or the redemption of Fund shares.
The S&P 500 Index is a broad-based, unmanaged measurement of changes in stock market conditions, based on the average of 500 widely held common stocks with dividends reinvested. The Russell Top 50 Index measures the performance of the largest companies in the Russell 3000 Index. It includes 50 of the largest securities, based on a combination of their market cap and current index membership, and represents approximately 40% of the total market capitalization of the Russell 3000 Index. The Bridgeway Ultra-Large 35 Index is an index comprised of very large, “blue chip” U.S. stocks, excluding tobacco; it is compiled by the adviser of the Fund. The Lipper Large-Cap Core Funds Index reflects the aggregate record of domestic large-cap core mutual funds as reported by Lipper, Inc. It is not possible to invest directly in an index. Periods longer than one year are annualized.
According to data from Lipper, Inc. as of June 30, 2012, Blue-Chip 35 Index Fund ranked 23rd of 1,042 large-cap core funds for the twelve months ending June 30, 2012, 105th of 807 over the last five years, 185th of 550 over the last ten years, and 59th of 259 since inception in July 1997. Lipper, Inc. is an independent mutual fund rating service that ranks funds in various fund categories by making comparative calculations using total returns.
| | |
71 | | Annual Report | June 30, 2012 |
| | |
Blue Chip 35 Index Fund MANAGER’S COMMENTARY (Unaudited) (continued) | | |
Blue Chip 35 Index Fund vs. S&P 500 Index, Russell Top 50 Index*, Bridgeway Ultra-Large 35 Index & Lipper Large-Cap Core Funds Index from Inception 7/31/97 to 6/30/12
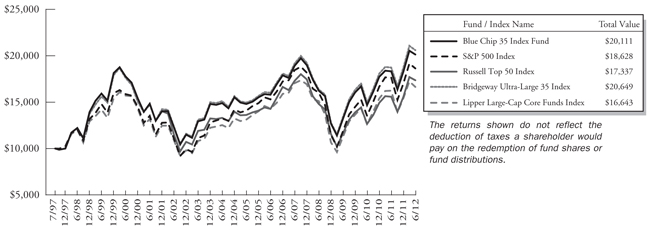
| * | The Russell Top 50 Index began on12/31/2001, and the line graph for the Index begins at the same value as the Fund on that date. |
Quarterly and Fiscal Year Performance by Company Size:
The Short Version: Ultra-large stocks were the place to be for the quarter and the year as they dominated nearly all other size stocks. Relative to our primary market benchmark, the S&P 500 Index, our Fund’s advantages over the last year included both its ultra-large size and our less risky “roughly equal” strategy of weighting stocks. The latter tends to help in choppy markets such as the last year.
As demonstrated in the table below, ultra-large or CRSP 1 decile stocks outperformed all other market cap stocks, with the exception of ultra-small or CRSP 10 stocks, for the quarter. This gave us a sizeable edge over the S&P 500 Index; almost 22% of its holdings fell outside the ultra-large stock category.
For the fiscal year ended June 30, 2012, ultra-large stocks outperformed all other deciles of market caps by at least seven and three-fourths percent. This market condition allowed us to rank as high as we did in the Lipper Large-Cap Core Funds category for the year as shown above. However, it is also one of the conditions where our equal weighting philosophy hinders performance, as demonstrated by our underperformance versus the market-cap weighted Russell Top 50 Index.
Standardized Returns as of June 30, 2012
| | | | | | | | | | | | | | | | | | | | |
| | | | | | | | | Annualized | |
| CRSP Decile1 | | Quarter | | | 1 Year | | | 5 Years | | | 10 Years | | | 86.5 Years | |
1 (ultra-large) | | | -2.27% | | | | 7.66% | | | | 0.49% | | | | 4.81% | | | | 9.09% | |
2 | | | -4.61% | | | | -0.15% | | | | 0.68% | | | | 8.05% | | | | 10.39% | |
3 | | | -6.33% | | | | -4.40% | | | | 0.89% | | | | 8.12% | | | | 10.77% | |
4 | | | -6.85% | | | | -3.88% | | | | 2.02% | | | | 8.92% | | | | 10.73% | |
5 | | | -5.81% | | | | -6.10% | | | | 2.84% | | | | 9.84% | | | | 11.27% | |
6 | | | -5.24% | | | | -1.48% | | | | 1.77% | | | | 8.45% | | | | 11.25% | |
7 | | | -4.02% | | | | -1.88% | | | | 3.09% | | | | 9.34% | | | | 11.25% | |
8 | | | -5.21% | | | | -2.22% | | | | 2.93% | | | | 9.69% | | | | 11.45% | |
9 | | | -4.13% | | | | -2.88% | | | | 1.61% | | | | 8.31% | | | | 11.46% | |
10 (ultra-small) | | | -2.01% | | | | -0.85% | | | | 0.97% | | | | 11.61% | | | | 13.02% | |
| | |
Blue Chip 35 Index Fund MANAGER’S COMMENTARY (Unaudited) (continued) | | |
| 1 | Performance figures are as of the period ended June 30, 2012. The CRSP Cap-Based Portfolio Indexes are unmanaged indexes of the publicly traded U.S. stocks with dividends reinvested, grouped by market capitalization, as reported by the Center for Research in Security Prices. Past performance is no guarantee of future results. |
Apart from a size advantage, our quarterly rebalancing of company weights, what we call a “roughly equal weighting strategy,” gave us a performance boost in the fiscal year. This strategy has a “buy low, sell high” feel to it. Historically, over the nearly 15 year history of our Fund — and not in every quarter or year — it has allowed our Fund to keep up with, or slightly exceed, the returns of the S&P 500 with less risk.
The poster child for this strategy in fiscal year 2012 is Occidental Petroleum. Occidental declined a whopping 30.90% in the September quarter, much worse than the 10.79% decline of the Fund overall. Following our roughly equal weighting strategy, we added to this position, bringing it back up near the Fund average weight in the downturn. If it weren’t for the disciplined and mechanical nature of this Fund rebalancing, it might take a lot of “guts” to do so. But the discipline of our investment process ensures that we take this kind of emotion out of the process. It worked particularly well in the December quarter, as Occidental was our single best performer, up 31.67%. However, after this nice run-up, our conservative process had us trimming Occidental back toward our roughly equal weighting strategy. Our trim was not too badly timed, as Occidental followed energy prices downward over the next quarter. Had we held Occidental without adding and trimming because of our equal weighting philosophy (what most index funds do), the stock, which declined 15.73% for the fiscal year, would have contributed a negative 0.98% to the Fund. Occidental’s actual contribution to return was a negative 0.27%. This 0.71% difference may not seem like a lot, but it is more than four times the entire operating expenses of our Fund.
Here’s the full list of our companies’ contribution to returns for the fiscal year:
| | | | | | |
| Rank | | Company | | Industry | | % Contribution
to Return |
1 | | Apple, Inc. | | Computers & Peripherals | | 2.3% |
2 | | Visa, Inc. | | IT Services | | 1.5% |
3 | | Wal-Mart Stores, Inc. | | Food & Staples Retailing | | 0.9% |
4 | | Intel Corp. | | Semiconductors & Semiconductor Equipment | | 0.8% |
5 | | Verizon Communications, Inc. | | Diversified Telecommunication Services | | 0.7% |
6 | | CVS Caremark Corp. | | Food & Staples Retailing | | 0.7% |
7 | | Abbott Laboratories | | Pharmaceuticals | | 0.7% |
8 | | Merck & Co., Inc. | | Pharmaceuticals | | 0.6% |
9 | | Monsanto Co. | | Chemicals | | 0.6% |
10 | | Wells Fargo & Co. | | Commercial Banks | | 0.6% |
11 | | Microsoft Corp. | | Software | | 0.5% |
12 | | AT&T, Inc. | | Diversified Telecommunication Services | | 0.5% |
13 | | Pfizer, Inc. | | Pharmaceuticals | | 0.5% |
14 | | International Business Machines Corp. | | IT Services | | 0.5% |
15 | | Cisco Systems, Inc. | | Communications Equipment | | 0.5% |
16 | | Coca-Cola Co. (The) | | Beverages | | 0.5% |
17 | | Google, Inc. | | Internet Software & Services | | 0.4% |
18 | | General Electric Co. | | Industrial Conglomerates | | 0.4% |
19 | | McDonald’s Corp. | | Hotels, Restaurants & Leisure | | 0.4% |
20 | | United Parcel Service, Inc. | | Air Freight & Logistics | | 0.3% |
21 | | Exxon Mobil Corp. | | Oil, Gas & Consumable Fuels | | 0.3% |
22 | | Berkshire Hathaway, Inc. | | Insurance | | 0.2% |
23 | | Chevron Corp. | | Oil, Gas & Consumable Fuels | | 0.2% |
| | |
73 | | Annual Report | June 30, 2012 |
| | |
Blue Chip 35 Index Fund MANAGER’S COMMENTARY (Unaudited) (continued) | | |
| | | | | | |
| Rank | | Company | | Industry | | % Contribution to Return |
24 | | Johnson & Johnson | | Pharmaceuticals | | 0.2% |
25 | | ConocoPhillips | | Oil, Gas & Consumable Fuels | | 0.1% |
26 | | PepsiCo, Inc. | | Beverages | | 0.1% |
27 | | Procter & Gamble Co. (The) | | Household Products | | 0.1% |
28 | | Phillips 66 | | Oil, Gas & Consumable Fuels | | 0.0% |
29 | | 3M Co. | | Industrial Conglomerates | | -0.1% |
30 | | Oracle Corp. | | Software | | -0.2% |
31 | | Occidental Petroleum Corp. | | Oil, Gas & Consumable Fuels | | -0.3% |
32 | | United Technologies Corp. | | Aerospace & Defense | | -0.3% |
33 | | JPMorgan Chase & Co. | | Diversified Financial Services | | -0.4% |
34 | | Bank of America Corp. | | Diversified Financial Services | | -0.5% |
35 | | Schlumberger, Ltd. | | Energy Equipment & Services | | -0.7% |
36 | | Goldman Sachs Group, Inc. (The) | | Capital Markets | | -0.8% |
37 | | Hewlett-Packard Co. | | Computers & Peripherals | | -1.5% |
* Returns are actual company returns for the period during which the Fund held shares.
Industry Sector Representation as of June 30, 2012
| | | | | | | | | | | | | | | |
| | | |
| | | % of Net Assets | | % of S&P 500 Index | | Difference |
Consumer Discretionary | | | | 3.0% | | | | | 11.0% | | | | | -8.0% | |
Consumer Staples | | | | 13.6% | | | | | 11.3% | | | | | 2.3% | |
Energy | | | | 13.5% | | | | | 10.8% | | | | | 2.7% | |
Financials | | | | 12.9% | | | | | 14.4% | | | | | -1.5% | |
Health Care | | | | 10.3% | | | | | 12.0% | | | | | -1.7% | |
Industrials | | | | 10.4% | | | | | 10.5% | | | | | -0.1% | |
Information Technology | | | | 27.8% | | | | | 19.7% | | | | | 8.1% | |
Materials | | | | 2.6% | | | | | 3.4% | | | | | -0.8% | |
Telecommunication Services | | | | 5.8% | | | | | 3.2% | | | | | 2.6% | |
Utilities | | | | 0.0% | | | | | 3.7% | | | | | -3.7% | |
Cash & Other Assets | | | | 0.1% | | | | | 0.0% | | | | | 0.1% | |
Total | | | | 100.0% | | | | | 100.0% | | | | | | |
Disclaimer
The views expressed here are exclusively those of Fund management. These views, including those of market sectors or individual stocks, are not meant as investment advice and should not be considered predictive in nature. Any favorable (or unfavorable) description of a holding applies only as of the quarter end, June 30, 2012, unless otherwise stated. Security positions can and do change thereafter. Discussions of historical performance do not guarantee and are not indicative of future performance.
The Fund is subject to significant market risk (volatility) and is not an appropriate investment for short-term investors.
Conclusion
Thank you for your continued investment in Blue Chip 35 Index Fund. We encourage your feedback; your reactions and concerns are important to us.
Sincerely,
The Investment Management Team
| | |
Bridgeway Blue Chip 35 Index Fund SCHEDULE OF INVESTMENTS | | |
Showing percentage of net assets as of June 30, 2012
| | | | | | | | |
| Industry Company | | Shares | | | Value | |
COMMON STOCKS - 100.08% | | | | | |
Aerospace & Defense - 2.54% | |
United Technologies Corp. | | | 88,680 | | | $ | 6,698,000 | |
| |
Air Freight & Logistics - 2.61% | |
United Parcel Service, Inc., Class B | | | 87,463 | | | | 6,888,586 | |
| | |
Beverages - 5.45% | | | | | | | | |
Coca-Cola Co. (The) | | | 97,857 | | | | 7,651,439 | |
PepsiCo, Inc. | | | 95,450 | | | | 6,744,497 | |
| | | | | | | | |
| | | | | | | 14,395,936 | |
| |
Capital Markets - 2.55% | |
Goldman Sachs Group, Inc. (The) | | | 70,200 | | | | 6,729,372 | |
| |
Chemicals - 2.60% | |
Monsanto Co. | | | 82,850 | | | | 6,858,323 | |
| | |
Commercial Banks - 2.60% | | | | | | | | |
Wells Fargo & Co. | | | 205,359 | | | | 6,867,205 | |
| |
Communications Equipment - 2.52% | |
Cisco Systems, Inc. | | | 387,708 | | | | 6,656,946 | |
| |
Computers & Peripherals - 6.47% | |
Apple, Inc.* | | | 17,800 | | | | 10,395,200 | |
Hewlett-Packard Co. | | | 332,700 | | | | 6,690,597 | |
| | | | | | | | |
| | | | | | | 17,085,797 | |
| |
Diversified Financial Services - 5.18% | |
Bank of America Corp. | | | 865,008 | | | | 7,075,766 | |
JPMorgan Chase & Co. | | | 185,295 | | | | 6,620,590 | |
| | | | | | | | |
| | | | | | | 13,696,356 | |
| |
Diversified Telecommunication Services - 5.84% | |
AT&T, Inc. | | | 218,325 | | | | 7,785,470 | |
Verizon Communications, Inc. | | | 171,889 | | | | 7,638,747 | |
| | | | | | | | |
| | | | | | | 15,424,217 | |
| |
Energy Equipment & Services - 2.50% | |
Schlumberger, Ltd. | | | 101,600 | | | | 6,594,856 | |
| |
Food & Staples Retailing - 5.59% | |
CVS Caremark Corp. | | | 146,100 | | | | 6,827,253 | |
Wal-Mart Stores, Inc. | | | 113,719 | | | | 7,928,489 | |
| | | | | | | | |
| | | | | | | 14,755,742 | |
| |
Hotels, Restaurants & Leisure - 3.03% | |
McDonald’s Corp. | | | 90,500 | | | | 8,011,965 | |
| | | | | | | | |
| | | | | | | | |
| | | | | | | | |
| | | | | | | | |
| | | | | | | | |
| Industry Company | | Shares | | | Value | |
| | | | | | | | |
Household Products - 2.53% | |
Procter & Gamble Co. (The) | | | 109,326 | | | $ | 6,696,218 | |
|
Industrial Conglomerates - 5.25% | |
3M Co. | | | 77,050 | | | | 6,903,680 | |
General Electric Co. | | | 333,843 | | | | 6,957,288 | |
| | | | | | | | |
| | | | | | | 13,860,968 | |
| | |
Insurance - 2.58% | | | | | | | | |
Berkshire Hathaway, Inc., Class B* | | | 81,950 | | | | 6,828,893 | |
|
Internet Software & Services - 2.59% | |
Google, Inc., Class A* | | | 11,780 | | | | 6,833,225 | |
|
IT Services - 7.09% | |
International Business Machines Corp. | | | 43,567 | | | | 8,520,834 | |
Visa, Inc., Class A | | | 82,650 | | | | 10,218,019 | |
| | | | | | | | |
| | | | | | | 18,738,853 | |
|
Oil, Gas & Consumable Fuels - 11.02% | |
Chevron Corp. | | | 65,195 | | | | 6,878,072 | |
ConocoPhillips | | | 118,115 | | | | 6,600,266 | |
Exxon Mobil Corp. | | | 80,687 | | | | 6,904,387 | |
Occidental Petroleum Corp. | | | 82,050 | | | | 7,037,428 | |
Phillips 66* | | | 50,957 | | | | 1,693,811 | |
| | | | | | | | |
| | | | | | | 29,113,964 | |
|
Pharmaceuticals - 10.35% | |
Abbott Laboratories | | | 106,700 | | | | 6,878,949 | |
Johnson & Johnson | | | 99,252 | | | | 6,705,465 | |
Merck & Co., Inc. | | | 165,635 | | | | 6,915,261 | |
Pfizer, Inc. | | | 297,244 | | | | 6,836,612 | |
| | | | | | | | |
| | | | | | | 27,336,287 | |
|
Semiconductors & Semiconductor Equipment - 3.47% | |
Intel Corp. | | | 343,743 | | | | 9,160,751 | |
|
Software - 5.72% | |
Microsoft Corp. | | | 262,745 | | | | 8,037,370 | |
Oracle Corp. | | | 238,513 | | | | 7,083,836 | |
| | | | | | | | |
| | | | | | | 15,121,206 | |
| | | | | | | | |
TOTAL COMMON STOCKS - 100.08% | | | | | | | 264,353,666 | |
| | | | | | | | |
(Cost $187,537,346) | | | | | | | | |
| | |
75 | | Annual Report | June 30, 2012 |
| | |
Bridgeway Blue Chip 35 Index Fund SCHEDULE OF INVESTMENTS (continued) | | |
Showing percentage of net assets as of June 30, 2012
| | | | | | | | |
| | | Rate^ | | Shares | | Value | |
MONEY MARKET FUND - 0.00% | | | | |
BlackRock FedFund | | 0.01% | | 5,950 | | | $5,950 | |
| | | | | | | | |
TOTAL MONEY MARKET FUND - 0.00% | | | 5,950 | |
| | | | | | | | |
(Cost $5,950) | | | | | | | | |
TOTAL INVESTMENTS - 100.08% | | | | | $264,359,616 | |
(Cost $187,543,296) | | | | | | | | |
Liabilities in Excess of Other Assets - (0.08%) | | | (199,010 | ) |
| | | | | | | | |
NET ASSETS - 100.00% | | | | | | | $264,160,606 | |
| | | | | | | | |
* Non-income producing security. ^ Rate disclosed as of June 30, 2012. | |
| |
| |
| |
| |
Summary of inputs used to value the Fund’s investments as of 06/30/2012 is as follows (See Note 2 in Notes to Financial Statements):
| | | | | | | | | | | | |
| | | Valuation Inputs | |
| | | Investment in Securities (Value) | |
| | | Level 1 Quoted Prices | | | Level 2
Significant
Observable
Inputs | | Level 3
Significant
Unobservable
Inputs | | Total | |
Common Stocks | | $ | 264,353,666 | | | $ — | | $ — | | $ | 264,353,666 | |
Money Market Fund | | | — | | | 5,950 | | — | | | 5,950 | |
| | | | | | | | | | | | |
TOTAL | | $ | 264,353,666 | | | $5,950 | | $ — | | $ | 264,359,616 | |
| | | | | | | | | | | | |
See Notes to Financial Statements.
| | |
Managed Volatility Fund MANAGER’S COMMENTARY (Unaudited) | | |
June 30, 2012
Dear Fellow Managed Volatility Fund Shareholder:
For the quarter ended June 30, 2012, Managed Volatility Fund returned 0.00%, outperforming our primary market benchmark, the S&P 500 Index (-2.75%), our peer benchmark, the Lipper Balanced Funds Index (-1.98%), but trailing the fixed income only Bloomberg/ EFFAS U.S. Government 1-3 Year Total Return Bond Index (+0.21%). It was a down quarter for the broad stock market, and we are pleased to have created a sizable cushion in a choppy, declining market.
For the full fiscal year ended June 30, 2012, the Fund appreciated 3.74%, trailing our primary market benchmark, the S&P 500 Index (+5.45%), but capturing 69% of the Index return — a favorable result. Our goal is to capture 40% or more of the market’s upside over the long term. Our short-term risk this quarter — a very short timeframe to measure it — was just over 50% (as measured by the standard deviation of monthly returns), compared to our goal of 40%.
Our hybrid Fund invests in both equity and fixed-income securities, while incorporating an options strategy designed to produce a conservative, lower-volatility Fund. During very favorable equity market conditions, the Fund often under-performs many of the more aggressive benchmarks. On the other hand, when stocks struggle and investors seek the safe haven of more conservative bonds, Managed Volatility Fund tends to perform better than the equity-only indexes. Thus, our Fund has generally performed according to our design over the last year.
The table below presents our June quarter, one-year, five-year, ten-year and inception-to-date financial results. See the next page for a graph of performance since inception.
Standardized Returns as of June 30, 2012
| | | | | | | | | | | | | | | | | | |
| | | | | | | | | Annualized |
| | | Quarter | | | 1 Year | | | 5 Years | | | 10 Years | | | Since Inception
(6/30/01) |
Managed Volatility Fund | | | 0.00% | | | | 3.74% | | | | 0.92% | | | | 4.04% | | | 3.59% |
S&P 500 Index | | | -2.75% | | | | 5.45% | | | | 0.22% | | | | 5.33% | | | 2.96% |
Bloomberg/EFFAS U.S. Government 1-3
Year Total Return Bond Index | | | 0.21% | | | | 0.84% | | | | 3.35% | | | | 3.07% | | | 3.40% |
Lipper Balanced Funds Index | | | -1.98% | | | | 1.77% | | | | 1.81% | | | | 5.37% | | | 4.12% |
Performance figures quoted in the table above and graph below represent past performance and are no guarantee of future results. Total return figures in the table above include the reinvestment of dividends and capital gains. The table above and the graph below do not reflect the deduction of taxes that a shareholder would pay on Fund distributions or the redemption of Fund shares.
The S&P 500 Index is a broad-based, unmanaged measurement of changes in stock market conditions, based on the average of 500 widely held common stocks with dividends reinvested. The Bloomberg/ EFFAS U.S. Government 1-3 year Total Return Bond Index is a transparent benchmark for the total return of the 1-3 year U.S. Government bond market. The Lipper Balanced Funds Index is an index of balanced funds compiled by Lipper, Inc. It is not possible to invest directly in an index. Periods longer than one year are annualized.
According to data from Lipper, Inc. as of June 30, 2012, the Managed Volatility Fund ranked 81st of 494 mixed-asset target allocation moderate funds for the fiscal year ended June 30, 2012, 297th of 402 over the past five years, 180th of 199 over the past ten years and 118th of 171 funds since inception on June 30, 2001. Lipper, Inc. is an independent mutual fund rating service that ranks funds in various fund categories by making comparative calculations using total returns.
| | |
77 | | Annual Report | June 30, 2012 |
| | |
Managed Volatility Fund MANAGER’S COMMENTARY (Unaudited) (continued) | | |
According to data from Morningstar as of June 30, 2012, the Managed Volatility Fund ranked 21st of 179 long-short funds for the fiscal year ended June 30, 2012, 15th out of 55 funds over the past five years and 9th of 19 funds over the last ten years. Morningstar ranks funds in various fund categories by making comparative calculations using total returns.
Managed Volatility Fund vs. S&P 500 Index, Bloomberg/EFFAS Bond Index & Lipper Balanced Funds Index
from Inception 6/30/01 to 6/30/12
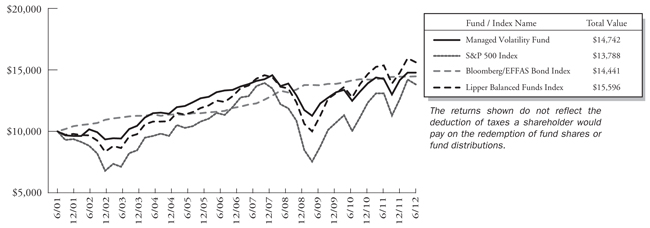
Detailed Explanation of Quarterly Performance
The Short Version: The stock portion of our Fund hurt our relative returns, but the options premiums and fixed income portions of our Fund helped us beat the returns of the S&P 500 Index.
Our three most heavily weighted sectors, Energy, Information Technology and Industrials all performed poorly and, combined with our slight overweighting versus the Index in each one, they cost us some relative performance. We were helped by having a little higher percentage of stock holdings in the best performing ultra-large, or decile 1 stocks in the Fund versus the S&P 500 Index. As is generally inherent in a relatively flat market, few options were exercised, and the premiums we received from our covered call and put options boosted our returns. The fixed income portion of our Fund is mainly invested in U.S. Treasuries, which always cushions negative returns in a down market such as this quarter.
Detailed Explanation of Fiscal Year Performance
The Short Version: The Information Technology sector helped the most for the fiscal year, and the fixed income portion of the Fund reduced volatility.
For the fiscal year, Information Technology, Consumer Staples and Health Care stocks helped our performance the most. Energy and Consumer Discretionary stocks cost us some returns. The fixed income portion of our Fund performed in line with our strategy, which is to keep our returns less volatile than the Index.
| | |
Managed Volatility Fund MANAGER’S COMMENTARY (Unaudited) (continued) | | |
Top Ten Holdings as of June 30, 2012
| | | | | | |
| Rank | | Description | | Industry | | % of Net
Assets |
1 | | Exxon Mobil Corp. | | Oil, Gas & Consumable Fuels | | 1.8% |
2 | | Seagate Technology PLC | | Computers & Peripherals | | 1.7% |
3 | | Chevron Corp. | | Oil, Gas & Consumable Fuels | | 1.5% |
4 | | Apple, Inc. | | Computers & Peripherals | | 1.5% |
5 | | United Rentals, Inc. | | Trading Companies & Distributors | | 1.4% |
6 | | AutoZone, Inc. | | Specialty Retail | | 1.4% |
7 | | Travelers Cos., Inc. (The) | | Insurance | | 1.2% |
8 | | Brown-Forman Corp. | | Beverages | | 1.2% |
9 | | Cabela’s, Inc. | | Specialty Retail | | 1.2% |
10 | | L-3 Communications Holdings, Inc. | | Aerospace & Defense | | 1.1% |
| | | | | | 14.0% |
Industry Sector Representation as of June 30, 2012
| | | | |
| Asset Type | | % of Net
Assets | |
Common Stock | | | 60.9% | |
Consumer Discretionary | | | 7.6% | |
Consumer Staples | | | 5.7% | |
Energy | | | 8.9% | |
Financials | | | 6.7% | |
Health Care | | | 5.5% | |
Industrials | | | 8.6% | |
Information Technology | | | 12.3% | |
Materials | | | 1.4% | |
Telecommunication Services | | | 0.9% | |
Utilities | | | 3.3% | |
U.S. Government Obligations | | | 37.3% | |
Covered Call Options Written | | | -1.1% | |
Put Options Written | | | -0.4% | |
Money Market Funds | | | 3.1% | |
Other Assets in Excess of Liabilities | | | 0.2% | |
Total | | | 100.0% | |
Disclaimer
The views expressed here are exclusively those of Fund management. These views, including those related to market sectors or individual stocks, are not meant as investment advice and should not be considered predictive in nature. Any favorable (or unfavorable) description of a holding applies only as of the quarter-end, June 30, 2012, unless otherwise stated. Security positions can and do change thereafter. Discussions of historical performance do not guarantee and may not be indicative of future performance.
Market volatility can significantly affect short-term performance. The Fund is not an appropriate investment for short-term investors. Investments in small companies and investments in foreign companies within this multi-cap fund generally carry greater risk than are customarily associated with larger, domestic companies. In addition, the stock of small companies and investments in foreign securities tend to be more volatile than the stock of large, domestic companies. The Fund’s use of options, futures, and leverage can magnify the risk of loss in an unfavorable market, and the Fund’s use of short-sale positions can, in theory, expose shareholders to unlimited loss. The Fund uses an option writing strategy in which the Fund may sell covered calls or secured put options. Up to 75% of Fund assets may be invested in options. Options are subject to special risks and
| | |
79 | | Annual Report | June 30, 2012 |
| | |
Managed Volatility Fund MANAGER’S COMMENTARY (Unaudited) (continued) | | |
may not fully protect the Fund against declines in the value of its stocks. In addition, an option writing strategy limits the upside profit potential normally associated with stocks. The Fund’s fixed-income holdings are subject to three types of risk. Interest rate risk is the chance that bond prices overall will decline as interest rates rise. Credit risk is the chance a bond issuer will fail to pay interest and principal. Prepayment risk is the chance a mortgage-backed bond issuer will repay a higher yielding bond, resulting in a lower paying yield.
Conclusion
Thank you for your continued investment in Managed Volatility Fund. We encourage your feedback; your reactions and concerns are extremely important to us.
Sincerely,
The Investment Management Team
| | |
Bridgeway Managed Volatility Fund SCHEDULE OF INVESTMENTS | | |
Showing percentage of net assets as of June 30, 2012
| | | | | | | | |
| Industry Company | | Shares | | | Value | |
COMMON STOCKS - 60.95% | | | | | | | | |
Aerospace & Defense - 3.10% | | | | | | | | |
Honeywell International, Inc.# | | | 2,100 | | | $ | 117,264 | |
L-3 Communications Holdings, Inc.# | | | 3,500 | | | | 259,035 | |
Lockheed Martin Corp. | | | 870 | | | | 75,760 | |
Northrop Grumman Corp.# | | | 400 | | | | 25,516 | |
Textron, Inc.# | | | 7,500 | | | | 186,525 | |
United Technologies Corp. | | | 940 | | | | 70,998 | |
| | | | | | | | |
| | | | | | | 735,098 | |
| | |
Air Freight & Logistics - 0.46% | | | | | | | | |
FedEx Corp. | | | 1,200 | | | | 109,932 | |
| | |
Beverages - 2.03% | | | | | | | | |
Brown-Forman Corp., Class B | | | 2,950 | | | | 285,707 | |
Coca-Cola Co. (The) | | | 2,500 | | | | 195,475 | |
| | | | | | | | |
| | | | | | | 481,182 | |
| | |
Biotechnology - 0.30% | | | | | | | | |
Gilead Sciences, Inc.*# | | | 1,400 | | | | 71,792 | |
| | |
Capital Markets - 0.82% | | | | | | | | |
Ameriprise Financial, Inc.# | | | 1,080 | | | | 56,441 | |
Bank of New York Mellon Corp. (The) | | | 1,032 | | | | 22,652 | |
Charles Schwab Corp. (The) | | | 3,500 | | | | 45,255 | |
Morgan Stanley | | | 800 | | | | 11,672 | |
State Street Corp.# | | | 1,300 | | | | 58,032 | |
| | | | | | | | |
| | | | | | | 194,052 | |
| | |
Chemicals - 1.11% | | | | | | | | |
Dow Chemical Co. (The)# | | | 2,900 | | | | 91,350 | |
Monsanto Co. | | | 500 | | | | 41,390 | |
Sherwin-Williams Co. (The) | | | 600 | | | | 79,410 | |
Sigma-Aldrich Corp. | | | 700 | | | | 51,751 | |
| | | | | | | | |
| | | | | | | 263,901 | |
| | |
Commercial Banks - 1.27% | | | | | | | | |
Comerica, Inc. | | | 1,600 | | | | 49,136 | |
KeyCorp | | | 3,700 | | | | 28,638 | |
US Bancorp# | | | 2,200 | | | | 70,752 | |
Wells Fargo & Co.# | | | 4,571 | | | | 152,854 | |
| | | | | | | | |
| | | | | | | 301,380 | |
| | |
Communications Equipment - 0.89% | | | | | | | | |
Cisco Systems, Inc.# | | | 11,600 | | | | 199,172 | |
Juniper Networks, Inc.*# | | | 700 | | | | 11,417 | |
| | | | | | | | |
| | | | | | | 210,589 | |
| | | | | | | | |
| | | | | | | | |
| | | | | | | | |
| | | | | | | | |
| | | | | | | | |
| Industry Company | | Shares | | | Value | |
| | | | | | | | |
Computers & Peripherals - 4.46% | | | | | |
Apple, Inc.*# | | | 600 | | | $ | 350,400 | |
Hewlett-Packard Co.# | | | 9,000 | | | | 180,990 | |
Lexmark International, Inc., Class A# | | | 1,800 | | | | 47,844 | |
SanDisk Corp.*# | | | 1,900 | | | | 69,312 | |
Seagate Technology PLC# | | | 16,500 | | | | 408,045 | |
| | | | | | | | |
| | | | | | | 1,056,591 | |
| |
Construction & Engineering - 0.16% | | | | | |
Dycom Industries, Inc.*# | | | 2,000 | | | | 37,220 | |
| | |
Consumer Finance - 0.83% | | | | | | | | |
American Express Co. | | | 1,500 | | | | 87,315 | |
Capital One Financial Corp. | | | 2,000 | | | | 109,320 | |
| | | | | | | | |
| | | | | | | 196,635 | |
| |
Diversified Financial Services - 1.10% | | | | | |
Bank of America Corp.# | | | 9,100 | | | | 74,438 | |
Citigroup, Inc. | | | 510 | | | | 13,979 | |
JPMorgan Chase & Co.# | | | 4,800 | | | | 171,504 | |
| | | | | | | | |
| | | | | | | 259,921 | |
|
Diversified Telecommunication Services - 0.78% | |
AT&T, Inc. | | | 3,400 | | | | 121,244 | |
Frontier Communications Corp.+ | | | 672 | | | | 2,574 | |
Verizon Communications, Inc. | | | 1,400 | | | | 62,216 | |
| | | | | | | | |
| | | | | | | 186,034 | |
| | |
Electric Utilities - 0.67% | | | | | | | | |
American Electric Power Co., Inc. | | | 1,600 | | | | 63,840 | |
Exelon Corp. | | | 1,100 | | | | 41,382 | |
Progress Energy, Inc. | | | 900 | | | | 54,153 | |
| | | | | | | | |
| | | | | | | 159,375 | |
| | |
Electrical Equipment - 0.22% | | | | | | | | |
Emerson Electric Co.# | | | 1,100 | | | | 51,238 | |
|
Electronic Equipment, Instruments & Components - 0.10% | |
FLIR Systems, Inc.# | | | 1,200 | | | | 23,400 | |
| |
Energy Equipment & Services - 1.30% | | | | | |
Halliburton Co.# | | | 9,000 | | | | 255,510 | |
National Oilwell Varco, Inc. | | | 800 | | | | 51,552 | |
| | | | | | | | |
| | | | | | | 307,062 | |
| |
Food & Staples Retailing - 1.15% | | | | | |
CVS Caremark Corp. | | | 1,400 | | | | 65,422 | |
| | |
81 | | Annual Report | June 30, 2012 |
| | |
Bridgeway Managed Volatility Fund SCHEDULE OF INVESTMENTS (continued) | | |
Showing percentage of net assets as of June 30, 2012
| | | | | | | | |
| Industry Company | | Shares | | | Value | | |
Common Stocks (continued) | | | | | | | | |
Food & Staples Retailing (continued) | | |
Kroger Co. (The)# | | | 1,000 | | | $ 23,190 | | |
Safeway, Inc.# | | | 4,400 | | | 79,860 | | |
Wal-Mart Stores, Inc. | | | 1,500 | | | 104,580 | | |
| | | | | | | | |
| | | | | | 273,052 | | |
| |
Food Products - 1.09% | | |
Archer-Daniels-Midland Co. | | | 1,500 | | | 44,280 | | |
General Mills, Inc.# | | | 2,400 | | | 92,496 | | |
Mead Johnson Nutrition Co.# | | | 1,516 | | | 122,053 | | |
| | | | | | | | |
| | | | | | 258,829 | | |
| |
Gas Utilities - 1.07% | | |
ONEOK, Inc.# | | | 6,000 | | | 253,860 | | |
| |
Health Care Equipment & Supplies - 0.88% | | |
Baxter International, Inc. | | | 1,300 | | | 69,095 | | |
Becton Dickinson & Co. | | | 220 | | | 16,445 | | |
CR Bard, Inc. | | | 500 | | | 53,720 | | |
Stryker Corp.# | | | 1,260 | | | 69,426 | | |
| | | | | | | | |
| | | | | | 208,686 | | |
| |
Health Care Providers & Services - 2.12% | | |
Express Scripts Holding Co.*# | | | 2,134 | | | 119,141 | | |
Laboratory Corp. of America Holdings* | | | 300 | | | 27,783 | | |
Quest Diagnostics, Inc. | | | 400 | | | 23,960 | | |
UnitedHealth Group, Inc. | | | 1,300 | | | 76,050 | | |
WellPoint, Inc.# | | | 4,000 | | | 255,160 | | |
| | | | | | | | |
| | | | | | 502,094 | | |
| |
Hotels, Restaurants & Leisure - 0.34% | | |
McDonald’s Corp. | | | 900 | | | 79,677 | | |
| |
Household Products - 1.45% | | |
Colgate-Palmolive Co. | | | 1,500 | | | 156,150 | | |
Kimberly-Clark Corp. | | | 1,000 | | | 83,770 | | |
Procter & Gamble Co. (The)# | | | 1,700 | | | 104,125 | | |
| | | | | | | | |
| | | | | | 344,045 | | |
| |
Independent Power Producers & Energy Traders - 0.22% | | |
AES Corp. (The)* | | | 4,100 | | | 52,603 | | |
| |
Industrial Conglomerates - 1.21% | | |
3M Co.# | | | 1,000 | | | 89,600 | | |
Danaher Corp.# | | | 2,000 | | | 104,160 | | |
General Electric Co.# | | | 4,500 | | | 93,780 | | |
| | | | | | | | |
| | | | | | 287,540 | | |
| |
Insurance - 2.32% | | |
Aflac, Inc.# | | | 800 | | | 34,072 | | |
| | | | | | |
| Industry Company | | Shares | | | Value |
| | | | | | |
Insurance (continued) |
Aon PLC# | | | 1,700 | | | $ 79,526 |
Chubb Corp. (The)# | | | 1,800 | | | 131,076 |
Progressive Corp. (The) | | | 820 | | | 17,081 |
Travelers Cos., Inc. (The)# | | | 4,500 | | | 287,280 |
| | | | | | |
| | | | | | 549,035 |
|
Internet & Catalog Retail - 0.48% |
Amazon.com, Inc.* | | | 500 | | | 114,175 |
|
Internet Software & Services - 1.02% |
eBay, Inc.*# | | | 3,000 | | | 126,030 |
Google, Inc., Class A* | | | 200 | | | 116,014 |
| | | | | | |
| | | | | | 242,044 |
|
IT Services - 2.75% |
International Business Machines Corp.# | | | 1,200 | | | 234,696 |
Teradata Corp.*# | | | 3,200 | | | 230,432 |
Visa, Inc., Class A# | | | 1,300 | | | 160,719 |
Western Union Co. (The) | | | 1,500 | | | 25,260 |
| | | | | | |
| | | | | | 651,107 |
|
Leisure Equipment & Products - 0.21% |
Hasbro, Inc.# | | | 1,500 | | | 50,805 |
|
Life Sciences Tools & Services - 0.26% |
Thermo Fisher Scientific, Inc. | | | 1,200 | | | 62,292 |
|
Machinery - 0.80% |
Eaton Corp.# | | | 4,800 | | | 190,224 |
|
Media - 1.39% |
Comcast Corp., Class A# | | | 3,950 | | | 126,282 |
News Corp., Class A# | | | 4,600 | | | 102,534 |
Omnicom Group, Inc. | | | 1,000 | | | 48,600 |
Time Warner, Inc.# | | | 1,333 | | | 51,320 |
| | | | | | |
| | | | | | 328,736 |
|
Metals & Mining - 0.07% |
United States Steel Corp.+ | | | 800 | | | 16,480 |
|
Multiline Retail - 1.22% |
Big Lots, Inc.*# | | | 2,100 | | | 85,659 |
Kohl’s Corp.# | | | 4,500 | | | 204,705 |
| | | | | | |
| | | | | | 290,364 |
|
Multi-Utilities - 1.35% |
Dominion Resources, Inc. | | | 1,920 | | | 103,680 |
Public Service Enterprise Group, Inc. | | | 2,600 | | | 84,500 |
Sempra Energy | | | 1,900 | | | 130,872 |
| | | | | | |
| | | | | | 319,052 |
| | |
Bridgeway Managed Volatility Fund SCHEDULE OF INVESTMENTS (continued) | | |
Showing percentage of net assets as of June 30, 2012
| | | | | | | | |
| Industry Company | | Shares | | | Value | | |
Common Stocks (continued) | | | | | | | | |
Oil, Gas & Consumable Fuels - 7.61% | | |
Anadarko Petroleum Corp. | | | 1,000 | | | $ 66,200 | | |
Apache Corp. | | | 500 | | | 43,945 | | |
Chesapeake Energy Corp.# | | | 500 | | | 9,300 | | |
Chevron Corp. | | | 3,378 | | | 356,379 | | |
ConocoPhillips# | | | 1,687 | | | 94,270 | | |
Devon Energy Corp.# | | | 3,000 | | | 173,970 | | |
EOG Resources, Inc.# | | | 1,500 | | | 135,165 | | |
Exxon Mobil Corp.# | | | 5,000 | | | 427,850 | | |
Occidental Petroleum Corp. | | | 1,200 | | | 102,924 | | |
Peabody Energy Corp.# | | | 8,200 | | | 201,064 | | |
Phillips 66* | | | 843 | | | 28,021 | | |
Whiting Petroleum Corp.*# | | | 4,000 | | | 164,480 | | |
| | | | | | | | |
| | | | | | 1,803,568 | | |
| |
Paper & Forest Products - 0.24% | | |
International Paper Co.# | | | 2,000 | | | 57,820 | | |
| |
Pharmaceuticals - 1.95% | | |
Allergan, Inc.# | | | 1,200 | | | 111,084 | | |
Bristol-Myers Squibb Co. | | | 3,079 | | | 110,690 | | |
Merck & Co., Inc. | | | 1,600 | | | 66,800 | | |
Pfizer, Inc.# | | | 7,600 | | | 174,800 | | |
| | | | | | | | |
| | | | | | 463,374 | | |
| |
Real Estate Investment Trusts (REITs) - 0.24% | | |
American Tower Corp. | | | 800 | | | 55,928 | | |
| |
Road & Rail - 0.75% | | |
Union Pacific Corp.# | | | 1,500 | | | 178,965 | | |
| |
Semiconductors & Semiconductor Equipment - 1.27% | | |
Broadcom Corp., Class A*# | | | 2,000 | | | 67,600 | | |
Intel Corp.# | | | 6,500 | | | 173,225 | | |
Texas Instruments, Inc.# | | | 2,070 | | | 59,388 | | |
| | | | | | | | |
| | | | | | 300,213 | | |
| |
Software - 1.85% | | |
BMC Software, Inc.* | | | 520 | | | 22,194 | | |
Citrix Systems, Inc.* | | | 1,400 | | | 117,516 | | |
Intuit, Inc.# | | | 1,400 | | | 83,090 | | |
Microsoft Corp. | | | 2,300 | | | 70,357 | | |
Oracle Corp.# | | | 4,860 | | | 144,342 | | |
| | | | | | | | |
| | | | | | 437,499 | | |
| |
Specialty Retail - 3.43% | | |
Ascena Retail Group, Inc.*# | | | 10,000 | | | 186,200 | | |
AutoZone, Inc.* | | | 900 | | | 330,453 | | |
Cabela’s, Inc.*# | | | 7,400 | | | 279,794 | | |
| | | | | | |
| Industry Company | | Shares | | | Value |
| | | | | | |
Specialty Retail (continued) |
Staples, Inc. | | | 1,250 | | | $ 16,313 |
| | | | | | |
| | | | | | 812,760 |
|
Textiles, Apparel & Luxury Goods - 0.56% |
NIKE, Inc., Class B# | | | 1,500 | | | 131,670 |
|
Thrifts & Mortgage Finance - 0.13% |
Hudson City Bancorp, Inc. | | | 4,800 | | | 30,576 |
|
Trading Companies & Distributors - 1.84% |
United Rentals, Inc.*# | | | 10,000 | | | 340,400 |
W.W. Grainger, Inc. | | | 500 | | | 95,620 |
| | | | | | |
| | | | | | 436,020 |
|
Wireless Telecommunication Services - 0.08% |
Sprint Nextel Corp.*# | | | 6,000 | | | 19,560 |
| | | | | | |
TOTAL COMMON STOCKS - 60.95% | | | | | | 14,448,055 |
| | | | | | |
(Cost $10,878,612) | | | | | | |
| | | | | | | | | | |
| Due Date | | Discount Rate or Coupon Rate | | | Principal
Amount | | | Value |
|
U.S. GOVERNMENT OBLIGATIONS - 37.29% |
U.S. Treasury Bills - 30.37% |
07/12/2012 | | | 0.085%(a) | | | $ | 1,200,000 | | | 1,199,974 |
08/02/2012 | | | 0.095%(a) | | | | 1,000,000 | | | 999,947 |
08/30/2012 | | | 0.086%(a) | | | | 3,000,000 | | | 2,999,754 |
09/27/2012 | | | 0.095%(a) | | | | 2,000,000 | | | 1,999,590 |
| | | | | | | | | | |
| | | | | | | | | | 7,199,265 |
|
U.S. Treasury Notes - 6.92% |
07/15/2012 | | | 1.500% | | | | 200,000 | | | 200,094 |
08/15/2012 | | | 1.750% | | | | 300,000 | | | 300,598 |
11/30/2012 | | | 3.375% | | | | 300,000 | | | 303,961 |
12/31/2012 | | | 3.625% | | | | 200,000 | | | 203,398 |
01/31/2013 | | | 0.625% | | | | 100,000 | | | 100,254 |
11/15/2013 | | | 4.250% | | | | 200,000 | | | 210,789 |
03/15/2014 | | | 1.250% | | | | 100,000 | | | 101,574 |
02/15/2015 | | | 4.000% | | | | 200,000 | | | 218,734 |
| | | | | | | | | | |
| | | | | | | | | | 1,639,402 |
| | | | | | | | | | |
TOTAL U.S. GOVERNMENT
OBLIGATIONS - 37.29% | | | | | | | 8,838,667 |
| | | | | | | | | | |
(Cost $8,798,361) | | | | | | | | | | |
| | |
83 | | Annual Report | June 30, 2012 |
| | |
Bridgeway Managed Volatility Fund SCHEDULE OF INVESTMENTS (continued) | | |
Showing percentage of net assets as of June 30, 2012
| | | | | | | | |
| | | Rate^ | | Shares | | Value |
MONEY MARKET FUND - 3.09% | | | | |
BlackRock FedFund | | 0.01% | | 733,662 | | $733,662 | | |
TOTAL MONEY MARKET FUND – 3.09% | | 733,662 | | |
(Cost $733,662) | | | | | | | | |
| | |
TOTAL INVESTMENTS - 101.33% | | $24,020,384 | | |
(Cost $20,410,635) | | | | | | | | |
Liabilities in Excess of Other Assets - (1.33%) | | (315,139) | | |
NET ASSETS - 100.00% | | | | | | $23,705,245 | | |
* Non-income producing security. # Security subject to call or put option written by the Fund. ^ Rate disclosed as of June 30, 2012. + This security or a portion of the security is out on loan at June 30, 2012. Total loaned securities had a value of $19,054 at June 30, 2012. (a) Rate represents the effective yield at purchase. PLC - Public Limited Company See Notes to Financial Statements. | | |
| | |
Bridgeway Managed Volatility Fund SCHEDULE OF OPTIONS WRITTEN | | |
Showing percentage of net assets as of June 30, 2012
| | | | | | |
| Company | | Number
of Contracts | | Value | |
CALL OPTIONS WRITTEN - (1.11%) | | | | |
3M Co. | | | | | | |
Expiring July, 2012 at $90.00 | | 5 | | $ | (480 | ) |
Aflac, Inc. | | | | | | |
Expiring August, 2012 at $46.00 | | 5 | | | (200 | ) |
Allergan, Inc. | | | | | | |
Expiring July, 2012 at $100.00 | | 6 | | | (90 | ) |
Aon PLC | | | | | | |
Expiring July, 2012 at $50.00 | | 7 | | | (105 | ) |
Apple, Inc. | | | | | | |
Expiring July, 2012 at $620.00 | | 2 | | | (378 | ) |
Ascena Retail Group, Inc. | | | | | | |
Expiring September, 2012 at $20.00 | | 100 | | | (7,000 | ) |
Bank of America Corp. | | | | | | |
Expiring July, 2012 at $9.00 | | 30 | | | (210 | ) |
Big Lots, Inc. | | | | | | |
Expiring July, 2012 at $37.50 | | 7 | | | (2,828 | ) |
Broadcom Corp., Class A | | | | | | |
Expiring August, 2012 at $40.00 | | 7 | | | (77 | ) |
Cabela’s, Inc. | | | | | | |
Expiring September, 2012 at $35.00 | | 74 | | | (34,040 | ) |
Chesapeake Energy Corp. | | | | | | |
Expiring July, 2012 at $18.00 | | 5 | | | (620 | ) |
Chubb Corp. (The) | | | | | | |
Expiring July, 2012 at $70.00 | | 7 | | | (1,827 | ) |
Cisco Systems, Inc. | | | | | | |
Expiring July, 2012 at $20.00 | | 25 | | | (25 | ) |
Comcast Corp., Class A | | | | | | |
Expiring July, 2012 at $31.00 | | 10 | | | (1,130 | ) |
ConocoPhillips | | | | | | |
Expiring August, 2012 at $72.50 | | 5 | | | (1,015 | ) |
Danaher Corp. | | | | | | |
Expiring September, 2012 at $52.50 | | 5 | | | (700 | ) |
Devon Energy Corp. | | | | | | |
Expiring July, 2012 at $67.50 | | 30 | | | (150 | ) |
Dow Chemical Co. (The) | | | | | | |
Expiring September, 2012 at $33.00 | | 8 | | | (800 | ) |
Dycom Industries, Inc. | | | | | | |
Expiring September, 2012 at $20.00 | | 20 | | | (1,900 | ) |
Eaton Corp. | | | | | | |
Expiring October, 2012 at $42.00 | | 12 | | | (1,440 | ) |
eBay, Inc. | | | | | | |
Expiring July, 2012 at $38.00 | | 10 | | | (4,400 | ) |
Emerson Electric Co. | | | | | | |
Expiring September, 2012 at $47.00 | | 5 | | | (675 | ) |
| | | | | | |
| Company | | Number
of Contracts | | Value | |
| | | | | | |
EOG Resources, Inc. | | | | | | |
Expiring July, 2012 at $110.00 | | 5 | | | $ (45 | ) |
Express Scripts Holding Co. | | | | | | |
Expiring August, 2012 at $55.00 | | 5 | | | (1,180 | ) |
Exxon Mobil Corp. | | | | | | |
Expiring July, 2012 at $87.50 | | 10 | | | (480 | ) |
Expiring October, 2012 at $82.50 | | 10 | | | (4,900 | ) |
| | | | | | |
| | | | | (5,380 | ) |
FLIR Systems, Inc. | | | | | | |
Expiring October, 2012 at $22.00 | | 6 | | | (300 | ) |
General Electric Co. | | | | | | |
Expiring July, 2012 at $20.00 | | 15 | | | (1,485 | ) |
General Mills, Inc. | | | | | | |
Expiring October, 2012 at $38.00 | | 10 | | | (1,110 | ) |
Gilead Sciences, Inc. | | | | | | |
Expiring August, 2012 at $52.50 | | 5 | | | (770 | ) |
Halliburton Co. | | | | | | |
Expiring July, 2012 at $34.00 | | 67 | | | (134 | ) |
Expiring October, 2012 at $30.00 | | 10 | | | (1,420 | ) |
| | | | | | |
| | | | | (1,554 | ) |
Hasbro, Inc. | | | | | | |
Expiring July, 2012 at $37.50 | | 6 | | | (30 | ) |
Hewlett-Packard Co. | | | | | | |
Expiring August, 2012 at $23.00 | | 90 | | | (1,080 | ) |
Honeywell International, Inc. | | | | | | |
Expiring September, 2012 at $57.50 | | 5 | | | (735 | ) |
Intel Corp. | | | | | | |
Expiring July, 2012 at $29.00 | | 15 | | | (90 | ) |
International Business Machines Corp. | | | | | | |
Expiring July, 2012 at $205.00 | | 6 | | | (324 | ) |
International Paper Co. | | | | | | |
Expiring July, 2012 at $34.00 | | 10 | | | (30 | ) |
Intuit, Inc. | | | | | | |
Expiring July, 2012 at $60.00 | | 7 | | | (525 | ) |
JPMorgan Chase & Co. | | | | | | |
Expiring July, 2012 at $46.00 | | 15 | | | (30 | ) |
Expiring September, 2012 at $34.00 | | 15 | | | (4,725 | ) |
| | | | | | |
| | | | | (4,755 | ) |
Juniper Networks, Inc. | | | | | | |
Expiring July, 2012 at $22.00 | | 4 | | | (8 | ) |
Kohl’s Corp. | | | | | | |
Expiring July, 2012 at $52.50 | | 45 | | | (225 | ) |
| | |
85 | | Annual Report | June 30, 2012 |
| | |
Bridgeway Managed Volatility Fund SCHEDULE OF OPTIONS WRITTEN (continued) | | |
Showing percentage of net assets as of June 30, 2012
| | | | | | |
| Company | | Number
of Contracts | | Value | |
Call Options Written (continued) | | | | | | |
Kroger Co. (The) | | | | | | |
Expiring October, 2012 at $22.00 | | 5 | | $ | (815 | ) |
L-3 Communications Holdings, Inc. | | | | | | |
Expiring July, 2012 at $70.00 | | 35 | | | (14,000 | ) |
Lexmark International, Inc., Class A | | | | | | |
Expiring July, 2012 at $31.00 | | 5 | | | (25 | ) |
Mead Johnson Nutrition Co. | | | | | | |
Expiring August, 2012 at $85.00 | | 5 | | | (790 | ) |
News Corp., Class A | | | | | | |
Expiring July, 2012 at $20.00 | | 12 | | | (2,700 | ) |
NIKE, Inc., Class B | | | | | | |
Expiring July, 2012 at $115.00 | | 5 | | | (5 | ) |
ONEOK, Inc. | | | | | | |
Expiring July, 2012 at $40.00 | | 60 | | | (23,400 | ) |
Oracle Corp. | | | | | | |
Expiring September, 2012 at $28.00 | | 15 | | | (3,705 | ) |
Peabody Energy Corp. | | | | | | |
Expiring September, 2012 at $25.00 | | 70 | | | (14,770 | ) |
Pfizer, Inc. | | | | | | |
Expiring September, 2012 at $22.00 | | 20 | | | (2,520 | ) |
Procter & Gamble Co. (The) | | | | | | |
Expiring October, 2012 at $65.00 | | 6 | | | (312 | ) |
Safeway, Inc. | | | | | | |
Expiring September, 2012 at $18.00 | | 25 | | | (2,875 | ) |
SanDisk Corp. | | | | | | |
Expiring July, 2012 at $38.00 | | 10 | | | (940 | ) |
Seagate Technology PLC | | | | | | |
Expiring September, 2012 at $24.00 | | 165 | | | (37,620 | ) |
Sprint Nextel Corp. | | | | | | |
Expiring August, 2012 at $3.00 | | 20 | | | (780 | ) |
State Street Corp. | | | | | | |
Expiring August, 2012 at $48.00 | | 5 | | | (180 | ) |
Stryker Corp. | | | | | | |
Expiring September, 2012 at $57.50 | | 5 | | | (550 | ) |
Teradata Corp. | | | | | | |
Expiring July, 2012 at $70.00 | | 10 | | | (3,060 | ) |
Texas Instruments, Inc. | | | | | | |
Expiring July, 2012 at $32.00 | | 5 | | | (15 | ) |
Textron, Inc. | | | | | | |
Expiring September, 2012 at $25.00 | | 75 | | | (13,050 | ) |
| | | | | | |
| Company | | Number
of Contracts | | Value | |
| | | | | | |
Travelers Cos., Inc. (The) | | | | | | |
Expiring July, 2012 at $65.00 | | 20 | | | $ (1,200 | ) |
Union Pacific Corp. | | | | | | |
Expiring August, 2012 at $115.00 | | 5 | | | (3,275 | ) |
United Rentals, Inc. | | | | | | |
Expiring September, 2012 at $33.00 | | 50 | | | (22,500 | ) |
Expiring September, 2012 at $35.00 | | 50 | | | (16,000 | ) |
| | | | | | |
| | | | | (38,500 | ) |
US Bancorp | | | | | | |
Expiring September, 2012 at $31.00 | | 7 | | | (1,428 | ) |
Visa, Inc., Class A | | | | | | |
Expiring September, 2012 at $130.00 | | 5 | | | (1,550 | ) |
WellPoint, Inc. | | | | | | |
Expiring September, 2012 at $67.50 | | 40 | | | (6,400 | ) |
Wells Fargo & Co. | | | | | | |
Expiring July, 2012 at $34.00 | | 10 | | | (480 | ) |
Expiring October, 2012 at $32.00 | | 10 | | | (2,700 | ) |
| | | | | | |
| | | | | (3,180 | ) |
Whiting Petroleum Corp. | | | | | | |
Expiring July, 2012 at $42.50 | | 24 | | | (2,160 | ) |
Expiring September, 2012 at $42.50 | | 16 | | | (4,400 | ) |
| | | | | | |
| | | | | (6,560 | ) |
| | | | | | |
TOTAL CALL OPTIONS WRITTEN — (1.11%) | | | (263,921 | ) |
| | | | | | |
(Premiums received $(322,393)) | | | | | | |
| |
PUT OPTIONS WRITTEN - (0.41%) | | | | |
| | |
Ameriprise Financial, Inc. | | | | | | |
Expiring September, 2012 at $45.00 | | 35 | | | (2,975 | ) |
Amgen, Inc. | | | | | | |
Expiring July, 2012 at $70.00 | | 35 | | | (1,050 | ) |
Apple, Inc. | | | | | | |
Expiring August, 2012 at $500.00 | | 5 | | | (1,750 | ) |
Expiring September, 2012 at $500.00 | | 5 | | | (3,675 | ) |
| | | | | | |
| | | | | (5,425 | ) |
| | |
Bridgeway Managed Volatility Fund SCHEDULE OF OPTIONS WRITTEN (continued) | | |
Showing percentage of net assets as of June 30, 2012
| | | | | | |
Company | | Number
of Contracts | | Value | |
Put Options Written (continued) | | | | | | |
CF Industries Holdings, Inc. | | | | | | |
Expiring August, 2012 at $150.00 | | 10 | | $ | (930 | ) |
Expiring November, 2012 at $150.00 | | 10 | | | (5,000 | ) |
| | | | | | |
| | | | | (5,930 | ) |
Comcast Corp., Class A | | | | | | |
Expiring October, 2012 at $30.00 | | 60 | | | (5,700 | ) |
ConocoPhillips | | | | | | |
Expiring August, 2012 at $50.00 | | 50 | | | (2,350 | ) |
Expiring November, 2012 at $50.00 | | 20 | | | (3,240 | ) |
| | | | | | |
| | | | | (5,590 | ) |
Cracker Barrel Old Country Store, Inc. | | | | | | |
Expiring September, 2012 at $55.00 | | 30 | | | (3,150 | ) |
Dean Food Co. | | | | | | |
Expiring September, 2012 at $15.00 | | 105 | | | (5,775 | ) |
Devon Energy Corp. | | | | | | |
Expiring October, 2012 at $52.50 | | 20 | | | (3,860 | ) |
Dillards, Inc., Class A | | | | | | |
Expiring August, 2012 at $65.00 | | 25 | | | (12,000 | ) |
Motorola Solutions, Inc. | | | | | | |
Expiring July, 2012 at $48.00 | | 40 | | | (3,840 | ) |
Norfolk Southern Corp. | | | | | | |
Expiring September, 2012 at $67.50 | | 35 | | | (6,650 | ) |
Northrop Grumman Corp. | | | | | | |
Expiring August, 2012 at $57.50 | | 40 | | | (1,400 | ) |
PartnerRe, Ltd. | | | | | | |
Expiring August, 2012 at $70.00 | | 10 | | | (650 | ) |
Safeway, Inc. | | | | | | |
Expiring September, 2012 at $17.00 | | 50 | | | (3,250 | ) |
Expiring September, 2012 at $18.00 | | 30 | | | (3,150 | ) |
| | | | | | |
| | | | | (6,400 | ) |
Time Warner, Inc. | | | | | | |
Expiring July, 2012 at $36.00 | | 70 | | | (1,330 | ) |
Torchmark Corp. | | | | | | |
Expiring August, 2012 at $45.00 | | 10 | | | (400 | ) |
Travelers Cos., Inc. (The) | | | | | | |
Expiring July, 2012 at $60.00 | | 20 | | | (700 | ) |
US Airways Group, Inc. | | | | | | |
Expiring September, 2012 at $10.00 | | 30 | | | (1,680 | ) |
| | | | | | |
| | | | | | |
| | | | | | |
| Company | | Number
of Contracts | | Value | |
| | | | | | |
Expiring September, 2012 at $11.00 | | 275 | | $ | (22,275 | ) |
| | | | | | |
| | | | | (23,955 | ) |
| | | | | | |
TOTAL PUT OPTIONS WRITTEN — (0.41%) | | | | | (96,780 | ) |
| | | | | | |
(Premiums received $(190,504)) | | | | | | |
| | |
TOTAL OPTIONS
WRITTEN — (1.52%) | | | | $ | (360,701 | ) |
| | | | | | |
(Premiums received $(512,897)) | | | | | | |
Summary of inputs used to value the Fund’s investments as of 06/30/2012 is as follows (See Note 2 in Notes to Financial Statements):
| | | | | | | | | | | | | | | | |
| | | Assets Table | |
| | | Valuation Inputs | |
| | | Investment in Securities (Value) | |
| | | Level 1
Quoted
Prices | | | Level 2
Significant
Observable
Inputs | | | Level 3
Significant
Unobservable
Inputs | | | Total | |
Common Stocks | | $ | 14,448,055 | | | $ | — | | | $ | — | | | $ | 14,448,055 | |
U.S. Government Obligations | | | — | | | | 8,838,667 | | | | — | | | | 8,838,667 | |
Money Market Fund | | | — | | | | 733,662 | | | | — | | | | 733,662 | |
| | | | | | | | | | | | | | | | |
TOTAL | | $ | 14,448,055 | | | $ | 9,572,329 | | | $ | — | | | $ | 24,020,384 | |
| | | | | | | | | | | | | | | | |
| | | | | | | | | | | | | | | | |
| | | Liabilities Table | |
| | | Valuation Inputs | |
| | | Investment in Securities (Value) | |
| | | Level 1
Quoted
Prices | | | Level 2
Significant
Observable
Inputs | | | Level 3
Significant
Unobservable
Inputs | | | Total | |
Written Options | | $ | (360,701 | ) | | $ | — | | | $ | — | | | $ | (360,701 | ) |
| | | | | | | | | | | | | | | | |
TOTAL | | $ | (360,701 | ) | | $ | — | | | $ | — | | | $ | (360,701 | ) |
| | | | | | | | | | | | | | | | |
See Notes to Financial Statements.
| | |
87 | | Annual Report | June 30, 2012 |
THIS PAGE INTENTIONALLY LEFT BLANK
STATEMENTS OF ASSETS AND LIABILITIES
| | | | | | | | | | | | | | | | | | | | |
June 30, 2012 | | | | | | | | | | | | | | | | | | | | |
| | | | |
| ASSETS | | Aggressive
Investors 1 | | Ultra-Small
Company | | Ultra-Small
Company Market | | Small-Cap
Momentum |
Investments at value | | | $ | 209,827,791 | | | | $ | 103,861,081 | | | | $ | 303,018,243 | | | | $ | 2,066,461 | |
Receivables: | | | | | | | | | | | | | | | | | | | | |
Portfolio securities sold | | | | 4,838,381 | | | | | 1,468,315 | | | | | 346,566 | | | | | 7,195 | |
Fund shares sold | | | | 73,347 | | | | | 46,200 | | | | | 19,349 | | | | | - | |
Dividends and interest | | | | 132,975 | | | | | 118,256 | | | | | 316,286 | | | | | 1,564 | |
Receivable from investment adviser | | | | - | | | | | - | | | | | - | | | | | 13,373 | |
Deposits with brokers | | | | - | | | | | - | | | | | - | | | | | - | |
Total return swap | | | | - | | | | | - | | | | | 11,563 | | | | | - | |
Prepaid expenses | | | | 40,799 | | | | | 18,491 | | | | | 52,140 | | | | | 9,599 | |
| | | | |
Total assets | | | | 214,913,293 | | | | | 105,512,343 | | | | | 303,764,147 | | | | | 2,098,192 | |
| | | | |
LIABILITIES | | | | | | | | | | | | | | | | | | | | |
Payables: | | | | | | | | | | | | | | | | | | | | |
Portfolio securities purchased | | | | 8,551,886 | | | | | 3,266,917 | | | | | 898,096 | | | | | - | |
Fund shares redeemed | | | | 146,045 | | | | | 12,559 | | | | | 163,739 | | | | | - | |
Due to custodian | | | | - | | | | | - | | | | | - | | | | | 7,197 | |
Loan payable | | | | - | | | | | - | | | | | - | | | | | - | |
Accrued Liabilities: | | | | | | | | | | | | | | | | | | | | |
Investment adviser fees | | | | 50,181 | | | | | 71,780 | | | | | 84,097 | | | | | - | |
Administration fees | | | | 6,850 | | | | | 3,301 | | | | | 9,831 | | | | | 68 | |
Directors’ fees | | | | 385 | | | | | 343 | | | | | 1,368 | | | | | 11 | |
Other | | | | 148,061 | | | | | 47,832 | | | | | 174,978 | | | | | 20,722 | |
Call options written at value | | | | - | | | | | - | | | | | - | | | | | - | |
Put options written at value | | | | - | | | | | - | | | | | - | | | | | - | |
| | | | |
Total liabilities | | | | 8,903,408 | | | | | 3,402,732 | | | | | 1,332,109 | | | | | 27,998 | |
| | | | |
NET ASSETS | | | $ | 206,009,885 | | | | $ | 102,109,611 | | | | $ | 302,432,038 | | | | $ | 2,070,194 | |
| | | | |
NET ASSETS REPRESENT | | | | | | | | | | | | | | | | | | | | |
Paid-in capital | | | $ | 407,554,675 | | | | $ | 98,740,429 | | | | $ | 194,331,649 | | | | $ | 1,827,153 | |
Undistributed (distributions in excess of) net investment income | | | | 155,065 | | | | | 70,401 | | | | | 2,339,297 | | | | | 10,077 | |
Accumulated net realized gain (loss) on investments | | | | (210,458,200 | ) | | | | (6,825,364 | ) | | | | 26,653,162 | | | | | 75,915 | |
Net unrealized appreciation on investments | | | | 8,758,345 | | | | | 10,124,145 | | | | | 79,107,930 | | | | | 157,049 | |
| | | | |
NET ASSETS | | | $ | 206,009,885 | | | | $ | 102,109,611 | | | | $ | 302,432,038 | | | | $ | 2,070,194 | |
| | | | |
Shares of common stock outstanding of $.001 par value* | | | | 6,219,104 | | | | | 3,703,361 | | | | | 20,614,633 | | | | | 184,005 | |
| | | | |
Net asset value, offering price and redemption price per share | | | $ | 33.13 | | | | $ | 27.57 | | | | $ | 14.67(a | ) | | | $ | 11.25(a | ) |
| | | | |
Total investments at cost | | | $ | 201,069,446 | | | | $ | 93,736,936 | | | | $ | 223,921,876 | | | | $ | 1,909,412 | |
Premiums received on call options written | | | $ | - | | | | $ | - | | | | $ | - | | | | $ | - | |
Premiums received on put options written | | | $ | - | | | | $ | - | | | | $ | - | | | | $ | - | |
| * | See Note 1 - Organization in the Notes to Financial Statements for shares authorized for each Fund. |
| (a) | Redemption of shares held less than six months may be charged a 2% redemption fee. See Note 8. |
See Notes to Financial Statements.
| | |
89 | | Annual Report | June 30, 2012 |
|
|
| | | | | | | | | | | | | | | | | | | | | | | |
Small-Cap
Growth | | Small-Cap
Value | | Large-Cap
Growth | | Blue Chip 35
Index | | Managed
Volatility |
| | | $ 31,748,078 | | | | $ | 67,505,864 | | | | $ | 48,085,629 | | | | $ | 264,359,616 | | | | $ | 24,020,384 | |
| | | | |
| | | 481,012 | | | | | 1,159,819 | | | | | 937,464 | | | | | 11,221,422 | | | | | 31,578 | |
| | | 2,253 | | | | | 43,669 | | | | | 474 | | | | | 31,600 | | | | | 8,162 | |
| | | 10,891 | | | | | 109,834 | | | | | 44,218 | | | | | 320,481 | | | | | 27,795 | |
| | | - | | | | | - | | | | | - | | | | | - | | | | | 3,027 | |
| | | - | | | | | - | | | | | - | | | | | - | | | | | 100 | |
| | | 832 | | | | | 33,837 | | | | | 17,951 | | | | | - | | | | | - | |
| | | 9,449 | | | | | 15,309 | | | | | 12,659 | | | | | 43,224 | | | | | 13,189 | |
| | | | |
| | | 32,252,515 | | | | | 68,868,332 | | | | | 49,098,395 | | | | | 275,976,343 | | | | | 24,104,235 | |
| | | | |
| | | 432,680 | | | | | 1,122,216 | | | | | 597,694 | | | | | 1,795,732 | | | | | - | |
| | | - | | | | | 58,672 | | | | | 5,928 | | | | | 251,728 | | | | | - | |
| | | - | | | | | - | | | | | - | | | | | - | | | | | - | |
| | | - | | | | | - | | | | | - | | | | | 9,665,000 | | | | | - | |
| | | | |
| | | 5,297 | | | | | 22,833 | | | | | 9,430 | | | | | 5,629 | | | | | - | |
| | | 1,033 | | | | | 2,211 | | | | | 1,612 | | | | | 9,242 | | | | | 803 | |
| | | 156 | | | | | 321 | | | | | 210 | | | | | 1,360 | | | | | 109 | |
| | | 35,088 | | | | | 52,233 | | | | | 40,006 | | | | | 87,046 | | | | | 37,377 | |
| | | - | | | | | - | | | | | - | | | | | - | | | | | 263,921 | |
| | | - | | | | | - | | | | | - | | | | | - | | | | | 96,780 | |
| | | | |
| | | 474,254 | | | | | 1,258,486 | | | | | 654,880 | | | | | 11,815,737 | | | | | 398,990 | |
| | | | |
| | | $ 31,778,261 | | | | $ | 67,609,846 | | | | $ | 48,443,515 | | | | $ | 264,160,606 | | | | $ | 23,705,245 | |
| | | | |
| | | $ 58,505,446 | | | | $ | 116,415,571 | | | | $ | 76,620,624 | | | | $ | 243,458,488 | | | | $ | 25,959,905 | |
| | | | |
| | | (55,726 | ) | | | | 597,918 | | | | | 149,800 | | | | | 3,580,113 | | | | | 99,873 | |
| | | (29,470,565 | ) | | | | (55,779,626 | ) | | | | (33,494,618 | ) | | | | (59,694,315 | ) | | | | (6,116,478 | ) |
| | | 2,799,106 | | | | | 6,375,983 | | | | | 5,167,709 | | | | | 76,816,320 | | | | | 3,761,945 | |
| | | | |
| | | $ 31,778,261 | | | | $ | 67,609,846 | | | | $ | 48,443,515 | | | | $ | 264,160,606 | | | | $ | 23,705,245 | |
| | | | |
| | | 2,732,824 | | | | | 4,560,561 | | | | | 3,635,169 | | | | | 32,356,609 | | | | | 1,985,764 | |
| | | | |
| | | $ 11.63 | | | | $ | 14.82 | | | | $ | 13.33 | | | | $ | 8.16 | | | | $ | 11.94 | |
| | | | |
| | | $ 28,948,972 | | | | $ | 61,163,718 | | | | $ | 42,935,871 | | | | $ | 187,543,296 | | | | $ | 20,410,635 | |
| | | $ - | | | | $ | - | | | | $ | - | | | | $ | - | | | | $ | 322,393 | |
| | | $ - | | | | $ | - | | | | $ | - | | | | $ | - | | | | $ | 190,504 | |
STATEMENTS OF OPERATIONS
| | | | | | | | | | | | | | | | | | | | |
Year Ended June 30, 2012 | | | | | | | | |
| | | | |
| | | Aggressive
Investors 1 | | Ultra-Small
Company | | Ultra-Small
Company Market | | Small-Cap
Momentum |
| | | | |
INVESTMENT INCOME | | | | | | | | | | | | | | | | | | | | |
Dividends | | | $ | 1,652,633 | | | | $ | 1,129,233 | | | | $ | 3,852,217 | | | | $ | 30,085 | |
Less: foreign taxes withheld | | | | (7,974 | ) | | | | (979 | ) | | | | - | | | | | (33 | ) |
Interest | | | | - | | | | | - | | | | | 13,942 | | | | | - | |
Securities lending | | | | 109,675 | | | | | 268,086 | | | | | 1,290,437 | | | | | 3,614 | |
| | | | |
Total Investment Income | | | | 1,754,334 | | | | | 1,396,340 | | | | | 5,156,596 | | | | | 33,666 | |
| | | | |
EXPENSES | | | | | | | | | | | | | | | | | | | | |
Investment advisory fees - Base fees | | | | 866,307 | | | | | 735,095 | | | | | 1,602,764 | | | | | 14,475 | |
Investment advisory fees - Performance adjustment | | | | (1,321,371 | ) | | | | - | | | | | - | | | | | - | |
Administration fees | | | | 38,145 | | | | | 32,181 | | | | | 126,185 | | | | | 1,036 | |
Accounting fees | | | | 56,721 | | | | | 58,762 | | | | | 109,314 | | | | | 57,086 | |
Transfer agent fees | | | | 86,705 | | | | | 52,956 | | | | | 157,154 | | | | | 31,978 | |
Professional fees | | | | 38,385 | | | | | 34,622 | | | | | 121,392 | | | | | 8,034 | |
Custody fees | | | | 8,044 | | | | | 10,210 | | | | | 29,601 | | | | | 15,217 | |
Blue sky fees | | | | 20,533 | | | | | 10,072 | | | | | 23,857 | | | | | 19,608 | |
Directors’ and officers’ fees | | | | 15,845 | | | | | 15,534 | | | | | 62,374 | | | | | 515 | |
Shareholder servicing fees | | | | 86,182 | | | | | 12,537 | | | | | 253,613 | | | | | 280 | |
Reports to shareholders | | | | 34,926 | | | | | 9,677 | | | | | 61,004 | | | | | 1,122 | |
Miscellaneous expenses | | | | 33,974 | | | | | 27,678 | | | | | 116,181 | | | | | 1,381 | |
| | | | |
Total Expenses | | | | (35,604 | ) | | | | 999,324 | | | | | 2,663,439 | | | | | 150,732 | |
| | | | |
Less investment advisory fees waived. | | | | - | | | | | - | | | | | (252,574 | ) | | | | (14,475 | ) |
Less expense reimbursed by investment adviser | | | | - | | | | | - | | | | | - | | | | | (112,570 | ) |
| | | | |
Net Expenses | | | | (35,604 | ) | | | | 999,324 | | | | | 2,410,865 | | | | | 23,687 | |
| | | | |
NET INVESTMENT INCOME (LOSS) | | | | 1,789,938 | | | | | 397,016 | | | | | 2,745,731 | | | | | 9,979 | |
| | | | |
NET REALIZED AND UNREALIZED GAIN (LOSS) ON INVESTMENTS | | | | | | | | | | | | | | | | | | | | |
Realized Gain (Loss) on: | | | | | | | | | | | | | | | | | | | | |
Investments | | | | (743,876 | ) | | | | (101,267 | ) | | | | 33,844,050 | | | | | 78,352 | |
Written options | | | | - | | | | | - | | | | | - | | | | | - | |
Futures contracts | | | | - | | | | | - | | | | | - | | | | | - | |
Swaps | | | | (49,052 | ) | | | | 24,309 | | | | | (23,983 | ) | | | | - | |
| | | | |
Net Realized Gain (Loss) | | | | (792,928 | ) | | | | (76,958 | ) | | | | 33,820,067 | | | | | 78,352 | |
| | | | |
Change in Unrealized Appreciation (Depreciation) on: | | | | | | | | | | | | | | | | | | | | |
Investments | | | | (2,846,754 | ) | | | | (3,856,826 | ) | | | | (38,786,906 | ) | | | | (135,060 | ) |
Written options | | | | - | | | | | - | | | | | - | | | | | - | |
Swaps | | | | (3,655 | ) | | | | (26,702 | ) | | | | 3,570 | | | | | - | |
| | | | |
Net Change in Unrealized Appreciation (Depreciation) | | | | (2,850,409 | ) | | | | (3,883,528 | ) | | | | (38,783,336 | ) | | | | (135,060 | ) |
| | | | |
Net Realized and Unrealized Gain (Loss) on Investments | | | | (3,643,337 | ) | | | | (3,960,486 | ) | | | | (4,963,269 | ) | | | | (56,708 | ) |
| | | | |
INCREASE (DECREASE) IN NET ASSETS RESULTING FROM OPERATIONS | | | $ | (1,853,399 | ) | | | $ | (3,563,470 | ) | | | $ | (2,217,538 | ) | | | $ | (46,729 | ) |
See Notes to Financial Statements.
| | |
91 | | Annual Report | June 30, 2012 |
|
|
| | | | | | | | | | | | | | | | | | | | | | | |
Small-Cap
Growth | | Small-Cap
Value | | Large-Cap
Growth | | Blue Chip 35
Index | | Managed
Volatility |
| | | | |
| | | $ 212,810 | | | | $ | 1,415,991 | | | | $ | 774,979 | | | | $ | 7,731,876 | | | | $ | 272,576 | |
| | | - | | | | | - | | | | | - | | | | | - | | | | | - | |
| | | - | | | | | - | | | | | - | | | | | - | | | | | 65,169 | |
| | | 79,943 | | | | | 118,154 | | | | | 4,729 | | | | | - | | | | | 2,508 | |
| | | | |
| | | 292,753 | | | | | 1,534,145 | | | | | 779,708 | | | | | 7,731,876 | | | | | 340,253 | |
| | | | |
| | | 217,783 | | | | | 449,641 | | | | | 246,708 | | | | | 254,031 | | | | | 153,426 | |
| | | (45,353 | ) | | | | (41,025 | ) | | | | (46,569 | ) | | | | - | | | | | - | |
| | | 14,295 | | | | | 29,517 | | | | | 19,451 | | | | | 125,154 | | | | | 10,088 | |
| | | 48,550 | | | | | 54,189 | | | | | 50,340 | | | | | 84,085 | | | | | 54,772 | |
| | | 54,970 | | | | | 76,838 | | | | | 58,150 | | | | | 50,906 | | | | | 38,651 | |
| | | 19,161 | | | | | 31,881 | | | | | 24,145 | | | | | 125,702 | | | | | 48,112 | |
| | | 3,100 | | | | | 4,263 | | | | | 2,713 | | | | | 7,688 | | | | | 6,946 | |
| | | 21,078 | | | | | 22,041 | | | | | 21,618 | | | | | 25,056 | | | | | 20,958 | |
| | | 7,064 | | | | | 14,604 | | | | | 9,637 | | | | | 62,999 | | | | | 5,109 | |
| | | 28,172 | | | | | 52,631 | | | | | 37,294 | | | | | 43,062 | | | | | 13,961 | |
| | | 11,041 | | | | | 20,217 | | | | | 13,512 | | | | | 25,743 | | | | | 4,519 | |
| | | 14,008 | | | | | 28,590 | | | | | 17,171 | | | | | 116,283 | | | | | 8,974 | |
| | | | |
| | | 393,869 | | | | | 743,387 | | | | | 454,170 | | | | | 920,709 | | | | | 365,516 | |
| | | | |
| | | (51,402 | ) | | | | (36,268 | ) | | | | (38,927 | ) | | | | (254,031 | ) | | | | (125,149 | ) |
| | | - | | | | | - | | | | | - | | | | | (176,844 | ) | | | | - | |
| | | | |
| | | 342,467 | | | | | 707,119 | | | | | 415,243 | | | | | 489,834 | | | | | 240,367 | |
| | | | |
| | | (49,714 | ) | | | | 827,026 | | | | | 364,465 | | | | | 7,242,042 | | | | | 99,886 | |
| | | | |
| | | 4,006,452 | | | | | 9,520,464 | | | | | 4,570,307 | | | | | 12,676,449 | | | | | (80,774 | ) |
| | | - | | | | | - | | | | | - | | | | | - | | | | | 1,063,395 | |
| | | - | | | | | - | | | | | - | | | | | - | | | | | (35,478 | ) |
| | | (102,453 | ) | | | | 21,513 | | | | | 6,197 | | | | | - | | | | | - | |
| | | | |
| | | 3,903,999 | | | | | 9,541,977 | | | | | 4,576,504 | | | | | 12,676,449 | | | | | 947,143 | |
| | | | |
| | | (7,033,389 | ) | | | | (12,264,099 | ) | | | | (5,378,857 | ) | | | | 11,937,364 | | | | | (568,080 | ) |
| | | - | | | | | - | | | | | - | | | | | - | | | | | 309,415 | |
| | | (7,720 | ) | | | | 23,943 | | | | | 12,767 | | | | | - | | | | | - | |
| | | | |
| | | (7,041,109 | ) | | | | (12,240,156 | ) | | | | (5,366,090 | ) | | | | 11,937,364 | | | | | (258,665 | ) |
| | | | |
| | | (3,137,110 | ) | | | | (2,698,179 | ) | | | | (789,586 | ) | | | | 24,613,813 | | | | | 688,478 | |
| | | | |
| | | $(3,186,824 | ) | | | $ | (1,871,153 | ) | | | $ | (425,121 | ) | | | $ | 31,855,855 | | | | $ | 788,364 | |
STATEMENTS OF CHANGES IN NET ASSETS
| | | | | | | | | | | | | | | | | | | | |
| | |
| | | Aggressive Investors 1 | | Ultra-Small Company |
| | |
| | | Year Ended June 30, | | Year Ended June 30, |
| | | 2012 | | 2011 | | 2012 | | 2011 |
| | | | |
OPERATIONS | | | | | | | | | | | | | | | | | | | | |
Net investment income | | | $ | 1,789,938 | | | | $ | 1,573,138 | | | | $ | 397,016 | | | | $ | 242,227 | |
Net realized gain (loss) on investments | | | | (792,928 | ) | | | | 15,409,159 | | | | | (76,958 | ) | | | | 13,651,385 | |
Net change in unrealized appreciation (depreciation) on investments | | | | (2,850,409 | ) | | | | 18,296,823 | | | | | (3,883,528 | ) | | | | 9,058,287 | |
| | | | |
Net increase (decrease) in net assets resulting from operations | | | | (1,853,399 | ) | | | | 35,279,120 | | | | | (3,563,470 | ) | | | | 22,951,899 | |
| | | | |
DISTRIBUTIONS: | | | | | | | | | | | | | | | | | | | | |
From net investment income | | | | (3,284,990 | ) | | | | (2,167,451 | ) | | | | (1,269,925 | ) | | | | (632,748 | ) |
From net realized gains | | | | - | | | | | - | | | | | - | | | | | - | |
| | | | |
Net decrease in net assets from distributions | | | | (3,284,990 | ) | | | | (2,167,451 | ) | | | | (1,269,925 | ) | | | | (632,748 | ) |
| | | | |
SHARE TRANSACTIONS: | | | | | | | | | | | | | | | | | | | | |
Proceeds from sale of shares | | | | 3,496,461 | | | | | 4,009,344 | | | | | 1,268,349 | | | | | 1,235,133 | |
Proceeds from conversion of shares* | | | | 118,655,804 | | | | | - | | | | | 18,444,305 | | | | | - | |
Reinvestment of distributions | | | | 3,097,726 | | | | | 2,051,684 | | | | | 1,200,763 | | | | | 608,040 | |
Cost of shares redeemed | | | | (20,858,925 | ) | | | | (25,423,129 | ) | | | | (8,403,947 | ) | | | | (11,310,433 | ) |
Redemption fees | | | | - | | | | | - | | | | | - | | | | | - | |
| | | | |
Net increase (decrease) in net assets resulting from share transactions | | | | 104,391,066 | | | | | (19,362,101 | ) | | | | 12,509,470 | | | | | (9,467,260 | ) |
| | | | |
Net increase (decrease) in net assets | | | | 99,252,677 | | | | | 13,749,568 | | | | | 7,676,075 | | | | | 12,851,891 | |
| | | | |
NET ASSETS: | | | | | | | | | | | | | | | | | | | | |
Beginning of year | | | | 106,757,208 | | | | | 93,007,640 | | | | | 94,433,536 | | | | | 81,581,645 | |
| | | | |
End of year** | | | $ | 206,009,885 | | | | $ | 106,757,208 | | | | $ | 102,109,611 | | | | $ | 94,433,536 | |
| | | | |
SHARES ISSUED & REDEEMED | | | | | | | | | | | | | | | | | | | | |
Issued | | | | 106,700 | | | | | 111,901 | | | | | 47,559 | | | | | 42,347 | |
Share conversions | | | | 3,846,030 | | | | | - | | | | | 734,641 | | | | | - | |
Distributions reinvested | | | | 99,645 | | | | | 58,220 | | | | | 49,214 | | | | | 21,208 | |
Redeemed | | | | (628,812 | ) | | | | (735,719 | ) | | | | (312,634 | ) | | | | (435,555 | ) |
| | | | |
Net increase (decrease) | | | | 3,423,563 | | | | | (565,598 | ) | | | | 518,780 | | | | | (372,000 | ) |
Outstanding at beginning of year | | | | 2,795,541 | | | | | 3,361,139 | | | | | 3,184,581 | | | | | 3,556,581 | |
| | | | |
Outstanding at end of year | | | | 6,219,104 | | | | | 2,795,541 | | | | | 3,703,361 | | | | | 3,184,581 | |
| | | | |
** Including undistributed net investment income of: | | | $ | 155,065 | | | | $ | 1,673,564 | | | | $ | 70,401 | | | | $ | 918,104 | |
| * | See Note 1 - Organization in the Notes to Financial Statements. |
See Notes to Financial Statements.
| | |
93 | | Annual Report | June 30, 2012 |
|
|
| | | | | | | | | | | | | | | | | | |
| Ultra-Small Company Market | | | Small-Cap Momentum | |
| | | | | |
| | | | Year Ended
June 30, | | | | | | | | Year Ended
June 30, | | | |
| 2012 | | | | | 2011 | | | 2012 | | | | | 2011 | |
| | | | | |
| | | | | | | | | | | | | | | | | | |
| $ | 2,745,731 | | | | | $ | 3,205,225 | | | $ | 9,979 | | | | | $ | 19,560 | |
| | 33,820,067 | | | | | | 24,835,564 | | | | 78,352 | | | | | | 283,835 | |
| | | | | |
| | (38,783,336 | ) | | | | | 79,001,816 | | | | (135,060 | ) | | | | | 427,560 | |
| | |
| | | | | |
| | | | | | | | | | | | | | | | | | |
| | (2,217,538 | ) | | | | | 107,042,605 | | | | (46,729 | ) | | | | | 730,955 | |
| | |
| | | | | |
| | (3,451,142 | ) | | | | | (4,111,396 | ) | | | (1,843 | ) | | | | | (16,889 | ) |
| | (13,433,187 | ) | | | | | - | | | | (287,704 | ) | | | | | - | |
| | |
| | (16,884,329 | ) | | | | | (4,111,396 | ) | | | (289,547 | ) | | | | | (16,889 | ) |
| | |
| | | | | |
| | | | | | | | | | | | | | | | | | |
| | 33,789,669 | | | | | | 54,560,870 | | | | 358,332 | | | | | | 420,997 | |
| | - | | | | | | - | | | | - | | | | | | - | |
| | 15,234,587 | | | | | | 3,618,063 | | | | 289,325 | | | | | | 16,889 | |
| | (121,461,084 | ) | | | | | (110,930,484 | ) | | | (1,245,596 | ) | | | | | (38,172 | ) |
| | 87,977 | | | | | | 34,909 | | | | 2,022 | | | | | | 498 | |
| | |
| | | | | |
| | (72,348,851 | ) | | | | | (52,716,642 | ) | | | (595,917 | ) | | | | | 400,212 | |
| | |
| | (91,450,718 | ) | | | | | 50,214,567 | | | | (932,193 | ) | | | | | 1,114,278 | |
| | | | | |
| | | | | | | | | | | | | | | | | | |
| | 393,882,756 | | | | | | 343,668,189 | | | | 3,002,387 | | | | | | 1,888,109 | |
| | |
| | | | | |
| $ | 302,432,038 | | | | | $ | 393,882,756 | | | $ | 2,070,194 | | | | | $ | 3,002,387 | |
| | |
| | | | | |
| | | | | | | | | | | | | | | | | | |
| | 2,508,563 | | | | | | 3,926,854 | | | | 32,696 | | | | | | 34,852 | |
| | - | | | | | | - | | | | - | | | | | | - | |
| | 1,217,793 | | | | | | 251,429 | | | | 28,505 | | | | | | 1,449 | |
| | (8,780,831 | ) | | | | | (7,841,213 | ) | | | (112,849 | ) | | | | | (3,022 | ) |
| | |
| | (5,054,475 | ) | | | | | (3,662,930 | ) | | | (51,648 | ) | | | | | 33,279 | |
| | 25,669,108 | | | | | | 29,332,038 | | | | 235,653 | | | | | | 202,374 | |
| | |
| | 20,614,633 | | | | | | 25,669,108 | | | | 184,005 | | | | | | 235,653 | |
| | |
| | | | | |
| $ | 2,339,297 | | | | | $ | 3,445,648 | | | $ | 10,077 | | | | | $ | 2,340 | |
STATEMENTS OF CHANGES IN NET ASSETS (continued)
| | | | | | | | | | | | | | | | | | |
| | | Small-Cap Growth | | | Small-Cap Value | | | |
| | | |
| | | Year Ended June 30, | | | Year Ended June 30, | | | |
| | | 2012 | | | 2011 | | | 2012 | | | 2011 | | | |
| | | | | |
OPERATIONS | | | | | | | | | | | | | | | | | | |
Net investment income (loss) | | $ | (49,714 | ) | | $ | (59,437 | ) | | $ | 827,026 | | | $ | 1,079,251 | | | |
Net realized gain (loss) on investments | | | 3,903,999 | | | | 7,059,093 | | | | 9,541,977 | | | | 20,467,377 | | | |
Net change in unrealized appreciation (depreciation) on investments | | | (7,041,109 | ) | | | 8,701,251 | | | | (12,240,156 | ) | | | 8,606,512 | | | |
| | | | | |
Net increase (decrease) in net assets resulting from operations | | | (3,186,824 | ) | | | 15,700,907 | | | | (1,871,153 | ) | | | 30,153,140 | | | |
| | | | | |
DISTRIBUTIONS: | | | | | | | | | | | | | | | | | | |
From net investment income. | | | (3,204 | ) | | | (107,719 | ) | | | (989,896 | ) | | | (557,827 | ) | | |
| | | | | |
Net decrease in net assets from distributions | | | (3,204 | ) | | | (107,719 | ) | | | (989,896 | ) | | | (557,827 | ) | | |
| | | | | |
SHARE TRANSACTIONS: | | | | | | | | | | | | | | | | | | |
Proceeds from sale of shares | | | 1,921,059 | | | | 3,223,456 | | | | 5,706,702 | | | | 5,959,606 | | | |
Reinvestment of distributions | | | 3,057 | | | | 103,847 | | | | 932,539 | | | | 518,027 | | | |
Cost of shares redeemed | | | (13,672,329 | ) | | | (29,215,374 | ) | | | (29,882,098 | ) | | | (51,060,064 | ) | | |
| | | | | |
Net increase (decrease) in net assets resulting from share transactions | | | (11,748,213 | ) | | | (25,888,071 | ) | | | (23,242,857 | ) | | | (44,582,431 | ) | | |
| | | | | |
Net increase (decrease) in net assets | | | (14,938,241 | ) | | | (10,294,883 | ) | | | (26,103,906 | ) | | | (14,987,118 | ) | | |
| | | | | |
NET ASSETS: | | | | | | | | | | | | | | | | | | |
Beginning of year | | | 46,716,502 | | | | 57,011,385 | | | | 93,713,752 | | | | 108,700,870 | | | |
| | | | | |
End of year* | | $ | 31,778,261 | | | $ | 46,716,502 | | | $ | 67,609,846 | | | $ | 93,713,752 | | | |
| | | | | |
SHARES ISSUED & REDEEMED | | | | | | | | | | | | | | | | | | |
Issued | | | 167,955 | | | | 298,349 | | | | 411,311 | | | | 436,595 | | | |
Distributions reinvested | | | 289 | | | | 9,466 | | | | 71,404 | | | | 38,515 | | | |
Redeemed | | | (1,198,273 | ) | | | (2,779,197 | ) | | | (2,121,083 | ) | | | (3,769,962 | ) | | |
| | | | | |
Net increase (decrease) | | | (1,030,029 | ) | | | (2,471,382 | ) | | | (1,638,368 | ) | | | (3,294,852 | ) | | |
Outstanding at beginning of year | | | 3,762,853 | | | | 6,234,235 | | | | 6,198,929 | | | | 9,493,781 | | | |
| | | | | |
Outstanding at end of year | | | 2,732,824 | | | | 3,762,853 | | | | 4,560,561 | | | | 6,198,929 | | | |
| | | | | |
* Including undistributed (distributions in excess of) net investment income of: | | $ | (55,726 | ) | | $ | (4,548 | ) | | $ | 597,918 | | | $ | 760,775 | | | |
See Notes to Financial Statements.
| | |
95 | | Annual Report | June 30, 2012 |
|
|
| | | | | | | | | | | | | | | | | | | | | | |
| Large-Cap Growth | | | Blue Chip 35 Index | | | Managed Volatility | |
| | |
Year Ended June 30, | | | Year Ended June 30, | | | Year Ended June 30, | |
| 2012 | | | 2011 | | | 2012 | | | 2011 | | | 2012 | | | 2011 | |
| | | | | |
| | | | | | | | | | | | | | | | | | | | | | |
| $ | 364,465 | | | $ | 275,540 | | | $ | 7,242,042 | | | $ | 6,126,678 | | | $ | 99,886 | | | $ | 200,467 | |
| | 4,576,504 | | | | 8,850,037 | | | | 12,676,449 | | | | (2,697,030 | ) | | | 947,143 | | | | 989,923 | |
| (5,366,090
| )
| |
| 7,456,725
|
| | | 11,937,364 | | | | 54,984,311 | | | | (258,665 | ) | | | 3,193,736 | |
| | | | | |
| | (425,121 | ) | | | 16,582,302 | | | | 31,855,855 | | | | 58,413,959 | | | | 788,364 | | | | 4,384,126 | |
| | | | | |
| | | | | | | | | | | | | | | | | | | | | | |
| | (342,838 | ) | | | (342,087 | ) | | | (7,110,502 | ) | | | (4,877,457 | ) | | | (151,314 | ) | | | (266,935 | ) |
| | | | | |
| | (342,838 | ) | | | (342,087 | ) | | | (7,110,502 | ) | | | (4,877,457 | ) | | | (151,314 | ) | | | (266,935 | ) |
| | | | | |
| | | | | | | | | | | | | | | | | | | | | | |
| | 2,710,341 | | | | 5,691,636 | | | | 115,003,984 | | | | 111,420,242 | | | | 4,643,420 | | | | 3,094,011 | |
| | 323,763 | | | | 317,943 | | | | 6,478,915 | | | | 4,439,505 | | | | 147,905 | | | | 261,827 | |
| | (12,300,164 | ) | | | (22,181,617 | ) | | | (213,632,698 | ) | | | (60,417,342 | ) | | | (10,969,395 | ) | | | (11,910,284 | ) |
| | | | | |
| | (9,266,060 | ) | | | (16,172,038 | ) | | | (92,149,799 | ) | | | 55,442,405 | | | | (6,178,070 | ) | | | (8,554,446 | ) |
| | | | | |
| | (10,034,019 | ) | | | 68,177 | | | | (67,404,446 | ) | | | 108,978,907 | | | | (5,541,020 | ) | | | (4,437,255 | ) |
| | | | | |
| | | | | | | | | | | | | | | | | | | | | | |
| | 58,477,534 | | | | 58,409,357 | | | | 331,565,052 | | | | 222,586,145 | | | | 29,246,265 | | | | 33,683,520 | |
| | | | | |
| $ | 48,443,515 | | | $ | 58,477,534 | | | $ | 264,160,606 | | | $ | 331,565,052 | | | $ | 23,705,245 | | | $ | 29,246,265 | |
| | | | | |
| | | | | | | | | | | | | | | | | | | | | | |
| | 211,030 | | | | 440,651 | | | | 15,067,275 | | | | 15,453,229 | | | | 408,226 | | | | 271,787 | |
| | 27,230 | | | | 25,703 | | | | 902,356 | | | | 613,191 | | | | 13,229 | | | | 23,315 | |
| | (972,552 | ) | | | (1,838,186 | ) | | | (27,262,476 | ) | | | (8,423,862 | ) | | | (960,731 | ) | | | (1,063,914 | ) |
| | | | | |
| | (734,292 | ) | | | (1,371,832 | ) | | | (11,292,845 | ) | | | 7,642,558 | | | | (539,276 | ) | | | (768,812 | ) |
| | 4,369,461 | | | | 5,741,293 | | | | 43,649,454 | | | | 36,006,896 | | | | 2,525,040 | | | | 3,293,852 | |
| | | | | |
| | 3,635,169 | | | | 4,369,461 | | | | 32,356,609 | | | | 43,649,454 | | | | 1,985,764 | | | | 2,525,040 | |
| | | | | |
| $ | 149,800 | | | $ | 121,976 | | | $ | 3,580,113 | | | $ | 3,448,573 | | | $ | 99,873 | | | $ | 151,301 | |
| | |
| FINANCIAL HIGHLIGHTS | | |
(for a share outstanding throughout the period indicated)
| | | | | | | | | | | | | | | | | | |
| | | | | | Income from Investment Operations | | | |
| | | Net Asset
Value,
Beginning
of Period | | | Net Investment
Income (Loss)(a) | | | Net Realized
and Unrealized
Gain\(Loss) | | | Total from
Investment
Operations | | | |
| | | | | |
AGGRESSIVE INVESTORS 1 | | | | | | | | | | | | | | | | | | |
| | | | | |
Year Ended June 30, 2012 | | $ | 38.19 | | | $ | 0.62 | | | $ | (4.37) | | | $ | (3.75 | ) | | |
Year Ended June 30, 2011 | | | 27.67 | | | | 0.51 | | | | 10.72 | | | | 11.23 | | | |
Year Ended June 30, 2010 | | | 25.93 | | | | 0.58 | | | | 1.40 | | | | 1.98 | | | |
Year Ended June 30, 2009 | | | 53.96 | | | | 0.30 | | | | (28.00) | | | | (27.70 | ) | | |
Year Ended June 30, 2008 | | | 61.90 | | | | (0.59) | | | | 3.14 | | | | 2.55 | | | |
| | | | | |
ULTRA-SMALL COMPANY | | | | | | | | | | | | | | | | | | |
| | | | | |
Year Ended June 30, 2012 | | | 29.65 | | | | 0.13 | | | | (1.79) | | | | (1.66 | ) | | |
Year Ended June 30, 2011 | | | 22.94 | | | | 0.07 | | | | 6.83 | | | | 6.90 | | | |
Year Ended June 30, 2010 | | | 19.76 | | | | 0.19 | | | | 3.22 | | | | 3.41 | | | |
Year Ended June 30, 2009 | | | 24.59 | | | | 0.23 | | | | (5.03) | | | | (4.80 | ) | | |
Year Ended June 30, 2008 | | | 37.65 | | | | 0.03 | | | | (8.67) | | |
| (8.64
| )
| | |
| | | | | |
ULTRA-SMALL COMPANY MARKET | | | | | | | | | | | | | | | | | | |
| | | | | |
Year Ended June 30, 2012 | | | 15.34 | | | | 0.12 | | | | (0.09) | | | | 0.03 | | | |
Year Ended June 30, 2011 | | | 11.72 | | | | 0.12 | | | | 3.65 | | | | 3.77 | | | |
Year Ended June 30, 2010 | | | 10.50 | | | | 0.14 | | | | 1.25 | | | | 1.39 | | | |
Year Ended June 30, 2009 | | | 15.33 | | | | 0.14 | | | | (3.88) | | | | (3.74 | ) | | |
Year Ended June 30, 2008 | | | 20.36 | | | | 0.14 | | | | (4.49) | | | | (4.35 | ) | | |
| | | | | |
SMALL-CAP MOMENTUM | | | | | | | | | | | | | | | | | | |
| | | | | |
Year Ended June 30, 2012 | | | 12.74 | | | | 0.04 | | | | (0.35) | | | | (0.31 | ) | | |
Year Ended June 30, 2011 | | | 9.33 | | | | 0.09 | | | | 3.40 | | | | 3.49 | | | |
Period Ended June 30, 2010(f) | | | 10.00 | | | | -(e) | | | | (0.67) | | | | (0.67 | ) | | |
| (a) | Per share amounts calculated based on the average daily shares outstanding during the period. |
| (b) | Annualized for periods less than one year. |
| (c) | For the years ended June 30, 2009, June 30, 2010, June 30, 2011 and June 30, 2012, the expense ratio was significantly lower than past years due to a negative performance adjustment to the investment advisory fee. Please refer to the Statements of Operations and Note 3 of the Notes to Financial Statements for further information. The rate shown may not be indicative of the rate going forward. |
| (d) | Total return may have been lower had various fees not been waived during the period. |
| (e) | Amount represents less than $0.005. |
| (f) | Commenced operations on May 28, 2010. |
See Notes to Financial Statements.
| | |
97 | | Annual Report | June 30, 2012 |
| | | | | | | | | | | | | | | | | | | | | | | | | | | | | | | | | | | | | | | | | | | | |
| | | Less Distributions to Shareholders from: | | | | | | | | | | | | Ratios & Supplemental Data | |
| | | Net Realized Gain | | | Net
Investment
Income | | | Total
Distributions | | | Paid in
Capital from
Redemption
Fees(a) | | | Net
Asset
Value,
End of
Period | | | Total
Return | | | Net
Assets
End of
Period (000’s) | | | Expenses
Before
Waivers
and
Reimburs- ements(b) | | | Expenses
After
Waivers
and
Reimburs- ements(b) | | | Net
Investment
Income
(Loss)
After
Waivers
and
Reimburs- ement(b) | | | Portfolio
Turnover
Rate | |
| |
| | | | | | | | | | | |
| | | | | | | | | | | | | | | | | | | | | | | | | | | | | | | | | | | | | | | | | | | | |
| | | | | | | | | | | |
| | $ | - | | | | $(1.31) | | | | $ (1.31) | | | | $ - | | | $ | 33.13 | | | | (9.57 | %) | | | $206,010 | | | | (0.04%)(c) | | | | (0.04%) | | | | 1.86% | | | | 125% | |
| | | - | | | | (0.71) | | | | (0.71) | | | | - | | | | 38.19 | | | | 40.81 | % | | | 106,757 | | | | (0.41%)(c) | | | | (0.41%) | | | | 1.49% | | | | 107% | |
| | | - | | | | (0.24) | | | | (0.24) | | | | - | | | | 27.67 | | | | 7.56 | % | | | 93,008 | | | | (0.51%)(c) | | | | (0.51%) | | | | 1.94% | | | | 118% | |
| | | (0.33) | | | | - | | | | (0.33) | | | | - | | | | 25.93 | | | | (51.31 | %) | | | 115,835 | | | | 0.34%(c) | | | | 0.34% | | | | 0.97% | | | | 134% | |
| | | (10.49) | | | | - | | | | (10.49) | | | | - | | | | 53.96 | | | | 3.54 | %(d) | | | 338,715 | | | | 1.78% | | | | 1.78% | | | | (1.03%) | | | | 142% | |
|
| |
| | | | | | | | | | | |
| | | | | | | | | | | | | | | | | | | | | | | | | | | | | | | | | | | | | | | | | | | | |
| | | | | | | | | | | |
| | | - | | | | (0.42) | | | | (0.42) | | | | - | | | | 27.57 | | | | (5.41 | %) | | | 102,110 | | | | 1.22% | | | | 1.22% | | | | 0.49% | | | | 93% | |
| | | - | | | | (0.19) | | | | (0.19) | | | | - | | | | 29.65 | | | | 30.12 | % | | | 94,434 | | | | 1.18% | | | | 1.18% | | | | 0.27% | | | | 110% | |
| | | - | | | | (0.23) | | | | (0.23) | | | | - | | | | 22.94 | | | | 17.26 | % | | | 81,582 | | | | 1.17% | | | | 1.17% | | | | 0.83% | | | | 133% | |
| | | - | | | | (0.03) | | | | (0.03) | | | | - | | | | 19.76 | | | | (19.48 | %) | | | 73,708 | | | | 1.16% | | | | 1.16% | | | | 1.23% | | | | 90% | |
| | | (4.31) | | | | (0.11) | | | | (4.42) | | | | - | | | | 24.59 | | | | (24.59 | %)(d) | | | 94,933 | | | | 1.07% | | | | 1.07% | | | | 0.10% | | | | 102% | |
|
| |
| | | | | | | | | | | |
| | | | | | | | | | | | | | | | | | | | | | | | | | | | | | | | | | | | | | | | | | | | |
| | | | | | | | | | | |
| | | (0.56) | | | | (0.14) | | | | (0.70) | | | | -(e) | | | | 14.67 | | | | 1.05 | %(d) | | | 302,432 | | | | 0.83% | | | | 0.75% | | | | 0.86% | | | | 31% | |
| | | - | | | | (0.15) | | | | (0.15) | | | | -(e) | | | | 15.34 | | | | 32.22 | %(d) | | | 393,883 | | | | 0.79% | | | | 0.75% | | | | 0.82% | | | | 42% | |
| | | - | | | | (0.17) | | | | (0.17) | | | | -(e) | | | | 11.72 | | | | 13.30 | %(d) | | | 343,668 | | | | 0.77% | | | | 0.75% | | | | 1.18% | | | | 48% | |
| | | (0.89) | | | | (0.21) | | | | (1.10) | | | | 0.01 | | | | 10.50 | | | | (23.47 | %)(d) | | | 342,923 | | | | 0.79% | | | | 0.75% | | | | 1.27% | | | | 42% | |
| | | (0.65) | | | | (0.04) | | | | (0.69) | | | | 0.01 | | | | 15.33 | | | | (21.72 | %)(d) | | | 721,412 | | | | 0.66% | | | | 0.66% | | | | 0.79% | | | | 29% | |
|
| |
| | | | | | | | | | | |
| | | | | | | | | | | | | | | | | | | | | | | | | | | | | | | | | | | | | | | | | | | | |
| | | | | | | | | | | |
| | | (1.18) | | | | (0.01) | | | | (1.19) | | | | 0.01 | | | | 11.25 | | | | (1.40 | %)(d) | | | 2,070 | | | | 5.73% | | | | 0.90% | | | | 0.38% | | | | 230% | |
| | | - | | | | (0.08) | | | | (0.08) | | | | -(e) | | | | 12.74 | | | | 37.49 | %(d) | | | 3,002 | | | | 5.43% | | | | 0.90% | | | | 0.79% | | | | 272% | |
| | | - | | | | - | | | | - | | | | - | | | | 9.33 | | | | (6.70 | %)(d) | | | 1,888 | | | | 11.24% | | | | 0.90% | | | | 0.50% | | | | 3% | |
| |
| | |
| FINANCIAL HIGHLIGHTS (continued) | | |
(for a share outstanding throughout the year indicated)
| | | | | | | | | | | | | | | | | | |
| | | | | | Income from Investment Operations | | | |
| | | Net Asset
Value,
Beginning
of Year | | | Net Investment
Income (Loss)(a) | | | Net Realized
and Unrealized
Gain\(Loss) | | | Total from
Investment
Operations | | | |
| | | | | |
SMALL-CAP GROWTH | | | | | | | | | | | | | | | | | | |
| | | | | |
Year Ended June 30, 2012 | | $ | 12.42 | | | $ | (0.02) | | | $ | (0.77) | | | $ | (0.79) | | | |
Year Ended June 30, 2011 | | | 9.14 | | | | (0.01) | | | | 3.31 | | | | 3.30 | | | |
Year Ended June 30, 2010 | | | 8.46 | | | | 0.02 | | | | 0.70 | | | | 0.72 | | | |
Year Ended June 30, 2009 | | | 13.95 | | | | 0.03 | | | | (5.52) | | | | (5.49) | | | |
Year Ended June 30, 2008 | | | 16.01 | | | | (0.03) | | | | (2.03) | | | | (2.06) | | | |
| | | | | |
SMALL-CAP VALUE | | | | | | | | | | | | | | | | | | |
| | | | | |
Year Ended June 30, 2012 | | | 15.12 | | | | 0.15 | | | | (0.26) | | | | (0.11) | | | |
Year Ended June 30, 2011 | | | 11.45 | | | | 0.14 | | | | 3.60 | | | | 3.74 | | | |
Year Ended June 30, 2010 | | | 9.73 | | | | 0.07 | | | | 1.72 | | | | 1.79 | | | |
Year Ended June 30, 2009 | | | 15.86 | | | | 0.08 | | | | (6.14) | | | | (6.06) | | | |
Year Ended June 30, 2008 | | | 18.74 | | | | 0.03 | | | | (2.91) | | | | (2.88) | | | |
| | | | | |
LARGE-CAP GROWTH | | | | | | | | | | | | | | | | | | |
| | | | | |
Year Ended June 30, 2012 | | | 13.38 | | | | 0.09 | | | | (0.05) | | | | 0.04 | | | |
Year Ended June 30, 2011 | | | 10.17 | | | | 0.06 | | | | 3.22 | | | | 3.28 | | | |
Year Ended June 30, 2010 | | | 9.06 | | | | 0.06 | | | | 1.11 | | | | 1.17 | | | |
Year Ended June 30, 2009 | | | 13.73 | | | | 0.06 | | | | (4.66) | | | | (4.60) | | | |
Year Ended June 30, 2008 | | | 14.12 | | | | 0.06 | | | | (0.41) | | | | (0.35) | | | |
| | | | | |
BLUE CHIP 35 INDEX | | | | | | | | | | | | | | | | | | |
| | | | | |
Year Ended June 30, 2012 | | | 7.60 | | | | 0.17 | | | | 0.55 | | | | 0.72 | | | |
Year Ended June 30, 2011 | | | 6.18 | | | | 0.15 | | | | 1.39 | | | | 1.54 | | | |
Year Ended June 30, 2010 | | | 5.66 | | | | 0.13 | | | | 0.52 | | | | 0.65 | | | |
Year Ended June 30, 2009 | | | 7.21 | | | | 0.15 | | | | (1.51) | | | | (1.36) | | | |
Year Ended June 30, 2008 | | | 8.52 | | | | 0.19 | | | | (1.39) | | | | (1.20) | | | |
| (a) | Per share amounts calculated based on the average daily shares outstanding during the period. |
| (b) | Amount represents less than $0.005. |
| (c) | Total return may have been lower had various fees not been waived during the period. |
| (d) | Total return includes the effect of a reimbursement by the Adviser and the accounting agent due to a trading error. |
See Notes to Financial Statements.
| | |
99 | | Annual Report | June 30, 2012 |
| | | | | | | | | | | | | | | | | | | | | | | | | | | | | | | | | | | | | | | | |
| | | Less Distributions to Shareholders from: | | | | | | | | | Ratios & Supplemental Data | |
| | | Net
Realized
Gain | | | Net
Investment
Income | | | Total
Distributions | | | Net Asset
Value,
End of
Year | | | Total
Return | | | Net Assets
End of
Year (000’s) | | | Expenses Before
Waivers and
Reimbursements | | | Expenses After
Waivers and
Reimbursements | | | Net Investment
Income (Loss)
After Waivers and
Reimbursements | | | Portfolio
Turnover
Rate | |
| | | | | | | | | | |
| | | $- | | | $ | -(b) | | | $ | - | | | $ | 11.63 | | | | (6.35 | %) (c) | | $ | 31,778 | | | | 1.08% | | | | 0.94% | | | | (0.14%) | | | | 63% | |
| | | - | | | | (0.02) | | | | (0.02) | | | | 12.42 | | | | 36.17 | %(c) | | | 46,717 | | | | 0.98% | | | | 0.94% | | | | (0.12%) | | | | 87% | |
| | | - | | | | (0.04) | | | | (0.04) | | | | 9.14 | | | | 8.44 | % | | | 57,011 | | | | 0.93% | | | | 0.93% | | | | 0.21% | | | | 87% | |
| | | - | | | | - | | | | - | | | | 8.46 | | | | (39.35 | %) | | | 71,697 | | | | 0.94% | | | | 0.94% | | | | 0.29% | | | | 75% | |
| | | - | | |
| -
|
| | | - | | | | 13.95 | | | | (12.87 | %) (c) | | | 144,668 | | | | 0.87% | | | | 0.87% | | | | (0.20%) | | | | 63% | |
| | | | | | | | | | | | | | | | | | | | | | | | | | | | | | | | | | | | | | | | |
| | | | | | | | | | |
| | | - | | | | (0.19) | | | | (0.19) | | | | 14.82 | | | | (0.59 | %) (c) | | | 67,610 | | | | 0.99% | | | | 0.94% | | | | 1.10% | | | | 49% | |
| | | - | | | | (0.07) | | | | (0.07) | | | | 15.12 | | | | 32.73 | % | | | 93,714 | | | | 0.87% | | | | 0.87% | | | | 1.03% | | | | 84% | |
| | | - | | | | (0.07) | | | | (0.07) | | | | 11.45 | | | | 18.35 | % | | | 108,701 | | | | 0.91% | | | | 0.91% | | | | 0.64% | | | | 81% | |
| | | - | | | | (0.07) | | | | (0.07) | | | | 9.73 | | | | (38.15 | %) | | | 132,229 | | | | 0.92% | | | | 0.92% | | | | 0.75% | | | | 83% | |
| | | - | | | | - | | | | - | | | | 15.86 | | | | (15.37 | %) (c) | | | 331,648 | | | | 0.83% | | | | 0.83% | | | | 0.18% | | | | 73% | |
| | | | | | | | | | | | | | | | | | | | | | | | | | | | | | | | | | | | | | | | |
| | | | | | | | | | |
| | | - | | | | (0.09) | | | | (0.09) | | | | 13.33 | | | | 0.37 | %(c) | | | 48,444 | | | | 0.92% | | | | 0.84% | | | | 0.74% | | | | 55% | |
| | | - | | | | (0.07) | | | | (0.07) | | | | 13.38 | | | | 32.31 | %(c) | | | 58,478 | | | | 0.86% | | | | 0.84% | | | | 0.47% | | | | 65% | |
| | | - | | | | (0.06) | | | | (0.06) | | | | 10.17 | | | | 12.89 | %(c) | | | 58,409 | | | | 0.86% | | | | 0.84% | | | | 0.55% | | | | 40% | |
| | | - | | | | (0.07) | | | | (0.07) | | | | 9.06 | | | | (33.43 | %) | | | 70,534 | | | | 0.82% | | | | 0.82% | | | | 0.63% | | | | 49% | |
| | | - | | | | (0.04) | | | | (0.04) | | | | 13.73 | | | | (2.50 | %) (c) | | | 174,813 | | | | 0.71% | | | | 0.71% | | | | 0.39% | | | | 37% | |
| | | | | | | | | | | | | | | | | | | | | | | | | | | | | | | | | | | | | | | | |
| | | | | | | | | | |
| | | - | | | | (0.16) | | | | (0.16) | | | | 8.16 | | | | 9.72 | %(c) | | | 264,161 | | | | 0.29% | | | | 0.15% | | | | 2.28% | | | | 33% | |
| | | - | | | | (0.12) | | | | (0.12) | | | | 7.60 | | | | 25.10 | %(c) | | | 331,565 | | | | 0.27% | | | | 0.15% | | | | 2.09% | | | | 19% | |
| | | - | | | | (0.13) | | | | (0.13) | | | | 6.18 | | | | 11.25 | %(c) (d) | | | 222,586 | | | | 0.27% | | | | 0.15% | | | | 1.99% | | | | 28% | |
| | | - | | | | (0.19) | | | | (0.19) | | | | 5.66 | | | | (18.77 | %) (c) | | | 188,012 | | | | 0.25% | | | | 0.15% | | | | 2.58% | | | | 86% | |
| | | - | | | | (0.11) | | | | (0.11) | | | | 7.21 | | | | (14.28 | %) (c) | | | 250,988 | | | | 0.22% | | | | 0.15% | | | | 2.35% | | | | 12% | |
| | | | | | | | | | | | | | | | | | | | | | | | | | | | | | | | | | | | | | | | |
| | |
FINANCIAL HIGHLIGHTS (continued) | | |
(for a share outstanding throughout the year indicated)
| | | | | | | | | | | | | | | | | | | | | | |
| | | | | Income from Investment Operations | | |
| | | Net Asset
Value,
Beginning
of Year | | Net
Investment
Income(a) | | Net Realized
and Unrealized
Gain\(Loss) | | Total from
Investment
Operations | | |
| | | | | |
MANAGED VOLATILITY | | | | | | | | | | | | | | | | | | | | | | |
| | | | | |
Year Ended June 30, 2012 | | | | $11.58 | | | | | $0.04 | | | | | $ 0.39 | | | | | $ 0.43 | | | |
Year Ended June 30, 2011 | | | | 10.23 | | | | | 0.07 | | | | | 1.37 | | | | | 1.44 | | | |
Year Ended June 30, 2010 | | | | 10.19 | | | | | 0.10 | | | | | 0.08 | | | | | 0.18 | | | |
Year Ended June 30, 2009 | | | | 12.58 | | | | | 0.18 | | | | | (1.69 | ) | | | | (1.51 | ) | | |
Year Ended June 30, 2008 | | | | 12.95 | | | | | 0.29 | | | | | (0.49 | ) | | | | (0.20 | ) | | |
| (a) | Per share amounts calculated based on the average daily shares outstanding during the period. |
| (b) | Total return may have been lower had various fees not been waived during the period. |
See Notes to Financial Statements.
| | |
101 | | Annual Report | June 30, 2012 |
| | | | | | | | | | | | | | | | | | | | | | | | | | | | | | | | | | | | | | | | | | | | | | | | | | |
| | | Less Distributions to Shareholders from | | | | | | Ratios & Supplemental Data |
| | | Net
Realized
Gain | | Net
Investment
Income | | Total
Distributions | | Net Asset
Value,
End of
Year | | Total
Return | | Net Assets
End of Year
(000’s) | | Expenses Before
Waivers and
Reimbursements | | Expenses After
Waivers and
Reimbursements | | Net Investment
Income
After Waivers and
Reimbursements | | Portfolio
Turnover
Rate |
| | | | | | | | | | |
| | | | $ - | | | | $ | (0.07 | ) | | | $ | (0.07 | ) | | | $ | 11.94 | | | | | 3.74 | %(b) | | | $ | 23,705 | | | | | 1.43 | % | | | | 0.94 | % | | | | 0.39 | % | | | | 41 | % |
| | | | - | | | | | (0.09 | ) | | | | (0.09 | ) | | | | 11.58 | | | | | 14.15 | %(b) | | | | 29,246 | | | | | 1.22 | % | | | | 0.94 | % | | | | 0.63 | % | | | | 34 | % |
| | | | - | | | | | (0.14 | ) | | | | (0.14 | ) | | | | 10.23 | | | | | 1.67 | %(b) | | | | 33,684 | | | | | 1.05 | % | | | | 0.94 | % | | | | 0.91 | % | | | | 33 | % |
| | | | (0.52 | ) | | | | (0.36 | ) | | | | (0.88 | ) | | | | 10.19 | | | | | (11.66 | %) (b) | | | | 47,299 | | | | | 1.01 | % | | | | 0.94 | % | | | | 1.72 | % | | | | 51 | % |
| | | | | - | | | | | (0.17 | ) | | | | (0.17 | ) | | | | 12.58 | | | | | (1.57 | %) (b) | | | | 75,417 | | | | | 0.88 | % | | | | 0.88 | % | | | | 2.23 | % | | | | 44 | % |
| | |
NOTES TO FINANCIAL STATEMENTS | | |
June 30, 2012
1. Organization:
Bridgeway Funds, Inc. (“Bridgeway” or the “Company”) was organized as a Maryland corporation on October 19, 1993, and is registered under the Investment Company Act of 1940, as amended (the “1940 Act”), as an open-end management investment company.
Bridgeway is organized as a series fund, with 11 investment funds as of June 30, 2012 (each, a “Fund” and collectively, the “Funds”): Aggressive Investors 1, Ultra-Small Company, Ultra-Small Company Market, Small-Cap Momentum, Small-Cap Growth, Small-Cap Value, Large-Cap Growth, Blue Chip 35 Index and Managed Volatility Funds are presented in this report. The Omni Tax-Managed Small-Cap Value Fund and the Omni Small-Cap Value Fund are included in a separate report.
Bridgeway is authorized to issue 1,987,343,706 shares of common stock at $0.001 per share. As of June 30, 2012, 100,000,000 shares have been classified into the Aggressive Investors 1 Fund. 130,000,000 shares have been classified into the Blue Chip 35 Index Fund. 15,000,000 shares have been classified into the Ultra-Small Company Fund. 100,000,000 shares each have been classified into the Ultra-Small Company Market, Omni Tax-Managed Small-Cap Value, Omni Small-Cap Value, Small-Cap Momentum, Small-Cap Growth, Small-Cap Value and Large-Cap Growth Funds. 50,000,000 shares have been classified into the Managed Volatility Fund. All shares outstanding currently represent Class N shares.
The Ultra-Small Company Fund is open to existing investors (direct only).
All of the Funds are no-load, diversified funds.
The Aggressive Investors 1 Fund seeks to exceed the stock market total return (primarily through capital appreciation) at a level of total risk roughly equal to that of the stock market over longer periods of time (three years or more).
The Ultra-Small Company, Ultra-Small Company Market, Small-Cap Momentum, Small-Cap Growth, Small-Cap Value and Large-Cap Growth Funds seek to provide a long-term total return of capital, primarily through capital appreciation.
The Blue Chip 35 Index Fund seeks to provide long-term total return of capital, primarily through capital appreciation but also some income.
The Managed Volatility Fund seeks to provide a high current return with short-term risk less than or equal to 40% of the stock market.
Bridgeway Capital Management, Inc. (the “Adviser”) is the investment adviser for all of the Funds.
On May 30, 2012, the shareholders of the Aggressive Investors 2 Fund and the Micro-Cap Limited Fund (the “Merged Funds”) approved an Agreement and Plan of Reorganization (the “Plan”) which provided for the transfer of all of the assets of the Merged Funds, listed in the table below, for shares of the respective acquiring funds, listed in the table below, and assumption of the liabilities of the Merged Funds. The acquisition was accomplished by a tax-free exchange of shares on June 4, 2012. For financial reporting purposes, assets received and shares issued by the Aggressive Investors 1 Fund and the Ultra-Small Company Fund were recorded at fair value; however, the cost basis of the investments received from the Aggressive Investors 2 Fund and the Micro-Cap Limited Fund was carried forward to align ongoing reporting of the Aggressive Investors 1 Fund’s and the Ultra-Small Company Fund’s realized and unrealized gains and losses with amounts distributable to shareholders for tax purposes.
| | | | | | | | | | | | | | |
| Merged Fund | | Shares | | | Acquiring Fund | | Shares | | | Value | |
Aggressive Investors 2 | | | 9,545,121 | | | Aggressive Investors 1 | | | 3,846,030 | | | | $118,655,804 | |
Micro-Cap Limited | | | 3,111,172 | | | Ultra-Small Company | | | 734,641 | | | | 18,444,305 | |
The Board of Directors approved a reduction in the maximum expense ratio for the Aggressive Investors 1 Fund from 1.80% to 1.75% to match that of the Aggressive Investors 2 Fund. The Board also approved a reduction in the maximum expense ratio for the Ultra-Small Company Fund from 2.00% to 1.85% to match that of the Micro-Cap Limited Fund.
| | |
103 | | Annual Report | June 30, 2012 |
| | |
NOTES TO FINANCIAL STATEMENTS (continued) | |
|
June 30, 2012
The net assets and net unrealized appreciation (depreciation) immediately before the acquisitions were as follows:
| | | | | | | | | | | | | | |
| Merged Fund | | Net Assets | | | Unrealized
Appreciation
(Depreciation) | | | Acquiring Fund | | Net Assets | |
Aggressive Investors 2 | | | $118,655,804 | | | | $(5,321,648) | | | Aggressive Investors 1 | | | $75,836,524 | |
Micro-Cap Limited | | | 18,444,305 | | | | (815,401) | | | Ultra-Small Company | | | 74,783,377 | |
Assuming the acquisition had been completed on July 1, 2011, the Aggressive Investor 1 Fund’s results of operations for the fiscal year ended June 30, 2012 would have been as follows:
| | | | | | |
Net Investment Income | | $ | 2,784,372 | | | (a) |
Net Realized and Unrealized Gain (Loss) on Investments | | | (6,084,694 | ) | | (b) |
| | | | | | |
Net Decrease in Net Assets Resulting from Operations | | $ | (3,300,322 | ) | | |
| | | | | | |
| (a) | $1,789,938 as reported in the Statement of Operations, plus $2,074,093 Net Investment Income from Aggressive Investors 2 Fund pre-merger, less $1,079,659 for pro-forma elimination of a portion of the performance fee adjustment and other expenses. |
| (b) | $(3,643,337) as reported in the Statement of Operations, plus $(2,441,357) Net Realized and Unrealized Gain (Loss) on Investments from Aggressive Investors 2 Fund pre-merger. |
Assuming the acquisition had been completed on July 1, 2011, the Ultra-Small Company Fund’s results of operations for the fiscal year ended June 30, 2012 would have been as follows:
| | | | | | |
Net Investment Income | | $ | 402,629 | | | (a) |
Net Realized and Unrealized Gain (Loss) on Investments | | | (4,692,661 | ) | | (b) |
| | | | | | |
Net Decrease in Net Assets Resulting from Operations | | $ | (4,290,032 | ) | | |
| | | | | | |
| (a) | $397,016 as reported in the Statement of Operations, plus $217,970 Net Investment Income from Micro-Cap Limited Fund pre-merger, less $212,357 for pro-forma elimination of the performance fee adjustment and other expenses. |
| (b) | $(3,960,486) as reported in the Statement of Operations, plus $(732,175) Net Realized and Unrealized Gain (Loss) on Investments from Micro-Cap Limited Fund pre-merger. |
Because both the Merged Funds, Aggressive Investors 2 Fund and Micro-Cap Limited Fund, and the acquiring funds, Aggressive Investors 1 Fund and Ultra-Small Company Fund, sold and redeemed shares throughout the period, it is not practicable to provide pro-forma information on a per-share basis.
2. Significant Accounting Policies:
The following summary of significant accounting policies, followed in the preparation of the financial statements of the Funds, are in conformity with accounting principles generally accepted in the United States of America (“GAAP”).
Securities, Options, Futures and Other Investments Valuation Other than options, portfolio securities that are principally traded on a national securities exchange are valued at their last sale price on the principal exchange on which they are traded prior to the close of the New York Stock Exchange (“NYSE”), on each day the NYSE is open for business. If there is no closing price on the NYSE, the portfolio security will be valued using a composite price, which is defined as the last price for the security on any exchange. Portfolio securities other than options that are principally traded on the National Association of Securities Dealers Automated Quotation System (“NASDAQ”) are valued at the NASDAQ Official Closing Price (“NOCP”). In the absence of recorded sales on their home exchange, or NOCP, in the case of NASDAQ traded securities, the security will be valued as follows: bid prices for long positions and ask prices for short positions.
Short-term fixed income securities having a remaining maturity of 60 days or less are valued at amortized cost, which approximates market value. Options are valued at the close if there is trading volume and if there is no trading volume, the bid on long positions and ask on the short positions. Other investments for which no sales are reported are valued at the latest bid price in accordance with the pricing policy established by the Board of Directors.
Investments in open-end registered investment companies and closed-end registered investment companies that do not trade on an exchange are valued at the end of day net asset value (“NAV”) per share.
| | |
NOTES TO FINANCIAL STATEMENTS (continued) | |
|
June 30, 2012
Investments in closed-end registered investment companies that trade on an exchange are valued at the last sales price as of the close of the customary trading session on the exchange where the security is principally traded.
When market quotations are not readily available or when events occur that make established valuation methods unreliable, securities of the Funds may be valued at fair value as determined in good faith by or under the direction of the Board of Directors. The valuation assigned to fair valued securities for purposes of calculating the Funds’ NAVs may differ from the security’s most recent closing market price and from the prices used by other mutual funds to calculate their NAVs.
The inputs and valuation techniques used to determine the value of a Fund’s investments are summarized into three levels as described in the hierarchy below:
| — | | Level 1 — quoted prices in active markets for identical assets |
Investments whose values are based on quoted market prices in active markets, and whose values are therefore classified as Level 1 prices, include active listed equity securities. The Funds do not adjust the quoted price for such investments, even in situations where the Funds hold a large position and a sale could reasonably impact the quoted price.
| — | | Level 2 — other significant observable inputs (including quoted prices for similar securities, interest rates, prepayments speeds, credit risk, etc.) |
Investments that trade in markets that are not considered to be active, but whose values are based on quoted market prices, dealer quotations or valuations provided by alternative pricing sources supported by observable inputs are classified as Level 2 prices. These generally include certain U.S. government and sovereign obligations, most government agency securities, investment-grade corporate bonds and less liquid listed equity securities. As investments whose values are classified as Level 2 prices include positions that are not traded in active markets and/or are subject to transfer restrictions, valuations may be adjusted to reflect illiquidity and/or non-transferability, which are generally based on available market information.
Money market fund investments consist of mutual funds which invest primarily in securities that are valued at amortized cost, a Level 2 investment. Therefore, the money market funds are classified as Level 2 investments. The Funds’ total return swap values are derived by applying observable inputs to the outstanding notional values and are therefore classified as Level 2 investments also.
| — | | Level 3 — significant unobservable inputs (including a Fund’s own assumptions in determining the fair value of investments) |
Investments whose values are classified as Level 3 prices have significant unobservable inputs, as they may trade infrequently or not at all. When observable prices are not available for these securities, the Funds use one or more valuation techniques for which sufficient and reliable data is available. The inputs used by the Funds in estimating the value of Level 3 prices may include the original transaction price, quoted prices for similar securities or assets in active markets, completed or pending third-party transactions in the underlying investment or comparable issuers, and changes in financial ratios or cash flows. Level 3 prices may also be adjusted to reflect illiquidity and/or non-transferability, with the amount of such discount estimated by the Funds in the absence of market information. Assumptions used by the Funds due to the lack of observable inputs may significantly impact the resulting value and therefore the Funds’ results of operations.
The inputs or methodology used for valuing investments are not necessarily an indication of the risk associated with investing in those investments. A summary of the inputs used to value the Funds’ investments as of June 30, 2012 is included with each Fund’s Schedule of Investments.
Effective January 1, 2012, the Funds adopted Accounting Standards Update (“ASU”) No. 2011-04 “Amendments to Achieve Common Fair Value Measurement and Disclosure Requirements in U.S. GAAP and International Financial Reporting Standards (“IFRSs”).” ASU No. 2011-04 is intended to result in common fair value and measurement requirements in U.S. GAAP and IFRS. ASU No. 2011-04 requires reporting entities to disclose quantitative information about the significant unobservable inputs used in the fair value measurements categorized within Level 3 of the fair value hierarchy. In addition, ASU No. 2011-04 requires reporting entities to make disclosures about amounts and reasons for all transfers in and out of Level 1 and Level 2 fair value measurements. Level 3 securities are not significant to the Funds. The adoption of ASU 2011-04 had no impact on net assets of the Funds.
| | |
105 | | Annual Report | June 30, 2012 |
| | |
NOTES TO FINANCIAL STATEMENTS (continued) | |
|
June 30, 2012
The Funds’ policy is to recognize transfers into, and transfers out of, each level of hierarchy as of the beginning of the reporting period. For the fiscal year ended June 30, 2012, there were no transfers between Level 1 and Level 2 in any of the Funds. Details regarding transfers into, and transfers out of, Level 3 can be found at the end of each Schedule of Investments for Funds that hold Level 3 securities.
Securities Lending Upon lending its securities to third parties, each Fund receives compensation in the form of fees. A Fund also continues to receive dividends on the securities loaned. The loans are secured by collateral at least equal to the fair value of the securities loaned plus accrued interest. Gain or loss in the fair value of the securities loaned that may occur during the term of the loan will be for the account of a Fund. Each Fund has the right under the lending agreement to recover the securities from the borrower on demand. Additionally, a Fund does not have the right to sell or re-pledge collateral received in the form of securities unless the borrower goes into default. The risks to a Fund of securities lending are that the borrower may not provide additional collateral when required or return the securities when due.
As of June 30, 2012, the Funds had securities on loan and related collateral with values shown below:
| | | | | | | | |
| Bridgeway Fund | | Securities on
Loan Value | | | Value of
Collateral | |
| | | | | | | | |
Aggressive Investors 1 | | | $ 2,632,710 | | | | $ 2,621,800 | |
Ultra-Small Company | | | 9,775,783 | | | | 9,989,323 | |
Ultra-Small Company Market | | | 40,200,979 | | | | 40,676,066 | |
Small-Cap Momentum | | | 115,744 | | | | 116,362 | |
Small-Cap Growth | | | 3,103,705 | | | | 3,056,037 | |
Small-Cap Value | | | 4,232,950 | | | | 4,313,486 | |
Managed Volatility | | | 19,054 | | | | 19,688 | |
It is each Fund’s policy to obtain additional collateral from, or return excess collateral to, the borrower by the end of the next business day, following the valuation date of the securities loaned. Therefore, the value of the collateral held may be temporarily less than that required under the lending contract. Aggressive Investors 1 and Small-Cap Growth Funds obtained additional collateral on the following business day after fiscal year end to ensure the securities on loan were adequately collateralized. As of June 30, 2012 the collateral consisted of an institutional money market fund.
Use of Estimates in Financial Statements In preparing financial statements in conformity with GAAP, management makes estimates and assumptions that affect the reported amounts of assets and liabilities at the date of the financial statements and the disclosure of contingent assets and liabilities at the date of the financial statements as well as the reported amounts of revenue and expenses during the reporting period. Actual results could differ from those estimates.
Risks and Uncertainties The Funds provide for various investment options, including stocks and call and put options. Such investments are exposed to various risks, such as interest rate, market and credit risks. Due to the risks involved, it is at least reasonably possible that changes in risks in the near term would materially affect shareholders’ account values and the amounts reported in the financial statements.
Security Transactions, Investment Income and Expenses Security transactions are accounted for as of the trade date, the date the order to buy or sell is executed. Realized gains and losses are computed on the identified cost basis. Dividend income is recorded on the ex-dividend date, and interest income is recorded on the accrual basis from settlement date. Particularly related to the Managed Volatility Fund, discounts and premiums are accreted/amortized on the effective interest method.
Fund expenses that are not series-specific are allocated to each series based upon its relative proportion of net assets to the Funds’ total net assets or other appropriate basis.
| | |
NOTES TO FINANCIAL STATEMENTS (continued) | |
|
June 30, 2012
Distributions to Shareholders The Funds pay dividends from net investment income and distribute realized capital gains annually, usually in December.
Derivatives
The Funds’ use of derivatives for the fiscal year ended June 30, 2012 was limited to futures contracts, total return swaps, purchased options and written options. The following is a summary of how these derivatives are treated in the financial statements and their impact on the Funds.
| | | | | | | | | | | | | | | | |
| | | | | Asset Derivatives | | | | | Liability Derivatives | |
Fund/Financial Instrument Type | | Type of
Derivative | | Location on
Statement of Assets and Liabilities | | Value | | | | | Location on Statement of Assets and Liabilities | | Value | |
| | | | | | |
Ultra-Small Company Market | | | | | | | | | | | | | | | | |
Other | | Swap | | Receivable, Total Return Swap | | | $11,563 | | | | | | | | $ - | |
| | | | | | |
Small-Cap Value | | | | | | | | | | | | | | | | |
Other | | Swap | | Receivable, Total Return Swap | | | 33,837 | | | | | | | | - | |
| | | | | | |
Large-Cap Growth | | | | | | | | | | | | | | | | |
Other | | Swap | | Receivable, Total Return Swap | | | 17,951 | | | | | | | | - | |
| | | | | | |
Managed Volatility | | | | | | | | | | | | | | | | |
Equity Contracts | | Written
Option | | | | | - | | | | | Call Options Written at value Put Options Written at value | |
| 263,921
96,780 |
|
| | | | | | | | | | | | |
Fund/Financial Instrument Type | | Type of
Derivative | | Location of Gain (Loss) on
Derivatives Recognized in Income | | Amount of
Realized Gain
(Loss) | | | Amount of
Unrealized
Gain
(Loss) | |
| | | | |
Aggressive Investors 1 | | | | | | | | | | | | |
Other | | Swap | | Realized Gain (Loss) on Swaps | | | $ (49,052) | | | | | |
| | | | Change in Unrealized Appreciation (Depreciation) on Swaps | | | | | | | $ (3,655) | |
Equity Contracts | | Purchased | | | | | | | | | | |
| | Option | | Realized Gain (Loss) on Investments | | | (119,097) | | | | | |
| | | | Change in Unrealized Appreciation (Depreciation) on Investments | | | | | | | 25,097 | |
| | | | |
Ultra-Small Company | | | | | | | | | | | | |
Other | | Swap | | Realized Gain (Loss) on Swaps | | | 24,309 | | | | | |
| | | | Change in Unrealized Appreciation (Depreciation) on Swaps | | | | | | | (26,702) | |
| | | | |
Ultra-Small Company Market | | | | | | | | | | | | |
Other | | Swap | | Realized Gain (Loss) on Swaps | | | (23,983) | | | | | |
| | | | Change in Unrealized Appreciation (Depreciation) on Swaps | | | | | | | 3,570 | |
| | |
107 | | Annual Report | June 30, 2012 |
| | |
NOTES TO FINANCIAL STATEMENTS (continued) | |
|
June 30, 2012
| | | | | | | | | | | | |
Fund/Financial Instrument Type | | Type of
Derivative | | Location of Gain (Loss) on
Derivatives Recognized in Income | | Amount of
Realized Gain
(Loss) | | | Amount of
Unrealized
Gain
(Loss) | |
| | | | |
Small-Cap Growth | | | | | | | | | | | | |
Other | | Swap | | Realized Gain (Loss) on Swaps | | | $ (102,453) | | | | | |
| | | | Change in Unrealized Appreciation (Depreciation) on Swaps | | | | | | | $ (7,720) | |
| | | | |
Small-Cap Value | | | | | | | | | | | | |
Other | | Swap | | Realized Gain (Loss) on Swaps | | | 21,513 | | | | | |
| | | | Change in Unrealized Appreciation (Depreciation) on Swaps | | | | | | | 23,943 | |
| | | | |
Large-Cap Growth | | | | | | | | | | | | |
Other | | Swap | | Realized Gain (Loss) on Swaps | | | 6,197 | | | | | |
| | | | Change in Unrealized Appreciation (Depreciation) on Swaps | | | | | | | 12,767 | |
| | | | |
Managed Volatility | | | | | | | | | | | | |
Equity Contracts | | Written | | | | | | | | | | |
| | Option | | Realized Gain (Loss) on Written Options | | | 1,063,395 | | | | | |
| | | | Change in Unrealized Appreciation (Depreciation) on Written Options | | | | | | | 309,415 | |
| | Futures | | | | | | | | | | |
| | Contract | | Realized Gain (Loss) on Futures Contracts | | | (35,478) | | | | | |
| | Purchased | | | | | | | | | | |
| | Option | | Realized Gain (Loss) on Investments | | | 14,953 | | | | | |
| | | | Change in Unrealized Appreciation (Depreciation) on Investments | | | | | | | 8,494 | |
The derivative instruments outstanding as of June 30, 2012, as disclosed in the Notes to the Financial Statements, and the amounts of realized and changes in unrealized gains and losses on derivative instruments during the period, as disclosed in the Statement of Operations, serve as indicators of the volume of derivative activity for the Funds.
Futures Contracts The Funds may purchase or sell financial futures contracts to hedge cash positions, manage market risk, and to dampen volatility in line with investment objectives. A futures contract is an agreement between two parties to buy or sell a financial instrument at a set price on a future date. Upon entering into such a contract, a Fund is required to pledge to the broker an amount of cash or U.S. government securities equal to the minimum “initial margin” requirements of the exchange on which the futures contract is traded. The contract amount reflects the extent of a Fund’s exposure in these financial instruments. A Fund’s participation in the futures markets involves certain risks, including imperfect correlation between movements in the price of futures contracts and movements in the price of the securities hedged or used for cover. Pursuant to a contract, such Fund agrees to receive from, or pay to, the broker an amount of cash equal to the fluctuation in value of the contract. Such receipts or payments are known as “variation margin” and are recorded by a Fund as unrealized appreciation or depreciation. When a contract is closed, a Fund records a realized gain or loss equal to the difference between the value of the contract at the time it was opened and the value at the time it was closed. With futures, there is minimal counterparty risk to the Funds since futures are exchange traded and the exchange’s clearinghouse, as counterparty to all exchange traded futures, guarantees the futures against default. As of June 30, 2012, the Funds had no open futures contracts.
Options The Aggressive Investors 1 Fund may buy and sell calls and puts to increase or decrease the Fund’s exposure to stock market risk or for purposes of diversification of risk. The Managed Volatility Fund may buy and sell calls and puts to reduce the Fund’s volatility and provide some cash flow. An option is a contract conveying a right to buy or sell a financial instrument at a specified price during a stipulated period. The premium paid by a Fund for the purchase of a call or a put option is included in such Fund’s Schedule of Investments as an investment and subsequently marked-to-market to reflect the
| | |
NOTES TO FINANCIAL STATEMENTS (continued) | |
|
June 30, 2012
current market value of the option. When a Fund writes a call or a put option, an amount equal to the premium received by such Fund is included in its Statement of Assets and Liabilities as a liability and is subsequently marked-to-market to reflect the current market value of the option written. If an option which a Fund has written either expires on its stipulated expiration date, or if such Fund enters into a closing purchase transaction, that Fund realizes a gain (or a loss if the cost of a closing purchase transaction exceeds the premium received when the option was written) without regard to any unrealized gain or loss on the underlying security, and the liability related to such options is extinguished. If a call option that a Fund has written is assigned, such Fund realizes a gain or loss from the sale of the underlying security and the proceeds from such sale are increased by the premium originally received. If a put option that a Fund has written is assigned, the amount of the premium originally received reduces the cost of the security that such Fund purchased upon exercise of the option. Buying calls increases a Fund’s exposure to the underlying security to the extent of any premium paid. Buying puts on a stock market index tends to limit a Fund’s exposure to a stock market decline. All options purchased by the Funds were listed on exchanges and considered liquid positions with readily available market quotes.
Covered Call Options and Secured Puts The Aggressive Investors 1 and Managed Volatility Funds may write call options on a covered basis, that is, a Fund will own the underlying security, or a Fund may write secured puts. The principal reason for writing covered calls and secured puts on a security is to attempt to realize income through the receipt of premiums. The option writer has, in return for the premium, given up the opportunity for profit from a substantial price increase in the underlying security so long as the obligation as a writer continues, but has retained the risk of loss should the price of the security decline. All options were listed on exchanges and considered liquid positions with readily available market quotes. Transactions in options written during the fiscal year ended June 30, 2012 are as follows:
| | | | | | | | | | | | | | | | |
| | | Managed Volatility Fund
Written Call Options | | | Managed Volatility Fund
Written Put Options | |
| | | Contracts | | | Premiums | | | Contracts | | | Premiums | |
| | | | | | | | | | | | | | | | |
Outstanding, June 30, 2011 | | | 2,535 | | | $ | 378,986 | | | | 1,735 | | | $ | 251,738 | |
Positions Opened | | | 6,977 | | | | 1,230,648 | | | | 5,134 | | | | 1,012,648 | |
Exercised | | | (2,891) | | | | (519,347) | | | | (2,469) | | | | (443,457) | |
Splits | | | 30 | | | | - | | | | 70 | | | | - | |
Expired | | | (4,492) | | | | (642,601) | | | | (2,982) | | | | (498,756) | |
Closed | | | (618) | | | | (125,293) | | | | (468) | | | | (131,669) | |
Outstanding, June 30, 2012 | | | 1,541 | | | $ | 322,393 | | | | 1,020 | | | $ | 190,504 | |
Market Value, June 30, 2012 | | | | | | $ | 263,921 | | | | | | | $ | 96,780 | |
The Aggressive Investors 1 Fund had no transactions in written options during the fiscal year ended June 30, 2012.
Swaps. Each Fund may enter into total return swaps. Total return swaps are agreements that provide a Fund with a return based on the performance of an underlying asset, in exchange for fee payments to a counterparty based on a specified rate. The difference in the value of these income streams is recorded daily by the Funds and is settled in cash monthly.
The fee paid by a Fund will typically be determined by multiplying the face value of the swap agreement by an agreed upon interest rate. In addition, if the underlying asset declines in value over the term of the swap, a Fund would also be required to pay the dollar value of that decline to the counterparty. Total return swaps could result in losses if the underlying asset does not perform as anticipated by the Adviser. A Fund may use its own NAV as the underlying asset in a total return swap. This strategy serves to reduce cash drag (the impact of cash on a Fund’s overall return) by replacing it with the impact of market exposure based upon a Fund’s own investment holdings. The following total return swaps were open as of June 30, 2012:
| | | | | | | | | | | | |
Bridgeway
Fund | | Swap
Counterparty | | Description | | Notional
Principal | | | Maturity
Date | | Net Unrealized
Gain\(Loss) |
| | | | | | | | | | | | |
| Ultra-Small Company Market | | ReFlow
Management
Co. | | Fund receives the total return of the reference entity, which is this Fund’s NAV. Fund pays a floating rate of 1-month LIBOR plus 2.39%. | | $ | 343,657 | | | July 2, 2012 | | $11,563 |
| Small-Cap Value | | ReFlow
Management
Co. | | Fund receives the total return of the reference entity, which is this Fund’s NAV. Fund pays a floating rate of 1-month LIBOR plus 2.39%. | | | 1,298,293 | | | July 2, 2012 | | 33,837 |
| Large-Cap Growth | | ReFlow
Management
Co. | | Fund receives the total return of the reference entity, which is this Fund’s NAV. Fund pays a floating rate of 1-month LIBOR plus 1.25%. | | | 710,051 | | | July 2, 2012 | | 17,951 |
| | |
109 | | Annual Report | June 30, 2012 |
| | |
NOTES TO FINANCIAL STATEMENTS (continued) | |
|
June 30, 2012
Indemnification Under the Company’s organizational documents, the Funds’ officers, directors, employees and agents are indemnified against certain liabilities that may arise out of the performance of their duties to the Funds. Additionally, in the normal course of business, the Funds enter into contracts that contain a variety of indemnification clauses. The Funds’ maximum exposure under these arrangements is unknown as this would involve future claims that may be made against the Funds that have not yet occurred. However, the Funds have not had prior claims or losses pursuant to these contracts.
3. Management Fees, Other Related Party Transactions and Contingencies:
The Funds have entered into management agreements with the Adviser. As compensation for the advisory services rendered, facilities furnished, and expenses borne by the Adviser, the Funds pay the Adviser a fee pursuant to each Fund’s management agreement, as described below.
Aggressive Investors 1: A total advisory fee is paid by the Fund to the Adviser that is comprised of a Base Fee and a Performance Adjustment. The Base Fee equals the Base Fee Rate times the average daily net assets of the Fund. The Base Fee Rate is based on the following annual rates: 0.90% of the first $250 million of the Fund’s average daily net assets, 0.875% of the next $250 million, 0.85% of the next $500 million and 0.80% of any excess over $1 billion.
The Performance Adjustment equals 4.67% times the difference in cumulative total return between the Fund and the Standard and Poor’s 500 Composite Stock Price Index with dividends reinvested (hereinafter “Index”) over a rolling five-year performance period. The Performance Adjustment Rate varies from a minimum of –0.70% to a maximum of +0.70%. However, the Performance Adjustment Rate is zero if the difference between the cumulative Fund performance and the Index performance is less than or equal to 2%.
Ultra-Small Company: The Fund pays management fees based on the following annual rates: 0.90% of the first $250 million of the Fund’s average daily net assets, 0.875% of the next $250 million and 0.85% of any excess over $500 million. The management fees are computed daily and are payable monthly. However, during any period that the Fund’s net assets range from $27,500,000 to $55,000,000, the advisory fee will be determined as if the Fund had $55,000,000 under management. This is limited to a maximum annualized expense ratio of 1.49% of average net assets.
Ultra-Small Company Market: The Fund’s management fee is a flat 0.50% of the value of the Fund’s average daily net assets, computed daily and payable monthly.
Small-Cap Momentum: The Fund’s management fee is a flat 0.55% of the value of the Fund’s average daily net assets, computed daily and payable monthly.
Small-Cap Growth and Small-Cap Value: A total advisory fee is paid by each Fund to the Adviser that is comprised of a Base Fee and a Performance Adjustment. The Base Fee equals the Base Fee Rate times the average daily net assets of the Fund. The Base Fee Rate is based on the annual rate of 0.60% of the value of the Fund’s average daily net assets.
The Performance Adjustment equals 0.33% times the difference in cumulative total return between the Fund and the Russell 2000 Growth Index for Small-Cap Growth Fund and the Russell 2000 Value Index for Small-Cap Value Fund, with dividends
| | |
NOTES TO FINANCIAL STATEMENTS (continued) | |
|
June 30, 2012
reinvested (hereinafter “Index”) over a rolling five-year performance period. The Performance Adjustment Rate varies from a minimum of -0.05% to a maximum of +0.05%. However, the Performance Adjustment Rate is zero if the difference between the cumulative Fund’s performance and the Index performance is less than or equal to 2%.
Large-Cap Growth: A total advisory fee is paid by the Fund to the Adviser that is comprised of a Base Fee and a Performance Adjustment. The Base Fee equals the Base Fee Rate times the average daily net assets of the Fund. The Base Fee Rate is based on the annual rate of 0.50% of the value of the Fund’s average daily net assets.
The Performance Adjustment equals 0.33% times the difference in cumulative total return between the Fund and the Russell 1000 Growth Index, with dividends reinvested (hereinafter “Index”) over a rolling five-year performance period. The Performance Adjustment Rate varies from a minimum of -0.05% to a maximum of +0.05%. However, the Performance Adjustment Rate is zero if the difference between the cumulative Fund’s performance and the Index performance is less than or equal to 2%.
Blue Chip 35 Index: The Fund’s management fee is a flat 0.08% of the value of the Fund’s average daily net assets, computed daily and payable monthly.
Managed Volatility: The Fund’s management fee is a flat 0.60% of the value of the Fund’s average daily net assets, computed daily and payable monthly.
Expense limitations: The Adviser has agreed to reimburse the Funds for operating expenses and management fees above the expense limitations shown in the table below, which are shown as a ratio of net expenses to average net assets, for each Fund, for the fiscal year ended June 30, 2012. Any material change to the expense limitation would require a vote by shareholders of the applicable Fund.
| | | | | | | | | | |
| Bridgeway Fund | | Expense
Limitation | | Total Waivers and
Reimbursements
for Period Ending
06/30/12 |
| | | | | | | | | | |
Aggressive Investors 1 | | | | 1.75% | | | | | $ - | |
Ultra-Small Company | | | | 1.85% | | | | | - | |
Ultra-Small Company Market | | | | 0.75% | | | | | 252,574 | |
Small-Cap Momentum* | | | | 0.90% | | | | | 127,045 | |
Small-Cap Growth | | | | 0.94% | | | | | 51,402 | |
Small-Cap Value | | | | 0.94% | | | | | 36,268 | |
Large-Cap Growth | | | | 0.84% | | | | | 38,927 | |
Blue Chip 35 Index | | | | 0.15% | | | | | 430,875 | |
Managed Volatility | | | | 0.94% | | | | | 125,149 | |
*The Fund is authorized to reimburse the Adviser for management fees previously waived and/or for expenses previously paid by the Adviser, provided, however, that any reimbursements must be paid at a date not more than three years after the fiscal year in which the Adviser waived the fees or reimbursed the expenses and the reimbursements do not cause the Fund to exceed the expense limitation in the agreement. The Fund has recoupable expenses of $11,221, $101,196 and $127,045, which expire June 30, 2013, June 30, 2014 and June 30, 2015, respectively.
| | |
111 | | Annual Report | June 30, 2012 |
| | |
NOTES TO FINANCIAL STATEMENTS (continued) | |
|
June 30, 2012
Other Related Party Transactions: On occasion, the Funds will engage in inter-portfolio trades when it is to the benefit of both parties. The Board of Directors reviews these trades quarterly. Inter-portfolio purchases and sales during the fiscal year ended June 30, 2012 were as follows:
| | | | | | | | | | |
| Bridgeway Fund | | Inter-portfolio
Purchases | | Inter-portfolio
Sales |
| | | | | | | | | | |
Aggressive Investors 1 | | | | $ - | | | | | $ 44,160 | |
Ultra-Small Company | | | | 90,206 | | | | | 2,791,658 | |
Ultra-Small Company Market | | | | 1,083,006 | | | | | 7,803,343 | |
Small-Cap Momentum | | | | 4,558 | | | | | 268,867 | |
Small-Cap Growth | | | | 1,246,463 | | | | | 470,794 | |
Small-Cap Value | | | | 4,151,491 | | | | | 344,610 | |
Large-Cap Growth | | | | 392,196 | | | | | 423,624 | |
Blue Chip 35 Index | | | | 423,624 | | | | | - | |
The Adviser entered into an Administrative Services Agreement with Bridgeway, pursuant to which the Adviser provides various administrative services to the Funds including, but not limited to: (i) supervising and managing various aspects of the Funds’ business and affairs; (ii) selecting, overseeing and/or coordinating activities with other service providers to the Funds; (iii) providing reports to the Board of Directors as requested from time to time; (iv) assisting and/or reviewing amendments and updates to the Funds’ registration statement and other filings with the Securities and Exchange Commission (“SEC”); (v) providing certain shareholder services; (vi) providing administrative support in connection with meetings of the Board of Directors; and (vii) providing certain record-keeping services. For its services to all of the Funds, the Adviser is paid an aggregate annual fee of $535,000 payable in equal monthly installments.
One director of Bridgeway, John Montgomery, is an owner and director of the Adviser. Another director of Bridgeway, Michael Mulcahy, is an executive and director of the Adviser. Under the 1940 Act definitions, each is considered to be an “affiliated person” of the Adviser and an “interested person” of the Adviser and of Bridgeway. Compensation for Mr. Montgomery and Mr. Mulcahy is borne by the Adviser rather than the Funds.
Board of Directors Compensation Independent Directors are paid an annual retainer of $14,000 with an additional retainer of $2,500 paid to the Independent Chairman of the Board and an additional retainer of $1,000 paid to the Nominating and Corporate Governance Committee Chair. Beginning in 2012 the retainer is paid in quarterly installments. Independent Directors are paid $6,000 per meeting for meeting fees. Such compensation is the total compensation from all Funds and is allocated among the Funds.
The Independent Directors receive this compensation in the form of shares of the Funds, credited to his or her account. Such Directors are reimbursed for any expenses incurred in attending meetings and conferences and expenses for subscriptions or printed materials. The amount of directors’ fees attributable to each Fund is disclosed in the Statements of Operations.
4. Distribution and Shareholder Servicing Fees:
Foreside Fund Services, LLC acts as distributor of the Funds’ shares pursuant to a Distribution Agreement dated November 12, 2010. The Adviser pays all costs and expenses associated with distribution of the Funds’ shares pursuant to a protective plan adopted by shareholders pursuant to Rule 12b-1.
| | |
NOTES TO FINANCIAL STATEMENTS (continued) | |
|
June 30, 2012
5. Purchases and Sales of Investment Securities:
Purchases and sales of investments, other than short-term securities, for each Fund for the fiscal year ended June 30, 2012 were as follows:
| | | | | | | | | | | | | | | | | | | | |
| | | Purchases | | Sales |
| Bridgeway Fund | | U.S. Government | | Other | | U.S. Government | | Other |
| | | | | | | | | | | | | | | | | | | | |
Aggressive Investors 1 | | | | $ - | | | | | $121,140,385 | | | | | $ - | | | | | $136,660,879 | |
Ultra-Small Company | | | | - | | | | | 76,255,169 | | | | | - | | | | | 85,277,636 | |
Ultra-Small Company Market | | | | - | | | | | 99,623,108 | | | | | | | | | | 185,697,212 | |
Small-Cap Momentum | | | | - | | | | | 6,140,783 | | | | | - | | | | | 7,017,900 | |
Small-Cap Growth | | | | - | | | | | 22,950,363 | | | | | - | | | | | 34,819,777 | |
Small-Cap Value | | | | - | | | | | 37,355,102 | | | | | - | | | | | 61,488,270 | |
Large-Cap Growth | | | | - | | | | | 27,321,102 | | | | | - | | | | | 36,997,101 | |
Blue Chip 35 Index | | | | - | | | | | 104,693,975 | | | | | - | | | | | 196,882,689 | |
Managed Volatility | | | | - | | | | | 7,166,942 | | | | | 800,000 | | | | | 9,691,301 | |
6. Federal Income Taxes
It is the Funds’ policy to continue to comply with the provisions of the Internal Revenue Code of 1986, as amended, applicable to regulated investment companies and distribute income to the extent necessary so that the Funds are not subject to federal income tax. Therefore, no federal income tax provision is required.
Unrealized Appreciation and Depreciation on Investments (Tax Basis) The amount of net unrealized appreciation/ depreciation and the cost of investment securities for tax purposes, including short-term securities at June 30, 2012, were as follows:
| | | | | | | | | | | | | | | |
| | | Aggressive Investors 1 | | Ultra-Small
Company | | Ultra-Small
Company Market |
Gross appreciation (excess of value over tax cost) | | | | $ 22,475,566 | | | | | $17,687,324 | | | | | $ 91,548,824 | |
Gross depreciation (excess of tax cost over value) | | | | (13,662,893) | | | | | (7,555,617) | | | | | (12,480,889) | |
Net unrealized appreciation (depreciation) | | | | $ 8,812,673 | | | | | $10,131,707 | | | | | $ 79,067,935 | |
Cost of investments for income tax purposes | | | | $201,015,118 | | | | | $93,729,374 | | | | | $223,950,308 | |
| | | |
| | | Small-Cap Momentum | | Small-Cap Growth | | Small-Cap Value |
Gross appreciation (excess of value over tax cost) | | | | $ 215,517 | | | | | $ 5,264,505 | | | | | $10,941,079 | |
Gross depreciation (excess of tax cost over value) | | | | (59,959) | | | | | (2,465,399) | | | | | (4,573,691) | |
Net unrealized appreciation (depreciation) | | | | $ 155,558 | | | | | $ 2,799,106 | | | | | $ 6,367,388 | |
Cost of investments for income tax purposes | | | | $1,910,903 | | | | | $28,948,972 | | | | | $61,138,476 | |
| | | |
| | | Large-Cap Growth | | Blue Chip 35 Index | | Managed Volatility |
Gross appreciation (excess of value over tax cost) | | | | $ 8,318,212 | | | | | $ 81,820,184 | | | | | $ 4,722,048 | |
Gross depreciation (excess of tax cost over value) | | | | (3,168,454) | | | | | (9,295,040) | | | | | (975,505) | |
Net unrealized appreciation (depreciation) | | | | $ 5,149,758 | | | | | $ 72,525,144 | | | | | $ 3,746,543 | |
Cost of investments for income tax purposes | | | | $42,935,871 | | | | | $191,834,472 | | | | | $19,913,140 | |
The differences between book and tax net unrealized appreciation (depreciation) are primarily due to wash sale loss deferrals, and adjustments to basis from investments in real estate investment trusts, business development companies, grantor trusts and partnerships.
Classifications of Distributions Net investment income (loss) and net realized gain (loss) may differ for financial statement and tax purposes. The character of distributions made during the year from net investment income or net realized gains may differ from its ultimate characterization for federal income tax purposes.
| | |
113 | | Annual Report | June 30, 2012 |
| | |
NOTES TO FINANCIAL STATEMENTS (continued) | |
|
June 30, 2012
The tax character of the distributions paid by the Funds during the last two fiscal years ended June 30, 2012 and June 30, 2011, respectively, are as follows:
| | | | | | | | | | | | | | | | | | | | |
| | | Aggressive Investors 1 | | Ultra-Small Company |
| | | Year Ended
June 30, 2012 | | Year Ended
June 30, 2011 | | Year Ended
June 30, 2012 | | Year Ended
June 30, 2011 |
Distributions paid from: | | | | | | | | | | | | | | | | | | | | |
Ordinary income | | | | $3,284,990 | | | | | $2,167,451 | | | | | $1,269,925 | | | | | $632,748 | |
Total | | | | $3,284,990 | | | | | $2,167,451 | | | | | $1,269,925 | | | | | $632,748 | |
| | |
| | | Ultra-Small Company Market | | Small-Cap Momentum |
| | | Year Ended
June 30, 2012 | | Year Ended
June 30, 2011 | | Year Ended
June 30, 2012 | | Year Ended
June 30, 2011 |
Distributions paid from: | | | | | | | | | | | | | | | | | | | | |
Ordinary income | | | | $ 3,451,142 | | | | | $4,111,396 | | | | | $ 280,424 | | | | | $ 16,889 | |
Long Term Capital Gain | | | | 13,433,187 | | | | | - | | | | | 9,123 | | | | | - | |
Total | | | | $16,884,329 | | | | | $4,111,396 | | | | | $ 289,547 | | | | | $ 16,889 | |
| | |
| | | Small-Cap Growth | | Small-Cap Value |
| | | Year Ended
June 30, 2012 | | Year Ended
June 30, 2011 | | Year Ended
June 30, 2012 | | Year Ended
June 30, 2011 |
Distributions paid from: | | | | | | | | | | | | | | | | | | | | |
Ordinary income | | | | $ 3,204 | | | | | $ 107,719 | | | | | $ 989,896 | | | | | $ 557,827 | |
Total | | | | $ 3,204 | | | | | $ 107,719 | | | | | $ 989,896 | | | | | $ 557,827 | |
| | |
| | | Large-Cap Growth | | Blue Chip 35 Index |
| | | Year Ended
June 30, 2012 | | Year Ended
June 30, 2011 | | Year Ended
June 30, 2012 | | Year Ended
June 30, 2011 |
Distributions paid from: | | | | | | | | | | | | | | | | | | | | |
Ordinary income | | | | $ 342,838 | | | | | $ 342,087 | | | | | $7,110,502 | | | | | $4,877,457 | |
Total | | | | $ 342,838 | | | | | $ 342,087 | | | | | $7,110,502 | | | | | $4,877,457 | |
| | |
| | | Managed Volatility | | |
| | | Year Ended
June 30, 2012 | | Year Ended
June 30, 2011 | |
Distributions paid from: | | | | | | | | | | | |
Ordinary income | | | | $ 151,314 | | | | | $ 266,935 | | |
Total | | | | $ 151,314 | | | | | $ 266,935 | | |
At June 30, 2012, the Funds had available for tax purposes, capital loss carryovers as follows:
| | | | | | | | | | | | | | | | | | |
| | | | | | | Aggressive Investor 1 | | | | Ultra-Small Company | | |
Expiring | | 6/30/2016 | | | | | | $ 9,342,674 | | | | | | | $1,346,595 | | | |
| | 6/30/2017 | | | | | | 177,345,455 | | | | | | | 1,662,540 | | | |
| | 6/30/2018 | | | | | | 16,094,317 | | | | | | | - | | | |
| | |
NOTES TO FINANCIAL STATEMENTS (continued) | |
|
June 30, 2012
| | | | | | | | |
| | | | | Small-Cap Growth | | | | Small-Cap Value |
Expiring | | 6/30/2017 | | $ 6,410,906 | | | | $ 4,037,798 |
| | 6/30/2018 | | 22,793,119 | | | | 50,552,993 |
| | | | | | | | | | | | |
| | | | | Large-Cap Growth | | | | Blue Chip 35 Index | | | | Managed Volatility |
Expiring | | 6/30/2017 | | $ - | | | | $17,847,189 | | | | $ - |
| | 6/30/2018 | | 33,176,486 | | | | 34,451,339 | | | | 6,090,159 |
| | 6/30/2019 | | - | | | | 2,656,190 | | | | - |
Under the Regulated Investment Company Modernization Act of 2010, capital losses incurred by these Funds after June 30, 2011 will not be subject to expiration and will retain their character as either short-term or long-term capital losses. In addition, such losses must be utilized prior to the losses incurred in the years preceding enactment. As a result of the mergers described in Note 1, pre-merger capital loss carryovers are subject to limitations under Internal Revenue Code Sections 381-384. As of the date of the merger the Aggressive Investors 1 Fund had accumulated capital losses of $62,647,229 which are subject to limitation and the Micro-Cap Limited Fund had accumulated losses of $8,287,942 which are subject to limitation.
There are no capital loss carryovers for Ultra-Small Company Market Fund and Small-Cap Momentum Fund as of June 30, 2012.
Capital loss carryovers utilized during the fiscal year June 30, 2012 were as follows:
| | |
| Bridgeway Fund | | Capital Loss
Carryover
Utilized |
| | |
Aggressive Investors 1 | | $ 6,940,180 |
Ultra-Small Company | | 3,714,932 |
Small-Cap Growth | | 4,272,992 |
Small-Cap Value | | 10,710,699 |
Large-Cap Growth | | 4,888,439 |
Blue Chip 35 Index | | 12,220,024 |
Managed Volatility | | 953,714 |
Components of Accumulated Earnings (Deficit) As of June 30, 2012, the components of accumulated earnings (deficit) on a tax basis were:
| | | | | | | | | | |
| | | Aggressive Investors 1 | | | | Ultra-Small Company | | | | Ultra-Small Company Market |
Accumulated Net Investment Income (Loss) | | $ 100,737 | | | | $ 62,838 | | | | $ 2,314,302 |
Accumulated Net Realized Gain (Loss) on Investments* | | (210,458,200) | | | | (6,825,363) | | | | 26,718,152 |
Net Unrealized Appreciation/Depreciation of Investments | | 8,812,673 | | | | 10,131,707 | | | | 79,067,935 |
Total | | $(201,544,790) | | | | $ 3,369,182 | | | | $108,100,389 |
| | | | | |
| | | Small-Cap Momentum | | | | Small-Cap Growth | | | | Small-Cap Value |
Accumulated Net Investment Income (Loss) | | $ 10,077 | | | | $ - | | | | $ 606,513 |
Accumulated Net Realized Gain (Loss) on Investments* | | 77,406 | | | | (29,526,291) | | | | (55,779,626) |
Net Unrealized Appreciation/Depreciation of Investments | | 155,558 | | | | 2,799,106 | | | | 6,367,388 |
Total | | $243,041 | | | | $(26,727,185) | | | | $(48,805,725) |
| | |
115 | | Annual Report | June 30, 2012 |
| | |
NOTES TO FINANCIAL STATEMENTS (continued) | |
|
June 30, 2012
| | | | | | | | | | | | |
| | | Large-Cap Growth | | | Blue Chip 35 Index | | | Managed Volatility | |
Accumulated Net Investment Income (Loss) | | | $ 167,751 | | | | $ 3,580,113 | | | | $ 99,873 | |
Accumulated Net Realized Gain (Loss) on Investments* | | | (33,494,618) | | | | (55,403,139) | | | | (6,101,076) | |
Net Unrealized Appreciation/Depreciation of Investments | | | 5,149,758 | | | | 72,525,144 | | | | 3,746,543 | |
Total | | | $(28,177,109) | | | | $ 20,702,118 | | | | $(2,254,660) | |
| * | Includes qualified late-year losses that the Funds have elected to defer to the beginning of their next fiscal year ending June 30, 2013. The Aggressive Investors 1, Ultra-Small Company, Ultra-Small Company Market, Small-Cap Growth, Small-Cap Value, Large-Cap Growth, Blue Chip 35 Index and Managed Volatility Funds have deferred qualified late-year losses of $7,675,754, $3,816,228, $1,992,931, $322,266, $1,188,835, $318,132, $448,421 and $10,917, respectively. |
For the fiscal year June 30, 2012, the Funds recorded the following reclassifications to the accounts listed below:
| | | | | | | | | | | | |
| | | Increase (Decrease) | |
| | | Aggressive Investors 1 | | | Ultra-Small Company | | | Ultra-Small Company Market | |
Paid-in-Capital | | | $ 139,586,414 | | | | $ 3,055,953 | | | | $ 6,510,635 | |
Undistributed Net Investment Income | | | (23,447) | | | | 25,206 | | | | (400,940) | |
Accumulated Net Realized (Gain) Loss | | | (139,562,967) | | | | (3,081,159) | | | | (6,109,695) | |
| | | |
| | | Small-Cap Momentum | | | Small-Cap Growth | | | Small-Cap Value | |
Paid-in-Capital | | | $ - | | | | $ (104,193) | | | | $ - | |
Undistributed Net Investment Income | | | (399) | | | | 1,740 | | | | 13 | |
Accumulated Net Realized Loss | | | 399 | | | | 102,453 | | | | (13) | |
| | | |
| | | Large-Cap Growth | | | Blue Chip 35 Index | | | Managed Volatility | |
Paid-in-Capital | | | $ - | | | | $ - | | | | $ - | |
Undistributed Net Investment Income | | | 6,197 | | | | - | | | | - | |
Accumulated Net Realized Loss | | | (6,197) | | | | - | | | | - | |
The difference between book and tax components of net assets and the resulting reclassifications were primarily a result of the differing book/tax treatment of the deduction of equalization debits for tax purposes and investments in swaps, partnerships, real estate investment trusts, business development companies, grantor trusts, passive foreign investment companies (PFICs) and adjustments resulting from fund mergers.
Accounting for Uncertainty in Income Taxes sets forth a minimum threshold for financial statement recognition of the benefit of a tax position taken or expected to be taken in a tax return. Management has analyzed each Fund’s tax positions and has concluded that no provision for income tax is required in each Fund’s financial statements. The Funds are not aware of any tax position for which it is reasonably possible that the total amounts of unrecognized tax benefits will significantly change in the next twelve months. Each Fund’s federal tax returns for the prior three fiscal years remains subject to examination by the Internal Revenue Service.
7. Line of Credit
Bridgeway established a line of credit agreement (“Facility”) with The Bank of New York Mellon effective November 5, 2010. The Facility is for temporary or emergency purposes, such as to provide liquidity for shareholder redemptions, and is cancellable by either party. Unless cancelled earlier, the Facility shall be held available until November 2, 2012. Advances under the Facility are limited to $10,000,000 in total for all Funds and advances to each Fund shall not exceed certain limits set forth in the credit agreement, including but not limited to, the maximum amount a Fund is permitted to borrow under the 1940 Act.
The Funds incur a commitment fee of 0.05% per annum on the unused portion of the Facility and interest expense to the extent of amounts borrowed under the Facility. Interest is based on the higher of (a) the Federal Funds rate, (b) the Overnight Eurodollar Rate, or (c) the One-month Eurodollar Rate, plus 1.25%. The commitment fees are payable quarterly in arrears and are allocated to all participating Funds. Interest expense is charged directly to a Fund based upon actual amounts borrowed by such Fund.
| | |
NOTES TO FINANCIAL STATEMENTS (continued) | |
|
June 30, 2012
For the fiscal year ended June 30, 2012, borrowings by the Funds under this line of credit were as follows:
| | | | | | | | | | | | | | | | | | | | | | | | | |
| Bridgeway Fund | | Weighted
Average
Interest Rate | | Weighted
Average
Loan Balance | | Number of
Days
Outstanding | | Interest
Expense
Incurred1 | | Maximum Amount
Borrowed During
the Period |
| | | | | | | | | | | | | | | | | | | | | | | | | |
Aggressive Investors 1 | | | | 1.50 | % | | | $ | 401,427 | | | | | 75 | | | | $ | 1,238 | | | | $ | 1,504,000 | |
Ultra-Small Company | | | | 1.49 | % | | | | 404,222 | | | | | 36 | | | | | 593 | | | | | 1,100,000 | |
Ultra-Small Company Market | | | | 1.50 | % | | | | 1,489,018 | | | | | 111 | | | | | 6,773 | | | | | 6,069,000 | |
Small-Cap Growth | | | | 1.49 | % | | | | 263,297 | | | | | 74 | | | | | 818 | | | | | 1,399,000 | |
Small-Cap Value | | | | 1.49 | % | | | | 377,168 | | | | | 137 | | | | | 2,095 | | | | | 1,877,000 | |
Large-Cap Growth | | | | 1.48 | % | | | | 172,611 | | | | | 90 | | | | | 512 | | | | | 630,000 | |
Blue Chip 35 Index | | | | 1.52 | % | | | | 2,094,296 | | | | | 159 | | | | | 13,525 | | | | | 10,000,000 | |
1Interest expense is included on the Statements of Operations in Miscellaneous expenses.
At June 30, 2012, Blue Chip 35 Index Fund had a loan outstanding in the amount of $9,665,000.
8. Redemption Fees
In Ultra-Small Company Market and Small-Cap Momentum Funds, a 2% redemption fee may be charged on shares held less than six months. The fee is charged for the benefit of the remaining shareholders and will be paid to the appropriate Fund to help offset transaction costs. The fee is accounted for as an addition to paid-in capital.
9. Subsequent Events
Management has evaluated the impact of all subsequent events on the Funds and has determined that there were no subsequent events requiring recognition or disclosure in the financial statements.
| | |
117 | | Annual Report | June 30, 2012 |
| | |
REPORT OF INDEPENDENT REGISTERED PUBLIC ACCOUNTING FIRM | |
|
To the Shareholders and Board of Directors of Bridgeway Funds, Inc. | | |
We have audited the accompanying statements of assets and liabilities of Aggressive Investors 1 Fund, Ultra-Small Company Fund, Ultra-Small Company Market Fund, Small-Cap Momentum Fund, Small-Cap Growth Fund, Small-Cap Value Fund, Large-Cap Growth Fund, Blue Chip 35 Index Fund and Managed Volatility Fund, each a series of Bridgeway Funds, Inc. (the “Funds”), including the schedules of investments, as of June 30, 2012, and the related statements of operations for the year then ended, the statements of changes in net assets for each of the years in the two year period then ended, and the financial highlights for each of the years and periods presented in the five year period then ended. These financial statements and financial highlights are the responsibility of the Funds’ management. Our responsibility is to express an opinion on these financial statements and financial highlights based on our audits.
We conducted our audits in accordance with the standards of the Public Company Accounting Oversight Board (United States). Those standards require that we plan and perform the audits to obtain reasonable assurance about whether the financial statements and financial highlights are free of material misstatement. An audit includes examining, on a test basis, evidence supporting the amounts and disclosures in the financial statements. Our procedures included confirmation of securities owned as of June 30, 2012 by correspondence with the custodian and brokers. An audit also includes assessing the accounting principles used and significant estimates made by management, as well as evaluating the overall financial statement presentation. We believe that our audits provide a reasonable basis for our opinion.
In our opinion, the financial statements and financial highlights referred to above present fairly, in all material respects, the financial position of Aggressive Investors 1 Fund, Ultra-Small Company Fund, Ultra-Small Company Market Fund, Small-Cap Momentum Fund, Small-Cap Growth Fund, Small-Cap Value Fund, Large-Cap Growth Fund, Blue Chip 35 Index Fund and Managed Volatility Fund as of June 30, 2012, the results of their operations for the year then ended, the changes in their net assets for each of the years in the two year period then ended, and financial highlights for each of the years and periods in the five year period then ended, in conformity with accounting principles generally accepted in the United States of America.
| | |
| |  |
| |
| | BBD, LLP |
Philadelphia, Pennsylvania
August 24, 2012
| | |
OTHER INFORMATION | |
|
June 30, 2012 (Unaudited)
1. Shareholder Tax Information
Certain tax information regarding the Funds is required to be provided to shareholders based upon each Fund’s income and distributions for the taxable year ended June 30, 2012. The information and distributions reported herein may differ from information and distributions taxable to the shareholders for the calendar year ended December 31, 2011.
The Funds report the following items with regard to distributions paid during the fiscal year ended June 30, 2012. All reportings are based on financial information available as of the date of this annual report and, accordingly, are subject to change. For each item, it is the intention of each Fund to report the maximum amount permitted under the Internal Revenue Code of 1986, as amended, and the regulations there under.
| | | | | | | | | | | | |
| | | Aggressive
Investor 1 | | | Ultra-Small
Company | | | Ultra-Small
Company Market | |
Corporate Dividends Received Deduction | | | 57.98% | | | | 63.51% | | | | 76.85% | |
Qualified Dividend Income | | | 62.13% | | | | 67.42% | | | | 77.70% | |
Qualified Interest Related Dividends | | | 0.00% | | | | 0.02% | | | | 0.20% | |
Qualified Short Term Capital Gain Dividends | | | 0.00% | | | | 0.00% | | | | 0.00% | |
U.S. Government Income | | | 0.00% | | | | 0.00% | | | | 0.00% | |
| | | Small-Cap
Momentum | | | Small-Cap
Growth | | | Small-Cap Value | |
Corporate Dividends Received Deduction | | | 7.69% | | | | 100.00% | | | | 99.20% | |
Qualified Dividend Income | | | 8.42% | | | | 100.00% | | | | 100.00% | |
Qualified Interest Related Dividends | | | 0.05% | | | | 0.00% | | | | 0.00% | |
Qualified Short Term Capital Gain Dividends | | | 100.00% | | | | 0.00% | | | | 0.00% | |
U.S. Government Income | | | 0.00% | | | | 0.00% | | | | 0.00% | |
| | | Large-Cap
Growth | | | Blue Chip
35 Index | | | Managed
Volatility | |
Corporate Dividends Received Deduction | | | 100.00% | | | | 100.00% | | | | 100.00% | |
Qualified Dividend Income | | | 100.00% | | | | 100.00% | | | | 100.00% | |
Qualified Interest Related Dividends | | | 0.00% | | | | 0.00% | | | | 37.33% | |
Qualified Short Term Capital Gain Dividends | | | 0.00% | | | | 0.00% | | | | 0.00% | |
U.S. Government Income | | | 0.00% | | | | 0.00% | | | | 28.65% | |
U.S. Government Income represents the amount of interest that was derived from direct U.S. Government obligations. Generally, such interest is exempt from state income tax. However, for residents of California, New York and Connecticut the statutory threshold requirements were not satisfied. Due to the diversity in state and local tax law, it is recommended you consult a tax adviser as to the applicability of the information provided for your specific situation.
During the fiscal year ended June 30, 2012, the Funds paid distributions from ordinary income and long-term capital gain which included equalization debits summarized below:
| | | | | | | | | | | | | | | | | | |
| | | Aggressive
Investors 1 | | | Ultra-Small
Company | | | Ultra-Small
Company Market | | | Small-Cap
Momentum | | | |
Ordinary Income Distributions | | $ | 3,284,990 | | | $ | 1,269,925 | | | $ | 3,451,142 | | | $ | 280,424 | | |
Equalization Debits Included in Ordinary Income Distributions | | | - | | | | - | | | | 257,148 | | | | - | | |
Equalization Debits Included in Long-Term Capital Gain Distributions | | | - | | | | - | | | | 6,253,487 | | | | - | | |
Long-Term Capital Gain Distributions | | | - | | | | - | | | | 13,433,187 | | | | 9,123 | | |
| | | | | |
| | | Small-Cap
Growth | | | Small-Cap
Value | | | Large-Cap
Growth | | | Blue Chip
35 Index | | | Managed Volatility |
Ordinary Income Distributions | | $ | 3,204 | | | $ | 989,896 | | | $ | 342,838 | | | $ | 7,110,502 | | | $151,314 |
| | |
119 | | Annual Report | June 30, 2012 |
| | |
OTHER INFORMATION (continued) | |
|
June 30, 2012 (Unaudited)
2. Proxy Voting
Fund policies and procedures used in determining how to vote proxies relating to the Funds’ securities and a summary of proxies voted by the Funds for the period ended June 30, 2012 are available without a charge, upon request, by contacting Bridgeway Funds at 1-800-661-3550 and on the SEC’s website at http://www.sec.gov.
3. Fund Holdings
The complete schedules of the Funds’ holdings for the second and fourth quarters of each fiscal year are contained in the Funds’ Semi-Annual and Annual shareholder reports, respectively.
The Bridgeway Funds file complete schedules of the Funds’ holdings with the SEC for the first and third quarters of each fiscal year on Form N-Q within 60 days after the end of the period. Copies of the Funds’ Form N-Q are available without charge, upon request, by contacting Bridgeway Funds at 1-800-661-3550 and on the SEC’s website at http://www.sec.gov. You may also review and copy Form N-Q at the SEC’s Public Reference Room in Washington, D.C. For more information about the operation of the Public Reference Room, please call 1-800-SEC-0330.
4. Approval of Investment Management Agreement
The Bridgeway Funds, Inc.’s (the “Company”) management agreement (the “Management Agreement”) with its investment adviser, Bridgeway Capital Management, Inc. (the “Adviser”), on behalf of each of the Company’s funds (each a “Fund” and collectively, the “Funds”) must be approved for an initial term no greater than two years and renewed at least annually thereafter (i) by the vote of the Directors or by a vote of the shareholders of each Fund and (ii) by the vote of a majority of the Directors who are not parties to the Management Agreement or “interested persons” of any party thereto (the “Independent Directors”), cast in person at a meeting called specifically for the purpose of voting on such approval.
The Board of Directors (the “Board”) has five regularly scheduled meetings each year and takes into account throughout the year matters bearing on the Management Agreement. The Board and its standing committees also consider at each meeting factors that are relevant to the annual renewal of each Fund’s Management Agreement, including the services and support provided to each Fund and its shareholders.
On June 1, 2012, the Board, including a majority of the Independent Directors, met in person (the “Meeting”) with the Adviser, Company counsel, independent legal counsel (“Independent Legal Counsel”) to the Independent Directors and others to give consideration to information bearing on the continuation of the Management Agreement with respect to the following Funds: Aggressive Investors 1 Fund, Ultra-Small Company Fund, Ultra-Small Company Market Fund, Small-Cap Growth Fund, Small-Cap Value Fund, Large-Cap Growth Fund, Blue Chip 35 Index Fund, Managed Volatility Fund and Small-Cap Momentum Fund. In preparation for the Meeting, the Independent Directors requested that the Adviser provide specific information relevant to their consideration of the renewal of each Fund’s Management Agreement. In response to that request, the Independent Directors were furnished with a wide variety of information with respect to each Fund, including:
| | — | | investment performance over various time periods and the fees and expenses of each Fund as compared to a comparable group of funds (the “peer funds”); |
| | — | | the nature, extent and quality of services provided by the Adviser to each Fund, including investment advisory and administrative services; |
| | — | | actual management fees paid by each Fund to the Adviser; |
| | — | | the Adviser’s costs of providing services to each Fund and the profitability of the Adviser derived from its relationship with each Fund; |
| | — | | the extent to which economies of scale may be present and if so, the degree to which they would be shared with the Fund’s shareholders; |
| | |
OTHER INFORMATION (continued) | |
|
June 30, 2012 (Unaudited)
| | — | | any “fall out” or ancillary benefits accruing to the Adviser as a result of its relationship with each Fund; and |
| | — | | information regarding the structure of the advisory fees, the method of computing fees and the frequency of payment of fees and any expense limitation or fee waiver arrangements for each Fund. |
The Independent Directors also met telephonically with Independent Legal Counsel prior to the Meeting to review and discuss the information provided by the Adviser and, as a result of the telephonic meeting, requested certain additional information from the Adviser. Moreover, the Independent Directors also met in executive session with Independent Legal Counsel to consider the continuation of the Management Agreement outside the presence of management during the Meeting.
In considering the aforementioned information, the Independent Directors took into account management style, investment strategies and prevailing market conditions. Furthermore, in evaluating the Management Agreement, the Directors also reviewed information provided by the Adviser concerning the following:
| | — | | the terms of the Management Agreement, including the services performed by the Adviser in managing each Fund in accordance with each Fund’s investment objectives, policies and restrictions and how those services and fees differ from the Adviser’s services to non-mutual fund accounts, to the extent applicable; |
| | — | | the services provided by the Adviser under a separate Administrative Services Agreement and the fact that those services were provided at approximately cost to the Funds; |
| | — | | the Adviser’s specialized skills and experience in statistical analysis and investment management and trading; |
| | — | | the Adviser’s personnel, staffing levels and the time and attention the Adviser’s personnel devote to the management of the Funds as compared to other Adviser clients; |
| | — | | the Adviser’s risk assessment and risk management capabilities; |
| | — | | the fact that the Adviser continues to use no soft dollars; and |
| | — | | the financial condition and stability of the Adviser, including supplemental financial information provided upon the request of the Independent Directors and the fact that at the current time, the Adviser is operating each Fund at a loss. |
After extensive discussion and consideration among themselves, and with the Adviser, Company counsel and Independent Legal Counsel, including during an executive session with Independent Legal Counsel, the Independent Directors concluded the following:
| | — | | the nature, extent and quality of the Adviser’s services were appropriate and consistent with the terms of the Management Agreement and mutual fund industry norms; |
| | — | | the investment performance of each Fund was either acceptable or better or subject to reasonable steps by the Adviser to monitor or address underperformance; |
| | — | | the management fees and overall expense levels, after taking into account any applicable management fee and expense waivers, were reasonable; |
| | — | | the costs of services provided by the Adviser to each Fund were fair and reasonable in relation to the services and benefits provided to each Fund; and |
| | — | | the shareholders of each Fund have appropriately benefitted from economies of scale, either directly through expense caps, fee waivers and/or breakpoints, or were not missing the opportunity to benefit from economies of scale in view of asset sizes and fee structures. |
| | |
121 | | Annual Report | June 30, 2012 |
| | |
OTHER INFORMATION (continued) | |
|
June 30, 2012 (Unaudited)
In summary, the Independent Directors renewed the Management Agreement with respect to each Fund. The Independent Directors valued access by the Funds to the Adviser’s proprietary statistically driven investment management services and favorable fee levels, considered the steps the Adviser was taking to address underperformance of certain Funds and concluded that renewal of the Management Agreement was in the best interests of each Fund and its shareholders. Based on all of the information presented, the Board, including a majority of its Independent Directors, determined on a Fund-by-Fund basis that the fees charged under the Management Agreement are reasonable in relation to the services that are provided under the Management Agreement. In view of the broad scope and variety of factors and information, the Directors did not identify any single factor as being of paramount importance in reaching their conclusions and determinations to approve the continuance of the Management Agreement for each Fund. Rather, the approval determinations were made on the basis of each Director’s business judgment after consideration of all of the factors taken in their entirety.
| | |
DISCLOSURE OF FUND EXPENSES | |
|
June 30, 2012 (Unaudited) | | |
As a shareholder of a Fund, you will incur no transaction costs from such Fund, including sales charges (loads) on purchases, on reinvested dividends or on other distributions. There are no exchange fees. Shareholders are subject to redemption fees on the Ultra-Small Company Market and Small-Cap Momentum Funds under certain circumstances. However, as a shareholder of a Fund, you will incur ongoing costs, including management fees and other Fund expenses. The following examples are intended to help you understand your ongoing costs (in dollars) of investing in a Fund and to compare these costs with ongoing costs of investing in other mutual funds. The examples are based on an investment of $1,000 invested on January 1, 2012 and held until June 30, 2012.
Actual Expenses. The first line of the table below provides information about actual account values and actual expenses. You may use the information in this line, together with the amount you invested, to estimate the expenses that you paid over the period. Simply divide your account value by $1,000 (for example, an $8,600 account value divided by $1,000 = 8.6), then multiply the result by the number in the first line under the heading “Expenses Paid During Period” to estimate the expenses you paid on your account during the period.
Hypothetical Example for Comparison Purposes. The second line of the table below provides information about hypothetical account values and hypothetical expenses based on the Fund’s actual expense ratio and an assumed rate of return of 5% per year before expenses, which is not the Fund’s actual return. The hypothetical account values and expenses may not be used to estimate the actual ending account balance or expenses you paid for the period. You may use this information to compare the ongoing costs of investing in a Fund and other mutual funds. To do so, compare this 5% hypothetical example with the 5% hypothetical examples that appear in the shareholder reports of other funds.
The expenses shown in the table are meant to highlight ongoing Fund costs only. Therefore, the second line of the table is useful in comparing ongoing costs only and will not help you determine the relative total costs of owning different funds, because other funds may also have transaction costs, such as sales charges, redemption fees or exchange fees.
| | | | | | | | |
| | | Beginning Account
Value at 1/1/12 | | Ending Account
Value at 6/30/12 | | Expense
Ratio | | Expenses Paid
During Period*
1/1/12 - 6/30/12 |
| | | | |
Bridgeway Aggressive Investors 1 | | | | | | | | |
Actual Fund Return | | $1,000.00 | | $1,086.20 | | 0.20% | | $1.04 |
Hypothetical Fund Return | | $1,000.00 | | $1,024.00 | | 0.20% | | $1.01 |
| | | | |
Bridgeway Ultra-Small Company Fund | | | | | | | | |
Actual Fund Return | | $1,000.00 | | $1,130.60 | | 1.22% | | $6.50 |
Hypothetical Fund Return | | $1,000.00 | | $1,018.90 | | 1.22% | | $6.16 |
| | | | |
Bridgeway Ultra-Small Company Market Fund | | | | | | | | |
Actual Fund Return | | $1,000.00 | | $1,139.00 | | 0.75% | | $4.01 |
Hypothetical Fund Return | | $1,000.00 | | $1,021.25 | | 0.75% | | $3.79 |
| | | | |
Bridgeway Small-Cap Momentum Fund | | | | | | | | |
Actual Fund Return | | $1,000.00 | | $1,073.50 | | 0.90% | | $4.67 |
Hypothetical Fund Return | | $1,000.00 | | $1,020.50 | | 0.90% | | $4.55 |
| | | | |
Bridgeway Small-Cap Growth Fund | | | | | | | | |
Actual Fund Return | | $1,000.00 | | $1,062.10 | | 0.94% | | $4.85 |
Hypothetical Fund Return | | $1,000.00 | | $1,020.30 | | 0.94% | | $4.75 |
| | | | |
Bridgeway Small-Cap Value Fund | | | | | | | | |
Actual Fund Return | | $1,000.00 | | $1,088.90 | | 0.94% | | $4.91 |
Hypothetical Fund Return | | $1,000.00 | | $1,020.30 | | 0.94% | | $4.75 |
| | |
123 | | Annual Report | June 30, 2012 |
| | |
DISCLOSURE OF FUND EXPENSES (continued) | |
|
June 30, 2012 (Unaudited)
| | | | | | | | | | | | | | | | | | | | |
| | | Beginning Account
Value at 1/1/12 | | Ending Account
Value at 6/30/12 | | Expense
Ratio | | Expenses Paid
During Period*
1/1/12 - 6/30/12 |
| | | | |
Bridgeway Large-Cap Growth Fund | | | | | | | | | | | | | | | | | | | | |
Actual Fund Return | | | $ | 1,000.00 | | | | $ | 1,089.10 | | | | | 0.84 | % | | | $ | 4.39 | |
Hypothetical Fund Return | | | $ | 1,000.00 | | | | $ | 1,020.80 | | | | | 0.84 | % | | | $ | 4.24 | |
| | | | |
Bridgeway Blue Chip 35 Index Fund | | | | | | | | | | | | | | | | | | | | |
Actual Fund Return | | | $ | 1,000.00 | | | | $ | 1,099.70 | | | | | 0.16 | % | | | $ | 0.84 | |
Hypothetical Fund Return | | | $ | 1,000.00 | | | | $ | 1,024.20 | | | | | 0.16 | % | | | $ | 0.81 | |
| | | | |
Bridgeway Managed Volatility | | | | | | | | | | | | | | | | | | | | |
Actual Fund Return | | | $ | 1,000.00 | | | | $ | 1,041.90 | | | | | 0.94 | % | | | $ | 4.80 | |
Hypothetical Fund Return | | | $ | 1,000.00 | | | | $ | 1,020.30 | | | | | 0.94 | % | | | $ | 4.75 | |
| * | Expenses are equal to the average account value times the Fund’s annualized expense ratio multiplied by the number of days in the most recent half-year divided by the number of days in the fiscal year. |
| | |
RESULTS OF SHAREHOLDER MEETING | | |
June 30, 2012 (Unaudited) | | |
On May 30, 2012, a Special Meeting of Shareholders for the Aggressive Investors 2 Fund (“AI2 Fund”) was held to consider the approval of the Plan of Reorganization between the AI2 Fund and the Aggressive Investors 1 Fund (“AI1 Fund”) which provides for (1) the conversion of the shares of the AI2 Fund into shares of the AI1 Fund and (2) the resulting transfer to the AI1 Fund of all of the property, assets and goodwill of the AI2 Fund. The following votes were recorded during the meeting (percentages are reflective of total shares voted at the meeting).
| | | | | | | | |
| | | Shares Voted | | | Percentage of Voted Shares | |
Votes For | | | 5,786,022.503 | | | | 94.41% | |
Votes Against | | | 221,560.981 | | | | 3.61% | |
Votes Abstained | | | 121,143.107 | | | | 1.98% | |
On May 30, 2012, a Special Meeting of Shareholders for the Micro-Cap Limited Fund (“MCL Fund”) was held to consider the approval of the Plan of Reorganization between MCL Fund and the Ultra-Small Company Fund (“USC Fund”) which provides for (1) the conversion of the shares of the MCL Fund into shares of the USC Fund and (2) the resulting transfer to the USC Fund of all of the property, assets and goodwill of the MCL Fund. The following votes were recorded during the meeting (percentages are reflective of total shares voted at the meeting).
| | | | | | | | |
| | | Shares Voted | | | Percentage of Voted Shares | |
Votes For | | | 1,708,427.845 | | | | 95.62% | |
Votes Against | | | 58,142.586 | | | | 3.25% | |
Votes Abstained | | | 20,136.313 | | | | 1.13% | |
| | |
125 | | Annual Report | June 30, 2012 (Unaudited) |
| | |
DIRECTORS & OFFICERS | | |
June 30, 2012 | | |
Independent Directors
| | | | | | | | | | |
Name, Address and Age1 | | Position Held with Bridgeway Funds | | Term of Office and Length of Time Served | | Principal Occupation(s) During Past Five Years | | No. of Bridgeway Funds Overseen by Director | | Other Directorships Held by Director |
| | | | | |
Kirbyjon Caldwell Age 59 | | Director | | Term: 1 Year Length: 2001 to Present. | | Senior Pastor of Windsor Village United Methodist Church, since 1982. | | Eleven | | American Church Mortgage Company, NRG Energy, Inc., Amegy Bancshares Advisory Board |
| | | | | |
Karen S. Gerstner Age 57 | | Director | | Term: 1 Year Length: 1994 to Present. | | Principal, Karen S. Gerstner & Associates, P.C., since 2004. | | Eleven | | None |
| | | | | |
Miles Douglas Harper, III* Age 49 | | Director | | Term: 1 Year Length: 1994 to Present. | | Partner, Gainer, Donnelly, Desroches, LLP, since 1998. | | Eleven | | Calvert Social Investment Fund (8 Portfolios), Calvert Social Index Series, Inc. (1 Portfolio), Calvert Impact Fund (4 Portfolios), Calvert World Values Fund (3 Portfolios) |
| | | | | |
Evan Harrel Age 51 | | Director | | Term: 1 Year Length: 2006 to Present. | | Executive Director, Small Steps Nurturing Center, 2004 through May 2012. | | Eleven | | None |
| | | | | |
| | | | | | | | | | |
|
| | |
DIRECTORS & OFFICERS (continued) | | |
June 30, 2012
“Interested” or Affiliated Directors and Officers
| | | | | | | | | | |
Name, Address and Age1 | | Position(s) Held with Bridgeway Funds | | Term of Office and Length of Time Served | | Principal Occupation(s) During Past Five Years | | No. of Bridgeway Funds Overseen by Director | | Other Directorships Held by Director |
| | | | | |
Michael D. Mulcahy2 Age 48 | | President and Director | | Term: 1 Year Length: 2003 to Present. | | President and Chief Operating Officer, Bridgeway Capital Management, Inc., 10/2010 - present, President, Bridgeway Funds, 6/2005 - present. Director, Secretary and Vice President, Bridgeway Capital Management, Inc., 12/2002 - 10/2010. | | Eleven | | None |
| | | | | |
John N. R. Montgomery3 Age 56 | | Vice President and Director | | Term: 1 Year Length: 1993 to Present. | | Chairman, Bridgeway Capital Management, Inc., 10/2010 - present, Vice President, Bridgeway Funds, 6/2005 - present, President, Bridgeway Capital Management, Inc., 11/1993 - 10/2010. | | Eleven | | None |
| | | | | |
| | | | | | | | | | |
|
| | |
127 | | Annual Report | June 30, 2012 |
| | |
DIRECTORS & OFFICERS (continued) | | |
June 30, 2012
Other Officers
| | | | | | | | | | |
Name, Address and Age1 | | Position Held with Bridgeway Funds | | Term of Office and Length of Time Served | | Principal Occupation(s) During Past Five Years | | No. of Bridgeway Funds Overseen by Officer | | Other Directorships Held by Officer |
| | | | | |
Richard P. Cancelmo, Jr. Age 54 | | Vice President | | Term: 1 Year Length: 2004 to Present. | | Vice President, Bridgeway Funds, 11/2004 - present, Staff member, Bridgeway Capital Management, Inc., since 2000. | | N/A | | None |
| | | | | |
Linda G. Giuffré Age 50 | | Treasurer and Chief Compliance Officer | | Term: 1 Year Length: 2004 to Present. | | Chief Compliance Officer, Bridgeway Capital Management, Inc., 12/2004 - present, Staff member, Bridgeway Capital Management, Inc., 5/2004 - present. | | N/A | | None |
| | | | | |
Deborah L. Hanna Age 47 | | Secretary | | Term: 1 Year Length: 2007 to Present. | | Self-employed, accounting and related projects for various organizations, 2001 - present. | | N/A | | None |
| | | | | |
Sharon Lester Age 57 | | Vice President | | Term: 1 Year Length: 2011 to Present. | | Staff member, Bridgeway Capital Management, Inc., 12/2010 - present. Prior to 12/2010, Director of Portfolio Operations, Invesco. | | N/A | | None |
| 1 | The address of all of the Directors and Officers of Bridgeway Funds is 20 Greenway Plaza, Suite 450, Houston, Texas, 77046. |
| 2 | Michael Mulcahy is a director and officer of Bridgeway Capital Management, Inc., and therefore an interested person of Bridgeway Funds. |
| 3 | John Montgomery is chairman, director and majority shareholder of Bridgeway Capital Management, Inc., and therefore an interested person of Bridgeway Funds. |
The overall management of the business and affairs of Bridgeway Funds is vested with its Board of Directors (the “Board”). The Board approves all significant agreements between Bridgeway Funds and persons or companies furnishing services to it, including agreements with its Adviser and Custodian. The day-to-day operations of Bridgeway Funds are delegated to its officers, subject to its investment objectives and policies and general supervision by the Board.
The Funds’ Statement of Additional Information includes additional information about the Board and is available, without charge, upon request by calling 1-800-661-3550.
THIS PAGE INTENTIONALLY LEFT BLANK
| | | | |
| | |
| | | | |
| | |
| | | | |
| | BRIDGEWAY FUNDS, INC. | | |
| | BNY Mellon Investment Servicing (US) Inc. 301 Bellevue Parkway Wilmington, DE 19809 | | |
| | CUSTODIAN | | |
| | The Bank of New York Mellon One Wall Street New York, NY 10286 | | |
| | DISTRIBUTOR | | |
| | Foreside Fund Services, LLC Three Canal Plaza, Suite 100 Portland, ME 04101 | | |
| | |
| | | | |
| | You can review and copy information about our Funds (including the SAIs) at the SEC’s Public Reference Room in Washington, D.C. To find out more about this public service, call the SEC at 800-SEC-0330. Reports and other information about the Funds is also available on the SEC’s website at www.sec.gov. You can receive copies of this information, for a fee, by writing the Public Reference Section, Securities and Exchange Commission, Washington, D.C. 20549-1520 or by sending an electronic request to the following email address: publicinfo@sec.gov. | | |

| | | | |
| | A no-load mutual fund family of domestic funds |
| | |
| | Annual Report | | |
| | |
| | June 30, 2012 | | |
| | |
| | OMNI SMALL-CAP VALUE | | BOSVX |
| | |
| | OMNI TAX-MANAGED SMALL-CAP VALUE | | BOTSX |
| | |
TABLE OF CONTENTS | | 
|
Bridgeway Funds Standardized Returns as of June 30, 2012 (Unaudited)
| | | | | | | | | | | | | | | | | | | | | | | | |
| | | | | | | Annualized | | | | | | | | |
| Fund | | Quarter | | Six Months | | 1 Year | | | 5 Years | | 10 Years | | Inception
to Date | | | Inception
Date | | | Gross
Expense
Ratio2 | | Net
Expense
Ratio |
Omni Small-Cap Value | | -6.32% | | 7.24% | | | NA | | | NA | | NA | | | 11.41%* | | | | 8/31/2011 | | | 1.00%1 | | 0.60%1 |
Omni Tax-Managed Small-Cap Value | | -6.42% | | 6.80% | | | -5.41% | | | NA | | NA | | | 0.69% | | | | 12/31/2010 | | | 1.56%1 | | 0.60%1 |
1 Some of the Funds’ fees were waived or expenses reimbursed; otherwise, returns would have been lower. The Adviser has contractually agreed to waive fees and/or reimburse expenses. Any material change to this Fund policy would require a vote by shareholders.
2 Expense ratios are as stated in the current prospectus. Please see financial highlights for expense ratios as of June 30, 2012.
* Not annualized.
Performance figures quoted represent past performance and are no guarantee of future results. Current performance may be lower or higher than the performance data quoted. Investment return and principal value will fluctuate, so that an investor’s shares, when redeemed, may be worth more or less than original cost. To obtain performance current to the most recent month-end, please visit our website at www.bridgeway.com or call 1-800-661-3550. Total return figures include the reinvestment of dividends and capital gains.
This report is submitted for the general information of the shareholders of each Fund. It is not authorized for distribution to prospective investors unless preceded or accompanied by an effective prospectus, which includes information regarding a Fund’s risks, objectives, fees and expenses, experience of its management, and other information. Investors should read the prospectus carefully before investing in a Fund. For questions or other Fund information, call 1-800-661-3550 or visit the Funds’ website at www.bridgeway.com. Funds are available for purchase by residents of the United States, Puerto Rico, U.S. Virgin Islands and Guam only. Foreside Fund Services, LLC, Distributor.
The views expressed here are exclusively those of Fund management. These views, including those relating to the market, sectors or individual stocks are not meant as investment advice and should not be considered predictive in nature.
| | |
| LETTER FROM THE INVESTMENT MANAGEMENT TEAM | | |
June 30, 2012
Dear Fellow Shareholders,
At Bridgeway, we have a shared passion for applying logic, data, and evidence to develop investment solutions. Our Omni Small-Cap Value and Omni Tax-Managed Small-Cap Value Funds are constructed based on fundamental academic research that relies on market efficiency to better capture risk premiums. We manage these Funds to provide broad diversification within the small-cap value universe and to keep transaction fees and expenses low. Bridgeway offers the Omni Small-Cap Value and Omni Tax-Managed Small-Cap Value Funds through a select group of advisers. We are committed to advisers and their clients who take a long-term perspective and whose investment goals fit our unique expertise: delivering investment solutions that are statistically driven and grounded in academic theory.
Thank you for your investment in Bridgeway’s Omni Small-Cap Value and Omni Tax-Managed Small-Cap Value Funds.
Sincerely,
Your Investment Management Team
| | | | |
 | |  | |  |
| John Montgomery | | Rasool Shaik | | Christine Liang |
Market Review
The positive momentum that carried the market at the end of 2011 and through the first quarter of 2012 came to an end in the second quarter. U.S. stocks were volatile during the quarter with most of the losses coming in May. Broad market returns for the quarter were down 3.15% as represented by the Russell 3000 Index. Value stocks generally outperformed growth stocks with large-cap value stocks leading the way as represented by the Russell 1000 Value index, down 2.20%.
For the fiscal year period ended June 30, 2012, broad market stocks were up 3.84% as represented by the Russell 3000 Index. Returns were mixed among value and growth stocks and across the market cap spectrum. Large-cap growth stocks, as represented by the Russell 1000 Growth Index, led the way, up 5.76%.
The following table presents returns for broad market, small-cap, mid-cap, and large-cap stocks as represented by various style-based Russell Indexes. Size (market capitalization) and style (value/growth) are among the key factors that drive differences in returns among U.S. stocks.
Russell Style-Based Indexes Ranked by Performance for the Quarter and Fiscal Year Ended June 30, 2012
| | | | | | | | |
| | | | | 2q12 | | 12-Months | | |
| | Best Performing | | Russell 1000 Value Index -2.20% | | Russell 1000 Growth Index +5.76% | | |
| | | | Russell 3000 Value Index -2.26% | | Russell 3000 Growth Index +5.05% | | |
| | | | Russell 2000 Value Index -3.01% | | Russell 1000 Value Index +3.01% | | |
| | | | Russell Mid-Cap Value Index -3.26% | | Russell 3000 Value Index +2.64% | | |
| | | | Russell 2000 Growth Index -3.94% | | Russell Mid-Cap Value Index -0.37% | | |
| | | | Russell 3000 Growth Index -4.02% | | Russell 2000 Value Index -1.44% | | |
| | | | Russell 1000 Growth Index -4.02% | | Russell 2000 Growth Index -2.71% | | |
| | Worst Performing | | Russell Mid-Cap Growth Index -5.60% | | Russell Mid-Cap Growth Index -2.99% | | |
The Bridgeway Omni Funds in this annual report are asset class exposure strategies that seek broad diversification and risk premium exposure. These Funds are designed to capture the size and style benefits within a specific asset class.
| | |
| Omni Small-Cap Value Fund | | |
MANAGER’S COMMENTARY (Unaudited) | | |
June 30, 2012
Dear Fellow Omni Small-Cap Value Fund Shareholder,
For the quarter ended June 30, 2012, total returns were -6.32% for the Fund and -3.01% for the Russell 2000 Value Index. For the partial fiscal year ended June 30, 2012, total returns were 11.41% for the Fund and 11.81% for the Russell 2000 Value Index.
The table below presents our June quarter and inception-to-date financial results. See below for a graph of performance since inception.
Standardized Returns as of June 30, 2012
| | | | | | |
| | | Quarter | | | Since Inception
(8/31/11) |
| | |
Omni Small-Cap Value Fund | | | -6.32% | | | 11.41% |
Russell 2000 Value Index | | | -3.01% | | | 11.81% |
Performance figures quoted in the table above and graph below represent past performance and are no guarantee of future results. Total return figures in the table above include the reinvestment of dividends and capital gains. The table above and the graph below do not reflect the deduction of taxes that a shareholder would pay on Fund distributions or the redemption of Fund shares.
The Russell 2000 Value Index is an unmanaged index that consists of stocks in the Russell 2000 Index with lower price-to-book ratios and lower forecasted growth values with dividends reinvested. It is not possible to invest directly in an index.
Omni Small-Cap Value Fund vs. Russell 2000 Value Index from Inception 8/31/11 to 6/30/12
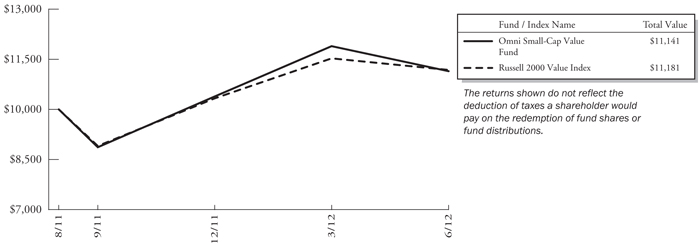
| | |
2 | | Annual Report | June 30, 2012 |
| | |
Omni Small-Cap Value Fund MANAGER’S COMMENTARY (Unaudited) (continued) | | |
Detailed Explanation of Quarterly Performance
The Omni Small-Cap Value Fund is designed to capture the returns of the small-cap value asset class through broad diversification of small company and value stocks. This approach is sometimes referred to as “passive, asset class investing.” As of June 30, 2012, we held 625 such stocks in a market cap weighted style. We make no attempt to track any public index in either performance or statistics.
The Fund returns were driven by the fact that returns for small stocks were negative across the board. Declines were broadly spread across almost all sectors. The design tilt towards smaller and deeper value stocks resulted in heavy underweighting in the strong performing Financials sector, which hurt the Fund’s performance for the quarter relative to the Russell 2000 Value Index.
Detailed Explanation of Fiscal Period Performance (8/31/11 - 6/30/12)
Our smaller-cap dominance and deeper value bent helped the performance for the fiscal year. The design tilt towards smaller and deeper value stocks resulted in heavy underweighting in the Financials sector, the best performing sector, which hurt the Fund’s return relative to the Russell 2000 Value Index.
Top Ten Holdings as of June 30, 2012
| | | | | | |
| Rank Description | | Industry | | % of Net
Assets |
| 1 | | Worthington Industries, Inc. | | Metals & Mining | | 0.9% |
| 2 | | ANN, Inc. | | Specialty Retail | | 0.8% |
| 3 | | Cloud Peak Energy, Inc. | | Oil, Gas & Consumable Fuels | | 0.8% |
| 4 | | Group 1 Automotive, Inc. | | Specialty Retail | | 0.8% |
| 5 | | SUPERVALU, Inc. | | Food & Staples Retailing | | 0.8% |
| 6 | | US Airways Group, Inc. | | Airlines | | 0.7% |
| 7 | | Cracker Barrel Old Country Store, Inc. | | Hotels, Restaurants & Leisure | | 0.7% |
| 8 | | SYNNEX Corp. | | Electronic Equipment, Instruments & Components | | 0.7% |
| 9 | | Cooper Tire & Rubber Co. | | Auto Components | | 0.7% |
| 10 | | Select Medical Holdings Corp. | | Health Care Providers & Services | | 0.7% |
| | | Total | | | | 7.6% |
Industry Sector Representation as of June 30, 2012
| | | | | | | | | | | | |
| | | % of Net Assets | | | % of Russell 2000
Value Index | | | Difference | |
Consumer Discretionary | | | 25.6% | | | | 11.4% | | | | 14.2% | |
Consumer Staples | | | 6.0% | | | | 2.7% | | | | 3.3% | |
Energy | | | 8.8% | | | | 6.7% | | | | 2.1% | |
Financials | | | 12.3% | | | | 35.8% | | | | -23.5% | |
Health Care | | | 5.5% | | | | 4.8% | | | | 0.7% | |
Industrials | | | 18.4% | | | | 12.9% | | | | 5.5% | |
Information Technology | | | 11.4% | | | | 13.0% | | | | -1.6% | |
Materials | | | 9.5% | | | | 5.1% | | | | 4.4% | |
Telecommunication Services | | | 1.9% | | | | 0.6% | | | | 1.3% | |
Utilities | | | 0.2% | | | | 7.0% | | | | -6.8% | |
Cash & Other Assets | | | 0.4% | | | | 0.0% | | | | 0.4% | |
Total | | | 100.0% | | | | 100.0% | | | | | |
| | |
Omni Small-Cap Value Fund MANAGER’S COMMENTARY (Unaudited) (continued) | | |
Disclaimer
The views expressed here are exclusively those of Fund management. These views, including those related to market sectors or individual stocks, are not meant as investment advice and should not be considered predictive in nature. Any favorable (or unfavorable) description of a holding applies only as of the quarter-end, June 30, 2012, unless otherwise stated. Security positions can and do change thereafter. Discussions of historical performance do not guarantee and may not be indicative of future performance.
Market volatility can significantly impact short-term performance. The Fund is not an appropriate investment for short-term investors. Investments in small companies generally carry greater risk than is customarily associated with larger companies. This additional risk is attributable to a number of factors, including the relatively limited financial resources that are typically available to small companies and the fact that small companies often have comparatively limited product lines. In addition, the stock of small companies tends to be more volatile than the stock of large companies, particularly in the short term and particularly in the early stages of an economic or market downturn. Shareholders of the Fund, therefore, are taking on more risk than they would if they invested in the stock market as a whole.
Conclusion
Thank you for your continued investment in Omni Small-Cap Value Fund. We encourage your feedback; your reactions and concerns are important to us.
Sincerely,
The Investment Management Team
| | |
4 | | Annual Report | June 30, 2012 |
| | |
Bridgeway Omni Small-Cap Value Fund SCHEDULE OF INVESTMENTS | | |
Showing percentage of net assets as of June 30, 2012
| | | | | | | | |
Industry Company | | Shares | | | Value | |
COMMON STOCKS - 99.55% | | | | | | | | |
Aerospace & Defense - 0.85% | | | | | | | | |
AAR Corp. | | | 32,000 | | | | $ 431,360 | |
Astrotech Corp.* | | | 30,000 | | | | 32,400 | |
Ducommun, Inc.* | | | 16,300 | | | | 159,903 | |
EDAC Technologies Corp.* | | | 6,900 | | | | 77,832 | |
GeoEye, Inc.* | | | 16,200 | | | | 250,776 | |
Orbital Sciences Corp.* | | | 28,150 | | | | 363,698 | |
Sparton Corp.* | | | 2,500 | | | | 24,750 | |
Sypris Solutions, Inc. | | | 26,100 | | | | 181,917 | |
| | | | | | | | |
| | | | | | | 1,522,636 | |
| | |
Air Freight & Logistics - 0.49% | | | | | | | | |
Air Transport Services Group, Inc.* | | | 64,600 | | | | 335,920 | |
Atlas Air Worldwide Holdings, Inc.* | | | 5,300 | | | | 230,603 | |
Pacer International, Inc.* | | | 28,400 | | | | 153,928 | |
Park-Ohio Holdings Corp.* | | | 8,700 | | | | 165,561 | |
| | | | | | | | |
| | | | | | | 886,012 | |
| | |
Airlines - 1.65% | | | | | | | | |
Hawaiian Holdings, Inc.* | | | 41,334 | | | | 269,084 | |
JetBlue Airways Corp.* | | | 184,950 | | | | 980,235 | |
Republic Airways Holdings, Inc.* | | | 34,000 | | | | 188,700 | |
SkyWest, Inc. | | | 33,800 | | | | 220,714 | |
US Airways Group, Inc.*+ | | | 97,900 | | | | 1,305,007 | |
| | | | | | | | |
| | | | | | | 2,963,740 | |
Auto Components - 2.21% | | | | | | | | |
China Automotive Systems, Inc.*+ | | | 22,400 | | | | 91,616 | |
China XD Plastics Co., Ltd.*+ | | | 50,900 | | | | 233,122 | |
Cooper Tire & Rubber Co. | | | 70,100 | | | | 1,229,554 | |
Exide Technologies* | | | 35,000 | | | | 117,600 | |
Federal-Mogul Corp.* | | | 54,000 | | | | 594,000 | |
Modine Manufacturing Co.* | | | 24,300 | | | | 168,399 | |
Shiloh Industries, Inc. | | | 4,700 | | | | 54,050 | |
SORL Auto Parts, Inc.*+ | | | 29,900 | | | | 72,059 | |
Spartan Motors, Inc. | | | 14,950 | | | | 78,338 | |
Standard Motor Products, Inc. | | | 38,000 | | | | 535,040 | |
Stoneridge, Inc.* | | | 38,900 | | | | 264,909 | |
Strattec Security Corp. | | | 1,300 | | | | 27,352 | |
Superior Industries International, Inc. | | | 12,200 | | | | 199,714 | |
Tower International, Inc.* | | | 28,900 | | | | 303,450 | |
| | | | | | | | |
| | | | | | | 3,969,203 | |
Beverages - 0.26% | | | | | | | | |
Coca-Cola Bottling Co. Consolidated | | | 7,200 | | | | 462,816 | |
| | | | | | | | |
Industry Company | | Shares | | | Value | |
| | | | | | | | |
Building Products - 0.73% | | | | | | | | |
Ameresco, Inc., Class A* | | | 27,000 | | | | $ 322,110 | |
Gibraltar Industries, Inc.* | | | 11,250 | | | | 116,775 | |
Griffon Corp. | | | 28,800 | | | | 247,104 | |
Nortek, Inc.* | | | 4,800 | | | | 240,192 | |
Patrick Industries, Inc.* | | | 10,300 | | | | 131,325 | |
Universal Forest Products, Inc. | | | 5,800 | | | | 226,084 | |
US Home Systems, Inc. | | | 2,800 | | | | 28,420 | |
| | | | | | | | |
| | | | | | | 1,312,010 | |
| | |
Capital Markets - 1.27% | | | | | | | | |
Calamos Asset Management, Inc., Class A | | | 13,000 | | | | 148,850 | |
Cowen Group, Inc., Class A* | | | 40,200 | | | | 106,932 | |
FBR & Co.* | | | 86,400 | | | | 239,328 | |
GFI Group, Inc. | | | 54,350 | | | | 193,486 | |
Gleacher & Co., Inc.* | | | 57,300 | | | | 45,840 | |
Hanover Capital Mortgage Holdings, Inc.* | | | 17,200 | | | | 403,168 | |
INTL FCStone, Inc.* | | | 12,500 | | | | 241,875 | |
Investment Technology Group, Inc.* | | | 18,350 | | | | 168,820 | |
Oppenheimer Holdings, Inc., Class A | | | 15,300 | | | | 240,516 | |
Piper Jaffray Cos.* | | | 11,400 | | | | 267,102 | |
SWS Group, Inc.* | | | 41,200 | | | | 219,596 | |
| | | | | | | | |
| | | | | | | 2,275,513 | |
| | |
Chemicals - 3.36% | | | | | | | | |
American Pacific Corp.* | | | 2,900 | | | | 30,566 | |
China Green Agriculture, Inc.*+ | | | 36,800 | | | | 131,744 | |
Core Molding Technologies, Inc.* | | | 6,200 | | | | 51,088 | |
Ferro Corp.* | | | 27,700 | | | | 132,960 | |
Georgia Gulf Corp. | | | 31,950 | | | | 820,156 | |
Gulf Resources, Inc.* | | | 42,400 | | | | 51,728 | |
Koppers Holdings, Inc. | | | 10,700 | | | | 363,800 | |
Kraton Performance Polymers, Inc.* | | | 48,350 | | | | 1,059,349 | |
Material Sciences Corp.* | | | 5,200 | | | | 42,640 | |
OM Group, Inc.* | | | 33,700 | | | | 640,300 | |
Omnova Solutions, Inc.* | | | 45,650 | | | | 344,201 | |
Penford Corp.* | | | 18,400 | | | | 164,680 | |
Schulman (A.), Inc. | | | 30,900 | | | | 613,365 | |
Spartech Corp.* | | | 24,700 | | | | 127,699 | |
TPC Group, Inc.* | | | 15,550 | | | | 574,572 | |
Tredegar Corp. | | | 28,800 | | | | 419,328 | |
Yongye International, Inc.*+ | | | 62,400 | | | | 192,816 | |
| | |
Bridgeway Omni Small-Cap Value Fund SCHEDULE OF INVESTMENTS (continued) | | |
Showing percentage of net assets as of June 30, 2012
| | | | | | | | |
| Industry Company | | Shares | | | Value | |
Common Stocks (continued) | | | | | | | | |
Chemicals (continued) | | | | | | | | |
Zep, Inc. | | | 19,400 | | | | $ 266,362 | |
| | | | | | | | |
| | | | | | | 6,027,354 | |
| | |
Commercial Banks - 3.84% | | | | | | | | |
Access National Corp.+ | | | 2,700 | | | | 35,370 | |
BancorpSouth, Inc. | | | 43,650 | | | | 633,798 | |
Bank of Commerce Holdings | | | 7,600 | | | | 31,008 | |
Banner Corp. | | | 7,550 | | | | 165,421 | |
C&F Financial Corp.+ | | | 1,200 | | | | 48,192 | |
Capital City Bank Group, Inc. | | | 7,650 | | | | 56,380 | |
Citizens Republic Bancorp, Inc.* | | | 18,000 | | | | 308,340 | |
CoBiz Financial, Inc. | | | 16,600 | | | | 103,916 | |
Fidelity Southern Corp.+ | | | 16,800 | | | | 145,152 | |
First Bancorp | | | 7,600 | | | | 67,564 | |
First BanCorp. (Puerto Rico)*+ | | | 87,300 | | | | 345,708 | |
First Business Financial Services, Inc. | | | 1,200 | | | | 27,240 | |
First Merchants Corp. | | | 11,500 | | | | 143,290 | |
First United Corp.* | | | 9,200 | | | | 39,652 | |
Firstbank Corp. | | | 14,800 | | | | 148,000 | |
Great Southern Bancorp, Inc. | | | 6,000 | | | | 165,480 | |
Guaranty Bancorp* | | | 24,000 | | | | 50,640 | |
Hampton Roads Bankshares, Inc.*+ | | | 22,300 | | | | 24,307 | |
Hanmi Financial Corp.* | | | 150 | | | | 1,572 | |
Heartland Financial USA, Inc. | | | 7,350 | | | | 176,400 | |
Horizon Bancorp+ | | | 2,100 | | | | 55,230 | |
Independent Bank Corp.* | | | 3,800 | | | | 9,538 | |
Intervest Bancshares Corp., Class A* | | | 32,800 | | | | 125,624 | |
Macatawa Bank Corp.* | | | 13,200 | | | | 45,012 | |
MainSource Financial Group, Inc. | | | 9,050 | | | | 107,062 | |
MBT Financial Corp.* | | | 24,300 | | | | 66,825 | |
Mercantile Bank Corp.* | | | 3,300 | | | | 60,885 | |
Metro Bancorp, Inc.* | | | 6,300 | | | | 75,789 | |
NewBridge Bancorp* | | | 7,000 | | | | 30,660 | |
Old Second Bancorp, Inc.* | | | 6,500 | | | | 8,450 | |
Orrstown Financial Services, Inc. | | | 5,600 | | | | 44,968 | |
Peoples Bancorp, Inc. | | | 4,800 | | | | 105,504 | |
PrivateBancorp, Inc. | | | 32,250 | | | | 476,010 | |
Republic Bancorp, Inc.,
Class A | | | 9,350 | | | | 208,038 | |
Savannah Bancorp, Inc. (The)* | | | 3,200 | | | | 15,520 | |
| | | | | | | | |
| Industry Company | | Shares | | | Value | |
| | | | | | | | |
Commercial Banks (continued) | | | | | | | | |
Southwest Bancorp, Inc.* | | | 23,600 | | | | $ 222,076 | |
Susquehanna Bancshares, Inc. | | | 68,450 | | | | 705,035 | |
Synovus Financial Corp. | | | 328,750 | | | | 650,925 | |
Taylor Capital Group, Inc.*+ | | | 641 | | | | 10,506 | |
Union First Market Bankshares Corp. | | | 11,700 | | | | 169,065 | |
United Community Banks, Inc.* | | | 35,650 | | | | 305,520 | |
Virginia Commerce Bancorp, Inc.* | | | 13,350 | | | | 112,540 | |
VIST Financial Corp. | | | 3,000 | | | | 34,860 | |
Wintrust Financial Corp. | | | 12,800 | | | | 454,400 | |
Yadkin Valley Financial Corp.* | | | 28,600 | | | | 75,790 | |
| | | | | | | | |
| | | | | | | 6,893,262 | |
|
Commercial Services & Supplies - 6.25% | |
ABM Industries, Inc. | | | 38,700 | | | | 756,972 | |
American Reprographics Co.* | | | 38,350 | | | | 192,900 | |
AMREP Corp.* | | | 9,700 | | | | 58,685 | |
Asset Acceptance Capital Corp.*+ | | | 31,500 | | | | 214,200 | |
Brink’s Co. (The) | | | 49,150 | | | | 1,139,297 | |
Casella Waste Systems, Inc., Class A* | | | 20,650 | | | | 120,803 | |
Consolidated Graphics, Inc.* | | | 18,675 | | | | 542,509 | |
Courier Corp. | | | 9,200 | | | | 121,900 | |
Deluxe Corp. | | | 40,600 | | | | 1,012,564 | |
EnergySolutions, Inc.* | | | 212,600 | | | | 359,294 | |
Geo Group, Inc. (The)* | | | 41,800 | | | | 949,696 | |
Herman Miller, Inc. | | | 29,300 | | | | 542,636 | |
HNI Corp. | | | 31,500 | | | | 811,125 | |
Industrial Services of America, Inc.*+ | | | 6,000 | | | | 29,760 | |
Intersections, Inc. | | | 31,300 | | | | 496,105 | |
Kimball International, Inc., Class B | | | 31,800 | | | | 244,860 | |
Metalico, Inc.* | | | 63,000 | | | | 138,600 | |
Multi-Color Corp. | | | 22,400 | | | | 498,176 | |
Perma-Fix Environmental Services* | | | 41,000 | | | | 47,970 | |
Schawk, Inc. | | | 14,200 | | | | 180,340 | |
Standard Parking Corp.* | | | 13,750 | | | | 295,900 | |
Standard Register Co. (The) | | | 11,450 | | | | 6,870 | |
Sykes Enterprises, Inc.* | | | 37,600 | | | | 600,096 | |
TMS International Corp., Class A* | | | 42,100 | | | | 419,737 | |
TRC Cos., Inc.* | | | 31,650 | | | | 192,432 | |
United Stationers, Inc. | | | 32,600 | | | | 878,570 | |
| | |
6 | | Annual Report | June 30, 2012 |
| | |
Bridgeway Omni Small-Cap Value Fund SCHEDULE OF INVESTMENTS (continued) | | |
Showing percentage of net assets as of June 30, 2012
| | | | | | | | |
| Industry Company | | Shares | | | Value | |
Common Stocks (continued) | | | | | | | | |
Commercial Services & Supplies (continued) | |
Versar, Inc.* | | | 8,900 | | | | $ 26,789 | |
Viad Corp. | | | 17,400 | | | | 348,000 | |
| | | | | | | | |
| | | | | | | 11,226,786 | |
| |
Communications Equipment - 0.73% | |
Bel Fuse, Inc., Class B | | | 13,500 | | | | 237,735 | |
Black Box Corp. | | | 18,250 | | | | 523,775 | |
Communications Systems, Inc. | | | 1,000 | | | | 11,170 | |
Globecomm Systems, Inc.* | | | 31,200 | | | | 316,368 | |
Network Engines, Inc.* | | | 19,200 | | | | 27,072 | |
Technical Communications Corp. | | | 900 | | | | 7,101 | |
Tessco Technologies, Inc. | | | 6,650 | | | | 146,633 | |
Zoom Technologies, Inc.* | | | 43,200 | | | | 44,928 | |
| | | | | | | | |
| | | | | | | 1,314,782 | |
| | |
Computers & Peripherals - 0.53% | | | | | | | | |
Cray, Inc.* | | | 16,300 | | | | 196,904 | |
Dot Hill Systems Corp.* | | | 35,800 | | | | 40,812 | |
Hutchinson Technology, Inc.* | | | 62,900 | | | | 91,834 | |
Imation Corp.* | | | 17,300 | | | | 102,243 | |
Novatel Wireless, Inc.* | | | 71,100 | | | | 177,039 | |
Xyratex, Ltd. | | | 30,200 | | | | 341,562 | |
| | | | | | | | |
| | | | | | | 950,394 | |
| |
Construction & Engineering - 0.83% | |
Argan, Inc. | | | 18,600 | | | | 260,028 | |
EMCOR Group, Inc. | | | 2,800 | | | | 77,896 | |
Great Lakes Dredge & Dock Corp. | | | 20,850 | | | | 148,452 | |
Layne Christensen Co.* | | | 5,050 | | | | 104,485 | |
Michael Baker Corp.* | | | 3,400 | | | | 88,706 | |
Northwest Pipe Co.* | | | 13,400 | | | | 325,084 | |
Orion Marine Group, Inc.* | | | 10,800 | | | | 75,168 | |
Primoris Services Corp. | | | 18,800 | | | | 225,600 | |
Sterling Construction Co., Inc.* | | | 18,250 | | | | 186,515 | |
| | | | | | | | |
| | | | | | | 1,491,934 | |
| | |
Construction Materials - 0.24% | | | | | | | | |
Headwaters, Inc.* | | | 84,800 | | | | 436,720 | |
| | |
Consumer Finance - 1.01% | | | | | | | | |
Cash America International, Inc. | | | 10,200 | | | | 449,208 | |
CompuCredit Holdings Corp.* | | | 32,600 | | | | 118,012 | |
DFC Global Corp.* | | | 19,600 | | | | 361,228 | |
First Marblehead Corp. (The)* | | | 159,100 | | | | 186,147 | |
| | | | | | | | |
| Industry Company | | Shares | | | Value | |
| | | | | | | | |
Consumer Finance (continued) | | | | | | | | |
Nelnet, Inc., Class A | | | 25,800 | | | | $ 593,400 | |
QC Holdings, Inc. | | | 27,300 | | | | 114,387 | |
| | | | | | | | |
| | | | | | | 1,822,382 | |
| | |
Containers & Packaging - 0.75% | | | | | | | | |
AEP Industries, Inc.* | | | 5,550 | | | | 241,703 | |
Boise, Inc. | | | 127,050 | | | | 835,989 | |
Mod-Pac Corp.* | | | 1,500 | | | | 7,740 | |
Myers Industries, Inc. | | | 15,600 | | | | 267,696 | |
| | | | | | | | |
| | | | | | | 1,353,128 | |
| | |
Distributors - 0.26% | | | | | | | | |
Amcon Distributing Co. | | | 600 | | | | 33,234 | |
Core-Mark Holding Co., Inc. | | | 5,600 | | | | 269,584 | |
VOXX International Corp.* | | | 18,200 | | | | 169,624 | |
| | | | | | | | |
| | | | | | | 472,442 | |
|
Diversified Consumer Services - 1.60% | |
Cambium Learning Group, Inc.* | | | 18,950 | | | | 18,002 | |
Capella Education Co.* | | | 9,700 | | | | 337,172 | |
Career Education Corp.* | | | 38,800 | | | | 259,572 | |
Carriage Services, Inc. | | | 13,950 | | | | 116,064 | |
Coinstar, Inc.* | | | 250 | | | | 17,165 | |
Corinthian Colleges, Inc.* | | | 108,650 | | | | 313,999 | |
Learning Tree International, Inc.* | | | 11,700 | | | | 51,129 | |
Lincoln Educational Services Corp. | | | 37,025 | | | | 240,662 | |
Mac-Gray Corp. | | | 11,100 | | | | 156,399 | |
Regis Corp. | | | 60,450 | | | | 1,085,682 | |
School Specialty, Inc.*+ | | | 8,550 | | | | 27,873 | |
Universal Technical Institute, Inc. | | | 18,500 | | | | 249,935 | |
| | | | | | | | |
| | | | | | | 2,873,654 | |
|
Diversified Financial Services - 0.76% | |
Gain Capital Holdings, Inc. | | | 26,899 | | | | 134,226 | |
Interactive Brokers Group, Inc., Class A | | | 21,150 | | | | 311,328 | |
PHH Corp.* | | | 45,050 | | | | 787,474 | |
Primus Guaranty, Ltd.* | | | 16,700 | | | | 125,250 | |
| | | | | | | | |
| | | | | | | 1,358,278 | |
|
Diversified Telecommunication Services - 1.44% | |
Atlantic Tele-Network, Inc. | | | 14,200 | | | | 478,966 | |
Cbeyond, Inc.* | | | 26,550 | | | | 179,744 | |
Consolidated Communications Holdings, Inc. | | | 22,300 | | | | 330,040 | |
| | |
| Bridgeway Omni Small-Cap Value Fund | | |
SCHEDULE OF INVESTMENTS (continued) | | |
Showing percentage of net assets as of June 30, 2012
| | | | | | | | |
| Industry Company | | Shares | | | Value | |
Common Stocks (continued) | | | | | | | | |
Diversified Telecommunication Services (continued) | |
General Communication, Inc., Class A* | | | 59,550 | | | | $ 494,860 | |
Hawaiian Telcom Holdco, Inc.*+ | | | 10,200 | | | | 199,002 | |
HickoryTech Corp. | | | 6,000 | | | | 66,660 | |
IDT Corp., Class B | | | 25,275 | | | | 247,948 | |
Iridium Communications, Inc.* | | | 29,800 | | | | 267,008 | |
Multiband Corp.* | | | 9,700 | | | | 23,086 | |
Premiere Global Services, Inc.* | | | 9,500 | | | | 79,705 | |
Primus Telecommunications Group, Inc.+ | | | 13,700 | | | | 213,309 | |
| | | | | | | | |
| | | | | | | 2,580,328 | |
| | |
Electrical Equipment - 0.84% | | | | | | | | |
Allied Motion Technologies, Inc. | | | 17,400 | | | | 104,400 | |
China BAK Battery, Inc.* | | | 1,800 | | | | 1,044 | |
Coleman Cable, Inc. | | | 18,400 | | | | 159,896 | |
Fushi Copperweld, Inc.*+ | | | 32,800 | | | | 285,032 | |
General Cable Corp.* | | | 3,900 | | | | 101,166 | |
Global Power Equipment Group, Inc. | | | 13,972 | | | | 305,148 | |
Lihua International, Inc. | | | 31,250 | | | | 171,250 | |
LSI Industries, Inc. | | | 36,100 | | | | 257,032 | |
Orion Energy Systems, Inc.* | | | 35,000 | | | | 77,000 | |
SL Industries, Inc.* | | | 1,650 | | | | 21,764 | |
Ultralife Corp.* | | | 7,350 | | | | 28,371 | |
| | | | | | | | |
| | | | | | | 1,512,103 | |
| |
Electronic Equipment, Instruments & Components - 4.04% | |
Agilysys, Inc.* | | | 14,400 | | | | 124,848 | |
Brightpoint, Inc.* | | | 22,200 | | | | 120,102 | |
IEC Electronics Corp.* | | | 800 | | | | 4,864 | |
Insight Enterprises, Inc.* | | | 29,800 | | | | 501,534 | |
Itron, Inc.* | | | 13,100 | | | | 540,244 | |
Kemet Corp.* | | | 58,850 | | | | 353,688 | |
LGL Group, Inc. (The)* | | | 100 | | | | 652 | |
LoJack Corp.* | | | 8,000 | | | | 24,160 | |
Multi-Fineline Electronix, Inc.* | | | 7,600 | | | | 187,264 | |
Newport Corp.* | | | 26,000 | | | | 312,520 | |
PAR Technology Corp.* | | | 29,000 | | | | 142,970 | |
PC Connection, Inc. | | | 12,000 | | | | 127,440 | |
PC Mall, Inc.* | | | 5,600 | | | | 30,296 | |
Plexus Corp.* | | | 40,200 | | | | 1,133,640 | |
Power-One, Inc.* | | | 8,800 | | | | 39,776 | |
Pulse Electronics Corp. | | | 18,650 | | | | 36,741 | |
Sanmina-SCI Corp.* | | | 102,150 | | | | 836,608 | |
SMTC Corp.*+ | | | 10,700 | | | | 34,989 | |
SYNNEX Corp.* | | | 35,900 | | | | 1,238,191 | |
| | | | | | | | |
| Industry Company | | Shares | | | Value | |
| | | | | | | | |
Electronic Equipment, Instruments & Components (continued) | |
TTM Technologies, Inc.* | | | 106,650 | | | | $ 1,003,577 | |
Viasystems Group, Inc.* | | | 26,700 | | | | 453,900 | |
| | | | | | | | |
| | | | | | | 7,248,004 | |
|
Energy Equipment & Services - 3.09% | |
Basic Energy Services, Inc.* | | | 49,000 | | | | 505,680 | |
Cal Dive International, Inc.* | | | 2,750 | | | | 7,975 | |
Dawson Geophysical Co.* | | | 26,000 | | | | 619,320 | |
ENGlobal Corp.* | | | 71,200 | | | | 106,800 | |
Exterran Holdings, Inc.* | | | 79,800 | | | | 1,017,450 | |
Global Geophysical Services, Inc.* | | | 41,500 | | | | 253,980 | |
Hercules Offshore, Inc.* | | | 47,300 | | | | 167,442 | |
Key Energy Services, Inc.* | | | 102,600 | | | | 779,760 | |
Matrix Service Co.* | | | 6,600 | | | | 74,910 | |
Parker Drilling Co.* | | | 104,450 | | | | 471,070 | |
PHI, Inc.* | | | 6,900 | | | | 191,889 | |
Pioneer Drilling Co.* | | | 63,000 | | | | 502,110 | |
TETRA Technologies, Inc.* | | | 30,600 | | | | 218,178 | |
TGC Industries, Inc.* | | | 11,655 | | | | 113,170 | |
Union Drilling, Inc.* | | | 27,800 | | | | 124,544 | |
Willbros Group, Inc.* | | | 60,300 | | | | 389,538 | |
| | | | | | | | |
| | | | | | | 5,543,816 | |
| | |
Food & Staples Retailing - 3.28% | | | | | | | | |
Andersons, Inc. (The) | | | 25,400 | | | | 1,083,564 | |
Ingles Markets, Inc., Class A | | | 22,400 | | | | 359,072 | |
Nash Finch Co. | | | 11,400 | | | | 244,872 | |
Pantry, Inc. (The)* | | | 20,800 | | | | 305,760 | |
Spartan Stores, Inc. | | | 16,700 | | | | 302,771 | |
SUPERVALU, Inc.+ | | | 268,100 | | | | 1,388,758 | |
Susser Holdings Corp.* | | | 18,850 | | | | 700,655 | |
Village Super Market, Inc., Class A | | | 13,000 | | | | 423,540 | |
Weis Markets, Inc. | | | 24,300 | | | | 1,081,836 | |
| | | | | | | | |
| | | | | | | 5,890,828 | |
| | |
Food Products - 1.44% | | | | | | | | |
American Lorain Corp.* | | | 13,300 | | | | 14,630 | |
Chiquita Brands International, Inc.* | | | 18,800 | | | | 94,000 | |
Diamond Foods, Inc.+ | | | 15,300 | | | | 272,952 | |
Dole Food Co., Inc.* | | | 40,700 | | | | 357,346 | |
Farmer Bros. Co.* | | | 12,700 | | | | 101,092 | |
Feihe International, Inc.*+ | | | 13,800 | | | | 94,392 | |
Fresh Del Monte Produce, Inc. | | | 33,800 | | | | 793,286 | |
John B. Sanfilippo & Son, Inc.* | | | 9,200 | | | | 164,220 | |
Omega Protein Corp.* | | | 23,650 | | | | 174,064 | |
| | |
8 | | Annual Report | June 30, 2012 |
| | |
Bridgeway Omni Small-Cap Value Fund SCHEDULE OF INVESTMENTS (continued) | | |
Showing percentage of net assets as of June 30, 2012
| | | | | | | | |
| Industry Company | | Shares | | | Value | |
Common Stocks (continued) | | | | | | | | |
Food Products (continued) | | | | | | | | |
Overhill Farms, Inc.* | | | 9,000 | | | | $ 35,280 | |
Seneca Foods Corp., Class A* | | | 5,200 | | | | 139,880 | |
SkyPeople Fruit Juice, Inc.* | | | 62,900 | | | | 100,640 | |
Westway Group, Inc. | | | 10,700 | | | | 64,093 | |
Zhongpin, Inc.* | | | 18,700 | | | | 172,227 | |
| | | | | | | | |
| | | | | | | 2,578,102 | |
| |
Health Care Equipment & Supplies - 0.28% | |
Dynatronics Corp.* | | | 6,000 | | | | 3,001 | |
DynaVox, Inc., Class A* | | | 66,300 | | | | 74,256 | |
Fonar Corp.* | | | 17,700 | | | | 72,747 | |
Invacare Corp. | | | 14,350 | | | | 221,420 | |
Medical Action Industries, Inc.* | | | 26,000 | | | | 90,480 | |
RTI Biologics, Inc.* | | | 1,600 | | | | 6,016 | |
Theragenics Corp.* | | | 20,000 | | | | 40,200 | |
| | | | | | | | |
| | | | | | | 508,120 | |
| |
Health Care Providers & Services - 5.16% | |
Addus HomeCare Corp.* | | | 4,800 | | | | 23,568 | |
Advocat, Inc. | | | 2,600 | | | | 16,640 | |
Almost Family, Inc.* | | | 4,250 | | | | 94,945 | |
Amedisys, Inc.* | | | 13,150 | | | | 163,718 | |
AMN Healthcare Services, Inc.* | | | 44,134 | | | | 261,715 | |
Amsurg Corp.* | | | 28,550 | | | | 855,929 | |
BioScrip, Inc.* | | | 24,550 | | | | 182,406 | |
CardioNet, Inc.* | | | 16,500 | | | | 33,495 | |
Chindex International, Inc.* | | | 8,500 | | | | 83,300 | |
Cross Country Healthcare, Inc.* | | | 24,050 | | | | 105,098 | |
Emeritus Corp.* | | | 31,200 | | | | 525,096 | |
Ensign Group, Inc. (The) | | | 9,450 | | | | 267,152 | |
Five Star Quality Care, Inc.* | | | 21,300 | | | | 65,391 | |
Gentiva Health Services, Inc.* | | | 950 | | | | 6,584 | |
Healthways, Inc.* | | | 15,150 | | | | 120,897 | |
Kindred Healthcare, Inc.* | | | 23,400 | | | | 230,022 | |
LHC Group, Inc.* | | | 8,450 | | | | 143,312 | |
Molina Healthcare, Inc.* | | | 41,650 | | | | 977,109 | |
National Healthcare Corp. | | | 6,200 | | | | 280,426 | |
PharMerica Corp.* | | | 44,350 | | | | 484,302 | |
Providence Service Corp. (The)* | | | 16,000 | | | | 219,360 | |
PSS World Medical, Inc.* | | | 40,100 | | | | 841,699 | |
Select Medical Holdings Corp.* | | | 118,800 | | | | 1,201,068 | |
Skilled Healthcare Group, Inc., Class A* | | | 46,748 | | | | 293,577 | |
Sun Healthcare Group, Inc.* | | | 49,300 | | | | 412,641 | |
| | | | | | | | |
| Industry Company | | Shares | | | Value | |
| | | | | | | | |
Health Care Providers & Services (continued) | | | | | |
Sunrise Senior Living, Inc.*+ | | | 36,950 | | | | $ 269,365 | |
Triple-S Management Corp., Class B* | | | 39,900 | | | | 729,372 | |
Universal American Corp.* | | | 35,100 | | | | 369,603 | |
| | | | | | | | |
| | | | | | | 9,257,790 | |
|
Hotels, Restaurants & Leisure - 6.26% | |
Ark Restaurants Corp. | | | 1,600 | | | | 23,104 | |
Benihana, Inc. | | | 9,950 | | | | 160,294 | |
Biglari Holdings, Inc.* | | | 612 | | | | 236,471 | |
Bob Evans Farms, Inc. | | | 21,275 | | | | 855,255 | |
Boyd Gaming Corp.*+ | | | 90,250 | | | | 649,800 | |
Caribou Coffee Co., Inc.* | | | 13,300 | | | | 171,703 | |
Carrols Restaurant Group, Inc.* | | | 18,025 | | | | 107,069 | |
CEC Entertainment, Inc. | | | 21,650 | | | | 787,410 | |
Cracker Barrel Old Country Store, Inc. | | | 20,600 | | | | 1,293,680 | |
DineEquity, Inc.* | | | 10,300 | | | | 459,792 | |
Dover Downs Gaming & Entertainment, Inc. | | | 12,500 | | | | 37,625 | |
Einstein Noah Restaurant Group, Inc. | | | 19,225 | | | | 337,591 | |
Famous Dave’s of America, Inc.* | | | 3,400 | | | | 37,570 | |
Fiesta Restaurant Group, Inc.* | | | 18,025 | | | | 238,471 | |
Frisch’s Restaurants, Inc. | | | 6,800 | | | | 192,712 | |
Full House Resorts, Inc.* | | | 8,400 | | | | 24,108 | |
Isle of Capri Casinos, Inc.* | | | 53,600 | | | | 330,712 | |
J. Alexander’s Corp.* | | | 2,300 | | | | 26,128 | |
Jack in the Box, Inc.* | | | 36,050 | | | | 1,005,074 | |
Kona Grill, Inc.* | | | 4,100 | | | | 36,982 | |
Lakes Entertainment, Inc.* | | | 22,700 | | | | 65,830 | |
Luby’s, Inc.* | | | 12,600 | | | | 84,420 | |
Marcus Corp. | | | 13,350 | | | | 183,696 | |
MTR Gaming Group, Inc.* | | | 40,600 | | | | 192,850 | |
Multimedia Games Holding Co., Inc.* | | | 11,900 | | | | 166,600 | |
Nevada Gold & Casinos, Inc.* | | | 7,800 | | | | 8,970 | |
PF Chang’s China Bistro, Inc. | | | 7,000 | | | | 360,290 | |
Pinnacle Entertainment, Inc.* | | | 47,450 | | | | 456,469 | |
Red Robin Gourmet Burgers, Inc.* | | | 16,200 | | | | 494,262 | |
Ruby Tuesday, Inc.* | | | 69,100 | | | | 470,571 | |
Ruth’s Hospitality Group, Inc.* | | | 44,000 | | | | 290,400 | |
Scientific Games Corp., Class A* | | | 41,350 | | | | 353,542 | |
| | |
Bridgeway Omni Small-Cap Value Fund SCHEDULE OF INVESTMENTS (continued) | | |
Showing percentage of net assets as of June 30, 2012
| | | | | | | | |
| Industry Company | | Shares | | | Value | |
Common Stocks (continued) | | | | | | | | |
Hotels, Restaurants & Leisure (continued) | | | | | |
Sonic Corp.* | | | 70,000 | | | | $ 701,400 | |
Town Sports International Holdings, Inc.* | | | 30,000 | | | | 398,700 | |
| | | | | | | | |
| | | | | | | 11,239,551 | |
| | |
Household Durables - 1.13% | | | | | | | | |
American Greetings Corp., Class A+ | | | 31,000 | | | | 453,220 | |
CSS Industries, Inc. | | | 11,800 | | | | 242,490 | |
Emerson Radio Corp.* | | | 10,500 | | | | 21,315 | |
Ethan Allen Interiors, Inc. | | | 11,700 | | | | 233,181 | |
Flexsteel Industries, Inc. | | | 4,900 | | | | 96,922 | |
Hooker Furniture Corp. | | | 10,900 | | | | 128,511 | |
La-Z-Boy, Inc.* | | | 21,800 | | | | 267,922 | |
Libbey, Inc.* | | | 30,649 | | | | 471,075 | |
Lifetime Brands, Inc. | | | 9,700 | | | | 120,959 | |
| | | | | | | | |
| | | | | | | 2,035,595 | |
| | |
Household Products - 0.73% | | | | | | | | |
Central Garden & Pet Co., Class A* | | | 31,750 | | | | 345,757 | |
Harbinger Group, Inc.*+ | | | 115,200 | | | | 897,408 | |
Oil-Dri Corp. of America | | | 3,150 | | | | 68,985 | |
| | | | | | | | |
| | | | | | | 1,312,150 | |
| |
Independent Power Producers & Energy Traders - 0.04% | |
Genie Energy, Ltd., Class B | | | 10,275 | | | | 79,837 | |
| | |
Industrial Conglomerates - 0.08% | | | | | | | | |
Standex International Corp. | | | 3,400 | | | | 144,738 | |
| | |
Insurance - 4.66% | | | | | | | | |
American Equity Investment Life Holding Co. | | | 53,850 | | | | 592,888 | |
American Safety Insurance Holdings, Ltd.* | | | 12,600 | | | | 236,250 | |
Crawford & Co., Class B | | | 56,150 | | | | 229,654 | |
Eastern Insurance Holdings, Inc. | | | 7,400 | | | | 125,800 | |
EMC Insurance Group, Inc. | | | 5,800 | | | | 117,160 | |
FBL Financial Group, Inc., Class A | | | 13,950 | | | | 390,740 | |
First American Financial Corp. | | | 28,875 | | | | 489,720 | |
Flagstone Reinsurance Holdings SA | | | 39,450 | | | | 315,994 | |
Hallmark Financial Services, Inc.* | | | 19,100 | | | | 148,980 | |
Homeowners Choice, Inc. | | | 9,900 | | | | 174,240 | |
Horace Mann Educators Corp. | | | 17,900 | | | | 312,892 | |
Independence Holding Co. | | | 19,326 | | | | 190,361 | |
| | | | | | | | |
| Industry Company | | Shares | | | Value | |
| | | | | | | | |
Insurance (continued) | | | | | | | | |
Maiden Holdings, Ltd. | | | 57,600 | | | | $ 499,968 | |
Meadowbrook Insurance Group, Inc. | | | 23,700 | | | | 208,323 | |
National Financial Partners Corp.* | | | 19,150 | | | | 256,610 | |
National Western Life Insurance Co., Class A | | | 1,625 | | | | 230,620 | |
Navigators Group, Inc. (The)* | | | 2,900 | | | | 145,145 | |
Protective Life Corp. | | | 3,600 | | | | 105,876 | |
SeaBright Holdings, Inc. | | | 29,300 | | | | 260,477 | |
Selective Insurance Group, Inc. | | | 24,250 | | | | 422,192 | |
StanCorp Financial Group, Inc. | | | 19,950 | | | | 741,342 | |
State Auto Financial Corp. | | | 18,100 | | | | 254,305 | |
Stewart Information Services Corp. | | | 8,650 | | | | 132,778 | |
Symetra Financial Corp. | | | 75,950 | | | | 958,489 | |
Tower Group, Inc. | | | 18,450 | | | | 385,051 | |
United Fire Group, Inc. | | | 11,600 | | | | 247,428 | |
Universal Insurance Holdings, Inc. | | | 56,816 | | | | 193,743 | |
| | | | | | | | |
| | | | | | | 8,367,026 | |
| | |
Internet & Catalog Retail - 0.56% | | | | | | | | |
1-800-Flowers.com, Inc., Class A* | | | 74,150 | | | | 258,783 | |
dELiA*s, Inc.* | | | 13,300 | | | | 20,615 | |
Nutrisystem, Inc.+ | | | 29,800 | | | | 344,488 | |
Orbitz Worldwide, Inc.* | | | 85,200 | | | | 310,980 | |
Overstock.com, Inc.*+ | | | 9,800 | | | | 67,718 | |
| | | | | | | | |
| | | | | | | 1,002,584 | |
| | |
Internet Software & Services - 0.71% | | | | | | | | |
EarthLink, Inc. | | | 88,700 | | | | 659,928 | |
Tucows, Inc.* | | | 76,800 | | | | 84,480 | |
United Online, Inc. | | | 126,900 | | | | 535,518 | |
| | | | | | | | |
| | | | | | | 1,279,926 | |
| | |
IT Services - 3.49% | | | | | | | | |
Acxiom Corp.* | | | 56,050 | | | | 846,916 | |
Analysts International Corp.* | | | 2,800 | | | | 11,816 | |
CACI International, Inc.
, Class A* | | | 21,400 | | | | 1,177,428 | |
CIBER, Inc.* | | | 90,550 | | | | 390,270 | |
Convergys Corp. | | | 61,650 | | | | 910,570 | |
CSG Systems International, Inc.* | | | 27,450 | | | | 474,336 | |
Dynamics Research Corp.* | | | 10,300 | | | | 59,843 | |
Edgewater Technology, Inc.* | | | 5,600 | | | | 21,784 | |
| | |
10 | | Annual Report | June 30, 2012 |
| | |
Bridgeway Omni Small-Cap Value Fund SCHEDULE OF INVESTMENTS (continued) | | |
Showing percentage of net assets as of June 30, 2012
| | | | | | | | |
| Industry Company | | Shares | | | Value | |
Common Stocks (continued) | | | | | | | | |
IT Services (continued) | | | | | | | | |
Global Cash Access Holdings, Inc.* | | | 51,500 | | | $ | 371,315 | |
Hackett Group, Inc. (The)* | | | 22,300 | | | | 124,211 | |
Lender Processing Services, Inc. | | | 10,700 | | | | 270,496 | |
Mantech International Corp., Class A+ | | | 44,200 | | | | 1,037,374 | |
Mattersight Corp.* | | | 7,000 | | | | 55,860 | |
NCI, Inc., Class A* | | | 6,100 | | | | 24,705 | |
Online Resources Corp.* | | | 53,250 | | | | 129,398 | |
Pfsweb, Inc.* | | | 10,300 | | | | 29,252 | |
StarTek, Inc.* | | | 6,900 | | | | 20,010 | |
TNS, Inc.* | | | 17,200 | | | | 308,568 | |
| | | | | | | | |
| | | | | | | 6,264,152 | |
| |
Leisure Equipment & Products - 1.13% | | | | | |
Arctic Cat, Inc.* | | | 8,400 | | | | 307,104 | |
Brunswick Corp. | | | 37,100 | | | | 824,362 | |
Cybex International, Inc.* | | | 39,400 | | | | 63,828 | |
Johnson Outdoors, Inc., Class A* | | | 15,700 | | | | 323,420 | |
Nautilus, Inc.* | | | 53,900 | | | | 178,409 | |
Smith & Wesson Holding Corp.* | | | 26,500 | | | | 220,215 | |
Summer Infant, Inc.* | | | 34,100 | | | | 111,848 | |
| | | | | | | | |
| | | | | | | 2,029,186 | |
| |
Life Sciences Tools & Services - 0.07% | | | | | |
Cambrex Corp.* | | | 13,150 | | | | 123,742 | |
| | |
Machinery - 2.07% | | | | | | | | |
Accuride Corp.* | | | 61,900 | | | | 371,400 | |
Albany International Corp., Class A | | | 11,350 | | | | 212,358 | |
Ampco-Pittsburgh Corp. | | | 3,800 | | | | 69,654 | |
Briggs & Stratton Corp. | | | 24,300 | | | | 425,007 | |
China Valves Technology, Inc.*+ | | | 56,500 | | | | 60,455 | |
Cleantech Solutions International, Inc.* | | | 11,500 | | | | 28,635 | |
Columbus McKinnon Corp.* | | | 18,500 | | | | 279,165 | |
Commercial Vehicle Group, Inc.* | | | 39,100 | | | | 337,042 | |
Federal Signal Corp.* | | | 23,200 | | | | 135,488 | |
FreightCar America, Inc. | | | 14,200 | | | | 326,174 | |
Key Technology, Inc.* | | | 2,100 | | | | 21,000 | |
L.S. Starrett Co., Class A (The) | | | 2,350 | | | | 27,190 | |
LB Foster Co., Class A | | | 3,900 | | | | 111,579 | |
Lydall, Inc.* | | | 8,200 | | | | 110,864 | |
Miller Industries, Inc. | | | 10,400 | | | | 165,672 | |
| | | | | | | | |
| Industry Company | | Shares | | | Value | |
| | | | | | | | |
Machinery (continued) | | | | | | | | |
Mueller Water Products, Inc., Class A | | | 92,000 | | | $ | 318,320 | |
NACCO Industries, Inc., Class A | | | 3,050 | | | | 354,562 | |
NF Energy Saving Corp.* | | | 29,200 | | | | 30,660 | |
NN, Inc.* | | | 17,950 | | | | 183,270 | |
Supreme Industries, Inc. Class A* | | | 34,100 | | | | 133,331 | |
Xerium Technologies, Inc.* | | | 5,400 | | | | 15,660 | |
| | | | | | | | |
| | | | | | | 3,717,486 | |
| | |
Marine - 0.22% | | | | | | | | |
Eagle Bulk Shipping, Inc.*+ | | | 19,000 | | | | 60,040 | |
Excel Maritime Carriers, Ltd.* | | | 99,400 | | | | 55,167 | |
Genco Shipping & Trading, Ltd.* | | | 45,200 | | | | 137,860 | |
International Shipholding Corp. | | | 8,050 | | | | 151,823 | |
| | | | | | | | |
| | | | | | | 404,890 | |
| | |
Media - 2.51% | | | | | | | | |
AH Belo Corp., Class A | | | 41,700 | | | | 167,634 | |
Ballantyne Strong, Inc.* | | | 14,000 | | | | 83,580 | |
Belo Corp., Class A | | | 28,550 | | | | 183,862 | |
Cumulus Media, Inc., Class A* | | | 25,200 | | | | 75,852 | |
Dex One Corp.* | | | 48,800 | | | | 45,628 | |
E.W. Scripps Co., Class A (The)* | | | 26,500 | | | | 254,665 | |
Entercom Communications Corp., Class A* | | | 37,500 | | | | 225,750 | |
Entravision Communications Corp., Class A | | | 38,300 | | | | 46,343 | |
Gray Television, Inc.* | | | 99,550 | | | | 146,338 | |
Journal Communications, Inc., Class A* | | | 57,100 | | | | 294,636 | |
Lee Enterprises, Inc.* | | | 43,200 | | | | 69,984 | |
Media General, Inc., Class A*+ | | | 15,300 | | | | 70,533 | |
Meredith Corp.+ | | | 20,950 | | | | 669,143 | |
Navarre Corp.* | | | 16,500 | | | | 26,235 | |
New York Times Co., Class A (The)* | | | 93,850 | | | | 732,030 | |
Radio One, Inc., Class D*+ | | | 23,100 | | | | 21,668 | |
Reading International, Inc., Class A*+ | | | 10,700 | | | | 57,887 | |
Saga Communications, Inc., Class A* | | | 1,900 | | | | 70,509 | |
Salem Communications Corp., Class A | | | 24,800 | | | | 135,656 | |
| | |
Bridgeway Omni Small-Cap Value Fund SCHEDULE OF INVESTMENTS (continued) | | |
Showing percentage of net assets as of June 30, 2012
| | | | | | | | |
| Industry Company | | Shares | | | Value | |
Common Stocks (continued) | | | | | | | | |
Media (continued) | | | | | | | | |
Scholastic Corp. | | | 18,250 | | | $ | 513,920 | |
Valassis Communications, Inc.*+ | | | 28,100 | | | | 611,175 | |
| | | | | | | | |
| | | | | | | 4,503,028 | |
| | |
Metals & Mining - 2.41% | | | | | | | | |
Friedman Industries, Inc. | | | 3,000 | | | | 30,510 | |
Golden Star Resources, Ltd.* | | | 343,000 | | | | 397,880 | |
Handy & Harman, Ltd.* | | | 12,500 | | | | 168,500 | |
Horsehead Holding Corp.* | | | 7,800 | | | | 77,688 | |
Jaguar Mining, Inc.*+ | | | 168,800 | | | | 195,808 | |
Materion Corp. | | | 16,600 | | | | 382,298 | |
Noranda Aluminum Holding Corp. | | | 89,850 | | | | 715,206 | |
Schnitzer Steel Industries, Inc., Class A | | | 28,800 | | | | 806,976 | |
Worthington Industries, Inc. | | | 76,200 | | | | 1,559,814 | |
| | | | | | | | |
| | | | | | | 4,334,680 | |
| | |
Multiline Retail - 0.59% | | | | | | | | |
Bon-Ton Stores, Inc. (The)+ | | | 25,950 | | | | 202,670 | |
Fred’s, Inc., Class A | | | 46,200 | | | | 706,398 | |
Tuesday Morning Corp.* | | | 34,600 | | | | 148,434 | |
| | | | | | | | |
| | | | | | | 1,057,502 | |
| |
Oil, Gas & Consumable Fuels - 5.70% | | | | | |
Adams Resources & Energy, Inc. | | | 5,900 | | | | 247,328 | |
Alon USA Energy, Inc. | | | 83,100 | | | | 703,026 | |
Andatee China Marine Fuel Services Corp.*+ | | | 7,800 | | | | 14,664 | |
Bill Barrett Corp.* | | | 11,200 | | | | 239,904 | |
BioFuel Energy Corp.*+ | | | 10,900 | | | | 38,804 | |
Callon Petroleum Co.* | | | 57,300 | | | | 244,098 | |
Clayton Williams Energy, Inc.* | | | 14,800 | | | | 716,024 | |
Cloud Peak Energy, Inc.* | | | 82,800 | | | | 1,400,148 | |
Crimson Exploration, Inc.* | | | 20,250 | | | | 92,948 | |
Crosstex Energy, Inc. | | | 59,450 | | | | 832,300 | |
Delek US Holdings, Inc. | | | 46,600 | | | | 819,694 | |
Double Eagle Petroleum Co.* | | | 17,600 | | | | 77,088 | |
GMX Resources, Inc.*+ | | | 33,100 | | | | 26,844 | |
Green Plains Renewable Energy, Inc.* | | | 58,200 | | | | 363,168 | |
Halcon Resources Corp.*+ | | | 16,667 | | | | 157,336 | |
James River Coal Co.*+ | | | 22,400 | | | | 60,704 | |
Longwei Petroleum Investment Holding, Ltd.* | | | 100,300 | | | | 127,381 | |
| | | | | | | | |
| Industry Company | | Shares | | | Value | |
| | | | | | | | |
Oil, Gas & Consumable Fuels (continued) | |
Patriot Coal Corp.*+ | | | 20,550 | | | $ | 25,071 | |
PostRock Energy Corp.* | | | 12,000 | | | | 19,080 | |
REX American Resources Corp.* | | | 18,100 | | | | 353,312 | |
Sino Clean Energy, Inc.*D+ | | | 50,300 | | | | 40,240 | |
Stone Energy Corp.* | | | 42,100 | | | | 1,066,814 | |
Swift Energy Co.* | | | 45,400 | | | | 844,894 | |
W&T Offshore, Inc. | | | 74,600 | | | | 1,141,380 | |
Western Refining, Inc. | | | 25,800 | | | | 574,566 | |
| | | | | | | | |
| | | | | | | 10,226,816 | |
| |
Paper & Forest Products - 2.75% | | | | | |
Clearwater Paper Corp.* | | | 7,600 | | | | 259,312 | |
KapStone Paper & Packaging Corp.* | | | 68,650 | | | | 1,088,102 | |
Mercer International, Inc.* | | | 77,250 | | | | 441,098 | |
Neenah Paper, Inc. | | | 20,200 | | | | 539,138 | |
Orient Paper, Inc. | | | 37,000 | | | | 96,940 | |
PH Glatfelter Co. | | | 53,450 | | | | 874,976 | |
Resolute Forest Products*+ | | | 77,000 | | | | 891,660 | |
Wausau Paper Corp. | | | 76,200 | | | | 741,426 | |
| | | | | | | | |
| | | | | | | 4,932,652 | |
| |
Personal Products - 0.26% | | | | | |
Medifast, Inc.* | | | 5,000 | | | | 98,400 | |
Nutraceutical International Corp.* | | | 7,700 | | | | 117,425 | |
Physicians Formula Holdings, Inc.* | | | 23,700 | | | | 82,713 | |
USANA Health Sciences, Inc.*+ | | | 3,900 | | | | 160,368 | |
| | | | | | | | |
| | | | | | | 458,906 | |
| |
Professional Services - 1.42% | | | | | |
Barrett Business Services, Inc. | | | 10,100 | | | | 213,514 | |
CBIZ, Inc.* | | | 42,775 | | | | 254,084 | |
CDI Corp. | | | 15,400 | | | | 252,560 | |
CRA International, Inc.* | | | 13,800 | | | | 202,722 | |
Dolan Co. (The)* | | | 11,100 | | | | 74,703 | |
Heidrick & Struggles International, Inc. | | | 3,600 | | | | 63,000 | |
Hudson Global, Inc.* | | | 32,300 | | | | 134,691 | |
ICF International, Inc.* | | | 7,150 | | | | 170,456 | |
Insperity, Inc. | | | 15,400 | | | | 416,570 | |
Kelly Services, Inc., Class A | | | 13,600 | | | | 175,576 | |
Kforce, Inc.* | | | 19,150 | | | | 257,759 | |
Navigant Consulting, Inc.* | | | 11,000 | | | | 139,040 | |
RCM Technologies, Inc.* | | | 6,100 | | | | 33,794 | |
| | |
12 | | Annual Report | June 30, 2012 |
| | |
Bridgeway Omni Small-Cap Value Fund SCHEDULE OF INVESTMENTS (continued) | | |
Showing percentage of net assets as of June 30, 2012
| | | | | | | | |
| Industry Company | | Shares | | | Value | |
Common Stocks (continued) | | | | | | | | |
Professional Services (continued) | | | | | |
VSE Corp. | | | 6,700 | | | $ | 159,393 | |
| | | | | | | | |
| | | | | | | 2,547,862 | |
| | |
Road & Rail - 2.06% | | | | | | | | |
Amerco, Inc. | | | 7,200 | | | | 647,784 | |
Arkansas Best Corp. | | | 25,000 | | | | 315,000 | |
Avis Budget Group, Inc.* | | | 70,750 | | | | 1,075,400 | |
Celadon Group, Inc. | | | 8,400 | | | | 137,592 | |
Con-way, Inc. | | | 21,000 | | | | 758,310 | |
Covenant Transportation Group, Inc., Class A* | | | 5,300 | | | | 19,716 | |
Marten Transport, Ltd. | | | 8,150 | | | | 173,269 | |
P.A.M. Transportation Services, Inc. | | | 3,500 | | | | 33,775 | |
Saia, Inc.* | | | 15,750 | | | | 344,768 | |
Swift Transportation Co.* | | | 8,800 | | | | 83,160 | |
Universal Truckload Services, Inc. | | | 7,809 | | | | 118,111 | |
USA Truck, Inc.* | | | 300 | | | | 1,413 | |
| | | | | | | | |
| | | | | | | 3,708,298 | |
| |
Semiconductors & Semiconductor Equipment - 1.78% | |
Advanced Energy Industries, Inc.* | | | 11,800 | | | | 158,356 | |
Amkor Technology, Inc.* | | | 157,550 | | | | 768,844 | |
Amtech Systems, Inc.* | | | 4,300 | | | | 16,168 | |
DSP Group, Inc.* | | | 700 | | | | 4,438 | |
GT Advanced Technologies, Inc.* | | | 96,700 | | | | 510,576 | |
inTEST Corp.* | | | 8,000 | | | | 27,120 | |
Kulicke & Soffa Industries, Inc.* | | | 45,000 | | | | 401,400 | |
LTX-Credence Corp.* | | | 15,000 | | | | 100,500 | |
Magnachip Semiconductor Corp.* | | | 38,400 | | | | 365,952 | |
OmniVision Technologies, Inc.* | | | 19,400 | | | | 259,184 | |
Photronics, Inc.* | | | 62,950 | | | | 383,995 | |
Ultra Clean Holdings* | | | 30,800 | | | | 198,044 | |
| | | | | | | | |
| | | | | | | 3,194,577 | |
| | |
Software - 0.14% | | | | | | | | |
Bsquare Corp.* | | | 4,800 | | | | 14,016 | |
Cinedigm Digital Cinema Corp., Class A* | | | 29,100 | | | | 43,650 | |
Majesco Entertainment Co.* | | | 58,800 | | | | 117,600 | |
Net 1 UEPS Technologies, Inc.* | | | 3,400 | | | | 28,458 | |
TeleCommunication Systems, Inc., Class A* | | | 32,600 | | | | 40,098 | |
| | | | | | | | |
| | | | | | | 243,822 | |
| | | | | | | | |
| Industry Company | | Shares | | | Value | |
| | | | | | | | |
Specialty Retail - 7.88% | | | | | | | | |
Aeropostale, Inc.* | | | 29,100 | | | $ | 518,853 | |
ANN, Inc.* | | | 57,600 | | | | 1,468,224 | |
Appliance Recycling Centers of America, Inc.* | | | 5,300 | | | | 22,154 | |
Asbury Automotive Group, Inc.* | | | 13,125 | | | | 310,931 | |
Barnes & Noble, Inc.*+ | | | 59,400 | | | | 977,724 | |
Body Central Corp.* | | | 26,100 | | | | 234,900 | |
Books-A-Million, Inc.* | | | 31,600 | | | | 101,120 | |
Brown Shoe Co., Inc.+ | | | 51,400 | | | | 663,574 | |
Build-A-Bear Workshop, Inc.* | | | 8,050 | | | | 38,479 | |
Casual Male Retail Group, Inc.* | | | 20,500 | | | | 74,415 | |
Children’s Place Retail Stores, Inc. (The)* | | | 22,100 | | | | 1,101,243 | |
Citi Trends, Inc.* | | | 2,600 | | | | 40,144 | |
Conn’s, Inc.*+ | | | 13,450 | | | | 199,060 | |
Destination Maternity Corp. | | | 10,400 | | | | 224,640 | |
Group 1 Automotive, Inc. | | | 30,600 | | | | 1,395,666 | |
Haverty Furniture Cos., Inc. | | | 11,300 | | | | 126,221 | |
hhgregg, Inc.*+ | | | 29,300 | | | | 331,383 | |
Hot Topic, Inc. | | | 29,150 | | | | 282,464 | |
Kirkland’s, Inc.* | | | 11,550 | | | | 129,938 | |
New York & Co., Inc.* | | | 26,200 | | | | 91,176 | |
Office Depot, Inc.* | | | 458,300 | | | | 989,928 | |
OfficeMax, Inc.* | | | 130,700 | | | | 661,342 | |
Pep Boys-Manny, Moe & Jack (The) | | | 52,000 | | | | 514,800 | |
Perfumania Holdings, Inc.*+ | | | 7,000 | | | | 58,030 | |
RadioShack Corp.+ | | | 41,804 | | | | 160,527 | |
rue21, inc.* | | | 8,300 | | | | 209,492 | |
Shoe Carnival, Inc. | | | 14,700 | | | | 315,903 | |
Sonic Automotive, Inc., Class A+ | | | 61,500 | | | | 840,705 | |
Stage Stores, Inc. | | | 46,600 | | | | 853,712 | |
Stein Mart, Inc.* | | | 33,750 | | | | 268,312 | |
Systemax, Inc.* | | | 15,400 | | | | 182,028 | |
TravelCenters of America LLC* | | | 35,400 | | | | 179,478 | |
West Marine, Inc.* | | | 29,800 | | | | 350,150 | |
Wet Seal, Inc., Class A (The)* | | | 72,200 | | | | 228,152 | |
| | | | | | | | |
| | | | | | | 14,144,868 | |
|
Textiles, Apparel & Luxury Goods - 1.41% | |
Alpha PRO Tech, Ltd.* | | | 12,400 | | | | 17,360 | |
Crown Crafts, Inc. | | | 24,500 | | | | 135,730 | |
Jones Group, Inc. (The) | | | 87,800 | | | | 839,368 | |
Lakeland Industries, Inc.* | | | 3,300 | | | | 23,331 | |
Movado Group, Inc. | | | 5,900 | | | | 147,618 | |
| | |
Bridgeway Omni Small-Cap Value Fund SCHEDULE OF INVESTMENTS (continued) | | |
Showing percentage of net assets as of June 30, 2012
| | | | | | | | |
| Industry Company | | Shares | | | Value | |
Common Stocks (continued) | | | | | | | | |
Textiles, Apparel & Luxury Goods (continued) | |
Perry Ellis International, Inc.* | | | 25,500 | | | $ | 529,125 | |
Quiksilver, Inc.* | | | 49,900 | | | | 116,267 | |
Rocky Brands, Inc.* | | | 9,900 | | | | 130,581 | |
Skechers U.S.A., Inc., Class A* | | | 14,800 | | | | 301,476 | |
Unifi, Inc.* | | | 25,800 | | | | 292,314 | |
| | | | | | | | |
| | | | | | | 2,533,170 | |
| |
Thrifts & Mortgage Finance - 0.77% | | | | | |
Astoria Financial Corp. | | | 44,200 | | | | 433,160 | |
BankAtlantic Bancorp, Inc., Class A* | | | 11,000 | | | | 60,720 | |
Doral Financial Corp.* | | | 57,100 | | | | 85,650 | |
Federal Agricultural Mortgage Corp., Class C | | | 6,500 | | | | 170,495 | |
First Defiance Financial Corp. | | | 4,400 | | | | 75,328 | |
First Financial Holdings, Inc. | | | 11,900 | | | | 127,568 | |
Meta Financial Group, Inc. | | | 1,400 | | | | 27,902 | |
MutualFirst Financial, Inc. | | | 10,900 | | | | 114,341 | |
NASB Financial, Inc.*+ | | | 1,800 | | | | 35,730 | |
Provident Financial Holdings, Inc. | | | 4,800 | | | | 55,344 | |
Pulaski Financial Corp.+ | | | 4,900 | | | | 36,309 | |
United Community Financial Corp.* | | | 52,300 | | | | 155,854 | |
| | | | | | | | |
| | | | | | | 1,378,401 | |
| |
Trading Companies & Distributors - 1.06% | |
Aceto Corp. | | | 13,300 | | | | 120,099 | |
Aircastle, Ltd. | | | 24,600 | | | | 296,430 | |
Interline Brands, Inc.* | | | 12,350 | | | | 309,614 | |
KSW, Inc. | | | 2,300 | | | | 8,993 | |
United Rentals, Inc.* | | | 30,100 | | | | 1,024,604 | |
Willis Lease Finance Corp.* | | | 12,100 | | | | 149,072 | |
| | | | | | | | |
| | | | | | | 1,908,812 | |
| |
Wireless Telecommunication Services - 0.47% | |
Leap Wireless International, Inc.* | | | 68,100 | | | | 437,883 | |
NTELOS Holdings Corp. | | | 11,800 | | | | 222,430 | |
Shenandoah Telecommunications Co. | | | 5,600 | | | | 76,216 | |
USA Mobility, Inc. | | | 8,400 | | | | 108,024 | |
| | | | | | | | |
| | | | | | | 844,553 | |
| | | | | | | | |
TOTAL COMMON STOCKS - 99.55% | | | | 178,750,947 | |
| | | | | | | | |
(Cost $168,036,273) | | | | | | | | |
| | | | | | | | | | | | |
| Industry Company | | | | | Shares | | | Value | |
RIGHTS - 0.01% | | | | | | | | | | | | |
Hampton Roads Bankshares, Inc.*D | | | | 22,300 | | | | $16,167 | |
| | | | | | | | | | | | |
TOTAL RIGHTS - 0.01% | | | | | | | | | | | 16,167 | |
| | | | | | | | | | | | |
(Cost $51,923) | | | | | | | | | | | | |
| | | |
| | | Rate^ | | | Shares | | | Value | |
| | | | |
MONEY MARKET FUND - 1.87% | | | | | |
BlackRock FedFund | | | 0.01 | % | | | 3,353,429 | | | | 3,353,429 | |
| | | | | | | | | | | | |
TOTAL MONEY MARKET FUND - 1.87% | | | | 3,353,429 | |
| | | | | | | | | | | | |
(Cost $3,353,429) | | | | | | | | | | | | |
| |
TOTAL INVESTMENTS - 101.43% | | | $ | 182,120,543 | |
(Cost $171,441,625) | | | | | | | | | | | | |
Liabilities in Excess of Other Assets - (1.43%) | | | | (2,567,836 | ) |
| | | | | | | | | | | | |
NET ASSETS - 100.00% | | | | | | | | | | $ | 179,552,707 | |
| | | | | | | | | | | | |
| * | Non-income producing security. |
| ^ | Rate disclosed as of June 30, 2012. |
| D | Security was fair valued under procedures adopted by the Board of Directors (see Note 2). |
| + | This security or a portion of the security is out on loan at June 30, 2012. Total loaned securities had a value of $13,371,957 at June 30, 2012. |
LLC - Limited Liability Company
Summary of inputs used to value the Fund’s investments as of 06/30/2012 is as follows (See Note 2 in Notes to Financial Statements):
| | | | | | | | | | | | | | | | |
| | | Valuation Inputs | |
| | | Investment in Securities (Value) | |
| | | Level 1 Quoted Prices | | | Level 2 Significant Observable Inputs | | | Level 3 Significant Unobservable Inputs | | | Total | |
Common Stocks | | $ | 178,710,707 | | | $ | — | | | | $40,240 | | | $ | 178,750,947 | |
Rights | | | — | | | | — | | | | 16,167 | | | | 16,167 | |
Money Market Fund | | | — | | | | 3,353,429 | | | | — | | | | 3,353,429 | |
| | | | | | | | | | | | | | | | |
TOTAL | | $ | 178,710,707 | | | $ | 3,353,429 | | | | $56,407 | | | $ | 182,120,543 | |
| | | | | | | | | | | | | | | | |
| | |
14 | | Annual Report | June 30, 2012 |
| | |
Bridgeway Omni Small-Cap Value Fund SCHEDULE OF INVESTMENTS (continued) | | |
| | | | | | | | | | | | | | | | |
Following is a reconciliation of Level 3 investments for which significant unobservable inputs were used to determine fair value: | | | | | |
| | | Investment in Securities (Value) | | | | |
| | | Common Stocks | | | Rights | | | Total | | | | |
Balance as of 08/31/2011 | | | $ — | | | $ | — | | | $ | — | | | | |
Purchases | | | 140,431 | | | | 51,923 | | | | 192,354 | | | | |
Sales | | | — | | | | — | | | | — | | | | |
Realized gain/(loss) | | | — | | | | — | | | | — | | | | |
Change in unrealized appreciation/ (depreciation)1 | | | (100,191) | | | | (35,756) | | | | (135,947) | | | | |
Transfers in | | | — | | | | — | | | | — | | | | |
Transfers out | | | — | | | | — | | | | — | | | | |
| | | | | | | | | | | | | | | |
Balance as of 06/30/2012 | | | $ 40,240 | | | $ | 16,167 | | | $ | 56,407 | | | | |
| | | | | | | | | | | | | | | |
Net change in unrealized appreciation (depreciation) from investments held as of 06/30/20121 | | | $(100,191) | | | $ | (35,756) | | | $ | (135,947) | | | | |
| | | | | | | | | | | | | | | |
| | | | | | | | |
1 Change in unrealized appreciation/(depreciation) for Level 3 securities is included on Statement of Operations in the Change in Unrealized Appreciation (Depreciation) on Investments. | | |
The securities in the table above were considered Level 3 securities because they were fair valued under procedures adopted by the Board of Directors at June 30, 2012. Such valuations are based on a review of inputs such as, but not limited to, similar securities, company specific financial information and company specific news. See Notes to Financial Statements. | | |
| | |
Omni Tax-Managed Small-Cap Value Fund MANAGER’S COMMENTARY (Unaudited) | | |
June 30, 2012
Dear Fellow Omni Tax-Managed Small-Cap Value Fund Shareholder,
For the quarter ended June 30, 2012, total returns were -6.42% for the Fund and -3.01% for the Russell 2000 Value Index. For the fiscal year ended June 30, 2012, total returns were -5.41% for the Fund and -1.44% for the Russell 2000 Value Index.
The table below presents our June quarter, one-year and inception-to-date financial results. See below for a graph of performance since inception.
Standardized Returns as of June 30, 2012
| | | | | | |
|
| | | |
| | | | | | | Annualized |
| | | | | | | Since Inception |
| | | Quarter | | 1 Year | | (12/31/10) |
|
Omni Tax-Managed Small-Cap Value Fund | | -6.42% | | -5.41% | | 0.69% |
Russell 2000 Value Index | | -3.01% | | -1.44% | | 1.51% |
Performance figures quoted in the table above and graph below represent past performance and are no guarantee of future results. Total return figures in the table above include the reinvestment of dividends and capital gains. The table above and the graph below do not reflect the deduction of taxes that a shareholder would pay on Fund distributions or the redemption of Fund shares.
The Russell 2000 Value Index is an unmanaged index that consists of stocks in the Russell 2000 Index with lower price-to-book ratios and lower forecasted growth values with dividends reinvested. It is not possible to invest directly in an index. Periods longer than one year are annualized.
Omni Tax-Managed Small-Cap Value Fund vs. Russell 2000 Value Index from Inception 12/31/10 to 6/30/12
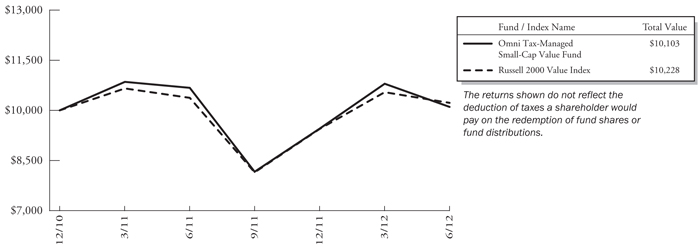
| | |
16 | | Annual Report | June 30, 2012 |
| | |
Omni Tax-Managed Small-Cap Value Fund MANAGER’S COMMENTARY (Unaudited) (continued) | | |
Detailed Explanation of Quarterly Performance
The Omni Tax-Managed Small-Cap Value Fund is designed to capture the returns of the small-cap value asset class through broad diversification of small company and value stocks. We also seek to minimize the distribution of capital gains within the constraints of the investment objective. This approach is sometimes referred to as “passive, asset class investing.” As of June 30, 2012, we held 724 such stocks in a market cap weighted style. We make no attempt to track any public index in either performance or statistics.
The Fund returns were driven by the fact that returns for small stocks were negative across the board. Declines were broadly spread across almost all sectors. The design tilt towards smaller and deeper value stocks resulted in heavy underweighting in the strong performing Financials sector, which hurt the Fund’s performance for the quarter relative to the Russell 2000 Value Index.
Detailed Explanation of Fiscal Year Performance
Our smaller-cap dominance and deeper value bent helped the performance for the fiscal year. The design tilt towards smaller and deeper value stocks resulted in heavy underweighting in the Financials sector, the best performing sector, which hurt the Fund’s return relative to the Russell 2000 Value Index.
Top Ten Holdings as of June 30, 2012
| | | | | | |
| Rank | | Description | | Industry | | % of Net
Assets |
1 | | Cracker Barrel Old Country Store, Inc. | | Hotels, Restaurants & Leisure | | 0.8% |
2 | | Brink’s Co. (The) | | Commercial Services & Supplies | | 0.8% |
3 | | Western Refining, Inc. | | Oil, Gas & Consumable Fuels | | 0.7% |
4 | | US Airways Group, Inc. | | Airlines | | 0.7% |
5 | | Symetra Financial Corp. | | Insurance | | 0.7% |
6 | | Brunswick Corp. | | Leisure Equipment & Products | | 0.7% |
7 | | Deluxe Corp. | | Commercial Services & Supplies | | 0.7% |
8 | | Weis Markets, Inc. | | Food & Staples Retailing | | 0.6% |
9 | | Geo Group, Inc. (The) | | Commercial Services & Supplies | | 0.6% |
10 | | SUPERVALU, Inc. | | Food & Staples Retailing | | 0.6% |
| | Total | | | | 6.9% |
Industry Sector Representation as of June 30, 2012
| | | | | | | | | | | | | | | |
| | | % of Net Assets | | % of Russell 2000
Value Index | | Difference |
Consumer Discretionary | | | | 25.3 | % | | | | 11.4 | % | | | | 13.9 | % |
Consumer Staples | | | | 6.7 | % | | | | 2.7 | % | | | | 4.0 | % |
Energy | | | | 7.9 | % | | | | 6.7 | % | | | | 1.2 | % |
Financials | | | | 14.0 | % | | | | 35.8 | % | | | | -21.8 | % |
Health Care | | | | 4.9 | % | | | | 4.8 | % | | | | 0.1 | % |
Industrials | | | | 19.0 | % | | | | 12.9 | % | | | | 6.1 | % |
Information Technology | | | | 10.7 | % | | | | 13.0 | % | | | | -2.3 | % |
Materials | | | | 8.9 | % | | | | 5.1 | % | | | | 3.8 | % |
Telecommunication Services | | | | 2.3 | % | | | | 0.6 | % | | | | 1.7 | % |
Utilities | | | | 0.2 | % | | | | 7.0 | % | | | | -6.8 | % |
Cash & Other Assets | | | | 0.1 | % | | | | 0.0 | % | | | | 0.1 | % |
Total | | | | 100.0 | % | | | | 100.0 | % | | | | | |
| | |
Omni Tax-Managed Small-Cap Value Fund MANAGER’S COMMENTARY (Unaudited) (continued) | | |
Disclaimer
The views expressed here are exclusively those of Fund management. These views, including those related to market sectors or individual stocks, are not meant as investment advice and should not be considered predictive in nature. Any favorable (or unfavorable) description of a holding applies only as of the quarter-end, June 30, 2012, unless otherwise stated. Security positions can and do change thereafter. Discussions of historical performance do not guarantee and may not be indicative of future performance.
Market volatility can significantly impact short-term performance. The Fund is not an appropriate investment for short-term investors. Investments in small companies generally carry greater risk than is customarily associated with larger companies. This additional risk is attributable to a number of factors, including the relatively limited financial resources that are typically available to small companies and the fact that small companies often have comparatively limited product lines. In addition, the stock of small companies tends to be more volatile than the stock of large companies, particularly in the short term and particularly in the early stages of an economic or market downturn. Shareholders of the Fund, therefore, are taking on more risk than they would if they invested in the stock market as a whole.
Conclusion
Thank you for your continued investment in Omni Tax-Managed Small-Cap Value Fund. We encourage your feedback; your reactions and concerns are important to us.
Sincerely,
The Investment Management Team
| | |
18 | | Annual Report | June 30, 2012 |
| | |
Bridgeway Omni Tax-Managed Small-Cap Value Fund SCHEDULE OF INVESTMENTS | | |
Showing percentage of net assets as of June 30, 2012
| | | | | | | | |
| Industry Company | | Shares | | | Value | |
COMMON STOCKS - 99.14% | | | | | | | | |
Aerospace & Defense - 0.75% | | | | | | | | |
AAR Corp. | | | 10,150 | | | $ | 136,822 | |
Astrotech Corp.* | | | 32,600 | | | | 35,208 | |
Ducommun, Inc.* | | | 12,950 | | | | 127,039 | |
GeoEye, Inc.* | | | 17,900 | | | | 277,092 | |
Orbital Sciences Corp.* | | | 12,900 | | | | 166,668 | |
Sparton Corp.* | | | 950 | | | | 9,405 | |
Sypris Solutions, Inc. | | | 28,400 | | | | 197,948 | |
| | | | | | | | |
| | | | | | | 950,182 | |
| | |
Air Freight & Logistics - 0.77% | | | | | | | | |
Air Transport Services Group, Inc.* | | | 25,250 | | | | 131,300 | |
Atlas Air Worldwide Holdings, Inc.* | | | 12,200 | | | | 530,822 | |
Pacer International, Inc.* | | | 36,000 | | | | 195,120 | |
Park-Ohio Holdings Corp.* | | | 6,154 | | | | 117,111 | |
| | | | | | | | |
| | | | | | | 974,353 | |
| | |
Airlines - 1.94% | | | | | | | | |
Alaska Air Group, Inc.* | | | 200 | | | | 7,180 | |
Allegiant Travel Co.* | | | 1,400 | | | | 97,552 | |
Hawaiian Holdings, Inc.* | | | 46,200 | | | | 300,762 | |
JetBlue Airways Corp.* | | | 119,050 | | | | 630,965 | |
Republic Airways Holdings, Inc.* | | | 39,200 | | | | 217,560 | |
SkyWest, Inc. | | | 45,600 | | | | 297,768 | |
US Airways Group, Inc.*+ | | | 68,950 | | | | 919,103 | |
| | | | | | | | |
| | | | | | | 2,470,890 | |
| | |
Auto Components - 1.79% | | | | | | | | |
China Automotive Systems, Inc.* | | | 22,700 | | | | 92,843 | |
China XD Plastics Co., Ltd.*+ | | | 16,000 | | | | 73,280 | |
Cooper Tire & Rubber Co. | | | 24,550 | | | | 430,607 | |
Drew Industries, Inc.* | | | 700 | | | | 19,495 | |
Exide Technologies* | | | 33,500 | | | | 112,560 | |
Federal-Mogul Corp.* | | | 32,200 | | | | 354,200 | |
Modine Manufacturing Co.* | | | 14,600 | | | | 101,178 | |
Shiloh Industries, Inc. | | | 6,950 | | | | 79,925 | |
SORL Auto Parts, Inc.* | | | 25,000 | | | | 60,250 | |
Spartan Motors, Inc. | | | 12,150 | | | | 63,666 | |
Standard Motor Products, Inc. | | | 23,300 | | | | 328,064 | |
Stoneridge, Inc.* | | | 28,900 | | | | 196,809 | |
Strattec Security Corp. | | | 4,380 | | | | 92,155 | |
Superior Industries International, Inc. | | | 6,600 | | | | 108,042 | |
Tower International, Inc.* | | | 15,600 | | | | 163,800 | |
| | | | | | | | |
| | | | | | | 2,276,874 | |
| | | | | | | | |
| Industry Company | | Shares | | | Value | |
| | | | | | | | |
Beverages - 0.22% | | | | | | | | |
Coca-Cola Bottling Co. Consolidated | | | 3,950 | | | $ | 253,906 | |
National Beverage Corp.* | | | 2,150 | | | | 32,121 | |
| | | | | | | | |
| | | | | | | 286,027 | |
| | |
Building Products - 0.74% | | | | | | | | |
Ameresco, Inc., Class A* | | | 20,000 | | | | 238,600 | |
Gibraltar Industries, Inc.* | | | 10,100 | | | | 104,838 | |
Griffon Corp. | | | 2,950 | | | | 25,311 | |
Nortek, Inc.* | | | 4,900 | | | | 245,196 | |
Patrick Industries, Inc.* | | | 11,800 | | | | 150,450 | |
Universal Forest Products, Inc. | | | 1,200 | | | | 46,776 | |
US Home Systems, Inc. | | | 12,400 | | | | 125,860 | |
| | | | | | | | |
| | | | | | | 937,031 | |
| | |
Capital Markets - 1.11% | | | | | | | | |
Calamos Asset Management, Inc., Class A | | | 700 | | | | 8,015 | |
Cowen Group, Inc., Class A* | | | 95,100 | | | | 252,966 | |
Direct Markets Holdings Corp.* | | | 46,900 | | | | 17,775 | |
GFI Group, Inc. | | | 63,600 | | | | 226,416 | |
Gleacher & Co., Inc.* | | | 49,500 | | | | 39,600 | |
INTL FCStone, Inc.* | | | 5,650 | | | | 109,328 | |
Investment Technology Group, Inc.* | | | 15,850 | | | | 145,820 | |
Oppenheimer Holdings, Inc., Class A | | | 16,250 | | | | 255,450 | |
Piper Jaffray Cos.* | | | 6,100 | | | | 142,923 | |
SWS Group, Inc.* | | | 39,600 | | | | 211,068 | |
| | | | | | | | |
| | | | | | | 1,409,361 | |
| | |
Chemicals - 3.64% | | | | | | | | |
American Pacific Corp.* | | | 3,900 | | | | 41,106 | |
American Vanguard Corp. | | | 900 | | | | 23,931 | |
China Green Agriculture, Inc.*+ | | | 39,800 | | | | 142,484 | |
Core Molding Technologies, Inc.* | | | 18,300 | | | | 150,792 | |
Ferro Corp.* | | | 29,100 | | | | 139,680 | |
Georgia Gulf Corp. | | | 20,300 | | | | 521,101 | |
Gulf Resources, Inc.*+ | | | 45,000 | | | | 54,900 | |
Innospec, Inc.* | | | 800 | | | | 23,688 | |
Koppers Holdings, Inc. | | | 14,400 | | | | 489,600 | |
Kraton Performance Polymers, Inc.* | | | 16,075 | | | | 352,203 | |
Material Sciences Corp.* | | | 14,900 | | | | 122,180 | |
| | |
Bridgeway Omni Tax-Managed Small-Cap Value Fund SCHEDULE OF INVESTMENTS (continued) | | |
Showing percentage of net assets as of June 30, 2012
| | | | | | | | |
| Industry Company | | Shares | | | Value | |
Common Stocks (continued) | | | | | | | | |
Chemicals (continued) | | | | | | | | |
OM Group, Inc.* | | | 19,100 | | | $ | 362,900 | |
Omnova Solutions, Inc.* | | | 32,500 | | | | 245,050 | |
Penford Corp.* | | | 4,850 | | | | 43,408 | |
Schulman (A.), Inc. | | | 30,900 | | | | 613,365 | |
Spartech Corp.* | | | 46,300 | | | | 239,371 | |
Stepan Co. | | | 350 | | | | 32,963 | |
TOR Minerals International, Inc.* | | | 200 | | | | 3,346 | |
TPC Group, Inc.* | | | 13,175 | | | | 486,816 | |
Tredegar Corp. | | | 16,300 | | | | 237,328 | |
Yongye International, Inc.*+ | | | 9,900 | | | | 30,591 | |
Zep, Inc. | | | 19,900 | | | | 273,227 | |
| | | | | | | | |
| | | | | | | 4,630,030 | |
| | |
Commercial Banks - 4.60% | | | | | | | | |
1st Source Corp. | | | 2,000 | | | | 45,200 | |
Access National Corp.+ | | | 600 | | | | 7,860 | |
Ameris Bancorp* | | | 1,400 | | | | 17,640 | |
BancFirst Corp. | | | 1,300 | | | | 54,483 | |
BancorpSouth, Inc. | | | 41,300 | | | | 599,676 | |
Bank of Commerce Holdings | | | 200 | | | | 816 | |
Banner Corp. | | | 2,057 | | | | 45,069 | |
BBCN Bancorp, Inc.* | | | 2,950 | | | | 32,125 | |
Boston Private Financial Holdings, Inc. | | | 4,850 | | | | 43,310 | |
C&F Financial Corp.+ | | | 2,400 | | | | 96,384 | |
Capital City Bank Group, Inc. | | | 1,950 | | | | 14,371 | |
Citizens Republic Bancorp, Inc.* | | | 19,400 | | | | 332,322 | |
CoBiz Financial, Inc. | | | 2,200 | | | | 13,772 | |
Fidelity Southern Corp.+ | | | 13,000 | | | | 112,320 | |
First Bancorp | | | 1,600 | | | | 14,224 | |
First BanCorp. (Puerto Rico)*+ | | | 69,300 | | | | 274,428 | |
First Commonwealth Financial Corp. | | | 5,200 | | | | 34,996 | |
First Interstate Bancsystem, Inc. | | | 2,900 | | | | 41,296 | |
First Merchants Corp. | | | 3,500 | | | | 43,610 | |
FNB Corp. | | | 653 | | | | 7,098 | |
Great Southern Bancorp, Inc. | | | 5,550 | | | | 153,069 | |
Guaranty Bancorp* | | | 2,900 | | | | 6,119 | |
Hanmi Financial Corp.* | | | 2,363 | | | | 24,764 | |
Heartland Financial USA, Inc. | | | 1,750 | | | | 42,000 | |
Horizon Bancorp+ | | | 909 | | | | 23,907 | |
Independent Bank Corp.* | | | 500 | | | | 1,255 | |
| | | | | | | | |
| Industry Company | | Shares | | | Value | |
| | | | | | | | |
Commercial Banks (continued) | | | | | | | | |
International Bancshares Corp. | | | 5,900 | | | $ | 115,168 | |
Intervest Bancshares Corp., Class A* | | | 29,200 | | | | 111,836 | |
Macatawa Bank Corp.* | | | 12,550 | | | | 42,796 | |
MainSource Financial Group, Inc. | | | 2,300 | | | | 27,209 | |
Mercantile Bank Corp.* | | | 500 | | | | 9,225 | |
Metro Bancorp, Inc.* | | | 1,250 | | | | 15,038 | |
MetroCorp Bancshares, Inc.* | | | 450 | | | | 4,802 | |
Middleburg Financial Corp. | | | 400 | | | | 6,800 | |
NewBridge Bancorp* | | | 800 | | | | 3,504 | |
Old Second Bancorp, Inc.* | | | 5,800 | | | | 7,540 | |
PacWest Bancorp | | | 2,400 | | | | 56,808 | |
Peapack Gladstone Financial Corp. | | | 250 | | | | 3,877 | |
Peoples Bancorp, Inc. | | | 4,850 | | | | 106,603 | |
Pinnacle Financial Partners, Inc.* | | | 2,650 | | | | 51,702 | |
PrivateBancorp, Inc. | | | 29,200 | | | | 430,992 | |
Republic Bancorp, Inc., Class A | | | 3,400 | | | | 75,650 | |
Savannah Bancorp, Inc. (The)* | | | 200 | | | | 970 | |
SCBT Financial Corp. | | | 1,300 | | | | 45,825 | |
Shore Bancshares, Inc. | | | 50 | | | | 297 | |
Southwest Bancorp, Inc.* | | | 1,200 | | | | 11,292 | |
StellarOne Corp. | | | 2,000 | | | | 24,960 | |
Susquehanna Bancshares, Inc. | | | 57,100 | | | | 588,130 | |
Synovus Financial Corp. | | | 347,700 | | | | 688,446 | |
Taylor Capital Group, Inc.*+ | | | 11,087 | | | | 181,716 | |
Trico Bancshares | | | 1,200 | | | | 18,480 | |
Union First Market Bankshares Corp. | | | 3,200 | | | | 46,240 | |
United Community Banks, Inc.* | | | 32,770 | | | | 280,839 | |
Virginia Commerce Bancorp, Inc.* | | | 4,000 | | | | 33,720 | |
VIST Financial Corp. | | | 3,200 | | | | 37,184 | |
West Bancorporation, Inc. | | | 1,100 | | | | 10,461 | |
Western Alliance Bancorp* | | | 7,300 | | | | 68,328 | |
Wintrust Financial Corp. | | | 17,000 | | | | 603,500 | |
Yadkin Valley Financial Corp.* | | | 23,100 | | | | 61,215 | |
| | | | | | | | |
| | | | | | | 5,853,267 | |
| |
Commercial Services & Supplies - 5.86% | | | | | |
ABM Industries, Inc. | | | 32,300 | | | | 631,788 | |
| | |
20 | | Annual Report | June 30, 2012 |
| | |
Bridgeway Omni Tax-Managed Small-Cap Value Fund SCHEDULE OF INVESTMENTS (continued) | | |
Showing percentage of net assets as of June 30, 2012
| | | | | | | | |
| Industry Company | | Shares | | | Value | |
Common Stocks (continued) | | | | | | | | |
Commercial Services & Supplies (continued) | |
American Reprographics Co.* | | | 47,500 | | | $ | 238,925 | |
AMREP Corp.* | | | 10,300 | | | | 62,315 | |
Asset Acceptance Capital Corp.*+ | | | 29,500 | | | | 200,600 | |
Asta Funding, Inc. | | | 350 | | | | 3,280 | |
Brink’s Co. (The) | | | 40,900 | | | | 948,062 | |
Casella Waste Systems, Inc., Class A* | | | 21,350 | | | | 124,898 | |
Consolidated Graphics, Inc.* | | | 7,950 | | | | 230,948 | |
Corrections Corp. of America | | | 2,300 | | | | 67,735 | |
Courier Corp. | | | 9,350 | | | | 123,888 | |
Deluxe Corp. | | | 33,000 | | | | 823,020 | |
EnergySolutions, Inc.* | | | 75,400 | | | | 127,426 | |
G&K Services, Inc., Class A | | | 1,350 | | | | 42,106 | |
Geo Group, Inc. (The)* | | | 35,400 | | | | 804,288 | |
Herman Miller, Inc. | | | 14,800 | | | | 274,096 | |
HNI Corp. | | | 17,900 | | | | 460,925 | |
Intersections, Inc. | | | 20,650 | | | | 327,302 | |
Kimball International, Inc., Class B | | | 33,100 | | | | 254,870 | |
Metalico, Inc.* | | | 32,600 | | | | 71,720 | |
Multi-Color Corp. | | | 5,750 | | | | 127,880 | |
Perma-Fix Environmental Services* | | | 71,300 | | | | 83,421 | |
Schawk, Inc. | | | 1,500 | | | | 19,050 | |
Standard Parking Corp.* | | | 2,250 | | | | 48,420 | |
Standard Register Co. (The) | | | 19,200 | | | | 11,520 | |
Sykes Enterprises, Inc.* | | | 17,850 | | | | 284,886 | |
TMS International Corp., Class A* | | | 18,800 | | | | 187,436 | |
TRC Cos., Inc.* | | | 9,950 | | | | 60,496 | |
UniFirst Corp. | | | 1,550 | | | | 98,812 | |
United Stationers, Inc. | | | 23,500 | | | | 633,325 | |
Versar, Inc.* | | | 11,400 | | | | 34,314 | |
Viad Corp. | | | 2,200 | | | | 44,000 | |
| | | | | | | | |
| | | | | | | 7,451,752 | |
| |
Communications Equipment - 1.03% | | | | | |
Bel Fuse, Inc., Class B | | | 3,600 | | | | 63,396 | |
Black Box Corp. | | | 16,700 | | | | 479,290 | |
Communications Systems, Inc. | | | 6,600 | | | | 73,722 | |
Comtech Telecommuni-cations Corp. | | | 9,300 | | | | 265,794 | |
Globecomm Systems, Inc.* | | | 23,500 | | | | 238,290 | |
Network Engines, Inc.* | | | 200 | | | | 282 | |
Technical Communications Corp. | | | 200 | | | | 1,578 | |
| | | | | | | | |
| Industry Company | | Shares | | | Value | |
| | | | | | | | |
Communications Equipment (continued) | |
Tessco Technologies, Inc. | | | 7,100 | | | $ | 156,555 | |
Zoom Technologies, Inc.* | | | 31,400 | | | | 32,656 | |
| | | | | | | | |
| | | | | | | 1,311,563 | |
| | |
Computers & Peripherals - 0.54% | | | | | | | | |
Cray, Inc.* | | | 10,300 | | | | 124,424 | |
Datalink Corp.* | | | 350 | | | | 3,343 | |
Dot Hill Systems Corp.* | | | 36,900 | | | | 42,066 | |
Hutchinson Technology, Inc.* | | | 51,000 | | | | 74,460 | |
Imation Corp.* | | | 13,800 | | | | 81,558 | |
Novatel Wireless, Inc.* | | | 57,700 | | | | 143,673 | |
Xyratex, Ltd. | | | 18,900 | | | | 213,759 | |
| | | | | | | | |
| | | | | | | 683,283 | |
| |
Construction & Engineering - 0.99% | | | | | |
Argan, Inc. | | | 150 | | | | 2,097 | |
Dycom Industries, Inc.* | | | 6,850 | | | | 127,478 | |
EMCOR Group, Inc. | | | 6,500 | | | | 180,830 | |
Great Lakes Dredge & Dock Corp. | | | 11,800 | | | | 84,016 | |
Layne Christensen Co.* | | | 7,800 | | | | 161,382 | |
Michael Baker Corp.* | | | 350 | | | | 9,132 | |
Northwest Pipe Co.* | | | 9,000 | | | | 218,340 | |
Orion Marine Group, Inc.* | | | 17,300 | | | | 120,408 | |
Pike Electric Corp.* | | | 6,551 | | | | 50,574 | |
Primoris Services Corp. | | | 21,300 | | | | 255,600 | |
Sterling Construction Co., Inc.* | | | 5,050 | | | | 51,611 | |
| | | | | | | | |
| | | | | | | 1,261,468 | |
| |
Construction Materials - 0.25% | | | | | |
Headwaters, Inc.* | | | 60,900 | | | | 313,635 | |
| |
Consumer Finance - 0.65% | | | | | |
Cash America International, Inc. | | | 1,900 | | | | 83,676 | |
CompuCredit Holdings Corp.* | | | 2,950 | | | | 10,679 | |
First Marblehead Corp. (The)* | | | 4,650 | | | | 5,441 | |
Nelnet, Inc., Class A | | | 25,900 | | | | 595,700 | |
QC Holdings, Inc. | | | 29,300 | | | | 122,767 | |
White River Capital, Inc. | | | 100 | | | | 2,253 | |
| | | | | | | | |
| | | | | | | 820,516 | |
| |
Containers & Packaging - 0.88% | | | | | |
AEP Industries, Inc.* | | | 6,100 | | | | 265,655 | |
Boise, Inc. | | | 90,825 | | | | 597,628 | |
Graphic Packaging Holding Co.* | | | 800 | | | | 4,400 | |
| | |
Bridgeway Omni Tax-Managed Small-Cap Value Fund SCHEDULE OF INVESTMENTS (continued) | | |
Showing percentage of net assets as of June 30, 2012
| | | | | | | | |
| Industry Company | | Shares | | | Value | |
Common Stocks (continued) | | | | | | | | |
Containers & Packaging (continued) | | | | | |
Mod-Pac Corp.* | | | 598 | | | $ | 3,086 | |
Myers Industries, Inc. | | | 14,750 | | | | 253,110 | |
| | | | | | | | |
| | | | | | | 1,123,879 | |
| | |
Distributors - 0.35% | | | | | | | | |
Amcon Distributing Co. | | | 400 | | | | 22,156 | |
Core-Mark Holding Co., Inc. | | | 8,150 | | | | 392,341 | |
VOXX International Corp.* | | | 3,014 | | | | 28,090 | |
| | | | | | | | |
| | | | | | | 442,587 | |
| |
Diversified Consumer Services - 1.96% | | | | | |
Bridgepoint Education, Inc.*+ | | | 3,400 | | | | 74,120 | |
Cambium Learning Group, Inc.* | | | 10,400 | | | | 9,880 | |
Capella Education Co.* | | | 12,600 | | | | 437,976 | |
Career Education Corp.* | | | 59,850 | | | | 400,397 | |
Carriage Services, Inc. | | | 6,550 | | | | 54,496 | |
Coinstar, Inc.* | | | 4,900 | | | | 336,434 | |
Corinthian Colleges, Inc.* | | | 59,850 | | | | 172,966 | |
Education Management Corp.*+ | | | 8,550 | | | | 59,422 | |
Learning Tree International, Inc.* | | | 12,200 | | | | 53,314 | |
Lincoln Educational Services Corp. | | | 18,625 | | | | 121,062 | |
Mac-Gray Corp. | | | 5,950 | | | | 83,836 | |
Regis Corp. | | | 34,050 | | | | 611,538 | |
School Specialty, Inc.* | | | 1,150 | | | | 3,749 | |
Universal Technical Institute, Inc. | | | 5,200 | | | | 70,252 | |
| | | | | | | | |
| | | | | | | 2,489,442 | |
| |
Diversified Financial Services - 1.06% | | | | | |
Gain Capital Holdings, Inc. | | | 41,900 | | | | 209,081 | |
Interactive Brokers Group, Inc., Class A | | | 31,050 | | | | 457,056 | |
PHH Corp.* | | | 31,000 | | | | 541,880 | |
Primus Guaranty, Ltd.*+ | | | 18,400 | | | | 138,000 | |
| | | | | | | | |
| | | | | | | 1,346,017 | |
| |
Diversified Telecommunication Services - 1.51% | |
Atlantic Tele-Network, Inc. | | | 9,150 | | | | 308,630 | |
Cbeyond, Inc.* | | | 25,450 | | | | 172,296 | |
Consolidated Communications Holdings, Inc. | | | 2,300 | | | | 34,040 | |
General Communication, Inc., Class A* | | | 21,400 | | | | 177,834 | |
Hawaiian Telcom Holdco, Inc.*+ | | | 9,000 | | | | 175,590 | |
HickoryTech Corp. | | | 2,650 | | | | 29,441 | |
| | | | | | | | |
| Industry Company | | Shares | | | Value | |
| | | | | | | | |
Diversified Telecommunication Services (continued) | |
IDT Corp., Class B | | | 9,100 | | | $ | 89,271 | |
Iridium Communications, Inc.* | | | 5,200 | | | | 46,592 | |
Lumos Networks Corp. | | | 1,325 | | | | 12,521 | |
Multiband Corp.* | | | 1,200 | | | | 2,856 | |
Premiere Global Services, Inc.* | | | 6,000 | | | | 50,340 | |
Primus Telecommunications Group, Inc.+ | | | 14,800 | | | | 230,436 | |
SureWest Communications | | | 3,630 | | | | 76,484 | |
Vonage Holdings Corp.* | | | 125,100 | | | | 251,451 | |
Windstream Corp.+ | | | 27,807 | | | | 268,616 | |
| | | | | | | | |
| | | | | | | 1,926,398 | |
| | |
Electrical Equipment - 0.62% | | | | | | | | |
Allied Motion Technologies, Inc. | | | 250 | | | | 1,500 | |
China BAK Battery, Inc.* | | | 750 | | | | 435 | |
Coleman Cable, Inc. | | | 17,600 | | | | 152,944 | |
Fushi Copperweld, Inc.* | | | 36,300 | | | | 315,447 | |
General Cable Corp.* | | | 2,000 | | | | 51,880 | |
Lihua International, Inc. | | | 4,300 | | | | 23,564 | |
LSI Industries, Inc. | | | 29,000 | | | | 206,480 | |
SL Industries, Inc.* | | | 400 | | | | 5,276 | |
Ultralife Corp.* | | | 7,150 | | | | 27,599 | |
| | | | | | | | |
| | | | | | | 785,125 | |
|
Electronic Equipment, Instruments & Components - 3.52% | |
Agilysys, Inc.* | | | 13,800 | | | | 119,646 | |
Brightpoint, Inc.* | | | 30,750 | | | | 166,358 | |
IEC Electronics Corp.* | | | 8,150 | | | | 49,552 | |
Insight Enterprises, Inc.* | | | 29,880 | | | | 502,880 | |
Itron, Inc.* | | | 8,400 | | | | 346,416 | |
Kemet Corp.* | | | 20,900 | | | | 125,609 | |
LoJack Corp.* | | | 3,650 | | | | 11,023 | |
Multi-Fineline Electronix, Inc.* | | | 7,300 | | | | 179,872 | |
Newport Corp.* | | | 12,600 | | | | 151,452 | |
PAR Technology Corp.* | | | 18,750 | | | | 92,438 | |
PC Connection, Inc. | | | 13,000 | | | | 138,060 | |
PC Mall, Inc.* | | | 6,450 | | | | 34,894 | |
Plexus Corp.* | | | 21,800 | | | | 614,760 | |
Power-One, Inc.* | | | 4,950 | | | | 22,374 | |
Pulse Electronics Corp. | | | 8,300 | | | | 16,351 | |
Sanmina-SCI Corp.* | | | 67,400 | | | | 552,006 | |
SMTC Corp.* | | | 4,750 | | | | 15,532 | |
SYNNEX Corp.* | | | 19,700 | | | | 679,453 | |
TTM Technologies, Inc.* | | | 45,075 | | | | 424,156 | |
Viasystems Group, Inc.* | | | 13,984 | | | | 237,728 | |
| | |
22 | | Annual Report | June 30, 2012 |
| | |
Bridgeway Omni Tax-Managed Small-Cap Value Fund SCHEDULE OF INVESTMENTS (continued) | | |
Showing percentage of net assets as of June 30, 2012
| | | | | | | | |
| Industry Company | | Shares | | | Value | |
Common Stocks (continued) | | | | | | | | |
Electronic Equipment, Instruments & Components (continued) | |
Wayside Technology Group, Inc. | | | 100 | | | $ | 1,235 | |
| | | | | | | | |
| | | | | | | 4,481,795 | |
| |
Energy Equipment & Services - 2.62% | | | | | |
Basic Energy Services, Inc.* | | | 25,400 | | | | 262,128 | |
Cal Dive International, Inc.* | | | 1,450 | | | | 4,205 | |
Dawson Geophysical Co.* | | | 19,000 | | | | 452,580 | |
ENGlobal Corp.* | | | 500 | | | | 750 | |
Exterran Holdings, Inc.* | | | 25,500 | | | | 325,125 | |
Global Geophysical Services, Inc.* | | | 38,700 | | | | 236,844 | |
Helix Energy Solutions Group, Inc.* | | | 7,000 | | | | 114,870 | |
Hercules Offshore, Inc.* | | | 32,950 | | | | 116,643 | |
Hornbeck Offshore Services, Inc.* | | | 900 | | | | 34,902 | |
Key Energy Services, Inc.* | | | 34,800 | | | | 264,480 | |
Matrix Service Co.* | | | 13,300 | | | | 150,955 | |
Mitcham Industries, Inc.* | | | 350 | | | | 5,939 | |
Parker Drilling Co.* | | | 55,400 | | | | 249,854 | |
PHI, Inc.* | | | 3,750 | | | | 104,288 | |
Pioneer Drilling Co.* | | | 56,500 | | | | 450,305 | |
TETRA Technologies, Inc.* | | | 22,100 | | | | 157,573 | |
TGC Industries, Inc.* | | | 472 | | | | 4,583 | |
Union Drilling, Inc.* | | | 22,700 | | | | 101,696 | |
Willbros Group, Inc.* | | | 45,100 | | | | 291,346 | |
| | | | | | | | |
| | | | | | | 3,329,066 | |
| |
Food & Staples Retailing - 3.63% | | | | | |
Andersons, Inc. (The) | | | 15,600 | | | | 665,496 | |
Arden Group, Inc., Class A | | | 956 | | | | 83,373 | |
Casey’s General Stores, Inc. | | | 2,450 | | | | 144,526 | |
Ingles Markets, Inc., Class A | | | 20,200 | | | | 323,806 | |
Nash Finch Co. | | | 11,550 | | | | 248,094 | |
Pantry, Inc. (The)* | | | 24,900 | | | | 366,030 | |
Spartan Stores, Inc. | | | 20,300 | | | | 368,039 | |
SUPERVALU, Inc.+ | | | 147,550 | | | | 764,309 | |
Susser Holdings Corp.* | | | 16,850 | | | | 626,314 | |
Village Super Market, Inc., Class A | | | 6,850 | | | | 223,173 | |
Weis Markets, Inc. | | | 18,200 | | | | 810,264 | |
| | | | | | | | |
| | | | | | | 4,623,424 | |
| | |
Food Products - 1.85% | | | | | | | | |
B&G Foods, Inc. | | | 2,400 | | | | 63,840 | |
Cal-Maine Foods, Inc. | | | 1,400 | | | | 54,740 | |
Chiquita Brands International, Inc.* | | | 9,800 | | | | 49,000 | |
Diamond Foods, Inc.+ | | | 8,900 | | | | 158,776 | |
| | | | | | | | |
| Industry Company | | Shares | | | Value | |
| | | | | | | | |
Food Products (continued) | | | | | | | | |
Dole Food Co., Inc.* | | | 41,550 | | | $ | 364,809 | |
Farmer Bros. Co.* | | | 18,700 | | | | 148,852 | |
Feihe International, Inc.*+ | | | 300 | | | | 2,052 | |
Fresh Del Monte Produce, Inc. | | | 16,450 | | | | 386,081 | |
Inventure Foods, Inc.* | | | 650 | | | | 4,095 | |
John B. Sanfilippo & Son, Inc.* | | | 8,750 | | | | 156,188 | |
Omega Protein Corp.* | | | 24,850 | | | | 182,896 | |
Overhill Farms, Inc.* | | | 5,650 | | | | 22,148 | |
Sanderson Farms, Inc. | | | 7,100 | | | | 325,322 | |
Seneca Foods Corp., Class A* | | | 1,350 | | | | 36,315 | |
SkyPeople Fruit Juice, Inc.* | | | 51,000 | | | | 81,600 | |
Westway Group, Inc. | | | 3,841 | | | | 23,008 | |
Zhongpin, Inc.* | | | 32,100 | | | | 295,641 | |
| | | | | | | | |
| | | | | | | 2,355,363 | |
| |
Health Care Equipment & Supplies - 0.47% | | | | | |
Fonar Corp.*+ | | | 13,600 | | | | 55,896 | |
Invacare Corp. | | | 25,550 | | | | 394,236 | |
Medical Action Industries, Inc.* | | | 10,350 | | | | 36,018 | |
RTI Biologics, Inc.* | | | 10,000 | | | | 37,600 | |
Theragenics Corp.* | | | 18,250 | | | | 36,683 | |
Wright Medical Group, Inc.* | | | 1,800 | | | | 38,430 | |
| | | | | | | | |
| | | | | | | 598,863 | |
| |
Health Care Providers & Services - 4.34% | | | | | |
Addus HomeCare Corp.* | | | 700 | | | | 3,437 | |
Advocat, Inc. | | | 2,700 | | | | 17,280 | |
Alliance HealthCare Services, Inc.* | | | 19,400 | | | | 19,361 | |
Almost Family, Inc.* | | | 2,050 | | | | 45,797 | |
Amedisys, Inc.* | | | 12,250 | | | | 152,512 | |
AMN Healthcare Services, Inc.* | | | 32,800 | | | | 194,504 | |
Amsurg Corp.* | | | 11,100 | | | | 332,778 | |
BioScrip, Inc.* | | | 9,500 | | | | 70,585 | |
CardioNet, Inc.* | | | 14,700 | | | | 29,841 | |
Chindex International, Inc.* | | | 8,000 | | | | 78,400 | |
Cross Country Healthcare, Inc.* | | | 7,200 | | | | 31,464 | |
Emeritus Corp.* | | | 16,600 | | | | 279,378 | |
Ensign Group, Inc. (The) | | | 10,200 | | | | 288,354 | |
Five Star Quality Care, Inc.* | | | 9,700 | | | | 29,779 | |
Gentiva Health Services, Inc.* | | | 10,900 | | | | 75,537 | |
Healthways, Inc.* | | | 29,321 | | | | 233,982 | |
Hooper Holmes, Inc.* | | | 4,200 | | | | 2,401 | |
InfuSystems Holdings, Inc.* | | | 700 | | | | 1,323 | |
Kindred Healthcare, Inc.* | | | 21,750 | | | | 213,802 | |
| | |
Bridgeway Omni Tax-Managed Small-Cap Value Fund SCHEDULE OF INVESTMENTS (continued) | | |
Showing percentage of net assets as of June 30, 2012
| | | | | | | | |
| Industry Company | | Shares | | | Value | |
Common Stocks (continued) | | | | | | | | |
Health Care Providers & Services (continued) | |
LHC Group, Inc.* | | | 9,250 | | | $ | 156,880 | |
Metropolitan Health Networks, Inc.* | | | 1,916 | | | | 18,336 | |
Molina Healthcare, Inc.* | | | 28,600 | | | | 670,956 | |
National Healthcare Corp. | | | 850 | | | | 38,446 | |
PDI, Inc.* | | | 5,200 | | | | 42,848 | |
PharMerica Corp.* | | | 5,300 | | | | 57,876 | |
Providence Service Corp. (The)* | | | 16,150 | | | | 221,416 | |
PSS World Medical, Inc.* | | | 18,300 | | | | 384,117 | |
Select Medical Holdings Corp.* | | | 68,250 | | | | 690,008 | |
Skilled Healthcare Group, Inc., Class A* | | | 14,650 | | | | 92,002 | |
Sun Healthcare Group, Inc.* | | | 24,400 | | | | 204,228 | |
Sunrise Senior Living, Inc.*+ | | | 34,900 | | | | 254,421 | |
Triple-S Management Corp., Class B* | | | 9,500 | | | | 173,660 | |
U.S. Physical Therapy, Inc. | | | 350 | | | | 8,901 | |
Universal American Corp.* | | | 22,525 | | | | 237,188 | |
WellCare Health Plans, Inc.* | | | 3,100 | | | | 164,300 | |
| | | | | | | | |
| | | | | | | 5,516,098 | |
| |
Hotels, Restaurants & Leisure - 6.47% | | | | | |
Ameristar Casinos, Inc. | | | 11,500 | | | | 204,355 | |
Ark Restaurants Corp. | | | 200 | | | | 2,888 | |
Benihana, Inc. | | | 12,545 | | | | 202,100 | |
Biglari Holdings, Inc.* | | | 399 | | | | 154,170 | |
Bluegreen Corp.* | | | 10,500 | | | | 52,080 | |
Bob Evans Farms, Inc. | | | 17,225 | | | | 692,445 | |
Boyd Gaming Corp.*+ | | | 68,550 | | | | 493,560 | |
Caribou Coffee Co., Inc.* | | | 11,300 | | | | 145,883 | |
Carrols Restaurant Group, Inc.* | | | 7,825 | | | | 46,480 | |
CEC Entertainment, Inc. | | | 8,500 | | | | 309,145 | |
Cracker Barrel Old Country Store, Inc. | | | 15,200 | | | | 954,560 | |
DineEquity, Inc.* | | | 12,475 | | | | 556,884 | |
Dover Downs Gaming & Entertainment, Inc. | | | 14,000 | | | | 42,140 | |
Einstein Noah Restaurant Group, Inc. | | | 6,050 | | | | 106,238 | |
Famous Dave’s of America, Inc.* | | | 1,650 | | | | 18,232 | |
Fiesta Restaurant Group, Inc.* | | | 7,825 | | | | 103,525 | |
Frisch’s Restaurants, Inc. | | | 2,400 | | | | 68,016 | |
Full House Resorts, Inc.* | | | 1,550 | | | | 4,449 | |
Isle of Capri Casinos, Inc.* | | | 32,150 | | | | 198,366 | |
J. Alexander’s Corp.* | | | 7,600 | | | | 86,336 | |
Jack in the Box, Inc.* | | | 24,550 | | | | 684,454 | |
| | | | | | | | |
| Industry Company | | Shares | | | Value | |
| | | | | | | | |
Hotels, Restaurants & Leisure (continued) | |
Kona Grill, Inc.* | | | 300 | | | $ | 2,706 | |
Lakes Entertainment, Inc.* | | | 23,900 | | | | 69,310 | |
Luby’s, Inc.* | | | 5,500 | | | | 36,850 | |
Marcus Corp. | | | 8,800 | | | | 121,088 | |
MTR Gaming Group, Inc.* | | | 9,900 | | | | 47,025 | |
Multimedia Games Holding Co., Inc.* | | | 6,575 | | | | 92,050 | |
Nevada Gold & Casinos, Inc.* | | | 7,000 | | | | 8,050 | |
Papa John’s International, Inc.* | | | 1,600 | | | | 76,112 | |
PF Chang’s China Bistro, Inc. | | | 12,400 | | | | 638,228 | |
Pinnacle Entertainment, Inc.* | | | 46,100 | | | | 443,482 | |
Red Lion Hotels Corp.* | | | 650 | | | | 5,622 | |
Red Robin Gourmet Burgers, Inc.* | | | 5,250 | | | | 160,178 | |
Ruby Tuesday, Inc.* | | | 46,500 | | | | 316,665 | |
Ruth’s Hospitality Group, Inc.* | | | 29,250 | | | | 193,050 | |
Scientific Games Corp., Class A* | | | 42,150 | | | | 360,382 | |
Sonic Corp.* | | | 19,850 | | | | 198,897 | |
Speedway Motorsports, Inc. | | | 1,950 | | | | 32,974 | |
Town Sports International Holdings, Inc.* | | | 23,000 | | | | 305,670 | |
| | | | | | | | |
| | | | | | | 8,234,645 | |
| | |
Household Durables - 0.90% | | | | | | | | |
American Greetings Corp., Class A+ | | | 12,950 | | | | 189,329 | |
Bassett Furniture Industries, Inc. | | | 400 | | | | 4,124 | |
Blyth, Inc. | | | 500 | | | | 17,280 | |
Comstock Holding Cos., Inc.* | | | 700 | | | | 917 | |
CSS Industries, Inc. | | | 8,058 | | | | 165,592 | |
Emerson Radio Corp.* | | | 700 | | | | 1,421 | |
Ethan Allen Interiors, Inc. | | | 5,800 | | | | 115,594 | |
Flexsteel Industries, Inc. | | | 150 | | | | 2,967 | |
Hooker Furniture Corp. | | | 9,300 | | | | 109,647 | |
La-Z-Boy, Inc.* | | | 4,300 | | | | 52,847 | |
Libbey, Inc.* | | | 22,805 | | | | 350,513 | |
Lifetime Brands, Inc. | | | 10,199 | | | | 127,181 | |
Universal Electronics, Inc.* | | | 600 | | | | 7,902 | |
| | | | | | | | |
| | | | | | | 1,145,314 | |
| | |
Household Products - 0.57% | | | | | | | | |
Central Garden & Pet Co., Class A* | | | 33,200 | | | | 361,548 | |
Harbinger Group, Inc.* | | | 44,700 | | | | 348,213 | |
| | |
24 | | Annual Report | June 30, 2012 |
| | |
Bridgeway Omni Tax-Managed Small-Cap Value Fund SCHEDULE OF INVESTMENTS (continued) | | |
Showing percentage of net assets as of June 30, 2012
| | | | | | | | |
| Industry Company | | Shares | | | Value | |
Common Stocks (continued) | | | | | | | | |
Household Products (continued) | | | | | | | | |
Oil-Dri Corp. of America | | | 450 | | | | $ 9,855 | |
Orchids Paper Products Co.+ | | | 50 | | | | 884 | |
| | | | | | | | |
| | | | | | | 720,500 | |
Independent Power Producers & Energy Traders - 0.06% | |
Genie Energy, Ltd., Class B | | | 9,100 | | | | 70,707 | |
Insurance - 5.37% | | | | | | | | |
American Equity Investment Life Holding Co. | | | 24,850 | | | | 273,598 | |
American Safety Insurance Holdings, Ltd.* | | | 12,350 | | | | 231,562 | |
Citizens, Inc.* | | | 3,900 | | | | 38,025 | |
Crawford & Co., Class B | | | 20,350 | | | | 83,232 | |
Eastern Insurance Holdings, Inc. | | | 7,800 | | | | 132,600 | |
EMC Insurance Group, Inc. | | | 2,850 | | | | 57,570 | |
Endurance Specialty Holdings, Ltd. | | | 5,800 | | | | 222,256 | |
FBL Financial Group, Inc., Class A | | | 19,666 | | | | 550,845 | |
First American Financial Corp. | | | 9,575 | | | | 162,392 | |
Flagstone Reinsurance Holdings SA | | | 28,500 | | | | 228,285 | |
Hallmark Financial Services, Inc.* | | | 4,000 | | | | 31,200 | |
Homeowners Choice, Inc. | | | 4,000 | | | | 70,400 | |
Horace Mann Educators Corp. | | | 23,050 | | | | 402,914 | |
Independence Holding Co. | | | 7,810 | | | | 76,928 | |
Infinity Property & Casualty Corp. | | | 3,600 | | | | 207,612 | |
Maiden Holdings, Ltd. | | | 37,550 | | | | 325,934 | |
Meadowbrook Insurance Group, Inc. | | | 34,150 | | | | 300,178 | |
Montpelier Re Holdings, Ltd. | | | 4,450 | | | | 94,740 | |
National Financial Partners Corp.* | | | 28,110 | | | | 376,674 | |
National Interstate Corp. | | | 1,200 | | | | 31,908 | |
National Western Life Insurance Co., Class A | | | 1,050 | | | | 149,016 | |
Navigators Group, Inc. (The)* | | | 1,250 | | | | 62,562 | |
Protective Life Corp. | | | 6,100 | | | | 179,401 | |
SeaBright Holdings, Inc. | | | 5,200 | | | | 46,228 | |
Selective Insurance Group, Inc. | | | 26,300 | | | | 457,883 | |
StanCorp Financial Group, Inc. | | | 1,600 | | | | 59,456 | |
State Auto Financial Corp. | | | 18,350 | | | | 257,818 | |
| | | | | | | | |
| Industry Company | | Shares | | | Value | |
| | | | | | | | |
Insurance (continued) | | | | | | | | |
Stewart Information Services Corp. | | | 1,450 | | | | $ 22,258 | |
Symetra Financial Corp. | | | 69,750 | | | | 880,245 | |
Tower Group, Inc. | | | 20,050 | | | | 418,444 | |
United Fire Group, Inc. | | | 12,500 | | | | 266,625 | |
Universal Insurance Holdings, Inc. | | | 40,650 | | | | 138,617 | |
| | | | | | | | |
| | | | | | | 6,837,406 | |
| | |
Internet & Catalog Retail - 0.51% | | | | | | | | |
1-800-Flowers.com, Inc., Class A* | | | 23,200 | | | | 80,968 | |
dELiA*s, Inc.* | | | 14,700 | | | | 22,785 | |
Nutrisystem, Inc. | | | 24,500 | | | | 283,220 | |
Orbitz Worldwide, Inc.* | | | 38,450 | | | | 140,342 | |
Overstock.com, Inc.*+ | | | 18,100 | | | | 125,071 | |
| | | | | | | | |
| | | | | | | 652,386 | |
| |
Internet Software & Services - 0.69% | | | | | |
Blucora, Inc.* | | | 1,650 | | | | 20,328 | |
EarthLink, Inc. | | | 49,000 | | | | 364,560 | |
EasyLink Services International Corp., Class A* | | | 37,900 | | | | 274,396 | |
United Online, Inc. | | | 50,800 | | | | 214,376 | |
| | | | | | | | |
| | | | | | | 873,660 | |
| | |
IT Services - 2.65% | | | | | | | | |
Acxiom Corp.* | | | 31,800 | | | | 480,498 | |
Analysts International Corp.* | | | 4,300 | | | | 18,146 | |
CACI International, Inc., Class A* | | | 13,400 | | | | 737,268 | |
CIBER, Inc.* | | | 27,401 | | | | 118,098 | |
Convergys Corp. | | | 22,575 | | | | 333,433 | |
CSG Systems International, Inc.* | | | 1,600 | | | | 27,648 | |
DST Systems, Inc. | | | 250 | | | | 13,577 | |
Dynamics Research Corp.* | | | 11,350 | | | | 65,943 | |
Edgewater Technology, Inc.* | | | 6,100 | | | | 23,729 | |
Global Cash Access Holdings, Inc.* | | | 11,950 | | | | 86,160 | |
Hackett Group, Inc. (The)* | | | 2,800 | | | | 15,596 | |
Heartland Payment Systems, Inc. | | | 1,600 | | | | 48,128 | |
Lender Processing Services, Inc. | | | 13,900 | | | | 351,392 | |
Mantech International Corp., Class A | | | 20,100 | | | | 471,747 | |
NCI, Inc., Class A* | | | 9,700 | | | | 39,285 | |
Online Resources Corp.* | | | 40,974 | | | | 99,567 | |
Pfsweb, Inc.* | | | 450 | | | | 1,278 | |
| | |
Bridgeway Omni Tax-Managed Small-Cap Value Fund SCHEDULE OF INVESTMENTS (continued) | | |
Showing percentage of net assets as of June 30, 2012
| | | | | | | | |
| Industry Company | | Shares | | | Value | |
Common Stocks (continued) | | | | | | | | |
IT Services (continued) | | | | | | | | |
PRGX Global, Inc.* | | | 800 | | | | $ 6,360 | |
StarTek, Inc.* | | | 2,650 | | | | 7,685 | |
TNS, Inc.* | | | 23,700 | | | | 425,178 | |
| | | | | | | | |
| | | | | | | 3,370,716 | |
| |
Leisure Equipment & Products - 1.00% | | | | | |
Arctic Cat, Inc.* | | | 450 | | | | 16,452 | |
Brunswick Corp. | | | 38,400 | | | | 853,248 | |
Cybex International, Inc.* | | | 35,700 | | | | 57,834 | |
JAKKS Pacific, Inc.+ | | | 5,500 | | | | 88,055 | |
Johnson Outdoors, Inc., Class A* | | | 3,950 | | | | 81,370 | |
Nautilus, Inc.* | | | 10,786 | | | | 35,702 | |
Smith & Wesson Holding Corp.* | | | 4,117 | | | | 34,212 | |
Steinway Musical Instruments, Inc.* | | | 450 | | | | 11,025 | |
Summer Infant, Inc.* | | | 27,700 | | | | 90,856 | |
| | | | | | | | |
| | | | | | | 1,268,754 | |
| |
Life Sciences Tools & Services - 0.04% | | | | | |
Cambrex Corp.* | | | 5,800 | | | | 54,578 | |
Machinery - 1.65% | | | | | | | | |
Accuride Corp.* | | | 49,800 | | | | 298,800 | |
Alamo Group, Inc. | | | 550 | | | | 17,254 | |
Albany International Corp., Class A | | | 9,200 | | | | 172,132 | |
Ampco-Pittsburgh Corp. | | | 3,700 | | | | 67,821 | |
Briggs & Stratton Corp. | | | 21,450 | | | | 375,160 | |
China Valves Technology, Inc.* | | | 52,700 | | | | 56,389 | |
Columbus McKinnon Corp.* | | | 19,700 | | | | 297,273 | |
Commercial Vehicle Group, Inc.* | | | 22,100 | | | | 190,502 | |
Federal Signal Corp.* | | | 2,900 | | | | 16,936 | |
FreightCar America, Inc. | | | 6,100 | | | | 140,117 | |
Hardinge, Inc. | | | 400 | | | | 3,640 | |
John Bean Technologies Corp. | | | 1,820 | | | | 24,697 | |
Key Technology, Inc.* | | | 300 | | | | 3,000 | |
L.S. Starrett Co., Class A (The) | | | 2,650 | | | | 30,660 | |
LB Foster Co., Class A | | | 1,750 | | | | 50,068 | |
Lydall, Inc.* | | | 550 | | | | 7,436 | |
Miller Industries, Inc. | | | 150 | | | | 2,389 | |
Mueller Water Products, Inc., Class A | | | 7,200 | | | | 24,912 | |
NACCO Industries, Inc., Class A | | | 1,350 | | | | 156,938 | |
NF Energy Saving Corp.* | | | 16,900 | | | | 17,745 | |
| | | | | | | | |
| Industry Company | | Shares | | | Value | |
| | | | | | | | |
Machinery (continued) | | | | | | | | |
NN, Inc.* | | | 3,100 | | | | $ 31,651 | |
Supreme Industries, Inc. Class A* | | | 29,000 | | | | 113,390 | |
Xerium Technologies, Inc.* | | | 150 | | | | 435 | |
| | | | | | | | |
| | | | | | | 2,099,345 | |
| | |
Marine - 0.28% | | | | | | | | |
Eagle Bulk Shipping, Inc.* | | | 187 | | | | 591 | |
Excel Maritime Carriers, Ltd.* | | | 101,600 | | | | 56,388 | |
Genco Shipping & Trading, Ltd.* | | | 48,750 | | | | 148,688 | |
Horizon Lines, Inc., Class A* | | | 248 | | | | 466 | |
International Shipholding Corp. | | | 7,850 | | | | 148,051 | |
Ultrapetrol Bahamas, Ltd.*+ | | | 6,000 | | | | 7,080 | |
| | | | | | | | |
| | | | | | | 361,264 | |
| | |
Media - 2.91% | | | | | | | | |
AH Belo Corp., Class A | | | 33,800 | | | | 135,876 | |
Ballantyne Strong, Inc.* | | | 14,300 | | | | 85,371 | |
Beasley Broadcasting Group, Inc., Class A* | | | 8,129 | | | | 47,880 | |
Belo Corp., Class A | | | 4,750 | | | | 30,590 | |
Carmike Cinemas, Inc.* | | | 450 | | | | 6,592 | |
Cinemark Holdings, Inc. | | | 1,650 | | | | 37,702 | |
Cumulus Media, Inc., Class A* | | | 69,865 | | | | 210,294 | |
Dex One Corp.*+ | | | 49,800 | | | | 46,563 | |
E.W. Scripps Co., Class A (The)* | | | 14,600 | | | | 140,306 | |
Entercom Communications Corp., Class A* | | | 33,050 | | | | 198,961 | |
Entravision Communications Corp., Class A | | | 36,350 | | | | 43,983 | |
Fisher Communications, Inc.* | | | 50 | | | | 1,496 | |
Gray Television, Inc.* | | | 19,450 | | | | 28,592 | |
Harte-Hanks, Inc. | | | 18,550 | | | | 169,547 | |
Journal Communications, Inc., Class A* | | | 47,450 | | | | 244,842 | |
Lee Enterprises, Inc.* | | | 4,050 | | | | 6,561 | |
McClatchy Co., Class A (The)* | | | 32,950 | | | | 72,490 | |
Media General, Inc., Class A*+ | | | 800 | | | | 3,688 | |
Meredith Corp.+ | | | 20,000 | | | | 638,800 | |
Navarre Corp.* | | | 17,900 | | | | 28,461 | |
New York Times Co., Class A (The)* | | | 60,550 | | | | 472,290 | |
Radio One, Inc., Class D*+ | | | 20,350 | | | | 19,088 | |
| | |
26 | | Annual Report | June 30, 2012 |
| | |
Bridgeway Omni Tax-Managed Small-Cap Value Fund SCHEDULE OF INVESTMENTS (continued) | | |
Showing percentage of net assets as of June 30, 2012
| | | | | | | | |
| Industry Company | | Shares | | | Value | |
Common Stocks (continued) | | | | | | | | |
Media (continued) | | | | | | | | |
Reading International, Inc., Class A*+ | | | 9,900 | | | | $ 53,559 | |
Saga Communications, Inc., Class A* | | | 1,752 | | | | 65,017 | |
Salem Communications Corp., Class A | | | 25,700 | | | | 140,579 | |
Scholastic Corp. | | | 13,800 | | | | 388,608 | |
Valassis Communications, Inc.* | | | 17,700 | | | | 384,975 | |
| | | | | | | | |
| | | | | | | 3,702,711 | |
| | |
Metals & Mining - 2.16% | | | | | | | | |
A.M. Castle & Co.* | | | 4,500 | | | | 47,790 | |
Friedman Industries, Inc. | | | 3,500 | | | | 35,595 | |
Golden Star Resources, Ltd.* | | | 287,500 | | | | 333,500 | |
Handy & Harman, Ltd.* | | | 13,300 | | | | 179,284 | |
Horsehead Holding Corp.* | | | 8,900 | | | | 88,644 | |
Jaguar Mining, Inc.*+ | | | 80,400 | | | | 93,264 | |
Materion Corp. | | | 19,400 | | | | 446,782 | |
Noranda Aluminum Holding Corp. | | | 73,400 | | | | 584,264 | |
Schnitzer Steel Industries, Inc., Class A | | | 12,400 | | | | 347,448 | |
Sutor Technology Group, Ltd.* | | | 450 | | | | 428 | |
Worthington Industries, Inc. | | | 29,100 | | | | 595,677 | |
| | | | | | | | |
| | | | | | | 2,752,676 | |
| | |
Multiline Retail - 0.36% | | | | | | | | |
Bon-Ton Stores, Inc. (The)+ | | | 9,050 | | | | 70,680 | |
Fred’s, Inc., Class A | | | 16,250 | | | | 248,463 | |
Tuesday Morning Corp.* | | | 32,950 | | | | 141,356 | |
| | | | | | | | |
| | | | | | | 460,499 | |
| |
Oil, Gas & Consumable Fuels - 5.47% | | | | | |
Adams Resources & Energy, Inc. | | | 4,000 | | | | 167,680 | |
Alon USA Energy, Inc. | | | 50,700 | | | | 428,922 | |
Bill Barrett Corp.* | | | 10,700 | | | | 229,194 | |
BioFuel Energy Corp.* | | | 10,000 | | | | 35,600 | |
Callon Petroleum Co.* | | | 56,300 | | | | 239,838 | |
Clayton Williams Energy, Inc.* | | | 5,600 | | | | 270,928 | |
Cloud Peak Energy, Inc.* | | | 44,300 | | | | 749,113 | |
Comstock Resources, Inc.* | | | 21,000 | | | | 344,820 | |
Crimson Exploration, Inc.* | | | 11,200 | | | | 51,408 | |
Crosstex Energy, Inc. | | | 13,700 | | | | 191,800 | |
Delek US Holdings, Inc. | | | 22,900 | | | | 402,811 | |
Double Eagle Petroleum Co.* | | | 12,050 | | | | 52,779 | |
GMX Resources, Inc.*+ | | | 15,700 | | | | 12,733 | |
| | | | | | | | |
| Industry Company | | Shares | | | Value | |
| | | | | | | | |
Oil, Gas & Consumable Fuels (continued) | | | | | |
Green Plains Renewable Energy, Inc.* | | | 26,450 | | | | $ 165,048 | |
Halcon Resources Corp.*+ | | | 1,217 | | | | 11,488 | |
James River Coal Co.*+ | | | 20,900 | | | | 56,639 | |
Longwei Petroleum Investment Holding, Ltd.* | | | 113,000 | | | | 143,510 | |
Patriot Coal Corp.*+ | | | 38,300 | | | | 46,726 | |
PostRock Energy Corp.* | | | 12,000 | | | | 19,080 | |
REX American Resources Corp.* | | | 5,250 | | | | 102,480 | |
SemGroup Corp., Class A* | | | 18,700 | | | | 597,091 | |
Stone Energy Corp.* | | | 25,100 | | | | 636,034 | |
Swift Energy Co.* | | | 18,800 | | | | 349,868 | |
W&T Offshore, Inc. | | | 47,800 | | | | 731,340 | |
Western Refining, Inc. | | | 41,500 | | | | 924,205 | |
| | | | | | | | |
| | | | | | | 6,961,135 | |
| |
Paper & Forest Products - 1.89% | | | | | |
Clearwater Paper Corp.* | | | 9,500 | | | | 324,140 | |
KapStone Paper & Packaging Corp.* | | | 20,575 | | | | 326,114 | |
Mercer International, Inc.* | | | 46,850 | | | | 267,513 | |
Neenah Paper, Inc. | | | 3,100 | | | | 82,739 | |
Orient Paper, Inc. | | | 34,250 | | | | 89,735 | |
PH Glatfelter Co. | | | 29,500 | | | | 482,915 | |
Resolute Forest Products*+ | | | 29,700 | | | | 343,926 | |
Wausau Paper Corp. | | | 49,550 | | | | 482,122 | |
| | | | | | | | |
| | | | | | | 2,399,204 | |
| |
Personal Products - 0.36% | | | | | |
Elizabeth Arden, Inc.* | | | 1,700 | | | | 65,977 | |
Natural Alternatives International, Inc.* | | | 50 | | | | 384 | |
Nutraceutical International Corp.* | | | 8,950 | | | | 136,488 | |
Physicians Formula Holdings, Inc.* | | | 17,200 | | | | 60,028 | |
USANA Health Sciences, Inc.* | | | 4,700 | | | | 193,264 | |
| | | | | | | | |
| | | | | | | 456,141 | |
| |
Pharmaceuticals - 0.05% | | | | | |
Cornerstone Therapeutics, Inc.* | | | 900 | | | | 5,697 | |
Par Pharmaceutical Cos., Inc.* | | | 1,700 | | | | 61,438 | |
| | | | | | | | |
| | | | | | | 67,135 | |
| |
Professional Services - 1.92% | | | | | |
Barrett Business Services, Inc. | | | 10,800 | | | | 228,312 | |
CBIZ, Inc.* | | | 5,275 | | | | 31,333 | |
| | |
Bridgeway Omni Tax-Managed Small-Cap Value Fund SCHEDULE OF INVESTMENTS (continued) | | |
Showing percentage of net assets as of June 30, 2012
| | | | | | | | |
| Industry Company | | Shares | | | Value | |
Common Stocks (continued) | | | | | | | | |
Professional Services (continued) | |
CDI Corp. | | | 13,500 | | | | $ 221,400 | |
CRA International, Inc.* | | | 10,700 | | | | 157,183 | |
Dolan Co. (The)* | | | 3,000 | | | | 20,190 | |
GP Strategies Corp.* | | | 650 | | | | 12,006 | |
Heidrick & Struggles International, Inc. | | | 10,350 | | | | 181,125 | |
Hudson Global, Inc.* | | | 34,300 | | | | 143,031 | |
Huron Consulting Group, Inc.* | | | 1,700 | | | | 53,805 | |
ICF International, Inc.* | | | 10,400 | | | | 247,936 | |
Insperity, Inc. | | | 17,300 | | | | 467,965 | |
Kelly Services, Inc., Class A | | | 8,800 | | | | 113,608 | |
Kforce, Inc.* | | | 8,200 | | | | 110,372 | |
Navigant Consulting, Inc.* | | | 14,600 | | | | 184,544 | |
On Assignment, Inc.* | | | 2,800 | | | | 44,688 | |
RCM Technologies, Inc.* | | | 400 | | | | 2,216 | |
TrueBlue, Inc.* | | | 3,400 | | | | 52,632 | |
VSE Corp. | | | 7,130 | | | | 169,623 | |
| | | | | | | | |
| | | | | | | 2,441,969 | |
| | |
Road & Rail - 1.97% | | | | | | | | |
Amerco, Inc. | | | 6,700 | | | | 602,799 | |
Arkansas Best Corp. | | | 8,500 | | | | 107,100 | |
Avis Budget Group, Inc.* | | | 49,700 | | | | 755,440 | |
Celadon Group, Inc. | | | 4,400 | | | | 72,072 | |
Con-way, Inc. | | | 7,100 | | | | 256,381 | |
Covenant Transportation Group, Inc., Class A* | | | 2,550 | | | | 9,486 | |
Marten Transport, Ltd. | | | 8,644 | | | | 183,771 | |
P.A.M. Transportation Services, Inc. | | | 250 | | | | 2,412 | |
RailAmerica, Inc.* | | | 4,600 | | | | 111,320 | |
Saia, Inc.* | | | 3,150 | | | | 68,954 | |
Swift Transportation Co.* | | | 24,000 | | | | 226,800 | |
Universal Truckload Services, Inc. | | | 7,503 | | | | 113,483 | |
USA Truck, Inc.* | | | 450 | | | | 2,120 | |
| | | | | | | | |
| | | | | | | 2,512,138 | |
| |
Semiconductors & Semiconductor Equipment - 1.92% | |
Advanced Energy Industries, Inc.* | | | 11,800 | | | | 158,356 | |
Amkor Technology, Inc.* | | | 86,600 | | | | 422,608 | |
Amtech Systems, Inc.* | | | 500 | | | | 1,880 | |
DSP Group, Inc.* | | | 5,200 | | | | 32,968 | |
GT Advanced Technologies, Inc.* | | | 50,800 | | | | 268,224 | |
inTEST Corp.* | | | 10,150 | | | | 34,409 | |
Kulicke & Soffa Industries, Inc.* | | | 41,600 | | | | 371,072 | |
| | | | | | | | |
| Industry Company | | Shares | | | Value | |
| | | | | | | | |
Semiconductors & Semiconductor Equipment (continued) | |
LTX-Credence Corp.* | | | 3,400 | | | | $ 22,780 | |
Magnachip Semiconductor Corp.* | | | 33,100 | | | | 315,443 | |
OmniVision Technologies, Inc.* | | | 25,600 | | | | 342,016 | |
Photronics, Inc.* | | | 47,100 | | | | 287,310 | |
Ultra Clean Holdings* | | | 28,900 | | | | 185,827 | |
| | | | | | | | |
| | | | | | | 2,442,893 | |
| | |
Software - 0.23% | | | | | | | | |
Bsquare Corp.* | | | 4,700 | | | | 13,724 | |
Cinedigm Digital Cinema Corp., Class A* | | | 2,200 | | | | 3,300 | |
Majesco Entertainment Co.*+ | | | 33,500 | | | | 67,000 | |
Net 1 UEPS Technologies, Inc.* | | | 15,700 | | | | 131,409 | |
TeleCommunication Systems, Inc., Class A* | | | 61,500 | | | | 75,645 | |
| | | | | | | | |
| | | | | | | 291,078 | |
| | |
Specialty Retail - 7.41% | | | | | | | | |
Aeropostale, Inc.* | | | 40,750 | | | | 726,572 | |
ANN, Inc.* | | | 27,100 | | | | 690,779 | |
Appliance Recycling Centers of America, Inc.* | | | 4,300 | | | | 17,974 | |
Asbury Automotive Group, Inc.* | | | 16,075 | | | | 380,817 | |
Barnes & Noble, Inc.*+ | | | 43,800 | | | | 720,948 | |
Body Central Corp.* | | | 18,000 | | | | 162,000 | |
Books-A-Million, Inc.* | | | 350 | | | | 1,120 | |
Brown Shoe Co., Inc. | | | 25,150 | | | | 324,686 | |
Build-A-Bear Workshop, Inc.* | | | 3,800 | | | | 18,164 | |
Casual Male Retail Group, Inc.* | | | 31,500 | | | | 114,345 | |
Cato Corp., Class A (The) | | | 1,000 | | | | 30,460 | |
Children’s Place Retail Stores, Inc. (The)* | | | 10,800 | | | | 538,164 | |
Citi Trends, Inc.* | | | 10,450 | | | | 161,348 | |
Conn’s, Inc.* | | | 23,400 | | | | 346,320 | |
Destination Maternity Corp. | | | 2,028 | | | | 43,805 | |
Finish Line, Inc., Class A (The) | | | 2,450 | | | | 51,230 | |
Genesco, Inc.* | | | 1,800 | | | | 108,270 | |
Group 1 Automotive, Inc. | | | 15,100 | | | | 688,711 | |
Haverty Furniture Cos., Inc. | | | 5,000 | | | | 55,850 | |
hhgregg, Inc.*+ | | | 26,250 | | | | 296,888 | |
Hot Topic, Inc. | | | 28,050 | | | | 271,804 | |
Kirkland’s, Inc.* | | | 3,900 | | | | 43,875 | |
| | |
28 | | Annual Report | June 30, 2012 |
| | |
Bridgeway Omni Tax-Managed Small-Cap Value Fund SCHEDULE OF INVESTMENTS (continued) | | |
Showing percentage of net assets as of June 30, 2012
| | | | | | | | |
| Industry Company | | Shares | | | Value | |
Common Stocks (continued) | | | | | |
Specialty Retail (continued) | | | | | |
MarineMax, Inc.* | | | 800 | | | | $ 7,608 | |
Men’s Wearhouse, Inc. (The) | | | 2,450 | | | | 68,943 | |
New York & Co., Inc.* | | | 26,300 | | | | 91,524 | |
Office Depot, Inc.* | | | 148,600 | | | | 320,976 | |
OfficeMax, Inc.* | | | 1,450 | | | | 7,337 | |
Pep Boys-Manny, Moe & Jack (The) | | | 12,250 | | | | 121,275 | |
Perfumania Holdings, Inc.* | | | 7,300 | | | | 60,517 | |
Pier 1 Imports, Inc. | | | 5,450 | | | | 89,544 | |
RadioShack Corp.+ | | | 61,150 | | | | 234,816 | |
rue21, inc.* | | | 8,400 | | | | 212,016 | |
Shoe Carnival, Inc. | | | 15,525 | | | | 333,632 | |
Sonic Automotive, Inc., Class A | | | 24,650 | | | | 336,966 | |
Stage Stores, Inc. | | | 24,700 | | | | 452,504 | |
Stein Mart, Inc.* | | | 32,400 | | | | 257,580 | |
Systemax, Inc.* | | | 29,300 | | | | 346,326 | |
TravelCenters of America LLC* | | | 34,150 | | | | 173,140 | |
West Marine, Inc.* | | | 22,679 | | | | 266,478 | |
Wet Seal, Inc., Class A (The)* | | | 79,350 | | | | 250,746 | |
| | | | | | | | |
| | | | | | | 9,426,058 | |
| |
Textiles, Apparel & Luxury Goods - 1.42% | |
Crown Crafts, Inc. | | | 21,000 | | | | 116,340 | |
Culp, Inc. | | | 5,650 | | | | 57,912 | |
Delta Apparel, Inc.* | | | 250 | | | | 3,415 | |
Jones Group, Inc. (The) | | | 36,400 | | | | 347,984 | |
Movado Group, Inc. | | | 2,300 | | | | 57,546 | |
Oxford Industries, Inc. | | | 550 | | | | 24,585 | |
Perry Ellis International, Inc.* | | | 19,800 | | | | 410,850 | |
Quiksilver, Inc.* | | | 43,100 | | | | 100,423 | |
R.G. Barry Corp. | | | 400 | | | | 5,436 | |
Rocky Brands, Inc.* | | | 3,150 | | | | 41,549 | |
Skechers U.S.A., Inc., Class A* | | | 20,900 | | | | 425,733 | |
Unifi, Inc.* | | | 19,100 | | | | 216,403 | |
| | | | | | | | |
| | | | | | | 1,808,176 | |
| |
Thrifts & Mortgage Finance - 0.89% | | | | | |
Astoria Financial Corp. | | | 49,600 | | | | 486,080 | |
Bank Mutual Corp. | | | 32,000 | | | | 141,120 | |
BankAtlantic Bancorp, Inc., Class A* | | | 590 | | | | 3,257 | |
Doral Financial Corp.* | | | 56,100 | | | | 84,150 | |
First Defiance Financial Corp. | | | 1,250 | | | | 21,400 | |
First Federal Bancshares of Arkansas, Inc.*+ | | | 1,200 | | | | 9,720 | |
First Financial Holdings, Inc. | | | 1,450 | | | | 15,544 | |
| | | | | | | | |
| Industry Company | | Shares | | | Value | |
| | | | | | | | |
Thrifts & Mortgage Finance (continued) | |
First Financial Northwest, Inc.*+ | | | 200 | | | | $ 1,624 | |
Flushing Financial Corp. | | | 2,700 | | | | 36,801 | |
Meta Financial Group, Inc. | | | 300 | | | | 5,979 | |
MutualFirst Financial, Inc. | | | 8,700 | | | | 91,263 | |
NASB Financial, Inc.*+ | | | 500 | | | | 9,925 | |
Provident Financial Holdings, Inc. | | | 5,400 | | | | 62,262 | |
Pulaski Financial Corp.+ | | | 800 | | | | 5,928 | |
Tree.com, Inc.* | | | 4,900 | | | | 56,056 | |
United Community Financial Corp.* | | | 33,400 | | | | 99,532 | |
| | | | | | | | |
| | | | | | | 1,130,641 | |
|
Trading Companies & Distributors - 1.55% | |
Aceto Corp. | | | 13,900 | | | | 125,517 | |
Aircastle, Ltd. | | | 32,700 | | | | 394,035 | |
Beacon Roofing Supply, Inc.* | | | 9,200 | | | | 232,024 | |
DXP Enterprises, Inc.* | | | 450 | | | | 18,671 | |
Interline Brands, Inc.* | | | 6,750 | | | | 169,222 | |
KSW, Inc. | | | 2,800 | | | | 10,948 | |
Rush Enterprises, Inc., Class A* | | | 10,700 | | | | 174,945 | |
United Rentals, Inc.* | | | 20,875 | | | | 710,585 | |
Willis Lease Finance Corp.* | | | 10,750 | | | | 132,440 | |
| | | | | | | | |
| | | | | | | 1,968,387 | |
|
Wireless Telecommunication Services - 0.75% | |
Leap Wireless International, Inc.* | | | 76,500 | | | | 491,895 | |
NTELOS Holdings Corp. | | | 12,625 | | | | 237,981 | |
Shenandoah Telecommunications Co. | | | 15,700 | | | | 213,677 | |
USA Mobility, Inc. | | | 1,300 | | | | 16,718 | |
| | | | | | | | |
| | | | | | | 960,271 | |
| | | | | | | | |
TOTAL COMMON STOCKS - 99.14% | | | | | | | 126,118,676 | |
| | | | | | | | |
(Cost $122,500,675) | | | | | | | | |
| | |
Bridgeway Omni Tax-Managed Small-Cap Value Fund SCHEDULE OF INVESTMENTS (continued) | | |
Showing percentage of net assets as of June 30, 2012
| | | | | | | | | | | | | | |
| | | Rate^ | | | Shares | | | Value | | | |
MONEY MARKET FUND - 0.74% | | | |
BlackRock FedFund | | | 0.01% | | | | 946,271 | | | | $946,271 | | | |
| | | | | | | | | | | | | | |
TOTAL MONEY MARKET FUND - 0.74% | | | | 946,271 | | | |
| | | | | | | | | | | | | | |
(Cost $946,271) | | | | | | | | | | | | | | |
| | |
TOTAL INVESTMENTS - 99.88% | | | | $127,064,947 | | | |
(Cost $123,446,946) | | | | | | | | | | | | | | |
Other Assets in Excess of Liabilities - 0.12% | | | | 151,369 | | | |
| | | | | | | | | | | | | | |
NET ASSETS - 100.00% | | | | $127,216,316 | | | |
| | | | | | | | | | | | | | |
| | |
* Non-income producing security. ^ Rate disclosed as of June 30, 2012. + This security or a portion of the security is out on loan at June 30, 2012. Total loaned securities had a value of $7,008,491 at June 30, 2012. LLC - Limited Liability Company Summary of inputs used to value the Fund’s investments as of 06/30/2012 is as follows (See Note 2 in Notes to Financial Statements): | | |
| | | | | | | | | | | | | | |
| | | Valuation Inputs | | | |
| | | Investment in Securities (Value) | | | |
| | | Level 1 Quoted Prices | | Level 2
Significant
Observable
Inputs | | | Level 3
Significant
Unobservable
Inputs | | Total | | | |
Common Stocks | | $126,118,676 | | | $ — | | | $— | | $ | 126,118,676 | | | |
Money Market Fund | | — | | | 946,271 | | | — | | | 946,271 | | | |
| | | | | | | | | | | | | | |
TOTAL | | $126,118,676 | | | $946,271 | | | $— | | $ | 127,064,947 | | | |
| | | | | | | | | | | | | | |
Following is a reconciliation of Level 3 investments for which significant unobservable inputs were used to determine fair value:
| | | | | | | | | | | | | | | |
| | | Investment in Securities (Value) |
| | | Common Stocks | | Total | | |
Balance as of 06/30/2011 | | | $ | 10,070 | | | | $ | 10,070 | | | |
Purchases | | | | — | | | | | — | | | |
Sales | | | | (3,484) | | | | | (3,484) | | | |
Realized gain/(loss)1 | | | | (21,846) | | | | | (21,846) | | | |
Change in unrealized appreciation/ (depreciation)2 | | | | 15,260 | | | | | 15,260 | | | |
Transfers in | | | | — | | | | | — | | | |
Transfers out | | | | — | | | | | — | | | |
| | | | | | | | | | | | | |
Balance as of 06/30/2012 | | | $ | — | | | | $ | — | | | |
| | | | | | | | | | | | | |
Net change in unrealized appreciation (depreciation) from investments held as of 06/30/20122 | | | $ | — | | | | $ | — | | | |
| | | | | | | | | | | | | |
1Realized gain/(loss) from Level 3 securities is included on the Statement of Operations in the Realized Gain (Loss) on Investments.
2Change in unrealized appreciation/(depreciation) for Level 3 securities is included on the Statement of Operations in the Change in Unrealized Appreciation (Depreciation) on Investments.
See Notes to Financial Statements.
| | |
30 | | Annual Report | June 30, 2012 |
| | |
STATEMENTS OF ASSETS AND LIABILITIES | | |
| | | | | | | | | | |
June 30, 2012 ASSETS | | Omni Small-Cap Value | | Omni Tax-Managed Small-Cap Value |
Investments at value | | | $ | 182,120,543 | | | | $ | 127,064,947 | |
Receivables: | | | | | | | | | | |
Portfolio securities sold | | | | 485,480 | | | | | - | |
Fund shares sold | | | | 456,288 | | | | | 1,016,580 | |
Dividends and interest | | | | 128,031 | | | | | 106,959 | |
Prepaid expenses | | | | 29,383 | | | | | 24,918 | |
Total assets | | | | 183,219,725 | | | | | 128,213,404 | |
LIABILITIES | | | | | | | | | | |
Payables: | | | | | | | | | | |
Portfolio securities purchased | | | | 3,374,402 | | | | | 922,426 | |
Fund shares redeemed | | | | 192,502 | | | | | - | |
Accrued Liabilities: | | | | | | | | | | |
Investment advisory fees | | | | 37,190 | | | | | 10,169 | |
Administration fees | | | | 5,579 | | | | | 4,048 | |
Directors’ fees | | | | 396 | | | | | 341 | |
Other | | | | 56,949 | | | | | 60,104 | |
Total liabilities | | | | 3,667,018 | | | | | 997,088 | |
NET ASSETS | | | $ | 179,552,707 | | | | $ | 127,216,316 | |
NET ASSETS REPRESENT | | | | | | | | | | |
Paid-in capital | | | $ | 168,511,448 | | | | $ | 123,998,466 | |
Undistributed net investment income | | | | 508,134 | | | | | 455,097 | |
Accumulated net realized loss on investments | | | | (145,793 | ) | | | | (855,248) | |
Net unrealized appreciation on investments | | | | 10,678,918 | | | | | 3,618,001 | |
NET ASSETS | | | $ | 179,552,707 | | | | $ | 127,216,316 | |
Shares of common stock outstanding of $.001 par value* | | | | 16,154,422 | | | | | 12,660,601 | |
Net asset value, offering price and redemption price per share | | | $ | 11.11 | | | | $ | 10.05 | |
Total investments at cost | | | $ | 171,441,625 | | | | $ | 123,446,946 | |
* See Note 1 - Organization in the Notes to Financial Statements for shares authorized for each Fund.
See Notes to Financial Statements.
| | |
STATEMENTS OF OPERATIONS | | |
| | | | | | | | | | |
Period Ended June 30, 2012 | | Omni
Small-Cap Value1 | | Omni Tax-Managed
Small-Cap Value |
INVESTMENT INCOME | | | | | | | | | | |
Dividends | | | $ | 1,067,656 | | | | $ | 1,079,554 | |
Securities lending | | | | 167,114 | | | | | 199,546 | |
Total Investment Income | | | | 1,234,770 | | | | | 1,279,100 | |
EXPENSES | | | | | | | | | | |
Investment advisory fees | | | | 406,173 | | | | | 411,607 | |
Administration fees | | | | 32,142 | | | | | 32,470 | |
Accounting fees | | | | 58,570 | | | | | 87,507 | |
Transfer agent fees | | | | 7,376 | | | | | 12,558 | |
Professional fees | | | | 33,040 | | | | | 36,747 | |
Custody fees | | | | 30,846 | | | | | 20,486 | |
Blue sky fees | | | | 9,125 | | | | | 30,691 | |
Directors’ and officers’ fees | | | | 15,652 | | | | | 15,809 | |
Shareholder servicing fees | | | | 62,158 | | | | | 54,922 | |
Reports to shareholders | | | | 16,812 | | | | | 16,852 | |
Miscellaneous expenses | | | | 12,642 | | | | | 17,411 | |
Total Expenses | | | | 684,536 | | | | | 737,060 | |
Less investment advisory fees waived | | | | (184,328 | ) | | | | (243,003) | |
Less other fees waived | | | | (12,766 | ) | | | | - | |
Net Expenses | | | | 487,442 | | | | | 494,057 | |
NET INVESTMENT INCOME | | | | 747,328 | | | | | 785,043 | |
NET REALIZED AND UNREALIZED GAIN (LOSS) ON INVESTMENTS | | | | | | | | | | |
Realized Gain (Loss) on: | | | | | | | | | | |
Investments | | | | (145,793 | ) | | | | (827,085) | |
Change in Unrealized Appreciation (Depreciation) on: | | | | | | | | | | |
Investments | | | | 10,678,918 | | | | | 3,181,198 | |
Net Realized and Unrealized Gain on Investments | | | | 10,533,125 | | | | | 2,354,113 | |
INCREASE IN NET ASSETS RESULTING FROM OPERATIONS | | | $ | 11,280,453 | | | | $ | 3,139,156 | |
1 For the period August 31, 2011 (commencement of operations) through June 30, 2012.
See Notes to Financial Statements.
| | |
32 | | Annual Report | June 30, 2012 |
| | |
STATEMENTS OF CHANGES IN NET ASSETS | | |
| | | | | | | | | | | | | | | |
| | | Omni | | Omni Tax-Managed |
| | | Small-Cap Value | | Small-Cap Value |
| | | For the Period August 31, 20111 through June 30, 2012 | | Year Ended June 30, 2012 | | For the Period
December 31, 20101
through June 30, 2011 |
OPERATIONS | | | | | | | | | | | | | | | |
Net investment income | | | | $ 747,328 | | | | | $ 785,043 | | | | | $ 57,746 | |
Net realized loss on investments | | | | (145,793 | ) | | | | (827,085 | ) | | | | (28,163) | |
Net change in unrealized appreciation (depreciation) on investments | | | | 10,678,918 | | | | | 3,181,198 | | | | | 436,803 | |
Net increase in net assets resulting from operations | | | | 11,280,453 | | | | | 3,139,156 | | | | | 466,386 | |
DISTRIBUTIONS: | | | | | | | | | | | | | | | |
From net investment income | | | | (218,329 | ) | | | | (379,007 | ) | | | | - | |
Net decrease in net assets resulting from distributions | | | | (218,329 | ) | | | | (379,007 | ) | | | | - | |
SHARE TRANSACTIONS: | | | | | | | | | | | | | | | |
Proceeds from sale of shares | | | | 178,590,444 | | | | | 112,796,648 | | | | | 39,874,315 | |
Reinvestment of distributions | | | | 218,329 | | | | | 379,007 | | | | | - | |
Cost of shares redeemed | | | | (10,318,190 | ) | | | | (26,664,208 | ) | | | | (2,395,981) | |
Net increase in net assets resulting from share transactions | | | | 168,490,583 | | | | | 86,511,447 | | | | | 37,478,334 | |
Net increase in net assets | | | | 179,552,707 | | | | | 89,271,596 | | | | | 37,944,720 | |
NET ASSETS: | | | | | | | | | | | | | | | |
Beginning of period | | | | - | | | | | 37,944,720 | | | | | - | |
End of period* | | | | $179,552,707 | | | | | $127,216,316 | | | | | $37,944,720 | |
SHARES ISSUED & REDEEMED | | | | | | | | | | | | | | | |
Issued | | | | 17,113,203 | | | | | 11,927,426 | | | | | 3,784,388 | |
Distributions reinvested | | | | 21,942 | | | | | 41,833 | | | | | - | |
Redeemed | | | | (980,723 | ) | | | | (2,861,204 | ) | | | | (231,842) | |
Net increase in shares | | | | 16,154,422 | | | | | 9,108,055 | | | | | 3,552,546 | |
Outstanding at beginning of period | | | | - | | | | | 3,552,546 | | | | | - | |
Outstanding at end of period | | | | 16,154,422 | | | | | 12,660,601 | | | | | 3,552,546 | |
* Including undistributed net investment income of: | | | | $ 508,134 | | | | | $ 455,097 | | | | | $ 54,379 | |
1Commencement of operations.
See Notes to Financial Statements.
FINANCIAL HIGHLIGHTS
(for a share outstanding throughout the period indicated)
| | | | | | | | | | | | | | | | | | | | | | |
| | | | | Income from
Investment Operations | | |
| | | Net Asset
Value,
Beginning
of Period | | Net Investment
Income(a) | | Net Realized
and Unrealized
Gain\(Loss) | | Total from
Investment
Operations | | |
| | | | | |
OMNI SMALL-CAP VALUE | | | | | | | | | | | | | | | | | | | | | | |
| | | | | |
Period Ended June 30, 2012(c) | | | $ | 10.00 | | | | $ | 0.08 | | | | $ | 1.06 | | | | $ | 1.14 | | | |
| | | | | |
OMNI TAX-MANAGED SMALL-CAP VALUE | | | | | | | | | | | | | | | | | | | | | | |
| | | | | |
Year Ended June 30, 2012 | | | | 10.68 | | | | | 0.09 | | | | | (0.67 | )(e) | | | | (0.58) | | | |
Period Ended June 30, 2011(f) | | | | 10.00 | | | | | 0.03 | | | | | 0.65 | | | | | 0.68 | | | |
| (a) | Per share amounts calculated based on the average daily shares outstanding during the period. |
| (b) | Annualized for periods less than one year. |
| (c) | Commenced operations on August 31, 2011. |
| (d) | Total return may have been lower had various fees not been waived during the period. |
| (e) | Realized and unrealized gain (loss) per share do not correlate to the aggregate of the net unrealized gain in the Statements of Operations for the year ended June 30, 2012, primarily due to the timing of the sales and repurchases of the Fund’s shares in relation to fluctuating market values for the Fund’s portfolio. |
| (f) | Commenced operations on December 31, 2010. |
See Notes to Financial Statements.
| | |
34 | | Annual Report | June 30, 2012 |
| | | | | | | | | | | | | | | | | | | | | | | | | | | | | | | | | | | | | | | | | | | | | | | | | | |
| | | Less Distributions
to Shareholders from: | | | | | | Ratios & Supplemental Data |
| | | Net
Realized
Gain | | Net
Investment
Income | | Total
Distributions | | Net Asset
Value,
End of
Period | | Total
Return | | Net Assets
End of
Period (000’s) | | Expenses Before
Waivers and
Reimbursements(b) | | Expenses After
Waivers and
Reimbursements(b) | | Net Investment
Income After Waivers and
Reimbursements(b) | | Portfolio
Turnover
Rate |
| | | | | | | | | | |
| | | | | $ - | | | | $ | (0.03 | ) | | | $ | (0.03 | ) | | | $ | 11.11 | | | | | 11.41 | %(d) | | | $ | 179,553 | | | | | 0.84 | % | | | | 0.60 | % | | | | 0.92 | % | | | | 8 | % |
| | | | | | | | | | |
| | | | - | | | | | (0.05 | ) | | | | (0.05 | ) | | | | 10.05 | | | | | (5.41 | %)(d) | | | | 127,216 | | | | | 0.90 | % | | | | 0.60 | % | | | | 0.95 | % | | | | 26 | % |
| | | | | - | | | | | - | | | | | - | | | | | 10.68 | | | | | 6.80 | %(d) | | | | 37,945 | | | | | 1.56 | % | | | | 0.60 | % | | | | 0.57 | % | | | | 7 | % |
| | |
NOTES TO FINANCIAL STATEMENTS | | |
June 30, 2012
1. Organization:
Bridgeway Funds, Inc. (“Bridgeway” or the “Company”) was organized as a Maryland corporation on October 19, 1993, and is registered under the Investment Company Act of 1940, as amended (the “1940 Act”), as an open-end management investment company.
Bridgeway is organized as a series fund, with 11 investment funds as of June 30, 2012 (each, a “Bridgeway Fund” and collectively, the “Bridgeway Funds”). Aggressive Investors 1, Ultra-Small Company, Ultra-Small Company Market, Small-Cap Momentum, Small-Cap Growth, Small-Cap Value, Large-Cap Growth, Blue Chip 35 Index and Managed Volatility Funds are presented in a separate report. The Omni Small-Cap Value Fund and the Omni Tax-Managed Small-Cap Value Fund (each a “Fund” and together, the “Funds”) commenced operations on August 31, 2011 and December 31, 2010, respectively, and are presented in this report.
Bridgeway is authorized to issue 1,987,343,706 shares of common stock at $0.001 per share. 100,000,000 shares have been classified into the Aggressive Investors 1 Fund. 130,000,000 shares have been classified into the Blue Chip 35 Index Fund. 15,000,000 shares have been classified into the Ultra-Small Company Fund. 100,000,000 shares each have been classified into the Ultra-Small Company Market, Omni Small-Cap Value, Omni Tax-Managed Small-Cap Value, Small-Cap Momentum, Small-Cap Growth, Small-Cap Value and Large-Cap Growth Funds. 50,000,000 shares have been classified into the Managed Volatility Fund. All shares outstanding currently represent Class N shares.
All of the Bridgeway Funds are no-load, diversified funds.
The Funds seek to provide long-term total return on capital, primarily through capital appreciation.
Bridgeway Capital Management, Inc. (the “Adviser”) is the investment adviser for all of the Bridgeway Funds.
2. Significant Accounting Policies:
The following summary of significant accounting policies, followed in the preparation of the financial statements of the Funds, are in conformity with accounting principles generally accepted in the United States of America (“GAAP”).
Securities, Options and Other Investments Valuation Other than options, portfolio securities that are principally traded on a national securities exchange are valued at their last sale price on the principal exchange on which they are traded prior to the close of the New York Stock Exchange (“NYSE”), on each day the NYSE is open for business. If there is no closing price on the NYSE, the portfolio security will be valued using a composite price, which is defined as the last price for the security on any exchange. Portfolio securities other than options that are principally traded on the National Association of Securities Dealers Automated Quotation System (“NASDAQ”) are valued at the NASDAQ Official Closing Price (“NOCP”). In the absence of recorded sales on their home exchange, or NOCP, in the case of NASDAQ traded securities, the security will be valued as follows: bid prices for long positions and ask prices for short positions. Other investments for which no sales are reported are valued at the latest bid price in accordance with the pricing policy established by the Board of Directors.
Investments in open-end registered investment companies and closed-end registered investment companies that do not trade on an exchange are valued at the end of day net asset value (“NAV”) per share.
Investments in closed-end registered investment companies that trade on an exchange are valued at the last sales price as of the close of the customary trading session on the exchange where the security is principally traded.
When market quotations are not readily available or when events occur that make established valuation methods unreliable, securities of the Funds may be valued at fair value as determined in good faith by or under the direction of the Board of Directors. The valuation assigned to fair valued securities for purposes of calculating the Funds’ NAV may differ from the security’s most recent closing market price and from the prices used by other mutual funds to calculate their NAVs.
| | |
36 | | Annual Report | June 30, 2012 |
| | |
NOTES TO FINANCIAL STATEMENTS (continued) | | |
June 30, 2012
The inputs and valuation techniques used to determine the value of a Fund’s investments are summarized into three levels as described in the hierarchy below:
| — | | Level 1 — quoted prices in active markets for identical assets |
Investments whose values are based on quoted market prices in active markets, and whose values are therefore classified as Level 1 prices, include active listed equity securities. The Funds do not adjust the quoted price for such investments, even in situations where the Funds hold a large position and a sale could reasonably impact the quoted price.
| — | | Level 2 — other significant observable inputs (including quoted prices for similar securities, interest rates, prepayments speeds, credit risk, etc.) |
Investments that trade in markets that are not considered to be active, but whose values are based on quoted market prices, dealer quotations or valuations provided by alternative pricing sources supported by observable inputs are classified as Level 2 prices. These generally include certain U.S. government and sovereign obligations, most government agency securities, investment-grade corporate bonds and less liquid listed equity securities. As investments whose values are classified as Level 2 prices include positions that are not traded in active markets and/or are subject to transfer restrictions, valuations may be adjusted to reflect illiquidity and/or non-transferability, which are generally based on available market information.
Money market fund investments consist of mutual funds which invest primarily in securities that are valued at amortized cost, a Level 2 investment. Therefore, the money market funds are classified as Level 2 investments.
| — | | Level 3 — significant unobservable inputs (including a Fund’s own assumptions in determining the fair value of investments) |
Investments whose values are classified as Level 3 prices have significant unobservable inputs, as they may trade infrequently or not at all. When observable prices are not available for these securities, the Funds use one or more valuation techniques for which sufficient and reliable data is available. The inputs used by the Funds in estimating the value of Level 3 prices may include the original transaction price, quoted prices for similar securities or assets in active markets, completed or pending third-party transactions in the underlying investment or comparable issuers, and changes in financial ratios or cash flows. Level 3 prices may also be adjusted to reflect illiquidity and/or non-transferability, with the amount of such discount estimated by the Funds in the absence of market information. Assumptions used by the Funds due to the lack of observable inputs may significantly impact the resulting value and therefore the Funds’ results of operations.
The inputs or methodology used for valuing investments are not necessarily an indication of the risk associated with investing in those investments. A summary of the inputs used to value the Funds’ investments as of June 30, 2012 is included with each Fund’s Schedule of Investments.
Effective January 1, 2012, the Funds adopted Accounting Standards Update (“ASU”) No. 2011-04 “Amendments to Achieve Common Fair Value Measurement and Disclosure Requirements in U.S. GAAP and International Financial Reporting Standards (“IFRSs”).” ASU No. 2011-04 is intended to result in common fair value and measurement requirements in U.S. GAAP and IFRSs. ASU No. 2011-04 requires reporting entities to disclose quantitative information about the significant unobservable inputs used in the fair value measurements categorized within Level 3 of the fair value hierarchy. In addition, ASU No. 2011-04 requires reporting entities to make disclosures about amounts and reasons for all transfers in and out of Level 1 and Level 2 fair value measurements. Level 3 securities are not significant to the Funds. The adoption of ASU 2011-04 had no impact on net assets of the Funds.
The Funds’ policy is to recognize transfers into, and transfers out of, each level of hierarchy as of the beginning of the reporting period. For the fiscal year ended June 30, 2012, there were no transfers between Level 1 and Level 2 in any of the Funds. Details regarding transfers into, and transfers out of, Level 3 can be found at the end of each Schedule of Investments for Funds that hold Level 3 securities.
Securities Lending Upon lending its securities to third parties, each Fund receives compensation in the form of fees. A Fund also continues to receive dividends on the securities loaned. The loans are secured by collateral at least equal to the fair value of the securities loaned plus accrued interest. Gain or loss in the fair value of the securities loaned that may occur during the
| | |
NOTES TO FINANCIAL STATEMENTS (continued) | | |
June 30, 2012
term of the loan will be for the account of a Fund. Each Fund has the right under the lending agreement to recover the securities from the borrower on demand. Additionally, a Fund does not have the right to sell or repledge collateral received in the form of securities unless the borrower goes into default. The risks to a Fund of securities lending are that the borrower may not provide additional collateral when required or return the securities when due.
As of June 30, 2012, the Funds had securities on loan and related collateral with values shown below:
| | | | | | | | | | |
| Bridgeway Fund | | Securities on
Loan Value | | Value of
Collateral |
| | | | | | | | | | |
Omni Small-Cap Value | | | $ | 13,371,957 | | | | $ | 13,429,177 | |
Omni Tax-Managed Small-Cap Value | | | | 7,008,491 | | | | | 7,152,453 | |
It is each Fund’s policy to obtain additional collateral from or return excess collateral to the borrower by the end of the next business day, following the valuation date of the securities loaned. Therefore, the value of the collateral held may be temporarily less than that required under the lending contract. As of June 30, 2012, the collateral consisted of an institutional money market fund.
Use of Estimates in Financial Statements In preparing financial statements in conformity with GAAP, management makes estimates and assumptions that affect the reported amounts of assets and liabilities at the date of the financial statements and the disclosure of contingent assets and liabilities at the date of the financial statements as well as the reported amounts of revenue and expenses during the reporting period. Actual results could differ from those estimates.
Risks and Uncertainties The Funds provide for various investment options, including stocks. Such investments are exposed to various risks, such as interest rate, market and credit risks. Due to the risks involved, it is at least reasonably possible that changes in risks in the near term would materially affect shareholders’ account values and the amounts reported in the financial statements.
Security Transactions, Investment Income and Expenses Security transactions are accounted for as of the trade date, the date the order to buy or sell is executed. Realized gains and losses are computed on the identified cost basis. Dividend income is recorded on the ex-dividend date, and interest income is recorded on the accrual basis from settlement date.
Bridgeway Funds’ expenses that are not series-specific are allocated to each series based upon its relative proportion of net assets to the Bridgeway Funds’ total net assets or other appropriate basis.
Distributions to Shareholders The Funds pay dividends from net investment income and distribute realized capital gains annually, usually in December.
Indemnification Under the Company’s organizational documents, the Funds’ officers, directors, employees and agents are indemnified against certain liabilities that may arise out of the performance of their duties to the Funds. Additionally, in the normal course of business, the Funds enter into contracts that contain a variety of indemnification clauses. The Funds’ maximum exposure under these arrangements is unknown as this would involve future claims that may be made against the Funds that have not yet occurred. However, the Funds have not had prior claims or losses pursuant to these contracts.
3. Management Fees, Other Related Party Transactions and Contingencies:
The Funds have entered into a management agreement with the Adviser. As compensation for the advisory services rendered, facilities furnished, and expenses borne by the Adviser, the Funds pay the Adviser a fee of 0.50% of the value of each Fund’s average daily net assets, computed daily and payable monthly.
| | |
38 | | Annual Report | June 30, 2012 |
| | |
NOTES TO FINANCIAL STATEMENTS (continued) | | |
June 30, 2012
Expense limitations: The Adviser has agreed to reimburse the Funds for operating expenses and management fees above the expense limitations shown in the table below, which are shown as a ratio of net expenses to average net assets, for each Fund, for the fiscal year ended June 30, 2012. Any material change to the expense limitation would require a vote by shareholders of the applicable Fund.
| | | | | | | | | | |
| Bridgeway Fund | | Expense
Limitation | | Total Waivers and Reimbursements for Period Ending 6/30/12 |
| | | | | | | | |
Omni Small-Cap Value* | | | | 0.60% | | | $184,328 |
Omni Tax-Managed Small-Cap Value* | | | | 0.60% | | | 243,003 |
| | | | | | | | |
*The Funds are authorized to reimburse the Adviser for management fees previously waived and/or for expenses previously paid by the Adviser, provided, however, that any reimbursements must be paid at a date not more than three years after the fiscal year in which the Adviser waived the fees or reimbursed the expenses and the reimbursements do not cause the Funds to exceed the expense limitation in the agreement. The Omni Small-Cap Value Fund has recoupable expenses of $184,328, which expire on June 30, 2015. The Omni Tax-Managed Small-Cap Value Fund has recoupable expenses of $85,793 and $243,003, which expire June 30, 2014 and June 30, 2015, respectively.
Other Waivers and Reimbursements: BNY Mellon Asset Servicing, the Funds’ accounting agent and transfer agent, at its discretion, voluntarily waived a portion of its accounting and transfer agent fees for the Omni Small-Cap Value Fund. For the fiscal period ended June 30, 2012, BNY Mellon Asset Servicing waived $9,766 in accounting fees and $3,000 in transfer agent fees for the Omni Small-Cap Value Fund.
Other Related Party Transactions: On occasion, the Bridgeway Funds will engage in inter-portfolio trades between funds when it is to the benefit of both parties. The Board of Directors reviews these trades quarterly. Inter-portfolio purchases and sales for the Funds during the fiscal year ended June 30, 2012 were as follows:
| | | | | | | | | | |
| Bridgeway Fund | | Inter-portfolio
Purchases | | Inter-portfolio Sales |
| | | | | | | | |
Omni Small-Cap Value | | | $ | 2,504,801 | | | $ - |
Omni Tax-Managed Small-Cap Value | | | | 1,815,929 | | | - |
The Adviser entered into an Administrative Services Agreement with Bridgeway, pursuant to which the Adviser provides various administrative services to the Funds including, but not limited to: (i) supervising and managing various aspects of the Funds’ business and affairs; (ii) selecting, overseeing and/or coordinating activities with other service providers to the Funds; (iii) providing reports to the Board of Directors as requested from time to time; (iv) assisting and/or reviewing amendments and updates to the Funds’ registration statement and other filings with the Securities and Exchange Commission (“SEC”); (v) providing certain shareholder services; (vi) providing administrative support in connection with meetings of the Board of Directors; and (vii) providing certain record-keeping services. For its services to all of the Bridgeway Funds, the Adviser is paid an aggregate annual fee of $535,000 payable in equal monthly installments. During the fiscal year ended June 30, 2012, the allocation of this expense to the Omni Small-Cap Value and Omni Tax-Managed Small-Cap Value Funds was $32,142 and $32,470, respectively.
One director of Bridgeway, John Montgomery, is an owner and director of the Adviser. Another director of Bridgeway, Michael Mulcahy, is an executive and director of the Adviser. Under the 1940 Act definitions, each is considered to be an “affiliated person” of the Adviser and an “interested person” of the Adviser and of Bridgeway. Compensation for Mr. Montgomery and Mr. Mulcahy is borne by the Adviser rather than the Bridgeway Funds.
| | |
NOTES TO FINANCIAL STATEMENTS (continued) | | |
June 30, 2012
Board of Directors Compensation Independent Directors are paid an annual retainer of $14,000 with an additional retainer of $2,500 paid to the Independent Chairman of the Board and an additional retainer of $1,000 paid to the Nominating and Corporate Governance Committee Chair. Beginning in 2012 the retainer is paid in quarterly installments. Independent Directors are paid $6,000 per meeting for meeting fees. Such compensation is the total compensation from all Bridgeway Funds and is allocated among the Bridgeway Funds.
The Independent Directors receive this compensation in the form of shares of the Bridgeway Funds, credited to his or her account. Such Directors are reimbursed for any expenses incurred in attending meetings and conferences and expenses for subscriptions or printed materials. The amount of Directors’ fees attributable to each Fund is disclosed in the Statement of Operations.
4. Distribution and Shareholder Servicing Fees:
Foreside Fund Services, LLC acts as distributor of the Funds’ shares pursuant to a Distribution Agreement dated November 12, 2010. The Adviser pays all costs and expenses associated with distribution of the Funds’ shares pursuant to a protective plan adopted by shareholders pursuant to Rule 12b-1.
5. Purchases and Sales of Investment Securities:
Purchases and sales of investments, other than short-term securities, for each Fund for the fiscal year ended June 30, 2012 were as follows:
| | | | | | | | | | | | | | | | | | | | |
| | | Purchases | | Sales |
| | | U.S. Government | | Other | | U.S. Government | | Other |
| | | | | | | | | | | | | | | | | | | | |
Omni Small-Cap Value | | | | $ - | | | | | $175,589,175 | | | | | $ - | | | | | $ 7,355,186 | |
Omni Tax-Managed Small-Cap Value | | | | - | | | | | 107,576,027 | | | | | - | | | | | 21,761,225 | |
6. Federal Income Taxes
It is the Funds’ policy to continue to comply with the provisions of the Internal Revenue Code of 1986, as amended (“Internal Revenue Code”), applicable to regulated investment companies and distribute income to the extent necessary so that such Fund is not subject to federal income tax. Therefore, no federal income tax provision is required.
Unrealized Appreciation and Depreciation on Investments (Tax Basis) The amount of net unrealized appreciation/ depreciation and the cost of investment securities for tax purposes, including short-term securities at June 30, 2012, were as follows:
| | | | |
| | | Omni Small-Cap Value | | Omni Tax-Managed Small-Cap Value |
Gross appreciation (excess of value over tax cost) | | $ 20,626,623 | | $ 14,541,081 |
Gross depreciation (excess of tax cost over value) | | (9,947,722) | | (10,993,865) |
Net unrealized appreciation (depreciation) | | $ 10,678,901 | | $ 3,547,216 |
Cost of investments for income tax purposes | | $171,441,642 | | $123,517,731 |
The differences between book and tax net unrealized appreciation (depreciation) are due to wash sale loss deferrals and passive foreign investment company (PFIC) adjustments.
Classifications of Distributions Net investment income (loss) and net realized gain (loss) may differ for financial statement and tax purposes. The character of distributions made during the year from net investment income or net realized gains may differ from its ultimate characterization for federal income tax purposes.
The Omni Small-Cap Value Fund commenced operations on August 31, 2011 and the Omni Tax-Managed Small-Cap Value Fund commenced operations on December 31, 2010. There were no cash distributions paid during the period ended June 30, 2011. The tax character of the distributions paid by the Funds during the fiscal year ended June 30, 2012, are as follows:
| | |
40 | | Annual Report | June 30, 2012 |
| | |
NOTES TO FINANCIAL STATEMENTS (continued) | | |
June 30, 2012
| | | | | | | | | | |
| | | Omni
Small-Cap Value | | Omni Tax-Managed Small-Cap Value |
| | | Year Ended June 30, 2012 | | Year Ended June 30, 2012 |
Distributions paid from: | | | | |
Ordinary Income | | $218,329 | | $379,007 |
Total | | $218,329 | | $379,007 |
Under the Regulated Investment Company Modernization Act of 2010, capital losses incurred by the Funds will not be subject to expiration and will retain their character as either short-term or long-term capital losses. At June 30, 2012, the Omni Tax-Managed Small-Cap Value Fund had $691,466 of short-term capital loss carryforwards available for tax purposes with an indefinite expiration date. There are no capital loss carryovers for Omni Small-Cap Value Fund as of June 30, 2012.
Components of Accumulated Earnings (Deficit) As of June 30, 2012, the components of accumulated earnings (deficit) on a tax basis were:
| | | | | | | | | | |
| | | Omni Small-Cap Value | | Omni Tax-Managed Small-Cap Value |
Undistributed Net Investment Income | | $ 508,151 | | $ 455,114 |
Accumulated Net Realized Loss on Investments* | | (145,793) | | (784,480) |
Net Unrealized Appreciation of Investments | | 10,678,901 | | 3,547,216 |
Total | | $11,041,259 | | $3,217,850 |
| * | Includes qualified late-year losses that the Funds have elected to defer to the beginning of their next fiscal year ending June 30, 2013. The Omni Small-Cap Value Fund and Omni Tax-Managed Small-Cap Value Fund have deferred post October losses of $145,793 and $93,014, respectively. |
For the fiscal year June 30, 2012, the Funds recorded the following reclassifications to the accounts listed below:
| | | | |
| | | Increase (Decrease) |
| | | Omni Small-Cap Value | | Omni Tax-Managed Small-Cap Value |
Paid-in-Capital | | $ 20,865 | | $ 5,318 |
Undistributed Net Investment Income | | (20,865) | | (5,318) |
Accumulated Net Realized Loss | | - | | - |
The difference between book and tax components of net assets and the resulting reclassifications were primarily a result of the deduction of equalization debits for tax purposes and disallowed expenses.
Accounting for Uncertainty in Income Taxes sets forth a minimum threshold for financial statement recognition of the benefit of a tax position taken or expected to be taken in a tax return. Management has analyzed each Fund’s tax positions and has concluded that no provision for income tax is required in each Fund’s financial statements. The Funds are not aware of any tax position for which it is reasonably possible that the total amounts of unrecognized tax benefits will significantly change in the next twelve months. Each Funds’ federal tax returns for the prior three fiscal years remain subject to examination by the Internal Revenue Service.
7. Line of Credit
Bridgeway established a line of credit agreement (“Facility”) with The Bank of New York Mellon effective November 5, 2010. The Facility is for temporary or emergency purposes, such as to provide liquidity for shareholder redemptions, and is cancellable by either party. Unless cancelled earlier, the Facility shall be held available until November 2, 2012. Advances under the Facility are limited to $10,000,000 in total for all Bridgeway Funds and advances to each Bridgeway Fund shall not exceed certain limits set forth in the credit agreement, including but not limited to, the maximum amount a Bridgeway Fund is permitted to borrow under the 1940 Act.
| | |
NOTES TO FINANCIAL STATEMENTS (continued) | | |
June 30, 2012
The Bridgeway Funds incur a commitment fee of 0.05% per annum on the unused portion of the Facility and interest expense to the extent of amounts borrowed under the Facility. Interest is based on the higher of (a) the Federal Funds rate, (b) the Overnight Eurodollar Rate, or (c) the One-month Eurodollar Rate, plus 1.25%. The commitment fees are payable quarterly in arrears and are allocated to all participating Bridgeway Funds. Interest expense is charged directly to a Bridgeway Fund based upon actual amounts borrowed by such Bridgeway Fund.
For the fiscal year ended June 30, 2012, borrowings by the Funds under this line of credit were as follows:
| | | | | | | | | | | | | | | | | | | | | | | | | |
| Bridgeway Fund | | Weighted
Average Interest Rate | | Weighted Average Loan Balance | | Number of Days Outstanding | | Interest Expense Incurred1 | | Maximum Amount Borrowed During the Period |
| | | | | | | | | | | | | | | | | | | | | | | | | |
Omni Small-Cap Value | | | | 1.55 | % | | | | $182,000 | | | | | 2 | | | | | $ 35 | | | | | $247,000 | |
Omni Tax-Managed Small-Cap Value | | | | 1.51 | % | | | | 350,500 | | | | | 12 | | | | | 128 | | | | | 627,000 | |
| | | | | | | | | | | | | | | | | | | | | | | | | |
| 1Interest expense is included on the Statements of Operations in Miscellaneous expenses. | | | | | | | | | | |
There were no outstanding borrowings by the Funds under this line of credit as of June 30, 2012.
8. Subsequent Events
Management has evaluated the impact of all subsequent events on the Funds and has determined that there were no subsequent events requiring recognition or disclosure in the financial statements.
| | |
42 | | Annual Report | June 30, 2012 |
| | |
REPORT OF INDEPENDENT REGISTERED PUBLIC ACCOUNTING FIRM | | |
To the Shareholders and Board of Directors of Bridgeway Funds, Inc.
We have audited the accompanying statements of assets and liabilities of the Omni Small-Cap Value Fund and Omni Tax-Managed Small-Cap Value Fund, each a series of Bridgeway Funds, Inc. (the “Funds”), including the schedules of investments, as of June 30, 2012, and the related statements of operations, the statements of changes in net assets and financial highlights for each of the years or periods presented. These financial statements and financial highlights are the responsibility of the Funds’ management. Our responsibility is to express an opinion on these financial statements and financial highlights based on our audits.
We conducted our audits in accordance with the standards of the Public Company Accounting Oversight Board (United States). Those standards require that we plan and perform the audits to obtain reasonable assurance about whether the financial statements and financial highlights are free of material misstatement. An audit includes examining, on a test basis, evidence supporting the amounts and disclosures in the financial statements. Our procedures included confirmation of securities owned as of June 30, 2012 by correspondence with the custodian and brokers. An audit also includes assessing the accounting principles used and significant estimates made by management, as well as evaluating the overall financial statement presentation. We believe that our audits provide a reasonable basis for our opinion.
In our opinion, the financial statements and financial highlights referred to above present fairly, in all material respects, the financial position of the Omni Small-Cap Value Fund and Omni Tax-Managed Small-Cap Value Fund as of June 30, 2012, the results of their operations, changes in their net assets and financial highlights for each of the years or periods presented, in conformity with accounting principles generally accepted in the United States of America.
| | |
| |  |
| |
| | BBD, LLP |
Philadelphia, Pennsylvania
August 24, 2012
| | |
OTHER INFORMATION | | |
June 30, 2012 (unaudited)
1. Shareholder Tax Information
Certain tax information regarding the Funds is required to be provided to shareholders based upon each Fund’s income and distributions for the taxable year ended June 30, 2012. The information and distributions reported herein may differ from information and distributions taxable to the shareholders for the calendar year ended December 31, 2011.
The Funds report the following items with regard to distributions paid during the fiscal year ended June 30, 2012. All reportings are based on financial information available as of the date of this annual report and, accordingly, are subject to change. For each item, it is the intention of each Fund to report the maximum amount permitted under the Internal Revenue Code of 1986, as amended, and the regulations thereunder.
| | | | | | | | | | |
| | | Omni Small-Cap Value | | Omni Tax-Managed Small Cap Value |
Corporate Dividends Received Deduction | | | | 100.00 | % | | | | 100.00 | % |
Qualified Dividend Income | | | | 100.00 | % | | | | 100.00 | % |
Qualified Interest Related Dividends | | | | 0.01 | % | | | | 0.01 | % |
Qualified Short Term Capital Gain Dividends | | | | 0.00 | % | | | | 0.00 | % |
During the fiscal year ended June 30, 2012, the Funds paid distributions from ordinary income and long-term capital gain which included equalization debits summarized below:
| | | | | | | | | | |
| | | Omni Small-Cap Value | | Omni Tax-Managed Small-Cap Value |
Ordinary Income Distributions | | | | $218,329 | | | | | $379,007 | |
Equalization Debits Included in Ordinary Income Distributions | | | | 21,162 | | | | | 5,318 | |
2. Proxy Voting
Fund policies and procedures used in determining how to vote proxies relating to the Funds’ securities and a summary of proxies voted by the Funds for the period ended June 30, 2012 are available without a charge, upon request, by contacting Bridgeway Funds at 1-800-661-3550 and on the SEC’s website at http://www.sec.gov.
3. Fund Holdings
The complete schedule of the Funds’ holdings for the second and fourth quarters of each fiscal year are contained in the Funds’ Semi-Annual and Annual shareholder reports, respectively.
The Bridgeway Funds file complete schedules of the Funds’ holdings with the SEC for the first and third quarters of each fiscal year on Form N-Q within 60 days after the end of the period. Copies of the Funds’ Form N-Q are available without charge, upon request, by contacting Bridgeway Funds at 1-800-661-3550 and on the SEC’s website at http://www.sec.gov. You may also review and copy Form N-Q at the SEC’s Public Reference Room in Washington, D.C. For more information about the operation of the Public Reference Room, please call 1-800-SEC-0330.
4. Approval of Investment Management Agreement For Omni Tax-Managed Small-Cap Value Fund
The Bridgeway Funds, Inc.’s (the “Company”) management agreement (the “Management Agreement”) with its investment adviser, Bridgeway Capital Management, Inc. (the “Adviser”), on behalf of each of the Company’s funds must be approved for an initial term no greater than two years and renewed at least annually thereafter (i) by the vote of the Directors or by a vote of the shareholders of each fund and (ii) by the vote of a majority of the Directors who are not parties to the Management Agreement or “interested persons” of any party thereto (the “Independent Directors”), cast in person at a meeting called specifically for the purpose of voting on such approval.
The Board of Directors (the “Board”) has five regularly scheduled meetings each year and takes into account throughout the year matters bearing on the Management Agreement. The Board and its standing committees also consider at each meeting
| | |
44 | | Annual Report | June 30, 2012 |
| | |
OTHER INFORMATION (continued) | | |
June 30, 2012 (unaudited)
factors that are relevant to the annual renewal of each fund’s Management Agreement, including the services and support provided to each fund and its shareholders.
On June 1, 2012, the Board, including a majority of the Independent Directors, met in person (the “Meeting”) with the Adviser, Company counsel, independent legal counsel (“Independent Legal Counsel”) to the Independent Directors and others to give consideration to information bearing on the continuation of the Management Agreement with respect to the Omni Tax-Managed Small-Cap Value Fund (the “Fund”).1 In preparation for the Meeting, the Independent Directors requested that the Adviser provide specific information relevant to their consideration of the renewal of the Fund’s Management Agreement. In response to that request, the Independent Directors were furnished with a wide variety of information with respect to the Fund, including:
| | — | | investment performance over various time periods and the fees and expenses of the Fund as compared to a comparable group of funds (the “peer funds”); |
| | — | | the nature, extent and quality of services provided by the Adviser to the Fund, including investment advisory and administrative services; |
| | — | | actual management fees paid by the Fund to the Adviser; |
| | — | | the Adviser’s costs of providing services to the Fund and the profitability of the Adviser derived from its relationship with the Fund; |
| | — | | the extent to which economies of scale may be present and if so, the degree to which they would be shared with the Fund’s shareholders; |
| | — | | any “fall out” or ancillary benefits accruing to the Adviser as a result of its relationship with the Fund; and |
| | — | | information regarding the structure of the advisory fees, the method of computing fees and the frequency of payment of fees and any expense limitation or fee waiver arrangements for the Fund. |
The Independent Directors also met telephonically with Independent Legal Counsel prior to the Meeting to review and discuss the information provided by the Adviser and, as a result of the telephonic meeting, requested certain additional information from the Adviser. Moreover, the Independent Directors also met in executive session with Independent Legal Counsel to consider the continuation of the Management Agreement outside the presence of management during the Meeting.
In considering the aforementioned information, the Independent Directors took into account management style, investment strategies and prevailing market conditions. Furthermore, in evaluating the Management Agreement, the Directors also reviewed information provided by the Adviser concerning the following:
| | — | | the terms of the Management Agreement, including the services performed by the Adviser in managing the Fund in accordance with the Fund’s investment objectives, policies and restrictions and how those services and fees differ from the Adviser’s services to non-mutual fund accounts; |
| | — | | the services provided by the Adviser under a separate Administrative Services Agreement and the fact that those services were provided at approximately cost to the Fund; |
1 The Management Agreement with respect to the Omni Small-Cap Value Fund was initially approved by the Board of Directors (and Independent Directors) for an initial period of two years beginning on the date of commencement of operation of the Fund at the Board’s meeting held on May 13, 2011 and therefore the Fund’s Management Agreement is not required to be renewed until 2013.
| | |
OTHER INFORMATION (continued) | | |
June 30, 2012 (unaudited)
| | — | | the Adviser’s specialized skills and experience in statistical analysis and investment management and trading; |
| | — | | the Adviser’s personnel, staffing levels and the time and attention the Adviser’s personnel devote to the management of all of the Bridgeway Funds as compared to other Adviser clients; |
| | — | | the Adviser’s risk assessment and risk management capabilities; |
| | — | | the fact that the Adviser continues to use no soft dollars; and |
| | — | | the financial condition and stability of the Adviser, including supplemental financial information provided upon the request of the Independent Directors and the fact that at the current time, the Adviser is operating the Fund at a loss. |
After extensive discussion and consideration among themselves, and with the Adviser, Company counsel and Independent Legal Counsel, including during an executive session with Independent Legal Counsel, the Independent Directors concluded the following:
| | — | | the nature, extent and quality of the Adviser’s services were appropriate and consistent with the terms of the Management Agreement and mutual fund industry norms; |
| | — | | the investment performance of the Fund was acceptable over the short operating history of the Fund; |
| | — | | the management fees and overall expense levels, after taking into account any applicable management fee and expense waivers, were significantly lower than peer funds; |
| | — | | the costs of services provided by the Adviser to the Fund were fair and reasonable in relation to the services and benefits provided to the Fund; and |
| | — | | although there were no breakpoints in the Fund’s fee schedule, shareholders of the Fund were not missing the opportunity to benefit from economies of scale in view of the fact that the Fund was priced low in anticipation of future growth. |
In summary, the Independent Directors renewed the Management Agreement with respect to the Fund. The Independent Directors valued access by the Fund to the Adviser’s proprietary statistically driven investment management services and favorable fee levels, considered the favorable short term performance of the Fund and concluded that renewal of the Management Agreement was in the best interests of the Fund and its shareholders. Based on all of the information presented, the Board, including a majority of its Independent Directors, determined that the fees charged under the Management Agreement are reasonable in relation to the services that are provided under the Management Agreement. In view of the broad scope and variety of factors and information, the Directors did not identify any single factor as being of paramount importance in reaching their conclusions and determinations to approve the continuance of the Management Agreement for the Fund. Rather, the approval determination was made on the basis of each Director’s business judgment after consideration of all of the factors taken in their entirety.
| | |
46 | | Annual Report | June 30, 2012 |
| | |
DISCLOSURE OF FUND EXPENSES | | |
June 30, 2012 (unaudited)
As a shareholder of a Fund, you will incur no transaction costs from such Fund, including sales charges (loads) on purchases, on reinvested dividends, or on other distributions. There are no exchange fees. However, as a shareholder of a Fund, you will incur ongoing costs, including management fees and other Fund expenses. The following examples are intended to help you understand your ongoing costs (in dollars) of investing in a Fund and to compare these costs with ongoing costs of investing in other mutual funds. The examples are based on an investment of $1,000 invested on January 1, 2012 and held until June 30, 2012.
Actual Expenses. The first line of the table below provides information about actual account values and actual expenses. You may use the information in this line, together with the amount you invested, to estimate the expenses that you paid over the period. Simply divide your account value by $1,000 (for example, an $8,600 account value divided by $1,000 = 8.6), then multiply the result by the number in the first line under the heading “Expenses Paid During Period” to estimate the expenses you paid on your account during the period.
Hypothetical Example for Comparison Purposes. The second line of the table below provides information about hypothetical account values and hypothetical expenses based on the Fund’s actual expense ratio and an assumed rate of return of 5% per year before expenses, which is not the Fund’s actual return. The hypothetical account values and expenses may not be used to estimate the actual ending account balance or expenses you paid for the period. You may use this information to compare the ongoing costs of investing in a Fund and other mutual funds. To do so, compare this 5% hypothetical example with the 5% hypothetical examples that appear in the shareholder reports of other funds.
The expenses shown in the table are meant to highlight ongoing Fund costs only. Therefore, the second line of the table is useful in comparing ongoing costs only and will not help you determine the relative total costs of owning different funds, because other funds may also have transaction costs, such as sales charges, redemption fees or exchange fees.
| | | | | | | | | | |
| | | Beginning Account Value at 1/1/12 | | Ending Account Value at 6/30/12 | | Expense Ratio | | | Expenses Paid During Period* 1/1/12 - 6/30/12 |
| | | | |
Bridgeway Omni Small-Cap Value | | | | | | | | | | |
Actual Fund Return | | $1,000.00 | | $1,072.40 | | | 0.60% | | | $3.11 |
Hypothetical Fund Return | | $1,000.00 | | $1,022.00 | | | 0.60% | | | $3.03 |
| | | | |
| Bridgeway Omni Tax-Managed Small-Cap Value | | | | | | | | | | |
Actual Fund Return | | $1,000.00 | | $1,068.00 | | | 0.60% | | | $3.10 |
Hypothetical Fund Return | | $1,000.00 | | $1,022.00 | | | 0.60% | | | $3.03 |
| * | Expenses are equal to the average account value times the Fund’s annualized expense ratio multiplied by the number of days in the most recent half-year divided by the number of days in the fiscal year. |
| | |
DIRECTORS & OFFICERS | | |
June 30, 2012
Independent Directors
| | | | | | | | | | |
Name, Address and Age1 | | Position Held with Bridgeway Funds | | Term of Office and Length of Time Served | | Principal Occupation(s) During Past Five Years | | No. of Bridgeway Funds Overseen by Director | | Other Directorships Held by Director |
| | | | | |
Kirbyjon Caldwell Age 59 | | Director | | Term: 1 Year
Length: 2001 to Present. | | Senior Pastor of Windsor Village United Methodist Church, since 1982. | | Eleven | | American Church Mortgage Company, NRG Energy, Inc., Amegy Bancshares Advisory Board |
| | | | | |
Karen S. Gerstner Age 57 | | Director | | Term: 1 Year
Length: 1994 to Present. | | Principal, Karen S. Gerstner & Associates, P.C., since 2004. | | Eleven | | None |
| | | | | |
Miles Douglas Harper, III* Age 49 | | Director | | Term: 1 Year
Length: 1994 to Present. | | Partner, Gainer, Donnelly, Desroches, LLP, since 1998. | | Eleven | | Calvert Social Investment Fund (8 Portfolios), Calvert Social Index Series, Inc. (1 Portfolio), Calvert Impact Fund (4 Portfolios), Calvert World Values Fund (3 Portfolios) |
| | | | | |
Evan Harrel Age 51 | | Director | | Term: 1 Year
Length: 2006 to Present. | | Executive Director, Small Steps Nurturing Center, 2004 through May 2012. | | Eleven | | None |
| | | | | |
| | | | | | | | | | | |
| | |
48 | | Annual Report | June 30, 2012 |
| | |
DIRECTORS & OFFICERS (continued) | | |
June 30, 2012
“Interested” or Affiliated Directors and Officers
| | | | | | | | | | |
Name, Address and Age1 | | Position(s) Held with Bridgeway Funds | | Term of Office and Length of Time Served | | Principal Occupation(s) During Past Five Years | | No. of Bridgeway Funds Overseen by Director | | Other Directorships Held by Director |
| | | | | |
Michael D. Mulcahy2 Age 48 | | President and
Director | | Term: 1 Year
Length: 2003 to Present. | | President and Chief Operating Officer, Bridgeway Capital Management, Inc., 10/2010 - present, President, Bridgeway Funds, 6/2005 - present. Director, Secretary and Vice President, Bridgeway Capital Management, Inc., 12/2002 - 10/2010. | | Eleven | | None |
| | | | | |
John N. R. Montgomery3 Age 56 | | Vice President
and Director | | Term: 1 Year
Length: 1993 to Present. | | Chairman, Bridgeway Capital Management, Inc., 10/2010 - present, Vice President, Bridgeway Funds, 6/2005 - present. President, Bridgeway Capital Management, Inc., 11/1993 - 10/2010. | | Eleven | | None |
| | | | | |
| | | | | | | | | | | |
| | |
DIRECTORS & OFFICERS (continued) | | |
June 30, 2012
Other Officers
| | | | | | | | | | |
Name, Address and Age1 | | Position Held with Bridgeway Funds | | Term of Office and Length of Time Served | | Principal Occupation(s) During Past Five Years | | No. of Bridgeway Funds Overseen by Officer | | Other Directorships Held by Officer |
| | | | | |
Richard P. Cancelmo, Jr. Age 54 | | Vice President | | Term: 1 Year
Length: 2004 to Present. | | Vice President, Bridgeway Funds, 11/2004 - present, Staff member, Bridgeway Capital Management, Inc., since 2000. | | N/A | | None |
| | | | | |
Linda G. Giuffré Age 50 | | Treasurer and
Chief Compliance Officer | | Term: 1 Year
Length: 2004 to Present. | | Chief Compliance Officer, Bridgeway Capital Management, Inc., 11/2004 - present, Staff member, Bridgeway Capital Management, Inc., 5/2004 - present. | | N/A | | None |
| | | | | |
Deborah L. Hanna Age 47 | | Secretary | | Term: 1 Year
Length: 2007 to Present. | | Self-employed, accounting and related projects for various organizations, 2001 - present. | | N/A | | None |
| | | | | |
Sharon Lester Age 57 | | Vice President
| | Term: 1 Year
Length: 2011 to Present. | | Staff member, Bridgeway Capital Management, Inc., 12/2010 - present. Prior to 12/2010, Director of Portfolio Operations, Invesco. | | N/A | | None |
| 1 | The address of all of the Directors and Officers of Bridgeway Funds is 20 Greenway Plaza, Suite 450, Houston, Texas, 77046. |
| 2 | Michael Mulcahy is a director and officer of Bridgeway Capital Management, Inc., and therefore an interested person of Bridgeway Funds. |
| 3 | John Montgomery is chairman, director and majority shareholder of Bridgeway Capital Management, Inc., and therefore an interested person of Bridgeway Funds. |
The overall management of the business and affairs of Bridgeway Funds is vested with its Board of Directors (the “Board”). The Board approves all significant agreements between Bridgeway Funds and persons or companies furnishing services to it, including agreements with its Adviser and Custodian. The day-to-day operations of Bridgeway Funds are delegated to its officers, subject to its investment objectives and policies and general supervision by the Board.
The Fund’s Statement of Additional Information includes additional information about the Board and is available, without charge, upon request by calling 1-800-661-3550.
| | |
50 | | Annual Report | June 30, 2012 |
| | | | |
| | |
| | | | |
| | BRIDGEWAY FUNDS, INC. BNY Mellon Investment Servicing (US) Inc. 301 Bellevue Parkway Wilmington, DE 19809 CUSTODIAN The Bank of New York Mellon One Wall Street New York, NY 10286 DISTRIBUTOR Foreside Fund Services, LLC Three Canal Plaza, Suite 100 Portland, ME 04101 |
| | You can review and copy information about our Funds (including the SAI) at the SEC’s Public Reference Room in Washington, D.C. To find out more about this public service, call the SEC at 800-SEC-0330. Reports and other information about the Funds is also available on the SEC’s website at www.sec.gov. You can receive copies of this information, for a fee, by writing the Public Reference Section, Securities and Exchange Commission, Washington, D.C. 20549-1520 or by sending an electronic request to the following email address: publicinfo@sec.gov. | | |
Item 2. Code of Ethics.
| | (a) | The registrant, as of the end of the period covered by this report, has adopted a code of ethics that applies to the registrant’s principal executive officer, principal financial officer, principal accounting officer or controller, or persons performing similar functions, regardless of whether these individuals are employed by the registrant or a third party. |
| | (c) | There have been no amendments, during the period covered by this report, to a provision of the code of ethics that applies to the registrant’s principal executive officer, principal financial officer, principal accounting officer or controller, or persons performing similar functions, regardless of whether these individuals are employed by the registrant or a third party, and that relates to any element of the code of ethics description. |
| | (d) | The registrant has not granted any waivers, including an implicit waiver, from a provision of the code of ethics that applies to the registrant’s principal executive officer, principal financial officer, principal accounting officer or controller, or persons performing similar functions, regardless of whether these individuals are employed by the registrant or a third party, that relates to one or more of the items set forth in paragraph (b) of this item’s instructions. |
Item 3. Audit Committee Financial Expert.
3(a)(1) The Registrant’s board of directors has determined that the registrant has at least one audit committee financial expert serving on its audit committee.
3(a)(2) The audit committee financial expert is Miles Douglas Harper III, who is “independent” for purposes of this Item 3 of Form N-CSR.
Item 4. Principal Accountant Fees and Services.
Audit Fees
| | (a) | The aggregate fees billed for each of the last two fiscal years for professional services rendered by the principal accountant for the audit of the registrant’s annual financial statements or services that are normally provided by the accountant in connection with statutory and regulatory filings or engagements were $227,000 for the fiscal year ended June 30, 2012 and $267,000 for the fiscal year ended June 30, 2011. |
Audit-Related Fees
| | (b) | The aggregate fees billed in each of the last two fiscal years for assurance and related services by the principal accountant that are reasonably related to the performance of the audit of the registrant’s financial statements and are not reported under paragraph (a) of this Item were $0 for the fiscal year ended June 30, 2012 and $0 for the fiscal year ended June 30, 2011. |
Tax Fees
| | | | |
| | (c) | | The aggregate fees billed in each of the last two fiscal years for professional services rendered by the principal accountant for tax compliance, tax advice, and tax planning were $26,000 for the fiscal year ended June 30, 2012 and $26,000 for the fiscal year ended June 30, 2011. Tax services include the review of the Funds’ federal income tax returns, the review of the Funds’ federal excise tax returns and the review of required distributions by the Funds. |
All Other Fees
| | | | |
| | (d) | | The aggregate fees billed in each of the last two fiscal years for products and services provided by the principal accountant, other than the services reported in paragraphs (a) through (c) of this Item were $0 for the fiscal year ended June 30, 2012 and $0 for the fiscal year ended June 30, 2011. |
| (e)(1) | | Disclose the audit committee’s pre-approval policies and procedures described in paragraph (c)(7) of Rule 2-01 of Regulation S-X. |
| | | | The Registrant’s Audit Committee has adopted an Audit Committee Charter that provides that the Audit Committee shall approve, prior to appointment, the engagement of the auditor to provide audit services to the Registrant and non-audit services to the Registrant, its investment advisor or any entity controlling, controlled by or under common control with the investment adviser that provides on-going services to the Registrant if the engagement relates directly to the operations and financial reporting of the Registrant. |
| (e)(2) | | No services described in paragraphs (b) through (d) above were approved pursuant to paragraph (c)(7)(i)(C) of Rule 2-01 of Regulation S-X. |
| | (f) | | Not applicable. |
| | (g) | | The aggregate non-audit fees billed by the registrant’s accountant for services rendered to the registrant, and rendered to the registrant’s investment adviser (not including any sub-adviser whose role is primarily portfolio management and is subcontracted with or overseen by another investment adviser), and any entity controlling, controlled by, or under common control with the adviser that provides ongoing services to the registrant for each of the last two fiscal years of the registrant was $0 for the fiscal year ended June 30, 2012 and $0 for the fiscal year ended June 30, 2011. |
| | (h)Not applicable. |
Item 5. Audit Committee of Listed registrants.
Not applicable.
Item 6. Investments.
| (a) | Schedule of Investments in securities of unaffiliated issuers as of the close of the reporting period is included as part of the report to shareholders filed under Item 1 of this form. |
| (b) | The registrant has divested itself of securities in accordance with Section 13(c) of the Investment Company Act of 1940 and is in accordance with The Sudan Accountability and Divestment Act of 2007. |
| | | | | | | | | | | | | | | | | | | | | | | | | | | | | | | | | | | | | | | | | | | | |
| Client Name/# | | Trade Date | | | Settle Date | | | Buy/Sell | | CUSIP | | | Security
Symbol | | Security Description | | Quantity | | | Unit Price | | | Principal/
Proceeds/
Notional Value | | | Total
Comm. | | | Total Fees | | | Net Proceeds | | | Broker |
| BRIDGEWAY AI2 | | | 4/5/2012 | | | | 4/11/2012 | | | Sell | | | 149123101 | | | CAT | | CATERPILLAR INC. | | | 15,100 | | | | 106.72 | | | | 1,611,449.35 | | | | 75.5 | | | | 36.1 | | | | 1,611,337.75 | | | DIRECT |
| BRIDGEWAY AI1 | | | 4/5/2012 | | | | 4/11/2012 | | | Sell | | | 149123101 | | | CAT | | CATERPILLAR INC. | | | 8,300 | | | | 106.72 | | | | 885,763.55 | | | | 41.5 | | | | 19.84 | | | | 885,702.21 | | | DIRECT |
| BRIDGEWAY LG | | | 4/12/2012 | | | | 4/17/2012 | | | Sell | | | 149123101 | | | CAT | | CATERPILLAR INC. | | | 4,700 | | | | 105.64 | | | | 496,486.85 | | | | 23.5 | | | | 11.12 | | | | 496,452.23 | | | DIRECT |
| BRIDGEWAY AI2 | | | 3/30/2012 | | | | 4/4/2012 | | | Sell | | | 149123101 | | | CAT | | CATERPILLAR INC. | | | 4,400 | | | | 106.63 | | | | 469,162.32 | | | | 22 | | | | 10.51 | | | | 469,129.81 | | | ITG TRITON |
| BRIDGEWAY AI1 | | | 3/30/2012 | | | | 4/4/2012 | | | Sell | | | 149123101 | | | CAT | | CATERPILLAR INC. | | | 1,200 | | | | 106.63 | | | | 127,953.36 | | | | 6 | | | | 2.87 | | | | 127,944.49 | | | ITG TRITON |
| BRIDGEWAY LG | | | 4/5/2012 | | | | 4/11/2012 | | | Sell | | | 149123101 | | | CAT | | CATERPILLAR INC. | | | 800 | | | | 105.9 | | | | 84,720.00 | | | | 4 | | | | 1.9 | | | | 84,714.10 | | | DIRECT |
Item 7. Disclosure of Proxy Voting Policies and Procedures for Closed-End Management Investment Companies.
Not applicable.
Item 8. Portfolio Managers of Closed-End Management Investment Companies.
Not applicable.
Item 9. Purchases of Equity Securities by Closed-End Management Investment Company and Affiliated Purchasers.
Not applicable.
Item 10. Submission of Matters to a Vote of Security Holders.
There have been no material changes to the procedures by which the shareholders may recommend nominees to the Registrant’s Board of Directors, where those changes were implemented after the registrant last provided disclosure in response to the requirements of Item 407(c)(2)(iv) of Regulation S-K (17 CFR 229.407) (as required by Item 22(b)(15) of Schedule 14A (17 CFR 240.14a-101)), or this Item.
Item 11. Controls and Procedures.
| | (a) | The registrant’s principal executive officer and principal financial officer, or persons performing similar functions, have concluded that the registrant’s disclosure controls and procedures (as defined in Rule 30a-3(c) under the Investment Company Act of 1940, as amended (the “1940 Act”) (17 CFR 270.30a-3(c))) are effectively designed, as of a date within 90 days of the filing date of the report that includes the disclosure required by this paragraph, based on their |
| | evaluation of these controls and procedures required by Rule 30a-3(b) under the 1940 Act (17 CFR 270.30a-3(b)) and Rules 13a-15(b) or 15d-15(b) under the Securities Exchange Act of 1934, as amended (17 CFR 240.13a-15(b) or 240.15d-15(b)). |
| | (b) | There were no changes in the registrant’s internal control over financial reporting (as defined in Rule 30a-3(d) under the Act (17 CFR 270.30a-3(d)) that occurred during the second fiscal quarter of the period covered by this report that have materially affected or are reasonably likely to materially affect, the registrant’s internal control over financial reporting. |
Item 12. Exhibits.
| | (a)(1) | Code of ethics, or any amendment thereto, that is the subject of disclosure required by Item 2 is attached hereto. |
| | (a)(2) | Certifications pursuant to Rule 30a-2(a) under the 1940 Act and Section 302 of the Sarbanes-Oxley Act of 2002 are attached hereto. |
| | (b) | Certifications pursuant to Rule 30a-2(b) under the 1940 Act and Section 906 of the Sarbanes- Oxley Act of 2002 are attached hereto. |
SIGNATURES
Pursuant to the requirements of the Securities Exchange Act of 1934 and the Investment Company Act of 1940, the registrant has duly caused this report to be signed on its behalf by the undersigned, thereunto duly authorized.
| | |
| (registrant) | | Bridgeway Funds, Inc. |
| | | | |
| By (Signature and Title)* | | /s/ Michael D. Mulcahy | | |
| | Michael D. Mulcahy, President and Principal Executive Officer |
| | (principal executive officer) |
Pursuant to the requirements of the Securities Exchange Act of 1934 and the Investment Company Act of 1940, this report has been signed below by the following persons on behalf of the registrant and in the capacities and on the dates indicated.
| | | | |
| By (Signature and Title)* | | /s/ Michael D. Mulcahy | | |
| | Michael D. Mulcahy, President and Principal Executive Officer |
| | (principal executive officer) |
| | | | |
| By (Signature and Title)* | | /s/ Linda G. Giuffré | | |
| | Linda G. Giuffré, Treasurer and Principal Financial Officer |
| | (principal financial officer) |
| | |
* | | Print the name and title of each signing officer under his or her signature. |