UNITED STATES
SECURITIES AND EXCHANGE COMMISSION
Washington, D.C. 20549
FORM N-CSR
CERTIFIED SHAREHOLDER REPORT OF REGISTERED MANAGEMENT
INVESTMENT COMPANIES
Investment Company Act file number 811-08200
Bridgeway Funds, Inc.
(Exact name of registrant as specified in charter)
20 Greenway Plaza, Suite 450
Houston, Texas 77046
(Address of principal executive offices) (Zip code)
Tammira Philippe, President
Bridgeway Funds, Inc.
20 Greenway Plaza, Suite 450
Houston, Texas 77046
(Name and address of agent for service)
Registrant’s telephone number, including area code: (713) 661-3500
Date of fiscal year end: June 30
Date of reporting period: December 31, 2022
Form N-CSR is to be used by management investment companies to file reports with the Commission not later than 10 days after the transmission to stockholders of any report that is required to be transmitted to stockholders under Rule 30e-1 under the Investment Company Act of 1940 (17 CFR 270.30e-1). The Commission may use the information provided on Form N-CSR in its regulatory, disclosure review, inspection, and policymaking roles.
A registrant is required to disclose the information specified by Form N-CSR, and the Commission will make this information public. A registrant is not required to respond to the collection of information contained in Form N-CSR unless the Form displays a currently valid Office of Management and Budget (“OMB”) control number. Please direct comments concerning the accuracy of the information collection burden estimate and any suggestions for reducing the burden to Secretary, Securities and Exchange Commission, 450 Fifth Street, NW, Washington, DC 20549-0609. The OMB has reviewed this collection of information under the clearance requirements of 44 U.S.C. § 3507.
Item 1. Reports to Stockholders.
| (a) | Include a copy of the report transmitted to stockholders pursuant to Rule 30e-1 under the Act (17 CFR 270.30e-1). |
The Report to Shareholders is attached herewith.
| 1 | ||||
| 3 | ||||
| 7 | ||||
| 10 | ||||
| 14 | ||||
| 19 | ||||
| 23 | ||||
| 34 | ||||
| 38 | ||||
| 41 | ||||
| 45 | ||||
| 52 | ||||
| 54 | ||||
| 56 | ||||
| 59 | ||||
| 64 | ||||
| 76 | ||||
| 77 | ||||
|
December 31, 2022 (Unaudited)
Bridgeway Funds Standardized Returns (%) as of December 31, 2022* (Unaudited)
| Annualized | ||||||||||||||||||||
| Fund | Quarter | Six Months | 1 Year | 5 Years | 10 Years | 15 Years | Inception to Date | Inception Date | Gross Ratio2 | Net Expense | ||||||||||
| Aggressive Investors 1 | 7.02 | 5.48 | -22.38 | 0.11 | 7.69 | 2.58 | 10.80 | 8/5/1994 | 0.39% | 0.39% | ||||||||||
| Ultra-Small Company | 10.14 | 3.45 | -10.72 | 7.62 | 8.31 | 5.82 | 12.54 | 8/5/1994 | 1.26% | 1.26% | ||||||||||
| Ultra-Small Co Market | 4.40 | -3.32 | -23.40 | 2.37 | 8.32 | 5.82 | 9.17 | 7/31/1997 | 0.81%1 | 0.78%1 | ||||||||||
| Small-Cap Value | 10.43 | 6.90 | -7.74 | 11.63 | 11.62 | 7.49 | 8.88 | 10/31/2003 | 0.83% | 0.83% | ||||||||||
| Managed Volatility | 4.21 | 5.15 | -4.93 | 4.03 | 4.58 | 3.28 | 4.07 | 6/30/2001 | 1.20%1 | 0.95%1 | ||||||||||
Bridgeway Funds Returns (%) for Calendar Years 2012 through 2022* (Unaudited)
| ||||||||||||||||||||
| 2013 | 2014 | 2015 | 2016 | 2017 | 2018 | 2019 | 2020 | 2021 | 2022 | |||||||||||
| Aggressive Investors 1 | 42.21 | 14.99 | -9.82 | 19.47 | 18.44 | -22.44 | 21.85 | 14.35 | 19.89 | -22.38 | ||||||||||
| Ultra-Small Company | 55.77 | -0.56 | -16.12 | 14.06 | 3.88 | -15.68 | 9.51 | 31.31 | 33.34 | -10.72 | ||||||||||
| Ultra-Small Co Market | 50.91 | 4.61 | -8.28 | 21.47 | 12.47 | -17.12 | 15.34 | 25.53 | 22.31 | -23.40 | ||||||||||
| Small-Cap Value | 39.72 | 0.79 | -9.43 | 26.79 | 7.11 | -13.06 | 14.98 | 12.04 | 67.74 | -7.74 | ||||||||||
| Managed Volatility | 9.25 | 5.95 | 0.17 | 2.42 | 8.18 | -3.97 | 11.88 | 10.55 | 7.91 | -4.93 | ||||||||||
Performance figures quoted represent past performance and are no guarantee of future results. Current performance may be lower or higher than the performance data quoted. Investment return and principal value will fluctuate, so that an investor’s shares, when redeemed, may be worth more or less than original cost. To obtain performance current to the most recent month-end, please visit bridgewayfunds.com or call 800-661-3550. Total return figures include the reinvestment of dividends and capital gains. Periods of less than one year are not annualized.
| 1 | Some of the Fund’s fees were waived or expenses reimbursed; otherwise, returns would have been lower. The Adviser is contractually obligated to waive fees and/or pay expenses. Any material change to this Fund policy would require a vote by shareholders. |
| 2 | Expense ratios are as stated in the current prospectus. Please see financial highlights for expense ratios as of December 31, 2022. |
* Numbers highlighted indicate periods when the Fund outperformed its primary benchmark.
This report is submitted for the general information of the shareholders of each Fund. It is not authorized for distribution to prospective investors unless preceded or accompanied by an effective prospectus, which includes information regarding a Fund’s risks, objectives, fees and expenses, experience of its management, and other information. Investors should read the prospectus carefully before investing in a Fund. For questions or other Fund information, call 800-661-3550 or visit the Funds’ website at bridgewayfunds.com. Funds are available for purchase by residents of the United States, Puerto Rico, US Virgin Islands, and Guam only.
The views expressed here are exclusively those of Fund management. These views, including those relating to the market, sectors, or individual stocks, are not meant as investment advice and should not be considered predictive in nature.
| i | Semi-Annual Report | December 31, 2022 (Unaudited) | |
December 31, 2022 (Unaudited)
Dear Fellow Shareholders,
Performance across domestic equity markets was positive for the December quarter. However, those gains were not enough to offset poor performance from earlier in 2022. Stocks in all size and style categories had negative returns for the year, but value stocks outperformed growth stocks across all size categories. Large-cap value stocks delivered the year’s best performance, while large-cap growth stocks had the worst performance. Market highlights appear on page 2. In this environment, the Bridgeway Funds performed within design expectations, guided by our statistically driven, evidence-based investment approach. Please see the enclosed letters for a detailed explanation of each Fund’s performance during the quarter and the calendar year. We hope you find the letters helpful.
As always, we appreciate your feedback. We take your comments very seriously and regularly discuss them to help us manage our Funds and this company. Please keep your ideas coming – both favorable and critical. They provide us with a vital tool to serve you better.
Sincerely,
Your Investment Management Team
|
|
| ||||||||
| John Montgomery | Christine L. Wang | Michael Whipple | ||||||||
|
| |||||||||
| Elena Khoziaeva | Dick Cancelmo | |||||||||


| bridgewayfunds.com | 1 | |
LETTER FROM THE INVESTMENT MANAGEMENT TEAM (continued) |
|
December 31, 2022 (Unaudited)
Market Review
Domestic equity markets rose during the quarter ended December 31, 2022 as investors reacted to signs of moderating inflation in October and November by driving stock prices higher. The positive trend reversed in December amid concerns about a potential recession, but the decline did not erase the quarter’s earlier gains. However, positive fourth-quarter performance was not enough to offset declines from earlier in the calendar year, which were largely driven by high inflation and the US Federal Reserve’s series of aggressive interest rate hikes. The S&P 500 returned +7.6% for the quarter, and the Dow Jones Industrial Average (DJIA) returned +16.0%. For the calendar year, the S&P 500 and the DJIA returned -18.1% and -6.9%, respectively.
All US equity style categories, as defined by Russell Indices, recorded positive returns for the quarter. Larger stocks outperformed smaller stocks in the value style category, but smaller stocks outperformed larger stocks in the growth style category. As a result, large-cap value stocks had the best performance during the quarter, returning +12.4%. Large-cap growth stocks had the worst performance on a relative basis, returning +2.2%.
All sectors of the S&P 500 except for the Consumer Discretionary and Communication Services sectors had positive returns for the quarter. The Energy sector recorded the largest gains, returning +23.1%, followed by Industrials (+19.2%) and Materials (+15.2%). The Consumer Discretionary sector had the worst performance, returning -10.2%.
Below are the stock market style box returns for the quarter and the calendar year.
| December 2022 Quarter | Calendar Year ended December 31,2022 | |||||||||||||||||||
| Value | All | Growth | Value | All | Growth | |||||||||||||||
| Large | +12.42% | +7.24% | +2.20% | Large | -7.54% | -19.13% | -29.14% | |||||||||||||
| Mid | +10.45% | +9.18% | +6.90% | Mid | -12.03% | -17.32% | -26.72% | |||||||||||||
| Small | +8.42% | +6.23% | +4.13% | Small | -14.48% | -20.44% | -26.36% | |||||||||||||
| 2 | Semi-Annual Report | December 31, 2022 (Unaudited) | |
December 31, 2022
Dear Fellow Aggressive Investors 1 Fund Shareholder,
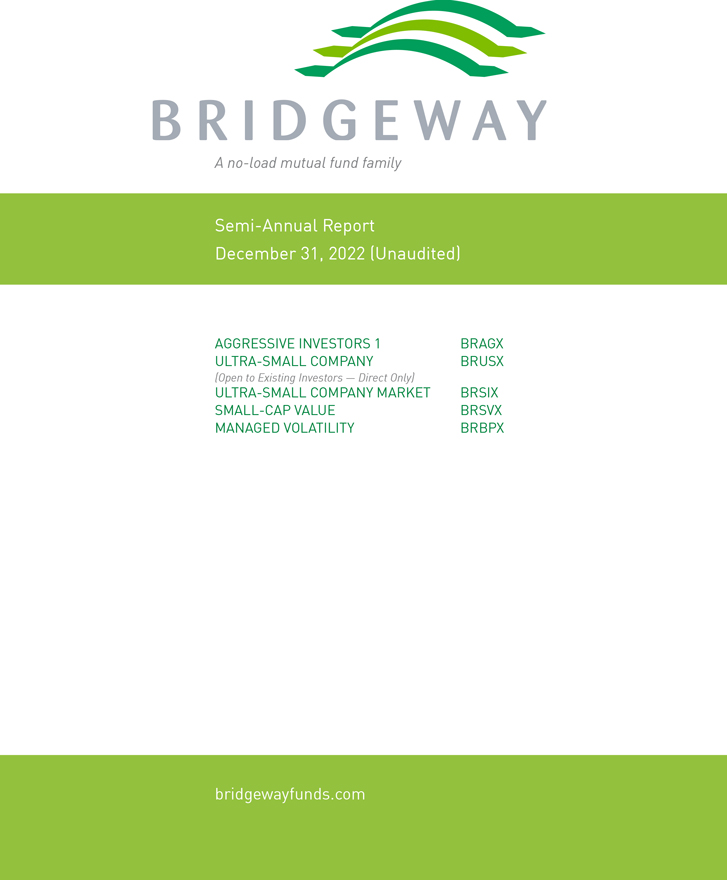
For the quarter ended December 31, 2022, our Fund returned +7.02%, underperforming our primary market benchmark, the S&P 500 Index (+7.56%), but outperforming the Russell 2000 Index (+6.23%). It was a good quarter on an absolute basis, and a mixed quarter on a relative basis.
For the calendar year, our Fund returned -22.38%, underperforming the S&P 500 Index (-18.11%), and the Russell 2000 Index (-20.44%).
The table below presents our December quarter, six months, one-year, five-year, 10-year, 15-year, and inception-to-date financial results. See the next page for a graph of performance since inception.
Standardized Returns as of December 31, 2022
| ||||||||||||||||||||||||||||
| Annualized | ||||||||||||||||||||||||||||
| Quarter | 6 Months | 1 Year | 5 Years | 10 Years | 15 Years | Since Inception (8/5/94) | ||||||||||||||||||||||
Aggressive Investors 1 Fund | 7.02% | 5.48% | -22.38% | 0.11% | 7.69% | 2.58% | 10.80% | |||||||||||||||||||||
S&P 500 Index | 7.56% | 2.31% | -18.11% | 9.42% | 12.56% | 8.81% | 9.82% | |||||||||||||||||||||
Russell 2000 Index | 6.23% | 3.91% | -20.44% | 4.13% | 9.01% | 7.16% | 8.63% | |||||||||||||||||||||
Performance figures quoted in the table above represent past performance and are no guarantee of future results. Total return figures in the table above include the reinvestment of dividends and capital gains. The table above does not reflect the deduction of taxes that a shareholder would pay on Fund distributions or on the redemption of Fund shares.
The S&P 500 Index is a broad-based, unmanaged measurement of changes in stock market conditions, based on the average of 500 widely held common stocks with dividends reinvested. The Russell 2000 Index is an unmanaged, market value-weighted index that measures the performance of the 2,000 companies between the 1,000th and 3,000th largest in the market with dividends reinvested. It is not possible to invest directly in an index. Periods longer than one year are annualized.
| bridgewayfunds.com | 3 | |
Aggressive Investors 1 Fund MANAGER’S COMMENTARY (Unaudited) (continued) |
|
Growth of a $10,000 Investment
from Inception August 5, 1994 to December 31, 2022
Detailed Explanation of Quarterly Performance
The Fund’s quality and sentiment models lagged the benchmark during the quarter, detracting from relative results. However, the Fund’s value metrics models outperformed the benchmark and offset some of this negative impact. By design, the Fund invests in higher beta (exhibit greater sensitivity than the broader market) and higher volatility stocks, and this positioning detracted from relative returns during the quarter. In contrast, the Fund’s tilt toward deeper value stocks helped relative results as value stocks outperformed growth stocks in the large-cap space. An overweighting in the benchmark’s smaller stocks also helped the Fund’s relative performance during the quarter.
From a sector perspective, the Fund’s allocation effect was positive. Overweightings in the Energy and Materials sectors and an underweighting in the Communication Services sector contributed most to relative performance. The Fund’s stock selection effect was negative, primarily driven by holdings in the Industrials, Consumer Staples, and Energy sectors.
Detailed Explanation of Calendar Year Performance
The Fund’s quality models underperformed the benchmark and detracted from relative results. However, the Fund’s sentiment and value metrics models outperformed the benchmark, partially offsetting this negative impact. Overweight exposure to higher beta and higher volatility stocks detracted from relative returns during the year. In contrast, the Fund’s tilt toward smaller stocks and deeper value stocks across multiple valuation metrics helped relative performance during the year.
From a sector perspective, the Fund’s allocation effect was positive, primarily driven by an overweighting in the Energy sector and an underweighting in the Communication Services sector. The Fund’s stock selection effect was negative, with holdings in the Communication Services, Information Technology, and Health Care sectors detracting the most from relative performance.
| 4 | Semi-Annual Report | December 31, 2022 (Unaudited) | |
Aggressive Investors 1 Fund MANAGER’S COMMENTARY (Unaudited) (continued) |
|
Top Ten Holdings as of December 31, 2022
| Rank | Description | Industry | % of Net Assets | |||||||
1 | Apple, Inc. | Information Technology | 2.9% | |||||||
2 | Microsoft Corp. | Information Technology | 2.8% | |||||||
3 | Cheniere Energy, Inc. | Energy | 2.4% | |||||||
4 | Amgen, Inc. | Health Care | 2.3% | |||||||
5 | UnitedHealth Group, Inc. | Health Care | 2.1% | |||||||
6 | UBS Group AG | Financials | 1.8% | |||||||
7 | Cigna Corp. | Health Care | 1.7% | |||||||
8 | JPMorgan Chase & Co. | Financials | 1.6% | |||||||
9 | Hologic, Inc. | Health Care | 1.6% | |||||||
10 | Automatic Data Processing, Inc. | Information Technology | 1.6% | |||||||
| Total | 20.8% | |||||||||
Industry Sector Representation as of December 31, 2022
| % of Net Assets | % of S&P 500 Index | Difference | ||||||
Communication Services | 4.1% | 7.3% | -3.2% | |||||
Consumer Discretionary | 14.9% | 9.8% | 5.1% | |||||
Consumer Staples | 2.6% | 7.2% | -4.6% | |||||
Energy | 10.8% | 5.2% | 5.6% | |||||
Financials | 12.9% | 11.7% | 1.2% | |||||
Health Care | 15.7% | 15.8% | -0.1% | |||||
Industrials | 8.8% | 8.7% | 0.1% | |||||
Information Technology | 24.1% | 25.7% | -1.6% | |||||
Materials | 5.5% | 2.7% | 2.8% | |||||
Real Estate | 0.0% | 2.7% | -2.7% | |||||
Utilities | 0.0% | 3.2% | -3.2% | |||||
Cash & Other Assets | 0.6% | 0.0% | 0.6% | |||||
Total | 100.0% | 100.0% | ||||||
Important Disclosure
The views expressed here are exclusively those of Fund management. These views, including those related to market sectors or individual stocks, are not meant as investment advice and should not be considered predictive in nature. Any favorable (or unfavorable) description of a holding applies only as of the quarter end, December 31, 2022, unless otherwise stated. Security positions can and do change thereafter. Discussions of historical performance do not guarantee and may not be indicative of future performance.
Market volatility can significantly affect short-term performance. The Fund is not an appropriate investment for short-term investors. Investments in the small companies within this multi-cap fund generally carry greater risk than is customarily associated with larger companies. This additional risk is attributable to a number of factors, including the relatively limited financial resources that are typically available to small companies and the fact that small companies often have comparatively limited product lines. In addition, the stock of small companies tends to be more volatile than the stock of large companies, particularly in the short term and particularly in the early stages of an economic or market downturn. The Fund’s use of options, futures, and leverage can magnify the risk of loss in an unfavorable market, and the Fund’s use of short-sale positions can, in theory, expose shareholders to unlimited loss. Finally, the Fund exposes shareholders to “focus risk,” which
| bridgewayfunds.com | 5 | |
Aggressive Investors 1 Fund MANAGER’S COMMENTARY (Unaudited) (continued) |
|
may add to Fund volatility through the possibility that a single company could significantly affect total return. Shareholders of the Fund, therefore, are taking on more risk than they would if they invested in the stock market as a whole.
Conclusion
Thank you for your continued investment in Aggressive Investors 1 Fund. We encourage your feedback; your reactions and concerns are important to us.
Sincerely,
The Investment Management Team
| 6 | Semi-Annual Report | December 31, 2022 (Unaudited) | |
Showing percentage of net assets as of December 31, 2022
| Industry Company | Shares | Value | ||||||
COMMON STOCKS - 99.49% |
| |||||||
Communication Services - 4.07% |
| |||||||
AT&T, Inc. | 115,000 | $ | 2,117,150 | |||||
Lumen Technologies, Inc.+ | 138,100 | 720,882 | ||||||
Meta Platforms, Inc., Class A* | 14,200 | 1,708,828 | ||||||
Netflix, Inc.* | 3,700 | 1,091,056 | ||||||
|
| |||||||
| 5,637,916 | ||||||||
Consumer Discretionary - 14.96% |
| |||||||
Amazon.com, Inc.* | 15,800 | 1,327,200 | ||||||
AutoNation, Inc.* | 16,000 | 1,716,800 | ||||||
Booking Holdings, Inc.* | 800 | 1,612,224 | ||||||
Choice Hotels International, Inc. | 13,000 | 1,464,320 | ||||||
Dollar Tree, Inc.* | 8,200 | 1,159,808 | ||||||
Etsy, Inc.* | 8,200 | 982,196 | ||||||
Expedia Group, Inc.* | 16,700 | 1,462,920 | ||||||
Five Below, Inc.* | 8,200 | 1,450,334 | ||||||
Genuine Parts Co. | 7,800 | 1,353,378 | ||||||
H&R Block, Inc.+ | 31,000 | 1,131,810 | ||||||
Penske Automotive Group, Inc. | 8,100 | 930,933 | ||||||
Tapestry, Inc. | 45,000 | 1,713,600 | ||||||
Tesla, Inc.* | 9,900 | 1,219,482 | ||||||
Ulta Beauty, Inc.* | 4,300 | 2,017,001 | ||||||
Whirlpool Corp. | 8,500 | 1,202,410 | ||||||
|
| |||||||
| 20,744,416 | ||||||||
Consumer Staples - 2.56% |
| |||||||
Albertsons Cos., Inc., Class A | 48,600 | 1,007,964 | ||||||
BJ’s Wholesale Club Holdings, Inc.* | 20,800 | 1,376,128 | ||||||
Tyson Foods, Inc., Class A | 18,800 | 1,170,300 | ||||||
|
| |||||||
| 3,554,392 | ||||||||
Energy - 10.82% |
| |||||||
APA Corp. | 42,000 | 1,960,560 | ||||||
Cheniere Energy, Inc. | 22,600 | 3,389,096 | ||||||
Chesapeake Energy Corp.+ | 17,300 | 1,632,601 | ||||||
HF Sinclair Corp. | 23,000 | 1,193,470 | ||||||
Marathon Petroleum Corp. | 13,000 | 1,513,070 | ||||||
Occidental Petroleum Corp. | 30,300 | 1,908,597 | ||||||
Texas Pacific Land Corp.+ | 800 | 1,875,384 | ||||||
Valero Energy Corp. | 12,000 | 1,522,320 | ||||||
|
| |||||||
| 14,995,098 | ||||||||
| Industry Company | Shares | Value | ||||||
Financials - 12.90% | ||||||||
Blackstone, Inc. | 6,400 | $ | 474,816 | |||||
Citigroup, Inc. | 30,000 | 1,356,900 | ||||||
Everest Re Group, Ltd. | 5,100 | 1,689,477 | ||||||
Jefferies Financial Group, Inc. | 42,000 | 1,439,760 | ||||||
JPMorgan Chase & Co. | 16,800 | 2,252,880 | ||||||
LPL Financial Holdings, Inc. | 8,700 | 1,880,679 | ||||||
MetLife, Inc. | 21,400 | 1,548,718 | ||||||
Morningstar, Inc. | 6,300 | 1,364,517 | ||||||
Royal Bank of Canada | 15,000 | 1,410,300 | ||||||
Synchrony Financial | 62,300 | 2,047,178 | ||||||
UBS Group AG | 130,000 | 2,427,100 | ||||||
|
| |||||||
| 17,892,325 | ||||||||
Health Care - 15.75% |
| |||||||
Amgen, Inc. | 12,000 | 3,151,680 | ||||||
Bio-Techne Corp. | 16,000 | 1,326,080 | ||||||
Cigna Corp. | 7,000 | 2,319,380 | ||||||
Halozyme Therapeutics, Inc.* | 33,400 | 1,900,460 | ||||||
Hologic, Inc.* | 29,100 | 2,176,971 | ||||||
IDEXX Laboratories, Inc.* | 4,000 | 1,631,840 | ||||||
McKesson Corp. | 4,200 | 1,575,504 | ||||||
Mettler-Toledo International, Inc.* | 1,300 | 1,879,085 | ||||||
Sarepta Therapeutics, Inc.* | 12,300 | 1,593,834 | ||||||
UnitedHealth Group, Inc. | 5,500 | 2,915,990 | ||||||
Veeva Systems, Inc., Class A* | 8,500 | 1,371,730 | ||||||
|
| |||||||
| 21,842,554 | ||||||||
Industrials - 8.84% |
| |||||||
Advanced Drainage Systems, Inc. | 10,800 | 885,276 | ||||||
Avis Budget Group, Inc.* | 8,900 | 1,458,977 | ||||||
Builders FirstSource, Inc.* | 23,000 | 1,492,240 | ||||||
Carlisle Cos., Inc. | 5,500 | 1,296,075 | ||||||
Owens Corning | 19,000 | 1,620,700 | ||||||
Rollins, Inc. | 35,850 | 1,309,959 | ||||||
Valmont Industries, Inc. | 2,000 | 661,340 | ||||||
WillScot Mobile Mini Holdings Corp.* | 41,500 | 1,874,555 | ||||||
WW Grainger, Inc. | 2,600 | 1,446,250 | ||||||
ZIM Integrated Shipping Services, Ltd.+ | 12,400 | 213,156 | ||||||
|
| |||||||
| 12,258,528 | ||||||||
Information Technology - 24.08% |
| |||||||
Adobe, Inc.* | 5,500 | 1,850,915 | ||||||
| bridgewayfunds.com | 7 | |
Aggressive Investors 1 Fund SCHEDULE OF INVESTMENTS (Unaudited) (continued) |
|
Showing percentage of net assets as of December 31, 2022
| Industry Company | Shares | Value | ||||||
Common Stocks (continued) |
| |||||||
Information Technology (continued) |
| |||||||
Advanced Micro Devices, Inc.* | 20,900 | $ | 1,353,693 | |||||
Apple, Inc. | 31,000 | 4,027,830 | ||||||
Arista Networks, Inc.* | 11,300 | 1,371,255 | ||||||
Automatic Data Processing, Inc. | 9,000 | 2,149,740 | ||||||
Cadence Design Systems, Inc.* | 10,000 | 1,606,400 | ||||||
Check Point Software Technologies, Ltd.* | 13,000 | 1,640,080 | ||||||
Dolby Laboratories, Inc., Class A | 20,000 | 1,410,800 | ||||||
Dropbox, Inc., Class A* | 63,800 | 1,427,844 | ||||||
Enphase Energy, Inc.* | 5,700 | 1,510,272 | ||||||
Fortinet, Inc.* | 25,500 | 1,246,695 | ||||||
Genpact, Ltd. | 31,000 | 1,435,920 | ||||||
HP, Inc. | 55,000 | 1,477,850 | ||||||
Mastercard, Inc., Class A | 5,000 | 1,738,650 | ||||||
Microsoft Corp. | 16,300 | 3,909,066 | ||||||
NetApp, Inc. | 21,100 | 1,267,266 | ||||||
Palo Alto Networks, Inc.* | 8,100 | 1,130,274 | ||||||
QUALCOMM, Inc. | 11,400 | 1,253,316 | ||||||
VeriSign, Inc.* | 7,700 | 1,581,888 | ||||||
|
| |||||||
| 33,389,754 | ||||||||
Materials - 5.51% |
| |||||||
Nucor Corp. | 16,000 | 2,108,960 | ||||||
Olin Corp. | 34,000 | 1,799,960 | ||||||
Steel Dynamics, Inc. | 20,100 | 1,963,770 | ||||||
West Fraser Timber Co., Ltd.+ | 24,400 | 1,763,876 | ||||||
|
| |||||||
| 7,636,566 | ||||||||
|
| |||||||
TOTAL COMMON STOCKS - 99.49% |
| 137,951,549 | ||||||
|
| |||||||
(Cost $140,112,021) | ||||||||
| Rate^ | Shares | Value | ||||||||||
| MONEY MARKET FUND - 0.28% |
| |||||||||||
Fidelity Investments Money Market Government Portfolio Class I | 4.06% | 389,056 | 389,056 | |||||||||
|
| |||||||||||
TOTAL MONEY MARKET FUND - 0.28% (Cost $389,056) |
| 389,056 | ||||||||||
|
| |||||||||||
| Rate^ | Shares | Value | ||||||||||
| INVESTMENTS PURCHASED WITH CASH PROCEEDS FROM SECURITIES LENDING - 1.28% |
| |||||||||||
Dreyfus Institutional Preferred Government Plus Money Market Fund** | 4.36 | % | 1,774,661 | $ | 1,774,661 | |||||||
|
| |||||||||||
TOTAL INVESTMENTS PURCHASED WITH CASH PROCEEDS FROM SECURITIES LENDING - 1.28% |
| 1,774,661 | ||||||||||
|
| |||||||||||
(Cost $1,774,661) |
| |||||||||||
TOTAL INVESTMENTS - 101.05% |
| $ | 140,115,266 | |||||||||
(Cost $142,275,738) |
| |||||||||||
Liabilities in Excess of Other Assets - (1.05%) |
| (1,454,749) | ||||||||||
|
| |||||||||||
NET ASSETS - 100.00% |
| $ | 138,660,517 | |||||||||
|
| |||||||||||
| * | Non-income producing security. |
| ** | This security represents the investment of the cash collateral received in connection with securities out on loan as of December 31, 2022. |
| ^ | Rate disclosed as of December 31, 2022. |
| + | This security or a portion of the security is out on loan as of December 31, 2022. Total loaned securities had a value of $5,508,222 as of December 31, 2022. See Note 2 for disclosure of cash and non-cash collateral. |
| 8 | Semi-Annual Report | December 31, 2022 (Unaudited) | |
Aggressive Investors 1 Fund SCHEDULE OF INVESTMENTS (Unaudited) (continued) |
|
Summary of inputs used to value the Fund’s investments as of 12/31/2022 (See Note 2 in Notes to Financial Statements):
| Valuation Inputs | ||||||||||||||||
| ||||||||||||||||
| Investment in Securities (Value) | ||||||||||||||||
| ||||||||||||||||
Level 1 Prices | Level 2 Significant Observable Inputs | Level 3 Significant Unobservable Inputs | Total | |||||||||||||
| ||||||||||||||||
Common Stocks (a) | $ | 137,951,549 | $– | $– | $ | 137,951,549 | ||||||||||
Money Market Fund | 389,056 | – | – | 389,056 | ||||||||||||
Investments Purchased With Cash Proceeds From Securities Lending | 1,774,661 | – | – | 1,774,661 | ||||||||||||
|
|
|
|
|
|
|
| |||||||||
TOTAL | $ | 140,115,266 | $– | $– | $ | 140,115,266 | ||||||||||
|
|
|
|
|
|
|
| |||||||||
| (a) | - Please refer to the Schedule of Investments for the industry classifications of these portfolio holdings. |
See Notes to Financial Statements.
| bridgewayfunds.com | 9 | |
December 31, 2022
Dear Fellow Ultra-Small Company Fund Shareholder,
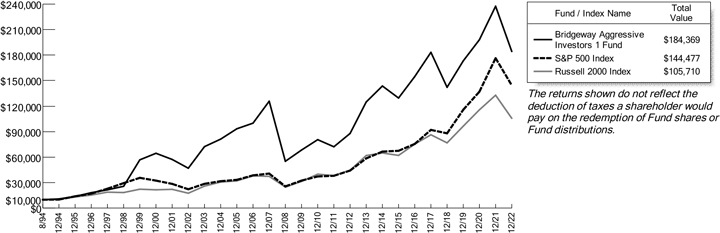
For the quarter ended December 31, 2022, our Fund returned +10.14%, outperforming our primary market benchmark, the Russell Microcap Index (+4.72%), the CRSP Cap-Based Portfolio 10 Index (+0.53%), and the Russell 2000 Index (+6.23%). It was a good quarter.
For the calendar year, our Fund returned -10.72%, outperforming the Russell Microcap Index (-21.96%), the CRSP Cap-Based Portfolio 10 Index (-25.05%), and the Russell 2000 Index (-20.44%).
The table below presents our December quarter, six months, one-year, five-year, 10-year, 15-year, and inception-to-date financial results.
Standardized Returns as of December 31, 2022
| ||||||||||||||||||||||||||||
Annualized | ||||||||||||||||||||||||||||
Quarter
| 6 Months
| 1 Year
| 5 Years
| 10 Years
| 15 Years
| Since
| ||||||||||||||||||||||
Ultra-Small Company Fund | 10.14% | 3.45% | -10.72% | 7.62% | 8.31% | 5.82% | 12.54% | |||||||||||||||||||||
| Russell Microcap Index | 4.72% | 4.22% | -21.96% | 3.69% | 8.86% | 6.34% | N/A | |||||||||||||||||||||
| CRSP Cap-Based Portfolio 10 Index | 0.53% | -2.11% | -25.05% | 4.95% | 9.18% | 7.78% | 10.87% | |||||||||||||||||||||
| Russell 2000 Index | 6.23% | 3.91% | -20.44% | 4.13% | 9.01% | 7.16% | 8.63% | |||||||||||||||||||||
Performance figures quoted in the table above represent past performance and are no guarantee of future results. Total return figures in the table above include the reinvestment of dividends and capital gains. The table above does not reflect the deduction of taxes that a shareholder would pay on Fund distributions or on the redemption of Fund shares.
The Russell Microcap Index measures the performance of the microcap segment of the US equity market. Microcap stocks make up less than 3% of the US equity market (by market cap) and consist of the smallest 1,000 securities in the small-cap Russell 2000® Index, plus the next 1,000 smallest eligible securities by market cap. The Russell Microcap Index is constructed to provide a comprehensive and unbiased barometer for the microcap segment trading on national exchanges. The Index is completely reconstituted annually to ensure new and growing equities are reflected and companies continue to reflect appropriate capitalization and value characteristics. The Russell 2000 Index is an unmanaged, market value weighted index that measures performance of the 2,000 companies that are between the 1,000th and 3,000th largest in the market (with dividends reinvested). The CRSP Cap-Based Portfolio 10 Index is an unmanaged index of 769 of the smallest publicly traded US stocks (with dividends reinvested), as reported by the Center for Research on Security Prices. It is not possible to invest directly in an index. Periods longer than one year are annualized.
| 10 | Semi-Annual Report | December 31, 2022 (Unaudited) | |
Ultra-Small Company Fund MANAGER’S COMMENTARY (Unaudited) (continued) |
|
Growth of a $10,000 Investment
from Inception August 5, 1994 to December 31, 2022
| * | The Russell Microcap Index began on 6/30/2000, and the line graph for the Index begins at the same value as the Fund on that date. |
Detailed Explanation of Quarterly Performance
The Fund’s quality and value model categories outperformed the benchmark during the quarter, boosting relative returns. However, the Fund’s sentiment model category lagged the benchmark and offset some of this positive impact. The Fund’s tilt toward deeper value stocks across multiple valuation metrics improved relative results during the quarter. In contrast, the Fund’s tilt toward the smallest stocks in the US stock market (CRSP 9 and CRSP 10 universes) detracted from relative performance. During the quarter, the Fund held approximately 96% of its assets, on average, in CRSP 9 and CRSP 10, versus approximately 33% for the benchmark.
From a sector perspective, the Fund’s allocation effect was positive, largely driven by overweightings in the Energy, Materials, and Health Care sectors. The Fund’s stock selection effect was strongly positive. Holdings in the Health Care, Financials, and Information Technology sectors added the most to relative performance.
| bridgewayfunds.com | 11 | |
Ultra-Small Company Fund MANAGER’S COMMENTARY (Unaudited) (continued) |
|
The table below presents index performance numbers for stocks in the different CRSP deciles during various time periods.
Annualized | ||||||||||||||
| CRSP Decile1 | Quarter | 6 Months | 1 Year | 5 Years | 10 Years | 97 Years | ||||||||
1 (ultra-large) | 6.15% | 1.48% | -20.26% | 9.71% | 12.76% | 9.46% | ||||||||
2 | 8.62% | 6.11% | -16.21% | 8.66% | 12.44% | 10.52% | ||||||||
| 3 | 7.73% | 4.81% | -19.57% | 5.91% | 10.78% | 10.85% | |||||||
4 | 6.88% | 4.01% | -18.46% | 4.76% | 9.46% | 10.63% | ||||||||
5 | 8.27% | 3.82% | -17.66% | 5.09% | 8.93% | 11.10% | ||||||||
6 | 6.04% | 4.82% | -23.16% | 4.38% | 9.28% | 11.08% | ||||||||
7 | 5.53% | 4.74% | -20.88% | 6.90% | 11.25% | 11.44% | ||||||||
8 | 1.36% | 0.44% | -28.06% | 0.15% | 6.63% | 10.92% | ||||||||
9 | 4.36% | 2.73% | -23.54% | 6.46% | 10.65% | 11.29% | ||||||||
10 (ultra-small) | 0.53% | -2.11% | -25.05% | 4.95% | 9.18% | 12.88% | ||||||||
| 1 | Performance figures are as of the period ended December 31, 2022. The CRSP Cap-Based Portfolio Indexes are unmanaged indexes of publicly traded US stocks with dividends reinvested, grouped by market capitalization, as reported by the Center for Research in Security Prices. Past performance is no guarantee of future results. |
Detailed Explanation of Calendar Year Performance
The Fund’s quality and value model categories outperformed the benchmark during the year, adding to relative results. Under-performance by the Fund’s sentiment model offset some of this positive impact. The Fund’s tilt toward deeper value stocks across multiple valuation metrics improved relative performance. In contrast, the Fund’s tilt toward the smallest stocks in the US stock market (CRSP 9 and CRSP 10 universes) detracted from relative results. During the year, the Fund held approximately 96% of its assets, on average, in CRSP 9 and 10, versus approximately 38% for the benchmark.
From a sector perspective, the Fund’s allocation effect was positive. An overweighting in the Energy sector and an underweighting in the Health Care sector contributed the most to relative results. The Fund’s stock selection effect was strongly positive, largely driven by holdings in the Industrials, Energy, Information Technology, and Health Care sectors.
Top Ten Holdings as of December 31, 2022
Rank
| Description
| Industry
| % of Net
| |||||||
1 | Harrow Health, Inc. | Health Care | 4.1% | |||||||
2 | Tactile Systems Technology, Inc. | Health Care | 3.1% | |||||||
3 | Assertio Holdings, Inc. | Health Care | 3.1% | |||||||
4 | Hallador Energy Co. | Energy | 2.3% | |||||||
5 | Hudson Technologies, Inc. | Industrials | 2.2% | |||||||
6 | ARC Document Solutions, Inc. | Industrials | 2.1% | |||||||
7 | inTEST Corp. | Information Technology | 2.0% | |||||||
8 | Agenus, Inc. | Health Care | 1.8% | |||||||
9 | Gold Resource Corp. | Materials | 1.8% | |||||||
10
| Richardson Electronics, Ltd.
| Information Technology
| 1.7%
| |||||||
| Total | 24.2% | |||||||||
| 12 | Semi-Annual Report | December 31, 2022 (Unaudited) | |
Ultra-Small Company Fund MANAGER’S COMMENTARY (Unaudited) (continued) |
|
Industry Sector Representation as of December 31, 2022
% of Net Assets
| % of Russell
| Difference
| ||||||
Communication Services | 3.5% | 2.5% | 1.0% | |||||
Consumer Discretionary | 10.4% | 9.2% | 1.2% | |||||
Consumer Staples | 1.7% | 2.0% | -0.3% | |||||
Energy | 8.4% | 6.6% | 1.8% | |||||
Financials | 13.0% | 21.3% | -8.3% | |||||
Health Care | 34.7% | 29.6% | 5.1% | |||||
Industrials | 10.6% | 10.5% | 0.1% | |||||
Information Technology | 10.2% | 10.8% | -0.6% | |||||
Materials | 7.0% | 3.4% | 3.6% | |||||
Real Estate | 0.7% | 3.3% | -2.6% | |||||
Utilities | 0.0% | 0.8% | -0.8% | |||||
Liabilities in Excess of Other Assets | -0.2% | 0.0% | -0.2% | |||||
Total | 100.0% | 100.0% | ||||||
Important Disclosure
The views expressed here are exclusively those of Fund management. These views, including those related to market sectors or individual stocks, are not meant as investment advice and should not be considered predictive in nature. Any favorable (or unfavorable) description of a holding applies only as of the quarter end, December 31, 2022, unless otherwise stated. Security positions can and do change thereafter. Discussions of historical performance do not guarantee and may not be indicative of future performance.
The Fund is subject to very high, above market risk (volatility) and is not an appropriate investment for short-term investors. Investments in ultra-small companies generally carry greater risk than is customarily associated with larger companies and even “small companies” for various reasons, such as narrower markets (fewer investors), limited financial resources and greater trading difficulty.
Conclusion
Ultra-Small Company Fund remains closed to new investors. We encourage your feedback; your reactions and concerns are important to us.
Sincerely,
The Investment Management Team
| bridgewayfunds.com | 13 | |
Showing percentage of net assets as of December 31, 2022
| Industry Company | Shares | Value | ||||||
COMMON STOCKS - 100.19% |
| |||||||
Communication Services - 3.48% |
| |||||||
Cumulus Media, Inc., Class A* | 188,995 | $ | 1,173,659 | |||||
DallasNews Corp. | 998 | 3,832 | ||||||
Direct Digital Holdings, Inc., Class A* | 3,900 | 9,555 | ||||||
Harte Hanks, Inc.* | 15,446 | 180,564 | ||||||
Salem Media Group, Inc.* | 526,376 | 552,695 | ||||||
SPAR Group, Inc.* | 120,200 | 157,462 | ||||||
Spok Holdings, Inc. | 10,200 | 83,538 | ||||||
SurgePays, Inc.*+ | 11,956 | 78,431 | ||||||
Townsquare Media, Inc., Class A* | 53,600 | 388,600 | ||||||
TrueCar, Inc.* | 37,800 | 94,878 | ||||||
Zedge, Inc., Class B* | 16,700 | 29,392 | ||||||
|
| |||||||
| 2,752,606 | ||||||||
Consumer Discretionary - 10.38% |
| |||||||
AMCON Distributing Co. | 2,380 | 430,780 | ||||||
American Outdoor Brands, Inc.* | 8,400 | 84,168 | ||||||
Barnes & Noble Education, Inc.* | 16,000 | 28,000 | ||||||
Bassett Furniture Industries, Inc. | 13,287 | 230,928 | ||||||
Betterware de Mexico SAPI de CV.+ | 4,600 | 29,532 | ||||||
Brilliant Earth Group, Inc., Class A*+ | 93,300 | 402,123 | ||||||
Cato Corp. (The), Class A | 9,700 | 90,501 | ||||||
Charles & Colvard, Ltd.* | 76,185 | 62,091 | ||||||
China Automotive Systems, Inc.* | 14,200 | 82,360 | ||||||
Conn’s, Inc.* | 113,500 | 780,880 | ||||||
Crown Crafts, Inc. | 41,600 | 222,144 | ||||||
Delta Apparel, Inc.* | 15,590 | 165,410 | ||||||
Dixie Group, Inc. (The)* | 25,600 | 20,506 | ||||||
Educational Development Corp. | 55,700 | 176,012 | ||||||
Envela Corp.* | 10,000 | 52,600 | ||||||
GAN, Ltd.* | 46,500 | 69,750 | ||||||
J Jill, Inc.* | 11,452 | 284,010 | ||||||
JAKKS Pacific, Inc.* | 34,625 | 605,591 | ||||||
Jerash Holdings US, Inc. | 24,900 | 96,612 | ||||||
Kandi Technologies Group, Inc.* | 197,572 | 454,416 | ||||||
Lakeland Industries, Inc.* | 15,300 | 203,490 | ||||||
Lincoln Educational Services Corp.* | 124,464 | 720,646 | ||||||
Live Ventures, Inc.* | 15,002 | 469,563 | ||||||
PlayAGS, Inc.* | 44,900 | 228,990 | ||||||
Potbelly Corp.* | 22,000 | 122,540 | ||||||
| Industry Company | Shares | Value | ||||||
Consumer Discretionary (continued) |
| |||||||
Red Robin Gourmet Burgers, Inc.* | 27,200 | $ | 151,776 | |||||
Spruce Power Holding Corp.* | 163,100 | 149,905 | ||||||
ThredUp, Inc., Class A* | 215,400 | 282,174 | ||||||
Tilly’s, Inc., Class A*+ | 136,500 | 1,235,325 | ||||||
Vince Holding Corp.*+ | 26,200 | 205,146 | ||||||
Weyco Group, Inc. | 2,515 | 53,217 | ||||||
XWELL, Inc.* | 16,700 | 6,060 | ||||||
|
| |||||||
| 8,197,246 | ||||||||
Consumer Staples - 1.74% |
| |||||||
Farmer Bros Co.* | 29,200 | 134,612 | ||||||
Lifeway Foods, Inc.*+ | 48,059 | 266,728 | ||||||
Mannatech, Inc. | 23,388 | 418,645 | ||||||
Natural Alternatives International, Inc.* | 50,300 | 422,017 | ||||||
Natural Grocers by Vitamin Cottage, Inc. | 4,500 | 41,130 | ||||||
Natural Health Trends Corp. | 7,600 | 25,840 | ||||||
Oil-Dri Corp. of America | 1,900 | 63,726 | ||||||
|
| |||||||
| 1,372,698 | ||||||||
Energy - 8.39% |
| |||||||
Adams Resources & Energy, Inc. | 4,600 | 179,032 | ||||||
American Resources Corp.* | 544,795 | 719,130 | ||||||
Ardmore Shipping Corp.* | 45,300 | 652,773 | ||||||
Barnwell Industries, Inc. | 80,030 | 236,601 | ||||||
Energy Services of America Corp.* | 15,000 | 38,850 | ||||||
ENGlobal Corp.* | 7,700 | 5,930 | ||||||
Epsilon Energy, Ltd. | 35,056 | 232,421 | ||||||
Evolution Petroleum Corp. | 69,917 | 527,873 | ||||||
Forum Energy Technologies, Inc.* | 2,300 | 67,850 | ||||||
Hallador Energy Co.*+ | 185,295 | 1,851,097 | ||||||
Mammoth Energy Services, Inc.* | 54,500 | 471,425 | ||||||
Mexco Energy Corp.* | 5,768 | 71,985 | ||||||
NACCO Industries, Inc., Class A | 26,913 | 1,022,694 | ||||||
Natural Gas Services Group, Inc.* | 11,116 | 127,389 | ||||||
NCS Multistage Holdings, Inc.* | 700 | 17,500 | ||||||
North American Construction Group, Ltd. | 1,703 | 22,769 | ||||||
PEDEVCO Corp.* | 51,417 | 56,559 | ||||||
| 14 | Semi-Annual Report | December 31, 2022 (Unaudited) | |
Ultra-Small Company Fund SCHEDULE OF INVESTMENTS (Unaudited) (continued) |
|
Showing percentage of net assets as of December 31, 2022
| Industry Company | Shares | Value | ||||||
Common Stocks (continued) |
| |||||||
Energy (continued) |
| |||||||
PHX Minerals, Inc. | 46,680 | $ | 181,585 | |||||
Smart Sand, Inc.* | 78,518 | 140,547 | ||||||
|
| |||||||
| 6,624,010 | ||||||||
Financials - 13.01% |
| |||||||
Acacia Research Corp.* | 84,500 | 355,745 | ||||||
ACNB Corp. | 3,900 | 155,259 | ||||||
AmeriServ Financial, Inc. | 15,000 | 58,950 | ||||||
Ames National Corp. | 1,800 | 42,498 | ||||||
Atlantic American Corp.+ | 81,700 | 188,727 | ||||||
Bank7 Corp. | 3,540 | 90,624 | ||||||
Blue Foundry Bancorp*+ | 13,800 | 177,330 | ||||||
C&F Financial Corp. | 3,000 | 174,810 | ||||||
CF Bankshares, Inc. | 4,800 | 101,664 | ||||||
Chemung Financial Corp. | 1,200 | 55,044 | ||||||
Citizens & Northern Corp. | 2,800 | 64,008 | ||||||
Citizens Community Bancorp, Inc. | 43,900 | 528,117 | ||||||
Citizens Financial Services, Inc.+ | 100 | 7,656 | ||||||
Citizens, Inc.* | 7,831 | 16,680 | ||||||
Codorus Valley Bancorp, Inc. | 2,000 | 47,600 | ||||||
Community Financial Corp. (The) | 1,200 | 47,880 | ||||||
Community West Bancshares | 5,000 | 74,850 | ||||||
Consumer Portfolio Services, Inc.*+ | 115,598 | 1,023,042 | ||||||
Curo Group Holdings Corp. | 7,600 | 26,980 | ||||||
Eagle Bancorp Montana, Inc. | 2,700 | 43,632 | ||||||
Elevate Credit, Inc.* | 607,000 | 1,062,250 | ||||||
ESSA Bancorp, Inc. | 1,476 | 30,804 | ||||||
Evans Bancorp, Inc. | 2,900 | 108,431 | ||||||
First Bank | 48 | 661 | ||||||
First United Corp. | 3,117 | 61,249 | ||||||
FS Bancorp, Inc. | 2,900 | 96,976 | ||||||
Greenhill & Co., Inc. | 22,800 | 233,700 | ||||||
Guild Holdings Co., Class A* | 4,300 | 43,387 | ||||||
Investcorp Credit Management BDC, Inc. | 23,898 | 84,599 | ||||||
Kingstone Cos., Inc. | 16,200 | 21,870 | ||||||
LCNB Corp. | 8,785 | 158,130 | ||||||
loanDepot, Inc., Class A | 40,100 | 66,165 | ||||||
Logan Ridge Finance Corp.* | 20,483 | 462,506 | ||||||
MainStreet Bancshares, Inc. | 4,200 | 115,458 | ||||||
| Industry Company | Shares | Value | ||||||
Financials (continued) | ||||||||
Manhattan Bridge Capital, Inc.+ | 15,216 | $ | 82,014 | |||||
Medallion Financial Corp.+ | 163,759 | 1,169,239 | ||||||
Meridian Corp. | 12,270 | 371,658 | ||||||
Middlefield Banc Corp. | 1,600 | 43,840 | ||||||
National Bankshares, Inc. | 300 | 12,090 | ||||||
Nexpoint Real Estate Finance, Inc. | 3,200 | 50,848 | ||||||
Northeast Bank+ | 6,685 | 281,439 | ||||||
Northeast Community Bancorp, Inc.+ | 3,800 | 56,696 | ||||||
Northrim BanCorp, Inc. | 1,400 | 76,398 | ||||||
OP Bancorp | 11,254 | 125,595 | ||||||
Portman Ridge Finance Corp. | 2,100 | 48,300 | ||||||
Security National Financial Corp., Class A* | 174,366 | 1,272,872 | ||||||
Silvercrest Asset Management Group, Inc., Class A | 20,344 | 381,857 | ||||||
Summit Financial Group, Inc. | 3,422 | 85,174 | �� | |||||
SuRo Capital Corp. | 20,000 | 76,000 | ||||||
Timberland Bancorp, Inc. | 2,600 | 88,738 | ||||||
Trean Insurance Group, Inc.* | 9,500 | 57,000 | ||||||
US Global Investors, Inc., Class A | 3,753 | 10,846 | ||||||
Western Asset Mortgage Capital Corp. | 12,600 | 114,786 | ||||||
Western New England Bancorp, Inc. | 4,400 | 41,624 | ||||||
|
| |||||||
| 10,274,296 | ||||||||
Health Care - 34.73% |
| |||||||
Accuray, Inc.* | 50,900 | 106,381 | ||||||
Acumen Pharmaceuticals, Inc.* | 2,800 | 15,120 | ||||||
Agenus, Inc.* | 600,300 | 1,440,720 | ||||||
Alimera Sciences, Inc.* | 18,300 | 49,593 | ||||||
American Shared Hospital Services* | 209,067 | 612,566 | ||||||
Anixa Biosciences, Inc.* | 21,000 | 89,250 | ||||||
Apollo Endosurgery, Inc.* | 90,800 | 905,276 | ||||||
ARCA biopharma, Inc.* | 46,948 | 110,797 | ||||||
ARS Pharmaceuticals, Inc.*+ | 13,644 | 116,383 | ||||||
Assembly Biosciences, Inc.* | 14,200 | 18,460 | ||||||
Assertio Holdings, Inc.*+ | 561,400 | 2,414,020 | ||||||
Athira Pharma, Inc.* | 106,200 | 336,654 | ||||||
| bridgewayfunds.com | 15 | |
Ultra-Small Company Fund SCHEDULE OF INVESTMENTS (Unaudited) (continued) |
|
Showing percentage of net assets as of December 31, 2022
| Industry Company | Shares | Value | ||||||
Common Stocks (continued) |
| |||||||
Health Care (continued) |
| |||||||
AVEO Pharmaceuticals, Inc.* | 53,000 | $ | 792,350 | |||||
Avita Medical, Inc.* | 28,518 | 188,219 | ||||||
Biocept, Inc.* | 109,436 | 58,001 | ||||||
Cabaletta Bio, Inc.*+ | 63,621 | 588,494 | ||||||
CareCloud, Inc.* | 211,251 | 593,615 | ||||||
Clearside Biomedical, Inc.* | 104,000 | 116,480 | ||||||
Clene, Inc.*+ | 100,774 | 100,774 | ||||||
Co.-Diagnostics, Inc.*+ | 305,500 | 769,860 | ||||||
Context Therapeutics, LLC* | 105,809 | 69,887 | ||||||
CorMedix, Inc.*+ | 29,300 | 123,646 | ||||||
Cumberland Pharmaceuticals, Inc.*# | 233,068 | 524,403 | ||||||
CVRx, Inc.* | 8,700 | 159,645 | ||||||
Cyclacel Pharmaceuticals, Inc.* | 64,068 | 42,733 | ||||||
Diffusion Pharmaceuticals, Inc.* | 16,565 | 84,482 | ||||||
Dominari Holdings, Inc.*+ | 20,500 | 66,625 | ||||||
Dyne Therapeutics, Inc.* | 10,400 | 120,536 | ||||||
Electromed, Inc.* | 79,338 | 832,256 | ||||||
Enzo Biochem, Inc.* | 168,600 | 241,098 | ||||||
Eton Pharmaceuticals, Inc.*+ | 190,562 | 533,574 | ||||||
Exagen, Inc.*+ | 6,500 | 15,600 | ||||||
Eyenovia, Inc.* | 47,900 | 78,077 | ||||||
Fennec Pharmaceuticals, Inc.* | 34,200 | 328,320 | ||||||
FONAR Corp.* | 47,300 | 792,275 | ||||||
Forte Biosciences, Inc.* | 36,865 | 36,865 | ||||||
Harrow Health, Inc.* | 221,400 | 3,267,864 | ||||||
Harvard Bioscience, Inc.* | 139,383 | 386,091 | ||||||
Icosavax, Inc.* | 8,052 | 63,933 | ||||||
IMARA, Inc.* | 27,900 | 114,111 | ||||||
IRIDEX Corp.* | 251,900 | 506,319 | ||||||
Kewaunee Scientific Corp.* | 16,900 | 262,795 | ||||||
Kronos Bio, Inc.* | 7,610 | 12,328 | ||||||
Lineage Cell Therapeutics, Inc.*+ | 324,200 | 379,314 | ||||||
Lipocine, Inc.* | 425,664 | 163,455 | ||||||
MaxCyte, Inc.* | 101,200 | 552,552 | ||||||
Milestone Scientific, Inc.* | 243,700 | 116,976 | ||||||
Myomo, Inc.* | 83,910 | 42,912 | ||||||
Neuronetics, Inc.* | 55,951 | 384,383 | ||||||
NextCure, Inc.* | 39,900 | 56,259 | ||||||
Olema Pharmaceuticals, Inc.* | 41,887 | 102,623 | ||||||
Omeros Corp.* | 12,600 | 28,476 | ||||||
Ovid therapeutics, Inc.* | 315,100 | 586,086 | ||||||
Passage Bio, Inc.* | 249,500 | 344,310 | ||||||
| Industry Company | Shares | Value | ||||||
Health Care (continued) | ||||||||
Pieris Pharmaceuticals, Inc.* | 116,500 | $ | 121,160 | |||||
Pro-Dex, Inc.* | 1,700 | 26,605 | ||||||
ProPhase Labs, Inc.+ | 51,888 | 499,681 | ||||||
Protara Therapeutics, Inc.* | 24,800 | 66,464 | ||||||
Pulmatrix, Inc.* | 9,700 | 37,636 | ||||||
Retractable Technologies, Inc.* | 66,434 | 108,958 | ||||||
RVL Pharmaceuticals PLC* | 31,500 | 35,280 | ||||||
scPharmaceuticals, Inc.*+ | 85,000 | 609,450 | ||||||
SeaSpine Holdings Corp.* | 39,500 | 329,825 | ||||||
Sensus Healthcare, Inc.* | 23,100 | 171,402 | ||||||
Singular Genomics Systems, Inc.* | 11,900 | 23,919 | ||||||
Societal CDMO, Inc.* | 249,600 | 371,904 | ||||||
Stereotaxis, Inc.* | 66,200 | 137,034 | ||||||
SunLink Health Systems, Inc.* | 192,800 | 117,608 | ||||||
Sunshine Biopharma, Inc.* | 286,100 | 183,104 | ||||||
Tactile Systems Technology, Inc.* | 212,666 | 2,441,406 | ||||||
Talaris Therapeutics, Inc.*+ | 34,400 | 35,088 | ||||||
TCR2 Therapeutics, Inc.* | 33,410 | 33,370 | ||||||
Tela Bio, Inc.* | 5,000 | 57,500 | ||||||
Terns Pharmaceuticals, Inc.* | 23,200 | 236,176 | ||||||
Theriva Biologics, Inc.* | 16,128 | 7,335 | ||||||
vTv Therapeutics, Inc., Class A* | 27,018 | 17,627 | ||||||
XBiotech, Inc.* | 41,300 | 144,963 | ||||||
Xilio Therapeutics, Inc.* | 34,400 | 92,536 | ||||||
XOMA Corp.* | 200 | 3,680 | ||||||
Zynex, Inc.+ | 49,100 | 682,981 | ||||||
|
| |||||||
| 27,436,514 | ||||||||
Industrials - 10.56% |
| |||||||
Acme United Corp. | 27,485 | 601,921 | ||||||
ARC Document Solutions, Inc. | 578,453 | 1,694,867 | ||||||
Avalon Holdings Corp., Class A* | 14,700 | 40,424 | ||||||
BGSF, Inc. | 4,500 | 68,940 | ||||||
Bowman Consulting Group, Ltd.* | 2,700 | 58,995 | ||||||
Broadwind, Inc.* | 10,792 | 19,318 | ||||||
DLH Holdings Corp.* | 100,700 | 1,194,805 | ||||||
Energous Corp.* | 133,200 | 111,355 | ||||||
Graham Corp.* | 4,800 | 46,176 | ||||||
Hudson Global, Inc.* | 11,158 | 252,506 | ||||||
Hudson Technologies, Inc.* | 175,200 | 1,773,024 | ||||||
| 16 | Semi-Annual Report | December 31, 2022 (Unaudited) | |
Ultra-Small Company Fund SCHEDULE OF INVESTMENTS (Unaudited) (continued) |
|
Showing percentage of net assets as of December 31, 2022
| Industry Company | Shares | Value | ||||||
Common Stocks (continued) |
| |||||||
Industrials (continued) |
| |||||||
Innovative Solutions and Support, Inc.* | 6,400 | $ | 52,608 | |||||
LS Starrett Co. (The), Class A* | 31,001 | 228,167 | ||||||
LSI Industries, Inc. | 7,600 | 93,024 | ||||||
Mastech Digital, Inc.* | 17,200 | 189,372 | ||||||
Mistras Group, Inc.* | 99,300 | 489,549 | ||||||
Northwest Pipe Co.* | 2,200 | 74,140 | ||||||
Orion Group Holdings, Inc.* | 23,965 | 57,037 | ||||||
Patriot Transportation Holding, Inc.* | 12,400 | 88,164 | ||||||
Quad/Graphics, Inc.* | 31,300 | 127,704 | ||||||
Quest Resource Holding Corp.* | 9,700 | 59,267 | ||||||
RCM Technologies, Inc.*+ | 33,114 | 408,627 | ||||||
Sunworks, Inc.*+ | 275,373 | 435,089 | ||||||
Virco Mfg. Corp.* | 17,600 | 79,552 | ||||||
Willis Lease Finance | ||||||||
Corp.* | 1,700 | 100,317 | ||||||
|
| |||||||
| 8,344,948 | ||||||||
Information Technology - 10.20% |
| |||||||
AstroNova, Inc.* | 28,300 | 362,806 | ||||||
AudioEye, Inc.* | 663 | 2,519 | ||||||
Aviat Networks, Inc.* | 2,100 | 65,499 | ||||||
Climb Global Solutions, Inc. | 2,500 | 78,825 | ||||||
Coda Octopus Group, Inc.* | 2,900 | 19,894 | ||||||
Computer Task Group, Inc.* | 128,810 | 973,803 | ||||||
CoreCard Corp.*+ | 3,401 | 98,527 | ||||||
Immersion Corp.* | 23,300 | 163,799 | ||||||
Information Services Group, Inc. | 23,548 | 108,321 | ||||||
Inpixon* | 31,900 | 54,230 | ||||||
inTEST Corp.* | 154,734 | 1,593,760 | ||||||
Issuer Direct Corp.* | 1,068 | 26,743 | ||||||
KVH Industries, Inc.* | 10,200 | 104,244 | ||||||
Mind CTI, Ltd. | 5,600 | 11,760 | ||||||
Park City Group, Inc. | 6,427 | 31,814 | ||||||
Paysign, Inc.* | 139,000 | 358,620 | ||||||
PCTEL, Inc. | 196,141 | 843,406 | ||||||
RF Industries, Ltd.* | 29,696 | 151,450 | ||||||
Richardson Electronics, Ltd. | 62,302 | 1,328,902 | ||||||
Schmitt Industries, Inc.* | 61,502 | 18,653 | ||||||
SigmaTron International, Inc.* | 70,800 | 271,872 | ||||||
SilverSun Technologies, Inc.* | 1,900 | 5,624 | ||||||
| Industry Company | Shares | Value | ||||||
Information Technology (continued) |
| |||||||
Synchronoss Technologies, Inc.* | 524,900 | $ | 324,441 | |||||
Taitron Components, Inc., Class A | 68,200 | 234,608 | ||||||
TESSCO Technologies, Inc.* | 49,629 | 239,212 | ||||||
TSR, Inc.*+ | 5,328 | 36,177 | ||||||
Universal Security Instruments, Inc.*+ | 100,600 | 204,218 | ||||||
Wireless Telecom Group, Inc.* | 191,592 | 342,950 | ||||||
|
| |||||||
| 8,056,677 | ||||||||
Materials - 6.96% |
| |||||||
Advanced Emissions Solutions, Inc.* | 306,164 | 743,979 | ||||||
AgroFresh Solutions, Inc.* | 154,592 | 457,592 | ||||||
Ampco-Pittsburgh Corp.* | 58,032 | 145,660 | ||||||
Ascent Industries Co.* | 43,255 | 375,021 | ||||||
Caledonia Mining Corp. PLC | 26,535 | 329,034 | ||||||
Core Molding Technologies, Inc.* | 54,268 | 704,941 | ||||||
Flexible Solutions International, Inc.* | 55,300 | 171,430 | ||||||
Friedman Industries, Inc. | 90,521 | 886,201 | ||||||
Gold Resource Corp. | 936,148 | 1,432,307 | ||||||
Gulf Resources, Inc.* | 81,460 | 251,711 | ||||||
Northern Technologies International Corp. | 252 | 3,354 | ||||||
|
| |||||||
| 5,501,230 | ||||||||
Real Estate - 0.74% |
| |||||||
American Realty Investors, Inc.* | 8,000 | 205,200 | ||||||
AMREP Corp.* | 28,100 | 324,555 | ||||||
Clipper Realty, Inc. | 3,863 | 24,723 | ||||||
Maui Land & Pineapple Co., Inc.* | 3,200 | 30,144 | ||||||
|
| |||||||
| 584,622 | ||||||||
|
| |||||||
TOTAL COMMON STOCKS - 100.19% |
| 79,144,847 | ||||||
|
| |||||||
(Cost $81,906,750) | ||||||||
| bridgewayfunds.com | 17 | |
Ultra-Small Company Fund SCHEDULE OF INVESTMENTS (Unaudited) (continued) |
|
Showing percentage of net assets as of December 31, 2022
| Rate^ | Shares | Value | ||||||||||
| INVESTMENTS PURCHASED WITH CASH PROCEEDS FROM SECURITIES LENDING - 5.90% |
| |||||||||||
Dreyfus Institutional Preferred Government Plus Money Market Fund** | 4.36 | % | 4,657,864 | $ | 4,657,864 | |||||||
|
| |||||||||||
TOTAL INVESTMENTS PURCHASED WITH CASH PROCEEDS FROM SECURITIES LENDING - 5.90% |
| 4,657,864 | ||||||||||
|
| |||||||||||
(Cost $4,657,864) |
| |||||||||||
TOTAL INVESTMENTS - 106.09% |
| $ | 83,802,711 | |||||||||
(Cost $86,564,614) |
| |||||||||||
Liabilities in Excess of Other Assets - (6.09%) |
| (4,808,724 | ) | |||||||||
|
| |||||||||||
NET ASSETS - 100.00% |
| $ | 78,993,987 | |||||||||
|
| |||||||||||
| # | Illiquid security as determined under procedures approved by the Board of Directors. The aggregate value of illiquid securities is $524,403, which is 0.66% of total net assets. |
| * | Non-income producing security. |
| ** | This security represents the investment of the cash collateral received in connection with securities out on loan as of December 31, 2022. |
| ^ | Rate disclosed as of December 31, 2022. |
| + | This security or a portion of the security is out on loan as of December 31, 2022. Total loaned securities had a value of $7,311,481 as of December 31, 2022. See Note 2 for disclosure of cash and non-cash collateral. |
LLC - Limited Liability Company
PLC - Public Limited Company
Summary of inputs used to value the Fund’s investments as of 12/31/2022 (See Note 2 in Notes to Financial Statements):
| Valuation Inputs | ||||||||||||||||
| ||||||||||||||||
| Investment in Securities (Value) | ||||||||||||||||
| ||||||||||||||||
| Level 1 Quoted Prices | Level 2 Significant Observable Inputs | Level 3 Significant Unobservable | Total | |||||||||||||
| ||||||||||||||||
Common Stocks Real Estate | $ | 260,067 | $ | 324,555 | $– | $ | 584,622 | |||||||||
Other Industries (a) | 78,560,225 | – | – | 78,560,225 | ||||||||||||
|
|
|
|
|
|
|
| |||||||||
Total Common Stocks | 78,820,292 | 324,555 | – | 79,144,847 | ||||||||||||
Investments Purchased With Cash Proceeds From Securities Lending | 4,657,864 | – | – | 4,657,864 | ||||||||||||
|
|
|
|
|
|
|
| |||||||||
TOTAL | $ | 83,478,156 | $ | 324,555 | $– | $ | 83,802,711 | |||||||||
|
|
|
|
|
|
|
| |||||||||
| (a) | - Please refer to the Schedule of Investments for the industry classifications of these portfolio holdings. |
See Notes to Financial Statements.
| 18 | Semi-Annual Report | December 31, 2022 (Unaudited) | |
December 31, 2022
Dear Fellow Ultra-Small Company Market Fund Shareholder,
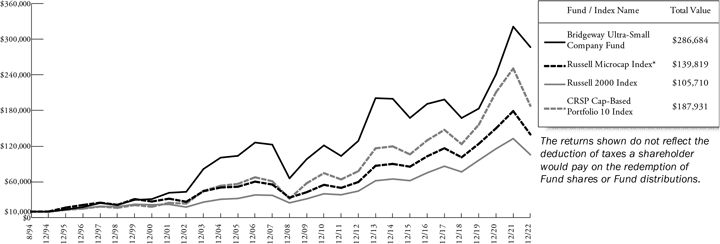
For the quarter ended December 31, 2022, our Fund returned +4.40%, underperforming our primary market benchmark, the Russell Microcap Index (+4.72%). The Fund also underperformed the Russell 2000 Index (+6.23%). The Fund outperformed the CRSP Cap-Based Portfolio 10 Index (+0.53%). It was a poor quarter on a relative basis, but a good one on an absolute basis.
For the calendar year, our Fund returned -23.40%, underperforming the Russell Microcap Index (-21.96%), and the Russell 2000 Index (-20.44%). The Fund outperformed the CRSP Cap-Based Portfolio 10 Index (-25.05%).
The table below presents our December quarter, six months, one-year, five-year, 10-year, 15-year, and inception-to-date financial results.
| Standardized Returns as of December 31, 2022 | ||||||||||||||||||||||||||||
| Annualized | ||||||||||||||||||||||||||||
| Quarter | 6 Months | 1 Year | 5 Years | 10 Years | 15 Years | Since Inception (7/31/97) | ||||||||||||||||||||||
Ultra-Small Company Market Fund | 4.40% | -3.32% | -23.40% | 2.37% | 8.32% | 5.82% | 9.17% | |||||||||||||||||||||
| Russell Microcap Index | 4.72% | 4.22% | -21.96% | 3.69% | 8.86% | 6.34% | N/A | |||||||||||||||||||||
| CRSP Cap-Based Portfolio 10 Index | 0.53% | -2.11% | -25.05% | 4.95% | 9.18% | 7.78% | 9.82% | |||||||||||||||||||||
| Russell 2000 Index | 6.23% | 3.91% | -20.44% | 4.13% | 9.01% | 7.16% | 7.26% | |||||||||||||||||||||
Performance figures quoted in the table above represent past performance and are no guarantee of future results. Total return figures in the table above include the reinvestment of dividends and capital gains. The table above does not reflect the deduction of taxes that a shareholder would pay on Fund distributions or on the redemption of Fund shares.
The Russell Microcap Index measures the performance of the microcap segment of the US equity market. Microcap stocks make up less than 3% of the US equity market (by market cap) and consist of the smallest 1,000 securities in the small-cap Russell 2000® Index, plus the next 1,000 smallest eligible securities by market cap. The Russell Microcap Index is constructed to provide a comprehensive and unbiased barometer for the microcap segment trading on national exchanges. The Index is completely reconstituted annually to ensure new and growing equities are reflected and companies continue to reflect appropriate capitalization and value characteristics. The Russell 2000 Index is an unmanaged, market value weighted index that measures performance of the 2,000 companies that are between the 1,000th and 3,000th largest in the market with dividends reinvested. The CRSP Cap-Based Portfolio 10 Index is an unmanaged index of 769 of the smallest publicly traded US stocks with dividends reinvested, as reported by the Center for Research on Security Prices. It is not possible to invest directly in an index. Periods longer than one year are annualized.
| bridgewayfunds.com | 19 | |
Ultra-Small Company Market Fund MANAGER’S COMMENTARY (Unaudited) (continued) |
|
Growth of a $10,000 Investment
from Inception July 31, 1997 to December 31, 2022
| * | The Russell Microcap Index began on 6/30/2000, and the line graph for the Index begins at the same value as the Fund on that date. |
Detailed Explanation of Quarterly Performance
The Fund’s investment universe focuses on the smallest stocks within the US stock market (CRSP 10 universe). This tilt toward the market’s smallest stocks detracted from relative results, as CRSP 10 stocks underperformed the Russell Microcap Index. On average, the Fund held about 84% of its assets in the CRSP 10 universe, versus 16% for the benchmark during the quarter. In contrast, the Fund’s sidestepping strategies, which eliminate exposure to stocks with high probability of a steep price decline, major financial distress or bankruptcy, helped performance relative to the CRSP 10 universe.
From a sector perspective, the Fund’s stock selection effect was negative. Holdings in the Health Care and Industrials sectors detracted the most from relative performance.
The table below presents index performance numbers for stocks in the different CRSP deciles during various time periods.
| Annualized | ||||||||||||||
| CRSP Decile1 | Quarter | 6 Months | 1 Year | 5 Years | 10 Years | 97 Years | ||||||||
1 (ultra-large) | 6.15% | 1.48% | -20.26% | 9.71% | 12.76% | 9.46% | ||||||||
| 2 | 8.62% | 6.11% | -16.21% | 8.66% | 12.44% | 10.52% | |||||||
3 | 7.73% | 4.81% | -19.57% | 5.91% | 10.78% | 10.85% | ||||||||
4 | 6.88% | 4.01% | -18.46% | 4.76% | 9.46% | 10.63% | ||||||||
5 | 8.27% | 3.82% | -17.66% | 5.09% | 8.93% | 11.10% | ||||||||
6 | 6.04% | 4.82% | -23.16% | 4.38% | 9.28% | 11.08% | ||||||||
7 | 5.53% | 4.74% | -20.88% | 6.90% | 11.25% | 11.44% | ||||||||
8 | 1.36% | 0.44% | -28.06% | 0.15% | 6.63% | 10.92% | ||||||||
9 | 4.36% | 2.73% | -23.54% | 6.46% | 10.65% | 11.29% | ||||||||
10 (ultra-small) | 0.53% | -2.11% | -25.05% | 4.95% | 9.18% | 12.88% | ||||||||
| 1 | Performance figures are as of the period ended December 31, 2022. The CRSP Cap-Based Portfolio Indexes are unmanaged indexes of publicly traded US stocks with dividends reinvested, grouped by market capitalization, as reported by the Center for Research in Security Prices. Past performance is no guarantee of future results. |
| 20 | Semi-Annual Report | December 31, 2022 (Unaudited) | |
Ultra-Small Company Market Fund MANAGER’S COMMENTARY (Unaudited) (continued) |
|
Detailed Explanation of Calendar Year Performance
The Fund’s investment universe focuses on the smallest stocks within the US stock market (CRSP 10 universe). Our tilt toward the market’s smallest stocks detracted from the Fund’s relative performance, as CRSP 10 stocks underperformed the Russell Microcap Index. On average, the Fund held 83% of its assets in CRSP 10 universe during the year, versus 17% for the benchmark. However, the Fund’s sidestepping strategies, which eliminate exposure to stocks with high probability of a steep price decline, major financial distress or bankruptcy, helped performance relative to the CRSP 10 universe.
From a sector perspective, the Fund’s stock selection effect was negative. Holdings in the Health Care and Information Technology sectors detracted the most from relative performance.
Top Ten Holdings as of December 31, 2022
| Rank | Description | Industry | % of Net Assets | |||||||
| 1 | Nine Energy Service, Inc. | Energy | 1.1% | |||||||
| 2 | Willis Lease Finance Corp. | Industrials | 0.7% | |||||||
| 3 | Enerflex, Ltd. | Energy | 0.7% | |||||||
| 4 | 89bio, Inc. | Health Care | 0.6% | |||||||
| 5 | LSI Industries, Inc. | Industrials | 0.6% | |||||||
| 6 | Performant Financial Corp. | Industrials | 0.5% | |||||||
| 7 | Cabaletta Bio, Inc. | Health Care | 0.5% | |||||||
| 8 | Actinium Pharmaceuticals, Inc. | Health Care | 0.5% | |||||||
| 9 | J Jill, Inc. | Consumer Discretionary | 0.5% | |||||||
| 10 | Trean Insurance Group, Inc. | Financials | 0.5% | |||||||
| Total | 6.2% |
Industry Sector Representation as of December 31, 2022
| % of Net Assets | % of Russell Microcap Index | Difference | |||||||||||||
Communication Services | 4.1 | % | 2.5 | % | 1.6 | % | |||||||||
Consumer Discretionary | 12.5 | % | 9.2 | % | 3.3 | % | |||||||||
Consumer Staples | 3.1 | % | 2.0 | % | 1.1 | % | |||||||||
Energy | 8.4 | % | 6.6 | % | 1.8 | % | |||||||||
Financials | 17.7 | % | 21.3 | % | -3.6 | % | |||||||||
Health Care | 28.3 | % | 29.6 | % | -1.3 | % | |||||||||
Industrials | 11.2 | % | 10.5 | % | 0.7 | % | |||||||||
Information Technology | 9.3 | % | 10.8 | % | -1.5 | % | |||||||||
Materials | 3.3 | % | 3.4 | % | -0.1 | % | |||||||||
Real Estate | 1.1 | % | 3.3 | % | -2.2 | % | |||||||||
Utilities | 0.9 | % | 0.8 | % | 0.1 | % | |||||||||
Cash & Other Assets | 0.1 | % | 0.0 | % | 0.1 | % | |||||||||
Total | 100.0 | % | 100.0 | % | |||||||||||
Important Disclosure
The views expressed here are exclusively those of Fund management. These views, including those related to market sectors or individual stocks, are not meant as investment advice and should not be considered predictive in nature. Any favorable (or unfavorable) description of a holding applies only as of the quarter-end, December 31, 2022, unless otherwise stated.
| bridgewayfunds.com | 21 | |
Ultra-Small Company Market Fund MANAGER’S COMMENTARY (Unaudited) (continued) |
|
Security positions can and do change thereafter. Discussions of historical performance do not guarantee and may not be indicative of future performance.
The Fund is subject to very high, above-market risk (volatility) and is not an appropriate investment for short-term investors. Investments in ultra-small companies generally carry greater risk than is customarily associated with larger companies and even “small companies” for various reasons, such as narrower markets (fewer investors), limited financial resources, and greater trading difficulty.
Conclusion
Thank you for your continued investment in Ultra-Small Company Market Fund. We encourage your feedback; your reactions and concerns are important to us.
Sincerely,
The Investment Management Team
| 22 | Semi-Annual Report | December 31, 2022 (Unaudited) | |
Showing percentage of net assets as of December 31, 2022
| Industry Company | Shares | Value | ||||||
COMMON STOCKS - 99.90% |
| |||||||
Communication Services - 4.08% |
| |||||||
Arena Group Holdings, Inc. (The)* | 51,200 | $ | 543,232 | |||||
Beasley Broadcast Group, Inc., Class A* | 49,625 | 45,665 | ||||||
BuzzFeed, Inc.* | 25,000 | 17,240 | ||||||
Cinedigm Corp., Class A* | 400,000 | 155,080 | ||||||
comScore, Inc.* | 284,900 | 330,484 | ||||||
Cumulus Media, Inc., Class A* | 68,100 | 422,901 | ||||||
Emerald Holding, Inc.* | 41,000 | 145,140 | ||||||
EverQuote, Inc., Class A* | 54,500 | 803,330 | ||||||
FG Group Holdings, Inc.* | 75,000 | 196,500 | ||||||
Fluent, Inc.* | 221,100 | 240,999 | ||||||
Gaia, Inc.* | 48,400 | 115,192 | ||||||
Harte Hanks, Inc.* | 20,000 | 233,800 | ||||||
IDW Media Holdings, Inc., Class B* | 35,500 | 33,370 | ||||||
KORE Group Holdings, Inc.* | 253,700 | 319,662 | ||||||
Leafly Holdings, Inc.* | 103,900 | 67,732 | ||||||
Lee Enterprises, Inc.* | 22,000 | 408,320 | ||||||
Liberty TripAdvisor Holdings, Inc., Class A* | 150,000 | 100,440 | ||||||
Loyalty Ventures, Inc.* | 100,000 | 241,000 | ||||||
Marchex, Inc., Class B* | 124,500 | 195,465 | ||||||
Moving Image Technologies, Inc.* | 20,300 | 23,345 | ||||||
National CineMedia, Inc. | 200,000 | 44,000 | ||||||
NII Holdings Escrow*Δ# | 287,700 | 71,925 | ||||||
Outbrain, Inc.* | 135,000 | 488,700 | ||||||
Saga Communications, Inc., Class A | 22,216 | 524,298 | ||||||
Salem Media Group, Inc.* | 104,000 | 109,200 | ||||||
Spok Holdings, Inc. | 80,416 | 658,607 | ||||||
Takung Art Co., Ltd.* | 76,000 | 41,830 | ||||||
Townsquare Media, Inc., Class A* | 52,700 | 382,075 | ||||||
Travelzoo* | 30,443 | 135,471 | ||||||
TrueCar, Inc.* | 205,000 | 514,550 | ||||||
Zedge, Inc., Class B* | 23,680 | 41,677 | ||||||
|
|
| ||||||
| 7,651,230 | ||||||||
Consumer Discretionary - 12.47% |
| |||||||
AMCON Distributing Co. | 1,900 | 343,900 | ||||||
American Outdoor Brands, Inc.* | 27,007 | 270,610 | ||||||
Ark Restaurants Corp. | 14,500 | 240,120 | ||||||
Aspen Group, Inc.* | 67,100 | 20,801 | ||||||
Barnes & Noble Education, Inc.* | 232,300 | 406,525 | ||||||
| Industry Company | Shares | Value | ||||||
Consumer Discretionary (continued) |
| |||||||
Bassett Furniture Industries, Inc. | 25,644 | $ | 445,693 | |||||
Boxed, Inc.* | 152,000 | 29,625 | ||||||
Build-A-Bear Workshop, Inc.* | 37,400 | 891,616 | ||||||
BurgerFi International, Inc.* | 38,588 | 48,621 | ||||||
Canterbury Park Holding Corp.+ | 11,689 | 365,398 | ||||||
Carrols Restaurant Group, Inc.* | 150,000 | 204,000 | ||||||
Cato Corp. (The), Class A | 57,373 | 535,290 | ||||||
Citi Trends, Inc.* | 30,000 | 794,400 | ||||||
Conn’s, Inc.* | 70,000 | 481,600 | ||||||
Cooper-Standard Holdings, Inc.* | 34,500 | 312,570 | ||||||
Culp, Inc. | 64,000 | 293,760 | ||||||
Delta Apparel, Inc.* | 20,588 | 218,439 | ||||||
Dixie Group, Inc. (The)* | 117,000 | 93,717 | ||||||
Duluth Holdings, Inc., Class B* | 25,000 | 154,500 | ||||||
Educational Development Corp. | 31,400 | 99,224 | ||||||
Emerson Radio Corp.* | 102,100 | 54,133 | ||||||
Envela Corp.* | 102,400 | 538,624 | ||||||
Escalade, Inc. | 34,508 | 351,291 | ||||||
Express, Inc.* | 298,500 | 304,470 | ||||||
Fiesta Restaurant Group, Inc.* | 74,106 | 544,679 | ||||||
Flanigan’s Enterprises, Inc. | 7,000 | 181,160 | ||||||
Flexsteel Industries, Inc.+ | 14,900 | 229,460 | ||||||
Fossil Group, Inc.* | 140,000 | 603,400 | ||||||
Greenlane Holdings, Inc., Class A* | 15,000 | 4,313 | ||||||
Hamilton Beach Brands Holding Co., Class A | 18,000 | 223,020 | ||||||
Hooker Furnishings Corp. | 31,560 | 590,172 | ||||||
Horizon Global Corp.* | 124,200 | 48,289 | ||||||
iMedia Brands, Inc.* | 59,817 | 38,283 | ||||||
J Jill, Inc.* | 36,300 | 900,240 | ||||||
JAKKS Pacific, Inc.* | 32,090 | 561,254 | ||||||
Kandi Technologies Group, Inc.* | 162,900 | 374,670 | ||||||
Kirkland’s, Inc.*+ | 48,500 | 160,050 | ||||||
Lakeland Industries, Inc.* | 19,857 | 264,098 | ||||||
Lifetime Brands, Inc. | 59,200 | 449,328 | ||||||
Lincoln Educational Services Corp.* | 77,705 | 449,912 | ||||||
LL Flooring Holdings, Inc.* | 75,000 | 421,500 | ||||||
Lulu’s Fashion Lounge Holdings, Inc.* | 80,000 | 200,800 | ||||||
Nathan’s Famous, Inc. | 9,700 | 651,937 | ||||||
Nautilus, Inc.* | 57,600 | 88,128 | ||||||
| bridgewayfunds.com | 23 | |
Ultra-Small Company Market Fund SCHEDULE OF INVESTMENTS (Unaudited) (continued) |
|
Showing percentage of net assets as of December 31, 2022
| Industry Company | Shares | Value | ||||||
Common Stocks (continued) |
| |||||||
Consumer Discretionary (continued) |
| |||||||
Noodles & Co.* | 75,000 | $ | 411,750 | |||||
PARTS iD, Inc.* | 195,900 | 191,003 | ||||||
Party City Holdco, Inc.* | 325,000 | 118,787 | ||||||
PlayAGS, Inc.* | 103,300 | 526,830 | ||||||
Polished.com, Inc.* | 100,000 | 57,770 | ||||||
Potbelly Corp.* | 89,600 | 499,072 | ||||||
RealReal, Inc. (The)*+ | 300,000 | 375,000 | ||||||
Red Robin Gourmet Burgers, Inc.* | 56,100 | 313,038 | ||||||
Regis Corp.* | 144,500 | 176,290 | ||||||
Rent the Runway, Inc., Class A* | 163,500 | 498,675 | ||||||
Rocky Brands, Inc. | 15,000 | 354,300 | ||||||
Strattec Security Corp.* | 15,700 | 322,635 | ||||||
Superior Group of Cos., Inc. | 61,600 | 619,696 | ||||||
Superior Industries International, Inc.* | 102,500 | 432,550 | ||||||
Sypris Solutions, Inc.* | 84,404 | 170,496 | ||||||
ThredUp, Inc., Class A* | 200,000 | 262,000 | ||||||
Tilly’s, Inc., Class A* | 50,000 | 452,500 | ||||||
Unifi, Inc.* | 60,000 | 516,600 | ||||||
Unique Fabricating, Inc.* | 92,500 | 51,014 | ||||||
Universal Technical Institute, Inc.* | 90,200 | 606,144 | ||||||
Vera Bradley, Inc.* | 118,700 | 537,711 | ||||||
Vince Holding Corp.*+ | 51,263 | 401,389 | ||||||
Volta, Inc.* | 434,000 | 154,244 | ||||||
VOXX International Corp.* | 36,100 | 302,518 | ||||||
Weyco Group, Inc. | 24,500 | 518,420 | ||||||
Xcel Brands, Inc.* | 75,000 | 52,500 | ||||||
|
|
| ||||||
| 23,406,552 | ||||||||
Consumer Staples - 3.06% |
| |||||||
Alico, Inc. | 24,550 | 586,009 | ||||||
AppHarvest, Inc.*+ | 394,000 | 223,556 | ||||||
Better Choice Co., Inc.* | 101,700 | 54,816 | ||||||
Blue Apron Holdings, Inc., Class A*+ | 137,500 | 114,125 | ||||||
Bridgford Foods Corp.*+ | 21,900 | 262,362 | ||||||
Farmer Bros Co.* | 44,900 | 206,989 | ||||||
Fresh Vine Wine, Inc.*+ | 25,000 | 24,472 | ||||||
Laird Superfood, Inc.* | 23,500 | 19,740 | ||||||
Lifecore Biomedical, Inc.* | 55,000 | 356,400 | ||||||
LifeMD, Inc.* | 92,800 | 180,032 | ||||||
Lifeway Foods, Inc.* | 37,401 | 207,576 | ||||||
Limoneira Co.+ | 50,000 | 610,500 | ||||||
Mannatech, Inc. | 8,300 | 148,570 | ||||||
Natural Alternatives International, Inc.* | 31,610 | 265,208 | ||||||
| Industry Company | Shares | Value | ||||||
Consumer Staples (continued) | ||||||||
Natural Grocers by Vitamin Cottage, Inc. | 29,500 | $ | 269,630 | |||||
Oil-Dri Corp. of America | 16,700 | 560,118 | ||||||
Planet Green Holdings Corp.* | 83,000 | 51,460 | ||||||
Rocky Mountain Chocolate Factory, Inc.* | 36,500 | 208,050 | ||||||
Splash Beverage Group, Inc.*+ | 102,300 | 98,351 | ||||||
United-Guardian, Inc. | 13,466 | 140,046 | ||||||
Village Super Market, Inc., Class A+ | 23,000 | 535,670 | ||||||
Vintage Wine Estates, Inc.*+ | 145,100 | 473,026 | ||||||
Zevia PBC, Class A*+ | 35,000 | 143,150 | ||||||
|
|
| ||||||
| 5,739,856 | ||||||||
Energy - 8.42% |
| |||||||
Adams Resources & Energy, Inc. | 22,000 | 856,240 | ||||||
Aemetis, Inc.*+ | 90,000 | 356,400 | ||||||
Amplify Energy Corp.* | 91,800 | 806,922 | ||||||
Barnwell Industries, Inc. | 35,000 | 103,474 | ||||||
Battalion Oil Corp.* | 56,500 | 548,615 | ||||||
Camber Energy, Inc.* | 2,000 | 4,040 | ||||||
Comstock, Inc.* | 229,000 | 62,975 | ||||||
Enerflex, Ltd.+ | 197,257 | 1,246,664 | ||||||
Enservco Corp.* | 36,093 | 58,832 | ||||||
Evolution Petroleum Corp. | 60,800 | 459,040 | ||||||
Forum Energy Technologies, Inc.* | 17,000 | 501,500 | ||||||
Geospace Technologies Corp.* | 50,500 | 213,110 | ||||||
Gran Tierra Energy, Inc.* | 450,000 | 445,500 | ||||||
Gulf Island Fabrication, Inc.* | 65,348 | 335,235 | ||||||
Houston American Energy Corp.*+ | 28,000 | 96,320 | ||||||
Independence Contract Drilling, Inc.* | 55,000 | 179,850 | ||||||
KLX Energy Services Holdings, Inc.* | 51,702 | 894,962 | ||||||
Mammoth Energy Services, Inc.* | 100,000 | 865,000 | ||||||
Mexco Energy Corp.* | 8,000 | 99,840 | ||||||
MIND Technology, Inc.* | 119,515 | 54,977 | ||||||
NACCO Industries, Inc., Class A | 13,470 | 511,860 | ||||||
Natural Gas Services Group, Inc.* | 64,076 | 734,311 | ||||||
NCS Multistage Holdings, Inc.* | 10,350 | 258,750 | ||||||
| 24 | Semi-Annual Report | December 31, 2022 (Unaudited) | |
Ultra-Small Company Market Fund SCHEDULE OF INVESTMENTS (Unaudited) (continued) |
|
Showing percentage of net assets as of December 31, 2022
| Industry Company | Shares | Value | ||||||
Common Stocks (continued) | ||||||||
Energy (continued) | ||||||||
New Concept Energy, Inc.* | 8,400 | $ | 9,156 | |||||
Nine Energy Service, Inc.*+ | 142,700 | 2,073,431 | ||||||
Oil States International, Inc.* | 46,800 | 349,128 | ||||||
Overseas Shipholding Group, Inc., Class A* | 222,496 | 643,013 | ||||||
PEDEVCO Corp.* | 195,000 | 214,500 | ||||||
PHX Minerals, Inc. | 120,200 | 467,578 | ||||||
Ranger Energy Services, Inc.* | 24,700 | 271,947 | ||||||
Ring Energy, Inc.* | 103,650 | 254,979 | ||||||
SEACOR Marine Holdings, Inc.* | 85,805 | 785,974 | ||||||
Smart Sand, Inc.* | 140,900 | 252,211 | ||||||
Superior Drilling Products, Inc.* | 166,100 | 152,662 | ||||||
VAALCO Energy, Inc. | 137,200 | 625,632 | ||||||
|
| |||||||
| 15,794,628 | ||||||||
Financials - 17.76% |
| |||||||
Acacia Research Corp.*+ | 103,100 | 434,051 | ||||||
AmeriServ Financial, Inc. | 59,171 | 232,542 | ||||||
Ashford, Inc.*+ | 5,000 | 69,399 | ||||||
Associated Capital Group, Inc., Class A | 10,000 | 419,900 | ||||||
Atlantic American Corp.# | 116,256 | 268,551 | ||||||
Auburn National BanCorp, Inc. | 7,500 | 173,813 | ||||||
Bank of Princeton (The) | 20,266 | 642,838 | ||||||
Bank7 Corp. | 27,910 | 714,496 | ||||||
BankFinancial Corp. | 30,600 | 322,218 | ||||||
Bankwell Financial Group, Inc. | 25,000 | 735,750 | ||||||
C&F Financial Corp. | 10,690 | 622,906 | ||||||
California BanCorp* | 17,200 | 409,016 | ||||||
CB Financial Services, Inc. | 18,700 | 400,741 | ||||||
Chemung Financial Corp. | 16,298 | 747,589 | ||||||
Citizens Community Bancorp, Inc. | 28,600 | 344,058 | ||||||
Citizens Holding Co. | 25,070 | 343,459 | ||||||
Citizens, Inc.* | 90,000 | 191,700 | ||||||
Codorus Valley Bancorp, Inc. | 25,137 | 598,261 | ||||||
Cohen & Co., Inc. | 5,000 | 41,700 | ||||||
Colony Bankcorp, Inc. | 10,950 | 138,956 | ||||||
Community West Bancshares | 21,657 | 324,205 | ||||||
Conifer Holdings, Inc.* | 13,000 | 20,410 | ||||||
Consumer Portfolio Services, Inc.* | 75,500 | 668,175 | ||||||
Curo Group Holdings Corp. | 129,000 | 457,950 | ||||||
| Industry Company | Shares | Value | ||||||
Financials (continued) | ||||||||
Eagle Bancorp Montana, Inc. | 19,521 | $ | 315,459 | |||||
eHealth, Inc.* | 50,000 | 242,000 | ||||||
Elevate Credit, Inc.* | 122,100 | 213,675 | ||||||
ESSA Bancorp, Inc. | 22,143 | 462,124 | ||||||
Evans Bancorp, Inc. | 17,000 | 635,630 | ||||||
FG Financial Group, Inc.* | 30,000 | 85,500 | ||||||
Finwise Bancorp* | 33,292 | 308,284 | ||||||
First Financial Northwest, Inc. | 34,770 | 520,855 | ||||||
First Guaranty Bancshares, Inc. | 14,856 | 348,373 | ||||||
First Northwest Bancorp | 26,600 | 408,576 | ||||||
First United Corp. | 23,292 | 457,688 | ||||||
First Western Financial, Inc.* | 22,051 | 620,736 | ||||||
GAMCO Investors, Inc., Class A+ | 33,000 | 502,920 | ||||||
Greenhill & Co., Inc. | 36,800 | 377,200 | ||||||
Hallmark Financial Services, Inc.* | 105,100 | 61,399 | ||||||
Hawthorn Bancshares, Inc. | 29,950 | 652,012 | ||||||
Heritage Insurance Holdings, Inc. | 66,000 | 118,800 | ||||||
HMN Financial, Inc. | 18,800 | 400,440 | ||||||
Investar Holding Corp. | 28,000 | 602,840 | ||||||
Katapult Holdings, Inc.* | 235,400 | 225,207 | ||||||
Kentucky First Federal Bancorp | 16,000 | 108,480 | ||||||
Lake Shore Bancorp, Inc. | 27,150 | 327,836 | ||||||
Landmark Bancorp, Inc.+ | 8,205 | 185,679 | ||||||
Magyar Bancorp, Inc. | 12,579 | 161,263 | ||||||
Malvern Bancorp, Inc.* | 21,100 | 374,525 | ||||||
Marygold Cos., Inc. (The)* | 46,000 | 69,000 | ||||||
Medallion Financial Corp.+ | 86,744 | 619,352 | ||||||
Meridian Corp. | 17,100 | 517,959 | ||||||
Northrim BanCorp, Inc. | 8,195 | 447,201 | ||||||
Norwood Financial Corp. | 25,512 | 853,121 | ||||||
Ocwen Financial Corp.* | 5,600 | 171,248 | ||||||
Ohio Valley Banc Corp. | 13,000 | 343,460 | ||||||
OP Bancorp | 38,000 | 424,080 | ||||||
Oportun Financial Corp.* | 121,200 | 667,812 | ||||||
Patriot National Bancorp, Inc.* | 8,500 | 90,100 | ||||||
PCB Bancorp | 7,300 | 129,137 | ||||||
Penns Woods Bancorp, Inc. | 31,066 | 826,977 | ||||||
Peoples Bancorp of North Carolina, Inc. | 20,830 | 678,225 | ||||||
Ponce Financial Group, Inc.*+ | 50,699 | 472,515 | ||||||
| bridgewayfunds.com | 25 | |
Ultra-Small Company Market Fund SCHEDULE OF INVESTMENTS (Unaudited) (continued) |
|
Showing percentage of net assets as of December 31, 2022
| Industry Company | Shares | Value | ||||||
Common Stocks (continued) | ||||||||
Financials (continued) | ||||||||
Professional Holding Corp., Class A* | 29,500 | $ | 818,330 | |||||
Provident Financial Holdings, Inc. | 27,817 | 383,040 | ||||||
Republic First Bancorp, Inc.*+ | 119,100 | 256,065 | ||||||
Riverview Bancorp, Inc. | 75,106 | 576,814 | ||||||
Safeguard Scientifics, Inc.* | 80,000 | 248,000 | ||||||
Security National Financial Corp., Class A* | 69,390 | 506,547 | ||||||
Silvercrest Asset Management Group, Inc., Class A | 24,602 | 461,780 | ||||||
Southern States Bancshares, Inc. | 20,000 | 579,000 | ||||||
Summit State Bank | 17,820 | 281,556 | ||||||
Sunlight Financial Holdings, Inc.*+ | 153,000 | 197,370 | ||||||
Territorial Bancorp, Inc. | 30,307 | 727,671 | ||||||
Timberland Bancorp, Inc. | 13,900 | 474,407 | ||||||
Trean Insurance Group, Inc.* | 150,000 | 900,000 | ||||||
Unico American Corp.* | 54,500 | 87,745 | ||||||
Union Bankshares, Inc. | 14,951 | 350,003 | ||||||
United Bancshares, Inc. | 7,700 | 144,144 | ||||||
United Security Bancshares | 15,000 | 109,650 | ||||||
Unity Bancorp, Inc. | 25,812 | 705,442 | ||||||
Western New England Bancorp, Inc. | 56,344 | 533,014 | ||||||
Westwood Holdings Group, Inc. | 36,000 | 400,813 | ||||||
WVS Financial Corp.# | 16,800 | 235,200 | ||||||
|
|
| ||||||
| 33,326,963 | ||||||||
Health Care - 28.26% | ||||||||
4D Molecular Therapeutics, Inc.* | 38,500 | 855,085 | ||||||
89bio, Inc.* | 91,800 | 1,168,614 | ||||||
Accuray, Inc.* | 223,200 | 466,488 | ||||||
AcelRx Pharmaceuticals, Inc.*+ | 12,370 | 27,956 | ||||||
Acorda Therapeutics, Inc.* | 76,706 | 58,810 | ||||||
Actinium Pharmaceuticals, Inc.*+ | 86,966 | 926,188 | ||||||
Acumen Pharmaceuticals, Inc.* | 75,400 | 407,160 | ||||||
Acutus Medical, Inc.* | 79,500 | 91,425 | ||||||
Aeglea BioTherapeutics, Inc.* | 150,000 | 67,485 | ||||||
AgeX Therapeutics, Inc.* | 165,000 | 91,064 | ||||||
AIM ImmunoTech, Inc.* | 140,000 | 43,666 | ||||||
| Industry Company | Shares | Value | ||||||
Health Care (continued) | ||||||||
Aligos Therapeutics, Inc.* | 112,000 | $ | 106,725 | |||||
Allakos, Inc.* | 50,000 | 421,000 | ||||||
Allarity Therapeutics, Inc.* | 20,000 | 5,876 | ||||||
Alpha Teknova, Inc.* | 35,000 | 197,400 | ||||||
American Shared Hospital Services* | 33,700 | 98,741 | ||||||
Angion Biomedica Corp.* | 175,000 | 142,030 | ||||||
Annovis Bio, Inc.* | 22,500 | 302,175 | ||||||
Apollo Endosurgery, Inc.* | 78,200 | 779,654 | ||||||
Applied Molecular Transport, Inc.* | 100,000 | 42,000 | ||||||
Applied Therapeutics, Inc.* | 50,000 | 38,000 | ||||||
Apyx Medical Corp.* | 288,000 | 673,920 | ||||||
Aquestive Therapeutics, Inc.*+ | 137,456 | 123,999 | ||||||
Ardelyx, Inc.* | 307,000 | 874,950 | ||||||
Armata Pharmaceuticals, Inc.*+ | 184,682 | 229,006 | ||||||
ARS Pharmaceuticals, Inc.*+ | 69,500 | 592,835 | ||||||
Assembly Biosciences, Inc.* | 165,000 | 214,500 | ||||||
Astria Therapeutics, Inc.* | 35,000 | 521,150 | ||||||
Athira Pharma, Inc.* | 102,000 | 323,340 | ||||||
ATI Physical Therapy, Inc.* | 60,000 | 18,300 | ||||||
Atreca, Inc., Class A* | 100,000 | 80,060 | ||||||
Avrobio, Inc.* | 146,000 | 104,083 | ||||||
Axcella Health, Inc.* | 195,009 | 63,865 | ||||||
Ayala Pharmaceuticals, Inc.* | 53,000 | 22,302 | ||||||
Aziyo Biologics, Inc., Class A*+ | 24,900 | 105,825 | ||||||
Berkeley Lights, Inc.* | 175,200 | 469,536 | ||||||
BioAtla, Inc.* | 22,000 | 181,500 | ||||||
Biodesix, Inc.* | 66,800 | 153,640 | ||||||
BiomX, Inc.* | 49,500 | 9,242 | ||||||
Biora Therapeutics, Inc.* | 432,000 | 56,894 | ||||||
Black Diamond Therapeutics, Inc.*+ | 117,800 | 212,040 | ||||||
Bolt Biotherapeutics, Inc.* | 187,600 | 243,880 | ||||||
Cabaletta Bio, Inc.*+ | 107,730 | 996,502 | ||||||
Calithera Biosciences, Inc.* | 6,158 | 20,075 | ||||||
Candel Therapeutics, Inc.* | 125,000 | 223,750 | ||||||
CareCloud, Inc.* | 67,363 | 189,290 | ||||||
CEL-SCI Corp.*+ | 118,600 | 278,710 | ||||||
China Pharma Holdings, Inc.* | 145,000 | 13,906 | ||||||
Clearside Biomedical, Inc.* | 212,600 | 238,112 | ||||||
Codex DNA, Inc.*+ | 117,000 | 146,250 | ||||||
Cognition Therapeutics, Inc.* | 66,200 | 139,020 | ||||||
| 26 | Semi-Annual Report | December 31, 2022 (Unaudited) | |
Ultra-Small Company Market Fund SCHEDULE OF INVESTMENTS (Unaudited) (continued) |
|
Showing percentage of net assets as of December 31, 2022
| Industry Company | Shares | Value | ||||||
Common Stocks (continued) | ||||||||
Health Care (continued) | ||||||||
Concert Pharmaceuticals, Inc.* | 138,100 | $ | 806,504 | |||||
CorMedix, Inc.*+ | 120,100 | 506,822 | ||||||
Corvus Pharmaceuticals, Inc.* | 155,700 | 132,345 | ||||||
Cumberland Pharmaceuticals, Inc.* | 49,887 | 112,246 | ||||||
Curis, Inc.* | 240,000 | 132,000 | ||||||
CVRx, Inc.* | 28,595 | 524,718 | ||||||
Cyclerion Therapeutics, Inc.* | 107,000 | 70,213 | ||||||
Cyteir Therapeutics, Inc.* | 119,584 | 197,314 | ||||||
CytomX Therapeutics, Inc.* | 176,000 | 281,600 | ||||||
Daxor Corp.*+ | 9,400 | 86,762 | ||||||
Decibel Therapeutics, Inc.*+ | 107,282 | 219,928 | ||||||
Disc Medicine, Inc.* | 7,500 | 149,175 | ||||||
ElectroCore, Inc.* | 70,000 | 17,976 | ||||||
Electromed, Inc.* | 27,000 | 283,230 | ||||||
Elevation Oncology, Inc.* | 128,000 | 121,306 | ||||||
Eliem Therapeutics, Inc.* | 53,323 | 190,896 | ||||||
Enzo Biochem, Inc.* | 146,500 | 209,495 | ||||||
Equillium, Inc.* | 123,500 | 135,850 | ||||||
Eton Pharmaceuticals, Inc.*+ | 50,900 | 142,520 | ||||||
Evelo Biosciences, Inc.* | 105,300 | 169,533 | ||||||
Exagen, Inc.*+ | 39,000 | 93,600 | ||||||
Finch Therapeutics Group, Inc.* | 157,667 | 75,680 | ||||||
Frequency Therapeutics, Inc.* | 82,400 | 317,240 | ||||||
Fulcrum Therapeutics, Inc.* | 40,000 | 291,200 | ||||||
Gain Therapeutics, Inc.* | 60,000 | 187,800 | ||||||
Galecto, Inc.* | 165,000 | 189,750 | ||||||
Galera Therapeutics, Inc.* | 183,200 | 272,968 | ||||||
Gelesis Holdings, Inc.* | 74,300 | 21,577 | ||||||
GlycoMimetics, Inc.*+ | 75,000 | 227,250 | ||||||
Graphite Bio, Inc.* | 130,500 | 433,260 | ||||||
Graybug Vision, Inc.* | 41,900 | 20,950 | ||||||
Great Elm Group, Inc.* | 104,597 | 211,286 | ||||||
Gritstone bio, Inc.*+ | 206,000 | 710,700 | ||||||
Harpoon Therapeutics, Inc.* | 50,000 | 36,285 | ||||||
Harrow Health, Inc.* | 45,500 | 671,580 | ||||||
Harvard Bioscience, Inc.* | 77,017 | 213,337 | ||||||
HCW Biologics, Inc.* | 72,600 | 139,392 | ||||||
Homology Medicines, Inc.* | 215,000 | 270,900 | ||||||
Hookipa Pharma, Inc.* | 200,800 | 162,648 | ||||||
Hyperfine, Inc.* | 125,000 | 105,000 | ||||||
iBio, Inc.* | 25,000 | 11,110 | ||||||
Icosavax, Inc.* | 80,000 | 635,200 | ||||||
Ikena Oncology, Inc.* | 82,350 | 219,051 | ||||||
| Industry Company | Shares | Value | ||||||
Health Care (continued) | ||||||||
IMARA, Inc.* | 66,800 | $ | 273,212 | |||||
Immuneering Corp., Class A*+ | 34,949 | 169,503 | ||||||
Immunic, Inc.*+ | 98,000 | 137,200 | ||||||
Impel Pharmaceuticals, Inc.*+ | 30,000 | 112,500 | ||||||
IN8bio, Inc.* | 68,700 | 158,697 | ||||||
Infinity Pharmaceuticals, Inc.* | 240,000 | 133,200 | ||||||
InfuSystem Holdings, Inc.* | 54,800 | 475,664 | ||||||
Inozyme Pharma, Inc.* | 130,000 | 136,500 | ||||||
InspireMD, Inc.* | 16,667 | 14,325 | ||||||
Invacare Corp.*+ | 108,346 | 45,505 | ||||||
IO Biotech, Inc.*+ | 132,200 | 304,060 | ||||||
IRIDEX Corp.* | 90,400 | 181,704 | ||||||
IsoPlexis Corp.* | 132,464 | 205,319 | ||||||
IsoRay, Inc.* | 184,000 | 45,466 | ||||||
Jounce Therapeutics, Inc.* | 147,000 | 163,170 | ||||||
Kala Pharmaceuticals, Inc.*+ | 3,500 | 133,525 | ||||||
KemPharm, Inc.*+ | 89,443 | 410,543 | ||||||
Kewaunee Scientific Corp.* | 13,200 | 205,260 | ||||||
Kronos Bio, Inc.* | 251,000 | 406,620 | ||||||
Landos Biopharma, Inc.* | 99,000 | 49,510 | ||||||
Lannett Co., Inc.*+ | 111,900 | 58,278 | ||||||
Larimar Therapeutics, Inc.* | 60,000 | 247,800 | ||||||
Leap Therapeutics, Inc.* | 288,301 | 129,735 | ||||||
Lineage Cell Therapeutics, Inc.* | 442,900 | 518,193 | ||||||
Longboard Pharmaceuticals, Inc.* | 25,000 | 79,000 | ||||||
Lucid Diagnostics, Inc.*+ | 135,000 | 183,600 | ||||||
Lucira Health, Inc.* | 110,500 | 12,277 | ||||||
Lumos Pharma, Inc.* | 46,744 | 168,746 | ||||||
Lyra Therapeutics, Inc.* | 144,900 | 454,986 | ||||||
Magenta Therapeutics, Inc.* | 209,500 | 82,753 | ||||||
Matinas BioPharma Holdings, Inc.* | 626,891 | 313,446 | ||||||
MediciNova, Inc.* | 190,247 | 390,006 | ||||||
Merrimack Pharmaceuticals, Inc.* | 32,500 | 372,450 | ||||||
Milestone Scientific, Inc.* | 274,500 | 131,760 | ||||||
Minerva Neurosciences, Inc.* | 15,436 | 24,543 | ||||||
Minerva Surgical, Inc.* | 127,200 | 28,416 | ||||||
MiNK Therapeutics, Inc.* | 8,500 | 21,930 | ||||||
Molecular Templates, Inc.* | 110,000 | 36,080 | ||||||
Mustang Bio, Inc.* | 206,900 | 81,705 | ||||||
Myomo, Inc.* | 56,600 | 28,945 | ||||||
NanoViricides, Inc.*+ | 94,039 | 104,383 | ||||||
NantHealth, Inc.*+ | 16,940 | 61,831 | ||||||
| bridgewayfunds.com | 27 | |
Ultra-Small Company Market Fund SCHEDULE OF INVESTMENTS (Unaudited) (continued) |
|
Showing percentage of net assets as of December 31, 2022
| Industry Company | Shares | Value | ||||||
Common Stocks (continued) | ||||||||
Health Care (continued) |
| |||||||
Navidea Biopharmaceuticals, Inc.* | 102,440 | $ | 21,512 | |||||
Neoleukin Therapeutics, Inc.* | 75,000 | 38,175 | ||||||
Neuronetics, Inc.* | 62,305 | 428,035 | ||||||
NeuroPace, Inc.*+ | 26,148 | 38,961 | ||||||
NexImmune, Inc.* | 50,000 | 12,155 | ||||||
NextCure, Inc.* | 100,000 | 141,000 | ||||||
NightHawk Biosciences, Inc.* | 100,000 | 80,510 | ||||||
NovaBay Pharmaceuticals, Inc.* | 4,429 | 8,637 | ||||||
NRX Pharmaceuticals, Inc.* | 178,700 | 198,357 | ||||||
Odonate Therapeutics, Inc.* | 215,000 | 376,250 | ||||||
Olema Pharmaceuticals, Inc.* | 86,200 | 211,190 | ||||||
Omeros Corp.*+ | 126,600 | 286,116 | ||||||
Oncocyte Corp.* | 200,000 | 64,180 | ||||||
Oncorus, Inc.* | 67,300 | 17,047 | ||||||
Optinose, Inc.* | 90,000 | 166,500 | ||||||
Oragenics, Inc.* | 140,000 | 14,714 | ||||||
OraSure Technologies, Inc.* | 100,000 | 482,000 | ||||||
ORIC Pharmaceuticals, Inc.* | 97,000 | 571,330 | ||||||
Ovid therapeutics, Inc.*+ | 227,700 | 423,522 | ||||||
Owlet, Inc.* | 231,500 | 129,432 | ||||||
Oyster Point Pharma, Inc.*+ | 40,000 | 446,800 | ||||||
Palatin Technologies, Inc.* | 14,800 | 37,888 | ||||||
Paratek Pharmaceuticals, Inc.*+ | 215,000 | 402,050 | ||||||
Pardes Biosciences, Inc.* | 198,900 | 336,141 | ||||||
Passage Bio, Inc.* | 240,100 | 331,338 | ||||||
Personalis, Inc.* | 115,500 | 228,690 | ||||||
Pluri, Inc.* | 102,600 | 96,444 | ||||||
Praxis Precision Medicines, Inc.*+ | 101,900 | 242,522 | ||||||
Precision BioSciences, Inc.* | 271,500 | 323,085 | ||||||
Prelude Therapeutics, Inc.*+ | 36,949 | 223,172 | ||||||
Protalix BioTherapeutics, Inc.*+ | 130,000 | 178,100 | ||||||
Protara Therapeutics, Inc.* | 39,200 | 105,056 | ||||||
Puma Biotechnology, Inc.* | 114,900 | 486,027 | ||||||
Pyxis Oncology, Inc.*+ | 170,295 | 228,195 | ||||||
Quince Therapeutics, Inc.*+ | 110,000 | 70,114 | ||||||
Rain Oncology, Inc.* | 10,000 | 80,000 | ||||||
| Industry Company | Shares | Value | ||||||
Health Care (continued) |
| |||||||
Rapid Micro Biosystems, Inc., Class A*+ | 138,000 | $ | 155,940 | |||||
Regional Health Properties, Inc.* | 10,000 | 33,200 | ||||||
Reneo Pharmaceuticals, Inc.* | 70,000 | 163,100 | ||||||
Retractable Technologies, Inc.* | 91,700 | 150,397 | ||||||
Rigel Pharmaceuticals, Inc.* | 325,000 | 487,500 | ||||||
Rocket Pharmaceuticals, Inc.* | 8,797 | 172,165 | ||||||
SAB Biotherapeutics, Inc.* | 84,000 | 49,552 | ||||||
Satsuma Pharmaceuticals, Inc.* | 65,000 | 58,500 | ||||||
Savara, Inc.* | 366,393 | 567,909 | ||||||
Science 37 Holdings, Inc.* | 225,000 | 93,420 | ||||||
scPharmaceuticals, Inc.*+ | 104,500 | 749,265 | ||||||
SCYNEXIS, Inc.* | 149,000 | 232,440 | ||||||
SeaSpine Holdings Corp.* | 75,000 | 626,250 | ||||||
Sensei Biotherapeutics, Inc.* | 112,900 | 168,221 | ||||||
Senti Biosciences, Inc.* | 95,000 | 133,950 | ||||||
Sera Prognostics, Inc., Class A* | 4,205 | 5,172 | ||||||
Shattuck Labs, Inc.* | 85,100 | 195,730 | ||||||
Sientra, Inc.* | 102,000 | 20,696 | ||||||
Sigilon Therapeutics, Inc.* | 125,000 | 43,750 | ||||||
Singular Genomics Systems, Inc.* | 215,600 | 433,356 | ||||||
Solid Biosciences, Inc.* | 18,700 | 100,606 | ||||||
Sonendo, Inc.* | 101,500 | 287,245 | ||||||
Sonida Senior Living, Inc.* | 20,615 | 257,688 | ||||||
Spruce Biosciences, Inc.*+ | 60,000 | 66,000 | ||||||
SQZ Biotechnologies Co.* | 62,400 | 46,176 | ||||||
Standard BioTools, Inc.*+ | 212,000 | 248,040 | ||||||
Star Equity Holdings, Inc.* | 110,390 | 94,372 | ||||||
Stereotaxis, Inc.* | 177,100 | 366,597 | ||||||
Summit Therapeutics, Inc.* | 76,500 | 325,125 | ||||||
SunLink Health Systems, Inc.* | 40,000 | 24,400 | ||||||
Surface Oncology, Inc.* | 157,500 | 129,150 | ||||||
Surgalign Holdings, Inc.* | 25,000 | 49,000 | ||||||
Synlogic, Inc.* | 216,900 | 164,844 | ||||||
Syros Pharmaceuticals, Inc.* | 8,670 | 31,125 | ||||||
Tabula Rasa HealthCare, Inc.* | 50,000 | 247,500 | ||||||
Tactile Systems Technology, Inc.* | 62,800 | 720,944 | ||||||
Talaris Therapeutics, Inc.*+ | 130,000 | 132,600 | ||||||
Talkspace, Inc.* | 250,000 | 152,575 | ||||||
| 28 | Semi-Annual Report | December 31, 2022 (Unaudited) | |
Ultra-Small Company Market Fund SCHEDULE OF INVESTMENTS (Unaudited) (continued) |
|
Showing percentage of net assets as of December 31, 2022
| Industry Company | Shares | Value | ||||||
Common Stocks (continued) |
| |||||||
Health Care (continued) | ||||||||
Taysha Gene Therapies, Inc.* | 99,269 | $ | 224,348 | |||||
TCR2 Therapeutics, Inc.* | 148,400 | 148,222 | ||||||
Tela Bio, Inc.* | 52,000 | 598,000 | ||||||
Tenaya Therapeutics, Inc.* | 102,300 | 205,623 | ||||||
Terns Pharmaceuticals, Inc.* | 66,000 | 671,880 | ||||||
TFF Pharmaceuticals, Inc.* | 56,200 | 59,010 | ||||||
TherapeuticsMD, Inc.* | 42,000 | 234,780 | ||||||
Theriva Biologics, Inc.* | 12,400 | 5,640 | ||||||
Trevi Therapeutics, Inc.* | 195,800 | 377,894 | ||||||
TScan Therapeutics, Inc.* | 115,000 | 187,450 | ||||||
UNITY Biotechnology, Inc.* | 60,705 | 166,332 | ||||||
Vapotherm, Inc.* | 99,500 | 268,650 | ||||||
Vaxxinity, Inc., Class A* | 72,000 | 100,800 | ||||||
Venus Concept, Inc.* | 208,644 | 66,766 | ||||||
Verastem, Inc.* | 355,000 | 142,888 | ||||||
Verrica Pharmaceuticals, Inc.* | 74,550 | 205,012 | ||||||
Vigil Neuroscience, Inc.* | 5,064 | 63,300 | ||||||
Viracta Therapeutics, Inc.* | 125,000 | 182,500 | ||||||
VolitionRX, Ltd.*+ | 120,000 | 291,600 | ||||||
Vor BioPharma, Inc.*+ | 95,000 | 631,750 | ||||||
Voyager Therapeutics, Inc.* | 95,481 | 582,434 | ||||||
Werewolf Therapeutics, Inc.* | 76,211 | 156,233 | ||||||
Xeris Biopharma Holdings, Inc.* | 355,151 | 472,351 | ||||||
Xilio Therapeutics, Inc.* | 76,081 | 204,658 | ||||||
Xtant Medical Holdings, Inc.* | 100,000 | 66,000 | ||||||
Zynerba Pharmaceuticals, Inc.* | 102,200 | 54,166 | ||||||
|
|
| ||||||
| 53,036,599 | ||||||||
Industrials - 11.19% |
| |||||||
Acme United Corp. | 11,535 | 252,616 | ||||||
AgEagle Aerial Systems, Inc.* | 200,000 | 70,000 | ||||||
Air Industries Group* | 9,000 | 38,250 | ||||||
Air T, Inc.* | 17,250 | 432,802 | ||||||
Alpha Pro Tech, Ltd.* | 52,900 | 212,658 | ||||||
American Superconductor Corp.* | 90,000 | 331,200 | ||||||
ARC Document Solutions, Inc. | 167,400 | 490,482 | ||||||
Avalon Holdings Corp., Class A* | 3,900 | 10,725 | ||||||
BGSF, Inc. | 39,700 | 608,204 | ||||||
BlackSky Technology, Inc.* | 325,000 | 500,500 | ||||||
| Industry Company | Shares | Value | ||||||
Industrials (continued) |
| |||||||
Bowman Consulting Group, Ltd.* | 30,000 | $ | 655,500 | |||||
CECO Environmental Corp.* | 48,300 | 564,144 | ||||||
Charah Solutions, Inc.* | 16,500 | 89,100 | ||||||
Chicago Rivet & Machine Co.+ | 8,000 | 229,040 | ||||||
Commercial Vehicle Group, Inc.* | 40,500 | 275,805 | ||||||
CompX International, Inc. | 44,200 | 816,816 | ||||||
Eastern Co. (The) | 21,200 | 408,736 | ||||||
Espey Mfg. & Electronics Corp.* | 16,108 | 228,734 | ||||||
FreightCar America, Inc.*+ | 73,000 | 233,600 | ||||||
GEE Group, Inc.* | 77,600 | 38,024 | ||||||
Gencor Industries, Inc.* | 29,200 | 294,920 | ||||||
Graham Corp.* | 18,900 | 181,818 | ||||||
Hudson Global, Inc.* | 10,942 | 247,617 | ||||||
Hurco Cos., Inc. | 7,500 | 195,975 | ||||||
Hydrofarm Holdings Group, Inc.* | 110,000 | 170,500 | ||||||
India Globalization Capital, Inc.* | 69,000 | 21,949 | ||||||
INNOVATE Corp.*+ | 241,392 | 451,403 | ||||||
Innovative Solutions and Support, Inc.* | 80,400 | 660,888 | ||||||
Knightscope, Inc., Class A* | 75,000 | 141,750 | ||||||
KULR Technology Group, Inc.*+ | 255,000 | 306,000 | ||||||
L B Foster Co., Class A* | 41,700 | 403,656 | ||||||
Lightning eMotors, Inc.* | 116,400 | 42,661 | ||||||
LS Starrett Co. (The), Class A* | 36,400 | 267,904 | ||||||
LSI Industries, Inc. | 88,000 | 1,077,120 | ||||||
Mastech Digital, Inc.* | 50,400 | 554,904 | ||||||
Matrix Service Co.* | 60,000 | 373,200 | ||||||
Mayville Engineering Co., Inc.* | 25,258 | 319,766 | ||||||
Mega Matrix Corp.* | 108,000 | 190,080 | ||||||
Mesa Air Group, Inc.* | 249,800 | 382,194 | ||||||
Mistras Group, Inc.* | 63,100 | 311,083 | ||||||
Momentus, Inc.*+ | 368,500 | 287,393 | ||||||
NN, Inc.* | 145,000 | 217,500 | ||||||
Ocean Power Technologies, Inc.* | 180,000 | 81,018 | ||||||
Orion Group Holdings, Inc.* | 115,100 | 273,938 | ||||||
P&F Industries, Inc., Class A | 10,500 | 52,395 | ||||||
Park Aerospace Corp. | 15,000 | 201,150 | ||||||
Patriot Transportation Holding, Inc.* | 7,471 | 53,119 | ||||||
| bridgewayfunds.com | 29 | |
Ultra-Small Company Market Fund SCHEDULE OF INVESTMENTS (Unaudited) (continued) |
|
Showing percentage of net assets as of December 31, 2022
| Industry Company | Shares | Value | ||||||
Common Stocks (continued) | ||||||||
Industrials (continued) | ||||||||
Performant Financial Corp.* | 278,300 | $ | 1,004,663 | |||||
Perma-Pipe International Holdings, Inc.* | 71,600 | 676,620 | ||||||
Pineapple Energy, Inc.* | 14,504 | 33,794 | ||||||
Quad/Graphics, Inc.* | 129,569 | 528,642 | ||||||
RCM Technologies, Inc.* | 43,242 | 533,606 | ||||||
Redwire Corp.*+ | 158,500 | 313,830 | ||||||
Servotronics, Inc.* | 16,653 | 175,856 | ||||||
Shapeways Holdings, Inc.* | 153,289 | 83,359 | ||||||
SIFCO Industries, Inc.* | 26,024 | 56,204 | ||||||
Spire Global, Inc.* | 290,000 | 278,400 | ||||||
Team, Inc.* | 19,580 | 102,795 | ||||||
Twin Disc, Inc.* | 58,100 | 564,732 | ||||||
Ultralife Corp.* | 72,400 | 279,464 | ||||||
US Xpress Enterprises, Inc., Class A* | 165,000 | 298,650 | ||||||
Virco Mfg. Corp.* | 25,800 | 116,616 | ||||||
Westwater Resources, Inc.* | 123,700 | 97,723 | ||||||
Williams Industrial Services Group, Inc.* | 88,300 | 90,075 | ||||||
Willis Lease Finance Corp.* | 21,400 | 1,262,814 | ||||||
Xos, Inc.* | 275,000 | 121,797 | ||||||
Yellow Corp.* | 53,000 | 133,030 | ||||||
|
|
| ||||||
| 21,001,507 | ||||||||
Information Technology - 9.31% |
| |||||||
Airspan Networks Holdings, Inc.* | 199,600 | 261,476 | ||||||
ALJ Regional Holdings, Inc.* | 202,000 | 375,720 | ||||||
Amtech Systems, Inc.* | 84,000 | 638,400 | ||||||
Applied Digital Corp.*+ | 250,000 | 460,000 | ||||||
Applied Optoelectronics, Inc.*+ | 126,500 | 239,085 | ||||||
Arteris, Inc.* | 55,000 | 236,500 | ||||||
AstroNova, Inc.* | 37,700 | 483,314 | ||||||
Aware, Inc.* | 124,579 | 213,030 | ||||||
Backblaze, Inc., Class A*+ | 27,500 | 169,125 | ||||||
Bel Fuse, Inc., Class B | 5,800 | 190,936 | ||||||
BK Technologies Corp.+ | 45,717 | 151,780 | ||||||
BM Technologies, Inc.*+ | 21,636 | 112,724 | ||||||
CalAmp Corp.* | 80,000 | 358,400 | ||||||
Climb Global Solutions, Inc. | 16,800 | 529,704 | ||||||
Computer Task Group, Inc.* | 62,100 | 469,476 | ||||||
CoreCard Corp.*+ | 19,737 | 571,781 | ||||||
CSP, Inc. | 45,000 | 424,350 | ||||||
Daktronics, Inc.* | 112,855 | 318,251 | ||||||
| Industry Company | Shares | Value | ||||||
Information Technology (continued) |
| |||||||
Diebold Nixdorf, Inc.* | 289,600 | $ | 411,232 | |||||
eMagin Corp.* | 251,000 | 213,350 | ||||||
Embark Technology, Inc.*+ | 42,500 | 139,825 | ||||||
EMCORE Corp.* | 102,473 | 98,630 | ||||||
Everspin Technologies, Inc.* | 73,900 | 410,884 | ||||||
Frequency Electronics, Inc.* | 21,500 | 151,575 | ||||||
Greenidge Generation Holdings, Inc.*+ | 80,000 | 23,128 | ||||||
GSI Technology, Inc.* | 54,217 | 93,795 | ||||||
Immersion Corp.* | 93,000 | 653,790 | ||||||
Innodata, Inc.* | 85,955 | 254,857 | ||||||
Inseego Corp.* | 50,000 | 42,125 | ||||||
Intellicheck, Inc.* | 110,300 | 220,600 | ||||||
inTEST Corp.* | 19,901 | 204,980 | ||||||
Intevac, Inc.* | 87,400 | 565,478 | ||||||
Inuvo, Inc.* | 306,000 | 67,779 | ||||||
Issuer Direct Corp.* | 16,500 | 413,160 | ||||||
Kaleyra, Inc.* | 235,900 | 178,128 | ||||||
Key Tronic Corp.* | 32,400 | 140,292 | ||||||
KVH Industries, Inc.* | 55,774 | 570,010 | ||||||
Latch, Inc.*+ | 405,000 | 287,510 | ||||||
LGL Group, Inc. (The)* | 29,200 | 118,260 | ||||||
LiveVox Holdings, Inc.* | 220,000 | 653,400 | ||||||
Marin Software, Inc.*+ | 60,000 | 60,000 | ||||||
M-Tron Industries, Inc.* | 14,600 | 127,750 | ||||||
Network-1 Technologies, Inc. | 134,000 | 294,800 | ||||||
Optical Cable Corp.* | 27,600 | 114,816 | ||||||
PCTEL, Inc. | 73,800 | 317,340 | ||||||
Pixelworks, Inc.* | 108,100 | 191,337 | ||||||
Powerfleet, Inc.* | 138,200 | 371,758 | ||||||
Quantum Corp.* | 285,000 | 310,650 | ||||||
RF Industries, Ltd.* | 43,230 | 220,473 | ||||||
Richardson Electronics, Ltd. | 32,011 | 682,795 | ||||||
SecureWorks Corp., Class A* | 23,180 | 148,120 | ||||||
SRAX, Inc.* | 50,000 | 76,500 | ||||||
StarTek, Inc.* | 97,762 | 366,608 | ||||||
Stronghold Digital Mining, Inc., Class A*+ | 50,000 | 23,955 | ||||||
Synchronoss Technologies, Inc.* | 213,100 | 131,717 | ||||||
TESSCO Technologies, Inc.* | 45,000 | 216,900 | ||||||
TransAct Technologies, Inc.* | 33,000 | 205,260 | ||||||
Trio-Tech International* | 26,800 | 120,603 | ||||||
Turtle Beach Corp.* | 50,000 | 358,500 | ||||||
| 30 | Semi-Annual Report | December 31, 2022 (Unaudited) | |
Ultra-Small Company Market Fund SCHEDULE OF INVESTMENTS (Unaudited) (continued) |
|
Showing percentage of net assets as of December 31, 2022
| Industry Company | Shares | Value | ||||||
Common Stocks (continued) |
| |||||||
Information Technology (continued) |
| |||||||
Universal Security Instruments, Inc.* | 6,000 | $ | 12,180 | |||||
Usio, Inc.* | 45,000 | 72,000 | ||||||
Velodyne Lidar, Inc.* | 350,000 | 258,545 | ||||||
Veritone, Inc.*+ | 44,000 | 233,200 | ||||||
VirnetX Holding Corp.* | 76,300 | 99,190 | ||||||
WidePoint Corp.* | 48,728 | 88,690 | ||||||
Wireless Telecom Group, Inc.* | 64,666 | 115,752 | ||||||
WM Technology, Inc.* | 130,000 | 131,300 | ||||||
|
|
| ||||||
| 17,467,579 | ||||||||
Materials - 3.35% |
| |||||||
Advanced Emissions Solutions, Inc.* | 89,000 | 216,270 | ||||||
AgroFresh Solutions, Inc.* | 204,300 | 604,728 | ||||||
Ampco-Pittsburgh Corp.* | 50,000 | 125,500 | ||||||
Ascent Industries Co.* | 26,838 | 232,685 | ||||||
Core Molding Technologies, Inc.* | 24,400 | 316,956 | ||||||
Flexible Solutions International, Inc.* | 45,707 | 141,692 | ||||||
Flotek Industries, Inc.* | 292,300 | 327,376 | ||||||
Friedman Industries, Inc. | 27,200 | 266,288 | ||||||
Gatos Silver, Inc.*+ | 140,000 | 572,600 | ||||||
Glatfelter Corp. | 175,000 | 486,500 | ||||||
Gold Resource Corp. | 236,300 | 361,539 | ||||||
Golden Minerals Co.* | 450,000 | 123,480 | ||||||
Gulf Resources, Inc.* | 67,360 | 208,142 | ||||||
IT Tech Packaging, Inc.* | 37,500 | 17,257 | ||||||
Loop Industries, Inc.* | 99,400 | 237,566 | ||||||
McEwen Mining, Inc.*+ | 115,000 | 673,900 | ||||||
Northern Technologies International Corp. | 27,900 | 371,349 | ||||||
Olympic Steel, Inc. | 18,300 | 614,514 | ||||||
Paramount Gold Nevada Corp.* | 150,000 | 51,750 | ||||||
Solitario Zinc Corp.* | 205,000 | 127,121 | ||||||
United States Antimony Corp.* | 195,500 | 95,189 | ||||||
Universal Stainless & Alloy Products, Inc.* | 16,850 | 120,815 | ||||||
|
|
| ||||||
| 6,293,217 | ||||||||
Real Estate - 1.14% |
| |||||||
American Realty Investors, Inc.*+ | 2,363 | 60,611 | ||||||
AMREP Corp.* | 35,800 | 413,490 | ||||||
CTO Realty Growth, Inc.+ | 24,300 | 444,204 | ||||||
Maui Land & Pineapple Co., Inc.* | 46,500 | 438,030 | ||||||
| Industry Company | Shares | Value | ||||||
Real Estate (continued) |
| |||||||
Rafael Holdings, Inc., Class B* | 51,656 | $ | 96,597 | |||||
Stratus Properties, Inc. | 24,250 | 467,782 | ||||||
Transcontinental Realty Investors, Inc.* | 2,800 | 123,704 | ||||||
Trinity Place Holdings, Inc.* | 131,800 | 97,519 | ||||||
|
|
| ||||||
| 2,141,937 | ||||||||
Utilities - 0.86% |
| |||||||
Cadiz, Inc.*+ | 137,400 | 343,500 | ||||||
Genie Energy, Ltd., Class B | 66,900 | 691,746 | ||||||
RGC Resources, Inc. | 25,000 | 551,250 | ||||||
Via Renewables, Inc.+ | 7,500 | 38,325 | ||||||
|
|
| ||||||
| 1,624,821 | ||||||||
|
|
| ||||||
TOTAL COMMON STOCKS - 99.90% |
| 187,484,889 | ||||||
|
|
| ||||||
(Cost $205,942,064) | ||||||||
RIGHTS - 0.00% |
| |||||||
Adamas Pharmaceuticals, Inc., CVR*Δ#+++ | 110,000 | – | ||||||
Adamas Pharmaceuticals, Inc., CVR*Δ#+++ | 110,000 | – | ||||||
Cogent Biosciences, Inc., CVR, expiring 12/31/49*Δ# | 160,000 | – | ||||||
Gemini Therapeutics, Inc., CVR*+++ | 75,000 | – | ||||||
Oncomed Pharmaceuticals, CVR, expiring 12/31/49*Δ# | 125,000 | – | ||||||
Pineapple Holdings, Inc., CVR*Δ#+++ | 14,504 | – | ||||||
PLBY Group, Inc., expiring 01/18/23*Δ+ | 50,000 | – | ||||||
ZAGG, Inc., CVR, expiring 12/31/99*Δ# | 65,000 | – | ||||||
|
|
| ||||||
TOTAL RIGHTS - 0.00% |
| – | ||||||
|
|
| ||||||
(Cost $29,976) | ||||||||
WARRANTS - 0.00% |
| |||||||
LGL Group, Inc. (The), expiring | 29,200 | 5,840 | ||||||
|
|
| ||||||
TOTAL WARRANTS - 0.00% |
| 5,840 | ||||||
|
|
| ||||||
(Cost $14,873) | ||||||||
| bridgewayfunds.com | 31 | |
Ultra-Small Company Market Fund SCHEDULE OF INVESTMENTS (Unaudited) (continued) |
|
Showing percentage of net assets as of December 31, 2022
| Rate^ | Shares | Value | ||||||||||
| MONEY MARKET FUND - 0.00% |
| |||||||||||
Fidelity Investments Money |
| |||||||||||
Market Government Portfolio Class I | 4.06 | % | 29 | $ | 29 | |||||||
|
| |||||||||||
TOTAL MONEY MARKET FUND - 0.00% |
| 29 | ||||||||||
|
| |||||||||||
(Cost $29) | ||||||||||||
| INVESTMENTS PURCHASED WITH CASH PROCEEDS FROM SECURITIES LENDING - 8.09% |
| |||||||||||
Dreyfus Institutional |
| |||||||||||
Preferred Government | ||||||||||||
Plus Money Market | ||||||||||||
Fund** | 4.36 | % | 15,178,678 | 15,178,678 | ||||||||
|
| |||||||||||
TOTAL INVESTMENTS PURCHASED WITH CASH PROCEEDS FROM SECURITIES LENDING - 8.09% |
| 15,178,678 | ||||||||||
|
| |||||||||||
(Cost $15,178,678) | ||||||||||||
TOTAL INVESTMENTS - 107.99% |
| $ | 202,669,436 | |||||||||
(Cost $221,165,620) | ||||||||||||
Liabilities in Excess of Other Assets - (7.99%) |
| (14,996,041 | ) | |||||||||
|
| |||||||||||
NET ASSETS - 100.00% |
| $ | 187,673,395 | |||||||||
|
| |||||||||||
| # | Illiquid security as determined under procedures approved by the Board of Directors. The aggregate value of illiquid securities is $575,676, which is 0.31% of total net assets. |
| * | Non-income producing security. |
| ** | This security represents the investment of the cash collateral received in connection with securities out on loan as of December 31, 2022. |
| ^ | Rate disclosed as of December 31, 2022. |
| Δ | Security was fair valued using significant unobservable inputs. As such, the security is classified as Level 3 in the fair value hierarchy. |
| + | This security or a portion of the security is out on loan at December 31, 2022. Total loaned securities had a value of $15,584,470, which included loaned securities with a value of $115,736 that have been sold and are pending settlement as of December 31, 2022. The total market value of loaned securities excluding these pending sales is $15,468,734. See Note 2 for disclosure of cash and non-cash collateral. |
| +++ | No stated maturity date. |
CVR - Contingent Value Right
| 32 | Semi-Annual Report | December 31, 2022 (Unaudited) | |
Ultra-Small Company Market Fund SCHEDULE OF INVESTMENTS (Unaudited) (continued) |
|
Summary of inputs used to value the Fund’s investments as of 12/31/2022
(See Note 2 in Notes to Financial Statements):
| Valuation Inputs | ||||||||||||||||
| ||||||||||||||||
| Investment in Securities (Value) | ||||||||||||||||
| ||||||||||||||||
Level 1 Quoted Prices | Level 2 Significant Observable Inputs | Level 3 Significant Unobservable Inputs | Total | |||||||||||||
| ||||||||||||||||
Common Stocks | ||||||||||||||||
Health Care | $52,511,174 | $525,425 | $– | $53,036,599 | ||||||||||||
Financials | 32,947,619 | 379,344 | – | 33,326,963 | ||||||||||||
Communication Services | 7,579,305 | – | 71,925 | 7,651,230 | ||||||||||||
Real Estate | 1,728,447 | 413,490 | – | 2,141,937 | ||||||||||||
Other Industries (a) | 91,328,160 | – | – | 91,328,160 | ||||||||||||
|
|
|
|
|
|
|
| |||||||||
Total Common Stocks | 186,094,705 | 1,318,259 | 71,925 | 187,484,889 | ||||||||||||
Rights | 0 | – | 0 | 0 | ||||||||||||
Warrants | 5,840 | – | – | 5,840 | ||||||||||||
Money Market Fund | 29 | – | – | 29 | ||||||||||||
Investments Purchased With Cash Proceeds From Securities Lending | 15,178,678 | – | – | 15,178,678 | ||||||||||||
|
|
|
|
|
|
|
| |||||||||
TOTAL | $201,279,252 | $1,318,259 | $ 71,925 | $202,669,436 | ||||||||||||
|
|
|
|
|
|
|
| |||||||||
(a) - Please refer to the Schedule of Investments for the industry classifications of these portfolio holdings. |
| |||||||||||||||
Following is a reconciliation of Level 3 investments for which significant unobservable inputs were used to determine fair value:
| Investment in Securities (Value) | ||||||||||||
| ||||||||||||
| Common Stocks | Rights | Total | ||||||||||
| ||||||||||||
Balance as of 06/30/2022 | $ | 71,925 | $ | 0 | $ | 71,925 | ||||||
Purchases/Issuances | – | – | – | |||||||||
Sales/Expirations | – | – | – | |||||||||
Return of Capital | – | – | – | |||||||||
Realized Gain/(Loss) | – | – | – | |||||||||
Change in unrealized Appreciation/(Depreciation) | – | – | – | |||||||||
Transfers in | – | – | – | |||||||||
Transfers out | – | – | – | |||||||||
|
| |||||||||||
Balance as of 12/31/2022 | $ | 71,925 | $ | 0 | $ | 71,925 | ||||||
|
| |||||||||||
Net change in unrealized Appreciation/(Depreciation) from investments held as of 12/31/2022 | $ | – | $ | – | $ | – | ||||||
|
| |||||||||||
See Notes to Financial Statements.
| bridgewayfunds.com | 33 | |
December 31, 2022
Dear Fellow Small-Cap Value Fund Shareholder,
For the quarter ended December 31, 2022, our Fund returned +10.43%, outperforming our primary market benchmark, the Russell 2000 Value Index (+8.42%). It was a good quarter.
For the calendar year, our Fund returned -7.74%, leading the Russell 2000 Value Index (-14.48%).
The table below presents our December quarter, six months, one-year, five-year, 10-year, 15-year, and inception-to-date financial results.
Standardized Returns as of December 31, 2021
Quarter | 6 Months | Annualized | ||||||||||||||||||||||||||
| 1 Year | 5 Years | 10 Years | 15 Years | Since Inception (10/31/03) | ||||||||||||||||||||||||
Small-Cap Value Fund | 10.43% | 6.90% | -7.74% | 11.63% | 11.62% | 7.49% | 8.88% | |||||||||||||||||||||
Russell 2000 Value Index | 8.42% | 3.42% | -14.48% | 4.13% | 8.48% | 6.81% | 7.67% | |||||||||||||||||||||
Performance figures quoted in the table above represent past performance and are no guarantee of future results. Total return figures in the table above include the reinvestment of dividends and capital gains. The table above does not reflect the deduction of taxes that a shareholder would pay on Fund distributions or on the redemption of Fund shares.
The Russell 2000 Value Index is an unmanaged index that consists of stocks in the Russell 2000 Index with lower price-to-book ratios and lower forecasted growth values with dividends reinvested. It is not possible to invest directly in an index. Periods longer than one year are annualized.
| 34 | Semi-Annual Report | December 31, 2022 (Unaudited) | |
Small-Cap Value Fund MANAGER’S COMMENTARY (Unaudited) (continued) |
|
Growth of a $10,000 Investment
from Inception October 31, 2003 to December 31, 2022
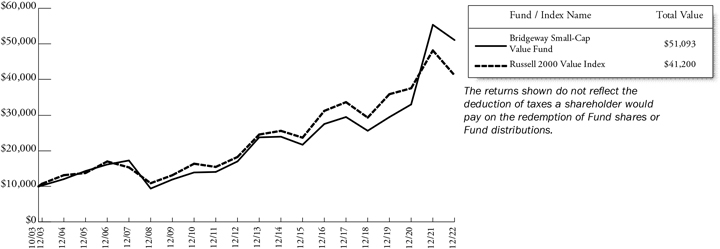
Detailed Explanation of Quarterly Performance
All three of the Fund’s model categories outperformed the benchmark during the quarter, adding to relative results. The Fund’s tilt toward deeper value stocks across multiple valuation metrics improved relative returns. However, its tilt toward smaller stocks in the small-cap value universe detracted from relative performance as smaller companies generally under-performed during the quarter.
From a sector perspective, the Fund’s allocation effect was positive. An underweighting in the Health Care sector and overweightings in the Materials and Consumer Discretionary sectors added the most to relative results. The Fund’s stock selection effect was also positive, with holdings in the Health Care, Financials, and Information Technology sectors adding the most to relative results.
Detailed Explanation of Calendar Year Performance
All three of the Fund’s model categories outperformed the benchmark, improving relative results. The Fund’s tilt toward deeper value stocks across multiple valuation metrics boosted relative returns during the year, although its tilt toward smaller stocks in the small-cap value universe detracted.
From a sector perspective, the Fund’s allocation effect was positive. An overweighting in the Energy sector made the largest positive contribution to relative results. The Fund’s stock selection effect was also strongly positive. Holdings in the Energy and Industrials sectors added the most to relative returns, with holdings in the Utilities and Materials sectors also making significant contributions.
| bridgewayfunds.com | 35 | |
Small-Cap Value Fund MANAGER’S COMMENTARY (Unaudited) (continued) |
|
Top Ten Holdings as of December 31, 2022
Rank
| Description
| Industry
| % of Net
| |||||
1 | ADMA Biologics, Inc. | Health Care | 1.8% | |||||
2 | Sterling Infrastructure, Inc. | Industrials | 1.6% | |||||
3 | Genworth Financial, Inc., Class A | Financials | 1.6% | |||||
4 | Academy Sports & Outdoors, Inc. | Consumer Discretionary | 1.5% | |||||
5 | Jackson Financial, Inc., Class A | Financials | 1.5% | |||||
6 | Cross Country Healthcare, Inc. | Health Care | 1.4% | |||||
7 | Red Rock Resorts, Inc., Class A | Consumer Discretionary | 1.4% | |||||
8 | Group 1 Automotive, Inc. | Consumer Discretionary | 1.4% | |||||
9 | Ingles Markets, Inc., Class A | Consumer Staples | 1.4% | |||||
10 | SunCoke Energy, Inc. | Materials | 1.4% | |||||
| Total | 15.0% |
Industry Sector Representation as of December 31, 2022
| % of Net Assets | % of Russell 2000 Value Index | Difference | ||||||
Communication Services | 2.3% | 2.9% | -0.6% | |||||
Consumer Discretionary | 12.4% | 10.0% | 2.4% | |||||
Consumer Staples | 5.1% | 2.7% | 2.4% | |||||
Energy | 7.5% | 6.2% | 1.3% | |||||
Financials | 25.7% | 28.8% | -3.1% | |||||
Health Care | 8.2% | 10.5% | -2.3% | |||||
Industrials | 9.9% | 13.3% | -3.4% | |||||
Information Technology | 6.8% | 5.5% | 1.3% | |||||
Materials | 7.6% | 4.1% | 3.5% | |||||
Real Estate | 11.6% | 10.7% | 0.9% | |||||
Utilities | 1.7% | 5.3% | -3.6% | |||||
Cash & Other Assets | 1.2% | 0.0% | 1.2% | |||||
Total | 100.0% | 100.0% | ||||||
Important Disclosure
The views expressed here are exclusively those of Fund management. These views, including those related to market sectors or individual stocks, are not meant as investment advice and should not be considered predictive in nature. Any favorable (or unfavorable) description of a holding applies only as of the quarter-end, December 31, 2022, unless otherwise stated. Security positions can and do change thereafter. Discussions of historical performance do not guarantee and may not be indicative of future performance.
Market volatility can significantly impact short-term performance. The Fund is not an appropriate investment for short-term investors. Investments in small companies generally carry greater risk than is customarily associated with larger companies. This additional risk is attributable to a number of factors, including the relatively limited financial resources that are typically available to small companies and the fact that small companies often have comparatively limited product lines. In addition, the stock of small companies tends to be more volatile than the stock of large companies, particularly in the short term and particularly in the early stages of an economic or market downturn. Shareholders of the Fund, therefore, are taking on more risk than they would if they invested in the stock market as a whole.
| 36 | Semi-Annual Report | December 31, 2022 (Unaudited) | |
Small-Cap Value Fund MANAGER’S COMMENTARY (Unaudited) (continued) |
|
Conclusion
Thank you for your continued investment in Small-Cap Value Fund. We encourage your feedback; your reactions and concerns are important to us.
Sincerely,
The Investment Management Team
| bridgewayfunds.com | 37 | |
Showing percentage of net assets as of December 31, 2022
| Industry Company | Shares | Value | ||||||
COMMON STOCKS - 98.78% |
| |||||||
Communication Services - 2.25% |
| |||||||
Gray Television, Inc. | 258,200 | $ | 2,889,258 | |||||
TEGNA, Inc. | 291,100 | 6,168,409 | ||||||
Telephone and Data Systems, Inc.+ | 268,600 | 2,817,614 | ||||||
|
| |||||||
| 11,875,281 | ||||||||
Consumer Discretionary - 12.41% |
| |||||||
Academy Sports & Outdoors, Inc. | 153,100 | 8,043,874 | ||||||
American Axle & Manufacturing Holdings, Inc.* | 21,900 | 171,258 | ||||||
Beazer Homes USA, Inc.* | 236,800 | 3,021,568 | ||||||
Chico’s FAS, Inc.*+ | 896,200 | 4,409,304 | ||||||
Citi Trends, Inc.* | 64,500 | 1,707,960 | ||||||
Ethan Allen Interiors, Inc.+ | 131,100 | 3,463,662 | ||||||
Group 1 Automotive, Inc. | 40,900 | 7,377,133 | ||||||
Red Rock Resorts, Inc., Class A | 186,300 | 7,453,863 | ||||||
SeaWorld Entertainment, Inc.* | 126,500 | 6,769,015 | ||||||
Signet Jewelers, Ltd.+ | 55,000 | 3,740,000 | ||||||
Sleep Number Corp.* | 129,754 | 3,371,009 | ||||||
Smith & Wesson Brands, Inc.+ | 408,703 | 3,547,542 | ||||||
Stitch Fix, Inc., Class A*+ | 1,645,000 | 5,115,950 | ||||||
TravelCenters of America, Inc.* | 119,641 | 5,357,524 | ||||||
Tupperware Brands Corp.* | 450,000 | 1,863,000 | ||||||
|
| |||||||
| 65,412,662 | ||||||||
Consumer Staples - 5.11% |
| |||||||
Hostess Brands, Inc.*+ | 265,600 | 5,960,064 | ||||||
Ingles Markets, Inc., Class A | 75,700 | 7,302,022 | ||||||
John B Sanfilippo & Son, Inc. | 26,300 | 2,138,716 | ||||||
Rite Aid Corp.*+ | 548,500 | 1,831,990 | ||||||
SpartanNash Co. | 189,500 | 5,730,480 | ||||||
United Natural Foods, Inc.* | 102,300 | 3,960,033 | ||||||
|
| |||||||
| 26,923,305 | ||||||||
Energy - 7.46% |
| |||||||
Amplify Energy Corp.* | 260,000 | 2,285,400 | ||||||
Callon Petroleum Co.*+ | 100,600 | 3,731,254 | ||||||
Chord Energy Corp. | 16,400 | 2,243,684 | ||||||
CONSOL Energy, Inc.+ | 98,000 | 6,370,000 | ||||||
DHT Holdings, Inc. | 659,800 | 5,859,024 | ||||||
FLEX LNG, Ltd.+ | 135,700 | 4,436,033 | ||||||
| Industry Company | Shares | Value | ||||||
|
| |||||||
Energy (continued) |
| |||||||
International Seaways, Inc.+ | 174,600 | $ | 6,463,692 | |||||
PBF Energy, Inc., Class A | 45,000 | 1,835,100 | ||||||
Teekay Tankers, Ltd., Class A* | 197,438 | 6,083,065 | ||||||
|
| |||||||
| 39,307,252 | ||||||||
Financials - 25.73% |
| |||||||
Amalgamated Financial Corp. | 232,000 | 5,345,280 | ||||||
American Equity Investment Life Holding Co. | 92,000 | 4,197,040 | ||||||
Ameris Bancorp+ | 65,300 | 3,078,242 | ||||||
AMERISAFE, Inc. | 92,403 | 4,802,184 | ||||||
Banco Latinoamericano de Comercio Exterior SA, Class E | 101,200 | 1,639,440 | ||||||
Banner Corp. | 51,000 | 3,223,200 | ||||||
Byline Bancorp, Inc. | 191,200 | 4,391,864 | ||||||
City Holding Co. | 66,400 | 6,181,176 | ||||||
CNO Financial Group, Inc. | 201,800 | 4,611,130 | ||||||
Customers Bancorp, Inc.*+ | 210,300 | 5,959,902 | ||||||
Encore Capital Group, Inc.* | 98,900 | 4,741,266 | ||||||
Enstar Group, Ltd.* | 14,100 | 3,257,664 | ||||||
EZCORP, Inc., Class A* | 738,800 | 6,021,220 | ||||||
Farmers & Merchants Bancorp, Inc./Archbold+ | 61,400 | 1,668,852 | ||||||
FB Financial Corp. | 72,100 | 2,605,694 | ||||||
First BanCorp | 404,000 | 5,138,880 | ||||||
Genworth Financial, Inc., Class A* | 1,581,800 | 8,367,722 | ||||||
German American Bancorp, Inc. | 35,400 | 1,320,420 | ||||||
Hanmi Financial Corp. | 263,200 | 6,514,200 | ||||||
HarborOne Bancorp, Inc. | 212,000 | 2,946,800 | ||||||
HomeStreet, Inc. | 50,000 | 1,379,000 | ||||||
Jackson Financial, Inc., Class A | 224,200 | 7,799,918 | ||||||
LendingClub Corp.* | 215,000 | 1,892,000 | ||||||
MVB Financial Corp. | 118,500 | 2,609,370 | ||||||
Oppenheimer Holdings, Inc., Class A | 46,500 | 1,968,345 | ||||||
Piper Sandler Cos. | 20,300 | 2,642,857 | ||||||
Provident Bancorp, Inc. | 132,518 | 964,731 | ||||||
Stewart Information Services Corp. | 168,400 | 7,195,732 | ||||||
Texas Capital Bancshares, Inc.* | 58,500 | 3,528,135 | ||||||
Tiptree, Inc.+ | 518,500 | 7,176,040 | ||||||
| 38 | Semi-Annual Report | December 31, 2022 (Unaudited) | |
Small-Cap Value Fund SCHEDULE OF INVESTMENTS (Unaudited) (continued) |
|
Showing percentage of net assets as of December 31, 2022
| Industry Company | Shares | Value | ||||||
Common Stocks (continued) |
| |||||||
Financials (continued) |
| |||||||
Universal Insurance Holdings, Inc. | 184,667 | $ | 1,955,624 | |||||
Valley National Bancorp+ | 547,600 | 6,193,356 | ||||||
Waterstone Financial, Inc. | 250,400 | 4,316,896 | ||||||
|
| |||||||
| 135,634,180 | ||||||||
Health Care - 8.20% |
| |||||||
Addus HomeCare Corp.* | 50,000 | 4,974,500 | ||||||
ADMA Biologics, Inc.* | 2,391,000 | 9,277,079 | ||||||
Atea Pharmaceuticals, Inc.* | 347,612 | 1,672,014 | ||||||
Cross Country Healthcare, Inc.*+ | 286,700 | 7,617,619 | ||||||
Inogen, Inc.* | 104,700 | 2,063,637 | ||||||
Neogen Corp.* | 395,000 | 6,015,850 | ||||||
OraSure Technologies, Inc.* | 390,000 | 1,879,800 | ||||||
PetIQ, Inc.* | 172,683 | 1,592,137 | ||||||
Prestige Consumer Healthcare, Inc.* | 106,100 | 6,641,860 | ||||||
Vanda Pharmaceuticals, Inc.* | 204,700 | 1,512,733 | ||||||
|
| |||||||
| 43,247,229 | ||||||||
Industrials - 9.93% |
| |||||||
AerSale Corp.* | 90,000 | 1,459,800 | ||||||
ArcBest Corp. | 88,720 | 6,213,949 | ||||||
Atlas Air Worldwide Holdings, Inc.* | 50,000 | 5,040,000 | ||||||
BlueLinx Holdings, Inc.* | 62,800 | 4,465,708 | ||||||
Boise Cascade Co. | 104,300 | 7,162,281 | ||||||
Kelly Services, Inc., Class A | 128,000 | 2,163,200 | ||||||
Primoris Services Corp. | 142,500 | 3,126,450 | ||||||
Sterling Infrastructure, Inc.* | 258,800 | 8,488,640 | ||||||
Textainer Group Holdings, Ltd. | 140,100 | 4,344,501 | ||||||
Triton International, Ltd. | 64,000 | 4,401,920 | ||||||
TrueBlue, Inc.* | 280,508 | 5,492,347 | ||||||
|
| |||||||
| 52,358,796 | ||||||||
Information Technology - 6.78% |
| |||||||
A10 Networks, Inc. | 335,000 | 5,571,050 | ||||||
Amkor Technology, Inc.+ | 139,300 | 3,340,414 | ||||||
Calix, Inc.* | 10,500 | 718,515 | ||||||
Hackett Group, Inc. (The) | 63,143 | 1,286,223 | ||||||
InterDigital, Inc. | 65,511 | 3,241,484 | ||||||
LiveRamp Holdings, Inc.* | 305,100 | 7,151,544 | ||||||
NetScout Systems, Inc.* | 167,800 | 5,455,178 | ||||||
Sanmina Corp.* | 29,000 | 1,661,410 | ||||||
ScanSource, Inc.* | 177,200 | 5,177,784 | ||||||
| Industry Company | Shares | Value | ||||||
Information Technology (continued) |
| |||||||
Turtle Beach Corp.* | 297,200 | $ | 2,130,924 | |||||
|
| |||||||
| 35,734,526 | ||||||||
Materials - 7.62% |
| |||||||
AdvanSix, Inc. | 119,400 | 4,539,588 | ||||||
Clearwater Paper Corp.* | 133,600 | 5,051,416 | ||||||
Olympic Steel, Inc. | 192,631 | 6,468,549 | ||||||
Ryerson Holding Corp. | 228,200 | 6,905,332 | ||||||
Schnitzer Steel Industries, Inc., Class A | 79,068 | 2,423,434 | ||||||
SunCoke Energy, Inc. | 841,600 | 7,263,008 | ||||||
Sylvamo Corp. | 45,000 | 2,186,550 | ||||||
TimkenSteel Corp.* | 292,700 | 5,318,359 | ||||||
|
| |||||||
| 40,156,236 | ||||||||
Real Estate - 11.62% |
| |||||||
Agree Realty Corp. | 89,800 | 6,369,514 | ||||||
Armada Hoffler Properties, Inc. | 195,400 | 2,247,100 | ||||||
Community Healthcare Trust, Inc. | 129,200 | 4,625,360 | ||||||
Empire State Realty Trust, Inc., Class A+ | 467,800 | 3,152,972 | ||||||
Equity Commonwealth | 149,000 | 3,720,530 | ||||||
Essential Properties Realty Trust, Inc. | 203,900 | 4,785,533 | ||||||
Four Corners Property Trust, Inc.+ | 100,000 | 2,593,000 | ||||||
Getty Realty Corp.+ | 97,400 | 3,296,990 | ||||||
Independence Realty Trust, Inc.+ | 360,200 | 6,072,972 | ||||||
NexPoint Residential Trust, Inc. | 92,100 | 4,008,192 | ||||||
Physicians Realty Trust | 369,300 | 5,343,771 | ||||||
Plymouth Industrial REIT, Inc. | 271,869 | 5,214,447 | ||||||
STAG Industrial, Inc. | 210,000 | 6,785,100 | ||||||
Terreno Realty Corp. | 53,100 | 3,019,797 | ||||||
|
| |||||||
| 61,235,278 | ||||||||
Utilities - 1.67% |
| |||||||
Avista Corp. | 147,312 | 6,531,814 | ||||||
MGE Energy, Inc. | 15,000 | 1,056,000 | ||||||
Otter Tail Corp. | 20,400 | 1,197,684 | ||||||
|
| |||||||
| 8,785,498 | ||||||||
|
| |||||||
TOTAL COMMON STOCKS - 98.78% |
| 520,670,243 | ||||||
|
| |||||||
(Cost $520,613,133) | ||||||||
| bridgewayfunds.com | 39 | |
Small-Cap Value Fund SCHEDULE OF INVESTMENTS (Unaudited) (continued) |
|
Showing percentage of net assets as of December 31, 2022
| Industry Company | Shares | Value | ||||||
EXCHANGE TRADED FUND - 0.74% |
| |||||||
iShares Russell 2000 Value ETF | 28,000 | $ | 3,882,760 | |||||
|
| |||||||
TOTAL EXCHANGE TRADED FUND - 0.74% |
| 3,882,760 | ||||||
|
| |||||||
(Cost $4,131,538) | ||||||||
| Rate^ | Shares | Value | ||||||||||
MONEY MARKET FUND - 0.41% |
| |||||||||||
Fidelity Investments Money Market Government Portfolio Class I | 4.06 | % | 2,144,747 | 2,144,747 | ||||||||
|
| |||||||||||
TOTAL MONEY MARKET FUND - 0.41% |
| 2,144,747 | ||||||||||
|
| |||||||||||
(Cost $2,144,747) | ||||||||||||
| INVESTMENTS PURCHASED WITH CASH PROCEEDS FROM SECURITIES LENDING - 1.97% |
| |||||||||||
Dreyfus Institutional | 4.36 | % | 10,403,275 | 10,403,275 | ||||||||
|
| |||||||||||
TOTAL INVESTMENTS PURCHASED WITH CASH PROCEEDS FROM SECURITIES LENDING - 1.97% |
| 10,403,275 | ||||||||||
|
| |||||||||||
(Cost $10,403,275) |
| |||||||||||
TOTAL INVESTMENTS - 101.90% |
| $ | 537,101,025 | |||||||||
(Cost $537,292,693) |
| |||||||||||
Liabilities in Excess of Other Assets - (1.90%) |
| (10,024,004 | ) | |||||||||
|
| |||||||||||
NET ASSETS - 100.00% |
| $ | 527,077,021 | |||||||||
|
| |||||||||||
| * | Non-income producing security. |
| ** | This security represents the investment of the cash collateral received in connection with securities out on loan as of December 31, 2022. |
| ^ | Rate disclosed as of December 31, 2022. |
| + | This security or a portion of the security is out on loan as of December 31, 2022. Total loaned securities had a value of $16,990,281 as of December 31, 2022. See Note 2 for disclosure of cash and non-cash collateral. |
Summary of inputs used to value the Fund’s investments as of 12/31/2022 (See Note 2 in Notes to Financial Statements):
| Valuation Inputs | ||||||||||||||||
| Investment in Securities (Value) | ||||||||||||||||
Level 1 Quoted Prices | Level 2 Significant Observable Inputs | Level 3 Significant Unobservable Inputs | Total | |||||||||||||
Common Stocks (a) | $520,670,243 | $– | $– | $520,670,243 | ||||||||||||
Exchange Traded Fund | 3,882,760 | – | – | 3,882,760 | ||||||||||||
Money Market Fund | 2,144,747 | – | – | 2,144,747 | ||||||||||||
Investments Purchased With Cash Proceeds From Securities Lending | 10,403,275 | – | – | 10,403,275 | ||||||||||||
|
|
|
|
|
|
|
| |||||||||
TOTAL | $537,101,025 | $– | $– | $537,101,025 | ||||||||||||
|
|
|
|
|
|
|
| |||||||||
| (a) | - Please refer to the Schedule of Investments for the industry classifications of these portfolio holdings. |
See Notes to Financial Statements.
| 40 | Semi-Annual Report | December 31, 2022 (Unaudited) | |
December 31, 2022
Dear Fellow Managed Volatility Fund Shareholder,
For the quarter ended December 31, 2022, our Fund returned +4.21%, underperforming our primary market benchmark, the S&P 500 Index (+7.56%). The Fund performed in line with its design during the quarter.
For the calendar year, our Fund returned -4.93%, outperforming the S&P 500 Index (-18.11%).
The table below presents our December quarter, six months, one-year, five-year, 10-year, 15-year, and inception-to-date financial results.
| Standardized Returns as of December 31, 2022 | ||||||||||||||
| Annualized | ||||||||||||||
| Quarter | 6 Months | 1 Year | 5 Years | 10 Years | 15 Years | Since Inception (6/30/01) | ||||||||
Managed Volatility Fund | 4.21% | 5.15% | -4.93% | 4.03% | 4.58% | 3.28% | 4.07% | |||||||
S&P 500 Index | 7.56% | 2.31% | -18.11% | 9.42% | 12.56% | 8.81% | 7.54% | |||||||
Performance figures quoted in the table above represent past performance and are no guarantee of future results. Total return figures in the table above include the reinvestment of dividends and capital gains. The table above does not reflect the deduction of taxes that a shareholder would pay on Fund distributions or on the redemption of Fund shares.
The S&P 500 Index is a broad-based, unmanaged measurement of changes in stock market conditions, based on the average of 500 widely held common stocks with dividends reinvested. It is not possible to invest directly in an index. Periods longer than one year are annualized.
| bridgewayfunds.com | 41 | |
Managed Volatility Fund MANAGER’S COMMENTARY (Unaudited) (continued) |
|
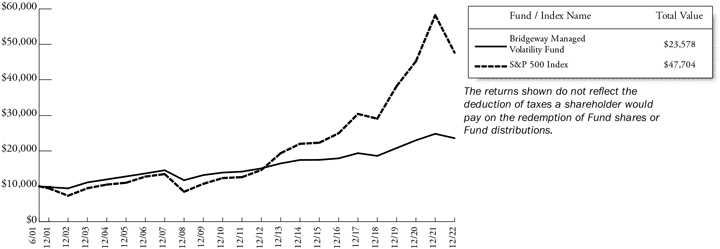
Detailed Explanation of Quarterly Performance
For the quarter, the Fund captured 56% of the S&P 500 Index’s return. The Fund had an annualized standard deviation of 8.86% during the quarter, which was 64% lower than the S&P 500’s annualized standard deviation of 24.92% during the same period. Standard deviation is a statistical tool that measures the deviation or dispersion of the data from the mean or average. When related to funds and indexes, it tells you how much the return from the Fund portfolio or index holdings is straying from the expected return, based on historical performance.
The portfolio’s futures component detracted from results, returning -1.2%. This performance was in line with expectations during a quarter characterized by a rising equity market. The portfolio’s equities component added the most to the Fund’s results, returning +3.1%. The portfolios options and fixed income components also helped the Fund’s performance, returning +2.0% and +0.2%, respectively.
Detailed Explanation of Calendar Year Performance
For the calendar year, the Fund outperformed the S&P 500 Index. The Fund’s annualized standard deviation of 10.16% was 59% lower than the S&P 500’s annualized standard deviation of 24.51% during the same period.
The portfolio’s equities component detracted from the Fund’s performance, returning -11.4%. However, the portfolio’s options and futures components added to results, returning +3.3% and +3.0%, respectively. The portfolio’s fixed income component also added to the Fund’s returns, returning +0.2.
The Fund continues to perform as designed, particularly over longer time horizons. For the past 10 years and since inception, the Fund has captured roughly 36% and 54%, respectively, of the S&P 500’s return. The Fund’s annualized standard deviation has been about 59% lower than the index’s for the last 10 years, and about 56% lower since inception.
| 42 | Semi-Annual Report | December 31, 2022 (Unaudited) | |
Managed Volatility Fund MANAGER’S COMMENTARY (Unaudited) (continued) |
|
Top Ten Holdings as of December 31, 2022
Rank
| Description
| Industry
| % of Net
| |||||
1 | Apple, Inc. | Information Technology | 4.4% | |||||
2 | UnitedHealth Group, Inc. | Health Care | 3.3% | |||||
3 | Microsoft Corp. | Information Technology | 2.5% | |||||
4 | McDonald’s Corp. | Consumer Discretionary | 1.6% | |||||
5 | Amazon.com, Inc. | Consumer Discretionary | 1.5% | |||||
6 | Alphabet, Inc., Class C | Communication Services | 1.3% | |||||
7 | Alphabet, Inc., Class A | Communication Services | 1.3% | |||||
8 | AbbVie, Inc. | Health Care | 1.0% | |||||
9 | Thermo Fisher Scientific, Inc. | Health Care | 0.9% | |||||
10 | Penske Automotive Group, Inc. | Consumer Discretionary | 0.9% | |||||
| Total | 18.7% |
Industry Sector Representation as of December 31, 2022
| Asset Type | % of Net Assets
| |||
Common Stock | 56.2% | |||
Communication Services | 3.4% | |||
Consumer Discretionary | 6.5% | |||
Consumer Staples | 3.6% | |||
Energy | 3.3% | |||
Financials | 6.2% | |||
Health Care | 9.6% | |||
Industrials | 5.2% | |||
Information Technology | 15.2% | |||
Materials | 0.9% | |||
Real Estate | 1.0% | |||
Utilities | 1.3% | |||
U.S. Government Obligations | 34.1% | |||
Call Options Written | -1.1% | |||
Put Options Written | -1.6% | |||
Money Market Fund | 6.6% | |||
Cash & Other Assets | 5.8% | |||
Total | 100% | |||
Important Disclosure
The views expressed here are exclusively those of Fund management. These views, including those related to market sectors or individual stocks, are not meant as investment advice and should not be considered predictive in nature. Any favorable (or unfavorable) description of a holding applies only as of the quarter end, December 31, 2022, unless otherwise stated. Security positions can and do change thereafter. Discussions of historical performance do not guarantee and may not be indicative of future performance.
Market volatility can significantly affect short-term performance. The Fund is not an appropriate investment for short-term investors. Investments in the small companies within this multi-cap fund generally carry greater risk than is customarily associated with larger companies. This additional risk is attributable to a number of factors, including the relatively limited financial resources that are typically available to small companies and the fact that small companies often have comparatively limited product lines. In addition, the stock of small companies tends to be more volatile than the stock of large
| bridgewayfunds.com | 43 | |
Managed Volatility Fund MANAGER’S COMMENTARY (Unaudited) (continued) |
|
companies, particularly in the short term and particularly in the early stages of an economic or market downturn. The Fund’s use of options, futures, and leverage can magnify the risk of loss in an unfavorable market, and the Fund’s use of short-sale positions can, in theory, expose shareholders to unlimited loss. Shareholders of the Fund, therefore, are taking on more risk than they would if they invested in the stock market as a whole. The Fund uses an option writing strategy in which the Fund may sell covered calls or secured put options. Options are subject to special risks and may not fully protect the Fund against declines in the value of its stocks. In addition, an option writing strategy limits the upside profit potential normally associated with stocks. Finally, the Fund’s fixed-income holdings are subject to three types of risk. Interest rate risk is the chance that bond prices overall will decline as interest rates rise. Credit risk is the chance that a bond issuer will fail to pay interest and principal. Prepayment risk is the chance that a mortgage-backed bond issuer will repay a higher yielding bond, resulting in a lower paying yield.
Conclusion
Thank you for your continued investment in Managed Volatility Fund. We encourage your feedback; your reactions and concerns are important to us.
Sincerely,
The Investment Management Team
| 44 | Semi-Annual Report | December 31, 2022 (Unaudited) | |
Showing percentage of net assets as of December 31, 2022
| Industry Company | Shares | Value | ||||||
COMMON STOCKS - 56.17% |
| |||||||
Communication Services - 3.39% |
| |||||||
Alphabet, Inc., Class A* | 4,200 | $ | 370,566 | |||||
Alphabet, Inc., Class C* | 4,200 | 372,666 | ||||||
AT&T, Inc. | 2,240 | 41,238 | ||||||
Comcast Corp., Class A | 600 | 20,982 | ||||||
Meta Platforms, Inc., Class A* | 400 | 48,136 | ||||||
Omnicom Group, Inc.# | 600 | 48,942 | ||||||
Verizon Communications, Inc. | 900 | 35,460 | ||||||
Walt Disney Co. (The)* | 565 | 49,087 | ||||||
Warner Bros Discovery, Inc.* | 541 | 5,129 | ||||||
|
| |||||||
| 992,206 | ||||||||
Consumer Discretionary - 6.51% |
| |||||||
Amazon.com, Inc.*# | 5,200 | 436,800 | ||||||
AutoZone, Inc.* | 100 | 246,618 | ||||||
Dollar General Corp. | 300 | 73,875 | ||||||
eBay, Inc.# | 500 | 20,735 | ||||||
Ford Motor Co. | 2,500 | 29,075 | ||||||
General Motors Co. | 1,300 | 43,732 | ||||||
McDonald’s Corp.# | 1,800 | 474,354 | ||||||
NIKE, Inc., Class B# | 600 | 70,206 | ||||||
Penske Automotive Group, Inc.# | 2,200 | 252,846 | ||||||
Ross Stores, Inc. | 500 | 58,035 | ||||||
Starbucks Corp.# | 400 | 39,680 | ||||||
Target Corp. | 300 | 44,712 | ||||||
Tesla, Inc.* | 600 | 73,908 | ||||||
Yum! Brands, Inc. | 300 | 38,424 | ||||||
|
| |||||||
| 1,903,000 | ||||||||
Consumer Staples - 3.61% |
| |||||||
Archer-Daniels-Midland Co. | 400 | 37,140 | ||||||
Coca-Cola Co. (The) | 1,700 | 108,137 | ||||||
Colgate-Palmolive Co.# | 400 | 31,516 | ||||||
Constellation Brands, Inc., Class A# | 500 | 115,875 | ||||||
Costco Wholesale Corp.# | 400 | 182,600 | ||||||
General Mills, Inc. | 500 | 41,925 | ||||||
J M Smucker Co. (The) | 400 | 63,384 | ||||||
Kimberly-Clark Corp.# | 600 | 81,450 | ||||||
Kroger Co. (The)# | 800 | 35,664 | ||||||
Mondelez International, Inc., Class A# | 700 | 46,655 | ||||||
PepsiCo, Inc.# | 900 | 162,594 | ||||||
Procter & Gamble Co. (The)# | 600 | 90,936 | ||||||
| Industry Company | Shares | Value | ||||||
Consumer Staples (continued) |
| |||||||
Walmart, Inc. | 400 | $ | 56,716 | |||||
|
| |||||||
| 1,054,592 | ||||||||
Energy - 3.25% |
| |||||||
Chevron Corp.# | 798 | 143,233 | ||||||
ConocoPhillips# | 1,187 | 140,066 | ||||||
EOG Resources, Inc.# | 500 | 64,760 | ||||||
Exxon Mobil Corp.# | 900 | 99,270 | ||||||
Kinder Morgan, Inc. | 800 | 14,464 | ||||||
Marathon Petroleum Corp.# | 1,200 | 139,668 | ||||||
Occidental Petroleum | ||||||||
Corp.# | 2,860 | 180,151 | ||||||
Phillips 66# | 593 | 61,720 | ||||||
Pioneer Natural Resources Co. | 100 | 22,839 | ||||||
Schlumberger, Ltd. | 600 | 32,076 | ||||||
Valero Energy Corp.# | 400 | 50,744 | ||||||
|
| |||||||
| 948,991 | ||||||||
Financials - 6.23% | ||||||||
American Express Co. | 300 | 44,325 | ||||||
Aon PLC, Class A | 200 | 60,028 | ||||||
Bank of America Corp. | 3,000 | 99,360 | ||||||
Berkshire Hathaway, Inc., Class B*# | 760 | 234,764 | ||||||
BlackRock, Inc. | 100 | 70,863 | ||||||
Capital One Financial Corp. | 200 | 18,592 | ||||||
Charles Schwab Corp. (The)# | 800 | 66,608 | ||||||
.Chubb, Ltd. | 461 | 101,697 | ||||||
Citigroup, Inc.# | 4,510 | 203,987 | ||||||
Comerica, Inc. | 300 | 20,055 | ||||||
Goldman Sachs Group, Inc. (The) | 200 | 68,676 | ||||||
Huntington Bancshares, Inc. | 3,200 | 45,120 | ||||||
JPMorgan Chase & Co.# | 1,000 | 134,100 | ||||||
KeyCorp. | 3,300 | 57,486 | ||||||
Marsh & McLennan Cos., Inc. | 400 | 66,192 | ||||||
Morgan Stanley# | 800 | 68,016 | ||||||
PNC Financial Services Group, Inc. (The) | 500 | 78,970 | ||||||
Progressive Corp. (The) | 420 | 54,478 | ||||||
S&P Global, Inc. | 400 | 133,976 | ||||||
T Rowe Price Group, Inc. | 200 | 21,812 | ||||||
Truist Financial Corp. | 300 | 12,909 | ||||||
U.S. Bancorp# | 1,900 | 82,859 | ||||||
| bridgewayfunds.com | 45 | |
Managed Volatility Fund SCHEDULE OF INVESTMENTS (Unaudited) (continued) |
|
Showing percentage of net assets as of December 31, 2022
| Industry Company | Shares | Value | ||||||
Common Stocks (continued) |
| |||||||
Financials (continued) |
| |||||||
Wells Fargo & Co.# | 1,871 | $ | 77,254 | |||||
|
| |||||||
| 1,822,127 | ||||||||
Health Care - 9.62% |
| |||||||
Abbott Laboratories# | 700 | 76,853 | ||||||
AbbVie, Inc.# | 1,859 | 300,433 | ||||||
Amgen, Inc.# | 500 | 131,320 | ||||||
Baxter International, Inc. | 300 | 15,291 | ||||||
Becton Dickinson and Co. | 173 | 43,994 | ||||||
Biogen, Inc.* | 200 | 55,384 | ||||||
Bristol-Myers Squibb Co. | 1,079 | 77,634 | ||||||
Cigna Corp. | 299 | 99,071 | ||||||
CVS Health Corp. | 400 | 37,276 | ||||||
Danaher Corp. | 200 | 53,084 | ||||||
DaVita, Inc.* | 400 | 29,868 | ||||||
Elevance Health, Inc. | 200 | 102,594 | ||||||
Embecta Corp. | 34 | 860 | ||||||
Gilead Sciences, Inc. | 400 | 34,340 | ||||||
Johnson & Johnson# | 1,000 | 176,650 | ||||||
Medtronic PLC# | 400 | 31,088 | ||||||
Merck & Co., Inc.# | 1,700 | 188,615 | ||||||
Pfizer, Inc.# | 1,700 | 87,108 | ||||||
Stryker Corp. | 160 | 39,118 | ||||||
Thermo Fisher Scientific, Inc.# | 500 | 275,345 | ||||||
UnitedHealth Group, Inc.# | 1,800 | 954,324 | ||||||
|
| |||||||
| 2,810,250 | ||||||||
Industrials - 5.15% |
| |||||||
3M Co.# | 1,800 | 215,856 | ||||||
Carrier Global Corp. | 540 | 22,275 | ||||||
Emerson Electric Co. | 400 | 38,424 | ||||||
FedEx Corp.# | 600 | 103,920 | ||||||
Hertz Global Holdings, Inc.*# | 11,000 | 169,290 | ||||||
Honeywell International, Inc. | 600 | 128,580 | ||||||
Ingersoll Rand, Inc. | 16 | 836 | ||||||
Johnson Controls International PLC# | 954 | 61,056 | ||||||
L3Harris Technologies, Inc. | 200 | 41,642 | ||||||
Lockheed Martin Corp. | 270 | 131,352 | ||||||
Northrop Grumman Corp.# | 400 | 218,244 | ||||||
Otis Worldwide Corp. | 270 | 21,144 | ||||||
Raytheon Technologies Corp.# | 1,240 | 125,141 | ||||||
Trane Technologies PLC | 200 | 33,618 | ||||||
Union Pacific Corp. | 300 | 62,121 | ||||||
| Industry Company | Shares | Value | ||||||
Industrials (continued) | ||||||||
United Parcel Service, Inc., Class B | 300 | $ | 52,152 | |||||
Waste Management, Inc. | 500 | 78,440 | ||||||
|
| |||||||
| 1,504,091 | ||||||||
Information Technology - 15.24% |
| |||||||
Accenture PLC, Class A | 200 | 53,368 | ||||||
Adobe, Inc.*# | 600 | 201,918 | ||||||
Analog Devices, Inc. | 200 | 32,806 | ||||||
Apple, Inc.# | 10,000 | 1,299,300 | ||||||
Applied Materials, Inc.# | 1,100 | 107,118 | ||||||
Automatic Data Processing, Inc. | 200 | 47,772 | ||||||
Broadcom, Inc. | 210 | 117,417 | ||||||
Cisco Systems, Inc.# | 2,000 | 95,280 | ||||||
Cognizant Technology Solutions Corp., Class A# | 700 | 40,033 | ||||||
Datadog, Inc., Class A*# | 3,000 | 220,500 | ||||||
Dell Technologies, Inc., Class C# | 2,500 | 100,550 | ||||||
Five9, Inc.*# | 100 | 6,786 | ||||||
GoDaddy, Inc., Class A*# | 500 | 37,410 | ||||||
HP, Inc. | 2,000 | 53,740 | ||||||
Intel Corp.# | 1,400 | 37,002 | ||||||
International Business Machines Corp. | 200 | 28,178 | ||||||
Intuit, Inc. | 200 | 77,844 | ||||||
Juniper Networks, Inc. | 600 | 19,176 | ||||||
Mastercard, Inc., Class A# | 600 | 208,638 | ||||||
Micron Technology, Inc.# | 2,100 | 104,958 | ||||||
Microsoft Corp.# | 3,100 | 743,442 | ||||||
NVIDIA Corp.# | 500 | 73,070 | ||||||
Oracle Corp.# | 860 | 70,297 | ||||||
Palo Alto Networks, Inc.*# | 900 | 125,586 | ||||||
PayPal Holdings, Inc.*# | 800 | 56,976 | ||||||
QUALCOMM, Inc.# | 1,800 | 197,892 | ||||||
Salesforce, Inc.*# | 700 | 92,813 | ||||||
Texas Instruments, Inc. | 470 | 77,653 | ||||||
Visa, Inc., Class A# | 600 | 124,656 | ||||||
|
| |||||||
| 4,452,179 | ||||||||
Materials - 0.92% |
| |||||||
Corteva, Inc. | 33 | 1,939 | ||||||
Dow, Inc. | 533 | 26,858 | ||||||
DuPont de Nemours, Inc. | 400 | 27,452 | ||||||
Ecolab, Inc. | 200 | 29,112 | ||||||
Freeport-McMoRan, Inc. | 1,600 | 60,800 | ||||||
Linde PLC | 300 | 97,854 | ||||||
| 46 | Semi-Annual Report | December 31, 2022 (Unaudited) | |
Managed Volatility Fund SCHEDULE OF INVESTMENTS (Unaudited) (continued) |
|
Showing percentage of net assets as of December 31, 2022
| Industry Company | Shares | Value | ||||||
Common Stocks (continued) |
| |||||||
Materials (continued) |
| |||||||
Sherwin-Williams Co. (The) | 100 | $ | 23,733 | |||||
|
| |||||||
| 267,748 | ||||||||
Real Estate - 0.95% |
| |||||||
American Tower Corp. | 300 | 63,558 | ||||||
Crown Castle, Inc.# | 500 | 67,820 | ||||||
Equinix, Inc. | 40 | 26,201 | ||||||
Prologis, Inc. | 500 | 56,365 | ||||||
Public Storage | 100 | 28,019 | ||||||
SBA Communications Corp. | 50 | 14,016 | ||||||
Welltower, Inc. | 200 | 13,110 | ||||||
Weyerhaeuser Co. | 300 | 9,300 | ||||||
|
| |||||||
| 278,389 | ||||||||
Utilities - 1.30% |
| |||||||
American Electric Power Co., Inc. | 400 | 37,980 | ||||||
Dominion Energy, Inc.# | 420 | 25,755 | ||||||
Duke Energy Corp. | 383 | 39,445 | ||||||
NextEra Energy, Inc.# | 2,500 | 209,000 | ||||||
Sempra Energy | 330 | 50,998 | ||||||
Xcel Energy, Inc. | 240 | 16,826 | ||||||
|
| |||||||
| 380,004 | ||||||||
|
| |||||||
TOTAL COMMON STOCKS - 56.17% |
| 16,413,577 | ||||||
|
| |||||||
(Cost $9,648,316) | ||||||||
| Due Date | Discount Rate or Coupon Rate(a) | Principal Amount | Value | |||||||||
U.S. GOVERNMENT OBLIGATIONS - 34.11% |
| |||||||||||
U.S. Treasury Bills - 34.11% |
| |||||||||||
01/05/2023 | 0.859 | % | $ | 3,000,000 | 2,999,394 | |||||||
01/26/2023 | 3.452 | % | 2,000,000 | 1,995,042 | ||||||||
02/09/2023 | 1.107 | % | 3,000,000 | 2,988,031 | ||||||||
02/23/2023 | 3.151 | % | 1,000,000 | 993,982 | ||||||||
03/23/2023 | 2.768 | % | 1,000,000 | 990,693 | ||||||||
|
| |||||||||||
TOTAL U.S. GOVERNMENT OBLIGATIONS |
| |||||||||||
- 34.11% |
| 9,967,142 | ||||||||||
|
| |||||||||||
(Cost $9,964,076) |
| |||||||||||
| Rate^ | Shares | Value | ||||||||||
MONEY MARKET FUND - 6.63% |
| |||||||||||
Fidelity Investments Money Market Government Portfolio Class I | 4.06 | % | | 1,936,147 | | $ | 1,936,147 | |||||
|
| |||||||||||
TOTAL MONEY MARKET FUND - 6.63% |
| 1,936,147 | ||||||||||
|
| |||||||||||
(Cost $1,936,147) |
| |||||||||||
TOTAL INVESTMENTS BEFORE |
| |||||||||||
OPTIONS WRITTEN - 96.91% |
| 28,316,866 | ||||||||||
|
| |||||||||||
(Cost $21,548,539) |
| |||||||||||
| Value | ||||||
WRITTEN OPTIONS - (2.69%) | ||||||
TOTAL WRITTEN OPTIONS - (2.69%) | $ | (786,343 | ) | |||
|
| |||||
(Premiums Received $(892,746)) | ||||||
TOTAL INVESTMENTS - 94.22% | $ | 27,530,523 | ||||
(Cost $20,655,793) | ||||||
Other Assets in Excess of Liabilities - 5.78% | 1,688,841 | |||||
|
| |||||
NET ASSETS - 100.00% | $ | 29,219,364 | ||||
|
| |||||
| * | Non-income producing security. |
| # | Security subject to call or put option written by the Fund. |
| (a) | Rate represents the effective yield at purchase. |
| ^ | Rate disclosed as of December 31, 2022. |
PLC - Public Limited Company
| bridgewayfunds.com | 47 | |
Managed Volatility Fund SCHEDULE OF INVESTMENTS (Unaudited) (continued) |
|
Showing percentage of net assets as of December 31, 2022
| Description | Number of Contracts | Notional Amount | Exercise Price | Expiration Date | Value | |||||||||||||||
EXCHANGE TRADED PUT OPTIONS WRITTEN - (1.63%) |
| |||||||||||||||||||
Alcoa Corp. | 80 | $ | (3,760) | $ | 37.00 | 01/20/23 | $ | (3,760) | ||||||||||||
APA Corp. | 55 | (2,035) | 40.00 | 01/20/23 | (2,035) | |||||||||||||||
APA Corp. | 15 | (555) | 45.00 | 01/20/23 | (2,295) | |||||||||||||||
CF Industries Holdings, Inc. | 30 | (36,900) | 97.50 | 01/20/23 | (38,700) | |||||||||||||||
Cheniere Energy, Inc. | 33 | (53,295) | 160.00 | 03/17/23 | (53,295) | |||||||||||||||
Chesapeake Energy Corp. | 30 | (11,100) | 95.00 | 01/20/23 | (11,100) | |||||||||||||||
Cleveland-Cliffs, Inc. | 120 | (4,920) | 15.00 | 01/20/23 | (4,920) | |||||||||||||||
Cleveland-Cliffs, Inc. | 86 | (3,526) | 13.00 | 01/20/23 | (860) | |||||||||||||||
Cloudflare, Inc. | 58 | (37,004) | 50.00 | 01/20/23 | (37,004) | |||||||||||||||
Colgate-Palmolive Co. | 25 | 196,975 | 75.00 | 01/20/23 | (1,025) | |||||||||||||||
ConocoPhillips | 23 | 271,400 | 130.00 | 03/17/23 | (37,260) | |||||||||||||||
Devon Energy Corp. | 42 | (36,414) | 70.00 | 01/20/23 | (36,414) | |||||||||||||||
Expedia Group, Inc. | 31 | (30,938) | 95.00 | 01/20/23 | (26,660) | |||||||||||||||
Fastenal Co. | 40 | (4,400) | 50.00 | 02/17/23 | (15,200) | |||||||||||||||
Fastenal Co. | 10 | (1,100) | 45.00 | 02/17/23 | (1,350) | |||||||||||||||
Fortinet, Inc. | 60 | (27,600) | 50.00 | 03/17/23 | (27,600) | |||||||||||||||
Johnson & Johnson | 17 | 300,305 | 175.00 | 02/17/23 | (6,205) | |||||||||||||||
JPMorgan Chase & Co. | 14 | 187,740 | 130.00 | 03/17/23 | (7,140) | |||||||||||||||
JPMorgan Chase & Co. | 10 | 134,100 | 125.00 | 03/17/23 | (3,530) | |||||||||||||||
Marathon Petroleum Corp. | 26 | 302,614 | 115.00 | 01/20/23 | (8,580) | |||||||||||||||
Medtronic PLC | 5 | (38,860) | 85.00 | 02/17/23 | (4,075) | |||||||||||||||
New Fortress Energy, Inc. | 35 | (43,155) | 50.00 | 03/17/23 | (49,000) | |||||||||||||||
Occidental Petroleum Corp. | 44 | 277,156 | 65.00 | 02/17/23 | (22,220) | |||||||||||||||
PepsiCo, Inc. | 16 | 289,056 | 180.00 | 01/20/23 | (4,256) | |||||||||||||||
Teck Resources, Ltd. | 93 | (3,441) | 31.00 | 02/17/23 | (4,371) | |||||||||||||||
Trade Desk, Inc. (The), Class A | 65 | (38,545) | 45.00 | 03/17/23 | (38,545) | |||||||||||||||
Valero Energy Corp. | 23 | 291,778 | 130.00 | 03/17/23 | (26,289) | |||||||||||||||
WillScot Mobile Mini Holdings Corp. | 20 | (2,700) | 45.00 | 01/20/23 | (2,400) | |||||||||||||||
|
| |||||||||||||||||||
Total Exchange Traded Put Options Written (Premiums Received $(525,506)) |
| $ | (476,089) | |||||||||||||||||
|
| |||||||||||||||||||
| 48 | Semi-Annual Report | December 31, 2022 (Unaudited) | |
Managed Volatility Fund SCHEDULE OF INVESTMENTS (Unaudited) (continued) |
|
Showing percentage of net assets as of December 31, 2022
| Description | Number of Contracts | Notional Amount | Exercise Price | Expiration Date | Value | |||||||||||||||
EXCHANGE TRADED CALL OPTIONS WRITTEN - (1.06%) |
| |||||||||||||||||||
3M Co. | 13 | $ | 155,896 | $ | 115.00 | 01/20/23 | $ | (8,580) | ||||||||||||
Abbott Laboratories | 3 | 32,937 | 100.00 | 02/17/23 | (3,120) | |||||||||||||||
AbbVie, Inc. | 6 | 96,966 | 155.00 | 02/17/23 | (5,298) | |||||||||||||||
Adobe, Inc. | 2 | 67,306 | 325.00 | 01/20/23 | (3,440) | |||||||||||||||
Amazon.com, Inc. | 20 | 168,000 | 95.00 | 03/17/23 | (6,500) | |||||||||||||||
Amgen, Inc. | 2 | 52,528 | 270.00 | 02/17/23 | (1,116) | |||||||||||||||
Apple, Inc. | 36 | 467,748 | 135.00 | 03/17/23 | (24,300) | |||||||||||||||
Apple, Inc. | 21 | 272,853 | 140.00 | 02/17/23 | (6,783) | |||||||||||||||
Applied Materials, Inc. | 4 | 38,952 | 90.00 | 01/20/23 | (3,580) | |||||||||||||||
Berkshire Hathaway, Inc., Class B | 2 | 61,780 | 320.00 | 03/17/23 | (1,700) | |||||||||||||||
Charles Schwab Corp. (The) | 3 | 24,978 | 80.00 | 03/17/23 | (2,010) | |||||||||||||||
Chevron Corp. | 3 | 53,847 | 180.00 | 01/20/23 | (1,425) | |||||||||||||||
Cisco Systems, Inc. | 7 | 33,348 | 45.00 | 01/20/23 | (1,617) | |||||||||||||||
Citigroup, Inc. | 37 | 167,351 | 45.00 | 03/17/23 | (10,360) | |||||||||||||||
Citigroup, Inc. | 3 | 13,569 | 47.50 | 01/20/23 | (192) | |||||||||||||||
Cognizant Technology Solutions Corp., Class A | 3 | 17,157 | 57.50 | 04/21/23 | (1,170) | |||||||||||||||
ConocoPhillips | 5 | 59,000 | 130.00 | 02/17/23 | (1,205) | |||||||||||||||
Constellation Brands, Inc., Class A | 2 | 46,350 | 235.00 | 04/21/23 | (2,460) | |||||||||||||||
Costco Wholesale Corp. | 2 | 91,300 | 470.00 | 04/21/23 | (4,448) | |||||||||||||||
Crown Castle, Inc. | 2 | 27,128 | 140.00 | 01/20/23 | (290) | |||||||||||||||
Datadog, Inc., Class A | 30 | 220,500 | 75.00 | 03/17/23 | (25,650) | |||||||||||||||
Dell Technologies, Inc., Class C | 25 | 100,550 | 35.00 | 01/20/23 | (13,750) | |||||||||||||||
Dominion Energy, Inc. | 3 | 18,396 | 77.50 | 01/20/23 | (135) | |||||||||||||||
eBay, Inc. | 2 | 8,294 | 42.50 | 03/17/23 | (494) | |||||||||||||||
EOG Resources, Inc. | 2 | 25,904 | 135.00 | 02/17/23 | (1,000) | |||||||||||||||
Exxon Mobil Corp. | 4 | 44,120 | 110.00 | 01/20/23 | (1,300) | |||||||||||||||
FedEx Corp. | 3 | 51,960 | 165.00 | 01/20/23 | (3,165) | |||||||||||||||
Five9, Inc. | 1 | 6,786 | 60.00 | 01/20/23 | (930) | |||||||||||||||
GoDaddy, Inc., Class A | 5 | 37,410 | 70.00 | 02/17/23 | (3,700) | |||||||||||||||
Hertz Global Holdings, Inc. | 110 | 169,290 | 17.50 | 03/17/23 | (7,810) | |||||||||||||||
Intel Corp. | 7 | 18,501 | 30.00 | 01/20/23 | (56) | |||||||||||||||
Johnson Controls International PLC | 4 | (25,600) | 60.00 | 01/20/23 | (1,752) | |||||||||||||||
JPMorgan Chase & Co. | 4 | 53,640 | 125.00 | 01/20/23 | (3,824) | |||||||||||||||
Kimberly-Clark Corp. | 3 | 40,725 | 140.00 | 04/21/23 | (1,329) | |||||||||||||||
Kroger Co. (The) | 3 | 13,374 | 45.00 | 01/20/23 | (273) | |||||||||||||||
Marathon Petroleum Corp. | 6 | 69,834 | 120.00 | 01/20/23 | (1,446) | |||||||||||||||
Mastercard, Inc., Class A | 2 | 69,546 | 360.00 | 03/17/23 | (3,020) | |||||||||||||||
McDonald’s Corp. | 13 | 342,589 | 270.00 | 03/17/23 | (9,386) | |||||||||||||||
Merck & Co., Inc. | 6 | 66,570 | 100.00 | 01/20/23 | (6,852) | |||||||||||||||
Micron Technology, Inc. | 7 | 34,986 | 55.00 | 03/17/23 | (1,393) | |||||||||||||||
Microsoft Corp. | 9 | 215,838 | 245.00 | 03/17/23 | (11,115) | |||||||||||||||
Mondelez International, Inc., Class A | 3 | 19,995 | 70.00 | 03/17/23 | (369) | |||||||||||||||
Morgan Stanley | 3 | 25,506 | 87.50 | 03/17/23 | (1,035) | |||||||||||||||
NextEra Energy, Inc. | 7 | 58,520 | 85.00 | 03/17/23 | (2,450) | |||||||||||||||
NIKE, Inc., Class B | 3 | 35,103 | 90.00 | 01/20/23 | (8,280) | |||||||||||||||
Northrop Grumman Corp. | 2 | 109,122 | 535.00 | 02/17/23 | (6,160) | |||||||||||||||
NVIDIA Corp. | 2 | 29,228 | 140.00 | 01/20/23 | (2,270) | |||||||||||||||
| bridgewayfunds.com | 49 | |
Managed Volatility Fund SCHEDULE OF INVESTMENTS (Unaudited) (continued) |
|
Showing percentage of net assets as of December 31, 2022
| Description | Number of Contracts | Notional Amount | Exercise Price | Expiration Date | Value | |||||||||||||||
Exchange Traded Call Options Written (continued) |
| |||||||||||||||||||
Occidental Petroleum Corp. | 25 | $ | 157,475 | $ | 65.00 | 03/17/23 | $ | (11,000) | ||||||||||||
Omnicom Group, Inc. | 3 | 24,471 | 80.00 | 02/17/23 | (1,440) | |||||||||||||||
Oracle Corp. | 4 | 32,696 | 75.00 | 01/20/23 | (2,800) | |||||||||||||||
Palo Alto Networks, Inc. | 9 | 125,586 | 155.00 | 01/20/23 | (495) | |||||||||||||||
PayPal Holdings, Inc. | 4 | 28,488 | 80.00 | 03/17/23 | (1,400) | |||||||||||||||
Penske Automotive Group, Inc. | 22 | 252,846 | 100.00 | 02/17/23 | (38,280) | |||||||||||||||
PepsiCo, Inc. | 3 | 54,198 | 180.00 | 01/20/23 | (1,011) | |||||||||||||||
Pfizer, Inc. | 5 | 25,620 | 55.00 | 03/17/23 | (480) | |||||||||||||||
Phillips 66 | 2 | 20,816 | 105.00 | 02/17/23 | (1,060) | |||||||||||||||
Procter & Gamble Co. (The) | 2 | 30,312 | 135.00 | 02/17/23 | (3,530) | |||||||||||||||
QUALCOMM, Inc. | 6 | 65,964 | 115.00 | 03/17/23 | (3,516) | |||||||||||||||
Raytheon Technologies Corp. | 4 | 40,368 | 95.00 | 02/17/23 | (3,216) | |||||||||||||||
Salesforce, Inc. | 3 | 39,777 | 165.00 | 02/17/23 | (132) | |||||||||||||||
Starbucks Corp. | 2 | 19,840 | 105.00 | 03/17/23 | (660) | |||||||||||||||
Thermo Fisher Scientific, Inc. | 2 | 110,138 | 550.00 | 03/17/23 | (6,220) | |||||||||||||||
U.S. Bancorp | 6 | 26,166 | 42.50 | 01/20/23 | (1,110) | |||||||||||||||
UnitedHealth Group, Inc. | 10 | 530,180 | 540.00 | 03/17/23 | (19,930) | |||||||||||||||
UnitedHealth Group, Inc. | 3 | 159,054 | 540.00 | 01/20/23 | (2,490) | |||||||||||||||
Visa, Inc., Class A | 3 | 62,328 | 205.00 | 01/20/23 | (1,890) | |||||||||||||||
Wells Fargo & Co. | 6 | 24,774 | 42.50 | 03/17/23 | (1,056) | |||||||||||||||
|
| |||||||||||||||||||
Total Exchange Traded Call Options Written (Premiums Received $(367,240)) |
| $ | (310,254) | |||||||||||||||||
|
| |||||||||||||||||||
| 50 | Semi-Annual Report | December 31, 2022 (Unaudited) | |
Managed Volatility Fund SCHEDULE OF INVESTMENTS (Unaudited) (continued) |
|
Summary of inputs used to value the Fund’s investments as of 12/31/2022
(See Note 2 in Notes to Financial Statements):
| Assets Table | ||||||||||||||||
| Valuation Inputs | ||||||||||||||||
| Investment in Securities (Value) | ||||||||||||||||
| Level 2 | Level 3 | |||||||||||||||
| Level 1 | Significant | Significant | ||||||||||||||
| Quoted | Observable | Unobservable | ||||||||||||||
| Prices | Inputs | Inputs | Total | |||||||||||||
Common Stocks (a) | $16,413,577 | $– | $– | $16,413,577 | ||||||||||||
U.S. Government Obligations | – | 9,967,142 | – | 9,967,142 | ||||||||||||
Money Market Fund | 1,936,147 | – | – | 1,936,147 | ||||||||||||
|
|
|
|
|
|
|
| |||||||||
TOTAL | $18,349,724 | $9,967,142 | $– | $28,316,866 | ||||||||||||
|
|
|
|
|
|
|
| |||||||||
| Liabilities Table | ||||||||||||||||
| Valuation Inputs | ||||||||||||||||
Investment in Securities (Value) | ||||||||||||||||
Level 1 Quoted Prices | Level 2 Significant Observable Inputs | Level 3 Significant Unobservable Inputs | Total | |||||||||||||
Written Options | $(562,392) | $(223,951) | $– | $(786,343) | ||||||||||||
|
|
|
|
|
|
|
| |||||||||
TOTAL | $(562,392) | $(223,951) | $– | $(786,343) | ||||||||||||
|
|
|
|
|
|
|
| |||||||||
(a) - Please refer to the Schedule of Investments for the industry classifications of these portfolio holdings.
See Notes to Financial Statements.
| bridgewayfunds.com | 51 | |
December 31, 2022 (Unaudited)
| Aggressive | Ultra-Small | |||||||||||||||
| ASSETS | Investors 1 | Company | ||||||||||||||
Investments at value(c) | $ | 140,115,266 | $ | 83,802,711 | ||||||||||||
Receivables: | ||||||||||||||||
Deposit with brokers for options written | – | – | ||||||||||||||
Portfolio securities sold | – | – | ||||||||||||||
Fund shares sold | 5,344 | – | ||||||||||||||
Dividends and interest | 410,149 | 42,011 | ||||||||||||||
Deposits with brokers for future contracts | – | – | ||||||||||||||
Prepaid expenses | 17,713 | 11,253 | ||||||||||||||
Total assets | 140,548,472 | 83,855,975 | ||||||||||||||
LIABILITIES | ||||||||||||||||
Payables: | ||||||||||||||||
Portfolio securities purchased | – | – | ||||||||||||||
Fund shares redeemed | 6,487 | 55,000 | ||||||||||||||
Due to custodian | – | 22,221 | ||||||||||||||
Loan payable | – | – | ||||||||||||||
Payable upon return of securities loaned | 1,774,661 | 4,657,864 | ||||||||||||||
Accrued Liabilities: | ||||||||||||||||
Investment adviser fees | 3,874 | 60,648 | ||||||||||||||
Administration fees | 592 | 290 | ||||||||||||||
Directors’ fees | 1,694 | 794 | ||||||||||||||
Other | 100,647 | 65,171 | ||||||||||||||
Put options written at value | – | – | ||||||||||||||
Call options written at value | – | – | ||||||||||||||
Total liabilities | 1,887,955 | 4,861,988 | ||||||||||||||
NET ASSETS | $ | 138,660,517 | $ | 78,993,987 | ||||||||||||
NET ASSETS REPRESENT | ||||||||||||||||
Paid-in capital | $ | 148,065,593 | $ | 82,554,349 | ||||||||||||
Distributable earnings | (9,405,076 | ) | (3,560,362 | ) | ||||||||||||
NET ASSETS | $ | 138,660,517 | $ | 78,993,987 | ||||||||||||
Shares of common stock outstanding of $.001 par value(a) | 2,314,515 | 3,090,758 | ||||||||||||||
Net asset value, offering price and redemption price per share | $ | 59.91 | $ | 25.56 | ||||||||||||
Total investments at cost | $ | 142,275,738 | $ | 86,564,614 | ||||||||||||
Premiums received on put options written | $ | – | $ | – | ||||||||||||
Premiums received on call options written | $ | – | $ | – | ||||||||||||
(a) See Note 1 - Organization in the Notes to Financial Statements for shares authorized for each Fund.
(b) Redemption of shares held less than six months may be charged a 2% redemption fee. See Note 8.
(c) Includes investments purchased with cash collateral for security lending, see Note 2.
See Notes to Financial Statements.
| 52 | Semi-Annual Report | December 31, 2022 (Unaudited) | |
|
|
| Ultra-Small | Small-Cap | Managed | ||||||||||||||||||
| Company Market | Value | Volatility | ||||||||||||||||||
$ | 202,669,436 | $ | 537,101,025 | $ | 28,316,866 | |||||||||||||||
| – | – | 195,304 | ||||||||||||||||||
| 1,491,043 | 427,801 | – | ||||||||||||||||||
| 40,206 | 796,561 | 100 | ||||||||||||||||||
| 162,488 | 614,309 | 17,961 | ||||||||||||||||||
| – | – | 1,523,595 | ||||||||||||||||||
| 21,295 | 57,957 | 11,573 | ||||||||||||||||||
| 204,384,468 | 538,997,653 | 30,065,399 | ||||||||||||||||||
| 157,257 | 923,790 | – | ||||||||||||||||||
| 112,419 | 146,818 | – | ||||||||||||||||||
| – | – | – | ||||||||||||||||||
| 1,025,000 | – | – | ||||||||||||||||||
| 15,178,678 | 10,403,275 | – | ||||||||||||||||||
| 58,868 | 293,117 | 5,813 | ||||||||||||||||||
| 698 | 2,085 | 145 | ||||||||||||||||||
| 3,440 | 104 | 214 | ||||||||||||||||||
| 174,713 | 151,443 | 53,520 | ||||||||||||||||||
| – | – | 476,089 | ||||||||||||||||||
| – | – | 310,254 | ||||||||||||||||||
| 16,711,073 | 11,920,632 | 846,035 | ||||||||||||||||||
$ | 187,673,395 | $ | 527,077,021 | $ | 29,219,364 | |||||||||||||||
$ | 215,608,316 | $ | 525,823,536 | $ | 21,913,083 | |||||||||||||||
| (27,934,921 | ) | 1,253,485 | 7,306,281 | |||||||||||||||||
$ | 187,673,395 | $ | 527,077,021 | $ | 29,219,364 | |||||||||||||||
| 18,305,030 | 15,179,044 | 1,886,551 | ||||||||||||||||||
$ | 10.25 | (b) | $ | 34.72 | $ | 15.49 | ||||||||||||||
$ | 221,165,620 | $ | 537,292,693 | $ | 21,548,539 | |||||||||||||||
$ | – | $ | – | $ | 525,506 | |||||||||||||||
$ | – | $ | – | $ | 367,240 | |||||||||||||||
| bridgewayfunds.com | 53 | |
Six Months Ended December 31, 2022 (Unaudited)
| Aggressive Investors 1 | Ultra-Small Company | ||||||||||||||||
INVESTMENT INCOME | |||||||||||||||||
Dividends | $ | 1,337,492 | $ | 361,763 | |||||||||||||
Less: foreign taxes withheld | (37,310 | ) | (423 | ) | |||||||||||||
Interest | 6,572 | 8,527 | |||||||||||||||
Securities lending | 19,474 | 75,330 | |||||||||||||||
Total Investment Income | 1,326,228 | 445,197 | |||||||||||||||
EXPENSES | |||||||||||||||||
Investment advisory fees - Base fees | 650,908 | 365,723 | |||||||||||||||
Investment advisory fees - Performance adjustment | (637,078 | ) | – | ||||||||||||||
Administration fees | 3,393 | 1,906 | |||||||||||||||
Accounting fees | 31,621 | 28,669 | |||||||||||||||
Transfer agent fees | 53,836 | 26,851 | |||||||||||||||
Audit fees | 6,022 | 5,475 | |||||||||||||||
Legal fees | 10,905 | 6,118 | |||||||||||||||
Custody fees | 2,950 | 7,843 | |||||||||||||||
Blue sky fees | 14,031 | 6,657 | |||||||||||||||
Directors’ and officers’ fees | 8,654 | 4,596 | |||||||||||||||
Shareholder servicing fees | 40,790 | 13,245 | |||||||||||||||
Reports to shareholders | 14,402 | 9,571 | |||||||||||||||
Insurance expenses | 6,064 | 3,227 | |||||||||||||||
Miscellaneous expenses | 9,573 | 10,490 | |||||||||||||||
Total Expenses | 216,071 | 490,371 | |||||||||||||||
Less investment advisory fees waived and other expenses reimbursed | – | – | |||||||||||||||
Net Expenses | 216,071 | 490,371 | |||||||||||||||
NET INVESTMENT INCOME (LOSS) | 1,110,157 | (45,174 | ) | ||||||||||||||
NET REALIZED AND UNREALIZED GAIN (LOSS) ON INVESTMENTS | |||||||||||||||||
Realized Gain (Loss) on: | |||||||||||||||||
Investments | (3,836,833 | ) | 5,890,936 | ||||||||||||||
Foreign Currency Transactions | (2 | ) | – | ||||||||||||||
Written options | – | – | |||||||||||||||
Futures contracts | – | – | |||||||||||||||
Net Realized Gain (Loss) | (3,836,835 | ) | 5,890,936 | ||||||||||||||
Change in Unrealized Appreciation (Depreciation) on: | |||||||||||||||||
Investments | 10,225,624 | (3,139,152 | ) | ||||||||||||||
Foreign Currency Transactions | (95 | ) | (1 | ) | |||||||||||||
Written options | – | – | |||||||||||||||
Net Change in Unrealized Appreciation (Depreciation) | 10,225,529 | (3,139,153 | ) | ||||||||||||||
Net Realized and Unrealized Gain (Loss) on Investments | 6,388,694 | 2,751,783 | |||||||||||||||
NET INCREASE (DECREASE) IN NET ASSETS RESULTING FROM OPERATIONS | $ | 7,498,851 | $ | 2,706,609 | |||||||||||||
See Notes to Financial Statements.
| 54 | Semi-Annual Report | December 31, 2022 (Unaudited) | |
|
|
| Ultra-Small Company Market | Small-Cap Value | Managed Volatility | ||||||||||||
| ||||||||||||||
| $ | 1,152,412 | $ | 6,110,104 | $ | 159,929 | |||||||||
| (553 | ) | (9,696 | ) | – | ||||||||||
| 15,116 | 62,090 | 159,600 | ||||||||||||
| 512,160 | 47,676 | – | ||||||||||||
| 1,679,135 | 6,210,174 | 319,529 | ||||||||||||
| 482,555 | 1,480,843 | 89,068 | ||||||||||||
| – | 42,974 | – | ||||||||||||
| 4,528 | 11,592 | 698 | ||||||||||||
| 39,505 | 55,545 | 26,314 | ||||||||||||
| 67,779 | 82,110 | 18,432 | ||||||||||||
| 7,488 | 17,036 | 6,903 | ||||||||||||
| 14,632 | 36,485 | 2,209 | ||||||||||||
| 11,849 | 12,619 | 3,177 | ||||||||||||
| 22,012 | 47,178 | 12,615 | ||||||||||||
| 12,172 | 24,420 | 1,624 | ||||||||||||
| 90,544 | 194,033 | 10,578 | ||||||||||||
| 19,340 | 28,651 | 7,916 | ||||||||||||
| 9,220 | 15,163 | 1,119 | ||||||||||||
| 23,126 | 49,264 | 4,296 | ||||||||||||
| 804,750 | 2,097,913 | 184,949 | ||||||||||||
| (80,918 | ) | – | (45,409 | ) | ||||||||||
| 723,832 | 2,097,913 | 139,540 | ||||||||||||
| 955,303 | 4,112,261 | 179,989 | ||||||||||||
| (10,388,963 | ) | 4,949,633 | (387,667 | ) | ||||||||||
| – | – | – | ||||||||||||
| – | – | 537,765 | ||||||||||||
| – | – | 631,550 | ||||||||||||
| (10,388,963 | ) | 4,949,633 | 781,648 | |||||||||||
| 3,187,295 | 17,845,255 | 418,129 | ||||||||||||
| (39 | ) | – | – | |||||||||||
| – | – | 88,178 | ||||||||||||
| 3,187,256 | 17,845,255 | 506,307 | ||||||||||||
| (7,201,707 | ) | 22,794,888 | 1,287,955 | |||||||||||
| $ | (6,246,404 | ) | $ | 26,907,149 | $ | 1,467,944 | ||||||||
| bridgewayfunds.com | 55 | |
| Aggressive Investors 1 | Ultra-Small Company | |||||||||||||||
Six Months Ended
| Year Ended
| Six Months Ended
| Year Ended
| |||||||||||||
| (Unaudited) | (Unaudited) | |||||||||||||||
OPERATIONS | ||||||||||||||||
Net investment income (loss) | $ | 1,110,157 | $ | 1,601,844 | $ | (45,174 | ) | $ | 469,417 | |||||||
Net realized gain (loss) on investments | (3,836,835 | ) | 4,549,754 | 5,890,936 | 21,533,226 | |||||||||||
Net change in unrealized appreciation (depreciation) on investments | 10,225,529 | (48,935,428 | ) | (3,139,153 | ) | (44,067,784 | ) | |||||||||
Net increase (decrease) in net assets resulting from operations | 7,498,851 | (42,783,830 | ) | 2,706,609 | (22,065,141 | ) | ||||||||||
DISTRIBUTIONS: | ||||||||||||||||
From net investment income and net realized gains | (2,003,138 | ) | (16,041,315 | ) | (12,493,631 | ) | (18,903,156 | ) | ||||||||
Net decrease in net assets from distributions | (2,003,138 | ) | (16,041,315 | ) | (12,493,631 | ) | (18,903,156 | ) | ||||||||
SHARE TRANSACTIONS: | ||||||||||||||||
Proceeds from sale of shares | 785,112 | 2,952,377 | 607,314 | 1,195,128 | ||||||||||||
Proceeds from shares issued in connection with acquisition from Plan of Reorganization(a) | – | – | – | – | ||||||||||||
Reinvestment of distributions | 1,909,352 | 15,459,881 | 11,514,136 | 17,262,121 | ||||||||||||
Cost of shares redeemed | (5,039,508 | ) | (14,325,323 | ) | (1,827,953 | ) | (8,593,146 | ) | ||||||||
Redemption fees | – | – | – | – | ||||||||||||
Net increase (decrease) in net assets resulting from share transactions | (2,345,044 | ) | 4,086,935 | 10,293,497 | 9,864,103 | |||||||||||
Net increase (decrease) in net assets | 3,150,669 | (54,738,210 | ) | 506,475 | (31,104,194 | ) | ||||||||||
NET ASSETS: | ||||||||||||||||
Beginning of period | 135,509,848 | 190,248,058 | 78,487,512 | 109,591,706 | ||||||||||||
End of period | $ | 138,660,517 | $ | 135,509,848 | $ | 78,993,987 | $ | 78,487,512 | ||||||||
SHARES ISSUED & REDEEMED | ||||||||||||||||
Issued | 13,090 | 37,715 | 21,345 | 34,955 | ||||||||||||
Shares issued in reorganization | – | – | – | – | ||||||||||||
Distributions reinvested | 31,286 | 200,674 | 455,825 | 526,927 | ||||||||||||
Redeemed | (81,922 | ) | (189,203 | ) | (64,467 | ) | (242,903 | ) | ||||||||
Net increase (decrease) | (37,546 | ) | 49,186 | 412,703 | 318,979 | |||||||||||
Outstanding at beginning of period | 2,352,061 | 2,302,875 | 2,678,055 | 2,359,076 | ||||||||||||
Outstanding at end of period | 2,314,515 | 2,352,061 | 3,090,758 | 2,678,055 | ||||||||||||
(a) See Note 9 - Reorganization in the Notes to Financial Statements.
See Notes to Financial Statements.
| 56 | Semi-Annual Report | December 31, 2022 (Unaudited) | |
|
|
| Ultra-Small Company Market | Small-Cap Value | |||||||||||||||||
Six Months Ended
| Year Ended
| Six Months Ended
| Year Ended
| |||||||||||||||
| (Unaudited) | (Unaudited) | |||||||||||||||||
| $ | 955,303 | $ | 2,281,180 | $ | 4,112,261 | $ | 1,821,824 | |||||||||||
| (10,388,963 | ) | 44,920,024 | 4,949,633 | 8,063,222 | ||||||||||||||
| | 3,187,256 |
| (140,034,510 | ) | 17,845,255 | (56,619,680 | ) | |||||||||||
| | (6,246,404 | ) | (92,833,306 | ) | 26,907,149 | (46,734,634 | ) | |||||||||||
| (3,941,983 | ) | (53,624,949 | ) | (4,893,779 | ) | (18,530,494 | ) | |||||||||||
| (3,941,983 | ) | (53,624,949 | ) | (4,893,779 | ) | (18,530,494 | ) | |||||||||||
| 21,360,262 | 64,813,031 | 160,699,016 | 486,184,203 | |||||||||||||||
| | – |
| – | – | 31,498,261 | |||||||||||||
| 3,707,860 | 50,228,114 | 4,723,623 | 17,763,527 | |||||||||||||||
| (16,525,485 | ) | (166,278,783 | ) | (83,071,634 | ) | (338,154,556 | ) | |||||||||||
| 15,409 | 484,129 | – | – | |||||||||||||||
| | 8,558,046 |
| (50,753,509 | ) | 82,351,005 | 197,291,435 | ||||||||||||
| (1,630,341 | ) | (197,211,764 | ) | 104,364,375 | 132,026,307 | |||||||||||||
| 189,303,736 | 386,515,500 | 422,712,646 | 290,686,339 | |||||||||||||||
| $ | 187,673,395 | $ | 189,303,736 | $ | 527,077,021 | $ | 422,712,646 | |||||||||||
| 2,019,650 | 4,188,288 | 4,557,540 | 13,083,837 | |||||||||||||||
| – | – | – | 870,985 | |||||||||||||||
| 368,208 | 3,734,432 | 135,736 | 486,768 | |||||||||||||||
| (1,554,683 | ) | (10,161,577 | ) | (2,406,984 | ) | (9,514,667 | ) | |||||||||||
| 833,175 | (2,238,857 | ) | 2,286,292 | 4,926,923 | ||||||||||||||
| 17,471,855 | 19,710,712 | 12,892,752 | 7,965,829 | |||||||||||||||
| 18,305,030 | 17,471,855 | 15,179,044 | 12,892,752 | |||||||||||||||
| bridgewayfunds.com | 57 | |
STATEMENT OF CHANGES IN NET ASETS (continued) |
|
| Managed Volatility | ||||||||
Six Months Ended
| Year Ended
| |||||||
| (Unaudited) | ||||||||
OPERATIONS | ||||||||
Net investment income (loss) | $ | 179,989 | $ | (26,779 | ) | |||
Net realized gain on investments | 781,648 | 1,298,522 | ||||||
Net change in unrealized appreciation (depreciation) on investments | 506,307 | (3,608,449 | ) | |||||
Net increase (decrease) in net assets resulting from operations | 1,467,944 | (2,336,706 | ) | |||||
DISTRIBUTIONS: | ||||||||
From net investment income and net realized gains | (1,771,090 | ) | (330,370 | ) | ||||
Net decrease in net assets from distributions | (1,771,090 | ) | (330,370 | ) | ||||
SHARE TRANSACTIONS: | ||||||||
Proceeds from sale of shares | 1,139,641 | 3,754,159 | ||||||
Proceeds from shares issued in connection with acquisition from Plan of Reorganization | – | – | ||||||
Reinvestment of distributions | 1,663,038 | 311,148 | ||||||
Cost of shares redeemed | (1,919,222 | ) | (8,918,751 | ) | ||||
Net increase (decrease) in net assets resulting from share transactions | 883,457 | (4,853,444 | ) | |||||
Net increase (decrease) in net assets | 580,311 | (7,520,520 | ) | |||||
NET ASSETS: | ||||||||
Beginning of period | 28,639,053 | 36,159,573 | ||||||
End of period | $ | 29,219,364 | $ | 28,639,053 | ||||
SHARES ISSUED & REDEEMED | ||||||||
Issued | 70,406 | 219,063 | ||||||
Shares issued in reorganization | – | – | ||||||
Distributions reinvested | 107,086 | 18,122 | ||||||
Redeemed | (119,812 | ) | (518,753 | ) | ||||
Net increase (decrease) | 57,680 | (281,568 | ) | |||||
Outstanding at beginning of period | 1,828,871 | 2,110,439 | ||||||
Outstanding at end of period | 1,886,551 | 1,828,871 | ||||||
See Notes to Financial Statements.
| 58 | Semi-Annual Report | December 31, 2022 (Unaudited) | |
(for a share outstanding throughout each period indicated)
AGGRESSIVE INVESTORS 1
| For the Six Months Ended 12/31/22 (Unaudited) | Year Ended June 30 | |||||||||||
| 2022 | 2021 | 2020 | 2019 | 2018 | ||||||||
Net Asset Value, Beginning of Period | $57.61 | $82.61 | $56.59 | $62.01 | $74.05 | $66.37 | ||||||
|
|
|
|
|
| |||||||
Income from Investment Operations: | ||||||||||||
Net Investment Income(a) | 0.48 | 0.69 | 0.86 | 0.61 | 0.98 | 0.23 | ||||||
Net Realized and Unrealized Gain (Loss) | 2.69 | (18.56) | 25.88 | (5.21) | (6.93) | 7.45 | ||||||
|
|
|
|
|
| |||||||
Total from Investment Operations | 3.17 | (17.87) | 26.74 | (4.60) | (5.95) | 7.68 | ||||||
|
|
|
|
|
| |||||||
Less Distributions to Shareholders from: | ||||||||||||
Net Investment Income | (0.87) | (0.83) | (0.72) | (0.82) | (1.21) | – | ||||||
Net Realized Gain | – | (6.30) | – | – | (4.88) | – | ||||||
|
|
|
|
|
| |||||||
Total Distributions | (0.87) | (7.13) | (0.72) | (0.82) | (6.09) | – | ||||||
|
|
|
|
|
| |||||||
Net Asset Value, End of Period | $59.91 | $57.61 | $82.61 | $56.59 | $62.01 | $74.05 | ||||||
|
|
|
|
|
| |||||||
Total Return | 5.48%(b) | (23.81%) | 47.48% | (7.53%) | (6.67%) | 11.57%(c) | ||||||
Ratios and Supplemental Data: | ||||||||||||
Net Assets, End of Period (in 000’s) | $138,661 | $135,510 | $190,248 | $142,728 | $181,367 | $227,562 | ||||||
Expenses Before Waivers and Reimbursements | 0.30%(d)(e) | 0.39%(e) | 0.34%(e) | 0.28%(e) | 0.35%(e) | 0.96% | ||||||
Expenses After Waivers and Reimbursements | 0.30%(d) | 0.39% | 0.34% | 0.28% | 0.35% | 0.96% | ||||||
Net Investment Income After Waivers and Reimbursements | 1.54%(d) | 0.90% | 1.22% | 1.04% | 1.52% | 0.31% | ||||||
Portfolio Turnover Rate | 46%(b) | 64% | 88% | 125% | 102% | 105% | ||||||
| (a) | Per share amounts calculated based on the average daily shares outstanding during the period. |
| (b) | Not annualized. |
| (c) | Includes adjustments in accordance with accounting principles generally accepted in the United States; consequently, the net asset value for financial reporting purposes and the returns based upon those net asset values may differ from the net asset values and returns for shareholder transactions. |
| (d) | Annualized for periods less than one year. |
| (e) | For period ended December 31, 2022 and the years June 30, 2022, June 30, 2021, June 30, 2020 and June 30, 2019 the expense ratios were significantly lower than in other periods, due to a negative performance adjustment to the investment advisory fee. Please refer to Note 3 of the Notes to Financial Statements for further information. The rate shown may not be indicative of the rate going forward. |
See Notes to Financial Statements.
| bridgewayfunds.com | 59 | |
FINANCIAL HIGHLIGHTS |
|
(for a share outstanding throughout each period indicated)
ULTRA-SMALL COMPANY
| For the Six Months Ended 12/31/22 (Unaudited) | Year Ended June 30 | |||||||||||
| 2022 | 2021 | 2020 | 2019 | 2018 | ||||||||
Net Asset Value, Beginning of Period | $29.31 | $46.46 | $22.06 | $24.16 | $32.13 | $30.04 | ||||||
|
|
|
|
|
| |||||||
Income from Investment Operations: | ||||||||||||
Net Investment Income (Loss)(a) | (0.02) | 0.19 | 0.16 | (0.02) | 0.28 | (0.04) | ||||||
Net Realized and Unrealized Gain (Loss) | 0.97 | (9.11) | 24.24 | (1.80) | (5.14) | 2.73 | ||||||
|
|
|
|
|
| |||||||
Total from Investment Operations | 0.95 | (8.92) | 24.40 | (1.82) | (4.86) | 2.69 | ||||||
|
|
|
|
|
| |||||||
Less Distributions to Shareholders from: | ||||||||||||
Net Investment Income | – | (0.24) | – | (0.28) | (0.01) | (0.41) | ||||||
Net Realized Gain | (4.71) | (7.99) | – | – | (3.10) | (0.19) | ||||||
|
|
|
|
|
| |||||||
Total Distributions | (4.71) | (8.23) | – | (0.28) | (3.11) | (0.60) | ||||||
|
|
|
|
|
| |||||||
Net Asset Value, End of Period | $25.56 | $29.31 | $46.46(b) | $22.06 | $24.16 | $32.13 | ||||||
|
|
|
|
|
| |||||||
Total Return | 3.45%(c) | (21.04%) | 110.61% | (7.63%) | (14.48%) | 9.13% | ||||||
Ratios and Supplemental Data: | ||||||||||||
Net Assets, End of Period (in 000’s) | $78,994 | $78,488 | $109,592 | $57,511 | $74,005 | $96,754 | ||||||
Expenses Before Waivers and Reimbursements | 1.21%(d) | 1.15% | 1.19% | 1.32% | 1.21% | 1.18% | ||||||
Expenses After Waivers and Reimbursements | 1.21%(d) | 1.15% | 1.19% | 1.32% | 1.21% | 1.18% | ||||||
Net Investment Income (Loss) After | ||||||||||||
Waivers and Reimbursements | (0.11%)(d) | 0.50% | 0.48% | (0.09%) | 1.00% | (0.14%) | ||||||
Portfolio Turnover Rate | 34%(c) | 109% | 82% | 104% | 93% | 89% | ||||||
| (a) | Per share amounts calculated based on the average daily shares outstanding during the period. |
| (b) | Includes adjustments in accordance with accounting principles generally accepted in the United States; consequently, the net asset value for financial reporting purposes and the returns based upon those net asset values may differ from the net asset values and returns for shareholder transactions. |
| (c) | Not annualized. |
| (d) | Annualized for periods less than one year. |
See Notes to Financial Statements.
| 60 | Semi-Annual Report | December 31, 2022 (Unaudited) | |
FINANCIAL HIGHLIGHTS |
|
(for a share outstanding throughout each period indicated)
ULTRA-SMALL COMPANY MARKET
| For the Six Months Ended 12/31/22 (Unaudited) | Year Ended June 30 | |||||||||||
| 2022 | 2021 | 2020 | 2019 | 2018 | ||||||||
Net Asset Value, Beginning of Period | $10.83 | $19.61 | $9.96 | $11.34 | $15.81 | $14.93 | ||||||
|
|
|
|
|
| |||||||
Income from Investment Operations: | ||||||||||||
Net Investment Income(a) | 0.05 | 0.13 | 0.13 | 0.13 | 0.11 | 0.08 | ||||||
Net Realized and Unrealized Gain (Loss) | (0.41) | (5.43) | 9.98 | (1.36) | (2.93) | 2.76 | ||||||
|
|
|
|
|
| |||||||
Total from Investment Operations | (0.36) | (5.30) | 10.11 | (1.23) | (2.82) | 2.84 | ||||||
|
|
|
|
|
| |||||||
Less Distributions to Shareholders from: | ||||||||||||
Net Investment Income | (0.11) | (0.12) | (0.14) | (0.15) | (0.08) | (0.02) | ||||||
Net Realized Gain | (0.11) | (3.39) | (0.35) | – | (1.57) | (1.94) | ||||||
|
|
|
|
|
| |||||||
Total Distributions | (0.22) | (3.51) | (0.49) | (0.15) | (1.65) | (1.96) | ||||||
|
|
|
|
|
| |||||||
Paid-in Capital from Redemption Fees(a) | 0.00(b) | 0.03 | 0.03 | 0.00(b) | 0.00(b) | 0.00(b) | ||||||
|
|
|
|
|
| |||||||
Net Asset Value, End of Period | $10.25 | $10.83 | $19.61 | $9.96 | $11.34 | $15.81 | ||||||
|
|
|
|
|
| |||||||
Total Return | (3.32%)(c)(d) | (30.38%)(d) | 103.83% | (10.99%)(d) | (16.98%)(d) | 20.86%(d) | ||||||
Ratios and Supplemental Data: | ||||||||||||
Net Assets, End of Period (in 000’s) | $187,673 | $189,304 | $386,516 | $150,054 | $236,371 | $378,144 | ||||||
Expenses Before Waivers and Reimbursements | 0.83%(e) | 0.78% | 0.75% | 0.82% | 0.77% | 0.75% | ||||||
Expenses After Waivers and Reimbursements | 0.75%(e) | 0.75% | 0.75% | 0.75% | 0.75% | 0.75% | ||||||
Net Investment Income After Waivers and Reimbursements | 0.99%(e) | 0.85% | 0.83% | 1.27% | 0.84% | 0.52% | ||||||
Portfolio Turnover Rate | 30%(c) | 47% | 52% | 51% | 38% | 35% | ||||||
| (a) | Per share amounts calculated based on the average daily shares outstanding during the period. |
| (b) | Amount represents less than $0.005. |
| (c) | Not annualized. |
| (d) | Total return would have been lower had various fees not been waived during the period. |
| (e) | Annualized for periods less than one year. |
See Notes to Financial Statements.
| bridgewayfunds.com | 61 | |
FINANCIAL HIGHLIGHTS |
|
(for a share outstanding throughout each period indicated)
SMALL-CAP VALUE
| For the Six Months Ended 12/31/22 (Unaudited) | Year Ended June 30 | |||||||||||
| 2022 | 2021 | 2020 | 2019 | 2018 | ||||||||
Net Asset Value, Beginning of Period | $32.79 | $36.49 | $16.52 | $20.24 | $29.60 | $24.82 | ||||||
|
|
|
|
|
| |||||||
Income from Investment Operations: | ||||||||||||
Net Investment Income(a) | 0.29 | 0.15 | 0.12 | 0.19 | 0.47 | 0.20 | ||||||
Net Realized and Unrealized Gain (Loss) | 1.97 | (2.12) | 20.05 | (3.40) | (5.72) | 4.81 | ||||||
|
|
|
|
|
| |||||||
Total from Investment Operations | 2.26 | (1.97) | 20.17 | (3.21) | (5.25) | 5.01 | ||||||
|
|
|
|
|
| |||||||
Less Distributions to Shareholders from: | ||||||||||||
Net Investment Income | (0.33) | (0.10) | (0.20) | (0.51) | (0.74) | (0.23) | ||||||
Net Realized Gain | – | (1.63) | – | – | (3.37) | – | ||||||
|
|
|
|
|
| |||||||
Total Distributions | (0.33) | (1.73) | (0.20) | (0.51) | (4.11) | (0.23) | ||||||
|
|
|
|
|
| |||||||
Net Asset Value, End of Period | $34.72 | $32.79 | $36.49 | $16.52 | $20.24 | $29.60 | ||||||
|
|
|
|
|
| |||||||
Total Return | 6.90%(b) | (5.81%) | 122.77% | (16.43%)(c) | (17.12%)(c) | 20.32%(c) | ||||||
Ratios and Supplemental Data: | ||||||||||||
Net Assets, End of Period (in 000’s) | $527,077 | $422,713 | $290,686 | $30,051 | $49,652 | $69,317 | ||||||
Expenses Before Waivers and Reimbursements | 0.85%(d)(e) | 0.83% | 0.91% | 1.12% | 1.00% | 0.94% | ||||||
Expenses After Waivers and Reimbursements | 0.85%(d)(e) | 0.83% | 0.91% | 0.94% | 0.94% | 0.94% | ||||||
Net Investment Income After Waivers and Reimbursements | 1.67%(d) | 0.42% | 0.40% | 1.01% | 1.97% | 0.74% | ||||||
Portfolio Turnover Rate | 25%(b) | 95% | 91% | 87% | 84% | 78% | ||||||
| (a) | Per share amounts calculated based on the average daily shares outstanding during the period. |
| (b) | Not annualized. |
| (c) | Total return would have been lower had various fees not been waived during the period. |
| (d) | Annualized for periods less than one year. |
| (e) | Includes interest expense of 0.01%. |
See Notes to Financial Statements.
| 62 | Semi-Annual Report | December 31, 2022 (Unaudited) | |
FINANCIAL HIGHLIGHTS |
|
(for a share outstanding throughout each period indicated)
MANAGED VOLATILITY
| For the Six Months Ended 12/31/22 (Unaudited) | Year Ended June 30 | |||||||||||
| 2022 | 2021 | 2020 | 2019 | 2018 | ||||||||
Net Asset Value, Beginning of Period | $15.66 | $17.13 | $15.56 | $15.05 | $15.75 | $14.79 | ||||||
|
|
|
|
|
| |||||||
Income from Investment Operations: | ||||||||||||
Net Investment Income (Loss)(a) | 0.10 | (0.01) | (0.01) | 0.12 | 0.16 | 0.10 | ||||||
Net Realized and Unrealized Gain (Loss) | 0.71 | (1.28) | 2.35 | 0.55 | 0.06 | 0.95 | ||||||
|
|
|
|
|
| |||||||
Total from Investment Operations | 0.81 | (1.29) | 2.34 | 0.67 | 0.22 | 1.05 | ||||||
|
|
|
|
|
| |||||||
Less Distributions to Shareholders from: | ||||||||||||
Net Investment Income | (0.05) | – | – | (0.16) | (0.31) | (0.09) | ||||||
Net Realized Gain | (0.93) | (0.18) | (0.77) | – | (0.61) | – | ||||||
|
|
|
|
|
| |||||||
Total Distributions | (0.98) | (0.18) | (0.77) | (0.16) | (0.92) | (0.09) | ||||||
|
|
|
|
|
| |||||||
Net Asset Value, End of Period | $15.49 | $15.66 | $17.13 | $15.56 | $15.05 | $15.75 | ||||||
|
|
|
|
|
| |||||||
Total Return(b) | 5.15%(c) | (7.62%) | 15.33% | 4.45% | 1.74% | 7.11% | ||||||
Ratios and Supplemental Data: | ||||||||||||
Net Assets, End of Period (in 000’s) | $29,219 | $28,639 | $36,160 | $29,383 | $30,657 | $32,816 | ||||||
Expenses Before Waivers and Reimbursements | 1.25%(d) | 1.19% | 1.21% | 1.27% | 1.24% | 1.20% | ||||||
Expenses After Waivers and Reimbursements | 0.94%(d) | 0.94% | 0.94% | 0.94% | 0.94% | 0.94% | ||||||
Net Investment Income (Loss) After Waivers and Reimbursements | 1.21%(d) | (0.08%) | (0.07%) | 0.77% | 1.06% | 0.64% | ||||||
Portfolio Turnover Rate | 17%(c) | 66% | 41% | 68% | 69% | 50% | ||||||
| (a) | Per share amounts calculated based on the average daily shares outstanding during the period. |
| (b) | Total return would have been lower had various fees not been waived during the period. |
| (c) | Not annualized. |
| (d) | Annualized for periods less than one year. |
See Notes to Financial Statements.
| bridgewayfunds.com | 63 | |
December 31, 2022 (Unaudited)
1. Organization
Bridgeway Funds, Inc. (“Bridgeway” or the “Company”) was organized as a Maryland corporation on October 19, 1993, and is registered under the Investment Company Act of 1940, as amended (the “1940 Act”), as an open-end management investment company.
Bridgeway is organized as a series fund, with seven investment funds as of December 31, 2022. The Aggressive Investors
1, Ultra-Small Company, Ultra-Small Company Market, Small-Cap Value, and Managed Volatility Funds are presented in this report (each is referred to as a “Fund” and collectively, the “Funds”). The Omni Small-Cap Value and Omni Tax-Managed Small-Cap Value Funds are included in a separate report.
Small-Cap Growth Fund was reorganized into Small-Cap Value Fund on September 24, 2021. (See Note 9).
Bridgeway is authorized to issue 1,915,000,000 shares of common stock at $0.001 per share. As of December 31, 2022, 15,000,000 shares have been classified into the Ultra-Small Company Fund. 100,000,000 shares each have been classified into the Aggressive Investors 1, Ultra-Small Company Market, Omni Small-Cap Value, Omni Tax-Managed Small-Cap Value, and Small-Cap Value Funds. 50,000,000 shares have been classified into the Managed Volatility Fund.
The Ultra-Small Company Fund is open to existing investors (direct only).
The Funds are no-load, diversified funds.
The Aggressive Investors 1 Fund seeks to exceed the stock market total return (primarily through capital appreciation) at a level of total risk roughly equal to that of the stock market over longer periods of time (three-year intervals or more).
The Ultra-Small Company, Ultra-Small Company Market, and Small-Cap Value Funds seek to provide a long-term total return-on-capital, primarily through capital appreciation.
The Managed Volatility Fund seeks to provide a high current return with short-term risk less than or equal to 40% of the stock market.
Bridgeway Capital Management, LLC (the “Adviser”) is the investment adviser for all of the Funds.
2. Significant Accounting Policies:
Following is a summary of significant accounting policies that are followed in the preparation of the financial statements of the Funds. They are in conformity with accounting principles generally accepted in the United States of America (“GAAP”). Each Fund is considered an investment company under GAAP and follows the accounting and reporting guidance applicable to investment companies.
Securities, Options, Futures, and Other Investments Valuation Other than options, securities for which market quotations are readily available are valued at the last sale price on the national exchange on which such securities are primarily traded. In the case of securities reported on the National Association of Securities Dealers Automated Quotation (“Nasdaq”) system, the securities are valued based on the Nasdaq Official Closing Price (“NOCP”). In the absence of recorded sales on their primary exchange, or NOCP, in the case of Nasdaq traded securities, the security will be valued as follows: bid prices for long positions and ask prices for short positions.
Fixed income securities are valued on the basis that incorporates market observable data such as reported sales of similar securities, broker quotes, bids, offers and current market quotations by a pricing service. Options are valued at the close if there is trading volume, and if there is no trading volume, the options are valued at the bid on long positions and the ask on the short positions.
Investments in open-end registered investment companies and closed-end registered investment companies that do not trade on an exchange are valued at the end of day net asset value (“NAV”) per share.
| 64 | Semi-Annual Report | December 31, 2022 (Unaudited) | |
| NOTES TO FINANCIAL STATEMENTS (continued) |
|
December 31, 2022 (Unaudited)
Investments in closed-end registered investment companies that trade on an exchange are valued at the last sales price as of the close of the customary trading session on the exchange where the security is principally traded.
When market quotations are not readily available or when events occur that make established valuation methods unreliable, securities of the Funds may be valued at fair value as determined in good faith by or under the direction of the Board of Directors. Pursuant to Rule 2a-5 under the 1940 Act, the Board has designated the Adviser as the “valuation designee” to make all necessary determinations of fair value. The valuation assigned to a fair valued security for purposes of calculating the Funds’ NAVs may differ from the security’s most recent closing market price and from the prices used by other mutual funds to calculate their NAVs.
The inputs and valuation techniques used to determine the value of a Fund’s investments are summarized into three levels as described in the hierarchy below:
| • | Level 1 — quoted prices in active markets for identical assets |
Investments whose values are based on quoted market prices in active markets, and whose values are therefore classified as Level 1 prices, include active listed equity securities. The Adviser does not adjust the quoted price for such investments, even in situations where the Funds hold a large position and a sale could reasonably impact the quoted price.
| • | Level 2 — other significant observable inputs (including quoted prices for similar securities, interest rates, prepayment speeds, credit risk, etc.) |
Investments that trade in markets that are not considered to be active, but whose values are based on quoted market prices, dealer quotations, or valuations provided by alternative pricing sources supported by observable inputs, are classified as Level 2 prices. These generally include certain US Government and sovereign obligations, most government agency securities, investment-grade corporate bonds, and less liquid listed equity securities. As investments whose values are classified as Level 2 prices include positions that are not traded in active markets and/or are subject to transfer restrictions, valuations may be adjusted to reflect illiquidity and/or non-transferability, which are generally based on available market information.
| • | Level 3 — significant unobservable inputs (including the Adviser’s own assumptions in determining the fair value of investments) |
Investments whose values are classified as Level 3 prices have significant unobservable inputs, as they may trade infrequently or not at all. When observable prices are not available for these securities, the Adviser uses one or more valuation techniques for which sufficient and reliable data is available. The inputs used by the Adviser in estimating the value of Level 3 prices may include the original transaction price, quoted prices for similar securities or assets in active markets, completed or pending third-party transactions in the underlying investment or comparable issuers, and changes in financial ratios or cash flows. Level 3 prices may also be adjusted to reflect illiquidity and/or non-transferability, with the amount of such discount estimated by the Adviser in the absence of market information. Assumptions used by the Adviser due to the lack of observable inputs may significantly impact the resulting value and therefore the results of the Funds’ operations.
The inputs or methodology used for valuing investments are not necessarily an indication of the risk associated with investing in those investments. A summary of the inputs used to value the Funds’ investments as of December 31, 2022 is included with each Fund’s Schedule of Investments.
Details regarding material transfers into, and material transfers out of, Level 3, if any, can be found at the end of each Schedule of Investments for Funds that held Level 3 securities.
Securities Lending Upon lending its securities to third parties, each participating Fund receives compensation in the form of fees. The loans are secured by collateral at least equal to the fair value of the securities loaned plus accrued interest. The remaining contractual maturity of all securities lending transactions is overnight and continuous. Each Fund has the right under the lending agreement to recover the securities from the borrower on demand. Additionally, a Fund does not have the right to sell or re-pledge collateral received in the form of securities unless the borrower goes into default. The risks to a Fund
| bridgewayfunds.com | 65 | |
NOTES TO FINANCIAL STATEMENTS (continued) |
|
December 31, 2022 (Unaudited)
of securities lending are that the borrower may not provide additional collateral when required or return the securities when due, resulting in a loss. Under the terms of the Securities Lending Agreement, the Funds are indemnified for such losses by the securities lending agent.
While securities are on loan, the Fund continues to receive dividends on the securities loaned and recognizes any unrealized gain or loss in the fair value of the securities loaned.
Securities lending transactions are entered into by a Fund under a Securities Lending Agreement which provides the right, in the event of default (including bankruptcy or insolvency) for the non-defaulting party to liquidate the collateral or to offset the market value of the collateral received against the market value of the securities loaned. The value of the collateral is typically greater than that of the market value of the securities loaned, leaving the lender with a net amount payable to the defaulting party. However, bankruptcy or insolvency laws of a particular jurisdiction may impose restrictions on or prohibitions against such a right of offset in the event of a counterparty’s bankruptcy or insolvency.
The market value of securities on loan, all of which are classified as common stocks in the Funds’ Schedules of Investments, and the value of the related cash collateral are shown in the Statements of Assets and Liabilities as a component of Investments at value. Securities lending transactions are considered to be overnight and continuous and can be terminated by the Funds or the borrower at any time. During the period ended December 31, 2022 the Managed Volatility Fund did not have any securities lending transactions.
The following table is a summary of the Funds’ payable upon return of securities loaned and related cash collateral, which are subject to a netting agreement as of December 31, 2022:
| Gross Amount Not Offset in the Statements of Assets and Liabilities | ||||||||||||||||||||||||
| Fund | Gross Amounts of Recognized Liabilities1 | Gross Amounts Offset in the Statements of Assets and Liabilities | Net Amounts of Assets Presented in the Statements of Assets and Liabilities | Financial Instruments | Collateral Received | Net Amount | ||||||||||||||||||
Aggressive Investors 1 | ||||||||||||||||||||||||
Securities lending | $1,774,661 | $– | $1,774,661 | $– | $1,774,661 | $– | ||||||||||||||||||
Ultra-Small Company | ||||||||||||||||||||||||
Securities lending | $4,657,864 | – | $4,657,864 | – | $4,657,864 | – | ||||||||||||||||||
Ultra-Small Company Market | ||||||||||||||||||||||||
Securities lending | $15,178,678 | – | $15,178,678 | – | $15,178,678 | – | ||||||||||||||||||
Small-Cap Value | ||||||||||||||||||||||||
Securities lending | $10,403,275 | – | $10,403,275 | – | $10,403,275 | – | ||||||||||||||||||
| 1 | Securities loaned with a value of $115,736 in Ultra-Small Company Market have been sold and are pending settlement on December 31, 2022. |
| 66 | Semi-Annual Report | December 31, 2022 (Unaudited) | |
NOTES TO FINANCIAL STATEMENTS (continued) |
|
December 31, 2022 (Unaudited)
The following table summarizes the securities received as non-cash collateral and cash collateral for securities lending:
| Non-Cash Collateral | ||||||||||||||||||||||||||||
| Fund | Collateral Type | Coupon Range | Maturity Date Range | Market Value | Cash Collateral | Total Collateral | Market Value of Securities on Loan | |||||||||||||||||||||
Aggressive Investors 1 | ||||||||||||||||||||||||||||
Securities lending | | U.S.Gov’t Obligations | | | 0.13%- 4.75% | | | 02/15/23- 11/15/51 | | $3,900,737 | $1,774,661 | $5,675,398 | $5,508,222 | |||||||||||||||
Ultra-Small Company | ||||||||||||||||||||||||||||
Securities lending | | U.S.Gov’t Obligations | | | 0.13%- 4.75% | | | 02/28/23- 11/15/51 | | $2,880,406 | $4,657,864 | $7,538,270 | $7,311,481 | |||||||||||||||
Ultra-Small Company Market | ||||||||||||||||||||||||||||
Securities lending | | U.S.Gov’t Obligations | | | 0.13%- 4.67% | | | 02/15/23- 11/15/51 | | $1,118,390 | $15,178,678 | $16,297,068 | $15,584,470 | |||||||||||||||
Small-Cap Value | ||||||||||||||||||||||||||||
Securities lending | | U.S.Gov’t Obligations | | | 0.13%- 4.75% | | | 02/15/23- 11/15/51 | | $7,064,537 | $10,403,275 | $17,467,812 | $16,990,281 | |||||||||||||||
It is each Fund’s policy to obtain additional collateral from, or return excess collateral to, the borrower by the end of the next business day following the valuation date of the securities loaned. Therefore, the value of the collateral held may be temporarily less than that required under the lending contract. As of December 31, 2022, the collateral consisted of an institutional government money market fund and US Government Obligations.
Use of Estimates in Financial Statements In preparing financial statements in conformity with GAAP, management makes estimates and assumptions that affect the reported amounts of assets and liabilities on the date of the financial statements and the disclosure of contingent assets and liabilities on the date of the financial statements, as well as the reported amounts of revenue and expenses during the reporting period. Actual results could differ from those estimates.
Concentrations of Credit Risk The Funds maintain cash and securities in its custody account, maintained by a high-credit, quality financial institution. Cash balances may, at times, exceed the FDIC insurance limit. Cash balances are generally invested in a short-term investment vehicle, which minimizes the risk of cash balances exceeding the FDIC insurance limit.
Sector Concentration Risk Companies with similar characteristics may be grouped together in broad categories called sectors. Although each Fund seeks investments across a number of sectors, from time to time, based on economic conditions, each Fund may have significant positions in particular sectors. A certain sector may underperform other sectors or the market as a whole. As more assets are held in a specific sector, a Fund’s performance will be more susceptible to any economic, business or other developments which generally affect that sector.
Risks and Uncertainties The Funds provide for various investment options, including stocks, bonds, and call and put options. Such investments are exposed to risks, such as interest rate, market, and credit risks. Due to the risks involved, it is at least reasonably possible that changes in risks in the near term would materially affect shareholders’ account values and the amounts reported in the financial statements.
The global pandemic outbreak of an infectious respiratory illness caused by a novel coronavirus known as COVID-19 has resulted in substantial market volatility and global business disruption, affecting the global economy and the financial health of individual companies in significant and unforeseen ways. COVID-19 has resulted in, among other things, travel restrictions, closed international borders, enhanced health screenings at ports of entry and elsewhere, disruption of and delays in healthcare service preparation and delivery, prolonged quarantines, significant disruptions to business operations, market closures, cancellations and restrictions, supply chain disruptions, lower consumer demand, and significant volatility and declines in global financial markets, as well as general concern and uncertainty. Instability in the United States, European and other credit markets has made it more difficult for borrowers to obtain financing or refinancing on attractive terms or at all. In particular, because of the current conditions in the credit markets, borrowers may be subject to increased interest expenses
| bridgewayfunds.com | 67 | |
NOTES TO FINANCIAL STATEMENTS (continued) |
|
December 31, 2022 (Unaudited)
for borrowed money and tightening underwriting standards. In addition, stock prices as well as yield could be negatively impacted to the extent that issuers of equity securities cancel or announce the suspension of dividends or share buybacks. The COVID-19 pandemic could continue to inhibit global, national, and local economic activity, and constrain access to capital and other sources of funding. Various recent government interventions have been aimed at curtailing the distress to financial markets caused by the COVID-19 outbreak. There can be no guarantee that these or other economic stimulus plans (within the United States or other affected countries throughout the world) will be sufficient or will have their intended effect. In addition, an unexpected or quick reversal of such policies could increase market volatility, which could adversely affect a Fund’s investments. The duration and future impact of COVID-19 are currently unknown, which may exacerbate the other risks that apply to a Fund and could negatively affect Fund performance and the value of your investment in a Fund.
Security Transactions, Investment Income, and Expenses Security transactions are accounted for as of the trade date, the date the order to buy or sell is executed. Realized gains and losses are computed on the identified cost basis. Dividend income is recorded on the ex-dividend date, and interest income is recorded on the accrual basis from settlement date. Particularly as related to the Managed Volatility Fund, discounts and premiums are accreted/amortized using the effective interest method. Income from the securities lending program is recorded when earned from the securities lending agent and reflected in the Statement of Operations under “Securities lending.”
Fund expenses that are not series-specific are allocated to each series based upon its relative proportion of net assets to the Funds’ total net assets or other appropriate basis.
Distributions to Shareholders The Funds pay dividends from net investment income and distribute realized capital gains annually, usually in December.
Derivatives The Funds’ use of derivatives for the period ended December 31, 2022 was limited to futures contracts, purchased options, and written options. The following is a summary of how these derivatives are treated in the financial statements and their impact on the Funds, categorized by primary underlying risk.
| Primary Underlying Risk/Fund | Derivative Assets | Derivative Liabilities | Location on Statement of Assets and Liabilities | |||
Equity Risk | ||||||
Managed Volatility: | ||||||
Written Put Options | – | $476,089 | Put options written at value | |||
Written Call Options | – | 310,254 | Call options written at value | |||
| Primary Underlying Risk/Fund | Amount of Realized Gain (Loss) on Derivatives | Amount of Unrealized Gain (Loss) on Derivatives | Location of Gain (Loss) in the Statement of Operations | |||
Equity Risk | ||||||
Managed Volatility: | ||||||
Written Options | $537,765 | Realized Gain (Loss) on Written Options | ||||
| Change in Unrealized Appreciation | ||||||
| $88,178 | (Depreciation) on Written Options | |||||
Futures Contracts | $631,550 | – | Realized Gain (Loss) on Futures Contracts | |||
The derivative instruments outstanding as of December 31, 2022, as disclosed in the Schedule of Investments, and the amounts of realized and changes in unrealized gains and losses on derivative instruments during the period ended December 31, 2022, as disclosed in the Statements of Operations, serve as indicators of the volume of derivatives activity for the Funds.
Futures Contracts The Funds may purchase or sell financial futures contracts to hedge cash positions, manage market risk, and to dampen volatility in line with investment objectives. A futures contract is an agreement between two parties to buy or sell a financial instrument at a set price on a future date. Upon entering into such a contract, a Fund is required to pledge
| 68 | Semi-Annual Report | December 31, 2022 (Unaudited) | |
NOTES TO FINANCIAL STATEMENTS (continued) |
|
December 31, 2022 (Unaudited)
to the broker an amount of cash or US Government securities equal to the minimum “initial margin” requirements of the exchange on which the futures contract is traded. The contract amount reflects the extent of a Fund’s exposure in these financial instruments. A Fund’s participation in the futures markets involves certain risks, including imperfect correlation between movements in the price of futures contracts and movements in the price of the securities hedged or used for cover. Pursuant to a contract, such Fund agrees to receive from, or pay to, the broker an amount of cash equal to the fluctuation in value of the contract. Such receipts or payments are known as “variation margin” and are recorded by a Fund as unrealized appreciation or depreciation. When a contract is closed, a Fund records a realized gain or loss equal to the difference between the value of the contract at the time it was opened and the value at the time it was closed. With futures, there is minimal counter-party risk to the Funds, since futures are exchange traded and the exchange’s clearinghouse, as counterparty to all exchange traded futures, guarantees the futures against default. As of December 31, 2022, the Funds had no open futures contracts.
Options The Managed Volatility Fund may buy and sell calls and puts to reduce the Fund’s volatility and provide some cash flow. An option is a contract conveying a right to buy or sell a financial instrument at a specified price during a stipulated period. The premium paid by a Fund for the purchase of a call or a put option is included in such Fund’s Schedule of Investments as an investment and subsequently marked-to-market to reflect the current market value of the option. When a Fund writes a call or a put option, an amount equal to the premium received by such Fund is included in its Statement of Assets and Liabilities as a liability and is subsequently marked-to-market to reflect the current market value of the option written. If an option that a Fund has written either expires on its stipulated expiration date, or if such Fund enters into a closing purchase transaction, that Fund realizes a gain (or a loss if the cost of a closing purchase transaction exceeds the premium received when the option was written) without regard to any unrealized gain or loss on the underlying security, and the liability related to such options is extinguished. If a call option that a Fund has written is assigned, such Fund realizes a gain or loss from the sale of the underlying security, and the proceeds from such sale are increased by the premium originally received. If a put option that a Fund has written is assigned, the amount of the premium originally received reduces the cost of the security that such Fund purchased upon exercise of the option. Buying calls increases a Fund’s exposure to the underlying security to the extent of any premium paid. Buying puts on a stock market index tends to limit a Fund’s exposure to a stock market decline. All options purchased by the Funds were listed on exchanges and considered liquid positions with readily available market quotes.
Covered Call Options and Secured Puts The Managed Volatility Fund may write call options on a covered basis; that is, the Fund will own the underlying security, or the Fund may write secured puts. The principal reason for writing covered calls and secured puts on a security is to attempt to realize income through the receipt of premiums. The option writer has, in return for the premium, given up the opportunity for profit from a substantial price increase in the underlying security so long as the obligation as a writer continues, but has retained the risk of loss should the price of the security decline. All options were listed on exchanges and considered liquid positions with readily available market quotes.
Outstanding written options as of December 31, 2022 for the Managed Volatility Fund are included in the Schedule of Investments.
Indemnification Under the Company’s organizational documents, the Funds’ officers, directors, employees and agents are indemnified against certain liabilities that may arise out of the performance of their duties to the Funds. Additionally, in the normal course of business, the Funds enter into contracts that contain a variety of indemnification clauses. The Funds’ maximum exposure under these arrangements is unknown, as this would involve future claims that may be made against the Funds that have not yet occurred. However, the Funds have not had prior claims or losses pursuant to these contracts.
3. Advisory Fees, Other Related Party Transactions and Contingencies:
The Funds have entered into management agreements with the Adviser. As compensation for the advisory services rendered, facilities furnished, and expenses borne by the Adviser, the Funds pay the Adviser a fee pursuant to each Fund’s management agreement, as described below.
Aggressive Investors 1 Fund and Small-Cap Value Fund each have management fees that are comprised of a base fee, which is applied to the Fund’s average annual net assets, and a performance adjustment, which adjusts the fee upward or
| bridgewayfunds.com | 69 | |
| NOTES TO FINANCIAL STATEMENTS (continued) |
|
December 31, 2022 (Unaudited)
downward depending on a Fund’s performance relative to the applicable market index over a rolling five-year performance period, and is applied to the Fund’s average daily net assets over this performance period.
Because the performance adjustment is based on a Fund’s performance relative to the applicable market index, and not the Fund’s absolute performance, the performance adjustment could increase the Adviser’s fee even if the Fund’s shares lose value over the performance period, provided that the Fund outperformed its market index, or could decrease the Adviser’s fee even if the Fund’s shares increase in value during the performance period, provided that the Fund underperformed its market index. Also, depending on a Fund’s performance relative to the applicable market index over the rolling five-year performance period, the performance adjustment could increase the Adviser’s fee even if the Fund has experienced underperformance relative to its market index in the short-term, or could decrease the Adviser’s fee even if the Fund has experienced outperformance relative to its market index in the short-term. However, no performance fee adjustment will be applied to the Adviser’s fee if the cumulative difference between a Fund’s performance and that of the applicable market index is less than or equal to 2% over the rolling five-year performance period.
Additionally, because the base fee is applied to average annual net assets, and the performance adjustment is calculated over a rolling five-year performance period, it is possible that if a Fund underperforms the applicable market index significantly over the performance period, and the Fund’s assets have declined significantly over that performance period, the negative performance adjustment may exceed the base fee. In this event, the Adviser would make a payment to the Fund.
Aggressive Investors 1: A total advisory fee is paid by the Fund to the Adviser that is comprised of a Base Fee and a Performance Adjustment. The Base Fee equals the Base Fee Rate times the average daily net assets of the Fund. The Base Fee Rate is based on the following annual rates: 0.90% of the first $250 million of the Fund’s average daily net assets, 0.875% of the next $250 million, 0.85% of the next $500 million and 0.80% of any net assets in excess of $1 billion.
The Performance Adjustment equals 4.67% times the difference in cumulative total return between the Fund and the Standard and Poor’s 500 Composite Stock Price Index with dividends reinvested (hereinafter “Index”) over a rolling five-year performance period. The Performance Adjustment Rate varies from a minimum of -0.70% to a maximum of +0.70%. However, the Performance Adjustment Rate is zero if the difference between the cumulative Fund performance and the Index performance is less than or equal to 2%.
Ultra-Small Company: The Fund pays advisory fees based on the following annual rates: 0.90% of the first $250 million of the Fund’s average daily net assets, 0.875% of the next $250 million and 0.85% of any excess over $500 million. The management fees are computed daily and are payable monthly. However, during any period when the Fund’s net assets range from $27,500,000 to $55,000,000, the advisory fee will be determined as if the Fund had $55,000,000 under management. This is limited to a maximum annualized expense ratio of 1.49% of average net assets.
Ultra-Small Company Market: The Fund’s advisory fee is a flat 0.50% of the value of the Fund’s average daily net assets, computed daily and payable monthly.
Small-Cap Value: A total advisory fee is paid by each Fund to the Adviser that is comprised of a Base Fee and a Performance Adjustment. The Base Fee equals the Base Fee Rate times the average daily net assets of the Fund. The Base Fee Rate is based on the annual rate of 0.60% of the value of each Fund’s average daily net assets.
The Performance Adjustment equals 0.33% times the difference in cumulative total return between the Fund and the Russell 2000 Value Index, with dividends reinvested (hereinafter “Index”) over a rolling five-year performance period. The Performance Adjustment Rate varies from a minimum of -0.05% to a maximum of +0.05%. However, the Performance Adjustment Rate is zero if the difference between the cumulative Fund Performance and the Index performance is less than or equal to 2%.
Managed Volatility: The Fund’s advisory fee is a flat 0.60% of the value of the Fund’s average daily net assets, computed daily and payable monthly.
Expense limitations: The Adviser has agreed to reimburse the Funds for operating expenses and management fees above the expense limitations shown in the table below, which are shown as a ratio of net expenses to average net assets, for each
| 70 | Semi-Annual Report | December 31, 2022 (Unaudited) | |
NOTES TO FINANCIAL STATEMENTS (continued) |
|
December 31, 2022 (Unaudited)
Fund, for the period ended December 31, 2022. Any material change to the expense limitation would require a vote by shareholders of the applicable Fund.
| Bridgeway Fund | Expense Limitation | Total Waivers and Reimbursements for Period Ended 12/31/22 | ||||||
Aggressive Investors 1 | 1.75 | % | $– | |||||
Ultra-Small Company | 1.85 | % | – | |||||
Ultra-Small Company Market | 0.75 | % | 80,918 | |||||
Small-Cap Value | 0.94 | % | – | |||||
Managed Volatility | 0.94 | % | 45,409 | |||||
Other Related Party Transactions: The Funds will engage in inter-portfolio trades when it is to the benefit of both parties. The Board of Directors reviews a report on inter-portfolio trades quarterly. Inter-portfolio purchases and sales during the period ended December 31, 2022 were as follows:
| Bridgeway Fund | Inter-Portfolio Purchases | Inter-Portfolio Sales | ||||||
Ultra-Small Company | $ | 5,864,207 | $ | 3,413,370 | ||||
Ultra-Small Company Market | 4,206,148 | 6,864,357 | ||||||
Small-Cap Value | 10,215,031 | 2,728,346 | ||||||
The Adviser entered into an Administrative Services Agreement with Bridgeway, pursuant to which the Adviser provides various administrative services to the Funds, including, but not limited to: (i) supervising and managing various aspects of the Funds’ business and affairs; (ii) selecting, overseeing and/or coordinating activities with other service providers to the Funds;(iii) providing reports to the Board of Directors as requested from time to time; (iv) assisting and/or reviewing amendments and updates to the Funds’ registration statement and other filings with the Securities and Exchange Commission (“SEC”); (v) providing certain shareholder services; (vi) providing administrative support in connection with meetings of the Board of Directors; and (vii) providing certain record-keeping services. For its services to all of the Bridgeway Funds, the Adviser is paid an annual aggregate fee of $150,000, payable in equal monthly installments. For the allocation of this expense to each of the Funds, please see the Statements of Operations.
Board of Directors Compensation Independent Directors are paid an annual retainer of $20,000, with an additional retainer of $5,000 paid to the Independent Chairman of the Board and an additional retainer of $1,000 paid to the Nominating and Corporate Governance Committee Chair. The retainer is paid in quarterly installments. In addition, Independent Directors are paid $14,000 per meeting for meeting fees. Such compensation is the total compensation from all Bridgeway Funds and is allocated among the Bridgeway Funds.
Independent Directors are reimbursed for any expenses incurred in attending meetings and conferences, as well as expenses for subscriptions or printed materials. The amount of directors’ fees attributable to each Fund is disclosed in the Statements of Operations.
One director of Bridgeway, John Montgomery, is an owner and director of the Adviser. Under the 1940 Act definitions, he is considered to be an “affiliated person” of the Adviser and an “interested person” of the Adviser and of Bridgeway. Compensation for Mr. Montgomery is borne by the Adviser rather than the Funds.
4. Distribution Agreement:
Foreside Fund Services, LLC acts as distributor of the Funds’ shares, pursuant to a Distribution Agreement dated September 30, 2021. The Adviser pays all costs and expenses associated with distribution of the Funds’ shares, pursuant to a protective plan adopted by shareholders pursuant to Rule 12b-1.
| bridgewayfunds.com | 71 | |
NOTES TO FINANCIAL STATEMENTS (continued) |
|
December 31, 2022 (Unaudited)
5. Purchases and Sales of Investment Securities:
Purchases and sales of investments, other than short-term securities, for each Fund for the period ended December 31, 2022 were as follows:
| Purchases | Sales | |||||||||||||||
| Bridgeway Fund | U.S. Government | Other | U.S. Government | Other | ||||||||||||
Aggressive Investors 1 | $– | $ | 64,764,372 | $– | $68,295,166 | |||||||||||
Ultra-Small Company | – | 27,357,171 | – | 29,260,765 | ||||||||||||
Ultra-Small Company Market | – | 62,600,429 | – | 56,167,116 | ||||||||||||
Small-Cap Value | – | 197,913,660 | – | 123,305,207 | ||||||||||||
Managed Volatility | – | 3,065,211 | – | 2,852,531 | ||||||||||||
6. Federal Income Taxes
It is the Funds’ policy to continue to comply with the provisions of the Internal Revenue Code of 1986, as amended (“Internal Revenue Code”), applicable to regulated investment companies, and to distribute income to the extent necessary so that the Funds are not subject to federal income tax. Therefore, no federal income tax provision is required.
Unrealized Appreciation and Depreciation on Investments (Tax Basis) The amount of net unrealized appreciation/depreciation and the cost of investment securities for tax purposes, including short-term securities as of December 31, 2022, were as follows:
| Aggressive Investors 1 | Ultra-Small Company | Ultra-Small Company Market | ||||
Gross appreciation (excess of value over tax cost) | $12,822,905 | $15,643,182 | $42,912,536 | |||
Gross depreciation (excess of tax cost over value) | (14,983,377) | (18,420,153) | (61,409,060) | |||
Net unrealized (depreciation) | $(2,160,472) | $(2,776,971) | $(18,496,524) | |||
Cost of investments for income tax purposes | $142,275,738 | $86,579,682 | $221,165,960 | |||
| Small-Cap Value | Managed Volatility | |||||
Gross appreciation (excess of value over tax cost) | $57,068,645 | $7,349,769 | ||||
Gross depreciation (excess of tax cost over value) | (57,702,930) | (544,734) | ||||
Net unrealized appreciation (depreciation) | $(634,285) | $6,805,035 | ||||
Cost of investments for income tax purposes | $537,735,310 | $20,725,488 | ||||
The differences between book and tax net unrealized appreciation (depreciation) are primarily due to wash sale and straddle loss deferrals.
Classifications of Distributions Net investment income (loss) and net realized gain (loss) may differ for financial statement and tax purposes. The character of distributions made during the year from net investment income or net realized gains may differ from its ultimate characterization for federal income tax purposes.
The tax character of the distributions paid by the Funds during the last two fiscal years ended June 30, 2022 and June 30, 2021 respectively, are as follows:
| Aggressive Investors 1 | Ultra-Small Company | |||||||||||||||||||
Year Ended | Year Ended | Year Ended | Year Ended | |||||||||||||||||
Distributions paid from: | ||||||||||||||||||||
Ordinary Income | $1,913,699 | $1,732,414 | $4,776,033 | $– | ||||||||||||||||
Long-Term Capital Gain | 14,127,616 | – | 14,127,123 | – | ||||||||||||||||
Total | $16,041,315 | $1,732,414 | $18,903,156 | $– | ||||||||||||||||
| 72 | Semi-Annual Report | December 31, 2022 (Unaudited) | |
NOTES TO FINANCIAL STATEMENTS (continued) |
|
December 31, 2022 (Unaudited)
| Ultra-Small Company Market | Small-Cap Value | |||||||||||||||||||
Year Ended | Year Ended | Year Ended | Year Ended | |||||||||||||||||
Distributions paid from: | ||||||||||||||||||||
Ordinary Income | $1,841,115 | $1,880,651 | $12,576,425 | $341,445 | ||||||||||||||||
Long-Term Capital Gain | 51,783,834 | 4,768,028 | 5,954,069 | – | ||||||||||||||||
Total | $53,624,949 | $6,648,679 | $18,530,494 | $341,445 | ||||||||||||||||
| Managed Volatility | ||||||||||||||||||||
Year Ended | Year Ended | |||||||||||||||||||
Distributions paid from: | ||||||||||||||||||||
Ordinary Income | $146,278 | $– | ||||||||||||||||||
Long-Term Capital Gain | 184,092 | 1,473,611 | ||||||||||||||||||
Total | $330,370 | $1,473,611 | ||||||||||||||||||
Components of Accumulated Earnings As of June 30, 2022, the components of accumulated earnings on a tax basis were:
| Aggressive Investors 1 | Ultra-Small Company | Ultra-Small Company Market | ||||
Accumulated Net Investment Income | $– | $– | $1,949,019 | |||
Capital Loss Carryovers | – | – | – | |||
Accumulated Net Realized Gain on Investments | – | 12,493,629 | 1,992,833 | |||
Qualified Late Year Deferred Losses* | (2,514,682) | (6,629,149) | – | |||
Other Temporary Differences** | – | – | – | |||
Net Unrealized (Depreciation) Appreciation of Investments | (12,386,107) | 362,180 | (21,688,386) | |||
Total | $(14,900,789) | $6,226,660 | $(17,746,534) |
| Small-Cap Value | Managed Volatility | |||
Accumulated Net Investment Income | $– | $– | ||
Capital Loss Carryovers | – | – | ||
Accumulated Net Realized Gain on Investments | – | 1,361,421 | ||
Qualified Late Year Deferred Losses* | (2,280,345) | – | ||
Other Temporary Differences** | – | (12,124) | ||
Net Unrealized (Depreciation) Appreciation of Investments | (18,479,540) | 6,260,130 | ||
Total | $(20,759,885) | $7,609,427 |
| * | Includes qualified late-year losses that the Funds have elected to defer to the beginning of their next fiscal year ending June 30, 2023. The Ultra Small Company Fund has elected to defer qualified short term losses of $(6,629,149). The Small-Cap Value Fund has elected to defer qualified short term and long term gains (losses) of $(2,280,345). The Aggressive Investors 1 Fund has elected to defer late-year ordinary, short term and long term capital gains (losses) of $(2,514,682). The Ultra-Small Company Market and Managed Volatility Funds have no deferred qualified ordinary late-year losses, short term capital losses or long term capital losses. |
| ** | Includes other temporary differences of $(12,124) for deferred straddle losses outstanding. |
| bridgewayfunds.com | 73 | |
NOTES TO FINANCIAL STATEMENTS (continued) |
|
December 31, 2022 (Unaudited)
For the fiscal year June 30, 2022, the Funds recorded the following reclassifications to the accounts listed below:
| Increase (Decrease) | ||||||
| Aggressive Investors 1 | Ultra-Small Company | Ultra-Small Company Market | ||||
Paid-In Capital | $14,690 | $510,366 | $6,839,365 | |||
Distributable Earnings | (14,690) | (510,366) | (6,839,365) | |||
| Increase (Decrease) | ||||||
| Small-Cap Value | Managed Volatility | |||||
Paid-In Capital | $(8,217,491) | $(26,780) | ||||
Distributable Earnings | 8,217,491 | 26,780 | ||||
The difference between book and tax components of net assets and the resulting reclassifications were primarily a result of the differing book/tax treatment of the deduction of equalization debits for tax purposes, excess distributions, the write-off of unused net operating loss, redesignation of dividends paid, investments in PFICs and the unrealized gains/(losses) from the reorganization of the Small-Cap Growth Fund into the Small-Cap Value Fund.
Accounting for Uncertainty in Income Taxes sets forth a minimum threshold for financial statement recognition of the benefit of a tax position taken or expected to be taken in a tax return. Management has analyzed each Fund’s tax positions and has concluded that no provision for income tax is required in the individual Fund’s financial statements. The Funds are not aware of any tax position for which it is reasonably possible that the total amounts of unrecognized tax benefits will significantly change in the next twelve months. Each Fund’s federal tax returns for the prior three fiscal years remain subject to examination by the Internal Revenue Service.
7. Line of Credit
Bridgeway established a line of credit agreement (“Facility”) with The Bank of New York Mellon, effective November 5, 2010. The Facility is for temporary or emergency purposes, such as to provide liquidity for shareholder redemptions, and is cancellable by either party. Unless cancelled earlier, the Facility shall be held available until October 6, 2023. Advances under the Facility are limited to $15,000,000 in total for all Funds, and advances to each Fund shall not exceed certain limits set forth in the credit agreement, including, but not limited to, the maximum amount a Fund is permitted to borrow under the 1940 Act.
The Funds incur a commitment fee of 0.10% per annum on the unused portion of the Facility and interest expense to the extent of amounts borrowed under the Facility. Interest is based on the “Overnight Rate” plus 1.25%. The Overnight Rate means the higher of (a) the Federal Funds rate, (b) the Overnight Eurodollar Rate, or (c) the One-Month Eurodollar Rate. The facility fees are payable quarterly in arrears and are allocated to all participating Funds. Interest expense is charged directly to a Fund based upon actual amounts borrowed by such Fund.
For the period ended December 31, 2022, borrowings by the Funds under this line of credit were as follows:
| Bridgeway Fund | Weighted Average Interest Rate | Weighted Loan Balance | Number Outstanding | Interest Expense Incurred1 | Maximum Amount Borrowed During the Period | ||||||||||||||||||||
Aggressive Investors 1 | 3.82% | $370,444 | 18 | $708 | $1,132,000 | ||||||||||||||||||||
Ultra-Small Company Market | 3.54% | 507,259 | 27 | 1,346 | 1,991,000 | ||||||||||||||||||||
Small-Cap Value | 3.31% | 2,759,643 | 28 | 7,101 | 5,823,000 | ||||||||||||||||||||
1Interest expense is included on the Statements of Operations in Miscellaneous expenses. |
| ||||||||||||||||||||||||
On December 31, 2022, Ultra-Small Company Market Fund had loans outstanding in the amount of $1,025,000, exclusive of interest payable on the loans.
| 74 | Semi-Annual Report | December 31, 2022 (Unaudited) | |
NOTES TO FINANCIAL STATEMENTS (continued) |
|
December 31, 2022 (Unaudited)
8. Redemption Fees
In Ultra-Small Company Market Fund, a 2% redemption fee may be charged on shares held less than six months. The fee is charged for the benefit of the remaining shareholders and will be paid to the Fund to help offset transaction costs. The fee is accounted for as an addition to paid-in capital.
9. Subsequent Events
Management has evaluated the impact of all subsequent events on the Funds and has determined that there were no subsequent events requiring recognition or disclosure in the financial statements.
| bridgewayfunds.com | 75 | |
December 31, 2022 (Unaudited)
1. Proxy Voting
A description of the policies and procedures that the Funds use to determine how to vote proxies relating to the portfolio securities and a summary of proxies voted by the Funds for the period ended December 31, 2022 are available without charge, upon request, by contacting Bridgeway Funds at 800-661-3550 and on the SEC’s website at http://www.sec.gov.
2. Fund Holdings
The complete schedules of the Funds’ holdings for the second and fourth quarters of each fiscal year are contained in the Funds’ Semi-Annual and Annual Shareholder Reports, respectively.
The Bridgeway Funds file complete schedules of the Funds’ holdings with the SEC for the first and third quarters of each fiscal year as an exhibit to Form N-PORT within 60 days after the end of the period. Copies of the Funds’ Form N-PORT exhibit are available without charge, upon request, by contacting Bridgeway Funds at 800-661-3550 and on the SEC’s website at http://www.sec.gov. You may also review and copy the Funds’ Form N-PORT exhibit at the SEC’s Public Reference Room in Washington, D.C. For more information about the operation of the Public Reference Room, please call 800-SEC-0330.
| 76 | Semi-Annual Report | December 31, 2022 (Unaudited) | |
December 31, 2022 (Unaudited)
As a shareholder of a Fund, you will incur no transaction costs from such Fund, including sales charges (loads) on purchases, on reinvested dividends or on other distributions. There are no exchange fees. Shareholders are subject to redemption fees on the Ultra-Small Company Market Fund under certain circumstances. However, as a shareholder of a Fund, you will incur ongoing costs, including management fees and other Fund expenses. The following examples are intended to help you understand your ongoing costs (in dollars) of investing in a Fund and to compare these costs with ongoing costs of investing in other mutual funds. The examples are based on an investment of $1,000 invested on July 1, 2022 and held until December 31, 2022.
Actual Expenses. The first line of the table below provides information about actual account values and actual expenses. You may use the information in this line, together with the amount you invested, to estimate the expenses that you paid over the period. Simply divide your account value by $1,000 (for example, an $8,600 account value divided by $1,000 = 8.6), then multiply the result by the number in the first line under the heading “Expenses Paid During Period” to estimate the expenses you paid on your account during the period.
Hypothetical Example for Comparison Purposes. The second line of the table below provides information about hypothetical account values and hypothetical expenses based on the Fund’s actual expense ratio and an assumed rate of return of 5% per year before expenses, which is not the Fund’s actual return. The hypothetical account values and expenses may not be used to estimate the actual ending account balance or expenses you paid for the period. You may use this information to compare the ongoing costs of investing in a Fund and other mutual funds. To do so, compare this 5% hypothetical example with the 5% hypothetical examples that appear in the shareholder reports of other funds.
The expenses shown in the table are meant to highlight ongoing Fund costs only. Therefore, the second line of the table is useful in comparing ongoing costs only and will not help you determine the relative total costs of owning different funds, because other funds may also have transaction costs, such as sales charges, redemption fees or exchange fees.
| Beginning Account Value at 7/1/22 | Ending Account Value at 12/31/22 | Expense Ratio | Expenses Paid During Period* 7/1/22 - 12/31/22 | |||||
Bridgeway Aggressive Investors 1 Fund | ||||||||
Actual Fund Return | $1,000.00 | $1,054.80 | 0.30% | $1.55 | ||||
Hypothetical Fund Return | $1,000.00 | $1,023.69 | 0.30% | $1.53 | ||||
| Bridgeway Ultra-Small Company Fund | ||||||||
Actual Fund Return | $1,000.00 | $1,034.50 | 1.21% | $6.20 | ||||
Hypothetical Fund Return | $1,000.00 | $1,019.11 | 1.21% | $6.16 | ||||
| Bridgeway Ultra-Small Company Market Fund | ||||||||
Actual Fund Return | $1,000.00 | $966.80 | 0.75% | $3.72 | ||||
Hypothetical Fund Return | $1,000.00 | $1,021.42 | 0.75% | $3.82 | ||||
| Bridgeway Small-Cap Value Fund | ||||||||
Actual Fund Return | $1,000.00 | $1,069.00 | 0.85% | $4.43 | ||||
Hypothetical Fund Return | $1,000.00 | $1,020.92 | 0.85% | $4.33 | ||||
| Bridgeway Managed Volatility Fund | ||||||||
Actual Fund Return | $1,000.00 | $1,051.50 | 0.94% | $4.86 | ||||
Hypothetical Fund Return | $1,000.00 | $1,020.47 | 0.94% | $4.79 | ||||
| * | Expenses are equal to the average account value times the Fund’s annualized expense ratio multiplied by the number of days in the most recent six- month period (184) divided by the number of days in the fiscal year (365). |
| bridgewayfunds.com | 77 | |
BRIDGEWAY FUNDS, INC.
BNY Mellon Investment Servicing (US) Inc.
P.O. Box 534435
Pittsburgh, PA 15253-4435
CUSTODIAN
The Bank of New York Mellon
One Wall Street
New York, NY 10286
DISTRIBUTOR
Foreside Fund Services, LLC
Three Canal Plaza, Suite 100
Portland, ME 04101
You can review and copy information about our Funds (including the SAIs) at the SEC’s Public Reference Room in Washington, D.C. To find out more about this public service, call the SEC at 800-SEC-0330. Reports and other information about the Funds are also available on the SEC’s website at ww.sec.gov. You can receive copies of this information, for a fee, by writing the Public Reference Section, Securities and Exchange Commission, Washington, D.C. 20549-1520 or by sending an electronic request to the following email address: publicinfo@ sec.gov.
| 1 | ||||
| 4 | ||||
| 8 | ||||
| 18 | ||||
| 22 | ||||
| 32 | ||||
| 33 | ||||
| 34 | ||||
| 35 | ||||
| 37 | ||||
| 45 | ||||
| 46 | ||||
 | ||
| ||
December 31, 2022 (Unaudited)
Bridgeway Funds Standardized Returns (%) as of December 31, 2022 (Unaudited)
Annualized | ||||||||||||||||||
| Gross | Net | |||||||||||||||||
| Fund1 | Quarter | Six Months | 1 Year | 5 Years | 10 Years | Inception to Date | Inception Date | Expense Ratio2 | Expense Ratio2 | |||||||||
Omni Small-Cap Value | 11.56 | 6.74 | -3.85 | 6.24 | 10.14 | 10.85 | 8/31/2011 | 0.66%1 | 0.60%1 | |||||||||
| Omni Tax-Managed Small-Cap Value | 11.40 | 6.58 | -5.01 | 5.56 | 9.72 | 8.93 | 12/31/2010 | 0.67%1 | 0.60%1 | |||||||||
| 1 | Some of the Fund’s fees were waived or expenses reimbursed; otherwise, returns would have been lower. The Adviser is contractually obligated to waive fees and/or pay expenses. Any material change to this Fund policy would require a vote by shareholders. |
| 2 | Expense ratios are as stated in the current prospectus. Please see financial highlights for expense ratios as of December 31, 2022. |
Performance figures quoted represent past performance and are no guarantee of future results. Current performance may be lower or higher than the performance data quoted. Investment return and principal value will fluctuate so that an investor’s shares, when redeemed, may be worth more or less than original cost. To obtain performance current to the most recent month-end, please visit our website at bridgewayfunds.com or call 800-661-3550. Total return figures include the reinvestment of dividends and capital gains. Periods of less than one year are not annualized.
This report is submitted for the general information of the shareholders of each Fund. It is not authorized for distribution to prospective investors unless preceded or accompanied by an effective prospectus, which includes information regarding a Fund’s risks, objectives, fees and expenses, experience of its management, and other information. Investors should read the prospectus carefully before investing in a Fund. For questions or other Fund information, call 800-661-3550 or visit the Funds’ website at bridgewayfunds.com. Funds are available for purchase by residents of the United States, Puerto Rico, US Virgin Islands, and Guam only.
The views expressed here are exclusively those of Fund management. These views, including those relating to the market, sectors, or individual stocks, are not meant as investment advice and should not be considered predictive in nature.
| ||
| i | Semi-Annual Report | December 31, 2022 (Unaudited) | |
Dear Fellow Shareholders,
At Bridgeway, we have a shared passion for applying logic, data, and evidence to develop investment solutions. Our Omni Small-Cap Value and Omni Tax-Managed Small-Cap Value Funds are constructed based on fundamental academic research that relies on market efficiency to better capture risk premiums. We manage these Funds to provide broad diversification within the small-cap value universe and to keep transaction fees and expenses low. Bridgeway offers the Omni Small-Cap Value and Omni Tax-Managed Small-Cap Value Funds to advisers and their clients who take a long-term perspective and whose investment goals fit our unique expertise: delivering investment solutions that are statistical and grounded in academic theory.
Thank you for your investment in Bridgeway’s Omni Small-Cap Value and Omni Tax-Managed Small-Cap Value Funds.
Sincerely,
Your Investment Management Team
|
|
| ||
| John Montgomery | Christine L. Wang | Michael Whipple | ||
| ||||
| Elena Khoziaeva |
| ||
| bridgewayfunds.com | 1 | |
| LETTER FROM THE INVESTMENT MANAGEMENT TEAM (continued) | | |
| ||
December 31, 2022 (Unaudited)
Market Review
Performance across domestic equity markets was positive for the December 2022 quarter. Broad market returns for the quarter rose +7.18%, as represented by the Russell 3000 Index.
For the 12 months ended December 31, 2022, broad market stocks fell -19.21%, as represented by the Russell 3000 Index. Value stocks outperformed growth stocks among all size categories. Larger value stocks outperformed their smaller peers, while larger growth stocks lagged their smaller peers. Large-cap value stocks, as represented by the Russell 1000 Value Index, had the best 12-month performance, returning -7.54%. Large-cap growth stocks, as represented by the Russell 1000 Growth Index, had the year’s worst performance, returning -29.14%.
The following table presents returns for the broad market, small-cap, mid-cap, and large-cap stocks, as represented by various style-based Russell Indexes. Size (market capitalization) and style (value/growth) are among the key factors that drive differences in returns among US stocks.
Russell Style-Based Indexes Ranked by Performance for the Quarter and Calendar Year Ended December 31, 2022
| Quarter | Calendar Year | |||||
| Best Performing | +12.42 % Russell 1000® Value Index | -7.54% Russell 1000® Value Index | ||||
+12.18 % Russell 3000® Value Index | -7.98% Russell 3000® Value Index | |||||
+10.45 % Russell Midcap® Value Index | -12.03% Russell Midcap® Value Index | |||||
+8.42 % Russell 2000® Value Index | -14.48% Russell 2000® Value Index | |||||
+6.90 % Russell Midcap® Growth Index | -26.36% Russell 2000® Growth Index | |||||
+4.13 % Russell 2000® Growth Index | -26.72% Russell Midcap® Growth Index | |||||
+2.31 % Russell 3000® Growth Index | -28.97% Russell 3000® Growth Index | |||||
| Worst Performing | +2.20 % Russell 1000® Growth Index | -29.14% Russell 1000® Growth Index |
The Bridgeway Omni Funds in this semi-annual report are asset class exposure strategies that seek broad diversification and strive for risk premium exposure with low tracking error. These Funds were designed to capture the size and style benefits within the small-cap value asset class.
The Russell 3000 Index is an unmanaged market-capitalization-weighted equity index. The index tracks the performance of the 3,000 largest US-traded stocks, which collectively account for roughly 97% of all US-incorporated equities. The Russell 3000 Value Index consists of stocks in the Russell 3000 Index with relatively lower price-to-book ratios and lower forecasted growth values. The Russell 3000 Growth Index consists of stocks in the Russell 3000 Index that display signs of above-average growth. The Russell 1000 Index is a stock market index that tracks the highest-ranking 1,000 stocks in the Russell 3000 Index. The Russell 1000 Value Index is a large-cap stock market index that consists of stocks in the Russell 1000 Index with lower price-to-book ratios and lower forecasted growth values. The Russell 1000 Growth Index is a large-cap stock market index that consists of stocks in the Russell 1000 Index that display signs of above-average growth. The Russell Midcap Index measures the performance of the 800 smallest companies in the Russell 1000 Index. The Russell Midcap Value Index is a midcap value index that consists of stocks in the Russell Midcap Index with lower price-to-book ratios and lower forecasted growth values. The Russell Midcap Growth Index is a midcap growth index that consists of stocks in the Russell Midcap Index that display signs of above-average growth. The Russell 2000 Index is a small-cap stock market index that makes up the smallest 2,000 stocks in the Russell 3000 Index. The Russell 2000 Value Index is a small-cap stock market index that consists of stocks in the Russell 2000 Index with lower price-to-book ratios and lower
| ||
| 2 | Semi-Annual Report | December 31, 2022 (Unaudited) | |
| LETTER FROM THE INVESTMENT MANAGEMENT TEAM (continued) | | |
| ||
| December 31, 2022 (Unaudited) | ||
forecasted growth values. The Russell 2000 Growth Index is a small-cap stock market index that consists of stocks in the Russell 2000 Index that display signs of above-average growth. It is not possible to invest directly in an index.
| ||
| bridgewayfunds.com | 3 | |
December 31, 2022
Dear Fellow Omni Small-Cap Value Fund Shareholder,
For the quarter ended December 31, 2022, our Fund returned +11.56%, outperforming our primary market benchmark, the Russell 2000 Value Index (+8.42%). It was a good quarter.
For the calendar year, our Fund returned -3.85%, outperforming the Russell 2000 Value Index (-14.48%).
The table below presents our December quarter, six months, one-year, five-year, 10-year, and inception-to-date financial results. See the next page for a graph of performance since inception.
Standardized Returns as of December 31, 2022
| Annualized | ||||||||||||||||||||||||
| Quarter | 6 Months | 1 Year | 5 Years | 10 Years | Since Inception (8/31/11) | |||||||||||||||||||
Omni Small-Cap Value Fund | 11.56% | 6.74 | % | -3.85 | % | 6.24 | % | 10.14 | % | 10.85 | % | |||||||||||||
Russell 2000 Value Index | 8.42% | 3.42 | % | -14.48 | % | 4.13 | % | 8.48 | % | 9.34 | % | |||||||||||||
Performance figures quoted in the table above and the graph on the next page represent past performance and are no guarantee of future results. Total return figures in the table above include the reinvestment of dividends and capital gains. The table above and the graph on the next page do not reflect the deduction of taxes that a shareholder would pay on Fund distributions or on the redemption of Fund shares.
The Russell 2000 Value Index is an unmanaged index that consists of stocks in the Russell 2000 Index with lower price-to-book ratios and lower forecasted growth values with dividends reinvested. It is not possible to invest directly in an index. Periods longer than one year are annualized.
| ||
| 4 | Semi-Annual Report | December 31, 2022 (Unaudited) | |
Omni Small-Cap Value Fund MANAGER’S COMMENTARY (Unaudited) (continued) | | |
| ||
Growth of a $10,000 Investment
from Inception August 31, 2011 to December 31, 2022
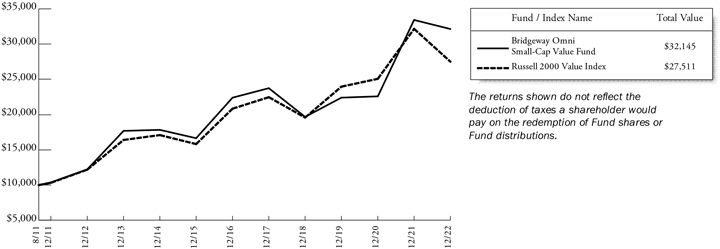
Detailed Explanation of Quarterly Performance
The Omni Small-Cap Value Fund is designed to capture the returns of the small-cap value asset class through broad diversification of small company and value stocks. This approach is sometimes referred to as “passive, asset class investing.” As of December 31, 2022, we held 580 such stocks in a market-cap weighted style. We make no attempt to track any particular index in either performance or statistics.
The Fund’s tilt toward deeper value stocks across multiple valuation metrics improved relative returns during the quarter. However, the Fund’s tilt toward smaller stocks in the small-cap value universe detracted from relative results, as the benchmark’s larger stocks generally outperformed during the quarter.
By design, the Fund does not hold Real Estate Investment Trusts (REITs) or Utilities stocks. The lack of exposure to REITs benefited relative results, but the lack of exposure to the Utilities stocks dragged on relative performance as the Utilities sector outperformed the benchmark during the quarter.
Detailed Explanation of Calendar Year Performance
The Fund’s tilt toward deeper value stocks across multiple valuation metrics boosted relative results during a period in which value stocks outperformed growth stocks. However, a tilt toward smaller stocks in the small-cap value universe detracted from relative results as smaller stocks underperformed their larger counterparts for the year.
By design, the Fund does not hold Real Estate Investment Trusts (REITs) and Utilities stocks. Our lack of exposure to REITs boosted relative results, but the lack of exposure to Utilities stocks detracted from relative performance.
| ||
| bridgewayfunds.com | 5 | |
Omni Small-Cap Value Fund MANAGER’S COMMENTARY (Unaudited) (continued) | | |
| ||
Top Ten Holdings as of December 31, 2022
| Rank | Description | Industry | % of Net Assets | |||
1 | PBF Energy, Inc., Class A | Energy | 1.2% | |||
2 | Scorpio Tankers, Inc. | Energy | 1.0% | |||
3 | Permian Resources Corp. | Energy | 1.0% | |||
4 | CONSOL Energy, Inc. | Energy | 0.8% | |||
5 | Golar LNG, Ltd. | Energy | 0.8% | |||
6 | United Natural Foods, Inc. | Consumer Staples | 0.8% | |||
7 | Atlas Air Worldwide Holdings, Inc. | Industrials | 0.7% | |||
8 | Weis Markets, Inc. | Consumer Staples | 0.7% | |||
9 | Frontline, Ltd. | Energy | 0.7% | |||
10 | Navient Corp. | Financials | 0.7% | |||
Total | 8.4% |
Industry Sector Representation as of December 31, 2022
| % of Net Assets |
% of Russell 2000 | Difference | ||||||
Communication Services | 4.8% | 2.9% | 1.9% | |||||
Consumer Discretionary | 12.0% | 10.0% | 2.0% | |||||
Consumer Staples | 4.6% | 2.7% | 1.9% | |||||
Energy | 14.3% | 6.2% | 8.1% | |||||
Financials | 36.9% | 28.8% | 8.1% | |||||
Health Care | 2.4% | 10.5% | -8.1% | |||||
Industrials | 13.3% | 13.3% | 0.0% | |||||
Information Technology | 4.2% | 5.5% | -1.3% | |||||
Materials | 6.8% | 4.1% | 2.7% | |||||
Real Estate | 0.7% | 10.7% | -10.0% | |||||
Utilities | 0.0% | 5.3% | -5.3% | |||||
Cash & Other Assets | 0.0% | 0.0% | 0.0% | |||||
Total | 100.0% | 100.0% | ||||||
Important Disclosure
The views expressed here are exclusively those of Fund management. These views, including those related to market sectors or individual stocks, are not meant as investment advice and should not be considered predictive in nature. Any favorable (or unfavorable) description of a holding applies only as of the quarter-end, December 31, 2022, unless otherwise stated. Security positions can and do change thereafter. Discussions of historical performance do not guarantee and may not be indicative of future performance.
Market volatility can significantly impact short-term performance. The Fund is not an appropriate investment for short-term investors. Investments in small companies generally carry greater risk than is customarily associated with larger companies. This additional risk is attributable to a number of factors, including the relatively limited financial resources that are typically available to small companies and the fact that small companies often have comparatively limited product lines. In addition, the stock of small companies tends to be more volatile than the stock of large companies, particularly in the short term and particularly in the early stages of an economic or market downturn. Shareholders of the Fund, therefore, are taking on more risk than they would if they invested in the stock market as a whole.
| ||
| 6 | Semi-Annual Report | December 31, 2022 (Unaudited) | |
Omni Small-Cap Value Fund MANAGER’S COMMENTARY (Unaudited) (continued) | | |
| ||
Conclusion
Thank you for your continued investment in Omni Small-Cap Value Fund. We encourage your feedback; your reactions and concerns are important to us.
Sincerely,
The Investment Management Team
| ||
| bridgewayfunds.com | 7 | |
Omni Small-Cap Value Fund | | |
| ||
| Showing percentage of net assets as of December 31, 2022 | ||
| Industry Company | Shares | Value | ||||||
COMMON STOCKS - 99.99% |
| |||||||
Communication Services - 4.85% |
| |||||||
Advantage Solutions, Inc.* | 1,500,000 | $3,120,000 | ||||||
AMC Networks, Inc., Class A* | 95,500 | 1,496,485 | ||||||
ATN International, Inc. | 63,500 | 2,877,185 | ||||||
Beasley Broadcast Group, Inc., Class A* | 163,600 | 150,545 | ||||||
comScore, Inc.* | 228,300 | 264,828 | ||||||
Consolidated Communications Holdings, Inc.* | 299,000 | 1,070,420 | ||||||
Cumulus Media, Inc., | ||||||||
Class A* | 120,200 | 746,442 | ||||||
DHI Group, Inc.* | 18,600 | 98,394 | ||||||
EchoStar Corp., Class A* | 317,500 | 5,295,900 | ||||||
Entravision Communications Corp., Class A | 339,800 | 1,631,040 | ||||||
EW Scripps Co. (The), Class A* | 356,166 | 4,697,829 | ||||||
Fluent, Inc.* | 320,000 | 348,800 | ||||||
Gannett Co., Inc.* | 625,900 | 1,270,577 | ||||||
Gray Television, Inc. | 319,400 | 3,574,086 | ||||||
Liberty Latin America, Ltd., Class A* | 100,000 | 753,000 | ||||||
Liberty Latin America, Ltd., Class C*+ | 550,000 | 4,180,000 | ||||||
Marcus Corp. (The) | 143,000 | 2,057,770 | ||||||
Saga Communications, Inc., Class A | 21,761 | 513,560 | ||||||
Salem Media Group, Inc.* | 55,800 | 58,590 | ||||||
Scholastic Corp. | 166,750 | 6,579,955 | ||||||
Sinclair Broadcast Group, Inc., Class A | 319,300 | 4,952,343 | ||||||
SPAR Group, Inc.* | 27,237 | 35,680 | ||||||
Spok Holdings, Inc. | 4,100 | 33,579 | ||||||
Telephone and Data Systems, Inc.+ | 465,800 | 4,886,242 | ||||||
Thryv Holdings, Inc.* | 148,000 | 2,812,000 | ||||||
Townsquare Media, Inc., Class A* | 129,900 | 941,775 | ||||||
Urban One, Inc.* | 151,800 | 570,768 | ||||||
|
| |||||||
| 55,017,793 | ||||||||
Consumer Discretionary - 12.01% |
| |||||||
Aaron’s Co., Inc. (The) | 105,000 | 1,254,750 | ||||||
Abercrombie & Fitch Co., | 215,000 | 4,925,650 | ||||||
Adtalem Global Education, Inc.* | 132,200 | 4,693,100 | ||||||
AMCON Distributing Co. | 2,450 | 443,450 | ||||||
| Industry Company | Shares | Value | ||||||
|
| |||||||
Consumer Discretionary (continued) |
| |||||||
American Axle & Manufacturing Holdings, Inc.* | 357,500 | $2,795,650 | ||||||
American Public Education, Inc.* | 61,500 | 755,835 | ||||||
AMMO, Inc.* | 61,200 | 105,876 | ||||||
Ark Restaurants Corp. | 21,100 | 349,416 | ||||||
Bally’s Corp.* | 150,000 | 2,907,000 | ||||||
Bassett Furniture Industries, Inc. | 26,750 | 464,915 | ||||||
Beazer Homes USA, Inc.* | 118,500 | 1,512,060 | ||||||
Big 5 Sporting Goods Corp.+ | 148,700 | 1,313,021 | ||||||
Big Lots, Inc.+ | 100,000 | 1,470,000 | ||||||
Biglari Holdings, Inc., Class B* | 6,200 | 860,560 | ||||||
Bluegreen Vacations Holding Corp. | 73,551 | 1,835,833 | ||||||
Carrols Restaurant Group, Inc.* | 168,700 | 229,432 | ||||||
Cato Corp. (The), Class A | 114,700 | 1,070,151 | ||||||
Century Casinos, Inc.* | 67,400 | 473,822 | ||||||
Charles & Colvard, Ltd.* | 42,700 | 34,800 | ||||||
China Automotive Systems, Inc.* | 146,350 | 848,830 | ||||||
Chuy’s Holdings, Inc.* | 23,000 | 650,900 | ||||||
Conn’s, Inc.* | 63,900 | 439,632 | ||||||
Container Store Group, Inc. (The)* | 226,150 | 974,706 | ||||||
Crown Crafts, Inc. | 21,050 | 112,407 | ||||||
Delta Apparel, Inc.* | 42,100 | 446,681 | ||||||
Dillard’s, Inc., Class A+ | 18,600 | 6,011,520 | ||||||
Dixie Group, Inc. (The)* | 44,950 | 36,005 | ||||||
El Pollo Loco Holdings, Inc. | 108,300 | 1,078,668 | ||||||
Ethan Allen Interiors, Inc. | 75,500 | 1,994,710 | ||||||
Flanigan’s Enterprises, Inc. | 14,000 | 362,320 | ||||||
Flexsteel Industries, Inc. | 14,700 | 226,380 | ||||||
Fossil Group, Inc.* | 137,000 | 590,470 | ||||||
Genesco, Inc.* | 59,500 | 2,738,190 | ||||||
G-III Apparel Group, Ltd.* | 102,800 | 1,409,388 | ||||||
Golden Entertainment, Inc.* | 4,500 | 168,300 | ||||||
Good Times Restaurants, Inc.* | 106,000 | 236,380 | ||||||
GoPro, Inc., Class A* | 563,800 | 2,807,724 | ||||||
Haverty Furniture Cos., Inc. | 82,400 | 2,463,760 | ||||||
Hibbett, Inc. | 45,900 | 3,131,298 | ||||||
Hooker Furnishings Corp. | 26,000 | 486,200 | ||||||
JAKKS Pacific, Inc.* | 40,000 | 699,600 | ||||||
Lakeland Industries, Inc.* | 33,450 | 444,885 | ||||||
Lands’ End, Inc.*+ | 116,000 | 880,440 | ||||||
Landsea Homes Corp.* | 90,300 | 470,463 | ||||||
| ||
| 8 | Semi-Annual Report | December 31, 2022 (Unaudited) | |
Omni Small-Cap Value Fund SCHEDULE OF INVESTMENTS (Unaudited) (continued) | | |
| ||
| Showing percentage of net assets as of December 31, 2022 | ||
| Industry Company | Shares | Value | ||||||
Common Stocks (continued) | ||||||||
Consumer Discretionary (continued) |
| |||||||
La-Z-Boy, Inc. | 166,000 | $ | 3,788,120 | |||||
Lazydays Holdings, Inc.*+ | 44,000 | 525,360 | ||||||
Legacy Housing Corp.* | 38,331 | 726,756 | ||||||
Lifetime Brands, Inc. Lincoln Educational | 77,650 | 589,363 | ||||||
Services Corp.* | 211,000 | 1,221,690 | ||||||
Live Ventures, Inc.* | 13,750 | 430,375 | ||||||
M/I Homes, Inc.* | 118,200 | 5,458,476 | ||||||
MarineMax, Inc.* | 77,000 | 2,403,940 | ||||||
Modine Manufacturing Co.* | 162,800 | 3,233,208 | ||||||
Motorcar Parts of America, Inc.* | 7,100 | 84,206 | ||||||
Movado Group, Inc. | 94,200 | 3,037,950 | ||||||
ODP Corp. (The)* | 145,000 | 6,603,300 | ||||||
OneWater Marine, Inc., Class A* | 11,100 | 317,460 | ||||||
Patrick Industries, Inc. | 80,000 | 4,848,000 | ||||||
Perdoceo Education Corp.* | 289,500 | 4,024,050 | ||||||
Rocky Brands, Inc. | 26,400 | 623,568 | ||||||
Shoe Carnival, Inc. | 99,500 | 2,379,045 | ||||||
Smith & Wesson Brands, Inc.+ | 130,000 | 1,128,400 | ||||||
Sonic Automotive, Inc., Class A | 146,400 | 7,213,128 | ||||||
Sportsman’s Warehouse Holdings, Inc.* | 60,800 | 572,128 | ||||||
Strategic Education, Inc. | 86,100 | 6,743,352 | ||||||
Strattec Security Corp.* | 18,800 | 386,340 | ||||||
Superior Group of Cos., Inc. | 38,000 | 382,280 | ||||||
Tilly’s, Inc., Class A*+ | 164,100 | 1,485,105 | ||||||
TravelCenters of America, Inc.* | 79,540 | 3,561,801 | ||||||
Tri Pointe Homes, Inc.* | 266,000 | 4,944,940 | ||||||
Unifi, Inc.* | 54,273 | 467,291 | ||||||
Universal Technical Institute, Inc.* | 221,400 | 1,487,808 | ||||||
Vera Bradley, Inc.* | 152,850 | 692,411 | ||||||
Vista Outdoor, Inc.*+ | 40,187 | 979,357 | ||||||
VOXX International Corp.* | 82,100 | 687,998 | ||||||
Weyco Group, Inc. | 31,500 | 666,540 | ||||||
Winnebago Industries, Inc.+ | 93,981 | 4,952,799 | ||||||
Zumiez, Inc.* | 104,800 | 2,278,352 | ||||||
|
| |||||||
| 136,130,075 | ||||||||
Consumer Staples - 4.60% | ||||||||
Andersons, Inc. (The) | 5,438 | 190,276 | ||||||
Coffee Holding Co., Inc. | 23,000 | 46,920 | ||||||
Cyanotech Corp.* | 400 | 440 | ||||||
| Industry Company | Shares | Value | ||||||
Consumer Staples (continued) |
| |||||||
Edgewell Personal Care Co. | 150,300 | $ | 5,792,562 | |||||
Fresh Del Monte Produce, Inc. | 207,800 | 5,442,282 | ||||||
Ingles Markets, Inc., Class A | 75,301 | 7,263,534 | ||||||
Lifevantage Corp. | 90,000 | 334,800 | ||||||
Mannatech, Inc. | 8,400 | 150,360 | ||||||
Natural Alternatives International, Inc.* | 23,000 | 192,970 | ||||||
Natural Grocers by Vitamin Cottage, Inc. | 36,100 | 329,954 | ||||||
Nature’s Sunshine Products, Inc.* | 6,593 | 54,854 | ||||||
Oil-Dri Corp. of America | 17,558 | 588,895 | ||||||
Seneca Foods Corp., Class A* | 40,100 | 2,444,095 | ||||||
SpartanNash Co. | 161,946 | 4,897,247 | ||||||
TreeHouse Foods, Inc.* | 124,700 | 6,157,686 | ||||||
United Natural Foods, Inc.* | 221,000 | 8,554,910 | ||||||
Village Super Market, Inc., Class A+ | 40,750 | 949,068 | ||||||
Vintage Wine Estates, Inc.*+ | 260,000 | 847,600 | ||||||
Weis Markets, Inc. | 92,325 | 7,597,424 | ||||||
Whole Earth Brands, Inc.*+ | 68,000 | 276,760 | ||||||
|
| |||||||
| 52,112,637 | ||||||||
Energy - 14.26% | ||||||||
Adams Resources & | ||||||||
Energy, Inc. | 20,500 | 797,860 | ||||||
Alto Ingredients, Inc.*+ | 300,000 | 864,000 | ||||||
Archrock, Inc. | 532,346 | 4,780,467 | ||||||
Ardmore Shipping Corp.* | 75,000 | 1,080,750 | ||||||
Berry Corp. | 383,400 | 3,067,200 | ||||||
Bristow Group, Inc.* | 141,299 | 3,833,442 | ||||||
CONSOL Energy, Inc. | 137,900 | 8,963,500 | ||||||
CVR Energy, Inc.+ | 39,700 | 1,244,198 | ||||||
Delek US Holdings, Inc. | 214,500 | 5,791,500 | ||||||
DHT Holdings, Inc. | 647,322 | 5,748,219 | ||||||
Dorian LPG, Ltd. | 211,300 | 4,004,135 | ||||||
Epsilon Energy, Ltd. | 90,000 | 596,700 | ||||||
Forum Energy Technologies, Inc.* | 9,000 | 265,500 | ||||||
Frontline, Ltd.+ | 621,100 | 7,540,154 | ||||||
Golar LNG, Ltd.*+ | 381,500 | 8,694,385 | ||||||
Gran Tierra Energy, Inc.* | 2,099,800 | 2,078,802 | ||||||
Hallador Energy Co.* | 255,000 | 2,547,450 | ||||||
Helix Energy Solutions Group, Inc.* | 881,000 | 6,501,780 | ||||||
International Seaways, Inc.+ | 10,590 | 392,042 | ||||||
| ||
| bridgewayfunds.com | 9 | |
Omni Small-Cap Value Fund SCHEDULE OF INVESTMENTS (Unaudited) (continued) | | |
| ||
| Showing percentage of net assets as of December 31, 2022 | ||
| Industry Company | Shares | Value | ||||||
Common Stocks (continued) | ||||||||
Energy (continued) | ||||||||
Laredo Petroleum, Inc.*+ | 72,500 | $3,727,950 | ||||||
Nabors Industries, Ltd.* | 32,200 | 4,986,814 | ||||||
NACCO Industries, Inc., Class A | 22,445 | 852,910 | ||||||
National Energy Services Reunited Corp.* | 298,700 | 2,072,978 | ||||||
Natural Gas Services Group, Inc.* | 114,752 | 1,315,058 | ||||||
NCS Multistage Holdings, Inc.* | 17,000 | 425,000 | ||||||
Newpark Resources, Inc.* | 469,300 | 1,947,595 | ||||||
Oil States International, Inc.* | 244,400 | 1,823,224 | ||||||
Overseas Shipholding Group, Inc., Class A* | 593,300 | 1,714,637 | ||||||
PBF Energy, Inc., Class A | 322,600 | 13,155,628 | ||||||
Permian Resources Corp. | 1,172,500 | 11,021,500 | ||||||
PHX Minerals, Inc. | 40,000 | 155,600 | ||||||
PrimeEnergy Resources Corp.* | 41 | 3,562 | ||||||
ProPetro Holding Corp.* | 520,000 | 5,392,400 | ||||||
Ranger Energy Services, Inc.* | 38,400 | 422,784 | ||||||
REX American Resources Corp.* | 10,900 | 347,274 | ||||||
Ring Energy, Inc.*+ | 949,500 | 2,335,770 | ||||||
SandRidge Energy, Inc.* | 130,050 | 2,214,751 | ||||||
Scorpio Tankers, Inc. | 213,467 | 11,478,121 | ||||||
SEACOR Marine Holdings, Inc.* | 86,800 | 795,088 | ||||||
SFL Corp., Ltd. | 711,000 | 6,555,420 | ||||||
Smart Sand, Inc.* | 195,200 | 349,408 | ||||||
Talos Energy, Inc.*+ | 293,400 | 5,539,392 | ||||||
Teekay Corp.* | 590,000 | 2,678,600 | ||||||
US Silica Holdings, Inc.* | 355,000 | 4,437,500 | ||||||
VAALCO Energy, Inc.+ | 400,000 | 1,824,000 | ||||||
World Fuel Services Corp. | 196,100 | 5,359,413 | ||||||
|
| |||||||
| 161,724,461 | ||||||||
Financials - 36.88% | ||||||||
1st Source Corp. | 85,000 | 4,512,650 | ||||||
Acacia Research Corp.*+ | 196,000 | 825,160 | ||||||
ACNB Corp. | 51,400 | 2,046,234 | ||||||
Affinity Bancshares, Inc.* | 31,500 | 475,650 | ||||||
Alerus Financial Corp. | 82,300 | 1,921,705 | ||||||
Amalgamated Financial Corp. | 104,930 | 2,417,587 | ||||||
A-Mark Precious Metals, Inc. | 15,558 | 540,329 | ||||||
Ambac Financial Group, Inc.* | 130,000 | 2,267,200 | ||||||
Amerant Bancorp, Inc. | 50,394 | 1,352,575 | ||||||
| Industry Company | Shares | Value | ||||||
Financials (continued) | ||||||||
American National Bankshares, Inc. | 25,000 | $923,250 | ||||||
AmeriServ Financial, Inc. | 118,000 | 463,740 | ||||||
Ames National Corp. | 1,008 | 23,799 | ||||||
Argo Group International Holdings, Ltd. | 100,384 | 2,594,926 | ||||||
Associated Capital Group, Inc., Class A | 22,571 | 947,756 | ||||||
Atlanticus Holdings Corp.* | 1,610 | 42,182 | ||||||
Auburn National BanCorp, Inc. | 12,000 | 278,100 | ||||||
Banc of California, Inc. | 203,043 | 3,234,475 | ||||||
Banco Latinoamericano de Comercio Exterior SA, Class E | 113,400 | 1,837,080 | ||||||
Bank of Marin Bancorp | 8,147 | 267,873 | ||||||
Bank of NT Butterfield & Son, Ltd. (The) | 46,500 | 1,386,165 | ||||||
Bank of Princeton (The) | 34,480 | 1,093,706 | ||||||
Bank of the James Financial Group, Inc. | 18,600 | 229,152 | ||||||
Bank7 Corp. | 51,500 | 1,318,400 | ||||||
Bankwell Financial Group, Inc. | 15,000 | 441,450 | ||||||
Banner Corp. | 91,127 | 5,759,226 | ||||||
Bar Harbor Bankshares | 50,966 | 1,632,951 | ||||||
BayCom Corp.+ | 913 | 17,329 | ||||||
BCB Bancorp, Inc. | 70,400 | 1,266,496 | ||||||
Blue Ridge Bankshares, Inc. | 59,500 | 743,155 | ||||||
Broadway Financial Corp.* | 288,600 | 291,486 | ||||||
Brookline Bancorp, Inc. | 250,000 | 3,537,500 | ||||||
Business First Bancshares, Inc. | 65,000 | 1,439,100 | ||||||
Byline Bancorp, Inc. | 120,800 | 2,774,776 | ||||||
C&F Financial Corp. | 11,900 | 693,413 | ||||||
Camden National Corp. | 65,600 | 2,734,864 | ||||||
Capital Bancorp, Inc. | 76,950 | 1,811,403 | ||||||
Capital City Bank Group, Inc. | 37,172 | 1,208,090 | ||||||
Capstar Financial Holdings, Inc. | 51,813 | 915,018 | ||||||
Carter Bankshares, Inc.* | 55,885 | 927,132 | ||||||
CB Financial Services, Inc. | 26,400 | 565,752 | ||||||
Central Pacific Financial Corp. | 76,000 | 1,541,280 | ||||||
Central Valley Community Bancorp | 55,000 | 1,164,900 | ||||||
Chemung Financial Corp. | 19,500 | 894,465 | ||||||
ChoiceOne Financial Services, Inc. | 28,500 | 826,500 | ||||||
| ||
| 10 | Semi-Annual Report | December 31, 2022 (Unaudited) | |
Omni Small-Cap Value Fund SCHEDULE OF INVESTMENTS (Unaudited) (continued) | | |
| ||
| Showing percentage of net assets as of December 31, 2022 | ||
| Industry Company | Shares | Value | ||||||
Common Stocks (continued) | ||||||||
Financials (continued) | ||||||||
Citizens Community Bancorp, Inc. | 59,400 | $ | 714,582 | |||||
Citizens, Inc.*+ | 171,040 | 364,315 | ||||||
Civista Bancshares, Inc. | 42,523 | 935,931 | ||||||
CNB Financial Corp. | 64,300 | 1,529,697 | ||||||
Codorus Valley Bancorp, Inc. | 56,622 | 1,347,604 | ||||||
Community Financial Corp. (The) | 34,590 | 1,380,141 | ||||||
Community Trust Bancorp, Inc. | 60,000 | 2,755,800 | ||||||
Community West Bancshares# | 57,000 | 853,290 | ||||||
ConnectOne Bancorp, Inc. | 113,446 | 2,746,528 | ||||||
Consumer Portfolio Services, Inc.* | 146,650 | 1,297,853 | ||||||
Cowen, Inc., Class A | 110,500 | 4,267,510 | ||||||
Crawford & Co., Class A+ | 60,000 | 333,600 | ||||||
Crawford & Co., Class B | 23,100 | 122,661 | ||||||
CrossFirst Bankshares, Inc.* | 164,100 | 2,036,481 | ||||||
Curo Group Holdings Corp. | 60,600 | 215,130 | ||||||
Customers Bancorp, Inc.* | 79,591 | 2,255,609 | ||||||
Dime Community Bancshares, Inc. | 125,616 | 3,998,357 | ||||||
Donegal Group, Inc., Class A | 123,000 | 1,746,600 | ||||||
Eagle Bancorp Montana, Inc. | 41,000 | 662,560 | ||||||
Eagle Bancorp, Inc. | 96,870 | 4,269,061 | ||||||
Elevate Credit, Inc.* | 157,900 | 276,325 | ||||||
Emclaire Financial Corp.+ | 1,200 | 37,920 | ||||||
Employers Holdings, Inc. | 27,600 | 1,190,388 | ||||||
Encore Capital Group, Inc.* | 97,600 | 4,678,944 | ||||||
Enova International, Inc.* | 90,407 | 3,468,917 | ||||||
Enterprise Bancorp, Inc. | 39,375 | 1,389,938 | ||||||
Equity Bancshares, Inc., Class A | 91,000 | 2,972,970 | ||||||
Esquire Financial Holdings, Inc. | 4,500 | 194,670 | ||||||
ESSA Bancorp, Inc. | 25,200 | 525,924 | ||||||
Evans Bancorp, Inc. | 18,101 | 676,796 | ||||||
EZCORP, Inc., Class A* | 416,200 | 3,392,030 | ||||||
Farmers National Banc Corp. | 88,450 | 1,248,914 | ||||||
Federal Agricultural Mortgage Corp., Class C | 26,600 | 2,998,086 | ||||||
Financial Institutions, Inc. | 53,400 | 1,300,824 | ||||||
First Bancshares, Inc. (The) | 79,400 | 2,541,594 | ||||||
| Industry Company | Shares | Value | ||||||
| ||||||||
Financials (continued) | ||||||||
First Bank | 61,800 | $ | 850,368 | |||||
First Busey Corp. | 184,000 | 4,548,480 | ||||||
First Business Financial Services, Inc. | 45,400 | 1,659,370 | ||||||
First Capital, Inc. | 15,035 | 374,372 | ||||||
First Commonwealth Financial Corp. | 273,800 | 3,824,986 | ||||||
First Community Corp. | 35,000 | 766,150 | ||||||
First Financial Bancorp | 200,000 | 4,846,000 | ||||||
First Financial Corp. | 39,362 | 1,813,801 | ||||||
First Financial Northwest, Inc. | 42,882 | 642,372 | ||||||
First Foundation, Inc. | 124,000 | 1,776,920 | ||||||
First Guaranty Bancshares, Inc. | 27,472 | 644,218 | ||||||
First Internet Bancorp | 61,600 | 1,495,648 | ||||||
First Merchants Corp. | 60,219 | 2,475,603 | ||||||
First Mid Bancshares, Inc. | 51,500 | 1,652,120 | ||||||
First National Corp. | 33,800 | 578,994 | ||||||
First Northwest Bancorp | 30,287 | 465,208 | ||||||
First of Long Island Corp. (The) | 90,000 | 1,620,000 | ||||||
First Savings Financial Group, Inc. | 14,300 | 286,000 | ||||||
First United Corp. | 29,176 | 573,308 | ||||||
First US Bancshares, Inc. | 6,468 | 56,272 | ||||||
First Western Financial, Inc.*+ | 64,800 | 1,824,120 | ||||||
Flushing Financial Corp. | 107,797 | 2,089,106 | ||||||
FNCB Bancorp, Inc. | 135,700 | 1,114,097 | ||||||
Franklin Financial Services Corp. | 30,700 | 1,108,270 | ||||||
FS Bancorp, Inc. | 28,700 | 959,728 | ||||||
FVCBankcorp, Inc.*+ | 22,000 | 419,540 | ||||||
Genworth Financial, Inc., Class A* | 1,300,000 | 6,877,000 | ||||||
Great Southern Bancorp, Inc. | 10,000 | 594,900 | ||||||
Green Dot Corp., Class A* | 145,000 | 2,293,900 | ||||||
Greenhill & Co., Inc. | 22,000 | 225,500 | ||||||
Guild Holdings Co., Class A* | 227,001 | 2,290,440 | ||||||
Hallmark Financial Services, Inc.* | 90,000 | 52,578 | ||||||
Hanmi Financial Corp. | 143,100 | 3,541,725 | ||||||
HarborOne Bancorp, Inc. | 169,100 | 2,350,490 | ||||||
Hawthorn Bancshares, Inc. | 27,312 | 594,582 | ||||||
Heartland Financial USA, Inc. | 102,100 | 4,759,902 | ||||||
Hennessy Advisors, Inc.+ | 7,000 | 58,800 | ||||||
Heritage Commerce Corp. | 12,900 | 167,700 | ||||||
Heritage Financial Corp. | 50,000 | 1,532,000 | ||||||
| ||
| bridgewayfunds.com | 11 | |
Omni Small-Cap Value Fund SCHEDULE OF INVESTMENTS (Unaudited) (continued) | | |
| ||
| Showing percentage of net assets as of December 31, 2022 | ||
| Industry Company | Shares | Value | ||||||
Common Stocks (continued) | ||||||||
Financials (continued) | ||||||||
HMN Financial, Inc. | 31,800 | $ | 677,340 | |||||
Home Bancorp, Inc. | 30,494 | 1,220,675 | ||||||
Home Point Capital, Inc. | 511,200 | 700,344 | ||||||
HomeStreet, Inc. | 71,800 | 1,980,244 | ||||||
HomeTrust Bancshares, Inc. | 44,100 | 1,065,897 | ||||||
Hope Bancorp, Inc. | 385,800 | 4,942,098 | ||||||
Horace Mann Educators Corp. | 96,200 | 3,594,994 | ||||||
Horizon Bancorp, Inc. | 177,667 | 2,679,218 | ||||||
HV Bancorp, Inc.* | 6,000 | 170,640 | ||||||
Independent Bank Corp. | 88,100 | 2,107,352 | ||||||
Independent Bank Group, Inc.+ | 37,750 | 2,268,020 | ||||||
Investar Holding Corp. | 43,000 | 925,790 | ||||||
Investors Title Co. | 5,494 | 810,640 | ||||||
Kearny Financial Corp.+ | 218,962 | 2,222,464 | ||||||
Kingstone Cos., Inc. | 45,300 | 61,155 | ||||||
Lakeland Bancorp, Inc. | 190,654 | 3,357,417 | ||||||
Landmark Bancorp, Inc. | 16,864 | 381,632 | ||||||
LCNB Corp. | 58,600 | 1,054,800 | ||||||
LendingClub Corp.* | 293,200 | 2,580,160 | ||||||
Limestone Bancorp, Inc. | 36,150 | 882,783 | ||||||
Logan Ridge Finance Corp.* | 12,600 | 284,508 | ||||||
Luther Burbank Corp. | 258,197 | 2,868,569 | ||||||
Macatawa Bank Corp. | 19,000 | 209,570 | ||||||
MainStreet Bancshares, Inc. | 21,000 | 577,290 | ||||||
Malvern Bancorp, Inc.* | 30,300 | 537,825 | ||||||
Mercantile Bank Corp. | 47,300 | 1,583,604 | ||||||
Merchants Bancorp | 152,611 | 3,711,500 | ||||||
Mercury General Corp.+ | 144,500 | 4,941,900 | ||||||
Meridian Corp. | 17,500 | 530,075 | ||||||
Metrocity Bankshares, Inc. | 9,291 | 200,964 | ||||||
Metropolitan Bank Holding Corp.* | 29,700 | 1,742,499 | ||||||
Mid Penn Bancorp, Inc. | 25,703 | 770,319 | ||||||
Middlefield Banc Corp. | 34,000 | 931,600 | ||||||
Midland States Bancorp, Inc. | 113,700 | 3,026,694 | ||||||
MidWestOne Financial Group, Inc. | 59,260 | 1,881,505 | ||||||
MVB Financial Corp. | 32,600 | 717,852 | ||||||
National Western Life Group, Inc., Class A | 10,778 | 3,028,618 | ||||||
Navient Corp. | 450,000 | 7,402,500 | ||||||
NI Holdings, Inc.* | 50,000 | 663,500 | ||||||
Nicholas Financial, Inc.* | 43,400 | 273,854 | ||||||
Nicolet Bankshares, Inc.* | 21,170 | 1,689,154 | ||||||
NMI Holdings, Inc., Class A* | 264,900 | 5,536,410 | ||||||
| Industry Company | Shares | Value | ||||||
Financials (continued) | ||||||||
Northeast Community | ||||||||
Bancorp, Inc.+ | 3,500 | $ | 52,220 | |||||
Northfield Bancorp, Inc. | 55,000 | 865,150 | ||||||
Northrim BanCorp, Inc. | 20,800 | 1,135,056 | ||||||
Northwest Bancshares, Inc. | 363,200 | 5,077,536 | ||||||
Oak Valley Bancorp | 40,000 | 906,000 | ||||||
OceanFirst Financial Corp. | 219,223 | 4,658,489 | ||||||
Ocwen Financial Corp.* | 42,501 | 1,299,681 | ||||||
OFG Bancorp | 120,000 | 3,307,200 | ||||||
Ohio Valley Banc Corp. | 15,700 | 414,794 | ||||||
Old Point Financial Corp. | 1,000 | 26,960 | ||||||
Old Second Bancorp, Inc. | 85,550 | 1,372,222 | ||||||
OP Bancorp | 91,900 | 1,025,604 | ||||||
Oportun Financial Corp.* | 54,500 | 300,295 | ||||||
Oppenheimer Holdings, Inc., Class A+ | 54,493 | 2,306,689 | ||||||
Origin Bancorp, Inc. | 30,622 | 1,123,827 | ||||||
Orrstown Financial Services, Inc. | 25,600 | 592,896 | ||||||
Parke Bancorp, Inc. | 50,099 | 1,039,053 | ||||||
Pathfinder Bancorp, Inc. | 3,000 | 57,420 | ||||||
Pathward Financial, Inc. | 101,931 | 4,388,130 | ||||||
Patriot National Bancorp, Inc.* | 18,500 | 196,100 | ||||||
PCB Bancorp | 58,600 | 1,036,634 | ||||||
Peapack-Gladstone Financial Corp. | 49,894 | 1,857,055 | ||||||
Penns Woods Bancorp, Inc. | 15,034 | 400,205 | ||||||
Peoples Bancorp of North Carolina, Inc. | 27,617 | 899,210 | ||||||
Peoples Bancorp, Inc. | 112,897 | 3,189,340 | ||||||
Peoples Financial Services Corp. | 22,900 | 1,187,136 | ||||||
Pioneer Bancorp, Inc.* | 7,600 | 86,640 | ||||||
Piper Sandler Cos. | 11,900 | 1,549,261 | ||||||
Plumas Bancorp | 2,000 | 74,100 | ||||||
Premier Financial Corp. | 120,300 | 3,244,491 | ||||||
Primis Financial Corp. | 89,158 | 1,056,522 | ||||||
ProAssurance Corp. | 150,700 | 2,632,729 | ||||||
PROG Holdings, Inc.* | 130,000 | 2,195,700 | ||||||
Provident Bancorp, Inc. | 54,600 | 397,488 | ||||||
Provident Financial Holdings, Inc. | 38,000 | 523,260 | ||||||
Provident Financial Services, Inc.+ | 142,731 | 3,048,734 | ||||||
QCR Holdings, Inc. | 61,000 | 3,028,040 | ||||||
RBB Bancorp | 65,883 | 1,373,661 | ||||||
Red River Bancshares, Inc. | 200 | 10,212 | ||||||
Regional Management Corp. | 56,100 | 1,575,288 | ||||||
| ||
| 12 | Semi-Annual Report | December 31, 2022 (Unaudited) | |
Omni Small-Cap Value Fund SCHEDULE OF INVESTMENTS (Unaudited) (continued) | | |
| ||
| Showing percentage of net assets as of December 31, 2022 | ||
| Industry Company | Shares | Value | ||||||
Common Stocks (continued) | ||||||||
Financials (continued) | ||||||||
Renasant Corp. | 159,780 | $ | 6,006,130 | |||||
Republic Bancorp, Inc., Class A | 49,362 | 2,019,893 | ||||||
Republic First Bancorp, Inc.*+ | 175,000 | 376,250 | ||||||
Rhinebeck Bancorp, Inc.* | 15,000 | 136,650 | ||||||
Riverview Bancorp, Inc. | 119,500 | 917,760 | ||||||
S&T Bancorp, Inc. | 139,601 | 4,771,562 | ||||||
Safety Insurance Group, Inc.+ | 54,445 | 4,587,536 | ||||||
Salisbury Bancorp, Inc. | 4,366 | 137,092 | ||||||
Sandy Spring Bancorp, Inc. | 151,400 | 5,333,822 | ||||||
SB Financial Group, Inc. | 35,490 | 594,812 | ||||||
Security National Financial Corp., Class A* | 41,592 | 303,622 | ||||||
Shore Bancshares, Inc. | 88,736 | 1,546,669 | ||||||
Sierra Bancorp | 78,000 | 1,656,720 | ||||||
SiriusPoint, Ltd.* | 606,300 | 3,577,170 | ||||||
SmartFinancial, Inc. | 56,500 | 1,553,750 | ||||||
Sound Financial Bancorp, Inc. | 10,000 | 404,800 | ||||||
South Plains Financial, Inc. | 99,700 | 2,744,741 | ||||||
Southern First Bancshares, Inc.* | 48,645 | 2,225,509 | ||||||
Southern Missouri Bancorp, Inc. | 11,000 | 504,130 | ||||||
Stellar Bancorp, Inc.+ | 51,103 | 1,505,494 | ||||||
Sterling Bancorp, Inc.* | 200,000 | 1,218,000 | ||||||
Stewart Information Services Corp. | 73,221 | 3,128,733 | ||||||
StoneX Group, Inc.* | 61,703 | 5,880,296 | ||||||
Summit Financial Group, Inc. | 65,515 | 1,630,668 | ||||||
Summit State Bank | 21,000 | 331,800 | ||||||
SWK Holdings Corp.* | 58,405 | 1,030,264 | ||||||
Territorial Bancorp, Inc. | 30,000 | 720,300 | ||||||
Timberland Bancorp, Inc. | 47,900 | 1,634,827 | ||||||
Tiptree, Inc. | 177,200 | 2,452,448 | ||||||
Trean Insurance Group, Inc.* | 20,750 | 124,500 | ||||||
TriCo Bancshares | 65,900 | 3,360,241 | ||||||
TrustCo Bank Corp. NY | 36,680 | 1,378,801 | ||||||
Trustmark Corp. | 140,500 | 4,904,855 | ||||||
Union Bankshares, Inc. | 139 | 3,254 | ||||||
United Bancorp, Inc. | 17,000 | 251,260 | ||||||
United Fire Group, Inc. | 93,300 | 2,552,688 | ||||||
Unity Bancorp, Inc. | 43,867 | 1,198,885 | ||||||
Universal Insurance Holdings, Inc. | 110,117 | 1,166,139 | ||||||
Univest Financial Corp. | 133,179 | 3,479,967 | ||||||
| Industry Company | Shares | Value | ||||||
Financials (continued) | ||||||||
US Global Investors, Inc., Class A | 48,500 | $ | 140,165 | |||||
Velocity Financial, Inc.* | 156,650 | 1,511,673 | ||||||
Veritex Holdings, Inc. | 102,380 | 2,874,830 | ||||||
Virtus Investment Partners, Inc. | 17,232 | 3,298,894 | ||||||
Walker & Dunlop, Inc. | 23,675 | 1,858,014 | ||||||
Washington Federal, Inc. | 140,000 | 4,697,000 | ||||||
Waterstone Financial, Inc. | 47,000 | 810,280 | ||||||
Western New England Bancorp, Inc. | 80,000 | 756,800 | ||||||
Westwood Holdings Group, Inc. | 36,452 | 405,846 | ||||||
World Acceptance Corp.*+ | 20,100 | 1,325,394 | ||||||
|
| |||||||
| 418,054,033 | ||||||||
Health Care - 2.36% | ||||||||
American Shared Hospital Services* | 8,500 | 24,905 | ||||||
Assertio Holdings, Inc.*+ | 250,000 | 1,075,000 | ||||||
Avanos Medical, Inc.* | 158,417 | 4,286,764 | ||||||
Bioventus, Inc., Class A* | 75,000 | 195,750 | ||||||
CareCloud, Inc.* | 31,700 | 89,077 | ||||||
Co.-Diagnostics, Inc.*+ | 100,400 | 253,008 | ||||||
Emergent BioSolutions, Inc.* | 157,000 | 1,854,170 | ||||||
FONAR Corp.* | 16,500 | 276,375 | ||||||
Fulgent Genetics, Inc.*+ | 138,708 | 4,130,724 | ||||||
Innoviva, Inc.*+ | 173,690 | 2,301,393 | ||||||
iTeos Therapeutics, Inc.* | 148,500 | 2,900,205 | ||||||
Multiplan Corp.* | 1,695,200 | 1,949,480 | ||||||
Ovid therapeutics, Inc.* | 221,100 | 411,246 | ||||||
Owens & Minor, Inc. | 253,600 | 4,952,808 | ||||||
REGENXBIO, Inc.* | 84,900 | 1,925,532 | ||||||
XBiotech, Inc.* | 25,000 | 87,750 | ||||||
|
| |||||||
| 26,714,187 | ||||||||
Industrials - 13.34% | ||||||||
ACCO Brands Corp. | 361,300 | 2,019,667 | ||||||
Air Transport Services Group, Inc.* | 165,000 | 4,286,700 | ||||||
Allegiant Travel Co.*+ | 70,200 | 4,772,898 | ||||||
American Woodmark Corp.* | 20,000 | 977,200 | ||||||
Apogee Enterprises, Inc. | 19,400 | 862,524 | ||||||
ARC Document Solutions, Inc. | 253,500 | 742,755 | ||||||
ArcBest Corp. | 69,500 | 4,867,780 | ||||||
Art’s-Way Manufacturing Co., Inc.* | 8,690 | 16,772 | ||||||
| ||
| bridgewayfunds.com | 13 | |
Omni Small-Cap Value Fund SCHEDULE OF INVESTMENTS (Unaudited) (continued) | | |
| ||
| Showing percentage of net assets as of December 31, 2022 | ||
| Industry Company | Shares | Value | ||||||
Common Stocks (continued) |
| |||||||
Industrials (continued) | ||||||||
Atlas Air Worldwide Holdings, Inc.* | 75,700 | $ 7,630,560 | ||||||
Avalon Holdings Corp., Class A* | 16,900 | 46,473 | ||||||
AZZ, Inc. | 15,000 | 603,000 | ||||||
BlueLinx Holdings, Inc.* | 35,000 | 2,488,850 | ||||||
Boise Cascade Co. | 106,000 | 7,279,020 | ||||||
BrightView Holdings, Inc.* | 209,300 | 1,442,077 | ||||||
Caesarstone, Ltd. | 107,100 | 611,541 | ||||||
CBAK Energy Technology, Inc.* | 110,000 | 108,900 | ||||||
Civeo Corp.* | 77,255 | 2,402,630 | ||||||
CompX International, Inc. | 1,000 | 18,480 | ||||||
Concrete Pumping Holdings, Inc.* | 313,000 | 1,831,050 | ||||||
Costamare, Inc. | 530,300 | 4,921,184 | ||||||
Covenant Logistics Group, Inc. | 85,400 | 2,952,278 | ||||||
Daseke, Inc.* | 43,000 | 244,670 | ||||||
Deluxe Corp. | 144,300 | 2,450,214 | ||||||
Eagle Bulk Shipping, Inc. | 80,600 | 4,025,164 | ||||||
Eastern Co. (The) | 19,601 | 377,907 | ||||||
Genco Shipping & Trading, Ltd. | 230,900 | 3,546,624 | ||||||
Hawaiian Holdings, Inc.* | 150,000 | 1,539,000 | ||||||
Heidrick & Struggles International, Inc. | 67,500 | 1,887,975 | ||||||
Hurco Cos., Inc. | 19,560 | 511,103 | ||||||
KAR Auction Services, Inc.* | 275,000 | 3,588,750 | ||||||
Kelly Services, Inc., Class A | 99,300 | 1,678,170 | ||||||
Limbach Holdings, Inc.* | 3,000 | 31,230 | ||||||
LS Starrett Co. (The), Class A* | 10,632 | 78,252 | ||||||
LSI Industries, Inc. | 17,459 | 213,698 | ||||||
Manitowoc Co., Inc. (The)* | 146,550 | 1,342,398 | ||||||
Matthews International Corp., Class A | 84,000 | 2,556,960 | ||||||
Maxar Technologies, Inc. | 83,000 | 4,294,420 | ||||||
Mayville Engineering Co., Inc.* | 28,710 | 363,469 | ||||||
Mesa Air Group, Inc.* | 45,400 | 69,462 | ||||||
Mistras Group, Inc.* | 95,200 | 469,336 | ||||||
MRC Global, Inc.* | 253,800 | 2,939,004 | ||||||
MYR Group, Inc.* | 31,020 | 2,856,011 | ||||||
NL Industries, Inc. | 57,594 | 392,215 | ||||||
NN, Inc.* | 126,000 | 189,000 | ||||||
Northwest Pipe Co.* | 50,000 | 1,685,000 | ||||||
NOW, Inc.* | 301,566 | 3,829,888 | ||||||
Orion Group Holdings, Inc.* | 100,472 | 239,123 | ||||||
| Industry Company | Shares | Value | ||||||
Industrials (continued) | ||||||||
PAM Transportation Services, Inc.* | 115,220 | $2,984,198 | ||||||
Pangaea Logistics | ||||||||
Solutions, Ltd. | 296,300 | 1,525,945 | ||||||
Park-Ohio Holdings Corp. | 43,315 | 529,742 | ||||||
Patriot Transportation Holding, Inc.* | 7,500 | 53,325 | ||||||
Perma-Pipe International Holdings, Inc.* | 14,000 | 132,300 | ||||||
Preformed Line Products Co. | 16,375 | 1,363,874 | ||||||
Primoris Services Corp. | 177,100 | 3,885,574 | ||||||
Proto Labs, Inc.* | 15,000 | 382,950 | ||||||
Quad/Graphics, Inc.* | 281,500 | 1,148,520 | ||||||
Quanex Building Products Corp. | 91,700 | 2,171,456 | ||||||
REV Group, Inc. | 250,000 | 3,155,000 | ||||||
Rush Enterprises, Inc., Class A | 74,000 | 3,868,720 | ||||||
Rush Enterprises, Inc., Class B | 56,410 | 3,174,191 | ||||||
Safe Bulkers, Inc. | 542,100 | 1,577,511 | ||||||
Servotronics, Inc.* | 1,500 | 15,840 | ||||||
SIFCO Industries, Inc.* | 6,500 | 14,038 | ||||||
SkyWest, Inc.*+ | 157,500 | 2,600,325 | ||||||
Sterling Infrastructure, Inc.* | 100,000 | 3,280,000 | ||||||
Textainer Group Holdings, Ltd. | 216,900 | 6,726,069 | ||||||
Titan Machinery, Inc.* | 129,800 | 5,156,954 | ||||||
TrueBlue, Inc.* | 117,350 | 2,297,713 | ||||||
Tutor Perini Corp.* | 185,000 | 1,396,750 | ||||||
Ultralife Corp.* | 77,400 | 298,764 | ||||||
Universal Logistics Holdings, Inc. | 22,100 | 739,024 | ||||||
US Xpress Enterprises, Inc., Class A* | 195,000 | 352,950 | ||||||
V2X, Inc.* | 35,000 | 1,445,150 | ||||||
Veritiv Corp. | 53,500 | 6,511,485 | ||||||
Williams Industrial Services Group, Inc.* | 55,000 | 56,106 | ||||||
Willis Lease Finance Corp.* | 35,400 | 2,088,954 | ||||||
|
| |||||||
| 151,214,810 | ||||||||
Information Technology - 4.24% | ||||||||
Adeia, Inc. | 481,800 | 4,567,464 | ||||||
Alpha & Omega Semiconductor, Ltd.*+ | 149,544 | 4,272,472 | ||||||
AXT, Inc.* | 175,000 | 766,500 | ||||||
Bel Fuse, Inc., Class B | 32,000 | 1,053,440 | ||||||
Benchmark Electronics, Inc. | 124,000 | 3,309,560 | ||||||
| ||
| 14 | Semi-Annual Report | December 31, 2022 (Unaudited) | |
Omni Small-Cap Value Fund SCHEDULE OF INVESTMENTS (Unaudited) (continued) | | |
| ||
| Showing percentage of net assets as of December 31, 2022 | ||
| Industry Company | Shares | Value | ||||||
Common Stocks (continued) |
| |||||||
Information Technology (continued) |
| |||||||
Computer Task Group, Inc.* | 21,150 | $ | 159,894 | |||||
Comtech Telecommunications Corp. | 91,200 | 1,107,168 | ||||||
Conduent, Inc.* | 805,800 | 3,263,490 | ||||||
Daktronics, Inc.* | 121,500 | 342,630 | ||||||
Ebix, Inc. | 111,100 | 2,217,556 | ||||||
EMCORE Corp.* | 98,700 | 94,999 | ||||||
Kimball Electronics, Inc.* | 87,600 | 1,978,884 | ||||||
Magnachip Semiconductor Corp.* | 155,000 | 1,455,450 | ||||||
NetScout Systems, Inc.* | 202,400 | 6,580,024 | ||||||
NetSol Technologies, Inc.* | 48,100 | 137,085 | ||||||
Network-1 Technologies, Inc. | 159,000 | 349,800 | ||||||
Photronics, Inc.* | 206,050 | 3,467,822 | ||||||
Richardson Electronics, Ltd. | 30,000 | 639,900 | ||||||
Sanmina Corp.* | 32,600 | 1,867,654 | ||||||
ScanSource, Inc.* | 71,983 | 2,103,343 | ||||||
StarTek, Inc.* | 232,000 | 870,000 | ||||||
Taitron Components, Inc., Class A | 10,000 | 34,400 | ||||||
TESSCO Technologies, Inc.* | 42,000 | 202,440 | ||||||
Trio-Tech International* | 21,800 | 98,102 | ||||||
TTM Technologies, Inc.* | 470,153 | 7,089,907 | ||||||
WidePoint Corp.* | 30,000 | 54,603 | ||||||
|
| |||||||
| 48,084,587 | ||||||||
Materials - 6.79% |
| |||||||
Advanced Emissions | ||||||||
Solutions, Inc.* | 92,075 | 223,742 | ||||||
AdvanSix, Inc. | 118,000 | 4,486,360 | ||||||
AgroFresh Solutions, Inc.* | 148,300 | 438,968 | ||||||
American Vanguard Corp. | 145,000 | 3,147,950 | ||||||
Ampco-Pittsburgh Corp.* | 60,000 | 150,600 | ||||||
Ascent Industries Co.*+ | 39,525 | 342,682 | ||||||
Caledonia Mining Corp. | ||||||||
PLC | 9,200 | 114,080 | ||||||
Carpenter Technology | ||||||||
Corp. | 140,000 | 5,171,600 | ||||||
Century Aluminum Co.* | 322,300 | 2,636,414 | ||||||
Clearwater Paper Corp.* | 91,650 | 3,465,287 | ||||||
Core Molding | ||||||||
Technologies, Inc.* | 30,000 | 389,700 | ||||||
FutureFuel Corp. | 212,800 | 1,730,064 | ||||||
Glatfelter Corp. | 140,400 | 390,312 | ||||||
Gold Resource Corp. | 322,250 | 493,042 | ||||||
Intrepid Potash, Inc.*+ | 83,356 | 2,406,488 | ||||||
| Industry Company | Shares | Value | ||||||
Materials (continued) |
| |||||||
Kaiser Aluminum Corp. | 17,500 | $ | 1,329,300 | |||||
Koppers Holdings, Inc. | 80,100 | 2,258,820 | ||||||
Kronos Worldwide, Inc. | 208,600 | 1,960,840 | ||||||
Mercer International, Inc.+ | 371,150 | 4,320,186 | ||||||
Olympic Steel, Inc. | 47,061 | 1,580,308 | ||||||
Pactiv Evergreen, Inc. | 39,500 | 448,720 | ||||||
Ramaco Resources, Inc.+ | 91,400 | 803,406 | ||||||
Rayonier Advanced | ||||||||
Materials, Inc.* | 359,500 | 3,451,200 | ||||||
Resolute Forest Products, Inc.*+ | 335,500 | 7,243,445 | ||||||
Ryerson Holding Corp. | 177,800 | 5,380,228 | ||||||
Schnitzer Steel Industries, Inc., Class A | 92,800 | 2,844,320 | ||||||
SunCoke Energy, Inc. | 497,700 | 4,295,151 | ||||||
TimkenSteel Corp.* | 289,000 | 5,251,130 | ||||||
Trinseo PLC+ | 134,500 | 3,054,495 | ||||||
Universal Stainless & Alloy | ||||||||
Products, Inc.* | 12,500 | 89,625 | ||||||
Valhi, Inc. | 90,364 | 1,988,008 | ||||||
Warrior Met Coal, Inc. | 146,992 | 5,091,803 | ||||||
|
| |||||||
| 76,978,274 | ||||||||
Real Estate - 0.66% | ||||||||
AMREP Corp.* | 52,000 | 600,600 | ||||||
Anywhere Real Estate, Inc.* | 391,200 | 2,499,768 | ||||||
Forestar Group, Inc.* | 159,800 | 2,462,518 | ||||||
Newmark Group, Inc., Class A | 200,000 | 1,594,000 | ||||||
RE/MAX Holdings, Inc., Class A | 20,000 | 372,800 | ||||||
|
| |||||||
| 7,529,686 | ||||||||
|
| |||||||
TOTAL COMMON STOCKS - 99.99% | 1,133,560,543 | |||||||
|
| |||||||
(Cost $913,633,254) | ||||||||
PREFERRED STOCK - 0.00% |
| |||||||
Air T Funding, 8.00%*** | 221 | 4,608 | ||||||
|
| |||||||
TOTAL PREFERRED STOCK - 0.00% | 4,608 | |||||||
|
| |||||||
(Cost $4,597) | ||||||||
RIGHTS - 0.00% | ||||||||
Pineapple Holdings, Inc., CVR*Δ#+++ | 5,000 | — | ||||||
Pan American Silver Corp., CVR* | 150,000 | 85,650 | ||||||
|
| |||||||
TOTAL RIGHTS - 0.00% | 85,650 | |||||||
|
| |||||||
(Cost $34,500) | ||||||||
| ||
| bridgewayfunds.com | 15 | |
Omni Small-Cap Value Fund SCHEDULE OF INVESTMENTS (Unaudited) (continued) | | |
| ||
| Showing percentage of net assets as of December 31, 2022 | ||
| Industry Company | Shares | Value | ||||||||||
WARRANTS - 0.02% |
| |||||||||||
Nabors Industries, Ltd.,expiring 06/11/26* |
| 7,920 | $ | 260,568 | ||||||||
|
| |||||||||||
TOTAL WARRANTS - 0.02% |
| 260,568 | ||||||||||
|
| |||||||||||
(Cost $ – ) |
| |||||||||||
| Rate^ | Shares | Value | ||||||||||
MONEY MARKET FUND - 0.23% |
| |||||||||||
Fidelity Investments Money Market Government Portfolio Class I | 4.06% | 2,563,966 | 2,563,966 | |||||||||
|
| |||||||||||
TOTAL MONEY MARKET FUND - 0.23% |
| 2,563,966 | ||||||||||
|
| |||||||||||
(Cost $2,563,966) |
| |||||||||||
INVESTMENTS PURCHASED WITH CASH PROCEEDS FROM SECURITIES LENDING - 1.34% |
| |||||||||||
Dreyfus Institutional Preferred Government Plus Money Market Fund** | 4.36% | 15,144,679 | 15,144,679 | |||||||||
|
| |||||||||||
TOTAL INVESTMENTS PURCHASED WITH CASH PROCEEDS FROM SECURITIES LENDING - 1.34% |
| 15,144,679 | ||||||||||
|
| |||||||||||
(Cost $15,144,679) |
| |||||||||||
TOTAL INVESTMENTS - 101.58% |
| $ | 1,151,620,014 | |||||||||
(Cost $931,380,996) |
| |||||||||||
Liabilities in Excess of Other Assets - (1.58%) |
| (17,961,581) | ||||||||||
|
| |||||||||||
NET ASSETS - 100.00% |
| $ | 1,133,658,433 | |||||||||
|
| |||||||||||
| # | Illiquid security as determined under procedures approved by the Board of Directors. The aggregate value of illiquid securities is $853,290, which is 0.08% of total net assets. |
| * | Non-income producing security. |
| ** | This security represents the investment of the cash collateral received in connection with securities out on loan as of December 31, 2022. |
| *** | Security is perpetual and has no stated maturity date. |
| ^ | Rate disclosed as of December 31, 2022. |
| Δ | Security was fair valued using significant unobservable inputs. As such, the security is classified as Level 3 in the fair value hierarchy. |
| + | This security or a portion of the security is out on loan at December 31, 2022. Total loaned securities had a value of $53,834,563, which included loaned securities with a value of $57,192 that have been sold and are pending settlement as of December 31, 2022. The total market value of loaned securities excluding these pending sales is $53,777,371. See Note 2 for disclosure of cash and non-cash collateral. |
| +++No | stated maturity date. |
CVR - Contingent Value Right
PLC - Public Limited Company
| ||
| 16 | Semi-Annual Report | December 31, 2022 (Unaudited) | |
Omni Small-Cap Value Fund SCHEDULE OF INVESTMENTS (Unaudited) (continued) | | |
| ||
Summary of inputs used to value the Fund’s investments as of 12/31/2022
(See Note 2 in Notes to Financial Statements):
| Valuation Inputs | ||||||||||||||||
| Investment in Securities (Value) | ||||||||||||||||
Level 1 Quoted Prices | Level 2 Significant Observable Inputs | Level 3 Significant Unobservable Inputs | Total | |||||||||||||
Common Stocks | ||||||||||||||||
Real Estate | $6,929,086 | $600,600 | $– | $7,529,686 | ||||||||||||
Other Industries (a) | 1,126,030,857 | – | – | 1,126,030,857 | ||||||||||||
|
|
|
|
|
|
|
| |||||||||
Total Common Stocks | 1,132,959,943 | 600,600 | – | 1,133,560,543 | ||||||||||||
Preferred Stock | 4,608 | – | – | 4,608 | ||||||||||||
Rights | 85,650 | – | 0 | 85,650 | ||||||||||||
Warrants | 260,568 | – | – | 260,568 | ||||||||||||
Money Market Fund | 2,563,966 | – | – | 2,563,966 | ||||||||||||
Investments Purchased With Cash Proceeds From Securities Lending | 15,144,679 | – | – | 15,144,679 | ||||||||||||
|
|
|
|
|
|
|
| |||||||||
TOTAL | $1,151,019,414 | $600,600 | $0 | $1,151,620,014 | ||||||||||||
|
|
|
|
|
|
|
| |||||||||
| (a) - Please | refer to the Schedule of Investments for the industry classifications of these portfolio holdings. |
Following is a reconciliation of Level 3 investments for which significant unobservable inputs were used to determine fair value:
| Investment in Securities (Value) | ||||
| Rights | ||||
Balance as of 06/30/2022 | $ 0 | |||
Purchases | – | |||
Sales | – | |||
Return of Capital | – | |||
Realized Gain/(Loss) | – | |||
Change in unrealized Appreciation/(Depreciation) | – | |||
Transfers in | – | |||
Transfers out | – | |||
|
| |||
Balance as of 12/31/2022 | $ 0 | |||
|
| |||
Net change in unrealized Appreciation/(Depreciation) from investments held as of 12/31/2022 | $ – | |||
|
| |||
See Notes to Financial Statements.
| ||
| bridgewayfunds.com | 17 | |
December 31, 2022
Dear Fellow Omni Tax-Managed Small-Cap Value Fund Shareholder,
For the quarter ended December 31, 2022, our Fund returned +11.40%, outperforming our primary market benchmark, the Russell 2000 Value Index (+8.42%). It was a good quarter.
For the calendar year, our Fund returned -5.01%, outperforming the Russell 2000 Value Index (-14.48%).
The table below presents our December quarter, six months, one-year, five-year, 10-year, and inception-to-date financial results. See the next page for a graph of performance since inception.
Standardized Returns as of December 31, 2022
| Annualized | ||||||||||||
| Since Inception | ||||||||||||
| Quarter | 6 Months | 1 Year | 5 Years | 10 Years | (12/31/10) | |||||||
Omni Tax-Managed Small-Cap Value Fund | 11.40% | 6.58% | -5.01% | 5.56% | 9.72% | 8.93% | ||||||
Russell 2000 Value Index | 8.42% | 3.42% | -14.48% | 4.13% | 8.48% | 7.99% | ||||||
Performance figures quoted in the table above and the graph on the next page represent past performance and are no guarantee of future results. Total return figures in the table above include the reinvestment of dividends and capital gains. The table above and the graph on the next page do not reflect the deduction of taxes that a shareholder would pay on Fund distributions or on the redemption of Fund shares.
The Russell 2000 Value Index is an unmanaged index that consists of stocks in the Russell 2000 Index with lower price-to-book ratios and lower forecasted growth values with dividends reinvested. It is not possible to invest directly in an index. Periods longer than one year are annualized.
| ||
| 18 | Semi-Annual Report | December 31, 2022 (Unaudited) | |
Omni Tax-Managed Small-Cap Value Fund MANAGER’S COMMENTARY (Unaudited) (continued) | | |
| ||
Growth of a $10,000 Investment
from Inception December 31, 2010 to December 31, 2022
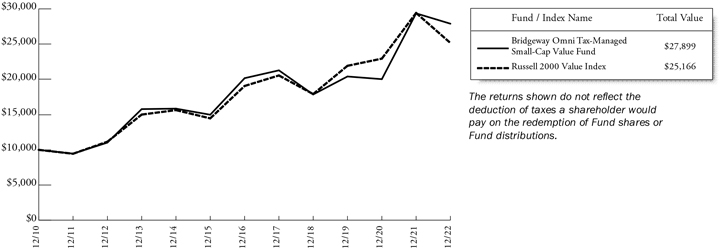
Detailed Explanation of Quarterly Performance
The Omni Tax-Managed Small-Cap Value Fund is designed to capture the returns of the small-cap value asset class through broad diversification of small company and value stocks. We also seek to minimize the distribution of capital gains within the constraints of the investment objective. This approach is sometimes referred to as “passive, asset class investing.” As of December 31, 2022, we held 587 such stocks in a market-cap weighted style. We make no attempt to track any particular index in either performance or statistics.
The Fund’s relative results benefited from its tilt toward deeper value stocks across multiple valuation metrics. However, the Fund’s tilt toward smaller stocks in the small-cap value universe detracted from relative returns, as the benchmark’s smallest stocks underperformed their larger counterparts during the quarter.
By design, the Fund does not hold Real Estate Investment Trusts (REITs) or Utilities stocks. The lack of exposure to REITs boosted relative results while the lack of exposure to Utilities stocks detracted from relative returns during the quarter.
Detailed Explanation of Calendar Year Performance
The Fund’s tilt toward deeper value stocks across multiple valuation metrics added to relative returns during a period in which value stocks outperformed growth stocks. However, the Fund’s tilt toward smaller stocks in the small-cap value universe dragged on relative results, as smaller stocks underperformed their larger counterparts.
By design, the Fund does not hold Real Estate Investment Trusts (REITs) and Utilities stocks. The lack of exposure to REITs boosted relative results, while the Fund’s lack of exposure to Utilities stocks detracted from relative returns.
| ||
| bridgewayfunds.com | 19 | |
Omni Tax-Managed Small-Cap Value Fund MANAGER’S COMMENTARY (Unaudited) (continued) | | |
| ||
Top Ten Holdings as of December 31, 2022
| Rank | Description | Industry | % of Net Assets | |||
1 | PBF Energy, Inc., Class A | Energy | 1.1% | |||
2 | Permian Resources Corp. | Energy | 0.9% | |||
3 | Scorpio Tankers, Inc. | Energy | 0.9% | |||
4 | CONSOL Energy, Inc. | Energy | 0.8% | |||
5 | Golar LNG, Ltd. | Energy | 0.7% | |||
6 | Frontline, Ltd. | Energy | 0.7% | |||
7 | Weis Markets, Inc. | Consumer Staples | 0.7% | |||
8 | Boise Cascade Co. | Industrials | 0.7% | |||
9 | Ingles Markets, Inc., Class A | Consumer Staples | 0.7% | |||
10 | Resolute Forest Products, Inc. | Materials | 0.6% | |||
Total | 7.8% |
Industry Sector Representation as of December 31, 2022
| % of Net Assets | % of Russell 2000 Value Index | Difference | ||||||||||
Communication Services | 4.9 | % | 2.9 | % | 2.0 | % | ||||||
Consumer Discretionary | 11.6 | % | 10.0 | % | 1.6 | % | ||||||
Consumer Staples | 4.5 | % | 2.7 | % | 1.8 | % | ||||||
Energy | 13.6 | % | 6.2 | % | 7.4 | % | ||||||
Financials | 37.0 | % | 28.8 | % | 8.2 | % | ||||||
Health Care | 2.6 | % | 10.5 | % | -7.9 | % | ||||||
Industrials | 13.2 | % | 13.3 | % | -0.1 | % | ||||||
Information Technology | 4.3 | % | 5.5 | % | -1.2 | % | ||||||
Materials | 6.6 | % | 4.1 | % | 2.5 | % | ||||||
Real Estate | 0.9 | % | 10.7 | % | -9.8 | % | ||||||
Utilities | 0.0 | % | 5.3 | % | -5.3 | % | ||||||
Cash & Other Assets | 0.8 | % | 0.0 | % | 0.8 | % | ||||||
Total | 100.0 | % | 100.0 | % | ||||||||
Important Disclosure
The views expressed here are exclusively those of Fund management. These views, including those related to market sectors or individual stocks, are not meant as investment advice and should not be considered predictive in nature. Any favorable (or unfavorable) description of a holding applies only as of the quarter-end, December 31, 2022, unless otherwise stated. Security positions can and do change thereafter. Discussions of historical performance do not guarantee and may not be indicative of future performance.
Market volatility can significantly impact short-term performance. The Fund is not an appropriate investment for short-term investors. Investments in small companies generally carry greater risk than is customarily associated with larger companies. This additional risk is attributable to a number of factors, including the relatively limited financial resources that are typically available to small companies and the fact that small companies often have comparatively limited product lines. In addition, the stock of small companies tends to be more volatile than the stock of large companies, particularly in the short term and particularly in the early stages of an economic or market downturn. Shareholders of the Fund, therefore, are taking on more risk than they would if they invested in the stock market as a whole.
| ||
| 20 | Semi-Annual Report | December 31, 2022 (Unaudited) | |
Omni Tax-Managed Small-Cap Value Fund MANAGER’S COMMENTARY (Unaudited) (continued) | | |
| ||
Conclusion
Thank you for your continued investment in Omni Tax-Managed Small-Cap Value Fund. We encourage your feedback; your reactions and concerns are important to us.
Sincerely,
The Investment Management Team
| ||
| bridgewayfunds.com | 21 | |
Omni Tax-Managed Small-Cap Value Fund | | |
| ||
| Showing percentage of net assets as of December 31, 2022 | ||
| Industry Company | Shares | Value | ||||||
COMMON STOCKS - 99.21% |
| |||||||
Communication Services - 4.93% |
| |||||||
Advantage Solutions, Inc.* | 900,000 | $ 1,872,000 | ||||||
AMC Networks, Inc., Class A* | 104,500 | 1,637,515 | ||||||
ATN International, Inc. | 49,500 | 2,242,845 | ||||||
Beasley Broadcast Group, Inc., Class A* | 65,000 | 59,813 | ||||||
comScore, Inc.* | 329,900 | 382,684 | ||||||
Consolidated Communications Holdings, Inc.* | 324,800 | 1,162,784 | ||||||
Cumulus Media, Inc., Class A* | 35,100 | 217,971 | ||||||
DHI Group, Inc.* | 3,500 | 18,515 | ||||||
EchoStar Corp., Class A* | 245,300 | 4,091,604 | ||||||
Entravision Communications Corp., Class A | 262,300 | 1,259,040 | ||||||
EW Scripps Co. (The), Class A*+ | 219,300 | 2,892,567 | ||||||
Gannett Co., Inc.* | 415,000 | 842,450 | ||||||
Gray Television, Inc. | 218,000 | 2,439,420 | ||||||
Liberty Latin America, Ltd., Class A* | 100,000 | 753,000 | ||||||
Liberty Latin America, Ltd., Class C*+ | 417,500 | 3,173,000 | ||||||
Marcus Corp. (The) | 111,600 | 1,605,924 | ||||||
Saga Communications, Inc., Class A | 15,100 | 356,360 | ||||||
Salem Media Group, Inc.* | 31,200 | 32,760 | ||||||
Scholastic Corp. | 121,100 | 4,778,606 | ||||||
Sinclair Broadcast Group, Inc., Class A | 218,300 | 3,385,833 | ||||||
SPAR Group, Inc.* | 44,000 | 57,640 | ||||||
Telephone and Data Systems, Inc.+ | 329,200 | 3,453,308 | ||||||
Thryv Holdings, Inc.* | 100,000 | 1,900,000 | ||||||
Townsquare Media, Inc., Class A* | 40,700 | 295,075 | ||||||
TrueCar, Inc.* | 41,356 | 103,803 | ||||||
Urban One, Inc.* | 105,000 | 394,800 | ||||||
|
| |||||||
| 39,409,317 | ||||||||
Consumer Discretionary - 11.59% |
| |||||||
Aaron’s Co., Inc. (The) | 120,000 | 1,434,000 | ||||||
Abercrombie & Fitch Co., Class A* | 120,600 | 2,762,946 | ||||||
Adtalem Global Education, Inc.* | 78,000 | 2,769,000 | ||||||
AMCON Distributing Co.+ | 1,950 | 352,950 | ||||||
American Axle & Manufacturing Holdings, Inc.* | 336,450 | 2,631,039 | ||||||
| Industry Company | Shares | Value | ||||||
|
| |||||||
Consumer Discretionary (continued) |
| |||||||
American Outdoor Brands, Inc.* | 16,000 | $ 160,320 | ||||||
American Public Education, Inc.* | 43,500 | 534,615 | ||||||
AMMO, Inc.*+ | 89,200 | 154,316 | ||||||
Ark Restaurants Corp. | 1,500 | 24,840 | ||||||
Bally’s Corp.*+ | 110,000 | 2,131,800 | ||||||
Bassett Furniture Industries, Inc. | 17,909 | 311,258 | ||||||
Beazer Homes USA, Inc.* | 56,500 | 720,940 | ||||||
Big 5 Sporting Goods Corp.+ | 110,000 | 971,300 | ||||||
Big Lots, Inc.+ | 34,000 | 499,800 | ||||||
Biglari Holdings, Inc., Class B* | 6,700 | 929,960 | ||||||
Bluegreen Vacations Holding Corp. | 50,328 | 1,256,187 | ||||||
Carrols Restaurant Group, Inc.* | 105,000 | 142,800 | ||||||
Cato Corp. (The), Class A | 68,000 | 634,440 | ||||||
Century Casinos, Inc.* | 52,700 | 370,481 | ||||||
China Automotive Systems, Inc.* | 35,650 | 206,770 | ||||||
Conn’s, Inc.* | 46,600 | 320,608 | ||||||
Container Store Group, Inc. (The)* | 160,050 | 689,815 | ||||||
Crown Crafts, Inc. | 30,050 | 160,467 | ||||||
Delta Apparel, Inc.* | 28,000 | 297,080 | ||||||
Dillard’s, Inc., Class A | 12,800 | 4,136,960 | ||||||
Dixie Group, Inc. (The)* | 33,550 | 26,874 | ||||||
El Pollo Loco Holdings, Inc. | 65,400 | 651,384 | ||||||
Ethan Allen Interiors, Inc. | 43,600 | 1,151,912 | ||||||
Ever-Glory International Group, Inc.* | 12,700 | 2,543 | ||||||
Express, Inc.* | 50,000 | 51,000 | ||||||
Flanigan’s Enterprises, Inc. | 10,000 | 258,800 | ||||||
Flexsteel Industries, Inc. | 15,600 | 240,240 | ||||||
Fossil Group, Inc.* | 71,800 | 309,458 | ||||||
Genesco, Inc.* | 49,100 | 2,259,582 | ||||||
G-III Apparel Group, Ltd.* | 32,000 | 438,720 | ||||||
Golden Entertainment, Inc.* | 37,000 | 1,383,800 | ||||||
Good Times Restaurants, Inc.* | 26,600 | 59,318 | ||||||
GoPro, Inc., Class A* | 374,500 | 1,865,010 | ||||||
Haverty Furniture Cos., Inc. | 56,659 | 1,694,104 | ||||||
Hibbett, Inc. | 31,500 | 2,148,930 | ||||||
Hooker Furnishings Corp. | 15,900 | 297,330 | ||||||
JAKKS Pacific, Inc.* | 38,000 | 664,620 | ||||||
Kandi Technologies Group, Inc.* | 40,000 | 92,000 | ||||||
Lakeland Industries, Inc.* | 19,250 | 256,025 | ||||||
| ||
| 22 | Semi-Annual Report | December 31, 2022 (Unaudited) | |
Omni Tax-Managed Small-Cap Value Fund SCHEDULE OF INVESTMENTS (Unaudited) (continued) | | |
| ||
| Showing percentage of net assets as of December 31, 2022 | ||
| Industry Company | Shares | Value | ||||||
| Common Stocks (continued) | ||||||||
Consumer Discretionary (continued) |
| |||||||
Lands’ End, Inc.* | 56,600 | $ 429,594 | ||||||
Landsea Homes Corp.* | 68,500 | 356,885 | ||||||
La-Z-Boy, Inc. | 120,000 | 2,738,400 | ||||||
Lazydays Holdings, Inc.*+ | 54,708 | 653,214 | ||||||
Legacy Housing Corp.* | 24,769 | 469,620 | ||||||
Lifetime Brands, Inc. | 57,449 | 436,038 | ||||||
Lincoln Educational Services Corp.* | 144,000 | 833,760 | ||||||
Live Ventures, Inc.*+ | 11,150 | 348,995 | ||||||
M/I Homes, Inc.* | 76,300 | 3,523,534 | ||||||
MarineMax, Inc.* | 44,900 | 1,401,778 | ||||||
Modine Manufacturing Co.* | 101,900 | 2,023,734 | ||||||
Movado Group, Inc. | 67,900 | 2,189,775 | ||||||
ODP Corp. (The)* | 102,390 | 4,662,841 | ||||||
OneWater Marine, Inc., Class A* | 25,575 | 731,445 | ||||||
Patrick Industries, Inc. | 50,000 | 3,030,000 | ||||||
Perdoceo Education Corp.* | 223,700 | 3,109,430 | ||||||
RumbleON, Inc., Class B*+ | 46,000 | 297,620 | ||||||
Shoe Carnival, Inc. | 69,200 | 1,654,572 | ||||||
Smith & Wesson Brands, Inc. | 90,000 | 781,200 | ||||||
Sonic Automotive, Inc., Class A | 82,000 | 4,040,140 | ||||||
Sportsman’s Warehouse Holdings, Inc.* | 86,900 | 817,729 | ||||||
Strategic Education, Inc. | 59,000 | 4,620,880 | ||||||
Strattec Security Corp.* | 17,300 | 355,515 | ||||||
Superior Group of Cos., Inc. | 13,100 | 131,786 | ||||||
Tilly’s, Inc., Class A*+ | 111,900 | 1,012,695 | ||||||
TravelCenters of America, Inc.* | 58,930 | 2,638,885 | ||||||
Tri Pointe Homes, Inc.* | 160,000 | 2,974,400 | ||||||
Unifi, Inc.* | 25,000 | 215,250 | ||||||
Universal Technical Institute, Inc.* | 148,600 | 998,592 | ||||||
Vera Bradley, Inc.* | 80,000 | 362,400 | ||||||
Vince Holding Corp.*+ | 15,000 | 117,450 | ||||||
Vista Outdoor, Inc.*+ | 32,813 | 799,653 | ||||||
VOXX International Corp.* | 52,164 | 437,134 | ||||||
Weyco Group, Inc. | 22,500 | 476,100 | ||||||
Winnebago Industries, Inc.+ | 68,500 | 3,609,950 | ||||||
Xcel Brands, Inc.* | 20,000 | 14,000 | ||||||
Zumiez, Inc.* | 37,800 | 821,772 | ||||||
|
| |||||||
| 92,573,108 | ||||||||
Consumer Staples - 4.46% |
| |||||||
Alico, Inc.+ | 10,961 | 261,639 | ||||||
| Industry Company | Shares | Value | ||||||
Consumer Staples (continued) |
| |||||||
Coffee Holding Co., Inc. | 10,000 | $ 20,400 | ||||||
Edgewell Personal Care Co. | 100,000 | 3,854,000 | ||||||
Fresh Del Monte Produce, Inc. | 144,000 | 3,771,360 | ||||||
Ingles Markets, Inc., Class A | 53,750 | 5,184,725 | ||||||
Lifevantage Corp. | 60,000 | 223,200 | ||||||
Mannatech, Inc. | 4,500 | 80,550 | ||||||
Natural Alternatives International, Inc.* | 16,800 | 140,952 | ||||||
Natural Grocers by Vitamin Cottage, Inc. | 52,100 | 476,194 | ||||||
Nature’s Sunshine Products, Inc.* | 4,500 | 37,440 | ||||||
Oil-Dri Corp. of America | 11,242 | 377,057 | ||||||
Seneca Foods Corp., Class A* | 25,450 | 1,551,177 | ||||||
SpartanNash Co. | 117,782 | 3,561,728 | ||||||
TreeHouse Foods, Inc.*+ | 90,000 | 4,444,200 | ||||||
United Natural Foods, Inc.* | 117,000 | 4,529,070 | ||||||
Village Super Market, Inc., Class A | 39,659 | 923,658 | ||||||
Vintage Wine Estates, Inc.*+ | 142,720 | 465,267 | ||||||
Weis Markets, Inc. | 66,600 | 5,480,514 | ||||||
Whole Earth Brands, Inc.*+ | 64,500 | 262,515 | ||||||
|
| |||||||
| 35,645,646 | ||||||||
Energy - 13.55% | ||||||||
Adams Resources & Energy, Inc. | 12,900 | 502,068 | ||||||
Alto Ingredients, Inc.*+ | 200,800 | 578,304 | ||||||
Archrock, Inc. | 297,700 | 2,673,346 | ||||||
Ardmore Shipping Corp.* | 107,011 | 1,542,029 | ||||||
Battalion Oil Corp.* | 993 | 9,642 | ||||||
Berry Corp. | 268,842 | 2,150,736 | ||||||
Bristow Group, Inc.* | 78,900 | 2,140,557 | ||||||
CONSOL Energy, Inc. | 100,200 | 6,513,000 | ||||||
Delek US Holdings, Inc. | 150,500 | 4,063,500 | ||||||
DHT Holdings, Inc. | 482,900 | 4,288,152 | ||||||
Dorian LPG, Ltd. | 148,029 | 2,805,150 | ||||||
Epsilon Energy, Ltd. | 60,000 | 397,800 | ||||||
Forum Energy Technologies, Inc.* | 7,000 | 206,500 | ||||||
Frontline, Ltd.+ | 465,000 | 5,645,100 | ||||||
Golar LNG, Ltd.*+ | 248,390 | 5,660,808 | ||||||
Gran Tierra Energy, Inc.* | 1,275,000 | 1,262,250 | ||||||
Hallador Energy Co.*+ | 153,900 | 1,537,461 | ||||||
Helix Energy Solutions Group, Inc.* | 145,000 | 1,070,100 | ||||||
| ||
| bridgewayfunds.com | 23 | |
Omni Tax-Managed Small-Cap Value Fund SCHEDULE OF INVESTMENTS (Unaudited) (continued) | | |
| ||
| Showing percentage of net assets as of December 31, 2022 | ||
| Industry Company | Shares | Value | ||||||
Common Stocks (continued) | ||||||||
Energy (continued) | ||||||||
International Seaways, Inc.+ | 33,493 | $ 1,239,911 | ||||||
Laredo Petroleum, Inc.*+ | 52,500 | 2,699,550 | ||||||
Nabors Industries, Ltd.* | 24,000 | 3,716,880 | ||||||
NACCO Industries, Inc., Class A | 21,450 | 815,100 | ||||||
National Energy Services Reunited Corp.* | 225,200 | 1,562,888 | ||||||
Natural Gas Services Group, Inc.* | 61,800 | 708,228 | ||||||
NCS Multistage Holdings, Inc.* | 6,500 | 162,500 | ||||||
Newpark Resources, Inc.* | 265,000 | 1,099,750 | ||||||
Oil States International, Inc.* | 146,000 | 1,089,160 | ||||||
Overseas Shipholding | ||||||||
Group, Inc., Class A* | 290,916 | 840,747 | ||||||
PBF Energy, Inc., Class A | 212,400 | 8,661,672 | ||||||
PEDEVCO Corp.* | 16,800 | 18,480 | ||||||
Permian Resources Corp. | 782,600 | 7,356,440 | ||||||
PHX Minerals, Inc. | 24,350 | 94,721 | ||||||
PrimeEnergy Resources Corp.* | 1,500 | 130,305 | ||||||
ProPetro Holding Corp.* | 357,310 | 3,705,305 | ||||||
Ranger Energy Services, Inc.* | 13,500 | 148,635 | ||||||
REX American Resources Corp.* | 35,202 | 1,121,536 | ||||||
Riley Exploration Permian, Inc.+ | 20,700 | 609,201 | ||||||
Ring Energy, Inc.*+ | 596,000 | 1,466,160 | ||||||
SandRidge Energy, Inc.* | 103,000 | 1,754,090 | ||||||
Scorpio Tankers, Inc. | 136,690 | 7,349,821 | ||||||
SEACOR Marine Holdings, Inc.* | 77,100 | 706,236 | ||||||
SFL Corp., Ltd. | 485,812 | 4,479,187 | ||||||
Smart Sand, Inc.* | 155,400 | 278,166 | ||||||
Talos Energy, Inc.*+ | 207,100 | 3,910,048 | ||||||
Teekay Corp.* | 470,000 | 2,133,800 | ||||||
US Silica Holdings, Inc.* | 249,500 | 3,118,750 | ||||||
VAALCO Energy, Inc. | 212,500 | 969,000 | ||||||
World Fuel Services Corp. | 118,156 | 3,229,203 | ||||||
|
| |||||||
| 108,221,973 | ||||||||
Financials - 36.95% | ||||||||
1st Source Corp. | 58,800 | 3,121,692 | ||||||
Acacia Research Corp.* | 104,500 | 439,945 | ||||||
ACNB Corp. | 32,900 | 1,309,749 | ||||||
Alerus Financial Corp. | 36,373 | 849,310 | ||||||
Amalgamated Financial Corp. | 55,000 | 1,267,200 | ||||||
| Industry Company | Shares | Value | ||||||
Financials (continued) | ||||||||
A-Mark Precious Metals, Inc. | 38,000 | $ 1,319,740 | ||||||
Ambac Financial Group, Inc.* | 95,000 | 1,656,800 | ||||||
Amerant Bancorp, Inc. | 42,850 | 1,150,094 | ||||||
American National Bankshares, Inc. | 31,000 | 1,144,830 | ||||||
AmeriServ Financial, Inc. | 66,000 | 259,380 | ||||||
Ames National Corp. | 8,000 | 188,880 | ||||||
Argo Group International Holdings, Ltd. | 62,694 | 1,620,640 | ||||||
Associated Capital Group, Inc., Class A | 33,827 | 1,420,396 | ||||||
Atlantic American Corp. | 1,204 | 2,781 | ||||||
Atlanticus Holdings Corp.* | 12,142 | 318,120 | ||||||
Auburn National BanCorp, Inc. | 7,374 | 170,892 | ||||||
Banc of California, Inc. | 139,150 | 2,216,660 | ||||||
Banco Latinoamericano de Comercio Exterior SA, Class E | 59,688 | 966,946 | ||||||
Bank of Marin Bancorp | 8,100 | 266,328 | ||||||
Bank of NT Butterfield & Son, Ltd. (The) | 17,400 | 518,694 | ||||||
Bank of Princeton (The) | 22,500 | 713,700 | ||||||
Bank of the James Financial Group, Inc. | 14,000 | 172,480 | ||||||
Bank7 Corp. | 23,100 | 591,360 | ||||||
Bankwell Financial Group, Inc. | 14,000 | 412,020 | ||||||
Banner Corp. | 62,000 | 3,918,400 | ||||||
Bar Harbor Bankshares | 30,541 | 978,534 | ||||||
BayCom Corp.+ | 15,300 | 290,394 | ||||||
BCB Bancorp, Inc. | 50,900 | 915,691 | ||||||
Blue Ridge Bankshares, Inc. | 42,296 | 528,277 | ||||||
Broadway Financial Corp.* | 119,223 | 120,415 | ||||||
Brookline Bancorp, Inc. | 178,500 | 2,525,775 | ||||||
Business First Bancshares, Inc. | 35,000 | 774,900 | ||||||
Byline Bancorp, Inc. | 81,200 | 1,865,164 | ||||||
C&F Financial Corp. | 7,800 | 454,506 | ||||||
Camden National Corp. | 45,700 | 1,905,233 | ||||||
Capital Bancorp, Inc. | 64,650 | 1,521,861 | ||||||
Capital City Bank Group, Inc. | 27,500 | 893,750 | ||||||
Capstar Financial Holdings, Inc. | 35,000 | 618,100 | ||||||
Carter Bankshares, Inc.* | 61,755 | 1,024,515 | ||||||
CB Financial Services, Inc. | 23,700 | 507,891 | ||||||
Central Pacific Financial Corp. | 60,000 | 1,216,800 | ||||||
| ||
| 24 | Semi-Annual Report | December 31, 2022 (Unaudited) | |
Omni Tax-Managed Small-Cap Value Fund SCHEDULE OF INVESTMENTS (Unaudited) (continued) | | |
| ||
| Showing percentage of net assets as of December 31, 2022 | ||
| Industry Company | Shares | Value | ||||||
Common Stocks (continued) | ||||||||
Financials (continued) | ||||||||
Central Valley Community Bancorp | 26,900 | $ 569,742 | ||||||
CF Bankshares, Inc. | 1,000 | 21,180 | ||||||
Chemung Financial Corp. | 11,593 | 531,771 | ||||||
ChoiceOne Financial Services, Inc. | 7,000 | 203,000 | ||||||
Citizens Community Bancorp, Inc. | 47,500 | 571,425 | ||||||
Citizens Holding Co. | 3,400 | 46,580 | ||||||
Citizens, Inc.*+ | 79,500 | 169,335 | ||||||
Civista Bancshares, Inc. | 34,821 | 766,410 | ||||||
CNB Financial Corp. | 48,000 | 1,141,920 | ||||||
Codorus Valley Bancorp, Inc. | 37,971 | 903,710 | ||||||
Cohen & Co., Inc. | 4,500 | 37,530 | ||||||
Community Financial Corp. (The) | 28,340 | 1,130,766 | ||||||
Community Trust Bancorp, Inc. | 36,300 | 1,667,259 | ||||||
Community West Bancshares | 28,821 | 431,450 | ||||||
ConnectOne Bancorp, Inc. | 110,854 | 2,683,775 | ||||||
Consumer Portfolio Services, Inc.*+ | 98,800 | 874,380 | ||||||
Cowen, Inc., Class A | 74,700 | 2,884,914 | ||||||
Crawford & Co., Class A | 22,500 | 125,100 | ||||||
Crawford & Co., Class B | 101 | 536 | ||||||
CrossFirst Bankshares, Inc.* | 127,200 | 1,578,552 | ||||||
Curo Group Holdings Corp. | 40,000 | 142,000 | ||||||
Customers Bancorp, Inc.* | 49,000 | 1,388,660 | ||||||
Dime Community Bancshares, Inc. | 90,420 | 2,878,069 | ||||||
Donegal Group, Inc., Class A | 87,600 | 1,243,920 | ||||||
Eagle Bancorp Montana, Inc. | 28,000 | 452,480 | ||||||
Eagle Bancorp, Inc. | 83,900 | 3,697,473 | ||||||
Elevate Credit, Inc.* | 90,200 | 157,850 | ||||||
Emclaire Financial Corp.+ | 700 | 22,120 | ||||||
Employers Holdings, Inc. | 40,730 | 1,756,685 | ||||||
Encore Capital Group, Inc.* | 76,600 | 3,672,204 | ||||||
Enova International, Inc.* | 54,900 | 2,106,513 | ||||||
Enterprise Bancorp, Inc. | 40,275 | 1,421,708 | ||||||
Enterprise Financial Services Corp. | 200 | 9,792 | ||||||
Equity Bancshares, Inc., Class A | 59,300 | 1,937,331 | ||||||
ESSA Bancorp, Inc. | 33,100 | 690,797 | ||||||
EZCORP, Inc., Class A* | 225,000 | 1,833,750 | ||||||
| Industry Company | Shares | Value | ||||||
Financials (continued) | ||||||||
Farmers National Banc Corp. | 62,500 | $ 882,500 | ||||||
Federal Agricultural Mortgage Corp., Class C | 19,900 | 2,242,929 | ||||||
Financial Institutions, Inc. | 46,300 | 1,127,868 | ||||||
First Bancorp, Inc. (The) | 5,000 | 149,700 | ||||||
First Bancshares, Inc. (The) | 64,600 | 2,067,846 | ||||||
First Bank | 42,622 | 586,479 | ||||||
First Busey Corp. | 132,900 | 3,285,288 | ||||||
First Business Financial Services, Inc. | 32,508 | 1,188,167 | ||||||
First Capital, Inc. | 10,000 | 249,000 | ||||||
First Commonwealth Financial Corp. | 145,000 | 2,025,650 | ||||||
First Community Bankshares, Inc. | 20,600 | 698,340 | ||||||
First Community Corp. | 5,800 | 126,962 | ||||||
First Financial Bancorp | 150,000 | 3,634,500 | ||||||
First Financial Corp. | 22,127 | 1,019,612 | ||||||
First Financial Northwest, Inc. | 20,700 | 310,086 | ||||||
First Foundation, Inc. | 65,000 | 931,450 | ||||||
First Guaranty Bancshares, Inc. | 14,713 | 345,020 | ||||||
First Internet Bancorp | 41,200 | 1,000,336 | ||||||
First Merchants Corp. | 23,267 | 956,506 | ||||||
First Mid Bancshares, Inc. | 22,000 | 705,760 | ||||||
First National Corp. | 9,500 | 162,735 | ||||||
First Northwest Bancorp | 25,600 | 393,216 | ||||||
First of Long Island Corp. (The) | 54,000 | 972,000 | ||||||
First Savings Financial Group, Inc. | 23,600 | 472,000 | ||||||
First United Corp. | 12,725 | 250,046 | ||||||
First US Bancshares, Inc. | 5,000 | 43,500 | ||||||
First Western Financial, Inc.* | 46,000 | 1,294,900 | ||||||
Flushing Financial Corp. | 65,141 | 1,262,433 | ||||||
FNCB Bancorp, Inc. | 92,600 | 760,246 | ||||||
Franklin Financial Services Corp. | 22,000 | 794,200 | ||||||
FS Bancorp, Inc. | 18,800 | 628,672 | ||||||
FVCBankcorp, Inc.* | 2,300 | 43,861 | ||||||
Genworth Financial, Inc., Class A* | 915,000 | 4,840,350 | ||||||
Great Southern Bancorp, Inc. | 22,300 | 1,326,627 | ||||||
Green Dot Corp., Class A* | 100,000 | 1,582,000 | ||||||
Greenhill & Co., Inc. | 35,000 | 358,750 | ||||||
Guild Holdings Co., Class A* | 187,000 | 1,886,830 | ||||||
| ||
| bridgewayfunds.com | 25 | |
Omni Tax-Managed Small-Cap Value Fund SCHEDULE OF INVESTMENTS (Unaudited) (continued) | | |
| ||
| Showing percentage of net assets as of December 31, 2022 | ||
| Industry Company | Shares | Value | ||||||
Common Stocks (continued) | ||||||||
Financials (continued) | ||||||||
Hallmark Financial Services, Inc.* | 62,000 | $ 36,220 | ||||||
Hanmi Financial Corp. | 114,000 | 2,821,500 | ||||||
HarborOne Bancorp, Inc. | 106,800 | 1,484,520 | ||||||
Hawthorn Bancshares, Inc. | 18,398 | 400,524 | ||||||
Heartland Financial USA, Inc. | 68,350 | 3,186,477 | ||||||
Hennessy Advisors, Inc.+ | 6,000 | 50,400 | ||||||
Heritage Commerce Corp. | 65,000 | 845,000 | ||||||
HMN Financial, Inc. | 22,500 | 479,250 | ||||||
Home Bancorp, Inc. | 21,097 | 844,513 | ||||||
Home Point Capital, Inc. | 336,500 | 461,005 | ||||||
HomeStreet, Inc. | 57,500 | 1,585,850 | ||||||
HomeTrust Bancshares, Inc. | 15,900 | 384,303 | ||||||
Hope Bancorp, Inc. | 271,500 | 3,477,915 | ||||||
Horace Mann Educators Corp. | 91,082 | 3,403,734 | ||||||
Horizon Bancorp, Inc. | 129,342 | 1,950,477 | ||||||
HV Bancorp, Inc.* | 3,700 | 105,228 | ||||||
Independent Bank Corp. | 65,500 | 1,566,760 | ||||||
Independent Bank Group, Inc. | 20,300 | 1,219,624 | ||||||
Investar Holding Corp. | 36,000 | 775,080 | ||||||
Investors Title Co. | 3,600 | 531,180 | ||||||
Kearny Financial Corp.+ | 150,000 | 1,522,500 | ||||||
Kingstone Cos., Inc. | 5,800 | 7,830 | ||||||
Lakeland Bancorp, Inc. | 146,371 | 2,577,593 | ||||||
Landmark Bancorp, Inc. | 9,073 | 205,322 | ||||||
LCNB Corp. | 38,900 | 700,200 | ||||||
LendingClub Corp.* | 146,600 | 1,290,080 | ||||||
Limestone Bancorp, Inc. | 23,300 | 568,986 | ||||||
Logan Ridge Finance Corp.* | 10,100 | 228,058 | ||||||
Luther Burbank Corp. | 183,900 | 2,043,129 | ||||||
Macatawa Bank Corp. | 9,000 | 99,270 | ||||||
MainStreet Bancshares, Inc. | 29,040 | 798,310 | ||||||
Malvern Bancorp, Inc.* | 20,800 | 369,200 | ||||||
Mercantile Bank Corp. | 26,500 | 887,220 | ||||||
Merchants Bancorp | 95,689 | 2,327,156 | ||||||
Mercury General Corp.+ | 99,500 | 3,402,900 | ||||||
Meridian Corp. | 19,500 | 590,655 | ||||||
Metrocity Bankshares, Inc. | 19,409 | 419,817 | ||||||
Metropolitan Bank Holding | ||||||||
Corp.* | 20,200 | 1,185,134 | ||||||
Mid Penn Bancorp, Inc. | 13,500 | 404,595 | ||||||
Middlefield Banc Corp. | 13,300 | 364,420 | ||||||
Midland States Bancorp, Inc. | 81,617 | 2,172,645 | ||||||
MidWestOne Financial Group, Inc. | 41,900 | 1,330,325 | ||||||
| Industry Company | Shares | Value | ||||||
Financials (continued) | ||||||||
National Western Life Group, Inc., Class A | 6,150 | $ 1,728,150 | ||||||
Navient Corp. | 277,000 | 4,556,650 | ||||||
NI Holdings, Inc.* | 28,000 | 371,560 | ||||||
Nicholas Financial, Inc.* | 19,400 | 122,414 | ||||||
Nicolet Bankshares, Inc.* | 22,097 | 1,763,120 | ||||||
NMI Holdings, Inc., Class A* | 150,000 | 3,135,000 | ||||||
Northeast Bank+ | 16,800 | 707,280 | ||||||
Northeast Community Bancorp, Inc.+ | 39,200 | 584,864 | ||||||
Northfield Bancorp, Inc. | 75,000 | 1,179,750 | ||||||
Northrim BanCorp, Inc. | 14,573 | 795,249 | ||||||
Northwest Bancshares, Inc. | 275,000 | 3,844,500 | ||||||
Oak Valley Bancorp | 26,720 | 605,208 | ||||||
OceanFirst Financial Corp. | 159,496 | 3,389,290 | ||||||
Ocwen Financial Corp.* | 29,820 | 911,896 | ||||||
OFG Bancorp | 91,000 | 2,507,960 | ||||||
Ohio Valley Banc Corp. | 6,000 | 158,520 | ||||||
Old Point Financial Corp. | 5,100 | 137,496 | ||||||
Old Second Bancorp, Inc. | 41,500 | 665,660 | ||||||
OP Bancorp | 35,000 | 390,600 | ||||||
Oportun Financial Corp.* | 24,500 | 134,995 | ||||||
Oppenheimer Holdings, Inc., Class A+ | 29,319 | 1,241,073 | ||||||
Origin Bancorp, Inc. | 15,700 | 576,190 | ||||||
Orrstown Financial Services, Inc. | 13,500 | 312,660 | ||||||
Parke Bancorp, Inc. | 36,959 | 766,530 | ||||||
Pathward Financial, Inc. | 68,434 | 2,946,084 | ||||||
Patriot National Bancorp, Inc.* | 13,500 | 143,100 | ||||||
PCB Bancorp+ | 36,300 | 642,147 | ||||||
Peapack-Gladstone Financial Corp. | 29,868 | 1,111,687 | ||||||
Penns Woods Bancorp, Inc. | 14,200 | 378,004 | ||||||
Peoples Bancorp of North Carolina, Inc. | 22,880 | 744,973 | ||||||
Peoples Bancorp, Inc. | 76,909 | 2,172,679 | ||||||
Peoples Financial Services Corp. | 21,200 | 1,099,008 | ||||||
Pioneer Bancorp, Inc.* | 40,000 | 456,000 | ||||||
Plumas Bancorp | 2,000 | 74,100 | ||||||
Ponce Financial Group, Inc.* | 8,600 | 80,152 | ||||||
Premier Financial Corp. | 96,900 | 2,613,393 | ||||||
Primis Financial Corp. | 63,600 | 753,660 | ||||||
ProAssurance Corp. | 103,100 | 1,801,157 | ||||||
PROG Holdings, Inc.* | 95,000 | 1,604,550 | ||||||
Provident Bancorp, Inc. | 28,000 | 203,840 | ||||||
| ||
| 26 | Semi-Annual Report | December 31, 2022 (Unaudited) | |
Omni Tax-Managed Small-Cap Value Fund SCHEDULE OF INVESTMENTS (Unaudited) (continued) | | |
| ||
| Showing percentage of net assets as of December 31, 2022 | ||
| Industry Company | Shares | Value | ||||||
Common Stocks (continued) | ||||||||
Financials (continued) | ||||||||
Provident Financial Holdings, Inc. | 44,710 | $ 615,657 | ||||||
Provident Financial Services, Inc. | 104,225 | 2,226,246 | ||||||
QCR Holdings, Inc. | 44,683 | 2,218,064 | ||||||
RBB Bancorp | 63,800 | 1,330,230 | ||||||
Red River Bancshares, Inc. | 1,350 | 68,931 | ||||||
Regional Management Corp. | 29,100 | 817,128 | ||||||
Renasant Corp. | 115,000 | 4,322,850 | ||||||
Republic Bancorp, Inc., Class A | 33,880 | 1,386,370 | ||||||
Republic First Bancorp, Inc.*+ | 140,000 | 301,000 | ||||||
Rhinebeck Bancorp, Inc.* | 35,000 | 318,850 | ||||||
Riverview Bancorp, Inc. | 62,478 | 479,831 | ||||||
S&T Bancorp, Inc. | 95,199 | 3,253,902 | ||||||
Safety Insurance Group, Inc. | 36,972 | 3,115,261 | ||||||
Salisbury Bancorp, Inc. | 3,366 | 105,692 | ||||||
Sandy Spring Bancorp, Inc. | 104,900 | 3,695,627 | ||||||
SB Financial Group, Inc. | 26,478 | 443,771 | ||||||
Security National Financial Corp., Class A* | 31,484 | 229,833 | ||||||
Shore Bancshares, Inc. | 36,421 | 634,818 | ||||||
Sierra Bancorp | 55,000 | 1,168,200 | ||||||
SiriusPoint, Ltd.* | 278,000 | 1,640,200 | ||||||
SmartFinancial, Inc. | 40,500 | 1,113,750 | ||||||
Sound Financial Bancorp, Inc. | 10,200 | 412,896 | ||||||
South Plains Financial, Inc. | 75,000 | 2,064,750 | ||||||
Southern First Bancshares, Inc.* | 25,900 | 1,184,925 | ||||||
Southern Missouri Bancorp, Inc. | 14,300 | 655,369 | ||||||
Stellar Bancorp, Inc.+ | 44,156 | 1,300,836 | ||||||
Sterling Bancorp, Inc.* | 140,000 | 852,600 | ||||||
Stewart Information Services Corp. | 63,592 | 2,717,286 | ||||||
StoneX Group, Inc.* | 41,911 | 3,994,118 | ||||||
Summit Financial Group, Inc. | 44,100 | 1,097,649 | ||||||
Summit State Bank | 17,875 | 282,425 | ||||||
SWK Holdings Corp.* | 39,595 | 698,456 | ||||||
Territorial Bancorp, Inc. | 22,500 | 540,225 | ||||||
Timberland Bancorp, Inc. | 36,725 | 1,253,424 | ||||||
Tiptree, Inc. | 122,700 | 1,698,168 | ||||||
Trean Insurance Group, Inc.* | 39,850 | 239,100 | ||||||
TriCo Bancshares | 35,300 | 1,799,947 | ||||||
TrustCo Bank Corp. NY | 17,400 | 654,066 | ||||||
| Industry Company | Shares | Value | ||||||
Financials (continued) | ||||||||
Trustmark Corp. | 105,700 | $ 3,689,987 | ||||||
Union Bankshares, Inc. | 400 | 9,364 | ||||||
United Bancorp, Inc. | 10,000 | 147,800 | ||||||
United Fire Group, Inc.+ | 64,500 | 1,764,720 | ||||||
Unity Bancorp, Inc. | 28,700 | 784,371 | ||||||
Universal Insurance Holdings, Inc. | 142,200 | 1,505,898 | ||||||
Univest Financial Corp. | 118,200 | 3,088,566 | ||||||
US Global Investors, Inc., Class A | 37,500 | 108,375 | ||||||
Velocity Financial, Inc.* | 112,250 | 1,083,213 | ||||||
Veritex Holdings, Inc. | 93,000 | 2,611,440 | ||||||
Virginia National Bankshares Corp. | 1,687 | 61,845 | ||||||
Virtus Investment Partners, Inc. | 15,000 | 2,871,600 | ||||||
Walker & Dunlop, Inc. | 22,775 | 1,787,382 | ||||||
Washington Federal, Inc. | 95,000 | 3,187,250 | ||||||
Waterstone Financial, Inc. | 51,500 | 887,860 | ||||||
Western New England Bancorp, Inc. | 55,365 | 523,753 | ||||||
Westwood Holdings Group, Inc. | 27,864 | 310,229 | ||||||
World Acceptance Corp.* | 10,900 | 718,746 | ||||||
|
| |||||||
| 295,106,799 | ||||||||
Health Care - 2.62% | ||||||||
American Shared Hospital Services* | 8,500 | 24,905 | ||||||
Assertio Holdings, Inc.*+ | 134,400 | 577,920 | ||||||
Avanos Medical, Inc.* | 125,500 | 3,396,030 | ||||||
Bioventus, Inc., Class A* | 75,000 | 195,750 | ||||||
CareCloud, Inc.* | 25,900 | 72,779 | ||||||
Co.-Diagnostics, Inc.*+ | 32,500 | 81,900 | ||||||
Emergent BioSolutions, Inc.* | 106,000 | 1,251,860 | ||||||
FONAR Corp.* | 8,400 | 140,700 | ||||||
Fulgent Genetics, Inc.*+ | 70,592 | 2,102,230 | ||||||
Innoviva, Inc.*+ | 171,490 | 2,272,242 | ||||||
iTeos Therapeutics, Inc.* | 95,000 | 1,855,350 | ||||||
Multiplan Corp.* | 1,500,000 | 1,725,000 | ||||||
Ovid therapeutics, Inc.* | 135,900 | 252,774 | ||||||
Owens & Minor, Inc. | 210,000 | 4,101,300 | ||||||
REGENXBIO, Inc.* | 85,000 | 1,927,800 | ||||||
Vanda Pharmaceuticals, Inc.* | 97,400 | 719,786 | ||||||
XBiotech, Inc.* | 57,100 | 200,421 | ||||||
|
| |||||||
| 20,898,747 | ||||||||
Industrials - 13.24% | ||||||||
ACCO Brands Corp. | 218,600 | 1,221,974 | ||||||
| ||
| bridgewayfunds.com | 27 | |
Omni Tax-Managed Small-Cap Value Fund SCHEDULE OF INVESTMENTS (Unaudited) (continued) | | |
| ||
| Showing percentage of net assets as of December 31, 2022 | ||
| Industry Company | Shares | Value | ||||||
Comman Stocks (continued) | ||||||||
Industrials (continued) | ||||||||
Air Transport Services Group, Inc.* | 118,300 | $3,073,433 | ||||||
Allegiant Travel Co.* | 50,700 | 3,447,093 | ||||||
American Woodmark Corp.* | 45,000 | 2,198,700 | ||||||
Apogee Enterprises, Inc. | 37,000 | 1,645,020 | ||||||
ARC Document Solutions, Inc. | 176,700 | 517,731 | ||||||
ArcBest Corp. | 45,400 | 3,179,816 | ||||||
Art’s-Way Manufacturing Co., Inc.* | 6,939 | 13,392 | ||||||
Atlas Air Worldwide Holdings, Inc.* | 49,400 | 4,979,520 | ||||||
AZZ, Inc. | 12,304 | 494,621 | ||||||
BlueLinx Holdings, Inc.* | 22,600 | 1,607,086 | ||||||
Boise Cascade Co. | 76,900 | 5,280,723 | ||||||
BrightView Holdings, Inc.* | 101,000 | 695,890 | ||||||
Caesarstone, Ltd. | 96,400 | 550,444 | ||||||
CBAK Energy Technology, Inc.* | 215,000 | 212,850 | ||||||
Civeo Corp.* | 51,700 | 1,607,870 | ||||||
CompX International, Inc. | 1,500 | 27,720 | ||||||
Concrete Pumping Holdings, Inc.* | 211,000 | 1,234,350 | ||||||
Costamare, Inc. | 360,300 | 3,343,584 | ||||||
Covenant Logistics Group, Inc. | 78,550 | 2,715,474 | ||||||
Daseke, Inc.* | 71,600 | 407,404 | ||||||
Deluxe Corp. | 100,000 | 1,698,000 | ||||||
Eagle Bulk Shipping, Inc. | 55,900 | 2,791,646 | ||||||
Eastern Co. (The) | 12,404 | 239,149 | ||||||
Eneti, Inc. | 85,000 | 854,250 | ||||||
Genco Shipping & Trading, Ltd. | 177,300 | 2,723,328 | ||||||
Greenbrier Cos., Inc. (The) | 25,400 | 851,662 | ||||||
Hawaiian Holdings, Inc.* | 100,000 | 1,026,000 | ||||||
Heidrick & Struggles International, Inc. | 39,000 | 1,090,830 | ||||||
Hudson Technologies, Inc.* | 31,500 | 318,780 | ||||||
Hurco Cos., Inc. | 13,372 | 349,410 | ||||||
KAR Auction Services, Inc.* | 220,000 | 2,871,000 | ||||||
Kelly Services, Inc., Class A | 66,400 | 1,122,160 | ||||||
Limbach Holdings, Inc.* | 6,200 | 64,542 | ||||||
LS Starrett Co. (The), Class A* | 8,068 | 59,380 | ||||||
LSI Industries, Inc. | 3,600 | 44,064 | ||||||
Manitowoc Co., Inc. (The)* | 90,850 | 832,186 | ||||||
Matthews International Corp., Class A | 89,700 | 2,730,468 | ||||||
Maxar Technologies, Inc. | 69,500 | 3,595,930 | ||||||
| Industry Company | Shares | Value | ||||||
Industrials (continued) | ||||||||
Mayville Engineering Co., Inc.* | 40,210 | $509,059 | ||||||
Mesa Air Group, Inc.* | 72,500 | 110,925 | ||||||
Mistras Group, Inc.* | 105,000 | 517,650 | ||||||
MRC Global, Inc.* | 178,200 | 2,063,556 | ||||||
MYR Group, Inc.* | 15,700 | 1,445,499 | ||||||
NL Industries, Inc. | 107,800 | 734,118 | ||||||
NN, Inc.* | 124,600 | 186,900 | ||||||
Northwest Pipe Co.* | 30,500 | 1,027,850 | ||||||
NOW, Inc.* | 192,700 | 2,447,290 | ||||||
Orion Group Holdings, Inc.* | 138,172 | 328,849 | ||||||
PAM Transportation Services, Inc.* | 40,000 | 1,036,000 | ||||||
Pangaea Logistics Solutions, Ltd. | 234,800 | 1,209,220 | ||||||
Park-Ohio Holdings Corp. | 22,116 | 270,479 | ||||||
Patriot Transportation Holding, Inc.* | 7,500 | 53,325 | ||||||
Preformed Line Products Co. | 10,600 | 882,874 | ||||||
Primoris Services Corp. | 117,800 | 2,584,532 | ||||||
Proto Labs, Inc.* | 12,800 | 326,784 | ||||||
Quad/Graphics, Inc.* | 193,757 | 790,529 | ||||||
Quanex Building Products Corp. | 42,000 | 994,560 | ||||||
REV Group, Inc. | 127,500 | 1,609,050 | ||||||
Rush Enterprises, Inc., Class A | 32,769 | 1,713,163 | ||||||
Rush Enterprises, Inc., Class B | 19,050 | 1,071,944 | ||||||
Safe Bulkers, Inc. | 360,200 | 1,048,182 | ||||||
Servotronics, Inc.* | 1,500 | 15,840 | ||||||
SIFCO Industries, Inc.* | 6,500 | 14,038 | ||||||
SkyWest, Inc.*+ | 146,500 | 2,418,715 | ||||||
Sterling Infrastructure, Inc.* | 64,800 | 2,125,440 | ||||||
Textainer Group Holdings, Ltd. | 125,400 | 3,888,654 | ||||||
Titan Machinery, Inc.* | 92,000 | 3,655,160 | ||||||
TrueBlue, Inc.* | 89,250 | 1,747,515 | ||||||
Tutor Perini Corp.* | 157,100 | 1,186,105 | ||||||
Ultralife Corp.* | 25,000 | 96,500 | ||||||
Universal Logistics Holdings, Inc. | 4,108 | 137,372 | ||||||
US Xpress Enterprises, Inc., Class A* | 90,000 | 162,900 | ||||||
V2X, Inc.* | 24,000 | 990,960 | ||||||
Veritiv Corp. | 28,900 | 3,517,419 | ||||||
Williams Industrial Services Group, Inc.* | 51,200 | 52,229 | ||||||
| ||
| 28 | Semi-Annual Report | December 31, 2022 (Unaudited) | |
Omni Tax-Managed Small-Cap Value Fund SCHEDULE OF INVESTMENTS (Unaudited) (continued) | | |
| ||
| Showing percentage of net assets as of December 31, 2022 | ||
| Industry Company | Shares | Value | ||||||
Common Stocks (continued) |
| |||||||
Industrials (continued) |
| |||||||
Willis Lease Finance Corp.* | 17,634 | $ 1,040,582 | ||||||
|
| |||||||
| 105,729,247 | ||||||||
Information Technology - 4.35% |
| |||||||
Adeia, Inc. | 349,216 | 3,310,568 | ||||||
Alpha & Omega Semiconductor, Ltd.* | 114,905 | 3,282,836 | ||||||
AstroNova, Inc.* | 7,857 | 100,727 | ||||||
AXT, Inc.* | 100,000 | 438,000 | ||||||
Bel Fuse, Inc., Class B | 29,272 | 963,634 | ||||||
Benchmark Electronics, Inc. | 90,100 | 2,404,769 | ||||||
Computer Task Group, Inc.* | 21,150 | 159,894 | ||||||
Comtech Telecommunications Corp. | 45,200 | 548,728 | ||||||
Conduent, Inc.* | 705,000 | 2,855,250 | ||||||
Daktronics, Inc.* | 79,000 | 222,780 | ||||||
Ebix, Inc. | 80,500 | 1,606,780 | ||||||
EMCORE Corp.* | 75,000 | 72,187 | ||||||
Kimball Electronics, Inc.* | 57,100 | 1,289,889 | ||||||
Magnachip Semiconductor Corp.* | 100,000 | 939,000 | ||||||
NetScout Systems, Inc.* | 143,600 | 4,668,436 | ||||||
NetSol Technologies, Inc.* | 35,100 | 100,035 | ||||||
Network-1 Technologies, | ||||||||
Inc. | 100,100 | 220,220 | ||||||
Photronics, Inc.* | 118,670 | 1,997,216 | ||||||
Sanmina Corp.* | 48,800 | 2,795,752 | ||||||
ScanSource, Inc.* | 31,000 | 905,820 | ||||||
StarTek, Inc.* | 124,500 | 466,875 | ||||||
TESSCO Technologies, Inc.* | 33,200 | 160,024 | ||||||
Trio-Tech International* | 25,100 | 112,953 | ||||||
TTM Technologies, Inc.* | 337,702 | 5,092,546 | ||||||
|
| |||||||
| 34,714,919 | ||||||||
Materials - 6.62% |
| |||||||
Advanced Emissions Solutions, Inc.* | 85,000 | 206,550 | ||||||
AdvanSix, Inc. | 87,400 | 3,322,948 | ||||||
AgroFresh Solutions, Inc.* | 78,900 | 233,544 | ||||||
American Vanguard Corp. | 103,000 | 2,236,130 | ||||||
Ampco-Pittsburgh Corp.* | 51,200 | 128,512 | ||||||
Ascent Industries Co.* | 29,748 | 257,915 | ||||||
Caledonia Mining Corp. PLC | 18,000 | 223,200 | ||||||
Carpenter Technology Corp. | 84,000 | 3,102,960 | ||||||
| Industry Company | Shares | Value | ||||||
Materials (continued) | ||||||||
Century Aluminum Co.* | 251,500 | $2,057,270 | ||||||
Clearwater Paper Corp.* | 74,050 | 2,799,830 | ||||||
Core Molding Technologies, Inc.* | 17,000 | 220,830 | ||||||
Friedman Industries, Inc. | 24,400 | 238,876 | ||||||
FutureFuel Corp. | 122,000 | 991,860 | ||||||
Glatfelter Corp. | 47,000 | 130,660 | ||||||
Gold Resource Corp. | 252,750 | 386,707 | ||||||
Intrepid Potash, Inc.* | 45,601 | 1,316,501 | ||||||
Koppers Holdings, Inc. | 66,000 | 1,861,200 | ||||||
Kronos Worldwide, Inc. | 218,000 | 2,049,200 | ||||||
Mercer International, Inc.+ | 274,950 | 3,200,418 | ||||||
Olympic Steel, Inc. | 33,639 | 1,129,598 | ||||||
Pactiv Evergreen, Inc. | 35,000 | 397,600 | ||||||
Ramaco Resources, Inc.+ | 79,900 | 702,321 | ||||||
Rayonier Advanced Materials, Inc.* | 197,400 | 1,895,040 | ||||||
Resolute Forest Products, Inc.*+ | 236,000 | 5,095,240 | ||||||
Ryerson Holding Corp. | 124,700 | 3,773,422 | ||||||
Schnitzer Steel Industries, Inc., Class A | 77,200 | 2,366,180 | ||||||
SunCoke Energy, Inc. | 320,000 | 2,761,600 | ||||||
TimkenSteel Corp.* | 153,887 | 2,796,127 | ||||||
Trinseo PLC+ | 75,000 | 1,703,250 | ||||||
Universal Stainless & Alloy Products, Inc.* | 11,500 | 82,455 | ||||||
Valhi, Inc. | 84,546 | 1,860,012 | ||||||
Warrior Met Coal, Inc. | 96,000 | 3,325,440 | ||||||
|
| |||||||
| 52,853,396 | ||||||||
Real Estate - 0.90% |
| |||||||
AMREP Corp.* | 29,900 | 345,345 | ||||||
Anywhere Real Estate, Inc.* | 270,718 | 1,729,888 | ||||||
Forestar Group, Inc.* | 104,001 | 1,602,655 | ||||||
Newmark Group, Inc., Class A | 370,951 | 2,956,480 | ||||||
RE/MAX Holdings, Inc., Class A | 30,000 | 559,200 | ||||||
|
| |||||||
| 7,193,568 | ||||||||
|
| |||||||
TOTAL COMMON STOCKS - 99.21% | 792,346,720 | |||||||
|
| |||||||
(Cost $640,451,748) | ||||||||
EXCHANGE TRADED FUND—0.55% |
| |||||||
iShares Russell 2000 ETF+ | 25,000 | 4,359,000 | ||||||
|
| |||||||
TOTAL EXCHANGE TRADED FUND - 0.55% |
| 4,359,000 | ||||||
|
| |||||||
(Cost $4,395,953) | ||||||||
| ||
| bridgewayfunds.com | 29 | |
Omni Tax-Managed Small-Cap Value Fund SCHEDULE OF INVESTMENTS (Unaudited) (continued) | | |
| ||
| Showing percentage of net assets as of December 31, 2022 | ||
| Industry Company | Shares | Value | ||||||
PREFERRED STOCK - 0.00% |
| |||||||
Air T Funding, 8.00%***+ | 529 | $ 11,030 | ||||||
|
| |||||||
TOTAL PREFERRED STOCK - 0.00% |
| 11,030 | ||||||
|
| |||||||
(Cost $11,003) |
| |||||||
RIGHTS - 0.00% | ||||||||
Pineapple Holdings, Inc., CVR*Δ#+++ | 3,750 | — | ||||||
ZAGG, Inc., CVR,expiring 12/31/99*Δ# | 30,000 | — | ||||||
|
| |||||||
TOTAL RIGHTS - 0.00% |
| — | ||||||
|
| |||||||
(Cost $ – ) |
| |||||||
WARRANTS - 0.02% | ||||||||
Nabors Industries, Ltd.,expiring 06/11/26* | 5,200 | 171,080 | ||||||
|
| |||||||
TOTAL WARRANTS - 0.02% |
| 171,080 | ||||||
|
| |||||||
(Cost $ – ) |
| |||||||
| Rate^ | Shares | Value | ||||||||||
MONEY MARKET FUND - 0.41% |
| |||||||||||
Fidelity Investments Money Market Government Portfolio Class I | 4.06 | % | 3,301,387 | 3,301,387 | ||||||||
|
| |||||||||||
TOTAL MONEY MARKET FUND - 0.41% |
| 3,301,387 | ||||||||||
|
| |||||||||||
(Cost $3,301,387) |
| |||||||||||
| INVESTMENTS PURCHASED WITH CASH PROCEEDS FROM SECURITIES LENDING - 2.29% |
| |||||||||||
Dreyfus Institutional Preferred Government Plus Money Market Fund** | 4.36 | % | 18,298,857 | 18,298,857 | ||||||||
|
| |||||||||||
TOTAL INVESTMENTS PURCHASED WITH CASH PROCEEDS FROM SECURITIES LENDING - 2.29% |
| 18,298,857 | ||||||||||
|
| |||||||||||
(Cost $18,298,857) |
| |||||||||||
TOTAL INVESTMENTS - 102.48% |
| $ 818,488,074 | ||||||||||
(Cost $666,458,948) |
| |||||||||||
Liabilities in Excess of Other Assets - (2.48%) |
| (19,841,455) | ||||||||||
|
| |||||||||||
NET ASSETS - 100.00% |
| $ 798,646,619 | ||||||||||
|
| |||||||||||
| * | Non-income producing security. |
| ** | This security represents the investment of the cash collateral received in connection with securities out on loan as of December 31, 2022. |
| *** | Security is perpetual and has no stated maturity date. |
| ^ | Rate disclosed as of December 31, 2022. |
| Δ | Security was fair valued using significant unobservable inputs. As such, the security is classified as Level 3 in the fair value hierarchy. |
| + | This security or a portion of the security is out on loan at December 31, 2022. Total loaned securities had a value of $41,485,953, which included loaned securities with a value of $3,920,310 that have been sold and are pending settlement as of December 31, 2022. The total market value of loaned securities excluding these pending sales is $37,565,643. See Note 2 for disclosure of cash and non-cash collateral. |
| +++No | stated maturity date. |
| # | Illiquid security as determined under procedures approved by the Board of Directors. The aggregate value of illiquid securities is $0, which is 0.00% of total net assets. |
CVR - Contingent Value Right
PLC - Public Limited Company
| ||
| 30 | Semi-Annual Report | December 31, 2022 (Unaudited) | |
Omni Tax-Managed Small-Cap Value Fund SCHEDULE OF INVESTMENTS (Unaudited) (continued) | | |
| ||
Summary of inputs used to value the Fund’s investments as of 12/31/2022 (See Note 2 in Notes to Financial Statements):
| Valuation Inputs | ||||||||||||||||
| ||||||||||||||||
Investment in Securities (Value) | ||||||||||||||||
| ||||||||||||||||
Level 1 Quoted Prices | Level 2 Significant Observable Inputs | Level 3 Significant Inputs | Total | |||||||||||||
| ||||||||||||||||
Common Stocks | ||||||||||||||||
Real Estate | $6,848,223 | $345,345 | $– | $7,193,568 | ||||||||||||
Other Industries (a) | 785,153,152 | – | – | 785,153,152 | ||||||||||||
|
|
|
|
|
|
|
| |||||||||
Total Common Stocks | 792,001,375 | 345,345 | – | 792,346,720 | ||||||||||||
Exchange Traded Fund | 4,359,000 | – | – | 4,359,000 | ||||||||||||
Preferred Stock | 11,030 | – | – | 11,030 | ||||||||||||
Rights | – | – | 0 | 0 | ||||||||||||
Warrants | 171,080 | – | – | 171,080 | ||||||||||||
Money Market Fund | 3,301,387 | – | – | 3,301,387 | ||||||||||||
Investments Purchased With Cash Proceeds From Securities Lending | 18,298,857 | – | – | 18,298,857 | ||||||||||||
|
|
|
|
|
|
|
| |||||||||
TOTAL | $818,142,729 | $345,345 | $0 | $818,488,074 | ||||||||||||
|
|
|
|
|
|
|
| |||||||||
| (a) | - Please refer to the Schedule of Investments for the industryclassifications of these portfolio holdings. |
Following is a reconciliation of Level 3 investments for which significantunobservable inputs were used to determine fair value:
| Investment in Securities (Value) | ||||
| Rights | ||||
Balance as of 06/30/2022 | $ 0 | |||
Purchases | – | |||
Sales | – | |||
Return of Capital | – | |||
Realized Gain/(Loss) | – | |||
Change in unrealized Appreciation/(Depreciation) | – | |||
Transfers in | – | |||
Transfers out | – | |||
|
| |||
Balance as of 12/31/2022 | $ 0 | |||
|
| |||
Net change in unrealized Appreciation/(Depreciation) from investments held as of 12/31/2022 | $ – | |||
|
| |||
See Notes to Financial Statements.
| ||
| bridgewayfunds.com | 31 | |
December 31, 2022 (Unaudited)
| ASSETS | Omni Small-Cap Value | Omni Tax- Managed Small-Cap Value | ||||||||||||||
Investments at value | $ | 1,151,620,014 | $ | 818,488,074 | ||||||||||||
Receivables: | ||||||||||||||||
Portfolio securities sold | 664,745 | 4,358,788 | ||||||||||||||
Fund shares sold | 934,354 | 3,830,571 | ||||||||||||||
Dividends and interest | 1,270,168 | 709,714 | ||||||||||||||
Prepaid expenses | 70,795 | 75,111 | ||||||||||||||
Total assets | 1,154,560,076 | 827,462,258 | ||||||||||||||
LIABILITIES | ||||||||||||||||
Payables: | ||||||||||||||||
Portfolio securities purchased | 4,078,754 | 9,443,699 | ||||||||||||||
Fund shares redeemed | 1,125,713 | 686,977 | ||||||||||||||
Payable upon return of securities loaned | 15,144,679 | 18,298,857 | ||||||||||||||
Accrued Liabilities: | ||||||||||||||||
Investment advisory fees | 267,695 | 177,057 | ||||||||||||||
Administration fees | 4,797 | 3,020 | ||||||||||||||
Directors’ fees | 6,496 | 4,834 | ||||||||||||||
Other | 273,509 | 201,195 | ||||||||||||||
Total liabilities | 20,901,643 | 28,815,639 | ||||||||||||||
NET ASSETS | $ | 1,133,658,433 | $ | 798,646,619 | ||||||||||||
NET ASSETS REPRESENT | ||||||||||||||||
Paid-in capital | $ | 845,861,476 | $ | 590,318,025 | ||||||||||||
Distributable earnings | 287,796,957 | 208,328,594 | ||||||||||||||
NET ASSETS | $ | 1,133,658,433 | $ | 798,646,619 | ||||||||||||
Shares of common stock outstanding of $ .001 par value* | 64,366,689 | 43,937,958 | ||||||||||||||
Net asset value, offering price and redemption price per share | $ | 17.61 | $ | 18.18 | ||||||||||||
Total investments at cost | $ | 931,380,996 | $ | 666,458,948 | ||||||||||||
| * | See Note 1 - Organization in the Notes to Financial Statements for shares authorized for each Fund. |
See Notes to Financial Statements.
| ||
| 32 | Semi-Annual Report | December 31, 2022 (Unaudited) | |
Six Months Ended December 31, 2022 (Unaudited)
Omni Small-Cap Value | Omni Tax- Managed Small-Cap Value | |||||||||||||||
INVESTMENT INCOME | ||||||||||||||||
Dividends | $ | 14,804,677 | $ | 9,753,386 | ||||||||||||
Less: foreign taxes withheld | (17,062 | ) | (12,634 | ) | ||||||||||||
Interest | 52,301 | 44,945 | ||||||||||||||
Securities lending | 159,833 | 121,953 | ||||||||||||||
Total Investment Income | 14,999,749 | 9,907,650 | ||||||||||||||
EXPENSES | ||||||||||||||||
Investment advisory fees | 3,097,204 | 2,145,083 | ||||||||||||||
Administration fees | 29,056 | 20,113 | ||||||||||||||
Accounting fees | 105,981 | 82,291 | ||||||||||||||
Transfer agent fees | 6,475 | 6,341 | ||||||||||||||
Professional fees | 119,342 | 86,522 | ||||||||||||||
Custody fees | 18,744 | 14,332 | ||||||||||||||
Blue sky fees | 28,489 | 22,380 | ||||||||||||||
Directors’ and officers’ fees | 65,023 | 45,807 | ||||||||||||||
Shareholder servicing fees | 541,689 | 388,290 | ||||||||||||||
Reports to shareholders | 27,075 | 18,221 | ||||||||||||||
Insurance expenses | 45,189 | 31,570 | ||||||||||||||
Miscellaneous expenses | 50,433 | 34,493 | ||||||||||||||
Total Expenses | 4,134,700 | 2,895,443 | ||||||||||||||
Less investment advisory fees waived | (1,223,328 | ) | (879,065 | ) | ||||||||||||
Net Expenses | 2,911,372 | 2,016,378 | ||||||||||||||
NET INVESTMENT INCOME | 12,088,377 | 7,891,272 | ||||||||||||||
NET REALIZED AND UNREALIZED GAIN (LOSS) ON INVESTMENTS | ||||||||||||||||
Realized Gain on: | ||||||||||||||||
Investments | 90,549,152 | 59,544,554 | ||||||||||||||
Change in Unrealized Appreciation (Depreciation) on: | ||||||||||||||||
Investments | (21,619,362 | ) | (15,858,861 | ) | ||||||||||||
Net Realized and Unrealized Gain on Investments | 68,929,790 | 43,685,693 | ||||||||||||||
NET INCREASE IN NET ASSETS RESULTING FROM OPERATIONS | $ | 81,018,167 | $ | 51,576,965 | ||||||||||||
See Notes to Financial Statements.
| ||
| bridgewayfunds.com | 33 | |
| Omni Tax-Managed Small-Cap | ||||||||||||||||||
| Omni Small-Cap Value | Value | |||||||||||||||||
| Six Months Ended December 31, 2022 | Year Ended June 30, 2022 | Six Months Ended December 31, 2022 | Year Ended June 30, 2022 | |||||||||||||||
| (Unaudited) | (Unaudited) | |||||||||||||||||
OPERATIONS | ||||||||||||||||||
Net investment income | $ | 12,088,377 | $ | 16,034,617 | $ | 7,891,272 | $ | 11,214,431 | ||||||||||
Net realized gain on investments | 90,549,152 | 233,381,693 | 59,544,554 | 132,587,575 | ||||||||||||||
Net change in unrealized appreciation (depreciation) on investments | (21,619,362 | ) | (299,843,646 | ) | (15,858,861 | ) | (196,995,797 | ) | ||||||||||
Net increase (decrease) in net assets resulting from operations | 81,018,167 | (50,427,336 | ) | 51,576,965 | (53,193,791 | ) | ||||||||||||
DISTRIBUTIONS: | ||||||||||||||||||
From net investment income and net realized gains | (218,697,351 | ) | (52,208,938 | ) | (99,730,578 | ) | (8,175,868 | ) | ||||||||||
Net decrease in net assets from distributions | (218,697,351 | ) | (52,208,938 | ) | (99,730,578 | ) | (8,175,868 | ) | ||||||||||
SHARE TRANSACTIONS: | ||||||||||||||||||
Proceeds from sale of shares | 140,218,589 | 204,195,915 | 135,994,019 | 148,205,758 | ||||||||||||||
Reinvestment of distributions | 218,471,046 | 51,814,442 | 99,141,349 | 8,132,143 | ||||||||||||||
Cost of shares redeemed | (246,293,454 | ) | (265,467,787 | ) | (202,890,246 | ) | (133,661,514 | ) | ||||||||||
Net increase (decrease) in net assets resulting from share transactions | 112,396,181 | (9,457,430 | ) | 32,245,122 | 22,676,387 | |||||||||||||
Net (decrease) in net assets | (25,283,003 | ) | (112,093,704 | ) | (15,908,491 | ) | (38,693,272 | ) | ||||||||||
NET ASSETS: | ||||||||||||||||||
Beginning of period | 1,158,941,436 | 1,271,035,140 | 814,555,110 | 853,248,382 | ||||||||||||||
End of period | $ | 1,133,658,433 | $ | 1,158,941,436 | $ | 798,646,619 | $ | 814,555,110 | ||||||||||
SHARES ISSUED & REDEEMED | ||||||||||||||||||
Issued | 7,180,145 | 9,301,268 | 7,200,186 | 7,078,597 | ||||||||||||||
Distributions reinvested | 12,505,498 | 2,384,466 | 5,489,554 | 384,317 | ||||||||||||||
Redeemed | (12,823,461 | ) | (11,875,882 | ) | (10,693,174 | ) | (6,375,686 | ) | ||||||||||
Net increase (decrease) in shares | 6,862,182 | (190,148 | ) | 1,996,566 | 1,087,228 | |||||||||||||
Outstanding at beginning of period | 57,504,507 | 57,694,655 | 41,941,392 | 40,854,164 | ||||||||||||||
Outstanding at end of period | 64,366,689 | 57,504,507 | 43,937,958 | 41,941,392 | ||||||||||||||
See Notes to Financial Statements.
| ||
| 34 | Semi-Annual Report | December 31, 2022 (Unaudited) | |
(for a share outstanding throughout each period indicated)
OMNI SMALL-CAP VALUE
| For the | ||||||||||||
| Six Months | ||||||||||||
| Ended | Year Ended June 30 | |||||||||||
| 12/31/22 | ||||||||||||
| (Unaudited) | 2022 | 2021 | 2020 | 2019 | 2018 | |||||||
Net Asset Value, Beginning of Period | $20.15 | $22.03 | $11.44 | $14.97 | $19.83 | $18.14 | ||||||
|
|
|
|
|
| |||||||
Income from Investment Operations: | ||||||||||||
Net Investment Income(a) | 0.21 | 0.28 | 0.21 | 0.19 | 0.20 | 0.17 | ||||||
Net Realized and Unrealized Gain (Loss) | 1.11 | (1.23) | 10.57 | (3.56) | (3.61) | 2.77 | ||||||
|
|
|
|
|
| |||||||
Total from Investment Operations | 1.32 | (0.95) | 10.78 | (3.37) | (3.41) | 2.94 | ||||||
|
|
|
|
|
| |||||||
Less Distributions to Shareholders from: | ||||||||||||
Net Investment Income | (0.32) | (0.41) | (0.19) | (0.08) | (0.17) | (0.16) | ||||||
Net Realized Gain | (3.54) | (0.52) | – | (0.08) | (1.28) | (1.09) | ||||||
|
|
|
|
|
| |||||||
Total Distributions | (3.86) | (0.93) | (0.19) | (0.16) | (1.45) | (1.25) | ||||||
|
|
|
|
|
| |||||||
Net Asset Value, End of Period | $17.61 | $20.15 | $22.03 | $11.44 | $14.97 | $19.83 | ||||||
|
|
|
|
|
| |||||||
Total Return(b) | 6.74%(c) | (4.65%) | 94.92% | (22.82%) | (16.82%) | 16.75% | ||||||
Ratios and Supplemental Data: | ||||||||||||
Net Assets, End of Period (in 000’s) | $1,133,658 | $1,158,941 | $1,271,035 | $828,480 | $989,015 | $913,198 | ||||||
Expenses Before Waivers and Reimbursements | 0.67%(d) | 0.66% | 0.68% | 0.72% | 0.70% | 0.70% | ||||||
Expenses After Waivers and Reimbursements | 0.47%(d) | 0.47% | 0.47% | 0.54% | 0.60% | 0.60% | ||||||
Net Investment Income After Waivers and Reimbursements | 1.95%(d) | 1.25% | 1.29% | 1.46% | 1.21% | 0.88% | ||||||
Portfolio Turnover Rate | 17%(c) | 30% | 21% | 43% | 29% | 24% | ||||||
| (a) | Per share amounts calculated based on the average daily shares outstanding during the period. |
| (b) | Total return would have been lower had various fees not been waived during the period. |
| (c) | Not annualized. |
| (d) | Annualized for periods less than one year. |
See Notes to Financial Statements.
| ||
| bridgewayfunds.com | 35 | |
| FINANCIAL HIGHLIGHTS | | |
| ||
(for a share outstanding throughout each period indicated)
OMNI TAX-MANAGED SMALL-CAP VALUE
| For the | ||||||||||||
| Six Months | ||||||||||||
| Ended | Year Ended June 30 | |||||||||||
| 12/31/22 | ||||||||||||
| (Unaudited) | 2022 | 2021 | 2020 | 2019 | 2018 | |||||||
Net Asset Value, Beginning of Period | $19.42 | $20.89 | $10.92 | $14.43 | $19.10 | $17.39 | ||||||
|
|
|
|
|
| |||||||
Income from Investment Operations: | ||||||||||||
Net Investment Income(a) | 0.19 | 0.27 | 0.19 | 0.19 | 0.20 | 0.16 | ||||||
Net Realized and Unrealized Gain (Loss) | 1.07 | (1.54) | 9.95 | (3.63) | (3.42) | 2.61 | ||||||
|
|
|
|
|
| |||||||
Total from Investment Operations | 1.26 | (1.27) | 10.14 | (3.44) | (3.22) | 2.77 | ||||||
|
|
|
|
|
| |||||||
Less Distributions to Shareholders from: | ||||||||||||
Net Investment Income | (0.45) | (0.20) | (0.17) | (0.07) | (0.20) | (0.23) | ||||||
Net Realized Gain | (2.05) | – | – | – | (1.25) | (0.83) | ||||||
|
|
|
|
|
| |||||||
Total Distributions | (2.50) | (0.20) | (0.17) | (0.07) | (1.45) | (1.06) | ||||||
|
|
|
|
|
| |||||||
Net Asset Value, End of Period | $18.18 | $19.42 | $20.89 | $10.92 | $14.43 | $19.10 | ||||||
|
|
|
|
|
| |||||||
Total Return(b) | 6.58%(c) | (6.17%) | 93.49% | (23.98%) | (16.49%) | 16.48% | ||||||
Ratios and Supplemental Data: | ||||||||||||
Net Assets, End of Period (in 000’s) | $798,647 | $814,555 | $853,248 | $427,515 | $608,368 | $805,188 | ||||||
Expenses Before Waivers and Reimbursements | 0.67%(d) | 0.67% | 0.69% | 0.74%(e) | 0.72% | 0.70% | ||||||
Expenses After Waivers and Reimbursements | 0.47%(d) | 0.47% | 0.47% | 0.55%(e) | 0.60% | 0.60% | ||||||
Net Investment Income After Waivers and Reimbursements | 1.84%(d) | 1.26% | 1.18% | 1.40% | 1.18% | 0.89% | ||||||
Portfolio Turnover Rate | 21%(c) | 30% | 26% | 63% | 42% | 27% | ||||||
| (a) | Per share amounts calculated based on the average daily shares outstanding during the period. |
| (b) | Total return would have been lower had various fees not been waived during the period. |
| (c) | Not annualized. |
| (d) | Annualized for periods less than one year. |
| (e) | Includes interest expense of 0.01%. |
See Notes to Financial Statements.
| ||
36 | Semi-Annual Report | December 31, 2022 (Unaudited) | |
1. Organization
Bridgeway Funds, Inc. (“Bridgeway” or the “Company”) was organized as a Maryland corporation on October 19, 1993, and is registered under the Investment Company Act of 1940, as amended (the “1940 Act”), as an open-end management investment company.
Bridgeway is organized as a series fund, with seven investment funds as of December 31, 2022 (each is referred to as a “Bridgeway Fund” and collectively, the “Bridgeway Funds”). The Aggressive Investors 1, Ultra-Small Company, Ultra-Small Company Market, Small-Cap Value, and Managed Volatility Funds are presented in a separate report. The Omni Small-Cap Value Fund and the Omni Tax-Managed Small-Cap Value Fund (each a “Fund” and together, the “Funds”) are presented in this report.
Bridgeway is authorized to issue 1,915,000,000 shares of common stock at $0.001 per share. As of December 31, 2022, 15,000,000 shares have been classified into the Ultra-Small Company Fund. 100,000,000 shares each have been classified into the Aggressive Investors 1, Ultra-Small Company Market, Omni Small-Cap Value, Omni Tax-Managed Small-Cap Value, and Small-Cap Value Funds. 50,000,000 shares have been classified into the Managed Volatility Fund.
The Funds are no-load, diversified funds.
The Funds seek to provide long-term total return on capital, primarily through capital appreciation.
Bridgeway Capital Management, LLC (the “Adviser”) is the investment adviser for all of the Funds.
2. Significant Accounting Policies:
Following is a summary of significant accounting policies that are followed in the preparation of the financial statements of the Funds. They are in conformity with accounting principles generally accepted in the United States of America (“GAAP”). Each Fund is considered an investment company under GAAP and follows the accounting and reporting guidance applicable to investment companies.
Securities and Other Investments Valuation Securities for which market quotations are readily available are valued at the last sale price on the national exchange on which such securities are primarily traded. In the case of securities reported on the National Association of Securities Dealers Automated Quotation (“Nasdaq”) system, the securities are valued based on the Nasdaq Official Closing Price (“NOCP”). In the absence of recorded sales on their home exchange, or NOCP, in the case of Nasdaq traded securities, the security will be valued as follows: bid prices for long positions and ask prices for short positions.
Investments in open-end registered investment companies and closed-end registered investment companies that do not trade on an exchange are valued at the end of day net asset value (“NAV”) per share.
Investments in closed-end registered investment companies that trade on an exchange are valued at the last sales price as of the close of the customary trading session on the exchange where the security is principally traded.
When market quotations are not readily available or when events occur that make established valuation methods unreliable, securities of the Funds may be valued at fair value as determined in good faith by or under the direction of the Board of Directors. Pursuant to Rule 2a-5 under the 1940 Act, the Board has designated the Adviser as the “valuation designee” to make all necessary determinations of fair value. The valuation assigned to a fair valued security for purposes of calculating the Funds’ NAVs may differ from the security’s most recent closing market price and from the prices used by other mutual funds to calculate their NAVs.
The inputs and valuation techniques used to determine the value of a Fund’s investments are summarized into three levels as described in the hierarchy below:
| • | Level 1 - quoted prices in active markets for identical assets |
| ||
| bridgewayfunds.com | 37 | |
| NOTES TO FINANCIAL STATEMENTS (continued) | | |
| ||
| December 31, 2022 (Unaudited) | ||
Investments whose values are based on quoted market prices in active markets, and whose values are therefore classified as Level 1 prices, include active listed equity securities. The Adviser does not adjust the quoted price for such investments, even in situations where the Funds hold a large position and a sale could reasonably impact the quoted price.
| • | Level 2 - other significant observable inputs (including quoted prices for similar securities, interest rates, prepayment speeds, credit risk, etc.) |
Investments that trade in markets that are not considered to be active, but whose values are based on quoted market prices, dealer quotations or valuations provided by alternative pricing sources supported by observable inputs, are classified as Level 2 prices. These generally include certain US Government and sovereign obligations, most government agency securities, investment-grade corporate bonds and less liquid listed equity securities. As investments whose values are classified as Level 2 prices include positions that are not traded in active markets and/or are subject to transfer restrictions, valuations may be adjusted to reflect illiquidity and/or non-transferability, which are generally based on available market information.
| • | Level 3 - significant unobservable inputs (including the Adviser’s own assumptions in determining the fair value of investments) |
Investments whose values are classified as Level 3 prices have significant unobservable inputs, as they may trade infrequently or not at all. When observable prices are not available for these securities, the Adviser uses one or more valuation techniques for which sufficient and reliable data is available. The inputs used by the Adviser in estimating the value of Level 3 prices may include the original transaction price, quoted prices for similar securities or assets in active markets, completed or pending third-party transactions in the underlying investment or comparable issuers, and changes in financial ratios or cash flows. Level 3 prices may also be adjusted to reflect illiquidity and/or non-transferability, with the amount of such discount estimated by the Adviser in the absence of market information. Assumptions used by the Adviser due to the lack of observable inputs may significantly impact the resulting value, and, therefore the results of the Funds’ operations.
The inputs or methodology used for valuing investments are not necessarily an indication of the risk associated with investing in those investments. A summary of the inputs used to value the Funds’ investments as of December 31, 2022 is included with each Fund’s Schedule of Investments.
Details regarding material transfers into, and material transfers out of, Level 3, if any, can be found at the end of each Schedule of Investments for Funds that held Level 3 securities.
Securities Lending Upon lending its securities to third parties, each participating Fund receives compensation in the form of fees. The loans are secured by collateral at least equal to the fair value of the securities loaned plus accrued interest. The remaining contractual maturity of all securities lending transactions is overnight and continuous. Each Fund has the right under the lending agreement to recover the securities from the borrower on demand. Additionally, a Fund does not have the right to sell or re-pledge collateral received in the form of securities unless the borrower goes into default. The risks to a Fund of securities lending are that the borrower may not provide additional collateral when required or return the securities when due, resulting in a loss. Under the terms of the Securities Lending Agreement, the Funds are indemnified for such losses by the securities lending agent.
While securities are on loan, the Fund continues to receive dividends on the securities loaned and recognizes any unrealized gain or loss in the fair value of the securities loaned.
Securities lending transactions are entered into by a Fund under a Securities Lending Agreement which provides the right, in the event of default (including bankruptcy or insolvency) for the non-defaulting party to liquidate the collateral or to offset the market value of the collateral received against the market value of the securities loaned. The value of the collateral is typically greater than that of the market value of the securities loaned, leaving the lender with a net amount payable to the defaulting party. However, bankruptcy or insolvency laws of a particular jurisdiction may impose restrictions on or prohibitions against such a right of offset in the event of a counterparty’s bankruptcy or insolvency.
| ||
| 38 | Semi-Annual Report | December 31, 2022 (Unaudited) | |
| NOTES TO FINANCIAL STATEMENTS (continued) | | |
| ||
| December 31, 2022 (Unaudited) | ||
The market value of securities on loan, all of which are classified as common stocks in the Funds’ Schedules of Investments, and the value of the related cash collateral are shown in the Statements of Assets and Liabilities as a component of Investments at value. Securities lending transactions are considered to be overnight and continuous and can be terminated by the Funds or the borrower at any time.
The following table is a summary of the Funds’ payable upon return of securities loaned and related cash collateral, which are subject to a netting agreement as of December 31, 2022:
| Gross Amount Not Offset in the Statement of Assets and Liabilities | ||||||||||||||||||||
| Gross | ||||||||||||||||||||
| Amounts | Net Amounts of | |||||||||||||||||||
| Gross | Offset in the | Assets Presented | ||||||||||||||||||
| Amounts of | Statement of | in the Statement | ||||||||||||||||||
| Recognized | Assets and | of Assets and | Financial | Collateral | ||||||||||||||||
| Fund | Assets1 | Liabilities | Liabilities | Instruments | Received | Net Amount | ||||||||||||||
Omni Small-Cap Value | ||||||||||||||||||||
Securities lending | $15,144,679 | $– | $15,144,679 | $– | $15,144,679 | $– | ||||||||||||||
Omni Tax-Managed Small-Cap Value | ||||||||||||||||||||
Securities lending | $18,298,857 | – | $18,298,857 | – | $18,298,857 | – | ||||||||||||||
| 1 | Securities loaned with a value of $57,192 and $ 3,920,310 in Omni Small-Cap Value and Omni Tax-Managed Small-Cap Value have been sold and are pending settlement on December 31, 2022. |
The following table summarizes the securities received as non-cash collateral and cash collateral for securities lending:
| Non-Cash Collateral | ||||||||||||||||||||||||||
| Fund | Collateral Type | Coupon Range | Maturity Date Range | Market Value | Cash Collateral | Total Collateral | Market Value of Securities on Loan | |||||||||||||||||||
Omni Small-Cap Value | ||||||||||||||||||||||||||
Securities lending | | U.S.Gov’t Obligations | | 0.00% - | | 02/07/23 - 11/15/51 | | $39,797,547 | $15,144,679 | $54,942,226 | $53,834,563 | |||||||||||||||
Omni Tax-Managed Small-Cap Value | ||||||||||||||||||||||||||
Securities lending | | U.S.Gov’t Obligations | | 0.00% - 4.75% | | 02/07/23 - 11/15/51 |
| $24,116,261 | $18,298,857 | $42,415,118 | $41,485,953 | |||||||||||||||
It is each Fund’s policy to obtain additional collateral from, or return excess collateral to, the borrower by the end of the next business day following the valuation date of the securities loaned. Therefore, the value of the collateral held may be temporarily less than that required under the lending contract. As of December 31, 2022, the collateral consisted of an institutional government money market fund and US Government Obligations.
Use of Estimates in Financial Statements In preparing financial statements in conformity with GAAP, management makes estimates and assumptions that affect the reported amounts of assets and liabilities on the date of the financial statements and the disclosure of contingent assets and liabilities on the date of the financial statements, as well as the reported amounts of revenue and expenses during the reporting period. Actual results could differ from those estimates.
Concentrations of Credit Risk The Funds maintain cash and securities in its custody account maintained by a high-credit, quality financial institution. Cash balances may, at times, exceed the FDIC insurance limit. Cash balances are generally invested in a short-term investment vehicle, which minimizes the risk of cash balances exceeding the FDIC insurance limit.
| ||
| bridgewayfunds.com | 39 | |
| NOTES TO FINANCIAL STATEMENTS (continued) | | |
| ||
| December 31, 2022 (Unaudited) | ||
Sector Concentration Risk Companies with similar characteristics may be grouped together in broad categories called sectors. Although each Fund seeks investments across a number of sectors, from time to time, based on economic conditions, each Fund may have significant positions in particular sectors. A certain sector may underperform other sectors or the market as a whole. As more assets are held in a specific sector, a Fund’s performance will be more susceptible to any economic, business or other developments which generally affect that sector.
Risks and Uncertainties The Funds provide for various investment options, including stocks. Such investments are exposed to risks, such as interest rate, market, and credit risks. Due to the risks involved, it is at least reasonably possible that changes in risks in the near term would materially affect shareholders’ account values and the amounts reported in the financial statements.
The global pandemic outbreak of an infectious respiratory illness caused by a novel coronavirus known as COVID-19 has resulted in substantial market volatility and global business disruption, affecting the global economy and the financial health of individual companies in significant and unforeseen ways. COVID-19 has resulted in, among other things, travel restrictions, closed international borders, enhanced health screenings at ports of entry and elsewhere, disruption of and delays in health-care service preparation and delivery, prolonged quarantines, significant disruptions to business operations, market closures, cancellations and restrictions, supply chain disruptions, lower consumer demand, and significant volatility and declines in global financial markets, as well as general concern and uncertainty. Instability in the United States, European and other credit markets has made it more difficult for borrowers to obtain financing or refinancing on attractive terms or at all. In particular, because of the current conditions in the credit markets, borrowers may be subject to increased interest expenses for borrowed money and tightening underwriting standards. In addition, stock prices as well as yield could be negatively impacted to the extent that issuers of equity securities cancel or announce the suspension of dividends or share buybacks. The COVID-19 pandemic could continue to inhibit global, national and local economic activity, and constrain access to capital and other sources of funding. Various recent government interventions have been aimed at curtailing the distress to financial markets caused by the COVID-19 outbreak. There can be no guarantee that these or other economic stimulus plans (within the United States or other affected countries throughout the world) will be sufficient or will have their intended effect. In addition, an unexpected or quick reversal of such policies could increase market volatility, which could adversely affect a Fund’s investments. The duration and future impact of COVID-19 are currently unknown, which may exacerbate the other risks that apply to a Fund and could negatively affect Fund performance and the value of your investment in a Fund.
Security Transactions, Investment Income and Expenses Security transactions are accounted for as of the trade date, the date the order to buy or sell is executed. Realized gains and losses are computed on the identified cost basis. Dividend income is recorded on the ex-dividend date, and interest income is recorded on the accrual basis from settlement date. Income from the securities lending program is recorded when earned from the securities lending agent and reflected in the Statements of Operations under “Securities lending.”
Bridgeway Funds’ expenses that are not series-specific are allocated to each series based upon its relative proportion of net assets to the Bridgeway Funds’ total net assets or other appropriate basis.
Distributions to Shareholders The Funds pay dividends from net investment income and distribute realized capital gains annually, usually in December, and are recorded on the ex-date.
Indemnification Under the Company’s organizational documents, the Funds’ officers, directors, employees, and agents are indemnified against certain liabilities that may arise out of the performance of their duties to the Funds. Additionally, in the normal course of business, the Funds enter into contracts that contain a variety of indemnification clauses. The Funds’ maximum exposure under these arrangements is unknown, as this would involve future claims that may be made against the Funds that have not yet occurred. However, the Funds have not had prior claims or losses pursuant to these contracts.
3. Advisory Fees, Other Related Party Transactions and Contingencies:
The Funds have entered into management agreements with the Adviser. As compensation for the advisory services rendered, facilities furnished, and expenses borne by the Adviser, the Funds pay the Adviser a fee of 0.50% of the value of each Fund’s average daily net assets, computed daily and payable monthly.
| ||
| 40 | Semi-Annual Report | December 31, 2022 (Unaudited) | |
| NOTES TO FINANCIAL STATEMENTS (continued) | | |
| ||
| December 31, 2022 (Unaudited) | ||
Expense limitations: The Adviser has contractually agreed to waive its management fees and/or reimburse expenses of the Funds to ensure the total annual fund operating expenses do not exceed 0.60% of the Funds’ average net assets. Any material change to this contractual expense limitation would require a vote by shareholders of the applicable Fund. Effective January 1, 2020, the Adviser voluntarily agreed to waive its management fees and/or reimburse expenses in an additional amount such that the net fiscal year expense ratio for each Fund does not exceed 0.47%. Fees waived for the period ended December 31, 2022 were as follows:
| Bridgeway Fund | Voluntary Expense Limitation | Total Waivers for Period Ended 12/31/22 | ||||||
| ||||||||
Omni Small-Cap Value* | 0.47% | $1,223,328 | ||||||
Omni Tax-Managed Small-Cap Value* | 0.47% | 879,065 | ||||||
*The Funds are authorized to reimburse the Adviser for management fees previously waived and/or for expenses previously paid by the Adviser to meet the 0.60% contractual expense limitation provided, however, that any reimbursements must be paid at a date not more than three years after the Adviser waived the fees or reimbursed the expenses and that the reimbursements do not cause the Funds to exceed the expense limitation in effect at the time of the waiver or the current expense limitation, if different. The Omni Small-Cap Value Fund has recoupable expenses of $ 418,055, $ 755,915, $ 836,967 and $ 1,075,642, which expire no later than June 30, 2026, June 30, 2025, June 30, 2024 and June 30, 2023, respectively. The Omni Tax-Managed Small-Cap Value Fund has recoupable expenses of $ 321,343, $ 580,513, $ 552,382 and $ 761,967, which expire no later than June 30, 2026, June 30, 2025, June 30, 2024 and June 30 2023, respectively.
Other Related Party Transactions: The Bridgeway Funds will engage in inter-portfolio trades with other Bridgeway Funds when it is to the benefit of both parties. The Board of Directors reviews a report on inter-portfolio trades quarterly. Inter-portfolio purchases and sales for the Funds during the period ended December 31, 2022 were as follows:
| Bridgeway Fund | Inter-Portfolio Purchases | Inter-Portfolio Sales | ||||||
| ||||||||
Omni Small-Cap Value | $ 18,142,064 | $ 21,953,501 | ||||||
Omni Tax-Managed Small-Cap Value | 18,571,970 | 22,039,847 | ||||||
The Adviser entered into an Administrative Services Agreement with Bridgeway Funds, pursuant to which the Adviser provides various administrative services to the Funds including, but not limited to: (i) supervising and managing various aspects of the Funds’ business and affairs; (ii) selecting, overseeing and/or coordinating activities with other service providers to the Funds; (iii) providing reports to the Board of Directors as requested from time to time; (iv) assisting and/or reviewing amendments and updates to the Funds’ registration statement and other filings with the Securities and Exchange Commission (“SEC”); (v) providing certain shareholder services; (vi) providing administrative support in connection with meetings of the Board of Directors; and (vii) providing certain record-keeping services. For its services to all of the Bridgeway Funds, the Adviser is paid an annual aggregate fee of $150,000, payable in equal monthly installments. During the period ended Decem-ber 31, 2022, the allocation of this expense to the Omni Small-Cap Value and Omni Tax-Managed Small-Cap Value Funds was $29,056 and $20,113, respectively.
Board of Directors Compensation Independent Directors are paid an annual retainer of $20,000, with an additional retainer of $5,000 paid to the Independent Chairman of the Board and an additional retainer of $1,000 paid to the Nominating and Corporate Governance Committee Chair. The retainer is paid in quarterly installments. In addition, Independent Directors are paid $14,000 per meeting for meeting fees. Such compensation is the total compensation from all Bridgeway Funds and is allocated among the Bridgeway Funds.
Independent Directors are reimbursed for any expenses incurred in attending meetings and conferences, as well as expenses for subscriptions or printed materials. The amount of directors’ fees attributable to each Fund is disclosed in the Statements of Operations.
| ||
| bridgewayfunds.com | 41 | |
| NOTES TO FINANCIAL STATEMENTS (continued) | | |
| ||
| December 31, 2022 (Unaudited) | ||
One director of Bridgeway, John Montgomery, is an owner and director of the Adviser. Under the 1940 Act definitions, he is considered to be an “affiliated person” of the Adviser and an “interested person” of the Adviser and of Bridgeway. Compensation for Mr. Montgomery is borne by the Adviser rather than the Funds.
4. Distribution Agreement:
Foreside Fund Services, LLC acts as distributor of the Funds’ shares, pursuant to a Distribution Agreement dated September 30, 2021. The Adviser pays all costs and expenses associated with distribution of the Funds’ shares, pursuant to a protective plan adopted by shareholders pursuant to Rule 12b-1, if any.
5. Purchases and Sales of Investment Securities:
Purchases and sales of investments, other than short-term securities, for each Fund for the year ended December 31, 2022 were as follows:
| Purchases | Sales | |||||||||||||||
| Bridgeway Fund | U.S. Government | Other | U.S. Government | Other | ||||||||||||
Omni Small-Cap Value | $— | $210,988,718 | $— | $301,361,245 | ||||||||||||
Omni Tax-Managed Small-Cap Value | — | 177,440,110 | — | 236,447,786 | ||||||||||||
6. Federal Income Taxes
It is the Funds’ policy to continue to comply with the provisions of the Internal Revenue Code of 1986, as amended (“Internal Revenue Code”), applicable to regulated investment companies, and to distribute income to the extent necessary so that the Funds are not subject to federal income tax. Therefore, no federal income tax provision is required.
Unrealized Appreciation and Depreciation on Investments (Tax Basis) The amount of net unrealized appreciation/depreciation and the cost of investment securities for tax purposes, including short-term securities as of December 31, 2022, were as follows:
| Omni Tax- | ||||
| Omni Small-Cap | Managed Small- | |||
| Value | Cap Value | |||
Gross appreciation (excess of value over tax cost) | $289,789,345 | $194,756,537 | ||
Gross depreciation (excess of tax cost over value) | (69,841,643) | (42,815,406) | ||
Net unrealized appreciation | $219,947,702 | $151,941,131 | ||
Cost of investments for income tax purposes | $931,672,312 | $666,546,943 |
The differences between book and tax net unrealized appreciation (depreciation) are primarily due to wash sales and passive foreign investment companies (PFICs).
Classifications of Distributions Net investment income (loss) and net realized gain (loss) may differ for financial statement and tax purposes. The character of distributions made during the year from net investment income or net realized gains may differ from its ultimate characterization for federal income tax purposes.
| ||
| 42 | Semi-Annual Report | December 31, 2022 (Unaudited) | |
| NOTES TO FINANCIAL STATEMENTS (continued) | | |
| ||
| December 31, 2022 (Unaudited) | ||
The tax character of the distributions paid by the Funds during the last two fiscal years ended June 30, 2022 and June 30, 2021, respectively, are as follows:
| Omni Tax-Managed Small-Cap | ||||||||||||||||||||
| Omni Small-Cap Value | Value | |||||||||||||||||||
| Year | Year | Year | Year | |||||||||||||||||
| Ended | Ended | Ended | Ended | |||||||||||||||||
| June 30, 2022 | June 30, 2021 | June 30, 2022 | June 30, 2021 | |||||||||||||||||
Distributions paid from: | ||||||||||||||||||||
Ordinary Income | $22,971,027 | $13,173,150 | $8,175,868 | $7,115,050 | ||||||||||||||||
Long-Term Capital Gain | 29,237,911 | — | — | — | ||||||||||||||||
Total | $52,208,938 | $13,173,150 | $8,175,868 | $7,115,050 | ||||||||||||||||
As of June 30, 2022, Omni Small-Cap Value Fund and Omni Tax-Managed Small Cap Value Fund utilized capital loss carryfor-wards of $13,117,348 and $48,973,864, respectively.
Components of Accumulated Earnings As of June 30, 2022, the components of accumulated deficit on a tax basis were:
Omni Small-Cap | Omni Tax- | |||||||
Accumulated Net Investment Income | $6,071,985 | $10,031,722 | ||||||
Capital Loss Carryovers | — | — | ||||||
Accumulated Net Realized Gain on Investments | 177,837,640 | 78,615,121 | ||||||
Qualified Late Year Deferred Losses | — | — | ||||||
Other Temporary Differences | — | — | ||||||
Net Unrealized Appreciation of Investments | 241,566,516 | 167,835,364 | ||||||
Total | $425,476,141 | $256,482,207 | ||||||
For the fiscal year June 30, 2022, the Funds recorded the following reclassifications to the accounts listed below:
| Increase (Decrease) | ||||
| Omni | Omni Tax-Managed | |||
| Small-Cap Value | Small-Cap Value | |||
Paid-In Capital | $14,425,549 | $5,693,793 | ||
Accumulated Earnings | (14,425,549) | (5,693,793) | ||
The differences between book and tax components of net assets and the resulting reclassifications were primarily a result of the differing book/tax treatment of the deduction of equalization debits.
Accounting for Uncertainty in Income Taxes sets forth a minimum threshold for financial statement recognition of the benefit of a tax position taken or expected to be taken in a tax return. Management has analyzed each Fund’s tax positions and has concluded that no provision for income tax is required in the individual Funds’ financial statements. The Funds are not aware of any tax position for which it is reasonably possible that the total amounts of unrecognized tax benefits will significantly change in the next twelve months. Each Fund’s federal tax returns for the prior three fiscal years remain subject to examination by the Internal Revenue Service.
7. Line of Credit
Bridgeway established a line of credit agreement (“Facility”) with The Bank of New York Mellon, effective November 5, 2010. The Facility is for temporary or emergency purposes, such as to provide liquidity for shareholder redemptions, and is cancellable by either party. Unless canceled earlier, the Facility shall be held available until October 6, 2023. Advances under the Facility are limited to $15,000,000 in total for all Bridgeway Funds, and advances to each Fund shall not exceed certain limits set forth in the credit agreement, including, but not limited to, the maximum amount a Fund is permitted to borrow under the 1940 Act.
| ||
| bridgewayfunds.com | 43 | |
| NOTES TO FINANCIAL STATEMENTS (continued) | | |
| ||
| December 31, 2022 (Unaudited) | ||
The Funds incur a commitment fee of 0.10% per annum on the unused portion of the Facility and interest expense to the extent of amounts borrowed under the Facility. Interest is based on the “Overnight Rate” plus 1.25%. The Overnight Rate means the higher of (a) the Federal Funds rate, (b) the Overnight Eurodollar Rate, or (c) the One-Month Eurodollar Rate. The facility fees are payable quarterly in arrears and are allocated to all participating Funds. Interest expense is charged directly to a Fund based upon actual amounts borrowed by such Bridgeway Fund.
For the period ended December 31, 2022, borrowings by the Funds under this line of credit were as follows:
| Bridgeway Fund | Weighted Average Interest Rate | Weighted Average Loan Balance | Number of Days | Interest Expense Incurred1 | Maximum Amount Borrowed During the Period | |||||||||||||||
| ||||||||||||||||||||
Omni Small-Cap Value | 5.09% | $4,234,923 | 13 | $7,783 | $13,500,000 | |||||||||||||||
Omni Tax-Managed Small-Cap Value | 4.80% | 1,945,300 | 20 | 5,190 | 7,000,000 | |||||||||||||||
1Interest expense is included on the Statements of Operations in Miscellaneous expenses. |
| |||||||||||||||||||
As of December 31, 2022, Omni Small-Cap Value and Omni Tax-Managed Small-Cap Value had no outstanding loan amounts.
8. Subsequent Events
On August 25, 2022, the Board of Directors of Bridgeway Funds, Inc., on behalf of the Omni Tax-Managed Small-Cap Value Fund (“OTMSCV Fund”), approved an Agreement and Plan of Reorganization (the “Plan”) providing for the reorganization of OTMSCV Fund into EA Bridgeway Omni Small-Cap Value ETF (the “Omni ETF”) a newly-organized series of the EA Series Trust. Under the Plan, the OTMSCV Fund will transfer all of its assets and liabilities to the Omni ETF in exchange for shares of the Omni ETF, which will be distributed to shareholders of the OTMSCV Fund at the same total value as held in the OTMSCV Fund immediately prior to the reorganization. The Plan is subject to approval by the shareholders of the OTMSCV Fund. The purpose of the reorganization is to convert the OTMSCV Fund into an exchange-traded fund (“ETF”).
| ||
| 44 | Semi-Annual Report | December 31, 2022 (Unaudited) | |
1. Proxy Voting
A description of the policies and procedures that the Funds use to determine how to vote proxies relating to the portfolio securities and a summary of proxies voted by the Funds for the period ended June 30, 2022 are available without charge, upon request, by contacting Bridgeway Funds at 1-800-661-3550 and on the SEC’s website at http://www.sec.gov.
2. Fund Holdings
The complete schedules of the Funds’ holdings for the second and fourth quarters of each fiscal year are contained in the Funds’ Semi-Annual and Annual Shareholder Reports, respectively.
The Bridgeway Funds file complete schedules of the Funds’ holdings with the SEC for the first and third quarters of each fiscal year as an exhibit to Form N-PORT within 60 days after the end of the period. Copies of the Funds’ Form N-PORT exhibit are available without charge, upon request, by contacting Bridgeway Funds at 1-800-661-3550 and on the SEC’s website at http://www.sec.gov. You may also review and copy the Funds’ Form N-PORT exhibit at the SEC’s Public Reference Room in Washington, D.C. For more information about the operation of the Public Reference Room, please call 1-800-SEC-0330.
| ||
| bridgewayfunds.com | 45 | |
As a shareholder of a Fund, you will incur no transaction costs from such Fund, including sales charges (loads) on purchases, on reinvested dividends or on other distributions. There are no exchange fees. However, as a shareholder of a Fund, you will incur ongoing costs, including management fees and other Fund expenses. The following examples are intended to help you under-stand your ongoing costs (in dollars) of investing in a Fund and to compare these costs with ongoing costs of investing in other mutual funds. The examples are based on an investment of $1,000 invested on July 1, 2022 and held until December 31, 2022.
Actual Expenses. The first line of the table below provides information about actual account values and actual expenses. You may use the information in this line, together with the amount you invested, to estimate the expenses that you paid over the period. Simply divide your account value by $1,000 (for example, an $8,600 account value divided by $1,000 = 8.6), then multiply the result by the number in the first line under the heading “Expenses Paid During Period” to estimate the expenses you paid on your account during the period.
Hypothetical Example for Comparison Purposes. The second line of the table below provides information about hypothetical account values and hypothetical expenses based on the Fund’s actual expense ratio and an assumed rate of return of 5% per year before expenses, which is not the Fund’s actual return. The hypothetical account values and expenses may not be used to estimate the actual ending account balance or expenses you paid for the period. You may use this information to compare the ongoing costs of investing in a Fund and other mutual funds. To do so, compare this 5% hypothetical example with the 5% hypothetical examples that appear in the shareholder reports of other funds.
The expenses shown in the table are meant to highlight ongoing Fund costs only. Therefore, the second line of the table is useful in comparing ongoing costs only and will not help you determine the relative total costs of owning different funds, because other funds may also have transaction costs, such as sales charges, redemption fees or exchange fees.
| Beginning Account Value at 7/1/22 | Ending Account Value at 12/31/22 | Expense Ratio | Expenses Paid During Period* 7/1/22 - 12/31/22 | |||||||||||||
Bridgeway Omni Small-Cap Value Fund | ||||||||||||||||
Actual Fund Return | $1,000.00 | $1,067.40 | 0.47% | $2.45 | ||||||||||||
Hypothetical Fund Return | $1,000.00 | $1,022.84 | 0.47% | $2.40 | ||||||||||||
| Bridgeway Omni Tax-Managed Small-Cap Value Fund | ||||||||||||||||
Actual Fund Return | $1,000.00 | $1,065.80 | 0.47% | $2.45 | ||||||||||||
Hypothetical Fund Return | $1,000.00 | $1,022.84 | 0.47% | $2.40 | ||||||||||||
| * | Expenses are equal to the average account value times the Fund’s annualized expense ratio multiplied by the number of days in the most recent six month period (184) divided by the number of days in the fiscal year (365). |
| ||
| 46 | Semi-Annual Report | December 31, 2022 (Unaudited) | |
THIS PAGE INTENTIONALLY LEFT BLANK
BRIDGEWAY FUNDS, INC.
BNY Mellon Investment Servicing (US) Inc. P.O. Box 534435 Pittsburgh, PA 15253-4435
CUSTODIAN
The Bank of New York Mellon One Wall Street New York, NY 10286
DISTRIBUTOR
Foreside Fund Services, LLC Three Canal Plaza, Suite 100 Portland, ME 04101 |
You can review and copy information about our Funds (including the SAIs) at the SEC’s Public Reference Room in Washington, D.C. To find out more about this public service, call the SEC at 800-SEC-0330. Reports and other information about the Funds are also available on the SEC’s website at ww.sec.gov. You can receive copies of this information, for a fee, by writing the Public Reference Section, Securities and Exchange Commission, Washington, D.C. 20549-1520 or by sending an electronic request to the following email address: publicinfo@ sec.gov.
| ||||
| (b) | Not applicable. |
Item 2. Code of Ethics.
Not applicable.
Item 3. Audit Committee Financial Expert.
Not applicable.
Item 4. Principal Accountant Fees and Services.
Not applicable.
Item 5. Audit Committee of Listed Registrants.
Not applicable.
Item 6. Investments.
| (a) | Schedule of Investments in securities of unaffiliated issuers as of the close of the reporting period is included as part of the report to shareholders filed under Item 1(a) of this form. |
| (b) | Not Applicable |
| Item 7. | Disclosure of Proxy Voting Policies and Procedures for Closed-End Management Investment Companies. |
Not applicable.
Item 8. Portfolio Managers of Closed-End Management Investment Companies.
Not applicable.
| Item 9. | Purchases of Equity Securities by Closed-End Management Investment Company and Affiliated Purchasers. |
Not applicable.
Item 10. Submission of Matters to a Vote of Security Holders.
There have been no material changes to the procedures by which the shareholders may recommend nominees to the Registrant’s Board of Directors, where those changes were implemented after the registrant last provided disclosure in response to the requirements of Item 407(c)(2)(iv) of Regulation S-K (17 CFR 229.407) (as required by Item 22(b)(15) of Schedule 14A (17 CFR 240.14a-101)), or this Item.
Item 11. Controls and Procedures.
| (a) | The registrant’s principal executive officer and principal financial officer, or persons performing similar functions, have concluded that the registrant’s disclosure controls and procedures (as defined in Rule 30a-3(c) under the Investment Company Act of 1940, as amended (the “1940 Act”) (17 CFR 270.30a-3(c))) are effectively designed, as of a date within 90 days of the filing date of the report that includes the disclosure required by this paragraph, based on their evaluation of these controls and procedures required by Rule 30a-3(b) under the 1940 Act (17 CFR 270.30a-3(b)) and Rules 13a-15(b) or 15d-15(b) under the Securities Exchange Act of 1934, as amended (17 CFR 240.13a-15(b) or 240.15d-15(b)). |
| (b) | There were no changes in the registrant’s internal control over financial reporting (as defined in Rule 30a-3(d) under the Act (17 CFR 270.30a-3(d))) that occurred during the period covered by this report that have materially affected or are reasonably likely to materially affect, the registrant’s internal control over financial reporting. |
| Item 12. | Disclosure of Securities Lending Activities for Closed-End Management Investment Companies. |
Not applicable.
Item 13. Exhibits.
| (a)(1) | Not applicable. |
| (a)(2) | ||
| (a)(2)(1) | Not applicable. | |
| (a)(2)(2) | Not applicable. | |
| (b) | ||
SIGNATURES
Pursuant to the requirements of the Securities Exchange Act of 1934 and the Investment Company Act of 1940, the registrant has duly caused this report to be signed on its behalf by the undersigned, thereunto duly authorized.
| (Registrant) | Bridgeway Funds, Inc. |
| By (Signature and Title)* | /s/ Tammira Philippe | |
| Tammira Philippe, President and Principal Executive Officer | ||
| (principal executive officer) |
Date March 8, 2023
Pursuant to the requirements of the Securities Exchange Act of 1934 and the Investment Company Act of 1940, this report has been signed below by the following persons on behalf of the registrant and in the capacities and on the dates indicated.
| By (Signature and Title)* | /s/ Tammira Philippe | |
| Tammira Philippe, President and Principal Executive Officer | ||
| (principal executive officer) |
| Date March 8, 2023 |
| By (Signature and Title)* | /s/ Deborah L. Hanna | |
| Deborah L. Hanna, Treasurer and Principal Financial Officer | ||
| (principal financial officer) |
Date March 8, 2023 |
* Print the name and title of each signing officer under his or her signature.