UNITED STATES
SECURITIES AND EXCHANGE COMMISSION
Washington, D.C. 20549
FORMN-CSR
CERTIFIED SHAREHOLDER REPORT OF REGISTERED MANAGEMENT
INVESTMENT COMPANIES
Investment Company Act file number 811-08200
Bridgeway Funds, Inc.
(Exact name of registrant as specified in charter)
20 Greenway Plaza, Suite 450
Houston, Texas 77046
(Address of principal executive offices) (Zip code)
Tammira Philippe, President
Bridgeway Funds, Inc.
20 Greenway Plaza, Suite 450
Houston, Texas 77046
(Name and address of agent for service)
Registrant’s telephone number, including area code: (713)661-3500
Date of fiscal year end:June 30
Date of reporting period: December 31, 2019
FormN-CSR is to be used by management investment companies to file reports with the Commission not later than 10 days after the transmission to stockholders of any report that is required to be transmitted to stockholders under Rule30e-1 under the Investment Company Act of 1940 (17 CFR270.30e-1). The Commission may use the information provided on FormN-CSR in its regulatory, disclosure review, inspection, and policymaking roles.
A registrant is required to disclose the information specified by FormN-CSR, and the Commission will make this information public. A registrant is not required to respond to the collection of information contained in FormN-CSR unless the Form displays a currently valid Office of Management and Budget (“OMB”) control number. Please direct comments concerning the accuracy of the information collection burden estimate and any suggestions for reducing the burden to Secretary, Securities and Exchange Commission, 450 Fifth Street, NW, Washington, DC 20549-0609. The OMB has reviewed this collection of information under the clearance requirements of 44 U.S.C. § 3507.
| Item 1. | Reports to Stockholders. |
The Report to Shareholders is attached herewith.

| | | | |
| |
| | Semi-Annual Report December 31, 2019 (Unaudited) |
| | |
| | AGGRESSIVE INVESTORS 1 | | BRAGX |
| | ULTRA-SMALL COMPANY | | BRUSX |
| | (Open to Existing Investors — Direct Only) | | |
| | ULTRA-SMALL COMPANY MARKET | | BRSIX |
| | SMALL-CAP GROWTH | | BRSGX |
| | SMALL-CAP VALUE | | BRSVX |
| | BLUE CHIP | | BRLIX |
| | (Formerly, Blue Chip 35 Index) | | |
| | MANAGED VOLATILITY | | BRBPX |
Beginning on January 1, 2021, as permitted by regulations adopted by the U.S. Securities and Exchange Commission, paper copies of the Funds’ annual and semi-annual shareholder reports will no longer be sent by mail, unless you specifically request paper copies of the reports. Instead, the reports will be made available on the Funds’ website (bridgeway.com), and you will be notified by mail each time a report is posted and provided with a website link to access the report.
If you already elected to receive shareholder reports electronically, you will not be affected by this change and you need not take any action. You may elect to receive shareholder reports and other communications from a Fund electronically anytime by contacting your financial intermediary (such as a broker-dealer or bank) or, if you are a direct investor, by calling800-661-3550.
You may elect to receive all future reports in paper free of charge. If you invest through a financial intermediary, you can contact your financial intermediary to request that you continue to receive paper copies of your shareholder reports. If you invest directly with a Fund, you can call800-661-3550 to let the Fund know you wish to continue receiving paper copies of your shareholder reports. Your election to receive reports in paper will apply to all Funds held in your account if you invest through your financial intermediary or to all Funds held with the fund complex if you invest directly with a Fund.
| | | | |
| TABLE OF CONTENTS | | |  | |
Bridgeway Funds Standardized Returns as of December 31, 2019* (Unaudited)
| | | | | | | | | | | | | | | | | | | | | | | |
| | | | | | |
| | | | | | | Annualized | | | | | | |
| Fund | | Quarter | | Six Months | | 1 Year | | 5 Years | | 10 Years | | 15 Years | | Inception
to Date | | Inception
Date | | Gross
Expense
Ratio2 | | Net
Expense
Ratio2 |
| | | | | | | | | | |
Aggressive Investors 1 | | 6.10% | | 3.01% | | 21.85% | | 3.82% | | 9.74% | | 5.18% | | 11.88% | | 8/5/1994 | | 0.35% | | 0.35% |
| | | | | | | | | | |
Ultra-Small Company | | 5.60% | | 1.63% | | 9.51% | | -1.70% | | 6.44% | | 4.07% | | 12.13% | | 8/5/1994 | | 2.13% | | 2.13% |
| | | | | | | | | | |
Ultra-Small Co Market | | 7.34% | | 3.84% | | 15.34% | | 3.67% | | 10.05% | | 5.34% | | 9.67% | | 7/31/1997 | | 0.96%1 | | 0.94%1 |
| | | | | | | | | | |
Small-Cap Growth | | 11.03% | | 4.53% | | 15.10% | | 8.29% | | 11.22% | | 6.32% | | 6.74% | | 10/31/2003 | | 1.11%1 | | 0.94%1 |
| | | | | | | | | | |
Small-Cap Value | | 6.47% | | 8.10% | | 14.98% | | 4.22% | | 9.45% | | 6.14% | | 6.91% | | 10/31/2003 | | 1.00%1 | | 0.94%1 |
| | | | | | | | | | |
Blue Chip | | 8.01% | | 10.68% | | 31.05% | | 12.07% | | 13.06% | | 8.77% | | 7.87% | | 7/31/1997 | | 0.25%1 | | 0.15%1 |
| | | | | | | | | | |
Managed Volatility | | 2.09% | | 3.18% | | 11.88% | | 3.58% | | 4.67% | | 3.76% | | 4.03% | | 6/30/2001 | | 1.25%1 | | 0.95%1 |
Bridgeway Funds Returns for Calendar Years 2003 through 2019* (Unaudited)
| | | | | | | | | | | | | | | | | | | | | | | | | | | | | | |
| | | | | | | | | | | | | | | |
| | | 2005 | | 2006 | | 2007 | | 2008 | | 2009 | | 2010 | | 2011 | | 2012 | | 2013 | | 2014 | | 2015 | | 2016 | | 2017 | | 2018 | | 2019 |
Aggressive Investors 1 | | 14.93% | | 7.11% | | 25.80% | | -56.16% | | 23.98% | | 17.82% | | -10.31% | | 21.58% | | 42.21% | | 14.99% | | -9.82% | | 19.47% | | 18.44% | | -22.44% | | 21.85% |
Ultra-Small Company | | 2.99% | | 21.55% | | -2.77% | | -46.24% | | 48.93% | | 23.55% | | -14.64% | | 24.49% | | 55.77% | | -0.56% | | -16.12% | | 14.06% | | 3.88% | | -15.68% | | 9.51% |
Ultra-Small Co Market | | 4.08% | | 11.48% | | -5.40% | | -39.49% | | 25.96% | | 24.86% | | -7.86% | | 19.83% | | 50.91% | | 4.61% | | -8.28% | | 21.47% | | 12.47% | | -17.12% | | 15.34% |
Small-Cap Growth | | 18.24% | | 5.31% | | 6.87% | | -43.48% | | 15.05% | | 11.77% | | -0.63% | | 11.05% | | 48.52% | | 6.13% | | 4.93% | | 16.10% | | 19.62% | | -11.21% | | 15.10% |
Small-Cap Value | | 18.92% | | 12.77% | | 6.93% | | -45.57% | | 26.98% | | 16.56% | | 1.05% | | 20.99% | | 39.72% | | 0.79% | | -9.43% | | 26.79% | | 7.11% | | -13.06% | | 14.98% |
Blue Chip | | 0.05% | | 15.42% | | 6.07% | | -33.30% | | 26.61% | | 10.60% | | 3.17% | | 15.20% | | 31.67% | | 11.51% | | 2.17% | | 13.18% | | 18.43% | | -1.48% | | 31.05% |
Managed Volatility | | 6.96% | | 6.65% | | 6.58% | | -19.38% | | 12.39% | | 5.41% | | 1.94% | | 6.46% | | 9.25% | | 5.95% | | 0.17% | | 2.42% | | 8.18% | | -3.97% | | 11.88% |
Performance figures quoted represent past performance and are no guarantee of future results. Current performance may be lower or higher than the performance data quoted. Investment return and principal value will fluctuate, so that an investor’s shares, when redeemed, may be worth more or less than original cost. To obtain performance current to the most recentmonth-end, please visit bridgeway.com or call1-800-661-3550. Total return figures include the reinvestment of dividends and capital gains. Periods of less than one year are not annualized.
| | 1 | Some of the Fund’s fees were waived or expenses reimbursed; otherwise, returns would have been lower. The Adviser is contractually obligated to waive fees and/or pay expenses. Any material change to this Fund policy would require a vote by shareholders. |
| | 2 | Expense ratios are as stated in the current prospectus. Please see financial highlights for expense ratios as of December 31, 2019. |
* Numbers highlighted indicate periods when the Fund outperformed its primary benchmark.
This report is submitted for the general information of the shareholders of each Fund. It is not authorized for distribution to prospective investors unless preceded or accompanied by an effective prospectus, which includes information regarding a Fund’s risks, objectives, fees and expenses, experience of its management, and other information. Investors should read the prospectus carefully before investing in a Fund. For questions or other Fund information, call1-800-661-3550 or visit the Funds’ website at bridgeway.com. Funds are available for purchase by residents of the United States, Puerto Rico, U.S. Virgin Islands and Guam only.
The views expressed here are exclusively those of Fund management. These views, including those relating to the market, sectors, or individual stocks, are not meant as investment advice and should not be considered predictive in nature.
Effective May 31, 2019, the name of the Blue Chip 35 Index Fund was changed to Blue Chip Fund. Effective July 31, 2019, the Fund’s principal strategies were modified, as indicated in the Supplement dated May 31, 2019 to the Prospectus dated October 31, 2018.
| | | | |
| LETTER FROM THE INVESTMENT MANAGEMENT TEAM | | | | |
December 31, 2019
Dear Fellow Shareholders,
Performance across all segments of the domestic equity markets was positive for the December quarter, contributing to strong returns for the 2019 calendar year. Stocks in all major size and style categories rose substantially, although larger stocks and growth stocks outpaced smaller stocks and value stocks. As a result, large growth stocks recorded the year’s best returns. Market highlights appear on page 2. In this environment, the Bridgeway Funds performed within design expectations, guided by our statistically driven, evidence-based investment approach. Please see the enclosed letters for a detailed explanation of each Fund’s performance during the quarter and calendar year. We hope you find the letters helpful.
Market conditions such as the continued strength of large growth stocks have contributed to the underperformance of many Bridgeway Funds. But they’ve also provided an opportunity to examine the last decade of equity performance in the context of longer-term market data. You can read about this research, and what we’ve learned from it, in “A Decade of Performance in Perspective: Headwinds, but Reasons for Optimism” on page 2.
Another investing trend we’ve been studying recently is the use of Environmental, Social and Governance (ESG) criteria to assemble portfolios. Naturally, we’re interested in finding evidence that “good” companies make good investments, and whether there is any connection between ESG criteria and the investment factors that have been shown to provide long-term return premiums. One of our studies generated some intriguing results, which you can read about in “Examining the Link Between Factors and ESG” on page 4.
Finally, Bridgeway Partner Tony Ledergerber reflects on how joining Bridgeway 14 years ago helped him channel his desire to give back through volunteer work with a therapeutic riding center. He shares his story in “Transformative Change: Creating Opportunities to Find and Nurture our Passions” on page 6.
As always, we appreciate your feedback. We take your comments very seriously and regularly discuss them to help us manage our Funds and this company. Please keep your ideas coming — both favorable and critical. They provide us with a vital tool to serve you better.
Sincerely,
Your Investment Management Team
| | | | |
 | |  | |  |
| | |
| John Montgomery | | Christine L. Wang | | Michael Whipple |
| | |
 | |  | | |
| | |
| Elena Khoziaeva | | Dick Cancelmo | | |
| | | | |
| LETTER FROM THE INVESTMENT MANAGEMENT TEAM(continued) | | | | |
Market Review
Domestic equities advanced steadily during the quarter ended December 31, 2019, capping a year of strong stock market performance. Investors’ risk tolerance remained high, buoyed by healthy economic results, lower interest rates and signs that global trade tensions were easing. The S&P 500 returned +9.07% for the quarter and the Dow Jones Industrial Average returned +6.67%. For the 2019 calendar year, the S&P 500 and the DJIA gained +31.49% and +25.34%, respectively.
All U.S. equity style categories, as defined by Russell Indices, posted positive returns for the quarter. Smaller stocks outperformed larger stocks across style categories, and growth outperformed value. Small growth stocks delivered the quarter’s best performance (+11.39%) whilemid-cap value stocks produced the lowest returns (+6.36%). However, larger stocks outperformed smaller stocks for the calendar year.
All of the S&P 500 sectors except Real Estate posted positive returns for the quarter. The Information Technology and Health Care sectors were the best performers, both returning +14.4%. The Financials sector also performed well, returning +10.4%. The Utilities and Real Estate sectors lagged, returning +0.75% and-0.54%, respectively.
Below are the stock market style box returns for the quarter and the calendar year.
| | | | | | |
| | December 2019 Quarter |
| | Value | | All | | Growth |
| Large | | 7.41% | | 9.04% | | 10.62% |
| Mid | | 6.36% | | 7.06% | | 8.17% |
| Small | | 8.49% | | 9.94% | | 11.39% |
| | | | | | |
| | Calendar Year Ended December 2019 |
| | Value | | All | | Growth |
| Large | | 26.54% | | 31.43% | | 36.39% |
| Mid | | 27.06% | | 30.54% | | 35.47% |
| Small | | 22.39% | | 25.53% | | 28.48% |
A Decade of Performance in Perspective: Headwinds, but Reasons for Optimism
Much of this semi-annual report focuses on how the Bridgeway Funds have performed in the past quarter and calendar year. But if you’ve kept your eye on longer time periods, or if you glance at the returns table on page i, you’ve probably noticed that most of our Funds are underperforming their benchmarks in the1-,5-, and10-year periods.
Falling behind over longer periods like this doesn’t feel good to us as financial professionals nor to you (and us) as shareholders. But even as we acknowledge that we’re in a period of poor relative performance, we are not discouraged. We want to share some historical perspective that explains some of the causes for this performance deficit, what we are doing about it, especially what we’re not doing about it, and why we’re very optimistic about the future.
Three conditions created substantial headwinds for our Funds over the past 10 years:
1. The value factor has beenout-of-favor
We are big believers in the value factor. Every Bridgeway Fund, even those on the growth side of the investment spectrum, has some exposure to value relative to its primary market benchmark. The reason for this tilt is simple: historical data shows that the value premium has been remarkably pervasive and consistent. We like to call it the “granddaddy of investment factors.” In10-year periods since 1926, the value factor provided additional return 93% of the time based on Bridgeway analysis of the Ken French data library. To “bet” purely on growth is to bet on the other slim 7%. We are currently in one of those “7%” periods. And history strongly suggests they don’t last.
However, we know that any factor can be out of favor for periods of time — and that’s where we’ve found ourselves for the past decade. Value has been so out of favor for so long that value stocks are now in the 94th percentile of relative “cheapness” as measured by a key academic measure, median book to market going back to 1980 and using the stock components of the
| | |
| 2 | | Semi-Annual Report | December 31, 2019 (Unaudited) |
| | | | |
| LETTER FROM THE INVESTMENT MANAGEMENT TEAM(continued) | | | | |
Russell 1000 value and growth universes. In other words, value stocks have only been cheaper 7% of the time in the last 40 years. Because we believe, as history has shown, that this trend eventually turns around, we are very optimistic about the next decade.
Suffering through a period when something is this out of favor isn’t fun. But there’s potential upside to being in the 94th percentile. Think of the value factor like a spring that’s under pressure. The farther down that spring compresses, the more loaded it is to bounce back. And when you’re at the 94th percentile of something, you’re loaded in a powerful way.
Of course, we can’t predict exactly when that turning point will come. We believe trying to time the market or even a factor is an expensive and fruitless exercise. But historical data does tell us something about the magnitude ofpreviousbouncebacks of value. During the period 1980-2019, when the value factor as measured by the Russell 1000 value and growth universes was in the cheapest 10%, as it is currently, the Russell 1000 Value Index outperformed the Russell 1000 Growth Index by an average of roughly five percentage points/year. By carefully rebalancing our portfolios to maintain their value exposure, our Funds appear poised to ride the tailwind we hope to see when value returns to favor.
What are we doing about value being out of favor? Nothing. We maintain our positioning and the discipline of our process.
All together, while we don’t like our trailing returns, we love the positioning of our Funds. Statistics indicate we are positioned to benefit from a return to value driven markets. We’ve identified ways to help mitigate the deleterious effects of high correlation spikes. Our people, systems, data, and technology are stronger than they’ve ever been. And we hope this explanation helps put your long-term Fund performance in perspective. Thank you for your continued investment and the trust you place in us.
2. An increase in high-correlation markets
A high-correlation market is when stocks in an asset class move together, reducing the benefit you’d expect to get from diversification. Until about 11 years ago, a high-correlation market, as Bridgeway measures it, happened roughly every other decade. For the past 11 years, we’ve experienced one at the rate of nearly one ayear— and they’ve corresponded with all four of the last quarters with negative returns.
This trend is due, we believe substantially, to major structural changes in the market, such as the growth of passive investing, index funds, and exchange traded funds that allow one to press a single button and sell hundreds or thousands of stocks at once, without regard to the differences in the fundamental economic health of these companies. Our research has shown that these broad selloffs work against some of our price momentum and company financial health models, reducing the diversification benefit we expect to get from them.
What are we doing about high-correlation markets? We now believe high-correlation markets are here to stay. In response, we’ve developed a new company financial health model that, based on history, has less exposure to these high correlation spikes. We are currently implementing it in some of our select funds. We’re also updating some of our other models, including a risk adjusted momentum model that already has less exposure than classical price momentum. This will remain a topic of further research in 2020.
3. The phenomenon of “shrinking alpha”
Alpha is the term for the excess, risk-adjusted return of an investment over the market itself. Twenty years ago, when the Bridgeway Funds were relatively new, using factor-based analysis in investment management was like shooting fish in a barrel — with solid research and extreme discipline, you could achieve some big returns, and the Bridgeway Funds enjoyed a lot of those. Since then, a number of developments have narrowed that gap. We have better data, faster machines, and more skilled investors using these sophisticated tools to search for better returns. The “easy” years may be in our history, but there is also good news.
The good news is that there is still irrationality in our complex capital markets, and a continuing opportunity to harvest it. Furthermore, Bridgeway itself is much more sophisticated in the application of technology, and has a far more experienced and talented team of researchers and portfolio managers than 20 years ago. What are we doing about shrinking alpha? One of the pillars of Bridgeway’s investment philosophy is continuous investment in research. In our 26 year history, we’ve relied on data and statistics, discipline, and a factors-based investment world view. We don’t make radical changes and our threshhold for
| | | | |
| LETTER FROM THE INVESTMENT MANAGEMENT TEAM(continued) | | | | |
changes is high — we want to see compelling data over decades of market and economic cycles and we want to establish an economic reason why a factor exists. Nevertheless, we are continually conducting research to examine new potential factors, to better measure and implement established factors, and to improve upon how we put these together into each of our strategies.
Examining the Link Between Factors and ESG
By John Montgomery, Founder and Chief Investment Officer, and Christine Wang, CFA, CPA, Portfolio Manager
Environmental, social and governance (ESG) investing has become increasingly popular among people who want to support companies that uphold sustainable and ethical business practices. Besides aligning their portfolios with their values, many investors also use ESG criteria because they believe sustainable businesses practices translate to better long-term stock performance.
We have been watching the rise of ESG investing with interest, because we run Bridgeway on many of the same ethical, sustainable and socially responsible practices included in ESG criteria. We also share the belief that “good” companies also make good investments. Yet we are equally committed to our evidence-based investment philosophy and our quantitative approach to investment management using data over longer time periods. For that reason, and because more data is becoming available, we’ve been examining some of the data that purport to show ESG’s effectiveness.
A number of authors have published articles and books arguing that sustainable/ethical companies reward investors with better stock performance. However, some of the data falls victim to research flaws like “survivorship bias,” which means looking at companies that fit the study’s criteria and are still in business, while ignoring ones that failed.
The best way to validate studies like these is to conduct further testing usingout-of-sample data — that is, a set of data that wasn’t used to create the model in the first place. And, as our Bridgeway colleague Kai Liu says, “the only trueout-of-sample time period is called the future.” With that in mind, our research team recently examined companies featured in the 2007 bestsellerFirms of Endearment: How World-Class Companies Profit from Passion and Purposeto see how those stocks have performed since publication.
Firms of Endearment(FoE) argues that the most successful companies are driven by a higher purpose than just financial gain. Instead, these businesses focus on ensuring all their stakeholders thrive — from customers, employees, suppliers and investors to their communities and society at large. Through this positive impact, say authors Raj Sisodia, Jag Sheth and David B. Wolfe, they become companies that people love to buy from, work for, and partner with.
Some of the FoE names are familiar to ESG investors, such as Whole Foods, Southwest Airlines and Chipotle. Others might be more surprising, including oilfield services company Schlumberger. But in addition to meeting the authors’ criteria for admired and respected companies, their stocks collectively had delivered exceptional shareholder returns. Over 15 years, the authors reported, U.S. FoE stocks delivered a cumulative 1,681% return and outperformed the S&P 500 by 15 times.
The real question, though, is what the future held for these stocks after the book’s publication.
Re-Examining Firms of Endearment:Out-of-sample data
By studying returns from 12 years ofout-of-sample data, we found strong and consistent outperformance by FoE stocks: For the years 2007-2018, the FoE portfolio had an average annualized return of 11.15%, versus an average annualized return of 7.11% for the S&P 500 Index.
This analysis offered promising evidence that “good” companies might consistently provide higher potential returns. But when we see intriguing data like this, we always ask if there is a reason why a performance advantage would exist.
One of the pillars of Bridgeway’s investment philosophy is that factors shape returns. To understand a portfolio’s performance, we analyze its exposure to specific factors — characteristics that have been shown through rigorous analysis to define the risk and return of a broad set of securities. Naturally, we wanted to see what factor exposures we could find in the FoE portfolio.
| | |
| 4 | | Semi-Annual Report | December 31, 2019 (Unaudited) |
| | | | |
| LETTER FROM THE INVESTMENT MANAGEMENT TEAM(continued) | | | | |
Specifically, we ran the FoE portfolio through a Fama-French 6 Factor regression analysis, which examines the impact of exposure to the factors Value, Momentum, Small Size, Market, Investment Intensiveness, and Profitability. That analysis revealed that the FoE portfolio was slightly loaded to the small size factor and negatively loaded to the momentum factor. The largest impact, however, was attributable to the profitability factor.
The evidence of a strong premium from the profitability factor helps support the central idea articulated by theFirms of Endearmentauthors: It makes good business sense to create a company in which all stakeholders prosper. Treating employees, customers, suppliers and your communities better earns the admiration of all those stakeholders. It stands to reason such firms might be better able to attract and retain good employees, build customer loyalty, and maintain profitability.
However, our analysis comes with a few important caveats. We would like to test our findings on a larger set of companies and a longer period. Likewise, the outperformance by FoE stocks coincided with a period in which the profitability factor performed relatively well. These results should be tested during a period in which the profitability factor isn’t in favor.
While not conclusive, our analysis revealed potentially corroborating evidence that ESG criteria help give exposure to classic factors that provide long-term return premiums. It also shows that ESG and factor-based investing don’t have to be kept separate. For example, if further studies show that the profitability factor helps explain the returns of sustainable, ethical, and well-managed companies, you could screen the entire universe of high-profitability names for those that also meet ESG criteria — helping a portfolio gain factor exposure alongside ESG preferences.
We believe this connection is worth further investigation and analysis. As the financial industry develops more data around ESG investing, it will have greater ability to build models that can help investors pursue long-term success in terms of both shareholder value and shareholder values.
| | | | |
| LETTER FROM THE INVESTMENT MANAGEMENT TEAM(continued) | | | | |
Transformative Change: Creating Opportunities to Find and Nurture our Passions
By Tony Ledergerber, Director of Marketing and Communications
When you read the personal stories of transformative change in our annual and semi-annual reports you might think that everyone working here came from a strong philanthropic background. While many of us did, for others it’s an aspect of our lives that we’ve been fortunate to develop through our service to Bridgeway. I know, because I’m in that latter group.
I was working at another asset management firm 14 years ago when I learned there was an opening for a marketing leader at Bridgeway Capital Management. As I began researching Bridgeway’s investment approach and philosophy, I got excited about joining a firm that followed a quantitative investment strategy, that was committed to providing cost-efficient funds, and that had a strong reputation for transparency. Then I came into the office for an interview and learned there was a lot more that made Bridgeway unique.
The Partners who interviewed me told me about Bridgeway’s practice of donating at least 50% of its profits to charity and the firm’s commitment to creating transformative change. Then they asked me about the causes I was passionate about and my personal history of giving back.
I was caught by surprise, and I realized that to that point I hadn’t had any significant experience in philanthropic activity. So I answered honestly, saying that while I lacked the background, I had the heart and the desire to give back — and that I saw an opportunity to change my life and the lives of others. I came out of the interview wanting the job even more than when I’d walked in.
Fortunately, Bridgeway hired me, and I soon learned how much the company culture helps each Partner nurture their own passions. We are all given time off for volunteer work, are offered the chance to join service trips, and are even given designations to donate to causes that are important to us. Just as valuable is the intangible benefit of being surrounded by people who talk passionately about the organizations they support, and who provide examples of giving back through service on boards and volunteer work.
This environment inspired me to imagine ways that I could make a difference. I thought about my family background spending my free time on a ranch, and the positive experiences I’d had working with horses. I had heard about organizations that use horse riding as a therapeutic activity for young people with physical, mental or emotional challenges, and I figured I could lend my time in some way — maybe saddling horses, caring for the equipment, or even just fixing fences.
I decided to get involved with a local ranch dedicated to therapeutic riding. Soon, I saw how I could contribute more than just manual labor. I’ve been able to put my professional experience to work helping raise awareness, contributing to fundraising activities, and guiding long-term planning. That organization has become a huge part of my life over the past 12 years — and what I’ve witnessed first-hand has been miraculous.
I’ve watched a nonverbal boy on the autism spectrum speak his first words — telling a horse “whoa!” when he needed it to slow down — and gradually learn more communication skills. I’ve seen children with physical limitations build up their core strength through the act of riding a large animal. And I’ve seen groups ofat-risk teenagers forming strong bonds with horses that have helped them overcome depression.
I’m grateful to have joined a company that’s taught me how to use my time, talent and treasure to support an organization making such a difference in children’s lives. I appreciate the fact that Bridgeway was willing to look past my lack of previous charitable experience, which is why I’ve become a strong proponent of hiring others like me who might not have a complete philanthropic resume. I look at it as another way that I can give back — by sharing the opportunity that Bridgeway provided me to find fulfillment through helping others.
| | |
| 6 | | Semi-Annual Report | December 31, 2019 (Unaudited) |
| | |
| Aggressive Investors 1 Fund | |
|
| MANAGER’S COMMENTARY (Unaudited) |
| | |
December 31, 2019
Dear Fellow Aggressive Investors 1 Fund Shareholder,
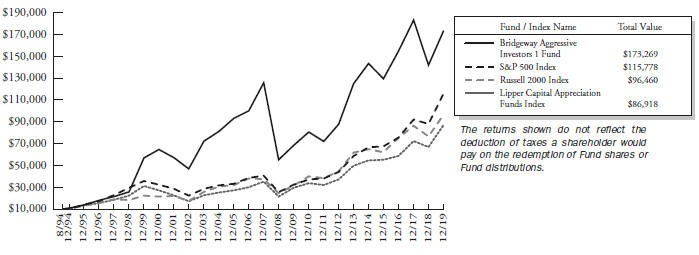
For the quarter ended December 31, 2019, our Fund returned +6.10%, trailing our primary market benchmark, the S&P 500 Index (+9.07%), our peer benchmark, the Lipper Capital Appreciation Funds Index (+8.84%), and the Russell 2000 Index (+9.94%). It was a poor quarter on a relative basis.
For the calendar year, our Fund returned +21.85%, underperforming our primary market benchmark, the S&P 500 Index (+31.49%), our peer benchmark, the Lipper Capital Appreciation Funds Index (+29.65%), and the Russell 2000 Index (+25.52%).
The table below presents our December quarter,six-month,one-year, five-year,10-year,15-year, andinception-to-date financial results. See the next page for a graph of performance since inception.
Standardized Returns as of December 31, 2019
| | | | | | | | | | | | | | | | | | | | | | | | | | | | | | | | | | | |
| | | | | | | | | Annualized | | |
| | | Quarter | | 6 Months | | 1 Year | | 5 Years | | 10 Years | | 15 Years | | Since Inception
(8/5/94) |
| | | | | | | |
Aggressive Investors 1 Fund | | | | 6.10% | | | | | 3.01% | | | | | 21.85% | | | | | 3.82% | | | | | 9.74 | % | | | | 5.18 | % | | | | 11.88 | % |
S&P 500 Index | | | | 9.07% | | | | | 10.92% | | | | | 31.49% | | | | | 11.70% | | | | | 13.56 | % | | | | 9.00 | % | | | | 10.09 | % |
Russell 2000 Index | | | | 9.94% | | | | | 7.30% | | | | | 25.52% | | | | | 8.23% | | | | | 11.83 | % | | | | 7.92 | % | | | | 9.30 | % |
Lipper Capital Appreciation Funds Index | | | | 8.84% | | | | | 8.79% | | | | | 29.65% | | | | | 9.65% | | | | | 11.43 | % | | | | 8.56 | % | | | | 8.81 | % |
Performance figures quoted in the table above represent past performance and are no guarantee of future results. Total return figures in the table above include the reinvestment of dividends and capital gains. The table above does not reflect the deduction of taxes that a shareholder would pay on Fund distributions or on the redemption of Fund shares.
The S&P 500 Index is a broad-based, unmanaged measurement of changes in stock market conditions, based on the average of 500 widely held common stocks with dividends reinvested. The Russell 2000 Index is an unmanaged, market value weighted index that measures performance of the 2,000 companies that are between the 1,000th and 3,000th largest in the market with dividends reinvested. The Lipper Capital Appreciation Funds Index reflects the record of the 30 largest funds in the category of more aggressive domestic growth mutual funds, as reported by Lipper, Inc. It is not possible to invest directly in an index. Periods longer than one year are annualized.
| | |
| Aggressive Investors 1 Fund | |
|
| MANAGER’S COMMENTARY (Unaudited) (continued) |
| | |
Growth of a $10,000 Investment
from Inception August 5, 1994 to December 31, 2019
Detailed Explanation of Quarterly Performance
The Fund’s company financial health and price momentum models underperformed the benchmark during the quarter and detracted from relative results. However, outperformance by the Fund’s value metrics models offset some of this negative impact. An overweighting in high momentum stocks hurt relative performance during the quarter as the momentum factor was strongly out of favor. The Fund’s tilt toward the benchmark’s smaller stocks also detracted from relative results during the period when larger names outperformed smaller ones.
By design, the Fund tends to invest in higher beta and higher volatility stocks, and the impact of this positioning was positive during the“risk-on” quarter. The Fund’s tilt toward deeper value stocks produced mixed results during the quarter.
From a sector perspective, the Fund’s allocation effect was negative, with overweightings in the Consumer Discretionary and Industrials sectors and an underweighting in the Information Technology sector detracting the most from relative performance. The Fund’s stock selection effect also was negative, primarily due to poor performance from holdings in the Financials, Information Technology, and Consumer Staples sectors.
Detailed Explanation of Calendar Year Performance
The Fund’s company financial health models significantly underperformed the benchmark and detracted from relative results during the year, while its value metrics models modestly underperformed. However, the Fund’s price momentum model outperformed the benchmark, offsetting some of this negative impact.
The Fund’s main design features also faced headwinds during the12-month period. Overweightings in higher beta and higher volatility stocks detracted from relative performance, as did overweight exposure to high momentum stocks that slightly lagged lower momentum stocks. The Fund’s tilts toward smaller and deeper value stocks also hurt relative results amid market conditions that favored larger, growth-oriented stocks.
From a sector perspective, the Fund’s allocation effect was negative, primarily driven by overweightings in the Consumer Discretionary and Materials sectors. The Fund’s stock selection effect was significantly negative, with holdings in the Energy, Health Care, and Industrials sectors detracting the most from relative performance.
| | |
| 8 | | Semi-Annual Report | December 31, 2019 (Unaudited) |
| | |
| Aggressive Investors 1 Fund | | |
| MANAGER’S COMMENTARY (Unaudited) (continued) | | |
| | |
Top Ten Holdings as of December 31, 2019
| | | | | | | | |
| Rank | | Description | | Industry | | % of Net
Assets | |
| 1 | | Micron Technology, Inc. | | Information Technology | | | 2.7% | |
| 2 | | Apple, Inc. | | Information Technology | | | 2.7% | |
| 3 | | Cadence Design Systems, Inc. | | Information Technology | | | 2.3% | |
| 4 | | Target Corp. | | Consumer Discretionary | | | 2.2% | |
| 5 | | RH | | Consumer Discretionary | | | 2.2% | |
| 6 | | CDW Corp. | | Information Technology | | | 2.1% | |
| 7 | | Merck & Co., Inc. | | Health Care | | | 2.0% | |
| 8 | | Fiat Chrysler Automobiles NV | | Consumer Discretionary | | | 1.8% | |
| 9 | | Credit Acceptance Corp. | | Financials | | | 1.7% | |
| 10 | | Ensign Group, Inc. (The) | | Health Care | | | 1.6% | |
| | | |
| | Total | | | | | 21.3% | |
Industry Sector Representation as of December 31, 2019
| | | | | | | | | | | | | | | |
| | | % of Net Assets | | % of S&P 500
Index | | Difference |
Communication Services | | | | 3.3 | % | | | | 10.4 | % | | | | -7.1% | |
Consumer Discretionary | | | | 17.6 | % | | | | 9.8 | % | | | | 7.8% | |
Consumer Staples | | | | 4.1 | % | | | | 7.2 | % | | | | -3.1% | |
Energy | | | | 4.4 | % | | | | 4.3 | % | | | | 0.1% | |
Financials | | | | 15.0 | % | | | | 13.0 | % | | | | 2.0% | |
Health Care | | | | 13.0 | % | | | | 14.2 | % | | | | -1.2% | |
Industrials | | | | 14.4 | % | | | | 9.0 | % | | | | 5.4% | |
Information Technology | | | | 19.9 | % | | | | 23.2 | % | | | | -3.3% | |
Materials | | | | 5.3 | % | | | | 2.7 | % | | | | 2.6% | |
Real Estate | | | | 3.1 | % | | | | 2.9 | % | | | | 0.2% | |
Utilities | | | | 0.0 | % | | | | 3.3 | % | | | | -3.3% | |
Liabilities in Excess of Other Assets | | | | -0.1 | % | | | | 0.0 | % | | | | -0.1% | |
| | | |
Total | | | | 100.0 | % | | | | 100.0 | % | | | | | |
Disclaimer
The views expressed here are exclusively those of Fund management. These views, including those related to market sectors or individual stocks, are not meant as investment advice and should not be considered predictive in nature. Any favorable (or unfavorable) description of a holding applies only as of the quarter end, December 31, 2019, unless otherwise stated. Security positions can and do change thereafter. Discussions of historical performance do not guarantee and may not be indicative of future performance.
Market volatility can significantly affect short-term performance. The Fund is not an appropriate investment for short-term investors. Investments in the small companies within thismulti-cap fund generally carry greater risk than is customarily associated with larger companies. This additional risk is attributable to a number of factors, including the relatively limited financial resources that are typically available to small companies and the fact that small companies often have comparatively limited product lines. In addition, the stock of small companies tends to be more volatile than the stock of large companies, particularly in the short term and particularly in the early stages of an economic or market downturn. The Fund’s use of options, futures, and leverage can magnify the risk of loss in an unfavorable market, and the Fund’s use of short-sale positions can, in theory, expose shareholders to unlimited loss. Finally, the Fund exposes shareholders to “focus risk,” which may add to Fund volatility through the possibility that a single company could significantly affect total return. Shareholders of the Fund, therefore, are taking on more risk than they would if they invested in the stock market as a whole.
| | |
| Aggressive Investors 1 Fund | |
|
| MANAGER’S COMMENTARY (Unaudited) (continued) |
| | |
Conclusion
Thank you for your continued investment in Aggressive Investors 1 Fund. We encourage your feedback; your reactions and concerns are important to us.
Sincerely,
The Investment Management Team
| | |
| 10 | | Semi-Annual Report | December 31, 2019 (Unaudited) |
| | |
| Aggressive Investors 1 Fund | |
|
| SCHEDULE OF INVESTMENTS (Unaudited) |
| Showing percentage of net assets as of December 31, 2019 | | |
| | | | | | |
| Industry Company | | Shares | | Value | |
|
COMMON STOCKS - 100.06% | |
Communication Services - 3.29% | |
Discovery, Inc., Class A*+ | | 63,700 | | $ | 2,085,538 | |
DISH Network Corp., Class A*+ | | 52,000 | | | 1,844,440 | |
Match Group, Inc.*+ | | 22,200 | | | 1,822,842 | |
| | | | | | |
| | |
| | | | | 5,752,820 | |
Consumer Discretionary - 17.61% | |
Chipotle Mexican Grill, Inc.* | | 2,700 | | | 2,260,197 | |
Dollar General Corp. | | 11,000 | | | 1,715,780 | |
eBay, Inc. | | 50,900 | | | 1,837,999 | |
Fiat Chrysler Automobiles NV+ | | 215,000 | | | 3,158,350 | |
Lear Corp. | | 12,300 | | | 1,687,560 | |
M/I Homes, Inc.* | | 40,000 | | | 1,574,000 | |
Office Depot, Inc. | | 520,000 | | | 1,424,800 | |
RH*+ | | 17,600 | | | 3,757,600 | |
Signet Jewelers, Ltd. | | 50,000 | | | 1,087,000 | |
Skyline Champion Corp.* | | 56,000 | | | 1,775,200 | |
Sonic Automotive, Inc., Class A | | 58,000 | | | 1,798,000 | |
Starbucks Corp. | | 28,000 | | | 2,461,760 | |
Target Corp. | | 30,400 | | | 3,897,584 | |
TopBuild Corp.* | | 22,700 | | | 2,339,916 | |
| | | | | | |
| | |
| | | | | 30,775,746 | |
Consumer Staples - 4.14% | |
Hershey Co. (The) | | 17,600 | | | 2,586,848 | |
Ingles Markets, Inc., Class A | | 24,700 | | | 1,173,497 | |
John B. Sanfilippo & Son, Inc. | | 19,000 | | | 1,734,320 | |
Pilgrim’s Pride Corp.* | | 53,000 | | | 1,733,895 | |
| | | | | | |
| | |
| | | | | 7,228,560 | |
Energy - 4.37% | |
Cabot Oil & Gas Corp. | | 98,700 | | | 1,718,367 | |
Halliburton Co. | | 60,000 | | | 1,468,200 | |
HollyFrontier Corp. | | 31,600 | | | 1,602,436 | |
Laredo Petroleum, Inc.* | | 325,000 | | | 932,750 | |
World Fuel Services Corp. | | 44,000 | | | 1,910,480 | |
| | | | | | |
| | |
| | | | | 7,632,233 | |
Financials - 14.98% | |
Ameriprise Financial, Inc. | | 15,500 | | | 2,581,990 | |
Arch Capital Group, Ltd.* | | 42,000 | | | 1,801,380 | |
Bank of Montreal | | 22,300 | | | 1,728,250 | |
Charles Schwab Corp. (The) | | 40,500 | | | 1,926,180 | |
Credit Acceptance Corp.* | | 6,900 | | | 3,052,077 | |
Curo Group Holdings Corp.*+ | | 65,400 | | | 796,572 | |
Enova International, Inc.* | | 61,000 | | | 1,467,660 | |
MarketAxess Holdings, Inc. | | 6,700 | | | 2,540,037 | |
| | | | | | |
| Industry Company | | Shares | | Value | |
| | |
Financials (continued) | | | | | | |
Mr Cooper Group, Inc.* | | 93,000 | | $ | 1,163,430 | |
Prudential Financial, Inc. | | 22,000 | | | 2,062,280 | |
RenaissanceRe Holdings, Ltd. | | 10,000 | | | 1,960,200 | |
Santander Consumer USA Holdings, Inc. | | 105,000 | | | 2,453,850 | |
Synchrony Financial | | 27,200 | | | 979,472 | |
TD Ameritrade Holding Corp. | | 33,500 | | | 1,664,950 | |
| | | | | | |
| | |
| | | | | 26,178,328 | |
Health Care - 12.97% | | | | | | |
Anthem, Inc. | | 6,200 | | | 1,872,586 | |
Cardinal Health, Inc. | | 31,500 | | | 1,593,270 | |
Chemed Corp. | | 4,300 | | | 1,888,818 | |
Cigna Corp. | | 8,600 | | | 1,758,614 | |
DaVita, Inc.* | | 24,500 | | | 1,838,235 | |
Edwards Lifesciences Corp.* | | 7,000 | | | 1,633,030 | |
Ensign Group, Inc. (The) | | 62,000 | | | 2,812,940 | |
HCA Healthcare, Inc. | | 14,200 | | | 2,098,902 | |
Insulet Corp.* | | 10,600 | | | 1,814,720 | |
Ionis Pharmaceuticals, Inc.*+ | | 30,000 | | | 1,812,300 | |
Merck & Co., Inc. | | 39,000 | | | 3,547,050 | |
| | | | | | |
| | |
| | | | | 22,670,465 | |
Industrials - 14.37% | | | | | | |
AerCap Holdings NV* | | 28,000 | | | 1,721,160 | |
Alaska Air Group, Inc. | | 28,600 | | | 1,937,650 | |
Allison Transmission Holdings, Inc. | | 36,600 | | | 1,768,512 | |
Atkore International Group, Inc.* | | 1,300 | | | 52,598 | |
Builders FirstSource, Inc.* | | 70,000 | | | 1,778,700 | |
CNH Industrial NV | | 175,000 | | | 1,925,000 | |
Copart, Inc.* | | 19,200 | | | 1,746,048 | |
CoStar Group, Inc.* | | 3,300 | | | 1,974,390 | |
Delta Air Lines, Inc. | | 29,200 | | | 1,707,616 | |
GMS, Inc.* | | 59,900 | | | 1,622,092 | |
H&E Equipment Services, Inc. | | 52,000 | | | 1,738,360 | |
Lockheed Martin Corp. | | 4,500 | | | 1,752,210 | |
SPX Corp.* | | 18,500 | | | 941,280 | |
United Airlines Holdings, Inc.* | | 20,400 | | | 1,797,036 | |
United Parcel Service, Inc., Class B | | 15,000 | | | 1,755,900 | |
Wabash National Corp.+ | | 60,000 | | | 881,400 | |
| | | | | | |
| | |
| | | | | 25,099,952 | |
| | |
| Aggressive Investors 1 Fund | | |
| SCHEDULE OF INVESTMENTS (Unaudited) (continued) | | |
| Showing percentage of net assets as of December 31, 2019 | | |
| | | | | | |
| Industry Company | | Shares | | Value | |
| | |
| Common Stocks (continued) | | | | | | |
Information Technology - 19.92% | |
Alliance Data Systems Corp. | | 14,000 | | $ | 1,570,800 | |
Apple, Inc. | | 16,000 | | | 4,698,400 | |
Cadence Design Systems, Inc.* | | 58,400 | | | 4,050,624 | |
CDW Corp. | | 25,100 | | | 3,585,284 | |
Micron Technology, Inc.* | | 89,000 | | | 4,786,420 | |
Sanmina Corp.* | | 58,000 | | | 1,985,920 | |
Seagate Technology PLC+ | | 34,900 | | | 2,076,550 | |
ServiceNow, Inc.* | | 6,600 | | | 1,863,312 | |
SunPower Corp.*+ | | 129,500 | | | 1,010,100 | |
Synaptics, Inc.*+ | | 15,000 | | | 986,550 | |
TTEC Holdings, Inc. | | 23,700 | | | 938,994 | |
Universal Display Corp. | | 9,000 | | | 1,854,630 | |
VeriSign, Inc.* | | 10,500 | | | 2,023,140 | |
VMware, Inc., Class A*+ | | 11,000 | | | 1,669,690 | |
Western Digital Corp. | | 27,000 | | | 1,713,690 | |
| | | | | | |
| | |
| | | | | 34,814,104 | |
Materials - 5.30% | |
CF Industries Holdings, Inc. | | 36,300 | | | 1,732,962 | |
Freeport-McMoRan, Inc. | | 164,800 | | | 2,162,176 | |
Innospec, Inc. | | 10,000 | | | 1,034,400 | |
Kirkland Lake Gold, Ltd.+ | | 37,300 | | | 1,643,811 | |
Teck Resources, Ltd., Class B | | 95,000 | | | 1,650,150 | |
Verso Corp., Class A* | | 57,100 | | | 1,029,513 | |
| | | | | | |
| | |
| | | | | 9,253,012 | |
Real Estate - 3.11% | |
American Tower Corp. | | 11,000 | | | 2,528,020 | |
Equinix, Inc. | | 3,000 | | | 1,751,100 | |
Realogy Holdings Corp.+ | | 120,000 | | | 1,161,600 | |
| | | | | | |
| | |
| | | | | 5,440,720 | |
| | | | | | |
| |
TOTAL COMMON STOCKS - 100.06% | | | 174,845,940 | |
| | | | | | |
(Cost $159,724,602) | | | | | | |
| | | | | | | | |
| | | Rate^ | | Shares | | | Value | |
| |
MONEY MARKET FUND - 0.01% | | | | |
Fidelity Investments Money Market Government Portfolio Class I | | 1.49% | | 16,992 | | | $16,992 | |
| | | | | | | | |
| |
TOTAL MONEY MARKET FUND - 0.01% | | | 16,992 | |
| | | | | | | | |
(Cost $16,992) | | | | |
| INVESTMENTS PURCHASED WITH CASH PROCEEDS FROM SECURITIES LENDING - 3.97% | |
Fidelity Investments Money Market Government Portfolio Class I** | | 1.49% | | 6,937,723 | | | 6,937,723 | |
| | | | | | | | |
TOTAL INVESTMENTS PURCHASED WITH CASH PROCEEDS FROM SECURITIES LENDING - 3.97% | | | 6,937,723 | |
| | | | | | | | |
(Cost $6,937,723) | | | | |
TOTAL INVESTMENTS - 104.04% | | $ | 181,800,655 | |
(Cost $166,679,317) | | | | |
Liabilities in Excess of Other Assets - (4.04%) | | | (7,062,634 | ) |
| | | | | | | | |
NET ASSETS - 100.00% | | $ | 174,738,021 | |
| | | | | | | | |
| * | Non-income producing security. |
| ** | This security represents the investment of the cash collateral received in connection with securities out on loan as of December 31, 2019. |
| ^ | Rate disclosed as of December 31, 2019. |
| + | This security or a portion of the security is out on loan as of December 31, 2019. Total loaned securities had a value of $19,305,022 as of December 31, 2019. See Note 2 for disclosure of cash andnon-cash collateral. |
PLC - Public Limited Company
| | |
12 | | Semi-Annual Report | December 31, 2019 (Unaudited) |
| | |
| Aggressive Investors 1 Fund | | |
| SCHEDULE OF INVESTMENTS (Unaudited) (continued) | | |
| Showing percentage of net assets as of December 31, 2019 | | |
Summary of inputs used to value the Fund’s investments as of 12/31/2019 (See Note 2 in Notes to Financial Statements):
| | | | | | | | | | | | | | | | |
| |
| | | Valuation Inputs | |
| | | Investment in Securities (Value) | |
| | | Level 1
Quoted
Prices | | | Level 2
Significant
Observable Inputs | | | Level 3
Significant
Unobservable
Inputs | | | Total | |
| | | | |
Common Stocks (a) | | $ | 174,845,940 | | | $ | — | | | $ | — | | | $ | 174,845,940 | |
Money Market Fund | | | — | | | | 16,992 | | | | — | | | | 16,992 | |
Investments Purchased with Cash Proceeds from Securities Lending | | | — | | | | 6,937,723 | | | | — | | | | 6,937,723 | |
| | | | | | | | | | | | | | | | |
TOTAL | | $ | 174,845,940 | | | $ | 6,954,715 | | | $ | — | | | $ | 181,800,655 | |
| | | | | | | | | | | | | | | | |
| (a) | - Please refer to the Schedule of Investments for the industry classifications of these portfolio holdings. |
See Notes to Financial Statements.
| | |
| Ultra-Small Company Fund | |
|
| MANAGER’S COMMENTARY (Unaudited) |
| | |
December 31, 2019
Dear Fellow Ultra-Small Company Fund Shareholder,
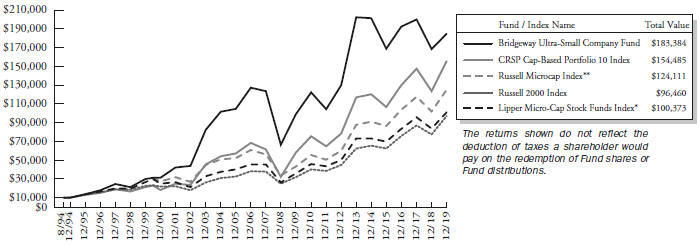
For the quarter ended December 31, 2019, our Fund returned +5.60%, underperforming our primary market benchmark, the CRSPCap-Based Portfolio 10 Index (+12.55%). The Fund also lagged our peer benchmark, the LipperMicro-Cap Stock Funds Index (+8.07%), as well as the Russell 2000 Index (+9.94%) and the Russell Microcap Index (+13.45%). It was a poor quarter on a relative basis.
For the calendar year, our Fund returned +9.51%, underperforming the CRSPCap-Based Portfolio 10 Index (+25.87%), the LipperMicro-Cap Stock Funds Index (+20.62%), the Russell 2000 Index (+25.52%), and the Russell Microcap Index (+22.43%).
The table below presents our December quarter,six-month,one-year, five-year,10-year,15-year, andinception-to-date financial results. See the next page for a graph of performance since inception.
Standardized Returns as of December 31, 2019
| | | | | | | | | | | | | | | | | | | | | | | | | | | | | | | | | | | |
| | | | | | | | | | | Annualized | | | | |
| | | Quarter | | 6 Months | | 1 Year | | 5 Years | | 10 Years | | 15 Years | | Since Inception
(8/5/94) |
| | | | | | | |
Ultra-Small Company Fund | | | | 5.60% | | | | | 1.63% | | | | | 9.51% | | | | | -1.70% | | | | | 6.44 | % | | | | 4.07 | % | | | | 12.13 | % |
CRSPCap-Based Portfolio 10 Index | | | | 12.55% | | | | | 8.59% | | | | | 25.87% | | | | | 5.29% | | | | | 10.33 | % | | | | 7.31 | % | | | | 11.37 | % |
Russell 2000 Index | | | | 9.94% | | | | | 7.30% | | | | | 25.52% | | | | | 8.23% | | | | | 11.83 | % | | | | 7.92 | % | | | | 9.30 | % |
Russell Microcap Index | | | | 13.45% | | | | | 7.26% | | | | | 22.43% | | | | | 6.57% | | | | | 11.26 | % | | | | 6.16 | % | | | | N/A | |
LipperMicro-Cap Stock Funds Index | | | | 8.07% | | | | | 4.31% | | | | | 20.62% | | | | | 6.74% | | | | | 10.88 | % | | | | 6.80 | % | | | | N/A | |
Performance figures quoted in the table above represent past performance and are no guarantee of future results. Total return figures in the table above include the reinvestment of dividends and capital gains. The table above does not reflect the deduction of taxes that a shareholder would pay on Fund distributions or on the redemption of Fund shares.
The CRSPCap-Based Portfolio 10 Index is an unmanaged index of 643 of the smallest publicly traded U.S. stocks (with dividends reinvested), as reported by the Center for Research on Security Prices. The Russell 2000 Index is an unmanaged, market value weighted index that measures performance of the 2,000 companies that are between the 1,000th and 3,000th largest in the market (with dividends reinvested). The Russell Microcap Index is an unmanaged, market value weighted index that measures performance of 1,000 of the smallest securities in the Russell 2000 Index. The LipperMicro-Cap Stock Funds Index is an index ofmicro-cap funds compiled by Lipper, Inc. It is not possible to invest directly in an index. Periods longer than one year are annualized.
| | |
| 14 | | Semi-Annual Report | December 31, 2019 (Unaudited) |
| | |
| Ultra-Small Company Fund | | |
| MANAGER’S COMMENTARY (Unaudited) (continued) | | |
| | |
Growth of a $10,000 Investment
from Inception August 5, 1994 to December 31, 2019
| * | The LipperMicro-Cap Stock Funds Index began on 12/31/1995, and the line graph for the Index begins at the same value as the Fund on that date. |
| ** | The Russell Microcap Index began on 6/30/2000, and the line graph for the Index begins at the same value as the Fund on that date. |
Detailed Explanation of Quarterly Performance
The Fund’s company financial health, price momentum and value metrics models all lagged the benchmark during the quarter and detracted from relative performance. The Fund’s tilt toward deeper value stocks across multiple valuation metrics also hurt relative results. Likewise, an underweighting in the highest-momentum stocks had a negative effect on relative returns.
During the quarter, the Fund held approximately 26% of its assets, on average, outside of CRSP 10, including stocks that appreciated into the CRSP 9 decile. The Fund’s holdings in CRSP 9 underperformed the CRSP 10 benchmark, detracting from relative results.
From a sector perspective, the Fund’s allocation effect was slightly negative. An underweighting in the Health Care sector and an overweighting in the Materials sector were the largest detractors from relative results. The Fund’s stock selection effect also was negative, driven largely by poor performance from holdings in the Health Care and Financials sectors.
| | |
| Ultra-Small Company Fund | |
|
| MANAGER’S COMMENTARY (Unaudited) (continued) |
| | |
The table below presents index performance numbers for stocks in the different CRSP deciles during various time periods.
| | | | | | | | | | | | | | | | | | | | | | | | |
| | | | | | | | | | | | Annualized | |
| CRSP Decile1 | | Quarter | | | 6 Months | | | 1 Year | | | 5 Years | | | 10 Years | | | 94 Years | |
| 1 (ultra-large) | | | 9.73% | | | | 11.38% | | | | 31.05% | | | | 12.28% | | | | 13.56% | | | | 9.52% | |
| 2 | | | 7.01% | | | | 7.23% | | | | 31.55% | | | | 10.04% | | | | 13.69% | | | | 10.62% | |
| 3 | | | 8.42% | | | | 6.24% | | | | 28.39% | | | | 10.12% | | | | 13.73% | | | | 11.07% | |
| 4 | | | 7.43% | | | | 5.20% | | | | 31.01% | | | | 8.65% | | | | 12.68% | | | | 10.88% | |
| 5 | | | 7.92% | | | | 4.41% | | | | 22.86% | | | | 6.26% | | | | 11.57% | | | | 11.31% | |
| 6 | | | 10.16% | | | | 6.62% | | | | 24.32% | | | | 7.02% | | | | 12.04% | | | | 11.29% | |
| 7 | | | 11.36% | | | | 7.81% | | | | 29.47% | | | | 10.40% | | | | 13.89% | | | | 11.59% | |
| 8 | | | 14.36% | | | | 8.63% | | | | 21.95% | | | | 6.62% | | | | 11.67% | | | | 11.38% | |
| 9 | | | 14.56% | | | | 7.98% | | | | 22.04% | | | | 7.76% | | | | 11.81% | | | | 11.43% | |
| 10 (ultra-small) | | | 12.55% | | | | 8.59% | | | | 25.87% | | | | 5.29% | | | | 10.33% | | | | 13.07% | |
| 1 | Performance figures are as of the period ended December 31, 2019. The CRSPCap-Based Portfolio Indexes are unmanaged indexes of publicly traded U.S. stocks with dividends reinvested, grouped by market capitalization, as reported by the Center for Research in Security Prices. Past performance is no guarantee of future results. |
Detailed Explanation of Calendar Year Performance
All three of the Fund’s model categories underperformed the benchmark and detracted from relative results for the year. The Fund’s tilt toward deeper value stocks across multiple valuation metrics also hurt relative results, as did an underweighting in highest-momentum stocks.
During the year, the Fund held approximately 28% of its assets, on average, outside of CRSP 10, including stocks that appreciated into the CRSP 9 decile. The Fund’s holdings in CRSP 9 underperformed the CRSP 10 benchmark, detracting from relative results.
From a sector perspective, the Fund’s allocation effect was slightly positive. An underweighting in the Energy sector and an overweighting in the Information Technology sector contributed most to relative results. However, the Fund’s stock selection effect was negative, driven largely by holdings in the Health Care, Financials, and Information Technology sectors.
Top Ten Holdings as of December 31, 2019
| | | | | | | | |
| Rank | | Description | | Industry | | % of Net
Assets | |
| 1 | | InfuSystem Holdings, Inc. | | Health Care | | | 3.2% | |
| 2 | | Electromed, Inc. | | Health Care | | | 2.5% | |
| 3 | | Citi Trends, Inc. | | Consumer Discretionary | | | 2.5% | |
| 4 | | Consumer Portfolio Services, Inc. | | Financials | | | 2.1% | |
| 5 | | Rocky Brands, Inc. | | Consumer Discretionary | | | 2.1% | |
| 6 | | Harvard Bioscience, Inc. | | Health Care | | | 2.0% | |
| 7 | | Lifevantage Corp. | | Consumer Staples | | | 2.0% | |
| 8 | | Capitala Finance Corp. | | Financials | | | 2.0% | |
| 9 | | Orion Energy Systems, Inc. | | Industrials | | | 1.9% | |
| 10 | | Transcat, Inc. | | Industrials | | | 1.9% | |
| | | |
| | Total | | | | | 22.2% | |
| | |
| 16 | | Semi-Annual Report | December 31, 2019 (Unaudited) |
| | |
| Ultra-Small Company Fund | | |
| MANAGER’S COMMENTARY (Unaudited) (continued) | | |
| | |
Industry Sector Representation as of December 31, 2019
| | | | | | | | | | | | | | | |
| | | % of Net Assets | | % of CRSP 10 Index | | Difference |
Communication Services | | | | 4.7 | % | | | | 4.1 | % | | | | 0.6% | |
Consumer Discretionary | | | | 14.2 | % | | | | 11.0 | % | | | | 3.2% | |
Consumer Staples | | | | 5.0 | % | | | | 2.0 | % | | | | 3.0% | |
Energy | | | | 8.2 | % | | | | 9.0 | % | | | | -0.8% | |
Financials | | | | 16.7 | % | | | | 21.6 | % | | | | -4.9% | |
Health Care | | | | 22.1 | % | | | | 29.7 | % | | | | -7.6% | |
Industrials | | | | 12.7 | % | | | | 10.0 | % | | | | 2.7% | |
Information Technology | | | | 11.7 | % | | | | 8.5 | % | | | | 3.2% | |
Materials | | | | 3.9 | % | | | | 2.6 | % | | | | 1.3% | |
Real Estate | | | | 0.9 | % | | | | 1.0 | % | | | | -0.1% | |
Utilities | | | | 0.0 | % | | | | 0.5 | % | | | | -0.9% | |
Liabilities in Excess of Other Assets | | | | -0.1 | % | | | | 0.0 | % | | | | -0.1% | |
| | | |
Total | | | | 100.0 | % | | | | 100.0 | % | | | | | |
Disclaimer
The views expressed here are exclusively those of Fund management. These views, including those related to market sectors or individual stocks, are not meant as investment advice and should not be considered predictive in nature. Any favorable (or unfavorable) description of a holding applies only as of the quarter end, December 31, 2019, unless otherwise stated. Security positions can and do change thereafter. Discussions of historical performance do not guarantee and may not be indicative of future performance.
The Fund is subject to very high, above market risk (volatility) and is not an appropriate investment for short-term investors. Investments in ultra-small companies generally carry greater risk than is customarily associated with larger companies and even “small companies” for various reasons, such as narrower markets (fewer investors), limited financial resources and greater trading difficulty.
Conclusion
Ultra-Small Company Fund remains closed to new investors. We encourage your feedback; your reactions and concerns are important to us.
Sincerely,
The Investment Management Team
| | |
| Ultra-Small Company Fund | | |
| SCHEDULE OF INVESTMENTS (Unaudited) | | |
| Showing percentage of net assets as of December 31, 2019 | | |
| | | | | | |
| Industry Company | | Shares | | Value | |
COMMON STOCKS - 100.14% | |
Communication Services - 4.74% | | | | |
Alaska Communications Systems Group, Inc.* | | 381,200 | | $ | 674,724 | |
Cinedigm Corp., Class A*+ | | 32,000 | | | 22,400 | |
Cumulus Media, Inc., Class A* | | 21,200 | | | 372,484 | |
DHI Group, Inc.* | | 26,900 | | | 80,969 | |
EverQuote, Inc., Class A*+ | | 23,700 | | | 814,095 | |
IDT Corp., Class B* | | 27,800 | | | 200,438 | |
Marchex, Inc., Class B* | | 8,500 | | | 32,130 | |
Travelzoo* | | 100,100 | | | 1,071,070 | |
| | | | | | |
| | |
| | | | | 3,268,310 | |
Consumer Discretionary - 14.24% | | | | |
AMCON Distributing Co. | | 2,100 | | | 151,221 | |
Barnes & Noble Education, Inc.* | | 20,400 | | | 87,108 | |
Bassett Furniture Industries, Inc. | | 7,000 | | | 116,760 | |
Big 5 Sporting Goods Corp.+ | | 162,300 | | | 486,900 | |
Charles & Colvard, Ltd.* | | 298,600 | | | 424,012 | |
China XD Plastics Co., Ltd.* | | 86,300 | | | 154,477 | |
Citi Trends, Inc. | | 75,100 | | | 1,736,312 | |
Comstock Holding Cos., Inc.*+ | | 54,400 | | | 104,448 | |
Crown Crafts, Inc. | | 34,400 | | | 211,560 | |
Delta Apparel, Inc.* | | 35,100 | | | 1,091,610 | |
Diversified Restaurant Holdings, Inc.* | | 19,707 | | | 20,495 | |
Educational Development Corp. | | 62,000 | | | 383,160 | |
Iconix Brand Group, Inc.*+ | | 19,600 | | | 26,460 | |
Lakeland Industries, Inc.* | | 43,500 | | | 469,800 | |
Lincoln Educational Services Corp.* | | 49,564 | | | 133,823 | |
Live Ventures, Inc.*+ | | 7,302 | | | 54,911 | |
ONE Group Hospitality, Inc. (The)*+ | | 27,400 | | | 99,736 | |
Rave Restaurant Group, Inc.* | | 15,300 | | | 25,245 | |
Rocky Brands, Inc. | | 49,000 | | | 1,442,070 | |
RTW RetailWinds, Inc.* | | 121,900 | | | 97,642 | |
Tile Shop Holdings, Inc.+ | | 77,900 | | | 131,651 | |
TravelCenters of America, Inc.* | | 47,920 | | | 821,828 | |
Tuesday Morning Corp.* | | 652,600 | | | 1,207,310 | |
Vince Holding Corp.* | | 19,400 | | | 335,814 | |
| | | | | | |
| | |
| | | | | 9,814,353 | |
Consumer Staples - 4.99% | | | | | | |
Alico, Inc. | | 1,100 | | | 39,413 | |
Farmer Brothers Co.* | | 34,200 | | | 515,052 | |
| | | | | | |
| Industry Company | | Shares | | Value | |
| | |
Consumer Staples (continued) | | | | | | |
Lifevantage Corp.* | | 88,400 | | $ | 1,379,924 | |
Mannatech, Inc. | | 13,809 | | | 216,249 | |
Natural Alternatives International, Inc.* | | 26,300 | | | 209,874 | |
Natural Grocers by Vitamin Cottage, Inc. | | 99,200 | | | 979,104 | |
Reliv International, Inc.*+ | | 26,939 | | | 102,368 | |
| | | | | | |
| | |
| | | | | 3,441,984 | |
Energy - 8.15% | | | | | | |
Adams Resources & Energy, Inc. | | 1,200 | | | 45,684 | |
Aspen Aerogels, Inc.* | | 5,400 | | | 41,904 | |
Earthstone Energy, Inc., Class A* | | 62,500 | | | 395,625 | |
Enservco Corp.* | | 496,100 | | | 92,361 | |
Era Group, Inc.* | | 3,700 | | | 37,629 | |
Gevo, Inc.* | | 18,300 | | | 42,273 | |
ION Geophysical Corp.* | | 75,300 | | | 653,604 | |
Lonestar Resources US, Inc., Class A* | | 134,700 | | | 351,567 | |
Mitcham Industries, Inc.* | | 93,000 | | | 266,910 | |
Navios Maritime Acquisition Corp. | | 129,600 | | | 1,101,600 | |
NCS Multistage Holdings, Inc.* | | 12,900 | | | 27,090 | |
PrimeEnergy Resources Corp.* | | 400 | | | 60,504 | |
SandRidge Energy, Inc.* | | 106,600 | | | 451,984 | |
SilverBow Resources, Inc.* | | 37,700 | | | 373,230 | |
Smart Sand, Inc.*+ | | 98,800 | | | 248,976 | |
Superior Drilling Products, Inc.* | | 122,800 | | | 100,696 | |
Teekay Tankers, Ltd., Class A* | | 20,012 | | | 479,688 | |
TransAtlantic Petroleum, Ltd.* | | 482,400 | | | 235,556 | |
VAALCO Energy, Inc.* | | 275,500 | | | 611,610 | |
| | | | | | |
| | |
| | | | | 5,618,491 | |
Financials - 16.68% | | | | | | |
1347 Property Insurance Holdings, Inc.*+ | | 7,800 | | | 43,056 | |
A-Mark Precious Metals, Inc.*+ | | 65,900 | | | 544,993 | |
AmeriServ Financial, Inc.+ | | 11,600 | | | 48,720 | |
Ashford, Inc.*+ | | 8,500 | | | 200,600 | |
Atlanticus Holdings Corp.* | | 17,800 | | | 160,378 | |
C&F Financial Corp. | | 14,252 | | | 788,563 | |
Capitala Finance Corp.+ | | 156,200 | | | 1,363,626 | |
CB Financial Services, Inc. | | 3,200 | | | 96,448 | |
Central Federal Corp.* | | 4,800 | | | 66,960 | |
| | |
18 | | Semi-Annual Report | December 31, 2019 (Unaudited) |
| | |
| Ultra-Small Company Fund | | |
| SCHEDULE OF INVESTMENTS (Unaudited) (continued) | | |
| Showing percentage of net assets as of December 31, 2019 | | |
| | | | | | |
| Industry Company | | Shares | | Value | |
| | |
Common Stocks (continued) | | | | | | |
Financials (continued) | | | | | | |
Community West Bancshares | | 5,000 | | $ | 55,500 | |
Consumer Portfolio Services, Inc.* | | 435,100 | | | 1,466,287 | |
Elevate Credit, Inc.* | | 70,500 | | | 313,725 | |
FedNat Holding Co. | | 29,900 | | | 497,237 | |
First Business Financial Services, Inc. | | 9,000 | | | 236,970 | |
First Savings Financial Group, Inc. | | 1,100 | | | 73,810 | |
First United Corp. | | 3,600 | | | 86,724 | |
FlexShopper, Inc.*+ | | 46,500 | | | 117,645 | |
Franklin Financial Services Corp. | | 1,300 | | | 50,297 | |
GAMCO Investors, Inc., Class A | | 8,900 | | | 173,461 | |
Hallmark Financial Services, Inc.* | | 3,800 | | | 66,766 | |
Impac Mortgage Holdings, Inc.*+ | | 102,181 | | | 537,472 | |
Investcorp Credit Management BDC, Inc. | | 95,400 | | | 639,180 | |
Manning & Napier, Inc. | | 134,900 | | | 234,726 | |
MVB Financial Corp. | | 11,400 | | | 284,088 | |
National Holdings Corp.* | | 80,400 | | | 205,020 | |
Northeast Bank | | 30,300 | | | 666,297 | |
Ocwen Financial Corp.* | | 235,400 | | | 322,498 | |
Portman Ridge Finance Corp. | | 280,200 | | | 594,024 | |
Provident Financial Holdings, Inc. | | 2,800 | | | 61,320 | |
Pzena Investment Management, Inc., Class A | | 60,600 | | | 522,372 | |
SB Financial Group, Inc. | | 17,422 | | | 343,039 | |
Security National Financial Corp., Class A* | | 86,334 | | | 505,054 | |
Silvercrest Asset Management Group, Inc., Class A | | 10,100 | | | 127,058 | |
| | | | | | |
| | |
| | | | | 11,493,914 | |
Health Care - 22.07% | | | | | | |
Affimed NV* | | 369,300 | | | 1,011,882 | |
Allied Healthcare Products, Inc.* | | 66,481 | | | 80,442 | |
American Renal Associates Holdings, Inc.* | | 11,600 | | | 120,292 | |
American Shared Hospital Services*+ | | 101,400 | | | 247,416 | |
Applied Genetic Technologies Corp.* | | 24,600 | | | 111,192 | |
Apyx Medical Corp.* | | 10,800 | | | 91,368 | |
| | | | | | |
| Industry Company | | Shares | | Value | |
| | |
Health Care (continued) | | | | | | |
Aravive, Inc.* | | 18,000 | | $ | 246,060 | |
Bioanalytical Systems, Inc.*+ | | 89,210 | | | 441,589 | |
Capital Senior Living Corp.* | | 13,000 | | | 40,170 | |
Castlight Health, Inc., Class B* | | 226,100 | | | 300,713 | |
Celldex Therapeutics, Inc.* | | 77,300 | | | 172,379 | |
Conformis, Inc.* | | 142,700 | | | 214,050 | |
Cumberland Pharmaceuticals, Inc.* | | 16,400 | | | 84,460 | |
CynergisTek, Inc.* | | 109,000 | | | 359,700 | |
Daxor Corp.*+ | | 4,400 | | | 41,360 | |
Digirad Corp.* | | 44,090 | | | 113,752 | |
Electromed, Inc.* | | 201,638 | | | 1,744,169 | |
Endologix, Inc.* | | 47,800 | | | 75,524 | |
Enzo Biochem, Inc.* | | 231,900 | | | 609,897 | |
FONAR Corp.* | | 10,700 | | | 210,683 | |
Fulgent Genetics, Inc.* | | 24,800 | | | 319,920 | |
Harvard Bioscience, Inc.* | | 458,300 | | | 1,397,815 | |
Infinity Pharmaceuticals, Inc.* | | 147,900 | | | 141,984 | |
InfuSystem Holdings, Inc.* | | 254,598 | | | 2,171,721 | |
IntriCon Corp.*+ | | 55,500 | | | 999,000 | |
IRIDEX Corp.* | | 20,900 | | | 46,816 | |
Jounce Therapeutics, Inc.* | | 72,300 | | | 631,179 | |
Kewaunee Scientific Corp. | | 16,100 | | | 216,545 | |
Kezar Life Sciences, Inc.* | | 11,400 | | | 45,714 | |
Milestone Scientific, Inc.*+ | | 79,500 | | | 110,505 | |
Misonix, Inc.* | | 60,200 | | | 1,120,322 | |
MRI Interventions, Inc.* | | 10,500 | | | 50,400 | |
MTBC, Inc.*+ | | 7,900 | | | 32,074 | |
Otonomy, Inc.* | | 26,500 | | | 101,495 | |
PhaseBio Pharmaceuticals, Inc.* | | 21,800 | | | 133,198 | |
Pro-Dex, Inc.*+ | | 19,800 | | | 347,490 | |
Retractable Technologies, Inc.*+ | | 66,900 | | | 100,350 | |
RTI Surgical Holdings, Inc.* | | 256,090 | | | 701,686 | |
SeaSpine Holdings Corp.* | | 4,500 | | | 54,045 | |
Sharps Compliance Corp.* | | 12,000 | | | 50,640 | |
SunLink Health Systems, Inc.* | | 4,700 | | | 5,029 | |
ThermoGenesis Holdings, Inc.* | | 19,500 | | | 85,800 | |
VIVUS, Inc.* | | 12,400 | | | 33,728 | |
| | | | | | |
| | |
| | | | | 15,214,554 | |
Industrials - 12.74% | | | | | | |
Acme United Corp. | | 19,400 | | | 461,526 | |
ARC Document Solutions, Inc.* | | 209,900 | | | 291,761 | |
Avalon Holdings Corp., Class A* | | 14,700 | | | 28,224 | |
| | |
| Ultra-Small Company Fund | | |
| SCHEDULE OF INVESTMENTS (Unaudited) (continued) | | |
| Showing percentage of net assets as of December 31, 2019 | | |
| | | | | | |
| Industry Company | | Shares | | Value | |
| | |
Common Stocks (continued) | | | | | | |
Industrials (continued) | | | | | | |
BG Staffing, Inc. | | 49,400 | | $ | 1,081,366 | |
Chicago Rivet & Machine Co. | | 1,900 | | | 49,015 | |
Continental Materials Corp.* | | 4,150 | | | 32,617 | |
DLH Holdings Corp.* | | 7,500 | | | 31,425 | |
Eastern Co. (The) | | 1,200 | | | 36,636 | |
Ecology and Environment, Inc., Class A | | 43,732 | | | 677,846 | |
Fuel Tech, Inc.* | | 203,500 | | | 189,662 | |
Hill International, Inc.* | | 11,900 | | | 37,604 | |
Houston Wire & Cable Co.* | | 16,500 | | | 72,765 | |
Hudson Global, Inc.* | | 2,019 | | | 24,127 | |
IES Holdings, Inc.* | | 2,500 | | | 64,150 | |
LB Foster Co., Class A* | | 9,300 | | | 180,234 | |
Limbach Holdings, Inc.* | | 37,700 | | | 142,506 | |
LS Starrett Co. (The), Class A* | | 32,300 | | | 184,756 | |
LSI Industries, Inc. | | 163,200 | | | 987,360 | |
Mastech Digital, Inc.* | | 10,200 | | | 112,914 | |
Navios Maritime Holdings, Inc.* | | 36,200 | | | 162,176 | |
Orion Energy Systems, Inc.* | | 396,300 | | | 1,327,605 | |
Orion Group Holdings, Inc.* | | 47,100 | | | 244,449 | |
Perma-Pipe International Holdings, Inc.* | | 4,500 | | | 42,210 | |
Quest Resource Holding Corp.*+ | | 22,000 | | | 47,960 | |
Tel-Instrument Electronics Corp.* | | 11,400 | | | 40,812 | |
Transcat, Inc.* | | 40,900 | | | 1,303,074 | |
Ultralife Corp.* | | 4,600 | | | 33,994 | |
Virco Manufacturing Corp. | | 17,600 | | | 74,624 | |
Volt Information Sciences, Inc.* | | 87,600 | | | 217,248 | |
Willis Lease Finance Corp.* | | 10,200 | | | 600,882 | |
| | | | | | |
| | |
| | | | | 8,781,528 | |
Information Technology - 11.72% | | | | | | |
Adesto Technologies | | | | | | |
Corp.*+ | | 88,100 | | | 748,850 | |
AstroNova, Inc. | | 5,600 | | | 76,832 | |
Aviat Networks, Inc.* | | 55,213 | | | 775,743 | |
Blonder Tongue Laboratories, Inc.* | | 290,100 | | | 220,476 | |
Communications Systems, Inc. | | 45,500 | | | 280,735 | |
Finjan Holdings, Inc.* | | 312,700 | | | 628,527 | |
GlobalSCAPE, Inc. | | 41,300 | | | 405,979 | |
Identiv, Inc.* | | 18,500 | | | 104,340 | |
inTEST Corp.* | | 213,400 | | | 1,269,730 | |
| | | | | | |
| | | | | | |
| Industry Company | | Shares | | Value | |
|
Information Technology (continued) | |
Intevac, Inc.* | | 33,800 | | $ | 238,628 | |
Luna Innovations, Inc.* | | 8,130 | | | 59,268 | |
NetSol Technologies, Inc.* | | 47,600 | | | 190,400 | |
One Stop Systems, Inc.* | | 20,800 | | | 42,016 | |
PC-Tel, Inc. | | 30,400 | | | 257,488 | |
Perceptron, Inc.* | | 10,700 | | | 58,850 | |
RF Industries, Ltd. | | 117,196 | | | 792,245 | |
Schmitt Industries, Inc.*+ | | 70,802 | | | 273,296 | |
ServiceSource International, Inc.* | | 113,000 | | | 188,710 | |
Synacor, Inc.* | | 26,000 | | | 39,520 | |
Taitron Components, Inc., Class A | | 68,500 | | | 194,540 | |
TESSCO Technologies, Inc. | | 44,900 | | | 503,778 | |
TransAct Technologies, Inc. | | 62,800 | | | 688,916 | |
Wayside Technology Group, Inc. | | 2,400 | | | 38,880 | |
| | | | | | |
| | |
| | | | | 8,077,747 | |
Materials - 3.94% | | | | | | |
AgroFresh Solutions, Inc.* | | 54,200 | | | 139,836 | |
Caledonia Mining Corp. PLC | | 4,700 | | | 39,574 | |
Flexible Solutions International, Inc. | | 66,300 | | | 170,391 | |
Friedman Industries, Inc. | | 71,800 | | | 432,236 | |
Gulf Resources, Inc.* | | 536,800 | | | 273,822 | |
LSB Industries, Inc.* | | 85,400 | | | 358,680 | |
Olympic Steel, Inc. | | 59,800 | | | 1,071,616 | |
Ramaco Resources, Inc.* | | 23,500 | | | 84,130 | |
Trecora Resources* | | 8,100 | | | 57,915 | |
UFP Technologies, Inc.* | | 1,700 | | | 84,337 | |
| | | | | | |
| | |
| | | | | 2,712,537 | |
Real Estate - 0.87% | | | | | | |
CIM Commercial Trust Corp. | | 16,300 | | | 236,350 | |
Griffin Industrial Realty, Inc. | | 9,200 | | | 363,860 | |
| | | | | | |
| | |
| | | | | 600,210 | |
| | | | | | |
| |
TOTAL COMMON STOCKS - 100.14% | | | 69,023,628 | |
| | | | | | |
(Cost $73,506,820) | | | | | | |
| | |
20 | | Semi-Annual Report | December 31, 2019 (Unaudited) |
| | |
| Ultra-Small Company Fund | | |
| SCHEDULE OF INVESTMENTS (Unaudited) (continued) | | |
| Showing percentage of net assets as of December 31, 2019 | | |
| | | | | | | | |
| | | Rate^ | | Shares | | | Value | |
| |
MONEY MARKET FUND - 0.85% | | | | |
Fidelity Investments Money Market Government Portfolio Class I | | 1.49% | | 584,597 | | | $584,597 | |
| | | | |
TOTAL MONEY MARKET FUND - 0.85% | | | 584,597 | |
| | | | |
(Cost $584,597) | | | | |
|
INVESTMENTS PURCHASED WITH CASH PROCEEDS FROM SECURITIES
LENDING - 2.35% | |
Fidelity Investments Money Market Government Portfolio Class I** | | 1.49% | | 1,618,090 | | | 1,618,090 | |
| | | | |
TOTAL INVESTMENTS PURCHASED WITH CASH PROCEEDS FROM SECURITIES LENDING -2.35% | | | 1,618,090 | |
| | | | |
(Cost $1,618,090) | | | | |
| |
TOTAL INVESTMENTS - 103.34% | | | $71,226,315 | |
| | | | |
(Cost $75,709,507) | | | | |
Liabilities in Excess of Other
Assets - (3.34%) | | | (2,301,958 | ) |
| | | | |
NET ASSETS - 100.00% | | | $68,924,357 | |
| | | | | | | | |
| * | Non-income producing security. |
| ** | This security represents the investment of the cash collateral received in connection with securities out on loan as of December 31, 2019. |
| ^ | Rate disclosed as of December 31, 2019. |
| + | This security or a portion of the security is out on loan as of December 31, 2019. Total loaned securities had a value of $2,512,696 as of December 31, 2019. See Note 2 for disclosure of cash andnon-cash collateral. |
PLC - Public Limited Company
Summary of inputs used to value the Fund’s investments as of 12/31/2019 (See Note 2 in Notes to Financial Statements):
| | | | | | | | | | | | | | | | |
| |
| | | Valuation Inputs | |
| | | Investment in Securities (Value) | |
| | | Level 1
Quoted
Prices | | | Level 2
Significant
Observable Inputs | | | Level 3
Significant
Unobservable
Inputs | | | Total | |
| | | | |
Common Stocks Industrials | | $ | 8,062,870 | | | $ | 718,658 | | | $ | — | | | $ | 8,781,528 | |
Other Industries (a) | | | 60,242,100 | | | | — | | | | — | | | | 60,242,100 | |
| | | | | | | | | | | | | | | | |
Total Common Stocks | | | 68,304,970 | | | | 718,658 | | | | — | | | | 69,023,628 | |
Money Market Fund | | | — | | | | 584,597 | | | | — | | | | 584,597 | |
Investments Purchased with Cash Proceeds from Securities Lending | | | — | | | | 1,618,090 | | | | — | | | | 1,618,090 | |
| | | | | | | | | | | | | | | | |
TOTAL | | $ | 68,304,970 | | | $ | 2,921,345 | | | $ | — | | | $ | 71,226,315 | |
| | | | | | | | | | | | | | | | |
| (a) | - Please refer to the Schedule of Investments for the industry classifications of these portfolio holdings. |
See Notes to Financial Statements.
| | |
| Ultra-Small Company Market Fund | |
|
| MANAGER’S COMMENTARY (Unaudited) |
| | |
December 31, 2019
Dear Fellow Ultra-Small Company Market Fund Shareholder,
For the quarter ended December 31, 2019, our Fund returned +7.34%, underperforming our primary market benchmark, the CRSPCap-Based Portfolio 10 Index (+12.55%). Our Fund also underperformed our peer benchmark, the LipperMicro-Cap Stock Funds Index (+8.07%), as well as the Russell 2000 Index (+9.94%) and the Russell Microcap Index (+13.45%). It was a poor quarter on a relative basis.
For the calendar year, our Fund returned +15.34%, trailing the CRSPCap-Based Portfolio 10 Index (+25.87%), the LipperMicro-Cap Stock Funds Index (+20.62%), the Russell 2000 Index (+25.52%), and the Russell Microcap Index (+22.43%).
The table below presents our December quarter,six-month,one-year, five-year,10-year,15-year, andinception-to-date financial results. See the next page for a graph of performance since inception.
Standardized Returns as of December 31, 2019
| | | | | | | | | | | | | | | | | | | | | | | | | | | | | | | | | | | |
| | | | | | | | | | | Annualized | | | | |
| | | Quarter | | 6 Months | | 1 Year | | 5 Years | | 10 Years | | 15 Years | | Since Inception
(7/31/97) |
| | | | | | | |
Ultra-Small Company Market Fund | | | | 7.34% | | | | | 3.84% | | | | | 15.34% | | | | | 3.67% | | | | | 10.05 | % | | | | 5.34 | % | | | | 9.67 | % |
CRSPCap-Based Portfolio 10 Index | | | | 12.55% | | | | | 8.59% | | | | | 25.87% | | | | | 5.29% | | | | | 10.33 | % | | | | 7.31 | % | | | | 10.23 | % |
Russell 2000 Index | | | | 9.94% | | | | | 7.30% | | | | | 25.52% | | | | | 8.23% | | | | | 11.83 | % | | | | 7.92 | % | | | | 7.83 | % |
Russell Microcap Index | | | | 13.45% | | | | | 7.26% | | | | | 22.43% | | | | | 6.57% | | | | | 11.26 | % | | | | 6.16 | % | | | | N/A | |
LipperMicro-Cap Stock Funds Index | | | | 8.07% | | | | | 4.31% | | | | | 20.62% | | | | | 6.74% | | | | | 10.88 | % | | | | 6.80 | % | | | | 7.77 | % |
Performance figures quoted in the table above represent past performance and are no guarantee of future results. Total return figures in the table above include the reinvestment of dividends and capital gains. The table above does not reflect the deduction of taxes that a shareholder would pay on Fund distributions or on the redemption of Fund shares.
The CRSPCap-Based Portfolio 10 Index is an unmanaged index of 643 of the smallest publicly traded U.S. stocks with dividends reinvested, as reported by the Center for Research on Security Prices. The Russell 2000 Index is an unmanaged, market value weighted index that measures performance of the 2,000 companies that are between the 1,000th and 3,000th largest in the market with dividends reinvested. The Russell Microcap Index is an unmanaged, market value weighted index that measures performance of 1,000 of the smallest securities in the Russell 2000 Index. The LipperMicro-Cap Stock Funds Index is an index ofmicro-cap funds compiled by Lipper, Inc. It is not possible to invest directly in an index. Periods longer than one year are annualized.
| | |
| 22 | | Semi-Annual Report | December 31, 2019 (Unaudited) |
| | |
| Ultra-Small Company Market Fund | | |
| MANAGER’S COMMENTARY (Unaudited) (continued) | | |
| | |
Growth of a $10,000 Investment
from Inception July 31, 1997 to December 31, 2019
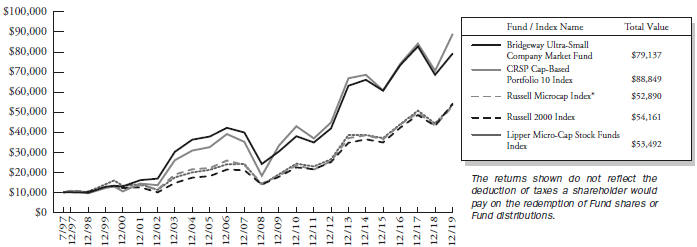
| * | The Russell Microcap Index began on 6/30/2000, and the line graph for the Index begins at the same value as the Fund on that date. |
Detailed Explanation of Quarterly Performance
During the quarter, the Fund held about 20% of its assets, on average, in stocks outside of CRSP 10, including stocks that appreciated into CRSP 9. These larger stocks underperformed the benchmark and hurt the Fund’s relative results. The Fund’s sidestepping strategies, which eliminated exposure to stocks with high probability of a steep price decline, major financial distress or bankruptcy, helped performance against the benchmark.
The Fund’s stock selection effect was negative, with holdings in the Health Care and Communication Services sectors detracting most from relative returns.
The table below presents index performance numbers for stocks in the different CRSP deciles during various time periods.
| | | | | | | | | | | | | | | | | | | | | | | | |
| | | | | | | | | | | | | | | Annualized | | | | |
CRSP Decile1
| | Quarter | | | 6 Months | | | 1 Year | | | 5 Years | | | 10 Years | | | 94 Years | |
| 1 (ultra-large) | | | 9.73% | | | | 11.38% | | | | 31.05% | | | | 12.28% | | | | 13.56% | | | | 9.52% | |
| 2 | | | 7.01% | | | | 7.23% | | | | 31.55% | | | | 10.04% | | | | 13.69% | | | | 10.62% | |
| 3 | | | 8.42% | | | | 6.24% | | | | 28.39% | | | | 10.12% | | | | 13.73% | | | | 11.07% | |
| 4 | | | 7.43% | | | | 5.20% | | | | 31.01% | | | | 8.65% | | | | 12.68% | | | | 10.88% | |
| 5 | | | 7.92% | | | | 4.41% | | | | 22.86% | | | | 6.26% | | | | 11.57% | | | | 11.31% | |
| 6 | | | 10.16% | | | | 6.62% | | | | 24.32% | | | | 7.02% | | | | 12.04% | | | | 11.29% | |
| 7 | | | 11.36% | | | | 7.81% | | | | 29.47% | | | | 10.40% | | | | 13.89% | | | | 11.59% | |
| 8 | | | 14.36% | | | | 8.63% | | | | 21.95% | | | | 6.62% | | | | 11.67% | | | | 11.38% | |
| 9 | | | 14.56% | | | | 7.98% | | | | 22.04% | | | | 7.76% | | | | 11.81% | | | | 11.43% | |
| 10 (ultra-small) | | | 12.55% | | | | 8.59% | | | | 25.87% | | | | 5.29% | | | | 10.33% | | | | 13.07% | |
| 1 | Performance figures are as of the period ended December 31, 2019. The CRSPCap-Based Portfolio Indexes are unmanaged indexes of publicly traded U.S. stocks with dividends reinvested, grouped by market capitalization, as reported by the Center for Research in Security Prices. Past performance is no guarantee of future results. |
| | |
| Ultra-Small Company Market Fund | |
|
| MANAGER’S COMMENTARY (Unaudited) (continued) |
| | |
Detailed Explanation of Calendar Year Performance
The Fund held about 19% of its assets, on average, in stocks outside of CRSP 10, including stocks that appreciated into CRSP 9. These larger stocks underperformed the benchmark during the year, which hurt relative results. However, the Fund’s sidestepping strategies, which eliminated exposure to stocks with high probability of a steep price decline, major financial distress or bankruptcy, helped performance against the benchmark.
The Fund’s stock selection effect was negative, with holdings in the Health Care and Industrials sectors detracting most from relative performance.
Top Ten Holdings as of December 31, 2019
| | | | | | | | |
| Rank | | Description | | Industry | | % of Net
Assets | |
| 1 | | Pacific Biosciences of California, Inc. | | Health Care | | | 0.7% | |
| 2 | | Jounce Therapeutics, Inc. | | Health Care | | | 0.6% | |
| 3 | | Constellation Pharmaceuticals, Inc. | | Health Care | | | 0.6% | |
| 4 | | CEL-SCI Corp. | | Health Care | | | 0.5% | |
| 5 | | Stratus Properties, Inc. | | Real Estate | | | 0.5% | |
| 6 | | Eiger BioPharmaceuticals, Inc. | | Health Care | | | 0.5% | |
| 7 | | Utah Medical Products, Inc. | | Health Care | | | 0.5% | |
| 8 | | Calithera Biosciences, Inc. | | Health Care | | | 0.5% | |
| 9 | | Pfenex, Inc. | | Health Care | | | 0.5% | |
| 10 | | Overseas Shipholding Group, Inc., Class A | | Energy | | | 0.5% | |
| | | |
| | Total | | | | | 5.4% | |
Industry Sector Representation as of December 31, 2019
| | | | | | | | | | | | | | | |
| | | % of Net Assets | | % of CRSP 10 Index | | Difference |
Communication Services | | | | 4.5 | % | | | | 4.1 | % | | | | 0.4% | |
Consumer Discretionary | | | | 12.3 | % | | | | 11.0 | % | | | | 1.3% | |
Consumer Staples | | | | 1.3 | % | | | | 2.0 | % | | | | -0.7% | |
Energy | | | | 9.8 | % | | | | 9.0 | % | | | | 0.8% | |
Financials | | | | 21.1 | % | | | | 21.6 | % | | | | -0.5% | |
Health Care | | | | 27.0 | % | | | | 29.7 | % | | | | -2.7% | |
Industrials | | | | 10.0 | % | | | | 10.0 | % | | | | 0.0% | |
Information Technology | | | | 8.8 | % | | | | 8.5 | % | | | | 0.3% | |
Materials | | | | 2.9 | % | | | | 2.6 | % | | | | 0.3% | |
Real Estate | | | | 1.7 | % | | | | 1.0 | % | | | | 0.7% | |
Utilities | | | | 0.6 | % | | | | 0.5 | % | | | | 0.1% | |
Cash & Other Assets | | | | 0.0 | % | | | | 0.0 | % | | | | 0.0% | |
| | | |
Total | | | | 100.0 | % | | | | 100.0 | % | | | | | |
Disclaimer
The views expressed here are exclusively those of Fund management. These views, including those related to market sectors or individual stocks, are not meant as investment advice and should not be considered predictive in nature. Any favorable (or unfavorable) description of a holding applies only as of the quarter end, December 31, 2019, unless otherwise stated. Security positions can and do change thereafter. Discussions of historical performance do not guarantee and may not be indicative of future performance.
The Fund is subject to very high, above market risk (volatility) and is not an appropriate investment for short-term investors. Investments in ultra-small companies generally carry greater risk than is customarily associated with larger companies and
| | |
| 24 | | Semi-Annual Report | December 31, 2019 (Unaudited) |
| | |
| Ultra-Small Company Market Fund | | |
| MANAGER’S COMMENTARY (Unaudited) (continued) | | |
| | |
even “small companies” for various reasons, such as narrower markets (fewer investors), limited financial resources and greater trading difficulty.
Conclusion
Thank you for your continued investment in Ultra-Small Company Market Fund. We encourage your feedback; your reactions and concerns are important to us.
Sincerely,
The Investment Management Team
| | |
| Ultra-Small Company Market Fund | | |
| SCHEDULE OF INVESTMENTS (Unaudited) | | |
| Showing percentage of net assets as of December 31, 2019 | | |
| | | | | | |
| Industry Company | | Shares | | Value | |
| | |
COMMON STOCKS - 99.85% | | | | | | |
Communication Services - 4.48% | | | | | | |
A.H. Belo Corp., Class A | | 90,883 | | $ | 256,290 | |
Alaska Communications Systems Group, Inc.* | | 279,500 | | | 494,715 | |
Ballantyne Strong, Inc.* | | 50,000 | | | 162,000 | |
Beasley Broadcast Group, Inc., Class A | | 11,125 | | | 34,376 | |
Chicken Soup For The Soul Entertainment, Inc.*+ | | 15,000 | | | 120,000 | |
DHI Group, Inc.* | | 205,500 | | | 618,555 | |
Emmis Communications Corp., Class A* | | 50,000 | | | 201,500 | |
Entravision Communications Corp., Class A | | 234,900 | | | 615,438 | |
EverQuote, Inc., Class A* | | 15,000 | | | 515,250 | |
Fluent, Inc.* | | 212,100 | | | 530,250 | |
Frontier Communications Corp.*+ | | 295,000 | | | 262,432 | |
Gaia, Inc.*+ | | 48,400 | | | 386,716 | |
Harte-Hanks, Inc.* | | 72,533 | | | 259,668 | |
IDT Corp., Class B* | | 73,200 | | | 527,772 | |
Lee Enterprises, Inc.* | | 195,300 | | | 277,326 | |
Marchex, Inc., Class B* | | 152,200 | | | 575,316 | |
NII Holdings, Inc.* | | 287,700 | | | 624,309 | |
Ooma, Inc.* | | 65,800 | | | 870,534 | |
Saga Communications, Inc., Class A | | 16,516 | | | 502,086 | |
Salem Media Group, Inc. | | 65,000 | | | 93,600 | |
Spok Holdings, Inc. | | 60,000 | | | 733,800 | |
Townsquare Media, Inc., Class A | | 38,500 | | | 383,845 | |
Travelzoo* | | 45,000 | | | 481,500 | |
Xcel Brands, Inc.* | | 91,000 | | | 136,500 | |
Zedge, Inc., Class B* | | 16,855 | | | 25,957 | |
| | | | | | |
| | |
| | | | | 9,689,735 | |
| |
Consumer Discretionary - 12.33% | | | | |
AMCON Distributing Co. | | 3,900 | | | 280,839 | |
Ark Restaurants Corp. | | 17,900 | | | 397,380 | |
Aspen Group, Inc.* | | 50,000 | | | 400,000 | |
Barnes & Noble Education, Inc.* | | 160,000 | | | 683,200 | |
Bassett Furniture Industries, Inc. | | 37,044 | | | 617,894 | |
BBQ Holdings, Inc.*+ | | 54,838 | | | 215,513 | |
Big 5 Sporting Goods Corp.+ | | 55,000 | | | 165,000 | |
Blue Apron Holdings, Inc., Class A*+ | | 17,000 | | | 111,860 | |
Build-A-Bear Workshop, Inc.*+ | | 54,200 | | | 175,608 | |
China XD Plastics Co., Ltd.* | | 56,000 | | | 100,240 | |
| | | | | | |
| Industry Company | | Shares | | Value | |
| | |
Consumer Discretionary (continued) | | | | | | |
Citi Trends, Inc. | | 40,800 | | $ | 943,296 | |
Collectors Universe, Inc. | | 36,760 | | | 847,318 | |
Container Store Group, Inc. (The)* | | 153,900 | | | 649,458 | |
CSS Industries, Inc. | | 37,000 | | | 163,170 | |
Culp, Inc. | | 42,700 | | | 581,574 | |
Delta Apparel, Inc.* | | 27,388 | | | 851,767 | |
Destination XL Group, Inc.*+ | | 237,222 | | | 303,644 | |
Dover Motorsports, Inc. | | 123,396 | | | 229,517 | |
Educational Development Corp. | | 41,400 | | | 255,852 | |
Emerson Radio Corp.* | | 187,100 | | | 153,422 | |
Envela Corp.* | | 25,000 | | | 33,750 | |
Escalade, Inc. | | 41,380 | | | 406,765 | |
Flexsteel Industries, Inc. | | 27,000 | | | 537,840 | |
GNC Holdings, Inc., Class A*+ | | 250,000 | | | 675,000 | |
Greenlane Holdings, Inc., Class A*+ | | 40,000 | | | 130,200 | |
Habit Restaurants, Inc. (The), Class A* | | 70,500 | | | 735,315 | |
Hamilton Beach Brands Holding Co., Class A | | 32,000 | | | 611,200 | |
Horizon Global Corp.*+ | | 115,000 | | | 401,350 | |
Iconix Brand Group, Inc.* | | 36,600 | | | 49,410 | |
J Alexander’s Holdings, Inc.* | | 53,100 | | | 507,636 | |
J. Jill, Inc.+ | | 129,900 | | | 146,787 | |
JAKKS Pacific, Inc.* | | 73,600 | | | 75,808 | |
Lakeland Industries, Inc.* | | 31,557 | | | 340,816 | |
Leaf Group, Ltd.* | | 113,000 | | | 452,000 | |
Libbey, Inc.* | | 97,000 | | | 140,650 | |
Lifetime Brands, Inc. | | 86,500 | | | 601,175 | |
Lincoln Educational Services Corp.* | | 154,405 | | | 416,894 | |
Liquidity Services, Inc.* | | 82,000 | | | 488,720 | |
Luby’s, Inc.* | | 96,600 | | | 212,520 | |
Nautilus, Inc.* | | 134,400 | | | 235,200 | |
New Home Co., Inc. (The)* | | 68,400 | | | 318,744 | |
P&F Industries, Inc., Class A | | 10,500 | | | 72,030 | |
Potbelly Corp.* | | 97,000 | | | 409,340 | |
Red Lion Hotels Corp.* | | 59,900 | | | 223,427 | |
Rocky Brands, Inc. | | 24,600 | | | 723,978 | |
RTW RetailWinds, Inc.* | | 271,900 | | | 217,792 | |
Shiloh Industries, Inc.* | | 74,500 | | | 265,220 | |
SORL Auto Parts, Inc.*+ | | 106,058 | | | 470,898 | |
Sportsman’s Warehouse Holdings, Inc.* | | 114,015 | | | 915,540 | |
Stage Stores, Inc.+ | | 100,000 | | | 812,000 | |
Stein Mart, Inc.*+ | | 160,800 | | | 107,607 | |
Strattec Security Corp. | | 23,800 | | | 528,598 | |
| | |
26 | | Semi-Annual Report | December 31, 2019 (Unaudited) |
| | |
| Ultra-Small Company Market Fund | | |
| SCHEDULE OF INVESTMENTS (Unaudited) (continued) | | |
| Showing percentage of net assets as of December 31, 2019 | | |
| | | | | | |
| Industry Company | | Shares | | Value | |
| | |
Common Stocks (continued) | | | | | | |
Consumer Discretionary (continued) | | | | |
Superior Industries International, Inc. | | 92,500 | | $ | 341,325 | |
Sypris Solutions, Inc.* | | 84,404 | | | 65,844 | |
Tandy Leather Factory, Inc.* | | 44,600 | | | 254,666 | |
Tilly’s, Inc., Class A | | 49,400 | | | 605,150 | |
Town Sports International Holdings, Inc.* | | 90,000 | | | 153,900 | |
TravelCenters of America, Inc.* | | 46,900 | | | 804,335 | |
Tuesday Morning Corp.* | | 44,500 | | | 82,325 | |
Turtle Beach Corp.*+ | | 66,854 | | | 631,770 | |
Unique Fabricating, Inc. | | 50,000 | | | 193,000 | |
Universal Technical Institute, Inc.* | | 102,100 | | | 787,191 | |
US Auto Parts Network, Inc.* | | 169,438 | | | 372,764 | |
Vince Holding Corp.* | | 32,500 | | | 562,575 | |
VOXX International Corp.* | | 64,500 | | | 282,510 | |
Weyco Group, Inc. | | 5,000 | | | 132,250 | |
ZAGG, Inc.*+ | | 98,400 | | | 798,024 | |
Zovio, Inc.* | | 100,000 | | | 206,000 | |
| | | | | | |
| | |
| | | | | 26,664,391 | |
| | |
Consumer Staples - 1.29% | | | | | | |
| | |
Bridgford Foods Corp.* | | 1,300 | | | 32,227 | |
Lifeway Foods, Inc.* | | 55,152 | | | 109,752 | |
Mannatech, Inc. | | 13,600 | | | 212,976 | |
Natural Alternatives International, Inc.* | | 40,310 | | | 321,674 | |
Natural Grocers by Vitamin Cottage, Inc. | | 69,400 | | | 684,978 | |
Oil-Dri Corp. of America | | 21,700 | | | 786,625 | |
Rocky Mountain Chocolate Factory, Inc. | | 30,000 | | | 276,900 | |
United-Guardian, Inc. | | 19,000 | | | 373,350 | |
| | | | | | |
| | |
| | | | | 2,798,482 | |
| | |
Energy - 9.77% | | | | | | |
Adams Resources & Energy, Inc. | | 24,300 | | | 925,101 | |
Altus Midstream Co., Class A* | | 100,000 | | | 286,000 | |
Amplify Energy Corp. | | 63,900 | | | 422,379 | |
Aspen Aerogels, Inc.* | | 71,700 | | | 556,392 | |
Centrus Energy Corp., Class A*+ | | 19,000 | | | 130,720 | |
Chaparral Energy, Inc., Class A* | | 258,700 | | | 455,312 | |
Contango Oil & Gas Co.*+ | | 60,000 | | | 220,200 | |
Dawson Geophysical Co.* | | 102,545 | | | 246,108 | |
Earthstone Energy, Inc., Class A* | | 79,302 | | | 501,982 | |
| | | | | | |
| Industry Company | | Shares | | Value | |
| | |
Energy (continued) | | | | | | |
Era Group, Inc.* | | 97,350 | | $ | 990,050 | |
Evolution Petroleum Corp. | | 130,123 | | | 711,773 | |
Forum Energy Technologies, Inc.* | | 135,000 | | | 226,800 | |
Geospace Technologies Corp.* | | 55,663 | | | 933,469 | |
Goodrich Petroleum Corp.* | | 50,000 | | | 502,000 | |
Gulf Island Fabrication, Inc.* | | 67,300 | | | 341,211 | |
Hi-Crush, Inc.* | | 215,000 | | | 189,759 | |
Independence Contract Drilling, Inc.* | | 184,100 | | | 183,511 | |
ION Geophysical Corp.* | | 78,016 | | | 677,179 | |
KLX Energy Services Holdings, Inc.* | | 35,000 | | | 225,400 | |
Lonestar Resources US, Inc., Class A* | | 164,100 | | | 428,301 | |
Mammoth Energy Services, Inc.+ | | 270,000 | | | 594,000 | |
Mexco Energy Corp.*+ | | 12,000 | | | 47,280 | |
Mitcham Industries, Inc.* | | 119,545 | | | 343,094 | |
Montage Resources Corp.*+ | | 90,000 | | | 714,600 | |
NACCO Industries, Inc., Class A | | 20,000 | | | 936,600 | |
Natural Gas Services Group, Inc.* | | 48,376 | | | 593,090 | |
NCS Multistage Holdings, Inc.* | | 161,600 | | | 339,360 | |
New Concept Energy, Inc.*+ | | 8,400 | | | 10,332 | |
Nine Energy Service, Inc.* | | 106,900 | | | 835,958 | |
Nuverra Environmental Solutions, Inc.*+ | | 2,689 | | | 7,785 | |
Overseas Shipholding Group, Inc., Class A* | | 433,200 | | | 996,360 | |
Panhandle Oil and Gas, Inc., Class A | | 45,594 | | | 511,109 | |
PEDEVCO Corp.*+ | | 40,000 | | | 66,400 | |
Quintana Energy Services, Inc.* | | 183,514 | | | 515,674 | |
Ranger Energy Services, Inc.* | | 29,700 | | | 191,268 | |
RigNet, Inc.* | | 71,309 | | | 470,639 | |
Ring Energy, Inc.* | | 274,000 | | | 723,360 | |
SandRidge Energy, Inc.* | | 145,000 | | | 614,800 | |
SEACOR Marine Holdings, Inc.* | | 33,640 | | | 463,896 | |
SilverBow Resources, Inc.* | | 46,148 | | | 456,865 | |
Smart Sand, Inc.*+ | | 166,800 | | | 420,336 | |
Superior Drilling Products, Inc.* | | 166,100 | | | 136,202 | |
Tengasco, Inc.* | | 25,000 | | | 12,252 | |
TETRA Technologies, Inc.* | | 360,000 | | | 705,600 | |
Unit Corp.* | | 95,000 | | | 66,082 | |
| | |
| Ultra-Small Company Market Fund | | |
| SCHEDULE OF INVESTMENTS (Unaudited) (continued) | | |
| Showing percentage of net assets as of December 31, 2019 | | |
| | | | | | |
| Industry Company | | Shares | | Value | |
| | |
Common Stocks (continued) | | | | | | |
Energy (continued) | | | | | | |
Uranium Energy Corp.* | | 720,000 | | $ | 661,824 | |
VAALCO Energy, Inc.* | | 237,100 | | | 526,362 | |
| | | | | | |
| | |
| | | | | 21,114,775 | |
| | |
Financials - 21.09% | | | | | | |
1347 Property Insurance Holdings, Inc.* | | 38,400 | | | 211,968 | |
1st Constitution Bancorp | | 24,033 | | | 531,850 | |
A-Mark Precious Metals, Inc.* | | 50,200 | | | 415,154 | |
American River Bankshares | | 31,000 | | | 460,970 | |
AmeriServ Financial, Inc. | | 52,571 | | | 220,798 | |
Ashford, Inc.* | | 5,200 | | | 122,720 | |
Asta Funding, Inc.* | | 68,400 | | | 706,572 | |
Atlantic American Corp. | | 74,856 | | | 140,729 | |
Atlanticus Holdings Corp.* | | 51,612 | | | 465,024 | |
Auburn National Bancorporation, Inc.+ | | 2,974 | | | 157,622 | |
Bank of Commerce Holdings | | 60,341 | | | 698,145 | |
Bank of Princeton (The) | | 13,910 | | | 438,026 | |
Bank7 Corp. | | 32,910 | | | 623,974 | |
BankFinancial Corp. | | 47,000 | | | 614,760 | |
Bankwell Financial Group, Inc. | | 18,937 | | | 546,143 | |
BCB Bancorp, Inc. | | 56,312 | | | 776,542 | |
C&F Financial Corp. | | 13,400 | | | 741,422 | |
Capital Bancorp, Inc.* | | 16,800 | | | 250,152 | |
Capitala Finance Corp. | | 51,580 | | | 450,293 | |
CB Financial Services, Inc. | | 13,700 | | | 412,918 | |
Chemung Financial Corp. | | 14,998 | | | 637,415 | |
Citizens Community Bancorp, Inc. | | 35,600 | | | 435,032 | |
Citizens Holding Co. | | 20,670 | | | 452,260 | |
Codorus Valley Bancorp, Inc. | | 30,937 | | | 712,479 | |
Colony Bankcorp, Inc. | | 36,568 | | | 603,372 | |
Community West Bancshares | | 28,357 | | | 314,763 | |
Conifer Holdings, Inc.*+ | | 19,000 | | | 76,000 | |
Consumer Portfolio Services, Inc.* | | 138,100 | | | 465,397 | |
Eagle Bancorp Montana, Inc. | | 22,021 | | | 471,029 | |
Elevate Credit, Inc.* | | 143,600 | | | 639,020 | |
Entegra Financial Corp.* | | 200 | | | 6,032 | |
ESSA Bancorp, Inc. | | 36,900 | | | 625,455 | |
Evans Bancorp, Inc. | | 16,201 | | | 649,660 | |
FedNat Holding Co. | | 43,112 | | | 716,953 | |
First Bank | | 62,863 | | | 694,636 | |
First Business Financial Services, Inc. | | 28,308 | | | 745,350 | |
| | | | | | |
| Industry Company | | Shares | | Value | |
| | |
Financials (continued) | | | | | | |
First Financial Northwest, Inc. | | 47,000 | | $ | 702,180 | |
First Guaranty Bancshares, Inc. | | 6,175 | | | 134,430 | |
First Internet Bancorp | | 33,000 | | | 782,430 | |
First Northwest Bancorp | | 42,500 | | | 770,525 | |
First United Corp. | | 19,492 | | | 469,562 | |
GAIN Capital Holdings, Inc.+ | | 112,400 | | | 443,980 | |
GAMCO Investors, Inc., Class A | | 10,000 | | | 194,900 | |
Guaranty Federal Bancshares, Inc. | | 15,856 | | | 399,571 | |
Hawthorn Bancshares, Inc. | | 28,121 | | | 717,086 | |
HMN Financial, Inc.* | | 25,000 | | | 525,250 | |
Horizon Technology Finance Corp. | | 53,600 | | | 693,048 | |
Impac Mortgage Holdings, Inc.*+ | | 16,600 | | | 87,316 | |
Investcorp Credit Management BDC, Inc. | | 5,800 | | | 38,860 | |
JMP Group, LLC | | 51,851 | | | 167,479 | |
Lake Shore Bancorp, Inc.+ | | 22,150 | | | 337,788 | |
Landmark Bancorp, Inc. | | 15,933 | | | 399,122 | |
Level One Bancorp, Inc. | | 25,000 | | | 629,000 | |
Malvern Bancorp, Inc.* | | 23,300 | | | 537,997 | |
Manning & Napier, Inc. | | 50,000 | | | 87,000 | |
Marlin Business Services Corp. | | 43,300 | | | 951,734 | |
Medallion Financial Corp.* | | 85,844 | | | 624,086 | |
Meridian Corp.* | | 24,000 | | | 484,560 | |
Mid Penn Bancorp, Inc. | | 23,648 | | | 681,062 | |
Monroe Capital Corp.+ | | 69,103 | | | 750,459 | |
MSB Financial Corp. | | 20,000 | | | 360,000 | |
Northeast Bank | | 35,300 | | | 776,247 | |
Northrim BanCorp, Inc. | | 24,250 | | | 928,775 | |
Norwood Financial Corp. | | 18,112 | | | 704,557 | |
Ohio Valley Banc Corp. | | 17,500 | | | 693,350 | |
OP Bancorp | | 41,851 | | | 433,995 | |
Pacific Mercantile Bancorp* | | 83,319 | | | 676,550 | |
Patriot National Bancorp, Inc. | | 16,500 | | | 210,540 | |
Penns Woods Bancorp, Inc. | | 24,600 | | | 874,776 | |
Peoples Bancorp of North Carolina, Inc. | | 22,830 | | | 749,966 | |
Portman Ridge Finance Corp. | | 201,300 | | | 426,756 | |
Premier Financial Bancorp, Inc. | | 41,655 | | | 755,622 | |
Provident Financial Holdings, Inc. | | 24,317 | | | 532,542 | |
Prudential Bancorp, Inc. | | 7,034 | | | 130,340 | |
| | |
28 | | Semi-Annual Report | December 31, 2019 (Unaudited) |
| | |
| Ultra-Small Company Market Fund | | |
| SCHEDULE OF INVESTMENTS (Unaudited) (continued) | | |
| Showing percentage of net assets as of December 31, 2019 | | |
| | | | | | |
| Industry Company | | Shares | | Value | |
| | |
Common Stocks (continued) | | | | | | |
Financials (continued) | | | | | | |
Pzena Investment Management, Inc., Class A | | 57,100 | | $ | 492,202 | |
Randolph Bancorp, Inc.* | | 15,000 | | | 264,750 | |
Riverview Bancorp, Inc. | | 91,226 | | | 748,965 | |
SB One Bancorp | | 23,000 | | | 573,160 | |
Security National Financial Corp., Class A* | | 58,480 | | | 342,108 | |
Select Bancorp, Inc.* | | 54,676 | | | 672,515 | |
Shore Bancshares, Inc. | | 38,700 | | | 671,832 | |
Silvercrest Asset Management Group, Inc., Class A | | 24,202 | | | 304,461 | |
Southern First Bancshares, Inc.* | | 12,215 | | | 519,015 | |
Summit State Bank | | 17,200 | | | 222,998 | |
Timberland Bancorp, Inc. | | 27,922 | | | 830,400 | |
Two River Bancorp | | 31,968 | | | 716,083 | |
Union Bankshares, Inc. | | 7,419 | | | 269,013 | |
United Bancshares, Inc.+ | | 15,200 | | | 345,192 | |
United Security Bancshares | | 55,400 | | | 594,442 | |
Unity Bancorp, Inc. | | 41,500 | | | 936,655 | |
| | | | | | |
| | |
| | | | | 45,597,867 | |
| | |
Health Care - 26.95% | | | | | | |
AcelRx Pharmaceuticals, Inc.*+ | | 308,150 | | | 650,197 | |
Aclaris Therapeutics, Inc.*+ | | 80,000 | | | 151,200 | |
Acorda Therapeutics, Inc.* | | 160,600 | | | 327,624 | |
Adamas Pharmaceuticals, Inc.* | | 101,500 | | | 384,685 | |
Aduro Biotech, Inc.* | | 300,000 | | | 354,000 | |
Aeglea BioTherapeutics, Inc.* | | 75,000 | | | 573,000 | |
AgeX Therapeutics, Inc.* | | 23,499 | | | 42,768 | |
Alimera Sciences, Inc.*+ | | 17,333 | | | 131,384 | |
Allena Pharmaceuticals, Inc.*+ | | 128,600 | | | 351,078 | |
Alphatec Holdings, Inc.* | | 125,000 | | | 886,875 | |
Alpine Immune Sciences, Inc.* | | 200 | | | 768 | |
Altimmune, Inc.* | | 21,100 | | | 39,879 | |
Apollo Endosurgery, Inc.* | | 103,700 | | | 295,545 | |
Applied Genetic Technologies Corp.* | | 54,400 | | | 245,888 | |
Aptinyx, Inc.* | | 141,000 | | | 482,220 | |
Apyx Medical Corp.* | | 79,970 | | | 676,546 | |
Aquestive Therapeutics, Inc.* | | 75,000 | | | 436,500 | |
Arcturus Therapeutics Holdings, Inc.* | | 35,000 | | | 380,450 | |
Ardelyx, Inc.* | | 109,100 | | | 818,796 | |
| | | | | | |
| Industry Company | | Shares | | Value | |
| | |
Health Care (continued) | | | | | | |
Assertio Therapeutics, Inc.* | | 292,000 | | $ | 365,000 | |
Bellicum Pharmaceuticals, Inc.*+ | | 71,700 | | | 92,493 | |
Calithera Biosciences, Inc.* | | 182,600 | | | 1,042,646 | |
Calyxt, Inc.*+ | | 120,000 | | | 841,200 | |
Capital Senior Living Corp.*+ | | 105,336 | | | 325,488 | |
Castlight Health, Inc., Class B* | | 380,700 | | | 506,331 | |
cbdMD, Inc.*+ | | 84,400 | | | 190,744 | |
CEL-SCI Corp.*+ | | 127,000 | | | 1,162,050 | |
Chiasma, Inc.* | | 187,600 | | | 930,496 | |
Chimerix, Inc.* | | 243,800 | | | 494,914 | |
Cidara Therapeutics, Inc.*+ | | 94,382 | | | 362,427 | |
Clearside Biomedical, Inc.*+ | | 90,000 | | | 261,000 | |
Concert Pharmaceuticals, Inc.* | | 80,000 | | | 738,000 | |
Conformis, Inc.* | | 210,000 | | | 315,000 | |
Constellation Pharmaceuticals, Inc.*+ | | 27,500 | | | 1,295,525 | |
CorMedix, Inc.*+ | | 83,800 | | | 610,064 | |
Corvus Pharmaceuticals, Inc.*+ | | 110,100 | | | 598,944 | |
Cumberland Pharmaceuticals, Inc.* | | 135,100 | | | 695,765 | |
Curis, Inc.* | | 256,800 | | | 436,560 | |
CynergisTek, Inc.* | | 55,000 | | | 181,500 | |
Eiger BioPharmaceuticals, Inc.* | | 71,000 | | | 1,057,900 | |
ElectroCore, Inc.*+ | | 111,200 | | | 176,808 | |
Electromed, Inc.* | | 45,000 | | | 389,250 | |
Eloxx Pharmaceuticals, Inc.*+ | | 109,000 | | | 802,240 | |
Endologix, Inc.*+ | | 40,000 | | | 63,200 | |
Enzo Biochem, Inc.* | | 151,100 | | | 397,393 | |
Evelo Biosciences, Inc.*+ | | 120,000 | | | 487,200 | |
EyePoint Pharmaceuticals, Inc.*+ | | 540,200 | | | 837,310 | |
Five Prime Therapeutics, Inc.* | | 121,800 | | | 559,062 | |
Fulgent Genetics, Inc.*+ | | 53,300 | | | 687,570 | |
Genesis Healthcare, Inc.* | | 405,400 | | | 664,856 | |
Geron Corp.*+ | | 250,000 | | | 340,000 | |
Harvard Bioscience, Inc.* | | 135,317 | | | 412,717 | |
Ideaya Biosciences, Inc.*+ | | 85,000 | | | 637,500 | |
Infinity Pharmaceuticals, Inc.* | | 240,000 | | | 230,400 | |
InfuSystem Holdings, Inc.* | | 59,900 | | | 510,947 | |
IntriCon Corp.* | | 26,300 | | | 473,400 | |
Invacare Corp.+ | | 70,000 | | | 631,400 | |
IRIDEX Corp.* | | 50,400 | | | 112,896 | |
| | |
| Ultra-Small Company Market Fund | | |
| SCHEDULE OF INVESTMENTS (Unaudited) (continued) | | |
| Showing percentage of net assets as of December 31, 2019 | | |
| | | | | | |
| Industry Company | | Shares | | Value | |
| | |
Common Stocks (continued) | | | | | | |
Health Care (continued) | | | | | | |
IVERIC bio, Inc.*+ | | 35,900 | | $ | 308,022 | |
Jounce Therapeutics, Inc.* | | 149,300 | | | 1,303,389 | |
Kala Pharmaceuticals, Inc.*+ | | 134,400 | | | 495,936 | |
Kaleido Biosciences, Inc.*+ | | 113,700 | | | 570,774 | |
KalVista Pharmaceuticals, Inc.*+ | | 51,100 | | | 910,091 | |
Kewaunee Scientific Corp. | | 11,600 | | | 156,020 | |
Kezar Life Sciences, Inc.* | | 66,769 | | | 267,744 | |
Kodiak Sciences, Inc.*+ | | 10,000 | | | 719,500 | |
Lannett Co., Inc.*+ | | 85,000 | | | 749,700 | |
Lineage Cell Therapeutics, Inc.* | | 507,661 | | | 451,818 | |
Magenta Therapeutics, Inc.* | | 30,287 | | | 459,151 | |
MannKind Corp.*+ | | 508,500 | | | 655,965 | |
Marinus Pharmaceuticals, Inc.* | | 281,500 | | | 608,040 | |
Matinas BioPharma Holdings, Inc.* | | 340,000 | | | 771,800 | |
Menlo Therapeutics, Inc.* | | 112,300 | | | 521,072 | |
Merrimack Pharmaceuticals, Inc.+ | | 55,000 | | | 173,250 | |
Mersana Therapeutics, Inc.* | | 128,600 | | | 736,878 | |
Micron Solutions, Inc.* | | 20,000 | | | 47,800 | |
Minerva Neurosciences, Inc.* | | 50,200 | | | 356,922 | |
Misonix, Inc.* | | 22,200 | | | 413,142 | |
Mustang Bio, Inc.* | | 140,000 | | | 571,200 | |
NantKwest, Inc.*+ | | 103,300 | | | 391,507 | |
Neoleukin Therapeutics, Inc.*+ | | 80,000 | | | 985,600 | |
Neon Therapeutics, Inc.* | | 89,800 | | | 105,964 | |
Neos Therapeutics, Inc.*+ | | 195,000 | | | 294,450 | |
Neuronetics, Inc.* | | 111,000 | | | 498,390 | |
NewLink Genetics Corp.*+ | | 105,700 | | | 267,421 | |
NovaBay Pharmaceuticals, Inc.* | | 25,000 | | | 16,000 | |
Novan, Inc.*+ | | 60,000 | | | 189,600 | |
Novavax, Inc.*+ | | 39,700 | | | 158,006 | |
Oncocyte Corp.* | | 175,000 | | | 393,750 | |
Organovo Holdings, Inc.* | | 129,676 | | | 46,126 | |
Otonomy, Inc.* | | 104,800 | | | 401,384 | |
Ovid therapeutics, Inc.*+ | | 175,000 | | | 726,250 | |
Owens & Minor, Inc. | | 100,000 | | | 517,000 | |
Pacific Biosciences of California, Inc.* | | 275,200 | | | 1,414,528 | |
Palatin Technologies, Inc.* | | 696,000 | | | 544,411 | |
Paratek Pharmaceuticals, Inc.*+ | | 95,000 | | | 382,850 | |
Pfenex, Inc.* | | 94,500 | | | 1,037,610 | |
PhaseBio Pharmaceuticals, Inc.*+ | | 122,000 | | | 745,420 | |
| | | | | | |
| Industry Company | | Shares | | Value | |
| | |
Health Care (continued) | | | | | | |
Protagonist Therapeutics, Inc.* | | 88,344 | | $ | 622,825 | |
Proteostasis Therapeutics, Inc.*+ | | 120,000 | | | 273,600 | |
Rockwell Medical, Inc.*+ | | 53,100 | | | 129,564 | |
RTI Surgical Holdings, Inc.* | | 21,000 | | | 57,540 | |
Savara, Inc.*+ | | 115,000 | | | 515,200 | |
scPharmaceuticals, Inc.*+ | | 50,000 | | | 283,000 | |
SCYNEXIS, Inc.* | | 150,000 | | | 136,500 | |
SeaSpine Holdings Corp.* | | 30,613 | | | 367,662 | |
Selecta Biosciences, Inc.* | | 163,100 | | | 388,178 | |
Sesen Bio, Inc.* | | 350,000 | | | 364,000 | |
Solid Biosciences, Inc.*+ | | 46,000 | | | 204,700 | |
Spero Therapeutics, Inc.* | | 59,979 | | | 576,698 | |
Surface Oncology, Inc.* | | 98,100 | | | 184,428 | |
Sutro Biopharma, Inc.* | | 48,800 | | | 536,800 | |
Syndax Pharmaceuticals, Inc.* | | 35,000 | | | 307,300 | |
Synlogic, Inc.* | | 193,000 | | | 497,940 | |
Syros Pharmaceuticals, Inc.* | | 10,000 | | | 69,100 | |
T2 Biosystems, Inc.*+ | | 125,000 | | | 146,250 | |
Tracon Pharmaceuticals, Inc.*+ | | 6,000 | | | 14,040 | |
Trevena, Inc.* | | 150,000 | | | 126,135 | |
Trevi Therapeutics, Inc.*+ | | 60,000 | | | 225,000 | |
Unum Therapeutics, Inc.* | | 45,000 | | | 32,409 | |
Utah Medical Products, Inc. | | 9,800 | | | 1,057,420 | |
Verastem, Inc.*+ | | 229,000 | | | 306,860 | |
VIVUS, Inc.* | | 52,200 | | | 141,984 | |
VolitionRX, Ltd.*+ | | 195,000 | | | 924,300 | |
XOMA Corp.*+ | | 23,149 | | | 631,968 | |
Xtant Medical Holdings, Inc.*+ | | 50,000 | | | 80,000 | |
Zynerba Pharmaceuticals, Inc.*+ | | 91,300 | | | 551,452 | |
| | | | | | |
| | |
| | | | | 58,264,933 | |
| | |
Industrials - 9.97% | | | | | | |
Acacia Research Corp.* | | 211,800 | | | 563,388 | |
Acme United Corp. | | 6,335 | | | 150,710 | |
AeroCentury Corp.*+ | | 10,900 | | | 49,050 | |
Alpha Pro Tech, Ltd.* | | 66,200 | | | 227,066 | |
American Superconductor Corp.* | | 45,100 | | | 354,035 | |
AMREP Corp.* | | 28,900 | | | 172,822 | |
ARC Document Solutions, Inc.* | | 196,419 | | | 273,022 | |
Armstrong Flooring, Inc.* | | 44,900 | | | 191,723 | |
Avalon Holdings Corp., Class A* | | 12,675 | | | 24,336 | |
| | |
30 | | Semi-Annual Report | December 31, 2019 (Unaudited) |
| | |
| Ultra-Small Company Market Fund | | |
| SCHEDULE OF INVESTMENTS (Unaudited) (continued) | | |
| Showing percentage of net assets as of December 31, 2019 | | |
| | | | | | |
| Industry Company | | Shares | | Value | |
| | |
Common Stocks (continued) | | | | | | |
Industrials (continued) | | | | | | |
Babcock & Wilcox Enterprises, Inc.*+ | | 155,000 | | $ | 564,200 | |
BG Staffing, Inc. | | 28,900 | | | 632,621 | |
BlueLinx Holdings, Inc.*+ | | 35,600 | | | 507,300 | |
Charah Solutions, Inc.* | | 61,900 | | | 151,036 | |
Chicago Rivet & Machine Co. | | 10,000 | | | 257,972 | |
Commercial Vehicle Group, Inc.* | | 100,100 | | | 635,635 | |
CompX International, Inc. | | 3,200 | | | 46,688 | |
CPI Aerostructures, Inc.* | | 39,700 | | | 267,181 | |
Eastern Co. (The) | | 21,200 | | | 647,236 | |
Ecology and Environment, Inc., Class A | | 13,000 | | | 201,500 | |
Espey Manufacturing & Electronics Corp.+ | | 10,700 | | | 231,120 | |
ExOne Co. (The)*+ | | 48,300 | | | 360,318 | |
FreightCar America, Inc.* | | 50,000 | | | 103,500 | |
Fuel Tech, Inc.* | | 49,228 | | | 45,880 | |
Gencor Industries, Inc.* | | 44,450 | | | 518,732 | |
Goldfield Corp. (The)* | | 108,080 | | | 383,684 | |
GP Strategies Corp.* | | 21,887 | | | 289,565 | |
Graham Corp. | | 35,900 | | | 785,492 | |
HC2 Holdings, Inc.*+ | | 38,000 | | | 82,460 | |
Hill International, Inc.* | | 176,351 | | | 557,269 | |
Houston Wire & Cable Co.* | | 57,100 | | | 251,811 | |
Hudson Global, Inc.* | | 10,942 | | | 130,757 | |
Hurco Cos., Inc. | | 23,734 | | | 910,436 | |
InnerWorkings, Inc.* | | 123,808 | | | 682,182 | |
Innovative Solutions & Support, Inc.* | | 80,400 | | | 469,536 | |
LB Foster Co., Class A* | | 29,600 | | | 573,648 | |
LSI Industries, Inc. | | 88,000 | | | 532,400 | |
Mastech Digital, Inc.* | | 37,000 | | | 409,590 | |
Mesa Air Group, Inc.* | | 60,000 | | | 536,400 | |
NL Industries, Inc.* | | 48,100 | | | 188,071 | |
Orion Group Holdings, Inc.* | | 80,000 | | | 415,200 | |
PAM Transportation Services, Inc.* | | 11,108 | | | 641,043 | |
Patriot Transportation Holding, Inc.* | | 30,871 | | | 601,367 | |
Performant Financial Corp.* | | 205,000 | | | 209,100 | |
Perma-Pipe International Holdings, Inc.* | | 61,600 | | | 577,808 | |
PICO Holdings, Inc.* | | 75,000 | | | 834,000 | |
RCM Technologies, Inc.* | | 80,710 | | | 242,130 | |
Servotronics, Inc. | | 15,653 | | | 157,469 | |
SIFCO Industries, Inc.* | | 16,024 | | | 63,295 | |
Titan International, Inc. | | 194,600 | | | 704,452 | |
Transcat, Inc.* | | 24,800 | | | 790,128 | |
Twin Disc, Inc.* | | 49,600 | | | 546,592 | |
| | | | | | |
| Industry Company | | Shares | | Value | |
| | |
Industrials (continued) | | | | | | |
Ultralife Corp.* | | 52,400 | | $ | 387,236 | |
US Xpress Enterprises, Inc., Class A*+ | | 50,000 | | | 251,500 | |
USA Truck, Inc.* | | 30,600 | | | 227,970 | |
Virco Manufacturing Corp. | | 16,800 | | | 71,232 | |
Volt Information Sciences, Inc.* | | 125,000 | | | 310,000 | |
Willis Lease Finance Corp.* | | 9,720 | | | 572,605 | |
| | | | | | |
| | |
| | | | | 21,563,499 | |
| | |
Information Technology - 8.79% | | | | | | |
Amtech Systems, Inc.* | | 46,500 | | | 332,940 | |
Applied Optoelectronics, Inc.*+ | | 20,000 | | | 237,600 | |
AstroNova, Inc. | | 32,800 | | | 450,016 | |
Aviat Networks, Inc.* | | 22,086 | | | 310,308 | |
Aware, Inc.* | | 74,579 | | | 250,585 | |
AXT, Inc.* | | 134,006 | | | 582,926 | |
Bel Fuse, Inc., Class B | | 21,000 | | | 430,500 | |
BK Technologies Corp. | | 163,744 | | | 507,606 | |
Blonder Tongue Laboratories, Inc.* | | 20,000 | | | 15,200 | |
Clearfield, Inc.* | | 41,600 | | | 579,904 | |
Communications Systems, Inc. | | 37,200 | | | 229,524 | |
Computer Task Group, Inc.* | | 69,800 | | | 361,564 | |
CSP, Inc. | | 34,700 | | | 452,835 | |
CyberOptics Corp.* | | 17,550 | | | 322,569 | |
Eastman Kodak Co.*+ | | 133,900 | | | 622,635 | |
EMCORE Corp.* | | 104,702 | | | 318,294 | |
Everspin Technologies, Inc.*+ | | 41,400 | | | 217,764 | |
Frequency Electronics, Inc.* | | 16,000 | | | 163,360 | |
GlobalSCAPE, Inc. | | 49,880 | | | 490,320 | |
GSI Technology, Inc.* | | 101,417 | | | 719,047 | |
IEC Electronics Corp.* | | 43,450 | | | 394,960 | |
Information Services Group, Inc.* | | 171,000 | | | 432,630 | |
Innodata, Inc.* | | 85,955 | | | 97,989 | |
Intellicheck, Inc.*+ | | 49,700 | | | 372,253 | |
Intelligent Systems Corp.* | | 5,300 | | | 211,682 | |
Internap Corp.* | | 95,000 | | | 104,500 | |
inTEST Corp.* | | 30,600 | | | 182,070 | |
Intevac, Inc.* | | 75,000 | | | 529,500 | |
Issuer Direct Corp.* | | 25,000 | | | 292,250 | |
Key Tronic Corp.* | | 57,100 | | | 310,624 | |
KVH Industries, Inc.* | | 56,510 | | | 628,956 | |
MagnaChip Semiconductor Corp.* | | 50,000 | | | 580,500 | |
MicroVision, Inc.* | | 100,000 | | | 72,000 | |
| | |
| Ultra-Small Company Market Fund | | |
| SCHEDULE OF INVESTMENTS (Unaudited) (continued) | | |
| Showing percentage of net assets as of December 31, 2019 | | |
| | | | | | |
| Industry Company | | Shares | | Value | |
| | |
Common Stocks (continued) | | | | | | |
Information Technology (continued) | | | | |
Net 1 UEPS Technologies, Inc.* | | 152,000 | | $ | 565,440 | |
Network-1 Technologies, Inc. | | 115,000 | | | 250,700 | |
Optical Cable Corp.*+ | | 20,100 | | | 65,325 | |
PC-Tel, Inc. | | 63,100 | | | 534,457 | |
Perceptron, Inc.* | | 30,800 | | | 169,400 | |
Pixelworks, Inc.* | | 158,900 | | | 622,888 | |
Powerfleet, Inc.*+ | | 33,000 | | | 214,830 | |
PRGX Global, Inc.* | | 79,216 | | | 389,743 | |
QAD, Inc., Class B | | 6,250 | | | 230,562 | |
RealNetworks, Inc.* | | 107,200 | | | 128,640 | |
RF Industries, Ltd.+ | | 53,900 | | | 364,364 | |
Richardson Electronics, Ltd. | | 99,011 | | | 557,432 | |
Seachange International, Inc.* | | 93,700 | | | 392,603 | |
ServiceSource International, Inc.* | | 200,000 | | | 334,000 | |
SMTC Corp.*+ | | 102,434 | | | 347,251 | |
Sonim Technologies, Inc.*+ | | 76,800 | | | 278,784 | |
Steel Connect, Inc.* | | 193,800 | | | 282,948 | |
Synacor, Inc.* | | 142,400 | | | 216,448 | |
TESSCO Technologies, Inc. | | 31,700 | | | 355,674 | |
TransAct Technologies, Inc. | | 30,000 | | | 329,100 | |
Trio-Tech International* | | 26,800 | | | 106,932 | |
Veritone, Inc.*+ | | 50,000 | | | 124,500 | |
Wayside Technology Group, Inc. | | 10,298 | | | 166,828 | |
Wireless Telecom Group, Inc.* | | 113,100 | | | 161,733 | |
| | | | | | |
| | |
| | | | | 18,995,993 | |
| | |
Materials - 2.90% | | | | | | |
Advanced Emissions | | | | | | |
Solutions, Inc.+ | | 62,075 | | | 651,788 | |
AgroFresh Solutions, Inc.*+ | | 157,200 | | | 405,576 | |
Ampco-Pittsburgh Corp.* | | 50,000 | | | 150,500 | |
Core Molding Technologies, Inc.* | | 28,700 | | | 93,275 | |
Flexible Solutions International, Inc. | | 45,707 | | | 117,467 | |
Flotek Industries, Inc.* | | 150,000 | | | 300,000 | |
Friedman Industries, Inc. | | 54,000 | | | 325,080 | |
Gold Resource Corp. | | 111,400 | | | 617,156 | |
Gulf Resources, Inc.* | | 284,800 | | | 145,276 | |
LSB Industries, Inc.* | | 76,100 | | | 319,620 | |
Northern Technologies International Corp. | | 27,900 | | | 392,274 | |
Olympic Steel, Inc. | | 38,400 | | | 688,128 | |
Paramount Gold Nevada Corp.* | | 40,000 | | | 30,936 | |
Ramaco Resources, Inc.* | | 139,800 | | | 500,484 | |
| | | | | | |
| Industry Company | | Shares | | Value | |
| | |
Materials (continued) | | | | | | |
Synalloy Corp.* | | 43,500 | | $ | 561,585 | |
Trecora Resources* | | 72,400 | | | 517,660 | |
Universal Stainless & Alloy Products, Inc.* | | 30,858 | | | 459,784 | |
| | | | | | |
| | |
| | | | | 6,276,589 | |
| | |
Real Estate - 1.72% | | | | | | |
American Realty Investors, Inc.* | | 1,697 | | | 29,070 | |
Consolidated-Tomoka Land Co. | | 11,247 | | | 678,419 | |
Griffin Industrial Realty, Inc. | | 16,905 | | | 668,593 | |
Maui Land & Pineapple Co., Inc.* | | 80,700 | | | 907,875 | |
Stratus Properties, Inc.* | | 37,150 | | | 1,150,907 | |
Trinity Place Holdings, Inc.*+ | | 91,100 | | | 274,211 | |
| | | | | | |
| | |
| | | | | 3,709,075 | |
| | |
Utilities - 0.56% | | | | | | |
Genie Energy, Ltd., | | | | | | |
Class B+ | | 48,667 | | | 376,196 | |
RGC Resources, Inc. | | 15,259 | | | 436,102 | |
Spark Energy, Inc., Class A | | 43,000 | | | 396,890 | |
| | | | | | |
| | |
| | | | | 1,209,188 | |
| | | | | | |
| |
TOTAL COMMON STOCKS - 99.85% | | | 215,884,527 | |
| | | | | | |
(Cost $ 186,629,166) | | | | | | |
| |
EXCHANGE TRADED FUND - 0.30% | | | | |
iSharesMicro-Cap ETF+ | | 6,525 | | | 649,172 | |
| | | | | | |
| |
TOTAL EXCHANGE TRADED FUND - 0.30% | | | 649,172 | |
| | | | | | |
(Cost $ 163,006) | | | | | | |
| | |
RIGHTS - 0.00% | | | | | | |
Elanco Animal Health, Inc., CVR, expiring 12/30/21*D | | 46,983 | | | — | |
OncoMed Pharmaceuticals, Inc., CVR, expiring 12/31/49*D | | 125,000 | | | — | |
OncoMed Pharmaceuticals, Inc., CVR, expiring 12/31/49*D | | 75,000 | | | — | |
| | | | | | |
| | |
TOTAL RIGHTS - 0.00% | | | | | — | |
| | | | | | |
(Cost $ 35,062) | | | | | | |
| | |
32 | | Semi-Annual Report | December 31, 2019 (Unaudited) |
| | |
| Ultra-Small Company Market Fund | | |
| SCHEDULE OF INVESTMENTS (Unaudited) (continued) | | |
| Showing percentage of net assets as of December 31, 2019 | | |
| | | | | | | | | | | | |
| Industry Company | | | | Shares | | | | Value | |
|
WARRANTS - 0.00% | |
SAExploration Series A, expire 07/27/21*D | | | | 848 | | | | $— | |
SAExploration Series B, expire 07/27/21*D | | | | 848 | | | | — | |
| | | | | | | | | | | | |
| |
TOTAL WARRANTS - 0.00% | | | | — | |
| | | | | |
(Cost $ — ) | | | | | |
| | | |
| | | Rate^ | | | | Shares | | | | Value | |
| |
MONEY MARKET FUND - 0.11% | | | | | |
Fidelity Investments Money Market Government Portfolio Class I | | | 1.49 | % | | | 227,753 | | | | 227,753 | |
| | | | | | | | | | | | |
| |
TOTAL MONEY MARKET FUND - 0.11% | | | | 227,753 | |
| | | | | |
(Cost $227,753) | | | | | |
|
| INVESTMENTS PURCHASED WITH CASH PROCEEDS FROM SECURITIESLENDING - 10.10% | |
Fidelity Investments Money Market Government Portfolio Class I** | | | 1.49 | % | | | 21,847,383 | | | | 21,847,383 | |
| | | | | | | | | | | | |
| |
TOTAL INVESTMENTS PURCHASED WITH CASH PROCEEDS FROM SECURITIES LENDING -10.10% | | | | 21,847,383 | |
| | | | | |
(Cost $21,847,383) | | | | | |
| |
TOTAL INVESTMENTS - 110.36% | | | $ | 238,608,835 | |
(Cost $208,902,370) | | | | | |
Liabilities in Excess of Other Assets - (10.36%) | | | | (22,401,858 | ) |
| | | | | |
NET ASSETS - 100.00% | | | $ | 216,206,977 | |
| | | | | | | | | | | | |
| * | Non-income producing security. |
| ** | This security represents the investment of the cash collateral received in connection with securities out on loan as of December 31, 2019. |
| ^ | Rate disclosed as of December 31, 2019. |
| D | Security was fair valued using significant unobservable inputs. As such, the security is classified as Level 3 in the fair value hierarchy. |
| + | This security or a portion of the security is out on loan at December 31, 2019. Total loaned securities had a value of $23,625,032, which included loaned securities with value of $184,240 that have been sold and are pending settlement as of December 31, 2019. The total market value of loaned securities excluding these pending sales is $23,440,791. See Note 2 for disclosure of cash andnon-cash collateral. |
CVR - Contingent Value Rights
LLC - Limited Liability Company
Summary of inputs used to value the Fund’s investments as of 12/31/2019 (See Note 2 in Notes to Financial Statements):
| | | | | | | | | | | | | | | | |
| |
| | | Valuation Inputs | |
| | | Investment in Securities (Value) | |
| | | Level 1
Quoted
Prices | | | Level 2
Significant
Observable Inputs | | | Level 3
Significant
Unobservable
Inputs | | | Total | |
| | | | |
Common Stocks Industrials | | $ | 21,361,999 | | | $ | 201,500 | | | $ | — | | | $ | 21,563,499 | |
Other Industries (a) | | | 194,321,028 | | | | — | | | | — | | | | 194,321,028 | |
| | | | | | | | | | | | | | | | |
Total Common Stock | | | 215,683,027 | | | | 201,500 | | | | — | | | | 215,884,527 | |
Exchange Traded Fund | | | 649,172 | | | | — | | | | — | | | | 649,172 | |
Rights | | | — | | | | — | | | | 0 | | | | 0 | |
Warrants | | | — | | | | — | | | | 0 | | | | 0 | |
Money Market Fund | | | — | | | | 227,753 | | | | — | | | | 227,753 | |
Investments Purchased with Cash Proceeds from Securities Lending | | | — | | | | 21,847,383 | | | | — | | | | 21,847,383 | |
| | | | | | | | | | | | | | | | |
TOTAL | | $ | 216,332,199 | | | $ | 22,276,636 | | | $ | 0 | | | $ | 238,608,835 | |
| | | | | | | | | | | | | | | | |
| (a) | - Please refer to the Schedule of Investments for the industry classifications of these portfolio holdings. |
See Notes to Financial Statements.
| | |
| Small-Cap Growth Fund | |
|
| MANAGER’S COMMENTARY (Unaudited) |
| | |
December 31, 2019
Dear FellowSmall-Cap Growth Fund Shareholder,
For the quarter ended December 31, 2019, our Fund returned +11.03%, slightly underperforming our primary market benchmark, the Russell 2000 Growth Index (+11.39%), but outperforming our peer benchmark, the LipperSmall-Cap Growth Funds Index (+8.40%). It was a strong quarter on an absolute basis, but a mixed one on a relative basis.
For the calendar year, our Fund returned +15.10%, lagging both the Russell 2000 Growth Index (+28.48%) and the LipperSmall-Cap Growth Funds Index (+30.31%). The Fund lags our benchmarks across the longer five-year,10-year,15-year, andinception-to-date periods as well.
The table below presents our December quarter,six-month,one-year, five-year,10-year,15-year, andinception-to-date financial results. See the next page for a graph of performance since inception.
Standardized Returns as of December 31, 2019
| | | | | | | | | | | | | | | | | | | | | | | | | | | | | | | | | | | |
| | | | | | | | | | | Annualized | | | | |
| | | Quarter | | 6 Months | | 1 Year | | 5 Years | | 10 Years | | 15 Years | | Since Inception
(10/31/03) |
| | | | | | | |
Small-Cap Growth Fund | | | | 11.03% | | | | | 4.53% | | | | | 15.10% | | | | | 8.29% | | | | | 11.22 | % | | | | 6.32 | % | | | | 6.74 | % |
Russell 2000 Growth Index | | | | 11.39% | | | | | 6.75% | | | | | 28.48% | | | | | 9.34% | | | | | 13.01 | % | | | | 8.81 | % | | | | 9.29 | % |
LipperSmall-Cap Growth Funds Index | | | | 8.40% | | | | | 4.17% | | | | | 30.31% | | | | | 10.81% | | | | | 12.89 | % | | | | 8.51 | % | | | | 8.75 | % |
Performance figures quoted in the table above represent past performance and are no guarantee of future results. Total return figures in the table above include the reinvestment of dividends and capital gains. The table above does not reflect the deduction of taxes that a shareholder would pay on Fund distributions or on the redemption of Fund shares.
The Russell 2000 Growth Index is an unmanaged index that consists of stocks in the Russell 2000 Index with higherprice-to-book ratios and higher forecasted growth values with dividends reinvested. The LipperSmall-Cap Growth Funds Index is an index of small-company, growth-oriented funds compiled by Lipper, Inc. It is not possible to invest directly in an index. Periods longer than one year are annualized.
| | |
| 34 | | Semi-Annual Report | December 31, 2019 (Unaudited) |
| | |
| Small-Cap Growth Fund | | |
| MANAGER’S COMMENTARY (Unaudited) (continued) | | |
| | |
Growth of a $10,000 Investment
from Inception October 31, 2003 to December 31, 2019
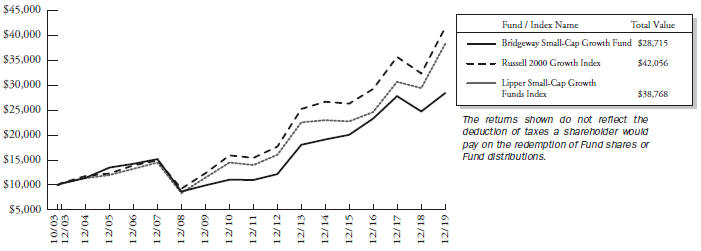
Detailed Explanation of Quarterly Performance
The Fund’s company financial health and price momentum models lagged the benchmark during the quarter, which weighed on relative results. This negative impact was partly offset by outperformance from the Fund’s value metrics models. The Fund’s greater-than-benchmark exposure to core stocks (as measured by multiple valuation metrics) detracted from relative results. In contrast, the Fund’s tilt toward smaller stocks in thesmall-cap growth universe improved relative performance.
From a sector perspective, the Fund’s allocation effect was negative. An underweighting in the Health Care sector and an overweighting in the Real Estate sector detracted the most from relative results. However, the Fund’s stock selection effect was positive, largely driven by the performance of holdings in the Materials and Consumer Discretionary sectors.
Detailed Explanation of Calendar Year Performance
All three of the Fund’s model categories underperformed the benchmark during the year. The Fund’s greater-than-benchmark exposure to core stocks (as measured by multiple valuation metrics) also detracted from relative returns, as did its tilt toward smaller stocks in thesmall-cap growth universe.
From a sector perspective, the Fund’s allocation effect was negative. Overweightings in the Energy and Materials sectors and an underweighting in the Real Estate sector detracted the most from relative results. The Fund’s stock selection effect was significantly negative, with holdings in the Health Care and Information Technology sectors weighing most heavily on relative performance.
| | |
| Small-Cap Growth Fund | |
|
| MANAGER’S COMMENTARY (Unaudited) (continued) |
| | |
Top Ten Holdings as of December 31, 2019
| | | | | | | | | | |
| Rank | | | | Description | | Industry | | % of Net
Assets | |
| 1 | | | | Crocs, Inc. | | Consumer Discretionary | | | 1.6% | |
| 2 | | | | TTEC Holdings, Inc. | | Information Technology | | | 1.6% | |
| 3 | | | | ACI Worldwide, Inc. | | Information Technology | | | 1.6% | |
| 4 | | | | AMN Healthcare Services, Inc. | | Health Care | | | 1.6% | |
| 5 | | | | Forterra, Inc. | | Materials | | | 1.5% | |
| 6 | | | | OSI Systems, Inc. | | Information Technology | | | 1.5% | |
| 7 | | | | Cimpress PLC | | Industrials | | | 1.5% | |
| 8 | | | | Hanger, Inc. | | Health Care | | | 1.5% | |
| 9 | | | | R1 RCM, Inc. | | Health Care | | | 1.5% | |
| 10 | | | | Castlight Health, Inc., Class B | | Health Care | | | 1.5% | |
| | | | |
| | | | Total | | | | | 15.4% | |
Industry Sector Representation as of December 31, 2019
| | | | | | | | | | | | | | | |
| | | % of Net Assets | | % of Russell 2000
Growth Index | | Difference |
Communication Services | | | | 4.7 | % | | | | 2.4 | % | | | | 2.3% | |
Consumer Discretionary | | | | 14.9 | % | | | | 12.0 | % | | | | 2.9% | |
Consumer Staples | | | | 2.8 | % | | | | 3.3 | % | | | | -0.6% | |
Energy | | | | 0.8 | % | | | | 0.6 | % | | | | 0.2% | |
Financials | | | | 7.3 | % | | | | 5.8 | % | | | | 1.5% | |
Health Care | | | | 27.9 | % | | | | 30.5 | % | | | | -2.6% | |
Industrials | | | | 16.0 | % | | | | 18.9 | % | | | | -2.9% | |
Information Technology | | | | 15.0 | % | | | | 17.3 | % | | | | -2.3% | |
Materials | | | | 2.7 | % | | | | 3.1 | % | | | | -0.4% | |
Real Estate | | | | 7.7 | % | | | | 4.6 | % | | | | 3.1% | |
Utilities | | | | 0.8 | % | | | | 1.5 | % | | | | -0.7% | |
Liabilities in Excess of Other Assets | | | | -0.6 | % | | | | 0.0 | % | | | | -0.6% | |
| | | |
Total | | | | 100.0 | % | | | | 100.0 | % | | | | | |
Disclaimer
The views expressed here are exclusively those of Fund management. These views, including those related to market sectors or individual stocks, are not meant as investment advice and should not be considered predictive in nature. Any favorable (or unfavorable) description of a holding applies only as of the quarter end, December 31, 2019, unless otherwise stated. Security positions can and do change thereafter. Discussions of historical performance do not guarantee and may not be indicative of future performance.
Market volatility can significantly impact short-term performance. The Fund is not an appropriate investment for short-term investors. Investments in small companies generally carry greater risk than is customarily associated with larger companies. This additional risk is attributable to a number of factors, including the relatively limited financial resources that are typically available to small companies and the fact that small companies often have comparatively limited product lines. In addition, the stock of small companies tends to be more volatile than the stock of large companies, particularly in the short term and particularly in the early stages of an economic or market downturn. Shareholders of the Fund, therefore, are taking on more risk than they would if they invested in the stock market as a whole.
| | |
| 36 | | Semi-Annual Report | December 31, 2019 (Unaudited) |
| | |
| Small-Cap Growth Fund | | |
| MANAGER’S COMMENTARY (Unaudited) (continued) | | |
| | |
Conclusion
Thank you for your continued investment inSmall-Cap Growth Fund. We encourage your feedback; your reactions and concerns are important to us.
Sincerely,
The Investment Management Team
| | |
| Small-Cap Growth Fund | | |
| SCHEDULE OF INVESTMENTS (Unaudited) | | |
| Showing percentage of net assets as of December 31, 2019 | | |
| | | | | | |
| Industry Company | | Shares | | Value | |
| |
COMMON STOCKS - 100.56% | | | | |
Communication Services - 4.66% | | | | |
Anterix, Inc.* | | 12,100 | | $ | 522,841 | |
Liberty Media Corp.-Liberty Braves, Class C* | | 5,300 | | | 156,562 | |
Meredith Corp.+ | | 15,800 | | | 513,026 | |
TechTarget, Inc.* | | 18,700 | | | 488,070 | |
| | | | | | |
| | |
| | | | | 1,680,499 | |
| | |
Consumer Discretionary - 14.92% | | | | | | |
America’sCar-Mart, Inc.* | | 5,000 | | | 548,300 | |
Asbury Automotive Group, Inc.* | | 4,300 | | | 480,697 | |
Bloomin’ Brands, Inc. | | 17,900 | | | 395,053 | |
Boot Barn Holdings, Inc.* | | 8,500 | | | 378,505 | |
Cheesecake Factory, Inc. (The)+ | | 7,400 | | | 287,564 | |
Crocs, Inc.* | | 13,600 | | | 569,704 | |
Dave & Buster’s Entertainment, Inc.+ | | 11,900 | | | 478,023 | |
Hibbett Sports, Inc.*+ | | 10,600 | | | 297,224 | |
LCI Industries | | 2,900 | | | 310,677 | |
LGI Homes, Inc.* | | 6,200 | | | 438,030 | |
Rent-A-Center, Inc. | | 4,600 | | | 132,664 | |
RH*+ | | 2,400 | | | 512,400 | |
Standard Motor Products, Inc. | | 10,300 | | | 548,166 | |
| | | | | | |
| | |
| | | | | 5,377,007 | |
| | |
Consumer Staples - 2.75% | | | | | | |
Coca-Cola Consolidated, Inc. | | 1,100 | | | 312,455 | |
John B. Sanfilippo & Son, Inc. | | 5,900 | | | 538,552 | |
Performance Food Group Co.* | | 2,700 | | | 138,996 | |
| | | | | | |
| | |
` | | | | | 990,003 | |
| | |
Energy - 0.82% | | | | | | |
DMC Global, Inc.+ | | 6,600 | | | 296,604 | |
| | |
Financials - 7.33% | | | | | | |
Curo Group Holdings Corp.*+ | | 42,000 | | | 511,560 | |
Elevate Credit, Inc.* | | 27,000 | | | 120,150 | |
Enova International, Inc.* | | 21,800 | | | 524,508 | |
Enstar Group, Ltd.* | | 2,500 | | | 517,150 | |
Moelis & Co., Class A | | 3,400 | | | 108,528 | |
Mr Cooper Group, Inc.* | | 18,200 | | | 227,682 | |
Seacoast Banking Corp of Florida* | | 3,000 | | | 91,710 | |
Selective Insurance Group, Inc. | | 8,300 | | | 541,077 | |
| | | | | | |
| | |
| | | | | 2,642,365 | |
| | | | | | |
| Industry Company | | Shares | | Value | |
| | |
Health Care - 27.92% | | | | | | |
American Renal Associates Holdings, Inc.* | | 42,000 | | $ | 435,540 | |
AMN Healthcare Services, Inc.* | | 9,000 | | | 560,791 | |
BioSpecifics Technologies Corp.* | | 9,500 | | | 540,930 | |
Castlight Health, Inc., Class B* | | 413,900 | | | 550,487 | |
Catasys, Inc.*+ | | 10,800 | | | 176,148 | |
Conformis, Inc.* | | 70,600 | | | 105,900 | |
Cutera, Inc.* | | 6,600 | | | 236,346 | |
Cymabay Therapeutics, Inc.* | | 277,600 | | | 544,096 | |
Genesis Healthcare, Inc.* | | 327,700 | | | 537,428 | |
GlycoMimetics, Inc.* | | 97,000 | | | 513,130 | |
Haemonetics Corp.* | | 3,800 | | | 436,620 | |
Hanger, Inc.* | | 20,000 | | | 552,200 | |
Innoviva, Inc.* | | 37,400 | | | 529,584 | |
Joint Corp. (The)* | | 19,500 | | | 314,730 | |
Lantheus Holdings, Inc.* | | 4,700 | | | 96,397 | |
Misonix, Inc.*+ | | 7,800 | | | 145,158 | |
National Research Corp. | | 8,200 | | | 540,708 | |
Omnicell, Inc.* | | 6,500 | | | 531,180 | |
Providence Service Corp. (The)* | | 8,200 | | | 485,276 | |
R1 RCM, Inc.* | | 42,500 | | | 551,650 | |
Savara, Inc.*+ | | 84,200 | | | 377,216 | |
Select Medical Holdings Corp.* | | 23,000 | | | 536,820 | |
Simulations Plus, Inc. | | 8,400 | | | 244,188 | |
Tactile Systems Technology, Inc.*+ | | 7,700 | | | 519,827 | |
| | | | | | |
| | |
| | | | | 10,062,350 | |
| | |
Industrials - 15.97% | | | | | | |
Allegiant Travel Co. | | 3,000 | | | 522,120 | |
Atkore International Group, Inc.* | | 12,900 | | | 521,934 | |
Brink’s Co. (The) | | 3,200 | | | 290,176 | |
Cimpress PLC* | | 4,400 | | | 553,388 | |
Comfort Systems USA, Inc. | | 6,300 | | | 314,055 | |
Harsco Corp.* | | 13,600 | | | 312,936 | |
Lawson Products, Inc.* | | 5,200 | | | 270,920 | |
MasTec, Inc.*+ | | 8,100 | | | 519,696 | |
Meritor, Inc.* | | 18,600 | | | 487,134 | |
Miller Industries, Inc. | | 9,600 | | | 356,448 | |
Patrick Industries, Inc. | | 5,000 | | | 262,150 | |
Radiant Logistics, Inc.* | | 97,000 | | | 540,290 | |
Tetra Tech, Inc. | | 6,300 | | | 542,808 | |
Willis Lease Finance Corp.* | | 4,400 | | | 259,204 | |
| | | | | | |
| | |
| | | | | 5,753,259 | |
| | |
38 | | Semi-Annual Report | December 31, 2019 (Unaudited) |
| | |
| Small-Cap Growth Fund | | |
| SCHEDULE OF INVESTMENTS (Unaudited) (continued) | | |
| Showing percentage of net assets as of December 31, 2019 | | |
| | | | | | |
| Industry Company | | Shares | | Value | |
| | |
Common Stocks (continued) | | | | | | |
Information Technology - 15.01% | | | | | | |
ACI Worldwide, Inc.* | | 14,900 | | $ | 564,486 | |
Alarm.com Holdings, Inc.*+ | | 8,200 | | | 352,354 | |
Avid Technology, Inc.* | | 60,800 | | | 521,664 | |
InterDigital, Inc. | | 8,800 | | | 479,512 | |
Itron, Inc.* | | 6,500 | | | 545,675 | |
MAXIMUS, Inc. | | 3,700 | | | 275,243 | |
MicroStrategy, Inc., Class A* | | 3,300 | | | 470,679 | |
OSI Systems, Inc.* | | 5,500 | | | 554,070 | |
Plantronics, Inc.+ | | 19,900 | | | 544,066 | |
TTEC Holdings, Inc. | | 14,300 | | | 566,566 | |
Unisys Corp.* | | 45,200 | | | 536,072 | |
| | | | | | |
| | |
| | | | | 5,410,387 | |
| | |
Materials - 2.70% | | | | | | |
Forterra, Inc.* | | 48,300 | | | 558,348 | |
Verso Corp., Class A* | | 22,900 | | | 412,887 | |
| | | | | | |
| | |
| | | | | 971,235 | |
| | |
Real Estate - 7.72% | | | | | | |
American Assets Trust, Inc. | | 5,700 | | | 261,630 | |
Bluerock Residential Growth REIT, Inc. | | 24,000 | | | 289,200 | |
EastGroup Properties, Inc. | | 1,300 | | | 172,471 | |
Four Corners Property Trust, Inc. | | 18,500 | | | 521,515 | |
Innovative Industrial Properties, Inc.+ | | 7,100 | | | 538,677 | |
NexPoint Residential Trust, Inc. | | 10,900 | | | 490,500 | |
Terreno Realty Corp. | | 9,400 | | | 508,916 | |
| | | | | | |
| | |
| | | | | 2,782,909 | |
| | |
Utilities - 0.76% | | | | | | |
Spark Energy, Inc., Class A | | 29,800 | | | 275,054 | |
| | | | | | |
| |
TOTAL COMMON STOCKS - 100.56% | | | 36,241,672 | |
| | | | | | |
(Cost $32,234,929) | |
| | | | | | | | |
| | | Rate^ | | Shares | | Value | |
|
| INVESTMENTS PURCHASED WITH CASH PROCEEDS FROM SECURITIES LENDING - 5.11% | |
Fidelity Investments Money Market Government Portfolio Class I** | | 1.49% | | 1,840,670 | | $ | 1,840,670 | |
| | | | | | | | |
TOTAL INVESTMENTS PURCHASED WITH CASH PROCEEDS FROM SECURITIES LENDING - 5.11% | | | 1,840,670 | |
| | | | |
(Cost $ 1,840,670) | | | | |
| |
TOTAL INVESTMENTS - 105.67% | | $ | 38,082,342 | |
(Cost $ 34,075,599) | | | | |
Liabilities in Excess of Other Assets - (5.67%) | | | (2,041,770 | ) |
| | | | |
NET ASSETS - 100.00% | | $ | 36,040,572 | |
| | | | | | | | |
| * | Non-income producing security. |
| ** | This security represents the investment of the cash collateral received in connection with securities out on loan as of December 31, 2019. |
| ^ | Rate disclosed as of December 31, 2019. |
| + | This security or a portion of the security is out on loan as of December 31, 2019. Total loaned securities had a value of $5,569,155 as of December 31, 2019. See Note 2 for disclosure of cash andnon-cash collateral. |
PLC - Public Limited Company
Summary of inputs used to value the Fund’s investments as of 12/31/2019 (See Note 2 in Notes to Financial Statements):
| | | | | | | | | | | | | | | | |
| |
| | | Valuation Inputs | |
| | | Investment in Securities (Value) | |
| | | Level 1
Quoted
Prices | | | Level 2
Significant
Observable Inputs | | | Level 3
Significant
Unobservable
Inputs | | | Total | |
| | | | |
Common Stocks (a) | | $ | 36,241,672 | | | $ | — | | | $ | — | | | $ | 36,241,672 | |
Investments Purchased with Cash Proceeds from Securities Lending | | | — | | | | 1,840,670 | | | | — | | | | 1,840,670 | |
| | | | | | | | | | | | | | | | |
TOTAL | | $ | 36,241,672 | | | $ | 1,840,670 | | | $ | — | | | $ | 38,082,342 | |
| | | | | | | | | | | | | | | | |
| (a) | - Please refer to the Schedule of Investments for the industry classifications of these portfolio holdings. |
See Notes to Financial Statements.
| | |
| Small-Cap Value Fund | |
|
| MANAGER’S COMMENTARY (Unaudited) |
| | |
December 31, 2019
Dear FellowSmall-Cap Value Fund Shareholder,
For the quarter ended December 31, 2019, our Fund returned +6.47%, underperforming our primary market benchmark, the Russell 2000 Value Index (+8.49%), and our peer benchmark, the LipperSmall-Cap Value Funds Index (+8.01%). It was a positive quarter on an absolute basis, but a poor one on a relative basis.
For the calendar year, our Fund returned +14.98%, trailing both the Russell 2000 Value Index (+22.39%) and the LipperSmall-Cap Value Funds Index (+21.81%). We lag our primary market and peer benchmarks in the longer five-year,10-year,15-year, andinception-to-date periods as well.
The table below presents our December quarter,six-month,one-year, five-year,10-year,15-year, andinception-to-date financial results. See the next page for a graph of performance since inception.
Standardized Returns as of December 31, 2019
| | | | | | | | | | | | | | | | | | | | | | | | | | | | | | | | | | | |
| | | | | | | | | Annualized |
| | | Quarter | | 6 Months | | 1 Year | | 5 Years | | 10 Years | | 15 Years | | Since Inception
(10/31/03) |
| | | | | | | |
Small-Cap Value Fund | | | | 6.47% | | | | | 8.10% | | | | | 14.98% | | | | | 4.22% | | | | | 9.45 | % | | | | 6.14 | % | | | | 6.91 | % |
Russell 2000 Value Index | | | | 8.49% | | | | | 7.87% | | | | | 22.39% | | | | | 6.99% | | | | | 10.56 | % | | | | 6.92 | % | | | | 8.23 | % |
LipperSmall-Cap Value Funds Index | | | | 8.01% | | | | | 7.39% | | | | | 21.81% | | | | | 5.81% | | | | | 9.84 | % | | | | 6.96 | % | | | | 8.21 | % |
Performance figures quoted in the table above represent past performance and are no guarantee of future results. Total return figures in the table above include the reinvestment of dividends and capital gains. The table above does not reflect the deduction of taxes that a shareholder would pay on Fund distributions or on the redemption of Fund shares.
The Russell 2000 Value Index is an unmanaged index that consists of stocks in the Russell 2000 Index with lowerprice-to-book ratios and lower forecasted growth values with dividends reinvested. The LipperSmall-Cap Value Funds Index is an index of small-company, value-oriented funds compiled by Lipper, Inc. It is not possible to invest directly in an index. Periods longer than one year are annualized.
| | |
| 40 | | Semi-Annual Report | December 31, 2019 (Unaudited) |
| | |
| Small-Cap Value Fund | | |
| MANAGER’S COMMENTARY (Unaudited) (continued) | | |
| | |
Growth of a $10,000 Investment
from Inception October 31, 2003 to December 31, 2019
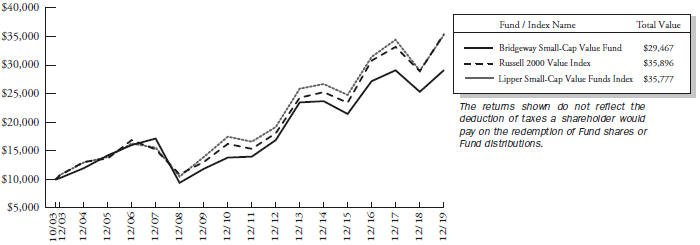
Detailed Explanation of Quarterly Performance
All three of the Fund’s model categories underperformed the benchmark during the quarter and detracted from relative results. This underperformance was partly offset by the Fund’s tilt toward smaller stocks in thesmall-cap value universe, which improved relative results. The impact of the Fund’s tilt toward deeper value stocks across multiple valuation metrics was mixed during the quarter.
From a sector perspective, the Fund’s allocation effect was positive, with underweightings in the Utilities and Communication Services sectors adding the most to relative results. The Fund’s stock selection effect was significantly negative, however, with holdings in the Health Care and Financials sectors detracting the most from relative performance.
Detailed Explanation of Calendar Year Performance
For the calendar year, the Fund’s core value metrics models and diversifying price momentum model lagged the benchmark and detracted from relative results. However, the Fund’s company financial health models outperformed the benchmark and offset some of that negative impact. The Fund’s tilt toward deeper value stocks across multiple valuation metrics also weighed on relative performance during the12-month period, as did its tilt toward smaller stocks in thesmall-cap value universe.
From a sector perspective, the Fund’s allocation effect was negative. Underweightings in the Information Technology and Real Estate sectors, along with an overweighting in the Health Care sector, particularly hurt relative results. The Fund’s stock selection effect also was negative, primarily due to poor performance from holdings in the Financials, Energy, and Materials sectors.
| | |
| Small-Cap Value Fund | |
|
| MANAGER’S COMMENTARY (Unaudited) (continued) |
| | |
Top Ten Holdings as of December 31, 2019
| | | | | | | | |
| Rank | | Description | | Industry | | % of Net
Assets | |
| 1 | | TherapeuticsMD, Inc. | | Health Care | | | 1.7% | |
| 2 | | Piper Sandler Cos. | | Financials | | | 1.6% | |
| 3 | | Gladstone Commercial Corp. | | Real Estate | | | 1.6% | |
| 4 | | Hibbett Sports, Inc. | | Consumer Discretionary | | | 1.5% | |
| 5 | | OFG Bancorp | | Financials | | | 1.5% | |
| 6 | | Standard Motor Products, Inc. | | Consumer Discretionary | | | 1.5% | |
| 7 | | TTM Technologies, Inc. | | Information Technology | | | 1.5% | |
| 8 | | Brady Corp., Class A | | Industrials | | | 1.5% | |
| 9 | | National Western Life Group, Inc., Class A | | Financials | | | 1.5% | |
| 10 | | Aircastle, Ltd. | | Industrials | | | 1.5% | |
| | | |
| | Total | | | | | 15.4% | |
Industry Sector Representation as of December 31, 2019
| | | | | | | | | | | | | | | |
| | | % of Net Assets | | % of Russell 2000
Value Index | | Difference |
Communication Services | | | | 0.0 | % | | | | 2.2 | % | | | | -2.2% | |
Consumer Discretionary | | | | 13.4 | % | | | | 9.7 | % | | | | 3.7% | |
Consumer Staples | | | | 2.6 | % | | | | 2.7 | % | | | | -0.1% | |
Energy | | | | 5.0 | % | | | | 5.8 | % | | | | -0.8% | |
Financials | | | | 31.3 | % | | | | 30.2 | % | | | | 1.1% | |
Health Care | | | | 5.3 | % | | | | 5.4 | % | | | | -0.1% | |
Industrials | | | | 12.9 | % | | | | 12.7 | % | | | | 0.2% | |
Information Technology | | | | 9.1 | % | | | | 9.6 | % | | | | -0.5% | |
Materials | | | | 4.2 | % | | | | 4.7 | % | | | | -0.5% | |
Real Estate | | | | 14.0 | % | | | | 11.1 | % | | | | 2.9% | |
Utilities | | | | 2.2 | % | | | | 5.9 | % | | | | -3.7% | |
Cash & Other Assets | | | | 0.0 | % | | | | 0.0 | % | | | | 0.0% | |
| | | |
Total | | | | 100.0 | % | | | | 100.0 | % | | | | | |
Disclaimer
The views expressed here are exclusively those of Fund management. These views, including those related to market sectors or individual stocks, are not meant as investment advice and should not be considered predictive in nature. Any favorable (or unfavorable) description of a holding applies only as of the quarter end, December 31, 2019, unless otherwise stated. Security positions can and do change thereafter. Discussions of historical performance do not guarantee and may not be indicative of future performance.
Market volatility can significantly impact short-term performance. The Fund is not an appropriate investment for short-term investors. Investments in small companies generally carry greater risk than is customarily associated with larger companies. This additional risk is attributable to a number of factors, including the relatively limited financial resources that are typically available to small companies and the fact that small companies often have comparatively limited product lines. In addition, the stock of small companies tends to be more volatile than the stock of large companies, particularly in the short term and particularly in the early stages of an economic or market downturn. Shareholders of the Fund, therefore, are taking on more risk than they would if they invested in the stock market as a whole.
| | |
| 42 | | Semi-Annual Report | December 31, 2019 (Unaudited) |
| | |
| Small-Cap Value Fund | | |
| MANAGER’S COMMENTARY (Unaudited) (continued) | | |
| | |
Conclusion
Thank you for your continued investment inSmall-Cap Value Fund. We encourage your feedback; your reactions and concerns are important to us.
Sincerely,
The Investment Management Team
| | |
| Small-Cap Value Fund | | |
| SCHEDULE OF INVESTMENTS (Unaudited) | | |
| Showing percentage of net assets as of December 31, 2019 | | |
| | | | | | |
| Industry Company | | Shares | | Value | |
|
COMMON STOCKS - 99.97% | |
Consumer Discretionary - 13.37% | |
American Axle & Manufacturing Holdings, Inc.* | | 35,900 | | $ | 386,284 | |
Barnes & Noble Education, Inc.* | | 67,900 | | | 289,933 | |
Caleres, Inc. | | 11,900 | | | 282,625 | |
Chico’s FAS, Inc. | | 153,000 | | | 582,930 | |
Dana, Inc. | | 25,100 | | | 456,820 | |
GameStop Corp., Class A+ | | 40,700 | | | 247,456 | |
Hibbett Sports, Inc.*+ | | 24,400 | | | 684,176 | |
JC Penney Co., Inc.*+ | | 120,100 | | | 134,512 | |
K12, Inc.* | | 5,700 | | | 115,995 | |
Meritage Homes Corp.* | | 2,500 | | | 152,775 | |
Michaels Cos., Inc. (The)*+ | | 39,600 | | | 320,364 | |
Murphy USA, Inc.* | | 4,200 | | | 491,400 | |
Office Depot, Inc. | | 154,300 | | | 422,782 | |
Shoe Carnival, Inc.+ | | 17,100 | | | 637,488 | |
Standard Motor Products, Inc. | | 12,800 | | | 681,216 | |
| | | | | | |
| | |
| | | | | 5,886,756 | |
| | |
Consumer Staples - 2.64% | | | | | | |
Ingles Markets, Inc., Class A | | 9,100 | | | 432,341 | |
Tootsie Roll Industries, Inc.+ | | 6,400 | | | 218,496 | |
United Natural Foods, Inc.*+ | | 58,500 | | | 512,460 | |
| | | | | | |
| | |
| | | | | 1,163,297 | |
| | |
Energy - 5.04% | | | | | | |
Arch Coal, Inc., Class A+ | | 7,900 | | | 566,746 | |
Callon Petroleum Co.*+ | | 132,800 | | | 641,424 | |
Laredo Petroleum, Inc.* | | 127,600 | | | 366,212 | |
World Fuel Services Corp. | | 14,800 | | | 642,616 | |
| | | | | | |
| | |
| | | | | 2,216,998 | |
| | |
Financials - 31.30% | | | | | | |
Argo Group International Holdings, Ltd. | | 10,135 | | | 666,376 | |
Banner Corp. | | 11,700 | | | 662,103 | |
Brookline Bancorp, Inc. | | 8,000 | | | 131,680 | |
City Holding Co. | | 2,800 | | | 229,460 | |
CVB Financial Corp. | | 16,000 | | | 345,280 | |
Enstar Group, Ltd.*+ | | 3,200 | | | 661,952 | |
Essent Group, Ltd. | | 12,800 | | | 665,472 | |
First BanCorp Puerto Rico | | 46,800 | | | 495,612 | |
Flagstar Bancorp, Inc. | | 5,300 | | | 202,725 | |
Fulton Financial Corp. | | 31,500 | | | 549,045 | |
GAMCO Investors, Inc., Class A | | 14,200 | | | 276,758 | |
Hancock Whitney Corp.+ | | 2,591 | | | 113,693 | |
HarborOne Bancorp, Inc.* | | 37,300 | | | 409,927 | |
HomeStreet, Inc.* | | 8,100 | | | 275,400 | |
| | | | | | |
| Industry Company | | Shares | | Value | |
| | |
Financials (continued) | | | | | | |
Independence Holding Co. | | 15,500 | | $ | 652,240 | |
INTL. FCStone, Inc.* | | 3,100 | | | 151,373 | |
James River Group Holdings, Ltd. | | 15,800 | | | 651,118 | |
LCNB Corp. | | 9,500 | | | 183,350 | |
National General Holdings Corp. | | 30,100 | | | 665,210 | |
National Western Life Group, Inc., Class A | | 2,300 | | | 669,024 | |
OFG Bancorp | | 28,900 | | | 682,329 | |
Oppenheimer Holdings, Inc., Class A | | 13,750 | | | 377,850 | |
Piper Sandler Cos. | | 8,700 | | | 695,478 | |
Provident Financial Services, Inc. | | 11,800 | | | 290,870 | |
Republic First Bancorp, Inc.* | | 126,200 | | | 527,516 | |
Selective Insurance Group, Inc. | | 6,200 | | | 404,178 | |
Stifel Financial Corp. | | 8,600 | | | 521,590 | |
Towne Bank | | 10,600 | | | 294,892 | |
TriCo Bancshares | | 3,200 | | | 130,592 | |
Walker & Dunlop, Inc. | | 10,200 | | | 659,736 | |
Waterstone Financial, Inc. | | 8,300 | | | 157,949 | |
Western New England Bancorp, Inc. | | 39,000 | | | 375,570 | |
| | | | | | |
| | |
| | | | | 13,776,348 | |
| | |
Health Care - 5.31% | | | | | | |
AMAG Pharmaceuticals, Inc.*+ | | 53,800 | | | 654,746 | |
Lannett Co., Inc.*+ | | 29,700 | | | 261,954 | |
Meridian Bioscience, Inc. | | 34,000 | | | 332,180 | |
Owens & Minor, Inc. | | 46,000 | | | 237,820 | |
RTI Surgical Holdings, Inc.* | | 40,700 | | | 111,518 | |
TherapeuticsMD, Inc.*+ | | 304,900 | | | 737,858 | |
| | | | | | |
| | |
| | | | | 2,336,076 | |
| | |
Industrials - 12.87% | | | | | | |
ABM Industries, Inc.+ | | 17,000 | | | 641,070 | |
Aircastle, Ltd. | | 20,900 | | | 669,009 | |
BMC Stock Holdings, Inc.* | | 8,300 | | | 238,127 | |
Brady Corp., Class A | | 11,700 | | | 669,942 | |
EMCOR Group, Inc. | | 3,500 | | | 302,050 | |
Hawaiian Holdings, Inc.+ | | 13,400 | | | 392,486 | |
InnerWorkings, Inc.* | | 20,500 | | | 112,955 | |
Kimball International, Inc., Class B | | 31,400 | | | 649,038 | |
Pitney Bowes, Inc.+ | | 38,900 | | | 156,767 | |
SkyWest, Inc. | | 10,200 | | | 659,226 | |
Titan Machinery, Inc.* | | 24,500 | | | 362,110 | |
TriMas Corp.* | | 6,200 | | | 194,742 | |
| | |
44 | | Semi-Annual Report | December 31, 2019 (Unaudited) |
| | |
| Small-Cap Value Fund | | |
| SCHEDULE OF INVESTMENTS (Unaudited) (continued) | | |
| Showing percentage of net assets as of December 31, 2019 | | |
| | | | | | |
| Industry Company | | Shares | | Value | |
| |
Common Stocks (continued) | | | | |
Industrials (continued) | | | | |
Triton International, Ltd./Bermuda | | 10,000 | | $ | 402,000 | |
Willis Lease Finance Corp.* | | 3,700 | | | 217,967 | |
| | | | | | |
| | |
| | | | | 5,667,489 | |
| | |
Information Technology - 9.07% | | | | | | |
Amkor Technology, Inc.* | | 49,700 | | | 646,100 | |
Cardtronics PLC, Class A* | | 7,000 | | | 312,550 | |
PDF Solutions, Inc.* | | 30,500 | | | 515,145 | |
Sanmina Corp.* | | 17,400 | | | 595,776 | |
Sykes Enterprises, Inc.* | | 15,900 | | | 588,141 | |
Tech Data Corp.* | | 4,600 | | | 660,560 | |
TTM Technologies, Inc.*+ | | 44,800 | | | 674,240 | |
| | | | | | |
| | |
| | | | | 3,992,512 | |
| | |
Materials - 4.23% | | | | | | |
Innospec, Inc. | | 4,800 | | | 496,512 | |
Stepan Co. | | 4,800 | | | 491,712 | |
Verso Corp., Class A* | | 18,400 | | | 331,752 | |
Warrior Met Coal, Inc. | | 25,700 | | | 543,041 | |
| | | | | | |
| | |
| | | | | 1,863,017 | |
| | |
Real Estate - 13.95% | | | | | | |
Armada Hoffler Properties, Inc. | | 32,600 | | | 598,210 | |
First Industrial Realty Trust, Inc. | | 10,900 | | | 452,459 | |
Gladstone Commercial Corp. | | 31,800 | | | 695,148 | |
Industrial Logistics Properties Trust | | 19,597 | | | 439,365 | |
Kennedy-Wilson Holdings, Inc. | | 3,500 | | | 78,050 | |
Monmouth Real Estate Investment Corp. | | 44,300 | | | 641,464 | |
National Health Investors, Inc. | | 6,600 | | | 537,768 | |
Physicians Realty Trust | | 27,800 | | | 526,532 | |
Piedmont Office Realty Trust, Inc., Class A | | 16,100 | | | 358,064 | |
Realogy Holdings Corp.+ | | 66,400 | | | 642,752 | |
Retail Opportunity Investments Corp. | | 20,600 | | | 363,796 | |
STAG Industrial, Inc. | | 11,800 | | | 372,526 | |
Terreno Realty Corp. | | 8,000 | | | 433,120 | |
| | | | | | |
| | |
| | | | | 6,139,254 | |
| | |
Utilities - 2.19% | | | | | | |
Atlantic Power Corp.* | | 257,800 | | | 600,674 | |
| | | | | | | | |
| Industry Company | | | | Shares | | Value | |
| | | |
Utilities (continued) | | | | | | | | |
Southwest Gas Holdings, Inc. | | | | 4,800 | | $ | 364,656 | |
| | | | | | | | |
| | | | | | | 965,330 | |
| | | | | | | | |
TOTAL COMMON STOCKS - 99.97% | | | 44,007,077 | |
| | | | | | | | |
(Cost $41,566,928) | | | | |
| | | |
| | | Rate^ | | Shares | | Value | |
| |
MONEY MARKET FUND - 0.00% | | | | |
Fidelity Investments Money Market Government Portfolio Class I | | 1.49% | | 768 | | | 768 | |
| | | | | | | | |
TOTAL MONEY MARKET FUND - 0.00% | | | 768 | |
| | | | | | | | |
(Cost $768) | | | | |
| |
| INVESTMENTS PURCHASED WITH CASH PROCEEDS FROM SECURITIES LENDING - 7.75% | | | | |
Fidelity Investments Money Market Government Portfolio Class I** | | 1.49% | | 3,409,392 | | | 3,409,392 | |
| | | | | | | | |
TOTAL INVESTMENTS PURCHASED WITH CASH PROCEEDS FROM SECURITIES LENDING -7.75% | | | 3,409,392 | |
| | | | | | | | |
(Cost $3,409,392) | | | | |
| |
TOTAL INVESTMENTS - 107.72% | | $ | 47,417,237 | |
(Cost $44,977,088) | | | | |
Liabilities in Excess of Other Assets - (7.72%) | | | (3,396,600 | ) |
| | | | | | | | |
NET ASSETS - 100.00% | | $ | 44,020,637 | |
| | | | | | | | |
| * | Non-income producing security. |
| ** | This security represents the investment of the cash collateral received in connection with securities out on loan as of December 31, 2019. |
| ^ | Rate disclosed as of December 31, 2019. |
| + | This security or a portion of the security is out on loan at December 31, 2019. Total loaned securities had a value of $6,941,242, which included loaned securities with a value of $40,115 that have been sold and are pending settlement as of December 31, 2019. The total market value of loaned securities excluding these pending sales is $6,901,127. See Note 2 for disclosure of cash andnon-cash collateral. |
PLC - Public Limited Company
| | |
| Small-Cap Value Fund | | |
| SCHEDULE OF INVESTMENTS (Unaudited) (continued) | | |
| Showing percentage of net assets as of December 31, 2019 | | |
Summary of inputs used to value the Fund’s investments as of 12/31/2019 (See Note 2 in Notes to Financial Statements):
| | | | | | | | | | | | | | |
| |
| | | Valuation Inputs | |
| | | Investment in Securities (Value) | |
| | | Level 1
Quoted
Prices | | | Level 2
Significant
Observable Inputs | | | Level 3
Significant
Unobservable
Inputs | | Total | |
| | | | |
Common Stocks | | $ | 44,007,077 | | | $ | — | | | $— | | $ | 44,007,077 | |
Money Market Fund | | | — | | | | 768 | | | — | | | 768 | |
Investments Purchased with Cash Proceeds from Securities Lending | | | — | | | | 3,409,392 | | | — | | | 3,409,392 | |
| | | | | | | | | | | | | | |
TOTAL | | $ | 44,007,077 | | | $ | 3,410,160 | | | $— | | $ | 47,417,237 | |
| | | | | | | | | | | | | | |
See Notes to Financial Statements.
| | |
46 | | Semi-Annual Report | December 31, 2019 (Unaudited) |
| | |
| Blue Chip Fund (Formerly, Blue Chip 35 Index Fund) | | |
| MANAGER’S COMMENTARY (Unaudited) | | |
| | |
December 31, 2019
Dear Fellow Blue Chip Fund Shareholder,
For the quarter ended December 31, 2019, our Fund returned +8.01%, underperforming our primary market benchmark, the S&P 500 Index (+9.07%), our peer benchmark, the LipperLarge-Cap Core Funds Index (+8.89%), and the Russell Top 50 Mega Cap Index (+10.46%). It was a good quarter on an absolute basis, but a poor one on a relative basis.
For the calendar year, our Fund returned +31.05%, slightly trailing the S&P 500 Index (+31.49%) and the Russell Top 50 Mega Cap Index (+32.86%) but outperforming the LipperLarge-Cap Core Funds Index (+29.00%).
The table below presents our December quarter,six-month,one-year, five-year,10-year,15-year, andinception-to-date financial results. See the next page for a graph of performance since inception.
Standardized Returns as of December 31, 2019
| | | | | | | | | | | | | | | | | | | | | | | | | | | | |
| | | | | | | | | | | | Annualized | | |
| | | Quarter | | | 6 Months | | 1 Year | | 5 Years | | 10 Years | | 15 Years | | Since Inception
(7/31/97) |
| | | | | | | |
Blue Chip Fund | | | 8.01% | | | | 10.68% | | | | 31.05% | | | | 12.07% | | | | 13.06% | | | | 8.77% | | | | 7.87% | |
S&P 500 Index | | | 9.07% | | | | 10.92% | | | | 31.49% | | | | 11.70% | | | | 13.56% | | | | 9.00% | | | | 7.60% | |
Russell Top 50 Mega Cap Index | | | 10.46% | | | | 12.33% | | | | 32.86% | | | | 12.77% | | | | 13.27% | | | | 8.63% | | | | 6.81% | |
Lipper Large-Cap Core Funds Index | | | 8.89% | | | | 10.17% | | | | 29.00% | | | | 10.54% | | | | 12.17% | | | | 8.17% | | | | 6.73% | |
Performance figures quoted in the table above represent past performance and are no guarantee of future results. Total return figures in the table above include the reinvestment of dividends and capital gains. The table above does not reflect the deduction of taxes that a shareholder would pay on Fund distributions or on the redemption of Fund shares.
The S&P 500 Index is a broad-based, unmanaged measurement of changes in stock market conditions, based on the average of 500 widely held common stocks with dividends reinvested. The Russell Top 50 Mega Cap Index measures the performance of the largest companies in the Russell 3000 Index. It includes 50 of the largest securities, based on a combination of their market cap and current index membership, and represents approximately 40% of the total market capitalization of the Russell 3000 Index. The LipperLarge-Cap Core Funds Index reflects the aggregate record of domesticlarge-cap core mutual funds as reported by Lipper, Inc. It is not possible to invest directly in an index. Periods longer than one year are annualized.
Effective May 31, 2019, the name of the Blue Chip 35 Index Fund was changed to Blue Chip Fund. Effective July 31, 2019, the Fund’s principal strategies were modified, as indicated in the Supplement dated May 31, 2019 to the Prospectus dated October 31, 2018.
| | |
| Blue Chip Fund (Formerly, Blue Chip 35 Index Fund) | |
|
| MANAGER’S COMMENTARY (Unaudited)(continued) |
| | |
Growth of a $10,000 Investment
from Inception July 31, 1997 to December 31, 2019
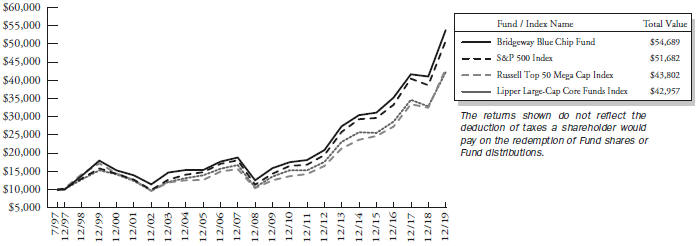
Detailed Explanation of Quarterly Performance
The Fund’smega-cap design had a mixed impact during the quarter. The emphasis on more stable, blue-chip stocks detracted from relative results by underweighting higher-volatility stocks that performed well during the quarter. However, the Fund’s overweighting in the benchmark’s larger stocks modestly improved relative performance.
From a sector perspective, the Fund’s allocation effect was positive, largely driven by underweightings in the Real Estate and Utilities sectors. In contrast, the Fund’s stock selection effect was negative. Holdings in the Information Technology, Consumer Discretionary, and Industrials sectors detracted the most from relative returns.
Detailed Explanation of Calendar Year Performance
Underperformance during the fourth quarter is largely responsible for dragging down the Fund’s relative returns for the year. Outside of that period, though, the Fund’s design features worked well. The impact of the Fund’s tilt towardmega-cap stocks was modestly positive during the12-month period. Likewise, disciplined rebalancing to maintain the Fund’s roughly equal weight design improved relative results.
From a sector perspective, the Fund’s allocation effect was positive. An underweighting in the Health Care sector and an overweighting in the Information Technology sector contributed the most to relative performance. However, the Fund’s stock selection effect was negative, largely driven by poor performance from holdings in the Health Care, Industrials, and Information Technology sectors.
| | |
| 48 | | Semi-Annual Report | December 31, 2019 (Unaudited) |
| | |
| Blue Chip Fund (Formerly, Blue Chip 35 Index Fund) | | |
| MANAGER’S COMMENTARY (Unaudited)(continued) | | |
| | |
The table below presents index performance numbers for stocks in the different CRSP deciles during various time periods. The table is intended to provide a frame of reference for size.
| | | | | | | | | | | | | | | | | | | | | | | | |
| | | | | | | | | | | | Annualized | |
| CRSP Decile1 | | Quarter | | | 6 Months | | | 1 Year | | | 5 Years | | | 10 Years | | | 94 Years | |
| 1 (ultra-large) | | | 9.73% | | | | 11.38% | | | | 31.05% | | | | 12.28% | | | | 13.56% | | | | 9.52% | |
| 2 | | | 7.01% | | | | 7.23% | | | | 31.55% | | | | 10.04% | | | | 13.69% | | | | 10.62% | |
| 3 | | | 8.42% | | | | 6.24% | | | | 28.39% | | | | 10.12% | | | | 13.73% | | | | 11.07% | |
| 4 | | | 7.43% | | | | 5.20% | | | | 31.01% | | | | 8.65% | | | | 12.68% | | | | 10.88% | |
| 5 | | | 7.92% | | | | 4.41% | | | | 22.86% | | | | 6.26% | | | | 11.57% | | | | 11.31% | |
| 6 | | | 10.16% | | | | 6.62% | | | | 24.32% | | | | 7.02% | | | | 12.04% | | | | 11.29% | |
| 7 | | | 11.36% | | | | 7.81% | | | | 29.47% | | | | 10.40% | | | | 13.89% | | | | 11.59% | |
| 8 | | | 14.36% | | | | 8.63% | | | | 21.95% | | | | 6.62% | | | | 11.67% | | | | 11.38% | |
| 9 | | | 14.56% | | | | 7.98% | | | | 22.04% | | | | 7.76% | | | | 11.81% | | | | 11.43% | |
| 10 (ultra-small) | | | 12.55% | | | | 8.59% | | | | 25.87% | | | | 5.29% | | | | 10.33% | | | | 13.07% | |
| 1 | Performance figures are as of the period ended December 31, 2019. The CRSPCap-Based Portfolio Indexes are unmanaged indexes of publicly traded U.S. stocks with dividends reinvested, grouped by market capitalization, as reported by the Center for Research in Security Prices. Past performance is no guarantee of future results. |
| | |
| Blue Chip Fund (Formerly, Blue Chip 35 Index Fund) | |
|
| MANAGER’S COMMENTARY (Unaudited)(continued) |
| | |
Contribution to Returns for Blue Chip Fund stocks for the calendar year December 31, 2019:
| | | | | | | | | |
| Rank | | Company | | Industry | | % Contribution
to Return |
| 1 | | Apple, Inc. | | Information Technology | | | | 2.7% | |
| 2 | | Microsoft Corp. | | Information Technology | | | | 2.1% | |
| 3 | | Visa, Inc., Class A | | Information Technology | | | | 1.7% | |
| 4 | | Bank of America Corp. | | Financials | | | | 1.6% | |
| 5 | | JPMorgan Chase & Co. | | Financials | | | | 1.6% | |
| 6 | | Facebook, Inc. Class A | | Communication Services | | | | 1.5% | |
| 7 | | QUALCOMM, Inc. | | Information Technology | | | | 1.5% | |
| 8 | | Citigroup, Inc. | | Financials | | | | 1.4% | |
| 9 | | Procter & Gamble Co. (The) | | Consumer Staples | | | | 1.3% | |
| 10 | | AT&T, Inc. | | Communication Services | | | | 1.1% | |
| 11 | | United Technologies Corp. | | Industrials | | | | 1.1% | |
| 12 | | Walt Disney Co. (The) | | Communication Services | | | | 0.9% | |
| 13 | | Comcast Corp., Class A | | Communication Services | | | | 0.9% | |
| 14 | | Amazon.com, Inc. | | Consumer Discretionary | | | | 0.9% | |
| 15 | | Home Depot, Inc. (The) | | Consumer Discretionary | | | | 0.8% | |
| 16 | | Intel Corp. | | Information Technology | | | | 0.8% | |
| 17 | | Walmart, Inc. | | Consumer Staples | | | | 0.8% | |
| 18 | | International Business Machines Corp. | | Information Technology | | | | 0.7% | |
| 19 | | United Parcel Service, Inc., Class B | | Industrials | | | | 0.7% | |
| 20 | | PepsiCo, Inc. | | Consumer Staples | | | | 0.7% | |
| 21 | | Merck & Co., Inc. | | Health Care | | | | 0.6% | |
| 22 | | Oracle Corp. | | Information Technology | | | | 0.6% | |
| 23 | | Alphabet, Inc., Class C | | Communication Services | | | | 0.6% | |
| 24 | | Alphabet, Inc., Class A | | Communication Services | | | | 0.6% | |
| 25 | | Wells Fargo & Co. | | Financials | | | | 0.5% | |
| 26 | | Coca-Cola Co. (The) | | Consumer Staples | | | | 0.5% | |
| 27 | | Cisco Systems, Inc. | | Information Technology | | | | 0.5% | |
| 28 | | Chevron Corp. | | Energy | | | | 0.4% | |
| 29 | | Johnson & Johnson | | Health Care | | | | 0.4% | |
| 30 | | UnitedHealth Group, Inc. | | Health Care | | | | 0.4% | |
| 31 | | McDonald’s Corp. | | Consumer Discretionary | | | | 0.4% | |
| 32 | | Verizon Communications, Inc. | | Communication Services | | | | 0.4% | |
| 33 | | Exxon Mobil Corp. | | Energy | | | | 0.3% | |
| 34 | | Boeing Co. (The) | | Industrials | | | | 0.3% | |
| 35 | | Berkshire Hathaway, Inc., Class B | | Financials | | | | 0.3% | |
| 36 | | 3M Co. | | Industrials | | | | 0.0% | |
| 37 | | Pfizer, Inc. | | Health Care | | | | -0.2% | |
| | |
| 50 | | Semi-Annual Report | December 31, 2019 (Unaudited) |
| | |
| Blue Chip Fund (Formerly, Blue Chip 35 Index Fund) | | |
| MANAGER’S COMMENTARY (Unaudited)(continued) | | |
| | |
Industry Sector Representation as of December 31, 2019
| | | | | | | | | | | | | | | |
| | | % of Net Assets | | % of S&P 500 Index | | Difference |
Communication Services | | | | 16.7% | | | | | 10.4% | | | | | 6.3% | |
Consumer Discretionary | | | | 8.3% | | | | | 9.8% | | | | | -1.5% | |
Consumer Staples | | | | 10.8% | | | | | 7.2% | | | | | 3.6% | |
Energy | | | | 4.8% | | | | | 4.3% | | | | | 0.5% | |
Financials | | | | 15.2% | | | | | 13.0% | | | | | 2.2% | |
Health Care | | | | 9.6% | | | | | 14.2% | | | | | -4.6% | |
Industrials | | | | 9.6% | | | | | 9.0% | | | | | 0.6% | |
Information Technology | | | | 24.9% | | | | | 23.2% | | | | | 1.7% | |
Materials | | | | 0.0% | | | | | 2.7% | | | | | -2.7% | |
Real Estate | | | | 0.0% | | | | | 2.9% | | | | | -2.9% | |
Utilities | | | | 0.0% | | | | | 3.3% | | | | | -3.3% | |
Cash & Other Assets | | | | 0.1% | | | | | 0.0% | | | | | 0.1% | |
Total | | | | 100.0% | | | | | 100.0% | | | | | | |
Disclaimer
The views expressed here are exclusively those of Fund management. These views, including those concerning market sectors or individual stocks, are not meant as investment advice and should not be considered predictive in nature. Any favorable (or unfavorable) description of a holding applies only as of the quarter end, December 31, 2019, unless otherwise stated. Security positions can and do change thereafter. Discussions of historical performance do not guarantee and are not indicative of future performance.
The Fund is subject to significant market risk (volatility) and is not an appropriate investment for short-term investors. The Fund also exposes shareholders to “focus risk,” which may add to Fund volatility through the possibility that a single company could significantly affect total return. Shareholders of the Fund, therefore, are taking on more risk than they would if they invested in the stock market as a whole.
Conclusion
Thank you for your continued investment in Blue Chip Fund. We encourage your feedback; your reactions and concerns are important to us.
Sincerely,
The Investment Management Team
| | |
| Blue Chip Fund (Formerly, Blue Chip 35 Index Fund) | | |
| SCHEDULE OF INVESTMENTS (Unaudited) | | |
Showing percentage of net assets as of December 31, 2019 | | |
| | | | |
| Industry Company | | Shares | | Value |
|
COMMON STOCKS - 99.87% |
| Communication Services - 16.75% |
Alphabet, Inc., Class A* | | 8,180 | | $10,956,210 |
Alphabet, Inc., Class C* | | 8,209 | | 10,975,597 |
AT&T, Inc. | | 341,505 | | 13,346,015 |
Comcast Corp., Class A | | 295,650 | | 13,295,381 |
Facebook, Inc., Class A* | | 88,500 | | 18,164,625 |
Verizon Communications, Inc. | | 217,739 | | 13,369,175 |
Walt Disney Co. (The) | | 93,050 | | 13,457,822 |
| | | | |
| | | | 93,564,825 |
|
Consumer Discretionary - 8.29% |
Amazon.com, Inc.* | | 10,550 | | 19,494,712 |
Home Depot, Inc. (The) | | 61,400 | | 13,408,532 |
McDonald’s Corp. | | 67,850 | | 13,407,839 |
| | | | |
| | | | 46,311,083 |
|
Consumer Staples - 10.78% |
Coca-Cola Co. (The) | | 241,714 | | 13,378,870 |
PepsiCo, Inc. | | 97,375 | | 13,308,241 |
Procter & Gamble Co. (The) | | 162,306 | | 20,272,019 |
Walmart, Inc. | | 111,769 | | 13,282,628 |
| | | | |
| | | | 60,241,758 |
|
Energy - 4.80% |
Chevron Corp. | | 111,395 | | 13,424,211 |
Exxon Mobil Corp. | | 192,287 | | 13,417,787 |
| | | | |
| | | | 26,841,998 |
|
Financials - 15.18% |
Bank of America Corp. | | 633,308 | | 22,305,108 |
Berkshire Hathaway, Inc., Class B* | | 59,150 | | 13,397,475 |
Citigroup, Inc. | | 168,000 | | 13,421,520 |
JPMorgan Chase & Co. | | 159,495 | | 22,233,603 |
Wells Fargo & Co. | | 250,159 | | 13,458,554 |
| | | | |
| | | | 84,816,260 |
|
Health Care - 9.58% |
Johnson & Johnson | | 91,712 | | 13,378,029 |
Merck & Co., Inc. | | 146,735 | | 13,345,548 |
Pfizer, Inc. | | 343,074 | | 13,441,639 |
UnitedHealth Group, Inc. | | 45,450 | | 13,361,391 |
| | | | |
| | | | 53,526,607 |
|
Industrials - 9.57% |
3M Co. | | 75,600 | | 13,337,352 |
Boeing Co. (The) | | 40,850 | | 13,307,296 |
United Parcel Service, Inc., Class B | | 114,563 | | 13,410,745 |
United Technologies Corp. | | 89,510 | | 13,405,018 |
| | | | |
| | | | 53,460,411 |
| | | | |
| Industry Company | | Shares | | Value |
|
Information Technology - 24.92% |
Apple, Inc. | | 76,300 | | $ 22,405,495 |
Cisco Systems, Inc. | | 282,408 | | 13,544,288 |
Intel Corp. | | 223,493 | | 13,376,056 |
International Business Machines Corp. | | 100,517 | | 13,473,299 |
Microsoft Corp. | | 141,245 | | 22,274,336 |
Oracle Corp. | | 253,513 | | 13,431,119 |
QUALCOMM, Inc. | | 215,900 | | 19,048,857 |
Visa, Inc., Class A | | 115,450 | | 21,693,055 |
| | | | |
| | | | 139,246,505 |
| | | | |
TOTAL COMMON STOCKS - 99.87% (Cost $ 261,078,406) | | 558,009,447 |
| | | | |
| |
TOTAL INVESTMENTS - 99.87% (Cost $ 261,078,406) | | $558,009,447 |
Other Assets in Excess of Liabilities - 0.13% | | 727,280 |
| | | | |
NET ASSETS - 100.00% | | | | $558,736,727 |
| | | | |
| * | Non-income producing security. |
Summary of inputs used to value the Fund’s investments as of 12/31/2019 (See Note 2 in Notes to Financial Statements):
| | | | | | | | | | | | |
| | | | | | Valuation Inputs | | | |
| | | | | | Investment in Securities (Value) | |
| | | Level 1 Quoted Prices | | | Level 2
Significant
Observable
Inputs | | Level 3 Significant
Unobservable
Inputs | | Total | |
| | | | |
Common Stocks (a) | | | $558,009,447 | | | $— | | $ — | | | $558,009,447 | |
| | | | | | | | | | | | |
TOTAL | | | $558,009,447 | | | $— | | $ — | | | $558,009,447 | |
| | | | | | | | | | | | |
| (a) | - Please refer to the Schedule of Investments for the industry classifications of these portfolio holdings. |
See Notes to Financial Statements.
| | |
52 | | Semi-Annual Report | December 31, 2019 (Unaudited) |
| | |
| Managed Volatility Fund | | |
| MANAGER’S COMMENTARY (Unaudited) | | |
| | |
December 31, 2019
Dear Fellow Managed Volatility Fund Shareholder,
For the quarter ended December 31, 2019, our Fund returned +2.09%, underperforming our primary market benchmark, the S&P 500 Index (+9.07%) and our peer benchmark, the Lipper Balanced Funds Index (+5.12%). However, the Fund performed in line with its design during the quarter.
For the calendar year, our Fund returned +11.88%, underperforming the S&P 500 Index (+31.49%) and the Lipper Balanced Funds Index (+19.44%).
The table below presents our December quarter,six-month,one-year, five-year,10-year,15-year, andinception-to-date financial results. See the next page for a graph of performance since inception.
Standardized Returns as of December 31, 2019
| | | | | | | | | | | | | | | | | | | | | | | | | | | | | | | | | | | |
| | | | | | | | | | | Annualized | | | | |
| | | Quarter | | 6 Months | | 1 Year | | 5 Years | | 10 Years | | 15 Years | | Since Inception
(6/30/01) |
| | | | | | | |
Managed Volatility Fund | | | | 2.09% | | | | | 3.18% | | | | | 11.88 | % | | | | 3.58 | % | | | | 4.67% | | | | | 3.76% | | | | | 4.03 | % |
S&P 500 Index | | | | 9.07% | | | | | 10.92% | | | | | 31.49 | % | | | | 11.70 | % | | | | 13.56% | | | | | 9.00% | | | | | 7.52 | % |
Lipper Balanced Funds Index | | | | 5.12% | | | | | 6.47% | | | | | 19.44 | % | | | | 6.76 | % | | | | 8.12% | | | | | 6.26% | | | | | 5.84 | % |
Performance figures quoted in the table above represent past performance and are no guarantee of future results. Total return figures in the table above include the reinvestment of dividends and capital gains. The table above does not reflect the deduction of taxes that a shareholder would pay on Fund distributions or on the redemption of Fund shares.
The S&P 500 Index is a broad-based, unmanaged measurement of changes in stock market conditions, based on the average of 500 widely held common stocks with dividends reinvested. The Lipper Balanced Funds Index is an index of balanced funds compiled by Lipper, Inc. It is not possible to invest directly in an index. Periods longer than one year are annualized.
| | |
| Managed Volatility Fund | |
|
| MANAGER’S COMMENTARY (Unaudited)(continued) |
| | |
Growth of a $10,000 Investment
from Inception June 30, 2001 to December 31, 2019
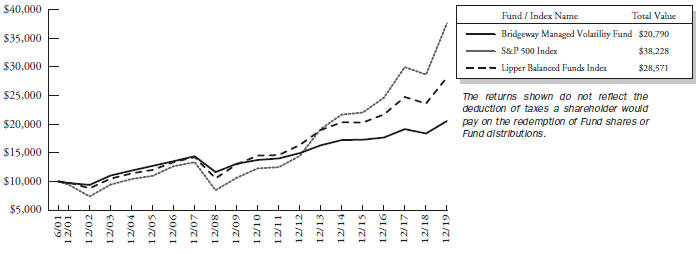
Detailed Explanation of Quarterly Performance
For the quarter, the Fund fell short of its objective to capture at least 40% of the S&P 500 Index’s return. The portfolio’s futures component detracted from performance, contributing roughly-3.0% to the Fund’s return. This performance was in line with expectations for a rising equity market. The portfolio’s options component modestly improved performance, contributing 0.5% to the Fund’s return. The portfolio’s equities component contributed roughly 4.6% to the Fund’s return. Returns for the portfolio’s fixed-income component were essentially flat for the quarter.
The Fund had an annualized standard deviation of 4.49% during the quarter, which was 52% lower than the S&P 500’s annualized standard deviation of 9.38% during the same period.
Detailed Explanation of Calendar Year Performance
For the calendar year, the Managed Volatility Fund fell just short of our goal to capture at least 40% of the S&P 500 Index’s return. The portfolio’s futures component detracted from performance, contributing about-3.2% to the Fund’s return. This performance was in line with expectations during a year characterized by a strong rising equity market. The portfolio’s fixed-income component modestly helped performance, returning about 0.2%. The portfolio’s equities component made the largest positive contribution to performance, returning about 5.2%.
The Fund had an annualized standard deviation of 5.42% during the year, which was 57% lower than the S&P 500’s annualized standard deviation of 12.64% during the same period.
The Fund continues to perform as designed, particularly over longer time horizons. For the past 10 years and since inception, the Fund has captured roughly 34% and 54%, respectively, of the S&P 500 Index’s return. The Fund’s annualized standard deviation has been about 55% lower than the index’s for the last 10 years and since inception.
| | |
| 54 | | Semi-Annual Report | December 31, 2019 (Unaudited) |
| | |
| Managed Volatility Fund | | |
| MANAGER’S COMMENTARY (Unaudited)(continued) | | |
| | |
Top Ten Equity Holdings as of December 31, 2019
| | | | | | |
| Rank | | Description | | Industry | | % of Net
Assets |
| 1 | | Micron Technology, Inc. | | Information Technology | | 3.2% |
| 2 | | Amazon.com, Inc. | | Consumer Discretionary | | 1.8% |
| 3 | | Apple, Inc. | | Information Technology | | 1.7% |
| 4 | | Berkshire Hathaway, Inc., Class B | | Financials | | 1.5% |
| 5 | | Microsoft Corp. | | Information Technology | | 1.5% |
| 6 | | Fair Isaac Corp. | | Information Technology | | 1.2% |
| 7 | | Alphabet, Inc., Class A | | Communication Services | | 1.1% |
| 8 | | Alphabet, Inc., Class C | | Communication Services | | 1.1% |
| 9 | | Eli Lilly & Co. | | Health Care | | 1.1% |
| 10 | | Public Storage | | Real Estate | | 1.0% |
| | Total | | | | 15.4% |
Industry Sector Representation as of December 31, 2019
| | |
| Asset Type | | % of Net
Assets |
Common Stock | | 58.7% |
Communication Services | | 5.0% |
Consumer Discretionary | | 5.6% |
Consumer Staples | | 3.6% |
Energy | | 3.3% |
Financials | | 8.6% |
Health Care | | 8.0% |
Industrials | | 4.7% |
Information Technology | | 14.8% |
Materials | | 1.3% |
Real Estate | | 2.1% |
Utilities | | 1.7% |
U.S. Government Obligations | | 32.8% |
Call Options Written | | -1.6% |
Put Options Written | | -0.5% |
Money Market Fund | | 5.5% |
Cash & Other Assets | | 5.1% |
Total | | 100% |
Disclaimer
The views expressed here are exclusively those of Fund management. These views, including those related to market sectors or individual stocks, are not meant as investment advice and should not be considered predictive in nature. Any favorable (or unfavorable) description of a holding applies only as of the quarter end, December 31, 2019, unless otherwise stated. Security positions can and do change thereafter. Discussions of historical performance do not guarantee and may not be indicative of future performance.
Market volatility can significantly affect short-term performance. The Fund is not an appropriate investment for short-term investors. Investments in the small companies within thismulti-cap fund generally carry greater risk than is customarily associated with larger companies. This additional risk is attributable to a number of factors, including the relatively limited financial resources that are typically available to small companies and the fact that small companies often have comparatively limited product lines. In addition, the stock of small companies tends to be more volatile than the stock of large companies, particularly in the short term and particularly in the early stages of an economic or market downturn. The Fund’s use of options,
| | |
| Managed Volatility Fund | |
|
| MANAGER’S COMMENTARY (Unaudited)(continued) |
| | |
futures, and leverage can magnify the risk of loss in an unfavorable market, and the Fund’s use of short-sale positions can, in theory, expose shareholders to unlimited loss. Shareholders of the Fund, therefore, are taking on more risk than they would if they invested in the stock market as a whole. The Fund uses an option writing strategy in which the Fund may sell covered calls or secured put options. Options are subject to special risks and may not fully protect the Fund against declines in the value of its stocks. In addition, an option writing strategy limits the upside profit potential normally associated with stocks. Finally, the Fund’s fixed-income holdings are subject to three types of risk. Interest rate risk is the chance that bond prices overall will decline as interest rates rise. Credit risk is the chance that a bond issuer will fail to pay interest and principal. Prepayment risk is the chance that a mortgage-backed bond issuer will repay a higher yielding bond, resulting in a lower paying yield.
Conclusion
Thank you for your continued investment in Managed Volatility Fund. We encourage your feedback; your reactions and concerns are important to us.
Sincerely,
The Investment Management Team
| | |
| 56 | | Semi-Annual Report | December 31, 2019 (Unaudited) |
| | |
| Managed Volatility Fund | | |
| SCHEDULE OF INVESTMENTS(Unaudited) | | |
| Showing percentage of net assets as of December 31, 2019 | | |
| | | | | | | | |
| Industry Company | | Shares | | | Value | |
|
COMMON STOCKS - 58.73% | |
Communication Services - 5.04% | |
Alphabet, Inc., Class A* | | | 260 | | | $ | 348,241 | |
Alphabet, Inc., Class C* | | | 260 | | | | 347,625 | |
AT&T, Inc.# | | | 3,140 | | | | 122,711 | |
CenturyLink, Inc. | | | 1,200 | | | | 15,852 | |
Comcast Corp., Class A# | | | 1,700 | | | | 76,449 | |
Discovery, Inc., Class C* | | | 1,014 | | | | 30,917 | |
Facebook, Inc., Class A*# | | | 1,300 | | | | 266,825 | |
Fox Corp., Class A | | | 266 | | | | 9,861 | |
Omnicom Group, Inc.# | | | 600 | | | | 48,612 | |
Verizon Communications, Inc.# | | | 1,600 | | | | 98,240 | |
Walt Disney Co. (The)# | | | 1,165 | | | | 168,494 | |
| | | | | | | | |
| | | | | | | 1,533,827 | |
|
Consumer Discretionary - 5.62% | |
Amazon.com, Inc.* | | | 300 | | | | 554,352 | |
AutoZone, Inc.* | | | 200 | | | | 238,262 | |
Carnival Corp. | | | 300 | | | | 15,249 | |
Delphi Technologies PLC* | | | 166 | | | | 2,130 | |
Dollar General Corp. | | | 500 | | | | 77,990 | |
eBay, Inc.# | | | 700 | | | | 25,277 | |
Ford Motor Co. | | | 2,900 | | | | 26,970 | |
Hasbro, Inc.# | | | 700 | | | | 73,927 | |
McDonald’s Corp.# | | | 1,500 | | | | 296,415 | |
NIKE, Inc., Class B | | | 600 | | | | 60,786 | |
Ross Stores, Inc.# | | | 500 | | | | 58,210 | |
Starbucks Corp. | | | 400 | | | | 35,168 | |
Target Corp.# | | | 500 | | | | 64,105 | |
Wynn Resorts, Ltd. | | | 200 | | | | 27,774 | |
Yum China Holdings, Inc. | | | 500 | | | | 24,005 | |
Yum! Brands, Inc.# | | | 1,300 | | | | 130,949 | |
| | | | | | | | |
| | | | | | | 1,711,569 | |
|
Consumer Staples - 3.58% | |
Archer-Daniels-Midland Co. | | | 400 | | | | 18,540 | |
Campbell Soup Co.# | | | 1,900 | | | | 93,898 | |
Coca-Cola Co. (The) | | | 900 | | | | 49,815 | |
Colgate-Palmolive Co. | | | 400 | | | | 27,536 | |
Constellation Brands, Inc., Class A | | | 500 | | | | 94,875 | |
Costco Wholesale Corp. | | | 300 | | | | 88,176 | |
General Mills, Inc.# | | | 1,600 | | | | 85,696 | |
Hershey Co. (The)# | | | 500 | | | | 73,490 | |
JM Smucker Co. (The) | | | 400 | | | | 41,652 | |
Kimberly-Clark Corp.# | | | 800 | | | | 110,040 | |
Kroger Co. (The)# | | | 800 | | | | 23,192 | |
Mondelez International, Inc., Class A | | | 1,200 | | | | 66,096 | |
PepsiCo, Inc.# | | | 900 | | | | 123,003 | |
Procter & Gamble Co. (The) | | | 800 | | | | 99,920 | |
| | | | | | | | |
| Industry Company | | Shares | | | Value | |
|
Consumer Staples (continued) | |
Walmart, Inc.# | | | 800 | | | $ | 95,072 | |
| | | | | | | | |
| | | | | | | 1,091,001 | |
|
Energy - 3.32% | |
Cabot Oil & Gas Corp.# | | | 4,000 | | | | 69,640 | |
Chevron Corp. | | | 1,278 | | | | 154,012 | |
ConocoPhillips# | | | 1,287 | | | | 83,694 | |
Continental Resources, Inc.# | | | 1,000 | | | | 34,300 | |
EOG Resources, Inc.# | | | 3,500 | | | | 293,160 | |
Exxon Mobil Corp. | | | 1,900 | | | | 132,582 | |
Halliburton Co.# | | | 700 | | | | 17,129 | |
Kinder Morgan, Inc. | | | 500 | | | | 10,585 | |
Marathon Petroleum Corp.# | | | 1,700 | | | | 102,425 | |
Occidental Petroleum Corp. | | | 205 | | | | 8,448 | |
Phillips 66 | | | 593 | | | | 66,066 | |
Valero Energy Corp. | | | 400 | | | | 37,460 | |
| | | | | | | | |
| | | | | | | 1,009,501 | |
|
Financials - 8.58% | |
Allstate Corp. (The) | | | 300 | | | | 33,735 | |
Ally Financial, Inc.# | | | 1,000 | | | | 30,560 | |
American Express Co.# | | | 600 | | | | 74,694 | |
Aon PLC | | | 300 | | | | 62,487 | |
Bank of America Corp.# | | | 1,100 | | | | 38,742 | |
Berkshire Hathaway, Inc., Class B*# | | | 2,000 | | | | 453,000 | |
BlackRock, Inc. | | | 300 | | | | 150,810 | |
Capital One Financial Corp. | | | 400 | | | | 41,164 | |
Charles Schwab Corp. (The) | | | 1,200 | | | | 57,072 | |
Chubb, Ltd.# | | | 961 | | | | 149,589 | |
Citigroup, Inc. | | | 1,310 | | | | 104,656 | |
Comerica, Inc. | | | 300 | | | | 21,525 | |
Goldman Sachs Group, Inc. (The)# | | | 500 | | | | 114,965 | |
Huntington Bancshares, Inc. | | | 3,200 | | | | 48,256 | |
JPMorgan Chase & Co. | | | 400 | | | | 55,760 | |
KeyCorp. | | | 3,300 | | | | 66,792 | |
LPL Financial Holdings, Inc.# | | | 1,000 | | | | 92,250 | |
Marsh & McLennan Cos., Inc.# | | | 700 | | | | 77,987 | |
Morgan Stanley# | | | 800 | | | | 40,896 | |
PNC Financial Services Group, Inc. (The) | | | 500 | | | | 79,815 | |
Principal Financial Group, Inc.# | | | 1,000 | | | | 55,000 | |
Progressive Corp. (The)# | | | 1,220 | | | | 88,316 | |
S&P Global, Inc. | | | 500 | | | | 136,525 | |
| | |
| Managed Volatility Fund | | |
| SCHEDULE OF INVESTMENTS(Unaudited) (continued) | | |
| Showing percentage of net assets as of December 31, 2019 | | |
| | | | | | | | |
| Industry Company | | Shares | | | Value | |
|
Common Stocks (continued) | |
Financials (continued) | | | | | | | | |
Santander Consumer USA Holdings, Inc.# | | | 500 | | | $ | 11,685 | |
State Street Corp.# | | | 300 | | | | 23,730 | |
TD Ameritrade Holding Corp.# | | | 3,500 | | | | 173,950 | |
Truist Financial Corp. | | | 300 | | | | 16,896 | |
U.S. Bancorp# | | | 1,900 | | | | 112,651 | |
Wells Fargo & Co.# | | | 3,671 | | | | 197,500 | |
| | | | | | | | |
| | | | | | | 2,611,008 | |
|
Health Care - 8.01% | |
Abbott Laboratories# | | | 1,400 | | | | 121,604 | |
AbbVie, Inc.# | | | 1,600 | | | | 141,664 | |
Allergan PLC | | | 300 | | | | 57,351 | |
Amgen, Inc.# | | | 500 | | | | 120,535 | |
Anthem, Inc. | | | 300 | | | | 90,609 | |
Baxter International, Inc.# | | | 600 | | | | 50,172 | |
Becton Dickinson & Co. | | | 473 | | | | 128,642 | |
Biogen, Inc.*# | | | 400 | | | | 118,692 | |
Bristol-Myers Squibb Co. | | | 1,779 | | | | 114,194 | |
Cardinal Health, Inc.# | | | 1,000 | | | | 50,580 | |
Cigna Corp. | | | 299 | | | | 61,143 | |
CVS Health Corp. | | | 400 | | | | 29,716 | |
Danaher Corp. | | | 500 | | | | 76,740 | |
DaVita, Inc.*# | | | 1,100 | | | | 82,533 | |
Eli Lilly & Co.# | | | 2,500 | | | | 328,575 | |
Gilead Sciences, Inc. | | | 400 | | | | 25,992 | |
Johnson & Johnson# | | | 1,000 | | | | 145,870 | |
Merck & Co., Inc.# | | | 2,200 | | | | 200,090 | |
Pfizer, Inc. | | | 1,700 | | | | 66,606 | |
Stryker Corp. | | | 360 | | | | 75,578 | |
Thermo Fisher Scientific, Inc. | | | 500 | | | | 162,435 | |
UnitedHealth Group, Inc. | | | 500 | | | | 146,990 | |
Veeva Systems, Inc., Class A*# | | | 300 | | | | 42,198 | |
| | | | | | | | |
| | | | | | | 2,438,509 | |
|
Industrials - 4.70% | |
3M Co.# | | | 500 | | | | 88,210 | |
Boeing Co. (The) | | | 300 | | | | 97,728 | |
Delta Air Lines, Inc.# | | | 3,000 | | | | 175,440 | |
Emerson Electric Co.# | | | 700 | | | | 53,382 | |
FedEx Corp.# | | | 600 | | | | 90,726 | |
Honeywell International, Inc. | | | 500 | | | | 88,500 | |
Ingersoll-Rand PLC | | | 200 | | | | 26,584 | |
Johnson Controls International PLC | | | 454 | | | | 18,482 | |
Lockheed Martin Corp. | | | 270 | | | | 105,133 | |
Northrop Grumman Corp.# | | | 700 | | | | 240,779 | |
Raytheon Co. | | | 300 | | | | 65,922 | |
Resideo Technologies, Inc.* | | | 133 | | | | 1,587 | |
| | | | | | | | |
| Industry Company | | Shares | | | Value | |
|
Industrials (continued) | |
Southwest Airlines Co. | | | 1,400 | | | $ | 75,572 | |
Spirit AeroSystems Holdings, Inc., Class A# | | | 1,000 | | | | 72,880 | |
Union Pacific Corp. | | | 500 | | | | 90,395 | |
United Technologies Corp. | | | 540 | | | | 80,870 | |
Waste Management, Inc. | | | 500 | | | | 56,980 | |
| | | | | | | | |
| | | | | | | 1,429,170 | |
|
Information Technology - 14.76% | |
Adobe, Inc.*# | | | 800 | | | | 263,848 | |
Apple, Inc.# | | | 1,800 | | | | 528,570 | |
Applied Materials, Inc.# | | | 1,100 | | | | 67,144 | |
Cadence Design Systems, Inc.*# | | | 1,500 | | | | 104,040 | |
Cisco Systems, Inc.# | | | 4,300 | | | | 206,228 | |
Citrix Systems, Inc. | | | 500 | | | | 55,450 | |
Cognizant Technology Solutions Corp., Class A# | | | 700 | | | | 43,414 | |
Dell Technologies, Inc., Class C* | | | 143 | | | | 7,349 | |
DXC Technology Co. | | | 171 | | | | 6,428 | |
Fair Isaac Corp.*# | | | 1,000 | | | | 374,680 | |
Hewlett Packard Enterprise Co.# | | | 4,200 | | | | 66,612 | |
HP, Inc. | | | 2,000 | | | | 41,100 | |
Intel Corp.# | | | 2,300 | | | | 137,655 | |
International Business Machines Corp. | | | 600 | | | | 80,424 | |
Intuit, Inc. | | | 400 | | | | 104,772 | |
Juniper Networks, Inc.# | | | 2,700 | | | | 66,501 | |
LogMeIn, Inc. | | | 189 | | | | 16,205 | |
Mastercard, Inc., Class A# | | | 800 | | | | 238,872 | |
Micro Focus International PLC, ADR | | | 162 | | | | 2,273 | |
Micron Technology, Inc.*# | | | 18,200 | | | | 978,796 | |
Microsoft Corp.# | | | 2,800 | | | | 441,560 | |
NetApp, Inc. | | | 400 | | | | 24,900 | |
Oracle Corp. | | | 860 | | | | 45,563 | |
PayPal Holdings, Inc.*# | | | 1,100 | | | | 118,987 | |
QUALCOMM, Inc. | | | 800 | | | | 70,584 | |
salesforce.com, Inc.* | | | 900 | | | | 146,376 | |
Texas Instruments, Inc.# | | | 670 | | | | 85,954 | |
Visa, Inc., Class A# | | | 900 | | | | 169,110 | |
| | | | | | | | |
| | | | | | | 4,493,395 | |
|
Materials - 1.31% | |
AdvanSix, Inc.* | | | 48 | | | | 958 | |
Corteva, Inc. | | | 833 | | | | 24,623 | |
Dow, Inc.# | | | 533 | | | | 29,171 | |
DuPont de Nemours, Inc. | | | 833 | | | | 53,479 | |
Ecolab, Inc. | | | 100 | | | | 19,299 | |
International Paper Co.# | | | 600 | | | | 27,630 | |
| | |
58 | | Semi-Annual Report | December 31, 2019 (Unaudited) |
| | |
| Managed Volatility Fund | | |
| SCHEDULE OF INVESTMENTS(Unaudited) (continued) | | |
| Showing percentage of net assets as of December 31, 2019 | | |
| | | | | | | | |
| Industry Company | | Shares | | | Value | |
|
Common Stocks (continued) | |
Materials (continued) | | | | | | | | |
Linde PLC# | | | 600 | | | $ | 127,740 | |
Sherwin-Williams Co. (The) | | | 200 | | | | 116,708 | |
| | | | | | | | |
| | | | | | | 399,608 | |
|
Real Estate - 2.08% | |
American Tower Corp.# | | | 800 | | | | 183,856 | |
Crown Castle International Corp. | | | 500 | | | | 71,075 | |
Public Storage# | | | 1,500 | | | | 319,440 | |
Simon Property Group, Inc. | | | 400 | | | | 59,584 | |
| | | | | | | | |
| | | | | | | 633,955 | |
|
Utilities - 1.73% | |
AES Corp. | | | 4,300 | | | | 85,570 | |
American Electric Power Co., Inc.# | | | 800 | | | | 75,608 | |
Dominion Energy, Inc.# | | | 720 | | | | 59,630 | |
Duke Energy Corp.# | | | 783 | | | | 71,417 | |
Exelon Corp.# | | | 700 | | | | 31,913 | |
NextEra Energy, Inc. | | | 300 | | | | 72,648 | |
Public Service Enterprise Group, Inc. | | | 900 | | | | 53,145 | |
Sempra Energy | | | 500 | | | | 75,740 | |
| | | | | | | | |
| | | | | | | 525,671 | |
| | | | | | | | |
TOTAL COMMON STOCKS - 58.72% (Cost $10,045,000) | | | | 17,877,214 | |
| | | | | | | | |
|
| RIGHTS - 0.01% | |
Bristol-Myers Squibb Co., CVR* | | | 800 | | | | 2,408 | |
| | | | | | | | |
TOTAL RIGHTS - 0.01% (Cost $1,840) | | | | | | | 2,408 | |
| | | | | | | | |
| | | | | | | | | | | | |
| | | |
| Due Date | | Discount
Rate or
Coupon
Rate | | | Principal
Amount | | | Value | |
|
U.S. GOVERNMENT OBLIGATIONS - 32.77% | |
U.S. Treasury Bills - 32.77% | |
01/09/2020 | | | 0.000%(a) | | | $ | 2,000,000 | | | | 1,999,453 | |
02/27/2020 | | | 1.566%(a) | | | | 3,000,000 | | | | 2,992,953 | |
03/19/2020 | | | 1.546%(a) | | | | 2,000,000 | | | | 1,993,662 | |
03/26/2020 | | | 1.561%(a) | | | | 3,000,000 | | | | 2,989,446 | |
| | | | | | | | | | | | |
| | | | | | | | | | | 9,975,514 | |
| | | | | | | | | | | | |
TOTAL U.S. GOVERNMENT
OBLIGATIONS - 32.77% (Cost $9,974,154) | | | | 9,975,514 | |
| | | | | | | | | | | | |
| | | | | | | | | | | | |
| | | Rate^ | | | Shares | | | Value | |
|
MONEY MARKET FUND - 5.50% | |
Fidelity Investments Money Market Government Portfolio Class I | | | 1.49 | % | | | 1,674,137 | | | | $ 1,674,137 | |
| | | | | | | | | | | | |
TOTAL MONEY MARKET FUND — 5.50% (Cost $1,674,137) | | | | 1,674,137 | |
| | | | | | | | | | | | |
TOTAL INVESTMENTS BEFORE OPTIONS WRITTEN - 97.00% (Cost $21,695,131) | | | | $29,529,273 | |
| | | | | | | | | | | | |
| |
WRITTEN OPTIONS - (2.06%) | | | | | |
TOTAL WRITTEN OPTIONS - (2.06%) | | | | $ (627,243 | ) |
| | | | | | | | | | | | |
(Premiums Received $(450,290)) | | | | | |
| |
TOTAL INVESTMENTS - 94.94% (Cost $21,244,841) | | | | $28,902,030 | |
Other Assets in Excess of Liabilities - 5.06% | | | | 1,539,610 | |
| | | | | | | | | | | | |
NET ASSETS - 100.00% | | | | $30,441,640 | |
| | | | | | | | | | | | |
| * | Non-income producing security. |
| # | Security subject to call or put option written by the Fund. |
| ^ | Rate disclosed as of December 31, 2019. |
| (a) | Rate represents the effective yield at purchase. |
ADR - American Depositary Receipt
PLC - Public Limited Company
CVR - Contingent Value Rights
| | |
| Managed Volatility Fund | | |
| SCHEDULE OF INVESTMENTS(Unaudited) (continued) | | |
| Showing percentage of net assets as of December 31, 2019 | | |
| | | | | | | | | | | | | | | | | | | | |
| Description | | Number of
Contracts | | | Notional
Amount | | | Exercise
Price | | | Expiration Date | | | Value | |
EXCHANGE TRADED PUT OPTIONS WRITTEN - (0.51%) | | | | | | | | | | | | | |
| | | | | |
AerCap Holdings NV | | | 50 | | | $ | (307,350 | ) | | $ | 57.50 | | | | 01/17/20 | | | $ | (1,000 | ) |
Aflac, Inc. | | | 5 | | | | (26,450 | ) | | | 52.50 | | | | 02/21/20 | | | | (600 | ) |
ANSYS, Inc. | | | 12 | | | | (308,892 | ) | | | 250.00 | | | | 01/17/20 | | | | (3,216 | ) |
Cardinal Health, Inc. | | | 20 | | | | (101,160 | ) | | | 55.00 | | | | 03/20/20 | | | | (11,400 | ) |
CDW Corp./DE | | | 23 | | | | (328,532 | ) | | | 135.00 | | | | 03/20/20 | | | | (8,740 | ) |
Chubb, Ltd. | | | 15 | | | | (233,490 | ) | | | 150.00 | | | | 01/17/20 | | | | (675 | ) |
Coupa Software, Inc. | | | 22 | | | | (321,750 | ) | | | 140.00 | | | | 03/20/20 | | | | (21,780 | ) |
DaVita, Inc. | | | 27 | | | | (202,581 | ) | | | 70.00 | | | | 01/17/20 | | | | (675 | ) |
DaVita, Inc. | | | 17 | | | | (127,551 | ) | | | 67.50 | | | | 01/17/20 | | | | (340 | ) |
Exact Sciences Corp. | | | 25 | | | | (231,200 | ) | | | 87.50 | | | | 03/20/20 | | | | (15,250 | ) |
General Motors Co. | | | 85 | | | | (311,100 | ) | | | 36.00 | | | | 01/17/20 | | | | (3,995 | ) |
Hartford Financial Services Group, Inc. (The) | | | 10 | | | | (60,770 | ) | | | 60.00 | | | | 01/17/20 | | | | (500 | ) |
Hartford Financial Services Group, Inc. (The) | | | 10 | | | | (60,770 | ) | | | 60.00 | | | | 03/20/20 | | | | (1,690 | ) |
HCA Healthcare, Inc. | | | 12 | | | | (177,372 | ) | | | 130.00 | | | | 01/17/20 | | | | (576 | ) |
HollyFrontier Corp. | | | 5 | | | | (25,355 | ) | | | 50.00 | | | | 03/20/20 | | | | (1,395 | ) |
Medtronic PLC | | | 8 | | | | (90,760 | ) | | | 110.00 | | | | 02/21/20 | | | | (1,624 | ) |
Morgan Stanley | | | 30 | | | | (153,360 | ) | | | 50.00 | | | | 02/21/20 | | | | (4,050 | ) |
RingCentral, Inc. | | | 18 | | | | (303,606 | ) | | | 165.00 | | | | 02/21/20 | | | | (14,220 | ) |
Rollins, Inc. | | | 15 | | | | (49,740 | ) | | | 35.00 | | | | 02/21/20 | | | | (3,870 | ) |
Square, Inc. | | | 37 | | | | (231,472 | ) | | | 65.00 | | | | 03/20/20 | | | | (20,831 | ) |
Square, Inc. | | | 10 | | | | (62,560 | ) | | | 60.00 | | | | 01/17/20 | | | | (760 | ) |
State Street Corp. | | | 10 | | | | (79,100 | ) | | | 77.50 | | | | 02/21/20 | | | | (2,480 | ) |
Synchrony Financial | | | 6 | | | | (21,606 | ) | | | 36.00 | | | | 01/17/20 | | | | (360 | ) |
Target Corp. | | | 25 | | | | (320,525 | ) | | | 120.00 | | | | 01/17/20 | | | | (1,600 | ) |
Teradyne, Inc. | | | 45 | | | | (306,855 | ) | | | 67.50 | | | | 01/17/20 | | | | (5,625 | ) |
TJX Cos, Inc. (The) | | | 20 | | | | (122,120 | ) | | | 57.50 | | | | 01/17/20 | | | | (220 | ) |
Verizon Communications, Inc. | | | 50 | | | | (307,000 | ) | | | 60.00 | | | | 03/20/20 | | | | (7,300 | ) |
Walmart, Inc. | | | 20 | | | | (237,680 | ) | | | 115.00 | | | | 01/17/20 | | | | (680 | ) |
Workday, Inc. | | | 19 | | | | (312,455 | ) | | | 160.00 | | | | 01/17/20 | | | | (3,952 | ) |
Yum! Brands, Inc. | | | 20 | | | | (201,460 | ) | | | 100.00 | | | | 01/17/20 | | | | (2,360 | ) |
Zendesk, Inc. | | | 42 | | | | (321,846 | ) | | | 72.50 | | | | 02/21/20 | | | | (12,180 | ) |
| | | | | | | | | | | | | | | | | | | | |
| | | |
Total Exchange Traded Put Options Written (Premiums received $(204,149)) | | | | | | | | | | | $ | (153,944 | ) |
| | | | | | | | | | | | | | | | | | | | |
| | | |
EXCHANGE TRADED CALL OPTIONS WRITTEN - (1.55%) | | | | | | | | | | | | | |
| | | | | |
3M Co. | | | 3 | | | $ | (52,926 | ) | | $ | 175.00 | | | | 04/17/20 | | | $ | (2,835 | ) |
Abbott Laboratories | | | 4 | | | | (34,744 | ) | | | 85.00 | | | | 02/21/20 | | | | (1,320 | ) |
AbbVie, Inc. | | | 5 | | | | (44,270 | ) | | | 90.00 | | | | 02/21/20 | | | | (1,040 | ) |
Adobe, Inc. | | | 3 | | | | (98,943 | ) | | | 330.00 | | | | 03/20/20 | | | | (4,551 | ) |
Ally Financial, Inc. | | | 10 | | | | (30,560 | ) | | | 32.00 | | | | 03/20/20 | | | | (950 | ) |
American Electric Power Co., Inc. | | | 3 | | | | (28,353 | ) | | | 90.00 | | | | 02/21/20 | | | | (1,590 | ) |
American Express Co. | | | 3 | | | | (37,347 | ) | | | 120.00 | | | | 01/17/20 | | | | (1,374 | ) |
American Tower Corp. | | | 3 | | | | (68,946 | ) | | | 220.00 | | | | 04/17/20 | | | | (4,992 | ) |
Amgen, Inc. | | | 2 | | | | (48,214 | ) | | | 225.00 | | | | 01/17/20 | | | | (3,170 | ) |
Apple, Inc. | | | 6 | | | | (176,190 | ) | | | 285.00 | | | | 03/20/20 | | | | (11,520 | ) |
Applied Materials, Inc. | | | 4 | | | | (24,416 | ) | | | 52.50 | | | | 01/17/20 | | | | (3,440 | ) |
AT&T, Inc. | | | 10 | | | | (39,080 | ) | | | 40.00 | | | | 01/17/20 | | | | (110 | ) |
| | |
| 60 | | Semi-Annual Report | December 31, 2019 (Unaudited) |
| | |
| Managed Volatility Fund | | |
| SCHEDULE OF INVESTMENTS(Unaudited) (continued) | | |
| Showing percentage of net assets as of December 31, 2019 | | |
| | | | | | | | | | | | | | | | | | | | |
| Description | | Number of
Contracts | | | Notional
Amount | | | Exercise
Price | | | Expiration Date | | | Value | |
Exchange Traded Call Options Written (continued) | | | | | | | | | | | | | | | | | | | | |
Bank of America Corp. | | | 4 | | | $ | (14,088 | ) | | $ | 35.00 | | | | 03/20/20 | | | $ | (596 | ) |
Baxter International, Inc. | | | 3 | | | | (25,086 | ) | | | 82.50 | | | | 02/21/20 | | | | (1,020 | ) |
Berkshire Hathaway, Inc., Class B | | | 15 | | | | (339,750 | ) | | | 220.00 | | | | 03/20/20 | | | | (16,500 | ) |
Biogen, Inc. | | | 2 | | | | (59,346 | ) | | | 320.00 | | | | 01/17/20 | | | | (174 | ) |
Cabot Oil & Gas Corp. | | | 40 | | | | (69,640 | ) | | | 18.00 | | | | 01/17/20 | | | | (880 | ) |
Cadence Design Systems, Inc. | | | 15 | | | | (104,040 | ) | | | 70.00 | | | | 02/21/20 | | | | (4,350 | ) |
Campbell Soup Co. | | | 6 | | | | (29,652 | ) | | | 47.00 | | | | 02/21/20 | | | | (1,410 | ) |
Cardinal Health, Inc. | | | 10 | | | | (50,580 | ) | | | 52.50 | | | | 03/20/20 | | | | (2,100 | ) |
Chubb, Ltd. | | | 5 | | | | (77,830 | ) | | | 155.00 | | | | 02/21/20 | | | | (2,035 | ) |
Cisco Systems, Inc. | | | 13 | | | | (62,348 | ) | | | 47.00 | | | | 01/17/20 | | | | (1,469 | ) |
Cognizant Technology Solutions Corp., Class A | | | 3 | | | | (18,606 | ) | | | 62.50 | | | | 01/17/20 | | | | (180 | ) |
Comcast Corp., Class A | | | 5 | | | | (22,485 | ) | | | 45.00 | | | | 01/17/20 | | | | (315 | ) |
ConocoPhillips | | | 4 | | | | (26,012 | ) | | | 60.00 | | | | 02/21/20 | | | | (2,380 | ) |
Continental Resources, Inc. | | | 10 | | | | (34,300 | ) | | | 35.00 | | | | 03/20/20 | | | | (2,500 | ) |
DaVita, Inc. | | | 4 | | | | (30,012 | ) | | | 57.50 | | | | 01/17/20 | | | | (7,920 | ) |
Delta Air Lines, Inc. | | | 20 | | | | (116,960 | ) | | | 60.00 | | | | 03/20/20 | | | | (3,320 | ) |
Delta Air Lines, Inc. | | | 7 | | | | (40,936 | ) | | | 55.00 | | | | 01/17/20 | | | | (2,667 | ) |
Delta Air Lines, Inc. | | | 3 | | | | (17,544 | ) | | | 57.50 | | | | 01/17/20 | | | | (573 | ) |
Dominion Energy, Inc. | | | 3 | | | | (24,846 | ) | | | 82.50 | | | | 01/17/20 | | | | (315 | ) |
Dow, Inc. | | | 3 | | | | (16,419 | ) | | | 55.00 | | | | 01/17/20 | | | | (282 | ) |
Duke Energy Corp. | | | 3 | | | | (27,363 | ) | | | 95.00 | | | | 01/17/20 | | | | (12 | ) |
eBay, Inc. | | | 3 | | | | (10,833 | ) | | | 39.00 | | | | 01/17/20 | | | | (15 | ) |
Eli Lilly & Co. | | | 25 | | | | (328,575 | ) | | | 115.00 | | | | 02/21/20 | | | | (47,000 | ) |
Emerson Electric Co. | | | 3 | | | | (22,878 | ) | | | 75.00 | | | | 01/17/20 | | | | (645 | ) |
EOG Resources, Inc. | | | 30 | | | | (251,280 | ) | | | 75.00 | | | | 01/17/20 | | | | (25,650 | ) |
Exelon Corp. | | | 3 | | | | (13,677 | ) | | | 45.00 | | | | 01/17/20 | | | | (285 | ) |
Facebook, Inc., Class A | | | 4 | | | | (82,100 | ) | | | 205.00 | | | | 03/20/20 | | | | (4,440 | ) |
Fair Isaac Corp. | | | 10 | | | | (374,680 | ) | | | 300.00 | | | | 01/17/20 | | | | (77,500 | ) |
FedEx Corp. | | | 3 | | | | (45,363 | ) | | | 150.00 | | | | 01/17/20 | | | | (1,143 | ) |
General Mills, Inc. | | | 5 | | | | (26,780 | ) | | | 55.00 | | | | 01/17/20 | | | | (110 | ) |
Goldman Sachs Group, Inc. (The) | | | 3 | | | | (68,979 | ) | | | 210.00 | | | | 01/17/20 | | | | (5,970 | ) |
Halliburton Co. | | | 3 | | | | (7,341 | ) | | | 22.50 | | | | 01/17/20 | | | | (612 | ) |
Hasbro, Inc. | | | 3 | | | | (31,683 | ) | | | 125.00 | | | | 01/17/20 | | | | (15 | ) |
Hershey Co. (The) | | | 5 | | | | (73,490 | ) | | | 145.00 | | | | 01/17/20 | | | | (1,280 | ) |
Hewlett Packard Enterprise Co. | | | 10 | | | | (15,860 | ) | | | 17.00 | | | | 01/17/20 | | | | (50 | ) |
Intel Corp. | | | 7 | | | | (41,895 | ) | | | 52.50 | | | | 01/17/20 | | | | (5,075 | ) |
International Paper Co. | | | 3 | | | | (13,815 | ) | | | 42.50 | | | | 01/17/20 | | | | (1,071 | ) |
Johnson & Johnson | | | 5 | | | | (72,935 | ) | | | 135.00 | | | | 01/17/20 | | | | (5,605 | ) |
Juniper Networks, Inc. | | | 8 | | | | (19,704 | ) | | | 24.00 | | | | 01/17/20 | | | | (696 | ) |
Kimberly-Clark Corp. | | | 3 | | | | (41,265 | ) | | | 140.00 | | | | 01/17/20 | | | | (270 | ) |
Kroger Co. (The) | | | 3 | | | | (8,697 | ) | | | 25.00 | | | | 01/17/20 | | | | (1,206 | ) |
Linde PLC | | | 3 | | | | (63,870 | ) | | | 210.00 | | | | 01/17/20 | | | | (1,260 | ) |
LPL Financial Holdings, Inc. | | | 10 | | | | (92,250 | ) | | | 80.00 | | | | 01/17/20 | | | | (14,700 | ) |
Marathon Petroleum Corp. | | | 5 | | | | (30,125 | ) | | | 60.00 | | | | 04/17/20 | | | | (2,000 | ) |
Marsh & McLennan Cos., Inc. | | | 3 | | | | (33,423 | ) | | | 100.00 | | | | 01/17/20 | | | | (3,390 | ) |
Mastercard, Inc., Class A | | | 3 | | | | (89,577 | ) | | | 300.00 | | | | 04/17/20 | | | | (3,750 | ) |
McDonald’s Corp. | | | 10 | | | | (197,610 | ) | | | 200.00 | | | | 03/20/20 | | | | (4,400 | ) |
Merck & Co., Inc. | | | 7 | | | | (63,665 | ) | | | 90.00 | | | | 03/20/20 | | | | (2,359 | ) |
Micron Technology, Inc. | | | 143 | | | | (769,054 | ) | | | 45.00 | | | | 01/17/20 | | | | (126,841 | ) |
| | |
| Managed Volatility Fund | | |
| SCHEDULE OF INVESTMENTS(Unaudited) (continued) | | |
| Showing percentage of net assets as of December 31, 2019 | | |
| | | | | | | | | | | | | | | | | | | | |
| Description | | Number of
Contracts | | | Notional
Amount | | | Exercise
Price | | | Expiration Date | | | Value | |
Exchange Traded Call Options Written (continued) | | | | | |
Micron Technology, Inc. | | | 12 | | | $ | (64,536 | ) | | $ | 57.50 | | | | 03/20/20 | | | $ | (2,736 | ) |
Microsoft Corp. | | | 9 | | | | (141,930 | ) | | | 160.00 | | | | 03/20/20 | | | | (4,230 | ) |
Northrop Grumman Corp. | | | 3 | | | | (103,191 | ) | | | 360.00 | | | | 02/21/20 | | | | (1,287 | ) |
Omnicom Group, Inc. | | | 3 | | | | (24,306 | ) | | | 77.50 | | | | 01/17/20 | | | | (1,170 | ) |
PayPal Holdings, Inc. | | | 3 | | | | (32,451 | ) | | | 105.00 | | | | 01/17/20 | | | | (1,230 | ) |
PepsiCo, Inc. | | | 3 | | | | (41,001 | ) | | | 140.00 | | | | 01/17/20 | | | | (84 | ) |
Principal Financial Group, Inc. | | | 10 | | | | (55,000 | ) | | | 55.00 | | | | 01/17/20 | | | | (900 | ) |
Progressive Corp. (The) | | | 4 | | | | (28,956 | ) | | | 75.00 | | | | 02/21/20 | | | | (240 | ) |
Public Storage | | | 10 | | | | (212,960 | ) | | | 220.00 | | | | 03/20/20 | | | | (3,970 | ) |
Ross Stores, Inc. | | | 3 | | | | (34,926 | ) | | | 115.00 | | | | 01/17/20 | | | | (750 | ) |
Santander Consumer USA Holdings, Inc. | | | 5 | | | | (11,685 | ) | | | 25.00 | | | | 04/17/20 | | | | (325 | ) |
Spirit AeroSystems Holdings, Inc., Class A | | | 10 | | | | (72,880 | ) | | | 85.00 | | | | 01/17/20 | | | | (400 | ) |
TD Ameritrade Holding Corp. | | | 35 | | | | (173,950 | ) | | | 45.00 | | | | 02/21/20 | | | | (19,950 | ) |
Texas Instruments, Inc. | | | 3 | | | | (38,487 | ) | | | 130.00 | | | | 01/17/20 | | | | (324 | ) |
U.S. Bancorp | | | 6 | | | | (35,574 | ) | | | 60.00 | | | | 01/17/20 | | | | (348 | ) |
Veeva Systems, Inc., Class A | | | 3 | | | | (42,198 | ) | | | 145.00 | | | | 03/20/20 | | | | (2,160 | ) |
Visa, Inc., Class A | | | 3 | | | | (56,370 | ) | | | 190.00 | | | | 03/20/20 | | | | (1,650 | ) |
Walt Disney Co. (The) | | | 3 | | | | (43,389 | ) | | | 150.00 | | | | 03/20/20 | | | | (1,137 | ) |
Wells Fargo & Co. | | | 12 | | | | (64,560 | ) | | | 50.00 | | | | 01/17/20 | | | | (4,740 | ) |
Yum! Brands, Inc. | | | 10 | | | | (100,730 | ) | | | 105.00 | | | | 01/17/20 | | | | (440 | ) |
| | | | | | | | | | | | | | | | | | | | |
Total Exchange Traded Call Options Written (Premiums received $(246,141)) | | | | | | | | | | | | | | | | | | $ | (473,299 | ) |
| | | | | | | | | | | | | | | | | | | | |
| | |
| 62 | | Semi-Annual Report | December 31, 2019 (Unaudited) |
| | |
| Managed Volatility Fund | | |
| SCHEDULE OF INVESTMENTS (Unaudited) (continued) | | |
| | | | | | | | | | | | | | | | | | | | | | | | | |
| Summary of inputs used to value the Fund’s investments as of 12/31/2019 (See Note 2 in Notes to Financial Statements): | | | | | | |
| | | | | Assets Table | | |
| | | | | Valuation Inputs | | |
| | | | | Investment in Securities (Value) | | |
| | | Level 1
Quoted
Prices | | Level 2
Significant
Observable
Inputs | | Level 3 Significant Unobservable Inputs | | Total |
Common Stocks | | | $ | 17,877,214 | | | | $ | — | | | | $ | — | | | | $ | 17,877,214 | |
Rights | | | | 2,408 | | | | | — | | | | | — | | | | | 2,408 | |
U.S. Government Obligations | | | | — | | | | | 9,975,514 | | | | | — | | | | | 9,975,514 | |
Money Market Fund | | | | — | | | | | 1,674,137 | | | | | — | | | | | 1,674,137 | |
| | | | | | | | | | | | | | | | | | | | |
TOTAL | | | $ | 17,879,622 | | | | $ | 11,649,651 | | | | $ | — | | | | $ | 29,529,273 | |
| | | | | | | | | | | | | | | | | | | | |
| | | | | Liabilities Table | | |
| | | | | Valuation Inputs | | |
| | | | | Investment in Securities (Value) | | |
| | | Level 1
Quoted
Prices | | Level 2
Significant
Observable
Inputs | | Level 3
Significant Unobservable Inputs | | Total |
Options Written | | | $ | (371,088 | ) | | | $ | (256,155 | ) | | | $ | — | | | | $ | (627,243 | ) |
| | | | | | | | | | | | | | | | | | | | |
TOTAL | | | $ | (371,088 | ) | | | $ | (256,155 | ) | | | $ | — | | | | $ | (627,243 | ) |
| | | | | | | | | | | | | | | | | | | | |
| |
| See Notes to Financial Statements. | | | | | | |
| | |
| STATEMENTS OF ASSETS AND LIABILITIES | | |
December 31, 2019 (Unaudited)
| | | | | | | | | | | | |
| ASSETS | | Aggressive
Investors 1 | | | | | Ultra-Small
Company | | | |
Investments at value | | $ | 181,800,655 | | | | | $ | 71,226,315 | | | |
Cash | | | - | | | | | | - | | | |
Receivables: | | | | | | | | | | | | |
Portfolio securities sold | | | - | | | | | | - | | | |
Fund shares sold | | | 42,922 | | | | | | - | | | |
Dividends and interest | | | 103,697 | | | | | | 89,674 | | | |
Receivable from investment adviser | | | - | | | | | | - | | | |
Deposits with brokers | | | - | | | | | | - | | | |
Prepaid expenses | | | 18,048 | | | | | | 9,792 | | | |
| | | | |
Total assets | | | 181,965,322 | | | | | | 71,325,781 | | | |
| | | | |
LIABILITIES | | | | | | | | | | | | |
Payables: | | | | | | | | | | | | |
Portfolio securities purchased | | | - | | | | | | - | | | |
Fund shares redeemed | | | 192,564 | | | | | | 25,579 | | | |
Due to custodian | | | - | | | | | | 655,980 | | | |
Loan payable | | | - | | | | | | - | | | |
Payable upon return of securities loaned | | | 6,937,723 | | | | | | 1,618,090 | | | |
Accrued Liabilities: | | | | | | | | | | | | |
Investment adviser fees | | | 3,885 | | | | | | 51,735 | | | |
Administration fees | | | 4,165 | | | | | | 1,625 | | | |
Directors’ fees | | | 1,696 | | | | | | 725 | | | |
Other | | | 87,268 | | | | | | 47,690 | | | |
Put options written at value | | | - | | | | | | - | | | |
Call options written at value | | | - | | | | | | - | | | |
| | | | |
Total liabilities | | | 7,227,301 | | | | | | 2,401,424 | | | |
NET ASSETS | | $ | 174,738,021 | | | | | $ | 68,924,357 | | | |
| | | | |
NET ASSETS REPRESENT | | | | | | | | | | | | |
Paid-in capital | | $ | 175,192,347 | | | | | $ | 74,885,271 | | | |
Distributable earnings | | | (454,326 | ) | | | | | (5,960,914 | ) | | |
| | | | |
NET ASSETS | | $ | 174,738,021 | | | | | $ | 68,924,357 | | | |
| | | | |
Shares of common stock outstanding of $.001 par value(a) | | | 2,772,057 | | | | | | 2,839,505 | | | |
| | | | |
Net asset value, offering price and redemption price per share | | $ | 63.04 | | | | | $ | 24.27 | | | |
| | | | |
Total investments at cost | | $ | 166,679,317 | | | | | $ | 75,709,507 | | | |
Premiums received on put options written | | $ | - | | | | | $ | - | | | |
Premiums received on call options written | | $ | - | | | | | $ | - | | | |
| (a) | See Note 1 - Organization in the Notes to Financial Statements for shares authorized for each Fund. |
| (b) | Redemption of shares held less than six months may be charged a 2% redemption fee. See Note 8. |
See Notes to Financial Statements.
| | |
| 64 | | Semi-Annual Report | December 31, 2019 (Unaudited) |
| | |
| | | |
| | | |
| | | | | | | | | | | | | | | | | | | | | | |
Ultra-Small
Company Market | | | Small-Cap
Growth | | | Small-Cap
Value | | | Blue Chip | | | Managed
Volatility | | | | |
| $ | 238,608,835 | | | $ | 38,082,342 | | | $ | 47,417,237 | | | | $558,009,447 | | | | $29,529,273 | | | | | |
| | - | | | | - | | | | - | | | | - | | | | 106 | | | | | |
| | | | | | | | | | | | | | | | | | | | | | | |
| | 1,340,717 | | | | 653,127 | | | | 371,940 | | | | 8,150,022 | | | | - | | | | | |
| | 119,854 | | | | 2,186 | | | | - | | | | 719,541 | | | | - | | | | | |
| | 224,869 | | | | 19,215 | | | | 61,008 | | | | 332,477 | | | | 15,730 | | | | | |
| | - | | | | - | | | | - | | | | 12,697 | | | | - | | | | | |
| | - | | | | - | | | | - | | | | - | | | | 1,609,896 | | | | | |
| | 25,791 | | | | 16,744 | | | | 17,397 | | | | 51,061 | | | | 12,217 | | | | | |
| | | | | |
| | 240,320,066 | | | | 38,773,614 | | | | 47,867,582 | | | | 567,275,245 | | | | 31,167,222 | | | | | |
| | | | | |
| | | | | | | | | | | | | | | | | | | | | | | |
| | | | | | | | | | | | | | | | | | | | | | |
| | - | | | | 555,463 | | | | - | | | | 7,996,325 | | | | - | | | | | |
| | 628,345 | | | | 122,316 | | | | 125,950 | | | | 393,961 | | | | 52,776 | | | | | |
| | 226,878 | | | | 160,897 | | | | - | | | | 27,620 | | | | - | | | | | |
| | 1,178,000 | | | | - | | | | 248,000 | | | | - | | | | - | | | | | |
| | 21,847,383 | | | | 1,840,670 | | | | 3,409,392 | | | | - | | | | - | | | | | |
| | | | | | | | | | | | | | | | | | | | | | | |
| | 81,384 | | | | 7,521 | | | | 14,123 | | | | - | | | | 5,951 | | | | | |
| | 5,171 | | | | 864 | | | | 1,158 | | | | 13,276 | | | | 729 | | | | | |
| | 2,760 | | | | 493 | | | | 468 | | | | 3,958 | | | | 248 | | | | | |
| | 143,168 | | | | 44,818 | | | | 47,854 | | | | 103,378 | | | | 38,635 | | | | | |
| | - | | | | - | | | | - | | | | - | | | | 153,944 | | | | | |
| | - | | | | - | | | | - | | | | - | | | | 473,299 | | | | | |
| | | | | |
| | 24,113,089 | | | | 2,733,042 | | | | 3,846,945 | | | | 8,538,518 | | | | 725,582 | | | | | |
| | | | | |
| $ | 216,206,977 | | | $ | 36,040,572 | | | $ | 44,020,637 | | | | $558,736,727 | | | | $30,441,640 | | | | | |
| | | | | |
| | | | | | | | | | | | | | | | | | | | | | | |
| $ | 187,255,657 | | | $ | 34,231,164 | | | $ | 46,379,941 | | | | $253,320,348 | | | | $23,581,557 | | | | | |
| | 28,951,320 | | | | 1,809,408 | | | | (2,359,304 | ) | | | 305,416,379 | | | | 6,860,083 | | | | | |
| | | | | |
| $ | 216,206,977 | | | $ | 36,040,572 | | | $ | 44,020,637 | | | | $558,736,727 | | | | $30,441,640 | | | | | |
| | | | | |
| | 18,601,426 | | | | 1,420,237 | | | | 2,060,341 | | | | 37,422,428 | | | | 1,980,578 | | | | | |
| | | | | |
| $ | 11.62 | (b) | | $ | 25.38 | | | $ | 21.37 | | | | $ 14.93 | | | | $ 15.37 | | | | | |
| | | | | |
| $ | 208,902,370 | | | $ | 34,075,599 | | | $ | 44,977,088 | | | | $261,078,406 | | | | $21,695,131 | | | | | |
| $ | - | | | $ | - | | | $ | - | | | | $ - | | | | $ 204,149 | | | | | |
| $ | - | | | $ | - | | | $ | - | | | | $ - | | | | $ 246,141 | | | | | |
Six Months Ended December 31, 2019 (Unaudited)
| | | | | | | | | | | | | | | | |
| | | Aggressive
Investors 1 | | | Ultra-Small
Company | | | Ultra-Small
Company Market | | | | |
| | | | |
INVESTMENT INCOME | | | | | | | | | | | | | | | | |
Dividends | | $ | 1,082,208 | | | $ | 613,748 | | | $ | 1,497,086 | | | | | |
Less: foreign taxes withheld | | | (2,784 | ) | | | (746 | ) | | | (514 | ) | | | | |
Interest | | | 7,837 | | | | 1,920 | | | | 9,370 | | | | | |
Securities lending | | | 14,387 | | | | 74,905 | | | | 1,179,496 | | | | | |
| | | | |
Total Investment Income | | | 1,101,648 | | | | 689,827 | | | | 2,685,438 | | | | | |
| | | | |
EXPENSES | | | | | | | | | | | | | | | | |
Investment advisory fees-Base fees | | | 788,013 | | | | 311,865 | | | | 547,986 | | | | | |
Investment advisory fees - Performance adjustment | | | (770,217 | ) | | | - | | | | - | | | | | |
Administration fees | | | 25,060 | | | | 9,916 | | | | 31,365 | | | | | |
Accounting fees | | | 38,142 | | | | 32,968 | | | | 48,727 | | | | | |
Transfer agent fees | | | 64,835 | | | | 30,817 | | | | 50,996 | | | | | |
Audit fees | | | 9,875 | | | | 6,765 | | | | 11,585 | | | | | |
Legal fees | | | 15,392 | | | | 6,109 | | | | 19,582 | | | | | |
Custody fees | | | 3,620 | | | | 5,138 | | | | 8,569 | | | | | |
Blue sky fees | | | 12,743 | | | | 5,477 | | | | 12,504 | | | | | |
Directors’ and officers’ fees | | | 10,567 | | | | 4,230 | | | | 13,727 | | | | | |
Shareholder servicing fees | | | 50,174 | | | | 10,448 | | | | 110,648 | | | | | |
Reports to shareholders | | | 16,802 | | | | 10,237 | | | | 21,565 | | | | | |
Miscellaneous expenses | | | 19,380 | | | | 11,564 | | | | 33,509 | | | | | |
| | | | |
Total Expenses | | | 284,386 | | | | 445,534 | | | | 910,763 | | | | | |
| | | | |
Less investment advisory fees waived and other expenses reimbursed | | | - | | | | - | | | | (88,783 | ) | | | | |
| | | | |
Net Expenses | | | 284,386 | | | | 445,534 | | | | 821,980 | | | | | |
| | | | |
NET INVESTMENT INCOME (LOSS) | | | 817,262 | | | | 244,293 | | | | 1,863,458 | | | | | |
| | | | |
NET REALIZED AND UNREALIZED GAIN (LOSS) ON INVESTMENTS | | | | | | | | | | | | | | | | |
Realized Gain (Loss) on: | | | | | | | | | | | | | | | | |
Investments | | | (2,309,881 | ) | | | (1,249,246 | ) | | | 281,916 | | | | | |
Written options | | | - | | | | - | | | | - | | �� | | | |
Futures contracts | | | - | | | | - | | | | - | | | | | |
Net Realized Gain (Loss) | | | (2,309,881 | ) | | | (1,249,246 | ) | | | 281,916 | | | | | |
| | | | |
Change in Unrealized Appreciation (Depreciation) on: | | | | | | | | | | | | | | | | |
Investments | | | 6,401,369 | | | | 1,925,208 | | | | 5,058,683 | | | | | |
Written options | | | - | | | | - | | | | - | | | | | |
| | | | |
Net Change in Unrealized Appreciation (Depreciation) | | | 6,401,369 | | | | 1,925,208 | | | | 5,058,683 | | | | | |
| | | | |
Net Realized and Unrealized Gain (Loss) on Investments | | | 4,091,488 | | | | 675,962 | | | | 5,340,599 | | | | | |
| | | | |
INCREASE (DECREASE) IN NET ASSETS RESULTING FROM OPERATIONS | | $ | 4,908,750 | | | $ | 920,255 | | | $ | 7,204,057 | | | | | |
See Notes to Financial Statements.
| | |
| 66 | | Semi-Annual Report | December 31, 2019 (Unaudited) |
| | |
| | | |
| | | |
| | | | | | | | | | | | | | |
| Small-Cap
Growth |
| |
| Small-Cap
Value |
| |
| Blue
Chip |
| |
| Managed
Volatility |
|
| | | |
| | | | | | | | | | | | | | | |
| | $ 134,757 | | | | $ 459,259 | | | | $ 6,248,340 | | | | $ 166,948 | |
| | - | | | | (800 | ) | | | - | | | | (34 | ) |
| | 530 | | | | 2,987 | | | | 4,664 | | | | 115,830 | |
| | 16,216 | | | | 58,780 | | | | - | | | | 2 | |
| | | |
| | 151,503 | | | | 520,226 | | | | 6,253,004 | | | | 282,746 | |
| | | |
| | | | | | | | | | | | | | | |
| | 111,716 | | | | 144,889 | | | | 213,845 | | | | 91,129 | |
| | (6,816 | ) | | | (15,646 | ) | | | - | | | | - | |
| | 5,334 | | | | 6,909 | | | | 76,428 | | | | 4,346 | |
| | 29,099 | | | | 30,202 | | | | 60,196 | | | | 32,295 | |
| | 29,404 | | | | 32,628 | | | | 39,393 | | | | 18,698 | |
| | 5,855 | | | | 6,072 | | | | 18,700 | | | | 8,044 | |
| | 3,386 | | | | 4,145 | | | | 57,243 | | | | 2,638 | |
| | 4,184 | | | | 3,259 | | | | 3,914 | | | | 2,279 | |
| | 11,687 | | | | 11,638 | | | | 18,618 | | | | 11,396 | |
| | 2,354 | | | | 2,881 | | | | 30,910 | | | | 1,800 | |
| | 11,996 | | | | 13,680 | | | | 44,111 | | | | 9,819 | |
| | 9,504 | | | | 10,232 | | | | 67,283 | | | | 8,628 | |
| | 7,865 | | | | 6,881 | | | | 51,961 | | | | 4,654 | |
| | 225,568 | | | | 257,770 | | | | 682,602 | | | | 195,726 | |
| | | |
| | (50,401 | ) | | | (30,639 | ) | | | (281,670 | ) | | | (52,955 | ) |
| | | |
| | 175,167 | | | | 227,131 | | | | 400,932 | | | | 142,771 | |
| | | |
| | (23,664 | ) | | | 293,095 | | | | 5,852,072 | | | | 139,975 | |
| | | |
| | | | | | | | | | | | | | | |
| | | | | | | | | | | | | | | |
| | | |
| | (404,997 | ) | | | (808,191 | ) | | | 14,622,037 | | | | 274,098 | |
| | - | | | | - | | | | - | | | | 286,452 | |
| | - | | | | - | | | | - | | | | (946,532 | ) |
| | (404,997 | ) | | | (808,191 | ) | | | 14,622,037 | | | | (385,982 | ) |
| | | |
| | | | | | | | | | | | | | | |
| | 1,664,904 | | | | 4,260,661 | | | | 34,316,643 | | | | 1,261,782 | |
| | | |
| | - | | | | - | | | | - | | | | (92,451 | ) |
| | | |
| | 1,664,904 | | | | 4,260,661 | | | | 34,316,643 | | | | 1,169,331 | |
| | | |
| | 1,259,907 | | | | 3,452,470 | | | | 48,938,680 | | | | 783,349 | |
| | | |
| | $1,236,243 | | | | $3,745,565 | | | | $54,790,752 | | | | $ 923,324 | |
STATEMENTS OF CHANGES IN NET ASSETS
| | | | | | | | | | | | | | | | | | | | |
| | | Aggressive Investors 1 | | | Ultra-Small Company | | | | |
| | | Six Months Ended
December 31, 2019 | | | Year Ended
June 30, 2019 | | | Six Months Ended
December 31, 2019 | | | Year Ended
June 30, 2019 | | | | |
| | | (Unaudited) | | | | | | (Unaudited) | | | | | | | |
| | | | | |
OPERATIONS | | | | | | | | | | | | | | | | | | | | |
Net investment income (loss) | | | $ 817,262 | | | | $ 2,951,642 | | | | $ 244,293 | | | | $ 860,428 | | | | | |
Net realized gain (loss) on investments | | | (2,309,881 | ) | | | (11,825,872 | ) | | | (1,249,246 | ) | | | (160,937 | ) | | | | |
Net change in unrealized appreciation (depreciation) on investments | | | 6,401,369 | | | | (8,208,119 | ) | | | 1,925,208 | | | | (14,307,616 | ) | | | | |
| |
Net increase (decrease) in net assets resulting from operations | | | 4,908,750 | | | | (17,082,349 | ) | | | 920,255 | | | | (13,608,125 | ) | | | | |
| |
| | | | | |
DISTRIBUTIONS: | | | | | | | | | | | | | | | | | | | | |
From net investment income and net realized gains | | | (2,253,130 | ) | | | (17,842,416 | ) | | | (780,772 | ) | | | (8,976,806 | ) | | | | |
| |
Net decrease in net assets from distributions | | | (2,253,130 | ) | | | (17,842,416 | ) | | | (780,772 | ) | | | (8,976,806 | ) | | | | |
| |
| | | | | |
SHARE TRANSACTIONS: | | | | | | | | | | | | | | | | | | | | |
Proceeds from sale of shares | | | 2,547,784 | | | | 2,826,662 | | | | 619,840 | | | | 1,238,828 | | | | | |
Reinvestment of distributions | | | 2,129,245 | | | | 17,139,212 | | | | 717,092 | | | | 8,375,017 | | | | | |
Cost of shares redeemed | | | (13,961,208 | ) | | | (31,236,846 | ) | | | (6,557,470 | ) | | | (9,777,274 | ) | | | | |
Redemption fees | | | - | | | | - | | | | - | | | | - | | | | | |
| |
Net decrease in net assets resulting from share transactions | | | (9,284,179 | ) | | | (11,270,972 | ) | | | (5,220,538 | ) | | | (163,429 | ) | | | | |
| |
Net decrease in net assets | | | (6,628,559 | ) | | | (46,195,737 | ) | | | (5,081,055 | ) | | | (22,748,360 | ) | | | | |
| | | | | |
NET ASSETS: | | | | | | | | | | | | | | | | | | | | |
Beginning of period | | | 181,366,580 | | | | 227,562,317 | | | | 74,005,412 | | | | 96,753,772 | | | | | |
| |
End of period | | | $174,738,021 | | | | $181,366,580 | | | | $68,924,357 | | | | $ 74,005,412 | | | | | |
| |
| | | | | |
SHARES ISSUED & REDEEMED | | | | | | | | | | | | | | | | | | | | |
Issued | | | 41,519 | | | | 46,127 | | | | 26,863 | | | | 47,786 | | | | | |
Distributions reinvested | | | 33,965 | | | | 322,773 | | | | 30,206 | | | | 369,758 | | | | | |
Redeemed | | | (228,230 | ) | | | (517,228 | ) | | | (280,106 | ) | | | (366,637 | ) | | | | |
| |
Net increase (decrease) | | | (152,746 | ) | | | (148,328 | ) | | | (223,037 | ) | | | 50,907 | | | | | |
Outstanding at beginning of period | | | 2,924,803 | | | | 3,073,131 | | | | 3,062,542 | | | | 3,011,635 | | | | | |
| |
Outstanding at end of period | | | 2,772,057 | | | | 2,924,803 | | | | 2,839,505 | | | | 3,062,542 | | | | | |
| |
See Notes to Financial Statements.
| | |
| 68 | | Semi-Annual Report | December 31, 2019 (Unaudited) |
| | |
| | | |
| | | | | | | | | | | | | | | | | | | | | | |
Ultra-Small Company Market | | | Small-Cap Growth | | | Small-Cap Value | |
Six Months Ended December 31, 2019 | | | Year Ended
June 30, 2019 | | | Six Months Ended
December 31, 2019 | | | Year Ended
June 30, 2019 | | | Six Months Ended
December 31, 2019 | | | Year Ended
June 30, 2019 | |
| (Unaudited) | | | | | | (Unaudited) | | | | | | (Unaudited) | | | | |
| | | | | |
| | | | | | | | | | | | | | | | | | | | | | | |
| | $ 1,863,458 | | | | $ 2,643,213 | | | | $ (23,664 | ) | | | $ (47,742 | ) | | | $ 293,095 | | | | $ 1,162,708 | |
| | 281,916 | | | | 10,012,500 | | | | (404,997 | ) | | | (218,258 | ) | | | (808,191 | ) | | | (3,088,648 | ) |
| | | | | |
| | 5,058,683 | | | | (79,246,838 | ) | | | 1,664,904 | | | | (5,797,297 | ) | | | 4,260,661 | | | | (9,795,116 | ) |
| | |
| | | | | |
| | 7,204,057 | | | | (66,591,125 | ) | | | 1,236,243 | | | | (6,063,297 | ) | | | 3,745,565 | | | | (11,721,056 | ) |
| | |
| | | | | |
| | | | | | | | | | | | | | | | | | | | | | | |
| | (2,859,334 | ) | | | (37,857,578 | ) | | | (948 | ) | | | (4,528,900 | ) | | | (1,172,540 | ) | | | (9,164,909 | ) |
| | |
| | (2,859,334 | ) | | | (37,857,578 | ) | | | (948 | ) | | | (4,528,900 | ) | | | (1,172,540 | ) | | | (9,164,909 | ) |
| | |
| | | | | |
| | | | | | | | | | | | | | | | | | | | | | | |
| | 11,716,815 | | | | 36,606,492 | | | | 432,812 | | | | 3,609,014 | | | | 841,269 | | | | 4,577,457 | |
| | 2,712,320 | | | | 36,666,837 | | | | 882 | | | | 4,410,107 | | | | 1,120,299 | | | | 8,787,349 | |
| | (38,975,168 | ) | | | (110,698,074 | ) | | | (7,713,663 | ) | | | (10,814,122 | ) | | | (10,165,717 | ) | | | (12,143,617 | ) |
| | 37,068 | | | | 100,303 | | | | - | | | | - | | | | - | | | | - | |
| | |
| | | | | |
| | (24,508,965 | ) | | | (37,324,442 | ) | | | (7,279,969 | ) | | | (2,795,001 | ) | | | (8,204,149 | ) | | | 1,221,189 | |
| | |
| | (20,164,242 | ) | | | (141,773,145 | ) | | | (6,044,674 | ) | | | (13,387,198 | ) | | | (5,631,124 | ) | | | (19,664,776 | ) |
| | | | | |
| | | | | | | | | | | | | | | | | | | | | | | |
| | 236,371,219 | | | | 378,144,364 | | | | 42,085,246 | | | | 55,472,444 | | | | 49,651,761 | | | | 69,316,537 | |
| | |
| | $216,206,977 | | | | $ 236,371,219 | | | | $36,040,572 | | | | $42,085,246 | | | | $44,020,637 | | | | $ 49,651,761 | |
| | |
| | | | | |
| | | | | | | | | | | | | | | | | | | | | | | |
| | 1,087,249 | | | | 2,955,119 | | | | 18,253 | | | | 126,783 | | | | 41,799 | | | | 172,771 | |
| | 240,241 | | | | 3,508,788 | | | | 35 | | | | 194,879 | | | | 52,522 | | | | 453,658 | |
| | (3,563,079 | ) | | | (9,539,072 | ) | | | (331,065 | ) | | | (417,997 | ) | | | (486,740 | ) | | | (515,773 | ) |
| | |
| | (2,235,589 | ) | | | (3,075,165 | ) | | | (312,777 | ) | | | (96,335 | ) | | | (392,419 | ) | | | 110,656 | |
| | 20,837,015 | | | | 23,912,180 | | | | 1,733,014 | | | | 1,829,349 | | | | 2,452,760 | | | | 2,342,104 | |
| | |
| | 18,601,426 | | | | 20,837,015 | | | | 1,420,237 | | | | 1,733,014 | | | | 2,060,341 | | | | 2,452,760 | |
| | |
STATEMENTS OF CHANGES IN NET ASSETS
| | | | | | | | | | | | | | | | | | | | |
| | | Blue Chip | | | Managed Volatility | | | | |
| | | Six Months Ended
December 31, 2019 | | | Year Ended
June 30, 2019 | | | Six Months Ended
December 31, 2019 | | | Year Ended
June 30, 2019 | | | | |
| | | (Unaudited) | | | | | | (Unaudited) | | | | | | | |
| | | | | |
OPERATIONS | | | | | | | | | | | | | | | | | | | | |
Net investment income | | | $ 5,852,072 | | | | $ 13,105,679 | | | | $ 139,975 | | | | $ 336,023 | | | | | |
Net realized gain (loss) on investments | | | 14,622,037 | | | | 68,602,183 | | | | (385,982 | ) | | | 568,555 | | | | | |
Net change in unrealized appreciation (depreciation) on investments | | | 34,316,643 | | | | 1,846,454 | | | | 1,169,331 | | | | (363,853 | ) | | | | |
| |
Net increase in net assets resulting from operations | | | 54,790,752 | | | | 83,554,316 | | | | 923,324 | | | | 540,725 | | | | | |
| |
| | | | | |
DISTRIBUTIONS: | | | | | | | | | | | | | | | | | | | | |
From net investment income and net realized gains | | | (56,389,851 | ) | | | (64,810,534 | ) | | | (311,246 | ) | | | (1,895,822 | ) | | | | |
| |
Net decrease in net assets from distributions | | | (56,389,851 | ) | | | (64,810,534 | ) | | | (311,246 | ) | | | (1,895,822 | ) | | | | |
| |
| | | | | |
SHARE TRANSACTIONS: | | | | | | | | | | | | | | | | | | | | |
Proceeds from sale of shares | | | 51,449,102 | | | | 77,791,859 | | | | 1,632,528 | | | | 3,893,273 | | | | | |
Reinvestment of distributions | | | 51,355,855 | | | | 59,566,051 | | | | 289,210 | | | | 1,794,927 | | | | | |
Cost of shares redeemed | | | (47,497,703 | ) | | | (218,586,219 | ) | | | (2,749,166 | ) | | | (6,492,503 | ) | | | | |
| |
Net increase (decrease) in net assets resulting from share transactions | | | 55,307,254 | | | | (81,228,309 | ) | | | (827,428 | ) | | | (804,303 | ) | | | | |
| |
Net increase (decrease) in net assets | | | 53,708,155 | | | | (62,484,527 | ) | | | (215,350 | ) | | | (2,159,400 | ) | | | | |
| | | | | |
NET ASSETS: | | | | | | | | | | | | | | | | | | | | |
Beginning of period | | | 505,028,572 | | | | 567,513,099 | | | | 30,656,990 | | | | 32,816,390 | | | | | |
| |
End of period | | | $558,736,727 | | | | $ 505,028,572 | | | | $30,441,640 | | | | $30,656,990 | | | | | |
| |
| | | | | |
SHARES ISSUED & REDEEMED | | | | | | | | | | | | | | | | | | | | |
Issued | | | 3,355,585 | | | | 5,333,074 | | | | 107,064 | | | | 258,675 | | | | | |
Distributions reinvested | | | 3,477,038 | | | | 4,639,100 | | | | 18,866 | | | | 126,493 | | | | | |
Redeemed | | | (3,112,269 | ) | | | (15,099,653 | ) | | | (182,717 | ) | | | (431,848 | ) | | | | |
| |
Net increase (decrease) | | | 3,720,354 | | | | (5,127,479 | ) | | | (56,787 | ) | | | (46,680 | ) | | | | |
Outstanding at beginning of period | | | 33,702,074 | | | | 38,829,553 | | | | 2,037,365 | | | | 2,084,045 | | | | | |
| |
Outstanding at end of period | | | 37,422,428 | | | | 33,702,074 | | | | 1,980,578 | | | | 2,037,365 | | | | | |
| |
See Notes to Financial Statements.
| | |
| 70 | | Semi-Annual Report | December 31, 2019 (Unaudited) |
FINANCIAL HIGHLIGHTS
(for a share outstanding throughout each period indicated)
AGGRESSIVE INVESTORS 1
| | | | | | | | | | | | | | | | | | | | | | | | |
| | | For the
Six Months Ended
12/31/19
(Unaudited) | | | Year Ended June 30 | |
| | | 2019 | | | 2018 | | | 2017 | | | 2016 | | | 2015 | |
| | | | | | |
Net Asset Value, Beginning of Period | | | $62.01 | | | | $74.05 | | | | $66.37 | | | | $54.75 | | | | $59.15 | | | | $56.69 | |
| | | | | | |
| | | | | | | | | | | | | | | | | | | | | | | | |
| | | | | | |
Income from Investment Operations: | | | | | | | | | | | | | | | | | | | | | | | | |
Net Investment Income (Loss)(a) | | | 0.29 | | | | 0.98 | | | | 0.23 | | | | (0.14) | | | | 0.31 | | | | 0.02 | |
Net Realized and Unrealized Gain (Loss) | | | 1.56 | | | | (6.93) | | | | 7.45 | | | | 12.12 | | | | (4.69) | | | | 2.56 | |
| | | | | | |
| | | | | | | | | | | | | | | | | | | | | | | | |
| | | | | | |
Total from Investment Operations | | | 1.85 | | | | (5.95) | | | | 7.68 | | | | 11.98 | | | | (4.38) | | | | 2.58 | |
| | | | | | |
| | | | | | | | | | | | | | | | | | | | | | | | |
| | | | | | |
Less Distributions to Shareholders from: | | | | | | | | | | | | | | | | | | | | | | | | |
Net Investment Income | | | (0.82) | | | | (1.21) | | | | - | | | | (0.36) | | | | (0.02) | | | | (0.12) | |
Net Realized Gain | | | - | | | | (4.88) | | | | - | | | | - | | | | - | | | | - | |
| | | | | | |
| | | | | | | | | | | | | | | | | | | | | | | | |
| | | | | | |
Total Distributions | | | (0.82) | | | | (6.09) | | | | - | | | | (0.36) | | | | (0.02) | | | | (0.12) | |
| | | | | | |
| | | | | | | | | | | | | | | | | | | | | | | | |
| | | | | | |
Net Asset Value, End of Period | | | $63.04 | | | | $62.01 | | | | $74.05 | | | | $66.37(b) | | | | $54.75 | | | | $59.15 | |
| | | | | | | | | | | | | | | | | | | | | | | | |
| | | | | | |
Total Return | | | 3.01%(c) | | | | (6.67%) | | | | 11.57%(b) | | | | 21.90%(b) | | | | (7.40%) | | | | 4.57% | |
| | | | | | |
Ratios and Supplemental Data: | | | | | | | | | | | | | | | | | | | | | | | | |
Net Assets, End of Period (in 000’s) | | | $174,738 | | | | $181,367 | | | | $227,562 | | | | $224,073 | | | | $207,229 | | | | $248,046 | |
Expenses Before Waivers and Reimbursements | | | 0.32%(d)(e) | | | | 0.35%(e) | | | | 0.96% | | | | 1.66% | | | | 0.63%(e) | | | | 1.32% | |
Expenses After Waivers and Reimbursements | | | 0.32%(d) | | | | 0.35% | | | | 0.96% | | | | 1.66% | | | | 0.63% | | | | 1.32% | |
Net Investment Income (Loss) After Waivers and Reimbursements | | | 0.93%(d) | | | | 1.52% | | | | 0.31% | | | | (0.23%) | | | | 0.58% | | | | 0.04% | |
Portfolio Turnover Rate | | | 58%(c) | | | | 102% | | | | 105% | | | | 153% | | | | 124% | | | | 107% | |
| (a) | Per share amounts calculated based on the average daily shares outstanding during the period. |
| (b) | Includes adjustments in accordance with accounting principles generally accepted in the United States; consequently, the net asset value for financial reporting purposes and the returns based upon those net asset values may differ from the net asset values and returns for shareholder transactions. |
| (d) | Annualized for periods less than one year. |
| (e) | For the periods ended December 31, 2019, June 30, 2019 and June 30, 2016 the expense ratios were significantly lower than in other periods, due to a negative performance adjustment to the investment advisory fee. Please refer to Note 3 of the Notes to Financial Statements for further information. The rate shown may not be indicative of the rate going forward. |
See Notes to Financial Statements.
FINANCIAL HIGHLIGHTS
(for a share outstanding throughout each period indicated)
ULTRA-SMALL COMPANY
| | | | | | | | | | | | | | | | | | | | | | | | |
| | | For the
Six Months Ended
12/31/19
(Unaudited) | | | Year Ended June 30 | |
| | | 2019 | | | 2018 | | | 2017 | | | 2016 | | | 2015 | |
| | | | | | |
Net Asset Value, Beginning of Period | | | $24.16 | | | | $32.13 | | | | $30.04 | | | | $25.99 | | | | $30.37 | | | | $41.83 | |
| | | | | | |
| | | | | | | | | | | | | | | | | | | | | | | | |
| | | | | | |
Income from Investment Operations: | | | | | | | | | | | | | | | | | | | | | | | | |
Net Investment Income (Loss)(a) | | | 0.08 | | | | 0.28 | | | | (0.04) | | | | 0.32 | | | | 0.28 | | | | 0.24 | |
Net Realized and Unrealized Gain (Loss) | | | 0.31 | | | | (5.14) | | | | 2.73 | | | | 4.06 | | | | (4.39) | | | | (3.53) | |
| | | | | | |
| | | | | | | | | | | | | | | | | | | | | | | | |
Total from Investment Operations | | | 0.39 | | | | (4.86) | | | | 2.69 | | | | 4.38 | | | | (4.11) | | | | (3.29) | |
| | | | | | |
| | | | | | | | | | | | | | | | | | | | | | | | |
| | | | | | |
Less Distributions to Shareholders from: | | | | | | | | | | | | | | | | | | | | | | | | |
Net Investment Income | | | (0.28) | | | | (0.01) | | | | (0.41) | | | | (0.33) | | | | (0.27) | | | | (0.30) | |
Net Realized Gain | | | - | | | | (3.10) | | | | (0.19) | | | | - | | | | - | | | | (7.87) | |
| | | | | | |
| | | | | | | | | | | | | | | | | | | | | | | | |
| | | | | | |
Total Distributions | | | (0.28) | | | | (3.11) | | | | (0.60) | | | | (0.33) | | | | (0.27) | | | | (8.17) | |
| | | | | | |
| | | | | | | | | | | | | | | | | | | | | | | | |
| | | | | | |
Net Asset Value, End of Period | | | $24.27 | | | | $24.16 | | | | $32.13 | | | | $30.04 | | | | $25.99 | | | | $30.37 | |
| | | | | | | | | | | | | | | | | | | | | | | | |
| | | | | | |
Total Return | | | 1.63%(b) | | | | (14.48)% | | | | 9.13% | | | | 16.88% | | | | (13.53)% | | | | (7.60)% | |
| | | | | | |
Ratios and Supplemental Data: | | | | | | | | | | | | | | | | | | | | | | | | |
Net Assets, End of Period (in 000’s) | | | $68,924 | | | | $74,005 | | | | $96,754 | | | | $100,984 | | | | $101,451 | | | | $127,717 | |
Expenses Before Waivers and Reimbursements | | | 1.29%(c) | | | | 1.21% | | | | 1.18% | | | | 1.18% | | | | 1.17% | | | | 1.11% | |
Expenses After Waivers and Reimbursements | | | 1.29%(c) | | | | 1.21% | | | | 1.18% | | | | 1.18% | | | | 1.17% | | | | 1.11% | |
Net Investment Income (Loss) After Waivers and Reimbursements | | | 0.71%(c) | | | | 1.00% | | | | (0.14%) | | | | 1.14% | | | | 1.05% | | | | 0.68% | |
Portfolio Turnover Rate | | | 46%(b) | | | | 93% | | | | 89% | | | | 113% | | | | 101% | | | | 90% | |
| (a) | Per share amounts calculated based on the average daily shares outstanding during the period. |
| (c) | Annualized for periods less than one year. |
See Notes to Financial Statements.
| | |
| 72 | | Semi-Annual Report | December 31, 2019 (Unaudited) |
FINANCIAL HIGHLIGHTS
(for a share outstanding throughout each period indicated)
ULTRA-SMALL COMPANY MARKET
| | | | | | | | | | | | | | | | | | | | | | | | |
| | | For the
Period Ended
12/31/19
(Unaudited) | | | Year Ended June 30 | |
| | | 2019 | | | 2018 | | | 2017 | | | 2016 | | | 2015 | |
| | | | | | |
Net Asset Value, Beginning of Period | | | $11.34 | | | | $15.81 | | | | $14.93 | | | | $12.77 | | | | $16.18 | | | | $17.46 | |
| | | | | | |
| | | | | | | | | | | | | | | | | | | | | | | | |
| | | | | | |
Income from Investment Operations: | | | | | | | | | | | | | | | | | | | | | | | | |
Net Investment Income(a) | | | 0.09 | | | | 0.11 | | | | 0.08 | | | | 0.17 | | | | 0.12 | | | | 0.12 | |
Net Realized and Unrealized Gain (Loss) | | | 0.34 | | | | (2.93) | | | | 2.76 | | | | 3.18 | | | | (1.87) | | | | 0.38 | |
| | | | | | |
| | | | | | | | | | | | | | | | | | | | | | | | |
Total from Investment Operations | | | 0.43 | | | | (2.82) | | | | 2.84 | | | | 3.35 | | | | (1.75) | | | | 0.50 | |
| | | | | | |
| | | | | | | | | | | | | | | | | | | | | | | | |
| | | | | | |
Less Distributions to Shareholders from: | | | | | | | | | | | | | | | | | | | | | | | | |
Net Investment Income | | | (0.15) | | | | (0.08) | | | | (0.02) | | | | (0.15) | | | | (0.13) | | | | (0.14) | |
Net Realized Gain | | | - | | | | (1.57) | | | | (1.94) | | | | (1.04) | | | | (1.53) | | | | (1.64) | |
| | | | | | |
| | | | | | | | | | | | | | | | | | | | | | | | |
| | | | | | |
Total Distributions | | | (0.15) | | | | (1.65) | | | | (1.96) | | | | (1.19) | | | | (1.66) | | | | (1.78) | |
| | | | | | |
| | | | | | | | | | | | | | | | | | | | | | | | |
| | | | | | |
Paid-in Capital from Redemption
Fees(a) | | | 0.00(b) | | | | 0.00(b) | | | | 0.00(b) | | | | 0.00(b) | | | | 0.00(b) | | | | 0.00(b) | |
| | | | | | |
| | | | | | | | | | | | | | | | | | | | | | | | |
| | | | | | |
Net Asset Value, End of Period | | | $11.62 | | | | $11.34 | | | | $15.81 | | | | $14.93 | | | | $12.77 | | | | $16.18 | |
| | | | | | | | | | | | | | | | | | | | | | | | |
| | | | | | |
Total Return | | | 3.84%(c)(d) | | | | (16.98%)(d) | | | | 20.86%(d) | | | | 26.61%(d) | | | | (10.83%)(d) | | | | 3.72% | |
| | | | | | |
Ratios and Supplemental Data: | | | | | | | | | | | | | | | | | | | | | | | | |
Net Assets, End of Period (in 000’s) | | | $216,207 | | | | $236,371 | | | | $378,144 | | | | $352,190 | | | | $331,535 | | | | $402,853 | |
Expenses Before Waivers and Reimbursements | | | 0.83%(e) | | | | 0.77% | | | | 0.75% | | | | 0.76% | | | | 0.75% | | | | 0.73% | |
Expenses After Waivers and Reimbursements | | | 0.75%(e) | | | | 0.75% | | | | 0.75% | | | | 0.75% | | | | 0.75% | | | | 0.73% | |
Net Investment Income After Waivers and Reimbursements | | | 1.70%(e) | | | | 0.84% | | | | 0.52% | | | | 1.21% | | | | 0.91% | | | | 0.74% | |
Portfolio Turnover Rate | | | 17%(c) | | | | 38% | | | | 35% | | | | 31% | | | | 41% | | | | 32% | |
| (a) | Per share amounts calculated based on the average daily shares outstanding during the period. |
| (b) | Amount represents less than $0.005. |
| (d) | Total return would have been lower had various fees not been waived during the period. |
| (e) | Annualized for periods less than one year. |
See Notes to Financial Statements.
FINANCIAL HIGHLIGHTS
(for a share outstanding throughout each period indicated)
SMALL-CAP GROWTH
| | | | | | | | | | | | | | | | | | | | | | | | |
| | | For the
Period Ended
12/31/19
(Unaudited) | | | Year Ended June 30 | |
| | | 2019 | | | 2018 | | | 2017 | | | 2016 | | | 2015 | |
| | | | | | |
Net Asset Value, Beginning of Period | | | $24.28 | | | | $30.32 | | | | $24.92 | | | | $20.33 | | | | $21.17 | | | | $18.68 | |
| | | | | | |
| | | | | | | | | | | | | | | | | | | | | | | | |
| | | | | | |
Income from Investment Operations: | | | | | | | | | | | | | | | | | | | | | | | | |
Net Investment Income (Loss)(a) | | | (0.02) | | | | (0.03) | | | | 0.09 | | | | 0.06 | | | | 0.07 | | | | (0.01) | |
Net Realized and Unrealized Gain (Loss) | | | 1.12 | | | | (3.43) | | | | 5.36 | | | | 4.60 | | | | (0.91) | | | | 2.51 | |
| | | | | | |
| | | | | | | | | | | | | | | | | | | | | | | | |
Total from Investment Operations | | | 1.10 | | | | (3.46) | | | | 5.45 | | | | 4.66 | | | | (0.84) | | | | 2.50 | |
| | | | | | |
| | | | | | | | | | | | | | | | | | | | | | | | |
| | | | | | |
Less Distributions to Shareholders from: | | | | | | | | | | | | | | | | | | | | | | | | |
Net Investment Income | | | - | | | | (0.10) | | | | (0.05) | | | | (0.07) | | | | - | | | | (0.01) | |
Net Realized Gain | | | (0.00)(b) | | | | (2.48) | | | | - | | | | - | | | | - | | | | - | |
| | | | | | |
| | | | | | | | | | | | | | | | | | | | | | | | |
| | | | | | |
Total Distributions | | | - | | | | (2.58) | | | | (0.05) | | | | (0.07) | | | | - | | | | (0.01) | |
| | | | | | |
| | | | | | | | | | | | | | | | | | | | | | | | |
| | | | | | |
Net Asset Value, End of Period | | | $25.38 | | | | $24.28 | | | | $30.32 | | | | $24.92 | | | | $20.33 | | | | $21.17 | |
| | | | | | | | | | | | | | | | | | | | | | | | |
| | | | | | |
Total Return(c) | | | 4.53%(d) | | | | (10.81%) | | | | 21.91% | | | | 22.97% | | | | (3.97%) | | | | 13.41% | |
| | | | | | |
Ratios and Supplemental Data: | | | | | | | | | | | | | | | | | | | | | | | | |
Net Assets, End of Period (in 000’s) | | | $36,041 | | | | $42,085 | | | | $55,472 | | | | $46,544 | | | | $36,394 | | | | $36,801 | |
Expenses Before Waivers and Reimbursements | | | 1.21%(e) | | | | 1.11% | | | | 1.08% | | | | 1.16% | | | | 1.20% | | | | 1.08% | |
Expenses After Waivers and Reimbursements | | | 0.94%(e) | | | | 0.94% | | | | 0.94% | | | | 0.94% | | | | 0.94% | | | | 0.94% | |
Net Investment Income (Loss) After Waivers and Reimbursements | | | (0.13%)(e) | | | | (0.10%) | | | | 0.35% | | | | 0.24% | | | | 0.36% | | | | (0.07%) | |
Portfolio Turnover Rate | | | 57%(d) | | | | 102% | | | | 122% | | | | 136% | | | | 137% | | | | 123% | |
| (a) | Per share amounts calculated based on the average daily shares outstanding during the period. |
| (b) | Amount represents less than $0.005. |
| (c) | Total return would have been lower had various fees not been waived during the period. |
| (e) | Annualized for periods less than one year. |
See Notes to Financial Statements.
| | |
| 74 | | Semi-Annual Report | December 31, 2019 (Unaudited) |
FINANCIAL HIGHLIGHTS
(for a share outstanding throughout each period indicated)
SMALL-CAP VALUE
| | | | | | | | | | | | | | | | | | | | | | | | |
| | | For the
Six Months Ended
12/31/19
(Unaudited) | | | Year Ended June 30 | |
| | | 2019 | | | 2018 | | | 2017 | | | 2016 | | | 2015 | |
| | | | | | |
Net Asset Value, Beginning of Period | | | $20.24 | | | | $29.60 | | | | $24.82 | | | | $20.87 | | | | $22.40 | | | | $23.06 | |
| | | | | | |
| | | | | | | | | | | | | | | | | | | | | | | | |
| | | | | | |
Income from Investment Operations: | | | | | | | | | | | | | | | | | | | | | | | | |
Net Investment Income(a) | | | 0.12 | | | | 0.47 | | | | 0.20 | | | | 0.22 | | | | 0.29 | | | | 0.29 | |
Net Realized and Unrealized Gain (Loss) | | | 1.52 | | | | (5.72) | | | | 4.81 | | | | 3.97 | | | | (1.43) | | | | (0.78) | |
| | | | | | |
| | | | | | | | | | | | | | | | | | | | | | | | |
Total from Investment Operations | | | 1.64 | | | | (5.25) | | | | 5.01 | | | | 4.19 | | | | (1.14) | | | | (0.49) | |
| | | | | | |
| | | | | | | | | | | | | | | | | | | | | | | | |
| | | | | | |
Less Distributions to Shareholders from: | | | | | | | | | | | | | | | | | | | | | | | | |
Net Investment Income | | | (0.51) | | | | (0.74) | | | | (0.23) | | | | (0.24) | | | | (0.39) | | | | (0.17) | |
Net Realized Gain | | | - | | | | (3.37) | | | | - | | | | - | | | | - | | | | - | |
| | | | | | |
| | | | | | | | | | | | | | | | | | | | | | | | |
| | | | | | |
Total Distributions | | | (0.51) | | | | (4.11) | | | | (0.23) | | | | (0.24) | | | | (0.39) | | | | (0.17) | |
| | | | | | |
| | | | | | | | | | | | | | | | | | | | | | | | |
| | | | | | |
Net Asset Value, End of Period | | | $21.37 | | | | $20.24 | | | | $29.60 | | | | $24.82 | | | | $20.87 | | | | $22.40 | |
| | | | | | | | | | | | | | | | | | | | | | | | |
| | | | | | |
Total Return(b) | | | 8.10%(c) | | | | (17.12%) | | | | 20.32% | | | | 20.08% | | | | (5.02%) | | | | (2.10%) | |
| | | | | | |
Ratios and Supplemental Data: | | | | | | | | | | | | | | | | | | | | | | | | |
Net Assets, End of Period (in 000’s) | | | $44,021 | | | | $49,652 | | | | $69,317 | | | | $61,981 | | | | $58,741 | | | | $73,241 | |
Expenses Before Waivers and Reimbursements | | | 1.07%(d) | | | | 1.00% | | | | 0.94% | | | | 0.98% | | | | 1.03% | | | | 0.98% | |
Expenses After Waivers and Reimbursements | | | 0.94%(d) | | | | 0.94% | | | | 0.94% | | | | 0.94% | | | | 0.94% | | | | 0.94% | |
Net Investment Income After Waivers and Reimbursements | | | 1.21%(d) | | | | 1.97% | | | | 0.74% | | | | 0.95% | | | | 1.41% | | | | 1.30% | |
Portfolio Turnover Rate | | | 40%(c) | | | | 84% | | | | 78% | | | | 77% | | | | 62% | | | | 74% | |
| (a) | Per share amounts calculated based on the average daily shares outstanding during the period. |
| (b) | Total return would have been lower had various fees not been waived during the period. |
| (d) | Annualized for periods less than one year. |
See Notes to Financial Statements.
FINANCIAL HIGHLIGHTS
(for a share outstanding throughout each period indicated)
BLUE CHIP
| | | | | | | | | | | | | | | | | | | | | | | | |
| | | For the
Six Months Ended
12/31/19
(Unaudited) | | | Year Ended June 30 | |
| | | 2019 | | | 2018 | | | 2017 | | | 2016 | | | 2015 | |
| | | | | | |
Net Asset Value, Beginning of Period | | | $14.99 | | | | $14.62 | | | | $13.71 | | | | $12.28 | | | | $11.81 | | | | $11.39 | |
| | | | | | |
| | | | | | | | | | | | | | | | | | | | | | | | |
| | | | | | |
Income from Investment Operations: | | | | | | | | | | | | | | | | | | | | | | | | |
Net Investment Income(a) | | | 0.17 | | | | 0.34 | | | | 0.31 | | | | 0.30 | | | | 0.28 | | | | 0.26 | |
Net Realized and Unrealized Gain | | | 1.41 | | | | 1.75 | | | | 1.33 | | | | 1.44 | | | | 0.49 | | | | 0.39 | |
| | | | | | |
| | | | | | | | | | | | | | | | | | | | | | | | |
Total from Investment Operations | | | 1.58 | | | | 2.09 | | | | 1.64 | | | | 1.74 | | | | 0.77 | | | | 0.65 | |
| | | | | | |
| | | | | | | | | | | | | | | | | | | | | | | | |
| | | | | | |
Less Distributions to Shareholders from: | | | | | | | | | | | | | | | | | | | | | | | | |
Net Investment Income | | | (0.32) | | | | (0.31) | | | | (0.31) | | | | (0.31) | | | | (0.30) | | | | (0.23) | |
Net Realized Gain | | | (1.32) | | | | (1.41) | | | | (0.42) | | | | - | | | | - | | | | - | |
| | | | | | |
| | | | | | | | | | | | | | | | | | | | | | | | |
| | | | | | |
Total Distributions | | | (1.64) | | | | (1.72) | | | | (0.73) | | | | (0.31) | | | | (0.30) | | | | (0.23) | |
| | | | | | |
| | | | | | | | | | | | | | | | | | | | | | | | |
| | | | | | |
Net Asset Value, End of Period | | | $14.93 | | | | $14.99 | | | | $14.62 | | | | $13.71 | | | | $12.28 | | | | $11.81 | |
| | | | | | | | | | | | | | | | | | | | | | | | |
| | | | | | |
Total Return(b) | | | 10.68%(c) | | | | 16.26% | | | | 11.98% | | | | 14.33% | | | | 6.60% | | | | 5.77% | |
| | | | | | |
Ratios and Supplemental Data: | | | | | | | | | | | | | | | | | | | | | | | | |
Net Assets, End of Period (in 000’s) | | | $558,737 | | | | $505,029 | | | | $567,513 | | | | $550,902 | | | | $571,644 | | | | $600,823 | |
Expenses Before Waivers and Reimbursements | | | 0.26%(d) | | | | 0.25% | | | | 0.22% | | | | 0.25% | | | | 0.25% | | | | 0.23% | |
Expenses After Waivers and Reimbursements | | | 0.15%(d) | | | | 0.15% | | | | 0.15% | | | | 0.15% | | | | 0.15% | | | | 0.15% | |
Net Investment Income After Waivers and Reimbursements | | | 2.19%(d) | | | | 2.28% | | | | 2.17% | | | | 2.30% | | | | 2.42% | | | | 2.19% | |
Portfolio Turnover Rate | | | 7%(c) | | | | 20% | | | | 14% | | | | 17% | | | | 23% | | | | 19% | |
| (a) | Per share amounts calculated based on the average daily shares outstanding during the period. |
| (b) | Total return would have been lower had various fees not been waived during the period. |
| (d) | Annualized for periods less than one year. |
See Notes to Financial Statements.
| | |
| 76 | | Semi-Annual Report | December 31, 2019 (Unaudited) |
FINANCIAL HIGHLIGHTS
(for a share outstanding throughout each period indicated)
MANAGED VOLATILITY
| | | | | | | | | | | | | | | | | | | | | | | | |
| | | For the
Six Months Ended
12/31/19
(Unaudited) | | | Year Ended June 30 | |
| | | 2019 | | | 2018 | | | 2017 | | | 2016 | | | 2015 | |
| | | | | | |
Net Asset Value, Beginning of Period | | | $15.05 | | | | $15.75 | | | | $14.79 | | | | $14.20 | | | | $14.05 | | | | $13.94 | |
| | | | | | |
| | | | | | | | | | | | | | | | | | | | | | | | |
| | | | | | |
Income from Investment Operations: | | | | | | | | | | | | | | | | | | | | | | | | |
Net Investment Income(a) | | | 0.07 | | | | 0.16 | | | | 0.10 | | | | 0.06 | | | | 0.04 | | | | 0.00(b) | |
Net Realized and Unrealized Gain | | | 0.41 | | | | 0.06 | | | | 0.95 | | | | 0.59 | | | | 0.11 | | | | 0.13 | |
| | | | | | |
| | | | | | | | | | | | | | | | | | | | | | | | |
| | | | | | |
Total from Investment Operations | | | 0.48 | | | | 0.22 | | | | 1.05 | | | | 0.65 | | | | 0.15 | | | | 0.13 | |
| | | | | | |
| | | | | | | | | | | | | | | | | | | | | | | | |
| | | | | | |
Less Distributions to Shareholders from: | | | | | | | | | | | | | | | | | | | | | | | | |
Net Investment Income | | | (0.16) | | | | (0.31) | | | | (0.09) | | | | (0.06) | | | | 0.00(b) | | | | (0.02) | |
Net Realized Gain | | | - | | | | (0.61) | | | | ---- | | | | | | | | | | | | | |
| | | | | | |
| | | | | | | | | | | | | | | | | | | | | | | | |
| | | | | | |
Total Distributions | | | (0.16) | | | | (0.92) | | | | (0.09) | | | | (0.06) | | | | 0.00(b) | | | | (0.02) | |
| | | | | | |
| | | | | | | | | | | | | | | | | | | | | | | | |
| | | | | | |
Net Asset Value, End of Period | | | $15.37 | | | | $15.05 | | | | $15.75 | | | | $14.79 | | | | $14.20 | | | | $14.05 | |
| | | | | | | | | | | | | | | | | | | | | | | | |
| | | | | | |
Total Return(c) | | | 3.18%(d) | | | | 1.74% | | | | 7.11% | | | | 4.59% | | | | 1.10% | | | | 0.92% | |
| | | | | | |
Ratios and Supplemental Data: | | | | | | | | | | | | | | | | | | | | | | | | |
Net Assets, End of Period (in 000’s) | | | $30,442 | | | | $30,657 | | | | $32,816 | | | | $36,523 | | | | $57,586 | | | | $59,008 | |
Expenses Before Waivers and Reimbursements | | | 1.29%(e) | | | | 1.24% | | | | 1.20% | | | | 1.12% | | | | 1.06% | | | | 1.04% | |
Expenses After Waivers and Reimbursements | | | 0.94%(e) | | | | 0.94% | | | | 0.94% | | | | 0.94% | | | | 0.94% | | | | 0.94% | |
Net Investment Income After Waivers and Reimbursements | | | 0.92%(e) | | | | 1.06% | | | | 0.64% | | | | 0.42% | | | | 0.31% | | | | 0.03% | |
Portfolio Turnover Rate | | | 18%(d) | | | | 69% | | | | 50% | | | | 50% | | | | 54% | | | | 38% | |
| (a) | Per share amounts calculated based on the average daily shares outstanding during the period. |
| (b) | Amount represents less than $0.005. |
| (c) | Total return would have been lower had various fees not been waived during the period. |
| (e) | Annualized for periods less than one year. |
See Notes to Financial Statements.
| | |
| NOTES TO FINANCIAL STATEMENTS | | |
December 31, 2019 (Unaudited)
1. Organization:
Bridgeway Funds, Inc. (“Bridgeway” or the “Company”) was organized as a Maryland corporation on October 19, 1993, and is registered under the Investment Company Act of 1940, as amended (the “1940 Act”), as anopen-end management investment company.
Bridgeway is organized as a series fund, with nine investment funds as of December 31, 2019. Effective May 31, 2019, the name of the Blue Chip 35 Index Fund was changed to Blue Chip Fund. The Aggressive Investors 1, Ultra-Small Company, Ultra-Small Company Market,Small-Cap Growth,Small-Cap Value, Blue Chip and Managed Volatility Funds are presented in this report (each is referred to as a “Fund” and collectively, the “Funds”). The OmniSmall-Cap Value and OmniTax-ManagedSmall-Cap Value Funds are included in a separate report.
Bridgeway is authorized to issue 1,915,000,000 shares of common stock at $0.001 per share. As of December 31, 2019, 100,000,000 shares have been classified into the Aggressive Investors 1 Fund. 130,000,000 shares have been classified into the Blue Chip Fund. 15,000,000 shares have been classified into the Ultra-Small Company Fund. 100,000,000 shares each have been classified into the Ultra-Small Company Market, OmniSmall-Cap Value, OmniTax-ManagedSmall-Cap Value,Small-Cap Growth, andSmall-Cap Value Funds. 50,000,000 shares have been classified into the Managed Volatility Fund.
The Ultra-Small Company Fund is open to existing investors (direct only).
All of the Funds areno-load, diversified funds.
The Aggressive Investors 1 Fund seeks to exceed the stock market total return (primarily through capital appreciation) at a level of total risk roughly equal to that of the stock market over longer periods of time (three year intervals or more).
The Ultra-Small Company, Ultra-Small Company Market,Small-Cap Growth andSmall-Cap Value Funds seek to provide a long-term total return on capital, primarily through capital appreciation.
The Blue Chip Fund seeks to provide long-term total return on capital, primarily through capital appreciation, but also some income.
The Managed Volatility Fund seeks to provide a high current return with short-term risk less than or equal to 40% of the stock market.
Bridgeway Capital Management, Inc. (the “Adviser”) is the investment adviser for all of the Funds.
2. Significant Accounting Policies:
The following summary of significant accounting policies, followed in the preparation of the financial statements of the Funds, are in conformity with accounting principles generally accepted in the United States of America (“GAAP”). Each Fund is considered an investment company under GAAP and follows the accounting and reporting guidance applicable to investment companies.
Securities, Options, Futures and Other Investments ValuationOther than options, securities for which market quotations are readily available are valued at the last sale price on the national exchange on which such securities are primarily traded. In the case of securities reported on the National Association of Securities Dealers Automated Quotation (“NASDAQ”) system, the securities are valued based on the NASDAQ Official Closing Price (“NOCP”). In the absence of recorded sales on their primary exchange, or NOCP, in the case of NASDAQ traded securities, the security will be valued as follows: bid prices for long positions and ask prices for short positions.
Fixed income securities are valued on the basis of current market quotations provided by a pricing service. Options are valued at the close if there is trading volume and, if there is no trading volume, the options are valued at the bid on long positions and the ask on the short positions.
| | |
| 78 | | Semi-Annual Report | December 31, 2019 (Unaudited) |
| | |
| NOTES TO FINANCIAL STATEMENTS (continued) | | |
December 31, 2019 (Unaudited)
Investments inopen-end registered investment companies andclosed-end registered investment companies that do not trade on an exchange are valued at the end of day net asset value (“NAV”) per share.
Investments inclosed-end registered investment companies that trade on an exchange are valued at the last sales price as of the close of the customary trading session on the exchange where the security is principally traded.
When market quotations are not readily available or when events occur that make established valuation methods unreliable, securities of the Funds may be valued at fair value as determined in good faith by or under the direction of the Board of Directors. The valuation assigned to a fair valued security for purposes of calculating the Funds’ NAVs may differ from the security’s most recent closing market price and from the prices used by other mutual funds to calculate their NAVs.
The inputs and valuation techniques used to determine the value of a Fund’s investments are summarized into three levels as described in the hierarchy below:
| ● | | Level 1 — quoted prices in active markets for identical assets |
Investments whose values are based on quoted market prices in active markets, and whose values are therefore classified as Level 1 prices, include active listed equity securities. The Funds do not adjust the quoted price for such investments, even in situations where the Funds hold a large position and a sale could reasonably impact the quoted price.
| ● | | Level 2 — other significant observable inputs (including quoted prices for similar securities, interest rates, prepayment speeds, credit risk, etc.) |
Investments that trade in markets that are not considered to be active, but whose values are based on quoted market prices, dealer quotations or valuations provided by alternative pricing sources supported by observable inputs, are classified as Level 2 prices. These generally include certain U.S. Government and sovereign obligations, most government agency securities, investment-grade corporate bonds and less liquid listed equity securities. As investments whose values are classified as Level 2 prices include positions that are not traded in active markets and/or are subject to transfer restrictions, valuations may be adjusted to reflect illiquidity and/ornon-transferability, which are generally based on available market information.
The Fidelity Investments Money Market Government Portfolio - Class I, which is held by each Fund, invests primarily in securities that are valued at amortized cost. Therefore, this investment is classified as a Level 2 investment.
| ● | | Level 3 — significant unobservable inputs (including the Fund’s own assumptions in determining the fair value of investments) |
Investments whose values are classified as Level 3 prices have significant unobservable inputs, as they may trade infrequently or not at all. When observable prices are not available for these securities, the Funds use one or more valuation techniques for which sufficient and reliable data is available. The inputs used by the Funds in estimating the value of Level 3 prices may include the original transaction price, quoted prices for similar securities or assets in active markets, completed or pending third-party transactions in the underlying investment or comparable issuers, and changes in financial ratios or cash flows. Level 3 prices may also be adjusted to reflect illiquidity and/ornon-transferability, with the amount of such discount estimated by the Funds in the absence of market information. Assumptions used by the Funds due to the lack of observable inputs may significantly impact the resulting value and therefore the results of the Funds’ operations.
The inputs or methodology used for valuing investments are not necessarily an indication of the risk associated with investing in those investments. A summary of the inputs used to value the Funds’ investments as of December 31, 2019 is included with each Fund’s Schedule of Investments.
Details regarding material transfers into, and material transfers out of, Level 3, if any, can be found at the end of each Schedule of Investments for Funds that held Level 3 securities.
Securities LendingUpon lending its securities to third parties, each participating Fund receives compensation in the form of fees. The loans are secured by collateral at least equal to the fair value of the securities loaned plus accrued interest. The
| | |
| NOTES TO FINANCIAL STATEMENTS (continued) | | |
December 31, 2019 (Unaudited)
remaining contractual maturity of all securities lending transactions is overnight and continuous. Each Fund has the right under the lending agreement to recover the securities from the borrower on demand. Additionally, a Fund does not have the right to sell orre-pledge collateral received in the form of securities unless the borrower goes into default. The risks to a Fund of securities lending are that the borrower may not provide additional collateral when required or return the securities when due, resulting in a loss. Under the terms of the Securities Lending Agreement, the Funds are indemnified for such losses by the securities lending agent.
While securities are on loan, the Fund continues to receive dividends on the securities loaned and recognizes any unrealized gain or loss in the fair value of the securities loaned.
Securities lending transactions are entered into by a Fund under a Securities Lending Agreement which provides the right, in the event of default (including bankruptcy or insolvency) for thenon-defaulting party to liquidate the collateral or to offset the market value of the collateral received against the market value of the securities loaned. The value of the collateral is typically greater than that of the market value of the securities loaned, leaving the lender with a net amount payable to the defaulting party. However, bankruptcy or insolvency laws of a particular jurisdiction may impose restrictions on or prohibitions against such a right of offset in the event of a counterparty’s bankruptcy or insolvency.
The market value of securities on loan, all of which are classified as common stocks in the Funds’ Schedules of Investments, and the value of the related cash collateral are shown in the Statements of Assets and Liabilities as a component of Investments at value. During the period ended December 31, 2019 the Blue Chip Fund and the Managed Volatility Fund did not have any securities lending transactions.
The following table is a summary of the Funds’ payable upon return of securities loaned and related cash collateral, which are subject to a netting agreement as of December 31, 2019:
| | | | | | | | | | | | | | | | | | | | | | |
| | | | | | | | | | | | Gross Amount Not
Offset in the Statement
of Assets and Liabilities | | | | |
| Fund | | Gross
Amounts of
Recognized
Assets1 | | | Gross Amounts
Offset in the
Statement of
Assets and
Liabilities | | | Net Amounts of
Assets Presented
in the Statement
of Assets and
Liabilities | | | Financial
Instruments | | Collateral
Received | | | Net
Amount | |
| |
| | | | | | |
Aggressive Investors 1 | | | | | | | | | | | | | | | | | | | | | | |
Securities lending | | | $ 6,937,723 | | | | - | | | | $ 6,937,723 | | | - | | | $ 6,937,723 | | | | - | |
| | | | | | |
Ultra-Small Company | | | | | | | | | | | | | | | | | | | | | | |
Securities lending | | | $ 1,618,090 | | | | - | | | | $ 1,618,090 | | | - | | | $ 1,618,090 | | | | - | |
| | | | | | |
Ultra-Small Company Market | | | | | | | | | | | | | | | | | | | | | | |
Securities lending | | | $21,847,383 | | | | - | | | | $21,847,383 | | | - | | | $21,847,383 | | | | - | |
| | | | | | |
Small-Cap Growth | | | | | | | | | | | | | | | | | | | | | | |
Securities lending | | | $ 1,840,670 | | | | - | | | | $ 1,840,670 | | | - | | | $ 1,840,670 | | | | - | |
| | | | | | |
Small-Cap Value | | | | | | | | | | | | | | | | | | | | | | |
Securities lending | | | $ 3,409,392 | | | | - | | | | $ 3,409,392 | | | - | | | $ 3,409,392 | | | | - | |
| 1 | Securities loaned with a value of $40,115 and $184,240 inSmall-Cap Value and Ultra-Small Company Market have been sold and are pending settlement on January 2, 2020, respectively. |
| | |
| 80 | | Semi-Annual Report | December 31, 2019 (Unaudited) |
| | |
| NOTES TO FINANCIAL STATEMENTS (continued) | | |
December 31, 2019 (Unaudited)
The following table summarizes the securities received asnon-cash collateral and cash collateral for securities lending:
| | | | | | | | | | | | | | | | | | | | | | | | | | |
| | | Non-Cash Collateral | | | | | | | | | | |
| Fund | | Collateral
Type | | Coupon
Range | | | Maturity Date
Range | | | Market
Value | | | Cash
Collateral | | | Total
Collateral | | | Market Value
of Securities
on Loan | |
| |
| | | | | | |
Aggressive Investors 1 | | | | | | | | | | | | | | | | | | | | | | | | |
Securities lending | | U.S.Gov’t
Obligations | |
| 0.00%
8.50% | -
| |
| 1/09/20-
11/15/49 |
| | $ | 12,751,217 | | | $ | 6,937,723 | | | $ | 19,688,940 | | | | $19,305,022 | |
| | | | | | |
Ultra-Small Company | | | | | | | | | | | | | | | | | | | | | | | | |
Securities lending | | U.S.Gov’t
Obligations | |
| 0.13%
3.13% | -
| |
| 4/15/20-
05/15/47 |
| | $ | 1,021,922 | | | $ | 1,618,090 | | | $ | 2,640,012 | | | | $ 2,512,696 | |
| | | | | | |
Ultra-Small Company Market | | | | | | | | | | | | | | | | | | | | | | | | |
Securities lending | | U.S.Gov’t
Obligations | |
| 0.00%
8.50% | -
| |
| 1/09/20-
11/15/49 |
| | $ | 2,529,138 | | | $ | 21,847,383 | | | $ | 24,376,521 | | | | $23,625,032 | |
| | | | | | |
Small-Cap Growth | | | | | | | | | | | | | | | | | | | | | | | | |
Securities lending | | U.S.Gov’t
Obligations | |
| 0.00%
8.50% | -
| |
| 1/09/20-
11/15/49 |
| | $ | 3,856,254 | | | $ | 1,840,670 | | | $ | 5,696,924 | | | | $ 5,569,155 | |
| | | | | | |
Small-Cap Value | | | | | | | | | | | | | | | | | | | | | | | | |
Securities lending | | U.S.Gov’t
Obligations | |
| 0.00%
8.50% | -
| |
| 1/09/20-
11/15/49 |
| | $ | 3,634,525 | | | $ | 3,409,392 | | | $ | 7,043,917 | | | | $ 6,941,242 | |
It is each Fund’s policy to obtain additional collateral from, or return excess collateral to, the borrower by the end of the next business day following the valuation date of the securities loaned. Therefore, the value of the collateral held may be temporarily less than that required under the lending contract. As of December 31, 2019 the collateral consisted of an institutional government money market fund and U.S. Government Obligations.
Use of Estimates in Financial StatementsIn preparing financial statements in conformity with GAAP, management makes estimates and assumptions that affect the reported amounts of assets and liabilities on the date of the financial statements and the disclosure of contingent assets and liabilities on the date of the financial statements, as well as the reported amounts of revenue and expenses during the reporting period. Actual results could differ from those estimates.
Concentrations of Credit RiskThe Funds maintain cash and securities in their custody account maintained by a high-credit, quality financial institution. Cash balances may, at times, exceed the FDIC insurance limit. Cash balances are generally invested in a short-term investment vehicle, which minimizes the risk of cash balances exceeding the FDIC insurance limit.
Risks and UncertaintiesThe Funds provide for various investment options, including stocks, bonds and call and put options. Such investments are exposed to risks, such as interest rate, market and credit risks. Due to the risks involved, it is at least reasonably possible that changes in risks in the near term would materially affect shareholders’ account values and the amounts reported in the financial statements.
Security Transactions, Investment Income and ExpensesSecurity transactions are accounted for as of the trade date, the date the order to buy or sell is executed. Realized gains and losses are computed on the identified cost basis. Dividend income is recorded on theex-dividend date, and interest income is recorded on the accrual basis from settlement date. Particularly as related to the Managed Volatility Fund, discounts and premiums are accreted/amortized on the effective interest method.
Fund expenses that are not series-specific are allocated to each series based upon its relative proportion of net assets to the Funds’ total net assets or other appropriate basis.
Distributions to ShareholdersThe Funds pay dividends from net investment income and distribute realized capital gains annually, usually in December.
| | |
| NOTES TO FINANCIAL STATEMENTS (continued) | | |
December 31, 2019 (Unaudited)
Derivatives
The Funds’ use of derivatives for the period ended December 31, 2019 was limited to futures contracts, purchased options, and written options. The following is a summary of how these derivatives are treated in the financial statements and their impact on the Funds, categorized by primary underlying risk.
| | | | | | | | | | | | | | |
Primary Underlying Risk/Fund | | Derivative
Assets | | | | | Derivative
Liabilities | | | | | Location on Statement of Assets and Liabilities |
|
| | | | | |
Equity Risk | | | | | | | | | | | | | | |
Managed Volatility: | | | | | | | | | | | | | | |
Written Put Options | | - | | | | | | | $153,944 | | | | | Put options written at value |
Written Call Options | | - | | | | | | | 473,299 | | | | | Call options written at value |
| | | | | | | | | | |
Primary Underlying Risk/Fund | | Amount of
Realized Gain
(Loss) on Derivatives | | | Amount of
Unrealized Gain
(Loss) on Derivatives | | | Location of Gain (Loss) in the Statement of Operations |
| | | |
Equity Risk | | | | | | | | | | |
Managed Volatility: | | | | | | | | | | |
Written Options | | | $ 286,452 | | | | | | | Realized Gain (Loss) on Written Options |
| | | | | | | | | | Change in Unrealized Appreciation |
| | | | | | | $(92,451) | | | (Depreciation) on Written Options |
| | | |
Futures Contracts | | | $(946,532) | | | | - | | | Realized Gain (Loss) on Futures Contracts |
The derivative instruments outstanding as of December 31, 2019, as disclosed in the Notes to the Financial Statements, and the amounts of realized and changes in unrealized gains and losses on derivative instruments during the period, as disclosed in the Statements of Operations, serve as indicators of the volume of derivatives activity for the Funds.
Futures ContractsThe Funds may purchase or sell financial futures contracts to hedge cash positions, manage market risk, and to dampen volatility in line with investment objectives. A futures contract is an agreement between two parties to buy or sell a financial instrument at a set price on a future date. Upon entering into such a contract, a Fund is required to pledge to the broker an amount of cash or U.S. Government securities equal to the minimum “initial margin” requirements of the exchange on which the futures contract is traded. The contract amount reflects the extent of a Fund’s exposure in these financial instruments. A Fund’s participation in the futures markets involves certain risks, including imperfect correlation between movements in the price of futures contracts and movements in the price of the securities hedged or used for cover. Pursuant to a contract, such Fund agrees to receive from, or pay to, the broker an amount of cash equal to the fluctuation in value of the contract. Such receipts or payments are known as “variation margin” and are recorded by a Fund as unrealized appreciation or depreciation. When a contract is closed, a Fund records a realized gain or loss equal to the difference between the value of the contract at the time it was opened and the value at the time it was closed. With futures, there is minimal counterparty risk to the Funds, since futures are exchange traded and the exchange’s clearinghouse, as counterparty to all exchange traded futures, guarantees the futures against default. As of December 31, 2019, the Funds had no open futures contracts.
OptionsThe Aggressive Investors 1 Fund may buy and sell calls and puts to increase or decrease the Fund’s exposure to stock market risk or for purposes of diversification of risk. The Managed Volatility Fund may buy and sell calls and puts to reduce the Fund’s volatility and provide some cash flow. An option is a contract conveying a right to buy or sell a financial instrument at a specified price during a stipulated period. The premium paid by a Fund for the purchase of a call or a put option is included in such Fund’s Schedule of Investments as an investment and subsequentlymarked-to-market to reflect the current market value of the option. When a Fund writes a call or a put option, an amount equal to the premium received by such Fund is included in its Statement of Assets and Liabilities as a liability and is subsequentlymarked-to-market to reflect the current market value of the option written. If an option that a Fund has written either expires on its stipulated expiration date, or if such Fund enters into a closing purchase transaction, that Fund realizes a gain (or a loss if the cost of a closing purchase transaction exceeds the premium received when the option was written) without regard to any unrealized gain or loss on the underlying security, and the liability related to such options is extinguished. If a call option that a Fund has written is assigned,
| | |
| 82 | | Semi-Annual Report | December 31, 2019 (Unaudited) |
| | |
| NOTES TO FINANCIAL STATEMENTS (continued) | | |
December 31, 2019 (Unaudited)
such Fund realizes a gain or loss from the sale of the underlying security, and the proceeds from such sale are increased by the premium originally received. If a put option that a Fund has written is assigned, the amount of the premium originally received reduces the cost of the security that such Fund purchased upon exercise of the option. Buying calls increases a Fund’s exposure to the underlying security to the extent of any premium paid. Buying puts on a stock market index tends to limit a Fund’s exposure to a stock market decline. All options purchased by the Funds were listed on exchanges and considered liquid positions with readily available market quotes.
Covered Call Options and Secured PutsThe Aggressive Investors 1 and Managed Volatility Funds may write call options on a covered basis; that is, a Fund will own the underlying security, or a Fund may write secured puts. The principal reason for writing covered calls and secured puts on a security is to attempt to realize income through the receipt of premiums. The option writer has, in return for the premium, given up the opportunity for profit from a substantial price increase in the underlying security so long as the obligation as a writer continues, but has retained the risk of loss should the price of the security decline. All options were listed on exchanges and considered liquid positions with readily available market quotes.
Outstanding written options as of December 31, 2019 for the Managed Volatility Fund are included in the Schedule of Investments. The Aggressive Investors 1 Fund had no transactions in written options during the period ended December 31, 2019.
IndemnificationUnder the Company’s organizational documents, the Funds’ officers, directors, employees and agents are indemnified against certain liabilities that may arise out of the performance of their duties to the Funds. Additionally, in the normal course of business, the Funds enter into contracts that contain a variety of indemnification clauses. The Funds’ maximum exposure under these arrangements is unknown, as this would involve future claims that may be made against the Funds that have not yet occurred. However, the Funds have not had prior claims or losses pursuant to these contracts.
3. Advisory Fees, Other Related Party Transactions and Contingencies:
The Funds have entered into management agreements with the Adviser. As compensation for the advisory services rendered, facilities furnished, and expenses borne by the Adviser, the Funds pay the Adviser a fee pursuant to each Fund’s management agreement, as described below.
Aggressive Investors 1 Fund,Small-Cap Growth Fund andSmall-Cap Value Fund each have management fees that are comprised of a base fee, which is applied to the Fund’s average annual net assets, and a performance adjustment, which adjusts the fee upward or downward depending on a Fund’s performance relative to the applicable market index over a rolling five-year performance period, and is applied to the Fund’s average daily net assets over this performance period.
Because the performance adjustment is based on a Fund’s performance relative to the applicable market index, and not the Fund’s absolute performance, the performance adjustment could increase the Adviser’s fee even if the Fund’s shares lose value over the performance period provided that the Fund outperformed its market index, or could decrease the Adviser’s fee even if the Fund’s shares increase in value during the performance period provided that the Fund underperformed its market index. Also, depending on a Fund’s performance relative to the applicable market index over the rolling five-year performance period, the performance adjustment could increase the Adviser’s fee even if the Fund has experienced underperformance relative to its market index in the short-term, or could decrease the Adviser’s fee even if the Fund has experienced outperformance relative to its market index in the short-term. However, no performance fee adjustment will be applied to the Adviser’s fee if the cumulative difference between a Fund’s performance and that of the applicable market index is less than or equal to 2% over the rolling five-year performance period.
Additionally, because the base fee is applied to average annual net assets, and the performance adjustment is calculated over a rolling five-year performance period, it is possible that if a Fund underperforms the applicable market index significantly over the performance period, and the Fund’s assets have declined significantly over that performance period, the negative performance adjustment may exceed the base fee. In this event, the Adviser would make a payment to the Fund.
Aggressive Investors 1:A total advisory fee is paid by the Fund to the Adviser that is comprised of a Base Fee and a Performance Adjustment. The Base Fee equals the Base Fee Rate times the average daily net assets of the Fund. The Base Fee Rate is based on the following annual rates: 0.90% of the first $250 million of the Fund’s average daily net assets, 0.875% of the next $250 million, 0.85% of the next $500 million and 0.80% of any excess over $1 billion.
| | |
| NOTES TO FINANCIAL STATEMENTS (continued) | | |
December 31, 2019 (Unaudited)
The Performance Adjustment equals 4.67% times the difference in cumulative total return between the Fund and the Standard and Poor’s 500 Composite Stock Price Index with dividends reinvested (hereinafter “Index”) over a rolling five-year performance period. The Performance Adjustment Rate varies from a minimum of-0.70% to a maximum of +0.70%. However, the Performance Adjustment Rate is zero if the difference between the cumulative Fund performance and the Index performance is less than or equal to 2%.
Ultra-Small Company:The Fund pays advisory fees based on the following annual rates: 0.90% of the first $250 million of the Fund’s average daily net assets, 0.875% of the next $250 million and 0.85% of any excess over $500 million. The management fees are computed daily and are payable monthly. However, during any period when the Fund’s net assets range from $27,500,000 to $55,000,000, the advisory fee will be determined as if the Fund had $55,000,000 under management. This is limited to a maximum annualized expense ratio of 1.49% of average net assets.
Ultra-Small Company Market:The Fund’s advisory fee is a flat 0.50% of the value of the Fund’s average daily net assets, computed daily and payable monthly.
Small-Cap Growth andSmall-Cap Value:A total advisory fee is paid by each Fund to the Adviser that is comprised of a Base Fee and a Performance Adjustment. The Base Fee equals the Base Fee Rate times the average daily net assets of the Fund. The Base Fee Rate is based on the annual rate of 0.60% of the value of each Fund’s average daily net assets.
The Performance Adjustment equals 0.33% times the difference in cumulative total return between the Fund and the Russell 2000 Growth Index forSmall-Cap Growth Fund and the Russell 2000 Value Index forSmall-Cap Value Fund, with dividends reinvested (hereinafter “Index”) over a rolling five-year performance period. The Performance Adjustment Rate varies from a minimum of-0.05% to a maximum of +0.05%. However, the Performance Adjustment Rate is zero if the difference between the cumulative Fund’s performance and the Index performance is less than or equal to 2%.
Blue Chip:The Fund’s advisory fee is a flat 0.08% of the value of the Fund’s average daily net assets, computed daily and payable monthly.
Managed Volatility:The Fund’s advisory fee is a flat 0.60% of the value of the Fund’s average daily net assets, computed daily and payable monthly.
Expense limitations:The Adviser has agreed to reimburse the Funds for operating expenses and management fees above the expense limitations shown in the table below, which are shown as a ratio of net expenses to average net assets, for each Fund, for the period ended December 31, 2019. Any material change to the expense limitation would require a vote by shareholders of the applicable Fund.
| | | | | | |
| Bridgeway Fund | | Expense
Limitation | | Total Waivers and
Reimbursements
for Period Ended
12/31/19 | |
| | | | | | |
Aggressive Investors 1 | | 1.75% | | | $ - | |
Ultra-Small Company | | 1.85% | | | - | |
Ultra-Small Company Market | | 0.75% | | | 88,783 | |
Small-Cap Growth | | 0.94% | | | 50,401 | |
Small-Cap Value | | 0.94% | | | 30,639 | |
Blue Chip | | 0.15% | | | 281,670 | |
Managed Volatility | | 0.94% | | | 52,955 | |
Other Related Party Transactions:The Funds will engage in inter-portfolio trades when it is to the benefit of both parties. The Board of Directors reviews these trades quarterly. Inter-portfolio purchases and sales during the period ended December 31, 2019 were as follows:
| | |
| 84 | | Semi-Annual Report | December 31, 2019 (Unaudited) |
| | |
| NOTES TO FINANCIAL STATEMENTS (continued) | | |
December 31, 2019 (Unaudited)
| | | | | | | | | | |
| Bridgeway Fund | | Inter-Portfolio
Purchases | | Inter-Portfolio
Sales |
| | | | | | | | | | |
Aggressive Investors 1 | | | | $ 550,849 | | | | | $1,603,680 | |
Ultra-Small Company | | | | 5,158,797 | | | | | 2,377,356 | |
Ultra-Small Company Market | | | | 5,334,681 | | | | | 9,135,931 | |
Small-Cap Growth | | | | 414,155 | | | | | 1,533,241 | |
Small-Cap Value | | | | 757,830 | | | | | 1,753,029 | |
The Adviser entered into an Administrative Services Agreement with Bridgeway, pursuant to which the Adviser provides various administrative services to the Funds, including, but not limited to: (i) supervising and managing various aspects of the Funds’ business and affairs; (ii) selecting, overseeing and/or coordinating activities with other service providers to the Funds; (iii) providing reports to the Board of Directors as requested from time to time; (iv) assisting and/or reviewing amendments and updates to the Funds’ registration statement and other filings with the Securities and Exchange Commission (“SEC”); (v) providing certain shareholder services; (vi) providing administrative support in connection with meetings of the Board of Directors; and (vii) providing certain record-keeping services. For its services to all of the Bridgeway Funds, the Adviser is paid an aggregate annual fee of $775,000, payable in equal monthly installments. For the allocation of this expense to each of the Funds, please see the Statements of Operations.
Board of Directors CompensationIndependent Directors are paid an annual retainer of $20,000, with an additional retainer of $5,000 paid to the Independent Chairman of the Board and an additional retainer of $1,000 paid to the Nominating and Corporate Governance Committee Chair. The retainer is paid in quarterly installments. In addition, effective November 14, 2019, Independent Directors are paid $12,000 per meeting for meeting fees. Prior to November 14, 2019, the meeting fee was $11,000 per meeting. Such compensation is the total compensation from all Bridgeway Funds and is allocated among the Bridgeway Funds.
Independent Directors are reimbursed for any expenses incurred in attending meetings and conferences, as well as expenses for subscriptions or printed materials. The amount of directors’ fees attributable to each Fund is disclosed in the Statements of Operations.
One director of Bridgeway, John Montgomery, is an owner and director of the Adviser. Under the 1940 Act definitions, he is considered to be an “affiliated person” of the Adviser and an “interested person” of the Adviser and of Bridgeway. Compensation for Mr. Montgomery is borne by the Adviser rather than the Funds.
4. Distribution Agreement:
Foreside Fund Services, LLC acts as distributor of the Funds’ shares, pursuant to a Distribution Agreement dated May 31, 2017. The Adviser pays all costs and expenses associated with distribution of the Funds’ shares, pursuant to a protective plan adopted by shareholders pursuant to Rule12b-1.
| | |
| NOTES TO FINANCIAL STATEMENTS (continued) | | |
December 31, 2019 (Unaudited)
5. Purchases and Sales of Investment Securities:
Purchases and sales of investments, other than short-term securities, for each Fund for the period ended December 31, 2019 were as follows:
| | | | | | | | | | | | |
| | | Purchases | | | Sales | | | |
| Bridgeway Fund | | U.S. Government | | Other | | | U.S. Government | | Other | |
| | | | | | | | | | | | |
Aggressive Investors 1 | | $ - | | | $100,991,525 | | | $ - | | | $109,791,957 | |
Ultra-Small Company | | - | | | 32,280,086 | | | - | | | 38,143,628 | |
Ultra-Small Company Market | | - | | | 37,798,345 | | | - | | | 60,130,611 | |
Small-Cap Growth | | - | | | 21,279,472 | | | - | | | 28,512,977 | |
Small-Cap Value | | - | | | 18,774,633 | | | - | | | 27,856,896 | |
Blue Chip | | - | | | 39,163,240 | | | - | | | 35,194,007 | |
Managed Volatility | | - | | | 3,342,935 | | | - | | | 5,645,858 | |
6. Federal Income Taxes
It is the Funds’ policy to continue to comply with the provisions of the Internal Revenue Code of 1986, as amended (“Internal Revenue Code”), applicable to regulated investment companies, and to distribute income to the extent necessary so that the Funds are not subject to federal income tax. Therefore, no federal income tax provision is required.
| | |
| 86 | | Semi-Annual Report | December 31, 2019 (Unaudited) |
| | |
| NOTES TO FINANCIAL STATEMENTS (continued) | | |
December 31, 2019 (Unaudited)
Unrealized Appreciation and Depreciation on Investments (Tax Basis)The amount of net unrealized appreciation/ depreciation and the cost of investment securities for tax purposes, including short-term securities as of December 31, 2019, were as follows:
| | | | | | | | | | |
| | | Aggressive Investors 1 | | | Ultra-Small
Company | | Ultra-Small
Company Market | |
Gross appreciation (excess of value over tax cost) | | | $ 20,385,308 | | | $ 9,345,103 | | | $ 57,803,565 | |
Gross depreciation (excess of tax cost over value) | | | (5,263,970) | | | (13,952,023) | | | (28,097,102) | |
| | | |
Net unrealized appreciation (depreciation) | | | $ 15,121,338 | | | $ (4,606,920) | | | $ 29,706,463 | |
| | | |
Cost of investments for income tax purposes | | | $166,679,317 | | | $ 75,833,235 | | | $ 208,902,372 | |
| | | | | | | | | | | | |
| | | |
| | | Small-Cap Growth | | | | | | Small-Cap Value | |
Gross appreciation (excess of value over tax cost) | | | $ 5,134,257 | | | | | | | | $ 5,130,933 | |
Gross depreciation (excess of tax cost over value) | | | (1,128,040) | | | | | | | | (2,690,784) | |
| | | |
Net unrealized (depreciation) | | | $ 4,006,217 | | | | | | | | $ 2,440,149 | |
Cost of investments for income tax purposes | | | $34,076,125 | | | | | | | | $44,977,088 | |
| | | | | | | | | | | | |
| | | |
| | | Blue Chip | | | | | | Managed Volatility | |
Gross appreciation (excess of value over tax cost) | | | $298,496,839 | | | | | | | | $ 7,991,948 | |
Gross depreciation (excess of tax cost over value) | | | (4,866,431) | | | | | | | | (164,955) | |
| | | |
Net unrealized appreciation | | | $293,630,408 | | | | | | | | $ 7,826,993 | |
Cost of investments for income tax purposes | | | $264,379,039 | | | | | | | | $21,702,280 | |
The differences between book and tax net unrealized appreciation (depreciation) are primarily due to wash sale and straddle loss deferrals and basis adjustments on investments in business development companies, partnerships and passive foreign investment companies (PFICs).
Classifications of DistributionsNet investment income (loss) and net realized gain (loss) may differ for financial statement and tax purposes. The character of distributions made during the year from net investment income or net realized gains may differ from its ultimate characterization for federal income tax purposes.
The tax character of the distributions paid by the Funds during the last two fiscal years ended June 30, 2019 and June 30, 2018, respectively, are as follows:
| | | | | | | | | | | | | | | | |
| | | Aggressive Investors 1 | | | Ultra-Small Company | |
| | | Year Ended
June 30, 2019 | | | Year Ended
June 30, 2018 | | | Year Ended
June 30, 2019 | | | Year Ended
June 30, 2018 | |
| | | | |
Distributions paid from: | | | | | | | | | | | | | | | | |
Ordinary Income | | | $ 3,559,542 | | | | $ - | | | | $ 31,355 | | | | $1,299,999 | |
Long-Term Capital Gain | | | 14,282,874 | | | | - | | | | 8,945,451 | | | | 614,549 | |
Total | | | $17,842,416 | | | | $ - | | | | $8,976,806 | | | | $1,914,548 | |
| | |
| | | Ultra-Small Company Market | | | Small-Cap Growth | |
| | | Year Ended
June 30, 2019 | | | Year Ended
June 30, 2018 | | | Year Ended
June 30, 2019 | | | Year Ended
June 30, 2018 | |
| | | | |
Distributions paid from: | | | | | | | | | | | | | | | | |
Ordinary Income | | $ | 1,740,331 | | | $ | 449,185 | | | | $ 173,020 | | | | $98,928 | |
Long-Term Capital Gain | | | 36,117,247 | | | | 43,056,482 | | | | 4,355,880 | | | | - | |
Total | | $ | 37,857,578 | | | $ | 43,505,667 | | | | $4,528,900 | | | | $98,928 | |
| | |
| NOTES TO FINANCIAL STATEMENTS (continued) | | |
December 31, 2019 (Unaudited)
| | | | | | | | | | | | | | | | | | | | |
| | |
| | | Small-Cap Value | | Blue Chip |
| | | Year Ended
June 30, 2019 | | Year Ended
June 30, 2018 | | Year Ended
June 30, 2019 | | Year Ended
June 30, 2018 |
| | | | |
Distributions paid from: | | | | | | | | | | | | | | | | | | | | |
Ordinary Income | | | $ | 1,650,853 | | | | $ | 547,906 | | | | $ | 11,830,171 | | | | $ | 11,665,340 | |
Long-Term Capital Gain | | | | 7,514,056 | | | | | - | | | | | 52,980,363 | | | | | 15,737,305 | |
Total | | | $ | 9,164,909 | | | | $ | 547,906 | | | | $ | 64,810,534 | | | | $ | 27,402,645 | |
| | |
| | | Managed Volatility | | |
| | | Year Ended
June 30, 2019 | | Year Ended
June 30, 2018 |
Distributions paid from: | | | | | | | | | | |
Ordinary Income | | | $ | 630,480 | | | | $ | 194,557 | |
Long-Term Capital Gain | | | | 1,265,342 | | | | | - | |
Total | | | $ | 1,895,822 | | | | $ | 194,557 | |
Under the Regulated Investment Company Modernization Act of 2010, capital losses incurred by the Funds after June 30, 2011 will not be subject to expiration and will retain their character as either short-term or long-term capital losses.
As of June 30, 2019, the following Funds had capital loss carryovers available to offset future realized capital gains which are not subject to expiration:
| | | | | | | | | | |
| | | Short-term | | | | Long-Term | | | | Total |
Aggressive Investors 1 | | $ 42,262 | | | | $ - | | | | $ 42,262 |
Small-Cap Value | | 693,062 | | | | - | | | | 693,062 |
Components of Accumulated EarningsAs of June 30, 2019, the components of accumulated earnings on a tax basis were:
| | | | | | | | | | | | | | | |
| | | Aggressive Investors 1 | | Ultra-Small Company | | Ultra-Small Company Market |
Accumulated Net Investment Income | | | $ | - | | | | $ | 780,748 | | | | $ | 2,465,910 | |
Accumulated Net Realized Gain (Loss) on Investments* | | | | (11,829,915 | ) | | | | (334,986 | ) | | | | (2,376,226 | ) |
Net Unrealized Appreciation of Investments | | | | 8,719,969 | | | | | (6,546,159 | ) | | | | 24,516,913 | |
Total | | | $ | (3,109,946 | ) | | | $ | (6,100,397 | ) | | | $ | 24,606,597 | |
| | | | | | | | | | | | | | | |
| | | Small-Cap Growth | | | | Small-Cap Value |
Accumulated Net Investment Income | | | $ | - | | | | | | | | | $ | - | |
Accumulated Net Realized Gain (Loss) on Investments* | | | | (1,724,248 | ) | | | | | | | | | (3,088,648 | ) |
Net Unrealized Appreciation of Investments | | | | 2,298,361 | | | | | | | | | | (1,843,681 | ) |
Total | | | $ | 574,113 | | | | | | | | | $ | (4,932,329 | ) |
| | |
| 88 | | Semi-Annual Report | December 31, 2019 (Unaudited) |
| | |
| NOTES TO FINANCIAL STATEMENTS (continued) | | |
December 31, 2019 (Unaudited)
| | | | | | | | | | | | | | | |
| | | Blue Chip | | | | Managed Volatility |
Accumulated Net Investment Income | | | $ | 5,174,345 | | | | | | | | | $ | - | |
Accumulated Net Realized Gain (Loss) on Investments* | | | | 42,452,769 | | | | | | | | | | (222,268 | ) |
Net Unrealized Appreciation of Investments | | | | 259,388,364 | | | | | | | | | | 6,470,273 | |
Total | | | $ | 307,015,478 | | | | | | | | | $ | 6,248,005 | |
| * | Includes qualified late-year losses that the Funds have elected to defer to the beginning of their next fiscal year ending June 30, 2020. TheSmall-Cap Growth Fund has elected to defer qualified ordinary late year losses of ($43,278). The Aggressive Investors 1, Ultra-Small Company, Ultra-Small Company Market,Small-Cap Value, Blue Chip and Managed Volatility Funds have no deferred qualified ordinary late-year losses. The Aggressive Investors 1, Ultra-Small Company, Ultra-Small Company Market,Small-Cap Growth,Small-Cap Value and Managed Volatility Funds have elected to defer late-year short term capital losses of ($10,983,638), ($334,986), ($2,376,226), ($1,680,970), ($2,422,773) and ($401,870). The Blue Chip Fund has no deferred late-year short term capital losses. The Aggressive Investors 1,Small-Cap Value and Managed Volatility Funds have elected to defer late-year long term capital gains/(losses) of ($804,015), $27,187 and $179,602. The Ultra-Small Company, Ultra-Small Company Market,Small-Cap Growth and Blue Chip Funds have no deferred late-year long term capital losses. |
For the fiscal year June 30, 2019, the Funds recorded the following reclassifications to the accounts listed below:
| | | | | | | | | | | | | | | |
| | | Increase (Decrease) |
| | | Aggressive Investors 1 | | Ultra-Small Company | | Ultra-Small Company Market |
Paid-In Capital | | | $ | (14,282,874 | ) | | | $ | 67,893 | | | | $ | 214,427 | |
Distributable Earnings | | | | 14,282,874 | | | | | (67,893 | ) | | | | (214,427 | ) |
| | | | | | | | | | | | | | | |
| | | Increase (Decrease) |
| | | Small-Cap Growth | | | | Small-Cap Value |
Paid-In Capital | | | $ | (2,198,309 | ) | | | | | | | | $ | (7,514,056 | ) |
Distributable Earnings | | | | 2,198,309 | | | | | | | | | | 7,514,056 | |
| |
| | | Increase (Decrease) |
| | | Blue Chip | | | | Managed Volatility |
Paid-In Capital | | | $ | 6,068,315 | | | | | | | | | | $(189,367) | |
Distributable Earnings | | | | (6,068,315 | ) | | | | | | | | | 189,367 | |
The difference between book and tax components of net assets and the resulting reclassifications were primarily a result of the differing book/tax treatment of the deduction of equalization debits for tax purposes, excess distributions, thewrite-off of unused net operating loss, and redesignation of dividends paid and investments in PFICs.
Accounting for Uncertainty in Income Taxes sets forth a minimum threshold for financial statement recognition of the benefit of a tax position taken or expected to be taken in a tax return. Management has analyzed each Fund’s tax positions and has concluded that no provision for income tax is required in the individual Fund’s financial statements. The Funds are not aware of any tax position for which it is reasonably possible that the total amounts of unrecognized tax benefits will significantly change in the next twelve months. Each Fund’s federal tax returns for the prior three fiscal years remain subject to examination by the Internal Revenue Service.
7. Line of Credit
Bridgeway established a line of credit agreement (“Facility”) with The Bank of New York Mellon, effective November 5, 2010. The Facility is for temporary or emergency purposes, such as to provide liquidity for shareholder redemptions, and is cancellable by either party. Unless cancelled earlier, the Facility shall be held available until September 10, 2020. Advances under the Facility are limited to $15,000,000 in total for all Funds, and advances to each Fund shall not exceed certain limits set forth in the credit agreement, including, but not limited to, the maximum amount a Fund is permitted to borrow under the 1940 Act.
The Funds incur a facility fee of 0.085% per annum on the unused portion of the Facility and interest expense to the extent of amounts borrowed under the Facility. Interest is based on the “Overnight Rate” plus 1.25%. The Overnight Rate means the higher of (a) the Federal Funds rate, (b) the Overnight Eurodollar Rate, or (c) theOne-Month Eurodollar Rate. The facility fees
| | |
| NOTES TO FINANCIAL STATEMENTS (continued) | | |
December 31, 2019 (Unaudited)
are payable quarterly in arrears and are allocated to all participating Funds. Interest expense is charged directly to a Fund based upon actual amounts borrowed by such Fund.
For the period ended December 31, 2019, borrowings by the Funds under this line of credit were as follows:
| | | | | | | | | | | | | | | | | | | | | | | | | |
| Bridgeway Fund | | Weighted
Average
Interest Rate | | Weighted
Average
Loan Balance | | Number of
Days
Outstanding | | Interest
Expense
Incurred1 | | Maximum Amount
Borrowed During
the Period |
| | | | | | | | | | | | | | | | | | | | | | | | | |
Aggressive Investors 1 | | | | 3.11 | % | | | | $ 770,097 | | | | | 31 | | | | | $2,064 | | | | | $2,806,000 | |
Ultra-Small Company | | | | 3.25 | % | | | | 354,961 | | | | | 102 | | | | | 3,271 | | | | | 920,000 | |
Ultra-Small Company Market | | | | 3.20 | % | | | | 1,098,474 | | | | | 78 | | | | | 7,617 | | | | | 2,828,000 | |
Small-Cap Growth | | | | 3.35 | % | | | | 298,978 | | | | | 92 | | | | | 2,559 | | | | | 1,509,000 | |
Small-Cap Value | | | | 3.13 | % | | | | 1,768,684 | | | | | 19 | | | | | 2,923 | | | | | 4,953,000 | |
Blue Chip | | | | 3.21 | % | | | | 560,262 | | | | | 42 | | | | | 2,101 | | | | | 3,272,000 | |
1Interest expense is included on the Statements of Operations in Miscellaneous expenses. | | | | | | |
On December 31, 2019, Ultra-Small Company Market andSmall-Cap Value had loans outstanding in the amounts of $1,178,000 and $248,000, respectively, exclusive of interest payable on the loans.
8. Redemption Fees
In Ultra-Small Company Market Fund, a 2% redemption fee may be charged on shares held less than six months. The fee is charged for the benefit of the remaining shareholders and will be paid to the Fund to help offset transaction costs. The fee is accounted for as an addition topaid-in capital.
9. Subsequent Events
Management has evaluated the impact of all subsequent events on the Funds and has determined that there were no subsequent events requiring recognition or disclosure in the financial statements.
| | |
| 90 | | Semi-Annual Report | December 31, 2019 (Unaudited) |
| | |
| OTHER INFORMATION | | |
December 31, 2019 (Unaudited)
1. Proxy Voting
Fund policies and procedures used in determining how to vote proxies relating to the Funds’ securities and a summary of proxies voted by the Funds for the period ended June 30, 2019 are available without a charge, upon request, by contacting Bridgeway Funds at1-800-661-3550 and on the SEC’s website at http://www.sec.gov.
2. Fund Holdings
The complete schedules of the Funds’ holdings for the second and fourth quarters of each fiscal year are contained in the Funds’ Semi-Annual and Annual Shareholder Reports, respectively.
The Bridgeway Funds file complete schedules of the Funds’ holdings with the SEC for the first and third quarters of each fiscal year as an exhibit to FormN-PORT within 60 days after the end of the period. Copies of the Funds’ FormN-PORT exhibit are available without charge, upon request, by contacting Bridgeway Funds at1-800-661-3550 and on the SEC’s website at http://www.sec.gov. You may also review and copy the Funds’ FormN-PORT exhibit at the SEC’s Public Reference Room in Washington, D.C. For more information about the operation of the Public Reference Room, please call1-800-SEC-0330.
| | |
| DISCLOSURE OF FUND EXPENSES | | |
December 31, 2019 (Unaudited)
As a shareholder of a Fund, you will incur no transaction costs from such Fund, including sales charges (loads) on purchases, on reinvested dividends or on other distributions. There are no exchange fees. Shareholders are subject to redemption fees on the Ultra-Small Company Market Fund under certain circumstances. However, as a shareholder of a Fund, you will incur ongoing costs, including management fees and other Fund expenses. The following examples are intended to help you understand your ongoing costs (in dollars) of investing in a Fund and to compare these costs with ongoing costs of investing in other mutual funds. The examples are based on an investment of $1,000 invested on July 1, 2019 and held until December 31, 2019.
Actual Expenses.The first line of the table below provides information about actual account values and actual expenses. You may use the information in this line, together with the amount you invested, to estimate the expenses that you paid over the period. Simply divide your account value by $1,000 (for example, an $8,600 account value divided by $1,000 = 8.6), then multiply the result by the number in the first line under the heading “Expenses Paid During Period” to estimate the expenses you paid on your account during the period.
Hypothetical Example for Comparison Purposes.The second line of the table below provides information about hypothetical account values and hypothetical expenses based on the Fund’s actual expense ratio and an assumed rate of return of 5% per year before expenses, which is not the Fund’s actual return. The hypothetical account values and expenses may not be used to estimate the actual ending account balance or expenses you paid for the period. You may use this information to compare the ongoing costs of investing in a Fund and other mutual funds. To do so, compare this 5% hypothetical example with the 5% hypothetical examples that appear in the shareholder reports of other funds.
The expenses shown in the table are meant to highlight ongoing Fund costs only. Therefore, the second line of the table is useful in comparing ongoing costs only and will not help you determine the relative total costs of owning different funds, because other funds may also have transaction costs, such as sales charges, redemption fees or exchange fees.
| | | | | | | | | | | | | | | | | | | | |
| | | Beginning Account
Value at 7/1/19 | | Ending Account
Value at 12/31/19 | | Expense
Ratio | | Expenses Paid
During Period*
7/1/19 - 12/31/19 |
| | |
Bridgeway Aggressive Investors 1 Fund | | | | | | | | | | | |
Actual Fund Return | | | | $1,000.00 | | | | | $1,030.10 | | | | | 0.32% | | | | | $1.63 | |
Hypothetical Fund Return | | | | $1,000.00 | | | | | $1,023.53 | | | | | 0.32% | | | | | $1.63 | |
| | |
Bridgeway Ultra-Small Company Fund | | | | | | | | | | | |
Actual Fund Return | | | | $1,000.00 | | | | | $1,016.30 | | | | | 1.29% | | | | | $6.54 | |
Hypothetical Fund Return | | | | $1,000.00 | | | | | $1,018.65 | | | | | 1.29% | | | | | $6.55 | |
| | |
Bridgeway Ultra-Small Company Market Fund | | | | | | | | | | | |
Actual Fund Return | | | | $1,000.00 | | | | | $1,038.40 | | | | | 0.75% | | | | | $3.84 | |
Hypothetical Fund Return | | | | $1,000.00 | | | | | $1,021.37 | | | | | 0.75% | | | | | $3.81 | |
| | |
BridgewaySmall-Cap Growth Fund | | | | | | | | | | | |
Actual Fund Return | | | | $1,000.00 | | | | | $1,045.30 | | | | | 0.94% | | | | | $4.83 | |
Hypothetical Fund Return | | | | $1,000.00 | | | | | $1,020.41 | | | | | 0.94% | | | | | $4.77 | |
| | |
BridgewaySmall-Cap Value Fund | | | | | | | | | | | |
Actual Fund Return | | | | $1,000.00 | | | | | $1,081.00 | | | | | 0.94% | | | | | $4.92 | |
Hypothetical Fund Return | | | | $1,000.00 | | | | | $1,020.41 | | | | | 0.94% | | | | | $4.77 | |
| | |
Bridgeway Blue Chip Fund | | | | | | | | | | | |
Actual Fund Return | | | | $1,000.00 | | | | | $1,106.80 | | | | | 0.15% | | | | | $0.79 | |
Hypothetical Fund Return | | | | $1,000.00 | | | | | $1,024.38 | | | | | 0.15% | | | | | $0.76 | |
| | |
| 92 | | Semi-Annual Report | December 31, 2019 (Unaudited) |
| | |
| DISCLOSURE OF FUND EXPENSES (continued) | | |
December 31, 2019 (Unaudited)
| | | | | | | | | | | | | | | | |
| | | Beginning Account
Value at 7/1/19 | | | Ending Account
Value at 12/31/19 | | | Expense
Ratio | | | Expenses Paid
During Period*
7/1/19 - 12/31/19 | |
| | | | |
Bridgeway Managed Volatility | | | | | | | | | | | | | | | | |
Actual Fund Return | | | $1,000.00 | | | | $1,031.80 | | | | 0.94% | | | | $4.80 | |
Hypothetical Fund Return | | | $1,000.00 | | | | $1,020.41 | | | | 0.94% | | | | $4.77 | |
| * | Expenses are equal to the average account value times the Fund’s annualized expense ratio multiplied by the number of days in the most recent six-month period (184) divided by the number of days in the fiscal year (366). |
THIS PAGE INTENTIONALLY LEFT BLANK
THIS PAGE INTENTIONALLY LEFT BLANK
| | | | | | |
| | | | | | |
| | | | | | |
| | BRIDGEWAY FUNDS, INC. BNY Mellon Investment Servicing (US) Inc. P.O. Box 9860 Providence, RI 02940-8060 CUSTODIAN The Bank of New York Mellon One Wall Street New York, NY 10286 DISTRIBUTOR Foreside Fund Services, LLC Three Canal Plaza, Suite 100 Portland, ME 04101 | | | | |
| | | |
| | | | | | |
| | You can review and copy information about our Funds (including the SAIs) at the SEC’s Public Reference Room in Washington, D.C. To find out more about this public service, call the SEC at800-SEC-0330. Reports and other information about the Funds are also available on the SEC’s website at www.sec.gov. You can receive copies of this information, for a fee, by writing the Public Reference Section, Securities and Exchange Commission, Washington, D.C. 20549-1520 or by sending an electronic request to the following email address: publicinfo@sec.gov. | | |
| | | | | | |

Ano-load mutual fund family
|
Semi-Annual Report December 31, 2019 (Unaudited) |
| | |
| OMNISMALL-CAP VALUE | | BOSVX |
| |
OMNITAX-MANAGEDSMALL-CAP
VALUE | | BOTSX |
Beginning on January 1, 2021, as permitted by regulations adopted by the U.S. Securities and Exchange Commission, paper copies of the Funds’ annual and semi-annual shareholder reports will no longer be sent by mail, unless you specifically request paper copies of the reports. Instead, the reports will be made available on the Funds’ website (bridgeway.com), and you will be notified by mail each time a report is posted and provided with a website link to access the report.
If you already elected to receive shareholder reports electronically, you will not be affected by this change and you need not take any action. You may elect to receive shareholder reports and other communications from a Fund electronically anytime by contacting your financial intermediary (such as a broker-dealer or bank) or, if you are a direct investor, by calling800-661-3550.
You may elect to receive all future reports in paper free of charge. If you invest through a financial intermediary, you can contact your financial intermediary to request that you continue to receive paper copies of your shareholder reports. If you invest directly with a Fund, you can call800-661-3550 to let the Fund know you wish to continue receiving paper copies of your shareholder reports. Your election to receive reports in paper will apply to all Funds held in your account if you invest through your financial intermediary or to all Funds held with the fund complex if you invest directly with a Fund.
| | |
| TABLE OF CONTENTS | |  |
|
|
| | |
| | | |
| Bridgeway Funds Standardized Returns as of December 31, 2019 (Unaudited) | | |
| | | | | | | | | | | | | | | | |
| | | | | | | Annualized | | | | | | |
| | | | | | | | | | | Gross | | Net |
| Fund1 | | Quarter | | Six Months | | 1 Year | | 5 Years | | Inception
to Date | | Inception
Date | | Expense
Ratio2 | | Expense
Ratio2 |
OmniSmall-Cap Value | | 9.07% | | 6.73% | | 13.89% | | 4.67% | | 10.17% | | 8/31/2011 | | 0.72% | | 0.62% |
OmniTax-ManagedSmall-Cap Value | | 9.37% | | 7.63% | | 14.28% | | 5.19% | | 8.25% | | 12/31/2010 | | 0.72% | | 0.60% |
| | 1 | Some of the Fund’s fees were waived or expenses reimbursed; otherwise, returns would have been lower. The Adviser is contractually obligated to waive fees and/or reimburse expenses. Any material change to this Fund policy would require a vote by shareholders. |
| | 2 | Expense ratios are as stated in the current prospectus. Please see financial highlights for expense ratios as of December 31, 2019. |
Performance figures quoted represent past performance and are no guarantee of future results. Current performance may be lower or higher than the performance data quoted. Investment return and principal value will fluctuate, so that an investor’s shares, when redeemed, may be worth more or less than original cost. To obtain performance current to the most recentmonth-end, please visit our website at bridgeway.com or call1-800-661-3550. Total return figures include the reinvestment of dividends and capital gains. Periods of less than one year are not annualized.
This report is submitted for the general information of the shareholders of each Fund. It is not authorized for distribution to prospective investors unless preceded or accompanied by an effective prospectus, which includes information regarding a Fund’s risks, objectives, fees and expenses, experience of its management, and other information. Investors should read the prospectus carefully before investing in a Fund. For questions or other Fund information, call1-800-661-3550 or visit the Funds’ website at bridgeway.com. Funds are available for purchase by residents of the United States, Puerto Rico, U.S. Virgin Islands and Guam only.
The views expressed here are exclusively those of Fund management. These views, including those relating to the market, sectors or individual stocks, are not meant as investment advice and should not be considered predictive in nature.
| | |
| LETTER FROM THE INVESTMENT MANAGEMENT TEAM | | |
December 31, 2019
Dear Fellow Shareholders,
At Bridgeway, we have a shared passion for applying logic, data and evidence to develop investment solutions. Our OmniSmall-Cap Value and OmniTax-ManagedSmall-Cap Value Funds are constructed based on fundamental academic research that relies on market efficiency to better capture risk premiums. We manage these Funds to provide broad diversification within thesmall-cap value universe and to keep transaction fees and expenses low. Bridgeway offers the OmniSmall-Cap Value and OmniTax-ManagedSmall-Cap Value Funds through a select group of advisors. We are committed to advisors and their clients who take a long-term perspective and whose investment goals fit our unique expertise: delivering investment solutions that are statistically driven and grounded in academic theory.
Thank you for your investment in Bridgeway’s OmniSmall-Cap Value and OmniTax-ManagedSmall-Cap Value Funds.
|
Sincerely, |
Your Investment Management Team |
| | | | |
 | |  | |  |
John Montgomery | | Christine L. Wang | | Michael Whipple |
 | | | | |
Elena Khoziaeva | | | | |
| | |
| LETTER FROM THE INVESTMENT MANAGEMENT TEAM(continued) | | |
Market Review
Performance across domestic equity markets was positive for the December 2019 quarter. Broad market returns for the quarter rose +9.10% as represented by the Russell 3000 Index.
For the calendar year ended December 31, 2019, broad market stocks advanced 31.02%, as represented by the Russell 3000 Index. Growth stocks outperformed value stocks in all size categories, and larger stocks outperformed their smaller peers. As result,large-cap growth stocks, as represented by the Russell 1000 Growth Index, had the best12-month performance, returning +36.39%.Small-cap value stocks, as represented by the Russell 2000 Value Index, had the year’s worst performance, returning +22.39%.
The following table presents returns for broad market,small-cap,mid-cap, andlarge-cap stocks, as represented by various style-based Russell Indexes. Size (market capitalization) and style (value/growth) are among the key factors that drive differences in returns among U.S. stock returns.
Russell Style-Based Indexes Ranked by Performance for the Quarter and Calendar Year Ended December 31, 2019
| | | | |
| | Quarter | | Calendar Year |
| | |
Best Performing | | +11.39% Russell2000 GrowthIndex | | +36.39% Russell1000 GrowthIndex |
| | |
| | +10.67% Russell3000 GrowthIndex | | +35.85% Russell3000 GrowthIndex |
| | |
| | +10.62% Russell1000 GrowthIndex | | +35.47% RussellMidcap GrowthIndex |
| | |
| | +8.49% Russell2000 ValueIndex | | +28.48% Russell2000 GrowthIndex |
| | |
| | +8.17% RussellMidcap GrowthIndex | | +27.06% RussellMidcap ValueIndex |
| | |
| | +7.48% Russell3000 ValueIndex | | +26.54% Russell1000 ValueIndex |
| | |
| | +7.41% Russell1000 ValueIndex | | +26.26% Russell3000 ValueIndex |
| | |
Worst Performing | | +6.36% RussellMidcap ValueIndex | | +22.39% Russell2000 ValueIndex |
The Bridgeway Omni Funds are asset class exposure strategies that seek broad diversification and strive for risk premium exposure. These Funds were designed to capture the size and style benefits within thesmall-cap value asset class.
| | |
|
| |
| 2 | | Semi-Annual Report | December 31, 2019 (Unaudited) |
| | |
OmniSmall-Cap Value Fund MANAGER’S COMMENTARY (Unaudited) | | |
|
|
December 31, 2019
Dear Fellow OmniSmall-Cap Value Fund Shareholder,
For the quarter ended December 31, 2019, our Fund returned +9.07%, outperforming our primary market benchmark, the Russell 2000 Value Index (+8.49%).
For the calendar year, our Fund returned +13.89%, underperforming the Russell 2000 Value Index (+22.39%).
The table below presents our December quarter,six-month,one-year, five-year, andinception-to-date financial results. See the next page for a graph of performance since inception.
Standardized Returns as of December 31, 2019
| | | | | | | | | | |
| | | | | | | | | Annualized |
| | | | | | | | | | | Since Inception |
| | | Quarter | | 6 Months | | 1 Year | | 5 Years | | (8/31/11) |
| | | | | |
OmniSmall-Cap Value Fund | | 9.07% | | 6.73% | | 13.89% | | 4.67% | | 10.17% |
Russell 2000 Value Index | | 8.49% | | 7.87% | | 22.39% | | 6.99% | | 11.06% |
Performance figures quoted in the table above and the graph on the next page represent past performance and are no guarantee of future results. Total return figures in the table above include the reinvestment of dividends and capital gains. The table above and the graph on the next page do not reflect the deduction of taxes that a shareholder would pay on Fund distributions or on the redemption of Fund shares.
The Russell 2000 Value Index is an unmanaged index that consists of stocks in the Russell 2000 Index with lowerprice-to-book ratios and lower forecasted growth values with dividends reinvested. It is not possible to invest directly in an index. Periods longer than one year are annualized.
| | |
OmniSmall-Cap Value Fund MANAGER’S COMMENTARY (Unaudited) (continued) | | |
|
|
Growth of a $10,000 Investment
from Inception August 31, 2011 to December 31, 2019
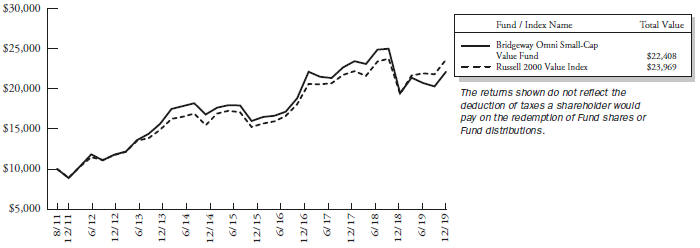
Detailed Explanation of Quarterly Performance
The OmniSmall-Cap Value Fund is designed to capture the returns of thesmall-cap value asset class through broad diversification of small company and value stocks. This approach is sometimes referred to as “passive, asset class investing.” As of December 31, 2019, we held 628 such stocks in amarket-cap weighted style. We make no attempt to track any particular index in either performance or statistics.
The Fund’s tilt toward smaller stocks in thesmall-cap value universe was a leading contributor to relative results, as smaller stocks outperformed their larger counterparts during the quarter. The Fund’s tilt toward deeper value stocks across multiple valuation metrics also helped relative performance.
By design, the Fund does not hold Real Estate Investment Trusts (REITs) or Utilities stocks. The lack of exposure to both these types of stocks added to relative results.
Detailed Explanation of Calendar Year Performance
The Fund’s tilt toward deeper value stocks across multiple valuation metrics was a leading detractor from relative performance. A tilt toward smaller stocks in thesmall-cap value universe also hurt relative results, as smaller stocks underperformed their larger counterparts for the12-month period.
By design, the Fund does not hold Real Estate Investment Trusts (REITs) and Utilities stocks. Our lack of exposure to REITs hurt relative results, but the Fund’s relative performance benefited slightly from the lack of exposure to Utilities stocks.
| | |
|
| |
| 4 | | Semi-Annual Report | December 31, 2019 (Unaudited) |
| | |
OmniSmall-Cap Value Fund MANAGER’S COMMENTARY (Unaudited) (continued) | | |
|
|
Top Ten Holdings as of December 31, 2019
| | | | | | |
| Rank | | Description | | Industry | | % of Net
Assets |
1 | | Group 1 Automotive, Inc. | | Consumer Discretionary | | 0.8% |
2 | | Aircastle, Ltd. | | Industrials | | 0.8% |
3 | | TTM Technologies, Inc. | | Information Technology | | 0.8% |
4 | | Meritage Homes Corp. | | Consumer Discretionary | | 0.7% |
5 | | Gray Television, Inc. | | Communication Services | | 0.7% |
6 | | Scorpio Tankers, Inc. | | Energy | | 0.7% |
7 | | BMC Stock Holdings, Inc. | | Industrials | | 0.7% |
8 | | Insight Enterprises, Inc. | | Information Technology | | 0.6% |
9 | | Prestige Consumer Healthcare, Inc. | | Health Care | | 0.6% |
10 | | Rush Enterprises, Inc., Class A | | Industrials | | 0.6% |
| | Total | | | | 7.0% |
Industry Sector Representation as of December 31, 2019
| | | | | | | | | | | | | | | |
| | | % of Net Assets | | % of Russell 2000
Value Index | | Difference |
Communication Services | | | | 4.0% | | | | | 2.2% | | | | | 1.8% | |
Consumer Discretionary | | | | 13.4% | | | | | 9.7% | | | | | 3.7% | |
Consumer Staples | | | | 4.2% | | | | | 2.7% | | | | | 1.5% | |
Energy | | | | 14.2% | | | | | 5.8% | | | | | 8.4% | |
Financials | | | | 31.5% | | | | | 30.2% | | | | | 1.3% | |
Health Care | | | | 2.9% | | | | | 5.4% | | | | | -2.5% | |
Industrials | | | | 15.1% | | | | | 12.7% | | | | | 2.4% | |
Information Technology | | | | 7.9% | | | | | 9.6% | | | | | -1.7% | |
Materials | | | | 5.9% | | | | | 4.7% | | | | | 1.2% | |
Real Estate | | | | 0.2% | | | | | 11.1% | | | | | -10.9% | |
Utilities | | | | 0.0% | | | | | 5.9% | | | | | -5.9% | |
Cash & Other Assets | | | | 0.7% | | | | | 0.0% | | | | | 0.7% | |
Total | | | | 100.0% | | | | | 100.0% | | | | | | |
Disclaimer
The views expressed here are exclusively those of Fund management. These views, including those related to market sectors or individual stocks, are not meant as investment advice and should not be considered predictive in nature. Any favorable (or unfavorable) description of a holding applies only as of the quarter end, December 31, 2019, unless otherwise stated. Security positions can and do change thereafter. Discussions of historical performance do not guarantee and may not be indicative of future performance.
Market volatility can significantly impact short-term performance. The Fund is not an appropriate investment for short-term investors. Investments in small companies generally carry greater risk than is customarily associated with larger companies. This additional risk is attributable to a number of factors, including the relatively limited financial resources that are typically available to small companies and the fact that small companies often have comparatively limited product lines. In addition, the stock of small companies tends to be more volatile than the stock of large companies, particularly in the short term and particularly in the early stages of an economic or market downturn. Shareholders of the Fund, therefore, are taking on more risk than they would if they invested in the stock market as a whole.
| | |
OmniSmall-Cap Value Fund MANAGER’S COMMENTARY (Unaudited) (continued) | | |
|
|
Conclusion
Thank you for your continued investment in OmniSmall-Cap Value Fund. We encourage your feedback; your reactions and concerns are important to us.
Sincerely,
The Investment Management Team
| | |
|
| |
| 6 | | Semi-Annual Report | December 31, 2019 (Unaudited) |
| | |
OmniSmall-Cap Value Fund SCHEDULE OF INVESTMENTS (Unaudited) | | |
|
|
| |
| Showing percentage of net assets as of December 31, 2019 | | |
| | | | | | | | |
| Industry Company | | Shares | | | Value | |
|
COMMON STOCKS - 99.25% | |
Communication Services - 3.96% | |
A.H. Belo Corp., Class A | | | 65,500 | | | $ | 184,710 | |
Alaska Communications Systems Group, Inc.* | | | 377,100 | | | | 667,467 | |
AMC Entertainment Holdings, Inc., Class A+ | | | 306,900 | | | | 2,221,956 | |
ATN International, Inc. | | | 28,500 | | | | 1,578,615 | |
Consolidated Communications Holdings, Inc.+ | | | 299,000 | | | | 1,160,120 | |
Cumulus Media, Inc., Class A* | | | 89,000 | | | | 1,563,730 | |
DHI Group, Inc.* | | | 231,900 | | | | 698,019 | |
Emerald Expositions Events, Inc.+ | | | 70,000 | | | | 738,500 | |
Emmis Communications Corp., Class A* | | | 102,700 | | | | 413,881 | |
Entercom Communications Corp., Class A | | | 363,695 | | | | 1,687,545 | |
Entravision Communications Corp., Class A | | | 190,300 | | | | 498,586 | |
Eros International PLC*+ | | | 237,750 | | | | 805,972 | |
EW Scripps Co. (The), Class A+ | | | 175,500 | | | | 2,757,105 | |
Fluent, Inc.* | | | 187,900 | | | | 469,750 | |
Gannett Co., Inc.+ | | | 355,212 | | | | 2,266,253 | |
Gray Television, Inc.* | | | 346,200 | | | | 7,422,528 | |
Liberty TripAdvisor Holdings, Inc., Class A* | | | 55,000 | | | | 404,250 | |
Marcus Corp. (The) | | | 82,250 | | | | 2,613,082 | |
Meet Group, Inc.
(The)*+ | | | 179,500 | | | | 899,295 | |
Meredith Corp.+ | | | 150,000 | | | | 4,870,500 | |
Saga Communications, Inc., Class A+ | | | 20,761 | | | | 631,134 | |
Salem Media Group, Inc. | | | 89,800 | | | | 129,312 | |
Scholastic Corp.+ | | | 131,490 | | | | 5,055,790 | |
Townsquare Media, Inc., Class A | | | 120,000 | | | | 1,196,400 | |
Urban One, Inc.* | | | 101,800 | | | | 193,420 | |
| | | | | | | | |
| | |
| | | | | | | 41,127,920 | |
Consumer Discretionary - 13.37% | |
Abercrombie & Fitch Co., Class A+ | | | 150,000 | | | | 2,593,500 | |
Adtalem Global Education, Inc.*+ | | | 117,500 | | | | 4,108,975 | |
AMCON Distributing Co. | | | 1,350 | | | | 97,213 | |
American Axle & Manufacturing Holdings, Inc.* | | | 392,200 | | | | 4,220,072 | |
American Outdoor Brands Corp.* | | | 184,327 | | | | 1,710,555 | |
American Public Education, Inc.* | | | 57,600 | | | | 1,577,664 | |
Ark Restaurants Corp. | | | 12,600 | | | | 279,720 | |
| | | | | | | | |
| Industry Company | | Shares | | | Value | |
|
Consumer Discretionary (continued) | |
Barnes & Noble Education, Inc.* | | | 186,824 | | | $ | 797,738 | |
Bassett Furniture Industries, Inc. | | | 77,400 | | | | 1,291,032 | |
BBX Capital Corp. | | | 326,039 | | | | 1,555,206 | |
Beazer Homes USA, Inc.* | | | 120,000 | | | | 1,695,600 | |
Bed Bath & Beyond, Inc.+ | | | 65,000 | | | | 1,124,500 | |
Big Lots, Inc.+ | | | 125,000 | | | | 3,590,000 | |
Biglari Holdings, Inc., Class B* | | | 7,500 | | | | 858,150 | |
Build-A-Bear Workshop, Inc.*+ | | | 49,500 | | | | 160,380 | |
Caleres, Inc.+ | | | 168,500 | | | | 4,001,875 | |
Canterbury Park Holding Corp. | | | 3,900 | | | | 48,360 | |
Carriage Services, Inc. | | | 40,000 | | | | 1,024,000 | |
Carrols Restaurant Group, Inc.*+ | | | 137,600 | | | | 970,080 | |
Cato Corp. (The), Class A | | | 65,000 | | | | 1,131,000 | |
Century Casinos, Inc.* | | | 124,600 | | | | 986,832 | |
Chico’s FAS, Inc.+ | | | 216,200 | | | | 823,722 | |
China Automotive Systems, Inc.* | | | 77,500 | | | | 244,125 | |
China XD Plastics Co., Ltd.* | | | 100,000 | | | | 179,000 | |
Citi Trends, Inc. | | | 78,840 | | | | 1,822,781 | |
Conn’s, Inc.*+ | | | 90,500 | | | | 1,121,295 | |
Container Store Group, Inc. (The)*+ | | | 141,150 | | | | 595,653 | |
Cooper Tire & Rubber Co. | | | 143,250 | | | | 4,118,437 | |
Crown Crafts, Inc. | | | 21,050 | | | | 129,457 | |
Culp, Inc. | | | 30,000 | | | | 408,600 | |
Del Taco Restaurants, Inc.* | | | 182,300 | | | | 1,441,081 | |
Delta Apparel, Inc.* | | | 29,900 | | | | 929,890 | |
Destination XL Group, Inc.* | | | 89,800 | | | | 114,944 | |
Dillard’s, Inc., Class A+ | | | 68,000 | | | | 4,996,640 | |
Dixie Group, Inc. (The)* | | | 34,800 | | | | 39,672 | |
Ethan Allen Interiors, Inc. | | | 82,500 | | | | 1,572,450 | |
Express, Inc.*+ | | | 197,000 | | | | 959,390 | |
Fiesta Restaurant Group, Inc.*+ | | | 60,000 | | | | 593,400 | |
Flanigan’s Enterprises, Inc. | | | 2,500 | | | | 55,350 | |
Flexsteel Industries, Inc. | | | 6,800 | | | | 135,456 | |
Fossil Group, Inc.*+ | | | 162,300 | | | | 1,278,924 | |
Full House Resorts, Inc.* | | | 71,000 | | | | 237,850 | |
GameStop Corp., Class A+ | | | 350,000 | | | | 2,128,000 | |
Genesco, Inc.*+ | | | 73,500 | | | | 3,522,120 | |
G-III Apparel Group, Ltd.*+ | | | 115,000 | | | | 3,852,500 | |
Golden Entertainment, Inc.* | | | 64,500 | | | | 1,239,690 | |
Good Times Restaurants, Inc.*+ | | | 106,000 | | | | 168,540 | |
Group 1 Automotive, Inc.+ | | | 84,000 | | | | 8,400,000 | |
Haverty Furniture Cos., Inc. | | | 98,400 | | | | 1,983,744 | |
| | |
OmniSmall-Cap Value Fund SCHEDULE OF INVESTMENTS (Unaudited) (continued) | | |
|
|
| |
| Showing percentage of net assets as of December 31, 2019 | | |
| | | | | | | | |
| Industry Company | | Shares | | | Value | |
|
Common Stocks (continued) | |
Consumer Discretionary (continued) | |
Hibbett Sports, Inc.*+ | | | 76,900 | | | $ | 2,156,276 | |
Houghton Mifflin Harcourt Co.* | | | 383,600 | | | | 2,397,500 | |
J Alexander’s Holdings, Inc.* | | | 55,650 | | | | 532,014 | |
J. Jill, Inc.+ | | | 145,000 | | | | 163,850 | |
JAKKS Pacific, Inc.* | | | 118,700 | | | | 122,261 | |
K12, Inc.* | | | 151,917 | | | | 3,091,511 | |
Lands’ End, Inc.*+ | | | 92,600 | | | | 1,555,680 | |
Libbey, Inc.* | | | 60,000 | | | | 87,000 | |
Lifetime Brands, Inc. | | | 41,150 | | | | 285,992 | |
Live Ventures, Inc.*+ | | | 3,200 | | | | 24,064 | |
MarineMax, Inc.* | | | 87,000 | | | | 1,452,030 | |
Meritage Homes Corp.* | | | 123,442 | | | | 7,543,541 | |
Modine Manufacturing Co.* | | | 235,800 | | | | 1,815,660 | |
Movado Group, Inc.+ | | | 75,000 | | | | 1,630,500 | |
Office Depot, Inc. | | | 1,385,000 | | | | 3,794,900 | |
P&F Industries, Inc., Class A | | | 696 | | | | 4,775 | |
Party City Holdco, Inc.*+ | | | 258,200 | | | | 604,188 | |
Playa Hotels & Resorts NV* | | | 481,800 | | | | 4,047,120 | |
Red Robin Gourmet Burgers, Inc.*+ | | | 51,000 | | | | 1,684,020 | |
Rent-A-Center, Inc. | | | 8,700 | | | | 250,908 | |
Rocky Brands, Inc.+ | | | 28,300 | | | | 832,869 | |
RTW RetailWinds, Inc.* | | | 165,400 | | | | 132,485 | |
Sequential Brands Group, Inc.* | | | 155,000 | | | | 53,088 | |
Shiloh Industries, Inc.* | | | 71,500 | | | | 254,540 | |
Shoe Carnival, Inc.+ | | | 63,600 | | | | 2,371,008 | |
Signet Jewelers, Ltd.+ | | | 105,000 | | | | 2,282,700 | |
Sonic Automotive, Inc., Class A | | | 132,600 | | | | 4,110,600 | |
SORL Auto Parts, Inc.*+ | | | 129,900 | | | | 576,756 | |
Sportsman’s Warehouse Holdings, Inc.* | | | 100,000 | | | | 803,000 | |
Stein Mart, Inc.* | | | 83,200 | | | | 55,677 | |
Strattec Security Corp. | | | 18,800 | | | | 417,548 | |
Superior Group of Cos., Inc. | | | 36,200 | | | | 490,148 | |
Tandy Leather Factory, Inc.*+ | | | 22,700 | | | | 129,617 | |
Tilly’s, Inc., Class A | | | 88,300 | | | | 1,081,675 | |
TravelCenters of America, Inc.* | | | 62,640 | | | | 1,074,276 | |
TRI Pointe Group, Inc.*+ | | | 266,000 | | | | 4,144,280 | |
Tuesday Morning Corp.* | | | 148,700 | | | | 275,095 | |
Vera Bradley, Inc.*+ | | | 149,200 | | | | 1,760,560 | |
Vista Outdoor, Inc.* | | | 164,087 | | | | 1,227,371 | |
VOXX International Corp.* | | | 75,100 | | | | 328,938 | |
William Lyon Homes, Class A* | | | 80,500 | | | | 1,608,390 | |
ZAGG, Inc.*+ | | | 75,000 | | | | 608,250 | |
Zumiez, Inc.* | | | 119,400 | | | | 4,124,076 | |
| | | | | | | | |
| | |
| | | | | | | 138,901,900 | |
| | | | | | | | |
| Industry Company | | Shares | | | Value | |
|
Consumer Staples - 4.16% | |
Alico, Inc. | | | 25,761 | | | $ | 923,017 | |
Andersons, Inc. (The)+ | | | 88,100 | | | | 2,227,168 | |
B&G Foods, Inc.+ | | | 185,000 | | | | 3,317,050 | |
Central Garden & Pet Co.* | | | 10,000 | | | | 310,700 | |
Central Garden & Pet Co., Class A* | | | 80,000 | | | | 2,348,800 | |
Coffee Holding Co., Inc.*+ | | | 23,000 | | | | 105,800 | |
Cott Corp. | | | 351,300 | | | | 4,805,784 | |
Edgewell Personal Care Co.* | | | 133,000 | | | | 4,117,680 | |
Fresh Del Monte Produce, Inc. | | | 178,500 | | | | 6,243,930 | |
Hostess Brands, Inc.* | | | 367,300 | | | | 5,340,542 | |
Ingles Markets, Inc., Class A | | | 79,900 | | | | 3,796,049 | |
Mannatech, Inc. | | | 8,400 | | | | 131,544 | |
Natural Alternatives International, Inc.* | | | 18,100 | | | | 144,438 | |
Natural Grocers by Vitamin Cottage, Inc. | | | 25,000 | | | | 246,750 | |
Nature’s Sunshine Products, Inc.* | | | 15,000 | | | | 133,950 | |
Seneca Foods Corp., Class A*+ | | | 40,100 | | | | 1,635,679 | |
SpartanNash Co. | | | 120,946 | | | | 1,722,271 | |
Village Super Market, Inc., Class A | | | 74,009 | | | | 1,717,009 | |
Weis Markets, Inc.+ | | | 97,625 | | | | 3,952,836 | |
| | | | | | | | |
| | |
| | | | | | | 43,220,997 | |
|
Energy - 14.19% | |
Adams Resources & Energy, Inc. | | | 23,100 | | | | 879,417 | |
Amplify Energy Corp.+ | | | 119,400 | | | | 789,234 | |
Arch Coal, Inc., Class A+ | | | 61,000 | | | | 4,376,140 | |
Archrock, Inc. | | | 447,000 | | | | 4,487,880 | |
Ardmore Shipping Corp.* | | | 172,688 | | | | 1,562,826 | |
Berry Petroleum Corp. | | | 310,000 | | | | 2,923,300 | |
Bonanza Creek Energy, Inc.*+ | | | 90,000 | | | | 2,100,600 | |
Callon Petroleum Co.*+ | | | 993,025 | | | | 4,796,311 | |
Comstock Resources, Inc.*+ | | | 292,800 | | | | 2,409,744 | |
CONSOL Energy, Inc.*+ | | | 103,600 | | | | 1,503,236 | |
Contango Oil & Gas Co.*+ | | | 142,000 | | | | 521,140 | |
Contura Energy, Inc.* | | | 55,800 | | | | 504,990 | |
Dawson Geophysical Co.* | | | 45,600 | | | | 109,440 | |
Denbury Resources, Inc.*+ | | | 1,480,000 | | | | 2,086,800 | |
DHT Holdings, Inc. | | | 542,322 | | | | 4,490,426 | |
Diamond Offshore Drilling, Inc.*+ | | | 260,000 | | | | 1,869,400 | |
Dorian LPG, Ltd.* | | | 175,500 | | | | 2,716,740 | |
| | |
|
| |
| 8 | | Semi-Annual Report | December 31, 2019 (Unaudited) |
| | |
OmniSmall-Cap Value Fund SCHEDULE OF INVESTMENTS (Unaudited) (continued) | | |
|
|
| |
| Showing percentage of net assets as of December 31, 2019 | | |
| | | | | | | | |
| Industry Company | | Shares | | | Value | |
|
Common Stocks (continued) | |
Energy (continued) | |
Earthstone Energy, Inc., Class A*+ | | | 187,000 | | | $ | 1,183,710 | |
Energy Transfer LP | | | 31,313 | | | | 401,746 | |
Epsilon Energy, Ltd.* | | | 90,000 | | | | 297,000 | |
Era Group, Inc.* | | | 144,800 | | | | 1,472,616 | |
Exterran Corp.* | | | 97,200 | | | | 761,076 | |
Extraction Oil & Gas, Inc.*+ | | | 332,000 | | | | 703,840 | |
Frontline, Ltd.+ | | | 180,000 | | | | 2,314,800 | |
GasLog, Ltd. | | | 314,300 | | | | 3,076,997 | |
Golar LNG, Ltd.+ | | | 165,000 | | | | 2,346,300 | |
Goodrich Petroleum Corp.* | | | 33,000 | | | | 331,320 | |
Gran Tierra Energy, Inc.*+ | | | 1,244,400 | | | | 1,605,276 | |
Green Plains, Inc.+ | | | 140,200 | | | | 2,163,286 | |
Gulfport Energy Corp.*+ | | | 507,000 | | | | 1,541,280 | |
Hallador Energy Co. | | | 166,600 | | | | 494,802 | |
Helix Energy Solutions Group, Inc.*+ | | | 670,500 | | | | 6,456,915 | |
Independence Contract Drilling, Inc.* | | | 183,319 | | | | 182,732 | |
Lonestar Resources US, Inc., Class A* | | | 109,250 | | | | 285,142 | |
Mammoth Energy Services, Inc.+ | | | 121,400 | | | | 267,080 | |
Matrix Service Co.* | | | 70,300 | | | | 1,608,464 | |
McDermott International, Inc.*+ | | | 250,131 | | | | 169,239 | |
Mitcham Industries, Inc.* | | | 15,100 | | | | 43,337 | |
Montage Resources Corp.*+ | | | 69,213 | | | | 549,551 | |
Nabors Industries, Ltd.+ | | | 810,000 | | | | 2,332,800 | |
NACCO Industries, Inc., Class A | | | 37,245 | | | | 1,744,183 | |
National Energy Services Reunited Corp.*+ | | | 202,700 | | | | 1,848,624 | |
Natural Gas Services Group, Inc.* | | | 68,800 | | | | 843,488 | |
Navigator Holdings, Ltd.* | | | 200,000 | | | | 2,694,000 | |
Newpark Resources, Inc.*+ | | | 305,000 | | | | 1,912,350 | |
NexTier Oilfield Solutions, Inc.* | | | 200,000 | | | | 1,340,000 | |
Nine Energy Service, Inc.*+ | | | 55,000 | | | | 430,100 | |
Noble Corp. PLC* | | | 237,200 | | | | 289,384 | �� |
Nordic American Tankers, Ltd. | | | 521,200 | | | | 2,564,304 | |
Northern Oil and Gas, Inc.*+ | | | 1,335,700 | | | | 3,125,538 | |
Oceaneering International, Inc.* | | | 150,000 | | | | 2,236,500 | |
Oil States International, Inc.* | | | 121,000 | | | | 1,973,510 | |
Overseas Shipholding Group, Inc., Class A* | | | 453,300 | | | | 1,042,590 | |
Par Pacific Holdings, Inc.* | | | 119,900 | | | | 2,786,476 | |
Penn Virginia Corp.* | | | 56,000 | | | | 1,699,600 | |
| | | | | | | | |
| Industry Company | | Shares | | | Value | |
| | |
Energy (continued) | | | | | | | | |
Profire Energy, Inc.* | | | 34,700 | | | $ | 50,315 | |
ProPetro Holding Corp.* | | | 242,500 | | | | 2,728,125 | |
QEP Resources, Inc.+ | | | 575,000 | | | | 2,587,500 | |
Ranger Energy Services, Inc.* | | | 38,400 | | | | 247,296 | |
Renewable Energy Group, Inc.*+ | | | 163,885 | | | | 4,416,701 | |
REX American Resources Corp.* | | | 33,920 | | | | 2,780,083 | |
Ring Energy, Inc.*+ | | | 50,000 | | | | 132,000 | |
SandRidge Energy, Inc.* | | | 70,100 | | | | 297,224 | |
Scorpio Tankers, Inc.+ | | | 182,967 | | | | 7,197,922 | |
SEACOR Holdings, Inc.* | | | 62,400 | | | | 2,692,560 | |
Select Energy Services, Inc., Class A* | | | 360,000 | | | | 3,340,800 | |
SFL Corp., Ltd.+ | | | 434,400 | | | | 6,316,176 | |
SilverBow Resources, Inc.* | | | 15,000 | | | | 148,500 | |
Smart Sand, Inc.*+ | | | 117,000 | | | | 294,840 | |
Solaris Oilfield Infrastructure, Inc., Class A+ | | | 182,300 | | | | 2,552,200 | |
Southwestern Energy Co.*+ | | | 1,000,000 | | | | 2,420,000 | |
SRC Energy, Inc.* | | | 608,500 | | | | 2,507,020 | |
Talos Energy, Inc.*+ | | | 162,000 | | | | 4,884,300 | |
Teekay Corp.+ | | | 340,000 | | | | 1,808,800 | |
Teekay Tankers, Ltd., Class A*+ | | | 125,925 | | | | 3,018,422 | |
TETRA Technologies, Inc.* | | | 150,000 | | | | 294,000 | |
TransAtlantic Petroleum, Ltd.* | | | 35,000 | | | | 17,090 | |
US Silica Holdings, Inc.+ | | | 120,000 | | | | 738,000 | |
VAALCO Energy, Inc.* | | | 300,000 | | | | 666,000 | |
| | | | | | | | |
| | |
| | | | | | | 147,383,454 | |
|
Financials - 31.48% | |
1347 Property Insurance Holdings, Inc.*+ | | | 24,300 | | | | 134,136 | |
1st Constitution Bancorp+ | | | 33,000 | | | | 730,290 | |
1st Source Corp. | | | 36,547 | | | | 1,896,058 | |
ACNB Corp. | | | 5,000 | | | | 189,100 | |
Allegiance Bancshares, Inc.*+ | | | 66,000 | | | | 2,481,600 | |
A-Mark Precious Metals, Inc.*+ | | | 5,000 | | | | 41,350 | |
Amerant Bancorp, Inc.* | | | 139,000 | | | | 3,028,810 | |
American National Bankshares, Inc. | | | 21,752 | | | | 860,727 | |
American River Bankshares | | | 21,300 | | | | 316,731 | |
Ameris Bancorp | | | 20,898 | | | | 889,001 | |
AmeriServ Financial, Inc.+ | | | 138,000 | | | | 579,600 | |
| | |
OmniSmall-Cap Value Fund SCHEDULE OF INVESTMENTS (Unaudited) (continued) | | |
|
|
| |
| Showing percentage of net assets as of December 31, 2019 | | |
| | | | | | | | |
| Industry Company | | Shares | | | Value | |
|
Common Stocks (continued) | |
Financials (continued) | |
Argo Group International Holdings, Ltd. | | | 71,884 | | | $ | 4,726,373 | |
Arlington Asset Investment Corp., Class A+ | | | 88,900 | | | | 495,173 | |
Atlantic Capital Bancshares, Inc.* | | | 109,800 | | | | 2,014,830 | |
B. Riley Financial, Inc. | | | 402 | | | | 10,122 | |
Banc of California, Inc. | | | 179,500 | | | | 3,083,810 | |
Banco Latinoamericano de Comercio Exterior SA, Class E | | | 132,000 | | | | 2,822,160 | |
Bancorp 34, Inc.+ | | | 15,400 | | | | 235,158 | |
Bancorp, Inc. (The)* | | | 169,500 | | | | 2,198,415 | |
Bank of Commerce Holdings | | | 56,200 | | | | 650,234 | |
Bank of Princeton (The) | | | 2,500 | | | | 78,725 | |
BankFinancial Corp. | | | 10,212 | | | | 133,573 | |
Bar Harbor Bankshares | | | 61,966 | | | | 1,573,317 | |
BCB Bancorp, Inc. | | | 60,400 | | | | 832,916 | |
Berkshire Hills Bancorp, Inc. | | | 164,801 | | | | 5,418,657 | |
Boston Private Financial Holdings, Inc. | | | 260,000 | | | | 3,127,800 | |
Bryn Mawr Bank Corp. | | | 10,000 | | | | 412,400 | |
Byline Bancorp, Inc. | | | 100,000 | | | | 1,957,000 | |
C&F Financial Corp. | | | 10,500 | | | | 580,965 | |
Cadence BanCorp. | | | 166,000 | | | | 3,009,580 | |
Camden National Corp. | | | 30,100 | | | | 1,386,406 | |
Capital City Bank Group, Inc. | | | 83,150 | | | | 2,536,075 | |
Capstar Financial Holdings, Inc. | | | 29,000 | | | | 482,850 | |
Carter Bank & Trust* | | | 92,000 | | | | 2,182,240 | |
CB Financial Services, Inc. | | | 14,000 | | | | 421,960 | |
Central Pacific Financial Corp. | | | 15,000 | | | | 443,700 | |
Central Valley Community Bancorp | | | 50,000 | | | | 1,083,500 | |
Century Bancorp, Inc., Class A | | | 15,200 | | | | 1,367,392 | |
Chemung Financial Corp. | | | 22,000 | | | | 935,000 | |
Citizens Community Bancorp, Inc.+ | | | 40,000 | | | | 488,800 | |
Citizens, Inc.*+ | | | 106,040 | | | | 715,770 | |
Civista Bancshares, Inc. | | | 57,523 | | | | 1,380,552 | |
CNB Financial Corp. | | | 73,800 | | | | 2,411,784 | |
Codorus Valley Bancorp, Inc. | | | 16,122 | | | | 371,290 | |
Colony Bankcorp, Inc. | | | 1,500 | | | | 24,750 | |
Community Bankers Trust Corp. | | | 40,800 | | | | 362,304 | |
Community Financial Corp. (The) | | | 12,500 | | | | 444,625 | |
| | | | | | | | |
| Industry Company | | Shares | | | Value | |
|
Financials (continued) | |
Community Trust Bancorp, Inc. | | | 20,000 | | | $ | 932,800 | |
Community West Bancshares | | | 2,000 | | | | 22,200 | |
ConnectOne Bancorp, Inc. | | | 105,200 | | | | 2,705,744 | |
Consumer Portfolio Services, Inc.* | | | 191,650 | | | | 645,860 | |
County Bancorp, Inc.+ | | | 12,237 | | | | 313,634 | |
Cowen, Inc., Class A*+ | | | 154,100 | | | | 2,427,075 | |
Customers Bancorp, Inc.* | | | 81,700 | | | | 1,945,277 | |
Dime Community Bancshares, Inc. | | | 97,900 | | | | 2,045,131 | |
Donegal Group, Inc., Class A+ | | | 169,000 | | | | 2,504,580 | |
Donnelley Financial Solutions, Inc.* | | | 39,100 | | | | 409,377 | |
Eagle Bancorp Montana, Inc. | | | 29,000 | | | | 620,310 | |
Elevate Credit, Inc.* | | | 135,600 | | | | 603,420 | |
Emclaire Financial Corp.+ | | | 200 | | | | 6,506 | |
Employers Holdings, Inc. | | | 114,900 | | | | 4,797,075 | |
Encore Capital Group, Inc.*+ | | | 114,500 | | | | 4,048,720 | |
Enova International, Inc.* | | | 152,807 | | | | 3,676,536 | |
Entegra Financial Corp.* | | | 25,000 | | | | 754,000 | |
Enterprise Bancorp, Inc. | | | 33,275 | | | | 1,127,024 | |
Equity Bancshares, Inc., Class A* | | | 36,000 | | | | 1,111,320 | |
ESSA Bancorp, Inc. | | | 55,200 | | | | 935,640 | |
Evans Bancorp, Inc. | | | 12,808 | | | | 513,601 | |
EZCORP, Inc., Class A*+ | | | 149,169 | | | | 1,017,333 | |
Farmers National Banc Corp.+ | | | 150 | | | | 2,448 | |
FB Financial Corp. | | | 75,000 | | | | 2,969,250 | |
FBL Financial Group, Inc., Class A | | | 75,806 | | | | 4,467,248 | |
Federal Agricultural Mortgage Corp., Class C | | | 34,000 | | | | 2,839,000 | |
FedNat Holding Co. | | | 50,900 | | | | 846,467 | |
Financial Institutions, Inc. | | | 68,000 | | | | 2,182,800 | |
First BanCorp Puerto Rico | | | 566,400 | | | | 5,998,176 | |
First Bank | | | 82,000 | | | | 906,100 | |
First Busey Corp. | | | 165,100 | | | | 4,540,250 | |
First Business Financial Services, Inc. | | | 42,400 | | | | 1,116,392 | |
First Capital, Inc.+ | | | 35 | | | | 2,555 | |
First Choice Bancorp | | | 40,000 | | | | 1,078,400 | |
First Community Bankshares, Inc. | | | 30,000 | | | | 930,600 | |
First Community Corp. | | | 600 | | | | 12,966 | |
First Financial Corp. | | | 43,862 | | | | 2,005,371 | |
| | |
|
| |
| 10 | | Semi-Annual Report | December 31, 2019 (Unaudited) |
| | |
OmniSmall-Cap Value Fund SCHEDULE OF INVESTMENTS (Unaudited) (continued) | | |
|
|
| |
| Showing percentage of net assets as of December 31, 2019 | | |
| | | | | | | | |
| Industry Company | | Shares | | | Value | |
|
Common Stocks (continued) | |
Financials (continued) | |
First Financial Northwest, Inc. | | | 35,182 | | | $ | 525,619 | |
First Foundation, Inc. | | | 159,300 | | | | 2,771,820 | |
First Guaranty Bancshares, Inc. | | | 10,620 | | | | 231,197 | |
First Internet Bancorp | | | 14,500 | | | | 343,795 | |
First Mid Bancshares, Inc. | | | 11,600 | | | | 408,900 | |
First Northwest Bancorp | | | 2,000 | | | | 36,260 | |
First of Long Island Corp. (The) | | | 14,600 | | | | 366,168 | |
First United Corp. | | | 21,876 | | | | 526,993 | |
First US Bancshares, Inc. | | | 4,368 | | | | 50,712 | |
Flushing Financial Corp. | | | 82,297 | | | | 1,778,027 | |
Franklin Financial Network, Inc. | | | 40,000 | | | | 1,373,200 | |
Franklin Financial Services Corp. | | | 100 | | | | 3,869 | |
FS Bancorp, Inc. | | | 9,150 | | | | 583,678 | |
FSB Bancorp, Inc.*+ | | | 1,000 | | | | 17,200 | |
GAIN Capital Holdings, Inc.+ | | | 71,605 | | | | 282,840 | |
Global Indemnity, Ltd. | | | 44,100 | | | | 1,306,683 | |
Great Southern Bancorp, Inc. | | | 36,900 | | | | 2,336,508 | |
Hanmi Financial Corp. | | | 93,000 | | | | 1,859,535 | |
Hawthorn Bancshares, Inc. | | | 16,981 | | | | 433,016 | |
Heartland Financial USA, Inc. | | | 108,900 | | | | 5,416,686 | |
Hennessy Advisors, Inc.+ | | | 4,000 | | | | 40,320 | |
Heritage Insurance Holdings, Inc. | | | 95,600 | | | | 1,266,700 | |
Hilltop Holdings, Inc. | | | 221,100 | | | | 5,512,023 | |
Hingham Institution for Savings | | | 30 | | | | 6,306 | |
HMN Financial, Inc.* | | | 23,800 | | | | 500,038 | |
Home Bancorp, Inc. | | | 47,994 | | | | 1,880,885 | |
HomeStreet, Inc.* | | | 112,200 | | | | 3,814,800 | |
Hope Bancorp, Inc. | | | 325,000 | | | | 4,829,500 | |
Horace Mann Educators Corp. | | | 107,000 | | | | 4,671,620 | |
Horizon Bancorp, Inc. | | | 172,887 | | | | 3,284,853 | |
Howard Bancorp, Inc.* | | | 96,000 | | | | 1,620,480 | |
Independence Holding Co. | | | 15,050 | | | | 633,304 | |
INTL. FCStone, Inc.* | | | 18,800 | | | | 918,004 | |
James River Group Holdings, Ltd. | | | 112,200 | | | | 4,623,762 | |
Kingstone Cos., Inc. | | | 12,100 | | | | 93,775 | |
Ladenburg Thalmann Financial Services, Inc. | | | 423,400 | | | | 1,473,432 | |
Lakeland Bancorp, Inc. | | | 131,750 | | | | 2,289,815 | |
Landmark Bancorp, Inc. | | | 14,569 | | | | 364,953 | |
| | | | | | | | |
| Industry Company | | Shares | | | Value | |
|
Financials (continued) | |
LCNB Corp. | | | 18,000 | | | $ | 347,400 | |
Limestone Bancorp, Inc.*+ | | | 12,500 | | | | 225,000 | |
Live Oak Bancshares, Inc.+ | | | 63,600 | | | | 1,209,036 | |
Luther Burbank Corp.+ | | | 212,900 | | | | 2,454,737 | |
Mackinac Financial Corp. | | | 40,800 | | | | 712,368 | |
Manning & Napier, Inc.+ | | | 209,000 | | | | 363,660 | |
Marlin Business Services Corp. | | | 51,280 | | | | 1,127,134 | |
Mercantile Bank Corp. | | | 2,200 | | | | 80,234 | |
Merchants Bancorp+ | | | 55,000 | | | | 1,084,050 | |
Meta Financial Group, Inc. | | | 143,931 | | | | 5,254,921 | |
Metropolitan Bank Holding Corp.* | | | 26,400 | | | | 1,273,272 | |
Mid Penn Bancorp, Inc. | | | 12,300 | | | | 354,240 | |
Middlefield Banc Corp.+ | | | 34,000 | | | | 887,060 | |
Midland States Bancorp, Inc. | | | 78,658 | | | | 2,277,936 | |
MidWestOne Financial Group, Inc. | | | 49,860 | | | | 1,806,428 | |
MMA Capital Holdings, Inc.* | | | 4,700 | | | | 149,460 | |
Mr Cooper Group, Inc.* | | | 262,066 | | | | 3,278,446 | |
MutualFirst Financial, Inc. | | | 18,900 | | | | 749,763 | |
MVB Financial Corp. | | | 42,718 | | | | 1,064,533 | |
National Holdings Corp.* | | | 2,000 | | | | 5,100 | |
National Security Group, Inc. (The) | | | 200 | | | | 2,982 | |
National Western Life Group, Inc., Class A | | | 12,714 | | | | 3,698,248 | |
Nicholas Financial, Inc.*+ | | | 43,400 | | | | 357,616 | |
Nicolet Bankshares, Inc.*+ | | | 19,355 | | | | 1,429,367 | |
Northeast Bank | | | 37,500 | | | | 824,625 | |
Northrim BanCorp, Inc. | | | 30,445 | | | | 1,166,044 | |
OceanFirst Financial Corp. | | | 150,000 | | | | 3,831,000 | |
Ocwen Financial Corp.* | | | 645,000 | | | | 883,650 | |
OFG Bancorp | | | 181,000 | | | | 4,273,410 | |
Old Point Financial Corp.+ | | | 1,000 | | | | 27,490 | |
Old Second Bancorp, Inc. | | | 88,550 | | | | 1,192,768 | |
On Deck Capital, Inc.* | | | 207,700 | | | | 859,878 | |
OP Bancorp | | | 47,600 | | | | 493,612 | |
Oppenheimer Holdings, Inc., Class A | | | 54,493 | | | | 1,497,468 | |
Opus Bank | | | 133,000 | | | | 3,440,710 | |
Orrstown Financial Services, Inc. | | | 35,500 | | | | 803,010 | |
Ottawa Bancorp, Inc.+ | | | 1,000 | | | | 13,830 | |
Pacific Mercantile Bancorp* | | | 82,086 | | | | 666,538 | |
Pacific Premier Bancorp, Inc. | | | 15,800 | | | | 515,159 | |
Parke Bancorp, Inc. | | | 61,909 | | | | 1,571,870 | |
Pathfinder Bancorp, Inc. | | | 3,000 | | | | 41,700 | |
| | |
OmniSmall-Cap Value Fund SCHEDULE OF INVESTMENTS (Unaudited) (continued) | | |
|
|
| |
| Showing percentage of net assets as of December 31, 2019 | | |
| | | | | | | | |
| Industry Company | | Shares | | | Value | |
|
Common Stocks (continued) | |
Financials (continued) | |
Patriot National Bancorp, Inc.+ | | | 13,000 | | | $ | 165,880 | |
PB Bancorp, Inc.+ | | | 15,500 | | | | 234,980 | |
PCB Bancorp | | | 47,600 | | | | 822,528 | |
Peapack Gladstone Financial Corp. | | | 75,894 | | | | 2,345,125 | |
Penns Woods Bancorp, Inc. | | | 3,034 | | | | 107,889 | |
PennyMac Financial Services, Inc. | | | 103,900 | | | | 3,536,756 | |
Peoples Bancorp of North Carolina, Inc.+ | | | 24,017 | | | | 788,958 | |
Peoples Bancorp, Inc. | | | 73,400 | | | | 2,544,044 | |
Peoples Financial Services Corp. | | | 22,900 | | | | 1,153,015 | |
People’s United Financial, Inc. | | | 170,975 | | | | 2,889,478 | |
Piper Sandler Cos. | | | 51,400 | | | | 4,108,916 | |
PRA Group, Inc.*+ | | | 67,000 | | | | 2,432,100 | |
Premier Financial Bancorp, Inc. | | | 79,650 | | | | 1,444,851 | |
Protective Insurance Corp., Class B | | | 75,300 | | | | 1,211,577 | |
Provident Financial Holdings, Inc. | | | 51,000 | | | | 1,116,900 | |
Provident Financial Services, Inc. | | | 118,900 | | | | 2,930,885 | |
Prudential Bancorp, Inc. | | | 4,600 | | | | 85,238 | |
QCR Holdings, Inc. | | | 42,500 | | | | 1,864,050 | |
RBB Bancorp | | | 60,000 | | | | 1,270,200 | |
Regional Management Corp.* | | | 65,000 | | | | 1,951,950 | |
Reliant Bancorp, Inc. | | | 45,000 | | | | 1,000,800 | |
Republic Bancorp, Inc., Class A | | | 66,142 | | | | 3,095,446 | |
Riverview Bancorp, Inc. | | | 87,000 | | | | 714,270 | |
Safety Insurance Group, Inc.+ | | | 2,356 | | | | 218,001 | |
Salisbury Bancorp, Inc. | | | 2,183 | | | | 99,698 | |
Sandy Spring Bancorp, Inc. | | | 111,900 | | | | 4,238,772 | |
SB Financial Group, Inc. | | | 30,400 | | | | 598,576 | |
SB One Bancorp | | | 32,300 | | | | 804,916 | |
Security National Financial Corp., Class A* | | | 95,147 | | | | 556,610 | |
Severn Bancorp, Inc. | | | 35,000 | | | | 325,850 | |
Shore Bancshares, Inc. | | | 67,012 | | | | 1,163,328 | |
SmartFinancial, Inc. | | | 45,000 | | | | 1,064,250 | |
Sound Financial Bancorp, Inc. | | | 1,000 | | | | 36,000 | |
Southern Missouri Bancorp, Inc. | | | 11,000 | | | | 421,960 | |
Southern National Bancorp of Virginia, Inc. | | | 101,858 | | | | 1,665,378 | |
| | | | | | | | |
| Industry Company | | Shares | | | Value | |
|
Financials (continued) | |
Standard AVB Financial Corp.+ | | | 25,900 | | | $ | 776,223 | |
Sterling Bancorp, Inc. | | | 180,000 | | | | 1,458,000 | |
Summit Financial Group, Inc. | | | 29,515 | | | | 799,561 | |
Sutter Rock Capital Corp.+ | | | 63,900 | | | | 418,545 | |
Territorial Bancorp, Inc. | | | 21,200 | | | | 655,928 | |
Third Point Reinsurance, Ltd.* | | | 252,600 | | | | 2,657,352 | |
Timberland Bancorp, Inc.+ | | | 35,300 | | | | 1,049,822 | |
Tiptree, Inc. | | | 135,200 | | | | 1,100,528 | |
TriState Capital Holdings, Inc.*+ | | | 70,000 | | | | 1,828,400 | |
Triumph Bancorp, Inc.* | | | 16,500 | | | | 627,330 | |
Two River Bancorp | | | 36,205 | | | | 810,992 | |
United Bancshares, Inc.+ | | | 1,000 | | | | 22,710 | |
United Community Financial Corp. | | | 43,524 | | | | 507,490 | |
United Fire Group, Inc. | | | 78,800 | | | | 3,445,924 | |
United Insurance Holdings Corp. | | | 72,200 | | | | 910,442 | |
Unity Bancorp, Inc. | | | 48,367 | | | | 1,091,643 | |
Universal Insurance Holdings, Inc. | | | 112,516 | | | | 3,149,323 | |
Univest Financial Corp. | | | 120,479 | | | | 3,226,428 | |
Veritex Holdings, Inc. | | | 52,930 | | | | 1,541,851 | |
Waddell & Reed Financial, Inc., Class A+ | | | 222,000 | | | | 3,711,840 | |
Walker & Dunlop, Inc. | | | 84,475 | | | | 5,463,843 | |
Waterstone Financial, Inc. | | | 49,000 | | | | 932,470 | |
Wellesley Bank+ | | | 1,000 | | | | 45,010 | |
WesBanco, Inc. | | | 50,996 | | | | 1,927,139 | |
Western New England Bancorp, Inc. | | | 165,000 | | | | 1,588,950 | |
World Acceptance Corp.*+ | | | 33,600 | | | | 2,903,040 | |
| | | | | | | | |
| | |
| | | | | | | 327,041,783 | |
| | |
Health Care - 2.93% | | | | | | | | |
Acorda Therapeutics, Inc.*+ | | | 112,000 | | | | 228,480 | |
AMAG Pharmaceuticals, Inc.*+ | | | 50,000 | | | | 608,500 | |
Assertio Therapeutics, Inc.* | | | 137,200 | | | | 171,500 | |
Brookdale Senior Living, Inc.* | | | 646,000 | | | | 4,696,420 | |
Cross Country Healthcare, Inc.* | | | 111,350 | | | | 1,293,887 | |
CynergisTek, Inc.*+ | | | 60,000 | | | | 198,000 | |
FONAR Corp.* | | | 30,400 | | | | 598,576 | |
InfuSystem Holdings, Inc.* | | | 71,100 | | | | 606,483 | |
Kewaunee Scientific Corp.+ | | | 3,000 | | | | 40,350 | |
Lannett Co., Inc.*+ | | | 150,000 | | | | 1,323,000 | |
| | |
|
| |
| 12 | | Semi-Annual Report | December 31, 2019 (Unaudited) |
| | |
OmniSmall-Cap Value Fund SCHEDULE OF INVESTMENTS (Unaudited) (continued) | | |
|
|
| |
| Showing percentage of net assets as of December 31, 2019 | | |
| | | | | | | | |
| Industry Company | | Shares | | | Value | |
|
Common Stocks (continued) | |
Health Care (continued) | |
Magellan Health, Inc.* | | | 78,300 | | | $ | 6,126,975 | |
Mallinckrodt PLC*+ | | | 359,000 | | | | 1,252,910 | |
Owens & Minor, Inc. | | | 150,000 | | | | 775,500 | |
Prestige Consumer Healthcare, Inc.*+ | | | 161,800 | | | | 6,552,900 | |
Surgery Partners, Inc.* | | | 152,241 | | | | 2,383,333 | |
Tivity Health, Inc.*+ | | | 60,000 | | | | 1,220,700 | |
Triple-S Management Corp., Class B* | | | 128,550 | | | | 2,376,890 | |
| | | | | | | | |
| | |
| | | | | | | 30,454,404 | |
| | |
Industrials - 15.14% | | | | | | | | |
Acacia Research Corp.* | | | 166,000 | | | | 441,560 | |
ACCO Brands Corp. | | | 364,300 | | | | 3,409,848 | |
Aegion Corp.* | | | 99,341 | | | | 2,222,258 | |
AeroCentury Corp.* | | | 4,300 | | | | 19,350 | |
Air T, Inc.* | | | 4,200 | | | | 84,630 | |
Aircastle, Ltd. | | | 261,100 | | | | 8,357,811 | |
Alpha Pro Tech, Ltd.* | | | 20,743 | | | | 71,148 | |
Apogee Enterprises, Inc. | | | 84,300 | | | | 2,739,750 | |
ARC Document Solutions, Inc.* | | | 50,000 | | | | 69,500 | |
ArcBest Corp. | | | 104,500 | | | | 2,884,200 | |
Armstrong Flooring, Inc.* | | | 62,100 | | | | 265,167 | |
Art’s-Way Manufacturing Co., Inc.* | | | 15,000 | | | | 26,700 | |
Atlas Air Worldwide Holdings, Inc.* | | | 58,800 | | | | 1,621,116 | |
BMC Stock Holdings, Inc.* | | | 240,300 | | | | 6,894,207 | |
Caesarstone, Ltd. | | | 110,600 | | | | 1,666,742 | |
CAI International, Inc.* | | | 104,600 | | | | 3,031,308 | |
Chicago Rivet & Machine Co. | | | 1,000 | | | | 25,797 | |
Commercial Vehicle Group, Inc.* | | | 102,300 | | | | 649,605 | |
CompX International, Inc. | | | 1,000 | | | | 14,590 | |
Costamare, Inc. | | | 488,200 | | | | 4,652,546 | |
Covenant Transportation Group, Inc., Class A* | | | 51,100 | | | | 660,467 | |
DLH Holdings Corp.* | | | 83,500 | | | | 349,865 | |
Ducommun, Inc.* | | | 35,550 | | | | 1,796,341 | |
Eagle Bulk Shipping, Inc.*+ | | | 305,000 | | | | 1,403,000 | |
Eastern Co. (The) | | | 18,401 | | | | 561,783 | |
Echo Global Logistics, Inc.* | | | 90,000 | | | | 1,863,000 | |
Ecology and Environment, Inc., Class A | | | 34,500 | | | | 534,750 | |
Ennis, Inc. | | | 66,892 | | | | 1,448,212 | |
EnPro Industries, Inc.+ | | | 64,800 | | | | 4,333,824 | |
Foundation Building Materials, Inc.* | | | 105,200 | | | | 2,035,620 | |
| | | | | | | | |
| Industry Company | | Shares | | | Value | |
|
Industrials (continued) | |
Fuel Tech, Inc.* | | | 115,000 | | | $ | 107,180 | |
Genco Shipping & Trading, Ltd. | | | 120,400 | | | | 1,278,648 | |
General Finance Corp.* | | | 115,764 | | | | 1,281,507 | |
GMS, Inc.* | | | 149,000 | | | | 4,034,920 | |
Goldfield Corp. (The)* | | | 121,000 | | | | 429,550 | |
Great Lakes Dredge & Dock Corp.* | | | 220,550 | | | | 2,498,831 | |
Greenbrier Cos., Inc. (The) | | | 102,800 | | | | 3,333,804 | |
Hawaiian Holdings, Inc.+ | | | 133,000 | | | | 3,895,570 | |
HC2 Holdings, Inc.*+ | | | 100,600 | | | | 218,302 | |
Heidrick & Struggles International, Inc. | | | 60,000 | | | | 1,950,000 | |
Herc Holdings, Inc.* | | | 84,500 | | | | 4,135,430 | |
Hertz Global Holdings, Inc.*+ | | | 374,474 | | | | 5,897,966 | |
Hillenbrand, Inc. | | | 33,852 | | | | 1,127,610 | |
Hub Group, Inc., Class A* | | | 122,000 | | | | 6,257,380 | |
Hurco Cos., Inc. | | | 27,857 | | | | 1,068,595 | |
IES Holdings, Inc.* | | | 1,467 | | | | 37,643 | |
Kelly Services, Inc., Class A+ | | | 143,800 | | | | 3,247,004 | |
LB Foster Co., Class A* | | | 19,800 | | | | 383,724 | |
Limbach Holdings, Inc.* | | | 32,800 | | | | 123,984 | |
LS Starrett Co. (The), Class A*+ | | | 15,000 | | | | 85,800 | |
LSI Industries, Inc.+ | | | 83,900 | | | | 507,595 | |
Lydall, Inc.* | | | 50,000 | | | | 1,026,000 | |
Marten Transport, Ltd. | | | 162,561 | | | | 3,493,436 | |
Matson, Inc. | | | 137,100 | | | | 5,593,680 | |
Matthews International Corp., Class A+ | | | 100,000 | | | | 3,817,000 | |
Mesa Air Group, Inc.* | | | 47,600 | | | | 425,544 | |
Miller Industries, Inc. | | | 7,300 | | | | 271,049 | |
Mistras Group, Inc.* | | | 98,200 | | | | 1,401,314 | |
MRC Global, Inc.*+ | | | 205,000 | | | | 2,796,200 | |
MYR Group, Inc.* | | | 50,000 | | | | 1,629,500 | |
Navios Maritime Holdings, Inc.* | | | 40,000 | | | | 179,200 | |
NL Industries, Inc.* | | | 5,000 | | | | 19,550 | |
NN, Inc. | | | 50,000 | | | | 462,500 | |
NOW, Inc.*+ | | | 332,200 | | | | 3,733,928 | |
Orion Group Holdings, Inc.* | | | 60,472 | | | | 313,850 | |
PAM Transportation Services, Inc.* | | | 22,805 | | | | 1,316,077 | |
Pangaea Logistics Solutions, Ltd. | | | 2,000 | | | | 5,900 | |
Park-Ohio Holdings Corp. | | | 47,300 | | | | 1,591,645 | |
Patriot Transportation Holding, Inc.* | | | 7,500 | | | | 146,100 | |
| | |
OmniSmall-Cap Value Fund SCHEDULE OF INVESTMENTS (Unaudited) (continued) | | |
|
|
| |
| Showing percentage of net assets as of December 31, 2019 | | |
| | | | | | | | |
| Industry Company | | Shares | | | Value | |
|
Common Stocks (continued) | |
Industrials (continued) | |
Preformed Line Products Co. | | | 6,535 | | | $ | 394,387 | |
Quanex Building Products Corp. | | | 75,000 | | | | 1,281,000 | |
Rush Enterprises, Inc., Class A | | | 139,600 | | | | 6,491,400 | |
Rush Enterprises, Inc., Class B | | | 46,500 | | | | 2,125,050 | |
Safe Bulkers, Inc.* | | | 225,200 | | | | 382,840 | |
Scorpio Bulkers, Inc. | | | 265,000 | | | | 1,688,050 | |
Servotronics, Inc. | | | 1,000 | | | | 10,060 | |
Spartan Motors, Inc. | | | 10,000 | | | | 180,800 | |
Sterling Construction Co., Inc.* | | | 100,000 | | | | 1,408,000 | |
Team, Inc.*+ | | | 100,700 | | | | 1,608,179 | |
Textainer Group Holdings, Ltd.* | | | 124,900 | | | | 1,337,679 | |
Titan Machinery, Inc.* | | | 83,900 | | | | 1,240,042 | |
TrueBlue, Inc.* | | | 125,650 | | | | 3,023,139 | |
Tutor Perini Corp.*+ | | | 115,900 | | | | 1,490,474 | |
Ultralife Corp.* | | | 22,400 | | | | 165,536 | |
Universal Logistics Holdings, Inc. | | | 20,000 | | | | 379,200 | |
USA Truck, Inc.* | | | 23,800 | | | | 177,310 | |
Vectrus, Inc.* | | | 38,000 | | | | 1,947,880 | |
Veritiv Corp.* | | | 69,600 | | | | 1,369,032 | |
VSE Corp. | | | 23,600 | | | | 897,744 | |
Wabash National Corp. | | | 172,400 | | | | 2,532,556 | |
Willis Lease Finance Corp.* | | | 48,400 | | | | 2,851,244 | |
| | | | | | | | |
| | |
| | | | | | | 157,239,813 | |
|
Information Technology - 7.88% | |
Alpha & Omega | | | | | | | | |
Semiconductor, Ltd.* | | | 214,244 | | | | 2,918,003 | |
Amkor Technology, Inc.* | | | 497,291 | | | | 6,464,783 | |
Avaya Holdings Corp.*+ | | | 350,500 | | | | 4,731,750 | |
Aviat Networks, Inc.* | | | 20,200 | | | | 283,810 | |
Benchmark Electronics, Inc. | | | 134,000 | | | | 4,604,240 | |
Comtech Telecommuni-cations Corp. | | | 111,015 | | | | 3,939,922 | |
CSP, Inc. | | | 5,150 | | | | 67,207 | |
Diodes, Inc.*+ | | | 56,899 | | | | 3,207,397 | |
Finjan Holdings, Inc.* | | | 193,200 | | | | 388,332 | |
Ichor Holdings, Ltd.* | | | 50,000 | | | | 1,663,500 | |
Innodata, Inc.* | | | 68,000 | | | | 77,520 | |
Insight Enterprises, Inc.*+ | | | 94,700 | | | | 6,656,463 | |
inTEST Corp.* | | | 55,000 | | | | 327,250 | |
KEMET Corp.+ | | | 188,750 | | | | 5,105,688 | |
Key Tronic Corp.* | | | 47,500 | | | | 258,400 | |
Kimball Electronics, Inc.* | | | 84,200 | | | | 1,477,710 | |
Methode Electronics, Inc. | | | 35,900 | | | | 1,412,665 | |
Mind CTI, Ltd. | | | 200 | | | | 483 | |
| | | | | | | | |
| Industry Company | | Shares | | | Value | |
|
Information Technology (continued) | |
NeoPhotonics Corp.* | | | 160,000 | | | $ | 1,411,200 | |
NetSol Technologies, Inc.* | | | 39,800 | | | | 159,200 | |
Network-1 Technologies, Inc. | | | 70,000 | | | | 152,600 | |
Nortech Systems, Inc.*+ | | | 1,500 | | | | 7,290 | |
PC-Tel, Inc. | | | 29,250 | | | | 247,748 | |
Photronics, Inc.* | | | 271,050 | | | | 4,271,748 | |
Ribbon Communications, Inc.*+ | | | 240,100 | | | | 744,310 | |
Sanmina Corp.* | | | 135,100 | | | | 4,625,824 | |
ScanSource, Inc.* | | | 108,500 | | | | 4,009,075 | |
Steel Connect, Inc.* | | | 170,600 | | | | 249,076 | |
Sykes Enterprises, Inc.* | | | 81,734 | | | | 3,023,341 | |
Synacor, Inc.* | | | 135,400 | | | | 205,808 | |
Synaptics, Inc.*+ | | | 74,500 | | | | 4,899,865 | |
TiVo Corp.+ | | | 308,000 | | | | 2,611,840 | |
Trio-Tech International* | | | 21,800 | | | | 86,982 | |
TSR, Inc.* | | | 1,000 | | | | 3,570 | |
TTM Technologies, Inc.*+ | | | 520,153 | | | | 7,828,303 | |
Ultra Clean Holdings, Inc.*+ | | | 143,700 | | | | 3,372,639 | |
Wayside Technology Group, Inc. | | | 16,400 | | | | 265,680 | |
Westell Technologies, Inc., Class A* | | | 66,100 | | | | 59,160 | |
| | | | | | | | |
| | |
| | | | | | | 81,820,382 | |
|
Materials - 5.90% | |
Advanced Emissions Solutions, Inc.+ | | | 37,500 | | | | 393,750 | |
AdvanSix, Inc.* | | | 90,000 | | | | 1,796,400 | |
Boise Cascade Co. | | | 78,500 | | | | 2,867,605 | |
Caledonia Mining Corp. PLC | | | 1,200 | | | | 10,104 | |
Carpenter Technology Corp.+ | | | 18,100 | | | | 901,018 | |
Clearwater Paper Corp.* | | | 50,000 | | | | 1,068,000 | |
Core Molding Technologies, Inc.* | | | 17,000 | | | | 55,250 | |
Forterra, Inc.* | | | 200,000 | | | | 2,312,000 | |
Friedman Industries, Inc. | | | 52,100 | | | | 313,642 | |
FutureFuel Corp. | | | 102,800 | | | | 1,273,692 | |
Gulf Resources, Inc.* | | | 81,200 | | | | 41,420 | |
Hecla Mining Co. | | | 1,272,000 | | | | 4,312,080 | |
Innophos Holdings, Inc. | | | 15,000 | | | | 479,700 | |
Intrepid Potash, Inc.* | | | 458,500 | | | | 1,242,535 | |
Kraton Corp.* | | | 142,150 | | | | 3,599,238 | |
Kronos Worldwide, Inc. | | | 80,000 | | | | 1,072,000 | |
LSB Industries, Inc.* | | | 74,600 | | | | 313,320 | |
Materion Corp. | | | 18,600 | | | | 1,105,770 | |
Mercer International, Inc.+ | | | 226,250 | | | | 2,782,875 | |
O-I Glass, Inc.+ | | | 487,000 | | | | 5,809,910 | |
| | |
|
| |
| 14 | | Semi-Annual Report | December 31, 2019 (Unaudited) |
| | |
OmniSmall-Cap Value Fund SCHEDULE OF INVESTMENTS (Unaudited) (continued) | | |
|
|
| |
| Showing percentage of net assets as of December 31, 2019 | | |
| | | | | | | | |
| Industry Company | | Shares | | | Value | |
|
Common Stocks (continued) | |
Materials (continued) | |
Olympic Steel, Inc. | | | 30,000 | | | $ | 537,600 | |
PH Glatfelter Co. | | | 159,400 | | | | 2,917,020 | |
Ramaco Resources, Inc.*+ | | | 70,700 | | | | 253,106 | |
Rayonier Advanced Materials, Inc.+ | | | 126,700 | | | | 486,528 | |
Resolute Forest Products, Inc.* | | | 312,000 | | | | 1,310,400 | |
Ryerson Holding Corp.* | | | 115,000 | | | | 1,360,450 | |
Schnitzer Steel Industries, Inc., Class A+ | | | 99,700 | | | | 2,161,496 | |
Schweitzer-Mauduit International, Inc. | | | 56,000 | | | | 2,351,440 | |
SunCoke Energy, Inc.+ | | | 234,700 | | | | 1,462,181 | |
Trecora Resources* | | | 11,600 | | | | 82,940 | |
Tredegar Corp. | | | 101,700 | | | | 2,272,995 | |
Trinseo SA | | | 100,000 | | | | 3,721,000 | |
Tronox Holdings PLC, Class A+ | | | 362,185 | | | | 4,136,153 | |
Universal Stainless & Alloy Products, Inc.*+ | | | 22,450 | | | | 334,505 | |
Verso Corp., Class A* | | | 50,000 | | | | 901,500 | |
Warrior Met Coal, Inc. | | | 250,000 | | | | 5,282,500 | |
| | | | | | | | |
| | |
| | | | | | | 61,322,123 | |
|
Real Estate - 0.24% | |
Altisource Portfolio Solutions SA*+ | | | 83,400 | | | | 1,612,122 | |
Consolidated-Tomoka Land Co. | | | 15,400 | | | | 928,928 | |
| | | | | | | | |
| | |
| | | | | | | 2,541,050 | |
| | | | | | | | |
| |
TOTAL COMMON STOCKS - 99.25% | | | | 1,031,053,826 | |
| | | | | | | | |
(Cost $ 923,967,856) | | | | | |
|
EXCHANGE TRADED FUND - 0.51% | |
iShares Russell 2000 Value ETF | | | 41,300 | | | | 5,310,354 | |
| | | | | | | | |
| |
TOTAL EXCHANGE TRADED FUND - 0.51% | | | | 5,310,354 | |
| | | | | | | | |
(Cost $ 4,438,399) | | | | | |
|
PREFERRED STOCK - 0.00% | |
Air T Funding, 8.00%***+ | | | 2,218 | | | | 5,478 | |
| | | | | | | | |
| |
TOTAL PREFERRED STOCK - 0.00% | | | | 5,478 | |
| | | | | | | | |
(Cost $ 4,613) | | | | | |
|
RIGHTS - 0.00% | |
Pan American Silver Corp., CVR, expiring 02/22/24*D | | | 150,000 | | | | — | |
TheStreet, Inc., CVR, expiring 02/03/20*D | | | 14,249 | | | | — | |
| | | | | | | | | | | | |
| Industry Company | | | Shares | | | Value | |
| | |
Newstar Financial, Inc.*D | | | | 120,000 | | | | $6,000 | |
| | | | | | | | | | | | |
| |
TOTAL RIGHTS - 0.00% | | | | 6,000 | |
| | | | | | | | | | | | |
(Cost $119,956) | | | | | |
|
| WARRANTS - 0.00% | |
Air T Funding, expiring 06/07/20* | | | | 11,644 | | | | 594 | |
Eagle Bulk Shipping, Inc., expiring 10/15/21* | | | | 3,317 | | | | 15 | |
| | | | | | | | | | | | |
| |
TOTAL WARRANTS - 0.00% | | | | 609 | |
| | | | | | | | | | | | |
(Cost $106,728) | | | | | |
| | | |
| | | Rate^ | | | Shares | | | Value | |
|
MONEY MARKET FUND - 0.40% | |
Fidelity Investments Money Market Government Portfolio Class I | | | 1.49 | % | | | 4,168,764 | | | | 4,168,764 | |
| | | | | | | | | | | | |
| |
TOTAL MONEY MARKET FUND - 0.40% | | | | 4,168,764 | |
| | | | | | | | | | | | |
(Cost $4,168,764) | | | | | |
|
| INVESTMENTS PURCHASED WITH CASH PROCEEDS FROM SECURITIESLENDING - 3.86% | |
Fidelity Investments Money Market Government Portfolio Class I** | | | 1.49 | % | | | 40,105,807 | | | | 40,105,807 | |
| | | | | | | | | | | | |
TOTAL INVESTMENTS PURCHASED WITH CASH PROCEEDS FROM SECURITIES LENDING - 3.86% | | | | 40,105,807 | |
| | | | | | | | | | | | |
(Cost $40,105,807) | | | | | |
| |
TOTAL INVESTMENTS - 104.02% | | | | $1,080,650,838 | |
(Cost $972,912,123) | | | | | |
Liabilities in Excess of OtherAssets - (4.02%) | | | | (41,722,935 | ) |
| | | | | | | | | | | | |
NET ASSETS - 100.00% | | | | $1,038,927,903 | |
| | | | | | | | | | | | |
| * | Non-income producing security. |
| ** | This security represents the investment of the cash collateral received in connection with securities out on loan as of December 31, 2019. |
| *** | Security is perpetual and has no stated maturity date. |
| ^ | Rate disclosed as of December 31, 2019. |
| D | Security was fair valued using significant unobservable inputs. As such, the security is classified as Level 3 in the fair value hierarchy. |
| + | This security or a portion of the security is out on loan as of December 31, 2019. Total loaned securities had a value of $88,133,148 as of December 31, 2019. See Note 2 for disclosure of cash andnon-cash collateral. |
CVR - Contingent Value Rights
PLC - Public Limited Company
| | |
OmniSmall-Cap Value Fund SCHEDULE OF INVESTMENTS (Unaudited) (continued) | | |
|
|
| |
| Showing percentage of net assets as of December 31, 2019 | | |
Summary of inputs used to value the Fund’s investments as of 12/31/2019 (See Note 2 in Notes to Financial Statements):
| | | | | | | | | | | | | | | | |
| | | Valuation Inputs | |
| | | Investment in Securities (Value) | |
| | | Level 1 Quoted Prices | | | Level 2
Significant
Observable
Inputs | | | Level 3
Significant Unobservable Inputs | | Total | |
Common Stocks Industrials | | $ | 162,514,973 | | | $ | 534,750 | | | $ | — | | | $ | 163,049,723 | |
Other Industries (a) | | | 868,004,103 | | | | — | | | | — | | | | 868,004,103 | |
| | | | | | | | | | | | | | | | |
Total Common Stocks | | | 1,030,519,076 | | | | 534,750 | | | | — | | | | 1,031,053,826 | |
Exchange Traded Fund | | | 5,310,354 | | | | — | | | | — | | | | 5,310,354 | |
Preferred Stock | | | — | | | | 5,478 | | | | — | | | | 5,478 | |
Rights | | | — | | | | — | | | | 6,000 | | | | 6,000 | |
Warrants | | | 609 | | | | — | | | | — | | | | 609 | |
Money Market Fund | | | — | | | | 4,168,764 | | | | — | | | | 4,168,764 | |
Investments Purchased with Cash Proceeds from Securities Lending | | | — | | | | 40,105,807 | | | | — | | | | 40,105,807 | |
| | | | | | | | | | | | | | | | |
TOTAL | | $ | 1,035,830,039 | | | $ | 44,814,799 | | | $ | 6,000 | | | $ | 1,080,650,838 | |
| | | | | | | | | | | | | | | | |
(a) - please refer to the Schedule of Investments for the industry classifications of these portfolio holdings.
Following is a reconciliation of Level 3 investments for which significant unobservable inputs were used to determine fair value:
| | | | |
| | | Investment in Securities (Value) |
| | | Rights |
| |
Balance as of 06/30/2019 | | | $8,400 | |
Purchases | | | 1,282 | |
Return of Capital | | | (2,172 | ) |
Realized gain/(loss) | | | — | |
Change in unrealized appreciation/ (depreciation) | | | (1,510 | ) |
Transfers in | | | — | |
Transfers out | | | — | |
| | | | |
| |
Balance as of 12/31/2019 | | | $6,000 | |
| | | | |
| |
Net change in unrealized appreciation (depreciation) from investments held as of 12/31/2019 | | | $(1,510 | ) |
| | | | |
See Notes to Financial Statements.
| | |
|
| |
| 16 | | Semi-Annual Report | December 31, 2019 (Unaudited) |
| | |
OmniTax-ManagedSmall-Cap Value Fund MANAGER’S COMMENTARY (Unaudited) | | |
|
|
December 31, 2019
Dear Fellow OmniTax-ManagedSmall-Cap Value Fund Shareholder,
For the quarter ended December 31, 2019, our Fund returned +9.37%, outperforming our primary market benchmark, the Russell 2000 Value Index (+8.49%).
For the calendar year, our Fund returned +14.28%, underperforming the Russell 2000 Value Index (+22.39%).
The table below presents our December quarter,six-month,one-year, five-year, andinception-to-date financial results. See the next page for a graph of performance since inception.
Standardized Returns as of December 31, 2019
| | | | | | | | | | |
| | | | | | | | | Annualized |
| | | Quarter | | 6 Months | | 1 Year | | 5 Years | | Since Inception
(12/31/10) |
| | | | | |
OmniTax-ManagedSmall-Cap Value Fund | | 9.37% | | 7.63% | | 14.28% | | 5.19% | | 8.25% |
Russell 2000 Value Index | | 8.49% | | 7.87% | | 22.39% | | 6.99% | | 9.12% |
Performance figures quoted in the table above and the graph on the next page represent past performance and are no guarantee of future results. Total return figures in the table above include the reinvestment of dividends and capital gains. The table above and the graph on the next page do not reflect the deduction of taxes that a shareholder would pay on Fund distributions or on the redemption of Fund shares.
The Russell 2000 Value Index is an unmanaged index that consists of stocks in the Russell 2000 Index with lowerprice-to-book ratios and lower forecasted growth values with dividends reinvested. It is not possible to invest directly in an index. Periods longer than one year are annualized.
| | |
OmniTax-ManagedSmall-Cap Value Fund MANAGER’S COMMENTARY (Unaudited) (continued) | | |
|
|
Growth of a $10,000 Investment
from Inception December 31, 2010 to December 31, 2019
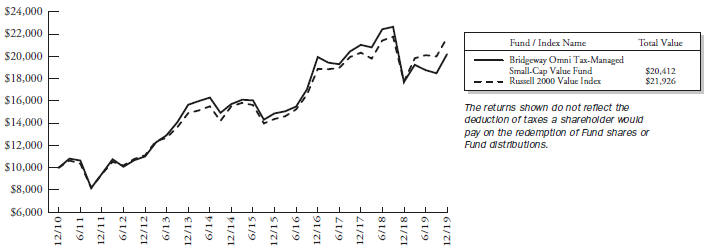
Detailed Explanation of Quarterly Performance
The OmniTax-ManagedSmall-Cap Value Fund is designed to capture the returns of thesmall-cap value asset class through broad diversification of small company and value stocks. This approach is sometimes referred to as “passive, asset class investing.” We also seek to minimize the distribution of capital gains within the constraints of the investment objective. As of December 31, 2019, we held 621 such stocks in amarket-cap weighted style. We make no attempt to track any particular index in either performance or statistics.
The Fund’s tilt toward smaller stocks in thesmall-cap value universe boosted relative returns during a quarter when smaller stocks outperformed their larger counterparts. The Fund’s tilt toward deeper value stocks across multiple valuation metrics also improved relative performance.
By design, the Fund does not hold Real Estate Investment Trusts (REITs) or Utilities stocks. The lack of exposure to REITs and Utilities stocks benefited relative results.
Detailed Explanation of Calendar Year Performance
The Fund’s tilt toward deeper value stocks across multiple valuation metrics detracted from relative results during the
12-month period. A tilt toward smaller stocks in thesmall-cap value universe also hurt relative results, as smaller stocks under-performed their larger counterparts.
By design, the Fund does not hold Real Estate Investment Trusts (REITs) and Utilities stocks. Lack of exposure to REITs hurt relative results, but the lack of exposure to Utilities stocks slightly helped relative performance.
| | |
|
| |
| 18 | | Semi-Annual Report | December 31, 2019 (Unaudited) |
| | |
OmniTax-ManagedSmall-Cap Value Fund MANAGER’S COMMENTARY (Unaudited) (continued) | | |
|
|
Top Ten Holdings as of December 31, 2019
| | | | | | |
| Rank | | Description | | Industry | | % of Net
Assets |
1 | | Renewable Energy Group, Inc. | | Energy | | 0.9% |
2 | | Aircastle, Ltd. | | Industrials | | 0.8% |
3 | | Amkor Technology, Inc. | | Information Technology | | 0.8% |
4 | | Insight Enterprises, Inc. | | Information Technology | | 0.7% |
5 | | Gray Television, Inc. | | Communication Services | | 0.7% |
6 | | Prestige Consumer Healthcare, Inc. | | Health Care | | 0.7% |
7 | | Scorpio Tankers, Inc. | | Energy | | 0.7% |
8 | | First BanCorp Puerto Rico | | Financials | | 0.7% |
9 | | BMC Stock Holdings, Inc. | | Industrials | | 0.6% |
10 | | Magellan Health, Inc. | | Health Care | | 0.6% |
| | Total | | | | 7.2% |
Industry Sector Representation as of December 31, 2019
| | | | | | | | | | | | |
| | | % of Net Assets | | % of Russell 2000
Value Index | | Difference |
Communication Services | | | 4.2% | | | | 2.2% | | | | 2.0% | |
Consumer Discretionary | | | 13.2% | | | | 9.7% | | | | 3.5% | |
Consumer Staples | | | 4.1% | | | | 2.7% | | | | 1.4% | |
Energy | | | 14.8% | | | | 5.8% | | | | 9.0% | |
Financials | | | 31.7% | | | | 30.2% | | | | 1.5% | |
Health Care | | | 3.5% | | | | 5.4% | | | | -1.9% | |
Industrials | | | 14.9% | | | | 12.7% | | | | 2.2% | |
Information Technology | | | 7.3% | | | | 9.6% | | | | -2.3% | |
Materials | | | 5.9% | | | | 4.7% | | | | 1.2% | |
Real Estate | | | 0.3% | | | | 11.1% | | | | -10.8% | |
Utilities | | | 0.0% | | | | 5.9% | | | | -5.9% | |
Cash & Other Assets | | | 0.1% | | | | 0.0% | | | | 0.1% | |
Total | | | 100.0% | | | | 100.0% | | | | | |
Disclaimer
The views expressed here are exclusively those of Fund management. These views, including those related to market sectors or individual stocks, are not meant as investment advice and should not be considered predictive in nature. Any favorable (or unfavorable) description of a holding applies only as of the quarter end, December 31, 2019, unless otherwise stated. Security positions can and do change thereafter. Discussions of historical performance do not guarantee and may not be indicative of future performance.
Market volatility can significantly impact short-term performance. The Fund is not an appropriate investment for short-term investors. Investments in small companies generally carry greater risk than is customarily associated with larger companies. This additional risk is attributable to a number of factors, including the relatively limited financial resources that are typically available to small companies and the fact that small companies often have comparatively limited product lines. In addition, the stock of small companies tends to be more volatile than the stock of large companies, particularly in the short term and particularly in the early stages of an economic or market downturn. Shareholders of the Fund, therefore, are taking on more risk than they would if they invested in the stock market as a whole.
| | |
OmniTax-ManagedSmall-Cap Value Fund MANAGER’S COMMENTARY (Unaudited) (continued) | | |
|
|
Conclusion
Thank you for your continued investment in OmniTax-ManagedSmall-Cap Value Fund. We encourage your feedback; your reactions and concerns are important to us.
Sincerely,
The Investment Management Team
| | |
|
| |
| 20 | | Semi-Annual Report | December 31, 2019 (Unaudited) |
| | |
OmniTax-ManagedSmall-Cap Value Fund SCHEDULE OF INVESTMENTS (Unaudited) | | |
|
|
| |
| Showing percentage of net assets as of December 31, 2019 | | |
| | | | | | | | |
| Industry Company | | Shares | | | Value | |
|
COMMON STOCKS - 99.83% | |
Communication Services - 4.22% | |
A.H. Belo Corp., Class A | | | 39,000 | | | | $ 109,980 | |
Alaska Communications Systems Group, Inc.* | | | 314,187 | | | | 556,111 | |
AMC Entertainment Holdings, Inc., Class A+ | | | 207,763 | | | | 1,504,204 | |
ATN International, Inc. | | | 22,000 | | | | 1,218,580 | |
Consolidated Communications Holdings, Inc.+ | | | 125,000 | | | | 485,000 | |
Cumulus Media, Inc., Class A* | | | 60,500 | | | | 1,062,985 | |
DHI Group, Inc.* | | | 147,000 | | | | 442,470 | |
Emerald Expositions Events, Inc.+ | | | 100,300 | | | | 1,058,165 | |
Emmis Communications Corp., Class A* | | | 57,200 | | | | 230,516 | |
Entercom Communications Corp., Class A | | | 229,130 | | | | 1,063,163 | |
Entravision Communications Corp., Class A | | | 147,600 | | | | 386,712 | |
EW Scripps Co. (The), Class A+ | | | 156,100 | | | | 2,452,331 | |
Fluent, Inc.* | | | 195,200 | | | | 488,000 | |
Gannett Co., Inc.+ | | | 215,163 | | | | 1,372,740 | |
Gray Television, Inc.* | | | 232,100 | | | | 4,976,224 | |
Liberty TripAdvisor Holdings, Inc., Class A* | | | 115,000 | | | | 845,250 | |
Marcus Corp. (The) | | | 92,054 | | | | 2,924,556 | |
Meet Group, Inc. (The)*+ | | | 120,500 | | | | 603,705 | |
Meredith Corp.+ | | | 92,000 | | | | 2,987,240 | |
Saga Communications, Inc., Class A | | | 14,100 | | | | 428,640 | |
Salem Media Group, Inc. | | | 4,352 | | | | 6,267 | |
Scholastic Corp. | | | 88,450 | | | | 3,400,902 | |
Townsquare Media, Inc., Class A | | | 100,100 | | | | 997,997 | |
Urban One, Inc.* | | | 140,000 | | | | 266,000 | |
| | | | | | | | |
| | |
| | | | | | | 29,867,738 | |
|
Consumer Discretionary - 13.18% | |
Abercrombie & Fitch Co., Class A+ | | | 139,600 | | | | 2,413,684 | |
Adtalem Global Education, Inc.*+ | | | 90,000 | | | | 3,147,300 | |
AMCON Distributing Co. | | | 1,350 | | | | 97,214 | |
American Axle & Manufacturing Holdings, Inc.* | | | 259,850 | | | | 2,795,986 | |
American Outdoor Brands Corp.* | | | 144,000 | | | | 1,336,320 | |
American Public Education, Inc.* | | | 37,700 | | | | 1,032,603 | |
| | | | | | | | |
| Industry Company | | Shares | | | Value | |
|
Consumer Discretionary (continued) | |
Ark Restaurants Corp. | | | 8,500 | | | | $ 188,700 | |
Barnes & Noble Education, Inc.* | | | 129,960 | | | | 554,929 | |
Bassett Furniture Industries, Inc. | | | 49,859 | | | | 831,648 | |
BBX Capital Corp. | | | 193,018 | | | | 920,696 | |
Beazer Homes USA, Inc.*+ | | | 85,000 | | | | 1,201,050 | |
Bed Bath & Beyond, Inc.+ | | | 202,500 | | | | 3,503,250 | |
Big Lots, Inc.+ | | | 80,500 | | | | 2,311,960 | |
Biglari Holdings, Inc., Class B* | | | 5,000 | | | | 572,100 | |
Build-A-Bear Workshop, Inc.* | | | 35,000 | | | | 113,400 | |
Caleres, Inc.+ | | | 80,000 | | | | 1,900,000 | |
Canterbury Park Holding Corp. | | | 511 | | | | 6,336 | |
Carriage Services, Inc. | | | 7,700 | | | | 197,120 | |
Carrols Restaurant Group, Inc.* | | | 87,400 | | | | 616,170 | |
Cato Corp. (The), Class A | | | 73,500 | | | | 1,278,900 | |
Century Casinos, Inc.* | | | 79,200 | | | | 627,264 | |
Chico’s FAS, Inc.+ | | | 216,200 | | | | 823,722 | |
China Automotive Systems, Inc.* | | | 29,200 | | | | 91,980 | |
China XD Plastics Co., Ltd.* | | | 108,400 | | | | 194,036 | |
Citi Trends, Inc. | | | 31,020 | | | | 717,182 | |
Conn’s, Inc.*+ | | | 84,000 | | | | 1,040,760 | |
Container Store Group, Inc. (The)* | | | 93,550 | | | | 394,781 | |
Cooper Tire & Rubber Co. | | | 90,550 | | | | 2,603,313 | |
Cooper-Standard Holdings, Inc.* | | | 32,000 | | | | 1,061,120 | |
Crown Crafts, Inc. | | | 30,050 | | | | 184,808 | |
Culp, Inc. | | | 20,000 | | | | 272,400 | |
Del Taco Restaurants, Inc.* | | | 117,600 | | | | 929,628 | |
Delta Apparel, Inc.* | | | 23,700 | | | | 737,070 | |
Destination XL Group, Inc.* | | | 72,200 | | | | 92,416 | |
Dillard’s, Inc., Class A+ | | | 50,500 | | | | 3,710,740 | |
Dixie Group, Inc. (The)* | | | 23,400 | | | | 26,676 | |
Ethan Allen Interiors, Inc. | | | 67,600 | | | | 1,288,456 | |
Express, Inc.*+ | | | 144,000 | | | | 701,280 | |
Fiesta Restaurant Group, Inc.* | | | 40,000 | | | | 395,600 | |
Flanigan’s Enterprises, Inc. | | | 2,500 | | | | 55,350 | |
Fossil Group, Inc.* | | | 115,500 | | | | 910,140 | |
Full House Resorts, Inc.* | | | 70,000 | | | | 234,500 | |
GameStop Corp., Class A+ | | | 140,000 | | | | 851,200 | |
Genesco, Inc.*+ | | | 51,500 | | | | 2,467,880 | |
G-III Apparel Group, Ltd.*+ | | | 75,600 | | | | 2,532,600 | |
Golden Entertainment, Inc.* | | | 47,000 | | | | 903,340 | |
| | |
OmniTax-ManagedSmall-Cap Value Fund SCHEDULE OF INVESTMENTS (Unaudited) (continued) | | |
|
|
| |
| Showing percentage of net assets as of December 31, 2019 | | |
| | | | | | | | |
| Industry Company | | Shares | | | Value | |
|
Common Stocks (continued) | |
Consumer Discretionary (continued) | |
Good Times Restaurants, Inc.* | | | 4,300 | | | | $ 6,837 | |
Group 1 Automotive, Inc.+ | | | 43,300 | | | | 4,330,000 | |
Hamilton Beach Brands Holding Co., Class A | | | 3,500 | | | | 66,850 | |
Haverty Furniture Cos., Inc. | | | 69,659 | | | | 1,404,325 | |
Hibbett Sports, Inc.*+ | | | 41,500 | | | | 1,163,660 | |
Houghton Mifflin Harcourt Co.* | | | 218,000 | | | | 1,362,500 | |
J Alexander’s Holdings, Inc.* | | | 45,250 | | | | 432,590 | |
J. Jill, Inc.+ | | | 137,500 | | | | 155,375 | |
JAKKS Pacific, Inc.* | | | 75,000 | | | | 77,250 | |
K12, Inc.* | | | 102,350 | | | | 2,082,822 | |
Lands’ End, Inc.*+ | | | 57,900 | | | | 972,720 | |
Lifetime Brands, Inc. | | | 37,449 | | | | 260,271 | |
Live Ventures, Inc.* | | | 3,200 | | | | 24,064 | |
MarineMax, Inc.* | | | 54,000 | | | | 901,260 | |
MDC Holdings, Inc. | | | 16,904 | | | | 645,057 | |
Meritage Homes Corp.* | | | 72,100 | | | | 4,406,031 | |
Modine Manufacturing Co.* | | | 58,900 | | | | 453,530 | |
Movado Group, Inc.+ | | | 61,600 | | | | 1,339,184 | |
Office Depot, Inc. | | | 965,000 | | | | 2,644,100 | |
P&F Industries, Inc., Class A | | | 492 | | | | 3,375 | |
Party City Holdco, Inc.*+ | | | 140,300 | | | | 328,302 | |
Playa Hotels & Resorts NV* | | | 324,300 | | | | 2,724,120 | |
Red Robin Gourmet Burgers, Inc.* | | | 34,800 | | | | 1,149,096 | |
Rent-A-Center, Inc. | | | 83,200 | | | | 2,399,488 | |
Rocky Brands, Inc. | | | 24,550 | | | | 722,506 | |
RTW RetailWinds, Inc.* | | | 145,700 | | | | 116,706 | |
Sequential Brands Group, Inc.* | | | 70,000 | | | | 23,975 | |
Shiloh Industries, Inc.* | | | 35,900 | | | | 127,804 | |
Shoe Carnival, Inc.+ | | | 35,600 | | | | 1,327,168 | |
Signet Jewelers, Ltd. | | | 25,000 | | | | 543,500 | |
Sonic Automotive, Inc., Class A | | | 70,000 | | | | 2,170,000 | |
SORL Auto Parts, Inc.*+ | | | 74,129 | | | | 329,133 | |
Sportsman’s Warehouse Holdings, Inc.* | | | 59,400 | | | | 476,982 | |
Strattec Security Corp. | | | 17,300 | | | | 384,233 | |
Superior Group of Cos., Inc. | | | 25,400 | | | | 343,916 | |
Tandy Leather Factory, Inc.* | | | 14,700 | | | | 83,937 | |
Tilly’s, Inc., Class A | | | 67,400 | | | | 825,650 | |
TravelCenters of America, Inc.* | | | 28,730 | | | | 492,720 | |
TRI Pointe Group, Inc.*+ | | | 65,000 | | | | 1,012,700 | |
Tuesday Morning Corp.* | | | 74,000 | | | | 136,900 | |
Unique Fabricating, Inc. | | | 15,000 | | | | 57,900 | |
Vera Bradley, Inc.* | | | 75,500 | | | | 890,900 | |
Vista Outdoor, Inc.* | | | 98,000 | | | | 733,040 | |
VOXX International Corp.* | | | 52,164 | | | | 228,478 | |
| | | | | | | | |
| Industry Company | | Shares | | | Value | |
|
Consumer Discretionary (continued) | |
William Lyon Homes, Class A* | | | 93,697 | | | | $ 1,872,066 | |
ZAGG, Inc.*+ | | | 50,000 | | | | 405,500 | |
Zumiez, Inc.* | | | 50,900 | | | | 1,758,086 | |
| | | | | | | | |
| | |
| | | | | | | 93,264,215 | |
| |
Consumer Staples - 4.09% | | | | | |
Alico, Inc. | | | 19,100 | | | | 684,353 | |
Andersons, Inc. (The) | | | 82,216 | | | | 2,078,420 | |
B&G Foods, Inc.+ | | | 127,000 | | | | 2,277,110 | |
Central Garden & Pet Co.* | | | 7,000 | | | | 217,490 | |
Central Garden & Pet Co., Class A* | | | 80,000 | | | | 2,348,800 | |
Coffee Holding Co., Inc.* | | | 10,000 | | | | 46,000 | |
Cott Corp. | | | 220,000 | | | | 3,009,600 | |
Edgewell Personal Care Co.* | | | 64,000 | | | | 1,981,440 | |
Fresh Del Monte Produce, Inc. | | | 121,000 | | | | 4,232,580 | |
Hostess Brands, Inc.* | | | 230,000 | | | | 3,344,200 | |
Ingles Markets, Inc., Class A | | | 50,950 | | | | 2,420,634 | |
Mannatech, Inc. | | | 25,700 | | | | 402,462 | |
Natural Alternatives International, Inc.* | | | 16,800 | | | | 134,064 | |
Natural Grocers by Vitamin Cottage, Inc. | | | 25,000 | | | | 246,750 | |
Nature’s Sunshine Products, Inc.* | | | 11,000 | | | | 98,230 | |
Seneca Foods Corp., Class A* | | | 23,150 | | | | 944,288 | |
SpartanNash Co. | | | 56,182 | | | | 800,032 | |
Village Super Market, Inc., Class A | | | 39,900 | | | | 925,680 | |
Weis Markets, Inc.+ | | | 67,100 | | | | 2,716,879 | |
| | | | | | | | |
| | |
| | | | | | | 28,909,012 | |
| | |
Energy - 14.76% | | | | | | | | |
Adams Resources & Energy, Inc. | | | 10,600 | | | | 403,542 | |
Amplify Energy Corp. | | | 141,000 | | | | 932,010 | |
Arch Coal, Inc., Class A | | | 44,400 | | | | 3,185,256 | |
Archrock, Inc. | | | 299,500 | | | | 3,006,980 | |
Ardmore Shipping Corp.* | | | 30,000 | | | | 271,500 | |
Berry Petroleum Corp. | | | 192,000 | | | | 1,810,560 | |
Bonanza Creek Energy, Inc.*+ | | | 56,800 | | | | 1,325,712 | |
Callon Petroleum Co.*+ | | | 420,050 | | | | 2,028,842 | |
Comstock Resources, Inc.*+ | | | 214,000 | | | | 1,761,220 | |
CONSOL Energy, Inc.*+ | | | 77,500 | | | | 1,124,525 | |
Contango Oil & Gas Co.*+ | | | 195,000 | | | | 715,650 | |
Contura Energy, Inc.* | | | 36,700 | | | | 332,135 | |
| | |
|
| |
| 22 | | Semi-Annual Report | December 31, 2019 (Unaudited) |
| | |
OmniTax-ManagedSmall-Cap Value Fund SCHEDULE OF INVESTMENTS (Unaudited) (continued) | | |
|
|
| |
| Showing percentage of net assets as of December 31, 2019 | | |
| | | | | | | | |
| Industry Company | | Shares | | | Value | |
|
Common Stocks (continued) | |
Energy (continued) | |
Dawson Geophysical Co.* | | | 28,000 | | | | $ 67,200 | |
Denbury Resources, Inc.*+ | | | 1,138,000 | | | | 1,604,580 | |
DHT Holdings, Inc. | | | 406,800 | | | | 3,368,304 | |
Diamond Offshore Drilling, Inc.*+ | | | 259,700 | | | | 1,867,243 | |
Dorian LPG, Ltd.* | | | 154,029 | | | | 2,384,369 | |
Earthstone Energy, Inc., Class A* | | | 90,000 | | | | 569,700 | |
Energy Transfer LP | | | 124,785 | | | | 1,600,992 | |
Epsilon Energy, Ltd.* | | | 60,000 | | | | 198,000 | |
Era Group, Inc.* | | | 74,900 | | | | 761,733 | |
Exterran Corp.* | | | 70,000 | | | | 548,100 | |
Frontline, Ltd.+ | | | 225,000 | | | | 2,893,500 | |
GasLog, Ltd. | | | 198,137 | | | | 1,939,761 | |
Golar LNG, Ltd.+ | | | 150,000 | | | | 2,133,000 | |
Goodrich Petroleum Corp.* | | | 22,000 | | | | 220,880 | |
Gran Tierra Energy, Inc.* | | | 324,500 | | | | 418,605 | |
Green Plains, Inc.+ | | | 101,950 | | | | 1,573,088 | |
Gulfport Energy Corp.*+ | | | 310,000 | | | | 942,400 | |
Hallador Energy Co. | | | 42,600 | | | | 126,522 | |
Helix Energy Solutions Group, Inc.* | | | 400,500 | | | | 3,856,815 | |
Lonestar Resources US, Inc., Class A* | | | 67,450 | | | | 176,044 | |
Matrix Service Co.* | | | 44,000 | | | | 1,006,720 | |
Mitcham Industries, Inc.* | | | 5,000 | | | | 14,350 | |
Montage Resources Corp.* | | | 25,053 | | | | 198,921 | |
Nabors Industries, Ltd.+ | | | 240,000 | | | | 691,200 | |
NACCO Industries, Inc., Class A | | | 31,450 | | | | 1,472,804 | |
National Energy Services Reunited Corp.* | | | 133,000 | | | | 1,212,960 | |
Natural Gas Services Group, Inc.* | | | 53,288 | | | | 653,311 | |
Navigator Holdings, Ltd.* | | | 114,100 | | | | 1,536,927 | |
Newpark Resources, Inc.*+ | | | 208,000 | | | | 1,304,160 | |
NexTier Oilfield Solutions, Inc.* | | | 120,000 | | | | 804,000 | |
Nine Energy Service, Inc.*+ | | | 37,700 | | | | 294,814 | |
Noble Corp. PLC* | | | 901,800 | | | | 1,100,196 | |
Nordic American Tankers, Ltd. | | | 328,800 | | | | 1,617,696 | |
Northern Oil and Gas, Inc.* | | | 910,000 | | | | 2,129,400 | |
Oceaneering International, Inc.* | | | 175,000 | | | | 2,609,250 | |
Oil States International, Inc.* | | | 78,000 | | | | 1,272,180 | |
Overseas Shipholding Group, Inc., Class A* | | | 255,916 | | | | 588,607 | |
Par Pacific Holdings, Inc.* | | | 110,300 | | | | 2,563,372 | |
Penn Virginia Corp.* | | | 36,000 | | | | 1,092,600 | |
Profire Energy, Inc.* | | | 100,000 | | | | 145,000 | |
ProPetro Holding Corp.* | | | 139,810 | | | | 1,572,862 | |
| | | | | | | | |
| Industry Company | | Shares | | | Value | |
|
Energy (continued) | |
QEP Resources, Inc.+ | | | 364,000 | | | | $ 1,638,000 | |
Ranger Energy Services, Inc.* | | | 23,500 | | | | 151,340 | |
Renewable Energy Group, Inc.*+ | | | 236,319 | | | | 6,368,797 | |
REX American Resources Corp.* | | | 25,250 | | | | 2,069,490 | |
Scorpio Tankers, Inc. | | | 122,190 | | | | 4,806,955 | |
SEACOR Holdings, Inc.* | | | 42,700 | | | | 1,842,505 | |
Select Energy Services, Inc., Class A* | | | 190,000 | | | | 1,763,200 | |
SFL Corp., Ltd.+ | | | 275,500 | | | | 4,005,770 | |
SilverBow Resources, Inc.* | | | 50,500 | | | | 499,950 | |
Smart Sand, Inc.*+ | | | 75,000 | | | | 189,000 | |
Solaris Oilfield Infrastructure, Inc., Class A+ | | | 124,300 | | | | 1,740,200 | |
Southwestern Energy Co.*+ | | | 725,000 | | | | 1,754,500 | |
SRC Energy, Inc.* | | | 397,000 | | | | 1,635,640 | |
Talos Energy, Inc.*+ | | | 107,200 | | | | 3,232,080 | |
Teekay Corp.+ | | | 245,000 | | | | 1,303,400 | |
Teekay Tankers, Ltd., Class A* | | | 85,000 | | | | 2,037,450 | |
TETRA Technologies, Inc.* | | | 100,000 | | | | 196,000 | |
US Silica Holdings, Inc.+ | | | 129,500 | | | | 796,425 | |
VAALCO Energy, Inc.* | | | 155,000 | | | | 344,100 | |
| | | | | | | | |
| | |
| | | | | | | 104,404,900 | |
| | |
Financials - 31.69% | | | | | | | | |
1347 Property Insurance Holdings, Inc.* | | | 17,500 | | | | 96,600 | |
1st Constitution Bancorp | | | 25,250 | | | | 558,783 | |
1st Source Corp. | | | 11,320 | | | | 587,282 | |
ACNB Corp. | | | 3,600 | | | | 136,152 | |
Allegiance Bancshares, Inc.* | | | 43,331 | | | | 1,629,246 | |
A-Mark Precious Metals, Inc.* | | | 11,500 | | | | 95,105 | |
Amerant Bancorp, Inc.*+ | | | 96,000 | | | | 2,091,840 | |
American National Bankshares, Inc. | | | 4,565 | | | | 180,637 | |
American River Bankshares | | | 20,744 | | | | 308,463 | |
Ameris Bancorp | | | 19,120 | | | | 813,365 | |
AmeriServ Financial, Inc. | | | 66,000 | | | | 277,200 | |
Argo Group International Holdings, Ltd. | | | 51,394 | | | | 3,379,156 | |
Arlington Asset Investment Corp., Class A | | | 72,600 | | | | 404,382 | |
Associated Capital Group, Inc., Class A+ | | | 10,000 | | | | 392,000 | |
Atlantic Capital Bancshares, Inc.* | | | 52,933 | | | | 971,321 | |
Banc of California, Inc. | | | 118,000 | | | | 2,027,240 | |
| | |
OmniTax-ManagedSmall-Cap Value Fund SCHEDULE OF INVESTMENTS (Unaudited) (continued) | | |
|
|
| |
| Showing percentage of net assets as of December 31, 2019 | | |
| | | | | | | | |
| Industry Company | | Shares | | | Value | |
|
Common Stocks (continued) | |
Financials (continued) | |
Banco Latinoamericano de Comercio Exterior SA, Class E | | | 13,388 | | | | $ 286,235 | |
Bancorp 34, Inc.+ | | | 9,300 | | | | 142,011 | |
Bancorp, Inc. (The)* | | | 151,800 | | | | 1,968,846 | |
Bank of Commerce Holdings | | | 34,800 | | | | 402,636 | |
Bank of Princeton (The) | | | 12,500 | | | | 393,625 | |
BankFinancial Corp. | | | 3,000 | | | | 39,240 | |
Banner Corp. | | | 3,000 | | | | 169,770 | |
Bar Harbor Bankshares | | | 34,541 | | | | 876,996 | |
BCB Bancorp, Inc. | | | 38,900 | | | | 536,431 | |
Berkshire Hills Bancorp, Inc. | | | 107,410 | | | | 3,531,641 | |
Blue Capital Reinsurance Holdings, Ltd. | | | 12,700 | | | | 87,122 | |
Boston Private Financial Holdings, Inc. | | | 177,800 | | | | 2,138,934 | |
Bryn Mawr Bank Corp. | | | 6,500 | | | | 268,060 | |
Byline Bancorp, Inc. | | | 65,000 | | | | 1,272,050 | |
C&F Financial Corp. | | | 7,400 | | | | 409,442 | |
Cadence BanCorp.+ | | | 60,000 | | | | 1,087,800 | |
Camden National Corp. | | | 33,779 | | | | 1,555,861 | |
Capital City Bank Group, Inc. | | | 55,750 | | | | 1,700,375 | |
Capstar Financial Holdings, Inc. | | | 29,900 | | | | 497,835 | |
Carter Bank & Trust* | | | 63,000 | | | | 1,494,360 | |
CB Financial Services, Inc. | | | 13,500 | | | | 406,890 | |
Central Pacific Financial Corp. | | | 6,496 | | | | 192,152 | |
Central Valley Community Bancorp | | | 51,000 | | | | 1,105,170 | |
Century Bancorp, Inc., Class A | | | 6,800 | | | | 611,728 | |
Chemung Financial Corp. | | | 12,293 | | | | 522,453 | |
Citizens Community Bancorp, Inc. | | | 32,000 | | | | 391,040 | |
Citizens Holding Co. | | | 3,400 | | | | 74,392 | |
Citizens, Inc.*+ | | | 17,200 | | | | 116,100 | |
Civista Bancshares, Inc. | | | 31,921 | | | | 766,104 | |
CNB Financial Corp. | | | 60,800 | | | | 1,986,944 | |
Codorus Valley Bancorp, Inc. | | | 12,971 | | | | 298,722 | |
Colony Bankcorp, Inc.+ | | | 1,500 | | | | 24,750 | |
Community Bankers Trust Corp. | | | 48,000 | | | | 426,240 | |
Community Financial Corp. (The) | | | 4,840 | | | | 172,159 | |
Community Trust Bancorp, Inc. | | | 3,000 | | | | 139,920 | |
Community West Bancshares | | | 11,000 | | | | 122,100 | |
ConnectOne Bancorp, Inc. | | | 80,200 | | | | 2,062,744 | |
| | | | | | | | |
| Industry Company | | Shares | | | Value | |
|
Financials (continued) | |
Consumer Portfolio Services, Inc.* | | | 97,000 | | | | $ 326,890 | |
County Bancorp, Inc. | | | 8,700 | | | | 222,981 | |
Cowen, Inc., Class A*+ | | | 104,700 | | | | 1,649,025 | |
Customers Bancorp, Inc.* | | | 58,500 | | | | 1,392,885 | |
Dime Community Bancshares, Inc. | | | 67,000 | | | | 1,399,630 | |
Donegal Group, Inc., Class A | | | 104,100 | | | | 1,542,762 | |
Donnelley Financial Solutions, Inc.* | | | 59,000 | | | | 617,730 | |
Eagle Bancorp Montana, Inc. | | | 19,000 | | | | 406,410 | |
Elevate Credit, Inc.* | | | 90,000 | | | | 400,500 | |
Emclaire Financial Corp. | | | 200 | | | | 6,506 | |
Employers Holdings, Inc. | | | 75,900 | | | | 3,168,825 | |
Encore Capital Group, Inc.*+ | | | 78,200 | | | | 2,765,152 | |
Enova International, Inc.* | | | 92,400 | | | | 2,223,144 | |
Entegra Financial Corp.* | | | 23,600 | | | | 711,776 | |
Enterprise Bancorp, Inc. | | | 27,475 | | | | 930,578 | |
Equity Bancshares, Inc., Class A* | | | 28,500 | | | | 879,795 | |
ESSA Bancorp, Inc. | | | 39,000 | | | | 661,050 | |
Evans Bancorp, Inc. | | | 21,500 | | | | 862,150 | |
EZCORP, Inc., Class A*+ | | | 145,100 | | | | 989,582 | |
Farmers National Banc Corp.+ | | | 150 | | | | 2,448 | |
FB Financial Corp. | | | 48,000 | | | | 1,900,320 | |
FBL Financial Group, Inc., Class A | | | 51,166 | | | | 3,015,212 | |
Federal Agricultural Mortgage Corp., Class C | | | 22,200 | | | | 1,853,700 | |
FedNat Holding Co. | | | 27,500 | | | | 457,325 | |
Financial Institutions, Inc. | | | 40,300 | | | | 1,293,630 | |
First BanCorp Puerto Rico | | | 450,000 | | | | 4,765,500 | |
First Bank | | | 41,622 | | | | 459,923 | |
First Busey Corp. | | | 112,593 | | | | 3,096,308 | |
First Business Financial Services, Inc. | | | 19,100 | | | | 502,903 | |
First Capital, Inc.+ | | | 500 | | | | 36,500 | |
First Choice Bancorp | | | 29,707 | | | | 800,901 | |
First Community Bankshares, Inc. | | | 11,000 | | | | 341,220 | |
First Community Corp. | | | 13,000 | | | | 280,930 | |
First Financial Corp. | | | 31,495 | | | | 1,439,951 | |
First Financial Northwest, Inc. | | | 26,400 | | | | 394,416 | |
First Foundation, Inc. | | | 100,000 | | | | 1,740,000 | |
First Guaranty Bancshares, Inc. | | | 16,354 | | | | 356,027 | |
First Internet Bancorp | | | 13,800 | | | | 327,198 | |
| | |
|
| |
| 24 | | Semi-Annual Report | December 31, 2019 (Unaudited) |
| | |
OmniTax-ManagedSmall-Cap Value Fund SCHEDULE OF INVESTMENTS (Unaudited) (continued) | | |
|
|
| |
| Showing percentage of net assets as of December 31, 2019 | | |
| | | | | | | | |
| Industry Company | | Shares | | | Value | |
|
Common Stocks (continued) | |
Financials (continued) | |
First Mid Bancshares, Inc. | | | 32,000 | | | | $1,128,000 | |
First Northwest Bancorp | | | 16,590 | | | | 300,777 | |
First of Long Island Corp. (The) | | | 45,000 | | | | 1,128,600 | |
First United Corp. | | | 14,425 | | | | 347,498 | |
First US Bancshares, Inc. | | | 5,000 | | | | 58,050 | |
Flushing Financial Corp. | | | 67,241 | | | | 1,452,742 | |
FNCB Bancorp, Inc. | | | 5,000 | | | | 42,250 | |
Franklin Financial Network, Inc. | | | 28,000 | | | | 961,240 | |
Franklin Financial Services Corp. | | | 2,000 | | | | 77,380 | |
FS Bancorp, Inc. | | | 7,850 | | | | 500,752 | |
GAIN Capital Holdings, Inc.+ | | | 39,900 | | | | 157,605 | |
Global Indemnity, Ltd. | | | 24,443 | | | | 724,246 | |
Great Elm Capital Corp.+ | | | 23,000 | | | | 178,940 | |
Great Southern Bancorp, Inc. | | | 31,006 | | | | 1,963,300 | |
Hanmi Financial Corp. | | | 69,000 | | | | 1,379,655 | |
Hawthorn Bancshares, Inc. | | | 12,979 | | | | 330,964 | |
Heartland Financial USA, Inc. | | | 74,450 | | | | 3,703,143 | |
Hennessy Advisors, Inc. | | | 2,000 | | | | 20,160 | |
Heritage Insurance Holdings, Inc. | | | 60,100 | | | | 796,325 | |
Hilltop Holdings, Inc. | | | 156,600 | | | | 3,904,038 | |
HMN Financial, Inc.* | | | 1,000 | | | | 21,010 | |
Home Bancorp, Inc. | | | 30,597 | | | | 1,199,096 | |
HomeStreet, Inc.* | | | 64,900 | | | | 2,206,600 | |
Hope Bancorp, Inc. | | | 135,000 | | | | 2,006,100 | |
Horace Mann Educators Corp. | | | 94,950 | | | | 4,145,517 | |
Horizon Bancorp, Inc. | | | 128,022 | | | | 2,432,418 | |
Howard Bancorp, Inc.* | | | 53,100 | | | | 896,328 | |
Independence Holding Co. | | | 14,950 | | | | 629,096 | |
INTL. FCStone, Inc.* | | | 26,000 | | | | 1,269,580 | |
James River Group Holdings, Ltd. | | | 79,100 | | | | 3,259,711 | |
Kingstone Cos., Inc. | | | 11,200 | | | | 86,800 | |
Ladenburg Thalmann Financial Services, Inc. | | | 347,700 | | | | 1,209,996 | |
Lakeland Bancorp, Inc. | | | 97,340 | | | | 1,691,769 | |
Landmark Bancorp, Inc. | | | 2,551 | | | | 63,903 | |
LCNB Corp. | | | 27,700 | | | | 534,610 | |
Limestone Bancorp, Inc.* | | | 1,000 | | | | 18,000 | |
Luther Burbank Corp. | | | 139,600 | | | | 1,609,588 | |
Mackinac Financial Corp. | | | 28,400 | | | | 495,864 | |
Manning & Napier, Inc. | | | 131,000 | | | | 227,940 | |
Marlin Business Services Corp. | | | 28,875 | | | | 634,672 | |
| | | | | | | | |
| Industry Company | | Shares | | | Value | |
|
Financials (continued) | |
Mercantile Bank Corp. | | | 2,000 | | | | $ 72,940 | |
Merchants Bancorp | | | 51,300 | | | | 1,011,123 | |
Meta Financial Group, Inc. | | | 97,234 | | | | 3,550,013 | |
Metropolitan Bank Holding Corp.* | | | 15,100 | | | | 728,273 | |
Mid Penn Bancorp, Inc. | | | 11,200 | | | | 322,560 | |
Middlefield Banc Corp. | | | 4,000 | | | | 104,360 | |
Midland States Bancorp, Inc. | | | 45,117 | | | | 1,306,588 | |
MidWestOne Financial Group, Inc. | | | 48,300 | | | | 1,749,909 | |
MMA Capital Holdings, Inc.* | | | 2,000 | | | | 63,600 | |
Mr Cooper Group, Inc.* | | | 158,603 | | | | 1,984,124 | |
MutualFirst Financial, Inc. | | | 700 | | | | 27,769 | |
MVB Financial Corp. | | | 40,300 | | | | 1,004,276 | |
National Bankshares, Inc. | | | 1,000 | | | | 44,930 | |
National Holdings Corp.* | | | 2,000 | | | | 5,100 | |
National Security Group, Inc. (The) | | | 200 | | | | 2,982 | |
National Western Life Group, Inc., Class A | | | 7,650 | | | | 2,225,232 | |
Nelnet, Inc., Class A | | | 16,900 | | | | 984,256 | |
Nicholas Financial, Inc.* | | | 19,400 | | | | 159,856 | |
Nicolet Bankshares, Inc.* | | | 16,900 | | | | 1,248,065 | |
Northeast Bank | | | 22,300 | | | | 490,377 | |
Northrim BanCorp, Inc. | | | 24,073 | | | | 921,996 | |
OceanFirst Financial Corp. | | | 114,000 | | | | 2,911,560 | |
Ocwen Financial Corp.* | | | 296,400 | | | | 406,068 | |
OFG Bancorp | | | 134,800 | | | | 3,182,628 | |
Old Second Bancorp, Inc. | | | 55,100 | | | | 742,197 | |
On Deck Capital, Inc.* | | | 138,300 | | | | 572,562 | |
OP Bancorp | | | 30,400 | | | | 315,248 | |
Oppenheimer Holdings, Inc., Class A | | | 35,419 | | | | 973,314 | |
Opus Bank | | | 92,000 | | | | 2,380,040 | |
Orrstown Financial Services, Inc. | | | 28,000 | | | | 633,360 | |
Pacific Mercantile Bancorp* | | | 55,300 | | | | 449,036 | |
Parke Bancorp, Inc. | | | 17,327 | | | | 439,933 | |
Patriot National Bancorp, Inc. | | | 11,000 | | | | 140,360 | |
PB Bancorp, Inc. | | | 14,500 | | | | 219,820 | |
PCB Bancorp | | | 29,300 | | | | 506,304 | |
Peapack Gladstone Financial Corp. | | | 49,968 | | | | 1,544,011 | |
Penns Woods Bancorp, Inc. | | | 1,500 | | | | 53,340 | |
PennyMac Financial Services, Inc. | | | 30,000 | | | | 1,021,200 | |
Peoples Bancorp of North Carolina, Inc. | | | 27,380 | | | | 899,433 | |
Peoples Bancorp, Inc. | | | 54,950 | | | | 1,904,567 | |
| | |
OmniTax-ManagedSmall-Cap Value Fund SCHEDULE OF INVESTMENTS (Unaudited) (continued) | | |
|
|
| |
| Showing percentage of net assets as of December 31, 2019 | | |
| | | | | | | | |
| Industry Company | | Shares | | | Value | |
|
Common Stocks (continued) | |
Financials (continued) | |
Peoples Financial Services Corp.+ | | | 17,600 | | | | $ 886,160 | |
Piper Sandler Cos. | | | 34,100 | | | | 2,725,954 | |
Premier Financial Bancorp, Inc. | | | 50,240 | | | | 911,354 | |
Protective Insurance Corp., Class B | | | 43,700 | | | | 703,133 | |
Provident Financial Holdings, Inc. | | | 53,710 | | | | 1,176,249 | |
Provident Financial Services, Inc. | | | 82,500 | | | | 2,033,625 | |
Prudential Bancorp, Inc. | | | 2,457 | | | | 45,528 | |
QCR Holdings, Inc. | | | 33,000 | | | | 1,447,380 | |
RBB Bancorp | | | 42,500 | | | | 899,725 | |
Regional Management Corp.* | | | 52,100 | | | | 1,564,563 | |
Reliant Bancorp, Inc. | | | 31,000 | | | | 689,440 | |
Republic Bancorp, Inc., Class A | | | 37,700 | | | | 1,764,360 | |
Riverview Bancorp, Inc. | | | 66,478 | | | | 545,784 | |
Safety Insurance Group, Inc. | | | 7,149 | | | | 661,497 | |
Salisbury Bancorp, Inc. | | | 1,683 | | | | 76,863 | |
Sandy Spring Bancorp, Inc. | | | 81,700 | | | | 3,094,796 | |
SB Financial Group, Inc. | | | 30,952 | | | | 609,445 | |
SB One Bancorp | | | 22,200 | | | | 553,224 | |
Security National Financial Corp., Class A* | | | 15,827 | | | | 92,588 | |
Severn Bancorp, Inc. | | | 30,000 | | | | 279,300 | |
Shore Bancshares, Inc. | | | 60,400 | | | | 1,048,544 | |
SmartFinancial, Inc. | | | 25,000 | | | | 591,250 | |
Sound Financial Bancorp, Inc. | | | 1,000 | | | | 36,000 | |
Southern Missouri Bancorp, Inc. | | | 7,300 | | | | 280,028 | |
Southern National Bancorp of Virginia, Inc. | | | 80,700 | | | | 1,319,445 | |
Standard AVB Financial Corp. | | | 18,000 | | | | 539,460 | |
Sterling Bancorp, Inc. | | | 112,000 | | | | 907,200 | |
Summit Financial Group, Inc. | | | 25,100 | | | | 679,959 | |
Summit State Bank | | | 6,250 | | | | 81,031 | |
Sutter Rock Capital Corp.+ | | | 42,700 | | | | 279,685 | |
Territorial Bancorp, Inc. | | | 21,900 | | | | 677,586 | |
Third Point Reinsurance, Ltd.* | | | 195,000 | | | | 2,051,400 | |
Tiptree, Inc. | | | 94,200 | | | | 766,788 | |
TriState Capital Holdings, Inc.* | | | 45,000 | | | | 1,175,400 | |
Triumph Bancorp, Inc.* | | | 15,000 | | | | 570,300 | |
Two River Bancorp | | | 36,015 | | | | 806,736 | |
United Community Financial Corp. | | | 10,163 | | | | 118,501 | |
| | | | | | | | |
| Industry Company | | Shares | | | Value | |
|
Financials (continued) | |
United Fire Group, Inc. | | | 50,200 | | | | $ 2,195,246 | |
United Insurance Holdings Corp.+ | | | 54,700 | | | | 689,767 | |
Unity Bancorp, Inc. | | | 44,200 | | | | 997,594 | |
Universal Insurance Holdings, Inc. | | | 72,695 | | | | 2,034,733 | |
Univest Financial Corp. | | | 76,500 | | | | 2,048,670 | |
Veritex Holdings, Inc.+ | | | 79,000 | | | | 2,301,270 | |
Waddell & Reed Financial, Inc., Class A | | | 187,800 | | | | 3,140,016 | |
Walker & Dunlop, Inc. | | | 67,275 | | | | 4,351,347 | |
Waterstone Financial, Inc. | | | 43,900 | | | | 835,417 | |
Wellesley Bank | | | 1,000 | | | | 45,010 | |
WesBanco, Inc. | | | 23,200 | | | | 876,728 | |
Western New England Bancorp, Inc. | | | 100,000 | | | | 963,000 | |
World Acceptance Corp.*+ | | | 22,500 | | | | 1,944,000 | |
WSFS Financial Corp. | | | 35,191 | | | | 1,548,052 | |
| | | | | | | | |
| | |
| | | | | | | 224,208,137 | |
| | |
Health Care - 3.47% | | | | | | | | |
Acorda Therapeutics, Inc.*+ | | | 35,000 | | | | 71,400 | |
AMAG Pharmaceuticals, Inc.*+ | | | 100,000 | | | | 1,217,000 | |
AngioDynamics, Inc.* | | | 9,400 | | | | 150,494 | |
Assertio Therapeutics, Inc.* | | | 200 | | | | 250 | |
Brookdale Senior Living, Inc.* | | | 410,500 | | | | 2,984,335 | |
Cross Country Healthcare, Inc.*+ | | | 70,150 | | | | 815,143 | |
CynergisTek, Inc.* | | | 40,000 | | | | 132,000 | |
Electromed, Inc.* | | | 10,000 | | | | 86,500 | |
FONAR Corp.* | | | 23,400 | | | | 460,746 | |
InfuSystem Holdings, Inc.* | | | 118,378 | | | | 1,009,764 | |
Kewaunee Scientific Corp. | | | 2,500 | | | | 33,625 | |
Lannett Co., Inc.*+ | | | 100,000 | | | | 882,000 | |
Magellan Health, Inc.* | | | 56,900 | | | | 4,452,425 | |
Mallinckrodt PLC*+ | | | 169,900 | | | | 592,951 | |
National HealthCare Corp. | | | 22,982 | | | | 1,986,334 | |
Owens & Minor, Inc. | | | 110,000 | | | | 568,700 | |
Prestige Consumer Healthcare, Inc.*+ | | | 120,600 | | | | 4,884,300 | |
Surgery Partners, Inc.* | | | 95,000 | | | | 1,487,225 | |
Tivity Health, Inc.*+ | | | 80,000 | | | | 1,627,600 | |
Triple-S Management Corp., Class B* | | | 58,967 | | | | 1,090,300 | |
| | | | | | | | |
| | |
| | | | | | | 24,533,092 | |
| | |
Industrials - 14.92% | | | | | | | | |
Acacia Research Corp.* | | | 101,500 | | | | 269,990 | |
ACCO Brands Corp. | | | 239,800 | | | | 2,244,528 | |
Aegion Corp.* | | | 47,100 | | | | 1,053,627 | |
| | |
|
| |
| 26 | | Semi-Annual Report | December 31, 2019 (Unaudited) |
| | |
OmniTax-ManagedSmall-Cap Value Fund SCHEDULE OF INVESTMENTS (Unaudited) (continued) | | |
|
|
| |
| Showing percentage of net assets as of December 31, 2019 | | |
| | | | | | | | |
| Industry Company | | Shares | | | Value | |
|
Common Stocks (continued) | |
Industrials (continued) | |
AeroCentury Corp.* | | | 4,300 | | | | $ 19,350 | |
Air T, Inc.* | | | 10,050 | | | | 202,508 | |
Aircastle, Ltd. | | | 170,900 | | | | 5,470,509 | |
Alpha Pro Tech, Ltd.* | | | 30,500 | | | | 104,615 | |
Apogee Enterprises, Inc. | | | 27,600 | | | | 897,000 | |
ARC Document Solutions, Inc.* | | | 173,700 | | | | 241,443 | |
ArcBest Corp. | | | 50,400 | | | | 1,391,040 | |
Armstrong Flooring, Inc.* | | | 45,000 | | | | 192,150 | |
Art’s-Way Manufacturing Co., Inc.* | | | 15,000 | | | | 26,700 | |
Atlas Air Worldwide Holdings, Inc.* | | | 39,800 | | | | 1,097,286 | |
BMC Stock Holdings, Inc.* | | | 158,800 | | | | 4,555,972 | |
Caesarstone, Ltd. | | | 79,000 | | | | 1,190,530 | |
CAI International, Inc.* | | | 64,500 | | | | 1,869,210 | |
Chicago Rivet & Machine Co. | | | 1,000 | | | | 25,797 | |
Commercial Vehicle Group, Inc.* | | | 73,600 | | | | 467,360 | |
CompX International, Inc. | | | 500 | | | | 7,295 | |
Costamare, Inc. | | | 340,600 | | | | 3,245,918 | |
Covenant Transportation Group, Inc., Class A* | | | 42,550 | | | | 549,959 | |
DLH Holdings Corp.* | | | 52,500 | | | | 219,975 | |
Ducommun, Inc.* | | | 24,300 | | | | 1,227,879 | |
Eagle Bulk Shipping, Inc.*+ | | | 230,000 | | | | 1,058,000 | |
Eastern Co. (The) | | | 20,104 | | | | 613,775 | |
Echo Global Logistics, Inc.* | | | 60,000 | | | | 1,242,000 | |
Ecology and Environment, Inc., Class A | | | 18,536 | | | | 287,308 | |
Ennis, Inc. | | | 46,365 | | | | 1,003,802 | |
EnPro Industries, Inc.+ | | | 42,600 | | | | 2,849,088 | |
Foundation Building Materials, Inc.* | | | 59,800 | | | | 1,157,130 | |
Genco Shipping & Trading, Ltd. | | | 79,600 | | | | 845,352 | |
General Finance Corp.* | | | 50,000 | | | | 553,500 | |
GMS, Inc.* | | | 101,000 | | | | 2,735,080 | |
Goldfield Corp. (The)* | | | 114,000 | | | | 404,700 | |
Great Lakes Dredge & Dock Corp.* | | | 144,800 | | | | 1,640,584 | |
Greenbrier Cos., Inc. (The) | | | 34,100 | | | | 1,105,863 | |
Hawaiian Holdings, Inc.+ | | | 93,900 | | | | 2,750,331 | |
Heidrick & Struggles International, Inc. | | | 35,000 | | | | 1,137,500 | |
Herc Holdings, Inc.* | | | 72,800 | | | | 3,562,832 | |
Hertz Global Holdings, Inc.* | | | 149,568 | | | | 2,355,696 | |
Hillenbrand, Inc. | | | 21,762 | | | | 724,892 | |
Hub Group, Inc., Class A* | | | 84,200 | | | | 4,318,618 | |
Hurco Cos., Inc. | | | 17,615 | | | | 675,711 | |
IES Holdings, Inc.* | | | 2,350 | | | | 60,301 | |
| | | | | | | | |
| Industry Company | | Shares | | | Value | |
| | |
Industrials (continued) | | | | | | | | |
Innovative Solutions & Support, Inc.* | | | 23,300 | | | | $ 136,072 | |
Kelly Services, Inc., Class A | | | 88,400 | | | | 1,996,072 | |
LB Foster Co., Class A* | | | 27,500 | | | | 532,950 | |
Limbach Holdings, Inc.* | | | 7,000 | | | | 26,460 | |
LS Starrett Co. (The), Class A* | | | 9,400 | | | | 53,768 | |
LSI Industries, Inc. | | | 55,000 | | | | 332,750 | |
Lydall, Inc.* | | | 30,000 | | | | 615,600 | |
Marten Transport, Ltd. | | | 100,776 | | | | 2,165,676 | |
Matson, Inc. | | | 90,590 | | | | 3,696,072 | |
Matthews International Corp., Class A+ | | | 58,500 | | | | 2,232,945 | |
Mesa Air Group, Inc.* | | | 50,000 | | | | 447,000 | |
Miller Industries, Inc. | | | 22,700 | | | | 842,851 | |
Mistras Group, Inc.* | | | 54,300 | | | | 774,861 | |
MRC Global, Inc.*+ | | | 155,000 | | | | 2,114,200 | |
MYR Group, Inc.* | | | 40,000 | | | | 1,303,600 | |
Navios Maritime Holdings, Inc.* | | | 25,000 | | | | 112,000 | |
NL Industries, Inc.* | | | 5,000 | | | | 19,550 | |
NN, Inc. | | | 97,600 | | | | 902,800 | |
Northwest Pipe Co.* | | | 10,100 | | | | 336,431 | |
NOW, Inc.* | | | 227,800 | | | | 2,560,472 | |
Orion Group Holdings, Inc.* | | | 52,672 | | | | 273,368 | |
PAM Transportation Services, Inc.* | | | 16,000 | | | | 923,360 | |
Pangaea Logistics Solutions, Ltd. | | | 4,800 | | | | 14,160 | |
Park-Ohio Holdings Corp. | | | 24,000 | | | | 807,600 | |
Patrick Industries, Inc.+ | | | 35,000 | | | | 1,835,050 | |
Patriot Transportation Holding, Inc.* | | | 7,500 | | | | 146,100 | |
Preformed Line Products Co. | | | 4,600 | | | | 277,610 | |
Quad/Graphics, Inc.+ | | | 120,300 | | | | 561,801 | |
Quanex Building Products Corp. | | | 70,000 | | | | 1,195,600 | |
Rush Enterprises, Inc., Class A | | | 48,600 | | | | 2,259,900 | |
Rush Enterprises, Inc., Class B | | | 34,700 | | | | 1,585,790 | |
Safe Bulkers, Inc.* | | | 312,100 | | | | 530,570 | |
Scorpio Bulkers, Inc. | | | 178,700 | | | | 1,138,319 | |
Servotronics, Inc. | | | 1,000 | | | | 10,060 | |
Spartan Motors, Inc. | | | 10,000 | | | | 180,800 | |
Sterling Construction Co., Inc.* | | | 53,800 | | | | 757,504 | |
Team, Inc.* | | | 66,300 | | | | 1,058,811 | |
Textainer Group Holdings, Ltd.* | | | 155,900 | | | | 1,669,689 | |
Titan Machinery, Inc.* | | | 47,800 | | | | 706,484 | |
| | |
OmniTax-ManagedSmall-Cap Value Fund SCHEDULE OF INVESTMENTS (Unaudited) (continued) | | |
|
|
| |
| Showing percentage of net assets as of December 31, 2019 | | |
| | | | | | | | |
| Industry Company | | Shares | | | Value | |
|
Common Stocks (continued) | |
Industrials (continued) | |
TrueBlue, Inc.* | | | 86,250 | | | | $ 2,075,175 | |
Tutor Perini Corp.*+ | | | 72,000 | | | | 925,920 | |
Universal Logistics Holdings, Inc. | | | 49,600 | | | | 940,416 | |
USA Truck, Inc.* | | | 17,700 | | | | 131,865 | |
Vectrus, Inc.* | | | 11,900 | | | | 609,994 | |
Veritiv Corp.* | | | 32,433 | | | | 637,957 | |
VSE Corp. | | | 25,560 | | | | 972,302 | |
Wabash National Corp. | | | 112,000 | | | | 1,645,280 | |
Willis Lease Finance Corp.* | | | 47,634 | | | | 2,806,119 | |
| | | | | | | | |
| | |
| | | | | | | 105,532,438 | |
|
Information Technology - 7.30% | |
Alpha & Omega | | | | | | | | |
Semiconductor, Ltd.* | | | 70,105 | | | | 954,830 | |
Amkor Technology, Inc.* | | | 408,000 | | | | 5,304,000 | |
Amtech Systems, Inc.* | | | 50,000 | | | | 358,000 | |
Avaya Holdings Corp.*+ | | | 239,300 | | | | 3,230,550 | |
Aviat Networks, Inc.* | | | 13,800 | | | | 193,890 | |
Benchmark Electronics, Inc. | | | 94,300 | | | | 3,240,148 | |
BK Technologies Corp. | | | 26,700 | | | | 82,770 | |
Comtech Telecommuni-cations Corp. | | | 61,785 | | | | 2,192,750 | |
CSP, Inc. | | | 5,150 | | | | 67,208 | |
Diodes, Inc.*+ | | | 39,600 | | | | 2,232,252 | |
Finjan Holdings, Inc.* | | | 88,700 | | | | 178,287 | |
Ichor Holdings, Ltd.* | | | 40,500 | | | | 1,347,435 | |
Innodata, Inc.* | | | 43,000 | | | | 49,020 | |
Insight Enterprises, Inc.*+ | | | 74,600 | | | | 5,243,634 | |
inTEST Corp.* | | | 54,500 | | | | 324,275 | |
KEMET Corp.+ | | | 140,750 | | | | 3,807,288 | |
Key Tronic Corp.* | | | 18,600 | | | | 101,184 | |
Kimball Electronics, Inc.* | | | 59,100 | | | | 1,037,205 | |
Mind CTI, Ltd. | | | 500 | | | | 1,208 | |
NeoPhotonics Corp.* | | | 71,000 | | | | 626,220 | |
NetSol Technologies, Inc.* | | | 15,700 | | | | 62,800 | |
Network-1 Technologies, Inc. | | | 50,000 | | | | 109,000 | |
Nortech Systems, Inc.*+ | | | 1,500 | | | | 7,290 | |
PC-Tel, Inc. | | | 37,950 | | | | 321,436 | |
Perceptron, Inc.* | | | 13,500 | | | | 74,250 | |
Photronics, Inc.* | | | 171,470 | | | | 2,702,367 | |
Ribbon Communications, Inc.* | | | 160,800 | | | | 498,480 | |
Sanmina Corp.* | | | 90,900 | | | | 3,112,416 | |
ScanSource, Inc.* | | | 64,500 | | | | 2,383,275 | |
Steel Connect, Inc.* | | | 135,000 | | | | 197,100 | |
Sykes Enterprises, Inc.* | | | 49,950 | | | | 1,847,650 | |
Synacor, Inc.* | | | 85,400 | | | | 129,808 | |
Synaptics, Inc.*+ | | | 20,000 | | | | 1,315,400 | |
TiVo Corp.+ | | | 160,400 | | | | 1,360,192 | |
| | | | | | | | |
| Industry Company | | Shares | | | Value | |
|
Information Technology (continued) | |
Trio-Tech International* | | | 13,000 | | | | $ 51,870 | |
TSR, Inc.* | | | 1,385 | | | | 4,944 | |
TTM Technologies, Inc.*+ | | | 264,402 | | | | 3,979,250 | |
Ultra Clean Holdings, Inc.* | | | 112,000 | | | | 2,628,640 | |
Wayside Technology Group, Inc. | | | 15,700 | | | | 254,340 | |
Westell Technologies, Inc., Class A* | | | 59,900 | | | | 53,610 | |
| | | | | | | | |
| | |
| | | | | | | 51,666,272 | |
| | |
Materials - 5.91% | | | | | | | | |
Advanced Emissions Solutions, Inc.+ | | | 27,500 | | | | 288,750 | |
AdvanSix, Inc.* | | | 58,900 | | | | 1,175,644 | |
Boise Cascade Co. | | | 68,400 | | | | 2,498,652 | |
Caledonia Mining Corp. PLC | | | 5,000 | | | | 42,100 | |
Clearwater Paper Corp.*+ | | | 46,000 | | | | 982,560 | |
Forterra, Inc.*+ | | | 170,000 | | | | 1,965,200 | |
Friedman Industries, Inc. | | | 32,900 | | | | 198,058 | |
FutureFuel Corp. | | | 79,500 | | | | 985,005 | |
Gulf Resources, Inc.* | | | 18,150 | | | | 9,258 | |
Hecla Mining Co. | | | 749,000 | | | | 2,539,110 | |
Innophos Holdings, Inc. | | | 10,000 | | | | 319,800 | |
Intrepid Potash, Inc.* | | | 300,000 | | | | 813,000 | |
Kraton Corp.* | | | 110,477 | | | | 2,797,278 | |
Kronos Worldwide, Inc.+ | | | 35,000 | | | | 469,000 | |
LSB Industries, Inc.* | | | 57,600 | | | | 241,920 | |
Materion Corp. | | | 21,400 | | | | 1,272,230 | |
Mercer International, Inc.+ | | | 129,850 | | | | 1,597,155 | |
O-I Glass, Inc. | | | 335,000 | | | | 3,996,550 | |
Olympic Steel, Inc. | | | 20,000 | | | | 358,400 | |
PH Glatfelter Co. | | | 105,000 | | | | 1,921,500 | |
Ramaco Resources, Inc.*+ | | | 69,900 | | | | 250,242 | |
Resolute Forest Products, Inc.* | | | 202,500 | | | | 850,500 | |
Ryerson Holding Corp.* | | | 80,700 | | | | 954,681 | |
Schnitzer Steel Industries, Inc., Class A+ | | | 77,600 | | | | 1,682,368 | |
SunCoke Energy, Inc. | | | 181,200 | | | | 1,128,876 | |
Synalloy Corp.* | | | 2,200 | | | | 28,402 | |
Trecora Resources* | | | 77,602 | | | | 554,854 | |
Tredegar Corp. | | | 77,600 | | | | 1,734,360 | |
Trinseo SA | | | 70,000 | | | | 2,604,700 | |
Tronox Holdings PLC, | | | | | | | | |
Class A+ | | | 245,000 | | | | 2,797,900 | |
Universal Stainless & Alloy Products, Inc.* | | | 15,250 | | | | 227,225 | |
Verso Corp., Class A* | | | 61,001 | | | | 1,099,848 | |
| | |
|
| |
| 28 | | Semi-Annual Report | December 31, 2019 (Unaudited) |
| | |
OmniTax-ManagedSmall-Cap Value Fund SCHEDULE OF INVESTMENTS (Unaudited) (continued) | | |
|
|
| |
| Showing percentage of net assets as of December 31, 2019 | | |
| | | | | | | | |
| Industry Company | | Shares | | | Value | |
|
Common Stocks (continued) | |
Materials (continued) | |
Warrior Met Coal, Inc. | | | 163,000 | | | | $ 3,444,190 | |
| | | | | | | | |
| | |
| | | | | | | 41,829,316 | |
| | |
Real Estate - 0.29% | | | | | | | | |
Altisource Portfolio Solutions SA*+ | | | 72,000 | | | | 1,391,760 | |
Consolidated-Tomoka Land Co. | | | 11,000 | | | | 663,520 | |
Forestar Group, Inc.* | | | 1 | | | | 21 | |
| | | | | | | | |
| | |
| | | | | | | 2,055,301 | |
| | | | | | | | |
| |
TOTAL COMMON STOCKS - 99.83% | | | | 706,270,421 | |
| | | | | | | | |
(Cost $ 608,903,514) | | | | | |
|
PREFERRED STOCK - 0.00% | |
Air T Funding, 8.00%***+ | | | 5,307 | | | | 13,108 | |
| | | | | | | | |
| |
TOTAL PREFERRED STOCK - 0.00% | | | | 13,108 | |
| | | | | | | | |
(Cost $ 11,039) | | | | | |
|
RIGHTS - 0.00% | |
TheStreet, Inc., CVR, expiring 02/03/20*D+ | | | 7,000 | | | | — | |
Newstar Financial, Inc.*D | | | 105,100 | | | | 5,255 | |
| | | | | | | | |
| |
TOTAL RIGHTS - 0.00% | | | | 5,255 | |
| | | | | | | | |
(Cost $ 74,352) | | | | | |
|
WARRANTS - 0.00% | |
Air T Funding, expiring 06/07/20* | | | 27,864 | | | | 1,421 | |
Eagle Bulk Shipping, Inc., expiring 10/15/21* | | | 8,501 | | | | 38 | |
| | | | | | | | |
| |
TOTAL WARRANTS - 0.00% | | | | 1,459 | |
| | | | | | | | |
(Cost $ 73,557) | | | | | |
| | | | | | | | | | | | |
| | | Rate^ | | | Shares | | | Value | |
|
MONEY MARKET FUND - 0.30% | |
Fidelity Investments Money Market Government Portfolio Class I | | | 1.49 | % | | | 2,098,696 | | | | $2,098,696 | |
| | | | | | | | | | | | |
| |
TOTAL MONEY MARKET FUND - 0.30% | | | | 2,098,696 | |
| | | | | | | | | | | | |
(Cost $2,098,696) | | | | | |
|
| INVESTMENTS PURCHASED WITH CASH PROCEEDS FROM SECURITIESLENDING - 4.04% | |
Fidelity Investments Money Market Government Portfolio Class I** | | | 1.49 | % | | | 28,570,990 | | | | 28,570,990 | |
| | | | | | | | | | | | |
| |
TOTAL INVESTMENTS PURCHASED WITH CASH PROCEEDS FROM SECURITIES LENDING - 4.04% | | | | 28,570,990 | |
| | | | | | | | | | | | |
(Cost $28,570,990) | | | | | |
| |
TOTAL INVESTMENTS - 104.17% | | | | $736,959,929 | |
(Cost $639,732,148) | | | | | |
Liabilities in Excess of OtherAssets - (4.17%) | | | | (29,531,648 | ) |
| | | | | | | | | | | | |
NET ASSETS - 100.00% | | | | $707,428,281 | |
| | | | | | | | | | | | |
| * | Non-income producing security. |
| ** | This security represents the investment of the cash collateral received in connection with securities out on loan as of December 31, 2019. |
| *** | Security is perpetual and has no stated maturity date. |
| ^ | Rate disclosed as of December 31, 2019. |
| D | Security was fair valued using significant unobservable inputs. As such, the security is classified as Level 3 in the fair value hierarchy. |
| + | This security or a portion of the security is out on loan as of December 31, 2019. Total loaned securities had a value of $76,767,310 as of December 31, 2019. See Note 2 for disclosure of cash andnon-cash collateral. |
CVR - Contingent Value Rights
PLC - Public Limited Company
| | |
OmniTax-ManagedSmall-Cap Value Fund SCHEDULE OF INVESTMENTS (Unaudited) (continued) | | |
|
|
| |
| Showing percentage of net assets as of December 31, 2019 | | |
Summary of inputs used to value the Fund’s investments as of 12/31/2019 (See Note 2 in Notes to Financial Statements):
| | | | | | | | | | | | | | | | |
| | | Valuation Inputs | |
| | | Investment in Securities (Value) | |
| | | Level 1 Quoted Prices | | | Level 2
Significant
Observable
Inputs | | | Level 3
Significant Unobservable Inputs | | Total | |
Common Stocks Industrials | | $ | 109,241,680 | | | $ | 287,308 | | | $ | | | | $ | 109,528,988 | |
Other Industries (a) | | | 596,741,433 | | | | — | | | | — | | | | 596,741,433 | |
| | | | | | | | | | | | | | | | |
Total Common Stocks | | | 705,983,113 | | | | 287,308 | | | | — | | | | 706,270,421 | |
Preferred Stock | | | — | | | | 13,108 | | | | — | | | | 13,108 | |
Rights | | | — | | | | — | | | | 5,255 | | | | 5,255 | |
Warrants | | | 1,459 | | | | — | | | | — | | | | 1,459 | |
Money Market Fund | | | — | | | | 2,098,696 | | | | — | | | | 2,098,696 | |
Investments Purchased with Cash Proceeds from Securities Lending | | | — | | | | 28,570,990 | | | | — | | | | 28,570,990 | |
| | | | | | | | | | | | | | | | |
TOTAL | | $ | 705,984,572 | | | $ | 30,970,102 | | | $ | 5,255 | | | $ | 736,959,929 | |
| | | | | | | | | | | | | | | | |
(a) - please refer to the Schedule of Investments for the industry classifications of these portfolio holdings
Following is a reconciliation of Level 3 investments for which significant
unobservable inputs were used to determine fair value:
| | | | |
| | | Investment in Securities (Value) |
| | | Rights |
| |
Balance as of 06/30/2019 | | | $7,357 | |
Purchases | | | 630 | |
Return of Capital | | | (1,902 | ) |
Realized gain/(loss) | | | — | |
Change in unrealized appreciation/ (depreciation) | | | (830 | ) |
Transfers in | | | — | |
Transfers out | | | — | |
| | | | |
| |
Balance as of 12/31/2019 | | | $5,255 | |
| | | | |
| |
Net change in unrealized appreciation (depreciation) from investments held as of 12/31/2019 | | | $(830 | ) |
| | | | |
See Notes to Financial Statements.
| | |
|
| |
| 30 | | Semi-Annual Report | December 31, 2019 (Unaudited) |
| | |
| STATEMENTS OF ASSETS AND LIABILITIES | | |
| December 31, 2019 (Unaudited) | | |
| | | | | | | | | | | | | | |
| ASSETS | | Omni Small-Cap Value | | | | Omni Tax-Managed Small-Cap Value | | |
| | | | |
Investments at value | | | $1,080,650,838 | | | | | | | | $736,959,929 | | | |
Receivables: | | | | | | | | | | | | | | |
Fund shares sold | | | 1,178,873 | | | | | | | | 1,049,159 | | | |
Dividends and interest | | | 691,563 | | | | | | | | 495,196 | | | |
Prepaid expenses | | | 105,449 | | | | | | | | 97,245 | | | |
| | | | |
Total assets | | | 1,082,626,723 | | | | | | | | 738,601,529 | | | |
| | | | |
LIABILITIES | | | | | | | | | | | | | | |
Payables: | | | | | | | | | | | | | | |
Portfolio securities purchased | | | 1,190,913 | | | | | | | | 1,279,757 | | | |
Fund shares redeemed | | | 1,245,024 | | | | | | | | 587,941 | | | |
Due to custodian | | | 517,500 | | | | | | | | 278,040 | | | |
Payable upon return of securities loaned | | | 40,105,807 | | | | | | | | 28,570,990 | | | |
Accrued Liabilities: | | | | | | | | | | | | | | |
Investment advisory fees | | | 341,697 | | | | | | | | 233,275 | | | |
Administration fees | | | 24,087 | | | | | | | | 16,428 | | | |
Directors’ fees | | | 6,956 | | | | | | | | 4,548 | | | |
Other | | | 266,836 | | | | | | | | 202,269 | | | |
| | | | |
Total liabilities | | | 43,698,820 | | | | | | | | 31,173,248 | | | |
| | | | |
NET ASSETS | | | $1,038,927,903 | | | | | | | | $707,428,281 | | | |
| | | | |
NET ASSETS REPRESENT | | | | | | | | | | | | | | |
Paid-in capital | | | $ 928,557,842 | | | | | | | | $602,258,099 | | | |
Distributable earnings | | | 110,370,061 | | | | | | | | 105,170,182 | | | |
| | | | |
NET ASSETS | | | $1,038,927,903 | | | | | | | | $707,428,281 | | | |
| | | | |
Shares of common stock outstanding of $.001 par value* | | | 65,690,158 | | | | | | | | 45,759,889 | | | |
| | | | |
Net asset value, offering price and redemption price per share | | | $15.82 | | | | | | | | $ 15.46 | | | |
| | | | |
Total investments at cost | | | $ 972,912,123 | | | | | | | | $639,732,148 | | | |
* See Note 1 - Organization in the Notes to Financial Statements for shares authorized for each Fund.
See Notes to Financial Statements.
| | |
| STATEMENTS OF OPERATIONS | | |
| Six Months Ended December 31, 2019 (Unaudited) | | |
| | | | | | | | | | | | | | | | |
| | | Omni Small-Cap Value | | | | | Omni Tax-Managed
Small-Cap Value | | | |
| | | | |
INVESTMENT INCOME | | | | | | | | | | | | | | | | |
Dividends | | | $ 8,383,187 | | | | | | | | $ 5,563,498 | | | | | |
Less: foreign taxes withheld | | | (17,922 | ) | | | | | | | (8,375 | ) | | | | |
Interest | | | 21,903 | | | | | | | | 36,699 | | | | | |
Securities lending | | | 723,571 | | | | | | | | 325,309 | | | | | |
| | | | |
Total Investment Income | | | 9,110,739 | | | | | | | | 5,917,131 | | | | | |
| | | | |
EXPENSES | | | | | | | | | | | | | | | | |
Investment advisory fees | | | 2,445,220 | | | | | | | | 1,602,284 | | | | | |
Administration fees | | | 139,797 | | | | | | | | 91,530 | | | | | |
Accounting fees | | | 100,167 | | | | | | | | 77,819 | | | | | |
Transfer agent fees | | | 5,833 | | | | | | | | 5,780 | | | | | |
Professional fees | | | 113,877 | | | | | | | | 74,077 | | | | | |
Custody fees | | | 12,645 | | | | | | | | 10,529 | | | | | |
Blue sky fees | | | 38,521 | | | | | | | | 30,796 | | | | | |
Directors’ and officers’ fees | | | 56,166 | | | | | | | | 36,170 | | | | | |
Shareholder servicing fees | | | 418,176 | | | | | | | | 275,846 | | | | | |
Reports to shareholders | | | 27,000 | | | | | | | | 19,799 | | | | | |
Miscellaneous expenses | | | 90,819 | | | | | | | | 63,853 | | | | | |
| | | | |
Total Expenses | | | 3,448,221 | | | | | | | | 2,288,483 | | | | | |
| | | | |
Less investment advisory fees waived | | | (513,883 | ) | | | | | | | (365,738 | ) | | | | |
| | | | |
Net Expenses | | | 2,934,338 | | | | | | | | 1,922,745 | | | | | |
| | | | |
NET INVESTMENT INCOME | | | 6,176,401 | | | | | | | | 3,994,386 | | | | | |
| | | | |
NET REALIZED AND UNREALIZED GAIN (LOSS) ON INVESTMENTS | | | | | | | | | | | | | | | | |
Realized Gain (Loss) on: | | | | | | | | | | | | | | | | |
Investments | | | (3,404,583 | ) | | | | | | | 4,089,196 | | | | | |
| | | | |
Change in Unrealized Appreciation (Depreciation) on: | | | | | | | | | | | | | | | | |
Investments | | | 62,590,186 | | | | | | | | 43,109,906 | | | | | |
| | | | |
Net Realized and Unrealized Gain on Investments | | | 59,185,603 | | | | | | | | 47,199,102 | | | | | |
| | | | |
NET INCREASE IN NET ASSETS RESULTING FROM OPERATIONS | | | $65,362,004 | | | | | | | | $51,193,488 | | | | | |
See Notes to Financial Statements.
| | |
|
| |
| 32 | | Semi-Annual Report | December 31, 2019 (Unaudited) |
| | |
| STATEMENTS OF CHANGES IN NET ASSETS | | |
| | | | | | | | | | | | | | | | |
| | | Omni Small-Cap Value | | | OmniTax-Managed Small-Cap Value | |
| | | Six Months Ended
December 31, 2019 | | | Year Ended June 30, 2019 | | | Six Months Ended
December 31, 2019 | | | Year Ended
June 30, 2019 | |
| | | (Unaudited) | | | | | | (Unaudited) | | | | |
| | | | |
OPERATIONS | | | | | | | | | | | | | | | | |
Net investment income | | | $ 6,176,401 | | | | $ 11,284,844 | | | | $ 3,994,386 | | | | $ 8,196,316 | |
Net realized gain (loss) on investments | | | (3,404,583 | ) | | | 33,634,476 | | | | 4,089,196 | | | | 16,849,423 | |
Net change in unrealized appreciation (depreciation) on investments | | | 62,590,186 | | | | (192,113,168 | ) | | | 43,109,906 | | | | (167,424,940 | ) |
| | | | |
Net increase (decrease) in net assets resulting from operations | | | 65,362,004 | | | | (147,193,848 | ) | | | 51,193,488 | | | | (142,379,201 | ) |
| | | | |
DISTRIBUTIONS: | | | | | | | | | | | | | | | | |
From net investment income and net realized gains | | | (10,234,482 | ) | | | (68,537,520 | ) | | | (3,169,046 | ) | | | (51,987,352 | ) |
| | | | |
Net decrease in net assets from distributions | | | (10,234,482 | ) | | | (68,537,520 | ) | | | (3,169,046 | ) | | | (51,987,352 | ) |
| | | | |
SHARE TRANSACTIONS: | | | | | | | | | | | | | | | | |
Proceeds from sale of shares | | | 150,808,583 | | | | 446,724,382 | | | | 164,182,230 | | | | 326,663,113 | |
Reinvestment of distributions | | | 10,232,320 | | | | 68,487,234 | | | | 3,155,635 | | | | 51,833,228 | |
Cost of shares redeemed | | | (166,255,868 | ) | | | (223,662,871 | ) | | | (116,302,048 | ) | | | (380,949,961 | ) |
| | | | |
Net increase (decrease) in net assets resulting from share transactions | | | (5,214,965 | ) | | | 291,548,745 | | | | 51,035,817 | | | | (2,453,620 | ) |
| | | | |
Net increase (decrease) in net assets | | | 49,912,557 | | | | 75,817,377 | | | | 99,060,259 | | | | (196,820,173 | ) |
NET ASSETS: | | | | | | | | | | | | | | | | |
Beginning of period | | | 989,015,346 | | | | 913,197,969 | | | | 608,368,022 | | | | 805,188,195 | |
| | | | |
End of period | | | $1,038,927,903 | | | | $989,015,346 | | | | $707,428,281 | | | | $608,368,022 | |
| | | | |
SHARES ISSUED & REDEEMED | | | | | | | | | | | | | | | | |
Issued | | | 10,454,221 | | | | 29,158,856 | | | | 11,747,118 | | | | 21,486,464 | |
Distributions reinvested | | | 651,325 | | | | 4,802,751 | | | | 205,713 | | | | 3,753,311 | |
Redeemed | | | (11,498,824 | ) | | | (13,930,780 | ) | | | (8,345,870 | ) | | | (25,251,515 | ) |
| | | | |
Net increase (decrease) in shares | | | (393,278 | ) | | | 20,030,827 | | | | 3,606,961 | | | | (11,740 | ) |
Outstanding at beginning of period | | | 66,083,436 | | | | 46,052,609 | | | | 42,152,928 | | | | 42,164,668 | |
| | | | |
Outstanding at end of period | | | 65,690,158 | | | | 66,083,436 | | | | 45,759,889 | | | | 42,152,928 | |
See Notes to Financial Statements.
| | |
FINANCIAL HIGHLIGHTS | | |
| (for a share outstanding throughout each period indicated) | | |
OMNISMALL-CAP VALUE
| | | | | | | | | | | | |
| | | For the | | | | | | | | | | |
| | | Six Months Ended | | Year Ended June 30 |
| | | 12/31/19 | | | | | | | | | | |
| | | (Unaudited) | | 2019 | | 2018 | | 2017 | | 2016 | | 2015 |
| | | | | | |
Net Asset Value, Beginning of Period | | $14.97 | | $19.83 | | $18.14 | | $14.66 | | $15.49 | | $16.63 |
| | | | | | | | | | | | |
| | | | | | |
Income from Investment Operations: | | | | | | | | | | | | |
Net Investment Income(a) | | 0.09 | | 0.20 | | 0.17 | | 0.17 | | 0.17 | | 0.14 |
Net Realized and Unrealized Gain (Loss) | | 0.92 | | (3.61) | | 2.77 | | 3.48 | | (0.86) | | (0.46) |
| | | | | | | | | | | | |
| | | | | | |
Total from Investment Operations | | 1.01 | | (3.41) | | 2.94 | | 3.65 | | (0.69) | | (0.32) |
| | | | | | | | | | | | |
| | | | | | |
Less Distributions to Shareholders from: | | | | | | | | | | | | |
Net Investment Income | | (0.08) | | (0.17) | | (0.16) | | (0.17) | | (0.14) | | (0.09) |
Net Realized Gain | | (0.08) | | (1.28) | | (1.09) | | - | | - | | (0.73) |
| | | | | | | | | | | | |
| | | | | | |
Total Distributions | | (0.16) | | (1.45) | | (1.25) | | (0.17) | | (0.14) | | (0.82) |
| | | | | | | | | | | | |
| | | | | | |
Net Asset Value, End of Period | | $15.82 | | $14.97 | | $19.83 | | $18.14 | | $14.66 | | $15.49 |
| | | | | | | | | | | | |
| | | | | | |
Total Return(b) | | 6.73%(c) | | (16.82%) | | 16.75% | | 24.83% | | (4.42%) | | (1.48%) |
| | | | | | |
Ratios and Supplemental Data: | | | | | | | | | | | | |
Net Assets, End of Period (in 000’s) | | $1,038,928 | | $989,015 | | $913,198 | | $710,357 | | $558,286 | | $459,367 |
Expenses Before Waivers and Reimbursements | | 0.71%(d) | | 0.70% | | 0.70% | | 0.71% | | 0.71% | | 0.71% |
Expenses After Waivers and Reimbursements | | 0.60%(d) | | 0.60% | | 0.60% | | 0.60% | | 0.60% | | 0.60% |
Net Investment Income After Waivers and Reimbursements | | 1.26%(d) | | 1.21% | | 0.88% | | 1.00% | | 1.17% | | 0.88% |
Portfolio Turnover Rate | | 19%(c) | | 29% | | 24% | | 23% | | 24% | | 25% |
| (a) | Per share amounts calculated based on the average daily shares outstanding during the period. |
| (b) | Total return would have been lower had various fees not been waived during the period. |
| (d) | Annualized for periods less than one year. |
See Notes to Financial Statements.
| | |
|
| |
| 34 | | Semi-Annual Report | December 31, 2019 (Unaudited) |
| | |
FINANCIAL HIGHLIGHTS | | |
| (for a share outstanding throughout each period indicated) | | |
OMNITAX-MANAGEDSMALL-CAP VALUE
| | | | | | | | | | | | |
| | | For the | | | | | | | | | | |
| | | Six Months Ended | | Year Ended June 30 |
| | | 12/31/19 | | | | | | | | | | |
| | | (Unaudited) | | 2019 | | 2018 | | 2017 | | 2016 | | 2015 |
| | | | | | |
Net Asset Value, Beginning of Period | | $14.43 | | $19.10 | | $ 17.39 | | $ 14.04 | | $14.65 | | $15.54 |
| | | | | | | | | | | | |
| | | | | | |
Income from Investment Operations: | | | | | | | | | | | | |
Net Investment Income(a) | | 0.09 | | 0.20 | | 0.16 | | 0.17 | | 0.16 | | 0.12 |
Net Realized and Unrealized Gain (Loss) | | 1.01 | | (3.42) | | 2.61 | | 3.32 | | (0.66) | | (0.42) |
| | | | | | | | | | | | |
| | | | | | |
Total from Investment Operations | | 1.10 | | (3.22) | | 2.77 | | 3.49 | | (0.50) | | (0.30) |
| | | | | | | | | | | | |
| | | | | | |
Less Distributions to Shareholders from: | | | | | | | | | | | | |
Net Investment Income | | (0.07) | | (0.20) | | (0.23) | | (0.14) | | (0.11) | | (0.03) |
Net Realized Gain | | - | | (1.25) | | (0.83) | | - | | - | | (0.56) |
| | | | | | | | | | | | |
| | | | | | |
Total Distributions | | (0.07) | | (1.45) | | (1.06) | | (0.14) | | (0.11) | | (0.59) |
| | | | | | | | | | | | |
| | | | | | |
Net Asset Value, End of Period | | $15.46 | | $14.43 | | $ 19.10 | | $ 17.39 | | $14.04 | | $14.65 |
| | | | | | | | | | | | |
| | | | | | |
Total Return(b) | | 7.63%(c) | | (16.49%) | | 16.48% | | 24.83% | | (3.42%) | | (1.62%) |
| | | | | | |
Ratios and Supplemental Data: | | | | | | | | | | | | |
Net Assets, End of Period (in 000’s) | | $707,428 | | $608,368 | | $805,188 | | $643,215 | | $505,995 | | $461,101 |
Expenses Before Waivers and Reimbursements | | 0.71%(d) | | 0.72% | | 0.70% | | 0.71% | | 0.72% | | 0.71% |
Expenses After Waivers and Reimbursements | | 0.60%(d) | | 0.60% | | 0.60% | | 0.60% | | 0.60% | | 0.60% |
Net Investment Income After Waivers and Reimbursements | | 1.25%(d) | | 1.18% | | 0.89% | | 1.04% | | 1.20% | | 0.84% |
Portfolio Turnover Rate | | 17%(c) | | 42% | | 27% | | 23% | | 29% | | 30% |
| (a) | Per share amounts calculated based on the average daily shares outstanding during the period. |
| (b) | Total return would have been lower had various fees not been waived during the period. |
| (d) | Annualized for periods less than one year. |
See Notes to Financial Statements.
| | |
| NOTES TO FINANCIAL STATEMENTS | | |
|
|
| December 31, 2019 (Unaudited) | | |
1. Organization:
Bridgeway Funds, Inc. (“Bridgeway” or the “Company”) was organized as a Maryland corporation on October 19, 1993, and is registered under the Investment Company Act of 1940, as amended (the “1940 Act”), as anopen-end management investment company.
Bridgeway is organized as a series fund, with 9 investment funds as of December 31, 2019 (each is referred to as a “Bridgeway Fund” and collectively, the “Bridgeway Funds”). The Aggressive Investors 1, Ultra-Small Company, Ultra-Small Company Market,Small-Cap Growth,Small-Cap Value, Blue Chip (formerly, Blue Chip 35 Index) and Managed Volatility Funds are presented in a separate report. The OmniSmall-Cap Value Fund and the OmniTax-ManagedSmall-Cap Value Fund (each a “Fund” and together, the “Funds”) are presented in this report.
Bridgeway is authorized to issue 1,915,000,000 shares of common stock at $0.001 per share. As of December 31, 2019, 100,000,000 shares have been classified into the Aggressive Investors 1 Fund. 130,000,000 shares have been classified into the Blue Chip Fund. 15,000,000 shares have been classified into the Ultra-Small Company Fund. 100,000,000 shares each have been classified into the Ultra-Small Company Market, OmniSmall-Cap Value, OmniTax-ManagedSmall-Cap Value,Small-Cap Growth andSmall-Cap Value Funds. 50,000,000 shares have been classified into the Managed Volatility Fund.
All of the Bridgeway Funds areno-load, diversified funds.
The Funds seek to provide long-term total return on capital, primarily through capital appreciation.
Bridgeway Capital Management, Inc. (the “Adviser”) is the investment adviser for all of the Bridgeway Funds.
2. Significant Accounting Policies:
The following summary of significant accounting policies, followed in the preparation of the financial statements of the Funds, are in conformity with accounting principles generally accepted in the United States of America (“GAAP”). Each Fund is considered an investment company under GAAP and follows the accounting and reporting guidance applicable to investment companies.
Securities and Other Investments ValuationSecurities for which market quotations are readily available are valued at the last sale price on the national exchange on which such securities are primarily traded. In the case of securities reported on the National Association of Securities Dealers Automated Quotation (“NASDAQ”) system, the securities are valued based on the NASDAQ Official Closing Price (“NOCP”). In the absence of recorded sales on their home exchange, or NOCP, in the case of NASDAQ traded securities, the security will be valued as follows: bid prices for long positions and ask prices for short positions.
Investments inopen-end registered investment companies andclosed-end registered investment companies that do not trade on an exchange are valued at the end of day net asset value (“NAV”) per share.
Investments inclosed-end registered investment companies that trade on an exchange are valued at the last sales price as of the close of the customary trading session on the exchange where the security is principally traded.
When market quotations are not readily available or when events occur that make established valuation methods unreliable, securities of the Funds may be valued at fair value as determined in good faith by or under the direction of the Board of Directors. The valuation assigned to a fair valued security for purposes of calculating the Funds’ NAV may differ from the security’s most recent closing market price and from the prices used by other mutual funds to calculate their NAVs.
The inputs and valuation techniques used to determine the value of a Fund’s investments are summarized into three levels as described in the hierarchy below:
| • | | Level 1 — quoted prices in active markets for identical assets |
| | |
|
| |
| 36 | | Semi-Annual Report | December 31, 2019 (Unaudited) |
| | |
| NOTES TO FINANCIAL STATEMENTS(continued) | | |
|
|
| December 31, 2019 (Unaudited) | | |
Investments whose values are based on quoted market prices in active markets, and whose values are therefore classified as Level 1 prices, include active listed equity securities. The Funds do not adjust the quoted price for such investments, even in situations where the Funds hold a large position and a sale could reasonably impact the quoted price.
| • | | Level 2 — other significant observable inputs (including quoted prices for similar securities, interest rates, prepayment speeds, credit risk, etc.) |
Investments that trade in markets that are not considered to be active, but whose values are based on quoted market prices, dealer quotations or valuations provided by alternative pricing sources supported by observable inputs, are classified as Level 2 prices. These generally include certain U.S. Government and sovereign obligations, most government agency securities, investment-grade corporate bonds and less liquid listed equity securities. As investments whose values are classified as Level 2 prices include positions that are not traded in active markets and/or are subject to transfer restrictions, valuations may be adjusted to reflect illiquidity and/ornon-transferability, which are generally based on available market information.
The Fidelity Investments Money Market Government Portfolio - Class I, which is held by the Funds, invests primarily in securities that are valued at amortized cost. Therefore, this investment is classified as a Level 2 investment.
| • | | Level 3 — significant unobservable inputs (including the Funds’ own assumptions in determining the fair value of investments) |
Investments whose values are classified as Level 3 prices have significant unobservable inputs, as they may trade infrequently or not at all. When observable prices are not available for these securities, the Funds use one or more valuation techniques for which sufficient and reliable data is available. The inputs used by the Funds in estimating the value of Level 3 prices may include the original transaction price, quoted prices for similar securities or assets in active markets, completed or pending third-party transactions in the underlying investment or comparable issuers, and changes in financial ratios or cash flows. Level 3 prices may also be adjusted to reflect illiquidity and/ornon-transferability, with the amount of such discount estimated by the Funds in the absence of market information. Assumptions used by the Funds due to the lack of observable inputs may significantly impact the resulting value and therefore the results of the Funds’ operations.
The inputs or methodology used for valuing investments are not necessarily an indication of the risk associated with investing in those investments. A summary of the inputs used to value the Funds’ investments as of December 31, 2019 is included with each Fund’s Schedule of Investments.
Details regarding material transfers into, and material transfers out of, Level 3, if any, can be found at the end of each Schedule of Investments for Funds that held Level 3 securities.
Securities LendingUpon lending its securities to third parties, each Fund receives compensation in the form of fees. The loans are secured by collateral at least equal to the fair value of the securities loaned plus accrued interest. The remaining contractual maturity of all securities lending transactions is overnight and continuous. Each Fund has the right under the lending agreement to recover the securities from the borrower on demand. Additionally, a Fund does not have the right to sell or repledge collateral received in the form of securities unless the borrower goes into default. The risks to a Fund of securities lending are that the borrower may not provide additional collateral when required or return the securities when due, resulting in a loss. Under the terms of the Securities Lending Agreement, the Funds are indemnified for such losses by the securities lending agent.
While securities are on loan, the Fund continues to receive dividends on the securities loaned and recognizes any unrealized gain or loss in the fair value of the securities loaned.
Securities lending transactions are entered into by a Fund under a Securities Lending Agreement that provides the right, in the event of default (including bankruptcy or insolvency) for thenon-defaulting party to liquidate the collateral or to offset the market value of the collateral received against the market value of the securities loaned. The value of the collateral is typically greater than that of the market value of the securities loaned, leaving the lender with a net amount payable to the defaulting party. However, bankruptcy or insolvency laws of a particular jurisdiction may impose restrictions on or prohibitions against such a right of offset in the event of a counterparty’s bankruptcy or insolvency.
| | |
| NOTES TO FINANCIAL STATEMENTS(continued) | | |
|
|
| December 31, 2019 (Unaudited) | | |
The market value of securities on loan, all of which are classified as common stocks in the Funds’ Schedules of Investments, and the value of the related cash collateral are shown in the Statements of Assets and Liabilities as a component of Investments at value.
The following table is a summary of the Funds payable upon return of securities loaned and related cash collateral, which are subject to a netting agreement as of December 31, 2019:
| | | | | | | | | | | | | | | | | | | | | | | | | | | |
| | | | | | | | | Gross Amount Not
Offset in the Statement
of Assets and Liabilities | | |
| Fund | | Gross Amounts of
Recognized
Assets | | Gross Amounts
Offset in the
Statement of
Assets and
Liabilities | | Net Amounts of
Assets Presented
in the Statement
of Assets and
Liabilities | | Financial
Instruments | | Collateral
Received | | Net
Amount |
| | | | | | |
OmniSmall-Cap Value | | | | | | | | | | | | | | | | | | | | | | | | | | | |
Securities lending | | | | $40,105,807 | | | | | - | | | | | $40,105,807 | | | | | - | | | | | $40,105,807 | | | - |
| | | | | | |
OmniTax-ManagedSmall-Cap Value | | | | | | | | | | | | | | | | | | | | | | | | | | | |
Securities lending | | | | $28,570,990 | | | | | - | | | | | $28,570,990 | | | | | - | | | | | $28,570,990 | | | - |
The following table summarizes the securities received asnon-cash collateral and cash collateral for securities lending:
| | | | | | | | | | | | | | | | | | | | | | | | | | | | | | |
| | | Non-Cash Collateral | | | | | | | | | | |
| Fund | | Collateral
Type | | | | | Coupon
Range | | | Maturity Date
Range | | | Market
Value | | | Cash
Collateral | | | Total
Collateral | | | Market Value
of Securities
on Loan | |
| |
OmniSmall-Cap Value | | | | | | | | | | | | | | | | | | | | | | | | | | | | |
Securities lending | | U.S.Gov’t
Obligations | | | | | |
| 0.00%-
8.50% |
| |
| 1/09/20-
11/15/49 |
| | | $49,751,763 | | | | $40,105,807 | | | | $89,857,570 | | | | $88,133,148 | |
OmniTax-ManagedSmall-Cap Value | | | | | | | | | | | | | | | | | | | | | | | | | | | | |
Securities lending | | U.S.Gov’t
Obligations | | | | | |
| 0.00%-
8.50% |
| |
| 1/09/20-
11/15/49 |
| | | $49,761,371 | | | | $28,570,990 | | | | $78,332,361 | | | | $76,767,310 | |
It is each Fund’s policy to obtain additional collateral from or return excess collateral to the borrower by the end of the next business day following the valuation date of the securities loaned. Therefore, the value of the collateral held may be temporarily less than that required under the lending contract. As of December 31, 2019, the collateral consisted of an institutional government money market fund and U.S. Government Obligations.
Use of Estimates in Financial StatementsIn preparing financial statements in conformity with GAAP, management makes estimates and assumptions that affect the reported amounts of assets and liabilities on the date of the financial statements and the disclosure of contingent assets and liabilities on the date of the financial statements, as well as the reported amounts of revenue and expenses during the reporting period. Actual results could differ from those estimates.
Concentrations of Credit RiskThe Funds maintain cash and securities in their custody account maintained by a high-credit, quality financial institution. Cash balances may, at times, exceed the FDIC insurance limit. Cash balances are generally invested in a short-term investment vehicle, which minimizes the risk of cash balances exceeding the FDIC insurance limit.
Risks and UncertaintiesThe Funds provide for various investment options, including stocks. Such investments are exposed to various risks, such as interest rate, market and credit risks. Due to the risks involved, it is at least reasonably possible that changes in risks in the near term would materially affect shareholders’ account values and the amounts reported in the financial statements.
| | |
|
| |
| 38 | | Semi-Annual Report | December 31, 2019 (Unaudited) |
| | |
| NOTES TO FINANCIAL STATEMENTS(continued) | | |
|
|
| December 31, 2019 (Unaudited) | | |
Security Transactions, Investment Income and ExpensesSecurity transactions are accounted for as of the trade date, the date the order to buy or sell is executed. Realized gains and losses are computed on the identified cost basis. Dividend income is recorded on theex-dividend date, and interest income is recorded on the accrual basis from settlement date.
Bridgeway Funds’ expenses that are not series-specific are allocated to each series based upon its relative proportion of net assets to the Bridgeway Funds’ total net assets or other appropriate basis.
Distributions to ShareholdersThe Funds pay dividends from net investment income and distribute realized capital gains annually, usually in December and are recorded onex-date.
IndemnificationUnder the Company’s organizational documents, the Funds’ officers, directors, employees and agents are indemnified against certain liabilities that may arise out of the performance of their duties to the Funds. Additionally, in the normal course of business, the Funds enter into contracts that contain a variety of indemnification clauses. The Funds’ maximum exposure under these arrangements is unknown, as this would involve future claims that may be made against the Funds that have not yet occurred. However, the Funds have not had prior claims or losses pursuant to these contracts.
3. Advisory Fees, Other Related Party Transactions and Contingencies:
The Funds have entered into a management agreement with the Adviser. As compensation for the advisory services rendered, facilities furnished, and expenses borne by the Adviser, the Funds pay the Adviser a fee of 0.50% of the value of each Fund’s average daily net assets, computed daily and payable monthly.
Expense limitations:The Adviser is contractually obligated to reimburse the Funds for operating expenses and advisory fees above the expense limitations presented in the table below, which are shown as a ratio of net expenses to average net assets, for each Fund, for the period ended December 31, 2019. Any material change to the expense limitation would require a vote by shareholders of the applicable Fund.
| | | | | | | | | | |
| Bridgeway Fund | | Expense
Limitation | | Total Waivers
for Period Ended
12/31/19 |
| | | | | | | | | | |
OmniSmall-Cap Value* | | | | 0.60 | % | | | | $513,883 | |
OmniTax-ManagedSmall-Cap Value* | | | | 0.60 | % | | | | 365,738 | |
| | | | | | | | | | |
*The Funds are authorized to reimburse the Adviser for management fees previously waived and/or for expenses previously paid by the Adviser, provided, however, that any reimbursements must be paid at a date not more than three years after the Adviser waived the fees or reimbursed the expenses and that the reimbursements do not cause the Funds to exceed the expense limitation in effect at the time of the waiver or the current expense limitation, if different. The OmniSmall-Cap Value Fund has recoupable expenses of $716,803, $759,479, $937,974, and $513,883, which expire no later than June 30, 2020, June 30, 2021, June 30, 2022, and December 31, 2022, respectively. The OmniTax-ManagedSmall-Cap Value Fund has recoupable expenses of $674,880, $691,272, $826,118, and $365,738, which expire no later than June 30, 2020, June 30, 2021, June 30, 2022, and December 31, 2022, respectively.
Effective January 1, 2020, the Adviser will voluntarily waive fees and/or pay Fund expenses in an additional amount such that the net fiscal year expense ratio for each of the Funds (management fees and other expenses less the contractual waiver and voluntary waiver) does not exceed 0.47%. For the fiscal year ending June 30, 2020, the 0.47% voluntary expense cap will be applied from the January 1, 2020 effective date through June 30, 2020 and not for the entire fiscal year.
| | |
| NOTES TO FINANCIAL STATEMENTS(continued) | | |
|
|
| December 31, 2019 (Unaudited) | | |
Other Related Party Transactions:The Bridgeway Funds will engage in inter-portfolio trades with other Bridgeway Funds when it is to the benefit of both parties. The Board of Directors reviews these trades quarterly. Inter-portfolio purchases and sales for the Funds during the period ended December 31, 2019 were as follows:
| | | | | | | | |
| Bridgeway Fund | | Inter-Portfolio
Purchases | | | Inter-Portfolio
Sales | |
| | | | | | | | |
OmniSmall-Cap Value | | | $11,891,458 | | | | $10,755,106 | |
OmniTax-ManagedSmall-Cap Value | | | 12,159,446 | | | | 9,108,874 | |
The Adviser entered into an Administrative Services Agreement with Bridgeway Funds, pursuant to which the Adviser provides various administrative services to the Funds including, but not limited to: (i) supervising and managing various aspects of the Funds’ business and affairs; (ii) selecting, overseeing and/or coordinating activities with other service providers to the Funds; (iii) providing reports to the Board of Directors as requested from time to time; (iv) assisting and/or reviewing amendments and updates to the Funds’ registration statement and other filings with the Securities and Exchange Commission (“SEC”); (v) providing certain shareholder services; (vi) providing administrative support in connection with meetings of the Board of Directors; and (vii) providing certain record-keeping services. For its services to all of the Bridgeway Funds, the Adviser is paid an aggregate annual fee of $775,000, payable in equal monthly installments. During the period ended December 31, 2019, the allocation of this expense to the OmniSmall-Cap Value and OmniTax-ManagedSmall-Cap Value Funds was $139,797 and $91,530, respectively.
Board of Directors CompensationIndependent Directors are paid an annual retainer of $20,000, with an additional retainer of $5,000 paid to the Independent Chairman of the Board and an additional retainer of $1,000 paid to the Nominating and Corporate Governance Committee Chair. The retainer is paid in quarterly installments. In addition, effective November 14, 2019 Independent Directors are paid $12,000 per meeting for meeting fees. Prior to November 14, 2019, the meeting fee was $11,000 per meeting. Such compensation is the total compensation from all Bridgeway Funds and is allocated among the Bridgeway Funds.
Independent Directors are reimbursed for any expenses incurred in attending meetings and conferences, as well as expenses for subscriptions or printed materials. The amount of Directors’ fees attributable to each Fund is disclosed in the Statements of Operations.
One director of Bridgeway, John Montgomery, is an owner and director of the Adviser. Under the 1940 Act definitions, he is considered to be an “affiliated person” of the Adviser and an “interested person” of the Adviser and of Bridgeway. Compensation for Mr. Montgomery is borne by the Adviser rather than the Bridgeway Funds.
4. Distribution Agreement:
Foreside Fund Services, LLC acts as distributor of the Funds’ shares, pursuant to a Distribution Agreement dated May 31, 2017. The Adviser pays all costs and expenses associated with distribution of the Funds’ shares, pursuant to a protective plan adopted by shareholders pursuant to Rule12b-1.
5. Purchases and Sales of Investment Securities:
Purchases and sales of investments, other than short-term securities, for each Fund for the period ended December 31, 2019 were as follows:
| | | | | | | | | | | | | | | | | | | | |
| | | Purchases | | Sales |
| | | U.S. Government | | Other | | U.S. Government | | Other |
| | | | | | | | | | | | | | | | | | | | |
OmniSmall-Cap Value | | | | $ - | | | | | $186,097,041 | | | | | $ - | | | | | $194,004,545 | |
OmniTax-ManagedSmall-Cap Value | | | | - | | | | | 160,370,033 | | | | | - | | | | | 107,162,756 | |
| | |
|
| |
| 40 | | Semi-Annual Report | December 31, 2019 (Unaudited) |
| | |
| NOTES TO FINANCIAL STATEMENTS(continued) | | |
|
|
| December 31, 2019 (Unaudited) | | |
6. Federal Income Taxes
It is the Funds’ policy to continue to comply with the provisions of the Internal Revenue Code of 1986, as amended (“Internal Revenue Code”), applicable to regulated investment companies, and to distribute income to the extent necessary so that such Fund is not subject to federal income tax. Therefore, no federal income tax provision is required.
Unrealized Appreciation and Depreciation on Investments (Tax Basis)The amount of net unrealized appreciation/
depreciation and the cost of investment securities for tax purposes, including short-term securities at December 31, 2019,
were as follows:
| | | | | | | | |
| | | Omni Small-Cap Value | | Omni Tax-Managed Small-Cap Value |
Gross appreciation (excess of value over tax cost) | | | $200,127,832 | | | | $147,965,716 | |
Gross depreciation (excess of tax cost over value) | | | (92,389,153 | ) | | | (50,867,199 | ) |
| | |
Net unrealized appreciation (depreciation) | | | $107,738,679 | | | | $ 97,098,517 | |
| | |
Cost of investments for income tax purposes | | | $972,912,159 | | | | $639,861,412 | |
The differences between book and tax net unrealized appreciation (depreciation) are due to wash sale loss deferrals and basis adjustments on passive foreign investment companies (PFICs).
Classifications of DistributionsNet investment income (loss) and net realized gain (loss) may differ for financial statement and tax purposes. The character of distributions made during the year from net investment income or net realized gains may differ from its ultimate characterization for federal income tax purposes.
The tax character of the distributions paid by the Funds during the fiscal years ended June 30, 2019 and 2018, is as follows:
| | | | | | | | | | | | | | | | | | | | |
| | | Omni Small-Cap Value | | OmniTax-Managed Small-Cap Value |
| | | Year Ended June 30, 2019 | | Year Ended June 30, 2018 | | Year Ended June 30, 2019 | | Year Ended
June 30, 2018 |
Distributions paid from: | | | | | | | | | | | | | | | | | | | | |
Ordinary Income | | | | $ 7,943,782 | | | | | $ 6,405,244 | | | | | $ 7,212,071 | | | | | $ 8,820,586 | |
Long-Term Capital Gain | | | | 60,593,738 | | | | | 44,141,688 | | | | | 44,775,281 | | | | | 31,691,559 | |
| | | | |
Total | | | | $68,537,520 | | | | | $50,546,932 | | | | | $51,987,352 | | | | | $40,512,145 | |
Components of Accumulated EarningsAs of June 30, 2019, the components of accumulated earnings on a tax basis were:
| | | | | | | | | | | | | | | |
| | | Omni
Small-Cap Value | | | | Omni Tax-Managed Small-Cap Value |
Undistributed Net Investment Income | | | | $ 5,305,674 | | | | | | | | | | $ 3,168,619 | |
Undistributed Net Realized Gain on Investments | | | | 4,928,024 | | | | | | | | | | - | |
Net Unrealized Appreciation of Investments | | | | 45,008,841 | | | | | | | | | | 53,977,121 | |
| | | |
Total | | | | $55,242,539 | | | | | | | | | | $57,145,740 | |
For the fiscal year June 30, 2019, the Funds recorded the following reclassifications to the accounts listed below:
| | | | | | | | | | | | |
| | | Increase (Decrease) | |
| | | Omni Small-Cap Value | | | | | | Omni Tax-Managed Small-Cap Value | |
Paid-in Capital | | | $ 5,549,815 | | | | | | | | $ 5,941,844 | |
Distributable Earnings | | | (5,549,815) | | | | | | | | (5,941,844) | |
| | |
| NOTES TO FINANCIAL STATEMENTS(continued) | | |
|
|
| December 31, 2019 (Unaudited) | | |
The difference between book and tax components of net assets and the resulting reclassifications were primarily a result of the differing book/tax treatment of the deduction of equalization debits for tax purposes and investments in PFICs and partnerships.
Accounting for Uncertainty in Income Taxes sets forth a minimum threshold for financial statement recognition of the benefit of a tax position taken or expected to be taken in a tax return. Management has analyzed each Fund’s tax positions and has concluded that no provision for income tax is required in any Fund’s financial statements. The Funds are not aware of any tax position for which it is reasonably possible that the total amounts of unrecognized tax benefits will significantly change in the next twelve months. Each Fund’s federal tax returns for the prior three fiscal years remain subject to examination by the Internal Revenue Service.
7. Line of Credit
Bridgeway established a line of credit agreement (“Facility”) with The Bank of New York Mellon, effective November 5, 2010. The Facility is for temporary or emergency purposes, such as to provide liquidity for shareholder redemptions, and is cancellable by either party. Unless cancelled earlier, the Facility shall be held available until September 10, 2020. Advances under the Facility are limited to $15,000,000 in total for all Bridgeway Funds, and advances to each Bridgeway Fund shall not exceed certain limits set forth in the credit agreement, including, but not limited to, the maximum amount a Bridgeway Fund is permitted to borrow under the 1940 Act.
The Bridgeway Funds incur a facility fee of 0.085% per annum on the unused portion of the Facility and interest expense to the extent of amounts borrowed under the Facility. Interest is based on the “Overnight Rate” plus 1.25%. The Overnight Rate means the higher of (a) the Federal Funds rate, (b) the Overnight Eurodollar Rate, or (c) theOne-Month Eurodollar Rate. The facility fees are payable quarterly in arrears and are allocated to all participating Bridgeway Funds. Interest expense is charged directly to each Bridgeway Fund, based upon actual amounts borrowed by such Bridgeway Fund.
For the period ended December 31, 2019, borrowings by the Funds under this line of credit were as follows:
| | | | | | | | | | | | | | | | | | | | | | | | | |
| Bridgeway Fund | | Weighted
Average
Interest Rate | | Weighted
Average
Loan Balance | | Number of
Days
Outstanding | | Interest
Expense
Incurred1 | | Maximum Amount
Borrowed During
the Period |
| | | | | | | | | | | | | | | | | | | | | | | | | |
OmniSmall-Cap Value | | | | 3.29 | % | | | | $1,528,000 | | | | | 32 | | | | | $4,471 | | | | | $5,927,000 | |
OmniTax-ManagedSmall-Cap Value | | | | 3.24 | % | | | | 2,530,381 | | | | | 21 | | | | | 4,787 | | | | | 4,914,000 | |
| 1Interest expense is included on the Statements of Operations in Miscellaneous expenses. | |
8. Subsequent Events
Management has evaluated the impact of all subsequent events on the Funds and has determined that there were no subsequent events requiring recognition or disclosure in the financial statements.
| | |
|
| |
| 42 | | Semi-Annual Report | December 31, 2019 (Unaudited) |
| | |
| OTHER INFORMATION | | |
|
|
| December 31, 2019 (Unaudited) | | |
1. Proxy Voting
Fund policies and procedures that the Funds used in determining how to vote proxies relating to the Funds’ securities and a summary of proxies voted by the Funds for the period ended June 30, 2019 are available without a charge, upon request, by contacting Bridgeway Funds at1-800-661-3550 and on the SEC’s website at http://www.sec.gov.
2. Fund Holdings
The complete schedule of the Funds’ holdings for the second and fourth quarters of each fiscal year are contained in the Funds’ Semi-Annual and Annual Shareholder Reports, respectively.
The Bridgeway Funds file complete schedules of the Funds’ holdings with the SEC for the first and third quarters of each fiscal year as an exhibit to FormN-PORT within 60 days after the end of the period. Copies of the Funds’ FormN-PORT exhibit are available without charge, upon request, by contacting Bridgeway Funds at1-800-661-3550 and on the SEC’s website at http://www.sec.gov. You may also review and copy the Funds’ FormN-PORT exhibit at the SEC’s Public Reference Room in Washington, D.C. For more information about the operation of the Public Reference Room, please call1-800-SEC-0330.
| | |
| DISCLOSURE OF FUND EXPENSES | | |
|
|
| December 31, 2019 (Unaudited) | | |
As a shareholder of a Fund, you will incur no transaction costs from such Fund, including sales charges (loads) on purchases, on reinvested dividends, or on other distributions. There are no exchange fees. However, as a shareholder of a Fund, you will incur ongoing costs, including management fees and other Fund expenses. The following examples are intended to help you understand your ongoing costs (in dollars) of investing in a Fund and to compare these costs with ongoing costs of investing in other mutual funds. The examples are based on an investment of $1,000 invested on July 1, 2019 and held until December 31, 2019.
Actual Expenses.The first line of the table below provides information about actual account values and actual expenses. You may use the information in this line, together with the amount you invested, to estimate the expenses that you paid over the period. Simply divide your account value by $1,000 (for example, an $8,600 account value divided by $1,000 = 8.6), then multiply the result by the number in the first line under the heading “Expenses Paid During Period” to estimate the expenses you paid on your account during the period.
Hypothetical Example for Comparison Purposes.The second line of the table below provides information about hypothetical account values and hypothetical expenses, based on the Fund’s actual expense ratio and an assumed rate of return of 5% per year before expenses, which is not the Fund’s actual return. The hypothetical account values and expenses may not be used to estimate the actual ending account balance or expenses you paid for the period. You may use this information to compare the ongoing costs of investing in a Fund and other mutual funds. To do so, compare this 5% hypothetical example with the 5% hypothetical examples that appear in the shareholder reports of other funds.
The expenses shown in the table are meant to highlight ongoing Fund costs only. Therefore, the second line of the table is useful in comparing ongoing costs only and will not help you determine the relative total costs of owning different funds, because other funds may also have transaction costs, such as sales charges, redemption fees or exchange fees.
| | | | | | | | |
| | | Beginning Account
Value at 7/1/19 | | Ending Account
Value at 12/31/19 | | Expense
Ratio | | Expenses Paid
During Period*
7/1/19 - 12/31/19 |
| | | | |
Bridgeway OmniSmall-Cap Value | | | | | | | | |
| | | | |
Actual Fund Return | | $1,000.00 | | $1,067.30 | | 0.60% | | $3.12 |
Hypothetical Fund Return | | $1,000.00 | | $1,022.12 | | 0.60% | | $3.05 |
|
Bridgeway OmniTax-ManagedSmall-Cap Value |
| | | | |
Actual Fund Return | | $1,000.00 | | $1,076.30 | | 0.60% | | $3.13 |
Hypothetical Fund Return | | $1,000.00 | | $1,022.12 | | 0.60% | | $3.05 |
| * | Expenses are equal to the average account value times the Fund’s annualized expense ratio multiplied by the number of days in the most recent six-month period (184) divided by the number of days in the fiscal year (366). |
| | |
|
| |
| 44 | | Semi-Annual Report | December 31, 2019 (Unaudited) |
THIS PAGE INTENTIONALLY LEFT BLANK
THIS PAGE INTENTIONALLY LEFT BLANK
BRIDGEWAY FUNDS, INC.
BNY Mellon Investment Servicing (US) Inc.
P.O. Box 9860
Providence, RI 02940-8060
CUSTODIAN
The Bank of New York Mellon
One Wall Street
New York, NY 10286
DISTRIBUTOR
Foreside Fund Services, LLC
Three Canal Plaza, Suite 100
Portland, ME 04101
|
You can review and copy information about our Funds (including the SAI) at the SEC’s Public Reference Room in Washington, D.C. To find out more about this public service, call the SEC at800-SEC-0330. Reports and other information about the Funds are also available on the SEC’s website at www.sec.gov. You can receive copies of this information, for a fee, by writing the Public Reference Section, Securities and Exchange Commission, Washington, D.C. 20549-1520 or by sending an electronic request to the following email address: publicinfo@sec.gov. |
Not applicable.
| Item 3. | Audit Committee Financial Expert. |
Not applicable.
| Item 4. | Principal Accountant Fees and Services. |
Not applicable.
| Item 5. | Audit Committee of Listed Registrants. |
Not applicable.
| (a) | Schedule of Investments in securities of unaffiliated issuers as of the close of the reporting period is included as part of the report to shareholders filed under Item 1 of this form. |
| Item 7. | Disclosure of Proxy Voting Policies and Procedures forClosed-End Management Investment Companies. |
Not applicable.
| Item 8. | Portfolio Managers ofClosed-End Management Investment Companies. |
Not applicable.
| Item 9. | Purchases of Equity Securities byClosed-End Management Investment Company and Affiliated Purchasers. |
Not applicable.
| Item 10. | Submission of Matters to a Vote of Security Holders. |
There have been no material changes to the procedures by which the shareholders may recommend nominees to the Registrant’s Board of Directors, where those changes were implemented after the registrant last provided disclosure in response to the requirements of Item 407(c)(2)(iv) of RegulationS-K (17 CFR 229.407) (as required by Item 22(b)(15) of Schedule 14A (17 CFR240.14a-101)), or this Item.
| Item 11. | Controls and Procedures. |
| | (a) | The registrant’s principal executive officer and principal financial officer, or persons performing similar functions, have concluded that the registrant’s disclosure controls and procedures (as defined in Rule30a-3(c) under the Investment Company Act of 1940, as amended (the “1940 Act”) (17 CFR270.30a-3(c))) are effectively designed, as of a date within 90 days of the filing date of the report that includes the disclosure required by this paragraph, based on their evaluation of these controls and procedures required by Rule30a-3(b) under the 1940 Act (17 CFR270.30a-3(b)) and Rules13a-15(b) or15d-15(b) under the Securities Exchange Act of 1934, as amended (17 CFR240.13a-15(b) or240.15d-15(b)). |
| | (b) | There were no changes in the registrant’s internal control over financial reporting (as defined in Rule30a-3(d) under the Act (17 CFR270.30a-3(d))) that occurred during the period covered by this report that have materially affected or are reasonably likely to materially affect, the registrant’s internal control over financial reporting. |
| Item 12. | Disclosure of Securities Lending Activities forClosed-End Management Investment Companies. |
Not applicable.
| | |
(a)(2) | | Certifications pursuant to Rule30a-2(a) under the 1940 Act and Section 302 of the Sarbanes-Oxley Act of 2002 are attached hereto. |
| |
(a)(3) | | Not applicable. |
| |
(a)(4) | | Not applicable. |
| |
(b) | | Certifications pursuant to Rule30a-2(b) under the 1940 Act and Section 906 of the Sarbanes-Oxley Act of 2002 are attached hereto. |
SIGNATURES
Pursuant to the requirements of the Securities Exchange Act of 1934 and the Investment Company Act of 1940, the registrant has duly caused this report to be signed on its behalf by the undersigned, thereunto duly authorized.
| | | | |
| (Registrant) Bridgeway Funds, Inc. |
| | | | |
| | |
| By (Signature and Title)* | | /s/ Tammira Philippe | | |
| | Tammira Philippe, President and Principal Executive Officer |
| | (principal executive officer) | | |
| | |
| Date March 5, 2020 | | | | |
Pursuant to the requirements of the Securities Exchange Act of 1934 and the Investment Company Act of 1940, this report has been signed below by the following persons on behalf of the registrant and in the capacities and on the dates indicated.
| | | | |
| | |
| By (Signature and Title)* | | /s/ Tammira Philippe | | |
| | Tammira Philippe, President and Principal Executive Officer |
| | (principal executive officer) | | |
| | |
| Date March 5, 2020 | | | | |
| | |
| By (Signature and Title)* | | /s/ Linda G. Giuffré | | |
| | Linda G. Giuffré, Treasurer and Principal Financial Officer |
| | (principal financial officer) | | |
| | |
| Date March 5, 2020 | | | | |
* Print the name and title of each signing officer under his or her signature.