UNITED STATES
SECURITIES AND EXCHANGE COMMISSION
Washington, D.C. 20549
FORM N-CSR
CERTIFIED SHAREHOLDER REPORT OF REGISTERED MANAGEMENT
INVESTMENT COMPANIES
Investment Company Act file number 811-08200
Bridgeway Funds, Inc.
(Exact name of registrant as specified in charter)
20 Greenway Plaza, Suite 450
Houston, Texas 77046
(Address of principal executive offices) (Zip code)
Tammira Philippe, President
Bridgeway Funds, Inc.
20 Greenway Plaza, Suite 450
Houston, Texas 77046
(Name and address of agent for service)
Registrant’s telephone number, including area code: (713) 661-3500
Date of fiscal year end: June 30
Date of reporting period: December 31, 2016
Form N-CSR is to be used by management investment companies to file reports with the Commission not later than 10 days after the transmission to stockholders of any report that is required to be transmitted to stockholders under Rule 30e-1 under the Investment Company Act of 1940 (17 CFR 270.30e-1). The Commission may use the information provided on Form N-CSR in its regulatory, disclosure review, inspection, and policymaking roles.
A registrant is required to disclose the information specified by Form N-CSR, and the Commission will make this information public. A registrant is not required to respond to the collection of information contained in Form N-CSR unless the Form displays a currently valid Office of Management and Budget (“OMB”) control number. Please direct comments concerning the accuracy of the information collection burden estimate and any suggestions for reducing the burden to Secretary, Securities and Exchange Commission, 450 Fifth Street, NW, Washington, DC 20549-0609. The OMB has reviewed this collection of information under the clearance requirements of 44 U.S.C. § 3507.
| Item 1. | Reports to Stockholders. |
The Report to Shareholders is attached herewith.

A no-load mutual fund family of domestic funds
| | | | |
| | Semi-Annual Report December 31, 2016 (Unaudited) |
| | |
| | AGGRESSIVE INVESTORS 1 | | BRAGX |
| | |
| | ULTRA-SMALL COMPANY | | BRUSX |
| | (Open to Existing Investors — Direct Only) | | |
| | |
| | ULTRA-SMALL COMPANY MARKET | | BRSIX |
| | |
| | SMALL-CAP MOMENTUM | | BRSMX |
| | |
| | SMALL-CAP GROWTH | | BRSGX |
| | |
| | SMALL-CAP VALUE | | BRSVX |
| | |
| | BLUE CHIP 35 INDEX | | BRLIX |
| | |
| | MANAGED VOLATILITY | | BRBPX |
| | www.bridgeway.com | | |
| | |
| TABLE OF CONTENTS | |  |
Bridgeway Funds Standardized Returns as of December 31, 2016* (Unaudited)
| | | | | | | | | | | | | | | | | | | | | | | | | | | | | | | | | | | | | | | | | | | | | |
| | | | | | | Annualized | | | | | | |
| Fund | | Quarter | | Six Months | | 1 Year | | 5 Years | | 10 Years | | Inception
to Date | | Inception
Date | | Gross
Expense
Ratio2 | | Net
Expense
Ratio2 |
Aggressive Investors 1 | | | | 9.55% | | | | | 16.81 | % | | | | 19.47 | % | | | | 16.45 | % | | | | 4.46 | % | | | | 13.01 | % | | | | 8/5/1994 | | | | | 0.63 | % | | | | 0.63 | % |
Ultra-Small Company | | | | 10.10% | | | | | 15.56 | % | | | | 14.06 | % | | | | 13.03 | % | | | | 4.24 | % | | | | 14.08 | % | | | | 8/5/1994 | | | | | 1.27 | % | | | | 1.27 | % |
Ultra-Small Co Market | | | | 9.12% | | | | | 22.70 | % | | | | 21.47 | % | | | | 16.08 | % | | | | 5.74 | % | | | | 10.83 | % | | | | 7/31/1997 | | | | | 0.84 | % | | | | 0.84 | % |
Small-Cap Momentum | | | | 5.94% | | | | | 11.56 | % | | | | 13.73 | % | | | | 12.04 | % | | | | N | A | | | | 11.75 | % | | | | 5/28/2010 | | | | | 3.96 | %1 | | | | 0.91 | %1 |
Small-Cap Growth | | | | 4.61% | | | | | 14.33 | % | | | | 16.10 | % | | | | 16.35 | % | | | | 5.11 | % | | | | 6.70 | % | | | | 10/31/2003 | | | | | 1.20 | %1 | | | | 0.94 | %1 |
Small-Cap Value | | | | 14.74% | | | | | 20.90 | % | | | | 26.79 | % | | | | 14.37 | % | | | | 5.47 | % | | | | 7.99 | % | | | | 10/31/2003 | | | | | 1.03 | %1 | | | | 0.94 | %1 |
Blue Chip 35 Index | | | | 3.93% | | | | | 7.74 | % | | | | 13.18 | % | | | | 14.36 | % | | | | 7.17 | % | | | | 6.78 | % | | | | 7/31/1997 | | | | | 0.25 | %1 | | | | 0.15 | %1 |
Managed Volatility | | | | 0.07% | | | | | 1.19 | % | | | | 2.42 | % | | | | 4.80 | % | | | | 2.75 | % | | | | 3.82 | % | | | | 6/30/2001 | | | | | 1.07 | %1 | | | | 0.95 | %1 |
Bridgeway Funds Returns for Calendar Years 2003 through 2016* (Unaudited)
| | | | | | | | | | | | | | | | | | | | | | | | | | | | | | | | | | | | | | | | | | | | | | | | | | | | | | | | | | | | | | | | | | | | | | |
| | | 2003 | | 2004 | | 2005 | | 2006 | | 2007 | | 2008 | | 2009 | | 2010 | | 2011 | | 2012 | | 2013 | | 2014 | | 2015 | | 2016 |
Aggressive Investors 1 | | | | 53.97 | % | | | | 12.21 | % | | | | 14.93 | % | | | | 7.11 | % | | | | 25.80 | % | | | | -56.16 | % | | | | 23.98 | % | | | | 17.82 | % | | | | -10.31 | % | | | | 21.58 | % | | | | 42.21 | % | | | | 14.99 | % | | | | -9.83 | % | | | | 19.47 | % |
Ultra-Small Company | | | | 88.57 | % | | | | 23.33 | % | | | | 2.99 | % | | | | 21.55 | % | | | | -2.77 | % | | | | -46.24 | % | | | | 48.93 | % | | | | 23.55 | % | | | | -14.64 | % | | | | 24.49 | % | | | | 55.77 | % | | | | -0.56 | % | | | | -16.12 | % | | | | 14.06 | % |
Ultra-Small Co Market | | | | 79.43 | % | | | | 20.12 | % | | | | 4.08 | % | | | | 11.48 | % | | | | -5.40 | % | | | | -39.49 | % | | | | 25.95 | % | | | | 24.86 | % | | | | -7.86 | % | | | | 19.83 | % | | | | 50.91 | % | | | | 4.61 | % | | | | -8.28 | % | | | | 21.47 | % |
Small-Cap Momentum | | | | | | | | | | | | | | | | | | | | | | | | | | | | | | | | | | | | | | | | | | | | -0.92 | % | | | | 14.18 | % | | | | 37.07 | % | | | | -0.94 | % | | | | 0.14 | % | | | | 13.73 | % |
Small-Cap Growth | | | | | | | | | 11.59 | % | | | | 18.24 | % | | | | 5.31 | % | | | | 6.87 | % | | | | -43.48 | % | | | | 15.04 | % | | | | 11.77 | % | | | | -0.63 | % | | | | 11.05 | % | | | | 48.52 | % | | | | 6.13 | % | | | | 4.93 | % | | | | 16.10 | % |
Small-Cap Value | | | | | | | | | 17.33 | % | | | | 18.92 | % | | | | 12.77 | % | | | | 6.93 | % | | | | -45.57 | % | | | | 26.98 | % | | | | 16.55 | % | | | | 1.05 | % | | | | 20.99 | % | | | | 39.72 | % | | | | 0.79 | % | | | | -9.43 | % | | | | 26.79 | % |
Blue Chip 35 Index | | | | 28.87 | % | | | | 4.79 | % | | | | 0.05 | % | | | | 15.42 | % | | | | 6.07 | % | | | | -33.30 | % | | | | 26.61 | % | | | | 10.60 | % | | | | 3.17 | % | | | | 15.20 | % | | | | 31.67 | % | | | | 11.51 | % | | | | 2.17 | % | | | | 13.18 | % |
Managed Volatility | | | | 17.82 | % | | | | 7.61 | % | | | | 6.96 | % | | | | 6.65 | % | | | | 6.58 | % | | | | -19.38 | % | | | | 12.39 | % | | | | 5.41 | % | | | | 1.94 | % | | | | 6.46 | % | | | | 9.25 | % | | | | 5.95 | % | | | | 0.17 | % | | | | 2.42 | % |
Performance figures quoted represent past performance and are no guarantee of future results. Current performance may be lower or higher than the performance data quoted. Investment return and principal value will fluctuate, so that an investor’s shares, when redeemed, may be worth more or less than original cost. To obtain performance current to the most recent month-end, please visit www.bridgeway.com or call 1-800-661-3550. Total return figures include the reinvestment of dividends and capital gains.
| | 1 | Some of the Fund’s fees were waived or expenses reimbursed; otherwise, returns would have been lower. The Adviser has contractually agreed to waive fees and/or reimburse expenses. Any material change to this Fund policy would require a vote by shareholders. |
| | 2 | Expense ratios are as stated in the current prospectus. Please see financial highlights for expense ratios as of December 31, 2016. |
* Numbers highlighted indicate periods when the Fund outperformed its primary benchmark.
This report is submitted for the general information of the shareholders of each Fund. It is not authorized for distribution to prospective investors unless preceded or accompanied by an effective prospectus, which includes information regarding a Fund’s risks, objectives, fees and expenses, experience of its management, and other information. Investors should read the prospectus carefully before investing in a Fund. For questions or other Fund information, call 1-800-661-3550 or visit the Funds’ website at www.bridgeway.com. Funds are available for purchase by residents of the United States, Puerto Rico, U.S. Virgin Islands and Guam only. Foreside Fund Services, LLC, Distributor.
The views expressed here are exclusively those of Fund management. These views, including those relating to the market, sectors, or individual stocks, are not meant as investment advice and should not be considered predictive in nature.
| | | | |
| LETTER FROM THE INVESTMENT MANAGEMENT TEAM | | | | |
December 31, 2016
Dear Fellow Shareholders,
Performance across all segments of the domestic equity markets was positive for the December quarter and for 2016. Small-cap value stocks delivered the greatest gains, as small size and the value factor were both strongly in favor. Market highlights appear on page 2. In this environment, the Bridgeway Funds performed within design expectations, guided by our statistically driven, evidence-based investment approach. Please see the enclosed letters for a detailed explanation of each Fund’s performance during the quarter and calendar year. We hope you find the letters helpful.
Loyal readers of our shareholder letters will remember the ongoing series of articles we’ve been writing on factor-based investing. In this report, we take a closer look at the debate surrounding the momentum factor. Our director of research, Dr. Andrew Berkin, provides an overview of the theories that potentially explain the momentum factor’s historical return premium, in “Understanding Factors: What Makes Momentum Work?” on page 2.
Bridgeway shareholders might also be familiar with our commitment to using trading strategies that maximize shareholder value. But as our head of equity trading, Dick Cancelmo, explains, some of the techniques that our traders use to buy and sell stocks efficiently can help anyone make day-to-day decisions that impact their financial lives. Read about the real-world benefits of a financial concept called arbitrage in “Think Like an Arbitrageur,” on page 3.
We have always thought a fair question to ask of any money manager is, “How do you invest your money?” On page 4, Bridgeway’s founder and chief investment officer, John Montgomery, publishes his target asset allocation plan. A note of caution: Each investor’s situation is different; we advise against just following his plan. Read on to learn more about his long-term view on asset allocation.
Finally, one of our newer Partners, Donald Chang, describes how he has come to understand — and be shaped by — Bridgeway’s commitment to transformative change. You can read his insights in “How Small Acts Compound to Create a Big Impact,” found on page 7.
As always, we appreciate your feedback. We take your comments very seriously and regularly discuss them to help us manage our Funds and this company. Please keep your ideas coming — both favorable and critical. They provide us with a vital tool to serve you better.
Sincerely,
Your Investment Management Team
| | | | |
 | |  | |  |
| | |
| John Montgomery | | Christine L. Wang | | Michael Whipple |

| | 
| | |
| | |
| Elena Khoziaeva | | Dick Cancelmo | | |
| | | | |
| LETTER FROM THE INVESTMENT MANAGEMENT TEAM (continued) | | | | |
Market Review
Domestic equity markets rose in the fourth quarter, capping a year of strong performance for stocks. These gains came amid a series of surprising global economic and political events, including the U.K.’s July vote to leave the European Union — which briefly roiled equity markets around the world — and the election of Donald Trump as President in November, which sparked a year-end rally for sectors such as Financials, Energy, Materials and Industrials. The S&P 500 returned 3.82% for the quarter and the Dow Jones Industrial Average returned 8.66%. For the year, the S&P 500 and the DJIA returned 11.96% and 16.50%, respectively.
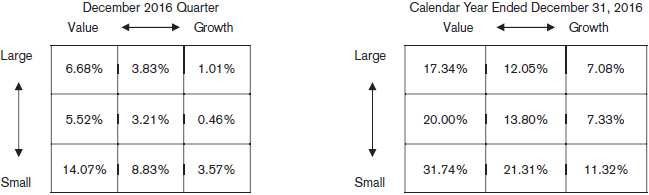
All U.S. equity style categories, as defined by Russell Indices, were up for the quarter, with small-cap stocks strongly outperforming large-cap stocks. Value stocks also significantly outpaced growth stocks, as value was the best performing factor in both the fourth quarter and the calendar year. As a result, small-cap value stocks posted the best quarterly results, returning 14.07%. Mid-cap and large-cap growth stocks were the relative laggards, returning 0.46% and 1.01%, respectively.
Nearly all of the S&P 500 sectors recorded positive performance for the quarter, with Financials leading the gains, returning 21%. The majority of that upswing came after the November presidential election, as investors anticipated the positive impact of higher interest rates and inflation on this sector, as well as the prospect of reduced regulation under the new administration. Energy stocks continued their recovery, returning 7.3%, while Industrials were just behind with a 7.2% return. Only three sectors lost ground during the quarter. The newly independent Real Estate sector returned -4.5%, while Health Care returned -4.0% and Consumer Staples returned -2.0%.
Below are the stock market style box returns for the quarter and the calendar year.
Understanding Factors: What Makes Momentum Work?
Andrew L. Berkin, Director of Research
(Note: This article is a continuation of Bridgeway’s series on factor-based investing started in our 2014 semi-annual report)
Small size and value were two of the first characteristics that academics identified that help explain a stock’s performance and provide historical above-market returns — a phenomenon we now call factors. Small size and value remain among the best known and widely used factors today. But another factor has become increasingly popular with mutual fund managers and other institutional investors: momentum.
Momentum is the tendency for assets to maintain their recent performance. For example, stocks that have outperformed tend to continue to outperform in the near term, while those that have lagged continue to lag in the near term. It thus is a simple form of trend following, which has been an investing strategy for decades. But only in the early 1990s did academics identify momentum as a factor that investors could target in a repeatable way.
Like small size and value, the momentum factor has offered a long-term return premium. Between 1927 and September 2016, the highest momentum stocks had an average annualized return of 16.63%, compared to the 9.78% annualized return for the
| | |
| 2 | | Semi-Annual Report | December 31, 2016 (Unaudited) |
| | | | |
| LETTER FROM THE INVESTMENT MANAGEMENT TEAM (continued) | | | | |
stock market overall during the same period. It’s also pervasive, with studies finding momentum effective across asset types and international markets.
However, momentum gets a little odd compared to other factors: Despite its broad acceptance and usage, the reason why momentum works isn’t clearly understood. There are certainly arguments about the rationale for all factors, but the debate surrounding momentum is especially vigorous.
One group of potential explanations says that momentum arises from investor behavior, including the effects of optimism: Some studies found that momentum works best in up markets, when investors presumably are feeling more optimistic, while other studies noted that momentum tends to fail after down markets, when investors presumably are more pessimistic.
Another group of theories centers on market frictions, such as the impact of taxes. If a big potential capital gains tax bill causes investors to hold on to shares that have enjoyed strong performance, that delay can further prolong the stock’s climb.
And while there isn’t as clear a risk-based explanation for momentum as there is with small size or value, still other theories suggest that momentum’s premium is compensation for bearing some type of risk. For example, momentum could arise simply from the risk of paying too much for something. Certainly anyone who bought an internet stock in 1999 or a house in 2005 is familiar with the risk of losing a lot of money from chasing the returns of overvalued assets.
While there is ample evidence for each of these categories playing a role in explaining momentum, it’s unlikely that we’ll have a definitive answer any time soon. So instead of just contemplating what makes momentum work, it is also useful to study when momentum works — and when it doesn’t. Understanding that pattern of potential returns can help determine the best way to incorporate momentum into a diversified, factor-based investment strategy.
For example, as we mentioned above, momentum tends to fail after bear markets. But we also know from historical data that momentum is negatively correlated with value. When one does well, the other does poorly. That makes momentum and value complementary factors — which means investors can improve their potential long-term results by assembling a portfolio with exposure to both.
Put another way, consider what value and momentum really mean: Value is based on some measure of a stock’s worth, such as book value or earnings, compared to its price. Momentum is based on price movements alone. Oscar Wilde noted that “the cynic knows the price of everything and the value of nothing.” So don’t be cynical — use momentum together with value.
This multi-factor diversification approach is at the heart of Bridgeway’s investment strategy. We believe it’s one of the most powerful tools available to investors, which is why it’s so important to understand not just what factors are available, but how the individual premiums they may provide can work together in pursuit of better potential outcomes.
Think Like an Arbitrageur
by Dick Cancelmo, Head of Equity Trading
Sitting on a trading desk for most of my career has given me a front row view into the way that financial markets have been impacted by a practice called arbitrage.
In the investing world, arbitrage refers to the nearly simultaneous purchase and sale of securities in different markets in order to profit from price discrepancies — for example, buying a stock on one exchange and quickly selling it for a profit on another exchange where it’s trading at a higher price. But this narrow definition hardly does arbitrage justice, because arbitrage is all around us.
Arbitrage is a cornerstone of the way markets function, and can help you make wise choices in all kinds of personal and business decisions. The key is to look for small differences in price, time or other potential costs that can add up to big long-term advantages, and that are essentially riskless. In other words, you can take advantage of these differences without taking on a big risk to do so.
One of my favorite examples of arbitrage comes from the TV show “Seinfeld.” In a two-part episode, Jerry’s wacky buddies Kramer and Newman decide to return “for deposit” bottles from New York to Michigan, where the deposit is 10 cents (double
| | | | |
| LETTER FROM THE INVESTMENT MANAGEMENT TEAM (continued) | | | | |
that of New York). The scheme eventually falls apart because their commandeered postal van never makes it to Michigan and it turns out to be illegal to return bottles from another state — but it’s a hilarious take on thinking like an arbitrageur.
If you have ever found creative ways to achieve a goal by spending less time or money without taking on additional risk, then congratulations: You are an arbitrageur! You’ve probably tested several options and found the best route and mode of transportation to get to work each morning — that’s an “arb.” If you’ve saved money by buying bulk goods at Costco instead of your local grocer, that’s also an arb. I recently spent $100 to purchase a $120 gift card for a nearby restaurant that I frequent. That arb saved me $20 off my lunch expenses.
Possibilities to arb like this are virtually everywhere, and should be considered almost any time you make a financial commitment — even as part of your investing strategy. Now, I’m not recommending that you start day-trading stocks. Instead, you can apply the concept of arbitrage when trying to find the best way to achieve your financial goals. For example, choosing passive funds over actively managed funds can be thought of as a type of arbitrage, as passive funds typically have lower expense ratios and lower turnover, which means fewer commissions paid and lower taxes.
Likewise, assembling a well-diversified portfolio and sticking to it for the long-term can be thought of as another arb. Staying the course with your investments helps avoid unnecessary transaction fees, reduces your taxes and potentially improves your long-term results by eliminating attempts to time the market’s ups and downs. That simple act alone means you’ll likely be more successful than investors who chase hot investments or panic during downturns. This type of “time arbitrage” is one of the tactics that has made Warren Buffet one of the greatest investors of all time.
So I encourage you to remember that arbitrage isn’t just a practice for institutional investors, but something that can help you navigate your life. In fact, the word arbitrage is derived from the French word arbiter, which translates into English as “to give judgment.” It’s a fitting etymology, as to give judgment really means to make the best possible decision. And if you think like an arbitrageur, you will.
How I Invest My Money
by John Montgomery, Founder and Chief Investment Officer
For years, I’ve been suggesting that investors ask an important question to the person managing their funds: “How do you invest your money?”
It’s a perfectly fair request, and one that I’ve been happy to answer for you in my capacity as Bridgeway’s Chief Investment Officer. And since I just made a minor change (or significant tweak, depending on how you view it) to my investments, I thought I’d give you an update and my thoughts.
If you’ve followed my writing in the past, you won’t be surprised to hear that my target allocation hasn’t changed much over time. Compared to others, I have a very long-term, very static view of asset allocation. I only make rare adjustments to my asset allocation based on extreme market conditions, or cash needs driven by life stage and careful planning. The biggest changes I can remember since starting Bridgeway 24 years ago are:
| ● | | Allocating more money to our Ultra-Small Company Fund in 1998 in the depth of a small-cap value bear market (Bridgeway Ultra-Small Company Fund’s net asset value fell by 50% over a six-month period, and ultra-small stocks were cheap by historical standards). |
| ● | | Allocating more of our income to savings/investments in 2008-09. |
Several things you should note about the changes above. First, they are infrequent — perhaps once a decade. Second, they are contrarian; I tend to act against the prevailing wisdom. Third, and this may be less clear from the details above, I spend very little time thinking about this and little time to implement it. The most time intensive part is keeping up with tax lots (a form of accounting for mutual fund shares), so that I pay less taxes than otherwise.
Also, I have to remind you that this is not for everybody. Everybody’s situation is different in terms of goals, risk tolerance, emergency fund cushion, discipline and especially time horizons. I am not recommending that you follow my specific target allocation, because your situation may be different than mine. I share it with you simply to show my thought process and also by way of disclosure and transparency.
| | |
| 4 | | Semi-Annual Report | December 31, 2016 (Unaudited) |
| | | | |
| LETTER FROM THE INVESTMENT MANAGEMENT TEAM (continued) | | | | |
So why am I tweaking my asset allocation now? Several things have been on my radar screen:
1. We haven’t had a bear market in eight years. Historically, roughly three in ten years are bear markets. On a relative valuation basis, most areas of the market are somewhat expensive to very expensive. I don’t believe in market timing — we could go another few years without a bear market — but the risk of a bear market is much higher today than it was five years ago. When the market is up, it’s a better time to consider taking care of needs or opportunities. For example, do you have a roof that needs replacing soon? Or a child who needs braces? Or expensive debt to pay off?
2. I had one opportunity (buying a new home) that intersected with another opportunity (very low interest rates). After 25 years in the same house, I’ve moved. My wife and I bought a “grand-parenting house” with nooks and crannies big enough to fit all our children and grandchildren. Previously, we had little exposure to real estate; now we have more, though still a reasonable and minority portion of our total assets, which represents some modest diversification. This opportunity dovetailed with the fact that interest rates are at a lifetime low. My first mortgage in 1980 was a 13% fixed rate. My new mortgage is 3.375%, and even less on an after tax basis.
3. With stock market valuations at the level I described above, I wanted to examine the possibility of taking 10% of our liquid investments out of the stock market. This is not a big change, and it probably is smaller than any financial planner would advise for my life stage (see my disclosures, below). I examined “alternative investments” and found that, sadly, they tend to have very high fees or very high minimums or both. However, I settled on five:
| ● | | First, Bridgeway’s own Managed Volatility Fund. This Fund uses options and futures in a conservative way to reduce risk down to a target of about 40% of the stock market’s risk. I am not increasing my exposure here, but I do consider 60% of my investment in this fund as being the equivalent of “out of the stock market.” |
| ● | | Second, I purchased an ETF that invests in company merger opportunities. Like our Managed Volatility Fund, this ETF will likely decline in a bear market, but by a much smaller amount. |
| ● | | Third, I bought Treasury Inflation Protected Securities. TIPS offer the most straightforward way to insure against the risk of rising inflation. However, it comes at a cost: lower interest income. |
| ● | | Fourth, I invested in high-quality direct consumer loans. This is an interesting fixed-income instrument, with considerably more risk (and hopefully higher return) than a certificate of deposit. It also will likely decline in an economic downturn, though I’m estimating little. |
| ● | | Fifth, I purchased an inverse interest rate ETF, which would benefit from rising interest rates. After a four-decade decline, I believe that interest rates are unlikely to decline much further. However, the possibility for a large increase in rates is substantial (and probably not good for the economy). |
One thing to note about all these investments is that they bear some risk of decline, especially after inflation. I’m not trying to eliminate volatility with this allocation (you could do that with a money market account or CD — at least before inflation). Rather, I’m trying to diversify, reducing my stock market risk exposure by about 10%. Secondarily, I’m creating a cache of funds from which I could rebalance if the market significantly declines at some point in the next decade.
Now, some disclosure before we get to my current allocation:
1. I am 61 years old, and my three children are all financially independent adults. My wife and I have living expenses that represent roughly 40% of our income. We donate roughly 20-40% of income and save the remaining amount.
2. Because we have kept a low spending rate for many years, we anticipate paying for emergencies out of income. We carry insurance for major catastrophes and “self-insure” most other risks.
3. My investments are long-term focused and earmarked for our retirement years. In the long-term, a diversified portfolio of only stocks is generally safe and a diversified portfolio of only fixed income (certificates of deposit, money market funds, treasury bills and bonds) is very risky. This contrarian assertion deserves qualification and explanation. It is based on more than nine decades of data for U.S. securities and measured on an after-inflation basis. If you think fixed income is safe, consider that from 1940 to 1950, the purchasing power of Treasury bills (with interest reinvested) declined 41%. Over the following decade they only recovered 2.4%. I consider that a permanent, not temporary loss. The U.S. stock market has always recovered from a downturn; fixed income has not. Based on my analysis of history, I keep a very high exposure to stocks, primarily
| | | | |
| LETTER FROM THE INVESTMENT MANAGEMENT TEAM (continued) | | | | |
through our Bridgeway managed funds. This has served me well over the last 30 years, despite experiencing the steepest market decline and longest running bear market since the Great Depression.
4. My friends tell me I am a very disciplined person. I plan financially to be able to invest more in Bridgeway Funds in bear markets — and I follow my plan. In 2008-9, for example, my wife and I significantly cut back our expenses in order to invest more in the stock market. Those investments are now among our most highly appreciated shares. It has been my experience that most individuals do not have the combination of a workable plan plus the discipline not to panic in a downturn. Thus, I do not think most people should follow my plan. If you buy high (euphoria) and sell low (panic), you will do much better with a more classic allocation to stocks, bonds and “cash” — which is one strong reason I recommend that most investors work with the right kind of qualified financial planner.
5. At any given time my actual allocation will vary somewhat from the targets below, due to periodic cash flow and tax management considerations. I try to harvest (sell) tax lots with declines and donate tax lots with high gains. I do the latter through a donor advised fund.
6. Since I am still in the income producing phase of life and have no specific or near-term retirement plans, I typically am able to rebalance by investing new money into the area of my allocation that has underperformed the most. I will also trim what has done really well, if necessary, to stay close to my targets below.
7. I like to “eat my own cooking” by investing in Bridgeway Funds. No portfolio manager at Bridgeway is permitted to buy domestic equities directly, due to the significant conflict of interest we believe that practice represents.
8. This table below does not include my substantial, majority ownership in Bridgeway Capital Management, since I plan to retire off of my personal investments as detailed below. However, Bridgeway Capital Management does also invest in our Funds, so I indirectly own a portion of these shares as well. Some detail of this ownership can be found in the Funds’ Statement of Additional Information on our website.
Whew! With those notes, clarification and disclosure, the following table depicts my current personal targeted allocation, but does not show or explain how the Bridgeway managers (including me) manage money within each Fund.
| | | | |
| Fund | | Allocation |
Bridgeway Aggressive Investors 1 Fund | | | 45.0 | % |
Bridgeway Ultra-Small Company Fund | | | 38.4 | % |
Bridgeway Managed Volatility Fund | | | 4.2 | % |
Bridgeway Small-Cap Momentum Fund | | | 0.2 | % |
Bridgeway Blue Chip 35 Index Fund | | | 0.2 | % |
American Beacon/Bridgeway Large-Cap Growth Fund | | | 0.4 | % |
American Beacon/Bridgeway Large-Cap Value Fund | | | 0.2 | % |
Bridgeway Small-Cap Growth Fund | | | 0.2 | % |
Bridgeway Small-Cap Value Fund | | | 1.7 | % |
Bridgeway Omni Small-Cap Value Fund | | | 1.3 | % |
Bridgeway Omni Tax-Managed Small-Cap Value Fund | | | 0.7 | % |
Bridgeway Ultra-Small Company Market Fund | | | 0.2 | % |
Treasury inflation protected securities | | | 1.0 | % |
No load short-term Treasury inflation protected securities | | | 1.0 | % |
Merger arbitrage ETF | | | 2.0 | % |
20+ Year Treasury bear ETF | | | 2.0 | % |
Peer-to-peer lending network (high quality) | | | 1.5 | % |
| | | | |
Total | | | 100.0 | % |
| | |
| 6 | | Semi-Annual Report | December 31, 2016 (Unaudited) |
| | | | |
| LETTER FROM THE INVESTMENT MANAGEMENT TEAM (continued) | | | | |
Transformative Change — How Small Acts Compound to Create a Big Impact
by Donald Chang, Investment Management Team
Before joining Bridgeway in October 2015, I wasn’t too familiar with the concept of transformative change. When I first heard the phrase, I immediately thought of the big events that shape a person’s life. I suspect this would be the case for many people, who consider decisions like where to live, who to marry and what career path to take to be the biggest forces of change in their lives. Yet I’ve come to realize that it’s not these major decisions themselves that cause change, but the many, smaller events that happen afterwards that make the biggest difference.
I heard many good things about the people at Bridgeway before I joined the firm — that they are passionate, generous and committed to helping the community. However, simply joining the team didn’t mean that I embodied these ideals overnight. Rather, it was the continuous exposure to the culture here, and the volunteer experiences I’ve had, that have changed me.
For example, I have taken part in volunteer events at the community garden at Pro-Vision, a charter school in Houston. The tasks I performed in the garden were small, and felt a lot like the yard work my mom asked me to do when I was young — pulling weeds and tilling the soil. But I could feel that this experience was different.
My colleagues and I were helping others, working alongside students of all ages in the garden. Together, we learned how to sustainably grow food for the community, and some of the literal fruits of this labor will be given to the school and a nearby nursing home. I was exposed to people from different walks of life, and the experience began to shape a passion in me for helping others.
You could argue that nothing outwardly amazing happened during my work in the garden, but transformative change doesn’t really work that way. Transformative change takes time, repeated exposure to these kinds of experiences, and a strong, supportive community — so that small actions add up little by little to change a person, and the world.
Working in the community garden was where I first started to feel this change happening in myself. I know that the feeling will continue to strengthen with each event I take part in, and that my commitment to helping people will continue to grow. As if that wasn’t enough, there’s also a side benefit: I learned some sustainable farming techniques I can teach my mom the next time she asks me to pull weeds in her garden.
| | |
| Aggressive Investors 1 Fund | |
|
| MANAGER’S COMMENTARY (Unaudited) | |
| | |
December 31, 2016
Dear Fellow Aggressive Investors 1 Fund Shareholder,
For the quarter ended December 31, 2016, our Fund returned 9.55%, outperforming our primary market benchmark, the S&P 500 Index (+3.82%), our peer benchmark, the Lipper Capital Appreciation Funds Index (+2.64%), and the Russell 2000 Index (+8.83%). It was a good quarter.
For the six-month semi-annual period ended December 31, 2016, our Fund returned 16.81%, outperforming the S&P 500 Index (+7.82%) and the Lipper Capital Appreciation Funds Index (+8.57%), but underperforming the Russell 2000 Index (+18.68%).
For the calendar year, our Fund returned 19.47%, outperforming the S&P 500 Index (+11.96%) and the Lipper Capital Appreciation Funds Index (+6.06%), but underperforming the Russell 2000 Index (+21.31%).
The table below presents our December quarter, six-month, one-year, five-year, 10-year, 15-year, and inception-to-date financial results.
Standardized Returns as of December 31, 2016
| | | | | | | | | | | | | | | | | | | | | | | | | | | | |
| | | | | | | | | | | | | | | Annualized | | | | | | |
| | | Quarter | | | 6 Months | | | 1 Year | | | 5 Years | | | 10 Years | | | 15 Years | | | Since Inception
(8/5/94) |
| | | | | | | | | | | | | |
Aggressive Investors 1 Fund | | | 9.55% | | | | 16.81% | | | | 19.47% | | | | 16.45% | | | | 4.46% | | | | 6.84% | | | | 13.01% | |
S&P 500 Index | | | 3.82% | | | | 7.82% | | | | 11.96% | | | | 14.66% | | | | 6.95% | | | | 6.69% | | | | 9.43% | |
Russell 2000 Index | | | 8.83% | | | | 18.68% | | | | 21.31% | | | | 14.46% | | | | 7.07% | | | | 8.49% | | | | 9.43% | |
Lipper Capital Appreciation Funds Index | | | 2.64% | | | | 8.57% | | | | 6.06% | | | | 12.75% | | | | 6.84% | | | | 6.48% | | | | 8.21% | |
Performance figures quoted in the table above represent past performance and are no guarantee of future results. Total return figures in the table above include the reinvestment of dividends and capital gains. The table above does not reflect the deduction of taxes that a shareholder would pay on Fund distributions or on the redemption of Fund shares.
The S&P 500 Index is a broad-based, unmanaged measurement of changes in stock market conditions, based on the average of 500 widely held common stocks with dividends reinvested. The Russell 2000 Index is an unmanaged, market value weighted index that measures performance of the 2,000 companies that are between the 1,000th and 3,000th largest in the market with dividends reinvested. The Lipper Capital Appreciation Funds Index reflects the record of the 30 largest funds in the category of more aggressive domestic growth mutual funds, as reported by Lipper, Inc. It is not possible to invest directly in an index. Periods longer than one year are annualized.
According to data from Lipper as of December 31, 2016, Aggressive Investors 1 Fund ranked 24th of 251 capital appreciation funds for the 12 months ended December 31, 2016, 13th of 221 over the last five years, 129th of 161 over the last 10 years, and 2nd of 40 since inception in August 1994. Lipper, a Thomson Reuters company, is an independent mutual fund rating service that ranks funds in various fund categories by making comparative calculations using total returns.
| | |
| 8 | | Semi-Annual Report | December 31, 2016 (Unaudited) |
| | |
| Aggressive Investors 1 Fund | | |
| MANAGER’S COMMENTARY (Unaudited) (continued) | | |
| | |
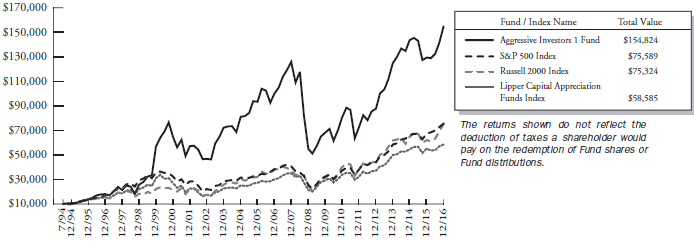
Aggressive Investors 1 Fund vs. S&P 500 Index, Russell 2000 Index & Lipper Capital Appreciation Funds Index
from Inception 8/5/94 to 12/31/16
Detailed Explanation of Quarterly Performance
The Fund’s company financial health and value metrics models strongly outperformed the market and boosted relative returns. Exposure to smaller stocks not in the S&P 500 Index also helped relative results, as these stocks generally outperformed larger stocks during the quarter. The beta factor was positive during the quarter, as uncertainty about the U.S. economy and the outcome of the election abated. As a result, the Fund’s exposure to higher beta stocks lifted relative performance. The Fund’s deeper value tilt also helped relative performance, as the value factor continued to be strongly in favor during the quarter. By contrast, it was a poor quarter for the momentum factor, which meant that the Fund’s tilt toward higher momentum stocks and the price momentum model detracted from relative performance.
Holdings in the Information Technology, Industrials and Consumer Discretionary sectors boosted relative performance. However, an underweight position and holdings in the Financials sector hurt relative returns. In particular, the Fund had less exposure to large banks and diversified financial institutions that surged following the November election.
Detailed Explanation of Calendar Year Performance
The Fund’s company financial health and value metrics models strongly outperformed the market and boosted relative results. A higher weighting of smaller stocks compared to the S&P 500 Index also boosted relative performance, as smaller stocks generally outperformed larger stocks during the year. Exposure to higher beta stocks made a large positive contribution to relative results, as did the Fund’s deeper value tilt due to the value factor coming back in favor in the second half of the year. However, exposure to higher momentum stocks and the Fund’s price momentum model detracted from relative results.
From a sector allocation standpoint, holdings in the Information Technology sector made a significant positive contribution to relative results. An underweight position and holdings in the lagging Health Care sector also lifted relative performance. However, holdings in the Consumer Staples, Financials and Energy sectors detracted from relative performance.
| | |
| Aggressive Investors 1 Fund | |
|
| MANAGER’S COMMENTARY (Unaudited) (continued) | |
| | |
Top Ten Holdings as of December 31, 2016
| | | | | | | | |
| Rank | | Description | | Industry | | % of Net
Assets | |
| 1 | | NVIDIA Corp. | | Semiconductors & Semiconductor Equipment | | | 2.8% | |
| 2 | | BHP Billiton Ltd. | | Metals & Mining | | | 1.9% | |
| 3 | | United Rentals Inc. | | Trading Companies & Distributo | | | 1.8% | |
| 4 | | AMN Healthcare Services Inc. | | Health Care Providers & Service | | | 1.8% | |
| 5 | | United Continental Holdings Inc. | | Airlines | | | 1.7% | |
| 6 | | Advanced Micro Devices Inc. | | Semiconductors & Semiconductor Equipment | | | 1.6% | |
| 7 | | Alaska Air Group Inc. | | Airlines | | | 1.6% | |
| 8 | | Southwest Airlines Co. | | Airlines | | | 1.6% | |
| 9 | | Petroleo Brasileiro SA. | | Oil, Gas & Consumable Fuels | | | 1.6% | |
| 10 | | VelocityShares Daily Inverse ETN Exchange Traded Note | | | 1.6% | |
| | | |
| | Total | | | | | 17.9% | |
Industry Sector Representation as of December 31, 2016
| | | | | | | | | | | | | | | |
| | | % of Net Assets | | % of S&P 500
Index | | Difference |
Consumer Discretionary | | | | 10.3% | | | | | 12.0% | | | | | -1.7% | |
Consumer Staples | | | | 6.1% | | | | | 9.4% | | | | | -3.3% | |
Energy | | | | 6.9% | | | | | 7.6% | | | | | -0.7% | |
Financials | | | | 14.0% | | | | | 14.8% | | | | | -0.8% | |
Health Care | | | | 8.8% | | | | | 13.6% | | | | | -4.8% | |
Industrials | | | | 16.1% | | | | | 10.3% | | | | | 5.8% | |
Information Technology | | | | 25.3% | | | | | 20.8% | | | | | 4.5% | |
Materials | | | | 8.2% | | | | | 2.8% | | | | | 5.4% | |
Real Estate | | | | 0.0% | | | | | 2.9% | | | | | -2.9% | |
Telecommunication Services | | | | 2.3% | | | | | 2.7% | | | | | -0.4% | |
Utilities | | | | 0.0% | | | | | 3.2% | | | | | -3.2% | |
Cash & Other Assets | | | | 2.0% | | | | | 0.0% | | | | | 2.0% | |
| | | |
Total | | | | 100.0% | | | | | 100.0% | | | | | | |
Disclaimer
The views expressed here are exclusively those of Fund management. These views, including those related to market sectors or individual stocks, are not meant as investment advice and should not be considered predictive in nature. Any favorable (or unfavorable) description of a holding applies only as of the quarter end, December 31, 2016, unless otherwise stated. Security positions can and do change thereafter. Discussions of historical performance do not guarantee and may not be indicative of future performance.
Market volatility can significantly affect short-term performance. The Fund is not an appropriate investment for short-term investors. Investments in the small companies within this multi-cap fund generally carry greater risk than is customarily associated with larger companies. This additional risk is attributable to a number of factors, including the relatively limited financial resources that are typically available to small companies and the fact that small companies often have comparatively limited product lines. In addition, the stock of small companies tends to be more volatile than the stock of large companies, particularly in the short term and particularly in the early stages of an economic or market downturn. The Fund’s use of options, futures, and leverage can magnify the risk of loss in an unfavorable market, and the Fund’s use of short-sale positions can, in theory, expose shareholders to unlimited loss. Finally, the Fund exposes shareholders to “focus risk,” which may add to Fund volatility through the possibility that a single company could significantly affect total return. Shareholders of the Fund, therefore, are taking on more risk than they would if they invested in the stock market as a whole.
| | |
10 | | Semi-Annual Report | December 31, 2016 (Unaudited) |
| | |
| Aggressive Investors 1 Fund | | |
| MANAGER’S COMMENTARY (Unaudited) (continued) | | |
| | |
Conclusion
Thank you for your continued investment in Aggressive Investors 1 Fund. We encourage your feedback; your reactions and concerns are important to us.
Sincerely,
The Investment Management Team
| | |
| Aggressive Investors 1 Fund | | |
| SCHEDULE OF INVESTMENTS | | |
| Showing percentage of net assets as of December 31, 2016 (Unaudited) | | |
| | | | | | |
| Industry Company | | Shares | | Value | | |
| |
COMMON STOCKS - 98.03% | | |
| Aerospace & Defense - 1.04% | | | | | | |
Spirit Aerosystems Holdings, Inc., Class A | | 40,000 | | $ 2,334,000 | | |
| Airlines - 6.83% | | | | | | |
Alaska Air Group, Inc. | | 40,200 | | 3,566,946 | | |
Delta Air Lines, Inc. | | 46,500 | | 2,287,335 | | |
JetBlue Airways Corp.* | | 95,300 | | 2,136,626 | | |
Southwest Airlines Co. | | 69,800 | | 3,478,832 | | |
United Continental Holdings, Inc.* | | 52,500 | | 3,826,200 | | |
| | | | | | |
| | | | 15,295,939 | | |
Auto Components - 2.96% | | | | | | |
Delphi Automotive PLC | | 33,800 | | 2,276,430 | | |
Lear Corp. | | 24,200 | | 3,203,354 | | |
Standard Motor Products, Inc. | | 21,500 | | 1,144,230 | | |
| | | | | | |
| | | | 6,624,014 | | |
Automobiles - 1.11% | | | | | | |
General Motors Co. | | 71,500 | | 2,491,060 | | |
Biotechnology - 1.86% | | | | | | |
Gilead Sciences, Inc. | | 26,000 | | 1,861,860 | | |
Ionis Pharmaceuticals, Inc.*+ | | 48,000 | | 2,295,840 | | |
| | | | | | |
| | | | 4,157,700 | | |
| |
Building Products - 1.10% | | |
Gibraltar Industries, Inc.* | | 59,300 | | 2,469,845 | | |
| |
Commercial Banks - 3.09% | | |
Bank of Nova Scotia (The) | | 43,000 | | 2,394,240 | | |
Canadian Imperial Bank of Commerce/Canada+ | | 27,000 | | 2,203,200 | | |
Royal Bank of Canada+ | | 34,300 | | 2,322,453 | | |
| | | | | | |
| | | | 6,919,893 | | |
| |
Communications Equipment - 0.87% | | |
NETGEAR, Inc.* | | 35,900 | | 1,951,165 | | |
| |
Computers & Peripherals - 1.30% | | |
HP, Inc. | | 196,100 | | 2,910,124 | | |
| |
Construction & Engineering - 1.15% | | |
Comfort Systems USA, Inc. | | 77,000 | | 2,564,100 | | |
| |
Consumer Finance - 2.03% | | |
Alliance Data Systems Corp. | | 10,900 | | 2,490,650 | | |
Ally Financial, Inc. | | 107,900 | | 2,052,258 | | |
| | | | | | |
| | | | 4,542,908 | | |
| |
Containers & Packaging - 1.29% | | |
Crown Holdings, Inc.* | | 54,800 | | 2,880,836 | | |
| | | | |
| Industry Company | | Shares | | Value |
|
|
Diversified Financial Services - 6.14% |
Bank of America Corp. | | 124,000 | | $ 2,740,400 |
Citigroup, Inc. | | 42,000 | | 2,496,060 |
Eaton Vance Corp. | | 54,300 | | 2,274,084 |
MarketAxess Holdings, Inc. | | 14,700 | | 2,159,724 |
MoneyGram International, Inc.* | | 100,000 | | 1,181,000 |
Voya Financial, Inc. | | 73,900 | | 2,898,358 |
| | | | |
| | | | 13,749,626 |
|
Diversified Telecommunication Services - 2.31% |
Windstream Holdings, Inc.+ | | 392,100 | | 2,874,093 |
Zayo Group Holdings, Inc.* | | 70,000 | | 2,300,200 |
| | | | |
| | | | 5,174,293 |
|
Electronic Equipment, Instruments & Components - 3.77% |
Arrow Electronics, Inc.* | | 14,692 | | 1,047,540 |
Fabrinet* | | 29,000 | | 1,168,700 |
Flex Ltd.* | | 207,700 | | 2,984,649 |
Itron, Inc.* | | 18,000 | | 1,131,300 |
TTM Technologies, Inc.* | | 155,000 | | 2,112,650 |
| | | | |
| | | | 8,444,839 |
|
Energy Equipment & Services - 2.07% |
Aegean Marine Petroleum Network, Inc. | | 104,000 | | 1,055,600 |
Teekay Corp.+ | | 110,000 | | 883,300 |
Unit Corp.* | | 100,000 | | 2,687,000 |
| | | | |
| | | | 4,625,900 |
|
Food & Staples Retailing - 0.90% |
Kroger Co. (The) | | 58,600 | | 2,022,286 |
|
Food Products - 2.86% |
Fresh Del Monte Produce, Inc. | | 34,000 | | 2,061,420 |
Ingredion, Inc. | | 20,000 | | 2,499,200 |
Tyson Foods, Inc., Class A | | 30,000 | | 1,850,400 |
| | | | |
| | | | 6,411,020 |
|
Health Care Equipment & Supplies - 0.75% |
Edwards Lifesciences Corp.* | | 18,000 | | 1,686,600 |
|
Health Care Providers & Services - 7.16% |
AmerisourceBergen Corp. | | 28,000 | | 2,189,320 |
AMN Healthcare Services, Inc.* | | 103,500 | | 3,979,575 |
Cardinal Health, Inc. | | 26,600 | | 1,914,402 |
HCA Holdings, Inc.* | | 27,500 | | 2,035,550 |
Insperity, Inc. | | 29,900 | | 2,121,405 |
Mallinckrodt PLC* | | 29,000 | | 1,444,780 |
| | |
| 12 | | Semi-Annual Report | December 31, 2016 (Unaudited) |
| | |
| Aggressive Investors 1 Fund | | |
| SCHEDULE OF INVESTMENTS (continued) | | |
| Showing percentage of net assets as of December 31, 2015 (Unaudited) | | |
| | | | | | | | | | | | |
| Industry Company | | Shares | | | Value | | | | |
| | | |
Common Stocks (continued) | | | | | | | | | | | | |
Health Care Providers & Services (continued) | | | | | |
WellCare Health Plans, Inc.* | | | 17,000 | | | $ | 2,330,360 | | | | | |
| | | | | | | | | | | | |
| | | | | | | 16,015,392 | | | | | |
| |
Hotels, Restaurants & Leisure - 1.14% | | | | | |
Darden Restaurants, Inc. | | | 35,000 | | | | 2,545,200 | | | | | |
| |
Household Products - 2.30% | | | | | |
Central Garden & Pet Co., Class A* | | | 92,700 | | | | 2,864,430 | | | | | |
Spectrum Brands Holdings, Inc. | | | 18,600 | | | | 2,275,338 | | | | | |
| | | | | | | | | | | | |
| | | | | | | 5,139,768 | | | | | |
| |
Industrials - 1.07% | | | | | |
Tenaris SA, ADR+ | | | 66,800 | | | | 2,385,428 | | | | | |
| |
Insurance - 2.73% | | | | | |
Aflac, Inc. | | | 43,000 | | | | 2,992,800 | | | | | |
Prudential Financial, Inc. | | | 30,000 | | | | 3,121,800 | | | | | |
| | | | | | | | | | | | |
| | | | | | | 6,114,600 | | | | | |
| |
Internet Software & Services - 3.30% | | | | | |
EarthLink Holdings Corp. | | | 167,700 | | | | 945,828 | | | | | |
F5 Networks, Inc.* | | | 15,700 | | | | 2,272,104 | | | | | |
Yelp, Inc.* | | | 52,000 | | | | 1,982,760 | | | | | |
Zillow Group, Inc., Class C*+ | | | 60,000 | | | | 2,188,200 | | | | | |
| | | | | | | | | | | | |
| | | | | | | 7,388,892 | | | | | |
| |
IT Services - 3.28% | | | | | |
Broadridge Financial Solutions, Inc. | | | 30,500 | | | | 2,022,150 | | | | | |
Jack Henry & Associates, Inc. | | | 26,000 | | | | 2,308,280 | | | | | |
Science Applications International Corp. | | | 35,400 | | | | 3,001,920 | | | | | |
| | | | | | | | | | | | |
| | | | | | | 7,332,350 | | | | | |
| |
Leisure Equipment & Products - 1.61% | | | | | |
LCI Industries | | | 17,000 | | | | 1,831,750 | | | | | |
Polaris Industries, Inc.+ | | | 21,500 | | | | 1,771,385 | | | | | |
| | | | | | | | | | | | |
| | | | | | | 3,603,135 | | | | | |
| |
Machinery - 2.09% | | | | | |
Greenbrier Companies., Inc. (The)+ | | | 30,500 | | | | 1,267,275 | | | | | |
Titan International, Inc. | | | 100,000 | | | | 1,121,000 | | | | | |
Xylem, Inc. | | | 46,000 | | | | 2,277,920 | | | | | |
| | | | | | | | | | | | |
| | | | | | | 4,666,195 | | | | | |
| |
Materials - 1.55% | | | | | |
Trinseo SA+ | | | 58,400 | | | | 3,463,120 | | | | | |
| | | | | | | | | | | | |
| | | | | | | | | | | | |
| | | | | | | | | | | | |
| | | | | | | | | | | | |
| | | | | | | | | | | | |
| | | | | | | | | | | | |
| | | | | | | | | | | | |
| | | | | | | | | | | | |
| | | | | | | | | | | | |
| | | | | | | | | | | | |
| | | | | | | | | | | | |
| | | | | | | | |
| Industry Company | | Shares | | | Value | |
|
| |
Media - 1.01% | | | | | | | | |
Scripps Networks Interactive, Inc., Class A | | | 31,600 | | | $ | 2,255,292 | |
|
Metals & Mining - 4.52% | |
AK Steel Holding Corp.*+ | | | 298,100 | | | | 3,043,601 | |
BHP Billiton, Ltd., ADR+ | | | 119,000 | | | | 4,257,820 | |
Kinross Gold Corp.* | | | 436,800 | | | | 1,358,448 | |
Silver Wheaton Corp.+ | | | 75,000 | | | | 1,449,000 | |
| | | | | | | | |
| | | | | | | 10,108,869 | |
|
Oil, Gas & Consumable Fuels - 4.20% | |
Chesapeake Energy Corp.*+ | | | 350,000 | | | | 2,457,000 | |
McDermott International, Inc.* | | | 211,100 | | | | 1,560,029 | |
Petroleo Brasileiro SA, ADR* | | | 343,000 | | | | 3,467,730 | |
SunCoke Energy, Inc.* | | | 94,000 | | | | 1,065,960 | |
TETRA Technologies, Inc.* | | | 170,000 | | | | 853,400 | |
| | | | | | | | |
| | | | | | | 9,404,119 | |
|
Paper & Forest Products - 0.39% | |
Resolute Forest Products, Inc.*+ | | | 161,199 | | | | 862,415 | |
|
Semiconductors & Semiconductor
Equipment - 10.36% | |
Advanced Micro Devices, Inc.* | | | 318,500 | | | | 3,611,790 | |
Lam Research Corp. | | | 30,000 | | | | 3,171,900 | |
Marvell Technology Group, Ltd. | | | 157,500 | | | | 2,184,525 | |
Micron Technology, Inc.* | | | 152,900 | | | | 3,351,568 | |
NVIDIA Corp. | | | 59,100 | | | | 6,308,334 | |
QUALCOMM, Inc. | | | 35,400 | | | | 2,308,080 | |
Texas Instruments, Inc. | | | 30,700 | | | | 2,240,179 | |
| | | | | | | | |
| | | | | | | 23,176,376 | |
|
Software - 0.78% | |
Splunk, Inc.* | | | 34,000 | | | | 1,739,100 | |
|
Specialty Retail - 3.62% | |
Best Buy Co., Inc. | | | 63,500 | | | | 2,709,545 | |
Children’s Place, Inc. (The) | | | 28,000 | | | | 2,826,600 | |
Rent-A-Center, Inc.+ | | | 83,000 | | | | 933,750 | |
Tailored Brands, Inc. | | | 64,000 | | | | 1,635,200 | |
| | | | | | | | |
| | | | | | | 8,105,095 | |
|
Thrifts & Mortgage Finance - 0.54% | |
Ocwen Financial Corp.*+ | | | 225,000 | | | | 1,212,750 | |
|
Trading Companies & Distributors - 2.95% | |
AerCap Holdings NV* | | | 26,800 | | | | 1,115,148 | |
| | |
| Aggressive Investors 1 Fund | |
|
| SCHEDULE OF INVESTMENTS (continued) | |
| Showing percentage of net assets as of December 31, 2016 (Unaudited) | | |
| | | | | | | | | | |
| Industry Company | | Shares | | Value | | | |
| |
Common Stocks (continued) | | | | |
Trading Companies & Distributors (continued) | | | | |
Rush Enterprises, Inc., Class A* | | 43,700 | | $ 1,394,030 | | | | |
United Rentals, Inc.* | | 38,700 | | 4,085,946 | | | | |
| | | | | | | | | | |
| | | | | | 6,595,124 | | | | |
| | | | | | | | | | |
| | |
TOTAL COMMON STOCKS - 98.03% | | 219,369,368 | | | | |
| | | | | | | | | | |
(Cost $186,908,548) | | | | | | | | | | |
| |
EXCHANGE TRADED NOTE - 1.55% | | | | |
Exchange Traded Note - 1.55% | | | | |
VelocityShares Daily Inverse ETN*+ | | 74,100 | | 3,464,175 | | | | |
| | | | | | | | | | |
TOTAL EXCHANGE TRADED NOTE - 1.55% | | 3,464,175 | | | | |
| | | | | | | | | | |
(Cost $1,813,008) | | | | | | | | | | |
| | | | |
| | | Rate^ | | Shares | | Value | | | |
| |
MONEY MARKET FUND - 0.00% | | | | |
Fidelity Institutional Government Portfolio Institutional Class | | 0.43% | | 517 | | 517 | | | | |
| | | | | | | | | | |
| | |
TOTAL MONEY MARKET FUND - 0.00% | | 517 | | | | |
| | | | | | | | | | |
(Cost $517) | | | | | | | | |
INVESTMENTS PURCHASED WITH CASH PROCEEDS FROM SECURITIES
LENDING - 12.98% | | | | | | |
Fidelity Institutional Government Portfolio Institutional Class** | | 0.43% | | 29,051,455 | | 29,051,455 | | | | |
| | | | | | | | | | |
TOTAL INVESTMENTS PURCHASED WITH CASH PROCEEDS FROM SECURITIES LENDING - 12.98% | | 29,051,455 | | | | |
| | | | | | | | | | |
(Cost $29,051,455) | | | | | | | | |
| | | | | | | | |
| | | | | | | | |
| | | | | | | | |
| | | | | | | | |
| | | | | | | | |
| | | | | | | | |
| | | | | | | | |
| | | | | | | | |
| | | | | | | | |
| | | | | | | | |
| | | | |
| | | Value | |
TOTAL INVESTMENTS - 112.56% | | $ | 251,885,515 | |
(Cost $217,773,528) | | | | |
Liabilities in Excess of Other
Assets - (12.56%) | | | (28,099,651 | ) |
| | | | |
NET ASSETS - 100.00% | | $ | 223,785,864 | |
| | | | |
| * | Non-income producing security. |
| ** | This security represents the investment of the collateral received in connection with securities out on loan as of December 31, 2016. |
| ^ | Rate disclosed as of December 31, 2016. |
| + | This security or a portion of the security is out on loan as of December 31, 2016. Total loaned securities had a value of $27,900,287 as of December 31, 2016. |
ETN - Exchange Traded Note
PLC - Public Limited Company
ADR - American Depositary Receipt
Summary of inputs used to value the Fund’s investments as of 12/31/2016 (See Note 2 in Notes to Financial Statements):
| | | | | | | | | | | | | | | | |
| | | Valuation Inputs | |
| | | Investment in Securities (Value) | |
| | | Level 1 Quoted Prices | | | Level 2 Significant Observable Inputs | | | Level 3 Significant Unobservable Inputs | | | Total | |
| | | | |
Common Stocks | | $ | 219,369,368 | | | $ | — | | | $ | — | | | $ | 219,369,368 | |
Exchange Traded Note | | | 3,464,175 | | | | — | | | | — | | | | 3,464,175 | |
Money Market Fund | | | — | | | | 517 | | | | — | | | | 517 | |
Investments Purchased with Cash Proceeds from Securities Lending | | | — | | | | 29,051,455 | | | | — | | | | 29,051,455 | |
| | | | | | | | | | | | | | | | |
TOTAL | | $ | 222,833,543 | | | $ | 29,051,972 | | | $ | — | | | $ | 251,885,515 | |
| | | | | | | | | | | | | | | | |
See Notes to Financial Statements.
| | |
| 14 | | Semi-Annual Report | December 31, 2016 (Unaudited) |
| | |
| Ultra-Small Company Fund | | |
| MANAGER’S COMMENTARY (Unaudited) | | |
| | |
December 31, 2016
Dear Fellow Ultra-Small Company Fund Shareholder,
For the quarter ended December 31, 2016, our Fund returned 10.10%, beating our primary market benchmark, the CRSP Cap-Based Portfolio 10 Index (+6.45%), our peer benchmark, the Lipper Micro-Cap Stock Funds Index (+8.12%), and the Russell 2000 Index (+8.83%). The Fund’s returns were effectively even with those of the Russell Microcap Index (+10.05%). It was a good quarter.
For the six-month semi-annual period ended December 31, 2016, our Fund returned 15.56%, underperforming the CRSP Cap-Based Portfolio 10 Index (+21.34%), the Lipper Micro-Cap Stock Funds Index (+19.63%), the Russell 2000 Index (+18.68%) and the Russell Microcap Index (+22.43%).
For the 2016 calendar year, our Fund returned 14.06%, underperforming the CRSP Cap-Based Portfolio 10 Index (+21.62%) as well as the Lipper Micro-Cap Stock Funds Index (+19.29%), the Russell 2000 Index (+21.31%) and the Russell Microcap Index (+20.37%).
The table below presents our December quarter, six-month, one-year, five-year, 10-year, 15-year and inception-to-date financial results.
Standardized Returns as of December 31, 2016
| | | | | | | | | | | | | | | | | | | | | | | | | | | | | | | | | | | |
| | | | | | | | | Annualized | | |
| | | Quarter | | 6 Months | | 1 Year | | 5 Years | | 10 Years | | 15 Years | | Since Inception
(8/5/94) |
| | | | | | | |
Ultra-Small Company Fund | | | | 10.10% | | | | | 15.56% | | | | | 14.06% | | | | | 13.03% | | | | | 4.24% | | | | | 10.69% | | | | | 14.08% | |
CRSP Cap-Based Portfolio 10 Index | | | | 6.45% | | | | | 21.34% | | | | | 21.62% | | | | | 14.87% | | | | | 6.59% | | | | | 11.57% | | | | | 12.03% | |
Russell 2000 Index | | | | 8.83% | | | | | 18.68% | | | | | 21.31% | | | | | 14.46% | | | | | 7.07% | | | | | 8.49% | | | | | 9.43% | |
Russell Microcap Index | | | | 10.05% | | | | | 22.43% | | | | | 20.37% | | | | | 15.59% | | | | | 5.47% | | | | | 8.16% | | | | | N/A | |
Lipper Micro-Cap Stock Funds Index | | | | 8.12% | | | | | 19.63% | | | | | 19.29% | | | | | 13.98% | | | | | 6.28% | | | | | 7.97% | | | | | N/A | |
Performance figures quoted in the table above represent past performance and are no guarantee of future results. Total return figures in the table above include the reinvestment of dividends and capital gains. The table above does not reflect the deduction of taxes that a shareholder would pay on Fund distributions or on the redemption of Fund shares.
The CRSP Cap-Based Portfolio 10 Index is an unmanaged index of 790 of the smallest publicly traded U.S. stocks (with dividends reinvested), as reported by the Center for Research on Security Prices. The Russell Microcap Index is an unmanaged, market value weighted index that measures performance of 1,000 of the smallest securities in the Russell 2000 Index and the next 1,000 smallest comapnies. The Russell 2000 Index is an unmanaged, market value weighted index that measures performance of the 2,000 companies that are between the 1,000th and 3,000th largest in the market (with dividends reinvested).
The Lipper Micro-Cap Stock Funds Index is an index of micro-cap funds compiled by Lipper, Inc. It is not possible to invest directly in an index. Periods longer than one year are annualized.
According to data from Lipper as of December 31, 2016, Ultra-Small Company Fund ranked 48th of 71 micro-cap funds for the 12 months ended December 31, 2016, 41st of 58 over the last five years, 32nd of 40 over the last 10 years, and 1st of 8 since inception in August 1994. Lipper, a Thomson Reuters company, is an independent mutual fund rating service that ranks funds in various fund categories by making comparative calculations using total returns.
| | |
| Ultra-Small Company Fund | |
|
| MANAGER’S COMMENTARY (Unaudited) (continued) | |
| | |
Ultra-Small Company Fund vs. CRSP Cap-Based Portfolio 10 Index, Russell Microcap Index**, Russell 2000 Index & Lipper Micro-Cap Stock Funds Index* from Inception 8/5/94 to 12/31/16
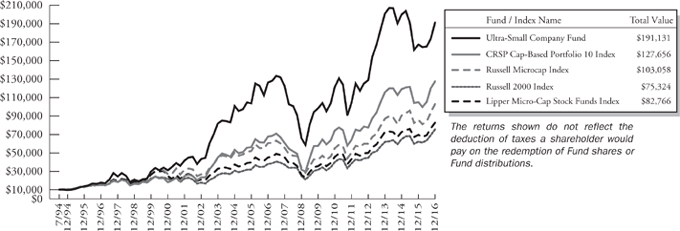
| * | The Lipper Micro-Cap Stock Funds Index began on 12/31/1995, and the line graph for the Index begins at the same value as the Fund on that date. |
| ** | The Russell Microcap Index began on 6/30/2000, and the line graph for the Index begins at the same value as the Fund on that date. |
Detailed Explanation of Quarterly Performance
The Fund’s company financial health, value metrics and price momentum models all helped it outperform the benchmark for the quarter. Greater exposure to the index’s deeper-value stocks also boosted relative returns. A tilt toward higher-momentum stocks contributed positively to relative performance as well, as momentum stocks in the CRSP-10 universe posted strong returns.
Some Fund holdings appreciated above the CRSP-10 cutoff. As a result, the Fund held about 20% of its assets in stocks out-side of the 10th CRSP decile. These holdings lagged the CRSP-10 benchmark, detracting from relative performance.
Holdings in Health Care, Energy, Financials and Materials added to relative performance. A significantly underweight position in the lagging Health Care sector also helped, as did an overweight stake in Industrials. Holdings in the Information Technology, Consumer Discretionary and Industrials sectors hurt relative performance.
The table below presents index performance numbers for stocks in the different CRSP deciles during various time periods.
| | | | | | | | | | | | | | | | | | | | | | | | |
| CRSP | | | | | | | | | | | Annualized | |
| Decile1 | | Quarter | | | 6 Months | | | 1 Year | | | 5 Years | | | 10 Years | | | 91 Years | |
| 1 (ultra-large) | | | 4.28% | | | | 8.27% | | | | 11.63% | | | | 14.39% | | | | 6.80% | | | | 9.30% | |
| 2 | | | 4.09% | | | | 9.84% | | | | 16.97% | | | | 15.86% | | | | 8.17% | | | | 10.55% | |
| 3 | | | 4.46% | | | | 10.39% | | | | 16.83% | | | | 14.80% | | | | 8.14% | | | | 11.03% | |
| 4 | | | 6.30% | | | | 10.89% | | | | 13.49% | | | | 13.90% | | | | 8.47% | | | | 10.84% | |
| 5 | | | 6.06% | | | | 14.64% | | | | 16.95% | | | | 13.27% | | | | 9.24% | | | | 11.48% | |
| 6 | | | 5.02% | | | | 15.57% | | | | 18.79% | | | | 14.21% | | | | 8.07% | | | | 11.36% | |
| 7 | | | 9.24% | | | | 20.79% | | | | 25.23% | | | | 16.16% | | | | 9.01% | | | | 11.57% | |
| 8 | | | 9.58% | | | | 21.05% | | | | 21.59% | | | | 14.48% | | | | 8.34% | | | | 11.55% | |
| 9 | | | 12.05% | | | | 28.22% | | | | 30.92% | | | | 15.36% | | | | 8.01% | | | | 11.54% | |
| 10 (ultra-small) | | | 6.45% | | | | 21.34% | | | | 21.62% | | | | 14.87% | | | | 6.59% | | | | 13.29% | |
| 1 | Performance figures are as of the period ended December 31, 2016. The CRSP Cap-Based Portfolio Indexes are unmanaged indexes of publicly traded U.S. stocks with dividends reinvested, grouped by market capitalization, as reported by the Center for Research in Security Prices. Past performance is no guarantee of future results. |
| | |
| 16 | | Semi-Annual Report | December 31, 2016 (Unaudited) |
| | |
| Ultra-Small Company Fund | | |
| MANAGER’S COMMENTARY (Unaudited) (continued) | | |
| | |
Detailed Explanation of Calendar Year Performance
The Fund’s strong performance in the fourth quarter was not enough to overcome benchmark-lagging returns earlier in the year. The Fund held about 25% of its assets on average in stocks that had appreciated out of the 10th CRSP decile, and those holdings hurt relative returns. Our company financial health and value metrics models also detracted from relative performance. Our price momentum model helped relative returns, as did exposure to the index’s deeper-value stocks and an under-weight position in the lowest-momentum shares.
Holdings in the Energy, Industrials, Information Technology and Consumer Discretionary sectors hurt returns relative to the benchmark. Relative performance benefited from an underweight position in the poor-performing Health Care sector and an overweight stake in Materials.
Top Ten Holdings as of December 31, 2016
| | | | | | | | |
| Rank | | Description | | Industry | | % of Net
Assets |
| 1 | | Olympic Steel, Inc. | | Metals & Mining | | | 2.3 | % |
| 2 | | Health Insurance Innovations, Inc. | | Insurance | | | 2.2 | % |
| 3 | | A-Mark Precious Metals, Inc. | | Metals & Mining | | | 2.0 | % |
| 4 | | Supreme Industries, Inc. | | Machinery | | | 2.0 | % |
| 5 | | Horizon Global Corp. | | Auto Components | | | 2.0 | % |
| 6 | | CoLucid Pharmaceuticals, Inc. | | Biotechnology | | | 1.7 | % |
| 7 | | Willbros Group, Inc. | | Energy Equipment & Services | | | 1.6 | % |
| 8 | | Ryerson Holding Corp. | | Metals & Mining | | | 1.6 | % |
| 9 | | Old Line Bancshares, Inc. | | Commercial Banks | | | 1.6 | % |
| 10 | | AxoGen, Inc. | | Health Care Equipment & Supplies | | | 1.5 | % |
| | Total | | | | | 18.4 | % |
Industry Sector Representation as of December 31, 2016
| | | | | | | | | | | | |
| | | % of Net Assets | | | % of CRSP 10 Index | | | Difference |
Consumer Discretionary | | | 14.7% | | | | 11.9% | | | | 2.9% | |
Consumer Staples | | | 3.1% | | | | 2.4% | | | | 0.7% | |
Energy | | | 9.1% | | | | 11.4% | | | | -2.3% | |
Financials | | | 24.2% | | | | 24.2% | | | | 0.1% | |
Health Care | | | 11.7% | | | | 16.0% | | | | -4.3% | |
Industrials | | | 16.1% | | | | 12.2% | | | | 3.8% | |
Information Technology | | | 12.9% | | | | 15.3% | | | | -2.4% | |
Materials | | | 5.1% | | | | 3.1% | | | | 2.0% | |
Real Estate | | | 1.7% | | | | 1.4% | | | | 0.4% | |
Telecommunication Services | | | 0.4% | | | | 0.6% | | | | -0.1% | |
Utilities | | | 0.9% | | | | 1.6% | | | | -0.7% | |
Cash & Other Assets | | | 0.1% | | | | 0.0% | | | | 0.1% | |
Total | | | 100.0% | | | | 100.0% | | | | | |
Disclaimer
The views expressed here are exclusively those of Fund management. These views, including those related to market sectors or individual stocks, are not meant as investment advice and should not be considered predictive in nature. Any favorable (or unfavorable) description of a holding applies only as of the quarter end, December 31, 2016, unless otherwise stated. Security positions can and do change thereafter. Discussions of historical performance do not guarantee and may not be indicative of future performance.
| | |
| Ultra-Small Company Fund | |
|
| MANAGER’S COMMENTARY (Unaudited) (continued) | |
| | |
The Fund is subject to very high, above market risk (volatility) and is not an appropriate investment for short-term investors. Investments in ultra-small companies generally carry greater risk than is customarily associated with larger companies and even “small companies” for various reasons, such as narrower markets (fewer investors), limited financial resources and greater trading difficulty.
Conclusion
Ultra-Small Company Fund remains closed to new investors. We encourage your feedback; your reactions and concerns are important to us.
Sincerely,
The Investment Management Team
| | |
| 18 | | Semi-Annual Report | December 31, 2016 (Unaudited) |
| | |
| Ultra-Small Company Fund | | |
| SCHEDULE OF INVESTMENTS | | |
| Showing percentage of net assets as of December 31, 2016 (Unaudited) | | |
| | | | | | | | | | |
| Industry Company | | Shares | | Value | | | | |
| |
COMMON STOCKS - 99.94% | | | | | |
Auto Components - 2.48% | | | | | |
China XD Plastics Co., Ltd.* | | 69,700 | | $ | 278,800 | | | | | |
Horizon Global Corp.* | | 89,200 | | | 2,140,800 | | | | | |
SORL Auto Parts, Inc.*+ | | 92,100 | | | 279,984 | | | | | |
| | | | | | | | | | |
| | | | | 2,699,584 | | | | | |
| |
Biotechnology - 4.46% | | | | | |
Adverum Biotechnologies, Inc.*+ | | 179,500 | | | 520,550 | | | | | |
CoLucid Pharmaceuticals, Inc.*+ | | 50,000 | | | 1,820,000 | | | | | |
MacroCure, Ltd.* | | 200,000 | | | 286,000 | | | | | |
MEI Pharma, Inc.* | | 427,500 | | | 615,600 | | | | | |
Nexvet Biopharma PLC* | | 44,400 | | | 162,948 | | | | | |
Novelion Therapeutics, Inc.*+ | | 34,500 | | | 290,490 | | | | | |
PharmAthene, Inc.* | | 191,700 | | | 623,025 | | | | | |
Pronai Therapeutics, Inc.* | | 180,300 | | | 268,647 | | | | | |
Verastem, Inc.* | | 235,800 | | | 264,096 | | | | | |
| | | | | | | | | | |
| | | | | 4,851,356 | | | | | |
| |
Chemicals - 0.78% | | | | | |
Gulf Resources, Inc.*+ | | 259,000 | | | 505,050 | | | | | |
Rentech, Inc.* | | 138,800 | | | 344,224 | | | | | |
| | | | | | | | | | |
| | | | | 849,274 | | | | | |
| |
Commercial Banks - 13.19% | | | | | |
ACNB Corp.+ | | 15,300 | | | 478,125 | | | | | |
American National Bankshares, Inc. | | 19,000 | | | 661,200 | | | | | |
Bankwell Financial Group, Inc.+ | | 26,200 | | | 851,500 | | | | | |
C&F Financial Corp. | | 5,200 | | | 259,220 | | | | | |
Civista Bancshares, Inc.+ | | 15,100 | | | 293,393 | | | | | |
CM Finance, Inc.+ | | 22,700 | | | 211,110 | | | | | |
Coastway Bancorp, Inc.*+ | | 8,700 | | | 136,155 | | | | | |
Codorus Valley Bancorp, Inc.+ | | 32,025 | | | 915,915 | | | | | |
Evans Bancorp, Inc.+ | | 5,000 | | | 157,750 | | | | | |
First Business Financial Services, Inc. | | 28,100 | | | 666,532 | | | | | |
First United Corp.* | | 12,000 | | | 191,400 | | | | | |
FS Bancorp, Inc. | | 5,000 | | | 179,750 | | | | | |
Hennessy Advisors, Inc. | | 12,400 | | | 393,700 | | | | | |
Medley Management, Inc., Class A | | 40,700 | | | 402,930 | | | | | |
MutualFirst Financial, Inc.+ | | 12,855 | | | 425,500 | | | | | |
NV5 Global, Inc.*+ | | 43,500 | | | 1,452,900 | | | | | |
Old Line Bancshares, Inc. | | 71,213 | | | 1,707,688 | | | | | |
Old Second Bancorp, Inc. | | 88,400 | | | 976,820 | | | | | |
Pacific Mercantile Bancorp*+ | | 72,100 | | | 526,330 | | | | | |
Provident Bancorp, Inc.*+ | | 9,700 | | | 173,630 | | | | | |
| | | | | | |
| Industry Company | | Shares | | Value | |
|
| |
Commercial Banks (continued) | |
Shore Bancshares, Inc. | | 82,600 | | $ | 1,259,650 | |
Southern First Bancshares, Inc.*+ | | 16,100 | | | 579,600 | |
TriplePoint Venture Growth BDC Corp.+ | | 92,100 | | | 1,084,938 | |
Westbury Bancorp, Inc.*+ | | 5,500 | | | 113,850 | |
Western New England Bancorp, Inc. | | 27,000 | | | 252,450 | |
| | | | | | |
| | | | | 14,352,036 | |
|
Commercial Services & Supplies - 2.61% | |
AMREP Corp.* | | 12,600 | | | 93,492 | |
Ascent Capital Group, Inc., Class A*+ | | 63,500 | | | 1,032,510 | |
Cenveo, Inc.*+ | | 51,675 | | | 361,208 | |
Civeo Corp.* | | 350,000 | | | 770,000 | |
Performant Financial Corp.* | | 191,200 | | | 449,320 | |
Virco Manufacturing Corp.* | | 32,200 | | | 138,460 | |
| | | | | | |
| | | | | 2,844,990 | |
|
Communications Equipment - 0.85% | |
Ceragon Networks, Ltd.* | | 283,900 | | | 743,818 | |
UTStarcom Holdings Corp.* | | 90,200 | | | 180,400 | |
| | | | | | |
| | | | | 924,218 | |
|
Computers & Peripherals - 0.80% | |
Datalink Corp.* | | 53,700 | | | 604,662 | |
TransAct Technologies, Inc. | | 40,200 | | | 265,320 | |
| | | | | | |
| | | | | 869,982 | |
|
Construction & Engineering - 1.68% | |
Goldfield Corp.
(The)* | | 172,600 | | | 880,260 | |
IES Holdings, Inc.* | | 8,200 | | | 157,030 | |
Willdan Group, Inc.* | | 35,000 | | | 790,650 | |
| | | | | | |
| | | | | 1,827,940 | |
|
Consumer Finance - 1.18% | |
Consumer Portfolio Services, Inc.* | | 174,300 | | | 892,416 | |
Regional Management Corp.* | | 15,000 | | | 394,200 | |
| | | | | | |
| | | | | 1,286,616 | |
|
Distributors - 0.13% | |
VOXX International Corp.* | | 30,000 | | | 141,000 | |
|
Diversified Consumer Services - 1.09% | |
Cambium Learning Group, Inc.* | | 167,250 | | | 834,578 | |
Lincoln Educational Services Corp.* | | 180,000 | | | 345,600 | |
| | | | | | |
| | | | | 1,180,178 | |
| | |
| Ultra-Small Company Fund | |
|
| SCHEDULE OF INVESTMENTS (continued) | |
| Showing percentage of net assets as of December 31, 2016 (Unaudited) | | |
| | | | | | | | | | |
| Industry Company | | Shares | | Value | | | | |
| |
Common Stocks (continued) | | | | | |
Diversified Financial Services - 0.19% | | | | | |
FXCM, Inc., Class A*+ | | 30,000 | | $ | 211,500 | | | | | |
| |
Diversified Telecommunication Services - 1.40% | | | | | |
Hawaiian Telcom Holdco, Inc.* | | 18,800 | | | 465,864 | | | | | |
HC2 Holdings, Inc.* | | 178,700 | | | 1,059,691 | | | | | |
| | | | | | | | | | |
| | | | | 1,525,555 | | | | | |
| |
Electronic Equipment, Instruments & Components - 5.74% | | | | | |
American Superconductor Corp.*+ | | 128,000 | | | 943,360 | | | | | |
Electro Scientific Industries, Inc.* | | 151,600 | | | 897,472 | | | | | |
IEC Electronics Corp.* | | 36,700 | | | 131,019 | | | | | |
Kemet Corp.* | | 210,000 | | | 1,392,300 | | | | | |
Napco Security Technologies, Inc.* | | 110,000 | | | 935,000 | | | | | |
PCM, Inc.* | | 37,280 | | | 838,800 | | | | | |
Radisys Corp.* | | 250,000 | | | 1,107,500 | | | | | |
| | | | | | | | | | |
| | | | | 6,245,451 | | | | | |
| |
Energy Equipment & Services - 4.63% | | | | | |
North American Energy Partners, Inc.+ | | 58,800 | | | 226,380 | | | | | |
North Atlantic Drilling, Ltd.*+ | | 194,500 | | | 616,565 | | | | | |
Ocean Rig UDW, Inc.*+ | | 451,400 | | | 785,436 | | | | | |
Pacific Drilling SA*+ | | 147,400 | | | 598,444 | | | | | |
Parker Drilling Co.* | | 402,406 | | | 1,046,256 | | | | | |
Willbros Group, Inc.* | | 545,900 | | | 1,768,716 | | | | | |
| | | | | | | | | | |
| | | | | 5,041,797 | | | | | |
| |
Food Products - 0.77% | | | | | |
Inventure Foods, Inc.*+ | | 37,800 | | | 372,330 | | | | | |
Rocky Mountain Chocolate Factory, Inc. | | 20,000 | | | 203,800 | | | | | |
S&W Seed Co.*+ | | 57,100 | | | 262,660 | | | | | |
| | | | | | | | | | |
| | | | | 838,790 | | | | | |
| |
Gas Utilities - 0.90% | | | | | |
Delta Natural Gas Co., Inc.+ | | 33,300 | | | 976,689 | | | | | |
| |
Health Care Equipment & Supplies - 3.65% | | | | | |
AxoGen, Inc.*+ | | 180,000 | | | 1,620,000 | | | | | |
Digirad Corp. | | 40,600 | | | 203,000 | | | | | |
Electromed, Inc.* | | 90,000 | | | 349,200 | | | | | |
FONAR Corp.* | | 64,100 | | | 1,227,515 | | | | | |
Kewaunee Scientific Corp. | | 10,200 | | | 249,390 | | | | | |
Lantheus Holdings, Inc.* | | 38,000 | | | 326,800 | | | | | |
| | | | | | | | | | |
| | | | | 3,975,905 | | | | | |
| |
Health Care Providers & Services - 1.35% | | | | | |
Alliance HealthCare Services, Inc.* | | 25,000 | | | 240,000 | | | | | |
| | | | | | |
| Industry Company | | Shares | | Value | |
|
| |
Health Care Providers & Services (continued) | |
Chembio Diagnostics, Inc.*+ | | 107,500 | | $ | 731,000 | |
Five Star Quality Care, Inc.* | | 46,228 | | | 124,816 | |
InfuSystems Holdings, Inc.* | | 48,700 | | | 124,185 | |
Psychemedics Corp. | | 10,000 | | | 246,800 | |
| | | | | | |
| | | | | 1,466,801 | |
|
Hotels, Restaurants & Leisure - 2.14% | |
Gaming Partners International Corp. | | 13,300 | | | 157,073 | |
Luby’s, Inc.* | | 63,200 | | | 270,496 | |
MCBC Holdings, Inc. | | 46,100 | | | 672,138 | |
Red Lion Hotels Corp.* | | 82,300 | | | 687,205 | |
Town Sports International Holdings, Inc.* | | 217,800 | | | 544,500 | |
| | | | | | |
| | | | | 2,331,412 | |
|
Household Durables - 0.59% | |
Skyline Corp.* | | 20,100 | | | 310,746 | |
UCP, Inc., Class A* | | 27,200 | | | 327,760 | |
| | | | | | |
| | | | | 638,506 | |
| | |
Insurance - 2.59% | | | | | | |
eHealth, Inc.* | | 43,000 | | | 457,950 | |
Health Insurance Innovations, Inc., Class A*+ | | 132,000 | | | 2,356,200 | |
| | | | | | |
| | | | | 2,814,150 | |
|
Internet & Catalog Retail - 0.40% | |
US Auto Parts Network, Inc.* | | 124,800 | | | 439,296 | |
|
Internet Software & Services - 3.41% | |
Brightcove, Inc.* | | 99,900 | | | 804,195 | |
Care.com, Inc.* | | 91,300 | | | 782,441 | |
Live Ventures, Inc.*+ | | 19,967 | | | 479,599 | |
Rightside Group Ltd*+ | | 57,200 | | | 473,044 | |
Rocket Fuel, Inc.*+ | | 189,600 | | | 324,216 | |
Support.com, Inc.* | | 285,800 | | | 245,788 | |
Synacor, Inc.* | | 72,800 | | | 225,680 | |
Travelzoo, Inc.*+ | | 40,000 | | | 376,000 | |
| | | | | | |
| | | | | 3,710,963 | |
|
IT Services - 2.62% | |
BG Staffing, Inc.+ | | 37,500 | | | 585,000 | |
Computer Task Group, Inc. | | 21,500 | | | 90,515 | |
Edgewater Technology, Inc.* | | 27,499 | | | 206,242 | |
Everi Holdings, Inc.* | | 50,000 | | | 108,500 | �� |
Information Services Group, Inc.* | | 50,100 | | | 182,364 | |
NCI, Inc., Class A | | 87,000 | | | 1,213,650 | |
PFSweb, Inc.* | | 26,300 | | | 223,550 | |
| | |
| 20 | | Semi-Annual Report | December 31, 2016 (Unaudited) |
| | |
| Ultra-Small Company Fund | | |
| SCHEDULE OF INVESTMENTS (continued) | | |
| Showing percentage of net assets as of December 31, 2016 (Unaudited) | | |
| | | | | | | | |
| Industry Company | | Shares | | Value | | | |
| |
Common Stocks (continued) | | | | |
IT Services (continued) | | | | |
PRGX Global, Inc.* | | 41,400 | | $ 244,260 | | | | |
| | | | | | | | |
| | | | 2,854,081 | | | | |
| |
Life Sciences Tools & Services - 0.26% | | | | |
Enzo Biochem, Inc.* | | 40,000 | | 277,600 | | | | |
| |
Machinery - 4.65% | | | | |
Ampco-Pittsburgh Corp. | | 31,000 | | 519,250 | | | | |
Commercial Vehicle Group, Inc.* | | 193,100 | | 1,067,843 | | | | |
Gencor Industries, Inc.* | | 74,000 | | 1,161,800 | | | | |
Key Technology, Inc.* | | 11,200 | | 130,592 | | | | |
Supreme Industries, Inc., Class A | | 139,200 | | 2,185,440 | | | | |
| | | | | | | | |
| | | | 5,064,925 | | | | |
| |
Marine - 1.01% | | | | |
DryShips, Inc.* | | 2,026 | | 7,476 | | | | |
Global Ship Lease, Inc., Class A* | | 321,600 | | 482,400 | | | | |
Navios Maritime Holdings, Inc.* | | 253,700 | | 357,717 | | | | |
Nordic American Offshore, Ltd.+ | | 90,700 | | 249,425 | | | | |
| | | | | | | | |
| | | | 1,097,018 | | | | |
| |
Media - 1.65% | | | | |
Global Sources, Ltd.*+ | | 18,900 | | 167,265 | | | | |
Lee Enterprises, Inc.*+ | | 360,200 | | 1,044,580 | | | | |
McClatchy Co. (The),
Class A* | | 20,011 | | 263,745 | | | | |
Salem Media Group, Inc. | | 50,700 | | 316,875 | | | | |
| | | | | | | | |
| | | | 1,792,465 | | | | |
| |
Metals & Mining - 5.98% | | | | |
ALJ Regional Holdings, Inc.*+ | | 21,700 | | 95,263 | | | | |
A-Mark Precious Metals, Inc.+ | | 112,700 | | 2,197,650 | | | | |
Olympic Steel, Inc. | | 102,800 | | 2,490,844 | | | | |
Ryerson Holding Corp.* | | 129,000 | | 1,722,150 | | | | |
| | | | | | | | |
| | | | 6,505,907 | | | | |
| |
Multiline Retail - 0.40% | | | | |
Bon-Ton Stores, Inc. (The)* | | 297,200 | | 436,884 | | | | |
| |
Oil, Gas & Consumable Fuels - 4.23% | | | | |
Adams Resources & Energy, Inc. | | 4,900 | | 194,285 | | | | |
Cloud Peak Energy, Inc.*+ | | 214,200 | | 1,201,662 | | | | |
Comstock Resources, Inc.*+ | | 50,440 | | 496,834 | | | | |
W&T Offshore, Inc.*+ | | 418,700 | | 1,159,799 | | | | |
| | | | |
| Industry Company | | Shares | | Value |
|
|
Oil, Gas & Consumable Fuels (continued) |
Westmoreland Coal Co.* | | 87,700 | | $ 1,549,659 |
| | | | |
| | | | 4,602,239 |
|
Personal Products - 2.33% |
Lifevantage Corp.*+ | | 80,200 | | 653,630 |
Mannatech, Inc. | | 9,500 | | 192,850 |
Natural Alternatives International, Inc.*+ | | 74,500 | | 841,850 |
Nutraceutical International Corp. | | 24,100 | | 842,295 |
| | | | |
| | | | 2,530,625 |
|
Pharmaceuticals - 1.96% |
Chiasma, Inc.*+ | | 153,200 | | 298,740 |
Juniper Pharmaceuticals, Inc.* | | 100,900 | | 565,040 |
Kindred Biosciences, Inc.* | | 80,300 | | 341,275 |
Tetraphase Pharmaceuticals, Inc.* | | 126,100 | | 508,183 |
Zafgen, Inc.*+ | | 131,300 | | 417,534 |
| | | | |
| | | | 2,130,772 |
|
Professional Services - 0.69% |
CRA International, Inc. | | 18,700 | | 684,420 |
RCM Technologies, Inc.+ | | 10,000 | | 63,600 |
| | | | |
| | | | 748,020 |
|
Real Estate Investment Trusts (REITs) - 0.18% |
BRT Realty Trust* | | 24,200 | | 198,198 |
|
Real Estate Management & Development - 1.56% |
American Realty Investors, Inc.*+ | | 7,100 | | 36,707 |
Farmland Partners, Inc.+ | | 68,600 | | 765,576 |
Nam Tai Property, Inc.+ | | 121,100 | | 896,140 |
| | | | |
| | | | 1,698,423 |
|
Road & Rail - 0.62% |
USA Truck, Inc.* | | 77,000 | | 670,670 |
|
Semiconductors & Semiconductor Equipment - 0.04% |
Intermolecular, Inc.* | | 44,900 | | 42,565 |
|
Software - 1.00% |
GlobalSCAPE, Inc. | | 41,400 | | 168,498 |
Planet Payment, Inc.* | | 225,000 | | 918,000 |
| | | | |
| | | | 1,086,498 |
|
Specialty Retail - 3.21% |
Christopher & Banks Corp.* | | 251,400 | | 588,276 |
Container Store Group, Inc. (The)*+ | | 100,000 | | 635,000 |
Kingold Jewelry, Inc.* | | 201,900 | | 260,451 |
| | |
| Ultra-Small Company Fund | |
|
| SCHEDULE OF INVESTMENTS (continued) | |
| Showing percentage of net assets as of December 31, 2016 (Unaudited) | | |
| | | | | | | | |
| Industry Company | | Shares | | Value | | | |
| | | |
Common Stocks (continued) | | | | | | | | |
Specialty Retail (continued) | | | | |
New York & Co., Inc.* | | 137,000 | | $ 310,990 | | | | |
Sears Hometown & Outlet Stores, Inc.*+ | | 135,500 | | 636,850 | | | | |
Stage Stores, Inc.+ | | 92,300 | | 403,351 | | | | |
Tilly’s, Inc., Class A* | | 50,000 | | 659,500 | | | | |
| | | | | | | | |
| | | | 3,494,418 | | | | |
| |
Textiles, Apparel & Luxury Goods - 1.20% | | | | |
Crown Crafts, Inc.+ | | 26,100 | | 202,275 | | | | |
Delta Apparel, Inc.* | | 53,400 | | 1,106,982 | | | | |
| | | | | | | | |
| | | | 1,309,257 | | | | |
| |
Thrifts & Mortgage Finance - 6.41% | | | | |
BSB Bancorp, Inc.* | | 14,500 | | 419,775 | | | | |
Charter Financial Corp. | | 39,800 | | 663,466 | | | | |
Entegra Financial Corp.* | | 12,100 | | 249,260 | | | | |
ESSA Bancorp, Inc. | | 38,100 | | 598,932 | | | | |
First Financial Northwest, Inc. | | 47,400 | | 935,676 | | | | |
Home Bancorp, Inc. | | 6,000 | | 231,660 | | | | |
OceanFirst Financial Corp. | | 18,947 | | 568,978 | | | | |
Ocwen Financial Corp.*+ | | 195,400 | | 1,053,206 | | | | |
Provident Financial Holdings, Inc. | | 47,000 | | 950,340 | | | | |
Prudential Bancorp, Inc.+ | | 7,200 | | 123,264 | | | | |
Security National Financial Corp., Class A*+ | | 41,055 | | 266,858 | | | | |
SI Financial Group, Inc. | | 59,500 | | 916,300 | | | | |
| | | | | | | | |
| | | | 6,977,715 | | | | |
| |
Trading Companies & Distributors - 2.93% | | | | |
Educational Development Corp.+ | | 20,400 | | 202,980 | | | | |
Huttig Building Products, Inc.*+ | | 123,300 | | 815,013 | | | | |
MFC Industrial, Ltd.* | | 155,900 | | 304,005 | | | | |
Titan Machinery, Inc.*+ | | 86,800 | | 1,264,676 | | | | |
Willis Lease Finance Corp.* | | 23,700 | | 606,246 | | | | |
| | | | | | | | |
| | | | 3,192,920 | | | | |
| | | | | | | | |
TOTAL COMMON STOCKS - 99.94% | | | | 108,755,189 | | | | |
| | | | | | | | |
(Cost $92,407,903) | | | | | | | | |
| WARRANTS - 0.00% | | | | | | | | |
Novelion Therapeutics, Inc. | | | | | | | | |
Class Action expire 12/31/21*D | | 172,500 | | — | | | | |
Novelion Therapeutics, Inc. DOJ/SEC expire 12/31/21*D | | 172,500 | | | | | | |
| | | | | | | | |
| TOTAL WARRANTS - 0.00% | | | | — | | | | |
| | | | | | | | |
| (Cost $ — ) | | | | | | | | |
| | | | | | | | |
| | | Rate^ | | Shares | | Value | |
| |
MONEY MARKET FUND - 0.04% | | | | |
Fidelity Institutional Government Portfolio Institutional Class | | 0.43% | | 36,808 | | $ | 36,808 | |
| | | | | | | | |
TOTAL MONEY MARKET FUND - 0.04% | | | 36,808 | |
| | | | | | | | |
(Cost $36,808) | | | | | | | | |
|
INVESTMENTS PURCHASED WITH CASH PROCEEDS FROM SECURITIES LENDING - 15.97% | |
Fidelity Institutional Government Portfolio Institutional Class** | | 0.43% | | 17,380,539 | | | 17,380,539 | |
| | | | | | | | |
TOTAL INVESTMENTS PURCHASED WITH CASH PROCEEDS FROM SECURITIES LENDING - 15.97% | | | 17,380,539 | |
| | | | | | | | |
(Cost $17,380,539) | | | | | | |
| |
TOTAL INVESTMENTS - 115.95% | | $ | 126,172,536 | |
(Cost $109,825,250) | | | | | | |
Liabilities in Excess of Other Assets - (15.95%) | | | (17,355,832 | ) |
| | | | | | | | |
NET ASSETS - 100.00% | | $ | 108,816,704 | |
| | | | | | | | |
| * | Non-income producing security. |
| ** | This security represents the investment of the collateral received in connection with securities out on loan as of December 31, 2016. |
| ^ | Rate disclosed as of December 31, 2016. |
| D | Security was fair valued under procedures adopted by the Board of Directors (see Note 2). |
| + | This security or a portion of the security is out on loan as of December 31, 2016. Total loaned securities had a value of $16,703,529 as of December 31, 2016. |
PLC - Public Limited Company
Summary of inputs used to value the Fund’s investments as of 12/31/2016 (See Note 2 in Notes to Financial Statements):
| | | | | | | | | | | | | | | | |
| | | Valuation Inputs | |
| | | Investment in Securities (Value) | |
| | | Level 1
Quoted
Prices | | | Level 2
Significant
Observable
Inputs | | | Level 3
Significant
Unobservable
Inputs | | | Total | |
| | | | |
Common Stocks | | $ | 108,755,189 | | | $ | — | | | $ | — | | | $ | 108,755,189 | |
| | | | |
Warrants | | | — | | | | — | | | | 0 | | | | 0 | |
| | | | |
Money Market Fund | | | — | | | | 36,808 | | | | — | | | | 36,808 | |
| | | | |
Investments Purchased with Cash Proceeds from Securities Lending | | | — | | | | 17,380,539 | | | | — | | | | 17,380,539 | |
| | | | | | | | | | | | | | | | |
| | | | |
TOTAL | | $ | 108,755,189 | | | $ | 17,417,347 | | | $ | 0 | | | $ | 126,172,536 | |
| | | | | | | | | | | | | | | | |
See Notes to Financial Statements.
| | |
| 22 | | Semi-Annual Report | December 31, 2016 (Unaudited) |
| | |
| Ultra-Small Company Market Fund | | |
| MANAGER’S COMMENTARY (Unaudited) | | |
| | |
December 31, 2016
Dear Fellow Ultra-Small Company Market Fund Shareholder,
For the quarter ended December 31, 2016, our Fund returned 9.12%, outperforming our primary market benchmark, the CRSP Cap-Based Portfolio 10 Index (+6.45%), our peer benchmark, the Lipper Micro-Cap Stock Funds Index (+8.12%), and the Russell 2000 Index (+8.83%). However, our Fund underperformed the Russell Microcap Index (+10.05%). It was a good quarter.
For the six-month semi-annual period ending December 31, 2016, our Fund returned 22.70%, outperforming the CRSP Cap-Based Portfolio 10 Index (+21.34%), the Lipper Micro-Cap Stock Funds Index (+19.63%), the Russell 2000 Index (+18.68%) and the Russell Microcap Index (+22.43%).
For the calendar year, our Fund returned 21.47%, underperforming the CRSP Cap-Based Portfolio 10 Index (+21.62%). Our Fund posted better results than the Lipper Micro-Cap Stock Funds Index (+19.29%), the Russell 2000 Index (+21.31%) and the Russell Microcap Index (+20.37%).
The table below presents our December quarter, six-month, one-year, five-year, 10-year, 15-year and inception-to-date financial results.
Standardized Returns as of December 31, 2016
| | | | | | | | | | | | | | | | | | | | | | | | | | | | |
| | | | | |
| | | | | | | | | | | | Annualized | | | | |
| | | Quarter | | | 6 Months | | | 1 Year | | | 5 Years | | | 10 Years | | | 15 Years | | | Since Inception (7/31/97) | |
| | | | | | | |
Ultra-Small Company Market Fund | | | 9.12% | | | | 22.70% | | | | 21.47% | | | | 16.08% | | | | 5.74% | | | | 10.69% | | | | 10.83% | |
CRSP Cap-Based Portfolio 10 Index | | | 6.45% | | | | 21.34% | | | | 21.62% | | | | 14.87% | | | | 6.59% | | | | 11.57% | | | | 10.83% | |
Russell 2000 Index | | | 8.83% | | | | 18.68% | | | | 21.31% | | | | 14.46% | | | | 7.07% | | | | 8.49% | | | | 7.71% | |
Russell Microcap Index | | | 10.05% | | | | 22.43% | | | | 20.37% | | | | 15.59% | | | | 5.47% | | | | 8.16% | | | | N/A | |
Lipper Micro-Cap Stock Funds Index | | | 8.12% | | | | 19.63% | | | | 19.29% | | | | 13.98% | | | | 6.28% | | | | 7.97% | | | | 7.94% | |
Performance figures quoted in the table above represent past performance and are no guarantee of future results. Total return figures in the table above include the reinvestment of dividends and capital gains. The table above does not reflect the deduction of taxes that a shareholder would pay on Fund distributions or on the redemption of Fund shares.
The CRSP Cap-Based Portfolio 10 Index is an unmanaged index of 790 of the smallest publicly traded U.S. stocks with dividends reinvested, as reported by the Center for Research on Security Prices. The Russell Microcap Index is an unmanaged, market value weighted index that measures performance of 1,000 of the smallest securities in the Russell 2000 Index and the next 1,000 smallest companies. The Russell 2000 Index is an unmanaged, market value weighted index that measures performance of the 2,000 companies that are between the 1,000th and 3,000th largest in the market with dividends reinvested. The Lipper Micro-Cap Stock Funds Index is an index of micro-cap funds compiled by Lipper, Inc. It is not possible to invest directly in an index. Periods longer than one year are annualized.
According to data from Lipper as of December 31, 2016, Ultra-Small Company Market Fund ranked 30th of 71 micro-cap funds for the 12 months ended December 31, 2016, 14th of 58 over the last five years, 23rd of 40 over the last 10 years, and 4th of 17 since inception in July 1997. Lipper, a Thomson Reuters company, is an independent mutual fund rating service that ranks funds in various fund categories by making comparative calculations using total returns.
| | |
| Ultra-Small Company Market Fund | |
|
| MANAGER’S COMMENTARY (Unaudited) (continued) | |
| | |
Ultra-Small Company Market Fund vs. CRSP Cap-Based Portfolio 10 Index, Russell Microcap Index*,
Russell 2000 Index & Lipper Micro-Cap Stock Funds Index from Inception 7/31/97 to 12/31/16
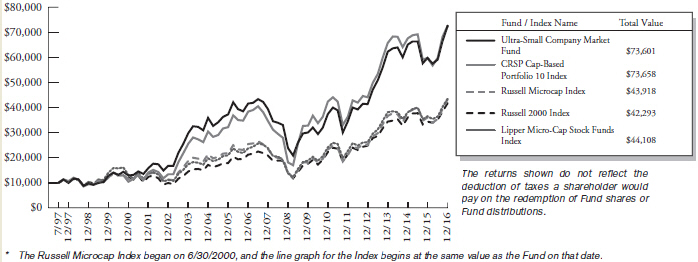
Detailed Explanation of Quarterly Performance
The Fund’s tilt toward stocks with high price momentum boosted relative performance, because momentum stocks in the CRSP-10 universe posted strong returns during the quarter. Relative performance also benefited from our sidestepping strategies, which reduce exposure to stocks with high probability of a steep price decline, major financial distress or bankruptcy. The Fund held about 20% of its assets in stocks that had appreciated out of the 10th CRSP decile. Those holdings generated better returns than the CRSP-10 benchmark, helping relative performance.
Holdings in the Health Care, Energy and Materials sectors helped the Fund outperform its benchmark. An underweight allocation to the lagging Health Care sector also helped. By contrast, holdings in the Information Technology sector hurt relative performance.
The table below presents index performance numbers for stocks in the different CRSP deciles during various time periods.
| | | | | | | | | | | | | | | | | | | | | | | | |
| | | | | | | | | | | | Annualized | |
| CRSP Decile1 | | Quarter | | | 6 Months | | | 1 Year | | | 5 Years | | | 10 Years | | | 91 Years | |
1 (ultra-large) | | | 4.28% | | | | 8.27% | | | | 11.63% | | | | 14.39% | | | | 6.80% | | | | 9.30% | |
2 | | | 4.09% | | | | 9.84% | | | | 16.97% | | | | 15.86% | | | | 8.17% | | | | 10.55% | |
3 | | | 4.46% | | | | 10.39% | | | | 16.83% | | | | 14.80% | | | | 8.14% | | | | 11.03% | |
4 | | | 6.30% | | | | 10.89% | | | | 13.49% | | | | 13.90% | | | | 8.47% | | | | 10.84% | |
5 | | | 6.06% | | | | 14.64% | | | | 16.95% | | | | 13.27% | | | | 9.24% | | | | 11.48% | |
6 | | | 5.02% | | | | 15.57% | | | | 18.79% | | | | 14.21% | | | | 8.07% | | | | 11.36% | |
7 | | | 9.24% | | | | 20.79% | | | | 25.23% | | | | 16.16% | | | | 9.01% | | | | 11.57% | |
8 | | | 9.58% | | | | 21.05% | | | | 21.59% | | | | 14.48% | | | | 8.34% | | | | 11.55% | |
9 | | | 12.05% | | | | 28.22% | | | | 30.92% | | | | 15.36% | | | | 8.01% | | | | 11.54% | |
10 (ultra-small) | | | 6.45% | | | | 21.34% | | | | 21.62% | | | | 14.87% | | | | 6.59% | | | | 13.29% | |
| 1 | Performance figures are as of the period ended December 31, 2016. The CRSP Cap-Based Portfolio Indexes are unmanaged indexes of publicly traded U.S. stocks with dividends reinvested, grouped by market capitalization, as reported by the Center for Research in Security Prices. Past performance is no guarantee of future results. |
| | |
| 24 | | Semi-Annual Report | December 31, 2016 (Unaudited) |
| | |
| Ultra-Small Company Market Fund | | |
| MANAGER’S COMMENTARY (Unaudited) (continued) | | |
| | |
Detailed Explanation of Calendar Year Performance
The Fund held about 25% of its assets on average in stocks that had appreciated out of the 10th CRSP decile. Those holdings hurt performance relative to the benchmark. The Fund’s momentum tilt, which provided greater exposure to high-momentum stocks while reducing exposure to low-momentum stocks, boosted relative performance. Our sidestepping strategies, which reduce exposure to stocks with high probability of a steep price decline, major financial distress or bankruptcy, also helped relative returns.
Holdings in the Financials, Materials, Information Technology and Consumer Discretionary sectors detracted from relative performance. By contrast, holdings in the Health Care and Energy sectors improved relative returns, as did an underweight position in Health Care and overweight stakes in Materials and Information Technology.
Top Ten Holdings as of December 31, 2016
| | | | | | |
| Rank | | Description | | Industry | | % of Net
Assets |
| 1 | | Utah Medical Products, Inc. | | Health Care Equipment & Supplies | | 0.7% |
| 2 | | Evolution Petroleum Corp. | | Oil, Gas & Consumable Fuels | | 0.6% |
| 3 | | Resolute Energy Corp. | | Oil, Gas & Consumable Fuels | | 0.6% |
| 4 | | Pioneer Energy Services Corp. | | Energy Equipment & Services | | 0.5% |
| 5 | | Dawson Geophysical Co. | | Energy Equipment & Services | | 0.5% |
| 6 | | Farmers Capital Bank Corp. | | Commercial Banks | | 0.5% |
| 7 | | Enzo Biochem,Inc. | | Life Sciences Tools & Services | | 0.5% |
| 8 | | Orion Group Holdings, Inc. | | Construction & Engineering | | 0.5% |
| 9 | | Home Bancorp Inc. | | Thrifts &Mortgage Finance | | 0.5% |
| 10 | | Achaogen, Inc. | | Pharmaceuticals | | 0.5% |
| | Total | | | | 5.4% |
Industry Sector Representation as of December 31, 2016
| | | | | | | | | | | | |
| | | % of Net Assets | | | % of CRSP 10 Index | | | Difference | |
Consumer Discretionary | | | 12.2% | | | | 11.9% | | | | 0.4% | |
Consumer Staples | | | 2.5% | | | | 2.4% | | | | 0.1% | |
Energy | | | 9.2% | | | | 11.4% | | | | -2.2% | |
Financials | | | 23.8% | | | | 24.2% | | | | -0.4% | |
Health Care | | | 16.1% | | | | 16.0% | | | | 0.2% | |
Industrials | | | 12.7% | | | | 12.2% | | | | 0.5% | |
Information Technology | | | 16.3% | | | | 15.3% | | | | 1.0% | |
Materials | | | 3.2% | | | | 3.1% | | | | 0.1% | |
Real Estate | | | 1.0% | | | | 1.4% | | | | -0.4% | |
Telecommunication Services | | | 0.8% | | | | 0.6% | | | | 0.2% | |
Utilities | | | 1.7% | | | | 1.6% | | | | 0.1% | |
Cash & Other Assets | | | 0.3% | | | | 0.0% | | | | 0.3% | |
Total | | | 100.0% | | | | 100.0% | | | | | |
Disclaimer
The views expressed here are exclusively those of Fund management. These views, including those related to market sectors or individual stocks, are not meant as investment advice and should not be considered predictive in nature. Any favorable (or unfavorable) description of a holding applies only as of the quarter end, December 31, 2016, unless otherwise stated. Security positions can and do change thereafter. Discussions of historical performance do not guarantee and may not be indicative of future performance.
| | |
| Ultra-Small Company Market Fund | |
|
| MANAGER’S COMMENTARY (Unaudited) (continued) | |
| | |
The Fund is subject to very high, above market risk (volatility) and is not an appropriate investment for short-term investors. Investments in ultra-small companies generally carry greater risk than is customarily associated with larger companies and even “small companies” for various reasons, such as narrower markets (fewer investors), limited financial resources and greater trading difficulty.
Conclusion
Thank you for your continued investment in Ultra-Small Company Market Fund. We encourage your feedback; your reactions and concerns are important to us.
Sincerely,
The Investment Management Team
| | |
| 26 | | Semi-Annual Report | December 31, 2016 (Unaudited) |
| | |
| Ultra-Small Company Market Fund | | |
| SCHEDULE OF INVESTMENTS | | |
| Showing percentage of net assets as of December 31, 2016 (Unaudited) | | |
| | | | | | | | | | | | |
| Industry Company | | Shares | | | Value | | | | |
| | |
COMMON STOCKS - 99.66% | | | | | | | | | |
Aerospace & Defense - 1.54% | | | | | | | | | |
Air Industries Group*+ | | | 80,000 | | | $ | 252,000 | | | | | |
Arotech Corp.*+ | | | 234,163 | | | | 819,570 | | | | | |
CPI Aerostructures, Inc.*+ | | | 40,079 | | | | 370,731 | | | | | |
Ducommun, Inc.* | | | 52,200 | | | | 1,334,232 | | | | | |
Innovative Solutions & Support, Inc.* | | | 172,054 | | | | 572,940 | | | | | |
LMI Aerospace, Inc.* | | | 54,558 | | | | 470,290 | | | | | |
SIFCO Industries, Inc.*+ | | | 55,046 | | | | 421,102 | | | | | |
Sparton Corp.* | | | 48,300 | | | | 1,151,955 | | | | | |
Sypris Solutions, Inc.* | | | 33,004 | | | | 29,040 | | | | | |
Tel-Instrument Electronics Corp.*+ | | | 15,000 | | | | 66,000 | | | | | |
| | | | | | | | | | | | |
| | | | | | | 5,487,860 | | | | | |
| | |
Air Freight & Logistics - 0.27% | | | | | | | | | |
Radiant Logistics, Inc.* | | | 247,200 | | | | 964,080 | | | | | |
| | |
Auto Components - 1.33% | | | | | | | | | |
China XD Plastics Co., Ltd.*+ | | | 56,000 | | | | 224,000 | | | | | |
Horizon Global Corp.* | | | 50,000 | | | | 1,200,000 | | | | | |
Shiloh Industries, Inc.* | | | 124,293 | | | | 858,865 | | | | | |
SORL Auto Parts, Inc.*+ | | | 109,900 | | | | 334,096 | | | | | |
Spartan Motors, Inc. | | | 148,200 | | | | 1,370,850 | | | | | |
Strattec Security Corp. | | | 19,100 | | | | 769,730 | | | | | |
| | | | | | | | | | | | |
| | | | | | | 4,757,541 | | | | | |
| | |
Beverages - 0.91% | | | | | | | | | |
Castle Brands, Inc.* | | | 899,187 | | | | 683,382 | | | | | |
Craft Brew Alliance, Inc.*+ | | | 81,840 | | | | 1,383,096 | | | | | |
Primo Water Corp.* | | | 79,830 | | | | 980,312 | | | | | |
Reed’s, Inc.*+ | | | 45,000 | | | | 184,500 | | | | | |
| | | | | | | | | | | | |
| | | | | | | 3,231,290 | | | | | |
| | |
Biotechnology - 7.49% | | | | | | | | | |
Actinium Pharmaceuticals, Inc.* | | | 240,200 | | | | 210,175 | | | | | |
Adverum Biotechnologies, Inc.* | | | 183,900 | | | | 533,310 | | | | | |
Aevi Genomic Medicine, Inc.*+ | | | 165,000 | | | | 854,700 | | | | | |
Akebia Therapeutics, Inc.*+ | | | 65,000 | | | | 676,650 | | | | | |
Aptevo Therapeutics, Inc.* | | | 5,150 | | | | 12,566 | | | | | |
Aquinox Pharmaceuticals, Inc.*+ | | | 50,000 | | | | 825,500 | | | | | |
Aratana Therapeutics, Inc.*+ | | | 86,983 | | | | 624,538 | | | | | |
Argos Therapeutics, Inc.*+ | | | 97,424 | | | | 477,378 | | | | | |
Arqule, Inc.* | | | 291,493 | | | | 367,281 | | | | | |
Asterias Biotherapeutics, Inc.*+ | | | 138,363 | | | | 636,470 | | | | | |
aTyr Pharma, Inc.*+ | | | 102,697 | | | | 220,799 | | | | | |
| | | | | | | | |
| Industry Company | | Shares | | | Value | |
|
| |
Biotechnology (continued) | | | | | | | | |
AVEO Pharmaceuticals, Inc.* | | | 380,000 | | | $ | 205,200 | |
Aviragen Therapeutics, Inc.* | | | 158,470 | | | | 194,918 | |
BioSpecifics Technologies Corp.* | | | 7,314 | | | | 407,390 | |
Calithera Biosciences, Inc.*+ | | | 158,100 | | | | 513,825 | |
Cara Therapeutics, Inc.*+ | | | 143,444 | | | | 1,332,595 | |
CareDx, Inc.*+ | | | 72,598 | | | | 196,015 | |
Catabasis Pharmaceuticals, Inc.*+ | | | 101,347 | | | | 365,863 | |
Cellular Biomedicine Group, Inc.*+ | | | 37,000 | | | | 484,700 | |
Cerulean Pharma, Inc.* | | | 202,623 | | | | 143,498 | |
ChemoCentryx, Inc.*+ | | | 48,496 | | | | 358,870 | |
Chiasma, Inc.*+ | | | 19,789 | | | | 38,589 | |
Cidara Therapeutics, Inc.*+ | | | 80,000 | | | | 832,000 | |
Codexis, Inc.* | | | 232,500 | | | | 1,069,500 | |
CoLucid Pharmaceuticals, Inc.*+ | | | 10,000 | | | | 364,000 | |
Conatus Pharmaceuticals, Inc.*+ | | | 103,000 | | | | 542,810 | |
Concert Pharmaceuticals, Inc.*+ | | | 28,200 | | | | 290,178 | |
CorMedix, Inc.*+ | | | 177,701 | | | | 271,883 | |
Curis, Inc.* | | | 265,960 | | | | 819,157 | |
Dicerna Pharmaceuticals, Inc.*+ | | | 85,000 | | | | 244,800 | |
Dimension Therapeutics, Inc.*+ | | | 41,400 | | | | 180,090 | |
Eiger BioPharmaceuticals, Inc.*+ | | | 28,165 | | | | 328,122 | |
Fate Therapeutics, Inc.*+ | | | 180,000 | | | | 451,800 | |
Flexion Therapeutics, Inc.*+ | | | 32,000 | | | | 608,640 | |
Genocea Biosciences, Inc.*+ | | | 119,000 | | | | 490,280 | |
GlycoMimetics, Inc.*+ | | | 81,764 | | | | 498,760 | |
Immunomedics, Inc.*+ | | | 288,900 | | | | 1,060,263 | |
Infinity Pharmaceuticals, Inc.*+ | | | 200,000 | | | | 270,000 | |
Invivo Therapeutics Holdings Corp.*+ | | | 66,350 | | | | 278,670 | |
IsoRay, Inc.* | | | 218,700 | | | | 126,846 | |
Kura Oncology, Inc.* | | | 63,000 | | | | 371,700 | |
MediciNova, Inc.*+ | | | 107,710 | | | | 649,491 | |
Minerva Neurosciences, Inc.*+ | | | 80,000 | | | | 940,000 | |
Mirna Therapeutics, Inc.* | | | 45,000 | | | | 81,000 | |
NanoViricides, Inc.*+ | | | 225,000 | | | | 240,750 | |
Neos Therapeutics, Inc.*+ | | | 65,000 | | | | 380,250 | |
Nivalis Therapeutics, Inc.* | | | 60,000 | | | | 134,400 | |
| | |
| Ultra-Small Company Market Fund | |
|
| SCHEDULE OF INVESTMENTS (continued) | |
| Showing percentage of net assets as of December 31, 2016 (Unaudited) | | |
| | | | | | | | |
| Industry Company | | Shares | | Value | | | |
| | |
Common Stocks (continued) | | | | | | |
Biotechnology (continued) | | | | | | |
Oncocyte Corp.*+ | | 100,000 | | $ 705,000 | | | | |
Oragenics, Inc.* | | 140,475 | | 75,856 | | | | |
OvaScience, Inc.*+ | | 184,400 | | 282,132 | | | | |
Pfenex, Inc.*+ | | 96,064 | | 871,300 | | | | |
PharmAthene, Inc.* | | 250,000 | | 812,500 | | | | |
Pronai Therapeutics, Inc.* | | 100,000 | | 149,000 | | | | |
Protalix BioTherapeutics, Inc.* | | 271,672 | | 120,894 | | | | |
Proteon Therapeutics, Inc.*+ | | 58,986 | | 112,073 | | | | |
REGENXBIO, Inc.* | | 27,852 | | 516,655 | | | | |
Regulus Therapeutics, Inc.*+ | | 210,700 | | 474,075 | | | | |
Rigel Pharmaceuticals, Inc.* | | 150,000 | | 357,000 | | | | |
Synthetic Biologics, Inc.*+ | | 344,905 | | 263,025 | | | | |
Tetraphase Pharmaceuticals, Inc.*+ | | 150,000 | | 604,500 | | | | |
Tokai Pharmaceuticals, Inc.*+ | | 100,000 | | 97,790 | | | | |
Verastem, Inc.* | | 53,900 | | 60,368 | | | | |
| | | | | | | | |
| | | | 26,708,388 | | | | |
| | |
Building Products - 0.21% | | | | | | |
Alpha Pro Tech, Ltd.*+ | | 211,200 | | 739,200 | | | | |
| | |
Capital Markets - 2.03% | | | | | | |
Calamos Asset Management, Inc., Class A | | 123,500 | | 1,055,925 | | | | |
Capitala Finance Corp.+ | | 81,280 | | 1,050,950 | | | | |
FBR & Co.+ | | 37,575 | | 488,475 | | | | |
Fifth Street Senior Floating Rate Corp. | | 103 | | 897 | | | | |
Horizon Technology Finance Corp.+ | | 20,000 | | 210,600 | | | | |
Institutional Financial Markets, Inc.+ | | 30,000 | | 35,700 | | | | |
JMP Group LLC+ | | 96,851 | | 594,665 | | | | |
KCAP Financial, Inc.+ | | 143,900 | | 572,722 | | | | |
Medallion Financial Corp.+ | | 145,411 | | 439,141 | | | | |
Monroe Capital Corp.+ | | 61,403 | | 944,378 | | | | |
Oppenheimer Holdings, Inc., Class A | | 31,550 | | 586,830 | | | | |
Pzena Investment Management, Inc., Class A | | 52,800 | | 586,608 | | | | |
Silvercrest Asset | | | | | | | | |
Management Group LLC, Class A | | 50,002 | | 657,526 | | | | |
| | | | | | | | |
| | | | 7,224,417 | | | | |
| | |
Chemicals - 0.92% | | | | | | |
Arcadia Biosciences, Inc.*+ | | 75,000 | | 69,000 | | | | |
BioAmber, Inc.*+ | | 166,700 | | 916,850 | | | | |
| | | | |
| Industry Company | | Shares | | Value |
|
|
Chemicals (continued) | | | | |
Core Molding Technologies, Inc.* | | 45,100 | | $ 771,661 |
Flexible Solutions International, Inc.* | | 1,200 | | 1,632 |
Gulf Resources, Inc.* | | 285,900 | | 557,505 |
KMG Chemicals, Inc. | | 10,000 | | 388,900 |
Marrone Bio Innovations, Inc.*+ | | 181,200 | | 387,768 |
Northern Technologies | | | | |
International Corp.*+ | | 13,950 | | 191,812 |
| | | | |
| | | | 3,285,128 |
Commercial Banks - 12.25% | | |
1st Constitution Bancorp+ | | 38,733 | | 724,307 |
Access National Corp.+ | | 33,500 | | 929,960 |
American National Bankshares, Inc. | | 31,746 | | 1,104,761 |
American River Bankshares* | | 56,000 | | 846,160 |
AmeriServ Financial, Inc. | | 155,671 | | 575,983 |
Anchor Bancorp, Inc.*+ | | 22,000 | | 598,400 |
Auburn National Bancorporation, Inc.+ | | 2,974 | | 93,116 |
Bank of Commerce Holdings+ | | 87,441 | | 830,689 |
Bankwell Financial Group, Inc. | | 8,000 | | 260,000 |
Bar Harbor Bankshares+ | | 18,050 | | 854,306 |
BCB Bancorp, Inc. | | 55,212 | | 717,756 |
C&F Financial Corp. | | 15,400 | | 767,690 |
Carolina Bank Holdings, Inc.* | | 27,000 | | 697,410 |
Century Bancorp, Inc., Class A | | 23,272 | | 1,396,320 |
Chemung Financial Corp.+ | | 29,998 | | 1,090,427 |
Citizens Holding Co.+ | | 20,670 | | 534,319 |
CM Finance, Inc. | | 35,000 | | 325,500 |
Codorus Valley Bancorp, Inc.+ | | 21,726 | | 621,351 |
Colony Bankcorp, Inc.* | | 22,868 | | 301,858 |
Community West Bancshares | | 38,357 | | 356,720 |
Eastern Virginia Bankshares, Inc. | | 48,000 | | 501,600 |
Evans Bancorp, Inc. | | 18,701 | | 590,017 |
Farmers Capital Bank Corp. | | 42,058 | | 1,768,539 |
First Bancorp, Inc. | | 30,800 | | 1,019,480 |
First Bancshares, Inc. (The)+ | | 40,194 | | 1,105,335 |
First Business Financial Services, Inc. | | 42,308 | | 1,003,546 |
First Northwest Bancorp* | | 15,000 | | 234,000 |
First South Bancorp, Inc. | | 56,980 | | 680,911 |
| | |
| 28 | | Semi-Annual Report | December 31, 2016 (Unaudited) |
| | |
| Ultra-Small Company Market Fund | | |
| SCHEDULE OF INVESTMENTS (continued) | | |
| Showing percentage of net assets as of December 31, 2016 (Unaudited) | | |
| | | | | | | | |
| Industry Company | | Shares | | Value | | | |
| | |
Common Stocks (continued) | | | | | | |
Commercial Banks (continued) | | | | | | |
First United Corp.* | | 9,200 | | $ 146,740 | | | | |
Landmark Bancorp, Inc.+ | | 12,165 | | 340,985 | | | | |
Macatawa Bank Corp. | | 51,500 | | 536,115 | | | | |
MBT Financial Corp. | | 119,185 | | 1,352,750 | | | | |
Medley Management, Inc., Class A | | 48,800 | | 483,120 | | | | |
MidSouth Bancorp, Inc. | | 60,600 | | 824,160 | | | | |
MSB Financial Corp./MD* | | 25,000 | | 367,500 | | | | |
MutualFirst Financial, Inc. | | 38,911 | | 1,287,954 | | | | |
Northeast Bancorp | | 35,000 | | 458,500 | | | | |
Northrim BanCorp, Inc. | | 34,750 | | 1,098,100 | | | | |
Ohio Valley Banc Corp.+ | | 19,500 | | 530,400 | | | | |
Old Second Bancorp, Inc. | | 118,690 | | 1,311,524 | | | | |
Pacific Mercantile Bancorp*+ | | 83,319 | | 608,229 | | | | |
Peapack Gladstone Financial Corp. | | 39,130 | | 1,208,334 | | | | |
Penns Woods Bancorp, Inc.+ | | 16,400 | | 828,200 | | | | |
Peoples Bancorp of North Carolina, Inc.+ | | 25,301 | | 634,296 | | | | |
Premier Financial Bancorp, Inc.+ | | 48,220 | | 969,222 | | | | |
Royal Bancshares of Pennsylvania, Inc., Class A* | | 78,195 | | 324,509 | | | | |
Select Bancorp, Inc.*+ | | 19,676 | | 193,809 | | | | |
Shore Bancshares, Inc. | | 83,400 | | 1,271,850 | | | | |
Sierra Bancorp | | 42,900 | | 1,140,711 | | | | |
Southern First Bancshares, Inc.* | | 32,215 | | 1,159,740 | | | | |
Southern National Bancorp of Virginia, Inc. | | 70,892 | | 1,158,375 | | | | |
Suffolk Bancorp | | 27,000 | | 1,156,140 | | | | |
Sussex Bancorp+ | | 23,000 | | 480,700 | | | | |
Two River Bancorp+ | | 38,065 | | 567,930 | | | | |
Union Bankshares, Inc./Morrisville VT+ | | 1,473 | | 66,948 | | | | |
Unity Bancorp, Inc.+ | | 41,500 | | 651,550 | | | | |
Veritex Holdings, Inc.* | | 20,000 | | 534,200 | | | | |
Western New England Bancorp, Inc. | | 158,362 | | 1,480,685 | | | | |
| | | | | | | | |
| | | | 43,703,737 | | | | |
| |
Commercial Services & Supplies - 1.41% | | | | |
Acme United Corp. | | 3,000 | | 76,740 | | | | |
AMREP Corp.* | | 17,000 | | 126,140 | | | | |
ARC Document Solutions, Inc.* | | 50,000 | | 254,000 | | | | |
Ascent Capital Group, Inc., Class A* | | 20,000 | | 325,200 | | | | |
Cenveo, Inc.* | | 32,762 | | 229,006 | | | | |
| | | | |
| Industry Company | | Shares | | Value |
| |
| | |
Commercial Services & Supplies (continued) |
CompX International, Inc. | | 3,200 | | $ 51,520 |
Ecology & Environment, Inc., Class A | | 3,000 | | 31,650 |
EnerNOC, Inc.*+ | | 179,100 | | 1,074,600 |
Fuel Tech, Inc.* | | 93,628 | | 107,672 |
Intersections, Inc.* | | 85,300 | | 340,347 |
Patriot National, Inc.*+ | | 105,000 | | 488,250 |
Performant Financial Corp.* | | 310,000 | | 728,500 |
TRC Cos., Inc.* | | 94,275 | | 999,315 |
Versar, Inc.* | | 129,938 | | 179,314 |
| | | | |
| | | | 5,012,254 |
Communications Equipment - 1.51% | | |
Black Box Corp. | | 31,764 | | 484,401 |
Communications Systems, Inc. | | 63,800 | | 295,394 |
EMCORE Corp. | | 98,702 | | 858,707 |
KVH Industries, Inc.* | | 84,510 | | 997,218 |
Numerex Corp., Class A*+ | | 50,008 | | 370,059 |
PC-Tel, Inc.+ | | 91,100 | | 490,118 |
RELM Wireless Corp. | | 243,744 | | 1,157,784 |
Tessco Technologies, Inc. | | 44,500 | | 578,500 |
Westell Technologies, Inc., Class A* | | 253,400 | | 164,710 |
| | | | |
| | | | 5,396,891 |
Computers & Peripherals - 1.34% | | |
AstroNova, Inc. | | 32,800 | | 467,400 |
Concurrent Computer Corp. | | 75,700 | | 404,995 |
Datalink Corp.* | | 123,700 | | 1,392,862 |
Imation Corp.* | | 145,100 | | 118,982 |
Intevac, Inc.* | | 82,933 | | 709,077 |
Quantum Corp.* | | 250,000 | | 208,025 |
Qumu Corp.* | | 85,200 | | 202,776 |
TransAct Technologies, Inc. | | 80,688 | | 532,541 |
USA Technologies, Inc.*+ | | 171,400 | | 737,020 |
| | | | |
| | | | 4,773,678 |
Construction & Engineering - 1.63% | | |
Goldfield Corp. (The)* | | 63,480 | | 323,748 |
Layne Christensen Co.*+ | | 36,430 | | 395,994 |
Northwest Pipe Co.* | | 50,295 | | 866,080 |
Orion Group Holdings, Inc.* | | 168,200 | | 1,673,590 |
Sterling Construction Co., Inc.* | | 182,736 | | 1,545,947 |
Willdan Group, Inc.* | | 45,000 | | 1,016,550 |
| | | | |
| | | | 5,821,909 |
Consumer Finance - 0.95% | | |
Asta Funding, Inc.* | | 122,300 | | 1,198,540 |
Atlanticus Holdings Corp.* | | 60,812 | | 173,314 |
| | |
| Ultra-Small Company Market Fund | |
|
| SCHEDULE OF INVESTMENTS (continued) | |
| Showing percentage of net assets as of December 31, 2016 (Unaudited) | | |
| | | | | | | | |
Industry Company | | Shares | | | Value | | |
| | |
Common Stocks (continued) | | | | | |
Consumer Finance (continued) | | | | | |
Consumer Portfolio Services, Inc.* | | | 155,100 | | | $ 794,112 | | |
Regional Management Corp.* | | | 47,000 | | | 1,235,160 | | |
| | | | | | | | |
| | | | | | 3,401,126 | | |
| | |
Containers & Packaging - 0.29% | | | | | |
AEP Industries, Inc. | | | 8,846 | | | 1,027,021 | | |
| | |
Distributors - 0.26% | | | | | |
AMCON Distributing Co.+ | | | 3,900 | | | 449,670 | | |
VOXX International Corp.* | | | 104,500 | | | 491,150 | | |
| | | | | | | | |
| | | | | | 940,820 | | |
| |
Diversified Consumer Services - 0.69% | | |
Collectors Universe, Inc. | | | 36,960 | | | 784,661 | | |
Liberty Tax, Inc.+ | | | 52,800 | | | 707,520 | | |
Lincoln Educational Services Corp.* | | | 153,400 | | | 294,528 | | |
National American University Holdings, Inc.+ | | | 350,988 | | | 684,427 | | |
| | | | | | | | |
| | | | | | 2,471,136 | | |
| |
Diversified Financial Services - 1.43% | | |
Ashford, Inc.* | | | 4,000 | | | 176,440 | | |
California First National Bancorp | | | 71,257 | | | 1,115,172 | | |
Emergent Capital, Inc.*+ | | | 102,454 | | | 123,969 | | |
FXCM, Inc.,
Class A*+ | | | 26,000 | | | 183,300 | | |
GAIN Capital Holdings, Inc. | | | 94,400 | | | 621,152 | | |
Impac Mortgage Holdings, Inc.*+ | | | 60,600 | | | 849,612 | | |
Marlin Business Services Corp. | | | 64,500 | | | 1,348,050 | | |
Stonegate Mortgage Corp.*+ | | | 115,000 | | | 686,550 | | |
| | | | | | | | |
| | | | | | 5,104,245 | | |
| |
Diversified Telecommunication Services - 1.16% | | |
Alaska Communications Systems Group, Inc.* | | | 243,000 | | | 398,520 | | |
Aviat Networks, Inc.* | | | 6,186 | | | 85,862 | | |
Hawaiian Telcom Holdco, Inc.* | | | 45,642 | | | 1,131,009 | | |
HC2 Holdings, Inc.* | | | 188,600 | | | 1,118,398 | | |
Hooper Holmes, Inc.* | | | 100,000 | | | 82,000 | | |
IDT Corp., Class B | | | 25,567 | | | 474,012 | | |
Ooma, Inc.*+ | | | 50,000 | | | 450,000 | | |
Straight Path Communications, Inc., Class B*+ | | | 12,143 | | | 411,769 | | |
| | | | | | | | |
| | | | | | 4,151,570 | | |
| | | | | | |
Industry Company | | Shares | | | Value |
| |
| | | |
Electric Utilities - 0.18% | | | | | | |
Spark Energy, Inc., Class A+ | | | 21,500 | | | $ 651,450 |
| |
Electrical Equipment - 0.62% | | | |
Allied Motion Technologies, Inc. | | | 35,650 | | | 762,553 |
Espey Manufacturing & Electronics Corp. | | | 10,700 | | | 273,385 |
Highpower International, Inc.* | | | 50,000 | | | 117,500 |
Preformed Line Products Co. | | | 8,489 | | | 493,381 |
Ultralife Corp.* | | | 112,400 | | | 556,380 |
| | | | | | |
| | | | | | 2,203,199 |
|
Electronic Equipment, Instruments & Components - 3.78% |
American Superconductor Corp.*+ | | | 37,025 | | | 272,874 |
Control4 Corp.* | | | 80,000 | | | 816,000 |
Echelon Corp.* | | | 30,000 | | | 141,000 |
Electro Scientific Industries, Inc.* | | | 126,700 | | | 750,064 |
Frequency Electronics, Inc.* | | | 41,000 | | | 442,800 |
ID Systems, Inc.* | | | 83,000 | | | 449,860 |
IEC Electronics Corp.* | | | 73,450 | | | 262,216 |
IntriCon Corp.* | | | 21,500 | | | 148,350 |
Iteris, Inc.* | | | 197,520 | | | 718,973 |
Kemet Corp.* | | | 197,800 | | | 1,311,414 |
Key Tronic Corp.* | | | 57,100 | | | 446,522 |
Maxwell Technologies, Inc.*+ | | | 80,000 | | | 409,600 |
MOCON, Inc. | | | 12,800 | | | 249,600 |
Napco Security Technologies Inc.*+ | | | 81,576 | | | 693,396 |
PAR Technology Corp.* | | | 104,750 | | | 584,505 |
PCM, Inc.* | | | 54,200 | | | 1,219,500 |
Perceptron, Inc.* | | | 80,000 | | | 531,200 |
Radisys Corp.* | | | 259,300 | | | 1,148,699 |
RF Industries, Ltd. | | | 35,000 | | | 61,250 |
Richardson Electronics, Ltd. | | | 102,011 | | | 642,669 |
SMTC Corp.* | | | 149,000 | | | 227,970 |
Vicon Industries, Inc.* | | | 29,900 | | | 17,940 |
Vishay Precision Group, Inc.* | | | 56,900 | | | 1,075,410 |
Wayside Technology Group, Inc. | | | 35,298 | | | 660,073 |
Wireless Telecom Group, Inc.* | | | 113,100 | | | 216,021 |
| | | | | | |
| | | | | | 13,497,906 |
| | |
| 30 | | Semi-Annual Report | December 31, 2016 (Unaudited) |
| | |
| Ultra-Small Company Market Fund | | |
| SCHEDULE OF INVESTMENTS (continued) | | |
| Showing percentage of net assets as of December 31, 2016 (Unaudited) | | |
| | | | | | |
| Industry Company | | Shares | | Value | | |
| | |
Common Stocks (continued) | | | | |
Energy Equipment & Services - 3.23% | | | | |
Dawson Geophysical Co.* | | 232,139 | | $ 1,866,398 | | |
Enservco Corp.* | | 227,398 | | 127,320 | | |
Era Group, Inc.* | | 71,650 | | 1,215,900 | | |
Geospace Technologies Corp.*+ | | 46,663 | | 950,059 | | |
Gulf Island Fabrication, Inc. | | 100,400 | | 1,194,760 | | |
Gulfmark Offshore, Inc., Class A* | | 115,800 | | 202,650 | | |
Mitcham Industries, Inc.* | | 141,900 | | 588,885 | | |
Natural Gas Services Group, Inc.* | | 47,185 | | 1,516,998 | | |
Pioneer Energy Services Corp.* | | 280,000 | | 1,918,000 | | |
SAExploration Holdings, Inc.*+ | | 718 | | 5,241 | | |
Superior Drilling Products, Inc.* | | 166,187 | | 219,367 | | |
Tidewater, Inc.+ | | 100,000 | | 341,000 | | |
Willbros Group, Inc.* | | 425,000 | | 1,377,000 | | |
| | | | | | |
| | | | 11,523,578 | | |
| | |
Food Products - 0.71% | | | | |
Griffin Industrial Realty, Inc. | | 13,300 | | 422,009 | | |
Inventure Foods, Inc.*+ | | 44,000 | | 433,400 | | |
Lifeway Foods, Inc.* | | 90,152 | | 1,037,650 | | |
Rocky Mountain Chocolate Factory, Inc.+ | | 10,000 | | 101,900 | | |
Seneca Foods Corp., Class A* | | 7,000 | | 280,350 | | |
TerraVia Holdings, Inc.*+ | | 212,696 | | 244,600 | | |
| | | | | | |
| | | | 2,519,909 | | |
| | |
Gas Utilities - 0.50% | | | | |
Delta Natural Gas Co., Inc. | | 40,000 | | 1,173,200 | | |
Gas Natural, Inc. | | 48,800 | | 612,440 | | |
| | | | | | |
| | | | 1,785,640 | | |
| |
Health Care Equipment & Supplies - 3.07% | | |
AdCare Health Systems, Inc.* | | 129,601 | | 189,217 | | |
Avinger, Inc.*+ | | 95,000 | | 351,500 | | |
CryoLife, Inc. | | 20,770 | | 397,745 | | |
Cutera, Inc.* | | 60,200 | | 1,044,470 | | |
Digirad Corp. | | 172,894 | | 864,470 | | |
Invuity, Inc.*+ | | 75,000 | | 431,250 | | |
Iridex Corp.*+ | | 45,500 | | 639,730 | | |
Kewaunee Scientific Corp.+ | | 14,000 | | 342,300 | | |
Lantheus Holdings, Inc.* | | 84,802 | | 729,297 | | |
Navidea Biopharmaceuticals, Inc.*+ | | 548,580 | | 344,728 | | |
Retractable Technologies, Inc.* | | 34,000 | | 31,620 | | |
| | | | |
| Industry Company | | Shares | | Value |
|
|
Health Care Equipment & Supplies (continued) |
Roka Bioscience, Inc.*+ | | 16,950 | | $ 71,868 |
RTI Surgical, Inc.* | | 70,000 | | 227,500 |
Seaspine Holdings Corp.* | | 65,800 | | 519,820 |
Sientra, Inc.*+ | | 134,200 | | 1,143,384 |
Span-America Medical Systems, Inc., Class A | | 3,000 | | 54,720 |
TransEnterix, Inc.*+ | | 175,000 | | 227,500 |
Unilife Corp.*+ | | 80,000 | | 184,000 |
Utah Medical Products, Inc. | | 33,900 | | 2,466,225 |
Veracyte, Inc.*+ | | 88,200 | | 682,668 |
| | | | |
| | | | 10,944,012 |
|
Health Care Providers & Services - 1.07% |
Addus HomeCare Corp.* | | 16,600 | | 581,830 |
Alliance HealthCare Services, Inc.* | | 48,436 | | 464,986 |
Almost Family, Inc.* | | 2,400 | | 105,840 |
BioScrip, Inc.*+ | | 46,338 | | 48,192 |
BioTelemetry, Inc.*+ | | 46,756 | | 1,044,997 |
InfuSystems Holdings, Inc.* | | 209,900 | | 535,245 |
Juniper Pharmaceuticals, Inc.*+ | | 59,200 | | 331,520 |
Nuvectra Corp.* | | 26,000 | | 130,780 |
RadNet, Inc.* | | 89,800 | | 579,210 |
| | | | |
| | | | 3,822,600 |
|
Hotels, Restaurants & Leisure - 2.44% |
Ark Restaurants Corp. | | 9,900 | | 240,075 |
Bravo Brio Restaurant Group, Inc.* | | 97,894 | | 371,997 |
Dover Downs Gaming & | | | | |
Entertainment, Inc.* | | 92,580 | | 95,357 |
Dover Motorsports, Inc. | | 82,896 | | 190,661 |
Famous Dave’s of America, Inc.*+ | | 45,200 | | 223,740 |
Gaming Partners International Corp. | | 56,300 | | 664,903 |
Golden Entertainment, Inc. | | 42,300 | | 512,253 |
Ignite Restaurant Group, Inc.*+ | | 173,100 | | 93,474 |
J Alexander’s Holdings, Inc.* | | 83,800 | | 900,850 |
Jamba, Inc.*+ | | 100,662 | | 1,036,819 |
Kona Grill, Inc.*+ | | 67,500 | | 847,125 |
Luby’s, Inc.* | | 135,600 | | 580,368 |
Monarch Casino & Resort, Inc.* | | 19,485 | | 502,323 |
Nathan’s Famous, Inc.* | | 12,000 | | 778,800 |
Nevada Gold & Casinos, Inc.* | | 120,000 | | 222,000 |
Papa Murphy’s Holdings, Inc.*+ | | 10,000 | | 42,200 |
Peak Resorts, Inc.+ | | 31,900 | | 177,045 |
| | |
| Ultra-Small Company Market Fund | |
|
| SCHEDULE OF INVESTMENTS (continued) | |
| Showing percentage of net assets as of December 31, 2016 (Unaudited) | | |
| | | | | | | | | | | | |
| Industry Company | | Shares | | | Value | | | | |
| | |
Common Stocks (continued) | | | | | | | | | |
Hotels, Restaurants & Leisure (continued) | | | | | | | | | |
Red Lion Hotels Corp.* | | | 74,900 | | | $ | 625,415 | | | | | |
Ruby Tuesday, Inc.* | | | 50,000 | | | | 161,500 | | | | | |
Town Sports International Holdings, Inc.* | | | 173,571 | | | | 433,928 | | | | | |
| | | | | | | | | | | | |
| | | | | | | 8,700,833 | | | | | |
| | |
Household Durables - 1.47% | | | | | | | | | |
Bassett Furniture Industries, Inc. | | | 12,234 | | | | 371,914 | | | | | |
CSS Industries, Inc. | | | 29,150 | | | | 789,090 | | | | | |
Dixie Group, Inc. (The)* | | | 100,600 | | | | 362,160 | | | | | |
Emerson Radio Corp.* | | | 198,100 | | | | 208,005 | | | | | |
Hooker Furniture Corp. | | | 32,227 | | | | 1,223,015 | | | | | |
Lifetime Brands, Inc. | | | 45,000 | | | | 798,750 | | | | | |
P&F Industries, Inc., Class A+ | | | 10,500 | | | | 86,835 | | | | | |
Stanley Furniture Co., Inc. | | | 129,383 | | | | 116,471 | | | | | |
Turtle Beach Corp.* | | | 267,416 | | | | 350,315 | | | | | |
UCP, Inc., Class A* | | | 30,500 | | | | 367,525 | | | | | |
ZAGG, Inc.* | | | 80,000 | | | | 568,000 | | | | | |
| | | | | | | | | | | | |
| | | | | | | 5,242,080 | | | | | |
| | |
Household Products - 0.44% | | | | | | | | | |
Oil-Dri Corp. of America | | | 27,500 | | | | 1,050,775 | | | | | |
Orchids Paper Products Co.+ | | | 20,000 | | | | 523,600 | | | | | |
| | | | | | | | | | | | |
| | | | | | | 1,574,375 | | | | | |
| | |
Independent Power Producers & Energy Traders - 0.27% | | | | | | | | | |
Genie Energy, Ltd., Class B+ | | | 98,667 | | | | 567,335 | | | | | |
Synthesis Energy Systems, Inc.* | | | 394,064 | | | | 394,064 | | | | | |
| | | | | | | | | | | | |
| | | | | | | 961,399 | | | | | |
| | |
Insurance - 1.50% | | | | | | | | | |
1347 Property Insurance Holdings, Inc.*+ | | | 38,400 | | | | 299,520 | | | | | |
Atlantic American Corp. | | | 21,056 | | | | 86,330 | | | | | |
eHealth, Inc.* | | | 45,000 | | | | 479,250 | | | | | |
Federated National Holding Co. | | | 38,000 | | | | 710,220 | | | | | |
First Acceptance Corp.* | | | 140,200 | | | | 145,808 | | | | | |
Hallmark Financial Services, Inc.* | | | 80,400 | | | | 935,052 | | | | | |
Health Insurance Innovations, Inc.,
Class A*+ | | | 26,900 | | | | 480,165 | | | | | |
Independence Holding Co. | | | 58,990 | | | | 1,153,254 | | | | | |
Investors Title Co. | | | 6,800 | | | | 1,075,624 | | | | | |
| | | | | | | | | | | | |
| | | | | | | 5,365,223 | | | | | |
| | | | | | | | |
| Industry Company | | Shares | | | Value | |
| |
| | | | | |
Internet & Catalog Retail - 0.41% | | | | | |
CafePress, Inc.* | | | 69,188 | | | $ | 203,413 | |
EVINE Live, Inc.* | | | 446,286 | | | | 669,429 | |
US Auto Parts Network, Inc.* | | | 164,751 | | | | 579,924 | |
| | | | | | | | |
| | | | | | | 1,452,766 | |
| |
Internet Software & Services - 4.25% | | | | | |
Amber Road, Inc.* | | | 92,800 | | | | 842,624 | |
BroadVision, Inc.*+ | | | 72,749 | | | | 338,283 | |
Carbonite, Inc.* | | | 22,400 | | | | 367,360 | |
Connecture, Inc.*+ | | | 205,000 | | | | 344,400 | |
DMC Global, Inc. | | | 86,458 | | | | 1,370,359 | |
Internap Corp.* | | | 233,600 | | | | 359,744 | |
Inuvo, Inc.* | | | 265,600 | | | | 443,552 | |
iPass, Inc.* | | | 50,000 | | | | 82,500 | |
Leaf Group, Ltd.* | | | 191,800 | | | | 1,256,290 | |
Limelight Networks, Inc.* | | | 276,537 | | | | 696,873 | |
Liquidity Services, Inc.* | | | 52,000 | | | | 507,000 | |
Marchex, Inc., Class B* | | | 195,500 | | | | 518,075 | |
Marin Software, Inc.* | | | 96,600 | | | | 227,010 | |
MaxPoint Interactive, Inc.* | | | 30,000 | | | | 180,000 | |
QuinStreet, Inc.* | | | 196,547 | | | | 739,017 | |
RealNetworks, Inc.* | | | 153,800 | | | | 747,468 | |
Reis, Inc. | | | 17,100 | | | | 380,475 | |
Rightside Group Ltd* | | | 87,056 | | | | 719,953 | |
Rocket Fuel, Inc.*+ | | | 229,112 | | | | 391,782 | |
Spark Networks, Inc.*+ | | | 249,500 | | | | 209,555 | |
Synacor, Inc.* | | | 100,000 | | | | 310,000 | |
TheStreet, Inc. | | | 342,700 | | | | 291,295 | |
Travelzoo, Inc.*+ | | | 70,000 | | | | 658,000 | |
Tremor Video, Inc.* | | | 460,200 | | | | 1,145,898 | |
Tucows, Inc., Class A*+ | | | 17,500 | | | | 616,875 | |
YuMe, Inc.*+ | | | 121,726 | | | | 435,779 | |
Zedge, Inc.,
Class B*+ | | | 16,855 | | | | 52,756 | |
Zix Corp.* | | | 187,582 | | | | 926,655 | |
| | | | | | | | |
| | | | | | | 15,159,578 | |
| |
IT Services - 1.77% | | | | | |
Computer Task Group, Inc. | | | 105,762 | | | | 445,258 | |
CSP, Inc.+ | | | 38,700 | | | | 409,446 | |
Edgewater Technology, Inc.* | | | 91,212 | | | | 684,090 | |
Everi Holdings, Inc.* | | | 13,500 | | | | 29,295 | |
Information Services Group, Inc.* | | | 196,600 | | | | 715,624 | |
Innodata, Inc.* | | | 294,955 | | | | 722,640 | |
Lionbridge Technologies, Inc.* | | | 36,200 | | | | 209,960 | |
Mattersight Corp.*+ | | | 164,896 | | | | 610,115 | |
NCI, Inc., Class A | | | 38,430 | | | | 536,098 | |
| | |
| 32 | | Semi-Annual Report | December 31, 2016 (Unaudited) |
| | |
| Ultra-Small Company Market Fund | | |
| SCHEDULE OF INVESTMENTS (continued) | | |
| Showing percentage of net assets as of December 31, 2016 (Unaudited) | | |
| | | | | | | | |
| Industry Company | | Shares | | Value | | | |
| | |
Common Stocks (continued) | | | | | | |
IT Services (continued) | | | | | | |
Newtek Business Services Corp.+ | | 18,200 | | $ 289,380 | | | | |
PRGX Global, Inc.* | | 178,800 | | 1,054,920 | | | | |
StarTek, Inc.* | | 65,000 | | 549,250 | | | | |
WidePoint Corp.* | | 70,447 | | 55,646 | | | | |
| | | | | | | | |
| | | | 6,311,722 | | | | |
| | |
Leisure Equipment & Products - 0.64% | | | | | | |
Arctic Cat, Inc.*+ | | 15,100 | | 226,802 | | | | |
Escalade, Inc. | | 39,780 | | 525,096 | | | | |
JAKKS Pacific, Inc.*+ | | 106,000 | | 545,900 | | | | |
Johnson Outdoors, Inc., Class A | | 24,800 | | 984,312 | | | | |
| | | | | | | | |
| | | | 2,282,110 | | | | |
| | |
Life Sciences Tools & Services - 0.83% | | | | | | |
Enzo Biochem, Inc.* | | 243,800 | | 1,691,972 | | | | |
Harvard Bioscience, Inc.* | | 317,017 | | 966,902 | | | | |
pSivida Corp.*+ | | 168,000 | | 287,280 | | | | |
| | | | | | | | |
| | | | 2,946,154 | | | | |
| | |
Machinery - 3.46% | | | | | | |
Ampco-Pittsburgh Corp. | | 57,999 | | 971,483 | | | | |
Chicago Rivet & Machine Co. | | 10,000 | | 416,000 | | | | |
Commercial Vehicle Group, Inc.* | | 131,000 | | 724,430 | | | | |
Eastern Co. (The) | | 33,600 | | 702,240 | | | | |
FreightCar America, Inc.+ | | 20,000 | | 298,600 | | | | |
Gencor Industries, Inc.* | | 80,250 | | 1,259,925 | | | | |
Graham Corp. | | 35,900 | | 795,185 | | | | |
Hardinge, Inc. | | 53,300 | | 590,564 | | | | |
Hurco Companies, Inc. | | 41,334 | | 1,368,155 | | | | |
Intelligent Systems Corp.+ | | 35,362 | | 149,935 | | | | |
Key Technology, Inc.* | | 23,900 | | 278,674 | | | | |
L.B. Foster Co., Class A | | 29,000 | | 394,400 | | | | |
L.S. Starrett Co. (The), Class A | | 38,136 | | 354,665 | | | | |
MFRI, Inc.* | | 71,100 | | 575,910 | | | | |
Miller Industries, Inc. | | 29,800 | | 788,210 | | | | |
Supreme Industries, Inc., Class A | | 92,993 | | 1,459,990 | | | | |
Twin Disc, Inc.*+ | | 56,600 | | 826,360 | | | | |
Unique Fabricating, Inc.+ | | 13,600 | | 198,560 | | | | |
Xerium Technologies, Inc.* | | 33,550 | | 188,551 | | | | |
| | | | | | | | |
| | | | 12,341,837 | | | | |
| | |
Media - 1.46% | | | | | | |
A.H. Belo Corp., Class A | | 34,900 | | 221,615 | | | | |
Ballantyne Strong, Inc.* | | 117,020 | | 936,160 | | | | |
Beasley Broadcast Group, Inc., Class A | | 28,125 | | 174,375 | | | | |
| | | | |
| Industry Company | | Shares | | Value |
| |
| | |
Media (continued) | | | | |
Emmis Communications | | | | |
Corp., Class A* | | 59,125 | | $ 193,930 |
Harte-Hanks, Inc. | | 175,000 | | 264,250 |
Lee Enterprises, Inc.*+ | | 220,000 | | 638,000 |
McClatchy Co. (The), | | | | |
Class A* | | 19,435 | | 256,153 |
Saga Communications, Inc., Class A | | 16,866 | | 848,360 |
Salem Media Group, Inc. | | 145,100 | | 906,875 |
Spanish Broadcasting | | | | |
System, Inc., Class A* | | 13,629 | | 41,568 |
Townsquare Media, Inc., Class A* | | 71,357 | | 742,826 |
| | | | |
| | | | 5,224,112 |
| |
Metals & Mining - 1.56% | | |
A.M. Castle & Co.* | | 121,400 | | 30,593 |
ALJ Regional Holdings, Inc.*+ | | 70,000 | | 307,300 |
A-Mark Precious Metals, Inc.+ | | 30,100 | | 586,950 |
Friedman Industries, Inc. | | 67,000 | | 446,220 |
Gold Resource Corp.+ | | 108,100 | | 470,235 |
Olympic Steel, Inc. | | 43,200 | | 1,046,736 |
Ryerson Holding Corp.* | | 89,000 | | 1,188,150 |
Synalloy Corp.*+ | | 77,400 | | 847,530 |
Universal Stainless & Alloy Products, Inc.*+ | | 48,286 | | 652,344 |
| | | | |
| | | | 5,576,058 |
| |
Multiline Retail - 0.33% | | |
Bon-Ton Stores, Inc. (The)* | | 120,439 | | 177,045 |
Flex Pharma, Inc.*+ | | 79,099 | | 417,643 |
Gaia, Inc.* | | 48,400 | | 418,660 |
Gordmans Stores, Inc.* | | 255,100 | | 174,744 |
| | | | |
| | | | 1,188,092 |
| |
Oil, Gas & Consumable Fuels - 5.91% | | |
Adams Resources & Energy, Inc. | | 22,300 | | 884,195 |
Aemetis, Inc.* | | 224,139 | | 311,553 |
Approach Resources, Inc.*+ | | 274,900 | | 920,915 |
Aspen Aerogels, Inc.* | | 171,130 | | 706,767 |
Bill Barrett Corp.*+ | | 52,100 | | 364,179 |
Bonanza Creek Energy, Inc.*+ | | 115,000 | | 117,300 |
Clayton Williams Energy, Inc.*+ | | 11,500 | | 1,371,490 |
Cloud Peak Energy, Inc.*+ | | 160,000 | | 897,600 |
Comstock Resources, Inc.*+ | | 85,480 | | 841,978 |
Contango Oil & Gas Co.* | | 75,000 | | 700,500 |
| | |
| Ultra-Small Company Market Fund | |
|
| SCHEDULE OF INVESTMENTS (continued) | |
| Showing percentage of net assets as of December 31, 2016 (Unaudited) | | |
| | | | | | | | |
| Industry Company | | Shares | | Value | | | |
Common Stocks (continued) | | | | | | |
Oil, Gas & Consumable Fuels (continued) | | | | | | |
Earthstone Energy, Inc.* | | 54,800 | | $ 752,952 | | | | |
Evolution Petroleum Corp. | | 217,123 | | 2,171,230 | | | | |
Gastar Exploration, Inc.* | | 345,200 | | 535,060 | | | | |
Harvest Natural Resources, Inc.*+ | | 56,125 | | 346,852 | | | | |
Independence Contract Drilling, Inc.* | | 148,000 | | 991,600 | | | | |
ION Geophysical Corp.*+ | | 85,150 | | 510,900 | | | | |
Jones Energy, Inc., Class A*+ | | 147,742 | | 738,710 | | | | |
Mexco Energy Corp.* | | 12,000 | | 60,000 | | | | |
Panhandle Oil & Gas, Inc., Class A | | 23,594 | | 555,639 | | | | |
PetroQuest Energy, Inc.* | | 136,573 | | 452,057 | | | | |
Resolute Energy Corp.* | | 48,000 | | 1,977,120 | | | | |
REX American Resources Corp.* | | 12,249 | | 1,209,589 | | | | |
Rex Energy Corp.* | | 465,300 | | 219,249 | | | | |
Ring Energy, Inc.*+ | | 38,358 | | 498,270 | | | | |
Triangle Petroleum Corp.* | | 271,000 | | 63,956 | | | | |
Uranium Energy Corp.*+ | | 145,000 | | 162,400 | | | | |
VAALCO Energy, Inc.* | | 237,100 | | 246,584 | | | | |
W&T Offshore, Inc.*+ | | 325,000 | | 900,250 | | | | |
Westmoreland Coal Co.* | | 75,000 | | 1,325,250 | | | | |
Yuma Energy, Inc.*+ | | 14,240 | | 48,416 | | | | |
Zion Oil & Gas, Inc.* | | 132,285 | | 181,230 | | | | |
| | | | | | | | |
| | | | 21,063,791 | | | | |
Paper & Forest Products - 0.05% | | | | | | |
Orient Paper, Inc.* | | 163,811 | | 190,021 | | | | |
Personal Products - 0.49% | | | | | | |
CCA Industries, Inc.*+ | | 15,752 | | 40,955 | | | | |
Mannatech, Inc. | | 13,600 | | 276,080 | | | | |
Natural Alternatives International, Inc.*+ | | 19,910 | | 224,983 | | | | |
Nutraceutical International Corp. | | 30,000 | | 1,048,500 | | | | |
United-Guardian, Inc. | | 10,000 | | 155,000 | | | | |
| | | | | | | | |
| | | | 1,745,518 | | | | |
Pharmaceuticals - 3.76% | | | | | | |
AcelRx Pharmaceuticals, Inc.*+ | | 243,650 | | 633,490 | | | | |
Achaogen, Inc.*+ | | 125,400 | | 1,632,708 | | | | |
Agile Therapeutics, Inc.*+ | | 98,034 | | 558,794 | | | | |
Alimera Sciences, Inc.*+ | | 234,444 | | 253,200 | | | | |
Corium International, Inc.*+ | | 85,000 | | 345,100 | | | | |
Cumberland Pharmaceuticals, Inc.* | | 202,500 | | 1,113,750 | | | | |
Durect Corp.* | | 608,600 | | 815,524 | | | | |
| | | | |
| Industry Company | | Shares | | Value |
| |
| | |
Pharmaceuticals (continued) | | |
Egalet Corp.*+ | | 166,950 | | $ 1,277,167 |
Endocyte, Inc.* | | 174,000 | | 443,700 |
Immune Design Corp.* | | 115,000 | | 632,500 |
Inotek Pharmaceuticals Corp.*+ | | 54,813 | | 334,359 |
Marinus Pharmaceuticals, Inc.* | | 30,000 | | 30,300 |
Ocera Therapeutics, Inc.* | | 90,000 | | 189,000 |
Ocular Therapeutix, Inc.*+ | | 100,000 | | 837,000 |
Pain Therapeutics, Inc.* | | 368,253 | | 209,978 |
Synutra International, Inc.*+ | | 75,900 | | 406,065 |
Tracon Pharmaceuticals, Inc.*+ | | 29,135 | | 142,762 |
Vital Therapies, Inc.*+ | | 90,000 | | 391,500 |
VIVUS, Inc.* | | 512,800 | | 589,720 |
vTv Therapeutics, Inc. Class A* | | 60,000 | | 289,800 |
Zafgen, Inc.*+ | | 124,351 | | 395,436 |
Zogenix, Inc.*+ | | 105,540 | | 1,282,311 |
Zynerba Pharmaceuticals, Inc.*+ | | 40,000 | | 623,600 |
| | | | |
| | | | 13,427,764 |
Professional Services - 1.87% | | |
CDI Corp.* | | 104,600 | | 774,040 |
CRA International, Inc. | | 39,500 | | 1,445,700 |
Franklin Covey Co.* | | 33,334 | | 671,680 |
Hill International, Inc.* | | 286,551 | | 1,246,497 |
Hudson Global, Inc. | | 304,760 | | 414,474 |
Mastech Digital, Inc.* | | 6,250 | | 42,562 |
RCM Technologies, Inc. | | 111,510 | | 709,204 |
Volt Information Sciences, Inc.* | | 81,576 | | 558,796 |
VSE Corp. | | 20,400 | | 792,336 |
| | | | |
| | | | 6,655,289 |
Real Estate Management &
Development - 0.89% | | |
AV Homes, Inc.*+ | | 37,800 | | 597,240 |
Consolidated-Tomoka Land Co. | | 21,249 | | 1,135,122 |
Maui Land & Pineapple Co., Inc.* | | 30,000 | | 217,500 |
Stratus Properties, Inc.* | | 37,150 | | 1,216,662 |
| | | | |
| | | | 3,166,524 |
Road & Rail - 0.58% | | |
Celadon Group, Inc.+ | | 77,600 | | 554,840 |
Covenant Transportation Group, Inc., Class A* | | 20,700 | | 400,338 |
| | |
34 | | Semi-Annual Report | December 31, 2016 (Unaudited) |
| | |
| Ultra-Small Company Market Fund | | |
| SCHEDULE OF INVESTMENTS (continued) | | |
| Showing percentage of net assets as of December 31, 2016 (Unaudited) | | |
| | | | | | |
| Industry Company | | Shares | | Value | | |
Common Stocks (continued) | | |
Road & Rail (continued) | | |
PAM Transportation Services, Inc.* | | 31,400 | | $ 815,772 | | |
USA Truck, Inc.* | | 35,000 | | 304,850 | | |
| | | | | | |
| | | | 2,075,800 | | |
Semiconductors & Semiconductor Equipment - 1.95% | | |
Amtech Systems, Inc.*+ | | 57,500 | | 244,375 | | |
AXT, Inc.* | | 201,006 | | 964,829 | | |
CyberOptics Corp.* | | 57,550 | | 1,502,055 | | |
GigPeak, Inc.* | | 221,900 | | 559,188 | | |
GSI Technology, Inc.* | | 161,417 | | 1,000,785 | | |
Intermolecular, Inc.* | | 347,600 | | 329,525 | | |
inTEST Corp.*+ | | 49,500 | | 227,700 | | |
Magnachip Semiconductor Corp.*+ | | 132,000 | | 818,400 | | |
Pixelworks, Inc.*+ | | 58,900 | | 164,920 | | |
Ultra Clean Holdings, Inc.* | | 118,377 | | 1,148,257 | | |
| | | | | | |
| | | | 6,960,034 | | |
Software - 2.05% | | |
American Software, Inc., Class A | | 35,700 | | 368,781 | | |
BSQUARE Corp.* | | 79,500 | | 465,075 | | |
Corindus Vascular Robotics, Inc.*+ | | 490,600 | | 342,635 | | |
Covisint Corp.*+ | | 187,200 | | 355,680 | | |
Exa Corp.* | | 74,150 | | 1,138,944 | | |
GlobalSCAPE, Inc. | | 121,700 | | 495,319 | | |
GSE Systems, Inc.*+ | | 195,125 | | 682,938 | | |
Guidance Software, Inc.*+ | | 134,481 | | 952,125 | | |
Inseego Corp.*+ | | 225,000 | | 549,000 | | |
Network-1 Technologies, Inc.* | | 50,000 | | 170,000 | | |
QAD, Inc., Class B | | 8,250 | | 210,788 | | |
Rosetta Stone, Inc.* | | 103,160 | | 919,156 | | |
Seachange International, Inc.* | | 119,000 | | 273,700 | | |
Upland Software, Inc.*+ | | 44,000 | | 393,800 | | |
| | | | | | |
| | | | 7,317,941 | | |
Specialty Retail - 1.87% | | |
Build-A-Bear Workshop, Inc.* | | 29,500 | | 405,625 | | |
Christopher & Banks Corp.* | | 132,200 | | 309,348 | | |
Container Store Group, Inc. (The)*+ | | 100,000 | | 635,000 | | |
Destination Maternity Corp.+ | | 69,155 | | 357,531 | | |
Destination XL Group, Inc.* | | 119,100 | | 506,175 | | |
hhgregg, Inc.*+ | | 100,000 | | 143,000 | | |
Kirkland’s, Inc.* | | 25,000 | | 387,750 | | |
New York & Co., Inc.* | | 308,500 | | 700,295 | | |
| | | | |
| Industry Company | | Shares | | Value |
| |
| | |
Specialty Retail (continued) | | | | |
Tandy Leather Factory, Inc.*+ | | 82,000 | | $ 664,200 |
Tilly’s, Inc., Class A* | | 102,175 | | 1,347,688 |
Trans World Entertainment Corp.* | | 98,403 | | 319,810 |
West Marine, Inc.* | | 85,432 | | 894,473 |
| | | | |
| | | | 6,670,895 |
Textiles, Apparel & Luxury Goods - 1.20% | | |
Charles & Colvard, Ltd.* | | 50,521 | | 55,573 |
Cherokee, Inc.*+ | | 16,100 | | 169,050 |
Culp, Inc.+ | | 26,016 | | 966,494 |
Delta Apparel, Inc.* | | 32,988 | | 683,841 |
Lakeland Industries, Inc.* | | 67,557 | | 702,593 |
Perry Ellis International, Inc.* | | 35,000 | | 871,850 |
Rocky Brands, Inc. | | 72,200 | | 833,910 |
| | | | |
| | | | 4,283,311 |
Thrifts & Mortgage Finance - 5.17% | | |
ASB Bancorp, Inc.*+ | | 21,000 | | 614,250 |
Atlantic Coast Financial Corp.* | | 57,150 | | 388,620 |
Bank Mutual Corp. | | 79,000 | | 746,550 |
Citizens Community Bancorp, Inc. | | 35,600 | | 442,508 |
Eagle Bancorp Montana, Inc.+ | | 6,289 | | 132,698 |
Entegra Financial Corp.* | | 26,800 | | 552,080 |
ESSA Bancorp, Inc. | | 59,000 | | 927,480 |
First Financial Northwest, Inc. | | 61,600 | | 1,215,984 |
Guaranty Federal Bancshares, Inc.+ | | 20,856 | | 441,730 |
Hawthorn Bancshares, Inc.+ | | 25,000 | | 441,250 |
Hingham Institution for Savings+ | | 2,500 | | 491,950 |
HMN Financial, Inc.* | | 30,000 | | 525,000 |
Home Bancorp, Inc. | | 42,300 | | 1,633,203 |
HopFed Bancorp, Inc. | | 32,988 | | 444,018 |
Lake Shore Bancorp, Inc.+ | | 22,150 | | 360,159 |
Lake Sunapee Bank Group | | 20,250 | | 477,698 |
Malvern Bancorp, Inc.*+ | | 37,800 | | 799,470 |
Provident Financial Holdings, Inc. | | 63,617 | | 1,286,336 |
Riverview Bancorp, Inc. | | 138,006 | | 966,042 |
Security National Financial Corp., Class A*+ | | 50,517 | | 328,360 |
SI Financial Group, Inc. | | 83,176 | | 1,280,910 |
Southern Missouri Bancorp, Inc.+ | | 45,800 | | 1,620,404 |
Territorial Bancorp, Inc. | | 22,300 | | 732,332 |
| | |
| Ultra-Small Company Market Fund | |
|
| SCHEDULE OF INVESTMENTS (continued) | |
| Showing percentage of net assets as of December 31, 2016 (Unaudited) | | |
| | | | | | | | |
| Industry Company | | Shares | | Value | | | |
| |
Common Stocks (continued) | | | | |
Thrifts & Mortgage Finance (continued) | | | | |
Timberland Bancorp, Inc. | | 49,022 | | $ 1,012,795 | | | | |
United Community Bancorp+ | | 26,200 | | 437,540 | | | | |
Wayne Savings Bancshares, Inc.+ | | 7,800 | | 128,700 | | | | |
| | | | | | | | |
| | | | 18,428,067 | | | | |
| |
Trading Companies & Distributors - 1.36% | | | | |
AeroCentury Corp.*+ | | 10,900 | | 103,005 | | | | |
CAI International, Inc.* | | 106,500 | | 923,355 | | | | |
Educational Development Corp.+ | | 34,000 | | 338,300 | | | | |
EnviroStar, Inc.+ | | 35,000 | | 507,500 | | | | |
General Finance Corp.*+ | | 136,723 | | 758,813 | | | | |
Houston Wire & Cable Co.+ | | 59,300 | | 385,450 | | | | |
Lawson Products, Inc.* | | 32,400 | | 771,120 | | | | |
Transcat, Inc.* | | 5,000 | | 54,000 | | | | |
Willis Lease Finance Corp.* | | 39,000 | | 997,620 | | | | |
| | | | | | | | |
| | | | 4,839,163 | | | | |
| |
Water Utilities - 0.90% | | | | |
Artesian Resources Corp., Class A | | 21,500 | | 686,710 | | | | |
Cadiz, Inc.*+ | | 96,700 | | 1,208,750 | | | | |
York Water Co., (The) | | 34,214 | | 1,306,975 | | | | |
| | | | | | | | |
| | | | 3,202,435 | | | | |
| | | | | | | | |
TOTAL COMMON STOCKS - 99.66% | | 355,503,477 | | | | |
| | | | | | | | |
| (Cost $267,952,632) | | | | | | | | |
| |
EXCHANGE TRADED FUND - 0.20% | | | | |
iShares Micro-Cap ETF+ | | 8,525 | | 731,786 | | | | |
| | | | | | | | |
TOTAL EXCHANGE TRADED
FUND - 0.20% | | 731,786 | | | | |
| | | | | | | | |
(Cost $218,805) | | | | | | | | |
| |
WARRANTS - 0.01% | | | | |
SAExploration Series A, expire 07/27/21*D | | 848 | | — | | | | |
SAExploration Series B, expire 07/27/21*D | | 848 | | — | | | | |
Asterias Biotherapeutics, Inc.,
expire 02/15/17*+ | | 27,672 | | 15,081 | | | | |
BioTime, Inc.,
expire 10/01/18*+ | | 16,058 | | 11,241 | | | | |
| | | | | | | | |
TOTAL WARRANTS - 0.01% | | 26,322 | | | | |
| | | | | | | | |
(Cost $36,343) | | | | | | | | |
| | | | | | |
| | | Rate^ | | Shares | | Value |
| INVESTMENTS PURCHASED WITH CASH PROCEEDS FROM SECURITIES LENDING - 13.27% |
Fidelity Institutional Government Portfolio Institutional Class** | | 0.43% | | 47,353,300 | | $ 47,353,300 |
| | | | | | |
TOTAL INVESTMENTS PURCHASED WITH CASH PROCEEDS FROM SECURITIES LENDING - 13.27% | | 47,353,300 |
| | | | | | |
(Cost $47,353,300) | | | | | | |
| |
TOTAL INVESTMENTS - 113.14% | | $403,614,885 |
(Cost $315,561,080) | | | | | | |
Liabilities in Excess of Other
Assets - (13.14%) | | (46,889,189) |
| | | | | | |
NET ASSETS - 100.00% | | $356,725,696 |
| | | | | | |
| * | Non-income producing security. |
| ** | This security represents the investment of the collateral received in connection with securities out on loan as of December 31, 2016. |
| ^ | Rate disclosed as of December 31, 2016. |
| D | Security was fair valued under procedures adopted by the Board of Directors (see Note 2). |
| + | This security or a portion of the security is out on loan as of December 31, 2016. Total loaned securities had a value of $45,214,621 as of December 31, 2016. |
LLC - Limited Liability Company
| | |
| 36 | | Semi-Annual Report | December 31, 2016 (Unaudited) |
| | |
| Ultra-Small Company Market Fund | | |
| SCHEDULE OF INVESTMENTS (continued) | | |
| Showing percentage of net assets as of December 31, 2016 (Unaudited) | | |
| | | | | | | | | | | | | | | | |
| Summary of inputs used to value the Fund’s investments as of 12/31/2016 (See Note 2 in Notes to Financial Statements): | |
| |
| | | Valuation Inputs | |
| |
| | | Investment in Securities (Value) | |
| |
| | | | | | Level 2 | | | Level 3 | | | | |
| | | Level 1 | | | Significant | | | Significant | | | | |
| | | Quoted | | | Observable | | | Unobservable | | | | |
| | | Prices | | | Inputs | | | Inputs | | | Total | |
| |
| | | | |
Common Stocks | | $ | 355,503,477 | | | $ | — | | | $ | — | | | $ | 355,503,477 | |
Exchange Traded Fund | | | 731,786 | | | | — | | | | — | | | | 731,786 | |
Warrants | | | 26,322 | | | | — | | | | — | | | | 26,322 | |
Investments Purchased with Cash Proceeds from Securities Lending | | | — | | | | 47,353,300 | | | | — | | | | 47,353,300 | |
| | | | | | | | | | | | | | | | |
TOTAL | | $ | 356,261,585 | | | $ | 47,353,300 | | | $ | — | | | $ | 403,614,885 | |
| | | | | | | | | | | | | | | | |
See Notes to Financial Statements.
| | |
| Small-Cap Momentum Fund | |
|
| MANAGER’S COMMENTARY (Unaudited) | |
| | |
December 31, 2016
Dear Fellow Small-Cap Momentum Fund Shareholder,
For the quarter ended December 31, 2016, our Fund returned 5.94%, underperforming our primary market benchmark, the Russell 2000 Index (+8.83%). It was a poor quarter on a relative basis.
For the six-month semi-annual period ended December 31, 2016, our Fund returned 11.56%, underperforming the Russell 2000 Index (+18.68%).
For the calendar year, our Fund returned 13.73%, lagging the Russell 2000 Index (+21.31%).
The table below presents the December quarter, six-month, one-year, five-year and inception-to-date financial results.
Standardized Returns as of December 31, 2016
| | | | | | | | | | | | | | | | | | | | | | |
| | | | | | | | | | | | | | | Annualized | | | |
| | | Quarter | | | 6 Months | | | 1 Year | | | 5 Year | | | Since Inception (5/28/10) | | | |
| | | | | | |
Small-Cap Momentum Fund | | | 5.94% | | | | 11.56% | | | | 13.73% | | | | 12.04% | | | 11.75% | | | | |
Russell 2000 Index | | | 8.83% | | | | 18.68% | | | | 21.31% | | | | 14.46% | | | 13.05% | | | | |
Performance figures quoted in the table above represent past performance and are no guarantee of future results. Total return figures in the table above include the reinvestment of dividends and capital gains. The table above does not reflect the deduction of taxes that a shareholder would pay on Fund distributions or on the redemption of Fund shares.
The Russell 2000 Index is an unmanaged, market value weighted index that measures performance of the 2,000 companies that are between the 1,000th and 3,000th largest in the market with dividends reinvested. It is not possible to invest directly in an index. Periods longer than one year are annualized.
According to data from Lipper as of December 31, 2016, Small-Cap Momentum Fund ranked 791st of 874 small-cap core funds for the 12 months ended December 31, 2016, 491st of 640 over the last five years, and 379th of 574 such funds since inception in May 2010. Lipper, a Thomson Reuters company, is an independent mutual fund rating service that ranks funds in various fund categories by making comparative calculations using total returns.
| | |
| 38 | | Semi-Annual Report | December 31, 2016 (Unaudited) |
| | |
| Small-Cap Momentum Fund | | |
| MANAGER’S COMMENTARY (Unaudited) (continued) | | |
| | |
Small-Cap Momentum Fund vs. Russell 2000 Index
from Inception 5/28/10 to 12/31/16
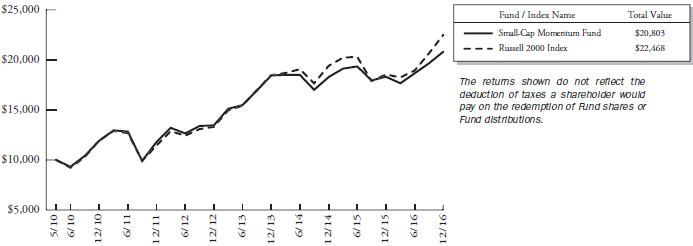
Detailed Explanation of Quarterly Performance
The momentum factor was out of favor during the quarter. As a result, the Fund’s holdings of higher momentum stocks underperformed the benchmark, hurting relative returns. However, the Fund’s risk-adjustment feature, which avoids some higher-volatility stocks, added to relative returns.
Detailed Explanation of Calendar Year Performance
Similar to the quarterly performance, the Fund’s exposure to higher momentum stocks hurt relative returns, as those stocks significantly underperformed. Losses were partially offset by the Fund’s risk-adjustment feature, which avoids some higher-volatility stocks.
Top Ten Holdings as of December 31, 2016
| | | | | | |
| Rank | | Description | | Industry | | % of Net Assets |
| 1 | | AK Steel Holding Corp. | | Metals & Mining | | 0.9% |
| 2 | | MKS Instruments, Inc. | | Semiconductors & Semiconductor Equipment | | 0.8% |
| 3 | | Integra LifeSciences Holdings Corp. | | Health Care Equipment & Supplies | | 0.8% |
| 4 | | PS Business Parks, Inc. | | Real Estate Investment Trusts | | 0.8% |
| 5 | | Tech Data Corp. | | Electronic Equipment, Instruments & Components | | 0.8% |
| 6 | | Education Realty Trust, Inc. | | Real Estate Investment Trusts | | 0.8% |
| 7 | | Greif, Inc. | | Containers & Packaging | | 0.8% |
| 8 | | National Health Investors, Inc. | | Real Estate Investment Trusts | | 0.8% |
| 9 | | InterDigital, Inc. | | Communications Equipment | | 0.8% |
| 10 | | MFA Financial, Inc. | | Real Estate Investment Trusts | | 0.7% |
| | Total | | | | 8.1% |
| | |
| Small-Cap Momentum Fund | |
|
| MANAGER’S COMMENTARY (Unaudited) (continued) | |
| | |
Industry Sector Representation as of December 31, 2016
| | | | | | | | | | | | | | | |
| | | % of Net Assets | | % of Russell 2000 Index | | Difference |
Consumer Discretionary | | | | 12.9 | % | | | | 12.6 | % | | | | 0.3% | |
Consumer Staples | | | | 5.1 | % | | | | 3.0 | % | | | | 2.1% | |
Energy | | | | 3.0 | % | | | | 3.8 | % | | | | -0.8% | |
Financials | | | | 9.3 | % | | | | 19.9 | % | | | | -10.6% | |
Health Care | | | | 6.3 | % | | | | 12.1 | % | | | | -5.8% | |
Industrials | | | | 15.1 | % | | | | 14.6 | % | | | | 0.5% | |
Information Technology | | | | 22.2 | % | | | | 17.0 | % | | | | 5.2% | |
Materials | | | | 10.2 | % | | | | 4.9 | % | | | | 5.4% | |
Real Estate | | | | 7.6 | % | | | | 7.9 | % | | | | -0.3% | |
Telecommunication Services | | | | 1.3 | % | | | | 0.7 | % | | | | 0.6% | |
Utilities | | | | 6.7 | % | | | | 3.5 | % | | | | 3.1% | |
Cash & Other Assets | | | | 0.3 | % | | | | 0.0 | % | | | | 0.3% | |
Total | | | | 100.0 | % | | | | 100.0 | % | | | | | |
Disclaimer
The views expressed here are exclusively those of Fund management. These views, including those related to market sectors or individual stocks, are not meant as investment advice and should not be considered predictive in nature. Any favorable (or unfavorable) description of a holding applies only as of December 31, 2016, unless otherwise stated. Security positions can and do change thereafter. Discussions of historical performance do not guarantee and are not indicative of future performance.
Market volatility can significantly impact short-term performance. The Fund is not an appropriate investment for short-term investors. Investments in small companies generally carry greater risk than is customarily associated with larger companies. This additional risk is attributable to a number of factors, including the relatively limited financial resources that are typically available to small companies and the fact that small companies often have comparatively limited product lines. In addition, the stock of small companies tends to be more volatile than the stock of large companies, particularly in the short term and particularly in the early stages of an economic or market downturn. Shareholders of the Fund, therefore, are taking on more risk than they would if they invested in the stock market as a whole.
Conclusion
Thank you for your continued investment in Small-Cap Momentum Fund. We encourage your feedback; your reactions and concerns are important to us.
Sincerely,
The Investment Management Team
| | |
| 40 | | Semi-Annual Report | December 31, 2016 (Unaudited) |
| | |
| Small-Cap Momentum Fund | | |
| SCHEDULE OF INVESTMENTS | | |
| Showing percentage of net assets as of December 31, 2016 (Unaudited) | | |
| | | | | | |
| Industry Company | | Shares | | Value | | |
| |
COMMON STOCKS - 99.72% | | |
Aerospace & Defense - 0.86% | | |
AAR Corp. | | 400 | | $13,220 | | |
DigitalGlobe, Inc.* | | 750 | | 21,488 | | |
KEYW Holding Corp.
(The)* | | 500 | | 5,895 | | |
| | | | | | |
| | | | 40,603 | | |
| |
Airlines - 0.50% | | |
SkyWest, Inc. | | 650 | | 23,692 | | |
| | |
Auto Components - 1.76% | | | | |
Cooper-Standard Holding, Inc.* | | 230 | | 23,777 | | |
Dorman Products, Inc.* | | 400 | | 29,224 | | |
Fox Factory Holding Corp.* | | 450 | | 12,488 | | |
Horizon Global Corp.* | | 250 | | 6,000 | | |
Spartan Motors, Inc. | | 400 | | 3,700 | | |
Superior Industries International, Inc. | | 300 | | 7,905 | | |
| | | | | | |
| | | | 83,094 | | |
| | |
Beverages - 0.68% | | | | |
Cott Corp. | | 1,700 | | 19,261 | | |
MGP Ingredients, Inc.+ | | 200 | | 9,996 | | |
Primo Water Corp.* | | 250 | | 3,070 | | |
| | | | | | |
| | | | 32,327 | | |
| | |
Biotechnology - 0.67% | | | | |
Codexis, Inc.* | | 500 | | 2,300 | | |
Foundation Medicine, Inc.*+ | | 450 | | 7,965 | | |
Kamada, Ltd.* | | 450 | | 2,452 | | |
PharmAthene, Inc.* | | 700 | | 2,275 | | |
Vanda Pharmaceuticals, Inc.* | | 550 | | 8,772 | | |
WaVe Life Sciences, Ltd.* | | 300 | | 7,845 | | |
| | | | | | |
| | | | 31,609 | | |
| | |
Building Products - 0.67% | | | | |
Gibraltar Industries, Inc.* | | 400 | | 16,660 | | |
Patrick Industries, Inc.* | | 200 | | 15,260 | | |
| | | | | | |
| | | | 31,920 | | |
| | |
Capital Markets - 0.22% | | | | |
Arlington Asset Investment
Corp., Class A+ | | 300 | | 4,446 | | |
PennantPark Investment
Corp. | | 750 | | 5,745 | | |
| | | | | | |
| | | | 10,191 | | |
| | |
Chemicals - 2.66% | | | | |
Balchem Corp. | | 400 | | 33,568 | | |
Chase Corp. | | 100 | | 8,355 | | |
Innophos Holdings, Inc. | | 250 | | 13,065 | | |
| | | | |
| Industry Company | | Shares | | Value |
|
|
Chemicals (continued) | | | | |
KMG Chemicals, Inc. | | 150 | | $ 5,834 |
Koppers Holdings, Inc.* | | 250 | | 10,075 |
Orion Engineered Carbons SA | | 700 | | 13,195 |
Quaker Chemical Corp. | | 150 | | 19,191 |
Stepan Co. | | 275 | | 22,407 |
| | | | |
| | | | 125,690 |
| |
Commercial Banks - 4.30% | | |
ACNB Corp.+ | | 50 | | 1,562 |
Arrow Financial Corp. | | 154 | | 6,237 |
BancFirst Corp. | | 200 | | 18,610 |
Bankwell Financial Group, Inc. | | 100 | | 3,250 |
Carolina Financial Corp. | | 150 | | 4,618 |
Central Valley Community Bancorp | | 100 | | 1,996 |
CNB Financial Corp. | | 200 | | 5,348 |
Commerce Union Bancshares, Inc. | | 100 | | 2,174 |
Farmers National Banc Corp. | | 300 | | 4,260 |
First BanCorp Puerto Rico* | | 2,600 | | 17,186 |
First Community Financial Partners, Inc.*+ | | 200 | | 2,340 |
First Mid-Illinois Bancshares, Inc.+ | | 150 | | 5,100 |
Franklin Financial Network,
Inc.* | | 150 | | 6,278 |
German American Bancorp,
Inc. | | 200 | | 10,522 |
Lakeland Bancorp, Inc. | | 550 | | 10,725 |
Macatawa Bank Corp. | | 350 | | 3,644 |
MBT Financial Corp. | | 250 | | 2,838 |
MutualFirst Financial, Inc. | | 100 | | 3,310 |
NV5 Global, Inc.* | | 150 | | 5,010 |
Old Line Bancshares, Inc. | | 150 | | 3,597 |
Orrstown Financial Services, Inc. | | 100 | | 2,240 |
Peoples Bancorp, Inc. | | 200 | | 6,492 |
People’s Utah Bancorp | | 200 | | 5,370 |
Premier Financial Bancorp, Inc. | | 110 | | 2,211 |
Provident Bancorp, Inc.* | | 100 | | 1,790 |
QCR Holdings, Inc. | | 150 | | 6,495 |
Republic Bancorp, Inc., Class A | | 200 | | 7,908 |
Southern National Bancorp of Virginia, Inc. | | 150 | | 2,451 |
Stock Yards Bancorp, Inc. | | 275 | | 12,911 |
Tompkins Financial Corp. | | 200 | | 18,908 |
| | |
| Small-Cap Momentum Fund | |
|
| SCHEDULE OF INVESTMENTS (continued) | |
| Showing percentage of net assets as of December 31, 2016 (Unaudited) | | |
| | | | | | |
| Industry Company | | Shares | | Value | | |
| | | |
Common Stocks (continued) | | | | | | |
Commercial Banks (continued) | | | | |
TriState Capital Holdings, Inc.* | | 350 | | $ 7,735 | | |
Union Bankshares, Inc./Morrisville VT+ | | 50 | | 2,272 | | |
Xenith Bankshares, Inc.*+ | | 285 | | 8,037 | | |
| | | | | | |
| | | | 203,425 | | |
| | |
Commercial Services & Supplies - 4.92% | | | | |
ABM Industries, Inc. | | 700 | | 28,588 | | |
ACCO Brands Corp.* | | 1,300 | | 16,965 | | |
Alarm.com Holdings, Inc.* | | 550 | | 15,306 | | |
Casella Waste Systems, Inc., Class A* | | 500 | | 6,205 | | |
Hudson Technologies, Inc.* | | 450 | | 3,604 | | |
MSA Safety, Inc. | | 450 | | 31,198 | | |
Performant Financial Corp.* | | 600 | | 1,410 | | |
Quad/Graphics, Inc. | | 450 | | 12,096 | | |
Sotheby’s* | | 650 | | 25,909 | | |
Tetra Tech, Inc. | | 700 | | 30,205 | | |
Travelport Worldwide, Ltd. | | 1,500 | | 21,150 | | |
UniFirst Corp. | | 200 | | 28,730 | | |
Viad Corp. | | 250 | | 11,025 | | |
| | | | | | |
| | | | 232,391 | | |
| | |
Communications Equipment - 2.29% | | | | |
Bel Fuse, Inc., Class B | | 150 | | 4,635 | | |
Clearfield, Inc.*+ | | 150 | | 3,105 | | |
Gigamon, Inc.* | | 450 | | 20,498 | | |
InterDigital, Inc. | | 400 | | 36,540 | | |
NETGEAR, Inc.* | | 400 | | 21,740 | | |
Oclaro, Inc.* | | 1,950 | | 17,452 | | |
Silicom, Ltd. | | 100 | | 4,109 | | |
| | | | | | |
| | | | 108,079 | | |
| | |
Computers & Peripherals - 0.04% | | | | |
USA Technologies, Inc.*+ | | 400 | | 1,720 | | |
| | |
Construction & Engineering - 1.66% | | | | |
Argan, Inc. | | 200 | | 14,110 | | |
Granite Construction, Inc. | | 500 | | 27,500 | | |
IES Holdings, Inc.* | | 250 | | 4,788 | | |
Installed Building Products, Inc.* | | 400 | | 16,520 | | |
Layne Christensen Co.* | | 250 | | 2,718 | | |
MYR Group, Inc.* | | 200 | | 7,536 | | |
Orion Group Holdings, Inc.* | | 300 | | 2,985 | | |
Sterling Construction Co., Inc.* | | 300 | | 2,538 | | |
| | | | | | |
| | | | 78,695 | | |
| | | | |
| Industry Company | | Shares | | Value |
|
|
Construction Materials - 0.08% | | |
United States Lime & Minerals, Inc. | | 50 | | $ 3,788 |
| |
Consumer Discretionary - 0.97% | | |
Avon Products, Inc.* | | 5,350 | | 26,964 |
Revlon, Inc., Class A* | | 650 | | 18,948 |
| | | | |
| | | | 45,912 |
| |
Consumer Finance - 1.02% | | |
Cardtronics PLC, Class A* | | 550 | | 30,014 |
Green Dot Corp., Class A* | | 600 | | 14,130 |
Regional Management Corp.* | | 150 | | 3,942 |
| | | | |
| | | | 48,086 |
| |
Containers & Packaging - 0.84% | | |
Greif, Inc., Class B+ | | 550 | | 37,152 |
UFP Technologies, Inc.* | | 100 | | 2,545 |
| | | | |
| | | | 39,697 |
| |
Diversified Consumer Services - 0.67% | | |
2U, Inc.* | | 550 | | 16,582 |
Capella Education Co. | | 150 | | 13,170 |
Collectors Universe, Inc. | | 100 | | 2,123 |
| | | | |
| | | | 31,875 |
| |
Diversified Financial Services - 0.09% | | |
Summit Financial Group, Inc.+ | | 150 | | 4,130 |
|
Diversified Telecommunication Services - 1.19% |
Cogent Communications Holdings, Inc. | | 550 | | 22,742 |
Consolidated Communications Holdings, Inc.+ | | 650 | | 17,452 |
IDT Corp., Class B | | 250 | | 4,635 |
Lumos Networks Corp.* | | 300 | | 4,686 |
ORBCOMM, Inc.* | | 800 | | 6,616 |
| | | | |
| | | | 56,131 |
| |
Electric Utilities - 2.16% | | |
MGE Energy, Inc. | | 450 | | 29,385 |
NRG Yield, Inc.+ | | 1,150 | | 18,170 |
Otter Tail Corp. | | 500 | | 20,400 |
PNM Resources, Inc. | | 1,000 | | 34,300 |
| | | | |
| | | | 102,255 |
| |
Electrical Equipment - 2.46% | | |
Brady Corp., Class A | | 550 | | 20,652 |
| | |
| 42 | | Semi-Annual Report | December 31, 2016 (Unaudited) |
| | |
| Small-Cap Momentum Fund | | |
| SCHEDULE OF INVESTMENTS (continued) | | |
| Showing percentage of net assets as of December 31, 2016 (Unaudited) | | |
| | | | | | |
| Industry Company | | Shares | | Value | | |
| | | |
Common Stocks (continued) | | | | | | |
Electrical Equipment (continued) | | | | |
Energizer Holdings, Inc. | | 750 | | $ 33,458 | | |
Franklin Electric Co., Inc. | | 550 | | 21,395 | | |
II-VI, Inc.* | | 750 | | 22,238 | | |
Orbotech, Ltd.* | | 550 | | 18,376 | | |
| | | | | | |
| | | | 116,119 | | |
| | |
Electronic Equipment, Instruments & Components - 6.06% | | | | |
Benchmark Electronics, Inc.* | | 600 | | 18,300 | | |
Control4 Corp.* | | 250 | | 2,550 | | |
Fabrinet* | | 450 | | 18,135 | | |
Itron, Inc.* | | 450 | | 28,282 | | |
Ituran Location And Control, Ltd. | | 250 | | 6,625 | | |
Kimball Electronics, Inc.* | | 300 | | 5,460 | | |
Lumentum Holdings, Inc.* | | 725 | | 28,021 | | |
Mercury Systems, Inc.* | | 500 | | 15,110 | | |
Napco Security Technologies, Inc.* | | 250 | | 2,125 | | |
PC Connection, Inc. | | 300 | | 8,427 | | |
PCM, Inc.* | | 150 | | 3,375 | | |
Plexus Corp.* | | 400 | | 21,616 | | |
Radisys Corp.* | | 400 | | 1,772 | | |
Sanmina Corp.* | | 900 | | 32,985 | | |
SPX Corp.* | | 500 | | 11,860 | | |
Tech Data Corp.* | | 450 | | 38,106 | | |
TTM Technologies, Inc.* | | 1,250 | | 17,038 | | |
Vishay Intertechnology, Inc.+ | | 1,650 | | 26,730 | | |
| | | | | | |
| | | | 286,517 | | |
| | |
Energy - 0.42% | | | | |
Pattern Energy Group, Inc. | | 1,050 | | 19,940 | | |
| | |
Energy Equipment & Services - 0.58% | | | | |
Forum Energy Technologies, Inc.* | | 1,100 | | 24,200 | | |
Geospace Technologies Corp.*+ | | 150 | | 3,054 | | |
| | | | | | |
| | | | 27,254 | | |
| | |
Food & Staples Retailing - 0.52% | | | | |
Village Super Market, Inc., Class A | | 100 | | 3,090 | | |
Weis Markets, Inc. | | 325 | | 21,723 | | |
| | | | | | |
| | | | 24,813 | | |
| | |
Food Products - 1.24% | | | | |
Adecoagro SA* | | 1,500 | | 15,570 | | |
Cosan, Ltd., Class A | | 2,200 | | 16,522 | | |
Sanderson Farms, Inc.+ | | 280 | | 26,387 | | |
| | | | | | |
| | | | 58,479 | | |
| | | | |
| Industry Company | | Shares | | Value |
|
|
Gas Utilities - 1.44% | | | | |
Chesapeake Utilities Corp. | | 200 | | $ 13,390 |
Northwest Natural Gas Co. | | 350 | | 20,930 |
South Jersey Industries, Inc. | | 1,000 | | 33,690 |
| | | | |
| | | | 68,010 |
Health Care Equipment & Supplies - 4.11% | | |
AngioDynamics, Inc.* | | 450 | | 7,591 |
AxoGen, Inc.* | | 400 | | 3,600 |
CRH Medical Corp.* | | 900 | | 4,725 |
CryoLife, Inc. | | 350 | | 6,702 |
Exactech, Inc.* | | 150 | | 4,095 |
Inogen, Inc.* | | 250 | | 16,792 |
Integra LifeSciences
Holdings Corp.* | | 450 | | 38,606 |
Iridex Corp.*+ | | 100 | | 1,406 |
LeMaitre Vascular, Inc. | | 250 | | 6,335 |
Merit Medical Systems, Inc.* | | 550 | | 14,575 |
Nevro Corp.*+ | | 350 | | 25,431 |
Penumbra, Inc.*+ | | 400 | | 25,520 |
Spectranetics Corp.* | | 550 | | 13,475 |
SurModics, Inc.* | | 150 | | 3,810 |
Zeltiq Aesthetics, Inc.* | | 500 | | 21,760 |
| | | | |
| | | | 194,423 |
Health Care Providers & Services - 0.40% | | |
BioScrip, Inc.* | | 1,400 | | 1,456 |
RadNet, Inc.* | | 550 | | 3,548 |
Trupanion, Inc.* | | 300 | | 4,656 |
U.S. Physical Therapy, Inc. | | 130 | | 9,126 |
| | | | |
| | | | 18,786 |
Health Care Technology - 0.48% | | |
Omnicell, Inc.* | | 475 | | 16,102 |
Vocera Communications, Inc.* | | 350 | | 6,472 |
| | | | |
| | | | 22,574 |
Hotels, Restaurants & Leisure - 2.29% | | |
Belmond, Ltd., Class A* | | 1,250 | | 16,688 |
Biglari Holdings, Inc.* | | 25 | | 11,830 |
Brinker International, Inc.+ | | 600 | | 29,718 |
Denny’s Corp.* | | 900 | | 11,547 |
Golden Entertainment, Inc. | | 250 | | 3,028 |
Intrawest Resorts Holdings, Inc.* | | 500 | | 8,925 |
Marcus Corp. (The) | | 250 | | 7,875 |
Monarch Casino & Resort, Inc.* | | 200 | | 5,156 |
Nathan’s Famous, Inc.* | | 50 | | 3,245 |
| | |
| Small-Cap Momentum Fund | |
|
| SCHEDULE OF INVESTMENTS (continued) | |
| Showing percentage of net assets as of December 31, 2016 (Unaudited) | | |
| | | | | | | | |
| Industry Company | | Shares | | Value | | | |
| | |
Common Stocks (continued) | | | | | | |
Hotels, Restaurants & Leisure (continued) | | | | | | |
Wingstop, Inc.+ | | 350 | | $ 10,356 | | | | |
| | | | | | | | |
| | | | 108,368 | | | | |
| | | |
Household Durables - 0.80% | | | | | | | | |
iRobot Corp.* | | 350 | | 20,458 | | | | |
NACCO Industries, Inc.,
Class A | | 50 | | 4,528 | | | | |
Universal Electronics, Inc.* | | 200 | | 12,910 | | | | |
| | | | | | | | |
| | | | 37,896 | | | | |
| | |
Household Products - 0.67% | | | | | | |
Central Garden & Pet Co.,
Class A* | | 650 | | 20,085 | | | | |
Oil-Dri Corp. of America | | 50 | | 1,910 | | | | |
SodaStream International,
Ltd.* | | 250 | | 9,868 | | | | |
| | | | | | | | |
| | | | 31,863 | | | | |
| | |
Independent Power Producers & Energy Traders - 0.68% | | | | | | |
Ormat Technologies, Inc. | | 600 | | 32,172 | | | | |
| | |
Insurance - 0.69% | | | | | | |
Blue Capital Reinsurance
Holdings, Ltd. | | 100 | | 1,845 | | | | |
Crawford & Co., Class A | | 750 | | 7,102 | | | | |
Donegal Group, Inc.,
Class A | | 300 | | 5,244 | | | | |
Independence Holding Co. | | 200 | | 3,910 | | | | |
Safety Insurance Group,
Inc. | | 200 | | 14,740 | | | | |
| | | | | | | | |
| | | | 32,841 | | | | |
| | |
Internet & Catalog Retail - 0.36% | | | | | | |
1-800-Flowers.com, Inc.,
Class A* | | 450 | | 4,815 | | | | |
Nutrisystem, Inc. | | 350 | | 12,128 | | | | |
| | | | | | | | |
| | | | 16,943 | | | | |
| | |
Internet Software & Services - 3.40% | | | | | | |
Amber Road, Inc.* | | 300 | | 2,724 | | | | |
Brightcove, Inc.* | | 350 | | 2,818 | | | | |
Carbonite, Inc.* | | 350 | | 5,740 | | | | |
CommVault Systems, Inc.* | | 550 | | 28,270 | | | | |
Etsy, Inc.* | | 1,400 | | 16,492 | | | | |
Five9, Inc.* | | 650 | | 9,224 | | | | |
MeetMe, Inc.*+ | | 500 | | 2,465 | | | | |
Mimecast, Ltd.* | | 700 | | 12,530 | | | | |
Shutterstock, Inc.*+ | | 400 | | 19,008 | | | | |
Tessera Holding Corp. | | 600 | | 26,520 | | | | |
Tucows, Inc., Class A*+ | | 150 | | 5,288 | | | | |
Varonis Systems, Inc.* | | 300 | | 8,040 | | | | |
Wix.com, Ltd.* | | 480 | | 21,384 | | | | |
| | | | | | | | |
| | | | 160,503 | | | | |
| | | | |
| Industry Company | | Shares | | Value |
|
|
IT Services - 0.54% | | | | |
Acxiom Corp.* | | 950 | | $ 25,460 |
| |
Leisure Equipment & Products - 1.65% | | |
Johnson Outdoors, Inc.,
Class A | | 100 | | 3,969 |
LCI Industries | | 300 | | 32,325 |
Marine Products Corp. | | 450 | | 6,242 |
Planet Fitness, Inc., Class A | | 600 | | 12,060 |
Smith & Wesson Holding
Corp.*+ | | 600 | | 12,648 |
Sturm Ruger & Co., Inc.+ | | 200 | | 10,540 |
| | | | |
| | | | 77,784 |
| |
Machinery - 3.08% | | |
Astec Industries, Inc. | | 300 | | 20,238 |
Blue Bird Corp.* | | 300 | | 4,635 |
Chart Industries, Inc.* | | 350 | | 12,607 |
CIRCOR International, Inc. | | 200 | | 12,976 |
Douglas Dynamics, Inc. | | 250 | | 8,412 |
Energy Recovery, Inc.*+ | | 600 | | 6,210 |
Gencor Industries, Inc.* | | 150 | | 2,355 |
John Bean Technologies Corp. | | 350 | | 30,082 |
Lydall, Inc.* | | 200 | | 12,370 |
Mueller Water Products, Inc., Class A | | 1,950 | | 25,954 |
Supreme Industries, Inc., Class A | | 150 | | 2,355 |
Titan International, Inc.+ | | 650 | | 7,286 |
| | | | |
| | | | 145,480 |
| |
Materials - 0.66% | | |
Trinseo SA | | 525 | | 31,132 |
| | |
Media - 0.99% | | | | |
Clear Channel Outdoor Holdings, Inc., Class A | | 600 | | 3,030 |
Eros International PLC* | | 400 | | 5,220 |
TiVo Corp.* | | 1,450 | | 30,305 |
World Wrestling Entertainment, Inc.,
Class A+ | | 450 | | 8,280 |
| | | | |
| | | | 46,835 |
| |
Metals & Mining - 6.23% | | |
AK Steel Holding Corp.* | | 3,950 | | 40,329 |
Alamos Gold, Inc., Class A+ | | 3,350 | | 22,914 |
Asanko Gold, Inc.* | | 2,500 | | 7,650 |
Coeur Mining, Inc.* | | 2,250 | | 20,452 |
Endeavour Silver Corp.*+ | | 1,600 | | 5,632 |
Fairmount Santrol Holdings, Inc.* | | 2,550 | | 30,064 |
Fortuna Silver Mines, Inc.*+ | | 1,850 | | 10,452 |
| | |
| 44 | | Semi-Annual Report | December 31, 2016 (Unaudited) |
| | |
| Small-Cap Momentum Fund | | |
| SCHEDULE OF INVESTMENTS (continued) | | |
| Showing percentage of net assets as .of December 31, 2016 (Unaudited) | | |
| | | | | | | | |
| Industry Company | | Shares | | | Value | | |
| | |
Common Stocks (continued) | | | | | |
Metals & Mining (continued) | | |
Gold Resource Corp.+ | | | 700 | | | $ 3,045 | | |
Hecla Mining Co. | | | 5,100 | | | 26,724 | | |
IAMGOLD Corp.* | | | 5,750 | | | 22,138 | | |
Klondex Mines, Ltd.* | | | 1,950 | | | 9,106 | | |
MAG Silver Corp.*+ | | | 1,050 | | | 11,582 | | |
McEwen Mining, Inc. | | | 3,800 | | | 11,058 | | |
Mountain Province Diamonds, Inc.*+ | | | 1,950 | | | 9,750 | | |
Olympic Steel, Inc. | | | 150 | | | 3,634 | | |
Pan American Silver Corp. | | | 2,000 | | | 30,140 | | |
Richmont Mines, Inc.*+ | | | 600 | | | 3,900 | | |
Sandstorm Gold, Ltd.* | | | 2,000 | | | 7,800 | | |
Schnitzer Steel Industries, Inc., Class A | | | 350 | | | 8,995 | | |
SunCoke Energy, Inc.* | | | 800 | | | 9,072 | | |
| | | | | | | | |
| | | | | | 294,437 | | |
| |
Multi-Utilities - 0.68% | | |
Avista Corp. | | | 800 | | | 31,992 | | |
| |
Oil, Gas & Consumable Fuels - 1.39% | | |
Advantage Oil & Gas, Ltd.* | | | 2,250 | | | 15,187 | | |
Callon Petroleum Co.* | | | 1,900 | | | 29,203 | | |
Cloud Peak Energy, Inc.*+ | | | 800 | | | 4,488 | | |
Pacific Ethanol, Inc.* | | | 500 | | | 4,750 | | |
REX American Resources Corp.* | | | 80 | | | 7,900 | | |
Westmoreland Coal Co.* | | | 250 | | | 4,418 | | |
| | | | | | | | |
| | | | | | 65,946 | | |
| |
Paper & Forest Products - 0.36% | | |
Neenah Paper, Inc. | | | 200 | | | 17,040 | | |
| |
Personal Products - 1.27% | | |
HMS Holdings Corp.* | | | 1,050 | | | 19,068 | | |
Medifast, Inc. | | | 150 | | | 6,244 | | |
Nu Skin Enterprises, Inc., Class A | | | 650 | | | 31,057 | | |
Nutraceutical International Corp. | | | 100 | | | 3,495 | | |
| | | | | | | | |
| | | | | | 59,864 | | |
| |
Pharmaceuticals - 0.42% | | |
Corbus Pharmaceuticals Holdings, Inc.*+ | | | 550 | | | 4,648 | | |
Supernus Pharmaceuticals, Inc.* | | | 600 | | | 15,150 | | |
| | | | | | | | |
| | | | | | 19,798 | | |
| |
Professional Services - 1.87% | | |
CRA International, Inc. | | | 100 | | | 3,660 | | |
Franklin Covey Co.* | | | 150 | | | 3,022 | | |
| | | | | | |
| Industry Company | | Shares | | | Value |
|
|
Professional Services (continued) |
ICF International, Inc.* | | | 250 | | | $13,800 |
Insperity, Inc. | | | 275 | | | 19,511 |
Navigant Consulting, Inc.* | | | 600 | | | 15,708 |
WageWorks, Inc.* | | | 450 | | | 32,625 |
| | | | | | |
| | | | | | 88,326 |
|
Real Estate Investment Trusts (REITs) - 10.06% |
AG Mortgage Investment Trust, Inc. | | | 350 | | | 5,988 |
Agree Realty Corp. | | | 300 | | | 13,815 |
Anworth Mortgage Asset Corp. | | | 1,000 | | | 5,170 |
Armada Hoffler Properties, Inc. | | | 650 | | | 9,470 |
Bluerock Residential Growth, Inc. | | | 200 | | | 2,744 |
CareTrust, Inc. | | | 800 | | | 12,256 |
City Office, Inc. | | | 250 | | | 3,292 |
CYS Investments, Inc.+ | | | 1,850 | | | 14,300 |
EastGroup Properties, Inc. | | | 400 | | | 29,536 |
Education Realty Trust, Inc. | | | 900 | | | 38,070 |
Four Corners Property Trust, Inc. | | | 750 | | | 15,390 |
Getty Realty Corp. | | | 400 | | | 10,196 |
Gladstone Commercial Corp.+ | | | 300 | | | 6,030 |
Hannon Armstrong Sustainable Infrastructure Capital, Inc. | | | 600 | | | 11,394 |
Lexington Realty Trust | | | 2,950 | | | 31,860 |
LTC Properties, Inc. | | | 500 | | | 23,490 |
MFA Financial, Inc. | | | 4,550 | | | 34,716 |
Monmouth Real Estate Investment Corp. | | | 700 | | | 10,668 |
MTGE Investment Corp. | | | 500 | | | 7,850 |
National Health Investors, Inc. | | | 500 | | | 37,085 |
New Senior Investment Group, Inc. | | | 1,000 | | | 9,790 |
NexPoint Residential Trust, Inc. | | | 200 | | | 4,468 |
Orchid Island Capital, Inc.+ | | | 250 | | | 2,708 |
Owens Realty Mortgage, Inc. | | | 100 | | | 1,852 |
Preferred Apartment Communities, Inc., Class A | | | 250 | | | 3,728 |
PS Business Parks, Inc. | | | 330 | | | 38,452 |
QTS Realty Trust, Inc., Class A | | | 600 | | | 29,790 |
Resource Capital Corp.+ | | | 400 | | | 3,332 |
| | |
| Small-Cap Momentum Fund | |
|
| SCHEDULE OF INVESTMENTS (continued) | |
| Showing percentage of net assets as of December 31, 2016 (Unaudited) | | |
| | | | | | | | | | |
| Industry Company | | Shares | | | Value | | | |
| |
Common Stocks (continued) | | | | |
Real Estate Investment Trusts (REITs) (continued) | | | | |
Rexford Industrial Realty, Inc. | | | 800 | | | $ 18,552 | | | | |
Sabra Health Care REIT, Inc. | | | 800 | | | 19,536 | | | | |
Terreno Realty Corp. | | | 550 | | | 15,670 | | | | |
UMH Properties, Inc. | | | 300 | | | 4,515 | | | | |
| | | | | | | | | | |
| | | | | | 475,713 | | | | |
| |
Real Estate Management & Development - 0.23% | | | | |
AV Homes, Inc.*+ | | | 300 | | | 4,740 | | | | |
Community Healthcare Trust, Inc. | | | 150 | | | 3,454 | | | | |
Trinity Place Holdings, Inc.* | | | 300 | | | 2,781 | | | | |
| | | | | | | | | | |
| | | | | | 10,975 | | | | |
| |
Road & Rail - 0.42% | | | | |
Saia, Inc.* | | | 300 | | | 13,245 | | | | |
Student Transportation, Inc.+ | | | 1,150 | | | 6,428 | | | | |
| | | | | | | | | | |
| | | | | | 19,673 | | | | |
| |
Semiconductors & Semiconductor
Equipment - 5.39% | | | | |
Advanced Energy Industries, Inc.* | | | 500 | | | 27,375 | | | | |
Alpha & Omega Semiconductor, Ltd.* | | | 250 | | | 5,318 | | | | |
Axcelis Technologies, Inc.* | | | 350 | | | 5,092 | | | | |
AXT, Inc.* | | | 400 | | | 1,920 | | | | |
Brooks Automation, Inc. | | | 850 | | | 14,510 | | | | |
Cabot Microelectronics Corp. | | | 300 | | | 18,951 | | | | |
CyberOptics Corp.* | | | 100 | | | 2,610 | | | | |
Entegris, Inc.* | | | 1,750 | | | 31,325 | | | | |
Exar Corp.* | | | 500 | | | 5,390 | | | | |
Kulicke & Soffa Industries, Inc.* | | | 850 | | | 13,558 | | | | |
MKS Instruments, Inc. | | | 650 | | | 38,610 | | | | |
Nanometrics, Inc.* | | | 300 | | | 7,518 | | | | |
Nova Measuring Instruments, Ltd.* | | | 350 | | | 4,599 | | | | |
PDF Solutions, Inc.* | | | 400 | | | 9,020 | | | | |
Power Integrations, Inc. | | | 350 | | | 23,748 | | | | |
Rudolph Technologies, Inc.* | | | 350 | | | 8,172 | | | | |
Semtech Corp.* | | | 800 | | | 25,240 | | | | |
Ultra Clean Holdings, Inc.* | | | 350 | | | 3,395 | | | | |
Ultratech, Inc.* | | | 350 | | | 8,393 | | | | |
| | | | | | | | | | |
| | | | | | 254,744 | | | | |
| |
Software - 2.51% | | | | |
American Software, Inc., Class A | | | 300 | | | 3,099 | | | | |
| | | | | | |
| Industry Company | | Shares | | | Value |
|
|
Software (continued) |
Appfolio, Inc., Class A*+ | | | 150 | | | $ 3,577 |
Ebix, Inc.+ | | | 400 | | | 22,820 |
Ellie Mae, Inc.*+ | | | 400 | | | 33,472 |
Globant SA* | | | 400 | | | 13,340 |
Magic Software Enterprises, Ltd. | | | 550 | | | 3,658 |
RealPage, Inc.* | | | 1,000 | | | 30,000 |
Sapiens International Corp. NV | | | 600 | | | 8,604 |
| | | | | | |
| | | | | | 118,570 |
Specialty Retail - 2.99% |
America’s Car-Mart, Inc.* | | | 100 | | | 4,375 |
Big 5 Sporting Goods Corp.+ | | | 250 | | | 4,338 |
Children’s Place, Inc. (The) | | | 225 | | | 22,714 |
Duluth Holdings, Inc.,
Class B* | | | 400 | | | 10,160 |
Five Below, Inc.* | | | 750 | | | 29,970 |
Hibbett Sports, Inc.*+ | | | 250 | | | 9,325 |
MarineMax, Inc.* | | | 250 | | | 4,838 |
Murphy USA, Inc.* | | | 450 | | | 27,662 |
Ollie’s Bargain Outlet Holdings, Inc.*+ | | | 750 | | | 21,338 |
Shoe Carnival, Inc. | | | 250 | | | 6,745 |
| | | | | | |
| | | | | | 141,465 |
Textiles, Apparel & Luxury Goods - 0.56% |
Wolverine World Wide, Inc. | | | 1,200 | | | 26,340 |
Thrifts & Mortgage Finance - 0.95% |
Federal Agricultural Mortgage Corp., Class C | | | 150 | | | 8,590 |
First Financial Northwest, Inc. | | | 150 | | | 2,961 |
Greene County Bancorp, Inc.+ | | | 150 | | | 3,435 |
HomeStreet, Inc.* | | | 300 | | | 9,480 |
Meta Financial Group, Inc. | | | 100 | | | 10,290 |
United Community Financial Corp. | | | 500 | | | 4,470 |
Waterstone Financial, Inc. | | | 300 | | | 5,520 |
| | | | | | |
| | | | | | 44,746 |
Trading Companies & Distributors - 1.23% |
Kaman Corp. | | | 350 | | | 17,126 |
NOW, Inc.* | | | 1,350 | | | 27,634 |
Veritiv Corp.* | | | 200 | | | 10,750 |
Willis Lease Finance Corp.* | | | 100 | | | 2,558 |
| | | | | | |
| | | | | | 58,068 |
| | |
| 46 | | Semi-Annual Report | December 31, 2016 (Unaudited) |
| | |
| Small-Cap Momentum Fund | | |
| SCHEDULE OF INVESTMENTS (continued) | | |
| | |
| | | | | | | | | | |
| Industry Company | | | | Shares | | Value | | | |
| | | |
Common Stocks (continued) | | | | | | | | |
Water Utilities - 1.27% | | | | | | | | |
Cadiz, Inc.* | | 250 | | | $ 3,125 | | | |
California Water Service Group | | 600 | | | 20,340 | | | |
Connecticut Water Service, Inc. | | 150 | | | 8,378 | | | |
Middlesex Water Co. | | 200 | | | 8,588 | | | |
SJW Corp. | | 250 | | | 13,995 | | | |
York Water Co., (The) | | 150 | | | 5,730 | | | |
| | | | | | | | |
| | | | | 60,156 | | | |
Wireless Telecommunication Services - 0.12% | | | |
Boingo Wireless, Inc.* | | 450 | | | 5,486 | | | |
| | | | | | | | |
TOTAL COMMON STOCKS - 99.72% | | | 4,712,841 | | | |
| | | | | | | | |
(Cost $4,376,897) | | | | | | | | |
| |
EXCHANGE TRADED FUND - 0.25% | | | |
iShares Russell 2000 ETF | | 90 | | | 12,136 | | | |
| | | | | | | | |
TOTAL EXCHANGE TRADED
FUND - 0.25% | | | 12,136 | | | |
| | | | | | | | |
(Cost $11,943) | | | | | | | | |
| | | | |
| | | Rate^ | | Shares | | Value | | | |
| |
MONEY MARKET FUND - 0.21% | | | |
Fidelity Institutional Government Portfolio Institutional Class | | 0.43% | | 9,884 | | | 9,884 | | | |
| | | | | | | | | | |
TOTAL MONEY MARKET FUND - 0.21% | | | 9,884 | | | |
| | | | | | | | | | |
(Cost $9,884) | | | | | | | | | | |
| |
INVESTMENTS PURCHASED WITH CASH PROCEEDS FROM SECURITIES
LENDING - 10.60% | | | |
Fidelity Institutional Government Portfolio Institutional Class** | | 0.43% | | 500,858 | | | 500,858 | | | |
| | | | | | | | | | |
TOTAL INVESTMENTS PURCHASED WITH CASH PROCEEDS FROM SECURITIES LENDING - 10.60% | | | 500,858 | | | |
| | | | | | | | | | |
(Cost $500,858) | | | | | | |
| | |
TOTAL INVESTMENTS - 110.78% | | | $5,235,719 | | | |
(Cost $4,899,582) | | | | | | | | | | |
Liabilities in Excess of Other
Assets - (10.78%) | | | (509,544 | ) | | |
| | | | | | | | | | |
NET ASSETS - 100.00% | | | | | $4,726,175 | | | |
| | | | | | | | | | |
| |
* Non-income producing security. ** This security represents the investment of the collateral received in connection with securities out on loan as of December 31, 2016. ^ Rate disclosed as of December 31, 2016. + This security or a portion of the security is out on loan as of December 31, 2016. Total loaned securities had a value of $480,555 as of December 31, 2016. | | | |
Summary of inputs used to value the Fund’s investments as of 12/31/2016 (See Note 2 in Notes to Financial Statements):
| | | | | | | | | | | | | | | | |
| | | Valuation Inputs | |
| | | Investment in Securities (Value) | |
| | | Level 1
Quoted
Prices | | | Level 2
Significant
Observable
Inputs | | | Level 3
Significant
Unobservable
Inputs | | | Total | |
Common Stocks | | $ | 4,712,841 | | | $ | — | | | $ | — | | | $ | 4,712,841 | |
Exchange Traded Fund | | | 12,136 | | | | — | | | | — | | | | 12,136 | |
Money Market Fund | | | — | | | | 9,884 | | | | — | | | | 9,884 | |
Investments Purchased with Cash Proceeds from Securities Lending | | | — | | | | 500,858 | | | | — | | | | 500,858 | |
| | | | | | | | | | | | | | | | |
TOTAL | | $ | 4,724,977 | | | $ | 510,742 | | | $ | — | | | $ | 5,235,719 | |
| | | | | | | | | | | | | | | | |
See Notes to Financial Statements.
| | |
| Small-Cap Growth Fund | |
|
| MANAGER’S COMMENTARY (Unaudited) | |
| | |
December 31, 2016
Dear Fellow Small-Cap Growth Fund Shareholder,
For the quarter ended December 31, 2016, our Fund gained 4.61%, outperforming our primary market benchmark, the Russell 2000 Growth Index (+3.57%), and our peer benchmark, the Lipper Small-Cap Growth Funds Index (+0.93%). It was a good quarter.
For the six-month semi-annual period ended December 31, 2016, our Fund returned 14.33%, outperforming the Russell 2000 Growth Index (+13.12%) and the Lipper Small-Cap Growth Funds Index (+8.63%).
For the calendar year, our Fund returned 16.10%, beating the Russell 2000 Growth Index (+11.32%) and the Lipper Small-Cap Growth Funds Index (+8.19%). It was a good year for the Fund. We also lead our benchmarks in the longer five-year period, although we still lag in the ten-year and inception-to-date periods.
The table below presents the December quarter, six-month, one-year, five-year, 10-year and inception-to-date financial results.
Standardized Returns as of December 31, 2016
| | | | | | | | | | | | | | | | | | | | | | |
| | | | | | | | | | | | Annualized | | | |
| | | Quarter | | | 6 Months | | | 1 Year | | | 5 Years | | | 10 Years | | | Since Inception
(10/31/03) |
| | | | | | |
Small-Cap Growth Fund | | | 4.61% | | | | 14.33% | | | | 16.10 | % | | | 16.35 | % | | | 5.11% | | | 6.70% |
Russell 2000 Growth Index | | | 3.57% | | | | 13.12% | | | | 11.32 | % | | | 13.74 | % | | | 7.76% | | | 8.58% |
Lipper Small-Cap Growth Funds Index | | | 0.93% | | | | 8.63% | | | | 8.19 | % | | | 12.07 | % | | | 6.46% | | | 7.15% |
Performance figures quoted in the table above represent past performance and are no guarantee of future results. Total return figures in the table above include the reinvestment of dividends and capital gains. The table above does not reflect the deduction of taxes that a shareholder would pay on Fund distributions or on the redemption of Fund shares.
The Russell 2000 Growth Index is an unmanaged index that consists of stocks in the Russell 2000 Index with higher price-to-book ratios and higher forecasted growth values with dividends reinvested. The Lipper Small-Cap Growth Funds Index is an index of small-company, growth-oriented funds compiled by Lipper, Inc. It is not possible to invest directly in an index. Periods longer than one year are annualized.
According to data from Lipper as of December 31, 2016, Small-Cap Growth Fund ranked 96th of 556 small-cap growth funds for the 12 months ended December 31, 2016, 5th of 442 over the last five years, 283rd of 321 over the last 10 years, and 202nd of 237 such funds since inception in October 2003. Lipper, a Thomson Reuters company, is an independent mutual fund rating service that ranks funds in various fund categories by making comparative calculations using total returns.
| | |
| 48 | | Semi-Annual Report | December 31, 2016 (Unaudited) |
| | |
| Small-Cap Growth Fund | | |
| MANAGER’S COMMENTARY (Unaudited) (continued) | | |
| | |
Small-Cap Growth Fund vs. Russell 2000 Growth Index & Lipper Small-Cap Growth Funds Index
from Inception 10/31/03 to 12/31/16
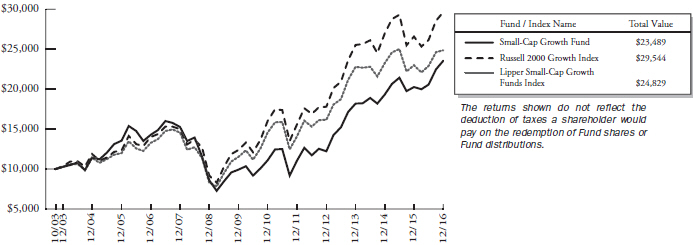
Detailed Explanation of Quarterly Performance
The Fund’s core company financial health models outperformed the benchmark during the quarter, boosting relative results. Our diversifying value metrics models and a tilt toward deeper value stocks also lifted relative performance. These gains were partially offset by the price momentum model, which significantly underperformed the benchmark. The Fund’s exposure to smaller stocks within the small-cap universe also detracted slightly from relative performance, as larger small-cap stocks delivered stronger returns during the quarter.
An underweight position and holdings in the Health Care sector — particularly in pharmaceutical and biotechnology companies — added to relative performance. An overweight position and holdings in the Industrials sector, as well as holdings in the Consumer Staples sector, also boosted relative results. Holdings in the Financials, Real Estate and Consumer Discretionary sectors hurt relative performance.
Detailed Explanation of Calendar Year Performance
The Fund’s company financial health and value metrics models outperformed the benchmark during the year, boosting relative results. Exposure to deeper value stocks also added to relative performance, as value was the best-performing factor during the year. In addition, our tilt toward smaller stocks in the small-cap growth universe helped relative performance because smaller stocks delivered the strongest 12-month returns. However, exposure to higher momentum stocks hurt relative performance due to the momentum factor being out of favor.
Holdings and a slight underweight position in the Health Care sector added strongly to relative results. Holdings and slight overweight positions in the Materials, Consumer Discretionary and Industrials sectors also lifted relative performance. However, holdings and underweight positions in the Information Technology and Consumer Staples sectors dragged on relative performance.
| | |
| Small-Cap Growth Fund | |
|
| MANAGER’S COMMENTARY (Unaudited) (continued) | |
| | |
Top Ten Holdings as of December 31, 2016
| | | | | | |
| Rank | | Description | | Industry | | % of Net
Assets |
| 1 | | WMIH Corp. | | Insurance | | 1.7% |
| 2 | | CLARCOR, Inc. | | Materials | | 1.7% |
| 3 | | National Bank Holdings Corp., Class A | | Commercial Banks | | 1.6% |
| 4 | | Masimo Corp. | | Health Care Equipment & Supplies | | 1.6% |
| 5 | | HNI Corp. | | Commercial Services & Supplies | | 1.5% |
| 6 | | SurModics, Inc. | | Health Care Equipment & Supplies | | 1.5% |
| 7 | | Isle of Capri Casinos, Inc. | | Hotels, Restaurants & Leisure | | 1.5% |
| 8 | | TriNet Group, Inc. | | Professional Services | | 1.5% |
| 9 | | Itron, Inc. | | Electronic Equipment, Instruments & Components | | 1.5% |
| 10 | | Wabash National Corp. | | Machinery | | 1.5% |
| | Total | | | | 15.6% |
Industry Sector Representation as of December 31, 2016
| | | | | | | | | | | | | | | | |
| | | % of Net Assets | | | % of Russell 2000 Growth Index | | | Difference | |
Consumer Discretionary | | | 17.2% | | | | | | | | 15.4% | | | | 1.8% | |
Consumer Staples | | | 1.5% | | | | | | | | 3.1% | | | | -1.6% | |
Energy | | | 0.4% | | | | | | | | 1.4% | | | | -1.0% | |
Financials | | | 5.8% | | | | | | | | 5.6% | | | | 0.2% | |
Health Care | | | 20.8% | | | | | | | | 20.9% | | | | -0.1% | |
Industrials | | | 19.8% | | | | | | | | 16.8% | | | | 3.0% | |
Information Technology | | | 22.9% | | | | | | | | 24.4% | | | | -1.5% | |
Materials | | | 4.3% | | | | | | | | 5.2% | | | | -0.9% | |
Real Estate | | | 5.1% | | | | | | | | 5.5% | | | | -0.4% | |
Telecommunication Services | | | 1.4% | | | | | | | | 0.8% | | | | 0.5% | |
Utilities | | | 0.0% | | | | | | | | 0.8% | | | | -0.8% | |
Cash & Other Assets | | | 0.9% | | | | | | | | 0.0% | | | | 0.9% | |
Total | | | 100.0% | | | | | | | | 100.0% | | | | | |
Disclaimer
The views expressed here are exclusively those of Fund management. These views, including those related to market sectors or individual stocks, are not meant as investment advice and should not be considered predictive in nature. Any favorable (or unfavorable) description of a holding applies only as of the quarter end, December 31, 2016, unless otherwise stated. Security positions can and do change thereafter. Discussions of historical performance do not guarantee and may not be indicative of future performance.
Market volatility can significantly impact short-term performance. The Fund is not an appropriate investment for short-term investors. Investments in small companies generally carry greater risk than is customarily associated with larger companies. This additional risk is attributable to a number of factors, including the relatively limited financial resources that are typically available to small companies and the fact that small companies often have comparatively limited product lines. In addition, the stock of small companies tends to be more volatile than the stock of large companies, particularly in the short term and particularly in the early stages of an economic or market downturn. Shareholders of the Fund, therefore, are taking on more risk than they would if they invested in the stock market as a whole.
| | |
| 50 | | Semi-Annual Report | December 31, 2016 (Unaudited) |
| | |
| Small-Cap Growth Fund | | |
| MANAGER’S COMMENTARY (Unaudited) (continued) | | |
| | |
Conclusion
Thank you for your continued investment in Small-Cap Growth Fund. We encourage your feedback; your reactions and concerns are important to us.
Sincerely,
The Investment Management Team
| | |
| Small-Cap Growth Fund | |
|
| SCHEDULE OF INVESTMENTS | |
| Showing percentage of net assets as of December 31, 2015 (Unaudited) | | |
| | | | | | |
| Industry Company | | Shares | | Value | | |
| |
COMMON STOCKS - 99.19% | | |
Air Freight & Logistics - 0.34% | | |
Radiant Logistics, Inc.* | | 34,300 | | $ 133,770 | | |
| |
Airlines - 1.33% | | |
Hawaiian Holdings, Inc.* | | 9,300 | | 530,100 | | |
| |
Auto Components - 1.44% | | |
Tenneco, Inc.* | | 9,200 | | 574,724 | | |
| |
Automobiles - 1.34% | | |
Winnebago Industries, Inc.+ | | 16,900 | | 534,885 | | |
| |
Biotechnology - 2.58% | | |
Emergent BioSolutions, Inc.* | | 17,700 | | 581,268 | | |
Myriad Genetics, Inc.*+ | | 27,000 | | 450,090 | | |
| | | | | | |
| | | | 1,031,358 | | |
| |
Building Products - 4.35% | | |
American Woodmark Corp.* | | 7,200 | | 541,800 | | |
Insteel Industries, Inc. | | 17,000 | | 605,880 | | |
Simpson Manufacturing Co., Inc. | | 13,500 | | 590,625 | | |
| | | | | | |
| | | | 1,738,305 | | |
| |
Capital Markets - 1.75% | | |
HFF, Inc., Class A | | 19,600 | | 592,900 | | |
Marcus & Millichap, Inc.* | | 3,900 | | 104,208 | | |
| | | | | | |
| | | | 697,108 | | |
| |
Chemicals - 1.46% | | |
Koppers Holdings, Inc.* | | 14,500 | | 584,350 | | |
| |
Commercial Banks - 1.87% | | |
Capital Bank Financial
Corp., Class A | | 2,800 | | 109,900 | | |
National Bank Holdings
Corp., Class A | | 20,000 | | 637,800 | | |
| | | | | | |
| | | | 747,700 | | |
| |
Commercial Services & Supplies - 3.87% | | |
Healthcare Services Group, Inc. | | 14,600 | | 571,882 | | |
HNI Corp. | | 11,000 | | 615,120 | | |
Interface, Inc. | | 5,600 | | 103,880 | | |
Kimball International, Inc., Class B | | 14,600 | | 256,376 | | |
| | | | | | |
| | | | 1,547,258 | | |
| |
Communications Equipment - 3.35% | | |
A10 Networks, Inc.* | | 22,800 | | 189,468 | | |
Extreme Networks, Inc.* | | 114,400 | | 575,432 | | |
Plantronics, Inc. | | 10,500 | | 574,980 | | |
| | | | | | |
| | | | 1,339,880 | | |
| | | | |
| Industry Company | | Shares | | Value |
|
|
Computers & Peripherals - 1.12% |
Eastman Kodak Co.* | | 28,900 | | $ 447,950 |
|
Construction & Engineering - 1.96% |
Installed Building Products, Inc.* | | 14,100 | | 582,330 |
Orion Group Holdings, Inc.* | | 20,100 | | 199,995 |
| | | | |
| | | | 782,325 |
|
Electrical Equipment - 1.51% |
General Cable Corp. | | 31,700 | | 603,885 |
|
Electronic Equipment, Instruments &
Components - 3.51% |
Badger Meter, Inc. | | 7,600 | | 280,820 |
Fabrinet* | | 12,700 | | 511,810 |
Itron, Inc.* | | 9,700 | | 609,645 |
| | | | |
| | | | 1,402,275 |
|
Energy Equipment & Services - 0.39% |
TETRA Technologies, Inc.* | | 31,200 | | 156,624 |
|
Food Products - 1.45% |
Tootsie Roll Industries, Inc.+ | | 14,600 | | 580,350 |
|
Health Care Equipment & Supplies - 4.28% |
Masimo Corp.* | | 9,200 | | 620,080 |
SurModics, Inc.* | | 24,200 | | 614,680 |
Vascular Solutions, Inc.* | | 8,500 | | 476,850 |
| | | | |
| | | | 1,711,610 |
|
Health Care Providers & Services - 8.21% |
Air Methods Corp.* | | 17,600 | | 560,560 |
AMN Healthcare Services, Inc.* | | 12,600 | | 484,470 |
BioTelemetry, Inc.* | | 6,000 | | 134,100 |
Chemed Corp. | | 3,400 | | 545,394 |
Ensign Group, Inc. (The) | | 26,200 | | 581,902 |
Molina Healthcare, Inc.*+ | | 9,500 | | 515,470 |
RadNet, Inc.* | | 71,200 | | 459,240 |
| | | | |
| | | | 3,281,136 |
|
Hotels, Restaurants & Leisure - 4.42% |
Cheesecake Factory,
Inc. (The) | | 9,900 | | 592,812 |
Isle of Capri Casinos, Inc.* | | 24,700 | | 609,843 |
Papa John’s International,
Inc. | | 6,600 | | 564,828 |
| | | | |
| | | | 1,767,483 |
|
Household Durables - 1.43% |
LGI Homes, Inc.*+ | | 6,000 | | 172,380 |
Universal Electronics, Inc.* | | 4,600 | | 296,930 |
| | |
| 52 | | Semi-Annual Report | December 31, 2016 (Unaudited) |
| | |
| Small-Cap Growth Fund | | |
| SCHEDULE OF INVESTMENTS (continued) | | |
| Showing percentage of net assets as of December 31, 2016 (Unaudited) | | |
| | | | | | |
| Industry Company | | Shares | | Value | | |
| |
Common Stocks (continued) | | |
Household Durables (continued) | | |
ZAGG, Inc.* | | 14,300 | | $ 101,530 | | |
| | | | | | |
| | | | 570,840 | | |
| |
Insurance - 3.35% | | |
Crawford & Co.,
Class B | | 9,300 | | 116,808 | | |
Primerica, Inc.+ | | 8,000 | | 553,200 | | |
WMIH Corp.* | | 431,300 | | 668,515 | | |
| | | | | | |
| | | | 1,338,523 | | |
| |
Internet & Catalog Retail - 1.32% | | |
Shutterfly, Inc.* | | 10,500 | | 526,890 | | |
| |
Internet Software & Services - 4.00% | | |
Brightcove, Inc.* | | 43,100 | | 346,955 | | |
Cimpress NV*+ | | 5,600 | | 513,016 | | |
EarthLink Holdings Corp. | | 83,800 | | 472,632 | | |
Five9, Inc.* | | 18,800 | | 266,772 | | |
| | | | | | |
| | | | 1,599,375 | | |
| |
IT Services - 4.00% | | |
CSG Systems International,
Inc.+ | | 12,200 | | 590,480 | | |
PFSweb, Inc.* | | 24,800 | | 210,800 | | |
TeleTech Holdings, Inc. | | 11,500 | | 350,750 | | |
Unisys Corp.*+ | | 29,800 | | 445,510 | | |
| | | | | | |
| | | | 1,597,540 | | |
| |
Leisure Equipment & Products - 2.34% | | |
LCI Industries | | 5,300 | | 571,075 | | |
Nautilus, Inc.* | | 19,700 | | 364,450 | | |
| | | | | | |
| | | | 935,525 | | |
| |
Life Sciences Tools & Services - 1.26% | | |
Cambrex Corp.* | | 9,300 | | 501,735 | | |
| |
Machinery - 1.77% | | |
Wabash National Corp. | | 38,500 | | 609,070 | | |
Watts Water Technologies, Inc., Class A | | 1,500 | | 97,800 | | |
| | | | | | |
| | | | 706,870 | | |
| |
Materials - 3.47% | | |
American Outdoor Brands Corp.* | | 7,400 | | 155,992 | | |
CLARCOR, Inc. | | 8,100 | | 668,007 | | |
Trinseo SA | | 9,500 | | 563,350 | | |
| | | | | | |
| | | | 1,387,349 | | |
| |
Metals & Mining - 1.42% | | |
Kaiser Aluminum Corp. | | 1,300 | | 100,997 | | |
Worthington Industries, Inc. | | 9,800 | | 464,912 | | |
| | | | | | |
| | | | 565,909 | | |
| | | | |
| Industry Company | | Shares | | Value |
|
|
Multiline Retail - 0.42% |
Big Lots, Inc.+ | | 3,300 | | $ 165,693 |
|
Pharmaceuticals - 4.47% |
Corcept Therapeutics, Inc.* | | 51,700 | | 375,342 |
Ophthotech Corp.*+ | | 119,600 | | 577,668 |
SciClone Pharmaceuticals, Inc.* | | 52,400 | | 565,920 |
Supernus Pharmaceuticals, Inc.* | | 10,500 | | 265,125 |
| | | | |
| | | | 1,784,055 |
|
Professional Services - 4.52% |
Mistras Group, Inc.* | | 23,600 | | 606,048 |
TriNet Group, Inc.* | | 23,800 | | 609,756 |
TrueBlue, Inc.* | | 24,000 | | 591,600 |
| | | | |
| | | | 1,807,404 |
|
Real Estate Investment Trusts (REITs) - 2.17% |
Acadia Realty Trust | | 3,900 | | 127,452 |
LTC Properties, Inc. | | 3,600 | | 169,128 |
National Health Investors, Inc. | | 6,400 | | 474,688 |
Potlatch Corp. | | 2,300 | | 95,795 |
| | | | |
| | | | 867,063 |
|
Real Estate Management & Development - 1.19% |
Altisource Portfolio Solutions SA*+ | | 17,800 | | 473,302 |
|
Semiconductors & Semiconductor
Equipment - 3.62% |
CEVA, Inc.* | | 18,100 | | 607,255 |
Integrated Device
Technology, Inc.* | | 25,200 | | 593,712 |
Monolithic Power Systems, Inc. | | 3,000 | | 245,790 |
| | | | |
| | | | 1,446,757 |
|
Software - 2.70% |
CommVault Systems, Inc.* | | 4,100 | | 210,740 |
Fair Isaac Corp. | | 5,000 | | 596,100 |
Varonis Systems, Inc.* | | 10,100 | | 270,680 |
| | | | |
| | | | 1,077,520 |
|
Specialty Retail - 2.02% |
Children’s Place, Inc. (The) | | 5,700 | | 575,415 |
FirstCash, Inc. | | 4,900 | | 230,300 |
| | | | |
| | | | 805,715 |
|
Telecommunication Services - 1.36% |
General Communication, Inc., Class A* | | 12,300 | | 239,235 |
| | |
| Small-Cap Growth Fund | |
|
| SCHEDULE OF INVESTMENTS (continued) | |
| Showing percentage of net assets as of December 31, 2016 (Unaudited) | | |
| | | | | | | | |
| Industry Company | | | | Shares | | Value | | |
| |
Common Stocks (continued) | | |
Telecommunication Services (continued) | | |
Windstream Holdings, Inc.+ | | 41,600 | | $ 304,928 | | |
| | | | | | | | |
| | | | | | 544,163 | | |
| |
Textiles, Apparel & Luxury Goods - 1.23% | | |
Wolverine World Wide, Inc. | | 22,300 | | 489,485 | | |
| |
Wireless Telecommunication Services - 0.60% | | |
RingCentral, Inc., Class A* | | 11,600 | | 238,960 | | |
| | | | | | | | |
TOTAL COMMON STOCKS - 99.19% | | 39,623,749 | | |
| | | | | | | | |
(Cost $34,490,878) | | | | |
| |
EXCHANGE TRADED FUND - 0.77% | | |
iShares Russell 2000 Growth ETF+ | | 2,000 | | 307,880 | | |
| | | | | | | | |
TOTAL EXCHANGE TRADED
FUND - 0.77% | | 307,880 | | |
| | | | | | | | |
(Cost $310,848) | | | | |
| | | | |
| | | Rate^ | | Shares | | Value | | |
| |
MONEY MARKET FUND - 0.12% | | |
Fidelity Institutional | | | | | | | | |
Government Portfolio | | | | | | | | |
Institutional Class | | 0.43% | | 48,805 | | 48,805 | | |
| | | | | | | | |
TOTAL MONEY MARKET
FUND - 0.12% | | 48,805 | | |
| | | | | | | | |
(Cost $48,805) | | | | | | | | |
| |
INVESTMENTS PURCHASED WITH CASH PROCEEDS FROM SECURITIES
LENDING - 13.02% | | |
Fidelity Institutional | | | | | | | | |
Government Portfolio | | | | | | | | |
Institutional Class** | | 0.43% | | 5,201,693 | | 5,201,693 | | |
| | | | | | | | |
TOTAL INVESTMENTS PURCHASED WITH CASH PROCEEDS FROM SECURITIES LENDING - 13.02% | | 5,201,693 | | |
| | | | | | | | |
(Cost $5,201,693) | | | | | | | | |
| | | | | | | | | | | | |
| | | | | | | | | Value | |
| |
TOTAL INVESTMENTS - 113.10% | | | $ | 45,182,127 | |
(Cost $40,052,224) | | | | | | | | | | | | |
Liabilities in Excess of Other
Assets - (13.10%) | | | | (5,231,952 | ) |
| | | | | | | | | | | | |
NET ASSETS - 100.00% | | | $ | 39,950,175 | |
| | | | | | | | | | | | |
| * | Non-income producing security. |
| ** | This security represents the investment of the collateral received in connection with securities out on loan as of December 31, 2016. |
| ^ | Rate disclosed as of December 31, 2016. |
| + | This security or a portion of the security is out on loan as of December 31, 2016. Total loaned securities had a value of $4,992,599 as of December 31, 2016. |
Summary of inputs used to value the Fund’s investments as of 12/31/2016 (See Note 2 in Notes to Financial Statements):
| | | | | | | | | | | | | | | | |
| | | Valuation Inputs | |
| | | Investment in Securities (Value) | |
| | | Level 1
Quoted
Prices | | | Level 2 Significant Observable
Inputs | | | Level 3 Significant Unobservable
Inputs | | | Total | |
| | | | |
Common Stocks | | $ | 39,623,749 | | | $ | — | | | $ | — | | | $ | 39,623,749 | |
Exchange Traded Fund | | | 307,880 | | | | — | | | | — | | | | 307,880 | |
Money Market Fund | | | — | | | | 48,805 | | | | — | | | | 48,805 | |
Investments Purchased with Cash Proceeds from Securities Lending | | | — | | | | 5,201,693 | | | | — | | | | 5,201,693 | |
| | | | | | | | | | | | | | | | |
TOTAL | | $ | 39,931,629 | | | $ | 5,250,498 | | | $ | — | | | $ | 45,182,127 | |
| | | | | | | | | | | | | | | | |
See Notes to Financial Statements.
| | |
| 54 | | Semi-Annual Report | December 31, 2016 (Unaudited) |
| | |
| Small-Cap Value Fund | | |
| MANAGER’S COMMENTARY (Unaudited) | | |
| | |
December 31, 2016
Dear Fellow Small-Cap Value Fund Shareholder,
For the quarter ended December 31, 2016, our Fund returned 14.74%, outperforming our primary market benchmark, the Russell 2000 Value Index (+14.07%), and our peer benchmark, the Lipper Small-Cap Value Funds Index (+12.99%). It was a good quarter.
For the six-month semi-annual period ended December 31, 2016, our Fund returned 20.90%, trailing the Russell 2000 Value Index (+24.19%) and the Lipper Small-Cap Value Funds Index (+22.03%).
For the calendar year, our Fund returned 26.79%, underperforming the Russell 2000 Value Index (+31.74%) and slightly lagging the Lipper Small-Cap Value Funds Index (+27.00%). The Fund is underperforming its primary market benchmark in the five-year and 10-year periods, and also lags its primary and peer benchmarks in the inception-to-date period.
The table below presents our December quarter, six-month, one-year, five-year, 10-year and inception-to-date financial results.
Standardized Returns as of December 31, 2016
| | | | | | | | | | | | | | | | | | | | | | |
| | | | | | | | | | | | Annualized | | | |
| | | Quarter | | | 6 Months | | | 1 Year | | | 5 Years | | | 10 Years | | | Since Inception
(10/31/03) |
| | | | | | |
Small-Cap Value Fund | | | 14.74% | | | | 20.90% | | | | 26.79 | % | | | 14.37 | % | | | 5.47% | | | 7.99% |
Russell 2000 Value Index | | | 14.07% | | | | 24.19% | | | | 31.74 | % | | | 15.07 | % | | | 6.26% | | | 9.03% |
Lipper Small-Cap Value Funds Index | | | 12.99% | | | | 22.03% | | | | 27.00 | % | | | 13.69 | % | | | 6.84% | | | 9.20% |
Performance figures quoted in the table above represent past performance and are no guarantee of future results. Total return figures in the table above include the reinvestment of dividends and capital gains. The table above does not reflect the deduction of taxes that a shareholder would pay on Fund distributions or on the redemption of Fund shares.
The Russell 2000 Value Index is an unmanaged index that consists of stocks in the Russell 2000 Index with lower price-to-book ratios and lower forecasted growth values with dividends reinvested. The Lipper Small-Cap Value Funds Index is an index of small-company, value-oriented funds compiled by Lipper, Inc. It is not possible to invest directly in an index. Periods longer than one year are annualized.
According to data from Lipper as of December 31, 2016, Small-Cap Value Fund ranked 149th of 314 small-cap value funds for the 12 months ended December 31, 2016, 113th of 238 over the last five years, 118th of 146 over the last 10 years, and 83rd of 102 such funds since inception in October 2003. Lipper, a Thomson Reuters company, is an independent mutual fund rating service that ranks funds in various fund categories by making comparative calculations using total returns.
| | |
| Small-Cap Value Fund | |
|
| MANAGER’S COMMENTARY (Unaudited) (continued) | |
| | |
Small-Cap Value Fund vs. Russell 2000 Value Index & Lipper Small-Cap Value Funds Index
from Inception 10/31/03 to 12/31/16
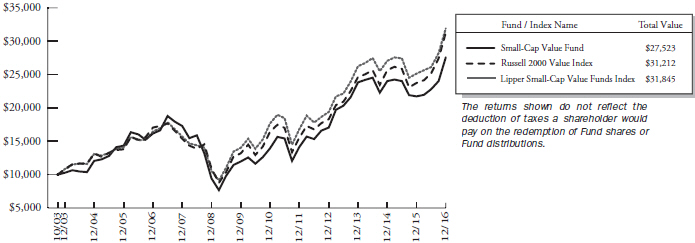
Detailed Explanation of Quarterly Performance
The Fund’s value metrics models and price momentum model outperformed the benchmark during the quarter, boosting relative results. These gains were partially offset by underperformance from the Fund’s company financial health models. The Fund’s exposure to smaller stocks within the small-cap value universe added slightly to relative performance, as did a tilt toward deeper value stocks. However, exposure to higher momentum stocks detracted from relative performance, as momentum was out of favor during the quarter.
Holdings in the Information Technology and Utilities sectors boosted relative results, as did an underweight position in the Real Estate sector. An underweight position and holdings in the Financials sector hurt relative performance, as did holdings in the Consumer Discretionary sector.
Detailed Explanation of Calendar Year Performance
The Fund’s exposure to higher momentum stocks significantly detracted from relative performance, as momentum was out of favor during the year. Exposure to smaller stocks in the small-cap value universe also detracted slightly from relative performance, as did the Fund’s company financial health and momentum models. By contrast, the Fund’s value metrics models, and a tilt toward deeper value stocks, helped relative returns.
Holdings in the Financials sector detracted significantly from relative results, particularly due to an underweight position in and holdings of large bank stocks. Holdings in the Energy sector also had a negative impact on relative performance. However, holdings in the Utilities and Information Technologies sectors added to relative performance.
| | |
| 56 | | Semi-Annual Report | December 31, 2016 (Unaudited) |
| | |
| Small-Cap Value Fund | | |
| MANAGER’S COMMENTARY (Unaudited) (continued) | | |
| | |
Top Ten Holdings as of December 31, 2016
| | | | | | |
| Rank | | Description | | Industry | | % of Net
Assets |
| 1 | | TTM Technologies, Inc. | | Electronic Equipment, Instruments & Components | | 2.1% |
| 2 | | Advanced Micro Devices, Inc. | | Software | | 2.1% |
| 3 | | Sanmina Corp. | | Electronic Equipment, Instruments & Components | | 2.0% |
| 4 | | Central Garden & Pet Co., Class A | | Household Products | | 1.9% |
| 5 | | Selective Insurance Group, Inc. | | Insurance | | 1.8% |
| 6 | | SkyWest, Inc. | | Airlines | | 1.7% |
| 7 | | ACCO Brands Corp. | | Commercial Services & Supplies | | 1.7% |
| 8 | | Summit Hotel Properties, Inc. | | Real Estate Investment Trusts (REITs) | | 1.5% |
| 9 | | Nelnet, Inc., Class A | | Consumer Finance | | 1.5% |
| 10 | | Rayonier Advanced Materials, Inc. | | Chemicals | | 1.5% |
| | Total | | | | 17.8% |
Industry Sector Representation as of December 31, 2016
| | | | | | | | | | | | |
| | | % of Net Assets | | | % of Russell 2000
Value Index | | | Difference | |
Consumer Discretionary | | | 9.2% | | | | 10.0% | | | | -0.8% | |
Consumer Staples | | | 6.0% | | | | 2.8% | | | | 3.2% | |
Energy | | | 5.8% | | | | 5.9% | | | | -0.1% | |
Financials | | | 28.6% | | | | 32.4% | | | | -3.8% | |
Health Care | | | 1.6% | | | | 4.3% | | | | -2.7% | |
Industrials | | | 16.4% | | | | 12.6% | | | | 3.7% | |
Information Technology | | | 13.2% | | | | 10.4% | | | | 2.9% | |
Materials | | | 7.8% | | | | 4.6% | | | | 3.1% | |
Real Estate | | | 4.1% | | | | 10.1% | | | | -6.0% | |
Telecommunication Services | | | 2.2% | | | | 0.7% | | | | 1.5% | |
Utilities | | | 4.5% | | | | 6.0% | | | | -1.4% | |
Cash & Other Assets | | | 0.6% | | | | 0.0% | | | | 0.6% | |
Total | | | 100.0% | | | | 100.0% | | | | | |
Disclaimer
The views expressed here are exclusively those of Fund management. These views, including those related to market sectors or individual stocks, are not meant as investment advice and should not be considered predictive in nature. Any favorable (or unfavorable) description of a holding applies only as of the quarter end, December 31, 2016, unless otherwise stated. Security positions can and do change thereafter. Discussions of historical performance do not guarantee and may not be indicative of future performance.
Market volatility can significantly impact short-term performance. The Fund is not an appropriate investment for short-term investors. Investments in small companies generally carry greater risk than is customarily associated with larger companies. This additional risk is attributable to a number of factors, including the relatively limited financial resources that are typically available to small companies and the fact that small companies often have comparatively limited product lines. In addition, the stock of small companies tends to be more volatile than the stock of large companies, particularly in the short term and particularly in the early stages of an economic or market downturn. Shareholders of the Fund, therefore, are taking on more risk than they would if they invested in the stock market as a whole.
| | |
| Small-Cap Value Fund | |
|
| MANAGER’S COMMENTARY (Unaudited) (continued) | |
| | |
Conclusion
Thank you for your continued investment in Small-Cap Value Fund. We encourage your feedback; your reactions and concerns are important to us.
Sincerely,
The Investment Management Team
| | |
| 58 | | Semi-Annual Report | December 31, 2016 (Unaudited) |
| | |
| Small-Cap Value Fund | | |
| SCHEDULE OF INVESTMENTS | | |
| Showing percentage of net assets as of December 31, 2016 (Unaudited) | | |
| | | | | | | | |
| Industry Company | | Shares | | | Value | | |
| |
COMMON STOCKS - 99.43% | | |
Aerospace & Defense - 0.80% | | |
Kratos Defense & Security Solutions, Inc.*+ | | | 72,200 | | | $ 534,280 | | |
| |
Airlines - 1.74% | | |
SkyWest, Inc. | | | 31,700 | | | 1,155,465 | | |
| |
Auto Components - 2.87% | | |
American Axle & Manufacturing Holdings, Inc.* | | | 26,900 | | | 519,170 | | |
Cooper Tire & Rubber Co. | | | 15,100 | | | 586,635 | | |
Cooper-Standard Holding, Inc.* | | | 5,800 | | | 599,604 | | |
Standard Motor Products, Inc. | | | 3,700 | | | 196,914 | | |
| | | | | | | | |
| | | | | | 1,902,323 | | |
| |
Building Products - 0.55% | | |
Gibraltar Industries, Inc.* | | | 8,800 | | | 366,520 | | |
| |
Chemicals - 4.00% | | |
American Vanguard Corp. | | | 43,900 | | | 840,685 | | |
Rayonier Advanced Materials, Inc.+ | | | 62,800 | | | 970,888 | | |
Stepan Co. | | | 10,400 | | | 847,392 | | |
| | | | | | | | |
| | | | | | 2,658,965 | | |
| |
Commercial Banks - 9.51% | | |
Banco Latinoamericano de Comercio Exterior SA, Class E+ | | | 27,700 | | | 815,488 | | |
Chemical Financial Corp. | | | 14,069 | | | 762,118 | | |
FCB Financial Holdings, Inc., Class A* | | | 17,800 | | | 849,060 | | |
First BanCorp Puerto Rico* | | | 118,000 | | | 779,980 | | |
Heartland Financial USA, Inc. | | | 12,400 | | | 595,200 | | |
Investors Bancorp, Inc. | | | 60,800 | | | 848,160 | | |
Kearny Financial Corp. | | | 45,400 | | | 705,970 | | |
PrivateBancorp, Inc. | | | 17,700 | | | 959,163 | | |
| | | | | | | | |
| | | | | | 6,315,139 | | |
| |
Commercial Services & Supplies - 3.95% | | |
ABM Industries, Inc. | | | 18,500 | | | 755,540 | | |
ACCO Brands Corp.* | | | 85,600 | | | 1,117,080 | | |
UniFirst Corp. | | | 5,200 | | | 746,980 | | |
| | | | | | | | |
| | | | | | 2,619,600 | | |
| |
Communications Equipment - 2.84% | | |
ATN International, Inc. | | | 9,000 | | | 721,170 | | |
Extreme Networks, Inc.* | | | 131,100 | | | 659,433 | | |
NETGEAR, Inc.* | | | 9,300 | | | 505,455 | | |
| | | | | | | | |
| | | | | | 1,886,058 | | |
| | | | | | |
| Industry Company | | Shares | | | Value |
|
|
Construction & Engineering - 1.84% |
Comfort Systems USA, Inc. | | | 22,200 | | | $ 739,260 |
Orion Group Holdings, Inc.* | | | 48,300 | | | 480,585 |
| | | | | | |
| | | | | | 1,219,845 |
|
Consumer Finance - 1.51% |
Nelnet, Inc., Class A | | | 19,700 | | | 999,775 |
|
Electric Utilities - 1.30% |
Otter Tail Corp. | | | 21,100 | | | 860,880 |
|
Electrical Equipment - 1.16% |
General Cable Corp. | | | 40,600 | | | 773,430 |
|
Electronic Equipment, Instruments &
Components - 9.45% |
Benchmark Electronics, Inc.* | | | 25,100 | | | 765,550 |
Sanmina Corp.* | | | 35,900 | | | 1,315,735 |
Spire, Inc. | | | 13,100 | | | 845,605 |
Tech Data Corp.* | | | 7,700 | | | 652,036 |
TTM Technologies, Inc.* | | | 101,500 | | | 1,383,445 |
Vishay Intertechnology, Inc.+ | | | 44,100 | | | 714,420 |
WGL Holdings, Inc. | | | 7,800 | | | 594,984 |
| | | | | | |
| | | | | | 6,271,775 |
|
Food & Staples Retailing - 0.83% |
SUPERVALU, Inc.* | | | 117,500 | | | 548,725 |
|
Food Products - 3.29% |
Fresh Del Monte Produce, Inc. | | | 10,000 | | | 606,300 |
Omega Protein Corp.* | | | 26,900 | | | 673,845 |
Sanderson Farms, Inc.+ | | | 9,600 | | | 904,704 |
| | | | | | |
| | | | | | 2,184,849 |
|
Health Care Providers & Services - 1.60% |
LHC Group, Inc.* | | | 14,500 | | | 662,650 |
Triple-S Management Corp., Class B* | | | 19,200 | | | 397,440 |
| | | | | | |
| | | | | | 1,060,090 |
|
Household Durables - 1.27% |
LGI Homes, Inc.*+ | | | 29,400 | | | 844,662 |
|
Household Products - 1.89% |
Central Garden & Pet Co., Class A* | | | 40,600 | | | 1,254,540 |
|
Insurance - 10.77% |
American Equity Investment Life Holding Co. | | | 28,600 | | | 644,644 |
Argo Group International Holdings Ltd. | | | 11,110 | | | 732,149 |
Employers Holdings, Inc. | | | 18,500 | | | 732,600 |
Enstar Group, Ltd.* | | | 2,900 | | | 573,330 |
| | |
| Small-Cap Value Fund | |
|
| SCHEDULE OF INVESTMENTS (continued) | |
| Showing percentage of net assets as of December 31, 2016 (Unaudited) | | |
| | | | | | | | |
| Industry Company | | Shares | | | Value | | |
| |
Common Stocks (continued) | | |
Insurance (continued) | | |
National Western Life Group, Inc., Class A | | | 2,600 | | | $ 808,080 | | |
Navigators Group, Inc. (The) | | | 6,700 | | | 788,925 | | |
OneBeacon Insurance Group Ltd., Class A | | | 60,220 | | | 966,531 | | |
Safety Insurance Group, Inc. | | | 9,800 | | | 722,260 | | |
Selective Insurance Group, Inc. | | | 27,500 | | | 1,183,875 | | |
| | | | | | | | |
| | | | | | 7,152,394 | | |
| |
IT Services - 1.26% | | |
Unisys Corp.*+ | | | 55,800 | | | 834,210 | | |
| |
Machinery - 4.03% | | |
Astec Industries, Inc. | | | 10,300 | | | 694,838 | | |
Douglas Dynamics, Inc. | | | 22,000 | | | 740,300 | | |
Greenbrier Companies., Inc. (The)+ | | | 19,700 | | | 818,535 | | |
Supreme Industries, Inc., Class A | | | 26,800 | | | 420,760 | | |
| | | | | | | | |
| | | | | | 2,674,433 | | |
| |
Media - 1.03% | | |
Time, Inc. | | | 38,300 | | | 683,655 | | |
| |
Metals & Mining - 3.77% | | |
Cliffs Natural Resources, Inc.*+ | | | 101,100 | | | 850,251 | | |
Ryerson Holding Corp.* | | | 63,900 | | | 853,065 | | |
Schnitzer Steel Industries, | | | | | | | | |
Inc., Class A | | | 31,100 | | | 799,270 | | |
| | | | | | | | |
| | | | | | 2,502,586 | | |
| |
Oil, Gas & Consumable Fuels - 5.08% | | |
Alon USA Energy, Inc.+ | | | 48,600 | | | 553,068 | | |
Renewable Energy Group, Inc.*+ | | | 77,000 | | | 746,900 | | |
Sanchez Energy Corp.*+ | | | 49,600 | | | 447,888 | | |
Ship Finance International, Ltd.+ | | | 44,900 | | | 666,765 | | |
Western Refining, Inc. | | | 25,300 | | | 957,605 | | |
| | | | | | | | |
| | | | | | 3,372,226 | | |
| |
Real Estate Investment Trusts (REITs) - 3.74% | | |
Colony Starwood Homes+ | | | 25,800 | | | 743,298 | | |
Healthcare Realty Trust, Inc. | | | 24,200 | | | 733,744 | | |
Summit Hotel Properties, Inc. | | | 62,800 | | | 1,006,684 | | |
| | | | | | | | |
| | | | | | 2,483,726 | | |
| | | | | | |
| Industry Company | | Shares | | | Value |
|
| |
Real Estate Management & Development - 0.39% |
Farmland Partners, Inc.+ | | | 23,100 | | | $ 257,796 |
|
Software - 2.94% |
Advanced Micro Devices, Inc.* | | | 120,900 | | | 1,371,006 |
Eastman Kodak Co.* | | | 18,500 | | | 286,750 |
Silver Spring Networks, Inc.* | | | 22,100 | | | 294,151 |
| | | | | | |
| | | | | | 1,951,907 |
|
Specialty Retail - 3.20% |
Container Store Group, Inc. (The)*+ | | | 58,300 | | | 370,205 |
Office Depot, Inc. | | | 155,800 | | | 704,216 |
Stage Stores, Inc.+ | | | 35,800 | | | 156,446 |
Tailored Brands, Inc. | | | 35,100 | | | 896,805 |
| | | | | | |
| | | | | | 2,127,672 |
|
Telecommunication Services - 1.14% |
Windstream Holdings, Inc.+ | | | 103,100 | | | 755,723 |
|
Textiles, Apparel & Luxury Goods - 0.84% |
Fossil Group, Inc.*+ | | | 21,500 | | | 555,990 |
|
Thrifts & Mortgage Finance - 6.80% |
Beneficial Bancorp, Inc. | | | 44,300 | | | 815,120 |
Capitol Federal Financial, Inc. | | | 45,200 | | | 743,992 |
Clifton Bancorp, Inc. | | | 28,900 | | | 488,988 |
Northwest Bancshares, Inc. | | | 49,300 | | | 888,879 |
Ocwen Financial Corp.*+ | | | 132,000 | | | 711,480 |
Provident Financial Services, Inc. | | | 30,600 | | | 865,980 |
| | | | | | |
| | | | | | 4,514,439 |
|
Trading Companies & Distributors - 2.28% |
GATX Corp.+ | | | 13,100 | | | 806,698 |
Rush Enterprises, Inc., Class A* | | | 12,600 | | | 401,940 |
Textainer Group Holdings, Ltd. | | | 40,800 | | | 303,960 |
| | | | | | |
| | | | | | 1,512,598 |
|
Transportation Infrastructure - 0.68% |
Scorpio Tankers, Inc. | | | 99,500 | | | 450,735 |
|
Water Utilities - 1.08% |
Middlesex Water Co. | | | 16,700 | | | 717,098 |
| | | | | | |
TOTAL COMMON STOCKS - 99.43% | | | 66,004,109 |
| | | | | | |
(Cost $55,025,641) | | | | | | |
| | |
| 60 | | Semi-Annual Report | December 31, 2016 (Unaudited) |
| | |
| Small-Cap Value Fund | | |
| SCHEDULE OF INVESTMENTS (continued) | | |
| Showing percentage of net assets as of December 31, 2016 (Unaudited) | | |
| | | | | | | | | | | | | | |
| | | Rate^ | | | Shares | | | Value | | | |
| |
MONEY MARKET FUND - 0.29% | | | |
Fidelity Institutional Government Portfolio Institutional Class | | | 0.43 | % | | | 191,090 | | | | $191,090 | | | |
| | | | | | | | | | | | | | |
TOTAL MONEY MARKET
FUND - 0.29% | | | | 191,090 | | | |
| | | | | | | | | | | | | | |
(Cost $191,090) | | | | | | | | | | | | | | |
| |
INVESTMENTS PURCHASED WITH CASH PROCEEDS FROM SECURITIES
LENDING - 17.91% | | | |
Fidelity Institutional Government Portfolio Institutional Class** | | | 0.43 | % | | | 11,893,527 | | | | 11,893,527 | | | |
| | | | | | | | | | | | | | |
TOTAL INVESTMENTS PURCHASED WITH CASH PROCEEDS FROM SECURITIES LENDING - 17.91% | | | | 11,893,527 | | | |
| | | | | | | | | | | | | | |
(Cost $11,893,527) | | | | | | | |
| | |
Total Investments - 117.63% | | | | $ 78,088,726 | | | |
(Cost $67,110,258) | | | | | | | |
Liabilities in Excess of Other
Assets - (17.63%) | | | | (11,705,205 | ) | | |
| | | | | | | | | | | | | | |
NET ASSETS - 100.00% | | | | $ 66,383,521 | | | |
| | | | | | | | | | | | | | |
| |
* Non-income producing security. ** This security represents the investment of the collateral received in connection with securities out on loan as of December 31, 2016. ^ Rate disclosed as of December 31, 2016. + This security or a portion of the security is out on loan as of December 31, 2016. Total loaned securities had a value of $11,477,566 as of December 31, 2016. | | | |
Summary of inputs used to value the Fund’s investments as of 12/31/2016 (See Note 2 in Notes to Financial Statements):
| | | | | | | | | | | | | | | | |
| | | Valuation Inputs | |
| | | Investment in Securities (Value) | |
| | | Level 1 Quoted Prices | | | Level 2 Significant Observable Inputs | | | Level 3 Significant Unobservable Inputs | | | Total | |
| | | | |
Common Stocks | | $ | 66,004,109 | | | $ | — | | | | $ — | | | $ | 66,004,109 | |
Money Market Fund | | | — | | | | 191,090 | | | | — | | | | 191,090 | |
Investments Purchased with Cash Proceeds from Securities Lending | | | — | | | | 11,893,527 | | | | — | | | | 11,893,527 | |
| | | | | | | | | | | | | | | | |
TOTAL | | $ | 66,004,109 | | | $ | 12,084,617 | | | | $ — | | | $ | 78,088,726 | |
| | | | | | | | | | | | | | | | |
See Notes to Financial Statements
| | |
| Blue Chip 35 Index Fund | |
|
| MANAGER’S COMMENTARY (Unaudited) | |
| | |
December 31, 2016
Dear Fellow Blue Chip 35 Index Fund Shareholder,
For the quarter ended December 31, 2016, our Fund returned 3.93%, outperforming our primary market benchmark, the S&P 500 Index (+3.82%), as well as the Russell Top 50 Mega Cap Index (+3.45%), but underperforming our peer benchmark, the Lipper Large-Cap Core Funds Index (+4.17%).
For the six-month semi-annual period ended December 31, 2016, our Fund returned 7.74%, lagging the S&P 500 Index (+7.82%) and the Lipper Large-Cap Core Funds Index (+9.03%), but outperforming the Russell Top 50 Mega Cap Index (+6.95%).
For the calendar year, our Fund returned 13.18%, outpacing the S&P 500 Index (+11.96%), the Russell Top 50 Mega Cap Index (+10.43%) and the Lipper Large-Cap Core Funds Index (+12.28%).
The table below presents our December quarter, six-month, one-year, five-year, 10-year, 15-year and inception-to-date financial results.
Standardized Returns as of December 31, 2016
| | | | | | | | | | | | | | | | | | | | | | | | | | | | | | | | | | | |
| | | | | | | | | Annualized |
| | | Quarter | | 6 Months | | 1 Year | | 5 Years | | 10 Years | | 15 Years | | Since Inception
(7/31/97) |
| | | | | | | |
Blue Chip 35 Index Fund | | | | 3.93 | % | | | | 7.74 | % | | | | 13.18 | % | | | | 14.36 | % | | | | 7.17 | % | | | | 6.45 | % | | | | 6.78 | % |
S&P 500 Index | | | | 3.82 | % | | | | 7.82 | % | | | | 11.96 | % | | | | 14.66 | % | | | | 6.95 | % | | | | 6.69 | % | | | | 6.46 | % |
Russell Top 50 Mega Cap Index | | | | 3.45 | % | | | | 6.95 | % | | | | 10.43 | % | | | | 13.96 | % | | | | 6.26 | % | | | | 5.33 | % | | | | 5.38 | % |
Lipper Large-Cap Core Funds Index | | | | 4.17 | % | | | | 9.03 | % | | | | 12.28 | % | | | | 13.55 | % | | | | 6.24 | % | | | | 5.82 | % | | | | 5.65 | % |
Bridgeway Ultra-Large 35 Index | | | | 3.99 | % | | | | 7.97 | % | | | | 13.52 | % | | | | 14.62 | % | | | | 7.45 | % | | | | 6.60 | % | | | | 6.98 | % |
Performance figures quoted in the table above represent past performance and are no guarantee of future results. Total return figures in the table above include the reinvestment of dividends and capital gains. The table above does not reflect the deduction of taxes that a shareholder would pay on Fund distributions or on the redemption of Fund shares.
The S&P 500 Index is a broad-based, unmanaged measurement of changes in stock market conditions, based on the average of 500 widely held common stocks with dividends reinvested. The Russell Top 50 Mega Cap Index measures the performance of the largest companies in the Russell 3000 Index. It includes 50 of the largest securities, based on a combination of their market cap and current index membership, and represents approximately 40% of the total market capitalization of the Russell 3000 Index. The Bridgeway Ultra-Large 35 Index is an index composed of very large, “blue chip” U.S. stocks, excluding tobacco; it is compiled by the adviser of the Fund. The Lipper Large-Cap Core Funds Index reflects the aggregate record of domestic large-cap core mutual funds as reported by Lipper, Inc. It is not possible to invest directly in an index. Periods longer than one year are annualized.
According to data from Lipper as of December 31, 2016, Blue Chip 35 Index Fund ranked 165th of 874 large-cap core funds for the 12 months ended December 31, 2016, 171st of 707 over the last five years, 86th of 558 over the last 10 years, and 35th of 164 since inception in July 1997. Lipper, a Thomson Reuters company, is an independent mutual fund rating service that ranks funds in various fund categories by making comparative calculations using total returns.
| | |
| 62 | | Semi-Annual Report | December 31, 2016 (Unaudited) |
| | |
| Blue Chip 35 Index Fund | | |
| MANAGER’S COMMENTARY (Unaudited) (continued) | | |
| | |
Blue Chip 35 Index Fund vs. S&P 500 Index, Russell Top 50 Mega Cap Index, Lipper Large-Cap Core Funds Index & Bridgeway Ultra-Large 35 Index from Inception 7/31/97 to 12/31/16
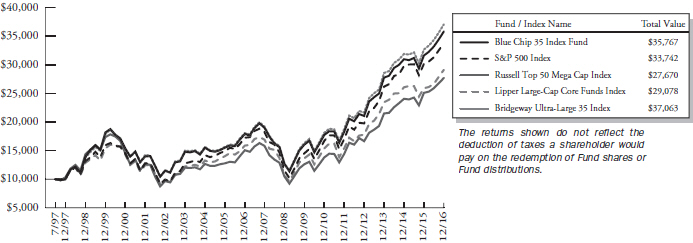
Detailed Explanation of Quarterly Performance
The Fund’s roughly equal-weight design feature helped it outpace the market-cap weighted Russell Top 50 Mega Cap Index because momentum was out of favor during the quarter, which aided equal-weight strategies. The Fund’s mega cap design also had a small positive impact on relative performance as it increased exposure to the market’s largest stocks, which performed well during the quarter. However, the Fund’s tilt toward less risky, lower beta stocks detracted from relative performance, as higher beta stocks generated better quarterly performance.
Holdings in the Financials sector boosted relative returns, as did an overweight position and holdings in the Energy sector. An underweight in position in the Health Care sector also helped relative returns, while overweight positions and holdings in the Consumer Staples and Information Technology sectors detracted from relative returns.
Detailed Explanation of Calendar Year Performance
The Fund’s roughly equal-weight design feature and disciplined rebalancing had a positive impact on relative performance. Reflecting the quality tilt of blue chip stocks, the Fund’s lower exposure to high-leverage companies also boosted relative returns, as high-leverage companies lagged for the year. However, the Fund’s mega cap design hurt relative performance because the Fund lacked exposure to some of the smaller large-cap stocks that performed well during the year. Exposure to less risky, lower beta stocks also hurt relative performance.
An underweight position in Health Care — the worst performing sector for the year — boosted relative performance, as did some of our holdings of pharmaceutical and biotechnology companies within the sector. Overweight positions in Energy and Telecommunication Services also helped relative performance, along with holdings in the Consumer Discretionary and Financials sectors. However, an overweight position and holdings in the Consumer Staples sector detracted from relative performance.
| | |
| Blue Chip 35 Index Fund | |
|
| MANAGER’S COMMENTARY (Unaudited) (continued) | |
| | |
The table below presents index performance numbers for stocks in the different CRSP deciles during various time periods.
| | | | | | | | | | | | | | | | | | | | | | | | |
| | | | | | | | | | | | Annualized | |
| CRSP Decile1 | | Quarter | | | 6 Months | | | 1 Year | | | 5 Years | | | 10 Years | | | 91 Years | |
| 1 (ultra-large) | | | 4.28% | | | | 8.27% | | | | 11.63% | | | | 14.39% | | | | 6.80% | | | | 9.30% | |
| 2 | | | 4.09% | | | | 9.84% | | | | 16.97% | | | | 15.86% | | | | 8.17% | | | | 10.55% | |
| 3 | | | 4.46% | | | | 10.39% | | | | 16.83% | | | | 14.80% | | | | 8.14% | | | | 11.03% | |
| 4 | | | 6.30% | | | | 10.89% | | | | 13.49% | | | | 13.90% | | | | 8.47% | | | | 10.84% | |
| 5 | | | 6.06% | | | | 14.64% | | | | 16.95% | | | | 13.27% | | | | 9.24% | | | | 11.48% | |
| 6 | | | 5.02% | | | | 15.57% | | | | 18.79% | | | | 14.21% | | | | 8.07% | | | | 11.36% | |
| 7 | | | 9.24% | | | | 20.79% | | | | 25.23% | | | | 16.16% | | | | 9.01% | | | | 11.57% | |
| 8 | | | 9.58% | | | | 21.05% | | | | 21.59% | | | | 14.48% | | | | 8.34% | | | | 11.55% | |
| 9 | | | 12.05% | | | | 28.22% | | | | 30.92% | | | | 15.36% | | | | 8.01% | | | | 11.54% | |
| 10 (ultra-small) | | | 6.45% | | | | 21.34% | | | | 21.62% | | | | 14.87% | | | | 6.59% | | | | 13.29% | |
| 1 | Performance figures are as of the period ended December 31, 2016. The CRSP Cap-Based Portfolio Indexes are unmanaged indexes of publicly traded U.S. stocks with dividends reinvested, grouped by market capitalization, as reported by the Center for Research in Security Prices. Past performance is no guarantee of future results. |
| | |
| 64 | | Semi-Annual Report | December 31, 2016 (Unaudited) |
| | |
| Blue Chip 35 Index Fund | | |
| MANAGER’S COMMENTARY (Unaudited) (continued) | | |
| | |
Contribution to Returns for Blue Chip 35 Index Fund stocks for the Calendar year December 31, 2016:
| | | | | | | | | |
| Rank | | Company | | Industry | | % Contribution
to Return |
| 1 | | Bank of America Corp. | | Financials | | | | 1.1 | % |
| 2 | | QUALCOMM, Inc. | | Information Technology | | | | 0.9 | % |
| 3 | | Chevron Corp. | | Energy | | | | 0.9 | % |
| 4 | | JPMorgan Chase & Co. | | Financials | | | | 0.9 | % |
| 5 | | AT&T, Inc. | | Telecommunication Services | | | | 0.8 | % |
| 6 | | Comcast Corp., Class A | | Consumer Discretionary | | | | 0.7 | % |
| 7 | | Schlumberger, Ltd. | | Energy | | | | 0.6 | % |
| 8 | | International Business Machines Corp. | | Information Technology | | | | 0.6 | % |
| 9 | | 3M Co. | | Industrials | | | | 0.6 | % |
| 10 | | Berkshire Hathaway Inc., Class B | | Financials | | | | 0.6 | % |
| 11 | | United Parcel Service, Inc., Class B | | Industrials | | | | 0.6 | % |
| 12 | | Verizon Communications, Inc. | | Telecommunication Services | | | | 0.6 | % |
| 13 | | Exxon Mobil Corp. | | Energy | | | | 0.6 | % |
| 14 | | Microsoft Corp. | | Information Technology | | | | 0.5 | % |
| 15 | | Wal-Mart Stores, Inc. | | Consumer Discretionary | | | | 0.5 | % |
| 16 | | Johnson & Johnson | | Health Care | | | | 0.4 | % |
| 17 | | Cisco Systems, Inc. | | Information Technology | | | | 0.4 | % |
| 18 | | United Technologies Corp. | | Industrials | | | | 0.4 | % |
| 19 | | Apple, Inc. | | Information Technology | | | | 0.4 | % |
| 20 | | Merck & Co., Inc. | | Health Care | | | | 0.4 | % |
| 21 | | Amazon.com, Inc. | | Consumer Discretionary | | | | 0.4 | % |
| 22 | | Procter & Gamble Co. (The) | | Consumer Staples | | | | 0.3 | % |
| 23 | | Oracle Corp. | | Information Technology | | | | 0.2 | % |
| 24 | | PepsiCo, Inc. | | Consumer Staples | | | | 0.2 | % |
| 25 | | ConocoPhillips | | Energy | | | | 0.2 | % |
| 26 | | McDonald’s Corp. | | Consumer Discretionary | | | | 0.2 | % |
| 27 | | Intel Corp. | | Information Technology | | | | 0.2 | % |
| 28 | | Wells Fargo & Co. | | Financials | | | | 0.2 | % |
| 29 | | General Electric Co. | | Industrials | | | | 0.1 | % |
| 30 | | Pfizer, Inc. | | Health Care | | | | 0.1 | % |
| 31 | | Coca-Cola Co. (The) | | Consumer Staples | | | | 0.0 | % |
| 32 | | Alphabet Inc., Class A | | Information Technology | | | | 0.0 | % |
| 33 | | Alphabet Inc., Class C | | Information Technology | | | | 0.0 | % |
| 34 | | Visa Inc., Class A | | Financials | | | | 0.0 | % |
| 35 | | Walt Disney Co. (The) | | Consumer Discretionary | | | | 0.0 | % |
| 36 | | CVS Health Corp. | | Consumer Staples | | | | -0.6 | % |
| 37 | | Gilead Sciences, Inc. | | Health Care | | | | -0.9 | % |
| | |
| Blue Chip 35 Index Fund | |
|
| MANAGER’S COMMENTARY (Unaudited) (continued) | |
| | |
Industry Sector Representation as of December 31, 2016
| | | | | | | | | | | | | | | |
| | | % of Net Assets | | % of S&P 500 Index | | Difference |
Consumer Discretionary | | | | 11.2% | | | | | 12.0% | | | | | -0.8% | |
Consumer Staples | | | | 12.6% | | | | | 9.4% | | | | | 3.2% | |
Energy | | | | 10.3% | | | | | 7.6% | | | | | 2.7% | |
Financials | | | | 12.8% | | | | | 14.8% | | | | | -2.0% | |
Health Care | | | | 10.2% | | | | | 13.6% | | | | | -3.4% | |
Industrials | | | | 10.4% | | | | | 10.3% | | | | | 0.1% | |
Information Technology | | | | 27.2% | | | | | 20.8% | | | | | 6.4% | |
Materials | | | | 0.0% | | | | | 2.8% | | | | | -2.8% | |
Real Estate | | | | 0.0% | | | | | 2.9% | | | | | -2.9% | |
Telecommunication Services | | | | 5.3% | | | | | 2.7% | | | | | 2.6% | |
Utilities | | | | 0.0% | | | | | 3.2% | | | | | -3.2% | |
Cash & Other Assets | | | | 0.1% | | | | | 0.0% | | | | | 0.1% | |
Total | | | | 100.0% | | | | | 100.0% | | | | | | |
Disclaimer
The views expressed here are exclusively those of Fund management. These views, including those concerning market sectors or individual stocks, are not meant as investment advice and should not be considered predictive in nature. Any favorable (or unfavorable) description of a holding applies only as of the quarter end, December 31, 2016, unless otherwise stated. Security positions can and do change thereafter. Discussions of historical performance do not guarantee and are not indicative of future performance.
The Fund is subject to significant market risk (volatility) and is not an appropriate investment for short-term investors.
Conclusion
Thank you for your continued investment in Blue Chip 35 Index Fund. We encourage your feedback; your reactions and concerns are important to us.
Sincerely,
The Investment Management Team
| | |
| 66 | | Semi-Annual Report | December 31, 2016 (Unaudited) |
| | |
| Blue Chip 35 Index Fund | | |
| SCHEDULE OF INVESTMENTS | | |
| Showing percentage of net assets as of December 31, 2016 (Unaudited) | | |
| | | | | | | | |
| Industry Company | | Shares | | Value | | | |
| |
COMMON STOCKS - 99.83% | | | | |
Aerospace & Defense - 2.66% | | | | |
United Technologies Corp. | | 140,080 | | $ 15,355,570 | | | | |
| |
Air Freight & Logistics - 2.57% | | | | |
United Parcel Service, Inc.,
Class B | | 129,363 | | 14,830,174 | | | | |
| |
Beverages - 5.00% | | | | |
Coca-Cola Co. (The) | | 347,014 | | 14,387,200 | | | | |
PepsiCo, Inc. | | 137,805 | | 14,418,537 | | | | |
| | | | | | | | |
| | | | 28,805,737 | | | | |
| |
Biotechnology - 2.51% | | | | |
Gilead Sciences, Inc. | | 201,800 | | 14,450,898 | | | | |
| |
Commercial Banks - 2.97% | | | | |
Wells Fargo & Co. | | 310,759 | | 17,125,928 | | | | |
| |
Communications Equipment - 2.50% | | | | |
Cisco Systems, Inc. | | 476,308 | | 14,394,028 | | | | |
| |
Computers & Peripherals - 3.47% | | | | |
Apple, Inc. | | 172,750 | | 20,007,905 | | | | |
| |
Diversified Financial Services - 9.83% | | | | |
Bank of America Corp. | | 1,043,508 | | 23,061,527 | | | | |
Berkshire Hathaway, Inc., Class B* | | 95,750 | | 15,605,335 | | | | |
JPMorgan Chase & Co. | | 208,795 | | 18,016,921 | | | | |
| | | | | | | | |
| | | | 56,683,783 | | | | |
| |
Diversified Telecommunication Services - 5.25% | | | | |
AT&T, Inc. | | 360,025 | | 15,311,863 | | | | |
Verizon Communications, Inc. | | 280,089 | | 14,951,151 | | | | |
| | | | | | | | |
| | | | 30,263,014 | | | | |
| |
Energy Equipment & Services - 2.60% | | | | |
Schlumberger, Ltd. | | 178,500 | | 14,985,075 | | | | |
| |
Food & Staples Retailing - 5.11% | | | | |
CVS Health Corp. | | 190,600 | | 15,040,246 | | | | |
Wal-Mart Stores, Inc. | | 208,519 | | 14,412,833 | | | | |
| | | | | | | | |
| | | | 29,453,079 | | | | |
| |
Hotels, Restaurants & Leisure - 2.65% | | | | |
McDonald’s Corp. | | 125,600 | | 15,288,032 | | | | |
| |
Household Products - 2.50% | | | | |
Procter & Gamble Co. (The) | | 171,426 | | 14,413,498 | | | | |
| |
Industrial Conglomerates - 5.15% | | | | |
3M Co. | | 82,450 | | 14,723,096 | | | | |
| | | | |
| Industry Company | | Shares | | Value |
|
|
Industrial Conglomerates (continued) |
General Electric Co. | | 473,343 | | $ 14,957,639 |
| | | | |
| | | | 29,680,735 |
|
Internet & Catalog Retail - 3.39% |
Amazon.com, Inc.* | | 26,100 | | 19,571,607 |
|
Internet Software & Services - 3.55% |
Alphabet, Inc., Class A* | | 12,770 | | 10,119,587 |
Alphabet, Inc., Class C* | | 13,414 | | 10,353,193 |
| | | | |
| | | | 20,472,780 |
|
IT Services - 6.00% |
International Business | | | | |
Machines Corp. | | 87,967 | | 14,601,642 |
Visa, Inc., Class A | | 255,900 | | 19,965,318 |
| | | | |
| | | | 34,566,960 |
|
Media - 5.14% |
Comcast Corp., Class A | | 209,600 | | 14,472,880 |
Walt Disney Co. (The) | | 145,400 | | 15,153,588 |
| | | | |
| | | | 29,626,468 |
|
Oil, Gas & Consumable Fuels - 7.65% |
Chevron Corp. | | 126,195 | | 14,853,152 |
ConocoPhillips | | 290,715 | | 14,576,450 |
Exxon Mobil Corp. | | 162,287 | | 14,648,025 |
| | | | |
| | | | 44,077,627 |
|
Pharmaceuticals - 7.69% |
Johnson & Johnson | | 124,752 | | 14,372,678 |
Merck & Co., Inc. | | 245,235 | | 14,436,984 |
Pfizer, Inc. | | 478,544 | | 15,543,109 |
| | | | |
| | | | 44,352,771 |
|
Semiconductors & Semiconductor Equipment - 5.16% |
Intel Corp. | | 425,743 | | 15,441,699 |
QUALCOMM, Inc. | | 219,900 | | 14,337,480 |
| | | | |
| | | | 29,779,179 |
|
Software - 6.48% |
Microsoft Corp. | | 369,445 | | 22,957,312 |
Oracle Corp. | | 374,813 | | 14,411,560 |
| | | | |
| | | | 37,368,872 |
| | | | |
TOTAL COMMON STOCKS - 99.83% | | 575,553,720 |
| | | | |
(Cost $343,051,318) | | | | |
| | |
| Blue Chip 35 Index Fund | |
|
| SCHEDULE OF INVESTMENTS (continued) | |
| Showing percentage of net assets as of December 31, 2016 (Unaudited) | | |
| | | | | | | | |
| | | Rate^ | | Shares | | Value | |
|
MONEY MARKET FUND - 0.28% | |
Fidelity Institutional Government Portfolio Institutional Class | | 0.43% | | 1,584,687 | | $ | 1,584,687 | |
| | | | | | | | |
| |
TOTAL MONEY MARKET FUND - 0.28% | | | 1,584,687 | |
| | | | | | | | |
(Cost $1,584,687) | | | | | | | | |
| |
TOTAL INVESTMENTS - 100.11% | | $ | 577,138,407 | |
(Cost $344,636,005) | | | | |
Liabilities in Excess of Other Assets - (0.11%) | | | (626,147 | ) |
| | | | | | | | |
| |
NET ASSETS - 100.00% | | $ | 576,512,260 | |
| | | | | | | | |
| * | Non-income producing security. |
| ^ | Rate disclosed as of December 31, 2016. |
Summary of inputs used to value the Fund’s investments as of 12/31/2016 (See Note 2 in Notes to Financial Statements):
| | | | | | | | | | | | | | | | |
| |
| | | Valuation Inputs | |
| |
| | | Investment in Securities (Value) | |
| |
| | | | | | Level 2 | | | Level 3 | | | | |
| | | Level 1 | | | Significant | | | Significant | | | | |
| | | Quoted | | | Observable | | | Unobservable | | | | |
| | | Prices | | | Inputs | | | Inputs | | | Total | |
| |
| | | | |
Common Stocks | | $ | 575,553,720 | | | $ | — | | | | $ — | | | $ | 575,553,720 | |
Money Market Fund | | | — | | | | 1,584,687 | | | | — | | | | 1,584,687 | |
| | | | | | | | | | | | | | | | |
TOTAL | | $ | 575,553,720 | | | $ | 1,584,687 | | | | $ — | | | $ | 577,138,407 | |
| | | | | | | | | | | | | | | | |
See Notes to Financial Statements.
| | |
| 68 | | Semi-Annual Report | December 31, 2016 (Unaudited) |
| | |
| Managed Volatility Fund | | |
| MANAGER’S COMMENTARY (Unaudited) | | |
| | |
December 31, 2016
Dear Fellow Managed Volatility Fund Shareholder,
For the quarter ended December 31, 2016, our Fund returned 0.07%, underperforming our primary market benchmark, the S&P 500 Index (+3.82%), and our peer benchmark, the Lipper Balanced Funds Index (+0.68%). Performance for the quarter was in line with the Fund’s design.
For the six-month semi-annual period ended December 31, 2016, our Fund returned 1.19%, trailing the S&P 500 Index (+7.82%) and the Lipper Balanced Funds Index (+3.77%).
For the calendar year, our Fund returned 2.42%, trailing the S&P 500 Index (+11.96%) and the Lipper Balanced Funds Index (+7.20%).
The table below presents our December quarter, six-month, one-year, five-year, 10-year, 15-year and inception-to-date financial results.
Standardized Returns as of December 31, 2016
| | | | | | | | | | | | | | | | | | | | | | | | | | | | | | | | | | | |
| | | | | | | | | Annualized |
| | | Quarter | | 6 Months | | 1 Year | | 5 Years | | 10 Years | | 15 Years | | Since Inception
(6/30/01) |
| | | | | | | |
Managed Volatility Fund | | | | 0.07% | | | | | 1.19% | | | | | 2.42% | | | | | 4.80% | | | | | 2.75% | | | | | 4.11% | | | | | 3.82% | |
S&P 500 Index | | | | 3.82% | | | | | 7.82% | | | | | 11.96% | | | | | 14.66% | | | | | 6.95% | | | | | 6.69% | | | | | 6.08% | |
Lipper Balanced Funds Index | | | | 0.68% | | | | | 3.77% | | | | | 7.20% | | | | | 8.32% | | | | | 5.01% | | | | | 5.51% | | | | | 5.22% | |
Performance figures quoted in the table above represent past performance and are no guarantee of future results. Total return figures in the table above include the reinvestment of dividends and capital gains. The table above does not reflect the deduction of taxes that a shareholder would pay on Fund distributions or on the redemption of Fund shares.
The S&P 500 Index is a broad-based, unmanaged measurement of changes in stock market conditions, based on the average of 500 widely held common stocks with dividends reinvested. The Lipper Balanced Funds Index is an index of balanced funds compiled by Lipper, Inc. It is not possible to invest directly in an index. Periods longer than one year are annualized.
According to data from Lipper as of December 31, 2016, the Managed Volatility Fund ranked 189th of 341 Alternative Long/ Short Equity funds for the 12 months ended December 31, 2016, 62nd of 112 over the past five years, 17th of 36 over the last 10 years, and 5th of 12 funds since inception on June 30, 2001. Lipper, a Thomson Reuters company, is an independent mutual fund rating service that ranks funds in various fund categories by making comparative calculations using total returns.
According to data from Morningstar as of December 31, 2016, Managed Volatility Fund ranked 88th of 113 Option Writing funds for the twelve months ended December 31, 2016, 21st of 28 Option Writing funds for the past five years, and 2nd of 6 over the last 10 years. Morningstar ranks funds in various fund categories by making comparative calculations using total returns. Please note that Morningstar changed the Managed Volatility Fund’s investment category to Option Writing from Long/Short Equity. This category change by Morningstar does not impact the Fund in any way. The Fund’s strategy and investment approach have not changed. Morningstar reviews fund categories on an ongoing basis and appoints categories based on each fund’s portfolio statistics and compositions over the past three years.
| | |
| Managed Volatility Fund | |
|
| MANAGER’S COMMENTARY (Unaudited) (continued) | |
| | |
Managed Volatility Fund vs. S&P 500 Index & Lipper Balanced Funds Index
from Inception 6/30/01 to 12/31/16
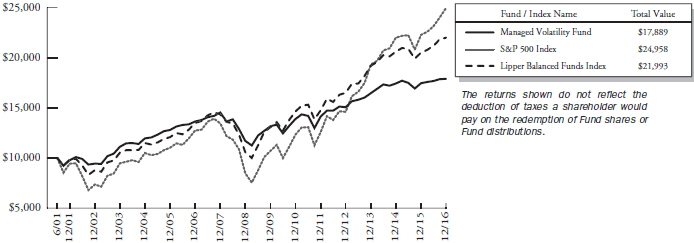
Detailed Explanation of Quarterly Performance
In the fourth quarter, the Fund failed to capture 40% of the S&P 500’s 3.82% return. The portfolio’s options and futures components were responsible for most of this underperformance, contributing -1.44% and -0.87% to the Fund’s return, respectively. The performance of the futures component was in line with expectations during a quarter characterized by a rising equity market, but our options component lagged due to holdings of covered calls that declined during the quarter. The portfolio’s fixed-income components also detracted from relative performance, contributing -0.16% to return. These declines were partially offset by positive absolute performance from the portfolio’s equities component, which contributed 2.53% to the Fund’s returns.
Detailed Explanation of Calendar Year Performance
The Fund failed to capture 40% of the S&P 500’s 11.96% return for the calendar year. The portfolio’s futures and options components were responsible for most of this underperformance, contributing -2.71% and -1.22% to the Fund’s return, respectively. The performance of the futures component was in line with expectations during a rising equity market, but our options component lagged due to holdings of covered calls that declined during the period. These declines were partially off-set by gains from the portfolio’s fixed-income and equities components, which contributed 0.04% and 6.29% to the Fund’s return, respectively.
For the 2016 calendar year, the Fund had a standard deviation of 5.68, representing 43% of the index’s 13.28 standard deviation during the same period. The Fund continues to perform as designed, particularly over longer time periods. For 10 years and since inception, the Fund has captured 40% and 63%, respectively, of the S&P 500 Index’s return with a standard deviation roughly 44% of the index’s.
| | |
| 70 | | Semi-Annual Report | December 31, 2016 (Unaudited) |
| | |
| Managed Volatility Fund | | |
| MANAGER’S COMMENTARY (Unaudited) (continued) | | |
| | |
Top Ten Equity Holdings as of December 31, 2016
| | | | | | | | |
| Rank | | Description | | Industry | | % of Net
Assets | |
| 1 | | Polaris Industries, Inc. | | Leisure Equipment & Products | | | 1.9% | |
| 2 | | Valero Energy Corp. | | Oil, Gas & Consumable Fuels | | | 1.5% | |
| 3 | | Campbell Soup Co. | | Food Products | | | 1.2% | |
| 4 | | Berkshire Hathaway, Inc. | | Diversified Financial Services | | | 1.1% | |
| 5 | | Ford Motor Co. | | Automobiles | | | 1.1% | |
| 6 | | Silver Wheaton Corp. | | Metals & Mining | | | 1.0% | |
| 7 | | Barrick Gold Corp. | | Chemicals | | | 1.0% | |
| 8 | | Gilead Sciences, Inc. | | Biotechnology | | | 1.0% | |
| 9 | | NIKE, Inc. | | Textiles, Apparel & Luxury Goods | | | 0.9% | |
| 10 | | Visa Inc | | IT Services | | | 0.9% | |
| | Total | | | | | 11.6% | |
Industry Sector Representation as of December 31, 2016
| | | | | |
| Asset Type | | % of Net
Assets |
Common Stock | | | | 57.0% | |
Consumer Discretionary | | | | 9.6% | |
Consumer Staples | | | | 5.4% | |
Energy | | | | 4.6% | |
Financials | | | | 7.9% | |
Health Care | | | | 7.0% | |
Industrials | | | | 4.6% | |
Information Technology | | | | 10.7% | |
Materials | | | | 3.5% | |
Real Estate | | | | 1.9% | |
Telecommunication Services | | | | 1.0% | |
Utilities | | | | 1.2% | |
U.S. Government Obligations | | | | 36.7% | |
Call Options Written | | | | -1.4% | |
Put Options Written | | | | -0.8% | |
Money Market Fund | | | | 9.2% | |
Liabilities in Excess of Other Assets | | | | -0.7% | |
Total | | | | 100% | |
Disclaimer
The views expressed here are exclusively those of Fund management. These views, including those related to market sectors or individual stocks, are not meant as investment advice and should not be considered predictive in nature. Any favorable (or unfavorable) description of a holding applies only as of the quarter end, December 31, 2016, unless otherwise stated. Security positions can and do change thereafter. Discussions of historical performance do not guarantee and may not be indicative of future performance.
Market volatility can significantly affect short-term performance. The Fund is not an appropriate investment for short-term investors. Investments in the small companies within this multi-cap fund generally carry greater risk than is customarily associated with larger companies. This additional risk is attributable to a number of factors, including the relatively limited financial resources that are typically available to small companies and the fact that small companies often have comparatively limited product lines. In addition, the stock of small companies tends to be more volatile than the stock of large companies, particularly in the short term and particularly in the early stages of an economic or market downturn. The Fund’s use of options,
| | |
| Managed Volatility Fund | |
|
| MANAGER’S COMMENTARY (Unaudited) (continued) | |
| | |
futures, and leverage can magnify the risk of loss in an unfavorable market, and the Fund’s use of short-sale positions can, in theory, expose shareholders to unlimited loss. Shareholders of the Fund, therefore, are taking on more risk than they would if they invested in the stock market as a whole. The Fund uses an option writing strategy in which the Fund may sell covered calls or secured put options. Options are subject to special risks and may not fully protect the Fund against declines in the value of its stocks. In addition, an option writing strategy limits the upside profit potential normally associated with stocks. Finally, the Fund’s fixed-income holdings are subject to three types of risk. Interest rate risk is the chance that bond prices overall will decline as interest rates rise. Credit risk is the chance that a bond issuer will fail to pay interest and principal. Prepayment risk is the chance that a mortgage-backed bond issuer will repay a higher yielding bond, resulting in a lower paying yield.
Conclusion
Thank you for your continued investment in Managed Volatility Fund. We encourage your feedback; your reactions and concerns are important to us.
Sincerely,
The Investment Management Team
| | |
| 72 | | Semi-Annual Report | December 31, 2016 (Unaudited) |
| | |
| Managed Volatility Fund | |
|
| SCHEDULE OF INVESTMENTS | |
| Showing percentage of net assets as of December 31, 2016 (Unaudited) | | |
| | | | | | | | | | | | |
| Industry Company | | Shares | | | Value | | | | |
| |
COMMON STOCKS - 56.76% | | | | | |
Aerospace & Defense - 1.86% | | | | | |
Honeywell International, Inc. | | | 1,200 | | | $ | 139,020 | | | | | |
Lockheed Martin Corp. | | | 870 | | | | 217,448 | | | | | |
Northrop Grumman Corp. | | | 1,100 | | | | 255,838 | | | | | |
Raytheon Co.# | | | 900 | | | | 127,800 | | | | | |
United Technologies Corp. | | | 1,140 | | | | 124,967 | | | | | |
| | | | | | | 865,073 | | | | | |
| |
Air Freight & Logistics - 0.40% | | | | | |
FedEx Corp.# | | | 1,000 | | | | 186,200 | | | | | |
| |
Airlines - 0.33% | | | | | |
JetBlue Airways Corp.*# | | | 2,500 | | | | 56,050 | | | | | |
Southwest Airlines Co. | | | 2,000 | | | | 99,680 | | | | | |
| | | | | | | 155,730 | | | | | |
| |
Auto Components - 0.23% | | | | | |
Adient PLC* | | | 495 | | | | 29,007 | | | | | |
Delphi Automotive PLC# | | | 500 | | | | 33,675 | | | | | |
Goodyear Tire & Rubber Co. (The)# | | | 1,400 | | | | 43,218 | | | | | |
| | | | | | | | | | | | |
| | | | | | | 105,900 | | | | | |
| |
Automobiles - 1.06% | | | | | |
Ford Motor Co.# | | | 40,600 | | | | 492,478 | | | | | |
| |
Beverages - 1.01% | | | | | |
Coca-Cola Co. (The)# | | | 4,100 | | | | 169,986 | | | | | |
Constellation Brands, Inc., Class A | | | 800 | | | | 122,648 | | | | | |
PepsiCo, Inc.# | | | 1,700 | | | | 177,871 | | | | | |
| | | | | | | | | | | | |
| | | | | | | 470,505 | | | | | |
| |
Biotechnology - 1.94% | | | | | |
Amgen, Inc. | | | 1,100 | | | | 160,831 | | | | | |
Biogen, Inc.* | | | 600 | | | | 170,148 | | | | | |
Celgene Corp.* | | | 1,100 | | | | 127,325 | | | | | |
Gilead Sciences, Inc.# | | | 6,200 | | | | 443,982 | | | | | |
| | | | | | | | | | | | |
| | | | | | | 902,286 | | | | | |
| |
Capital Markets - 1.27% | | | | | |
BlackRock, Inc. | | | 300 | | | | 114,162 | | | | | |
Charles Schwab Corp. (The)# | | | 3,600 | | | | 142,092 | | | | | |
Goldman Sachs Group, Inc. (The) | | | 500 | | | | 119,725 | | | | | |
Morgan Stanley# | | | 3,300 | | | | 139,425 | | | | | |
State Street Corp. | | | 1,000 | | | | 77,720 | | | | | |
| | | | | | | | | | | | |
| | | | | | | 593,124 | | | | | |
| |
Chemicals - 1.99% | | | | | |
AdvanSix, Inc.* | | | 48 | | | | 1,063 | | | | | |
| | | | | | | | |
| Industry Company | | Shares | | | Value | |
|
| |
Chemicals (continued) | |
Barrick Gold Corp.# | | | 28,000 | | | $ | 447,440 | |
Dow Chemical Co. (The)# | | | 1,800 | | | | 102,996 | |
LyondellBasell Industries NV, Class A | | | 800 | | | | 68,624 | |
Monsanto Co. | | | 900 | | | | 94,689 | |
Praxair, Inc.# | | | 900 | | | | 105,471 | |
Sherwin-Williams Co. (The) | | | 400 | | | | 107,496 | |
| | | | | | | | |
| | | | | | | 927,779 | |
|
Commercial Banks - 1.90% | |
BB&T Corp.# | | | 1,100 | | | | 51,722 | |
Comerica, Inc. | | | 1,100 | | | | 74,921 | |
Huntington Bancshares, Inc. | | | 7,700 | | | | 101,794 | |
KeyCorp | | | 4,800 | | | | 87,696 | |
PNC Financial Services Group, Inc. (The)# | | | 1,400 | | | | 163,744 | |
U.S. Bancorp | | | 2,800 | | | | 143,836 | |
Wells Fargo & Co.# | | | 4,771 | | | | 262,930 | |
| | | | | | | 886,643 | |
|
Commercial Services & Supplies - 0.17% | |
Waste Management, Inc. | | | 1,100 | | | | 78,001 | |
|
Communications Equipment - 1.01% | |
Cisco Systems, Inc.# | | | 8,500 | | | | 256,870 | |
Juniper Networks, Inc.# | | | 7,500 | | | | 211,950 | |
| | | | | | | | |
| | | | | | | 468,820 | |
|
Computers & Peripherals - 1.08% | |
Apple, Inc.# | | | 3,000 | | | | 347,460 | |
Dell Technologies, Inc. - VMware Inc.* | | | 222 | | | | 12,203 | |
HP, Inc. | | | 2,900 | | | | 43,036 | |
Western Digital Corp.# | | | 1,510 | | | | 102,604 | |
| | | | | | | | |
| | | | | | | 505,303 | |
|
Consumer Finance - 0.54% | |
American Express Co.# | | | 2,600 | | | | 192,608 | |
Capital One Financial Corp. | | | 700 | | | | 61,068 | |
| | | | | | | | |
| | | | | | | 253,676 | |
|
Containers & Packaging - 0.06% | |
Ball Corp. | | | 400 | | | | 30,028 | |
|
Diversified Financial Services - 2.55% | |
AerCap Holdings NV*# | | | 1,100 | | | | 45,771 | |
Bank of America Corp.# | | | 5,500 | | | | 121,550 | |
Berkshire Hathaway, Inc., Class B*# | | | 3,200 | | | | 521,536 | |
Citigroup, Inc.# | | | 4,010 | | | | 238,314 | |
| | |
| Managed Volatility Fund | | |
| SCHEDULE OF INVESTMENTS (continued) | | |
| Showing percentage of net assets as of December 31, 2016 (Unaudited) | | |
| | | | | | | | | | | | |
| Industry Company | | Shares | | | Value | | | | |
| |
Common Stocks (continued) | | | | | |
Diversified Financial Services (continued) | | | | | |
JPMorgan Chase & Co.# | | | 3,000 | | | $ | 258,870 | | | | | |
| | | | | | | | | | | | |
| | | | | | | 1,186,041 | | | | | |
| |
Diversified Telecommunication Services - 0.98% | | | | | |
AT&T, Inc.# | | | 6,700 | | | | 284,951 | | | | | |
CenturyLink, Inc.# | | | 1,800 | | | | 42,804 | | | | | |
Verizon Communications, Inc. | | | 2,400 | | | | 128,112 | | | | | |
| | | | | | | | | | | | |
| | | | | | | 455,867 | | | | | |
| |
Electric Utilities - 0.63% | | | | | |
American Electric Power Co., Inc. | | | 1,500 | | | | 94,440 | | | | | |
Duke Energy Corp.# | | | 1,283 | | | | 99,586 | | | | | |
Exelon Corp.# | | | 2,800 | | | | 99,372 | | | | | |
| | | | | | | | | | | | |
| | | | | | | 293,398 | | | | | |
| |
Electrical Equipment - 0.41% | | | | | |
Emerson Electric Co.# | | | 1,500 | | | | 83,625 | | | | | |
Fortive Corp. | | | 850 | | | | 45,586 | | | | | |
Johnson Controls International PLC# | | | 1,454 | | | | 59,890 | | | | | |
| | | | | | | | | | | | |
| | | | | | | 189,101 | | | | | |
| |
Energy Equipment & Services - 0.36% | | | | | |
Halliburton Co.# | | | 1,700 | | | | 91,953 | | | | | |
Helmerich & Payne, Inc. | | | 1,000 | | | | 77,400 | | | | | |
| | | | | | | | | | | | |
| | | | | | | 169,353 | | | | | |
| |
Financials - 0.13% | | | | | |
PayPal Holdings, Inc.*# | | | 1,500 | | | | 59,205 | | | | | |
| |
Food & Staples Retailing - 0.92% | | | | | |
Costco Wholesale Corp. | | | 700 | | | | 112,077 | | | | | |
CVS Health Corp. | | | 900 | | | | 71,019 | | | | | |
Kroger Co. (The)# | | | 2,300 | | | | 79,373 | | | | | |
Wal-Mart Stores, Inc.# | | | 2,400 | | | | 165,888 | | | | | |
| | | | | | | | | | | | |
| | | | | | | 428,357 | | | | | |
| |
Food Products - 2.50% | | | | | |
Archer-Daniels-Midland Co.# | | | 2,000 | | | | 91,300 | | | | | |
Campbell Soup Co.# | | | 8,900 | | | | 538,183 | | | | | |
General Mills, Inc.# | | | 3,200 | | | | 197,664 | | | | | |
JM Smucker Co. (The)# | | | 1,400 | | | | 179,284 | | | | | |
Mondelez International, Inc. Class A# | | | 3,600 | | | | 159,588 | | | | | |
| | | | | | | | | | | | |
| | | | | | | 1,166,019 | | | | | |
| |
Health Care Equipment & Supplies - 1.07% | | | | | |
Abbott Laboratories# | | | 1,800 | | | | 69,138 | | | | | |
Baxter International, Inc. | | | 900 | | | | 39,906 | | | | | |
| | | | | | | | |
| Industry Company | | Shares | | | Value | |
|
| |
|
Health Care Equipment & Supplies (continued) | |
Becton Dickinson & Co. | | | 520 | | | $ | 86,086 | |
C.R. Bard, Inc. | | | 900 | | | | 202,194 | |
Stryker Corp. | | | 860 | | | | 103,037 | |
| | | | | | | | |
| | | | | | | 500,361 | |
|
Health Care Providers & Services - 1.09% | |
DaVita, Inc.*# | | | 1,600 | | | | 102,720 | |
Express Scripts Holding Co.*# | | | 1,734 | | | | 119,282 | |
Laboratory Corp. of America Holdings* | | | 600 | | | | 77,028 | |
UnitedHealth Group, Inc.# | | | 1,300 | | | | 208,052 | |
| | | | | | | | |
| | | | | | | 507,082 | |
|
Hotels, Restaurants & Leisure - 0.76% | |
Carnival Corp.# | | | 900 | | | | 46,854 | |
McDonald’s Corp.# | | | 900 | | | | 109,548 | |
Starbucks Corp.# | | | 1,900 | | | | 105,488 | |
Wynn Resorts, Ltd.+ | | | 500 | | | | 43,255 | |
Yum China Holdings, Inc.* | | | 1,100 | | | | 28,732 | |
Yum! Brands, Inc.# | | | 300 | | | | 18,999 | |
| | | | | | | | |
| | | | | | | 352,876 | |
|
Household Products - 0.95% | |
Colgate-Palmolive Co. | | | 1,600 | | | | 104,704 | |
Kimberly-Clark Corp. | | | 1,400 | | | | 159,768 | |
Procter & Gamble Co. (The)# | | | 2,100 | | | | 176,568 | |
| | | | | | | | |
| | | | | | | 441,040 | |
|
Independent Power Producers & Energy
Traders - 0.11% | |
AES Corp. | | | 4,300 | | | | 49,966 | |
|
Industrial Conglomerates - 1.02% | |
3M Co.# | | | 1,100 | | | | 196,427 | |
Danaher Corp.# | | | 1,700 | | | | 132,328 | |
General Electric Co.# | | | 4,600 | | | | 145,360 | |
| | | | | | | | |
| | | | | | | 474,115 | |
|
Insurance - 1.24% | |
Allstate Corp. (The)# | | | 1,300 | | | | 96,356 | |
Aon PLC# | | | 1,600 | | | | 178,448 | |
Chubb, Ltd. | | | 361 | | | | 47,695 | |
Marsh & McLennan Cos., Inc. | | | 1,500 | | | | 101,385 | |
Progressive Corp. (The) | | | 2,220 | | | | 78,810 | |
Travelers Cos., Inc. (The) | | | 600 | | | | 73,452 | |
| | | | | | | | |
| | | | | | | 576,146 | |
|
Internet & Catalog Retail - 1.12% | |
Amazon.com, Inc.* | | | 500 | | | | 374,935 | |
| | |
| 74 | | Semi-Annual Report | December 31, 2016 (Unaudited) |
| | |
| Managed Volatility Fund | | |
| SCHEDULE OF INVESTMENTS (continued) | | |
| Showing percentage of net assets as of December 31, 2016 (Unaudited) | | |
| | | | | | | | | | | | |
| Industry Company | | Shares | | | Value | | | | |
| |
Common Stocks (continued) | | | | | |
Internet & Catalog Retail (continued) | | | | | |
Priceline Group, Inc. (The)* | | | 100 | | | $ | 146,606 | | | | | |
| | | | | | | | | | | | |
| | | | | | | 521,541 | | | | | |
| |
Internet Software & Services - 2.33% | | | | | |
Alphabet, Inc.,
Class A* | | | 260 | | | | 206,037 | | | | | |
Alphabet, Inc.,
Class C* | | | 260 | | | | 200,673 | | | | | |
eBay, Inc.* | | | 1,500 | | | | 44,535 | | | | | |
Facebook, Inc., Class A*# | | | 3,000 | | | | 345,150 | | | | | |
VeriSign, Inc.*# | | | 3,800 | | | | 289,066 | | | | | |
| | | | | | | | | | | | |
| | | | | | | 1,085,461 | | | | | |
| |
IT Services - 2.26% | | | | | |
Automatic Data Processing, Inc. | | | 900 | | | | 92,502 | | | | | |
Cognizant Technology Solutions Corp., Class A*# | | | 2,300 | | | | 128,869 | | | | | |
International Business Machines Corp.# | | | 1,300 | | | | 215,787 | | | | | |
MasterCard, Inc., Class A# | | | 1,200 | | | | 123,900 | | | | | |
S&P Global, Inc. | | | 500 | | | | 53,770 | | | | | |
Visa, Inc., Class A | | | 5,200 | | | | 405,704 | | | | | |
Western Union Co. (The)#+ | | | 1,500 | | | | 32,580 | | | | | |
| | | | | | | | | | | | |
| | | | | | | 1,053,112 | | | | | |
| |
Leisure Equipment & Products - 2.20% | | | | | |
Hasbro, Inc.# | | | 1,500 | | | | 116,685 | | | | | |
Polaris Industries, Inc.#+ | | | 11,000 | | | | 906,290 | | | | | |
| | | | | | | | | | | | |
| | | | | | | 1,022,975 | | | | | |
| |
Life Sciences Tools & Services - 0.42% | | | | | |
Thermo Fisher Scientific, Inc.# | | | 1,400 | | | | 197,540 | | | | | |
| |
Machinery - 0.42% | | | | | |
Deere & Co.# | | | 1,900 | | | | 195,776 | | | | | |
| |
Media - 1.32% | | | | | |
Comcast Corp., Class A# | | | 2,050 | | | | 141,553 | | | | | |
Omnicom Group, Inc. | | | 1,200 | | | | 102,132 | | | | | |
Scripps Networks Interactive, Inc., Class A# | | | 1,400 | | | | 99,918 | | | | | |
Time Warner, Inc. | | | 933 | | | | 90,062 | | | | | |
Twenty-First Century Fox, Inc., Class A# | | | 1,700 | | | | 47,668 | | | | | |
Walt Disney Co. (The)# | | | 1,300 | | | | 135,486 | | | | | |
| | | | | | | | | | | | |
| | | | | | | 616,819 | | | | | |
| |
Metals & Mining - 1.25% | | | | | |
Kinross Gold Corp.*# | | | 31,300 | | | | 97,343 | | | | | |
Silver Wheaton Corp.# | | | 25,000 | | | | 483,000 | | | | | |
| | | | | | | | | | | | |
| | | | | | | 580,343 | | | | | |
| | | | | | | | |
| Industry Company | | Shares | | | Value | |
|
| |
Multiline Retail - 0.57% | |
Big Lots, Inc.+ | | | 500 | | | $ | 25,105 | |
Dollar General Corp.# | | | 1,000 | | | | 74,070 | |
Target Corp.# | | | 2,300 | | | | 166,129 | |
| | | | | | | | |
| | | | | | | 265,304 | |
|
Multi-Utilities - 0.44% | |
Dominion Resources, Inc.# | | | 1,520 | | | | 116,417 | |
Public Service Enterprise Group, Inc. | | | 900 | | | | 39,492 | |
Sempra Energy | | | 500 | | | | 50,320 | |
| | | | | | | | |
| | | | | | | 206,229 | |
|
Oil, Gas & Consumable Fuels - 4.21% | |
Anadarko Petroleum Corp. | | | 1,000 | | | | 69,730 | |
Chesapeake Energy Corp.*#+ | | | 2,100 | | | | 14,742 | |
Chevron Corp.# | | | 2,378 | | | | 279,891 | |
ConocoPhillips | | | 1,287 | | | | 64,530 | |
EOG Resources, Inc.# | | | 800 | | | | 80,880 | |
Exxon Mobil Corp.# | | | 3,900 | | | | 352,014 | |
Kinder Morgan, Inc. | | | 2,600 | | | | 53,846 | |
Marathon Petroleum Corp.# | | | 2,400 | | | | 120,840 | |
Occidental Petroleum Corp. | | | 1,200 | | | | 85,476 | |
Phillips 66# | | | 1,393 | | | | 120,369 | |
Valero Energy Corp.# | | | 10,500 | | | | 717,360 | |
| | | | | | | | |
| | | | | | | 1,959,678 | |
|
Paper & Forest Products - 0.17% | |
International Paper Co.# | | | 1,500 | | | | 79,590 | |
|
Pharmaceuticals - 2.20% | |
AbbVie, Inc.# | | | 2,800 | | | | 175,336 | |
Allergan PLC* | | | 300 | | | | 63,003 | |
Bristol-Myers Squibb Co.# | | | 3,079 | | | | 179,937 | |
Johnson & Johnson# | | | 1,800 | | | | 207,378 | |
Merck & Co., Inc.# | | | 3,400 | | | | 200,158 | |
Pfizer, Inc.# | | | 5,100 | | | | 165,648 | |
Shire PLC, ADR | | | 192 | | | | 32,713 | |
| | | | | | | | |
| | | | | | | 1,024,173 | |
|
Real Estate Investment Trusts (REITs) - 1.90% | |
American Tower Corp. | | | 800 | | | | 84,544 | |
Crown Castle International Corp.# | | | 1,200 | | | | 104,124 | |
Digital Realty Trust, Inc.# | | | 3,000 | | | | 294,780 | |
Public Storage | | | 1,000 | | | | 223,500 | |
Simon Property Group, Inc. | | | 1,000 | | | | 177,670 | |
| | | | | | | | |
| | | | | | | 884,618 | |
|
Road & Rail - 0.18% | |
Union Pacific Corp. | | | 800 | | | | 82,944 | |
| | |
| Managed Volatility Fund | |
|
| SCHEDULE OF INVESTMENTS (continued) | |
| Showing percentage of net assets as of December 31, 2016 (Unaudited) | | |
| | | | | | | | | | |
| Industry Company | | Shares | | | Value | | | |
| |
Common Stocks (continued) | | | |
Semiconductors & Semiconductor
Equipment - 1.68% | | | |
Applied Materials, Inc.# | | | 6,600 | | | $ | 212,982 | | | |
Intel Corp.# | | | 4,400 | | | | 159,588 | | | |
Micron Technology, Inc.*# | | | 8,000 | | | | 175,360 | | | |
QUALCOMM, Inc. | | | 1,400 | | | | 91,280 | | | |
Texas Instruments, Inc. | | | 1,970 | | | | 143,751 | | | |
| | | | | | | | | | |
| | | | | | | 782,961 | | | |
| |
Software - 2.23% | | | |
Adobe Systems, Inc.* | | | 800 | | | | 82,360 | | | |
CA, Inc.# | | | 2,500 | | | | 79,425 | | | |
Citrix Systems, Inc.* | | | 1,100 | | | | 98,241 | | | |
Electronic Arts, Inc.* | | | 1,200 | | | | 94,512 | | | |
Hewlett Packard Enterprise Co. | | | 2,000 | | | | 46,280 | | | |
Intuit, Inc.# | | | 800 | | | | 91,688 | | | |
Microsoft Corp.# | | | 5,200 | | | | 323,128 | | | |
Oracle Corp.# | | | 2,360 | | | | 90,742 | | | |
salesforce.com, Inc.*# | | | 1,900 | | | | 130,074 | | | |
| | | | | | | | | | |
| | | | | | | 1,036,450 | | | |
| |
Specialty Retail - 0.66% | | | |
AutoZone, Inc.* | | | 300 | | | | 236,937 | | | |
Ross Stores, Inc. | | | 1,100 | | | | 72,160 | | | |
| | | | | | | | | | |
| | | | | | | 309,097 | | | |
| |
Textiles, Apparel & Luxury Goods - 1.47% | | | |
NIKE, Inc.,
Class B# | | | 8,000 | | | | 406,640 | | | |
Skechers U.S.A., Inc., Class A*# | | | 11,400 | | | | 280,212 | | | |
| | | | | | | | | | |
| | | | | | | 686,852 | | | |
| |
Trading Companies & Distributors - 0.16% | | | |
NOW, Inc.* | | | 200 | | | | 4,094 | | | |
W.W. Grainger, Inc. | | | 300 | | | | 69,675 | | | |
| | | | | | | | | | |
| | | | | | | 73,769 | | | |
| | | | | | | | | | |
TOTAL COMMON STOCKS - 56.76% | | | | 26,435,705 | | | |
| | | | | | | | | | |
(Cost $19,680,372) | | | | | | | |
| | | |
Discount Rate or Coupon Due Date Rate | | Principal Amount | | | Value | | | |
| |
U.S. GOVERNMENT OBLIGATIONS - 36.48% | | | |
U.S. Treasury Bills - 36.48% | | | |
01/12/2017 0.000%(a) | | $ | 4,000,000 | | | | 3,999,600 | | | |
02/23/2017 0.000%(a) | | | 2,000,000 | | | | 1,998,666 | | | |
03/02/2017 0.000%(a) | | | 4,000,000 | | | | 3,996,880 | | | |
03/16/2017 0.000%(a) | | | 2,000,000 | | | | 1,998,000 | | | |
03/23/2017 0.000%(a) | | | 1,000,000 | | | | 998,903 | | | |
| | | | | | | | | | | | |
| Due Date | | Discount Rate
or Coupon Rate | | | Principal
Amount | | | Value | |
| |
U.S. Treasury Bills (continued) | | | | | |
03/30/2017 | | | 0.000 | %(a) | | | $4,000,000 | | | $ | 3,995,232 | |
| | | | | | | | | | | | |
| | | | | | | | | | | 16,987,281 | |
| | | | | | | | | | | | |
TOTAL U.S. GOVERNMENT
OBLIGATIONS - 36.48% | | | | 16,987,281 | |
| | | | | | | | | | | | |
(Cost $16,986,115) | | | | | | | | | |
| | | |
| | | Rate^ | | | Shares | | | Value | |
| |
MONEY MARKET FUND - 8.66% | | | | | |
Fidelity Institutional Government Portfolio Institutional Class | | | 0.43 | % | | | 4,035,562 | | | | 4,035,562 | |
| | | | | | | | | | | | |
TOTAL MONEY MARKET FUND - 8.66% | | | | 4,035,562 | |
| | | | | | | | | | | | |
(Cost $4,035,562) | | | | | | | | | |
|
INVESTMENTS PURCHASED WITH CASH PROCEEDS FROM SECURITIES LENDING - 0.56% | |
| | | | | | | | | | | | |
Fidelity Institutional Government Portfolio Institutional Class** | | | 0.43 | % | | | 259,360 | | | | 259,360 | |
| | | | | | | | | | | | |
TOTAL INVESTMENTS PURCHASED WITH CASH PROCEEDS FROM SECURITIES LENDING - 0.56% | | | | 259,360 | |
| | | | | | | | | | | | |
(Cost $259,360) | | | | | | | | | |
TOTAL INVESTMENTS - 102.46% | | | | 47,717,908 | |
(Cost $40,961,409) | | | | | | | | | |
Liabilities in Excess of Other Assets - (2.46%) | | | | (1,147,878 | ) |
| | | | | | | | | | | | |
NET ASSETS - 100.00% | | | $ | 46,570,030 | |
| | | | | | | | | | | | |
| * | Non-income producing security. |
| ** | This security represents the investment of the collateral received in connection with securities out on loan as of December 31, 2016. |
| # | Security subject to call or put option written by the Fund. |
| ^ | Rate disclosed as of December 31, 2016. |
| + | This security or a portion of the security is out on loan as of December 31, 2016. Total loaned securities had a value of $254,884 as of December 31, 2016. |
| (a) | Rate represents the effective yield at purchase. |
| PLC | - Public Limited Company |
| ADR | - American Depositary Receipt |
| See | Notes to Financial Statements. |
| | |
| 76 | | Semi-Annual Report | December 31, 2016 (Unaudited) |
| | |
| Managed Volatility Fund | | |
| SCHEDULE OF OPTIONS WRITTEN | | |
| Showing percentage of net assets as of December 31, 2016 (Unaudited) | | |
| | | | | | | | | | | | | | | | |
| Company | | Number
of Contracts | | | Value | | | | |
| |
CALL OPTIONS WRITTEN - (1.41%) | | | | | |
| | | | |
3M Co. | | | | | | | | | | | | | | | | |
Expiring January, 2017 at $185.00 | | | 4 | | | | | | | $ | (160) | | | | | |
Abbott Laboratories | | | | | | | | | | | | | | | | |
Expiring January, 2017 at $45.00 | | | 5 | | | | | | | | (5) | | | | | |
AbbVie, Inc. | | | | | | | | | | | | | | | | |
Expiring January, 2017 at $65.00 | | | 8 | | | | | | | | (208) | | | | | |
AerCap Holdings NV | | | | | | | | | | | | | | | | |
Expiring January, 2017 at $42.50 | | | 11 | | | | | | | | (671) | | | | | |
| | | | |
Allstate Corp. (The) | | | | | | | | | | | | | | | | |
Expiring January, 2017 at $70.00 | | | 5 | | | | | | | | (2,185) | | | | | |
American Express Co. | | | | | | | | | | | | | | | | |
Expiring January, 2017 at $67.50 | | | 8 | | | | | | | | (5,360) | | | | | |
Aon PLC | | | | | | | | | | | | | | | | |
Expiring April, 2017 at $115.00 | | | 5 | | | | | | | | (1,605) | | | | | |
Apple, Inc. | | | | | | | | | | | | | | | | |
Expiring February, 2017 at $110.00 | | | 7 | | | | | | | | (5,250) | | | | | |
| | | | |
Applied Materials,Inc. | | | | | | | | | | | | | | | | |
Expiring January, 2017 at $30.00 | | | 25 | | | | | | | | (6,000) | | | | | |
Archer-Daniels-Midland Co. | | | | | | | | | | | | | | | | |
Expiring January, 2017 at $45.00 | | | 6 | | | | | | | | (780) | | | | | |
AT&T, Inc. | | | | | | | | | | | | | | | | |
Expiring January, 2017 at $41.00 | | | 23 | | | | | | | | (3,726) | | | | | |
Bank of America Corp. | | | | | | | | | | | | | | | | |
Expiring March, 2017 at $23.00 | | | 16 | | | | | | | | (1,280) | | | | | |
| | | | |
Barrick Gold Corp. | | | | | | | | | | | | | | | | |
Expiring January, 2017 at $14.50 | | | 280 | | | | | | | | (64,680) | | | | | |
BB&T Corp. | | | | | | | | | | | | | | | | |
Expiring March, 2017 at $47.00 | | | 5 | | | | | | | | (875) | | | | | |
| | | | |
Berkshire Hathaway, Inc.,
Class B | | | | | | | | | | | | | | | | |
Expiring January, 2017 at $150.00 | | | 25 | | | | | | | | (33,375) | | | | | |
Bristol-Myers Squibb Co. | | | | | | | | | | | | | | | | |
Expiring January, 2017 at $57.50 | | | 12 | | | | | | | | (1,956) | | | | | |
| | | | |
CA, Inc. | | | | | | | | | | | | | | | | |
Expiring February, 2017 at $32.00 | | | 25 | | | | | | | | (2,250) | | | | | |
Campbell Soup Co. | | | | | | | | | | | | | | | | |
Expiring January, 2017 at $57.50 | | | 70 | | | | | | | | (23,100) | | | | | |
Expiring January, 2017 at $60.00 | | | 6 | | | | | | | | (732) | | | | | |
| | | | | | | | | | | | | | | | |
| | | | | | | | | | | (23,832) | | | | | |
Carnival Corp. | | | | | | | | | | | | | | | | |
Expiring January, 2017 at $48.00 | | | 5 | | | | | | | | (2,200) | | | | | |
| | | | |
CenturyLink, Inc. | | | | | | | | | | | | | | | | |
Expiring January, 2017 at $27.00 | | | 13 | | | | | | | | (65) | | | | | |
| | | | |
Charles Schwab Corp. (The) | | | | | | | | | | | | | | | | |
Expiring March, 2017 at $40.00 | | | 10 | | | | | | | | (1,880) | | | | | |
| | | | | | | | | | | | |
| Company | | Number
of Contracts | | | Value | |
|
Chevron Corp. | |
Expiring January, 2017 at $105.00 | | | 7 | | | | | | | $ | (8,890 | ) |
Cisco Systems, Inc. | | | | | | | | | | | | |
Expiring March, 2017 at $31.00 | | | 25 | | | | | | | | (1,550 | ) |
Citigroup, Inc. | | | | | | | | | | | | |
Expiring January, 2017 at $50.00 | | | 15 | | | | | | | | (14,100 | ) |
Coca-Cola Co., (The) | | | | | | | | | | | | |
Expiring March, 2017 at $42.00 | | | 12 | | | | | | | | (1,080 | ) |
Cognizant Technology Solutions Corp., Class A | | | | | | | | | | | | |
Expiring January, 2017 at $60.00 | | | 13 | | | | | | | | (312 | ) |
Comcast Corp., Class A | | | | | | | | | | | | |
Expiring April, 2017 at $72.50 | | | 8 | | | | | | | | (1,472 | ) |
Danaher Corp. | | | | | | | | | | | | |
Expiring January, 2017 at $80.00 | | | 5 | | | | | | | | (225 | ) |
DaVita, Inc. | | | | | | | | | | | | |
Expiring April, 2017 at $67.50 | | | 5 | | | | | | | | (875 | ) |
Deere & Co. | | | | | | | | | | | | |
Expiring March, 2017 at $105.00 | | | 6 | | | | | | | | (2,370 | ) |
Digital Realty Trust, Inc. | | | | | | | | | | | | |
Expiring January, 2017 at $100.00 | | | 30 | | | | | | | | (5,100 | ) |
Dollar General Corp. | | | | | | | | | | | | |
Expiring February, 2017 at $72.50 | | | 5 | | | | | | | | (1,900 | ) |
Dominion Resources, Inc. | | | | | | | | | | | | |
Expiring January, 2017 at $77.50 | | | 6 | | | | | | | | (420 | ) |
Dow Chemical Co. (The) | | | | | | | | | | | | |
Expiring March, 2017 at $60.00 | | | 5 | | | | | | | | (595 | ) |
Duke Energy Corp. | | | | | | | | | | | | |
Expiring January, 2017 at $82.50 | | | 5 | | | | | | | | (75 | ) |
Emerson Electric Co. | | | | | | | | | | | | |
Expiring January, 2017 at $50.00 | | | 4 | | | | | | | | (2,424 | ) |
EOG Resources, Inc. | | | | | | | | | | | | |
Expiring January, 2017 at $95.00 | | | 3 | | | | | | | | (2,265 | ) |
Exelon Corp. | | | | | | | | | | | | |
Expiring January, 2017 at $33.00 | | | 13 | | | | | | | | (3,900 | ) |
Express Scripts Holding Co. | | | | | | | | | | | | |
Expiring February, 2017 at $77.50 | | | 5 | | | | | | | | (205 | ) |
Exxon Mobil Corp. | | | | | | | | | | | | |
Expiring February, 2017 at $95.00 | | | 13 | | | | | | | | (689 | ) |
Facebook, Inc. | | | | | | | | | | | | |
Expiring March, 2017 at $125.00 | | | 10 | | | | | | | | (2,290 | ) |
FedEx Corp. | | | | | | | | | | | | |
Expiring January, 2017 at $170.00 | | | 4 | | | | | | | | (6,612 | ) |
| | |
| Managed Volatility Fund | | |
| SCHEDULE OF OPTIONS WRITTEN (continued) | | |
| Showing percentage of net assets as of December 31, 2016 (Unaudited) | | |
| | | | | | | | | | | | | | | | |
| Company | | Number of
Contracts | | | Value | | | | |
| | | |
Call Options Written (continued) | | | | | | | | | | | | | |
Ford Motor Co. | | | | | | | | | | | | | | | | |
Expiring February, 2017 at $12.00 | | | 355 | | | | | | | | $ (16,685) | | | | | |
Expiring March, 2017 at $13.00 | | | 15 | | | | | | | | (315) | | | | | |
| | | | | | | | | | | | | | | | |
| | | | | | | | | | | (17,000) | | | | | |
General Electric Co. | | | | | | | | | | | | | | | | |
Expiring March, 2017 at $32.00 | | | 13 | | | | | | | | (910) | | | | | |
General Mills, Inc. | | | | | | | | | | | | | | | | |
Expiring January, 2017 at $65.00 | | | 10 | | | | | | | | (130) | | | | | |
Gilead Sciences, Inc. | | | | | | | | | | | | | | | | |
Expiring February, 2017 at $75.00 | | | 50 | | | | | | | | (9,500) | | | | | |
Goodyear Tire & Rubber Co. (The) | | | | | | | | | | | | | | | | |
Expiring January, 2017 at $30.00 | | | 8 | | | | | | | | (1,560) | | | | | |
Halliburton Co. | | | | | | | | | | | | | | | | |
Expiring April, 2017 at $50.00 | | | 5 | | | | | | | | (3,050) | | | | | |
Hasbro, Inc. | | | | | | | | | | | | | | | | |
Expiring January, 2017 at $85.00 | | | 4 | | | | | | | | (60) | | | | | |
Intel Corp. | | | | | | | | | | | | | | | | |
Expiring March, 2017 at $39.00 | | | 13 | | | | | | | | (559) | | | | | |
International Business Machines Corp. | | | | | | | | | | | | | | | | |
Expiring January, 2017 at $155.00 | | | 4 | | | | | | | | (4,780) | | | | | |
International Paper Co. | | | | | | | | | | | | | | | | |
Expiring January, 2017 at $47.00 | | | 4 | | | | | | | | (2,468) | | | | | |
Intuit, Inc. | | | | | | | | | | | | | | | | |
Expiring January, 2017 at $110.00 | | | 4 | | | | | | | | (2,120) | | | | | |
JetBlue Airways Corp. | | | | | | | | | | | | | | | | |
| | | 25 | | | | | | | | (11,000) | | | | | |
JM Smucker Co. (The) | | | | | | | | | | | | | | | | |
Expiring January, 2017 at $135.00 | | | 5 | | | | | | | | (100) | | | | | |
Johnson & Johnson | | | | | | | | | | | | | | | | |
Expiring January, 2017 at $115.00 | | | 10 | | | | | | | | (1,720) | | | | | |
Johnson Controls International PLC | | | | | | | | | | | | | | | | |
Expiring January, 2017 at $45.00 | | | 14 | | | | | | | | (4,480) | | | | | |
JPMorgan Chase & Co. | | | | | | | | | | | | | | | | |
Expiring March, 2017 at $87.50 | | | 12 | | | | | | | | (3,480) | | | | | |
Juniper Networks, Inc. | | | | | | | | | | | | | | | | |
Expiring January, 2017 at $30.00 | | | 22 | | | | | | | | (1,188) | | | | | |
Kinross Gold Corp. | | | | | | | | | | | | | | | | |
Expiring February, 2017 at $3.50 | | | 313 | | | | | | | | (5,634) | | | | | |
Kroger Co. (The) | | | | | | | | | | | | | | | | |
Expiring January, 2017 at $30.00 | | | 15 | | | | | | | | (7,200) | | | | | |
Marathon Petroleum Corp. | | | | | | | | | | | | | | | | |
Expiring January, 2017 at $45.00 | | | 7 | | | | | | | | (3,871) | | | | | |
| | | | | | | | | | | | |
| Company | | | | | Number
of Contracts | | | Value | |
| | | |
Marsh & McLennan Cos, Inc. | | | | | | | | | | | | |
Expiring January, 2017 at $65.00 | | | | | | | 4 | | | | $ (1,320) | |
MasterCard, Inc., Class A | | | | | | | | | | | | |
Expiring January, 2017 at $105.00 | | | | | | | 4 | | | | (400) | |
McDonald’s Corp. | | | | | | | | | | | | |
Expiring January, 2017 at $115.00 | | | | | | | 4 | | | | (2,744) | |
Merck & Co., Inc. | | | | | | | | | | | | |
Expiring March, 2017 at $62.50 | | | | | | | 12 | | | | (948) | |
Micron Technology, Inc. | | | | | | | | | | | | |
Expiring January, 2017 at $21.00 | | | | | | | 24 | | | | (3,504) | |
Microsoft Corp. | | | | | | | | | | | | |
Expiring February, 2017 at $62.50 | | | | | | | 15 | | | | (2,925) | |
Mondelez International, Inc. | | | | | | | | | | | | |
Expiring March, 2017 at $45.00 | | | | | | | 12 | | | | (2,940) | |
Morgan Stanley | | | | | | | | | | | | |
Expiring January, 2017 at $34.00 | | | | | | | 16 | | | | (13,120) | |
NIKE, Inc., Class B | | | | | | | | | | | | |
Expiring January, 2017 at $52.50 | | | | | | | 50 | | | | (1,900) | |
Expiring January, 2017 at $55.00 | | | | | | | 11 | | | | (66) | |
| | | | | | | | | | | | |
| | | | | | | | | | | (1,966) | |
Oracle Corp. | | | | | | | | | | | | |
Expiring January, 2017 at $40.00 | | | | | | | 11 | | | | (99) | |
PayPal Holdings, Inc. | | | | | | | | | | | | |
Expiring January, 2017 at $44.00 | | | | | | | 5 | | | | (10) | |
PepsiCo, Inc. | | | | | | | | | | | | |
Expiring January, 2017 at $110.00 | | | | | | | 5 | | | | (20) | |
Pfizer, Inc. | | | | | | | | | | | | |
Expiring January, 2017 at $35.00 | | | | | | | 15 | | | | (45) | |
Phillips 66 | | | | | | | | | | | | |
Expiring January, 2017 at $82.50 | | | | | | | 5 | | | | (2,325) | |
PNC Financial Services Group, Inc. (The) | | | | | | | | | | | | |
Expiring January, 2017 at $92.50 | | | | | | | 6 | | | | (14,634) | |
Polaris Industries, Inc. | | | | | | | | | | | | |
Expiring March, 2017 at $85.00 | | | | | | | 110 | | | | (44,000) | |
Praxair, Inc. | | | | | | | | | | | | |
Expiring January, 2017 at $120.00 | | | | | | | 4 | | | | (356) | |
Procter & Gamble Co. (The) | | | | | | | | | | | | |
Expiring January, 2017 at $90.00 | | | | | | | 7 | | | | (21) | |
salesforce.com, Inc. | | | | | | | | | | | | |
Expiring January, 2017 at $77.50 | | | | | | | 5 | | | | (45) | |
Scripps Networks Interactive, Inc., Class A | | | | | | | | | | | | |
Expiring March, 2017 at $75.00 | | | | | | | 4 | | | | (1,000) | |
| | |
| 78 | | Semi-Annual Report | December 31, 2016 (Unaudited) |
| | |
| Managed Volatility Fund | | |
| SCHEDULE OF OPTIONS WRITTEN (continued) | | |
| Showing percentage of net assets as of December 31, 2016 (Unaudited) | | |
| | | | | | | | | | | | | | | | |
| Company | | Number
of Contracts | | | Value | | | | |
| | |
Call Options Written (continued) | | | | | | | | | |
Silver Wheaton Corp. | | | | | | | | | | | | | | | | |
Expiring February, 2017 at $18.00 | | | 225 | | | | | | | | $ (51,075) | | | | | |
Expiring March, 2017 at $20.00 | | | 25 | | | | | | | | (3,700) | | | | | |
| | | | | | | | | | | | | | | | |
| | | | | | | | | | | (54,775) | | | | | |
Skechers U.S.A., Inc., Class A | | | | | | | | | | | | | | | | |
Expiring January, 2017 at $20.00 | | | 114 | | | | | | | | (54,720) | | | | | |
Starbucks Corp. | | | | | | | | | | | | | | | | |
Expiring January, 2017 at $60.00 | | | 7 | | | | | | | | (203) | | | | | |
Target Corp. | | | | | | | | | | | | | | | | |
Expiring January, 2017 at $70.00 | | | 7 | | | | | | | | (1,988) | | | | | |
Thermo Fisher Scientific, Inc. | | | | | | | | | | | | | | | | |
Expiring January, 2017 at $150.00 | | | 5 | | | | | | | | (125) | | | | | |
Twenty-First Century Fox, Inc. | | | | | | | | | | | | | | | | |
Expiring January, 2017 at $25.00 | | | 11 | | | | | | | | (4,070) | | | | | |
UnitedHealth Group, Inc. | | | | | | | | | | | | | | | | |
Expiring January, 2017 at $145.00 | | | 9 | | | | | | | | (14,670) | | | | | |
US Bancorp | | | | | | | | | | | | | | | | |
Expiring January, 2017 at $52.00 | | | 8 | | | | | | | | (608) | | | | | |
Valero Energy Corp. | | | | | | | | | | | | | | | | |
Expiring January, 2017 at $57.50 | | | 85 | | | | | | | | (95,030) | | | | | |
VeriSign, Inc. | | | | | | | | | | | | | | | | |
Expiring March, 2017 at $80.00 | | | 38 | | | | | | | | (7,030) | | | | | |
Visa, Inc. | | | | | | | | | | | | | | | | |
Expiring March, 2017 at $75.00 | | | 15 | | | | | | | | (7,500) | | | | | |
Wal-Mart Stores, Inc. | | | | | | | | | | | | | | | | |
Expiring January, 2017 at $75.00 | | | 7 | | | | | | | | (28) | | | | | |
Walt Disney Co. (The) | | | | | | | | | | | | | | | | |
Expiring January, 2017 at $100.00 | | | 7 | | | | | | | | (3,290) | | | | | |
Wells Fargo & Co. | | | | | | | | | | | | | | | | |
Expiring January, 2017 at $45.00 | | | 16 | | | | | | | | (16,512) | | | | | |
Western Digital Corp. | | | | | | | | | | | | | | | | |
Expiring April, 2017 at $60.00 | | | 5 | | | | | | | | (5,200) | | | | | |
Western Union Co. (The) | | | | | | | | | | | | | | | | |
Expiring January, 2017 at $20.00 | | | 4 | | | | | | | | (780) | | | | | |
Yum! Brands, Inc. | | | | | | | | | | | | | | | | |
Expiring January, 2017 at $92.50 | | | 3 | | | | | | | | (141) | | | | | |
| | | | | | | | | | | | | | | | |
TOTAL CALL OPTIONS WRITTEN - (1.41%) | | | | | | | | | | | (655,594) | | | | | |
| | | | | | | | | | | | | | | | |
(Premiums received $(378,810)) | | | | | | | | | | | | | | | | |
| | |
PUT OPTIONS WRITTEN - (0.77%) | | | | | | | | | |
| | | | |
Allstate Corp. (The) | | | | | | | | | | | | | | | | |
Expiring January, 2017 at $67.50 | | | 50 | | | | | | | | (400) | | | | | |
AmerisourceBergen Corp. | | | | | | | | | | | | | | | | |
Expiring January, 2017 at $82.50 | | | 40 | | | | | | | | (20,400) | | | | | |
Bank of America Corp. | | | | | | | | | | | | | | | | |
Expiring March, 2017 at $22.00 | | | 180 | | | | | | | | (20,880) | | | | | |
| | | | | | | | | | | | |
| Company | | Number
of Contracts | | | Value | |
| | | |
Barrick Gold Corp. | | | | | | | | | | | | |
Expiring January, 2017 at $20.00 | | | 110 | | | | | | | | $ (37,400) | |
Berkshire Hathaway, Inc., Class B | | | | | | | | | | | | |
Expiring January, 2017 at $140.00 | | | 30 | | | | | | | | (300) | |
Best Buy Co., Inc. | | | | | | | | | | | | |
Expiring March, 2017 at $43.00 | | | 40 | | | | | | | | (13,200) | |
Expiring March, 2017 at $45.00 | | | 70 | | | | | | | | (31,500) | |
| | | | | | | | | | | | |
| | | | | | | | | | | (44,700) | |
BHP Billiton, Ltd. | | | | | | | | | | | | |
Expiring February, 2017 at $35.00 | | | 245 | | | | | | | | (35,770) | |
Chesapeake Energy Corp. | | | | | | | | | | | | |
Expiring January, 2017 at $7.00 | | | 200 | | | | | | | | (8,000) | |
Clorox Co. (The) | | | | | | | | | | | | |
Expiring January, 2017 at $120.00 | | | 50 | | | | | | | | (10,000) | |
Crown Holdings, Inc. | | | | | | | | | | | | |
Expiring January, 2017 at $50.00 | | | 10 | | | | | | | | (350) | |
Delphi Automotive PLC | | | | | | | | | | | | |
Expiring February, 2017 at $67.50 | | | 50 | | | | | | | | (17,500) | |
Fiat Chrysler Automobiles NV | | | | | | | | | | | | |
Expiring March, 2017 at $7.00 | | | 7 | | | | | | | | (105) | |
General Motors Co. | | | | | | | | | | | | |
Expiring March, 2017 at $32.00 | | | 95 | | | | | | | | (9,025) | |
Johnson & Johnson | | | | | | | | | | | | |
Expiring January, 2017 at $115.00 | | | 50 | | | | | | | | (6,250) | |
Kellogg Co. | | | | | | | | | | | | |
Expiring January, 2017 at $75.00 | | | 75 | | | | | | | | (16,875) | |
Kinross Gold Corp. | | | | | | | | | | | | |
Expiring January, 2017 at $4.00 | | | 520 | | | | | | | | (46,800) | |
Marvell Technology Group, Ltd. | | | | | | | | | | | | |
Expiring January, 2017 at $12.00 | | | 175 | | | | | | | | (2,275) | |
Nordstrom, Inc. | | | | | | | | | | | | |
Expiring April, 2017 at $55.00 | | | 20 | | | | | | | | (17,900) | |
ONEOK, Inc. | | | | | | | | | | | | |
Expiring January, 2017 at $50.00 | | | 1 | | | | | | | | (50) | |
Petroleo Brasileiro SA | | | | | | | | | | | | |
Expiring January, 2017 at $9.00 | | | 160 | | | | | | | | (1,600) | |
Procter & Gamble Co. (The) | | | | | | | | | | | | |
Expiring January, 2017 at $85.00 | | | 70 | | | | | | | | (14,350) | |
Raytheon Co. | | | | | | | | | | | | |
Expiring January, 2017 at $130.00 | | | 45 | | | | | | | | (945) | |
Southern Copper Corp. | | | | | | | | | | | | |
Expiring March, 2017 at $32.00 | | | 90 | | | | | | | | (16,650) | |
| | |
| Managed Volatility Fund | |
|
| SCHEDULE OF OPTIONS WRITTEN (continued) | |
| | |
| | | | | | | | | | | | |
| Company | | Number of
Contracts | | | Value | | | | |
| |
Put Options Written (continued) | | | | | |
Toronto-Dominion Bank (The) | | | | | | | | | | | | |
Expiring January, 2017 at $42.50 | | | 20 | | | $ | (200 | ) | | | | |
Expiring January, 2017 at $45.00 | | | 60 | | | | (1,200 | ) | | | | |
| | | | | | | | | | | | |
| | | | | | | (1,400 | ) | | | | |
United Continental Holdings, Inc. | | | | | | | | | | | | |
Expiring January, 2017 at $50.00 | | | 20 | | | | (100 | ) | | | | |
Expiring March, 2017 at $62.50 | | | 60 | | | | (8,640 | ) | | | | |
| | | | | | | | | | | | |
| | | | | | | (8,740 | ) | | | | |
United Rentals, Inc. | | | | | | | | | | | | |
Expiring March, 2017 at $90.00 | | | 60 | | | | (16,800 | ) | | | | |
| | | | | | | | | | | | |
TOTAL PUT OPTIONS WRITTEN — (0.77%) | | | | (355,465 | ) | | | | |
| | | | | | | | | | | | |
(Premiums received $(445,640)) | | | | | | | | | | | | |
TOTAL OPTIONS
WRITTEN — (2.18%) | | | | | | $ | (1,011,059 | ) | | | | |
| | | | | | | | | | | | |
(Premiums received $(824,450)) | | | | | | | | | |
| | |
| | | | | | | | | |
Summary of inputs used to value the Fund’s investments as of 12/31/2016 (See Note 2 in Notes to Financial Statements):
| | | | | | | | | | | | | | | | |
| | | Assets Table | |
| | | Valuation Inputs | |
| | | Investment in Securities (Value) | |
| | | Level 1 Quoted Prices | | | Level 2
Significant
Observable
Inputs | | | Level 3
Significant
Unobservable
Inputs | | | Total | |
Common Stocks | | | $26,435,705 | | | | $ — | | | | $ — | | | | $26,435,705 | |
U.S. Government Obligations | | | — | | | | 16,987,281 | | | | — | | | | 16,987,281 | |
Money Market Fund | | | — | | | | 4,035,562 | | | | — | | | | 4,035,562 | |
Investments Purchased with Cash Proceeds from Securities Lending | | | — | | | | 259,360 | | | | — | | | | 259,360 | |
| | | | | | | | | | | | | | | | |
TOTAL | | | $26,435,705 | | | | $21,282,203 | | | | $ — | | | | $47,717,908 | |
| | | | | | | | | | | | | | | | |
| | | | | | | | | | | | | | | | |
| | | Liabilities Table | |
| | | Valuation Inputs | |
| | | Investment in Securities (Value) | |
| | | Level 1
Quoted
Prices | | | Level 2
Significant
Observable
Inputs | | | Level 3
Significant
Unobservable
Inputs Total | | | | |
Options Written | | | $(876,726) | | | | $(134,333) | | | | $ — | | | | $(1,011,059) | |
| | | | | | | | | | | | | | | | |
TOTAL | | | $(876,726) | | | | $(134,333) | | | | $ — | | | | $(1,011,059) | |
| | | | | | | | | | | | | | | | |
See Notes to Financial Statements.
| | |
| 80 | | Semi-Annual Report | December 31, 2016 (Unaudited) |
THIS PAGE INTENTIONALLY LEFT BLANK
STATEMENTS OF ASSETS AND LIABILITIES
December 31, 2016 (Unaudited)
| | | | | | | | | | | | |
| ASSETS | | Aggressive
Investors 1 | | | Ultra-Small
Company | | | Ultra-Small
Company Market | |
| |
Investments at value | | $ | 251,885,515 | | | $ | 126,172,536 | | | $ | 403,614,885 | |
Cash | | | - | | | | - | | | | 752 | |
Receivables: | | | | | | | | | | | | |
Portfolio securities sold | | | 4,457,532 | | | | - | | | | 1,136,069 | |
Fund shares sold | | | 52,544 | | | | - | | | | 117,083 | |
Dividends and interest | | | 231,497 | | | | 150,970 | | | | 553,760 | |
Receivable from investment adviser | | | - | | | | - | | | | - | |
Deposits with brokers | | | - | | | | - | | | | - | |
Prepaid expenses | | | 11,883 | | | | 12,017 | | | | 36,625 | |
| |
Total assets | | | 256,638,971 | | | | 126,335,523 | | | | 405,459,174 | |
| |
| | | |
LIABILITIES | | | | | | | | | | | | |
Payables: | | | | | | | | | | | | |
Portfolio securities purchased | | | 2,733,278 | | | | - | | | | 652,061 | |
Fund shares redeemed | | | 67,652 | | | | 9,925 | | | | 93,272 | |
Loan payable | | | 349,031 | | | | - | | | | 345,374 | |
Payable upon return of securities loaned | | | 29,051,455 | | | | 17,380,539 | | | | 47,353,300 | |
Accrued Liabilities: | | | | | | | | | | | | |
Investment adviser fees | | | 557,396 | | | | 83,388 | | | | 150,378 | |
Administration fees | | | 4,483 | | | | 2,183 | | | | 7,256 | |
Directors’ fees | | | 1,075 | | | | 181 | | | | 1,381 | |
Other | | | 88,737 | | | | 42,603 | | | | 130,456 | |
Call options written at value | | | - | | | | - | | | | - | |
Put options written at value | | | - | | | | - | | | | - | |
| |
Total liabilities | | | 32,853,107 | | | | 17,518,819 | | | | 48,733,478 | |
| |
NET ASSETS | | $ | 223,785,864 | | | $ | 108,816,704 | | | $ | 356,725,696 | |
| |
| | | |
NET ASSETS REPRESENT | | | | | | | | | | | | |
Paid-in capital | | $ | 279,461,044 | | | $ | 99,358,200 | | | $ | 256,805,625 | |
Undistributed net investment income (loss) | | | (381,898) | | | | 159,877 | | | | (1,635,631) | |
Accumulated net realized gain (loss) on investments | | | (89,405,269) | | | | (7,048,659) | | | | 13,501,897 | |
Net unrealized appreciation on investments | | | 34,111,987 | | | | 16,347,286 | | | | 88,053,805 | |
| |
NET ASSETS | | $ | 223,785,864 | | | $ | 108,816,704 | | | $ | 356,725,696 | |
| |
Shares of common stock outstanding of $.001 par value* | | | 3,518,870 | | | | 3,663,829 | | | | 24,656,036 | |
| |
Net asset value, offering price and redemption price per share | | $ | 63.60 | | | $ | 29.70 | | | $ | 14.47(a) | |
| |
Total investments at cost | | $ | 217,773,528 | | | $ | 109,825,250 | | | $ | 315,561,080 | |
Premiums received on call options written | | $ | - | | | $ | - | | | $ | - | |
Premiums received on put options written | | $ | - | | | $ | - | | | $ | - | |
| * | See Note 1 - Organization in the Notes to Financial Statements for shares authorized for each Fund. |
| (a) | Redemption of shares held less than six months may be charged a 2% redemption fee. See Note 8. |
See Notes to Financial Statements.
| | |
| 82 | | Semi-Annual Report | December 31, 2016 (Unaudited) |
| | |
| | | |
| | | |
| | | | | | | | | | | | | | | | | | |
| Small-Cap
Momentum |
| |
| Small-Cap
Growth |
| |
| Small-Cap
Value |
| |
| Blue Chip 35
Index |
| |
| Managed
Volatility |
|
| | |
| $ | 5,235,719 | | | $ | 45,182,127 | | | $ | 78,088,726 | | | | $577,138,407 | | | | $ 47,717,908 | |
| | 39 | | | | - | | | | - | | | | - | | | | - | |
| | | | | | | | | | | | | | | | | | | |
| | - | | | | 252,825 | | | | 643,819 | | | | 3,055,689 | | | | 4,675 | |
| | - | | | | 25,990 | | | | 20,021 | | | | 654,458 | | | | 12,204 | |
| | 7,636 | | | | 51,818 | | | | 63,156 | | | | 673,662 | | | | 26,159 | |
| | 9,815 | | | | - | | | | - | | | | 12,065 | | | | - | |
| | - | | | | - | | | | - | | | | - | | | | 218,923 | |
| | 8,121 | | | | 13,874 | | | | 14,875 | | | | 36,587 | | | | 14,183 | |
| | |
| | 5,261,330 | | | | 45,526,634 | | | | 78,830,597 | | | | 581,570,868 | | | | 47,994,052 | |
| | |
| | | | |
| | | | | | | | | | | | | | | | | | | |
| | | | | | | | | | | | | | | | | | | |
| | 10,168 | | | | - | | | | 457,333 | | | | 4,714,440 | | | | - | |
| | - | | | | 72,174 | | | | 19,987 | | | | 214,704 | | | | 96,221 | |
| | - | | | | 252,997 | | | | - | | | | 479 | | | | 1,154 | |
| | 500,858 | | | | 5,201,693 | | | | 11,893,527 | | | | - | | | | 259,360 | |
| | | | | | | | | | | | | | | | | | | |
| | - | | | | 17,282 | | | | 32,686 | | | | - | | | | 15,305 | |
| | 95 | | | | 802 | | | | 1,340 | | | | 11,434 | | | | 987 | |
| | 17 | | | | 162 | | | | 314 | | | | 3,728 | | | | 302 | |
| | 24,017 | | | | 31,349 | | | | 41,889 | | | | 113,823 | | | | 39,634 | |
| | - | | | | - | | | | - | | | | - | | | | 655,594 | |
| | - | | | | - | | | | - | | | | - | | | | 355,465 | |
| | |
| | 535,155 | | | | 5,576,459 | | | | 12,447,076 | | | | 5,058,608 | | | | 1,424,022 | |
| | |
| $ | 4,726,175 | | | $ | 39,950,175 | | | $ | 66,383,521 | | | | $576,512,260 | | | | $ 46,570,030 | |
| | |
| | | | | | | | | | | | | | | | | | | |
| $ | 4,161,772 | | | $ | 43,951,487 | | | $ | 77,803,754 | | | | $348,343,356 | | | | $ 42,699,657 | |
| | (4,022) | | | | 30,556 | | | | 277,423 | | | | (7,485 | ) | | | 84,080 | |
| | 232,288 | | | | (9,161,771 | ) | | | (22,676,124 | ) | | | (4,326,013 | ) | | | (2,783,597) | |
| | 336,137 | | | | 5,129,903 | | | | 10,978,468 | | | | 232,502,402 | | | | 6,569,890 | |
| | |
| $ | 4,726,175 | | | $ | 39,950,175 | | | $ | 66,383,521 | | | | $576,512,260 | | | | $ 46,570,030 | |
| | |
| | 383,873 | | | | 1,723,986 | | | | 2,656,674 | | | | 44,627,091 | | | | 3,254,811 | |
| | |
| $ | 12.31(a) | | | $ | 23.17 | | | $ | 24.99 | | | | $12.92 | | | | $ 14.31 | |
| | |
| $ | 4,899,582 | | | $ | 40,052,224 | | | $ | 67,110,258 | | | | $344,636,005 | | | | $ 40,961,409 | |
| $ | - | | | $ | - | | | $ | - | | | | $ - | | | | $ 378,810 | |
| $ | - | | | $ | - | | | $ | - | | | | $ - | | | | $ 445,640 | |
STATEMENTS OF OPERATIONS
Six Months Ended December 31, 2016 (Unaudited)
| | | | | | | | | | | | |
| | | Aggressive
Investors 1 | | | Ultra-
Small
Company | | | Ultra-Small
Company Market | |
| |
INVESTMENT INCOME | | | | | | | | | | | | |
Dividends | | $ | 1,340,053 | | | $ | 450,062 | | | $ | 2,278,540 | |
Less: foreign taxes withheld | | | (26,690) | | | | (267) | | | | - | |
Interest | | | - | | | | - | | | | - | |
Securities lending. | | | 154,051 | | | | 372,457 | | | | 871,364 | |
| |
Total Investment Income | | | 1,467,414 | | | | 822,252 | | | | 3,149,904 | |
| |
EXPENSES | | | | | | | | | | | | |
Investment advisory fees - Base fees | | | 969,642 | | | | 464,758 | | | | 880,232 | |
Investment advisory fees - Performance adjustment | | | 593,845 | | | | - | | | | - | |
Administration fees. | | | 27,564 | | | | 13,215 | | | | 45,071 | |
Accounting fees | | | 39,083 | | | | 33,741 | | | | 59,017 | |
Transfer agent fees | | | 67,488 | | | | 32,834 | | | | 55,512 | |
Audit fees | | | 11,276 | | | | 7,810 | | | | 15,369 | |
Legal fees | | | 13,372 | | | | 6,421 | | | | 21,582 | |
Custody fees | | | 3,036 | | | | 4,424 | | | | 10,488 | |
Blue sky fees | | | 12,505 | | | | 5,825 | | | | 13,386 | |
Directors’ and officers’ fees | | | 11,002 | | | | 4,921 | | | | 17,756 | |
Shareholder servicing fees | | | 61,600 | | | | 15,573 | | | | 145,014 | |
Reports to shareholders | | | 14,830 | | | | 5,182 | | | | 21,502 | |
Miscellaneous expenses | | | 24,040 | | | | 11,374 | | | | 41,203 | |
| |
Total Expenses | | | 1,849,283 | | | | 606,078 | | | | 1,326,132 | |
| |
Less investment advisory fees waived | | | - | | | | - | | | | (6,119) | |
Less expenses reimbursed by investment adviser | | | - | | | | - | | | | - | |
| |
Net Expenses | | | 1,849,283 | | | | 606,078 | | | | 1,320,013 | |
| |
NET INVESTMENT INCOME | | | (381,869) | | | | 216,174 | | | | 1,829,891 | |
| |
NET REALIZED AND UNREALIZED GAIN (LOSS) ON INVESTMENTS | | | | | | | | | | | | |
Realized Gain (Loss) on: | | | | | | | | | | | | |
Investments | | | 12,977,805 | | | | 2,016,815 | | | | 21,584,279 | |
Written options | | | - | | | | - | | | | - | |
Futures contracts | | | - | | | | - | | | | - | |
| |
Net Realized Gain (Loss) | | | 12,977,805 | | | | 2,016,815 | | | | 21,584,279 | |
| |
Change in Unrealized Appreciation (Depreciation) on: | | | | | | | | | | | | |
Investments | | | 20,635,178 | | | | 12,703,298 | | | | 48,135,568 | |
Written options | | | - | | | | - | | | | - | |
| |
Net Change in Unrealized Appreciation (Depreciation) | | | 20,635,178 | | | | 12,703,298 | | | | 48,135,568 | |
| |
Net Realized and Unrealized Gain (Loss) on Investments | | | 33,612,983 | | | | 14,720,113 | | | | 69,719,847 | |
| |
INCREASE (DECREASE) IN NET ASSETS RESULTING FROM OPERATIONS | | $ | 33,231,114 | | | $ | 14,936,287 | | | $ | 71,549,738 | |
| |
See Notes to Financial Statements.
| | |
| 84 | | Semi-Annual Report | December 31, 2016 (Unaudited) |
| | |
| | | |
| | | |
| | | | | | | | | | | | | | | | | | |
Small-Cap Momentum | | | Small-Cap
Growth | | | Small-Cap
Value | | | Blue Chip
35 Index | | | Managed
Volatility | |
| | |
| | | | | | | | | | | | | | | | | | | |
| | $ 36,825 | | | $ | 157,100 | | | $ | 535,682 | | | $ | 7,186,895 | | | $ | 332,128 | |
| | (86 | ) | | | - | | | | - | | | | - | | | | (84 | ) |
| | - | | | | - | | | | - | | | | - | | | | 37,752 | |
| | 3,539 | | | | 52,503 | | | | 71,290 | | | | - | | | | 578 | |
| | |
| | 40,278 | | | | 209,603 | | | | 606,972 | | | | 7,186,895 | | | | 370,374 | |
| | |
| | | | |
| | | | | | | | | | | | | | | | | | |
| | 12,330 | | | | 114,169 | | | | 183,773 | | | | 229,180 | | | | 166,986 | |
| | - | | | | 8,598 | | | | (7,481 | ) | | | - | | | | - | |
| | 574 | | | | 4,867 | | | | 7,828 | | | | 73,390 | | | | 7,143 | |
| | 31,724 | | | | 27,774 | | | | 29,046 | | | | 60,207 | | | | 33,876 | |
| | 18,040 | | | | 29,358 | | | | 34,886 | | | | 27,275 | | | | 27,003 | |
| | 4,731 | | | | 5,761 | | | | 6,477 | | | | 23,100 | | | | 8,953 | |
| | 272 | | | | 2,345 | | | | 3,752 | | | | 37,347 | | | | 3,674 | |
| | 6,516 | | | | 2,348 | | | | 1,444 | | | | 5,695 | | | | 3,470 | |
| | 9,929 | | | | 11,455 | | | | 12,196 | | | | 28,064 | | | | 12,409 | |
| | 224 | | | | 1,916 | | | | 3,100 | | | | 30,356 | | | | 2,967 | |
| | 1,615 | | | | 10,888 | | | | 18,526 | | | | 101,064 | | | | 22,369 | |
| | 214 | | | | 2,799 | | | | 4,793 | | | | 55,417 | | | | 3,629 | |
| | 1,855 | | | | 4,198 | | | | 6,716 | | | | 58,486 | | | | 8,249 | |
| | |
| | 88,024 | | | | 226,476 | | | | 305,056 | | | | 729,581 | | | | 300,728 | |
| | |
| | (12,330 | ) | | | (47,437 | ) | | | (17,607 | ) | | | (229,180 | ) | | | (38,695 | ) |
| | (55,519 | ) | | | - | | | | - | | | | (70,688 | ) | | | - | |
| | |
| | 20,175 | | | | 179,039 | | | | 287,449 | | | | 429,713 | | | | 262,033 | |
| | |
| | 20,103 | | | | 30,564 | | | | 319,523 | | | | 6,757,182 | | | | 108,341 | |
| | |
| | | | |
| | | | | | | | | | | | | | | | | | |
| | | | |
| | | | | | | | | | | | | | | | | | |
| | 389,981 | | | | 3,533,213 | | | | 389,765 | | | | 4,465,279 | | | | 1,483,869 | |
| | - | | | | - | | | | - | | | | - | | | | 1,024,019 | |
| | - | | | | - | | | | - | | | | - | | | | (1,696,183 | ) |
| | |
| | 389,981 | | | | 3,533,213 | | | | 389,765 | | | | 4,465,279 | | | | 811,705 | |
| | |
| | | | | | | | | | | | | | | | | | |
| | 78,610 | | | | 1,423,870 | | | | 10,951,495 | | | | 30,688,699 | | | | (113,753 | ) |
| | - | | | | - | | | | - | | | | - | | | | (151,110 | ) |
| | |
| | 78,610 | | | | 1,423,870 | | | | 10,951,495 | | | | 30,688,699 | | | | (264,863 | ) |
| | |
| | 468,591 | | | | 4,957,083 | | | | 11,341,260 | | | | 35,153,978 | | | | 546,842 | |
| | |
| | $488,694 | | | $ | 4,987,647 | | | $ | 11,660,783 | | | $ | 41,911,160 | | | $ | 655,183 | |
| | |
STATEMENTS OF CHANGES IN NET ASSETS
| | | | | | | | | | | | | | | | | | | | |
| | | Aggressive Investors 1 | | | Ultra-Small Company | | | | |
| | | Six Months Ended | | | Year Ended | | | Six Months Ended | | | Year Ended | | | | |
| | | December 31, 2016 | | | June 30, 2016 | | | December 31, 2016 | | | June 30, 2016 | | | | |
| | | (Unaudited) | | | | | | (Unaudited) | | | | | | | |
OPERATIONS | | | | | | | | | | | | | | | | | | | | |
Net investment income (loss) | | | $ (381,869) | | | | $ 1,255,312 | | | | $ 216,174 | | | | $ 1,137,071 | | | | | |
Net realized gain (loss) on investments | | | 12,977,805 | | | | (2,615,832) | | | | 2,016,815 | | | | (5,021,149) | | | | | |
Net change in unrealized appreciation (depreciation) on investments | | | 20,635,178 | | | | (17,416,880) | | | | 12,703,298 | | | | (13,372,489) | | | | | |
| |
| | | | | |
Net increase (decrease) in net assets resulting from operations | | | 33,231,114 | | | | (18,777,400) | | | | 14,936,287 | | | | (17,256,567) | | | | | |
| |
| | | | | |
DISTRIBUTIONS: | | | | | | | | | | | | | | | | | | | | |
From net investment income | | | (1,255,319) | | | | (99,024) | | | | (1,212,208) | | | | (1,116,218) | | | | | |
From net realized gains | | | - | | | | - | | | | - | | | | - | | | | | |
| |
Net decrease in net assets from distributions | | | (1,255,319) | | | | (99,024) | | | | (1,212,208) | | | | (1,116,218) | | | | | |
| |
| | | | | |
SHARE TRANSACTIONS: | | | | | | | | | | | | | | | | | | | | |
Proceeds from sale of shares | | | 3,394,595 | | | | 12,201,386 | | | | 431,529 | | | | 1,946,202 | | | | | |
Reinvestment of distributions | | | 1,210,678 | | | | 95,200 | | | | 1,132,706 | | | | 1,038,194 | | | | | |
Cost of shares redeemed | | | (20,024,281) | | | | (34,237,152) | | | | (7,922,323) | | | | (10,877,563) | | | | | |
Redemption fees | | | - | | | | - | | | | - | | | | - | | | | | |
| |
| | | | | |
Net increase (decrease) in net assets resulting from share transactions | | | (15,419,008) | | | | (21,940,566) | | | | (6,358,088) | | | | (7,893,167) | | | | | |
| |
| | | | | |
Net increase (decrease) in net assets | | | 16,556,787 | | | | (40,816,990) | | | | 7,365,991 | | | | (26,265,952) | | | | | |
| | | | | |
NET ASSETS: | | | | | | | | | | | | | | | | | | | | |
Beginning of period | | | 207,229,077 | | | | 248,046,067 | | | | 101,450,713 | | | | 127,716,665 | | | | | |
| |
| | | | | |
End of period** | | | $223,785,864 | | | | $207,229,077 | | | | $108,816,704 | | | | $101,450,713 | | | | | |
| |
| | | | | |
SHARES ISSUED & REDEEMED | | | | | | | | | | | | | | | | | | | | |
Issued | | | 56,921 | | | | 226,120 | | | | 15,840 | | | | 71,929 | | | | | |
Distributions reinvested | | | 18,811 | | | | 1,751 | | | | 38,177 | | | | 39,808 | | | | | |
Redeemed | | | (342,022) | | | | (636,420) | | | | (293,657) | | | | (413,482) | | | | | |
| |
| | | | | |
Net increase (decrease) | | | (266,290) | | | | (408,549) | | | | (239,640) | | | | (301,745) | | | | | |
Outstanding at beginning of period | | | 3,785,160 | | | | 4,193,709 | | | | 3,903,469 | | | | 4,205,214 | | | | | |
| |
| | | | | |
Outstanding at end of period | | | 3,518,870 | | | | 3,785,160 | | | | 3,663,829 | | | | 3,903,469 | | | | | |
| |
| | | | | |
** Including undistributed net investment income of: | | | $ (381,898) | | | | $ 1,255,290 | | | | $ 159,877 | | | | $ 1,155,911 | | | | | |
See Notes to Financial Statements.
| | |
| 86 | | Semi-Annual Report | December 31, 2016 (Unaudited) |
| | |
| | | |
| | | |
| | | | | | | | | | | | | | |
| |
Ultra-Small Company Market | | | Small-Cap Momentum | |
Six Months Ended
December 31, 2016 | | | Year Ended
June 30, 2016 | | | Six Months Ended
December 31, 2016 | | | Year Ended
June 30, 2016 | |
| | |
| (Unaudited) | | | | | | (Unaudited) | | | | |
| | | | | | | | | | | | | | |
| | $ 1,829,891 | | | | $ 3,169,017 | | | | $ 20,103 | | | | $ 26,619 | |
| | 21,584,279 | | | | 28,557,753 | | | | 389,981 | | | | (11,415) | |
|
48,135,568 |
| | | (75,235,595) | | | | 78,610 | | | | (179,316) | |
| | |
|
71,549,738 |
| | | (43,508,825) | | | | 488,694 | | | | (164,112) | |
| | |
| | | | | | | | | | | | | | |
| | (3,465,525) | | | | (3,152,924) | | | | (48,202) | | | | (9,442) | |
| | (24,304,049) | | | | (37,504,226) | | | | (147,252) | | | | (115,288) | |
| | |
| | (27,769,574) | | | | (40,657,150) | | | | (195,454) | | | | (124,730) | |
| | |
| | | |
| | | | | | | | | | | | | | |
| | 10,489,143 | | | | 52,017,890 | | | | 154,234 | | | | 261,156 | |
| | 26,765,299 | | | | 39,249,741 | | | | 194,812 | | | | 124,006 | |
| | (55,862,280) | | | | (78,477,718) | | | | (91,700) | | | | (1,043,587) | |
| | 17,980 | | | | 58,448 | | | | - | | | | 303 | |
| | |
|
(18,589,858) |
| | | 12,848,361 | | | | 257,346 | | | | (658,122) | |
| | |
| | 25,190,306 | | | | (71,317,614) | | | | 550,586 | | | | (946,964) | |
| | | | | | | | | | | | | | |
| | 331,535,390 | | | | 402,853,004 | | | | 4,175,589 | | | | 5,122,553 | |
| | |
| | $356,725,696 | | | | $331,535,390 | | | | $4,726,175 | | | | $4,175,589 | |
| | |
| | | |
| | | | | | | | | | | | | | |
| | 745,694 | | | | 3,904,938 | | | | 13,885 | | | | 22,889 | |
| | 1,858,701 | | | | 3,073,590 | | | | 15,787 | | | | 10,802 | |
| | (3,915,382) | | | | (5,905,983) | | | | (8,647) | | | | (87,732) | |
| | |
| | (1,310,987) | | | | 1,072,545 | | | | 21,025 | | | | (54,041) | |
| | 25,967,023 | | | | 24,894,478 | | | | 362,848 | | | | 416,889 | |
| | |
| | | |
| | 24,656,036 | | | | 25,967,023 | | | | 383,873 | | | | 362,848 | |
| | |
| | | |
| | $ (1,635,631) | | | | $ 3 | | | | $ (4,022) | | | | $ 24,077 | |
STATEMENTS OF CHANGES IN NET ASSETS (continued)
| | | | | | | | | | | | | | | | | | | | |
| | | Small-Cap Growth | | | Small-Cap Value | | | | |
| | | Six Months Ended | | | Year Ended | | | Six Months Ended | | | Year Ended | | | | |
| | | December 31, 2016 | | | June 30, 2016 | | | December 31, 2016 | | | June 30, 2016 | | | | |
| | | (Unaudited) | | | | | | (Unaudited) | | | | | | | |
OPERATIONS | | | | | | | | | | | | | | | | | | | | |
Net investment income (loss) | | | $ 30,564 | | | | $ 129,866 | | | | $ 319,523 | | | | $ 877,190 | | | | | |
Net realized gain (loss) on investments | | | 3,533,213 | | | | 470,966 | | | | 389,765 | | | | (2,163,966) | | | | | |
Net change in unrealized appreciation (depreciation) on investments | | | 1,423,870 | | | | (2,039,755) | | | | 10,951,495 | | | | (2,863,660) | | | | | |
| |
Net increase (decrease) in net assets resulting from operations | | | 4,987,647 | | | | (1,438,923) | | | | 11,660,783 | | | | (4,150,436) | | | | | |
| |
DISTRIBUTIONS: | | | | | | | | | | | | | | | | | | | | |
From net investment income | | | (128,436) | | | | - | | | | (644,905) | | | | (1,200,493) | | | | | |
| |
Net decrease in net assets from distributions | | | (128,436) | | | | - | | | | (644,905) | | | | (1,200,493) | | | | | |
| |
SHARE TRANSACTIONS: | | | | | | | | | | | | | | | | | | | | |
Proceeds from sale of shares | | | 3,274,186 | | | | 8,174,017 | | | | 2,323,384 | | | | 2,974,064 | | | | | |
Reinvestment of distributions. | | | 124,435 | | | | - | | | | 621,803 | | | | 1,160,995 | | | | | |
Cost of shares redeemed | | | (4,701,300) | | | | (7,142,746) | | | | (6,318,049) | | | | (13,284,863) | | | | | |
| |
Net increase (decrease) in net assets resulting from share transactions | | | (1,302,679) | | | | 1,031,271 | | | | (3,372,862) | | | | (9,149,804) | | | | | |
| |
Net increase (decrease) in net assets | | | 3,556,532 | | | | (407,652) | | | | 7,643,016 | | | | (14,500,733) | | | | | |
| | | | | |
NET ASSETS: | | | | | | | | | | | | | | | | | | | | |
Beginning of period | | | 36,393,643 | | | | 36,801,295 | | | | 58,740,505 | | | | 73,241,238 | | | | | |
| |
| | | | | |
End of period* | | | $39,950,175 | | | | $36,393,643 | | | | $66,383,521 | | | | $58,740,505 | | | | | |
| |
| | | | | |
SHARES ISSUED & REDEEMED | | | | | | | | | | | | | | | | | | | | |
| | | | | |
Issued | | | 148,529 | | | | 417,698 | | | | 97,735 | | | | 146,711 | | | | | |
Distributions reinvested | | | 5,311 | | | | - | | | | 24,714 | | | | 57,532 | | | | | |
Redeemed | | | (220,207) | | | | (365,757) | | | | (279,860) | | | | (660,493) | | | | | |
| |
Net increase (decrease) | | | (66,367) | | | | 51,941 | | | | (157,411) | | | | (456,250) | | | | | |
Outstanding at beginning of period | | | 1,790,353 | | | | 1,738,412 | | | | 2,814,085 | | | | 3,270,335 | | | | | |
| |
Outstanding at end of period | | | 1,723,986 | | | | 1,790,353 | | | | 2,656,674 | | | | 2,814,085 | | | | | |
| |
* Including undistributed net investment income of: | | | $ 30,556 | | | | $ 128,428 | | | | $ 277,423 | | | | $ 602,805 | | | | | |
See Notes to Financial Statements.
| | |
| 88 | | Semi-Annual Report | December 31, 2016 (Unaudited) |
| | |
| | | |
| | | |
| | | | | | | | | | | | | | |
| | | | | |
| |
Blue Chip 35 Index | | | Managed Volatility | |
Six Months Ended
December 31, 2016 | | | Year Ended June 30, 2016 | | | Six Months Ended
December 31, 2016 | | | Year Ended
June 30, 2016 | |
| | |
| (Unaudited) | | | | | | (Unaudited) | | | | |
| | | | | | | | | | | | | | |
| | $ 6,757,182 | | | | $ 13,796,994 | | | | $ 108,341 | | | | $ 174,794 | |
| | 4,465,279 | | | | 11,244,582 | | | | 811,705 | | | | 571,246 | |
|
30,688,699 |
| | | 6,959,629 | | | | (264,863) | | | | (118,120) | |
| | |
| | 41,911,160 | | | | 32,001,205 | | | | 655,183 | | | | 627,920 | |
| | |
| | | |
| | | | | | | | | | | | | | |
| | (13,425,245) | | | | (14,480,684) | | | | (195,475) | | | | (15,844) | |
| | |
| | (13,425,245) | | | | (14,480,684) | | | | (195,475) | | | | (15,844) | |
| | |
| | | |
| | | | | | | | | | | | | | |
| | 74,456,281 | | | | 197,709,355 | | | | 3,651,487 | | | | 13,489,567 | |
| | 12,574,239 | | | | 13,464,160 | | | | 183,366 | | | | 15,001 | |
| | (110,647,764) | | | | (257,873,552) | | | | (15,310,693) | | | | (15,538,847) | |
| | |
|
(23,617,244) |
| | | (46,700,037) | | | | (11,475,840) | | | | (2,034,279) | |
| | |
| | 4,868,671 | | | | (29,179,516) | | | | (11,016,132) | | | | (1,422,203) | |
| | 571,643,589 | | | | 600,823,105 | | | | 57,586,162 | | | | 59,008,365 | |
| | |
| | $ 576,512,260 | | | | $ 571,643,589 | | | | $ 46,570,030 | | | | $ 57,586,162 | |
| | |
| | | |
| | | | | | | | | | | | | | |
| | 5,824,200 | | | | 16,712,171 | | | | 255,293 | | | | 970,595 | |
| | 962,069 | | | | 1,130,492 | | | | 12,814 | | | | 1,078 | |
| | (8,702,005) | | | | (22,178,814) | | | | (1,067,420) | | | | (1,118,179) | |
| | |
| | (1,915,736) | | | | (4,336,151) | | | | (799,313) | | | | (146,506) | |
| | 46,542,827 | | | | 50,878,978 | | | | 4,054,124 | | | | 4,200,630 | |
| | |
| | 44,627,091 | | | | 46,542,827 | | | | 3,254,811 | | | | 4,054,124 | |
| | |
| | $ (7,485) | | | | $ 6,660,578 | | | | $ 84,080 | | | | $ 171,214 | |
FINANCIAL HIGHLIGHTS
(for a share outstanding throughout each period indicated)
AGGRESSIVE INVESTORS 1
| | | | | | | | | | | | |
| | | For the
Period Ended
12/31/16
(Unaudited) | | Year Ended June 30 |
| | | | 2016 | | 2015 | | 2014 | | 2013 | | 2012 |
| | | | | | |
Net Asset Value, Beginning of Period | | $54.75 | | $59.15 | | $56.69 | | $43.21 | | $33.13 | | $38.19 |
| | | | | | |
| | | | | | | | | | | | |
| | | | | | |
Income from Investment Operations: | | | | | | | | | | | | |
Net Investment Income (Loss)(a) | | (0.11) | | 0.31 | | 0.02 | | 0.11 | | 0.65 | | 0.62 |
Net Realized and Unrealized Gain (Loss) | | 9.32 | | (4.69) | | 2.56 | | 13.73 | | 9.84 | | (4.37) |
| | | | | | |
| | | | | | | | | | | | |
| | | | | | |
Total from Investment Operations | | 9.21 | | (4.38) | | 2.58 | | 13.84 | | 10.49 | | (3.75) |
| | | | | | |
| | | | | | | | | | | | |
| | | | | | |
Less Distributions to Shareholders from: | | | | | | | | | | | | |
Net Investment Income | | (0.36) | | (0.02) | | (0.12) | | (0.36) | | (0.41) | | (1.31) |
| | | | | | |
| | | | | | | | | | | | |
| | | | | | |
Total Distributions | | (0.36) | | (0.02) | | (0.12) | | (0.36) | | (0.41) | | (1.31) |
| | | | | | |
| | | | | | | | | | | | |
| | | | | | |
Net Asset Value, End of Period | | $63.60 | | $54.75 | | $59.15 | | $56.69 | | $43.21 | | $33.13 |
| | | | | | | | | | | | |
| | | | | | |
Total Return | | 16.81%(b) | | (7.40%) | | 4.57% | | 32.14% | | 31.92% | | (9.57%) |
| | | | | | |
Ratios and Supplemental Data: | | | | | | | | | | | | |
Net Assets, End of Period (in 000’s) | | $223,786 | | $207,229 | | $248,046 | | $259,402 | | $221,337 | | $206,010 |
Expenses Before Waivers and Reimbursements | | 1.72%(c) | | 0.63%(d) | | 1.32% | | 1.01% | | 0.74%(d) | | (0.04%)(d) |
Expenses After Waivers and Reimbursements | | 1.72%(c) | | 0.63% | | 1.32% | | 1.01% | | 0.74% | | (0.04%) |
Net Investment Income After Waivers and Reimbursements | | (0.35%)(c) | | 0.58% | | 0.04% | | 0.22% | | 1.69% | | 1.86% |
Portfolio Turnover Rate | | 58%(b) | | 124% | | 107% | | 125% | | 149% | | 125% |
| (a) | Per share amounts calculated based on the average daily shares outstanding during the period. |
| (c) | Annualized for periods less than one year. |
| (d) | For the years ended June 30, 2012, June 30, 2013, and June 30, 2016 the expense ratio was significantly lower than in other years, due to a negative performance adjustment to the investment advisory fee. Please refer to Note 3 of the Notes to Financial Statements for further information. The rate shown may not be indicative of the rate going forward. |
See Notes to Financial Statements.
| | |
| 90 | | Semi-Annual Report | December 31,2016 (Unaudited) |
FINANCIAL HIGHLIGHTS
(for a share outstanding throughout each period indicated)
ULTRA-SMALL COMPANY
| | | | | | | | | | | | |
| | | For the
Period Ended
12/31/16
(Unaudited) | | Year Ended June 30 |
| | | | 2016 | | 2015 | | 2014 | | 2013 | | 2012 |
| | | | | | |
Net Asset Value, Beginning of Period | | $25.99 | | $30.37 | | $41.83 | | $39.36 | | $27.57 | | $29.65 |
| | | | | | |
| | | | | | | | | | | | |
| | | | | | |
Income from Investment Operations: | | | | | | | | | | | | |
Net Investment Income(a) | | 0.06 | | 0.28 | | 0.24 | | 0.41 | | 0.43 | | 0.13 |
Net Realized and Unrealized Gain (Loss) | | 3.98 | | (4.39) | | (3.53) | | 8.33 | | 11.38 | | (1.79) |
| | | | | | |
| | | | | | | | | | | | |
| | | | | | |
Total from Investment Operations | | 4.04 | | (4.11) | | (3.29) | | 8.74 | | 11.81 | | (1.66) |
| | | | | | |
| | | | | | | | | | | | |
| | | | | | |
Less Distributions to Shareholders from: | | | | | | | | | | | | |
Net Investment Income | | (0.33) | | (0.27) | | (0.30) | | (0.76) | | (0.02) | | (0.42) |
Net Realized Gain | | - | | - | | (7.87) | | (5.51) | | - | | - |
| | | | | | |
| | | | | | | | | | | | |
| | | | | | |
Total Distributions | | (0.33) | | (0.27) | | (8.17) | | (6.27) | | (0.02) | | (0.42) |
| | | | | | |
| | | | | | | | | | | | |
| | | | | | |
Net Asset Value, End of Period | | $29.70 | | $25.99 | | $30.37 | | $41.83 | | $39.36 | | $27.57 |
| | | | | | | | | | | | |
| | | | | | |
Total Return | | 15.56%(b) | | (13.53)% | | (7.60)% | | 23.72% | | 42.85% | | (5.41%) |
| | | | | | |
Ratios and Supplemental Data: | | | | | | | | | | | | |
Net Assets, End of Period (in 000’s) | | $108,817 | | $101,451 | | $127,717 | | $152,331 | | $132,064 | | $102,110 |
Expenses Before Waivers and Reimbursements | | 1.17%(c) | | 1.17% | | 1.11% | | 1.10% | | 1.17% | | 1.22% |
Expenses After Waivers and Reimbursements | | 1.17%(c) | | 1.17% | | 1.11% | | 1.10% | | 1.17% | | 1.22% |
Net Investment Income After Waivers and Reimbursements | | 0.42%(c) | | 1.05% | | 0.68% | | 0.98% | | 1.33% | | 0.49% |
Portfolio Turnover Rate | | 23%(b) | | 101% | | 90% | | 99% | | 89% | | 93% |
| (a) | Per share amounts calculated based on the average daily shares outstanding during the period. |
| (c) | Annualized for periods less than one year. |
See Notes to Financial Statements.
FINANCIAL HIGHLIGHTS
(for a share outstanding throughout each period indicated)
ULTRA-SMALL COMPANY MARKET
| | | | | | | | | | | | |
| | | For the
Period Ended
12/31/16
(Unaudited) | | Year Ended June 30 |
| | | | 2016 | | 2015 | | 2014 | | 2013 | | 2012 |
| | | | | | |
Net Asset Value, Beginning of Period | | $12.77 | | $16.18 | | $17.46 | | $15.44 | | $14.67 | | $15.34 |
| | | | | | |
| | | | | | | | | | | | |
| | | | | | |
Income from Investment Operations: | | | | | | | | | | | | |
Net Investment Income(a) | | 0.07 | | 0.12 | | 0.12 | | 0.12 | | 0.22 | | 0.12 |
Net Realized and Unrealized Gain (Loss) | | 2.82 | | (1.87) | | 0.38 | | 3.66 | | 3.49 | | (0.09) |
| | | | | | |
| | | | | | | | | | | | |
| | | | | | |
Total from Investment Operations | | 2.89 | | (1.75) | | 0.50 | | 3.78 | | 3.71 | | 0.03 |
| | | | | | |
| | | | | | | | | | | | |
| | | | | | |
Less Distributions to Shareholders from: | | | | | | | | | | | | |
Net Investment Income | | (0.15) | | (0.13) | | (0.14) | | (0.18) | | (0.40) | | (0.14) |
Net Realized Gain | | (1.04) | | (1.53) | | (1.64) | | (1.59) | | (2.54) | | (0.56) |
| | | | | | |
| | | | | | | | | | | | |
| | | | | | |
Total Distributions | | (1.19) | | (1.66) | | (1.78) | | (1.77) | | (2.94) | | (0.70) |
| | | | | | |
| | | | | | | | | | | | |
| | | | | | |
Paid in Capital from Redemption Fees(a) | | 0.00(b) | | 0.00(b) | | 0.00(b) | | 0.01 | | 0.00(b) | | 0.00(b) |
| | | | | | |
| | | | | | | | | | | | |
| | | | | | |
Net Asset Value, End of Period | | $14.47 | | $12.77 | | $16.18 | | $17.46 | | $15.44 | | $14.67 |
| | | | | | | | | | | | |
| | | | | | |
Total Return | | 22.70%(c)(d) | | (10.83%)(d) | | 3.72% | | 25.48% | | 29.95%(d) | | 1.05%(d) |
| | | | | | |
Ratios and Supplemental Data: | | | | | | | | | | | | |
Net Assets, End of Period (in 000’s) | | $356,726 | | $331,535 | | $402,853 | | $424,096 | | $341,647 | | $302,432 |
Expenses Before Waivers and Reimbursements | | 0.75%(e) | | 0.75% | | 0.73% | | 0.72% | | 0.79% | | 0.83% |
Expenses After Waivers and Reimbursements | | 0.75%(e) | | 0.75% | | 0.73% | | 0.72% | | 0.75% | | 0.75% |
Net Investment Income After Waivers and Reimbursements | | 1.04%(e) | | 0.91% | | 0.74% | | 0.73% | | 1.52% | | 0.86% |
Portfolio Turnover Rate | | 10%(c) | | 41% | | 32% | | 29% | | 41% | | 31% |
| (a) | Per share amounts calculated based on the average daily shares outstanding during the period. |
| (b) | Amount represents less than $0.005. |
| (d) | Total return would have been lower had various fees not been waived during the period. |
| (e) | Annualized for periods less than one year. |
See Notes to Financial Statements.
| | |
| 92 | | Semi-Annual Report | December 31,2016 (Unaudited) |
FINANCIAL HIGHLIGHTS
(for a share outstanding throughout each period indicated)
SMALL-CAP MOMENTUM
| | | | | | | | | | | | |
| | | For the
Period Ended
12/31/16
(Unaudited) | | Year Ended June 30 |
| | | | 2016 | | 2015 | | 2014 | | 2013 | | 2012 |
| | | | | | |
Net Asset Value, Beginning of Period | | $11.51 | | $12.29 | | $13.00 | | $12.19 | | $11.25 | | $12.74 |
| | | | | | |
| | | | | | | | | | | | |
| | | | | | |
Income from Investment Operations: | | | | | | | | | | | | |
Net Investment Income(a) | | 0.05 | | 0.07 | | 0.09 | | 0.01 | | 0.10 | | 0.04 |
Net Realized and Unrealized Gain (Loss) | | 1.28 | | (0.50) | | 0.37 | | 2.29 | | 2.20 | | (0.35) |
| | | | | | |
| | | | | | | | | | | | |
| | | | | | |
Total from Investment Operations | | 1.33 | | (0.43) | | 0.46 | | 2.30 | | 2.30 | | (0.31) |
| | | | | | |
| | | | | | | | | | | | |
| | | | | | |
Less Distributions to Shareholders from: | | | | | | | | | | | | |
Net Investment Income | | (0.13) | | (0.03) | | (0.07) | | (0.02) | | (0.19) | | (0.01) |
Net Realized Gain | | (0.40) | | (0.32) | | (1.10) | | (1.47) | | (1.17) | | (1.18) |
| | | | | | |
| | | | | | | | | | | | |
| | | | | | |
Total Distributions | | (0.53) | | (0.35) | | (1.17) | | (1.49) | | (1.36) | | (1.19) |
| | | | | | |
| | | | | | | | | | | | |
| | | | | | |
Paid in Capital from Redemption Fees(a) | | - | | 0.00(b) | | 0.00(b) | | 0.00(b) | | 0.00(b) | | 0.01 |
| | | | | | |
| | | | | | | | | | | | |
| | | | | | |
Net Asset Value, End of Period | | $12.31 | | $11.51 | | $12.29 | | $13.00 | | $12.19 | | $11.25 |
| | | | | | | | | | | | |
| | | | | | |
Total Return(c) | | 11.56%(d) | | (3.48%) | | 4.54% | | 19.46% | | 22.31% | | (1.40%) |
| | | | | | |
Ratios and Supplemental Data: | | | | | | | | | | | | |
Net Assets, End of Period (in 000’s) | | $4,726 | | $4,176 | | $5,123 | | $5,894 | | $4,437 | | $2,070 |
Expenses Before Waivers and | | | | | | | | | | | | |
Reimbursements | | 3.93%(e) | | 3.95% | | 3.36% | | 3.08% | | 5.42% | | 5.73% |
Expenses After Waivers and Reimbursements | | 0.90%(e) | | 0.90% | | 0.90% | �� | 0.90% | | 0.90% | | 0.90% |
Net Investment Income After Waivers and Reimbursements | | 0.90%(e) | | 0.62% | | 0.77% | | 0.07% | | 0.89% | | 0.38% |
Portfolio Turnover Rate | | 109%(d) | | 184% | | 198% | | 242% | | 264% | | 230% |
| (a) | Per share amounts calculated based on the average daily shares outstanding during the period. |
| (b) | Amount represents less than $0.005. |
| (c) | Total return would have been lower had various fees not been waived during the period. |
| (e) | Annualized for periods less than one year. |
See Notes to Financial Statements.
FINANCIAL HIGHLIGHTS
(for a share outstanding throughout each period indicated)
SMALL-CAP GROWTH
| | | | | | | | | | | | |
| | | For the
Period Ended
12/31/16
(Unaudited) | | Year Ended June 30 |
| | | | 2016 | | 2015 | | 2014 | | 2013 | | 2012 |
Net Asset Value, Beginning of Period | | $20.33 | | $21.17 | | $18.68 | | $15.11 | | $11.63 | | $12.42 |
| | | | | | |
| | | | | | | | | | | | |
| | | | | | |
Income from Investment Operations: | | | | | | | | | | | | |
Net Investment Income (Loss)(a) | | 0.02 | | 0.07 | | (0.01) | | 0.01 | | 0.08 | | (0.02) |
Net Realized and Unrealized Gain (Loss) | | 2.89 | | (0.91) | | 2.51 | | 3.63 | | 3.40 | | (0.77) |
| | | | | | |
| | | | | | | | | | | | |
| | | | | | |
Total from Investment Operations | | 2.91 | | (0.84) | | 2.50 | | 3.64 | | 3.48 | | (0.79) |
| | | | | | |
| | | | | | | | | | | | |
| | | | | | |
Less Distributions to Shareholders from: | | | | | | | | | | | | |
Net Investment Income | | (0.07) | | - | | (0.01) | | (0.07) | | - | | 0.00(b) |
| | | | | | |
| | | | | | | | | | | | |
| | | | | | |
Total Distributions | | (0.07) | | - | | (0.01) | | (0.07) | | - | | 0.00(b) |
| | | | | | |
| | | | | | | | | | | | |
| | | | | | |
Net Asset Value, End of Period | | $23.17 | | $20.33 | | $21.17 | | $18.68 | | $15.11 | | $11.63 |
| | | | | | | | | | | | |
| | | | | | |
Total Return(c) | | 14.33%(d) | | (3.97%) | | 13.41% | | 24.11% | | 29.92% | | (6.35%) |
| | | | | | |
Ratios and Supplemental Data: | | | | | | | | | | | | |
Net Assets, End of Period (in 000’s) | | $39,950 | | $36,394 | | $36,801 | | $33,419 | | $30,605 | | $31,778 |
Expenses Before Waivers and Reimbursements | | 1.19%(e) | | 1.20% | | 1.08% | | 1.07% | | 1.13% | | 1.08% |
Expenses After Waivers and Reimbursements | | 0.94%(e) | | 0.94% | | 0.94% | | 0.94% | | 0.94% | | 0.94% |
Net Investment Income (Loss) After Waivers and Reimbursements | | 0.16%(e) | | 0.36% | | (0.07%) | | 0.06% | | 0.60% | | (0.14%) |
Portfolio Turnover Rate | | 68%(d) | | 137% | | 123% | | 121% | | 78% | | 63% |
| (a) | Per share amounts calculated based on the average daily shares outstanding during the period. |
| (b) | Amount represents less than $0.005. |
| (c) | Total return would have been lower had various fees not been waived during the period. |
| (e) | Annualized for periods less than one year. |
See Notes to Financial Statements.
| | |
| 94 | | Semi-Annual Report | December 31,2016 (Unaudited) |
FINANCIAL HIGHLIGHTS
(for a share outstanding throughout each period indicated)
SMALL-CAP VALUE
| | | | | | | | | | | | | | | | | | | | | | | | |
| | | For the
Period Ended
12/31/16
(Unaudited) | | | Year Ended June 30 | |
| | | | 2016 | | | 2015 | | | 2014 | | | 2013 | | | 2012 | |
Net Asset Value, Beginning of Period | | | $20.87 | | | | $22.40 | | | | $23.06 | | | | $19.21 | | | | $14.82 | | | | $15.12 | |
| | | | | | | | | | | | | | | | | | | | | | | | |
| | | | | | |
Income from Investment Operations: | | | | | | | | | | | | | | | | | | | | | | | | |
Net Investment Income(a) | | | 0.12 | | | | 0.29 | | | | 0.29 | | | | 0.15 | | | | 0.29 | | | | 0.15 | |
Net Realized and Unrealized Gain (Loss) | | | 4.24 | | | | (1.43) | | | | (0.78) | | | | 3.80 | | | | 4.46 | | | | (0.26) | |
| | | | | | | | | | | | | | | | | | | | | | | | |
| | | | | | |
Total from Investment Operations | | | 4.36 | | | | (1.14) | | | | (0.49) | | | | 3.95 | | | | 4.75 | | | | (0.11) | |
| | | | | | |
| | | | | | | | | | | | | | | | | | | | | | | | |
| | | | | | |
Less Distributions to Shareholders from: | | | | | | | | | | | | | | | | | | | | | | | | |
Net Investment Income | | | (0.24) | | | | (0.39) | | | | (0.17) | | | | (0.10) | | | | (0.36) | | | | (0.19) | |
| | | | | | | | | | | | | | | | | | | | | | | | |
| | | | | | |
Total Distributions | | | (0.24) | | | | (0.39) | | | | (0.17) | | | | (0.10) | | | | (0.36) | | | | (0.19) | |
| | | | | | |
| | | | | | | | | | | | | | | | | | | | | | | | |
| | | | | | |
Net Asset Value, End of Period | | | $24.99 | | | | $20.87 | | | | $22.40 | | | | $23.06 | | | | $19.21 | | | | $14.82 | |
| | | | | | | | | | | | | | | | | | | | | | | | |
| | | | | | |
Total Return | | | 20.90%(b)(c) | | | | (5.02%)(c) | | | | (2.10%)(c) | | | | 20.63%(c) | | | | 32.49% | | | | (0.59%)(c) | |
| | | | | | |
Ratios and Supplemental Data: | | | | | | | | | | | | | | | | | | | | | | | | |
Net Assets, End of Period (in 000’s) | | | $66,384 | | | | $58,741 | | | | $73,241 | | | | $85,782 | | | | $79,248 | | | | $67,610 | |
Expenses Before Waivers and Reimbursements | | | 1.00%(d) | | | | 1.03% | | | | 0.98% | | | | 0.97% | | | | 0.91% | | | | 0.99% | |
Expenses After Waivers and Reimbursements | | | 0.94%(d) | | | | 0.94% | | | | 0.94% | | | | 0.94% | | | | 0.91% | | | | 0.94% | |
Net Investment Income After Waivers and Reimbursements | | | 1.04%(d) | | | | 1.41% | | | | 1.30% | | | | 0.71% | | | | 1.71% | | | | 1.10% | |
Portfolio Turnover Rate | | | 34%(b) | | | | 62% | | | | 74% | | | | 83% | | | | 64% | | | | 49% | |
| (a) | Per share amounts calculated based on the average daily shares outstanding during the period. |
| (c) | Total return would have been lower had various fees not been waived during the period. |
| (d) | Annualized for periods less than one year. |
See Notes to Financial Statements.
FINANCIAL HIGHLIGHTS
(for a share outstanding throughout each period indicated)
BLUE CHIP 35 INDEX
| | | | | | | | | | | | | | | | | | | | | | | | |
| | | For the
Period Ended
12/31/16
(Unaudited) | | | Year Ended June 30 | |
| | | | 2016 | | | 2015 | | | 2014 | | | 2013 | | | 2012 | |
Net Asset Value, Beginning of Period | | | $12.28 | | | | $11.81 | | | | $11.39 | | | | $9.59 | | | | $8.16 | | | | $7.60 | |
| | | | | | |
| | | | | | | | | | | | | | | | | | | | | | | | |
| | | | | | |
Income from Investment Operations: | | | | | | | | | | | | | | | | | | | | | | | | |
Net Investment Income(a) | | | 0.15 | | | | 0.28 | | | | 0.26 | | | | 0.23 | | | | 0.21 | | | | 0.17 | |
Net Realized and Unrealized Gain | | | 0.80 | | | | 0.49 | | | | 0.39 | | | | 1.77 | | | | 1.46 | | | | 0.55 | |
| | | | | | | | | | | | | | | | | | | | | | | | |
| | | | | | |
Total from Investment Operations | | | 0.95 | | | | 0.77 | | | | 0.65 | | | | 2.00 | | | | 1.67 | | | | 0.72 | |
| | | | | | |
| | | | | | | | | | | | | | | | | | | | | | | | |
| | | | | | |
Less Distributions to Shareholders from: | | | | | | | | | | | | | | | | | | | | | | | | |
Net Investment Income | | | (0.31) | | | | (0.30) | | | | (0.23) | | | | (0.20) | | | | (0.24) | | | | (0.16) | |
| | | | | | | | | | | | | | | | | | | | | | | | |
| | | | | | |
Total Distributions | | | (0.31) | | | | (0.30) | | | | (0.23) | | | | (0.20) | | | | (0.24) | | | | (0.16) | |
| | | | | | |
| | | | | | | | | | | | | | | | | | | | | | | | |
| | | | | | |
Net Asset Value, End of Period | | | $12.92 | | | | $12.28 | | | | $11.81 | | | | $11.39 | | | | $9.59 | | | | $8.16 | |
| | | | | | | | | | | | | | | | | | | | | | | | |
| | | | | | |
Total Return(b) | | | 7.74%(c) | | | | 6.60% | | | | 5.77% | | | | 21.11% | | | | 20.89% | | | | 9.72% | |
| | | | | | |
Ratios and Supplemental Data: | | | | | | | | | | | | | | | | | | | | | | | | |
Net Assets, End of Period (in 000’s) | | | $576,512 | | | | $571,644 | | | | $600,823 | | | | $556,985 | | | | $463,146 | | | | $264,161 | |
Expenses Before Waivers and Reimbursements | | | 0.25%(d) | | | | 0.25% | | | | 0.23% | | | | 0.25% | | | | 0.27% | | | | 0.29% | |
Expenses After Waivers and Reimbursements | | | 0.15%(d) | | | | 0.15% | | | | 0.15% | | | | 0.15% | | | | 0.15% | | | | 0.15% | |
Net Investment Income After Waivers and Reimbursements | | | 2.36%(d) | | | | 2.42% | | | | 2.19% | | | | 2.20% | | | | 2.36% | | | | 2.28% | |
Portfolio Turnover Rate | | | 9%(c) | | | | 23% | | | | 19% | | | | 28% | | | | 28% | | | | 33% | |
| (a) | Per share amounts calculated based on the average daily shares outstanding during the period. |
| (b) | Total return would have been lower had various fees not been waived during the period. |
| (d) | Annualized for periods less than one year. |
See Notes to Financial Statements.
| | |
| 96 | | Semi-Annual Report | December 31,2016 (Unaudited) |
FINANCIAL HIGHLIGHTS
(for a share outstanding throughout each period indicated)
MANAGED VOLATILITY
| | | | | | | | | | | | | | | | | | | | | | | | |
| | | For the
Period Ended
12/31/16
(Unaudited) | | | Year Ended June 30 | |
| | | | 2016 | | | 2015 | | | 2014 | | | 2013 | | | 2012 | |
Net Asset Value, Beginning of Period | | | $14.20 | | | | $14.05 | | | | $13.94 | | | | $12.75 | | | | $11.94 | | | | $11.58 | |
| | | | | | |
| | | | | | | | | | | | | | | | | | | | | | | | |
| | | | | | |
Income from Investment Operations: | | | | | | | | | | | | | | | | | | | | | | | | |
Net Investment Income(a) | | | 0.03 | | | | 0.04 | | | | 0.00(b) | | | | 0.02 | | | | 0.05 | | | | 0.04 | |
Net Realized and Unrealized Gain | | | 0.14 | | | | 0.11 | | | | 0.13 | | | | 1.20 | | | | 0.81 | | | | 0.39 | |
| | | | | | | | | | | | | | | | | | | | | | | | |
| | | | | | |
Total from Investment Operations | | | 0.17 | | | | 0.15 | | | | 0.13 | | | | 1.22 | | | | 0.86 | | | | 0.43 | |
| | | | | | |
| | | | | | | | | | | | | | | | | | | | | | | | |
| | | | | | |
Less Distributions to Shareholders from: | | | | | | | | | | | | | | | | | | | | | | | | |
Net Investment Income | | | (0.06) | | | | 0.00(b) | | | | (0.02) | | | | (0.03) | | | | (0.05) | | | | (0.07) | |
| | | | | | | | | | | | | | | | | | | | | | | | |
| | | | | | |
Total Distributions | | | (0.06) | | | | 0.00(b) | | | | (0.02) | | | | (0.03) | | | | (0.05) | | | | (0.07) | |
| | | | | | |
| | | | | | | | | | | | | | | | | | | | | | | | |
| | | | | | |
Net Asset Value, End of Period | | | $14.31 | | | | $14.20 | | | | $14.05 | | | | $13.94 | | | | $12.75 | | | | $11.94 | |
| | | | | | |
| | | | | | | | | | | | | | | | | | | | | | | | |
Total Return(c) | | | 1.19%(d) | | | | 1.10% | | | | 0.92% | | | | 9.61% | | | | 7.23% | | | | 3.74% | |
| | | | | | |
Ratios and Supplemental Data: | | | | | | | | | | | | | | | | | | | | | | | | |
Net Assets, End of Period (in 000’s) | | | $46,570 | | | | $57,586 | | | | $59,008 | | | | $46,908 | | | | $26,703 | | | | $23,705 | |
Expenses Before Waivers and Reimbursements | | | 1.08%(e) | | | | 1.06% | | | | 1.04% | | | | 1.14% | | | | 1.35% | | | | 1.43% | |
Expenses After Waivers and Reimbursements | | | 0.94%(e) | | | | 0.94% | | | | 0.94% | | | | 0.94% | | | | 0.94% | | | | 0.94% | |
Net Investment Income After Waivers and Reimbursements | | | 0.39%(e) | | | | 0.31% | | | | 0.03% | | | | 0.17% | | | | 0.37% | | | | 0.39% | |
Portfolio Turnover Rate | | | 18%(d) | | | | 54% | | | | 38% | | | | 39% | | | | 45% | | | | 41% | |
| (a) | Per share amounts calculated based on the average daily shares outstanding during the period. |
| (b) | Amount represents less than $0.005. |
| (c) | Total return would have been lower had various fees not been waived during the period. |
| (e) | Annualized for periods less than one year. |
See Notes to Financial Statements.
| | |
| NOTES TO FINANCIAL STATEMENTS | | |
December 31, 2016 (Unaudited)
1. Organization:
Bridgeway Funds, Inc. (“Bridgeway” or the “Company”) was organized as a Maryland corporation on October 19, 1993, and is registered under the Investment Company Act of 1940, as amended (the “1940 Act”), as an open-end management investment company.
Bridgeway is organized as a series fund, with 10 investment funds as of December 31, 2016. The Aggressive Investors 1, Ultra-Small Company, Ultra-Small Company Market, Small-Cap Momentum, Small-Cap Growth, Small-Cap Value, Blue Chip 35 Index and Managed Volatility Funds are presented in this report (each is referred to as a “Fund” and collectively, the “Funds”). The Omni Small-Cap Value and Omni Tax-Managed Small-Cap Value Funds are included in a separate report.
Bridgeway is authorized to issue 1,915,000,000 shares of common stock at $0.001 per share. As of December 31, 2016, 100,000,000 shares have been classified into the Aggressive Investors 1 Fund. 130,000,000 shares have been classified into the Blue Chip 35 Index Fund. 15,000,000 shares have been classified into the Ultra-Small Company Fund. 100,000,000 shares each have been classified into the Ultra-Small Company Market, Omni Small-Cap Value, Omni Tax-Managed Small-Cap Value, Small-Cap Momentum, Small-Cap Growth, and Small-Cap Value Funds. 50,000,000 shares have been classified into the Managed Volatility Fund.
The Ultra-Small Company Fund is open to existing investors (direct only).
All of the Funds are no-load, diversified funds.
The Aggressive Investors 1 Fund seeks to exceed the stock market total return (primarily through capital appreciation) at a level of total risk roughly equal to that of the stock market over longer periods of time (three year intervals or more).
The Ultra-Small Company, Ultra-Small Company Market, Small-Cap Momentum, Small-Cap Growth, and Small-Cap Value Funds seek to provide a long-term total return on capital, primarily through capital appreciation.
The Blue Chip 35 Index Fund seeks to provide long-term total return on capital, primarily through capital appreciation, but also some income.
The Managed Volatility Fund seeks to provide a high current return with short-term risk less than or equal to 40% of the stock market.
Bridgeway Capital Management, Inc. (the “Adviser”) is the investment adviser for all of the Funds.
2. Significant Accounting Policies:
The following summary of significant accounting policies, followed in the preparation of the financial statements of the Funds, are in conformity with accounting principles generally accepted in the United States of America (“GAAP”). Each Fund is considered an investment company under GAAP and follows the accounting and reporting guidance applicable to investment companies.
Securities, Options, Futures and Other Investments Valuation Other than options, securities for which market quotations are readily available are valued at the last sale price on the national exchange on which such securities are primarily traded. In the case of securities reported on the National Association of Securities Dealers Automated Quotation (“NASDAQ”) system, the securities are valued based on the NASDAQ Official Closing Price (“NOCP”). In the absence of recorded sales on their primary exchange, or NOCP, in the case of NASDAQ traded securities, the security will be valued as follows: bid prices for long positions and ask prices for short positions.
Fixed income securities are valued on the basis of current market quotations provided by a pricing service. Options are valued at the close if there is trading volume and, if there is no trading volume, the options are valued at the bid on long positions and the ask on the short positions.
| | |
98 | | Semi-Annual Report | December 31, 2016 (Unaudited) |
| | |
| NOTES TO FINANCIAL STATEMENTS (continued) | | |
December 31, 2016 (Unaudited)
Investments in open-end registered investment companies and closed-end registered investment companies that do not trade on an exchange are valued at the end of day net asset value (“NAV”) per share.
Investments in closed-end registered investment companies that trade on an exchange are valued at the last sales price as of the close of the customary trading session on the exchange where the security is principally traded.
When market quotations are not readily available or when events occur that make established valuation methods unreliable, securities of the Funds may be valued at fair value as determined in good faith by or under the direction of the Board of Directors. The valuation assigned to a fair valued security for purposes of calculating the Funds’ NAVs may differ from the security’s most recent closing market price and from the prices used by other mutual funds to calculate their NAVs.
The inputs and valuation techniques used to determine the value of a Fund’s investments are summarized into three levels as described in the hierarchy below:
| ● | | Level 1 – quoted prices in active markets for identical assets |
Investments whose values are based on quoted market prices in active markets, and whose values are therefore classified as Level 1 prices, include active listed equity securities. The Funds do not adjust the quoted price for such investments, even in situations where the Funds hold a large position and a sale could reasonably impact the quoted price.
| ● | | Level 2 – other significant observable inputs (including quoted prices for similar securities, interest rates, prepayment speeds, credit risk, etc.) |
Investments that trade in markets that are not considered to be active, but whose values are based on quoted market prices, dealer quotations or valuations provided by alternative pricing sources supported by observable inputs, are classified as Level 2 prices. These generally include certain U.S. Government and sovereign obligations, most government agency securities, investment-grade corporate bonds and less liquid listed equity securities. As investments whose values are classified as Level 2 prices include positions that are not traded in active markets and/or are subject to transfer restrictions, valuations may be adjusted to reflect illiquidity and/or non-transferability, which are generally based on available market information.
The Fidelity Institutional Government Portfolio, which is held by each Fund, invests primarily in securities that are valued at amortized cost. Therefore, this investment is classified as a Level 2 investment.
| ● | | Level 3 – significant unobservable inputs (including the Fund’s own assumptions in determining the fair value of investments) |
Investments whose values are classified as Level 3 prices have significant unobservable inputs, as they may trade infrequently or not at all. When observable prices are not available for these securities, the Funds use one or more valuation techniques for which sufficient and reliable data is available. The inputs used by the Funds in estimating the value of Level 3 prices may include the original transaction price, quoted prices for similar securities or assets in active markets, completed or pending third-party transactions in the underlying investment or comparable issuers, and changes in financial ratios or cash flows. Level 3 prices may also be adjusted to reflect illiquidity and/or non-transferability, with the amount of such discount estimated by the Funds in the absence of market information. Assumptions used by the Funds due to the lack of observable inputs may significantly impact the resulting value and therefore the results of the Funds’ operations.
The inputs or methodology used for valuing investments are not necessarily an indication of the risk associated with investing in those investments. A summary of the inputs used to value the Funds’ investments as of December 31, 2016 is included with each Fund’s Schedule of Investments.
The Funds’ policy is to recognize transfers into, and transfers out of, each level of hierarchy as of the beginning of the reporting period. For the period ended December 31, 2016, there were no transfers between Level 1 and Level 2 in any of
the Funds. Details regarding transfers into, and transfers out of, Level 3, if any, can be found at the end of each Schedule of Investments for Funds that held Level 3 securities.
| | |
| NOTES TO FINANCIAL STATEMENTS (continued) | | |
December 31, 2016 (Unaudited)
Securities Lending Upon lending its securities to third parties, each Fund receives compensation in the form of fees. The loans are secured by collateral at least equal to the fair value of the securities loaned plus accrued interest. Each Fund has the right under the lending agreement to recover the securities from the borrower on demand. Additionally, a Fund does not have the right to sell or re-pledge collateral received in the form of securities unless the borrower goes into default. The risks to a Fund of securities lending are that the borrower may not provide additional collateral when required or return the securities when due, resulting in a loss. Under the terms of the Securities Lending Agreement, the Funds are indemnified for such losses by the securities lending agent.
While securities are on loan, the Fund continues to receive dividends on the securities loaned and recognizes any gain or loss in the fair value of the securities loaned.
Securities lending transactions are entered into by a Fund under a Securities Lending Agreement which provides the right, in the event of default (including bankruptcy or insolvency) for the non-defaulting party to liquidate the collateral or to offset the market value of the collateral received against the market value of the securities loaned. The value of the collateral is typically greater than that of the market value of the securities loaned, leaving the lender with a net amount payable to the defaulting party. However, bankruptcy or insolvency laws of a particular jurisdiction may impose restrictions on or prohibitions against such a right of offset in the event of a counterparty’s bankruptcy or insolvency.
The market value of securities on loan, all of which are classified as common stocks in the Funds’ Schedules of Investments, and the value of the related collateral are shown in the Statements of Assets and Liabilities as a component of Investments at value.
The following table is a summary of the Funds’ securities loaned and related collateral, which are subject to a netting agreement as of December 31, 2016:
| | | | | | | | | | | | | | | | | | | | | | |
| | | | | | | | | | | | Gross Amount Not
Offset in the Statement
of Assets and Liabilities | | | | |
| Fund | | Gross
Amounts of
Recognized
Assets1 | | | Gross Amounts
Offset in the
Statement of
Assets and
Liabilities | | | Net Amounts of
Assets Presented
in the Statement
of Assets and
Liabilities | | | Financial
Instruments | | Cash
Collateral
Received2 | | | Net
Amount | |
| |
| | | | | | |
Aggressive Investors 1 | | | | | | | | | | | | | | | | | | | | | | |
Securities lending | | | $27,900,287 | | | | - | | | | $27,900,287 | | | - | | | $27,900,287 | | | | - | |
| | | | | | |
Ultra-Small Company | | | | | | | | | | | | | | | | | | | | | | |
Securities lending | | | $16,703,529 | | | | - | | | | $16,703,529 | | | - | | | $16,703,529 | | | | - | |
| | | | | | |
Ultra-Small Company Market | | | | | | | | | | | | | | | | | | | | | | |
Securities lending | | | $45,214,621 | | | | - | | | | $45,214,621 | | | - | | | $45,214,621 | | | | - | |
| | | | | | |
Small-Cap Momentum | | | | | | | | | | | | | | | | | | | | | | |
Securities lending | | | $ 480,555 | | | | - | | | | $ 480,555 | | | - | | | $ 480,555 | | | | - | |
| | | | | | |
Small-Cap Growth | | | | | | | | | | | | | | | | | | | | | | |
Securities lending | | | $ 4,992,599 | | | | - | | | | $ 4,992,599 | | | - | | | $ 4,992,599 | | | | - | |
| | | | | | |
Small-Cap Value | | | | | | | | | | | | | | | | | | | | | | |
Securities lending | | | $ 11,477,566 | | | | - | | | | $ 11,477,566 | | | - | | | $ 11,477,566 | | | | - | |
| | | | | | |
Managed Volatility | | | | | | | | | | | | | | | | | | | | | | |
Securities lending | | | $ 254,884 | | | | - | | | | $ 254,884 | | | - | | | $ 254,884 | | | | - | |
| 1 | Securities loaned with a value of $5,475 and $603,374 in Ultra-Small Company Market and Small-Cap Value, respectively, have been sold and are pending settlement on January 1, 2017. |
| 2 | Collateral with a value of $29,051,455, $17,380,539, $47,353,300, $500,858, $5,201,693, $11,893,527, and $259,360 has been received in connection with securities lending of Aggressive Investors 1, Ultra-Small Company, Ultra-Small Company Market, Small-Cap Momentum, Small-Cap |
| | |
100 | | Semi-Annual Report | December 31, 2016 (Unaudited) |
| | |
| NOTES TO FINANCIAL STATEMENTS (continued) | | |
December 31, 2016 (Unaudited)
| | Growth, Small-Cap Value, and Managed Volatility Funds, respectively. Excess of collateral received from an individual counterparty is not shown here for financial reporting purposes. |
It is each Fund’s policy to obtain additional collateral from, or return excess collateral to, the borrower by the end of the next business day following the valuation date of the securities loaned. Therefore, the value of the collateral held may be temporarily less than that required under the lending contract. As of December 31, 2016 the collateral consisted of an institutional Government money market fund.
Use of Estimates in Financial Statements In preparing financial statements in conformity with GAAP, management makes estimates and assumptions that affect the reported amounts of assets and liabilities on the date of the financial statements and the disclosure of contingent assets and liabilities on the date of the financial statements, as well as the reported amounts of revenue and expenses during the reporting period. Actual results could differ from those estimates.
Risks and Uncertainties The Funds provide for various investment options, including stocks, bonds and call and put options. Such investments are exposed to various risks, such as interest rate, market and credit risks. Due to the risks involved, it is at least reasonably possible that changes in risks in the near term would materially affect shareholders’ account values and the amounts reported in the financial statements.
Security Transactions, Investment Income and Expenses Security transactions are accounted for as of the trade date, the date the order to buy or sell is executed. Realized gains and losses are computed on the identified cost basis. Dividend income is recorded on the ex-dividend date, and interest income is recorded on the accrual basis from settlement date. Particularly related to the Managed Volatility Fund, discounts and premiums are accreted/amortized on the effective interest method.
Fund expenses that are not series-specific are allocated to each series based upon its relative proportion of net assets to the Funds’ total net assets or other appropriate basis.
Distributions to Shareholders The Funds pay dividends from net investment income and distribute realized capital gains annually, usually in December.
Derivatives
The Funds’ use of derivatives for the period ended December 31, 2016 was limited to futures contracts, purchased options, and written options. The following is a summary of how these derivatives are treated in the financial statements and their impact on the Funds, categorized by primary underlying risk.
| | | | | | | | | | | | | | |
Primary Underlying Risk/Fund | | Derivative Assets | | | | | | Derivative Liabilities | | | Location on Statement of Assets and Liabilities |
|
Equity Risk | | | | | | | | | | | | | | |
Managed Volatility: | | | | | | | | | | | | | | |
Written Call Options | | | - | | | | | | | | $655,594 | | | Call options written at value |
Written Put Options | | | - | | | | | | | | 355,465 | | | Put options written at value |
| | |
| NOTES TO FINANCIAL STATEMENTS (continued) | | |
December 31, 2016 (Unaudited)
| | | | | | | | | | |
Primary Underlying Risk/Fund | | Amount of
Realized Gain
(Loss) on Derivatives | | | Amount of
Unrealized Gain
(Loss) on Derivatives | | | Location of Gain (Loss) in the Statement of Operations |
| | | |
Equity Risk | | | | | | | | | | |
Managed Volatility: | | | | | | | | | | |
Written Options | | | $ 1,024,019 | | | | | | | Realized Gain (Loss) on Written Options |
| | | | | | | | | | Change in Unrealized Depreciation |
| | | | | | | $(151,110) | | | (Depreciation) on Written Options |
Futures Contracts | | | $(1,696,183) | | | | $ - | | | Realized Gain (Loss) on Futures Contracts |
The derivative instruments outstanding as of December 31, 2016, as disclosed in the Notes to the Financial Statements, and the amounts of realized and changes in unrealized gains and losses on derivative instruments during the period, as disclosed in the Statements of Operations, serve as indicators of the volume of derivatives activity for the Funds.
Futures Contracts The Funds may purchase or sell financial futures contracts to hedge cash positions, manage market risk, and to dampen volatility in line with investment objectives. A futures contract is an agreement between two parties to buy or sell a financial instrument at a set price on a future date. Upon entering into such a contract, a Fund is required to pledge to the broker an amount of cash or U.S. Government securities equal to the minimum “initial margin” requirements of the exchange on which the futures contract is traded. The contract amount reflects the extent of a Fund’s exposure in these financial instruments. A Fund’s participation in the futures markets involves certain risks, including imperfect correlation between movements in the price of futures contracts and movements in the price of the securities hedged or used for cover. Pursuant to a contract, such Fund agrees to receive from, or pay to, the broker an amount of cash equal to the fluctuation in value of the contract. Such receipts or payments are known as “variation margin” and are recorded by a Fund as unrealized appreciation or depreciation. When a contract is closed, a Fund records a realized gain or loss equal to the difference between the value of the contract at the time it was opened and the value at the time it was closed. With futures, there is minimal counterparty risk to the Funds, since futures are exchange traded and the exchange’s clearinghouse, as counterparty to all exchange traded futures, guarantees the futures against default. As of December 31, 2016, the Funds had no open futures contracts.
Options The Aggressive Investors 1 Fund may buy and sell calls and puts to increase or decrease the Fund’s exposure to stock market risk or for purposes of diversification of risk. The Managed Volatility Fund may buy and sell calls and puts to reduce the Fund’s volatility and provide some cash flow. An option is a contract conveying a right to buy or sell a financial instrument at a specified price during a stipulated period. The premium paid by a Fund for the purchase of a call or a put option is included in such Fund’s Schedule of Investments as an investment and subsequently marked-to-market to reflect the current market value of the option. When a Fund writes a call or a put option, an amount equal to the premium received by such Fund is included in its Statement of Assets and Liabilities as a liability and is subsequently marked-to-market to reflect the current market value of the option written. If an option that a Fund has written either expires on its stipulated expiration date, or if such Fund enters into a closing purchase transaction, that Fund realizes a gain (or a loss if the cost of a closing purchase transaction exceeds the premium received when the option was written) without regard to any unrealized gain or loss on the underlying security, and the liability related to such options is extinguished. If a call option that a Fund has written is assigned, such Fund realizes a gain or loss from the sale of the underlying security, and the proceeds from such sale are increased by the premium originally received. If a put option that a Fund has written is assigned, the amount of the premium originally received reduces the cost of the security that such Fund purchased upon exercise of the option. Buying calls increases a Fund’s exposure to the underlying security to the extent of any premium paid. Buying puts on a stock market index tends to limit a Fund’s exposure to a stock market decline. All options purchased by the Funds were listed on exchanges and considered liquid positions with readily available market quotes.
Covered Call Options and Secured Puts The Aggressive Investors 1 and Managed Volatility Funds may write call options on a covered basis; that is, a Fund will own the underlying security, or a Fund may write secured puts. The principal reason for writing covered calls and secured puts on a security is to attempt to realize income through the receipt of premiums. The option writer has, in return for the premium, given up the opportunity for profit from a substantial price increase in the underlying security so long as the obligation as a writer continues, but has retained the risk of loss should the price of the security
| | |
102 | | Semi-Annual Report | December 31, 2016 (Unaudited) |
| | |
| NOTES TO FINANCIAL STATEMENTS (continued) | | |
December 31, 2016 (Unaudited)
decline. All options were listed on exchanges and considered liquid positions with readily available market quotes. Transactions in options written during the period ended December 31, 2016 are as follows:
| | | | | | | | | | | | | | | | |
| | | Managed Volatility Fund | | Managed Volatility Fund |
| | | Written Call Options | | Written Put Options |
| | | Contracts | | Premiums | | | Contracts | | Premiums | |
| |
| | | | | | | | | | | | | | | | |
Outstanding, June 30, 2016 | | | 2,218 | | | $ | 388,392 | | | | 2,502 | | | $ | 491,574 | |
Positions Opened | | | 5,300 | | | | 725,913 | | | | 5,056 | | | | 902,014 | |
Exercised | | | (1,627) | | | | (245,174) | | | | (1,860) | | | | (299,302) | |
Splits | | | - | | | | - | | | | - | | | | - | |
Expired | | | (2,482) | | | | (367,841) | | | | (2,835) | | | | (589,816) | |
Closed | | | (808) | | | | (122,480) | | | | (260) | | | | (58,830) | |
| |
Outstanding, December 31, 2016 | | | 2,601 | | | $ | 378,810 | | | | 2,603 | | | $ | 445,640 | |
| |
Market Value, December 31, 2016 | | | | | | $ | (655,594) | | | | | | | $ | (355,465) | |
| |
The Aggressive Investors 1 Fund had no transactions in written options during the period ended December 31, 2016.
Indemnification Under the Company’s organizational documents, the Funds’ officers, directors, employees and agents are indemnified against certain liabilities that may arise out of the performance of their duties to the Funds. Additionally, in the normal course of business, the Funds enter into contracts that contain a variety of indemnification clauses. The Funds’ maximum exposure under these arrangements is unknown, as this would involve future claims that may be made against the Funds that have not yet occurred. However, the Funds have not had prior claims or losses pursuant to these contracts.
3. Advisory Fees, Other Related Party Transactions and Contingencies:
The Funds have entered into management agreements with the Adviser. As compensation for the advisory services rendered, facilities furnished, and expenses borne by the Adviser, the Funds pay the Adviser a fee pursuant to each Fund’s management agreement, as described below.
Aggressive Investors 1: A total advisory fee is paid by the Fund to the Adviser that is comprised of a Base Fee and a Performance Adjustment. The Base Fee equals the Base Fee Rate times the average daily net assets of the Fund. The Base Fee Rate is based on the following annual rates: 0.90% of the first $250 million of the Fund’s average daily net assets, 0.875% of the next $250 million, 0.85% of the next $500 million and 0.80% of any excess over $1 billion.
The Performance Adjustment equals 4.67% times the difference in cumulative total return between the Fund and the Standard and Poor’s 500 Composite Stock Price Index with dividends reinvested (hereinafter “Index”) over a rolling five-year performance period. The Performance Adjustment Rate varies from a minimum of -0.70% to a maximum of +0.70%. However, the Performance Adjustment Rate is zero if the difference between the cumulative Fund performance and the Index performance is less than or equal to 2%.
Ultra-Small Company: The Fund pays advisory fees based on the following annual rates: 0.90% of the first $250 million of the Fund’s average daily net assets, 0.875% of the next $250 million and 0.85% of any excess over $500 million. The management fees are computed daily and are payable monthly. However, during any period when the Fund’s net assets range from $27,500,000 to $55,000,000, the advisory fee will be determined as if the Fund had $55,000,000 under management. This is limited to a maximum annualized expense ratio of 1.49% of average net assets.
Ultra-Small Company Market: The Fund’s advisory fee is a flat 0.50% of the value of the Fund’s average daily net assets, computed daily and payable monthly.
Small-Cap Momentum: The Fund’s advisory fee is a flat 0.55% of the value of the Fund’s average daily net assets, computed daily and payable monthly.
| | |
| NOTES TO FINANCIAL STATEMENTS (continued) | | |
December 31, 2016 (Unaudited)
Small-Cap Growth and Small-Cap Value: A total advisory fee is paid by each Fund to the Adviser that is comprised of a Base Fee and a Performance Adjustment. The Base Fee equals the Base Fee Rate times the average daily net assets of the Fund. The Base Fee Rate is based on the annual rate of 0.60% of the value of each Fund’s average daily net assets.
The Performance Adjustment equals 0.33% times the difference in cumulative total return between the Fund and the Russell 2000 Growth Index for Small-Cap Growth Fund and the Russell 2000 Value Index for Small-Cap Value Fund, with dividends reinvested (hereinafter “Index”) over a rolling five-year performance period. The Performance Adjustment Rate varies from a minimum of -0.05% to a maximum of +0.05%. However, the Performance Adjustment Rate is zero if the difference between the cumulative Fund’s performance and the Index performance is less than or equal to 2%.
Blue Chip 35 Index: The Fund’s advisory fee is a flat 0.08% of the value of the Fund’s average daily net assets, computed daily and payable monthly.
Managed Volatility: The Fund’s advisory fee is a flat 0.60% of the value of the Fund’s average daily net assets, computed daily and payable monthly.
Expense limitations: The Adviser has agreed to reimburse the Funds for operating expenses and management fees above the expense limitations shown in the table below, which are shown as a ratio of net expenses to average net assets, for each Fund, for the year ended December 31, 2016. Any material change to the expense limitation would require a vote by shareholders of the applicable Fund.
| | | | | | | | |
| Bridgeway Fund | | Expense
Limitation | | | Total Waivers and
Reimbursements
for Year Ending
12/31/16 | |
| |
| | | | | | | | |
Aggressive Investors 1 | | | 1.75% | | | | $ - | |
Ultra-Small Company | | | 1.85% | | | | - | |
Ultra-Small Company Market | | | 0.75% | | | | 6,119 | |
Small-Cap Momentum* | | | 0.90% | | | | 67,849 | |
Small-Cap Growth | | | 0.94% | | | | 47,437 | |
Small-Cap Value | | | 0.94% | | | | 17,607 | |
Blue Chip 35 Index | | | 0.15% | | | | 299,868 | |
Managed Volatility | | | 0.94% | | | | 38,695 | |
| | | | | | | | |
* The Fund is authorized to reimburse the Adviser for management fees previously waived and/or for expenses previously paid by the Adviser, provided, however, that any reimbursements must be paid at a date not more than three years after the Adviser waived the fees or reimbursed the expenses and the reimbursements do not cause the Fund to exceed the expense limitation in effect at the time of the waiver or the current expense limitation if different. The Fund has recoupable expenses of $56,624, $128,110, $131,006 and $67,849 which expire June 30, 2017, June 30, 2018, June 30, 2019, and December 31, 2019 respectively. | |
| | |
| 104 | | Semi-Annual Report | December 31, 2016 (Unaudited) |
| | |
| NOTES TO FINANCIAL STATEMENTS (continued) | | |
December 31, 2016 (Unaudited)
Other Related Party Transactions: The Funds will engage in inter-portfolio trades when it is to the benefit of both parties. The Board of Directors reviews and approves these trades quarterly. Inter-portfolio purchases and sales during the period ended December 31, 2016 were as follows:
| | | | | | | | |
| Bridgeway Fund | | Inter-Portfolio
Purchases | | | Inter-Portfolio
Sales | |
| |
| | | | | | | | |
Aggressive Investors 1 | | | $ 447,590 | | | | $ 918,540 | |
Ultra-Small Company | | | 45,351 | | | | 2,334,181 | |
Ultra-Small Company Market | | | 4,958,804 | | | | 5,822,965 | |
Small-Cap Momentum | | | 1,568 | | | | - | |
Small-Cap Growth | | | - | | | | 12,217,177 | |
Small-Cap Value | | | 492,852 | | | | 749,707 | |
The Adviser entered into an Administrative Services Agreement with Bridgeway, pursuant to which the Adviser provides various administrative services to the Funds including, but not limited to: (i) supervising and managing various aspects of the Funds’ business and affairs; (ii) selecting, overseeing and/or coordinating activities with other service providers to the Funds; (iii) providing reports to the Board of Directors as requested from time to time; (iv) assisting and/or reviewing amendments and updates to the Funds’ registration statement and other filings with the Securities and Exchange Commission (“SEC”); (v) providing certain shareholder services; (vi) providing administrative support in connection with meetings of the Board of Directors; and (vii) providing certain record-keeping services. For its services to all of the Bridgeway Funds, the Adviser is paid an aggregate annual fee of $665,000, payable in equal monthly installments.
Board of Directors Compensation Independent Directors are paid an annual retainer of $15,000, with an additional retainer of $5,000 paid to the Independent Chairman of the Board and an additional retainer of $1,000 paid to the Nominating and Corporate Governance Committee Chair. The retainer is paid in quarterly installments. Effective November 11, 2016, Independent Directors are paid $8,500 per meeting for meeting fees. Prior to November 11, 2016, Independent Directors were paid $7,500 per meeting. Such compensation is the total compensation from all Funds and is allocated among the Funds.
The Independent Directors each receive this compensation in the form of shares of the Bridgeway Funds, credited to his or her account. Such Directors are reimbursed for any expenses incurred in attending meetings and conferences, as well as expenses for subscriptions or printed materials. The amount of directors’ fees attributable to each Fund is disclosed in the Statements of Operations.
One director of Bridgeway, John Montgomery, is an owner and director of the Adviser. Under the 1940 Act definitions, he is considered to be an “affiliated person” of the Adviser and an “interested person” of the Adviser and of Bridgeway. Compensation for Mr. Montgomery is borne by the Adviser rather than the Funds.
4. Distribution and Shareholder Servicing Fees:
Foreside Fund Services, LLC acts as distributor of the Funds’ shares, pursuant to a Distribution Agreement dated November 12, 2010. The Adviser pays all costs and expenses associated with distribution of the Funds’ shares, pursuant to a protective plan adopted by shareholders pursuant to Rule 12b-1.
| | |
| NOTES TO FINANCIAL STATEMENTS (continued) | | |
December 31, 2016 (Unaudited)
5. Purchases and Sales of Investment Securities:
Purchases and sales of investments, other than short-term securities, for each Fund for the period ended December 31, 2016 were as follows:
| | | | | | | | | | | | | | | | |
| | | Purchases | | | Sales | |
| Bridgeway Fund | | U.S. Government | | | Other | | | U.S. Government | | | Other | |
| |
| | | | | | | | | | | | | | | | |
Aggressive Investors 1 | | | $ - | | | | $123,964,034 | | | | $ - | | | | $141,653,184 | |
Ultra-Small Company | | | - | | | | 23,522,203 | | | | - | | | | 31,123,350 | |
Ultra-Small Company Market | | | - | | | | 37,824,815 | | | | - | | | | 82,401,172 | |
Small-Cap Momentum | | | - | | | | 4,908,619 | | | | - | | | | 4,835,979 | |
Small-Cap Growth | | | - | | | | 25,339,865 | | | | - | | | | 26,109,635 | |
Small-Cap Value | | | - | | | | 20,244,617 | | | | - | | | | 23,758,276 | |
Blue Chip 35 Index | | | - | | | | 26,934,247 | | | | - | | | | 67,461,553 | |
Managed Volatility | | | - | | | | 5,429,449 | | | | - | | | | 13,920,634 | |
6. Federal Income Taxes
It is the Funds’ policy to continue to comply with the provisions of the Internal Revenue Code of 1986, as amended, applicable to regulated investment companies, and to distribute income to the extent necessary so that the Funds are not subject to federal income tax. Therefore, no federal income tax provision is required.
Unrealized Appreciation and Depreciation on Investments (Tax Basis) The amount of net unrealized appreciation/ depreciation and the cost of investment securities for tax purposes, including short-term securities as of December 31, 2016, were as follows:
| | | | | | | | | | | | | | | |
| | | Aggressive Investors 1 | | Ultra-Small
Company | | Ultra-Small
Company Market |
Gross appreciation (excess of value over tax cost) | | | | $ 40,812,958 | | | | | $ 25,827,529 | | | | | $121,738,251 | |
Gross depreciation (excess of tax cost over value) | | | | (7,523,051 | ) | | | | (9,480,243 | ) | | | | (33,700,149 | ) |
Net unrealized appreciation (depreciation) | | | | $ 33,289,907 | | | | | $ 16,347,286 | | | | | $ 88,038,102 | |
Cost of investments for income tax purposes | | | | $218,595,608 | | | | | $109,825,250 | | | | | $315,576,783 | |
| | | | | | | | | | | | | | | |
| | | |
| | | Small-Cap Momentum | | Small-Cap Growth | | Small-Cap Value |
Gross appreciation (excess of value over tax cost) | | | | $ 446,487 | | | | | $ 6,297,979 | | | | | $13,602,972 | |
Gross depreciation (excess of tax cost over value) | | | | (110,350 | ) | | | | (1,226,208 | ) | | | | (2,624,504 | ) |
Net unrealized appreciation (depreciation) | | | | $ 336,137 | | | | | $ 5,071,771 | | | | | $10,978,468 | |
Cost of investments for income tax purposes | | | | $4,899,582 | | | | | $40,110,356 | | | | | $67,110,258 | |
| | | | | | | | | | |
| | |
| | | Blue Chip 35 Index | | Managed Volatility |
Gross appreciation (excess of value over tax cost) | | | | $233,016,948 | | | | | $ 7,531,709 | |
Gross depreciation (excess of tax cost over value) | | | | (4,396,468 | ) | | | | (794,749 | ) |
Net unrealized appreciation (depreciation) | | | | $228,620,480 | | | | | $ 6,736,960 | |
Cost of investments for income tax purposes | | | | $348,517,927 | | | | | $40,980,948 | |
The differences between book and tax net unrealized appreciation (depreciation) are primarily due to wash sale and straddle loss deferrals and basis adjustments on investments in business development companies, partnerships and passive foreign investment companies (PFICs).
Classifications of Distributions Net investment income (loss) and net realized gain (loss) may differ for financial statement and tax purposes. The character of distributions made during the year from net investment income or net realized gains may differ from its ultimate characterization for federal income tax purposes.
| | |
| 106 | | Semi-Annual Report | December 31, 2016 (Unaudited) |
| | |
| NOTES TO FINANCIAL STATEMENTS (continued) | | |
December 31, 2016 (Unaudited)
The tax character of the distributions paid by the Funds during the last two fiscal years ended June 30, 2016 and June 30, 2015 respectively, are as follows:
| | | | | | | | | | | | | | | | |
| | | Aggressive Investors 1 | | | Ultra-Small Company | |
| |
| | | Year | | | Year | | | Year | | | Year | |
| | | Ended | | | Ended | | | Ended | | | Ended | |
| | | June 30, 2016 | | | June 30, 2015 | | | June 30, 2016 | | | June 30, 2015 | |
| |
Distributions paid from: | | | | | | | | | | | | | | | | |
Ordinary Income | | | $99,024 | | | | $540,861 | | | | $1,116,218 | | | | $ 1,052,434 | |
Long-Term Capital Gain | | | - | | | | - | | | | - | | | | 27,750,353 | |
| |
Total | | | $99,024 | | | | $540,861 | | | | $1,116,218 | | | | $28,802,787 | |
| |
| | | Ultra-Small Company Market | | | Small-Cap Momentum | |
| |
| | | Year | | | Year | | | Year | | | Year | |
| | | Ended | | | Ended | | | Ended | | | Ended | |
| | | June 30, 2016 | | | June 30, 2015 | | | June 30, 2016 | | | June 30, 2015 | |
| |
Distributions paid from: | | | | | | | | | | | | | | | | |
Ordinary Income | | | $ 3,152,924 | | | | $ 2,780,087 | | | | $ 9,441 | | | | $ 282,147 | |
Long-Term Capital Gain | | | 37,504,226 | | | | 38,343,165 | | | | 115,289 | | | | 188,250 | |
| |
Total | | | $40,657,150 | | | | $41,123,252 | | | | $ 124,730 | | | | $ 470,397 | |
| |
| | | Small-Cap Growth | | | Small-Cap Value | |
| |
| | | Year | | | Year | | | Year | | | Year | |
| | | Ended | | | Ended | | | Ended | | | Ended | |
| | | June 30, 2016 | | | June 30, 2015 | | | June 30, 2016 | | | June 30, 2015 | |
| |
Distributions paid from: | | | | | | | | | | | | | | | | |
Ordinary Income | | | $ - | | | | $ 21,907 | | | | $1,200,493 | | | | $ 581,377 | |
| |
Total | | | $ - | | | | $ 21,907 | | | | $1,200,493 | | | | $ 581,377 | |
| |
| | | Blue Chip 35 Index | | | Managed Volatility | |
| |
| | | Year | | | Year | | | Year | | | Year | |
| | | Ended | | | Ended | | | Ended | | | Ended | |
| | | June 30, 2016 | | | June 30, 2015 | | | June 30, 2016 | | | June 30, 2015 | |
| |
Distributions paid from: | | | | | | | | | | | | | | | | |
Ordinary Income | | | $14,480,684 | | | | $11,713,217 | | | | $ 15,844 | | | | $ 59,691 | |
| |
Total | | | $14,480,684 | | | | $11,713,217 | | | | $ 15,844 | | | | $ 59,691 | |
| |
As of June 30, 2016, the Funds had available for tax purposes expiring capital loss carryovers as follows:
| | | | | | |
| | | | | Aggressive Investors 1 | | Ultra-Small Company |
|
Expiring | | 6/30/2017 | | $80,187,088 | | $1,203,654 |
| | 6/30/2018 | | 16,094,317 | | - |
| | | |
| | | | | Small-Cap Growth | | Small-Cap Value |
|
Expiring | | 6/30/2018 | | $10,814,526 | | 20,917,186 |
| | |
| NOTES TO FINANCIAL STATEMENTS (continued) | | |
December 31, 2016 (Unaudited)
| | | | | | |
| | | | | Blue Chip 35 Index | | Managed Volatility |
|
Expiring | | 6/30/2018 | | $ - | | $2,770,129 |
| | 6/30/2019 | | 2,100,878 | | - |
For Aggressive Investors 1 and Ultra-Small Company Funds, capital losses related to prior year reorganizations are subject to limitations under Internal Revenue Code Section 381-384. For Aggressive Investors 1 and Ultra-Small Company Funds, capital losses of $16,094,317 and $1,203,654, respectively, are subject to limitation.
Under the Regulated Investment Company Modernization Act of 2010, capital losses incurred by these Funds after June 30, 2011 will not be subject to expiration and will retain their character as either short-term or long-term capital losses. In addition, such losses must be utilized prior to the losses incurred in the years preceding enactment.
As of December 31, 2016, the following Funds had capital loss carryovers available to offset future realized capital gains which are not subject to expiration:
| | | | | | | | | | | | |
| | | Short-term | | | Long-Term | | | Total | |
| |
Ultra-Small Company | | | 7,859,925 | | | | - | | | | 7,859,925 | |
Small-Cap Value | | | 1,209,727 | | | | 938,977 | | | | 2,148,704 | |
Small-Cap Momentum | | | 10,440 | | | | - | | | | 10,440 | |
There are no capital loss carryovers for Ultra-Small Company Market Fund as of June 30, 2016.
Capital loss carryovers utilized during the period ended June 30, 2016 were as follows:
| | | | |
| | | Capital Loss | |
| Bridgeway Fund | | Carryover Utilized | |
| | | | |
Aggressive Investors 1 | | | $3,485,837 | |
Small-Cap Growth | | | 2,295,891 | |
Blue Chip 35 Index | | | 14,423,859 | |
Managed Volatility | | | 1,388,431 | |
Components of Accumulated Earnings (Deficit) As of June 30, 2016, the components of accumulated earnings (deficit) on a tax basis were:
| | | | | | | | | | | | |
| | | | | | | | | Ultra-Small | |
| | | Aggressive Investors 1 | | | Ultra-Small Company | | | Company Market | |
| |
Accumulated Net Investment Income | | | $ 1,255,289 | | | | $ 1,212,205 | | | | $ - | |
Accumulated Net Realized Gain (Loss) on Investments* | | | (101,426,962) | | | | (9,063,579) | | | | 16,118,023 | |
Net Unrealized Appreciation of Investments | | | 12,520,698 | | | | 3,585,799 | | | | 40,021,884 | |
| |
Total | | | $ (87,650,975) | | | | $(4,265,575) | | | | $56,139,907 | |
| |
| | | Small-Cap Momentum | | | Small-Cap Growth | | | Small-Cap Value | |
| |
Accumulated Net Investment Income | | | $ 25,346 | | | | $ 128,428 | | | | $ 602,805 | |
Accumulated Net Realized (Loss) on Investments* | | | (10,440) | | | | (12,574,855) | | | | (23,065,889) | |
Net Unrealized Appreciation of Investments | | | 256,257 | | | | 3,585,904 | | | | 26,973 | |
| |
Total | | | $ 271,163 | | | | $ (8,860,523) | | | | $(22,436,111) | |
| |
| | |
108 | | Semi-Annual Report | December 31, 2016 (Unaudited) |
| | |
| NOTES TO FINANCIAL STATEMENTS (continued) | | |
December 31, 2016 (Unaudited)
| | | | | | | | |
| | | Blue Chip 35 Index | | | Managed Volatility | |
| |
Accumulated Net Investment Income | | $ | 6,660,578 | | | $ | 171,214 | |
Accumulated Net Realized (Loss) on Investments* | | | (4,645,350) | | | | (3,574,092) | |
Net Unrealized Appreciation of Investments | | | 197,667,761 | | | | 6,813,543 | |
| |
Total | | $ | 199,682,989 | | | $ | 3,410,665 | |
| |
| * | Includes qualified late-year losses that the Funds have elected to defer to the beginning of their next fiscal year ending June 30, 2017. The Aggressive Investors I, Small-Cap Growth, and Blue Chip 35 Index Funds have elected to defer qualified short-term late-year losses of ($5,145,557), ($1,760,329), and ($2,544,472), respectively. Managed Volatility Fund has elected to defer qualified long-term late-year losses of ($803,963). The Ultra-Small Company, Ultra-Small Company Market, Small-Cap Momentum, and Small-Cap Value Funds have no deferred qualified late-year losses. |
For the fiscal year June 30, 2016, the Funds recorded the following reclassifications to the accounts listed below:
| | | | | | | | | | | | |
| | | Increase (Decrease) | |
| |
| | | Aggressive Investors 1 | | | Ultra-Small Company | | | Ultra-Small Company Market | |
| |
Paid-in-Capital | | | $ - | | | | $ 1 | | | | $ 1,348,569 | |
Undistributed Net Investment Income | | | - | | | | 538,991 | | | | (16,093) | |
Accumulated Net Realized Gain (Loss) on Investments | | | - | | | | (538,992) | | | | (1,332,476) | |
| |
| | | |
| | | Small-Cap Momentum | | | Small-Cap Growth | | | Small-Cap Value | |
| |
Paid-in-Capital | | | $1,568 | | | | $ - | | | | $ - | |
Undistributed Net Investment Income | | | (2,542) | | | | (1,438) | | | | (15,262) | |
Accumulated Net Realized Gain (Loss) on Investments | | | 974 | | | | 1,438 | | | | 15,262 | |
| |
| | | |
| | | Blue Chip 35 Index | | | Managed Volatility | | | | |
| | | | | |
Paid-in-Capital | | | $ - | | | | $ - | | | | | |
Undistributed Net Investment Income | | | - | | | | (3,571) | | | | | |
Accumulated Net Realized Gain (Loss) on Investments | | | - | | | | 3,571 | | | | | |
| | | | | |
The difference between book and tax components of net assets and the resulting reclassifications were primarily a result of the differing book/tax treatment of the deduction of equalization debits for tax purposes, redesignation of dividends paid and investments in real estate investment trusts, business development companies, partnerships and passive foreign investment companies (PFICs).
Accounting for Uncertainty in Income Taxes sets forth a minimum threshold for financial statement recognition of the benefit of a tax position taken or expected to be taken in a tax return. Management has analyzed each Fund’s tax positions and has concluded that no provision for income tax is required in each Fund’s financial statements. The Funds are not aware of any tax position for which it is reasonably possible that the total amounts of unrecognized tax benefits will significantly change in the next twelve months. Each Fund’s federal tax returns for the prior three fiscal years remain subject to examination by the Internal Revenue Service.
7. Line of Credit
Bridgeway established a line of credit agreement (“Facility”) with The Bank of New York Mellon, effective November 5, 2010. The Facility is for temporary or emergency purposes, such as to provide liquidity for shareholder redemptions, and is cancel-lable by either party. Unless cancelled earlier, the Facility shall be held available until September 14, 2017. Advances under the Facility are limited to $15,000,000 in total for all Funds, and advances to each Fund shall not exceed certain limits set forth in the credit agreement, including, but not limited to, the maximum amount a Fund is permitted to borrow under the 1940 Act.
The Funds incur a commitment fee of 0.085% per annum on the unused portion of the Facility and interest expense to the extent of amounts borrowed under the Facility. Interest is based on the “Overnight Rate” plus 1.25%. The Overnight Rate means the higher of (a) the Federal Funds rate, (b) the Overnight Eurodollar Rate, or (c) the One-Month Eurodollar Rate. The commitment fees are payable quarterly in arrears and are allocated to all participating Funds. Interest expense is charged directly to a Fund based upon actual amounts borrowed by such Fund.
| | |
| NOTES TO FINANCIAL STATEMENTS (continued) | | |
December 31, 2016 (Unaudited)
For the period ended December 31, 2016, borrowings by the Funds under this line of credit were as follows:
| | | | | | | | | | | | | | | | | | |
| Bridgeway Fund | | Weighted
Average
Interest Rate | | Weighted
Average
Loan Balance | | | Number of
Days
Outstanding | | | Interest
Expense
Incurred1 | | | Maximum Amount
Borrowed During
the Period | |
| | | | | | | | | | | | | | | | | | |
Aggressive Investors 1 | | 1.77% | | $ | 925,029 | | | | 70 | | | $ | 3,142 | | | $ | 2,472,000 | |
Ultra-Small Company | | 1.76% | | | 567,273 | | | | 22 | | | | 602 | | | | 1,313,000 | |
Ultra-Small Company Market | | 1.88% | | | 1,419,487 | | | | 113 | | | | 8,255 | | | | 7,789,000 | |
Small-Cap Growth | | 1.76% | | | 587,700 | | | | 10 | | | | 284 | | | | 1,056,000 | |
Small-Cap Value | | 1.78% | | | 309,227 | | | | 22 | | | | 331 | | | | 469,000 | |
Blue Chip 35 Index | | 1.79% | | | 1,365,638 | | | | 47 | | | | 3,145 | | | | 6,353,000 | |
Managed Volatility | | 1.91% | | | 1,226,333 | | | | 18 | | | | 1,156 | | | | 2,201,000 | |
Small Cap Momentum | | 0.00% | | | - | | | | - | | | | - | | | | - | |
1Interest expense is included on the Statements of Operations in Miscellaneous expenses. | | | | | |
On December 31, 2016, Aggressive Investors 1, Ultra-Small Company Market and Small-Cap Growth had loans outstanding in the amounts of $343,000, $338,000 and $253,000, respectively, exclusive of interest payable on the loans.
8. Redemption Fees
In Ultra-Small Company Market and Small-Cap Momentum Funds, a 2% redemption fee may be charged on shares held less than six months. The fee is charged for the benefit of the remaining shareholders and will be paid to the appropriate Fund to help offset transaction costs. The fee is accounted for as an addition to paid-in capital.
9. Subsequent Events
Management has evaluated the impact of all subsequent events on the Funds and has determined that there were no subsequent events requiring recognition or disclosure in the financial statements.
| | |
| 110 | | Semi-Annual Report | December 31, 2016 (Unaudited) |
| | |
| OTHER INFORMATION | | |
December 31, 2016 (Unaudited)
1. Proxy Voting
Fund policies and procedures used in determining how to vote proxies relating to the Funds’ securities and a summary of proxies voted by the Funds for the period ended June 30, 2016 are available without a charge, upon request, by contacting Bridgeway Funds at 1-800-661-3550 and on the SEC’s website at http://www.sec.gov.
2. Fund Holdings
The complete schedules of the Funds’ holdings for the second and fourth quarters of each fiscal year are contained in the Funds’ Semi-Annual and Annual Shareholder Reports, respectively.
The Bridgeway Funds file complete schedules of the Funds’ holdings with the SEC for the first and third quarters of each fiscal year on Form N-Q within 60 days after the end of the period. Copies of the Funds’ Form N-Q are available without charge, upon request, by contacting Bridgeway Funds at 1-800-661-3550 and on the SEC’s website at http://www.sec.gov. You may also review and copy Form N-Q at the SEC’s Public Reference Room in Washington, D.C. For more information about the operation of the Public Reference Room, please call 1-800-SEC-0330.
| | |
| DISCLOSURE OF FUND EXPENSES | | |
December 31, 2016 (Unaudited)
As a shareholder of a Fund, you will incur no transaction costs from such Fund, including sales charges (loads) on purchases, on reinvested dividends or on other distributions. There are no exchange fees. Shareholders are subject to redemption fees on the Ultra-Small Company Market and Small-Cap Momentum Funds under certain circumstances. However, as a shareholder of a Fund, you will incur ongoing costs, including management fees and other Fund expenses. The following examples are intended to help you understand your ongoing costs (in dollars) of investing in a Fund and to compare these costs with ongoing costs of investing in other mutual funds. The examples are based on an investment of $1,000 invested on January 1, 2016 and held until December 31, 2016.
Actual Expenses. The first line of the table below provides information about actual account values and actual expenses. You may use the information in this line, together with the amount you invested, to estimate the expenses that you paid over the period. Simply divide your account value by $1,000 (for example, an $8,600 account value divided by $1,000 = 8.6), then multiply the result by the number in the first line under the heading “Expenses Paid During Period” to estimate the expenses you paid on your account during the period.
Hypothetical Example for Comparison Purposes. The second line of the table below provides information about hypothetical account values and hypothetical expenses based on the Fund’s actual expense ratio and an assumed rate of return of 5% per year before expenses, which is not the Fund’s actual return. The hypothetical account values and expenses may not be used to estimate the actual ending account balance or expenses you paid for the period. You may use this information to compare the ongoing costs of investing in a Fund and other mutual funds. To do so, compare this 5% hypothetical example with the 5% hypothetical examples that appear in the shareholder reports of other funds.
The expenses shown in the table are meant to highlight ongoing Fund costs only. Therefore, the second line of the table is useful in comparing ongoing costs only and will not help you determine the relative total costs of owning different funds, because other funds may also have transaction costs, such as sales charges, redemption fees or exchange fees.
| | | | | | | | | | | | | | | | |
| | | Beginning Account
Value at 7/1/16 | | | Ending Account
Value at 12/31/16 | | | Expense
Ratio | | | Expenses Paid
During Period*
7/1/16 - 12/31/16 | |
| | | | |
Bridgeway Aggressive Investors 1 Fund | | | | | | | | | | | | | | | | |
| | | | |
Actual Fund Return | | | $1,000.00 | | | | $1,168.10 | | | | 1.72% | | | | $9.40 | |
Hypothetical Fund Return | | | $1,000.00 | | | | $1,016.53 | | | | 1.72% | | | | $8.74 | |
| | | | |
Bridgeway Ultra-Small Company Fund | | | | | | | | | | | | | | | | |
| | | | |
Actual Fund Return | | | $1,000.00 | | | | $1,155.60 | | | | 1.17% | | | | $6.36 | |
Hypothetical Fund Return | | | $1,000.00 | | | | $1,019.31 | | | | 1.17% | | | | $5.96 | |
| | | | |
Bridgeway Ultra-Small Company Market Fund | | | | | | | | | | | | | | | | |
| | | | |
Actual Fund Return | | | $1,000.00 | | | | $1,227.00 | | | | 0.75% | | | | $4.21 | |
Hypothetical Fund Return | | | $1,000.00 | | | | $1,021.42 | | | | 0.75% | | | | $3.82 | |
| | | | |
Bridgeway Small-Cap Momentum Fund | | | | | | | | | | | | | | | | |
| | | | |
Actual Fund Return | | | $1,000.00 | | | | $1,115.60 | | | | 0.90% | | | | $4.80 | |
Hypothetical Fund Return | | | $1,000.00 | | | | $1,020.67 | | | | 0.90% | | | | $4.58 | |
| | | | |
Bridgeway Small-Cap Growth Fund | | | | | | | | | | | | | | | | |
| | | | |
Actual Fund Return | | | $1,000.00 | | | | $1,143.30 | | | | 0.94% | | | | $5.08 | |
Hypothetical Fund Return | | | $1,000.00 | | | | $1,020.47 | | | | 0.94% | | | | $4.79 | |
| | | | |
Bridgeway Small-Cap Value Fund | | | | | | | | | | | | | | | | |
| | | | |
Actual Fund Return | | | $1,000.00 | | | | $1,209.00 | | | | 0.94% | | | | $5.23 | |
Hypothetical Fund Return | | | $1,000.00 | | | | $1,020.47 | | | | 0.94% | | | | $4.79 | |
| | |
112 | | Semi-Annual Report December 31, 2016 (Unaudited) |
| | |
| DISCLOSURE OF FUND EXPENSES (continued) | | |
December 31, 2016 (Unaudited)
| | | | | | | | | | | | | | | | |
| | | Beginning Account
Value at 7/1/16 | | | Ending Account
Value at 12/31/16 | | | Expense
Ratio | | | Expenses Paid
During Period*
7/1/16 - 12/31/16 | |
| | | | |
Bridgeway Blue Chip 35 Index Fund | | | | | | | | | | | | | | | | |
| | | | |
Actual Fund Return | | | $1,000.00 | | | | $1,077.40 | | | | 0.15% | | | | $0.79 | |
Hypothetical Fund Return | | | $1,000.00 | | | | $1,024.45 | | | | 0.15% | | | | $0.77 | |
| | | | |
Bridgeway Managed Volatility | | | | | | | | | | | | | | | | |
| | | | |
Actual Fund Return | | | $1,000.00 | | | | $1,011.90 | | | | 0.94% | | | | $4.77 | |
Hypothetical Fund Return | | | $1,000.00 | | | | $1,020.47 | | | | 0.94% | | | | $4.79 | |
| * | Expenses are equal to the average account value times the Fund’s annualized expense ratio multiplied by the number of days in the most recent six-month period (184) divided by the number of days in the fiscal year (365). |
BRIDGEWAY FUNDS, INC.
BNY Mellon Investment Servicing (US) Inc.
P.O. Box 9860
Providence, RI 02940-8060
CUSTODIAN
The Bank of New York Mellon
One Wall Street
New York, NY 10286
DISTRIBUTOR
Foreside Fund Services, LLC
Three Canal Plaza, Suite 100
Portland, ME 04101
| | | | |
| | You can review and copy information about our Funds (including the SAIs) at the SEC’s Public Reference Room in Washington, D.C. To find out more about this public service, call the SEC at 800-SEC-0330. Reports and other information about the Funds are also available on the SEC’s website at www.sec.gov. You can receive copies of this information, for a fee, by writing the Public Reference Section, Securities and Exchange Commission, Washington, D.C. 20549-1520 or by sending an electronic request to the following email address: publicinfo@sec.gov. | | |
.

A no-load mutual fund family of domestic funds
| | | | |
| | Semi-Annual Report | | |
| | December 31, 2016 (Unaudited) | | |
| | OMNI SMALL-CAP VALUE | | BOSVX |
| | OMNI TAX-MANAGED SMALL-CAP VALUE | | BOTSX |
| | www.bridgeway.com | | |
| | |
TABLE OF CONTENTS | |  |
Bridgeway Funds Standardized Returns as of December 31, 2016 (Unaudited)
| | | | | | | | | | | | | | | | |
| | | | | | | Annualized | | | | | | |
| Fund | | Quarter | | Six Months | | 1 Year | | 5 Years | | Inception
to Date | | Inception
Date | | Gross
Expense
Ratio2 | | Net
Expense
Ratio2 |
|
Omni Small-Cap Value | | 17.66% | | 29.37% | | 34.51% | | 16.61% | | 16.32% | | 8/31/2011 | | 0.71%1 | | 0.61%1 |
Omni Tax-Managed Small-Cap Value | | 17.35% | | 29.13% | | 34.60% | | 16.35% | | 12.41% | | 12/31/2010 | | 0.72%1 | | 0.60%1 |
| | 1 | Some of the Fund’s fees were waived or expenses reimbursed; otherwise, returns would have been lower. The Adviser has contractually agreed to waive fees and/or reimburse expenses. Any material change to this Fund policy would require a vote by shareholders. |
| | 2 | Expense ratios are as stated in the current prospectus. Please see financial highlights for expense ratios as of December 31, 2016. |
Performance figures quoted represent past performance and are no guarantee of future results. Current performance may be lower or higher than the performance data quoted. Investment return and principal value will fluctuate, so that an investor’s shares, when redeemed, may be worth more or less than original cost. To obtain performance current to the most recent month-end, please visit our website at www.bridgeway.com or call 1-800-661-3550. Total return figures include the reinvestment of dividends and capital gains.
This report is submitted for the general information of the shareholders of each Fund. It is not authorized for distribution to prospective investors unless preceded or accompanied by an effective prospectus, which includes information regarding a Fund’s risks, objectives, fees and expenses, experience of its management, and other information. Investors should read the prospectus carefully before investing in a Fund. For questions or other Fund information, call 1-800-661-3550 or visit the Funds’ website at www.bridgeway.com. Funds are available for purchase by residents of the United States, Puerto Rico, U.S. Virgin Islands and Guam only. Foreside Fund Services, LLC, Distributor.
The views expressed here are exclusively those of Fund management. These views, including those relating to the market, sectors or individual stocks are not meant as investment advice and should not be considered predictive in nature.
| | |
LETTER FROM THE INVESTMENT MANAGEMENT TEAM | | |
December 31, 2016
Dear Fellow Shareholders,
At Bridgeway, we have a shared passion for applying logic, data and evidence to develop investment solutions. The construction of our Omni Small-Cap Value and Omni Tax-Managed Small-Cap Value Funds is based on fundamental academic research that relies on market efficiency to better capture risk premiums. We manage these Funds to provide broad diversification within the small-cap value universe and to keep transaction fees and expenses low. Bridgeway offers the Omni Small-Cap Value and Omni Tax-Managed Small-Cap Value Funds through a select group of advisers. We are committed to advisers and their clients who take a long-term perspective and whose investment goals fit our unique expertise: delivering investment solutions that are statistically driven and grounded in academic theory.
Thank you for your investment in Bridgeway’s Omni Small-Cap Value and Omni Tax-Managed Small-Cap Value Funds.
Sincerely,
Your Investment Management Team
| | | | |
 | |  | | 
|
| John Montgomery | | Christine L. Wang | | Michael Whipple |
 | | | | |
Elena Khoziaeva | | | | |
| | |
LETTER FROM THE INVESTMENT MANAGEMENT TEAM (continued) | | |
Market Review
Performance across domestic equity markets was positive for the December 2016 quarter. Broad market returns for the quarter were up 4.21% as represented by the Russell 3000 Index.
For the calendar year ended December 31, 2016, broad market stocks were up 12.74%, as represented by the Russell 3000 Index. Returns among value stocks outperformed growth stocks across the market cap spectrum. Small-cap value stocks lead the way, up 31.74%, followed by mid-cap value stocks, up 20.00%.
The following table presents returns for broad market, small-cap, mid-cap, and large-cap stocks, as represented by various style-based Russell Indexes. Size (market capitalization) and style (value/growth) are among the key factors that drive differences in returns among U.S. stocks.
Russell Style-Based Indexes Ranked by Performance for the Quarter and Calendar Year Ended December 31, 2016
| | | | |
| | Quarter | | Calendar Year |
| Best | | 14.07% | | 31.74% |
| Performing | | Russell 2000 Value Index | | Russell 2000 Value Index |
| | 7.24% | | 20.00% |
| | Russell 3000 Value Index | | Russell Midcap Value Index |
| | 6.68% | | 18.40% |
| | Russell 1000 Value Index | | Russell 3000 Value Index |
| | 5.52% | | 17.34% |
| | Russell Midcap Value Index | | Russell 1000 Value Index |
| | 3.57% | | 11.32% |
| | Russell 2000 Growth Index | | Russell 2000 Growth Index |
| | 1.20% | | 7.39% |
| | Russell 3000 Growth Index | | Russell 3000 Growth Index |
| | 1.01% | | 7.33% |
| | Russell 1000 Growth Index | | Russell Midcap Growth Index |
| Worst | | 0.46% | | 7.08% |
Performing | | Russell Midcap Growth Index | | Russell 1000 Growth Index |
The Bridgeway Omni Funds in this annual report are asset class exposure strategies that seek broad diversification and risk premium exposure. These Funds were designed to capture the size and style benefits within a specific asset class.
| | |
| 2 | | Semi-Annual Report | December 31, 2016 (Unaudited) |
| | |
Omni Small-Cap Value Fund MANAGER’S COMMENTARY (Unaudited) | |
|
December 31, 2016
Dear Fellow Omni Small-Cap Value Fund Shareholder,
For the quarter ended December 31, 2016, our Fund returned 17.66%, outperforming our primary market benchmark, the Russell 2000 Value Index (+14.07%). It was a good quarter.
For the six-month semi-annual period ended December 31, 2016, our Fund returned 29.37%, outpacing the Russell 2000 Value Index (+24.19%).
For the calendar year, our Fund returned 34.51%, outperforming the Russell 2000 Value Index (+31.74%).
The table below presents our December quarter, six-month, one-year, five-year and inception-to-date financial results. See the next page for a graph of performance since inception.
Standardized Returns as of December 31, 2016
| | | | | | | | | | | | | | | | | | | | |
| | | | | | | | | | | | Annualized | |
| | | Quarter | | | 6 Months | | | 1 Year | | | 5 Year | | | Since Inception
(8/31/11) | |
| |
| | | | | |
Omni Small-Cap Value Fund | | | 17.66 | % | | | 29.37 | % | | | 34.51 | % | | | 16.61 | % | | | 16.32 | % |
Russell 2000 Value Index | | | 14.07 | % | | | 24.19 | % | | | 31.74 | % | | | 15.07 | % | | | 14.76 | % |
Performance figures quoted in the table above and the graph on the next page represent past performance and are no guarantee of future results. Total return figures in the table above include the reinvestment of dividends and capital gains. The table above and the graph on the next page do not reflect the deduction of taxes that a shareholder would pay on Fund distributions or on the redemption of Fund shares.
The Russell 2000 Value Index is an unmanaged index that consists of stocks in the Russell 2000 Index with lower price-to-book ratios and lower forecasted growth values with dividends reinvested. It is not possible to invest directly in an index. Periods longer than one year are annualized.
According to data from Lipper as of December 31, 2016, Omni Small-Cap Value Fund ranked 13th of 314 small-cap value funds for the 12 months ended December 31, 2016, 17th of 238 over the past five years and 14th of 234 such funds since inception in August 2011. Lipper, a Thomson Reuters company, is an independent mutual fund rating service that ranks funds in various fund categories by making comparative calculations using total returns.
| | |
Omni Small-Cap Value Fund MANAGER’S COMMENTARY (Unaudited) (continued) | | |
Omni Small-Cap Value Fund vs. Russell 2000 Value Index
from Inception 8/31/11 to 12/31/16
Detailed Explanation of Quarterly Performance
The Omni Small-Cap Value Fund is designed to capture the returns of the small-cap value asset class through broad diversification of small company and value stocks. This approach is sometimes referred to as “passive, asset class investing.” As of December 31, 2016, we held 667 such stocks in a market-cap weighted style. We make no attempt to track any particular index in either performance or statistics.
The Fund’s focus on smaller stocks within the small-cap universe helped relative performance during the quarter, as smaller stocks posted some of the highest returns. The Fund’s design of tilting towards deeper value stocks by multiple measures also boosted relative performance, as these stocks had strong relative returns during the quarter. Exposure to higher momentum stocks detracted slightly from relative performance because the momentum factor was out of favor.
By design, the Fund does not hold Utilities stocks or Real Estate Investment Trusts (REITs). This positioning boosted relative returns, as these assets underperformed during the quarter. Holdings in the Industrials and Consumer Staples sectors also boosted relative performance. However, an overweight position in the Consumer Discretionary sector detracted from relative results, as did holdings in the Materials sector.
Detailed Explanation of Calendar Year Performance
The Fund’s focus on smaller stocks within the small-cap universe helped relative performance in 2016, as smaller stocks posted some of the highest returns for the year. The Fund’s design of tilting toward deeper value stocks by multiple measures also boosted relative performance as these stocks had strong relative returns during the year, with price-to-book particularly effective. However, exposure to higher momentum stocks detracted from relative performance, as momentum stocks were out of favor for the year.
The Fund’s lack of holdings in the Utilities sector and of Real Estate Investment Trusts (REITs) boosted relative returns, as these assets underperformed during the year. Holdings in the Consumer Staples and Information Technology sectors also contributed positively to relative performance, while an overweight position in the Consumer Discretionary sector and holdings in the Materials sector detracted from relative results.
| | |
| 4 | | Semi-Annual Report | December 31, 2016 (Unaudited) |
| | |
Omni Small-Cap Value Fund MANAGER’S COMMENTARY (Unaudited) (continued) | | |
Top Ten Holdings as of December 31, 2016
| | | | | | | | | |
| Rank | | Description | | Industry | | % of Net
Assets |
| 1 | | Central Garden & Pet Co. | | Household Products | | 1.1% |
| 2 | | TTM Technologies, Inc. | | Electronic Equipment, Instruments & Components | | 1.0% |
| 3 | | Stepan Co. | | Chemicals | | 1.0% |
| 4 | | Clayton Williams Energy, Inc. | | Oil, Gas & Consumable Fuels | | 0.9% |
| 5 | | Navigant Consulting, Inc. | | Professional Services | | 0.9% |
| 6 | | SpartanNash Co. | | Food & Staples Retailing | | 0.8% |
| 7 | | Rush Enterprises, Inc. | | Trading Companies & Distributors | | 0.8% |
| 8 | | SkyWest, Inc. | | Airlines | | 0.8% |
| 9 | | Cooper-Standard Holdings, Inc. | | Auto Components | | 0.8% |
| 10 | | Sanmina Corp | | Electronic Equipment, Instruments & Components | | 0.7% |
| | Total | | | | 8.8% |
Industry Sector Representation as of December 31, 2016
| | | | | | | | | | | | | | | |
| | | % of Net Assets | | % of Russell 2000
Value Index | | Difference |
| Consumer Discretionary | | | | 14.0% | | | | | 10.0% | | | | | 4.0% | |
| Consumer Staples | | | | 4.0% | | | | | 2.8% | | | | | 1.1% | |
| Energy | | | | 9.7% | | | | | 5.9% | | | | | 3.9% | |
| Financials | | | | 33.5% | | | | | 32.4% | | | | | 1.1% | |
| Health Care | | | | 2.2% | | | | | 4.3% | | | | | -2.1% | |
| Industrials | | | | 18.2% | | | | | 12.6% | | | | | 5.6% | |
| Information Technology | | | | 10.5% | | | | | 10.4% | | | | | 0.1% | |
| Materials | | | | 6.2% | | | | | 4.6% | | | | | 1.6% | |
| Real Estate | | | | 0.3% | | | | | 10.1% | | | | | -9.9% | |
| Telecommunication Services | | | | 1.3% | | | | | 0.7% | | | | | 0.6% | |
| Utilities | | | | 0.0% | | | | | 6.0% | | | | | -6.0% | |
| Cash & Other Assets | | | | 0.1% | | | | | 0.0% | | | | | 0.1% | |
Total | | | | 100.0% | | | | | 100.0% | | | | | | |
Disclaimer
The views expressed here are exclusively those of Fund management. These views, including those related to market sectors or individual stocks, are not meant as investment advice and should not be considered predictive in nature. Any favorable (or unfavorable) description of a holding applies only as of the quarter end, December 31, 2016, unless otherwise stated. Security positions can and do change thereafter. Discussions of historical performance do not guarantee and may not be indicative of future performance.
Market volatility can significantly impact short-term performance. The Fund is not an appropriate investment for short-term investors. Investments in small companies generally carry greater risk than is customarily associated with larger companies. This additional risk is attributable to a number of factors, including the relatively limited financial resources that are typically available to small companies and the fact that small companies often have comparatively limited product lines. In addition, the stock of small companies tends to be more volatile than the stock of large companies, particularly in the short term and particularly in the early stages of an economic or market downturn. Shareholders of the Fund, therefore, are taking on more risk than they would if they invested in the stock market as a whole.
| | |
Omni Small-Cap Value Fund MANAGER’S COMMENTARY (Unaudited) (continued) | | |
Conclusion
Thank you for your continued investment in Omni Small-Cap Value Fund. We encourage your feedback; your reactions and concerns are important to us.
Sincerely,
The Investment Management Team
| | |
| 6 | | Semi-Annual Report | December 31, 2016 (Unaudited) |
| | |
Omni Small-Cap Value Fund SCHEDULE OF INVESTMENTS | | |
Showing percentage of net assets as of December 31, 2016 (Unaudited)
| | | | | | | | | | | | |
| Industry | | Company | | Shares | | | Value | | | |
| |
COMMON STOCKS - 99.94% | | | | |
Aerospace & Defense - 1.13% | | | | |
| | AAR Corp. | | | 92,600 | | | $3,060,430 | | | | |
| | Arotech Corp.* | | | 94,300 | | | 330,050 | | | | |
| | CPI Aerostructures, Inc.*+ | | | 4,700 | | | 43,475 | | | | |
| | Cubic Corp. | | | 24,500 | | | 1,174,775 | | | | |
| | DigitalGlobe, Inc.* | | | 29,800 | | | 853,770 | | | | |
| | Ducommun, Inc.* | | | 43,300 | | | 1,106,748 | | | | |
| | Kratos Defense & Security Solutions, Inc.*+ | | | 25,000 | | | 185,000 | | | | |
| | LMI Aerospace, Inc.* | | | 52,600 | | | 453,412 | | | | |
| | National Presto Industries, Inc.+ | | | 5,020 | | | 534,128 | | | | |
| | Sypris Solutions, Inc.* | | | 6,400 | | | 5,631 | | | | |
| | Vectrus, Inc.* | | | 5,000 | | | 119,250 | | | | |
| | | | | | | | | | | | |
| | | | | | | | 7,866,669 | | | | |
| |
Air Freight & Logistics - 1.36% | | | | |
| | Air T, Inc.*+ | | | 2,800 | | | 64,120 | | | | |
| | Air Transport Services Group, Inc.* | | | 291,924 | | | 4,659,107 | | | | |
| | Atlas Air Worldwide Holdings, Inc.* | | | 57,700 | | | 3,009,055 | | | | |
| | Wesco Aircraft Holdings, Inc.* | | | 113,800 | | | 1,701,310 | | | | |
| | | | | | | | | | | | |
| | | | | | | | 9,433,592 | | | | |
| |
Airlines - 1.03% | | | | |
| | Hawaiian Holdings, Inc.* | | | 30,634 | | | 1,746,138 | | | | |
| | SkyWest, Inc. | | | 148,791 | | | 5,423,432 | | | | |
| | | | | | | | | | | | |
| | | | | | | | 7,169,570 | | | | |
| |
Auto Components - 1.92% | | | | |
| | American Axle & Manufacturing Holdings, Inc.*+ | | | 15,000 | | | 289,500 | | | | |
| | China Automotive Systems, Inc.* | | | 28,200 | | | 151,152 | | | | |
| | China XD Plastics Co., Ltd.*+ | | | 163,000 | | | 652,000 | | | | |
| | Commercial Vehicle Group, Inc.* | | | 57,300 | | | 316,869 | | | | |
| | Cooper-Standard Holding, Inc.* | | | 51,000 | | | 5,272,380 | | | | |
| | Modine Manufacturing Co.* | | | 142,900 | | | 2,129,210 | | | | |
| | Shiloh Industries, Inc.* | | | 500 | | | 3,455 | | | | |
| | SORL Auto Parts, Inc.*+ | | | 129,900 | | | 394,896 | | | | |
| | Spartan Motors, Inc. | | | 22,000 | | | 203,500 | | | | |
| | Strattec Security Corp. | | | 10,600 | | | 427,180 | | | | |
| | Superior Industries International, Inc.+ | | | 115,400 | | | 3,040,790 | | | | |
| | Titan International, Inc. | | | 25,000 | | | 280,250 | | | | |
| | | | | | | | | | | | |
| | | | | | | | | | | | |
| | | | | | | | |
| Industry | | Company | | Shares | | | Value |
Auto Components (continued) |
| | Tower International, Inc. | | | 5,000 | | | $ 141,750 |
| | Westport Fuel Systems, Inc.* | | | 302 | | | 341 |
| | | | | | | | |
| | | | | | | | 13,303,273 |
|
Biotechnology - 0.20% |
| | AMAG Pharmaceuticals, Inc.*+ | | | 19,000 | | | 661,200 |
| | Applied Genetic Technologies Corp.* | | | 25,000 | | | 233,750 |
| | Enzon Pharmaceuticals, Inc. | | | 60,300 | | | 22,010 |
| | PDL BioPharma, Inc. | | | 25,000 | | | 53,000 |
| | PharmAthene, Inc.* | | | 137,777 | | | 447,775 |
| | | | | | | | |
| | | | | | | | 1,417,735 |
|
Building Products - 1.09% |
| | Alpha Pro Tech, Ltd.* | | | 20,743 | | | 72,601 |
| | Boise Cascade Co.* | | | 16,000 | | | 360,000 |
| | Gibraltar Industries, Inc.* | | | 78,350 | | | 3,263,278 |
| | Griffon Corp. | | | 115,900 | | | 3,036,580 |
| | Quanex Building Products Corp. | | | 35,000 | | | 710,500 |
| | Universal Forest Products, Inc. | | | 1,000 | | | 102,180 |
| | | | | | | | |
| | | | | | | | 7,545,139 |
|
Capital Markets - 1.36% |
| | Arlington Asset Investment Corp., Class A+ | | | 13,700 | | | 203,034 |
| | Calamos Asset Management, Inc., Class A | | | 74,000 | | | 632,700 |
| | Cowen Group, Inc., Class A*+ | | | 82,450 | | | 1,277,975 |
| | FBR & Co.+ | | | 600 | | | 7,800 |
| | GAMCO Investors, Inc., Class A | | | 10,000 | | | 308,900 |
| | Great Elm Capital Group, Inc.* | | | 833 | | | 3,124 |
| | INTL FCStone, Inc.* | | | 15,100 | | | 597,960 |
| | Investment Technology Group, Inc. | | | 57,050 | | | 1,126,167 |
| | JMP Group LLC+ | | | 300 | | | 1,842 |
| | KCG Holdings, Inc., Class A* | | | 159,500 | | | 2,113,375 |
| | Oppenheimer Holdings, Inc., Class A | | | 31,093 | | | 578,330 |
| | Piper Jaffray Cos.* | | | 35,500 | | | 2,573,750 |
| | | | | | | | |
| | | | | | | | 9,424,957 |
| | |
Omni Small-Cap Value Fund SCHEDULE OF INVESTMENTS (continued) | | |
Showing percentage of net assets as of December 31, 2016 (Unaudited)
| | | | | | | | | | | | |
| Industry | | Company | | Shares | | | Value | | | |
| |
Common Stocks (continued) | | | | |
Chemicals - 3.13% | | | | |
| | American Vanguard Corp. | | | 20,000 | | | $ 383,000 | | | | |
| | China Green Agriculture, Inc.* | | | 133,000 | | | 160,930 | | | | |
| | Core Molding Technologies, Inc.* | | | 17,000 | | | 290,870 | | | | |
| | Flexible Solutions International, Inc.* | | | 5,000 | | | 6,800 | | | | |
| | FutureFuel Corp. | | | 72,800 | | | 1,011,920 | | | | |
| | Gulf Resources, Inc.*+ | | | 178,200 | | | 347,490 | | | | |
| | Innophos Holdings, Inc. | | | 10,000 | | | 522,600 | | | | |
| | KMG Chemicals, Inc. | | | 33,200 | | | 1,291,148 | | | | |
| | Kraton Corp.* | | | 142,150 | | | 4,048,432 | | | | |
| | LSB Industries, Inc.*+ | | | 30,000 | | | 252,600 | | | | |
| | Minerals Technologies, Inc. | | | 15,000 | | | 1,158,750 | | | | |
| | Olin Corp.+ | | | 52,500 | | | 1,344,525 | | | | |
| | Rayonier Advanced Materials, Inc. | | | 20,000 | | | 309,200 | | | | |
| | Schulman (A.), Inc. | | | 38,608 | | | 1,291,438 | | | | |
| | Stepan Co. | | | 82,000 | | | 6,681,360 | | | | |
| | Trecora Resources* | | | 7,000 | | | 96,950 | | | | |
| | Tredegar Corp. | | | 76,700 | | | 1,840,800 | | | | |
| | Tronox, Ltd., Class A | | | 65,000 | | | 670,150 | | | | |
| | | | | | | | | | | | |
| | | | | | | | 21,708,963 | | | | |
| |
Commercial Banks - 17.03% | | | | |
| | 1st Constitution Bancorp+ | | | 3,000 | | | 56,100 | | | | |
| | 1st Source Corp. | | | 86,847 | | | 3,878,587 | | | | |
| | Access National Corp.+ | | | 2,700 | | | 74,952 | | | | |
| | ACNB Corp.+ | | | 1,000 | | | 31,250 | | | | |
| | American National Bankshares, Inc.+ | | | 21,800 | | | 758,640 | | | | |
| | American River Bankshares* | | | 21,300 | | | 321,843 | | | | |
| | AmeriServ Financial, Inc. | | | 5,000 | | | 18,500 | | | | |
| | Banco Latinoamericano de Comercio Exterior SA, Class E+ | | | 25,000 | | | 736,000 | | | | |
| | Bank of Commerce Holdings | | | 83,450 | | | 792,775 | | | | |
| | Bankwell Financial Group, Inc.+ | | | 13,300 | | | 432,250 | | | | |
| | Banner Corp. | | | 11,450 | | | 639,025 | | | | |
| | Bar Harbor Bankshares | | | 11,250 | | | 532,463 | | | | |
| | BCB Bancorp, Inc. | | | 10,400 | | | 135,200 | | | | |
| | Blue Hills Bancorp, Inc.+ | | | 15,000 | | | 281,250 | | | | |
| | BNC Bancorp | | | 11,344 | | | 361,874 | | | | |
| | Boston Private Financial Holdings, Inc. | | | 10,000 | | | 165,500 | | | | |
| | BSB Bancorp, Inc.* | | | 31,633 | | | 915,775 | | | | |
| | C&F Financial Corp. | | | 1,200 | | | 59,820 | | | | |
| | Camden National Corp. | | | 14,250 | | | 633,412 | | | | |
| | Capital City Bank Group, Inc. | | | 83,150 | | | 1,702,912 | | | | |
| | | | | | | | |
| Industry | | Company | | Shares | | | Value |
| | | | | | | | |
Commercial Banks (continued) |
| | Cardinal Financial Corp. | | | 25,000 | | | $ 819,750 |
| | Carolina Bank Holdings, Inc.* | | | 500 | | | 12,915 |
| | Cascade Bancorp* | | | 17,726 | | | 143,935 |
| | Central Pacific Financial Corp. | | | 25,000 | | | 785,500 |
| | Central Valley Community Bancorp | | | 50,000 | | | 998,000 |
| | Centrue Financial Corp.* | | | 7,500 | | | 164,400 |
| | Century Bancorp, Inc., Class A | | | 15,200 | | | 912,000 |
| | Chemung Financial Corp.+ | | | 13,500 | | | 490,725 |
| | Civista Bancshares, Inc. | | | 21,500 | | | 417,745 |
| | CNB Financial Corp. | | | 83,800 | | | 2,240,812 |
| | Coastway Bancorp, Inc.*+ | | | 1,513 | | | 23,678 |
| | Codorus Valley Bancorp, Inc.+ | | | 4,398 | | | 125,796 |
| | Community Bankers Trust Corp.* | | | 40,800 | | | 295,800 |
| | Community Financial Corp. (The)+ | | | 12,500 | | | 346,875 |
| | Community Trust Bancorp, Inc. | | | 17,500 | | | 868,000 |
| | ConnectOne Bancorp, Inc.+ | | | 15,000 | | | 389,250 |
| | DNB Financial Corp.+ | | | 465 | | | 13,206 |
| | Eastern Virginia Bankshares, Inc. | | | 28,300 | | | 295,735 |
| | Enterprise Bancorp, Inc.+ | | | 38,775 | | | 1,456,389 |
| | Enterprise Financial Services Corp. | | | 27,700 | | | 1,191,100 |
| | Evans Bancorp, Inc. | | | 4,000 | | | 126,200 |
| | Farmers Capital Bank Corp. | | | 34,400 | | | 1,446,520 |
| | Farmers National Banc Corp. | | | 150 | | | 2,130 |
| | Fidelity Southern Corp. | | | 37,623 | | | 890,536 |
| | Financial Institutions, Inc. | | | 39,300 | | | 1,344,060 |
| | First BanCorp Puerto Rico* | | | 436,500 | | | 2,885,265 |
| | First BanCorp Southern Pines NC+ | | | 114,571 | | | 3,109,457 |
| | First Bancorp, Inc.+ | | | 9,045 | | | 299,390 |
| | First Bancshares, Inc. (The)+ | | | 14,900 | | | 409,750 |
| | First Busey Corp. | | | 22,191 | | | 683,039 |
| | First Business Financial Services, Inc. | | | 16,000 | | | 379,520 |
| | First Commonwealth Financial Corp. | | | 158,300 | | | 2,244,694 |
| | First Community Bancshares, Inc. | | | 44,000 | | | 1,326,160 |
| | First Community Corp. | | | 600 | | | 10,830 |
| | First Connecticut Bancorp, Inc.+ | | | 16,100 | | | 364,665 |
| | |
8 | | Semi-Annual Report | December 31, 2016 (Unaudited) |
| | |
Omni Small-Cap Value Fund SCHEDULE OF INVESTMENTS (continued) | | |
Showing percentage of net assets as of December 31, 2016 (Unaudited)
| | | | | | | | | | |
| Industry | | Company | | Shares | | | Value | | |
|
Common Stocks (continued) |
Commercial Banks (continued) | | |
| | First Financial Corp. | | | 37,000 | | | $ 1,953,600 | | |
| | First Internet Bancorp | | | 1,500 | | | 48,000 | | |
| | First Interstate BancSystem, Inc., Class A+ | | | 80,200 | | | 3,412,510 | | |
| | First Merchants Corp. | | | 54,311 | | | 2,044,809 | | |
| | First Midwest Bancorp, Inc. | | | 129,000 | | | 3,254,670 | | |
| | First of Long Island Corp. (The) | | | 18,000 | | | 513,900 | | |
| | First United Corp.* | | | 5,000 | | | 79,750 | | |
| | First US Bancshares, Inc. | | | 4,000 | | | 44,600 | | |
| | Flushing Financial Corp. | | | 44,297 | | | 1,301,889 | | |
| | Great Southern Bancorp, Inc. | | | 26,900 | | | 1,470,085 | | |
| | Great Western Bancorp, Inc. | | | 20,000 | | | 871,800 | | |
| | Green Bancorp, Inc.* | | | 52,000 | | | 790,400 | | |
| | Heartland Financial USA, Inc. | | | 41,600 | | | 1,996,800 | | |
| | Heritage Financial Corp. | | | 69,860 | | | 1,798,895 | | |
| | Heritage Oaks Bancorp | | | 139,800 | | | 1,723,734 | | |
| | HomeTrust Bancshares, Inc.* | | | 2,961 | | | 76,690 | | |
| | Horizon Bancorp | | | 4,725 | | | 132,300 | | |
| | Independent Bank Corp. | | | 28,625 | | | 621,162 | | |
| | Independent Bank Group, Inc. | | | 16,900 | | | 1,054,560 | | |
| | International Bancshares Corp. | | | 65,687 | | | 2,680,030 | | |
| | Lakeland Bancorp, Inc. | | | 102,050 | | | 1,989,975 | | |
| | Landmark Bancorp, Inc.+ | | | 1,102 | | | 30,889 | | |
| | LegacyTexas Financial Group, Inc. | | | 10,000 | | | 430,600 | | |
| | Mackinac Financial Corp.+ | | | 15,800 | | | 212,826 | | |
| | MainSource Financial Group, Inc. | | | 67,610 | | | 2,325,784 | | |
| | MBT Financial Corp. | | | 60,322 | | | 684,655 | | |
| | Mercantile Bank Corp. | | | 44,100 | | | 1,662,570 | | |
| | Middleburg Financial Corp. | | | 21,400 | | | 743,650 | | |
| | MidSouth Bancorp, Inc.+ | | | 17,000 | | | 231,200 | | |
| | MidWestOne Financial Group, Inc. | | | 24,860 | | | 934,736 | | |
| | MutualFirst Financial, Inc.+ | | | 18,900 | | | 625,590 | | |
| | National Bankshares, Inc.+ | | | 2,500 | | | 108,625 | | |
| | National Commerce Corp.* | | | 5,400 | | | 200,610 | | |
| | NBT Bancorp, Inc. | | | 10,000 | | | 418,800 | | |
| | Nicolet Bankshares, Inc.* | | | 1,355 | | | 64,620 | | |
| | Northrim BanCorp, Inc. | | | 30,445 | | | 962,062 | | |
| | OFG Bancorp | | | 99,200 | | | 1,299,520 | | |
| | Old Line Bancshares, Inc. | | | 50 | | | 1,199 | | |
| | Old Second Bancorp, Inc. | | | 54,750 | | | 604,988 | | |
| | | | | | | | | | |
| | | | | | | | | | |
| | | | | | | | | | |
| Industry | | Company | | Shares | | | Value | |
| | | | | | | | | |
|
Commercial Banks (continued) | |
| | Opus Bank | | | 1,500 | | | $ | 45,075 | |
| | Orrstown Financial Services, Inc.+ | | | 35,500 | | | | 795,200 | |
| | Pacific Continental Corp. | | | 55,500 | | | | 1,212,675 | |
| | Park Sterling Corp. | | | 248,817 | | | | 2,684,735 | |
| | Parke Bancorp, Inc. | | | 330 | | | | 6,650 | |
| | Peapack Gladstone Financial Corp. | | | 6,894 | | | | 212,887 | |
| | Peoples Bancorp of North Carolina, Inc.+ | | | 4,800 | | | | 120,336 | |
| | Peoples Bancorp, Inc. | | | 29,200 | | | | 947,832 | |
| | Preferred Bank | | | 35,700 | | | | 1,871,394 | |
| | Premier Financial Bancorp, Inc.+ | | | 27,720 | | | | 557,172 | |
| | QCR Holdings, Inc. | | | 2,000 | | | | 86,600 | |
| | Renasant Corp. | | | 97,046 | | | | 4,097,282 | |
| | Republic Bancorp, Inc., Class A | | | 26,550 | | | | 1,049,787 | |
| | Republic First Bancorp, Inc.*+ | | | 37,000 | | | | 308,950 | |
| | S&T Bancorp, Inc. | | | 40,045 | | | | 1,563,357 | |
| | Salisbury Bancorp, Inc. | | | 1,183 | | | | 44,362 | |
| | Sandy Spring Bancorp, Inc. | | | 24,000 | | | | 959,760 | |
| | SB Financial Group, Inc. | | | 28,400 | | | | 455,820 | |
| | Shore Bancshares, Inc.+ | | | 67,012 | | | | 1,021,933 | |
| | Sierra Bancorp | | | 77,800 | | | | 2,068,702 | |
| | Southern National Bancorp of Virginia, Inc.+ | | | 30,000 | | | | 490,200 | |
| | Southside Bancshares, Inc. | | | 22,575 | | | | 850,400 | |
| | State Bank Financial Corp. | | | 66,784 | | | | 1,793,818 | |
| | Stonegate Bank | | | 44,100 | | | | 1,840,293 | |
| | Sussex Bancorp+ | | | 15,000 | | | | 313,500 | |
| | TowneBank+ | | | 1,642 | | | | 54,596 | |
| | TriCo Bancshares | | | 600 | | | | 20,508 | |
| | TriState Capital Holdings, Inc.* | | | 61,900 | | | | 1,367,990 | |
| | Triumph Bancorp, Inc.* | | | 20,000 | | | | 523,000 | |
| | Two River Bancorp | | | 28,100 | | | | 419,252 | |
| | Union Bankshares Corp. | | | 60,966 | | | | 2,178,925 | |
| | Univest Corp. of Pennsylvania | | | 92,764 | | | | 2,866,408 | |
| | Veritex Holdings, Inc.* | | | 30,400 | | | | 811,984 | |
| | WesBanco, Inc. | | | 70,273 | | | | 3,025,955 | |
| | Westbury Bancorp, Inc.* | | | 1,000 | | | | 20,700 | |
| | Western New England Bancorp, Inc. | | | 83,393 | | | | 779,725 | |
| | Xenith Bankshares, Inc.* | | | 41,175 | | | | 1,161,135 | |
| | | | | | | | | | |
| | | | | | | | | 118,073,936 | |
| | |
Omni Small-Cap Value Fund SCHEDULE OF INVESTMENTS | | |
Showing percentage of net assets as of December 31, 2016 (Unaudited)
| | | | | | | | | | | | |
| Industry | | Company | | Shares | | | Value | | | |
| |
Common Stocks (continued) | | | | |
Commercial Services & Supplies - 2.85% | | | | |
| | ACCO Brands Corp.* | | | 364,300 | | | $ 4,754,115 | | | | |
| | Acme United Corp. | | | 735 | | | 18,801 | | | | |
| | Appliance Recycling Centers of America, Inc.* | | | 2,900 | | | 3,248 | | | | |
| | Ascent Capital Group, Inc., Class A* | | | 15,000 | | | 243,900 | | | | |
| | Command Security Corp.*+ | | | 26,800 | | | 73,700 | | | | |
| | Ecology & Environment, Inc., Class A+ | | | 3,500 | | | 36,925 | | | | |
| | Ennis, Inc.+ | | | 136,892 | | | 2,375,076 | | | | |
| | Heritage-Crystal Clean, Inc.* | | | 39,854 | | | 625,708 | | | | |
| | Huron Consulting Group, Inc.* | | | 4,000 | | | 202,600 | | | | |
| | James River Group Holdings, Ltd. | | | 70,600 | | | 2,933,430 | | | | |
| | Kelly Services, Inc., Class A | | | 35,500 | | | 813,660 | | | | |
| | Kimball International, Inc., Class B | | | 8,174 | | | 143,535 | | | | |
| | McGrath RentCorp | | | 83,300 | | | 3,264,527 | | | | |
| | PRGX Global, Inc.* | | | 115,739 | | | 682,860 | | | | |
| | Quad/Graphics, Inc. | | | 59,300 | | | 1,593,984 | | | | |
| | RCM Technologies, Inc. | | | 55,200 | | | 351,072 | | | | |
| | RR Donnelley & Sons Co.+ | | | 38,500 | | | 628,320 | | | | |
| | TRC Cos., Inc.* | | | 10,600 | | | 112,360 | | | | |
| | Versar, Inc.* | | | 8,600 | | | 11,868 | | | | |
| | Viad Corp. | | | 17,400 | | | 767,340 | | | | |
| | Willdan Group, Inc.* | | | 3,900 | | | 88,101 | | | | |
| | | | | | | | | | | | |
| | | | | | | | 19,725,130 | | | | |
| |
Communications Equipment - 0.95% | | | | |
| | Bel Fuse, Inc., Class B | | | 18,500 | | | 571,650 | | | | |
| | Black Box Corp. | | | 35,900 | | | 547,475 | | | | |
| | Comtech Telecommunications Corp. | | | 10,000 | | | 118,500 | | | | |
| | DASAN Zhone Solutions, Inc.* | | | 38,100 | | | 37,483 | | | | |
| | Digi International, Inc.* | | | 45,325 | | | 623,219 | | | | |
| | Finisar Corp.* | | | 80,700 | | | 2,442,789 | | | | |
| | Harmonic, Inc.* | | | 700 | | | 3,500 | | | | |
| | Infosonics Corp.* | | | 15,000 | | | 5,848 | | | | |
| | NETGEAR, Inc.* | | | 36,030 | | | 1,958,230 | | | | |
| | PC-Tel, Inc. | | | 56,700 | | | 305,046 | | | | |
| | | | | | | | | | | | |
| | | | | | | | 6,613,740 | | | | |
| |
Computers & Peripherals - 0.04% | | | | |
| | Concurrent Computer Corp. | | | 53,600 | | | 286,760 | | | | |
| |
Construction & Engineering - 2.25% | | | | |
| | Aegion Corp.* | | | 99,341 | | | 2,354,382 | | | | |
| | Goldfield Corp. (The)* | | | 121,000 | | | 617,100 | | | | |
| | Great Lakes Dredge & Dock Corp.* | | | 187,550 | | | 787,710 | | | | |
| | | | | | | | | | | | |
| Industry | | Company | | Shares | | | Value | | | |
| | | | | | | | | | | | |
Common Stocks (continued) | | | | |
Construction & Engineering (continued) | |
| | IES Holdings, Inc.* | | | 2,717 | | | $52,031 | | | | |
| | KB Home+ | | | 175,900 | | | 2,780,979 | | | | |
| | MasTec, Inc.* | | | 103,700 | | | 3,966,525 | | | | |
| | MYR Group, Inc.* | | | 12,100 | | | 455,928 | | | | |
| | Northwest Pipe Co.* | | | 1,000 | | | 17,220 | | | | |
| | Orion Group Holdings, Inc.* | | | 27,592 | | | 274,540 | | | | |
| | Sterling Construction Co., Inc.* | | | 96,400 | | | 815,544 | | | | |
| | TimkenSteel Corp.*+ | | | 30,000 | | | 464,400 | | | | |
| | Tutor Perini Corp.* | | | 107,300 | | | 3,004,400 | | | | |
| | | | | | | | | | | | |
| | | | | | | | 15,590,759 | | | | |
| |
Consumer Finance - 0.82% | | | | |
| | Consumer Portfolio | | | | | | | | | | |
| | Services, Inc.* | | | 97,000 | | | 496,640 | | | | |
| | Encore Capital Group, Inc.* | | | 10,000 | | | 286,500 | | | | |
| | EZCORP, Inc., Class A* | | | 33,900 | | | 361,035 | | | | |
| | Green Dot Corp., Class A* | | | 84,600 | | | 1,992,330 | | | | |
| | Nelnet, Inc., Class A | | | 7,800 | | | 395,850 | | | | |
| | Nicholas Financial, Inc.* | | | 43,400 | | | 516,026 | | | | |
| | Regional Management Corp.* | | | 43,100 | | | 1,132,668 | | | | |
| | World Acceptance Corp.*+ | | | 7,700 | | | 494,956 | | | | |
| | | | | | | | | | | | |
| | | | | | | | 5,676,005 | | | | |
| |
Distributors - 0.20% | | | | |
| | AMCON Distributing Co.+ | | | 1,350 | | | 155,655 | | | | |
| | Essendant, Inc. | | | 27,300 | | | 570,570 | | | | |
| | VOXX International Corp.*+ | | | 67,100 | | | 315,370 | | | | |
| | Weyco Group, Inc. | | | 10,200 | | | 319,260 | | | | |
| | | | | | | | | | | | |
| | | | | | | | 1,360,855 | | | | |
| |
Diversified Consumer Services - 0.68% | | | | |
| | American Public Education, Inc.* | | | 10,000 | | | 245,500 | | | | |
| | DeVry Education Group, Inc.+ | | | 22,900 | | | 714,480 | | | | |
| | K12, Inc.* | | | 66,100 | | | 1,134,276 | | | | |
| | Lincoln Educational Services Corp.* | | | 91,900 | | | 176,448 | | | | |
| | Regis Corp.* | | | 168,150 | | | 2,441,538 | | | | |
| | | | | | | | | | | | |
| | | | | | | | 4,712,242 | | | | |
| |
Diversified Financial Services - 0.50% | | | | |
| | Enova International, Inc.* | | | 15,000 | | | 188,250 | | | | |
| | FNFV Group*+ | | | 10,000 | | | 137,000 | | | | |
| | GAIN Capital Holdings, Inc.+ | | | 139,805 | | | 919,917 | | | | |
| | Marlin Business Services Corp. | | | 10,580 | | | 221,122 | | | | |
| | NewStar Financial, Inc.* | | | 15,000 | | | 138,750 | | | | |
| | |
| 10 | | Semi-Annual Report December 31, 2016 (Unaudited) |
| | |
Omni Small-Cap Value Fund SCHEDULE OF INVESTMENTS (continued) | | |
Showing percentage of net assets as of December 31, 2016 (Unaudited)
| | | | | | | | | | |
| Industry | | Company | | Shares | | | Value | | |
| |
Common Stocks (continued) | | |
Diversified Financial Services (continued) | | |
| | PHH Corp.* | | | 80,050 | | | $ 1,213,558 | | |
| | Summit Financial Group, Inc.+ | | | 22,015 | | | 606,073 | | |
| | Tiptree Financial, Inc., Class A+ | | | 10,000 | | | 61,500 | | |
| | | | | | | | | | |
| | | | | | | | 3,486,170 | | |
| |
Diversified Telecommunication Services - 0.93% |
| | Alaska Communications Systems Group, Inc.* | | | 347,100 | | | 569,244 | | |
| | Hawaiian Telcom Holdco, Inc.* | | | 44,500 | | | 1,102,710 | | |
| | Iridium Communications, Inc.*+ | | | 391,325 | | | 3,756,720 | | |
| | Lumos Networks Corp.* | | | 5,000 | | | 78,100 | | |
| | Windstream Holdings, Inc.+ | | | 125,000 | | | 916,250 | | |
| | | | | | | | | | |
| | | | | | | | 6,423,024 | | |
| |
Electrical Equipment - 0.80% |
| | Broadwind Energy, Inc.* | | | 25,000 | | | 101,125 | | |
| | Encore Wire Corp. | | | 16,500 | | | 715,275 | | |
| | General Cable Corp. | | | 65,000 | | | 1,238,250 | | |
| | Highpower International, Inc.* | | | 25,923 | | | 60,919 | | |
| | II-VI, Inc.* | | | 79,250 | | | 2,349,762 | | |
| | Powell Industries, Inc. | | | 25,000 | | | 975,000 | | |
| | Preformed Line Products Co. | | | 1,000 | | | 58,120 | | |
| | Ultralife Corp.* | | | 7,350 | | | 36,382 | | |
| | | | | | | | | | |
| | | | | | | | 5,534,833 | | |
| |
Electronic Equipment, Instruments & Components - 3.86% |
| | Benchmark Electronics, Inc.* | | | 134,000 | | | 4,087,000 | | |
| | Electro Scientific Industries, Inc.*+ | | | 15,000 | | | 88,800 | | |
| | Fabrinet* | | | 30,050 | | | 1,211,015 | | |
| | Insight Enterprises, Inc.* | | | 64,800 | | | 2,620,512 | | |
| | Iteris, Inc.*+ | | | 87,000 | | | 316,680 | | |
| | Kemet Corp.* | | | 57,500 | | | 381,225 | | |
| | Key Tronic Corp.* | | | 40,600 | | | 317,492 | | |
| | Kimball Electronics, Inc.* | | | 50,400 | | | 917,280 | | |
| | PAR Technology Corp.* | | | 90,200 | | | 503,316 | | |
| | PCM, Inc.* | | | 8,769 | | | 197,302 | | |
| | Sanmina Corp.* | | | 137,600 | | | 5,043,040 | | |
| | ScanSource, Inc.* | | | 16,500 | | | 665,775 | | |
| | SigmaTron International, Inc.* | | | 2,500 | | | 11,825 | | |
| | SMTC Corp.* | | | 7,500 | | | 11,475 | | |
| | TTM Technologies, Inc.*+ | | | 520,153 | | | 7,089,685 | | |
| | Vishay Precision Group, Inc.* | | | 166,448 | | | 3,145,867 | | |
| | | | | | | |
| | | | | | | |
| | | | | | | | | | |
| Industry | | Company | | Shares | | | Value | | |
| | | | | | | | | | |
| Electronic Equipment, Instruments & Components (continued) | | |
| | Wayside Technology Group, Inc. | | | 7,900 | | | $ 147,730 | | |
| | | | | | | | | | |
| | | | | | | | 26,756,019 | | |
|
Energy Equipment & Services - 1.62% |
| | ENGlobal Corp.* | | | 60,422 | | | 144,409 | | |
| | Era Group, Inc.* | | | 45,300 | | | 768,741 | | |
| | Gulf Island Fabrication, Inc. | | | 15,003 | | | 178,536 | | |
| | Helix Energy Solutions Group, Inc.* | | | 10,000 | | | 88,200 | | |
| | Natural Gas Services Group, Inc.* | | | 68,800 | | | 2,211,920 | | |
| | Newpark Resources, Inc.*+ | | | 101,500 | | | 761,250 | | |
| | Parker Drilling Co.* | | | 664,950 | | | 1,728,870 | | |
| | PHI, Inc.* | | | 12,300 | | | 221,646 | | |
| | Pioneer Energy Services Corp.* | | | 198,300 | | | 1,358,355 | | |
| | SEACOR Holdings, Inc.* | | | 45,900 | | | 3,271,752 | | |
| | Unit Corp.* | | | 17,300 | | | 464,851 | | |
| | | | | | | | | | |
| | | | | | | | 11,198,530 | | |
|
Food & Staples Retailing - 1.92% |
| | Andersons, Inc. (The) | | | 88,100 | | | 3,938,070 | | |
| | Ingles Markets, Inc., Class A | | | 49,800 | | | 2,395,380 | | |
| | SpartanNash Co. | | | 145,946 | | | 5,770,705 | | |
| | Village Super Market, Inc., Class A | | | 1,709 | | | 52,808 | | |
| | Weis Markets, Inc. | | | 17,500 | | | 1,169,700 | | |
| | | | | | | | | | |
| | | | | | | | 13,326,663 | | |
|
Food Products - 0.75% |
| | Alico, Inc. | | | 5,800 | | | 157,470 | | |
| | Dean Foods Co. | | | 10,000 | | | 217,800 | | |
| | Omega Protein Corp.* | | | 123,750 | | | 3,099,938 | | |
| | S&W Seed Co.*+ | | | 20,000 | | | 92,000 | | |
| | Seneca Foods Corp., Class A*+ | | | 40,100 | | | 1,606,005 | | |
| | | | | | | | | | |
| | | | | | | | 5,173,213 | | |
|
Health Care Equipment & Supplies - 0.21% |
| | AngioDynamics, Inc.* | | | 14,400 | | | 242,928 | | |
| | Exactech, Inc.* | | | 17,500 | | | 477,750 | | |
| | Halyard Health, Inc.* | | | 17,800 | | | 658,244 | | |
| | Kewaunee Scientific Corp. | | | 3,000 | | | 73,350 | | |
| | | | | | | | | | |
| | | | | | | | 1,452,272 | | |
|
Health Care Providers & Services - 1.67% |
| | Almost Family, Inc.* | | | 600 | | | 26,460 | | |
| | Amedisys, Inc.* | | | 16,100 | | | 686,343 | | |
| | Five Star Quality Care, Inc.* | | | 214,650 | | | 579,555 | | |
| | |
Omni Small-Cap Value Fund SCHEDULE OF INVESTMENTS (continued) | | |
Showing percentage of net assets as of December 31, 2016 (Unaudited)
| | | | | | | | | | |
| Industry | | Company | | Shares | | | Value | | |
| |
Common Stocks (continued) | | |
Health Care Providers & Services (continued) | | |
| | Healthways, Inc.* | | | 10,000 | | | $ 227,500 | | |
| | InfuSystems Holdings, Inc.* | | | 71,100 | | | 181,305 | | |
| | Kindred Healthcare, Inc. | | | 116,350 | | | 913,348 | | |
| | LHC Group, Inc.* | | | 1,000 | | | 45,700 | | |
| | Magellan Health, Inc.* | | | 26,225 | | | 1,973,431 | | |
| | National Healthcare Corp. | | | 13,000 | | | 985,270 | | |
| | Nobilis Health Corp.* | | | 20,000 | | | 42,000 | | |
| | PharMerica Corp.* | | | 36,750 | | | 924,262 | | |
| | Select Medical Holdings Corp.*+ | | | 185,000 | | | 2,451,250 | | |
| | Triple-S Management Corp., Class B* | | | 122,300 | | | 2,531,610 | | |
| | | | | | | | | | |
| | | | | | | | 11,568,034 | | |
| |
Hotels, Restaurants & Leisure - 2.42% | | |
| | Caesars Entertainment Corp.*+ | | | 126,600 | | | 1,076,100 | | |
| | Century Casinos, Inc.* | | | 59,600 | | | 490,508 | | |
| | Del Frisco’s Restaurant Group, Inc.* | | | 39,700 | | | 674,900 | | |
| | Del Taco Restaurants, Inc.* | | | 10,000 | | | 141,200 | | |
| | Eldorado Resorts, Inc.*+ | | | 15,000 | | | 254,250 | | |
| | Flanigan’s Enterprises, Inc. | | | 2,500 | | | 60,875 | | |
| | International Speedway Corp., Class A | | | 76,456 | | | 2,813,581 | | |
| | Intrawest Resorts Holdings, Inc.* | | | 79,300 | | | 1,415,505 | | |
| | Luby’s, Inc.* | | | 181,900 | | | 778,532 | | |
| | Marcus Corp. (The) | | | 130,150 | | | 4,099,725 | | |
| | Monarch Casino & Resort, Inc.* | | | 29,400 | | | 757,932 | | |
| | Nevada Gold & Casinos, Inc.* | | | 10,300 | | | 19,055 | | |
| | Peak Resorts, Inc. | | | 104,000 | | | 577,200 | | |
| | Red Lion Hotels Corp.* | | | 43,905 | | | 366,607 | | |
| | Ruby Tuesday, Inc.* | | | 200,300 | | | 646,969 | | |
| | Speedway Motorsports, Inc. | | | 120,800 | | | 2,617,736 | | |
| | | | | | | | | | |
| | | | | | | | 16,790,675 | | |
| |
Household Durables - 1.20% | | |
| | Bassett Furniture Industries, Inc. | | | 80,500 | | | 2,447,200 | | |
| | CSS Industries, Inc. | | | 53,100 | | | 1,437,417 | | |
| | Flexsteel Industries, Inc. | | | 11,500 | | | 709,205 | | |
| | Hooker Furniture Corp. | | | 15,000 | | | 569,250 | | |
| | Lifetime Brands, Inc. | | | 60,900 | | | 1,080,975 | | |
| | NACCO Industries, Inc., Class A | | | 9,250 | | | 837,588 | | |
| | P&F Industries, Inc., Class A+ | | | 696 | | | 5,756 | | |
| | UCP, Inc., Class A* | | | 18,200 | | | 219,310 | | |
| | | | | | | | | | |
| | | | | | | | | | |
| | | | | | | | | | | | |
| Industry | | Company | | Shares | | | Value | | | |
|
Household Durables (continued) | |
| | ZAGG, Inc.* | | | 145,700 | | | $ 1,034,470 | | | | |
| | | | | | | | | | | | |
| | | | | | | | 8,341,171 | | | | |
| |
Household Products - 1.11% | | | | |
| | Central Garden & Pet Co.,
Class A* | | | 245,003 | | | 7,570,593 | | | | |
| | Oil-Dri Corp. of America | | | 3,000 | | | 114,630 | | | | |
| | | | | | | | | | | | |
| | | | | | | | 7,685,223 | | | | |
| |
Insurance - 9.44% | | | | |
| | 1347 Property Insurance Holdings, Inc.*+ | | | 24,300 | | | 189,540 | | | | |
| | Ambac Financial Group, Inc.* | | | 69,000 | | | 1,552,500 | | | | |
| | American Equity Investment Life Holding Co. | | | 850 | | | 19,159 | | | | |
| | AMERISAFE, Inc. | | | 26,800 | | | 1,670,980 | | | | |
| | Argo Group International Holdings Ltd. | | | 39,160 | | | 2,580,644 | | | | |
| | Baldwin & Lyons, Inc., Class B | | | 75,300 | | | 1,897,560 | | | | |
| | Blue Capital Reinsurance | | | | | | | | | | |
| | Holdings, Ltd.+ | | | 12,173 | | | 224,592 | | | | |
| | Citizens, Inc.* | | | 13,040 | | | 128,053 | | | | |
| | Crawford & Co., Class A+ | | | 11,600 | | | 109,852 | | | | |
| | Donegal Group, Inc., Class A | | | 38,200 | | | 667,736 | | | | |
| | eHealth, Inc.* | | | 15,000 | | | 159,750 | | | | |
| | EMC Insurance Group, Inc. | | | 46,550 | | | 1,396,966 | | | | |
| | Employers Holdings, Inc. | | | 91,300 | | | 3,615,480 | | | | |
| | FBL Financial Group, Inc., Class A+ | | | 50,806 | | | 3,970,489 | | | | |
| | Federated National Holding Co. | | | 37,288 | | | 696,913 | | | | |
| | Fidelity & Guaranty Life+ | | | 40,800 | | | 966,960 | | | | |
| | First Acceptance Corp.* | | | 140,000 | | | 145,600 | | | | |
| | Hallmark Financial Services, Inc.* | | | 57,800 | | | 672,214 | | | | |
| | HCI Group, Inc.+ | | | 40,400 | | | 1,594,992 | | | | |
| | Heritage Insurance Holdings, Inc.+ | | | 35,000 | | | 548,450 | | | | |
| | Horace Mann Educators Corp. | | | 93,600 | | | 4,006,080 | | | | |
| | Independence Holding Co. | | | 15,050 | | | 294,228 | | | | |
| | Infinity Property & Casualty Corp. | | | 20,900 | | | 1,837,110 | | | | |
| | Investors Title Co. | | | 1,000 | | | 158,180 | | | | |
| | Kansas City Life Insurance Co. | | | 7,000 | | | 332,500 | | | | |
| | Kingstone Cos., Inc. | | | 4,300 | | | 59,125 | | | | |
| | Maiden Holdings, Ltd. | | | 219,500 | | | 3,830,275 | | | | |
| | |
12 | | Semi-Annual Report | December 31, 2016 (Unaudited) |
| | |
Omni Small-Cap Value Fund SCHEDULE OF INVESTMENTS (continued) | | |
Showing percentage of net assets as of December 31, 2016 (Unaudited)
| | | | | | | | | | | | |
| Industry | | Company | | Shares | | | Value | | | |
| |
Common Stocks (continued) | | | | |
Insurance (continued) | | | | |
| | MBIA, Inc.* | | | 100,000 | | | $1,070,000 | | | | |
| | National Security Group,
Inc. (The) | | | 200 | | | 3,500 | | | | |
| | National Western Life | | | | | | | | | | |
| | Group, Inc., Class A+ | | | 5,614 | | | 1,744,831 | | | | |
| | Navigators Group, Inc. (The) | | | 37,350 | | | 4,397,962 | | | | |
| | NMI Holdings, Inc., Class A* | | | 250,000 | | | 2,662,500 | | | | |
| | OneBeacon Insurance
Group Ltd., Class A | | | 163,900 | | | 2,630,595 | | | | |
| | Safety Insurance Group, Inc. | | | 24,000 | | | 1,768,800 | | | | |
| | Selective Insurance Group,
Inc. | | | 90,950 | | | 3,915,398 | | | | |
| | State Auto Financial Corp. | | | 55,550 | | | 1,489,296 | | | | |
| | State National Cos, Inc. | | | 25,000 | | | 346,500 | | | | |
| | Stewart Information Services Corp. | | | 87,150 | | | 4,015,872 | | | | |
| | Third Point Reinsurance
Ltd.*+ | | | 70,000 | | | 808,500 | | | | |
| | United Fire Group, Inc. | | | 78,800 | | | 3,874,596 | | | | |
| | United Insurance Holdings Corp. | | | 60,000 | | | 908,400 | | | | |
| | Universal Insurance
Holdings, Inc.+ | | | 86,316 | | | 2,451,374 | | | | |
| | | | | | | | | | | | |
| | | | | | | | 65,414,052 | | | | |
| |
Internet & Catalog Retail - 0.11% | | | | |
| | CafePress, Inc.* | | | 43,400 | | | 127,596 | | | | |
| | FTD Cos., Inc.*+ | | | 25,380 | | | 605,059 | | | | |
| | | | | | | | | | | | |
| | | | | | | | 732,655 | | | | |
| |
Internet Software & Services - 0.37% | | | | |
| | Autobytel, Inc.* | | | 500 | | | 6,725 | | | | |
| | Blucora, Inc.* | | | 67,197 | | | 991,156 | | | | |
| | Liquidity Services, Inc.* | | | 43,550 | | | 424,612 | | | | |
| | Marchex, Inc., Class B* | | | 70,000 | | | 185,500 | | | | |
| | MeetMe, Inc.*+ | | | 35,100 | | | 173,043 | | | | |
| | RetailMeNot, Inc.*+ | | | 15,000 | | | 139,500 | | | | |
| | Sohu.com, Inc.* | | | 10,000 | | | 338,900 | | | | |
| | Synacor, Inc.* | | | 64,000 | | | 198,400 | | | | |
| | YuMe, Inc.*+ | | | 35,700 | | | 127,806 | | | | |
| | | | | | | | | | | | |
| | | | | | | | 2,585,642 | | | | |
| |
IT Services - 1.80% | | | | |
| | CIBER, Inc.* | | | 350 | | | 221 | | | | |
| | Computer Task Group, Inc. | | | 4,400 | | | 18,524 | | | | |
| | Edgewater Technology, Inc.* | | | 51,100 | | | 383,250 | | | | |
| | Engility Holdings, Inc.* | | | 56,700 | | | 1,910,790 | | | | |
| | Everi Holdings, Inc.* | | | 60,000 | | | 130,200 | | | | |
| | ManTech International Corp.,
Class A | | | 108,800 | | | 4,596,800 | | | | |
| | ModusLink Global Solutions,
Inc.* | | | 152,200 | | | 222,212 | | | | |
| | | | | | | | |
| Industry | | Company | | Shares | | | Value |
| | | | | | | | |
IT Services (continued) |
| | NCI, Inc., Class A | | | 62,804 | | | $ 876,116 |
| | NeuStar, Inc., Class A*+ | | | 64,881 | | | 2,167,025 |
| | Sykes Enterprises, Inc.* | | | 75,134 | | | 2,168,367 |
| | | | | | | | |
| | | | | | | | 12,473,505 |
|
Leisure Equipment & Products - 0.22% |
| | JAKKS Pacific, Inc.*+ | | | 40,600 | | | 209,090 |
| | Johnson Outdoors, Inc.,
Class A | | | 32,779 | | | 1,300,999 |
| | | | | | | | |
| | | | | | | | 1,510,089 |
|
Machinery - 2.04% |
| | American Railcar Industries,
Inc.+ | | | 26,900 | | | 1,218,301 |
| | Ampco-Pittsburgh Corp. | | | 24,047 | | | 402,787 |
| | Babcock & Wilcox
Enterprises, Inc.* | | | 35,000 | | | 580,650 |
| | Briggs & Stratton Corp. | | | 114,300 | | | 2,544,318 |
| | Chart Industries, Inc.* | | | 52,800 | | | 1,901,856 |
| | Chicago Rivet & Machine
Co.+ | | | 1,000 | | | 41,600 |
| | Cleantech Solutions
International, Inc.* | | | 1,000 | | | 660 |
| | Columbus McKinnon Corp. | | | 5,400 | | | 146,016 |
| | Eastern Co. (The) | | | 18,401 | | | 384,581 |
| | FreightCar America, Inc. | | | 22,381 | | | 334,148 |
| | Hardinge, Inc. | | | 86,400 | | | 957,312 |
| | Hurco Companies, Inc. | | | 17,857 | | | 591,067 |
| | Kennametal, Inc. | | | 13,000 | | | 406,380 |
| | L.B. Foster Co., Class A | | | 8,900 | | | 121,040 |
| | L.S. Starrett Co. (The),
Class A | | | 27,500 | | | 255,750 |
| | NN, Inc. | | | 45,500 | | | 866,775 |
| | SPX FLOW, Inc.* | | | 20,000 | | | 641,200 |
| | Supreme Industries, Inc.,
Class A | | | 35,805 | | | 562,138 |
| | TriMas Corp.* | | | 20,000 | | | 470,000 |
| | Wabash National Corp.+ | | | 110,100 | | | 1,741,782 |
| | WSI Industries, Inc.+ | | | 1,300 | | | 3,965 |
| | | | | | | | |
| | | | | | | | 14,172,326 |
|
Marine - 1.12% |
| | Dorian LPG, Ltd.*+ | | | 144,000 | | | 1,182,240 |
| | Frontline, Ltd.+ | | | 35,300 | | | 250,983 |
| | International Seaways, Inc.* | | | 439 | | | 6,158 |
| | Navios Maritime Acquisition
Corp. | | | 318,800 | | | 541,960 |
| | Nordic American Tankers
Ltd.+ | | | 131,300 | | | 1,102,920 |
| | Overseas Shipholding
Group, Inc., Class A | | | 1,316 | | | 5,040 |
| | Scorpio Tankers, Inc.+ | | | 230,000 | | | 1,041,900 |
| | |
Omni Small-Cap Value Fund SCHEDULE OF INVESTMENTS (continued) | | |
Showing percentage of net assets as of December 31, 2016 (Unaudited)
| | | | | | | | | | | | |
| Industry | | Company | | Shares | | | Value | | | |
| Common Stocks (continued) | | | |
| Marine (continued) | | | |
| | Ship Finance International,
Ltd.+ | | | 185,000 | | | $2,747,250 | | | | |
| | Teekay Tankers, Ltd.,
Class A | | | 404,800 | | | 914,848 | | | | |
| | | | | | | | | | | | |
| | | | | | | | 7,793,299 | | | | |
| |
Media - 2.09% | | | | |
| | A.H. Belo Corp., Class A | | | 2,983 | | | 18,942 | | | | |
| | Entercom Communications
Corp., Class A | | | 220,225 | | | 3,369,442 | | | | |
| | Eros International PLC*+ | | | 72,050 | | | 940,252 | | | | |
| | Gannett Co., Inc. | | | 160,000 | | | 1,553,600 | | | | |
| | Global Sources, Ltd.*+ | | | 4,200 | | | 37,170 | | | | |
| | Harte-Hanks, Inc.+ | | | 83,400 | | | 125,934 | | | | |
| | Insignia Systems, Inc. | | | 4,900 | | | 11,711 | | | | |
| | McClatchy Co. (The),
Class A*+ | | | 15,432 | | | 203,394 | | | | |
| | New Media Investment Group, Inc. | | | 93,300 | | | 1,491,867 | | | | |
| | Radio One, Inc., Class D*+ | | | 800 | | | 2,320 | | | | |
| | Reading International, Inc.,
Class A* | | | 31,209 | | | 518,069 | | | | |
| | Saga Communications, Inc., Class A | | | 6,765 | | | 340,280 | | | | |
| | Salem Media Group, Inc.+ | | | 83,452 | | | 521,575 | | | | |
| | Scholastic Corp. | | | 72,800 | | | 3,457,272 | | | | |
| | Time, Inc. | | | 26,350 | | | 470,348 | | | | |
| | Townsquare Media, Inc.,
Class A* | | | 140,056 | | | 1,457,983 | | | | |
| | | | | | | | | | | | |
| | | | | | | | 14,520,159 | | | | |
| |
Metals & Mining - 1.94% | | | | |
| | Carpenter Technology Corp. | | | 51,600 | | | 1,866,372 | | | | |
| | Coeur Mining, Inc.*+ | | | 91,800 | | | 834,462 | | | | |
| | Ferroglobe PLC | | | 20,000 | | | 216,600 | | | | |
| | Handy & Harman, Ltd.* | | | 8,150 | | | 208,232 | | | | |
| | Haynes International, Inc. | | | 25,200 | | | 1,083,348 | | | | |
| | Hecla Mining Co.+ | | | 557,000 | | | 2,918,680 | | | | |
| | Kaiser Aluminum Corp. | | | 21,980 | | | 1,707,626 | | | | |
| | Materion Corp. | | | 48,600 | | | 1,924,560 | | | | |
| | Olympic Steel, Inc. | | | 20,000 | | | 484,600 | | | | |
| | Schnitzer Steel Industries,
Inc., Class A | | | 59,700 | | | 1,534,290 | | | | |
| | Stillwater Mining Co.*+ | | | 20,000 | | | 322,200 | | | | |
| | Synalloy Corp.*+ | | | 14,000 | | | 153,300 | | | | |
| | Universal Stainless & Alloy
Products, Inc.* | | | 16,250 | | | 219,538 | | | | |
| | | | | | | | | | | | |
| | | | | | | | 13,473,808 | | | | |
| |
Multiline Retail - 0.36% | | | | |
| | Fred’s, Inc., Class A+ | | | 133,600 | | | 2,479,616 | | | | |
| | | | | | | | |
| Industry | | Company | | Shares | | | Value |
| | | |
| | | | | | | | |
Oil, Gas & Consumable Fuels - 7.63% |
| | Adams Resources & Energy,
Inc.+ | | | 23,100 | | | $ 915,915 |
| | Alon USA Energy, Inc. | | | 198,250 | | | 2,256,085 |
| | Approach Resources, Inc.*+ | | | 79,326 | | | 265,742 |
| | Archrock, Inc. | | | 20,000 | | | 264,000 |
| | Ardmore Shipping Corp.+ | | | 99,700 | | | 737,780 |
| | Bill Barrett Corp.*+ | | | 51,000 | | | 356,490 |
| | California Resources
Corp.*+ | | | 40,000 | | | 851,600 |
| | Callon Petroleum Co.* | | | 311,300 | | | 4,784,681 |
| | Clayton Williams Energy,
Inc.*+ | | | 54,500 | | | 6,499,670 |
| | Cloud Peak Energy,
Inc.*+ | | | 800 | | | 4,488 |
| | Delek US Holdings, Inc.+ | | | 90,000 | | | 2,166,300 |
| | Denbury Resources, Inc.*+ | | | 107,500 | | | 395,600 |
| | DHT Holdings, Inc.+ | | | 301,722 | | | 1,249,129 |
| | Earthstone Energy, Inc.*+ | | | 3,202 | | | 43,995 |
| | EP Energy Corp., Class A*+ | | | 50,000 | | | 327,500 |
| | Forum Energy Technologies,
Inc.* | | | 148,310 | | | 3,262,820 |
| | GasLog Ltd.+ | | | 25,000 | | | 402,500 |
| | Gastar Exploration, Inc.* | | | 2,540 | | | 3,937 |
| | Gran Tierra Energy, Inc.*+ | | | 148,100 | | | 447,262 |
| | Green Plains, Inc. | | | 90,200 | | | 2,512,070 |
| | Hallador Energy Co. | | | 70,000 | | | 636,300 |
| | Independence Contract
Drilling, Inc.* | | | 115,519 | | | 773,977 |
| | ION Geophysical Corp.*+ | | | 3,333 | | | 19,998 |
| | Matador Resources Co.*+ | | | 95,000 | | | 2,447,200 |
| | McDermott International,
Inc.*+ | | | 538,400 | | | 3,978,776 |
| | Mitcham Industries, Inc.*+ | | | 15,100 | | | 62,665 |
| | MRC Global, Inc.* | | | 195,500 | | | 3,960,830 |
| | New Concept Energy, Inc.* | | | 4,800 | | | 10,368 |
| | Northern Oil and Gas, Inc.*+ | | | 1,000 | | | 2,750 |
| | Oasis Petroleum, Inc.* | | | 237,000 | | | 3,588,180 |
| | Oil States International, Inc.* | | | 18,000 | | | 702,000 |
| | Pacific Ethanol, Inc.*+ | | | 1,000 | | | 9,500 |
| | Renewable Energy Group,
Inc.*+ | | | 163,885 | | | 1,589,684 |
| | REX American Resources
Corp.*+ | | | 33,920 | | | 3,349,600 |
| | Ring Energy, Inc.*+ | | | 50,000 | | | 649,500 |
| | SM Energy Co. | | | 12,000 | | | 413,760 |
| | SunCoke Energy, Inc.* | | | 40,000 | | | 453,600 |
| | Synergy Resources Corp.*+ | | | 110,000 | | | 980,100 |
| | TETRA Technologies, Inc.* | | | 303,600 | | | 1,524,072 |
| | W&T Offshore, Inc.*+ | | | 800 | | | 2,216 |
| | | | | | | | |
| | | | | | | | 52,902,640 |
| | |
| 14 | | Semi-Annual Report | December 31, 2016 (Unaudited) |
| | |
Omni Small-Cap Value Fund SCHEDULE OF INVESTMENTS (continued) | | |
Showing percentage of net assets as of December 31, 2016 (Unaudited)
| | | | | | | | | | | | | | |
| Industry Company | | Shares | | | Value | | | |
| |
Common Stocks (continued) | |
Paper & Forest Products - 0.93% | |
| | | | Clearwater Paper Corp.* | | | 30,500 | | | $ 1,999,275 | | | | |
| | | | Mercer International, Inc. | | | 276,250 | | | 2,942,062 | | | | |
| | | | PH Glatfelter Co. | | | 63,800 | | | 1,524,182 | | | | |
| | | | | | | | | | | | | | |
| | | | | | | | | | 6,465,519 | | | | |
| | |
| | Personal Products - 0.18% | | | | |
| | | | Mannatech, Inc.+ | | | 8,400 | | | 170,520 | | | | |
| | | | Natural Alternatives
International, Inc.* | | | 6,400 | | | 72,320 | | | | �� |
| | | | Nutraceutical International
Corp. | | | 28,700 | | | 1,003,065 | | | | |
| | | | | | | | | | | | | | |
| | | | | | | | | | 1,245,905 | | | | |
| | |
| | Pharmaceuticals - 0.12% | | | | |
| | | | Cumberland | | | | | | | | | | |
| | | | Pharmaceuticals, Inc.* | | | 23,000 | | | 126,500 | | | | |
| | | | Enanta Pharmaceuticals, Inc.* | | | 20,000 | | | 670,000 | | | | |
| | | | | | | | | | | | | | |
| | | | | | | | | | 796,500 | | | | |
| | |
| | Professional Services - 2.85% | | | | |
| | | | CBIZ, Inc.* | | | 142,600 | | | 1,953,620 | | | | |
| | | | CRA International, Inc. | | | 53,500 | | | 1,958,100 | | | | |
| | | | FTI Consulting, Inc.* | | | 56,700 | | | 2,556,036 | | | | |
| | | | Heidrick & Struggles
International, Inc. | | | 55,000 | | | 1,328,250 | | | | |
| | | | ICF International, Inc.* | | | 36,229 | | | 1,999,841 | | | | |
| | | | Mistras Group, Inc.* | | | 15,000 | | | 385,200 | | | | |
| | | | Navigant Consulting, Inc.* | | | 239,600 | | | 6,272,728 | | | | |
| | | | RPX Corp.* | | | 212,600 | | | 2,296,080 | | | | |
| | | | SPAR Group, Inc.* | | | 1,500 | | | 1,500 | | | | |
| | | | TrueBlue, Inc.* | | | 2,750 | | | 67,788 | | | | |
| | | | VSE Corp. | | | 23,600 | | | 916,624 | | | | |
| | | | | | | | | | | | | | |
| | | | | | | | | | 19,735,767 | | | | |
| | |
| | Real Estate Management & Development - 0.26% | | | | |
| | | | AV Homes, Inc.*+ | | | 7,500 | | | 118,500 | | | | |
| | | | Forestar Group, Inc.* | | | 80,000 | | | 1,064,000 | | | | |
| | | | RE/MAX Holdings, Inc.,
Class A | | | 6,168 | | | 345,408 | | | | |
| | | | St. Joe Co. (The)* | | | 15,000 | | | 285,000 | | | | |
| | | | | | | | | | | | | | |
| | | | | | | | | | 1,812,908 | | | | |
| | |
| | Road & Rail - 1.41% | | | | |
| | | | ArcBest Corp. | | | 94,500 | | | 2,612,925 | | | | |
| | | | Celadon Group, Inc.+ | | | 8,400 | | | 60,060 | | | | |
| | | | Covenant Transportation
Group, Inc., Class A* | | | 93,900 | | | 1,816,026 | | | | |
| | | | Greenbrier Companies., Inc.
(The)+ | | | 18,000 | | | 747,900 | | | | |
| | | | Marten Transport, Ltd. | | | 152,982 | | | 3,564,481 | | | | |
| | | | | | | | |
| Industry | | Company | | Shares | | | Value |
| | | | | | | | |
Road & Rail (continued) |
| | PAM Transportation Services,
Inc.* | | | 19,205 | | | $ 498,946 |
| | USA Truck, Inc.*+ | | | 51,436 | | | 448,008 |
| | | | | | | | |
| | | | | | | | 9,748,346 |
|
Semiconductors & Semiconductor Equipment - 2.46% |
| | Alpha & Omega
Semiconductor, Ltd.* | | | 214,244 | | | 4,556,970 |
| | Amkor Technology, Inc.* | | | 202,291 | | | 2,134,170 |
| | AXT, Inc.* | | | 100,000 | | | 480,000 |
| | Brooks Automation, Inc. | | | 400 | | | 6,828 |
| | Cohu, Inc. | | | 5,000 | | | 69,500 |
| | Diodes, Inc.* | | | 105,399 | | | 2,705,592 |
| | FormFactor, Inc.* | | | 15,000 | | | 168,000 |
| | GigPeak, Inc.* | | | 60,000 | | | 151,200 |
| | inTEST Corp.*+ | | | 55,000 | | | 253,000 |
| | IXYS Corp. | | | 57,500 | | | 684,250 |
| | Kulicke & Soffa Industries,
Inc.* | | | 123,632 | | | 1,971,930 |
| | NeoPhotonics Corp.*+ | | | 50,000 | | | 540,500 |
| | Photronics, Inc.* | | | 205,050 | | | 2,317,065 |
| | Ultra Clean Holdings, Inc.* | | | 85,700 | | | 831,290 |
| | Xcerra Corp.* | | | 25,000 | | | 191,000 |
| | | | | | | | |
| | | | | | | | 17,061,295 |
|
Software - 0.81% |
| | Ebix, Inc.+ | | | 40,000 | | | 2,282,000 |
| | GSE Systems, Inc.* | | | 22,500 | | | 78,750 |
| | Mind CTI Ltd. | | | 200 | | | 488 |
| | Net 1 UEPS Technologies,
Inc.* | | | 252,900 | | | 2,903,292 |
| | NetSol Technologies, Inc.* | | | 31,000 | | | 161,200 |
| | Network-1 Technologies,
Inc.* | | | 50,000 | | | 170,000 |
| | | | | | | | |
| | | | | | | | 5,595,730 |
|
Specialty Retail - 4.13% |
| | Barnes & Noble Education,
Inc.* | | | 64,824 | | | 743,531 |
| | Barnes & Noble, Inc. | | | 112,000 | | | 1,248,800 |
| | Big 5 Sporting Goods
Corp.+ | | | 132,345 | | | 2,296,186 |
| | Caleres, Inc. | | | 53,000 | | | 1,739,460 |
| | Children’s Place, Inc. (The) | | | 20,200 | | | 2,039,190 |
| | Citi Trends, Inc. | | | 53,900 | | | 1,015,476 |
| | Destination Maternity Corp.+ | | | 9,800 | | | 50,666 |
| | Express, Inc.* | | | 60,000 | | | 645,600 |
| | Finish Line, Inc. (The),
Class A+ | | | 53,600 | | | 1,008,216 |
| | FirstCash, Inc. | | | 67,788 | | | 3,186,036 |
| | Genesco, Inc.* | | | 42,500 | | | 2,639,250 |
| | |
Omni Small-Cap Value Fund SCHEDULE OF INVESTMENTS (continued) | | |
Showing percentage of net assets as of December 31, 2016 (Unaudited)
| | | | | | | | | | | | |
| Industry | | Company | | Shares | | | Value | | | |
| |
Common Stocks (continued) | | | | |
Specialty Retail (continued) | | | | |
| | Group 1 Automotive, Inc. | | | 14,000 | | | $ 1,091,160 | | | | |
| | Guess?, Inc. | | | 99,100 | | | 1,199,110 | | | | |
| | Haverty Furniture Cos., Inc. | | | 12,700 | | | 300,990 | | | | |
| | hhgregg, Inc.*+ | | | 48,100 | | | 68,783 | | | | |
| | Kirkland’s, Inc.* | | | 10,000 | | | 155,100 | | | | |
| | New York & Co., Inc.* | | | 126,700 | | | 287,609 | | | | |
| | Pier 1 Imports, Inc. | | | 50,000 | | | 427,000 | | | | |
| | Rent-A-Center, Inc.+ | | | 2,000 | | | 22,500 | | | | |
| | Sears Hometown & Outlet
Stores, Inc.*+ | | | 10,000 | | | 47,000 | | | | |
| | Shoe Carnival, Inc. | | | 63,600 | | | 1,715,928 | | | | |
| | Sonic Automotive, Inc.,
Class A | | | 63,500 | | | 1,454,150 | | | | |
| | Stage Stores, Inc.+ | | | 54,255 | | | 237,094 | | | | |
| | Stein Mart, Inc.+ | | | 53,000 | | | 290,440 | | | | |
| | Systemax, Inc. | | | 8,500 | | | 74,545 | | | | |
| | Tandy Leather Factory,
Inc.*+ | | | 8,000 | | | 64,800 | | | | |
| | Tilly’s, Inc., Class A* | | | 88,300 | | | 1,164,677 | | | | |
| | Trans World Entertainment
Corp.* | | | 70,000 | | | 227,500 | | | | |
| | TravelCenters of America
LLC* | | | 219,400 | | | 1,557,740 | | | | |
| | Vitamin Shoppe, Inc.* | | | 35,000 | | | 831,250 | | | | |
| | West Marine, Inc.* | | | 42,400 | | | 443,928 | | | | |
| | Zumiez, Inc.*+ | | | 15,500 | | | 338,675 | | | | |
| | | | | | | | | | | | |
| | | | |
| | | | | | | | 28,612,390 | | | | |
| |
Textiles, Apparel & Luxury Goods - 0.88% | | | | |
| | Abercrombie & Fitch Co.,
Class A+ | | | 124,000 | | | 1,488,000 | | | | |
| | Delta Apparel, Inc.* | | | 25,500 | | | 528,615 | | | | |
| | Movado Group, Inc. | | | 15,000 | | | 431,250 | | | | |
| | Perry Ellis International, Inc.* | | | 138,100 | | | 3,440,071 | | | | |
| | Rocky Brands, Inc. | | | 9,900 | | | 114,345 | | | | |
| | Unifi, Inc.* | | | 3,900 | | | 127,257 | | | | |
| | | | | | | | | | | | |
| | | | |
| | | | | | | | 6,129,538 | | | | |
| |
Thrifts & Mortgage Finance - 3.53% | | | | |
| | Astoria Financial Corp. | | | 87,100 | | | 1,624,415 | | | | |
| | Bank Mutual Corp. | | | 79,700 | | | 753,165 | | | | |
| | Berkshire Hills Bancorp, Inc. | | | 60,565 | | | 2,231,820 | | | | |
| | Brookline Bancorp, Inc. | | | 45,000 | | | 738,000 | | | | |
| | Charter Financial Corp. | | | 17,500 | | | 291,725 | | | | |
| | Citizens Community
Bancorp, Inc. | | | 15,000 | | | 186,450 | | | | |
| | Entegra Financial Corp.* | | | 13,200 | | | 271,920 | | | | |
| | ESSA Bancorp, Inc.+ | | | 33,100 | | | 520,332 | | | | |
| | Federal Agricultural
Mortgage Corp., Class C | | | 21,500 | | | 1,231,305 | | | | |
| | | | | | | | |
| Industry | | Company | | Shares | | | Value |
| | | | | | | | |
Thrifts & Mortgage Finance (continued) |
| | First Defiance Financial Corp. | | | 29,000 | | | $ 1,471,460 |
| | First Financial Northwest, Inc. | | | 35,182 | | | 694,493 |
| | Hingham Institution for Savings | | | 30 | | | 5,903 |
| | HMN Financial, Inc.* | | | 23,800 | | | 416,500 |
| | Home Bancorp, Inc. | | | 31,994 | | | 1,235,288 |
| | HomeStreet, Inc.* | | | 57,000 | | | 1,801,200 |
| | HopFed Bancorp, Inc.+ | | | 18,100 | | | 243,626 |
| | Lake Sunapee Bank Group | | | 2,000 | | | 47,180 |
| | Meta Financial Group, Inc. | | | 16,477 | | | 1,695,483 |
| | Ocwen Financial Corp.*+ | | | 131,000 | | | 706,090 |
| | Pathfinder Bancorp, Inc. | | | 3,000 | | | 40,350 |
| | Provident Financial Holdings, Inc. | | | 51,000 | | | 1,031,220 |
| | Provident Financial Services, Inc. | | | 69,700 | | | 1,972,510 |
| | Riverview Bancorp, Inc. | | | 87,000 | | | 609,000 |
| | Security National Financial Corp., Class A* | | | 82,191 | | | 534,242 |
| | SI Financial Group, Inc. | | | 55,700 | | | 857,780 |
| | Territorial Bancorp, Inc. | | | 21,200 | | | 696,208 |
| | Timberland Bancorp, Inc. | | | 39,000 | | | 805,740 |
| | TrustCo Bank Corp. | | | 55,000 | | | 481,250 |
| | United Community Bancorp | | | 11,800 | | | 197,060 |
| | United Community Financial Corp. | | | 324 | | | 2,897 |
| | Walker & Dunlop, Inc.* | | | 28,975 | | | 904,020 |
| | Waterstone Financial, Inc. | | | 8,000 | | | 147,200 |
| | | | | | | | |
| | | |
| | | | | | | | 24,445,832 |
|
Trading Companies & Distributors - 1.87% |
| | AeroCentury Corp.* | | | 4,300 | | | 40,635 |
| | Aircastle, Ltd. | | | 24,600 | | | 512,910 |
| | CAI International, Inc.* | | | 27,100 | | | 234,957 |
| | General Finance Corp.*+ | | | 30,700 | | | 170,385 |
| | Houston Wire & Cable Co. | | | 46,100 | | | 299,650 |
| | Kaman Corp. | | | 6,600 | | | 322,938 |
| | Rush Enterprises, Inc., Class A* | | | 177,700 | | | 5,668,630 |
| | Rush Enterprises, Inc., Class B* | | | 46,500 | | | 1,435,455 |
| | Titan Machinery, Inc.*+ | | | 43,900 | | | 639,623 |
| | Veritiv Corp.* | | | 45,200 | | | 2,429,500 |
| | Willis Lease Finance Corp.* | | | 48,400 | | | 1,238,072 |
| | | | | | | | |
| | | |
| | | | | | | | 12,992,755 |
| | |
| 16 | | Semi-Annual Report | December 31, 2016 (Unaudited) |
| | |
Omni Small-Cap Value Fund SCHEDULE OF INVESTMENTS (continued) | | |
| | | | | | | | | | | | | | |
| Industry Company | | | | | Shares | | Value | | | | | |
| Common Stocks (continued) | | | | | | | | | | | |
Wireless Telecommunication Services - 0.36% | | | | | | |
Spok Holdings, Inc. | | | | | | 118,864 | | $ 2,466,428 | | | | | | |
| | | | | | | | | | | | | | |
| | | |
TOTAL COMMON STOCKS - 99.94% | | 692,811,856 | | | | | | |
| | | | | | | | | | | | | | |
(Cost $473,109,124) | | | | | | | | | | | | | | |
| | | | | |
RIGHTS - 0.00% | | | | | | | | | | | | | | |
Leap Wireless CVR*D | | | | | | 32,900 | | — | | | | | | |
| | | | | | | | | | | | | | |
| | | | | |
TOTAL RIGHTS - 0.00% | | | | | | | | — | | | | | | |
(Cost $80,276) | | | | | | | | |
| | | |
WARRANTS - 0.00% | | | | | | | | |
Eagle Bulk Shipping, Inc., expiring 10/15/21* | | | | | | 3,317 | | 217 | | | | | | |
| | | | | | | | | | | | | | |
| | | | |
TOTAL WARRANTS - 0.00% | | | | | 217 | | | | | | |
| | | | | | | | | | | | | | |
(Cost $105,563) | | | | | | | | |
| | | | | |
| | | Rate^ | | | Shares | | Value | | | | | |
| | |
| MONEY MARKET FUND - 0.00% | | | | | | |
Fidelity Institutional Government Portfolio Institutional Class | | | 0.43 | % | | 369 | | 369 | | | | | | |
| | | | | | | | | | | | | | |
| | | |
| TOTAL MONEY MARKET FUND - 0.00% | | 369 | | | | | | |
| | | | | | | | | | | | | | |
(Cost $369) | | | | | | | | |
| | |
INVESTMENTS PURCHASED WITH
CASH PROCEEDS FROM SECURITIES
LENDING - 2.41% | | | | | | |
Fidelity Institutional Government Portfolio Institutional Class** | | | 0.43 | % | | 16,705,785 | | 16,705,785 | | | | | | |
| | | | | | | | | | | | | | |
TOTAL INVESTMENTS PURCHASED WITH CASH PROCEEDS FROM SECURITIES LENDING - 2.41% | | 16,705,785 | | | | | | |
| | | | | | | | | | | | | | |
(Cost $16,705,785) | | | | | | | | |
| | | |
TOTAL INVESTMENTS - 102.35% | | $709,518,227 | | | | | | |
(Cost $490,001,117) | | | | | | | | | | | | | | |
Liabilities in Excess of Other Assets - (2.35%) | | (16,302,205) | | | | | | |
| | | | | | | | | | | | | | |
| | | | |
NET ASSETS - 100.00% | | | | | $693,216,022 | | | | | | |
| | | | | | | | | | | | | | |
| * | Non-income producing security. |
| ** | This security represents the investment of the collateral received in connection with securities out on loan as of December 31, 2016. |
| ^ | Rate disclosed as of December 31, 2016. |
| D | Security was fair valued under procedures adopted by the Board of Directors (see Note 2). |
| + | This security or a portion of the security is out on loan as of December 31, 2016. Total loaned securities had a value of $16,035,539 as of December 31, 2016. |
CVR - Contingent Value Right
LLC - Limited Liability Company
PLC - Public Limited Company
Summary of inputs used to value the Fund’s investments as of 12/31/2016 (See Note 2 in Notes to Financial Statements):
| | | | | | | | | | | | | | | | |
| | | Valuation Inputs | |
| |
| | | Investment in Securities (Value) | |
| |
| | | | |
| | |
| Level 1
Quoted
Prices |
| |
| Level 2
Significant
Observable
Inputs |
| |
| Level 3
Significant
Unobservable
Inputs |
| | | Total | |
| | | | |
Common Stocks | | $ | 692,811,856 | | | $ | — | | | $ | — | | | $ | 692,811,856 | |
| | | | |
Rights | | | — | | | | — | | | | 0 | | | | 0 | |
| | | | |
Warrants | | | 217 | | | | — | | | | — | | | | 217 | |
| | | | |
Money Market Fund | | | — | | | | 369 | | | | — | | | | 369 | |
| | | | |
Investments Purchased with Cash Proceeds from Securities Lending | | | — | | | | 16,705,785 | | | | — | | | | 16,705,785 | |
| | | | | | | | | | | | | | | | |
TOTAL | | $ | 692,812,073 | | | $ | 16,706,154 | | | $ | 0 | | | $ | 709,518,227 | |
| | | | | | | | | | | | | | | | |
See Notes to Financial Statements.
| | |
Omni Tax-Managed Small-Cap Value Fund MANAGER’S COMMENTARY (Unaudited) | | |
December 31, 2016
Dear Fellow Omni Tax-Managed Small-Cap Value Fund Shareholder,
For the quarter ended December 31, 2016, our Fund returned 17.35%, outperforming our primary market benchmark, the Russell 2000 Value Index (+14.07%). It was a good quarter.
For the six-month semi-annual period ended December 31, 2016, our Fund returned 29.13%, outperforming Russell 2000 Value Index (+24.19%).
For the calendar year, our Fund returned 34.60%, outperforming the Russell 2000 Value Index (+31.74%).
The table below presents our December quarter, six-month, one-year, five-year and inception-to-date financial results. See the next page for a graph of performance since inception.
Standardized Returns as of December 31, 2016
| | | | | | | | | | | | | | | | | | | | | | | | | |
| | | | | | | | | Annualized |
| | | Quarter | | 6 Months | | 1 Year | | 5 Years | | Since Inception
(12/31/10) |
| | | | | |
Omni Tax-Managed Small-Cap Value Fund | | | | 17.35% | | | | | 29.13% | | | | | 34.60% | | | | | 16.35% | | | | | 12.41% | |
Russell 2000 Value Index | | | | 14.07% | | | | | 24.19% | | | | | 31.74% | | | | | 15.07% | | | | | 11.35% | |
Performance figures quoted in the table above and the graph on the next page represent past performance and are no guarantee of future results. Total return figures in the table above include the reinvestment of dividends and capital gains. The table above and the graph on the next page do not reflect the deduction of taxes that a shareholder would pay on Fund distributions or on the redemption of Fund shares.
The Russell 2000 Value Index is an unmanaged index that consists of stocks in the Russell 2000 Index with lower price-to-book ratios and lower forecasted growth values with dividends reinvested. It is not possible to invest directly in an index. Periods longer than one year are annualized.
According to data from Lipper as of December 31, 2016, Omni Tax-Managed Small-Cap Value Fund ranked 12th of 314 small-cap value funds for the 12 months ended December 31, 2016, 24th of 238 over the past five years and 30th of 219 such funds since inception in December 2010. Lipper, a Thomson Reuters company, is an independent mutual fund rating service that ranks funds in various fund categories by making comparative calculations using total returns.
| | |
| 18 | | Semi-Annual Report | December 31, 2016 (Unaudited) |
| | |
Omni Tax-Managed Small-Cap Value Fund MANAGER’S COMMENTARY (Unaudited) (continued) | | |
Omni Tax-Managed Small-Cap Value Fund vs. Russell 2000 Value Index
from Inception 12/31/10 to 12/31/16
Detailed Explanation of Quarterly Performance
The Omni Tax-Managed Small-Cap Value Fund is designed to capture the returns of the small-cap value asset class through broad diversification of small company and value stocks. We also seek to minimize the distribution of capital gains within the constraints of the investment objective. This approach is sometimes referred to as “passive, asset class investing.” As of December 31, 2016, we held 641 such stocks in a market-cap weighted style. We make no attempt to track any particular index in either performance or statistics.
The Fund’s focus on smaller stocks within the small-cap universe helped relative results during a quarter that saw strong performance from smaller market cap stocks. Our design tilt towards deeper value stocks also boosted relative results, as did our multi-factor definition of value, which categorizes value stocks using several different metrics, because several measures of value performed well during the quarter. However, exposure to higher momentum stocks detracted slightly from relative performance, as momentum was out of favor during the quarter.
By design, the Fund does not hold Utilities sector stocks and Real Estate Investment Trusts (REITs). This positioning boosted relative returns, as these assets underperformed during the quarter. Holdings in the Industrials sector also contributed positively to relative performance. An overweight position in the Consumer Discretionary sector and holdings in the Materials sector detracted from relative results.
Detailed Explanation of Calendar Year Performance
The Fund’s focus on smaller stocks within the small-cap universe helped relative results during a year that saw strong performance from smaller market cap stocks. Deeper value as measured by price-to-book also was a leading contributor to relative performance, as was our multi-factor value strategy. Exposure to higher momentum stocks detracted from relative performance, as momentum was out of favor during the year.
Our Fund’s lack of exposure to Utilities stocks and Real Estate Investment Trusts (REITs) boosted relative returns, as these assets performed poorly during the quarter. An overweight position in the Materials sector also contributed positively to relative performance. However, an overweight position in the Consumer Discretionary sector and holdings in the Materials and Energy sectors detracted from relative results.
| | |
Omni Tax-Managed Small-Cap Value Fund MANAGER’S COMMENTARY (Unaudited) (continued) | | |
Top Ten Holdings as of December 31, 2016
| | | | | | | | | |
| Rank | | Description | | Industry | | % of Net
Assets |
| 1 | | Clayton Williams Energy, Inc. | | Oil, Gas & Consumable Fuels | | 1.1% |
| 2 | | Central Garden & Pet Co. | | Household Products | | 1.1% |
| 3 | | McDermott International, Inc. | | Oil, Gas & Consumable Fuels | | 1.0% |
| 4 | | Cooper-Standard Holdings, Inc. | | Auto Components | | 0.9% |
| 5 | | Navigant Consulting, Inc. | | Professional Services | | 0.9% |
| 6 | | NETGEAR, Inc. | | Communications Equipment | | 0.9% |
| 7 | | Sanmina Corp. | | Electronic Equipment, Instruments & Components | | 0.9% |
| 8 | | Stepan Co. | | Chemicals | | 0.8% |
| 9 | | SkyWest, Inc. | | Airlines | | 0.8% |
| 10 | | Kraton Corp. | | Chemicals | | 0.8% |
| | Total | | | | 9.2% |
Industry Sector Representation as of December 31, 2016
| | | | | | | | | | | | | | | |
| | | % of Net Assets | | % of Russell 2000 Value Index | | Difference |
| Consumer Discretionary | | | | 14.4% | | | | | 10.0% | | | | | 4.5% | |
| Consumer Staples | | | | 4.0% | | | | | 2.8% | | | | | 1.2% | |
| Energy | | | | 10.0% | | | | | 5.9% | | | | | 4.1% | |
| Financials | | | | 32.9% | | | | | 32.4% | | | | | 0.4% | |
| Health Care | | | | 2.2% | | | | | 4.3% | | | | | -2.1% | |
| Industrials | | | | 18.3% | | | | | 12.6% | | | | | 5.7% | |
| Information Technology | | | | 10.0% | | | | | 10.4% | | | | | -0.4% | |
| Materials | | | | 6.5% | | | | | 4.6% | | | | | 1.9% | |
| Real Estate | | | | 0.5% | | | | | 10.1% | | | | | -9.7% | |
| Telecommunication Services | | | | 1.2% | | | | | 0.7% | | | | | 0.5% | |
| Utilities | | | | 0.0% | | | | | 6.0% | | | | | -6.0% | |
| Cash & Other Assets | | | | 0.0% | | | | | 0.0% | | | | | 0.0% | |
Total | | | | 100.0% | | | | | 100.0% | | | | | | |
Disclaimer
The views expressed here are exclusively those of Fund management. These views, including those related to market sectors or individual stocks, are not meant as investment advice and should not be considered predictive in nature. Any favorable (or unfavorable) description of a holding applies only as of the quarter end, December 31, 2016, unless otherwise stated. Security positions can and do change thereafter. Discussions of historical performance do not guarantee and may not be indicative of future performance.
Market volatility can significantly impact short-term performance. The Fund is not an appropriate investment for short-term investors. Investments in small companies generally carry greater risk than is customarily associated with larger companies. This additional risk is attributable to a number of factors, including the relatively limited financial resources that are typically available to small companies and the fact that small companies often have comparatively limited product lines. In addition, the stock of small companies tends to be more volatile than the stock of large companies, particularly in the short term and particularly in the early stages of an economic or market downturn. Shareholders of the Fund, therefore, are taking on more risk than they would if they invested in the stock market as a whole.
| | |
| 20 | | Semi-Annual Report | December 31, 2016 (Unaudited) |
| | |
Omni Tax-Managed Small-Cap Value Fund MANAGER’S COMMENTARY (Unaudited) (continued) | | |
Conclusion
Thank you for your continued investment in Omni Tax-Managed Small-Cap Value Fund. We encourage your feedback; your reactions and concerns are important to us.
Sincerely,
The Investment Management Team
| | |
Omni Tax-Managed Small-Cap Value Fund SCHEDULE OF INVESTMENTS | | |
Showing percentage of net assets as of December 31, 2016 (Unaudited)
| | | | | | | | | | |
| Industry | | Company | | Shares | | | Value | |
| |
COMMON STOCKS - 100.00% | |
Aerospace & Defense - 1.08% | |
| | AAR Corp. | | | 89,560 | | | $ | 2,959,958 | |
| | Arotech Corp.* | | | 52,800 | | | | 184,800 | |
| | Cubic Corp. | | | 10,000 | | | | 479,500 | |
| | DigitalGlobe, Inc.* | | | 29,800 | | | | 853,770 | |
| | Ducommun, Inc.* | | | 34,750 | | | | 888,210 | |
| | Kratos Defense & Security Solutions, Inc.* | | | 10,000 | | | | 74,000 | |
| | LMI Aerospace, Inc.* | | | 35,000 | | | | 301,700 | |
| | National Presto Industries, Inc.+ | | | 9,435 | | | | 1,003,884 | |
| | Vectrus, Inc.* | | | 5,000 | | | | 119,250 | |
| | | | | | | | | | |
| | | | | | | | | 6,865,072 | |
| |
Air Freight & Logistics - 1.39% | |
| | Air T, Inc.* | | | 6,700 | | | | 153,430 | |
| | Air Transport Services Group, Inc.* | | | 291,526 | | | | 4,652,755 | |
| | Atlas Air Worldwide Holdings, Inc.* | | | 41,900 | | | | 2,185,085 | |
| | Wesco Aircraft Holdings, Inc.* | | | 124,200 | | | | 1,856,790 | |
| | | | | | | | | | |
| | | | | | | | | 8,848,060 | |
| | |
Airlines - 1.34% | | | | | | | | |
| | Hawaiian Holdings, Inc.* | | | 56,200 | | | | 3,203,400 | |
| | SkyWest, Inc. | | | 145,600 | | | | 5,307,120 | |
| | | | | | | | | | |
| | | | | | | | | 8,510,520 | |
| |
Auto Components - 2.17% | | | | | |
| | American Axle & Manufacturing Holdings, Inc.* | | | 30,000 | | | | 579,000 | |
| | China Automotive Systems, Inc.*+ | | | 28,500 | | | | 152,760 | |
| | China XD Plastics Co., Ltd.* | | | 17,400 | | | | 69,600 | |
| | Cooper-Standard Holding, Inc.* | | | 55,510 | | | | 5,738,624 | |
| | Metaldyne Performance Group, Inc. | | | 43,900 | | | | 1,007,505 | |
| | Modine Manufacturing Co.* | | | 28,900 | | | | 430,610 | |
| | Shiloh Industries, Inc.* | | | 500 | | | | 3,455 | |
| | SORL Auto Parts, Inc.* | | | 74,129 | | | | 225,352 | |
| | Spartan Motors, Inc. | | | 88,600 | | | | 819,550 | |
| | Strattec Security Corp. | | | 3,600 | | | | 145,080 | |
| | Superior Industries International, Inc. | | | 118,700 | | | | 3,127,745 | |
| | Titan International, Inc. | | | 136,000 | | | | 1,524,560 | |
| | Westport Fuel Systems, Inc.*+ | | | 995 | | | | 1,124 | |
| | | | | | | | | | |
| | | | | | | | | 13,824,965 | |
| | | | | | | | | | |
| Industry | | Company | | Shares | | | Value | |
| | | |
| | | | | | | | | | |
| |
Biotechnology - 0.20% | | | | | |
| | AMAG Pharmaceuticals, Inc.*+ | | | 17,000 | | | $ | 591,600 | |
| | Applied Genetic Technologies Corp.* | | | 20,000 | | | | 187,000 | |
| | Enzon Pharmaceuticals, Inc. | | | 93,500 | | | | 34,128 | |
| | PDL BioPharma, Inc. | | | 25,000 | | | | 53,000 | |
| | PharmAthene, Inc.* | | | 125,467 | | | | 407,768 | |
| | | | | | | | | | |
| | | | | | | | | 1,273,496 | |
| |
Building Products - 1.09% | | | | | |
| | Alpha Pro Tech, Ltd.* | | | 500 | | | | 1,750 | |
| | Boise Cascade Co.* | | | 15,000 | | | | 337,500 | |
| | Gibraltar Industries, Inc.* | | | 69,706 | | | | 2,903,255 | |
| | Griffon Corp. | | | 115,250 | | | | 3,019,550 | |
| | Quanex Building Products Corp. | | | 35,000 | | | | 710,500 | |
| | | | | | | | | | |
| | | | | | | | | 6,972,555 | |
| |
Capital Markets - 1.19% | | | | | |
| | Arlington Asset Investment Corp., Class A+ | | | 13,700 | | | | 203,034 | |
| | Calamos Asset Management, Inc., Class A | | | 69,700 | | | | 595,935 | |
| | Cowen Group, Inc., Class A*+ | | | 62,850 | | | | 974,175 | |
| | FBR & Co. | | | 775 | | | | 10,075 | |
| | Great Elm Capital Group, Inc.*+ | | | 833 | | | | 3,124 | |
| | INTL FCStone, Inc.* | | | 26,900 | | | | 1,065,240 | |
| | Investment Technology Group, Inc. | | | 76,000 | | | | 1,500,240 | |
| | KCG Holdings, Inc., Class A* | | | 149,900 | | | | 1,986,175 | |
| | Oppenheimer Holdings, Inc., Class A | | | 4,419 | | | | 82,193 | |
| | Piper Jaffray Cos.* | | | 16,100 | | | | 1,167,250 | |
| | | | | | | | | | |
| | | | | | | | | 7,587,441 | |
| |
Chemicals - 2.85% | | | | | |
| | American Vanguard Corp. | | | 34,200 | | | | 654,930 | |
| | China Green Agriculture, Inc.* | | | 80,300 | | | | 97,163 | |
| | Core Molding Technologies, Inc.* | | | 11,900 | | | | 203,609 | |
| | Flexible Solutions International, Inc.* | | | 5,000 | | | | 6,800 | |
| | FutureFuel Corp. | | | 54,500 | | | | 757,550 | |
| | Gulf Resources, Inc.* | | | 85,750 | | | | 167,212 | |
| | Kraton Corp.* | | | 169,500 | | | | 4,827,360 | |
| | |
| 22 | | Semi-Annual Report | December 31, 2016 (Unaudited) |
| | |
Omni Tax-Managed Small-Cap Value Fund SCHEDULE OF INVESTMENTS (continued) | | |
Showing percentage of net assets as of December 31, 2016 (Unaudited)
| | | | | | | | | | |
| Industry | | Company | | Shares | | | Value | |
| |
Common Stocks (continued) | | | | | |
Chemicals (continued) | | | | | |
| | OMNOVA Solutions, Inc.* | | | 62,300 | | | $ | 623,000 | |
| | Rayonier Advanced Materials, Inc. | | | 20,000 | | | | 309,200 | |
| | Schulman (A.), Inc. | | | 92,000 | | | | 3,077,400 | |
| | Stepan Co. | | | 65,400 | | | | 5,328,792 | |
| | Trecora Resources* | | | 8,600 | | | | 119,110 | |
| | Tredegar Corp. | | | 28,900 | | | | 693,600 | |
| | Tronox, Ltd., Class A | | | 124,000 | | | | 1,278,440 | |
| | | | | | | | | | |
| | | | | | | | | 18,144,166 | |
| |
Commercial Banks - 16.20% | | | | | |
| | 1st Constitution Bancorp | | | 5,250 | | | | 98,175 | |
| | 1st Source Corp. | | | 57,750 | | | | 2,579,115 | |
| | Access National Corp.+ | | | 600 | | | | 16,656 | |
| | ACNB Corp. | | | 600 | | | | 18,750 | |
| | American National Bankshares, Inc. | | | 13,060 | | | | 454,488 | |
| | American River Bankshares* | | | 20,744 | | | | 313,442 | |
| | AmeriServ Financial, Inc. | | | 5,000 | | | | 18,500 | |
| | Banco Latinoamericano de Comercio Exterior SA, Class E | | | 25,000 | | | | 736,000 | |
| | Bank of Commerce Holdings | | | 75,550 | | | | 717,725 | |
| | Bankwell Financial Group, Inc. | | | 1,000 | | | | 32,500 | |
| | Banner Corp. | | | 5,057 | | | | 282,231 | |
| | Bar Harbor Bankshares | | | 10,500 | | | | 496,965 | |
| | BCB Bancorp, Inc. | | | 11,300 | | | | 146,900 | |
| | BNC Bancorp | | | 12,456 | | | | 397,346 | |
| | Boston Private Financial Holdings, Inc. | | | 10,000 | | | | 165,500 | |
| | BSB Bancorp, Inc.* | | | 23,800 | | | | 689,010 | |
| | C&F Financial Corp. | | | 2,400 | | | | 119,640 | |
| | Camden National Corp. | | | 8,779 | | | | 390,227 | |
| | Capital City Bank Group, Inc. | | | 81,250 | | | | 1,664,000 | |
| | Cardinal Financial Corp. | | | 24,478 | | | | 802,634 | |
| | Central Pacific Financial Corp. | | | 47,100 | | | | 1,479,882 | |
| | Central Valley Community Bancorp | | | 51,000 | | | | 1,017,960 | |
| | Centrue Financial Corp.* | | | 4,000 | | | | 87,680 | |
| | Century Bancorp, Inc., Class A | | | 14,300 | | | | 858,000 | |
| | Chemung Financial Corp.+ | | | 3,000 | | | | 109,050 | |
| | Civista Bancshares, Inc. | | | 19,921 | | | | 387,065 | |
| | CNB Financial Corp.+ | | | 70,800 | | | | 1,893,192 | |
| | Codorus Valley Bancorp, Inc. | | | 4,397 | | | | 125,766 | |
| | Community Bankers Trust Corp.* | | | 25,000 | | | | 181,250 | |
| | | | | | | | | | |
| | | | | | | | | | |
| | | | | | | | | | |
| | | | | | | | | | |
| | | | | | | | | | |
| | | | | | | | | | |
| | | | | | | | | | |
| Industry | | Company | | Shares | | | Value | |
| | | |
| | | | | | | | | | |
Commercial Banks (continued) | | | | | |
| | Community Financial Corp. (The)+ | | | 3,840 | | | $ | 106,560 | |
| | Community Trust Bancorp, Inc. | | | 32,500 | | | | 1,612,000 | |
| | ConnectOne Bancorp, Inc. | | | 40,000 | | | | 1,038,000 | |
| | Eastern Virginia Bankshares, Inc. | | | 25,751 | | | | 269,098 | |
| | Enterprise Bancorp, Inc. | | | 53,175 | | | | 1,997,253 | |
| | Evans Bancorp, Inc. | | | 9,000 | | | | 283,950 | |
| | Farmers Capital Bank Corp. | | | 30,400 | | | | 1,278,320 | |
| | Farmers National Banc Corp. | | | 150 | | | | 2,130 | |
| | Financial Institutions, Inc. | | | 40,300 | | | | 1,378,260 | |
| | First BanCorp Puerto Rico* | | | 364,100 | | | | 2,406,701 | |
| | First BanCorp Southern Pines NC | | | 102,856 | | | | 2,791,512 | |
| | First Bancorp, Inc. | | | 19,550 | | | | 647,105 | |
| | First Bancshares, Inc. (The) | | | 14,715 | | | | 404,663 | |
| | First Busey Corp. | | | 37,798 | | | | 1,163,422 | |
| | First Business Financial Services, Inc. | | | 14,100 | | | | 334,452 | |
| | First Commonwealth Financial Corp. | | | 121,200 | | | | 1,718,616 | |
| | First Community Bancshares, Inc. | | | 61,300 | | | | 1,847,582 | |
| | First Connecticut Bancorp, Inc. | | | 4,800 | | | | 108,720 | |
| | First Financial Corp. | | | 38,830 | | | | 2,050,224 | |
| | First Internet Bancorp+ | | | 1,200 | | | | 38,400 | |
| | First Interstate BancSystem, Inc., Class A+ | | | 84,600 | | | | 3,599,730 | |
| | First Merchants Corp. | | | 41,000 | | | | 1,543,650 | |
| | First Midwest Bancorp, Inc. | | | 115,900 | | | | 2,924,157 | |
| | First of Long Island Corp. (The) | | | 27,000 | | | | 770,850 | |
| | First United Corp.* | | | 3,000 | | | | 47,850 | |
| | First US Bancshares, Inc.+ | | | 3,000 | | | | 33,450 | |
| | Flushing Financial Corp. | | | 43,300 | | | | 1,272,587 | |
| | German American Bancorp, Inc. | | | 500 | | | | 26,305 | |
| | Great Southern Bancorp, Inc. | | | 39,850 | | | | 2,177,802 | |
| | Green Bancorp, Inc.*+ | | | 100,000 | | | | 1,520,000 | |
| | Heartland Financial USA, Inc. | | | 26,950 | | | | 1,293,600 | |
| | Heritage Financial Corp. | | | 60,102 | | | | 1,547,626 | |
| | Heritage Oaks Bancorp | | | 127,600 | | | | 1,573,308 | |
| | HomeTrust Bancshares, Inc.* | | | 50,000 | | | | 1,295,000 | |
| | Horizon Bancorp | | | 35,695 | | | | 999,460 | |
| | Independent Bank Group, Inc. | | | 17,787 | | | | 1,109,909 | |
| | |
Omni Tax-Managed Small-Cap Value Fund SCHEDULE OF INVESTMENTS (continued) | | |
Showing percentage of net assets as of December 31, 2016 (Unaudited)
| | | | | | | | | | |
| Industry | | Company | | Shares | | | Value | |
| | |
Common Stocks (continued) | | | | | | | | |
Commercial Banks (continued) | | | | | | | | |
| | International Bancshares Corp. | | | 64,600 | | | $ | 2,635,680 | |
| | Lakeland Bancorp, Inc. | | | 104,940 | | | | 2,046,330 | |
| | Landmark Bancorp, Inc. | | | 2,205 | | | | 61,806 | |
| | LCNB Corp. | | | 1,500 | | | | 34,875 | |
| | LegacyTexas Financial Group, Inc. | | | 20,000 | | | | 861,200 | �� |
| | Mackinac Financial Corp.+ | | | 13,400 | | | | 180,498 | |
| | MainSource Financial Group, Inc. | | | 41,765 | | | | 1,436,716 | |
| | MBT Financial Corp. | | | 62,011 | | | | 703,825 | |
| | Mercantile Bank Corp. | | | 2,000 | | | | 75,400 | |
| | Middleburg Financial Corp. | | | 22,463 | | | | 780,589 | |
| | MidSouth Bancorp, Inc. | | | 16,000 | | | | 217,600 | |
| | MidWestOne Financial Group, Inc. | | | 23,300 | | | | 876,080 | |
| | MutualFirst Financial, Inc. | | | 700 | | | | 23,170 | |
| | National Bankshares, Inc.+ | | | 1,000 | | | | 43,450 | |
| | National Commerce Corp.*+ | | | 10,000 | | | | 371,500 | |
| | NBT Bancorp, Inc. | | | 11,434 | | | | 478,856 | |
| | Northrim BanCorp, Inc. | | | 24,073 | | | | 760,707 | |
| | Norwood Financial Corp.+ | | | 1,000 | | | | 33,140 | |
| | OFG Bancorp | | | 75,000 | | | | 982,500 | |
| | Old Line Bancshares, Inc. | | | 8,050 | | | | 193,039 | |
| | Old Second Bancorp, Inc. | | | 30,050 | | | | 332,052 | |
| | Opus Bank | | | 5,000 | | | | 150,250 | |
| | Orrstown Financial Services, Inc. | | | 28,000 | | | | 627,200 | |
| | Pacific Continental Corp. | | | 56,600 | | | | 1,236,710 | |
| | Park Sterling Corp. | | | 50,298 | | | | 542,715 | |
| | Parke Bancorp, Inc. | | | 1,320 | | | | 26,598 | |
| | Peapack Gladstone Financial Corp. | | | 4,968 | | | | 153,412 | |
| | Peoples Bancorp of North Carolina, Inc. | | | 4,800 | | | | 120,336 | |
| | Peoples Bancorp, Inc. | | | 29,850 | | | | 968,931 | |
| | Peoples Financial Services Corp.+ | | | 2,600 | | | | 126,620 | |
| | Preferred Bank | | | 21,200 | | | | 1,111,304 | |
| | Premier Financial Bancorp, Inc. | | | 28,672 | | | | 576,307 | |
| | QCR Holdings, Inc. | | | 27,300 | | | | 1,182,090 | |
| | Renasant Corp. | | | 88,004 | | | | 3,715,529 | |
| | Republic Bancorp, Inc., Class A | | | 25,700 | | | | 1,016,178 | |
| | S&T Bancorp, Inc. | | | 20,700 | | | | 808,128 | |
| | Salisbury Bancorp, Inc.+ | | | 1,183 | | | | 44,362 | |
| | Sandy Spring Bancorp, Inc. | | | 14,300 | | | | 571,857 | |
| | SB Financial Group, Inc.+ | | | 28,952 | | | | 464,680 | |
| | Shore Bancshares, Inc. | | | 60,400 | | | | 921,100 | |
| | Sierra Bancorp | | | 59,400 | | | | 1,579,446 | |
| | | | | | | | | | |
| Industry | | Company | | Shares | | | Value | |
| | | |
| | | | | | | | | | |
Commercial Banks (continued) | |
| | Southern National Bancorp of Virginia, Inc. | | | 35,000 | | | $ | 571,900 | |
| | Stonegate Bank | | | 29,000 | | | | 1,210,170 | |
| | Summit State Bank+ | | | 5,000 | | | | 75,000 | |
| | Sussex Bancorp | | | 15,000 | | | | 313,500 | |
| | Tompkins Financial Corp. | | | 8,400 | | | | 794,136 | |
| | TowneBank | | | 743 | | | | 24,705 | |
| | TriCo Bancshares | | | 200 | | | | 6,836 | |
| | TriState Capital Holdings, Inc.* | | | 51,760 | | | | 1,143,896 | |
| | Triumph Bancorp, Inc.* | | | 11,600 | | | | 303,340 | |
| | Trustmark Corp. | | | 20,800 | | | | 741,520 | |
| | Two River Bancorp | | | 34,300 | | | | 511,756 | |
| | Union Bankshares Corp. | | | 84,148 | | | | 3,007,450 | |
| | Univest Corp. of Pennsylvania | | | 49,415 | | | | 1,526,924 | |
| | WesBanco, Inc. | | | 66,385 | | | | 2,858,538 | |
| | Westbury Bancorp, Inc.* | | | 1,000 | | | | 20,700 | |
| | Western New England Bancorp, Inc. | | | 83,312 | | | | 778,967 | |
| | Xenith Bankshares, Inc.*+ | | | 26,522 | | | | 747,920 | |
| | | | | | | | | | |
| | | | | | | | | 103,201,925 | |
|
Commercial Services & Supplies - 3.10% | |
| | ACCO Brands Corp.* | | | 339,800 | | | | 4,434,390 | |
| | Acme United Corp. | | | 2,000 | | | | 51,160 | |
| | Ascent Capital Group, Inc., Class A* | | | 5,000 | | | | 81,300 | |
| | Command Security Corp.*+ | | | 17,800 | | | | 48,950 | |
| | Ecology & Environment, Inc., Class A | | | 2,811 | | | | 29,656 | |
| | Ennis, Inc.+ | | | 149,265 | | | | 2,589,748 | |
| | Heritage-Crystal Clean, Inc.* | | | 14,246 | | | | 223,662 | |
| | Huron Consulting Group, Inc.* | | | 9,100 | | | | 460,915 | |
| | James River Group Holdings, Ltd. | | | 65,600 | | | | 2,725,680 | |
| | Kelly Services, Inc., Class A | | | 68,400 | | | | 1,567,728 | |
| | McGrath RentCorp | | | 93,000 | | | | 3,644,670 | |
| | Quad/Graphics, Inc. | | | 25,000 | | | | 672,000 | |
| | RCM Technologies, Inc. | | | 4,000 | | | | 25,440 | |
| | TRC Cos., Inc.* | | | 51,400 | | | | 544,840 | |
| | Versar, Inc.* | | | 35,000 | | | | 48,300 | |
| | Viad Corp. | | | 57,894 | | | | 2,553,125 | |
| | Willdan Group, Inc.* | | | 1,600 | | | | 36,144 | |
| | | | | | | | | | |
| | | | | | | | | 19,737,708 | |
Communications Equipment - 1.83% | |
| | Bel Fuse, Inc., Class B | | | 63,600 | | | | 1,965,240 | |
| | Black Box Corp. | | | 42,275 | | | | 644,694 | |
| | |
| 24 | | Semi-Annual Report | December 31, 2016 (Unaudited) |
| | |
Omni Tax-Managed Small-Cap Value Fund SCHEDULE OF INVESTMENTS (continued) | | |
Showing percentage of net assets as of December 31, 2016 (Unaudited)
| | | | | | | | | | |
| Industry | | Company | | Shares | | | Value | |
| | |
Common Stocks (continued) | | | | | | | | |
Communications Equipment (continued) | | | | | | | | |
| | Blonder Tongue Laboratories* | | | 17,859 | | | $ | 8,215 | |
| | Comtech Telecommunications Corp. | | | 40,000 | | | | 474,000 | |
| | DASAN Zhone Solutions, Inc.* | | | 34,000 | | | | 33,449 | |
| | Digi International, Inc.* | | | 30,325 | | | | 416,969 | |
| | Finisar Corp.* | | | 68,000 | | | | 2,058,360 | |
| | Harmonic, Inc.* | | | 600 | | | | 3,000 | |
| | KVH Industries, Inc.* | | | 18,200 | | | | 214,760 | |
| | NETGEAR, Inc.* | | | 101,900 | | | | 5,538,265 | |
| | PC-Tel, Inc. | | | 56,000 | | | | 301,280 | |
| | | | | | | | | | |
| | | | | | | | | 11,658,232 | |
| |
Computers & Peripherals - 0.00% | |
| | Concurrent Computer Corp. | | | 3,400 | | | | 18,190 | |
| | Datalink Corp.* | | | 500 | | | | 5,630 | |
| | | | | | | | | | |
| | | | | | | | | 23,820 | |
| |
Construction & Engineering - 2.10% | | | | | |
| | Aegion Corp.* | | | 120,300 | | | | 2,851,110 | |
| | Goldfield Corp. (The)* | | | 114,000 | | | | 581,400 | |
| | Great Lakes Dredge & Dock Corp.* | | | 167,000 | | | | 701,400 | |
| | IES Holdings, Inc.* | | | 3,600 | | | | 68,940 | |
| | KB Home+ | | | 134,700 | | | | 2,129,607 | |
| | MasTec, Inc.* | | | 63,500 | | | | 2,428,875 | |
| | MYR Group, Inc.* | | | 25,000 | | | | 942,000 | |
| | Northwest Pipe Co.* | | | 1,000 | | | | 17,220 | |
| | Orion Group Holdings, Inc.* | | | 37,072 | | | | 368,866 | |
| | Sterling Construction Co., Inc.* | | | 35,000 | | | | 296,100 | |
| | TimkenSteel Corp.* | | | 20,000 | | | | 309,600 | |
| | Tutor Perini Corp.* | | | 96,200 | | | | 2,693,600 | |
| | | | | | | | | | |
| | | | | | | | | 13,388,718 | |
| | |
Consumer Finance - 1.01% | | | | | | | | |
| | Consumer Portfolio | | | | | | | | |
| | Services, Inc.* | | | 116,650 | | | | 597,248 | |
| | Encore Capital Group, Inc.*+ | | | 16,000 | | | | 458,400 | |
| | EZCORP, Inc., Class A* | | | 26,100 | | | | 277,965 | |
| | Green Dot Corp., Class A* | | | 56,900 | | | | 1,339,995 | |
| | Nelnet, Inc., Class A | | | 26,900 | | | | 1,365,175 | |
| | Nicholas Financial, Inc.* | | | 50,200 | | | | 596,878 | |
| | Regional Management Corp.* | | | 52,100 | | | | 1,369,188 | |
| | World Acceptance Corp.*+ | | | 7,000 | | | | 449,960 | |
| | | | | | | | | | |
| | | | | | | | | 6,454,809 | |
| | |
Distributors - 0.20% | | | | | | | | |
| | AMCON Distributing Co. | | | 1,350 | | | | 155,655 | |
| | | | | | | | | | |
| Industry | | Company | | Shares | | | Value | |
| | | |
| | | | | | | | | | |
| | |
Distributors (continued) | | | | | | | | |
| | Essendant, Inc. | | | 20,000 | | | $ | 418,000 | |
| | VOXX International Corp.* | | | 83,064 | | | | 390,401 | |
| | Weyco Group, Inc. | | | 9,900 | | | | 309,870 | |
| | | | | | | | | | |
| | | | | | | | | 1,273,926 | |
| |
Diversified Consumer Services - 0.63% | | | | | |
| | American Public Education, Inc.* | | | 13,000 | | | | 319,150 | |
| | DeVry Education Group, Inc. | | | 39,000 | | | | 1,216,800 | |
| | K12, Inc.* | | | 59,600 | | | | 1,022,736 | |
| | Lincoln Educational Services Corp.* | | | 134,605 | | | | 258,442 | |
| | Regis Corp.* | | | 83,250 | | | | 1,208,790 | |
| | | | | | | | | | |
| | | | | | | | | 4,025,918 | |
| |
Diversified Financial Services - 0.79% | | | | | |
| | Enova International, Inc.* | | | 45,000 | | | | 564,750 | |
| | FNFV Group* | | | 10,000 | | | | 137,000 | |
| | GAIN Capital Holdings, Inc. | | | 146,000 | | | | 960,680 | |
| | Marlin Business Services Corp. | | | 15,775 | | | | 329,698 | |
| | NewStar Financial, Inc.* | | | 15,000 | | | | 138,750 | |
| | PHH Corp.* | | | 73,300 | | | | 1,111,228 | |
| | Sterling Bancorp | | | 47,576 | | | | 1,113,278 | |
| | Summit Financial Group, Inc.+ | | | 11,500 | | | | 316,595 | |
| | Tiptree Financial, Inc., Class A | | | 56,200 | | | | 345,630 | |
| | | | | | | | | | |
| | | | | | | | | 5,017,609 | |
|
Diversified Telecommunication Services - 0.82% | |
| | Alaska Communications | | | | | | | | |
| | Systems Group, Inc.* | | | 344,187 | | | | 564,467 | |
| | Hawaiian Telcom Holdco, Inc.* | | | 17,600 | | | | 436,128 | |
| | Iridium Communications, Inc.*+ | | | 392,125 | | | | 3,764,400 | |
| | Windstream Holdings, Inc.+ | | | 62,000 | | | | 454,460 | |
| | | | | | | | | | |
| | | | | | | | | 5,219,455 | |
| | |
Electrical Equipment - 0.89% | | | | | | | | |
| | Broadwind Energy, Inc.* | | | 26,075 | | | | 105,473 | |
| | Encore Wire Corp. | | | 6,500 | | | | 281,775 | |
| | General Cable Corp. | | | 120,000 | | | | 2,286,000 | |
| | Highpower International, Inc.* | | | 25,922 | | | | 60,917 | |
| | II-VI, Inc.* | | | 63,404 | | | | 1,879,929 | |
| | Powell Industries, Inc. | | | 25,000 | | | | 975,000 | |
| | Preformed Line Products Co. | | | 1,200 | | | | 69,744 | |
| | |
Omni Tax-Managed Small-Cap Value Fund SCHEDULE OF INVESTMENTS (continued) | | |
Showing percentage of net assets as of December 31, 2016 (Unaudited)
| | | | | | | | | | |
| Industry | | Company | | Shares | | | Value | |
| | |
Common Stocks (continued) | | | | | | | | |
Electrical Equipment (continued) | | | | | | | | |
| | Ultralife Corp.* | | | 8,350 | | | $ | 41,332 | |
| | | | | | | | | | |
| | | | | | | | | 5,700,170 | |
| |
Electronic Equipment, Instruments &
Components - 3.20% | |
| | Benchmark Electronics, Inc.* | | | 121,800 | | | | 3,714,900 | |
| | Electro Scientific Industries, Inc.* | | | 15,000 | | | | 88,800 | |
| | Fabrinet* | | | 29,150 | | | | 1,174,745 | |
| | Insight Enterprises, Inc.* | | | 44,883 | | | | 1,815,069 | |
| | Iteris, Inc.* | | | 65,000 | | | | 236,600 | |
| | Kemet Corp.* | | | 81,500 | | | | 540,345 | |
| | Key Tronic Corp.* | | | 30,500 | | | | 238,510 | |
| | Kimball Electronics, Inc.* | | | 59,100 | | | | 1,075,620 | |
| | PCM, Inc.* | | | 82,175 | | | | 1,848,938 | |
| | Plexus Corp.* | | | 500 | | | | 27,020 | |
| | Sanmina Corp.* | | | 149,100 | | | | 5,464,515 | |
| | ScanSource, Inc.* | | | 10,000 | | | | 403,500 | |
| | SMTC Corp.* | | | 13,500 | | | | 20,655 | |
| | TTM Technologies, Inc.* | | | 219,402 | | | | 2,990,449 | |
| | Vishay Precision Group, Inc.* | | | 31,667 | | | | 598,506 | |
| | Wayside Technology Group, Inc. | | | 7,200 | | | | 134,640 | |
| | | | | | | | | | |
| | | | | | | | | 20,372,812 | |
| |
Energy Equipment & Services - 1.48% | | | | | |
| | CARBO Ceramics, Inc.*+ | | | 500 | | | | 5,230 | |
| | ENGlobal Corp.* | | | 55,878 | | | | 133,548 | |
| | Era Group, Inc.* | | | 33,300 | | | | 565,101 | |
| | Gulf Island Fabrication, Inc. | | | 15,000 | | | | 178,500 | |
| | Natural Gas Services Group, Inc.* | | | 75,888 | | | | 2,439,799 | |
| | Newpark Resources, Inc.* | | | 51,000 | | | | 382,500 | |
| | Parker Drilling Co.* | | | 493,630 | | | | 1,283,438 | |
| | PHI, Inc.* | | | 3,750 | | | | 67,575 | |
| | Pioneer Energy Services Corp.* | | | 163,700 | | | | 1,121,345 | |
| | SEACOR Holdings, Inc.* | | | 30,200 | | | | 2,152,656 | |
| | Unit Corp.* | | | 40,700 | | | | 1,093,609 | |
| | | | | | | | | | |
| | | | | | | | | 9,423,301 | |
| | |
Food & Staples Retailing - 2.08% | | | | | | | | |
| | Andersons, Inc. (The) | | | 94,700 | | | | 4,233,090 | |
| | Ingles Markets, Inc., Class A | | | 92,805 | | | | 4,463,920 | |
| | SpartanNash Co. | | | 78,682 | | | | 3,111,086 | |
| | Village Super Market, Inc., Class A | | | 1,100 | | | | 33,990 | |
| | Weis Markets, Inc. | | | 20,700 | | | | 1,383,588 | |
| | | | | | | | | | |
| | | | | | | | | 13,225,674 | |
| | | | | | | | |
| Industry | | Company | | Shares | | | Value |
| | | |
| | | | | | | | |
Food Products - 0.68% | | | | | | |
| | Alico, Inc. | | | 8,100 | | | $219,915 |
| | Dean Foods Co. | | | 16,600 | | | 361,548 |
| | Omega Protein Corp.* | | | 123,650 | | | 3,097,432 |
| | S&W Seed Co.* | | | 10,000 | | | 46,000 |
| | Seneca Foods Corp., Class A* | | | 14,650 | | | 586,732 |
| | | | | | | | |
| | | | | | | | 4,311,627 |
|
Health Care Equipment & Supplies - 0.39% |
| | AngioDynamics, Inc.* | | | 52,000 | | | 877,240 |
| | Electromed, Inc.* | | | 10,000 | | | 38,800 |
| | Exactech, Inc.* | | | 17,500 | | | 477,750 |
| | FONAR Corp.* | | | 2,000 | | | 38,300 |
| | Halyard Health, Inc.* | | | 27,000 | | | 998,460 |
| | Kewaunee Scientific Corp. | | | 2,500 | | | 61,125 |
| | | | | | | | |
| | | | | | | | 2,491,675 |
|
Health Care Providers & Services - 1.54% |
| | Amedisys, Inc.* | | | 14,210 | | | 605,772 |
| | Five Star Quality Care, Inc.* | | | 141,650 | | | 382,455 |
| | Healthways, Inc.* | | | 24,500 | | | 557,375 |
| | InfuSystems Holdings, Inc.* | | | 70,178 | | | 178,954 |
| | Kindred Healthcare, Inc. | | | 106,700 | | | 837,595 |
| | LHC Group, Inc.* | | | 500 | | | 22,850 |
| | Magellan Health, Inc.* | | | 27,125 | | | 2,041,156 |
| | National Healthcare Corp. | | | 8,920 | | | 676,047 |
| | Nobilis Health Corp.* | | | 20,000 | | | 42,000 |
| | PharMerica Corp.* | | | 5,300 | | | 133,295 |
| | Select Medical Holdings Corp.* | | | 170,000 | | | 2,252,500 |
| | Triple-S Management Corp., Class B* | | | 102,100 | | | 2,113,470 |
| | | | | | | | |
| | | | | | | | 9,843,469 |
|
Hotels, Restaurants & Leisure - 2.44% |
| | Caesars Entertainment Corp.*+ | | | 95,000 | | | 807,500 |
| | Century Casinos, Inc.* | | | 79,200 | | | 651,816 |
| | Del Frisco’s Restaurant Group, Inc.* | | | 25,000 | | | 425,000 |
| | Del Taco Restaurants, Inc.* | | | 10,000 | | | 141,200 |
| | Eldorado Resorts, Inc.*+ | | | 15,000 | | | 254,250 |
| | Flanigan’s Enterprises, Inc.+ | | | 2,500 | | | 60,875 |
| | Golden Entertainment, Inc. | | | 10,000 | | | 121,100 |
| | International Speedway Corp., Class A | | | 75,760 | | | 2,787,968 |
| | Intrawest Resorts Holdings, Inc.* | | | 25,000 | | | 446,250 |
| | Luby’s, Inc.* | | | 155,800 | | | 666,824 |
| | Marcus Corp. (The) | | | 136,454 | | | 4,298,301 |
| | |
| 26 | | Semi-Annual Report | December 31, 2016 (Unaudited) |
| | |
Omni Tax-Managed Small-Cap Value Fund SCHEDULE OF INVESTMENTS (continued) | | |
Showing percentage of net assets as of December 31, 2016 (Unaudited)
| | | | | | | | | | |
| Industry | | Company | | Shares | | | Value | |
| |
Common Stocks (continued) | |
Hotels, Restaurants & Leisure (continued) | |
| | Monarch Casino & Resort, Inc.* | | | 22,300 | | | $ | 574,894 | |
| | Nevada Gold & Casinos, Inc.* | | | 10,000 | | | | 18,500 | |
| | Peak Resorts, Inc. | | | 93,600 | | | | 519,480 | |
| | Red Lion Hotels Corp.* | | | 80,695 | | | | 673,803 | |
| | Ruby Tuesday, Inc.* | | | 333,800 | | | | 1,078,174 | |
| | Speedway Motorsports, Inc. | | | 93,963 | | | | 2,036,178 | |
| | | | | | | | | | |
| | | | | | | | | 15,562,113 | |
| |
Household Durables - 1.30% | |
| | Bassett Furniture Industries, Inc. | | | 52,959 | | | | 1,609,954 | |
| | CSS Industries, Inc. | | | 68,558 | | | | 1,855,865 | |
| | Flexsteel Industries, Inc. | | | 10,500 | | | | 647,535 | |
| | Hooker Furniture Corp. | | | 15,000 | | | | 569,250 | |
| | Lifetime Brands, Inc. | | | 51,499 | | | | 914,107 | |
| | NACCO Industries, Inc., Class A | | | 16,450 | | | | 1,489,548 | |
| | P&F Industries, Inc., Class A | | | 492 | | | | 4,069 | |
| | UCP, Inc., Class A* | | | 16,700 | | | | 201,235 | |
| | ZAGG, Inc.* | | | 144,000 | | | | 1,022,400 | |
| | | | | | | | | | |
| | | | | | | | | 8,313,963 | |
| |
Household Products - 1.07% | |
| | Central Garden & Pet Co., Class A* | | | 221,400 | | | | 6,841,260 | |
| |
Insurance - 8.96% | |
| | 1347 Property Insurance | | | | | | | | |
| | Holdings, Inc.* | | | 17,500 | | | | 136,500 | |
| | Ambac Financial Group, Inc.* | | | 45,000 | | | | 1,012,500 | |
| | American Equity Investment | | | | | | | | |
| | Life Holding Co. | | | 30,250 | | | | 681,835 | |
| | AMERISAFE, Inc. | | | 56,500 | | | | 3,522,775 | |
| | Argo Group International Holdings Ltd. | | | 22,865 | | | | 1,506,804 | |
| | Baldwin & Lyons, Inc., Class B | | | 43,700 | | | | 1,101,240 | |
| | Blue Capital Reinsurance Holdings, Ltd. | | | 11,127 | | | | 205,293 | |
| | Citizens, Inc.*+ | | | 14,800 | | | | 145,336 | |
| | Donegal Group, Inc., Class A | | | 74,100 | | | | 1,295,268 | |
| | eHealth, Inc.* | | | 15,000 | | | | 159,750 | |
| | EMC Insurance Group, Inc. | | | 39,025 | | | | 1,171,140 | |
| | Employers Holdings, Inc. | | | 75,900 | | | | 3,005,640 | |
| | FBL Financial Group, Inc., Class A+ | | | 45,666 | | | | 3,568,798 | |
| | Federated National Holding Co. | | | 38,012 | | | | 710,444 | |
| | Fidelity & Guaranty Life+ | | | 45,000 | | | | 1,066,500 | |
| | | | | | | | | | |
| Industry | | Company | | Shares | | | Value | |
| | |
| | | | | | | | |
Insurance (continued) | |
| | First Acceptance Corp.* | | | 145,000 | | | $ | 150,800 | |
| | Hallmark Financial Services, Inc.* | | | 50,158 | | | | 583,338 | |
| | HCI Group, Inc.+ | | | 20,000 | | | | 789,600 | |
| | Heritage Insurance Holdings, Inc. | | | 20,000 | | | | 313,400 | |
| | Horace Mann Educators Corp. | | | 74,950 | | | | 3,207,860 | |
| | Independence Holding Co. | | | 14,950 | | | | 292,272 | |
| | Infinity Property & Casualty Corp. | | | 9,200 | | | | 808,680 | |
| | Investors Title Co. | | | 1,000 | | | | 158,180 | |
| | Kansas City Life Insurance Co. | | | 24,900 | | | | 1,182,750 | |
| | Kingstone Cos., Inc.+ | | | 4,000 | | | | 55,000 | |
| | Maiden Holdings, Ltd. | | | 167,450 | | | | 2,922,002 | |
| | MBIA, Inc.* | | | 102,800 | | | | 1,099,960 | |
| | National Security Group, Inc. (The) | | | 200 | | | | 3,500 | |
| | National Western Life | | | | | | | | |
| | Group, Inc., Class A | | | 5,350 | | | | 1,662,780 | |
| | Navigators Group, Inc. (The) | | | 37,650 | | | | 4,433,288 | |
| | NMI Holdings, Inc., Class A* | | | 185,000 | | | | 1,970,250 | |
| | OneBeacon Insurance | | | | | | | | |
| | Group Ltd., Class A | | | 151,400 | | | | 2,429,970 | |
| | Safety Insurance Group, Inc. | | | 31,800 | | | | 2,343,660 | |
| | Selective Insurance Group, Inc. | | | 50,100 | | | | 2,156,805 | |
| | State Auto Financial Corp. | | | 46,436 | | | | 1,244,949 | |
| | State National Cos, Inc. | | | 50,500 | | | | 699,930 | |
| | Stewart Information Services Corp. | | | 68,350 | | | | 3,149,568 | |
| | Third Point Reinsurance Ltd.*+ | | | 100,500 | | | | 1,160,775 | |
| | United Fire Group, Inc. | | | 60,900 | | | | 2,994,453 | |
| | United Insurance Holdings Corp. | | | 53,400 | | | | 808,476 | |
| | Universal Insurance | | | | | | | | |
| | Holdings, Inc. | | | 40,600 | | | | 1,153,040 | |
| | | | | | | | | | |
| | | | | | | | | 57,065,109 | |
|
Internet & Catalog Retail - 0.12% | |
| | CafePress, Inc.* | | | 43,400 | | | | 127,596 | |
| | FTD Cos., Inc.* | | | 27,160 | | | | 647,494 | |
| | | | | | | | | | |
| | | | | | | | | 775,090 | |
|
Internet Software & Services - 0.46% | |
| | Autobytel, Inc.* | | | 600 | | | | 8,070 | |
| | Blucora, Inc.* | | | 65,500 | | | | 966,125 | |
| | Liquidity Services, Inc.* | | | 37,350 | | | | 364,162 | |
| | Marchex, Inc., Class B* | | | 167,169 | | | | 442,998 | |
| | MeetMe, Inc.*+ | | | 41,731 | | | | 205,734 | |
| | |
Omni Tax-Managed Small-Cap Value Fund SCHEDULE OF INVESTMENTS (continued) | | |
Showing percentage of net assets as of December 31, 2016 (Unaudited)
| | | | | | | | | | |
| Industry | | Company | | Shares | | | Value | |
| | |
Common Stocks (continued) | | | | | | | | |
Internet Software & Services (continued) | |
| | RetailMeNot, Inc.* | | | 30,000 | | | $ | 279,000 | |
| | Sohu.com, Inc.*+ | | | 17,500 | | | | 593,075 | |
| | Synacor, Inc.* | | | 15,000 | | | | 46,500 | |
| | | | | | | | | | |
| | | | | | | | | 2,905,664 | |
| |
IT Services - 1.55% | |
| | CIBER, Inc.* | | | 501 | | | | 317 | |
| | Computer Task Group, Inc. | | | 72,400 | | | | 304,804 | |
| | Edgewater Technology, Inc.* | | | 11,710 | | | | 87,825 | |
| | Engility Holdings, Inc.* | | | 31,650 | | | | 1,066,605 | |
| | ManTech International Corp., Class A | | | 78,882 | | | | 3,332,764 | |
| | NCI, Inc., Class A | | | 60,700 | | | | 846,765 | |
| | NeuStar, Inc., Class A*+ | | | 61,481 | | | | 2,053,465 | |
| | PRGX Global, Inc.* | | | 97,300 | | | | 574,070 | |
| | Sykes Enterprises, Inc.* | | | 56,750 | | | | 1,637,805 | |
| | | | | | | | | | |
| | | | | | | | | 9,904,420 | |
| |
Leisure Equipment & Products - 0.50% | |
| | JAKKS Pacific, Inc.*+ | | | 129,100 | | | | 664,865 | |
| | Johnson Outdoors, Inc., Class A | | | 63,850 | | | | 2,534,206 | |
| | | | | | | | | | |
| | | | | | | | | 3,199,071 | |
| |
Machinery - 2.41% | |
| | American Railcar Industries, Inc.+ | | | 10,000 | | | | 452,900 | |
| | Ampco-Pittsburgh Corp. | | | 64,005 | | | | 1,072,084 | |
| | Art’s-Way Manufacturing Co. Inc.* | | | 5,000 | | | | 17,000 | |
| | Babcock & Wilcox Enterprises, Inc.* | | | 10,000 | | | | 165,900 | |
| | Briggs & Stratton Corp. | | | 169,450 | | | | 3,771,957 | |
| | Chart Industries, Inc.* | | | 48,000 | | | | 1,728,960 | |
| | Chicago Rivet & Machine Co. | | | 1,000 | | | | 41,600 | |
| | Cleantech Solutions International, Inc.*+ | | | 22,500 | | | | 14,850 | |
| | Columbus McKinnon Corp. | | | 33,800 | | | | 913,952 | |
| | Eastern Co. (The) | | | 20,104 | | | | 420,174 | |
| | FreightCar America, Inc. | | | 700 | | | | 10,451 | |
| | Hardinge, Inc. | | | 82,600 | | | | 915,208 | |
| | Hurco Companies, Inc. | | | 11,015 | | | | 364,596 | |
| | Hyster-Yale Materials Handling, Inc. | | | 2,700 | | | | 172,179 | |
| | Kennametal, Inc. | | | 24,000 | | | | 750,240 | |
| | L.B. Foster Co., Class A | | | 100 | | | | 1,360 | |
| | L.S. Starrett Co. (The), Class A | | | 23,900 | | | | 222,270 | |
| | NN, Inc. | | | 47,500 | | | | 904,875 | |
| | Park-Ohio Holdings Corp. | | | 10,000 | | | | 426,000 | |
| | SPX FLOW, Inc.* | | | 20,000 | | | | 641,200 | |
| | | | | | | | | | |
| Industry | | Company | | Shares | | | Value | |
| | |
| | | | | | | | |
Machinery (continued) | |
| | Supreme Industries, Inc., Class A | | | 30,450 | | | $ | 478,065 | |
| | TriMas Corp.* | | | 19,500 | | | | 458,250 | |
| | Wabash National Corp. | | | 87,000 | | | | 1,376,340 | |
| | WSI Industries, Inc.+ | | | 1,000 | | | | 3,050 | |
| | | | | | | | | | |
| | | | | | | | | 15,323,461 | |
|
Marine - 1.34% | |
| | Dorian LPG, Ltd.*+ | | | 170,954 | | | | 1,403,532 | |
| | Frontline, Ltd.+ | | | 30,500 | | | | 216,855 | |
| | International Seaways, Inc.* | | | 400 | | | | 5,615 | |
| | Navios Maritime Acquisition Corp. | | | 406,200 | | | | 690,540 | |
| | Nordic American Tankers Ltd.+ | | | 149,400 | | | | 1,254,960 | |
| | Overseas Shipholding Group, Inc., Class A | | | 1,200 | | | | 4,596 | |
| | Scorpio Tankers, Inc. | | | 580,000 | | | | 2,627,400 | |
| | Ship Finance International, Ltd.+ | | | 95,500 | | | | 1,418,175 | |
| | Teekay Tankers, Ltd., Class A | | | 410,010 | | | | 926,623 | |
| | | | | | | | | | |
| | | | | | | | | 8,548,296 | |
|
Media - 1.88% | |
| | Entercom Communications
Corp., Class A | | | 122,405 | | | | 1,872,797 | |
| | Eros International PLC*+ | | | 91,000 | | | | 1,187,550 | |
| | Gannett Co., Inc. | | | 45,000 | | | | 436,950 | |
| | Global Sources, Ltd.*+ | | | 5,000 | | | | 44,250 | |
| | Harte-Hanks, Inc. | | | 500 | | | | 755 | |
| | McClatchy Co. (The), Class A* | | | 15,432 | | | | 203,394 | |
| | New Media Investment Group, Inc. | | | 78,600 | | | | 1,256,814 | |
| | Reading International, Inc., Class A* | | | 70,400 | | | | 1,168,640 | |
| | Saga Communications, Inc., Class A | | | 2,250 | | | | 113,175 | |
| | Salem Media Group, Inc. | | | 38,600 | | | | 241,250 | |
| | Scholastic Corp. | | | 75,950 | | | | 3,606,866 | |
| | Time, Inc. | | | 26,350 | | | | 470,348 | |
| | Townsquare Media, Inc., Class A* | | | 130,044 | | | | 1,353,758 | |
| | | | | | | | | | |
| | | | | | | | | 11,956,547 | |
|
Metals & Mining - 2.57% | |
| | Carpenter Technology Corp. | | | 50,400 | | | | 1,822,968 | |
| | Coeur Mining, Inc.* | | | 179,700 | | | | 1,633,473 | |
| | Ferroglobe PLC | | | 10,000 | | | | 108,300 | |
| | Gold Resource Corp. | | | 20,000 | | | | 87,000 | |
| | Handy & Harman, Ltd.* | | | 30,300 | | | | 774,165 | |
| | |
| 28 | | Semi-Annual Report | December 31, 2016 (Unaudited) |
| | |
Omni Tax-Managed Small-Cap Value Fund SCHEDULE OF INVESTMENTS (continued) | | |
Showing percentage of net assets as of December 31, 2016 (Unaudited)
| | | | | | | | | | |
| Industry | | Company | | Shares | | | Value | |
| |
Common Stocks (continued) | |
Metals & Mining (continued) | |
| | Haynes International, Inc. | | | 22,200 | | | $ | 954,378 | |
| | Hecla Mining Co.+ | | | 749,000 | | | | 3,924,760 | |
| | Kaiser Aluminum Corp. | | | 17,200 | | | | 1,336,268 | |
| | Materion Corp. | | | 71,700 | | | | 2,839,320 | |
| | Olympic Steel, Inc. | | | 22,300 | | | | 540,329 | |
| | Schnitzer Steel Industries, Inc., Class A | | | 66,500 | | | | 1,709,050 | |
| | Stillwater Mining Co.* | | | 24,465 | | | | 394,131 | |
| | Synalloy Corp.* | | | 5,000 | | | | 54,750 | |
| | Universal Stainless & Alloy Products, Inc.* | | | 16,250 | | | | 219,538 | |
| | | | | | | | | | |
| | | | | | | | | 16,398,430 | |
| |
Multiline Retail - 0.32% | |
| | Fred’s, Inc., Class A+ | | | 108,450 | | | | 2,012,832 | |
| |
Oil, Gas & Consumable Fuels - 7.66% | |
| | Adams Resources & Energy, Inc. | | | 11,600 | | | | 459,940 | |
| | Alon USA Energy, Inc.+ | | | 195,600 | | | | 2,225,928 | |
| | Approach Resources, Inc.*+ | | | 72,174 | | | | 241,783 | |
| | Archrock, Inc. | | | 20,000 | | | | 264,000 | |
| | Ardmore Shipping Corp.+ | | | 123,988 | | | | 917,511 | |
| | Bill Barrett Corp.*+ | | | 50,500 | | | | 352,995 | |
| | California Resources Corp.*+ | | | 53,400 | | | | 1,136,886 | |
| | Callon Petroleum Co.* | | | 122,200 | | | | 1,878,214 | |
| | Clayton Williams Energy, Inc.*+ | | | 61,100 | | | | 7,286,786 | |
| | Cloud Peak Energy, Inc.*+ | | | 1,000 | | | | 5,610 | |
| | Delek US Holdings, Inc. | | | 60,000 | | | | 1,444,200 | |
| | Denbury Resources, Inc.*+ | | | 98,000 | | | | 360,640 | |
| | DHT Holdings, Inc.+ | | | 261,800 | | | | 1,083,852 | |
| | Earthstone Energy, Inc.* | | | 4,000 | | | | 54,960 | |
| | EP Energy Corp., Class A*+ | | | 50,000 | | | | 327,500 | |
| | Forum Energy Technologies, Inc.* | | | 75,000 | | | | 1,650,000 | |
| | GasLog Ltd.+ | | | 38,700 | | | | 623,070 | |
| | Gran Tierra Energy, Inc.* | | | 527,700 | | | | 1,593,654 | |
| | Green Plains, Inc. | | | 51,450 | | | | 1,432,882 | |
| | Hallador Energy Co. | | | 71,600 | | | | 650,844 | |
| | Independence Contract Drilling, Inc.* | | | 108,081 | | | | 724,143 | |
| | ION Geophysical Corp.* | | | 9,333 | | | | 55,998 | |
| | Matador Resources Co.*+ | | | 59,500 | | | | 1,532,720 | |
| | McDermott International, Inc.*+ | | | 857,000 | | | | 6,333,230 | |
| | Mitcham Industries, Inc.* | | | 5,000 | | | | 20,750 | |
| | MRC Global, Inc.* | | | 138,020 | | | | 2,796,285 | |
| | New Concept Energy, Inc.* | | | 3,600 | | | | 7,776 | |
| | Northern Oil and Gas, Inc.*+ | | | 15,000 | | | | 41,250 | |
| | | | | | | | | | |
| Industry | | Company | | Shares | | | Value | |
| | |
| | | | | | | | |
Oil, Gas & Consumable Fuels (continued) | |
| | Oasis Petroleum, Inc.* | | | 213,000 | | | $ | 3,224,820 | |
| | Oil States International, Inc.* | | | 18,000 | | | | 702,000 | |
| | Pacific Ethanol, Inc.*+ | | | 800 | | | | 7,600 | |
| | Renewable Energy Group, Inc.*+ | | | 348,319 | | | | 3,378,694 | |
| | REX American Resources Corp.* | | | 25,250 | | | | 2,493,438 | |
| | Ring Energy, Inc.* | | | 28,300 | | | | 367,617 | |
| | SM Energy Co. | | | 22,000 | | | | 758,560 | |
| | SunCoke Energy, Inc.* | | | 10,700 | | | | 121,338 | |
| | Synergy Resources Corp.*+ | | | 100,000 | | | | 891,000 | |
| | TETRA Technologies, Inc.* | | | 269,900 | | | | 1,354,898 | |
| | W&T Offshore, Inc.* | | | 600 | | | | 1,662 | |
| | | | | | | | | | |
| | | | | | | | | 48,805,034 | |
|
Paper & Forest Products - 0.80% | |
| | Clearwater Paper Corp.* | | | 16,182 | | | | 1,060,730 | |
| | Mercer International, Inc. | | | 89,950 | | | | 957,968 | |
| | PH Glatfelter Co. | | | 129,500 | | | | 3,093,755 | |
| | | | | | | | | | |
| | | | | | | | | 5,112,453 | |
|
Personal Products - 0.22% | |
| | Mannatech, Inc. | | | 25,700 | | | | 521,710 | |
| | Natural Alternatives International, Inc.* | | | 6,000 | | | | 67,800 | |
| | Nutraceutical International Corp. | | | 23,250 | | | | 812,588 | |
| | | | | | | | | | |
| | | | | | | | | 1,402,098 | |
|
Pharmaceuticals - 0.02% | |
| | Cumberland Pharmaceuticals, Inc.* | | | 20,300 | | | | 111,650 | |
|
Professional Services - 2.75% | |
| | CBIZ, Inc.* | | | 128,300 | | | | 1,757,710 | |
| | CRA International, Inc. | | | 51,000 | | | | 1,866,600 | |
| | FTI Consulting, Inc.* | | | 56,500 | | | | 2,547,020 | |
| | Heidrick & Struggles International, Inc. | | | 55,440 | | | | 1,338,876 | |
| | ICF International, Inc.* | | | 35,000 | | | | 1,932,000 | |
| | Navigant Consulting, Inc.* | | | 215,900 | | | | 5,652,262 | |
| | RPX Corp.* | | | 105,596 | | | | 1,140,437 | |
| | SPAR Group, Inc.* | | | 1,500 | | | | 1,500 | |
| | TrueBlue, Inc.* | | | 2,750 | | | | 67,788 | |
| | VSE Corp. | | | 31,660 | | | | 1,229,674 | |
| | | | | | | | | | |
| | | | | | | | | 17,533,867 | |
|
Real Estate Management & Development - 0.48% | |
| | AV Homes, Inc.* | | | 7,500 | | | | 118,500 | |
| | Forestar Group, Inc.* | | | 100,500 | | | | 1,336,650 | |
| | |
Omni Tax-Managed Small-Cap Value Fund SCHEDULE OF INVESTMENTS (continued) | | |
Showing percentage of net assets as of December 31, 2016 (Unaudited)
| | | | | | | | | | |
| Industry | | Company | | Shares | | | Value | |
| |
Common Stocks (continued) | |
Real Estate Management & Development (continued) | |
| | Griffin Industrial Realty, Inc. | | | 4,000 | | | $ | 126,920 | |
| | RE/MAX Holdings, Inc., Class A | | | 26,900 | | | | 1,506,400 | |
| | | | | | | | | | |
| | | | | | | | | 3,088,470 | |
| |
Road & Rail - 0.93% | |
| | ArcBest Corp. | | | 40,400 | | | | 1,117,060 | |
| | Celadon Group, Inc.+ | | | 2,900 | | | | 20,735 | |
| | Covenant Transportation Group, Inc., Class A* | | | 80,650 | | | | 1,559,771 | |
| | Greenbrier Companies., Inc. (The)+ | | | 22,100 | | | | 918,255 | |
| | Marten Transport, Ltd. | | | 60,466 | | | | 1,408,858 | |
| | PAM Transportation Services, Inc.* | | | 27,527 | | | | 715,151 | |
| | USA Truck, Inc.* | | | 21,435 | | | | 186,699 | |
| | | | | | | | | | |
| | | | | | | | | 5,926,529 | |
| |
Semiconductors & Semiconductor Equipment - 2.05% | |
| | Alpha & Omega Semiconductor, Ltd.* | | | 161,905 | | | | 3,443,719 | |
| | Amkor Technology, Inc.* | | | 255,200 | | | | 2,692,360 | |
| | AXT, Inc.* | | | 25,000 | | | | 120,000 | |
| | Brooks Automation, Inc. | | | 500 | | | | 8,535 | |
| | Cohu, Inc. | | | 30,000 | | | | 417,000 | |
| | Diodes, Inc.* | | | 44,400 | | | | 1,139,748 | |
| | GigPeak, Inc.* | | | 65,000 | | | | 163,800 | |
| | inTEST Corp.* | | | 54,500 | | | | 250,700 | |
| | IXYS Corp. | | | 39,000 | | | | 464,100 | |
| | Kulicke & Soffa Industries, Inc.* | | | 100,300 | | | | 1,599,785 | |
| | Photronics, Inc.* | | | 171,470 | | | | 1,937,611 | |
| | Sigma Designs, Inc.* | | | 3,800 | | | | 22,800 | |
| | Ultra Clean Holdings, Inc.* | | | 57,000 | | | | 552,900 | |
| | Xcerra Corp.* | | | 30,000 | | | | 229,200 | |
| | | | | | | | | | |
| | | | | | | | | 13,042,258 | |
| |
Software - 0.72% | |
| | Ebix, Inc.+ | | | 40,000 | | | | 2,282,000 | |
| | GSE Systems, Inc.* | | | 22,500 | | | | 78,750 | |
| | Mind CTI Ltd. | | | 500 | | | | 1,220 | |
| | Net 1 UEPS Technologies, Inc.* | | | 171,100 | | | | 1,964,228 | |
| | NetSol Technologies, Inc.* | | | 16,680 | | | | 86,736 | |
| | Network-1 Technologies, Inc.* | | | 50,000 | | | | 170,000 | |
| | | | | | | | | | |
| | | | | | | | | 4,582,934 | |
| |
Specialty Retail - 4.47% | |
| | Barnes & Noble Education, Inc.* | | | 50,560 | | | | 579,923 | |
| | Barnes & Noble, Inc. | | | 114,000 | | | | 1,271,100 | |
| | | | | | | | | | |
| | | | | | | | | | |
| | | | | | | | | | |
| Industry | | Company | | Shares | | | Value | |
| | |
| | | | | | | | |
Specialty Retail (continued) | |
| | Big 5 Sporting Goods Corp. | | | 119,603 | | | $ | 2,075,112 | |
| | Caleres, Inc. | | | 30,000 | | | | 984,600 | |
| | Children’s Place, Inc. (The) | | | 17,900 | | | | 1,807,005 | |
| | Christopher & Banks Corp.* | | | 200 | | | | 468 | |
| | Citi Trends, Inc. | | | 76,150 | | | | 1,434,666 | |
| | Destination Maternity Corp.+ | | | 2,200 | | | | 11,374 | |
| | Express, Inc.* | | | 37,000 | | | | 398,120 | |
| | Finish Line, Inc. (The), Class A | | | 103,000 | | | | 1,937,430 | |
| | FirstCash, Inc. | | | 71,484 | | | | 3,359,748 | |
| | Genesco, Inc.* | | | 30,000 | | | | 1,863,000 | |
| | Group 1 Automotive, Inc. | | | 13,000 | | | | 1,013,220 | |
| | Guess?, Inc.+ | | | 87,000 | | | | 1,052,700 | |
| | Haverty Furniture Cos., Inc. | | | 30,300 | | | | 718,110 | |
| | hhgregg, Inc.*+ | | | 38,500 | | | | 55,055 | |
| | Kirkland’s, Inc.* | | | 7,400 | | | | 114,774 | |
| | New York & Co., Inc.* | | | 125,700 | | | | 285,339 | |
| | Pier 1 Imports, Inc. | | | 50,000 | | | | 427,000 | |
| | Rent-A-Center, Inc. | | | 800 | | | | 9,000 | |
| | Sears Hometown & Outlet Stores, Inc.* | | | 10,000 | | | | 47,000 | |
| | Shoe Carnival, Inc. | | | 57,500 | | | | 1,551,350 | |
| | Sonic Automotive, Inc., Class A | | | 73,500 | | | | 1,683,150 | |
| | Stage Stores, Inc. | | | 245 | | | | 1,071 | |
| | Stein Mart, Inc. | | | 60,800 | | | | 333,184 | |
| | Systemax, Inc. | | | 21,000 | | | | 184,170 | |
| | Tilly’s, Inc., Class A* | | | 79,900 | | | | 1,053,881 | |
| | Trans World Entertainment Corp.* | | | 30,000 | | | | 97,500 | |
| | TravelCenters of America LLC* | | | 189,850 | | | | 1,347,935 | |
| | Vitamin Shoppe, Inc.* | | | 35,000 | | | | 831,250 | |
| | West Marine, Inc.* | | | 86,000 | | | | 900,420 | |
| | Zumiez, Inc.*+ | | | 48,400 | | | | 1,057,540 | |
| | | | | | | | | | |
| | | | | | | | | 28,486,195 | |
|
Textiles, Apparel & Luxury Goods - 0.91% | |
| | Abercrombie & Fitch Co., | | | | | | | | |
| | Class A | | | 63,000 | | | | 756,000 | |
| | Delta Apparel, Inc.* | | | 23,700 | | | | 491,301 | |
| | Movado Group, Inc. | | | 25,600 | | | | 736,000 | |
| | Perry Ellis International, Inc.* | | | 135,184 | | | | 3,367,433 | |
| | Rocky Brands, Inc. | | | 30,450 | | | | 351,698 | |
| | Unifi, Inc.* | | | 2,800 | | | | 91,364 | |
| | | | | | | | | | |
| | | | | | | | | 5,793,796 | |
|
Thrifts & Mortgage Finance - 3.80% | |
| | Astoria Financial Corp. | | | 120,900 | | | | 2,254,785 | |
| | Berkshire Hills Bancorp, Inc. | | | 55,570 | | | | 2,047,755 | |
| | Brookline Bancorp, Inc. | | | 30,000 | | | | 492,000 | |
| | |
| 30 | | Semi-Annual Report | December 31, 2016 (Unaudited) |
| | |
Omni Tax-Managed Small-Cap Value Fund SCHEDULE OF INVESTMENTS (continued) | | |
Showing percentage of net assets as of December 31, 2016 (Unaudited)
| | | | | | | | | | |
| Industry | | Company | | Shares | | | Value | |
| |
Common Stocks (continued) | |
Thrifts & Mortgage Finance (continued) | |
| | Charter Financial Corp. | | | 12,500 | | | $ | 208,375 | |
| | Citizens Community Bancorp, Inc. | | | 17,500 | | | | 217,525 | |
| | Entegra Financial Corp.* | | | 12,000 | | | | 247,200 | |
| | ESSA Bancorp, Inc. | | | 35,000 | | | | 550,200 | |
| | Federal Agricultural Mortgage Corp., Class C | | | 9,700 | | | | 555,519 | |
| | First Defiance Financial Corp. | | | 29,150 | | | | 1,479,071 | |
| | First Financial Northwest, Inc. | | | 26,400 | | | | 521,136 | |
| | Hingham Institution for Savings | | | 1,143 | | | | 224,920 | |
| | Home Bancorp, Inc. | | | 15,597 | | | | 602,200 | |
| | HomeStreet, Inc.* | | | 54,000 | | | | 1,706,400 | |
| | HopFed Bancorp, Inc. | | | 23,500 | | | | 316,310 | |
| | Lake Sunapee Bank Group | | | 2,000 | | | | 47,180 | |
| | Meta Financial Group, Inc. | | | 20,078 | | | | 2,066,026 | |
| | Nationstar Mortgage Holdings, Inc.*+ | | | 35,000 | | | | 632,100 | |
| | Ocwen Financial Corp.*+ | | | 50,000 | | | | 269,500 | |
| | Provident Financial Holdings, Inc. | | | 53,710 | | | | 1,086,016 | |
| | Provident Financial Services, Inc. | | | 67,400 | | | | 1,907,420 | |
| | Prudential Bancorp, Inc. | | | 957 | | | | 16,384 | |
| | Riverview Bancorp, Inc. | | | 72,478 | | | | 507,346 | |
| | Security National Financial Corp., Class A* | | | 13,671 | | | | 88,862 | |
| | SI Financial Group, Inc. | | | 30,000 | | | | 462,000 | |
| | Territorial Bancorp, Inc. | | | 21,900 | | | | 719,196 | |
| | Timberland Bancorp, Inc. | | | 32,000 | | | | 661,120 | |
| | TrustCo Bank Corp. | | | 20,000 | | | | 175,000 | |
| | United Community Bancorp | | | 10,000 | | | | 167,000 | |
| | United Community Financial Corp. | | | 163 | | | | 1,457 | |
| | United Financial Bancorp, Inc. | | | 10,000 | | | | 181,600 | |
| | Walker & Dunlop, Inc.* | | | 48,175 | | | | 1,503,060 | |
| | Waterstone Financial, Inc. | | | 15,000 | | | | 276,000 | |
| | WSFS Financial Corp. | | | 43,000 | | | | 1,993,050 | |
| | | | | | | | | | |
| | | | | | | | | 24,183,713 | |
| |
Trading Companies & Distributors - 1.66% | |
| | AeroCentury Corp.* | | | 4,300 | | | | 40,635 | |
| | Aircastle, Ltd. | | | 30,000 | | | | 625,500 | |
| | CAI International, Inc.* | | | 37,100 | | | | 321,657 | |
| | General Finance Corp.* | | | 135,064 | | | | 749,605 | |
| | Houston Wire & Cable Co. | | | 46,100 | | | | 299,650 | |
| | Kaman Corp. | | | 16,500 | | | | 807,345 | |
| | Rush Enterprises, Inc., | | | | | | | | |
| | Class A* | | | 48,600 | | | | 1,550,340 | |
| | | | | | | | | | | | | | |
| Industry | | Company | | | | | Shares | | | Value | |
|
| |
Trading Companies & Distributors (continued) | |
| | Rush Enterprises, Inc., Class B* | | | | 41,700 | | | $ | 1,287,279 | |
| | Titan Machinery, Inc.*+ | | | | 75,500 | | | | 1,100,035 | |
| | Veritiv Corp.* | | | | 46,133 | | | | 2,479,649 | |
| | Willis Lease Finance Corp.* | | | | 50,950 | | | | 1,303,301 | |
| | | | | | | | | | | | | | |
| | | | | | | | | | | | | 10,564,996 | |
|
Wireless Telecommunication Services - 0.36% | |
| | Spok Holdings, Inc. | | | | 111,100 | | | | 2,305,325 | |
| | | | | | | | | | | | | | |
TOTAL COMMON STOCKS - 100.00% | | | | 637,142,697 | |
| | | | | | | | | | | | | | |
(Cost $430,262,523) | |
|
WARRANTS - 0.00% | |
| | Eagle Bulk Shipping, Inc.,expiring 10/15/21* | | | | 8,501 | | | | 556 | |
| | | | | | | | | | | | | | |
TOTAL WARRANTS - 0.00% | | | | 556 | |
| | | | | | | | | | | | | | |
(Cost $70,770) | | | | | |
|
INVESTMENTS PURCHASED WITH CASH PROCEEDS FROM SECURITIES LENDING - 7.26% | |
Fidelity Institutional Government Portfolio Institutional Class** | | | 0.43 | % | | | 46,224,925 | | | | 46,224,925 | |
| | | | | | | | | | | | | | |
TOTAL INVESTMENTS PURCHASED WITH CASH PROCEEDS FROM SECURITIES LENDING - 7.26% | | | | 46,224,925 | |
| | | | | | | | | | | | | | |
(Cost $46,224,925) | | | | | | | | | | | | |
| |
TOTAL INVESTMENTS - 107.26% | | | $ | 683,368,178 | |
(Cost $476,558,218) | | | | | | | | | | | | |
Liabilities in Excess of Other Assets - (7.26%) | | | | (46,233,779 | ) |
| | | | | | | | | | | | | | |
NET ASSETS - 100.00% | | | $ | 637,134,399 | |
| | | | | | | | | | | | | | |
| * | Non-income producing security. |
| ** | This security represents the investment of the collateral received in connection with securities out on loan as of December 31, 2016. |
| ^ | Rate disclosed as of December 31, 2016. |
| + | This security or a portion of the security is out on loan as of December 31, 2016. Total loaned securities had a value of $44,094,833 as of December 31, 2016. |
LLC - Limited Liability Company
PLC - Public Limited Company
| | |
Omni Tax-Managed Small-Cap Value Fund SCHEDULE OF INVESTMENTS (continued) | | |
Showing percentage of net assets as of December 31, 2016 (Unaudited)
| | | | | | | | | | | | | | |
Summary of inputs used to value the Fund’s investments as of 12/31/2016 (See Note 2 in Notes to Financial Statements): | |
| | | Valuation Inputs | |
| |
| | | Investment in Securities (Value) | |
| |
| | | | |
| |
| Level 1
Quoted
Prices |
| |
| Level 2
Significant
Observable
Inputs |
| | Level 3
Significant
Unobservable
Inputs | | | Total | |
| |
| | | | |
Common Stocks | | $ | 637,142,697 | | | $ | — | | | $ — | | $ | 637,142,697 | |
| | | | |
Warrants | | | 556 | | | | — | | | — | | | 556 | |
| | | | |
Money Market Fund | | | — | | | | — | | | — | | | — | |
| | | | |
Investments Purchased with Cash Proceeds from Securities Lending | | | — | | | | 46,224,925 | | | — | | | 46,224,925 | |
| | | | | | | | | | | | | | |
| | | | |
TOTAL | | $ | 637,143,253 | | | $ | 46,224,925 | | | $ — | | $ | 683,368,178 | |
| | | | | | | | | | | | | | |
|
| See Notes to Financial Statements. | |
| | |
| 32 | | Semi-Annual Report | December 31, 2016 (Unaudited) |
| | |
STATEMENTS OF ASSETS AND LIABILITIES | | |
December 31, 2016 (Unaudited)
| | | | | | | | | | | | | | | | | | | | |
| ASSETS | | Omni Small-Cap Value | | | | | Omni Tax-Managed
Small-Cap Value | | | |
| | | | | | |
Investments at value | | | $709,518,227 | | | | | | | | | | $683,368,178 | | | | | | | |
| | | | | | |
Receivables: | | | | | | | | | | | | | | | | | | | | |
| | | | | | |
Portfolio securities sold | | | 2,462,783 | | | | | | | | | | 1,966,269 | | | | | | | |
| | | | | | |
Fund shares sold | | | 498,491 | | | | | | | | | | 537,439 | | | | | | | |
| | | | | | |
Dividends and interest . | | | 556,541 | | | | | | | | | | 494,479 | | | | | | | |
| | | | | | |
Prepaid expenses. | | | 58,218 | | | | | | | | | | 51,233 | | | | | | | |
| | | | | | |
Total assets | | | 713,094,260 | | | | | | | | | | 686,417,598 | | | | | | | |
| | | | | | |
LIABILITIES | | | | | | | | | | | | | | | | | | | | |
| | | | | | |
Payables: | | | | | | | | | | | | | | | | | | | | |
| | | | | | |
Portfolio securities purchased | | | 714,101 | | | | | | | | | | 1,716,190 | | | | | | | |
| | | | | | |
Fund shares redeemed | | | 695,866 | | | | | | | | | | 681,997 | | | | | | | |
| | | | | | |
Due to custodian | | | - | | | | | | | | | | 3,667 | | | | | | | |
| | | | | | |
Loan payable | | | 1,354,436 | | | | | | | | | | 284,214 | | | | | | | |
| | | | | | |
Payable upon return of securities loaned | | | 16,705,785 | | | | | | | | | | 46,224,925 | | | | | | | |
| | | | | | |
Accrued Liabilities: | | | | | | | | | | | | | | | | | | | | |
| | | | | | |
Investment advisory fees. | | | 238,048 | | | | | | | | | | 220,216 | | | | | | | |
| | | | | | |
Administration fees | | | 17,101 | | | | | | | | | | 12,876 | | | | | | | |
| | | | | | |
Directors’ fees | | | 1,848 | | | | | | | | | | 1,675 | | | | | | | |
| | | | | | |
Other | | | 151,053 | | | | | | | | | | 137,439 | | | | | | | |
| | | | | | |
Total liabilities | | | 19,878,238 | | | | | | | | | | 49,283,199 | | | | | | | |
| | | | | | |
NET ASSETS | | | $693,216,022 | | | | | | | | | | $637,134,399 | | | | | | | |
| | | | | | |
NET ASSETS REPRESENT | | | | | | | | | | | | | | | | | | | | |
| | | | | | |
Paid-in capital | | | $463,185,069 | | | | | | | | | | $422,430,342 | | | | | | | |
| | | | | | |
Undistributed net investment income | | | 29,172 | | | | | | | | | | 3,215,646 | | | | | | | |
| | | | | | |
Accumulated net realized gain on investments | | | 10,484,671 | | | | | | | | | | 4,678,451 | | | | | | | |
| | | | | | |
Net unrealized appreciation on investments | | | 219,517,110 | | | | | | | | | | 206,809,960 | | | | | | | |
| | | | | | |
NET ASSETS | | | $693,216,022 | | | | | | | | | | $637,134,399 | | | | | | | |
| | | | | | |
Shares of common stock outstanding of $.001 par
value* | | | 36,881,235 | | | | | | | | | | 35,416,827 | | | | | | | |
| | | | | | |
Net asset value, offering price and redemption price per
share | | | $ 18.80 | | | | | | | | | | $ 17.99 | | | | | | | |
| | | | | | |
Total investments at cost | | | $490,001,117 | | | | | | | | | | $476,558,218 | | | | | | | |
* See Note 1 - Organization in the Notes to Financial Statements for shares authorized for each Fund.
See Notes to Financial Statements.
| | |
STATEMENTS OF OPERATIONS | | |
Six Months Ended December 31, 2016 (Unaudited)
| | | | | | | | | | | | | | | | | | | | |
| | | Omni
Small-Cap Value | | | | Omni Tax-Managed
Small-Cap Value | | |
| | | | |
INVESTMENT INCOME | | | | | | | | | | | | | | | | | | | | |
| | | | |
Dividends | | | | $ 4,959,332 | | | | | | | | | | $ 4,605,714 | | | | | | |
| | | | |
Less: foreign taxes withheld | | | | (845 | ) | | | | | | | | | (500 | ) | | | | | |
| | | | |
Securities lending | | | | 224,344 | | | | | | | | | | 324,098 | | | | | | |
| | | | |
Total Investment Income | | | | 5,182,831 | | | | | | | | | | 4,929,312 | | | | | | |
| | | | |
EXPENSES | | | | | | | | | | | | | | | | | | | | |
| | | | |
Investment advisory fees | | | | 1,567,570 | | | | | | | | | | 1,427,780 | | | | | | |
| | | | |
Administration fees. | | | | 83,053 | | | | | | | | | | 73,000 | | | | | | |
| | | | |
Accounting fees | | | | 77,658 | | | | | | | | | | 73,528 | | | | | | |
| | | | |
Transfer agent fees | | | | 7,197 | | | | | | | | | | 7,170 | | | | | | |
| | | | |
Professional fees | | | | 60,330 | | | | | | | | | | 55,411 | | | | | | |
| | | | |
Custody fees | | | | 9,431 | | | | | | | | | | 9,173 | | | | | | |
| | | | |
Blue sky fees | | | | 28,100 | | | | | | | | | | 34,019 | | | | | | |
| | | | |
Directors’ and officers’ fees | | | | 30,195 | | | | | | | | | | 27,512 | | | | | | |
| | | | |
Shareholder servicing fees | | | | 258,270 | | | | | | | | | | 227,944 | | | | | | |
| | | | |
Reports to shareholders | | | | 16,906 | | | | | | | | | | 13,865 | | | | | | |
| | | | |
Miscellaneous expenses | | | | 55,269 | | | | | | | | | | 50,177 | | | | | | |
| | | | |
Total Expenses | | | | 2,193,979 | | | | | | | | | | 1,999,579 | | | | | | |
| | | | |
Less investment advisory fees waived | | | | (312,895 | ) | | | | | | | | | (286,243 | ) | | | | | |
| | | | |
Net Expenses | | | | 1,881,084 | | | | | | | | | | 1,713,336 | | | | | | |
| | | | |
NET INVESTMENT INCOME | | | | 3,301,747 | | | | | | | | | | 3,215,976 | | | | | | |
| | | | |
NET REALIZED AND UNREALIZED GAIN ON INVESTMENTS | | | | | | | | | | | | | | | | | | | | |
| | | | |
Realized Gain on: | | | | | | | | | | | | | | | | | | | | |
| | | | |
Investments | | | | 19,688,560 | | | | | | | | | | 13,260,539 | | | | | | |
| | | | |
Change in Unrealized Appreciation (Depreciation) on: | | | | | | | | | | | | | | | | | | | | |
| | | | |
Investments | | | | 139,800,005 | | | | | | | | | | 130,771,610 | | | | | | |
| | | | |
Net Realized and Unrealized Gain on Investments | | | | 159,488,565 | | | | | | | | | | 144,032,149 | | | | | | |
| | | | |
NET INCREASE IN NET ASSETS RESULTING FROM OPERATIONS | | | | $162,790,312 | | | | | | | | | | $147,248,125 | | | | | | |
See Notes to Financial Statements.
| | |
| 34 | | Semi-Annual Report | December 31, 2016 (Unaudited) |
| | |
STATEMENTS OF CHANGES IN NET ASSETS | | |
| | | | | | | | | | | | | | | | | | | | |
| | | Omni
Small-Cap Value | | Omni Tax-Managed
Small-Cap Value |
| | | Six Months Ended
December 31, 2016
(Unaudited) | | Year Ended
June 30, 2016 | | Six Months Ended
December 31, 2016
(Unaudited) | | Year Ended
June 30, 2016 |
| | | | |
OPERATIONS | | | | | | | | | | | | | | | | | | | | |
| | | | |
Net investment income | | | | $ 3,301,747 | | | | | $ 5,760,972 | | | | | $ 3,215,976 | | | | | $ 5,292,328 | |
| | | | |
Net realized gain (loss) on investments | | | | 19,688,560 | | | | | (5,156,734 | ) | | | | 13,260,539 | | | | | (5,787,803 | ) |
| | | | |
Net change in unrealized appreciation (depreciation) on investments | | | | 139,800,005 | | | | | (11,917,008 | ) | | | | 130,771,610 | | | | | (12,483,133 | ) |
| | | | |
Net increase (decrease) in net assets resulting from operations | | | | 162,790,312 | | | | | (11,312,770 | ) | | | | 147,248,125 | | | | | (12,978,608 | ) |
| | | | |
DISTRIBUTIONS: | | | | | | | | | | | | | | | | | | | | |
| | | | |
From net investment income. | | | | (6,191,149 | ) | | | | (4,704,613 | ) | | | | (4,983,381 | ) | | | | (3,274,284 | ) |
| | | | |
Net decrease in net assets resulting from distributions | | | | (6,191,149 | ) | | | | (4,704,613 | ) | | | | (4,983,381 | ) | | | | (3,274,284 | ) |
| | | | |
SHARE TRANSACTIONS: | | | | | | | | | | | | | | | | | | | | |
| | | | |
Proceeds from sale of shares | | | | 43,466,853 | | | | | 267,382,250 | | | | | 47,398,707 | | | | | 280,799,281 | |
| | | | |
Reinvestment of distributions | | | | 6,188,289 | | | | | 4,704,241 | | | | | 4,967,930 | | | | | 3,264,234 | |
| | | | |
Cost of shares redeemed | | | | (71,323,826 | ) | | | | (157,150,700 | ) | | | | (63,491,939 | ) | | | | (222,916,519 | ) |
| | | | |
Net increase (decrease) in net assets resulting from share transactions | | | | (21,668,684 | ) | | | | 114,935,791 | | | | | (11,125,302 | ) | | | | 61,146,996 | |
| | | | |
Net increase in net assets | | | | 134,930,479 | | | | | 98,918,408 | | | | | 131,139,442 | | | | | 44,894,104 | |
| | | | |
NET ASSETS: | | | | | | | | | | | | | | | | | | | | |
| | | | |
Beginning of period | | | | 558,285,543 | | | | | 459,367,135 | | | | | 505,994,957 | | | | | 461,100,853 | |
| | | | |
End of period* | | | | $693,216,022 | | | | | $558,285,543 | | | | | $637,134,399 | | | | | $505,994,957 | |
| | | | |
SHARES ISSUED & REDEEMED | | | | | | | | | | | | | | | | | | | | |
| | | | |
Issued | | | | 2,608,718 | | | | | 19,594,288 | | | | | 2,998,213 | | | | | 21,596,228 | |
| | | | |
Distributions reinvested | | | | 328,117 | | | | | 330,354 | | | | | 275,079 | | | | | 240,017 | |
| | | | |
Redeemed | | | | (4,143,767 | ) | | | | (11,488,298 | ) | | | | (3,894,095 | ) | | | | (17,275,572 | ) |
| | | | |
Net increase (decrease) in shares | | | | (1,206,932 | ) | | | | 8,436,344 | | | | | (620,803 | ) | | | | 4,560,673 | |
| | | | |
Outstanding at beginning of period | | | | 38,088,167 | | | | | 29,651,823 | | | | | 36,037,630 | | | | | 31,476,957 | |
| | | | |
Outstanding at end of period | | | | 36,881,235 | | | | | 38,088,167 | | | | | 35,416,827 | | | | | 36,037,630 | |
| | | | |
* Including undistributed net investment income of: | | | | $ 29,172 | | | | | $ 2,918,574 | | | | | $ 3,215,646 | | | | | $ 4,983,051 | |
See Notes to Financial Statements.
(for a share outstanding throughout each period indicated)
| | | | | | | | | | | | | | | | | | | | | | | | |
| OMNI SMALL-CAP VALUE | | | | | | | | | | | | | | | | | | | | | | | | |
| | | | | | Year Ended June 30 | | | | |
| | | For the
Period Ended
12/31/16
(Unaudited) | | | 2016 | | | 2015 | | | 2014 | | | 2013 | | | For the
Period Ended
06/30/2012(a) | |
| | | | | | | | | | | | | | | | | | | | | | | | |
Net Asset Value, Beginning of Period | | | $14.66 | | | | $15.49 | | | | $16.63 | | | | $14.11 | | | | $11.11 | | | | $10.00 | |
| | | | | | | | | | | | | | | | | | | | | | | | |
| | | | | |
Income from Investment Operations: | | | | | | | | | | | | | | | | | | | | | |
| | | | | | |
Net Investment Income(b) | | | 0.09 | | | | 0.17 | | | | 0.14 | | | | 0.11 | | | | 0.17 | | | | 0.08 | |
Net Realized and Unrealized Gain (Loss) | | | 4.22 | | | | (0.86) | | | | (0.46) | | | | 3.58 | | | | 3.12 | | | | 1.06 | |
| | | | | | | | | | | | | | | | | | | | | | | | |
| | | | | | |
Total from Investment Operations | | | 4.31 | | | | (0.69) | | | | (0.32) | | | | 3.69 | | | | 3.29 | | | | 1.14 | |
| | | | | | | | | | | | | | | | | | | | | | | | |
| | | | | |
Less Distributions to Shareholders from: | | | | | | | | | | | | | | | | | | | | | |
| | | | | | |
Net Investment Income | | | (0.17) | | | | (0.14) | | | | (0.09) | | | | (0.08) | | | | (0.16) | | | | (0.03) | |
Net Realized Gain | | | - | | | | - | | | | (0.73) | | | | (1.09) | | | | (0.13) | | | | - | |
| | | | | | | | | | | | | | | | | | | | | | | | |
| | | | | | |
Total Distributions | | | (0.17) | | | | (0.14) | | | | (0.82) | | | | (1.17) | | | | (0.29) | | | | (0.03) | |
| | | | | | | | | | | | | | | | | | | | | | | | |
| | | | | | |
Net Asset Value, End of Period | |
| $18.80
|
| |
| $14.66
|
| |
| $15.49
|
| |
| $16.63
|
| |
| $14.11
|
| |
| $11.11
|
|
| | | | | | | | | | | | | | | | | | | | | | | | |
| | | | | | |
Total Return(c) | | | 29.37%(d) | | | | (4.42%) | | | | (1.48%) | | | | 26.89% | | | | 30.08% | | | | 11.41%(d) | |
| | | | | |
Ratios and Supplemental Data: | | | | | | | | | | | | | | | | | | | | | |
| | | | | | |
Net Assets, End of Period (in 000’s) | | | $693,216 | | | | $558,286 | | | | $459,367 | | | | $407,192 | | | | $260,909 | | | | $179,553 | |
| | | | | | |
Expenses Before Waivers and | | | | | | | | | | | | | | | | | | | | | | | | |
| | | | | | |
Reimbursements | | | 0.70%(e) | | | | 0.71% | | | | 0.71% | | | | 0.71% | | | | 0.78% | | | | 0.84%(e) | |
| | | | | | |
Expenses After Waivers and Reimbursements | | | 0.60%(e) | | | | 0.60% | | | | 0.60% | | | | 0.60% | | | | 0.60% | | | | 0.60%(e) | |
| | | | | | |
Net Investment Income After Waivers and Reimbursements | | | 1.05%(e) | | | | 1.17% | | | | 0.88% | | | | 0.70% | | | | 1.36% | | | | 0.92%(e) | |
| | | | | | |
Portfolio Turnover Rate | | | 8%(d) | | | | 24% | | | | 25% | | | | 31% | | | | 34% | | | | 8%(d) | |
| (a) | Commenced operations on August 31, 2011. |
| (b) | Per share amounts calculated based on the average daily shares outstanding during the period. |
| (c) | Total return would have been lower had various fees not been waived during the period. |
| (e) | Annualized for periods less than one year. |
See Notes to Financial Statements.
| | |
| 36 | | Semi-Annual Report | December 31, 2016 (Unaudited) |
(for a share outstanding throughout each period indicated)
| | | | | | | | | | | | |
| OMNI TAX-MANAGED SMALL-CAP VALUE |
| | | | | Year Ended June 30 | | |
| | | For the Period Ended
12/31/16
(Unaudited) | | 2016 | | 2015 | | 2014 | | 2013 | | 2012 |
| | | | | | | | | | | | |
| | | | | | |
Net Asset Value, Beginning of Period | | $14.04 | | $14.65 | | $15.54 | | $12.75 | | $10.05 | | $10.68 |
| | | | | | | | | | | | |
| | | | | | |
Income from Investment Operations: | | | | | | | | | | | | |
| | | | | | |
Net Investment Income(a) | | 0.09 | | 0.16 | | 0.12 | | 0.09 | | 0.15 | | 0.09 |
Net Realized and Unrealized Gain (Loss) | | 4.00 | | (0.66) | | (0.42) | | 3.26 | | 2.68 | | (0.67)(b) |
| | | | | | | | | | | | |
| | | | | | |
Total from Investment Operations | | 4.09 | | (0.50) | | (0.30) | | 3.35 | | 2.83 | | (0.58) |
| | | | | | | | | | | | |
| | | | | | |
Less Distributions to Shareholders from: | | | | | | | | | | | | |
| | | | | | |
Net Investment Income | | (0.14) | | (0.11) | | (0.03) | | (0.08) | | (0.13) | | (0.05) |
Net Realized Gain | | - | | - | | (0.56) | | (0.48) | | - | | - |
| | | | | | | | | | | | |
| | | | | | |
Total Distributions | | (0.14) | | (0.11) | | (0.59) | | (0.56) | | (0.13) | | (0.05) |
| | | | | | | | | | | | |
| | | | | | |
Net Asset Value, End of Period | | $17.99 | | $14.04 | | $14.65 | | $15.54 | | $12.75 | | $10.05 |
| | | | | | | | | | | | |
| | | | | | |
Total Return(c) | | 29.13%(d) | | (3.42%) | | (1.62%) | | 26.71% | | 28.43% | | (5.41%) |
| | | | | | |
Ratios and Supplemental Data: | | | | | | | | | | | | |
| | | | | | |
Net Assets, End of Period (in 000’s) | | $637,134 | | $505,995 | | $461,101 | | $425,330 | | $262,088 | | $127,216 |
| | | | | | |
Expenses Before Waivers and Reimbursements | | 0.70%(e) | | 0.72% | | 0.71% | | 0.71% | | 0.77% | | 0.90% |
| | | | | | |
Expenses After Waivers and Reimbursements | | 0.60%(e) | | 0.60% | | 0.60% | | 0.60% | | 0.60% | | 0.60% |
| | | | | | |
Net Investment Income After Waivers and Reimbursements | | 1.13%(e) | | 1.20% | | 0.84% | | 0.65% | | 1.34% | | 0.95% |
| | | | | | |
Portfolio Turnover Rate | | 9%(d) | | 29% | | 30% | | 25% | | 34% | | 26% |
| (a) | Per share amounts calculated based on the average daily shares outstanding during the period. |
| (b) | Realized and unrealized gain (loss) per share do not correlate to the aggregate of the net unrealized and realized gain in the Statements of Changes in Net Assets for the year ended June 30, 2012, primarily due to the timing of the sales and repurchases of the Fund’s shares in relation to fluctuating market values for the Fund’s portfolio. |
| (c) | Total return would have been lower had various fees not been waived during the period. |
| (e) | Annualized for periods less than one year. |
See Notes to Financial Statements.
| | |
NOTES TO FINANCIAL STATEMENTS | | |
December 31, 2016 (Unaudited)
1. Organization:
Bridgeway Funds, Inc. (“Bridgeway” or the “Company”) was organized as a Maryland corporation on October 19, 1993, and is registered under the Investment Company Act of 1940, as amended (the “1940 Act”), as an open-end management investment company.
Bridgeway is organized as a series fund, with 10 investment funds as of December 31, 2016 (each is referred to as a “Bridgeway Fund” and collectively, the “Bridgeway Funds”). The Aggressive Investors 1, Ultra-Small Company, Ultra-Small Company Market, Small-Cap Momentum, Small-Cap Growth, Small-Cap Value, Blue Chip 35 Index and Managed Volatility Funds are presented in a separate report. The Omni Small-Cap Value Fund and the Omni Tax-Managed Small-Cap Value Fund (each a “Fund” and together, the “Funds”) are presented in this report.
Bridgeway is authorized to issue 1,915,000,000 shares of common stock at $0.001 per share. As of December 31, 2016, 100,000,000 shares have been classified into the Aggressive Investors 1 Fund. 130,000,000 shares have been classified into the Blue Chip 35 Index Fund. 15,000,000 shares have been classified into the Ultra-Small Company Fund. 100,000,000 shares each have been classified into the Ultra-Small Company Market, Omni Small-Cap Value, Omni Tax-Managed Small-Cap Value, Small-Cap Momentum, Small-Cap Growth and Small-Cap Value Funds. 50,000,000 shares have been classified into the Managed Volatility Fund.
All of the Bridgeway Funds are no-load, diversified funds.
The Funds seek to provide long-term total return on capital, primarily through capital appreciation.
Bridgeway Capital Management, Inc. (the “Adviser”) is the investment adviser for all of the Bridgeway Funds.
2. Significant Accounting Policies:
The following summary of significant accounting policies, followed in the preparation of the financial statements of the Funds, are in conformity with accounting principles generally accepted in the United States of America (“GAAP”). Each Fund is considered an investment company under GAAP and follows the accounting and reporting guidance applicable to investment companies.
Securities and Other Investments Valuation Securities for which market quotations are readily available are valued at the last sale price on the national exchange on which such securities are primarily traded. In the case of securities reported on the National Association of Securities Dealers Automated Quotation (“NASDAQ”) system, the securities are valued based on the NASDAQ Official Closing Price (“NOCP”). In the absence of recorded sales on their home exchange, or NOCP, in the case of NASDAQ traded securities, the security will be valued as follows: bid prices for long positions and ask prices for short positions.
Investments in open-end registered investment companies and closed-end registered investment companies that do not trade on an exchange are valued at the end of day net asset value (“NAV”) per share.
Investments in closed-end registered investment companies that trade on an exchange are valued at the last sales price as of the close of the customary trading session on the exchange where the security is principally traded.
When market quotations are not readily available or when events occur that make established valuation methods unreliable, securities of the Funds may be valued at fair value as determined in good faith by or under the direction of the Board of Directors. The valuation assigned to a fair valued security for purposes of calculating the Funds’ NAV may differ from the security’s most recent closing market price and from the prices used by other mutual funds to calculate their NAVs.
| | |
| 38 | | Semi-Annual Report | December 31, 2016 (Unaudited) |
| | |
NOTES TO FINANCIAL STATEMENTS (continued) | | |
December 31, 2016 (Unaudited)
The inputs and valuation techniques used to determine the value of a fund’s investments are summarized into three levels as described in the hierarchy below:
| ● | | Level 1 — quoted prices in active markets for identical assets |
Investments whose values are based on quoted market prices in active markets, and whose values are therefore classified as Level 1 prices, include active listed equity securities. The Funds do not adjust the quoted price for such investments, even in situations where the Funds hold a large position and a sale could reasonably impact the quoted price.
| ● | | Level 2 — other significant observable inputs (including quoted prices for similar securities, interest rates, prepayment speeds, credit risk, etc.) |
Investments that trade in markets that are not considered to be active, but whose values are based on quoted market prices, dealer quotations or valuations provided by alternative pricing sources supported by observable inputs, are classified as Level 2 prices. These generally include certain U.S. Government and sovereign obligations, most government agency securities, investment-grade corporate bonds and less liquid listed equity securities. As investments whose values are classified as Level 2 prices include positions that are not traded in active markets and/or are subject to transfer restrictions, valuations may be adjusted to reflect illiquidity and/or non-transferability, which are generally based on available market information.
The Fidelity Institutional Government Portfolio, which is held by the Funds, invests primarily in securities that are valued at amortized cost. Therefore, this investment is classified as a Level 2 investment.
| ● | | Level 3 — significant unobservable inputs (including the Funds’ own assumptions in determining the fair value of investments) |
Investments whose values are classified as Level 3 prices have significant unobservable inputs, as they may trade infrequently or not at all. When observable prices are not available for these securities, the Funds use one or more valuation techniques for which sufficient and reliable data is available. The inputs used by the Funds in estimating the value of Level 3 prices may include the original transaction price, quoted prices for similar securities or assets in active markets, completed or pending third-party transactions in the underlying investment or comparable issuers, and changes in financial ratios or cash flows. Level 3 prices may also be adjusted to reflect illiquidity and/or non-transferability, with the amount of such discount estimated by the Funds in the absence of market information. Assumptions used by the Funds due to the lack of observable inputs may significantly impact the resulting value and therefore the results of the Funds’ operations.
The inputs or methodology used for valuing investments are not necessarily an indication of the risk associated with investing in those investments. A summary of the inputs used to value the Funds’ investments as of December 31, 2016 is included with each Fund’s Schedule of Investments.
The Funds’ policy is to recognize transfers into, and transfers out of, each level of hierarchy as of the beginning of the reporting period. For the period ended December 31, 2016, there were no transfers from Level 1 to Level 2 or from Level 2 to Level 1 in any of the Funds.
Securities Lending Upon lending its securities to third parties, each Fund receives compensation in the form of fees. The loans are secured by collateral at least equal to the fair value of the securities loaned plus accrued interest. Each Fund has the right under the lending agreement to recover the securities from the borrower on demand. Additionally, a Fund does not have the right to sell or repledge collateral received in the form of securities unless the borrower goes into default. The risks to a Fund of securities lending are that the borrower may not provide additional collateral when required or return the securities when due, resulting in a loss. Under the terms of the Securities Lending Agreement, the Funds are indemnified for such losses by the securities lending agent.
While securities are on loan, the Fund continues to receive dividends on the securities loaned and recognizes any gain or loss in the fair value of the securities loaned.
| | |
| NOTES TO FINANCIAL STATEMENTS (continued) | | |
December 31, 2016 (Unaudited)
Securities lending transactions are entered into by a Fund under a Securities Lending Agreement which provides the right, in the event of default (including bankruptcy or insolvency) for the non-defaulting party to liquidate the collateral or to offset the market value of the collateral received against the market value of the securities loaned. The value of the collateral is typically greater than that of the market value of the securities loaned, leaving the lender with a net amount payable to the defaulting party. However, bankruptcy or insolvency laws of a particular jurisdiction may impose restrictions on or prohibitions against such a right of offset in the event of a counterparty’s bankruptcy or insolvency.
The market value of securities on loan, all of which are classified as common stocks in the Funds’ Schedules of Investments, and the value of the related collateral are shown in the Statements of Assets and Liabilities as a component of Investments at value.
The following table is a summary of the Funds’ securities loaned and related collateral, which are subject to a netting agreement as of December 31, 2016:
| | | | | | | | | | | | | | | | | | | | | | | | |
| | | | | | | | | | | | Gross Amount Not
Offset in the Statement
of Assets and Liabilities | | | | |
| Fund | | Gross
Amounts of
Recognized
Assets1 | | | Gross Amounts
Offset in the
Statement of
Assets and
Liabilities | | | Net Amounts of
Assets Presented
in the Statement
of Assets and
Liabilities | | | Financial
Instruments | | | Cash
Collateral
Received2 | | | Net
Amount | |
| | | | | | |
| Omni Small-Cap Value | | | | | | | | | | | | | | | | | | | | | | | | |
Securities lending | | | $16,035,539 | | | | - | | | | $16,035,539 | | | | - | | | | $16,035,539 | | | | - | |
| | | | | | |
Omni Tax-Managed Small-Cap Value | | | | | | | | | | | | | | | | | | | | | | | | |
Securities lending | | | $44,094,833 | | | | - | | | | $44,094,833 | | | | - | | | | $44,094,833 | | | | - | |
| 1 | Securities loaned with a value of $220,866 and $316,508 in Omni Small-Cap Value and Omni Tax-Managed Small-Cap Value, respectively, have been sold and are pending settlement on January 1, 2017. |
| 2 | Collateral with a value of $16,705,785 and $46,224,925 has been received in connection with securities lending of Omni Small-Cap Value Fund and Omni Tax-Managed Small-Cap Value Fund, respectively. Excess of collateral received from an individual counterparty is not shown here for financial reporting purposes. |
It is each Fund’s policy to obtain additional collateral from or return excess collateral to the borrower by the end of the next business day following the valuation date of the securities loaned. Therefore, the value of the collateral held may be temporarily less than that required under the lending contract. As of December 31, 2016, the collateral consisted of an institutional Government money market fund.
Use of Estimates in Financial Statements In preparing financial statements in conformity with GAAP, management makes estimates and assumptions that affect the reported amounts of assets and liabilities on the date of the financial statements and the disclosure of contingent assets and liabilities on the date of the financial statements, as well as the reported amounts of revenue and expenses during the reporting period. Actual results could differ from those estimates.
Risks and Uncertainties The Funds provide for various investment options, including stocks. Such investments are exposed to various risks, such as interest rate, market and credit risks. Due to the risks involved, it is at least reasonably possible that changes in risks in the near term would materially affect shareholders’ account values and the amounts reported in the financial statements.
Security Transactions, Investment Income and Expenses Security transactions are accounted for as of the trade date, the date the order to buy or sell is executed. Realized gains and losses are computed on the identified cost basis. Dividend income is recorded on the ex-dividend date, and interest income is recorded on the accrual basis from settlement date.
Bridgeway Funds’ expenses that are not series-specific are allocated to each series based upon its relative proportion of net assets to the Bridgeway Funds’ total net assets or other appropriate basis.
| | |
| 40 | | Semi-Annual Report | December 31, 2016 (Unaudited) |
| | |
| NOTES TO FINANCIAL STATEMENTS (continued) | | |
December 31, 2016 (Unaudited)
Distributions to Shareholders The Funds pay dividends from net investment income and distribute realized capital gains annually, usually in December.
Indemnification Under the Company’s organizational documents, the Funds’ officers, directors, employees and agents are indemnified against certain liabilities that may arise out of the performance of their duties to the Funds. Additionally, in the normal course of business, the Funds enter into contracts that contain a variety of indemnification clauses. The Funds’ maximum exposure under these arrangements is unknown, as this would involve future claims that may be made against the Funds that have not yet occurred. However, the Funds have not had prior claims or losses pursuant to these contracts.
3. Advisory Fees, Other Related Party Transactions and Contingencies:
The Funds have entered into a management agreement with the Adviser. As compensation for the advisory services rendered, facilities furnished, and expenses borne by the Adviser, the Funds pay the Adviser a fee of 0.50% of the value of each Fund’s average daily net assets, computed daily and payable monthly.
Expense limitations: The Adviser has agreed to reimburse the Funds for operating expenses and advisory fees above the expense limitations shown in the table below, which are shown as a ratio of net expenses to average net assets, for each Fund, for the period ended December 31, 2016. Any material change to the expense limitation would require a vote by share-holders of the applicable Fund.
| | | | | | | | |
| Bridgeway Fund | | Expense
Limitation | | | Total Waivers
for Period Ending
12/31/16 | |
| | | | | | | | |
| Omni Small-Cap Value* | | | 0.60% | | | | $312,895 | |
| Omni Tax-Managed Small-Cap Value* | | | 0.60% | | | | 286,243 | |
| | | | | | | | |
*The Funds are authorized to reimburse the Adviser for management fees previously waived and/or for expenses previously paid by the Adviser, provided, however, that any reimbursements must be paid at a date not more than three years after the Adviser waived the fees or reimbursed the expenses and that the reimbursements do not cause the Funds to exceed the expense limitation in effect at the time of the waiver or the current expense limitation if different. The Omni Small-Cap Value Fund has recoupable expenses of $199,942, $480,284, $561,512 and $312,895 which expire on June 30, 2017, June 30, 2018, June 30, 2019, and December 31, 2019 respectively. The Omni Tax-Managed Small-Cap Value Fund has recoupable expenses of $221,129, $479,218, $547,245 and $286,243 which expire June 30, 2017, June 30, 2018, June 30, 2019 and December 31, 2019 respectively.
Other Related Party Transactions: The Bridgeway Funds will engage in inter-portfolio trades with other Bridgeway Funds when it is to the benefit of both parties. The Board of Directors reviews and approves these trades quarterly. Inter-portfolio purchases and sales for the Funds during the period ended December 31, 2016 were as follows:
| | | | | | | | |
| Bridgeway Fund | | Inter-Portfolio
Purchases | | | Inter-Portfolio
Sales | |
| | | | | | | | |
| Omni Small-Cap Value | | | $4,411,801 | | | | $1,697,069 | |
| Omni Tax-Managed Small-Cap Value | | | 4,739,594 | | | | 1,948,862 | |
The Adviser entered into an Administrative Services Agreement with Bridgeway, pursuant to which the Adviser provides various administrative services to the Funds including, but not limited to: (i) supervising and managing various aspects of the Funds’ business and affairs; (ii) selecting, overseeing and/or coordinating activities with other service providers to the Funds; (iii) providing reports to the Board of Directors as requested from time to time; (iv) assisting and/or reviewing amendments and updates to the Funds’ registration statement and other filings with the Securities and Exchange Commission (“SEC”); (v) providing certain shareholder services; (vi) providing administrative support in connection with meetings of the Board of Directors; and (vii) providing certain record-keeping services. For its services to all of the Bridgeway Funds, the Adviser is paid an aggregate annual fee of $665,000, payable in equal monthly installments. During the period ended December 31, 2016,
| | |
| NOTES TO FINANCIAL STATEMENTS (continued) | | |
December 31, 2016 (Unaudited)
the allocation of this expense to the Omni Small-Cap Value and Omni Tax-Managed Small-Cap Value Funds was $83,053 and $73,000, respectively.
Board of Directors Compensation Independent Directors are paid an annual retainer of $15,000, with an additional retainer of $5,000 paid to the Independent Chairman of the Board and an additional retainer of $1,000 paid to the Nominating and Corporate Governance Committee Chair. The retainer is paid in quarterly installments. Effective November 11, 2016, Independent Directors are paid $8,500 per meeting for meeting fees. Prior to November 11, 2016, Independent Directors were paid $7,500 per meeting. Such compensation is the total compensation from all Bridgeway Funds and is allocated among the Bridgeway Funds.
The Independent Directors each receive this compensation in the form of shares of the Bridgeway Funds, credited to his or her account. Such Directors are reimbursed for any expenses incurred in attending meetings and conferences, as well as expenses for subscriptions or printed materials. The amount of Directors’ fees attributable to each Fund is disclosed in the Statement of Operations.
One director of Bridgeway, John Montgomery, is an owner and director of the Adviser. Under the 1940 Act definitions, he is considered to be an “affiliated person” of the Adviser and an “interested person” of the Adviser and of Bridgeway. Compensation for Mr. Montgomery is borne by the Adviser rather than the Bridgeway Funds.
4. Distribution and Shareholder Servicing Fees:
Foreside Fund Services, LLC acts as distributor of the Funds’ shares pursuant to a Distribution Agreement dated November 12, 2010. The Adviser pays all costs and expenses associated with distribution of the Funds’ shares, pursuant to a protective plan adopted by shareholders pursuant to Rule 12b-1.
5. Purchases and Sales of Investment Securities:
Purchases and sales of investments, other than short-term securities, for each Fund for the period ended December 31, 2016 were as follows:
| | | | | | | | | | | | | | | | |
| | | Purchases | | | Sales | |
| | | U.S. Government | | | Other | | | U.S. Government | | | Other | |
| | | | | | | | | | | | | | | | |
| Omni Small-Cap Value | | | $ - | | | | $46,123,427 | | | | $ - | | | | $67,249,867 | |
| Omni Tax-Managed Small-Cap Value | | | - | | | | 47,998,448 | | | | - | | | | 62,590,361 | |
6. Federal Income Taxes
It is the Funds’ policy to continue to comply with the provisions of the Internal Revenue Code of 1986, as amended (“Internal Revenue Code”), applicable to regulated investment companies, and to distribute income to the extent necessary so that such Fund is not subject to federal income tax. Therefore, no federal income tax provision is required.
Unrealized Appreciation and Depreciation on Investments (Tax Basis) The amount of net unrealized appreciation/ depreciation and the cost of investment securities for tax purposes, including short-term securities at December 31, 2016, were as follows:
| | | | | | | | | | |
| | | Omni Small-Cap Value | | Omni Tax-Managed
Small-Cap Value |
| Gross appreciation (excess of value over tax cost) | | | | $237,987,846 | | | | | $223,061,221 | |
| Gross depreciation (excess of tax cost over value) | | | | (18,595,006 | ) | | | | (16,257,654 | ) |
| Net unrealized appreciation | | | | $219,392,840 | | | | | $206,803,567 | |
| Cost of investments for income tax purposes | | | | $490,125,387 | | | | | $476,564,611 | |
The differences between book and tax net unrealized appreciation (depreciation) are due to wash sale loss deferrals and basis adjustments on passive foreign investment companies (PFICs), and partnerships.
| | |
| 42 | | Semi-Annual Report | December 31, 2016 (Unaudited) |
| | |
| NOTES TO FINANCIAL STATEMENTS (continued) | | |
December 31, 2016 (Unaudited)
Classifications of Distributions Net investment income (loss) and net realized gain (loss) may differ for financial statement and tax purposes. The character of distributions made during the year from net investment income or net realized gains may differ from its ultimate characterization for federal income tax purposes.
The tax character of the distributions paid by the Funds during the fiscal years ended June 30, 2016 and 2015, is as follows:
| | | | | | | | | | | | | | | | | | | | |
| | | Omni
Small-Cap Value | | Omni Tax-Managed
Small-Cap Value |
| | | Year
Ended
June 30, 2016 | | Year
Ended
June 30, 2015 | | Year
Ended
June 30, 2016 | | Year
Ended
June 30, 2015 |
Distributions paid from: | | | | | | | | | | | | | | | | | | | | |
Ordinary Income | | | | $4,704,613 | | | | | $ 2,478,657 | | | | | $3,274,284 | | | | | $ 767,401 | |
Long-Term Capital Gain | | | | - | | | | | 20,389,241 | | | | | - | | | | | 14,502,076 | |
Total | | | | $4,704,613 | | | | | $22,867,898 | | | | | $3,274,284 | | | | | $15,269,477 | |
At June 30, 2016, the Omni Small-Cap Value and Omni Tax-Managed Small-Cap Value Funds had net short-term capital loss carryforwards for federal income tax purposes of $9,051,476 and $8,573,286, respectively, which are available to reduce future required distributions of net capital gains to shareholders for an unlimited period. These capital losses will retain their character as short-term capital losses.
Components of Accumulated Earnings As of June 30, 2016, the components of accumulated earnings on a tax basis were:
| | | | | | | | | | |
| | | Omni
Small-Cap Value | | Omni Tax-Managed
Small-Cap Value |
| Undistributed Net Investment Income | | $ 2,918,574 | | $ 4,983,051 |
| Accumulated Net Realized Loss on Investments | | (9,051,476) | | (8,573,286) |
| Net Unrealized Appreciation of Investments | | 79,564,692 | | 76,029,548 |
| Total | | $73,431,790 | | $72,439,313 |
For the fiscal year June 30, 2016, the Funds recorded the following reclassifications to the accounts listed below:
| | | | | | | | | | |
| | | Increase (Decrease) |
| | | Omni
Small-Cap Value | | Omni Tax-Managed
Small-Cap Value |
Paid-in-Capital | | | | $ 293,634 | | | | | $ 433,310 | |
Undistributed Net Investment Income | | | | (164,911 | ) | | | | (306,858 | ) |
Accumulated Net Realized Loss on Investments | | | | (128,723 | ) | | | | (126,452 | ) |
The difference between book and tax components of net assets and the resulting reclassifications were primarily a result of the differing book/tax treatment of the deduction of equalization debits for tax purposes and investments in passive foreign investment companies (PFICs), partnerships and business development companies.
Accounting for Uncertainty in Income Taxes sets forth a minimum threshold for financial statement recognition of the benefit of a tax position taken or expected to be taken in a tax return. Management has analyzed each Fund’s tax positions and has concluded that no provision for income tax is required in each Fund’s financial statements. The Funds are not aware of any tax position for which it is reasonably possible that the total amounts of unrecognized tax benefits will significantly change in the next twelve months. Each Fund’s federal tax returns for the prior three fiscal years remain subject to examination by the Internal Revenue Service.
| | |
| NOTES TO FINANCIAL STATEMENTS (continued) | | |
December 31, 2016 (Unaudited)
7. Line of Credit
Bridgeway established a line of credit agreement (“Facility”) with The Bank of New York Mellon, effective November 5, 2010. The Facility is for temporary or emergency purposes, such as to provide liquidity for shareholder redemptions, and is cancellable by either party. Unless cancelled earlier, the Facility shall be held available until September 14, 2017. Advances under the Facility are limited to $15,000,000 in total for all Bridgeway Funds, and advances to each Bridgeway Fund shall not exceed certain limits set forth in the credit agreement, including, but not limited to, the maximum amount a Bridgeway Fund is permitted to borrow under the 1940 Act.
The Bridgeway Funds incur a commitment fee of 0.085% per annum on the unused portion of the Facility and interest expense to the extent of amounts borrowed under the Facility. Interest is based on the “Overnight Rate” plus 1.25%. The Overnight Rate means the higher of (a) the Federal Funds rate, (b) the Overnight Eurodollar Rate, or (c) the One-month Euro-dollar Rate. The commitment fees are payable quarterly in arrears and are allocated to all participating Bridgeway Funds. Interest expense is charged directly to each Bridgeway Fund, based upon actual amounts borrowed by such Bridgeway Fund.
For the period ended December 31, 2016, borrowings by the Funds under this line of credit were as follows:
| | | | | | | | | | | | | | | | | | | | |
| Bridgeway Fund | | Weighted
Average
Interest Rate | | | Weighted
Average
Loan Balance | | | Number of
Days
Outstanding | | | Interest
Expense
Incurred1 | | | Maximum Amount
Borrowed During
the Period | |
| | | | | | | | | | | | | | | | | | | | |
| Omni Small-Cap Value | | | 1.93% | | | | $1,507,258 | | | | 62 | | | | $4,937 | | | | $ 4,723,000 | |
Omni Tax-Managed Small-Cap Value | | | 1.82% | | | | 1,812,368 | | | | 57 | | | | 5,146 | | | | 6,406,000 | |
| 1Interest expense is included on the Statements of Operations in Miscellaneous expenses. | |
On December 31, 2016, Omni Small-Cap Value Fund and Omni Tax-Managed Small-Cap Value had loans outstanding in the amount of $1,351,000 and $283,000, respectively, exclusive of interest payable on the loan.
8. Subsequent Events
Management has evaluated the impact of all subsequent events on the Funds and has determined that there were no subsequent events requiring recognition or disclosure in the financial statements.
| | |
| 44 | | Semi-Annual Report | December 31, 2016 (Unaudited) |
| | |
| OTHER INFORMATION | | |
December 31, 2016 (unaudited)
1. Proxy Voting
Fund policies and procedures used in determining how to vote proxies relating to the Funds’ securities and a summary of proxies voted by the Funds for the period ended June 30, 2016 are available without a charge, upon request, by contacting Bridgeway Funds at 1-800-661-3550 and on the SEC’s website at http://www.sec.gov.
2. Fund Holdings
The complete schedule of the Funds’ holdings for the second and fourth quarters of each fiscal year are contained in the Funds’ Semi-Annual and Annual Shareholder Reports, respectively.
The Bridgeway Funds file complete schedules of the Funds’ holdings with the SEC for the first and third quarters of each fiscal year on Form N-Q within 60 days after the end of the period. Copies of the Funds’ Form N-Q are available without charge, upon request, by contacting Bridgeway Funds at 1-800-661-3550 and on the SEC’s website at http://www.sec.gov. You may also review and copy Form N-Q at the SEC’s Public Reference Room in Washington, D.C. For more information about the operation of the Public Reference Room, please call 1-800-SEC-0330.
| | |
| DISCLOSURE OF FUND EXPENSES | | |
December 31, 2016 (Unaudited)
As a shareholder of a Fund, you will incur no transaction costs from such Fund, including sales charges (loads) on purchases, on reinvested dividends, or on other distributions. There are no exchange fees. However, as a shareholder of a Fund, you will incur ongoing costs, including management fees and other Fund expenses. The following examples are intended to help you understand your ongoing costs (in dollars) of investing in a Fund and to compare these costs with ongoing costs of investing in other mutual funds. The examples are based on an investment of $1,000 invested on July 1, 2016 and held until December 31, 2016.
Actual Expenses. The first line of the table below provides information about actual account values and actual expenses. You may use the information in this line, together with the amount you invested, to estimate the expenses that you paid over the period. Simply divide your account value by $1,000 (for example, an $8,600 account value divided by $1,000 = 8.6), then multiply the result by the number in the first line under the heading “Expenses Paid During Period” to estimate the expenses you paid on your account during the period.
Hypothetical Example for Comparison Purposes. The second line of the table below provides information about hypothetical account values and hypothetical expenses based on the Fund’s actual expense ratio and an assumed rate of return of 5% per year before expenses, which is not the Fund’s actual return. The hypothetical account values and expenses may not be used to estimate the actual ending account balance or expenses you paid for the period. You may use this information to compare the ongoing costs of investing in a Fund and other mutual funds. To do so, compare this 5% hypothetical example with the 5% hypothetical examples that appear in the shareholder reports of other funds.
The expenses shown in the table are meant to highlight ongoing Fund costs only. Therefore, the second line of the table is useful in comparing ongoing costs only and will not help you determine the relative total costs of owning different funds, because other funds may also have transaction costs, such as sales charges, redemption fees or exchange fees.
| | | | | | | | | | | | | | | | | | | | |
| | | Beginning Account
Value at 7/1/16 | | Ending Account
Value at 12/31/16 | | Expense
Ratio | | Expenses Paid
During Period*
7/1/16 - 12/31/16 |
| | | | |
| Bridgeway Omni Small-Cap Value | | | | | | | | | | | | | | | | | | | | |
| Actual Fund Return | | | $ | 1,000.00 | | | | $ | 1,293.70 | | | | | 0.60 | % | | | $ | 3.47 | |
Hypothetical Fund Return | | | $ | 1,000.00 | | | | $ | 1,022.18 | | | | | 0.60 | % | | | $ | 3.06 | |
| | | | |
| Bridgeway Omni Tax-Managed Small-Cap Value | | | | | | | | | | | | | | | | | | | | |
| Actual Fund Return | | | $ | 1,000.00 | | | | $ | 1,293.30 | | | | | 0.60 | % | | | $ | 3.47 | |
Hypothetical Fund Return | | | $ | 1,000.00 | | | | $ | 1,022.18 | | | | | 0.60 | % | | | $ | 3.06 | |
| * | Expenses are equal to the average account value times the Fund’s annualized expense ratio multiplied by the number of days in the most recent six-month period (184) divided by the number of days in the fiscal year (365). |
| | |
| 46 | | Semi-Annual Report | December 31, 2016 (Unaudited) |
| | | | |
| | | | |
| | | | |
| | | | |
| | | | |
| | | | |
| | BRIDGEWAY FUNDS, INC. | | |
| | |
| | BNY Mellon Investment Servicing (US) Inc. | | |
| | P.O. Box 9860 | | |
| | Providence, RI 02940-8060 | | |
| | |
| | CUSTODIAN | | |
| | |
| | The Bank of New York Mellon | | |
| | One Wall Street | | |
| | New York, NY 10286 | | |
| | |
| | DISTRIBUTOR | | |
| | |
| | Foreside Fund Services, LLC | | |
| | Three Canal Plaza, Suite 100 | | |
| | Portland, ME 04101 | | |
| | You can review and copy information about our Funds (including the SAI) at the SEC’s Public Reference Room in Washington, D.C. To find out more about this public service, call the SEC at 800-SEC-0330. Reports and other information about the Funds are also available on the SEC’s website at www.sec.gov. You can receive copies of this information, for a fee, by writing the Public Reference Section, Securities and Exchange Commission, Washington, D.C. 20549-1520 or by sending an electronic request to the following email address: publicinfo@sec.gov. | | |
Not applicable.
| Item 3. | Audit Committee Financial Expert. |
Not applicable.
| Item 4. | Principal Accountant Fees and Services. |
Not applicable.
| Item 5. | Audit Committee of Listed Registrants. |
Not applicable.
| (a) | Schedule of Investments in securities of unaffiliated issuers as of the close of the reporting period is included as part of the report to shareholders filed under Item 1 of this form. |
| (b) | The Registrant made no divestments of securities in accordance with section 13(c) of the Investment Company Act of 1940. |
| Item 7. | Disclosure of Proxy Voting Policies and Procedures for Closed-End Management Investment Companies. |
Not applicable.
| Item 8. | Portfolio Managers of Closed-End Management Investment Companies. |
Not applicable.
| Item 9. | Purchases of Equity Securities by Closed-End Management Investment Company and Affiliated Purchasers. |
Not applicable.
| Item 10. | Submission of Matters to a Vote of Security Holders. |
There have been no material changes to the procedures by which the shareholders may recommend nominees to the Registrant’s Board of Directors, where those changes were implemented after the registrant last provided disclosure in response to the requirements of Item 407(c)(2)(iv) of Regulation S-K (17 CFR 229.407) (as required by Item 22(b)(15) of Schedule 14A (17 CFR 240.14a-101)), or this Item.
| Item 11. | Controls and Procedures. |
| (a) | The registrant’s principal executive officer and principal financial officer, or persons performing similar functions, have concluded that the registrant’s disclosure controls and procedures (as defined in Rule 30a-3(c) under the Investment Company Act of 1940, as amended (the “1940 Act”) (17 CFR 270.30a-3(c))) are effectively designed, as of a date within 90 days of the filing date of the report that includes the disclosure required by this paragraph, based on their evaluation of these controls and procedures required by Rule 30a-3(b) under the 1940 Act (17 CFR 270.30a-3(b)) and Rules 13a-15(b) or 15d-15(b) under the Securities Exchange Act of 1934, as amended (17 CFR 240.13a-15(b) or 240.15d-15(b)). |
| (b) | There were no changes in the registrant’s internal control over financial reporting (as defined in Rule 30a-3(d) under the Act (17 CFR 270.30a-3(d))) that occurred during the second fiscal quarter of the period covered by this report that have materially affected or are reasonably likely to materially affect, the registrant’s internal control over financial reporting. |
| | (a)(2) | Certifications pursuant to Rule 30a-2(a) under the 1940 Act and Section 302 of the Sarbanes-Oxley Act of 2002 are attached hereto. |
| | (b) | Certifications pursuant to Rule 30a-2(b) under the 1940 Act and Section 906 of the Sarbanes-Oxley Act of 2002 are attached hereto. |
SIGNATURES
Pursuant to the requirements of the Securities Exchange Act of 1934 and the Investment Company Act of 1940, the registrant has duly caused this report to be signed on its behalf by the undersigned, thereunto duly authorized.
(Registrant) Bridgeway Funds, Inc.
| | | | |
| By (Signature and Title)* | | /s/ Tammira Philippe | | |
| | Tammira Philippe, President and Principal Executive Officer | | |
| | (principal executive officer) | | |
Pursuant to the requirements of the Securities Exchange Act of 1934 and the Investment Company Act of 1940, this report has been signed below by the following persons on behalf of the registrant and in the capacities and on the dates indicated.
| | | | |
| By (Signature and Title)* | | /s/ Tammira Philippe | | |
| | Tammira Philippe, President and Principal Executive Officer | | |
| | (principal executive officer) | | |
| | | | |
| By (Signature and Title)* | | /s/ Linda G. Giuffré | | |
| | Linda G. Giuffré, Treasurer and Principal Financial Officer | | |
| | (principal financial officer) | | |
* Print the name and title of each signing officer under his or her signature.