UNITED STATES
SECURITIES AND EXCHANGE COMMISSION
Washington, D.C. 20549
FORM N-CSR
CERTIFIED SHAREHOLDER REPORT OF REGISTERED MANAGEMENT
INVESTMENT COMPANIES
Investment Company Act file number 811-08200
Bridgeway Funds, Inc.
(Exact name of registrant as specified in charter)
20 Greenway Plaza, Suite 450
Houston, Texas 77046
(Address of principal executive offices) (Zip code)
John N. R. Montgomery, President
Bridgeway Funds, Inc.
20 Greenway Plaza, Suite 450
Houston, Texas 77046
(Name and address of agent for service)
Registrant’s telephone number, including area code: (713) 661-3500
Date of fiscal year end: June 30
Date of reporting period: July 1, 2015 through December 31, 2015
Form N-CSR is to be used by management investment companies to file reports with the Commission not later than 10 days after the transmission to stockholders of any report that is required to be transmitted to stockholders under Rule 30e-1 under the Investment Company Act of 1940 (17 CFR 270.30e-1). The Commission may use the information provided on Form N-CSR in its regulatory, disclosure review, inspection, and policymaking roles.
A registrant is required to disclose the information specified by Form N-CSR, and the Commission will make this information public. A registrant is not required to respond to the collection of information contained in Form N-CSR unless the Form displays a currently valid Office of Management and Budget (“OMB”) control number. Please direct comments concerning the accuracy of the information collection burden estimate and any suggestions for reducing the burden to Secretary, Securities and Exchange Commission, 100 F Street, NE, Washington, DC 20549. The OMB has reviewed this collection of information under the clearance requirements of 44 U.S.C. § 3507.
Item 1. Reports to Stockholders.
The Report to Shareholders is attached herewith.
| | |

A no-load mutual fund family of domestic funds |
| | | | |
| | Semi-Annual Report December 31, 2015 (Unaudited) |
| | |
| | AGGRESSIVE INVESTORS 1 | | BRAGX |
| | |
| | ULTRA-SMALL COMPANY | | BRUSX |
| | (Open to Existing Investors — Direct Only) | | |
| | |
| | ULTRA-SMALL COMPANY MARKET | | BRSIX |
| | |
| | SMALL-CAP MOMENTUM | | BRSMX |
| | |
| | SMALL-CAP GROWTH | | BRSGX |
| | |
| | SMALL-CAP VALUE | | BRSVX |
| | |
| | LARGE-CAP GROWTH | | BRLGX |
| | |
| | BLUE CHIP 35 INDEX | | BRLIX |
| | |
| | MANAGED VOLATILITY | | BRBPX |
| | www.bridgeway.com | | |
| | |
| TABLE OF CONTENTS | |  |
| | | | |
| | | | |
Bridgeway Funds Standardized Returns as of December 31, 2015* (Unaudited)
| | | | | | | | | | | | | | | | | | | | | | | | | | | | | | | | | | | | | | | | | | | | | |
| | | | | | | Annualized | | | | | | |
| Fund | | Quarter | | Six Months | | 1 Year | | 5 Years | | 10 Years | | Inception
to Date | | Inception
Date | | Gross
Expense
Ratio2 | | Net
Expense
Ratio2 |
Aggressive Investors 1 | | | | 1.57 | % | | | | -9.46 | % | | | | -9.82 | % | | | | 9.96 | % | | | | 3.33% | | | | | 12.71 | % | | | | 8/5/1994 | | | | | 1.32% | | | | | 1.32% | |
Ultra-Small Company | | | | 3.57 | % | | | | -12.40 | % | | | | -16.12 | % | | | | 6.66 | % | | | | 4.90% | | | | | 14.07 | % | | | | 8/5/1994 | | | | | 1.15% | | | | | 1.15% | |
Ultra-Small Co Market | | | | 3.73 | % | | | | -9.92 | % | | | | -8.28 | % | | | | 9.84 | % | | | | 4.84% | | | | | 10.28 | % | | | | 7/31/1997 | | | | | 0.78% | | | | | 0.78% | |
Small-Cap Momentum | | | | 2.07 | % | | | | -5.32 | % | | | | 0.14 | % | | | | 8.99 | % | | | | NA | | | | | 11.39 | % | | | | 5/28/2010 | | | | | 3.36%1 | | | | | 0.90%1 | |
Small-Cap Growth | | | | 2.51 | % | | | | -5.43 | % | | | | 4.93 | % | | | | 12.79 | % | | | | 4.09% | | | | | 5.96 | % | | | | 10/31/2003 | | | | | 1.08%1 | | | | | 0.94%1 | |
Small-Cap Value | | | | -0.75 | % | | | | -9.43 | % | | | | -9.43 | % | | | | 9.29 | % | | | | 4.24% | | | | | 6.58 | % | | | | 10/31/2003 | | | | | 0.98%1 | | | | | 0.94%1 | |
Large-Cap Growth | | | | 3.71 | % | | | | -1.19 | % | | | | 3.62 | % | | | | 14.25 | % | | | | 7.47% | | | | | 7.76 | % | | | | 10/31/2003 | | | | | 0.82% | | | | | 0.82% | |
Blue Chip 35 Index | | | | 7.87 | % | | | | 1.48 | % | | | | 2.17 | % | | | | 12.26 | % | | | | 7.38% | | | | | 6.45 | % | | | | 7/31/1997 | | | | | 0.23%1 | | | | | 0.15%1 | |
Managed Volatility | | | | 3.19 | % | | | | -0.12 | % | | | | 0.17 | % | | | | 4.70 | % | | | | 3.17% | | | | | 3.92 | % | | | | 6/30/2001 | | | | | 1.05%1 | | | | | 0.95%1 | |
Bridgeway Funds Returns for Calendar Years 2002 through 2015* (Unaudited)
| | | | | | | | | | | | | | | | | | | | | | | | | | | | | | | | | | | | | | | | | | | | | | | | | | | | | | | | | | | | | | | | | | | | | | |
| | | 2002 | | 2003 | | 2004 | | 2005 | | 2006 | | 2007 | | 2008 | | 2009 | | 2010 | | 2011 | | 2012 | | 2013 | | 2014 | | 2015 |
Aggressive Investors 1 | | | | -18.01 | % | | | | 53.97 | % | | | | 12.21 | % | | | | 14.93 | % | | | | 7.11 | % | | | | 25.80 | % | | | | -56.16 | % | | | | 23.98 | % | | | | 17.82 | % | | | | -10.31 | % | | | | 21.58 | % | | | | 42.21 | % | | | | 14.99 | % | | | | -9.82 | % |
Ultra-Small Company | | | | 3.98 | % | | | | 88.57 | % | | | | 23.33 | % | | | | 2.99 | % | | | | 21.55 | % | | | | -2.77 | % | | | | -46.24 | % | | | | 48.93 | % | | | | 23.55 | % | | | | -14.64 | % | | | | 24.49 | % | | | | 55.77 | % | | | | -0.56 | % | | | | -16.12 | % |
Ultra-Small Co Market | | | | 4.90 | % | | | | 79.43 | % | | | | 20.12 | % | | | | 4.08 | % | | | | 11.48 | % | | | | -5.40 | % | | | | -39.49 | % | | | | 25.95 | % | | | | 24.86 | % | | | | -7.86 | % | | | | 19.83 | % | | | | 50.91 | % | | | | 4.61 | % | | | | -8.28 | % |
Small-Cap Momentum | | | | | | | | | | | | | | | | | | | | | | | | | | | | | | | | | | | | | | | | | | | | | | | | | -0.92 | % | | | | 14.18 | % | | | | 37.07 | % | | | | -0.94 | % | | | | 0.14 | % |
Small-Cap Growth | | | | | | | | | | | | | | 11.59 | % | | | | 18.24 | % | | | | 5.31 | % | | | | 6.87 | % | | | | -43.48 | % | | | | 15.04 | % | | | | 11.77 | % | | | | -0.63 | % | | | | 11.05 | % | | | | 48.52 | % | | | | 6.13 | % | | | | 4.93 | % |
Small-Cap Value | | | | | | | | | | | | | | 17.33 | % | | | | 18.92 | % | | | | 12.77 | % | | | | 6.93 | % | | | | -45.57 | % | | | | 26.98 | % | | | | 16.55 | % | | | | 1.05 | % | | | | 20.99 | % | | | | 39.72 | % | | | | 0.79 | % | | | | -9.43 | % |
Large-Cap Growth | | | | | | | | | | | | | | 6.77 | % | | | | 9.33 | % | | | | 4.99 | % | | | | 19.01 | % | | | | -45.42 | % | | | | 36.66 | % | | | | 13.34 | % | | | | -0.71 | % | | | | 16.21 | % | | | | 37.19 | % | | | | 18.66 | % | | | | 3.62 | % |
Blue Chip 35 Index | | | | -18.02 | % | | | | 28.87 | % | | | | 4.79 | % | | | | 0.05 | % | | | | 15.42 | % | | | | 6.07 | % | | | | -33.30 | % | | | | 26.61 | % | | | | 10.60 | % | | | | 3.17 | % | | | | 15.20 | % | | | | 31.67 | % | | | | 11.51 | % | | | | 2.17 | % |
Managed Volatility | | | | -3.51 | % | | | | 17.82 | % | | | | 7.61 | % | | | | 6.96 | % | | | | 6.65 | % | | | | 6.58 | % | | | | -19.38 | % | | | | 12.39 | % | | | | 5.41 | % | | | | 1.94 | % | | | | 6.46 | % | | | | 9.25 | % | | | | 5.95 | % | | | | 0.17 | % |
Performance figures quoted represent past performance and are no guarantee of future results. Current performance may be lower or higher than the performance data quoted. Investment return and principal value will fluctuate, so that an investor’s shares, when redeemed, may be worth more or less than original cost. To obtain performance current to the most recent month-end, please visit www.bridgeway.com or call 1-800-661-3550. Total return figures include the reinvestment of dividends and capital gains.
| | 1 | Some of the Funds’ fees were waived or expenses reimbursed; otherwise, returns would have been lower. The Adviser has contractually agreed to waive fees and/or reimburse expenses. Any material change to this Fund policy would require a vote by shareholders. |
| | 2 | Expense ratios are as stated in the current prospectus. Please see financial highlights for expense ratios as of December 31, 2015. |
* Numbers highlighted indicate periods when the Fund outperformed its primary benchmark.
This report is submitted for the general information of the shareholders of each Fund. It is not authorized for distribution to prospective investors unless preceded or accompanied by an effective prospectus, which includes information regarding a Fund’s risks, objectives, fees and expenses, experience of its management, and other information. Investors should read the prospectus carefully before investing in a Fund. For questions or other Fund information, call 1-800-661-3550 or visit the Funds’ website at www.bridgeway.com. Funds are available for purchase by residents of the United States, Puerto Rico, U.S. Virgin Islands and Guam only. Foreside Fund Services, LLC, Distributor.
The views expressed here are exclusively those of Fund management. These views, including those relating to the market, sectors, or individual stocks, are not meant as investment advice and should not be considered predictive in nature.
THIS PAGE INTENTIONALLY LEFT BLANK
| | |
LETTER FROM THE INVESTMENT MANAGEMENT TEAM | | |
December 31, 2015
Dear Fellow Shareholders,
Domestic equity markets posted gains in the fourth quarter and finished the calendar year in positive territory, despite periods of sharp volatility. Larger, growth-oriented companies generally outperformed smaller, value-oriented companies during both the quarter and the calendar year. Market highlights appear on page 2. In this environment, the Bridgeway Funds performed within design expectations, guided by our statistically driven, evidence-based investment approach. Please see the enclosed letters for a detailed explanation of each Fund’s performance during the quarter. We hope you find the letters helpful.
Despite value stocks being relatively out-of-favor in the recent quarter, value remains an important factor in Bridgeway’s investment strategy. The new installment in our series of articles on factor investment takes a deeper look at the nature of value. You can find “Understanding Factors: What’s Behind the Value Effect” on page 2.
Maintaining an intense focus on cost-efficiency is another core Bridgeway value, and careful execution of trading strategies is a key part of that effort. Our head of equity trading, Dick Cancelmo, provides an inside look at the process in “Adding Value Through Efficient Trading,” on page 3.
Bridgeway’s commitment to creating transformative change in our communities also sets us apart from other investment firms. One of the most visible examples of this commitment is the Bridgeway Foundation, our company’s charitable giving arm. On page 4, we’ve asked Shannon Sedgwick Davis, CEO of the Bridgeway Foundation, to reflect on her team’s achievements countering mass atrocities and human rights violations in central Africa.
We believe that our philosophy and values help create a unique corporate culture — and recently, that culture received outside recognition. Read about Bridgeway’s selection as one of the “Best Places to Work in Money Management,” on page 5.
As always, we appreciate your feedback. We take your comments very seriously and regularly discuss them to help us manage our Funds and this company. Please keep your ideas coming — both favorable and critical. They provide us with a vital tool to serve you better.
| | | | |
| Sincerely, | | | | |
| Your Investment Management Team | | | | |
| | |
 | |  | |  |
| | |
| John Montgomery | | Christine L. Wang | | Michael Whipple |
| | |
 | |  | | |
| | |
| Elena Khoziaeva | | Dick Cancelmo | | |
| | |
| 1 | | Semi-Annual Report | December 31, 2015 (Unaudited) |
| | | | |
| LETTER FROM THE INVESTMENT MANAGEMENT TEAM (continued) | | | | |
Market Review
Domestic equity markets posted positive returns in the fourth quarter, which helped stocks finish the year up slightly. However, those returns came amid sharp volatility, with all the gains due to positive market performance in the month of October. For the quarter, the S&P 500 returned 7.0% and the Dow Jones Industrial Average (DJIA) rose 7.7%. For the year, the S&P 500 and the DJIA were up 1.4% and 0.2%, respectively.
Returns were positive across all U.S. equity style boxes, as defined by Morningstar. Large stocks outperformed smaller stocks overall, and investors favored growth over value. As a result, large growth stocks delivered the best performance (6.73%) during the quarter, while small value stocks produced the lowest relative return (2.03%).
All sectors of the S&P 500 were up for the quarter. The Consumer Discretionary sector led the gains, up 10.1%, followed by Health Care (6.9%) and Consumer Staples (6.6%). The battered Energy sector was the worst performer, gaining 0.2%, with Utilities recording the second-worst returns (1.1%).
Below are the stock market style box returns for the quarter and the calendar year.

Understanding Factors: What’s Behind the Value Effect?
by John Montgomery, Founder and Chief Investment Officer
A fundamental part of Bridgeway’s statistically driven, evidence-based investing strategy is the use of factors — the characteristics that drive the risk and reward profile for categories of stocks. That’s why we’ve been exploring the phenomenon of investment factors in our recent quarterly reports, including an examination of the small size factor in our last annual report.
Small size was one of the first factors identified by academics and put into practice by investors. Another of the oldest, most widely used factors is value. The value effect is the tendency for long-term outperformance by stocks that trade at lower prices relative to some measure of their fundamental worth, compared to stocks that trade at higher prices relative to their worth. According to data from researcher Kenneth French’s website, from 1926 through 2015, value stocks outperformed their growth counterparts on average by 4.20% annually.
That doesn’t mean value stocks beat growth stocks every year. In fact, in 2015 growth outperformed value on average by 10.56%, according to data of French’s website. But the evidence for superior long-term returns is one reason we incorporate the value factor into many of the Bridgeway Funds’ portfolios. As convincing as the long-term data is, though, some aspects of the value factor remain complicated — even a little controversial — when you dig deeper into them.
For starters, there are many ways to measure a stock’s value. The most widely accepted approach in academia is to use the ratio of a company’s stock price to its book value — an accounting calculation of what the company’s net assets are worth according to audited financial statements. This isn’t a foolproof measure of value. Among other complications, no one knows what the company would really receive from buyers if it had to sell off all its assets and pay off debts. But book value can stand in as an acceptable proxy for a company’s worth.
| | | | |
| LETTER FROM THE INVESTMENT MANAGEMENT TEAM (continued) | | | | |
However, there are many other ways to measure value, such as the ratio of price to earnings, cash flow, dividends, or sales, as well as even more esoteric metrics. None of these measures is perfect, which is one reason Bridgeway prefers a “multi-factor” approach to valuation. We believe that using multiple measurements of value provides more diversification than a single metric.
So, measuring a company’s value is complicated. But trying to explain what causes the value premium is even trickier. There are two main arguments for why value stocks outperform over time. The first is based on the potential risk of these investments; the second considers the impact of investor behavior.
The risk argument seems straightforward enough: Stocks with lower valuations include companies that have fallen on hard times, have higher debt, or face other fundamental flaws that make them less attractive to investors. As a result, these stocks may be more volatile than the broader market, and investors should therefore expect a return premium for taking on the additional risk.
Yet this straightforward argument starts to break down when we look at historical market data. In fact, in the six calendar-year market downturns for the Russell 1000 Index since 1979, the Russell 1000 Value Index fell less than the Russell 1000 Growth Index in five of those downturns.
The fact that value stocks offer a cushion during downturns suggests they actually may be less risky than growth stocks. That’s one reason why some researchers have proposed a behavioral explanation for the value premium: Value investing is a contrarian strategy that delivers better long-term returns because it helps investors avoid overpriced, overhyped stocks — stocks dubbed “glamour stocks” by academia.
Many investors overvalue recent, short-term performance. They are attracted to fast-growing companies and are willing to pay higher prices for their stocks in the belief that the strong performance will continue. But rapid growth tends to be a short-term phenomenon — high-flying glamour stocks eventually come down to earth. When they do, investors end up having overpaid for long-term mediocre performance.
At the same time, many investors overreact to short-term bad news, driving a stock’s price well below its true value. Over the long term, investors who can resist following the herd and instead focus on those undervalued stocks can reap higher returns.
Where do I come down on the question of what’s driving the value factor? I believe that both arguments have merit, but it’s difficult to tell whether risk or behavior is the more important driver of long-term performance. Instead, I like to think of the value factor in simpler terms.
If you go into any purchase with two options of equal value but different price, you’re going to pick the cheaper one. Imagine you’re buying a new refrigerator: You do your research and find two models that have all the features you want, use the same amount of energy each year, and have strong reputations for reliability. Essentially, they’re the same — but one is $650 and one is $599. You’re going to buy the one that costs $599.
Value stocks are like that $599 fridge. By paying less up-front for their long-term performance, you can achieve higher total returns. We see the evidence for this premium in the historical market data. We have at least two valid hypotheses for why this premium exists. So it makes sense to incorporate the value factor into a well-diversified investment portfolio.
We’ll continue examining individual factors, and how Bridgeway combines them to create our investment strategies, in future quarterly reports.
Adding Value Through Efficient Trading
by Dick Cancelmo, Head of Equity Trading
At a recent conference I introduced myself to a gentleman as the leader of Bridgeway’s trading team. His immediate response was to ask me if I was “A red-eye devil bond trader?” After a hearty laugh I told him that, no, we don’t really trade bonds and that my sole focus was to get the best transaction costs on behalf of our shareholders and clients.
| | |
| 3 | | Semi-Annual Report | December 31, 2015 (Unaudited) |
| | | | |
| LETTER FROM THE INVESTMENT MANAGEMENT TEAM (continued) | | | | |
This exchange reminded me of the negative view that many Main Street investors have about Wall Street traders — a reputation that, sadly, is in some ways deserved. Consider the depiction of the 2008 financial crisis in the new move The Big Short, or the recent debate about the ethics of high-frequency trading sparked by the book Flash Boys.
But there is a significant difference between those types of traders and the ones who work for Bridgeway and most other mutual fund companies. The traders that most non-professional investors hear about are called “position traders.” They take big risks with capital because they believe those bets will be profitable, and they use techniques like seeking millisecond-based electronic trades or making concentrated bets that a particular stock, bond, currency or other asset will go up or down. There is nothing inherently wrong with these strategies, or with trying to profit from your intellect and knowledge. But the few bad actors get almost 100% of the headlines.
Traders for mutual fund companies like Bridgeway have a completely different function. We are “execution traders,” not “position traders.” Our job is to help our Fund shareholders by finding the most efficient, cost-effective ways to execute our investment strategies. Mutual funds are built upon a three-legged investment process: research, portfolio management and trading. If not managed properly, the final and critical step of trading is where value can be destroyed.
That’s why we focus a great deal of our time, energy and financial resources on the process of trading and the goal of reducing execution costs. We have an experienced team of three traders with combined investment experience of more than 70 years. Our traders maintain constant and high-level communication with our investment management team to effectively execute our statistical and evidenced-based approach. We have equally strong communication with our brokers and trading partners. And we have a strong culture of compliance that focuses on repetitive processes, technology, systems and redundancy.
This trading process also has built-in features specifically designed to reduce our execution costs, which aren’t seen in a Fund’s expense ratio but can still be quite real. These features include:
| ● | | An overall low level of commissions, thanks to our use of electronic trading and our need to only pay for trade execution, not research. |
| ● | | Avoiding “soft dollar” arrangements that pay brokers with shareholders’ dollars. |
| ● | | A deep understanding of market structure, order routing, algorithms and crossing networks to maximize trade efficiency. |
| ● | | Providing a source of liquidity for distressed micro-cap sellers, which allows us to buy some stocks at discounts. |
| ● | | Processes and technology that allow us to buy and sell internally between funds with no market impact. |
| ● | | Matching the trading strategy with our portfolio motivation. For example, it can be difficult to buy and sell micro-cap stocks, so for our Ultra-Small Company Market Fund we identify more stocks than we need to hold in the portfolio. Then, all things being equal, we concentrate on buying only those stocks we can acquire for reasonable trading costs. |
Above all, we are continually studying our transaction costs and looking for potential improvements. It’s part of our commitment to you, our shareholders, to put your interests first. By now, I hope it’s clear that Bridgeway’s traders are not “red-eye devils,” but a strong team dedicated to reducing execution costs to help you achieve your long-term financial goals.
Transformative Change – Reducing Violence in Central Africa
by Shannon Sedgwick Davis, CEO of the Bridgeway Foundation
In each shareholder letter, we ask one Partner to share his or her experiences giving back to their communities. As the head of the Bridgeway Foundation, Bridgeway Capital Management’s charitable giving arm, my full-time job is dedicated to these kinds of activities, which support our commitment to create transformative change for our people and our world.
When I reflect on our foundation’s work, I’m particularly proud of our achievements addressing our core mission: preventing mass atrocities and transforming volatile communities that are experiencing grave human rights violations. This ambitious goal has resulted in our support for meaningful projects and incredible local partners in places like Burma, South Sudan, India and here on U.S. soil.
For the past five years, Bridgeway Foundation has invested most heavily in ending the atrocities in central Africa perpetrated by Joseph Kony and his Lord’s Resistance Army (the LRA). Kony is the first person indicted by the International Criminal Court
| | | | |
| LETTER FROM THE INVESTMENT MANAGEMENT TEAM (continued) | | | | |
and stands accused of war crimes and crimes against humanity that include the abduction of up to 66,000 children during nearly three decades of conflict.
Over several years, the Bridgeway Foundation team pioneered a new approach to conflict resolution — one that relies on private individuals to fill gaps that the United Nations, the military and non-governmental organizations were not positioned to address. We remained small and nimble, focusing on flexibility in an always-changing environment. We took an unconventional approach to civilian protection that was built upon personal sacrifice and continuity of key relationships. Our strategy allowed us to accrue years of institutional knowledge, and it brought me to our field staff’s small bush camp in the dense jungles of the Central African Republic for weeks on end.
Wherever we found organizations doing good work, we supported them. Through our local partners on the ground we pioneered an early warning radio network, provided rehabilitation for hundreds of victims, and gave livelihood support to former child combatants reintegrating back into their communities.
We also focused on ending the conflict. One of the first major gaps we helped fill was providing African Union (AU) forces additional training intended to increase their effectiveness and ensure they upheld human rights standards. A third-party study showed this intensive training was directly responsible for 68% of all LRA captures and rescues over a two-year period.
But with few aircraft operating in an area roughly the size of California, these newly trained forces weren’t always able to respond rapidly to LRA atrocities. So with the support of the Howard G. Buffett foundation, we provided airlift support to the African Union mission, contracting a fixed-wing plane and several helicopters in times of high activity. The aircraft rescued abducted women and children, provided medical evacuation for partners and helped to repatriate hundreds of former LRA members. Overall, the same third-party study showed that our airlift support contributed to 56% of all LRA captures and rescues in the field during its time of deployment.
Beyond training and aircraft, we created an intelligence network in the most remote parts of the region, where the LRA kept its bases and frequently attacked and looted. This steady flow of human intelligence provided vital information that not only helped prevent imminent attacks on civilians, but also led to the surrender of dozens of LRA combatants.
We used timely intelligence to target individual commanders with “defection messaging” — a combination of helicopter speaker messages, radio announcements and fliers that encouraged LRA members to surrender peacefully. Carefully crafted defection messages were delivered directly over LRA hotspots for weeks at a time, directly contributing to 703 LRA escapes and surrenders.
Today, as I write this, I’m thrilled to report a 90% reduction in violence in the LRA conflict over the course of our five-year intervention. The many partners and groups engaged on this issue helped bring about such meaningful change. It was a privilege to be a witness to humanity coming together for the sake of others. We have learned invaluable lessons from our partners on the ground in central Africa, and we look forward to adapting and expanding this model to bring transformative change to other areas of conflict around the world.
Bridgeway Named a “Best Place to Work”
We’re proud to report that Bridgeway has been named one of the Best Places to Work in Money Management by Pensions & Investments, an international newspaper covering the money management industry.
This is the second year in a row that we’ve been included on the Pensions & Investments “Best Places to Work” list, which uses workplace surveys to score companies on issues such as employer relations, social responsibility, diversity and work-life balance. In 2015, we ranked first among the five winning firms in the category of managers with staffs of fewer than 50 people. The year before, we ranked third in the same category.
We believe that this back-to-back achievement highlights our unique culture — one that fosters a fun, positive and challenging workplace for all of our Partners. This culture helps us attract and retain some of the best talent in the industry to serve our clients, which is just as important to our firm’s success as our investment models.
We’re honored by the recognition and committed to upholding the values that help create such a strong working environment. It’s good for both our Partners and our shareholders.
| | |
| 5 | | Semi-Annual Report | December 31, 2015 (Unaudited) |
| | |
| Aggressive Investors 1 Fund | | |
| MANAGER’S COMMENTARY (Unaudited) | | |
December 31, 2015
Dear Fellow Aggressive Investors 1 Fund Shareholder,
For the quarter ended December 31, 2015, our Fund returned 1.57%, underperforming our primary market benchmark, the S&P 500 Index (7.04%), our peer benchmark, the Lipper Capital Appreciation Funds Index (6.48%), and the Russell 2000 Index (3.59%). It was a poor quarter on a relative basis.
For the six-month semi-annual period ended December 31, 2015, our Fund returned -9.46%, underperforming the S&P 500 Index (0.15%), the Lipper Capital Appreciation Funds Index (-2.99%) and the Russell 2000 Index (-8.75%).
For the calendar year, our Fund returned -9.82%, underperforming the S&P 500 Index (1.38%), the Lipper Capital Appreciation Funds Index (0.74%) and the Russell 2000 Index (-4.41%).
The table below presents our December quarter, six months, one-year, five-year, 10-year, 15-year, and inception-to-date financial results.
Standardized Returns as of December 31, 2015
| | | | | | | | | | | | | | | | | | | | | | | | | | | | |
| | | | | | | | | | | | Annualized | |
| | | Quarter | | | 6 Months | | | 1 Year | | | 5 Years | | | 10 Years | | | 15 Years | | | Since Inception
(8/5/94) | |
| | | | | | | |
Aggressive Investors 1 Fund | | | 1.57% | | | | -9.46% | | | | -9.82% | | | | 9.96% | | | | 3.33% | | | | 4.75% | | | | 12.71% | |
S&P 500 Index | | | 7.04% | | | | 0.15% | | | | 1.38% | | | | 12.57% | | | | 7.31% | | | | 5.00% | | | | 9.32% | |
Russell 2000 Index | | | 3.59% | | | | -8.75% | | | | -4.41% | | | | 9.19% | | | | 6.80% | | | | 7.28% | | | | 8.90% | |
Lipper Capital Appreciation Funds Index | | | 6.48% | | | | -2.99% | | | | 0.74% | | | | 10.22% | | | | 7.28% | | | | 4.85% | | | | 8.31% | |
Performance figures quoted in the table above represent past performance and are no guarantee of future results. Total return figures in the table above include the reinvestment of dividends and capital gains. The table above does not reflect the deduction of taxes that a shareholder would pay on Fund distributions or on the redemption of Fund shares.
The S&P 500 Index is a broad-based, unmanaged measurement of changes in stock market conditions, based on the average of 500 widely held common stocks with dividends reinvested. The Russell 2000 Index is an unmanaged, market value weighted index that measures performance of the 2,000 companies that are between the 1,000th and 3,000th largest in the market with dividends reinvested. The Lipper Capital Appreciation Funds Index reflects the record of the 30 largest funds in the category of more aggressive domestic growth mutual funds, as reported by Lipper, Inc. It is not possible to invest directly in an index. Periods longer than one year are annualized.
According to data from Lipper, Inc. as of December 31, 2015, Aggressive Investors 1 Fund ranked 249th of 255 capital appreciation funds for the 12 months ended December 31, 2015, 129th of 225 over the last five years, 141st of 155 over the last 10 years, and 3rd of 43 since inception in August 1994. Lipper, Inc. is an independent mutual fund rating service that ranks funds in various fund categories by making comparative calculations using total returns.
| | |
| Aggressive Investors 1 Fund | |
|
| MANAGER’S COMMENTARY (Unaudited) (continued) | |
| | |
Aggressive Investors 1 Fund vs. S&P 500 Index, Russell 2000 Index & Lipper Capital Appreciation Funds Index
from Inception 8/5/94 to 12/31/15

Detailed Explanation of Quarterly Performance
Large company stocks generally outperformed stocks of smaller companies during the recent quarter. In this environment, the Fund’s investment in smaller company stocks detracted from relative returns. In addition, all model categories contributed to the Fund’s underperformance. Our price momentum model lagged the most during the volatile quarter. Company financial health models also suffered, as the macro-driven market caused a spike in correlation among stock returns. The value factor was strongly out of favor during the quarter, and the Fund’s exposure to deeper value stocks, as well as small- and mid-cap value stocks, particularly hurt relative performance.
Sector allocation had a negligible effect on relative performance. However, some individual holdings had a large negative impact on relative returns, including Skechers USA, which was responsible for nearly 20% of the Fund’s total underperformance after its price tumbled on lower-than-expected sales.
Detailed Explanation of Calendar Year Performance
The Fund’s investment in smaller stocks hurt relative performance during the calendar year. Small-cap stocks underperformed stocks of larger companies in all but one quarter, and the cumulative effect for the year was a 7.7% gap between returns of small-cap stocks and large-cap stocks (as measured by the Russell 2000 Index and the Russell 1000 Index, respectively). Exposure to higher-beta stocks also detracted from relative performance, as those stocks suffered during a volatile year.
Sector allocation had a slightly negative impact on relative performance, primarily due to our underweighted position in Health Care and our overweighted positions in the lagging Energy, Materials and Industrials sectors.
| | |
| 7 | | Semi-Annual Report | December 31, 2015 (Unaudited) |
| | |
| Aggressive Investors 1 Fund | | |
| MANAGER’S COMMENTARY (Unaudited) (continued) | | |
| | |
Top Ten Holdings as of December 31, 2015
| | | | | | | | |
| Rank | | Description | | Industry | | % of Net
Assets | |
| 1 | | United Continental Holdings, Inc. | | Airlines | | | 2.1% | |
| 2 | | Skechers U.S.A., Inc. | | Textiles, Apparel & Luxury Goo | | | 2.0% | |
| 3 | | Edwards Lifesciences Corp. | | Health Care Equipment & Supplies | | | 2.0% | |
| 4 | | Global Payments, Inc. | | IT Services | | | 1.8% | |
| 5 | | WhiteWave Foods Co. (The) | | Food Products | | | 1.8% | |
| 6 | | Southwest Airlines Co. | | Airlines | | | 1.8% | |
| 7 | | Tesoro Corp. | | Oil, Gas & Consumable Fuels | | | 1.8% | |
| 8 | | AMN Healthcare Services, Inc. | | Health Care Providers & Services | | | 1.8% | |
| 9 | | Apple, Inc. | | Computers & Peripherals | | | 1.6% | |
| 10 | | John Bean Technologies Corp. | | Machinery | | | 1.6% | |
| | | |
| | Total | | | | | 18.3% | |
Industry Sector Representation as of December 31, 2015
| | | | | | | | | | | | | | | |
| | | % of Net Assets | | % of S&P 500
Index | | Difference |
Consumer Discretionary | | | | 18.9% | | | | | 12.9% | | | | | 6.0% | |
Consumer Staples | | | | 7.2% | | | | | 10.1% | | | | | -2.9% | |
Energy | | | | 5.3% | | | | | 6.5% | | | | | -1.2% | |
Financials | | | | 11.9% | | | | | 16.5% | | | | | -4.6% | |
Health Care | | | | 10.6% | | | | | 15.2% | | | | | -4.6% | |
Industrials | | | | 20.1% | | | | | 10.0% | | | | | 10.1% | |
Information Technology | | | | 17.0% | | | | | 20.7% | | | | | -3.7% | |
Materials | | | | 4.2% | | | | | 2.8% | | | | | 1.4% | |
Telecommunication Services | | | | 2.2% | | | | | 2.4% | | | | | -0.2% | |
Utilities | | | | 1.1% | | | | | 3.0% | | | | | -1.9% | |
Cash & Other Assets | | | | 1.6% | | | | | 0.0% | | | | | 1.6% | |
| | | |
Total | | | | 100.0% | | | | | 100.0% | | | | | | |
Disclaimer
The views expressed here are exclusively those of Fund management. These views, including those related to market sectors or individual stocks, are not meant as investment advice and should not be considered predictive in nature. Any favorable (or unfavorable) description of a holding applies only as of the quarter end, December 31, 2015, unless otherwise stated. Security positions can and do change thereafter. Discussions of historical performance do not guarantee and may not be indicative of future performance.
Market volatility can significantly affect short-term performance. The Fund is not an appropriate investment for short-term investors. Investments in the small companies within this multi-cap fund generally carry greater risk than is customarily associated with larger companies. This additional risk is attributable to a number of factors, including the relatively limited financial resources that are typically available to small companies and the fact that small companies often have comparatively limited product lines. In addition, the stock of small companies tends to be more volatile than the stock of large companies, particularly in the short term and particularly in the early stages of an economic or market downturn. The Fund’s use of options, futures, and leverage can magnify the risk of loss in an unfavorable market, and the Fund’s use of short-sale positions can, in theory, expose shareholders to unlimited loss. Finally, the Fund exposes shareholders to “focus risk,” which may add to Fund volatility through the possibility that a single company could significantly affect total return. Shareholders of the Fund, therefore, are taking on more risk than they would if they invested in the stock market as a whole.
| | |
| Aggressive Investors 1 Fund | |
|
| MANAGER’S COMMENTARY (Unaudited) (continued) | |
| | |
Conclusion
Thank you for your continued investment in Aggressive Investors 1 Fund. We encourage your feedback; your reactions and concerns are important to us.
Sincerely,
The Investment Management Team
| | |
| 9 | | Semi-Annual Report | December 31, 2015 (Unaudited) |
| | |
| Aggressive Investors 1 Fund | | |
| SCHEDULE OF INVESTMENTS | | |
| Showing percentage of net assets as of December 31, 2015 (Unaudited) | | |
| | | | | | | | | | |
| Industry Company | | Shares | | | Value | | | |
| |
COMMON STOCKS - 98.36% | | | |
Airlines - 7.47% | | | | | | | | | | |
Alaska Air Group, Inc. | | | 40,200 | | | $ | 3,236,502 | | | |
Delta Air Lines, Inc. | | | 46,500 | | | | 2,357,085 | | | |
JetBlue Airways Corp.* | | | 95,300 | | | | 2,158,545 | | | |
Southwest Airlines Co. | | | 88,800 | | | | 3,823,728 | | | |
United Continental Holdings, Inc.* | | | 78,200 | | | | 4,480,860 | | | |
| | | | | | | | | | |
| | | | | | | 16,056,720 | | | |
| |
Auto Components - 3.00% | | | |
Goodyear Tire & Rubber Co. (The) | | | 66,400 | | | | 2,169,288 | | | |
Lear Corp. | | | 24,200 | | | | 2,972,486 | | | |
Tower International, Inc. | | | 46,000 | | | | 1,314,220 | | | |
| | | | | | | | | | |
| | | | | | | 6,455,994 | | | |
| |
Automobiles - 1.13% | | | |
General Motors Co. | | | 71,500 | | | | 2,431,715 | | | |
| |
Beverages - 1.32% | | | |
Monster Beverage Corp.* | | | 19,000 | | | | 2,830,240 | | | |
| |
Biotechnology - 1.22% | | | |
Gilead Sciences, Inc. | | | 26,000 | | | | 2,630,940 | | | |
| |
Building Products - 1.27% | | | |
American Woodmark Corp.* | | | 34,000 | | | | 2,719,320 | | | |
| |
Chemicals - 1.89% | | | |
Koppers Holdings, Inc.* | | | 52,500 | | | | 958,125 | | | |
LyondellBasell Industries NV, Class A | | | 25,500 | | | | 2,215,950 | | | |
Rayonier Advanced Materials, Inc. | | | 90,000 | | | | 881,100 | | | |
| | | | | | | | | | |
| | | | | | | 4,055,175 | | | |
| |
Commercial Banks - 1.09% | | | |
Royal Bank of Canada | | | 43,700 | | | | 2,341,446 | | | |
| |
Commercial Services & Supplies - 1.98% | | | |
ACCO Brands Corp.* | | | 296,800 | | | | 2,116,184 | | | |
Rollins, Inc. | | | 82,600 | | | | 2,139,340 | | | |
| | | | | | | | | | |
| | | | | | | 4,255,524 | | | |
| |
Computers & Peripherals - 3.12% | | | |
Apple, Inc. | | | 33,600 | | | | 3,536,736 | | | |
HP, Inc. | | | 196,100 | | | | 2,321,824 | | | |
Seagate Technology PLC | | | 22,800 | | | | 835,848 | | | |
| | | | | | | | | | |
| | | | | | | 6,694,408 | | | |
| |
Construction & Engineering - 2.02% | | | |
Comfort Systems USA, Inc. | | | 77,000 | | | | 2,188,340 | | | |
Dycom Industries, Inc.* | | | 30,700 | | | | 2,147,772 | | | |
| | | | | | | | | | |
| | | | | | | 4,336,112 | | | |
| | | | | | | | |
| Industry Company | | Shares | | | Value | |
|
| |
Consumer Finance - 2.99% | |
Cash America International, Inc. | | | 50,000 | | | $ | 1,497,500 | |
Navient Corp. | | | 96,000 | | | | 1,099,200 | |
Santander Consumer USA Holdings, Inc.* | | | 101,900 | | | | 1,615,115 | |
Synchrony Financial* | | | 72,500 | | | | 2,204,725 | |
| | | | | | | | |
| | | | | | | 6,416,540 | |
|
Containers & Packaging - 1.29% | |
Crown Holdings, Inc.* | | | 54,800 | | | | 2,778,360 | |
|
Diversified Financial Services - 4.03% | |
Berkshire Hathaway, Inc., Class B* | | | 8,700 | | | | 1,148,748 | |
Citigroup, Inc. | | | 42,000 | | | | 2,173,500 | |
SEI Investments Co. | | | 50,000 | | | | 2,620,000 | |
Voya Financial, Inc. | | | 73,900 | | | | 2,727,649 | |
| | | | | | | | |
| | | | | | | 8,669,897 | |
|
Diversified Telecommunication Services - 2.23% | |
Cincinnati Bell, Inc.* | | | 340,000 | | | | 1,224,000 | |
FairPoint Communications, Inc.*+ | | | 65,000 | | | | 1,044,550 | |
Windstream Holdings, Inc.+ | | | 392,100 | | | | 2,525,124 | |
| | | | | | | | |
| | | | | | | 4,793,674 | |
|
Electronic Equipment, Instruments & Components - 2.84% | |
Acuity Brands, Inc. | | | 12,000 | | | | 2,805,600 | |
Flextronics International, Ltd.* | | | 207,700 | | | | 2,328,317 | |
TTM Technologies, Inc.* | | | 147,300 | | | | 958,923 | |
| | | | | | | | |
| | | | | | | 6,092,840 | |
|
Energy Equipment & Services - 0.43% | |
Unit Corp.*+ | | | 75,000 | | | | 915,000 | |
|
Financials - 2.96% | |
Global Payments, Inc. | | | 60,000 | | | | 3,870,600 | |
Total System Services, Inc. | | | 50,000 | | | | 2,490,000 | |
| | | | | | | | |
| | | | | | | 6,360,600 | |
|
Food & Staples Retailing - 3.06% | |
Ingles Markets, Inc., Class A | | | 40,500 | | | | 1,785,240 | |
Kroger Co. (The) | | | 58,600 | | | | 2,451,238 | |
Rite Aid Corp.* | | | 297,400 | | | | 2,331,616 | |
| | | | | | | | |
| | | | | | | 6,568,094 | |
|
Food Products - 2.81% | |
Hormel Foods Corp. | | | 27,700 | | | | 2,190,516 | |
WhiteWave Foods Co. (The)* | | | 98,700 | | | | 3,840,417 | |
| | | | | | | | |
| | | | | | | 6,030,933 | |
| | |
| Aggressive Investors 1 Fund | |
|
| SCHEDULE OF INVESTMENTS (continued) | |
| Showing percentage of net assets as of December 31, 2015 (Unaudited) | | |
| | | | | | | | | | |
| Industry Company | | Shares | | | Value | | | |
| | | |
Common Stocks (continued) | | | | | | | | | | |
Health Care Equipment & Supplies - 3.04% | | | |
C.R. Bard, Inc. | | | 11,500 | | | $ | 2,178,560 | | | |
Edwards Lifesciences Corp.* | | | 55,000 | | | | 4,343,900 | | | |
| | | | | | | | | | |
| | | | | | | 6,522,460 | | | |
| |
Health Care Providers & Services - 5.06% | | | |
AMN Healthcare Services, Inc.* | | | 121,500 | | | | 3,772,575 | | | |
Centene Corp.* | | | 18,700 | | | | 1,230,647 | | | |
Cigna Corp. | | | 8,600 | | | | 1,258,438 | | | |
MEDNAX, Inc.* | | | 28,500 | | | | 2,042,310 | | | |
Molina Healthcare, Inc.*+ | | | 42,900 | | | | 2,579,577 | | | |
| | | | | | | | | | |
| | | | | | | 10,883,547 | | | |
| |
Hotels, Restaurants & Leisure - 5.25% | | | |
Arcos Dorados Holdings, Inc., Class A | | | 344,300 | | | | 1,070,773 | | | |
Cheesecake Factory, Inc. (The) | | | 50,500 | | | | 2,328,555 | | | |
Isle of Capri Casinos, Inc.* | | | 112,000 | | | | 1,560,160 | | | |
Norwegian Cruise Line Holdings, Ltd.* | | | 36,000 | | | | 2,109,600 | | | |
Penn National Gaming, Inc.* | | | 123,000 | | | | 1,970,460 | | | |
Starbucks Corp. | | | 37,400 | | | | 2,245,122 | | | |
| | | | | | | | | | |
| | | | | | | 11,284,670 | | | |
| | | |
Insurance - 2.66% | | | | | | | | | | |
Aflac, Inc. | | | 43,000 | | | | 2,575,700 | | | |
AmTrust Financial Services, Inc. | | | 17,400 | | | | 1,071,492 | | | |
Manulife Financial Corp. | | | 138,700 | | | | 2,077,726 | | | |
| | | | | | | | | | |
| | | | | | | 5,724,918 | | | |
| |
Internet & Catalog Retail - 1.59% | | | |
1-800-Flowers.com, Inc., Class A* | | | 161,300 | | | | 1,174,264 | | | |
Expedia, Inc. | | | 18,000 | | | | 2,237,400 | | | |
| | | | | | | | | | |
| | | | | | | 3,411,664 | | | |
| |
Internet Software & Services - 2.27% | | | |
eBay, Inc.* | | | 95,300 | | | | 2,618,844 | | | |
Facebook, Inc., Class A* | | | 21,500 | | | | 2,250,190 | | | |
| | | | | | | | | | |
| | | | | | | 4,869,034 | | | |
| |
IT Services - 3.07% | | | |
Fiserv, Inc.* | | | 25,000 | | | | 2,286,500 | | | |
Heartland Payment Systems, Inc. | | | 22,500 | | | | 2,133,450 | | | |
Vantiv, Inc., Class A* | | | 46,000 | | | | 2,181,320 | | | |
| | | | | | | | | | |
| | | | | | | 6,601,270 | | | |
| | | | | | | | |
| Industry Company | | Shares | | | Value | |
|
| |
Machinery - 3.73% | | | | | | | | |
John Bean Technologies Corp. | | | 68,600 | | | $ | 3,418,338 | |
Meritor, Inc.* | | | 150,000 | | | | 1,252,500 | |
Middleby Corp. (The)* | | | 20,500 | | | | 2,211,335 | |
Wabash National Corp.* | | | 96,000 | | | | 1,135,680 | |
| | | | | | | | |
| | | | | | | 8,017,853 | |
|
Metals & Mining - 0.44% | |
AK Steel Holding Corp.*+ | | | 426,100 | | | | 954,464 | |
|
Multi-Utilities - 1.07% | |
Public Service Enterprise Group, Inc. | | | 59,200 | | | | 2,290,448 | |
|
Oil, Gas & Consumable Fuels - 4.85% | |
Antero Resources Corp.*+ | | | 111,400 | | | | 2,428,520 | |
Encana Corp. | | | 195,000 | | | | 992,550 | |
Tesoro Corp. | | | 35,900 | | | | 3,782,783 | |
Valero Energy Corp. | | | 45,600 | | | | 3,224,376 | |
| | | | | | | | |
| | | | | | | 10,428,229 | |
|
Paper & Forest Products - 0.57% | |
Resolute Forest Products, Inc.*+ | | | 161,199 | | | | 1,220,276 | |
|
Pharmaceuticals - 1.28% | |
Diplomat Pharmacy, Inc.*+ | | | 80,400 | | | | 2,751,288 | |
|
Real Estate Investment Trusts (REITs) - 1.08% | |
Equinix, Inc. | | | 7,700 | | | | 2,328,480 | |
| | |
Road & Rail - 0.45% | | | | | | | | |
YRC Worldwide, Inc.* | | | 68,600 | | | | 972,748 | |
|
Semiconductors & Semiconductor Equipment - 2.18% | |
Lam Research Corp. | | | 30,000 | | | | 2,382,600 | |
Micron Technology, Inc.* | | | 162,400 | | | | 2,299,584 | |
| | | | | | | | |
| | | | | | | 4,682,184 | |
|
Software - 1.88% | |
Cadence Design Systems, Inc.* | | | 100,000 | | | | 2,081,000 | |
Fortinet, Inc.* | | | 63,000 | | | | 1,963,710 | |
| | | | | | | | |
| | | | | | | 4,044,710 | |
|
Specialty Retail - 5.85% | |
Aaron’s, Inc. | | | 67,800 | | | | 1,518,042 | |
Asbury Automotive Group, Inc.* | | | 28,000 | | | | 1,888,320 | |
Lithia Motors, Inc., Class A | | | 20,800 | | | | 2,218,736 | |
O’Reilly Automotive, Inc.* | | | 9,700 | | | | 2,458,174 | |
Select Comfort Corp.* | | | 104,000 | | | | 2,226,640 | |
| | |
| 11 | | Semi-Annual Report | December 31, 2015 (Unaudited) |
| | |
| Aggressive Investors 1 Fund | | |
| SCHEDULE OF INVESTMENTS (continued) | | |
| Showing percentage of net assets as of December 31, 2015 (Unaudited) | | |
| | | | | | | | |
| Industry Company | | | | Shares | | Value | | |
| |
Common Stocks (continued) | | |
Specialty Retail (continued) | | |
Ulta Salon Cosmetics & Fragrance, Inc.* | | 12,200 | | $ 2,257,000 | | |
| | | | | | | | |
| | | | | | 12,566,912 | | |
| |
Textiles, Apparel & Luxury Goods - 2.03% | | |
Skechers U.S.A., Inc., Class A* | | 144,600 | | 4,368,366 | | |
| |
Trading Companies & Distributors - 1.86% | | |
AerCap Holdings NV* | | 26,800 | | 1,156,688 | | |
United Rentals, Inc.* | | 38,700 | | 2,807,298 | | |
Veritiv Corp.* | | 992 | | 35,930 | | |
| | | | | | | | |
| | | | |
| | | | | | 3,999,916 | | |
| | | | | | | | |
| | |
TOTAL COMMON STOCKS - 98.36% | | 211,356,969 | | |
| | | | | | | | |
(Cost $203,905,590) | | | | | | |
| | | |
| Industry Company | | Shares | | Value | | |
| | |
| |
EXCHANGE TRADED FUND - 1.08% | | |
Exchange Traded Fund - 1.08% | | |
VelocityShares Daily Inverse ETN* | | 89,900 | | 2,319,420 | | |
| | | | | | | | |
TOTAL EXCHANGE TRADED FUND - 1.08% | | 2,319,420 | | |
| | | | | | | | |
| | | |
(Cost $2,600,070) | | | | | | |
| | | | |
| | | | | Number
of Contracts | | Value | | |
| |
CALL OPTIONS PURCHASED - 0.00% | | |
American Airlines Group, Inc. | | |
Expiring January, 2016 at $46.00 | | 530 | | 7,950 | | |
| | | | | | | | |
TOTAL CALL OPTIONS
PURCHASED — 0.00% | | 7,950 | | |
| | | | | | | | |
(Cost $102,534) | | | | | | |
| | | | |
| | | Rate^ | | Shares | | Value | | |
| |
MONEY MARKET FUND - 0.17% | | |
Dreyfus Cash Management Fund | | 0.18% | | 354,016 | | 354,016 | | |
| | | | | | | | |
| | |
TOTAL MONEY MARKET FUND - 0.17% | | 354,016 | | |
| | | | | | | | |
(Cost $354,016) | | | | | | |
| | | | | | |
| | | | | | |
| | | | | | |
| | | | | | |
| | | | | | |
| | | Rate^ | | Shares | | Value |
|
INVESTMENTS PURCHASED WITH CASH PROCEEDS FROM SECURITIES LENDING - 5.02% |
Dreyfus Cash Management Fund** | | 0.18% | | 10,789,705 | | $10,789,705 |
| | | | | | |
TOTAL INVESTMENTS PURCHASED WITH CASH PROCEEDS FROM SECURITIES LENDING - 5.02% | | 10,789,705 |
| | | | | | |
(Cost $ 10,789,705) | | |
| |
TOTAL INVESTMENTS - 104.63% | | 224,828,060 |
| |
(Cost $ 217,751,915) | | |
Liabilities in Excess of Other Assets - (4.63%) | | (9,940,213) |
| | | | | | |
NET ASSETS - 100.00% | | $214,887,847 |
| | | | | | |
| * | Non-income producing security. |
| ** | This security represents the investment of the collateral received in connection with securities out on loan as of December 31, 2015. |
| ^ | Rate disclosed as of December 31, 2015. |
| + | This security or a portion of the security is out on loan as of December 31, 2015. Total loaned securities had a value of $10,469,156 as of December 31, 2015. |
ETN - Exchange Traded Note
PLC - Public Limited Company
Summary of inputs used to value the Fund’s investments as of 12/31/2015 (See Note 2 in Notes to Financial Statements):
| | | | | | | | | | | | | | | | |
| | | Valuation Inputs | |
| | | Investment in Securities (Value) | |
| | | Level 1 Quoted Prices | | | Level 2
Significant
Observable
Inputs | | | Level 3
Significant
Unobservable
Inputs | | | Total | |
| | | | |
Common Stocks | | $ | 211,356,969 | | | $ | — | | | $ | — | | | $ | 211,356,969 | |
Exchange Traded Fund | | | 2,319,420 | | | | — | | | | — | | | | 2,319,420 | |
Call Options Purchased | | | 7,950 | | | | — | | | | — | | | | 7,950 | |
Money Market Fund | | | — | | | | 354,016 | | | | — | | | | 354,016 | |
Investments Purchased with Cash Proceeds from Securities Lending | | | — | | | | 10,789,705 | | | | — | | | | 10,789,705 | |
| | | | | | | | | | | | | | | | |
TOTAL | | $ | 213,684,339 | | | $ | 11,143,721 | | | $ | — | | | $ | 224,828,060 | |
| | | | | | | | | | | | | | | | |
See Notes to Financial Statements. | |
| | |
| Ultra-Small Company Fund | |
|
| MANAGER’S COMMENTARY (Unaudited) | |
| | |
December 31, 2015
Dear Fellow Ultra-Small Company Fund Shareholder,
For the quarter ended December 31, 2015, our Fund returned 3.57%, beating our primary market benchmark, the CRSP Cap-Based Portfolio 10 Index (1.14%), and our peer benchmark, the Lipper Micro-Cap Stock Funds Index (3.31%), but slightly lagging the Russell 2000 Index (3.59%) and the Russell Microcap Index (3.74%). It was a good quarter.
For the six-month semi-annual period ended December 31, 2015, our Fund declined -12.40%, outperforming the CRSP Cap-Based Portfolio 10 Index (-13.60%), but lagging the Lipper Micro-Cap Stock Funds Index (-8.67%), the Russell 2000 Index (-8.75%) and the Russell Microcap Index (-10.55%).
For the 2015 calendar year, our Fund declined -16.12%, underperforming the CRSP Cap-Based Portfolio 10 Index (-11.61%), the Lipper Micro-Cap Stock Funds Index (-4.21%), the Russell 2000 Index (-4.41%) and the Russell Microcap Index (-5.16%).
The table below presents our December quarter, six months, one-year, five-year, 10-year, 15-year, and inception-to-date financial results.
Standardized Returns as of December 31, 2015
| | | | | | | | | | | | | | | | | | | | | | | | | | | | | | | | | | | |
| | | | | | | | | Annualized | | |
| | | Quarter | | 6 Months | | 1 Year | | 5 Years | | 10 Years | | 15 Years | | Since Inception
(8/5/94) |
| | | | | | | |
Ultra-Small Company Fund | | | | 3.57% | | | | | -12.40% | | | | | -16.12% | | | | | 6.66% | | | | | 4.90% | | | | | 11.88% | | | | | 14.07% | |
CRSP Cap-Based Portfolio 10 Index | | | | 1.14% | | | | | -13.60% | | | | | -11.61% | | | | | 7.17% | | | | | 6.54% | | | | | 12.51% | | | | | 11.66% | |
Russell 2000 Index | | | | 3.59% | | | | | -8.75% | | | | | -4.41% | | | | | 9.19% | | | | | 6.80% | | | | | 7.28% | | | | | 8.90% | |
Russell Microcap Index | | | | 3.74% | | | | | -10.55% | | | | | -5.16% | | | | | 9.23% | | | | | 5.13% | | | | | 7.99% | | | | | N/A | |
Lipper Micro-Cap Stock Funds Index | | | | 3.31% | | | | | -8.67% | | | | | -4.21% | | | | | 8.77% | | | | | 5.73% | | | | | 7.09% | | | | | N/A | |
Performance figures quoted in the table above represent past performance and are no guarantee of future results. Total return figures in the table above include the reinvestment of dividends and capital gains. The table above does not reflect the deduction of taxes that a shareholder would pay on Fund distributions or on the redemption of Fund shares.
The CRSP Cap-Based Portfolio 10 Index is an unmanaged index of 796 of the smallest publicly traded U.S. stocks (with dividends reinvested), as reported by the Center for Research on Security Prices. The Russell Microcap Index is an unmanaged, market value weighted index that measures performance of 1,000 of the smallest securities in the Russell 2000 Index. The Russell 2000 Index is an unmanaged, market value weighted index that measures performance of the 2,000 companies that are between the 1,000th and 3,000th largest in the market (with dividends reinvested). The Lipper Micro-Cap Stock Funds Index is an index of micro-cap funds compiled by Lipper, Inc. It is not possible to invest directly in an index. Periods longer than one year are annualized.
According to data from Lipper, Inc. as of December 31, 2015, Ultra-Small Company Fund ranked 69th of 69 micro-cap funds for the 12 months ended December 31, 2015, 46th of 55 over the last five years, 25th of 39 over the last 10 years, and 1st of 8 since inception in August 1994. Lipper, Inc. is an independent mutual fund rating service that ranks funds in various fund categories by making comparative calculations using total returns.
| | |
| 13 | | Semi-Annual Report | December 31, 2015 (Unaudited) |
| | |
| Ultra-Small Company Fund | |
|
| MANAGER’S COMMENTARY (Unaudited) (continued) | | |
| | |
Ultra-Small Company Fund vs. CRSP Cap-Based Portfolio 10 Index, Russell Microcap Index**, Russell 2000 Index & Lipper Micro-Cap Stock Funds Index* from Inception 8/5/94 to 12/31/15

* The Lipper Micro-Cap Stock Funds Index began on 12/31/1995, and the line graph for the Index begins at the same value as the Fund on that date.
| ** | The Russell Microcap Index began on 6/30/2000, and the line graph for the Index begins at the same value as the Fund on that date. |
Detailed Explanation of Quarterly Performance
Exposure to the slightly larger stocks in CRSP’s 9th decile was the largest positive contributor to relative performance, as the 9th decile’s overall returns outperformed the ultra-small 10th decile by a considerable margin. The Fund held only 67% of its holdings in CRSP 10 stocks during the period, compared to 76% in the previous quarter, due to companies appreciating into the 9th decile and the decreasing market capitalization cut-off for CRSP’s 10th decile. Three of the Fund’s top 10 performing holdings came from CRSP’s 9th decile.
Strong performance from our company financial health and momentum models also boosted relative returns. However, our value metrics models lagged the benchmark overall, which detracted from relative performance.
Holdings within the Consumer Discretionary, Consumer Staples and Information Technology sectors lifted relative performance. The Fund also benefited from a slight underweighted position in the slumping Energy sector.
The table below presents index performance numbers for stocks in the different deciles during various time periods.
| | | | | | | | | | | | | | | | | | | | |
| CRSP Decile1 | | Quarter | | | 1 Year | | | 5 Years | | | 10 Years | | | 90 Years | |
| 1 (ultra-large) | | | 7.44% | | | | 1.74% | | | | 12.40% | | | | 7.17% | | | | 9.28% | |
| 2 | | | 2.56% | | | | -3.69% | | | | 12.26% | | | | 8.06% | | | | 10.48% | |
| 3 | | | 3.99% | | | | -2.80% | | | | 10.86% | | | | 7.92% | | | | 10.97% | |
| 4 | | | 1.27% | | | | -4.77% | | | | 11.24% | | | | 8.27% | | | | 10.81% | |
| 5 | | | 1.41% | | | | -7.35% | | | | 9.61% | | | | 9.13% | | | | 11.43% | |
| 6 | | | 3.17% | | | | -7.33% | | | | 10.01% | | | | 7.71% | | | | 11.28% | |
| 7 | | | 3.93% | | | | -5.87% | | | | 9.89% | | | | 8.15% | | | | 11.43% | |
| 8 | | | 4.22% | | | | -7.81% | | | | 8.79% | | | | 8.06% | | | | 11.45% | |
| 9 | | | 4.63% | | | | -11.34% | | | | 7.58% | | | | 6.76% | | | | 11.35% | |
| 10 (ultra-small) | | | 1.14% | | | | -11.61% | | | | 7.17% | | | | 6.54% | | | | 13.22% | |
| 1 | Performance figures are as of the period ended December 31, 2015. The CRSP Cap-Based Portfolio Indexes are unmanaged indexes of publicly traded U.S. stocks with dividends reinvested, grouped by market capitalization, as reported by the Center for Research in Security Prices. Past performance is no guarantee of future results. |
| | |
| Ultra-Small Company Fund | | |
| MANAGER’S COMMENTARY (Unaudited) (continued) | | |
| | |
Detailed Explanation of Calendar Year Performance
Positive performance in the fourth quarter was not enough to overcome the negative effects of market turbulence earlier in the year. The Fund’s value metrics models weighed down relative returns most heavily for the calendar year. Exposure to deeper value stocks, in particular, hurt performance. By contrast, our diversifying momentum and company financial health models performed well.
From a sector standpoint, the Fund’s Energy holdings were the largest detractor from absolute performance. Investments in the Industrials and Financials sectors lagged as well.
Top Ten Holdings as of December 31, 2015
| | | | | | | | | |
| Rank | | Description | | Industry | | % of Net
Assets |
| 1 | | ZAGG, Inc. | | Household Durables | | | | 2.4 | % |
| 2 | | NeoPhotonics Corp. | | Semiconductors & Semiconductor Equipment | | | | 2.3 | % |
| 3 | | Allied Motion Technologies, Inc. | | Electrical Equipment | | | | 2.2 | % |
| 4 | | Hooker Furniture Corp. | | Household Durables | | | | 1.9 | % |
| 5 | | EMCORE Corp. | | Communications Equipment | | | | 1.8 | % |
| 6 | | MGP Ingredients, Inc. | | Beverages | | | | 1.7 | % |
| 7 | | Sientra, Inc. | | Health Care | | | | 1.6 | % |
| 8 | | Mattson Technology, Inc. | | Semiconductors & Semiconductor Equipment | | | | 1.6 | % |
| 9 | | Oclaro, Inc. | | Communications Equipment | | | | 1.4 | % |
| 10 | | Regional Management Corp. | | Consumer Finance | | | | 1.3 | % |
| | Total | | | | | | 18.2 | % |
Industry Sector Representation as of December 31, 2015
| | | | | | | | | | | | | | | |
| | | % of Net Assets | | % of CRSP 10 Index | | Difference |
Consumer Discretionary | | | | 17.6% | | | | | 8.8% | | | | | 8.8% | |
Consumer Staples | | | | 2.4% | | | | | 3.1% | | | | | -0.7% | |
Energy | | | | 4.4% | | | | | 11.7% | | | | | -7.3% | |
Financials | | | | 21.5% | | | | | 12.4% | | | | | 9.1% | |
Health Care | | | | 11.2% | | | | | 2.6% | | | | | 8.6% | |
Industrials | | | | 15.9% | | | | | 18.1% | | | | | -2.2% | |
Information Technology | | | | 21.7% | | | | | 24.2% | | | | | -2.5% | |
Materials | | | | 3.2% | | | | | 17.3% | | | | | -14.1% | |
Telecommunication Services | | | | 0.6% | | | | | 0.6% | | | | | 0.0% | |
Utilities | | | | 0.0% | | | | | 1.4% | | | | | -1.4% | |
Cash & Other Assets | | | | 1.4% | | | | | 0.0% | | | | | 1.4% | |
Total | | | | 100.0% | | | | | 100.0% | | | | | | |
Disclaimer
The views expressed here are exclusively those of Fund management. These views, including those related to market sectors or individual stocks, are not meant as investment advice and should not be considered predictive in nature. Any favorable (or unfavorable) description of a holding applies only as of the quarter end, December 31, 2015, unless otherwise stated. Security positions can and do change thereafter. Discussions of historical performance do not guarantee and may not be indicative of future performance.
| | |
| 15 | | Semi-Annual Report | December 31, 2015 (Unaudited) |
| | |
| Ultra-Small Company Fund | | |
| MANAGER’S COMMENTARY (Unaudited) (continued) | | |
| | |
The Fund is subject to very high, above market risk (volatility) and is not an appropriate investment for short-term investors. Investments in ultra-small companies generally carry greater risk than is customarily associated with larger companies and even “small companies” for various reasons, such as narrower markets (fewer investors), limited financial resources and greater trading difficulty.
Conclusion
Ultra-Small Company Fund remains closed to new investors. We encourage your feedback; your reactions and concerns are important to us.
Sincerely,
The Investment Management Team
| | |
| Ultra-Small Company Fund | |
|
| SCHEDULE OF INVESTMENTS | |
| Showing percentage of net assets as of December 31, 2015 (Unaudited) | | |
| | | | | | | | | | |
| Industry Company | | Shares | | | Value | | | |
| |
COMMON STOCKS - 98.90% | | | |
Aerospace & Defense - 1.89% | | | |
Breeze-Eastern Corp. | | | 10,000 | | | $ | 198,000 | | | |
Ducommun, Inc.* | | | 52,300 | | | | 848,306 | | | |
LMI Aerospace, Inc.*+ | | | 40,000 | | | | 402,800 | | | |
Vectrus, Inc.* | | | 28,200 | | | | 589,098 | | | |
| | | | | | | | | | |
| | | | | | | 2,038,204 | | | |
| |
Air Freight & Logistics - 0.85% | | | |
Air T, Inc.* | | | 20,400 | | | | 499,188 | | | |
Radiant Logistics, Inc.*+ | | | 122,900 | | | | 421,547 | | | |
| | | | | | | | | | |
| | | | | | | 920,735 | | | |
| |
Auto Components - 0.42% | | | |
China XD Plastics Co., Ltd.*+ | | | 69,700 | | | | 308,074 | | | |
SORL Auto Parts, Inc.* | | | 56,700 | | | | 143,451 | | | |
| | | | | | | | | | |
| | | | | | | 451,525 | | | |
| |
Beverages - 2.18% | | | |
MGP Ingredients, Inc.+ | | | 72,000 | | | | 1,868,400 | | | |
Primo Water Corp.* | | | 60,000 | | | | 480,000 | | | |
| | | | | | | | | | |
| | | | | | | 2,348,400 | | | |
| |
Biotechnology - 2.39% | | | |
Biota Pharmaceuticals, Inc.* | | | 65,000 | | | | 126,100 | | | |
CoLucid Pharmaceuticals, Inc.*+ | | | 50,000 | | | | 418,500 | | | |
MacroCure, Ltd.* | | | 200,000 | | | | 256,000 | | | |
MEI Pharma, Inc.* | | | 390,000 | | | | 624,000 | | | |
Nexvet Biopharma PLC* | | | 44,400 | | | | 151,404 | | | |
OncoGenex Pharmaceutical, Inc.*+ | | | 215,500 | | | | 260,755 | | | |
Verastem, Inc.* | | | 397,800 | | | | 739,908 | | | |
| | | | | | | | | | |
| | | | | | | 2,576,667 | | | |
| |
Capital Markets - 0.57% | | | |
Monroe Capital Corp. | | | 47,300 | | | | 619,157 | | | |
| |
Chemicals - 1.87% | | | |
Core Molding Technologies, Inc.* | | | 75,000 | | | | 962,250 | | | |
Gulf Resources, Inc.* | | | 259,000 | | | | 471,380 | | | |
Rentech, Inc.* | | | 166,800 | | | | 587,136 | | | |
| | | | | | | | | | |
| | | | | | | 2,020,766 | | | |
| |
Commercial Banks - 7.00% | | | |
American National Bankshares, Inc.+ | | | 19,000 | | | | 486,590 | | | |
Bank of Commerce Holdings | | | 22,900 | | | | 152,972 | | | |
Bar Harbor Bankshares+ | | | 33,000 | | | | 1,135,860 | | | |
C&F Financial Corp. | | | 4,400 | | | | 171,600 | | | |
| | | | | | | | |
| Industry Company | | Shares | | | Value | |
|
| |
Commercial Banks (continued) | |
Citizens & Northern Corp. | | | 33,500 | | | $ | 703,500 | |
Coastway Bancorp, Inc.*+ | | | 8,700 | | | | 114,318 | |
Farmers Capital Bank Corp.*+ | | | 42,800 | | | | 1,160,308 | |
Farmers National Banc Corp.+ | | | 22,400 | | | | 192,640 | |
First Bancorp, Inc. | | | 15,500 | | | | 317,285 | |
First United Corp.* | | | 12,000 | | | | 139,200 | |
FS Bancorp, Inc.+ | | | 5,000 | | | | 128,900 | |
Northrim BanCorp, Inc.+ | | | 16,600 | | | | 441,560 | |
NV5 Global, Inc.*+ | | | 59,600 | | | | 1,310,008 | |
Old Second Bancorp, Inc.* | | | 88,400 | | | | 693,056 | |
Porter Bancorp, Inc.* | | | 83,000 | | | | 117,030 | |
Shore Bancshares, Inc. | | | 12,000 | | | | 130,560 | |
Your Community Bankshares, Inc. | | | 4,900 | | | | 154,448 | |
| | | | | | | | |
| | | | | | | 7,549,835 | |
|
Commercial Services & Supplies - 0.89% | |
Cenveo, Inc.*+ | | | 413,400 | | | | 360,237 | |
Civeo Corp.* | | | 350,000 | | | | 497,000 | |
Virco Manufacturing Corp.* | | | 32,200 | | | | 107,226 | |
| | | | | | | | |
| | | | | | | 964,463 | |
|
Communications Equipment - 5.20% | |
Bel Fuse, Inc., Class B | | | 65,000 | | | | 1,123,850 | |
Ceragon Networks, Ltd.* | | | 169,600 | | | | 205,216 | |
ClearOne, Inc.+ | | | 10,000 | | | | 129,300 | |
Digi International, Inc.* | | | 60,650 | | | | 690,197 | |
EMCORE Corp.* | | | 315,000 | | | | 1,930,950 | |
Oclaro, Inc.*+ | | | 440,500 | | | | 1,532,940 | |
| | | | | | | | |
| | | | | | | 5,612,453 | |
|
Computers & Peripherals - 0.84% | |
Hutchinson Technology, Inc.*+ | | | 157,500 | | | | 565,425 | |
TransAct Technologies, Inc. | | | 40,200 | | | | 344,916 | |
| | | | | | | | |
| | | | | | | 910,341 | |
|
Construction & Engineering - 0.97% | |
Integrated Electrical Services, Inc.* | | | 8,200 | | | | 90,774 | |
Sterling Construction Co., Inc.* | | | 157,500 | | | | 957,600 | |
| | | | | | | | |
| | | | | | | 1,048,374 | |
|
Consumer Finance - 2.54% | |
Consumer Portfolio Services, Inc.* | | | 174,300 | | | | 904,617 | |
Nicholas Financial, Inc.* | | | 36,800 | | | | 428,720 | |
| | |
| 17 | | Semi-Annual Report | December 31, 2015 (Unaudited) |
| | |
| Ultra-Small Company Fund | | |
| SCHEDULE OF INVESTMENTS (continued) | | |
| Showing percentage of net assets as of December 31, 2015 (Unaudited) | | |
| | | | | | | | | | |
| Industry Company | | Shares | | | Value | | | |
| |
Common Stocks (continued) | | | |
Consumer Finance (continued) | | | |
Regional Management Corp.*+ | | | 90,900 | | | $ | 1,406,223 | | | |
| | | | | | | | | | |
| | | | | | | 2,739,560 | | | |
| | | |
Distributors - 0.44% | | | | | | | | | | |
AMCON Distributing Co. | | | 2,700 | | | | 218,430 | | | |
VOXX International Corp.* | | | 48,900 | | | | 257,214 | | | |
| | | | | | | | | | |
| | | | | | | 475,644 | | | |
| |
Diversified Consumer Services - 2.25% | | | |
Cambium Learning Group, Inc.* | | | 167,250 | | | | 811,162 | | | |
ITT Educational Services, Inc.*+ | | | 337,000 | | | | 1,257,010 | | | |
Lincoln Educational Services Corp. | | | 180,000 | | | | 358,200 | | | |
| | | | | | | | | | |
| | | | | | | 2,426,372 | | | |
| |
Diversified Telecommunication Services - 1.84% | | | |
Alaska Communications Systems Group, Inc.* | | | 368,213 | | | | 644,373 | | | |
HC2 Holdings, Inc.*+ | | | 178,700 | | | | 945,323 | | | |
MRV Communications, Inc.*+ | | | 32,500 | | | | 396,500 | | | |
| | | | | | | | | | |
| | | | | | | 1,986,196 | | | |
| |
Electrical Equipment - 4.23% | | | |
Allied Motion Technologies, Inc. | | | 89,200 | | | | 2,335,256 | | | |
Highpower International, Inc.*+ | | | 183,200 | | | | 549,600 | | | |
LSI Industries, Inc. | | | 104,800 | | | | 1,277,512 | | | |
TCP International Holdings, Ltd.* | | | 100,000 | | | | 96,500 | | | |
Ultralife Corp.*+ | | | 46,700 | | | | 301,682 | | | |
| | | | | | | | | | |
| | | | | | | 4,560,550 | | | |
| |
Electronic Equipment, Instruments & Components - 2.25% | | | |
Key Tronic Corp.*+ | | | 16,600 | | | | 126,160 | | | |
LoJack Corp.* | | | 61,400 | | | | 341,384 | | | |
Maxwell Technologies, Inc.*+ | | | 77,100 | | | | 550,494 | | | |
NAPCO Security Technologies, Inc.*+ | | | 110,000 | | | | 649,000 | | | |
PCM, Inc.* | | | 33,700 | | | | 334,641 | | | |
Radisys Corp.* | | | 153,300 | | | | 424,641 | | | |
| | | | | | �� | | | | |
| | | | | | | 2,426,320 | | | |
| |
Energy Equipment & Services - 1.61% | | | |
Basic Energy Services, Inc.*+ | | | 190,300 | | | | 510,004 | | | |
| | | | | | | | |
| Industry Company | | Shares | | | Value | |
|
| |
Energy Equipment & Services (continued) | |
Gulfmark Offshore, Inc., Class A+ | | | 90,800 | | | $ | 424,036 | |
Key Energy Services, Inc.* | | | 743,400 | | | | 358,393 | |
Nuverra Environmental Solutions, Inc.*+ | | | 205,800 | | | | 105,534 | |
Seventy Seven Energy, Inc.*+ | | | 322,100 | | | | 338,205 | |
| | | | | | | | |
| | | | | | | 1,736,172 | |
|
Health Care Equipment & Supplies - 3.24% | |
Bellerophon Therapeutics, Inc.*+ | | | 100,000 | | | | 296,000 | |
FONAR Corp.* | | | 64,100 | | | | 1,106,366 | |
RTI Surgical, Inc.* | | | 81,000 | | | | 321,570 | |
Sientra, Inc.*+ | | | 298,600 | | | | 1,767,712 | |
| | | | | | | | |
| | | | | | | 3,491,648 | |
|
Health Care Providers & Services - 3.24% | |
Alliance HealthCare Services, Inc.*+ | | | 53,800 | | | | 493,884 | |
Chembio Diagnostics, Inc.*+ | | | 107,500 | | | | 572,975 | |
Five Star Quality Care, Inc.* | | | 332,000 | | | | 1,055,760 | |
RadNet, Inc.* | | | 222,600 | | | | 1,375,668 | |
| | | | | | | | |
| | | | | | | 3,498,287 | |
|
Hotels, Restaurants & Leisure - 2.79% | |
Bravo Brio Restaurant Group, Inc.* | | | 109,700 | | | | 987,300 | |
Century Casinos, Inc.* | | | 75,200 | | | | 585,056 | |
Golden Entertainment, Inc.* | | | 35,300 | | | | 361,119 | |
Luby’s, Inc.*+ | | | 63,200 | | | | 282,504 | |
Red Lion Hotels Corp.* | | | 82,300 | | | | 576,923 | |
Town Sports International Holdings, Inc.*+ | | | 180,000 | | | | 214,200 | |
| | | | | | | | |
| | | | | | | 3,007,102 | |
| | |
Household Durables - 5.69% | | | | | | | | |
Bassett Furniture Industries, Inc. | | | 41,000 | | | | 1,028,280 | |
Hooker Furniture Corp. | | | 81,400 | | | | 2,054,536 | |
Lifetime Brands, Inc. | | | 33,000 | | | | 437,580 | |
ZAGG, Inc.*+ | | | 239,100 | | | | 2,615,754 | |
| | | | | | | | |
| | | | | | | 6,136,150 | |
| | |
Insurance - 2.32% | | | | | | | | |
Blue Capital Reinsurance Holdings, Ltd. | | | 23,300 | | | | 399,595 | |
First Acceptance Corp.*+ | | | 43,500 | | | | 103,530 | |
Hallmark Financial Services, Inc.* | | | 99,500 | | | | 1,163,155 | |
| | |
| Ultra-Small Company Fund | |
|
| SCHEDULE OF INVESTMENTS (continued) | |
| Showing percentage of net assets as of December 31, 2015 (Unaudited) | | |
| | | | | | | | | | |
| Industry Company | | Shares | | | Value | | | |
| |
Common Stocks (continued) | | | |
Insurance (continued) | | | |
Health Insurance Innovations, Inc., Class A*+ | | | 46,400 | | | $ | 310,880 | | | |
Investors Title Co. | | | 1,500 | | | | 145,200 | | | |
Kingstone Cos., Inc. | | | 42,200 | | | | 379,800 | | | |
| | | | | | | | | | |
| | | | | | | 2,502,160 | | | |
| |
Internet & Catalog Retail - 0.59% | | | |
CafePress, Inc.* | | | 64,800 | | | | 248,832 | | | |
Gaiam, Inc., Class A*+ | | | 58,000 | | | | 361,920 | | | |
US Auto Parts Network, Inc.* | | | 9,333 | | | | 27,439 | | | |
| | | | | | | | | | |
| | | | | | | 638,191 | | | |
| |
Internet Software & Services - 2.30% | | | |
Autobytel, Inc.* | | | 58,200 | | | | 1,312,992 | | | |
Demand Media, Inc.* | | | 101,000 | | | | 555,500 | | | |
Inuvo, Inc.* | | | 120,200 | | | | 324,540 | | | |
Support.com, Inc.* | | | 285,800 | | | | 288,658 | | | |
| | | | | | | | | | |
| | | | | | | 2,481,690 | | | |
| |
IT Services - 3.54% | | | |
Edgewater Technology, Inc.*+ | | | 3,700 | | | | 29,637 | | | |
Hackett Group, Inc. (The) | | | 51,400 | | | | 825,998 | | | |
Information Services Group, Inc. | | | 97,600 | | | | 353,312 | | | |
NCI, Inc., Class A | | | 87,000 | | | | 1,187,550 | | | |
Newtek Business Services Corp. | | | 98,961 | | | | 1,417,124 | | | |
| | | | | | | | | | |
| | | | | | | 3,813,621 | | | |
| |
Leisure Equipment & Products - 0.77% | | | |
JAKKS Pacific, Inc.*+ | | | 104,300 | | | | 830,228 | | | |
| |
Machinery - 2.30% | | | |
Accuride Corp.* | | | 304,300 | | | | 505,138 | | | |
Commercial Vehicle Group, Inc.* | | | 94,300 | | | | 260,268 | | | |
Hardinge, Inc. | | | 22,800 | | | | 212,496 | | | |
Hurco Companies, Inc. | | | 29,200 | | | | 775,552 | | | |
Supreme Industries, Inc., Class A | | | 30,900 | | | | 211,665 | | | |
Xerium Technologies, Inc.* | | | 43,800 | | | | 519,030 | | | |
| | | | | | | | | | |
| | | | | | | 2,484,149 | | | |
| |
Marine - 0.07% | | | |
Rand Logistics, Inc.* | | | 43,900 | | | | 70,240 | | | |
| |
Media - 1.44% | | | |
Lee Enterprises, Inc.*+ | | | 275,000 | | | | 462,000 | | | |
| | | | | | | | |
| Industry Company | | Shares | | | Value | |
|
| |
Media (continued) | |
Reading International, Inc., Class A* | | | 24,800 | | | $ | 325,128 | |
Townsquare Media, Inc., Class A* | | | 64,000 | | | | 765,440 | |
| | | | | | | | |
| | | | | | | 1,552,568 | |
|
Metals & Mining - 1.66% | |
A-Mark Precious Metals, Inc.+ | | | 19,200 | | | | 368,640 | |
Noranda Aluminum Holding Corp.+ | | | 64,900 | | | | 20,768 | |
Olympic Steel, Inc. | | | 4,900 | | | | 56,742 | |
Richmont Mines, Inc.* | | | 230,000 | | | | 738,300 | |
Ryerson Holding Corp.*+ | | | 129,000 | | | | 602,430 | |
| | | | | | | | |
| | | | | | | 1,786,880 | |
|
Multiline Retail - 0.58% | |
Bon-Ton Stores, Inc. (The)+ | | | 297,200 | | | | 624,120 | |
|
Oil, Gas & Consumable Fuels - 2.77% | |
Adams Resources & Energy, Inc. | | | 4,900 | | | | 188,160 | |
Cloud Peak Energy, Inc.*+ | | | 389,900 | | | | 810,992 | |
Comstock Resources, Inc.+ | | | 297,700 | | | | 556,699 | |
Energy XXI, Ltd. | | | 472,600 | | | | 477,326 | |
Geopark, Ltd.* | | | 43,900 | | | | 118,530 | |
Midstates Petroleum Co., Inc.* | | | 75,000 | | | | 151,500 | |
PrimeEnergy Corp.*+ | | | 4,300 | | | | 220,375 | |
Triangle Petroleum Corp.* | | | 606,900 | | | | 467,313 | |
| | | | | | | | |
| | | | | | | 2,990,895 | |
|
Personal Products - 0.28% | |
Mannatech, Inc.*+ | | | 9,500 | | | | 180,405 | |
Natural Alternatives International, Inc.*+ | | | 11,300 | | | | 116,842 | |
| | | | | | | | |
| | | | | | | 297,247 | |
|
Pharmaceuticals - 2.39% | |
Avalanche Biotechnologies, Inc.* | | | 132,200 | | | | 1,258,544 | |
Dipexium Pharmaceuticals, Inc.*+ | | | 24,600 | | | | 275,520 | |
Juniper Pharmaceuticals, Inc.* | | | 100,900 | | | | 1,039,270 | |
| | | | | | | | |
| | | | | | | 2,573,334 | |
|
Real Estate Investment Trusts (REITs) - 1.09% | |
Armada Hoffler Properties, Inc. | | | 111,900 | | | | 1,172,712 | |
| | |
| | |
| 19 | | Semi-Annual Report | December 31, 2015 (Unaudited) |
| | |
| Ultra-Small Company Fund | | |
| SCHEDULE OF INVESTMENTS (continued) | | |
| Showing percentage of net assets as of December 31, 2015 (Unaudited) | | |
| | | | | | | | |
| Industry Company | | Shares | | Value | | | |
| | | |
Common Stocks (continued) | | | | | | | | |
Real Estate Management & Development - 0.65% | | | |
Nam Tai Property, Inc. | | 121,100 | | | $ 701,169 | | | |
| |
Road & Rail - 2.21% | | | |
P.A.M. Transportation Services, Inc.* | | 37,700 | | | 1,040,143 | | | |
USA Truck, Inc.* | | 77,000 | | | 1,343,650 | | | |
| | | | | | | | |
| | | | | 2,383,793 | | | |
| |
Semiconductors & Semiconductor Equipment - 5.94% | | | |
Cascade Microtech, Inc.* | | 54,203 | | | 880,799 | | | |
Mattson Technology, Inc.* | | 482,600 | | | 1,703,578 | | | |
NeoPhotonics Corp.*+ | | 226,328 | | | 2,457,922 | | | |
Sigma Designs, Inc.* | | 216,000 | | | 1,365,120 | | | |
| | | | | | | | |
| | | | | 6,407,419 | | | |
| |
Software - 2.58% | | | |
Bsquare Corp.*+ | | 155,700 | | | 948,213 | | | |
Covisint Corp.* | | 115,500 | | | 288,750 | | | |
FalconStor Software, Inc.* | | 67,300 | | | 126,524 | | | |
NetSol Technologies, Inc.*+ | | 33,500 | | | 259,960 | | | |
TeleCommunication Systems, Inc., Class A* | | 234,200 | | | 1,163,974 | | | |
| | | | | | | | |
| | | | | 2,787,421 | | | |
| | | |
Specialty Retail - 1.37% | | | | | | | | |
hhgregg, Inc.*+ | | 106,000 | | | 387,960 | | | |
Sears Hometown & Outlet Stores, Inc.* | | 135,500 | | | 1,084,000 | | | |
| | | | | | | | |
| | | | | 1,471,960 | | | |
| |
Textiles, Apparel & Luxury Goods - 1.29% | | | |
Crown Crafts, Inc. | | 26,100 | | | 221,589 | | | |
Lakeland Industries, Inc.*+ | | 97,900 | | | 1,168,926 | | | |
| | | | | | | | |
| | | | | 1,390,515 | | | |
| |
Thrifts & Mortgage Finance - 7.12% | | | |
Atlantic Coast Financial Corp.*+ | | 37,100 | | | 217,406 | | | |
BSB Bancorp, Inc.* | | 14,500 | | | 339,155 | | | |
Cape Bancorp, Inc. | | 40,800 | | | 507,144 | | | |
Charter Financial Corp. | | 101,000 | | | 1,334,210 | | | |
Entegra Financial Corp.* | | 5,699 | | | 108,623 | | | |
ESSA Bancorp, Inc. | | 38,100 | | | 521,208 | | | |
Fox Chase Bancorp, Inc. | | 7,000 | | | 142,030 | | | |
Hingham Institution for Savings+ | | 5,200 | | | 622,960 | | | |
Impac Mortgage Holdings, Inc.*+ | | 74,000 | | | 1,332,000 | | | |
Malvern Bancorp, Inc.* | | 11,200 | | | 196,672 | | | |
Ocean Shore Holding Co.+ | | 19,600 | | | 336,140 | | | |
Provident Financial Holdings, Inc. | | 15,000 | | | 283,350 | | | |
| | | | | | | | |
| Industry Company | | | | Shares | | Value | |
| |
| | | | |
Thrifts & Mortgage Finance (continued) | |
Prudential Bancorp, Inc.+ | | 8,800 | | $ | 133,408 | |
Pulaski Financial Corp. | | 17,200 | | | 274,512 | |
Security National Financial Corp., Class A*+ | | 39,100 | | | 256,105 | |
Southern Missouri Bancorp, Inc. | | 5,700 | | | 136,230 | |
Territorial Bancorp, Inc. | | 33,700 | | | 934,838 | |
| | | | | | | | |
| | | | | | | 7,675,991 | |
|
Trading Companies & Distributors - 0.45% | |
General Finance Corp.*+ | | 68,300 | | | 272,517 | |
MFC Industrial, Ltd. | | 5,300 | | | 10,335 | |
Willis Lease Finance Corp.* | | 10,000 | | | 201,000 | |
| | | | | | | | |
| | | | | | | 483,852 | |
| | | | | | | | |
TOTAL COMMON STOCKS - 98.90% | | | 106,665,076 | |
| | | | | | | | |
(Cost $109,993,464) | | | | | | | | |
| | | |
| | | Rate^ | | Shares | | Value | |
| |
MONEY MARKET FUND - 1.70% | | | | |
Dreyfus Cash Management Fund | | 0.18% | | 1,830,882 | | | 1,830,882 | |
| | | | | | | | |
TOTAL MONEY MARKET FUND - 1.70% | | | 1,830,882 | |
| | | | | | | | |
(Cost $1,830,882) | | | | | | | | |
| | | |
| | Rate^ | | Shares | | Value | |
|
INVESTMENTS PURCHASED WITH CASH PROCEEDS FROM SECURITIES LENDING - 11.53% | |
Dreyfus Cash Management Fund** | | 0.18% | | 12,430,202 | | | 12,430,202 | |
| | | | | | | | |
| |
TOTAL INVESTMENTS PURCHASED WITH CASH PROCEEDS FROM SECURITIES LENDING - 11.53% | | | 12,430,202 | |
| | | | | | | | |
(Cost $12,430,202) | | | | | | | | |
| |
TOTAL INVESTMENTS - 112.13% | | | 120,926,160 | |
(Cost $124,254,548) | | | | | | | | |
Liabilities in Excess of Other Assets - (12.13%) | | | (13,078,892) | |
| | | | | | | | |
| |
NET ASSETS - 100.00% | | | $107,847,268 | |
| | | | | | | | |
| * | Non-income producing security. |
| ** | This security represents the investment of the collateral received in connection with securities out on loan as of December 31, 2015. |
| ^ | Rate disclosed as of December 31, 2015. |
| + | This security or a portion of the security is out on loan as of December 31, 2015. Total loaned securities had a value of $11,715,841 as of December 31, 2015. |
PLC - Public Limited Company
| | |
| Ultra-Small Company Fund | |
|
| SCHEDULE OF INVESTMENTS (continued) | |
| Showing percentage of net assets as of December 31, 2015 (Unaudited) | | |
| | | | | | | | | | | | | | | | | | | | |
Summary of inputs used to value the Fund’s investments as of 12/31/2015 (See Note 2 in Notes to Financial Statements): | |
| | | Valuation Inputs |
| | | Investment in Securities (Value) |
| | | Level 1 Quoted Prices | | Level 2 Significant Observable Inputs | | Level 3 Significant Unobservable Inputs | | Total |
| | | | |
Common Stocks | | | $ | 106,665,076 | | | | $ | — | | | | $ | — | | | | $ | 106,665,076 | |
| | | | |
Money Market Fund | | | | — | | | | | 1,830,882 | | | | | — | | | | | 1,830,882 | |
| | | | |
Investments Purchased with Cash Proceeds from Securities Lending | | | | — | | | | | 12,430,202 | | | | | — | | | | | 12,430,202 | |
| | | | | | | | | | | | | | | | | | | | |
| | | | |
TOTAL | | | $ | 106,665,076 | | | | $ | 14,261,084 | | | | $ | — | | | | $ | 120,926,160 | |
| | | | | | | | | | | | | | | | | | | | |
| | | | |
| | | | | | | | | | | | | | | | | | | | |
| | | | | | | | | | | | | | | | | |
| | | Following is a reconciliation of Level 3 investments for which significant unobservable inputs were used to determine fair value: | |
| | | | | Investment in Securities (Value) |
| | | | |
| | | | | Common Stocks | | Dividend Note | | Total |
| | | | |
| | | | | |
| | | Balance as of 06/30/2015 | | | $ | 15,300 | | | | $ | 8,007 | | | | $ | 23,307 | |
| | | | | |
| | | Purchases | | | | — | | | | | — | | | | | — | |
| | | | | |
| | | Sales | | | | (15,300) | | | | | (8,007) | | | | | (23,307 | ) |
| | | | | |
| | | Realized Gain/(Loss) | | | | — | | | | | — | | | | | — | |
| | | | | |
| | | Change in Unrealized Appreciation/ (Depreciation) | | | | — | | | | | — | | | | | — | |
| | | | | |
| | | Transfers in | | | | — | | | | | — | | | | | — | |
| | | | | |
| | | Transfers out | | | | — | | | | | — | | | | | — | |
| | | | | | | | | | | | | | | | | | |
| | | | | |
| | | Balance as of 12/31/2015 | | | $ | — | | | | $ | — | | | | $ | — | |
| | | | | | | | | | | | | | | | | | |
| | | | | |
| | | Net Change in Unrealized Appreciation (Depreciation) from Investments Held as of 12/31/2015 | | | $ | — | | | | $ | — | | | | $ | — | |
| | | | | | | | | | | | | | | | | |
See Notes to Financial Statements.
| | |
| 21 | | Semi-Annual Report | December 31, 2015 (Unaudited) |
| | |
| Ultra-Small Company Market Fund | | |
| MANAGER’S COMMENTARY (Unaudited) | | |
| | |
December 31, 2015
Dear Fellow Ultra-Small Company Market Fund Shareholder,
For the quarter ended December 31, 2015, our Fund returned 3.73%, outperforming our primary market benchmark, the CRSP Cap-Based Portfolio 10 Index (1.14%), our peer benchmark, the Lipper Micro-Cap Stock Funds Index (3.31%), and the Russell 2000 Index (3.59%). However, our Fund slightly underperformed the Russell Microcap Index (3.74%). It was a strong quarter on a relative basis.
For the six-month semi-annual period ending December 31, 2015, our Fund returned -9.92%, outperforming the CRSP Cap-Based Portfolio 10 Index (-13.60%) and the Russell Microcap Index (-10.55%). Our Fund trailed the Lipper Micro-Cap Stock Funds Index (-8.67%) and the Russell 2000 Index (-8.75%).
For the calendar year, our Fund returned -8.28%, outperforming the CRSP Cap-Based Portfolio 10 Index (-11.61%). Our Fund trailed the Lipper Micro-Cap Stock Funds Index (-4.21%), the Russell Microcap Index (-5.16%) and the Russell 2000 Index (-4.41%).
The table below presents our December quarter, six months, one-year, five-year, 10-year, 15-year, and inception-to-date financial results.
Standardized Returns as of December 31, 2015
| | | | | | | | | | | | | | | | | | | | | | | | | | | | |
| | | | | |
| | | | | | | | | | | | Annualized | | | | |
| | | Quarter | | | 6 Months | | | 1 Year | | | 5 Years | | | 10 Years | | | 15 Years | | | Since Inception (7/31/97) | |
| | | | | | | |
Ultra-Small Company Market Fund | | | 3.73% | | | | -9.92% | | | | -8.28% | | | | 9.84% | | | | 4.84% | | | | 10.84% | | | | 10.28% | |
CRSP Cap-Based Portfolio 10 Index | | | 1.14% | | | | -13.60% | | | | -11.61% | | | | 7.17% | | | | 6.54% | | | | 12.51% | | | | 10.34% | |
Russell 2000 Index | | | 3.59% | | | | -8.75% | | | | -4.41% | | | | 9.19% | | | | 6.80% | | | | 7.28% | | | | 7.02% | |
Russell Microcap Index | | | 3.74% | | | | -10.55% | | | | -5.16% | | | | 9.23% | | | | 5.13% | | | | 7.99% | | | | N/A | |
Lipper Micro-Cap Stock Funds Index | | | 3.31% | | | | -8.67% | | | | -4.21% | | | | 8.77% | | | | 5.73% | | | | 7.09% | | | | 7.36% | |
Performance figures quoted in the table above represent past performance and are no guarantee of future results. Total return figures in the table above include the reinvestment of dividends and capital gains. The table above does not reflect the deduction of taxes that a shareholder would pay on Fund distributions or on the redemption of Fund shares.
The CRSP Cap-Based Portfolio 10 Index is an unmanaged index of 796 of the smallest publicly traded U.S. stocks with dividends reinvested, as reported by the Center for Research on Security Prices. The Russell Microcap Index is an unmanaged, market value weighted index that measures performance of 1,000 of the smallest securities in the Russell 2000 Index. The Russell 2000 Index is an unmanaged, market value weighted index that measures performance of the 2,000 companies that are between the 1,000th and 3,000th largest in the market with dividends reinvested. The Lipper Micro-Cap Stock Funds Index is an index of micro-cap funds compiled by Lipper, Inc. It is not possible to invest directly in an index. Periods longer than one year are annualized.
According to data from Lipper, Inc. as of December 31, 2015, Ultra-Small Company Market Fund ranked 44th of 69 micro-cap funds for the 12 months ended December 31, 2015, 19th of 55 over the last five years, 26th of 39 over the last 10 years, and 3rd of 17 since inception in July 1997. Lipper, Inc. is an independent mutual fund rating service that ranks funds in various fund categories by making comparative calculations using total returns.
| | |
| Ultra-Small Company Market Fund | |
|
| MANAGER’S COMMENTARY (Unaudited) (continued) | |
| | |
Ultra-Small Company Market Fund vs. CRSP Cap-Based Portfolio 10 Index, Russell Microcap Index*,
Russell 2000 Index & Lipper Micro-Cap Stock Funds Index from Inception 7/31/97 to 12/31/15

| * The | Russell Microcap Index began on 6/30/2000, and the line graph for the Index begins at the same value as the Fund on that date. |
Detailed Explanation of Quarterly Performance
The Fund benefited from select holdings in CRSP’s 9th decile, which we held in part due to appreciation of stocks and in part due to a decline in the market capitalization cut-off for CRSP’s 10th decile. The 9th decile’s overall returns outperformed the ultra-small 10th decile by a considerable margin, and the Fund held roughly 60% of its assets in CRSP 10th decile names during the period — a lower allocation than in previous quarters.
A significant underweighted position in the Energy sector relative to the benchmark boosted relative performance. Energy stocks were among the quarter’s worst performers due to continued weakness in commodities prices. By design, the Fund does not invest in shares of master limited partnerships or royalty trusts, two structures used primarily as energy sector investment vehicles. The benchmark, however, includes a roughly 5% allocation to these investments.
The table below presents index performance numbers for stocks in the different deciles during various time periods.
| | | | | | | | | | | | | | | | | | | | |
| CRSP Decile1 | | Quarter | | | 1 Year | | | 5 Years | | | 10 Years | | | 90 Years | |
1 (ultra-large) | | | 7.44% | | | | 1.74% | | | | 12.40% | | | | 7.17% | | | | 9.28% | |
| 2 | | | 2.56% | | | | -3.69% | | | | 12.26% | | | | 8.06% | | | | 10.48% | |
3 | | | 3.99% | | | | -2.80% | | | | 10.86% | | | | 7.92% | | | | 10.97% | |
| 4 | | | 1.27% | | | | -4.77% | | | | 11.24% | | | | 8.27% | | | | 10.81% | |
5 | | | 1.41% | | | | -7.35% | | | | 9.61% | | | | 9.13% | | | | 11.43% | |
| 6 | | | 3.17% | | | | -7.33% | | | | 10.01% | | | | 7.71% | | | | 11.28% | |
7 | | | 3.93% | | | | -5.87% | | | | 9.89% | | | | 8.15% | | | | 11.43% | |
| 8 | | | 4.22% | | | | -7.81% | | | | 8.79% | | | | 8.06% | | | | 11.45% | |
9 | | | 4.63% | | | | -11.34% | | | | 7.58% | | | | 6.76% | | | | 11.35% | |
| 10 (ultra-small) | | | 1.14% | | | | -11.61% | | | | 7.17% | | | | 6.54% | | | | 13.22% | |
| 1 | Performance figures are as of the period ended December 31, 2015. The CRSP Cap-Based Portfolio Indexes are unmanaged indexes of publicly traded U.S. stocks with dividends reinvested, grouped by market capitalization, as reported by the Center for Research in Security Prices. Past performance is no guarantee of future results. |
| | |
| 23 | | Semi-Annual Report | December 31, 2015 (Unaudited) |
| | |
| Ultra-Small Company Market Fund | | |
| MANAGER’S COMMENTARY (Unaudited) (continued) | | |
| | |
Detailed Explanation of Calendar Year Performance
Our Fund outperformed its primary benchmark, the CRSP Cap-Based Portfolio 10 Index, for the calendar year. The Fund benefited from exposure to larger companies in CRSP’s 9th decile. Our “sidestepping” strategy of avoiding stocks that might experience a precipitous price fall, major financial distress or bankruptcy also boosted relative performance for the calendar year. We are pleased with the Fund’s performance, which was in line with Fund design.
Top Ten Holdings as of December 31, 2015
| | | | | | |
| Rank | | Description | | Industry | | % of Net
Assets |
| 1 | | Utah Medical Products, Inc. | | Health Care Equipment & Supplies | | 0.6% |
| 2 | | MGP Ingredients, Inc. | | Beverages | | 0.6% |
| 3 | | York Water Co., (The) | | Water Utilities | | 0.5% |
| 4 | | BioTelemetry, Inc. | | Health Care Providers & Services | | 0.5% |
| 5 | | Farmers Capital Bank Corp. | | Commercial Banks | | 0.5% |
| 6 | | Natural Gas Services Group, Inc. | | Energy Equipment & Services | | 0.4% |
| 7 | | Geron Corp. | | Biotechnology | | 0.4% |
| 8 | | SciClone Pharmaceuticals, Inc. | | Pharmaceuticals | | 0.4% |
| 9 | | Allied Motion Technologies, Inc. | | Electrical Equipment | | 0.4% |
| 10 | | John B Sanfilippo & Son, Inc. | | Food Products | | 0.4% |
| | Total | | | | 4.8% |
Industry Sector Representation as of December 31, 2015
| | | | | | |
| | | % of Net Assets | | % of CRSP 10 Index | | Difference |
Consumer Discretionary | | 13.5% | | 8.8% | �� | 4.7% |
Consumer Staples | | 3.6% | | 3.1% | | 0.5% |
Energy | | 5.8% | | 11.7% | | -5.9% |
| Financials | | 23.1% | | 12.4% | | 10.7% |
Health Care | | 16.9% | | 2.6% | | 14.3% |
| Industrials | | 12.9% | | 18.1% | | -5.2% |
Information Technology | | 18.2% | | 24.2% | | -6.0% |
| Materials | | 3.3% | | 17.3% | | -14.0% |
Telecommunication Services | | 1.0% | | 0.6% | | 0.4% |
| Utilities | | 1.4% | | 1.4% | | 0.0% |
Cash & Other Assets | | 0.4% | | 0.0% | | 0.4% |
Total | | 100.0% | | 100.0% | | |
Disclaimer
The views expressed here are exclusively those of Fund management. These views, including those related to market sectors or individual stocks, are not meant as investment advice and should not be considered predictive in nature. Any favorable (or unfavorable) description of a holding applies only as of the quarter end, December 31, 2015, unless otherwise stated. Security positions can and do change thereafter. Discussions of historical performance do not guarantee and may not be indicative of future performance.
The Fund is subject to very high, above market risk (volatility) and is not an appropriate investment for short-term investors. Investments in ultra-small companies generally carry greater risk than is customarily associated with larger companies and even “small companies” for various reasons, such as narrower markets (fewer investors), limited financial resources and greater trading difficulty.
| | |
| Ultra-Small Company Market Fund | |
|
| MANAGER’S COMMENTARY (Unaudited) (continued) | |
| | |
Conclusion
Thank you for your continued investment in Ultra-Small Company Market Fund. We encourage your feedback; your reactions and concerns are important to us.
Sincerely,
The Investment Management Team
| | |
| 25 | | Semi-Annual Report | December 31, 2015 (Unaudited) |
| | |
| Ultra-Small Company Market Fund | | |
| SCHEDULE OF INVESTMENTS | | |
| Showing percentage of net assets as of December 31, 2015 (Unaudited) | | |
| | | | | | | | | | |
| Industry Company | | Shares | | | Value | | | |
| | |
COMMON STOCKS - 100.12% | | | | | | | |
Aerospace & Defense - 1.38% | | | | | | | |
Air Industries Group+ | | | 3,000 | | | $ | 23,760 | | | |
Arotech Corp.*+ | | | 234,163 | | | | 477,693 | | | |
Breeze-Eastern Corp. | | | 10,500 | | | | 207,900 | | | |
CPI Aerostructures, Inc.*+ | | | 58,079 | | | | 565,109 | | | |
Ducommun, Inc.* | | | 25,300 | | | | 410,366 | | | |
Erickson, Inc.*+ | | | 102,000 | | | | 210,120 | | | |
Innovative Solutions & Support, Inc.* | | | 132,354 | | | | 365,297 | | | |
LMI Aerospace, Inc.* | | | 104,558 | | | | 1,052,899 | | | |
SIFCO Industries, Inc.*+ | | | 39,022 | | | | 370,709 | | | |
Sparton Corp.* | | | 48,300 | | | | 965,517 | | | |
Sypris Solutions, Inc. | | | 25,000 | | | | 27,250 | | | |
Tel-Instrument Electronics Corp.* | | | 15,000 | | | | 71,850 | | | |
| | | | | | | | | | |
| | | | | | | 4,748,470 | | | |
| | |
Air Freight & Logistics - 0.12% | | | | | | | |
Radiant Logistics, Inc.* | | | 125,000 | | | | 428,750 | | | |
| | | |
Auto Components - 0.78% | | | | | | | | | | |
China XD Plastics Co., Ltd.* | | | 56,000 | | | | 247,520 | | | |
Fuel Systems Solutions, Inc.* | | | 18,000 | | | | 88,020 | | | |
Shiloh Industries, Inc.*+ | | | 74,300 | | | | 389,332 | | | |
SORL Auto Parts, Inc.* | | | 109,900 | | | | 278,047 | | | |
Spartan Motors, Inc. | | | 191,500 | | | | 595,565 | | | |
Strattec Security Corp.+ | | | 19,100 | | | | 1,078,959 | | | |
| | | | | | | | | | |
| | | | | | | 2,677,443 | | | |
| | |
Beverages - 1.26% | | | | | | | |
Castle Brands, Inc.* | | | 549,187 | | | | 675,500 | | | |
Craft Brew Alliance, Inc.*+ | | | 92,200 | | | | 771,714 | | | |
MGP Ingredients, Inc. | | | 75,862 | | | | 1,968,619 | | | |
Primo Water Corp.* | | | 112,930 | | | | 903,440 | | | |
| | | | | | | | | | |
| | | | | | | 4,319,273 | | | |
| | |
Biotechnology - 7.27% | | | | | | | |
Actinium Pharmaceuticals, Inc.*+ | | | 160,200 | | | | 517,446 | | | |
Akebia Therapeutics, Inc.*+ | | | 85,250 | | | | 1,101,430 | | | |
Applied Genetic Technologies Corp.* | | | 655 | | | | 13,362 | | | |
Aquinox Pharmaceuticals, Inc.*+ | | | 15,000 | | | | 187,200 | | | |
Ardelyx, Inc.*+ | | | 30,000 | | | | 543,600 | | | |
Argos Therapeutics, Inc.* | | | 40,000 | | | | 92,400 | | | |
Arqule, Inc.* | | | 241,493 | | | | 524,040 | | | |
Asterias Biotherapeutics, Inc.*+ | | | 138,363 | | | | 543,767 | | | |
AVEO Pharmaceuticals, Inc.* | | | 233,087 | | | | 293,690 | | | |
| | | |
| | | | | | | | | | |
| | | | | | | | |
| Industry Company | | Shares | | | Value | |
|
| |
Biotechnology (continued) | | | | | | | | |
BIND Therapeutics, Inc.*+ | | | 113,593 | | | | $ 260,128 | |
BioSpecifics Technologies Corp.* | | | 22,314 | | | | 958,833 | |
Biota Pharmaceuticals, Inc.* | | | 98,370 | | | | 190,838 | |
Calithera Biosciences, Inc.*+ | | | 77,850 | | | | 596,331 | |
Cara Therapeutics, Inc.*+ | | | 58,867 | | | | 992,498 | |
CareDx, Inc.*+ | | | 90,750 | | | | 580,800 | |
Cerulean Pharma, Inc.*+ | | | 102,623 | | | | 287,344 | |
ChemoCentryx, Inc.* | | | 50,000 | | | | 405,000 | |
Codexis, Inc.* | | | 232,500 | | | | 983,475 | |
Conatus Pharmaceuticals, Inc.*+ | | | 88,000 | | | | 253,440 | |
Concert Pharmaceuticals, Inc.*+ | | | 43,500 | | | | 825,195 | |
CorMedix, Inc.*+ | | | 168,001 | | | | 341,042 | |
Curis, Inc.* | | | 220,000 | | | | 640,200 | |
Dicerna Pharmaceuticals, Inc.*+ | | | 55,000 | | | | 652,850 | |
Eleven Biotherapeutics, Inc.*+ | | | 50,000 | | | | 150,500 | |
Fate Therapeutics, Inc.* | | | 224,537 | | | | 756,690 | |
Genocea Biosciences, Inc.*+ | | | 64,200 | | | | 338,334 | |
Geron Corp.*+ | | | 315,000 | | | | 1,524,600 | |
GlycoMimetics, Inc.* | | | 109,764 | | | | 627,850 | |
Immunomedics, Inc.*+ | | | 288,900 | | | | 886,923 | |
IsoRay, Inc.*+ | | | 265,300 | | | | 248,719 | |
Loxo Oncology, Inc.*+ | | | 30,000 | | | | 853,500 | |
Medgenics, Inc.*+ | | | 100,000 | | | | 602,000 | |
MediciNova, Inc.*+ | | | 77,710 | | | | 275,871 | |
Minerva Neurosciences, Inc.*+ | | | 71,097 | | | | 431,559 | |
NanoViricides, Inc.* | | | 225,000 | | | | 265,500 | |
Ocata Therapeutics, Inc.* | | | 106,282 | | | | 894,894 | |
Oncothyreon, Inc.* | | | 424,988 | | | | 943,473 | |
Oragenics, Inc.* | | | 60,500 | | | | 90,145 | |
OvaScience, Inc.*+ | | | 25,000 | | | | 244,250 | |
PharmAthene, Inc.* | | | 263,244 | | | | 500,164 | |
Protalix BioTherapeutics, Inc.* | | | 318,630 | | | | 325,003 | |
Proteon Therapeutics, Inc.*+ | | | 11,835 | | | | 183,561 | |
Regulus Therapeutics, Inc.*+ | | | 50,000 | | | | 436,000 | |
Rigel Pharmaceuticals, Inc.* | | | 150,000 | | | | 454,500 | |
Synthetic Biologics, Inc.*+ | | | 219,605 | | | | 502,895 | |
TetraLogic Pharmaceuticals Corp.*+ | | | 18,553 | | | | 32,097 | |
Tokai Pharmaceuticals, Inc.*+ | | | 10,000 | | | | 87,200 | |
Trevena, Inc.* | | | 37,337 | | | | 392,039 | |
| | |
| Ultra-Small Company Market Fund | |
|
| SCHEDULE OF INVESTMENTS (continued) | |
| Showing percentage of net assets as of December 31, 2015 (Unaudited) | | |
| | | | | | | | | | |
| Industry Company | | Shares | | | Value | | | |
| | | |
Common Stocks (continued) | | | | | | | | | | |
Biotechnology (continued) | | | | | | | | | | |
Vanda Pharmaceuticals, Inc.*+ | | | 59,300 | | | $ | 552,083 | | | |
Verastem, Inc.* | | | 190,200 | | | | 353,772 | | | |
Vitae Pharmaceuticals, Inc.* | | | 10,100 | | | | 182,810 | | | |
| | | | | | | | | | |
| | | | | | | 24,921,841 | | | |
| | | |
Building Products - 0.15% | | | | | | | | | | |
Alpha Pro Tech, Ltd.* | | | 211,200 | | | | 369,600 | | | |
Ameresco, Inc., Class A* | | | 24,548 | | | | 153,425 | | | |
| | | | | | | | | | |
| | | | | | | 523,025 | | | |
| | | |
Capital Markets - 1.78% | | | | | | | | | | |
Calamos Asset Management, Inc., Class A | | | 98,500 | | | | 953,480 | | | |
Capitala Finance Corp.+ | | | 31,280 | | | | 377,862 | | | |
FBR & Co.+ | | | 37,575 | | | | 747,743 | | | |
Institutional Financial Markets, Inc. | | | 30,000 | | | | 34,800 | | | |
JMP Group LLC+ | | | 96,851 | | | | 528,806 | | | |
KCAP Financial, Inc.+ | | | 93,900 | | | | 382,173 | | | |
Medallion Financial Corp.+ | | | 86,711 | | | | 610,445 | | | |
Monroe Capital Corp. | | | 31,403 | | | | 411,065 | | | |
OFS Capital Corp.+ | | | 39,700 | | | | 455,756 | | | |
Oppenheimer Holdings, Inc., Class A | | | 31,550 | | | | 548,339 | | | |
Pzena Investment Management, Inc., Class A+ | | | 52,800 | | | | 454,080 | | | |
Silvercrest Asset Management Group LLC, Class A+ | | | 50,002 | | | | 594,524 | | | |
| | | | | | | | | | |
| | | | | | | 6,099,073 | | | |
| | | |
Chemicals - 1.54% | | | | | | | | | | |
BioAmber, Inc.*+ | | | 11,480 | | | | 70,946 | | | |
Chase Corp.+ | | | 27,800 | | | | 1,132,294 | | | |
China Green Agriculture, Inc.* | | | 197,000 | | | | 301,410 | | | |
Core Molding Technologies, Inc.* | | | 65,100 | | | | 835,233 | | | |
Flexible Solutions International, Inc.* | | | 1,200 | | | | 1,194 | | | |
Gulf Resources, Inc.* | | | 212,900 | | | | 387,478 | | | |
KMG Chemicals, Inc. | | | 40,100 | | | | 923,102 | | | |
Landec Corp.* | | | 69,200 | | | | 818,636 | | | |
Marrone Bio Innovations, Inc.*+ | | | 181,200 | | | | 199,320 | | | |
Northern Technologies | | | | | | | | | | |
International Corp.* | | | 13,950 | | | | 193,487 | | | |
OMNOVA Solutions, Inc.* | | | 66,000 | | | | 404,580 | | | |
| | | | | | | | | | |
| | | | | | | 5,267,680 | | | |
| | | | | | | | |
| Industry Company | | Shares | | | Value | |
|
| |
Commercial Banks - 11.92% | | | | | | | | |
1st Constitution Bancorp*+ | | | 12,127 | | | | $ 156,074 | |
Access National Corp. | | | 33,500 | | | | 685,410 | |
American National Bankshares, Inc. | | | 31,746 | | | | 813,015 | |
American River Bankshares* | | | 56,000 | | | | 592,480 | |
AmeriServ Financial, Inc. | | | 155,671 | | | | 498,147 | |
Anchor Bancorp, Inc.*+ | | | 22,000 | | | | 567,380 | |
Auburn National Bancorporation, Inc.+ | | | 2,974 | | | | 88,090 | |
Bank of Commerce Holdings | | | 87,441 | | | | 584,106 | |
Bar Harbor Bankshares | | | 18,000 | | | | 619,560 | |
BCB Bancorp, Inc. | | | 40,212 | | | | 418,205 | |
C&F Financial Corp. | | | 9,400 | | | | 366,600 | |
Carolina Bank Holdings, Inc.*+ | | | 27,000 | | | | 497,880 | |
Century Bancorp, Inc., Class A | | | 23,272 | | | | 1,011,401 | |
Chemung Financial Corp.+ | | | 29,998 | | | | 829,745 | |
Citizens Holding Co.+ | | | 20,670 | | | | 491,946 | |
CNB Financial Corp. | | | 52,100 | | | | 939,363 | |
Codorus Valley Bancorp, Inc. | | | 14,691 | | | | 298,815 | |
Colony Bankcorp, Inc.* | | | 16,668 | | | | 161,846 | |
Community West Bancshares | | | 38,357 | | | | 272,335 | |
Enterprise Bancorp, Inc.+ | | | 12,602 | | | | 287,956 | |
Evans Bancorp, Inc. | | | 16,701 | | | | 425,876 | |
Farmers Capital Bank Corp.* | | | 57,149 | | | | 1,549,309 | |
Financial Institutions, Inc. | | | 31,900 | | | | 893,200 | |
First Bancorp | | | 33,200 | | | | 622,168 | |
First Bancorp, Inc. | | | 43,300 | | | | 886,351 | |
First Bancshares, Inc.+ | | | 22,894 | | | | 419,876 | |
First Business Financial Services, Inc. | | | 42,308 | | | | 1,058,123 | |
First Northwest Bancorp*+ | | | 15,000 | | | | 212,250 | |
First South Bancorp, Inc.+ | | | 33,322 | | | | 285,236 | |
First United Corp.* | | | 9,200 | | | | 106,720 | |
First West Virginia Bancorp+ | | | 1,380 | | | | 24,150 | |
German American Bancorp, Inc.+ | | | 17,500 | | | | 583,100 | |
Guaranty Bancorp | | | 61,440 | | | | 1,016,218 | |
Heritage Commerce Corp. | | | 74,300 | | | | 888,628 | |
Higher One Holdings, Inc.*+ | | | 133,528 | | | | 432,631 | |
Horizon Bancorp | | | 30,500 | | | | 852,780 | |
Landmark Bancorp, Inc. | | | 11,586 | | | | 304,364 | |
Macatawa Bank Corp.+ | | | 71,500 | | | | 432,575 | |
MBT Financial Corp.* | | | 87,485 | | | | 597,523 | |
Medley Management, Inc., Class A+ | | | 10,000 | | | | 56,900 | |
| | |
| 27 | | Semi-Annual Report | December 31, 2015 (Unaudited) |
| | |
| Ultra-Small Company Market Fund | |
|
| SCHEDULE OF INVESTMENTS (continued) | | |
| Showing percentage of net assets as of December 31, 2015 (Unaudited) | | |
| | | | | | | | | | |
| Industry Company | | Shares | | | Value | | | |
| |
Common Stocks (continued) | | | |
Commercial Banks (continued) | | | |
Merchants Bancshares, Inc.+ | | | 28,700 | | | $ | 903,763 | | | |
Metro Bancorp, Inc. | | | 40,600 | | | | 1,274,028 | | | |
MidSouth Bancorp, Inc. | | | 93,600 | | | | 849,888 | | | |
MutualFirst Financial, Inc. | | | 30,849 | | | | 768,757 | | | |
NewBridge Bancorp | | | 86,806 | | | | 1,057,297 | | | |
Northeast Bancorp | | | 35,000 | | | | 367,500 | | | |
Northrim BanCorp, Inc. | | | 34,700 | | | | 923,020 | | | |
Ohio Valley Banc Corp. | | | 19,500 | | | | 483,015 | | | |
Old Second Bancorp, Inc.* | | | 118,690 | | | | 930,530 | | | |
Pacific Continental Corp. | | | 53,611 | | | | 797,732 | | | |
Pacific Mercantile Bancorp* | | | 48,521 | | | | 344,984 | | | |
Park Sterling Corp. | | | 120,700 | | | | 883,524 | | | |
Peapack Gladstone Financial Corp.+ | | | 39,777 | | | | 820,202 | | | |
Penns Woods Bancorp, Inc. | | | 16,400 | | | | 696,344 | | | |
Peoples Bancorp of North Carolina, Inc. | | | 34,901 | | | | 673,938 | | | |
Premier Financial Bancorp, Inc. | | | 43,837 | | | | 720,680 | | | |
QCR Holdings, Inc.+ | | | 33,900 | | | | 823,431 | | | |
Republic First Bancorp, Inc.*+ | | | 23,000 | | | | 99,590 | | | |
Royal Bancshares of Pennsylvania, Inc., Class A*+ | | | 78,195 | | | | 163,427 | | | |
Select Bancorp, Inc.* | | | 10,076 | | | | 81,515 | | | |
Shore Bancshares, Inc. | | | 44,700 | | | | 486,336 | | | |
Sierra Bancorp | | | 42,900 | | | | 757,185 | | | |
Southern First Bancshares, Inc.* | | | 32,215 | | | | 728,059 | | | |
Southern National Bancorp of Virginia, Inc.+ | | | 70,892 | | | | 925,850 | | | |
Suffolk Bancorp | | | 37,000 | | | | 1,048,950 | | | |
Sussex Bancorp+ | | | 23,000 | | | | 301,990 | | | |
Unity Bancorp, Inc.+ | | | 15,000 | | | | 187,500 | | | |
West Bancorporation, Inc. | | | 48,200 | | | | 951,950 | | | |
Yadkin Financial Corp. | | | 1 | | | | 25 | | | |
| | | | | | | | | | |
| | | | | | | 40,879,342 | | | |
| |
Commercial Services & Supplies - 1.17% | | | |
Acme United Corp. | | | 3,000 | | | | 51,000 | | | |
AMREP Corp.* | | | 17,000 | | | | 73,950 | | | |
Casella Waste Systems, Inc., Class A* | | | 167,656 | | | | 1,002,583 | | | |
CECO Environmental Corp. | | | 26,856 | | | | 206,254 | | | |
Cenveo, Inc.*+ | | | 382,098 | | | | 332,960 | | | |
CompX International, Inc. | | | 3,200 | | | | 36,480 | | | |
Ecology & Environment, Inc., Class A+ | | | 3,000 | | | | 30,690 | | | |
Fuel Tech, Inc.* | | | 69,400 | | | | 131,166 | | | |
| | | | | | | | | | |
| | | | | | | | |
| Industry Company | | Shares | | | Value | |
|
| |
|
Commercial Services & Supplies (continued) | |
Intersections, Inc.*+ | | | 85,300 | | | $ | 244,811 | |
Performant Financial Corp.* | | | 391,000 | | | | 699,890 | |
TRC Cos., Inc.* | | | 94,275 | | | | 872,044 | |
Versar, Inc.* | | | 107,800 | | | | 333,102 | |
| | | | | | | | |
| | | | | | | 4,014,930 | |
|
Communications Equipment - 2.45% | |
Alliance Fiber Optic Products, Inc.+ | | | 45,000 | | | | 682,200 | |
Applied Optoelectronics, Inc.*+ | | | 30,000 | | | | 514,800 | |
Aviat Networks, Inc.* | | | 350,239 | | | | 268,914 | |
Bel Fuse, Inc., Class B | | | 35,100 | | | | 606,879 | |
Clearfield, Inc.*+ | | | 48,300 | | | | 647,703 | |
Communications Systems, Inc. | | | 36,000 | | | | 279,720 | |
Digi International, Inc.* | | | 70,000 | | | | 796,600 | |
EMCORE Corp.* | | | 118,580 | | | | 726,895 | |
KVH Industries, Inc.* | | | 60,410 | | | | 569,062 | |
Numerex Corp., Class A*+ | | | 70,408 | | | | 452,019 | |
PC-Tel, Inc.+ | | | 147,000 | | | | 668,850 | |
RELM Wireless Corp.* | | | 245,900 | | | | 968,846 | |
Tessco Technologies, Inc. | | | 39,500 | | | | 769,065 | |
Westell Technologies, Inc., Class A* | | | 362,000 | | | | 456,120 | |
| | | | | | | | |
| | | | | | | 8,407,673 | |
|
Computers & Peripherals - 1.27% | |
Astro-Med, Inc. | | | 32,800 | | | | 473,960 | |
Concurrent Computer Corp. | | | 81,300 | | | | 402,435 | |
Datalink Corp.*+ | | | 123,700 | | | | 841,160 | |
Hutchinson Technology, Inc.* | | | 179,150 | | | | 643,149 | |
Imation Corp.* | | | 245,800 | | | | 336,746 | |
Intevac, Inc.* | | | 42,933 | | | | 202,214 | |
Novatel Wireless, Inc.*+ | | | 253,800 | | | | 423,846 | |
Qumu Corp.* | | | 36,400 | | | | 98,644 | |
TransAct Technologies, Inc. | | | 70,000 | | | | 600,600 | |
USA Technologies, Inc.*+ | | | 111,400 | | | | 343,112 | |
| | | | | | | | |
| | | | | | | 4,365,866 | |
|
Construction & Engineering - 1.47% | |
Furmanite Corp.* | | | 125,500 | | | | 835,830 | |
Goldfield Corp. (The)* | | | 63,480 | | | | 98,394 | |
Integrated Electrical Services, Inc.* | | | 109,312 | | | | 1,210,084 | |
Layne Christensen Co.*+ | | | 6,430 | | | | 33,822 | |
Northwest Pipe Co.* | | | 91,795 | | | | 1,027,186 | |
Orion Marine Group, Inc.*+ | | | 47,344 | | | | 197,424 | |
Sterling Construction Co., Inc.* | | | 207,736 | | | | 1,263,035 | |
| | |
| Ultra-Small Company Market Fund | |
|
| SCHEDULE OF INVESTMENTS (continued) | |
| Showing percentage of net assets as of December 31, 2015 (Unaudited) | | |
| | | | | | | | | | |
| Industry Company | | Shares | | | Value | | | |
| |
Common Stocks (continued) | | | |
Construction & Engineering (continued) | | | |
Willdan Group, Inc.* | | | 45,000 | | | $ | 377,100 | | | |
| | | | | | | | | | |
| | | | | | | 5,042,875 | | | |
| |
Construction Materials - 0.15% | | | |
United States Lime & Minerals, Inc.+ | | | 9,663 | | | | 531,078 | | | |
| |
Consumer Finance - 0.66% | | | |
Asta Funding, Inc.*+ | | | 122,300 | | | | 972,285 | | | |
Atlanticus Holdings Corp.* | | | 59,812 | | | | 191,398 | | | |
Consumer Portfolio Services, Inc.* | | | 135,000 | | | | 700,650 | | | |
QC Holdings, Inc. | | | 66,600 | | | | 97,236 | | | |
Regional Management Corp.* | | | 20,000 | | | | 309,400 | | | |
| | | | | | | | | | |
| | | | | | | 2,270,969 | | | |
| |
Containers & Packaging - 0.25% | | | |
AEP Industries, Inc.* | | | 10,900 | | | | 840,935 | | | |
| | | |
Distributors - 0.59% | | | | | | | | | | |
AMCON Distributing Co. | | | 3,900 | | | | 315,510 | | | |
Sequential Brands Group, Inc.*+ | | | 62,761 | | | | 496,439 | | | |
VOXX International Corp.* | | | 173,901 | | | | 914,719 | | | |
Weyco Group, Inc.+ | | | 10,883 | | | | 291,229 | | | |
| | | | | | | | | | |
| | | | | | | 2,017,897 | | | |
| |
Diversified Consumer Services - 0.77% | | | |
Career Education Corp.* | | | 169,550 | | | | 615,467 | | | |
Collectors Universe, Inc. | | | 36,960 | | | | 572,880 | | | |
ITT Educational Services, Inc.*+ | | | 37,500 | | | | 139,875 | | | |
Lincoln Educational Services Corp. | | | 78,400 | | | | 156,016 | | | |
National American University Holdings, Inc.+ | | | 350,988 | | | | 733,565 | | | |
Universal Technical Institute, Inc. | | | 93,400 | | | | 435,244 | | | |
| | | | | | | | | | |
| | | | | | | 2,653,047 | | | |
| |
Diversified Financial Services - 0.98% | | | |
Ashford, Inc.*+ | | | 4,000 | | | | 213,000 | | | |
California First National Bancorp | | | 54,257 | | | | 705,884 | | | |
Gain Capital Holdings, Inc. | | | 94,400 | | | | 765,584 | | | |
JG Wentworth Co.*+ | | | 65,802 | | | | 118,444 | | | |
Marlin Business Services Corp. | | | 64,500 | | | | 1,035,870 | | | |
Resource America, Inc., Class A+ | | | 83,600 | | | | 512,468 | | | |
| | | | | | | | | | |
| | | | | | | 3,351,250 | | | |
| | | | | | | | |
| Industry Company | | Shares | | | Value | |
|
Diversified Telecommunication Services - 0.80% | |
Alaska Communications Systems Group, Inc.* | | | 243,000 | | | $ | 425,250 | |
Hawaiian Telcom Holdco, Inc.* | | | 24,686 | | | | 613,694 | |
IDT Corp., Class B | | | 50,567 | | | | 589,611 | |
Lumos Networks Corp. | | | 35,000 | | | | 392,000 | |
Straight Path Communications, Inc., Class B*+ | | | 42,470 | | | | 727,936 | |
| | | | | | | | |
| | | | | | | 2,748,491 | |
|
Electric Utilities - 0.13% | |
Spark Energy, Inc., Class A | | | 21,500 | | | | 445,480 | |
|
Electrical Equipment - 1.79% | |
Allied Motion Technologies, Inc. | | | 53,650 | | | | 1,404,557 | |
Espey Manufacturing & Electronics Corp. | | | 10,700 | | | | 278,414 | |
Global Power Equipment Group, Inc. | | | 67,272 | | | | 234,107 | |
Highpower International, Inc.* | | | 50,000 | | | | 150,000 | |
LSI Industries, Inc. | | | 84,000 | | | | 1,023,960 | |
PowerSecure International, Inc.*+ | | | 88,500 | | | | 1,331,925 | |
Preformed Line Products Co. | | | 8,489 | | | | 357,387 | |
SL Industries, Inc.* | | | 20,250 | | | | 645,570 | |
Ultralife Corp.* | | | 112,400 | | | | 726,104 | |
| | | | | | | | |
| | | | | | | 6,152,024 | |
|
Electronic Equipment, Instruments & Components - 3.60% | |
Agilysys, Inc.*+ | | | 82,700 | | | | 826,173 | |
Electro Rent Corp. | | | 44,200 | | | | 406,640 | |
Electro Scientific Industries, Inc.* | | | 143,500 | | | | 744,765 | |
Frequency Electronics, Inc.* | | | 41,000 | | | | 435,420 | |
ID Systems, Inc.* | | | 83,000 | | | | 381,800 | |
IEC Electronics Corp.*+ | | | 73,450 | | | | 239,447 | |
IntriCon Corp.*+ | | | 21,500 | | | | 162,970 | |
Iteris, Inc.* | | | 272,520 | | | | 585,918 | |
Kemet Corp.* | | | 397,058 | | | | 941,027 | |
Key Tronic Corp.* | | | 37,200 | | | | 282,720 | |
LoJack Corp.* | | | 92,650 | | | | 515,134 | |
Maxwell Technologies, Inc.*+ | | | 61,500 | | | | 439,110 | |
MOCON, Inc. | | | 12,800 | | | | 186,112 | |
NAPCO Security Technologies, Inc.* | | | 51,576 | | | | 304,298 | |
PAR Technology Corp.* | | | 104,750 | | | | 704,967 | |
PCM, Inc.* | | | 74,200 | | | | 736,806 | |
Perceptron, Inc.* | | | 100,000 | | | | 779,000 | |
| | |
| 29 | | Semi-Annual Report | December 31, 2015 (Unaudited) |
| | |
| Ultra-Small Company Market Fund | |
|
| SCHEDULE OF INVESTMENTS (continued) | | |
| Showing percentage of net assets as of December 31, 2015 (Unaudited) | | |
| | | | | | | | | | |
| Industry Company | | Shares | | | Value | | | |
| |
Common Stocks (continued) | | | |
Electronic Equipment, Instruments & Components (continued) | | | |
Radisys Corp.* | | | 329,300 | | | $ | 912,161 | | | |
RF Industries, Ltd.+ | | | 35,000 | | | | 153,650 | | | |
Richardson Electronics, Ltd. | | | 102,011 | | | | 578,402 | | | |
SMTC Corp.* | | | 149,000 | | | | 230,950 | | | |
Vicon Industries, Inc.* | | | 29,900 | | | | 52,624 | | | |
Vishay Precision Group, Inc.* | | | 71,900 | | | | 813,908 | | | |
Wayside Technology Group, Inc. | | | 50,398 | | | | 924,299 | | | |
| | | | | | | | | | |
| | | |
| | | | | | | 12,338,301 | | | |
Energy Equipment & Services - 2.06% | | | |
Dawson Geophysical Co.* | | | 232,139 | | | | 803,201 | | | |
Enservco Corp.* | | | 241,298 | | | | 130,301 | | | |
Forbes Energy Services, Ltd.* | | | 152,000 | | | | 44,080 | | | |
Geospace Technologies Corp.*+ | | | 46,663 | | | | 656,548 | | | |
Gulf Island Fabrication, Inc. | | | 117,800 | | | | 1,232,188 | | | |
Gulfmark Offshore, Inc., Class A+ | | | 25,000 | | | | 116,750 | | | |
ION Geophysical Corp.* | | | 170,010 | | | | 85,532 | | | |
Key Energy Services, Inc.* | | | 557,200 | | | | 268,626 | | | |
Mitcham Industries, Inc.* | | | 193,400 | | | | 582,134 | | | |
Natural Gas Services Group, Inc.* | | | 68,600 | | | | 1,529,780 | | | |
Nuverra Environmental Solutions, Inc.*+ | | | 195,000 | | | | 99,996 | | | |
SAExploration Holdings, Inc.*+ | | | 77,015 | | | | 154,030 | | | |
Seventy Seven Energy, Inc.* | | | 200,000 | | | | 210,000 | | | |
Superior Drilling Products, Inc.*+ | | | 22,187 | | | | 23,318 | | | |
Willbros Group, Inc.* | | | 425,000 | | | | 1,143,250 | | | |
| | | | | | | | | | |
| | | |
| | | | | | | 7,079,734 | | | |
| |
Food & Staples Retailing - 0.03% | | | |
Fairway Group Holdings Corp.*+ | | | 142,171 | | | | 93,847 | | | |
| |
Food Products - 1.27% | | | |
Griffin Industrial Realty, Inc. | | | 13,300 | | | | 346,997 | | | |
Inventure Foods, Inc.*+ | | | 44,000 | | | | 312,400 | | | |
John B. Sanfilippo & Son, Inc. | | | 25,900 | | | | 1,399,377 | | | |
Liberator Medical Holdings, Inc.+ | | | 166,400 | | | | 555,776 | | | |
Lifeway Foods, Inc.* | | | 90,152 | | | | 1,000,687 | | | |
Seneca Foods Corp., Class A* | | | 25,000 | | | | 724,500 | | | |
| | | | | | | | | | |
| | | |
| | | | | | | 4,339,737 | | | |
| | | | | | | | | | |
| | | | | | | | |
| Industry Company | | Shares | | | Value | |
|
| |
Gas Utilities - 0.43% | |
Delta Natural Gas Co., Inc. | | | 40,000 | | | $ | 839,600 | |
Gas Natural, Inc. | | | 83,800 | | | | 624,310 | |
| | | | | | | | |
| | |
| | | | | | | 1,463,910 | |
|
Health Care Equipment & Supplies - 2.85% | |
AdCare Health Systems, Inc.+ | | | 137,500 | | | | 342,375 | |
CryoLife, Inc. | | | 107,270 | | | | 1,156,371 | |
Cutera, Inc.* | | | 60,200 | | | | 769,958 | |
Digirad Corp. | | | 100,000 | | | | 579,000 | |
ERBA Diagnostics, Inc.* | | | 19,096 | | | | 26,543 | |
Kewaunee Scientific Corp. | | | 14,000 | | | | 249,060 | |
Lantheus Holdings, Inc.* | | | 84,802 | | | | 286,631 | |
LeMaitre Vascular, Inc. | | | 50,000 | | | | 862,500 | |
Navidea Biopharmaceuticals, Inc.* | | | 548,580 | | | | 729,611 | |
PhotoMedex, Inc.* | | | 94,000 | | | | 42,300 | |
Retractable Technologies, Inc.* | | | 34,000 | | | | 105,400 | |
Roka Bioscience, Inc.* | | | 207,500 | | | | 255,225 | |
RTI Surgical, Inc.* | | | 148,600 | | | | 589,942 | |
Sientra, Inc.* | | | 30,200 | | | | 178,784 | |
TransEnterix, Inc.*+ | | | 214,942 | | | | 533,056 | |
TriVascular Technologies, Inc.*+ | | | 67,200 | | | | 446,880 | |
Unilife Corp.*+ | | | 458,989 | | | | 227,245 | |
Utah Medical Products, Inc. | | | 35,900 | | | | 2,101,586 | |
Veracyte, Inc.*+ | | | 41,000 | | | | 295,200 | |
| | | | | | | | |
| | |
| | | | | | | 9,777,667 | |
|
Health Care Providers & Services - 2.35% | |
Addus HomeCare Corp.* | | | 28,600 | | | | 665,808 | |
Alliance HealthCare Services, Inc.* | | | 60,900 | | | | 559,062 | |
Almost Family, Inc.*+ | | | 15,900 | | | | 607,857 | |
BioScrip, Inc.*+ | | | 230,000 | | | | 402,500 | |
BioTelemetry, Inc.* | | | 137,700 | | | | 1,608,336 | |
Cross Country Healthcare, Inc.* | | | 71,000 | | | | 1,163,690 | |
Five Star Quality Care, Inc.* | | | 228,800 | | | | 727,584 | |
InfuSystems Holdings, Inc.* | | | 174,900 | | | | 533,445 | |
Interpace Diagnostics Group, Inc.* | | | 125,000 | | | | 62,250 | |
RadNet, Inc.* | | | 89,800 | | | | 554,964 | |
Trupanion, Inc.*+ | | | 118,700 | | | | 1,158,512 | |
| | | | | | | | |
| | |
| | | | | | | 8,044,008 | |
Health Care Technology - 0.29% | |
Vocera Communications, Inc.* | | | 82,000 | | | | 1,000,400 | |
| | |
| Ultra-Small Company Market Fund | |
|
| SCHEDULE OF INVESTMENTS (continued) | |
| Showing percentage of net assets as of December 31, 2015 (Unaudited) | | |
| | | | | | | | | | |
| Industry Company | | Shares | | | Value | | | |
| |
Common Stocks (continued) | | | |
Hotels, Restaurants & Leisure - 2.88% | | | |
Ark Restaurants Corp. | | | 9,900 | | | $ | 228,690 | | | |
Bravo Brio Restaurant Group, Inc.* | | | 84,429 | | | | 759,861 | | | |
Carrols Restaurant Group, Inc.* | | | 69,100 | | | | 811,234 | | | |
Dover Downs Gaming & Entertainment, Inc.* | | | 92,580 | | | | 89,914 | | | |
Empire Resorts, Inc.*+ | | | 10,000 | | | | 180,000 | | | |
Famous Dave’s of America, Inc.*+ | | | 45,200 | | | | 313,688 | | | |
Gaming Partners International Corp.* | | | 56,300 | | | | 499,944 | | | |
Golden Entertainment, Inc.* | | | 42,300 | | | | 432,729 | | | |
Ignite Restaurant Group, Inc.*+ | | | 111,300 | | | | 467,460 | | | |
Isle of Capri Casinos, Inc.* | | | 67,450 | | | | 939,579 | | | |
Jamba, Inc.*+ | | | 40,662 | | | | 548,530 | | | |
Kona Grill, Inc.*+ | | | 67,500 | | | | 1,070,550 | | | |
Luby’s, Inc.* | | | 135,600 | | | | 606,132 | | | |
Monarch Casino & Resort, Inc.* | | | 34,485 | | | | 783,499 | | | |
Morgans Hotel Group Co.* | | | 134,300 | | | | 452,591 | | | |
Nathan’s Famous, Inc.+ | | | 12,000 | | | | 618,720 | | | |
Nevada Gold & Casinos, Inc.* | | | 120,000 | | | | 272,400 | | | |
Papa Murphy’s Holdings, Inc.*+ | | | 15,000 | | | | 168,900 | | | |
Red Lion Hotels Corp.* | | | 74,900 | | | | 525,049 | | | |
Town Sports International Holdings, Inc.* | | | 83,571 | | | | 99,449 | | | |
| | | | | | | | | | |
| | | | | | | 9,868,919 | | | |
| |
Household Durables - 2.43% | | | |
Bassett Furniture Industries, Inc. | | | 41,834 | | | | 1,049,197 | | | |
CSS Industries, Inc. | | | 32,700 | | | | 928,026 | | | |
Dixie Group, Inc. (The)*+ | | | 60,000 | | | | 313,800 | | | |
Emerson Radio Corp.* | | | 198,100 | | | | 196,099 | | | |
Flexsteel Industries, Inc.+ | | | 27,050 | | | | 1,195,069 | | | |
Hooker Furniture Corp. | | | 53,300 | | | | 1,345,292 | | | |
Lifetime Brands, Inc. | | | 65,000 | | | | 861,900 | | | |
P&F Industries, Inc., Class A* | | | 10,500 | | | | 92,820 | | | |
Skullcandy, Inc.* | | | 170,350 | | | | 805,755 | | | |
Stanley Furniture Co., Inc.* | | | 129,383 | | | | 360,979 | | | |
Turtle Beach Corp.*+ | | | 47,300 | | | | 95,073 | | | |
ZAGG, Inc.* | | | 100,000 | | | | 1,094,000 | | | |
| | | | | | | | | | |
| | | | | | | 8,338,010 | | | |
| |
Household Products - 0.48% | | | |
Oil-Dri Corp. of America | | | 27,500 | | | | 1,012,825 | | | |
| | | | | | | | |
| Industry Company | | Shares | | | Value | |
|
Household Products (continued) | |
Orchids Paper Products Co. | | | 20,000 | | | $ | 618,400 | |
| | | | | | | | |
| | | | | | | 1,631,225 | |
|
Independent Power Producers & Energy Traders - 0.19% | |
Genie Energy, Ltd., Class B+ | | | 48,667 | | | | 542,637 | |
Synthesis Energy Systems, Inc.* | | | 111,464 | | | | 106,894 | |
| | | | | | | | |
| | | | | | | 649,531 | |
|
Insurance - 1.31% | |
American Independence Corp.*+ | | | 7,500 | | | | 63,825 | |
Atlantic American Corp. | | | 21,056 | | | | 104,648 | |
Federated National Holding Co. | | | 38,000 | | | | 1,123,280 | |
First Acceptance Corp.* | | | 266,700 | | | | 634,746 | |
Hallmark Financial Services, Inc.* | | | 80,400 | | | | 939,876 | |
Health Insurance Innovations, Inc., Class A*+ | | | 51,016 | | | | 341,807 | |
Independence Holding Co.+ | | | 69,190 | | | | 958,282 | |
Investors Title Co. | | | 3,500 | | | | 338,800 | |
| | | | | | | | |
| | | | | | | 4,505,264 | |
|
Internet & Catalog Retail - 0.77% | |
1-800-Flowers.com, Inc., Class A* | | | 54,400 | | | | 396,032 | |
CafePress, Inc.* | | | 119,188 | | | | 457,682 | |
EVINE Live, Inc.* | | | 221,286 | | | | 393,889 | |
Gaiam, Inc., Class A* | | | 93,400 | | | | 582,816 | |
PetMed Express, Inc.+ | | | 18,400 | | | | 315,376 | |
US Auto Parts Network, Inc.* | | | 164,751 | | | | 484,368 | |
| | | | | | | | |
| | | | | | | 2,630,163 | |
|
Internet Software & Services - 4.22% | |
Aerohive Networks, Inc.*+ | | | 98,500 | | | | 503,335 | |
Amber Road, Inc.* | | | 92,800 | | | | 472,352 | |
Brightcove, Inc.* | | | 39,387 | | | | 244,199 | |
BroadVision, Inc.* | | | 72,749 | | | | 436,494 | |
Carbonite, Inc.* | | | 58,060 | | | | 568,988 | |
Care.com, Inc.* | | | 25,831 | | | | 184,950 | |
Demand Media, Inc.* | | | 212,500 | | | | 1,168,750 | |
Five9, Inc.*+ | | | 98,500 | | | | 856,950 | |
Limelight Networks, Inc.* | | | 276,537 | | | | 403,744 | |
Liquidity Services, Inc.* | | | 52,000 | | | | 338,000 | |
Marchex, Inc., Class B | | | 195,500 | | | | 760,495 | |
Marin Software, Inc.* | | | 96,600 | | | | 345,828 | |
| | |
| 31 | | Semi-Annual Report | December 31, 2015 (Unaudited) |
| | |
| Ultra-Small Company Market Fund | |
|
| SCHEDULE OF INVESTMENTS (continued) | | |
| Showing percentage of net assets as of December 31, 2015 (Unaudited) | | |
| | | | | | | | | | |
| Industry Company | | Shares | | | Value | | | |
| |
Common Stocks (continued) | | | |
Internet Software & Services (continued) | | | |
QuinStreet, Inc.*+ | | | 111,547 | | | $ | 478,537 | | | |
Reis, Inc. | | | 42,100 | | | | 999,033 | | | |
Rightside Group Ltd*+ | | | 37,056 | | | | 307,565 | | | |
Spark Networks, Inc.*+ | | | 149,300 | | | | 574,805 | | | |
Support.com, Inc.* | | | 339,545 | | | | 342,940 | | | |
Synacor, Inc.* | | | 50,000 | | | | 87,500 | | | |
TechTarget, Inc.* | | | 145,900 | | | | 1,171,577 | | | |
TheStreet, Inc. | | | 242,700 | | | | 364,050 | | | |
Travelzoo, Inc.*+ | | | 25,000 | | | | 209,250 | | | |
Tremor Video, Inc.* | | | 496,600 | | | | 1,022,996 | | | |
Tucows, Inc., Class A* | | | 37,500 | | | | 791,250 | | | |
United Online, Inc.*+ | | | 73,900 | | | | 871,281 | | | |
Zix Corp.* | | | 187,582 | | | | 952,917 | | | |
| | | | | | | | | | |
| | | |
| | | | | | | 14,457,786 | | | |
| | | |
IT Services - 2.06% | | | | | | | | | | |
CIBER, Inc.* | | | 215,000 | | | | 754,650 | | | |
Computer Task Group, Inc. | | | 64,830 | | | | 429,175 | | | |
CSP, Inc.+ | | | 38,700 | | | | 268,578 | | | |
Edgewater Technology, Inc.*+ | | | 91,212 | | | | 730,608 | | | |
Information Services Group, Inc. | | | 196,600 | | | | 711,692 | | | |
Innodata, Inc.* | | | 148,955 | | | | 424,522 | | | |
Lionbridge Technologies, Inc.* | | | 193,995 | | | | 952,515 | | | |
Mattersight Corp.*+ | | | 152,477 | | | | 1,000,249 | | | |
ModusLink Global Solutions, Inc.*+ | | | 198,455 | | | | 492,168 | | | |
NCI, Inc., Class A | | | 38,430 | | | | 524,570 | | | |
PRGX Global, Inc.*+ | | | 130,300 | | | | 484,716 | | | |
StarTek, Inc.* | | | 65,000 | | | | 232,700 | | | |
WidePoint Corp.* | | | 70,447 | | | | 48,961 | | | |
| | | | | | | | | | |
| | | |
| | | | | | | 7,055,104 | | | |
| |
Leisure Equipment & Products -0.53% | | | |
Escalade, Inc. | | | 39,780 | | | | 527,085 | | | |
JAKKS Pacific, Inc.*+ | | | 61,000 | | | | 485,560 | | | |
Johnson Outdoors, Inc., Class A | | | 37,400 | | | | 818,686 | | | |
| | | | | | | | | | |
| | | |
| | | | | | | 1,831,331 | | | |
| |
Life Sciences Tools & Services -1.08% | | | |
Enzo Biochem, Inc.* | | | 268,800 | | | | 1,209,600 | | | |
Harvard Bioscience, Inc.*+ | | | 217,017 | | | | 753,049 | | | |
NanoString Technologies, Inc.*+ | | | 63,700 | | | | 937,027 | | | |
pSivida Corp.*+ | | | 168,000 | | | | 809,760 | | | |
| | | | | | | | | | |
| | | |
| | | | | | | 3,709,436 | | | |
| | | |
Machinery - 3.97% | | | | | | | | | | |
Accuride Corp.* | | | 222,312 | | | | 369,038 | | | |
| | | | | | | | | | |
| | | | | | | | |
| Industry Company | | Shares | | | Value | |
|
| |
Machinery (continued) | | | | | | | | |
Ampco-Pittsburgh Corp.+ | | | 57,999 | | | $ | 595,070 | |
Chicago Rivet & Machine Co. | | | 10,000 | | | | 233,200 | |
Commercial Vehicle Group, Inc.* | | | 231,000 | | | | 637,560 | |
Dynamic Materials Corp. | | | 151,400 | | | | 1,058,286 | |
Eastern Co. (The)+ | | | 33,600 | | | | 630,000 | |
Energy Recovery, Inc.*+ | | | 86,174 | | | | 609,250 | |
FreightCar America, Inc. | | | 24,675 | | | | 479,435 | |
Gencor Industries, Inc.* | | | 73,500 | | | | 830,550 | |
Global Brass & Copper Holdings, Inc. | | | 50,000 | | | | 1,065,000 | |
Graham Corp. | | | 45,900 | | | | 772,038 | |
Hardinge, Inc. | | | 53,300 | | | | 496,756 | |
Hurco Companies, Inc. | | | 51,334 | | | | 1,363,431 | |
Intelligent Systems Corp.* | | | 35,362 | | | | 114,219 | |
Key Technology, Inc.* | | | 23,900 | | | | 247,843 | |
L.S. Starrett Co. (The), Class A | | | 38,136 | | | | 370,682 | |
MFRI, Inc.* | | | 71,100 | | | | 464,994 | |
Miller Industries, Inc. | | | 49,800 | | | | 1,084,644 | |
Supreme Industries, Inc., Class A | | | 58,993 | | | | 404,102 | |
Twin Disc, Inc. | | | 79,000 | | | | 831,080 | |
Xerium Technologies, Inc.* | | | 79,550 | | | | 942,667 | |
| | | | | | | | |
| | |
| | | | | | | 13,599,845 | |
| | |
Media - 1.74% | | | | | | | | |
A.H. Belo Corp., Class A | | | 46,400 | | | | 232,000 | |
Ballantyne Strong, Inc.* | | | 117,020 | | | | 533,611 | |
Beasley Broadcast Group, Inc., Class A | | | 28,125 | | | | 100,969 | |
Emmis Communications Corp., Class A* | | | 236,500 | | | | 151,360 | |
Entravision Communications Corp., Class A | | | 108,800 | | | | 838,848 | |
Lee Enterprises, Inc.*+ | | | 431,860 | | | | 725,525 | |
McClatchy Co. (The), Class A* | | | 453,000 | | | | 548,130 | |
ReachLocal, Inc.*+ | | | 47,400 | | | | 78,210 | |
Saga Communications, Inc., Class A+ | | | 16,866 | | | | 648,498 | |
Salem Media Group, Inc. | | | 145,100 | | | | 722,598 | |
Sizmek, Inc.* | | | 138,710 | | | | 506,291 | |
Spanish Broadcasting System, Inc., Class A* | | | 13,629 | | | | 44,158 | |
Townsquare Media, Inc., Class A* | | | 69,852 | | | | 835,430 | |
| | | | | | | | |
| | |
| | | | | | | 5,965,628 | |
| | |
Metals & Mining - 1.21% | | | | | | | | |
A.M. Castle & Co.*+ | | | 173,200 | | | | 275,388 | |
| | |
| Ultra-Small Company Market Fund | | |
| SCHEDULE OF INVESTMENTS (continued) | | |
| Showing percentage of net assets as of December 31, 2015 (Unaudited) | | |
| | | | | | | | | | |
| Industry Company | | Shares | | | Value | | | |
| | | |
Common Stocks (continued) | | | | | | | | | | |
Metals & Mining (continued) | | | | | | | | | | |
A-Mark Precious Metals, Inc. | | | 5,000 | | | $ | 96,000 | | | |
Energy Fuels, Inc.* | | | 131,274 | | | | 387,258 | | | |
Friedman Industries, Inc. | | | 68,300 | | | | 377,016 | | | |
Gold Resource Corp.+ | | | 233,600 | | | | 387,776 | | | |
Olympic Steel, Inc.+ | | | 69,300 | | | | 802,494 | | | |
Ryerson Holding Corp.*+ | | | 114,000 | | | | 532,380 | | | |
Synalloy Corp. | | | 104,897 | | | | 721,691 | | | |
Universal Stainless & Alloy Products, Inc.*+ | | | 63,078 | | | | 585,995 | | | |
| | | | | | | | | | |
| | | |
| | | | | | | 4,165,998 | | | |
| | | |
Multiline Retail - 0.28% | | | | | | | | | | |
Bon-Ton Stores, Inc. (The)+ | | | 150,439 | | | | 315,922 | | | |
Gordmans Stores, Inc.*+ | | | 200,000 | | | | 630,000 | | | |
| | | | | | | | | | |
| | | |
| | | | | | | 945,922 | | | |
| |
Oil, Gas & Consumable Fuels -3.62% | | | |
Adams Resources & Energy, Inc. | | | 22,300 | | | | 856,320 | | | |
Aemetis, Inc.*+ | | | 204,139 | | | | 592,003 | | | |
Amyris, Inc.*+ | | | 277,748 | | | | 449,952 | | | |
Approach Resources, Inc.* | | | 225,400 | | | | 414,736 | | | |
Arch Coal, Inc.*+ | | | 11,848 | | | | 11,689 | | | |
Aspen Aerogels, Inc.* | | | 129,630 | | | | 786,854 | | | |
Callon Petroleum Co.* | | | 132,800 | | | | 1,107,552 | | | |
Comstock Resources, Inc.+ | | | 157,175 | | | | 293,917 | | | |
Contango Oil & Gas Co.* | | | 75,000 | | | | 480,750 | | | |
Earthstone Energy, Inc.*+ | | | 18,000 | | | | 239,580 | | | |
Emerald Oil, Inc.*+ | | | 13,475 | | | | 15,227 | | | |
Evolution Petroleum Corp. | | | 182,123 | | | | 876,012 | | | |
FieldPoint Petroleum Corp.* | | | 30,000 | | | | 18,600 | | | |
Gastar Exploration, Inc.* | | | 245,200 | | | | 321,212 | | | |
Harvest Natural Resources, Inc.* | | | 224,500 | | | | 95,413 | | | |
Independence Contract Drilling, Inc.*+ | | | 148,000 | | | | 747,400 | | | |
Jones Energy, Inc., Class A*+ | | | 147,742 | | | | 568,807 | | | |
Midstates Petroleum Co., Inc.* | | | 24,619 | | | | 49,730 | | | |
Panhandle Oil & Gas, Inc., Class A | | | 23,594 | | | | 381,279 | | | |
PetroQuest Energy, Inc.* | | | 743,800 | | | | 371,900 | | | |
Resolute Energy Corp.* | | | 219,300 | | | | 190,791 | | | |
REX American Resources Corp.*+ | | | 20,249 | | | | 1,094,863 | | | |
Rex Energy Corp.*+ | | | 115,300 | | | | 121,065 | | | |
Ring Energy, Inc.*+ | | | 95,353 | | | | 672,239 | | | |
Solazyme, Inc.*+ | | | 143,096 | | | | 354,878 | | | |
Triangle Petroleum Corp.* | | | 271,000 | | | | 208,670 | | | |
Uranium Energy Corp.*+ | | | 145,000 | | | | 153,700 | | | |
VAALCO Energy, Inc.* | | | 350,000 | | | | 560,000 | | | |
| | | | | | | | | | |
| | | | | | | | |
| Industry Company | | Shares | | | Value | |
|
| |
Oil, Gas & Consumable Fuels (continued) | |
Warren Resources, Inc.* | | | 450,700 | | | $ | 94,647 | |
Yuma Energy, Inc.* | | | 144,800 | | | | 27,512 | |
Zion Oil & Gas, Inc.* | | | 132,285 | | | | 246,050 | |
| | | | | | | | |
| | |
| | | | | | | 12,403,348 | |
| |
Paper & Forest Products - 0.07% | | | | | |
Orient Paper, Inc.* | | | 163,811 | | | | 237,526 | |
| | |
Personal Products - 0.48% | | | | | | | | |
CCA Industries, Inc.* | | | 15,752 | | | | 49,146 | |
Mannatech, Inc.* | | | 13,600 | | | | 258,264 | |
Natural Alternatives International, Inc.* | | | 19,910 | | | | 205,869 | |
Nutraceutical International Corp.* | | | 37,000 | | | | 955,340 | |
United-Guardian, Inc. | | | 10,000 | | | | 191,500 | |
| | | | | | | | |
| | |
| | | | | | | 1,660,119 | |
| | |
Pharmaceuticals - 3.48% | | | | | | | | |
AcelRx Pharmaceuticals, Inc.*+ | | | 98,000 | | | | 377,300 | |
Achaogen, Inc.*+ | | | 127,950 | | | | 734,433 | |
Agile Therapeutics, Inc.* | | | 59,634 | | | | 582,028 | |
Alimera Sciences, Inc.*+ | | | 244,444 | | | | 591,554 | |
Ampio Pharmaceuticals, Inc.*+ | | | 100,750 | | | | 352,625 | |
Corium International, Inc.*+ | | | 70,000 | | | | 568,400 | |
Cumberland Pharmaceuticals, Inc.* | | | 67,500 | | | | 355,050 | |
Durect Corp.* | | | 283,600 | | | | 626,756 | |
Egalet Corp.*+ | | | 74,700 | | | | 823,194 | |
Endocyte, Inc.*+ | | | 155,000 | | | | 621,550 | |
Marinus Pharmaceuticals, Inc.*+ | | | 50,500 | | | | 385,820 | |
Ocera Therapeutics, Inc.*+ | | | 79,800 | | | | 248,976 | |
Pain Therapeutics, Inc.* | | | 285,353 | | | | 499,368 | |
Pernix Therapeutics Holdings, Inc.*+ | | | 202,056 | | | | 596,065 | |
Pozen, Inc.*+ | | | 93,200 | | | | 636,556 | |
SciClone Pharmaceuticals, Inc.* | | | 161,750 | | | | 1,488,100 | |
Tonix Pharmaceuticals Holding Corp.*+ | | | 94,401 | | | | 724,056 | |
Tracon Pharmaceuticals, Inc.*+ | | | 37,135 | | | | 343,127 | |
VIVUS, Inc.*+ | | | 462,800 | | | | 472,056 | |
Zogenix, Inc.*+ | | | 60,828 | | | | 896,605 | |
| | | | | | | | |
| | |
| | | | | | | 11,923,619 | |
| |
Professional Services - 1.70% | | | | | |
CDI Corp. | | | 72,000 | | | | 486,720 | |
CRA International, Inc.* | | | 54,500 | | | | 1,016,425 | |
| | |
| 33 | | Semi-Annual Report | December 31, 2015 (Unaudited) |
| | |
| Ultra-Small Company Market Fund | |
|
| SCHEDULE OF INVESTMENTS (continued) | | |
| Showing percentage of net assets as of December 31, 2015 (Unaudited) | | |
| | | | | | | | | | |
Industry Company | | Shares | | | Value | | | |
| | |
Common Stocks (continued) | | | | | | | |
Professional Services (continued) | | | |
Franklin Covey Co.* | | | 33,334 | | | $ | 558,011 | | | |
Hill International, Inc.* | | | 326,171 | | | | 1,265,543 | | | |
Hudson Global, Inc.* | | | 114,606 | | | | 334,650 | | | |
Mastech Holdings, Inc.* | | | 6,250 | | | | 45,688 | | | |
RCM Technologies, Inc.+ | | | 111,510 | | | | 613,305 | | | |
Volt Information Sciences, Inc.* | | | 31,676 | | | | 257,843 | | | |
VSE Corp. | | | 20,200 | | | | 1,256,036 | | | |
| | | | | | | | | | |
| | | |
| | | | | | | 5,834,221 | | | |
| |
Real Estate Management & Development - 0.80% | | | |
AV Homes, Inc.*+ | | | 52,800 | | | | 676,368 | | | |
Consolidated-Tomoka Land Co. | | | 21,249 | | | | 1,120,035 | | | |
Maui Land & Pineapple Co., Inc.*+ | | | 30,000 | | | | 163,800 | | | |
Stratus Properties, Inc.* | | | 37,150 | | | | 772,906 | | | |
| | | | | | | | | | |
| | | |
| | | | | | | 2,733,109 | | | |
| | | |
Road & Rail - 0.43% | | | | | | | | | | |
Covenant Transportation Group, Inc., Class A* | | | 30,700 | | | | 579,923 | | | |
Providence & Worcester Railroad Co.+ | | | 5,000 | | | | 69,200 | | | |
USA Truck, Inc.* | | | 46,800 | | | | 816,660 | | | |
| | | | | | | | | | |
| | | |
| | | | | | | 1,465,783 | | | |
| |
Semiconductors & Semiconductor
Equipment - 2.39% | | | |
Amtech Systems, Inc.* | | | 57,500 | | | | 359,950 | | | |
AXT, Inc.* | | | 101,006 | | | | 250,495 | | | |
Cascade Microtech, Inc.* | | | 69,700 | | | | 1,132,625 | | | |
CyberOptics Corp.* | | | 99,300 | | | | 759,645 | | | |
DSP Group, Inc.* | | | 131,300 | | | | 1,239,472 | | | |
GigOptix, Inc.* | | | 100,000 | | | | 304,000 | | | |
GSI Technology, Inc.* | | | 161,417 | | | | 600,471 | | | |
Intermolecular, Inc.* | | | 347,600 | | | | 806,432 | | | |
inTEST Corp.*+ | | | 49,500 | | | | 209,385 | | | |
Kopin Corp.* | | | 90,000 | | | | 244,800 | | | |
Mattson Technology, Inc.* | | | 259,800 | | | | 917,094 | | | |
Pixelworks, Inc.*+ | | | 122,500 | | | | 291,550 | | | |
Sigma Designs, Inc.* | | | 73,790 | | | | 466,353 | | | |
Ultra Clean Holdings, Inc.* | | | 118,377 | | | | 606,090 | | | |
| | | | | | | | | | |
| | | |
| | | | | | | 8,188,362 | | | |
| | | |
Software - 2.22% | | | | | | | | | | |
American Software, Inc., Class A | | | 72,400 | | | | 737,032 | | | |
Bsquare Corp.* | | | 79,500 | | | | 484,155 | | | |
Covisint Corp.*+ | | | 90,600 | | | | 226,500 | | | |
Digimarc Corp.*+ | | | 15,000 | | | | 547,650 | | | |
Exa Corp.* | | | 74,000 | | | | 859,140 | | | |
FalconStor Software, Inc.* | | | 177,300 | | | | 333,324 | | | |
| | | | | | | | |
| Industry Company | | Shares | | | Value | |
| | |
Software (continued) | | | | | | | | |
Globalscape, Inc. | | | 81,700 | | | $ | 323,532 | |
GSE Systems, Inc.* | | | 195,125 | | | | 468,300 | |
Guidance Software, Inc.*+ | | | 132,857 | | | | 799,799 | |
QAD, Inc., Class B+ | | | 8,250 | | | | 152,130 | |
Rosetta Stone, Inc.* | | | 103,160 | | | | 690,140 | |
Smith Micro Software, Inc.* | | | 75,400 | | | | 54,967 | |
TeleCommunication | | | | | | | | |
Systems, Inc., Class A* | | | 180,834 | | | | 898,745 | |
Telenav, Inc.* | | | 153,000 | | | | 870,570 | |
| | |
Upland Software, Inc.* | | | 22,000 | | | | 155,100 | |
| | | | | | | | |
| | |
| | | | | | | 7,601,084 | |
| | |
Specialty Retail - 1.82% | | | | | | | | |
Aeropostale, Inc.*+ | | | 158,600 | | | | 44,408 | |
bebe stores, inc.+ | | | 167,200 | | | | 94,468 | |
Big 5 Sporting Goods Corp. | | | 14,200 | | | | 141,858 | |
Build-A-Bear Workshop, Inc.* | | | 29,500 | | | | 361,080 | |
Christopher & Banks Corp.* | | | 210,500 | | | | 347,325 | |
Destination Maternity Corp.+ | | | 61,000 | | | | 531,920 | |
Destination XL Group, Inc.* | | | 174,100 | | | | 961,032 | |
hhgregg, Inc.*+ | | | 111,700 | | | | 408,822 | |
Kirkland’s, Inc. | | | 19,500 | | | | 282,750 | |
New York & Co., Inc.* | | | 142,100 | | | | 325,409 | |
Pacific Sunwear of California, Inc.* | | | 238,549 | | | | 57,395 | |
Sportsman’s Warehouse Holdings, Inc.* | | | 55,000 | | | | 709,500 | |
Tandy Leather Factory, Inc.*+ | | | 10,000 | | | | 73,400 | |
Tilly’s, Inc., Class A* | | | 142,175 | | | | 942,620 | |
Trans World Entertainment Corp.*+ | | | 98,403 | | | | 352,283 | |
West Marine, Inc.* | | | 73,132 | | | | 620,891 | |
| | | | | | | | |
| | |
| | | | | | | 6,255,161 | |
|
Textiles, Apparel & Luxury Goods - 0.94% | |
Charles & Colvard, Ltd.* | | | 50,521 | | | | 56,584 | |
Cherokee, Inc.* | | | 1,100 | | | | 18,975 | |
Culp, Inc. | | | 36,016 | | | | 917,328 | |
Delta Apparel, Inc.*+ | | | 29,988 | | | | 421,032 | |
Lakeland Industries, Inc.*+ | | | 13,300 | | | | 158,802 | |
Perry Ellis International, Inc.* | | | 35,000 | | | | 644,700 | |
Rocky Brands, Inc. | | | 72,200 | | | | 834,632 | |
Superior Uniform Group, Inc.+ | | | 10,000 | | | | 169,800 | |
| | | | | | | | |
| | |
| | | | | | | 3,221,853 | |
|
Thrifts & Mortgage Finance - 5.46% | |
ASB Bancorp, Inc.*+ | | | 21,000 | | | | 539,910 | |
Bank Mutual Corp. | | | 129,000 | | | | 1,006,200 | |
Cape Bancorp, Inc. | | | 42,102 | | | | 523,328 | |
| | |
| Ultra-Small Company Market Fund | |
|
| SCHEDULE OF INVESTMENTS (continued) | |
| Showing percentage of net assets as of December 31, 2015 (Unaudited) | | |
| | | | | | | | | | |
| Industry Company | | Shares | | | Value | | | |
| | | |
Common Stocks (continued) | | | | | | | | | | |
Thrifts & Mortgage Finance (continued) | | | |
Chicopee Bancorp, Inc. | | | 26,500 | | | $ | 459,510 | | | |
Citizens Community Bancorp, Inc. | | | 35,600 | | | | 336,064 | | | |
Eagle Bancorp Montana, Inc. | | | 6,289 | | | | 77,732 | | | |
ESSA Bancorp, Inc. | | | 59,000 | | | | 807,120 | | | |
First Defiance Financial Corp. | | | 26,900 | | | | 1,016,282 | | | |
First Financial Northwest, Inc. | | | 61,600 | | | | 859,936 | | | |
Fox Chase Bancorp, Inc. | | | 14,133 | | | | 286,759 | | | |
Guaranty Federal Bancshares, Inc. | | | 20,856 | | | | 317,845 | | | |
HF Financial Corp. | | | 36,700 | | | | 693,263 | | | |
Hingham Institution for Savings+ | | | 2,500 | | | | 299,500 | | | |
HMN Financial, Inc.* | | | 25,000 | | | | 290,750 | | | |
Home Bancorp, Inc. | | | 42,300 | | | | 1,098,954 | | | |
HopFed Bancorp, Inc. | | | 32,988 | | | | 395,526 | | | |
Lake Shore Bancorp, Inc.+ | | | 22,150 | | | | 299,025 | | | |
Lake Sunapee Bank Group | | | 20,250 | | | | 284,108 | | | |
Meta Financial Group, Inc. | | | 17,155 | | | | 787,929 | | | |
Northeast Community Bancorp, Inc. | | | 55,658 | | | | 396,285 | | | |
Ocean Shore Holding Co. | | | 51,837 | | | | 889,004 | | | |
OceanFirst Financial Corp. | | | 29,200 | | | | 584,876 | | | |
Provident Financial Holdings, Inc. | | | 63,617 | | | | 1,201,725 | | | |
Pulaski Financial Corp. | | | 43,500 | | | | 694,260 | | | |
Riverview Bancorp, Inc.+ | | | 138,006 | | | | 647,248 | | | |
Security National Financial Corp., Class A* | | | 38,588 | | | | 252,751 | | | |
SI Financial Group, Inc. | | | 66,676 | | | | 910,127 | | | |
Southern Missouri Bancorp, Inc. | | | 100 | | | | 2,390 | | | |
Territorial Bancorp, Inc. | | | 22,300 | | | | 618,602 | | | |
Timberland Bancorp, Inc.+ | | | 24,222 | | | | 300,595 | | | |
United Community Bancorp+ | | | 26,200 | | | | 391,428 | | | |
United Community Financial Corp. | | | 137,800 | | | | 813,020 | | | |
Wayne Savings Bancshares, Inc. | | | 7,800 | | | | 105,066 | | | |
Westfield Financial, Inc.+ | | | 64,100 | | | | 538,440 | | | |
| | | | | | | | | | |
| | | | | | | 18,725,558 | | | |
| |
Trading Companies & Distributors - 1.03% | | | |
AeroCentury Corp.* | | | 10,900 | | | | 138,103 | | | |
EnviroStar, Inc.+ | | | 35,000 | | | | 145,250 | | | |
General Finance Corp.*+ | | | 211,500 | | | | 843,885 | | | |
Houston Wire & Cable Co. | | | 156,400 | | | | 825,792 | | | |
| | | | | | | | | | |
| Industry Company | | | | Shares | | | Value | |
|
| |
Trading Companies & Distributors (continued) | |
Lawson Products, Inc.* | | | 32,400 | | | $ | 756,540 | |
Transcat, Inc.*+ | | | 5,000 | | | | 49,700 | |
Willis Lease Finance Corp.* | | | 39,000 | | | | 783,900 | |
| | | | | | | | | | |
| | | | | | | 3,543,170 | |
|
Water Utilities - 0.74% | |
Artesian Resources Corp., Class A | | | 21,500 | | | | 595,550 | |
Cadiz, Inc.*+ | | | 36,700 | | | | 193,042 | |
York Water Co., (The) | | | 69,850 | | | | 1,742,059 | |
| | | | | | | | | | |
| | | | | | | | | 2,530,651 | |
|
Wireless Telecommunication Services - 0.23% | |
Boingo Wireless, Inc.* | | | 120,000 | | | | 794,400 | |
| | | | | | | | | | |
TOTAL COMMON STOCKS - 100.12% | | | | 343,317,142 | |
| | | | | | | | | | |
(Cost $298,759,994) | | | | | | | | |
|
EXCHANGE TRADED FUND - 0.35% | |
iShares Micro-Cap ETF+ | | | 16,525 | | | | 1,191,453 | |
| | | | | | | | | | |
TOTAL EXCHANGE TRADED FUND - 0.35% | | | | 1,191,453 | |
| | | | | | | | | | |
(Cost $442,002) | | | | | | | | |
|
RIGHTS - 0.00% | |
Zion Oil & Gas, Inc.D | | | 1,323 | | | | — | |
| | | | | | | | | | |
TOTAL RIGHTS - 0.00% | | | | — | |
| | | | | | | | | | |
(Cost $ — ) | | | | | | | | |
|
WARRANTS - 0.01% | |
Biotime, Inc., expire 10/01/18*+ | | | 16,058 | | | | 17,021 | |
| | | | | | | | | | |
TOTAL WARRANTS - 0.01% | | | | 17,021 | |
| | | | | | | | | | |
(Cost $15,589) | |
| | | |
| | | Rate^ | | Shares | | | Value | |
|
MONEY MARKET FUND - 0.40% | |
Dreyfus Cash Management Fund | | 0.18% | | | 1,386,256 | | | | 1,386,256 | |
| | | | | | | | | | |
TOTAL MONEY MARKET FUND - 0.40% | | | | 1,386,256 | |
| | | | | | | | | | |
(Cost $1,386,256) | | | | | | | | | | |
| | |
| 35 | | Semi-Annual Report | December 31, 2015 (Unaudited) |
| | |
| Ultra-Small Company Market Fund | | |
| SCHEDULE OF INVESTMENTS (continued) | |
| Showing percentage of net assets as of December 31, 2015 (Unaudited) | | |
| | | | | | | | | | | | |
| | | Rate^ | | | Shares | | | Value | |
|
INVESTMENTS PURCHASED WITH CASH PROCEEDS FROM SECURITIES
LENDING - 10.59% | |
Dreyfus Cash Management Fund** | | | 0.18 | % | | | 36,309,249 | | | | $36,309,249 | |
| | | | | | | | | | | | |
| |
TOTAL INVESTMENTS PURCHASED WITH CASH PROCEEDS FROM SECURITIES LENDING - 10.59% | | | | 36,309,249 | |
| | | | | | | | | | | | |
(Cost $36,309,249) | | | | | |
| |
TOTAL INVESTMENTS - 111.47% | | | | 382,221,121 | |
| |
(Cost $336,913,090) | | | | | |
Liabilities in Excess of Other Assets - (11.47%) | | | | (39,316,172 | ) |
| | | | | | | | | | | | |
NET ASSETS - 100.00% | | | | $342,904,949 | |
| | | | | | | | | | | | |
| * | Non-income producing security. |
| ** | This security represents the investment of the collateral received in connection with securities out on loan as of December 31, 2015. |
| ^ | Rate disclosed as of December 31, 2015. |
| D | Security was fair valued under procedures adopted by the Board of Directors (see Note 2). |
| + | This security or a portion of the security is out on loan as of December 31, 2015. Total loaned securities had a value of $34,254,298 as of December 31, 2015. |
| LLC | - Limited Liability Company |
| | | | | | | | | | | | | | |
Summary of inputs used to value the Fund’s investments as of 12/31/2015 (See Note 2 in Notes to Financial Statements): | |
| |
| | | Valuation Inputs | |
| |
| | | Investment in Securities (Value) | |
| |
| | | | | | Level 2 | | | Level 3 | | | |
| | | Level 1 | | | Significant | | | Significant | | | |
| | | Quoted | | | Observable | | | Unobservable | | | |
| | | Prices | | | Inputs | | | Inputs | | Total | |
| |
| | | | |
Common Stocks | | $ | 343,317,142 | | | $ | — | | | $ — | | $ | 343,317,142 | |
Exchange Traded Fund | | | 1,191,453 | | | | — | | | — | | | 1,191,453 | |
Rights | | | — | | | | — | | | — | | | — | |
Warrants | | | 17,021 | | | | — | | | — | | | 17,021 | |
Money Market Fund | | | — | | | | 1,386,256 | | | — | | | 1,386,256 | |
Investments Purchased with Cash Proceeds from Securities Lending | | | — | | | | 36,309,249 | | | — | | | 36,309,249 | |
| | | | | | | | | | | | | | |
TOTAL | | $ | 344,525,616 | | | $ | 37,695,505 | | | $ — | | $ | 382,221,121 | |
| | | | | | | | | | | | | | |
| | | | | | | | | | | | | | |
| | |
| | | Following is a reconciliation of Level 3 investments for which significant unobservable inputs were used to determine fair value: |
| | | | | Investment in Securities (Value) | | |
| | | |
| | | | | Common Stocks | | | Total | | | | | |
| | | | | |
| | | Balance as of 06/30/2015 | | $ | 2,740 | | | $ | 2,740 | | | | | |
| | | Purchases | | | — | | | | — | | | | | |
| | | Sales | | | (27) | | | | (27 | ) | | | | |
| | | Realized Gain/(Loss) | | | (118,341) | | | | (118,341 | ) | | | | |
| | | Change in Unrealized Appreciation/ (Depreciation) | | | 115,628 | | | | 115,628 | | | | | |
| | | Transfers in | | | — | | | | — | | | | | |
| | | Transfers out | | | — | | | | — | | | | | |
| | | | | | | | | | | | | | | |
| | | Balance as of 12/31/2015 | | $ | — | | | $ | — | | | | | |
| | | | | | | | | | | | | | | |
| | | Net Change in Unrealized Appreciation (Depreciation) from Investments Held as of 12/31/2015 | | $ | 115,628 | | | $ | 115,628 | | | | | |
| | | | | | | | | | | | | | | |
| | | See Notes to Financial Statements. |
| | | |
| | | |
| | |
| Small-Cap Momentum Fund | |
|
| MANAGER’S COMMENTARY (Unaudited) | |
| | |
December 31, 2015
Dear Fellow Small-Cap Momentum Fund Shareholder,
For the quarter ended December 31, 2015, our Fund returned 2.07%, underperforming our primary market benchmark, the Russell 2000 Index (3.59%). It was a poor quarter on a relative basis.
For the six-month semi-annual period ended December 31, 2015, our Fund returned -5.32%, outpacing the Russell 2000 Index (-8.75%).
For the calendar year, our Fund returned 0.14%, outperforming the Russell 2000 Index (-4.41%).
The table below presents our December quarter, six months, one-year, five-year, and inception-to-date financial results.
Standardized Returns as of December 31, 2015
| | | | | | | | | | | | | | | | | | | | |
| | | | | | | | | | | | | | | Annualized | | |
| | | Quarter | | | 6 Months | | | 1 Year | | | 5 Year | | | Since Inception (5/28/10) | | |
| | | | | | |
Small-Cap Momentum Fund | | | 2.07% | | | | -5.32% | | | | 0.14% | | | | 8.99% | | | 11.39% | | |
Russell 2000 Index | | | 3.59% | | | | -8.75% | | | | -4.41% | | | | 9.19% | | | 11.64% | | |
Performance figures quoted in the table above represent past performance and are no guarantee of future results. Total return figures in the table above include the reinvestment of dividends and capital gains. The table above does not reflect the deduction of taxes that a shareholder would pay on Fund distributions or on the redemption of Fund shares.
The Russell 2000 Index is an unmanaged, market value weighted index that measures performance of the 2,000 companies that are between the 1,000th and 3,000th largest in the market with dividends reinvested. It is not possible to invest directly in an index. Periods longer than one year are annualized.
According to data from Lipper, Inc. as of December 31, 2015, Small-Cap Momentum Fund ranked 30th of 797 small-cap core funds for the 12 months ended December 31, 2015, 266th of 603 over the last five years, and 252nd of 575 such funds since inception in May 2010. Lipper, Inc. is an independent mutual fund rating service that ranks funds in various fund categories by making comparative calculations using total returns.
| | |
| 37 | | Semi-Annual Report | December 31, 2015 (Unaudited) |
| | |
| Small-Cap Momentum Fund | | |
| MANAGER’S COMMENTARY (Unaudited) (continued) | | |
| | |
Small-Cap Momentum Fund vs. Russell 2000 Index
from Inception 5/28/10 to 12/31/15
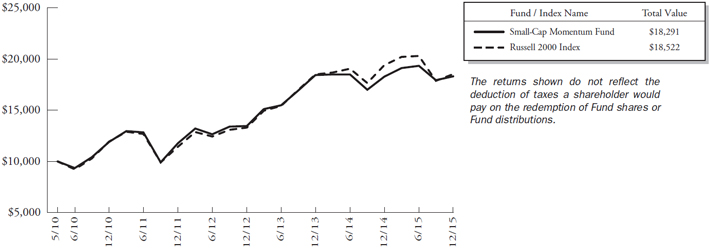
Detailed Explanation of Quarterly Performance
It was a poor quarter for the price momentum factor, which detracted from the Fund’s relative returns compared to its benchmark. In addition, the Fund’s risk-adjustment feature, which avoids some of the higher-volatility stocks in the momentum factor, hurt relative performance, as such stocks performed well in a rising market environment.
Detailed Explanation of Calendar Year Performance
Momentum holdings outperformed the Russell 2000 Index for the calendar year, and the risk-adjustment overlay feature performed according to design, boosting relative returns.
Top Ten Holdings as of December 31, 2015
| | | | | | |
| Rank | | Description | | Industry | | % of Net Assets |
| 1 | | China Biologic Products Inc | | Biotechnology | | 1.0% |
| 2 | | Heartland Payment Systems Inc | | IT Services | | 0.8% |
| 3 | | Blackbaud Inc | | Software | | 0.8% |
| 4 | | WGL Holdings Inc | | Electronic Equipment, Instruments & Components | | 0.8% |
| 5 | | Fair Isaac Corp | | Software | | 0.7% |
| 6 | | Myriad Genetics Inc | | Biotechnology | | 0.7% |
| 7 | | Allscripts Healthcare Solutions Inc | | Health Care Technology | | 0.7% |
| 8 | | Prestige Brands Holdings Inc | | Personal Products | | 0.7% |
| 9 | | Churchill Downs Inc | | Hotels, Restaurants & Leisure | | 0.7% |
| 10 | | Portola Pharmaceuticals Inc | | Biotechnology | | 0.7% |
| | Total | | | | 7.6% |
| | |
| Small-Cap Momentum Fund | |
|
| MANAGER’S COMMENTARY (Unaudited) (continued) | |
| | |
Industry Sector Representation as of December 31, 2015
| | | | | | | | | | | | | | | |
| | | % of Net Assets | | % of
Russell 2000 Index | | Difference |
Consumer Discretionary | | | | 11.4 | % | | | | 13.4 | % | | | | -2.0% | |
Consumer Staples | | | | 4.7 | % | | | | 3.4 | % | | | | 1.3% | |
Energy | | | | 2.6 | % | | | | 2.7 | % | | | | -0.1% | |
Financials | | | | 28.6 | % | | | | 25.6 | % | | | | 3.0% | |
Health Care | | | | 18.8 | % | | | | 16.5 | % | | | | 2.3% | |
Industrials | | | | 11.1 | % | | | | 12.2 | % | | | | -1.1% | |
Information Technology | | | | 16.8 | % | | | | 18.0 | % | | | | -1.2% | |
Materials | | | | 2.7 | % | | | | 3.6 | % | | | | -0.9% | |
Telecommunication Services | | | | 1.2 | % | | | | 0.8 | % | | | | 0.4% | |
Utilities | | | | 2.5 | % | | | | 3.7 | % | | | | -1.2% | |
Cash & Other Assets | | | | -0.4 | % | | | | 0.0 | % | | | | -0.4% | |
Total | | | | 100.0 | % | | | | 100.0 | % | | | | | |
Disclaimer
The views expressed here are exclusively those of Fund management. These views, including those related to market sectors or individual stocks, are not meant as investment advice and should not be considered predictive in nature. Any favorable (or unfavorable) description of a holding applies only as of December 31, 2015, unless otherwise stated. Security positions can and do change thereafter. Discussions of historical performance do not guarantee and are not indicative of future performance.
Market volatility can significantly impact short-term performance. The Fund is not an appropriate investment for short-term investors. Investments in small companies generally carry greater risk than is customarily associated with larger companies. This additional risk is attributable to a number of factors, including the relatively limited financial resources that are typically available to small companies and the fact that small companies often have comparatively limited product lines. In addition, the stock of small companies tends to be more volatile than the stock of large companies, particularly in the short term and particularly in the early stages of an economic or market downturn. Shareholders of the Fund, therefore, are taking on more risk than they would if they invested in the stock market as a whole.
Conclusion
Thank you for your continued investment in Small-Cap Momentum Fund. We encourage your feedback; your reactions and concerns are important to us.
Sincerely,
The Investment Management Team
| | |
| 39 | | Semi-Annual Report | December 31, 2015 (Unaudited) |
| | |
| Small-Cap Momentum Fund | |
|
| SCHEDULE OF INVESTMENTS | | |
| Showing percentage of net assets as of December 31, 2015 (Unaudited) | | |
| | | | | | | | | | |
| Industry Company | | Shares | | | Value | | | |
| |
COMMON STOCKS - 100.37% | | | |
Aerospace & Defense - 0.10% | | | |
National Presto Industries, Inc.+ | | | 50 | | | $ | 4,143 | | | |
| |
Air Freight & Logistics - 0.18% | | | |
Air Transport Services Group, Inc.* | | | 750 | | | | 7,560 | | | |
| | | |
Airlines - 0.84% | | | | | | | | | | |
Allegiant Travel Co. | | | 150 | | | | 25,175 | | | |
SkyWest, Inc. | | | 500 | | | | 9,510 | | | |
| | | | | | | | | | |
| | | |
| | | | | | | 34,685 | | | |
| | |
Auto Components - 1.51% | | | | | | | |
Cooper-Standard Holding, Inc.* | | | 200 | | | | 15,518 | | | |
Drew Industries, Inc. | | | 250 | | | | 15,223 | | | |
Fox Factory Holding Corp.* | | | 350 | | | | 5,786 | | | |
Gentherm, Inc.* | | | 350 | | | | 16,590 | | | |
Stoneridge, Inc.* | | | 300 | | | | 4,440 | | | |
Superior Industries International, Inc. | | | 250 | | | | 4,605 | | | |
| | | | | | | | | | |
| | | |
| | | | | | | 62,162 | | | |
| | | |
Beverages - 0.70% | | | | | | | | | | |
Coca-Cola Bottling Co. | | | | | | | | | | |
Consolidated | | | 80 | | | | 14,601 | | | |
Cott Corp. | | | 1,100 | | | | 12,089 | | | |
Primo Water Corp.* | | | 250 | | | | 2,000 | | | |
| | | | | | | | | | |
| | | |
| | | | | | | 28,690 | | | |
| | | |
Biotechnology - 6.73% | | | | | | | | | | |
BioSpecifics Technologies Corp.* | | | 50 | | | | 2,149 | | | |
China Biologic Products, Inc.* | | | 275 | | | | 39,177 | | | |
Coherus Biosciences, Inc.*+ | | | 400 | | | | 9,184 | | | |
Concert Pharmaceuticals, Inc.*+ | | | 200 | | | | 3,794 | | | |
Dynavax Technologies Corp.* | | | 400 | | | | 9,664 | | | |
Eagle Pharmaceuticals, Inc.* | | | 150 | | | | 13,301 | | | |
Emergent BioSolutions, Inc.* | | | 400 | | | | 16,004 | | | |
Exelixis, Inc.*+ | | | 2,300 | | | | 12,972 | | | |
Insmed, Inc.* | | | 700 | | | | 12,705 | | | |
Ligand Pharmaceuticals, Inc.* | | | 200 | | | | 21,684 | | | |
Loxo Oncology, Inc.* | | | 200 | | | | 5,690 | | | |
Merrimack Pharmaceuticals, Inc.*+ | | | 1,150 | | | | 9,085 | | | |
Momenta Pharmaceuticals, Inc.* | | | 700 | | | | 10,388 | | | |
Myriad Genetics, Inc.*+ | | | 700 | | | | 30,212 | | | |
| | | | | | | | | | |
| | | | | | | | | | |
| | | | | | | | |
| Industry Company | | Shares | | | Value | |
|
| |
Biotechnology (continued) | |
Portola Pharmaceuticals, Inc.* | | | 550 | | | $ | 28,297 | |
Prothena Corp. PLC* | | | 300 | | | | 20,433 | |
TESARO, Inc.*+ | | | 400 | | | | 20,928 | |
Threshold Pharmaceuticals, Inc.* | | | 700 | | | | 336 | |
ZIOPHARM Oncology, Inc.*+ | | | 1,350 | | | | 11,218 | |
| | | | | | | | |
| | | | | | | 277,221 | |
| |
Building Products - 1.47% | | | | | |
Advanced Drainage Systems, Inc.+ | | | 550 | | | | 13,217 | |
American Woodmark Corp.* | | | 150 | | | | 11,997 | |
Gibraltar Industries, Inc.* | | | 300 | | | | 7,632 | |
Griffon Corp. | | | 550 | | | | 9,790 | |
Tecnoglass, Inc.* | | | 300 | | | | 4,122 | |
Universal Forest Products, Inc. | | | 200 | | | | 13,674 | |
| | | | | | | | |
| | |
| | | | | | | 60,432 | |
| | |
Capital Markets - 0.86% | | | | | | | | |
Diamond Hill Investment Group, Inc. | | | 35 | | | | 6,615 | |
INTL FCStone, Inc.* | | | 200 | | | | 6,692 | |
WisdomTree Investments, Inc.+ | | | 1,400 | | | | 21,952 | |
| | | | | | | | |
| | |
| | | | | | | 35,259 | |
| | |
Chemicals - 1.42% | | | | | | | | |
Chase Corp.+ | | | 100 | | | | 4,073 | |
Chemtura Corp.* | | | 700 | | | | 19,089 | |
Hawkins, Inc. | | | 100 | | | | 3,577 | |
Innospec, Inc. | | | 250 | | | | 13,577 | |
Kraton Performance Polymers, Inc.* | | | 350 | | | | 5,813 | |
Stepan Co. | | | 250 | | | | 12,422 | |
| | | | | | | | |
| | |
| | | | | | | 58,551 | |
| |
Commercial Banks - 16.15% | | | | | |
1st Source Corp. | | | 250 | | | | 7,718 | |
Access National Corp. | | | 100 | | | | 2,046 | |
Ameris Bancorp | | | 350 | | | | 11,897 | |
Anchor BanCorp Wisconsin, Inc.* | | | 100 | | | | 4,352 | |
BancorpSouth, Inc. | | | 950 | | | | 22,791 | |
Banner Corp. | | | 200 | | | | 9,172 | |
Bar Harbor Bankshares | | | 50 | | | | 1,721 | |
BBCN Bancorp, Inc. | | | 800 | | | | 13,776 | |
BNC Bancorp | | | 400 | | | | 10,152 | |
Bridge Bancorp, Inc. | | | 200 | | | | 6,086 | |
| | |
| Small-Cap Momentum Fund | |
|
| SCHEDULE OF INVESTMENTS (continued) | |
| Showing percentage of net assets as of December 31, 2015 (Unaudited) | | |
| | | | | | | | | | | | |
| Industry Company | | Shares | | | Value | | | | | |
| | |
Common Stocks (continued) | | | | | |
Commercial Banks (continued) | | | | | |
BSB Bancorp, Inc.*+ | | | 100 | | | $ | 2,339 | | | | | |
Capital Bank Financial Corp., Class A+ | | | 300 | | | | 9,594 | | | | | |
Cardinal Financial Corp. | | | 350 | | | | 7,963 | | | | | |
Cascade Bancorp* | | | 750 | | | | 4,553 | | | | | |
Cathay General Bancorp | | | 800 | | | | 25,064 | | | | | |
CenterState Banks, Inc.+ | | | 500 | | | | 7,825 | | | | | |
Central Pacific Financial Corp. | | | 300 | | | | 6,606 | | | | | |
Chemical Financial Corp. | | | 400 | | | | 13,708 | | | | | |
City Holding Co. | | | 150 | | | | 6,846 | | | | | |
Columbia Banking System, Inc. | | | 600 | | | | 19,506 | | | | | |
CU Bancorp* | | | 150 | | | | 3,804 | | | | | |
Customers Bancorp, Inc.* | | | 284 | | | | 7,730 | | | | | |
CVB Financial Corp.+ | | | 1,100 | | | | 18,612 | | | | | |
Eagle Bancorp, Inc.* | | | 350 | | | | 17,665 | | | | | |
Enterprise Financial Services Corp. | | | 200 | | | | 5,670 | | | | | |
Farmers Capital Bank Corp.* | | | 100 | | | | 2,711 | | | | | |
Fidelity Southern Corp. | | | 250 | | | | 5,578 | | | | | |
Financial Institutions, Inc. | | | 150 | | | | 4,200 | | | | | |
First Bancorp, Inc. | | | 100 | | | | 2,047 | | | | | |
First Business Financial Services, Inc. | | | 50 | | | | 1,251 | | | | | |
First Community Bancshares, Inc. | | | 200 | | | | 3,726 | | | | | |
First Connecticut Bancorp, Inc. | | | 150 | | | | 2,612 | | | | | |
First Foundation, Inc.* | | | 150 | | | | 3,539 | | | | | |
First Merchants Corp. | | | 400 | | | | 10,168 | | | | | |
Flushing Financial Corp. | | | 300 | | | | 6,492 | | | | | |
Fulton Financial Corp. | | | 1,750 | | | | 22,768 | | | | | |
Great Southern Bancorp, Inc.+ | | | 150 | | | | 6,789 | | | | | |
Great Western Bancorp, Inc. | | | 550 | | | | 15,961 | | | | | |
Hanmi Financial Corp. | | | 300 | | | | 7,116 | | | | | |
Heartland Financial USA, Inc. | | | 200 | | | | 6,272 | | | | | |
Heritage Commerce Corp. | | | 300 | | | | 3,588 | | | | | |
Heritage Oaks Bancorp | | | 350 | | | | 2,803 | | | | | |
HomeTrust Bancshares, Inc.* | | | 200 | | | | 4,050 | | | | | |
Independent Bank Corp., MA | | | 250 | | | | 11,630 | | | | | |
Independent Bank Corp., MI | | | 250 | | | | 3,807 | | | | | |
Lakeland Financial Corp. | | | 150 | | | | 6,993 | | | | | |
MainSource Financial Group, Inc. | | | 200 | | | | 4,576 | | | | | |
| | | | | | | | |
| Industry Company | | Shares | | | Value | |
|
Commercial Banks (continued) | |
Mercantile Bank Corp. | | | 150 | | | $ | 3,681 | |
Merchants Bancshares, Inc.+ | | | 50 | | | | 1,574 | |
NBT Bancorp, Inc. | | | 450 | | | | 12,546 | |
NV5 Global, Inc.* | | | 100 | | | | 2,198 | |
Old Second Bancorp, Inc.* | | | 300 | | | | 2,352 | |
Opus Bank | | | 300 | | | | 11,091 | |
Pacific Premier Bancorp, Inc.* | | | 200 | | | | 4,250 | |
Park National Corp. | | | 150 | | | | 13,572 | |
Peapack Gladstone Financial Corp.+ | | | 150 | | | | 3,093 | |
Pinnacle Financial Partners, Inc. | | | 425 | | | | 21,828 | |
Preferred Bank | | | 150 | | | | 4,953 | |
QCR Holdings, Inc.+ | | | 100 | | | | 2,429 | |
Renasant Corp. | | | 400 | | | | 13,764 | |
Republic Bancorp, Inc., Class A | | | 200 | | | | 5,282 | |
S&T Bancorp, Inc. | | | 350 | | | | 10,787 | |
Sandy Spring Bancorp, Inc. | | | 250 | | | | 6,740 | |
Seacoast Banking Corp. of Florida* | | | 350 | | | | 5,243 | |
ServisFirst Bancshares, Inc. | | | 250 | | | | 11,882 | |
Simmons First National Corp., Class A | | | 300 | | | | 15,408 | |
South State Corp. | | | 250 | | | | 17,987 | |
State Bank Financial Corp. | | | 350 | | | | 7,360 | |
Stock Yards Bancorp, Inc. | | | 150 | | | | 5,668 | |
Suffolk Bancorp | | | 100 | | | | 2,835 | |
Talmer Bancorp, Inc., Class A | | | 650 | | | | 11,771 | |
Tompkins Financial Corp. | | | 150 | | | | 8,424 | |
TowneBank | | | 300 | | | | 6,261 | |
TriState Capital Holdings, Inc.* | | | 350 | | | | 4,896 | |
United Bankshares, Inc. | | | 725 | | | | 26,818 | |
United Community Banks, Inc. | | | 758 | | | | 14,773 | |
West Bancorporation, Inc. | | | 150 | | | | 2,962 | |
Wilshire Bancorp, Inc. | | | 800 | | | | 9,240 | |
Yadkin Financial Corp. | | | 300 | | | | 7,551 | |
| | | | | | | | |
| | | | | | | 665,092 | |
|
Commercial Services & Supplies - 3.19% | |
Brink’s Co. (The) | | | 500 | | | | 14,430 | |
Casella Waste Systems, Inc., Class A*+ | | | 400 | | | | 2,392 | |
Ennis, Inc. | | | 300 | | | | 5,775 | |
| | |
| 41 | | Semi-Annual Report | December 31, 2015 (Unaudited) |
| | |
| Small-Cap Momentum Fund | | |
| SCHEDULE OF INVESTMENTS (continued) | | |
| Showing percentage of net assets as of December 31, 2015 (Unaudited) | | |
| | | | | | | | | | |
| Industry Company | | Shares | | | Value | | | |
| | |
Common Stocks (continued) | | | | | | | |
Commercial Services & Supplies (continued) | | | |
Healthcare Services Group, Inc. | | | 750 | | | $ | 26,153 | | | |
INC Research Holdings, Inc., Class A* | | | 550 | | | | 26,680 | | | |
Kimball International, Inc., Class B | | | 400 | | | | 3,908 | | | |
Knoll, Inc. | | | 550 | | | | 10,340 | | | |
Multi-Color Corp. | | | 150 | | | | 8,971 | | | |
Steelcase, Inc., Class A | | | 900 | | | | 13,410 | | | |
Sykes Enterprises, Inc.* | | | 450 | | | | 13,851 | | | |
Viad Corp. | | | 200 | | | | 5,646 | | | |
| | | | | | | | | | |
| | | |
| | | | | | | 131,556 | | | |
| |
Communications Equipment - 0.88% | | | |
A10 Networks, Inc.* | | | 650 | | | | 4,264 | | | |
Applied Optoelectronics, Inc.*+ | | | 150 | | | | 2,574 | | | |
Digi International, Inc.* | | | 250 | | | | 2,845 | | | |
EMCORE Corp.* | | | 250 | | | | 1,533 | | | |
Gigamon, Inc.* | | | 350 | | | | 9,300 | | | |
Ixia* | | | 800 | | | | 9,944 | | | |
ShoreTel, Inc.* | | | 650 | | | | 5,752 | | | |
| | | | | | | | | | |
| | | |
| | | | | | | 36,212 | | | |
| |
Construction & Engineering - 1.30% | | | |
Argan, Inc. | | | 150 | | | | 4,860 | | | |
Comfort Systems USA, Inc. | | | 400 | | | | 11,368 | | | |
Dycom Industries, Inc.* | | | 350 | | | | 24,486 | | | |
Installed Building Products, Inc.* | | | 300 | | | | 7,449 | | | |
WCI Communities, Inc.* | | | 250 | | | | 5,570 | | | |
| | | | | | | | | | |
| | | |
| | | | | | | 53,733 | | | |
| | | |
Construction Materials - 0.50% | | | | | | | | | | |
Headwaters, Inc.* | | | 750 | | | | 12,653 | | | |
U.S. Concrete, Inc.*+ | | | 150 | | | | 7,899 | | | |
| | | | | | | | | | |
| | | |
| | | | | | | 20,552 | | | |
| |
Consumer Finance - 0.18% | | | |
Cash America International, Inc. | | | 250 | | | | 7,488 | | | |
| |
Containers & Packaging - 0.09% | | | |
AEP Industries, Inc.* | | | 50 | | | | 3,858 | | | |
| |
Diversified Consumer Services - 0.51% | | | |
Cambium Learning Group, Inc.* | | | 500 | | | | 2,425 | | | |
Matthews International Corp., Class A | | | 350 | | | | 18,707 | | | |
| | | | | | | | | | |
| | | |
| | | | | | | 21,132 | | | |
| | | | | | | | | | |
| | | | | | | | |
| Industry Company | | Shares | | | Value | |
|
| |
Diversified Financial Services - 0.51% | |
Sterling Bancorp | | | 1,300 | | | $ | 21,086 | |
|
Diversified Telecommunication Services - 0.49% | |
General Communication, Inc., Class A* | | | 400 | | | | 7,912 | |
Vonage Holdings Corp.* | | | 2,150 | | | | 12,341 | |
| | | | | | | | |
| | |
| | | | | | | 20,253 | |
|
Electrical Equipment - 0.77% | |
AZZ, Inc. | | | 250 | | | | 13,893 | |
Encore Wire Corp. | | | 200 | | | | 7,418 | |
General Cable Corp. | | | 500 | | | | 6,715 | |
LSI Industries, Inc. | | | 300 | | | | 3,657 | |
| | | | | | | | |
| | |
| | | | | | | 31,683 | |
|
Electronic Equipment, Instruments & Components - 2.08% | |
Fabrinet* | | | 350 | | | | 8,337 | |
Insight Enterprises, Inc.* | | | 400 | | | | 10,048 | |
Mercury Systems, Inc.* | | | 350 | | | | 6,426 | |
Mesa Laboratories, Inc. | | | 50 | | | | 4,975 | |
OSI Systems, Inc.* | | | 200 | | | | 17,732 | |
TTM Technologies, Inc.* | | | 1,000 | | | | 6,510 | |
WGL Holdings, Inc. | | | 500 | | | | 31,495 | |
| | | | | | | | |
| | |
| | | | | | | 85,523 | |
|
Food & Staples Retailing - 0.40% | |
Ingles Markets, Inc., Class A | | | 150 | | | | 6,612 | |
SpartanNash Co. | | | 450 | | | | 9,738 | |
| | | | | | | | |
| | |
| | | | | | | 16,350 | |
|
Food Products - 2.44% | |
B&G Foods, Inc.+ | | | 600 | | | | 21,012 | |
Fresh Del Monte Produce, Inc. | | | 550 | | | | 21,384 | |
J&J Snack Foods Corp. | | | 200 | | | | 23,334 | |
John B. Sanfilippo & Son, Inc. | | | 100 | | | | 5,403 | |
Omega Protein Corp.* | | | 250 | | | | 5,550 | |
Snyders-Lance, Inc.+ | | | 700 | | | | 24,010 | |
| | | | | | | | |
| | |
| | | | | | | 100,693 | |
|
Gas Utilities - 1.14% | |
Chesapeake Utilities Corp. | | | 150 | | | | 8,513 | |
Just Energy Group, Inc. | | | 1,500 | | | | 10,680 | |
ONE Gas, Inc.+ | | | 550 | | | | 27,593 | |
| | | | | | | | |
| | |
| | | | | | | 46,786 | |
|
Health Care Equipment & Supplies - 4.25% | |
Analogic Corp. | | | 150 | | | | 12,390 | |
Cantel Medical Corp. | | | 400 | | | | 24,856 | |
| | |
| Small-Cap Momentum Fund | |
|
| SCHEDULE OF INVESTMENTS (continued) | |
| Showing percentage of net assets as of December 31, 2015 (Unaudited) | | |
| | | | | | | | | | |
| Industry Company | | Shares | | | Value | | | |
| |
Common Stocks (continued) | | | |
Health Care Equipment & Supplies (continued) | | | |
Cutera, Inc.* | | | 150 | | | $ | 1,919 | | | |
Cynosure, Inc., Class A* | | | 250 | | | | 11,168 | | | |
ICU Medical, Inc.* | | | 150 | | | | 16,917 | | | |
Inogen, Inc.* | | | 200 | | | | 8,018 | | | |
Integra LifeSciences Holdings Corp.* | | | 400 | | | | 27,112 | | | |
Invacare Corp. | | | 350 | | | | 6,086 | | | |
iRadimed Corp.* | | | 100 | | | | 2,803 | | | |
LeMaitre Vascular, Inc. | | | 200 | | | | 3,450 | | | |
Masimo Corp.* | | | 500 | | | | 20,755 | | | |
Meridian Bioscience, Inc. | | | 400 | | | | 8,208 | | | |
Natus Medical, Inc.* | | | 350 | | | | 16,817 | | | |
Orthofix International Nv* | | | 200 | | | | 7,842 | | | |
Vascular Solutions, Inc.* | | | 200 | | | | 6,878 | | | |
| | | | | | | | | | |
| | | | | | | 175,219 | | | |
| |
Health Care Providers & Services - 2.09% | | | |
Almost Family, Inc.*+ | | | 100 | | | | 3,823 | | | |
AMN Healthcare Services, Inc.* | | | 500 | | | | 15,525 | | | |
Chemed Corp.+ | | | 150 | | | | 22,470 | | | |
China Cord Blood Corp.* | | | 800 | | | | 5,096 | | | |
Civitas Solutions, Inc.* | | | 400 | | | | 11,516 | | | |
LHC Group, Inc.* | | | 200 | | | | 9,058 | | | |
PharMerica Corp.* | | | 300 | | | | 10,500 | | | |
U.S. Physical Therapy, Inc. | | | 150 | | | | 8,052 | | | |
| | | | | | | | | | |
| | | | | | | 86,040 | | | |
| |
Health Care Technology - 0.80% | | | |
Allscripts Healthcare Solutions, Inc.* | | | 1,900 | | | | 29,222 | | | |
Vocera Communications, Inc.* | | | 300 | | | | 3,660 | | | |
| | | | | | | | | | |
| | | | | | | 32,882 | | | |
| |
Hotels, Restaurants & Leisure - 4.42% | | | |
Boyd Gaming Corp.*+ | | | 1,150 | | | | 22,851 | | | |
Carrols Restaurant Group, Inc.* | | | 350 | | | | 4,109 | | | |
Century Casinos, Inc.* | | | 250 | | | | 1,945 | | | |
Churchill Downs, Inc. | | | 200 | | | | 28,298 | | | |
Chuy’s Holdings, Inc.*+ | | | 150 | | | | 4,701 | | | |
Dave & Buster’s Entertainment, Inc.* | | | 400 | | | | 16,696 | | | |
Diamond Resorts International, Inc.*+ | | | 725 | | | | 18,495 | | | |
Eldorado Resorts, Inc.* | | | 450 | | | | 4,950 | | | |
International Speedway Corp., Class A | | | 250 | | | | 8,430 | | | |
Isle of Capri Casinos, Inc.* | | | 450 | | | | 6,268 | | | |
| | | | | | | | | | |
| | | | | | | | | | |
| | | | | | | | | | |
| | | | | | | | |
| Industry Company | | Shares | | | Value | |
Hotels, Restaurants & Leisure (continued) | |
Marcus Corp. (The) | | | 200 | | | $ | 3,794 | |
Monarch Casino & Resort, Inc.* | | | 150 | | | | 3,408 | |
Papa John’s International, Inc. | | | 395 | | | | 22,069 | |
Penn National Gaming, Inc.* | | | 800 | | | | 12,816 | |
Ruth’s Hospitality Group, Inc. | | | 350 | | | | 5,572 | |
SeaWorld Entertainment, Inc. | | | 900 | | | | 17,721 | |
| | | | | | | | |
| | | | | | | 182,123 | |
|
Household Durables - 0.44% | |
Bassett Furniture Industries, Inc. | | | 100 | | | | 2,508 | |
Hooker Furniture Corp. | | | 100 | | | | 2,524 | |
LGI Homes, Inc.* | | | 200 | | | | 4,866 | |
Libbey, Inc. | | | 225 | | | | 4,797 | |
ZAGG, Inc.* | | | 300 | | | | 3,282 | |
| | | | | | | | |
| | | | | | | 17,977 | |
|
Household Products - 1.21% | |
Central Garden & Pet Co., Class A* | | | 500 | | | | 6,800 | |
Helen Of Troy, Ltd.* | | | 300 | | | | 28,275 | |
WD-40 Co. | | | 150 | | | | 14,797 | |
| | | | | | | | |
| | | | | | | 49,872 | |
|
Independent Power Producers & Energy Traders - 0.44% | |
Ormat Technologies, Inc.+ | | | 500 | | | | 18,235 | |
| | |
Insurance - 4.60% | | | | | | | | |
AMERISAFE, Inc. | | | 200 | | | | 10,180 | |
Argo Group International Holdings Ltd. | | | 300 | | | | 17,952 | |
Atlas Financial Holdings, Inc.* | | | 150 | | | | 2,985 | |
EMC Insurance Group, Inc.+ | | | 225 | | | | 5,693 | |
FBL Financial Group, Inc., Class A | | | 250 | | | | 15,910 | |
Hallmark Financial Services, Inc.* | | | 200 | | | | 2,338 | |
Horace Mann Educators Corp. | | | 400 | | | | 13,272 | |
Infinity Property & Casualty Corp. | | | 100 | | | | 8,223 | |
Maiden Holdings, Ltd. | | | 750 | | | | 11,182 | |
ProAssurance Corp. | | | 550 | | | | 26,691 | |
RLI Corp. | | | 450 | | | | 27,788 | |
| | |
| 43 | | Semi-Annual Report | December 31, 2015 (Unaudited) |
| | |
| Small-Cap Momentum Fund | | |
| SCHEDULE OF INVESTMENTS (continued) | | |
| Showing percentage of net assets as of December 31, 2015 (Unaudited) | | |
| | | | | | | | | | |
| Industry Company | | Shares | | | Value | | | |
| | |
Common Stocks (continued) | | | | | | | |
Insurance (continued) | | | |
Selective Insurance Group, Inc. | | | 600 | | | | $20,148 | | | |
State Auto Financial Corp. | | | 400 | | | | 8,236 | | | |
United Fire Group, Inc. | | | 250 | | | | 9,577 | | | |
Universal Insurance Holdings, Inc.+ | | | 400 | | | | 9,272 | | | |
| | | | | | | | | | |
| | | |
| | | | | | | 189,447 | | | |
| |
Internet & Catalog Retail - 0.08% | | | |
PetMed Express, Inc. | | | 200 | | | | 3,428 | | | |
| |
Internet Software & Services - 1.26% | | | |
Autobytel, Inc.* | | | 100 | | | | 2,256 | | | |
EarthLink Holdings Corp. | | | 1,050 | | | | 7,802 | | | |
LogMeIn, Inc.* | | | 250 | | | | 16,775 | | | |
Stamps.com, Inc.* | | | 150 | | | | 16,441 | | | |
Textura Corp.*+ | | | 250 | | | | 5,395 | | | |
Zix Corp.* | | | 650 | | | | 3,302 | | | |
| | | | | | | | | | |
| | | |
| | | | | | | 51,971 | | | |
| |
IT Services - 3.33% | | | |
Convergys Corp.+ | | | 1,000 | | | | 24,890 | | | |
CSG Systems International, Inc. | | | 350 | | | | 12,593 | | | |
ExlService Holdings, Inc.* | | | 350 | | | | 15,726 | | | |
Hackett Group, Inc. (The) | | | 300 | | | | 4,821 | | | |
Heartland Payment Systems, Inc. | | | 350 | | | | 33,187 | | | |
Luxoft Holding, Inc.* | | | 200 | | | | 15,426 | | | |
Newtek Business Services Corp. | | | 114 | | | | 1,629 | | | |
PFSweb, Inc.* | | | 200 | | | | 2,574 | | | |
TeleTech Holdings, Inc. | | | 500 | | | | 13,955 | | | |
Virtusa Corp.* | | | 300 | | | | 12,402 | | | |
| | | | | | | | | | |
| | | |
| | | | | | | 137,203 | | | |
| |
Leisure Equipment & Products - 0.54% | | | |
Callaway Golf Co. | | | 850 | | | | 8,007 | | | |
Escalade, Inc. | | | 150 | | | | 1,988 | | | |
Smith & Wesson Holding Corp.* | | | 550 | | | | 12,089 | | | |
| | | | | | | | | | |
| | | |
| | | | | | | 22,084 | | | |
| |
Life Sciences Tools & Services - 0.46% | | | |
Cambrex Corp.* | | | 300 | | | | 14,127 | | | |
NeoGenomics, Inc.*+ | | | 600 | | | | 4,722 | | | |
| | | | | | | | | | |
| | | |
| | | | | | | 18,849 | | | |
| |
Machinery - 0.77% | | | |
Global Brass & Copper Holdings, Inc. | | | 200 | | | | 4,260 | | | |
| | | | | | | | | | |
| | | | | | | | |
| Industry Company | | Shares | | | Value | |
|
| |
Machinery (continued) | |
John Bean Technologies Corp. | | | 300 | | | $ | 14,949 | |
Standex International Corp. | | | 150 | | | | 12,472 | |
| | | | | | | | |
| | |
| | | | | | | 31,681 | |
|
Marine - 1.00% | |
Matson, Inc. | | | 450 | | | | 19,183 | |
Scorpio Tankers, Inc. | | | 1,800 | | | | 14,436 | |
Tsakos Energy Navigation, Ltd. | | | 950 | | | | 7,524 | |
| | | | | | | | |
| | |
| | | | | | | 41,143 | |
|
Materials - 0.34% | |
Trinseo SA* | | | 500 | | | | 14,100 | |
|
Media - 0.90% | |
Crown Media Holdings, Inc., Class A* | | | 3,650 | | | | 20,477 | |
Reading International, Inc., Class A*+ | | | 250 | | | | 3,278 | |
Scholastic Corp. | | | 350 | | | | 13,496 | |
| | | | | | | | |
| | |
| | | | | | | 37,251 | |
|
Oil, Gas & Consumable Fuels - 2.11% | |
Advantage Oil & Gas, Ltd.* | | | 1,750 | | | | 8,890 | |
Ardmore Shipping Corp. | | | 250 | | | | 3,180 | |
DHT Holdings, Inc. | | | 1,050 | | | | 8,494 | |
Matador Resources Co.*+ | | | 850 | | | | 16,804 | |
Nordic American Tankers Ltd. | | | 900 | | | | 13,986 | |
PDC Energy, Inc.* | | | 400 | | | | 21,352 | |
Ring Energy, Inc.*+ | | | 300 | | | | 2,115 | |
Solazyme, Inc.*+ | | | 800 | | | | 1,984 | |
Teekay Tankers, Ltd., Class A | | | 1,450 | | | | 9,976 | |
| | | | | | | | |
| | |
| | | | | | | 86,781 | |
|
Paper & Forest Products - 0.23% | |
Neenah Paper, Inc. | | | 150 | | | | 9,364 | |
|
Personal Products - 1.33% | |
Inter Parfums, Inc. | | | 300 | | | | 7,146 | |
Prestige Brands Holdings, Inc.* | | | 550 | | | | 28,314 | |
USANA Health Sciences, Inc.* | | | 150 | | | | 19,162 | |
| | | | | | | | |
| | |
| | | | | | | 54,622 | |
|
Pharmaceuticals - 3.11% | |
Amphastar Pharmaceuticals, Inc.* | | | 450 | | | | 6,404 | |
| | |
| Small-Cap Momentum Fund | |
|
| SCHEDULE OF INVESTMENTS (continued) | |
| Showing percentage of net assets as of December 31, 2015 (Unaudited) | | |
| | | | | | | | | | |
| Industry Company | | Shares | | | Value | | | |
| |
Common Stocks (continued) | | | |
Pharmaceuticals (continued) | | | |
Clovis Oncology, Inc.* | | | 400 | | | $ | 14,000 | | | |
Heron Therapeutics, Inc.*+ | | | 350 | | | | 9,345 | | | |
Heska Corp.* | | | 50 | | | | 1,934 | | | |
Intra-Cellular Therapies, Inc.*+ | | | 450 | | | | 24,205 | | | |
Lipocine, Inc.* | | | 200 | | | | 2,586 | | | |
Mirati Therapeutics, Inc.* | | | 200 | | | | 6,320 | | | |
PRA Health Sciences, Inc.* | | | 600 | | | | 27,162 | | | |
Revance Therapeutics, Inc.* | | | 300 | | | | 10,248 | | | |
Supernus Pharmaceuticals, Inc.* | | | 550 | | | | 7,392 | | | |
TherapeuticsMD, Inc.* | | | 1,800 | | | | 18,666 | | | |
| | | | | | | | | | |
| | | | | | | 128,262 | | | |
| |
Professional Services - 2.32% | | | |
Barrett Business Services, Inc.+ | | | 50 | | | | 2,177 | | | |
CBIZ, Inc.* | | | 550 | | | | 5,423 | | | |
Exponent, Inc. | | | 250 | | | | 12,488 | | | |
Insperity, Inc.+ | | | 250 | | | | 12,037 | | | |
Kforce, Inc. | | | 300 | | | | 7,584 | | | |
Korn/Ferry International | | | 500 | | | | 16,590 | | | |
Navigant Consulting, Inc.* | | | 500 | | | | 8,030 | | | |
On Assignment, Inc.* | | | 550 | | | | 24,722 | | | |
Resources Connection, Inc. | | | 400 | | | | 6,536 | | | |
| | | | | | | | | | |
| | | | | | | 95,587 | | | |
| |
Real Estate Investment Trusts (REITs) - 1.61% | | | |
CoreSite Realty Corp. | | | 260 | | | | 14,747 | | | |
CyrusOne, Inc. | | | 650 | | | | 24,343 | | | |
Hannon Armstrong Sustainable Infrastructure Capital, Inc. | | | 350 | | | | 6,622 | | | |
Preferred Apartment Communities, Inc., Class A | | | 200 | | | | 2,616 | | | |
QTS Realty Trust, Inc., Class A | | | 400 | | | | 18,044 | | | |
| | | | | | | | | | |
| | | | | | | 66,372 | | | |
| |
Real Estate Management & Development - 0.56% | | | |
Colliers International Group, Inc. | | | 350 | | | | 15,593 | | | |
Nam Tai Property, Inc. | | | 350 | | | | 2,026 | | | |
RE/MAX Holdings, Inc., Class A | | | 150 | | | | 5,595 | | | |
| | | | | | | | | | |
| | | | | | | 23,214 | | | |
| |
Semiconductors & Semiconductor Equipment - 2.52% | | | |
Advanced Energy Industries, Inc.* | | | 400 | | | | 11,292 | | | |
CEVA, Inc.* | | | 200 | | | | 4,672 | | | |
| | | | | | | | | | |
| | | | | | | | |
| Industry Company | | Shares | | | Value | |
Semiconductors & Semiconductor Equipment (continued) | |
Cirrus Logic, Inc.* | | | 650 | | | $ | 19,195 | |
Inphi Corp.* | | | 400 | | | | 10,808 | |
MaxLinear, Inc., Class A* | | | 550 | | | | 8,101 | |
Monolithic Power Systems, Inc. | | | 400 | | | | 25,484 | |
Rudolph Technologies, Inc.* | | | 350 | | | | 4,977 | |
Silicon Laboratories, Inc.* | | | 400 | | | | 19,416 | |
| | | | | | | | |
| | | | | | | 103,945 | |
|
Software - 7.22% | |
ACI Worldwide, Inc.* | | | 1,200 | | | | 25,680 | |
American Software, Inc., Class A | | | 250 | | | | 2,545 | |
AVG Technologies NV* | | | 500 | | | | 10,025 | |
Blackbaud, Inc. | | | 500 | | | | 32,930 | |
BroadSoft, Inc.* | | | 300 | | | | 10,608 | |
Ebix, Inc.+ | | | 350 | | | | 11,477 | |
Ellie Mae, Inc.* | | | 300 | | | | 18,069 | |
ePlus, Inc.* | | | 100 | | | | 9,326 | |
Fair Isaac Corp. | | | 325 | | | | 30,609 | |
Fleetmatics Group PLC* | | | 400 | | | | 20,316 | |
Globant SA* | | | 350 | | | | 13,128 | |
HubSpot, Inc.* | | | 350 | | | | 19,708 | |
Mentor Graphics Corp. | | | 1,200 | | | | 22,104 | |
Park City Group, Inc.* | | | 200 | | | | 2,382 | |
Pegasystems, Inc. | | | 800 | | | | 22,000 | |
Proofpoint, Inc.* | | | 400 | | | | 26,004 | |
Q2 Holdings, Inc.* | | | 400 | | | | 10,548 | |
QAD, Inc., Class A | | | 200 | | | | 4,104 | |
Sapiens International Corp. NV | | | 550 | | | | 5,610 | |
| | | | | | | | |
| | | | | | | 297,173 | |
|
Specialty Retail - 1.82% | |
Destination XL Group, Inc.* | | | 500 | | | | 2,760 | |
Express, Inc.* | | | 850 | | | | 14,688 | |
Lithia Motors, Inc., Class A | | | 250 | | | | 26,667 | |
Monro Muffler Brake, Inc. | | | 300 | | | | 19,866 | |
Sportsman’s Warehouse Holdings, Inc.* | | | 500 | | | | 6,450 | |
Winmark Corp. | | | 50 | | | | 4,650 | |
| | | | | | | | |
| | | | | | | 75,081 | |
|
Textiles, Apparel & Luxury Goods - 0.59% | |
Culp, Inc. | | | 150 | | | | 3,821 | |
G-III Apparel Group, Ltd.* | | | 460 | | | | 20,360 | |
| | | | | | | | |
| | | | | | | 24,181 | |
|
Thrifts & Mortgage Finance - 4.12% | |
Astoria Financial Corp.+ | | | 700 | | | | 11,095 | |
Banc of California, Inc. | | | 400 | | | | 5,848 | |
| | |
| 45 | | Semi-Annual Report | December 31, 2015 (Unaudited) |
| | |
| Small-Cap Momentum Fund | | |
| SCHEDULE OF INVESTMENTS (continued) | | |
| | |
| | | | | | | | | | |
| Industry Company | | Shares | | | Value | | | |
| | |
Common Stocks (continued) | | | | | | | |
Thrifts & Mortgage Finance (continued) | | | |
Bank Mutual Corp. | | | 450 | | | $ | 3,510 | | | |
Brookline Bancorp, Inc. | | | 700 | | | | 8,050 | | | |
Cape Bancorp, Inc. | | | 150 | | | | 1,865 | | | |
Charter Financial Corp. | | | 200 | | | | 2,642 | | | |
Clifton Bancorp, Inc.+ | | | 250 | | | | 3,585 | | | |
Dime Community | | | | | | | | | | |
Bancshares, Inc. | | | 400 | | | | 6,996 | | | |
First Defiance Financial Corp. | | | 100 | | | | 3,778 | | | |
Flagstar Bancorp, Inc.* | | | 550 | | | | 12,711 | | | |
Hingham Institution for Savings | | | 20 | | | | 2,396 | | | |
Home Bancorp, Inc. | | | 50 | | | | 1,299 | | | |
HomeStreet, Inc.* | | | 250 | | | | 5,427 | | | |
Impac Mortgage Holdings, Inc.*+ | | | 100 | | | | 1,800 | | | |
LendingTree, Inc.* | | | 130 | | | | 11,606 | | | |
Meridian Bancorp, Inc. | | | 606 | | | | 8,545 | | | |
Meta Financial Group, Inc. | | | 100 | | | | 4,593 | | | |
OceanFirst Financial Corp. | | | 200 | | | | 4,006 | | | |
Oritani Financial Corp. | | | 500 | | | | 8,250 | | | |
Provident Financial Services, Inc. | | | 650 | | | | 13,097 | | | |
Pulaski Financial Corp. | | | 150 | | | | 2,394 | | | |
Southern Missouri Bancorp, Inc. | | | 100 | | | | 2,390 | | | |
Territorial Bancorp, Inc. | | | 100 | | | | 2,774 | | | |
Walker & Dunlop, Inc.* | | | 300 | | | | 8,643 | | | |
Washington Federal, Inc. | | | 950 | | | | 22,638 | | | |
WSFS Financial Corp. | | | 300 | | | | 9,708 | | | |
| | | | | | | | | | |
| | | |
| | | | | | | 169,646 | | | |
| |
Trading Companies & Distributors - 0.60% | | | |
Beacon Roofing Supply, Inc.* | | | 600 | | | | 24,708 | | | |
| | |
Water Utilities - 0.19% | | | | | | | |
Middlesex Water Co. | | | 150 | | | | 3,981 | | | |
York Water Co., (The) | | | 150 | | | | 3,741 | | | |
| | | | | | | | | | |
| | | |
| | | | | | | 7,722 | | | |
| |
Wireless Telecommunication Services - 0.67% | | | |
RingCentral, Inc., Class A* | | | 550 | | | | 12,969 | | | |
Shenandoah Telecommunications Co. | | | 250 | | | | 10,762 | | | |
Spok Holdings, Inc. | | | 200 | | | | 3,664 | | | |
| | | | | | | | | | |
| | | |
| | | | | | | 27,395 | | | |
| | | | | | | | | | |
| | |
TOTAL COMMON STOCKS - 100.37% | | | | 4,134,258 | | | |
| | | | | | | | | | |
(Cost $3,966,305) | | | | | | | | | | |
| | | | | | | | | | |
| | | | | | | | | | | | |
| | | Rate^ | | | Shares | | | Value | |
|
INVESTMENTS PURCHASED WITH CASH PROCEEDS FROM SECURITIES
LENDING - 12.10% | |
Dreyfus Cash Management Fund** | | | 0.18 | % | | | 498,353 | | | | $498,353 | |
| | | | | | | | | | | | |
| |
TOTAL INVESTMENTS PURCHASED WITH CASH PROCEEDS FROM SECURITIES LENDING - 12.10% | | | | 498,353 | |
| | | | | | | | | | | | |
(Cost $ 498,353) | | | | | | | | | | | | |
| |
TOTAL INVESTMENTS - 112.47% | | | | $4,632,611 | |
(Cost $ 4,464,658) | | | | | | | | | | | | |
Liabilities in Excess of Other Assets - (12.47%) | | | | (513,807 | ) |
| | | | | | | | | | | | |
NET ASSETS - 100.00% | | | | | | | | | | | $4,118,804 | |
| | | | | | | | | | | | |
| * | Non-income producing security. |
| ** | This security represents the investment of the collateral received in connection with securities out on loan as of December 31, 2015. |
| ^ | Rate disclosed as of December 31, 2015. |
| + | This security or a portion of the security is out on loan as of December 31, 2015. Total loaned securities had a value of $477,945 as of December 31, 2015. |
PLC - Public Limited Company
Summary of inputs used to value the Fund’s investments as of 12/31/2015 (See Note 2 in Notes to Financial Statements):
| | | | | | | | | | | | | | | | |
| | | Valuation Inputs | |
| | | Investment in Securities (Value) | |
| | | Level 1 Quoted Prices | | | Level 2 Significant Observable Inputs | | | Level 3 Significant Unobservable Inputs | | | Total | |
| | | | |
Common Stocks | | $ | 4,134,258 | | | $ | — | | | | $ — | | | $ | 4,134,258 | |
Investments Purchased with Cash Proceeds from Securities Lending | | | — | | | | 498,353 | | | | — | | | | 498,353 | |
| | | | | | | | | | | | | | | | |
TOTAL | | $ | 4,134,258 | | | $ | 498,353 | | | | $ — | | | $ | 4,632,611 | |
| | | | | | | | | | | | | | | | |
|
| See Notes to Financial Statements. | |
| | |
| Small-Cap Growth Fund | |
|
| MANAGER’S COMMENTARY (Unaudited) | |
| | |
December 31, 2015
Dear Fellow Small-Cap Growth Fund Shareholder,
For the quarter ended December 31, 2015, our Fund returned 2.51%, underperforming our primary market benchmark, the Russell 2000 Growth Index (4.32%), and our peer benchmark, the Lipper Small-Cap Growth Funds Index (3.51%). It was a good quarter on an absolute basis, but a weak one on a relative basis.
For the six-month semi-annual period ended December 31, 2015, our Fund returned -5.43%, outperforming the Russell 2000 Growth Index (-9.31%) and the Lipper Small-Cap Growth Funds Index (-8.08%).
For the calendar year, our Fund returned 4.93%, significantly beating the Russell 2000 Growth Index (-1.38%) and the Lipper Small-Cap Growth Funds Index (-1.15%). It was a good year for the Fund, and we are now leading our benchmarks in the longer five-year period, although we still lag in the 10-year and inception-to-date periods.
The table below presents our December quarter, six months, one-year, five-year, 10-year, and inception-to-date financial results.
Standardized Returns as of December 31, 2015
| | | | | | | | | | | | | | | | | | | | | | |
| | | | | | | | | | | | Annualized | | | |
| | | Quarter | | | 6 Months | | | 1 Year | | | 5 Years | | | 10 Years | | | Since Inception (10/31/03) |
| | | | | | |
Small-Cap Growth Fund | | | 2.51% | | | | -5.43% | | | | 4.93 | % | | | 12.79 | % | | | 4.09% | | | 5.96% |
Russell 2000 Growth Index | | | 4.32% | | | | -9.31% | | | | -1.38 | % | | | 10.67 | % | | | 7.95% | | | 8.35% |
Lipper Small-Cap Growth Funds Index | | | 3.51% | | | | -8.08% | | | | -1.15 | % | | | 9.55 | % | | | 6.70% | | | 7.07% |
Performance figures quoted in the table above represent past performance and are no guarantee of future results. Total return figures in the table above include the reinvestment of dividends and capital gains. The table above does not reflect the deduction of taxes that a shareholder would pay on Fund distributions or on the redemption of Fund shares.
The Russell 2000 Growth Index is an unmanaged index that consists of stocks in the Russell 2000 Index with higher price-to-book ratios and higher forecasted growth values with dividends reinvested. The Lipper Small-Cap Growth Funds Index is an index of small-company, growth-oriented funds compiled by Lipper, Inc. It is not possible to invest directly in an index. Periods longer than one year are annualized.
According to data from Lipper, Inc. as of December 31, 2015, Small-Cap Growth Fund ranked 36th of 558 small-cap growth funds for the 12 months ended December 31, 2015, 28th of 437 over the last five years, 298th of 311 over the last 10 years, and 225th of 250 such funds since inception in October 2003. Lipper, Inc. is an independent mutual fund rating service that ranks funds in various fund categories by making comparative calculations using total returns.
| | |
| 47 | | Semi-Annual Report | December 31, 2015 (Unaudited) |
| | |
| Small-Cap Growth Fund | | |
| MANAGER’S COMMENTARY (Unaudited) (continued) | |
| | |
Small-Cap Growth Fund vs. Russell 2000 Growth Index & Lipper Small-Cap Growth Funds Index
from Inception 10/31/03 to 12/31/15
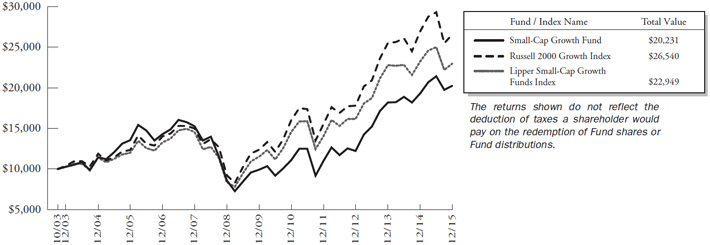
Detailed Explanation of Quarterly Performance
The Fund’s relative returns lagged due to underperformance of our company financial health and value metrics models. Exposure to deeper diversifying value stocks, in particular, hurt relative returns during a quarter in which growth outperformed value. Strong gains from our diversifying momentum model helped offset some of the underperformance.
Holdings within the Consumer Discretionary, Consumer Staples and Information Technology sectors negatively affected relative results. A slight underweighting in Health Care stocks also detracted from relative performance.
Detailed Explanation of Calendar Year Performance
All model categories helped the Fund outperform the Russell 2000 Growth Index for the year. It was a strong year for the momentum factor, and as a result our diversifying momentum model posted the biggest gains for the period. The company financial health model category also averaged strong returns and added to relative results.
Holdings in the Health Care, Industrials and Materials sectors boosted relative results for the year.
Top Ten Holdings as of December 31, 2015
| | | | | | | | | |
| Rank | | Description | | Industry | | % of Net
Assets |
| 1 | | Rentech, Inc. | | Chemicals | | | | 1.6 | % |
| 2 | | Avalanche Biotechnologies, Inc. | | Health Care | | | | 1.6 | % |
| 3 | | Diplomat Pharmacy, Inc. | | Health Care Providers & Services | | | | 1.6 | % |
| 4 | | Sientra, Inc. | | Health Care | | | | 1.6 | % |
| 5 | | MarketAxess Holdings, Inc. | | Diversified Financial Services | | | | 1.6 | % |
| 6 | | Park-Ohio Holdings Corp. | | Air Freight & Logistics | | | | 1.6 | % |
| 7 | | CSG Systems International, Inc. | | IT Services | | | | 1.6 | % |
| 8 | | Molina Healthcare, Inc. | | Health Care Providers & Services | | | | 1.6 | % |
| 9 | | Ciena Corp. | | Communications Equipment | | | | 1.5 | % |
| 10 | | Wabash National Corp. | | Machinery | | | | 1.5 | % |
| | Total | | | | | | 15.8 | % |
| | |
| Small-Cap Growth Fund | | |
| MANAGER’S COMMENTARY (Unaudited) (continued) | |
| | |
Industry Sector Representation as of December 31, 2015
| | | | | | | | | | | | | | | |
| | | % of Net Assets | | % of Russell 2000
Growth Index | | Difference |
Consumer Discretionary | | | | 20.5% | | | | | 16.7% | | | | | 3.8% | |
Consumer Staples | | | | 2.1% | | | | | 3.5% | | | | | -1.4% | |
Energy | | | | 1.2% | | | | | 1.0% | | | | | 0.2% | |
Financials | | | | 10.0% | | | | | 7.8% | | | | | 2.2% | |
Health Care | | | | 24.8% | | | | | 28.2% | | | | | -3.4% | |
Industrials | | | | 13.8% | | | | | 12.7% | | | | | 1.1% | |
Information Technology | | | | 21.2% | | | | | 25.1% | | | | | -3.9% | |
Materials | | | | 4.8% | | | | | 4.0% | | | | | 0.8% | |
Telecommunication Services | | | | 0.0% | | | | | 0.8% | | | | | -0.8% | |
Utilities | | | | 0.0% | | | | | 0.1% | | | | | -0.1% | |
Cash & Other Assets | | | | 1.7% | | | | | 0.0% | | | | | 1.7% | |
Total | | | | 100.0% | | | | | 100.0% | | | | | | |
Disclaimer
The views expressed here are exclusively those of Fund management. These views, including those related to market sectors or individual stocks, are not meant as investment advice and should not be considered predictive in nature. Any favorable (or unfavorable) description of a holding applies only as of the quarter end, December 31, 2015, unless otherwise stated. Security positions can and do change thereafter. Discussions of historical performance do not guarantee and may not be indicative of future performance.
Market volatility can significantly impact short-term performance. The Fund is not an appropriate investment for short-term investors. Investments in small companies generally carry greater risk than is customarily associated with larger companies. This additional risk is attributable to a number of factors, including the relatively limited financial resources that are typically available to small companies and the fact that small companies often have comparatively limited product lines. In addition, the stock of small companies tends to be more volatile than the stock of large companies, particularly in the short term and particularly in the early stages of an economic or market downturn. Shareholders of the Fund, therefore, are taking on more risk than they would if they invested in the stock market as a whole.
Conclusion
Thank you for your continued investment in Small-Cap Growth Fund. We encourage your feedback; your reactions and concerns are important to us.
Sincerely,
The Investment Management Team
| | |
| 49 | | Semi-Annual Report | December 31, 2015 (Unaudited) |
| | |
| Small-Cap Growth Fund | | |
| SCHEDULE OF INVESTMENTS | | |
Showing percentage of net assets as of December 31, 2015 (Unaudited) | | |
| | | | | | | | | | |
| Industry Company | | Shares | | | Value | | | |
| |
COMMON STOCKS - 98.21% | | | |
Air Freight & Logistics - 1.56% | | | |
Park-Ohio Holdings Corp. | | | 15,400 | | | $ | 566,412 | | | |
| |
Airlines - 1.39% | | | |
Hawaiian Holdings, Inc.* | | | 14,300 | | | | 505,219 | | | |
| |
Auto Components - 3.81% | | | |
Drew Industries, Inc. | | | 8,900 | | | | 541,921 | | | |
Tenneco, Inc.* | | | 9,200 | | | | 422,372 | | | |
Tower International, Inc. | | | 14,600 | | | | 417,122 | | | |
| | | | | | | | | | |
| | | |
| | | | | | | 1,381,415 | | | |
| |
Biotechnology - 1.84% | | | |
Dynavax Technologies Corp.* | | | 3,500 | | | | 84,560 | | | |
Insmed, Inc.* | | | 11,500 | | | | 208,725 | | | |
Insys Therapeutics, Inc.*+ | | | 13,000 | | | | 372,190 | | | |
| | | | | | | | | | |
| | | |
| | | | | | | 665,475 | | | |
| |
Building Products - 1.41% | | | |
American Woodmark Corp.* | | | 6,400 | | | | 511,872 | | | |
| |
Chemicals - 4.48% | | | |
KMG Chemicals, Inc. | | | 22,200 | | | | 511,044 | | | |
Koppers Holdings, Inc.* | | | 28,400 | | | | 518,300 | | | |
Rentech, Inc.* | | | 168,500 | | | | 593,120 | | | |
| | | | | | | | | | |
| | | |
| | | | | | | 1,622,464 | | | |
| |
Commercial Services & Supplies - 0.89% | | | |
Casella Waste Systems, Inc., Class A* | | | 53,700 | | | | 321,126 | | | |
| |
Communications Equipment - 4.11% | | | |
Ciena Corp.* | | | 27,000 | | | | 558,630 | | | |
Extreme Networks, Inc.* | | | 47,300 | | | | 192,984 | | | |
Harmonic, Inc.* | | | 50,400 | | | | 205,128 | | | |
Plantronics, Inc. | | | 11,200 | | | | 531,104 | | | |
| | | | | | | | | | |
| | | |
| | | | | | | 1,487,846 | | | |
| |
Construction & Engineering - 0.41% | | | |
Comfort Systems USA, Inc. | | | 5,200 | | | | 147,784 | | | |
| |
Consumer Finance - 0.87% | | | |
Regional Management Corp.* | | | 20,300 | | | | 314,041 | | | |
| |
Distributors - 0.36% | | | |
VOXX International Corp.* | | | 24,600 | | | | 129,396 | | | |
| |
Diversified Consumer Services - 0.57% | | | |
Weight Watchers International, Inc.* | | | 9,000 | | | | 205,200 | | | |
| | | | | | | | | | |
| | | | | | | | |
| Industry Company | | Shares | | | Value | |
|
| |
Diversified Financial Services - 2.36% | |
Ashford, Inc.* | | | 5,400 | | | $ | 287,550 | |
MarketAxess Holdings, Inc. | | | 5,100 | | | | 569,109 | |
| | | | | | | | |
| | |
| | | | | | | 856,659 | |
|
Electrical Equipment - 0.85% | |
General Cable Corp. | | | 23,000 | | | | 308,890 | |
|
Food & Staples Retailing - 0.85% | |
Fairway Group Holdings Corp.*+ | | | 92,000 | | | | 60,729 | |
Ingles Markets, Inc., Class A | | | 5,600 | | | | 246,848 | |
| | | | | | | | |
| | |
| | | | | | | 307,577 | |
|
Food Products - 1.14% | |
Cal-Maine Foods, Inc.+ | | | 8,900 | | | | 412,426 | |
|
Health Care Equipment & Supplies - 6.57% | |
Abaxis, Inc. | | | 6,100 | | | | 339,648 | |
ABIOMED, Inc.* | | | 4,900 | | | | 442,372 | |
LDR Holding Corp.* | | | 2,300 | | | | 57,753 | |
Masimo Corp.* | | | 12,500 | | | | 518,875 | |
Sientra, Inc.* | | | 97,200 | | | | 575,424 | |
Vascular Solutions, Inc.* | | | 3,300 | | | | 113,487 | |
Zeltiq Aesthetics, Inc.*+ | | | 11,600 | | | | 330,948 | |
| | | | | | | | |
| | |
| | | | | | | 2,378,507 | |
|
Health Care Providers & Services - 8.22% | |
AMN Healthcare Services, Inc.* | | | 17,500 | | | | 543,375 | |
BioTelemetry, Inc.* | | | 33,000 | | | | 385,440 | |
Chemed Corp. | | | 3,700 | | | | 554,260 | |
LHC Group, Inc.* | | | 9,500 | | | | 430,255 | |
Molina Healthcare, Inc.*+ | | | 9,300 | | | | 559,209 | |
RadNet, Inc.* | | | 81,400 | | | | 503,052 | |
| | | | | | | | |
| | |
| | | | | | | 2,975,591 | |
|
Hotels, Restaurants & Leisure - 6.95% | |
BJ’s Restaurants, Inc.* | | | 5,000 | | | | 217,350 | |
Boyd Gaming Corp.* | | | 26,800 | | | | 532,516 | |
Isle of Capri Casinos, Inc.* | | | 15,700 | | | | 218,701 | |
Marriott Vacations Worldwide Corp. | | | 8,300 | | | | 472,685 | |
Papa John’s International, Inc. | | | 9,500 | | | | 530,765 | |
Texas Roadhouse, Inc. | | | 15,200 | | | | 543,704 | |
| | | | | | | | |
| | |
| | | | | | | 2,515,721 | |
|
Insurance - 1.44% | |
Maiden Holdings, Ltd. | | | 10,800 | | | | 161,028 | |
| | |
| Small-Cap Growth Fund | |
|
| SCHEDULE OF INVESTMENTS (continued) | |
| Showing percentage of net assets as of December 31, 2015 (Unaudited) | | |
| | | | | | | | | | |
| Industry Company | | Shares | | | Value | | | |
| |
Common Stocks (continued) | | | |
Insurance (continued) | | | |
Universal Insurance Holdings, Inc.+ | | | 15,600 | | | $ | 361,608 | | | |
| | | | | | | | | | |
| | | | | | | 522,636 | | | |
| |
Internet & Catalog Retail - 1.29% | | | |
1-800-Flowers.com, Inc., Class A* | | | 64,000 | | | | 465,920 | | | |
| |
Internet Software & Services - 5.18% | | | |
Cimpress NV* | | | 6,300 | | | | 511,182 | | | |
EarthLink Holdings Corp. | | | 61,300 | | | | 455,459 | | | |
EVERTEC, Inc. | | | 5,600 | | | | 93,744 | | | |
MaxPoint Interactive, Inc.* | | | 121,700 | | | | 208,107 | | | |
RetailMeNot, Inc.* | | | 25,700 | | | | 254,944 | | | |
XO Group, Inc.* | | | 22,000 | | | | 353,320 | | | |
| | | | | | | | | | |
| | | | | | | 1,876,756 | | | |
| |
IT Services - 5.81% | | | |
CSG Systems International, Inc. | | | 15,600 | | | | 561,288 | | | |
Forrester Research, Inc. | | | 3,400 | | | | 96,832 | | | |
Luxoft Holding, Inc.* | | | 7,100 | | | | 547,623 | | | |
PFSweb, Inc.* | | | 41,300 | | | | 531,531 | | | |
Science Applications International Corp. | | | 8,000 | | | | 366,240 | | | |
| | | | | | | | | | |
| | | | | | | 2,103,514 | | | |
| |
Leisure Equipment & Products - 0.91% | | | |
Nautilus, Inc.* | | | 19,700 | | | | 329,384 | | | |
| |
Life Sciences Tools & Services - 1.62% | | | |
Cambrex Corp.* | | | 10,300 | | | | 485,027 | | | |
PAREXEL International Corp.* | | | 1,500 | | | | 102,180 | | | |
| | | | | | | | | | |
| | | | | | | 587,207 | | | |
| |
Machinery - 4.36% | | | |
Blount International, Inc.* | | | 20,100 | | | | 197,181 | | | |
Greenbrier Companies., Inc. (The) | | | 8,600 | | | | 280,532 | | | |
John Bean Technologies Corp. | | | 10,900 | | | | 543,147 | | | |
Wabash National Corp.* | | | 47,200 | | | | 558,376 | | | |
| | | | | | | | | | |
| | | | | | | 1,579,236 | | | |
| |
Metals & Mining - 0.30% | | | |
Kaiser Aluminum Corp. | | | 1,300 | | | | 108,758 | | | |
| |
Oil, Gas & Consumable Fuels - 1.19% | | | |
Western Refining, Inc.+ | | | 12,100 | | | | 431,002 | | | |
| | | | | | | | | | |
| | | | | | | | | | |
| | | | | | | | | | |
| | | | | | | | | | |
| | | | | | | | |
| Industry Company | | Shares | | | Value | |
Personal Products - 0.25% | | | | | | | | |
USANA Health Sciences, Inc.* | | | 700 | | | $ | 89,425 | |
|
Pharmaceuticals - 6.51% | |
Avalanche Biotechnologies, Inc.* | | | 62,100 | | | | 591,192 | |
Diplomat Pharmacy, Inc.*+ | | | 17,000 | | | | 581,740 | |
Lannett Co., Inc.*+ | | | 7,100 | | | | 284,852 | |
SciClone Pharmaceuticals, Inc.* | | | 60,300 | | | | 554,760 | |
Sucampo Pharmaceuticals, Inc., Class A* | | | 20,000 | | | | 345,800 | |
| | | | | | | | |
| | | | | | | 2,358,344 | |
|
Professional Services - 1.70% | |
GP Strategies Corp.* | | | 3,700 | | | | 92,907 | |
TrueBlue, Inc.* | | | 20,300 | | | | 522,928 | |
| | | | | | | | |
| | | | | | | 615,835 | |
|
Real Estate Investment Trusts (REITs) - 2.95% | |
Inland Real Estate Corp. | | | 49,700 | | | | 527,814 | |
Ryman Hospitality Properties, Inc. | | | 10,500 | | | | 542,220 | |
| | | | | | | | |
| | | | | | | 1,070,034 | |
|
Real Estate Management & Development - 0.25% | |
Altisource Portfolio Solutions SA* | | | 3,300 | | | | 91,773 | |
|
Road & Rail - 1.18% | |
Knight Transportation, Inc. | | | 13,700 | | | | 331,951 | |
P.A.M. Transportation Services, Inc.* | | | 3,400 | | | | 93,806 | |
| | | | | | | | |
| | | | | | | 425,757 | |
|
Semiconductors & Semiconductor
Equipment - 1.82% | |
Cavium, Inc.* | | | 2,800 | | | | 183,988 | |
Synaptics, Inc.* | | | 2,100 | | | | 168,714 | |
Xcerra Corp.* | | | 50,400 | | | | 304,920 | |
| | | | | | | | |
| | | | | | | 657,622 | |
|
Software - 4.26% | |
ACI Worldwide, Inc.* | | | 4,300 | | | | 92,020 | |
Fair Isaac Corp. | | | 5,500 | | | | 517,990 | |
Manhattan Associates, Inc.* | | | 7,600 | | | | 502,892 | |
Marin Software, Inc.* | | | 45,600 | | | | 163,248 | |
QAD, Inc., Class A | | | 13,000 | | | | 266,760 | |
| | | | | | | | |
| | | | | | | 1,542,910 | |
| | |
| 51 | | Semi-Annual Report | December 31, 2015 (Unaudited) |
| | |
| Small-Cap Growth Fund | | |
| SCHEDULE OF INVESTMENTS (continued) | |
| Showing percentage of net assets as of December 31, 2015 (Unaudited) | | |
| | | | | | | | | | |
| Industry Company | | | | Shares | | Value | | | |
| | |
Common Stocks (continued) | | | | | | |
Specialty Retail - 3.44% | | | | | | | | |
Men’s Wearhouse, Inc. (The) | | 28,400 | | $ | 416,912 | | | |
Outerwall, Inc.+ | | 3,900 | | | 142,506 | | | |
Pier 1 Imports, Inc.+ | | 4,200 | | | 21,378 | | | |
Select Comfort Corp.* | | 24,600 | | | 526,686 | | | |
Sportsman’s Warehouse Holdings, Inc.* | | 10,600 | | | 136,740 | | | |
| | | | | | | | | | |
| | | |
| | | | | 1,244,222 | | | |
| |
Textiles, Apparel & Luxury Goods - 3.00% | | | |
Culp, Inc. | | 6,000 | | | 152,820 | | | |
G-III Apparel Group, Ltd.* | | 11,800 | | | 522,268 | | | |
Wolverine World Wide, Inc. | | 24,600 | | | 411,066 | | | |
| | | | | | | | | | |
| | | |
| | | | | 1,086,154 | | | |
| | |
Thrifts & Mortgage Finance - 2.11% | | | | | | |
BofI Holding, Inc.*+ | | 16,800 | | | 353,640 | | | |
Meridian Bancorp, Inc. | | 29,200 | | | 411,720 | | | |
| | | | | | | | | | |
| | | |
| | | | | 765,360 | | | |
| | | | | | | | | | |
| | |
TOTAL COMMON STOCKS - 98.21% | | | 35,565,470 | | | |
| | | | | | | | | | |
(Cost $34,756,827) | | | | | | | | |
| Industry Company | | | | Shares | | Value | | | |
| | | |
| |
EXCHANGE TRADED FUND - 1.27% | | | |
Exchange Traded Fund - 1.27% | | | | | | |
iShares Russell 2000 Growth ETF+ | | 3,300 | | | 460,053 | | | |
| | | | | | | | | | |
| | |
TOTAL EXCHANGE TRADED FUND - 1.27% | | | 460,053 | | | |
| | | | | | | | | | |
(Cost $479,560) | | | | | | | | | | |
| | | Rate^ | | Shares | | Value | | | |
| | |
MONEY MARKET FUND - 1.06% | | | | | | |
Dreyfus Cash Management Fund | | 0.18% | | 385,791 | | | 385,791 | | | |
| | | | | | | | | | |
| | |
TOTAL MONEY MARKET FUND - 1.06% | | | 385,791 | | | |
| | | | | | | | | | |
(Cost $385,791) | | | | | | | | |
| | | | | | | | | | |
| | | | | | | | | | | | |
| | | Rate^ | | | Shares | | | Value | |
|
INVESTMENTS PURCHASED WITH CASH PROCEEDS FROM SECURITIES
LENDING - 12.81% | |
Dreyfus Cash Management Fund** | | | 0.18 | % | | | 4,637,788 | | | $ | 4,637,788 | |
| | | | | | | | | | | | |
TOTAL INVESTMENTS PURCHASED WITH CASH PROCEEDS FROM SECURITIES LENDING - 12.81% | | | | 4,637,788 | |
| | | | | | | | | | | | |
(Cost $4,637,788) | | | | | | | | | | | | |
| |
TOTAL INVESTMENTS - 113.35% | | | $ | 41,049,102 | |
(Cost $40,259,966) | | | | | | | | | | | | |
Liabilities in Excess of Other Assets - (13.35%) | | | | (4,833,744 | ) |
| | | | | | | | | | | | |
NET ASSETS - 100.00% | | | $ | 36,215,358 | |
| | | | | | | | | | | | |
| * | Non-income producing security. |
| ** | This security represents the investment of the collateral received in connection with securities out on loan as of December 31, 2015. Rate disclosed as of December 31, 2015. |
| + | This security or a portion of the security is out on loan as of December 31, 2015. Total loaned securities had a value of $4,286,368 as of December 31, 2015. |
Summary of inputs used to value the Fund’s investments as of 12/31/2015 (See Note 2 in Notes to Financial Statements):
| | | | | | | | | | | | | | | | |
| | | Valuation Inputs | |
| | | Investment in Securities (Value) | |
| | | Level 1 Quoted Prices | | | Level 2 Significant Observable Inputs | | | Level 3 Significant Unobservable Inputs | | | Total | |
| | | | |
Common Stocks | | $ | 35,565,470 | | | $ | — | | | | $ — | | | $ | 35,565,470 | |
Exchange Traded Fund | | | 460,053 | | | | — | | | | — | | | | 460,053 | |
Money Market Fund | | | — | | | | 385,791 | | | | — | | | | 385,791 | |
Investments Purchased with Cash Proceeds from Securities Lending | | | — | | | | 4,637,788 | | | | — | | | | 4,637,788 | |
| | | | | | | | | | | | | | | | |
TOTAL | | $ | 36,025,523 | | | $ | 5,023,579 | | | | $ — | | | $ | 41,049,102 | |
| | | | | | | | | | | | | | | | |
|
| See Notes to Financial Statements. | |
| | |
| Small-Cap Value Fund | | |
| MANAGER’S COMMENTARY (Unaudited) | |
| | |
December 31, 2015
Dear Fellow Small-Cap Value Fund Shareholder,
For the quarter ended December 31, 2015, our Fund returned -0.75%, underperforming our primary market benchmark, the Russell 2000 Value Index (2.88%), and our peer benchmark, the Lipper Small-Cap Value Funds Index (2.41%). It was a poor quarter.
For the six-month semi-annual period ended December 31, 2015, our Fund returned -9.43%, trailing the Russell 2000 Value Index (-8.17%) and the Lipper Small-Cap Value Funds Index (-8.45%).
For the calendar year, our Fund returned -9.43%, trailing the Russell 2000 Value Index (-7.47%) and the Lipper Small-Cap Value Funds Index (-7.16%). We are leading our primary market benchmark in the five-year period, but lagging in the 10-year period. We still lag our primary and peer benchmarks in the inception-to-date period.
The table below presents our December quarter, six months, one-year, five-year, 10-year, and inception-to-date financial results.
Standardized Returns as of December 31, 2015
| | | | | | | | | | | | | | | | | | | | | | | | |
| | | | | | | | | | | | Annualized |
| | | Quarter | | | 6 Months | | | 1 Year | | | 5 Years | | | 10 Years | | | Since Inception
(10/31/03) | | |
| | | | | | | |
Small-Cap Value Fund | | | -0.75% | | | | -9.43% | | | | -9.43% | | | | 9.29% | | | | 4.24% | | | 6.58% | | |
Russell 2000 Value Index | | | 2.88% | | | | -8.17% | | | | -7.47% | | | | 7.67% | | | | 5.57% | | | 7.35% | | |
Lipper Small-Cap Value Funds Index | | | 2.41% | | | | -8.45% | | | | -7.16% | | | | 7.32% | | | | 5.98% | | | 7.85% | | |
Performance figures quoted in the table above represent past performance and are no guarantee of future results. Total return figures in the table above include the reinvestment of dividends and capital gains. The table above does not reflect the deduction of taxes that a shareholder would pay on Fund distributions or on the redemption of Fund shares.
The Russell 2000 Value Index is an unmanaged index that consists of stocks in the Russell 2000 Index with lower price-to-book ratios and lower forecasted growth values with dividends reinvested. The Lipper Small-Cap Value Funds Index is an index of small-company, value-oriented funds compiled by Lipper, Inc. It is not possible to invest directly in an index. Periods longer than one year are annualized.
According to data from Lipper, Inc. as of December 31, 2015, Small-Cap Value Fund ranked 240th of 309 small-cap value funds for the 12 months ended December 31, 2015, 50th of 227 over the last five years, 122nd of 143 over the last 10 years, and 87th of 106 such funds since inception in October 2003. Lipper, Inc. is an independent mutual fund rating service that ranks funds in various fund categories by making comparative calculations using total returns.
| | |
| 53 | | Semi-Annual Report | December 31, 2015 (Unaudited) |
| | |
| Small-Cap Value Fund | | |
| MANAGER’S COMMENTARY (Unaudited) (continued) | |
| | |
Small-Cap Value Fund vs. Russell 2000 Value Index & Lipper Small-Cap Value Funds Index
from Inception 10/31/03 to 12/31/15

Detailed Explanation of Quarterly Performance
During a period in which value stocks underperformed growth stocks, the Fund’s deeper value exposure detracted from relative performance. The Fund’s diversifying company financial health models also lagged during the period, contributing to our underperformance. Strong gains in the diversifying price momentum model provided some cushion for the Fund’s relative performance.
Holdings in the Consumer Discretionary, Industrials and Utilities sectors detracted most from relative returns. These three sectors held half of the Fund’s 10 worst-performing stocks.
Detailed Explanation of Calendar Year Performance
A poor fourth-quarter performance was enough to erase previous gains and cause the Fund to underperform for the year. The core value metrics models lagged the market and dragged on relative returns. Our diversifying price momentum model and company financial health models made positive contributions to relative performance, even as they had negative absolute returns for the year.
Holdings in the Health Care and Utilities sectors dragged on the Fund’s relative returns over the year. Our investments in the Energy sector outperformed the benchmark’s energy holdings, which helped boost relative results.
| | |
| Small-Cap Value Fund | | |
| MANAGER’S COMMENTARY (Unaudited) (continued) | |
| | |
Top Ten Holdings as of December 31, 2015
| | | | | | | | |
| Rank | | Description | | Industry | | % of Net
Assets | |
| 1 | | Sanmina Corp. | | Electronic Equipment, Instruments & Components | | | 2.0% | |
| 2 | | Amkor Technology, Inc. | | Semiconductors & Semiconductor Equipment | | | 1.7% | |
| 3 | | Maiden Holdings Ltd. | | Insurance | | | 1.6% | |
| 4 | | Talmer Bancorp, Inc. | | Commercial Banks | | | 1.6% | |
| 5 | | Matson, Inc. | | Marine | | | 1.6% | |
| 6 | | Selective Insurance Group, Inc. | | Insurance | | | 1.5% | |
| 7 | | Capitol Federal Financial, Inc. | | Thrifts & Mortgage Finance | | | 1.5% | |
| 8 | | Innospec, Inc. | | Chemicals | | | 1.4% | |
| 9 | | Isle of Capri Casinos, Inc. | | Hotels, Restaurants & Leisure | | | 1.4% | |
| 10 | | Neenah Paper, Inc. | | Paper & Forest Products | | | 1.4% | |
| | Total | | | | | 15.7% | |
Industry Sector Representation as of December 31, 2015
| | | | | | | | | | | | | | | |
| | | % of Net Assets | | % of
Russell 2000
Value Index | | Difference |
Consumer Discretionary | | | | 12.4% | | | | | 10.1% | | | | | 2.3% | |
Consumer Staples | | | | 4.1% | | | | | 3.3% | | | | | 0.8% | |
Energy | | | | 4.7% | | | | | 4.4% | | | | | 0.3% | |
Financials | | | | 38.1% | | | | | 43.8% | | | | | -5.7% | |
Health Care | | | | 6.9% | | | | | 4.6% | | | | | 2.3% | |
Industrials | | | | 14.9% | | | | | 11.6% | | | | | 3.3% | |
Information Technology | | | | 10.8% | | | | | 10.8% | | | | | 0.0% | |
Materials | | | | 4.6% | | | | | 3.1% | | | | | 1.5% | |
Telecommunication Services | | | | 1.2% | | | | | 0.9% | | | | | 0.3% | |
Utilities | | | | 2.7% | | | | | 7.4% | | | | | -4.7% | |
Cash & Other Assets | | | | -0.5% | | | | | 0.0% | | | | | -0.5% | |
Total | | | | 100.0% | | | | | 100.0% | | | | | | |
Disclaimer
The views expressed here are exclusively those of Fund management. These views, including those related to market sectors or individual stocks, are not meant as investment advice and should not be considered predictive in nature. Any favorable (or unfavorable) description of a holding applies only as of the quarter end, December 31, 2015, unless otherwise stated. Security positions can and do change thereafter. Discussions of historical performance do not guarantee and may not be indicative of future performance.
Market volatility can significantly impact short-term performance. The Fund is not an appropriate investment for short-term investors. Investments in small companies generally carry greater risk than is customarily associated with larger companies. This additional risk is attributable to a number of factors, including the relatively limited financial resources that are typically available to small companies and the fact that small companies often have comparatively limited product lines. In addition, the stock of small companies tends to be more volatile than the stock of large companies, particularly in the short term and particularly in the early stages of an economic or market downturn. Shareholders of the Fund, therefore, are taking on more risk than they would if they invested in the stock market as a whole.
| | |
| 55 | | Semi-Annual Report | December 31, 2015 (Unaudited) |
| | |
| Small-Cap Value Fund | | |
| MANAGER’S COMMENTARY (Unaudited) (continued) | |
| | |
Conclusion
Thank you for your continued investment in Small-Cap Value Fund. We encourage your feedback; your reactions and concerns are important to us.
Sincerely,
The Investment Management Team
| | |
| Small-Cap Value Fund | |
|
| SCHEDULE OF INVESTMENTS | |
| Showing percentage of net assets as of December 31, 2015 (Unaudited) | | |
| | | | | | | | | | |
| Industry Company | | Shares | | | Value | | | |
COMMON STOCKS - 100.57% | | | |
Aerospace & Defense - 1.26% | | | |
Cubic Corp. | | | 16,200 | | | $ | 765,450 | | | |
| |
Air Freight & Logistics - 1.10% | | | |
Atlas Air Worldwide Holdings, Inc.* | | | 16,200 | | | | 669,708 | | | |
| |
Airlines - 1.65% | | | |
Allegiant Travel Co. | | | 2,400 | | | | 402,792 | | | |
SkyWest, Inc. | | | 31,700 | | | | 602,934 | | | |
| | | | | | | | | | |
| | | | | | | 1,005,726 | | | |
| |
Biotechnology - 0.77% | | | |
PDL BioPharma, Inc.+ | | | 132,800 | | | | 470,112 | | | |
| |
Building Products - 0.73% | | | |
Advanced Drainage Systems, Inc.+ | | | 18,500 | | | | 444,555 | | | |
| |
Chemicals - 2.45% | | | |
Innospec, Inc. | | | 16,200 | | | | 879,822 | | | |
Rayonier Advanced Materials, Inc. | | | 62,800 | | | | 614,812 | | | |
| | | | | | | | | | |
| | | | | | | 1,494,634 | | | |
| |
Commercial Banks - 12.72% | | | |
Customers Bancorp, Inc.* | | | 27,000 | | | | 734,940 | | | |
FCB Financial Holdings, Inc., Class A*+ | | | 17,800 | | | | 637,062 | | | |
First BanCorp.* | | | 118,000 | | | | 383,500 | | | |
FNB Corp. | | | 53,100 | | | | 708,354 | | | |
Independent Bank Corp., MA | | | 17,200 | | | | 800,144 | | | |
Investors Bancorp, Inc. | | | 60,800 | | | | 756,352 | | | |
PrivateBancorp, Inc. | | | 17,700 | | | | 726,054 | | | |
Talmer Bancorp, Inc., Class A | | | 54,900 | | | | 994,239 | | | |
Valley National Bancorp+ | | | 58,000 | | | | 571,300 | | | |
Webster Financial Corp. | | | 18,300 | | | | 680,577 | | | |
Wilshire Bancorp, Inc. | | | 66,100 | | | | 763,455 | | | |
| | | | | | | | | | |
| | | | | | | 7,755,977 | | | |
| |
Commercial Services & Supplies - 1.86% | | | |
ABM Industries, Inc. | | | 18,500 | | | | 526,695 | | | |
ACCO Brands Corp.* | | | 85,600 | | | | 610,328 | | | |
| | | | | | | | | | |
| | | | | | | 1,137,023 | | | |
| |
Communications Equipment - 0.88% | | | |
Extreme Networks, Inc.* | | | 131,100 | | | | 534,888 | | | |
| |
Construction & Engineering - 1.03% | | | |
Comfort Systems USA, Inc. | | | 22,200 | | | | 630,924 | | | |
| | | | | | | | | | |
| | | | | | | | | | |
| | | | | | | | | | |
| | | | | | | | | | |
| | | | | | | | |
| Industry Company | | Shares | | | Value | |
| | |
| | | | | | | | |
Consumer Finance - 2.17% | |
Cash America International, Inc. | | | 22,200 | | | $ | 664,890 | |
Nelnet, Inc., Class A | | | 19,700 | | | | 661,329 | |
| | | | | | | | |
| | | | | | | 1,326,219 | |
|
Diversified Consumer Services - 1.31% | |
Matthews International Corp., Class A | | | 15,000 | | | | 801,750 | |
|
Diversified Financial Services - 0.85% | |
Ladder Capital Corp. | | | 41,500 | | | | 515,430 | |
|
Diversified Telecommunication Services - 1.15% | |
Atlantic Tele-Network, Inc. | | | 9,000 | | | | 704,070 | |
|
Electrical Equipment - 0.89% | |
General Cable Corp. | | | 40,600 | | | | 545,258 | |
|
Electronic Equipment, Instruments &
Components - 3.90% | |
Sanmina Corp.* | | | 58,700 | | | | 1,208,046 | |
Tech Data Corp.* | | | 7,700 | | | | 511,126 | |
TTM Technologies, Inc.* | | | 101,500 | | | | 660,765 | |
| | | | | | | | |
| | | | | | | 2,379,937 | |
|
Food & Staples Retailing - 1.24% | |
Ingles Markets, Inc., Class A | | | 17,100 | | | | 753,768 | |
|
Food Products - 2.00% | |
Cal-Maine Foods, Inc.+ | | | 10,300 | | | | 477,302 | |
Sanderson Farms, Inc.+ | | | 9,600 | | | | 744,192 | |
| | | | | | | | |
| | | | | | | 1,221,494 | |
|
Gas Utilities - 1.28% | |
Laclede Group, Inc. (The) | | | 13,100 | | | | 778,271 | |
|
Health Care Providers & Services - 6.18% | |
AMN Healthcare Services, Inc.* | | | 16,500 | | | | 512,325 | |
Cross Country Healthcare, Inc.* | | | 45,800 | | | | 750,662 | |
LHC Group, Inc.* | | | 14,500 | | | | 656,705 | |
Owens & Minor, Inc. | | | 23,500 | | | | 845,530 | |
RadNet, Inc.* | | | 88,500 | | | | 546,930 | |
Triple-S Management Corp., Class B* | | | 19,200 | | | | 459,072 | |
| | | | | | | | |
| | | | | | | 3,771,224 | |
|
Hotels, Restaurants & Leisure - 4.67% | |
Cracker Barrel Old Country Store, Inc.+ | | | 5,400 | | | | 684,882 | |
Isle of Capri Casinos, Inc.* | | | 62,700 | | | | 873,411 | |
| | |
| 57 | | Semi-Annual Report | December 31, 2015 (Unaudited) |
| | |
| Small-Cap Value Fund | | |
| SCHEDULE OF INVESTMENTS (continued) | | |
| Showing percentage of net assets as of December 31, 2015 (Unaudited) | | |
| | | | | | | | | | |
| Industry Company | | Shares | | | Value | | | |
| |
Common Stocks (continued) | | | |
Hotels, Restaurants & Leisure (continued) | | | |
Marriott Vacations Worldwide Corp. | | | 8,800 | | | $ | 501,160 | | | |
Penn National Gaming, Inc.* | | | 49,100 | | | | 786,582 | | | |
| | | | | | | | | | |
| | | |
| | | | | | | 2,846,035 | | | |
| |
Household Durables - 2.11% | | | |
Bassett Furniture Industries, Inc. | | | 22,700 | | | | 569,316 | | | |
LGI Homes, Inc.*+ | | | 29,400 | | | | 715,302 | | | |
| | | | | | | | | | |
| | | |
| | | | | | | 1,284,618 | | | |
| |
Household Products -0.91% | | | |
Central Garden & Pet Co., Class A* | | | 40,600 | | | | 552,160 | | | |
| |
Independent Power Producers & Energy Traders - 0.65% | | | |
Talen Energy Corp.* | | | 63,500 | | | | 395,605 | | | |
| |
Insurance - 12.54% | | | |
American Equity Investment Life Holding Co. | | | 28,600 | | | | 687,258 | | | |
AmTrust Financial Services, Inc.+ | | | 1,800 | | | | 110,844 | | | |
CNO Financial Group, Inc. | | | 30,500 | | | | 582,245 | | | |
FBL Financial Group, Inc., Class A | | | 12,800 | | | | 814,592 | | | |
Fidelity & Guaranty Life | | | 24,000 | | | | 608,880 | | | |
Heritage Insurance Holdings, Inc. | | | 29,400 | | | | 641,508 | | | |
Maiden Holdings, Ltd. | | | 67,500 | | | | 1,006,425 | | | |
National Western Life Group, Inc., Class A | | | 2,600 | | | | 655,044 | | | |
Navigators Group, Inc. (The)* | | | 6,700 | | | | 574,793 | | | |
OneBeacon Insurance Group Ltd., Class A | | | 60,220 | | | | 747,330 | | | |
Selective Insurance Group, Inc. | | | 27,500 | | | | 923,450 | | | |
State Auto Financial Corp. | | | 14,300 | | | | 294,437 | | | |
| | | | | | | | | | |
| | | |
| | | | | | | 7,646,806 | | | |
| |
Internet & Catalog Retail - 1.62% | | | |
1-800-Flowers.com, Inc., Class A* | | | 78,900 | | | | 574,392 | | | |
Lands’ End, Inc.*+ | | | 17,600 | | | | 412,544 | | | |
| | | | | | | | | | |
| | | |
| | | | | | | 986,936 | | | |
| |
Internet Software & Services - 2.19% | | | |
EarthLink Holdings Corp. | | | 76,600 | | | | 569,138 | | | |
j2 Global, Inc. | | | 9,300 | | | | 765,576 | | | |
| | | | | | | | | | |
| | | |
| | | | | | | 1,334,714 | | | |
| | | | | | | | |
| Industry Company | | Shares | | | Value | |
| | |
IT Services - 1.29% | | | | | | | | |
Convergys Corp. | | | 31,700 | | | $ | 789,013 | |
| | |
Machinery - 1.86% | | | | | | | | |
Global Brass & Copper Holdings, Inc. | | | 38,200 | | | | 813,660 | |
Titan International, Inc. | | | 82,000 | | | | 323,080 | |
| | | | | | | | |
| | |
| | | | | | | 1,136,740 | |
| | |
Marine - 1.59% | | | | | | | | |
Matson, Inc. | | | 22,800 | | | | 971,964 | |
| | |
Media - 0.82% | | | | | | | | |
Time, Inc. | | | 32,100 | | | | 503,007 | |
| | |
Metals & Mining - 0.73% | | | | | | | | |
Schnitzer Steel Industries, Inc., Class A | | | 31,100 | | | | 446,907 | |
|
Oil, Gas & Consumable Fuels - 4.75% | |
Alon USA Energy, Inc.+ | | | 48,600 | | | | 721,224 | |
Green Plains, Inc. | | | 23,500 | | | | 538,150 | |
Pacific Ethanol, Inc.*+ | | | 36,800 | | | | 175,904 | |
Renewable Energy Group, Inc.* | | | 77,000 | | | | 715,330 | |
Ship Finance International, Ltd. | | | 44,900 | | | | 743,993 | |
| | | | | | | | |
| | |
| | | | | | | 2,894,601 | |
| |
Paper & Forest Products - 1.40% | | | | | |
Neenah Paper, Inc. | | | 13,700 | | | | 855,291 | |
|
Real Estate Investment Trusts (REITs) - 5.57% | |
Geo Group, Inc. (The) | | | 17,400 | | | | 503,034 | |
Gramercy Property Trust | | | 103,000 | | | | 795,160 | |
Inland Real Estate Corp. | | | 75,500 | | | | 801,810 | |
Ramco-Gershenson Properties Trust | | | 45,400 | | | | 754,094 | |
Summit Hotel Properties, Inc. | | | 45,400 | | | | 542,530 | |
| | | | | | | | |
| | |
| | | | | | | 3,396,628 | |
|
Semiconductors & Semiconductor Equipment - 1.71% | |
Amkor Technology, Inc.* | | | 171,500 | | | | 1,042,720 | |
| | |
Software - 0.79% | | | | | | | | |
Mentor Graphics Corp. | | | 26,100 | | | | 480,762 | |
| | |
Specialty Retail - 2.31% | | | | | | | | |
Build-A-Bear Workshop, Inc.* | | | 29,750 | | | | 364,140 | |
Sportsman’s Warehouse Holdings, Inc.* | | | 55,900 | | | | 721,110 | |
| | |
| Small-Cap Value Fund | |
|
| SCHEDULE OF INVESTMENTS (continued) | |
| Showing percentage of net assets as of December 31, 2015 (Unaudited) | | |
| | | | | | | | | | |
| Industry Company | | Shares | | Value | | | |
| |
Common Stocks (continued) | | | |
Specialty Retail (continued) | | | |
Stage Stores, Inc.+ | | 35,800 | | $ | 326,138 | | | |
| | | | | | | | | | |
| | | 1,411,388 | | | |
| |
Textiles, Apparel & Luxury Goods - 0.90% | | | |
Perry Ellis International, Inc.* | | 29,800 | | | 548,916 | | | |
| |
Thrifts & Mortgage Finance - 4.29% | | | |
Capitol Federal Financial, Inc. | | 71,900 | | | 903,064 | | | |
Clifton Bancorp, Inc.+ | | 28,900 | | | 414,426 | | | |
Impac Mortgage Holdings, Inc.*+ | | 35,500 | | | 639,000 | | | |
Northwest Bancshares, Inc. | | 49,300 | | | 660,127 | | | |
| | | | | | | | | | |
| | | 2,616,617 | | | |
| |
Trading Companies & Distributors - 1.65% | | | |
Textainer Group Holdings, Ltd. | | 40,800 | | | 575,688 | | | |
Titan Machinery, Inc.*+ | | 39,400 | | | 430,642 | | | |
| | | | | | | | | | |
| | | 1,006,330 | | | |
| |
Water Utilities - 0.80% | | | |
California Water Service Group | | 20,909 | | | 486,553 | | | |
| | | | | | | | | | |
TOTAL COMMON STOCKS - 100.57% | | | 61,340,729 | | | |
| | | | | | | | | | |
(Cost $65,336,707) | | | | | | |
| | | Rate^ | | Shares | | Value | | | |
| |
MONEY MARKET FUND - 0.00% | | | |
Dreyfus Cash Management Fund | | 0.18% | | 278 | | | 278 | | | |
| | | | | | | | | | |
TOTAL MONEY MARKET FUND - 0.00% | | | 278 | | | |
| | | | | | | | | | |
(Cost $278) | | | | | | |
| | |
| | | | | | |
| | | | | | | | |
| | | Rate^ | | Shares | | Value | |
|
INVESTMENTS PURCHASED WITH CASH PROCEEDS FROM SECURITIES LENDING - 13.45% | |
Dreyfus Cash Management Fund** | | 0.18% | | 8,205,146 | | | $8,205,146 | |
| | | | | | | | |
TOTAL INVESTMENTS PURCHASED WITH CASH PROCEEDS FROM SECURITIES LENDING - 13.45% | | | 8,205,146 | |
| | | | | | | | |
(Cost $8,205,146) | | | | |
| |
Total Investments - 114.02% | | | $69,546,153 | |
(Cost $73,542,131) | | | | |
Liabilities in Excess of Other Assets - (14.02%) | | | (8,550,671) | |
| | | | | | | | |
NET ASSETS - 100.00% | | | $60,995,482 | |
| | | | | | | | |
| * | Non-income producing security. |
| ** | This security represents the investment of the collateral received in connection with securities out on loan as of December 31, 2015. |
| ^ | Rate disclosed as of December 31, 2015. |
| + | This security or a portion of the security is out on loan as of December 31, 2015. Total loaned securities had a value of $7,892,496 as of December 31, 2015. |
Summary of inputs used to value the Fund’s investments as of 12/31/2015 (See Note 2 in Notes to Financial Statements):
| | | | | | | | | | | | | | | | |
| | | Valuation Inputs | |
| | | Investment in Securities (Value) | |
| | | Level 1
Quoted
Prices | | | Level 2
Significant
Observable
Inputs | | | Level 3
Significant
Unobservable
Inputs | | | Total | |
Common Stocks | | $ | 61,340,729 | | | $ | — | | | $ | — | | | $ | 61,340,729 | |
Money Market Fund | | | — | | | | 278 | | | | — | | | | 278 | |
Investments Purchased with Cash Proceeds from Securities Lending | | | — | | | | 8,205,146 | | | | — | | | | 8,205,146 | |
| | | | | | | | | | | | | | | | |
TOTAL | | $ | 61,340,729 | | | $ | 8,205,424 | | | $ | — | | | $ | 69,546,153 | |
| | | | | | | | | | | | | | | | |
See Notes to Financial Statements
| | |
| 59 | | Semi-Annual Report | December 31, 2015 (Unaudited) |
| | |
| Large-Cap Growth Fund | | |
| MANAGER’S COMMENTARY (Unaudited) | | |
| | |
December 31, 2015
Dear Fellow Large-Cap Growth Fund Shareholder,
For the quarter ended December 31, 2015, our Fund returned 3.71%, underperforming our primary market benchmark, the Russell 1000 Growth Index (7.32%), and our peer benchmark, the Lipper Large-Cap Growth Funds Index (8.23%). It was a good quarter on an absolute basis, but a poor one on a relative basis during a period of high volatility.
For the six-month semi-annual period ended December 31, 2015, our Fund returned -1.19%, underperforming the Russell 1000 Growth Index (1.64%) and the Lipper Large-Cap Growth Funds Index (1.14%).
For the calendar year, our Fund was up 3.62%, lagging the Russell 1000 Growth Index (5.67%) and the Lipper Large-Cap Growth Funds Index (5.61%). It was a good year for the Fund on an absolute and relative basis until the fourth quarter, which saw a reversal of performance. We are leading our benchmarks in the five-year period, but are slightly lagging our primary benchmark in the longer 10-year and inception-to-date periods.
The table below presents our December quarter, six months, one-year, five-year, 10-year, and inception-to-date financial results.
Standardized Returns as of December 31, 2015
| | | | | | | | | | | | | | | | | | | | | | | | |
| | | | | | | | | | | | Annualized | |
| | | Quarter | | | 6 Months | | | 1 Year | | | 5 Years | | | 10 Years | | | Since Inception
(10/31/03) | |
| | | | | | |
Large-Cap Growth Fund | | | 3.71% | | | | -1.19% | | | | 3.62% | | | | 14.25% | | | | 7.47% | | | | 7.76% | |
Russell 1000 Growth Index | | | 7.32% | | | | 1.64% | | | | 5.67% | | | | 13.53% | | | | 8.53% | | | | 8.35% | |
Lipper Large-Cap Growth Funds Index | | | 8.23% | | | | 1.14% | | | | 5.61% | | | | 12.17% | | | | 7.17% | | | | 7.45% | |
Performance figures quoted in the table above represent past performance and are no guarantee of future results. The table above does not reflect the deduction of taxes that a shareholder would pay on Fund distributions or on the redemption of Fund shares.
The Russell 1000 Growth Index is an unmanaged index that consists of stocks in the Russell 1000 Index with higher price-to-book ratios and higher forecasted growth values with dividends reinvested. The Lipper Large-Cap Growth Funds Index is an index of large-company, growth-oriented funds compiled by Lipper, Inc. It is not possible to invest directly in an index. Periods longer than one year are annualized.
According to data from Lipper, Inc. as of December 31, 2015, Large-Cap Growth Fund ranked 264th of 622 multi-cap growth funds for the 12 months ended December 31, 2015, 25th of 461 over the last five years, 157th of 315 over the last 10 years, and 163rd of 276 such funds since inception in October 2003. Lipper, Inc. is an independent mutual fund rating service that ranks funds in various fund categories by making comparative calculations using total returns.
| | |
| Large-Cap Growth Fund | |
|
| MANAGER’S COMMENTARY (Unaudited) (continued) | |
| | |
Large-Cap Growth Fund vs. Russell 1000 Growth Index & Lipper Large-Cap Growth Funds Index
from Inception 10/31/03 to 12/31/15
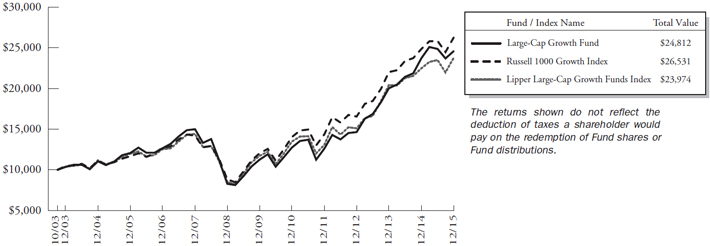
Detailed Explanation of Quarterly Performance
A design bias toward smaller stock size was the primary driver of the Fund’s underperformance versus its benchmark, the Russell 1000 Growth Index. All model categories also lagged during the period, which featured increasing stock correlations.
Holdings within Consumer Discretionary and Information Technology sectors detracted from the Fund’s relative performance. These sectors held the Fund’s two largest detractors. Skechers USA declined in performance after reporting lower-than-expected third quarter sales, while software company Fortinet underperformed after lowering its fourth-quarter earnings guidance. The Fund’s Energy holdings added to performance, however, even though Energy was the worst-performing sector during the period.
Detailed Explanation of Calendar Year Performance
The Fund’s bias toward smaller stock size was a large detractor from relative performance in the calendar year. Our diversifying value metrics models also hurt relative performance, as growth generally outperformed value. On an overall basis, the core company financial health model category added to relative results, as did our diversifying price momentum model.
Holdings in the Consumer Discretionary and Information Technology sectors negatively affected the Fund’s relative returns. The Fund’s Energy holdings added to relative results, even though the broader Energy sector posted large losses for the period.
| | |
| 61 | | Semi-Annual Report | December 31, 2015 (Unaudited) |
| | |
| Large-Cap Growth Fund | | |
| MANAGER’S COMMENTARY (Unaudited) (continued) | | |
| | |
Top Ten Holdings as of December 31, 2015
| | | | | | | | | | | |
| Rank | | | | Description | | Industry | | % of Net Assets |
| 1 | | | | Kroger Co (The) | | Food & Staples Retailing | | | | 2.2% | |
| 2 | | | | Tesoro Corp | | Oil, Gas & Consumable Fuels | | | | 2.1% | |
| 3 | | | | Amazon.com Inc | | Internet & Catalog Retail | | | | 2.1% | |
| 4 | | | | Starbucks Corp | | Hotels, Restaurants & Leisure | | | | 2.1% | |
| 5 | | | | VeriSign Inc | | Internet Software & Services | | | | 2.0% | |
| 6 | | | | O’Reilly Automotive Inc | | Specialty Retail | | | | 2.0% | |
| 7 | | | | Foot Locker Inc | | Specialty Retail | | | | 1.9% | |
| 8 | | | | Facebook Inc | | Internet Software & Services | | | | 1.8% | |
| 9 | | | | Aetna Inc | | Health Care Providers & Services | | | | 1.8% | |
| 10 | | | | Lear Corp | | Auto Components | | | | 1.7% | |
| | | | Total | | | | | | 19.7% | |
Industry Sector Representation as of December 31, 2015
| | | | | | | | | | | | | | | | |
| | | | | |
| | | % of Net Assets | | | | | % of Russell 1000
Growth Index | | | | | Difference | |
Consumer Discretionary | | | 22.3% | | | | | | 21.2% | | | | | | 1.1% | |
Consumer Staples | | | 12.0% | | | | | | 11.3% | | | | | | 0.7% | |
Energy | | | 4.2% | | | | | | 0.5% | | | | | | 3.7% | |
Financials | | | 5.5% | | | | | | 5.5% | | | | | | 0.0% | |
Health Care | | | 14.6% | | | | | | 17.1% | | | | | | -2.5% | |
Industrials | | | 12.0% | | | | | | 10.8% | | | | | | 1.2% | |
Information Technology | | | 25.7% | | | | | | 28.0% | | | | | | -2.3% | |
Materials | | | 3.6% | | | | | | 3.4% | | | | | | 0.2% | |
Telecommunication Services | | | 0.0% | | | | | | 2.2% | | | | | | -2.2% | |
Utilities | | | 0.0% | | | | | | 0.0% | | | | | | 0.0% | |
Cash & Other Assets | | | 0.1% | | | | | | 0.0% | | | | | | 0.1% | |
Total | | | 100.0% | | | | | | 100.0% | | | | | | | |
Disclaimer
The views expressed here are exclusively those of Fund management. These views, including those related to market sectors or individual stocks, are not meant as investment advice and should not be considered predictive in nature. Any favorable (or unfavorable) description of a holding applies only as of the quarter end, December 31, 2015, unless otherwise stated. Security positions can and do change thereafter. Discussions of historical performance do not guarantee and may not be indicative of future performance.
The Fund is subject to market risk (volatility) and is not an appropriate investment for short-term investors.
Conclusion
Thank you for your continued investment in Large-Cap Growth Fund. We encourage your feedback; your reactions and concerns are important to us.
Sincerely,
The Investment Management Team
| | |
| Large-Cap Growth Fund | | |
| SCHEDULE OF INVESTMENTS | |
| Showing percentage of net assets as of December 31, 2015 (Unaudited) | | |
| | | | | | | | | | |
| Industry Company | | Shares | | | Value | | | |
| |
COMMON STOCKS – 99.92% | | | |
Aerospace & Defense - 2.01% | | | |
Honeywell International, Inc. | | | 13,400 | | | $ | 1,387,838 | | | |
Lockheed Martin Corp. | | | 9,000 | | | | 1,954,350 | | | |
| | | | | | | | | | |
| | | |
| | | | | | | 3,342,188 | | | |
| |
Airlines - 5.57% | | | |
Alaska Air Group, Inc. | | | 22,900 | | | | 1,843,679 | | | |
American Airlines Group, Inc. | | | 36,100 | | | | 1,528,835 | | | |
Delta Air Lines, Inc. | | | 38,900 | | | | 1,971,841 | | | |
Southwest Airlines Co. | | | 39,700 | | | | 1,709,482 | | | |
United Continental Holdings, Inc.* | | | 38,800 | | | | 2,223,240 | | | |
| | | | | | | | | | |
| | | |
| | | | | | | 9,277,077 | | | |
| |
Auto Components - 1.73% | | | |
Lear Corp. | | | 23,500 | | | | 2,886,505 | | | |
| |
Beverages - 2.13% | | | |
Monster Beverage Corp.* | | | 16,000 | | | | 2,383,360 | | | |
PepsiCo, Inc. | | | 11,600 | | | | 1,159,072 | | | |
| | | | | | | | | | |
| | | |
| | | | | | | 3,542,432 | | | |
| |
Biotechnology - 4.03% | | | |
Gilead Sciences, Inc. | | | 16,700 | | | | 1,689,873 | | | |
Incyte Corp.* | | | 11,300 | | | | 1,225,485 | | | |
Regeneron Pharmaceuticals, Inc.* | | | 3,700 | | | | 2,008,619 | | | |
United Therapeutics Corp.* | | | 11,400 | | | | 1,785,354 | | | |
| | | | | | | | | | |
| | | |
| | | | | | | 6,709,331 | | | |
| |
Chemicals - 3.55% | | | |
Airgas, Inc. | | | 9,400 | | | | 1,300,208 | | | |
Dow Chemical Co. (The) | | | 18,500 | | | | 952,380 | | | |
LyondellBasell Industries NV, Class A | | | 19,000 | | | | 1,651,100 | | | |
Praxair, Inc. | | | 6,400 | | | | 655,360 | | | |
Sherwin-Williams Co. (The) | | | 5,200 | | | | 1,349,920 | | | |
| | | | | | | | | | |
| | | |
| | | | | | | 5,908,968 | | | |
| |
Commercial Services & Supplies - 2.15% | | | |
Equifax, Inc. | | | 15,500 | | | | 1,726,235 | | | |
Waste Management, Inc. | | | 34,700 | | | | 1,851,939 | | | |
| | | | | | | | | | |
| | | |
| | | | | | | 3,578,174 | | | |
| |
Computers & Peripherals - 1.37% | | | |
Apple, Inc. | | | 21,700 | | | | 2,284,142 | | | |
| |
Consumer Finance - 3.57% | | | |
Ally Financial, Inc.* | | | 81,500 | | | | 1,519,160 | | | |
Discover Financial Services | | | 31,600 | | | | 1,694,392 | | | |
Santander Consumer USA Holdings, Inc.* | | | 81,800 | | | | 1,296,530 | | | |
| | | | | | | | |
| Industry Company | | Shares | | | Value | |
|
| |
Consumer Finance (continued) | |
Synchrony Financial* | | | 47,000 | | | $ | 1,429,270 | |
| | | | | | | | |
| | |
| | | | | | | 5,939,352 | |
|
Electronic Equipment, Instruments &
Components - 0.90% | |
Amphenol Corp., Class A | | | 28,800 | | | | 1,504,224 | |
|
Financials - 2.09% | |
Global Payments, Inc. | | | 27,200 | | | | 1,754,672 | |
Total System Services, Inc. | | | 34,600 | | | | 1,723,080 | |
| | | | | | | | |
| | |
| | | | | | | 3,477,752 | |
|
Food & Staples Retailing - 6.59% | |
Costco Wholesale Corp. | | | 11,500 | | | | 1,857,250 | |
CVS Health Corp. | | | 15,400 | | | | 1,505,658 | |
Kroger Co. (The) | | | 86,200 | | | | 3,605,746 | |
Rite Aid Corp.* | | | 218,100 | | | | 1,709,904 | |
Sysco Corp. | | | 35,500 | | | | 1,455,500 | |
Walgreens Boots Alliance, Inc. | | | 9,700 | | | | 826,003 | |
| | | | | | | | |
| | |
| | | | | | | 10,960,061 | |
|
Food Products - 3.33% | |
ConAgra Foods, Inc. | | | 40,400 | | | | 1,703,264 | |
Hormel Foods Corp. | | | 32,400 | | | | 2,562,192 | |
WhiteWave Foods Co. (The)* | | | 32,900 | | | | 1,280,139 | |
| | | | | | | | |
| | |
| | | | | | | 5,545,595 | |
|
Health Care Equipment & Supplies - 1.49% | |
C.R. Bard, Inc. | | | 4,100 | | | | 776,704 | |
Edwards Lifesciences Corp.* | | | 21,600 | | | | 1,705,968 | |
| | | | | | | | |
| | |
| | | | | | | 2,482,672 | |
|
Health Care Providers & Services - 8.17% | |
Aetna, Inc. | | | 27,500 | | | | 2,973,300 | |
Cardinal Health, Inc. | | | 19,100 | | | | 1,705,057 | |
Centene Corp.* | | | 35,600 | | | | 2,342,836 | |
Cigna Corp. | | | 10,500 | | | | 1,536,465 | |
Envision Healthcare Holdings, Inc.* | | | 31,300 | | | | 812,861 | |
HCA Holdings, Inc.* | | | 39,100 | | | | 2,644,333 | |
UnitedHealth Group, Inc. | | | 13,400 | | | | 1,576,376 | |
| | | | | | | | |
| | |
| | | | | | | 13,591,228 | |
|
Hotels, Restaurants & Leisure - 4.71% | |
Darden Restaurants, Inc. | | | 26,400 | | | | 1,680,096 | |
Hilton Worldwide Holdings, Inc. | | | 48,000 | | | | 1,027,200 | |
Norwegian Cruise Line Holdings, Ltd.* | | | 29,100 | | | | 1,705,260 | |
| | |
|
| 63 | | Semi-Annual Report | December 31, 2015 (Unaudited) |
| | |
| Large-Cap Growth Fund | | |
| SCHEDULE OF INVESTMENTS (continued) | |
| Showing percentage of net assets as of December 31, 2015 (Unaudited) | | |
| | | | | | | | | | |
| Industry Company | | Shares | | | Value | | | |
| |
Common Stocks (continued) | | | |
Hotels, Restaurants & Leisure (continued) | | | |
Starbucks Corp. | | | 57,100 | | | $ | 3,427,713 | | | |
| | | | | | | | | | |
| | | |
| | | | | | | 7,840,269 | | | |
| |
Insurance - 0.95% | | | |
Reinsurance Group of America, Inc. | | | 18,400 | | | | 1,574,120 | | | |
| |
Internet & Catalog Retail - 2.07% | | | |
Amazon.com, Inc.* | | | 5,100 | | | | 3,447,039 | | | |
| |
Internet Software & Services - 6.86% | | | |
Alphabet, Inc., Class C* | | | 3,300 | | | | 2,504,304 | | | |
eBay, Inc.* | | | 69,200 | | | | 1,901,616 | | | |
Facebook, Inc., Class A* | | | 28,600 | | | | 2,993,276 | | | |
Rackspace Hosting, Inc.* | | | 26,700 | | | | 676,044 | | | |
VeriSign, Inc.* | | | 38,200 | | | | 3,337,152 | | | |
| | | | | | | | | | |
| | | |
| | | | | | | 11,412,392 | | | |
| |
IT Services - 5.58% | | | |
Broadridge Financial Solutions, Inc. | | | 32,300 | | | | 1,735,479 | | | |
CDW Corp. | | | 48,900 | | | | 2,055,756 | | | |
Fidelity National Information Services, Inc. | | | 24,000 | | | | 1,454,400 | | | |
Fiserv, Inc.* | | | 24,700 | | | | 2,259,062 | | | |
Paychex, Inc. | | | 33,600 | | | | 1,777,104 | | | |
| | | | | | | | | | |
| | | |
| | | | | | | 9,281,801 | | | |
| |
Machinery - 1.07% | | | |
Stanley Black & Decker, Inc. | | | 16,700 | | | | 1,782,391 | | | |
| |
Media - 2.65% | | | |
Comcast Corp., Class A | | | 15,800 | | | | 891,594 | | | |
FactSet Research Systems, Inc. | | | 11,800 | | | | 1,918,326 | | | |
Netflix, Inc.* | | | 14,000 | | | | 1,601,320 | | | |
| | | | | | | | | | |
| | | |
| | | | | | | 4,411,240 | | | |
| |
Oil, Gas & Consumable Fuels - 4.22% | | | |
Marathon Petroleum Corp. | | | 33,400 | | | | 1,731,456 | | | |
Tesoro Corp. | | | 33,000 | | | | 3,477,210 | | | |
Valero Energy Corp. | | | 25,600 | | | | 1,810,176 | | | |
| | | | | | | | | | |
| | | |
| | | | | | | 7,018,842 | | | |
| |
Pharmaceuticals - 0.94% | | | |
Allergan PLC* | | | 5,000 | | | | 1,562,500 | | | |
| |
Professional Services - 0.59% | | | |
Robert Half International, Inc. | | | 20,800 | | | | 980,512 | | | |
| |
Road & Rail - 0.63% | | | |
Union Pacific Corp. | | | 13,400 | | | | 1,047,880 | | | |
| | | | | | | | |
| Industry Company | | Shares | | | Value | |
|
| |
Semiconductors & Semiconductor Equipment - 5.01% | |
Avago Technologies, Ltd. | | | 13,100 | | | $ | 1,901,465 | |
Lam Research Corp. | | | 22,800 | | | | 1,810,776 | |
Micron Technology, Inc.* | | | 93,800 | | | | 1,328,208 | |
NXP Semiconductors NV* | | | 9,929 | | | | 836,518 | |
Skyworks Solutions, Inc. | | | 32,000 | | | | 2,458,560 | |
| | | | | | | | |
| | |
| | | | | | | 8,335,527 | |
|
Software - 2.68% | |
Electronic Arts, Inc.* | | | 24,400 | | | | 1,676,768 | |
Fortinet, Inc.* | | | 39,700 | | | | 1,237,449 | |
Microsoft Corp. | | | 28,000 | | | | 1,553,440 | |
| | | | | | | | |
| | |
| | | | | | | 4,467,657 | |
|
Specialty Retail - 11.05% | |
Best Buy Co., Inc. | | | 47,600 | | | | 1,449,420 | |
Foot Locker, Inc. | | | 49,300 | | | | 3,208,937 | |
Home Depot, Inc. (The) | | | 13,600 | | | | 1,798,600 | |
L Brands, Inc. | | | 17,200 | | | | 1,648,104 | |
Lowe’s Companies, Inc. | | | 28,100 | | | | 2,136,724 | |
O’Reilly Automotive, Inc.* | | | 13,000 | | | | 3,294,460 | |
Ross Stores, Inc. | | | 31,300 | | | | 1,684,253 | |
Ulta Salon Cosmetics & Fragrance, Inc.* | | | 13,000 | | | | 2,405,000 | |
Williams-Sonoma, Inc. | | | 13,100 | | | | 765,171 | |
| | | | | | | | |
| | |
| | | | | | | 18,390,669 | |
|
Textiles, Apparel & Luxury Goods - 2.23% | |
Skechers U.S.A., Inc., Class A* | | | 55,100 | | | | 1,664,571 | |
Under Armour, Inc., Class A* | | | 25,300 | | | | 2,039,433 | |
| | | | | | | | |
| | |
| | | | | | | 3,704,004 | |
| | | | | | | | |
| |
TOTAL COMMON STOCKS - 99.92% | | | | 166,286,544 | |
| | | | | | | | |
(Cost $153,254,605) | | | | | | | | |
| | | | | | | | | | | | |
| | | Rate^ | | | Shares | | | Value | |
|
MONEY MARKET FUND – 1.12% | |
Dreyfus Cash Management Fund | | | 0.18 | % | | | 1,864,489 | | | | 1,864,489 | |
| | | | | | | | | | | | |
| |
TOTAL MONEY MARKET FUND - 1.12% | | | | 1,864,489 | |
| | | | | | | | | | | | |
(Cost $1,864,489) | | | | | | | | | | | | |
| | |
| Large-Cap Growth Fund | | |
| SCHEDULE OF INVESTMENTS (continued) | |
| Showing percentage of net assets as of December 31, 2015 (Unaudited) | | |
| | | | | | | | | | | | |
| | | | | | | | | | | Value | |
| | |
TOTAL INVESTMENTS - 101.04% | | | | $ | 168,151,033 | |
(Cost $155,119,094) | | | | | | |
Liabilities in Excess of Other Assets - (1.04%) | | | | | (1,731,908 | ) |
| | | | | | | | | | | | |
NET ASSETS - 100.00% | | | | $ | 166,419,125 | |
| | | | | | | | | | | | |
| | | | | | | | | | |
* Non-income producing security. ^ Rate disclosed as of December 31, 2015. PLC - Public Limited Company | | | | | | | | | | |
| | | | | | | | | | | | | | |
Summary of inputs used to value the Fund’s investments as of 12/31/2015 (See Note 2 in Notes to Financial Statements): | |
| |
| | | Valuation Inputs | |
| |
| | | Investment in Securities (Value) | |
| |
| | | Level 1 Quoted Prices | | | Level 2
Significant
Observable
Inputs | | | Level 3
Significant
Unobservable
Inputs | | Total | |
| |
| | | | |
Common Stocks | | $ | 166,286,544 | | | $ | — | | | $ — | | | $166,286,544 | |
Money Market Fund | | | — | | | | 1,864,489 | | | — | | | 1,864,489 | |
| | | | | | | | | | | | | | |
TOTAL | | $ | 166,286,544 | | | $ | 1,864,489 | | | $ — | | | $168,151,033 | |
| | | | | | | | | | | | | | |
See Notes to Financial Statements. | | | | |
| | |
| 65 | | Semi-Annual Report | December 31, 2015 (Unaudited) |
| | |
| Blue Chip 35 Index Fund | | |
| MANAGER’S COMMENTARY (Unaudited) | |
| | |
December 31, 2015
Dear Fellow Blue Chip 35 Index Fund Shareholder,
For the quarter ended December 31, 2015, our Fund returned 7.87%, outperforming our primary market benchmark, the S&P 500 Index (7.04%), and our peer benchmark, the Lipper Large-Cap Core Funds Index (6.17%), but lagging the Russell Top 50 Mega Cap Index (9.34%). It was a good quarter.
For the six-month semi-annual period ended December 31, 2015, our Fund returned 1.48%, beating the S&P 500 Index (0.15%) and the Lipper Large-Cap Core Funds Index (-1.42%), but underperforming the Russell Top 50 Mega Cap Index (3.31%).
For the calendar year, our Fund returned 2.17%, beating the S&P 500 Index (1.38%) and the Lipper Large-Cap Core Funds Index (-0.67%). Our fund trailed the Russell Top 50 Mega Cap Index (4.33%).
The table below presents our December quarter, six months, one-year, five-year, 10-year, 15-year, and inception-to-date financial results.
Standardized Returns as of December 31, 2015
| | | | | | | | | | | | | | | | | | | | | | | | | | | | |
| | | | | | | | | | | | Annualized | |
| | | Quarter | | | 6 Months | | | 1 Year | | | 5 Years | | | 10 Years | | | 15 Years | | | Since Inception
(7/31/97) | |
| | | | | | | |
Blue Chip 35 Index Fund | | | 7.87% | | | | 1.48% | | | | 2.17% | | | | 12.26% | | | | 7.38% | | | | 4.91% | | | | 6.45% | |
S&P 500 Index | | | 7.04% | | | | 0.15% | | | | 1.38% | | | | 12.57% | | | | 7.31% | | | | 5.00% | | | | 6.17% | |
Russell Top 50 Mega Cap Index | | | 9.34% | | | | 3.31% | | | | 4.33% | | | | 12.68% | | | | 6.99% | | | | 3.71% | | | | 5.11% | |
Lipper Large-Cap Core Funds Index | | | 6.17% | | | | -1.42% | | | | -0.67% | | | | 10.97% | | | | 6.35% | | | | 4.05% | | | | 5.30% | |
Bridgeway Ultra-Large 35 Index | | | 7.98% | | | | 1.64% | | | | 2.43% | | | | 12.52% | | | | 7.63% | | | | 5.32% | | | | 6.64% | |
Performance figures quoted in the table above represent past performance and are no guarantee of future results. Total return figures in the table above include the reinvestment of dividends and capital gains. The table above does not reflect the deduction of taxes that a shareholder would pay on Fund distributions or on the redemption of Fund shares.
The S&P 500 Index is a broad-based, unmanaged measurement of changes in stock market conditions, based on the average of 500 widely held common stocks with dividends reinvested. The Russell Top 50 Mega Cap Index measures the performance of the largest companies in the Russell 3000 Index. It includes 50 of the largest securities, based on a combination of their market cap and current index membership, and represents approximately 40% of the total market capitalization of the Russell 3000 Index. The Bridgeway Ultra-Large 35 Index is an index composed of very large, “blue chip” U.S. stocks, excluding tobacco; it is compiled by the adviser of the Fund. The Lipper Large-Cap Core Funds Index reflects the aggregate record of domestic large-cap core mutual funds as reported by Lipper, Inc. It is not possible to invest directly in an index. Periods longer than one year are annualized.
According to data from Lipper, Inc. as of December 31, 2015, Blue-Chip 35 Index Fund ranked 169th of 876 large-cap core funds for the 12 months ended December 31, 2015, 150th of 708 over the last five years, 106th of 516 over the last 10 years, and 41st of 172 since inception in July 1997. Lipper, Inc. is an independent mutual fund rating service that ranks funds in various fund categories by making comparative calculations using total returns.
| | |
| Blue Chip 35 Index Fund | | |
| MANAGER’S COMMENTARY (Unaudited) (continued) | |
| | |
Blue Chip 35 Index Fund vs. S&P 500 Index, Russell Top 50 Mega Cap Index, Lipper Large-Cap Core Funds Index & Bridgeway Ultra-Large 35 Index from Inception 7/31/97 to 12/31/15
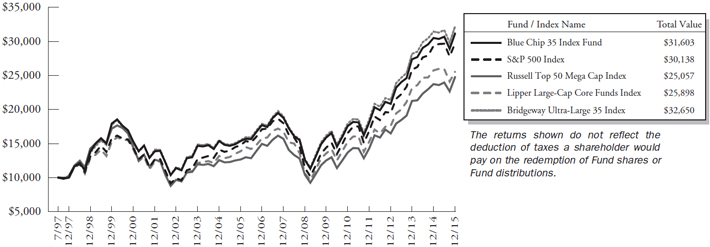
Detailed Explanation of Quarterly Performance
The Fund’s mega-cap design contributed to relative performance during a quarter in which larger stocks strongly outperformed smaller company shares. The Fund’s exposure to larger stocks helped it outperform the S&P 500, but was not enough to beat the even largers stocks held in the Russell Top 50 Mega Cap Index.
Detailed Explanation of Calendar Year Performance
Mega-cap exposure helped the Fund’s relative performance in a year that strongly favored the stocks of larger companies. For the year, stocks in CRSP decile 1 outperformed those in CRSP decile 2 by 5.42 percentage points.
However, we trailed the market-cap weighted Russell Top 50 Mega Cap Index due to our equal weight design feature, in order to maintain balanced weightings, this feature calls for selling stocks that have appreciated the most while buying those that have declined. By contrast, the index gives more weight to those stocks that have appreciated the most.
The table below presents index performance numbers for stocks in the different deciles during various time periods.
| | | | | | | | | | |
| CRSP Decile1 | | Quarter | | 1 Year | | 5 Years | | 10 Years | | 90 Years |
1 (ultra-large) | | 7.44% | | 1.74% | | 12.40% | | 7.17% | | 9.28% |
2 | | 2.56% | | -3.69% | | 12.26% | | 8.06% | | 10.48% |
3 | | 3.99% | | -2.80% | | 10.86% | | 7.92% | | 10.97% |
4 | | 1.27% | | -4.77% | | 11.24% | | 8.27% | | 10.81% |
5 | | 1.41% | | -7.35% | | 9.61% | | 9.13% | | 11.43% |
6 | | 3.17% | | -7.33% | | 10.01% | | 7.71% | | 11.28% |
7 | | 3.93% | | -5.87% | | 9.89% | | 8.15% | | 11.43% |
8 | | 4.22% | | -7.81% | | 8.79% | | 8.06% | | 11.45% |
9 | | 4.63% | | -11.34% | | 7.58% | | 6.76% | | 11.35% |
10 (ultra-small) | | 1.14% | | -11.61% | | 7.17% | | 6.54% | | 13.22% |
| 1 | Performance figures are as of the period ended December 31, 2015. The CRSP Cap-Based Portfolio Indexes are unmanaged indexes of publicly traded U.S. stocks with dividends reinvested, grouped by market capitalization, as reported by the Center for Research in Security Prices. Past performance is no guarantee of future results. |
| | |
| 67 | | Semi-Annual Report | December 31, 2015 (Unaudited) |
| | |
| Blue Chip 35 Index Fund | |
|
| MANAGER’S COMMENTARY (Unaudited) (continued) | | |
| | |
Contribution to Returns for Blue Chip 35 Index Fund stocks for the calendar year December 31, 2015:
| | | | | | |
| Rank | | Company | | Industry | | % Contribution to Return |
| 1 | | Amazon.com, Inc. | | Consumer Discretionary | | 2.7% |
| 2 | | Microsoft Corporation | | Information Technology | | 0.7% |
| 3 | | McDonald’s Corporation | | Consumer Discretionary | | 0.7% |
| 4 | | General Electric Company | | Industrials | | 0.7% |
| 5 | | Visa Inc. Class A | | Information Technology | | 0.6% |
| 6 | | Alphabet Inc. Class A | | Information Technology | | 0.6% |
| 7 | | Alphabet Inc. Class C | | Information Technology | | 0.6% |
| 8 | | Walt Disney Company | | Consumer Discretionary | | 0.4% |
| 9 | | PepsiCo, Inc. | | Consumer Staples | | 0.2% |
| 10 | | Pfizer Inc. | | Health Care | | 0.2% |
| 11 | | AT&T Inc. | | Telecommunication Services | | 0.2% |
| 12 | | Gilead Sciences, Inc. | | Health Care | | 0.2% |
| 13 | | JPMorgan Chase & Co. | | Financials | | 0.2% |
| 14 | | Coca-Cola Company | | Consumer Staples | | 0.1% |
| 15 | | Verizon Communications Inc. | | Telecommunication Services | | 0.1% |
| 16 | | CVS Health Corporation | | Consumer Staples | | 0.1% |
| 17 | | Wells Fargo & Company | | Financials | | 0.0% |
| 18 | | Cisco Systems, Inc. | | Information Technology | | 0.0% |
| 19 | | Johnson & Johnson | | Health Care | | 0.0% |
| 20 | | Comcast Corporation Class A | | Consumer Discretionary | | 0.0% |
| 21 | | Apple, Inc. | | Information Technology | | 0.0% |
| 22 | | Intel Corporation | | Information Technology | | 0.0% |
| 23 | | Merck & Co., Inc. | | Health Care | | -0.1% |
| 24 | | 3M Company | | Industrials | | -0.1% |
| 25 | | Bank of America Corporation | | Financials | | -0.2% |
| 26 | | Procter & Gamble Company | | Consumer Staples | | -0.3% |
| 27 | | International Business Machines Corporation | | Information Technology | | -0.3% |
| 28 | | Exxon Mobil Corporation | | Energy | | -0.3% |
| 29 | | United Parcel Service, Inc. Class B | | Industrials | | -0.3% |
| 30 | | Berkshire Hathaway Inc. Class B | | Financials | | -0.3% |
| 31 | | United Technologies Corporation | | Industrials | | -0.3% |
| 32 | | Chevron Corporation | | Energy | | -0.4% |
| 33 | | Schlumberger NV | | Energy | | -0.4% |
| 34 | | Oracle Corporation | | Information Technology | | -0.5% |
| 35 | | ConocoPhillips | | Energy | | -0.7% |
| 36 | | Wal-Mart Stores, Inc. | | Consumer Staples | | -0.8% |
| 37 | | QUALCOMM Incorporated | | Information Technology | | -0.9% |
| | |
| Blue Chip 35 Index Fund | | |
| MANAGER’S COMMENTARY (Unaudited) (continued) | |
| | |
Industry Sector Representation as of December 31, 2015
| | | | | | | | | | | | | | | |
| | | % of Net Assets | | % of S&P 500 Index | | Difference |
Consumer Discretionary | | | | 12.4% | | | | | 12.9% | | | | | -0.5% | |
Consumer Staples | | | | 13.6% | | | | | 10.1% | | | | | 3.5% | |
Energy | | | | 10.1% | | | | | 6.5% | | | | | 3.6% | |
Financials | | | | 10.2% | | | | | 16.5% | | | | | -6.3% | |
Health Care | | | | 10.7% | | | | | 15.2% | | | | | -4.5% | |
Industrials | | | | 10.5% | | | | | 10.0% | | | | | 0.5% | |
Information Technology | | | | 27.3% | | | | | 20.7% | | | | | 6.6% | |
Materials | | | | 0.0% | | | | | 2.8% | | | | | -2.8% | |
Telecommunication Services | | | | 5.1% | | | | | 2.4% | | | | | 2.7% | |
Utilities | | | | 0.0% | | | | | 3.0% | | | | | -3.0% | |
Cash & Other Assets | | | | 0.1% | | | | | 0.0% | | | | | 0.1% | |
Total | | | | 100.0% | | | | | 100.0% | | | | | | |
Disclaimer
The views expressed here are exclusively those of Fund management. These views, including those concerning market sectors or individual stocks, are not meant as investment advice and should not be considered predictive in nature. Any favorable (or unfavorable) description of a holding applies only as of the quarter end, December 31, 2015, unless otherwise stated. Security positions can and do change thereafter. Discussions of historical performance do not guarantee and are not indicative of future performance.
The Fund is subject to significant market risk (volatility) and is not an appropriate investment for short-term investors.
Conclusion
Thank you for your continued investment in Blue Chip 35 Index Fund. We encourage your feedback; your reactions and concerns are important to us.
Sincerely,
The Investment Management Team
| | |
| 69 | | Semi-Annual Report | December 31, 2015 (Unaudited) |
| | |
| Blue Chip 35 Index Fund | | |
| SCHEDULE OF INVESTMENTS | | |
| Showing percentage of net assets as of December 31, 2015 (Unaudited) | | |
| | | | | | | | | | |
| Industry Company | | Shares | | | Value | | | |
| |
COMMON STOCKS - 99.78% | | | |
Aerospace & Defense - 2.58% | | | |
United Technologies Corp. | | | 153,680 | | | $ | 14,764,038 | | | |
| |
Air Freight & Logistics - 2.52% | | | |
United Parcel Service, Inc., Class B | | | 149,963 | | | | 14,430,939 | | | |
| |
Beverages - 5.12% | | | |
Coca-Cola Co. (The) | | | 339,214 | | | | 14,572,633 | | | |
PepsiCo, Inc. | | | 147,305 | | | | 14,718,716 | | | |
| | | | | | | | | | |
| | | | | | | 29,291,349 | | | |
| |
Biotechnology - 3.03% | | | |
Gilead Sciences, Inc. | | | 171,300 | | | | 17,333,847 | | | |
| |
Commercial Banks - 2.58% | | | |
Wells Fargo & Co. | | | 271,159 | | | | 14,740,203 | | | |
| |
Communications Equipment - 2.52% | | | |
Cisco Systems, Inc. | | | 530,108 | | | | 14,395,083 | | | |
| |
Computers & Peripherals - 3.29% | | | |
Apple, Inc. | | | 178,850 | | | | 18,825,751 | | | |
| |
Diversified Financial Services - 7.64% | | | |
Bank of America Corp. | | | 877,508 | | | | 14,768,460 | | | |
Berkshire Hathaway, Inc., Class B* | | | 107,450 | | | | 14,187,698 | | | |
JPMorgan Chase & Co. | | | 223,495 | | | | 14,757,375 | | | |
| | | | | | | | | | |
| | | | | | | 43,713,533 | | | |
| |
Diversified Telecommunication Services - 5.11% | | | |
AT&T, Inc. | | | 423,625 | | | | 14,576,936 | | | |
Verizon Communications, Inc. | | | 316,189 | | | | 14,614,256 | | | |
| | | | | | | | | | |
| | | | | | | 29,191,192 | | | |
| |
Energy Equipment & Services - 2.51% | | | |
Schlumberger, Ltd. | | | 205,900 | | | | 14,361,525 | | | |
| |
Food & Staples Retailing - 5.87% | | | |
CVS Health Corp. | | | 198,900 | | | | 19,446,453 | | | |
Wal-Mart Stores, Inc. | | | 230,019 | | | | 14,100,165 | | | |
| | | | | | | | | | |
| | | | | | | 33,546,618 | | | |
| |
Hotels, Restaurants & Leisure - 2.77% | | | |
McDonald’s Corp. | | | 134,300 | | | | 15,866,202 | | | |
| |
Household Products - 2.58% | | | |
Procter & Gamble Co. (The) | | | 185,926 | | | | 14,764,384 | | | |
| |
Industrial Conglomerates - 5.37% | | | |
3M Co. | | | 96,250 | | | | 14,499,100 | | | |
| | | | | | | | | | |
| | | | | | | | | | |
| | | | | | | | |
| Industry Company | | Shares | | | Value | |
|
| |
Industrial Conglomerates (continued) | |
General Electric Co. | | | 520,043 | | | $ | 16,199,339 | |
| | | | | | | | |
| | | | | | | 30,698,439 | |
|
Internet & Catalog Retail - 4.23% | |
Amazon.com, Inc.* | | | 35,800 | | | | 24,196,862 | |
|
Internet Software & Services - 3.59% | |
Alphabet, Inc., Class A* | | | 13,370 | | | | 10,401,994 | |
Alphabet, Inc., Class C* | | | 13,314 | | | | 10,103,728 | |
| | | | | | | | |
| | | | | | | 20,505,722 | |
|
IT Services - 6.44% | |
International Business Machines Corp. | | | 104,567 | | | | 14,390,511 | |
Visa, Inc., Class A | | | 289,400 | | | | 22,442,970 | |
| | | | | | | | |
| | | | | | | 36,833,481 | |
|
Media - 5.36% | |
Comcast Corp., Class A | | | 253,500 | | | | 14,305,005 | |
Walt Disney Co. (The) | | | 155,400 | | | | 16,329,432 | |
| | | | | | | | |
| | | | | | | 30,634,437 | |
|
Oil, Gas & Consumable Fuels - 7.62% | |
Chevron Corp. | | | 164,495 | | | | 14,797,970 | |
ConocoPhillips | | | 307,435 | | | | 14,354,140 | |
Exxon Mobil Corp. | | | 185,087 | | | | 14,427,532 | |
| | | | | | | | |
| | | | | | | 43,579,642 | |
|
Pharmaceuticals - 7.64% | |
Johnson & Johnson | | | 144,452 | | | | 14,838,109 | |
Merck & Co., Inc. | | | 277,435 | | | | 14,654,117 | |
Pfizer, Inc. | | | 440,144 | | | | 14,207,848 | |
| | | | | | | | |
| | | | | | | 43,700,074 | |
|
Semiconductors & Semiconductor Equipment - 5.11% | |
Intel Corp. | | | 430,643 | | | | 14,835,651 | |
QUALCOMM, Inc. | | | 287,700 | | | | 14,380,684 | |
| | | | | | | | |
| | | | | | | 29,216,335 | |
|
Software - 6.30% | |
Microsoft Corp. | | | 391,045 | | | | 21,695,177 | |
Oracle Corp. | | | 392,013 | | | | 14,320,235 | |
| | | | | | | | |
| | | | | | | 36,015,412 | |
| | | | | | | | |
TOTAL COMMON STOCKS - 99.78% | | | | 570,605,068 | |
| | | | | | | | |
(Cost $383,053,467) | | | | | | | | |
| | |
| Blue Chip 35 Index Fund | | |
| SCHEDULE OF INVESTMENTS (continued) | | |
| Showing percentage of net assets as of December 31, 2015 (Unaudited) | | |
| | | | | | | | | | | | | | |
| | | Rate^ | | | Shares | | | Value | | | |
| |
MONEY MARKET FUND - 0.32% | | | |
Dreyfus Cash Management Fund | | | 0.18% | | | | 1,833,976 | | | | $1,833,976 | | | |
| | | | | | | | | | | | | | |
TOTAL MONEY MARKET FUND - 0.32% | | | | 1,833,976 | | | |
| | | | | | | | | | | | | | |
(Cost $1,833,976) | | | | | | | | | | | |
| | |
TOTAL INVESTMENTS - 100.10% | | | | $572,439,044 | | | |
(Cost $384,887,443) | | | | | | | | | | | |
Liabilities in Excess of Other Assets - (0.10%) | | | | (555,714 | ) | | |
| | | | | | | | | | | | | | |
NET ASSETS - 100.00% | | | | $571,883,330 | | | |
| | | | | | | | | | | | | | |
* Non-income producing security. ^ Rate disclosed as of December 31, 2015. | | | |
| | | |
| | | |
Summary of inputs used to value the Fund’s investments as of 12/31/2015 (See Note 2 in Notes to Financial Statements):
| | | | | | | | | | | | | | | | |
| | | Valuation Inputs | |
| | | Investment in Securities (Value) | |
| | | Level 1 Quoted Prices | | | Level 2 Significant Observable Inputs | | | Level 3 Significant Unobservable Inputs | | | Total | |
| | | | |
Common Stocks | | $ | 570,605,068 | | | $ | — | | | $ | — | | | $ | 570,605,068 | |
Money Market Fund | | | — | | | | 1,833,976 | | | | — | | | | 1,833,976 | |
| | | | | | | | | | | | | | | | |
TOTAL | | $ | 570,605,068 | | | $ | 1,833,976 | | | $ | — | | | $ | 572,439,044 | |
| | | | | | | | | | | | | | | | |
See Notes to Financial Statements.
| | |
| 71 | | Semi-Annual Report | December 31, 2015 (Unaudited) |
| | |
| Managed Volatility Fund | | |
| MANAGER’S COMMENTARY (Unaudited) | | |
| | |
December 31, 2015
Dear Fellow Managed Volatility Fund Shareholder,
For the quarter ended December 31, 2015, our Fund returned 3.19%, underperforming our primary market benchmark, the S&P 500 Index (7.04%), but outperforming our peer benchmark, the Lipper Balanced Funds Index (2.98%), and the fixed-income only Bloomberg/EFFAS U.S. Government 1-3 Year Total Return Bond Index (-0.46%). Performance for the quarter was in line with the Fund’s design.
For the six-month semi-annual period ended December 31, 2015, our Fund returned -0.12%, trailing the S&P 500 Index (0.15%) and the Bloomberg/EFFAS U.S. Government 1-3 Year Total Return Bond Index (-0.10%). However, we outperformed the Lipper Balanced Funds Index (-1.75%).
For the calendar year, our Fund returned 0.17%, trailing the S&P 500 Index (1.38%) and the Bloomberg/EFFAS U.S. Government 1-3 Year Total Return Bond Index (0.56%), but beating the Lipper Balanced Funds Index (-0.42%).
The table below presents our December quarter, six months, one-year, five-year, 10-year, and inception-to-date financial results.
Standardized Returns as of December 31, 2015
| | | | | | | | | | | | | | | | | | | | | | | | | | |
| | | | | | | | | | | | Annualized |
| | | Quarter | | | 6 Months | | | 1 Year | | | 5 Years | | | 10 Years | | | Since Inception
(6/30/01) | | | |
| | | | | | | |
Managed Volatility Fund | | | 3.19% | | | | -0.12% | | | | 0.17% | | | | 4.70% | | | | 3.17% | | | | 3.92% | | | |
S&P 500 Index | | | 7.04% | | | | 0.15% | | | | 1.38% | | | | 12.57% | | | | 7.31% | | | | 5.68% | | | |
Bloomberg/EFFAS U.S. Government 1-3 Year Total Return Bond Index | | | -0.46% | | | | -0.10% | | | | 0.56% | | | | 0.77% | | | | 2.48% | | | | 2.71% | | | |
Lipper Balanced Funds Index | | | 2.98% | | | | -1.75% | | | | -0.42% | | | | 6.98% | | | | 5.43% | | | | 5.08% | | | |
Performance figures quoted in the table above represent past performance and are no guarantee of future results. Total return figures in the table above include the reinvestment of dividends and capital gains. The table above does not reflect the deduction of taxes that a shareholder would pay on Fund distributions or on the redemption of Fund shares.
The S&P 500 Index is a broad-based, unmanaged measurement of changes in stock market conditions, based on the average of 500 widely held common stocks with dividends reinvested. The Bloomberg/EFFAS U.S. Government 1-3 year Total Return Bond Index is a transparent benchmark for the total return of the 1-3 year U.S. Government bond market. The Lipper Balanced Funds Index is an index of balanced funds compiled by Lipper, Inc. It is not possible to invest directly in an index. Periods longer than one year are annualized.
According to data from Lipper, Inc. as of December 31, 2015, the Managed Volatility Fund ranked 116th of 333 Alternative Long/Short Equity funds for the 12 months ended December 31, 2015, 43rd of 97 over the past five years, 14th of 34 over the last 10 years, and 5th of 15 funds since inception on June 30, 2001. Lipper, Inc. is an independent mutual fund rating service that ranks funds in various fund categories by making comparative calculations using total returns.
According to data from Morningstar as of December 31, 2015, the Managed Volatility Fund ranked 157th of 439 Long-Short funds for the 12 months ended September 31, 2015, 46th of 104 funds over the past five years, and 18th of 33 funds over the last 10 years. Morningstar ranks funds in various fund categories by making comparative calculations using total returns.
| | |
| Managed Volatility Fund | | |
| MANAGER’S COMMENTARY (Unaudited) (continued) | | |
| | |
Managed Volatility Fund vs. S&P 500 Index, Bloomberg/EFFAS Bond Index & Lipper Balanced Funds Index
from Inception 6/30/01 to 12/31/15
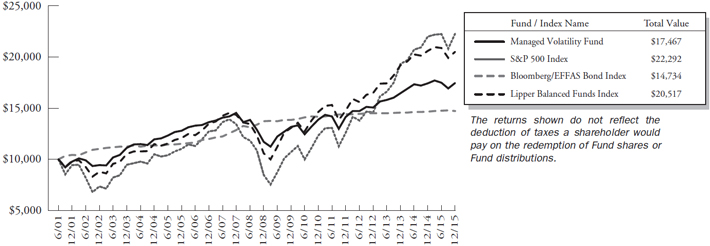
Detailed Explanation of Quarterly Performance
The Fund’s 3.19% return represents 45% of the S&P 500 Index’s return of 7.04% for the quarter, which is in line with our objective of capturing 40% of the market’s upside over the long term. During a quarter that saw strong gains for stocks, the equity and option components drove the Fund’s performance, contributing approximately 3.1% and 1.7% to returns, respectively. The futures and fixed-income components returned -1.5% and -0.2%, respectively, which is in line with our expectations for their performance during market conditions such as we experienced in the quarter.
Detailed Explanation of Calendar Year Performance
For the calendar year, the Fund’s 0.17% return failed to capture at least 40% of the S&P 500’s Index’s 1.38% return. The Fund’s equity and fixed-income components were responsible for this underperformance, returning -2.14% and -0.04%, respectively. These declines were partially offset by derivative performance, specifically, a 2.19% return for the Fund’s options component and a 0.16% return for its futures component.
For the calendar year, the Fund had a standard deviation of 4.85, which was 37% of the index’s 13.08 standard deviation during the same period. The Fund continues to perform as designed, particularly over longer time horizons. For 10 years and since inception, the Fund has captured 43% and 69%, respectively, of the S&P 500 Index’s return, with a standard deviation roughly 45% of the Index.
| | |
| 73 | | Semi-Annual Report | December 31, 2015 (Unaudited) |
| | |
| Managed Volatility Fund | | |
| MANAGER’S COMMENTARY (Unaudited) (continued) | | |
| | |
Top Ten Holdings as of December 31, 2015
| | | | | | | | | |
| Rank | | Description | | Industry | | % of Net
Assets |
| 1 | | Facebook Inc | | Internet Software & Services | | | | 1.6 | % |
| 2 | | Gilead Sciences Inc | | Biotechnology | | | | 1.4 | % |
| 3 | | Exxon Mobil Corp | | Oil, Gas & Consumable Fuels | | | | 1.1 | % |
| 4 | | American Airlines Group Inc | | Airlines | | | | 1.0 | % |
| 5 | | Everest Re Group Ltd | | Insurance | | | | 1.0 | % |
| 6 | | Tyco International Plc | | Commercial Services & Supplies | | | | 0.9 | % |
| 7 | | United Continental Holdings Inc | | Airlines | | | | 0.9 | % |
| 8 | | United Rentals Inc | | Trading Companies & Distributors | | | | 0.9 | % |
| 9 | | Apple Inc | | Computers & Peripherals | | | | 0.9 | % |
| 10 | | Skyworks Solutions Inc | | Semiconductors & Semiconductor Equipment | | | | 0.9 | % |
| | Total | | | | | | 10.6 | % |
Industry Sector Representation as of December 31, 2015
| | | | |
| Asset Type | | % of Net Assets | |
Common Stock | | | 59.8% | |
Consumer Discretionary | | | 11.4% | |
Consumer Staples | | | 8.6% | |
Energy | | | 7.6% | |
Financials | | | 15.7% | |
Health Care | | | 14.0% | |
Industrials | | | 14.4% | |
Information Technology | | | 19.0% | |
Materials | | | 4.9% | |
Telecommunication Services | | | 2.2% | |
Utilities | | | 2.2% | |
U.S. Government Obligations | | | 38.7% | |
Call Options Written | | | -0.7% | |
Put Options Written | | | -0.9% | |
Money Market Funds | | | 1.5% | |
Other Assets in Excess of Liabilities | | | 1.6% | |
Total | | | 100% | |
Disclaimer
The views expressed here are exclusively those of Fund management. These views, including those related to market sectors or individual stocks, are not meant as investment advice and should not be considered predictive in nature. Any favorable (or unfavorable) description of a holding applies only as of the quarter end, December 31, 2015, unless otherwise stated. Security positions can and do change thereafter. Discussions of historical performance do not guarantee and may not be indicative of future performance.
Market volatility can significantly affect short-term performance. The Fund is not an appropriate investment for short-term investors. Investments in the small companies within this multi-cap fund generally carry greater risk than is customarily associated with larger companies. This additional risk is attributable to a number of factors, including the relatively limited financial resources that are typically available to small companies and the fact that small companies often have comparatively limited product lines. In addition, the stock of small companies tends to be more volatile than the stock of large companies, particularly in the short term and particularly in the early stages of an economic or market downturn. The Fund’s use of options, futures, and leverage can magnify the risk of loss in an unfavorable market, and the Fund’s use of short-sale positions can, in
| | |
| Managed Volatility Fund | | |
| MANAGER’S COMMENTARY (Unaudited) (continued) | | |
| | |
theory, expose shareholders to unlimited loss. Shareholders of the Fund, therefore, are taking on more risk than they would if they invested in the stock market as a whole. The Fund uses an option writing strategy in which the Fund may sell covered calls or secured put options. Options are subject to special risks and may not fully protect the Fund against declines in the value of its stocks. In addition, an option writing strategy limits the upside profit potential normally associated with stocks. Finally, the Fund’s fixed-income holdings are subject to three types of risk. Interest rate risk is the chance that bond prices overall will decline as interest rates rise. Credit risk is the chance that a bond issuer will fail to pay interest and principal. Prepayment risk is the chance that a mortgage-backed bond issuer will repay a higher yielding bond, resulting in a lower paying yield.
Conclusion
Thank you for your continued investment in Managed Volatility Fund. We encourage your feedback; your reactions and concerns are important to us.
Sincerely,
The Investment Management Team
| | |
| 75 | | Semi-Annual Report | December 31, 2015 (Unaudited) |
| | |
| Managed Volatility Fund | | |
| SCHEDULE OF INVESTMENTS | | |
| Showing percentage of net assets as of December 31, 2015 (Unaudited) | | |
| | | | | | | | | | |
| Industry Company | | Shares | | | Value | | | |
| |
COMMON STOCKS - 59.83% | | | |
Aerospace & Defense - 1.60% | | | |
Honeywell International, Inc. | | | 1,700 | | | | $ 176,069 | | | |
Lockheed Martin Corp. | | | 870 | | | | 188,920 | | | |
Northrop Grumman Corp.# | | | 1,100 | | | | 207,691 | | | |
Raytheon Co.# | | | 1,800 | | | | 224,154 | | | |
United Technologies Corp. | | | 1,140 | | | | 109,520 | | | |
| | | | | | | | | | |
| | | | | | | 906,354 | | | |
| |
Air Freight & Logistics - 0.31% | | | |
FedEx Corp.# | | | 1,200 | | | | 178,788 | | | |
| |
Airlines - 2.20% | | | |
American Airlines Group, Inc.# | | | 13,000 | | | | 550,550 | | | |
Southwest Airlines Co.# | | | 4,200 | | | | 180,852 | | | |
United Continental Holdings, Inc.*# | | | 9,000 | | | | 515,700 | | | |
| | | | | | | | | | |
| | | | | | | 1,247,102 | | | |
| |
Auto Components - 0.34% | | | |
Delphi Automotive PLC | | | 900 | | | | 77,157 | | | |
Goodyear Tire & Rubber Co. (The)# | | | 2,400 | | | | 78,408 | | | |
Johnson Controls, Inc. | | | 900 | | | | 35,541 | | | |
| | | | | | | | | | |
| | | | | | | 191,106 | | | |
| |
Automobiles - 0.33% | | | |
Ford Motor Co.# | | | 7,400 | | | | 104,266 | | | |
General Motors Co.# | | | 2,500 | | | | 85,025 | | | |
| | | | | | | | | | |
| | | | | | | 189,291 | | | |
| |
Beverages - 1.01% | | | |
Coca-Cola Co. (The)# | | | 2,500 | | | | 107,400 | | | |
Constellation Brands, Inc., Class A# | | | 2,100 | | | | 299,124 | | | |
PepsiCo, Inc.# | | | 1,700 | | | | 169,864 | | | |
| | | | | | | | | | |
| | | | | | | 576,388 | | | |
| |
Biotechnology - 2.70% | | | |
Alexion Pharmaceuticals, Inc,* | | | 500 | | | | 95,375 | | | |
Amgen, Inc.# | | | 1,600 | | | | 259,728 | | | |
Biogen, Inc.*# | | | 900 | | | | 275,715 | | | |
Celgene Corp.* | | | 1,100 | | | | 131,736 | | | |
Gilead Sciences, Inc.# | | | 7,600 | | | | 769,044 | | | |
| | | | | | | | | | |
| | | | | | | 1,531,598 | | | |
| |
Capital Markets - 1.29% | | | |
Ameriprise Financial, Inc. | | | 680 | | | | 72,366 | | | |
BlackRock, Inc. | | | 300 | | | | 102,156 | | | |
| | | | | | | | | | |
| | | | | | | | | | |
| | | | | | | | |
| Industry Company | | Shares | | | Value | |
|
| |
Capital Markets (continued) | |
Charles Schwab Corp. (The)# | | | 7,100 | | | | $ 233,803 | |
Goldman Sachs Group, Inc. (The) | | | 700 | | | | 126,161 | |
Morgan Stanley# | | | 3,300 | | | | 104,973 | |
State Street Corp. | | | 1,400 | | | | 92,904 | |
| | | | | | | | |
| | | | | | | 732,363 | |
|
Chemicals - 2.01% | |
Ashland, Inc.# | | | 4,500 | | | | 462,150 | |
Dow Chemical Co. (The)# | | | 2,700 | | | | 138,996 | |
LyondellBasell Industries NV, Class A# | | | 1,200 | | | | 104,280 | |
Monsanto Co.# | | | 1,300 | | | | 128,076 | |
PPG Industries, Inc. | | | 800 | | | | 79,056 | |
Praxair, Inc. | | | 1,200 | | | | 122,880 | |
Sherwin-Williams Co. (The) | | | 400 | | | | 103,840 | |
| | | | | | | | |
| | | | | | | 1,139,278 | |
|
Commercial Banks - 2.16% | |
BB&T Corp. | | | 1,500 | | | | 56,715 | |
CIT Group, Inc.# | | | 7,500 | | | | 297,750 | |
Comerica, Inc.# | | | 1,100 | | | | 46,013 | |
Huntington Bancshares, Inc. | | | 7,700 | | | | 85,162 | |
KeyCorp# | | | 4,800 | | | | 63,312 | |
PNC Financial Services Group, Inc. (The)# | | | 2,100 | | | | 200,151 | |
U.S. Bancorp# | | | 4,100 | | | | 174,947 | |
Wells Fargo & Co.# | | | 5,571 | | | | 302,839 | |
| | | | | | | | |
| | | | | | | 1,226,889 | |
|
Commercial Services & Supplies - 1.14% | |
Tyco International PLC# | | | 16,400 | | | | 522,996 | |
Waste Management, Inc.# | | | 2,300 | | | | 122,751 | |
| | | | | | | | |
| | | | | | | 645,747 | |
|
Communications Equipment - 0.96% | |
Cisco Systems, Inc.# | | | 12,500 | | | | 339,437 | |
Juniper Networks, Inc.# | | | 7,500 | | | | 207,000 | |
| | | | | | | | |
| | | | | | | 546,437 | |
|
Computers & Peripherals - 1.39% | |
Apple, Inc.# | | | 4,700 | | | | 494,722 | |
EMC Corp.# | | | 2,000 | | | | 51,360 | |
HP, Inc. | | | 5,900 | | | | 69,856 | |
SanDisk Corp. | | | 1,300 | | | | 98,787 | |
Western Digital Corp. | | | 1,200 | | | | 72,060 | |
| | | | | | | | |
| | | | | | | 786,785 | |
| | |
| Managed Volatility Fund | |
|
| SCHEDULE OF INVESTMENTS (continued) | | |
| Showing percentage of net assets as of December 31, 2015 (Unaudited) | | |
| | | | | | | | | | |
| Industry Company | | Shares | | | Value | | | |
| |
Common Stocks (continued) | | | |
Consumer Finance - 0.56% | | | |
American Express Co.# | | | 1,800 | | | $ | 125,190 | | | |
Capital One Financial Corp.# | | | 2,000 | | | | 144,360 | | | |
Santander Consumer USA | | | | | | | | | | |
Holdings, Inc.*# | | | 3,000 | | | | 47,550 | | | |
| | | | | | | | | | |
| | | | | | | 317,100 | | | |
| |
Containers & Packaging - 0.05% | | | |
Ball Corp. | | | 400 | | | | 29,092 | | | |
| |
Diversified Financial Services - 1.88% | | | |
Bank of America Corp.# | | | 7,800 | | | | 131,274 | | | |
Berkshire Hathaway, Inc., Class B* | | | 1,600 | | | | 211,264 | | | |
Citigroup, Inc.# | | | 5,110 | | | | 264,443 | | | |
JPMorgan Chase & Co.# | | | 4,400 | | | | 290,532 | | | |
McGraw Hill Financial, Inc.# | | | 1,000 | | | | 98,580 | | | |
Voya Financial, Inc.# | | | 2,000 | | | | 73,820 | | | |
| | | | | | | | | | |
| | | | | | | 1,069,913 | | | |
| |
Diversified Telecommunication Services - 1.34% | | | |
AT&T, Inc.# | | | 8,200 | | | | 282,162 | | | |
CenturyLink, Inc.# | | | 10,800 | | | | 271,728 | | | |
Verizon Communications, Inc.# | | | 4,500 | | | | 207,990 | | | |
| | | | | | | | | | |
| | | | | | | 761,880 | | | |
| |
Electric Utilities - 0.62% | | | |
American Electric Power Co., Inc. | | | 1,900 | | | | 110,713 | | | |
Duke Energy Corp. | | | 1,683 | | | | 120,149 | | | |
Exelon Corp.# | | | 4,300 | | | | 119,411 | | | |
| | | | | | | | | | |
| | | | | | | 350,273 | | | |
| |
Electrical Equipment - 0.65% | | | |
Emerson Electric Co.# | | | 1,500 | | | | 71,745 | | | |
Garmin, Ltd.# | | | 8,000 | | | | 297,360 | | | |
| | | | | | | | | | |
| | | | | | | 369,105 | | | |
| |
Energy Equipment & Services - 0.83% | | | |
Halliburton Co. | | | 1,700 | | | | 57,868 | | | |
Helmerich & Payne, Inc.+ | | | 1,000 | | | | 53,550 | | | |
National Oilwell Varco, Inc.# | | | 10,800 | | | | 361,692 | | | |
| | | | | | | | | | |
| | | | | | | 473,110 | | | |
| | | |
Financials - 0.10% | | | | | | | | | | |
PayPal Holdings, Inc.*# | | | 1,500 | | | | 54,300 | | | |
| |
Food & Staples Retailing - 1.14% | | | |
Costco Wholesale Corp. | | | 700 | | | | 113,050 | | | |
CVS Health Corp.# | | | 1,800 | | | | 175,986 | | | |
| | | | | | | | |
| Industry Company | | Shares | | | Value | |
|
Food & Staples Retailing (continued) | |
Kroger Co. (The)# | | | 5,000 | | | $ | 209,150 | |
Wal-Mart Stores, Inc.# | | | 2,400 | | | | 147,120 | |
| | | | | | | | |
| | | | | | | 645,306 | |
|
Food Products - 2.07% | |
Archer-Daniels-Midland Co.# | | | 2,900 | | | | 106,372 | |
General Mills, Inc.# | | | 3,200 | | | | 184,512 | |
JM Smucker Co. (The)# | | | 1,400 | | | | 172,676 | |
Keurig Green Mountain, Inc. | | | 900 | | | | 80,982 | |
Mondelez International, Inc.# | | | 3,600 | | | | 161,424 | |
WhiteWave Foods Co. (The)*# | | | 12,000 | | | | 466,920 | |
| | | | | | | | |
| | | | | | | 1,172,886 | |
|
Health Care Equipment & Supplies - 1.05% | |
Abbott Laboratories# | | | 1,800 | | | | 80,838 | |
Baxter International, Inc.# | | | 1,300 | | | | 49,595 | |
Becton Dickinson & Co.# | | | 920 | | | | 141,763 | |
C.R. Bard, Inc.# | | | 1,100 | | | | 208,384 | |
Stryker Corp.# | | | 1,260 | | | | 117,104 | |
| | | | | | | | |
| | | | | | | 597,684 | |
|
Health Care Providers & Services - 2.08% | |
AmerisourceBergen Corp. | | | 500 | | | | 51,855 | |
Centene Corp.*# | | | 7,000 | | | | 460,670 | |
DaVita HealthCare Partners, Inc.* | | | 1,600 | | | | 111,536 | |
Express Scripts Holding Co.* | | | 1,334 | | | | 116,605 | |
Laboratory Corp. of America Holdings* | | | 900 | | | | 111,276 | |
UnitedHealth Group, Inc.# | | | 2,800 | | | | 329,392 | |
| | | | | | | | |
| | | | | | | 1,181,334 | |
|
Hotels, Restaurants & Leisure - 1.10% | |
Carnival Corp.# | | | 1,700 | | | | 92,616 | |
McDonald’s Corp. | | | 900 | | | | 106,326 | |
Starbucks Corp.# | | | 2,700 | | | | 162,081 | |
Starwood Hotels & Resorts Worldwide, Inc.# | | | 2,800 | | | | 193,984 | |
Wynn Resorts, Ltd.+ | | | 500 | | | | 34,595 | |
Yum! Brands, Inc.# | | | 500 | | | | 36,525 | |
| | | | | | | | |
| | | | | | | 626,127 | |
|
Household Products - 0.90% | |
Colgate-Palmolive Co.# | | | 2,500 | | | | 166,550 | |
Kimberly-Clark Corp.# | | | 1,400 | | | | 178,220 | |
Procter & Gamble Co. (The)# | | | 2,100 | | | | 166,761 | |
| | | | | | | | |
| | | | | | | 511,531 | |
| | |
| 77 | | Semi-Annual Report | December 31, 2015 (Unaudited) |
| | |
| Managed Volatility Fund | |
|
| SCHEDULE OF INVESTMENTS (continued) | | |
| Showing percentage of net assets as of December 31, 2015 (Unaudited) | | |
| | | | | | | | | | |
| Industry Company | | Shares | | | Value | | | |
| |
Common Stocks (continued) | | | |
Independent Power Producers & Energy
Traders - 0.11% | | | |
AES Corp. | | | 6,800 | | | $ | 65,076 | | | |
| |
Industrial Conglomerates - 1.02% | | | |
3M Co.# | | | 1,400 | | | | 210,896 | | | |
Danaher Corp.# | | | 2,400 | | | | 222,912 | | | |
General Electric Co.# | | | 4,600 | | | | 143,290 | | | |
| | | | | | | | | | |
| | | | | | | 577,098 | | | |
| | | |
Insurance - 2.23% | | | | | | | | | | |
Aon PLC# | | | 1,600 | | | | 147,536 | | | |
Chubb Corp. (The) | | | 600 | | | | 79,584 | | | |
Everest Re Group, Ltd.# | | | 3,000 | | | | 549,270 | | | |
Progressive Corp. (The) | | | 2,020 | | | | 64,236 | | | |
Reinsurance Group of America, Inc.# | | | 1,000 | | | | 85,550 | | | |
Travelers Cos., Inc. (The)# | | | 3,000 | | | | 338,580 | | | |
| | | | | | | | | | |
| | | | | | | 1,264,756 | | | |
| |
Internet & Catalog Retail - 0.82% | | | |
Amazon.com, Inc.*# | | | 500 | | | | 337,945 | | | |
Priceline Group, Inc. (The)* | | | 100 | | | | 127,495 | | | |
| | | | | | | | | | |
| | | | | | | 465,440 | | | |
| |
Internet Software & Services - 2.40% | | | |
Alphabet, Inc., Class A*# | | | 260 | | | | 202,283 | | | |
Alphabet, Inc., Class C* | | | 260 | | | | 197,309 | | | |
eBay, Inc.*# | | | 1,500 | | | | 41,220 | | | |
Facebook, Inc., Class A*# | | | 8,800 | | | | 921,008 | | | |
| | | | | | | | | | |
| | | | | | | 1,361,820 | | | |
| | | |
IT Services - 1.92% | | | | | | | | | | |
Automatic Data Processing, Inc.# | | | 1,300 | | | | 110,136 | | | |
Cognizant Technology Solutions Corp., Class A*# | | | 4,100 | | | | 246,082 | | | |
International Business Machines Corp. | | | 1,300 | | | | 178,906 | | | |
MasterCard, Inc., Class A# | | | 1,200 | | | | 116,832 | | | |
Teradata Corp.*+ | | | 400 | | | | 10,568 | | | |
Visa, Inc., Class A# | | | 5,200 | | | | 403,260 | | | |
Western Union Co. (The) | | | 1,500 | | | | 26,865 | | | |
| | | | | | | | | | |
| | | | | | | 1,092,649 | | | |
| |
Leisure Equipment & Products - 0.18% | | | |
Hasbro, Inc. | | | 1,500 | | | | 101,040 | | | |
| |
Life Sciences Tools & Services - 0.35% | | | |
Thermo Fisher Scientific, Inc.# | | | 1,400 | | | | 198,590 | | | |
| | | |
Machinery - 0.36% | | | | | | | | | | |
Deere & Co.#+ | | | 2,700 | | | | 205,929 | | | |
| | | | | | | | |
| Industry Company | | Shares | | | Value | |
| | |
Media - 1.43% | | | | | | | | |
Comcast Corp., Class A# | | | 3,850 | | | $ | 217,256 | |
News Corp., Class A | | | 3,300 | | | | 44,088 | |
Omnicom Group, Inc. | | | 1,200 | | | | 90,792 | |
Scripps Networks Interactive, Inc., Class A | | | 1,400 | | | | 77,294 | |
Time Warner, Inc. | | | 933 | | | | 60,337 | |
Twenty-First Century Fox, Inc., Class A# | | | 3,300 | | | | 89,628 | |
Walt Disney Co. (The)# | | | 2,200 | | | | 231,176 | |
| | | | | | | | |
| | | | | | | 810,571 | |
| | |
Metals & Mining - 0.73% | | | | | | | | |
Alcoa, Inc.# | | | 33,000 | | | | 325,710 | |
Freeport-McMoRan, Inc.# | | | 13,000 | | | | 88,010 | |
| | | | | | | | |
| | | | | | | 413,720 | |
| | |
Multiline Retail - 0.62% | | | | | | | | |
Big Lots, Inc. | | | 500 | | | | 19,270 | |
Dollar General Corp.# | | | 2,300 | | | | 165,301 | |
Target Corp. | | | 2,300 | | | | 167,003 | |
| | | | | | | | |
| | | | | | | 351,574 | |
| | |
Multi-Utilities - 0.58% | | | | | | | | |
Dominion Resources, Inc. | | | 1,920 | | | | 129,869 | |
Public Service Enterprise Group, Inc. | | | 2,300 | | | | 88,987 | |
Sempra Energy | | | 1,200 | | | | 112,812 | |
| | | | | | | | |
| | | | | | | 331,668 | |
|
Oil, Gas & Consumable Fuels - 3.70% | |
Anadarko Petroleum Corp. | | | 1,000 | | | | 48,580 | |
Apache Corp. | | | 500 | | | | 22,235 | |
California Resources Corp. | | | 480 | | | | 1,118 | |
Chesapeake Energy Corp.#+ | | | 2,100 | | | | 9,450 | |
Chevron Corp.# | | | 2,378 | | | | 213,925 | |
ConocoPhillips# | | | 1,787 | | | | 83,435 | |
EOG Resources, Inc. | | | 1,000 | | | | 70,790 | |
Exxon Mobil Corp.# | | | 7,800 | | | | 608,010 | |
Kinder Morgan, Inc.# | | | 3,300 | | | | 49,236 | |
Marathon Petroleum Corp.# | | | 2,400 | | | | 124,416 | |
Murphy Oil Corp.# | | | 11,300 | | | | 253,685 | |
Occidental Petroleum Corp. | | | 1,200 | | | | 81,132 | |
Phillips 66 | | | 1,693 | | | | 138,487 | |
Southwestern Energy Co.*# | | | 13,000 | | | | 92,430 | |
Valero Energy Corp.# | | | 4,100 | | | | 289,911 | |
Williams Cos., Inc. (The)# | | | 500 | | | | 12,850 | |
| | | | | | | | |
| | | | | | | 2,099,690 | |
|
Paper & Forest Products - 0.14% | |
International Paper Co. | | | 2,100 | | | | 79,170 | |
| | |
| Managed Volatility Fund | |
|
| SCHEDULE OF INVESTMENTS (continued) | | |
| Showing percentage of net assets as of December 31, 2015 (Unaudited) | | |
| | | | | | | | | | |
| Industry Company | | Shares | | | Value | | | |
| |
Common Stocks (continued) | | | |
Pharmaceuticals - 2.22% | | | |
AbbVie, Inc.# | | | 4,000 | | | $ | 236,960 | | | |
Allergan PLC*# | | | 300 | | | | 93,750 | | | |
Baxalta, Inc. | | | 1,300 | | | | 50,739 | | | |
Bristol-Myers Squibb Co.# | | | 2,279 | | | | 156,772 | | | |
Johnson & Johnson# | | | 3,300 | | | | 338,976 | | | |
Merck & Co., Inc.# | | | 4,200 | | | | 221,844 | | | |
Pfizer, Inc.# | | | 5,100 | | | | 164,628 | | | |
| | | | | | | | | | |
| | | | | | | 1,263,669 | | | |
| |
Professional Services - 0.18% | | | |
Nielsen Holdings PLC# | | | 2,200 | | | | 102,520 | | | |
| |
Real Estate Investment Trusts (REITs) - 1.28% | | | |
American Tower Corp.# | | | 1,200 | | | | 116,340 | | | |
Crown Castle International | | | | | | | | | | |
Corp. | | | 1,200 | | | | 103,740 | | | |
Public Storage | | | 1,100 | | | | 272,470 | | | |
Simon Property Group, Inc. | | | 1,200 | | | | 233,328 | | | |
| | | | | | | | | | |
| | | | | | | 725,878 | | | |
| | | |
Road & Rail - 0.61% | | | | | | | | | | |
Avis Budget Group, Inc.*# | | | 7,000 | | | | 254,030 | | | |
Union Pacific Corp. | | | 1,200 | | | | 93,840 | | | |
| | | | | | | | | | |
| | | | | | | 347,870 | | | |
| |
Semiconductors & Semiconductor
Equipment - 2.50% | | | |
Applied Materials, Inc.# | | | 10,300 | | | | 192,301 | | | |
Intel Corp.# | | | 3,600 | | | | 124,020 | | | |
Micron Technology, Inc.*# | | | 28,000 | | | | 396,480 | | | |
QUALCOMM, Inc.# | | | 2,800 | | | | 139,958 | | | |
Skyworks Solutions, Inc.# | | | 6,400 | | | | 491,712 | | | |
Texas Instruments, Inc. | | | 1,370 | | | | 75,090 | | | |
| | | | | | | | | | |
| | | | | | | 1,419,561 | | | |
| | | |
Software - 2.07% | | | | | | | | | | |
Adobe Systems, Inc.* | | | 800 | | | | 75,152 | | | |
Citrix Systems, Inc.*# | | | 1,600 | | | | 121,040 | | | |
Electronic Arts, Inc.*# | | | 2,000 | | | | 137,440 | | | |
Hewlett Packard Enterprise Co.# | | | 5,900 | | | | 89,680 | | | |
Intuit, Inc. | | | 1,300 | | | | 125,450 | | | |
Microsoft Corp.# | | | 6,300 | | | | 349,524 | | | |
Oracle Corp.# | | | 5,460 | | | | 199,454 | | | |
salesforce.com, inc.* | | | 1,000 | | | | 78,400 | | | |
| | | | | | | | | | |
| | | | | | | 1,176,140 | | | |
| | | |
Specialty Retail - 1.03% | | | | | | | | | | |
AutoZone, Inc.*# | | | 600 | | | | 445,146 | | | |
Gap, Inc. (The)# | | | 600 | | | | 14,820 | | | |
Ross Stores, Inc.# | | | 2,300 | | | | 123,763 | | | |
| | | | | | | | | | |
| | | | | | | 583,729 | | | |
| | | | | | | | |
| Industry Company | | Shares | | | Value | |
|
Textiles, Apparel & Luxury Goods - 0.46% | |
NIKE, Inc., Class B# | | | 4,200 | | | $ | 262,500 | |
|
Trading Companies & Distributors - 1.08% | |
NOW, Inc.* | | | 200 | | | | 3,164 | |
United Rentals, Inc.*# | | | 7,000 | | | | 507,780 | |
Veritiv Corp.*+ | | | 28 | | | | 1,014 | |
W.W. Grainger, Inc.+ | | | 500 | | | | 101,295 | |
| | | | | | | | |
| | | | | | | 613,253 | |
| | | | | | | | |
TOTAL COMMON STOCKS - 59.83% | | | | 33,971,678 | |
| | | | | | | | |
(Cost $29,513,532) | | | | | | | | |
| | | | | | | | | | | | |
| Due Date | | Discount Rate
or Coupon Rate | | | Principal
Amount | | | Value | |
|
U.S. GOVERNMENT OBLIGATIONS - 38.73% | |
U.S. Treasury Bills - 38.73% | |
01/14/2016 | | | 0.000 | %(a) | | $ | 4,000,000 | | | | 3,999,876 | |
02/25/2016 | | | 0.000 | %(a) | | | 3,000,000 | | | | 2,999,637 | |
03/03/2016 | | | 0.000 | %(a) | | | 4,000,000 | | | | 3,999,296 | |
03/17/2016 | | | 0.000 | %(a) | | | 4,000,000 | | | | 3,999,188 | |
03/24/2016 | | | 0.000 | %(a) | | | 4,000,000 | | | | 3,998,424 | |
03/31/2016 | | | 0.000 | %(a) | | | 3,000,000 | | | | 2,998,734 | |
| | | | | | | | | | | | |
| | | | | | | | | | | 21,995,155 | |
| | | | | | | | | | | | |
TOTAL U.S. GOVERNMENT OBLIGATIONS - 38.73% | | | | | | | | 21,995,155 | |
| | | | | | | | | | | | |
(Cost $21,991,257) | | | | | |
| | | |
| | | Rate^ | | | Shares | | | Value | |
| |
MONEY MARKET FUND - 1.54% | | | | | |
Dreyfus Cash Management Fund | | | 0.18 | % | | | 875,937 | | | | 875,937 | |
| | | | | | | | | | | | |
TOTAL MONEY MARKET FUND — 1.54% | | | | 875,937 | |
| | | | | | | | | | | | |
(Cost $875,937) | | | | | | | | | |
|
INVESTMENTS PURCHASED WITH CASH PROCEEDS FROM SECURITIES LENDING - 0.37% | |
Dreyfus Cash Management Fund** | | | 0.18 | % | | | 207,932 | | | | 207,932 | |
| | | | | | | | | | | | |
TOTAL INVESTMENTS PURCHASED WITH CASH PROCEEDS FROM SECURITIES LENDING - 0.37% | | | | 207,932 | |
| | | | | | | | | | | | |
(Cost $207,932) | | | | | | | | | |
| | |
| 79 | | Semi-Annual Report | December 31, 2015 (Unaudited) |
| | |
| Managed Volatility Fund | |
|
| SCHEDULE OF INVESTMENTS (continued) | | |
| Showing percentage of net assets as of December 31, 2015 (Unaudited) | | |
| | | | | | |
| | | Value | | | |
| | |
TOTAL INVESTMENTS - 100.47% | | | $57,050,702 | | | |
(Cost $52,588,658) | | | | | | |
Liabilities in Excess of Other Assets - (0.47%) | | | (268,112 | ) | | |
| | | | | | |
NET ASSETS - 100.00% | | | $56,782,590 | | | |
| | | | | | |
* Non-income producing security. ** This security represents the investment of the collateral received in connection with securities out on loan as of December 31, 2015. # Security subject to call or put option written by the Fund. ^ Rate disclosed as of December 31, 2015. + This security or a portion of the security is out on loan as of December 31, 2015. Total loaned securities had a value of $183,874 as of December 31, 2015. (a) Rate represents the effective yield at purchase. PLC - Public Limited Company See Notes to Financial Statements. | | | |
| | |
| Managed Volatility Fund | |
|
| SCHEDULE OF OPTIONS WRITTEN | | |
| Showing percentage of net assets as of December 31, 2015 (Unaudited) | | |
| | | | | | | | | | | | |
| Company | | Number
of Contracts | | Value | | | |
| |
CALL OPTIONS WRITTEN - (0.73%) | | | |
| | | | |
3M Co. | | | | | | | | | | | | |
Expiring January, 2016 at $150.00 | | | 4 | | | | | $ | (1,280) | | | |
Abbott Laboratories | | | | | | | | | | | | |
Expiring January, 2016 at $47.00 | | | 5 | | | | | | (50) | | | |
AbbVie, Inc. | | | | | | | | | | | | |
Expiring February, 2016 at $57.50 | | | 12 | | | | | | (3,984) | | | |
Alcoa, Inc. | | | | | | | | | | | | |
Expiring February, 2016 at $10.00 | | | 330 | | | | | | (17,820) | | | |
Allergan PLC | | | | | | | | | | | | |
Expiring January, 2016 at $300.00 | | | 3 | | | | | | (4,740) | | | |
Amazon.com, Inc. | | | | | | | | | | | | |
Expiring January, 2016 at $550.00 | | | 2 | | | | | | (25,800) | | | |
American Airlines Group, Inc. | | | | | | | | | | | | |
Expiring January, 2016 at $45.00 | | | 130 | | | | | | (2,990) | | | |
American Express Co. | | | | | | | | | | | | |
Expiring January, 2016 at $77.50 | | | 5 | | | | | | (10) | | | |
American Tower Corp. | | | | | | | | | | | | |
Expiring January, 2016 at $92.50 | | | 3 | | | | | | (1,410) | | | |
Amgen, Inc. | | | | | | | | | | | | |
Expiring January, 2016 at $155.00 | | | 4 | | | | | | (3,560) | | | |
Aon PLC | | | | | | | | | | | | |
Expiring January, 2016 at $95.00 | | | 4 | | | | | | (200) | | | |
Apple, Inc. | | | | | | | | | | | | |
Expiring February, 2016 at $120.00 | | | 12 | | | | | | (624) | | | |
Applied Materials, Inc. | | | | | | | | | | | | |
Expiring January, 2016 at $17.00 | | | 26 | | | | | | (4,368) | | | |
Archer-Daniels-Midland Co. | | | | | | | | | | | | |
Expiring January, 2016 at $45.00 | | | 8 | | | | | | (24) | | | |
Ashland, Inc. | | | | | | | | | | | | |
Expiring January, 2016 at $110.00 | | | 45 | | | | | | (2,250) | | | |
AT&T, Inc. | | | | | | | | | | | | |
Expiring February, 2016 at $35.00 | | | 22 | | | | | | (748) | | | |
Automatic Data Processing, Inc. | | | | | | | | | | | | |
Expiring February, 2016 at $87.50 | | | 4 | | | | | | (480) | | | |
AutoZone, Inc. | | | | | | | | | | | | |
Expiring January, 2016 at $730.00 | | | 2 | | | | | | (4,430) | | | |
Avis Budget Group, Inc. | | | | | | | | | | | | |
Expiring February, 2016 at $42.50 | | | 70 | | | | | | (3,850) | | | |
Bank Of America Corp. | | | | | | | | | | | | |
Expiring February, 2016 at $17.00 | | | 20 | | | | | | (1,200) | | | |
| | | | | | |
| | | | | | |
| | | | | | |
| | | | | | |
| | | | | | |
| | | | | | |
| | | | | | |
| | | | | | |
| | | | | | | | | | |
| Company | | Number
of Contracts | | Value | |
|
Baxter International, Inc. | |
Expiring January, 2016 at $37.50 | | | 3 | | | | | $ | (333 | ) |
Becton Dickinson & Co. | | | | | | | | | | |
Expiring March, 2016 at $155.00 | | | 3 | | | | | | (1,320 | ) |
Biogen, Inc. | | | | | | | | | | |
Expiring January, 2016 at $310.00 | | | 3 | | | | | | (1,770 | ) |
Bristol-Myers Squibb Co. | | | | | | | | | | |
Expiring March, 2016 at $70.00 | | | 7 | | | | | | (1,680 | ) |
C.R. Bard, Inc. | | | | | | | | | | |
Expiring January, 2016 at $200.00 | | | 3 | | | | | | (30 | ) |
Capital One Financial Corp. | | | | | | | | | | |
Expiring January, 2016 at $80.00 | | | 7 | | | | | | (14 | ) |
Carnival Corp. | | | | | | | | | | |
Expiring January, 2016 at $55.00 | | | 5 | | | | | | (425 | ) |
Centene Corp. | | | | | | | | | | |
Expiring February, 2016 at $67.50 | | | 70 | | | | | | (20,300 | ) |
CenturyLink, Inc. | | | | | | | | | | |
Expiring April, 2016 at $26.00 | | | 12 | | | | | | (1,260 | ) |
Expiring January, 2016 at $28.00 | | | 65 | | | | | | (260 | ) |
| | | | | | | | | | |
| | | | | | | | | (1,520 | ) |
Charles Schwab Corp. (The) | | | | | | | | | | |
Expiring January, 2016 at $30.00 | | | 20 | | | | | | (6,000 | ) |
Chesapeake Energy Corp. | | | | | | | | | | |
Expiring January, 2016 at $8.00 | | | 8 | | | | | | (72 | ) |
Chevron Corp. | | | | | | | | | | |
Expiring January, 2016 at $95.00 | | | 8 | | | | | | (320 | ) |
Cisco Systems, Inc. | | | | | | | | | | |
Expiring January, 2016 at $27.00 | | | 30 | | | | | | (1,290 | ) |
CIT Group, Inc. | | | | | | | | | | |
Expiring January, 2016 at $42.00 | | | 75 | | | | | | (825 | ) |
Citigroup, Inc. | | | | | | | | | | |
Expiring January, 2016 at $52.50 | | | 15 | | | | | | (1,125 | ) |
Citrix Systems, Inc. | | | | | | | | | | |
Expiring January, 2016 at $75.00 | | | 5 | | | | | | (1,215 | ) |
Coca-Cola Co. (The) | | | | | | | | | | |
Expiring March, 2016 at $43.00 | | | 8 | | | | | | (984 | ) |
Cognizant Technology Solutions Corp., Class A | | | | | | | | | | |
Expiring January, 2016 at $67.50 | | | 15 | | | | | | (45 | ) |
Colgate-Palmolive Co. | | | | | | | | | | |
Expiring February, 2016 at $67.50 | | | 7 | | | | | | (679 | ) |
Comcast Corp., Class A | | | | | | | | | | |
Expiring January, 2016 at $62.50 | | | 10 | | | | | | (30 | ) |
Comerica, Inc. | | | | | | | | | | |
Expiring January, 2016 at $43.00 | | | 3 | | | | | | (144 | ) |
ConocoPhillips | | | | | | | | | | |
Expiring January, 2016 at $50.00 | | | 4 | | | | | | (160 | ) |
| | |
81 | | Semi-Annual Report | December 31, 2015 (Unaudited) |
| | |
| Managed Volatility Fund | | |
| SCHEDULE OF OPTIONS WRITTEN (continued) | | |
| Showing percentage of net assets as of December 31, 2015 (Unaudited) | | |
| | | | | | | | | | | | |
| Company | | Number
of Contracts | | Value | | | |
| | | |
Call Options Written (continued) | | | | | | | | | |
Constellation Brands, Inc., Class A | | | | | | | | | | | | |
Expiring January, 2016 at $140.00 | | | 7 | | | | | | $(3,290) | | | |
CVS Health Corp. | | | | | | | | | | | | |
Expiring January, 2016 at $110.00 | | | 5 | | | | | | (5) | | | |
Danaher Corp. | | | | | | | | | | | | |
Expiring March, 2016 at $95.00 | | | 8 | | | | | | (1,760) | | | |
Deere & Co. | | | | | | | | | | | | |
Expiring January, 2016 at $82.50 | | | 7 | | | | | | (70) | | | |
Dollar General Corp. | | | | | | | | | | | | |
Expiring February, 2016 at $72.50 | | | 7 | | | | | | (1,435) | | | |
Dow Chemical Co. (The) | | | | | | | | | | | | |
Expiring March, 2016 at $50.00 | | | 9 | | | | | | (3,105) | | | |
eBay, Inc. | | | | | | | | | | | | |
Expiring January, 2016 at $27.50 | | | 5 | | | | | | (240) | | | |
Electronic Arts, Inc. | | | | | | | | | | | | |
Expiring January, 2016 at $70.00 | | | 5 | | | | | | (660) | | | |
EMC Corp. | | | | | | | | | | | | |
Expiring January, 2016 at $26.00 | | | 20 | | | | | | (600) | | | |
Emerson Electric Co. | | | | | | | | | | | | |
Expiring January, 2016 at $48.00 | | | 5 | | | | | | (500) | | | |
Everest Re Group, Ltd. | | | | | | | | | | | | |
Expiring January, 2016 at $180.00 | | | 30 | | | | | | (12,900) | | | |
Exelon Corp. | | | | | | | | | | | | |
Expiring April, 2016 at $28.00 | | | 12 | | | | | | (1,260) | | | |
Exxon Mobil Corp. | | | | | | | | | | | | |
Expiring February, 2016 at $80.00 | | | 20 | | | | | | (3,120) | | | |
Expiring January, 2016 at $75.00 | | | 15 | | | | | | (5,310) | | | |
| | | | | | | | | | | | |
| | | | | | | | | (8,430) | | | |
Facebook, Inc., Class A | | | | | | | | | | | | |
Expiring February, 2016 at $105.00 | | | 55 | | | | | | (25,795) | | | |
Expiring March, 2016 at $110.00 | | | 10 | | | | | | (3,480) | | | |
| | | | | | | | | | | | |
| | | | | | | | | (29,275) | | | |
FedEx Corp. | | | | | | | | | | | | |
Expiring January, 2016 at $160.00 | | | 4 | | | | | | (36) | | | |
Ford Motor Co. | | | | | | | | | | | | |
Expiring March, 2016 at $14.00 | | | 25 | | | | | | (1,475) | | | |
Freeport-McMoRan, Inc. | | | | | | | | | | | | |
Expiring February, 2016 at $9.00 | | | 130 | | | | | | (2,340) | | | |
Gap, Inc. (The) | | | | | | | | | | | | |
Expiring January, 2016 at $33.00 | | | 6 | | | | | | (12) | | | |
Garmin, Ltd. | | | | | | | | | | | | |
Expiring January, 2016 at $35.00 | | | 80 | | | | | | (19,440) | | | |
| | | | | | | | | | | | |
| | | | | | | | | | | | |
| | | | | | | | | | |
| Company | | Number
of Contracts | | Value | |
| | | |
General Electric Co. | | | | | | | | | | |
Expiring March, 2016 at $31.00 | | | 10 | | | | | | $(1,060) | |
General Mills, Inc. | | | | | | | | | | |
Expiring April, 2016 at $62.50 | | | 10 | | | | | | (460) | |
General Motors Co. | | | | | | | | | | |
Expiring March, 2016 at $35.00 | | | 25 | | | | | | (2,625) | |
Gilead Sciences, Inc. | | | | | | | | | | |
Expiring April, 2016 at $105.00 | | | 8 | | | | | | (2,592) | |
Expiring February, 2016 at $110.00 | | | 50 | | | | | | (4,900) | |
| | | | | | | | | | |
| | | | | | | | | (7,492) | |
Hewlett-Packard Co. | | | | | | | | | | |
Expiring February, 2016 at $30.00 | | | 15 | | | | | | (240) | |
Intel Corp. | | | | | | | | | | |
Expiring February, 2016 at $36.00 | | | 8 | | | | | | (392) | |
JM Smucker Co. (The) | | | | | | | | | | |
Expiring January, 2016 at $120.00 | | | 4 | | | | | | (1,600) | |
Johnson & Johnson | | | | | | | | | | |
Expiring January, 2016 at $100.00 | | | 8 | | | | | | (2,768) | |
JPMorgan Chase & Co. | | | | | | | | | | |
Expiring January, 2016 at $65.00 | | | 15 | | | | | | (2,520) | |
Juniper Networks, Inc. | | | | | | | | | | |
Expiring January, 2016 at $30.00 | | | 25 | | | | | | (75) | |
KeyCorp | | | | | | | | | | |
Expiring March, 2016 at $13.00 | | | 15 | | | | | | (1,170) | |
Kimberly-Clark Corp. | | | | | | | | | | |
Expiring April, 2016 at $125.00 | | | 4 | | | | | | (2,480) | |
Kinder Morgan, Inc. | | | | | | | | | | |
Expiring January, 2016 at $32.50 | | | 8 | | | | | | (8) | |
Kroger Co. (The) | | | | | | | | | | |
Expiring January, 2016 at $40.00 | | | 15 | | | | | | (3,225) | |
LyondellBasell Industries NV, Class A | | | | | | | | | | |
Expiring January, 2016 at $90.00 | | | 4 | | | | | | (340) | |
Marathon Petroleum Corp. | | | | | | | | | | |
Expiring January, 2016 at $50.00 | | | 6 | | | | | | (1,530) | |
MasterCard, Inc., Class A | | | | | | | | | | |
Expiring January, 2016 at $100.00 | | | 4 | | | | | | (176) | |
McGraw Hill Financial, Inc. | | | | | | | | | | |
Expiring February, 2016 at $97.50 | | | 3 | | | | | | (1,080) | |
Merck & Co., Inc. | | | | | | | | | | |
Expiring January, 2016 at $55.00 | | | 12 | | | | | | (120) | |
Micron Technology, Inc. | | | | | | | | | | |
Expiring January, 2016 at $16.00 | | | 200 | | | | | | (800) | |
| | |
| Managed Volatility Fund | |
|
| SCHEDULE OF OPTIONS WRITTEN (continued) | | |
| Showing percentage of net assets as of December 31, 2015 (Unaudited) | | |
| | | | | | | | | | | | |
| Company | | Number
of Contracts | | Value | | | |
| | | | |
Call Options Written (continued) | | | | | | | | | | | | |
Expiring January, 2016 at $18.00 | | | 20 | | | | | | $ (20) | | | |
| | | | | | | | | | | | |
| | | | | | | | | (820) | | | |
Microsoft Corp. | | | | | | | | | | | | |
Expiring February, 2016 at $55.00 | | | 20 | | | | | | (4,700) | | | |
Mondelez International, Inc. | | | | | | | | | | | | |
Expiring March, 2016 at $45.00 | | | 10 | | | | | | (2,170) | | | |
Monsanto Co. | | | | | | | | | | | | |
Expiring April, 2016 at $105.00 | | | 5 | | | | | | (950) | | | |
Morgan Stanley | | | | | | | | | | | | |
Expiring January, 2016 at $36.00 | | | 10 | | | | | | (10) | | | |
Murphy Oil Corp. | | | | | | | | | | | | |
Expiring February, 2016 at $22.50 | | | 113 | | | | | | (17,967) | | | |
National Oilwell Varco, Inc. | | | | | | | | | | | | |
Expiring February, 2016 at $40.00 | | | 100 | | | | | | (1,500) | | | |
Nielsen Holdings PLC | | | | | | | | | | | | |
Expiring February, 2016 at $48.00 | | | 7 | | | | | | (770) | | | |
NIKE, Inc., Class B | | | | | | | | | | | | |
Expiring January, 2016 at $65.00 | | | 14 | | | | | | (462) | | | |
Northrop Grumman Corp. | | | | | | | | | | | | |
Expiring February, 2016 at $190.00 | | | 4 | | | | | | (2,136) | | | |
Oracle Corp. | | | | | | | | | | | | |
Expiring January, 2016 at $39.00 | | | 15 | | | | | | (45) | | | |
PayPal Holdings, Inc. | | | | | | | | | | | | |
Expiring January, 2016 at $35.00 | | | 4 | | | | | | (700) | | | |
PepsiCo, Inc. | | | | | | | | | | | | |
Expiring April, 2016 at $100.00 | | | 4 | | | | | | (1,400) | | | |
Pfizer, Inc. | | | | | | | | | | | | |
Expiring March, 2016 at $33.00 | | | 15 | | | | | | (1,020) | | | |
PNC Financial Services Group, Inc. (The) | | | | | | | | | | | | |
Expiring February, 2016 at $97.50 | | | 6 | | | | | | (1,116) | | | |
Procter & Gamble Co. (The) | | | | | | | | | | | | |
Expiring April, 2016 at $82.50 | | | 7 | | | | | | (868) | | | |
QUALCOMM, Inc. | | | | | | | | | | | | |
Expiring January, 2016 at $57.50 | | | 7 | | | | | | (14) | | | |
Raytheon Co. | | | | | | | | | | | | |
Expiring February, 2016 at $130.00 | | | 7 | | | | | | (1,057) | | | |
Reinsurance Group of America, Inc. | | | | | | | | | | | | |
Expiring January, 2016 at $90.00 | | | 10 | | | | | | (550) | | | |
Ross Stores, Inc. | | | | | | | | | | | | |
Expiring February, 2016 at $52.50 | | | 6 | | | | | | (1,770) | | | |
Santander Consumer USA Holdings, Inc. | | | | | | | | | | | | |
Expiring April, 2016 at $16.00 | | | 30 | | | | | | (3,450) | | | |
| | | | | | | | | | | | |
| | | | | | | | | | | | |
| | | | | | | | | | |
| Company | | Number
of Contracts | | Value | |
| | | |
Skyworks Solutions, Inc. | | | | | | | | | | |
Expiring February, 2016 at $80.00 | | | 60 | | | | | | $(22,200) | |
Southwest Airlines Co. | | | | | | | | | | |
Expiring January, 2016 at $46.00 | | | 12 | | | | | | (132) | |
Southwestern Energy Co. | | | | | | | | | | |
Expiring March, 2016 at $6.00 | | | 130 | | | | | | (23,530) | |
Starbucks Corp. | | | | | | | | | | |
Expiring January, 2016 at $62.50 | | | 8 | | | | | | (160) | |
Starwood Hotels & Resorts Worldwide, Inc. | | | | | | | | | | |
Expiring February, 2016 at $75.00 | | | 28 | | | | | | (1,596) | |
Stryker Corp. | | | | | | | | | | |
Expiring January, 2016 at $100.00 | | | 4 | | | | | | (20) | |
Thermo Fisher Scientific, Inc. | | | | | | | | | | |
Expiring January, 2016 at $130.00 | | | 4 | | | | | | (4,760) | |
Travelers Cos., Inc. (The) | | | | | | | | | | |
Expiring January, 2016 at $115.00 | | | 10 | | | | | | (710) | |
Twenty-First Century Fox, Inc., Class A | | | | | | | | | | |
Expiring January, 2016 at $31.00 | | | 7 | | | | | | (35) | |
Tyco International PLC | | | | | | | | | | |
Expiring April, 2016 at $32.00 | | | 13 | | | | | | (1,742) | |
Expiring January, 2016 at $37.00 | | | 120 | | | | | | (3,240) | |
| | | | | | | | | | |
| | | | | | | | | (4,982) | |
U.S. Bancorp | | | | | | | | | | |
Expiring January, 2016 at $43.00 | | | 12 | | | | | | (924) | |
United Continental Holdings, Inc. | | | | | | | | | | |
Expiring February, 2016 at $60.00 | | | 90 | | | | | | (15,750) | |
United Rentals, Inc. | | | | | | | | | | |
Expiring February, 2016 at $75.00 | | | 70 | | | | | | (22,400) | |
UnitedHealth Group, Inc. | | | | | | | | | | |
Expiring March, 2016 at $120.00 | | | 9 | | | | | | (4,095) | |
Valero Energy Corp. | | | | | | | | | | |
Expiring January, 2016 at $65.00 | | | 12 | | | | | | (7,500) | |
Verizon Communications, Inc. | | | | | | | | | | |
Expiring February, 2016 at $47.00 | | | 15 | | | | | | (765) | |
Visa, Inc., Class A | | | | | | | | | | |
Expiring January, 2016 at $80.00 | | | 15 | | | | | | (495) | |
Voya Financial, Inc. | | | | | | | | | | |
Expiring February, 2016 at $42.00 | | | 20 | | | | | | (100) | |
Wal-Mart Stores, Inc. | | | | | | | | | | |
Expiring January, 2016 at $67.50 | | | 8 | | | | | | (8) | |
| | |
| 83 | | Semi-Annual Report | December 31, 2015 (Unaudited) |
| | |
| Managed Volatility Fund | |
|
| SCHEDULE OF OPTIONS WRITTEN (continued) | | |
| Showing percentage of net assets as of December 31, 2015 (Unaudited) | | |
| | | | | | | | | | |
| Company | | Number
of Contracts | | | Value | | | |
| |
Call Options Written (continued) | | | |
Walt Disney Co. (The) | | | | | | | | | | |
Expiring January, 2016 at $110.00 | | | 6 | | | $ | (234 | ) | | |
Waste Management, Inc. | | | | | | | | | | |
Expiring January, 2016 at $55.00 | | | 7 | | | | (175 | ) | | |
Wells Fargo & Co. | | | | | | | | | | |
Expiring January, 2016 at $55.00 | | | 15 | | | | (1,005 | ) | | |
WhiteWave Foods Co. (The) | | | | | | | | | | |
Expiring February, 2016 at $40.00 | | | 120 | | | | (20,760 | ) | | |
Williams Cos., Inc. (The) | | | | | | | | | | |
Expiring January, 2016 at $50.00 | | | 5 | | | | (15 | ) | | |
Yum! Brands, Inc. | | | | | | | | | | |
Expiring January, 2016 at $85.00 | | | 5 | | | | (10 | ) | | |
| | | | | | | | | | |
TOTAL CALL OPTIONS WRITTEN — (0.73%) | | | | (412,129 | ) | | |
| | | | | | | | | | |
(Premiums received $(654,220)) | | | | | | | | | | |
| |
PUT OPTIONS WRITTEN - (0.89%) | | | |
| | | |
Acuity Brands, Inc. | | | | | | | | | | |
Expiring February, 2016 at $230.00 | | | 10 | | | | (8,520 | ) | | |
AerCap Holdings NV | | | | | | | | | | |
Expiring January, 2016 at $40.00 | | | 100 | | | | (1,500 | ) | | |
Aflac, Inc. | | | | | | | | | | |
Expiring February, 2016 at $65.00 | | | 90 | | | | (48,600 | ) | | |
Alphabet, Inc., Class A | | | | | | | | | | |
Expiring March, 2016 at $720.00 | | | 8 | | | | (17,080 | ) | | |
Amazon.com, Inc. | | | | | | | | | | |
Expiring February, 2016 at $650.00 | | | 11 | | | | (27,511 | ) | | |
Apple, Inc. | | | | | | | | | | |
Expiring January, 2016 at $100.00 | | | 60 | | | | (3,660 | ) | | |
Baxter International, Inc. | | | | | | | | | | |
Expiring January, 2016 at $32.50 | | | 90 | | | | (180 | ) | | |
Delta Air Lines, Inc. | | | | | | | | | | |
Expiring March, 2016 at $50.00 | | | 110 | | | | (29,150 | ) | | |
Edison International | | | | | | | | | | |
Expiring January, 2016 at $62.50 | | | 20 | | | | (6,400 | ) | | |
Exelon Corp. | | | | | | | | | | |
Expiring January, 2016 at $27.00 | | | 105 | | | | (3,675 | ) | | |
Exxon Mobil Corp. | | | | | | | | | | |
Expiring January, 2016 at $80.00 | | | 70 | | | | (17,570 | ) | | |
General Motors Co. | | | | | | | | | | |
Expiring March, 2016 at $35.00 | | | 150 | | | | (32,400 | ) | | |
Goodyear Tire & Rubber Co. (The) | | | | | | | | | | |
Expiring January, 2016 at $31.00 | | | 120 | | | | (1,800 | ) | | |
Johnson & Johnson | | | | | | | | | | |
Expiring January, 2016 at $97.50 | | | 60 | | | | (960 | ) | | |
NIKE, Inc., Class B | | | | | | | | | | |
Expiring January, 2016 at $60.00 | | | 50 | | | | (2,400 | ) | | |
| | | | | | | | | | |
| | | | | | | | | | |
| Company | | Number
of Contracts | | | Value | | | |
| | | |
Santander Consumer USA Holdings, Inc. | | | | | | | | | | |
Expiring January, 2016 at $20.00 | | | 9 | | | $ | (3,150 | ) | | |
Expiring January, 2016 at $21.00 | | | 106 | | | | (47,700 | ) | | |
| | | | | | | | | | |
| | | | | | | (50,850 | ) | | |
Seagate Technology PLC | | | | | | | | | | |
Expiring January, 2016 at $32.00 | | | 40 | | | | (520 | ) | | |
Skechers U.S.A., Inc. | | | | | | | | | | |
Expiring January, 2016 at $46.67 | | | 114 | | | | (165,300 | ) | | |
Starbucks Corp. | | | | | | | | | | |
Expiring January, 2016 at $57.50 | | | 60 | | | | (1,740 | ) | | |
Tesoro Corp. | | | | | | | | | | |
Expiring February, 2016 at $105.00 | | | 20 | | | | (11,500 | ) | | |
Expiring February, 2016 at $110.00 | | | 35 | | | | (29,750 | ) | | |
| | | | | | | | | | |
| | | | | | | (41,250 | ) | | |
Valero Energy Corp. | | | | | | | | | | |
Expiring March, 2016 at $67.50 | | | 70 | | | | (21,700 | ) | | |
VeriSign, Inc. | | | | | | | | | | |
Expiring March, 2016 at $90.00 | | | 40 | | | | (22,200 | ) | | |
| | | | | | | | | | |
TOTAL PUT OPTIONS WRITTEN — (0.89%) | | | | (504,966 | ) | | |
| | | | | | | | | | |
(Premiums received $(438,367)) | | | | | | | | | | |
TOTAL OPTIONS
WRITTEN — (1.62%) | | | | | | $ | (917,095 | ) | | |
| | | | | | | | | | |
(Premiums received $(1,092,587)) | | | | | | | |
| | |
| Managed Volatility Fund | | 
|
| SCHEDULE OF OPTIONS WRITTEN (continued) | |
| | |
Summary of inputs used to value the Fund’s investments as of 12/31/2015 (See Note 2 in Notes to Financial Statements):
| | | | | | | | | | | | | | | | |
| | | Assets Table | |
| | | Valuation Inputs | |
| | | Investment in Securities (Value) | |
| | | Level 1 Quoted Prices | | | Level 2
Significant
Observable
Inputs | | | Level 3
Significant
Unobservable
Inputs | | | Total | |
Common Stocks | | | $33,971,678 | | | | $ — | | | | $ — | | | | $33,971,678 | |
U.S. Government Obligations | | | — | | | | 21,995,155 | | | | — | | | | 21,995,155 | |
Money Market Fund | | | — | | | | 875,937 | | | | — | | | | 875,937 | |
Investments Purchased with Cash Proceeds from Securities Lending | | | — | | | | 207,932 | | | | — | | | | 207,932 | |
| | | | | | | | | | | | | | | | |
TOTAL | | | $33,971,678 | | | | $23,079,024 | | | | $ — | | | | $57,050,702 | |
| | | | | | | | | | | | | | | | |
| | | | | | | | | | | | | | | | |
| | | Liabilities Table | |
| | | Valuation Inputs | |
| | | Investment in Securities (Value) | |
| | | Level 1
Quoted
Prices | | | Level 2
Significant
Observable
Inputs | | | Level 3
Significant
Unobservable
Inputs | | | Total | |
Options Written | | | $(909,887 | ) | | | $(7,208) | | | | $ — | | | | $(917,095 | ) |
| | | | | | | | | | | | | | | | |
TOTAL | | | $(909,887 | ) | | | $(7,208) | | | | $ — | | | | $(917,095 | ) |
| | | | | | | | | | | | | | | | |
See Notes to Financial Statements.
| | |
| 85 | | Semi-Annual Report | December 31, 2015 (Unaudited) |
THIS PAGE INTENTIONALLY LEFT BLANK
STATEMENTS OF ASSETS AND LIABILITIES
December 31, 2015 (Unaudited)
| | | | | | | | | | | | | | | | |
| ASSETS | | Aggressive
Investors 1 | | | Ultra-Small
Company | | | Ultra-Small
Company Market | | | Small-Cap
Momentum | |
| |
Investments at value | | $ | 224,828,060 | | | $ | 120,926,160 | | | | $382,221,121 | | | $ | 4,632,611 | |
Receivables: | | | | | | | | | | | | | | | | |
Portfolio securities sold | | | 2,992,983 | | | | 553,950 | | | | 833,162 | | | | 6,868 | |
Fund shares sold | | | 302,257 | | | | 44,100 | | | | 529,855 | | | | - | |
Dividends and interest | | | 152,299 | | | | 151,738 | | | | 266,162 | | | | 4,716 | |
Receivable from investment adviser | | | - | | | | - | | | | - | | | | 8,457 | |
Deposits with brokers | | | - | | | | - | | | | - | | | | - | |
Prepaid expenses | | | 22,457 | | | | 11,807 | | | | 35,665 | | | | 4,782 | |
| |
Total assets | | | 228,298,056 | | | | 121,687,755 | | | | 383,885,965 | | | | 4,657,434 | |
| |
| | | | |
LIABILITIES | | | | | | | | | | | | | | | | |
Payables: | | | | | | | | | | | | | | | | |
Portfolio securities purchased | | | 2,195,798 | | | | 1,006,296 | | | | 847,538 | | | | 185 | |
Fund shares redeemed | | | 260,980 | | | | 271,998 | | | | 3,501,882 | | | | - | |
Due to custodian | | | - | | | | - | | | | - | | | | 12,837 | |
Loan payable | | | 435 | | | | - | | | | 2,784 | | | | - | |
Payable upon return of securities loaned | | | 10,789,705 | | | | 12,430,202 | | | | 36,309,249 | | | | 498,353 | |
Accrued Liabilities: | | | | | | | | | | | | | | | | |
Investment adviser fees | | | 50,800 | | | | 83,753 | | | | 165,386 | | | | - | |
Administration fees | | | 4,238 | | | | 2,153 | | | | 6,992 | | | | 82 | |
Directors’ fees | | | 2,683 | | | | 1,412 | | | | 4,340 | | | | 56 | |
Other | | | 105,570 | | | | 44,673 | | | | 142,845 | | | | 27,117 | |
Call options written at value | | | - | | | | - | | | | - | | | | - | |
Put options written at value | | | - | | | | - | | | | - | | | | - | |
| |
Total liabilities | | | 13,410,209 | | | | 13,840,487 | | | | 40,981,016 | | | | 538,630 | |
| |
NET ASSETS | | $ | 214,887,847 | | | $ | 107,847,268 | | | | $342,904,949 | | | $ | 4,118,804 | |
| |
| | | | |
NET ASSETS REPRESENT | | | | | | | | | | | | | | | | |
Paid-in capital | | $ | 306,753,984 | | | $ | 110,554,649 | | | | $282,182,085 | | | $ | 3,927,781 | |
Undistributed (distributions in excess of) net investment income | | | 257,076 | | | | 159,023 | | | | (1,610,142) | | | | 13,925 | |
Accumulated net realized gain (loss) on investments | | | (99,199,358 | ) | | | 461,984 | | | | 17,024,975 | | | | 9,145 | |
Net unrealized appreciation (depreciation) on investments | | | 7,076,145 | | | | (3,328,388 | ) | | | 45,308,031 | | | | 167,953 | |
| |
NET ASSETS | | $ | 214,887,847 | | | $ | 107,847,268 | | | | $342,904,949 | | | $ | 4,118,804 | |
| |
Shares of common stock outstanding of $.001 par value* | | | 4,014,339 | | | | 4,095,333 | | | | 26,590,996 | | | | 364,957 | |
| |
Net asset value, offering price and redemption price per share | | $ | 53.53 | | | $ | 26.33 | | | | $ 12.90(a) | | | $ | 11.29(a) | |
| |
Total investments at cost | | $ | 217,751,915 | | | $ | 124,254,548 | | | | $336,913,090 | | | $ | 4,464,658 | |
Premiums received on call options written | | $ | - | | | $ | - | | | | $ - | | | $ | - | |
Premiums received on put options written | | $ | - | | | $ | - | | | | $ - | | | $ | - | |
| * | See Note1 - Organization in the Notes to Financial Statements for shares authorized for each Fund. |
| (a) | Redemption of shares held less than six months may be charged a 2% redemption fee. See Note 8. |
See Notes to Financial Statements.
| | |
| 87 | | Semi-Annual Report | December 31, 2015 (Unaudited) |
| | |
| | | |
| | | |
| | |
| | | | | | | | | | | | | | | | | | |
| Small-Cap
Growth |
| |
| Small-Cap
Value |
| |
| Large-Cap
Growth |
| |
| Blue Chip 35
Index |
| |
| Managed
Volatility |
|
| | |
| $ | 41,049,102 | | | $ | 69,546,153 | | | | $168,151,033 | | | | $572,439,044 | | | | $57,050,702 | |
| | | | | | | | | | | | | | | | | | | |
| | - | | | | 1,480,003 | | | | - | | | | 3,053,928 | | | | - | |
| | 60,315 | | | | 43,103 | | | | 407,135 | | | | 1,047,734 | | | | 218,560 | |
| | 33,942 | | | | 140,404 | | | | 51,336 | | | | 679,631 | | | | 24,271 | |
| | - | | | | - | | | | - | | | | - | | | | - | |
| | - | | | | - | | | | - | | | | - | | | | 727,651 | |
| | 14,025 | | | | 16,847 | | | | 16,352 | | | | 61,760 | | | | 12,919 | |
| | |
| | 41,157,384 | | | | 71,226,510 | | | | 168,625,856 | | | | 577,282,097 | | | | 58,034,103 | |
| | |
| | | | |
| | | | | | | | | | | | | | | | | | | |
| | | | | | | | | | | | | | | | | | | |
| | 236,277 | | | | 1,226,698 | | | | 1,712,001 | | | | 4,797,438 | | | | - | |
| | 18,233 | | | | 82,797 | | | | 369,648 | | | | 460,148 | | | | 64,059 | |
| | - | | | | - | | | | - | | | | - | | | | - | |
| | - | | | | 629,004 | | | | - | | | | 2,381 | | | | - | |
| | 4,637,788 | | | | 8,205,146 | | | | - | | | | - | | | | 207,932 | |
| | | | | | | | | | | | | | | | | | | |
| | 18,431 | | | | 40,575 | | | | 74,564 | | | | 13,143 | | | | 28,062 | |
| | 705 | | | | 1,251 | | | | 3,246 | | | | 11,291 | | | | 1,134 | |
| | 336 | | | | 782 | | | | 163 | | | | 5,532 | | | | 484 | |
| | 30,256 | | | | 44,775 | | | | 47,109 | | | | 108,834 | | | | 32,747 | |
| | - | | | | - | | | | - | | | | - | | | | 412,129 | |
| | - | | | | - | | | | - | | | | - | | | | 504,966 | |
| | |
| | 4,942,026 | | | | 10,231,028 | | | | 2,206,731 | | | | 5,398,767 | | | | 1,251,513 | |
| | |
| $ | 36,215,358 | | | $ | 60,995,482 | | | | $166,419,125 | | | | $571,883,330 | | | | $56,782,590 | |
| | |
| | | | | | | | | | | | | | | | | | | |
| $ | 45,695,448 | | | $ | 86,026,503 | | | | $166,264,013 | | | | $396,463,294 | | | | $54,050,448 | |
| | | | | | | | | | | | | | | | | | |
| | 26,341 | | | | 284,803 | | | | (12,661 | ) | | | (4,109 | ) | | | 67,917 | |
| | (10,295,567 | ) | | | (21,319,846 | ) | | | (12,864,166 | ) | | | (12,127,456 | ) | | | (1,973,311 | ) |
| | 789,136 | | | | (3,995,978 | ) | | | 13,031,939 | | | | 187,551,601 | | | | 4,637,536 | |
| | |
| $ | 36,215,358 | | | $ | 60,995,482 | | | | $166,419,125 | | | | $571,883,330 | | | | $56,782,590 | |
| | |
| | 1,808,756 | | | | 3,064,502 | | | | 7,136,452 | | | | 48,917,867 | | | | 4,043,364 | |
| | |
| | | | |
$ | 20.02 | | | $ | 19.90 | | | | $ 23.32 | | | | $ 11.69 | | | | $14.04 | |
| | |
| $ | 40,259,966 | | | $ | 73,542,131 | | | | $155,119,094 | | | | $384,887,443 | | | | $52,588,658 | |
| $ | - | | | $ | - | | | | $ - | | | | $ - | | | | $ 654,220 | |
| $ | - | | | $ | - | | | | $ - | | | | $ - | | | | $ 438,367 | |
STATEMENTS OF OPERATIONS
Six Months Ended December 31, 2015 (Unaudited)
| | | | | | | | | | | | | | | | | | |
| | | Aggressive
Investors 1 | | | Ultra-Small
Company | | | Ultra-Small
Company Market | | | Small-Cap
Momentum | | | |
|
INVESTMENT INCOME | | | | | | | | | | | | | | | | | | |
Dividends | | $ | 1,086,607 | | | $ | 655,255 | | | | $ 2,165,490 | | | | $ 31,474 | | | |
Less: foreign taxes withheld | | | (13,150 | ) | | | (2,645 | ) | | | - | | | | (94 | ) | | |
Interest | | | - | | | | - | | | | - | | | | - | | | |
Securities lending | | | 86,494 | | | | 702,591 | | | | 758,894 | | | | 3,658 | | | |
|
Total Investment Income | | | 1,159,951 | | | | 1,355,201 | | | | 2,924,384 | | | | 35,038 | | | |
|
EXPENSES | | | | | | | | | | | | | | | | | | |
Investment advisory fees - Base fees | | | 1,039,311 | | | | 522,926 | | | | 930,664 | | | | 12,902 | | | |
Investment advisory fees - Performance adjustment | | | (463,128 | ) | | | - | | | | - | | | | - | | | |
Administration fees | | | 26,876 | | | | 13,516 | | | | 43,345 | | | | 546 | | | |
Accounting fees | | | 38,135 | | | | 32,879 | | | | 62,253 | | | | 30,941 | | | |
Transfer agent fees | | | 80,865 | | | | 30,152 | | | | 58,363 | | | | 18,168 | | | |
Audit fees | | | 12,753 | | | | 8,815 | | | | 17,676 | | | | 5,094 | | | |
Legal fees | | | 13,383 | | | | 6,869 | | | | 21,111 | | | | 274 | | | |
Custody fees | | | 4,325 | | | | 9,539 | | | | 11,357 | | | | 6,336 | | | |
Blue sky fees | | | 12,939 | | | | 6,006 | | | | 14,544 | | | | 12,111 | | | |
Directors’ and officers’ fees | | | 12,883 | | | | 6,496 | | | | 20,640 | | | | 265 | | | |
Shareholder servicing fees | | | 87,591 | | | | 22,097 | | | | 174,022 | | | | 2,124 | | | |
Reports to shareholders | | | 13,647 | | | | 3,351 | | | | 17,753 | | | | 147 | | | |
Miscellaneous expenses | | | 23,273 | | | | 13,381 | | | | 33,929 | | | | 2,849 | | | |
|
Total Expenses | | | 902,853 | | | | 676,027 | | | | 1,405,657 | | | | 91,757 | | | |
|
Less expenses reimbursed by investment adviser | | | - | | | | - | | | | (24,052 | ) | | | (70,644 | ) | | |
|
Net Expenses | | | 902,853 | | | | 676,027 | | | | 1,381,605 | | | | 21,113 | | | |
|
NET INVESTMENT INCOME | | | 257,098 | | | | 679,174 | | | | 1,542,779 | | | | 13,925 | | | |
|
NET REALIZED AND UNREALIZED GAIN (LOSS) ON INVESTMENTS | | | | | | | | | | | | | | | | | | |
Realized Gain (Loss) on: | | | | | | | | | | | | | | | | | | |
Investments | | | 567,884 | | | | 3,967,317 | | | | 28,024,805 | | | | 9,146 | | | |
Written options | | | - | | | | - | | | | - | | | | - | | | |
Futures contracts | | | - | | | | - | | | | - | | | | - | | | |
|
Net Realized Gain (Loss) | | | 567,884 | | | | 3,967,317 | | | | 28,024,805 | | | | 9,146 | | | |
|
Change in Unrealized Appreciation (Depreciation) on: | | | | | | | | | | | | | | | | | | |
Investments | | | (23,817,545 | ) | | | (20,344,865 | ) | | | (69,845,801 | ) | | | (268,890 | ) | | |
Written options | | | - | | | | - | | | | - | | | | - | | | |
|
Net Change in Unrealized Appreciation (Depreciation) | | | (23,817,545 | ) | | | (20,344,865 | ) | | | (69,845,801 | ) | | | (268,890 | ) | | |
|
Net Realized and Unrealized Gain (Loss) on Investments | | | (23,249,661 | ) | | | (16,377,548 | ) | | | (41,820,996 | ) | | | (259,744 | ) | | |
|
INCREASE (DECREASE) IN NET ASSETS RESULTING FROM OPERATIONS | | $ | (22,992,563 | ) | | $ | (15,698,374 | ) | | | $(40,278,217 | ) | | | $(245,819 | ) | | |
|
See Notes to Financial Statements.
| | |
| 89 | | Semi-Annual Report | December 31, 2015 (Unaudited) |
| | |
| | | |
| | |
| | | | | | | | | | | | | | | | | | |
Small-Cap
Growth | | | Small-Cap
Value | | | Large-Cap
Growth | | | Blue Chip 35
Index | | | Managed
Volatility |
| | |
| | | | | | | | | | | | | | | | | | | |
| | $ 153,651 | | | | $ 792,226 | | | | $ 848,137 | | | | $ 7,574,278 | | | | $ 335,144 | |
| | - | | | | - | | | | - | | | | - | | | | - | |
| | - | | | | - | | | | - | | | | - | | | | 4,299 | |
| | 44,441 | | | | 71,524 | | | | 52,008 | | | | - | | | | 718 | |
| | |
| | 198,092 | | | | 863,750 | | | | 900,145 | | | | 7,574,278 | | | | 340,161 | |
| | |
| | | | |
| | | | | | | | | | | | | | | | | | | |
| | 109,276 | | | | 204,000 | | | | 408,366 | | | | 235,718 | | | | 173,767 | |
| | 7,301 | | | | 15,065 | | | | 8,815 | | | | - | | | | - | |
| | 4,234 | | | | 7,926 | | | | 18,943 | | | | 68,478 | | | | 6,737 | |
| | 25,852 | | | | 27,919 | | | | 33,323 | | | | 59,072 | | | | 33,114 | |
| | 27,027 | | | | 33,363 | | | | 31,015 | | | | 30,611 | | | | 23,016 | |
| | 6,153 | | | | 7,223 | | | | 20,019 | | | | 24,244 | | | | 9,642 | |
| | 1,963 | | | | 3,961 | | | | 12,104 | | | | 33,184 | | | | 3,070 | |
| | 2,160 | | | | 1,945 | | | | 2,001 | | | | 5,137 | | | | 4,544 | |
| | 11,689 | | | | 12,007 | | | | 43,735 | | | | 25,090 | | | | 12,785 | |
| | 1,926 | | | | 3,794 | | | | 7,379 | | | | 31,450 | | | | 3,044 | |
| | 13,367 | | | | 26,077 | | | | 66,372 | | | | 107,063 | | | | 22,601 | |
| | 2,302 | | | | 5,000 | | | | 11,913 | | | | 52,993 | | | | 2,643 | |
| | 3,435 | | | | 7,580 | | | | 12,655 | | | | 57,591 | | | | 5,023 | |
| | |
| | 216,685 | | | | 355,860 | | | | 676,640 | | | | 730,631 | | | | 299,986 | |
| | |
| | (44,934) | | | | (36,036 | ) | | | - | | | | (288,660 | ) | | | (27,751) | |
| | |
| | 171,751 | | | | 319,824 | | | | 676,640 | | | | 441,971 | | | | 272,235 | |
| | |
| | 26,341 | | | | 543,926 | | | | 223,505 | | | | 7,132,307 | | | | 67,926 | |
| | |
| | | | | | | | | | | | | | | | | | | |
| | | | | | | | | | | | | | | | | | | |
| | | | | | | | | | | | | | | | | | | |
| | 2,871,821 | | | | (402,661 | ) | | | (98,496 | ) | | | 7,908,418 | | | | 265,315 | |
| | - | | | | - | | | | - | | | | - | | | | 1,266,712 | |
| | - | | | | - | | | | - | | | | - | | | | 664,781 | |
| | |
| | 2,871,821 | | | | (402,661 | ) | | | (98,496 | ) | | | 7,908,418 | | | | 2,196,808 | |
| | |
| | | | | | | | | | | | | | | | | | | |
| | (4,956,652) | | | | (6,886,611 | ) | | | (2,024,793 | ) | | | (7,302,473 | ) | | | (2,340,034) | |
| | - | | | | - | | | | - | | | | - | | | | 24,697 | |
| | |
| | (4,956,652) | | | | (6,886,611 | ) | | | (2,024,793 | ) | | | (7,302,473 | ) | | | (2,315,337) | |
| | |
| | (2,084,831) | | | | (7,289,272 | ) | | | (2,123,289 | ) | | | 605,945 | | | | (118,529) | |
| | |
| | | | | | | | | | | | | | | | | | | |
| | $(2,058,490) | | | | $(6,745,346 | ) | | | $(1,899,784 | ) | | | $ 7,738,252 | | | | $ (50,603) | |
| | |
STATEMENTS OF CHANGES IN NET ASSETS
| | | | | | | | | | | | | | | | | | |
| | | Aggressive Investors 1 | | | Ultra-Small Company | | | |
| | | Six Months Ended | | | Year Ended | | | Six Months Ended | | | Year Ended | | | |
| | | December 31, 2015 | | | June 30, 2015 | | | December 31, 2015 | | | June 30, 2015 | | | |
| | | (Unaudited) | | | | | | (Unaudited) | | | | | | |
OPERATIONS | | | | | | | | | | | | | | | | | | |
Net investment income | | | $ 257,098 | | | | $ 99,006 | | | | $ 679,174 | | | | $ 945,005 | | | |
Net realized gain (loss) on investments | | | 567,884 | | | | 25,307,168 | | | | 3,967,317 | | | | (1,713,902) | | | |
Net change in unrealized appreciation (depreciation) on investments | | | (23,817,545) | | | | (13,663,556) | | | | (20,344,865) | | | | (10,407,890) | | | |
|
| | | | | |
Net increase (decrease) in net assets resulting from operations | | | (22,992,563) | | | | 11,742,618 | | | | (15,698,374) | | | | (11,176,787) | | | |
|
| | | | | |
DISTRIBUTIONS: | | | | | | | | | | | | | | | | | | |
From net investment income. | | | (99,024) | | | | (540,861) | | | | (1,116,218) | | | | (1,052,434) | | | |
From net realized gains | | | - | | | | - | | | | - | | | | (27,750,353) | | | |
|
| | | | | |
Net decrease in net assets from distributions | | | (99,024) | | | | (540,861) | | | | (1,116,218) | | | | (28,802,787) | | | |
|
| | | | | |
SHARE TRANSACTIONS: | | | | | | | | | | | | | | | | | | |
Proceeds from sale of shares | | | 7,738,695 | | | | 9,973,079 | | | | 1,194,371 | | | | 1,395,869 | | | |
Reinvestment of distributions | | | 95,200 | | | | 511,322 | | | | 1,038,195 | | | | 27,164,352 | | | |
Cost of shares redeemed | | | (17,900,528) | | | | (33,042,204) | | | | (5,287,371) | | | | (13,194,608) | | | |
Redemption fees | | | - | | | | - | | | | - | | | | - | | | |
|
| | | | | |
Net increase (decrease) in net assets resulting from share transactions | | | (10,066,633) | | | | (22,557,803) | | | | (3,054,805) | | | | 15,365,613 | | | |
|
| | | | | |
Net decrease in net assets | | | (33,158,220) | | | | (11,356,046) | | | | (19,869,397) | | | | (24,613,961) | | | |
| | | | | |
NET ASSETS: | | | | | | | | | | | | | | | | | | |
Beginning of period | | | 248,046,067 | | | | 259,402,113 | | | | 127,716,665 | | | | 152,330,626 | | | |
|
| | | | | |
End of period** | | | $214,887,847 | | | | $248,046,067 | | | | $107,847,268 | | | | $127,716,665 | | | |
|
| | | | | |
SHARES ISSUED & REDEEMED | | | | | | | | | | | | | | | | | | |
Issued | | | 140,265 | | | | 172,109 | | | | 41,877 | | | | 41,473 | | | |
Distributions reinvested | | | 1,751 | | | | 9,139 | | | | 39,808 | | | | 906,990 | | | |
Redeemed | | | (321,386) | | | | (563,075) | | | | (191,566) | | | | (384,777) | | | |
|
| | | | | |
Net increase (decrease) | | | (179,370) | | | | (381,827) | | | | (109,881) | | | | 563,686 | | | |
Outstanding at beginning of period | | | 4,193,709 | | | | 4,575,536 | | | | 4,205,214 | | | | 3,641,528 | | | |
|
| | | | | |
Outstanding at end of period | | | 4,014,339 | | | | 4,193,709 | | | | 4,095,333 | | | | 4,205,214 | | | |
|
| | | | | |
** Including undistributed net investment income (loss) of: | | | $ 257,076 | | | | $ 99,002 | | | | $ 159,023 | | | | $ 596,067 | | | |
See Notes to Financial Statements.
| | |
| 91 | | Semi-Annual Report | December 31, 2015 (Unaudited) |
| | |
| | |
|
| | | | | | | | | | | | | | |
| |
| | | | | |
| |
Ultra-Small Company Market | | | Small-Cap Momentum | |
Six Months Ended December 31, 2015 | | | Year Ended June 30, 2015 | | | Six Months Ended December 31, 2015 | | | Year Ended June 30, 2015 | |
| | |
| (Unaudited) | | | | | | (Unaudited) | | | | |
| | | | | | | | | | | | | | |
| | $ 1,542,779 | | | | $ 2,968,400 | | | | $ 13,925 | | | | $ 40,172 | |
| | 28,024,805 | | | | 33,400,024 | | | | 9,146 | | | | 142,632 | |
| (69,845,801) | | | | (23,058,470) | | | | (268,890) | | | | 11,922 | |
| | |
| (40,278,217) | | | | 13,309,954 | | | | (245,819) | | | | 194,726 | |
| | |
| | | |
| | | | | | | | | | | | | | |
| | (3,152,924) | | | | (3,294,374) | | | | (9,442) | | | | (27,463) | |
| | (37,500,446) | | | | (37,828,878) | | | | (115,289) | | | | (442,934) | |
| | |
| | | |
| | (40,653,370) | | | | (41,123,252) | | | | (124,731) | | | | (470,397) | |
| | |
| 27,972,490 | | | | 46,724,160 | | | | 194,215 | | | | 181,242 | |
| | 39,249,741 | | | | 39,489,770 | | | | 124,005 | | | | 467,987 | |
| | (46,256,181) | | | | (79,731,098) | | | | (951,474) | | | | (1,145,289) | |
| | 17,481 | | | | 87,151 | | | | 55 | | | | 28 | |
| | |
| | | |
|
20,983,531 |
| | | 6,569,983 | | | | (633,199) | | | | (496,032) | |
| | |
| | | |
| | (59,948,056) | | | | (21,243,315) | | | | (1,003,749) | | | | (771,703) | |
| | | | | | | | | | | | | | |
| | 402,853,004 | | | | 424,096,319 | | | | 5,122,553 | | | | 5,894,256 | |
| | |
| | | |
| | $342,904,948 | | | | $402,853,004 | | | | $4,118,804 | | | | $5,122,553 | |
| | |
| 1,917,636 | | | | 2,862,947 | | | | 16,511 | | | | 14,977 | |
| | 3,073,590 | | | | 2,643,224 | | | | 10,802 | | | | 42,390 | |
| | (3,294,708) | | | | (4,894,380) | | | | (79,245) | | | | (93,856) | |
| | |
| 1,696,518 | | | | 611,791 | | | | (51,932) | | | | (36,489) | |
| | 24,894,478 | | | | 24,282,687 | | | | 416,889 | | | | 453,378 | |
| | |
| | | |
| | 26,590,996 | | | | 24,894,478 | | | | 364,957 | | | | 416,889 | |
| | |
| | | |
| | $ (1,610,142) | | | | $ 3 | | | | $ 13,925 | | | | $ 9,442 | |
STATEMENTS OF CHANGES IN NET ASSETS (continued)
| | | | | | | | | | | | | | | | | | |
| | | Small-Cap Growth | | | Small-Cap Value | | | |
| | | Six Months Ended | | | Year Ended | | | Six Months Ended | | | Year Ended | | | |
| | | December 31, 2015 | | | June 30, 2015 | | | December 31, 2015 | | | June 30, 2015 | | | |
| | | (Unaudited) | | | | | | (Unaudited) | | | | | | |
OPERATIONS | | | | | | | | | | | | | | | | | | |
Net investment income (loss) | | | $ 26,341 | | | | $ (23,592) | | | | $ 543,926 | | | | $ 1,006,371 | | | |
Net realized gain (loss) on investments | | | 2,871,821 | | | | 4,000,306 | | | | (402,661) | | | | 5,855,994 | | | |
Net change in unrealized appreciation (depreciation) on investments | | | (4,956,652) | | | | 481,668 | | | | (6,886,611) | | | | (8,924,705) | | | |
|
| | | | | |
Net increase (decrease) in net assets resulting from operations | | | (2,058,490) | | | | 4,458,382 | | | | (6,745,346) | | | | (2,062,340) | | | |
|
| | | | | |
DISTRIBUTIONS: | | | | | | | | | | | | | | | | | | |
From net investment income | | | - | | | | (21,907) | | | | (1,200,493) | | | | (581,377) | | | |
|
| | | | | |
Net decrease in net assets from distributions | | | - | | | | (21,907) | | | | (1,200,493) | | | | (581,377) | | | |
|
| | | | | |
SHARE TRANSACTIONS: | | | | | | | | | | | | | | | | | | |
Proceeds from sale of shares | | | 4,430,136 | | | | 4,488,921 | | | | 1,621,324 | | | | 5,477,606 | | | |
Reinvestment of distributions | | | - | | | | 20,925 | | | | 1,160,996 | | | | 548,083 | | | |
Cost of shares redeemed | | | (2,957,583) | | | | (5,563,663) | | | | (7,082,237) | | | | (15,922,282) | | | |
|
| | | | | |
Net increase (decrease) in net assets resulting from share transactions | | | 1,472,553 | | | | (1,053,817) | | | | (4,299,917) | | | | (9,896,593) | | | |
|
| | | | | |
Net increase (decrease) in net assets | | | (585,937) | | | | 3,382,658 | | | | (12,245,756) | | | | (12,540,310) | | | |
| | | | | |
NET ASSETS: | | | | | | | | | | | | | | | | | | |
Beginning of period | | | 36,801,295 | | | | 33,418,637 | | | | 73,241,238 | | | | 85,781,548 | | | |
|
| | | | | |
End of period* | | | $36,215,358 | | | | $36,801,295 | | | | $60,995,482 | | | | $73,241,238 | | | |
|
| | | | | |
SHARES ISSUED & REDEEMED | | | | | | | | | | | | | | | | | | |
Issued | | | 213,041 | | | | 228,708 | | | | 75,648 | | | | 248,054 | | | |
Distributions reinvested | | | - | | | | 1,168 | | | | 57,532 | | | | 26,087 | | | |
Redeemed | | | (142,697) | | | | (280,771) | | | | (339,013) | | | | (723,093) | | | |
|
| | | | | |
Net increase (decrease) | | | 70,344 | | | | (50,895) | | | | (205,833) | | | | (448,952) | | | |
Outstanding at beginning of period | | | 1,738,412 | | | | 1,789,307 | | | | 3,270,335 | | | | 3,719,287 | | | |
|
| | | | | |
Outstanding at end of period | | | 1,808,756 | | | | 1,738,412 | | | | 3,064,502 | | | | 3,270,335 | | | |
|
| | | | | |
* Including undistributed net investment income (loss) of: | | | $ 26,341 | | | | $ - | | | | $ 284,803 | | | | $ 941,370 | | | |
See Notes to Financial Statements.
| | |
| 93 | | Semi-Annual Report | December 31, 2015 (Unaudited) |
| | |
| | |
|
| | | | | | | | | | | | | | | | | | | | | | |
| | |
Large-Cap Growth | | | Blue Chip 35 Index | | | Managed Volatility | |
Six Months Ended December 31, 2015 | | | Year Ended June 30, 2015 | | | Six Months Ended December 31, 2015 | | | Year Ended June 30, 2015 | | | Six Months Ended December 31, 2015 | | | Year Ended June 30, 2015 | |
| | |
| (Unaudited) | | | | | | (Unaudited) | | | | | | (Unaudited) | | | | |
| | | | | | | | | | | | | | | | | | | | | | |
| $ 223,505 | | | | $ 678,230 | | | | $ 7,132,307 | | | | $ 13,543,483 | | | | $ 67,926 | | | | $ 15,857 | |
| | (98,496) | | | | 7,237,893 | | | | 7,908,418 | | | | 4,936,744 | | | | 2,196,808 | | | | 950,869 | |
| | (2,024,793) | | | | 1,817,428 | | | | (7,302,473) | | | | 16,801,251 | | | | (2,315,337) | | | | (716,847) | |
| | |
| (1,899,784) | | | | 9,733,551 | | | | 7,738,252 | | | | 35,281,478 | | | | (50,603) | | | | 249,879 | |
| | |
| | | | | | | | | | | | | | | | | | | | | | |
| (775,100) | | | | (330,018) | | | | (14,480,684) | | | | (11,713,217) | | | | (15,844) | | | | (59,691) | |
| | |
| (775,100) | | | | (330,018) | | | | (14,480,684) | | | | (11,713,217) | | | | (15,844) | | | | (59,691) | |
| | |
| | | | | | | | | | | | | | | | | | | | | | |
| 28,014,555 | | | | 101,191,213 | | | | 55,811,447 | | | | 187,796,541 | | | | 5,582,795 | | | | 24,595,261 | |
| | 753,120 | | | | 316,957 | | | | 13,464,160 | | | | 11,360,966 | | | | 15,002 | | | | 55,735 | |
| | (16,166,971) | | | | (10,761,992) | | | | (91,472,950) | | | | (178,887,373) | | | | (7,757,125) | | | | (12,740,758) | |
| | |
| 12,600,704 | | | | 90,746,178 | | | | (22,197,343) | | | | 20,270,134 | | | | (2,159,328) | | | | 11,910,238 | |
| | |
| 9,925,820 | | | | 100,149,711 | | | | (28,939,775) | | | | 43,838,395 | | | | (2,225,775) | | | | 12,100,426 | |
| | | | | | | | | | | | | | | | | | | | | | |
| 156,493,305 | | | | 56,343,594 | | | | 600,823,105 | | | | 556,984,710 | | | | 59,008,365 | | | | 46,907,939 | |
| | |
| $166,419,125 | | | | $156,493,305 | | | | $571,883,330 | | | | $600,823,105 | | | | $56,782,590 | | | | $59,008,365 | |
| | |
| | | | | | | | | | | | | | | | | | | | | | |
| | 1,190,302 | | | | 4,302,332 | | | | 4,756,977 | | | | 16,033,306 | | | | 401,410 | | | | 1,745,954 | |
| | 31,858 | | | | 14,681 | | | | 1,130,492 | | | | 1,007,178 | | | | 1,078 | | | | 4,036 | |
| | (685,167) | | | | (464,212) | | | | (7,848,580) | | | | (15,052,751) | | | | (559,754) | | | | (913,317) | |
| | |
| 536,993 | | | | 3,852,801 | | | | (1,961,111) | | | | 1,987,733 | | | | (157,266) | | | | 836,673 | |
| | 6,599,459 | | | | 2,746,658 | | | | 50,878,978 | | | | 48,891,245 | | | | 4,200,630 | | | | 3,363,957 | |
| | |
| 7,136,452 | | | | 6,599,459 | | | | 48,917,867 | | | | 50,878,978 | | | | 4,043,364 | | | | 4,200,630 | |
| | |
| | | | | |
| | $ (12,661) | | | | $ 538,934 | | | | $ (4,109) | | | | $ 7,344,268 | | | | $ 67,917 | | | | $ 15,835 | |
FINANCIAL HIGHLIGHTS
(for a share outstanding throughout each period indicated)
AGGRESSIVE INVESTORS 1
| | | | | | | | | | | | |
| | | For the
Period Ended
12/31/15
(Unaudited) | | Year Ended June 30 |
| | | | 2015 | | 2014 | | 2013 | | 2012 | | 2011 |
| | | | | | |
Net Asset Value, Beginning of Period | | $59.15 | | $56.69 | | $43.21 | | $33.13 | | $38.19 | | $27.67 |
| | | | | | |
| | | | | | | | | | | | |
| | | | | | |
Income from Investment Operations: | | | | | | | | | | | | |
Net Investment Income(a) | | 0.06 | | 0.02 | | 0.11 | | 0.65 | | 0.62 | | 0.51 |
Net Realized and Unrealized Gain (Loss) | | (5.66) | | 2.56 | | 13.73 | | 9.84 | | (4.37) | | 10.72 |
| | | | | | |
| | | | | | | | | | | | |
| | | | | | |
Total from Investment Operations | | (5.60) | | 2.58 | | 13.84 | | 10.49 | | (3.75) | | 11.23 |
| | | | | | |
| | | | | | | | | | | | |
| | | | | | |
Less Distributions to Shareholders from: | | | | | | | | | | | | |
Net Investment Income | | (0.02) | | (0.12) | | (0.36) | | (0.41) | | (1.31) | | (0.71) |
| | | | | | |
| | | | | | | | | | | | |
| | | | | | |
Total Distributions | | (0.02) | | (0.12) | | (0.36) | | (0.41) | | (1.31) | | (0.71) |
| | | | | | |
| | | | | | | | | | | | |
| | | | | | |
Net Asset Value, End of Period | | $53.53 | | $59.15 | | $56.69 | | $43.21 | | $33.13 | | $38.19 |
| | | | | | | | | | | | |
| | | | | | |
Total Return | | (9.46%)(b) | | 4.57% | | 32.14% | | 31.92% | | (9.57%) | | 40.81% |
| | | | | | |
Ratios and Supplemental Data: | | | | | | | | | | | | |
Net Assets, End of Period (in 000’s) | | $214,888 | | $248,046 | | $259,402 | | $221,337 | | $206,010 | | $106,757 |
Expenses Before Waivers and Reimbursements | | 0.78%(c) | | 1.32% | | 1.01% | | 0.74%(d) | | (0.04%)(d) | | (0.41%)(d) |
Expenses After Waivers and Reimbursements | | 0.78%(c) | | 1.32% | | 1.01% | | 0.74% | | (0.04%) | | (0.41%) |
Net Investment Income After Waivers and Reimbursements | | 0.22%(c) | | 0.04% | | 0.22% | | 1.69% | | 1.86% | | 1.49% |
Portfolio Turnover Rate | | 65%(b) | | 107% | | 125% | | 149% | | 125% | | 107% |
| (a) | Per share amounts calculated based on the average daily shares outstanding during the period. |
| (c) | Annualized for periods less than one year. |
| (d) | For the years ended June 30, 2011, June 30, 2012 and June 30, 2013, the expense ratio was significantly lower than in past years, due to a negative performance adjustment to the investment advisory fee. Please refer to Note 3 of the Notes to Financial Statements for further information. The rate shown may not be indicative of the rate going forward. |
See Notes to Financial Statements.
| | |
| 95 | | Semi-Annual Report | December 31, 2015 (Unaudited) |
FINANCIAL HIGHLIGHTS
(for a share outstanding throughout each period indicated)
ULTRA-SMALL COMPANY
| | | | | | | | | | | | |
| | | For the
Period Ended
12/31/15
(Unaudited) | | Year Ended June 30 |
| | | | 2015 | | 2014 | | 2013 | | 2012 | | 2011 |
| | | | | | |
Net Asset Value, Beginning of Period | | $30.37 | | $41.83 | | $39.36 | | $27.57 | | $29.65 | | $22.94 |
| | | | | | |
| | | | | | | | | | | | |
| | | | | | |
Income from Investment Operations: | | | | | | | | | | | | |
Net Investment Income(a) | | 0.16 | | 0.24 | | 0.41 | | 0.43 | | 0.13 | | 0.07 |
Net Realized and Unrealized Gain (Loss) | | (3.93) | | (3.53) | | 8.33 | | 11.38 | | (1.79) | | 6.83 |
| | | | | | |
| | | | | | | | | | | | |
| | | | | | |
Total from Investment Operations | | (3.77) | | (3.29) | | 8.74 | | 11.81 | | (1.66) | | 6.90 |
| | | | | | |
| | | | | | | | | | | | |
| | | | | | |
Less Distributions to Shareholders from: | | | | | | | | | | | | |
Net Investment Income | | (0.27) | | (0.30) | | (0.76) | | (0.02) | | (0.42) | | (0.19) |
Net Realized Gain | | - | | (7.87) | | (5.51) | | - | | - | | - |
| | | | | | |
| | | | | | | | | | | | |
| | | | | | |
Total Distributions | | (0.27) | | (8.17) | | (6.27) | | (0.02) | | (0.42) | | (0.19) |
| | | | | | |
| | | | | | | | | | | | |
| | | | | | |
Net Asset Value, End of Period | | $26.33 | | $30.37 | | $41.83 | | $39.36 | | $27.57 | | $29.65 |
| | | | | | | | | | | | |
| | | | | | |
Total Return | | (12.40)%(b) | | (7.60)% | | 23.72% | | 42.85% | | (5.41%) | | 30.12% |
| | | | | | |
Ratios and Supplemental Data: | | | | | | | | | | | | |
Net Assets, End of Period (in 000’s) | | $107,847 | | $127,717 | | $152,331 | | $132,064 | | $102,110 | | $94,434 |
Expenses Before Waivers and Reimbursements | | 1.16%(c) | | 1.11% | | 1.10% | | 1.17% | | 1.22% | | 1.18% |
Expenses After Waivers and Reimbursements . | | 1.16%(c) | | 1.11% | | 1.10% | | 1.17% | | 1.22% | | 1.18% |
Net Investment Income After Waivers and Reimbursements | | 1.17%(c) | | 0.68% | | 0.98% | | 1.33% | | 0.49% | | 0.27% |
Portfolio Turnover Rate | | 49%(b) | | 90% | | 99% | | 89% | | 93% | | 110% |
| (a) | Per share amounts calculated based on the average daily shares outstanding during the period. |
| (c) | Annualized for periods less than one year. |
See Notes to Financial Statements.
FINANCIAL HIGHLIGHTS
(for a share outstanding throughout each period indicated)
ULTRA-SMALL COMPANY MARKET
| | | | | | | | | | | | |
| | | For the
Period Ended
12/31/15
(Unaudited) | | Year Ended June 30 |
| | | | 2015 | | 2014 | | 2013 | | 2012 | | 2011 |
| | | | | | |
Net Asset Value, Beginning of Period | | $16.18 | | $17.46 | | $15.44 | | $14.67 | | $15.34 | | $11.72 |
| | | | | | |
| | | | | | | | | | | | |
| | | | | | |
Income from Investment Operations: | | | | | | | | | | | | |
Net Investment Income(a) | | 0.06 | | 0.12 | | 0.12 | | 0.22 | | 0.12 | | 0.12 |
Net Realized and Unrealized Gain (Loss) | | (1.68) | | 0.38 | | 3.66 | | 3.49 | | (0.09) | | 3.65 |
| | | | | | |
| | | | | | | | | | | | |
| | | | | | |
Total from Investment Operations | | (1.62) | | 0.50 | | 3.78 | | 3.71 | | 0.03 | | 3.77 |
| | | | | | |
| | | | | | | | | | | | |
| | | | | | |
Less Distributions to Shareholders from: | | | | | | | | | | | | |
Net Investment Income | | (0.13) | | (0.14) | | (0.18) | | (0.40) | | (0.14) | | (0.15) |
Net Realized Gain | | (1.53) | | (1.64) | | (1.59) | | (2.54) | | (0.56) | | — |
| | | | | | |
| | | | | | | | | | | | |
| | | | | | |
Total Distributions | | (1.66) | | (1.78) | | (1.77) | | (2.94) | | (0.70) | | (0.15) |
| | | | | | |
| | | | | | | | | | | | |
| | | | | | |
Paid in Capital from Redemption Fees(a) | | 0.00(b) | | 0.00(b) | | 0.01 | | 0.00(b) | | 0.00(b) | | 0.00(b) |
| | | | | | |
| | | | | | | | | | | | |
| | | | | | |
Net Asset Value, End of Period | | $12.90 | | $16.18 | | $17.46 | | $15.44 | | $14.67 | | $15.34 |
| | | | | | | | | | | | |
| | | | | | |
Total Return | | (9.92%)(c)(d) | | 3.72% | | 25.48% | | 29.95%(d) | | 1.05%(d) | | 32.22%(d) |
| | | | | | |
Ratios and Supplemental Data: | | | | | | | | | | | | |
Net Assets, End of Period (in 000’s) | | $342,905 | | $402,853 | | $424,096 | | $341,647 | | $302,432 | | $393,883 |
Expenses Before Waivers and Reimbursements | | 0.76%(e) | | 0.73% | | 0.72% | | 0.79% | | 0.83% | | 0.79% |
Expenses After Waivers and Reimbursements | | 0.75%(e) | | 0.73% | | 0.72% | | 0.75% | | 0.75% | | 0.75% |
Net Investment Income After Waivers and Reimbursements | | 0.83%(e) | | 0.74% | | 0.73% | | 1.52% | | 0.86% | | 0.82% |
Portfolio Turnover Rate | | 19%(c) | | 32% | | 29% | | 41% | | 31% | | 42% |
| (a) | Per share amounts calculated based on the average daily shares outstanding during the period. |
| (b) | Amount represents less than $0.005. |
| (d) | Total return would have been lower had various fees not been waived during the period. |
| (e) | Annualized for periods less than one year. |
See Notes to Financial Statements.
| | |
| 97 | | Semi-Annual Report | December 31, 2015 (Unaudited) |
FINANCIAL HIGHLIGHTS
(for a share outstanding throughout each period indicated)
SMALL-CAP MOMENTUM
| | | | | | | | | | | | |
| | | For the
Period Ended
12/31/15
(Unaudited) | | Year Ended June 30 |
| | | | 2015 | | 2014 | | 2013 | | 2012 | | 2011 |
| | | | | | |
Net Asset Value, Beginning of Period | | $12.29 | | $13.00 | | $12.19 | | $11.25 | | $12.74 | | $9.33 |
| | | | | | |
| | | | | | | | | | | | |
| | | | | | |
Income from Investment Operations: | | | | | | | | | | | | |
Net Investment Income(a) | | 0.04 | | 0.09 | | 0.01 | | 0.10 | | 0.04 | | 0.09 |
Net Realized and Unrealized Gain (Loss) | | (0.69) | | 0.37 | | 2.29 | | 2.20 | | (0.35) | | 3.40 |
| | | | | | |
| | | | | | | | | | | | |
| | | | | | |
Total from Investment Operations | | (0.65) | | 0.46 | | 2.30 | | 2.30 | | (0.31) | | 3.49 |
| | | | | | |
| | | | | | | | | | | | |
| | | | | | |
Less Distributions to Shareholders from: | | | | | | | | | | | | |
Net Investment Income | | (0.03) | | (0.07) | | (0.02) | | (0.19) | | (0.01) | | (0.08) |
Net Realized Gain | | (0.32) | | (1.10) | | (1.47) | | (1.17) | | (1.18) | | - |
| | | | | | |
| | | | | | | | | | | | |
| | | | | | |
Total Distributions | | (0.35) | | (1.17) | | (1.49) | | (1.36) | | (1.19) | | (0.08) |
| | | | | | |
| | | | | | | | | | | | |
| | | | | | |
Paid in Capital from Redemption Fees(a) | | 0.00(b) | | 0.00(b) | | 0.00(b) | | 0.00(b) | | 0.01 | | 0.00(b) |
| | | | | | |
| | | | | | | | | | | | |
| | | | | | |
Net Asset Value, End of Period | | $11.29 | | $12.29 | | $13.00 | | $12.19 | | $11.25 | | $12.74 |
| | | | | | | | | | | | |
| | | | | | |
Total Return | | (5.32%)(c)(d) | | 4.54%(d) | | 19.46%(d) | | 22.31%(d) | | (1.40%)(d) | | 37.49%(d) |
| | | | | | |
Ratios and Supplemental Data: | | | | | | | | | | | | |
Net Assets, End of Period (in 000’s) | | $4,119 | | $5,123 | | $5,894 | | $4,437 | | $2,070 | | $3,002 |
Expenses Before Waivers and Reimbursements | | 3.91%(e) | | 3.36% | | 3.08% | | 5.42% | | 5.73% | | 5.43% |
Expenses After Waivers and Reimbursements | | 0.90%(e) | | 0.90% | | 0.90% | | 0.90% | | 0.90% | | 0.90% |
Net Investment Income After Waivers and Reimbursements | | 0.59%(e) | | 0.77% | | 0.07% | | 0.89% | | 0.38% | | 0.79% |
Portfolio Turnover Rate | | 91%(c) | | 198% | | 242% | | 264% | | 230% | | 272% |
| (a) | Per share amounts calculated based on the average daily shares outstanding during the period. |
| (b) | Amount represents less than $0.005. |
| (d) | Total return would have been lower had various fees not been waived during the period. |
| (e) | Annualized for periods less than one year. |
See Notes to Financial Statements.
FINANCIAL HIGHLIGHTS
(for a share outstanding throughout each period indicated)
SMALL-CAP GROWTH
| | | | | | | | | | | | |
| | | For the
Period Ended
12/31/15
(Unaudited) | | Year Ended June 30 |
| | | | 2015 | | 2014 | | 2013 | | 2012 | | 2011 |
| | | | | | |
Net Asset Value, Beginning of Period | | $21.17 | | $18.68 | | $15.11 | | $11.63 | | $12.42 | | $9.14 |
| | | | | | |
| | | | | | | | | | | | |
| | | | | | |
Income from Investment Operations: | | | | | | | | | | | | |
Net Investment Income (Loss)(a) | | 0.02 | | (0.01) | | 0.01 | | 0.08 | | (0.02) | | (0.01) |
Net Realized and Unrealized Gain (Loss) | | (1.17) | | 2.51 | | 3.63 | | 3.40 | | (0.77) | | 3.31 |
| | | | | | |
| | | | | | | | | | | | |
| | | | | | |
Total from Investment Operations | | (1.15) | | 2.50 | | 3.64 | | 3.48 | | (0.79) | | 3.30 |
| | | | | | |
| | | | | | | | | | | | |
| | | | | | |
Less Distributions to Shareholders from: | | | | | | | | | | | | |
Net Investment Income | | - | | (0.01) | | (0.07) | | - | | 0.00(b) | | (0.02) |
| | | | | | |
| | | | | | | | | | | | |
| | | | | | |
Total Distributions | | - | | (0.01) | | (0.07) | | - | | 0.00(b) | | (0.02) |
| | | | | | |
| | | | | | | | | | | | |
| | | | | | |
Net Asset Value, End of Period | | $20.02 | | $21.17 | | $18.68 | | $15.11 | | $11.63 | | $12.42 |
| | | | | | | | | | | | |
| | | | | | |
Total Return | | (5.43%)(c)(d) | | 13.41%(d) | | 24.11%(d) | | 29.92%(d) | | (6.35%)(d) | | 36.17%(d) |
| | | | | | |
Ratios and Supplemental Data: | | | | | | | | | | | | |
Net Assets, End of Period (in 000’s) | | $36,215 | | $36,801 | | $33,419 | | $30,605 | | $31,778 | | $46,717 |
Expenses Before Waivers and Reimbursements | | 1.19%(e) | | 1.08% | | 1.07% | | 1.13% | | 1.08% | | 0.98% |
Expenses After Waivers and Reimbursements . | | 0.94%(e) | | 0.94% | | 0.94% | | 0.94% | | 0.94% | | 0.94% |
Net Investment Income (Loss) After Waivers and Reimbursements | | 0.14%(e) | | (0.07%) | | 0.06% | | 0.60% | | (0.14%) | | (0.12%) |
Portfolio Turnover Rate | | 70%(c) | | 123% | | 121% | | 78% | | 63% | | 87% |
| (a) | Per share amounts calculated based on the average daily shares outstanding during the period. |
| (b) | Amount represents less than $0.005. |
| (d) | Total return would have been lower had various fees not been waived during the period. |
| (e) | Annualized for periods less than one year. |
See Notes to Financial Statements.
| | |
| 99 | | Semi-Annual Report | December 31, 2015 (Unaudited) |
FINANCIAL HIGHLIGHTS
(for a share outstanding throughout each period indicated)
SMALL-CAP VALUE
| | | | | | | | | | | | |
| | | For the
Period Ended
12/31/15
(Unaudited) | | Year Ended June 30 |
| | | 2015 | | 2014 | | 2013 | | 2012 | | 2011 |
| | | | | | |
Net Asset Value, Beginning of Period | | $22.40 | | $23.06 | | $19.21 | | $14.82 | | $15.12 | | $11.45 |
| | | | | | | | | | | | |
| | | | | | |
Income from Investment Operations: | | | | | | | | | | | | |
Net Investment Income(a) | | 0.17 | | 0.29 | | 0.15 | | 0.29 | | 0.15 | | 0.14 |
Net Realized and Unrealized Gain (Loss) | | (2.28) | | (0.78) | | 3.80 | | 4.46 | | (0.26) | | 3.60 |
| | | | | | | | | | | | |
| | | | | | |
Total from Investment Operations | | (2.11) | | (0.49) | | 3.95 | | 4.75 | | (0.11) | | 3.74 |
| | | | | | | | | | | | |
| | | | | | |
Less Distributions to Shareholders from: | | | | | | | | | | | | |
Net Investment Income | | (0.39) | | (0.17) | | (0.10) | | (0.36) | | (0.19) | | (0.07) |
| | | | | | | | | | | | |
| | | | | | |
Total Distributions | | (0.39) | | (0.17) | | (0.10) | | (0.36) | | (0.19) | | (0.07) |
| | | | | | | | | | | | |
| | | | | | |
Net Asset Value, End of Period | | $19.90 | | $22.40 | | $23.06 | | $19.21 | | $14.82 | | $15.12 |
| | | | | | | | | | | | |
| | | | | | |
Total Return | | (9.43%)(b)(c) | | (2.10%)(c) | | 20.63%(c) | | 32.49% | | (0.59%)(c) | | 32.73% |
| | | | | | |
Ratios and Supplemental Data: | | | | | | | | | | | | |
Net Assets, End of Period (in 000’s) | | $60,995 | | $73,241 | | $85,782 | | $79,248 | | $67,610 | | $93,714 |
Expenses Before Waivers and Reimbursements | | 1.05%(d) | | 0.98% | | 0.97% | | 0.91% | | 0.99% | | 0.87% |
Expenses After Waivers and Reimbursements | | 0.94%(d) | | 0.94% | | 0.94% | | 0.91% | | 0.94% | | 0.87% |
Net Investment Income After Waivers and Reimbursements | | 1.60%(d) | | 1.30% | | 0.71% | | 1.71% | | 1.10% | | 1.03% |
Portfolio Turnover Rate | | 38%(b) | | 74% | | 83% | | 64% | | 49% | | 84% |
| (a) | Per share amounts calculated based on the average daily shares outstanding during the period. |
| (c) | Total return would have been lower had various fees not been waived during the period. |
| (d) | Annualized for periods less than one year. |
See Notes to Financial Statements.
FINANCIAL HIGHLIGHTS
(for a share outstanding throughout each period indicated)
LARGE-CAP GROWTH
| | | | | | | | | | | | |
| | | For the
Period Ended
12/31/15
(Unaudited) | | Year Ended June 30 |
| | | | 2015 | | 2014 | | 2013 | | 2012 | | 2011 |
| | | | | | |
Net Asset Value, Beginning of Period | | $23.71 | | $20.51 | | $16.18 | | $13.33 | | $13.38 | | $10.17 |
| | | | | | | | | | | | |
| | | | | | |
Income from Investment Operations: | | | | | | | | | | | | |
Net Investment Income(a) | | 0.03 | | 0.17 | | 0.13 | | 0.16 | | 0.09 | | 0.06 |
Net Realized and Unrealized Gain (Loss) | | (0.31) | | 3.14 | | 4.29 | | 2.88 | | (0.05) | | 3.22 |
| | | | | | | | | | | | |
| | | | | | |
Total from Investment Operations | | (0.28) | | 3.31 | | 4.42 | | 3.04 | | 0.04 | | 3.28 |
| | | | | | | | | | | | |
| | | | | | |
Less Distributions to Shareholders from: | | | | | | | | | | | | |
Net Investment Income | | (0.11) | | (0.11) | | (0.09) | | (0.19) | | (0.09) | | (0.07) |
| | | | | | | | | | | | |
| | | | | | |
Total Distributions | | (0.11) | | (0.11) | | (0.09) | | (0.19) | | (0.09) | | (0.07) |
| | | | | | | | | | | | |
| | | | | | |
Net Asset Value, End of Period | | $23.32 | | $23.71 | | $20.51 | | $16.18 | | $13.33 | | $13.38 |
| | | | | | | | | | | | |
| | | | | | |
Total Return | | (1.19%)(b)(c) | | 16.19% | | 27.41%(c) | | 23.06%(c) | | 0.37%(c) | | 32.31%(c) |
| | | | | | |
Ratios and Supplemental Data: | | | | | | | | | | | | |
Net Assets, End of Period (in 000’s) | | $166,419 | | $156,493 | | $56,344 | | $47,967 | | $48,444 | | $58,478 |
Expenses Before Waivers and Reimbursements | | 0.83%(d) | | 0.81% | | 0.87% | | 0.90% | | 0.92% | | 0.86% |
Expenses After Waivers and Reimbursements | | 0.83%(d) | | 0.81% | | 0.84% | | 0.84% | | 0.84% | | 0.84% |
Net Investment Income After Waivers and Reimbursements | | 0.27%(d) | | 0.75% | | 0.70% | | 1.10% | | 0.74% | | 0.47% |
Portfolio Turnover Rate | | 29%(b) | | 48% | | 74% | | 49% | | 55% | | 65% |
| (a) | Per share amounts calculated based on the average daily shares outstanding during the period. |
| (c) | Total return would have been lower had various fees not been waived during the period. |
| (d) | Annualized for periods less than one year. |
See Notes to Financial Statements.
| | |
| 101 | | Semi-Annual Report | December 31, 2015 (Unaudited) |
FINANCIAL HIGHLIGHTS
(for a share outstanding throughout each period indicated)
BLUE CHIP 35 INDEX
| | | | | | | | | | | | |
| | | For the
Period Ended
12/31/15
(Unaudited) | | Year Ended June 30 |
| | | 2015 | | 2014 | | 2013 | | 2012 | | 2011 |
Net Asset Value, Beginning of Period | | $11.81 | | $11.39 | | $9.59 | | $8.16 | | $7.60 | | $6.18 |
| | | | | | | | | | | | |
| | | | | | |
Income from Investment Operations: | | | | | | | | | | | | |
Net Investment Income(a) | | 0.14 | | 0.26 | | 0.23 | | 0.21 | | 0.17 | | 0.15 |
Net Realized and Unrealized Gain | | 0.04 | | 0.39 | | 1.77 | | 1.46 | | 0.55 | | 1.39 |
| | | | | | | | | | | | |
Total from Investment Operations | | 0.18 | | 0.65 | | 2.00 | | 1.67 | | 0.72 | | 1.54 |
| | | | | | | | | | | | |
| | | | | | |
Less Distributions to Shareholders from: | | | | | | | | | | | | |
Net Investment Income | | (0.30) | | (0.23) | | (0.20) | | (0.24) | | (0.16) | | (0.12) |
| | | | | | | | | | | | |
| | | | | | |
Total Distributions | | (0.30) | | (0.23) | | (0.20) | | (0.24) | | (0.16) | | (0.12) |
| | | | | | | | | | | | |
| | | | | | |
Net Asset Value, End of Period | | $11.69 | | $11.81 | | $11.39 | | $9.59 | | $8.16 | | $7.60 |
| | | | | | | | | | | | |
| | | | | | |
Total Return | | 1.48%(b)(c) | | 5.77%(c) | | 21.11%(c) | | 20.89%(c) | | 9.72%(c) | | 25.10%(c) |
| | | | | | |
Ratios and Supplemental Data: | | | | | | | | | | | | |
Net Assets, End of Period (in 000’s) | | $571,883 | | $600,823 | | $556,985 | | $463,146 | | $264,161 | | $331,565 |
Expenses Before Waivers and Reimbursements | | 0.25%(d) | | 0.23% | | 0.25% | | 0.27% | | 0.29% | | 0.27% |
Expenses After Waivers and Reimbursements | | 0.15%(d) | | 0.15% | | 0.15% | | 0.15% | | 0.15% | | 0.15% |
Net Investment Income After Waivers and Reimbursements | | 2.42%(d) | | 2.19% | | 2.20% | | 2.36% | | 2.28% | | 2.09% |
Portfolio Turnover Rate | | 5%(b) | | 19% | | 28% | | 28% | | 33% | | 19% |
| (a) | Per share amounts calculated based on the average daily shares outstanding during the period. |
| (c) | Total return would have been lower had various fees not been waived during the period. |
| (d) | Annualized for periods less than one year. |
See Notes to Financial Statements.
FINANCIAL HIGHLIGHTS
(for a share outstanding throughout each period indicated)
MANAGED VOLATILITY
| | | | | | | | | | | | |
| | | For the
Period Ended
12/31/15
(Unaudited) | | Year Ended June 30 |
| | | 2015 | | 2014 | | 2013 | | 2012 | | 2011 |
| | | | | | |
Net Asset Value, Beginning of Period | | $14.05 | | $13.94 | | $12.75 | | $11.94 | | $11.58 | | $10.23 |
| | | | | | | | | | | | |
| | | | | | |
Income from Investment Operations: | | | | | | | | | | | | |
Net Investment Income(a) | | 0.02 | | 0.00(b) | | 0.02 | | 0.05 | | 0.04 | | 0.07 |
Net Realized and Unrealized Gain | | (0.03) | | 0.13 | | 1.20 | | 0.81 | | 0.39 | | 1.37 |
| | | | | | | | | | | | |
| | | | | | |
Total from Investment Operations | | (0.01) | | 0.13 | | 1.22 | | 0.86 | | 0.43 | | 1.44 |
| | | | | | | | | | | | |
| | | | | | |
Less Distributions to Shareholders from: | | | | | | | | | | | | |
Net Investment Income | | 0.00(b) | | (0.02) | | (0.03) | | (0.05) | | (0.07) | | (0.09) |
| | | | | | | | | | | | |
| | | | | | |
Total Distributions | | 0.00(b) | | (0.02) | | (0.03) | | (0.05) | | (0.07) | | (0.09) |
| | | | | | | | | | | | |
| | | | | | |
Net Asset Value, End of Period | | $14.04 | | $14.05 | | $13.94 | | $12.75 | | $11.94 | | $11.58 |
| | | | | | | | | | | | |
| | | | | | |
Total Return | | (0.12%)(c)(d) | | 0.92%(d) | | 9.61%(d) | | 7.23%(d) | | 3.74%(d) | | 14.15%(d) |
| | | | | | |
Ratios and Supplemental Data: | | | | | | | | | | | | |
Net Assets, End of Period (in 000’s) | | $56,783 | | $59,008 | | $46,908 | | $26,703 | | $23,705 | | $29,246 |
Expenses Before Waivers and Reimbursements | | 1.04%(e) | | 1.04% | | 1.14% | | 1.35% | | 1.43% | | 1.22% |
Expenses After Waivers and Reimbursements | | 0.94%(e) | | 0.94% | | 0.94% | | 0.94% | | 0.94% | | 0.94% |
Net Investment Income After Waivers and Reimbursements | | 0.23%(e) | | 0.03% | | 0.17% | | 0.37% | | 0.39% | | 0.63% |
Portfolio Turnover Rate | | 21%(c) | | 38% | | 39% | | 45% | | 41% | | 34% |
| (a) | Per share amounts calculated based on the average daily shares outstanding during the period. |
| (b) | Amount represents less than $0.005. |
| (d) | Total return would have been lower had various fees not been waived during the period. |
| (e) | Annualized for periods less than one year. |
See Notes to Financial Statements.
| | |
| 103 | | Semi-Annual Report | December 31, 2015 (Unaudited) |
| | |
| NOTES TO FINANCIAL STATEMENTS | | |
December 31, 2015 (Unaudited)
1. Organization:
Bridgeway Funds, Inc. (“Bridgeway” or the “Company”) was organized as a Maryland corporation on October 19, 1993, and is registered under the Investment Company Act of 1940, as amended (the “1940 Act”), as an open-end management investment company.
Bridgeway is organized as a series fund, with 11 investment funds as of December 31, 2015 (each is referred to as a “Fund” and collectively, the “Funds”). The Aggressive Investors 1, Ultra-Small Company, Ultra-Small Company Market, Small-Cap Momentum, Small-Cap Growth, Small-Cap Value, Large-Cap Growth, Blue Chip 35 Index and Managed Volatility Funds are presented in this report. The Omni Small-Cap Value and Omni Tax-Managed Small-Cap Value Funds are included in a separate report.
Bridgeway is authorized to issue 1,915,000,000 shares of common stock at $0.001 per share. As of December 31, 2015, 100,000,000 shares have been classified into the Aggressive Investors 1 Fund. 130,000,000 shares have been classified into the Blue Chip 35 Index Fund. 15,000,000 shares have been classified into the Ultra-Small Company Fund. 100,000,000 shares each have been classified into the Ultra-Small Company Market, Omni Small-Cap Value, Omni Tax-Managed Small-Cap Value, Small-Cap Momentum, Small-Cap Growth, Small-Cap Value and Large-Cap Growth Funds. 50,000,000 shares have been classified into the Managed Volatility Fund.
The Ultra-Small Company Fund is open to existing investors (direct only).
All of the Funds are no-load, diversified funds.
The Aggressive Investors 1 Fund seeks to exceed the stock market total return (primarily through capital appreciation) at a level of total risk roughly equal to that of the stock market over longer periods of time (three year intervals or more).
The Ultra-Small Company, Ultra-Small Company Market, Small-Cap Momentum, Small-Cap Growth, Small-Cap Value and Large-Cap Growth Funds seek to provide a long-term total return on capital, primarily through capital appreciation.
The Blue Chip 35 Index Fund seeks to provide long-term total return on capital, primarily through capital appreciation, but also some income.
The Managed Volatility Fund seeks to provide a high current return with short-term risk less than or equal to 40% of the stock market.
Bridgeway Capital Management, Inc. (the “Adviser”) is the investment adviser for all of the Funds.
2. Significant Accounting Policies:
The following summary of significant accounting policies, followed in the preparation of the financial statements of the Funds, are in conformity with accounting principles generally accepted in the United States of America (“GAAP”). Each Fund is considered an investment company under GAAP and follows the accounting and reporting guidance applicable to investment companies.
Securities, Options, Futures and Other Investments Valuation Other than options, securities for which market quotations are readily available are valued at the last sale price on the national exchange on which such securities are primarily traded. In the case of securities reported on the National Association of Securities Dealers Automated Quotation (“NASDAQ”) system, the securities are valued based on the NASDAQ Official Closing Price (“NOCP”). In the absence of recorded sales on their primary exchange, or NOCP, in the case of NASDAQ traded securities, the security will be valued as follows: bid prices for long positions and ask prices for short positions.
Fixed income securities are valued on the basis of current market quotations provided by a pricing service. Options are valued at the close if there is trading volume and, if there is no trading volume, the options are valued at the bid on long positions and the ask on the short positions.
| | |
| NOTES TO FINANCIAL STATEMENTS (continued) | | |
December 31, 2015 (Unaudited)
Investments in open-end registered investment companies and closed-end registered investment companies that do not trade on an exchange are valued at the end of day net asset value (“NAV”) per share.
Investments in closed-end registered investment companies that trade on an exchange are valued at the last sales price as of the close of the customary trading session on the exchange where the security is principally traded.
When market quotations are not readily available or when events occur that make established valuation methods unreliable, securities of the Funds may be valued at fair value as determined in good faith by or under the direction of the Board of Directors. The valuation assigned to a fair valued security for purposes of calculating the Funds’ NAVs may differ from the security’s most recent closing market price and from the prices used by other mutual funds to calculate their NAVs.
The inputs and valuation techniques used to determine the value of a Fund’s investments are summarized into three levels as described in the hierarchy below:
| ● | | Level 1 – quoted prices in active markets for identical assets |
Investments whose values are based on quoted market prices in active markets, and whose values are therefore classified as Level 1 prices, include active listed equity securities. The Funds do not adjust the quoted price for such investments, even in situations where the Funds hold a large position and a sale could reasonably impact the quoted price.
| ● | | Level 2 – other significant observable inputs (including quoted prices for similar securities, interest rates, prepayment speeds, credit risk, etc.) |
Investments that trade in markets that are not considered to be active, but whose values are based on quoted market prices, dealer quotations or valuations provided by alternative pricing sources supported by observable inputs, are classified as Level 2 prices. These generally include certain U.S. Government and sovereign obligations, most government agency securities, investment-grade corporate bonds and less liquid listed equity securities. As investments whose values are classified as Level 2 prices include positions that are not traded in active markets and/or are subject to transfer restrictions, valuations may be adjusted to reflect illiquidity and/or non-transferability, which are generally based on available market information.
The Dreyfus Cash Management Fund, which is held by each Fund, invests primarily in securities that are valued at cost or amortized cost. Therefore, these investments are classified as Level 2 investments.
| ● | | Level 3 – significant unobservable inputs (including the Fund’s own assumptions in determining the fair value of investments) |
Investments whose values are classified as Level 3 prices have significant unobservable inputs, as they may trade infrequently or not at all. When observable prices are not available for these securities, the Funds use one or more valuation techniques for which sufficient and reliable data is available. The inputs used by the Funds in estimating the value of Level 3 prices may include the original transaction price, quoted prices for similar securities or assets in active markets, completed or pending third-party transactions in the underlying investment or comparable issuers, and changes in financial ratios or cash flows. Level 3 prices may also be adjusted to reflect illiquidity and/or non-transferability, with the amount of such discount estimated by the Funds in the absence of market information. Assumptions used by the Funds due to the lack of observable inputs may significantly impact the resulting value and therefore the results of the Funds’ operations.
The inputs or methodology used for valuing investments are not necessarily an indication of the risk associated with investing in those investments. A summary of the inputs used to value the Funds’ investments as of December 31, 2015 is included with each Fund’s Schedule of Investments.
The Funds’ policy is to recognize transfers into, and transfers out of, each level of hierarchy as of the beginning of the reporting period. For the period ended December 31, 2015, the Ultra-Small Company Market Fund transferred a security with a value of $436,985 from Level 2 to Level 1 as of the end of the period, due to the market becoming active. There were no transfers between Level 1 and Level 2 in any of the other Funds. Details regarding transfers into, and transfers out of, Level 3 can be found at the end of each Schedule of Investments for Funds that held Level 3 securities.
| | |
| 105 | | Semi-Annual Report | December 31, 2015 (Unaudited) |
| | |
| NOTES TO FINANCIAL STATEMENTS (continued) | | |
December 31, 2015 (Unaudited)
Securities Lending Upon lending its securities to third parties, each Fund receives compensation in the form of fees. The loans are secured by collateral at least equal to the fair value of the securities loaned plus accrued interest. Each Fund has the right under the lending agreement to recover the securities from the borrower on demand. Additionally, a Fund does not have the right to sell or re-pledge collateral received in the form of securities unless the borrower goes into default. The risks to a Fund of securities lending are that the borrower may not provide additional collateral when required or return the securities when due, resulting in a loss. Under the terms of the Securities Lending Agreement, the Funds are indemnified for such losses by the securities lending agent.
While securities are on loan, the Fund continues to receive dividends on the securities loaned and recognizes any gain or loss in the fair value of the securities loaned.
Securities lending transactions are entered into by a Fund under a Securities Lending Agreement which provides the right, in the event of default (including bankruptcy or insolvency) for the non-defaulting party to liquidate the collateral or to offset the market value of the collateral received against the market value of the securities loaned. The value of the collateral is typically greater than that of the market value of the securities loaned, leaving the lender with a net amount payable to the defaulting party. However, bankruptcy or insolvency laws of a particular jurisdiction may impose restrictions on or prohibitions against such a right of offset in the event of a counterparty’s bankruptcy or insolvency.
The market value of securities on loan, all of which are classified as common stocks in the Funds’ Schedules of Investments, and the value of the related collateral are shown together in the Statements of Assets and Liabilities as a component of Investments at value.
The following table is a summary of the Funds’ securities loaned and related collateral, which are subject to a netting agreement as of December 31, 2015:
| | | | | | | | | | | | | | | | |
| | | | | | | | | Gross Amount Not
Offset in the Statement
of Assets and Liabilities | | | | |
| Fund | | Gross
Amounts of
Recognized
Assets1 | | Gross Amounts
Offset in the
Statement of
Assets and
Liabilities | | Net Amounts of
Assets Presented
in the Statement
of Assets and
Liabilities | | Financial
Instruments | | Cash
Collateral
Received2 | | | Net
Amount | |
| |
| | | | | | |
Aggressive Investors 1 | | | | | | | | | | | | | | | | |
Securities lending | | $10,469,156 | | - | | $10,469,156 | | - | | | $10,469,156 | | | | - | |
| | | | | | |
Ultra-Small Company | | | | | | | | | | | | | | | | |
Securities lending | | $11,715,841 | | - | | $11,715,841 | | - | | | $11,715,841 | | | | - | |
| | | | | | |
Ultra-Small Company Market | | | | | | | | | | | - | | | | - | |
Securities lending | | $34,254,298 | | - | | $34,254,298 | | - | | | $34,254,298 | | | | - | |
| | | | | | |
Small-Cap Momentum | | | | | | | | | | | | | | | | |
Securities lending | | $ 477,945 | | - | | $ 477,945 | | - | | | $ 477,945 | | | | - | |
| | | | | | |
Small-Cap Growth | | | | | | | | | | | | | | | | |
Securities lending | | $ 4,286,368 | | - | | $ 4,286,368 | | - | | | $ 4,286,368 | | | | - | |
| | | | | | |
Small-Cap Value | | | | | | | | | | | | | | | | |
Securities lending | | $ 7,892,496 | | - | | $ 7,892,496 | | - | | | $ 7,892,496 | | | | - | |
| | | | | | |
Managed Volatility | | | | | | | | | | | | | | | | |
Securities lending | | $ 183,874 | | - | | $ 183,874 | | - | | | $ 183,874 | | | | - | |
| 1 | Securities loaned with a value of $2,937, $965,900, $22,855, $39,165, $509,515, and $1,249,316 in Aggressive Investors 1, Ultra-Small Company, Ultra-Small Company Market, Small-Cap Momentum, Small-Cap Growth, and Small-Cap Value, respectively, have been sold and are pending settlement on January 1, 2016. |
| 2 | Collateral with a value of $10,789,705, $12,430,202, $36,309,249, $498,353, $4,637,788, $8,205,146, and $207,932 has been received in |
| | |
| NOTES TO FINANCIAL STATEMENTS (continued) | | |
December 31, 2015 (Unaudited)
| | connection with securities lending of Aggressive Investors 1, Ultra-Small Company, Ultra-Small Company Market, Small-Cap Momentum, Small-Cap Growth, Small-Cap Value, and Managed Volatility Funds, respectively. Excess of collateral received from an individual counterparty is not shown here for financial reporting purposes. |
It is each Fund’s policy to obtain additional collateral from, or return excess collateral to, the borrower by the end of the next business day following the valuation date of the securities loaned. Therefore, the value of the collateral held may be temporarily less than that required under the lending contract. As of December 31, 2015 the collateral consisted of an institutional money market fund.
Use of Estimates in Financial Statements In preparing financial statements in conformity with GAAP, management makes estimates and assumptions that affect the reported amounts of assets and liabilities on the date of the financial statements and the disclosure of contingent assets and liabilities on the date of the financial statements, as well as the reported amounts of revenue and expenses during the reporting period. Actual results could differ from those estimates.
Risks and Uncertainties The Funds provide for various investment options, including stocks, bonds and call and put options. Such investments are exposed to various risks, such as interest rate, market and credit risks. Due to the risks involved, it is at least reasonably possible that changes in risks in the near term would materially affect shareholders’ account values and the amounts reported in the financial statements.
Security Transactions, Investment Income and Expenses Security transactions are accounted for as of the trade date, the date the order to buy or sell is executed. Realized gains and losses are computed on the identified cost basis. Dividend income is recorded on the ex-dividend date, and interest income is recorded on the accrual basis from settlement date. Particularly related to the Managed Volatility Fund, discounts and premiums are accreted/amortized on the effective interest method.
Fund expenses that are not series-specific are allocated to each series based upon its relative proportion of net assets to the Funds’ total net assets or other appropriate basis.
Distributions to Shareholders The Funds pay dividends from net investment income and distribute realized capital gains annually, usually in December.
Derivatives
The Funds’ use of derivatives for the period ended December 31, 2015 was limited to futures contracts, purchased options, and written options. The following is a summary of how these derivatives are treated in the financial statements and their impact on the Funds, categorized by primary underlying risk.
| | | | | | | | | | | | |
Primary Underlying Risk/Fund | | Derivative Assets | | | | | Derivative Liabilities | | | Location on Statement of Assets and Liabilities |
|
Equity Risk | | | | | | | | | | | | |
Aggresive Investors 1: | | | | | | | | | | | | |
Call Options Purchased | | | $7,950 | | | | | | — | | | Investments at Value |
| | | | |
Managed Volatility: | | | | | | | | | | | | |
Written Call Options | | | — | | | | | | $412,129 | | | Call options written at value |
Written Put Options | | | — | | | | | | 504,966 | | | Put options written at value |
| | |
| 107 | | Semi-Annual Report | December 31, 2015 (Unaudited) |
| | |
| NOTES TO FINANCIAL STATEMENTS (continued) | | |
December 31, 2015 (Unaudited)
| | | | | | |
Primary Underlying Risk/Fund | | Amount of
Realized Gain
(Loss) on Derivatives | | Amount of
Unrealized Gain
(Loss) on Derivatives | | Location of Gain (Loss) in the Statement of Operations |
| | | |
Equity Risk | | | | | | |
Aggresive Investors 1: | | | | | | |
Call Options Purchased | | | | | | Change in Unrealized Appreciation |
| | — | | $(94,584) | | (Depreciation) on Investments |
| | | |
Managed Volatility: | | | | | | |
Written Options | | $1,266,712 | | $ 24,697 | | Realized Gain (Loss) on Written Options |
| | | | | | and Change in Unrealized Appreciation |
| | | | | | (Depreciation) on Written options |
Futures Contracts | | $ 664,781 | | — | | Realized Gain (Loss) on Futures contracts |
The derivative instruments outstanding as of December 31, 2015, as disclosed in the Notes to the Financial Statements, and the amounts of realized and changes in unrealized gains and losses on derivative instruments during the period, as disclosed in the Statements of Operations, serve as indicators of the volume of derivatives activity for the Funds.
Futures Contracts The Funds may purchase or sell financial futures contracts to hedge cash positions, manage market risk, and to dampen volatility in line with investment objectives. A futures contract is an agreement between two parties to buy or sell a financial instrument at a set price on a future date. Upon entering into such a contract, a Fund is required to pledge to the broker an amount of cash or U.S. Government securities equal to the minimum “initial margin” requirements of the exchange on which the futures contract is traded. The contract amount reflects the extent of a Fund’s exposure in these financial instruments. A Fund’s participation in the futures markets involves certain risks, including imperfect correlation between movements in the price of futures contracts and movements in the price of the securities hedged or used for cover. Pursuant to a contract, such Fund agrees to receive from, or pay to, the broker an amount of cash equal to the fluctuation in value of the contract. Such receipts or payments are known as “variation margin” and are recorded by a Fund as unrealized appreciation or depreciation. When a contract is closed, a Fund records a realized gain or loss equal to the difference between the value of the contract at the time it was opened and the value at the time it was closed. With futures, there is minimal counterparty risk to the Funds, since futures are exchange traded and the exchange’s clearinghouse, as counterparty to all exchange traded futures, guarantees the futures against default. As of December 31, 2015, the Funds had no open futures contracts.
Options The Aggressive Investors 1 Fund may buy and sell calls and puts to increase or decrease the Fund’s exposure to stock market risk or for purposes of diversification of risk. The Managed Volatility Fund may buy and sell calls and puts to reduce the Fund’s volatility and provide some cash flow. An option is a contract conveying a right to buy or sell a financial instrument at a specified price during a stipulated period. The premium paid by a Fund for the purchase of a call or a put option is included in such Fund’s Schedule of Investments as an investment and subsequently marked-to-market to reflect the current market value of the option. When a Fund writes a call or a put option, an amount equal to the premium received by such Fund is included in its Statement of Assets and Liabilities as a liability and is subsequently marked-to-market to reflect the current market value of the option written. If an option that a Fund has written either expires on its stipulated expiration date, or if such Fund enters into a closing purchase transaction, that Fund realizes a gain (or a loss if the cost of a closing purchase transaction exceeds the premium received when the option was written) without regard to any unrealized gain or loss on the underlying security, and the liability related to such options is extinguished. If a call option that a Fund has written is assigned, such Fund realizes a gain or loss from the sale of the underlying security, and the proceeds from such sale are increased by the premium originally received. If a put option that a Fund has written is assigned, the amount of the premium originally received reduces the cost of the security that such Fund purchased upon exercise of the option. Buying calls increases a Fund’s exposure to the underlying security to the extent of any premium paid. Buying puts on a stock market index tends to limit a Fund’s exposure to a stock market decline. All options purchased by the Funds were listed on exchanges and considered liquid positions with readily available market quotes.
Covered Call Options and Secured Puts The Aggressive Investors 1 and Managed Volatility Funds may write call options on a covered basis; that is, a Fund will own the underlying security, or a Fund may write secured puts. The principal reason for
| | |
| NOTES TO FINANCIAL STATEMENTS (continued) | | |
December 31, 2015 (Unaudited)
writing covered calls and secured puts on a security is to attempt to realize income through the receipt of premiums. The option writer has, in return for the premium, given up the opportunity for profit from a substantial price increase in the underlying security so long as the obligation as a writer continues, but has retained the risk of loss should the price of the security decline. All options were listed on exchanges and considered liquid positions with readily available market quotes. Transactions in options written during the period ended December 31, 2015 are as follows:
| | | | | | | | | | | | | | | | |
| | | Managed Volatility Fund | | Managed Volatility Fund |
| | | Written Call Options | | Written Put Options |
| | | Contracts | | Premiums | | | Contracts | | Premiums | |
| |
| | | | | | | | | | | | | | | | |
Outstanding, June 30, 2015 | | | 2,062 | | | | $ 334,365 | | | | 2,016 | | | | $ 448,204 | |
Positions Opened | | | 7,517 | | | | 1,425,261 | | | | 3,374 | | | | 927,825 | |
Exercised | | | (644) | | | | (156,038) | | | | (1,850) | | | | (402,893) | |
Splits | | | 22 | | | | - | | | | 215 | | | | - | |
Expired | | | (4,799) | | | | (764,994) | | | | (2,207) | | | | (534,769) | |
Closed | | | (928) | | | | (184,374) | | | | - | | | | - | |
| |
Outstanding, December 31, 2015 | | | 3,230 | | | | $ 654,220 | | | | 1,548 | | | | $ 438,367 | |
| |
Value, December 31, 2015 | | | | | | | $ (412,129) | | | | | | | | $(504,966) | |
| |
The Aggressive Investors 1 Fund had no transactions in written options during the period ended December 31, 2015.
Indemnification Under the Company’s organizational documents, the Funds’ officers, directors, employees and agents are indemnified against certain liabilities that may arise out of the performance of their duties to the Funds. Additionally, in the normal course of business, the Funds enter into contracts that contain a variety of indemnification clauses. The Funds’ maximum exposure under these arrangements is unknown, as this would involve future claims that may be made against the Funds that have not yet occurred. However, the Funds have not had prior claims or losses pursuant to these contracts.
3. Advisory Fees, Other Related Party Transactions and Contingencies:
The Funds have entered into management agreements with the Adviser. As compensation for the advisory services rendered, facilities furnished, and expenses borne by the Adviser, the Funds pay the Adviser a fee pursuant to each Fund’s management agreement, as described below.
Aggressive Investors 1: A total advisory fee is paid by the Fund to the Adviser that is comprised of a Base Fee and a Performance Adjustment. The Base Fee equals the Base Fee Rate times the average daily net assets of the Fund. The Base Fee Rate is based on the following annual rates: 0.90% of the first $250 million of the Fund’s average daily net assets, 0.875% of the next $250 million, 0.85% of the next $500 million and 0.80% of any excess over $1 billion.
The Performance Adjustment equals 4.67% times the difference in cumulative total return between the Fund and the Standard and Poor’s 500 Composite Stock Price Index with dividends reinvested (hereinafter “Index”) over a rolling five-year performance period. The Performance Adjustment Rate varies from a minimum of -0.70% to a maximum of +0.70%. However, the Performance Adjustment Rate is zero if the difference between the cumulative Fund performance and the Index performance is less than or equal to 2%.
Ultra-Small Company: The Fund pays advisory fees based on the following annual rates: 0.90% of the first $250 million of the Fund’s average daily net assets, 0.875% of the next $250 million and 0.85% of any excess over $500 million. The management fees are computed daily and are payable monthly. However, during any period when the Fund’s net assets range from $27,500,000 to $55,000,000, the advisory fee will be determined as if the Fund had $55,000,000 under management. This is limited to a maximum annualized expense ratio of 1.49% of average net assets.
Ultra-Small Company Market: The Fund’s advisory fee is a flat 0.50% of the value of the Fund’s average daily net assets, computed daily and payable monthly.
| | |
| 109 | | Semi-Annual Report | December 31, 2015 (Unaudited) |
| | |
| NOTES TO FINANCIAL STATEMENTS (continued) | | |
December 31, 2015 (Unaudited)
Small-Cap Momentum: The Fund’s advisory fee is a flat 0.55% of the value of the Fund’s average daily net assets, computed daily and payable monthly.
Small-Cap Growth and Small-Cap Value: A total advisory fee is paid by each Fund to the Adviser that is comprised of a Base Fee and a Performance Adjustment. The Base Fee equals the Base Fee Rate times the average daily net assets of the Fund. The Base Fee Rate is based on the annual rate of 0.60% of the value of the Fund’s average daily net assets.
The Performance Adjustment equals 0.33% times the difference in cumulative total return between the Fund and the Russell 2000 Growth Index for Small-Cap Growth Fund and the Russell 2000 Value Index for Small-Cap Value Fund, with dividends reinvested (hereinafter “Index”) over a rolling five-year performance period. The Performance Adjustment Rate varies from a minimum of -0.05% to a maximum of +0.05%. However, the Performance Adjustment Rate is zero if the difference between the cumulative Fund’s performance and the Index performance is less than or equal to 2%.
Large-Cap Growth: A total advisory fee is paid by the Fund to the Adviser that is comprised of a Base Fee and a Performance Adjustment. The Base Fee equals the Base Fee Rate times the average daily net assets of the Fund. The Base Fee Rate is based on the annual rate of 0.50% of the value of the Fund’s average daily net assets.
The Performance Adjustment equals 0.33% times the difference in cumulative total return between the Fund and the Russell 1000 Growth Index, with dividends reinvested (hereinafter “Index”) over a rolling five-year performance period. The Performance Adjustment Rate varies from a minimum of -0.05% to a maximum of +0.05%. However, the Performance Adjustment Rate is zero if the difference between the cumulative Fund’s performance and the Index performance is less than or equal to 2%.
Blue Chip 35 Index: The Fund’s advisory fee is a flat 0.08% of the value of the Fund’s average daily net assets, computed daily and payable monthly.
Managed Volatility: The Fund’s advisory fee is a flat 0.60% of the value of the Fund’s average daily net assets, computed daily and payable monthly.
Expense limitations: The Adviser has agreed to reimburse the Funds for operating expenses and management fees above the expense limitations shown in the table below, which are shown as a ratio of net expenses to average net assets, for each Fund, for the year ended December 31, 2015. Any material change to the expense limitation would require a vote by shareholders of the applicable Fund.
| | | | | | | | |
| Bridgeway Fund | | Expense
Limitation | | | Total Waivers and
Reimbursements
for Period Ending
12/31/15 | |
| |
| | | | | | | | |
Aggressive Investors 1 | | | 1.75% | | | | $ - | |
Ultra-Small Company | | | 1.85% | | | | - | |
Ultra-Small Company Market | | | 0.75% | | | | 24,052 | |
Small-Cap Momentum* | | | 0.90% | | | | 70,644 | |
Small-Cap Growth | | | 0.94% | | | | 44,934 | |
Small-Cap Value | | | 0.94% | | | | 36,036 | |
Large-Cap Growth | | | 0.84% | | | | - | |
Blue Chip 35 Index | | | 0.15% | | | | 288,660 | |
Managed Volatility | | | 0.94% | | | | 27,751 | |
| | |
| NOTES TO FINANCIAL STATEMENTS (continued) | | |
December 31, 2015 (Unaudited)
| | | | |
| Bridgeway Fund | | Expense
Limitation | | Total Waivers and
Reimbursements
for Period Ending
12/31/15 |
|
| *The Fund is authorized to reimburse the Adviser for management fees previously waived and/or for expenses previously paid by the Adviser, provided, however, that any reimbursements must be paid at a date not more than three years after the fiscal year in which the Adviser waived the fees or reimbursed the expenses and the reimbursements do not cause the Fund to exceed the expense limitation in the agreement. The Fund has recoupable expenses of $128,493, $121,419, $128,110 and $70,644 which expire June 30, 2016, June 30, 2017, June 30, 2018, and June 30, 2019, respectively. |
Other Related Party Transactions: The Funds will engage in inter-portfolio trades when it is to the benefit of both parties. The Board of Directors reviews these trades quarterly. Inter-portfolio purchases and sales during the period ended December 31, 2015 were as follows:
| | | | | | | | |
| Bridgeway Fund | | Inter-Portfolio
Purchases | | | Inter-Portfolio
Sales | |
| |
| | | | | | | | |
Aggressive Investors 1 | | | $ - | | | | $ 4,124,559 | |
Ultra-Small Company | | | 995,577 | | | | 11,606,257 | |
Ultra-Small Company Market | | | 14,326,380 | | | | 6,256,886 | |
Small-Cap Momentum | | | 2,639 | | | | 65,870 | |
Small-Cap Growth | | | 3,320,987 | | | | 1,212,604 | |
Small-Cap Value | | | 722,541 | | | | 2,618,483 | |
Large-Cap Growth | | | 1,957,905 | | | | - | |
The Adviser entered into an Administrative Services Agreement with Bridgeway, pursuant to which the Adviser provides various administrative services to the Funds including, but not limited to: (i) supervising and managing various aspects of the Funds’ business and affairs; (ii) selecting, overseeing and/or coordinating activities with other service providers to the Funds; (iii) providing reports to the Board of Directors as requested from time to time; (iv) assisting and/or reviewing amendments and updates to the Funds’ registration statement and other filings with the Securities and Exchange Commission (“SEC”); (v) providing certain shareholder services; (vi) providing administrative support in connection with meetings of the Board of Directors; and (vii) providing certain record-keeping services. For its services to all of the Bridgeway Funds, the Adviser is paid an aggregate annual fee of $590,000, payable in equal monthly installments.
Board of Directors Compensation Independent Directors are paid an annual retainer of $15,000, with an additional retainer of $5,000 paid to the Independent Chairman of the Board and an additional retainer of $1,000 paid to the Nominating and Corporate Governance Committee Chair. The retainer is paid in quarterly installments. Effective November 13, 2015, Independent Directors are paid $7,500 per meeting for meeting fees. Prior to November 13, 2015, Independent Directors were paid $6,250 per meeting. Such compensation is the total compensation from all Funds and is allocated among the Funds.
The Independent Directors each receive this compensation in the form of shares of the Bridgeway Funds, credited to his or her account. Such Directors are reimbursed for any expenses incurred in attending meetings and conferences, as well as expenses for subscriptions or printed materials. The amount of directors’ fees attributable to each Fund is disclosed in the Statements of Operations.
One director of Bridgeway, John Montgomery, is an owner and director of the Adviser. Under the 1940 Act definitions, he is considered to be an “affiliated person” of the Adviser and an “interested person” of the Adviser and of Bridgeway. Compensation for Mr. Montgomery is borne by the Adviser rather than the Funds.
4. Distribution and Shareholder Servicing Fees:
Foreside Fund Services, LLC acts as distributor of the Funds’ shares, pursuant to a Distribution Agreement dated November 12, 2010. The Adviser pays all costs and expenses associated with distribution of the Funds’ shares, pursuant to a protective plan adopted by shareholders pursuant to Rule 12b-1.
| | |
| 111 | | Semi-Annual Report | December 31, 2015 (Unaudited) |
| | |
| NOTES TO FINANCIAL STATEMENTS (continued) | | |
December 31, 2015 (Unaudited)
5. Purchases and Sales of Investment Securities:
Purchases and sales of investments, other than short-term securities, for each Fund for the period ended December 31, 2015 were as follows:
| | | | | | | | | | | | |
| | | Purchases | | | Sales | |
| Bridgeway Fund | | U.S. Government | | Other | | | U.S. Government | | Other | |
| |
| | | | | | | | | | | | |
Aggressive Investors 1 | | $ - | | | $147,379,313 | | | $ - | | | $160,561,491 | |
Ultra-Small Company | | - | | | 56,056,092 | | | - | | | 60,220,202 | |
Ultra-Small Company Market | | - | | | 71,344,572 | | | - | | | 86,171,674 | |
Small-Cap Momentum | | - | | | 4,188,905 | | | - | | | 4,927,127 | |
Small-Cap Growth | | - | | | 27,273,658 | | | - | | | 25,126,713 | |
Small-Cap Value | | - | | | 25,250,762 | | | - | | | 30,605,490 | |
Large-Cap Growth | | - | | | 60,973,260 | | | - | | | 46,780,370 | |
Blue Chip 35 Index | | - | | | 27,593,810 | | | - | | | 57,649,872 | |
Managed Volatility | | - | | | 12,353,682 | | | - | | | 7,076,514 | |
6. Federal Income Taxes
It is the Funds’ policy to continue to comply with the provisions of the Internal Revenue Code of 1986, as amended, applicable to regulated investment companies, and to distribute income to the extent necessary so that the Funds are not subject to federal income tax. Therefore, no federal income tax provision is required.
Unrealized Appreciation and Depreciation on Investments (Tax Basis) The amount of net unrealized appreciation/ depreciation and the cost of investment securities for tax purposes, including short-term securities as of December 31, 2015, were as follows:
| | | | | | | | | | | | | | | |
| | | Aggressive Investors 1 | | Ultra-Small
Company | | Ultra-Small
Company Market |
Gross appreciation (excess of value over tax cost) | | | | $ 21,307,565 | | | | | $ 13,671,223 | | | | | $ 93,628,990 | |
Gross depreciation (excess of tax cost over value) | | | | (14,231,420 | ) | | | | (17,511,324 | ) | | | | (48,290,152 | ) |
Net unrealized appreciation (depreciation) | | | | $ 7,076,145 | | | | | $ (3,840,101 | ) | | | | $ 45,338,838 | |
Cost of investments for income tax purposes | | | | $217,751,915 | | | | | $124,766,261 | | | | | $336,882,283 | |
| | | | | | | | | | | | | | | |
| | | |
| | | Small-Cap Momentum | | Small-Cap Growth | | Small-Cap Value |
Gross appreciation (excess of value over tax cost) | | | | $ 348,059 | | | | | $ 3,680,397 | | | | | $ 3,875,373 | |
Gross depreciation (excess of tax cost over value) | | | | (180,106 | ) | | | | (2,948,232 | ) | | | | (7,871,351 | ) |
Net unrealized appreciation (depreciation) | | | | $ 167,953 | | | | | $ 732,165 | | | | | $ (3,995,978 | ) |
Cost of investments for income tax purposes | | | | $4,464,658 | | | | | $40,316,937 | | | | | $73,542,131 | |
| | | | | | | | | | | | | | | |
| | | |
| | | Large-Cap Growth | | Blue Chip 35 Index | | Managed Volatility |
Gross appreciation (excess of value over tax cost) | | | | $ 19,782,416 | | | | | $191,917,028 | | | | | $12,734,879 | |
Gross depreciation (excess of tax cost over value) | | | | (6,750,477 | ) | | | | (7,876,564 | ) | | | | (7,501,825 | ) |
Net unrealized appreciation (depreciation) | | | | $ 13,031,939 | | | | | $184,040,464 | | | | | $ 5,233,054 | |
Cost of investments for income tax purposes | | | | $155,119,094 | | | | | $388,398,580 | | | | | $51,817,648 | |
The differences between book and tax net unrealized appreciation (depreciation) are primarily due to wash sale and straddle loss deferrals and basis adjustments on investments in business development companies, partnerships and passive foreign investment companies (PFICs).
Classifications of Distributions Net investment income (loss) and net realized gain (loss) may differ for financial statement and tax purposes. The character of distributions made during the year from net investment income or net realized gains may differ from its ultimate characterization for federal income tax purposes.
| | |
| NOTES TO FINANCIAL STATEMENTS (continued) | | |
December 31, 2015 (Unaudited)
The tax character of the distributions paid by the Funds during the last two fiscal years ended June 30, 2015 and June 30, 2014, respectively, are as follows:
| | | | | | | | | | | | | | | | |
| | | Aggressive Investors 1 | | | Ultra-Small Company | |
| |
| | | Year | | | Year | | | Year | | | Year | |
| | | Ended | | | Ended | | | Ended | | | Ended | |
| | | June 30, 2015 | | | June 30, 2014 | | | June 30, 2015 | | | June 30, 2014 | |
| |
Distributions paid from: | | | | | | | | | | | | | | | | |
Ordinary Income | | | $540,861 | | | | $1,735,698 | | | | $ 1,052,434 | | | | $ 2,464,929 | |
Long-Term Capital Gain | | | - | | | | - | | | | 27,750,353 | | | | 17,948,088 | |
| |
Total | | | $540,861 | | | | $1,735,698 | | | | $28,802,787 | | | | $20,413,017 | |
| |
| | | Ultra-Small Company Market | | | Small-Cap Momentum | |
| |
| | | Year | | | Year | | | Year | | | Year | |
| | | Ended | | | Ended | | | Ended | | | Ended | |
| | | June 30, 2015 | | | June 30, 2014 | | | June 30, 2015 | | | June 30, 2014 | |
| |
Distributions paid from: | | | | | | | | | | | | | | | | |
Ordinary Income | | | $ 2,780,087 | | | | $ 2,799,151 | | | | $ 282,147 | | | | $ 490,538 | |
Long-Term Capital Gain | | | 38,343,165 | | | | 37,195,176 | | | | 188,250 | | | | 131,251 | |
| |
Total | | | $41,123,252 | | | | $39,994,327 | | | | $ 470,397 | | | | $ 621,789 | |
| |
| | | Small-Cap Growth | | | Small-Cap Value | |
| |
| | | Year | | | Year | | | Year | | | Year | |
| | | Ended | | | Ended | | | Ended | | | Ended | |
| | | June 30, 2015 | | | June 30, 2014 | | | June 30, 2015 | | | June 30, 2014 | |
| |
Distributions paid from: | | | | | | | | | | | | | | | | |
Ordinary Income | | | $ 21,907 | | | | $ 134,922 | | | | $ 581,377 | | | | $ 411,510 | |
| |
Total | | | $ 21,907 | | | | $ 134,922 | | | | $ 581,377 | | | | $ 411,510 | |
| |
| | | Large-Cap Growth | | | Blue Chip 35 Index | |
| |
| | | Year | | | Year | | | Year | | | Year | |
| | | Ended | | | Ended | | | Ended | | | Ended | |
| | | June 30, 2015 | | | June 30, 2014 | | | June 30, 2015 | | | June 30, 2014 | |
| |
Distributions paid from: | | | | | | | | | | | | | | | | |
Ordinary Income | | | $ 330,018 | | | | $ 269,798 | | | | $11,713,217 | | | | $9,822,019 | |
| |
Total | | | $ 330,018 | | | | $ 269,798 | | | | $11,713,217 | | | | $9,822,019 | |
| |
| | | Managed Volatility | | | | | | | |
| | | | | | | | | |
| | | Year | | | Year | | | | | | | |
| | | Ended | | | Ended | | | | | | | |
| | | June 30, 2015 | | | June 30, 2014 | | | | | | | |
| | | | | | | | | |
Distributions paid from: | | | | | | | | | | | | | | | | |
Ordinary Income | | | $ 59,691 | | | | $ 90,423 | | | | | | | | | |
| | | | | | | | | |
Total | | | $ 59,691 | | | | $ 90,423 | | | | | | | | | |
| | | | | | | | | |
| | |
| 113 | | Semi-Annual Report | December 31, 2015 (Unaudited) |
| | |
| NOTES TO FINANCIAL STATEMENTS (continued) | | |
December 31, 2015 (Unaudited)
As of June 30, 2015, the Funds had available for tax purposes, capital loss carryovers as follows:
| | | | | | |
| | | | | Aggressive Investors 1 | | Ultra-Small Company |
|
Expiring | | 6/30/2017 | | $83,672,925 | | $1,203,654 |
| | 6/30/2018 | | 16,094,317 | | - |
| | | | | | |
| | | | | Small-Cap Growth | | Small-Cap Value |
|
Expiring | | 6/30/2018 | | $13,110,417 | | $20,917,185 |
| | | | | | | | |
| | | | | Large-Cap Growth | | Blue Chip 35 Index | | Managed Volatility |
|
Expiring | | 6/30/2018 | | $12,765,670 | | $13,868,547 | | $4,158,560 |
| | 6/30/2019 | | - | | 2,656,190 | | - |
Under the Regulated Investment Company Modernization Act of 2010, capital losses incurred by these Funds after June 30, 2011 will not be subject to expiration and will retain their character as either short-term or long-term capital losses. In addition, such losses must be utilized prior to the losses incurred in the years preceding enactment. For Aggressive Investors 1 and Ultra-Small Company Funds, capital losses related to prior year reorganizations are subject to limitations under Internal Revenue Code Section 381-384. As of the date of the reorganizations, Aggressive Investors 1 and Ultra-Small Company had accumulated capital losses of $99,797,242 and $1,203,654, respectively, which are subject to limitation.
There are no capital loss carryovers for Ultra-Small Company Market Fund and Small-Cap Momentum Fund as of June 30, 2015.
Capital loss carryovers utilized during the period ended June 30, 2015 were as follows:
| | | | |
| | | Capital Loss | |
| Bridgeway Fund | | Carryover Utilized | |
| | | | |
Aggressive Investors 1 | | | $25,307,168 | |
Ultra-Small Company | | | 601,827 | |
Small-Cap Growth | | | 4,041,588 | |
Small-Cap Value | | | 5,688,882 | |
Large-Cap Growth | | | 7,237,893 | |
Blue Chip 35 Index | | | 5,687,442 | |
Managed Volatility | | | 927,552 | |
Components of Accumulated Earnings (Deficit) As of June 30, 2015, the components of accumulated earnings (deficit) on a tax basis were:
| | | | | | | | | | | | |
| | | | | | | | | Ultra-Small | |
| | | Aggressive Investors 1 | | | Ultra-Small Company | | | Company Market | |
| |
Accumulated Net Investment Income (Loss) | | | $ 99,002 | | | | $ 1,116,193 | | | | $ - | |
Accumulated Net Realized Gain (Loss) on Investments* | | | (99,767,242) | | | | (3,508,746) | | | | 26,469,812 | |
Net Unrealized Appreciation/Depreciation of Investments | | | 30,893,689 | | | | 16,499,764 | | | | 115,184,639 | |
| |
Total | | | $(68,774,551) | | | | $14,107,211 | | | | $141,654,451 | |
| |
| | | Small-Cap Momentum | | | Small-Cap Growth | | | Small-Cap Value | |
| |
Accumulated Net Investment Income (Loss) | | | $ 9,442 | | | | $ - | | | | $ 941,370 | |
Accumulated Net Realized Gain (Loss) on Investments* | | | 115,288 | | | | (13,110,417) | | | | (20,917,185) | |
Net Unrealized Appreciation/Depreciation of Investments | | | 436,843 | | | | 5,688,817 | | | | 2,890,633 | |
| |
Total | | | $561,573 | | | | $ (7,421,600) | | | | $(17,085,182) | |
| |
| | |
| NOTES TO FINANCIAL STATEMENTS (continued) | | |
December 31, 2015 (Unaudited)
| | | | | | | | | | | | |
| | | Large-Cap Growth | | | Blue Chip 35 Index | | | Managed Volatility | |
| |
Accumulated Net Investment Income (Loss) | | | $ 538,934 | | | | $ 7,344,268 | | | | $ 15,835 | |
Accumulated Net Realized Gain (Loss) on Investments* | | | (12,765,670) | | | | (16,524,737) | | | | (4,158,560) | |
Net Unrealized Appreciation/Depreciation of Investments | | | 15,056,732 | | | | 191,342,937 | | | | 6,941,314 | |
| |
Total | | | $ 2,829,996 | | | | $182,162,468 | | | | $ 2,798,589 | |
| |
| * | Includes qualified late-year losses that the Funds have elected to defer to the beginning of their next fiscal year ending June 30, 2016. The Ultra-Small Company Fund has elected to defer qualified short-term late-year losses of ($2,305,092). The Aggressive Investors 1, Ultra-Small Company Market, Small-Cap Momentum, Small-Cap Growth, Small-Cap Value, Large-Cap Growth, Blue Chip 35 Index Fund, and Managed Volatility Funds have no deferred qualified late-year losses. |
For the fiscal year June 30, 2015, the Funds recorded the following reclassifications to the accounts listed below:
| | | | | | | | | | | | |
| | | Increase (Decrease) | |
| |
| | | Aggressive Investors 1 | | | Ultra-Small Company | | | Ultra-Small Company Market | |
| |
Paid-in-Capital | | | $ - | | | | $ - | | | | $2,099,239 | |
Undistributed Net Investment Income | | | - | | | | (14,057) | | | | 222,437 | |
Accumulated Net Realized Gain (Loss) on Investments | | | - | | | | 14,057 | | | | (2,321,676) | |
| |
| | | |
| | | Small-Cap Momentum | | | Small-Cap Growth | | | Small-Cap Value | |
| |
Paid-in-Capital | | | $10,366 | | | | $(23,610) | | | | $ - | |
Undistributed Net Investment Income | | | (3,267) | | | | 23,610 | | | | 5,432 | |
Accumulated Net Realized Gain (Loss) on Investments | | | (7,099) | | | | - | | | | (5,432) | |
| |
| | | |
| | | Large-Cap Growth | | | Blue Chip 35 Index | | | Managed Volatility | |
| |
Paid-in-Capital | | | $ - | | | | $ - | | | | $ - �� | |
Undistributed Net Investment Income | | | - | | | | - | | | | - | |
Accumulated Net Realized Gain (Loss) on Investments | | | - | | | | - | | | | - | |
| |
The difference between book and tax components of net assets and the resulting reclassifications were primarily a result of the differing book/tax treatment of the deduction of equalization debits for tax purposes, redesignation of dividends paid, net operating loss, distributions in excess of profits and investments in real estate investment trusts, business development companies, grantor trusts, partnerships and passive foreign investment companies (PFICs).
Accounting for Uncertainty in Income Taxes sets forth a minimum threshold for financial statement recognition of the benefit of a tax position taken or expected to be taken in a tax return. Management has analyzed each Fund’s tax positions and has concluded that no provision for income tax is required in each Fund’s financial statements. The Funds are not aware of any tax position for which it is reasonably possible that the total amounts of unrecognized tax benefits will significantly change in the next twelve months. Each Fund’s federal tax returns for the prior three fiscal years remain subject to examination by the Internal Revenue Service.
7. Line of Credit
Bridgeway established a line of credit agreement (“Facility”) with The Bank of New York Mellon, effective November 5, 2010. The Facility is for temporary or emergency purposes, such as to provide liquidity for shareholder redemptions, and is cancellable by either party. Unless cancelled earlier, the Facility shall be held available until September 15, 2016. Advances under the Facility are limited to $15,000,000 in total for all Funds, and advances to each Fund shall not exceed certain limits set forth in the credit agreement, including, but not limited to, the maximum amount a Fund is permitted to borrow under the 1940 Act.
The Funds incur a commitment fee of 0.07% per annum on the unused portion of the Facility and interest expense to the extent of amounts borrowed under the Facility. Interest is based on the “Overnight Rate” plus 1.25%. The Overnight Rate means the higher of (a) the Federal Funds rate, (b) the Overnight Eurodollar Rate, or (c) the One-Month Eurodollar Rate. The
| | |
| 115 | | Semi-Annual Report | December 31, 2015 (Unaudited) |
| | |
| NOTES TO FINANCIAL STATEMENTS (continued) | | |
December 31, 2015 (Unaudited)
commitment fees are payable quarterly in arrears and are allocated to all participating Funds. Interest expense is charged directly to a Fund based upon actual amounts borrowed by such Fund.
For the period ended December 31, 2015, borrowings by the Funds under this line of credit were as follows:
| | | | | | | | | | | | | | | | |
| Bridgeway Fund | | Weighted
Average
Interest Rate | | Weighted
Average
Loan Balance | | | Number of
Days
Outstanding | | Interest
Expense
Incurred1 | | | Maximum Amount
Borrowed During
the Period | |
| | | | | | | | | | | | | | | | |
Aggressive Investors 1 | | 1.48% | | | $ 823,837 | | | 49 | | | $1,641 | | | | $2,042,000 | |
Ultra-Small Company | | 1.44% | | | 852,729 | | | 48 | | | 1,616 | | | | 3,070,000 | |
Ultra-Small Company Market | | 1.45% | | | 504,517 | | | 29 | | | 583 | | | | 1,357,000 | |
Small-Cap Growth | | 1.44% | | | 228,714 | | | 14 | | | 126 | | | | 383,000 | |
Small-Cap Value | | 1.46% | | | 569,909 | | | 22 | | | 501 | | | | 932,000 | |
Blue Chip 35 Index | | 1.55% | | | 2,120,000 | | | 49 | | | 4,421 | | | | 7,319,000 | |
Small Cap Momentum | | 1.48% | | | 210,000 | | | 6 | | | 51 | | | | 416,000 | |
1Interest expense is included on the Statements of Operations in Miscellaneous expenses.
On December 31, 2015, Small-Cap Value had loans outstanding in the amounts of $629,000, exclusive of interest payable on the loans.
8. Redemption Fees
In Ultra-Small Company Market and Small-Cap Momentum Funds, a 2% redemption fee may be charged on shares held less than six months. The fee is charged for the benefit of the remaining shareholders and will be paid to the appropriate Fund to help offset transaction costs. The fee is accounted for as an addition to paid-in capital.
9. Subsequent Events
Management has evaluated the impact of all subsequent events on the Funds and has determined that the following subsequent event requires recognition or disclosure in the financial statements.
At close of business on February 5, 2016, the Bridgeway Large-Cap Growth Fund was reorganized into the American Beacon Bridgeway Large Cap Growth Fund (“American Beacon Fund”), a newly created series of the American Beacon Funds, pursuant to an Agreement and Plan of Reorganization and Termination (“Plan of Reorganization”) approved by the Board of Directors of the Bridgeway Large-Cap Growth Fund at a meeting held on August 27, 2015, and by shareholders of the Bridgeway Large-Cap Growth Fund at a meeting held on January 15, 2016. The purpose of the reorganization was to move the Bridgeway Large-Cap Growth Fund into the American Beacon family of funds. Under the Plan of Reorganization, the Bridgeway Large-Cap Growth Fund transferred substantially all of its assets and liabilities to the American Beacon Fund in exchange solely for institutional class shares of the American Beacon Fund, which were distributed to shareholders of the Bridgeway Large-Cap Growth Fund according to their interests held in the fund immediately prior to the reorganization.
| | |
| OTHER INFORMATION | | |
December 31, 2015 (unaudited)
1. Proxy Voting
Fund policies and procedures used in determining how to vote proxies relating to the Funds’ securities and a summary of proxies voted by the Funds for the period ended June 30, 2015 are available without a charge, upon request, by contacting Bridgeway Funds at 1-800-661-3550 and on the SEC’s website at http://www.sec.gov.
2. Fund Holdings
The complete schedules of the Funds’ holdings for the second and fourth quarters of each fiscal year are contained in the Funds’ Semi-Annual and Annual Shareholder Reports, respectively.
The Bridgeway Funds file complete schedules of the Funds’ holdings with the SEC for the first and third quarters of each fiscal year on Form N-Q within 60 days after the end of the period. Copies of the Funds’ Form N-Q are available without charge, upon request, by contacting Bridgeway Funds at 1-800-661-3550 and on the SEC’s website at http://www.sec.gov. You may also review and copy Form N-Q at the SEC’s Public Reference Room in Washington, D.C. For more information about the operation of the Public Reference Room, please call 1-800-SEC-0330.
| | |
| 117 | | Semi-Annual Report | December 31, 2015 (Unaudited) |
| | |
| DISCLOSURE OF FUND EXPENSES | | |
December 31, 2015 (Unaudited)
As a shareholder of a Fund, you will incur no transaction costs from such Fund, including sales charges (loads) on purchases, on reinvested dividends or on other distributions. There are no exchange fees. Shareholders are subject to redemption fees on the Ultra-Small Company Market and Small-Cap Momentum Funds under certain circumstances. However, as a shareholder of a Fund, you will incur ongoing costs, including management fees and other Fund expenses. The following examples are intended to help you understand your ongoing costs (in dollars) of investing in a Fund and to compare these costs with ongoing costs of investing in other mutual funds. The examples are based on an investment of $1,000 invested on July 1, 2015 and held until December 31, 2015.
Actual Expenses. The first line of the table below provides information about actual account values and actual expenses. You may use the information in this line, together with the amount you invested, to estimate the expenses that you paid over the period. Simply divide your account value by $1,000 (for example, an $8,600 account value divided by $1,000 = 8.6), then multiply the result by the number in the first line under the heading “Expenses Paid During Period” to estimate the expenses you paid on your account during the period.
Hypothetical Example for Comparison Purposes. The second line of the table below provides information about hypothetical account values and hypothetical expenses based on the Fund’s actual expense ratio and an assumed rate of return of 5% per year before expenses, which is not the Fund’s actual return. The hypothetical account values and expenses may not be used to estimate the actual ending account balance or expenses you paid for the period. You may use this information to compare the ongoing costs of investing in a Fund and other mutual funds. To do so, compare this 5% hypothetical example with the 5% hypothetical examples that appear in the shareholder reports of other funds.
The expenses shown in the table are meant to highlight ongoing Fund costs only. Therefore, the second line of the table is useful in comparing ongoing costs only and will not help you determine the relative total costs of owning different funds, because other funds may also have transaction costs, such as sales charges, redemption fees or exchange fees.
| | | | | | | | | | | | | | | | | | | | |
| | | Beginning Account
Value at 7/1/15 | | Ending Account
Value at 12/31/15 | | Expense
Ratio | | Expenses Paid
During Period*
7/1/15 - 12/31/15 |
| | | | |
Bridgeway Aggressive Investors 1 Fund | | | | | | | | | | | | | | | | | | | | |
| | | | |
Actual Fund Return | | | $ | 1,000.00 | | | | $ | 905.40 | | | | | 0.78 | % | | | $ | 3.74 | |
Hypothetical Fund Return | | | $ | 1,000.00 | | | | $ | 1,021.27 | | | | | 0.78 | % | | | $ | 3.96 | |
| | | | |
Bridgeway Ultra-Small Company Fund | | | | | | | | | | | | | | | | | | | | |
| | | | |
Actual Fund Return | | | $ | 1,000.00 | | | | $ | 876.00 | | | | | 1.16 | % | | | $ | 5.47 | |
Hypothetical Fund Return | | | $ | 1,000.00 | | | | $ | 1,019.30 | | | | | 1.16 | % | | | $ | 5.89 | |
| | | | |
Bridgeway Ultra-Small Company Market Fund | | | | | | | | | | | | | | | | | | | | |
| | | | |
Actual Fund Return | | | $ | 1,000.00 | | | | $ | 900.80 | | | | | 0.75 | % | | | $ | 3.58 | |
Hypothetical Fund Return | | | $ | 1,000.00 | | | | $ | 1,021.42 | | | | | 0.75 | % | | | $ | 3.81 | |
| | | | |
Bridgeway Small-Cap Momentum Fund | | | | | | | | | | | | | | | | | | | | |
| | | | |
Actual Fund Return | | | $ | 1,000.00 | | | | $ | 946.80 | | | | | 0.90 | % | | | $ | 4.40 | |
Hypothetical Fund Return | | | $ | 1,000.00 | | | | $ | 1,020.61 | | | | | 0.90 | % | | | $ | 4.57 | |
| | | | |
Bridgeway Small-Cap Growth Fund | | | | | | | | | | | | | | | | | | | | |
| | | | |
Actual Fund Return | | | $ | 1,000.00 | | | | $ | 945.70 | | | | | 0.94 | % | | | $ | 4.60 | |
Hypothetical Fund Return | | | $ | 1,000.00 | | | | $ | 1,020.41 | | | | | 0.94 | % | | | $ | 4.77 | |
| | | | |
Bridgeway Small-Cap Value Fund | | | | | | | | | | | | | | | | | | | | |
| | | | |
Actual Fund Return | | | $ | 1,000.00 | | | | $ | 905.70 | | | | | 0.94 | % | | | $ | 4.50 | |
Hypothetical Fund Return | | | $ | 1,000.00 | | | | $ | 1,020.41 | | | | | 0.94 | % | | | $ | 4.77 | |
| | |
| DISCLOSURE OF FUND EXPENSES (continued) | | |
December 31, 2015 (Unaudited)
| | | | | | | | | | | | | | | | | | | | |
| | | Beginning Account
Value at 7/1/15 | | Ending Account
Value at 12/31/15 | | Expense
Ratio | | Expenses Paid
During Period*
7/1/15 - 12/31/15 |
| | | | |
Bridgeway Large-Cap Growth Fund | | | | | | | | | | | | | | | | | | | | |
| | | | |
Actual Fund Return | | | $ | 1,000.00 | | | | $ | 988.10 | | | | | 0.83 | % | | | $ | 4.15 | |
Hypothetical Fund Return | | | $ | 1,000.00 | | | | $ | 1,020.96 | | | | | 0.83 | % | | | $ | 4.22 | |
| | | | |
Bridgeway Blue Chip 35 Index Fund | | | | | | | | | | | | | | | | | | | | |
| | | | |
Actual Fund Return | | | $ | 1,000.00 | | | | $ | 1,014.80 | | | | | 0.15 | % | | | $ | 0.76 | |
Hypothetical Fund Return | | | $ | 1,000.00 | | | | $ | 1,024.38 | | | | | 0.15 | % | | | $ | 0.76 | |
| | | | |
Bridgeway Managed Volatility | | | | | | | | | | | | | | | | | | | | |
| | | | |
Actual Fund Return | | | $ | 1,000.00 | | | | $ | 998.80 | | | | | 0.94 | % | | | $ | 4.72 | |
Hypothetical Fund Return | | | $ | 1,000.00 | | | | $ | 1,020.41 | | | | | 0.94 | % | | | $ | 4.77 | |
| * | Expenses are equal to the average account value times the Fund’s annualized expense ratio multiplied by the number of days in the most recent six-month period (184) divided by the number of days in the fiscal year (365). |
| | |
| 119 | | Semi-Annual Report | December 31, 2015 (Unaudited) |
BRIDGEWAY FUNDS, INC.
BNY Mellon Investment Servicing (US) Inc.
P.O. Box 9860
Providence, RI 02940-8060
CUSTODIAN
The Bank of New York Mellon
One Wall Street
New York, NY 10286
DISTRIBUTOR
Foreside Fund Services, LLC
Three Canal Plaza, Suite 100
Portland, ME 04101
| | | | |
| | You can review and copy information about our Funds (including the SAIs) at the SEC’s Public Reference Room in Washington, D.C. To find out more about this public service, call the SEC at 800-SEC-0330. Reports and other information about the Funds are also available on the SEC’s website at www.sec.gov. You can receive copies of this information, for a fee, by writing the Public Reference Section, Securities and Exchange Commission, Washington, D.C. 20549-1520 or by sending an electronic request to the following email address: publicinfo@sec.gov. | | |

A no-load mutual fund family of domestic funds
| | | | |
| | Semi-Annual Report | | |
| | December 31, 2015 (Unaudited) | | |
| | OMNI SMALL-CAP VALUE | | BOSVX |
| | OMNI TAX-MANAGED SMALL-CAP VALUE | | BOTSX |
| | www.bridgeway.com | | |
| | |
TABLE OF CONTENTS | |  |
Bridgeway Funds Standardized Returns as of December 31, 2015 (Unaudited)
| | | | | | | | | | | | | | | | |
| | | | | | | Annualized | | | | | | |
| Fund | | Quarter | | Six Months | | 1 Year | | 5 Years | | Inception
to Date | | Inception
Date | | Gross
Expense
Ratio2 | | Net
Expense
Ratio2 |
|
Omni Small-Cap Value | | 3.34% | | -8.07% | | -6.62% | | N/A | | 12.49% | | 8/31/2011 | | 0.74%1 | | 0.63%1 |
Omni Tax-Managed Small-Cap Value | | 4.02% | | -7.34% | | -5.47% | | 8.43% | | 8.43% | | 12/31/2010 | | 0.72%1 | | 0.61%1 |
| | 1 | Some of the Funds’ fees were waived or expenses reimbursed; otherwise, returns would have been lower. The Adviser has contractually agreed to waive fees and/or reimburse expenses. Any material change to this Fund policy would require a vote by shareholders. |
| | 2 | Expense ratios are as stated in the current prospectus. Please see financial highlights for expense ratios as of December 31, 2015. |
Performance figures quoted represent past performance and are no guarantee of future results. Current performance may be lower or higher than the performance data quoted. Investment return and principal value will fluctuate, so that an investor’s shares, when redeemed, may be worth more or less than original cost. To obtain performance current to the most recent month-end, please visit our website at www.bridgeway.com or call 1-800-661-3550. Total return figures include the reinvestment of dividends and capital gains.
This report is submitted for the general information of the shareholders of each Fund. It is not authorized for distribution to prospective investors unless preceded or accompanied by an effective prospectus, which includes information regarding a Fund’s risks, objectives, fees and expenses, experience of its management, and other information. Investors should read the prospectus carefully before investing in a Fund. For questions or other Fund information, call 1-800-661-3550 or visit the Funds’ website at www.bridgeway.com. Funds are available for purchase by residents of the United States, Puerto Rico, U.S. Virgin Islands and Guam only. Foreside Fund Services, LLC, Distributor.
The views expressed here are exclusively those of Fund management. These views, including those relating to the market, sectors or individual stocks are not meant as investment advice and should not be considered predictive in nature.
| | |
LETTER FROM THE INVESTMENT MANAGEMENT TEAM | | |
December 31, 2015
Dear Fellow Shareholders,
At Bridgeway, we have a shared passion for applying logic, data and evidence to develop investment solutions. The construction of our Omni Small-Cap Value and Omni Tax-Managed Small-Cap Value Funds is based on fundamental academic research that relies on market efficiency to better capture risk premiums. We manage these Funds to provide broad diversification within the small-cap value universe and to keep transaction fees and expenses low. Bridgeway offers the Omni Small-Cap Value and Omni Tax-Managed Small-Cap Value Funds through a select group of advisers. We are committed to advisers and their clients who take a long-term perspective and whose investment goals fit our unique expertise: delivering investment solutions that are statistically driven and grounded in academic theory.
Thank you for your investment in Bridgeway’s Omni Small-Cap Value and Omni Tax-Managed Small-Cap Value Funds.
Sincerely,
Your Investment Management Team
| | | | |
 | |  | | 
|
| John Montgomery | | Christine L. Wang | | Michael Whipple |
 | | | | |
Elena Khoziaeva | | | | |
| | |
LETTER FROM THE INVESTMENT MANAGEMENT TEAM (continued) | | |
Market Review
The domestic equity markets rose in the fourth quarter of 2015, despite increased volatility caused by a range of global economic concerns and questions about the Federal Reserve’s interest rate strategy. Broad market returns for the quarter were up 6.27%, as represented by the Russell 3000 Index.
For the calendar year ended December 31, 2015, broad market stocks were up 0.48%, as represented by the Russell 3000 Index. Growth stocks generally outperformed value stocks across the market cap spectrum. Large-cap growth stocks led the way, up 5.67%; small-cap value stocks lagged, down -7.47%.
The following table presents returns for broad market, small-cap, mid-cap and large-cap stocks, as represented by various style-based Russell Indexes. Size (market capitalization) and style (value/growth) are among the key factors that drive differences in U.S. stock returns.
Russell Style-Based Indexes Ranked by Performance for the Quarter and Calendar Year Ended December 31, 2015
| | | | |
| | Quarter | | Calendar Year |
| Best | | 7.32% | | 5.67% |
| Performing | | Russell 1000 Growth Index | | Russell 1000 Growth Index |
| | 7.09% | | 5.09% |
| | Russell 3000 Growth Index | | Russell 3000 Growth Index |
| | 5.64% | | -0.20% |
| | Russell 1000 Value Index | | Russell Midcap Growth Index |
| | 5.41% | | -1.38% |
| | Russell 3000 Value Index | | Russell 2000 Growth Index |
| | 4.32% | | -3.83% |
| | Russell 2000 Growth Index | | Russell 1000 Growth Index |
| | 4.12% | | -4.13% |
| | Russell Midcap Growth Index | | Russell 3000 Value Index |
| | 3.12% | | -4.78% |
| | Russell Midcap Value Index | | Russell Midcap Value Index |
| Worst | | 2.88% | | -7.47% |
Performing | | Russell 2000 Value Index | | Russell 2000 Value Index |
The Bridgeway Omni Funds in this semi-annual report are asset class exposure strategies that seek broad diversification and risk premium exposure with low tracking error. These Funds were designed to capture the size and style benefits within the small-cap value asset class.
| | |
| 2 | | Semi-Annual Report | December 31, 2015 (Unaudited) |
| | |
Omni Small-Cap Value Fund MANAGER’S COMMENTARY (Unaudited) | |
|
December 31, 2015
Dear Fellow Omni Small-Cap Value Fund Shareholder,
For the quarter ended December 31, 2015, our Fund returned 3.34%, outperforming our primary market benchmark, the Russell 2000 Value Index (+2.88%).
For the six-month semi-annual period ended December 31, 2015, total returns were -8.07%, slightly outpacing the Russell 2000 Value Index (-8.17%).
For the calendar year, our Fund returned -6.62%, outperforming the Russell 2000 Value Index (-7.47%).
The table below presents our December quarter, six-month, one-year, and inception-to-date financial results. See the next page for a graph of performance since inception.
Standardized Returns as of December 31, 2015
| | | | | | | | | | | | | | | | |
| |
| | | | | | | | | | | | Annualized | |
| | | Quarter | | | 6 Months | | | 1 Year | | | Since Inception
(8/31/11) | |
| |
| | | | |
Omni Small-Cap Value Fund | | | 3.34% | | | | -8.07% | | | | -6.62% | | | | 12.49% | |
Russell 2000 Value Index | | | 2.88% | | | | -8.17% | | | | -7.47% | | | | 11.17% | |
Performance figures quoted in the table above and the graph on the next page represent past performance and are no guarantee of future results. Total return figures in the table above include the reinvestment of dividends and capital gains. The table above and the graph on the next page do not reflect the deduction of taxes that a shareholder would pay on Fund distributions or on the redemption of Fund shares.
The Russell 2000 Value Index is an unmanaged index that consists of stocks in the Russell 2000 Index with lower price-to-book ratios and lower forecasted growth values with dividends reinvested. It is not possible to invest directly in an index. Periods longer than one year are annualized.
According to data from Lipper, Inc. as of December 31, 2015, Omni Small-Cap Value Fund ranked 155th of 309 small-cap value funds for the 12-month period ended December 31, 2015 and 72nd of 243 such funds since inception in August 2011. Lipper, Inc. is an independent mutual fund rating service that ranks funds in various fund categories by making comparative calculations using total returns.
| | |
Omni Small-Cap Value Fund MANAGER’S COMMENTARY (Unaudited) (continued) | | |
Omni Small-Cap Value Fund vs. Russell 2000 Value Index
from Inception 8/31/11 to 12/31/15
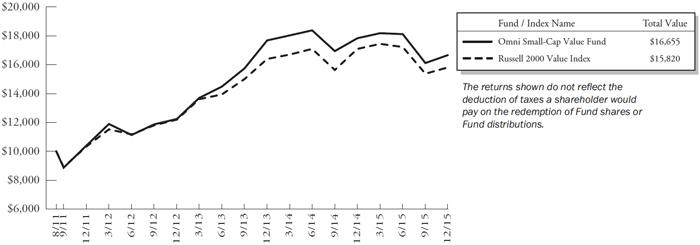
Detailed Explanation of Quarterly Performance
The Omni Small-Cap Value Fund is designed to capture the returns of the small-cap value asset class through broad diversification of small company and value stocks. This approach is sometimes referred to as “passive, asset class investing.” As of December 31, 2015, we held 658 such stocks in a market-cap weighted style. We make no attempt to track any particular index in either performance or statistics.
The Fund’s investment in smaller cap stocks generally contributed positively to the Fund’s relative performance, while a bias toward deeper value stocks hurt. By design, the Fund does not hold Utility sector stocks and Real Estate Investment Trusts (REITs). Those assets performed relatively well during the quarter, which hurt the Fund’s relative returns. Our Fund’s higher weighting in Financial sector stocks other than REITs contributed positively to relative returns, as did holdings in the Energy sector. A higher weighting in Information Technology stocks also helped relative results.
Detailed Explanation of Calendar Year Performance
The Fund benefited from its exposure to higher momentum stocks. However, a greater relative weighting in smaller stocks detracted from calendar year performance. A lack of exposure to Utility sector stocks, which performed well for the calendar year, hurt relative performance. A higher weighting in Information Technology stocks and Financial sector stocks other than REITs helped relative results.
| | |
| 4 | | Semi-Annual Report | December 31, 2015 (Unaudited) |
| | |
Omni Small-Cap Value Fund MANAGER’S COMMENTARY (Unaudited) (continued) | | |
Top Ten Holdings as of December 31, 2015
| | | | | | | | | |
| Rank | | Description | | Industry | | % of Net
Assets |
| 1 | | Hawaiian Holdings Inc | | Airlines | | 1.0% |
| 2 | | Stepan Co | | Chemicals | | 0.9% |
| 3 | | Cooper-Standard Holding Inc | | Auto Components | | 0.8% |
| 4 | | Amedisys Inc | | Health Care Providers & Services | | 0.8% |
| 5 | | Ebix Inc | | Software | | 0.8% |
| 6 | | Fresh Del Monte Produce Inc | | Food Products | | 0.7% |
| 7 | | Central Garden & Pet Co | | Household Products | | 0.7% |
| 8 | | Iridium Communications Inc | | Diversified Telecommunication | | 0.7% |
| 9 | | Mantech International Corp/Va | | IT Services | | 0.7% |
| 10 | | Air Transport Services Group Inc | | Air Freight & Logistics | | 0.7% |
| | Total | | | | 7.8% |
Industry Sector Representation as of December 31, 2015
| | | | | | | | | | | | | | | |
| | | % of Portfolio | | % of Russell 2000
Value Index | | Difference |
| Consumer Discretionary | | | | 14.1% | | | | | 10.1% | | | | | 4.0% | |
| Consumer Staples | | | | 4.3% | | | | | 3.3% | | | | | 1.0% | |
| Energy | | | | 9.1% | | | | | 4.4% | | | | | 4.7% | |
| Financials | | | | 33.5% | | | | | 43.8% | | | | | -10.3% | |
| Health Care | | | | 2.7% | | | | | 4.6% | | | | | -1.9% | |
| Industrials | | | | 16.6% | | | | | 11.6% | | | | | 5.0% | |
| Information Technology | | | | 12.3% | | | | | 10.8% | | | | | 1.5% | |
| Materials | | | | 5.3% | | | | | 3.1% | | | | | 2.2% | |
| Telecommunication Services | | | | 1.7% | | | | | 0.9% | | | | | 0.8% | |
| Utilities | | | | 0.0% | | | | | 7.4% | | | | | -7.4% | |
| Cash | | | | 0.4% | | | | | 0.0% | | | | | 0.4% | |
Total | | | | 100.0% | | | | | 100.0% | | | | | | |
Disclaimer
The views expressed here are exclusively those of Fund management. These views, including those related to market sectors or individual stocks, are not meant as investment advice and should not be considered predictive in nature. Any favorable (or unfavorable) description of a holding applies only as of the quarter end, December 31, 2015, unless otherwise stated. Security positions can and do change thereafter. Discussions of historical performance do not guarantee and may not be indicative of future performance.
Market volatility can significantly impact short-term performance. The Fund is not an appropriate investment for short-term investors. Investments in small companies generally carry greater risk than is customarily associated with larger companies. This additional risk is attributable to a number of factors, including the relatively limited financial resources that are typically available to small companies and the fact that small companies often have comparatively limited product lines. In addition, the stock of small companies tends to be more volatile than the stock of large companies, particularly in the short term and particularly in the early stages of an economic or market downturn. Shareholders of the Fund, therefore, are taking on more risk than they would if they invested in the stock market as a whole.
Conclusion
Thank you for your continued investment in Omni Small-Cap Value Fund. We encourage your feedback; your reactions and concerns are important to us.
Sincerely,
The Investment Management Team
| | |
Omni Small-Cap Value Fund SCHEDULE OF INVESTMENTS | | |
Showing percentage of net assets as of December 31, 2015 (Unaudited)
| | | | | | | | | | |
| Industry | | Company | | Shares | | | Value | | |
| |
COMMON STOCKS - 99.51% | | |
Aerospace & Defense - 1.41% | | |
| | AAR Corp. | | | 92,600 | | | $2,434,454 | | |
| | Arotech Corp.* | | | 94,300 | | | 192,372 | | |
| | CPI Aerostructures, Inc.* | | | 4,700 | | | 45,731 | | |
| | Cubic Corp. | | | 44,500 | | | 2,102,625 | | |
| | DigitalGlobe, Inc.* | | | 10,000 | | | 156,600 | | |
| | Ducommun, Inc.* | | | 62,770 | | | 1,018,129 | | |
| | Erickson, Inc.* | | | 1,417 | | | 2,919 | | |
| | LMI Aerospace, Inc.*+ | | | 35,000 | | | 352,450 | | |
| | National Presto Industries, Inc.+ | | | 5,020 | | | 415,957 | | |
| | Sypris Solutions, Inc. | | | 6,400 | | | 6,976 | | |
| | | | | | | | | | |
| | | | | | | | 6,728,213 | | |
| |
Air Freight & Logistics - 1.48% | | |
| | Air T, Inc.* | | | 2,800 | | | 68,516 | | |
| | Air Transport Services Group, Inc.* | | | 321,924 | | | 3,244,994 | | |
| | Atlas Air Worldwide Holdings, Inc.* | | | 57,700 | | | 2,385,318 | | |
| | Wesco Aircraft Holdings, Inc.*+ | | | 113,800 | | | 1,362,186 | | |
| | | | | | | | | | |
| | | | | | | | 7,061,014 | | |
| |
Airlines - 1.61% | | |
| | Hawaiian Holdings, Inc.* | | | 135,634 | | | 4,791,949 | | |
| | Republic Airways Holdings, Inc.* | | | 163,250 | | | 641,573 | | |
| | SkyWest, Inc. | | | 118,791 | | | 2,259,405 | | |
| | | | | | | | | | |
| | | | | | | | 7,692,927 | | |
| |
Auto Components - 1.97% | | |
| | China Automotive Systems, Inc.*+ | | | 28,200 | | | 129,156 | | |
| | China XD Plastics Co., Ltd.*+ | | | 163,000 | | | 720,460 | | |
| | Commercial Vehicle Group, Inc.* | | | 57,300 | | | 158,148 | | |
| | Cooper-Standard Holding, Inc.* | | | 51,000 | | | 3,957,090 | | |
| | Fuel Systems Solutions, Inc.* | | | 122 | | | 597 | | |
| | Modine Manufacturing Co.* | | | 142,900 | | | 1,293,245 | | |
| | Shiloh Industries, Inc.*+ | | | 500 | | | 2,620 | | |
| | SORL Auto Parts, Inc.*+ | | | 129,900 | | | 328,647 | | |
| | Spartan Motors, Inc. | | | 22,000 | | | 68,420 | | |
| | Stoneridge, Inc.* | | | 900 | | | 13,320 | | |
| | Strattec Security Corp.+ | | | 10,600 | | | 598,794 | | |
| | Superior Industries International, Inc. | | | 115,400 | | | 2,125,668 | | |
| | | | | | | | | | |
| | | | | | | | 9,396,165 | | |
| | | | | | | | | | |
| | | | | | | | | | |
| | | | | | | | |
| Industry | | Company | | Shares | | | Value |
| | | | | | | | |
Biotechnology - 0.13% |
| | AMAG Pharmaceuticals, Inc.*+ | | | 19,000 | | | $ 573,610 |
| | Enzon Pharmaceuticals, Inc. | | | 60,300 | | | 41,155 |
| | | | | | | | |
| | | | | | | | 614,765 |
|
Building Products - 1.22% |
| | Alpha Pro Tech, Ltd.* | | | 743 | | | 1,300 |
| | Gibraltar Industries, Inc.* | | | 126,850 | | | 3,227,064 |
| | Griffon Corp. | | | 140,900 | | | 2,508,020 |
| | Universal Forest Products, Inc. | | | 1,000 | | | 68,370 |
| | | | | | | | |
| | | | | | | | 5,804,754 |
|
Capital Markets - 1.10% |
| | American Capital Senior Floating Ltd. | | | 39,000 | | | 383,370 |
| | Arlington Asset Investment Corp., Class A+ | | | 23,700 | | | 313,551 |
| | BlackRock Capital Investment Corp. | | | 1,000 | | | 9,400 |
| | Calamos Asset Management, Inc., Class A | | | 74,000 | | | 716,320 |
| | Cowen Group, Inc., Class A*+ | | | 228,700 | | | 875,921 |
| | FBR & Co.+ | | | 600 | | | 11,940 |
| | Gladstone Capital Corp.+ | | | 900 | | | 6,579 |
| | INTL FCStone, Inc.* | | | 15,100 | | | 505,246 |
| | Investment Technology Group, Inc. | | | 57,050 | | | 970,991 |
| | JMP Group LLC+ | | | 300 | | | 1,638 |
| | KCG Holdings, Inc., Class A* | | | 35,000 | | | 430,850 |
| | OFS Capital Corp. | | | 708 | | | 8,128 |
| | Oppenheimer Holdings, Inc., Class A | | | 31,093 | | | 540,396 |
| | Piper Jaffray Cos.* | | | 11,400 | | | 460,560 |
| | | | | | | | |
| | | | | | | | 5,234,890 |
|
Chemicals - 2.89% |
| | American Vanguard Corp. | | | 10,000 | | | 140,100 |
| | China Green Agriculture, Inc.* | | | 133,000 | | | 203,490 |
| | Core Molding Technologies, Inc.* | | | 17,000 | | | 218,110 |
| | FutureFuel Corp. | | | 72,800 | | | 982,800 |
| | Gulf Resources, Inc.* | | | 178,200 | | | 324,324 |
| | Innophos Holdings, Inc. | | | 10,000 | | | 289,800 |
| | Intrepid Potash, Inc.* | | | 93,600 | | | 276,120 |
| | KMG Chemicals, Inc. | | | 58,200 | | | 1,339,764 |
| | |
| 6 | | Semi-Annual Report | December 31, 2015 (Unaudited) |
| | |
Omni Small-Cap Value Fund SCHEDULE OF INVESTMENTS (continued) | | |
Showing percentage of net assets as of December 31, 2015 (Unaudited)
| | | | | | | | | | |
| Industry | | Company | | Shares | | | Value | | |
| |
Common Stocks (continued) | | |
Chemicals (continued) | | |
| | Kraton Performance Polymers, Inc.* | | | 142,150 | | | $ 2,361,112 | | |
| | LSB Industries, Inc.*+ | | | 30,000 | | | 217,500 | | |
| | Olin Corp. | | | 52,500 | | | 906,150 | | |
| | Schulman (A.), Inc. | | | 45,108 | | | 1,382,109 | | |
| | Stepan Co. | | | 82,000 | | | 4,074,580 | | |
| | Tredegar Corp. | | | 76,700 | | | 1,044,654 | | |
| | | | | | | | | | |
| | | | | | | | 13,760,613 | | |
| |
Commercial Banks - 15.80% | | |
| | 1st Source Corp. | | | 86,847 | | | 2,680,967 | | |
| | Access National Corp. | | | 2,700 | | | 55,242 | | |
| | American National Bankshares, Inc. | | | 21,800 | | | 558,298 | | |
| | American River Bankshares* | | | 21,300 | | | 225,354 | | |
| | AmeriServ Financial, Inc. | | | 5,000 | | | 16,000 | | |
| | Banco Latinoamericano de Comercio Exterior SA | | | 15,000 | | | 388,950 | | |
| | Bank of Commerce Holdings | | | 45,300 | | | 302,604 | | |
| | Bankwell Financial Group, Inc.+ | | | 13,300 | | | 264,005 | | |
| | Banner Corp. | | | 11,450 | | | 525,097 | | |
| | Bar Harbor Bankshares | | | 11,250 | | | 387,225 | | |
| | Baylake Corp.+ | | | 3,000 | | | 43,830 | | |
| | BBCN Bancorp, Inc. | | | 15,000 | | | 258,300 | | |
| | BCB Bancorp, Inc. | | | 10,400 | | | 108,160 | | |
| | Blue Hills Bancorp, Inc. | | | 15,000 | | | 229,650 | | |
| | BNC Bancorp+ | | | 73,844 | | | 1,874,161 | | |
| | Boston Private Financial Holdings, Inc. | | | 10,000 | | | 113,400 | | |
| | BSB Bancorp, Inc.* | | | 31,633 | | | 739,896 | | |
| | C&F Financial Corp. | | | 1,200 | | | 46,800 | | |
| | Camden National Corp. | | | 9,500 | | | 418,855 | | |
| | Capital City Bank Group, Inc.+ | | | 48,750 | | | 748,313 | | |
| | Cardinal Financial Corp. | | | 25,000 | | | 568,750 | | |
| | Carolina Bank Holdings, Inc.* | | | 500 | | | 9,220 | | |
| | Cascade Bancorp* | | | 17,726 | | | 107,597 | | |
| | Central Pacific Financial Corp. | | | 25,000 | | | 550,500 | | |
| | Central Valley Community Bancorp | | | 20,000 | | | 247,200 | | |
| | Century Bancorp, Inc., Class A | | | 15,200 | | | 660,592 | | |
| | Chemical Financial Corp. | | | 61,500 | | | 2,107,605 | | |
| | Chemung Financial Corp.+ | | | 13,500 | | | 373,410 | | |
| | Citizens & Northern Corp. | | | 15,000 | | | 315,000 | | |
| | Civista Bancshares, Inc. | | | 2,000 | | | 25,660 | | |
| | CNB Financial Corp. | | | 29,000 | | | 522,870 | | |
| | | | | | | | | | |
| | | | | | | | | | |
| | | | | | | | | | |
| Industry | | Company | | Shares | | | Value | |
| | | | | | | | | | |
Commercial Banks (continued) | |
| | Codorus Valley Bancorp, Inc. | | | 4,189 | | | $ | 85,204 | |
| | Community Bankers Trust Corp.* | | | 5,000 | | | | 26,850 | |
| | Community Trust Bancorp, Inc. | | | 17,500 | | | | 611,800 | |
| | Customers Bancorp, Inc.* | | | 20,000 | | | | 544,400 | |
| | DNB Financial Corp.+ | | | 465 | | | | 13,187 | |
| | Enterprise Bancorp, Inc. | | | 11,775 | | | | 269,059 | |
| | Enterprise Financial Services Corp. | | | 27,700 | | | | 785,295 | |
| | Farmers Capital Bank Corp.* | | | 18,400 | | | | 498,824 | |
| | Farmers National Banc Corp.+ | | | 150 | | | | 1,290 | |
| | Fidelity Southern Corp. | | | 55,723 | | | | 1,243,180 | |
| | Financial Institutions, Inc. | | | 39,300 | | | | 1,100,400 | |
| | First Bancorp | | | 49,571 | | | | 928,961 | |
| | First Bancorp, Inc. | | | 1,295 | | | | 26,509 | |
| | First BanCorp.* | | | 436,500 | | | | 1,418,625 | |
| | First Busey Corp. | | | 18,570 | | | | 383,099 | |
| | First Commonwealth Financial Corp. | | | 158,300 | | | | 1,435,781 | |
| | First Community Bancshares, Inc. | | | 44,000 | | | | 819,720 | |
| | First Connecticut Bancorp, Inc. | | | 16,100 | | | | 280,301 | |
| | First Financial Corp. | | | 37,000 | | | | 1,256,890 | |
| | First Internet Bancorp | | | 1,500 | | | | 43,035 | |
| | First Interstate BancSystem, Inc., Class A | | | 95,200 | | | | 2,767,464 | |
| | First Merchants Corp. | | | 79,311 | | | | 2,016,086 | |
| | First Midwest Bancorp, Inc. | | | 129,000 | | | | 2,377,470 | |
| | First of Long Island Corp. (The)+ | | | 12,000 | | | | 360,000 | |
| | First United Corp.* | | | 5,000 | | | | 58,000 | |
| | Flushing Financial Corp. | | | 44,297 | | | | 958,587 | |
| | German American Bancorp, Inc.+ | | | 13,000 | | | | 433,160 | |
| | Great Southern Bancorp, Inc.+ | | | 26,900 | | | | 1,217,494 | |
| | Hampton Roads Bankshares, Inc.* | | | 386,754 | | | | 711,627 | |
| | Heartland Financial USA, Inc. | | | 41,600 | | | | 1,304,576 | |
| | Heritage Commerce Corp. | | | 28,100 | | | | 336,076 | |
| | Heritage Financial Corp. | | | 60,260 | | | | 1,135,298 | |
| | Heritage Oaks Bancorp | | | 200 | | | | 1,602 | |
| | HomeTrust Bancshares, Inc.* | | | 2,961 | | | | 59,960 | |
| | Horizon Bancorp | | | 3,150 | | | | 88,074 | |
| | |
Omni Small-Cap Value Fund SCHEDULE OF INVESTMENTS (continued) | | |
Showing percentage of net assets as of December 31, 2015 (Unaudited)
| | | | | | | | | | |
| Industry | | Company | | Shares | | | Value | | |
| | | |
Common Stocks (continued) | | | | | | | | |
Commercial Banks (continued) | | | | | | | | |
| | Independent Bank Corp., MI | | | 75,625 | | | $1,151,769 | | |
| | International Bancshares Corp. | | | 90,687 | | | 2,330,656 | | |
| | Lakeland Bancorp, Inc. | | | 102,050 | | | 1,203,170 | | |
| | Landmark Bancorp, Inc. | | | 1,050 | | | 27,584 | | |
| | Macatawa Bank Corp.+ | | | 13,200 | | | 79,860 | | |
| | MainSource Financial Group, Inc. | | | 67,400 | | | 1,542,112 | | |
| | MBT Financial Corp.* | | | 60,322 | | | 411,999 | | |
| | Mercantile Bank Corp. | | | 31,600 | | | 775,464 | | |
| | Merchants Bancshares, Inc. | | | 5,000 | | | 157,450 | | |
| | Metro Bancorp, Inc. | | | 27,300 | | | 856,674 | | |
| | Middleburg Financial Corp. | | | 21,400 | | | 395,472 | | |
| | MidWestOne Financial Group, Inc. | | | 15,000 | | | 456,150 | | |
| | Monarch Financial Holdings, Inc.+ | | | 728 | | | 13,097 | | |
| | MutualFirst Financial, Inc. | | | 900 | | | 22,428 | | |
| | National Bankshares, Inc.+ | | | 2,500 | | | 88,850 | | |
| | NBT Bancorp, Inc. | | | 13,000 | | | 362,440 | | |
| | NewBridge Bancorp | | | 7,000 | | | 85,260 | | |
| | Northrim BanCorp, Inc.+ | | | 30,445 | | | 809,837 | | |
| | OFG Bancorp | | | 45,800 | | | 335,256 | | |
| | Old Line Bancshares, Inc.+ | | | 50 | | | 878 | | |
| | Old National Bancorp | | | 20,000 | | | 271,200 | | |
| | Old Second Bancorp, Inc.* | | | 54,750 | | | 429,240 | | |
| | Orrstown Financial Services, Inc. | | | 16,800 | | | 302,064 | | |
| | Pacific Continental Corp. | | | 55,500 | | | 825,840 | | |
| | Pacific Mercantile Bancorp* | | | 20,000 | | | 142,200 | | |
| | Park Sterling Corp. | | | 48,852 | | | 357,597 | | |
| | Parke Bancorp, Inc.+ | | | 300 | | | 3,744 | | |
| | Peapack Gladstone Financial Corp. | | | 6,894 | | | 142,154 | | |
| | Peoples Bancorp, Inc. | | | 29,200 | | | 550,128 | | |
| | Preferred Bank | | | 35,700 | | | 1,178,814 | | |
| | Premier Financial Bancorp, Inc. | | | 25,200 | | | 414,288 | | |
| | QCR Holdings, Inc. | | | 2,000 | | | 48,580 | | |
| | Renasant Corp. | | | 47,946 | | | 1,649,822 | | |
| | Republic Bancorp, Inc., Class A | | | 21,550 | | | 569,135 | | |
| | Republic First Bancorp, Inc.*+ | | | 37,000 | | | 160,210 | | |
| | S&T Bancorp, Inc. | | | 49,300 | | | 1,519,426 | | |
| | Salisbury Bancorp, Inc.+ | | | 1,183 | | | 39,512 | | |
| | Sandy Spring Bancorp, Inc. | | | 24,000 | | | 647,040 | | |
| | SB Financial Group, Inc. | | | 400 | | | 4,456 | | |
| | Shore Bancshares, Inc. | | | 46,112 | | | 501,699 | | |
| | Sierra Bancorp | | | 45,000 | | | 794,250 | | |
| | | | | | | | | | |
| | | | | | | | | | |
| | | | | | | | |
| Industry | | Company | | Shares | | | Value |
| | | | | | | | |
Commercial Banks (continued) | | | | | | |
| | South State Corp. | | | 14,506 | | | $ 1,043,707 |
| | Southern National Bancorp of Virginia, Inc. | | | 30,000 | | | 391,800 |
| | Southwest Bancorp, Inc. | | | 32,900 | | | 575,092 |
| | State Bank Financial Corp. | | | 97,384 | | | 2,047,985 |
| | Sussex Bancorp | | | 15,000 | | | 196,950 |
| | Tompkins Financial Corp. | | | 12,808 | | | 719,297 |
| | TowneBank+ | | | 1,000 | | | 20,870 |
| | Trico Bancshares | | | 600 | | | 16,464 |
| | TriState Capital Holdings, Inc.* | | | 50,000 | | | 699,500 |
| | Trustmark Corp. | | | 32,100 | | | 739,584 |
| | Union Bankshares Corp. | | | 60,966 | | | 1,538,782 |
| | United Community Banks, Inc. | | | 35,650 | | | 694,818 |
| | United Security Bancshares, Inc. | | | 2,000 | | | 17,780 |
| | Univest Corp. of Pennsylvania | | | 62,600 | | | 1,305,836 |
| | WesBanco, Inc. | | | 70,273 | | | 2,109,595 |
| | Wilshire Bancorp, Inc. | | | 40,000 | | | 462,000 |
| | Yadkin Financial Corp. | | | 1 | | | 25 |
| | | | | | | | |
| | | | | | | | 75,309,285 |
|
Commercial Services & Supplies - 1.86% |
| | ACCO Brands Corp.* | | | 333,000 | | | 2,374,290 |
| | Acme United Corp. | | | 735 | | | 12,495 |
| | Brink’s Co. (The) | | | 4,200 | | | 121,212 |
| | Command Security Corp.* | | | 26,800 | | | 61,908 |
| | Ecology & Environment, Inc., Class A | | | 3,500 | | | 35,805 |
| | EnerNOC, Inc.*+ | | | 89,100 | | | 343,035 |
| | Ennis, Inc. | | | 136,892 | | | 2,635,171 |
| | Heritage-Crystal Clean, Inc.* | | | 13,954 | | | 147,912 |
| | Huron Consulting Group, Inc.* | | | 4,000 | | | 237,600 |
| | James River Group Holdings Ltd. | | | 15,000 | | | 503,100 |
| | Kelly Services, Inc., Class A | | | 22,000 | | | 355,300 |
| | Kimball International, Inc., Class B | | | 31,800 | | | 310,686 |
| | McGrath RentCorp | | | 18,300 | | | 460,977 |
| | PRGX Global, Inc.* | | | 11,539 | | | 42,925 |
| | Quad/Graphics, Inc. | | | 59,300 | | | 551,490 |
| | RCM Technologies, Inc. | | | 6,200 | | | 34,100 |
| | TRC Cos., Inc.* | | | 10,600 | | | 98,050 |
| | Versar, Inc.* | | | 8,600 | | | 26,574 |
| | Viad Corp. | | | 17,400 | | | 491,202 |
| | |
| 8 | | Semi-Annual Report | December 31, 2015 (Unaudited) |
| | |
Omni Small-Cap Value Fund SCHEDULE OF INVESTMENTS (continued) | | |
Showing percentage of net assets as of December 31, 2015 (Unaudited)
| | | | | | | | | | |
| Industry | | Company | | Shares | | | Value | | |
| |
Common Stocks (continued) | | |
Commercial Services & Supplies (continued) | | |
| | Willdan Group, Inc.* | | | 3,900 | | | $ 32,682 | | |
| | | | | | | | 8,876,514 | | |
| | | | | | | | | | |
| |
Communications Equipment - 1.35% | | |
| | Bel Fuse, Inc., Class B | | | 18,500 | | | 319,865 | | |
| | Black Box Corp. | | | 63,775 | | | 607,776 | | |
| | ClearOne, Inc. | | | 27,500 | | | 355,575 | | |
| | Communications Systems, Inc. | | | 4,150 | | | 32,246 | | |
| | Comtech Telecommunications Corp. | | | 50,000 | | | 1,004,500 | | |
| | Finisar Corp.*+ | | | 80,700 | | | 1,173,378 | | |
| | Harmonic, Inc.* | | | 700 | | | 2,849 | | |
| | Infosonics Corp.* | | | 15,000 | | | 23,700 | | |
| | NETGEAR, Inc.* | | | 36,030 | | | 1,510,017 | | |
| | PC-Tel, Inc. | | | 56,700 | | | 257,985 | | |
| | Polycom, Inc.* | | | 92,300 | | | 1,162,057 | | |
| | | | | | | | | | |
| | | | | | | | 6,449,948 | | |
| |
Computers & Peripherals - 0.58% | | |
| | Concurrent Computer Corp. | | | 53,600 | | | 265,320 | | |
| | Hutchinson Technology, Inc.* | | | 200,900 | | | 721,231 | | |
| | QLogic Corp.* | | | 137,150 | | | 1,673,230 | | |
| | USA Technologies, Inc.*+ | | | 25,000 | | | 77,000 | | |
| | | | | | | | | | |
| | | | | | | | 2,736,781 | | |
| |
Construction & Engineering - 1.18% | | |
| | Aegion Corp.* | | | 87,800 | | | 1,695,418 | | |
| | Goldfield Corp. (The)* | | | 121,000 | | | 187,550 | | |
| | Great Lakes Dredge & Dock Corp.* | | | 255,000 | | | 1,009,800 | | |
| | Integrated Electrical Services, Inc.* | | | 2,717 | | | 30,077 | | |
| | KB Home | | | 125,900 | | | 1,552,347 | | |
| | MasTec, Inc.* | | | 27,200 | | | 472,736 | | |
| | MYR Group, Inc.* | | | 12,100 | | | 249,381 | | |
| | Northwest Pipe Co.* | | | 1,000 | | | 11,190 | | |
| | Orion Marine Group, Inc.*+ | | | 43,920 | | | 183,146 | | |
| | Tutor Perini Corp.* | | | 14,900 | | | 249,426 | | |
| | | | | | | | | | |
| | | | | | | | 5,641,071 | | |
| |
Consumer Finance - 1.10% | | |
| | Asta Funding, Inc.* | | | 37,900 | | | 301,305 | | |
| | Cash America International, Inc. | | | 25,700 | | | 769,715 | | |
| | Consumer Portfolio Services, Inc.* | | | 97,000 | | | 503,430 | | |
| | Encore Capital Group, Inc.*+ | | | 19,600 | | | 569,968 | | |
| | Ezcorp, Inc., Class A* | | | 67,800 | | | 338,322 | | |
| | Green Dot Corp., Class A* | | | 84,600 | | | 1,389,132 | | |
| | Nelnet, Inc., Class A | | | 7,800 | | | 261,846 | | |
| | | | | | | | |
| Industry | | Company | | Shares | | | Value |
| | | | | | | | |
Consumer Finance (continued) |
| | Nicholas Financial, Inc.* | | | 25,000 | | | $ 291,250 |
| | Regional Management Corp.* | | | 35,000 | | | 541,450 |
| | World Acceptance Corp.*+ | | | 7,700 | | | 285,670 |
| | | | | | | | |
| | | | | | | | 5,252,088 |
|
Distributors - 0.25% |
| | Essendant, Inc. | | | 25,600 | | | 832,256 |
| | VOXX International Corp.* | | | 67,100 | | | 352,946 |
| | Weyco Group, Inc.+ | | | 200 | | | 5,352 |
| | | | | | | | |
| | | | | | | | 1,190,554 |
|
Diversified Consumer Services - 0.64% |
| | American Public Education, Inc.* | | | 10,000 | | | 186,100 |
| | K12, Inc.* | | | 55,600 | | | 489,280 |
| | Lincoln Educational Services Corp. | | | 5,000 | | | 9,950 |
| | Regis Corp.* | | | 168,150 | | | 2,379,322 |
| | | | | | | | |
| | | | | | | | 3,064,652 |
|
Diversified Financial Services - 0.70% |
| | Enova International, Inc.* | | | 9,333 | | | 61,691 |
| | Gain Capital Holdings, Inc. | | | 47,599 | | | 386,028 |
| | Higher One Holdings, Inc.* | | | 91,000 | | | 294,840 |
| | Marlin Business Services Corp. | | | 2,100 | | | 33,726 |
| | PHH Corp.* | | | 69,550 | | | 1,126,710 |
| | Resource America, Inc., Class A+ | | | 65,291 | | | 400,234 |
| | Sterling Bancorp | | | 58,384 | | | 946,988 |
| | Summit Financial Group, Inc. | | | 2,115 | | | 25,147 |
| | Tiptree Financial, Inc., Class A+ | | | 10,000 | | | 61,400 |
| | | | | | | | |
| | | | | | | | 3,336,764 |
|
Diversified Telecommunication Services - 1.23% |
| | Alaska Communications | | | | | | |
| | Systems Group, Inc.* | | | 277,800 | | | 486,150 |
| | Atlantic Tele-Network, Inc. | | | 11,475 | | | 897,689 |
| | Hawaiian Telcom Holdco, Inc.* | | | 44,500 | | | 1,106,270 |
| | Iridium Communications, Inc.*+ | | | 391,325 | | | 3,291,043 |
| | Lumos Networks Corp. | | | 5,000 | | | 56,000 |
| | | | | | | | |
| | | | | | | | 5,837,152 |
|
Electrical Equipment - 0.63% |
| | Broadwind Energy, Inc.* | | | 25,000 | | | 52,000 |
| | Encore Wire Corp. | | | 16,500 | | | 611,985 |
| | General Cable Corp. | | | 40,000 | | | 537,200 |
| | |
Omni Small-Cap Value Fund SCHEDULE OF INVESTMENTS (continued) | | |
Showing percentage of net assets as of December 31, 2015 (Unaudited)
| | | | | | | | | | |
| Industry | | Company | | Shares | | | Value | | |
| |
Common Stocks (continued) | | |
Electrical Equipment (continued) | | |
| | Highpower International, Inc.*+ | | | 25,923 | | | $ 77,769 | | |
| | II-VI, Inc.* | | | 79,250 | | | 1,470,880 | | |
| | LSI Industries, Inc. | | | 15,000 | | | 182,850 | | |
| | Preformed Line Products Co. | | | 1,000 | | | 42,100 | | |
| | Ultralife Corp.* | | | 7,350 | | | 47,481 | | |
| | | | | | | | | | |
| | | | | | | | 3,022,265 | | |
| |
Electronic Equipment, Instruments & Components - 3.16% | | |
| | Benchmark Electronics, Inc.* | | | 112,200 | | | 2,319,174 | | |
| | Electro Rent Corp. | | | 20,000 | | | 184,000 | | |
| | Fabrinet* | | | 30,050 | | | 715,791 | | |
| | GSI Group, Inc.* | | | 9,600 | | | 130,752 | | |
| | Insight Enterprises, Inc.* | | | 64,800 | | | 1,627,776 | | |
| | Iteris, Inc.* | | | 87,000 | | | 187,050 | | |
| | Key Tronic Corp.* | | | 22,000 | | | 167,200 | | |
| | Kimball Electronics, Inc.* | | | 50,400 | | | 553,896 | | |
| | Multi-Fineline Electronix, Inc.* | | | 35,000 | | | 723,800 | | |
| | PAR Technology Corp.* | | | 101,800 | | | 685,114 | | |
| | PCM, Inc.* | | | 8,769 | | | 87,076 | | |
| | Rofin-Sinar Technologies, Inc.* | | | 20,000 | | | 535,600 | | |
| | Sanmina Corp.* | | | 142,700 | | | 2,936,766 | | |
| | ScanSource, Inc.* | | | 500 | | | 16,110 | | |
| | Sigmatron International, Inc.* | | | 500 | | | 3,765 | | |
| | SMTC Corp.* | | | 7,500 | | | 11,625 | | |
| | TTM Technologies, Inc.* | | | 351,538 | | | 2,288,512 | | |
| | Vishay Precision Group, Inc.* | | | 166,448 | | | 1,884,191 | | |
| | Wireless Telecom Group, Inc.* | | | 10,000 | | | 17,200 | | |
| | | | | | | | | | |
| | | | | | | | 15,075,398 | | |
| |
Energy Equipment & Services - 1.68% | | |
| | Basic Energy Services, Inc.*+ | | | 800 | | | 2,144 | | |
| | C&J Energy Services, Ltd.*+ | | | 1,200 | | | 5,712 | | |
| | Checkpoint Systems, Inc. | | | 500 | | | 3,135 | | |
| | ENGlobal Corp.* | | | 83,200 | | | 80,704 | | |
| | Era Group, Inc.* | | | 56,300 | | | 627,745 | | |
| | Gulf Island Fabrication, Inc. | | | 13,503 | | | 141,241 | | |
| | Helix Energy Solutions Group, Inc.* | | | 15,000 | | | 78,900 | | |
| | ION Geophysical Corp.* | | | 50,000 | | | 25,155 | | |
| | Natural Gas Services Group, Inc.* | | | 68,800 | | | 1,534,240 | | |
| | Newpark Resources, Inc.* | | | 85,000 | | | 448,800 | | |
| | Parker Drilling Co.* | | | 614,950 | | | 1,119,209 | | |
| | | | | | | | | | |
| | | | | | | | | | |
| | | | | | | | |
| Industry | | Company | | Shares | | | Value |
| | | | | | | | |
Energy Equipment & Services (continued) |
| | PHI, Inc.* | | | 60,200 | | | $ 987,882 |
| | Pioneer Energy Services Corp.* | | | 198,300 | | | 430,311 |
| | SEACOR Holdings, Inc.* | | | 44,400 | | | 2,333,664 |
| | Tesco Corp. | | | 25,000 | | | 181,000 |
| | | | | | | | |
| | | | | | | | 7,999,842 |
|
Food & Staples Retailing - 1.14% |
| | Andersons, Inc. (The) | | | 38,100 | | | 1,205,103 |
| | Ingles Markets, Inc., Class A | | | 49,800 | | | 2,195,184 |
| | SpartanNash Co. | | | 56,146 | | | 1,214,999 |
| | Village Super Market, Inc., Class A | | | 1,709 | | | 45,032 |
| | Weis Markets, Inc. | | | 17,500 | | | 775,250 |
| | | | | | | | |
| | | | | | | | 5,435,568 |
|
Food Products - 2.21% |
| | Fresh Del Monte Produce, Inc. | | | 88,000 | | | 3,421,440 |
| | Omega Protein Corp.* | | | 123,750 | | | 2,747,250 |
| | Post Holdings, Inc.* | | | 52,000 | | | 3,208,400 |
| | Seneca Foods Corp., Class A* | | | 40,100 | | | 1,162,098 |
| | | | | | | | |
| | | | | | | | 10,539,188 |
|
Health Care Equipment & Supplies - 0.14% |
| | Exactech, Inc.* | | | 17,500 | | | 317,625 |
| | Invacare Corp. | | | 900 | | | 15,651 |
| | Kewaunee Scientific Corp. | | | 3,000 | | | 53,370 |
| | Symmetry Surgical, Inc.* | | | 31,250 | | | 287,500 |
| | | | | | | | |
| | | | | | | | 674,146 |
|
Health Care Providers & Services - 2.31% |
| | Almost Family, Inc.* | | | 600 | | | 22,938 |
| | Amedisys, Inc.* | | | 93,950 | | | 3,694,114 |
| | Five Star Quality Care, Inc.* | | | 214,650 | | | 682,587 |
| | Healthways, Inc.* | | | 10,000 | | | 128,700 |
| | InfuSystems Holdings, Inc.* | | | 36,100 | | | 110,105 |
| | Kindred Healthcare, Inc. | | | 81,350 | | | 968,879 |
| | LHC Group, Inc.* | | | 1,000 | | | 45,290 |
| | Magellan Health, Inc.* | | | 26,225 | | | 1,617,034 |
| | National Healthcare Corp. | | | 13,000 | | | 802,100 |
| | PharMerica Corp.* | | | 36,750 | | | 1,286,250 |
| | Premier, Inc., Class A* | | | 12,500 | | | 440,875 |
| | Triple-S Management Corp., Class B* | | | 50,800 | | | 1,214,628 |
| | | | | | | | |
| | | | | | | | 11,013,500 |
|
Hotels, Restaurants & Leisure - 3.13% |
| | Century Casinos, Inc.* | | | 57,400 | | | 446,572 |
| | |
| 10 | | Semi-Annual Report | December 31, 2015 (Unaudited) |
| | |
Omni Small-Cap Value Fund SCHEDULE OF INVESTMENTS (continued) | | |
Showing percentage of net assets as of December 31, 2015 (Unaudited)
| | | | | | | | | | |
| Industry | | Company | | Shares | | | Value | | |
| |
Common Stocks (continued) | | |
Hotels, Restaurants & Leisure (continued) | | |
| | Flanigan’s Enterprises, Inc.+ | | | 2,500 | | | $ 54,700 | | |
| | International Speedway Corp., Class A | | | 76,456 | | | 2,578,096 | | |
| | Intrawest Resorts Holdings, Inc.* | | | 79,300 | | | 620,126 | | |
| | Isle of Capri Casinos, Inc.* | | | 46,200 | | | 643,566 | | |
| | Luby’s, Inc.* | | | 207,600 | | | 927,972 | | |
| | Marcus Corp. (The) | | | 130,150 | | | 2,468,946 | | |
| | Monarch Casino & Resort, Inc.* | | | 29,400 | | | 667,968 | | |
| | Nevada Gold & Casinos, Inc.* | | | 300 | | | 681 | | |
| | Penn National Gaming, Inc.* | | | 133,800 | | | 2,143,476 | | |
| | Red Lion Hotels Corp.* | | | 43,905 | | | 307,774 | | |
| | Ruby Tuesday, Inc.* | | | 303,900 | | | 1,674,489 | | |
| | Speedway Motorsports, Inc. | | | 114,900 | | | 2,380,728 | | |
| | | | | | | | | | |
| | | | | | | | 14,915,094 | | |
| |
Household Durables - 1.37% |
| | Bassett Furniture Industries, Inc. | | | 80,500 | | | 2,018,940 | | |
| | CSS Industries, Inc. | | | 53,100 | | | 1,506,978 | | |
| | Hooker Furniture Corp. | | | 15,000 | | | 378,600 | | |
| | Lifetime Brands, Inc. | | | 34,400 | | | 456,144 | | |
| | NACCO Industries, Inc., Class A | | | 9,250 | | | 390,350 | | |
| | P&F Industries, Inc., Class A* | | | 696 | | | 6,153 | | |
| | William Lyon Homes, Class A* | | | 10,000 | | | 165,000 | | |
| | ZAGG, Inc.* | | | 145,700 | | | 1,593,958 | | |
| | | | | | | | | | |
| | | | | | | | 6,516,123 | | |
| |
Household Products - 0.72% | | |
| | Central Garden & Pet Co., Class A* | | | 245,003 | | | 3,332,041 | | |
| | Oil-Dri Corp. of America | | | 3,000 | | | 110,490 | | |
| | | | | | | | | | |
| | | | | | | | 3,442,531 | | |
| |
Insurance - 10.15% | | |
| | 1347 Property Insurance Holdings, Inc.* | | | 17,500 | | | 133,875 | | |
| | Ambac Financial Group, Inc.* | | | 81,000 | | | 1,141,290 | | |
| | American Equity Investment Life Holding Co. | | | 850 | | | 20,426 | | |
| | American Independence Corp.* | | | 1,800 | | | 15,318 | | |
| | AMERISAFE, Inc. | | | 26,800 | | | 1,364,120 | | |
| | Argo Group International | | | | | | | | |
| | Holdings Ltd. | | | 35,600 | | | 2,130,304 | | |
| | | | | | | | | | |
| | | | | | | | | | |
| | | | | | | | |
| Industry | | Company | | Shares | | | Value |
| | | | | | | | |
Insurance (continued) |
| | Baldwin & Lyons, Inc., Class B | | | 37,900 | | | $ 910,737 |
| | Citizens, Inc.*+ | | | 13,040 | | | 96,887 |
| | Crawford & Co., Class A | | | 11,600 | | | 58,812 |
| | Donegal Group, Inc., Class A | | | 26,900 | | | 378,752 |
| | EMC Insurance Group, Inc. | | | 30,550 | | | 772,915 |
| | Employers Holdings, Inc. | | | 91,300 | | | 2,492,490 |
| | Endurance Specialty Holdings Ltd. | | | 21,900 | | | 1,401,381 |
| | FBL Financial Group, Inc., Class A | | | 50,806 | | | 3,233,294 |
| | Federated National Holding Co. | | | 37,288 | | | 1,102,233 |
| | Fidelity & Guaranty Life | | | 40,800 | | | 1,035,096 |
| | First Acceptance Corp.*+ | | | 140,000 | | | 333,200 |
| | Hallmark Financial Services, Inc.* | | | 57,800 | | | 675,682 |
| | HCI Group, Inc.+ | | | 40,400 | | | 1,407,940 |
| | Heritage Insurance Holdings, Inc.+ | | | 50,000 | | | 1,091,000 |
| | Horace Mann Educators Corp. | | | 72,000 | | | 2,388,960 |
| | Independence Holding Co. | | | 15,050 | | | 208,443 |
| | Infinity Property & Casualty Corp. | | | 20,900 | | | 1,718,607 |
| | Investors Title Co. | | | 1,000 | | | 96,800 |
| | Kansas City Life Insurance Co. | | | 7,000 | | | 268,030 |
| | Kingstone Cos., Inc. | | | 4,300 | | | 38,700 |
| | Maiden Holdings, Ltd.+ | | | 182,600 | | | 2,722,566 |
| | MBIA, Inc.* | | | 100,000 | | | 648,000 |
| | National Interstate Corp. | | | 23,000 | | | 614,100 |
| | National Western Life Group, Inc., Class A | | | 5,614 | | | 1,414,391 |
| | Navigators Group, Inc. (The)* | | | 37,200 | | | 3,191,388 |
| | OneBeacon Insurance Group Ltd., Class A | | | 87,800 | | | 1,089,598 |
| | Safety Insurance Group, Inc. | | | 24,000 | | | 1,353,120 |
| | Selective Insurance Group, Inc. | | | 90,950 | | | 3,054,101 |
| | State Auto Financial Corp. | | | 48,400 | | | 996,556 |
| | State National Cos, Inc. | | | 25,000 | | | 245,250 |
| | Stewart Information Services Corp. | | | 62,150 | | | 2,320,059 |
| | Third Point Reinsurance Ltd.* | | | 70,000 | | | 938,700 |
| | United Fire Group, Inc. | | | 58,800 | | | 2,252,628 |
| | United Insurance Holdings Corp. | | | 60,000 | | | 1,026,000 |
| | |
Omni Small-Cap Value Fund SCHEDULE OF INVESTMENTS (continued) | | |
Showing percentage of net assets as of December 31, 2015 (Unaudited)
| | | | | | | | | | |
| Industry | | Company | | Shares | | | Value | | |
| |
Common Stocks (continued) | | |
Insurance (continued) | | |
| | Universal Insurance Holdings, Inc.+ | | | 86,316 | | | $ 2,000,805 | | |
| | | | | | | | | | |
| | | | | | | | 48,382,554 | | |
| |
Internet & Catalog Retail - 0.20% | | |
| | CafePress, Inc.* | | | 11,000 | | | 42,240 | | |
| | FTD Cos., Inc.*+ | | | 25,380 | | | 664,195 | | |
| | Lands’ End, Inc.*+ | | | 10,000 | | | 234,400 | | |
| | | | | | | | | | |
| | | | | | | | 940,835 | | |
| |
Internet Software & Services - 0.89% | | |
| | Autobytel, Inc.* | | | 500 | | | 11,280 | | |
| | Blucora, Inc.* | | | 83,097 | | | 814,351 | | |
| | Liquidity Services, Inc.* | | | 41,200 | | | 267,800 | | |
| | Marchex, Inc., Class B | | | 70,000 | | | 272,300 | | |
| | MeetMe, Inc.* | | | 35,100 | | | 125,658 | | |
| | Monster Worldwide, Inc.*+ | | | 269,200 | | | 1,542,516 | | |
| | RetailMeNot, Inc.* | | | 15,000 | | | 148,800 | | |
| | Synacor, Inc.* | | | 64,000 | | | 112,000 | | |
| | United Online, Inc.* | | | 69,729 | | | 822,105 | | |
| | Unwired Planet, Inc.* | | | 10,000 | | | 8,630 | | |
| | YuMe, Inc.* | | | 35,700 | | | 125,307 | | |
| | | | | | | | | | |
| | | | | | | | 4,250,747 | | |
| |
IT Services - 2.07% | | |
| | CIBER, Inc.* | | | 350 | | | 1,229 | | |
| | Computer Task Group, Inc.+ | | | 4,400 | | | 29,128 | | |
| | Edgewater Technology, Inc.*+ | | | 51,100 | | | 409,311 | | |
| | Engility Holdings, Inc. | | | 51,400 | | | 1,669,472 | | |
| | Everi Holdings, Inc.* | | | 145,000 | | | 636,550 | | |
| | ManTech International Corp., Class A | | | 108,800 | | | 3,290,112 | | |
| | ModusLink Global Solutions, Inc.*+ | | | 46,900 | | | 116,312 | | |
| | NCI, Inc., Class A | | | 62,804 | | | 857,275 | | |
| | NeuStar, Inc., Class A*+ | | | 20,400 | | | 488,988 | | |
| | Newtek Business Services Corp. | | | 2,637 | | | 37,757 | | |
| | Sykes Enterprises, Inc.* | | | 75,134 | | | 2,312,625 | | |
| | | | | | | | | | |
| | | | | | | | 9,848,759 | | |
| |
Leisure Equipment & Products - 0.18% | | |
| | Arctic Cat, Inc. | | | 8,000 | | | 131,040 | | |
| | Johnson Outdoors, Inc., Class A | | | 32,779 | | | 717,532 | | |
| | | | | | | | | | |
| | | | | | | | 848,572 | | |
| |
Machinery - 1.31% | | |
| | American Railcar Industries, Inc.+ | | | 12,900 | | | 597,012 | | |
| | | | | | | | | | |
| | | | | | | | |
| Industry | | Company | | Shares | | | Value |
| | | | | | | | |
Machinery (continued) |
| | Ampco-Pittsburgh Corp. | | | 1,200 | | | $ 12,312 |
| | Briggs & Stratton Corp. | | | 99,300 | | | 1,717,890 |
| | Chicago Rivet & Machine Co. | | | 1,000 | | | 23,320 |
| | Cleantech Solutions International, Inc.*+ | | | 11,500 | | | 16,445 |
| | Columbus McKinnon Corp. | | | 5,400 | | | 102,060 |
| | Dynamic Materials Corp. | | | 20,100 | | | 140,499 |
| | Eastern Co. (The)+ | | | 18,401 | | | 345,019 |
| | FreightCar America, Inc. | | | 11,600 | | | 225,388 |
| | Hardinge, Inc.+ | | | 75,000 | | | 699,000 |
| | Hurco Companies, Inc. | | | 10,607 | | | 281,722 |
| | Kennametal, Inc. | | | 13,000 | | | 249,600 |
| | L.B. Foster Co., Class A | | | 100 | | | 1,366 |
| | L.S. Starrett Co. (The), Class A | | | 27,500 | | | 267,300 |
| | NN, Inc. | | | 15,500 | | | 247,070 |
| | Supreme Industries, Inc., Class A | | | 35,805 | | | 245,264 |
| | TriMas Corp.* | | | 20,000 | | | 373,000 |
| | Wabash National Corp.* | | | 60,100 | | | 710,983 |
| | WSI Industries, Inc. | | | 1,300 | | | 5,655 |
| | | | | | | | |
| | | | | | | | 6,260,905 |
|
Marine - 1.60% |
| | Dorian LPG Ltd*+ | | | 163,000 | | | 1,918,510 |
| | Navios Maritime Acquisition Corp. | | | 312,600 | | | 940,926 |
| | Navios Maritime Holdings, Inc. | | | 500 | | | 875 |
| | Nordic American Tankers Ltd.+ | | | 131,300 | | | 2,040,402 |
| | Rand Logistics, Inc.*+ | | | 9,000 | | | 14,400 |
| | Scorpio Tankers, Inc. | | | 30,000 | | | 240,600 |
| | Ship Finance International, Ltd.+ | | | 50,000 | | | 828,500 |
| | Teekay Tankers, Ltd., Class A | | | 235,000 | | | 1,616,800 |
| | | | | | | | |
| | | | | | | | 7,601,013 |
|
Media - 2.12% |
| | Entercom Communications Corp., Class A* | | | 220,225 | | | 2,473,127 |
| | Eros International PLC*+ | | | 24,700 | | | 226,005 |
| | Global Sources Ltd.* | | | 4,200 | | | 32,760 |
| | Harte-Hanks, Inc. | | | 286,500 | | | 928,260 |
| | Insignia Systems, Inc.* | | | 4,900 | | | 14,357 |
| | Media General, Inc.*+ | | | 40,000 | | | 646,000 |
| | New Media Investment Group, Inc. | | | 63,300 | | | 1,231,818 |
| | Radio One, Inc., Class D* | | | 800 | | | 1,376 |
| | |
| 12 | | Semi-Annual Report | December 31, 2015 (Unaudited) |
| | |
Omni Small-Cap Value Fund SCHEDULE OF INVESTMENTS (continued) | | |
Showing percentage of net assets as of December 31, 2015 (Unaudited)
| | | | | | | | | | |
| Industry | | Company | | Shares | | | Value | | |
| |
Common Stocks (continued) | | |
Media (continued) | | |
| | Reading International, Inc., Class A* | | | 31,209 | | | $ 409,150 | | |
| | Saga Communications, Inc., Class A | | | 6,765 | | | 260,114 | | |
| | Salem Media Group, Inc. | | | 83,452 | | | 415,591 | | |
| | Scholastic Corp. | | | 72,800 | | | 2,807,168 | | |
| | Sizmek, Inc.* | | | 4,700 | | | 17,155 | | |
| | Townsquare Media, Inc., Class A*+ | | | 53,000 | | | 633,880 | | |
| | | | | | | | | | |
| | | | | | | | 10,096,761 | | |
| |
Metals & Mining - 1.45% | | |
| | Carpenter Technology Corp. | | | 15,600 | | | 472,212 | | |
| | Century Aluminum Co.*+ | | | 147,100 | | | 650,182 | | |
| | Coeur Mining, Inc.*+ | | | 91,800 | | | 227,664 | | |
| | Ferroglobe PLC | | | 20,000 | | | 215,000 | | |
| | Handy & Harman, Ltd.* | | | 8,150 | | | 167,157 | | |
| | Haynes International, Inc. | | | 21,900 | | | 803,511 | | |
| | Hecla Mining Co. | | | 467,000 | | | 882,630 | | |
| | Kaiser Aluminum Corp. | | | 21,980 | | | 1,838,847 | | |
| | Materion Corp. | | | 33,600 | | | 940,800 | | |
| | Noranda Aluminum Holding Corp.+ | | | 58 | | | 19 | | |
| | Schnitzer Steel Industries, Inc., Class A | | | 34,700 | | | 498,639 | | |
| | Stillwater Mining Co.* | | | 20,000 | | | 171,400 | | |
| | Synalloy Corp. | | | 7,000 | | | 48,160 | | |
| | Thompson Creek Metals Co., Inc.* | | | 3,500 | | | 707 | | |
| | Universal Stainless & Alloy Products, Inc.*+ | | | 1,508 | | | 14,009 | | |
| | | | | | | | | | |
| | | | | | | | 6,930,937 | | |
| |
Multiline Retail - 0.46% | | |
| | Fred’s, Inc., Class A+ | | | 133,600 | | | 2,187,032 | | |
| |
Oil, Gas & Consumable Fuels - 6.01% | | |
| | Abraxas Petroleum Corp.* | | | 180,200 | | | 191,012 | | |
| | Adams Resources & Energy, Inc. | | | 23,100 | | | 887,040 | | |
| | Alon USA Energy, Inc. | | | 172,350 | | | 2,557,674 | | |
| | Ardmore Shipping Corp. | | | 147,200 | | | 1,872,384 | | |
| | Bill Barrett Corp.*+ | | | 1,000 | | | 3,930 | | |
| | Bonanza Creek Energy, Inc.*+ | | | 16,000 | | | 84,320 | | |
| | California Resources Corp. | | | 400,000 | | | 932,000 | | |
| | Callon Petroleum Co.* | | | 336,300 | | | 2,804,742 | | |
| | Carrizo Oil & Gas, Inc.* | | | 1,000 | | | 29,580 | | |
| | Clayton Williams Energy, Inc.*+ | | | 54,500 | | | 1,611,565 | | |
| | Cloud Peak Energy, Inc.*+ | | | 800 | | | 1,664 | | |
| | | | | | | | | | |
| | | | | | | | | | |
| | | | | | | | |
| Industry | | Company | | Shares | | | Value |
| | | | | | | | | |
Oil, Gas & Consumable Fuels (continued) |
| | Delek US Holdings, Inc. | | | 10,000 | | | $ 246,000 |
| | DHT Holdings, Inc. | | | 240,122 | | | 1,942,587 |
| | Earthstone Energy, Inc.*+ | | | 3,202 | | | 42,619 |
| | Forum Energy Technologies, Inc.* | | | 73,310 | | | 913,443 |
| | Frontline, Ltd.+ | | | 176,500 | | | 527,735 |
| | Gastar Exploration, Inc.* | | | 2,540 | | | 3,327 |
| | Golden Ocean Group Ltd.* | | | 1,000 | | | 1,070 |
| | Gran Tierra Energy, Inc.* | | | 1,000 | | | 2,170 |
| | Green Plains, Inc. | | | 90,200 | | | 2,065,580 |
| | Halcon Resources Corp.* | | | 200 | | | 252 |
| | Hallador Energy Co.+ | | | 70,000 | | | 319,200 |
| | Independence Contract Drilling, Inc.*+ | | | 110,200 | | | 556,510 |
| | Matador Resources Co.* | | | 55,000 | | | 1,087,350 |
| | McDermott International, Inc.*+ | | | 713,400 | | | 2,389,890 |
| | Mexco Energy Corp.* | | | 6,000 | | | 19,380 |
| | Mitcham Industries, Inc.*+ | | | 15,100 | | | 45,451 |
| | MRC Global, Inc.* | | | 53,000 | | | 683,700 |
| | New Concept Energy, Inc.* | | | 4,800 | | | 5,184 |
| | Northern Oil and Gas, Inc.*+ | | | 1,000 | | | 3,860 |
| | Oasis Petroleum, Inc.*+ | | | 237,000 | | | 1,746,690 |
| | Pacific Ethanol, Inc.*+ | | | 1,000 | | | 4,780 |
| | PDC Energy, Inc.* | | | 10,000 | | | 533,800 |
| | Penn Virginia Corp.*+ | | | 2,000 | | | 601 |
| | Renewable Energy Group, Inc.* | | | 167,885 | | | 1,559,652 |
| | REX American Resources Corp.*+ | | | 33,920 | | | 1,834,054 |
| | Sanchez Energy Corp.*+ | | | 500 | | | 2,155 |
| | SM Energy Co.+ | | | 12,000 | | | 235,920 |
| | Stone Energy Corp.*+ | | | 100 | | | 429 |
| | TETRA Technologies, Inc.* | | | 105,000 | | | 789,600 |
| | Transatlantic Petroleum, Ltd.* | | | 28,500 | | | 39,615 |
| | VAALCO Energy, Inc.* | | | 26,500 | | | 42,400 |
| | W&T Offshore, Inc.*+ | | | 800 | | | 1,848 |
| | | | | | | | |
| | | | | | | | 28,622,763 |
|
Paper & Forest Products - 0.99% |
| | Clearwater Paper Corp.*+ | | | 15,500 | | | 705,715 |
| | Mercer International, Inc. | | | 176,250 | | | 1,595,062 |
| | Orient Paper, Inc.* | | | 593 | | | 860 |
| | PH Glatfelter Co. | | | 84,300 | | | 1,554,492 |
| | Resolute Forest Products, Inc.* | | | 112,800 | | | 853,896 |
| | | | | | | | |
| | | | | | | | 4,710,025 |
| | |
Omni Small-Cap Value Fund SCHEDULE OF INVESTMENTS (continued) | | |
Showing percentage of net assets as of December 31, 2015 (Unaudited)
| | | | | | | | | | |
| Industry | | Company | | Shares | | | Value | | |
| |
Common Stocks (continued) | | |
Personal Products - 0.20% | | |
| | Mannatech, Inc.* | | | 8,400 | | | $ 159,516 | | |
| | Natural Alternatives International, Inc.* | | | 6,400 | | | 66,176 | | |
| | Nutraceutical International Corp.* | | | 28,700 | | | 741,034 | | |
| | | | | | | | | | |
| | | | | | | | 966,726 | | |
| |
Pharmaceuticals - 0.16% | | |
| | Cumberland Pharmaceuticals, Inc.* | | | 23,000 | | | 120,980 | | |
| | Enanta Pharmaceuticals, Inc.*+ | | | 20,000 | | | 660,400 | | |
| | | | | | | | | | |
| | | | | | | | 781,380 | | |
| |
Professional Services - 2.83% | | |
| | CBIZ, Inc.* | | | 92,600 | | | 913,036 | | |
| | CDI Corp. | | | 156,289 | | | 1,056,514 | | |
| | CRA International, Inc.* | | | 86,300 | | | 1,609,495 | | |
| | FTI Consulting, Inc.* | | | 47,800 | | | 1,656,748 | | |
| | Heidrick & Struggles International, Inc. | | | 55,000 | | | 1,497,100 | | |
| | ICF International, Inc.* | | | 26,229 | | | 932,703 | | |
| | Mistras Group, Inc.* | | | 15,000 | | | 286,350 | | |
| | Navigant Consulting, Inc.* | | | 144,600 | | | 2,322,276 | | |
| | RPX Corp.* | | | 224,300 | | | 2,467,300 | | |
| | VSE Corp. | | | 11,800 | | | 733,724 | | |
| | | | | | | | | | |
| | | | | | | | 13,475,246 | | |
| |
Real Estate Management & Development - 0.26% | | |
| | Forestar Group, Inc.* | | | 65,000 | | | 711,100 | | |
| | RE/MAX Holdings, Inc., Class A | | | 6,168 | | | 230,066 | | |
| | St. Joe Co. (The)*+ | | | 15,000 | | | 277,650 | | |
| | | | | | | | | | |
| | | | | | | | 1,218,816 | | |
| |
Road & Rail - 1.93% | | |
| | ArcBest Corp. | | | 88,700 | | | 1,897,293 | | |
| | Celadon Group, Inc. | | | 57,200 | | | 565,708 | | |
| | Covenant Transportation Group, Inc., Class A* | | | 93,900 | | | 1,773,771 | | |
| | Greenbrier Companies., Inc. (The)+ | | | 18,000 | | | 587,160 | | |
| | Marten Transport, Ltd. | | | 152,982 | | | 2,707,781 | | |
| | P.A.M. Transportation Services, Inc.* | | | 19,205 | | | 529,866 | | |
| | Providence & Worcester Railroad Co.+ | | | 531 | | | 7,349 | | |
| | Roadrunner Transportation Systems, Inc.* | | | 25,200 | | | 237,636 | | |
| | USA Truck, Inc.* | | | 51,436 | | | 897,558 | | |
| | | | | | | | | | |
| | | | | | | | 9,204,122 | | |
| | | | | | | | | | |
| | | | | | | | |
| Industry | | Company | | Shares | | | Value |
| | | |
| | | | | | | | |
Semiconductors & Semiconductor Equipment - 3.12% |
| | Advanced Energy Industries, Inc.* | | | 44,400 | | | $ 1,253,412 |
| | Alpha & Omega Semiconductor Ltd.* | | | 114,500 | | | 1,052,255 |
| | Amkor Technology, Inc.* | | | 162,600 | | | 988,608 |
| | AXT, Inc.* | | | 100,000 | | | 248,000 |
| | Brooks Automation, Inc. | | | 400 | | | 4,272 |
| | Cirrus Logic, Inc.* | | | 29,800 | | | 879,994 |
| | Cohu, Inc. | | | 5,000 | | | 60,350 |
| | Diodes, Inc.* | | | 35,799 | | | 822,661 |
| | FormFactor, Inc.* | | | 15,000 | | | 135,000 |
| | GigOptix, Inc.* | | | 60,000 | | | 182,400 |
| | inTEST Corp.*+ | | | 55,000 | | | 232,650 |
| | IXYS Corp. | | | 57,500 | | | 726,225 |
| | Kulicke & Soffa Industries, Inc.* | | | 123,632 | | | 1,442,785 |
| | NeoPhotonics Corp.*+ | | | 50,000 | | | 543,000 |
| | OmniVision Technologies, Inc.* | | | 79,100 | | | 2,295,482 |
| | Photronics, Inc.* | | | 205,050 | | | 2,552,872 |
| | Rudolph Technologies, Inc.* | | | 39,600 | | | 563,112 |
| | SunEdison Semiconductor Ltd.* | | | 40,000 | | | 313,600 |
| | Ultra Clean Holdings, Inc.* | | | 85,700 | | | 438,784 |
| | Xcerra Corp.* | | | 25,000 | | | 151,250 |
| | | | | | | | |
| | | | | | | | 14,886,712 |
|
Software - 1.05% |
| | Ebix, Inc.+ | | | 110,000 | | | 3,606,900 |
| | Epiq Systems, Inc. | | | 50,000 | | | 653,500 |
| | Everyday Health, Inc.*+ | | | 8,000 | | | 48,160 |
| | GSE Systems, Inc.* | | | 22,500 | | | 54,000 |
| | Mind CTI Ltd. | | | 200 | | | 506 |
| | Net 1 UEPS Technologies, Inc.* | | | 28,400 | | | 383,684 |
| | NetSol Technologies, Inc.* | | | 31,000 | | | 240,560 |
| | | | | | | | |
| | | | | | | | 4,987,310 |
|
Specialty Retail - 2.67% |
| | Barnes & Noble Education, Inc.* | | | 51,824 | | | 515,649 |
| | Barnes & Noble, Inc. | | | 112,000 | | | 975,520 |
| | Big 5 Sporting Goods Corp. | | | 132,345 | | | 1,322,127 |
| | Children’s Place, Inc. (The) | | | 20,200 | | | 1,115,040 |
| | Citi Trends, Inc. | | | 28,900 | | | 614,125 |
| | Finish Line, Inc. (The), Class A | | | 23,600 | | | 426,688 |
| | Genesco, Inc.* | | | 7,000 | | | 397,810 |
| | Haverty Furniture Cos., Inc. | | | 12,700 | | | 272,288 |
| | hhgregg, Inc.*+ | | | 48,100 | | | 176,046 |
| | New York & Co., Inc.* | | | 48,100 | | | 110,149 |
| | |
| 14 | | Semi-Annual Report | December 31, 2015 (Unaudited) |
| | |
Omni Small-Cap Value Fund SCHEDULE OF INVESTMENTS (continued) | | |
Showing percentage of net assets as of December 31, 2015 (Unaudited)
| | | | | | | | | | |
| Industry | | Company | | Shares | | | Value | | |
| |
Common Stocks (continued) | | |
Specialty Retail (continued) | | |
| | Pep Boys-Manny, Moe & Jack (The)* | | | 52,900 | | | $ 973,889 | | |
| | Rent-A-Center, Inc. | | | 2,000 | | | 29,940 | | |
| | Shoe Carnival, Inc. | | | 41,400 | | | 960,480 | | |
| | Sonic Automotive, Inc., Class A | | | 30,000 | | | 682,800 | | |
| | Stage Stores, Inc.+ | | | 54,255 | | | 494,263 | | |
| | Systemax, Inc.* | | | 500 | | | 4,300 | | |
| | Tandy Leather Factory, Inc.* | | | 3,000 | | | 22,020 | | |
| | Tilly’s, Inc., Class A* | | | 75,800 | | | 502,554 | | |
| | Trans World Entertainment Corp.*+ | | | 70,000 | | | 250,600 | | |
| | TravelCenters of America LLC* | | | 249,400 | | | 2,344,360 | | |
| | West Marine, Inc.* | | | 35,300 | | | 299,697 | | |
| | Zumiez, Inc.* | | | 15,500 | | | 234,360 | | |
| | | | | | | | | | |
| | | | | | | | 12,724,705 | | |
| |
Textiles, Apparel & Luxury Goods - 0.95% | | |
| | Abercrombie & Fitch Co., Class A | | | 50,000 | | | 1,350,000 | | |
| | Delta Apparel, Inc.* | | | 10,000 | | | 140,400 | | |
| | Movado Group, Inc. | | | 15,000 | | | 385,650 | | |
| | Perry Ellis International, Inc.* | | | 138,100 | | | 2,543,802 | | |
| | Rocky Brands, Inc. | | | 9,900 | | | 114,444 | | |
| | | | | | | | | | |
| | | | | | | | 4,534,296 | | |
| |
Thrifts & Mortgage Finance - 4.26% | | |
| | Astoria Financial Corp. | | | 112,100 | | | 1,776,785 | | |
| | Bank Mutual Corp. | | | 124,700 | | | 972,660 | | |
| | Berkshire Hills Bancorp, Inc. | | | 50,565 | | | 1,471,947 | | |
| | Brookline Bancorp, Inc. | | | 45,000 | | | 517,500 | | |
| | Cape Bancorp, Inc. | | | 29,300 | | | 364,199 | | |
| | Cheviot Financial Corp. | | | 3,893 | | | 59,680 | | |
| | Chicopee Bancorp, Inc. | | | 12,500 | | | 216,750 | | |
| | Dime Community Bancshares, Inc. | | | 42,100 | | | 736,329 | | |
| | ESSA Bancorp, Inc. | | | 33,100 | | | 452,808 | | |
| | Federal Agricultural Mortgage Corp., Class C | | | 21,500 | | | 678,755 | | |
| | First Defiance Financial Corp. | | | 29,000 | | | 1,095,620 | | |
| | First Financial Northwest, Inc. | | | 35,182 | | | 491,141 | | |
| | Fox Chase Bancorp, Inc. | | | 31,000 | | | 628,990 | | |
| | Hingham Institution for Savings+ | | | 30 | | | 3,594 | | |
| | HMN Financial, Inc.* | | | 23,800 | | | 276,794 | | |
| | Home Bancorp, Inc.+ | | | 17,311 | | | 449,740 | | |
| | HomeStreet, Inc.* | | | 1,000 | | | 21,710 | | |
| | HopFed Bancorp, Inc.+ | | | 18,100 | | | 217,019 | | |
| | | | | | | | | | |
| | | | | | | | | | |
| | | | | | | | |
| Industry | | Company | | Shares | | | Value |
| | | |
| | | | | | | | |
Thrifts & Mortgage Finance (continued) |
| | Lake Sunapee Bank Group | | | 2,000 | | | $ 28,060 |
| | Meta Financial Group, Inc. | | | 7,900 | | | 362,847 |
| | Northwest Bancshares, Inc. | | | 107,266 | | | 1,436,292 |
| | Ocean Shore Holding Co. | | | 14,200 | | | 243,530 |
| | OceanFirst Financial Corp. | | | 39,900 | | | 799,197 |
| | Oritani Financial Corp. | | | 74,400 | | | 1,227,600 |
| | Provident Financial Holdings, Inc. | | | 26,600 | | | 502,474 |
| | Provident Financial Services, Inc. | | | 69,700 | | | 1,404,455 |
| | Pulaski Financial Corp. | | | 29,900 | | | 477,204 |
| | Riverview Bancorp, Inc.+ | | | 87,000 | | | 408,030 |
| | Security National Financial Corp., Class A* | | | 78,278 | | | 512,721 |
| | SI Financial Group, Inc. | | | 31,000 | | | 423,150 |
| | Territorial Bancorp, Inc. | | | 21,200 | | | 588,088 |
| | Timberland Bancorp, Inc. | | | 9,000 | | | 111,690 |
| | TrustCo Bank Corp. - NY | | | 55,000 | | | 337,700 |
| | United Community Bancorp | | | 11,800 | | | 176,292 |
| | United Community Financial Corp. | | | 324 | | | 1,912 |
| | Westfield Financial, Inc.+ | | | 53,081 | | | 445,880 |
| | WSFS Financial Corp. | | | 12,000 | | | 388,320 |
| | | | | | | | |
| | | | | | | | 20,307,463 |
|
Trading Companies & Distributors - 1.20% |
| | AeroCentury Corp.*+ | | | 3,300 | | | 41,811 |
| | Aircastle, Ltd. | | | 24,600 | | | 513,894 |
| | CAI International, Inc.* | | | 90,600 | | | 913,248 |
| | General Finance Corp.*+ | | | 80,700 | | | 321,993 |
| | Houston Wire & Cable Co. | | | 24,000 | | | 126,720 |
| | Kaman Corp. | | | 6,600 | | | 269,346 |
| | Rush Enterprises, Inc., Class A* | | | 58,500 | | | 1,280,565 |
| | TAL International Group, Inc. | | | 17,250 | | | 274,275 |
| | Titan Machinery, Inc.*+ | | | 49,500 | | | 541,035 |
| | Veritiv Corp.* | | | 12,700 | | | 459,994 |
| | Willis Lease Finance Corp.* | | | 48,400 | | | 972,840 |
| | | | | | | | |
| | | | | | | | 5,715,721 |
|
Wireless Telecommunication Services - 0.46% |
| | Spok Holdings, Inc. | | | 118,864 | | | 2,177,588 |
| | | | | | | | |
TOTAL COMMON STOCKS - 99.51% | | | 474,282,793 |
| | | | | | | | |
(Cost $424,077,707) | | | |
| |
RIGHTS - 0.01% | | | |
| | Leap Wireless CVR*D | | | 32,900 | | | 41,454 |
| | | | | | | | |
TOTAL RIGHTS - 0.01% | | | 41,454 |
| | | | | | | | |
(Cost $80,276) | | | |
| | |
Omni Small-Cap Value Fund SCHEDULE OF INVESTMENTS (continued) | | |
| | | | | | | | | | | | | | |
| Industry Company | | | Shares | | | Value | | | | |
| | |
| Rights (continued) | | | | |
WARRANTS - 0.00% | | | | |
Eagle Bulk Shipping, Inc.* | | | | 3,317 | | | $315 | | | | |
| | | | | | | | | | | | | | |
TOTAL WARRANTS - 0.00% | | | 315 | | | | |
| | | | | | | | | | | | | | |
(Cost $105,563) | | | | |
| | | | | |
| | | Rate^ | | | Shares | | | Value | | | | |
| | | | | | | |
MONEY MARKET FUND - 0.46% | | | | |
Dreyfus Cash Management Fund | | | 0.18 | % | | | 2,208,018 | | | 2,208,018 | | | | |
| | | | | | | | | | | | | | |
TOTAL MONEY MARKET FUND - 0.46% | | | 2,208,018 | | | | |
| | | | | | | | | | | | | | |
(Cost $2,208,018) | | | | | | | |
| | |
INVESTMENTS PURCHASED WITH CASH PROCEEDS FROM SECURITIES LENDING - 3.50% | | | | |
Dreyfus Cash Management Fund** | | | 0.18 | % | | | 16,671,950 | | | 16,671,950 | | | | |
| | | | | | | | | | | | | | |
TOTAL INVESTMENTS PURCHASED WITH CASH PROCEEDS FROM SECURITIES LENDING - 3.50% | | | 16,671,950 | | | | |
| | | | | | | | | | | | | | |
(Cost $16,671,950) | | | | | | | |
TOTAL INVESTMENTS - 103.48% | | | $493,204,530 | | | | |
(Cost $443,143,514) | | | | | | | |
Liabilities in Excess of Other Assets - (3.48%) | | | (16,591,641) | | | | |
| | | | | | | | | | | | | | |
NET ASSETS - 100.00% | | | $476,612,889 | | | | |
| | | | | | | | | | | | | | |
* Non-income producing security. ** This security represents the investment of the collateral received in connection with securities out on loan as of December 31, 2015. ^ Rate disclosed as of December 31, 2015. D Security was fair valued under procedures adopted by the Board of Directors (see Note 2). + This security or a portion of the security is out on loan as of December 31, 2015. Total loaned securities had a value of $16,003,142 as of December 31, 2015. CVR - Contingent Value Right LLC - Limited Liability Company PLC - Public Limited Company | | | | |
| | | | | | | | | | | | | | |
| | | | | | | | | | | | | | |
| | | | | | | | | | | | | | |
| | | | | | | | | | | | | | |
| | | | | | | | | | | | | | |
| | | | | | | | | | | | | | |
| | | | | | | | | | | | | | |
| | | | | | | | | | | | | | |
Summary of inputs used to value the Fund’s investments as of 12/31/2015 (See Note 2 in Notes to Financial Statements):
| | | | | | | | | | | | | | | | |
| | | Valuation Inputs | |
| |
| | | Investment in Securities (Value) | |
| |
| | | Level 1 Quoted Prices | | | Level 2
Significant
Observable
Inputs | | | Level 3
Significant
Unobservable
Inputs | | | Total | |
| |
| | | | |
Common Stocks | | $ | 474,282,793 | | | $ | — | | | $ | — | | | $ | 474,282,793 | |
Rights | | | — | | | | — | | | | 41,454 | | | | 41,454 | |
Warrants | | | 315 | | | | — | | | | — | | | | 315 | |
Money Market Fund | | | — | | | | 2,208,018 | | | | — | | | | 2,208,018 | |
Investments Purchased with Cash Proceeds from Securities Lending | | | — | | | | 16,671,950 | | | | — | | | | 16,671,950 | |
| | | | | | | | | | | | | | | | |
TOTAL | | $ | 474,283,108 | | | $ | 18,879,968 | | | $ | 41,454 | | | $ | 493,204,530 | |
| | | | | | | | | | | | | | | | |
Following is a reconciliation of Level 3 investments for which significant unobservable inputs were used to determine fair value:
| | | | | | | | | | | | |
| | | Investment in Securities (Value) | |
| |
| | | Rights | | | | | | Total | |
| |
| | | |
Balance as of 06/30/2015 | | | $41,454 | | | | | | | | $41,454 | |
Purchases | | | — | | | | | | | | — | |
Sales | | | — | | | | | | | | — | |
Realized gain/(loss) | | | — | | | | | | | | — | |
Change in Unrealized Appreciation/ (Depreciation) | | | — | | | | | | | | — | |
Transfers in | | | — | | | | | | | | — | |
Transfers out | | | — | | | | | | | | — | |
| | | | | | | | | | | | |
Balance as of 12/31/2015 | | | $41,454 | | | | | | | | $41,454 | |
| | | | | | | | | | | | |
Net change in Unrealized Appreciation (Depreciation) from Investments Held as of 12/31/2015 | | | $ — | | | | | | | | $ — | |
| | | | | | | | | | | | |
See Notes to Financial Statements.
| | |
| 16 | | Semi-Annual Report | December 31, 2015 (Unaudited) |
| | |
Omni Tax-Managed Small-Cap Value Fund MANAGER’S COMMENTARY (Unaudited) | | |
December 31, 2015
Dear Fellow Omni Tax-Managed Small-Cap Value Fund Shareholder,
For the quarter ended December 31, 2015, our Fund returned 4.02%, outperforming our primary market benchmark, the Russell 2000 Value Index (2.88%).
For the six-month semi-annual period ended December 31, 2015, our Fund returned -7.34%, outperforming the Russell 2000 Value Index (-8.17%).
For the calendar year, our Fund returned -5.47%, outperforming the Russell 2000 Value Index (-7.47%).
The table below presents our December quarter, six-month, one-year, five-year, and inception-to-date financial results. See the next page for a graph of performance since inception.
Standardized Returns as of December 31, 2015
| | | | | | | | | | | | | | | | | | | | | | | | | |
| | | | | | | | | | | Annualized |
| | | Quarter | | 6 Months | | 1 Year | | 5 Year | | Since Inception
(12/31/10) |
| | | | | |
Omni Tax-Managed Small-Cap Value Fund | | | | 4.02% | | | | | -7.34% | | | | | -5.47% | | | | | 8.43% | | | | | 8.43% | |
Russell 2000 Value Index | | | | 2.88% | | | | | -8.17% | | | | | -7.47% | | | | | 7.67% | | | | | 7.67% | |
Performance figures quoted in the table above and the graph on the next page represent past performance and are no guarantee of future results. Total return figures in the table above include the reinvestment of dividends and capital gains. The table above and the graph on the next page do not reflect the deduction of taxes that a shareholder would pay on Fund distributions or on the redemption of Fund shares.
The Russell 2000 Value Index is an unmanaged index that consists of stocks in the Russell 2000 Index with lower price-to-book ratios and lower forecasted growth values with dividends reinvested. It is not possible to invest directly in an index. Periods longer than one year are annualized.
According to data from Lipper, Inc. as of December 31, 2015, Omni Tax-Managed Small-Cap Value Fund ranked 111th of 309 small-cap value funds for the 12 months ended December 31, 2015, 93rd of 227 over the last five years, and 93rd of 227 such funds since inception in December 2010. Lipper, Inc. is an independent mutual fund rating service that ranks funds in various fund categories by making comparative calculations using total returns.
| | |
Omni Tax-Managed Small-Cap Value Fund MANAGER’S COMMENTARY (Unaudited) (continued) | | |
Omni Tax-Managed Small-Cap Value Fund vs. Russell 2000 Value Index
from Inception 12/31/10 to 12/31/15
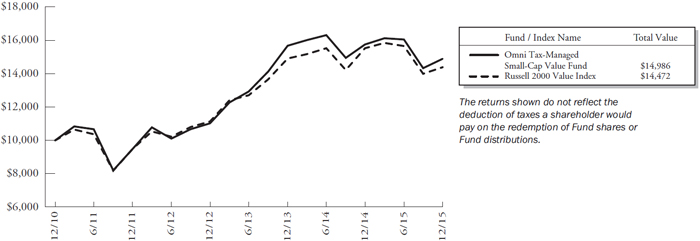
Detailed Explanation of Quarterly Performance
The Omni Tax-Managed Small-Cap Value Fund is designed to capture the returns of the small-cap value asset class through broad diversification of small company and value stocks. We also seek to minimize the distribution of capital gains within the constraints of the investment objective. This approach is sometimes referred to as “passive, asset class investing.” As of December 31, 2015, we held 629 such stocks in a market-cap weighted style. We make no attempt to track any particular index in either performance or statistics.
Our design tilt toward smaller stocks contributed positively to relative performance. However, a bias toward deeper value stocks dragged on relative results, as value stocks generally underperformed growth stocks during the three-month period. The Fund’s multifactor definition of value, which categorizes value stocks using several different metrics, contributed positively to performance relative to funds that use just one valuation factor to select stocks.
By design, the Fund does not hold Utility sector stocks and Real Estate Investment Trusts (REITs). Those assets performed relatively well during the quarter, which hurt the Fund’s relative performance. Our Fund’s higher weighting in Financial sector stocks other than REITs contributed positively to relative returns, as did holdings in the Energy sector. A higher weighting in Information Technology sector stocks also boosted relative results.
Detailed Explanation of Calendar Year Performance
Our Fund’s tilt toward higher momentum stocks benefited relative results. However, a greater relative weighting in smaller stocks detracted from calendar year performance. The Fund’s investment in deeper value stocks versus the index also detracted from relative performance. Our Fund’s lack of exposure to Utilities stocks negatively affected relative results, but higher weightings in Financial sector stocks other than REITs and Information Technology sector stocks boosted relative returns.
| | |
| 18 | | Semi-Annual Report | December 31, 2015 (Unaudited) |
| | |
Omni Tax-Managed Small-Cap Value Fund MANAGER’S COMMENTARY (Unaudited) (continued) | | |
Top Ten Holdings as of December 31, 2015
| | | | | | | | | | | | |
| Rank | | Description | | Industry | | % of Net
Assets |
| | | 1 | | | Hawaiian Holdings Inc | | Airlines | | 1.1% |
| | | 2 | | | Cooper-Standard Holding Inc | | Auto Components | | 1.0% |
| | | 3 | | | NETGEAR Inc | | Communications Equipment | | 1.0% |
| | | 4 | | | Fresh Del Monte Produce Inc | | Food Products | | 0.8% |
| | | 5 | | | Stepan Co | | Chemicals | | 0.8% |
| | | 6 | | | Navigators Group Inc (The) | | Insurance | | 0.8% |
| | | 7 | | | Iridium Communications Inc | | Diversified Telecommunication | | 0.7% |
| | | 8 | | | Sanmina Corp | | Electronic Equip., Instruments | | 0.7% |
| | | 9 | | | AAR Corp | | Aerospace & Defense | | 0.7% |
| | | 10 | | | Central Garden & Pet Co | | Household Products | | 0.7% |
| | | | | | Total | | | | 8.2% |
Industry Sector Representation as of December 31, 2015
| | | | | | | | | | | | | | | |
| | | % of Net Assets | | % of Russell 2000 Value Index | | Difference |
| Consumer Discretionary | | | | 14.3% | | | | | 10.1% | | | | | 4.2% | |
| Consumer Staples | | | | 4.1% | | | | | 3.3% | | | | | 0.8% | |
| Energy | | | | 9.2% | | | | | 4.4% | | | | | 4.8% | |
| Financials | | | | 32.5% | | | | | 43.8% | | | | | -11.3% | |
| Health Care | | | | 2.4% | | | | | 4.6% | | | | | -2.2% | |
| Industrials | | | | 18.1% | | | | | 11.6% | | | | | 6.5% | |
| Information Technology | | | | 11.8% | | | | | 10.8% | | | | | 1.0% | |
| Materials | | | | 5.3% | | | | | 3.1% | | | | | 2.2% | |
| Telecommunication Services | | | | 2.0% | | | | | 0.9% | | | | | 1.1% | |
| Utilities | | | | 0.0% | | | | | 7.4% | | | | | -7.4% | |
| Cash | | | | 0.3% | | | | | 0.0% | | | | | 0.3% | |
Total | | | | 100.0% | | | | | 100.0% | | | | | | |
Disclaimer
The views expressed here are exclusively those of Fund management. These views, including those related to market sectors or individual stocks, are not meant as investment advice and should not be considered predictive in nature. Any favorable (or unfavorable) description of a holding applies only as of the quarter end, December 31, 2015, unless otherwise stated. Security positions can and do change thereafter. Discussions of historical performance do not guarantee and may not be indicative of future performance.
Market volatility can significantly impact short-term performance. The Fund is not an appropriate investment for short-term investors. Investments in small companies generally carry greater risk than is customarily associated with larger companies. This additional risk is attributable to a number of factors, including the relatively limited financial resources that are typically available to small companies and the fact that small companies often have comparatively limited product lines. In addition, the stock of small companies tends to be more volatile than the stock of large companies, particularly in the short term and particularly in the early stages of an economic or market downturn. Shareholders of the Fund, therefore, are taking on more risk than they would if they invested in the stock market as a whole.
Conclusion
Thank you for your continued investment in Omni Tax-Managed Small-Cap Value Fund. We encourage your feedback; your reactions and concerns are important to us.
Sincerely,
The Investment Management Team
| | |
Omni Tax-Managed Small-Cap Value Fund SCHEDULE OF INVESTMENTS | | |
Showing percentage of net assets as of December 31, 2015 (Unaudited)
| | | | | | | | | | |
| Industry | | Company | | Shares | | | Value | |
| |
COMMON STOCKS - 99.56% | |
Aerospace & Defense - 1.43% | |
| | AAR Corp. | | | 114,560 | | | $ | 3,011,782 | |
| | Arotech Corp.* | | | 52,800 | | | | 107,712 | |
| | Cubic Corp. | | | 10,000 | | | | 472,500 | |
| | DigitalGlobe, Inc.* | | | 10,000 | | | | 156,600 | |
| | Ducommun, Inc.* | | | 69,220 | | | | 1,122,748 | |
| | Erickson, Inc.* | | | 1,500 | | | | 3,090 | |
| | LMI Aerospace, Inc.* | | | 52,600 | | | | 529,682 | |
| | National Presto Industries, Inc. | | | 9,435 | | | | 781,784 | |
| | Sypris Solutions, Inc. | | | 8,004 | | | | 8,724 | |
| | | | | | | | | | |
| | | | | | | | | 6,194,622 | |
| |
Air Freight & Logistics - 1.31% | |
| | Air T, Inc.* | | | 6,700 | | | | 163,949 | |
| | Air Transport Services Group, Inc.* | | | 291,526 | | | | 2,938,582 | |
| | Atlas Air Worldwide Holdings, Inc.* | | | 25,800 | | | | 1,066,572 | |
| | Wesco Aircraft Holdings, Inc.* | | | 124,200 | | | | 1,486,674 | |
| | | | | | | | | | |
| | | | | | | | | 5,655,777 | |
| |
Airlines - 1.80% | |
| | Hawaiian Holdings, Inc.* | | | 135,600 | | | | 4,790,748 | |
| | Republic Airways Holdings, Inc.* | | | 56,404 | | | | 221,668 | |
| | SkyWest, Inc. | | | 145,600 | | | | 2,769,312 | |
| | | | | | | | | | |
| | | | | | | | | 7,781,728 | |
| |
Auto Components - 1.89% | |
| | China Automotive Systems, Inc.*+ | | | 28,500 | | | | 130,530 | |
| | China XD Plastics Co., Ltd.* | | | 17,400 | | | | 76,908 | |
| | Cooper-Standard Holding, Inc.* | | | 55,510 | | | | 4,307,021 | |
| | Fuel Systems Solutions, Inc.* | | | 402 | | | | 1,966 | |
| | Modine Manufacturing Co.* | | | 28,900 | | | | 261,545 | |
| | Shiloh Industries, Inc.* | | | 500 | | | | 2,620 | |
| | SORL Auto Parts, Inc.*+ | | | 74,129 | | | | 187,546 | |
| | Spartan Motors, Inc. | | | 88,600 | | | | 275,546 | |
| | Strattec Security Corp. | | | 3,600 | | | | 203,364 | |
| | Superior Industries International, Inc. | | | 118,700 | | | | 2,186,454 | |
| | Titan International, Inc. | | | 136,000 | | | | 535,840 | |
| | | | | | | | | | |
| | | | | | | | | 8,169,340 | |
| |
Biotechnology - 0.13% | |
| | AMAG Pharmaceuticals, Inc.*+ | | | 17,000 | | | | 513,230 | |
| | Enzon Pharmaceuticals, Inc. | | | 93,500 | | | | 63,814 | |
| | | | | | | | | | |
| | | | | | | | | 577,044 | |
| | | | | | | | | | |
| Industry | | Company | | Shares | | | Value | |
| | |
| | | | | | | | |
Building Products - 1.08% | |
| | Alpha Pro Tech, Ltd.* | | | 500 | | | $ | 875 | |
| | Gibraltar Industries, Inc.* | | | 84,706 | | | | 2,154,921 | |
| | Griffon Corp. | | | 140,250 | | | | 2,496,450 | |
| | | | | | | | | | |
| | | | | | | | | 4,652,246 | |
|
Capital Markets - 1.16% | |
| | American Capital Senior Floating Ltd. | | | 16,000 | | | | 157,280 | |
| | Arlington Asset Investment Corp., Class A+ | | | 3,700 | | | | 48,951 | |
| | Calamos Asset Management, Inc., Class A | | | 69,700 | | | | 674,696 | |
| | Cowen Group, Inc., Class A*+ | | | 201,400 | | | | 771,362 | |
| | FBR & Co. | | | 775 | | | | 15,423 | |
| | INTL FCStone, Inc.* | | | 26,900 | | | | 900,074 | |
| | Investment Technology Group, Inc. | | | 76,000 | | | | 1,293,520 | |
| | KCG Holdings, Inc., Class A* | | | 35,000 | | | | 430,850 | |
| | Oppenheimer Holdings, Inc., Class A | | | 4,419 | | | | 76,802 | |
| | Piper Jaffray Cos.* | | | 16,100 | | | | 650,440 | |
| | | | | | | | | | |
| | | | | | | | | 5,019,398 | |
|
Chemicals - 1.95% | |
| | American Vanguard Corp. | | | 34,200 | | | | 479,142 | |
| | China Green Agriculture, Inc.*+ | | | 80,300 | | | | 122,859 | |
| | Core Molding Technologies, Inc.* | | | 11,900 | | | | 152,677 | |
| | FutureFuel Corp. | | | 34,500 | | | | 465,750 | |
| | Gulf Resources, Inc.* | | | 85,750 | | | | 156,065 | |
| | Intrepid Potash, Inc.* | | | 50,000 | | | | 147,500 | |
| | KMG Chemicals, Inc. | | | 38,200 | | | | 879,364 | |
| | Kraton Performance Polymers, Inc.* | | | 54,875 | | | | 911,474 | |
| | Olin Corp. | | | 20,900 | | | | 360,734 | |
| | OMNOVA Solutions, Inc.* | | | 62,300 | | | | 381,899 | |
| | Schulman (A.), Inc. | | | 24,100 | | | | 738,424 | |
| | Stepan Co. | | | 65,400 | | | | 3,249,726 | |
| | Tredegar Corp. | | | 28,900 | | | | 393,618 | |
| | | | | | | | | | |
| | | | | | | | | 8,439,232 | |
|
Commercial Banks - 15.64% | |
| | 1st Constitution Bancorp* | | | 5,000 | | | | 64,350 | |
| | 1st Source Corp. | | | 57,750 | | | | 1,782,743 | |
| | Access National Corp. | | | 600 | | | | 12,276 | |
| | American National Bankshares, Inc. | | | 13,060 | | | | 334,467 | |
| | American River Bankshares* | | | 20,744 | | | | 219,472 | |
| | |
| 20 | | Semi-Annual Report | December 31, 2015 (Unaudited) |
| | |
Omni Tax-Managed Small-Cap Value Fund SCHEDULE OF INVESTMENTS (continued) | | |
Showing percentage of net assets as of December 31, 2015 (Unaudited)
| | | | | | | | | | |
| Industry | | Company | | Shares | | | Value | |
| | |
Common Stocks (continued) | | | | | | | | |
Commercial Banks (continued) | | | | | | | | |
| | AmeriServ Financial, Inc. | | | 5,000 | | | $ | 16,000 | |
| | Bank of Commerce Holdings | | | 47,900 | | | | 319,972 | |
| | Banner Corp. | | | 25,057 | | | | 1,149,114 | |
| | Bar Harbor Bankshares | | | 10,500 | | | | 361,410 | |
| | Baylake Corp.+ | | | 5,600 | | | | 81,816 | |
| | BBCN Bancorp, Inc. | | | 2,600 | | | | 44,772 | |
| | BCB Bancorp, Inc. | | | 11,300 | | | | 117,520 | |
| | Beneficial Bancorp, Inc.* | | | 20,000 | | | | 266,400 | |
| | BNC Bancorp | | | 74,956 | | | | 1,902,383 | |
| | Boston Private Financial Holdings, Inc. | | | 10,000 | | | | 113,400 | |
| | BSB Bancorp, Inc.*+ | | | 23,800 | | | | 556,682 | |
| | C&F Financial Corp. | | | 2,400 | | | | 93,600 | |
| | Camden National Corp. | | | 5,853 | | | | 258,059 | |
| | Capital City Bank Group, Inc. | | | 47,950 | | | | 736,033 | |
| | Cardinal Financial Corp. | | | 24,478 | | | | 556,875 | |
| | Central Pacific Financial Corp. | | | 30,400 | | | | 669,408 | |
| | Central Valley Community Bancorp+ | | | 21,000 | | | | 259,560 | |
| | Century Bancorp, Inc., Class A | | | 14,300 | | | | 621,478 | |
| | Chemical Financial Corp. | | | 60,300 | | | | 2,066,481 | |
| | Chemung Financial Corp.+ | | | 3,000 | | | | 82,980 | |
| | Citizens & Northern Corp. | | | 10,000 | | | | 210,000 | |
| | Civista Bancshares, Inc.+ | | | 2,000 | | | | 25,660 | |
| | CNB Financial Corp. | | | 31,900 | | | | 575,157 | |
| | Codorus Valley Bancorp, Inc. | | | 4,188 | | | | 85,184 | |
| | Community Bankers Trust Corp.* | | | 25,000 | | | | 134,250 | |
| | Community Trust Bancorp, Inc. | | | 32,500 | | | | 1,136,200 | |
| | Customers Bancorp, Inc.* | | | 20,000 | | | | 544,400 | |
| | Eastern Virginia Bankshares, Inc. | | | 7,051 | | | | 50,626 | |
| | Enterprise Bancorp, Inc. | | | 175 | | | | 3,999 | |
| | Farmers Capital Bank Corp.* | | | 13,400 | | | | 363,274 | |
| | Farmers National Banc Corp. | | | 150 | | | | 1,290 | |
| | Fidelity Southern Corp. | | | 16,200 | | | | 361,422 | |
| | Financial Institutions, Inc. | | | 40,300 | | | | 1,128,400 | |
| | First Bancorp | | | 51,600 | | | | 966,984 | |
| | First Bancorp, Inc. | | | 11,800 | | | | 241,546 | |
| | First BanCorp.* | | | 146,000 | | | | 474,500 | |
| | First Busey Corp. | | | 37,166 | | | | 766,735 | |
| | First Commonwealth Financial Corp. | | | 121,200 | | | | 1,099,284 | |
| | | | | | | | | | |
| | | | | | | | | | |
| | | | | | | | | | |
| Industry | | Company | | Shares | | | Value | |
| | | |
| | | | | | | | | | |
Commercial Banks (continued) | | | | | | | | |
| | First Community Bancshares, Inc. | | | 44,100 | | | $ | 821,583 | |
| | First Connecticut Bancorp, Inc. | | | 4,800 | | | | 83,568 | |
| | First Financial Corp.+ | | | 38,830 | | | | 1,319,055 | |
| | First Internet Bancorp | | | 1,200 | | | | 34,428 | |
| | First Interstate BancSystem, Inc., Class A | | | 94,600 | | | | 2,750,022 | |
| | First Merchants Corp. | | | 71,000 | | | | 1,804,820 | |
| | First Midwest Bancorp, Inc. | | | 115,900 | | | | 2,136,037 | |
| | First of Long Island Corp. (The) | | | 18,000 | | | | 540,000 | |
| | Flushing Financial Corp. | | | 43,300 | | | | 937,012 | |
| | German American Bancorp, Inc. | | | 12,500 | | | | 416,500 | |
| | Great Southern Bancorp, Inc. | | | 39,850 | | | | 1,803,611 | |
| | Hampton Roads Bankshares, Inc.* | | | 265,225 | | | | 488,014 | |
| | Heartland Financial USA, Inc. | | | 10,950 | | | | 343,392 | |
| | Heritage Commerce Corp. | | | 30,000 | | | | 358,800 | |
| | Heritage Financial Corp. | | | 40,502 | | | | 763,058 | |
| | Heritage Oaks Bancorp | | | 200 | | | | 1,602 | |
| | HomeTrust Bancshares, Inc.* | | | 50,000 | | | | 1,012,500 | |
| | Horizon Bancorp | | | 20,363 | | | | 569,349 | |
| | Independent Bank Corp., MI | | | 80,500 | | | | 1,226,015 | |
| | International Bancshares Corp. | | | 89,200 | | | | 2,292,440 | |
| | Lakeland Bancorp, Inc.+ | | | 104,940 | | | | 1,237,243 | |
| | Landmark Bancorp, Inc. | | | 2,100 | | | | 55,167 | |
| | LCNB Corp.+ | | | 1,500 | | | | 24,540 | |
| | Macatawa Bank Corp. | | | 12,550 | | | | 75,927 | |
| | MainSource Financial Group, Inc. | | | 41,500 | | | | 949,520 | |
| | MBT Financial Corp.* | | | 62,011 | | | | 423,535 | |
| | Mercantile Bank Corp. | | | 2,000 | | | | 49,080 | |
| | Merchants Bancshares, Inc. | | | 5,000 | | | | 157,450 | |
| | Metro Bancorp, Inc. | | | 26,250 | | | | 823,725 | |
| | Middleburg Financial Corp. | | | 22,463 | | | | 415,116 | |
| | MidWestOne Financial Group, Inc. | | | 12,000 | | | | 364,920 | |
| | Monarch Financial Holdings, Inc. | | | 591 | | | | 10,632 | |
| | MutualFirst Financial, Inc. | | | 700 | | | | 17,444 | |
| | National Bankshares, Inc.+ | | | 1,000 | | | | 35,540 | |
| | NBT Bancorp, Inc. | | | 20,932 | | | | 583,584 | |
| | Northrim BanCorp, Inc. | | | 24,073 | | | | 640,342 | |
| | Norwood Financial Corp.+ | | | 1,000 | | | | 28,710 | |
| | OFG Bancorp | | | 4,200 | | | | 30,744 | |
| | |
Omni Tax-Managed Small-Cap Value Fund SCHEDULE OF INVESTMENTS (continued) | | |
Showing percentage of net assets as of December 31, 2015 (Unaudited)
| | | | | | | | | | | | |
| Industry | | Company | | Shares | | | Value | | | |
| |
Common Stocks (continued) | | | |
Commercial Banks (continued) | | | |
| | Old Line Bancshares, Inc.+ | | | 50 | | | $ | 879 | | | |
| | Old National Bancorp | | | 30,600 | | | | 414,936 | | | |
| | Old Second Bancorp, Inc.* | | | 30,050 | | | | 235,592 | | | |
| | Orrstown Financial Services, Inc. | | | 16,700 | | | | 300,266 | | | |
| | Pacific Continental Corp. | | | 56,600 | | | | 842,208 | | | |
| | Pacific Mercantile Bancorp* | | | 20,000 | | | | 142,200 | | | |
| | Park Sterling Corp. | | | 50,298 | | | | 368,181 | | | |
| | Parke Bancorp, Inc.+ | | | 1,200 | | | | 14,976 | | | |
| | Peapack Gladstone Financial Corp. | | | 468 | | | | 9,650 | | | |
| | Peoples Bancorp, Inc. | | | 28,550 | | | | 537,882 | | | |
| | Preferred Bank | | | 36,000 | | | | 1,188,720 | | | |
| | Premier Financial Bancorp, Inc. | | | 26,066 | | | | 428,525 | | | |
| | QCR Holdings, Inc. | | | 27,300 | | | | 663,117 | | | |
| | Renasant Corp. | | | 70,004 | | | | 2,408,838 | | | |
| | Republic Bancorp, Inc., Class A | | | 25,700 | | | | 678,737 | | | |
| | S&T Bancorp, Inc. | | | 30,700 | | | | 946,174 | | | |
| | Salisbury Bancorp, Inc.+ | | | 1,183 | | | | 39,512 | | | |
| | Sandy Spring Bancorp, Inc. | | | 14,300 | | | | 385,528 | | | |
| | Shore Bancshares, Inc. | | | 30,000 | | | | 326,400 | | | |
| | Sierra Bancorp | | | 42,200 | | | | 744,830 | | | |
| | South State Corp. | | | 16,911 | | | | 1,216,746 | | | |
| | Southern National Bancorp of Virginia, Inc. | | | 35,000 | | | | 457,100 | | | |
| | Southwest Bancorp, Inc. | | | 23,900 | | | | 417,772 | | | |
| | State Bank Financial Corp. | | | 39,300 | | | | 826,479 | | | |
| | Summit State Bank+ | | | 5,000 | | | | 68,250 | | | |
| | Sussex Bancorp | | | 15,000 | | | | 196,950 | | | |
| | Tompkins Financial Corp. | | | 8,400 | | | | 471,744 | | | |
| | TowneBank | | | 222 | | | | 4,633 | | | |
| | Trico Bancshares | | | 200 | | | | 5,488 | | | |
| | TriState Capital Holdings, Inc.* | | | 50,000 | | | | 699,500 | | | |
| | Trustmark Corp. | | | 20,800 | | | | 479,232 | | | |
| | Union Bankshares Corp. | | | 58,628 | | | | 1,479,771 | | | |
| | United Community Banks, Inc. | | | 57,770 | | | | 1,125,937 | | | |
| | Univest Corp. of Pennsylvania | | | 39,200 | | | | 817,712 | | | |
| | WesBanco, Inc. | | | 66,385 | | | | 1,992,878 | | | |
| | Wilshire Bancorp, Inc. | | | 25,000 | | | | 288,750 | | | |
| | | | | | | | | | | | |
| | | | | | | | | 67,707,280 | | | |
| |
Commercial Services & Supplies - 3.13% | | | |
| | ACCO Brands Corp.* | | | 339,800 | | | | 2,422,774 | | | |
| | Acme United Corp. | | | 2,000 | | | | 34,000 | | | |
| | Brink’s Co. (The) | | | 22,500 | | | | 649,350 | | | |
| | Command Security Corp.*+ | | | 17,800 | | | | 41,118 | | | |
| | | | |
| | | | | | | | | | | | |
| | | | | | | | | | | | |
| Industry | | Company | | Shares | | | Value | | | |
| | | |
| | | | | | | | | | |
Commercial Services & Supplies (continued) | | | |
| | Ecology & Environment, Inc., Class A | | | 2,811 | | | $ | 28,757 | | | |
| | EnerNOC, Inc.*+ | | | 148,100 | | | | 570,185 | | | |
| | Ennis, Inc. | | | 149,265 | | | | 2,873,351 | | | |
| | Heritage-Crystal Clean, Inc.* | | | 14,246 | | | | 151,008 | | | |
| | Huron Consulting Group, Inc.* | | | 9,100 | | | | 540,540 | | | |
| | James River Group Holdings Ltd. | | | 15,600 | | | | 523,224 | | | |
| | Kelly Services, Inc., Class A | | | 68,400 | | | | 1,104,660 | | | |
| | Kimball International, Inc., Class B | | | 103,800 | | | | 1,014,126 | | | |
| | McGrath RentCorp | | | 23,000 | | | | 579,370 | | | |
| | Quad/Graphics, Inc. | | | 82,300 | | | | 765,390 | | | |
| | RCM Technologies, Inc. | | | 4,000 | | | | 22,000 | | | |
| | TRC Cos., Inc.* | | | 51,400 | | | | 475,450 | | | |
| | Versar, Inc.* | | | 35,000 | | | | 108,150 | | | |
| | Viad Corp. | | | 57,894 | | | | 1,634,348 | | | |
| | Willdan Group, Inc.* | | | 1,600 | | | | 13,408 | | | |
| | | | | | | | | | | | |
| | | | | | | | | 13,551,209 | | | |
| |
Communications Equipment - 2.05% | | | |
| | Bel Fuse, Inc., Class B | | | 63,600 | | | | 1,099,644 | | | |
| | Black Box Corp. | | | 46,164 | | | | 439,943 | | | |
| | Blonder Tongue Laboratories* | | | 17,859 | | | | 6,992 | | | |
| | ClearOne, Inc. | | | 26,500 | | | | 342,645 | | | |
| | Communications Systems, Inc. | | | 4,950 | | | | 38,462 | | | |
| | Comtech Telecommunications Corp. | | | 29,215 | | | | 586,929 | | | |
| | Finisar Corp.* | | | 68,000 | | | | 988,720 | | | |
| | Harmonic, Inc.* | | | 600 | | | | 2,442 | | | |
| | KVH Industries, Inc.* | | | 18,200 | | | | 171,444 | | | |
| | NETGEAR, Inc.* | | | 101,900 | | | | 4,270,629 | | | |
| | PC-Tel, Inc. | | | 56,000 | | | | 254,800 | | | |
| | Polycom, Inc.* | | | 54,100 | | | | 681,119 | | | |
| | | | | | | | | | | | |
| | | | | | | | | 8,883,769 | | | |
| |
Computers & Peripherals - 0.25% | | | |
| | Concurrent Computer Corp. | | | 3,400 | | | | 16,830 | | | |
| | Datalink Corp.* | | | 500 | | | | 3,400 | | | |
| | Hutchinson Technology, Inc.* | | | 5,500 | | | | 19,745 | | | |
| | QLogic Corp.* | | | 76,500 | | | | 933,300 | | | |
| | USA Technologies, Inc.*+ | | | 30,000 | | | | 92,400 | | | |
| | | | | | | | | | | | |
| | | | | | | | | 1,065,675 | | | |
| |
Construction & Engineering - 1.19% | | | |
| | Aegion Corp.* | | | 120,300 | | | | 2,322,993 | | | |
| | Goldfield Corp. (The)* | | | 114,000 | | | | 176,700 | | | |
| | |
| 22 | | Semi-Annual Report | December 31, 2015 (Unaudited) |
| | |
Omni Tax-Managed Small-Cap Value Fund SCHEDULE OF INVESTMENTS (continued) | | |
Showing percentage of net assets as of December 31, 2015 (Unaudited)
| | | | | | | | | | | | |
| Industry | | Company | | Shares | | | Value | | | |
| |
Common Stocks (continued) | | | |
Construction & Engineering (continued) | | | |
| | Great Lakes Dredge & Dock Corp.* | | | 99,550 | | | $ | 394,218 | | | |
| | Integrated Electrical Services, Inc.* | | | 3,600 | | | | 39,852 | | | |
| | KB Home | | | 30,400 | | | | 374,832 | | | |
| | MasTec, Inc.* | | | 48,500 | | | | 842,930 | | | |
| | MYR Group, Inc.* | | | 25,000 | | | | 515,250 | | | |
| | Northwest Pipe Co.* | | | 1,000 | | | | 11,190 | | | |
| | Orion Marine Group, Inc.* | | | 58,000 | | | | 241,860 | | | |
| | Tutor Perini Corp.* | | | 13,200 | | | | 220,968 | | | |
| | | | | | | | | | | | |
| | | | | | | | | 5,140,793 | | | |
| |
Consumer Finance - 1.02% | | | |
| | Asta Funding, Inc.* | | | 10,350 | | | | 82,283 | | | |
| | Cash America International, Inc. | | | 24,900 | | | | 745,755 | | | |
| | Consumer Portfolio Services, Inc.* | | | 116,650 | | | | 605,414 | | | |
| | Encore Capital Group, Inc.*+ | | | 23,400 | | | | 680,472 | | | |
| | Ezcorp, Inc., Class A* | | | 6,100 | | | | 30,439 | | | |
| | Green Dot Corp., Class A* | | | 36,900 | | | | 605,898 | | | |
| | Nelnet, Inc., Class A | | | 6,900 | | | | 231,633 | | | |
| | Nicholas Financial, Inc.* | | | 31,800 | | | | 370,470 | | | |
| | Regional Management Corp.* | | | 52,100 | | | | 805,987 | | | |
| | World Acceptance Corp.*+ | | | 7,000 | | | | 259,700 | | | |
| | | | | | | | | | | | |
| | | | | | | | | 4,418,051 | | | |
| |
Distributors - 0.37% | | | |
| | Essendant, Inc. | | | 35,600 | | | | 1,157,356 | | | |
| | VOXX International Corp.* | | | 83,064 | | | | 436,917 | | | |
| | | | | | | | | | | | |
| | | | | | | | | 1,594,273 | | | |
| |
Diversified Consumer Services - 0.40% | | | |
| | American Public Education, Inc.* | | | 8,000 | | | | 148,880 | | | |
| | K12, Inc.* | | | 23,500 | | | | 206,800 | | | |
| | Lincoln Educational Services Corp. | | | 91,300 | | | | 181,687 | | | |
| | Regis Corp.* | | | 83,250 | | | | 1,177,987 | | | |
| | Universal Technical Institute, Inc. | | | 5,000 | | | | 23,300 | | | |
| | | | | | | | | | | | |
| | | | | | | | | 1,738,654 | | | |
| |
Diversified Financial Services - 0.74% | | | |
| | Enova International, Inc.* | | | 22,783 | | | | 150,596 | | | |
| | Gain Capital Holdings, Inc. | | | 39,900 | | | | 323,589 | | | |
| | Higher One Holdings, Inc.* | | | 80,400 | | | | 260,496 | | | |
| | Marlin Business Services Corp. | | | 15,775 | | | | 253,346 | | | |
| | | | |
| | | | | | | | | | | | |
| | | | | | | | | | | | |
| Industry | | Company | | | Shares | | | | Value | | | |
| |
| | | |
Diversified Financial Services (continued) | | | |
| | PHH Corp.* | | | 19,000 | | | $ | 307,800 | | | |
| | Resource America, Inc., Class A | | | 71,900 | | | | 440,747 | | | |
| | Sterling Bancorp | | | 87,576 | | | | 1,420,483 | | | |
| | Tiptree Financial, Inc., Class A+ | | | 10,000 | | | | 61,400 | | | |
| | | | | | | | | | | | |
| | | | | | | | | 3,218,457 | | | |
| |
Diversified Telecommunication Services - 1.57% | | | |
| | Alaska Communications Systems Group, Inc.* | | | 313,487 | | | | 548,602 | | | |
| | Atlantic Tele-Network, Inc. | | | 25,900 | | | | 2,026,157 | | | |
| | Hawaiian Telcom Holdco, Inc.* | | | 45,400 | | | | 1,128,644 | | | |
| | Iridium Communications, Inc.*+ | | | 367,125 | | | | 3,087,521 | | | |
| | | | | | | | | | | | |
| | | | | | | | | 6,790,924 | | | |
| |
Electrical Equipment - 0.49% | | | |
| | Broadwind Energy, Inc.*+ | | | 6,075 | | | | 12,636 | | | |
| | Encore Wire Corp. | | | 6,500 | | | | 241,085 | | | |
| | General Cable Corp. | | | 25,000 | | | | 335,750 | | | |
| | Highpower International, Inc.* | | | 25,922 | | | | 77,766 | | | |
| | II-VI, Inc.* | | | 63,404 | | | | 1,176,778 | | | |
| | LSI Industries, Inc. | | | 15,000 | | | | 182,850 | | | |
| | Preformed Line Products Co. | | | 1,200 | | | | 50,520 | | | |
| | Ultralife Corp.* | | | 8,350 | | | | 53,941 | | | |
| | | | | | | | | | | | |
| | | | | | | | | 2,131,326 | | | |
| |
Electronic Equipment, Instruments & Components - 3.57% | | | |
| | Benchmark Electronics, Inc.* | | | 121,800 | | | | 2,517,606 | | | |
| | Electro Rent Corp. | | | 31,503 | | | | 289,828 | | | |
| | Fabrinet* | | | 60,150 | | | | 1,432,773 | | | |
| | GSI Group, Inc.* | | | 11,000 | | | | 149,820 | | | |
| | Insight Enterprises, Inc.* | | | 44,883 | | | | 1,127,461 | | | |
| | Iteris, Inc.* | | | 65,000 | | | | 139,750 | | | |
| | Key Tronic Corp.* | | | 11,900 | | | | 90,440 | | | |
| | Kimball Electronics, Inc.* | | | 59,100 | | | | 649,509 | | | |
| | Multi-Fineline Electronix, Inc.* | | | 54,330 | | | | 1,123,544 | | | |
| | PAR Technology Corp.* | | | 98,400 | | | | 662,232 | | | |
| | PCM, Inc.* | | | 82,175 | | | | 815,998 | | | |
| | Plexus Corp.* | | | 500 | | | | 17,460 | | | |
| | Rofin-Sinar Technologies, Inc.* | | | 26,200 | | | | 701,636 | | | |
| | Sanmina Corp.* | | | 149,100 | | | | 3,068,478 | | | |
| | SMTC Corp.* | | | 13,500 | | | | 20,925 | | | |
| | TTM Technologies, Inc.* | | | 348,615 | | | | 2,269,484 | | | |
| | |
Omni Tax-Managed Small-Cap Value Fund SCHEDULE OF INVESTMENTS (continued) | | |
Showing percentage of net assets as of December 31, 2015 (Unaudited)
| | | | | | | | | | | | |
| Industry | | Company | | Shares | | | Value | | | |
| | |
Common Stocks (continued) | | | | | | | |
Electronic Equipment, Instruments & Components (continued) | | | |
| | Vishay Precision Group, Inc.* | | | 31,667 | | | $ | 358,470 | | | |
| | Wireless Telecom Group, Inc.* | | | 10,000 | | | | 17,200 | | | |
| | | | | | | | | | | | |
| | | | | | | | | 15,452,614 | | | |
| |
Energy Equipment & Services - 1.40% | | | |
| | Basic Energy Services, Inc.*+ | | | 700 | | | | 1,876 | | | |
| | C&J Energy Services, Ltd.*+ | | | 30,000 | | | | 142,800 | | | |
| | CARBO Ceramics, Inc.+ | | | 500 | | | | 8,600 | | | |
| | Checkpoint Systems, Inc. | | | 500 | | | | 3,135 | | | |
| | ENGlobal Corp.* | | | 86,300 | | | | 83,711 | | | |
| | Era Group, Inc.* | | | 57,200 | | | | 637,780 | | | |
| | Gulf Island Fabrication, Inc. | | | 10,100 | | | | 105,646 | | | |
| | Helix Energy Solutions Group, Inc.* | | | 15,000 | | | | 78,900 | | | |
| | ION Geophysical Corp.* | | | 140,000 | | | | 70,434 | | | |
| | Natural Gas Services Group, Inc.* | | | 69,205 | | | | 1,543,271 | | | |
| | Newpark Resources, Inc.* | | | 12,500 | | | | 66,000 | | | |
| | Parker Drilling Co.* | | | 543,630 | | | | 989,407 | | | |
| | PHI, Inc.*+ | | | 27,750 | | | | 455,377 | | | |
| | Pioneer Energy Services Corp.* | | | 63,700 | | | | 138,229 | | | |
| | SEACOR Holdings, Inc.* | | | 31,700 | | | | 1,666,152 | | | |
| | Tesco Corp. | | | 10,500 | | | | 76,020 | | | |
| | | | | | | | | | | | |
| | | | | | | | | 6,067,338 | | | |
| |
Food & Staples Retailing - 1.28% | | | |
| | Andersons, Inc. (The) | | | 32,700 | | | | 1,034,301 | | | |
| | Ingles Markets, Inc., Class A | | | 50,950 | | | | 2,245,876 | | | |
| | SpartanNash Co. | | | 60,860 | | | | 1,317,010 | | | |
| | Village Super Market, Inc., Class A | | | 1,100 | | | | 28,985 | | | |
| | Weis Markets, Inc. | | | 20,700 | | | | 917,010 | | | |
| | | | | | | | | | | | |
| | | | | | | | | 5,543,182 | | | |
| |
Food Products - 1.83% | | | |
| | Fresh Del Monte Produce, Inc.+ | | | 90,800 | | | | 3,530,304 | | | |
| | Omega Protein Corp.* | | | 123,650 | | | | 2,745,030 | | | |
| | Post Holdings, Inc.* | | | 23,700 | | | | 1,462,290 | | | |
| | Seneca Foods Corp., Class A* | | | 6,650 | | | | 192,717 | | | |
| | | | | | | | | | | | |
| | | | | | | | | 7,930,341 | | | |
| |
Health Care Equipment & Supplies - 0.35% | | | |
| | AngioDynamics, Inc.* | | | 17,000 | | | | 206,380 | | | |
| | Electromed, Inc.* | | | 10,000 | | | | 18,500 | | | |
| | | | |
| | | | | | | | | | | | |
| | | | | | | | | | | | |
| Industry | | Company | | Shares | | | Value | | | |
| | |
| | | | | | | |
Health Care Equipment & Supplies (continued) | | | |
| | Exactech, Inc.* | | | 17,500 | | | $ | 317,625 | | | |
| | FONAR Corp.* | | | 2,000 | | | | 34,520 | | | |
| | Halyard Health, Inc.* | | | 7,000 | | | | 233,870 | | | |
| | Invacare Corp. | | | 12,000 | | | | 208,680 | | | |
| | Kewaunee Scientific Corp. | | | 2,500 | | | | 44,475 | | | |
| | Merit Medical Systems, Inc.* | | | 18,100 | | | | 336,479 | | | |
| | Symmetry Surgical, Inc.* | | | 13,200 | | | | 121,440 | | | |
| | | | | | | | | | | | |
| | | | | | | | | 1,521,969 | | | |
| |
Health Care Providers & Services - 1.92% | | | |
| | Amedisys, Inc.* | | | 43,710 | | | | 1,718,677 | | | |
| | Five Star Quality Care, Inc.* | | | 51,650 | | | | 164,247 | | | |
| | Healthways, Inc.* | | | 24,500 | | | | 315,315 | | | |
| | InfuSystems Holdings, Inc.* | | | 35,178 | | | | 107,293 | | | |
| | Kindred Healthcare, Inc. | | | 101,700 | | | | 1,211,247 | | | |
| | LHC Group, Inc.* | | | 500 | | | | 22,645 | | | |
| | Magellan Health, Inc.* | | | 27,125 | | | | 1,672,527 | | | |
| | National Healthcare Corp. | | | 8,920 | | | | 550,364 | | | |
| | PharMerica Corp.* | | | 36,300 | | | | 1,270,500 | | | |
| | Premier, Inc., Class A* | | | 13,000 | | | | 458,510 | | | |
| | Triple-S Management Corp., Class B* | | | 34,100 | | | | 815,331 | | | |
| | | | | | | | | | | | |
| | | | | | | | | 8,306,656 | | | |
| |
Hotels, Restaurants & Leisure - 2.82% | | | |
| | Flanigan’s Enterprises, Inc. | | | 2,500 | | | | 54,700 | | | |
| | International Speedway Corp., Class A | | | 75,760 | | | | 2,554,627 | | | |
| | Intrawest Resorts Holdings, Inc.* | | | 25,000 | | | | 195,500 | | | |
| | Luby’s, Inc.* | | | 179,100 | | | | 800,577 | | | |
| | Marcus Corp. (The) | | | 136,454 | | | | 2,588,532 | | | |
| | Monarch Casino & Resort, Inc.* | | | 22,300 | | | | 506,656 | | | |
| | Nevada Gold & Casinos, Inc.* | | | 10,000 | | | | 22,700 | | | |
| | Penn National Gaming, Inc.* | | | 125,500 | | | | 2,010,510 | | | |
| | Red Lion Hotels Corp.* | | | 80,695 | | | | 565,672 | | | |
| | Ruby Tuesday, Inc.* | | | 178,200 | | | | 981,882 | | | |
| | Speedway Motorsports, Inc. | | | 92,863 | | | | 1,924,121 | | | |
| | | | | | | | | | | | |
| | | | | | | | | 12,205,477 | | | |
| |
Household Durables - 1.39% | | | |
| | Bassett Furniture Industries, Inc. | | | 52,959 | | | | 1,328,212 | | | |
| | CSS Industries, Inc. | | | 51,558 | | | | 1,463,216 | | | |
| | Hooker Furniture Corp. | | | 15,000 | | | | 378,600 | | | |
| | Lifetime Brands, Inc. | | | 24,999 | | | | 331,487 | | | |
| | NACCO Industries, Inc., Class A | | | 16,450 | | | | 694,190 | | | |
| | |
| 24 | | Semi-Annual Report | December 31, 2015 (Unaudited) |
| | |
Omni Tax-Managed Small-Cap Value Fund SCHEDULE OF INVESTMENTS (continued) | | |
Showing percentage of net assets as of December 31, 2015 (Unaudited)
| | | | | | | | | | | | |
| Industry | | Company | | Shares | | | Value | | | |
| | | |
Common Stocks (continued) | | | | | | | | | | |
Household Durables (continued) | | | | | | | |
| | P&F Industries, Inc., Class A* | | | 492 | | | $ | 4,349 | | | |
| | William Lyon Homes, Class A* | | | 15,000 | | | | 247,500 | | | |
| | ZAGG, Inc.* | | | 144,000 | | | | 1,575,360 | | | |
| | | | | | | | | | | | |
| | | | | | | | | 6,022,914 | | | |
| | |
Household Products - 0.70% | | | | | | | |
| | Central Garden & Pet Co., Class A* | | | 221,400 | | | | 3,011,040 | | | |
| | | |
Insurance - 9.37% | | | | | | | | | | |
| | 1347 Property Insurance Holdings, Inc.* | | | 17,500 | | | | 133,875 | | | |
| | Ambac Financial Group, Inc.* | | | 3,000 | | | | 42,270 | | | |
| | American Equity Investment Life Holding Co. | | | 250 | | | | 6,008 | | | |
| | American Independence Corp.* | | | 15,264 | | | | 129,897 | | | |
| | AMERISAFE, Inc. | | | 56,500 | | | | 2,875,850 | | | |
| | Argo Group International Holdings Ltd. | | | 20,787 | | | | 1,243,894 | | | |
| | Baldwin & Lyons, Inc., Class B+ | | | 32,200 | | | | 773,766 | | | |
| | Citizens, Inc.*+ | | | 14,800 | | | | 109,964 | | | |
| | Donegal Group, Inc., Class A | | | 57,100 | | | | 803,968 | | | |
| | EMC Insurance Group, Inc. | | | 34,025 | | | | 860,833 | | | |
| | Employers Holdings, Inc. | | | 61,900 | | | | 1,689,870 | | | |
| | Endurance Specialty Holdings Ltd. | | | 20,744 | | | | 1,327,409 | | | |
| | FBL Financial Group, Inc., Class A | | | 45,666 | | | | 2,906,184 | | | |
| | Federated National Holding Co. | | | 38,012 | | | | 1,123,635 | | | |
| | Fidelity & Guaranty Life | | | 45,000 | | | | 1,141,650 | | | |
| | First Acceptance Corp.* | | | 145,000 | | | | 345,100 | | | |
| | Hallmark Financial Services, Inc.* | | | 50,158 | | | | 586,347 | | | |
| | HCI Group, Inc.+ | | | 20,000 | | | | 697,000 | | | |
| | Heritage Insurance Holdings, Inc. | | | 20,000 | | | | 436,400 | | | |
| | Horace Mann Educators Corp. | | | 74,950 | | | | 2,486,841 | | | |
| | Independence Holding Co. | | | 14,950 | | | | 207,057 | | | |
| | Infinity Property & Casualty Corp. | | | 9,200 | | | | 756,516 | | | |
| | Investors Title Co. | | | 1,000 | | | | 96,800 | | | |
| | Kansas City Life Insurance Co. | | | 24,900 | | | | 953,421 | | | |
| | Kingstone Cos., Inc. | | | 4,000 | | | | 36,000 | | | |
| | | | |
| | | | | | | | | | | | |
| | | | |
| | | | | | | | | | | | |
| | | | |
| | | | | | | | | | | | |
| | | | |
| | | | | | | | | | | | |
| | | | |
| | | | | | | | | | | | |
| | | | | | | | | | | | |
| Industry | | Company | | Shares | | | Value | | | |
| | | |
| | | | | | | | | | |
Insurance (continued) | | | | | | | | | | |
| | Maiden Holdings, Ltd. | | | 167,450 | | | $ | 2,496,679 | | | |
| | MBIA, Inc.* | | | 102,800 | | | | 666,144 | | | |
| | National Interstate Corp. | | | 16,000 | | | | 427,200 | | | |
| | National Western Life Group, Inc., Class A | | | 5,350 | | | | 1,347,879 | | | |
| | Navigators Group, Inc. (The)* | | | 37,650 | | | | 3,229,993 | | | |
| | OneBeacon Insurance Group Ltd., Class A | | | 75,500 | | | | 936,955 | | | |
| | Safety Insurance Group, Inc. | | | 31,800 | | | | 1,792,884 | | | |
| | Selective Insurance Group, Inc. | | | 50,100 | | | | 1,682,358 | | | |
| | State Auto Financial Corp. | | | 20,800 | | | | 428,272 | | | |
| | State National Cos, Inc. | | | 20,000 | | | | 196,200 | | | |
| | Stewart Information Services Corp. | | | 45,950 | | | | 1,715,313 | | | |
| | Third Point Reinsurance Ltd.* | | | 45,500 | | | | 610,155 | | | |
| | United Fire Group, Inc. | | | 60,900 | | | | 2,333,079 | | | |
| | United Insurance Holdings Corp. | | | 53,400 | | | | 913,140 | | | |
| | | | | | | | | | | | |
| | | | | | | | | 40,546,806 | | | |
| | |
Internet & Catalog Retail - 0.26% | | | | | | | |
| | CafePress, Inc.* | | | 11,000 | | | | 42,240 | | | |
| | FTD Cos., Inc.* | | | 27,160 | | | | 710,777 | | | |
| | Lands’ End, Inc.*+ | | | 16,000 | | | | 375,040 | | | |
| | | | | | | | | | | | |
| | | | | | | | | 1,128,057 | | | |
| |
Internet Software & Services - 0.82% | | | |
| | Autobytel, Inc.* | | | 600 | | | | 13,536 | | | |
| | Blucora, Inc.* | | | 45,000 | | | | 441,000 | | | |
| | Marchex, Inc., Class B | | | 88,000 | | | | 342,320 | | | |
| | MeetMe, Inc.* | | | 41,731 | | | | 149,397 | | | |
| | Monster Worldwide, Inc.* | | | 310,000 | | | | 1,776,300 | | | |
| | RetailMeNot, Inc.* | | | 10,000 | | | | 99,200 | | | |
| | United Online, Inc.* | | | 59,999 | | | | 707,388 | | | |
| | Unwired Planet, Inc.* | | | 10,000 | | | | 8,630 | | | |
| | | | | | | | | | | | |
| | | | | | | | | 3,537,771 | | | |
| |
IT Services - 1.58% | | | |
| | CIBER, Inc.* | | | 501 | | | | 1,759 | | | |
| | Edgewater Technology, Inc.* | | | 11,710 | | | | 93,797 | | | |
| | Engility Holdings, Inc. | | | 36,950 | | | | 1,200,136 | | | |
| | ManTech International Corp., Class A | | | 78,882 | | | | 2,385,392 | | | |
| | ModusLink Global Solutions, Inc.*+ | | | 55,300 | | | | 137,144 | | | |
| | NCI, Inc., Class A | | | 60,700 | | | | 828,555 | | | |
| | NeuStar, Inc., Class A* | | | 17,000 | | | | 407,490 | | | |
| | |
Omni Tax-Managed Small-Cap Value Fund SCHEDULE OF INVESTMENTS (continued) | | |
Showing percentage of net assets as of December 31, 2015 (Unaudited)
| | | | | | | | | | | | |
| Industry | | Company | | Shares | | | Value | | | |
| | | |
Common Stocks (continued) | | | | | | | | | | |
IT Services (continued) | | | | | | | | | | |
| | Newtek Business Services Corp. | | | 2,730 | | | | $ 39,093 | | | |
| | Sykes Enterprises, Inc.* | | | 56,750 | | | | 1,746,765 | | | |
| | | | | | | | | | | | |
| | | | | | | | | 6,840,131 | | | |
| |
Leisure Equipment & Products - 0.35% | | | |
| | Arctic Cat, Inc. | | | 7,100 | | | | 116,298 | | | |
| | Johnson Outdoors, Inc., Class A | | | 63,850 | | | | 1,397,676 | | | |
| | | | | | | | | | | | |
| | | | | | | | | 1,513,974 | | | |
| | | |
Machinery - 2.07% | | | | | | | | | | |
| | American Railcar Industries, Inc.+ | | | 18,000 | | | | 833,040 | | | |
| | Ampco-Pittsburgh Corp. | | | 905 | | | | 9,285 | | | |
| | Art’s-Way Manufacturing Co. Inc. | | | 5,000 | | | | 15,500 | | | |
| | Briggs & Stratton Corp. | | | 169,450 | | | | 2,931,485 | | | |
| | Chicago Rivet & Machine Co. | | | 1,000 | | | | 23,320 | | | |
| | Cleantech Solutions International, Inc.*+ | | | 12,000 | | | | 17,160 | | | |
| | Columbus McKinnon Corp. | | | 33,800 | | | | 638,820 | | | |
| | Dynamic Materials Corp. | | | 100 | | | | 699 | | | |
| | Eastern Co. (The) | | | 20,104 | | | | 376,950 | | | |
| | FreightCar America, Inc. | | | 20,700 | | | | 402,201 | | | |
| | Hardinge, Inc. | | | 71,200 | | | | 663,584 | | | |
| | Hurco Companies, Inc. | | | 3,765 | | | | 99,998 | | | |
| | Hyster-Yale Materials Handling, Inc. | | | 2,700 | | | | 141,615 | | | |
| | Kennametal, Inc. | | | 24,000 | | | | 460,800 | | | |
| | L.B. Foster Co., Class A | | | 8,900 | | | | 121,574 | | | |
| | L.S. Starrett Co. (The), Class A | | | 23,900 | | | | 232,308 | | | |
| | NN, Inc. | | | 47,500 | | | | 757,150 | | | |
| | Supreme Industries, Inc., Class A | | | 30,450 | | | | 208,582 | | | |
| | THT Heat Transfer Technology, Inc.* | | | 4,400 | | | | 2,024 | | | |
| | TriMas Corp.* | | | 19,500 | | | | 363,675 | | | |
| | Wabash National Corp.* | | | 57,000 | | | | 674,310 | | | |
| | WSI Industries, Inc.+ | | | 1,000 | | | | 4,350 | | | |
| | | | | | | | | | | | |
| | | | | | | | | 8,978,430 | | | |
| | | |
Marine - 1.95% | | | | | | | | | | |
| | Dorian LPG Ltd*+ | | | 139,522 | | | | 1,642,174 | | | |
| | Navios Maritime Acquisition Corp. | | | 381,200 | | | | 1,147,412 | | | |
| | Nordic American Tankers Ltd.+ | | | 149,400 | | | | 2,321,676 | | | |
| | Rand Logistics, Inc.* | | | 6,600 | | | | 10,560 | | | |
| | | | | | | | | | | | |
| | | | | | | | | | | | |
| | | | | | | | | | | | |
| Industry | | Company | | Shares | | | Value | | | |
| | | |
| | | | | | | | | | |
Marine (continued) | | | | | | | | | | |
| | Scorpio Tankers, Inc. | | | 110,000 | | | | $ 882,200 | | | |
| | Ship Finance International, Ltd.+ | | | 54,900 | | | | 909,693 | | | |
| | Teekay Tankers, Ltd., Class A | | | 223,200 | | | | 1,535,616 | | | |
| | | | | | | | | | | | |
| | | | | | | | | 8,449,331 | | | |
| | | |
Media - 1.63% | | | | | | | | | | |
| | Entercom Communications Corp., Class A* | | | 122,405 | | | | 1,374,608 | | | |
| | Eros International PLC*+ | | | 19,300 | | | | 176,595 | | | |
| | Global Sources Ltd.*+ | | | 5,000 | | | | 39,000 | | | |
| | Harte-Hanks, Inc. | | | 25,200 | | | | 81,648 | | | |
| | Journal Media Group, Inc. | | | 683 | | | | 8,210 | | | |
| | New Media Investment Group, Inc. | | | 29,800 | | | | 579,908 | | | |
| | Reading International, Inc., Class A* | | | 70,400 | | | | 922,944 | | | |
| | Saga Communications, Inc., Class A | | | 2,250 | | | | 86,512 | | | |
| | Salem Media Group, Inc. | | | 25,700 | | | | 127,986 | | | |
| | Scholastic Corp. | | | 75,950 | | | | 2,928,632 | | | |
| | Sizmek, Inc.* | | | 32,500 | | | | 118,625 | | | |
| | Townsquare Media, Inc., Class A* | | | 52,600 | | | | 629,096 | | | |
| | | | | | | | | | | | |
| | | | | | | | | 7,073,764 | | | |
| | | |
Metals & Mining - 2.37% | | | | | | | | | | |
| | Carpenter Technology Corp. | | | 25,400 | | | | 768,858 | | | |
| | Century Aluminum Co.*+ | | | 107,900 | | | | 476,918 | | | |
| | Coeur Mining, Inc.* | | | 179,700 | | | | 445,656 | | | |
| | Ferroglobe PLC | | | 50,000 | | | | 537,500 | | | |
| | Handy & Harman, Ltd.* | | | 30,300 | | | | 621,453 | | | |
| | Haynes International, Inc. | | | 22,200 | | | | 814,518 | | | |
| | Hecla Mining Co. | | | 749,000 | | | | 1,415,610 | | | |
| | Kaiser Aluminum Corp. | | | 26,700 | | | | 2,233,722 | | | |
| | Materion Corp. | | | 56,700 | | | | 1,587,600 | | | |
| | Noranda Aluminum Holding Corp.+ | | | 100 | | | | 32 | | | |
| | Schnitzer Steel Industries, Inc., Class A | | | 66,500 | | | | 955,605 | | | |
| | Stillwater Mining Co.* | | | 24,465 | | | | 209,665 | | | |
| | Synalloy Corp. | | | 7,000 | | | | 48,160 | | | |
| | Thompson Creek Metals Co., Inc.* | | | 10,000 | | | | 2,020 | | | |
| | Universal Stainless & Alloy Products, Inc.*+ | | | 16,200 | | | | 150,498 | | | |
| | | | | | | | | | | | |
| | | | | | | | | 10,267,815 | | | |
| | |
| 26 | | Semi-Annual Report | December 31, 2015 (Unaudited) |
| | |
Omni Tax-Managed Small-Cap Value Fund SCHEDULE OF INVESTMENTS (continued) | | |
Showing percentage of net assets as of December 31, 2015 (Unaudited)
| | | | | | | | | | | | |
| Industry | | Company | | Shares | | | Value | | | |
| |
Common Stocks (continued) | | | |
Multiline Retail - 0.41% | | | |
| | Fred’s, Inc., Class A | | | 108,450 | | | | $ 1,775,327 | | | |
| |
Oil, Gas & Consumable Fuels - 6.06% | | | |
| | Abraxas Petroleum Corp.* | | | 81,600 | | | | 86,496 | | | |
| | Adams Resources & Energy, Inc. | | | 11,600 | | | | 445,440 | | | |
| | Alon USA Energy, Inc.+ | | | 160,100 | | | | 2,375,884 | | | |
| | Ardmore Shipping Corp. | | | 128,300 | | | | 1,631,976 | | | |
| | Bill Barrett Corp.*+ | | | 500 | | | | 1,965 | | | |
| | Bonanza Creek Energy, Inc.*+ | | | 5,000 | | | | 26,350 | | | |
| | California Resources Corp. | | | 754,000 | | | | 1,756,820 | | | |
| | Callon Petroleum Co.* | | | 122,200 | | | | 1,019,148 | | | |
| | Carrizo Oil & Gas, Inc.* | | | 1,000 | | | | 29,580 | | | |
| | Clayton Williams Energy, Inc.*+ | | | 68,600 | | | | 2,028,502 | | | |
| | Cloud Peak Energy, Inc.* | | | 1,000 | | | | 2,080 | | | |
| | Delek US Holdings, Inc. | | | 20,000 | | | | 492,000 | | | |
| | DHT Holdings, Inc. | | | 212,500 | | | | 1,719,125 | | | |
| | Earthstone Energy, Inc.*+ | | | 4,000 | | | | 53,240 | | | |
| | Forum Energy Technologies, Inc.* | | | 50,000 | | | | 623,000 | | | |
| | GasLog Ltd.+ | | | 34,500 | | | | 286,350 | | | |
| | Golden Ocean Group Ltd.* | | | 1,000 | | | | 1,070 | | | |
| | Gran Tierra Energy, Inc.* | | | 200 | | | | 434 | | | |
| | Green Plains, Inc. | | | 96,450 | | | | 2,208,705 | | | |
| | Hallador Energy Co.+ | | | 71,600 | | | | 326,496 | | | |
| | Independence Contract Drilling, Inc.* | | | 97,800 | | | | 493,890 | | | |
| | Matador Resources Co.* | | | 59,500 | | | | 1,176,315 | | | |
| | McDermott International, Inc.*+ | | | 682,000 | | | | 2,284,700 | | | |
| | Mexco Energy Corp.* | | | 6,000 | | | | 19,380 | | | |
| | Mitcham Industries, Inc.* | | | 5,000 | | | | 15,050 | | | |
| | MRC Global, Inc.* | | | 66,000 | | | | 851,400 | | | |
| | New Concept Energy, Inc.* | | | 3,600 | | | | 3,888 | | | |
| | Northern Oil and Gas, Inc.*+ | | | 15,000 | | | | 57,900 | | | |
| | Oasis Petroleum, Inc.*+ | | | 213,000 | | | | 1,569,810 | | | |
| | Pacific Ethanol, Inc.*+ | | | 800 | | | | 3,824 | | | |
| | PDC Energy, Inc.* | | | 13,100 | | | | 699,278 | | | |
| | Penn Virginia Corp.*+ | | | 16,000 | | | | 4,806 | | | |
| | Renewable Energy Group, Inc.* | | | 153,509 | | | | 1,426,099 | | | |
| | REX American Resources Corp.*+ | | | 25,250 | | | | 1,365,267 | | | |
| | Sanchez Energy Corp.*+ | | | 500 | | | | 2,155 | | | |
| | SM Energy Co. | | | 22,000 | | | | 432,520 | | | |
| | Stone Energy Corp.*+ | | | 100 | | | | 429 | | | |
| | TETRA Technologies, Inc.* | | | 90,000 | | | | 676,800 | | | |
| | VAALCO Energy, Inc.* | | | 30,500 | | | | 48,800 | | | |
| | W&T Offshore, Inc.*+ | | | 600 | | | | 1,386 | | | |
| | | | | | | | | | | | |
| | | | | | | | | 26,248,358 | | | |
| | | | | | | | | | | | |
| | | | | | | | | | | | |
| Industry | | Company | | Shares | | | Value | | | |
| | | |
| | | | | | | | | | |
Paper & Forest Products - 0.94% | | | |
| | Clearwater Paper Corp.* | | | 7,900 | | | | $ 359,687 | | | |
| | Mercer International, Inc. | | | 189,950 | | | | 1,719,047 | | | |
| | Orient Paper, Inc.*+ | | | 200 | | | | 290 | | | |
| | PH Glatfelter Co. | | | 69,000 | | | | 1,272,360 | | | |
| | Resolute Forest Products, Inc.*+ | | | 94,700 | | | | 716,879 | | | |
| | | | | | | | | | | | |
| | | | | | | | | 4,068,263 | | | |
| |
Personal Products - 0.27% | | | |
| | Mannatech, Inc.* | | | 25,700 | | | | 488,043 | | | |
| | Natural Alternatives International, Inc.* | | | 6,000 | | | | 62,040 | | | |
| | Nutraceutical International Corp.* | | | 23,250 | | | | 600,315 | | | |
| | | | | | | | | | | | |
| | | | | | | | | 1,150,398 | | | |
| |
Pharmaceuticals - 0.02% | | | |
| | Cumberland Pharmaceuticals, Inc.* | | | 20,300 | | | | 106,778 | | | |
| |
Professional Services - 2.52% | | | |
| | CBIZ, Inc.* | | | 128,300 | | | | 1,265,038 | | | |
| | CDI Corp. | | | 35,700 | | | | 241,332 | | | |
| | CRA International, Inc.* | | | 18,200 | | | | 339,430 | | | |
| | FTI Consulting, Inc.* | | | 36,500 | | | | 1,265,090 | | | |
| | Heidrick & Struggles International, Inc. | | | 55,440 | | | | 1,509,077 | | | |
| | ICF International, Inc.* | | | 25,000 | | | | 889,000 | | | |
| | Navigant Consulting, Inc.* | | | 170,900 | | | | 2,744,654 | | | |
| | RPX Corp.* | | | 150,496 | | | | 1,655,456 | | | |
| | VSE Corp. | | | 15,830 | | | | 984,309 | | | |
| | | | | | | | | | | | |
| | | | | | | | | 10,893,386 | | | |
| |
Real Estate Management & Development - 0.37% | | | |
| | Farmland Partners, Inc.+ | | | 3,800 | | | | 41,686 | | | |
| | Forestar Group, Inc.* | | | 50,500 | | | | 552,470 | | | |
| | Griffin Industrial Realty, Inc. | | | 4,000 | | | | 104,360 | | | |
| | RE/MAX Holdings, Inc., Class A | | | 16,900 | | | | 630,370 | | | |
| | St. Joe Co. (The)*+ | | | 15,000 | | | | 277,650 | | | |
| | | | | | | | | | | | |
| | | | | | | | | 1,606,536 | | | |
| | | |
Road & Rail - 1.49% | | | | | | | | | | |
| | ArcBest Corp. | | | 57,800 | | | | 1,236,342 | | | |
| | Celadon Group, Inc. | | | 60,600 | | | | 599,334 | | | |
| | Covenant Transportation Group, Inc., Class A* | | | 80,650 | | | | 1,523,479 | | | |
| | Greenbrier Companies., Inc. (The)+ | | | 22,100 | | | | 720,902 | | | |
| | Marten Transport, Ltd. | | | 60,466 | | | | 1,070,248 | | | |
| | P.A.M. Transportation Services, Inc.* | | | 27,527 | | | | 759,470 | | | |
| | |
Omni Tax-Managed Small-Cap Value Fund SCHEDULE OF INVESTMENTS (continued) | | |
Showing percentage of net assets as of December 31, 2015 (Unaudited)
| | | | | | | | | | | | |
| Industry | | Company | | Shares | | | Value | | | |
| | | |
Common Stocks (continued) | | | | | | | | | | |
Road & Rail (continued) | | | | | | | | | | |
| | Roadrunner Transportation Systems, Inc.* | | | 18,767 | | | | $ 176,973 | | | |
| | USA Truck, Inc.* | | | 21,435 | | | | 374,041 | | | |
| | | | | | | | | | | | |
| | | | | | | | | 6,460,789 | | | |
| | |
Semiconductors & Semiconductor Equipment - 2.69% | | | | | | | |
| | Advanced Energy Industries, Inc.* | | | 23,000 | | | | 649,290 | | | |
| | Alpha & Omega Semiconductor Ltd.* | | | 61,905 | | | | 568,907 | | | |
| | Amkor Technology, Inc.* | | | 165,200 | | | | 1,004,416 | | | |
| | AXT, Inc.* | | | 25,000 | | | | 62,000 | | | |
| | Brooks Automation, Inc. | | | 500 | | | | 5,340 | | | |
| | Cirrus Logic, Inc.* | | | 30,500 | | | | 900,665 | | | |
| | Cohu, Inc. | | | 30,000 | | | | 362,100 | | | |
| | Diodes, Inc.* | | | 17,200 | | | | 395,256 | | | |
| | FormFactor, Inc.* | | | 15,000 | | | | 135,000 | | | |
| | GigOptix, Inc.* | | | 65,000 | | | | 197,600 | | | |
| | inTEST Corp.* | | | 54,500 | | | | 230,535 | | | |
| | IXYS Corp. | | | 39,000 | | | | 492,570 | | | |
| | Kulicke & Soffa Industries, Inc.* | | | 100,300 | | | | 1,170,501 | | | |
| | OmniVision Technologies, Inc.* | | | 81,800 | | | | 2,373,836 | | | |
| | Photronics, Inc.* | | | 171,470 | | | | 2,134,801 | | | |
| | Rudolph Technologies, Inc.* | | | 31,100 | | | | 442,242 | | | |
| | Sigma Designs, Inc.* | | | 3,800 | | | | 24,016 | | | |
| | Ultra Clean Holdings, Inc.* | | | 57,000 | | | | 291,840 | | | |
| | Xcerra Corp.* | | | 30,000 | | | | 181,500 | | | |
| | | | | | | | | | | | |
| | | | | | | | | 11,622,415 | | | |
| | | |
Software - 0.60% | | | | | | | | | | |
| | Ebix, Inc.+ | | | 40,000 | | | | 1,311,600 | | | |
| | Epiq Systems, Inc. | | | 30,000 | | | | 392,100 | | | |
| | Everyday Health, Inc.* | | | 37,000 | | | | 222,740 | | | |
| | GSE Systems, Inc.* | | | 22,500 | | | | 54,000 | | | |
| | Mind CTI Ltd. | | | 500 | | | | 1,265 | | | |
| | Net 1 UEPS Technologies, Inc.* | | | 35,700 | | | | 482,307 | | | |
| | NetSol Technologies, Inc.* | | | 16,680 | | | | 129,437 | | | |
| | | | | | | | | | | | |
| | | | | | | | | 2,593,449 | | | |
| | | |
Specialty Retail - 3.95% | | | | | | | | | | |
| | Barnes & Noble Education, Inc.* | | | 50,560 | | | | 503,072 | | | |
| | Barnes & Noble, Inc. | | | 156,300 | | | | 1,361,373 | | | |
| | Big 5 Sporting Goods Corp. | | | 119,603 | | | | 1,194,834 | | | |
| | Children’s Place, Inc. (The) | | | 17,900 | | | | 988,080 | | | |
| | Christopher & Banks Corp.* | | | 200 | | | | 330 | | | |
| | Citi Trends, Inc. | | | 51,150 | | | | 1,086,938 | | | |
| | Finish Line, Inc. (The), Class A | | | 78,400 | | | | 1,417,472 | | | |
| | | | | | | | | | | | |
| | | | | | | | | | | | |
| Industry | | Company | | Shares | | | Value | | | |
| | | | |
| | | | | | | | | | | | |
Specialty Retail (continued) | | | | | | | | | | |
| | Genesco, Inc.* | | | 5,000 | | | | $ 284,150 | | | |
| | Haverty Furniture Cos., Inc. | | | 30,300 | | | | 649,632 | | | |
| | hhgregg, Inc.*+ | | | 38,500 | | | | 140,910 | | | |
| | New York & Co., Inc.* | | | 32,700 | | | | 74,883 | | | |
| | Pep Boys-Manny, Moe & Jack (The)* | | | 124,200 | | | | 2,286,522 | | | |
| | Rent-A-Center, Inc.+ | | | 800 | | | | 11,976 | | | |
| | Shoe Carnival, Inc. | | | 46,600 | | | | 1,081,120 | | | |
| | Sonic Automotive, Inc., Class A | | | 73,500 | | | | 1,672,860 | | | |
| | Stage Stores, Inc. | | | 245 | | | | 2,232 | | | |
| | Systemax, Inc.* | | | 3,000 | | | | 25,800 | | | |
| | Tilly’s, Inc., Class A* | | | 67,400 | | | | 446,862 | | | |
| | Trans World Entertainment Corp.* | | | 30,000 | | | | 107,400 | | | |
| | TravelCenters of America LLC* | | | 243,750 | | | | 2,291,250 | | | |
| | West Marine, Inc.* | | | 86,000 | | | | 730,140 | | | |
| | Zumiez, Inc.* | | | 48,400 | | | | 731,808 | | | |
| | | | | | | | | | | | |
| | | | | | | | | 17,089,644 | | | |
| |
Textiles, Apparel & Luxury Goods - 1.12% | | | |
| | Abercrombie & Fitch Co., Class A+ | | | 43,000 | | | | 1,161,000 | | | |
| | Delta Apparel, Inc.* | | | 13,200 | | | | 185,328 | | | |
| | Movado Group, Inc. | | | 25,600 | | | | 658,176 | | | |
| | Perry Ellis International, Inc.* | | | 135,184 | | | | 2,490,089 | | | |
| | Rocky Brands, Inc. | | | 30,450 | | | | 352,002 | | | |
| | | | | | | | | | | | |
| | | | | | | | | 4,846,595 | | | |
| |
Thrifts & Mortgage Finance - 4.07% | | | |
| | Astoria Financial Corp. | | | 120,900 | | | | 1,916,265 | | | |
| | Bank Mutual Corp. | | | 121,800 | | | | 950,040 | | | |
| | Berkshire Hills Bancorp, Inc. | | | 30,970 | | | | 901,537 | | | |
| | Brookline Bancorp, Inc. | | | 30,000 | | | | 345,000 | | | |
| | Cape Bancorp, Inc. | | | 26,100 | | | | 324,423 | | | |
| | Cheviot Financial Corp. | | | 1,200 | | | | 18,396 | | | |
| | Chicopee Bancorp, Inc. | | | 12,500 | | | | 216,750 | | | |
| | Dime Community Bancshares, Inc. | | | 15,000 | | | | 262,350 | | | |
| | ESSA Bancorp, Inc. | | | 35,000 | | | | 478,800 | | | |
| | Federal Agricultural Mortgage Corp., Class C | | | 7,500 | | | | 236,775 | | | |
| | First Defiance Financial Corp. | | | 29,150 | | | | 1,101,287 | | | |
| | First Financial Northwest, Inc. | | | 26,400 | | | | 368,544 | | | |
| | Fox Chase Bancorp, Inc. | | | 10,500 | | | | 213,045 | | | |
| | Hingham Institution for Savings | | | 1,143 | | | | 136,931 | | | |
| | Home Bancorp, Inc. | | | 15,597 | | | | 405,210 | | | |
| | HopFed Bancorp, Inc. | | | 23,500 | | | | 281,765 | | | |
| | |
| 28 | | Semi-Annual Report | December 31, 2015 (Unaudited) |
| | |
Omni Tax-Managed Small-Cap Value Fund SCHEDULE OF INVESTMENTS (continued) | | |
Showing percentage of net assets as of December 31, 2015 (Unaudited)
| | | | | | | | | | |
| Industry | | Company | | Shares | | | Value | | |
| | |
Common Stocks (continued) | | | | | |
Thrifts & Mortgage Finance (continued) | | |
| | Lake Sunapee Bank Group+ | | | 2,000 | | | $ 28,060 | | |
| | Laporte Bancorp, Inc.+ | | | 11,000 | | | 167,200 | | |
| | Meta Financial Group, Inc. | | | 11,500 | | | 528,195 | | |
| | Northwest Bancshares, Inc. | | | 44,837 | | | 600,367 | | |
| | Ocean Shore Holding Co. | | | 14,800 | | | 253,820 | | |
| | OceanFirst Financial Corp. | | | 50,488 | | | 1,011,275 | | |
| | Oritani Financial Corp. | | | 50,000 | | | 825,000 | | |
| | Provident Financial Holdings, Inc. | | | 26,600 | | | 502,474 | | |
| | Provident Financial Services, Inc. | | | 67,400 | | | 1,358,110 | | |
| | Prudential Bancorp, Inc. | | | 957 | | | 14,508 | | |
| | Pulaski Financial Corp. | | | 800 | | | 12,768 | | |
| | Riverview Bancorp, Inc. | | | 72,478 | | | 339,922 | | |
| | Security National Financial Corp., Class A* | | | 13,020 | | | 85,281 | | |
| | SI Financial Group, Inc. | | | 30,000 | | | 409,500 | | |
| | Territorial Bancorp, Inc. | | | 21,900 | | | 607,506 | | |
| | Timberland Bancorp, Inc. | | | 7,000 | | | 86,870 | | |
| | United Community Bancorp | | | 10,000 | | | 149,400 | | |
| | United Community Financial Corp. | | | 163 | | | 962 | | |
| | Westfield Financial, Inc. | | | 53,000 | | | 445,200 | | |
| | WSFS Financial Corp. | | | 63,000 | | | 2,038,680 | | |
| | | | | | | | | | |
| | | | | | | | 17,622,216 | | |
| |
Trading Companies & Distributors - 1.32% | | |
| | AeroCentury Corp.* | | | 3,300 | | | 41,811 | | |
| | Aircastle, Ltd. | | | 32,700 | | | 683,103 | | |
| | CAI International, Inc.* | | | 37,100 | | | 373,968 | | |
| | General Finance Corp.*+ | | | 85,064 | | | 339,405 | | |
| | Houston Wire & Cable Co. | | | 24,000 | | | 126,720 | | |
| | Kaman Corp. | | | 16,500 | | | 673,365 | | |
| | Rush Enterprises, Inc., Class A* | | | 73,600 | | | 1,611,104 | | |
| | TAL International Group, Inc. | | | 7,000 | | | 111,300 | | |
| | Titan Machinery, Inc.* | | | 30,500 | | | 333,365 | | |
| | Veritiv Corp.* | | | 11,133 | | | 403,237 | | |
| | Willis Lease Finance Corp.* | | | 50,950 | | | 1,024,095 | | |
| | | | | | | | | | |
| | | | | | | | 5,721,473 | | |
| |
Wireless Telecommunication Services - 0.47% | | |
| | Spok Holdings, Inc. | | | 111,100 | | | 2,035,352 | | |
| | | | | | | | | | |
TOTAL COMMON STOCKS - 99.56% | | | | | | 430,968,387 | | |
| | | | | | | | | | |
(Cost $375,891,472) | | | | | | | | |
WARRANTS - 0.00% | | |
| | Eagle Bulk Shipping, Inc.* | | | 8,501 | | | 808 | | |
| | | | | | | | | | |
TOTAL WARRANTS - 0.00% | | | | | | 808 | | |
| | | | | | | | | | |
(Cost $70,770) | | | | | | | | |
| | | | | | | | |
| | | | | | | | |
| | | | | | | | | | | | |
| | | Rate^ | | | Shares | | | Value | |
|
MONEY MARKET FUND - 0.64% | |
Dreyfus Cash Management Fund | | | 0.18 | % | | | 2,774,891 | | | | $2,774,891 | |
| | | | | | | | | | | | |
TOTAL MONEY MARKET FUND - 0.64% | | | | 2,774,891 | |
| | | | | | | | | | | | |
(Cost $2,774,891) | | | | | | | | | | | | |
|
INVESTMENTS PURCHASED WITH CASH PROCEEDS FROM SECURITIES LENDING - 4.94% | |
Dreyfus Cash Management Fund** | | | 0.18 | % | | | 21,362,064 | | | | 21,362,064 | |
| | | | | | | | | | | | |
TOTAL INVESTMENTS PURCHASED WITH CASH PROCEEDS FROM SECURITIES LENDING - 4.94% | | | | 21,362,064 | |
| | | | | | | | | | | | |
(Cost $21,362,064) | | | | | | | | | |
| |
TOTAL INVESTMENTS - 105.14% | | | $ | 455,106,150 | |
| | |
(Cost $400,099,197) | | | | | | | | | |
Liabilities in Excess of Other Assets - (5.14%) | | | | (22,246,215 | ) |
| | | | | | | | | | | | |
NET ASSETS - 100.00% | | | | | | | $ | 432,859,935 | |
| | | | | | | | | | | | |
| * | Non-income producing security. |
| ** | This security represents the investment of the collateral received in connection with securities out on loan as of December 31, 2015. |
| ^ | Rate disclosed as of December 31, 2015. |
| + | This security or a portion of the security is out on loan as of December 31, 2015. Total loaned securities had a value of $20,690,988 as of December 31, 2015. |
LLC - Limited Liability Company
PLC - Public Limited Company
| | |
Omni Tax-Managed Small-Cap Value Fund SCHEDULE OF INVESTMENTS (continued) | |
|
Showing percentage of net assets as of December 31, 2015 (Unaudited)
| | | | | | | | | | | | | | |
Summary of inputs used to value the Fund’s investments as of 12/31/2015 (See Note 2 in Notes to Financial Statements): | |
| | | Valuation Inputs | |
| |
| | | Investment in Securities (Value) | |
| |
| | | | |
| |
| Level 1
Quoted Prices |
| |
| Level 2
Significant
Observable Inputs |
| | Level 3
Significant Unobservable Inputs | | | Total | |
| |
| | | | |
Common Stocks | | $ | 430,968,387 | | | $ | — | | | $ — | | $ | 430,968,387 | |
Warrants | | | 808 | | | | — | | | — | | | 808 | |
Money Market Fund | | | — | | | | 2,774,891 | | | — | | | 2,774,891 | |
Investments Purchased with Cash Proceeds from Securities Lending | | | — | | | | 21,362,064 | | | — | | | 21,362,064 | |
| | | | | | | | | | | | | | |
TOTAL | | $ | 430,969,195 | | | $ | 24,136,955 | | | $ — | | $ | 455,106,150 | |
| | | | | | | | | | | | | | |
|
| See Notes to Financial Statements. | |
| | |
| 30 | | Semi-Annual Report | December 31, 2015 (Unaudited) |
| | |
| STATEMENTS OF ASSETS AND LIABILITIES | |
|
December 31, 2015 (Unaudited)
| | | | | | | | | | |
| ASSETS | | Omni Small-Cap Value | | | | Omni Tax-Managed
Small-Cap Value | | | |
| | | | |
Investments at value | | $493,204,530 | | | | $455,106,150 | | | | |
| | | | |
Receivables: | | | | | | | | | | |
| | | | |
Portfolio securities sold | | 604,752 | | | | 100,951 | | | | |
| | | | |
Fund shares sold | | 1,369,667 | | | | 1,483,061 | | | | |
| | | | |
Dividends and interest | | 293,669 | | | | 270,054 | | | | |
| | | | |
Prepaid expenses | | 45,703 | | | | 59,309 | | | | |
| | | | |
Total assets | | 495,518,321 | | | | 457,019,525 | | | | |
| | | | |
LIABILITIES | | | | | | | | | | |
| | | | |
Payables: | | | | | | | | | | |
| | | | |
Portfolio securities purchased | | 1,027,414 | | | | 1,737,733 | | | | |
| | | | |
Fund shares redeemed | | 873,114 | | | | 748,443 | | | | |
| | | | |
Due to custodian | | - | | | | 6,447 | | | | |
| | | | |
Payable upon return of securities loaned | | 16,671,950 | | | | 21,362,064 | | | | |
| | | | |
Accrued Liabilities: | | | | | | | | | | |
| | | | |
Investment advisory fees | | 171,156 | | | | 155,103 | | | | |
| | | | |
Administration fees | | 9,498 | | | | 8,213 | | | | |
| | | | |
Directors’ fees | | 3,606 | | | | 5,097 | | | | |
| | | | |
Other | | 148,694 | | | | 136,490 | | | | |
| | | | |
Total liabilities | | 18,905,432 | | | | 24,159,590 | | | | |
| | | | |
NET ASSETS | | $476,612,889 | | | | $432,859,935 | | | | |
| | | | |
NET ASSETS REPRESENT | | | | | | | | | | |
| | | | |
Paid-in capital | | $428,664,185 | | | | $382,225,999 | | | | |
| | | | |
Undistributed net investment income | | 14,442 | | | | 2,442,140 | | | | |
| | | | |
Accumulated net realized loss on investments | | (2,127,196) | | | | (6,815,157) | | | | |
| | | | |
Net unrealized appreciation on investments | | 50,061,458 | | | | 55,006,953 | | | | |
| | | | |
NET ASSETS | | $476,612,889 | | | | $432,859,935 | | | | |
| | | | |
Shares of common stock outstanding of $.001 par value* | | 33,809,880 | | | | 32,144,520 | | | | |
| | | | |
Net asset value, offering price and redemption price per share | | $ 14.10 | | | | $ 13.47 | | | | |
| | | | |
Total investments at cost | | $443,143,514 | | | | $400,099,197 | | | | |
* See Note 1 - Organization in the Notes to Financial Statements for shares authorized for each Fund.
See Notes to Financial Statements.
| | |
| STATEMENTS OF OPERATIONS | |
|
Six Months Ended December 31, 2015 (Unaudited)
| | | | | | | | | | | | | | | | | | | | |
| | | Omni Small-Cap Value | | | | Omni Tax-Managed
Small-Cap Value | | |
| | | | |
INVESTMENT INCOME | | | | | | | | | | | | | | | | | | | | |
| | | | |
Dividends | | | | $ 3,932,855 | | | | | | | | | | $ 3,603,907 | | | | | | |
| | | | |
Less: foreign taxes withheld | | | | (2,685 | ) | | | | | | | | | (1,150 | ) | | | | | |
| | | | |
Securities lending | | | | 180,128 | | | | | | | | | | 115,768 | | | | | | |
| | | | |
Total Investment Income | | | | 4,110,298 | | | | | | | | | | 3,718,525 | | | | | | |
| | | | |
EXPENSES | | | | | | | | | | | | | | | | | | | | |
| | | | |
Investment advisory fees | | | | 1,181,974 | | | | | | | | | | 1,059,914 | | | | | | |
| | | | |
Administration fees | | | | 55,075 | | | | | | | | | | 49,019 | | | | | | |
| | | | |
Accounting fees | | | | 65,632 | | | | | | | | | | 62,528 | | | | | | |
| | | | |
Transfer agent fees | | | | 7,193 | | | | | | | | | | 7,230 | | | | | | |
| | | | |
Professional fees | | | | 44,986 | | | | | | | | | | 43,129 | | | | | | |
| | | | |
Custody fees | | | | 10,823 | | | | | | | | | | 10,730 | | | | | | |
| | | | |
Blue sky fees | | | | 37,660 | | | | | | | | | | 38,964 | | | | | | |
| | | | |
Directors’ and officers’ fees | | | | 24,069 | | | | | | | | | | 23,626 | | | | | | |
| | | | |
Shareholder servicing fees | | | | 226,155 | | | | | | | | | | 212,318 | | | | | | |
| | | | |
Reports to shareholders | | | | 13,922 | | | | | | | | | | 12,165 | | | | | | |
| | | | |
Miscellaneous expenses | | | | 40,199 | | | | | | | | | | 45,734 | | | | | | |
| | | | |
Total Expenses | | | | 1,707,688 | | | | | | | | | | 1,565,357 | | | | | | |
| | | | |
Less expenses reimbursed by investment adviser | | | | (289,319 | ) | | | | | | | | | (291,391 | ) | | | | | |
| | | | |
Net Expenses | | | | 1,418,369 | | | | | | | | | | 1,273,966 | | | | | | |
| | | | |
NET INVESTMENT INCOME | | | | 2,691,929 | | | | | | | | | | 2,444,559 | | | | | | |
| | | | |
NET REALIZED AND UNREALIZED GAIN (LOSS) ON INVESTMENTS | | | | | | | | | | | | | | | | | | | | |
| | | | |
Realized Gain (Loss) on: | | | | | | | | | | | | | | | | | | | | |
| | | | |
Investments | | | | 1,791,678 | | | | | | | | | | (4,147,324 | ) | | | | | |
| | | | |
Change in Unrealized Appreciation on: | | | | | | | | | | | | | | | | | | | | |
| | | | |
Investments | | | | (41,573,097 | ) | | | | | | | | | (33,514,530 | ) | | | | | |
| | | | |
Net Realized and Unrealized Loss on Investments | | | | (39,781,419 | ) | | | | | | | | | (37,661,854 | ) | | | | | |
| | | | |
NET DECREASE IN NET ASSETS RESULTING FROM OPERATIONS | | | | $(37,089,490 | ) | | | | | | | | | $(35,217,295 | ) | | | | | |
See Notes to Financial Statements.
| | |
| 32 | | Semi-Annual Report | December 31, 2015 (Unaudited) |
| | |
| STATEMENTS OF CHANGES IN NET ASSETS | |
|
| | | | | | | | | | | | | | | | | | | | |
| | | Omni Small-Cap Value | | Omni Tax-Managed Small-Cap Value |
| | | Six Months Ended
December 31, 2015
(Unaudited) | | Year Ended June 30, 2015 | | Six Months Ended December 31, 2015 (Unaudited) | | Year Ended June 30, 2015 |
| | | | |
OPERATIONS | | | | | | | | | | | | | | | | | | | | |
| | | | |
Net investment income | | | | $ 2,691,929 | | | | | $ 3,851,176 | | | | | $ 2,444,559 | | | | | $ 3,547,309 | |
| | | | |
Net realized gain (loss) on investments | | | | 1,791,678 | | | | | (1,654,820 | ) | | | | (4,147,324 | ) | | | | (2,599,989 | ) |
| | | | |
Net change in unrealized appreciation (depreciation) on investments | | | | (41,573,097 | ) | | | | (4,763,662 | ) | | | | (33,514,530 | ) | | | | (10,832,450 | ) |
| | | | |
Net decrease in net assets resulting from operations | | | | (37,089,490 | ) | | | | (2,567,306 | ) | | | | (35,217,295 | ) | | | | (9,885,130 | ) |
| | | | |
DISTRIBUTIONS: | | | | | | | | | | | | | | | | | | | | |
| | | | |
From net investment income | | | | (4,704,613 | ) | | | | (2,478,657 | ) | | | | (3,274,284 | ) | | | | (767,401 | ) |
| | | | |
From net realized gains | | | | - | | | | | (20,389,241 | ) | | | | - | | | | | (14,502,076 | ) |
| | | | |
Net decrease in net assets resulting from distributions | | | | (4,704,613 | ) | | | | (22,867,898 | ) | | | | (3,274,284 | ) | | | | (15,269,477 | ) |
| | | | |
SHARE TRANSACTIONS: | | | | | | | | | | | | | | | | | | | | |
| | | | |
Proceeds from sale of shares | | | | 137,833,534 | | | | | 150,345,339 | | | | | 129,159,995 | | | | | 153,736,050 | |
| | | | |
Reinvestment of distributions | | | | 4,704,241 | | | | | 22,867,898 | | | | | 3,264,234 | | | | | 15,267,233 | |
| | | | |
Cost of shares redeemed | | | | (83,497,918 | ) | | | | (95,602,458 | ) | | | | (122,173,568 | ) | | | | (108,078,029 | ) |
| | | | |
Net increase in net assets resulting from share transactions | | | | 59,039,857 | | | | | 77,610,779 | | | | | 10,250,661 | | | | | 60,925,254 | |
| | | | |
Net increase (decrease) in net assets | | | | 17,245,754 | | | | | 52,175,575 | | | | | (28,240,918 | ) | | | | 35,770,647 | |
| | | | |
NET ASSETS: | | | | | | | | | | | | | | | | | | | | |
| | | | |
Beginning of period | | | | 459,367,135 | | | | | 407,191,560 | | | | | 461,100,853 | | | | | 425,330,206 | |
| | | | |
End of period* | | | | $476,612,889 | | | | | $459,367,135 | | | | | $432,859,935 | | | | | $461,100,853 | |
| | | | |
SHARES ISSUED & REDEEMED | | | | | | | | | | | | | | | | | | | | |
| | | | |
Issued | | | | 9,714,085 | | | | | 9,811,973 | | | | | 9,579,140 | | | | | 10,661,864 | |
| | | | |
Distributions reinvested | | | | 330,354 | | | | | 1,604,765 | | | | | 240,017 | | | | | 1,131,744 | |
| | | | |
Redeemed | | | | (5,886,382 | ) | | | | (6,248,268 | ) | | | | (9,151,594 | ) | | | | (7,678,666 | ) |
| | | | |
Net increase in shares | | | | 4,158,057 | | | | | 5,168,470 | | | | | 667,563 | | | | | 4,114,942 | |
| | | | |
Outstanding at beginning of period | | | | 29,651,823 | | | | | 24,483,353 | | | | | 31,476,957 | | | | | 27,362,015 | |
| | | | |
Outstanding at end of period | | | | 33,809,880 | | | | | 29,651,823 | | | | | 32,144,520 | | | | | 31,476,957 | |
| | | | |
* Including undistributed net investment income of: | | | | $ 14,442 | | | | | $ 2,027,126 | | | | | $ 2,442,140 | | | | | $ 3,271,865 | |
See Notes to Financial Statements.
(for a share outstanding throughout each period indicated)
| | | | | | | | | | |
| OMNI SMALL-CAP VALUE | | | | | | | | | | |
| | | | | Year Ended June 30 | | |
| | | For the
Period Ended
12/31/15
(Unaudited) | | 2015 | | 2014 | | 2013 | | For the
Period Ended
06/30/2012(a) |
| | | | | | | | | | |
Net Asset Value, Beginning of Period | | $15.49 | | $16.63 | | $14.11 | | $11.11 | | $10.00 |
| | | | | | | | | | |
| | | | | |
Income from Investment Operations: | | | | | | | | | | |
| | | | | |
Net Investment Income(b) | | 0.08 | | 0.14 | | 0.11 | | 0.17 | | 0.08 |
Net Realized and Unrealized Gain (Loss) | | (1.33) | | (0.46) | | 3.58 | | 3.12 | | 1.06 |
| | | | | | | | | | �� |
| | | | | |
Total from Investment Operations | | (1.25) | | (0.32) | | 3.69 | | 3.29 | | 1.14 |
| | | | | | | | | | |
| | | | | |
Less Distributions to Shareholders from: | | | | | | | | | | |
| | | | | |
Net Investment Income | | (0.14) | | (0.09) | | (0.08) | | (0.16) | | (0.03) |
Net Realized Gain | | - | | (0.73) | | (1.09) | | (0.13) | | - |
| | | | | | | | | | |
| | | | | |
Total Distributions | | (0.14) | | (0.82) | | (1.17) | | (0.29) | | (0.03) |
| | | | | | | | | | |
| | | | | |
Net Asset Value, End of Period | | $14.10 | | $15.49 | | $16.63 | | $14.11 | | $11.11 |
| | | | | | | | | | |
| | | | | |
Total Return | | (8.07%)(c)(d) | | (1.48%)(d) | | 26.89%(d) | | 30.08%(d) | | 11.41%(c)(d) |
| | | | | |
Ratios and Supplemental Data: | | | | | | | | | | |
| | | | | |
Net Assets, End of Period (in 000’s) | | $476,613 | | $459,367 | | $407,192 | | $260,909 | | $179,553 |
| | | | | |
Expenses Before Waivers and Reimbursements | | 0.72%(e) | | 0.71% | | 0.71% | | 0.78% | | 0.84%(e) |
| | | | | |
Expenses After Waivers and Reimbursements | | 0.60%(e) | | 0.60% | | 0.60% | | 0.60% | | 0.60%(e) |
| | | | | |
Net Investment Income After Waivers and Reimbursements | | 1.14%(e) | | 0.88% | | 0.70% | | 1.36% | | 0.92%(e) |
| | | | | |
Portfolio Turnover Rate | | 18%(c) | | 25% | | 31% | | 34% | | 8%(c) |
| (a) | Commenced operations on August 31, 2011. |
| (b) | Per share amounts calculated based on the average daily shares outstanding during the period. |
| (d) | Total return would have been lower had various fees not been waived during the period. |
| (e) | Annualized for periods less than one year. |
See Notes to Financial Statements.
| | |
| 34 | | Semi-Annual Report | December 31, 2015 (Unaudited) |
(for a share outstanding throughout each period indicated)
| | | | | | | | | | | | |
| OMNI TAX-MANAGED SMALL-CAP VALUE |
| | | | | Year Ended June 30 | | |
| | | For the
Period Ended
12/31/15
(Unaudited) | | 2015 | | 2014 | | 2013 | | 2012 | | For the
Period Ended
06/30/11(a) |
| | | | | | | | | | | | |
| | | | | | |
Net Asset Value, Beginning of Period | | $14.65 | | $15.54 | | $12.75 | | $10.05 | | $10.68 | | $10.00 |
| | | | | | | | | | | | |
| | | | | | |
Income from Investment Operations: | | | | | | | | | | | | |
| | | | | | |
Net Investment Income(b) | | 0.08 | | 0.12 | | 0.09 | | 0.15 | | 0.09 | | 0.03 |
Net Realized and Unrealized Gain (Loss) | | (1.15) | | (0.42) | | 3.26 | | 2.68 | | (0.67)(c) | | 0.65 |
| | | | | | | | | | | | |
| | | | | | |
Total from Investment Operations | | (1.07) | | (0.30) | | 3.35 | | 2.83 | | (0.58) | | 0.68 |
| | | | | | | | | | | | |
| | | | | | |
Less Distributions to Shareholders from: | | | | | | | | | | | | |
| | | | | | |
Net Investment Income | | (0.11) | | (0.03) | | (0.08) | | (0.13) | | (0.05) | | - |
Net Realized Gain | | - | | (0.56) | | (0.48) | | - | | - | | - |
| | | | | | | | | | | | |
| | | | | | |
Total Distributions | | (0.11) | | (0.59) | | (0.56) | | (0.13) | | (0.05) | | - |
| | | | | | | | | | | | |
| | | | | | |
Net Asset Value, End of Period | | $13.47 | | $14.65 | | $15.54 | | $12.75 | | $10.05 | | $10.68 |
| | | | | | | | | | | | |
| | | | | | |
Total Return | | (7.34%)(d)(e) | | (1.62%)(e) | | 26.71%(e) | | 28.43%(e) | | (5.41%)(e) | | 6.80%(d)(e) |
| | | | | | |
Ratios and Supplemental Data: | | | | | | | | | | | | |
| | | | | | |
Net Assets, End of Period (in 000’s) | | $432,860 | | $461,101 | | $425,330 | | $262,088 | | $127,216 | | $37,945 |
| | | | | | |
Expenses Before Waivers and Reimbursements | | 0.74%(f) | | 0.71% | | 0.71% | | 0.77% | | 0.90% | | 1.56%(f) |
| | | | | | |
Expenses After Waivers and Reimbursements | | 0.60%(f) | | 0.60% | | 0.60% | | 0.60% | | 0.60% | | 0.60%(f) |
| | | | | | |
Net Investment Income After Waivers and Reimbursements | | 1.15%(f) | | 0.84% | | 0.65% | | 1.34% | | 0.95% | | 0.57%(f) |
| | | | | | |
Portfolio Turnover Rate | | 22%(d) | | 30% | | 25% | | 34% | | 26% | | 7%(d) |
| (a) | Commenced operations on December 31, 2010. |
| (b) | Per share amounts calculated based on the average daily shares outstanding during the period. |
| (c) | Realized and unrealized gain (loss) per share do not correlate to the aggregate of the net unrealized and realized gain in the Statements of Changes in Net Assets for the year ended June 30, 2012, primarily due to the timing of the sales and repurchases of the Fund’s shares in relation to fluctuating market values for the Fund’s portfolio. |
| (e) | Total return would have been lower had various fees not been waived during the period. |
| (f) | Annualized for periods less than one year. |
See Notes to Financial Statements.
| | |
| NOTES TO FINANCIAL STATEMENTS | | |
December 31, 2015 (Unaudited)
1. Organization:
Bridgeway Funds, Inc. (“Bridgeway” or the “Company”) was organized as a Maryland corporation on October 19, 1993, and is registered under the Investment Company Act of 1940, as amended (the “1940 Act”), as an open-end management investment company.
Bridgeway is organized as a series fund, with 11 investment funds as of December 31, 2015 (each is referred to as a “Bridgeway Fund” and collectively, the “Bridgeway Funds”). The Aggressive Investors 1, Ultra-Small Company, Ultra-Small Company Market, Small-Cap Momentum, Small-Cap Growth, Small-Cap Value, Large-Cap Growth, Blue Chip 35 Index and Managed Volatility Funds are presented in a separate report. The Omni Small-Cap Value Fund and the Omni Tax-Managed Small-Cap Value Fund (each a “Fund” and together, the “Funds”) are presented in this report.
Bridgeway is authorized to issue 1,915,000,000 shares of common stock at $0.001 per share. As of December 31, 2015, 100,000,000 shares have been classified into the Aggressive Investors 1 Fund. 130,000,000 shares have been classified into the Blue Chip 35 Index Fund. 15,000,000 shares have been classified into the Ultra-Small Company Fund. 100,000,000 shares each have been classified into the Ultra-Small Company Market, Omni Small-Cap Value, Omni Tax-Managed Small-Cap Value, Small-Cap Momentum, Small-Cap Growth, Small-Cap Value and Large-Cap Growth Funds. 50,000,000 shares have been classified into the Managed Volatility Fund.
All of the Bridgeway Funds are no-load, diversified funds.
The Funds seek to provide long-term total return on capital, primarily through capital appreciation.
Bridgeway Capital Management, Inc. (the “Adviser”) is the investment adviser for all of the Bridgeway Funds.
2. Significant Accounting Policies:
The following summary of significant accounting policies, followed in the preparation of the financial statements of the Funds, are in conformity with accounting principles generally accepted in the United States of America (“GAAP”). Each Fund is considered an investment company under GAAP and follows the accounting and reporting guidance applicable to investment companies.
Securities and Other Investments Valuation Securities for which market quotations are readily available are valued at the last sale price on the national exchange on which such securities are primarily traded. In the case of securities reported on the National Association of Securities Dealers Automated Quotation (“NASDAQ”) system, the securities are valued based on the NASDAQ Official Closing Price (“NOCP”). In the absence of recorded sales on their home exchange, or NOCP, in the case of NASDAQ traded securities, the security will be valued as follows: bid prices for long positions and ask prices for short positions.
Investments in open-end registered investment companies and closed-end registered investment companies that do not trade on an exchange are valued at the end of day net asset value (“NAV”) per share.
Investments in closed-end registered investment companies that trade on an exchange are valued at the last sales price as of the close of the customary trading session on the exchange where the security is principally traded.
When market quotations are not readily available or when events occur that make established valuation methods unreliable, securities of the Funds may be valued at fair value as determined in good faith by or under the direction of the Board of Directors. The valuation assigned to a fair valued security for purposes of calculating the Funds’ NAV may differ from the security’s most recent closing market price and from the prices used by other mutual funds to calculate their NAVs.
| | |
| 36 | | Semi-Annual Report | December 31, 2015 (Unaudited) |
| | |
| NOTES TO FINANCIAL STATEMENTS (continued) | | |
December 31, 2015 (Unaudited)
The inputs and valuation techniques used to determine the value of a fund’s investments are summarized into three levels as described in the hierarchy below:
| ● | | Level 1 — quoted prices in active markets for identical assets |
Investments whose values are based on quoted market prices in active markets, and whose values are therefore classified as Level 1 prices, include active listed equity securities. The Funds do not adjust the quoted price for such investments, even in situations where the Funds hold a large position and a sale could reasonably impact the quoted price.
| ● | | Level 2 — other significant observable inputs (including quoted prices for similar securities, interest rates, prepayment speeds, credit risk, etc.) |
Investments that trade in markets that are not considered to be active, but whose values are based on quoted market prices, dealer quotations or valuations provided by alternative pricing sources supported by observable inputs, are classified as Level 2 prices. These generally include certain U.S. Government and sovereign obligations, most government agency securities, investment-grade corporate bonds and less liquid listed equity securities. As investments whose values are classified as Level 2 prices include positions that are not traded in active markets and/or are subject to transfer restrictions, valuations may be adjusted to reflect illiquidity and/or non-transferability, which are generally based on available market information.
The Dreyfus Cash Management Fund, which is held by the Funds, invests primarily in securities that are valued at cost or amortized cost. Therefore, these investments are classified as Level 2 investments.
| ● | | Level 3 — significant unobservable inputs (including the Funds’ own assumptions in determining the fair value of investments) |
Investments whose values are classified as Level 3 prices have significant unobservable inputs, as they may trade infrequently or not at all. When observable prices are not available for these securities, the Funds use one or more valuation techniques for which sufficient and reliable data is available. The inputs used by the Funds in estimating the value of Level 3 prices may include the original transaction price, quoted prices for similar securities or assets in active markets, completed or pending third-party transactions in the underlying investment or comparable issuers, and changes in financial ratios or cash flows. Level 3 prices may also be adjusted to reflect illiquidity and/or non-transferability, with the amount of such discount estimated by the Funds in the absence of market information. Assumptions used by the Funds due to the lack of observable inputs may significantly impact the resulting value and therefore the results of the Funds’ operations.
The inputs or methodology used for valuing investments are not necessarily an indication of the risk associated with investing in those investments. A summary of the inputs used to value the Funds’ investments as of December 31, 2015 is included with each Fund’s Schedule of Investments.
The Funds’ policy is to recognize transfers into, and transfers out of, each level of hierarchy as of the beginning of the reporting period. For the period ended December 31, 2015, the Omni Small-Cap Value Fund and the Omni Tax-Managed Small-Cap Value Fund each transferred a security with a value of $216,750 from Level 2 to Level 1 as of the end of the period, due to the market becoming active. There were no transfers from Level 1 to Level 2 in any of the Funds.
Securities Lending Upon lending its securities to third parties, each Fund receives compensation in the form of fees. The loans are secured by collateral at least equal to the fair value of the securities loaned plus accrued interest. Each Fund has the right under the lending agreement to recover the securities from the borrower on demand. Additionally, a Fund does not have the right to sell or repledge collateral received in the form of securities unless the borrower goes into default. The risks to a Fund of securities lending are that the borrower may not provide additional collateral when required or return the securities when due, resulting in a loss. Under the terms of the Securities Lending Agreement, the Funds are indemnified for such losses by the securities lending agent.
While securities are on loan, the Fund continues to receive dividends on the securities loaned and recognizes any gain or loss in the fair value of the securities loaned.
| | |
| NOTES TO FINANCIAL STATEMENTS (continued) | | |
December 31, 2015 (Unaudited)
Securities lending transactions are entered into by a Fund under a Securities Lending Agreement which provides the right, in the event of default (including bankruptcy or insolvency) for the non-defaulting party to liquidate the collateral or to offset the market value of the collateral received against the market value of the securities loaned. The value of the collateral is typically greater than that of the market value of the securities loaned, leaving the lender with a net amount payable to the defaulting party. However, bankruptcy or insolvency laws of a particular jurisdiction may impose restrictions on or prohibitions against such a right of offset in the event of a counterparty’s bankruptcy or insolvency.
The market value of securities on loan, all of which are classified as common stocks in the Funds’ Schedules of Investments, and the value of the related collateral are shown together in the Statements of Assets and Liabilities as a component of Investments at value.
The following table is a summary of the Funds’ securities loaned and related collateral, which are subject to a netting agreement as of December 31, 2015:
| | | | | | | | | | | | | | |
| | | | | | | | | Gross Amount Not
Offset in the Statement
of Assets and Liabilities | | | |
| Fund | | Gross
Amounts of
Recognized
Assets1 | | Gross Amounts
Offset in the
Statement of
Assets and
Liabilities | | Net Amounts of
Assets Presented
in the Statement
of Assets and
Liabilities | | Financial
Instruments | | Cash
Collateral
Received2 | | Net
Amount | |
| | | | | | |
| Omni Small-Cap Value | | | | | | | | | | | | | | |
Securities lending | | $16,003,142 | | - | | $16,003,142 | | - | | $16,003,142 | | | - | |
| | | | | | |
Omni Tax-Managed Small-Cap Value | | | | | | | | | | | | | | |
Securities lending | | $20,690,988 | | - | | $20,690,988 | | - | | $20,690,988 | | | - | |
| 1 | Securities loaned with a value of $2,948,937 and $3,267,156 in Omni Small-Cap Value and Omni Tax-Managed Small Cap Value, respectively, have been sold and are pending settlement on January 1, 2016. |
| 2 | Collateral with a value of $16,671,950 and $21,362,064 has been received in connection with securities lending of Omni Small-Cap Value Fund and Omni Tax-Managed Small Cap Value Fund, respectively. Excess of collateral received from individual counterparty is not shown here for financial reporting purposes. |
It is each Fund’s policy to obtain additional collateral from or return excess collateral to the borrower by the end of the next business day following the valuation date of the securities loaned. Therefore, the value of the collateral held may be temporarily less than that required under the lending contract. As of December 31, 2015, the collateral consisted of an institutional money market fund.
Use of Estimates in Financial Statements In preparing financial statements in conformity with GAAP, management makes estimates and assumptions that affect the reported amounts of assets and liabilities on the date of the financial statements and the disclosure of contingent assets and liabilities on the date of the financial statements, as well as the reported amounts of revenue and expenses during the reporting period. Actual results could differ from those estimates.
Risks and Uncertainties The Funds provide for various investment options, including stocks. Such investments are exposed to various risks, such as interest rate, market and credit risks. Due to the risks involved, it is at least reasonably possible that changes in risks in the near term would materially affect shareholders’ account values and the amounts reported in the financial statements.
Security Transactions, Investment Income and Expenses Security transactions are accounted for as of the trade date, the date the order to buy or sell is executed. Realized gains and losses are computed on the identified cost basis. Dividend income is recorded on the ex-dividend date, and interest income is recorded on the accrual basis from settlement date.
Bridgeway Funds’ expenses that are not series-specific are allocated to each series based upon its relative proportion of net assets to the Bridgeway Funds’ total net assets or other appropriate basis.
| | |
38 | | Semi-Annual Report | December 31, 2015 (Unaudited) |
| | |
| NOTES TO FINANCIAL STATEMENTS (continued) | | |
December 31, 2015 (Unaudited)
Distributions to Shareholders The Funds pay dividends from net investment income and distribute realized capital gains annually, usually in December.
Indemnification Under the Company’s organizational documents, the Funds’ officers, directors, employees and agents are indemnified against certain liabilities that may arise out of the performance of their duties to the Funds. Additionally, in the normal course of business, the Funds enter into contracts that contain a variety of indemnification clauses. The Funds’ maximum exposure under these arrangements is unknown, as this would involve future claims that may be made against the Funds that have not yet occurred. However, the Funds have not had prior claims or losses pursuant to these contracts.
3. Advisory Fees, Other Related Party Transactions and Contingencies:
The Funds have entered into a management agreement with the Adviser. As compensation for the advisory services rendered, facilities furnished, and expenses borne by the Adviser, the Funds pay the Adviser a fee of 0.50% of the value of each Fund’s average daily net assets, computed daily and payable monthly.
Expense limitations: The Adviser has agreed to reimburse the Funds for operating expenses and advisory fees above the expense limitations shown in the table below, which are shown as a ratio of net expenses to average net assets, for each Fund, for the period ended December 31, 2015. Any material change to the expense limitation would require a vote by shareholders of the applicable Fund.
| | | | | | |
| Bridgeway Fund | | Expense
Limitation | | | Total Waivers and
Reimbursements
for Period Ending
12/31/15 |
| | | | | | |
| Omni Small-Cap Value* | | | 0.60% | | | $289,319 |
| Omni Tax-Managed Small-Cap Value* | | | 0.60% | | | 291,391 |
| | | | | | |
*The Funds are authorized to reimburse the Adviser for management fees previously waived and/or for expenses previously paid by the Adviser, provided, however, that any reimbursements must be paid at a date not more than three years after the fiscal year in which the Adviser waived the fees or reimbursed the expenses and that the reimbursements do not cause the Funds to exceed the expense limitation in the agreement. The Omni Small-Cap Value Fund has recoupable expenses of $384,005, $367,842, $480,284, and $289,319, which expire on June 30, 2016, June 30, 2017, June 30, 2018, and June 30, 2019, respectively. The Omni Tax-Managed Small-Cap Value Fund has recoupable expenses of $328,970, $382,335, $479,218, and $291,391, which expire June 30, 2016, June 30, 2017, June 30, 2018, and June 30, 2019, respectively.
Other Related Party Transactions: The Bridgeway Funds will engage in inter-portfolio trades with other Bridgeway Funds when it is to the benefit of both parties. The Board of Directors reviews these trades quarterly. Inter-portfolio purchases and sales for the Funds during the period ended December 31, 2015 were as follows:
| | | | |
| Bridgeway Fund | | Inter-Portfolio
Purchases | | Inter-Portfolio
Sales |
| | | | |
| Omni Small-Cap Value | | $17,571,605 | | $ 5,277,029 |
| Omni Tax-Managed Small-Cap Value | | 8,516,845 | | 16,252,790 |
The Adviser entered into an Administrative Services Agreement with Bridgeway, pursuant to which the Adviser provides various administrative services to the Funds including, but not limited to: (i) supervising and managing various aspects of the Funds’ business and affairs; (ii) selecting, overseeing and/or coordinating activities with other service providers to the Funds; (iii) providing reports to the Board of Directors as requested from time to time; (iv) assisting and/or reviewing amendments and updates to the Funds’ registration statement and other filings with the Securities and Exchange Commission (“SEC”); (v) providing certain shareholder services; (vi) providing administrative support in connection with meetings of the Board of Directors; and (vii) providing certain record-keeping services. For its services to all of the Bridgeway Funds, the Adviser is paid an aggregate annual fee of $590,000, payable in equal monthly installments. During the period ended December 31, 2015,
| | |
| NOTES TO FINANCIAL STATEMENTS (continued) | | |
December 31, 2015 (Unaudited)
the allocation of this expense to the Omni Small-Cap Value and Omni Tax-Managed Small-Cap Value Funds was $55,075 and $49,019, respectively.
Board of Directors Compensation Independent Directors are paid an annual retainer of $15,000, with an additional retainer of $5,000 paid to the Independent Chairman of the Board and an additional retainer of $1,000 paid to the Nominating and Corporate Governance Committee Chair. The retainer is paid in quarterly installments. Effective November 13, 2015, Independent Directors are paid $7,500 per meeting for meeting fees. Prior to November 13, 2015, Independent Directors were paid $6,250 per meeting. Such compensation is the total compensation from all Bridgeway Funds and is allocated among the Bridgeway Funds.
The Independent Directors each receive this compensation in the form of shares of the Bridgeway Funds, credited to his or her account. Such Directors are reimbursed for any expenses incurred in attending meetings and conferences, as well as expenses for subscriptions or printed materials. The amount of Directors’ fees attributable to each Fund is disclosed in the Statement of Operations.
One director of Bridgeway, John Montgomery, is an owner and director of the Adviser. Under the 1940 Act definitions, he is considered to be an “affiliated person” of the Adviser and an “interested person” of the Adviser and of Bridgeway. Compensation for Mr. Montgomery is borne by the Adviser rather than the Bridgeway Funds.
4. Distribution and Shareholder Servicing Fees:
Foreside Fund Services, LLC acts as distributor of the Funds’ shares pursuant to a Distribution Agreement dated November 12, 2010. The Adviser pays all costs and expenses associated with distribution of the Funds’ shares, pursuant to a protective plan adopted by shareholders pursuant to Rule 12b-1.
5. Purchases and Sales of Investment Securities:
Purchases and sales of investments, other than short-term securities, for each Fund for the period ended December 31, 2015 were as follows:
| | | | | | | | | | | | | | | | | | | | |
| | | Purchases | | Sales |
| | | U.S. Government | | Other | | U.S. Government | | Other |
| | | | | | | | | | | | | | | | | | | | |
| Omni Small-Cap Value | | | $ | - | | | | $ | 134,706,862 | | | | $ | - | | | | $ | 82,613,907 | |
Omni Tax-Managed Small-Cap Value | | | | - | | | | | 108,367,287 | | | | | - | | | | | 94,923,979 | |
6. Federal Income Taxes
It is the Funds’ policy to continue to comply with the provisions of the Internal Revenue Code of 1986, as amended (“Internal Revenue Code”), applicable to regulated investment companies, and to distribute income to the extent necessary so that such Fund is not subject to federal income tax. Therefore, no federal income tax provision is required.
Unrealized Appreciation and Depreciation on Investments (Tax Basis) The amount of net unrealized appreciation/ depreciation and the cost of investment securities for tax purposes, including short-term securities at December 31, 2015, were as follows:
| | | | | | | | | | |
| | | Omni Small-Cap Value | | Omni Tax-Managed Small-Cap Value |
| Gross appreciation (excess of value over tax cost) | | | | $ 87,597,967 | | | | | $ 82,671,741 | |
| Gross depreciation (excess of tax cost over value) | | | | (37,620,184 | ) | | | | (27,679,364 | ) |
| Net unrealized appreciation | | | | $ 49,977,783 | | | | | $ 54,992,377 | |
| Cost of investments for income tax purposes | | | | $443,226,747 | | | | | $400,113,773 | |
The differences between book and tax net unrealized appreciation (depreciation) are due to wash sale loss deferrals and basis adjustments on passive foreign investment companies (PFICs), partnerships and business development companies.
| | |
40 | | Semi-Annual Report | December 31, 2015 (Unaudited) |
| | |
| NOTES TO FINANCIAL STATEMENTS (continued) | | |
December 31, 2015 (Unaudited)
Classifications of Distributions Net investment income (loss) and net realized gain (loss) may differ for financial statement and tax purposes. The character of distributions made during the year from net investment income or net realized gains may differ from its ultimate characterization for federal income tax purposes.
The tax character of the distributions paid by the Funds during the fiscal years ended June 30, 2015 and 2014, is as follows:
| | | | | | | | | | | | | | | | | | | | |
| | | Omni Small-Cap Value | | Omni Tax-Managed Small-Cap Value |
| | | Year Ended June 30, 2015 | | Year Ended June 30, 2014 | | Year Ended June 30, 2015 | | Year Ended June 30, 2014 |
| Distributions paid from: | | | | | | | | | | | | | | | | | | | | |
| Ordinary Income | | | | $ 2,478,657 | | | | | $ 1,694,743 | | | | | $ 767,401 | | | | | $ 1,891,418 | |
| Long-Term Capital Gain | | | | 20,389,241 | | | | | 21,789,088 | | | | | 14,502,076 | | | | | 10,989,498 | |
| Total | | | | $22,867,898 | | | | | $23,483,831 | | | | | $15,269,477 | | | | | $12,880,916 | |
Components of Accumulated Earnings As of June 30, 2015, the components of accumulated earnings on a tax basis were:
| | | | | | | | | | |
| | | Omni Small-Cap Value | | Omni Tax-Managed Small-Cap Value |
| Undistributed Net Investment Income | | $ 2,027,126 | | $ 3,274,274 |
| Accumulated Net Realized Loss on Investments* | | (3,835,199) | | (2,655,666) |
| Net Unrealized Appreciation of Investments | | 91,550,880 | | 88,506,907 |
| Total | | $89,742,807 | | $89,125,515 |
| * | Includes qualified late-year losses that the Funds have elected to defer to the beginning of their next fiscal year ending June 30, 2016. The Omni Small-Cap Value Fund and Omni Tax-Managed Small-Cap Value Fund have elected to defer late-year short term capital losses of ($3,835,199) and ($2,655,666), respectively. |
For the fiscal year June 30, 2015, the Funds recorded the following reclassifications to the accounts listed below:
| | | | | | | | | | |
| | | Increase (Decrease) |
| | | Omni
Small-Cap Value | | Omni Tax-Managed
Small-Cap Value |
| Paid-in-Capital | | | | $ 171,816 | | | | | $ 284,723 | |
| Undistributed Net Investment Income | | | | (230,921 | ) | | | | (275,398 | ) |
| Accumulated Net Realized Gain (Loss) on Investments | | | | 59,105 | | | | | (9,325 | ) |
The difference between book and tax components of net assets and the resulting reclassifications were primarily a result of the differing book/tax treatment of the deduction of equalization debits for tax purposes and investments in passive foreign investment companies (PFICs), partnerships and business development companies.
Accounting for Uncertainty in Income Taxes sets forth a minimum threshold for financial statement recognition of the benefit of a tax position taken or expected to be taken in a tax return. Management has analyzed each Fund’s tax positions and has concluded that no provision for income tax is required in each Fund’s financial statements. The Funds are not aware of any tax position for which it is reasonably possible that the total amounts of unrecognized tax benefits will significantly change in the next twelve months. Each Fund’s federal tax returns for the prior three fiscal years remain subject to examination by the Internal Revenue Service.
7. Line of Credit
Bridgeway established a line of credit agreement (“Facility”) with The Bank of New York Mellon, effective November 5, 2010. The Facility is for temporary or emergency purposes, such as to provide liquidity for shareholder redemptions, and is cancellable by either party. Unless cancelled earlier, the Facility shall be held available until September 15, 2016. Advances under
| | |
| NOTES TO FINANCIAL STATEMENTS (continued) | | |
December 31, 2015 (Unaudited)
the Facility are limited to $15,000,000 in total for all Bridgeway Funds, and advances to each Bridgeway Fund shall not exceed certain limits set forth in the credit agreement, including, but not limited to, the maximum amount a Bridgeway Fund is permitted to borrow under the 1940 Act.
The Bridgeway Funds incur a commitment fee of 0.07% per annum on the unused portion of the Facility and interest expense to the extent of amounts borrowed under the Facility. Interest is based on the “Overnight Rate” plus 1.25%. The Overnight Rate means the higher of (a) the Federal Funds rate, (b) the Overnight Eurodollar Rate, or (c) the One-month Eurodollar Rate. The commitment fees are payable quarterly in arrears and are allocated to all participating Bridgeway Funds. Interest expense is charged directly to each Bridgeway Fund, based upon actual amounts borrowed by such Bridgeway Fund.
For the period ended December 31, 2015, borrowings by the Funds under this line of credit were as follows:
| | | | | | | | | | |
| Bridgeway Fund | | Weighted
Average
Interest Rate | | Weighted
Average
Loan Balance | | Number of
Days
Outstanding | | Interest
Expense
Incurred1 | | Maximum Amount
Borrowed During
the Period |
| | | | | | | | | | |
| Omni Small-Cap Value | | 1.46% | | $2,125,923 | | 26 | | $2,215 | | $ 5,932,000 |
Omni Tax-Managed Small-Cap Value | | 1.45% | | 5,558,450 | | 40 | | 8,837 | | 14,200,000 |
| 1Interest expense is included on the Statements of Operations in Miscellaneous expenses. |
There were no outstanding borrowings by the Funds under this line of credit as of December 31, 2015.
8. Subsequent Events
Management has evaluated the impact of all subsequent events on the Funds and has determined that there were no subsequent events requiring recognition or disclosure in the financial statements.
| | |
42 | | Semi-Annual Report | December 31, 2015 (Unaudited) |
| | |
| OTHER INFORMATION | | |
December 31, 2015 (unaudited)
1. Proxy Voting
Fund policies and procedures used in determining how to vote proxies relating to the Funds’ securities and a summary of proxies voted by the Funds for the period ended June 30, 2015 are available without a charge, upon request, by contacting Bridgeway Funds at 1-800-661-3550 and on the SEC’s website at http://www.sec.gov.
2. Fund Holdings
The complete schedule of the Funds’ holdings for the second and fourth quarters of each fiscal year are contained in the Funds’ Semi-Annual and Annual Shareholder Reports, respectively.
The Bridgeway Funds file complete schedules of the Funds’ holdings with the SEC for the first and third quarters of each fiscal year on Form N-Q within 60 days after the end of the period. Copies of the Funds’ Form N-Q are available without charge, upon request, by contacting Bridgeway Funds at 1-800-661-3550 and on the SEC’s website at http://www.sec.gov. You may also review and copy Form N-Q at the SEC’s Public Reference Room in Washington, D.C. For more information about the operation of the Public Reference Room, please call 1-800-SEC-0330.
| | |
| DISCLOSURE OF FUND EXPENSES | | |
December 31, 2015 (Unaudited)
As a shareholder of a Fund, you will incur no transaction costs from such Fund, including sales charges (loads) on purchases, on reinvested dividends, or on other distributions. There are no exchange fees. However, as a shareholder of a Fund, you will incur ongoing costs, including management fees and other Fund expenses. The following examples are intended to help you understand your ongoing costs (in dollars) of investing in a Fund and to compare these costs with ongoing costs of investing in other mutual funds. The examples are based on an investment of $1,000 invested on July 1, 2015 and held until December 31, 2015.
Actual Expenses. The first line of the table below provides information about actual account values and actual expenses. You may use the information in this line, together with the amount you invested, to estimate the expenses that you paid over the period. Simply divide your account value by $1,000 (for example, an $8,600 account value divided by $1,000 = 8.6), then multiply the result by the number in the first line under the heading “Expenses Paid During Period” to estimate the expenses you paid on your account during the period.
Hypothetical Example for Comparison Purposes. The second line of the table below provides information about hypothetical account values and hypothetical expenses based on the Fund’s actual expense ratio and an assumed rate of return of 5% per year before expenses, which is not the Fund’s actual return. The hypothetical account values and expenses may not be used to estimate the actual ending account balance or expenses you paid for the period. You may use this information to compare the ongoing costs of investing in a Fund and other mutual funds. To do so, compare this 5% hypothetical example with the 5% hypothetical examples that appear in the shareholder reports of other funds.
The expenses shown in the table are meant to highlight ongoing Fund costs only. Therefore, the second line of the table is useful in comparing ongoing costs only and will not help you determine the relative total costs of owning different funds, because other funds may also have transaction costs, such as sales charges, redemption fees or exchange fees.
| | | | | | | | | | | | | | | | | | | | |
| | | Beginning Account
Value at 7/1/15 | | Ending Account
Value at 12/31/15 | | Expense
Ratio | | Expenses Paid
During Period*
7/1/15 - 12/31/15 |
| | | | |
| Bridgeway Omni Small-Cap Value | | | | | | | | | | | | | | | | | | | | |
| Actual Fund Return | | | $ | 1,000.00 | | | | $ | 919.30 | | | | | 0.60 | % | | | $ | 2.89 | |
Hypothetical Fund Return | | | $ | 1,000.00 | | | | $ | 1,022.12 | | | | | 0.60 | % | | | $ | 3.05 | |
| | | | |
Bridgeway Omni Tax-Managed Small-Cap Value | | | | | | | | | | | | | | | | | | | | |
| Actual Fund Return | | | $ | 1,000.00 | | | | $ | 926.60 | | | | | 0.60 | % | | | $ | 2.91 | |
Hypothetical Fund Return | | | $ | 1,000.00 | | | | $ | 1,022.12 | | | | | 0.60 | % | | | $ | 3.05 | |
| * | Expenses are equal to the average account value times the Fund’s annualized expense ratio multiplied by the number of days in the most recent six-month period (184) divided by the number of days in the fiscal year (365). |
| | |
44 | | Semi-Annual Report | December 31, 2015 (Unaudited) |
| | | | |
| | | | |
| | | | |
| | | | |
| | | | |
| | | | |
| | BRIDGEWAY FUNDS, INC. | | |
| | |
| | BNY Mellon Investment Servicing (US) Inc. | | |
| | P.O. Box 9860 | | |
| | Providence, RI 02940-8060 | | |
| | |
| | CUSTODIAN | | |
| | |
| | The Bank of New York Mellon | | |
| | One Wall Street | | |
| | New York, NY 10286 | | |
| | |
| | DISTRIBUTOR | | |
| | |
| | Foreside Fund Services, LLC | | |
| | Three Canal Plaza, Suite 100 | | |
| | Portland, ME 04101 | | |
| | You can review and copy information about our Funds (including the SAI) at the SEC’s Public Reference Room in Washington, D.C. To find out more about this public service, call the SEC at 800-SEC-0330. Reports and other information about the Funds are also available on the SEC’s website at www.sec.gov. You can receive copies of this information, for a fee, by writing the Public Reference Section, Securities and Exchange Commission, Washington, D.C. 20549-1520 or by sending an electronic request to the following email address: publicinfo@sec.gov. | | |
Item 2. Code of Ethics.
Not applicable.
Item 3. Audit Committee Financial Expert.
Not applicable.
Item 4. Principal Accountant Fees and Services.
Not applicable.
Item 5. Audit Committee of Listed Registrants.
Not applicable.
Item 6. Investments.
| (a) | Schedule of Investments in securities of unaffiliated issuers as of the close of the reporting period is included as part of the report to shareholders filed under Item 1 of this form. |
| (b) | The Registrant made no divestments of securities in accordance with section 13(c) of the Investment Company Act of 1940. |
| | |
| Item 7. | | Disclosure of Proxy Voting Policies and Procedures for Closed-End Management Investment Companies. |
Not applicable.
Item 8. Portfolio Managers of Closed-End Management Investment Companies.
Not applicable.
| | |
| Item 9. | | Purchases of Equity Securities by Closed-End Management Investment Company and Affiliated Purchasers. |
Not applicable.
Item 10. Submission of Matters to a Vote of Security Holders.
There have been no material changes to the procedures by which the shareholders may recommend nominees to the Registrant’s Board of Directors, where those changes were implemented after the registrant last provided disclosure in response to the requirements of Item 407(c)(2)(iv) of Regulation S-K (17 CFR 229.407) (as required by Item 22(b)(15) of Schedule 14A (17 CFR 240.14a-101)), or this Item.
Item 11. Controls and Procedures.
| | (a) | The registrant’s principal executive officer and principal financial officer, or persons performing similar functions, have concluded that the registrant’s disclosure controls and procedures (as defined in Rule 30a-3(c) under the Investment Company Act of 1940, as amended (the “1940 Act”) (17 CFR 270.30a-3(c))) are effectively designed, as of a date within 90 days of the filing date of the report that includes the disclosure required by this paragraph, based on their evaluation of these controls and procedures required by Rule 30a-3(b) under the 1940 Act (17 CFR 270.30a-3(b)) and Rules 13a-15(b) or 15d-15(b) under the Securities Exchange Act of 1934, as amended (17 CFR 240.13a-15(b) or 240.15d-15(b)). |
| | (b) | There were no changes in the registrant’s internal control over financial reporting (as defined in Rule 30a-3(d) under the Act (17 CFR 270.30a-3(d)) that occurred during the second fiscal quarter of the period covered by this report that have materially affected or are reasonably likely to materially affect, the registrant’s internal control over financial reporting. |
Item 12. Exhibits.
| | (a)(2) | Certifications pursuant to Rule 30a-2(a) under the 1940 Act and Section 302 of the Sarbanes-Oxley Act of 2002 are attached hereto. |
| | (b) | Certifications pursuant to Rule 30a-2(b) under the 1940 Act and Section 906 of the Sarbanes-Oxley Act of 2002 are attached hereto. |
SIGNATURES
Pursuant to the requirements of the Securities Exchange Act of 1934 and the Investment Company Act of 1940, the registrant has duly caused this report to be signed on its behalf by the undersigned, thereunto duly authorized.
| | |
| (Registrant) | | Bridgeway Funds, Inc. |
| | |
| By (Signature and Title)* | | /s/ John N. R. Montgomery |
|
John N. R. Montgomery, President and Principal Executive Officer |
(principal executive officer) |
Pursuant to the requirements of the Securities Exchange Act of 1934 and the Investment Company Act of 1940, this report has been signed below by the following persons on behalf of the registrant and in the capacities and on the dates indicated.
| | |
| By (Signature and Title)* | | /s/ John N. R. Montgomery |
|
John N. R. Montgomery, President and Principal Executive Officer |
(principal executive officer) |
| | |
| By (Signature and Title)* | | /s/ Linda G. Giuffré |
| | Linda G. Giuffré, Treasurer and Principal Financial Officer |
| | (principal financial officer) |
* Print the name and title of each signing officer under his or her signature.