UNITED STATES
SECURITIES AND EXCHANGE COMMISSION
Washington, D.C. 20549
FORMN-CSR
CERTIFIED SHAREHOLDER REPORT OF REGISTERED MANAGEMENT
INVESTMENT COMPANIES
Investment Company Act file number 811-08200
Bridgeway Funds, Inc.
(Exact name of registrant as specified in charter)
20 Greenway Plaza, Suite 450
Houston, Texas 77046
(Address of principal executive offices) (Zip code)
Tammira Philippe, President
Bridgeway Funds, Inc.
20 Greenway Plaza, Suite 450
Houston, Texas 77046
(Name and address of agent for service)
Registrant’s telephone number, including area code: (713)661-3500
Date of fiscal year end:June 30
Date of reporting period: December 31, 2018
FormN-CSR is to be used by management investment companies to file reports with the Commission not later than 10 days after the transmission to stockholders of any report that is required to be transmitted to stockholders under Rule30e-1 under the Investment Company Act of 1940 (17 CFR270.30e-1). The Commission may use the information provided on FormN-CSR in its regulatory, disclosure review, inspection, and policymaking roles.
A registrant is required to disclose the information specified by FormN-CSR, and the Commission will make this information public. A registrant is not required to respond to the collection of information contained in FormN-CSR unless the Form displays a currently valid Office of Management and Budget (“OMB”) control number. Please direct comments concerning the accuracy of the information collection burden estimate and any suggestions for reducing the burden to Secretary, Securities and Exchange Commission, 100 F Street, NE, Washington, DC 20549. The OMB has reviewed this collection of information under the clearance requirements of 44 U.S.C. § 3507.
Item 1. Reports to Stockholders.
The Report to Shareholders is attached herewith.

| | | | |
| | Ano-load mutual fund family | | |
| | | | |
| |
| | Semi-Annual Report December 31, 2018 (Unaudited) |
| | |
| | AGGRESSIVE INVESTORS 1 | | BRAGX |
| | ULTRA-SMALL COMPANY | | BRUSX |
| | (Open to Existing Investors — Direct Only) | | |
| | ULTRA-SMALL COMPANY MARKET | | BRSIX |
| | SMALL-CAP GROWTH | | BRSGX |
| | SMALL-CAP VALUE | | BRSVX |
| | BLUE CHIP 35 INDEX | | BRLIX |
| | MANAGED VOLATILITY | | BRBPX |
Beginning on January 1, 2021, as permitted by regulations adopted by the U.S. Securities and Exchange Commission, paper copies of the Funds’ annual and semi-annual shareholder reports will no longer be sent by mail, unless you specifically request paper copies of the reports. Instead, the reports will be made available on the Funds’ website (www.bridgeway.com), and you will be notified by mail each time a report is posted and provided with a website link to access the report.
If you already elected to receive shareholder reports electronically, you will not be affected by this change and you need not take any action. You may elect to receive shareholder reports and other communications from a Fund electronically anytime by contacting your financial intermediary (such as a broker-dealer or bank) or, if you are a direct investor, by calling800-661-3550.
Beginning on January 1, 2019, you may elect to receive all future reports in paper free of charge. If you invest through a financial intermediary, you can contact your financial intermediary to request that you continue to receive paper copies of your shareholder reports. If you invest directly with a Fund, you can call800-661-3550 to let the Fund know you wish to continue receiving paper copies of your shareholder reports. Your election to receive reports in paper will apply to all Funds held in your account if you invest through your financial intermediary or to all Funds held with the fund complex if you invest directly with a Fund.
| | | | |
| TABLE OF CONTENTS | | |  | |
Bridgeway Funds Standardized Returns as of December 31, 2018* (Unaudited)
| | | | | | | | | | | | | | | | | | | | | | | |
| | | | | | |
| | | | | | | Annualized | | | | | | |
| Fund | | Quarter | | Six Months | | 1 Year | | 5 Years | | 10 Years | | | | Inception
to Date | | Inception
Date | | Gross
Expense
Ratio2 | | Net
Expense
Ratio2 |
| | | | | | | | | | |
Aggressive Investors 1 | | -21.79% | | -21.11% | | -22.44% | | 2.62% | | 9.93% | | | | 11.49% | | 8/5/1994 | | 0.96% | | 0.96% |
| | | | | | | | | | |
Ultra-Small Company | | -22.64% | | -20.64% | | -15.68% | | -3.58% | | 9.76% | | | | 12.24% | | 8/5/1994 | | 2.03% | | 2.03% |
| | | | | | | | | | |
Ultra-Small Co Market | | -25.39% | | -25.25% | | -17.12% | | 1.67% | | 11.03% | | | | 9.41% | | 7/31/1997 | | 0.86% | | 0.86% |
| | | | | | | | | | |
Small-Cap Growth | | -22.16% | | -19.00% | | -11.21% | | 6.55% | | 11.21% | | | | 6.21% | | 10/31/2003 | | 1.08%1 | | 0.94%1 |
| | | | | | | | | | |
Small-Cap Value | | -22.97% | | -22.08% | | -13.06% | | 1.51% | | 10.54% | | | | 6.40% | | 10/31/2003 | | 0.94% | | 0.94% |
| | | | | | | | | | |
Blue Chip 35 Index | | -10.62% | | -1.81% | | -1.48% | | 8.51% | | 12.67% | | | | 6.90% | | 7/31/1997 | | 0.22%1 | | 0.15%1 |
| | | | | | | | | | |
Managed Volatility | | -7.40% | | -6.17% | | -3.97% | | 2.46% | | 4.72% | | | | 3.60% | | 6/30/2001 | | 1.21%1 | | 0.95%1 |
Bridgeway Funds Returns for Calendar Years 2003 through 2018* (Unaudited)
| | | | | | | | | | | | | | | | | | | | | | | | | | | | | | | | |
| | | | | | | | | | | | | | | | |
| | | 2003 | | 2004 | | 2005 | | 2006 | | 2007 | | 2008 | | 2009 | | 2010 | | 2011 | | 2012 | | 2013 | | 2014 | | 2015 | | 2016 | | 2017 | | 2018 |
Aggressive Investors 1 | | 53.98% | | 12.21% | | 14.93% | | 7.11% | | 25.80% | | -56.16% | | 23.98% | | 17.82% | | -10.31% | | 21.58% | | 42.21% | | 14.99% | | -9.82% | | 19.47% | | 18.44% | | -22.44% |
Ultra-Small Company | | 88.57% | | 23.34% | | 2.99% | | 21.55% | | -2.77% | | -46.24% | | 48.93% | | 23.55% | | -14.64% | | 24.49% | | 55.77% | | -0.56% | | -16.12% | | 14.06% | | 3.88% | | -15.68% |
Ultra-Small Co Market | | 79.43% | | 20.12% | | 4.08% | | 11.48% | | -5.40% | | -39.49% | | 25.96% | | 24.86% | | -7.86% | | 19.83% | | 50.91% | | 4.61% | | -8.28% | | 21.47% | | 12.47% | | -17.12% |
Small-Cap Growth | | | | 11.59% | | 18.24% | | 5.31% | | 6.87% | | -43.48% | | 15.05% | | 11.77% | | -0.63% | | 11.05% | | 48.52% | | 6.13% | | 4.93% | | 16.10% | | 19.62% | | -11.21% |
Small-Cap Value | | | | 17.33% | | 18.92% | | 12.77% | | 6.93% | | -45.57% | | 26.98% | | 16.56% | | 1.05% | | 20.99% | | 39.72% | | 0.79% | | -9.43% | | 26.79% | | 7.11% | | -13.06% |
Blue Chip 35 Index | | 28.87% | | 4.79% | | 0.05% | | 15.42% | | 6.07% | | -33.30% | | 26.61% | | 10.60% | | 3.17% | | 15.20% | | 31.67% | | 11.51% | | 2.17% | | 13.18% | | 18.43% | | -1.48% |
Managed Volatility | | 17.82% | | 7.61% | | 6.96% | | 6.65% | | 6.58% | | -19.38% | | 12.39% | | 5.41% | | 1.94% | | 6.46% | | 9.25% | | 5.95% | | 0.17% | | 2.42% | | 8.18% | | -3.97% |
Performance figures quoted represent past performance and are no guarantee of future results. Current performance may be lower or higher than the performance data quoted. Investment return and principal value will fluctuate, so that an investor’s shares, when redeemed, may be worth more or less than original cost. To obtain performance current to the most recentmonth-end, please visit www.bridgeway.com or call1-800-661-3550. Total return figures include the reinvestment of dividends and capital gains. Periods of less than one year are not annualized.
| | 1 | Some of the Fund’s fees were waived or expenses reimbursed; otherwise, returns would have been lower. The Adviser is contractually obligated to waive fees and/or pay expenses. Any material change to this Fund policy would require a vote by shareholders. |
| | 2 | Expense ratios are as stated in the current prospectus. Please see financial highlights for expense ratios as of December 31, 2018. |
* Numbers highlighted indicate periods when the Fund outperformed its primary benchmark.
This report is submitted for the general information of the shareholders of each Fund. It is not authorized for distribution to prospective investors unless preceded or accompanied by an effective prospectus, which includes information regarding a Fund’s risks, objectives, fees and expenses, experience of its management, and other information. Investors should read the prospectus carefully before investing in a Fund. For questions or other Fund information, call1-800-661-3550 or visit the Funds’ website at www.bridgeway.com. Funds are available for purchase by residents of the United States, Puerto Rico, U.S. Virgin Islands and Guam only. Foreside Fund Services, LLC, Distributor.
The views expressed here are exclusively those of Fund management. These views, including those relating to the market, sectors, or individual stocks, are not meant as investment advice and should not be considered predictive in nature.
| | | | |
| LETTER FROM THE INVESTMENT MANAGEMENT TEAM | | | | |
December 31, 2018
Dear Fellow Shareholders,
Performance across all segments of the domestic equity markets was significantly negative for the December quarter, contributing to losses for the 2018 calendar year. Stocks in all major size and style categories declined, with smaller stocks and value stocks suffering the most. As a result, small value stocks delivered the year’s worst performance. Market highlights appear on page 2. In this environment, the Bridgeway Funds performed within design expectations, guided by our statistically driven, evidence-based investment approach. Please see the enclosed letters for a detailed explanation of each Fund’s performance during the quarter and calendar year. We hope you find the letters helpful.
Bridgeway remains focused on developing investment strategies grounded in academic research and long-term market data. That’s why in 2018 we announced plans to broaden our investment capabilities to include international equity. Read more about our plans, and the people leading the effort, in “Bridgeway Goes International” on page 2.
Our investment process also includes a commitment to continually review our strategies’ design and performance characteristics. This quarter, we’ve been examining underperformance by our Aggressive Investors 1 Fund. The accompanying shareholder letter details reasons for the Fund’s poor performance in the December quarter and the 2018 calendar year, but we’ve also included an analysis of longer-term trends that have created headwinds for the Fund. Read John Montgomery’s explanation in “Aggressive Investors 1 Fund: What’s Behind Its Underperformance?” on page 3.
Market volatility such as the kind we experienced during the December quarter can be difficult to tolerate, tempting some investors to veer from a carefully designed, long-term investment strategy. Researchers have identified specific ways that our emotions influence our investment decisions, which are called behavioral biases. Fortunately, an evidence-based investment strategy such as the one Bridgeway follows can help people identify and even counter these traps. Portfolio Manager Christine Wang explains why in “How Evidence-Based Investing Helps Manage Behavioral Biases” on page 4.
Understanding how our brains process information doesn’t only help with investment decisions. It also provides important insights for organizations looking to strengthen and likewise draw the best out of their teams. “Harnessing the Power of Different Perspectives,” found on page 5, describes how Bridgeway uses personality assessment tools to understand each colleague’s preferred style of thinking and to assemble well-rounded teams to make decisions.
Finally, Bridgeway Partner Kendra Adams shares how getting married and becoming a mother as a teenager inspired her lifelong commitment to counseling other married couples. Read her story in “Transformative Change: Nurturing a Community to Build Healthy Marriages,” found on page 6.
As always, we appreciate your feedback. We take your comments very seriously and regularly discuss them to help us manage our Funds and this company. Please keep your ideas coming — both favorable and critical. They provide us with a vital tool to serve you better.
Sincerely,
Your Investment Management Team
| | | | |
| LETTER FROM THE INVESTMENT MANAGEMENT TEAM(continued) | | | | |
Market Review
Domestic equities fell sharply during the quarter ended December 31, 2018, resulting in the stock market’s first annual decline in nine years. The December quarter was marked by high volatility caused by investor concerns about slowing economic growth and global trade tensions. The S&P 500 returned-13.52% for the quarter and the Dow Jones Industrial Average returned-11.31%. For the 2018 calendar year, the S&P 500 and the DJIA were down-4.38% and-3.48%, respectively.
All U.S. equity style categories, as defined by Russell Indices, posted negative returns for the quarter. Larger stocks outperformed smaller stocks across style categories, and value outperformed growth. As a result, large value stocks delivered the quarter’s best performance(-11.72%) while small growth stocks produced the lowest returns(-21.65%). However, value stocks in all size categories still lagged growth stocks significantly for the calendar year.
All of the S&P 500 sectors except Utilities recorded negative returns for the quarter. The Energy sector returned-23.7%, the worst performing sector for the quarter ended December 31, 2018. The Consumer Discretionary sector also lagged, returning-16.4%. The Utilities sector returned +1.4%.
Below are the stock market style box returns for the quarter and the calendar year.
| | | | | | |
| | December 2018 Quarter |
| | Value | | Core | | Growth |
| | | |
| Large | | -11.72% | | -13.82% | | -15.89% |
|
|
| | | |
| Mid | | -14.95% | | -15.37% | | -15.99% |
|
|
| | | |
| Small | | -18.67% | | -20.20% | | -21.65% |
|
|
| | | | | | |
| | Calendar year ended December 2018 |
| | Value | | Core | | Growth |
| | | |
| Large | | -8.27% | | -4.78% | | -1.51% |
|
|
| | | |
| Mid | | -12.29% | | -9.06% | | -4.75% |
|
|
| | | |
| Small | | -12.86% | | -11.01% | | -9.31% |
|
|
Bridgeway Goes International
This year, we reached another important milestone in Bridgeway’s evolution: In September 2018, we announced plans to broaden our investment capabilities to include international equity strategies.
Since our founding in 1993, we have attracted sophisticated investors with our statistically driven, evidence-based U.S. equity strategies. But many investors during the past 25 years have told us they wished we could apply that same disciplined approach to stock investmentsoutsidethe United States. Following a recent period of strong growth and our work to ensure that Bridgeway will be an enduring firm, we determined it was the right time to expand our capabilities to include international, global and emerging markets strategies.
Of course, successful investing requires great talent, and we are fortunate to have added two new Partners to support these initiatives. Jacob Pozharny, Ph.D., joined Bridgeway in September to lead our international investing efforts. Jacob has spent 25 years developing and managing quantitative global investment strategies, most recently as head of international equity research and portfolio management at QMA, a Prudential Global Investment Management (PGIM) company. Prior to that, he served as head of international quantitative equity at TIAA-CREF (now TIAA).
Working alongside Jacob is another new Partner, Amitabh Dugar, Ph.D., CPA, who will conduct investment research, risk management, and statistical modeling. Amitabh has extensive experience in quantitative investment research, investment strategy, and equity portfolio management with firms such as BNP Paribas Asset Management and Mellon Capital Management.
Besides bringing extensive international investing capabilities to the team, Jacob and Amitabh proved to be a great fit for Bridgeway’s unique culture — which includes a passion for investing based on data and
evidence and a commitment to putting investors’ needs first. Their contributions will help strengthen the research supporting our existing U.S. strategies, while
| | |
| 2 | | Semi-Annual Report | December 31, 2018 (Unaudited) |
| | | | |
| LETTER FROM THE INVESTMENT MANAGEMENT TEAM(continued) | | | | |
simultaneously broadening our capabilities into global investing. This is an exciting time for Bridgeway and for investors who share our belief that we can build a different kind of firm — one that offers the chance for meaningful investment outcomes, while providing excellent service to our clients, our colleagues, and our communities.
Aggressive Investors 1 Fund: What’s Behind Its Underperformance?
By John Montgomery, Founder and Chief Investment Officer
The individual Fund letters in this report are Bridgeway’s systematic way of updating you on our Funds’ quarterly and annual performance. Sometimes, though, we feel it is important to offer additional commentary, which is why I wanted to write about our Aggressive Investors 1 Fund.
The Fund performed poorly in 2018, as we explain in the accompanying Fund letter. With this down year, Aggressive Investors 1 has now only outperformed its primary market benchmark in five of the last 10 calendar years. What’s more, when the Fund has underperformed, it has been by a larger amount than when we outperformed, causing our10-year annualized return to lag the benchmark.
My wife and I have a personal total mutual fund target asset allocation of 45% in Aggressive Investors 1, so I feel the pain along with you. I would like to review four reasons for the Fund’s underperformance in 2018 and to highlight what Bridgeway is doing —and not doing— about it.
Reason 1. Small size stocks have been out of favor
We buy all size companies in the Aggressive Investors 1 Fund. However, the sum total of the portfolio leans toward smaller companies relative to our primary market benchmark, the S&P 500 Index. We believe in the small company size premium, which is based on the theory that small companies are riskier and thus should command a higher return in the marketplace over the long term.
Historically, though, the reverse has been true for long time periods, including the past 10 years. We also believe in reversion to the mean — the statistical principle that when the pendulum swings very far in one direction, it will eventually swing back in the other direction. Yet our research, which corroborates academic research on the topic, concludes it is impossible to know when the pendulum will swing back, and that it is unwise to try to time it. The bottom line is that we still believe in the small company size premium, and we are not changing the Fund’s design on this point.
Reason 2. Value stocks have been out of favor
For diversification, the Aggressive Investors 1 Fund buys both value and growth stocks. But overall, the portfolio leans more toward value than the S&P 500 as these stocks have become relatively cheaper. We believe in the value premium — the historical tendency for value stocks to provide greater risk-adjusted returns over growth stocks. Statistical research over long time periods supports the value premium.
However, like the small company size premium, the value premium also can be out of favor for relatively long time periods, which has been true over the last decade. For example, the Russell 1000 Value Index has underperformed the Russell 1000 Growth Index by more than 4%per year on average over the last decade. The Russell 1000 Value Index’s underperformance was even greater over the last year. As we still believe in the value premium, and because we believe in reversion to the mean, we will continue to maintain our value tilt in the Aggressive Investors 1 Fund.
Reason 3. Our stock weighting and portfolio construction techniques haven’t been rewarded
Many fund managers weight individual stocks in their portfolios by market capitalization, as signified by the amount the stock represents in a relevant market index. Thus, if a single stock represents 4% of the market index, they consider 4% a “neutral” position in the portfolio. We don’t use market cap weights in the Aggressive Investors 1 Fund. We set a target weighting based on our research — typically 0.5% to 2% — and regularly move each holding back toward its target weight as determined by the research. Similarly, we move the overall portfolio back to specific weights — also determined by our research — for each model we include in the portfolio. This technique is called rebalancing, and it tends to result in a contrarian, “buy low, sell high” approach.
| | | | |
| LETTER FROM THE INVESTMENT MANAGEMENT TEAM(continued) | | | | |
Unfortunately, neither of these aspects of portfolio construction have worked well in the bull market of the last decade. However, we believe that longer term history supports this approach, and we have no plans to change it.
Reason 4. High correlation markets hurt the performance of our company financial health category of models
As Bridgeway documented in 2011, high correlation markets — those in which many stocks move in tandem without regard to company fundamentals — have a particularly negative effect on one category of Bridgeway models: those we call “company financial health.”These are markets in which investors take their eyes off the ball of the economic health of individual companies in favor of moving money into entire segments of the market.
High correlation markets are not the same as bear markets. For example, the period 2000-2002 was a severe and extended bear market, but it exhibited low correlation characteristics. Before 2008, high correlation markets occurred about every other decade between 1940 to 2007, as measured by Bridgeway. Since then they have occurred nine times over an11-year period as more investors have moved to a passive investing style, selling and buying large baskets of stocks at the same time.
What are we doing and not doing about this? We are currently conducting research based on a hypothesis that unlike our expectation that the size and value factors will experience a reversion to the mean, the opposite might be true for high correlation markets. Rather than diminishing in frequency, high correlation markets may continue to occur more often than in the past. And if we conclude that this hypothesis is true? As always and within the framework of our overarching investment philosophy of continuous investment in research, Bridgeway has been engaged in extensive research over the past year that seeks to reduce the negative effects of high correlation markets, particularly on our company financial health models.
As with all research, it is not done until it is done, and there are trade-offs. In our process, we implement when we expect the net impact to be beneficial to shareholders with a long-term perspective. To be clear, we have made no updates yet, and any updates that we implement will be evolutionary rather than revolutionary. Nevertheless, we are encouraged with the potential benefits of the recent research on Aggressive Investors 1 Fund and will keep you posted.
Thank you for your patience and continued investment. The Aggressive Investors 1 Fund is one of Bridgeway’s original Funds, and we continue to believe strongly in this investment approach.
How Evidence-based Investing Helps Manage Behavioral Biases
By Christine Wang, CFA, CPA, Portfolio Manager
Bridgeway regularly reminds our shareholders, as evidence-based investors, about the importance of making decisions based on academic research and fundamental data. At the same time, we understand that we are all only human. And being human means that some funny things happen when it comes to our brains and money — namely, that we are susceptible to mental traps that seem to help us make rational decisions but that can actually work against our interests and hurt our long-term returns.
Researchers call these trapsbehavioral biases.These biases can sometimes be attributed to cognitive shortcuts that help us sort through the vast quantities of information that bombard us each day. There are dozens of these biases that show up in different types of decisions. And while cognitive shortcuts are helpful in some instances, they are particularly dangerous for investing.
Fortunately, following an evidence-based strategy not only provides a better way to design and manage investment portfolios, it also can help protect against behavioral biases. Rather than making moves based on mental shortcuts or guesswork, you can research the data and make decisions grounded in science. Let’s take a closer look at two common biases and explore how an evidence-based strategy helps insulate you from their effects.
Loss aversion
Our brains perceive losses and gains very differently. When it comes to investing, that means the pain we feel from losing money is greater than the pleasure we feel from an equal gain. To avoid this feeling, investors often avoid taking a loss and hold on to declining investments too long. To sell an investment at a loss feels painful — as if we are admitting defeat. After all, if an investment loss is still unrealized, it could rebound.
| | |
| 4 | | Semi-Annual Report | December 31, 2018 (Unaudited) |
| | | | |
| LETTER FROM THE INVESTMENT MANAGEMENT TEAM(continued) | | | | |
Bridgeway’s evidence-based investing strategies reduce the impact of loss aversion by systematically rebalancing portfolios to maintain target weightings. We often sell what has done well recently and buy more of assets that declined. Evidence-based strategies also rely on research-based rules that determine when to buy and sell a stock. An added benefit to objectively classifying investments according to their characteristics is that we are not wedded to any individual stock. Thus, it is easier to sell losses because we do not have an emotional attachment to the name.
Recency bias
Recency bias is our tendency to place more emphasis on recent data or experiences when making decisions. For investors, that means we assume that the latest trends or patterns we observe will continue into the future.
Think about Bitcoin. In 2017, the price of a Bitcoin soared from $984 to just over $12,000. Most people had never heard of Bitcoin before that year, but once it was in the news, all they had ever experienced was its upward climb. Many of those people bought in assuming it would continue its staggering gains. What they overlooked, however, is that Bitcoin was launched after the financial crisis of 2008, and its price had stayed flat for a long, long time. This older information was discounted in favor of the euphoria of Bitcoin’s recent trend. (Note: Bridgeway Funds do not invest in Bitcoin or other crypto-currencies.)
Recency bias might contribute in part to the value factor, which is a key component of evidence-based investing. It could help push up the price of glamour stocks —everyone wants to be invested in Google and Netflix when their stock prices are rising— while depressing the prices of neglected value stocks. But when stock prices revert to the mean, value stocks capture the benefits of being underpriced at the beginning of the period.
It is hard to avoid recency bias. After all, we are awash inup-to-the-second news, which by definition tells us what just happened. You might have turned on TV late last year to see that the stock market was headed for its worst December since the Great Depression. If that was all you focused on, that was recency bias. You discounted the fact that the stock market had gone up nine calendar years in a row since 2008. One of the benefits of Bridgeway’s evidence-based investing strategy is that it systematically accounts for new information in the context of long-term historical data.
These examples highlight just a few ways that evidence-based investing helps counter the effects of behavioral biases. With evidence-based investing, most decisions can be managed throughpre-established rules that have been vetted through back tests and data analysis. That approach is much more reliable than having to make decisions on the fly, in the heat of both emotion and time sensitivity.
Finally, knowledge is power. The more you are aware of these biases, the more you can try to protect yourselves from them. Experiencing behavioral biases is human and completely normal. But armed with a little bit of knowledge and evidence-basedguardrailsaround you, you are more likely to increase your opportunities for investment success.
Harnessing the Power of Different Perspectives
By Melissa Garrison,SHRM-SCP, Director of Talent
As Bridgeway Funds shareholders, you have heard us describe our use of research and data to learn more about how the markets work. You might not realize that we also use research and data inside the firm to learn more about ourselves and bolster the work we do together.
Motivational and behavioral assessment tools are an integral part of Bridgeway’s professional development strategy. These questionnaires — typically designed by psychologists or other scientists — uncover patterns and preferences in how people make decisions, interact with others, and react to specific situations. The goal of these assessments is to understand how each person thinks and to highlight their specific strengths. That’s why they have become popular with organizations like Bridgeway that want to maximize each team member’s potential by putting their skills to the highest and best use.
One of the primary tools we use is the Hermann Brain Dominance Instrument®(HBDI®). This assessment is different from many others in that it is a brain-based profile that measures how we each prefer to process information. Participants complete a120-question survey based on work elements, key descriptors, and adjectives they would use to describe themselves, answering questions like these:
| | | | |
| LETTER FROM THE INVESTMENT MANAGEMENT TEAM(continued) | | | | |
| ● | | Are you more conservative or empathetic? |
| ● | | Do you prefer problem-solving or planning? |
| ● | | Which work elements are your strongest — administrative, expressing ideas, technical, innovating, financial, etc.? |
The result of the survey is a personal profile that shows how strongly you align with one of four thinking styles in the HBDI®model: Analytical, Experimental, Practical, or Relational.
Together, these four thinking styles represent what Hermann International calls “whole brain thinking.” None of the four styles is better or worse than the others. In fact, everyone uses a mix of them to varying degrees. But understanding which styles we prefer and use most often helps each Bridgeway partner do our jobs better — and helps us make better decisions as an organization.
For example, my HBDI®assessment revealed that I have a strong preference for practical and relational thinking — which means I’m organized, detail-focused, and process oriented, but I also consider interpersonal relationships and how other people feel. I am less aligned with the analytical and experimental styles, which are characterized by logical/quantitative and intuitive/visionary thinking, respectively.
This insight helps me accomplish tasks and deal with problems related to my job. I know where my strengths lie, and I can reach out to others with different thinking styles to get their perspective. Even for something as simple as planning our annual corporate retreat, I will reach out to our Head of Finance and Talent, Von Celestine — a strong analytical and quantitative thinker — to help examine costs. I’ll also reach out to our President, Tammira Philippe — abig-picture, visionary thinker —to help articulate what we really want our people, and Bridgeway as an organization, to get out of the event.
Taking a “whole brain” approach like this is how Bridgeway tackles most of our decisions, because it supports our commitment to collaboration and our respect for a diversity of ideas. Whether we are considering changes to our investment lineup, examining how we communicate with customers, or strategizing plans for future growth, we make sure to assemble a team that represents all four of the HBDI®thinking styles. We want an analytical thinker who will bear down on what it costs, a practical thinker who knows what needs to happen to get it done, a relational thinker to consider how the plan will affect people inside and outside the company, and an experimental thinker who can define how it fits into Bridgeway’s vision for the future.
Fortunately, when we combine the HBDI®results for every Bridgeway partner we end up with a good representation of people in all four thinking styles. We are essentially a “whole brain” organization, thanks to the diverse group of thinkers that we have attracted.
In addition to identifying normal thinking preferences, the HBDI®assessment also measures our preferred thinking style in times of stress or difficulty. This analysis revealed something else important about the Bridgeway team: When under stress, our organization as a whole shifts strongly toward the relational thinking style. That means Bridgeway partners become evenmorefocused on other people during difficult times. We want to protect personal relationships, understand the emotional elements of a situation, and find ways to offer support.
In other words, the HBDI®assessment shows that our partners have thoroughly internalized Bridgeway’s commitment to always look out for our clients, our communities, and each other. Like the market and asset-class data we examine to manage our investment strategies, this evidence-based approach to personal development helps Bridgeway harness our individual and collective strengths to ensure we are meeting our responsibilities to shareholders and our goals as an organization.
Transformative Change: Nurturing a Community to Build Healthy Marriages
By Kendra Adams, Executive Assistant
As a teen, I found myself in an unplanned pregnancy situation. Mynow-husband, Jessie, wanted to “do the right thing,” so he proposed, and by the age of 16 I was married with a baby girl.
The chances of any teen marriage succeeding can be low, and I faced some particularly difficult challenges: My parents were divorced, and I didn’t have many role models for what a healthy marriage looked like. Thankfully, our church’s pastor and his wife — who also married young — took us under their wing. They mentored us and helped our marriage succeed by providing
| | |
| 6 | | Semi-Annual Report | December 31, 2018 (Unaudited) |
| | | | |
| LETTER FROM THE INVESTMENT MANAGEMENT TEAM(continued) | | | | |
premarital counseling, as well as remaining a resource for us whenever we encountered challenges during the early years of our marriage. Together, my husband and I applied the knowledge they shared and were able to work through problems that many couples face in the areas of communication, intimacy, and even deep-rooted issues that dealt with loss and grief.
From this experience, my husband and I developed a passion for helping other young couples entering into marriage. In 1995, we moved into our first home and discovered that many of our neighbors were experiencing marital challenges. We reached out to them, inviting them into our home once a month for informal, small-group meetings to share topics related to marriage. During these conversations, we could share our experiences and knowledge on various topics, such as building trust, resolving differences, and forgiveness, in an effort to encourage and empower relationships. These gatherings led us to launchHeaven on Earth Marriage Ministry, which continues to this day.
Since beginning the ministry, my husband and I have mentored numerous young married couples. We continued our education to become faith-based counselors, as well as certified facilitators of premarital counseling. In addition to our personal work throughHeaven on Earth, we have served as part of the marriage ministry in our local church and community for more than 20 years. We also facilitate premarital classes at the Houston Pregnancy Help Center, where I’ve been a volunteer for the past four years.
I can’t overemphasize the impact that marriage mentoring and counseling can have. We like to refer to it as “marriage maintenance.” Not only does it help couples build and maintain a healthy marriage, but it also empowers them to become role models for others and pass along their own success.
In our journey, we have witnessed countless instances of the powerful impact of marriage mentoring. For example, couples who have come from families where divorce is generational are now experiencing strong, enduring marriages because they have a resource to help them. One success story we have personally encountered is having the opportunity to mentor a young couple in their early 30s with a blended family that was having trouble communicating. We worked with them to implement effective communication skills and other strategies to use when challenges surface. Now that they are experiencing their own success in marriage, they are helping to mentor other couples. And that’s the whole goal for us — to build up other couples as positive role models who, in turn, help other couples maintain a healthy marriage relationship.
Against all odds, my husband and I are grateful to have celebrated 33 years of marriage on May 4, 2018. We now have two married adult children, two grandchildren, and two more on the way. We don’t take the longevity of our marriage for granted, and we continue to invest in our relationship. We also remain committed to the call of helping other young couples build strong, healthy marriages — which, in turn, helps create stronger, healthier communities.
| | |
| Aggressive Investors 1 Fund | |
|
| MANAGER’S COMMENTARY (Unaudited) |
| | |
December 31, 2018
Dear Fellow Aggressive Investors 1 Fund Shareholder,
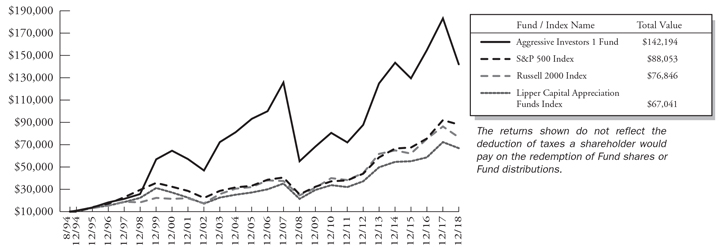
For the quarter ended December 31, 2018, our Fund returned-21.79%, underperforming our primary market benchmark, the S&P 500 Index(-13.52%), our peer benchmark, the Lipper Capital Appreciation Funds Index(-15.83%), and the Russell 2000 Index(-20.20%). It was a very poor quarter.
For the calendar year, our Fund returned-22.44%, significantly underperforming our primary market benchmark, the S&P 500 Index(-4.38%), our peer benchmark, the Lipper Capital Appreciation Funds Index(-7.41%), and the Russell 2000 Index(-11.01%).
The table below presents our December quarter,six-month,one-year, five-year,10-year,15-year, andinception-to-date financial results. See the next page for a graph of performance since inception.
Standardized Returns as of December 31, 2018
| | | | | | | | | | | | | | | | | | | | | | | | | | | | |
| | | | | | | | | | | | Annualized | | | | |
| | | Quarter | | | 6 Months | | 1 Year | | 5 Years | | 10 Years | | 15 Years | | Since Inception
(8/5/94) |
| | | | | | | |
Aggressive Investors 1 Fund | | | -21.79% | | | | -21.11% | | | | -22.44% | | | | 2.62% | | | | 9.93 | % | | | 4.60 | % | | | 11.49 | % |
S&P 500 Index | | | -13.52% | | | | -6.85% | | | | -4.38% | | | | 8.49% | | | | 13.12 | % | | | 7.77 | % | | | 9.29 | % |
Russell 2000 Index | | | -20.20% | | | | -17.35% | | | | -11.01% | | | | 4.41% | | | | 11.97 | % | | | 7.50 | % | | | 8.69 | % |
Lipper Capital Appreciation Funds Index | | | -15.83% | | | | -10.33% | | | | -7.41% | | | | 6.07% | | | | 12.07 | % | | | 7.46 | % | | | 8.03 | % |
Performance figures quoted in the table above represent past performance and are no guarantee of future results. Total return figures in the table above include the reinvestment of dividends and capital gains. The table above does not reflect the deduction of taxes that a shareholder would pay on Fund distributions or on the redemption of Fund shares.
The S&P 500 Index is a broad-based, unmanaged measurement of changes in stock market conditions, based on the average of 500 widely held common stocks with dividends reinvested. The Russell 2000 Index is an unmanaged, market value weighted index that measures performance of the 2,000 companies that are between the 1,000thand 3,000thlargest in the market with dividends reinvested. The Lipper Capital Appreciation Funds Index reflects the record of the 30 largest funds in the category of more aggressive domestic growth mutual funds, as reported by Lipper, Inc. It is not possible to invest directly in an index. Periods longer than one year are annualized.
| | |
| 8 | | Semi-Annual Report | December 31, 2018 (Unaudited) |
| | |
| Aggressive Investors 1 Fund | | |
| MANAGER’S COMMENTARY (Unaudited) (continued) | | |
| | |
Growth of a $10,000 Investment
from Inception August 5, 1994 to December 31, 2018
Detailed Explanation of Quarterly Performance
The December quarter was a“risk-off” quarter, in which investors sold off and drove down the prices of stocks they perceived to be risky. Many of these stocks are the type the Fund invests in, including smaller stocks, higher momentum stocks, and higher volatility stocks. This trend created significant headwinds for the Fund.
All three of our model categories underperformed the benchmark during the quarter, with our company financial health models lagging by the widest margin because of their selection of stocks with positive growth characteristics. Such stocks typically perform poorly in high-correlation quarters such as the one we just experienced. An overweighting in higher momentum stocks across all model categories also detracted from relative performance because investors favored stocks with negative momentum. Likewise, the Fund’s tilt toward smaller stocks hurt relative performance, as did the Fund’s overweighting in higher volatility stocks, which significantly lagged lower volatility stocks.
In contrast, the Fund’s overweighting in deeper value stocks across multiple value metrics boosted relative performance during the quarter, but not enough to offset the negative impacts of small size, momentum, high volatility, and high correlation.
From a sector perspective, the Fund’s allocation effect was negative. Underweightings in the Utilities, Real Estate, and Consumer Staples sectors detracted the most from relative results. The Fund’s stock selection effect was significantly negative. Every sector except for Utilities and Real Estate detracted from relative results, with holdings in the Energy, Industrials, Health Care, and Communication Services sectors delivering the worst performance.
Detailed Explanation of Calendar Year Performance
The Fund faced several headwinds during the year, particularly in the 4th quarter, due to a market environment that favored larger stocks over smaller stocks, growth stocks over value stocks, and lower volatility stocks over higher volatility stocks.
The Fund’s company financial health and value metrics models lagged the benchmark considerably during the year and detracted from relative results. A tilt toward smaller stocks also hurt relative performance, as did overweightings in higher beta and higher volatility stocks. Likewise, the Fund’s greater-than-benchmark exposure to deeper value stocks across multiple value metrics detracted from relative returns, as value stocks continued to lag growth stocks for most of the calendar year.
| | |
| Aggressive Investors 1 Fund | |
|
| MANAGER’S COMMENTARY (Unaudited) (continued) |
| | |
In contrast, the Fund’s price momentum models and an overweighting in higher momentum stocks across all model categories boosted relative results, but not enough to offset the negative performance generated by the Fund’s other design features.
From a sector perspective, the Fund’s allocation effect was slightly negative, with an overweighting in the Materials sector and an underweighting in the Health Care sector detracting the most from relative performance. The Fund’s selection effect was significantly negative, with all sectors except for Communication Services and Real Estate detracting from relative results. Poor performance from holdings in the Information Technology and Consumer Discretionary sectors detracted the most from relative performance.
Top Ten Holdings as of December 31, 2018
| | | | | | | | |
| Rank | | Description | | Industry | | % of Net
Assets | |
| 1 | | Zebra Technologies Corp., Class A | | Information Technology | | | 3.1% | |
| 2 | | HCA Healthcare, Inc. | | Health Care | | | 2.6% | |
| 3 | | Church & Dwight Co., Inc. | | Consumer Staples | | | 2.5% | |
| 4 | | Merck & Co., Inc. | | Health Care | | | 2.3% | |
| 5 | | Lam Research Corp. | | Information Technology | | | 2.2% | |
| 6 | | Applied Materials, Inc. | | Information Technology | | | 2.0% | |
| 7 | | Micron Technology, Inc. | | Information Technology | | | 2.0% | |
| 8 | | Fiat Chrysler Automobiles NV | | Consumer Discretionary | | | 1.9% | |
| 9 | | Credit Acceptance Corp. | | Financials | | | 1.6% | |
| 10 | | CenterPoint Energy, Inc. | | Utilities | | | 1.6% | |
| | | |
| | Total | | | | | 21.8% | |
Industry Sector Representation as of December 31, 2018
| | | | | | | | | | | | | | | |
| | | % of Net Assets | | % of S&P 500
Index | | Difference |
Communication Services | | | | 3.3 | % | | | | 10.1 | % | | | | -6.8% | |
Consumer Discretionary | | | | 16.6 | % | | | | 9.9 | % | | | | 6.7% | |
Consumer Staples | | | | 3.6 | % | | | | 7.4 | % | | | | -3.8% | |
Energy | | | | 5.8 | % | | | | 5.3 | % | | | | 0.5% | |
Financials | | | | 11.2 | % | | | | 13.3 | % | | | | -2.1% | |
Health Care | | | | 17.7 | % | | | | 15.5 | % | | | | 2.2% | |
Industrials | | | | 12.6 | % | | | | 9.2 | % | | | | 3.4% | |
Information Technology | | | | 19.6 | % | | | | 20.1 | % | | | | -0.5% | |
Materials | | | | 7.0 | % | | | | 2.7 | % | | | | 4.3% | |
Real Estate | | | | 0.0 | % | | | | 3.0 | % | | | | -3.0% | |
Utilities | | | | 2.4 | % | | | | 3.3 | % | | | | -0.9% | |
Cash & Other Assets | | | | 0.2 | % | | | | 0.2 | % | | | | 0.0% | |
| | | |
Total | | | | 100.0 | % | | | | 100.0 | % | | | | | |
Disclaimer
The views expressed here are exclusively those of Fund management. These views, including those related to market sectors or individual stocks, are not meant as investment advice and should not be considered predictive in nature. Any favorable (or unfavorable) description of a holding applies only as of the quarter end, December 31, 2018, unless otherwise stated. Security positions can and do change thereafter. Discussions of historical performance do not guarantee and may not be indicative of future performance.
Market volatility can significantly affect short-term performance. The Fund is not an appropriate investment for short-term investors. Investments in the small companies within thismulti-cap fund generally carry greater risk than is customarily associated
| | |
| 10 | | Semi-Annual Report | December 31, 2018 (Unaudited) |
| | |
| Aggressive Investors 1 Fund | | |
| MANAGER’S COMMENTARY (Unaudited) (continued) | | |
| | |
with larger companies. This additional risk is attributable to a number of factors, including the relatively limited financial resources that are typically available to small companies and the fact that small companies often have comparatively limited product lines. In addition, the stock of small companies tends to be more volatile than the stock of large companies, particularly in the short term and particularly in the early stages of an economic or market downturn. The Fund’s use of options, futures, and leverage can magnify the risk of loss in an unfavorable market, and the Fund’s use of short-sale positions can, in theory, expose shareholders to unlimited loss. Finally, the Fund exposes shareholders to “focus risk,” which may add to Fund volatility through the possibility that a single company could significantly affect total return. Shareholders of the Fund, therefore, are taking on more risk than they would if they invested in the stock market as a whole.
Conclusion
Thank you for your continued investment in Aggressive Investors 1 Fund. We encourage your feedback; your reactions and concerns are important to us.
Sincerely,
The Investment Management Team
| | |
| Aggressive Investors 1 Fund | |
|
| SCHEDULE OF INVESTMENTS (Unaudited) |
| Showing percentage of net assets as of December 31, 2018 | | |
| | | | | | |
| Industry Company | | Shares | | Value | | |
| |
COMMON STOCKS- 99.78% | | |
| Communication Services - 3.28% | | |
Charter Communications, Inc., Class A* | | 7,000 | | $1,994,790 | | |
DISH Network Corp., Class A* | | 62,000 | | 1,548,140 | | |
United States Cellular
Corp.* | | 33,300 | | 1,730,601 | | |
| | | | | | |
| | | | 5,273,531 | | |
| |
Consumer Discretionary - 16.63% | | |
Abercrombie & Fitch Co., | | | | | | |
Class A | | 89,300 | | 1,790,465 | | |
BJ’s Restaurants, Inc. | | 37,000 | | 1,871,090 | | |
Fiat Chrysler Automobiles | | | | | | |
NV* | | 215,000 | | 3,108,900 | | |
Lear Corp. | | 16,000 | | 1,965,760 | | |
LGI Homes, Inc.*+ | | 41,400 | | 1,872,108 | | |
Lululemon Athletica, Inc.* | | 19,300 | | 2,347,073 | | |
O’Reilly Automotive, Inc.* | | 6,200 | | 2,134,846 | | |
RH*+ | | 17,600 | | 2,108,832 | | |
Sonic Automotive, Inc., | | | | | | |
Class A | | 58,000 | | 798,080 | | |
Starbucks Corp. | | 28,000 | | 1,803,200 | | |
Tailored Brands, Inc.+ | | 75,000 | | 1,023,000 | | |
TJX Cos., Inc. (The) | | 37,600 | | 1,682,224 | | |
VF Corp. | | 24,800 | | 1,769,232 | | |
Vista Outdoor, Inc.* | | 65,000 | | 737,750 | | |
Winnebago Industries, Inc. | | 71,200 | | 1,723,752 | | |
| | | | | | |
| | | | | | |
| | | | 26,736,312 | | |
| |
Consumer Staples - 3.64% | | |
Church & Dwight Co., Inc. | | 60,300 | | 3,965,328 | | |
McCormick & Co., Inc., | | | | | | |
Non-Voting Shares | | 13,500 | | 1,879,740 | | |
| | | | | | |
| | | | 5,845,068 | | |
| |
Energy - 5.84% | | |
Apache Corp. | | 30,000 | | 787,500 | | |
CONSOL Energy, Inc.* | | 37,000 | | 1,173,270 | | |
CVR Energy, Inc. | | 49,200 | | 1,696,416 | | |
Denbury Resources, Inc.* | | 700,000 | | 1,197,000 | | |
Newfield Exploration Co.* | | 72,000 | | 1,055,520 | | |
Par Pacific Holdings, Inc.* | | 65,000 | | 921,700 | | |
PBF Energy, Inc., Class A | | 47,000 | | 1,535,490 | | |
Renewable Energy Group, Inc.* | | 40,000 | | 1,028,000 | | |
| | | | | | |
| | | | 9,394,896 | | |
| |
Financials - 11.16% | | |
Aflac, Inc. | | 41,800 | | 1,904,408 | | |
Ally Financial, Inc. | | 73,400 | | 1,663,244 | | |
Ameriprise Financial, Inc. | | 15,500 | | 1,617,735 | | |
Credit Acceptance Corp.* | | 6,900 | | 2,634,144 | | |
| | | | | | | | |
| Industry Company | | | Shares | | | | Value | |
| | |
| | | | | | | | |
Financials (continued) | | | | |
Enova International, Inc.* | | | 61,000 | | | | $1,187,060 | |
Progressive Corp. (The) | | | 32,000 | | | | 1,930,560 | |
Prudential Financial, Inc. | | | 22,000 | | | | 1,794,100 | |
Santander Consumer USA | | | | | | | | |
Holdings, Inc. | | | 105,000 | | | | 1,846,950 | |
Synchrony Financial | | | 80,000 | | | | 1,876,800 | |
Unum Group | | | 50,500 | | | | 1,483,690 | |
| | | | | | | | |
| | | | | | | 17,938,691 | |
Health Care - 17.68% | | | | |
AmerisourceBergen Corp. | | | 24,900 | | | | 1,852,560 | |
AMN Healthcare Services, | | | | | | | | |
Inc.* | | | 20,000 | | | | 1,133,200 | |
Centene Corp.* | | | 20,500 | | | | 2,363,650 | |
Cigna Corp. | | | 9,736 | | | | 1,849,061 | |
Eli Lilly & Co. | | | 16,700 | | | | 1,932,524 | |
Encompass Health Corp. | | | 29,000 | | | | 1,789,300 | |
Endo International PLC* | | | 142,800 | | | | 1,042,440 | |
Ensign Group, Inc. (The) | | | 62,000 | | | | 2,404,980 | |
Gilead Sciences, Inc. | | | 34,000 | | | | 2,126,700 | |
HCA Healthcare, Inc. | | | 33,800 | | | | 4,206,410 | |
Merck & Co., Inc. | | | 49,000 | | | | 3,744,090 | |
Thermo Fisher Scientific, | | | | | | | | |
Inc. | | | 8,600 | | | | 1,924,594 | |
WellCare Health Plans, Inc.* | | | 8,700 | | | | 2,053,983 | |
| | | | | | | | |
| | | | | | | 28,423,492 | |
Industrials - 12.55% | | | | |
Aerojet Rocketdyne | | | | | | | | |
Holdings, Inc.* | | | 46,000 | | | | 1,620,580 | |
ArcBest Corp. | | | 38,000 | | | | 1,301,880 | |
CSX Corp. | | | 26,500 | | | | 1,646,445 | |
Insperity, Inc. | | | 25,900 | | | | 2,418,024 | |
KAR Auction Services, Inc. | | | 38,000 | | | | 1,813,360 | |
NOW, Inc.* | | | 135,500 | | | | 1,577,220 | |
Quad/Graphics, Inc. | | | 50,000 | | | | 616,000 | |
Spirit Airlines, Inc.* | | | 38,400 | | | | 2,224,128 | |
Systemax, Inc. | | | 61,000 | | | | 1,457,290 | |
Tennant Co. | | | 15,000 | | | | 781,650 | |
United Continental Holdings, Inc.* | | | 30,000 | | | | 2,511,900 | |
United Rentals, Inc.* | | | 21,500 | | | | 2,204,395 | |
| | | | | | | | |
| | | | | | | 20,172,872 | |
Information Technology - 19.56% | | | | |
Alliance Data Systems Corp. | | | 11,300 | | | | 1,695,904 | |
Apple, Inc. | | | 16,000 | | | | 2,523,840 | |
Applied Materials, Inc. | | | 99,900 | | | | 3,270,726 | |
Cardtronics PLC, Class A* | | | 46,500 | | | | 1,209,000 | |
Fortinet, Inc.* | | | 26,300 | | | | 1,852,309 | |
Juniper Networks, Inc. | | | 81,000 | | | | 2,179,710 | |
| | |
| 12 | | Semi-Annual Report | December 31, 2018 (Unaudited) |
| | |
| Aggressive Investors 1 Fund | |
|
| SCHEDULE OF INVESTMENTS (Unaudited)(continued) |
| Showing percentage of net assets as of December 31, 2018 | | |
| | | | | | | | |
| Industry Company | | Shares | | Value | | | | |
Common Stocks (continued) | | | | | | |
Information Technology (continued) | | | | |
Lam Research Corp. | | 25,900 | | $ 3,526,803 | | | | |
Micron Technology, Inc.* | | 100,000 | | 3,173,000 | | | | |
Microsoft Corp. | | 17,000 | | 1,726,690 | | | | |
Seagate Technology PLC | | 52,900 | | 2,041,411 | | | | |
Unisys Corp.* | | 56,000 | | 651,280 | | | | |
Western Digital Corp. | | 27,000 | | 998,190 | | | | |
WEX, Inc.* | | 11,500 | | 1,610,690 | | | | |
Zebra Technologies Corp., Class A* | | 31,300 | | 4,983,899 | | | | |
| | | | | | | | |
| | | | 31,443,452 | | | | |
| | |
Materials - 6.99% | | | | |
Chemours Co. (The) | | 55,000 | | 1,552,100 | | | | |
Freeport-McMoRan, Inc. | | 164,800 | | 1,699,088 | | | | |
Packaging Corp. of America | | 20,900 | | 1,744,314 | | | | |
SunCoke Energy, Inc.* | | 201,300 | | 1,721,115 | | | | |
Teck Resources, Ltd., Class B+ | | 95,000 | | 2,046,300 | | | | |
Verso Corp., Class A* | | 38,000 | | 851,200 | | | | |
Westlake Chemical Corp. | | 24,500 | | 1,621,165 | | | | |
| | | | | | | | |
| | | | 11,235,282 | | | | |
| | |
Utilities - 2.45% | | | | |
CenterPoint Energy, Inc. | | 91,200 | | 2,574,576 | | | | |
New Jersey Resources Corp. | | 30,000 | | 1,370,100 | | | | |
| | | | | | | | |
| | | | 3,944,676 | | | | |
| | | | | | | | |
TOTAL COMMON STOCKS - 99.78% | | 160,408,272 | | | | |
| | | | | | | | |
(Cost $184,862,799) | | | | | | | | |
| | | | | | | | | | |
| | | | | |
| | | Rate^ | | Shares | | Value | | | | |
| | |
MONEY MARKET FUND - 0.05% | | | | |
Fidelity Investments Money Market Government Portfolio Class I | | 2.25% | | 76,302 | | 76,302 | | | | |
| | | | | | | | | | |
TOTAL MONEY MARKET FUND - 0.05% | | 76,302 | | | | |
| | | | | | | | | | |
(Cost $76,302) | | | | | | |
| | | | | | |
| | | | | | | | |
| | | Rate^ | | Shares | | Value | | |
| |
| INVESTMENTS PURCHASED WITH CASH PROCEEDS FROM SECURITIESLENDING - 1.71% | | |
Fidelity Investments Money Market Government Portfolio Class I** | | 2.25% | | 2,746,838 | | $2,746,838 | | |
| | | | | | | | |
TOTAL INVESTMENTS PURCHASED WITH CASH PROCEEDS FROM SECURITIES LENDING - 1.71% | | 2,746,838 | | |
| | | | | | | | |
(Cost $2,746,838) | | | | |
TOTAL INVESTMENTS - 101.54% | | $163,231,412 | | |
(Cost $187,685,939) | | | | |
Liabilities in Excess of Other Assets - (1.54%) | | (2,469,575) | | |
| | | | | | | | |
NET ASSETS - 100.00% | | $160,761,837 | | |
| | | | | | | | |
* Non-income producing security. ** This security represents the investment of the collateral received in connection with securities out on loan as of December 31, 2018. ^ Rate disclosed as of December 31, 2018. + This security or a portion of the security is out on loan as of December 31, 2018. Total loaned securities had a value of $2,649,094 as of December 31, 2018. PLC - Public Limited Company Summary of inputs used to value the Fund’s investments as of 12/31/2018 (See Note 2 in Notes to Financial Statements): | | |
| | | | | | | | | | | | | | | | | | | | |
| | |
| | | Valuation Inputs | | | | |
| | | Investment in Securities (Value) | | | | |
| | | Level 1
Quoted
Prices | | | Level 2
Significant
Observable Inputs | | | Level 3
Significant
Unobservable
Inputs | | | Total | | | | |
Common Stocks (a) | | | $160,408,272 | | | | $ — | | | | $ — | | | | $160,408,272 | | | | | |
Money Market Fund | | | — | | | | 76,302 | | | | — | | | | 76,302 | | | | | |
Investments Purchased with Cash Proceeds from Securities Lending | | | — | | | | 2,746,838 | | | | — | | | | 2,746,838 | | | | | |
| | | | | | | | | | | | | | | | | | | | |
TOTAL | | | $160,408,272 | | | | $2,823,140 | | | | $ — | | | | $163,231,412 | | | | | |
| | | | | | | | | | | | | | | | | | | | |
| (a) | - Please refer to the Schedule of Investments for the industry classifications of these portfolio holdings. |
See Notes to Financial Statements.
| | |
Ultra-Small Company Fund | |
|
MANAGER’S COMMENTARY (Unaudited) |
| | |
December 31, 2018
Dear Fellow Ultra-Small Company Fund Shareholder,
For the quarter ended December 31, 2018, our Fund returned-22.64%, outperforming our primary market benchmark, the CRSPCap-Based Portfolio 10 Index(-26.17%). The Fund lagged our peer benchmark, the LipperMicro-Cap Stock Funds Index(-21.82%), as well as the Russell 2000 Index(-20.20%) and the Russell Microcap Index(-22.14%). Results in this quarter were mixed.
For the calendar year, our Fund returned-15.68%, outperforming the CRSPCap-Based Portfolio 10 Index(-16.29%). It under-performed the LipperMicro-Cap Stock Funds Index(-12.47%), the Russell 2000 Index(-11.01%) and the Russell Microcap Index(-13.08%).
The table below presents our December quarter,six-month,one-year, five-year,10-year,15-year, andinception-to-date financial results. See the next page for a graph of performance since inception.
Standardized Returns as of December 31, 2018
| | | | | | | | | | | | | | | | | | | | | | | | | | |
| | | | | | | | | | | | Annualized | | | |
| | | Quarter | | | 6 Months | | | 1 Year | | | 5 Years | | | 10 Years | | | 15 Years | | | Since Inception
(8/5/94) |
| | | | | | | |
Ultra-Small Company Fund | | | -22.64% | | | | -20.64% | | | | -15.68% | | | | -3.58% | | | | 9.76% | | | | 4.90% | | | 12.24% |
CRSPCap-Based Portfolio 10 Index | | | -26.17% | | | | -26.32% | | | | -16.29% | | | | 1.00% | | | | 14.40% | | | | 6.87% | | | 10.79% |
Russell 2000 Index | | | -20.20% | | | | -17.35% | | | | -11.01% | | | | 4.41% | | | | 11.97% | | �� | | 7.50% | | | 8.69% |
Russell Microcap Index | | | -22.14% | | | | -21.49% | | | | -13.08% | | | | 3.08% | | | | 11.71% | | | | 5.67% | | | N/A |
LipperMicro-Cap Stock Funds Index | | | -21.82% | | | | -19.78% | | | | -12.47% | | | | 2.78% | | | | 12.39% | | | | 6.42% | | | N/A |
Performance figures quoted in the table above represent past performance and are no guarantee of future results. Total return figures in the table above include the reinvestment of dividends and capital gains. The table above does not reflect the deduction of taxes that a shareholder would pay on Fund distributions or on the redemption of Fund shares.
The CRSPCap-Based Portfolio 10 Index is an unmanaged index of 725 of the smallest publicly traded U.S. stocks (with dividends reinvested), as reported by the Center for Research in Security Prices. The Russell Microcap Index is an unmanaged, market value weighted index that measures performance of 1,000 of the smallest securities in the Russell 2000 Index. The Russell 2000 Index is an unmanaged, market value weighted index that measures performance of the 2,000 companies that are between the 1,000thand 3,000thlargest in the market (with dividends reinvested). The LipperMicro-Cap Stock Funds Index is an index ofmicro-cap funds compiled by Lipper, Inc. It is not possible to invest directly in an index. Periods longer than one year are annualized.
| | |
| 14 | | Semi-Annual Report | December 31, 2018 (Unaudited) |
| | |
| Ultra-Small Company Fund | | |
| MANAGER’S COMMENTARY (Unaudited) (continued) | | |
| | |
Growth of a $10,000 Investment
from Inception August 5, 1994 to December 31, 2018
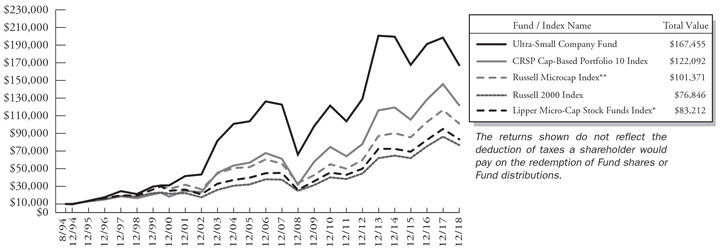
| * | The LipperMicro-Cap Stock Funds Index began on 12/31/1995, and the line graph for the Index begins at the same value as the Fund on that date. |
| ** | The Russell Microcap Index began on 6/30/2000, and the line graph for the Index begins at the same value as the Fund on that date. |
Detailed Explanation of Quarterly Performance
The Fund’s company financial health and value metrics models outperformed the benchmark during the quarter and helped relative performance. However, our diversifying price momentum models lagged the benchmark and offset some of this positive impact. The Fund’s tilt toward deeper value stocks across multiple value metrics also boosted the Fund’s return relative to the CRSP 10 Index, as did an underweighting in lower-momentum stocks.
The Fund held approximately 18% of its assets, on average, in stocks that had appreciated into CRSP 9. The Fund’s holdings in CRSP 9 outperformed the CRSP 10 benchmark during the quarter, adding to relative return.
From a sector perspective, the Fund’s allocation effect was slightly positive, due largely to an underweighting in the Energy sector and an overweighting in the Information Technology sector. The Fund’s selection effect was significantly positive, with holdings in the Health Care sector boosting relative results the most.
| | |
| Ultra-Small Company Fund | |
|
| MANAGER’S COMMENTARY (Unaudited)(continued) |
| | |
The table below presents index performance numbers for stocks in the different CRSP deciles during various time periods.
| | | | | | | | | | | | | | | | | | | | | | | | |
| | | | | | | | | | | | Annualized | |
| CRSP Decile1 | | Quarter | | | 6 Months | | | 1 Year | | | 5 Years | | | 10 Years | | | 93 Years | |
1 (ultra-large) | | | -13.31% | | | | -6.07% | | | | -2.93% | | | | 8.87% | | | | 12.80% | | | | 9.30% | |
2 | | | -14.07% | | | | -9.27% | | | | -8.25% | | | | 7.27% | | | | 14.32% | | | | 10.41% | |
3 | | | -17.67% | | | | -13.12% | | | | -9.77% | | | | 6.81% | | | | 14.54% | | | | 10.90% | |
4 | | | -17.67% | | | | -14.07% | | | | -9.92% | | | | 4.37% | | | | 13.78% | | | | 10.68% | |
5 | | | -18.80% | | | | -15.07% | | | | -11.16% | | | | 3.21% | | | | 13.49% | | | | 11.21% | |
6 | | | -19.91% | | | | -18.22% | | | | -13.88% | | | | 3.48% | | | | 13.54% | | | | 11.17% | |
7 | | | -21.09% | | | | -15.11% | | | | -7.21% | | | | 6.07% | | | | 14.92% | | | | 11.41% | |
8 | | | -22.02% | | | | -18.54% | | | | -10.35% | | | | 2.79% | | | | 13.88% | | | | 11.27% | |
9 | | | -21.19% | | | | -19.94% | | | | -8.82% | | | | 4.09% | | | | 14.23% | | | | 11.32% | |
10 (ultra-small) | | | -26.17% | | | | -26.32% | | | | -16.29% | | | | 1.00% | | | | 14.40% | | | | 12.93% | |
| 1 | Performance figures are as of the period ended December 31, 2018. The CRSPCap-Based Portfolio Indexes are unmanaged indexes of publicly traded U.S. stocks with dividends reinvested, grouped by market capitalization, as reported by the Center for Research in Security Prices. Past performance is no guarantee of future results. |
Detailed Explanation of Calendar Year Performance
The Fund’s value metrics and company financial health models contributed positively to relative performance for the calendar year. However, this impact was partially offset by underperformance of the Fund’s price momentum models. The Fund’s tilt toward deeper value stocks across multiple value metrics also helped relative returns, as did an underweighting in lower-momentum stocks.
The Fund held approximately 12% of its assets, on average, in stocks that had appreciated into CRSP 9 during the year. The Fund’s holdings in CRSP 9 underperformed the CRSP 10 benchmark, detracting from relative returns.
From a sector perspective, the Fund’s allocation effect was slightly positive, with an underweighting in the Energy sector and an overweighting in the Information Technology sector contributing the most to relative returns. The Fund’s selection effect was also positive, with holdings in the Health Care sector providing a particularly large boost to relative performance.
Top Ten Holdings as of December 31, 2018
| | | | | | | | |
Rank | | Description | | Industry | |
| % of Net
Assets |
|
| 1 | | KCAP Financial, Inc. | | Financials | | | 2.8% | |
| 2 | | SeaSpine Holdings Corp. | | Health Care | | | 2.3% | |
| 3 | | FedNat Holding Co. | | Financials | | | 2.1% | |
| 4 | | inTEST Corp. | | Information Technology | | | 2.1% | |
| 5 | | RTI Surgical, Inc. | | Health Care | | | 2.1% | |
| 6 | | Rocky Brands, Inc. | | Consumer Discretionary | | | 2.0% | |
| 7 | | RF Industries, Ltd. | | Information Technology | | | 1.9% | |
| 8 | | Enphase Energy, Inc. | | Industrials | | | 1.9% | |
| 9 | | Inseego Corp. | | Information Technology | | | 1.9% | |
| 10 | | TravelCenters of America, LLC | | Consumer Discretionary | | | 1.9% | |
| | Total | | | | | 21.0% | |
| | |
| 16 | | Semi-Annual Report | December 31, 2018 (Unaudited) |
| | |
| Ultra-Small Company Fund | | |
| MANAGER’S COMMENTARY (Unaudited)(continued) | | |
| | |
Industry Sector Representation as of December 31, 2018
| | | | | | | | | | | | |
| | | |
| | | % of Net Assets | | | % of CRSP 10 Index | | | Difference | |
Communication Services | | | 4.3% | | | | 3.6% | | | | 0.7% | |
Consumer Discretionary | | | 15.8% | | | | 11.7% | | | | 4.1% | |
Consumer Staples | | | 4.8% | | | | 2.4% | | | | 2.4% | |
Energy | | | 5.2% | | | | 8.9% | | | | -3.7% | |
Financials | | | 19.7% | | | | 26.2% | | | | -6.5% | |
Health Care | | | 19.6% | | | | 17.4% | | | | 2.2% | |
Industrials | | | 11.0% | | | | 10.8% | | | | 0.2% | |
Information Technology | | | 17.0% | | | | 12.7% | | | | 4.3% | |
Materials | | | 2.4% | | | | 2.6% | | | | -0.2% | |
Real Estate | | | 0.3% | | | | 2.0% | | | | -1.7% | |
Utilities | | | 0.1% | | | | 1.7% | | | | -1.6% | |
Liabilities in Excess of Other Assets | | | -0.2% | | | | 0.0% | | | | -0.2% | |
Total | | | 100.0% | | | | 100.0% | | | | | |
Disclaimer
The views expressed here are exclusively those of Fund management. These views, including those related to market sectors or individual stocks, are not meant as investment advice and should not be considered predictive in nature. Any favorable (or unfavorable) description of a holding applies only as of the quarter end, December 31, 2018, unless otherwise stated. Security positions can and do change thereafter. Discussions of historical performance do not guarantee and may not be indicative of future performance.
The Fund is subject to very high, above market risk (volatility) and is not an appropriate investment for short-term investors. Investments in ultra-small companies generally carry greater risk than is customarily associated with larger companies and even “small companies” for various reasons, such as narrower markets (fewer investors), limited financial resources, and greater trading difficulty.
Conclusion
Ultra-Small Company Fund remains closed to new investors. We encourage your feedback; your reactions and concerns are important to us.
Sincerely,
The Investment Management Team
| | |
| Ultra-Small Company Fund | |
|
| SCHEDULE OF INVESTMENTS (Unaudited) |
Showing percentage of net assets as of December 31, 2018 | | |
| | | | | | | | |
| Industry Company | | Shares | | Value | | | | |
| | |
COMMON STOCKS - 100.17% | | | | |
Communication Services - 4.26% | | | | |
Alaska Communications Systems Group, Inc.* | | 381,200 | | $ 548,928 | | | | |
DHI Group, Inc.* | | 137,600 | | 209,152 | | | | |
Marchex, Inc., Class B | | 18,600 | | 49,290 | | | | |
NII Holdings, Inc.*+ | | 298,800 | | 1,317,708 | | | | |
Ooma, Inc.* | | 56,900 | | 789,772 | | | | |
Travelzoo* | | 16,900 | | 166,127 | | | | |
| | | | | | | | |
| | | | 3,080,977 | | | | |
Consumer Discretionary - 15.78% | | | | |
AMCON Distributing Co. | | 2,100 | | 209,475 | | | | |
Build-A-Bear Workshop, Inc.* | | 16,500 | | 65,175 | | | | |
Century Casinos, Inc.*+ | | 147,600 | | 1,090,764 | | | | |
Charles & Colvard, Ltd.* | | 144,300 | | 122,655 | | | | |
China XD Plastics Co., Ltd.* | | 86,300 | | 151,888 | | | | |
Clarus Corp. | | 47,500 | | 480,700 | | | | |
Comstock Holding Cos, Inc.*+ | | 54,400 | | 91,392 | | | | |
Destination Maternity Corp.*+ | | 31,900 | | 90,596 | | | | |
Educational Development Corp. | | 62,000 | | 528,860 | | | | |
Francesca’s Holdings Corp.* | | 43,800 | | 42,521 | | | | |
Lakeland Industries, Inc.* | | 62,900 | | 656,676 | | | | |
Lincoln Educational Services Corp.*+ | | 49,564 | | 158,605 | | | | |
Live Ventures, Inc.*+ | | 7,302 | | 49,069 | | | | |
MasterCraft Boat Holdings, Inc.* | | 50,900 | | 951,830 | | | | |
ONE Group Hospitality, Inc. (The)*+ | | 27,400 | | 84,118 | | | | |
Rocky Brands, Inc. | | 56,100 | | 1,458,600 | | | | |
RTW RetailWinds, Inc.* | | 220,600 | | 624,298 | | | | |
Shiloh Industries, Inc.* | | 10,200 | | 59,466 | | | | |
Tilly’s, Inc., Class A | | 50,000 | | 543,000 | | | | |
TravelCenters of America, LLC* | | 360,900 | | 1,356,984 | | | | |
Tuesday Morning Corp.*+ | | 542,000 | | 921,400 | | | | |
Turtle Beach Corp.*+ | | 73,900 | | 1,054,553 | | | | |
Vince Holding Corp.*+ | | 59,900 | | 558,867 | | | | |
Vitamin Shoppe, Inc.*+ | | 11,600 | | 54,984 | | | | |
| | | | | | | | |
| | | | 11,406,476 | | | | |
Consumer Staples - 4.80% | | | | | | | | |
Lifevantage Corp.* | | 78,900 | | 1,040,691 | | | | |
Mannatech, Inc. | | 13,809 | | 259,609 | | | | |
Natural Alternatives International, Inc.* | | 26,300 | | 258,529 | | | | |
| | | | |
| Industry Company | | Shares | | Value |
| | | | |
Consumer Staples (continued) | | | | |
Natural Grocers by Vitamin | | | | |
Cottage, Inc.*+ | | 76,200 | | $1,168,146 |
Reliv International, Inc.* | | 26,939 | | 101,021 |
Village Super Market, Inc., Class A+ | | 24,000 | | 641,760 |
| | | | |
| | | | 3,469,756 |
Energy - 5.21% | | | | |
Approach Resources, Inc.* | | 48,900 | | 42,641 |
Basic Energy Services, Inc.*+ | | 77,300 | | 296,832 |
Dawson Geophysical Co.* | | 98,200 | | 331,916 |
Earthstone Energy, Inc., Class A* | | 73,500 | | 332,220 |
Enservco Corp.* | | 496,100 | | 183,488 |
ION Geophysical Corp.* | | 47,089 | | 243,921 |
Lonestar Resources US, Inc., Class A* | | 200,700 | | 732,555 |
Mitcham Industries, Inc.* | | 108,000 | | 276,480 |
NACCO Industries, Inc., Class A | | 1,800 | | 61,020 |
SilverBow Resources, Inc.* | | 22,500 | | 531,900 |
Superior Drilling Products, Inc.* | | 87,600 | | 102,492 |
TransAtlantic Petroleum, Ltd.* | | 482,400 | | 501,696 |
VAALCO Energy, Inc.* | | 85,700 | | 125,979 |
| | | | |
| | | | 3,763,140 |
Financials - 19.71% | | | | |
1347 Property Insurance | | | | |
Holdings, Inc.* | | 7,800 | | 31,356 |
ACNB Corp. | | 1,200 | | 47,100 |
A-Mark Precious Metals, Inc.+ | | 65,900 | | 776,961 |
AmeriServ Financial, Inc. | | 11,600 | | 46,748 |
Ashford, Inc.* | | 1,200 | | 62,280 |
C&F Financial Corp. | | 11,352 | | 604,040 |
Capitala Finance Corp. | | 184,000 | | 1,319,280 |
Central Federal Corp.* | | 4,800 | | 56,112 |
CM Finance, Inc. | | 112,400 | | 702,500 |
Codorus Valley Bancorp, Inc. | | 13,972 | | 296,905 |
Community West Bancshares | | 5,000 | | 50,150 |
Consumer Portfolio Services, Inc.* | | 435,100 | | 1,309,651 |
FedNat Holding Co. | | 76,700 | | 1,527,864 |
First Business Financial Services, Inc. | | 1,400 | | 27,314 |
| | |
| 18 | | Semi-Annual Report | December 31, 2018 (Unaudited) |
| | |
| Ultra-Small Company Fund | | |
| SCHEDULE OF INVESTMENTS (Unaudited)(continued) | | |
| Showing percentage of net assets as of December 31, 2018 | | |
| | | | | | | | |
| Industry Company | | Shares | | Value | | | | |
| | |
Common Stocks (continued) | | | | |
Financials (continued) | | | | |
First Savings Financial Group, Inc.+ | | 1,100 | | $ 57,134 | | | | |
First United Corp. | | 10,100 | | 160,792 | | | | |
GAIN Capital Holdings, Inc.+ | | 178,400 | | 1,098,944 | | | | |
Hallmark Financial Services, Inc.* | | 5,000 | | 53,450 | | | | |
Horizon Technology Finance Corp. | | 71,300 | | 802,125 | | | | |
Impac Mortgage Holdings, Inc.*+ | | 77,081 | | 291,366 | | | | |
KCAP Financial, Inc.+ | | 581,500 | | 2,011,990 | | | | |
Kingstone Cos, Inc. | | 20,400 | | 360,876 | | | | |
Manning & Napier, Inc.+ | | 106,100 | | 186,736 | | | | |
National Holdings Corp.* | | 80,400 | | 217,080 | | | | |
Northeast Bancorp | | 39,100 | | 654,143 | | | | |
Northrim BanCorp, Inc. | | 2,500 | | 82,175 | | | | |
Ohio Valley Banc Corp.+ | | 1,200 | | 42,468 | | | | |
Provident Financial Holdings, Inc. | | 2,800 | | 43,400 | | | | |
Pzena Investment Management, Inc., Class A+ | | 27,000 | | 233,550 | | | | |
SB Financial Group, Inc. | | 17,422 | | 286,592 | | | | |
Security National Financial Corp., Class A* | | 82,223 | | 424,271 | | | | |
Shore Bancshares, Inc. | | 21,200 | | 308,248 | | | | |
Solar Senior Capital, Ltd. | | 4,800 | | 72,576 | | | | |
| | | | | | | | |
| | | | 14,246,177 | | | | |
Health Care - 19.58% | | | | |
Aduro Biotech, Inc.* | | 109,100 | | 288,024 | | | | |
Aeterna Zentaris, Inc.* | | 111,000 | | 326,340 | | | | |
Allied Healthcare Products, Inc.* | | 66,481 | | 132,962 | | | | |
Alphatec Holdings, Inc.*+ | | 43,900 | | 100,531 | | | | |
American Shared Hospital Services* | | 101,400 | | 241,332 | | | | |
Aravive, Inc.* | | 11,500 | | 40,480 | | | | |
Bioanalytical Systems, Inc.* | | 121,110 | | 153,810 | | | | |
Castlight Health, Inc., Class B* | | 347,300 | | 753,641 | | | | |
Cumberland Pharmaceuticals, Inc.* | | 16,400 | | 103,320 | | | | |
CynergisTek, Inc.*+ | | 109,000 | | 516,660 | | | | |
Digirad Corp. | | 440,900 | | 251,313 | | | | |
Electromed, Inc.* | | 207,638 | | 1,056,877 | | | | |
Enzo Biochem, Inc.* | | 86,000 | | 239,080 | | | | |
Harrow Health, Inc.* | | 43,100 | | 245,239 | | | | |
Harvard Bioscience, Inc.* | | 420,700 | | 1,337,826 | | | | |
InfuSystem Holdings, Inc.* | | 273,798 | | 941,865 | | | | |
| | | | | | | | |
| Industry Company | | Shares | | Value | | | | |
| | |
Health Care (continued) | | | | |
InVivo Therapeutics Holdings Corp.*+ | | 25,000 | | $ 37,750 | | | | |
IRIDEX Corp.* | | 10,700 | | 50,290 | | | | |
Kewaunee Scientific Corp. | | 12,600 | | 418,824 | | | | |
Medical Transcription Billing Corp.* | | 28,000 | | 106,400 | | | | |
Misonix, Inc.* | | 51,700 | | 827,717 | | | | |
NantHealth, Inc.* | | 60,900 | | 33,142 | | | | |
Nuvectra Corp.* | | 64,300 | | 1,050,662 | | | | |
Onconova Therapeutics, Inc.* | | 14,200 | | 29,962 | | | | |
Pro-Dex, Inc.*+ | | 45,000 | | 543,600 | | | | |
RTI Surgical, Inc.* | | 402,190 | | 1,488,103 | | | | |
SeaSpine Holdings Corp.* | | 92,900 | | 1,694,496 | | | | |
SunLink Health Systems, Inc.* | | 4,700 | | 5,358 | | | | |
Veracyte, Inc.*+ | | 76,200 | | 958,596 | | | | |
Vical, Inc.* | | 87,496 | | 103,245 | | | | |
XOMA Corp.*+ | | 5,608 | | 70,941 | | | | |
| | | | | | | | |
| | | | 14,148,386 | | | | |
| | |
Industrials - 11.04% | | | | |
ARC Document Solutions, Inc.* | | 33,000 | | 67,650 | | | | |
Avalon Holdings Corp., Class A* | | 14,700 | | 38,955 | | | | |
BG Staffing, Inc. | | 18,900 | | 390,285 | | | | |
Chicago Rivet & Machine Co. | | 1,900 | | 59,850 | | | | |
CompX International, Inc. | | 1,620 | | 22,048 | | | | |
Continental Materials Corp.* | | 4,150 | | 44,866 | | | | |
DMC Global, Inc. | | 8,300 | | 291,496 | | | | |
Ecology and Environment, Inc., Class A | | 43,732 | | 495,921 | | | | |
Enphase Energy, Inc.*+ | | 291,600 | | 1,379,268 | | | | |
Fuel Tech, Inc.* | | 49,500 | | 58,905 | | | | |
General Finance Corp.* | | 3,100 | | 31,341 | | | | |
Houston Wire & Cable Co.* | | 9,800 | | 49,588 | | | | |
Hudson Global, Inc.* | | 20,184 | | 27,248 | | | | |
Hurco Cos, Inc. | | 2,600 | | 92,820 | | | | |
Jason Industries, Inc.* | | 291,400 | | 399,218 | | | | |
LB Foster Co., Class A* | | 43,100 | | 685,290 | | | | |
LS Starrett Co. (The), Class A* | | 32,300 | | 168,929 | | | | |
LSI Industries, Inc. | | 100,700 | | 319,219 | | | | |
Orion Group Holdings, Inc.* | | 22,400 | | 96,096 | | | | |
Quest Resource Holding Corp.*+ | | 22,000 | | 29,920 | | | | |
Radiant Logistics, Inc.* | | 306,600 | | 1,303,050 | | | | |
Safe Bulkers, Inc.* | | 55,200 | | 98,256 | | | | |
| | |
| Ultra-Small Company Fund | |
|
| SCHEDULE OF INVESTMENTS (Unaudited)(continued) |
| Showing percentage of net assets as of December 31, 2018 | | |
| | | | | | | | |
| Industry Company | | Shares | | Value | | | | |
| | |
Common Stocks (continued) | | | | |
Industrials (continued) | | | | |
Transcat, Inc.* | | 19,300 | | $ 367,086 | | | | |
USA Truck, Inc.* | | 18,300 | | 273,951 | | | | |
Virco Manufacturing Corp. | | 17,600 | | 75,504 | | | | |
Volt Information Sciences, Inc.* | | 87,600 | | 188,340 | | | | |
Willdan Group, Inc.* | | 16,800 | | 587,664 | | | | |
Willis Lease Finance Corp.* | | 9,600 | | 332,160 | | | | |
| | | | | | | | |
| | | | 7,974,924 | | | | |
Information Technology - 17.04% | | | | |
Aviat Networks, Inc.* | | 72,913 | | 966,097 | | | | |
Bel Fuse, Inc., Class B | | 3,400 | | 62,628 | | | | |
Blonder Tongue Laboratories, Inc.*+ | | 290,100 | | 320,561 | | | | |
Computer Task Group, Inc.* | | 37,100 | | 151,368 | | | | |
DASAN Zhone Solutions, Inc.* | | 12,300 | | 171,093 | | | | |
Digital Turbine, Inc.* | | 63,600 | | 116,388 | | | | |
Finjan Holdings, Inc.* | | 445,600 | | 1,118,456 | | | | |
Inseego Corp.*+ | | 330,500 | | 1,371,575 | | | | |
Intermolecular, Inc.* | | 113,100 | | 114,231 | | | | |
inTEST Corp.* | | 243,000 | | 1,489,590 | | | | |
Iteris, Inc.* | | 184,402 | | 687,819 | | | | |
Lantronix, Inc.* | | 53,500 | | 157,290 | | | | |
Luna Innovations, Inc.* | | 306,430 | | 1,026,541 | | | | |
Marin Software, Inc.*+ | | 21,030 | | 111,669 | | | | |
Napco Security Technologies, Inc.* | | 21,400 | | 337,050 | | | | |
Net Element, Inc.*+ | | 37,600 | | 215,072 | | | | |
NetSol Technologies, Inc.* | | 35,000 | | 215,250 | | | | |
Optical Cable Corp.*+ | | 20,100 | | 76,581 | | | | |
PC-Tel, Inc. | | 87,900 | | 377,091 | | | | |
PRGX Global, Inc.* | | 17,800 | | 168,566 | | | | |
RF Industries, Ltd.+ | | 193,898 | | 1,407,699 | | | | |
Richardson Electronics, Ltd. | | 23,400 | | 203,346 | | | | |
Schmitt Industries, Inc.*+ | | 70,802 | | 199,662 | | | | |
Smith Micro Software, Inc.*+ | | 55,500 | | 99,900 | | | | |
Synacor, Inc.* | | 26,000 | | 38,480 | | | | |
TESSCO Technologies, Inc. | | 49,200 | | 590,400 | | | | |
TransAct Technologies, Inc. | | 57,900 | | 519,942 | | | | |
| | | | | | | | |
| | | | 12,314,345 | | | | |
Materials - 2.35% | | | | |
China Advanced Construction Materials Group, Inc*+ | | 15,700 | | 40,820 | | | | |
Friedman Industries, Inc. | | 71,800 | | 506,190 | | | | |
Gulf Resources, Inc.* | | 536,800 | | 423,482 | | | | |
Olympic Steel, Inc. | | 15,200 | | 216,904 | | | | |
Synalloy Corp. | | 6,300 | | 104,517 | | | | |
UFP Technologies, Inc.* | | 3,500 | | 105,140 | | | | |
| | | | | | |
| Industry Company | | Shares | | Value | | |
| |
| | |
Materials (continued) | | |
Universal Stainless & Alloy Products, Inc.* | | 18,500 | | $ 299,885 | | |
| | | | | | |
| | | | 1,696,938 | | |
| |
Real Estate - 0.31% | | |
Griffin Industrial Realty, Inc. | | 7,000 | | 223,300 | | |
| |
Utilities - 0.09% | | |
Genie Energy, Ltd., Class B | | 11,100 | | 66,933 | | |
| | | | | | |
| | |
TOTAL COMMON STOCKS - 100.17% | | 72,391,352 | | |
| | | | | | |
| |
(Cost $83,587,529) | | |
| | | | | | |
| | | Rate^ | | Shares | | Value |
|
| INVESTMENTS PURCHASED WITH CASH PROCEEDS FROM SECURITIES LENDING - 10.12% |
Fidelity Investments Money Market Government Portfolio Class I** | | 2.25% | | 7,314,718 | | 7,314,718 |
| | | | | | |
TOTAL INVESTMENTS PURCHASED WITH CASH PROCEEDS FROM SECURITIES LENDING - 10.12% | | 7,314,718 |
| | | | | | |
(Cost $7,314,718) | | |
| | |
TOTAL INVESTMENTS -110.29% | | | | $79,706,070 |
(Cost $90,902,247) | | | | | | |
Liabilities in Excess of Other Assets - (10.29%) | | (7,439,293) |
| | | | | | |
NET ASSETS - 100.00% | | | | | | $ 72,266,777 |
| | | | | | |
| * | Non-income producing security. |
| ** | This security represents the investment of the collateral received in connection with securities out on loan as of December 31, 2018. |
| ^ | Rate disclosed as of December 31, 2018. |
| + | This security or a portion of the security is out on loan as of December 31, 2018. Total loaned securities had a value of $7,088,959 as of December 31, 2018. |
LLC - Limited Liability Company
| | |
| 20 | | Semi-Annual Report | December 31, 2018 (Unaudited) |
| | |
| Ultra-Small Company Fund | | |
| SCHEDULE OF INVESTMENTS (Unaudited)(continued) | | |
Showing percentage of net assets as of December 31, 2018 | | |
| | | | | | | | | | | | | | | | | | |
| Summary of inputs used to value the Fund’s investments as of 12/31/2018 (See Note 2 in Notes to Financial Statements): | | | |
| | |
| | | Valuation Inputs | | | |
| | | Investment in Securities (Value) | | | |
| | | Level 1 Quoted Prices | | | Level 2 Significant
Observable Inputs | | | Level 3 Significant Unobservable
Inputs | | | Total | | | |
Common Stocks (a) | | $ | 72,391,352 | | | $ | — | | | $ | — | | | $ | 72,391,352 | | | |
Investments Purchased with Cash Proceeds from Securities Lending | | | — | | | | 7,314,718 | | | | — | | | | 7,314,718 | | | |
| | | | | | | | | | | | | | | | | | |
TOTAL | | $ | 72,391,352 | | | $ | 7,314,718 | | | $ | — | | | $ | 79,706,070 | | | |
| | | | | | | | | | | | | | | | | | |
(a) - Please refer to the Schedule of Investments for the industry classifications of these portfolio holdings. See Notes to Financial Statements. | | | |
| | |
| Ultra-Small Company Market Fund | |
|
| MANAGER’S COMMENTARY (Unaudited) |
| | |
December 31, 2018
Dear Fellow Ultra-Small Company Market Fund Shareholder,
For the quarter ended December 31, 2018, our Fund returned-25.39%, outperforming our primary market benchmark, the CRSPCap-Based Portfolio 10 Index(-26.17%). However, our Fund underperformed our peer benchmark, the LipperMicro-Cap Stock Funds Index(-21.82%), as well as the Russell 2000 Index(-20.20%) and the Russell Microcap Index(-22.14%). Results in this quarter were mixed.
For the calendar year, our Fund returned-17.12%. Our Fund trailed the CRSPCap-Based Portfolio 10 Index(-16.29%), the LipperMicro-Cap Stock Funds Index(-12.47%), the Russell 2000 Index(-11.01%) and the Russell Microcap Index(-13.08%).
The table below presents our December quarter,six-month,one-year, five-year,10-year,15-year, andinception-to-date financial results. See the next page for a graph of performance since inception.
Standardized Returns as of December 31, 2018
| | | | | | | | | | | | | | | | | | | | | | | | | | | | |
| | | | | | | | | | | | Annualized | | | | |
| | | Quarter | | 6 Months | | 1 Year | | | 5 Years | | 10 Years | | 15 Years | | Since Inception
(7/31/97) |
Ultra-Small Company Market Fund | | | -25.39 | % | | | -25.25 | % | | | -17.12 | % | | | 1.67 | % | | | 11.03 | % | | | 5.62 | % | | | 9.41 | % |
CRSPCap-Based Portfolio 10 Index | | | -26.17 | % | | | -26.32 | % | | | -16.29 | % | | | 1.00 | % | | | 14.40 | % | | | 6.87 | % | | | 9.53 | % |
Russell 2000 Index | | | -20.20 | % | | | -17.35 | % | | | -11.01 | % | | | 4.41 | % | | | 11.97 | % | | | 7.50 | % | | | 7.07 | % |
Russell Microcap Index | | | -22.14 | % | | | -21.49 | % | | | -13.08 | % | | | 3.08 | % | | | 11.71 | % | | | 5.67 | % | | | N/A | |
LipperMicro-Cap Stock Funds Index | | | -21.82 | % | | | -19.78 | % | | | -12.47 | % | | | 2.78 | % | | | 12.39 | % | | | 6.42 | % | | | 7.20 | % |
Performance figures quoted in the table above represent past performance and are no guarantee of future results. Total return figures in the table above include the reinvestment of dividends and capital gains. The table above does not reflect the deduction of taxes that a shareholder would pay on Fund distributions or on the redemption of Fund shares.
The CRSPCap-Based Portfolio 10 Index is an unmanaged index of 725 of the smallest publicly traded U.S. stocks with dividends reinvested, as reported by the Center for Research in Security Prices. The Russell Microcap Index is an unmanaged, market value weighted index that measures performance of 1,000 of the smallest securities in the Russell 2000 Index. The Russell 2000 Index is an unmanaged, market value weighted index that measures performance of the 2,000 companies that are between the 1,000thand 3,000thlargest in the market with dividends reinvested. The LipperMicro-Cap Stock Funds Index is an index ofmicro-cap funds compiled by Lipper, Inc. It is not possible to invest directly in an index. Periods longer than one year are annualized.
| | |
| 22 | | Semi-Annual Report | December 31, 2018 (Unaudited) |
| | |
| Ultra-Small Company Market Fund | | |
| MANAGER’S COMMENTARY (Unaudited)(continued) | | |
| | |
Growth of a $10,000 Investment
from Inception July 31, 1997 to December 31, 2018
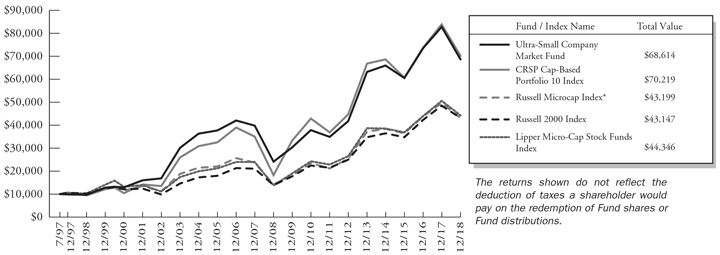
| * | The Russell Microcap Index began on 6/30/2000, and the line graph for the Index begins at the same value as the Fund on that date. |
Detailed Explanation of Quarterly Performance
The Fund held about 18% of its assets, on average, in stocks that had appreciated into CRSP 9 during the quarter. CRSP 9 stocks outperformed the benchmark, helping the Fund’s relative performance. The Fund’s sidestepping strategies, which eliminated exposure to stocks with high probability of steep price decline, major financial distress or bankruptcy, also helped performance against the benchmark.
From a sector perspective, the Fund’s selection effect was positive, driven primarily by strong performance from holdings in the Health Care sector.
The table below presents index performance numbers for stocks in the different CRSP deciles during various time periods.
| | | | | | | | | | | | | | | | | | | | | | | | |
| | | | | | | | | | | Annualized | | |
| CRSP Decile1 | | Quarter | | 6 Months | | 1 Year | | 5 Years | | 10 Years | | 93 Years |
1 (ultra-large) | | | -13.31 | % | | | -6.07 | % | | | -2.93 | % | | | 8.87 | % | | | 12.80 | % | | | 9.30 | % |
2 | | | -14.07 | % | | | -9.27 | % | | | -8.25 | % | | | 7.27 | % | | | 14.32 | % | | | 10.41 | % |
3 | | | -17.67 | % | | | -13.12 | % | | | -9.77 | % | | | 6.81 | % | | | 14.54 | % | | | 10.90 | % |
4 | | | -17.67 | % | | | -14.07 | % | | | -9.92 | % | | | 4.37 | % | | | 13.78 | % | | | 10.68 | % |
5 | | | -18.80 | % | | | -15.07 | % | | | -11.16 | % | | | 3.21 | % | | | 13.49 | % | | | 11.21 | % |
6 | | | -19.91 | % | | | -18.22 | % | | | -13.88 | % | | | 3.48 | % | | | 13.54 | % | | | 11.17 | % |
7 | | | -21.09 | % | | | -15.11 | % | | | -7.21 | % | | | 6.07 | % | | | 14.92 | % | | | 11.41 | % |
8 | | | -22.02 | % | | | -18.54 | % | | | -10.35 | % | | | 2.79 | % | | | 13.88 | % | | | 11.27 | % |
9 | | | -21.19 | % | | | -19.94 | % | | | -8.82 | % | | | 4.09 | % | | | 14.23 | % | | | 11.32 | % |
10 (ultra-small) | | | -26.17 | % | | | -26.32 | % | | | -16.29 | % | | | 1.00 | % | | | 14.40 | % | | | 12.93 | % |
| 1 | Performance figures are as of the period ended December 31, 2018. The CRSPCap-Based Portfolio Indexes are unmanaged indexes of publicly traded U.S. stocks with dividends reinvested, grouped by market capitalization, as reported by the Center for Research in Security Prices. Past performance is no guarantee of future results. |
| | |
| Ultra-Small Company Market Fund | | |
MANAGER’S COMMENTARY (Unaudited)(continued) | | |
Detailed Explanation of Calendar Year Performance
For the year, the Ultra Small Company Market Fund performed in line with the CRSPCap-Based Portfolio 10 Index, minus fees and expenses. The Fund held about 14% of its assets, on average, in CRSP 9 stocks during the year. As a group these larger stocks outperformed the benchmark and boosted the Fund’s relative return. The Fund’s sidestepping strategies, which eliminated exposure to stocks with high probability of steep price decline, major financial distress or bankruptcy, also helped relative performance.
From a sector perspective, the Fund’s selection effect was positive. Holdings in the Health Care sector made the largest positive impact on relative return.
Top Ten Holdings as of December 31, 2018
| | | | | | | | |
| Rank | | Description | | Industry | | % of Net
Assets |
| 1 | | Pacific Biosciences of California, Inc. | | Health Care | | | 0.8 | % |
| 2 | | Evolution Petroleum Corp. | | Energy | | | 0.5 | % |
| 3 | | Utah Medical Products, Inc. | | Health Care | | | 0.5 | % |
| 4 | | PRGX Global, Inc. | | Information Technology | | | 0.5 | % |
| 5 | | Aratana Therapeutics, Inc. | | Health Care | | | 0.5 | % |
| 6 | | Hurco Cos, Inc. | | Industrials | | | 0.5 | % |
| 7 | | Cellular Biomedicine Group, Inc. | | Health Care | | | 0.5 | % |
| 8 | | Willis Lease Finance Corp. | | Industrials | | | 0.5 | % |
| 9 | | Fluidigm Corp. | | Health Care | | | 0.5 | % |
| 10 | | Zix Corp. | | Information Technology | | | 0.5 | % |
| | | |
| | Total | | | | | 5.3 | % |
Industry Sector Representation as of December 31, 2018
| | | | | | | | |
| | | % of Net Assets | | % of CRSP 10 Index | | Difference | |
Communication Services | | 3.6% | | 3.6% | | | 0.0% | |
Consumer Discretionary | | 12.9% | | 11.7% | | | 1.2% | |
Consumer Staples | | 1.9% | | 2.4% | | | -0.5% | |
Energy | | 8.5% | | 8.9% | | | -0.4% | |
Financials | | 24.6% | | 26.2% | | | -1.6% | |
Health Care | | 17.8% | | 17.4% | | | 0.4% | |
Industrials | | 11.6% | | 10.8% | | | 0.8% | |
Information Technology | | 13.4% | | 12.7% | | | 0.7% | |
Materials | | 3.1% | | 2.6% | | | 0.5% | |
Real Estate | | 1.4% | | 2.0% | | | -0.6% | |
Utilities | | 1.7% | | 1.7% | | | 0.0% | |
Liabilities in Excess of Other Assets | | -0.5% | | 0.0% | | | -0.5% | |
| | | |
Total | | 100.0% | | 100.0% | | | | |
Disclaimer
The views expressed here are exclusively those of Fund management. These views, including those related to market sectors or individual stocks, are not meant as investment advice and should not be considered predictive in nature. Any favorable (or unfavorable) description of a holding applies only as of the quarter end, December 31, 2018, unless otherwise stated. Security positions can and do change thereafter. Discussions of historical performance do not guarantee and may not be indicative of future performance.
| | |
| 24 | | Semi-Annual Report | December 31, 2018 (Unaudited) |
| | |
| Ultra-Small Company Market Fund | | |
MANAGER’S COMMENTARY (Unaudited)(continued) | | |
The Fund is subject to very high, above market risk (volatility) and is not an appropriate investment for short-term investors. Investments in ultra-small companies generally carry greater risk than is customarily associated with larger companies and even “small companies” for various reasons, such as narrower markets (fewer investors), limited financial resources and greater trading difficulty.
| | |
| Ultra-Small Company Market Fund | |
|
MANAGER’S COMMENTARY (Unaudited) (continued) |
| | |
Conclusion
Thank you for your continued investment in Ultra-Small Company Market Fund. We encourage your feedback; your reactions and concerns are important to us.
Sincerely,
The Investment Management Team
| | |
| 26 | | Semi-Annual Report | December 31, 2018 (Unaudited) |
| | |
| Ultra-Small Company Market Fund | |
|
SCHEDULE OF INVESTMENTS (Unaudited) |
Showing percentage of net assets as of December 31, 2018 | | |
| | | | | | | | |
| Industry Company | | Shares | | Value | | | | |
COMMON STOCKS - 100.54% | | | | |
Communication Services - 3.63% | | | | |
A.H. Belo Corp., Class A | | 46,383 | | $ 156,311 | | | | |
Alaska Communications Systems Group, Inc.* | | 279,500 | | 402,480 | | | | |
Ballantyne Strong, Inc.* | | 92,020 | | 105,823 | | | | |
Beasley Broadcast Group, Inc., Class A | | 82,125 | | 307,969 | | | | |
Chicken Soup For The Soul Entertainment, Inc. | | 15,000 | | 112,800 | | | | |
DHI Group, Inc.* | | 182,200 | | 276,944 | | | | |
Emmis Communications Corp., Class A* | | 67,300 | | 214,687 | | | | |
Entravision Communications Corp., Class A | | 90,000 | | 261,900 | | | | |
Fluent, Inc.* | | 200,000 | | 720,000 | | | | |
Harte-Hanks, Inc.* | | 73,340 | | 177,483 | | | | |
Hemisphere Media Group, Inc.* | | 20,000 | | 242,800 | | | | |
IDT Corp., Class B | | 78,600 | | 486,534 | | | | |
Lee Enterprises, Inc.* | | 232,700 | | 490,997 | | | | |
Marchex, Inc., Class B | | 222,400 | | 589,360 | | | | |
McClatchy Co. (The), Class A*+ | | 45,011 | | 344,334 | | | | |
NII Holdings, Inc.*+ | | 241,500 | | 1,065,015 | | | | |
Ooma, Inc.* | | 52,500 | | 728,700 | | | | |
Saga Communications, Inc., Class A | | 16,866 | | 560,457 | | | | |
Salem Media Group, Inc. | | 100,000 | | 209,000 | | | | |
Spok Holdings, Inc. | | 68,500 | | 908,310 | | | | |
Townsquare Media, Inc., Class A | | 78,500 | | 320,280 | | | | |
Travelzoo* | | 45,000 | | 442,350 | | | | |
Windstream Holdings, Inc.*+ | | 56,200 | | 117,458 | | | | |
Xcel Brands, Inc.*+ | | 91,000 | | 102,830 | | | | |
Zedge, Inc., Class B* | | 16,855 | | 41,261 | | | | |
| | | | | | | | |
| | | | |
| | | | 9,386,083 | | | | |
Consumer Discretionary - 12.87% | | | | |
AMCON Distributing Co. | | 3,900 | | 389,025 | | | | |
Ark Restaurants Corp. | | 17,900 | | 328,644 | | | | |
Barnes & Noble Education, Inc.* | | 25,000 | | 100,250 | | | | |
Bassett Furniture Industries, Inc. | | 39,544 | | 792,462 | | | | |
Big 5 Sporting Goods Corp.+ | | 80,748 | | 209,137 | | | | |
Bridgepoint Education, Inc.* | | 99,500 | | 697,495 | | | | |
Build-A-Bear Workshop, Inc.* | | 78,900 | | 311,655 | | | | |
China XD Plastics Co., Ltd.* | | 56,000 | | 98,560 | | | | |
Citi Trends, Inc. | | 40,800 | | 831,912 | | | | |
Clarus Corp. | | 57,500 | | 581,900 | | | | |
| | | | |
| Industry Company | | Shares | | Value |
|
| Consumer Discretionary (continued) |
Collectors Universe, Inc. | | 51,760 | | $587,994 |
Container Store Group, Inc. (The)* | | 128,300 | | 611,991 |
CSS Industries, Inc. | | 41,950 | | 376,292 |
Culp, Inc. | | 15,000 | | 283,500 |
Del Frisco’s Restaurant Group, Inc.* | | 101,500 | | 725,725 |
Delta Apparel, Inc.* | | 32,988 | | 568,383 |
Destination Maternity Corp.* | | 133,800 | | 379,992 |
Destination XL Group, Inc.*+ | | 219,622 | | 476,580 |
Dixie Group, Inc. (The)* | | 133,200 | | 93,626 |
Dover Downs Gaming & Entertainment, Inc.*+ | | 50,000 | | 138,500 |
Dover Motorsports, Inc. | | 123,396 | | 231,984 |
Educational Development Corp. | | 41,400 | | 353,142 |
Emerson Radio Corp.* | | 198,100 | | 285,264 |
Escalade, Inc. | | 33,780 | | 386,781 |
EVINE Live, Inc.* | | 270,810 | | 108,026 |
Famous Dave’s of America, Inc.*+ | | 54,838 | | 251,706 |
Flexsteel Industries, Inc. | | 27,000 | | 596,160 |
Francesca’s Holdings Corp.* | | 56,800 | | 55,141 |
Gaia, Inc.*+ | | 48,400 | | 501,424 |
Gaming Partners | | | | |
International Corp. | | 56,300 | | 731,900 |
Habit Restaurants, Inc. (The), Class A* | | 30,500 | | 320,250 |
Hamilton Beach Brands Holding Co., Class A | | 32,000 | | 750,720 |
Horizon Global Corp.*+ | | 79,100 | | 113,113 |
Hovnanian Enterprises, Inc., Class A* | | 361,000 | | 246,888 |
J Alexander’s Holdings, Inc.* | | 83,800 | | 689,674 |
J. Jill, Inc.* | | 50,000 | | 266,500 |
JAKKS Pacific, Inc.*+ | | 163,600 | | 240,492 |
Kandi Technologies Group, Inc.*+ | | 70,100 | | 254,463 |
Kirkland’s, Inc.* | | 61,900 | | 589,907 |
Kona Grill, Inc.*+ | | 102,500 | | 107,625 |
Lakeland Industries, Inc.* | | 51,557 | | 538,255 |
Leaf Group, Ltd.* | | 105,000 | | 719,250 |
Libbey, Inc. | | 95,000 | | 368,600 |
Lifetime Brands, Inc. | | 79,200 | | 794,376 |
Lincoln Educational Services Corp.* | | 229,405 | | 734,096 |
Liquidity Services, Inc.* | | 82,000 | | 505,940 |
Luby’s, Inc.* | | 145,500 | | 174,600 |
Nathan’s Famous, Inc. | | 5,191 | | 344,942 |
| | |
| Ultra-Small Company Market Fund | |
|
SCHEDULE OF INVESTMENTS (Unaudited) (continued) |
Showing percentage of net assets as of December 31, 2018 | | |
| | | | | | | | |
| Industry Company | | Shares | | Value | | | | |
| | |
Common Stocks (continued) | | | | |
Consumer Discretionary (continued) | | | | |
National American University Holdings, Inc.* | | 53,699 | | $ 9,666 | | | | |
Nevada Gold & Casinos, Inc.*+ | | 120,000 | | 285,600 | | | | |
New Home Co., Inc. (The)*+ | | 151,800 | | 793,914 | | | | |
Noodles & Co.* | | 14,400 | | 100,656 | | | | |
P&F Industries, Inc., Class A | | 10,500 | | 81,165 | | | | |
Papa Murphy’s Holdings, Inc.*+ | | 78,900 | | 374,775 | | | | |
Peak Resorts, Inc. | | 76,000 | | 355,680 | | | | |
Pier 1 Imports, Inc. | | 100,000 | | 30,580 | | | | |
Potbelly Corp.*+ | | 97,000 | | 780,850 | | | | |
Red Lion Hotels Corp.* | | 49,900 | | 409,180 | | | | |
Rocky Brands, Inc. | | 34,600 | | 899,600 | | | | |
RTW RetailWinds, Inc.* | | 279,000 | | 789,570 | | | | |
Shiloh Industries, Inc.* | | 74,500 | | 434,335 | | | | |
SORL Auto Parts, Inc.*+ | | 106,058 | | 199,389 | | | | |
Sportsman’s Warehouse Holdings, Inc.* | | 164,015 | | 718,386 | | | | |
Stage Stores, Inc. | | 100,000 | | 74,000 | | | | |
Stein Mart, Inc.*+ | | 160,800 | | 172,056 | | | | |
Strattec Security Corp. | | 16,700 | | 480,960 | | | | |
Superior Group of Cos, Inc. | | 56,500 | | 997,225 | | | | |
Sypris Solutions, Inc.* | | 39,404 | | 30,735 | | | | |
Tandy Leather Factory, Inc.* | | 72,000 | | 408,960 | | | | |
Tilly’s, Inc., Class A | | 52,175 | | 566,620 | | | | |
Town Sports International Holdings, Inc.* | | 123,571 | | 790,854 | | | | |
Trans World Entertainment Corp.* | | 173,403 | | 109,244 | | | | |
TravelCenters of America, LLC* | | 166,500 | | 626,040 | | | | |
Tuesday Morning Corp.*+ | | 123,800 | | 210,460 | | | | |
Turtle Beach Corp.*+ | | 66,854 | | 954,007 | | | | |
Unique Fabricating, Inc.+ | | 50,000 | | 211,000 | | | | |
Universal Technical Institute, Inc.* | | 61,600 | | 224,840 | | | | |
UQM Technologies, Inc.*+ | | 94,000 | | 79,900 | | | | |
US Auto Parts Network, Inc.* | | 169,438 | | 154,189 | | | | |
Vince Holding Corp.*+ | | 31,800 | | 296,694 | | | | |
Vitamin Shoppe, Inc.* | | 50,000 | | 237,000 | | | | |
VOXX International Corp.* | | 94,500 | | 374,220 | | | | |
Weyco Group, Inc. | | 5,000 | | 145,850 | | | | |
YogaWorks, Inc.* | | 47,000 | | 23,970 | | | | |
| | | | | | | | |
| | | | |
| | | | 33,277,012 | | | | |
| | | | |
Consumer Staples - 1.93% | | | | | | | | |
Alico, Inc. | | 12,200 | | 359,900 | | | | |
Bridgford Foods Corp.* | | 1,000 | | 19,870 | | | | |
Castle Brands, Inc.*+ | | 463,987 | | 394,621 | | | | |
| | | | |
| Industry Company | | Shares | | Value |
|
|
Consumer Staples (continued) |
CCA Industries, Inc.*+ | | 1,652 | | $ 3,634 |
Lifeway Foods, Inc.* | | 80,152 | | 150,686 |
Limoneira Co. | | 2,596 | | 50,752 |
Mannatech, Inc. | | 13,600 | | 255,680 |
Natural Alternatives International, Inc.* | | 40,310 | | 396,247 |
Natural Grocers by Vitamin Cottage, Inc.* | | 76,000 | | 1,165,080 |
Oil-Dri Corp. of America | | 27,500 | | 728,750 |
Reed’s, Inc.*+ | | 53,700 | | 111,159 |
Rocky Mountain Chocolate Factory, Inc.+ | | 30,000 | | 252,300 |
Seneca Foods Corp., Class A* | | 26,500 | | 747,830 |
United-Guardian, Inc. | | 19,000 | | 348,460 |
| | | | |
| | |
| | | | 4,984,969 |
Energy - 8.53% |
Adams Resources & Energy, Inc. | | 24,300 | | 940,653 |
Aemetis, Inc.* | | 85,439 | | 51,819 |
Amyris, Inc.*+ | | 165,000 | | 551,100 |
Approach Resources, Inc.* | | 455,774 | | 397,435 |
Aspen Aerogels, Inc.*+ | | 117,100 | | 249,423 |
Barnwell Industries, Inc.* | | 54,320 | | 72,246 |
Basic Energy Services, Inc.* | | 90,000 | | 345,600 |
Bristow Group, Inc.*+ | | 100,000 | | 243,000 |
CARBO Ceramics, Inc.*+ | | 180,500 | | 628,140 |
Clean Energy Fuels Corp.*+ | | 555,000 | | 954,600 |
Cloud Peak Energy, Inc.* | | 511,000 | | 187,179 |
Contango Oil & Gas Co.*+ | | 89,230 | | 289,998 |
Dawson Geophysical Co.* | | 172,945 | | 584,554 |
Earthstone Energy, Inc., Class A* | | 44,002 | | 198,889 |
Era Group, Inc.* | | 97,350 | | 850,839 |
Evolution Petroleum Corp.+ | | 205,123 | | 1,398,939 |
Geospace Technologies Corp.* | | 21,663 | | 223,346 |
Goodrich Petroleum Corp.* | | 50,000 | | 675,000 |
Gulf Island Fabrication, Inc.* | | 63,400 | | 457,748 |
Hornbeck Offshore Services, Inc.* | | 179,080 | | 257,875 |
Independence Contract Drilling, Inc.* | | 284,100 | | 886,392 |
ION Geophysical Corp.* | | 127,816 | | 662,087 |
Key Energy Services, Inc.* | | 89,000 | | 184,230 |
Lilis Energy, Inc.* | | 270,000 | | 369,900 |
Lonestar Resources US, Inc., Class A* | | 113,500 | | 414,275 |
Matrix Service Co.* | | 50,000 | | 897,000 |
Mexco Energy Corp.*+ | | 12,000 | | 33,240 |
| | |
| 28 | | Semi-Annual Report | December 31, 2018 (Unaudited) |
| | |
| Ultra-Small Company Market Fund | | |
| SCHEDULE OF INVESTMENTS (Unaudited)(continued) |
Showing percentage of net assets as of December 31, 2018 | | |
| | | | | | |
| Industry Company | | Shares | | Value | | |
| |
Common Stocks (continued) | | |
Energy (continued) | | |
Midstates Petroleum Co., Inc.* | | 125,000 | | $ 938,750 | | |
Mitcham Industries, Inc.* | | 119,545 | | 306,035 | | |
NACCO Industries, Inc., Class A | | 20,000 | | 678,000 | | |
Natural Gas Services Group, Inc.* | | 64,185 | | 1,055,201 | | |
New Concept Energy, Inc.*+ | | 8,400 | | 11,760 | | |
Nuverra Environmental Solutions, Inc.* | | 589 | | 4,830 | | |
Overseas Shipholding Group, Inc., Class A* | | 385,000 | | 639,100 | | |
Panhandle Oil and Gas, Inc., Class A | | 35,594 | | 551,707 | | |
PHI, Inc.*+ | | 104,550 | | 193,418 | | |
Pioneer Energy Services Corp.* | | 395,000 | | 485,850 | | |
Quintana Energy Services, Inc.*+ | | 133,514 | | 461,958 | | |
Ranger Energy Services, Inc.*+ | | 40,600 | | 209,902 | | |
REX American Resources Corp.* | | 6,249 | | 425,619 | | |
RigNet, Inc.*+ | | 16,309 | | 206,146 | | �� |
SEACOR Marine Holdings, Inc.* | | 45,440 | | 534,374 | | |
SilverBow Resources, Inc.* | | 21,148 | | 499,939 | | |
Smart Sand, Inc.*+ | | 200,000 | | 444,000 | | |
Superior Drilling Products, Inc.* | | 75,300 | | 88,101 | | |
Uranium Energy Corp.*+ | | 395,000 | | 493,750 | | |
VAALCO Energy, Inc.* | | 237,100 | | 348,537 | | |
W&T Offshore, Inc.* | | 115,000 | | 473,800 | | |
| | | | | | |
| | | |
| | | | 22,056,284 | | |
Financials - 24.61% | | |
1347 Property Insurance Holdings, Inc.*+ | | 38,400 | | 154,368 | | |
1st Constitution Bancorp | | 38,733 | | 771,949 | | |
A-Mark Precious Metals, Inc.+ | | 60,200 | | 709,758 | | |
American National Bankshares, Inc. | | 29,746 | | 871,855 | | |
American River Bankshares | | 56,000 | | 772,800 | | |
AmeriServ Financial, Inc. | | 155,671 | | 627,354 | | |
Ashford, Inc.* | | 4,000 | | 207,600 | | |
Asta Funding, Inc.+ | | 68,400 | | 291,384 | | |
Atlantic American Corp. | | 74,856 | | 181,152 | | |
Atlanticus Holdings Corp.* | | 60,812 | | 221,356 | | |
Auburn National Bancorporation, Inc.+ | | 2,974 | | 94,157 | | |
Bank of Commerce Holdings | | 87,441 | | 958,353 | | |
| | | | |
| Industry Company | | Shares | | Value |
|
Financials (continued) |
Bank of Princeton (The) | | 6,900 | | $ 192,510 |
Bank7 Corp.* | | 44,010 | | 587,534 |
BankFinancial Corp. | | 57,000 | | 852,150 |
Bankwell Financial Group, Inc. | | 26,937 | | 773,361 |
Baycom Corp.* | | 35,000 | | 808,150 |
BCB Bancorp, Inc. | | 79,812 | | 835,632 |
Business First Bancshares, Inc. | | 39,381 | | 954,202 |
C&F Financial Corp. | | 15,400 | | 819,434 |
Capitala Finance Corp. | | 86,380 | | 619,345 |
Capstar Financial Holdings, Inc. | | 40,000 | | 589,200 |
CB Financial Services, Inc.+ | | 21,700 | | 537,726 |
Chemung Financial Corp. | | 14,998 | | 619,567 |
Citizens Community Bancorp, Inc. | | 35,600 | | 388,040 |
Citizens First Corp.+ | | 2,633 | | 56,425 |
Citizens Holding Co. | | 20,670 | | 429,729 |
Civista Bancshares, Inc. | | 19,996 | | 348,330 |
CM Finance, Inc. | | 63,500 | | 396,875 |
Codorus Valley Bancorp, Inc. | | 29,464 | | 626,110 |
Cohen & Co., Inc.+ | | 3,000 | | 25,290 |
Colony Bankcorp, Inc. | | 22,868 | | 333,873 |
Community West Bancshares | | 38,357 | | 384,721 |
Conifer Holdings, Inc.*+ | | 19,000 | | 66,500 |
Consumer Portfolio Services, Inc.* | | 138,100 | | 415,681 |
County Bancorp, Inc. | | 24,000 | | 416,880 |
Eagle Bancorp Montana, Inc. | | 7,021 | | 113,530 |
eHealth, Inc.* | | 17,700 | | 680,034 |
Elevate Credit, Inc.* | | 100,000 | | 448,000 |
Entegra Financial Corp.* | | 26,800 | | 556,100 |
ESSA Bancorp, Inc. | | 59,000 | | 920,990 |
Evans Bancorp, Inc. | | 24,701 | | 803,030 |
FedNat Holding Co. | | 23,012 | | 458,399 |
Fidelity D&D Bancorp, Inc. | | 1,000 | | 64,180 |
First Bancorp, Inc.+ | | 20,915 | | 550,064 |
First Bank | | 85,463 | | 1,035,812 |
First Business Financial Services, Inc. | | 42,308 | | 825,429 |
First Financial Northwest, Inc. | | 47,000 | | 727,090 |
First Guaranty Bancshares, Inc.+ | | 5,614 | | 130,301 |
First Internet Bancorp | | 25,000 | | 511,000 |
First Northwest Bancorp | | 42,500 | | 630,275 |
First United Corp. | | 24,192 | | 385,137 |
| | |
| Ultra-Small Company Market Fund | |
|
| SCHEDULE OF INVESTMENTS (Unaudited)(continued) |
Showing percentage of net assets as of December 31, 2018 | | |
| | | | | | |
| Industry Company | | Shares | | Value | | |
| |
Common Stocks (continued) | | |
Financials (continued) | | |
GAIN Capital Holdings, Inc.+ | | 179,400 | | $1,105,104 | | |
GAMCO Investors, Inc., Class A | | 10,000 | | 168,900 | | |
Guaranty Federal Bancshares, Inc. | | 20,856 | | 455,495 | | |
Hallmark Financial Services, Inc.* | | 75,400 | | 806,026 | | |
Hawthorn Bancshares, Inc. | | 27,040 | | 568,651 | | |
HMN Financial, Inc.* | | 30,000 | | 588,600 | | |
Home Bancorp, Inc. | | 16,500 | | 584,100 | | |
HopFed Bancorp, Inc. | | 32,988 | | 438,411 | | |
Horizon Technology Finance Corp. | | 53,600 | | 603,000 | | |
Impac Mortgage Holdings, Inc.*+ | | 99,198 | | 374,968 | | |
Independence Holding Co. | | 8,120 | | 285,824 | | |
Investar Holding Corp.+ | | 18,000 | | 446,400 | | |
Investors Title Co.+ | | 2,028 | | 358,307 | | |
JMP GROUP, LLC+ | | 96,851 | | 377,719 | | |
KCAP Financial, Inc. | | 131,600 | | 455,336 | | |
Lake Shore Bancorp, Inc.+ | | 22,150 | | 327,820 | | |
Landmark Bancorp, Inc. | | 15,175 | | 347,583 | | |
Level One Bancorp, Inc. | | 25,000 | | 560,750 | | |
Malvern Bancorp, Inc.* | | 33,300 | | 657,009 | | |
Manning & Napier, Inc.+ | | 50,000 | | 88,000 | | |
Marlin Business Services Corp. | | 43,300 | | 966,889 | | |
MBT Financial Corp. | | 114,185 | | 1,061,920 | | |
Medallion Financial Corp.* | | 8,700 | | 40,803 | | |
Medley Management, Inc., Class A+ | | 10,000 | | 38,600 | | |
Mid Penn Bancorp, Inc.+ | | 18,348 | | 422,371 | | |
MidSouth Bancorp, Inc.+ | | 52,000 | | 551,200 | | |
Monroe Capital Corp.+ | | 61,403 | | 589,469 | | |
MSB Financial Corp./MD | | 25,000 | | 446,250 | | |
MutualFirst Financial, Inc. | | 38,911 | | 1,033,865 | | |
Northeast Bancorp | | 44,000 | | 736,120 | | |
Northrim BanCorp, Inc. | | 24,250 | | 797,098 | | |
Norwood Financial Corp. | | 18,112 | | 597,696 | | |
Oaktree Strategic, Income Corp. | | 103 | | 798 | | |
Ohio Valley Banc Corp. | | 19,500 | | 690,105 | | |
OP Bancorp* | | 71,851 | | 637,318 | | |
Pacific City Financial Corp. | | 28,900 | | 452,285 | | |
Pacific Mercantile Bancorp* | | 117,319 | | 838,831 | | |
Patriot National Bancorp, Inc. | | 16,500 | | 235,125 | | |
PDL Community Bancorp* | | 13,000 | | 165,620 | | |
Penns Woods Bancorp, Inc.+ | | 16,400 | | 659,936 | | |
| | | | |
| Industry Company | | Shares | | Value |
|
Financials (continued) |
Peoples Bancorp of North Carolina, Inc. | | 27,830 | | $ 680,722 |
Peoples Financial Services Corp. | | 8,000 | | 352,480 |
Premier Financial Bancorp, Inc. | | 60,275 | | 898,700 |
Provident Financial Holdings, Inc. | | 38,617 | | 598,564 |
Prudential Bancorp, Inc. | | 7,034 | | 123,798 |
Pzena Investment Management, Inc., Class A | | 52,800 | | 456,720 |
Regional Management Corp.* | | 40,000 | | 962,000 |
Riverview Bancorp, Inc. | | 91,226 | | 664,125 |
Safeguard Scientifics, Inc.* | | 19,500 | | 168,090 |
SB One Bancorp+ | | 43,000 | | 878,920 |
Security National Financial Corp., Class A* | | 55,695 | | 287,386 |
Select Bancorp, Inc.* | | 54,676 | | 676,889 |
Shore Bancshares, Inc. | | 48,500 | | 705,190 |
SI Financial Group, Inc. | | 47,676 | | 606,915 |
Silvercrest Asset Management Group, Inc., Class A | | 50,002 | | 661,526 |
Southern First Bancshares, Inc.* | | 25,715 | | 824,680 |
Southern Missouri Bancorp, Inc. | | 30,000 | | 1,017,000 |
Spirit of Texas Bancshares, Inc.* | | 34,500 | | 785,910 |
Summit State Bank | | 17,200 | | 202,444 |
Territorial Bancorp, Inc. | | 30,000 | | 779,400 |
Timberland Bancorp, Inc. | | 34,222 | | 763,151 |
Two River Bancorp | | 39,968 | | 609,912 |
Union Bankshares, Inc./Morrisville VT | | 5,419 | | 258,757 |
United Bancshares, Inc.+ | | 15,200 | | 294,880 |
United Security Bancshares | | 5,400 | | 51,732 |
Unity Bancorp, Inc. | | 46,500 | | 965,340 |
Western New England Bancorp, Inc. | | 101,362 | | 1,017,674 |
| | | | |
| | |
| | | | 63,631,929 |
Health Care - 17.81% |
AAC Holdings, Inc.*+ | | 98,000 | | 137,200 |
AcelRx Pharmaceuticals, Inc.*+ | | 308,150 | | 711,827 |
Aceto Corp. | | 110,000 | | 92,400 |
Adverum Biotechnologies, Inc.*+ | | 183,900 | | 579,285 |
| | |
| 30 | | Semi-Annual Report | December 31, 2018 (Unaudited) |
| | |
| Ultra-Small Company Market Fund | | |
| SCHEDULE OF INVESTMENTS (Unaudited)(continued) |
Showing percentage of net assets as of December 31, 2018 | | |
| | | | | | |
| Industry Company | | Shares | | Value | | |
| |
Common Stocks (continued) | | |
Health Care (continued) | | |
Aeglea BioTherapeutics, Inc.* | | 75,000 | | $ 561,750 | | |
Aevi Genomic Medicine, Inc.* | | 220,000 | | 154,000 | | |
AgeX Therapeutics, Inc.*+ | | 23,500 | | 70,265 | | |
Alimera Sciences, Inc.*+ | | 360,000 | | 258,516 | | |
Allena Pharmaceuticals, Inc.* | | 68,000 | | 370,600 | | |
Alphatec Holdings, Inc.* | | 143,500 | | 328,615 | | |
Alpine Immune Sciences, Inc.* | | 32,000 | | 117,760 | | |
Apollo Endosurgery, Inc.*+ | | 79,000 | | 272,550 | | |
Applied Genetic Technologies Corp.* | | 122,400 | | 304,776 | | |
Aptevo Therapeutics, Inc.* | | 83,802 | | 106,429 | | |
Apyx Medical Corp.* | | 124,970 | | 809,806 | | |
Aratana Therapeutics, Inc.*+ | | 197,483 | | 1,210,571 | | |
Ardelyx, Inc.* | | 142,000 | | 254,180 | | |
ArQule, Inc.* | | 167,599 | | 464,249 | | |
Asterias Biotherapeutics, Inc.*+ | | 172,763 | | 107,113 | | |
AVEO Pharmaceuticals, Inc.*+ | | 280,000 | | 448,000 | | |
Axsome Therapeutics, Inc.*+ | | 63,000 | | 177,660 | | |
Bellerophon Therapeutics, Inc.* | | 183,000 | | 146,656 | | |
Bellicum Pharmaceuticals, Inc.*+ | | 121,700 | | 355,364 | | |
BioTime, Inc.*+ | | 235,000 | | 214,555 | | |
Calithera Biosciences, Inc.* | | 97,600 | | 391,376 | | |
Castlight Health, Inc., Class B* | | 72,400 | | 157,108 | | |
Cellular Biomedicine Group, Inc.*+ | | 67,800 | | 1,197,348 | | |
CEL-SCI Corp.*+ | | 40,000 | | 114,800 | | |
Chiasma, Inc.* | | 187,600 | | 583,436 | | |
Chimerix, Inc.* | | 144,100 | | 370,337 | | |
Cidara Therapeutics, Inc.*+ | | 64,382 | | 151,298 | | |
Clearside Biomedical, Inc.* | | 116,200 | | 124,334 | | |
Conatus Pharmaceuticals, Inc.*+ | | 80,000 | | 138,400 | | |
Conformis, Inc.* | | 250,000 | | 89,500 | | |
Corindus Vascular Robotics, Inc.*+ | | 823,683 | | 691,894 | | |
Corvus Pharmaceuticals, Inc.* | | 79,600 | | 292,132 | | |
Cumberland Pharmaceuticals, Inc.* | | 152,500 | | 960,750 | | |
CynergisTek, Inc.* | | 55,000 | | 260,700 | | |
Digirad Corp. | | 186,594 | | 106,359 | | |
Durect Corp.* | | 591,100 | | 285,560 | | |
Eiger BioPharmaceuticals, Inc.*+ | | 71,000 | | 721,360 | | |
| | | | |
| Industry Company | | Shares | | Value |
|
Health Care (continued) | | | | |
Electromed, Inc.* | | 70,000 | | $ 356,300 |
Endologix, Inc.* | | 375,000 | | 268,500 |
Enzo Biochem, Inc.* | | 74,000 | | 205,720 |
EyePoint Pharmaceuticals, Inc.*+ | | 100,000 | | 189,000 |
Fluidigm Corp.*+ | | 138,772 | | 1,196,215 |
Fulgent Genetics, Inc.*+ | | 78,100 | | 247,577 |
Genesis Healthcare, Inc.* | | 330,000 | | 389,400 |
GenMark Diagnostics, Inc.* | | 179,900 | | 874,314 |
Harvard Bioscience, Inc.* | | 166,717 | | 530,160 |
Infinity Pharmaceuticals, Inc.* | | 170,000 | | 200,600 |
InfuSystem Holdings, Inc.* | | 124,900 | | 429,656 |
IntriCon Corp.* | | 21,500 | | 567,170 |
IRIDEX Corp.* | | 60,600 | | 284,820 |
IsoRay, Inc.* | | 168,700 | | 50,610 |
Jounce Therapeutics, Inc.* | | 147,600 | | 497,412 |
Kadmon Holdings, Inc.*+ | | 258,000 | | 536,640 |
Kala Pharmaceuticals, Inc.*+ | | 85,000 | | 415,650 |
KalVista Pharmaceuticals, Inc.* | | 51,400 | | 1,015,150 |
KemPharm, Inc.*+ | | 55,000 | | 97,900 |
Kewaunee Scientific Corp. | | 11,600 | | 385,584 |
Lannett Co., Inc.*+ | | 85,000 | | 421,600 |
Leap Therapeutics, Inc.*+ | | 36,300 | | 72,600 |
MannKind Corp.*+ | | 387,000 | | 410,220 |
Marinus Pharmaceuticals, Inc.*+ | | 67,606 | | 194,029 |
MediciNova, Inc.*+ | | 127,710 | | 1,043,391 |
Menlo Therapeutics, Inc.*+ | | 105,500 | | 434,660 |
Micron Solutions, Inc.* | | 20,000 | | 53,200 |
Millendo Therapeutics, Inc.*+ | | 6,666 | | 52,995 |
Minerva Neurosciences, Inc.* | | 50,000 | | 337,000 |
Misonix, Inc.* | | 14,700 | | 235,347 |
Mustang Bio, Inc.*+ | | 50,000 | | 147,000 |
NanoString Technologies, Inc.* | | 52,400 | | 777,092 |
NantKwest, Inc.*+ | | 251,400 | | 291,624 |
Novan, Inc.* | | 60,000 | | 49,800 |
Nuvectra Corp.* | | 35,100 | | 573,534 |
Ocular Therapeutix, Inc.*+ | | 100,000 | | 398,000 |
Oncocyte Corp.*+ | | 145,000 | | 200,100 |
OncoMed Pharmaceuticals, Inc.* | | 125,000 | | 93,412 |
Ophthotech Corp.* | | 212,800 | | 255,360 |
Organovo Holdings, Inc.* | | 448,600 | | 429,355 |
OrthoPediatrics Corp.* | | 18,500 | | 645,280 |
Otonomy, Inc.* | | 85,000 | | 157,250 |
Ovid therapeutics, Inc.* | | 84,440 | | 204,345 |
| | |
| Ultra-Small Company Market Fund | |
|
| SCHEDULE OF INVESTMENTS (Unaudited)(continued) |
Showing percentage of net assets as of December 31, 2018 | | |
| | | | | | |
| Industry Company | | Shares | | Value | | |
| |
Common Stocks (continued) | | |
Health Care (continued) | | |
Pacific Biosciences of California, Inc.* | | 275,200 | | $ 2,036,480 | | |
Palatin Technologies, Inc.* | | 696,000 | | 493,046 | | |
Pfenex, Inc.* | | 94,500 | | 301,455 | | |
Protagonist Therapeutics, Inc.* | | 85,600 | | 576,088 | | |
Protalix BioTherapeutics, Inc.* | | 171,672 | | 53,390 | | |
Proteostasis Therapeutics, Inc.* | | 80,000 | | 259,200 | | |
Quanterix Corp.*+ | | 30,400 | | 556,624 | | |
Quorum Health Corp.* | | 34,700 | | 100,283 | | |
Ra Pharmaceuticals, Inc.*+ | | 43,224 | | 786,677 | | |
resTORbio, Inc.*+ | | 95,000 | | 818,900 | | |
Rexahn Pharmaceuticals, Inc.* | | 100,100 | | 93,093 | | |
Rockwell Medical, Inc.*+ | | 85,600 | | 193,456 | | |
RTI Surgical, Inc.* | | 207,000 | | 765,900 | | |
Savara, Inc.* | | 40,000 | | 302,800 | | |
scPharmaceuticals, Inc.* | | 2,800 | | 10,528 | | |
SCYNEXIS, Inc.*+ | | 150,000 | | 72,255 | | |
SeaSpine Holdings Corp.* | | 64,200 | | 1,171,008 | | |
Sesen Bio, Inc.*+ | | 100,000 | | 142,000 | | |
Sienna Biopharmaceuticals, Inc.* | | 15,200 | | 35,264 | | |
Sierra Oncology, Inc.* | | 289,300 | | 381,876 | | |
Spero Therapeutics, Inc.* | | 22,379 | | 137,631 | | |
Surface Oncology, Inc.*+ | | 83,700 | | 354,888 | | |
Synlogic, Inc.* | | 25,000 | | 175,250 | | |
Syros Pharmaceuticals, Inc.*+ | | 65,900 | | 367,063 | | |
T2 Biosystems, Inc.* | | 125,000 | | 376,250 | | |
Teligent, Inc.*+ | | 216,981 | | 297,264 | | |
Tetraphase Pharmaceuticals, Inc.*+ | | 105,000 | | 118,650 | | |
Tocagen, Inc.*+ | | 100,000 | | 821,000 | | |
Utah Medical Products, Inc. | | 16,800 | | 1,395,744 | | |
Verastem, Inc.*+ | | 83,900 | | 281,904 | | |
VolitionRX, Ltd.*+ | | 195,000 | | 352,950 | | |
vTv Therapeutics, Inc., Class A*+ | | 68,800 | | 182,320 | | |
XOMA Corp.*+ | | 21,700 | | 274,505 | | |
Xtant Medical Holdings, Inc.* | | 50,000 | | 80,500 | | |
Zafgen, Inc.* | | 85,434 | | 422,898 | | |
Zynerba Pharmaceuticals, Inc.* | | 55,500 | | 164,835 | | |
| | | | | | |
| | | | 46,060,366 | | |
Industrials - 11.63% | | |
Acacia Research Corp.* | | 161,800 | | 482,164 | | |
Acme United Corp. | | 12,935 | | 184,324 | | |
| | | | |
| Industry Company | | Shares | | Value |
|
Industrials (continued) |
AeroCentury Corp.*+ | | 10,900 | | $ 104,313 |
Alpha Pro Tech, Ltd.*+ | | 151,200 | | 560,952 |
American Superconductor Corp.*+ | | 70,100 | | 781,615 |
AMREP Corp.* | | 30,100 | | 179,095 |
ARC Document Solutions, Inc.* | | 114,000 | | 233,700 |
Arotech Corp.* | | 121,367 | | 317,982 |
Avalon Holdings Corp., Class A*+ | | 12,675 | | 33,589 |
BG Staffing, Inc. | | 37,500 | | 774,375 |
BlueLinx Holdings, Inc.*+ | | 35,600 | | 879,676 |
CECO Environmental Corp.* | | 69,710 | | 470,542 |
Charah Solutions, Inc.* | | 100,000 | | 835,000 |
Chicago Rivet & Machine Co. | | 10,000 | | 315,000 |
Command Security Corp.*+ | | 44,600 | | 125,326 |
Commercial Vehicle Group, Inc.* | | 125,100 | | 713,070 |
CompX International, Inc. | | 3,200 | | 43,552 |
CPI Aerostructures, Inc.* | | 4,700 | | 29,939 |
CRA International, Inc. | | 23,500 | | 999,925 |
Eastern Co. (The) | | 28,047 | | 678,176 |
Ecology and Environment, Inc., Class A | | 8,000 | | 90,720 |
Enphase Energy, Inc.*+ | | 150,000 | | 709,500 |
Espey Manufacturing & Electronics Corp.+ | | 10,700 | | 266,644 |
ExOne Co. (The)*+ | | 48,300 | | 319,746 |
Franklin Covey Co.* | | 22,000 | | 491,260 |
Fuel Tech, Inc.* | | 118,628 | | 141,167 |
FuelCell Energy, Inc.* | | 300,000 | | 165,150 |
Gencor Industries, Inc.* | | 66,450 | | 728,956 |
Goldfield Corp. (The)* | | 108,080 | | 244,261 |
GP Strategies Corp.* | | 15,000 | | 189,150 |
Graham Corp. | | 35,900 | | 819,956 |
HC2 Holdings, Inc.*+ | | 104,000 | | 274,560 |
Highpower International, Inc.*+ | | 50,000 | | 108,500 |
Hill International, Inc.* | | 201,551 | | 620,777 |
Houston Wire & Cable Co.* | | 83,300 | | 421,498 |
Hudson Global, Inc.* | | 59,416 | | 80,212 |
Hurco Cos, Inc. | | 33,734 | | 1,204,304 |
Innovative Solutions & Support, Inc.* | | 106,400 | | 234,612 |
Intersections, Inc.*+ | | 12,500 | | 46,125 |
Lawson Products, Inc.* | | 32,400 | | 1,023,840 |
LB Foster Co., Class A* | | 47,600 | | 756,840 |
LSI Industries, Inc. | | 46,000 | | 145,820 |
Mastech Digital, Inc.*+ | | 18,500 | | 116,550 |
| | |
| 32 | | Semi-Annual Report | December 31, 2018 (Unaudited) |
| | |
| Ultra-Small Company Market Fund | | |
| SCHEDULE OF INVESTMENTS (Unaudited)(continued) |
Showing percentage of net assets as of December 31, 2018 | | |
| | | | | | |
| Industry Company | | Shares | | Value | | |
| |
Common Stocks (continued) | | |
Industrials (continued) | | |
Miller Industries, Inc. | | 29,800 | | $ 804,600 | | |
NL Industries, Inc.* | | 48,100 | | 168,831 | | |
Northwest Pipe Co.* | | 21,200 | | 493,748 | | |
Orion Group Holdings, Inc.* | | 163,000 | | 699,270 | | |
PAM Transportation Services, Inc.* | | 20,408 | | 804,279 | | |
Patriot Transportation Holding, Inc.* | | 30,871 | | 601,676 | | |
Performant Financial Corp.* | | 305,000 | | 686,250 | | |
Perma-Pipe International Holdings, Inc.* | | 66,100 | | 578,375 | | |
PICO Holdings, Inc.* | | 85,000 | | 776,900 | | |
Radiant Logistics, Inc.* | | 175,000 | | 743,750 | | |
RCM Technologies, Inc.* | | 180,710 | | 560,201 | | |
Red Violet, Inc.*+ | | 9,813 | | 66,140 | | |
Servotronics, Inc.+ | | 15,653 | | 155,747 | | |
SIFCO Industries, Inc.* | | 16,024 | | 55,283 | | |
Tel-Instrument Electronics Corp.*+ | | 15,000 | | 57,150 | | |
Transcat, Inc.* | | 24,800 | | 471,696 | | |
Twin Disc, Inc.* | | 49,600 | | 731,600 | | |
Ultralife Corp.* | | 52,400 | | 353,700 | | |
USA Truck, Inc.* | | 33,871 | | 507,049 | | |
Virco Manufacturing Corp. | | 16,800 | | 72,072 | | |
Volt Information Sciences, Inc.* | | 150,000 | | 322,500 | | |
Willdan Group, Inc.* | | 20,000 | | 699,600 | | |
Willis Lease Finance Corp.* | | 34,600 | | 1,197,160 | | |
YRC Worldwide, Inc.*+ | | 165,000 | | 519,750 | | |
| | | | | | |
| | | |
| | | | 30,069,790 | | |
Information Technology - 13.39% | | |
Aerohive Networks, Inc.* | | 210,000 | | 684,600 | | |
Alithya Group, Inc., Class A* | | 60,663 | | 143,771 | | |
ALJ Regional Holdings, Inc.* | | 88,000 | | 115,280 | | |
Amber Road, Inc.* | | 123,300 | | 1,014,759 | | |
Amtech Systems, Inc.* | | 91,500 | | 414,495 | | |
AstroNova, Inc. | | 32,800 | | 615,000 | | |
Aviat Networks, Inc.* | | 22,086 | | 292,640 | | |
Avid Technology, Inc.* | | 150,000 | | 712,500 | | |
Aware, Inc.* | | 24,979 | | 90,174 | | |
AXT, Inc.* | | 158,006 | | 687,326 | | |
Bel Fuse, Inc., Class B | | 25,000 | | 460,500 | | |
BK Technologies, Inc. | | 163,744 | | 614,040 | | |
Blonder Tongue Laboratories, Inc.* | | 20,000 | | 22,100 | | |
Brightcove, Inc.* | | 143,300 | | 1,008,832 | | |
BSQUARE Corp.* | | 59,500 | | 92,225 | | |
Clearfield, Inc.* | | 41,600 | | 412,672 | | |
Communications Systems, Inc. | | 47,100 | | 95,613 | | |
| | | | |
| Industry Company | | Shares | | Value |
|
Information Technology (continued) |
Computer Task Group, Inc.* | | 69,800 | | $ 284,784 |
CSP, Inc. | | 38,700 | | 378,099 |
CyberOptics Corp.* | | 42,550 | | 750,156 |
Digi International, Inc.* | | 43,700 | | 440,933 |
DSP Group, Inc.* | | 83,500 | | 935,200 |
EMCORE Corp.* | | 138,702 | | 582,548 |
Frequency Electronics, Inc.* | | 16,000 | | 169,600 |
GlobalSCAPE, Inc. | | 161,180 | | 722,086 |
GSE Systems, Inc.*+ | | 145,125 | | 304,762 |
GSI Technology, Inc.* | | 111,417 | | 572,683 |
ID Systems, Inc.* | | 63,000 | | 352,170 |
IEC Electronics Corp.*+ | | 53,450 | | 305,734 |
Impinj, Inc.*+ | | 43,000 | | 625,650 |
Information Services Group, Inc.* | | 183,300 | | 777,192 |
Innodata, Inc.* | | 286,955 | | 430,432 |
Inseego Corp.*+ | | 46,900 | | 194,635 |
Intellicheck, Inc.*+ | | 49,700 | | 106,358 |
Intelligent Systems Corp.*+ | | 35,362 | | 456,877 |
Internap Corp.*+ | | 46,800 | | 194,220 |
inTEST Corp.* | | 55,600 | | 340,828 |
Intevac, Inc.*+ | | 65,000 | | 339,950 |
Issuer Direct Corp. | | 25,000 | | 283,750 |
Iteris, Inc.* | | 29,720 | | 110,856 |
Key Tronic Corp.* | | 57,100 | | 322,615 |
KVH Industries, Inc.* | | 80,510 | | 828,448 |
Majesco*+ | | 6,000 | | 42,540 |
Marin Software, Inc.*+ | | 44,614 | | 236,900 |
Maxwell Technologies, Inc.*+ | | 130,000 | | 269,100 |
MoneyGram International, Inc.* | | 101,000 | | 202,000 |
Napco Security Technologies, Inc.* | | 69,976 | | 1,102,122 |
NeoPhotonics Corp.*+ | | 105,000 | | 680,400 |
Network-1 Technologies, Inc. | | 115,000 | | 256,450 |
PAR Technology Corp.*+ | | 39,750 | | 864,562 |
PCM, Inc.* | | 52,000 | | 915,720 |
PC-Tel, Inc. | | 78,100 | | 335,049 |
PDF Solutions, Inc.*+ | | 45,000 | | 379,350 |
Perceptron, Inc.* | | 55,000 | | 443,300 |
Pixelworks, Inc.* | | 163,900 | | 475,310 |
PRGX Global, Inc.* | | 128,100 | | 1,213,107 |
QAD, Inc., Class B | | 8,250 | | 243,540 |
Quantum Corp.* | | 165,000 | | 330,000 |
QuickLogic Corp.*+ | | 130,000 | | 95,420 |
RealNetworks, Inc.* | | 138,500 | | 319,935 |
RF Industries, Ltd. | | 14,100 | | 102,366 |
Richardson Electronics, Ltd. | | 99,011 | | 860,406 |
| | |
| Ultra-Small Company Market Fund | |
|
| SCHEDULE OF INVESTMENTS (Unaudited) (continued) |
Showing percentage of net assets as of December 31, 2018 | | |
| | | | | | |
| Industry Company | | Shares | | Value | | |
| | | |
Common Stocks (continued) | | | | | | |
Information Technology (continued) | | | | |
Rubicon Project, Inc. (The)* | | 200,000 | | $ 746,000 | | |
Seachange International, Inc.* | | 91,300 | | 115,038 | | |
ServiceSource International, Inc.*+ | | 248,000 | | 267,840 | | |
SMTC Corp.*+ | | 135,000 | | 550,800 | | |
StarTek, Inc.*+ | | 113,800 | | 756,770 | | |
Steel Connect, Inc.* | | 249,500 | | 431,635 | | |
Synacor, Inc.* | | 292,400 | | 432,752 | | |
Telaria, Inc.* | | 291,900 | | 796,887 | | |
Telenav, Inc.* | | 214,100 | | 869,246 | | |
TransAct Technologies, Inc. | | 50,000 | | 449,000 | | |
Trio-Tech International* | | 26,800 | | 65,928 | | |
Wayside Technology Group, Inc.+ | | 10,298 | | 102,980 | | |
Wireless Telecom Group, Inc.* | | 113,100 | | 200,187 | | |
Zix Corp.* | | 204,582 | | 1,172,255 | | |
| | | | | | |
| | | | 34,611,988 | | |
Materials - 3.07% | | | | | | |
Advanced Emissions Solutions, Inc.+ | | 77,075 | | 813,141 | | |
AgroFresh Solutions, Inc.*+ | | 127,000 | | 481,330 | | |
Ampco-Pittsburgh Corp.* | | 50,000 | | 155,000 | | |
China Green Agriculture, Inc.* | | 25,000 | | 12,495 | | |
Core Molding Technologies, Inc. | | 45,100 | | 320,661 | | |
Flexible Solutions International, Inc.*+ | | 45,707 | | 61,704 | | |
Flotek Industries, Inc.*+ | | 150,000 | | 163,500 | | |
Friedman Industries, Inc. | | 57,000 | | 401,850 | | |
Gold Resource Corp. | | 203,100 | | 812,400 | | |
Gulf Resources, Inc.* | | 362,900 | | 286,292 | | |
Intrepid Potash, Inc.* | | 155,000 | | 403,000 | | |
LSB Industries, Inc.*+ | | 107,500 | | 593,400 | | |
Northern Technologies International Corp. | | 13,950 | | 412,780 | | |
Olympic Steel, Inc. | | 43,200 | | 616,464 | | |
Paramount Gold Nevada Corp.* | | 40,000 | | 33,200 | | |
Ramaco Resources, Inc.*+ | | 122,800 | | 607,860 | | |
Synalloy Corp. | | 43,500 | | 721,665 | | |
Trecora Resources* | | 30,000 | | 234,000 | | |
Universal Stainless & Alloy Products, Inc.* | | 50,686 | | 821,620 | | |
| | | | | | |
| | | | 7,952,362 | | |
Real Estate - 1.37% | | | | | | |
American Realty Investors, Inc.*+ | | 11,113 | | 134,134 | | |
| | | | |
| Industry Company | | Shares | | Value |
|
Real Estate (continued) |
Consolidated-Tomoka Land Co. | | 15,449 | | $ 811,072 |
Griffin Industrial Realty, Inc. | | 17,905 | | 571,170 |
Maui Land & Pineapple Co., Inc.*+ | | 65,700 | | 651,744 |
Stratus Properties, Inc.* | | 37,150 | | 890,857 |
Transcontinental Realty Investors, Inc.*+ | | 3,097 | | 87,707 |
Trinity Place Holdings, Inc.* | | 91,100 | | 395,374 |
| | | | |
| | | | 3,542,058 |
| | |
Utilities - 1.70% | | | | |
Artesian Resources Corp., Class A | | 19,500 | | 679,965 |
Cadiz, Inc.*+ | | 71,700 | | 738,510 |
Genie Energy, Ltd., Class B | | 98,667 | | 594,962 |
Global Water Resources, Inc. | | 86,400 | | 876,096 |
RGC Resources, Inc. | | 15,259 | | 457,160 |
Spark Energy, Inc., Class A+ | | 43,000 | | 319,490 |
York Water Co. (The)+ | | 22,793 | | 730,744 |
| | | | |
| | | | 4,396,927 |
| | | | |
TOTAL COMMON STOCKS - 100.54% | | 259,969,768 |
| | | | |
(Cost $260,280,210) | | | | |
EXCHANGE TRADED FUND - 0.21% | | |
iShares Micro-Cap ETF | | 6,525 | | 537,986 |
| | | | |
| | |
TOTAL EXCHANGE TRADED FUND - 0.21% | | | | 537,986 |
| | | | |
(Cost $163,006) | | | | |
| | |
WARRANTS - 0.00% | | | | |
SAExploration Series A, expire 07/27/21*D | | 848 | | — |
SAExploration Series B, expire 07/27/21*D | | 848 | | — |
| | | | |
| | |
TOTAL WARRANTS - 0.00%
(Cost $ – ) | | | | — |
| | | | |
| | |
| 34 | | Semi-Annual Report | December 31, 2018 (Unaudited) |
| | |
| Ultra-Small Company Market Fund | | |
| SCHEDULE OF INVESTMENTS (Unaudited) (continued) | | |
Showing percentage of net assets as of December 31, 2018 | | |
| | | | | | | | | | | | | | | | |
| | | Rate^ | | | Shares | | | Value | | | | |
| | |
MONEY MARKET FUND - 0.00% | | | | | | | | | |
Fidelity Investments Money Market Government Portfolio Class I | | | 2.25 | % | | | 421 | | | | $421 | | | | | |
| | | | | | | | | | | | | | | | |
TOTAL MONEY MARKET FUND - 0.00% | | | | 421 | | | | | |
| | | | | | | | | | | | | | | | |
(Cost $421) | | | | | | | | | | | | | | | | |
| | |
INVESTMENTS PURCHASED WITH CASH PROCEEDS FROM SECURITIES LENDING - 9.05% | | | | | | | | | |
Fidelity Investments Money Market Government Portfolio Class I** | | | 2.25 | % | | | 23,396,252 | | | | 23,396,252 | | | | | |
| | | | | | | | | | | | | | | | |
TOTAL INVESTMENTS PURCHASED WITH CASH PROCEEDS FROM SECURITIES LENDING - 9.05% | | | | | | | | | | | 23,396,252 | | | | | |
| | | | | | | | | | | | | | | | |
(Cost $23,396,252) | | | | | | | | | | | | | | | | |
TOTAL INVESTMENTS - 109.80% | | | | $283,904,427 | | | | | |
(Cost $283,839,889) | | | | | | | | | | | | | | | | |
Liabilities in Excess of Other Assets - (9.80%) | | | | (25,331,605 | ) | | | | |
| | | | | | | | | | | | | | | | |
NET ASSETS - 100.00% | | | | | | | | $258,572,822 | | | | | |
| | | | | | | | | | | | | | | | |
* Non-income producing security. ** This security represents the investment of the collateral received in connection with securities out on loan as of December 31, 2018. ^ Rate disclosed as of December 31, 2018. D Security was fair valued using significant unobservable inputs (see Note 2). As such, the security is classified as Level 3 in the fair value hierarchy. + This security or a portion of the security is out on loan as of December 31, 2018. Total loaned securities had a value of $22,264,499 as of December 31, 2018. LLC - Limited Liability Company | | | | | |
Summary of inputs used to value the Fund’s investments as of 12/31/2018 (See Note 2 in Notes to Financial Statements):
| | | | | | | | | | | | | | |
| | | Valuation Inputs | |
| |
| | | Investment in Securities (Value) | |
| | | | |
| | | Level 1 Quoted Prices | | Level 2
Significant
Observable
Inputs | | | Level 3 Significant Unobservable
Inputs | | | Total | |
| | | | |
Common Stocks (a) | | $259,969,768 | | | $ — | | | | $ — | | | | $259,969,768 | |
Exchange Traded Fund | | 537,986 | | | — | | | | — | | | | 537,986 | |
Warrants | | — | | | — | | | | 0 | | | | 0 | |
Money Market Fund | | — | | | 421 | | | | — | | | | 421 | |
Investments Purchased with Cash Proceeds from Securities Lending | | — | | | 23,396,252 | | | | — | | | | 23,396,252 | |
| | | | | | | | | | | | | | |
TOTAL | | $260,507,754 | | | $23,396,673 | | | | $ 0 | | | | $283,904,427 | |
| | | | | | | | | | | | | | |
| (a) | - Please refer to the Schedule of Investments for the industry classifications of these portfolio holdings. |
| | |
| Ultra-Small Company Market Fund | |
|
| SCHEDULE OF INVESTMENTS (Unaudited) (continued) |
Showing percentage of net assets as of December 31, 2018 | | |
Following is a reconciliation of Level 3 investments for which significant unobservable inputs were used to determine fair value:
| | | | | | |
| | | Investment in Securities (Value) | | |
| | | Warrants | | Total | | |
Balance as of 06/30/2018 | | $ 0 | | $ 0 | | |
Purchases/Issuances | | — | | — | | |
Sales/Expirations | | — | | — | | |
Realized Gain/(Loss) | | — | | — | | |
Change in Unrealized Appreciation/ (Depreciation) | | — | | — | | |
Transfers in | | — | | — | | |
Transfers out | | — | | — | | |
| | | | | | |
Balance as of 12/31/2018 | | $— | | $— | | |
| | | | | | |
Net Change in Unrealized Appreciation (Depreciation) from Investments Held as of 12/31/2018 | | $— | | $— | | |
| | | | | | |
See Notes to Financial Statements.
| | |
| 36 | | Semi-Annual Report | December 31, 2018 (Unaudited) |
| | |
| Small-Cap Growth Fund | | |
| MANAGER’S COMMENTARY (Unaudited) | | |
| | |
December 31, 2018
Dear FellowSmall-Cap Growth Fund Shareholder,
For the quarter ended December 31, 2018, our Fund returned-22.16%, underperforming our primary market benchmark, the Russell 2000 Growth Index(-21.65%), and our peer benchmark, the LipperSmall-Cap Growth Funds Index(-20.46%). It was a poor quarter.
For the calendar year, our Fund declined-11.21%, lagging both the Russell 2000 Growth Index(-9.31%) and the LipperSmall-Cap Growth Funds Index(-3.93%). The Fund led our benchmarks in the longer five-year period, although it lagged in the10-year andinception-to-date periods.
The table below presents our December quarter,six-month,one-year, five-year,10-year, andinception-to-date financial results. See the next page for a graph of performance since inception.
Standardized Returns as of December 31, 2018
| | | | | | | | | | | | | | | | | | | | | | |
| | | | | | | | | | | | Annualized |
| | | Quarter | | | 6 Months | | | 1 Year | | | 5 Years | | | 10 Years | | | Since Inception
(10/31/03) |
| | | | | | |
Small-Cap Growth Fund | | | -22.16 | % | | | -19.00 | % | | | -11.21 | % | | | 6.55 | % | | | 11.21 | % | | 6.21% |
Russell 2000 Growth Index | | | -21.65 | % | | | -17.33 | % | | | -9.31 | % | | | 5.13 | % | | | 13.52 | % | | 8.13% |
LipperSmall-Cap Growth Funds Index | | | -20.46 | % | | | -14.50 | % | | | -3.93 | % | | | 5.51 | % | | | 13.55 | % | | 7.46% |
Performance figures quoted in the table above represent past performance and are no guarantee of future results. Total return figures in the table above include the reinvestment of dividends and capital gains. The table above does not reflect the deduction of taxes that a shareholder would pay on Fund distributions or on the redemption of Fund shares.
The Russell 2000 Growth Index is an unmanaged index that consists of stocks in the Russell 2000 Index with higherprice-to-book ratios and higher forecasted growth values with dividends reinvested. The LipperSmall-Cap Growth Funds Index is an index of small-company, growth-oriented funds compiled by Lipper, Inc. It is not possible to invest directly in an index. Periods longer than one year are annualized.
| | |
| Small-Cap Growth Fund | |
|
| MANAGER’S COMMENTARY (Unaudited) (continued) |
| | |
Growth of a $10,000 Investment
from Inception October 31, 2003 to December 31, 2018

Detailed Explanation of Quarterly Performance
The Fund’s diversifying value metrics models lagged the benchmark and detracted from relative results for the quarter. However, our core company financial health models and diversifying price momentum models helped offset some of that impact. The Fund’s tilt toward smaller stocks in thesmall-cap growth universe also hurt relative results, as this positioning created underweightings in some of the benchmark’s better-performing larger stocks. In contrast, the Fund’s overall greater-than-benchmark core exposure (as measured by multiple value metrics) added to relative performance.
From a sector perspective, the Fund’s allocation effect was modestly positive. An underweighting in the Health Care sector and an overweighting in the Financials sector boosted relative performance for the quarter. However, the Fund’s stock selection effect was negative. Poor performance from holdings in the Industrials, Materials, and Consumer Staples sectors weighed on relative results the most and offset the positive impact of selection among Health Care stocks.
Detailed Explanation of Calendar Year Performance
All three of the Fund’s model categories lagged the benchmark and detracted from relative results. The Fund’s greater-than-benchmark core exposure (as measured by multiple value metrics) detracted significantly from relative performance during a year in which value stocks underperformed growth stocks. A tilt toward smaller stocks in thesmall-cap growth universe also weighed on relative results. However, the Fund’s exposure to higher momentum stocks boosted relative results.
From a sector perspective, the Fund’s allocation effect was slightly positive for the calendar year. An overweighting in the Communication Services sector and an underweighting in the Materials sector added to relative results. The Fund’s overall stock selection effect (including interaction effect) was negative, with holdings in the Communication Services and the Consumer Staples sectors detracting the most from relative results.
| | |
| 38 | | Semi-Annual Report | December 31, 2018 (Unaudited) |
| | |
| Small-Cap Growth Fund | | |
| MANAGER’S COMMENTARY (Unaudited)(continued) | | |
| | |
Top Ten Holdings as of December 31, 2018
| | | | | | | | |
| Rank | | Description | | Industry | | % of Net
Assets | |
| 1 | | Five9, Inc. | | Information Technology | | | 2.0% | |
| 2 | | Corcept Therapeutics, Inc. | | Health Care | | | 2.0% | |
| 3 | | QuinStreet, Inc. | | Communication Services | | | 1.9% | |
| 4 | | Vocera Communications, Inc. | | Health Care | | | 1.9% | |
| 5 | | BioSpecifics Technologies Corp. | | Health Care | | | 1.9% | |
| 6 | | LGI Homes, Inc. | | Consumer Discretionary | | | 1.8% | |
| 7 | | Crocs, Inc. | | Consumer Discretionary | | | 1.8% | |
| 8 | | Lindsay Corp. | | Industrials | | | 1.7% | |
| 9 | | Asbury Automotive Group, Inc. | | Consumer Discretionary | | | 1.7% | |
| 10 | | Lumentum Holdings, Inc. | | Information Technology | | | 1.7% | |
| | | |
| | Total | | | | | 18.4% | |
Industry Sector Representation as of December 31, 2018
| | | | | | | | | | | | | | | |
| | | % of Net Assets | | % of Russell 2000
Growth Index | | Difference |
Communication Services | | | | 5.2% | | | | | 3.5% | | | | | 1.7% | |
Consumer Discretionary | | | | 16.4% | | | | | 14.8% | | | | | 1.6% | |
Consumer Staples | | | | 3.6% | | | | | 3.1% | | | | | 0.5% | |
Energy | | | | 2.1% | | | | | 1.7% | | | | | 0.4% | |
Financials | | | | 7.1% | | | | | 7.5% | | | | | -0.4% | |
Health Care | | | | 23.1% | | | | | 26.3% | | | | | -3.2% | |
Industrials | | | | 21.9% | | | | | 17.7% | | | | | 4.2% | |
Information Technology | | | | 18.2% | | | | | 18.5% | | | | | -0.3% | |
Materials | | | | 1.9% | | | | | 3.4% | | | | | -1.5% | |
Real Estate | | | | 0.6% | | | | | 3.0% | | | | | -2.4% | |
Utilities | | | | 0.0% | | | | | 0.5% | | | | | -0.5% | |
Liabilities in Excess of Other Assets | | | | -0.1% | | | | | 0.0% | | | | | -0.1% | |
| | | |
Total | | | | 100.0% | | | | | 100.0% | | | | | | |
Disclaimer
The views expressed here are exclusively those of Fund management. These views, including those related to market sectors or individual stocks, are not meant as investment advice and should not be considered predictive in nature. Any favorable (or unfavorable) description of a holding applies only as of the quarter end, December 31, 2018, unless otherwise stated. Security positions can and do change thereafter. Discussions of historical performance do not guarantee and may not be indicative of future performance.
Market volatility can significantly impact short-term performance. The Fund is not an appropriate investment for short-term investors. Investments in small companies generally carry greater risk than is customarily associated with larger companies. This additional risk is attributable to a number of factors, including the relatively limited financial resources that are typically available to small companies and the fact that small companies often have comparatively limited product lines. In addition, the stock of small companies tends to be more volatile than the stock of large companies, particularly in the short term and particularly in the early stages of an economic or market downturn. Shareholders of the Fund, therefore, are taking on more risk than they would if they invested in the stock market as a whole.
| | |
| Small-Cap Growth Fund | |
|
| MANAGER’S COMMENTARY (Unaudited)(continued) |
| | |
Conclusion
Thank you for your continued investment inSmall-Cap Growth Fund. We encourage your feedback; your reactions and concerns are important to us.
Sincerely,
The Investment Management Team
| | |
| 40 | | Semi-Annual Report | December 31, 2018 (Unaudited) |
| | |
| Small-Cap Growth Fund | | |
| SCHEDULE OF INVESTMENTS (Unaudited) | | |
Showing percentage of net assets as of December 31, 2018 | | |
| | | | | | |
| Industry Company | | Shares | | Value | | |
| |
COMMON STOCKS - 100.13% | | |
| Communication Services - 5.19% | | |
Boingo Wireless, Inc.* | | 9,200 | | $ 189,244 | | |
Entravision Communications Corp., Class A | | 154,700 | | 450,177 | | |
MDC Partners, Inc., Class A* | | 50,500 | | 131,805 | | |
QuinStreet, Inc.* | | 50,400 | | 817,992 | | |
Tribune Publishing Co.* | | 52,200 | | 591,948 | | |
| | | | | | |
| | | | 2,181,166 | | |
| |
Consumer Discretionary - 16.40% | | |
Asbury Automotive Group, Inc.* | | 10,900 | | 726,594 | | |
BJ’s Restaurants, Inc. | | 12,800 | | 647,296 | | |
Bloomin’ Brands, Inc. | | 21,100 | | 377,479 | | |
Boot Barn Holdings, Inc.* | | 30,500 | | 519,415 | | |
Cheesecake Factory, Inc. (The) | | 4,900 | | 213,199 | | |
Children’s Place, Inc. (The) | | 4,900 | | 441,441 | | |
Crocs, Inc.* | | 28,400 | | 737,832 | | |
Dave & Buster’s Entertainment, Inc. | | 11,900 | | 530,264 | | |
LCI Industries | | 6,000 | | 400,800 | | |
LGI Homes, Inc.*+ | | 17,100 | | 773,262 | | |
Penn National Gaming, Inc.* | | 2,478 | | 46,661 | | |
Red Rock Resorts, Inc., Class A | | 5,700 | | 115,767 | | |
RH*+ | | 4,900 | | 587,118 | | |
Sleep Number Corp.* | | 3,800 | | 120,574 | | |
Stamps.com, Inc.* | | 1,500 | | 233,460 | | |
Tailored Brands, Inc. | | 30,700 | | 418,748 | | |
| | | | | | |
| | | | 6,889,910 | | |
| |
Consumer Staples - 3.57% | | |
Chefs’ Warehouse, Inc. (The)* | | 20,700 | | 661,986 | | |
Medifast, Inc. | | 3,500 | | 437,570 | | |
Performance Food Group | | | | | | |
Co.* | | 12,400 | | 400,148 | | |
| | | | | | |
| | | | 1,499,704 | | |
| |
Energy - 2.08% | | |
Carrizo Oil & Gas, Inc.* | | 17,200 | | 194,188 | | |
Renewable Energy Group, Inc.* | | 26,500 | | 681,050 | | |
| | | | | | |
| | | | 875,238 | | |
| |
Financials - 7.10% | | |
Diamond Hill Investment Group, Inc. | | 1,000 | | 149,450 | | |
Enova International, Inc.* | | 27,600 | | 537,096 | | |
FedNat Holding Co. | | 23,600 | | 470,112 | | |
FirstCash, Inc. | | 9,600 | | 694,560 | | |
| | | | | | | | |
| Industry Company | | Shares | | | Value | |
|
| |
Financials (continued) | |
Universal Insurance Holdings, Inc. | | | 16,000 | | | $ | 606,720 | |
Walker & Dunlop, Inc. | | | 12,100 | | | | 523,325 | |
| | | | | | | | |
| | | | | | | 2,981,263 | |
|
Health Care - 23.15% | |
AMN Healthcare Services, Inc.* | | | 12,100 | | | | 685,586 | |
AxoGen, Inc.* | | | 3,800 | | | | 77,634 | |
BioSpecifics Technologies Corp.* | | | 13,000 | | | | 787,800 | |
BioTelemetry, Inc.* | | | 11,700 | | | | 698,724 | |
Corcept Therapeutics, Inc.*+ | | | 61,400 | | | | 820,304 | |
Emergent BioSolutions, Inc.* | | | 10,700 | | | | 634,296 | |
Ensign Group, Inc. (The) | | | 16,600 | | | | 643,914 | |
Genesis Healthcare, Inc.* | | | 544,200 | | | | 642,156 | |
GTx, Inc.*+ | | | 488,900 | | | | 381,342 | |
Haemonetics Corp.* | | | 7,100 | | | | 710,355 | |
Insys Therapeutics, Inc.* | | | 33,800 | | | | 118,300 | |
Intersect ENT, Inc.* | | | 4,500 | | | | 126,810 | |
Jounce Therapeutics, Inc.* | | | 150,700 | | | | 507,859 | |
Providence Service Corp. (The)* | | | 11,200 | | | | 672,224 | |
Quorum Health Corp.* | | | 172,500 | | | | 498,525 | |
RTI Surgical, Inc.* | | | 34,500 | | | | 127,650 | |
Supernus Pharmaceuticals, Inc.* | | | 14,800 | | | | 491,656 | |
Tactile Systems Technology, Inc.* | | | 2,000 | | | | 91,100 | |
Vericel Corp.* | | | 11,100 | | | | 193,140 | |
Vocera Communications, Inc.* | | | 20,700 | | | | 814,545 | |
| | | | | | | | |
| | | | | | | 9,723,920 | |
|
Industrials - 21.88% | |
Advanced Drainage Systems, Inc. | | | 21,400 | | | | 518,950 | |
Allegiant Travel Co. | | | 4,400 | | | | 440,968 | |
ArcBest Corp. | | | 11,000 | | | | 376,860 | |
Avis Budget Group, Inc.* | | | 26,700 | | | | 600,216 | |
Brink’s Co. (The) | | | 3,200 | | | | 206,880 | |
Builders FirstSource, Inc.* | | | 33,500 | | | | 365,485 | |
Comfort Systems USA, Inc. | | | 12,700 | | | | 554,736 | |
Continental Building Products, Inc.* | | | 14,500 | | | | 369,025 | |
Covanta Holding Corp. | | | 21,640 | | | | 290,409 | |
DMC Global, Inc. | | | 19,600 | | | | 688,352 | |
General Finance Corp.* | | | 40,400 | | | | 408,444 | |
Harsco Corp.* | | | 28,200 | | | | 560,052 | |
Insperity, Inc. | | | 7,500 | | | | 700,200 | |
Kadant, Inc. | | | 7,300 | | | | 594,658 | |
| | |
| Small-Cap Growth Fund | |
|
| SCHEDULE OF INVESTMENTS (Unaudited) (continued) |
Showing percentage of net assets as of December 31, 2018 | | |
| | | | | | | | | | |
| Industry Company | | Shares | | | Value | | | |
| |
Common Stocks (continued) | | | |
Industrials (continued) | | | |
Lindsay Corp. | | | 7,600 | | | $ | 731,500 | | | |
MasTec, Inc.* | | | 3,700 | | | | 150,072 | | | |
Meritor, Inc.* | | | 7,400 | | | | 125,134 | | | |
PAM Transportation Services, Inc.* | | | 3,700 | | | | 145,817 | | | |
Patrick Industries, Inc.* | | | 5,000 | | | | 148,050 | | | |
Systemax, Inc. | | | 9,900 | | | | 236,511 | | | |
Tennant Co. | | | 7,400 | | | | 385,614 | | | |
TriNet Group, Inc.* | | | 14,200 | | | | 595,690 | | | |
| | | | | | | | | | |
| | | |
| | | | | | | 9,193,623 | | | |
| |
Information Technology - 18.20% | | | |
3D Systems Corp.*+ | | | 60,400 | | | | 614,268 | | | |
ACI Worldwide, Inc.* | | | 18,100 | | | | 500,827 | | | |
Advanced Energy Industries, Inc.* | | | 4,300 | | | | 184,599 | | | |
Alarm.com Holdings, Inc.* | | | 8,000 | | | | 414,960 | | | |
Bottomline Technologies, Inc.* | | | 12,000 | | | | 576,000 | | | |
Cirrus Logic, Inc.* | | | 10,000 | | | | 331,800 | | | |
Extreme Networks, Inc.* | | | 43,700 | | | | 266,570 | | | |
Five9, Inc.* | | | 18,800 | | | | 821,936 | | | |
InterDigital, Inc. | | | 9,700 | | | | 644,371 | | | |
Limelight Networks, Inc.* | | | 41,700 | | | | 97,578 | | | |
Lumentum Holdings, Inc.* | | | 17,200 | | | | 722,572 | | | |
MAXIMUS, Inc. | | | 10,100 | | | | 657,409 | | | |
QAD, Inc., Class A | | | 3,800 | | | | 149,454 | | | |
SMART Global Holdings, Inc.*+ | | | 23,200 | | | | 689,040 | | | |
Synaptics, Inc.* | | | 16,200 | | | | 602,802 | | | |
Unisys Corp.*+ | | | 31,800 | | | | 369,834 | | | |
| | | | | | | | | | |
| | | |
| | | | | | | 7,644,020 | | | |
| |
Materials - 1.89% | | | |
Ryerson Holding Corp.* | | | 43,900 | | | | 278,326 | | | |
Verso Corp., Class A* | | | 23,100 | | | | 517,440 | | | |
| | | | | | | | | | |
| | | |
| | | | | | | 795,766 | | | |
| |
Real Estate - 0.67% | | | |
HFF, Inc., Class A | | | 8,500 | | | | 281,860 | | | |
| | | | | | | | | | |
| | |
TOTAL COMMON STOCKS - 100.13% | | | | 42,066,470 | | | |
| | | | | | | | | | |
(Cost $43,333,672) | | | | | | | | | | |
| | | | | | | | |
| | | Rate^ | | Shares | | Value | |
|
| INVESTMENTS PURCHASED WITH CASH PROCEEDS FROM SECURITIES LENDING - 8.08% | |
Fidelity Investments Money Market Government Portfolio Class I** | | 2.25% | | 3,394,722 | | | $3,394,722 | |
| | | | | | | | |
TOTAL INVESTMENTS PURCHASED WITH CASH PROCEEDS FROM SECURITIES LENDING - 8.08% | | | 3,394,722 | |
| | | | | | | | |
(Cost $3,394,722) | | | | | | | | |
| |
TOTAL INVESTMENTS - 108.21% | | | $45,461,192 | |
(Cost $46,728,394) | | | | | | | | |
Liabilities in Excess of Other Assets - (8.21%) | | | (3,450,741) | |
| | | | | | | | |
NET ASSETS - 100.00% | | | $42,010,451 | |
| | | | | | | | |
| * | Non-income producing security. |
| ** | This security represents the investment of the collateral received in connection with securities out on loan as of December 31, 2018. |
| ^ | Rate disclosed as of December 31, 2018. |
| + | This security or a portion of the security is out on loan as of December 31, 2018. Total loaned securities had a value of $3,248,555 as of December 31, 2018. |
Summary of inputs used to value the Fund’s investments as of 12/31/2018 (See Note 2 in Notes to Financial Statements):
| | | | | | | | | | | | | | | | |
| | | Valuation Inputs | |
| |
| | | Investment in Securities (Value) | |
| |
| | | | | | Level 2 | | | Level 3 | | | | |
| | | Level 1
Quoted
Prices | | | Significant Observable
Inputs | | | Significant
Unobservable
Inputs | | | Total | |
| |
| | | | |
Common Stocks | | $ | 42,066,470 | | | $ | — | | | $ | — | | | $ | 42,066,470 | |
Investments Purchased with Cash Proceeds from Securities Lending | | | — | | | | 3,394,722 | | | | — | | | | 3,394,722 | |
| | | | | | | | | | | | | | | | |
TOTAL | | $ | 42,066,470 | | | $ | 3,394,722 | | | $ | — | | | $ | 45,461,192 | |
| | | | | | | | | | | | | | | | |
See Notes to Financial Statements.
| | |
| 42 | | Semi-Annual Report | December 31, 2018 (Unaudited) |
| | |
| Small-Cap Value Fund | | |
| MANAGER’S COMMENTARY (Unaudited) | | |
| | |
December 31, 2018
Dear FellowSmall-Cap Value Fund Shareholder,
For the quarter ended December 31, 2018, our Fund returned-22.97%, underperforming our primary market benchmark, the Russell 2000 Value Index(-18.67%), and our peer benchmark, the LipperSmall-Cap Value Funds Index(-19.29%). It was a poor quarter.
For the calendar year, our Fund returned-13.06%, trailing the Russell 2000 Value Index(-12.86%), but outperforming the LipperSmall-Cap Value Funds Index(-15.82%). We lag our primary market and peer benchmarks in the five-year andinception-to-date periods, while in the10-year period we are slightly ahead of our primary market benchmark but still lagging our peer benchmark.
The table below presents our December quarter,six-month,one-year, five-year,10-year, andinception-to-date financial results. See the next page for a graph of performance since inception.
Standardized Returns as of December 31, 2018
| | | | | | | | | | | | | | | | | | | | | | | | | | | | | | |
| | | | | | | | | | | Annualized | | |
| | | Quarter | | 6 Months | | 1 Year | | 5 Years | | 10 Years | | Since Inception
(10/31/03) |
| | | | | | |
Small-Cap Value Fund | | | | -22.97 | % | | | | -22.08 | % | | | | -13.06 | % | | | | 1.51 | % | | | | 10.54 | % | | | | 6.40 | % |
Russell 2000 Value Index | | | | -18.67 | % | | | | -17.36 | % | | | | -12.86 | % | | | | 3.61 | % | | | | 10.40 | % | | | | 7.35 | % |
Lipper Small-Cap Value Funds Index | | | | -19.29 | % | | | | -18.37 | % | | | | -15.82 | % | | | | 2.33 | % | | | | 10.81 | % | | | | 7.37 | % |
Performance figures quoted in the table above represent past performance and are no guarantee of future results. Total return figures in the table above include the reinvestment of dividends and capital gains. The table above does not reflect the deduction of taxes that a shareholder would pay on Fund distributions or on the redemption of Fund shares.
The Russell 2000 Value Index is an unmanaged index that consists of stocks in the Russell 2000 Index with lowerprice-to-book ratios and lower forecasted growth values with dividends reinvested. The LipperSmall-Cap Value Funds Index is an index of small-company, value-oriented funds compiled by Lipper, Inc. It is not possible to invest directly in an index. Periods longer than one year are annualized.
| | |
Small-Cap Value Fund | |
|
MANAGER’S COMMENTARY (Unaudited) (continued) |
| | |
Growth of a $10,000 Investment
from Inception October 31, 2003 to December 31, 2018
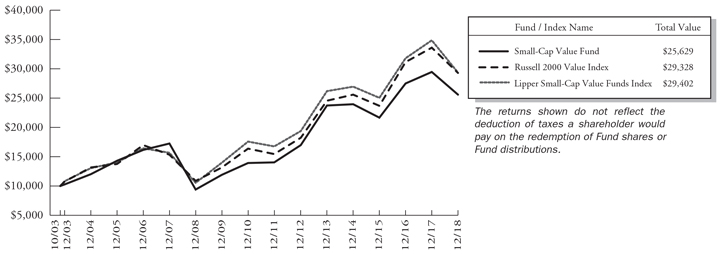
Detailed Explanation of Quarterly Performance
The Fund’s core value metrics models and diversifying company financial health models underperformed the benchmark during the quarter. However, our diversifying price momentum models partially offset the impact of that underperformance. The Fund’s tilt toward deeper value stocks across multiple value metrics also weighed on relative results, as did our tilt toward smaller stocks in thesmall-cap value universe.
From a sector perspective, the Fund’s allocation effect was negative, with an underweighting in the Utilities sector and overweightings in the Energy and Health Care sectors reducing relative results. The Fund’s stock selection effect was significantly negative, with holdings in the Information Technology, Consumer Discretionary, and Financials sectors detracting the most from relative performance.
Detailed Explanation of Calendar Year Performance
All three of the Fund’s model categories modestly outperformed the benchmark during the year, boosting relative results. However, the Fund’s tilt toward deeper value stocks across multiple value metrics and its exposure to higher momentum stocks weighed on relative results and offset the Fund’s positive model performance. The impact of the Fund’s tilt toward smaller stocks in thesmall-cap value universe was neutral during the calendar year.
From a sector perspective, the Fund’s allocation effect was negative. An underweighting in the Utilities sector and overweightings in the Health Care and Energy sectors weighed on relative results. In contrast, the Fund’s stock selection effect was positive, with holdings in the Communication Services, Energy, and Materials sectors boosting relative results the most. These gains were partly offset by the poor performance of holdings in the Real Estate and Consumer Discretionary sectors.
| | |
| 44 | | Semi-Annual Report | December 31, 2018 (Unaudited) |
| | |
Small-Cap Value Fund | | |
MANAGER’S COMMENTARY (Unaudited) (continued) | | |
Top Ten Holdings as of December 31, 2018
| | | | | | | | |
| Rank | | Description | | Industry | | % of Net
Assets | |
| 1 | | Atlantic Power Corp. | | Utilities | | | 1.6% | |
| 2 | | American Equity Investment Life Holding Co. | | Financials | | | 1.6% | |
| 3 | | Piper Jaffray Cos | | Financials | | | 1.6% | |
| 4 | | Sanderson Farms, Inc. | | Consumer Staples | | | 1.6% | |
| 5 | | Shoe Carnival, Inc. | | Consumer Discretionary | | | 1.6% | |
| 6 | | Renewable Energy Group, Inc. | | Energy | | | 1.6% | |
| 7 | | Civitas Solutions, Inc. | | Health Care | | | 1.6% | |
| 8 | | Argo Group International Holdings, Ltd. | | Financials | | | 1.6% | |
| 9 | | Intelsat SA | | Communication Services | | | 1.6% | |
| 10 | | National General Holdings Corp. | | Financials | | | 1.6% | |
| | | |
| | Total | | | | | 16.0% | |
Industry Sector Representation as of December 31, 2018
| | | | | | | | | | | | | | | |
| | | % of Net Assets | | % of Russell 2000
Value Index | | Difference |
Communication Services | | | | 4.3 | % | | | | 3.1 | % | | | | 1.2% | |
Consumer Discretionary | | | | 12.3 | % | | | | 9.4 | % | | | | 2.9% | |
Consumer Staples | | | | 4.7 | % | | | | 2.6 | % | | | | 2.1% | |
Energy | | | | 6.1 | % | | | | 5.4 | % | | | | 0.7% | |
Financials | | | | 25.6 | % | | | | 29.5 | % | | | | -3.9% | |
Health Care | | | | 7.3 | % | | | | 4.3 | % | | | | 3.0% | |
Industrials | | | | 14.1 | % | | | | 11.8 | % | | | | 2.3% | |
Information Technology | | | | 8.4 | % | | | | 10.8 | % | | | | -2.4% | |
Materials | | | | 4.6 | % | | | | 4.1 | % | | | | 0.5% | |
Real Estate | | | | 8.1 | % | | | | 11.7 | % | | | | -3.6% | |
Utilities | | | | 4.4 | % | | | | 7.3 | % | | | | -2.9% | |
Cash & Other Assets | | | | 0.1 | % | | | | 0.0 | % | | | | 0.1% | |
| | | |
Total | | | | 100.0 | % | | | | 100.0 | % | | | | | |
Disclaimer
The views expressed here are exclusively those of Fund management. These views, including those related to market sectors or individual stocks, are not meant as investment advice and should not be considered predictive in nature. Any favorable (or unfavorable) description of a holding applies only as of the quarter end, December 31, 2018, unless otherwise stated. Security positions can and do change thereafter. Discussions of historical performance do not guarantee and may not be indicative of future performance.
Market volatility can significantly impact short-term performance. The Fund is not an appropriate investment for short-term investors. Investments in small companies generally carry greater risk than is customarily associated with larger companies. This additional risk is attributable to a number of factors, including the relatively limited financial resources that are typically available to small companies and the fact that small companies often have comparatively limited product lines. In addition, the stock of small companies tends to be more volatile than the stock of large companies, particularly in the short term and particularly in the early stages of an economic or market downturn. Shareholders of the Fund, therefore, are taking on more risk than they would if they invested in the stock market as a whole.
| | |
| Small-Cap Value Fund | |
|
| MANAGER’S COMMENTARY (Unaudited) (continued) |
| | |
Conclusion
Thank you for your continued investment inSmall-Cap Value Fund. We encourage your feedback; your reactions and concerns are important to us.
Sincerely,
The Investment Management Team
| | |
| 46 | | Semi-Annual Report | December 31, 2018 (Unaudited) |
| | |
| Small-Cap Value Fund | | |
| SCHEDULE OF INVESTMENTS (Unaudited) | | |
Showing percentage of net assets as of December 31, 2018 | | |
| | | | | | | | |
| Industry Company | | Shares | | Value | | | | |
COMMON STOCKS - 99.67% | | | | | | |
Communication Services - 4.26% | | | | | | |
Entravision Communications Corp., Class A | | 184,100 | | $ 535,731 | | | | |
Intelsat SA* | | 36,800 | | 787,152 | | | | |
Marcus Corp. (The) | | 19,400 | | 766,300 | | | | |
Windstream Holdings, Inc.*+ | | 20,620 | | 43,096 | | | | |
| | | | | | | | |
| | | | |
| | | | 2,132,279 | | | | |
Consumer Discretionary - 12.29% | | | | | | |
American Axle & Manufacturing Holdings, Inc.* | | 35,900 | | 398,490 | | | | |
Caleres, Inc. | | 11,900 | | 331,177 | | | | |
Conn’s, Inc.* | | 21,200 | | 399,832 | | | | |
Dana, Inc. | | 28,900 | | 393,907 | | | | |
Fossil Group, Inc.* | | 34,200 | | 537,966 | | | | |
GameStop Corp., Class A+ | | 40,700 | | 513,634 | | | | |
Hibbett Sports, Inc.*+ | | 51,200 | | 732,160 | | | | |
KB Home | | 26,800 | | 511,880 | | | | |
Office Depot, Inc. | | 154,300 | | 398,094 | | | | |
Shoe Carnival, Inc.+ | | 23,700 | | 794,187 | | | | |
Tilly’s, Inc., Class A | | 53,900 | | 585,354 | | | | |
Tower International, Inc. | | 23,500 | | 559,300 | | | | |
| | | | | | | | |
| | | | |
| | | | 6,155,981 | | | | |
Consumer Staples - 4.66% | | | | | | |
Darling Ingredients, Inc.* | | 32,700 | | 629,148 | | | | |
Ingles Markets, Inc., Class A | | 9,100 | | 247,702 | | | | |
Natural Health Trends Corp.+ | | 35,900 | | 663,791 | | | | |
Sanderson Farms, Inc. | | 8,000 | | 794,320 | | | | |
| | | | | | | | |
| | | | |
| | | | 2,334,961 | | | | |
Energy - 6.06% | | | | | | |
Arch Coal, Inc., Class A | | 7,900 | | 655,621 | | | | |
California Resources Corp.*+ | | 26,200 | | 446,448 | | | | |
Denbury Resources, Inc.* | | 112,200 | | 191,862 | | | | |
Renewable Energy Group, Inc.*+ | | 30,800 | | 791,560 | | | | |
Rowan Cos Plc, Class A* | | 55,900 | | 469,001 | | | | |
Teekay Corp.+ | | 144,700 | | 483,298 | | | | |
| | | | | | | | |
| | | | |
| | | | 3,037,790 | | | | |
| | | | |
Financials - 25.55% | | | | | | | | |
American Equity Investment Life Holding Co. | | 28,600 | | 799,084 | | | | |
Argo Group International Holdings, Ltd. | | 11,735 | | 789,179 | | | | |
Banco Latinoamericano de Comercio Exterior SA, Class E | | 27,700 | | 479,210 | | | | |
Banner Corp. | | 11,700 | | 625,716 | | | | |
| | | | |
| Industry Company | | Shares | | Value |
| |
| | |
Financials (continued) | | | | |
Enstar Group, Ltd.* | | 2,900 | | $ 485,953 |
Enterprise Financial Services Corp. | | 19,500 | | 733,785 |
EZCORP, Inc., Class A* | | 15,600 | | 120,588 |
FedNat Holding Co. | | 16,900 | | 336,648 |
First BanCorp Puerto Rico | | 90,100 | | 774,860 |
GAIN Capital Holdings, Inc.+ | | 93,000 | | 572,880 |
GAMCO Investors, Inc., Class A+ | | 23,000 | | 388,470 |
HomeStreet, Inc.* | | 22,200 | | 471,306 |
Independence Holding Co. | | 20,800 | | 732,160 |
Maiden Holdings, Ltd. | | 114,300 | | 188,595 |
Mr Cooper Group, Inc.* | | 2,978 | | 34,753 |
National General Holdings Corp. | | 32,400 | | 784,404 |
National Western Life Group, Inc., Class A | | 2,600 | | 781,820 |
Ocwen Financial Corp.* | | 271,000 | | 363,140 |
Oppenheimer Holdings, Inc., Class A | | 29,750 | | 760,112 |
Piper Jaffray Cos | | 12,100 | | 796,664 |
Provident Financial Services, Inc. | | 11,800 | | 284,734 |
Walker & Dunlop, Inc. | | 17,400 | | 752,550 |
Waterstone Financial, Inc. | | 8,300 | | 139,108 |
Western New England Bancorp, Inc. | | 60,500 | | 607,420 |
| | | | |
| | |
| | | | 12,803,139 |
| | |
Health Care - 7.30% | | | | |
ArQule, Inc.* | | 204,300 | | 565,911 |
Civitas Solutions, Inc.* | | 45,200 | | 791,452 |
Community Health Systems, Inc.*+ | | 47,900 | | 135,078 |
Concert Pharmaceuticals, Inc.* | | 10,500 | | 131,775 |
Luminex Corp. | | 23,500 | | 543,085 |
Meridian Bioscience, Inc.+ | | 34,000 | | 590,240 |
Orthofix Medical, Inc.* | | 14,300 | | 750,607 |
RTI Surgical, Inc.* | | 40,700 | | 150,590 |
| | | | |
| | |
| | | | 3,658,738 |
| | |
Industrials - 14.10% | | | | |
ACCO Brands Corp. | | 76,500 | | 518,670 |
Aircastle, Ltd. | | 27,100 | | 467,204 |
CRA International, Inc. | | 7,500 | | 319,125 |
Federal Signal Corp. | | 14,900 | | 296,510 |
GATX Corp. | | 10,500 | | 743,505 |
Gorman-Rupp Co. (The) | | 9,300 | | 301,413 |
Greenbrier Cos, Inc. (The) | | 17,200 | | 680,088 |
InnerWorkings, Inc.* | | 94,300 | | 352,682 |
| | |
| Small-Cap Value Fund | |
|
| SCHEDULE OF INVESTMENTS (Unaudited) (continued) |
| Showing percentage of net assets as of December 31, 2018 | | |
| | | | | | | | | | | | | | | | |
| Industry Company | | Shares | | | Value | | | | | | | |
Common Stocks (continued) | | | | | | | | | |
Industrials (continued) | | | | | | | | | | | | | | | | |
Kimball International, Inc., Class B | | | 53,800 | | | $ | 763,422 | | | | | | | | | |
Mistras Group, Inc.* | | | 16,600 | | | | 238,708 | | | | | | | | | |
Moog, Inc., Class A | | | 3,700 | | | | 286,676 | | | | | | | | | |
Radiant Logistics, Inc.* | | | 115,100 | | | | 489,175 | | | | | | | | | |
SkyWest, Inc. | | | 15,900 | | | | 707,073 | | | | | | | | | |
Titan Machinery, Inc.* | | | 24,500 | | | | 322,175 | | | | | | | | | |
Triton International, Ltd./Bermuda | | | 10,000 | | | | 310,700 | | | | | | | | | |
TrueBlue, Inc.* | | | 12,100 | | | | 269,225 | | | | | | | | | |
| | | | | | | | | | | | | | | | |
| | | | |
| | | | | | | 7,066,351 | | | | | | | | | |
| | |
Information Technology - 8.37% | | | | | | | | | |
Amkor Technology, Inc.* | | | 41,300 | | | | 270,928 | | | | | | | | | |
CTS Corp. | | | 10,800 | | | | 279,612 | | | | | | | | | |
Harmonic, Inc.* | | | 150,700 | | | | 711,304 | | | | | | | | | |
Information Services Group, Inc.* | | | 7,500 | | | | 31,800 | | | | | | | | | |
Tech Data Corp.* | | | 7,700 | | | | 629,937 | | | | | | | | | |
TTM Technologies, Inc.* | | | 36,100 | | | | 351,253 | | | | | | | | | |
Unisys Corp.*+ | | | 50,600 | | | | 588,478 | | | | | | | | | |
Vishay Intertechnology, Inc. | | | 40,000 | | | | 720,400 | | | | | | | | | |
Vishay Precision Group, Inc.* | | | 20,100 | | | | 607,623 | | | | | | | | | |
| | | | | | | | | | | | | | | | |
| | | | |
| | | | | | | 4,191,335 | | | | | | | | | |
| | |
Materials - 4.59% | | | | | | | | | |
Gold Resource Corp. | | | 170,000 | | | | 680,000 | | | | | | | | | |
SunCoke Energy, Inc.* | | | 74,700 | | | | 638,685 | | | | | | | | | |
Verso Corp., Class A* | | | 18,400 | | | | 412,160 | | | | | | | | | |
Warrior Met Coal, Inc. | | | 23,500 | | | | 566,585 | | | | | | | | | |
| | | | | | | | | | | | | | | | |
| | | | |
| | | | | | | 2,297,430 | | | | | | | | | |
| | |
Real Estate - 8.13% | | | | | | | | | |
CBL & Associates Properties, Inc.+ | | | 87,600 | | | | 168,192 | | | | | | | | | |
Cousins Properties, Inc. | | | 90,600 | | | | 715,740 | | | | | | | | | |
Global Net Lease, Inc. | | | 29,700 | | | | 523,314 | | | | | | | | | |
Healthcare Realty Trust, Inc. | | | 21,500 | | | | 611,460 | | | | | | | | | |
Industrial Logistics | | | | | | | | | | | | | | | | |
Properties Trust | | | 19,598 | | | | 385,490 | | | | | | | | | |
Monmouth Real Estate Investment Corp. | | | 59,400 | | | | 736,560 | | | | | | | | | |
Select Income REIT | | | 39,000 | | | | 287,040 | | | | | | | | | |
Washington Prime Group, Inc.+ | | | 103,700 | | | | 503,982 | | | | | | | | | |
Whitestone REIT+ | | | 11,700 | | | | 143,442 | | | | | | | | | |
| | | | | | | | | | | | | | | | |
| | | | |
| | | | | | | 4,075,220 | | | | | | | | | |
| | |
Utilities - 4.36% | | | | | | | | | |
ALLETE, Inc. | | | 9,900 | | | | 754,578 | | | | | | | | | |
Atlantic Power Corp.*+ | | | 368,500 | | | | 799,645 | | | | | | | | | |
| | | | | | | | | | | | |
| Industry Company | | | | | Shares | | | Value | |
| | | |
Utilities (continued) | | | | | | | | | | | | |
Portland General Electric Co. | | | | 13,800 | | | $ | 632,730 | |
| | | | | | | | | | | | |
| | | | | | | | | | | 2,186,953 | |
| | | | | | | | | | | | |
TOTAL COMMON STOCKS - 99.67% | | | | 49,940,177 | |
| | | | | | | | | | | | |
(Cost $57,300,524) | | | | | | | | | | | | |
| | | |
| | | Rate^ | | | Shares | | | Value | |
| | | | |
MONEY MARKET FUND - 0.53% | | | | | |
Fidelity Investments Money Market Government Portfolio Class I | | | 2.25 | % | | | 264,566 | | | | 264,566 | |
| | | | | | | | | | | | |
| |
TOTAL MONEY MARKET FUND - 0.53% | | | | 264,566 | |
| | | | | | | | | | | | |
(Cost $264,566) | | | | | | | | | | | | |
|
| INVESTMENTS PURCHASED WITH CASH PROCEEDS FROM SECURITIES LENDING - 6.69% | |
Fidelity Investments Money Market Government Portfolio Class I** | | | 2.25 | % | | | 3,349,453 | | | | 3,349,453 | |
| | | | | | | | | | | | |
TOTAL INVESTMENTS PURCHASED WITH CASH PROCEEDS FROM SECURITIES LENDING - 6.69% | | | | 3,349,453 | |
| | | | | | | | | | | | |
(Cost $3,349,453) | | | | | | | | | | | | |
| |
TOTAL INVESTMENTS - 106.89% | | | $ | 53,554,196 | |
(Cost $60,914,543) | | | | | | | | | | | | |
Liabilities in Excess of Other Assets - (6.89%) | | | | (3,450,632 | ) |
| | | | | | | | | | | | |
NET ASSETS - 100.00% | | | $ | 50,103,564 | |
| | | | | | | | | | | | |
| * | Non-income producing security. |
| ** | This security represents the investment of the collateral received in connection with securities out on loan as of December 31, 2018. |
| ^ | Rate disclosed as of December 31, 2018. |
| + | This security or a portion of the security is out on loan as of December 31, 2018. Total loaned securities had a value of $3,164,772 as of December 31, 2018. |
| | |
| 48 | | Semi-Annual Report | December 31, 2018 (Unaudited) |
| | |
| Small-Cap Value Fund | | |
| SCHEDULE OF INVESTMENTS(Unaudited) (continued) | | |
Showing percentage of net assets as of December 31, 2018 |
Summary of inputs used to value the Fund’s investments as of 12/31/2018
(See Note 2 in Notes to Financial Statements):
| | | | | | | | | | | | | | | | |
| | | Valuation Inputs | |
| | | Investment in Securities (Value) | |
| | | Level 1 Quoted Prices | | | Level 2
Significant
Observable
Inputs | | | Level 3
Significant
Unobservable
Inputs | | | Total | |
Common Stocks | | $ | 49,940,177 | | | $ | — | | | $ | — | | | $ | 49,940,177 | |
Money Market Fund | | | — | | | | 264,566 | | | | — | | | | 264,566 | |
Investments Purchased with Cash Proceeds from Securities Lending | | | — | | | | 3,349,453 | | |
| —
|
| | | 3,349,453 | |
| | | | | | | | | | | | | | | | |
| | | | |
TOTAL | | $ | 49,940,177 | | | $ | 3,614,019 | | | $ | — | | | $ | 53,554,196 | |
| | | | | | | | | | | | | | | | |
See Notes to Financial Statements.
| | |
| Blue Chip 35 Index Fund | |
|
| MANAGER’S COMMENTARY (Unaudited) |
| | |
December 31, 2018
Dear Fellow Blue Chip 35 Index Fund Shareholder,
For the quarter ended December 31, 2018, our Fund returned-10.62%, outperforming our primary market benchmark, the S&P 500 Index(-13.52%), our peer benchmark, the LipperLarge-Cap Core Funds Index(-13.23%), and the Russell Top 50 Mega Cap Index(-13.18%). It was a good quarter on a relative basis, but a poor one on an absolute basis.
For the calendar year, our Fund returned-1.48%, leading the S&P 500 Index(-4.38%), the LipperLarge-Cap Core Funds Index(-5.13%), and the Russell Top 50 Mega Cap Index(-2.98%).
The table below presents our December quarter,six-month,one-year, five-year,10-year,15-year, andinception-to-date financial results. See the next page for a graph of performance since inception.
Standardized Returns as of December 31, 2018
| | | | | | | | | | | | | | | | | | | | | | | | | | | | |
| | | | | | | | | | | | Annualized | | |
| | | Quarter | | | 6 Months | | 1 Year | | 5 Years | | 10 Years | | 15 Years | | Since Inception
(7/31/97) |
| | | | | | | |
Blue Chip 35 Index Fund | | | -10.62% | | | | -1.81% | | | | -1.48% | | | | 8.51% | | | | 12.67% | | | | 7.16% | | | | 6.90% | |
S&P 500 Index | | | -13.52% | | | | -6.85% | | | | -4.38% | | | | 8.49% | | | | 13.12% | | | | 7.77% | | | | 6.60% | |
Russell Top 50 Mega Cap Index | | | -13.18% | | | | -5.10% | | | | -2.98% | | | | 8.92% | | | | 12.16% | | | | 6.97% | | | | 5.73% | |
Lipper Large-Cap Core Funds Index | | | -13.23% | | | | -6.85% | | | | -5.13% | | | | 7.33% | | | | 12.09% | | | | 6.92% | | | | 5.79% | |
Bridgeway Ultra-Large 35 Index | | | -10.50% | | | | -1.62% | | | | -1.28% | | | | 8.76% | | | | 13.02% | | | | 7.35% | | | | 7.07% | |
Performance figures quoted in the table above represent past performance and are no guarantee of future results. Total return figures in the table above include the reinvestment of dividends and capital gains. The table above does not reflect the deduction of taxes that a shareholder would pay on Fund distributions or on the redemption of Fund shares.
The S&P 500 Index is a broad-based, unmanaged measurement of changes in stock market conditions, based on the average of 500 widely held common stocks with dividends reinvested. The Russell Top 50 Mega Cap Index measures the performance of the largest companies in the Russell 3000 Index. It includes 50 of the largest securities, based on a combination of their market cap and current index membership, and represents approximately 40% of the total market capitalization of the Russell 3000 Index. The Bridgeway Ultra-Large 35 Index is an index composed of very large, “blue chip” U.S. stocks, excluding tobacco; it is compiled by the adviser of the Fund. The LipperLarge-Cap Core Funds Index reflects the aggregate record of domesticlarge-cap core mutual funds as reported by Lipper, Inc. It is not possible to invest directly in an index. Periods longer than one year are annualized.
| | |
| 50 | | Semi-Annual Report | December 31, 2018 (Unaudited) |
| | |
| Blue Chip 35 Index Fund | | |
| MANAGER’S COMMENTARY (Unaudited)(continued) | | |
| | |
Growth of a $10,000 Investment
from Inception July 31, 1997 to December 31, 2018
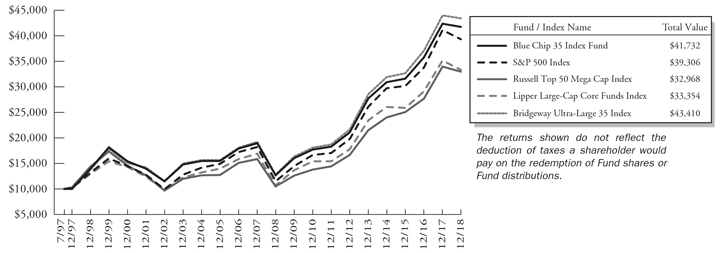
Detailed Explanation of Quarterly Performance
The Fund’smega-cap design boosted relative results during the quarter because the benchmark’s largest stocks outperformed its smaller stocks. The Fund’s equal-weight design also helped relative results, as it resulted in below-benchmark exposure to higher momentum stocks that underperformed during the quarter.
From a sector perspective, the Fund’s allocation effect was negative. The Fund lacked exposure to the Real Estate and Utilities sectors, which hurt relative performance. An underweighting in the Health Care sector also detracted from relative returns. In contrast, the Fund’s stock selection effect was significantly positive. Holdings in the Health Care, Consumer Staples, and Communication Services sectors contributed the most to relative performance.
Detailed Explanation of Calendar Year Performance
The Fund’s investments inmega-cap stocks helped relative results during the year because the benchmark’s largest stocks outperformed its smaller ones. The Fund’s disciplined rebalancing process to maintain its equal-weight design also improved relative results, as the positions we added to during the year outperformed the positions we trimmed.
From a sector perspective, the Fund’s allocation effect was positive, primarily driven by an overweighting in the Information Technology sector and an underweighting in the Materials sector. The Fund’s stock selection effect was significantly positive, helped by strong performance from holdings in the Consumer Discretionary, Health Care, Energy, and Consumer Staples sectors.
| | |
| Blue Chip 35 Index Fund | |
|
| MANAGER’S COMMENTARY (Unaudited)(continued) |
| | |
The table below presents index performance numbers for stocks in the different CRSP deciles during various time periods.
The table is intended to provide a frame of reference for size.
| | | | | | | | | | | | | | | | | | | | | | | | |
| | | | | | | | | | | | Annualized | |
| CRSP Decile1 | | Quarter | | | 6 Months | | | 1 Year | | | 5 Years | | | 10 Years | | | 93 Years | |
| 1 (ultra-large) | | | -13.31% | | | | -6.07% | | | | -2.93% | | | | 8.87% | | | | 12.80% | | | | 9.30% | |
| 2 | | | -14.07% | | | | -9.27% | | | | -8.25% | | | | 7.27% | | | | 14.32% | | | | 10.41% | |
| 3 | | | -17.67% | | | | -13.12% | | | | -9.77% | | | | 6.81% | | | | 14.54% | | | | 10.90% | |
| 4 | | | -17.67% | | | | -14.07% | | | | -9.92% | | | | 4.37% | | | | 13.78% | | | | 10.68% | |
| 5 | | | -18.80% | | | | -15.07% | | | | -11.16% | | | | 3.21% | | | | 13.49% | | | | 11.21% | |
| 6 | | | -19.91% | | | | -18.22% | | | | -13.88% | | | | 3.48% | | | | 13.54% | | | | 11.17% | |
| 7 | | | -21.09% | | | | -15.11% | | | | -7.21% | | | | 6.07% | | | | 14.92% | | | | 11.41% | |
| 8 | | | -22.02% | | | | -18.54% | | | | -10.35% | | | | 2.79% | | | | 13.88% | | | | 11.27% | |
| 9 | | | -21.19% | | | | -19.94% | | | | -8.82% | | | | 4.09% | | | | 14.23% | | | | 11.32% | |
| 10 (ultra-small) | | | -26.17% | | | | -26.32% | | | | -16.29% | | | | 1.00% | | | | 14.40% | | | | 12.93% | |
| 1 | Performance figures are as of the period ended December 31, 2018. The CRSPCap-Based Portfolio Indexes are unmanaged indexes of publicly traded U.S. stocks with dividends reinvested, grouped by market capitalization, as reported by the Center for Research in Security Prices. Past performance is no guarantee of future results. |
| | |
| 52 | | Semi-Annual Report | December 31, 2018 (Unaudited) |
| | |
| Blue Chip 35 Index Fund | | |
| MANAGER’S COMMENTARY (Unaudited)(continued) | | |
| | |
Contribution to Returns for Blue Chip 35 Index Fund stocks for the calendar year December 31, 2018:
| | | | | | | | | |
| Rank | | Company | | Industry | | % Contribution
to Return |
| 1 | | Amazon.com, Inc. | | Consumer Discretionary | | | | 1.2% | |
| 2 | | ConocoPhillips | | Energy | | | | *0.9% | |
| 3 | | Merck & Co., Inc. | | Health Care | | | | 0.8% | |
| 4 | | Microsoft Corp. | | Information Technology | | | | 0.8% | |
| 5 | | Visa, Inc., Class A | | Information Technology | | | | 0.6% | |
| 6 | | Pfizer, Inc. | | Health Care | | | | 0.5% | |
| 7 | | Cisco Systems, Inc. | | Information Technology | | | | 0.4% | |
| 8 | | Verizon Communications, Inc. | | Communication Services | | | | 0.3% | |
| 9 | | CVS Health Corp. | | Health Care | | | | *0.2% | |
| 10 | | Gilead Sciences, Inc. | | Health Care | | | | *0.2% | |
| 11 | | Coca-Cola Co. (The) | | Consumer Staples | | | | 0.1% | |
| 12 | | Intel Corp. | | Information Technology | | | | 0.1% | |
| 13 | | Procter & Gamble Co. (The) | | Consumer Staples | | | | 0.1% | |
| 14 | | McDonald’s Corp. | | Consumer Discretionary | | | | 0.1% | |
| 15 | | Walt Disney Co. (The) | | Communication Services | | | | 0.1% | |
| 16 | | Berkshire Hathaway, Inc., Class B | | Financials | | | | 0.1% | |
| 17 | | Apple, Inc. | | Information Technology | | | | 0.1% | |
| 18 | | Alphabet, Inc., Class A | | Communication Services | | | | 0.0% | |
| 19 | | Alphabet, Inc., Class C | | Communication Services | | | | 0.0% | |
| 20 | | Oracle Corp. | | Information Technology | | | | -0.1% | |
| 21 | | QUALCOMM, Inc. | | Information Technology | | | | -0.1% | |
| 22 | | PepsiCo, Inc. | | Consumer Staples | | | | -0.1% | |
| 23 | | Walmart, Inc. | | Consumer Staples | | | | -0.1% | |
| 24 | | Johnson & Johnson | | Health Care | | | | -0.1% | |
| 25 | | Schlumberger, Ltd. | | Energy | | | | *-0.1% | |
| 26 | | UnitedHealth Group, Inc. | | Health Care | | | | **-0.2% | |
| 27 | | Chevron Corp. | | Energy | | | | -0.2% | |
| 28 | | JPMorgan Chase & Co. | | Financials | | | | -0.2% | |
| 29 | | Comcast Corp., Class A | | Communication Services | | | | -0.3% | |
| 30 | | Boeing Co. (The) | | Industrials | | | | **-0.3% | |
| 31 | | United Parcel Service, Inc., Class B | | Industrials | | | | -0.3% | |
| 32 | | Exxon Mobil Corp. | | Energy | | | | -0.4% | |
| 33 | | United Technologies Corp. | | Industrials | | | | -0.4% | |
| 34 | | Home Depot, Inc. (The) | | Consumer Discretionary | | | | **-0.4% | |
| 35 | | 3M Co. | | Industrials | | | | -0.4% | |
| 36 | | Facebook, Inc., Class A | | Communication Services | | | | **-0.5% | |
| 37 | | Bank of America Corp. | | Financials | | | | -0.5% | |
| 38 | | International Business Machines Corp. | | Information Technology | | | | -0.6% | |
| 39 | | Wells Fargo & Co. | | Financials | | | | -0.6% | |
| 40 | | AT&T, Inc. | | Communication Services | | | | -0.6% | |
| 41 | | Citigroup, Inc. | | Financials | | | | **-0.7% | |
| 42 | | General Electric Co. | | Financials | | | | *-0.8% | |
| * | These securities were included in our Fund only for the period up until September. |
| ** | These stocks were included in our Fund for the period from September and thereafter. |
| | |
| Blue Chip 35 Index Fund | |
|
| MANAGER’S COMMENTARY (Unaudited)(continued) |
| | |
Industry Sector Representation as of December 31, 2018
| | | | | | | | | | | | | | | |
| | | % of Net Assets | | % of S&P 500 Index | | Difference |
Communication Services | | | | 16.5% | | | | | 10.1% | | | | | 6.4% | |
Consumer Discretionary | | | | 8.5% | | | | | 9.9% | | | | | -1.4% | |
Consumer Staples | | | | 10.7% | | | | | 7.4% | | | | | 3.3% | |
Energy | | | | 5.0% | | | | | 5.3% | | | | | -0.3% | |
Financials | | | | 14.3% | | | | | 13.3% | | | | | 1.0% | |
Health Care | | | | 11.1% | | | | | 15.5% | | | | | -4.4% | |
Industrials | | | | 10.1% | | | | | 9.2% | | | | | 0.9% | |
Information Technology | | | | 23.7% | | | | | 20.1% | | | | | 3.6% | |
Materials | | | | 0.0% | | | | | 2.7% | | | | | -2.7% | |
Real Estate | | | | 0.0% | | | | | 3.0% | | | | | -3.0% | |
Utilities | | | | 0.0% | | | | | 3.3% | | | | | -3.3% | |
Cash & Other Assets | | | | 0.1% | | | | | 0.2% | | | | | -0.1% | |
Total | | | | 100.0% | | | | | 100.0% | | | | | | |
Disclaimer
The views expressed here are exclusively those of Fund management. These views, including those concerning market sectors or individual stocks, are not meant as investment advice and should not be considered predictive in nature. Any favorable (or unfavorable) description of a holding applies only as of the quarter end, December 31, 2018, unless otherwise stated. Security positions can and do change thereafter. Discussions of historical performance do not guarantee and are not indicative of future performance.
The Fund is subject to significant market risk (volatility) and is not an appropriate investment for short-term investors.
Conclusion
Thank you for your continued investment in Blue Chip 35 Index Fund. We encourage your feedback; your reactions and concerns are important to us.
Sincerely,
The Investment Management Team
| | |
| 54 | | Semi-Annual Report | December 31, 2018 (Unaudited) |
| | |
| Blue Chip 35 Index Fund | | |
| SCHEDULE OF INVESTMENTS (Unaudited) | | |
Showing percentage of net assets as of December 31, 2018 | | |
| | | | | | | | |
| Industry Company | | Shares | | Value | | | | |
| | |
COMMON STOCKS - 99.85% | | | | |
| Communication Services - 16.49% | | | | |
Alphabet, Inc., Class A* | | 9,730 | | $10,167,461 | | | | |
Alphabet, Inc., Class C* | | 9,859 | | 10,210,079 | | | | |
AT&T, Inc. | | 458,305 | | 13,080,025 | | | | |
Comcast Corp., Class A | | 388,850 | | 13,240,343 | | | | |
Facebook, Inc., Class A* | | 98,300 | | 12,886,147 | | | | |
Verizon Communications, Inc. | | 241,589 | | 13,582,134 | | | | |
Walt Disney Co. (The) | | 124,100 | | 13,607,565 | | | | |
| | | | | | | | |
| | | | 86,773,754 | | | | |
| | |
Consumer Discretionary - 8.47% | | | | |
Amazon.com, Inc.* | | 11,900 | | 17,873,443 | | | | |
Home Depot, Inc. (The) | | 76,600 | | 13,161,412 | | | | |
McDonald’s Corp. | | 76,400 | | 13,566,348 | | | | |
| | | | | | | | |
| | | | 44,601,203 | | | | |
| | |
Consumer Staples - 10.70% | | | | |
Coca-Cola Co. (The) | | 281,864 | | 13,346,260 | | | | |
PepsiCo, Inc. | | 120,375 | | 13,299,030 | | | | |
Procter & Gamble Co. (The) | | 175,806 | | 16,160,088 | | | | |
Walmart, Inc. | | 144,969 | | 13,503,862 | | | | |
| | | | | | | | |
| | | | 56,309,240 | | | | |
| | |
Energy - 5.02% | | | | |
Chevron Corp. | | 123,095 | | 13,391,505 | | | | |
Exxon Mobil Corp. | | 191,337 | | 13,047,270 | | | | |
| | | | | | | | |
| | | | 26,438,775 | | | | |
| | |
Financials - 14.29% | | | | |
Bank of America Corp. | | 718,508 | | 17,704,037 | | | | |
Berkshire Hathaway, Inc., Class B* | | 66,450 | | 13,567,761 | | | | |
Citigroup, Inc. | | 252,400 | | 13,139,944 | | | | |
JPMorgan Chase & Co. | | 178,745 | | 17,449,087 | | | | |
Wells Fargo & Co. | | 290,359 | | 13,379,743 | | | | |
| | | | | | | | |
| | | | 75,240,572 | | | | |
| | |
Health Care - 11.10% | | | | |
Johnson & Johnson | | 102,902 | | 13,279,503 | | | | |
Merck & Co., Inc. | | 202,335 | | 15,460,417 | | | | |
Pfizer, Inc. | | 370,474 | | 16,171,190 | | | | |
UnitedHealth Group, Inc. | | 54,300 | | 13,527,216 | | | | |
| | | | | | | | |
| | | | 58,438,326 | | | | |
| | |
Industrials - 10.05% | | | | |
3M Co. | | 69,700 | | 13,280,638 | | | | |
Boeing Co. (The) | | 41,000 | | 13,222,500 | | | | |
United Parcel Service, Inc., Class B | | 135,163 | | 13,182,447 | | | | |
United Technologies Corp. | | 123,860 | | 13,188,613 | | | | |
| | | | | | | | |
| | | | 52,874,198 | | | | |
| | | | |
| Industry Company | | Shares | | Value |
|
Information Technology - 23.73% |
Apple, Inc. | | 105,600 | | $ 16,657,344 |
Cisco Systems, Inc. | | 311,058 | | 13,478,143 |
Intel Corp. | | 283,093 | | 13,285,554 |
International Business Machines Corp. | | 115,817 | | 13,164,918 |
Microsoft Corp. | | 207,345 | | 21,060,032 |
Oracle Corp. | | 291,013 | | 13,139,237 |
QUALCOMM, Inc. | | 229,600 | | 13,066,536 |
Visa, Inc., Class A | | 159,650 | | 21,064,221 |
| | | | |
| | | | 124,915,985 |
| | | | |
TOTAL COMMON STOCKS - 99.85% | | | | 525,592,053 |
| | | | |
(Cost $309,186,195) | | | | |
| | | | | | | | | | | | |
| | | Rate^ | | | Shares | | | Value | |
|
MONEY MARKET FUND - 0.01% | |
Fidelity Investments Money Market Government Portfolio Class I | | | 2.25 | % | | | 59,546 | | | | 59,546 | |
| | | | | | | | | | | | |
TOTAL MONEY MARKET FUND - 0.01% | | | | 59,546 | |
| | | | | | | | | | | | |
(Cost $59,546) | | | | | |
| |
TOTAL INVESTMENTS - 99.86% | | | $ | 525,651,599 | |
(Cost $309,245,741) | | | | | |
Other Assets in Excess of Liabilities - 0.14% | | | | 725,219 | |
| | | | | | | | | | | | |
NET ASSETS - 100.00% | | | $ | 526,376,818 | |
| | | | | | | | | | | | |
| * | Non-income producing security. |
| ^ | Rate disclosed as of December 31, 2018. |
Summary of inputs used to value the Fund’s investments as of 12/31/2018 (See Note 2 in Notes to Financial Statements):
| | | | | | | | | | | | | | | | |
| | | | | | Valuation Inputs | | | | |
| | | | | | Investment in Securities (Value) | |
| | | Level 1 Quoted Prices | | | Level 2
Significant
Observable
Inputs | | | Level 3 Significant
Unobservable
Inputs | | | Total | |
Common Stocks | | | $525,592,053 | | | | $ — | | | | $ — | | | | $525,592,053 | |
Money Market Fund | | | — | | | | 59,546 | | | | — | | | | 59,546 | |
| | | | | | | | | | | | | | | | |
TOTAL | | | $525,592,053 | | | | $59,546 | | | | $ — | | | | $525,651,599 | |
| | | | | | | | | | | | | | | | |
See Notes to Financial Statements.
| | |
| Managed Volatility Fund | |
|
| MANAGER’S COMMENTARY (Unaudited) |
| | |
December 31, 2018
Dear Fellow Managed Volatility Fund Shareholder,
For the quarter ended December 31, 2018, our Fund returned-7.40%, outperforming our primary market benchmark, the S&P 500 Index(-13.52%), and our peer benchmark, the Lipper Balanced Funds Index(-7.65%). The Fund performed in line with its design during the quarter.
For the calendar year, our Fund returned-3.97%, outperforming the S&P 500 Index(-4.38%) and the Lipper Balanced Funds Index(-4.68%).
The table below presents our December quarter,six-month,one-year, five-year,10-year,15-year, andinception-to-date financial results. See the next page for a graph of performance since inception.
Standardized Returns as of December 31, 2018
| | | | | | | | | | | | | | | | | | | | | | | | | | | | | | | | | | | |
| | | | | | | | | | | Annualized | | | | |
| | | Quarter | | 6 Months | | 1 Year | | 5 Years | | 10 Years | | 15 Years | | Since Inception
(6/30/01) |
| | | | | | | |
Managed Volatility Fund | | | | -7.40% | | | | | -6.17% | | | | | -3.97 | % | | | | 2.46 | % | | | | 4.72% | | | | | 3.49% | | | | | 3.60 | % |
S&P 500 Index | | | | -13.52% | | | | | -6.85% | | | | | -4.38 | % | | | | 8.49 | % | | | | 13.12% | | | | | 7.77% | | | | | 6.29 | % |
Lipper Balanced Funds Index | | | | -7.65% | | | | | -4.81% | | | | | -4.68 | % | | | | 4.48 | % | | | | 8.47% | | | | | 5.61% | | | | | 5.11 | % |
Performance figures quoted in the table above represent past performance and are no guarantee of future results. Total return figures in the table above include the reinvestment of dividends and capital gains. The table above does not reflect the deduction of taxes that a shareholder would pay on Fund distributions or on the redemption of Fund shares.
The S&P 500 Index is a broad-based, unmanaged measurement of changes in stock market conditions, based on the average of 500 widely held common stocks with dividends reinvested. The Lipper Balanced Funds Index is an index of balanced funds compiled by Lipper, Inc. It is not possible to invest directly in an index. Periods longer than one year are annualized.
| | |
| 56 | | Semi-Annual Report | December 31, 2018 (Unaudited) |
| | |
| Managed Volatility Fund | | |
| MANAGER’S COMMENTARY (Unaudited) (continued) | | |
| | |
Growth of a $10,000 Investment
from Inception June 30, 2001 to December 31, 2018

Detailed Explanation of Quarterly Performance
The Fund outperformed the S&P 500 during the quarter. The portfolio’s futures component added the most to relative performance, contributing 3.08% to the Fund’s return. The portfolio’s fixed income component also added modestly to relative performance, contributing 0.25% to the Fund’s return.
The portfolio’s equities component was down for the quarter but outperformed the S&P 500’s return, contributing-7.81% to the Fund’s return. The portfolio’s options component detracted from relative performance, contributing-2.70% to the Fund’s return.
The Fund had a standard deviation of 0.69% during the quarter, which was 53% lower than the S&P 500’s standard deviation of 1.48% during the same period.
Detailed Explanation of Calendar Year Performance
The Fund outperformed the S&P 500 for the year. The portfolio’s futures component added the most to relative performance, contributing 1.17% to the Fund’s return. The portfolio’s fixed income component also modestly helped relative performance, contributing 0.29% to the Fund’s return.
In contrast, the portfolio’s equities and options components detracted from relative performance, contributing-5.91% and-1.61% to the Fund’s return, respectively.
For the year, the Fund had a standard deviation of 8.06%, which was 53% lower than the S&P 500’s standard deviation of 17.30% during the same period. The Fund continues to perform as designed, particularly over longer time horizons. For 10 years and since inception, the Fund has captured roughly 36% and 57%, respectively, of the S&P 500 Index’s return. The Fund’s standard deviation for the last 10 years and since inception is 58% and 55% lower than the index’s, respectively.
| | |
| Managed Volatility Fund | |
|
| MANAGER’S COMMENTARY (Unaudited) (continued) |
| | |
Top Ten Equity Holdings as of December 31, 2018
| | | | | | |
| Rank | | Description | | Industry | | % of Net
Assets |
| 1 | | Apple, Inc. | | Information Technology | | 2.7% |
| 2 | | Micron Technology, Inc. | | Information Technology | | 1.9% |
| 3 | | Amazon.com, Inc. | | Consumer Discretionary | | 1.5% |
| 4 | | United Rentals, Inc. | | Industrials | | 1.2% |
| 5 | | Applied Materials, Inc. | | Information Technology | | 1.1% |
| 6 | | Capital One Financial Corp. | | Financials | | 1.1% |
| 7 | | HCA Healthcare, Inc. | | Health Care | | 1.0% |
| 8 | | Ford Motor Co. | | Consumer Discretionary | | 1.0% |
| 9 | | Lululemon Athletica, Inc. | | Consumer Discretionary | | 1.0% |
| 10 | | Microsoft Corp. | | Information Technology | | 1.0% |
| | Total | | | | 13.5% |
Industry Sector Representation as of December 31, 2018
| | |
| Asset Type | | % of Net
Assets |
Common Stock | | 68.2% |
Communication Services | | 5.6% |
Consumer Discretionary | | 8.8% |
Consumer Staples | | 3.9% |
Energy | | 2.7% |
Financials | | 10.0% |
Health Care | | 8.6% |
Industrials | | 6.6% |
Information Technology | | 15.2% |
Materials | | 3.3% |
Real Estate | | 1.9% |
Utilities | | 1.6% |
U.S. Government Obligations | | 30.0% |
Call Options Written | | -0.9% |
Put Options Written | | -0.6% |
Money Market Fund | | 5.1% |
Liabilities in Excess of Other Assets | | -1.8% |
Total | | 100% |
Disclaimer
The views expressed here are exclusively those of Fund management. These views, including those related to market sectors or individual stocks, are not meant as investment advice and should not be considered predictive in nature. Any favorable (or unfavorable) description of a holding applies only as of the quarter end, December 31, 2018, unless otherwise stated. Security positions can and do change thereafter. Discussions of historical performance do not guarantee and may not be indicative of future performance.
Market volatility can significantly affect short-term performance. The Fund is not an appropriate investment for short-term investors. Investments in the small companies within thismulti-cap fund generally carry greater risk than is customarily associated with larger companies. This additional risk is attributable to a number of factors, including the relatively limited financial resources that are typically available to small companies and the fact that small companies often have comparatively limited product lines. In addition, the stock of small companies tends to be more volatile than the stock of large companies, particularly in the short term and particularly in the early stages of an economic or market downturn. The Fund’s use of options,
| | |
| 58 | | Semi-Annual Report | December 31, 2018 (Unaudited) |
| | |
| Managed Volatility Fund | | |
| MANAGER’S COMMENTARY (Unaudited) (continued) | | |
futures, and leverage can magnify the risk of loss in an unfavorable market, and the Fund’s use of short-sale positions can, in theory, expose shareholders to unlimited loss. Shareholders of the Fund, therefore, are taking on more risk than they would if they invested in the stock market as a whole. The Fund uses an option writing strategy in which the Fund may sell covered calls or secured put options. Options are subject to special risks and may not fully protect the Fund against declines in the value of its stocks. In addition, an option writing strategy limits the upside profit potential normally associated with stocks. Finally, the Fund’s fixed-income holdings are subject to three types of risk. Interest rate risk is the chance that bond prices overall will decline as interest rates rise. Credit risk is the chance that a bond issuer will fail to pay interest and principal. Prepayment risk is the chance that a mortgage-backed bond issuer will repay a higher yielding bond, resulting in a lower paying yield.
Conclusion
Thank you for your continued investment in Managed Volatility Fund. We encourage your feedback; your reactions and concerns are important to us.
Sincerely,
The Investment Management Team
| | |
| Managed Volatility Fund | |
|
| SCHEDULE OF INVESTMENTS [Unaudited] |
Showing percentage of net assets as of December 31, 2018 | | |
| | | | | | | | |
| Industry Company | | Shares | | Value | | | | |
| | | |
COMMON STOCKS - 68.17% | | | | | | |
Communication Services - 5.60% | | | | |
Alphabet, Inc., Class A* | | 260 | | $ 271,690 | | | | |
Alphabet, Inc., Class C* | | 260 | | 269,258 | | | | |
AT&T, Inc.# | | 6,440 | | 183,798 | | | | |
CenturyLink, Inc. | | 1,200 | | 18,180 | | | | |
Comcast Corp., Class A | | 2,500 | | 85,125 | | | | |
Discovery, Inc., Class C*# | | 1,514 | | 34,943 | | | | |
DISH Network Corp., Class A*# | | 9,500 | | 237,215 | | | | |
Electronic Arts, Inc.*# | | 800 | | 63,128 | | | | |
Facebook, Inc., Class A*# | | 1,500 | | 196,635 | | | | |
Omnicom Group, Inc. | | 900 | | 65,916 | | | | |
Twenty-First Century Fox, | | | | | | | | |
Inc., Class A# | | 1,200 | | 57,744 | | | | |
Verizon Communications, Inc.# | | 1,600 | | 89,952 | | | | |
Walt Disney Co. (The) | | 900 | | 98,685 | | | | |
| | | | | | | | |
| | | | 1,672,269 | | | | |
| | |
Consumer Discretionary - 8.82% | | | | |
Adient PLC | | 495 | | 7,455 | | | | |
Amazon.com, Inc.* | | 300 | | 450,591 | | | | |
Aptiv PLC | | 500 | | 30,785 | | | | |
AutoZone, Inc.* | | 200 | | 167,668 | | | | |
Booking Holdings, Inc.* | | 100 | | 172,242 | | | | |
Carnival Corp. | | 600 | | 29,580 | | | | |
Delphi Technologies PLC | | 166 | | 2,377 | | | | |
Dollar General Corp. | | 500 | | 54,040 | | | | |
eBay, Inc.* | | 700 | | 19,649 | | | | |
Ford Motor Co.# | | 39,900 | | 305,235 | | | | |
Garrett Motion, Inc.* | | 80 | | 987 | | | | |
Goodyear Tire & Rubber Co. | | | | | | | | |
(The) | | 200 | | 4,082 | | | | |
Hasbro, Inc.# | | 700 | | 56,875 | | | | |
Lear Corp.# | | 1,500 | | 184,290 | | | | |
Lululemon Athletica, Inc.*# | | 2,500 | | 304,025 | | | | |
Macy’s, Inc.# | | 1,000 | | 29,780 | | | | |
Magna International, Inc.# | | 4,200 | | 190,890 | | | | |
McDonald’s Corp. | | 500 | | 88,785 | | | | |
NIKE, Inc., Class B# | | 1,500 | | 111,210 | | | | |
Ross Stores, Inc.# | | 500 | | 41,600 | | | | |
Starbucks Corp.# | | 700 | | 45,080 | | | | |
Target Corp. | | 500 | | 33,045 | | | | |
TJX Cos., Inc. (The)# | | 5,200 | | 232,648 | | | | |
Wynn Resorts, Ltd. | | 200 | | 19,782 | | | | |
Yum China Holdings, Inc.# | | 800 | | 26,824 | | | | |
Yum! Brands, Inc. | | 300 | | 27,576 | | | | |
| | | | | | | | |
| | | | 2,637,101 | | | | |
| | |
Consumer Staples- 3.91% | | | | |
Archer-Daniels-Midland Co. | | 1,000 | | 40,970 | | | | |
| | | | |
| Industry Company | | Shares | | Value |
|
Consumer Staples (continued) |
Campbell Soup Co.# | | 1,900 | | $ 62,681 |
Coca-Cola Co. (The) | | 900 | | 42,615 |
Colgate-Palmolive Co.# | | 700 | | 41,664 |
Constellation Brands, Inc., Class A | | 500 | | 80,410 |
Costco Wholesale Corp. | | 500 | | 101,855 |
General Mills, Inc. | | 1,600 | | 62,304 |
JM Smucker Co. (The) | | 400 | | 37,396 |
Kimberly-Clark Corp.# | | 800 | | 91,152 |
Kroger Co. (The)# | | 800 | | 22,000 |
McCormick & Co., Inc.,Non-Voting Shares# | | 1,000 | | 139,240 |
Mondelez International, Inc., Class A | | 2,500 | | 100,075 |
PepsiCo, Inc. | | 1,300 | | 143,624 |
Procter & Gamble Co. (The) | | 1,100 | | 101,112 |
Walmart, Inc.# | | 1,100 | | 102,465 |
| | | | |
| | | | 1,169,563 |
| | |
Energy - 2.66% | | | | |
Anadarko Petroleum Corp.# | | 700 | | 30,688 |
Chevron Corp. | | 1,778 | | 193,429 |
ConocoPhillips# | | 1,287 | | 80,244 |
Continental Resources, Inc.*# | | 1,000 | | 40,190 |
EOG Resources, Inc. | | 500 | | 43,605 |
Exxon Mobil Corp. | | 2,400 | | 163,656 |
Halliburton Co. | | 700 | | 18,606 |
Helmerich & Payne, Inc. | | 300 | | 14,382 |
Kinder Morgan, Inc.# | | 1,800 | | 27,684 |
Marathon Petroleum Corp. | | 1,700 | | 100,317 |
Phillips 66 | | 593 | | 51,087 |
Valero Energy Corp. | | 400 | | 29,988 |
| | | | |
| | | | 793,876 |
| | |
Financials - 9.99% | | | | |
Allstate Corp. (The) | | 300 | | 24,789 |
American Express Co.# | | 600 | | 57,192 |
American Financial Group, Inc. | | 1,000 | | 90,530 |
Aon PLC | | 500 | | 72,680 |
Athene Holding, Ltd., Class A*# | | 5,700 | | 227,031 |
Bank of America Corp.# | | 2,300 | | 56,672 |
BB&T Corp.# | | 800 | | 34,656 |
Berkshire Hathaway, Inc., Class B* | | 500 | | 102,090 |
BlackRock, Inc. | | 300 | | 117,846 |
Capital One Financial Corp.# | | 4,300 | | 325,037 |
| | |
| 60 | | Semi-Annual Report | December 31, 2018 (Unaudited) |
| | |
| Managed Volatility Fund | | |
| SCHEDULE OF INVESTMENTS (Unaudited) (continued) | | |
| Showing percentage of net assets as of December 31, 2018 | | |
| | | | | | | | |
| Industry Company | | Shares | | Value | | | | |
| | | |
Common Stocks (continued) | | | | | | |
Financials (continued) | | | | |
Charles Schwab Corp. (The) | | 1,800 | | $ 74,754 | | | | |
Chubb, Ltd. | | 761 | | 98,306 | | | | |
Citigroup, Inc. | | 2,810 | | 146,289 | | | | |
Comerica, Inc. | | 300 | | 20,607 | | | | |
Goldman Sachs Group, Inc. (The) | | 500 | | 83,525 | | | | |
Huntington Bancshares, Inc.# | | 3,200 | | 38,144 | | | | |
JPMorgan Chase & Co. | | 1,000 | | 97,620 | | | | |
KeyCorp.# | | 4,800 | | 70,944 | | | | |
Marsh & McLennan Cos., Inc. | | 700 | | 55,825 | | | | |
MetLife, Inc.# | | 6,000 | | 246,360 | | | | |
Morgan Stanley | | 2,300 | | 91,195 | | | | |
PNC Financial Services | | | | | | | | |
Group, Inc. (The) | | 500 | | 58,455 | | | | |
Progressive Corp. (The)# | | 1,220 | | 73,603 | | | | |
Prudential Financial, Inc.# | | 3,000 | | 244,650 | | | | |
S&P Global, Inc. | | 500 | | 84,970 | | | | |
State Street Corp.# | | 700 | | 44,149 | | | | |
T. Rowe Price Group, Inc.# | | 1,000 | | 92,320 | | | | |
U.S. Bancorp | | 1,900 | | 86,830 | | | | |
Wells Fargo & Co. | | 3,671 | �� | 169,160 | | | | |
| | | | | | | | |
| | | | 2,986,229 | | | | |
| | |
Health Care - 8.64% | | | | |
Abbott Laboratories# | | 1,900 | | 137,427 | | | | |
AbbVie, Inc.# | | 1,600 | | 147,504 | | | | |
Allergan PLC | | 300 | | 40,098 | | | | |
Amgen, Inc. | | 500 | | 97,335 | | | | |
Anthem, Inc. | | 300 | | 78,789 | | | | |
Baxter International, Inc.# | | 600 | | 39,492 | | | | |
Becton Dickinson & Co.# | | 773 | | 174,172 | | | | |
Biogen, Inc.* | | 400 | | 120,368 | | | | |
Bristol-Myers Squibb Co.# | | 1,479 | | 76,878 | | | | |
Celgene Corp.* | | 1,100 | | 70,499 | | | | |
Cigna Corp.# | | 300 | | 57,043 | | | | |
CVS Health Corp.# | | 700 | | 45,864 | | | | |
Danaher Corp. | | 500 | | 51,560 | | | | |
DaVita, Inc.*# | | 1,100 | | 56,606 | | | | |
Gilead Sciences, Inc.# | | 700 | | 43,785 | | | | |
HCA Healthcare, Inc.# | | 2,500 | | 311,125 | | | | |
Johnson & Johnson | | 1,400 | | 180,670 | | | | |
Merck & Co., Inc.# | | 2,200 | | 168,102 | | | | |
Pfizer, Inc.# | | 2,500 | | 109,125 | | | | |
Stryker Corp. | | 660 | | 103,455 | | | | |
Thermo Fisher Scientific, Inc. | | 500 | | 111,895 | | | | |
| | | | |
| Industry Company | | Shares | | Value |
|
Health Care (continued) |
UnitedHealth Group, Inc. | | 500 | | $ 124,560 |
WellCare Health Plans, Inc.*# | | 1,000 | | 236,090 |
| | | | |
| | | | 2,582,442 |
| | |
Industrials - 6.63% | | | | |
3M Co. | | 500 | | 95,270 |
AerCap Holdings NV*# | | 1,100 | | 43,560 |
Boeing Co. (The) | | 300 | | 96,750 |
Deere & Co. | | 400 | | 59,668 |
Emerson Electric Co. | | 1,000 | | 59,750 |
FedEx Corp.# | | 600 | | 96,798 |
General Electric Co. | | 900 | | 6,813 |
Honeywell International, | | | | |
Inc.# | | 800 | | 105,696 |
Ingersoll-Rand PLC | | 200 | | 18,246 |
JetBlue Airways Corp.*# | | 10,700 | | 171,842 |
Johnson Controls | | | | |
International PLC | | 754 | | 22,356 |
Lockheed Martin Corp. | | 270 | | 70,697 |
Northrop Grumman Corp.# | | 700 | | 171,430 |
NOW, Inc.* | | 200 | | 2,328 |
Raytheon Co. | | 300 | | 46,005 |
Resideo Technologies, Inc.* | | 133 | | 2,733 |
Southwest Airlines Co. | | 1,400 | | 65,072 |
TransUnion# | | 500 | | 28,400 |
Union Pacific Corp.# | | 500 | | 69,115 |
United Rentals, Inc.*# | | 3,600 | | 369,108 |
United Technologies Corp. | | 1,140 | | 121,387 |
Waste Management, Inc.# | | 800 | | 71,192 |
XPO Logistics, Inc.*# | | 3,300 | | 188,232 |
| | | | |
| | | | 1,982,448 |
| | |
Information Technology - 15.19% | | | | |
Adobe, Inc.*# | | 800 | | 180,992 |
Apple, Inc.# | | 5,200 | | 820,248 |
Applied Materials, Inc.# | | 10,100 | | 330,674 |
Cisco Systems, Inc.# | | 4,300 | | 186,319 |
Citrix Systems, Inc.# | | 500 | | 51,230 |
Cognizant Technology | | | | |
Solutions Corp., Class A# | | 700 | | 44,436 |
Dell Technologies, Inc., | | | | |
Class C* | | 144 | | 7,029 |
DXC Technology Co. | | 171 | | 9,092 |
Fortinet, Inc.*# | | 1,000 | | 70,430 |
Hewlett Packard Enterprise | | | | |
Co.# | | 4,200 | | 55,482 |
HP, Inc.# | | 2,000 | | 40,920 |
Intel Corp.# | | 3,300 | | 154,869 |
| | |
| Managed Volatility Fund | |
|
| SCHEDULE OF INVESTMENTS (Unaudited) (continued) |
| Showing percentage of net assets as of December 31, 2018 | | |
| | | | | | | | |
| Industry Company | | Shares | | Value | | | | |
| | | |
Common Stocks (continued) | | | | | | |
| | |
Information Technology (continued) | | | | |
International Business Machines Corp.# | | 1,300 | | $ 147,771 | | | | |
Intuit, Inc. | | 400 | | 78,740 | | | | |
Juniper Networks, Inc.# | | 2,700 | | 72,657 | | | | |
Lam Research Corp.# | | 1,600 | | 217,872 | | | | |
LogMeIn, Inc. | | 189 | | 15,417 | | | | |
Mastercard, Inc., Class A# | | 800 | | 150,920 | | | | |
Micro Focus International | | | | | | |
PLC, ADR | | 196 | | 3,373 | | | | |
Micron Technology, Inc.*# | | 18,200 | | 577,486 | | | | |
Microsoft Corp.# | | 2,800 | | 284,396 | | | | |
NetApp, Inc. | | 400 | | 23,868 | | | | |
ON Semiconductor Corp.*# | | 9,000 | | 148,590 | | | | |
Oracle Corp. | | 860 | | 38,829 | | | | |
PayPal Holdings, Inc.* | | 1,100 | | 92,499 | | | | |
Perspecta, Inc. | | 85 | | 1,464 | | | | |
QUALCOMM, Inc. | | 1,700 | | 96,747 | | | | |
salesforce.com, Inc.*# | | 1,300 | | 178,061 | | | | |
Seagate Technology PLC# | | 4,000 | | 154,360 | | | | |
Texas Instruments, Inc.# | | 670 | | 63,315 | | | | |
Visa, Inc., Class A | | 1,300 | | 171,522 | | | | |
WEX, Inc.*# | | 500 | | 70,030 | | | | |
| | | | | | | | |
| | | | 4,539,638 | | | | |
| | |
Materials - 3.25% | | | | |
AdvanSix, Inc.* | | 48 | | 1,168 | | | | |
Chemours Co. (The)# | | 4,900 | | 138,278 | | | | |
DowDuPont, Inc.# | | 2,500 | | 133,700 | | | | |
Eastman Chemical Co.# | | 2,100 | | 153,531 | | | | |
Ecolab, Inc. | | 100 | | 14,735 | | | | |
Huntsman Corp.# | | 10,000 | | 192,900 | | | | |
International Paper Co.# | | 1,200 | | 48,432 | | | | |
Linde PLC | | 600 | | 93,624 | | | | |
Sherwin-Williams Co. (The) | | 300 | | 118,038 | | | | |
Steel Dynamics, Inc.# | | 2,500 | | 75,100 | | | | |
| | | | | | | | |
| | | | 969,506 | | | | |
| | |
Real Estate - 1.87% | | | | |
Alexandria Real Estate | | | | | | |
Equities, Inc.# | | 1,100 | | 126,764 | | | | |
American Tower Corp.# | | 800 | | 126,552 | | | | |
Crown Castle International | | | | | | |
Corp. | | 500 | | 54,315 | | | | |
Public Storage | | 500 | | 101,205 | | | | |
Simon Property Group, Inc. | | 900 | | 151,191 | | | | |
| | | | | | | | |
| | | | 560,027 | | | | |
| | |
Utilities - 1.61% | | | | |
AES Corp.# | | 4,300 | | 62,178 | | | | |
American Electric Power | | | | | | |
Co., Inc.# | | 1,000 | | 74,740 | | | | |
Dominion Energy, Inc.# | | 720 | | 51,451 | | | | |
| | | | | | |
| Industry Company | | | | Shares | | Value |
|
Utilities (continued) |
Duke Energy Corp.# | | 1,083 | | $ 93,463 |
Exelon Corp.# | | 1,000 | | 45,100 |
NextEra Energy, Inc. | | 300 | | 52,146 |
Public Service Enterprise | | | | |
Group, Inc. | | 900 | | 46,845 |
Sempra Energy | | 500 | | 54,095 |
| | | | | | |
| | | | | | 480,018 |
| | | | | | |
TOTAL COMMON STOCKS - 68.17% | | 20,373,117 |
| | | | | | |
(Cost $17,029,605) | | |
| | | |
| Due Date | | Discount
Rate or
Coupon
Rate | | Principal
Amount | | Value |
|
U.S. GOVERNMENT OBLIGATIONS - 30.01% |
U.S. Treasury Bills - 30.01% |
01/10/2019 | | 2.233%(a) | | $3,000,000 | | 2,998,497 |
02/28/2019 | | 2.384%(a) | | 3,000,000 | | 2,988,689 |
03/28/2019 | | 2.397%(a) | | 3,000,000 | | 2,983,204 |
| | | | | | |
| | | | | | 8,970,390 |
| | | | | | |
TOTAL U.S. GOVERNMENT
OBLIGATIONS - 30.01% | | 8,970,390 |
| | | | | | |
(Cost $8,969,835) | | |
| | | Rate^ | | Shares | | Value |
|
MONEY MARKET FUND - 5.11% |
Fidelity Investments Money Market Government Portfolio | | | | |
Class I | | 2.25% | | 1,527,281 | | 1,527,281 |
| | |
| |
TOTAL MONEY MARKET FUND — 5.11% | | 1,527,281 |
| | |
(Cost $1,527,281) | | |
| |
TOTAL INVESTMENTS BEFORE OPTIONS WRITTEN - 103.29%
(Cost $27,526,721) | | $30,870,788 |
| | |
|
WRITTEN OPTIONS - (1.47%) |
TOTAL WRITTEN OPTIONS - (1.47%) | | $(440,041) |
| | |
(Premiums Received $(476,256)) | | |
| | |
| 62 | | Semi-Annual Report | December 31, 2018 (Unaudited) |
| | |
| Managed Volatility Fund | | |
| SCHEDULE OF INVESTMENTS (Unaudited)(continued) | | |
| Showing percentage of net assets as of December 31, 2018 | | |
| | | | | | | | |
| | | Value | | | | | |
| | | |
TOTAL INVESTMENTS - 101.82% | | $ | 30,430,747 | | | | | |
(Cost $27,050,465) | | | | | | | | |
Liabilities in Excess of Other Assets - (1.82%) | | | (544,108 | ) | | | | |
| | | | | | | | |
NET ASSETS - 100.00% | | $ | 29,886,639 | | | | | |
| | | | | | | | |
* Non-income producing security. | | | | | | | | |
# Security subject to call or put option written by the Fund. | | | | | | | | |
^ Rate disclosed as of December 31, 2018. | | | | | | | | |
(a) Rate represents the effective yield at purchase. | | | | | | | | |
| PLC - Public Limited Company | | | | | | | | |
| ADR - American Depositary Receipt | | | | | | | | |
| | | | | | | | |
| | | | | | | | |
| | | | | | | | |
| | | | | | | | |
| | | | | | | | |
| | | | | | | | |
| | | | | | | | |
| | | | | | | | |
| | | | | | | | |
| | | | | | | | |
| | | | | | | | |
| | | | | | | | |
| | | | | | | | |
| | | | | | | | |
| | | | | | | | |
| | | | | | | | |
| | | | | | | | |
| | | | | | | | |
| | | | | | | | |
| | | | | | | | |
| | | | | | | | |
| | | | | | | | |
| | | | | | | | |
| | | | | | | | |
| | | | | | | | |
| | | | | | | | |
| | | | | | | | |
| | | | | | | | |
| | | | | | | | |
| | | | | | | | |
| | | | | | | | |
| | | | | | | | |
| | | | | | | | |
| | | | | | | | |
| | | | | | | | |
| | |
| Managed Volatility Fund | |
|
| SCHEDULE OF INVESTMENTS (Unaudited) (continued) |
| Showing percentage of net assets as of December 31, 2018 | | |
| | | | | | | | | | | | | | | | | | | | | | | | | |
| Description | | Number of
Contracts | | Notional
Amount | | Exercise
Price | | Expiration
Date | | Value |
EXCHANGE TRADED PUT OPTIONS WRITTEN - (0.63%) | | | | | | | | | | | | | | | | |
| | | | | |
Air Products & Chemicals, Inc. | | | | 5 | | | | $ | (80,025) | | | | $ | 155.00 | | | | | 01/18/19 | | | | $ | (1,075) | |
Encompass Health Corp. | | | | 10 | | | | | (61,700 | ) | | | | 75.00 | | | | | 01/18/19 | | | | | (15,700 | ) |
Freeport-McMoRan, Inc. | | | | 50 | | | | | (51,550 | ) | | | | 12.00 | | | | | 01/18/19 | | | | | (9,400 | ) |
Intercontinental Exchange, Inc. | | | | 30 | | | | | (225,990 | ) | | | | 77.50 | | | | | 03/15/19 | | | | | (13,500 | ) |
O’Reilly Automotive, Inc. | | | | 10 | | | | | (344,330 | ) | | | | 320.00 | | | | | 01/18/19 | | | | | (3,200 | ) |
Principal Financial Group, Inc. | | | | 40 | | | | | (176,680 | ) | | | | 50.00 | | | | | 01/18/19 | | | | | (25,600 | ) |
Prologis, Inc. | | | | 50 | | | | | (293,600 | ) | | | | 65.00 | | | | | 02/15/19 | | | | | (34,500 | ) |
Reinsurance Group of America, Inc. | | | | 23 | | | | | (322,529 | ) | | | | 135.00 | | | | | 01/18/19 | | | | | (8,050 | ) |
Synchrony Financial | | | | 70 | | | | | (164,220 | ) | | | | 28.00 | | | | | 01/18/19 | | | | | (33,320 | ) |
TJX Cos., Inc. (The) | | | | 8 | | | | | (35,792 | ) | | | | 52.50 | | | | | 01/18/19 | | | | | (6,560 | ) |
Torchmark Corp. | | | | 10 | | | | | (74,530 | ) | | | | 80.00 | | | | | 02/15/19 | | | | | (6,500 | ) |
Zebra Technologies Corp. | | | | 19 | | | | | (302,537 | ) | | | | 170.00 | | | | | 02/15/19 | | | | | (31,540 | ) |
| | | | | | | | | | | | | | | | | | | | | | | | | |
Total Exchange Traded Put Options Written (Premiums received $(96,201)) | | | | | | | | | | | | | | | | | | | $ | (188,945 | ) |
| | | | | | | | | | | | | | | | | | | | | | | | | |
| | | |
EXCHANGE TRADED CALL OPTIONS WRITTEN - (0.84%) | | | | | | | | | | | | | | | | |
| | | | | |
Abbott Laboratories | | | | 3 | | | | $ | (21,699) | | | | $ | 72.50 | | | | | 02/15/19 | | | | $ | (795) | |
AbbVie, Inc. | | | | 5 | | | | | (46,095 | ) | | | | 92.50 | | | | | 02/15/19 | | | | | (1,875 | ) |
Adobe, Inc. | | | | 3 | | | | | (67,872 | ) | | | | 255.00 | | | | | 01/18/19 | | | | | (201 | ) |
AerCap Holdings NV | | | | 11 | | | | | (43,560 | ) | | | | 52.50 | | | | | 01/18/19 | | | | | (275 | ) |
AES Corp. | | | | 13 | | | | | (18,798 | ) | | | | 15.00 | | | | | 01/18/19 | | | | | (195 | ) |
Alexandria Real Estate Equities, Inc. | | | | 11 | | | | | (126,764 | ) | | | | 125.00 | | | | | 01/18/19 | | | | | (220 | ) |
American Electric Power Co., Inc. | | | | 3 | | | | | (22,422 | ) | | | | 75.00 | | | | | 02/15/19 | | | | | (675 | ) |
American Express Co. | | | | 3 | | | | | (28,596 | ) | | | | 110.00 | | | | | 01/18/19 | | | | | (15 | ) |
American Tower Corp. | | | | 3 | | | | | (47,457 | ) | | | | 150.00 | | | | | 01/18/19 | | | | | (2,610 | ) |
Anadarko Petroleum Corp. | | | | 3 | | | | | (13,152 | ) | | | | 65.00 | | | | | 01/18/19 | | | | | (21 | ) |
Apple, Inc. | | | | 28 | | | | | (441,672 | ) | | | | 180.00 | | | | | 02/15/19 | | | | | (4,172 | ) |
Apple, Inc. | | | | 6 | | | | | (94,644 | ) | | | | 160.00 | | | | | 02/15/19 | | | | | (4,650 | ) |
Applied Materials, Inc. | | | | 5 | | | | | (16,370 | ) | | | | 33.00 | | | | | 02/15/19 | | | | | (1,000 | ) |
AT&T, Inc. | | | | 19 | | | | | (54,226 | ) | | | | 35.00 | | | | | 01/18/19 | | | | | (19 | ) |
Athene Holding, Ltd., Class A | | | | 57 | | | | | (227,031 | ) | | | | 45.00 | | | | | 02/15/19 | | | | | (2,565 | ) |
Bank of America Corp. | | | | 7 | | | | | (17,248 | ) | | | | 25.00 | | | | | 02/15/19 | | | | | (651 | ) |
Baxter International, Inc. | | | | 3 | | | | | (19,746 | ) | | | | 70.00 | | | | | 01/18/19 | | | | | (96 | ) |
BB&T Corp. | | | | 3 | | | | | (12,996 | ) | | | | 45.00 | | | | | 03/15/19 | | | | | (423 | ) |
Becton Dickinson & Co. | | | | 3 | | | | | (67,596 | ) | | | | 230.00 | | | | | 03/15/19 | | | | | (2,520 | ) |
Bristol-Myers Squibb Co. | | | | 5 | | | | | (25,990 | ) | | | | 52.50 | | | | | 03/15/19 | | | | | (1,020 | ) |
Campbell Soup Co. | | | | 5 | | | | | (16,495 | ) | | | | 40.00 | | | | | 02/15/19 | | | | | (50 | ) |
Capital One Financial Corp. | | | | 36 | | | | | (272,124 | ) | | | | 80.00 | | | | | 02/01/19 | | | | | (4,860 | ) |
Capital One Financial Corp. | | | | 3 | | | | | (22,677 | ) | | | | 77.50 | | | | | 03/15/19 | | | | | (945 | ) |
Chemours Co. (The) | | | | 49 | | | | | (138,278 | ) | | | | 29.00 | | | | | 01/04/19 | | | | | (735 | ) |
Cigna Corp. | | | | 4 | | | | | (18,232 | ) | | | | 100.00 | | | | | 02/15/19 | | | | | (67 | ) |
Cisco Systems, Inc. | | | | 13 | | | | | (56,329 | ) | | | | 45.00 | | | | | 02/01/19 | | | | | (975 | ) |
Citrix Systems, Inc. | | | | 3 | | | | | (30,738 | ) | | | | 110.00 | | | | | 03/15/19 | | | | | (780 | ) |
Cognizant Technology Solutions Corp., Class A | | | | 3 | | | | | (19,044 | ) | | | | 75.00 | | | | | 01/18/19 | | | | | (15 | ) |
Colgate-Palmolive Co. | | | | 3 | | | | | (17,856 | ) | | | | 65.00 | | | | | 02/15/19 | | | | | (195 | ) |
ConocoPhillips | | | | 4 | | | | | (24,940 | ) | | | | 67.50 | | | | | 02/15/19 | | | | | (444 | ) |
Continental Resources, Inc. | | | | 10 | | | | | (40,190 | ) | | | | 40.00 | | | | | 02/15/19 | | | | | (3,300 | ) |
| | |
| 64 | | Semi-Annual Report | December 31, 2018 (Unaudited) |
| | |
| Managed Volatility Fund | | |
| SCHEDULE OF INVESTMENTS (Unaudited) (continued) | | |
Showing percentage of net assets as of December 31, 2018 | | |
| | | | | | | | | | | | | | | | | | | | | | | | | |
| Description | | Number of
Contracts | | Notional
Amount | | Exercise
Price | | Expiration
Date | | Value |
Exchange Traded Call Options Written (continued) | | | | | | | | | | | | | | | | | | | | | | | | | |
CVS Health Corp. | | | | 3 | | | | $ | (19,656) | | | | $ | 82.50 | | | | | 02/15/19 | | | | $ | (15) | |
DaVita, Inc. | | | | 4 | | | | | (20,584 | ) | | | | 55.00 | | | | | 01/18/19 | | | | | (320 | ) |
Discovery, Inc., Class C | | | | 5 | | | | | (11,540 | ) | | | | 30.00 | | | | | 01/18/19 | | | | | (50 | ) |
DISH Network Corp., Class A | | | | 95 | | | | | (237,215 | ) | | | | 27.50 | | | | | 03/15/19 | | | | | (14,250 | ) |
Dominion Energy, Inc. | | | | 3 | | | | | (21,438 | ) | | | | 75.00 | | | | | 01/18/19 | | | | | (150 | ) |
DowDuPont, Inc. | | | | 3 | | | | | (16,044 | ) | | | | 55.00 | | | | | 01/18/19 | | | | | (267 | ) |
Duke Energy Corp. | | | | 3 | | | | | (25,890 | ) | | | | 85.00 | | | | | 01/18/19 | | | | | (711 | ) |
Eastman Chemical Co. | | | | 21 | | | | | (153,531 | ) | | | | 72.50 | | | | | 03/15/19 | | | | | (10,500 | ) |
Electronic Arts, Inc. | | | | 3 | | | | | (23,673 | ) | | | | 85.00 | | | | | 03/15/19 | | | | | (1,050 | ) |
Exelon Corp. | | | | 3 | | | | | (13,530 | ) | | | | 45.00 | | | | | 01/18/19 | | | | | (270 | ) |
Facebook, Inc., Class A | | | | 5 | | | | | (65,545 | ) | | | | 140.00 | | | | | 03/15/19 | | | | | (2,895 | ) |
FedEx Corp. | | | | 3 | | | | | (48,399 | ) | | | | 260.00 | | | | | 01/18/19 | | | | | (3 | ) |
Ford Motor Co. | | | | 370 | | | | | (283,050 | ) | | | | 9.00 | | | | | 01/18/19 | | | | | (370 | ) |
Fortinet, Inc. | | | | 10 | | | | | (70,430 | ) | | | | 70.00 | | | | | 03/15/19 | | | | | (7,000 | ) |
Gilead Sciences, Inc. | | | | 3 | | | | | (18,765 | ) | | | | 70.00 | | | | | 01/25/19 | | | | | (96 | ) |
Hasbro, Inc. | | | | 3 | | | | | (24,375 | ) | | | | 97.50 | | | | | 01/18/19 | | | | | (15 | ) |
HCA Healthcare, Inc. | | | | 25 | | | | | (311,125 | ) | | | | 125.00 | | | | | 03/15/19 | | | | | (18,250 | ) |
Hewlett Packard Enterprise Co. | | | | 5 | | | | | (6,605 | ) | | | | 17.00 | | | | | 01/18/19 | | | | | (25 | ) |
Honeywell International, Inc. | | | | 3 | | | | | (39,636 | ) | | | | 140.00 | | | | | 03/15/19 | | | | | (735 | ) |
HP, Inc. | | | | 6 | | | | | (12,276 | ) | | | | 25.00 | | | | | 01/18/19 | | | | | (6 | ) |
Huntington Bancshares, Inc. | | | | 10 | | | | | (11,920 | ) | | | | 15.00 | | | | | 01/18/19 | | | | | (50 | ) |
Huntsman Corp. | | | | 100 | | | | | (192,900 | ) | | | | 22.00 | | | | | 02/15/19 | | | | | (2,200 | ) |
Intel Corp. | | | | 10 | | | | | (46,930 | ) | | | | 48.00 | | | | | 02/15/19 | | | | | (1,850 | ) |
International Business Machines Corp. | | | | 4 | | | | | (45,468 | ) | | | | 135.00 | | | | | 01/18/19 | | | | | (8 | ) |
International Paper Co. | | | | 3 | | | | | (12,108 | ) | | | | 43.00 | | | | | 01/18/19 | | | | | (81 | ) |
JetBlue Airways Corp. | | | | 107 | | | | | (171,842 | ) | | | | 16.00 | | | | | 03/15/19 | | | | | (11,449 | ) |
Juniper Networks, Inc. | | | | 8 | | | | | (21,528 | ) | | | | 30.00 | | | | | 01/18/19 | | | | | (48 | ) |
KeyCorp. | | | | 15 | | | | | (22,170 | ) | | | | 20.00 | | | | | 01/18/19 | | | | | (15 | ) |
Kimberly-Clark Corp. | | | | 3 | | | | | (34,182 | ) | | | | 110.00 | | | | | 01/18/19 | | | | | (1,428 | ) |
Kinder Morgan, Inc. | | | | 6 | | | | | (9,228 | ) | | | | 19.00 | | | | | 01/18/19 | | | | | (6 | ) |
Kroger Co. (The) | | | | 3 | | | | | (8,250 | ) | | | | 30.00 | | | | | 01/18/19 | | | | | (39 | ) |
Lam Research Corp. | | | | 16 | | | | | (217,872 | ) | | | | 150.00 | | | | | 02/15/19 | | | | | (5,616 | ) |
Lear Corp. | | | | 15 | | | | | (184,290 | ) | | | | 125.00 | | | | | 03/15/19 | | | | | (12,600 | ) |
Lululemon Athletica, Inc. | | | | 15 | | | | | (182,415 | ) | | | | 130.00 | | | | | 03/15/19 | | | | | (9,675 | ) |
Macy’s, Inc. | | | | 10 | | | | | (29,780 | ) | | | | 35.00 | | | | | 01/18/19 | | | | | (150 | ) |
Magna International, Inc. | | | | 42 | | | | | (190,890 | ) | | | | 47.50 | | | | | 03/15/19 | | | | | (10,080 | ) |
Mastercard, Inc., Class A | | | | 3 | | | | | (56,595 | ) | | | | 230.00 | | | | | 01/18/19 | | | | | (18 | ) |
McCormick & Co., Inc.,Non-Voting Shares | | | | 10 | | | | | (139,240 | ) | | | | 140.00 | | | | | 03/15/19 | | | | | (7,700 | ) |
| | |
| Managed Volatility Fund | |
|
| SCHEDULE OF INVESTMENTS (Unaudited) (continued) |
Showing percentage of net assets as of December 31, 2018 | | |
| | | | | | | | | | | | | | | | | | | | | | | | | |
| Description | | Number of
Contracts | | Notional
Amount | | Exercise
Price | | Expiration
Date | | Value |
Exchange Traded Call Options Written (continued) | | | | | | | | | | | | | | | | | | | | | | | | | |
Merck & Co., Inc. | | | | 7 | | | | $ | (53,487 | ) | | | $ | 72.50 | | | | | 01/18/19 | | | | $ | (3,066 | ) |
MetLife, Inc. | | | | 56 | | | | | (229,936 | ) | | | | 40.00 | | | | | 02/15/19 | | | | | (12,768 | ) |
MetLife, Inc. | | | | 4 | | | | | (16,424 | ) | | | | 41.00 | | | | | 01/25/19 | | | | | (640 | ) |
Micron Technology, Inc. | | | | 64 | | | | | (203,072 | ) | | | | 42.00 | | | | | 01/18/19 | | | | | (64 | ) |
Micron Technology, Inc. | | | | 24 | | | | | (76,152 | ) | | | | 37.50 | | | | | 01/04/19 | | | | | (72 | ) |
Microsoft Corp. | | | | 8 | | | | | (81,256 | ) | | | | 110.00 | | | | | 02/15/19 | | | | | (1,464 | ) |
NIKE, Inc., Class B | | | | 5 | | | | | (37,070 | ) | | | | 75.00 | | | | | 01/18/19 | | | | | (860 | ) |
Northrop Grumman Corp. | | | | 3 | | | | | (73,470 | ) | | | | 280.00 | | | | | 02/15/19 | | | | | (495 | ) |
ON Semiconductor Corp. | | | | 90 | | | | | (148,590 | ) | | | | 19.00 | | | | | 01/18/19 | | | | | (1,350 | ) |
Pfizer, Inc. | | | | 8 | | | | | (34,920 | ) | | | | 45.00 | | | | | 01/18/19 | | | | | (296 | ) |
Progressive Corp. (The) | | | | 4 | | | | | (24,132 | ) | | | | 67.50 | | | | | 02/15/19 | | | | | (300 | ) |
Prudential Financial, Inc. | | | | 30 | | | | | (244,650 | ) | | | �� | 82.50 | | | | | 03/15/19 | | | | | (12,300 | ) |
Ross Stores, Inc. | | | | 3 | | | | | (24,960 | ) | | | | 105.00 | | | | | 02/15/19 | | | | | (15 | ) |
salesforce.com, Inc. | | | | 4 | | | | | (54,788 | ) | | | | 135.00 | | | | | 02/15/19 | | | | | (3,600 | ) |
Seagate Technology PLC | | | | 23 | | | | | (88,757 | ) | | | | 45.00 | | | | | 01/18/19 | | | | | (299 | ) |
Seagate Technology PLC | | | | 17 | | | | | (65,603 | ) | | | | 42.00 | | | | | 01/18/19 | | | | | (799 | ) |
Starbucks Corp. | | | | 3 | | | | | (19,320 | ) | | | | 70.00 | | | | | 01/18/19 | | | | | (15 | ) |
State Street Corp. | | | | 3 | | | | | (18,921 | ) | | | | 72.50 | | | | | 02/15/19 | | | | | (204 | ) |
Steel Dynamics, Inc. | | | | 25 | | | | | (75,100 | ) | | | | 40.00 | | | | | 02/15/19 | | | | | (250 | ) |
T. Rowe Price Group, Inc. | | | | 10 | | | | | (92,320 | ) | | | | 100.00 | | | | | 01/18/19 | | | | | (200 | ) |
Texas Instruments, Inc. | | | | 3 | | | | | (28,350 | ) | | | | 100.00 | | | | | 01/18/19 | | | | | (276 | ) |
TJX Cos., Inc. (The) | | | | 30 | | | | | (134,220 | ) | | | | 45.00 | | | | | 02/15/19 | | | | | (5,100 | ) |
TJX Cos., Inc. (The) | | | | 22 | | | | | (98,428 | ) | | | | 45.00 | | | | | 01/18/19 | | | | | (2,420 | ) |
TransUnion | | | | 5 | | | | | (28,400 | ) | | | | 65.00 | | | | | 01/18/19 | | | | | (525 | ) |
Twenty-First Century Fox, Inc., Class A | | | | 4 | | | | | (19,248 | ) | | | | 47.00 | | | | | 01/18/19 | | | | | (1,040 | ) |
Union Pacific Corp. | | | | 3 | | | | | (41,469 | ) | | | | 155.00 | | | | | 01/18/19 | | | | | (24 | ) |
United Rentals, Inc. | | | | 36 | | | | | (369,108 | ) | | | | 105.00 | | | | | 03/15/19 | | | | | (27,360 | ) |
Verizon Communications, Inc. | | | | 5 | | | | | (28,110 | ) | | | | 55.00 | | | | | 01/18/19 | | | | | (790 | ) |
Walmart, Inc. | | | | 3 | | | | | (27,945 | ) | | | | 105.00 | | | | | 01/18/19 | | | | | (9 | ) |
Waste Management, Inc. | | | | 3 | | | | | (26,697 | ) | | | | 90.00 | | | | | 01/18/19 | | | | | (285 | ) |
WellCare Health Plans, Inc. | | | | 10 | | | | | (236,090 | ) | | | | 240.00 | | | | | 03/15/19 | | | | | (15,300 | ) |
Wex, Inc. | | | | 5 | | | | | (70,030 | ) | | | | 165.00 | | | | | 02/15/19 | | | | | (575 | ) |
XPO Logistics, Inc. | | | | 25 | | | | | (142,600 | ) | | | | 85.00 | | | | | 02/15/19 | | | | | (1,375 | ) |
XPO Logistics, Inc. | | | | 8 | | | | | (45,632 | ) | | | | 80.00 | | | | | 02/15/19 | | | | | (560 | ) |
Yum China Holdings, Inc. | | | | 3 | | | | | (10,059 | ) | | | | 37.50 | | | | | 01/18/19 | | | | | (45 | ) |
| | | | | | | | | | | | | | | | | | | | | | | | | |
Total Exchange Traded Call Options Written (Premiums received $(380,055)) | | | | | | | | | | | | | | | | | | | | | | | $ | (251,096 | ) |
| | | | | | | | | | | | | | | | | | | | | | | | | |
| | |
| 66 | | Semi-Annual Report | December 31, 2018 (Unaudited) |
| | |
| Managed Volatility Fund | | |
| SCHEDULE OF INVESTMENTS (continued) | | |
| | | | | | | | | | | | | | | | | | | | | | | | | |
| Summary of inputs used to value the Fund’s investments as of 12/31/2018 (See Note 2 in Notes to Financial Statements): | | | | | | |
| | | | | Assets Table | | |
| | | | | Valuation Inputs | | |
| | | | | Investment in Securities (Value) | | |
| | | Level 1
Quoted
Prices | | Level 2
Significant
Observable
Inputs | | Level 3 Significant Unobservable Inputs | | Total |
Common | | | | | | | | | | | | | | | | | | | | |
Stocks | | | $ | 20,373,117 | | | | $ | — | | | | $ | — | | | | $ | 20,373,117 | |
U.S. | | | | | | | | | | | | | | | | | | | | |
Government | | | | | | | | | | | | | | | | | | | | |
Obligations | | | | — | | | | | 8,970,390 | | | | | — | | | | | 8,970,390 | |
Money Market | | | | | | | | | | | | | | | | | | | | |
Fund | | | | — | | | | | 1,527,281 | | | | | — | | | | | 1,527,281 | |
| | | | | | | | | | | | | | | | | | | | |
TOTAL | | | $ | 20,373,117 | | | | $ | 10,497,671 | | | | $ | — | | | | $ | 30,870,788 | |
| | | | | | | | | | | | | | | | | | | | |
| | | | | Liabilities Table | | |
| | | | | Valuation Inputs | | |
| | | | | Investment in Securities (Value) | | |
| | | Level 1
Quoted
Prices | | Level 2
Significant
Observable
Inputs | | Level 3
Significant Unobservable Inputs | | Total |
Options Written | | | $ | (427,435 | ) | | | $ | (12,606 | ) | | | $ | — | | | | $ | (440,041 | ) |
| | | | | | | | | | | | | | | | | | | | |
TOTAL | | | $ | (427,435 | ) | | | $ | (12,606 | ) | | | $ | — | | | | $ | (440,041 | ) |
| | | | | | | | | | | | | | | | | | | | |
| See Notes to Financial Statements. | |
| | |
| STATEMENTS OF ASSETS AND LIABILITIES | | |
December 31, 2018 (Unaudited)
| | | | | | | | | | | | |
| ASSETS | | Aggressive
Investors 1 | | | | | Ultra-Small
Company | | | |
Investments at value | | | $163,231,412 | | | | | | $79,706,070 | | | |
Cash | | | - | | | | | | - | | | |
Receivables: | | | | | | | | | | | | |
Portfolio securities sold | | | 7,354,140 | | | | | | 252,717 | | | |
Fund shares sold | | | 75,369 | | | | | | 2,500 | | | |
Dividends and interest | | | 538,149 | | | | | | 103,576 | | | |
Futures margin | | | - | | | | | | - | | | |
Receivable from investment adviser | | | 17,003 | | | | | | - | | | |
Prepaid expenses | | | 20,025 | | | | | | 10,288 | | | |
| | | | |
Total assets | | | 171,236,098 | | | | | | 80,075,151 | | | |
| | | | |
LIABILITIES | | | | | | | | | | | | |
Payables: | | | | | | | | | | | | |
Portfolio securities purchased | | | - | | | | | | - | | | |
Fund shares redeemed | | | 218,778 | | | | | | 228,366 | | | |
Due to custodian | | | - | | | | | | 146,796 | | | |
Due to broker | | | - | | | | | | - | | | |
Loan payable | | | 7,380,000 | | | | | | - | | | |
Payable upon return of securities loaned | | | 2,746,838 | | | | | | 7,314,718 | | | |
Accrued Liabilities: | | | | | | | | | | | | |
Investment adviser fees | | | - | | | | | | 58,239 | | | |
Administration fees | | | 4,562 | | | | | | 1,987 | | | |
Directors’ fees | | | 2,101 | | | | | | 1,038 | | | |
Other | | | 121,982 | | | | | | 57,230 | | | |
Put options written at value | | | - | | | | | | - | | | |
Call options written at value | | | - | | | | | | - | | | |
| | | | |
Total liabilities | | | 10,474,261 | | | | | | 7,808,374 | | | |
NET ASSETS | | | $160,761,837 | | | | |
| $72,266,777
|
| | |
| | | | |
NET ASSETS REPRESENT | | | | | | | | | | | | |
Paid-in capital | | | $207,296,814 | | | | | | $83,975,723 | | | |
Distributable earnings(a) | | | (46,534,977 | ) | | | | | (11,708,946 | ) | | |
| | | | |
NET ASSETS | | | $160,761,837 | | | | | | $72,266,777 | | | |
| | | | |
Shares of common stock outstanding of $.001 par value(b) | | | 3,066,932 | | | | | | 3,222,663 | | | |
| | | | |
Net asset value, offering price and redemption price per share | | | $ 52.42 | | | | | | $ 22.42 | | | |
| | | | |
Total investments at cost | | | $187,685,939 | | | | | | $90,902,247 | | | |
Premiums received on put options written | | | $ - | | | | | | $ - | | | |
Premiums received on call options written | | | $ - | | | | | | $ - | | | |
| (a) | Effective December 31, 2018, the Fund has adopted disclosure requirements conforming to SEC Rule6-04.17 of RegulationS-X and discloses total distributable earnings. See Note 2 for further details. |
| (b) | See Note 1 - Organization in the Notes to Financial Statements for shares authorized for each Fund. |
| (c) | Redemption of shares held less than six months may be charged a 2% redemption fee. See Note 8. |
See Notes to Financial Statements.
| | |
| 68 | | Semi-Annual Report | December 31, 2018 (Unaudited) |
| | |
| | | |
| | |
|
| | | | | | | | | | | | | | | | | | | | | | |
Ultra-Small
Company Market | | | Small-Cap
Growth | | | Small-Cap
Value | | | Blue Chip 35
Index | | | Managed
Volatility | | | | |
| | | | | | |
| | $283,904,427 | | | $ | 45,461,192 | | | $ | 53,554,196 | | | | $525,651,599 | | | | $30,870,788 | | | | | |
| | - | | | | - | | | | - | | | | - | | | | 176,666 | | | | | |
| | 1,279,086 | | | | 58,639 | | | | - | | | | 8,647,027 | | | | 15,975 | | | | | |
| | 2,458,699 | | | | 79,657 | | | | 5,737 | | | | 739,557 | | | | 180,621 | | | | | |
| | 216,007 | | | | 83,911 | | | | 30,719 | | | | 514,681 | | | | 22,167 | | | | | |
| | - | | | | - | | | | - | | | | - | | | | 135,593 | | | | | |
| | - | | | | - | | | | - | | | | 6,422 | | | | - | | | | | |
| | 24,072 | | | | 17,000 | | | | 17,175 | | | | 55,352 | | | | 9,451 | | | | | |
| | |
| | 287,882,291 | | | | 45,700,399 | | | | 53,607,827 | | | | 535,614,638 | | | | 31,411,261 | | | | | |
| | |
| | | | | |
| | - | | | | - | | | | - | | | | 8,438,893 | | | | 593,560 | | | | | |
| | 3,233,090 | | | | 218,842 | | | | 81,317 | | | | 651,891 | | | | 331,151 | | | | | |
| | - | | | | 8,758 | | | | - | | | | - | | | | - | | | | | |
| | - | | | | - | | | | - | | | | - | | | | 101,564 | | | | | |
| | 2,406,000 | | | | - | | | | - | | | | - | | | | - | | | | | |
| | 23,396,252 | | | | 3,394,722 | | | | 3,349,453 | | | | - | | | | - | | | | | |
| | 98,639 | | | | 17,452 | | | | 18,090 | | | | - | | | | 6,406 | | | | | |
| | 7,353 | | | | 1,171 | | | | 1,381 | | | | 14,255 | | | | 800 | | | | | |
| | 3,873 | | | | 481 | | | | 644 | | | | 5,816 | | | | 428 | | | | | |
| | 164,262 | | | | 48,522 | | | | 53,378 | | | | 126,965 | | | | 50,672 | | | | | |
| | - | | | | - | | | | - | | | | - | | | | 188,945 | | | | | |
| | - | | | | - | | | | - | | | | - | | | | 251,096 | | | | | |
| | |
| | | | | |
| | 29,309,469 | | | | 3,689,948 | | | | 3,504,263 | | | | 9,237,820 | | | | 1,524,622 | | | | | |
| | |
| | | | | |
| | $258,572,822 | | | $ | 42,010,451 | | | $ | 50,103,564 | | | | $526,376,818 | | | | $ 29,886,639 | | | | | |
| | |
| | | | | |
| | $260,794,401 | | | $ | 47,865,812 | | | $ | 65,806,665 | | | | $305,353,279 | | | | $ 26,307,588 | | | | | |
| | (2,221,579 | ) | | | (5,855,361 | ) | | | (15,703,101 | ) | | | 221,023,539 | | | | 3,579,051 | | | | | |
| | |
| | | | | |
| | $258,572,822 | | | $ | 42,010,451 | | | $ | 50,103,564 | | | | $526,376,818 | | | | $ 29,886,639 | | | | | |
| | |
| | | | | |
| | 25,327,071 | | | | 1,905,233 | | | | 2,632,448 | | | | 41,562,537 | | | | 2,152,506 | | | | | |
| | |
| | | | | |
| | $ 10.21(c | ) | | $ | 22.05 | | | $ | 19.03 | | | | $ 12.66 | | | | $ 13.88 | | | | | |
| | |
| | $ 283,839,889 | | | $ | 46,728,394 | | | $ | 60,914,543 | | | | $ 309,245,741 | | | | $ 27,526,721 | | | | | |
| | $ - | | | $ | - | | | $ | - | | | | $ - | | | | $ 96,201 | | | | | |
| | $ - | | | $ | - | | | $ | - | | | | $ - | | | | $ 380,055 | | | | | |
Six Months Ended December 31, 2018 (Unaudited)
| | | | | | | | | | | | | | | | |
| | | Aggressive
Investors 1 | | | Ultra-Small
Company | | | Ultra-Small
Company Market | | | | |
| | | | |
INVESTMENT INCOME | | | | | | | | | | | | | | | | |
Dividends | | | $ 1,950,355 | | | | $ 555,039 | | | | $ 1,563,949 | | | | | |
Less: foreign taxes withheld | | | (13,655) | | | | - | | | | - | | | | | |
Interest | | | 7,878 | | | | 8,511 | | | | 4,789 | | | | | |
Securities lending | | | 22,367 | | | | 210,657 | | | | 1,161,406 | | | | | |
Total Investment Income | | | 1,966,945 | | | | 774,207 | | | | 2,730,144 | | | | | |
| | | | |
EXPENSES | | | | | | | | | | | | | | | | |
Investment advisory fees - Base fees | | | 950,362 | | | | 418,208 | | | | 883,767 | | | | | |
Investment advisory fees - Performance adjustment | | | (835,962) | | | | - | | | | - | | | | | |
Administration fees | | | 26,896 | | | | 11,836 | | | | 44,965 | | | | | |
Accounting fees | | | 40,004 | | | | 36,260 | | | | 62,807 | | | | | |
Transfer agent fees | | | 63,951 | | | | 30,008 | | | | 54,106 | | | | | |
Audit fees | | | 10,596 | | | | 7,058 | | | | 13,593 | | | | | |
Legal fees | | | 15,316 | | | | 6,577 | | | | 25,011 | | | | | |
Custody fees | | | 3,825 | | | | 5,387 | | | | 10,022 | | | | | |
Blue sky fees | | | 14,143 | | | | 5,611 | | | | 20,414 | | | | | |
Directors’ and officers’ fees | | | 11,164 | | | | 4,684 | | | | 17,600 | | | | | |
Shareholder servicing fees | | | 69,494 | | | | 13,191 | | | | 161,964 | | | | | |
Reports to shareholders | | | 16,658 | | | | 8,283 | | | | 23,696 | | | | | |
Miscellaneous expenses | | | 22,083 | | | | 9,676 | | | | 30,085 | | | | | |
Total Expenses | | | 408,530 | | | | 556,779 | | | | 1,348,030 | | | | | |
Less investment advisory fees waived | | | - | | | | - | | | | (22,328 | ) | | | | |
Net Expenses | | | 408,530 | | | | 556,779 | | | | 1,325,702 | | | | | |
NET INVESTMENT INCOME | | | 1,558,415 | | | | 217,428 | | | | 1,404,442 | | | | | |
| | | | |
NET REALIZED AND UNREALIZED GAIN (LOSS) ON INVESTMENTS | | | | | | | | | | | | | | | | |
Realized Gain (Loss) on: | | | | | | | | | | | | | | | | |
Investments | | | (6,400,305) | | | | (406,602 | ) | | | 8,791,912 | | | | | |
Written options | | | - | | | | - | | | | - | | | | | |
Futures contracts | | | - | | | | - | | | | - | | | | | |
Net Realized Gain (Loss) | | | (6,400,305) | | | | (406,602 | ) | | | 8,791,912 | | | | | |
| | | | |
Change in Unrealized Appreciation (Depreciation) on: Investments | | | (41,382,615) | | | | (19,095,393 | ) | | | (103,830,082 | ) | | | | |
Written options | | | - | | | | - | | | | - | | | | | |
Net Change in Unrealized Appreciation (Depreciation) | | | (41,382,615) | | | | (19,095,393 | ) | | | (103,830,082 | ) | | | | |
Net Realized and Unrealized Gain (Loss) on Investments | | | (47,782,920) | | | | (19,501,995 | ) | | | (95,038,170 | ) | | | | |
DECREASE IN NET ASSETS RESULTING FROM OPERATIONS | | | $(46,224,505) | | | | $(19,284,567 | ) | | | $ (93,633,728 | ) | | | | |
See Notes to Financial Statements.
| | |
| 70 | | Semi-Annual Report | December 31, 2018 (Unaudited) |
| | |
| | | |
| | | |
| | | | | | | | | | | | | | |
| Small-Cap
Growth |
| |
| Small-Cap
Value |
| |
| Blue Chip 35
Index |
| |
| Managed
Volatility |
|
| | |
| | | |
| | $ 219,005 | | | | $ 970,425 | | | | $ 7,326,582 | | | | $ 195,649 | |
| | - | | | | (298) | | | | - | | | | (208) | |
| | 3,257 | | | | 7,702 | | | | 189 | | | | 123,385 | |
| | 34,007 | | | | 35,540 | | | | - | | | | 87 | |
| | |
| | 256,269 | | | | 1,013,369 | | | | 7,326,771 | | | | 318,913 | |
| | |
| | | |
| | 161,209 | | | | 197,711 | | | | 237,376 | | | | 97,535 | |
| | 6,592 | | | | (10,047) | | | | - | | | | - | |
| | 6,845 | | | | 8,387 | | | | 75,969 | | | | 4,166 | |
| | 31,907 | | | | 32,859 | | | | 65,083 | | | | 36,685 | |
| | 30,011 | | | | 32,773 | | | | 30,653 | | | | 19,442 | |
| | 5,870 | | | | 6,171 | | | | 19,121 | | | | 7,959 | |
| | 3,671 | | | | 4,564 | | | | 39,846 | | | | 2,231 | |
| | 2,515 | | | | 2,338 | | | | 5,343 | | | | 2,782 | |
| | 10,818 | | | | 10,554 | | | | 12,001 | | | | 12,385 | |
| | 2,591 | | | | 3,219 | | | | 28,256 | | | | 1,562 | |
| | 16,357 | | | | 19,254 | | | | 41,215 | | | | 10,470 | |
| | 6,721 | | | | 7,654 | | | | 60,997 | | | | 5,787 | |
| | 4,337 | | | | 5,380 | | | | 47,039 | | | | 2,932 | |
| | |
| | 289,444 | | | | 320,817 | | | | 662,899 | | | | 203,936 | |
| | |
| | (36,833) | | | | (11,282) | | | | (217,710) | | | | (51,290) | |
| | |
| | 252,611 | | | | 309,535 | | | | 445,189 | | | | 152,646 | |
| | |
| | 3,658 | | | | 703,834 | | | | 6,881,582 | | | | 166,267 | |
| | |
| | | |
| | (891,783) | | | | (346,656) | | | | 28,974,566 | | | | 341,329 | |
| | - | | | | - | | | | - | | | | 525,427 | |
| | - | | | | - | | | | - | | | | 499,544 | |
| | |
| | (891,783) | | | | (346,656) | | | | 28,974,566 | | | | 1,366,300 | |
| | |
| | | |
| | (9,406,337) | | | | (15,334,951) | | | | (44,362,086) | | | | (3,502,131) | |
| | - | | | | - | | | | - | | | | 30,702 | |
| | |
| | (9,406,337) | | | | (15,334,951) | | | | (44,362,086) | | | | (3,471,429) | |
| | |
| | | |
| | (10,298,120) | | | | (15,681,607) | | | | (15,387,520) | | | | (2,105,129) | |
| | |
| | | |
| | $(10,294,462) | | | | $(14,977,773) | | | | $(8,505,938) | | | | $(1,938,862) | |
| | |
STATEMENTS OF CHANGES IN NET ASSETS
| | | | | | | | | | | | | | | | | | | | |
| | | Aggressive Investors 1 | | | Ultra-Small Company | | | | |
| | | Six Months Ended
December 31, 2018 | | | Year Ended
June 30, 2018 | | | Six Months Ended
December 31, 2018 | | | Year Ended
June 30, 2018 | | | | |
| | | (Unaudited) | | | | | | (Unaudited) | | | | | | | |
| | | | | |
OPERATIONS | | | | | | | | | | | | | | | | | | | | |
Net investment income (loss) | | | $ 1,558,415 | | | | $ 732,685 | | | | $ 217,428 | | | | $ (135,877) | | | | | |
Net realized gain (loss) on investments | | | (6,400,305 | ) | | | 12,329,001 | | | | (406,602 | ) | | | 9,407,702 | | | | | |
Net change in unrealized appreciation (depreciation) on investments | | | (41,382,615 | ) | | | 12,741,483 | | | | (19,095,393 | ) | | | (881,449 | ) | | | | |
| |
Net increase (decrease) in net assets resulting from operations | | | (46,224,505 | ) | | | 25,803,169 | | | | (19,284,567 | ) | | | 8,390,376 | | | | | |
| |
| | | | | |
DISTRIBUTIONS: | | | | | | | | | | | | | | | | | | | | |
From net investment income and net realized gains(a) | | | (17,842,417 | ) | | | - | | | | (8,976,806 | ) | | | (1,914,548 | ) | | | | |
| |
Net decrease in net assets from distributions(b) | | | (17,842,417 | ) | | | - | | | | (8,976,806 | ) | | | (1,914,548 | ) | | | | |
| |
| | | | | |
SHARE TRANSACTIONS: | | | | | | | | | | | | | | | | | | | | |
Proceeds from sale of shares | | | 1,018,212 | | | | 5,854,674 | | | | 395,701 | | | | 1,024,003 | | | | | |
Reinvestment of distributions. | | | 17,136,002 | | | | - | | | | 8,375,017 | | | | 1,769,198 | | | | | |
Cost of shares redeemed | | | (20,887,772 | ) | | | (28,168,849 | ) | | | (4,996,340 | ) | | | (13,499,110 | ) | | | | |
Redemption fees | | | - | | | | - | | | | - | | | | - | | | | | |
| |
Net increase (decrease) in net assets resulting from share transactions | | | (2,733,558 | ) | | | (22,314,175 | ) | | | 3,774,378 | | | | (10,705,909 | ) | | | | |
| |
Net increase (decrease) in net assets | | | (66,800,480 | ) | | | 3,488,994 | | | | (24,486,995 | ) | | | (4,230,081 | ) | | | | |
| | | | | |
NET ASSETS: | | | | | | | | | | | | | | | | | | | | |
Beginning of period | | | 227,562,317 | | | | 224,073,323 | | | | 96,753,772 | | | | 100,983,853 | | | | | |
| |
End of period | | | $160,761,837 | | | | $227,562,317 | | | | $ 72,266,777 | | | | $ 96,753,772 | | | | | |
| |
| | | | | |
SHARES ISSUED & REDEEMED | | | | | | | | | | | | | | | | | | | | |
Issued. | | | 15,195 | | | | 79,909 | | | | 15,457 | | | | 33,925 | | | | | |
Distributions reinvested | | | 322,712 | | | | - | | | | 369,758 | | | | 59,509 | | | | | |
Redeemed | | | (344,106 | ) | | | (383,079 | ) | | | (174,187 | ) | | | (443,586 | ) | | | | |
| |
Net increase (decrease) | | | (6,199 | ) | | | (303,170 | ) | | | 211,028 | | | | (350,152 | ) | | | | |
Outstanding at beginning of period | | | 3,073,131 | | | | 3,376,301 | | | | 3,011,635 | | | | 3,361,787 | | | | | |
| |
Outstanding at end of period | | | 3,066,932 | | | | 3,073,131 | | | | 3,222,663 | | | | 3,011,635 | | | | | |
| |
| (a) | For the year ended June 30, 2018, the distributions to shareholders from net investment income were $0, $1,299,999, $449,185, $98,928, and $547,906, and net realized gains were $0, $614,549, $43,056,482, $0, and $0 for Aggressive Investors 1, Ultra-Small Company, Ultra-Small Company Market,Small-Cap Growth andSmall-Cap Value Funds, respectively. |
| (b) | Effective December 31, 2018, the Fund has adopted disclosure requirements conforming to SEC Rule6-04.17 of RegulationS-X. See Note 2 for further details. |
See Notes to Financial Statements.
| | |
72 | | Semi-Annual Report | December 31, 2018 (Unaudited) |
| | |
| | | |
| | | |
| | | | | | | | | | | | | | | | | | | | | | |
Ultra-Small Company Market | | | Small-Cap Growth | | | Small-Cap Value | |
Six Months Ended
December 31, 2018 | | | Year Ended
June 30, 2018 | | | Six Months Ended
December 31, 2018 | | | Year Ended
June 30, 2018 | | | Six Months Ended
December 31, 2018 | | | Year Ended
June 30, 2018 | |
| (Unaudited) | | | | | | (Unaudited) | | | | | | (Unaudited) | | | | |
| | | | | |
| | $ 1,404,442 | | | | $ 1,891,928 | | | | $ 3,658 | | | | $ 173,023 | | | | $ 703,834 | | | | $ 464,982 | |
| | 8,791,912 | | | | 42,623,829 | | | | (891,783 | ) | | | 7,272,557 | | | | (346,656 | ) | | | 10,753,725 | |
| | | | | |
| | (103,830,082 | ) | | | 23,216,969 | | | | (9,406,337 | ) | | | 2,400,796 | | | | (15,334,951 | ) | | | 429,349 | |
| | |
| | | | | |
| | (93,633,728 | ) | | | 67,732,726 | | | | (10,294,462 | ) | | | 9,846,376 | | | | (14,977,773 | ) | | | 11,648,056 | |
| | |
| | | | | |
| | (37,857,578 | ) | | | (43,505,667 | ) | | | (4,528,900 | ) | | | (98,928 | ) | | | (9,164,908 | ) | | | (547,906 | ) |
| | |
| | | | | |
| | (37,857,578 | ) | | | (43,505,667 | ) | | | (4,528,900 | ) | | | (98,928 | ) | | | (9,164,908 | ) | | | (547,906 | ) |
| | |
| | | | | |
| | 21,769,414 | | | | 29,455,134 | | | | 2,859,098 | | | | 6,059,966 | | | | 3,749,452 | | | | 4,835,839 | |
| | 36,666,837 | | | | 41,869,482 | | | | 4,410,107 | | | | 95,874 | | | | 8,787,349 | | | | 525,341 | |
| | (46,598,981 | ) | | | (69,611,584 | ) | | | (5,907,836 | ) | | | (6,974,363 | ) | | | (7,607,191 | ) | | | (9,125,499 | ) |
| | 82,494 | | | | 14,360 | | | | - | | | | - | | | | 98 | | | | - | |
| | |
| | | | | |
| | 11,919,764 | | | | 1,727,392 | | | | 1,361,369 | | | | (818,523 | ) | | | 4,929,708 | | | | (3,764,319 | ) |
| | |
| | (119,571,542 | ) | | | 25,954,451 | | | | (13,461,993 | ) | | | 8,928,925 | | | | (19,212,973 | ) | | | 7,335,831 | |
| | | | | |
| | 378,144,364 | | | | 352,189,913 | | | | 55,472,444 | | | | 46,543,519 | | | | 69,316,537 | | | | 61,980,706 | |
| | |
| | $ 258,572,822 | | | | $ 378,144,364 | | | | $ 42,010,451 | | | | $ 55,472,444 | | | | $ 50,103,564 | | | | $ 69,316,537 | |
| | |
| | | | | |
| | 1,660,851 | | | | 1,963,750 | | | | 95,817 | | | | 216,113 | | | | 132,381 | | | | 170,722 | |
| | 3,508,788 | | | | 3,025,252 | | | | 194,879 | | | | 3,546 | | | | 453,658 | | | | 20,268 | |
| | (3,754,748 | ) | | | (4,661,379 | ) | | | (214,812 | ) | | | (257,898 | ) | | | (295,695 | ) | | | (346,128 | ) |
| | |
| | 1,414,891 | | | | 327,623 | | | | 75,884 | | | | (38,239 | ) | | | 290,344 | | | | (155,138 | ) |
| | 23,912,180 | | | | 23,584,557 | | | | 1,829,349 | | | | 1,867,588 | | | | 2,342,104 | | | | 2,497,242 | |
| | |
| | 25,327,071 | | | | 23,912,180 | | | | 1,905,233 | | | | 1,829,349 | | | | 2,632,448 | | | | 2,342,104 | |
| | |
STATEMENTS OF CHANGES IN NET ASSETS
| | | | | | | | | | | | | | | | | | | | |
| | | Blue Chip 35 Index | | | Managed Volatility | | | | |
| | | Six Months Ended
December 31, 2018 | | | Year Ended
June 30, 2018 | | | Six Months Ended
December 31, 2018 | | | Year Ended
June 30, 2018 | | | | |
| | | (Unaudited) | | | | | | (Unaudited) | | | | | | | |
| | | | | |
OPERATIONS | | | | | | | | | | | | | | | | | | | | |
Net investment income | | | $ 6,881,582 | | | | $ 12,438,959 | | | | $ 166,267 | | | | $ 215,935 | | | | | |
Net realized gain on investments | | | 28,974,566 | | | | 37,821,971 | | | | 1,366,300 | | | | 1,879,183 | | | | | |
Net change in unrealized appreciation (depreciation) on investments | | | (44,362,086 | ) | | | 14,695,536 | | | | (3,471,429 | ) | | | 197,322 | | | | | |
| |
Net increase in net assets resulting from operations | | | (8,505,938 | ) | | | 64,956,466 | | | | (1,938,862 | ) | | | 2,292,440 | | | | | |
| |
| | | | | |
DISTRIBUTIONS: | | | | | | | | | | | | | | | | | | | | |
From net investment income and net realized gains(a) | | | (64,810,534 | ) | | | (27,402,645 | ) | | | (1,895,822 | ) | | | (194,557 | ) | | | | |
| |
Net decrease in net assets from distributions(b) | | | (64,810,534 | ) | | | (27,402,645 | ) | | | (1,895,822 | ) | | | (194,557 | ) | | | | |
| |
| | | | | |
SHARE TRANSACTIONS: | | | | | | | | | | | | | | | | | | | | |
Proceeds from sale of shares | | | 35,465,281 | | | | 98,026,171 | | | | 2,611,650 | | | | 3,971,588 | | | | | |
Reinvestment of distributions | | | 59,566,050 | | | | 25,719,282 | | | | 1,794,927 | | | | 181,357 | | | | | |
Cost of shares redeemed | | | (62,851,140 | ) | | | (144,688,020 | ) | | | (3,501,644 | ) | | | (9,957,718 | ) | | | | |
| |
Net increase (decrease) in net assets resulting from share transactions | | | 32,180,191 | | | | (20,942,567 | ) | | | 904,933 | | | | (5,804,773 | ) | | | | |
| |
Net increase (decrease) in net assets | | | (41,136,281 | ) | | | 16,611,254 | | | | (2,929,751 | ) | | | (3,706,890 | ) | | | | |
| | | | | |
NET ASSETS: | | | | | | | | | | | | | | | | | | | | |
Beginning of period | | | 567,513,099 | | | | 550,901,845 | | | | 32,816,390 | | | | 36,523,280 | | | | | |
| |
End of period | | | $526,376,818 | | | | $ 567,513,099 | | | | $29,886,639 | | | | $32,816,390 | | | | | |
| |
| | | | | |
SHARES ISSUED & REDEEMED | | | | | | | | | | | | | | | | | | | | |
Issued. | | | 2,340,973 | | | | 6,741,303 | | | | 171,529 | | | | 256,503 | | | | | |
Distributions reinvested | | | 4,639,100 | | | | 1,779,881 | | | | 126,492 | | | | 11,807 | | | | | |
Redeemed | | | (4,247,089 | ) | | | (9,878,238 | ) | | | (229,560 | ) | | | (653,621 | ) | | | | |
| |
Net increase (decrease) | | | 2,732,984 | | | | (1,357,054 | ) | | | 68,461 | | | | (385,311 | ) | | | | |
Outstanding at beginning of period | | | 38,829,553 | | | | 40,186,607 | | | | 2,084,045 | | | | 2,469,356 | | | | | |
| |
Outstanding at end of period | | | 41,562,537 | | | | 38,829,553 | | | | 2,152,506 | | | | 2,084,045 | | | | | |
| |
| (a) | For the year ended June 30, 2018, the distributions to shareholders from net investment income were $11,665,340 and $194,557 and net realized gains were $15,737,305 and $0 for Blue Chip 35 Index and Managed Volatility Funds, respectively. |
| (b) | Effective December 31, 2018, the Fund has adopted disclosure requirements conforming to SEC Rule6-04.17 of RegulationS-X. See Note 2 for further details. |
See Notes to Financial Statements.
| | |
| 74 | | Semi-Annual Report | December 31, 2018 (Unaudited) |
FINANCIAL HIGHLIGHTS
(for a share outstanding throughout each period indicated)
AGGRESSIVE INVESTORS 1
| | | | | | | | | | | | | | | | | | | | | | | | |
| | | For the
Six Months Ended
12/31/18
(Unaudited) | | | Year Ended June 30 | |
| | | 2018 | | | 2017 | | | 2016 | | | 2015 | | | 2014 | |
| | | | | | |
Net Asset Value, Beginning of Period | | | $74.05 | | | | $66.37 | | | | $54.75 | | | | $59.15 | | | | $56.69 | | | | $43.21 | |
| | | | | | |
| | | | | | | | | | | | | | | | | | | | | | | | |
| | | | | | |
Income from Investment Operations: | | | | | | | | | | | | | | | | | | | | | | | | |
Net Investment Income (Loss)(a) | | | 0.52 | | | | 0.23 | | | | (0.14) | | | | 0.31 | | | | 0.02 | | | | 0.11 | |
Net Realized and Unrealized Gain (Loss) | | | (16.06) | | | | 7.45 | | | | 12.12 | | | | (4.69) | | | | 2.56 | | | | 13.73 | |
| | | | | | |
| | | | | | | | | | | | | | | | | | | | | | | | |
| | | | | | |
Total from Investment Operations | | | (15.54) | | | | 7.68 | | | | 11.98 | | | | (4.38) | | | | 2.58 | | | | 13.84 | |
| | | | | | |
| | | | | | | | | | | | | | | | | | | | | | | | |
| | | | | | |
Less Distributions to Shareholders from: | | | | | | | | | | | | | | | | | | | | | | | | |
Net Investment Income | | | (0.36) | | | | - | | | | (0.36) | | | | (0.02) | | | | (0.12) | | | | (0.36) | |
Net Realized Gain | | | (5.73) | | | | - | | | | - | | | | - | | | | - | | | | - | |
| | | | | | |
| | | | | | | | | | | | | | | | | | | | | | | | |
| | | | | | |
Total Distributions | | | (6.09) | | | | - | | | | (0.36) | | | | (0.02) | | | | (0.12) | | | | (0.36) | |
| | | | | | |
| | | | | | | | | | | | | | | | | | | | | | | | |
| | | | | | |
Net Asset Value, End of Period | | | $52.42 | | | | $74.05 | | | | $66.37(b) | | | | $54.75 | | | | $59.15 | | | | $56.69 | |
| | | | | | | | | | | | | | | | | | | | | | | | |
| | | | | | |
Total Return | | | (21.11%)(c) | | | | 11.57%(b) | | | | 21.90%(b) | | | | (7.40%) | | | | 4.57% | | | | 32.14% | |
| | | | | | |
Ratios and Supplemental Data: | | | | | | | | | | | | | | | | | | | | | | | | |
Net Assets, End of Period (in 000’s) | | | $160,762 | | | | $227,562 | | | | $224,073 | | | | $207,229 | | | | $248,046 | | | | $259,402 | |
Expenses Before Waivers and
Reimbursements | | | 0.39%(d)(e) | | | | 0.96% | | | | 1.66% | | | | 0.63%(e) | | | | 1.32% | | | | 1.01% | |
Expenses After Waivers and Reimbursements | | | 0.39%(d) | | | | 0.96% | | | | 1.66% | | | | 0.63% | | | | 1.32% | | | | 1.01% | |
Net Investment Income (Loss) After Waivers and Reimbursements | | | 1.48%(d) | | | | 0.31% | | | | (0.23%) | | | | 0.58% | | | | 0.04% | | | | 0.22% | |
Portfolio Turnover Rate | | | 48%(c) | | | | 105% | | | | 153% | | | | 124% | | | | 107% | | | | 125% | |
| (a) | Per share amounts calculated based on the average daily shares outstanding during the period. |
| (b) | Includes adjustments in accordance with accounting principles generally accepted in the United States and, consequently, the net asset value for financial reporting purposes and the returns based upon those net asset values may differ from the net asset values and returns for shareholder transactions. |
| (d) | Annualized for periods less than one year. |
| (e) | For the six month period ended December 31, 2018 and the year ended June 30, 2016 the expense ratios were significantly lower than in other years, due to a negative performance adjustment to the investment advisory fee. Please refer to Note 3 of the Notes to Financial Statements for further information. The rate shown may not be indicative of the rate going forward. |
See Notes to Financial Statements.
FINANCIAL HIGHLIGHTS
(for a share outstanding throughout each period indicated)
ULTRA-SMALL COMPANY
| | | | | | | | | | | | | | | | | | | | | | | | |
| | | For the
Six Months Ended
12/31/18
(Unaudited) | | | Year Ended June 30 | |
| | | 2018 | | | 2017 | | | 2016 | | | 2015 | | | 2014 | |
| | | | | | |
Net Asset Value, Beginning of Period | | | $32.13 | | | | $30.04 | | | | $25.99 | | | | $30.37 | | | | $41.83 | | | | $39.36 | |
| | | | | | |
| | | | | | | | | | | | | | | | | | | | | | | | |
| | | | | | |
Income from Investment Operations: | | | | | | | | | | | | | | | | | | | | | | | | |
Net Investment Income (Loss)(a) | | | 0.07 | | | | (0.04) | | | | 0.32 | | | | 0.28 | | | | 0.24 | | | | 0.41 | |
Net Realized and Unrealized Gain (Loss) | | | (6.67) | | | | 2.73 | | | | 4.06 | | | | (4.39) | | | | (3.53) | | | | 8.33 | |
| | | | | | |
| | | | | | | | | | | | | | | | | | | | | | | | |
Total from Investment Operations | | | (6.60) | | | | 2.69 | | | | 4.38 | | | | (4.11) | | | | (3.29) | | | | 8.74 | |
| | | | | | |
| | | | | | | | | | | | | | | | | | | | | | | | |
| | | | | | |
Less Distributions to Shareholders from: | | | | | | | | | | | | | | | | | | | | | | | | |
Net Investment Income | | | (0.01) | | | | (0.41) | | | | (0.33) | | | | (0.27) | | | | (0.30) | | | | (0.76) | |
Net Realized Gain | | | (3.10) | | | | (0.19) | | |
| -
|
| |
| -
|
| | | (7.87) | | | | (5.51) | |
| | | | | | |
| | | | | | | | | | | | | | | | | | | | | | | | |
| | | | | | |
Total Distributions | | | (3.11) | | | | (0.60) | | | | (0.33) | | | | (0.27) | | | | (8.17) | | | | (6.27) | |
| | | | | | |
| | | | | | | | | | | | | | | | | | | | | | | | |
Net Asset Value, End of Period | | | $22.42 | | | | $32.13 | | | | $30.04 | | | | $25.99 | | | | $30.37 | | | | $41.83 | |
| | | | | | | | | | | | | | | | | | | | | | | | |
Total Return | | | (20.64)%(b) | | | | 9.13% | | | | 16.88% | | | | (13.53)% | | | | (7.60)% | | | | 23.72% | |
| | | | | | |
Ratios and Supplemental Data: | | | | | | | | | | | | | | | | | | | | | | | | |
Net Assets, End of Period (in 000’s) | | | $72,267 | | | | $96,754 | | | | $100,984 | | | | $101,451 | | | | $127,717 | | | | $152,331 | |
Expenses Before Waivers and Reimbursements | | | 1.20%(c) | | | | 1.18% | | | | 1.18% | | | | 1.17% | | | | 1.11% | | | | 1.10% | |
Expenses After Waivers and Reimbursements | | | 1.20%(c) | | | | 1.18% | | | | 1.18% | | | | 1.17% | | | | 1.11% | | | | 1.10% | |
Net Investment Income (Loss) After Waivers and Reimbursements | | | 0.47%(c) | | | | (0.14%) | | | | 1.14% | | | | 1.05% | | | | 0.68% | | | | 0.98% | |
Portfolio Turnover Rate | | | 41%(b) | | | | 89% | | | | 113% | | | | 101% | | | | 90% | | | | 99% | |
| (a) | Per share amounts calculated based on the average daily shares outstanding during the period. |
| (c) | Annualized for periods less than one year. |
See Notes to Financial Statements.
| | |
| 76 | | Semi-Annual Report | December 31, 2018 (Unaudited) |
FINANCIAL HIGHLIGHTS
(for a share outstanding throughout each period indicated)
ULTRA-SMALL COMPANY MARKET
| | | | | | | | | | | | | | | | | | | | | | | | |
| | | For the
Six Months Ended
12/31/18
(Unaudited) | | | Year Ended June 30 | |
| | | 2018 | | | 2017 | | | 2016 | | | 2015 | | | 2014 | |
| | | | | | |
Net Asset Value, Beginning of Period | | | $15.81 | | | | $14.93 | | | | $12.77 | | | | $16.18 | | | | $17.46 | | | | $15.44 | |
| | | | | | |
| | | | | | | | | | | | | | | | | | | | | | | | |
| | | | | | |
Income from Investment Operations: | | | | | | | | | | | | | | | | | | | | | | | | |
Net Investment Income(a) | | | 0.06 | | | | 0.08 | | | | 0.17 | | | | 0.12 | | | | 0.12 | | | | 0.12 | |
Net Realized and Unrealized Gain (Loss) | | | (4.01) | | | | 2.76 | | | | 3.18 | | | | (1.87) | | | | 0.38 | | | | 3.66 | |
| | | | | | |
| | | | | | | | | | | | | | | | | | | | | | | | |
| | | | | | |
Total from Investment Operations | | | (3.95) | | | | 2.84 | | | | 3.35 | | | | (1.75) | | | | 0.50 | | | | 3.78 | |
| | | | | | |
| | | | | | | | | | | | | | | | | | | | | | | | |
| | | | | | |
Less Distributions to Shareholders from: | | | | | | | | | | | | | | | | | | | | | | | | |
Net Investment Income | | | (0.08) | | | | (0.02) | | | | (0.15) | | | | (0.13) | | | | (0.14) | | | | (0.18) | |
Net Realized Gain | | | (1.57) | | | | (1.94) | | | | (1.04) | | | | (1.53) | | | | (1.64) | | | | (1.59) | |
| | | | | | |
| | | | | | | | | | | | | | | | | | | | | | | | |
Total Distributions | | | (1.65) | | | | (1.96) | | | | (1.19) | | | | (1.66) | | | | (1.78) | | | | (1.77) | |
| | | | | | |
| | | | | | | | | | | | | | | | | | | | | | | | |
| | | | | | |
Paid-in Capital from Redemption Fees(a) | | | 0.00(b) | | | | 0.00(b) | | | | 0.00(b) | | | | 0.00(b) | | | | 0.00(b) | | | | 0.01 | |
| | | | | | |
| | | | | | | | | | | | | | | | | | | | | | | | |
Net Asset Value, End of Period | | | $10.21 | | | | $15.81 | | | | $14.93 | | | | $12.77 | | | | $16.18 | | | | $17.46 | |
| | | | | | | | | | | | | | | | | | | | | | | | |
| | | | | | |
Total Return | | | (25.25%)(c)(d) | | | | 20.86%(d) | | | | 26.61%(d) | | | | (10.83%)(d) | | | | 3.72% | | | | 25.48% | |
| | | | | | |
Ratios and Supplemental Data: | | | | | | | | | | | | | | | | | | | | | | | | |
Net Assets, End of Period (in 000’s) | | | $258,573 | | | | $378,144 | | | | $352,190 | | | | $331,535 | | | | $402,853 | | | | $424,096 | |
Expenses Before Waivers and Reimbursements | | | 0.76%(e) | | | | 0.75% | | | | 0.76% | | | | 0.75% | | | | 0.73% | | | | 0.72% | |
Expenses After Waivers and Reimbursements | | | 0.75%(e) | | | | 0.75% | | | | 0.75% | | | | 0.75% | | | | 0.73% | | | | 0.72% | |
Net Investment Income After Waivers and Reimbursements | | | 0.79%(e) | | | | 0.52% | | | | 1.21% | | | | 0.91% | | | | 0.74% | | | | 0.73% | |
Portfolio Turnover Rate | | | 20%(c) | | | | 35% | | | | 31% | | | | 41% | | | | 32% | | | | 29% | |
| (a) | Per share amounts calculated based on the average daily shares outstanding during the period. |
| (b) | Amount represents less than $0.005. |
| (d) | Total return would have been lower had various fees not been waived during the period. |
| (e) | Annualized for periods less than one year. |
See Notes to Financial Statements.
FINANCIAL HIGHLIGHTS
(for a share outstanding throughout each period indicated)
SMALL-CAP GROWTH
| | | | | | | | | | | | | | | | | | | | | | | | |
| | | For the
Six Months Ended
12/31/18
(Unaudited) | | | Year Ended June 30 | |
| | | 2018 | | | 2017 | | | 2016 | | | 2015 | | | 2014 | |
| | | | | | |
Net Asset Value, Beginning of Period | | | $30.32 | | | | $24.92 | | | | $20.33 | | | | $21.17 | | | | $18.68 | | | | $15.11 | |
| | | | | | |
| | | | | | | | | | | | | | | | | | | | | | | | |
| | | | | | |
Income from Investment Operations: | | | | | | | | | | | | | | | | | | | | | | | | |
Net Investment Income (Loss)(a) | |
| -
|
| | | 0.09 | | | | 0.06 | | | | 0.07 | | | | (0.01) | | | | 0.01 | |
Net Realized and Unrealized Gain (Loss) | | | (5.69) | | | | 5.36 | | | | 4.60 | | | | (0.91) | | | | 2.51 | | | | 3.63 | |
| | | | | | |
| | | | | | | | | | | | | | | | | | | | | | | | |
| | | | | | |
Total from Investment Operations | | | (5.69) | | | | 5.45 | | | | 4.66 | | | | (0.84) | | | | 2.50 | | | | 3.64 | |
| | | | | | |
| | | | | | | | | | | | | | | | | | | | | | | | |
| | | | | | |
Less Distributions to Shareholders from: | | | | | | | | | | | | | | | | | | | | | | | | |
Net Investment Income | | | (0.10) | | | | (0.05) | | | | (0.07) | | |
| -
|
| | | (0.01) | | | | (0.07) | |
Net Realized Gain | | | (2.48) | | |
| -
|
| |
| -
|
| |
| -
|
| |
| -
|
| |
| -
|
|
| | | | | | |
| | | | | | | | | | | | | | | | | | | | | | | | |
| | | | | | |
Total Distributions | | | (2.58) | | | | (0.05) | | | | (0.07) | | | | - | | | | (0.01) | | | | (0.07) | |
| | | | | | |
| | | | | | | | | | | | | | | | | | | | | | | | |
| | | | | | |
Net Asset Value, End of Period | | | $22.05 | | | | $30.32 | | | | $24.92 | | | | $20.33 | | | | $21.17 | | | | $18.68 | |
| | | | | | | | | | | | | | | | | | | | | | | | |
| | | | | | |
Total Return(b) | | | (19.00%)(c) | | | | 21.91% | | | | 22.97% | | | | (3.97%) | | | | 13.41% | | | | 24.11% | |
| | | | | | |
Ratios and Supplemental Data: | | | | | | | | | | | | | | | | | | | | | | | | |
Net Assets, End of Period (in 000’s) | | | $42,010 | | | | $55,472 | | | | $46,544 | | | | $36,394 | | | | $36,801 | | | | $33,419 | |
Expenses Before Waivers and Reimbursements | | | 1.08%(d) | | | | 1.08% | | | | 1.16% | | | | 1.20% | | | | 1.08% | | | | 1.07% | |
Expenses After Waivers and Reimbursements | | | 0.94%(d) | | | | 0.94% | | | | 0.94% | | | | 0.94% | | | | 0.94% | | | | 0.94% | |
Net Investment Income (Loss) After Waivers and Reimbursements | | | 0.01%(d) | | | | 0.35% | | | | 0.24% | | | | 0.36% | | | | (0.07%) | | | | 0.06% | |
Portfolio Turnover Rate | | | 55%(c) | | | | 122% | | | | 136% | | | | 137% | | | | 123% | | | | 121% | |
| (a) | Per share amounts calculated based on the average daily shares outstanding during the period. |
| (b) | Total return would have been lower had various fees not been waived during the period. |
| (d) | Annualized for periods less than one year. |
See Notes to Financial Statements.
| | |
| 78 | | Semi-Annual Report | December 31, 2018 (Unaudited) |
FINANCIAL HIGHLIGHTS
(for a share outstanding throughout each period indicated)
SMALL-CAP VALUE
| | | | | | | | | | | | | | | | | | | | | | | | |
| | | For the
Six Months Ended
12/31/18
(Unaudited) | | | Year Ended June 30 | |
| | | 2018 | | | 2017 | | | 2016 | | | 2015 | | | 2014 | |
| | | | | | |
Net Asset Value, Beginning of Period | | | $29.60 | | | | $24.82 | | | | $20.87 | | | | $22.40 | | | | $23.06 | | | | $19.21 | |
| | | | | | |
| | | | | | | | | | | | | | | | | | | | | | | | |
| | | | | | |
Income from Investment Operations: | | | | | | | | | | | | | | | | | | | | | | | | |
Net Investment Income(a) | | | 0.30 | | | | 0.20 | | | | 0.22 | | | | 0.29 | | | | 0.29 | | | | 0.15 | |
Net Realized and Unrealized Gain (Loss) | | | (6.76) | | | | 4.81 | | | | 3.97 | | | | (1.43) | | | | (0.78) | | | | 3.80 | |
| | | | | | |
| | | | | | | | | | | | | | | | | | | | | | | | |
| | | | | | |
Total from Investment Operations | | | (6.46) | | | | 5.01 | | | | 4.19 | | | | (1.14) | | | | (0.49) | | | | 3.95 | |
| | | | | | |
| | | | | | | | | | | | | | | | | | | | | | | | |
| | | | | | |
Less Distributions to Shareholders from: | | | | | | | | | | | | | | | | | | | | | | | | |
Net Investment Income | | | (0.24) | | | | (0.23) | | | | (0.24) | | | | (0.39) | | | | (0.17) | | | | (0.10) | |
Net Realized Gain | | | (3.87) | | | | - | | | | - | | | | - | | | | - | | | | - | |
| | | | | | |
| | | | | | | | | | | | | | | | | | | | | | | | |
| | | | | | |
Total Distributions | | | (4.11) | | | | (0.23) | | | | (0.24) | | | | (0.39) | | | | (0.17) | | | | (0.10) | |
| | | | | | |
| | | | | | | | | | | | | | | | | | | | | | | | |
| | | | | | |
Net Asset Value, End of Period | | | $19.03 | | | | $29.60 | | | | $24.82 | | | | $20.87 | | | | $22.40 | | | | $23.06 | |
| | | | | | | | | | | | | | | | | | | | | | | | |
| | | | | | |
Total Return(b) | | | (22.08%)(c) | | | | 20.32% | | | | 20.08% | | | | (5.02%) | | | | (2.10%) | | | | 20.63% | |
| | | | | | |
Ratios and Supplemental Data: | | | | | | | | | | | | | | | | | | | | | | | | |
Net Assets, End of Period (in 000’s) | | | $50,104 | | | | $69,317 | | | | $61,981 | | | | $58,741 | | | | $73,241 | | | | $85,782 | |
Expenses Before Waivers and Reimbursements | | | 0.97%(d) | | | | 0.94% | | | | 0.98% | | | | 1.03% | | | | 0.98% | | | | 0.97% | |
Expenses After Waivers and Reimbursements | | | 0.94%(d) | | | | 0.94% | | | | 0.94% | | | | 0.94% | | | | 0.94% | | | | 0.94% | |
Net Investment Income After Waivers and Reimbursements | | | 2.14%(d) | | | | 0.74% | | | | 0.95% | | | | 1.41% | | | | 1.30% | | | | 0.71% | |
Portfolio Turnover Rate | | | 41%(c) | | | | 78% | | | | 77% | | | | 62% | | | | 74% | | | | 83% | |
| (a) | Per share amounts calculated based on the average daily shares outstanding during the period. |
| (b) | Total return would have been lower had various fees not been waived during the period. |
| (d) | Annualized for periods less than one year. |
See Notes to Financial Statements.
FINANCIAL HIGHLIGHTS
(for a share outstanding throughout each period indicated)
BLUE CHIP 35 INDEX
| | | | | | | | | | | | | | | | | | | | | | | | |
| | | For the
Six Months Ended
12/31/18
(Unaudited) | | | Year Ended June 30 | |
| | | 2018 | | | 2017 | | | 2016 | | | 2015 | | | 2014 | |
| | | | | | |
Net Asset Value, Beginning of Period | | | $14.62 | | | | $13.71 | | | | $12.28 | | | | $11.81 | | | | $11.39 | | | | $9.59 | |
| | | | | | |
| | | | | | | | | | | | | | | | | | | | | | | | |
| | | | | | |
Income from Investment Operations: | | | | | | | | | | | | | | | | | | | | | | | | |
Net Investment Income(a) | | | 0.18 | | | | 0.31 | | | | 0.30 | | | | 0.28 | | | | 0.26 | | | | 0.23 | |
Net Realized and Unrealized Gain (Loss) | | | (0.42) | | | | 1.33 | | | | 1.44 | | | | 0.49 | | | | 0.39 | | | | 1.77 | |
| | | | | | |
| | | | | | | | | | | | | | | | | | | | | | | | |
| | | | | | |
Total from Investment Operations | | | (0.24) | | | | 1.64 | | | | 1.74 | | | | 0.77 | | | | 0.65 | | | | 2.00 | |
| | | | | | |
| | | | | | | | | | | | | | | | | | | | | | | | |
| | | | | | |
Less Distributions to Shareholders from: | | | | | | | | | | | | | | | | | | | | | | | | |
Net Investment Income | | | (0.31) | | | | (0.31) | | | | (0.31) | | | | (0.30) | | | | (0.23) | | | | (0.20) | |
Net Realized Gain | | | (1.41) | | | | (0.42) | | | | - | | | | - | | | | - | | | | - | |
| | | | | | |
| | | | | | | | | | | | | | | | | | | | | | | | |
| | | | | | |
Total Distributions | | | (1.72) | | | | (0.73) | | | | (0.31) | | | | (0.30) | | | | (0.23) | | | | (0.20) | |
| | | | | | |
| | | | | | | | | | | | | | | | | | | | | | | | |
| | | | | | |
Net Asset Value, End of Period | | | $12.66 | | | | $14.62 | | | | $13.71 | | | | $12.28 | | | | $11.81 | | | | $11.39 | |
| | | | | | | | | | | | | | | | | | | | | | | | |
| | | | | | |
Total Return(b) | | | (1.81%)(c) | | | | 11.98% | | | | 14.33% | | | | 6.60% | | | | 5.77% | | | | 21.11% | |
| | | | | | |
Ratios and Supplemental Data: | | | | | | | | | | | | | | | | | | | | | | | | |
Net Assets, End of Period (in 000’s) | | | $526,377 | | | | $567,513 | | | | $550,902 | | | | $571,644 | | | | $600,823 | | | | $556,985 | |
Expenses Before Waivers and Reimbursements | | | 0.22%(d) | | | | 0.22% | | | | 0.25% | | | | 0.25% | | | | 0.23% | | | | 0.25% | |
Expenses After Waivers and Reimbursements | | | 0.15%(d) | | | | 0.15% | | | | 0.15% | | | | 0.15% | | | | 0.15% | | | | 0.15% | |
Net Investment Income After Waivers and Reimbursements | | | 2.32%(d) | | | | 2.17% | | | | 2.30% | | | | 2.42% | | | | 2.19% | | | | 2.20% | |
Portfolio Turnover Rate | | | 17%(c) | | | | 14% | | | | 17% | | | | 23% | | | | 19% | | | | 28% | |
| (a) | Per share amounts calculated based on the average daily shares outstanding during the period. |
| (b) | Total return would have been lower had various fees not been waived during the period. |
| (d) | Annualized for periods less than one year. |
See Notes to Financial Statements.
| | |
| 80 | | Semi-Annual Report | December 31, 2018 (Unaudited) |
FINANCIAL HIGHLIGHTS
(for a share outstanding throughout each period indicated)
MANAGED VOLATILITY
| | | | | | | | | | | | | | | | | | | | | | | | |
| | | For the
Six Months Ended
12/31/18
(Unaudited) | | | Year Ended June 30 | |
| | | 2018 | | | 2017 | | | 2016 | | | 2015 | | | 2014 | |
| | | | | | |
Net Asset Value, Beginning of Period | | | $15.75 | | | | $14.79 | | | | $14.20 | | | | $14.05 | | | | $13.94 | | | | $12.75 | |
| | | | | | |
| | | | | | | | | | | | | | | | | | | | | | | | |
| | | | | | |
Income from Investment Operations: | | | | | | | | | | | | | | | | | | | | | | | | |
Net Investment Income(a) | | | 0.08 | | | | 0.10 | | | | 0.06 | | | | 0.04 | | | | 0.00(b) | | | | 0.02 | |
Net Realized and Unrealized Gain (Loss) | | | (1.03) | | | | 0.95 | | | | 0.59 | | | | 0.11 | | | | 0.13 | | | | 1.20 | |
| | | | | | |
| | | | | | | | | | | | | | | | | | | | | | | | |
| | | | | | |
Total from Investment Operations | | | (0.95) | | | | 1.05 | | | | 0.65 | | | | 0.15 | | | | 0.13 | | | | 1.22 | |
| | | | | | |
| | | | | | | | | | | | | | | | | | | | | | | | |
| | | | | | |
Less Distributions to Shareholders from: | | | | | | | | | | | | | | | | | | | | | | | | |
Net Investment Income | | | (0.14) | | | | (0.09) | | | | (0.06) | | | | 0.00(b) | | | | (0.02) | | | | (0.03) | |
Net Realized Gain | | | (0.78) | | | | - | | | | - | | | | - | | | | - | | | | - | |
| | | | | | |
| | | | | | | | | | | | | | | | | | | | | | | | |
| | | | | | |
Total Distributions | | | (0.92) | | | | (0.09) | | | | (0.06) | | | | 0.00(b) | | | | (0.02) | | | | (0.03) | |
| | | | | | |
| | | | | | | | | | | | | | | | | | | | | | | | |
| | | | | | |
Net Asset Value, End of Period | | | $13.88 | | | | $15.75 | | | | $14.79 | | | | $14.20 | | | | $14.05 | | | | $13.94 | |
| | | | | | | | | | | | | | | | | | | | | | | | |
| | | | | | |
Total Return(c) | | | (6.17%)(d) | | | | 7.11% | | | | 4.59% | | | | 1.10% | | | | 0.92% | | | | 9.61% | |
| | | | | | |
Ratios and Supplemental Data: | | | | | | | | | | | | | | | | | | | | | | | | |
Net Assets, End of Period (in 000’s) | | | $29,887 | | | | $32,816 | | | | $36,523 | | | | $57,586 | | | | $59,008 | | | | $46,908 | |
Expenses Before Waivers and Reimbursements | | | 1.25%(e) | | | | 1.20% | | | | 1.12% | | | | 1.06% | | | | 1.04% | | | | 1.14% | |
Expenses After Waivers and Reimbursements | | | 0.94%(e) | | | | 0.94% | | | | 0.94% | | | | 0.94% | | | | 0.94% | | | | 0.94% | |
Net Investment Income After Waivers and Reimbursements | | | 1.02%(e) | | | | 0.64% | | | | 0.42% | | | | 0.31% | | | | 0.03% | | | | 0.17% | |
Portfolio Turnover Rate | | | 23%(d) | | | | 50% | | | | 50% | | | | 54% | | | | 38% | | | | 39% | |
| (a) | Per share amounts calculated based on the average daily shares outstanding during the period. |
| (b) | Amount represents less than $0.005. |
| (c) | Total return would have been lower had various fees not been waived during the period. |
| (e) | Annualized for periods less than one year. |
See Notes to Financial Statements.
| | |
| NOTES TO FINANCIAL STATEMENTS | | |
December 31, 2018 (Unaudited)
1. Organization:
Bridgeway Funds, Inc. (“Bridgeway” or the “Company”) was organized as a Maryland corporation on October 19, 1993, and is registered under the Investment Company Act of 1940, as amended (the “1940 Act”), as anopen-end management investment company.
Bridgeway is organized as a series fund, with nine investment funds as of December 31, 2018. The Aggressive Investors 1, Ultra-Small Company, Ultra-Small Company Market,Small-Cap Growth,Small-Cap Value, Blue Chip 35 Index and Managed Volatility Funds are presented in this report (each is referred to as a “Fund” and collectively, the “Funds”). The OmniSmall-Cap Value and OmniTax-ManagedSmall-Cap Value Funds are included in a separate report.
Bridgeway is authorized to issue 1,915,000,000 shares of common stock at $0.001 per share. As of December 31, 2018, 100,000,000 shares have been classified into the Aggressive Investors 1 Fund. 130,000,000 shares have been classified into the Blue Chip 35 Index Fund. 15,000,000 shares have been classified into the Ultra-Small Company Fund. 100,000,000 shares each have been classified into the Ultra-Small Company Market, OmniSmall-Cap Value, OmniTax-ManagedSmall-Cap Value,Small-Cap Growth, andSmall-Cap Value Funds. 50,000,000 shares have been classified into the Managed Volatility Fund.
The Ultra-Small Company Fund is open to existing investors (direct only).
All of the Funds areno-load, diversified funds.
The Aggressive Investors 1 Fund seeks to exceed the stock market total return (primarily through capital appreciation) at a level of total risk roughly equal to that of the stock market over longer periods of time (three year intervals or more).
The Ultra-Small Company, Ultra-Small Company Market,Small-Cap Growth andSmall-Cap Value Funds seek to provide a long-term total return on capital, primarily through capital appreciation.
The Blue Chip 35 Index Fund seeks to provide long-term total return on capital, primarily through capital appreciation, but also some income.
The Managed Volatility Fund seeks to provide a high current return with short-term risk less than or equal to 40% of the stock market.
Bridgeway Capital Management, Inc. (the “Adviser”) is the investment adviser for all of the Funds.
2. Significant Accounting Policies:
The following summary of significant accounting policies, followed in the preparation of the financial statements of the Funds, are in conformity with accounting principles generally accepted in the United States of America (“GAAP”). Each Fund is considered an investment company under GAAP and follows the accounting and reporting guidance applicable to investment companies.
New Accounting PronouncementsThe SEC recently adopted changes to RegulationS-X to simplify the reporting of information by registered investment companies in financial statements. The amendments require presentation of the total, rather than the components, of distributable earnings on the Statement of Assets and Liabilities and also require presentation of the total, rather than the components, of distributions to shareholders, except for tax return of capital distributions, if any, on the Statement of Changes in Net Assets. The amendments also removed the requirement for parenthetical disclosure of undistributed net investment income on the Statement of Changes in Net Assets. These RegulationS-X amendments are reflected in the Fund’s financial statements for the six months ended December 31, 2018.
Securities, Options, Futures and Other Investments ValuationOther than options, securities for which market quotations are readily available are valued at the last sale price on the national exchange on which such securities are primarily traded. In the case of securities reported on the National Association of Securities Dealers Automated Quotation (“NASDAQ”) system, the securities are valued based on the NASDAQ Official Closing Price (“NOCP”). In the absence of recorded sales on
| | |
| 82 | | Semi-Annual Report | December 31, 2018 (Unaudited) |
| | |
| NOTES TO FINANCIAL STATEMENTS (continued) | | |
December 31, 2018 (Unaudited)
their primary exchange, or NOCP, in the case of NASDAQ traded securities, the security will be valued as follows: bid prices for long positions and ask prices for short positions.
Fixed income securities are valued on the basis of current market quotations provided by a pricing service. Options are valued at the close if there is trading volume and, if there is no trading volume, the options are valued at the bid on long positions and the ask on the short positions.
Investments inopen-end registered investment companies andclosed-end registered investment companies that do not trade on an exchange are valued at the end of day net asset value (“NAV”) per share.
Investments inclosed-end registered investment companies that trade on an exchange are valued at the last sales price as of the close of the customary trading session on the exchange where the security is principally traded.
When market quotations are not readily available or when events occur that make established valuation methods unreliable, securities of the Funds may be valued at fair value as determined in good faith by or under the direction of the Board of Directors. The valuation assigned to a fair valued security for purposes of calculating the Funds’ NAVs may differ from the security’s most recent closing market price and from the prices used by other mutual funds to calculate their NAVs.
The inputs and valuation techniques used to determine the value of a Fund’s investments are summarized into three levels as described in the hierarchy below:
| ● | | Level 1 — quoted prices in active markets for identical assets |
Investments whose values are based on quoted market prices in active markets, and whose values are therefore classified as Level 1 prices, include active listed equity securities. The Funds do not adjust the quoted price for such investments, even in situations where the Funds hold a large position and a sale could reasonably impact the quoted price.
| ● | | Level 2 — other significant observable inputs (including quoted prices for similar securities, interest rates, prepayment speeds, credit risk, etc.) |
Investments that trade in markets that are not considered to be active, but whose values are based on quoted market prices, dealer quotations or valuations provided by alternative pricing sources supported by observable inputs, are classified as Level 2 prices. These generally include certain U.S. Government and sovereign obligations, most government agency securities, investment-grade corporate bonds and less liquid listed equity securities. As investments whose values are classified as Level 2 prices include positions that are not traded in active markets and/or are subject to transfer restrictions, valuations may be adjusted to reflect illiquidity and/ornon-transferability, which are generally based on available market information.
The Fidelity Investments Money Market Government Portfolio - Class I, which is held by each Fund, invests primarily in securities that are valued at amortized cost. Therefore, this investment is classified as a Level 2 investment.
| ● | | Level 3 — significant unobservable inputs (including the Fund’s own assumptions in determining the fair value of investments) |
Investments whose values are classified as Level 3 prices have significant unobservable inputs, as they may trade infrequently or not at all. When observable prices are not available for these securities, the Funds use one or more valuation techniques for which sufficient and reliable data is available. The inputs used by the Funds in estimating the value of Level 3 prices may include the original transaction price, quoted prices for similar securities or assets in active markets, completed or pending third-party transactions in the underlying investment or comparable issuers, and changes in financial ratios or cash flows. Level 3 prices may also be adjusted to reflect illiquidity and/ornon-transferability, with the amount of such discount estimated by the Funds in the absence of market information. Assumptions used by the Funds due to the lack of observable inputs may significantly impact the resulting value and therefore the results of the Funds’ operations.
| | |
| NOTES TO FINANCIAL STATEMENTS (continued) | | |
December 31, 2018 (Unaudited)
The inputs or methodology used for valuing investments are not necessarily an indication of the risk associated with investing in those investments. A summary of the inputs used to value the Funds’ investments as of December 31, 2018 is included with each Fund’s Schedule of Investments.
The Funds’ policy is to recognize transfers into, and transfers out of, each level of hierarchy as of the beginning of the reporting period. For the period ended December 31, 2018, there were no transfers between Level 1 and Level 2 in any of the Funds. Details regarding material transfers into, and material transfers out of, Level 3, if any, can be found at the end of each Schedule of Investments for Funds that held Level 3 securities.
Securities LendingUpon lending its securities to third parties, each participating Fund receives compensation in the form of fees. The loans are secured by collateral at least equal to the fair value of the securities loaned plus accrued interest. The remaining contractual maturity of all securities lending transactions is overnight and continuous. Each Fund has the right under the lending agreement to recover the securities from the borrower on demand. Additionally, a Fund does not have the right to sell orre-pledge collateral received in the form of securities unless the borrower goes into default. The risks to a Fund of securities lending are that the borrower may not provide additional collateral when required or return the securities when due, resulting in a loss. Under the terms of the Securities Lending Agreement, the Funds are indemnified for such losses by the securities lending agent.
While securities are on loan, the Fund continues to receive dividends on the securities loaned and recognizes any gain or loss in the fair value of the securities loaned.
Securities lending transactions are entered into by a Fund under a Securities Lending Agreement which provides the right, in the event of default (including bankruptcy or insolvency) for thenon-defaulting party to liquidate the collateral or to offset the market value of the collateral received against the market value of the securities loaned. The value of the collateral is typically greater than that of the market value of the securities loaned, leaving the lender with a net amount payable to the defaulting party. However, bankruptcy or insolvency laws of a particular jurisdiction may impose restrictions on or prohibitions against such a right of offset in the event of a counterparty’s bankruptcy or insolvency.
The market value of securities on loan, all of which are classified as common stocks in the Funds’ Schedules of Investments, and the value of the related collateral are shown in the Statements of Assets and Liabilities as a component of Investments at value. During the period ended December 31, 2018 the Blue Chip 35 Index Fund did not have any securities lending transactions.
| | |
| 84 | | Semi-Annual Report | December 31, 2018 (Unaudited) |
| | |
| NOTES TO FINANCIAL STATEMENTS (continued) | | |
December 31, 2018 (Unaudited)
The following table is a summary of the Funds’ securities loaned and related collateral, which are subject to a netting agreement as of December 31, 2018:
| | | | | | | | | | | | | | | | | | | | | | |
| | | | | | | | | | | | Gross Amount Not Offset
in the Statement
of Assets and Liabilities | | | | |
| Fund | | Gross
Amounts of
Recognized
Assets1 | | | Gross Amounts
Offset in the
Statement of
Assets and
Liabilities | | | Net Amounts of
Assets Presented
in the Statement
of Assets and
Liabilities | | | Financial
Instruments | | Collateral
Received2 | | | Net
Amount | |
| |
| | | | | | |
Aggressive Investors 1 | | | | | | | | | | | | | | | | | | | | | | |
Securities lending | | | $ 2,649,094 | | | | - | | | | $ 2,649,094 | | | - | | | $ 2,649,094 | | | | - | |
| | | | | | |
Ultra-Small Company | | | | | | | | | | | | | | | | | | | | | | |
Securities lending | | | $ 7,088,959 | | | | - | | | | $ 7,088,959 | | | - | | | $ 7,088,959 | | | | - | |
| | | | | | |
Ultra-Small Company Market | | | | | | | | | | | | | | | | | | | | | | |
Securities lending | | | $22,264,499 | | | | - | | | | $22,264,499 | | | - | | | $22,264,499 | | | | - | |
| | | | | | |
Small-Cap Growth | | | | | | | | | | | | | | | | | | | | | | |
Securities lending | | | $ 3,248,555 | | | | - | | | | $ 3,248,555 | | | - | | | $ 3,248,555 | | | | - | |
| | | | | | |
Small-Cap Value | | | | | | | | | | | | | | | | | | | | | | |
Securities lending | | | $ 3,164,772 | | | | - | | | | $ 3,164,772 | | | - | | | $ 3,164,772 | | | | - | |
| 1 | Securities loaned with a value of $1,589 and $59,784 in Ultra-Small Company and Ultra-Small Company Market, respectively, have been sold and are pending settlement on January 2, 2019. |
| 2 | Collateral with a value of $2,746,838, $7,314,718, $23,396,252, $3,394,722, and $3,349,453 has been received in connection with securities lending of Aggressive Investors 1, Ultra-Small Company, Ultra-Small Company Market,Small-Cap Growth, andSmall-Cap Value, respectively. Excess of collateral received from an individual counterparty is not shown here for financial reporting purposes. |
It is each Fund’s policy to obtain additional collateral from, or return excess collateral to, the borrower by the end of the next business day following the valuation date of the securities loaned. Therefore, the value of the collateral held may be temporarily less than that required under the lending contract. As of December 31, 2018 the collateral consisted of an institutional government money market fund.
Use of Estimates in Financial StatementsIn preparing financial statements in conformity with GAAP, management makes estimates and assumptions that affect the reported amounts of assets and liabilities on the date of the financial statements and the disclosure of contingent assets and liabilities on the date of the financial statements, as well as the reported amounts of revenue and expenses during the reporting period. Actual results could differ from those estimates.
Concentrations of Credit RiskThe Funds maintain cash and securities in its custody account maintained by a high-credit, quality financial institution. Cash balances may, at times, exceed the FDIC insurance limit. Cash balances are generally invested in a short-term investment vehicle, which minimizes the risk of cash balances exceeding the FDIC insurance limit.
Risks and UncertaintiesThe Funds provide for various investment options, including stocks, bonds and call and put options. Such investments are exposed to risks, such as interest rate, market and credit risks. Due to the risks involved, it is at least reasonably possible that changes in risks in the near term would materially affect shareholders’ account values and the amounts reported in the financial statements.
Security Transactions, Investment Income and ExpensesSecurity transactions are accounted for as of the trade date, the date the order to buy or sell is executed. Realized gains and losses are computed on the identified cost basis. Dividend income is recorded on theex-dividend date, and interest income is recorded on the accrual basis from settlement date. Particularly related to the Managed Volatility Fund, discounts and premiums are accreted/amortized on the effective interest method.
Fund expenses that are not series-specific are allocated to each series based upon its relative proportion of net assets to the Funds’ total net assets or other appropriate basis.
| | |
| NOTES TO FINANCIAL STATEMENTS (continued) | | |
December 31, 2018 (Unaudited)
Distributions to ShareholdersThe Funds pay dividends from net investment income and distribute realized capital gains annually, usually in December.
Derivatives
The Funds’ use of derivatives for the period ended December 31, 2018 was limited to futures contracts, purchased options, and written options. The following is a summary of how these derivatives are treated in the financial statements and their impact on the Funds, categorized by primary underlying risk.
| | | | | | | | | | | | | | | | |
Primary Underlying Risk/Fund | | Derivative
Assets | | | | | | Derivative
Liabilities | | | | | Location on Statement of Assets and Liabilities |
|
Equity Risk | | | | | | | | | | | | | | | | |
Managed Volatility: | | | | | | | | | | | | | | | | |
Written Put Options | | | - | | | | | | | | $188,945 | | | | | Put options written at value |
Written Call Options | | | - | | | | | | | | 251,096 | | | | | Call options written at value |
| | | | | | | | | | |
| | | |
Primary Underlying Risk/Fund | | Amount of
Realized Gain
(Loss) on Derivatives | | | Amount of
Unrealized Gain
(Loss) on Derivatives | | | Location of Gain (Loss) in the Statement of Operations |
| | | |
Equity Risk | | | | | | | | | | |
Managed Volatility: | | | | | | | | | | |
Written Options | | | $525,427 | | | | | | | Realized Gain (Loss) on Written Options |
| | | | | | | | | | Change in Unrealized Appreciation |
| | | | | | | $30,702 | | | (Depreciation) on Written Options |
Futures Contracts | | | $499,544 | | | | - | | | Realized Gain (Loss) on Futures Contracts |
The derivative instruments outstanding as of December 31, 2018, as disclosed in the Notes to the Financial Statements, and the amounts of realized and changes in unrealized gains and losses on derivative instruments during the period, as disclosed in the Statements of Operations, serve as indicators of the volume of derivatives activity for the Funds.
Futures ContractsThe Funds may purchase or sell financial futures contracts to hedge cash positions, manage market risk, and to dampen volatility in line with investment objectives. A futures contract is an agreement between two parties to buy or sell a financial instrument at a set price on a future date. Upon entering into such a contract, a Fund is required to pledge to the broker an amount of cash or U.S. Government securities equal to the minimum “initial margin” requirements of the exchange on which the futures contract is traded. The contract amount reflects the extent of a Fund’s exposure in these financial instruments. A Fund’s participation in the futures markets involves certain risks, including imperfect correlation between movements in the price of futures contracts and movements in the price of the securities hedged or used for cover. Pursuant to a contract, such Fund agrees to receive from, or pay to, the broker an amount of cash equal to the fluctuation in value of the contract. Such receipts or payments are known as “variation margin” and are recorded by a Fund as unrealized appreciation or depreciation. When a contract is closed, a Fund records a realized gain or loss equal to the difference between the value of the contract at the time it was opened and the value at the time it was closed. With futures, there is minimal counterparty risk to the Funds, since futures are exchange traded and the exchange’s clearinghouse, as counterparty to all exchange traded futures, guarantees the futures against default. As of December 31, 2018, the Funds had no open futures contracts.
OptionsThe Aggressive Investors 1 Fund may buy and sell calls and puts to increase or decrease the Fund’s exposure to stock market risk or for purposes of diversification of risk. The Managed Volatility Fund may buy and sell calls and puts to reduce the Fund’s volatility and provide some cash flow. An option is a contract conveying a right to buy or sell a financial instrument at a specified price during a stipulated period. The premium paid by a Fund for the purchase of a call or a put option is included in such Fund’s Schedule of Investments as an investment and subsequentlymarked-to-market to reflect the current market value of the option. When a Fund writes a call or a put option, an amount equal to the premium received by such Fund is included in its Statement of Assets and Liabilities as a liability and is subsequentlymarked-to-market to reflect the current market value of the option written. If an option that a Fund has written either expires on its stipulated expiration date, or if such Fund enters into a closing purchase transaction, that Fund realizes a gain (or a loss if the cost of a closing purchase
| | |
| 86 | | Semi-Annual Report | December 31, 2018 (Unaudited) |
| | |
| NOTES TO FINANCIAL STATEMENTS (continued) | | |
December 31, 2018 (Unaudited)
transaction exceeds the premium received when the option was written) without regard to any unrealized gain or loss on the underlying security, and the liability related to such options is extinguished. If a call option that a Fund has written is assigned, such Fund realizes a gain or loss from the sale of the underlying security, and the proceeds from such sale are increased by the premium originally received. If a put option that a Fund has written is assigned, the amount of the premium originally received reduces the cost of the security that such Fund purchased upon exercise of the option. Buying calls increases a Fund’s exposure to the underlying security to the extent of any premium paid. Buying puts on a stock market index tends to limit a Fund’s exposure to a stock market decline. All options purchased by the Funds were listed on exchanges and considered liquid positions with readily available market quotes.
Covered Call Options and Secured PutsThe Aggressive Investors 1 and Managed Volatility Funds may write call options on a covered basis; that is, a Fund will own the underlying security, or a Fund may write secured puts. The principal reason for writing covered calls and secured puts on a security is to attempt to realize income through the receipt of premiums. The option writer has, in return for the premium, given up the opportunity for profit from a substantial price increase in the underlying security so long as the obligation as a writer continues, but has retained the risk of loss should the price of the security decline. All options were listed on exchanges and considered liquid positions with readily available market quotes.
Outstanding written options as of December 31, 2018 for the Managed Volatility Fund are included in the Schedule of Investments. The Aggressive Investors 1 Fund had no transactions in written options during the period ended December 31, 2018.
IndemnificationUnder the Company’s organizational documents, the Funds’ officers, directors, employees and agents are indemnified against certain liabilities that may arise out of the performance of their duties to the Funds. Additionally, in the normal course of business, the Funds enter into contracts that contain a variety of indemnification clauses. The Funds’ maximum exposure under these arrangements is unknown, as this would involve future claims that may be made against the Funds that have not yet occurred. However, the Funds have not had prior claims or losses pursuant to these contracts.
3. Advisory Fees, Other Related Party Transactions and Contingencies:
The Funds have entered into management agreements with the Adviser. As compensation for the advisory services rendered, facilities furnished, and expenses borne by the Adviser, the Funds pay the Adviser a fee pursuant to each Fund’s management agreement, as described below.
Aggressive Investors 1:A total advisory fee is paid by the Fund to the Adviser that is comprised of a Base Fee and a Performance Adjustment. The Base Fee equals the Base Fee Rate times the average daily net assets of the Fund. The Base Fee Rate is based on the following annual rates: 0.90% of the first $250 million of the Fund’s average daily net assets, 0.875% of the next $250 million, 0.85% of the next $500 million and 0.80% of any excess over $1 billion.
The Performance Adjustment equals 4.67% times the difference in cumulative total return between the Fund and the Standard and Poor’s 500 Composite Stock Price Index with dividends reinvested (hereinafter “Index”) over a rolling five-year performance period. The Performance Adjustment Rate varies from a minimum of-0.70% to a maximum of +0.70%. However, the Performance Adjustment Rate is zero if the difference between the cumulative Fund performance and the Index performance is less than or equal to 2%.
Ultra-Small Company:The Fund pays advisory fees based on the following annual rates: 0.90% of the first $250 million of the Fund’s average daily net assets, 0.875% of the next $250 million and 0.85% of any excess over $500 million. The management fees are computed daily and are payable monthly. However, during any period when the Fund’s net assets range from $27,500,000 to $55,000,000, the advisory fee will be determined as if the Fund had $55,000,000 under management. This is limited to a maximum annualized expense ratio of 1.49% of average net assets.
Ultra-Small Company Market:The Fund’s advisory fee is a flat 0.50% of the value of the Fund’s average daily net assets, computed daily and payable monthly.
Small-Cap Growth andSmall-Cap Value:A total advisory fee is paid by each Fund to the Adviser that is comprised of a Base Fee and a Performance Adjustment. The Base Fee equals the Base Fee Rate times the average daily net assets of the Fund. The Base Fee Rate is based on the annual rate of 0.60% of the value of each Fund’s average daily net assets.
| | |
NOTES TO FINANCIAL STATEMENTS (continued) | | |
December 31, 2018 (Unaudited)
The Performance Adjustment equals 0.33% times the difference in cumulative total return between the Fund and the Russell 2000 Growth Index forSmall-Cap Growth Fund and the Russell 2000 Value Index forSmall-Cap Value Fund, with dividends reinvested (hereinafter “Index”) over a rolling five-year performance period. The Performance Adjustment Rate varies from a minimum of-0.05% to a maximum of +0.05%. However, the Performance Adjustment Rate is zero if the difference between the cumulative Fund’s performance and the Index performance is less than or equal to 2%.
Blue Chip 35 Index:The Fund’s advisory fee is a flat 0.08% of the value of the Fund’s average daily net assets, computed daily and payable monthly.
Managed Volatility:The Fund’s advisory fee is a flat 0.60% of the value of the Fund’s average daily net assets, computed daily and payable monthly.
Expense limitations:The Adviser has agreed to reimburse the Funds for operating expenses and management fees above the expense limitations shown in the table below, which are shown as a ratio of net expenses to average net assets, for each Fund, for the period ended December 31, 2018. Any material change to the expense limitation would require a vote by shareholders of the applicable Fund.
| | | | | | |
| Bridgeway Fund | | Expense
Limitation | | Total Waivers and
Reimbursements
for Period Ended
12/31/18 | |
| | | | | | |
Aggressive Investors 1 | | 1.75% | | | - | |
Ultra-Small Company | | 1.85% | | | - | |
Ultra-Small Company Market | | 0.75% | | | $ 22,328 | |
Small-Cap Growth | | 0.94% | | | 36,833 | |
Small-Cap Value | | 0.94% | | | 11,282 | |
Blue Chip 35 Index | | 0.15% | | | 217,710 | |
Managed Volatility | | 0.94% | | | 51,290 | |
Other Related Party Transactions:The Funds will engage in inter-portfolio trades when it is to the benefit of both parties. The Board of Directors reviews these trades quarterly. Inter-portfolio purchases and sales during the period ended December 31, 2018 were as follows:
| | | | | | | | | | |
| Bridgeway Fund | | Inter-Portfolio
Purchases | | Inter-Portfolio
Sales |
| | | | | | | | | | |
Aggressive Investors 1 | | | | - | | | | | $3,246,300 | |
Ultra-Small Company | | | | $ 6,000,747 | | | | | 7,219,026 | |
Ultra-Small Company Market | | | | 11,429,000 | | | | | 8,729,585 | |
Small-Cap Growth | | | | 1,901,464 | | | | | 1,065,744 | |
Small-Cap Value | | | | 1,675,451 | | | | | 1,234,950 | |
The Adviser entered into an Administrative Services Agreement with Bridgeway, pursuant to which the Adviser provides various administrative services to the Funds including, but not limited to: (i) supervising and managing various aspects of the Funds’ business and affairs; (ii) selecting, overseeing and/or coordinating activities with other service providers to the Funds; (iii) providing reports to the Board of Directors as requested from time to time; (iv) assisting and/or reviewing amendments and updates to the Funds’ registration statement and other filings with the Securities and Exchange Commission (“SEC”); (v) providing certain shareholder services; (vi) providing administrative support in connection with meetings of the Board of Directors; and (vii) providing certain record-keeping services. For its services to all of the Bridgeway Funds, the Adviser is paid an aggregate annual fee of $775,000, payable in equal monthly installments. For the allocation of this expense to each of the Funds, please see the Statements of Operations.
| | |
88 | | Semi-Annual Report | December 31, 2018 (Unaudited) |
| | |
| NOTES TO FINANCIAL STATEMENTS (continued) | | |
December 31, 2018 (Unaudited)
Board of Directors CompensationEffective November 8, 2018, Independent Directors are paid an annual retainer of $20,000, with an additional retainer of $5,000 paid to the Independent Chairman of the Board and an additional retainer of $1,000 paid to the Nominating and Corporate Governance Committee Chair. The retainer is paid in quarterly installments. In addition, Independent Directors are paid $11,000 per meeting for meeting fees. Prior to November 8, 2018, Independent Directors were paid an annual retainer of $15,000, with an additional retainer of $5,000 paid to the Independent Chairman of the Board and an additional retainer of $1,000 paid to the Nominating and Corporate Governance Committee Chair, and $9,000 per meeting. Such compensation is the total compensation from all Bridgeway Funds and is allocated among the Bridgeway Funds.
Each Independent Director receives this compensation in the form of shares of the Bridgeway Funds, credited to his or her account. Such Directors are reimbursed for any expenses incurred in attending meetings and conferences, as well as expenses for subscriptions or printed materials. The amount of directors’ fees attributable to each Fund is disclosed in the Statements of Operations.
One director of Bridgeway, John Montgomery, is an owner and director of the Adviser. Under the 1940 Act definitions, he is considered to be an “affiliated person” of the Adviser and an “interested person” of the Adviser and of Bridgeway. Compensation for Mr. Montgomery is borne by the Adviser rather than the Funds.
4. Distribution Agreement:
Foreside Fund Services, LLC acts as distributor of the Funds’ shares, pursuant to a Distribution Agreement dated May 31, 2017. The Adviser pays all costs and expenses associated with distribution of the Funds’ shares, pursuant to a protective plan adopted by shareholders pursuant to Rule12b-1.
5. Purchases and Sales of Investment Securities:
Purchases and sales of investments, other than short-term securities, for each Fund for the period ended December 31, 2018 were as follows:
| | | | | | | | | | | | |
| | | Purchases | | | Sales | | | |
| Bridgeway Fund | | U.S. Government | | Other | | | U.S. Government | | Other | |
| | | | | | | | | | | | |
Aggressive Investors 1 | | $ - | | | $100,200,578 | | | $ - | | | $118,900,082 | |
Ultra-Small Company | | - | | | 37,519,030 | | | - | | | 41,854,348 | |
Ultra-Small Company Market | | - | | | 68,607,390 | | | - | | | 89,562,326 | |
Small-Cap Growth | | - | | | 28,704,620 | | | - | | | 31,322,768 | |
Small-Cap Value | | - | | | 26,130,262 | | | - | | | 27,697,488 | |
Blue Chip 35 Index | | - | | | 97,362,502 | | | - | | | 123,548,793 | |
Managed Volatility | | - | | | 8,590,958 | | | - | | | 4,793,367 | |
6. Federal Income Taxes
It is the Funds’ policy to continue to comply with the provisions of the Internal Revenue Code of 1986, as amended (“Internal Revenue Code”), applicable to regulated investment companies, and to distribute income to the extent necessary so that the Funds are not subject to federal income tax. Therefore, no federal income tax provision is required.
| | |
| NOTES TO FINANCIAL STATEMENTS (continued) | | |
December 31, 2018 (Unaudited)
Unrealized Appreciation and Depreciation on Investments (Tax Basis)The amount of net unrealized appreciation/ depreciation and the cost of investment securities for tax purposes, including short-term securities as of December 31, 2018, were as follows:
| | | | | | | | |
| | | Aggressive Investors 1 | | | Ultra-Small
Company | | Ultra-Small
Company Market |
Gross appreciation (excess of value over tax cost) | | | $ 5,721,826 | | | $ 6,237,918 | | $ 55,061,048 |
Gross depreciation (excess of tax cost over value) | | | (30,176,353) | | | (17,601,817) | | (55,056,468) |
| | | |
Net unrealized appreciation (depreciation) | | | $(24,454,527) | | | $ (11,363,899) | | $ 4,580 |
| | | |
Cost of investments for income tax purposes | | | $187,685,939 | | | $ 91,069,969 | | $ 283,899,847 |
| | | | | | | | | | | | |
| | | |
| | | Small-Cap Growth | | | | | | Small-Cap Value | |
Gross appreciation (excess of value over tax cost) | | | $ 4,671,928 | | | | | | | | $ 3,546,678 | |
Gross depreciation (excess of tax cost over value) | | | (5,971,692) | | | | | | | | (10,907,025) | |
| | | |
Net unrealized (depreciation) | | | $ (1,299,764) | | | | | | | | $ (7,360,347) | |
| | | |
Cost of investments for income tax purposes | | | $46,760,956 | | | | | | | | $ 60,914,543 | |
| | | | | | | | | | | | |
| | | |
| | | Blue Chip 35 Index | | | | | | Managed Volatility | |
Gross appreciation (excess of value over tax cost) | | | $228,108,312 | | | | | | | | $ 5,455,034 | |
Gross depreciation (excess of tax cost over value) | | | (14,777,601) | | | | | | | | (2,122,807) | |
| | | |
Net unrealized appreciation | | | $213,330,711 | | | | | | | | $ 3,332,227 | |
| | | |
Cost of investments for income tax purposes | | | $312,320,888 | | | | | | | | $27,538,561 | |
The differences between book and tax net unrealized appreciation (depreciation) are primarily due to wash sale and straddle loss deferrals and basis adjustments on investments in business development companies, partnerships and passive foreign investment companies (PFICs).
Classifications of DistributionsNet investment income (loss) and net realized gain (loss) may differ for financial statement and tax purposes. The character of distributions made during the year from net investment income or net realized gains may differ from its ultimate characterization for federal income tax purposes.
The tax character of the distributions paid by the Funds during the last two fiscal years ended June 30, 2018 and June 30, 2017, respectively, are as follows:
| | | | | | | | | | | | | | | | |
| | | Aggressive Investors 1 | | | Ultra-Small Company | |
| | | Year Ended
June 30, 2018 | | | Year Ended
June 30, 2017 | | | Year Ended
June 30, 2018 | | | Year Ended
June 30, 2017 | |
| | | | |
Distributions paid from: | | | | | | | | | | | | | | | | |
Ordinary Income | | | $ - | | | | $1,255,319 | | | | $1,299,999 | | | | $1,212,208 | |
Long-Term Capital Gain | | | - | | | | - | | | | 614,549 | | | | - | |
Total | | | $ - | | | | $1,255,319 | | | | $1,914,548 | | | | $1,212,208 | |
| | |
| | | Ultra-Small Company Market | | | Small-Cap Growth | |
| | | Year Ended
June 30, 2018 | | | Year Ended
June 30, 2017 | | | Year Ended
June 30, 2018 | | | Year Ended
June 30, 2017 | |
| | | | |
Distributions paid from: | | | | | | | | | | | | | | | | |
Ordinary Income | | $ | 449,185 | | | $ | 3,465,525 | | | | $98,928 | | | | $128,436 | |
Long-Term Capital Gain | | | 43,056,482 | | | | 24,304,051 | | | | - | | | | - | |
Total | | $ | 43,505,667 | | | $ | 27,769,576 | | | | $98,928 | | | | $128,436 | |
| | |
| 90 | | Semi-Annual Report | December 31, 2018 (Unaudited) |
| | |
NOTES TO FINANCIAL STATEMENTS (continued) | | |
December 31, 2018 (Unaudited)
| | | | | | | | | | | | | | | | |
| | |
| | | Small-Cap Value | | | Blue Chip 35 Index | |
| | | Year
Ended
June 30, 2018 | | | Year
Ended
June 30, 2017 | | | Year
Ended
June 30, 2018 | | | Year
Ended
June 30, 2017 | |
| | | | |
Distributions paid from: | | | | | | | | | | | | | | | | |
Ordinary Income | | $ | 547,906 | | | $ | 644,905 | | | $ | 11,665,340 | | | $ | 13,425,245 | |
Long-Term Capital Gain | | | - | | | | - | | | | 15,737,305 | | | | - | |
Total | | $ | 547,906 | | | $ | 644,905 | | | $ | 27,402,645 | | | $ | 13,425,245 | |
| | | | | | | | |
| |
| | | Managed Volatility | |
| | | Year Ended
June 30, 2018 | | | Year Ended
June 30, 2017 | |
| | |
Distributions paid from: | | | | | | | | |
Ordinary Income | | | $194,557 | | | | $195,475 | |
Total | | | $194,557 | | | | $195,475 | |
Under the Regulated Investment Company Modernization Act of 2010, capital losses incurred by the Funds after June 30, 2011 will not be subject to expiration and will retain their character as either short-term or long-term capital losses.
As of June 30, 2018, the Funds had no remaining capital loss carryovers.
Capital loss carryovers utilized during the period ended June 30, 2018 were as follows:
| | | | |
| Bridgeway Fund | | Capital Loss Carryover Utilized | |
| | | | |
Aggressive Investors 1 | | | $12,329,001 | |
Small-Cap Growth | | | 6,535,338 | |
Small-Cap Value | | | 10,753,725 | |
Managed Volatility | | | 1,499,825 | |
During the period ended June 30, 2018, Aggressive Investors 1 andSmall-Cap Value Funds had capital loss carryforwards expire in the amounts of $3,765,316 and $9,257,491, respectively.
Components of Accumulated EarningsAs of June 30, 2018, the components of accumulated earnings on a tax basis were:
| | | | | | | | | | | | | | | |
| | | Aggressive Investors 1 | | Ultra-Small Company | | Ultra-Small
Company Market |
Accumulated Net Investment Income | | | | $ 603,857 | | | | | $ 31,332 | | | | | $ 1,740,460 | |
Accumulated Net Realized Gain (Loss) on Investments | | | | — | | | | | 8,945,423 | | | | | 23,579,264 | |
Net Unrealized Appreciation of Investments | | | | 16,928,088 | | | | | 7,575,672 | | | | | 103,950,003 | |
Total | | | | $17,531,945 | | | | | $16,552,427 | | | | | $129,269,727 | |
| | | | | | | | | | | | | | | |
| | | Small-Cap Growth | | | | Small-Cap Value |
Accumulated Net Investment Income | | | | $ 173,020 | | | | | | | | | | $ 468,066 | |
Accumulated Net Realized Gain (Loss) on Investments | | | | 709,647 | | | | | | | | | | — | |
Net Unrealized Appreciation of Investments | | | | 8,085,334 | | | | | | | | | | 7,971,513 | |
Total | | | | $8,968,001 | | | | | | | | | | $8,439,579 | |
| | |
NOTES TO FINANCIAL STATEMENTS (continued) | | |
December 31, 2018 (Unaudited)
| | | | | | | | | | | | |
| | | Blue Chip 35 Index | | | | | | Managed Volatility | |
Accumulated Net Investment Income | | | $ 4,947,291 | | | | | | | | $ 201,988 | |
Accumulated Net Realized Gain (Loss) on Investments | | | 31,804,950 | | | | | | | | 376,724 | |
Net Unrealized Appreciation of Investments | | | 257,587,770 | | | | | | | | 6,835,023 | |
Total | | | $294,340,011 | | | | | | | | $7,413,735 | |
For the fiscal year June 30, 2018, the Funds recorded the following reclassifications to the accounts listed below:
| | | | | | |
| | | Increase (Decrease) |
| | | Aggressive Investors 1 | | Ultra-Small Company | | Ultra-Small Company Market |
Paid-In Capital | | $(3,765,316) | | $ 320,784 | | $ 2,721,756 |
Undistributed Net Investment Income | | (1) | | 289,672 | | (151,346) |
Accumulated Net Realized Gain (Loss) on Investments | | 3,765,317 | | (610,456) | | (2,570,410) |
| | | | | | | | | | |
| | | Increase (Decrease) | |
| | | Small-Cap Growth | | | | | Small-Cap Value | |
Paid-In Capital | | $ - | | | | | | $ | (9,257,491) | |
Undistributed Net Investment Income | | - | | | | | | | - | |
Accumulated Net Realized Gain (Loss) on Investments | | - | | | | | | | 9,257,491 | |
| | | | | | | | | | |
| | | Increase (Decrease) |
| | | Blue Chip 35 Index | | | | | | Managed Volatility |
Paid-In Capital | | | $ 3,143,030 | | | | | | | $ - |
Undistributed Net Investment Income | | | (995,117 | ) | | | | | | - |
Accumulated Net Realized Gain (Loss) on Investments | | | (2,147,913 | ) | | | | | | - |
The difference between book and tax components of net assets and the resulting reclassifications were primarily a result of the differing book/tax treatment of the deduction of equalization debits for tax purposes, redesignation of dividends paid and investments in real estate investment trusts, business development companies, partnerships and passive foreign investment companies (PFICs).
Accounting for Uncertainty in Income Taxes sets forth a minimum threshold for financial statement recognition of the benefit of a tax position taken or expected to be taken in a tax return. Management has analyzed each Fund’s tax positions and has concluded that no provision for income tax is required in each Fund’s financial statements. The Funds are not aware of any tax position for which it is reasonably possible that the total amounts of unrecognized tax benefits will significantly change in the next twelve months. Each Fund’s federal tax returns for the prior three fiscal years remain subject to examination by the Internal Revenue Service.
7. Line of Credit
Bridgeway established a line of credit agreement (“Facility”) with The Bank of New York Mellon, effective November 5, 2010. The Facility is for temporary or emergency purposes, such as to provide liquidity for shareholder redemptions, and is cancellable by either party. Unless cancelled earlier, the Facility shall be held available until September 12, 2019. Advances under the Facility are limited to $15,000,000 in total for all Funds, and advances to each Fund shall not exceed certain limits set forth in the credit agreement, including, but not limited to, the maximum amount a Fund is permitted to borrow under the 1940 Act.
The Funds incur a commitment fee of 0.085% per annum on the unused portion of the Facility and interest expense to the extent of amounts borrowed under the Facility. Interest is based on the “Overnight Rate” plus 1.25%. The Overnight Rate means the higher of (a) the Federal Funds rate, (b) the Overnight Eurodollar Rate, or (c) theOne-Month Eurodollar Rate. The commitment fees are payable quarterly in arrears and are allocated to all participating Funds. Interest expense is charged directly to a Fund based upon actual amounts borrowed by such Fund.
| | |
| 92 | | Semi-Annual Report | December 31, 2018 (Unaudited) |
| | |
| NOTES TO FINANCIAL STATEMENTS (continued) | | |
December 31, 2018 (Unaudited)
For the period ended December 31, 2018, borrowings by the Funds under this line of credit were as follows:
| | | | | | | | | | | | | | | | | | | | | | | | | |
| Bridgeway Fund | | Weighted
Average
Interest Rate | | Weighted
Average
Loan Balance | | Number of
Days
Outstanding | | Interest
Expense
Incurred1 | | Maximum Amount
Borrowed During
the Period |
| | | | | | | | | | | | | | | | | | | | | | | | | |
Aggressive Investors 1 | | | | 3.63 | % | | | | $1,394,143 | | | | | 35 | | | | | $4,847 | | | | | $7,380,000 | |
Ultra-Small Company | | | | 3.62 | % | | | | 702,906 | | | | | 32 | | | | | 2,229 | | | | | 1,413,000 | |
Ultra-Small Company Market | | | | 3.49 | % | | | | 811,349 | | | | | 43 | | | | | 3,335 | | | | | 2,406,000 | |
Small-Cap Growth | | | | 3.52 | % | | | | 621,667 | | | | | 3 | | | | | 180 | | | | | 1,440,000 | |
Small-Cap Value | | | | 3.56 | % | | | | 415,200 | | | | | 10 | | | | | 405 | | | | | 943,000 | |
Blue Chip 35 Index | | | | 3.55 | % | | | | 514,875 | | | | | 96 | | | | | 4,810 | | | | | 2,029,000 | |
1Interest expense is included on the Statements of Operations in Miscellaneous expenses. | | | | | | |
On December 31, 2018, Aggressive Investors 1 and Ultra-Small Company Market Funds had loans outstanding in the amounts of $7,380,000, and $2,406,000, respectively, exclusive of interest payable on the loans.
8. Redemption Fees
In Ultra-Small Company Market Fund, a 2% redemption fee may be charged on shares held less than six months. The fee is charged for the benefit of the remaining shareholders and will be paid to the Fund to help offset transaction costs. The fee is accounted for as an addition topaid-in capital.
9. Subsequent Events
Management has evaluated the impact of all subsequent events on the Funds and has determined that there were no subsequent events requiring recognition or disclosure in the financial statements.
| | |
| OTHER INFORMATION | | |
December 31, 2018 (Unaudited)
1. Proxy Voting
Fund policies and procedures used in determining how to vote proxies relating to the Funds’ securities and a summary of proxies voted by the Funds for the period ended June 30, 2018 are available without a charge, upon request, by contacting Bridgeway Funds at1-800-661-3550 and on the SEC’s website at http://www.sec.gov.
2. Fund Holdings
The complete schedules of the Funds’ holdings for the second and fourth quarters of each fiscal year are contained in the Funds’ Semi-Annual and Annual Shareholder Reports, respectively.
The Bridgeway Funds file complete schedules of the Funds’ holdings with the SEC for the first and third quarters of each fiscal year on FormN-Q within 60 days after the end of the period. Copies of the Funds’ FormN-Q are available without charge, upon request, by contacting Bridgeway Funds at1-800-661-3550 and on the SEC’s website at http://www.sec.gov. You may also review and copy FormN-Q at the SEC’s Public Reference Room in Washington, D.C. For more information about the operation of the Public Reference Room, please call1-800-SEC-0330.
| | |
| 94 | | Semi-Annual Report | December 31, 2018 (Unaudited) |
| | |
| DISCLOSURE OF FUND EXPENSES | | |
December 31, 2018 (Unaudited)
As a shareholder of a Fund, you will incur no transaction costs from such Fund, including sales charges (loads) on purchases, on reinvested dividends or on other distributions. There are no exchange fees. Shareholders are subject to redemption fees on the Ultra-Small Company Market Fund under certain circumstances. However, as a shareholder of a Fund, you will incur ongoing costs, including management fees and other Fund expenses. The following examples are intended to help you understand your ongoing costs (in dollars) of investing in a Fund and to compare these costs with ongoing costs of investing in other mutual funds. The examples are based on an investment of $1,000 invested on July 1, 2018 and held until December 31, 2018.
Actual Expenses.The first line of the table below provides information about actual account values and actual expenses. You may use the information in this line, together with the amount you invested, to estimate the expenses that you paid over the period. Simply divide your account value by $1,000 (for example, an $8,600 account value divided by $1,000 = 8.6), then multiply the result by the number in the first line under the heading “Expenses Paid During Period” to estimate the expenses you paid on your account during the period.
Hypothetical Example for Comparison Purposes.The second line of the table below provides information about hypothetical account values and hypothetical expenses based on the Fund’s actual expense ratio and an assumed rate of return of 5% per year before expenses, which is not the Fund’s actual return. The hypothetical account values and expenses may not be used to estimate the actual ending account balance or expenses you paid for the period. You may use this information to compare the ongoing costs of investing in a Fund and other mutual funds. To do so, compare this 5% hypothetical example with the 5% hypothetical examples that appear in the shareholder reports of other funds.
The expenses shown in the table are meant to highlight ongoing Fund costs only. Therefore, the second line of the table is useful in comparing ongoing costs only and will not help you determine the relative total costs of owning different funds, because other funds may also have transaction costs, such as sales charges, redemption fees or exchange fees.
| | | | | | | | | | | | | | | | | | | | |
| | | Beginning Account
Value at 7/1/18 | | Ending Account
Value at 12/31/18 | | Expense
Ratio | | Expenses Paid
During Period*
7/1/18 -12/31/18 |
| | |
Bridgeway Aggressive Investors 1 Fund | | | | | | | | | | | |
Actual Fund Return | | | | $1,000.00 | | | | | $ 788.90 | | | | | 0.39% | | | | | $1.76 | |
Hypothetical Fund Return | | | | $1,000.00 | | | | | $1,023.24 | | | | | 0.39% | | | | | $1.99 | |
| | |
Bridgeway Ultra-Small Company Fund | | | | | | | | | | | |
Actual Fund Return | | | | $1,000.00 | | | | | $ 793.60 | | | | | 1.20% | | | | | $5.43 | |
Hypothetical Fund Return | | | | $1,000.00 | | | | | $1,019.16 | | | | | 1.20% | | | | | $6.11 | |
| | |
Bridgeway Ultra-Small Company Market Fund | | | | | | | | | | | |
Actual Fund Return | | | | $1,000.00 | | | | | $ 747.50 | | | | | 0.75% | | | | | $3.30 | |
Hypothetical Fund Return | | | | $1,000.00 | | | | | $1,021.42 | | | | | 0.75% | | | | | $3.82 | |
| | |
BridgewaySmall-Cap Growth Fund | | | | | | | | | | | |
Actual Fund Return | | | | $1,000.00 | | | | | $ 810.00 | | | | | 0.94% | | | | | $4.29 | |
Hypothetical Fund Return | | | | $1,000.00 | | | | | $1,020.47 | | | | | 0.94% | | | | | $4.79 | |
| | |
BridgewaySmall-Cap Value Fund | | | | | | | | | | | |
Actual Fund Return | | | | $1,000.00 | | | | | $ 779.20 | | | | | 0.94% | | | | | $4.22 | |
Hypothetical Fund Return | | | | $1,000.00 | | | | | $1,020.47 | | | | | 0.94% | | | | | $4.79 | |
| | |
Bridgeway Blue Chip 35 Index Fund | | | | | | | | | | | |
Actual Fund Return | | | | $1,000.00 | | | | | $ 981.90 | | | | | 0.15% | | | | | $0.75 | |
Hypothetical Fund Return | | | | $1,000.00 | | | | | $1,024.45 | | | | | 0.15% | | | | | $0.77 | |
| | |
| DISCLOSURE OF FUND EXPENSES (continued) | | |
December 31, 2018 (Unaudited)
| | | | | | | | | | | | | | | | |
| | | Beginning Account
Value at 7/1/18 | | | Ending Account
Value at 12/31/18 | | | Expense
Ratio | | | Expenses Paid
During Period*
7/1/18 - 12/31/18 | |
| | | | |
Bridgeway Managed Volatility | | | | | | | | | | | | | | | | |
Actual Fund Return | | | $1,000.00 | | | | $ 938.30 | | | | 0.94% | | | | $4.59 | |
Hypothetical Fund Return | | | $1,000.00 | | | | $1,020.47 | | | | 0.94% | | | | $4.79 | |
| * | Expenses are equal to the average account value times the Fund’s annualized expense ratio multiplied by the number of days in the most recentsix-month period (184) divided by the number of days in the fiscal year (365). |
| | |
| 96 | | Semi-Annual Report | December 31, 2018 (Unaudited) |
THIS PAGE INTENTIONALLY LEFT BLANK
THIS PAGE INTENTIONALLY LEFT BLANK
| | | | | | |
| | | | | | |
| | | | | | |
| | BRIDGEWAY FUNDS, INC. BNY Mellon Investment Servicing (US) Inc. P.O. Box 9860 Providence, RI 02940-8060 CUSTODIAN The Bank of New York Mellon One Wall Street New York, NY 10286 DISTRIBUTOR Foreside Fund Services, LLC Three Canal Plaza, Suite 100 Portland, ME 04101 | | | | |
| | | |
| | | | | | |
| | You can review and copy information about our Funds (including the SAIs) at the SEC’s Public Reference Room in Washington, D.C. To find out more about this public service, call the SEC at800-SEC-0330. Reports and other information about the Funds are also available on the SEC’s website at www.sec.gov. You can receive copies of this information, for a fee, by writing the Public Reference Section, Securities and Exchange Commission, Washington, D.C. 20549-1520 or by sending an electronic request to the following email address: publicinfo@sec.gov. | | |
| | | | | | |

A no-load mutual fund family
| | | | |
| | Semi-Annual Report | | |
| | December 31, 2018 (Unaudited) | | |
| | OMNI SMALL-CAP VALUE | | BOSVX |
| | OMNI TAX-MANAGED SMALL-CAP VALUE | | BOTSX |
Beginning on January 1, 2021, as permitted by regulations adopted by the U.S. Securities and Exchange Commission, paper copies of the Funds’ annual and semi-annual shareholder reports will no longer be sent by mail, unless you specifically request paper copies of the reports. Instead, the reports will be made available on the Funds’ website (www.bridgeway.com), and you will be notified by mail each time a report is posted and provided with a website link to access the report.
If you already elected to receive shareholder reports electronically, you will not be affected by this change and you need not take any action. You may elect to receive shareholder reports and other communications from a Fund electronically anytime by contacting your financial intermediary (such as a broker-dealer or bank) or, if you are a direct investor, by calling800-661-3550.
Beginning on January 1, 2019, you may elect to receive all future reports in paper free of charge. If you invest through a financial intermediary, you can contact your financial intermediary to request that you continue to receive paper copies of your shareholder reports. If you invest directly with a Fund, you can call800-661-3550 to let the Fund know you wish to continue receiving paper copies of your shareholder reports. Your election to receive reports in paper will apply to all Funds held in your account if you invest through your financial intermediary or to all Funds held with the fund complex if you invest directly with a Fund.
| | |
TABLE OF CONTENTS | |  |
Bridgeway Funds Standardized Returns as of December 31, 2018 (Unaudited)
| | | | | | | | | | | | | | | | |
| | | | | | | Annualized | | | | | | |
| Fund | | Quarter | | Six Months | | 1 Year | | 5 Years | | Inception
to Date | | Inception
Date | | Gross
Expense
Ratio2 | | Net
Expense
Ratio2 |
| | | | | | | | | | | | | | | | | |
OmniSmall-Cap Value | | -22.31% | | -22.04% | | -17.15% | | 2.15% | | 9.67% | | 8/31/2011 | | 0.70%1 | | 0.60%1 |
OmniTax-ManagedSmall-Cap Value | | -22.13% | | -21.35% | | -16.08% | | 2.50% | | 7.52% | | 12/31/2010 | | 0.70%1 | | 0.60%1 |
| | 1 | Some of the Fund’s fees were waived or expenses reimbursed; otherwise, returns would have been lower. The Adviser is contractually obligated to waive fees and/or reimburse expenses. Any material change to this Fund policy would require a vote by shareholders. |
| | 2 | Expense ratios are as stated in the current prospectus. Please see financial highlights for expense ratios as of December 31, 2018. |
Performance figures quoted represent past performance and are no guarantee of future results. Current performance may be lower or higher than the performance data quoted. Investment return and principal value will fluctuate, so that an investor’s shares, when redeemed, may be worth more or less than original cost. To obtain performance current to the most recentmonth-end, please visit our website at www.bridgeway.com or call1-800-661-3550. Total return figures include the reinvestment of dividends and capital gains. Periods of less than one year are not annualized.
This report is submitted for the general information of the shareholders of each Fund. It is not authorized for distribution to prospective investors unless preceded or accompanied by an effective prospectus, which includes information regarding a Fund’s risks, objectives, fees and expenses, experience of its management, and other information. Investors should read the prospectus carefully before investing in a Fund. For questions or other Fund information, call1-800-661-3550 or visit the Funds’ website at www.bridgeway.com. Funds are available for purchase by residents of the United States, Puerto Rico, U.S. Virgin Islands and Guam only. Foreside Fund Services, LLC, Distributor.
The views expressed here are exclusively those of Fund management. These views, including those relating to the market, sectors or individual stocks, are not meant as investment advice and should not be considered predictive in nature.
| | |
LETTER FROM THE INVESTMENT MANAGEMENT TEAM | | |
December 31, 2018
Dear Fellow Shareholders,
At Bridgeway, we share a passion for applying logic, data and evidence to develop investment solutions. Our OmniSmall-Cap Value and OmniTax-ManagedSmall-Cap Value Funds are constructed based on fundamental academic research that relies on market efficiency to better capture risk premiums. We manage these Funds to provide broad diversification within thesmall-cap value universe and to keep transaction fees and expenses low. Bridgeway offers the OmniSmall-Cap Value and OmniTax-ManagedSmall-Cap Value Funds through a select group of advisers. We are committed to advisers and their clients who take a long-term perspective and whose investment goals fit our unique capabilities: delivering investment solutions that are statistically driven and grounded in academic theory.
Thank you for your investment in Bridgeway’s OmniSmall-Cap Value and OmniTax-ManagedSmall-Cap Value Funds.
Sincerely,
Your Investment Management Team
| | | | |
 | | 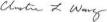 | | 
|
| John Montgomery | | Christine L. Wang | | Michael Whipple |
 | | | | |
Elena Khoziaeva | | | | |
| | |
LETTER FROM THE INVESTMENT MANAGEMENT TEAM (continued) | | |
Market Review
Performance across domestic equity markets was negative for the December 2018 quarter. Broad market returns for the quarter were down-14.30%, as represented by the Russell 3000 Index.
For the calendar year ended December 31, 2018, broad market stocks were down-5.24%, as represented by the Russell 3000 Index. Growth stocks outperformed value stocks in all size categories, and larger stocks outperformed smaller ones. As a result,large-cap growth stocks, as represented by the Russell 1000 Growth Index, performed the best, returning-1.51%.Small-cap value stocks, as represented by the Russell 2000 Value Index, performed the worst, returning-12.86%.
The following table presents returns for broad market,small-cap,mid-cap, andlarge-cap stocks, as represented by various style-based Russell Indexes. Size (market capitalization) and style (value/growth) are among the key factors that drive differences in returns among U.S. stock returns.
Russell Style-Based Indexes Ranked by Performance for the Quarter and Calendar Year Ended December 31, 2018
| | | | | | |
| | Quarter | | Calendar Year | | |
| Best | | -11.72% | | -1.51% | | |
| Performing | | Russell1000 Value Index | | Russell1000 Growth Index | | |
| | -12.24% | | -2.12% | | |
| | Russell3000 Value Index | | Russell3000 Growth Index | | |
| | -14.95% | | -4.75% | | |
| | RussellMidcap Value Index | | RussellMidcap Growth Index | | |
| | -15.89% | | -8.27% | | |
| | Russell1000 Growth Index | | Russell1000 Value Index | | |
| | -15.99% | | -8.58% | | |
| | RussellMidcap Growth Index | | Russell3000 Value Index | | |
| | -16.33% | | -9.31% | | |
| | Russell3000 Growth Index | | Russell2000 Growth Index | | |
| | -18.67% | | -12.29% | | |
| | Russell2000 Value Index | | RussellMidcap Value Index | | |
| Worst | | -21.65% | | -12.86% | | |
| Performing | | Russell2000 Growth Index | | Russell2000 Value Index | | |
The Bridgeway Omni Funds in this annual report are asset class exposure strategies that seek broad diversification and risk premium exposure with low tracking error. These Funds were designed to capture the size and style benefits within thesmall-cap value asset class.
| | |
| 2 | | Semi-Annual Report | December 31, 2018 (Unaudited) |
| | |
OmniSmall-Cap Value Fund MANAGER’S COMMENTARY (Unaudited) | | |
December 31, 2018
Dear Fellow OmniSmall-Cap Value Fund Shareholder,
For the quarter ended December 31, 2018, our Fund returned-22.31%, underperforming our primary market benchmark, the Russell 2000 Value Index(-18.67%).
For the calendar year, our Fund returned-17.15%, underperforming the Russell 2000 Value Index(-12.86%).
The table below presents our December quarter,six-month,one-year, five-year, andinception-to-date financial results. See the next page for a graph of performance since inception.
Standardized Returns as of December 31, 2018
| | | | | | | | | | | | | | | | | | | | |
| | | | | | | | | | | | Annualized | |
| | | Quarter | | | 6 Months | | | 1 Year | | | 5 Years | | | Since Inception
(8/31/11) | |
| | | | | |
OmniSmall-Cap Value Fund | | | -22.31% | | | | -22.04% | | | | -17.15% | | | | 2.15% | | | | 9.67% | |
Russell 2000 Value Index | | | -18.67% | | | | -17.36% | | | | -12.86% | | | | 3.61% | | | | 9.60% | |
Performance figures quoted in the table above and the graph on the next page represent past performance and are no guarantee of future results. Total return figures in the table above include the reinvestment of dividends and capital gains. The table above and the graph on the next page do not reflect the deduction of taxes that a shareholder would pay on Fund distributions or on the redemption of Fund shares.
The Russell 2000 Value Index is an unmanaged index that consists of stocks in the Russell 2000 Index with lowerprice-to-book ratios and lower forecasted growth values with dividends reinvested. It is not possible to invest directly in an index. Periods longer than one year are annualized.
| | |
OmniSmall-Cap Value Fund MANAGER’S COMMENTARY (Unaudited) (continued) | | |
Growth of a $10,000 Investment
from Inception August 31, 2011 to December 31, 2018
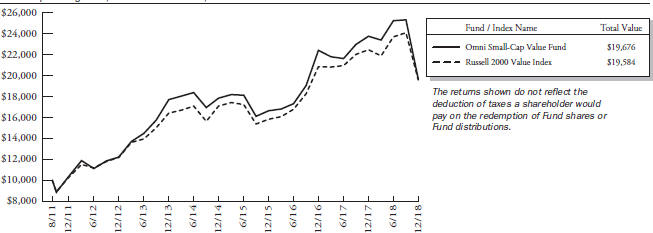
Detailed Explanation of Quarterly Performance
The OmniSmall-Cap Value Fund is designed to capture the returns of thesmall-cap value asset class through broad diversification of small company and value stocks. This approach is sometimes referred to as “passive, asset class investing.” As of December 31, 2018, we held 665 such stocks in amarket-cap weighted style. We make no attempt to track any particular index in either performance or statistics.
The Fund’s primary design features worked against it during the quarter: A tilt toward smaller stocks in thesmall-cap value universe and a tilt toward deeper value stocks across multiple value metrics were a drag on relative results. In addition, an overweighting in higher momentum stocks hurt relative results.
By design, the Fund does not hold Real Estate Investment Trusts (REITs) and Utilities stocks. Our lack of exposure to both REITs and Utilities stocks detracted from relative performance during the quarter.
Detailed Explanation of Calendar Year Performance
The Fund’s tilt toward deeper value stocks across multiple value metrics detracted from relative results during the calendar year. An overweighting in higher momentum stocks also hurt relative performance. However, a tilt toward smaller stocks in thesmall-cap value universe boosted the Fund’s relative performance, as the benchmark’s smaller stocks outperformed their larger counterparts during the year.
By design, the Fund does not hold Real Estate Investment Trusts (REITs) and Utilities stocks. This positioning hurt relative results, particularly as Utilities was the benchmark’s best performing sector during the12-month period.
| | |
| 4 | | Semi-Annual Report | December 31, 2018 (Unaudited) |
| | |
OmniSmall-Cap Value Fund MANAGER’S COMMENTARY (Unaudited) (continued) | | |
Top Ten Holdings as of December 31, 2018
| | | | | | | | | |
| Rank | | Description | | Industry | | % of Net
Assets |
| 1 | | Iridium Communications, Inc. | | Communication Services | | 0.8% |
| 2 | | iShares Russell 2000 Value ETF | | Exchange Traded Fund | | 0.6% |
| 3 | | International Speedway Corp., Class A | | Consumer Discretionary | | 0.6% |
| 4 | | Navigators Group, Inc. (The) | | Financials | | 0.6% |
| 5 | | Marcus Corp. (The) | | Communication Services | | 0.6% |
| 6 | | TTM Technologies, Inc. | | Information Technology | | 0.6% |
| 7 | | Insight Enterprises, Inc. | | Information Technology | | 0.6% |
| 8 | | First BanCorp Puerto Rico | | Financials | | 0.6% |
| 9 | | Navigant Consulting, Inc. | | Industrials | | 0.6% |
| 10 | | Argo Group International Holdings, Ltd. | | Financials | | 0.6% |
| | Total | | | | 6.2% |
Industry Sector Representation as of December 31, 2018
| | | | | | | | | | | | | | | |
| | | % of Net Assets | | % of Russell 2000
Value Index | | Difference |
| Communication Services | | | | 5.7% | | | | | 3.1% | | | | | 2.6% | |
| Consumer Discretionary | | | | 17.1% | | | | | 9.4% | | | | | 7.7% | |
| Consumer Staples | | | | 2.4% | | | | | 2.6% | | | | | -0.2% | |
| Energy | | | | 12.1% | | | | | 5.4% | | | | | 6.7% | |
| Financials | | | | 28.9% | | | | | 29.5% | | | | | -0.6% | |
| Health Care | | | | 3.5% | | | | | 4.3% | | | | | -0.8% | |
| Industrials | | | | 15.1% | | | | | 11.8% | | | | | 3.3% | |
| Information Technology | | | | 7.0% | | | | | 10.8% | | | | | -3.8% | |
| Materials | | | | 5.4% | | | | | 4.1% | | | | | 1.3% | |
| Real Estate | | | | 0.2% | | | | | 11.7% | | | | | -11.5% | |
| Utilities | | | | 0.0% | | | | | 7.3% | | | | | -7.3% | |
| Cash & Other Assets | | | | 2.6% | | | | | 0.0% | | | | | 2.6% | |
Total | | | | 100.0% | | | | | 100.0% | | | | | | |
Disclaimer
The views expressed here are exclusively those of Fund management. These views, including those related to market sectors or individual stocks, are not meant as investment advice and should not be considered predictive in nature. Any favorable (or unfavorable) description of a holding applies only as of the quarter end, December 31, 2018, unless otherwise stated. Security positions can and do change thereafter. Discussions of historical performance do not guarantee and may not be indicative of future performance.
Market volatility can significantly impact short-term performance. The Fund is not an appropriate investment for short-term investors. Investments in small companies generally carry greater risk than is customarily associated with larger companies. This additional risk is attributable to a number of factors, including the relatively limited financial resources that are typically available to small companies and the fact that small companies often have comparatively limited product lines. In addition, the stock of small companies tends to be more volatile than the stock of large companies, particularly in the short term and particularly in the early stages of an economic or market downturn. Shareholders of the Fund, therefore, are taking on more risk than they would if they invested in the stock market as a whole.
| | |
OmniSmall-Cap Value Fund MANAGER’S COMMENTARY (Unaudited) (continued) | | |
Conclusion
Thank you for your continued investment in OmniSmall-Cap Value Fund. We encourage your feedback; your reactions and concerns are important to us.
Sincerely,
The Investment Management Team
| | |
| 6 | | Semi-Annual Report | December 31, 2018 (Unaudited) |
| | |
OmniSmall-Cap Value Fund SCHEDULE OF INVESTMENTS (Unaudited) | | |
Showing percentage of net assets as of December 31, 2018
| | | | | | | | | | | | | | | | |
| Industry | | Company | | Shares | | | Value | | | | | | |
COMMON STOCKS - 97.43% | | | | | | | | |
| Communication Services - 5.73% | | | | | | |
| | AH Belo Corp., Class A | | | 15,000 | | | $ 50,550 | | | | | | | | |
| | Alaska Communications Systems Group, Inc.* | | | 377,100 | | | 543,024 | | | | | | | | |
| | AMC Entertainment Holdings, Inc., Class A+ | | | 261,900 | | | 3,216,132 | | | | | | | | |
| | ATN International, Inc. | | | 28,500 | | | 2,038,605 | | | | | | | | |
| | Beasley Broadcast Group, Inc., Class A | | | 2,500 | | | 9,375 | | | | | | | | |
| | Cars.com, Inc.* | | | 195,000 | | | 4,192,500 | | | | | | | | |
| | Consolidated Communi-cations Holdings, Inc. | | | 310,000 | | | 3,062,800 | | | | | | | | |
| | DHI Group, Inc.* | | | 110,000 | | | 167,200 | | | | | | | | |
| | Emmis Communications Corp., Class A* | | | 62,600 | | | 199,694 | | | | | | | | |
| | Entercom Communications Corp., Class A | | | 320,225 | | | 1,828,485 | | | | | | | | |
| | Entravision Communications Corp., Class A | | | 59,700 | | | 173,727 | | | | | | | | |
| | Eros International PLC*+ | | | 161,100 | | | 1,335,519 | | | | | | | | |
| | EW Scripps Co. (The), Class A | | | 220,000 | | | 3,460,600 | | | | | | | | |
| | Gannett Co., Inc. | | | 316,700 | | | 2,701,451 | | | | | | | | |
| | Gray Television, Inc.* | | | 256,200 | | | 3,776,388 | | | | | | | | |
| | Iridium Communications, Inc.* | | | 391,325 | | | 7,219,946 | | | | | | | | |
| | Marcus Corp. (The) | | | 130,150 | | | 5,140,925 | | | | | | | | |
| | New Media Investment Group, Inc. | | | 208,500 | | | 2,412,345 | | | | | | | | |
| | Saga Communications, Inc., Class A | | | 8,761 | | | 291,128 | | | | | | | | |
| | Salem Media Group, Inc. | | | 24,800 | | | 51,832 | | | | | | | | |
| | Scholastic Corp. | | | 95,800 | | | 3,856,908 | | | | | | | | |
| | SPAR Group, Inc.* | | | 46,500 | | | 23,343 | | | | | | | | |
| | Spok Holdings, Inc. | | | 118,864 | | | 1,576,137 | | | | | | | | |
| | Townsquare Media, Inc., Class A | | | 265,556 | | | 1,083,468 | | | | | | | | |
| | Tribune Publishing Co.* | | | 15,000 | | | 170,100 | | | | | | | | |
| | Urban One, Inc.* | | | 101,800 | | | 163,898 | | | | | | | | |
| | | | | | | | | | | | | | | | |
| | | | | | | | 48,746,080 | | | | | | | | |
| | |
Consumer Discretionary - 17.13% | | | | | | | | |
| | 1-800-Flowers.com, Inc., Class A* | | | 60,000 | | | 733,800 | | | | | | | | |
| | Abercrombie & Fitch Co., Class A | | | 210,000 | | | 4,210,500 | | | | | | | | |
| | AMCON Distributing Co. | | | 1,350 | | | 134,662 | | | | | | | | |
| | American Axle & Manufacturing Holdings, Inc.* | | | 234,700 | | | 2,605,170 | | | | | | | | |
| | American Outdoor Brands Corp.* | | | 154,327 | | | 1,984,645 | | | | | | | | |
| | American Public Education, Inc.* | | | 37,600 | | | 1,070,096 | | | | | | | | |
| | | | | | | | |
| Industry | | Company | | Shares | | | Value |
| | | |
| | | | | | | | |
Consumer Discretionary (continued) |
| | Appliance Recycling Centers of America, Inc.* | | | 2,900 | | | $ 1,276 |
| | Ark Restaurants Corp. | | | 12,600 | | | 231,336 |
| | Ascena Retail Group, Inc.* | | | 726,500 | | | 1,823,515 |
| | Barnes & Noble Education, Inc.* | | | 181,824 | | | 729,114 |
| | Barnes & Noble, Inc. | | | 172,900 | | | 1,225,861 |
| | Bassett Furniture Industries, Inc. | | | 80,500 | | | 1,613,220 |
| | BBX Capital Corp. | | | 351,039 | | | 2,011,453 |
| | Beazer Homes USA, Inc.* | | | 120,000 | | | 1,137,600 |
| | Big Lots, Inc. | | | 80,000 | | | 2,313,600 |
| | Biglari Holdings, Inc., Class A* | | | 210 | | | 123,411 |
| | Biglari Holdings, Inc., Class B* | | | 2,100 | | | 238,518 |
| | BJ’s Restaurants, Inc. | | | 59,000 | | | 2,983,630 |
| | Boot Barn Holdings, Inc.* | | | 54,000 | | | 919,620 |
| | Buckle, Inc. (The)+ | | | 75,400 | | | 1,458,236 |
| | Build-A-Bear Workshop, Inc.* | | | 49,500 | | | 195,525 |
| | Caleres, Inc. | | | 123,500 | | | 3,437,005 |
| | Canterbury Park Holding Corp. | | | 3,900 | | | 54,249 |
| | Carriage Services, Inc. | | | 40,000 | | | 620,000 |
| | Carrols Restaurant Group, Inc.* | | | 75,900 | | | 746,856 |
| | Cato Corp. (The), Class A | | | 80,000 | | | 1,141,600 |
| | Century Casinos, Inc.* | | | 124,600 | | | 920,794 |
| | Chico’s FAS, Inc. | | | 366,200 | | | 2,058,044 |
| | China Automotive Systems, Inc.* | | | 37,500 | | | 91,500 |
| | China XD Plastics Co., Ltd.* | | | 163,000 | | | 286,880 |
| | Citi Trends, Inc. | | | 78,840 | | | 1,607,548 |
| | Conn’s, Inc.* | | | 103,000 | | | 1,942,580 |
| | Container Store Group, Inc.
(The)* | | | 141,150 | | | 673,285 |
| | Cooper Tire & Rubber Co. | | | 96,350 | | | 3,114,995 |
| | Cooper-Standard Holdings, Inc.* | | | 51,000 | | | 3,168,120 |
| | Crown Crafts, Inc. | | | 13,050 | | | 70,470 |
| | CSS Industries, Inc. | | | 11,800 | | | 105,846 |
| | Del Frisco’s Restaurant Group, Inc.* | | | 39,700 | | | 283,855 |
| | Del Taco Restaurants, Inc.* | | | 102,300 | | | 1,021,977 |
| | Delta Apparel, Inc.* | | | 25,500 | | | 439,365 |
| | Destination Maternity Corp.* | | | 9,800 | | | 27,832 |
| | Destination XL Group, Inc.* | | | 139,800 | | | 303,366 |
| | Dillard’s, Inc., Class A+ | | | 68,000 | | | 4,101,080 |
| | DSW, Inc., Class A | | | 186,500 | | | 4,606,550 |
| | El Pollo Loco Holdings, Inc.* | | | 90,500 | | | 1,372,885 |
| | Escalade, Inc. | | | 3,600 | | | 41,220 |
| | |
Omni Small-Cap Value Fund SCHEDULE OF INVESTMENTS (Unaudited) (continued) | | |
Showing percentage of net assets as of December 31, 2018
| | | | | | | | | | | | | | |
| Industry | | Company | | Shares | | | Value | | | | |
Common Stocks (continued) | | | | | | | | | | | | |
Consumer Discretionary (continued) | | | | | |
| | Ethan Allen Interiors, Inc. | | | 82,500 | | | $ | 1,451,175 | | | | | |
| | EVINE Live, Inc.* | | | 202,700 | | | | 80,857 | | | | | |
| | Express, Inc.*+ | | | 292,000 | | | | 1,492,120 | | | | | |
| | Fiesta Restaurant Group, Inc.* | | | 20,800 | | | | 322,608 | | | | | |
| | Flanigan’s Enterprises, Inc. | | | 2,500 | | | | 63,525 | | | | | |
| | Flexsteel Industries, Inc. | | | 4,800 | | | | 105,984 | | | | | |
| | Fossil Group, Inc.* | | | 150,000 | | | | 2,359,500 | | | | | |
| | Full House Resorts, Inc.* | | | 71,000 | | | | 143,420 | | | | | |
| | GameStop Corp., Class A+ | | | 200,000 | | | | 2,524,000 | | | | | |
| | Gaming Partners International Corp. | | | 1,200 | | | | 15,600 | | | | | |
| | Genesco, Inc.* | | | 60,000 | | | | 2,658,000 | | | | | |
| | Good Times Restaurants, Inc.* | | | 43,000 | | | | 107,500 | | | | | |
| | Group 1 Automotive, Inc. | | | 59,000 | | | | 3,110,480 | | | | | |
| | Haverty Furniture Cos, Inc. | | | 98,400 | | | | 1,847,952 | | | | | |
| | Hibbett Sports, Inc.* | | | 76,900 | | | | 1,099,670 | | | | | |
| | Houghton Mifflin Harcourt Co.* | | | 275,000 | | | | 2,436,500 | | | | | |
| | International Speedway Corp., Class A | | | 118,456 | | | | 5,195,480 | | | | | |
| | J Alexander’s Holdings, Inc.* | | | 49,950 | | | | 411,088 | | | | | |
| | J. Jill, Inc.* | | | 70,000 | | | | 373,100 | | | | | |
| | K12, Inc.* | | | 121,217 | | | | 3,004,969 | | | | | |
| | KB Home | | | 175,900 | | | | 3,359,690 | | | | | |
| | Kirkland’s, Inc.* | | | 54,000 | | | | 514,620 | | | | | |
| | Lakeland Industries, Inc.* | | | 30,050 | | | | 313,722 | | | | | |
| | Lands’ End, Inc.*+ | | | 91,500 | | | | 1,300,215 | | | | | |
| | La-Z-Boy, Inc., | | | 9,500 | | | | 263,245 | | | | | |
| | Libbey, Inc. | | | 30,000 | | | | 116,400 | | | | | |
| | Lifetime Brands, Inc. | | | 60,900 | | | | 610,827 | | | | | |
| | Live Ventures, Inc.*+ | | | 3,200 | | | | 21,504 | | | | | |
| | Luby’s, Inc.* | | | 75,800 | | | | 90,960 | | | | | |
| | MarineMax, Inc.* | | | 80,000 | | | | 1,464,800 | | | | | |
| | MDC Holdings, Inc. | | | 131,760 | | | | 3,703,774 | | | | | |
| | Meritage Homes Corp.* | | | 66,442 | | | | 2,439,750 | | | | | |
| | Modine Manufacturing Co.* | | | 142,900 | | | | 1,544,749 | | | | | |
| | Movado Group, Inc. | | | 45,000 | | | | 1,422,900 | | | | | |
| | Nevada Gold & Casinos, | | | | | | | | | | | | |
| | Inc.*+ | | | 38,300 | | | | 91,154 | | | | | |
| | Office Depot, Inc. | | | 1,150,000 | | | | 2,967,000 | | | | | |
| | P&F Industries, Inc., Class A | | | 696 | | | | 5,380 | | | | | |
| | Papa Murphy’s Holdings, Inc.*+ | | | 65,000 | | | | 308,750 | | | | | |
| | Party City Holdco, Inc.*+ | | | 273,200 | | | | 2,726,536 | | | | | |
| | Peak Resorts, Inc. | | | 114,000 | | | | 533,520 | | | | | |
| | Pier 1 Imports, Inc. | | | 136,200 | | | | 41,650 | | | | | |
| | Red Robin Gourmet | | | | | | | | | | | | |
| | Burgers, Inc.* | | | 17,000 | | | | 454,240 | | | | | |
| | Regis Corp.* | | | 153,150 | | | | 2,595,892 | | | | | |
| | | | | | | | | | |
| Industry | | Company | | Shares | | | Value | |
| | | | | | | | | | |
Consumer Discretionary (continued) | |
| | Rent-A-Center, Inc.* | | | 65,500 | | | $ | 1,060,445 | |
| | Rocky Brands, Inc. | | | 28,300 | | | | 735,800 | |
| | RTW RetailWinds, Inc.* | | | 126,700 | | | | 358,561 | |
| | Shiloh Industries, Inc.* | | | 71,500 | | | | 416,845 | |
| | Shoe Carnival, Inc. | | | 63,600 | | | | 2,131,236 | |
| | Signet Jewelers, Ltd. | | | 105,000 | | | | 3,335,850 | |
| | Sonic Automotive, Inc., Class A | | | 119,100 | | | | 1,638,816 | |
| | SORL Auto Parts, Inc.*+ | | | 129,900 | | | | 244,212 | |
| | Speedway Motorsports, Inc. | | | 145,700 | | | | 2,370,539 | |
| | Stage Stores, Inc.+ | | | 100,000 | | | | 74,000 | |
| | Stein Mart, Inc.* | | | 83,200 | | | | 89,024 | |
| | Stoneridge, Inc.* | | | 50,000 | | | | 1,232,500 | |
| | Strattec Security Corp.+ | | | 25,900 | | | | 745,920 | |
| | Superior Industries International, Inc. | | | 92,500 | | | | 444,925 | |
| | Tandy Leather Factory, Inc.* | | | 8,000 | | | | 45,440 | |
| | Tilly’s, Inc., Class A | | | 125,300 | | | | 1,360,758 | |
| | Tower International, Inc. | | | 52,000 | | | | 1,237,600 | |
| | TravelCenters of America, LLC* | | | 176,000 | | | | 661,760 | |
| | TRI Pointe Group, Inc.* | | | 266,000 | | | | 2,907,380 | |
| | Tuesday Morning Corp.*+ | | | 236,000 | | | | 401,200 | |
| | Unifi, Inc.* | | | 31,900 | | | | 728,596 | |
| | US Auto Parts Network, Inc.* | | | 98,900 | | | | 89,999 | |
| | Vera Bradley, Inc.* | | | 149,200 | | | | 1,278,644 | |
| | Vista Outdoor, Inc.* | | | 162,500 | | | | 1,844,375 | |
| | Vitamin Shoppe, Inc.* | | | 100,000 | | | | 474,000 | |
| | VOXX International Corp.* | | | 65,000 | | | | 257,400 | |
| | Weyco Group, Inc. | | | 20,200 | | | | 589,234 | |
| | William Lyon Homes, Class A*+ | | | 80,500 | | | | 860,545 | |
| | Zumiez, Inc.* | | | 119,400 | | | | 2,288,898 | |
| | | | | | | | | | |
| | | | | | | | | 145,581,998 | |
| | |
Consumer Staples - 2.36% | | | | | | | | |
| | Alico, Inc. | | | 10,461 | | | | 308,599 | |
| | Andersons, Inc. (The) | | | 88,100 | | | | 2,633,309 | |
| | Dean Foods Co. | | | 245,000 | | | | 933,450 | |
| | Hostess Brands, Inc.* | | | 282,300 | | | | 3,088,362 | |
| | Ingles Markets, Inc., Class A | | | 79,900 | | | | 2,174,878 | |
| | Landec Corp.* | | | 16,000 | | | | 189,440 | |
| | Mannatech, Inc. | | | 8,400 | | | | 157,920 | |
| | Natural Alternatives International, Inc.* | | | 18,100 | | | | 177,923 | |
| | Natural Grocers by Vitamin Cottage, Inc.* | | | 25,000 | | | | 383,250 | |
| | Natural Health Trends Corp. | | | 3,000 | | | | 55,470 | |
| | Nature’s Sunshine Products, Inc.* | | | 3,000 | | | | 24,450 | |
| | |
| 8 | | Semi-Annual Report | December 31, 2018 (Unaudited) |
| | |
OmniSmall-Cap Value Fund SCHEDULE OF INVESTMENTS (Unaudited) (continued) | | |
Showing percentage of net assets as of December 31, 2018
| | | | | | | | | | | | |
| Industry | | Company | | Shares | | | Value | | | | |
Common Stocks (continued) | | | | |
Consumer Staples (continued) | | | | |
| | S&W Seed Co.*+ | | | 7,000 | | | $ 12,670 | | | | |
| | Seneca Foods Corp., Class A* | | | 40,100 | | | 1,131,622 | | | | |
| | Smart & Final Stores, Inc.* | | | 162,394 | | | 769,748 | | | | |
| | SpartanNash Co. | | | 145,946 | | | 2,507,352 | | | | |
| | United Natural Foods, Inc.* | | | 78,300 | | | 829,197 | | | | |
| | Village Super Market, Inc., Class A | | | 35,709 | | | 954,859 | | | | |
| | Weis Markets, Inc.+ | | | 78,125 | | | 3,732,812 | | | | |
| | | | | | | | | | | | |
| | | | | | | | 20,065,311 | | | | |
| | |
Energy - 12.11% | | | | |
| | Adams Resources & Energy, Inc. | | | 23,100 | | | 894,201 | | | | |
| | Approach Resources, Inc.* | | | 214,026 | | | 186,631 | | | | |
| | Arch Coal, Inc., Class A | | | 55,500 | | | 4,605,945 | | | | |
| | Archrock, Inc. | | | 447,000 | | | 3,348,030 | | | | |
| | Ardmore Shipping Corp.* | | | 127,688 | | | 596,303 | | | | |
| | Bonanza Creek Energy, Inc.* | | | 60,000 | | | 1,240,200 | | | | |
| | Bristow Group, Inc.*+ | | | 20,500 | | | 49,815 | | | | |
| | Callon Petroleum Co.* | | | 60,000 | | | 389,400 | | | | |
| | Carrizo Oil & Gas, Inc.* | | | 235,800 | | | 2,662,182 | | | | |
| | Clean Energy Fuels Corp.* | | | 300,000 | | | 516,000 | | | | |
| | Cloud Peak Energy, Inc.* | | | 221,500 | | | 81,135 | | | | |
| | Contango Oil & Gas Co.* | | | 102,500 | | | 333,125 | | | | |
| | Dawson Geophysical Co.* | | | 57,250 | | | 193,505 | | | | |
| | Delek US Holdings, Inc. | | | 32,080 | | | 1,042,921 | | | | |
| | Denbury Resources, Inc.* | | | 1,690,000 | | | 2,889,900 | | | | |
| | DHT Holdings, Inc. | | | 347,322 | | | 1,361,502 | | | | |
| | Diamond Offshore Drilling, Inc.*+ | | | 326,000 | | | 3,077,440 | | | | |
| | Dorian LPG, Ltd.* | | | 130,500 | | | 760,815 | | | | |
| | Earthstone Energy, Inc., Class A* | | | 75,000 | | | 339,000 | | | | |
| | Eclipse Resources Corp.* | | | 538,700 | | | 565,635 | | | | |
| | Ensco PLC, Class A+ | | | 248,000 | | | 882,880 | | | | |
| | EP Energy Corp., Class A* | | | 464,000 | | | 324,800 | | | | |
| | Era Group, Inc.* | | | 45,800 | | | 400,292 | | | | |
| | Euronav NV | | | 125,442 | | | 869,313 | | | | |
| | Exterran Corp.* | | | 92,000 | | | 1,628,400 | | | | |
| | Extraction Oil & Gas, Inc.*+ | | | 390,400 | | | 1,674,816 | | | | |
| | Forum Energy Technologies, Inc.* | | | 48,310 | | | 199,520 | | | | |
| | Frontline, Ltd.*+ | | | 180,000 | | | 995,400 | | | | |
| | GasLog, Ltd. | | | 239,300 | | | 3,938,878 | | | | |
| | Gran Tierra Energy, Inc.* | | | 1,299,900 | | | 2,820,783 | | | | |
| | Green Plains, Inc. | | | 110,200 | | | 1,444,722 | | | | |
| | Gulf Island Fabrication, Inc.* | | | 15,000 | | | 108,300 | | | | |
| | Halcon Resources Corp.*+ | | | 280,000 | | | 476,000 | | | | |
| | Hallador Energy Co. | | | 166,600 | | | 844,662 | | | | |
| | Helix Energy Solutions Group, Inc.* | | | 545,500 | | | 2,951,155 | | | | |
| | | | | | | | |
| Industry | | Company | | Shares | | | Value |
|
Energy (continued) |
| | HighPoint Resources Corp.* | | | 452,546 | | | $1,126,840 |
| | Independence Contract Drilling, Inc.*+ | | | 83,319 | | | 259,955 |
| | International Seaways, Inc.* | | | 438 | | | 7,376 |
| | Keane Group, Inc.* | | | 200,000 | | | 1,636,000 |
| | Lonestar Resources US, Inc., Class A* | | | 117,000 | | | 427,050 |
| | Mammoth Energy Services, Inc. | | | 134,000 | | | 2,409,320 |
| | Matador Resources Co.* | | | 37,000 | | | 574,610 |
| | Matrix Service Co.* | | | 62,500 | | | 1,121,250 |
| | McDermott International, Inc.*+ | | | 325,131 | | | 2,126,357 |
| | Midstates Petroleum Co., Inc.* | | | 66,000 | | | 495,660 |
| | Mitcham Industries, Inc.* | | | 15,100 | | | 38,656 |
| | Nabors Industries, Ltd. | | | 810,000 | | | 1,620,000 |
| | NACCO Industries, Inc., Class A | | | 34,445 | | | 1,167,686 |
| | Natural Gas Services Group, Inc.* | | | 68,800 | | | 1,131,072 |
| | Noble Corp. PLC* | | | 743,000 | | | 1,946,660 |
| | Oil States International, Inc.* | | | 121,000 | | | 1,727,880 |
| | Overseas Shipholding Group, Inc., Class A* | | | 525,916 | | | 873,021 |
| | Pacific Ethanol, Inc.* | | | 86,900 | | | 74,821 |
| | Par Pacific Holdings, Inc.* | | | 119,900 | | | 1,700,182 |
| | Penn Virginia Corp.* | | | 20,000 | | | 1,081,200 |
| | Pioneer Energy Services Corp.* | | | 343,100 | | | 422,013 |
| | ProPetro Holding Corp.* | | | 170,000 | | | 2,094,400 |
| | QEP Resources, Inc.* | | | 475,000 | | | 2,674,250 |
| | Renewable Energy Group, Inc.* | | | 163,885 | | | 4,211,844 |
| | REX American Resources Corp.* | | | 33,920 | | | 2,310,291 |
| | Ring Energy, Inc.* | | | 50,000 | | | 254,000 |
| | Rowan Cos Plc, Class A* | | | 207,900 | | | 1,744,281 |
| | SandRidge Energy, Inc.* | | | 68,500 | | | 521,285 |
| | SEACOR Holdings, Inc.* | | | 53,400 | | | 1,975,800 |
| | SEACOR Marine Holdings, Inc.* | | | 18,468 | | | 217,184 |
| | SemGroup Corp., Class A+ | | | 212,500 | | | 2,928,250 |
| | Ship Finance International, Ltd. | | | 309,400 | | | 3,257,982 |
| | SilverBow Resources, Inc.* | | | 36,600 | | | 865,224 |
| | SM Energy Co. | | | 257,000 | | | 3,978,360 |
| | Smart Sand, Inc.*+ | | | 40,000 | | | 88,800 |
| | SRC Energy, Inc.* | | | 608,500 | | | 2,859,950 |
| | Superior Energy Services, Inc.* | | | 310,000 | | | 1,038,500 |
| | Teekay Corp.+ | | | 340,000 | | | 1,135,600 |
| | |
OmniSmall-Cap Value Fund SCHEDULE OF INVESTMENTS (Unaudited) (continued) | | |
Showing percentage of net assets as of December 31, 2018
| | | | | | | | | | | | |
| Industry | | Company | | Shares | | | Value | | | | |
| | |
Common Stocks (continued) | | | | |
Energy (continued) | | | | |
| | TETRA Technologies, Inc.* | | | 200,000 | | | $ 336,000 | | | | |
| | TransAtlantic Petroleum, Ltd.* | | | 35,000 | | | 36,400 | | | | |
| | Unit Corp.* | | | 175,725 | | | 2,509,353 | | | | |
| | US Silica Holdings, Inc.+ | | | 79,500 | | | 809,310 | | | | |
| | VAALCO Energy, Inc.* | | | 300,000 | | | 441,000 | | | | |
| | | | | | | | | | | | |
| | | | | | | | 102,949,279 | | | | |
| | |
Financials - 28.88% | | | | |
| | 1347 Property Insurance Holdings, Inc.* | | | 24,300 | | | 97,686 | | | | |
| | 1st Constitution Bancorp | | | 3,000 | | | 59,790 | | | | |
| | 1st Source Corp. | | | 39,347 | | | 1,587,258 | | | | |
| | Access National Corp. | | | 35,191 | | | 750,624 | | | | |
| | ACNB Corp. | | | 3,000 | | | 117,750 | | | | |
| | American Equity Investment Life Holding Co. | | | 850 | | | 23,749 | | | | |
| | American National Bankshares, Inc. | | | 21,752 | | | 637,551 | | | | |
| | American River Bankshares | | | 21,300 | | | 293,940 | | | | |
| | AmeriServ Financial, Inc. | | | 138,000 | | | 556,140 | | | | |
| | Argo Group International Holdings, Ltd. | | | 71,884 | | | 4,834,199 | | | | |
| | Arlington Asset Investment Corp., Class A+ | | | 69,500 | | | 503,180 | | | | |
| | Atlantic Capital Bancshares, Inc.* | | | 59,800 | | | 978,926 | | | | |
| | Atlas Financial Holdings, Inc.* | | | 6,500 | | | 52,585 | | | | |
| | B. Riley Financial, Inc. | | | 10,402 | | | 147,708 | | | | |
| | Banc of California, Inc. | | | 135,000 | | | 1,796,850 | | | | |
| | Banco Latinoamericano de Comercio Exterior SA, Class E | | | 117,000 | | | 2,024,100 | | | | |
| | Bancorp, Inc. (The)* | | | 154,500 | | | 1,229,820 | | | | |
| | Bank of Commerce Holdings+ | | | 83,450 | | | 914,612 | | | | |
| | Bankwell Financial Group, Inc. | | | 1,800 | | | 51,678 | | | | |
| | Banner Corp. | | | 32,000 | | | 1,711,360 | | | | |
| | Bar Harbor Bankshares | | | 34,366 | | | 770,829 | | | | |
| | BCB Bancorp, Inc. | | | 10,400 | | | 108,888 | | | | |
| | Beneficial Bancorp, Inc. | | | 125,000 | | | 1,786,250 | | | | |
| | Berkshire Hills Bancorp, Inc. | | | 138,065 | | | 3,723,613 | | | | |
| | Blucora, Inc.* | | | 29,297 | | | 780,472 | | | | |
| | Blue Capital Reinsurance Holdings, Ltd.+ | | | 12,173 | | | 66,952 | | | | |
| | BSB Bancorp, Inc.* | | | 8,200 | | | 230,092 | | | | |
| | C&F Financial Corp. | | | 4,200 | | | 223,482 | | | | |
| | Cadence BanCorp. | | | 166,000 | | | 2,785,480 | | | | |
| | California First National Bancorp | | | 31,500 | | | 445,725 | | | | |
| | | | | | | | | | |
| Industry | | Company | | Shares | | | Value | | |
| | | | |
| | | | | | | | | | |
Financials (continued) | | |
| | Camden National Corp. | | | 30,100 | | | $1,082,697 | | |
| | Cannae Holdings, Inc.* | | | 61,700 | | | 1,056,304 | | |
| | Capital City Bank Group, Inc. | | | 83,150 | | | 1,929,911 | | |
| | Capstar Financial Holdings, Inc. | | | 29,000 | | | 427,170 | | |
| | CB Financial Services, Inc. | | | 14,000 | | | 346,920 | | |
| | Central Pacific Financial Corp. | | | 15,000 | | | 365,250 | | |
| | Central Valley Community Bancorp | | | 50,000 | | | 943,500 | | |
| | Century Bancorp, Inc., Class A | | | 15,200 | | | 1,029,496 | | |
| | Chemung Financial Corp. | | | 13,500 | | | 557,685 | | |
| | Citizens Community Bancorp, Inc. | | | 40,000 | | | 436,000 | | |
| | Citizens, Inc.*+ | | | 106,040 | | | 797,421 | | |
| | Civista Bancshares, Inc. | | | 37,527 | | | 653,720 | | |
| | CNB Financial Corp. | | | 83,800 | | | 1,923,210 | | |
| | Codorus Valley Bancorp, Inc. | | | 8,255 | | | 175,419 | | |
| | Colony Bankcorp, Inc. | | | 1,500 | | | 21,900 | | |
| | Community Bankers Trust Corp.* | | | 40,800 | | | 294,576 | | |
| | Community Financial Corp. (The) | | | 12,500 | | | 365,500 | | |
| | Community Trust Bancorp, Inc. | | | 17,500 | | | 693,175 | | |
| | Community West Bancshares | | | 2,000 | | | 20,060 | | |
| | ConnectOne Bancorp, Inc. | | | 105,200 | | | 1,943,044 | | |
| | Consumer Portfolio Services, Inc.* | | | 191,650 | | | 576,866 | | |
| | County Bancorp, Inc. | | | 15,237 | | | 264,667 | | |
| | Cowen, Inc.*+ | | | 91,500 | | | 1,220,610 | | |
| | Crawford & Co., Class A | | | 47,600 | | | 423,640 | | |
| | Crawford & Co., Class B | | | 16,400 | | | 147,600 | | |
| | Customers Bancorp, Inc.* | | | 81,700 | | | 1,486,940 | | |
| | Dime Community Bancshares, Inc. | | | 97,900 | | | 1,662,342 | | |
| | DNB Financial Corp. | | | 13,465 | | | 363,555 | | |
| | Donegal Group, Inc., Class A | | | 94,000 | | | 1,282,630 | | |
| | Eagle Bancorp Montana, Inc. | | | 3,000 | | | 48,510 | | |
| | Elevate Credit, Inc.* | | | 5,600 | | | 25,088 | | |
| | EMC Insurance Group, Inc. | | | 46,550 | | | 1,482,617 | | |
| | Emclaire Financial Corp.+ | | | 200 | | | 6,068 | | |
| | Employers Holdings, Inc. | | | 103,900 | | | 4,360,683 | | |
| | Encore Capital Group, Inc.*+ | | | 73,000 | | | 1,715,500 | | |
| | Enova International, Inc.* | | | 132,307 | | | 2,574,694 | | |
| | |
| 10 | | Semi-Annual Report | December 31, 2018 (Unaudited) |
| | |
OmniSmall-Cap Value Fund SCHEDULE OF INVESTMENTS (Unaudited) (continued) | | |
Showing percentage of net assets as of December 31, 2018
| | | | | | | | | | | | |
| Industry | | Company | | Shares | | | Value | | | | |
| | |
Common Stocks (continued) | | | | |
Financials (continued) | | | | |
| | Entegra Financial Corp.* | | | 25,000 | | | $ 518,750 | | | | |
| | Enterprise Bancorp, Inc. | | | 36,275 | | | 1,166,604 | | | | |
| | ESSA Bancorp, Inc.+ | | | 33,100 | | | 516,691 | | | | |
| | EZCORP, Inc., Class A* | | | 194,169 | | | 1,500,926 | | | | |
| | Farmers National Banc Corp. | | | 150 | | | 1,911 | | | | |
| | FBL Financial Group, Inc., Class A+ | | | 60,806 | | | 3,991,914 | | | | |
| | Federal Agricultural Mortgage Corp., Class C | | | 34,000 | | | 2,054,960 | | | | |
| | FedNat Holding Co. | | | 40,900 | | | 814,728 | | | | |
| | Fidelity Southern Corp. | | | 76,123 | | | 1,980,720 | | | | |
| | Financial Institutions, Inc. | | | 39,300 | | | 1,010,010 | | | | |
| | First BanCorp Puerto Rico | | | 566,400 | | | 4,871,040 | | | | |
| | First Bancorp, Inc. | | | 5,500 | | | 144,650 | | | | |
| | First Bank/NJ | | | 50,000 | | | 606,000 | | | | |
| | First Busey Corp. | | | 115,100 | | | 2,824,554 | | | | |
| | First Business Financial Services, Inc. | | | 21,000 | | | 409,710 | | | | |
| | First Capital, Inc. | | | 35 | | | 1,390 | | | | |
| | First Commonwealth Financial Corp. | | | 102,995 | | | 1,244,180 | | | | |
| | First Community Bankshares, Inc. | | | 30,000 | | | 944,400 | | | | |
| | First Community Corp./SC+ | | | 600 | | | 11,658 | | | | |
| | First Financial Corp. | | | 37,000 | | | 1,485,550 | | | | |
| | First Financial Northwest, Inc. | | | 35,182 | | | 544,266 | | | | |
| | First Guaranty Bancshares, Inc. | | | 5,499 | | | 127,632 | | | | |
| | First Internet Bancorp+ | | | 14,500 | | | 296,380 | | | | |
| | FirstMid-Illinois Bancshares, Inc. | | | 16,476 | | | 525,914 | | | | |
| | First Northwest Bancorp | | | 2,000 | | | 29,660 | | | | |
| | First United Corp. | | | 14,876 | | | 236,826 | | | | |
| | First US Bancshares, Inc. | | | 4,368 | | | 34,726 | | | | |
| | Flushing Financial Corp. | | | 60,697 | | | 1,306,806 | | | | |
| | Franklin Financial Network, Inc.* | | | 40,000 | | | 1,054,800 | | | | |
| | FS Bancorp, Inc. | | | 9,150 | | | 392,352 | | | | |
| | FS KKR Capital Corp. | | | 470,000 | | | 2,434,600 | | | | |
| | FSB Bancorp, Inc./NY*+ | | | 1,000 | | | 16,830 | | | | |
| | GAIN Capital Holdings, Inc.+ | | | 139,805 | | | 861,199 | | | | |
| | Global Indemnity, Ltd. | | | 28,400 | | | 1,028,932 | | | | |
| | Great Southern Bancorp, Inc. | | | 36,900 | | | 1,698,507 | | | | |
| | Great Western Bancorp, Inc. | | | 78,000 | | | 2,437,500 | | | | |
| | Green Bancorp, Inc. | | | 67,000 | | | 1,148,380 | | | | |
| | Hallmark Financial Services, Inc.* | | | 57,800 | | | 617,882 | | | | |
| | | | | | | | |
| Industry | | Company | | Shares | | | Value |
| | | |
| | | | | | | | |
Financials (continued) |
| | Hanmi Financial Corp. | | | 75,000 | | | $1,477,500 |
| | Hawthorn Bancshares, Inc. | | | 16,328 | | | 343,378 |
| | HCI Group, Inc. | | | 23,000 | | | 1,168,630 |
| | Heartland Financial USA, Inc. | | | 87,800 | | | 3,858,810 |
| | Hennessy Advisors, Inc. | | | 4,000 | | | 40,040 |
| | Heritage Insurance Holdings, Inc. | | | 60,000 | | | 883,200 |
| | Hilltop Holdings, Inc. | | | 112,100 | | | 1,998,743 |
| | Hingham Institution for Savings+ | | | 30 | | | 5,932 |
| | HMN Financial, Inc.* | | | 23,800 | | | 466,956 |
| | Home Bancorp, Inc. | | | 31,994 | | | 1,132,588 |
| | HomeStreet, Inc.* | | | 73,100 | | | 1,551,913 |
| | HomeTrust Bancshares, Inc. | | | 2,961 | | | 77,519 |
| | Hope Bancorp, Inc. | | | 210,000 | | | 2,490,600 |
| | HopFed Bancorp, Inc. | | | 18,100 | | | 240,549 |
| | Horace Mann Educators Corp. | | | 104,600 | | | 3,917,270 |
| | Horizon Bancorp, Inc. | | | 27,087 | | | 427,433 |
| | Independence Holding Co. | | | 15,050 | | | 529,760 |
| | Independent Bank Group, Inc.+ | | | 2,200 | | | 100,694 |
| | INTL. FCStone, Inc.* | | | 28,500 | | | 1,042,530 |
| | James River Group Holdings, Ltd. | | | 87,600 | | | 3,200,904 |
| | Kingstone Cos, Inc. | | | 16,100 | | | 284,809 |
| | Ladenburg Thalmann Financial Services, Inc. | | | 254,000 | | | 591,820 |
| | Lakeland Bancorp, Inc. | | | 109,950 | | | 1,628,359 |
| | Landmark Bancorp, Inc. | | | 1,214 | | | 27,807 |
| | LCNB Corp. | | | 8,000 | | | 121,200 |
| | Live Oak Bancshares, Inc. | | | 39,100 | | | 579,071 |
| | Mackinac Financial Corp. | | | 15,800 | | | 215,670 |
| | Manning & Napier, Inc. | | | 105,000 | | | 184,800 |
| | Marlin Business Services Corp.+ | | | 48,280 | | | 1,078,092 |
| | Mercantile Bank Corp. | | | 2,200 | | | 62,172 |
| | Meta Financial Group, Inc. | | | 79,431 | | | 1,540,167 |
| | Metropolitan Bank Holding Corp.* | | | 16,500 | | | 509,025 |
| | Mid Penn Bancorp, Inc. | | | 12,300 | | | 283,146 |
| | Middlefield Banc Corp. | | | 17,000 | | | 721,310 |
| | Midland States Bancorp, Inc. | | | 78,658 | | | 1,757,220 |
| | MidSouth Bancorp, Inc.+ | | | 25,512 | | | 270,427 |
| | MidWestOne Financial Group, Inc. | | | 49,860 | | | 1,238,024 |
| | MMA Capital Holdings, Inc.*+ | | | 1,700 | | | 42,840 |
| | Mr Cooper Group, Inc.* | | | 184,866 | | | 2,157,386 |
| | |
OmniSmall-Cap Value Fund SCHEDULE OF INVESTMENTS (Unaudited) (continued) | | |
Showing percentage of net assets as of December 31, 2018
| | | | | | | | | | | | |
| Industry | | Company | | Shares | | | Value | | | | |
| | |
Common Stocks (continued) | | | | |
Financials (continued) | | | | |
| | MutualFirst Financial, Inc. | | | 18,900 | | | $ 502,173 | | | | |
| | MVB Financial Corp. | | | 42,718 | | | 770,633 | | | | |
| | National Commerce Corp.* | | | 5,000 | | | 180,000 | | | | |
| | National Holdings Corp.* | | | 2,000 | | | 5,400 | | | | |
| | National Security Group, Inc. (The)+ | | | 200 | | | 2,602 | | | | |
| | National Western Life Group, Inc., Class A | | | 8,614 | | | 2,590,230 | | | | |
| | Navigators Group, Inc. (The) | | | 74,700 | | | 5,190,903 | | | | |
| | Nelnet, Inc., Class A | | | 37,800 | | | 1,978,452 | | | | |
| | Nicholas Financial, Inc.*+ | | | 43,400 | | | 451,360 | | | | |
| | Nicolet Bankshares, Inc.*+ | | | 19,355 | | | 944,524 | | | | |
| | NMI Holdings, Inc., Class A* | | | 250,000 | | | 4,462,500 | | | | |
| | Northeast Bancorp | | | 12,500 | | | 209,125 | | | | |
| | Northrim BanCorp, Inc. | | | 30,445 | | | 1,000,727 | | | | |
| | Northwest Bancshares, Inc. | | | 236,000 | | | 3,997,840 | | | | |
| | Ocwen Financial Corp.* | | | 708,400 | | | 949,256 | | | | |
| | OFG Bancorp | | | 153,500 | | | 2,526,610 | | | | |
| | Old Second Bancorp, Inc. | | | 79,750 | | | 1,036,750 | | | | |
| | On Deck Capital, Inc.* | | | 252,200 | | | 1,487,980 | | | | |
| | Oppenheimer Holdings, Inc., Class A | | | 39,093 | | | 998,826 | | | | |
| | Opus Bank | | | 158,000 | | | 3,095,220 | | | | |
| | Orrstown Financial Services, Inc. | | | 35,500 | | | 646,455 | | | | |
| | Ottawa Bancorp, Inc. | | | 1,000 | | | 13,330 | | | | |
| | Pacific Premier Bancorp, Inc.* | | | 55,800 | | | 1,424,016 | | | | |
| | Parke Bancorp, Inc. | | | 61,909 | | | 1,158,627 | | | | |
| | Pathfinder Bancorp, Inc. | | | 3,000 | | | 42,450 | | | | |
| | Patriot National Bancorp, Inc. | | | 13,000 | | | 185,250 | | | | |
| | PB Bancorp, Inc. | | | 15,500 | | | 168,950 | | | | |
| | Peapack Gladstone Financial Corp. | | | 35,894 | | | 903,811 | | | | |
| | Penns Woods Bancorp, Inc. | | | 2,023 | | | 81,406 | | | | |
| | Peoples Bancorp of North Carolina, Inc. | | | 24,017 | | | 587,456 | | | | |
| | Peoples Bancorp, Inc. | | | 43,400 | | | 1,306,340 | | | | |
| | Peoples Financial Services Corp. | | | 22,900 | | | 1,008,974 | | | | |
| | People’s United Financial, Inc. | | | 3,622 | | | 52,265 | | | | |
| | Piper Jaffray Cos | | | 51,400 | | | 3,384,176 | | | | |
| | PRA Group, Inc.* | | | 67,000 | | | 1,632,790 | | | | |
| | Premier Financial Bancorp, Inc. | | | 49,650 | | | 740,282 | | | | |
| | Protective Insurance Corp., Class B+ | | | 75,300 | | | 1,253,745 | | | | |
| | Provident Financial Holdings, Inc. | | | 51,000 | | | 790,500 | | | | |
| | | | | | | | |
| Industry | | Company | | Shares | | | Value |
| | | |
| | | | | | | | |
Financials (continued) | | | | | | |
| | Provident Financial Services, Inc. | | | 118,900 | | | $2,869,057 |
| | Prudential Bancorp, Inc. | | | 4,600 | | | 80,960 |
| | Regional Management Corp.* | | | 55,000 | | | 1,322,750 |
| | Reliant Bancorp, Inc.+ | | | 2,500 | | | 57,600 |
| | Renasant Corp. | | | 54,100 | | | 1,632,738 |
| | Republic Bancorp, Inc., Class A | | | 52,742 | | | 2,042,170 |
| | Riverview Bancorp, Inc. | | | 87,000 | | | 633,360 |
| | S&T Bancorp, Inc. | | | 20,045 | | | 758,503 |
| | Safety Insurance Group, Inc. | | | 2,356 | | | 192,744 |
| | Salisbury Bancorp, Inc. | | | 1,183 | | | 42,801 |
| | Sandy Spring Bancorp, Inc. | | | 7,400 | | | 231,916 |
| | SB Financial Group, Inc. | | | 30,400 | | | 500,080 |
| | SB One Bancorp | | | 5,000 | | | 102,200 |
| | Security National Financial Corp., Class A* | | | 90,616 | | | 467,579 |
| | Severn Bancorp, Inc. | | | 35,000 | | | 279,300 |
| | Shore Bancshares, Inc. | | | 67,012 | | | 974,354 |
| | SI Financial Group, Inc. | | | 55,700 | | | 709,061 |
| | Sierra Bancorp | | | 61,000 | | | 1,465,830 |
| | Sound Financial Bancorp, Inc. | | | 1,000 | | | 32,550 |
| | Southern National Bancorp of Virginia, Inc. | | | 56,958 | | | 752,985 |
| | Standard AVB Financial Corp. | | | 900 | | | 26,892 |
| | State Auto Financial Corp. | | | 83,550 | | | 2,844,042 |
| | Stewardship Financial Corp.+ | | | 1,000 | | | 9,100 |
| | Stewart Information Services Corp. | | | 87,150 | | | 3,608,010 |
| | Summit Financial Group, Inc. | | | 29,515 | | | 569,935 |
| | Territorial Bancorp, Inc. | | | 21,200 | | | 550,776 |
| | TheStreet, Inc.* | | | 67,490 | | | 137,005 |
| | Timberland Bancorp, Inc. | | | 39,000 | | | 869,700 |
| | Tiptree, Inc. | | | 114,100 | | | 637,819 |
| | Towne Bank | | | 1,642 | | | 39,326 |
| | TriCo Bancshares | | | 600 | | | 20,274 |
| | TriState Capital Holdings, Inc.* | | | 16,000 | | | 311,360 |
| | Two River Bancorp | | | 29,505 | | | 450,246 |
| | Union Bankshares Corp. | | | 84,481 | | | 2,384,899 |
| | United Community Banks, Inc./GA | | | 111,972 | | | 2,402,919 |
| | United Community Financial Corp. | | | 43,524 | | | 385,187 |
| | United Financial Bancorp, Inc. | | | 95,400 | | | 1,402,380 |
| | |
| 12 | | Semi-Annual Report | December 31, 2018 (Unaudited) |
| | |
OmniSmall-Cap Value Fund SCHEDULE OF INVESTMENTS (Unaudited) (continued) | | |
Showing percentage of net assets as of December 31, 2018
| | | | | | | | | | | | |
| Industry | | Company | | Shares | | | Value | | | | |
| | | | |
Common Stocks (continued) | | | | | | | | | | |
Financials (continued) | | |
| | United Fire Group, Inc. | | | 78,800 | | | $ 4,369,460 | | | | |
| | United Insurance Holdings Corp. | | | 84,700 | | | 1,407,714 | | | | |
| | Universal Insurance Holdings, Inc. | | | 86,316 | | | 3,273,103 | | | | |
| | Univest Financial Corp. | | | 74,979 | | | 1,617,297 | | | | |
| | Waddell & Reed Financial, Inc., Class A+ | | | 193,000 | | | 3,489,440 | | | | |
| | Walker & Dunlop, Inc. | | | 84,475 | | | 3,653,544 | | | | |
| | Waterstone Financial, Inc. | | | 49,000 | | | 821,240 | | | | |
| | Wellesley Bank | | | 1,000 | | | 27,740 | | | | |
| | WesBanco, Inc. | | | 93,996 | | | 3,448,713 | | | | |
| | World Acceptance Corp.*+ | | | 26,100 | | | 2,668,986 | | | | |
| | | | | | | | | | | | |
| | | | | | | | 245,475,668 | | | | |
Health Care - 3.49% | | |
| | Acorda Therapeutics, Inc.* | | | 112,000 | | | 1,744,960 | | | | |
| | AMAG Pharmaceuticals, Inc.* | | | 112,000 | | | 1,701,280 | | | | |
| | AngioDynamics, Inc.* | | | 105,300 | | | 2,119,689 | | | | |
| | Brookdale Senior Living, Inc.* | | | 200,000 | | | 1,340,000 | | | | |
| | Community Health Systems, Inc.* | | | 153,900 | | | 433,998 | | | | |
| | Concert Pharmaceuticals, Inc.* | | | 160,800 | | | 2,018,040 | | | | |
| | Cross Country Healthcare, Inc.* | | | 76,700 | | | 562,211 | | | | |
| | FONAR Corp.* | | | 30,400 | | | 615,296 | | | | |
| | InfuSystem Holdings, Inc.* | | | 71,100 | | | 244,584 | | | | |
| | Kewaunee Scientific Corp. | | | 3,000 | | | 99,720 | | | | |
| | Magellan Health, Inc.* | | | 71,300 | | | 4,056,257 | | | | |
| | Mallinckrodt PLC* | | | 245,000 | | | 3,871,000 | | | | |
| | National HealthCare Corp. | | | 25,500 | | | 2,000,475 | | | | |
| | PDL BioPharma, Inc.* | | | 591,000 | | | 1,713,900 | | | | |
| | Prestige Consumer Healthcare, Inc.* | | | 94,900 | | | 2,930,512 | | | | |
| | Quorum Health Corp.* | | | 25,000 | | | 72,250 | | | | |
| | Surgery Partners, Inc.*+ | | | 202,241 | | | 1,979,939 | | | | |
| | Triple-S Management Corp., Class B* | | | 122,300 | | | 2,126,797 | | | | |
| | | | | | | | | | | | |
| | | | | | | | 29,630,908 | | | | |
Industrials - 15.09% | | |
| | Acacia Research Corp.* | | | 35,000 | | | 104,300 | | | | |
| | ACCO Brands Corp. | | | 364,300 | | | 2,469,954 | | | | |
| | Aegion Corp.* | | | 99,341 | | | 1,621,245 | | | | |
| | AeroCentury Corp.* | | | 4,300 | | | 41,151 | | | | |
| | Air T, Inc.* | | | 2,800 | | | 68,600 | | | | |
| | Aircastle, Ltd. | | | 212,000 | | | 3,654,880 | | | | |
| | Alpha Pro Tech, Ltd.* | | | 20,743 | | | 76,957 | | | | |
| | | | | | | | |
| Industry | | Company | | Shares | | | Value |
| | |
| | | | | | |
Industrials (continued) |
| | AMREP Corp.* | | | 25,500 | | | $ 151,725 |
| | Apogee Enterprises, Inc. | | | 47,981 | | | 1,432,233 |
| | ARC Document Solutions, Inc.* | | | 118,000 | | | 241,900 |
| | ArcBest Corp. | | | 94,500 | | | 3,237,570 |
| | Armstrong Flooring, Inc.* | | | 65,000 | | | 769,600 |
| | Arotech Corp.* | | | 94,300 | | | 247,066 |
| | Art’s-Way Manufacturing Co., Inc.* | | | 15,000 | | | 30,000 |
| | ASV Holdings, Inc.* | | | 53,000 | | | 106,000 |
| | Atkore International Group, Inc.* | | | 85,000 | | | 1,686,400 |
| | Atlas Air Worldwide Holdings, Inc.* | | | 70,600 | | | 2,978,614 |
| | BMC Stock Holdings, Inc.* | | | 132,200 | | | 2,046,456 |
| | Briggs & Stratton Corp. | | | 149,300 | | | 1,952,844 |
| | CAI International, Inc.* | | | 82,600 | | | 1,918,798 |
| | CBIZ, Inc.* | | | 143,273 | | | 2,822,478 |
| | Cemtrex, Inc.*+ | | | 21,000 | | | 12,058 |
| | Chicago Rivet & Machine Co. | | | 1,000 | | | 31,500 |
| | Civeo Corp.* | | | 564,830 | | | 807,707 |
| | Commercial Vehicle Group, Inc.* | | | 67,300 | | | 383,610 |
| | Costamare, Inc. | | | 342,500 | | | 1,503,575 |
| | Covenant Transportation Group, Inc., Class A* | | | 93,900 | | | 1,802,880 |
| | CRA International, Inc. | | | 43,800 | | | 1,863,690 |
| | DLH Holdings Corp.* | | | 57,500 | | | 271,975 |
| | Ducommun, Inc.* | | | 50,550 | | | 1,835,976 |
| | Eagle Bulk Shipping, Inc.* | | | 205,000 | | | 945,050 |
| | Eastern Co. (The) | | | 18,401 | | | 444,936 |
| | Ecology and Environment, Inc., Class A | | | 3,500 | | | 39,690 |
| | Engility Holdings, Inc.* | | | 56,700 | | | 1,613,682 |
| | Ennis, Inc. | | | 136,892 | | | 2,635,171 |
| | EnPro Industries, Inc. | | | 24,800 | | | 1,490,480 |
| | Essendant, Inc. | | | 90,000 | | | 1,132,200 |
| | Foundation Building Materials, Inc.* | | | 105,200 | | | 874,212 |
| | FreightCar America, Inc.* | | | 35,881 | | | 240,044 |
| | FTI Consulting, Inc.* | | | 68,500 | | | 4,564,840 |
| | Genco Shipping & Trading, Ltd.* | | | 105,000 | | | 828,450 |
| | General Finance Corp.* | | | 115,764 | | | 1,170,374 |
| | Goldfield Corp. (The)* | | | 121,000 | | | 273,460 |
| | Great Lakes Dredge & Dock Corp.* | | | 220,550 | | | 1,460,041 |
| | Greenbrier Cos, Inc. (The) | | | 90,300 | | | 3,570,462 |
| | Griffon Corp. | | | 42,000 | | | 438,900 |
| | Hawaiian Holdings, Inc. | | | 90,000 | | | 2,376,900 |
| | |
OmniSmall-Cap Value Fund SCHEDULE OF INVESTMENTS (Unaudited) (continued) | | |
Showing percentage of net assets as of December 31, 2018
| | | | | | | | | | | | |
| Industry | | Company | | Shares | | | Value | | | | |
| | |
Common Stocks (continued) | | | | |
Industrials (continued) | | | | |
| | HC2 Holdings, Inc.*+ | | | 100,600 | | | $ 265,584 | | | | |
| | Heidrick & Struggles International, Inc. | | | 6,250 | | | 194,937 | | | | |
| | Herc Holdings, Inc.* | | | 67,500 | | | 1,754,325 | | | | |
| | Hertz Global Holdings, Inc.* | | | 169,000 | | | 2,306,850 | | | | |
| | Highpower International, Inc.* | | | 55,923 | | | 121,353 | | | | |
| | Hub Group, Inc., Class A* | | | 70,000 | | | 2,594,900 | | | | |
| | Hurco Cos, Inc. | | | 17,857 | | | 637,495 | | | | |
| | Huron Consulting Group, Inc.* | | | 32,800 | | | 1,682,968 | | | | |
| | Hyster-Yale Materials Handling, Inc. | | | 5,000 | | | 309,800 | | | | |
| | ICF International, Inc. | | | 36,229 | | | 2,346,915 | | | | |
| | IES Holdings, Inc.* | | | 2,717 | | | 42,249 | | | | |
| | Innovative Solutions & Support, Inc.* | | | 25,000 | | | 55,125 | | | | |
| | Kelly Services, Inc., Class A | | | 95,000 | | | 1,945,600 | | | | |
| | LB Foster Co., Class A* | | | 38,400 | | | 610,560 | | | | |
| | Limbach Holdings, Inc.*+ | | | 14,800 | | | 54,464 | | | | |
| | LS Starrett Co. (The), Class A* | | | 15,000 | | | 78,450 | | | | |
| | Manitowoc Co., Inc. (The)* | | | 35,000 | | | 516,950 | | | | |
| | Marten Transport, Ltd. | | | 162,561 | | | 2,631,863 | | | | |
| | Matson, Inc. | | | 117,100 | | | 3,749,542 | | | | |
| | Milacron Holdings Corp.* | | | 105,000 | | | 1,248,450 | | | | |
| | Miller Industries, Inc. | | | 7,300 | | | 197,100 | | | | |
| | MYR Group, Inc.* | | | 42,500 | | | 1,197,225 | | | | |
| | Navigant Consulting, Inc. | | | 202,028 | | | 4,858,773 | | | | |
| | Nexeo Solutions, Inc.*+ | | | 220,000 | | | 1,889,800 | | | | |
| | NL Industries, Inc.* | | | 5,000 | | | 17,550 | | | | |
| | Northwest Pipe Co.* | | | 21,800 | | | 507,722 | | | | |
| | Orion Group Holdings, Inc.* | | | 37,072 | | | 159,039 | | | | |
| | PAM Transportation Services, Inc.* | | | 20,905 | | | 823,866 | | | | |
| | Pangaea Logistics Solutions, Ltd.*+ | | | 2,000 | | | 6,060 | | | | |
| | Park-Ohio Holdings Corp. | | | 15,200 | | | 466,488 | | | | |
| | Patriot Transportation Holding, Inc.* | | | 7,500 | | | 146,175 | | | | |
| | Performant Financial Corp.* | | | 97,367 | | | 219,076 | | | | |
| | Powell Industries, Inc. | | | 25,000 | | | 625,250 | | | | |
| | Preformed Line Products Co. | | | 5,135 | | | 278,574 | | | | |
| | Quad/Graphics, Inc.+ | | | 105,800 | | | 1,303,456 | | | | |
| | Quanex Building Products Corp. | | | 75,000 | | | 1,019,250 | | | | |
| | Rush Enterprises, Inc., Class A | | | 139,600 | | | 4,813,408 | | | | |
| | Rush Enterprises, Inc., Class B | | | 46,500 | | | 1,655,400 | | | | |
| | Safe Bulkers, Inc.* | | | 380,200 | | | 676,756 | | | | |
| | | | | | | | | | | | |
| | | | | | | | |
| Industry | | Company | | Shares | | | Value |
| | | |
| | | | | | | | |
Industrials (continued) |
| | Scorpio Bulkers, Inc. | | | 205,000 | | | $ 1,133,650 |
| | Servotronics, Inc. | | | 1,000 | | | 9,950 |
| | SkyWest, Inc. | | | 45,291 | | | 2,014,091 |
| | Spartan Motors, Inc. | | | 10,000 | | | 72,300 |
| | SPX FLOW, Inc.* | | | 99,100 | | | 3,014,622 |
| | Steelcase, Inc., Class A | | | 274,000 | | | 4,063,420 |
| | Sterling Construction Co., Inc.* | | | 7,000 | | | 76,230 |
| | Textainer Group Holdings, Ltd.* | | | 166,500 | | | 1,658,340 |
| | Titan Machinery, Inc.* | | | 83,900 | | | 1,103,285 |
| | Triumph Group, Inc. | | | 87,000 | | | 1,000,500 |
| | TrueBlue, Inc.* | | | 74,750 | | | 1,663,188 |
| | Tutor Perini Corp.* | | | 107,300 | | | 1,713,581 |
| | Ultralife Corp.* | | | 63,050 | | | 425,588 |
| | USA Truck, Inc.* | | | 3,800 | | | 56,886 |
| | Vectrus, Inc.* | | | 34,500 | | | 744,510 |
| | Veritiv Corp.* | | | 57,400 | | | 1,433,278 |
| | VSE Corp. | | | 23,600 | | | 705,876 |
| | Wabash National Corp. | | | 110,100 | | | 1,440,108 |
| | Willis Lease Finance Corp.* | | | 48,400 | | | 1,674,640 |
| | | | | | | | |
| | | | | | | | 128,284,025 |
| | |
Information Technology - 7.00% | | | | | | |
| | Alpha & Omega Semiconductor, Ltd.* | | | 214,244 | | | 2,183,146 |
| | Amkor Technology, Inc.* | | | 202,291 | | | 1,327,029 |
| | Amtech Systems, Inc.* | | | 30,000 | | | 135,900 |
| | Applied Optoelectronics, Inc.*+ | | | 55,000 | | | 848,650 |
| | Aviat Networks, Inc.* | | | 15,200 | | | 201,400 |
| | Axcelis Technologies, Inc.* | | | 14,100 | | | 250,980 |
| | AXT, Inc.* | | | 30,700 | | | 133,545 |
| | Bel Fuse, Inc., Class B | | | 18,500 | | | 340,770 |
| | Benchmark Electronics, Inc. | | | 134,000 | | | 2,838,120 |
| | BK Technologies, Inc. | | | 40,000 | | | 150,000 |
| | Cabot Microelectronics Corp. | | | 1,980 | | | 188,793 |
| | Communications Systems, Inc. | | | 12,500 | | | 25,375 |
| | Computer Task Group, Inc.* | | | 73,862 | | | 301,357 |
| | Comtech Telecommunications Corp. | | | 64,215 | | | 1,562,993 |
| | CSP, Inc. | | | 5,150 | | | 50,315 |
| | Data I/O Corp.* | | | 25,500 | | | 127,500 |
| | Diodes, Inc.* | | | 138,899 | | | 4,480,882 |
| | Fabrinet* | | | 30,000 | | | 1,539,300 |
| | Finjan Holdings, Inc.* | | | 124,500 | | | 312,495 |
| | Ichor Holdings, Ltd.*+ | | | 45,000 | | | 733,500 |
| | Insight Enterprises, Inc.* | | | 119,700 | | | 4,877,775 |
| | inTEST Corp.* | | | 55,000 | | | 337,150 |
| | |
| 14 | | Semi-Annual Report | December 31, 2018 (Unaudited) |
| | |
OmniSmall-Cap Value Fund SCHEDULE OF INVESTMENTS (Unaudited) (continued) | | |
Showing percentage of net assets as of December 31, 2018
| | | | | | | | | | | | |
| Industry | | Company | | Shares | | | Value | | | | |
| | | | |
Common Stocks (continued) | | | | | | | | | | |
Information Technology (continued) | | | | |
| | KEMET Corp. | | | 63,750 | | | $ 1,118,175 | | | | |
| | Key Tronic Corp.* | | | 52,500 | | | 296,625 | | | | |
| | Kimball Electronics, Inc.* | | | 74,900 | | | 1,160,201 | | | | |
| | Knowles Corp.* | | | 198,200 | | | 2,638,042 | | | | |
| | ManTech International Corp., Class A | | | 28,800 | | | 1,506,096 | | | | |
| | Methode Electronics, Inc. | | | 73,500 | | | 1,711,815 | | | | |
| | Mind CTI, Ltd.+ | | | 200 | | | 456 | | | | |
| | Net 1 UEPS Technologies, Inc.*+ | | | 152,900 | | | 717,101 | | | | |
| | NetSol Technologies, Inc.* | | | 21,200 | | | 130,380 | | | | |
| | Network-1 Technologies, Inc. | | | 60,000 | | | 133,800 | | | | |
| | Nortech Systems, Inc.*+ | | | 1,500 | | | 5,325 | | | | |
| | PCM, Inc.* | | | 30,569 | | | 538,320 | | | | |
| | PC-Tel, Inc. | | | 72,650 | | | 311,668 | | | | |
| | Photronics, Inc.* | | | 205,050 | | | 1,984,884 | | | | |
| | Presidio, Inc. | | | 212,000 | | | 2,766,600 | | | | |
| | PRGX Global, Inc.* | | | 12,916 | | | 122,315 | | | | |
| | Rambus, Inc.* | | | 140,000 | | | 1,073,800 | | | | |
| | Sanmina Corp.* | | | 135,100 | | | 3,250,506 | | | | |
| | ScanSource, Inc.* | | | 88,500 | | | 3,042,630 | | | | |
| | SigmaTron International, Inc.* | | | 6,500 | | | 15,275 | | | | |
| | Steel Connect, Inc.* | | | 10,500 | | | 18,165 | | | | |
| | Stratasys, Ltd.*+ | | | 135,000 | | | 2,431,350 | | | | |
| | SunPower Corp.*+ | | | 285,000 | | | 1,416,450 | | | | |
| | Sykes Enterprises, Inc.* | | | 104,534 | | | 2,585,126 | | | | |
| | TiVo Corp. | | | 167,000 | | | 1,571,470 | | | | |
| | Trio-Tech International* | | | 21,800 | | | 53,628 | | | | |
| | TSR, Inc.* | | | 1,000 | | | 4,650 | | | | |
| | TTM Technologies, Inc.* | | | 520,153 | | | 5,061,089 | | | | |
| | Ultra Clean Holdings, Inc.* | | | 73,700 | | | 624,239 | | | | |
| | Wayside Technology Group, Inc. | | | 16,400 | | | 164,000 | | | | |
| | Westell Technologies, Inc., Class A* | | | 66,100 | | | 124,929 | | | | |
| | | | | | | | | | | | |
| | | | | | | | 59,526,085 | | | | |
Materials - 5.39% | | | | | | | | | | |
| | AdvanSix, Inc.* | | | 20,000 | | | 486,800 | | | | |
| | AgroFresh Solutions, Inc.* | | | 18,600 | | | 70,494 | | | | |
| | American Vanguard Corp. | | | 14,100 | | | 214,179 | | | | |
| | Boise Cascade Co. | | | 78,500 | | | 1,872,225 | | | | |
| | Carpenter Technology Corp. | | | 97,100 | | | 3,457,731 | | | | |
| | Clearwater Paper Corp.* | | | 9,000 | | | 219,330 | | | | |
| | Coeur Mining, Inc.* | | | 370,900 | | | 1,657,923 | | | | |
| | Core Molding Technologies, Inc. | | | 17,000 | | | 120,870 | | | | |
| | | | | | | | |
| Industry | | Company | | Shares | | | Value |
| | |
| | | | | | |
Materials (continued) |
| | Flexible Solutions International, Inc.* | | | 5,000 | | | $ 6,750 |
| | Forterra, Inc.*+ | | | 200,000 | | | 752,000 |
| | Friedman Industries, Inc. | | | 5,000 | | | 35,250 |
| | FutureFuel Corp. | | | 102,800 | | | 1,630,408 |
| | Gulf Resources, Inc.* | | | 81,200 | | | 64,059 |
| | Haynes International, Inc. | | | 12,979 | | | 342,646 |
| | Hecla Mining Co. | | | 557,000 | | | 1,314,520 |
| | Intrepid Potash, Inc.* | | | 318,500 | | | 828,100 |
| | IT Tech Packaging, Inc.* | | | 35,000 | | | 22,137 |
| | Kaiser Aluminum Corp. | | | 22,630 | | | 2,020,633 |
| | Kraton Corp.* | | | 142,150 | | | 3,104,556 |
| | Kronos Worldwide, Inc. | | | 180,000 | | | 2,073,600 |
| | LSB Industries, Inc.* | | | 11,000 | | | 60,720 |
| | Materion Corp. | | | 28,600 | | | 1,286,714 |
| | Mercer International, Inc. | | | 276,250 | | | 2,884,050 |
| | PH Glatfelter Co. | | | 159,400 | | | 1,555,744 |
| | Ramaco Resources, Inc.* | | | 70,700 | | | 349,965 |
| | Rayonier Advanced Materials, Inc. | | | 136,700 | | | 1,455,855 |
| | Resolute Forest Products, Inc. | | | 352,000 | | | 2,791,360 |
| | Schnitzer Steel Industries, Inc., Class A | | | 79,700 | | | 1,717,535 |
| | Schweitzer-Mauduit International, Inc. | | | 56,000 | | | 1,402,800 |
| | Stepan Co. | | | 20,000 | | | 1,480,000 |
| | SunCoke Energy, Inc.* | | | 234,700 | | | 2,006,685 |
| | Tahoe Resources, Inc.* | | | 150,000 | | | 547,500 |
| | Trecora Resources* | | | 25,602 | | | 199,696 |
| | Tredegar Corp. | | | 101,700 | | | 1,612,962 |
| | Universal Stainless & Alloy Products, Inc.* | | | 1,350 | | | 21,884 |
| | Verso Corp., Class A* | | | 115,700 | | | 2,591,680 |
| | Warrior Met Coal, Inc. | | | 148,000 | | | 3,568,280 |
| | | | | | | | |
| | | | | | | | 45,827,641 |
Real Estate - 0.25% | | | | | | |
| | Altisource Portfolio Solutions SA*+ | | | 58,400 | | | 1,313,416 |
| | Consolidated-Tomoka Land Co. | | | 15,400 | | | 808,500 |
| | | | | | | | |
| | | | | | | | 2,121,916 |
| | | | | | | | |
TOTAL COMMON STOCKS - 97.43% | | | | | | 828,208,911 |
| | | | | | | | |
(Cost $842,201,161) | | | | | | |
| | |
OmniSmall-Cap Value Fund SCHEDULE OF INVESTMENTS (Unaudited) (continued) | | |
Showing percentage of net assets as of December 31, 2018
| | | | | | |
| Industry Company | | | | Shares | | Value |
| | | | | | | | | | | | |
| | | |
EXCHANGE TRADED FUND - 0.63% | | | | | |
| | iShares Russell 2000 Value ETF | | 49,300 | | $ | 5,301,722 | | | | | |
| | | | | | | | | | | | |
| | | |
TOTAL EXCHANGE TRADED FUND - 0.63% | | | 5,301,722 | | | | | |
| | | | | | | | | | | | |
(Cost $5,298,138) | | | | | | | | | | |
| | | |
RIGHTS - 0.00% | | | | | | | | |
| | Newstar Financial, Inc.,
expiring 12/26/19*D | | 120,000 | | | 8,400 | | | | | |
| | | | | | | | | | | | |
| | | |
TOTAL RIGHTS - 0.00% | | | 8,400 | | | | | |
| | | | | | | | | | | | |
(Cost $86,346) | | | | | | | | | | |
| | | | |
WARRANTS - 0.00% | | | | | | | | | | |
| | Eagle Bulk Shipping, Inc.,
expiring 10/15/21* | | 3,317 | | | 133 | | | | | |
| | | | | | | | | | | | |
| | | |
TOTAL WARRANTS - 0.00% | | | 133 | | | | | |
| | | | | | | | | | | | |
(Cost $105,563) | | | | | | | | | | |
| | | | | | | | | | | | | | | | |
| | | | | | |
| | | Rate^ | | | Shares | | Value | | | | | | | |
| | | | |
| MONEY MARKET FUND - 6.13% | | | | | | | |
Fidelity Investments Money Market Government Portfolio Class I | | | 2.25 | % | | 52,127,050 | | | 52,127,050 | | | | | | | |
| | | | | | | | | | | | | | | | |
| | | | |
| TOTAL MONEY MARKET FUND - 6.13% | | | 52,127,050 | | | | | | | |
| | | | | | | | | | | | | | | | |
| (Cost $52,127,050) | | | | | | | | | | |
| | | | |
INVESTMENTS PURCHASED WITH CASH PROCEEDS FROM SECURITIES
LENDING - 3.18% | | | | | | | |
Fidelity Investments Money Market Government Portfolio Class I** | | | 2.25 | % | | 27,052,208 | | | 27,052,208 | | | | | | | |
| | | | | | | | | | | | | | | | |
| | | | |
TOTAL INVESTMENTS PURCHASED WITH CASH PROCEEDS FROM SECURITIES LENDING - 3.18% | | | 27,052,208 | | | | | | | |
| | | | | | | | | | | | | | | | |
| (Cost $27,052,208) | | | | | | | | | | |
| | | | |
| TOTAL INVESTMENTS - 107.37% | | | $912,698,424 | | | | | | | |
| (Cost $926,870,466) | | | | | | | | | | |
| Liabilities in Excess of Other Assets - (7.37%) | | | (62,641,718 | ) | | | | | | |
| | | | | | | | | | | | | | | | |
| | | | |
| NET ASSETS - 100.00% | | | $850,056,706 | | | | | | | |
| | | | | | | | | | | | | | | | |
| | | | | | | | | | | | | | | | | | |
* Non-income producing security. | | | | | | | | | | | | |
** This security represents the investment of the collateral received in connection with securities out on loan as of December 31, 2018. | | | | | | | | | | | | |
^ Rate disclosed as of December 31, 2018. | | | | | | | | | | | | |
D Security was fair valued using significant unobservable inputs (see Note 2). As such, the security is classified as Level 3 in the fair value hierarchy. | | | | | | | | | | | | |
+ This security or a portion of the security is out on loan as of December 31, 2018. Total loaned securities had a value of $26,072,003 as of December 31, 2018. | | | | | | | | | | | | |
| LLC - Limited Liability Company | | | | | | | | | | | | |
| PLC - Public Limited Company | | | | | | | | | | | | |
| | | | | | | | | | | | | | | | |
| Summary of inputs used to value the Fund’s investments as of 12/31/2018 (See Note 2 in Notes to Financial Statements): | |
| | | | | | | | | | | | | | | | |
Valuation Inputs | |
Investment in Securities (Value) | |
| | | Level 1
Quoted
Prices | | | Level 2
Significant
Observable
Inputs | | | Level 3
Significant
Unobservable
Inputs | | | Total | |
| |
Common Stocks (a) | | $ | 828,208,911 | | | $ | — | | | | $ — | | | $ | 828,208,911 | |
Exchange Traded Fund | | | 5,301,722 | | | | — | | | | — | | | | 5,301,722 | |
Rights | | | — | | | | — | | | | 8,400 | | | | 8,400 | |
Warrants | | | 133 | | | | — | | | | — | | | | 133 | |
Money Market Fund | | | — | | | | 52,127,050 | | | | — | | | | 52,127,050 | |
Investments Purchased with Cash Proceeds from Securities Lending | | | — | | | | 27,052,208 | | | | — | | | | 27,052,208 | |
| | | | | | | | | | | | | | | | |
TOTAL | | $ | 833,510,766 | | | $ | 79,179,258 | | | $ | 8,400 | | | $ | 912,698,424 | |
| | | | | | | | | | | | | | | | |
| | | | | | | | | | | | | | | | |
| | | | | | | | | | | | | | | | | |
(a) - please refer to the Schedule of Investments for the industry classifications of these portfolio holdings. | |
| | |
| 16 | | Semi-Annual Report | December 31, 2018 (Unaudited) |
| | |
OmniSmall-Cap Value Fund SCHEDULE OF INVESTMENTS (Unaudited) (continued) | | |
Showing percentage of net assets as of December 31, 2018
| | | | | | |
| Following is a reconciliation of Level 3 investments for which significant unobservable inputs were used to determine fair value: | | |
| | | | | | |
Investment in Securities (Value) | | |
| | | Rights | | Total | | |
| | |
| | | |
Balance as of 06/30/2018 | | $ 36,000 | | $ 36,000 | | |
Purchases | | — | | — | | |
Return of | | | | | | |
Capital | | (27,926) | | (27,926) | | |
Realized gain/(loss) | | — | | — | | |
Change in unrealized appreciation/ (depreciation) | | 326 | | 326 | | |
Transfers in | | — | | — | | |
Transfers out | | — | | — | | |
| | | | | | |
| | | |
Balance as of 12/31/2018 | | $ 8,400 | | $ 8,400 | | |
| | | | | | |
| | | |
Net change in unrealized appreciation (depreciation) from investments held as of 12/31/2018 | | $ 326 | | $ 326 | | |
| | | | | | |
| | |
| See Notes to Financial Statements. | | |
| | | | | | |
| | | | | | |
| | | | | | |
| | | | | | |
| | | | | | |
| | | | | | |
| | | | | | |
| | | | | | |
| | | | | | |
| | | | | | |
| | | | | | |
| | | | | | |
| | | | | | |
| | | | | | |
| | | | | | |
| | | | | | |
| | | | | | |
| | | | | | |
| | | | | | |
| | | | | | |
| | | | | | |
| | | | | | |
| | | | | | |
| | | | | | |
| | | | | | |
| | | | | | |
| | | | | | |
| | | | | | |
| | | | | | |
| | |
OmniTax-ManagedSmall-Cap Value Fund MANAGER’S COMMENTARY (Unaudited) | | |
December 31, 2018
Dear Fellow OmniTax-ManagedSmall-Cap Value Fund Shareholder,
For the quarter ended December 31, 2018, our Fund returned-22.13%, underperforming our primary market benchmark, the Russell 2000 Value Index(-18.67%).
For the calendar year, our Fund returned-16.08%, underperforming the Russell 2000 Value Index(-12.86%).
The table below presents our December quarter,six-month,one-year, five-year, andinception-to-date financial results. See the next page for a graph of performance since inception.
Standardized Returns as of December 31, 2018
| | | | | | | | | | | | | | | | | | | | |
| | | | | | | | | | | | Annualized | |
| | | Quarter | | | 6 Months | | | 1 Year | | | 5 Years | | | Since Inception
(12/31/10) | |
| | | | | |
OmniTax-ManagedSmall-Cap Value Fund | | | -22.13 | % | | | -21.35 | % | | | -16.08% | | | | 2.50% | | | | 7.52% | |
Russell 2000 Value Index | | | -18.67 | % | | | -17.36 | % | | | -12.86% | | | | 3.61% | | | | 7.56% | |
Performance figures quoted in the table above and the graph on the next page represent past performance and are no guarantee of future results. Total return figures in the table above include the reinvestment of dividends and capital gains. The table above and the graph on the next page do not reflect the deduction of taxes that a shareholder would pay on Fund distributions or on the redemption of Fund shares.
The Russell 2000 Value Index is an unmanaged index that consists of stocks in the Russell 2000 Index with lowerprice-to-book ratios and lower forecasted growth values with dividends reinvested. It is not possible to invest directly in an index. Periods longer than one year are annualized.
| | |
| 18 | | Semi-Annual Report | December 31, 2018 (Unaudited) |
| | |
OmniTax-ManagedSmall-Cap Value Fund MANAGER’S COMMENTARY (Unaudited) (continued) | | |
Growth of a $10,000 Investment
from Inception December 31, 2010 to December 31, 2018
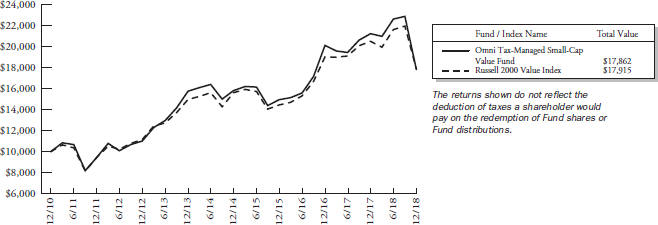
Detailed Explanation of Quarterly Performance
The OmniTax-ManagedSmall-Cap Value Fund is designed to capture the returns of thesmall-cap value asset class through broad diversification of small company and value stocks. We also seek to minimize the distribution of capital gains within the constraints of the investment objective. This approach is sometimes referred to as “passive, asset class investing.” As of December 31, 2018, we held 658 such stocks in amarket-cap weighted style. We make no attempt to track any particular index in either performance or statistics.
The Fund’s primary design features — a tilt toward smaller stocks in thesmall-cap value universe and a tilt toward deeper value stocks across multiple value metrics — hurt relative performance during the quarter. An overweight position in higher momentum stocks also dragged on relative results.
By design, the Fund does not hold Real Estate Investment Trusts (REITs) and Utilities stocks. This positioning hurt relative results, as both the Real Estate and Utilities sectors outperformed the benchmark during the quarter.
Detailed Explanation of Calendar Year Performance
The Fund’s tilt toward deeper value stocks across multiple value metrics hurt relative returns during the year, as did an overweighting in higher momentum stocks. However, the Fund’s tilt toward smaller stocks in thesmall-cap value universe benefited relative results due to smaller stocks outperforming their larger counterparts during the year.
By design, the Fund does not hold Real Estate Investment Trusts (REITs) and Utilities stocks. Our lack of exposure to REITs and Utilities stocks detracted from relative performance.
| | |
OmniTax-ManagedSmall-Cap Value Fund MANAGER’S COMMENTARY (Unaudited) (continued) | | |
Top Ten Holdings as of December 31, 2018
| | | | | | | | | |
| Rank | | Description | | Industry | | % of Net
Assets |
| 1 | | Renewable Energy Group, Inc. | | Energy | | 1.2% |
| 2 | | Iridium Communications, Inc. | | Communication Services | | 1.1% |
| 3 | | International Speedway Corp., Class A | | Consumer Discretionary | | 0.8% |
| 4 | | Waddell & Reed Financial, Inc., Class A | | Financials | | 0.8% |
| 5 | | First BanCorp Puerto Rico | | Financials | | 0.8% |
| 6 | | FTI Consulting, Inc. | | Industrials | | 0.7% |
| 7 | | Arch Coal, Inc., Class A | | Energy | | 0.7% |
| 8 | | DSW, Inc., Class A | | Consumer Discretionary | | 0.7% |
| 9 | | Marcus Corp. (The) | | Communication Services | | 0.7% |
| 10 | | Diodes, Inc. | | Information Technology | | 0.7% |
| | Total | | | | 8.2% |
Industry Sector Representation as of December 31, 2018
| | | | | | | | | | | | | | | |
| | | % of Net Assets | | % of Russell 2000
Value Index | | Difference |
| Communication Services | | | | 5.7% | | | | | 3.1% | | | | | 2.6% | |
| Consumer Discretionary | | | | 17.5% | | | | | 9.4% | | | | | 8.1% | |
| Consumer Staples | | | | 2.7% | | | | | 2.6% | | | | | 0.1% | |
| Energy | | | | 11.6% | | | | | 5.4% | | | | | 6.2% | |
| Financials | | | | 30.0% | | | | | 29.5% | | | | | 0.5% | |
| Health Care | | | | 2.5% | | | | | 4.3% | | | | | -1.8% | |
| Industrials | | | | 16.3% | | | | | 11.8% | | | | | 4.5% | |
| Information Technology | | | | 8.3% | | | | | 10.8% | | | | | -2.5% | |
| Materials | | | | 5.0% | | | | | 4.1% | | | | | 0.9% | |
| Real Estate | | | | 0.4% | | | | | 11.7% | | | | | -11.3% | |
| Utilities | | | | 0.0% | | | | | 7.3% | | | | | -7.3% | |
| Cash & Other Assets | | | | 0.0% | | | | | 0.0% | | | | | 0.0% | |
Total | | | | 100.0% | | | | | 100.0% | | | | | | |
Disclaimer
The views expressed here are exclusively those of Fund management. These views, including those related to market sectors or individual stocks, are not meant as investment advice and should not be considered predictive in nature. Any favorable (or unfavorable) description of a holding applies only as of the quarter end, December 31, 2018, unless otherwise stated. Security positions can and do change thereafter. Discussions of historical performance do not guarantee and may not be indicative of future performance.
Market volatility can significantly impact short-term performance. The Fund is not an appropriate investment for short-term investors. Investments in small companies generally carry greater risk than is customarily associated with larger companies. This additional risk is attributable to a number of factors, including the relatively limited financial resources that are typically available to small companies and the fact that small companies often have comparatively limited product lines. In addition, the stock of small companies tends to be more volatile than the stock of large companies, particularly in the short term and particularly in the early stages of an economic or market downturn. Shareholders of the Fund, therefore, are taking on more risk than they would if they invested in the stock market as a whole.
| | |
| 20 | | Semi-Annual Report | December 31, 2018 (Unaudited) |
| | |
OmniTax-ManagedSmall-Cap Value Fund MANAGER’S COMMENTARY (Unaudited) (continued) | | |
Conclusion
Thank you for your continued investment in OmniTax-ManagedSmall-Cap Value Fund. We encourage your feedback; your reactions and concerns are important to us.
Sincerely,
The Investment Management Team
| | |
OmniTax-ManagedSmall-Cap Value Fund (Unaudited) | | |
Showing percentage of net assets as of December 31, 2018
| | | | | | | | | | | | |
| Industry Company | | Shares | | | Value | | | |
| | |
COMMON STOCKS - 99.99% | | | |
Communication Services - 5.66% | | | |
| | Alaska Communications | | | | | | | | | | |
| | Systems Group, Inc.* | | | 314,187 | | | $ | 452,429 | | | |
| | AMC Entertainment | | | | | | | | | | |
| | Holdings, Inc., Class A+ | | | 47,763 | | | | 586,530 | | | |
| | ATN International, Inc. | | | 22,000 | | | | 1,573,660 | | | |
| | Beasley Broadcast Group, | | | | | | | | | | |
| | Inc., Class A | | | 25,800 | | | | 96,750 | | | |
| | Cars.com, Inc.* | | | 90,000 | | | | 1,935,000 | | | |
| | Emmis Communications | | | | | | | | | | |
| | Corp., Class A* | | | 57,200 | | | | 182,468 | | | |
| | Entercom Communications | | | | | | | | | | |
| | Corp., Class A | | | 35,300 | | | | 201,563 | | | |
| | Entravision Communications | | | | | | | | | | |
| | Corp., Class A | | | 147,600 | | | | 429,516 | | | |
| | Eros International PLC*+ | | | 107,284 | | | | 889,384 | | | |
| | EW Scripps Co. (The), | | | | | | | | | | |
| | Class A | | | 133,500 | | | | 2,099,955 | | | |
| | Gannett Co., Inc. | | | 251,000 | | | | 2,141,030 | | | |
| | Gray Television, Inc.* | | | 212,100 | | | | 3,126,354 | | | |
| | Iridium Communications, | | | | | | | | | | |
| | Inc.* | | | 308,625 | | | | 5,694,131 | | | |
| | Marcus Corp. (The) | | | 92,054 | | | | 3,636,133 | | | |
| | New Media Investment | | | | | | | | | | |
| | Group, Inc. | | | 137,200 | | | | 1,587,404 | | | |
| | Saga Communications, Inc., | | | | | | | | | | |
| | Class A | | | 7,250 | | | | 240,918 | | | |
| | Salem Media Group, Inc. | | | 69,352 | | | | 144,946 | | | |
| | Scholastic Corp. | | | 70,450 | | | | 2,836,317 | | | |
| | SPAR Group, Inc.* | | | 16,500 | | | | 8,283 | | | |
| | Spok Holdings, Inc. | | | 75,500 | | | | 1,001,130 | | | |
| | Townsquare Media, Inc., | | | | | | | | | | |
| | Class A | | | 44 | | | | 180 | | | |
| | Tribune Publishing Co.* | | | 6,200 | | | | 70,308 | | | |
| | | | | | | | | | | | |
| | | | | | | | | 28,934,389 | | | |
| | |
Consumer Discretionary - 17.54% | | | |
| | 1-800-Flowers.com, Inc., | | | | | | | | | | |
| | Class A* | | | 60,000 | | | | 733,800 | | | |
| | Abercrombie & Fitch Co., | | | | | | | | | | |
| | Class A | | | 139,600 | | | | 2,798,980 | | | |
| | AMCON Distributing Co. | | | 1,350 | | | | 134,663 | | | |
| | American Axle & | | | | | | | | | | |
| | Manufacturing Holdings, | | | | | | | | | | |
| | Inc.* | | | 159,850 | | | | 1,774,335 | | | |
| | American Public Education, | | | | | | | | | | |
| | Inc.* | | | 27,700 | | | | 788,342 | | | |
| | America’sCar-Mart, Inc.* | | | 10,000 | | | | 724,500 | | | |
| | Appliance Recycling | | | | | | | | | | |
| | Centers of America, Inc.* | | | 2,000 | | | | 880 | | | |
| | Ark Restaurants Corp. | | | 8,500 | | | | 156,060 | | | |
| | Ascena Retail Group, Inc.* | | | 423,400 | | | | 1,062,734 | | | |
| | Barnes & Noble Education, | | | | | | | | | | |
| | Inc.* | | | 17,060 | | | | 68,411 | | | |
| | | | | | |
| Industry Company | | | | Shares | | Value |
|
Consumer Discretionary (continued) |
| | | | | | | | | | |
| | Barnes & Noble, Inc. | | | 23,000 | | | $ | 163,070 | |
| | Bassett Furniture Industries, | | | | | | | | |
| | Inc. | | | 52,959 | | | | 1,061,298 | |
| | BBX Capital Corp. | | | 193,018 | | | | 1,105,993 | |
| | Beazer Homes USA, Inc.* | | | 50,000 | | | | 474,000 | |
| | Big Lots, Inc. | | | 31,500 | | | | 910,980 | |
| | Biglari Holdings, Inc., | | | | | | | | |
| | Class A* | | | 30 | | | | 17,630 | |
| | Biglari Holdings, Inc., | | | | | | | | |
| | Class B* | | | 1,400 | | | | 159,012 | |
| | BJ’s Restaurants, Inc. | | | 43,500 | | | | 2,199,795 | |
| | Buckle, Inc. (The)+ | | | 65,000 | | | | 1,257,100 | |
| | Build-A-Bear Workshop, | | | | | | | | |
| | Inc.* | | | 35,000 | | | | 138,250 | |
| | Caleres, Inc. | | | 90,000 | | | | 2,504,700 | |
| | Canterbury Park Holding | | | | | | | | |
| | Corp. | | | 511 | | | | 7,108 | |
| | Carriage Services, Inc. | | | 7,700 | | | | 119,350 | |
| | Carrols Restaurant Group, | | | | | | | | |
| | Inc.* | | | 80,000 | | | | 787,200 | |
| | Cato Corp. (The), Class A | | | 16,000 | | | | 228,320 | |
| | Century Casinos, Inc.* | | | 79,200 | | | | 585,288 | |
| | Chico’s FAS, Inc. | | | 226,200 | | | | 1,271,244 | |
| | China Automotive Systems, | | | | | | | | |
| | Inc.* | | | 69,200 | | | | 168,848 | |
| | China XD Plastics Co., Ltd.* | | | 48,400 | | | | 85,184 | |
| | Citi Trends, Inc. | | | 31,020 | | | | 632,498 | |
| | Conn’s, Inc.* | | | 71,500 | | | | 1,348,490 | |
| | Container Store Group, Inc. | | | | | | | | |
| | (The)* | | | 167,250 | | | | 797,782 | |
| | Cooper Tire & Rubber Co. | | | 67,650 | | | | 2,187,124 | |
| | Cooper-Standard Holdings, | | | | | | | | |
| | Inc.* | | | 32,000 | | | | 1,987,840 | |
| | Crown Crafts, Inc. | | | 13,050 | | | | 70,470 | |
| | CSS Industries, Inc. | | | 23,658 | | | | 212,212 | |
| | Del Frisco’s Restaurant | | | | | | | | |
| | Group, Inc.* | | | 19,768 | | | | 141,341 | |
| | Del Taco Restaurants, Inc.* | | | 92,600 | | | | 925,074 | |
| | Delta Apparel, Inc.* | | | 23,700 | | | | 408,351 | |
| | Destination XL Group, Inc.* | | | 147,000 | | | | 318,990 | |
| | Dillard’s, Inc., Class A+ | | | 43,500 | | | | 2,623,485 | |
| | DSW, Inc., Class A | | | 149,000 | | | | 3,680,300 | |
| | El Pollo Loco Holdings, Inc.* | | | 89,300 | | | | 1,354,681 | |
| | Escalade, Inc. | | | 4,000 | | | | 45,800 | |
| | Ethan Allen Interiors, Inc. | | | 58,100 | | | | 1,021,979 | |
| | Express, Inc.* | | | 129,000 | | | | 659,190 | |
| | Flanigan’s Enterprises, Inc. | | | 2,500 | | | | 63,525 | |
| | Flexsteel Industries, Inc. | | | 2,000 | | | | 44,160 | |
| | Full House Resorts, Inc.* | | | 70,000 | | | | 141,400 | |
| | GameStop Corp., Class A+ | | | 130,000 | | | | 1,640,600 | |
| | Gaming Partners International Corp. | | | 1,000 | | | | 13,000 | |
| | |
| 22 | | Semi-Annual Report | December 31, 2018 (Unaudited) |
| | |
OmniTax-ManagedSmall-Cap Value Fund (Unaudited) (continued) | |
|
Showing percentage of net assets as of December 31, 2018
| | | | | | | | | | | | |
| Industry Company | | Shares | | | Value | | | |
Common Stocks (continued) | | | |
Consumer Discretionary (continued) | | | |
| | Genesco, Inc.* | | | 51,500 | | | $ | 2,281,450 | | | |
| | Good Times Restaurants, Inc.* | | | 4,300 | | | | 10,750 | | | |
| | Group 1 Automotive, Inc. | | | 38,000 | | | | 2,003,360 | | | |
| | Hamilton Beach Brands | | | | | | | | | | |
| | Holding Co., Class A | | | 3,500 | | | | 82,110 | | | |
| | Haverty Furniture Cos, Inc. | | | 69,659 | | | | 1,308,196 | | | |
| | Hibbett Sports, Inc.* | | | 18,000 | | | | 257,400 | | | |
| | Houghton Mifflin Harcourt Co.* | | | 50,000 | | | | 443,000 | | | |
| | International Speedway Corp., Class A | | | 94,760 | | | | 4,156,174 | | | |
| | J Alexander’s Holdings, Inc.* | | | 45,250 | | | | 372,408 | | | |
| | J. Jill, Inc.* | | | 45,000 | | | | 239,850 | | | |
| | K12, Inc.* | | | 82,350 | | | | 2,041,456 | | | |
| | KB Home | | | 134,700 | | | | 2,572,770 | | | |
| | Kirkland’s, Inc.* | | | 44,900 | | | | 427,897 | | | |
| | Lakeland Industries, Inc.* | | | 26,450 | | | | 276,138 | | | |
| | Lands’ End, Inc.*+ | | | 79,300 | | | | 1,126,853 | | | |
| | Lifetime Brands, Inc. | | | 24,999 | | | | 250,740 | | | |
| | Live Ventures, Inc.* | | | 3,200 | | | | 21,504 | | | |
| | Luby’s, Inc.* | | | 31,900 | | | | 38,280 | | | |
| | MarineMax, Inc.* | | | 52,000 | | | | 952,120 | | | |
| | MDC Holdings, Inc. | | | 117,504 | | | | 3,303,037 | | | |
| | Modine Manufacturing Co.* | | | 71,800 | | | | 776,158 | | | |
| | Movado Group, Inc. | | | 61,600 | | | | 1,947,792 | | | |
| | Nevada Gold & Casinos, Inc.* | | | 36,100 | | | | 85,918 | | | |
| | Office Depot, Inc. | | | 1,045,000 | | | | 2,696,100 | | | |
| | P&F Industries, Inc., Class A | | | 492 | | | | 3,803 | | | |
| | Papa Murphy’s Holdings, Inc.*+ | | | 45,000 | | | | 213,750 | | | |
| | Party City Holdco, Inc.*+ | | | 175,800 | | | | 1,754,484 | | | |
| | Peak Resorts, Inc. | | | 98,600 | | | | 461,448 | | | |
| | Pier 1 Imports, Inc. | | | 113,300 | | | | 34,647 | | | |
| | Red Robin Gourmet Burgers, Inc.* | | | 4,800 | | | | 128,256 | | | |
| | Regis Corp.* | | | 108,350 | | | | 1,836,532 | | | |
| | Rent-A-Center, Inc.* | | | 83,200 | | | | 1,347,008 | | | |
| | Rocky Brands, Inc. | | | 24,550 | | | | 638,300 | | | |
| | RTW RetailWinds, Inc.* | | | 125,700 | | | | 355,731 | | | |
| | Shiloh Industries, Inc.* | | | 35,900 | | | | 209,297 | | | |
| | Shoe Carnival, Inc. | | | 33,800 | | | | 1,132,638 | | | |
| | Sonic Automotive, Inc., Class A | | | 83,500 | | | | 1,148,960 | | | |
| | SORL Auto Parts, Inc.*+ | | | 74,129 | | | | 139,363 | | | |
| | Speedway Motorsports, Inc. | | | 80,556 | | | | 1,310,646 | | | |
| | Stage Stores, Inc. | | | 42,100 | | | | 31,154 | | | |
| | Stoneridge, Inc.* | | | 47,000 | | | | 1,158,550 | | | |
| | Strattec Security Corp. | | | 17,300 | | | | 498,240 | | | |
| | Superior Industries International, Inc. | | | 46,700 | | | | 224,627 | | | |
| | | | | | | | | | |
| Industry Company | | Shares | | | Value | |
|
Consumer Discretionary (continued) | |
| | Tandy Leather Factory, Inc.* | | | 2,000 | | | $ | 11,360 | |
| | Tilly’s, Inc., Class A | | | 79,800 | | | | 866,628 | |
| | Tower International, Inc. | | | 46,000 | | | | 1,094,800 | |
| | TravelCenters of America, LLC* | | | 79,850 | | | | 300,236 | |
| | TRI Pointe Group, Inc.* | | | 65,000 | | | | 710,450 | |
| | Tuesday Morning Corp.*+ | | | 14,000 | | | | 23,800 | |
| | Unifi, Inc.* | | | 10,800 | | | | 246,672 | |
| | Unique Fabricating, Inc. | | | 15,000 | | | | 63,300 | |
| | Vera Bradley, Inc.* | | | 55,500 | | | | 475,635 | |
| | Vista Outdoor, Inc.* | | | 99,587 | | | | 1,130,312 | |
| | Vitamin Shoppe, Inc.* | | | 63,400 | | | | 300,516 | |
| | VOXX International Corp.* | | | 22,164 | | | | 87,769 | |
| | Weyco Group, Inc. | | | 16,400 | | | | 478,388 | |
| | William Lyon Homes, Class A* | | | 59,497 | | | | 636,023 | |
| | ZAGG, Inc.* | | | 24,235 | | | | 237,018 | |
| | Zumiez, Inc.* | | | 50,900 | | | | 975,753 | |
| | | | | | | | | | |
| | | | | | | | | 89,742,922 | |
|
Consumer Staples - 2.68% | |
| | Alico, Inc. | | | 16,600 | | | | 489,700 | |
| | Andersons, Inc. (The) | | | 82,216 | | | | 2,457,436 | |
| | Hostess Brands, Inc.* | | | 200,000 | | | | 2,188,000 | |
| | Ingles Markets, Inc., Class A | | | 50,950 | | | | 1,386,859 | |
| | Mannatech, Inc. | | | 25,700 | | | | 483,160 | |
| | Natural Alternatives International, Inc.* | | | 16,800 | | | | 165,144 | |
| | Natural Grocers by Vitamin Cottage, Inc.* | | | 25,000 | | | | 383,250 | |
| | Natural Health Trends Corp.+ | | | 3,000 | | | | 55,470 | |
| | Seneca Foods Corp., Class A* | | | 23,150 | | | | 653,293 | |
| | Smart & Final Stores, Inc.* | | | 132,400 | | | | 627,576 | |
| | SpartanNash Co. | | | 70,882 | | | | 1,217,753 | |
| | Village Super Market, Inc., Class A | | | 33,000 | | | | 882,420 | |
| | Weis Markets, Inc. | | | 56,500 | | | | 2,699,570 | |
| | | | | | | | | | |
| | | | | | | | | 13,689,631 | |
|
Energy - 11.57% | |
| | Adams Resources & Energy, Inc. | | | 10,600 | | | | 410,326 | |
| | Approach Resources, Inc.* | | | 207,000 | | | | 180,504 | |
| | Arch Coal, Inc., Class A | | | 44,400 | | | | 3,684,756 | |
| | Archrock, Inc. | | | 178,000 | | | | 1,333,220 | |
| | Ardmore Shipping Corp.* | | | 75,000 | | | | 350,250 | |
| | Bonanza Creek Energy, Inc.* | | | 50,300 | | | | 1,039,701 | |
| | Callon Petroleum Co.* | | | 56,300 | | | | 365,387 | |
| | Carrizo Oil & Gas, Inc.* | | | 102,500 | | | | 1,157,225 | |
| | |
OmniTax-ManagedSmall-Cap Value Fund (Unaudited) (continued) | | |
Showing percentage of net assets as of December 31, 2018
| | | | | | | | |
| Industry Company | | | | Shares | | Value | | |
| | | | | | | | | | | | | | |
| | |
| Common Stocks (continued) | | | | |
Energy (continued) | | | | | |
| | Cloud Peak Energy, Inc.* | | | 157,300 | | | $ | 57,619 | | | | | |
| | Contango Oil & Gas Co.* | | | 47,500 | | | | 154,375 | | | | | |
| | Dawson Geophysical Co.* | | | 57,250 | | | | 193,505 | | | | | |
| | Denbury Resources, Inc.* | | | 928,000 | | | | 1,586,880 | | | | | |
| | DHT Holdings, Inc. | | | 291,800 | | | | 1,143,856 | | | | | |
| | Diamond Offshore Drilling, Inc.* | | | 58,700 | | | | 554,128 | | | | | |
| | Dorian LPG, Ltd.* | | | 104,029 | | | | 606,489 | | | | | |
| | Eclipse Resources Corp.* | | | 275,300 | | | | 289,065 | | | | | |
| | Ensco PLC, Class A+ | | | 127,000 | | | | 452,120 | | | | | |
| | EP Energy Corp., Class A* | | | 40,000 | | | | 28,000 | | | | | |
| | Era Group, Inc.* | | | 32,800 | | | | 286,672 | | | | | |
| | Euronav NV | | | 5,253 | | | | 36,403 | | | | | |
| | Exterran Corp.* | | | 75,200 | | | | 1,331,040 | | | | | |
| | Extraction Oil & Gas, Inc.*+ | | | 351,400 | | | | 1,507,506 | | | | | |
| | Frontline, Ltd.* | | | 175,000 | | | | 967,750 | | | | | |
| | GasLog, Ltd. | | | 198,137 | | | | 3,261,335 | | | | | |
| | Gran Tierra Energy, Inc.* | | | 952,000 | | | | 2,065,840 | | | | | |
| | Green Plains, Inc. | | | 51,450 | | | | 674,510 | | | | | |
| | Gulf Island Fabrication, Inc.* | | | 15,000 | | | | 108,300 | | | | | |
| | Halcon Resources Corp.*+ | | | 190,300 | | | | 323,510 | | | | | |
| | Hallador Energy Co. | | | 25,000 | | | | 126,750 | | | | | |
| | Helix Energy Solutions Group, Inc.* | | | 290,500 | | | | 1,571,605 | | | | | |
| | HighPoint Resources Corp.* | | | 488,000 | | | | 1,215,120 | | | | | |
| | Independence Contract Drilling, Inc.* | | | 115,281 | | | | 359,677 | | | | | |
| | International Seaways, Inc.* | | | 399 | | | | 6,719 | | | | | |
| | Keane Group, Inc.* | | | 70,000 | | | | 572,600 | | | | | |
| | Lonestar Resources US, Inc., Class A* | | | 14,700 | | | | 53,655 | | | | | |
| | Mammoth Energy Services, Inc. | | | 117,400 | | | | 2,110,852 | | | | | |
| | Matrix Service Co.* | | | 43,000 | | | | 771,420 | | | | | |
| | McDermott International, Inc.* | | | 140,001 | | | | 915,607 | | | | | |
| | Midstates Petroleum Co., Inc.* | | | 58,300 | | | | 437,833 | | | | | |
| | Mitcham Industries, Inc.* | | | 5,000 | | | | 12,800 | | | | | |
| | Nabors Industries, Ltd. | | | 240,000 | | | | 480,000 | | | | | |
| | NACCO Industries, Inc., Class A | | | 31,450 | | | | 1,066,155 | | | | | |
| | Natural Gas Services Group, Inc.* | | | 58,888 | | | | 968,119 | | | | | |
| | Noble Corp. PLC* | | | 396,000 | | | | 1,037,520 | | | | | |
| | Oil States International, Inc.* | | | 18,000 | | | | 257,040 | | | | | |
| | Overseas Shipholding Group, Inc., Class A* | | | 183,300 | | | | 304,278 | | | | | |
| | Par Pacific Holdings, Inc.* | | | 110,300 | | | | 1,564,054 | | | | | |
| | Pioneer Energy Services Corp.* | | | 175,000 | | | | 215,250 | | | | | |
| | | | | | | | | | | | | | |
| | | | | | | | | | | | | | |
| | | | | | | | | | |
| Industry | | Company | | Shares | | | Value | |
| | | |
| | | | | | | | | | |
Energy (continued) | |
| | ProPetro Holding Corp.* | | | 78,500 | | | $ | 967,120 | |
| | Renewable Energy Group, Inc.* | | | 236,319 | | | | 6,073,398 | |
| | REX American Resources Corp.* | | | 25,250 | | | | 1,719,778 | |
| | Ring Energy, Inc.* | | | 28,300 | | | | 143,764 | |
| | SandRidge Energy, Inc.* | | | 69,500 | | | | 528,895 | |
| | SEACOR Holdings, Inc.* | | | 40,200 | | | | 1,487,400 | |
| | SEACOR Marine Holdings, Inc.* | | | 11,063 | | | | 130,101 | |
| | SemGroup Corp., Class A+ | | | 100,000 | | | | 1,378,000 | |
| | Ship Finance International, Ltd. | | | 235,500 | | | | 2,479,815 | |
| | SilverBow Resources, Inc.* | | | 21,400 | | | | 505,896 | |
| | SM Energy Co. | | | 22,000 | | | | 340,560 | |
| | SRC Energy, Inc.* | | | 397,000 | | | | 1,865,900 | |
| | Superior Energy Services, Inc.* | | | 90,000 | | | | 301,500 | |
| | Teekay Corp.+ | | | 145,000 | | | | 484,300 | |
| | TETRA Technologies, Inc.* | | | 100,000 | | | | 168,000 | |
| | TransAtlantic Petroleum, Ltd.* | | | 70,000 | | | | 72,800 | |
| | Unit Corp.* | | | 135,025 | | | | 1,928,157 | |
| | US Silica Holdings, Inc.+ | | | 40,000 | | | | 407,200 | |
| | | | | | | | | | |
| | | | | | | | | 59,179,910 | |
| | |
Financials - 29.97% | | | | | | | | |
| | 1347 Property Insurance | | | | | | | | |
| | Holdings, Inc.* | | | 17,500 | | | | 70,350 | |
| | 1st Constitution Bancorp | | | 5,250 | | | | 104,632 | |
| | 1st Source Corp. | | | 11,320 | | | | 456,649 | |
| | Access National Corp. | | | 30,506 | | | | 650,693 | |
| | ACNB Corp. | | | 2,600 | | | | 102,050 | |
| | American National Bankshares, Inc. | | | 4,565 | | | | 133,800 | |
| | American River Bankshares | | | 20,744 | | | | 286,267 | |
| | AmeriServ Financial, Inc. | | | 66,000 | | | | 265,980 | |
| | Argo Group International Holdings, Ltd. | | | 51,394 | | | | 3,456,246 | |
| | Arlington Asset Investment Corp., Class A+ | | | 40,000 | | | | 289,600 | |
| | Atlantic Capital Bancshares, Inc.* | | | 52,933 | | | | 866,513 | |
| | Banc of California, Inc. | | | 98,000 | | | | 1,304,380 | |
| | Banco Latinoamericano de Comercio Exterior SA, Class E | | | 77,000 | | | | 1,332,100 | |
| | Bancorp, Inc. (The)* | | | 151,800 | | | | 1,208,328 | |
| | Bank of Commerce Holdings | | | 75,550 | | | | 828,028 | |
| | Bank of Princeton (The) | | | 12,500 | | | | 348,750 | |
| | |
| 24 | | Semi-Annual Report | December 31, 2018 (Unaudited) |
| | |
OmniTax-ManagedSmall-Cap Value Fund (Unaudited)(continued) | | |
Showing percentage of net assets as of December 31, 2018
| | | | | | | | | | | | | | |
| Industry | | Company | | Shares | | | Value | | | | |
| | |
Common Stocks (continued) | | | | | | | | | |
Financials (continued) | | | | | |
| | BankFinancial Corp. | | | 3,000 | | | $ | 44,850 | | | | | |
| | Bankwell Financial Group, Inc. | | | 1,500 | | | | 43,065 | | | | | |
| | Banner Corp. | | | 20,000 | | | | 1,069,600 | | | | | |
| | Bar Harbor Bankshares | | | 20,241 | | | | 454,006 | | | | | |
| | BCB Bancorp, Inc. | | | 11,300 | | | | 118,311 | | | | | |
| | Beneficial Bancorp, Inc. | | | 116,800 | | | | 1,669,072 | | | | | |
| | Berkshire Hills Bancorp, Inc. | | | 81,570 | | | | 2,199,943 | | | | | |
| | Blue Capital Reinsurance Holdings, Ltd.+ | | | 11,127 | | | | 61,198 | | | | | |
| | BSB Bancorp, Inc.* | | | 25,500 | | | | 715,530 | | | | | |
| | C&F Financial Corp. | | | 3,400 | | | | 180,914 | | | | | |
| | California First National Bancorp | | | 12,100 | | | | 171,215 | | | | | |
| | Camden National Corp. | | | 33,779 | | | | 1,215,031 | | | | | |
| | Capital City Bank Group, Inc. | | | 55,750 | | | | 1,293,958 | | | | | |
| | Capstar Financial Holdings, Inc. | | | 29,900 | | | | 440,427 | | | | | |
| | CB Financial Services, Inc.+ | | | 13,500 | | | | 334,530 | | | | | |
| | Central Pacific Financial Corp. | | | 6,496 | | | | 158,178 | | | | | |
| | Central Valley Community Bancorp | | | 51,000 | | | | 962,370 | | | | | |
| | Century Bancorp, Inc., Class A | | | 6,800 | | | | 460,564 | | | | | |
| | Chemung Financial Corp. | | | 12,293 | | | | 507,824 | | | | | |
| | Citizens Community Bancorp, Inc. | | | 32,000 | | | | 348,800 | | | | | |
| | Citizens, Inc.*+ | | | 17,200 | | | | 129,344 | | | | | |
| | Civista Bancshares, Inc. | | | 31,921 | | | | 556,064 | | | | | |
| | CNB Financial Corp. | | | 70,800 | | | | 1,624,860 | | | | | |
| | Codorus Valley Bancorp, Inc. | | | 8,154 | | | | 173,273 | | | | | |
| | Colony Bankcorp, Inc. | | | 1,500 | | | | 21,900 | | | | | |
| | Community Bankers Trust Corp.* | | | 48,000 | | | | 346,560 | | | | | |
| | Community Financial Corp. (The) | | | 3,840 | | | | 112,282 | | | | | |
| | ConnectOne Bancorp, Inc. | | | 58,000 | | | | 1,071,260 | | | | | |
| | Consumer Portfolio Services, Inc.* | | | 97,000 | | | | 291,970 | | | | | |
| | County Bancorp, Inc. | | | 8,700 | | | | 151,119 | | | | | |
| | Cowen, Inc.*+ | | | 49,300 | | | | 657,662 | | | | | |
| | Crawford & Co., Class A | | | 44,000 | | | | 391,600 | | | | | |
| | Crawford & Co., Class B | | | 40,000 | | | | 360,000 | | | | | |
| | Customers Bancorp, Inc.* | | | 34,500 | | | | 627,900 | | | | | |
| | Dime Community Bancshares, Inc. | | | 67,000 | | | | 1,137,660 | | | | | |
| | DNB Financial Corp. | | | 12,000 | | | | 324,000 | | | | | |
| | Donegal Group, Inc., Class A+ | | | 74,100 | | | | 1,011,094 | | | | | |
| | | | | | | | | | |
| Industry | | Company | | Shares | | | Value | |
| | | |
| | | | | | | | | | |
Financials (continued) | |
| | Eagle Bancorp Montana, Inc. | | | 3,000 | | | $ | 48,510 | |
| | Elevate Credit, Inc.* | | | 20,000 | | | | 89,600 | |
| | EMC Insurance Group, Inc. | | | 39,025 | | | | 1,242,946 | |
| | Emclaire Financial Corp.+ | | | 200 | | | | 6,068 | |
| | Employers Holdings, Inc. | | | 75,900 | | | | 3,185,523 | |
| | Encore Capital Group, Inc.*+ | | | 64,700 | | | | 1,520,450 | |
| | Enova International, Inc.* | | | 92,400 | | | | 1,798,104 | |
| | Entegra Financial Corp.* | | | 23,600 | | | | 489,700 | |
| | Enterprise Bancorp, Inc. | | | 30,475 | | | | 980,076 | |
| | ESSA Bancorp, Inc. | | | 35,000 | | | | 546,350 | |
| | Evans Bancorp, Inc. | | | 7,000 | | | | 227,570 | |
| | EZCORP, Inc., Class A* | | | 170,300 | | | | 1,316,419 | |
| | Farmers National Banc Corp. | | | 150 | | | | 1,911 | |
| | FBL Financial Group, Inc., Class A | | | 45,666 | | | | 2,997,973 | |
| | Federal Agricultural Mortgage Corp., Class C | | | 18,200 | | | | 1,100,008 | |
| | FedNat Holding Co. | | | 27,500 | | | | 547,800 | |
| | Fidelity Southern Corp. | | | 61,400 | | | | 1,597,628 | |
| | Financial Institutions, Inc. | | | 40,300 | | | | 1,035,710 | |
| | First BanCorp Puerto Rico | | | 450,000 | | | | 3,870,000 | |
| | First Bancorp, Inc. | | | 15,880 | | | | 417,644 | |
| | First Busey Corp. | | | 67,593 | | | | 1,658,732 | |
| | First Business Financial Services, Inc. | | | 19,100 | | | | 372,641 | |
| | First Capital, Inc. | | | 500 | | | | 19,860 | |
| | First Community Bankshares, Inc. | | | 11,000 | | | | 346,280 | |
| | First Financial Corp. | | | 27,520 | | | | 1,104,928 | |
| | First Financial Northwest, Inc. | | | 26,400 | | | | 408,408 | |
| | First Guaranty Bancshares, Inc.+ | | | 5,499 | | | | 127,632 | |
| | First Internet Bancorp | | | 13,800 | | | | 282,072 | |
| | FirstMid-Illinois Bancshares, Inc. | | | 36,500 | | | | 1,165,080 | |
| | First Northwest Bancorp | | | 16,590 | | | | 246,030 | |
| | First United Corp. | | | 12,225 | | | | 194,622 | |
| | First US Bancshares, Inc. | | | 5,000 | | | | 39,750 | |
| | Flushing Financial Corp. | | | 30,041 | | | | 646,783 | |
| | Franklin Financial Network, Inc.* | | | 3,000 | | | | 79,110 | |
| | FS Bancorp, Inc. | | | 7,850 | | | | 336,608 | |
| | GAIN Capital Holdings, Inc.+ | | | 146,000 | | | | 899,360 | |
| | German American Bancorp, Inc. | | | 750 | | | | 20,828 | |
| | Global Indemnity, Ltd. | | | 2,600 | | | | 94,198 | |
| | |
OmniTax-ManagedSmall-Cap Value Fund (Unaudited)(continued) | | |
Showing percentage of net assets as of December 31, 2018
| | | | | | | | | | | | | | |
| Industry | | Company | | Shares | | | Value | | | | |
| | | |
Common Stocks (continued) | | | | | | | | | | | | |
Financials (continued) | | | | | | | | | | | | |
| | Great Southern Bancorp, Inc. | | | 31,006 | | | $ | 1,427,206 | | | | | |
| | Green Bancorp, Inc. | | | 100,000 | | | | 1,714,000 | | | | | |
| | Hallmark Financial Services, Inc.* | | | 50,158 | | | | 536,189 | | | | | |
| | Hanmi Financial Corp. | | | 42,400 | | | | 835,280 | | | | | |
| | Hawthorn Bancshares, Inc. | | | 12,480 | | | | 262,454 | | | | | |
| | HCI Group, Inc. | | | 18,400 | | | | 934,904 | | | | | |
| | Heartland Financial USA, Inc. | | | 51,950 | | | | 2,283,202 | | | | | |
| | Hennessy Advisors, Inc. | | | 2,000 | | | | 20,020 | | | | | |
| | Heritage Insurance Holdings, Inc. | | | 30,000 | | | | 441,600 | | | | | |
| | Home Bancorp, Inc. | | | 15,597 | | | | 552,134 | | | | | |
| | HomeStreet, Inc.* | | | 64,900 | | | | 1,377,827 | | | | | |
| | HopFed Bancorp, Inc. | | | 23,500 | | | | 312,315 | | | | | |
| | Horace Mann Educators Corp. | | | 94,950 | | | | 3,555,878 | | | | | |
| | Horizon Bancorp, Inc. | | | 53,542 | | | | 844,893 | | | | | |
| | Howard Bancorp, Inc.* | | | 4,000 | | | | 57,200 | | | | | |
| | Independence Holding Co. | | | 14,950 | | | | 526,240 | | | | | |
| | INTL. FCStone, Inc.* | | | 2,558 | | | | 93,572 | | | | | |
| | James River Group Holdings, Ltd. | | | 79,100 | | | | 2,890,314 | | | | | |
| | Kingstone Cos, Inc. | | | 21,700 | | | | 383,873 | | | | | |
| | Ladenburg Thalmann Financial Services, Inc. | | | 30,000 | | | | 69,900 | | | | | |
| | Lakeland Bancorp, Inc. | | | 70,040 | | | | 1,037,292 | | | | | |
| | Landmark Bancorp, Inc. | | | 2,430 | | | | 55,659 | | | | | |
| | LCNB Corp.+ | | | 12,700 | | | | 192,405 | | | | | |
| | Mackinac Financial Corp. | | | 13,400 | | | | 182,910 | | | | | |
| | Maiden Holdings, Ltd. | | | 62,600 | | | | 103,290 | | | | | |
| | Marlin Business Services Corp. | | | 28,875 | | | | 644,779 | | | | | |
| | Mercantile Bank Corp. | | | 2,000 | | | | 56,520 | | | | | |
| | Meta Financial Group, Inc. | | | 60,234 | | | | 1,167,937 | | | | | |
| | Mid Penn Bancorp, Inc. | | | 11,200 | | | | 257,824 | | | | | |
| | Middlefield Banc Corp. | | | 2,000 | | | | 84,860 | | | | | |
| | Midland States Bancorp, Inc. | | | 45,117 | | | | 1,007,914 | | | | | |
| | MidSouth Bancorp, Inc.+ | | | 41,000 | | | | 434,600 | | | | | |
| | MidWestOne Financial Group, Inc. | | | 48,300 | | | | 1,199,289 | | | | | |
| | MMA Capital Holdings, Inc.* | | | 1,500 | | | | 37,800 | | | | | |
| | Mr Cooper Group, Inc.* | | | 9,703 | | | | 113,234 | | | | | |
| | MutualFirst Financial, Inc. | | | 700 | | | | 18,599 | | | | | |
| | MVB Financial Corp. | | | 40,300 | | | | 727,012 | | | | | |
| | National Bankshares, Inc. | | | 1,000 | | | | 36,430 | | | | | |
| | National Holdings Corp.* | | | 2,000 | | | | 5,400 | | | | | |
| | National Security Group, Inc. (The) | | | 200 | | | | 2,602 | | | | | |
| | | | | | | | | | |
| Industry | | Company | | Shares | | | Value | |
| | | |
| | | | | | | | | | |
Financials (continued) | | | | | | | | |
| | National Western Life Group, Inc., Class A | | | 8,450 | | | $ | 2,540,915 | |
| | Nelnet, Inc., Class A | | | 36,900 | | | | 1,931,346 | |
| | Nicholas Financial, Inc.* | | | 18,400 | | | | 191,360 | |
| | Nicolet Bankshares, Inc.* | | | 16,900 | | | | 824,720 | |
| | NMI Holdings, Inc., Class A* | | | 135,000 | | | | 2,409,750 | |
| | Northeast Bancorp | | | 8,400 | | | | 140,532 | |
| | Northrim BanCorp, Inc. | | | 24,073 | | | | 791,280 | |
| | Northwest Bancshares, Inc. | | | 155,000 | | | | 2,625,700 | |
| | Ocwen Financial Corp.* | | | 71,400 | | | | 95,676 | |
| | OFG Bancorp | | | 100,000 | | | | 1,646,000 | |
| | On Deck Capital, Inc.* | | | 208,000 | | | | 1,227,200 | |
| | Oppenheimer Holdings, Inc., Class A | | | 23,619 | | | | 603,465 | |
| | Opus Bank | | | 50,000 | | | | 979,500 | |
| | Orrstown Financial Services, Inc. | | | 28,000 | | | | 509,880 | |
| | Parke Bancorp, Inc. | | | 17,327 | | | | 324,275 | |
| | Patriot National Bancorp, Inc. | | | 11,000 | | | | 156,750 | |
| | PB Bancorp, Inc. | | | 14,500 | | | | 158,050 | |
| | Peapack Gladstone Financial Corp. | | | 19,968 | | | | 502,794 | |
| | Penns Woods Bancorp, Inc. | | | 1,000 | | | | 40,240 | |
| | Peoples Bancorp of North Carolina, Inc. | | | 27,380 | | | | 669,715 | |
| | Peoples Bancorp, Inc. | | | 39,550 | | | | 1,190,455 | |
| | Peoples Financial Services Corp.+ | | | 17,600 | | | | 775,456 | |
| | Piper Jaffray Cos | | | 28,700 | | | | 1,889,608 | |
| | Premier Financial Bancorp, Inc. | | | 43,740 | | | | 652,163 | |
| | Protective Insurance Corp., Class B | | | 43,700 | | | | 727,605 | |
| | Provident Financial Holdings, Inc. | | | 53,710 | | | | 832,505 | |
| | Provident Financial Services, Inc. | | | 82,500 | | | | 1,990,725 | |
| | Prudential Bancorp, Inc. | | | 2,457 | | | | 43,243 | |
| | Regional Management Corp.* | | | 52,100 | | | | 1,253,005 | |
| | Reliant Bancorp, Inc.+ | | | 1,000 | | | | 23,040 | |
| | Republic Bancorp, Inc., Class A | | | 35,700 | | | | 1,382,304 | |
| | Riverview Bancorp, Inc. | | | 66,478 | | | | 483,960 | |
| | Safety Insurance Group, Inc. | | | 12,949 | | | | 1,059,358 | |
| | Salisbury Bancorp, Inc. | | | 1,183 | | | | 42,801 | |
| | Sandy Spring Bancorp, Inc. | | | 14,300 | | | | 448,162 | |
| | SB Financial Group, Inc. | | | 30,952 | | | | 509,160 | |
| | SB One Bancorp | | | 5,000 | | | | 102,200 | |
| | |
| 26 | | Semi-Annual Report | December 31, 2018 (Unaudited) |
| | |
OmniTax-ManagedSmall-Cap Value Fund (Unaudited) (continued) | | |
Showing percentage of net assets as of December 31, 2018
| | | | | | | | | | | | | | | | | | |
| Industry Company | | Shares | | | Value | | | | | | | |
| | |
Common Stocks (continued) | | | | | | | | | |
Financials (continued) | | | | | | | | | |
| | Security National Financial Corp., Class A* | | | 15,073 | | | $ | 77,777 | | | | | | | | | |
| | Severn Bancorp, Inc.+ | | | 30,000 | | | | 239,400 | | | | | | | | | |
| | Shore Bancshares, Inc. | | | 60,400 | | | | 878,216 | | | | | | | | | |
| | SI Financial Group, Inc. | | | 35,500 | | | | 451,915 | | | | | | | | | |
| | Sierra Bancorp | | | 28,439 | | | | 683,389 | | | | | | | | | |
| | Sound Financial Bancorp, Inc. | | | 1,000 | | | | 32,550 | | | | | | | | | |
| | Southern National Bancorp of Virginia, Inc. | | | 57,500 | | | | 760,150 | | | | | | | | | |
| | State Auto Financial Corp. | | | 81,836 | | | | 2,785,697 | | | | | | | | | |
| | Stewart Information Services Corp. | | | 47,750 | | | | 1,976,850 | | | | | | | | | |
| | Summit Financial Group, Inc. | | | 25,100 | | | | 484,681 | | | | | | | | | |
| | Summit State Bank | | | 6,250 | | | | 73,562 | | | | | | | | | |
| | Territorial Bancorp, Inc. | | | 21,900 | | | | 568,962 | | | | | | | | | |
| | TheStreet, Inc.* | | | 145,000 | | | | 294,350 | | | | | | | | | |
| | Timberland Bancorp, Inc. | | | 19,600 | | | | 437,080 | | | | | | | | | |
| | Tiptree, Inc. | | | 94,200 | | | | 526,578 | | | | | | | | | |
| | Towne Bank | | | 743 | | | | 17,795 | | | | | | | | | |
| | TriCo Bancshares | | | 200 | | | | 6,758 | | | | | | | | | |
| | Two River Bancorp | | | 36,015 | | | | 549,589 | | | | | | | | | |
| | Union Bankshares Corp. | | | 576 | | | | 16,260 | | | | | | | | | |
| | United Community Financial Corp. | | | 10,163 | | | | 89,943 | | | | | | | | | |
| | United Financial Bancorp, Inc. | | | 118,100 | | | | 1,736,070 | | | | | | | | | |
| | United Fire Group, Inc. | | | 50,200 | | | | 2,783,590 | | | | | | | | | |
| | United Insurance Holdings Corp.+ | | | 78,400 | | | | 1,303,008 | | | | | | | | | |
| | Universal Insurance Holdings, Inc. | | | 71,495 | | | | 2,711,090 | | | | | | | | | |
| | Univest Financial Corp. | | | 45,000 | | | | 970,650 | | | | | | | | | |
| | Waddell & Reed Financial, Inc., Class A+ | | | 217,800 | | | | 3,937,824 | | | | | | | | | |
| | Walker & Dunlop, Inc. | | | 58,175 | | | | 2,516,069 | | | | | | | | | |
| | Waterstone Financial, Inc. | | | 43,900 | | | | 735,764 | | | | | | | | | |
| | Wellesley Bank | | | 1,000 | | | | 27,740 | | | | | | | | | |
| | WesBanco, Inc. | | | 23,200 | | | | 851,208 | | | | | | | | | |
| | Westbury Bancorp, Inc.* | | | 2,750 | | | | 56,100 | | | | | | | | | |
| | World Acceptance Corp.* | | | 22,500 | | | | 2,300,850 | | | | | | | | | |
| | | | | | | | | | | | | | | | | | |
| | | | | | | | | 153,346,932 | | | | | | | | | |
| | |
Health Care - 2.53% | | | | | | | | | |
| | Acorda Therapeutics, Inc.* | | | 105,000 | | | | 1,635,900 | | | | | | | | | |
| | AMAG Pharmaceuticals, Inc.* | | | 50,000 | | | | 759,500 | | | | | | | | | |
| | AngioDynamics, Inc.* | | | 87,000 | | | | 1,751,310 | | | | | | | | | |
| | Concert Pharmaceuticals, Inc.* | | | 45,000 | | | | 564,750 | | | | | | | | | |
| | | | | | | | | | |
| Industry Company | | Shares | | | Value | |
| | | |
| | | | | | | | | | |
Health Care (continued) | |
| | Cross Country Healthcare, Inc.* | | | 65,300 | | | $ | 478,649 | |
| | Electromed, Inc.* | | | 10,000 | | | | 50,900 | |
| | FONAR Corp.* | | | 23,400 | | | | 473,616 | |
| | InfuSystem Holdings, Inc.* | | | 118,378 | | | | 407,220 | |
| | Kewaunee Scientific Corp. | | | 2,500 | | | | 83,100 | |
| | Magellan Health, Inc.* | | | 39,500 | | | | 2,247,155 | |
| | National HealthCare Corp. | | | 22,982 | | | | 1,802,938 | |
| | PDL BioPharma, Inc.* | | | 380,800 | | | | 1,104,320 | |
| | Quorum Health Corp.* | | | 25,000 | | | | 72,250 | |
| | Surgery Partners, Inc.* | | | 55,500 | | | | 543,345 | |
| | Triple-S Management Corp., Class B* | | | 56,100 | | | | 975,579 | |
| | | | | | | | | | |
| | | | | | | | | 12,950,532 | |
|
Industrials - 16.29% | |
| | Acacia Research Corp.* | | | 35,000 | | | | 104,300 | |
| | ACCO Brands Corp. | | | 239,800 | | | | 1,625,844 | |
| | Aegion Corp.* | | | 72,100 | | | | 1,176,672 | |
| | AeroCentury Corp.* | | | 4,300 | | | | 41,151 | |
| | Air T, Inc.* | | | 6,700 | | | | 164,150 | |
| | Aircastle, Ltd. | | | 103,400 | | | | 1,782,616 | |
| | Alpha Pro Tech, Ltd.* | | | 30,500 | | | | 113,155 | |
| | AMREP Corp.* | | | 8,100 | | | | 48,195 | |
| | ArcBest Corp. | | | 50,400 | | | | 1,726,704 | |
| | Armstrong Flooring, Inc.* | | | 45,000 | | | | 532,800 | |
| | Arotech Corp.* | | | 35,596 | | | | 93,262 | |
| | Art’s-Way Manufacturing Co., Inc.* | | | 15,000 | | | | 30,000 | |
| | ASV Holdings, Inc.* | | | 50,000 | | | | 100,000 | |
| | Atkore International Group, Inc.* | | | 75,000 | | | | 1,488,000 | |
| | Atlas Air Worldwide Holdings, Inc.* | | | 48,000 | | | | 2,025,120 | |
| | BMC Stock Holdings, Inc.* | | | 128,800 | | | | 1,993,824 | |
| | Briggs & Stratton Corp. | | | 80,700 | | | | 1,055,556 | |
| | CAI International, Inc.* | | | 36,500 | | | | 847,895 | |
| | CBIZ, Inc.* | | | 129,033 | | | | 2,541,950 | |
| | Chicago Rivet & Machine Co. | | | 1,000 | | | | 31,500 | |
| | Civeo Corp.* | | | 113,700 | | | | 162,591 | |
| | Commercial Vehicle Group, Inc.* | | | 8,700 | | | | 49,590 | |
| | Costamare, Inc. | | | 230,000 | | | | 1,009,700 | |
| | Covenant Transportation Group, Inc., Class A* | | | 42,550 | | | | 816,960 | |
| | CRA International, Inc. | | | 31,000 | | | | 1,319,050 | |
| | DLH Holdings Corp.* | | | 52,500 | | | | 248,325 | |
| | Ducommun, Inc.* | | | 34,300 | | | | 1,245,776 | |
| | Eagle Bulk Shipping, Inc.* | | | 230,000 | | | | 1,060,300 | |
| | |
OmniTax-ManagedSmall-Cap Value Fund (Unaudited) (continued) | | |
Showing percentage of net assets as of December 31, 2018
| | | | | | | | | | | | | | | | | | |
| Industry Company | | Shares | | | Value | | | | | | | |
| | | | |
Common Stocks (continued) | | | | | | | | | | | | | | | | |
Industrials (continued) | | | | | | | | | | | | | | | | |
| | Eastern Co. (The) | | | 20,104 | | | $ | 486,115 | | | | | | | | | |
| | Ecology and Environment, Inc., Class A | | | 3,536 | | | | 40,098 | | | | | | | | | |
| | Engility Holdings, Inc.* | | | 38,600 | | | | 1,098,556 | | | | | | | | | |
| | Ennis, Inc. | | | 124,265 | | | | 2,392,101 | | | | | | | | | |
| | EnPro Industries, Inc. | | | 25,000 | | | | 1,502,500 | | | | | | | | | |
| | Essendant, Inc. | | | 72,000 | | | | 905,760 | | | | | | | | | |
| | Foundation Building Materials, Inc.* | | | 59,800 | | | | 496,938 | | | | | | | | | |
| | FreightCar America, Inc.* | | | 16,200 | | | | 108,378 | | | | | | | | | |
| | FTI Consulting, Inc.* | | | 56,500 | | | | 3,765,160 | | | | | | | | | |
| | Genco Shipping & Trading, Ltd.* | | | 95,000 | | | | 749,550 | | | | | | | | | |
| | General Finance Corp.* | | | 50,000 | | | | 505,500 | | | | | | | | | |
| | Goldfield Corp. (The)* | | | 114,000 | | | | 257,640 | | | | | | | | | |
| | Great Lakes Dredge & Dock Corp.* | | | 144,800 | | | | 958,576 | | | | | | | | | |
| | Greenbrier Cos, Inc. (The) | | | 59,100 | | | | 2,336,814 | | | | | | | | | |
| | Hawaiian Holdings, Inc. | | | 37,300 | | | | 985,093 | | | | | | | | | |
| | Herc Holdings, Inc.* | | | 55,000 | | | | 1,429,450 | | | | | | | | | |
| | Hertz Global Holdings, Inc.* | | | 70,000 | | | | 955,500 | | | | | | | | | |
| | Highpower International, Inc.* | | | 25,922 | | | | 56,251 | | | | | | | | | |
| | Hub Group, Inc., Class A* | | | 15,600 | | | | 578,292 | | | | | | | | | |
| | Hurco Cos, Inc. | | | 17,615 | | | | 628,856 | | | | | | | | | |
| | Huron Consulting Group, Inc.* | | | 10,300 | | | | 528,493 | | | | | | | | | |
| | Hyster-Yale Materials Handling, Inc. | | | 17,200 | | | | 1,065,712 | | | | | | | | | |
| | ICF International, Inc. | | | 31,500 | | | | 2,040,570 | | | | | | | | | |
| | IES Holdings, Inc.* | | | 3,600 | | | | 55,980 | | | | | | | | | |
| | Innovative Solutions & Support, Inc.* | | | 23,300 | | | | 51,376 | | | | | | | | | |
| | Kelly Services, Inc., Class A | | | 56,400 | | | | 1,155,072 | | | | | | | | | |
| | LB Foster Co., Class A* | | | 32,500 | | | | 516,750 | | | | | | | | | |
| | Limbach Holdings, Inc.* | | | 25,000 | | | | 92,000 | | | | | | | | | |
| | LS Starrett Co. (The), Class A* | | | 9,400 | | | | 49,162 | | | | | | | | | |
| | Manitowoc Co., Inc. (The)* | | | 16,000 | | | | 236,320 | | | | | | | | | |
| | Marten Transport, Ltd. | | | 100,776 | | | | 1,631,563 | | | | | | | | | |
| | Matson, Inc. | | | 76,090 | | | | 2,436,402 | | | | | | | | | |
| | Miller Industries, Inc. | | | 22,700 | | | | 612,900 | | | | | | | | | |
| | Navigant Consulting, Inc. | | | 125,900 | | | | 3,027,895 | | | | | | | | | |
| | Nexeo Solutions, Inc.*+ | | | 191,100 | | | | 1,641,549 | | | | | | | | | |
| | NL Industries, Inc.* | | | 5,000 | | | | 17,550 | | | | | | | | | |
| | Northwest Pipe Co.* | | | 20,100 | | | | 468,129 | | | | | | | | | |
| | Orion Group Holdings, Inc.* | | | 148,672 | | | | 637,803 | | | | | | | | | |
| | PAM Transportation Services, Inc.* | | | 10,000 | | | | 394,100 | | | | | | | | | |
| | Pangaea Logistics Solutions, Ltd.* | | | 4,800 | | | | 14,544 | | | | | | | | | |
| | Park-Ohio Holdings Corp. | | | 10,000 | | | | 306,900 | | | | | | | | | |
| | | | | | | | | | | | | | |
| Industry Company | | Shares | | | Value | | | | |
| |
Industrials (continued) | | | | | |
| | Patriot Transportation Holding, Inc.* | | | 7,500 | | | $ | 146,175 | | | | | |
| | Performant Financial Corp.* | | | 93,833 | | | | 211,124 | | | | | |
| | Powell Industries, Inc. | | | 25,000 | | | | 625,250 | | | | | |
| | Preformed Line Products Co. | | | 2,600 | | | | 141,050 | | | | | |
| | Quad/Graphics, Inc. | | | 62,600 | | | | 771,232 | | | | | |
| | Quanex Building Products Corp. | | | 70,000 | | | | 951,300 | | | | | |
| | Rush Enterprises, Inc., Class A | | | 48,600 | | | | 1,675,728 | | | | | |
| | Rush Enterprises, Inc., Class B | | | 34,700 | | | | 1,235,320 | | | | | |
| | Safe Bulkers, Inc.* | | | 337,100 | | | | 600,038 | | | | | |
| | Scorpio Bulkers, Inc. | | | 195,000 | | | | 1,078,350 | | | | | |
| | Servotronics, Inc. | | | 1,000 | | | | 9,950 | | | | | |
| | SkyWest, Inc. | | | 25,200 | | | | 1,120,644 | | | | | |
| | Spartan Motors, Inc. | | | 10,000 | | | | 72,300 | | | | | |
| | SPX FLOW, Inc.* | | | 74,700 | | | | 2,272,374 | | | | | |
| | Steelcase, Inc., Class A | | | 202,600 | | | | 3,004,558 | | | | | |
| | Sterling Construction Co., Inc.* | | | 800 | | | | 8,712 | | | | | |
| | Textainer Group Holdings, Ltd.* | | | 114,300 | | | | 1,138,428 | | | | | |
| | Titan Machinery, Inc.* | | | 47,800 | | | | 628,570 | | | | | |
| | TrueBlue, Inc.* | | | 44,250 | | | | 984,562 | | | | | |
| | Tutor Perini Corp.* | | | 96,200 | | | | 1,536,314 | | | | | |
| | Ultralife Corp.* | | | 57,350 | | | | 387,112 | | | | | |
| | USA Truck, Inc.* | | | 9,500 | | | | 142,215 | | | | | |
| | Vectrus, Inc.* | | | 5,400 | | | | 116,532 | | | | | |
| | Veritiv Corp.* | | | 11,633 | | | | 290,476 | | | | | |
| | VSE Corp. | | | 25,560 | | | | 764,500 | | | | | |
| | Wabash National Corp. | | | 87,000 | | | | 1,137,960 | | | | | |
| | Willis Lease Finance Corp.* | | | 47,634 | | | | 1,648,136 | | | | | |
| | | | | | | | | | | | | | |
| | | | | | | | | 83,351,794 | | | | | |
| |
Information Technology - 8.33% | | | | | |
| | Alpha & Omega | | | | | | | | | | | | |
| | Semiconductor, Ltd.* | | | 161,905 | | | | 1,649,812 | | | | | |
| | Amkor Technology, Inc.* | | | 255,200 | | | | 1,674,112 | | | | | |
| | Applied Optoelectronics, Inc.*+ | | | 50,000 | | | | 771,500 | | | | | |
| | Aviat Networks, Inc.* | | | 13,800 | | | | 182,850 | | | | | |
| | Axcelis Technologies, Inc.* | | | 14,100 | | | | 250,980 | | | | | |
| | Bel Fuse, Inc., Class B | | | 60,200 | | | | 1,108,884 | | | | | |
| | Benchmark Electronics, Inc. | | | 86,300 | | | | 1,827,834 | | | | | |
| | BK Technologies, Inc. | | | 35,000 | | | | 131,250 | | | | | |
| | Communications Systems, Inc. | | | 5,800 | | | | 11,774 | | | | | |
| | Computer Task Group, Inc.* | | | 81,000 | | | | 330,480 | | | | | |
| | Comtech Telecommunications Corp. | | | 61,785 | | | | 1,503,847 | | | | | |
| | |
| 28 | | Semi-Annual Report | December 31, 2018 (Unaudited) |
| | |
OmniTax-ManagedSmall-Cap Value Fund (Unaudited) (continued) | | |
Showing percentage of net assets as of December 31, 2018
| | | | | | | | | | | | | | | | | | |
| Industry Company | | Shares | | | Value | | | | | | | |
| | |
Common Stocks (continued) | | | | | | | | | |
Information Technology (continued) | | | | | | | | | |
| | CSP, Inc. | | | 5,150 | | | $ | 50,316 | | | | | | | | | |
| | Data I/O Corp.* | | | 22,500 | | | | 112,500 | | | | | | | | | |
| | Digi International, Inc.* | | | 48,325 | | | | 487,599 | | | | | | | | | |
| | Diodes, Inc.* | | | 112,600 | | | | 3,632,476 | | | | | | | | | |
| | Finjan Holdings, Inc.* | | | 20,700 | | | | 51,957 | | | | | | | | | |
| | GSE Systems, Inc.* | | | 22,500 | | | | 47,250 | | | | | | | | | |
| | Ichor Holdings, Ltd.*+ | | | 40,500 | | | | 660,150 | | | | | | | | | |
| | IEC Electronics Corp.* | | | 17,700 | | | | 101,244 | | | | | | | | | |
| | Insight Enterprises, Inc.* | | | 16,600 | | | | 676,450 | | | | | | | | | |
| | inTEST Corp.* | | | 54,500 | | | | 334,085 | | | | | | | | | |
| | KEMET Corp. | | | 126,750 | | | | 2,223,195 | | | | | | | | | |
| | Key Tronic Corp.* | | | 18,600 | | | | 105,090 | | | | | | | | | |
| | Kimball Electronics, Inc.* | | | 59,100 | | | | 915,459 | | | | | | | | | |
| | Knowles Corp.* | | | 156,800 | | | | 2,087,008 | | | | | | | | | |
| | KVH Industries, Inc.* | | | 18,200 | | | | 187,278 | | | | | | | | | |
| | LightPath Technologies, Inc., Class A*+ | | | 65,000 | | | | 96,850 | | | | | | | | | |
| | Mind CTI, Ltd. | | | 500 | | | | 1,140 | | | | | | | | | |
| | Net 1 UEPS Technologies, Inc.* | | | 216,400 | | | | 1,014,916 | | | | | | | | | |
| | Network-1 Technologies, Inc. | | | 50,000 | | | | 111,500 | | | | | | | | | |
| | Nortech Systems, Inc.*+ | | | 1,500 | | | | 5,325 | | | | | | | | | |
| | PCM, Inc.* | | | 10,500 | | | | 184,905 | | | | | | | | | |
| | PC-Tel, Inc. | | | 71,950 | | | | 308,666 | | | | | | | | | |
| | Photronics, Inc.* | | | 171,470 | | | | 1,659,830 | | | | | | | | | |
| | Presidio, Inc. | | | 167,300 | | | | 2,183,265 | | | | | | | | | |
| | Rambus, Inc.* | | | 110,000 | | | | 843,700 | | | | | | | | | |
| | RF Industries, Ltd. | | | 35,000 | | | | 254,100 | | | | | | | | | |
| | Sanmina Corp.* | | | 90,900 | | | | 2,187,054 | | | | | | | | | |
| | ScanSource, Inc.* | | | 45,500 | | | | 1,564,290 | | | | | | | | | |
| | SigmaTron International, Inc.* | | | 7,000 | | | | 16,450 | | | | | | | | | |
| | Steel Connect, Inc.* | | | 10,000 | | | | 17,300 | | | | | | | | | |
| | Stratasys, Ltd.*+ | | | 115,000 | | | | 2,071,150 | | | | | | | | | |
| | SunPower Corp.*+ | | | 300,000 | | | | 1,491,000 | | | | | | | | | |
| | Sykes Enterprises, Inc.* | | | 92,750 | | | | 2,293,708 | | | | | | | | | |
| | TiVo Corp. | | | 186,400 | | | | 1,754,024 | | | | | | | | | |
| | Trio-Tech International* | | | 13,000 | | | | 31,980 | | | | | | | | | |
| | TSR, Inc.* | | | 1,385 | | | | 6,440 | | | | | | | | | |
| | TTM Technologies, Inc.* | | | 219,402 | | | | 2,134,781 | | | | | | | | | |
| | Ultra Clean Holdings, Inc.* | | | 7,000 | | | | 59,290 | | | | | | | | | |
| | Vishay Precision Group, Inc.* | | | 31,667 | | | | 957,293 | | | | | | | | | |
| | Wayside Technology Group, Inc. | | | 15,700 | | | | 157,000 | | | | | | | | | |
| | Westell Technologies, Inc., Class A* | | | 59,900 | | | | 113,211 | | | | | | | | | |
| | | | | | | | | | | | | | | | | | |
| | | | | | | | | 42,634,548 | | | | | | | | | |
| | |
Materials - 4.99% | | | | | | | | | |
| | AdvanSix, Inc.* | | | 11,200 | | | | 272,608 | | | | | | | | | |
| | | | | | | | | | |
| Industry Company | | Shares | | | Value | |
|
Materials (continued) | |
| | AgroFresh Solutions, Inc.*+ | | | 38,600 | | | $ | 146,294 | |
| | American Vanguard Corp. | | | 4,800 | | | | 72,912 | |
| | Boise Cascade Co. | | | 68,400 | | | | 1,631,340 | |
| | Clearwater Paper Corp.* | | | 7,000 | | | | 170,590 | |
| | Coeur Mining, Inc.* | | | 97,500 | | | | 435,825 | |
| | Flexible Solutions | | | | | | | | |
| | International, Inc.* | | | 5,000 | | | | 6,750 | |
| | Forterra, Inc.*+ | | | 170,000 | | | | 639,200 | |
| | Friedman Industries, Inc. | | | 5,000 | | | | 35,250 | |
| | FutureFuel Corp. | | | 54,500 | | | | 864,370 | |
| | Gulf Resources, Inc.* | | | 18,150 | | | | 14,319 | |
| | Hecla Mining Co. | | | 749,000 | | | | 1,767,640 | |
| | Intrepid Potash, Inc.* | | | 100,000 | | | | 260,000 | |
| | Kraton Corp.* | | | 110,477 | | | | 2,412,818 | |
| | Kronos Worldwide, Inc. | | | 35,000 | | | | 403,200 | |
| | Materion Corp. | | | 31,400 | | | | 1,412,686 | |
| | Mercer International, Inc. | | | 129,950 | | | | 1,356,678 | |
| | PH Glatfelter Co. | | | 50,000 | | | | 488,000 | |
| | Rayonier Advanced Materials, Inc. | | | 131,000 | | | | 1,395,150 | |
| | Resolute Forest Products, Inc. | | | 237,500 | | | | 1,883,375 | |
| | Schnitzer Steel Industries, Inc., Class A | | | 77,600 | | | | 1,672,280 | |
| | Stepan Co. | | | 4,000 | | | | 296,000 | |
| | SunCoke Energy, Inc.* | | | 216,200 | | | | 1,848,510 | |
| | Synalloy Corp. | | | 2,200 | | | | 36,498 | |
| | Trecora Resources* | | | 18,600 | | | | 145,080 | |
| | Tredegar Corp. | | | 77,600 | | | | 1,230,736 | |
| | Universal Stainless & Alloy Products, Inc.* | | | 1,350 | | | | 21,884 | |
| | Verso Corp., Class A* | | | 85,301 | | | | 1,910,742 | |
| | Warrior Met Coal, Inc. | | | 113,000 | | | | 2,724,430 | |
| | | | | | | | | | |
| | | | | | | | | 25,555,165 | |
Real Estate - 0.43% | | | | | | | | |
| | Altisource Portfolio Solutions SA*+ | | | 72,000 | | | | 1,619,280 | |
| | Consolidated-Tomoka Land Co. | | | 11,000 | | | | 577,500 | |
| | Forestar Group, Inc.*+ | | | 1 | | | | 14 | |
| | | | | | | | | | |
| | | |
| | | | | | | | | 2,196,794 | |
| | | | | | | | | | |
| |
TOTAL COMMON STOCKS - 99.99% | | | | 511,582,617 | |
| | | | | | | | | | |
(Cost $501,587,924) | | | | | |
|
RIGHTS - 0.00% | |
| | Newstar Financial, Inc., expiring 12/26/19*D | | | 105,100 | | | | 7,357 | |
| | | | | | | | | | |
| |
| TOTAL RIGHTS - 0.00% | | | | 7,357 | |
| | | | | | | | | | |
| (Cost $75,625) | | | | | |
| | |
OmniTax-ManagedSmall-Cap Value Fund (Unaudited) (continued) | | |
Showing percentage of net assets as of December 31, 2018
| | | | | | | | | | | | | | | | |
| Industry Company | | | Shares | | | Value | | | | |
| |
WARRANTS - 0.00% | | | | | |
Eagle Bulk Shipping, Inc., expiring 10/15/21* | | | | 8,501 | | | | $341 | | | | | |
| | | | | | | | | | | | | | | | |
TOTAL WARRANTS - 0.00% | | | | 341 | | | | | |
| | | | | | | | | | | | | | | | |
(Cost $70,770) | | | | | | | | | | | | | |
| | | | |
| | | Rate^ | | | Shares | | | Value | | | | |
MONEY MARKET FUND - 0.00% | | | | | |
Fidelity Investments Money Market Government Portfolio Class I | | | 2.25% | | | | 322 | | | | 322 | | | | | |
| | | | | | | | | | | | | | | | |
TOTAL MONEY MARKET
FUND - 0.00% | | | | 322 | | | | | |
| | | | | | | | | | | | | | | | |
(Cost $322) | | | | | | | | | | | | | | | | |
| |
| INVESTMENTS PURCHASED WITH CASH PROCEEDS FROM SECURITIES LENDING - 3.64% | | | | | |
Fidelity Investments Money Market Government Portfolio Class I** | | | 2.25 | % | | | 18,626,884 | | | | 18,626,884 | | | | | |
| | | | | | | | | | | | | | | | |
TOTAL INVESTMENTS PURCHASED WITH CASH PROCEEDS FROM SECURITIES LENDING - 3.64% | | | | 18,626,884 | | | | | |
| | | | | | | | | | | | | | | | |
(Cost $18,626,884) | | | | | | | | | | | | | | | | |
| | |
TOTAL INVESTMENTS - 103.63% | | | $ | 530,217,521 | | | | | |
(Cost $520,361,525) | | | | | | | | | | | | | | | | |
Liabilities in Excess of Other
Assets - (3.63%) | | | | (18,593,825 | ) | | | | |
| | | | | | | | | | | | | | | | |
NET ASSETS - 100.00% | | | $ | 511,623,696 | | | | | |
| | | | | | | | | | | | | | | | |
* Non-income producing security. ** This security represents the investment of the collateral received in connection with securities out on loan as of December 31, 2018. ^ Rate disclosed as of December 31, 2018. D Security was fair valued using significant unobservable inputs (see Note 2). As such, the security is classified as Level 3 in the fair value hierarchy. + This security or a portion of the security is out on loan as of December 31, 2018. Total loaned securities had a value of $18,170,644 as of December 31, 2018. LLC - Limited Liability Company PLC - Public Limited Company | | | | | |
Summary of inputs used to value the Fund’s investments as of 12/31/2018 (See Note 2 in Notes to Financial Statements):
| | | | | | | | | | | | | | | | |
| | | Valuation Inputs | |
| |
| | | Investment in Securities (Value) | |
| |
| |
| Level 1
Quoted
Prices |
| |
| Level 2
Significant
Observable
Inputs |
| |
| Level 3
Significant
Unobservable
Inputs |
| | | Total | |
| |
| | | | |
Common Stocks (a) | | $ | 511,582,617 | | | $ | — | | | | $ — | | | $ | 511,582,617 | |
Rights | | | — | | | | — | | | | 7,357 | | | | 7,357 | |
Warrants | | | 341 | | | | — | | | | — | | | | 341 | |
Money Market Fund | | | — | | | | 322 | | | | — | | | | 322 | |
Investments Purchased with Cash Proceeds from Securities Lending | | | — | | | | 18,626,884 | | | | — | | | | 18,626,884 | |
| | | | | | | | | | | | | | | | |
TOTAL | | $ | 511,582,958 | | | $ | 18,627,206 | | | | $ 7,357 | | | $ | 530,217,521 | |
| | | | | | | | | | | | | | | | |
(a) - please refer to the Schedule of Investments for the industry classifications of these portfolio holdings
Following is a reconciliation of Level 3 investments for which significant unobservable inputs were used to determine fair value:
| | | | | | | | |
| | | Investment in Securities (Value) | |
| |
| | | Rights | | | | Total | |
| |
Balance as of 06/30/2018 | | | $ 31,530 | | | | $ 31,530 | |
Purchases | | | — | | | | — | |
Return of Capital | | | (24,459 | ) | | | (24,459 | ) |
Realized gain/(loss) | | | — | | | | — | |
Change in unrealized appreciation/ (depreciation) | | | 286 | | | | 286 | |
Transfers in | | | — | | | | — | |
Transfers out | | | — | | | | — | |
| | | | | | | | |
Balance as of 12/31/2018 | | | $ 7,357 | | | | $ 7,357 | |
| | | | | | | | |
Net change in unrealized appreciation (depreciation) from investments held as of 12/31/2018 | | | $ 286 | | | | $ 286 | |
| | | | | | | | |
See Notes to Financial Statements.
| | |
| 30 | | Semi-Annual Report | December 31, 2018 (Unaudited) |
| | |
STATEMENTS OF ASSETS AND LIABILITIES | | |
December 31, 2018 (Unaudited)
| | | | | | | | | | | | | | | | | | | | |
| ASSETS | | Omni Small-Cap Value | | | | | Omni Tax-Managed
Small-Cap Value | | | |
| | | | | | |
Investments at value | | | $912,698,424 | | | | | | | | | | $530,217,521 | | | | | | | |
| | | | | | |
Receivables: | | | | | | | | | | | | | | | | | | | | |
| | | | | | |
Portfolio securities sold | | | - | | | | | | | | | | 6,119,634 | | | | | | | |
| | | | | | |
Fund shares sold | | | 15,434,232 | | | | | | | | | | 15,899,466 | | | | | | | |
| | | | | | |
Dividends and interest | | | 552,398 | | | | | | | | | | 393,791 | | | | | | | |
| | | | | | |
Prepaid expenses | | | 79,969 | | | | | | | | | | 76,714 | | | | | | | |
| | | | | | |
Total assets | | | 928,765,023 | | | | | | | | | | 552,707,126 | | | | | | | |
| | | | | | |
LIABILITIES | | | | | | | | | | | | | | | | | | | | |
| | | | | | |
Payables: | | | | | | | | | | | | | | | | | | | | |
| | | | | | |
Portfolio securities purchased | | | 48,160,171 | | | | | | | | | | - | | | | | | | |
| | | | | | |
Fund shares redeemed | | | 2,987,214 | | | | | | | | | | 16,943,279 | | | | | | | |
| | | | | | |
Loan payable | | | - | | | | | | | | | | 5,096,000 | | | | | | | |
| | | | | | |
Payable upon return of securities loaned | | | 27,052,208 | | | | | | | | | | 18,626,884 | | | | | | | |
| | | | | | |
Accrued Liabilities: | | | | | | | | | | | | | | | | | | | | |
| | | | | | |
Investment advisory fees | | | 236,415 | | | | | | | | | | 145,650 | | | | | | | |
| | | | | | |
Administration fees | | | 20,267 | | | | | | | | | | 15,727 | | | | | | | |
| | | | | | |
Directors’ fees | | | 7,394 | | | | | | | | | | 6,633 | | | | | | | |
| | | | | | |
Other | | | 244,648 | | | | | | | | | | 249,257 | | | | | | | |
| | | | | | |
Total liabilities | | | 78,708,317 | | | | | | | | | | 41,083,430 | | | | | | | |
| | | | | | |
NET ASSETS | | | $850,056,706 | | | | | | | | | | $511,623,696 | | | | | | | |
| | | | | | |
NET ASSETS REPRESENT | | | | | | | | | | | | | | | | | | | | |
| | | | | | |
Paid-in capital | | | $845,468,609 | | | | | | | | | | $476,507,113 | | | | | | | |
| | | | | | |
Distributable Earnings* | | | 4,588,097 | | | | | | | | | | 35,116,583 | | | | | | | |
| | | | | | |
NET ASSETS | | | $850,056,706 | | | | | | | | | | $511,623,696 | | | | | | | |
| | | | | | |
Shares of common stock outstanding of $ .001 par value** | | | 60,599,121 | | | | | | | | | | 37,647,808 | | | | | | | |
| | | | | | |
Net asset value, offering price and redemption price per share | | | $ 14.03 | | | | | | | | | | $ 13.59 | | | | | | | |
| | | | | | |
Total investments at cost | | | $926,870,466 | | | | | | | | | | $520,361,525 | | | | | | | |
| * | Effective December 31, 2018, the Fund has adopted disclosure requirements conforming to SEC Rule6-04.17 of RegulationS-X and discloses total distributable earnings. See Note 2 for further details. |
| ** | See Note 1 - Organization in the Notes to Financial Statements for shares authorized for each Fund. |
See Notes to Financial Statements.
| | |
STATEMENTS OF OPERATIONS | | |
Six Months Ended December 31, 2018 (Unaudited)
| | | | | | | | | | | | | | | | | | | | |
| | | Omni
Small-Cap Value | | | | Omni Tax-Managed
Small-Cap Value | | |
| | | | |
INVESTMENT INCOME | | | | | | | | | | | | | | | | | | | | |
| | | | |
Dividends | | | | $ 7,192,520 | | | | | | | | | | $ 6,253,237 | | | | | | |
| | | | |
Less: foreign taxes withheld | | | | (10,006 | ) | | | | | | | | | (3,731 | ) | | | | | |
| | | | |
Interest | | | | 50,806 | | | | | | | | | | 10,559 | | | | | | |
| | | | |
Securities lending | | | | 627,159 | | | | | | | | | | 516,422 | | | | | | |
| | | | |
Total Investment Income | | | | 7,860,479 | | | | | | | | | | 6,776,487 | | | | | | |
| | | | |
EXPENSES | | | | | | | | | | | | | | | | | | | | |
| | | | |
Investment advisory fees | | | | 2,219,182 | | | | | | | | | | 1,932,987 | | | | | | |
| | | | |
Administration fees | | | | 113,373 | | | | | | | | | | 98,247 | | | | | | |
| | | | |
Accounting fees | | | | 100,084 | | | | | | | | | | 93,608 | | | | | | |
| | | | |
Transfer agent fees | | | | 5,268 | | | | | | | | | | 5,406 | | | | | | |
| | | | |
Professional fees | | | | 84,626 | | | | | | | | | | 75,181 | | | | | | |
| | | | |
Custody fees | | | | 12,902 | | | | | | | | | | 11,926 | | | | | | |
| | | | |
Blue sky fees | | | | 21,163 | | | | | | | | | | 16,473 | | | | | | |
| | | | |
Directors’ and officers’ fees | | | | 42,287 | | | | | | | | | | 37,723 | | | | | | |
| | | | |
Shareholder servicing fees | | | | 391,533 | | | | | | | | | | 354,506 | | | | | | |
| | | | |
Reports to shareholders | | | | 23,642 | | | | | | | | | | 19,527 | | | | | | |
| | | | |
Miscellaneous expenses | | | | 71,627 | | | | | | | | | | 86,217 | | | | | | |
| | | | |
Total Expenses | | | | 3,085,687 | | | | | | | | | | 2,731,801 | | | | | | |
| | | | |
Less investment advisory fees waived | | | | (422,669 | ) | | | | | | | | | (412,250 | ) | | | | | |
| | | | |
Net Expenses | | | | 2,663,018 | | | | | | | | | | 2,319,551 | | | | | | |
| | | | |
NET INVESTMENT INCOME | | | | 5,197,461 | | | | | | | | | | 4,456,936 | | | | | | |
| | | | |
NET REALIZED AND UNREALIZED GAIN (LOSS) ON INVESTMENTS | | | | | | | | | | | | | | | | | | | | |
| | | | |
Realized Gain on: | | | | | | | | | | | | | | | | | | | | |
| | | | |
Investments | | | | 42,838,173 | | | | | | | | | | 36,879,681 | | | | | | |
| | | | |
Change in Unrealized Appreciation (Depreciation) on: | | | | | | | | | | | | | | | | | | | | |
| | | | |
Investments | | | | (251,433,739 | ) | | | | | | | | | (211,686,819 | ) | | | | | |
| | | | |
Net Realized and Unrealized Gain (Loss) on Investments | | | | (208,595,566 | ) | | | | | | | | | (174,807,138 | ) | | | | | |
| | | | |
NET DECREASE IN NET ASSETS RESULTING FROM OPERATIONS | | | | $(203,398,105) | | | | | | | | | | $(170,350,202) | | | | | | |
See Notes to Financial Statements.
| | |
| 32 | | Semi-Annual Report | December 31, 2018 (Unaudited) |
| | |
STATEMENTS OF CHANGES IN NET ASSETS | | |
| | | | | | | | | | | | | | | | | | | | |
| | | Omni
Small-Cap Value | | OmniTax-Managed
Small-Cap Value |
| | | | |
| | | Six Months Ended
December 31, 2018
(Unaudited) | | Year Ended
June 30, 2018 | | Six Months Ended
December 31, 2018
(Unaudited) | | Year Ended
June 30, 2018 |
| | | | |
OPERATIONS | | | | | | | | | | | | | | | | | | | | |
| | | | |
Net investment income | | | | $ 5,197,461 | | | | | $ 6,995,943 | | | | | $ 4,456,936 | | | | | $ 6,345,885 | |
| | | | |
Net realized gain on investments | | | | 42,838,173 | | | | | 54,647,102 | | | | | 36,879,681 | | | | | 46,319,987 | |
| | | | |
Net change in unrealized appreciation (depreciation) on investments | | | | (251,433,739 | ) | | | | 63,773,834 | | | | | (211,686,819 | ) | | | | 55,911,577 | |
| | | | |
Net increase (decrease) in net assets resulting from operations | | | | (203,398,105 | ) | | | | 125,416,879 | | | | | (170,350,202 | ) | | | | 108,577,449 | |
| | | | |
DISTRIBUTIONS: | | | | | | | | | | | | | | | | | | | | |
| | | | |
From net investment income and net realized gains* | | | | (68,537,520 | ) | | | | (50,546,932 | ) | | | | (51,987,352 | ) | | | | (40,512,145 | ) |
| | | | |
Net decrease in net assets from distributions** | | | | (68,537,520 | ) | | | | (50,546,932 | ) | | | | (51,987,352 | ) | | | | (40,512,145 | ) |
| | | | |
SHARE TRANSACTIONS: | | | | | | | | | | | | | | | | | | | | |
| | | | |
Proceeds from sale of shares | | | | 285,102,725 | | | | | 203,730,487 | | | | | 175,895,828 | | | | | 168,009,722 | |
| | | | |
Reinvestment of distributions | | | | 68,487,234 | | | | | 50,537,299 | | | | | 51,833,228 | | | | | 40,413,658 | |
| | | | |
Cost of shares redeemed | | | | (144,795,597 | ) | | | | (126,296,700 | ) | | | | (298,956,001 | ) | | | | (114,515,838 | ) |
| | | | |
Net increase (decrease) in net assets resulting from share transactions | | | | 208,794,362 | | | | | 127,971,086 | | | | | (71,226,945 | ) | | | | 93,907,542 | |
| | | | |
Net increase (decrease) in net assets | | | | (63,141,263 | ) | | | | 202,841,033 | | | | | (293,564,499 | ) | | | | 161,972,846 | |
| | | | |
NET ASSETS: | | | | | | | | | | | | | | | | | | | | |
| | | | |
Beginning of period | | | | 913,197,969 | | | | | 710,356,936 | | | | | 805,188,195 | | | | | 643,215,349 | |
| | | | |
End of period | | | | $850,056,706 | | | | | $913,197,969 | | | | | $511,623,696 | | | | | $805,188,195 | |
| | | | |
SHARES ISSUED & REDEEMED | | | | | | | | | | | | | | | | | | | | |
| | | | |
Issued | | | | 18,452,709 | | | | | 10,867,100 | | | | | 11,220,280 | | | | | 9,329,371 | |
| | | | |
Distributions reinvested | | | | 4,802,751 | | | | | 2,766,136 | | | | | 3,753,311 | | | | | 2,304,085 | |
| | | | |
Redeemed | | | | (8,708,948 | ) | | | | (6,729,805 | ) | | | | (19,490,451 | ) | | | | (6,460,884 | ) |
| | | | |
Net increase (decrease) in shares | | | | 14,546,512 | | | | | 6,903,431 | | | | | (4,516,860 | ) | | | | 5,172,572 | |
| | | | |
Outstanding at beginning of period | | | | 46,052,609 | | | | | 39,149,178 | | | | | 42,164,668 | | | | | 36,992,096 | |
| | | | |
Outstanding at end of period | | | | 60,599,121 | | | | | 46,052,609 | | | | | 37,647,808 | | | | | 42,164,668 | |
| * | For the year ended June 30, 2018, the distributions to shareholders from net investment income were $6,405,244 and $8,820,586, and net realized gains were $44,141,688 and $31,691,559 for OmniSmall-Cap Value Fund and OmniTax-ManagedSmall-Cap Value Fund, respectively. |
| ** | Effective December 31, 2018, the Fund has adopted disclosure requirements conforming to SEC Rule6-04.17 of RegulationS-X. See Note 2 for further details. |
See Notes to Financial Statements.
(for a share outstanding throughout each period indicated)
OMNISMALL-CAP VALUE
| | | | | | | | | | | | |
| | | For the
Six Months Ended
12/31/18 (Unaudited) | | Year Ended June 30 |
| | | 2018 | | 2017 | | 2016 | | 2015 | | 2014 |
| | | | | | | | | | | | |
| | | | | | |
Net Asset Value, Beginning of Period | | $19.83 | | $18.14 | | $14.66 | | $15.49 | | $16.63 | | $14.11 |
| | | | | | | | | | | | |
| | | | | |
Income from Investment Operations: | | | | | | | | | | |
| | | | | | |
Net Investment Income(a) | | 0.11 | | 0.17 | | 0.17 | | 0.17 | | 0.14 | | 0.11 |
Net Realized and Unrealized Gain (Loss) | | (4.46) | | 2.77 | | 3.48 | | (0.86) | | (0.46) | | 3.58 |
| | | | | | | | | | | | |
| | | | | | |
Total from Investment Operations | | (4.35) | | 2.94 | | 3.65 | | (0.69) | | (0.32) | | 3.69 |
| | | | | | | | | | | | |
| | | | | |
Less Distributions to Shareholders from: | | | | | | | | | | |
| | | | | | |
Net Investment Income | | (0.17) | | (0.16) | | (0.17) | | (0.14) | | (0.09) | | (0.08) |
Net Realized Gain | | (1.28) | | (1.09) | | - | | - | | (0.73) | | (1.09) |
| | | | | | | | | | | | |
| | | | | | |
Total Distributions | | (1.45) | | (1.25) | | (0.17) | | (0.14) | | (0.82) | | (1.17) |
| | | | | | | | | | | | |
| | | | | | |
Net Asset Value, End of Period | | $14.03 | | $19.83 | | $18.14 | | $14.66 | | $15.49 | | $16.63 |
| | | | | | | | | | | | |
| | | | | | |
Total Return(b) | | (22.04%)(c) | | 16.75% | | 24.83% | | (4.42%) | | (1.48%) | | 26.89% |
| | | | | |
Ratios and Supplemental Data: | | | | | | | | | | |
| | | | | | |
Net Assets, End of Period (in 000’s) | | $850,057 | | $913,198 | | $710,357 | | $558,286 | | $459,367 | | $407,192 |
Expenses Before Waivers and Reimbursements | | 0.70%(d) | | 0.70% | | 0.71% | | 0.71% | | 0.71% | | 0.71% |
| | | | | | |
Expenses After Waivers and Reimbursements | | 0.60%(d) | | 0.60% | | 0.60% | | 0.60% | | 0.60% | | 0.60% |
Net Investment Income After Waivers and Reimbursements | | 1.17%(d) | | 0.88% | | 1.00% | | 1.17% | | 0.88% | | 0.70% |
| | | | | | |
Portfolio Turnover Rate | | 18%(c) | | 24% | | 23% | | 24% | | 25% | | 31% |
| (a) | Per share amounts calculated based on the average daily shares outstanding during the period. |
| (b) | Total return would have been lower had various fees not been waived during the period. |
| (d) | Annualized for periods less than one year. |
See Notes to Financial Statements.
| | |
| 34 | | Semi-Annual Report | December 31, 2018 (Unaudited) |
(for a share outstanding throughout each period indicated)
OMNITAX-MANAGEDSMALL-CAP VALUE
| | | | | | | | | | | | |
| | | For the
Six Months Ended
12/31/18
(Unaudited) | | Year Ended June 30 |
| | | 2018 | | 2017 | | 2016 | | 2015 | | 2014 |
| | | | | | | | | | | | |
Net Asset Value, Beginning of Period | | $19.10 | | $17.39 | | $14.04 | | $14.65 | | $15.54 | | $12.75 |
| | | | | | | | | | | | |
| | | | | |
Income from Investment Operations: | | | | | | | | | | |
Net Investment Income(a) | | 0.11 | | 0.16 | | 0.17 | | 0.16 | | 0.12 | | 0.09 |
Net Realized and Unrealized Gain (Loss) | | (4.17) | | 2.61 | | 3.32 | | (0.66) | | (0.42) | | 3.26 |
| | | | | | | | | | | | |
| | | | | | |
Total from Investment Operations | | (4.06) | | 2.77 | | 3.49 | | (0.50) | | (0.30) | | 3.35 |
| | | | | | | | | | | | |
| | | | | |
Less Distributions to Shareholders from: | | | | | | | | | | |
Net Investment Income | | (0.20) | | (0.23) | | (0.14) | | (0.11) | | (0.03) | | (0.08) |
Net Realized Gain | | (1.25) | | (0.83) | | - | | - | | (0.56) | | (0.48) |
| | | | | | | | | | | | |
| | | | | | |
Total Distributions | | (1.45) | | (1.06) | | (0.14) | | (0.11) | | (0.59) | | (0.56) |
| | | | | | | | | | | | |
| | | | | | |
Net Asset Value, End of Period | | $13.59 | | $19.10 | | $17.39 | | $14.04 | | $14.65 | | $15.54 |
| | | | | | | | | | | | |
| | | | | | |
Total Return(b) | | (21.35%)(c) | | 16.48% | | 24.83% | | (3.42%) | | (1.62%) | | 26.71% |
| | | | | |
Ratios and Supplemental Data: | | | | | | | | | | |
Net Assets, End of Period (in 000’s) | | $511,624 | | $805,188 | | $643,215 | | $505,995 | | $461,101 | | $425,330 |
Expenses Before Waivers and Reimbursements | | 0.71%(d) | | 0.70% | | 0.71% | | 0.72% | | 0.71% | | 0.71% |
Expenses After Waivers and Reimbursements . | | 0.60%(d) | | 0.60% | | 0.60% | | 0.60% | | 0.60% | | 0.60% |
Net Investment Income After Waivers and Reimbursements | | 1.15%(d) | | 0.89% | | 1.04% | | 1.20% | | 0.84% | | 0.65% |
Portfolio Turnover Rate | | 18%(c) | | 27% | | 23% | | 29% | | 30% | | 25% |
| (a) | Per share amounts calculated based on the average daily shares outstanding during the period. |
| (b) | Total return would have been lower had various fees not been waived during the period. |
| (d) | Annualized for periods less than one year. |
See Notes to Financial Statements.
| | |
| NOTES TO FINANCIAL STATEMENTS | | |
December 31, 2018 (Unaudited)
1. Organization:
Bridgeway Funds, Inc. (“Bridgeway” or the “Company”) was organized as a Maryland corporation on October 19, 1993, and is registered under the Investment Company Act of 1940, as amended (the “1940 Act”), as anopen-end management investment company.
Bridgeway is organized as a series fund, with 9 investment funds as of December 31, 2018 (each is referred to as a “Bridgeway Fund” and collectively, the “Bridgeway Funds”). The Aggressive Investors 1, Ultra-Small Company, Ultra-Small Company Market,Small-Cap Growth,Small-Cap Value, Blue Chip 35 Index and Managed Volatility Funds are presented in a separate report. The OmniSmall-Cap Value Fund and the OmniTax-ManagedSmall-Cap Value Fund (each a “Fund” and together, the “Funds”) are presented in this report.
Bridgeway is authorized to issue 1,915,000,000 shares of common stock at $0.001 per share. As of December 31, 2018, 100,000,000 shares have been classified into the Aggressive Investors 1 Fund. 130,000,000 shares have been classified into the Blue Chip 35 Index Fund. 15,000,000 shares have been classified into the Ultra-Small Company Fund. 100,000,000 shares each have been classified into the Ultra-Small Company Market, OmniSmall-Cap Value, OmniTax-ManagedSmall-Cap Value,Small-Cap Growth andSmall-Cap Value Funds. 50,000,000 shares have been classified into the Managed Volatility Fund.
All of the Bridgeway Funds areno-load, diversified funds.
The Funds seek to provide long-term total return on capital, primarily through capital appreciation.
Bridgeway Capital Management, Inc. (the “Adviser”) is the investment adviser for all of the Bridgeway Funds.
2. Significant Accounting Policies:
The following summary of significant accounting policies, followed in the preparation of the financial statements of the Funds, are in conformity with accounting principles generally accepted in the United States of America (“GAAP”). Each Fund is considered an investment company under GAAP and follows the accounting and reporting guidance applicable to investment companies.
New Accounting PronouncementsThe SEC recently adopted changes to RegulationS-X to simplify the reporting of information by registered investment companies in financial statements. The amendments require presentation of the total, rather than the components, of distributable earnings on the Statement of Assets and Liabilities and also require presentation of the total, rather than the components, of distributions to shareholders, except for tax return of capital distributions, if any, on the Statement of Changes in Net Assets. The amendments also removed the requirement for parenthetical disclosure of undistributed net investment income on the Statement of Changes in Net Assets. These RegulationS-X amendments are reflected in the Fund’s financial statements for the six months ended December 31, 2018.
Securities and Other Investments ValuationSecurities for which market quotations are readily available are valued at the last sale price on the national exchange on which such securities are primarily traded. In the case of securities reported on the National Association of Securities Dealers Automated Quotation (“NASDAQ”) system, the securities are valued based on the NASDAQ Official Closing Price (“NOCP”). In the absence of recorded sales on their home exchange, or NOCP, in the case of NASDAQ traded securities, the security will be valued as follows: bid prices for long positions and ask prices for short positions.
Investments inopen-end registered investment companies andclosed-end registered investment companies that do not trade on an exchange are valued at the end of day net asset value (“NAV”) per share.
Investments inclosed-end registered investment companies that trade on an exchange are valued at the last sales price as of the close of the customary trading session on the exchange where the security is principally traded.
| | |
| |
| 36 | | Semi-Annual Report | December 31, 2018 (Unaudited) |
| | |
| NOTES TO FINANCIAL STATEMENTS(continued) | | |
December 31, 2018 (Unaudited)
When market quotations are not readily available or when events occur that make established valuation methods unreliable, securities of the Funds may be valued at fair value as determined in good faith by or under the direction of the Board of Directors. The valuation assigned to a fair valued security for purposes of calculating the Funds’ NAV may differ from the security’s most recent closing market price and from the prices used by other mutual funds to calculate their NAVs.
The inputs and valuation techniques used to determine the value of a Fund’s investments are summarized into three levels as described in the hierarchy below:
| ● | | Level 1 — quoted prices in active markets for identical assets |
Investments whose values are based on quoted market prices in active markets, and whose values are therefore classified as Level 1 prices, include active listed equity securities. The Funds do not adjust the quoted price for such investments, even in situations where the Funds hold a large position and a sale could reasonably impact the quoted price.
| ● | | Level 2 — other significant observable inputs (including quoted prices for similar securities, interest rates, prepayment speeds, credit risk, etc.) |
Investments that trade in markets that are not considered to be active, but whose values are based on quoted market prices, dealer quotations or valuations provided by alternative pricing sources supported by observable inputs, are classified as Level 2 prices. These generally include certain U.S. Government and sovereign obligations, most government agency securities, investment-grade corporate bonds and less liquid listed equity securities. As investments whose values are classified as Level 2 prices include positions that are not traded in active markets and/or are subject to transfer restrictions, valuations may be adjusted to reflect illiquidity and/ornon-transferability, which are generally based on available market information.
The Fidelity Investments Money Market Government Portfolio - Class I, which is held by the Funds, invests primarily in securities that are valued at amortized cost. Therefore, this investment is classified as a Level 2 investment.
| ● | | Level 3 — significant unobservable inputs (including the Funds’ own assumptions in determining the fair value of investments) |
Investments whose values are classified as Level 3 prices have significant unobservable inputs, as they may trade infrequently or not at all. When observable prices are not available for these securities, the Funds use one or more valuation techniques for which sufficient and reliable data is available. The inputs used by the Funds in estimating the value of Level 3 prices may include the original transaction price, quoted prices for similar securities or assets in active markets, completed or pending third-party transactions in the underlying investment or comparable issuers, and changes in financial ratios or cash flows. Level 3 prices may also be adjusted to reflect illiquidity and/ornon-transferability, with the amount of such discount estimated by the Funds in the absence of market information. Assumptions used by the Funds due to the lack of observable inputs may significantly impact the resulting value and therefore the results of the Funds’ operations.
The inputs or methodology used for valuing investments are not necessarily an indication of the risk associated with investing in those investments. A summary of the inputs used to value the Funds’ investments as of December 31, 2018 is included with each Fund’s Schedule of Investments.
The Funds’ policy is to recognize transfers into, and transfers out of, each level of hierarchy as of the beginning of the reporting period. For the period ended December 31, 2018, there were no transfers from Level 1 to Level 2 or from Level 2 to Level 1 in any of the Funds. Details regarding material transfers into, and material transfers out of, Level 3, if any, can be found at the end of each Schedule of Investments for Funds that held Level 3 securities.
Securities Lending Upon lending its securities to third parties, each Fund receives compensation in the form of fees. The loans are secured by collateral at least equal to the fair value of the securities loaned plus accrued interest. The remaining contractual maturity of all securities lending transactions is overnight and continuous. Each Fund has the right under the lending agreement to recover the securities from the borrower on demand. Additionally, a Fund does not have the right to sell or repledge collateral received in the form of securities unless the borrower goes into default. The risks to a Fund of securities
| | |
| NOTES TO FINANCIAL STATEMENTS(continued) | | |
December 31, 2018 (Unaudited)
lending are that the borrower may not provide additional collateral when required or return the securities when due, resulting in a loss. Under the terms of the Securities Lending Agreement, the Funds are indemnified for such losses by the securities lending agent.
While securities are on loan, the Fund continues to receive dividends on the securities loaned and recognizes any gain or loss in the fair value of the securities loaned.
Securities lending transactions are entered into by a Fund under a Securities Lending Agreement that provides the right, in the event of default (including bankruptcy or insolvency) for thenon-defaulting party to liquidate the collateral or to offset the market value of the collateral received against the market value of the securities loaned. The value of the collateral is typically greater than that of the market value of the securities loaned, leaving the lender with a net amount payable to the defaulting party. However, bankruptcy or insolvency laws of a particular jurisdiction may impose restrictions on or prohibitions against such a right of offset in the event of a counterparty’s bankruptcy or insolvency.
The market value of securities on loan, all of which are classified as common stocks in the Funds’ Schedules of Investments, and the value of the related collateral are shown in the Statements of Assets and Liabilities as a component of Investments at value.
The following table is a summary of the Funds’ securities loaned and related collateral, which are subject to a netting agreement as of December 31, 2018:
| | | | | | | | | | | | | | | | | | | | | | | | |
| | | | | | | | | | | | Gross Amount Not
Offset in the Statement
of Assets and Liabilities | | | | |
| Fund | | Gross
Amounts of
Recognized
Assets1 | | | Gross Amounts
Offset in the
Statement of
Assets and
Liabilities | | | Net Amounts of
Assets Presented
in the Statement
of Assets and
Liabilities | | | Financial
Instruments | | | Collateral
Received2 | | | Net
Amount | |
| | | | | | |
| OmniSmall-Cap Value | | | | | | | | | | | | | | | | | | | | | | | | |
Securities lending | | | $26,072,003 | | | | - | | | | $26,072,003 | | | | - | | | | $26,072,003 | | | | - | |
| | | | | | |
| OmniTax-ManagedSmall-Cap Value | | | | | | | | | | | | | | | | | | | | | | | | |
Securities lending | | | $18,170,644 | | | | - | | | | $18,170,644 | | | | - | | | | $18,170,644 | | | | - | |
| 1 | Securities loaned with a value of $175,100 in OmniTax-ManagedSmall-Cap Value have been sold and are pending settlement on January 2, 2019. |
| 2 | Collateral with a value of $27,052,208 and $18,626,884 has been received in connection with securities lending of OmniSmall-Cap Value Fund and OmniTax-ManagedSmall-Cap Value Fund, respectively. Excess of collateral received from an individual counterparty is not shown here for financial reporting purposes. |
It is each Fund’s policy to obtain additional collateral from or return excess collateral to the borrower by the end of the next business day following the valuation date of the securities loaned. Therefore, the value of the collateral held may be temporarily less than that required under the lending contract. As of December 31, 2018, the collateral consisted of an institutional government money market fund.
Use of Estimates in Financial Statements In preparing financial statements in conformity with GAAP, management makes estimates and assumptions that affect the reported amounts of assets and liabilities on the date of the financial statements and the disclosure of contingent assets and liabilities on the date of the financial statements, as well as the reported amounts of revenue and expenses during the reporting period. Actual results could differ from those estimates.
Risks and Uncertainties The Funds provide for various investment options, including stocks. Such investments are exposed to various risks, such as interest rate, market and credit risks. Due to the risks involved, it is at least reasonably possible that changes in risks in the near term would materially affect shareholders’ account values and the amounts reported in the financial statements.
| | |
| |
| 38 | | Semi-Annual Report | December 31, 2018 (Unaudited) |
| | |
NOTES TO FINANCIAL STATEMENTS(continued) | | |
December 31, 2018 (Unaudited)
Security Transactions, Investment Income and Expenses Security transactions are accounted for as of the trade date, the date the order to buy or sell is executed. Realized gains and losses are computed on the identified cost basis. Dividend income is recorded on theex-dividend date, and interest income is recorded on the accrual basis from settlement date.
Bridgeway Funds’ expenses that are not series-specific are allocated to each series based upon its relative proportion of net assets to the Bridgeway Funds’ total net assets or other appropriate basis.
Distributions to Shareholders The Funds pay dividends from net investment income and distribute realized capital gains annually, usually in December.
Indemnification Under the Company’s organizational documents, the Funds’ officers, directors, employees and agents are indemnified against certain liabilities that may arise out of the performance of their duties to the Funds. Additionally, in the normal course of business, the Funds enter into contracts that contain a variety of indemnification clauses. The Funds’ maximum exposure under these arrangements is unknown, as this would involve future claims that may be made against the Funds that have not yet occurred. However, the Funds have not had prior claims or losses pursuant to these contracts.
3. Advisory Fees, Other Related Party Transactions and Contingencies:
The Funds have entered into a management agreement with the Adviser. As compensation for the advisory services rendered, facilities furnished, and expenses borne by the Adviser, the Funds pay the Adviser a fee of 0.50% of the value of each Fund’s average daily net assets, computed daily and payable monthly.
Expense limitations: The Adviser has agreed to reimburse the Funds for operating expenses and advisory fees above the expense limitations presented in the table below, which are shown as a ratio of net expenses to average net assets, for each Fund, for the period ended December 31, 2018. Any material change to the expense limitation would require a vote by shareholders of the applicable Fund.
| | | | | | |
| Bridgeway Fund | | Expense
Limitation | | Total Waivers
for Period Ended
12/31/18 | |
| | | | | | | |
| OmniSmall-Cap Value* | | 0.60% | | | $422,669 | |
| OmniTax-ManagedSmall-Cap Value* | | 0.60% | | | 412,250 | |
| | | | | | | |
*The Funds are authorized to reimburse the Adviser for management fees previously waived and/or for expenses previously paid by the Adviser, provided, however, that any reimbursements must be paid at a date not more than three years after the Adviser waived the fees or reimbursed the expenses and that the reimbursements do not cause the Funds to exceed the expense limitation in effect at the time of the waiver or the current expense limitation, if different. The OmniSmall-Cap Value Fund has recoupable expenses of $272,193, $716,803, $759,479 and $422,669, which expire no later than June 30, 2019, June 30, 2020, June 30, 2021 and December 31, 2021, respectively. The OmniTax-ManagedSmall-Cap Value Fund has recoupable expenses of $255,854, $674,880, $691,272 and $412,250, which expire no later than June 30, 2019, June 30, 2020, June 30, 2021 and December 31, 2021, respectively.
Other Related Party Transactions: The Bridgeway Funds will engage in inter-portfolio trades with other Bridgeway Funds when it is to the benefit of both parties. The Board of Directors reviews these trades quarterly. Inter-portfolio purchases and sales for the Funds during the period ended December 31, 2018 were as follows:
| | | | | | |
| Bridgeway Fund | | Inter-Portfolio
Purchases | | | Inter-Portfolio
Sales |
| | | | | | |
| OmniSmall-Cap Value | | | $29,363,774 | | | $11,760,235 |
| OmniTax-ManagedSmall-Cap Value | | | 11,894,082 | | | 29,458,715 |
| | |
| NOTES TO FINANCIAL STATEMENTS(continued) | | |
December 31, 2018 (Unaudited)
The Adviser entered into an Administrative Services Agreement with Bridgeway Funds, pursuant to which the Adviser provides various administrative services to the Funds including, but not limited to: (i) supervising and managing various aspects of the Funds’ business and affairs; (ii) selecting, overseeing and/or coordinating activities with other service providers to the Funds; (iii) providing reports to the Board of Directors as requested from time to time; (iv) assisting and/or reviewing amendments and updates to the Funds’ registration statement and other filings with the Securities and Exchange Commission (“SEC”); (v) providing certain shareholder services; (vi) providing administrative support in connection with meetings of the Board of Directors; and (vii) providing certain record-keeping services. For its services to all of the Bridgeway Funds, the Adviser is paid an aggregate annual fee of $775,000, payable in equal monthly installments. During the period ended December 31, 2018, the allocation of this expense to the OmniSmall-Cap Value and OmniTax-ManagedSmall-Cap Value Funds was $113,373 and $98,247, respectively.
Board of Directors Compensation Effective November 8, 2018, Independent Directors are paid an annual retainer of $20,000, with an additional retainer of $5,000 paid to the Independent Chairman of the Board and an additional retainer of $1,000 paid to the Nominating and Corporate Governance Committee Chair. The retainer is paid in quarterly installments. In addition, Independent Directors are paid $11,000 per meeting for meeting fees. Prior to November 8, 2018, Independent Directors were paid an annual retainer of $15,000, with an additional retainer of $5,000 paid to the Independent Chairman of the Board and an additional retainer of $1,000 paid to the Nominating and Corporate Governance Committee Chair, and $9,000 per meeting. Such compensation is the total compensation from all Bridgeway Funds and is allocated among the Bridgeway Funds.
Each Independent Director receives this compensation in the form of shares of the Bridgeway Funds, credited to his or her account. Such Directors are reimbursed for any expenses incurred in attending meetings and conferences, as well as expenses for subscriptions or printed materials. The amount of Directors’ fees attributable to each Fund is disclosed in the Statements of Operations.
One director of Bridgeway, John Montgomery, is an owner and director of the Adviser. Under the 1940 Act definitions, he is considered to be an “affiliated person” of the Adviser and an “interested person” of the Adviser and of Bridgeway. Compensation for Mr. Montgomery is borne by the Adviser rather than the Bridgeway Funds.
4. Distribution Agreement:
Foreside Fund Services, LLC acts as distributor of the Funds’ shares, pursuant to a Distribution Agreement dated May 31, 2017. The Adviser pays all costs and expenses associated with distribution of the Funds’ shares, pursuant to a protective plan adopted by shareholders pursuant to Rule12b-1.
5. Purchases and Sales of Investment Securities:
Purchases and sales of investments, other than short-term securities, for each Fund for the period ended December 31, 2018 were as follows:
| | | | | | | | | | | | |
| | | Purchases | | | Sales | |
| | | U.S. Government | | Other | | | U.S. Government | | Other | |
| | | | | | | | | | | | |
| OmniSmall-Cap Value | | $ - | | $ | 289,442,461 | | | $ - | | $ | 155,753,334 | |
| OmniTax-ManagedSmall-Cap Value | | - | | | 132,972,533 | | | - | | | 250,014,458 | |
6. Federal Income Taxes
It is the Funds’ policy to continue to comply with the provisions of the Internal Revenue Code of 1986, as amended (“Internal Revenue Code”), applicable to regulated investment companies, and to distribute income to the extent necessary so that such Fund is not subject to federal income tax. Therefore, no federal income tax provision is required.
| | |
| |
| 40 | | Semi-Annual Report | December 31, 2018 (Unaudited) |
| | |
| NOTES TO FINANCIAL STATEMENTS(continued) | | |
December 31, 2018 (Unaudited)
Unrealized Appreciation and Depreciation on Investments (Tax Basis) The amount of net unrealized appreciation/ depreciation and the cost of investment securities for tax purposes, including short-term securities at December 31, 2018, were as follows:
| | | | | | | | | | |
| | | Omni Small-Cap Value | | Omni Tax-Managed Small-Cap Value |
| Gross appreciation (excess of value over tax cost) | | | | $ 106,999,816 | | | $ 81,312,896 |
| Gross depreciation (excess of tax cost over value) | | | | (121,171,877) | | | (71,466,856) |
| Net unrealized appreciation (depreciation) | | | | $ (14,172,061) | | | $ 9,846,040 |
| Cost of investments for income tax purposes | | | | $ 926,870,485 | | | $520,371,481 |
The differences between book and tax net unrealized appreciation (depreciation) are due to wash sale loss deferrals and basis adjustments on passive foreign investment companies (PFICs) and partnerships.
Classifications of DistributionsNet investment income (loss) and net realized gain (loss) may differ for financial statement and tax purposes. The character of distributions made during the year from net investment income or net realized gains may differ from its ultimate characterization for federal income tax purposes.
The tax character of the distributions paid by the Funds during the fiscal years ended June 30, 2018 and 2017, is as follows:
| | | | | | | | | | | | | | | | |
| | | Omni Small-Cap Value | | | Omni Tax-Managed Small-Cap Value | |
| | | Year Ended
June 30, 2018 | | | Year Ended
June 30, 2017 | | | Year Ended
June 30, 2018 | | | Year Ended
June 30, 2017 | |
| | | | |
Distributions paid from: | | | | | | | | | | | | | | | | |
Ordinary Income | | | $ 6,405,244 | | | | $6,191,149 | | | | $ 8,820,586 | | | | $4,983,381 | |
Long-Term Capital Gain | | | 44,141,688 | | | | - | | | | 31,691,559 | | | | - | |
Total | | | $50,546,932 | | | | $6,191,149 | | | | $40,512,145 | | | | $4,983,381 | |
Components of Accumulated EarningsAs of June 30, 2018, the components of accumulated earnings on a tax basis were:
| | | | | | | | |
| | | Omni
Small-Cap Value | | | Omni Tax-Managed
Small-Cap Value | |
| Undistributed Net Investment Income | | | $ 2,782,031 | | | | $ 2,735,279 | |
| Undistributed Net Realized Gain on Investments | | | 36,527,048 | | | | 33,205,286 | |
| Net Unrealized Appreciation of Investments | | | 237,214,643 | | | | 221,513,572 | |
| Total | | | $276,523,722 | | | | $257,454,137 | |
For the fiscal year June 30, 2018, the Funds recorded the following reclassifications to the accounts listed below:
| | | | | | | | |
| | | Increase (Decrease) | |
| | | Omni
Small-Cap Value | | | Omni Tax-Managed
Small-Cap Value | |
Paid-in Capital | | | $ 3,056,072 | | | | $ 2,924,911 | |
Undistributed Net Investment Income | | | (542,684 | ) | | | (509,021 | ) |
Undistributed Net Realized Gain on Investments | | | (2,513,388 | ) | | | (2,415,890 | ) |
The difference between book and tax components of net assets and the resulting reclassifications were primarily a result of the differing book/tax treatment of the deduction of equalization debits for tax purposes and investments in passive foreign investment companies (PFICs), partnerships and business development companies.
| | |
| NOTES TO FINANCIAL STATEMENTS(continued) | | |
December 31, 2018 (Unaudited)
Accounting for Uncertainty in Income Taxes sets forth a minimum threshold for financial statement recognition of the benefit of a tax position taken or expected to be taken in a tax return. Management has analyzed each Fund’s tax positions and has concluded that no provision for income tax is required in any Fund’s financial statements. The Funds are not aware of any tax position for which it is reasonably possible that the total amounts of unrecognized tax benefits will significantly change in the next twelve months. Each Fund’s federal tax returns for the prior three fiscal years remain subject to examination by the Internal Revenue Service.
7. Line of Credit
Bridgeway established a line of credit agreement (“Facility”) with The Bank of New York Mellon, effective November 5, 2010. The Facility is for temporary or emergency purposes, such as to provide liquidity for shareholder redemptions, and is cancellable by either party. Unless cancelled earlier, the Facility shall be held available until September 12, 2019. Advances under the Facility are limited to $15,000,000 in total for all Bridgeway Funds, and advances to each Bridgeway Fund shall not exceed certain limits set forth in the credit agreement, including, but not limited to, the maximum amount a Bridgeway Fund is permitted to borrow under the 1940 Act.
The Bridgeway Funds incur a commitment fee of 0.085% per annum on the unused portion of the Facility and interest expense to the extent of amounts borrowed under the Facility. Interest is based on the “Overnight Rate” plus 1.25%. The Overnight Rate means the higher of (a) the Federal Funds rate, (b) the Overnight Eurodollar Rate, or (c) theOne-Month Euro-dollar Rate. The commitment fees are payable quarterly in arrears and are allocated to all participating Bridgeway Funds. Interest expense is charged directly to each Bridgeway Fund, based upon actual amounts borrowed by such Bridgeway Fund.
For the period ended December 31, 2018, borrowings by the Funds under this line of credit were as follows:
| | | | | | | | | | |
| Bridgeway Fund | | Weighted
Average
Interest Rate | | Weighted
Average Loan Balance | | Number of
Days Outstanding | | Interest
Expense Incurred1 | | Maximum Amount
Borrowed During
the Period |
| | | | | |
| OmniSmall-Cap Value | | 3.47% | | $1,922,744 | | 43 | | $ 7,871 | | $ 6,900,000 |
OmniTax-ManagedSmall-Cap Value | | 3.67% | | 5,333,000 | | 55 | | 29,476 | | 15,000,000 |
| 1Interest expense is included on the Statements of Operations in Miscellaneous expenses. |
8. Subsequent Events
Management has evaluated the impact of all subsequent events on the Funds and has determined that there were no subsequent events requiring recognition or disclosure in the financial statements.
| | |
42 | | Semi-Annual Report | December 31, 2018 (Unaudited) |
| | |
OTHER INFORMATION | | |
December 31, 2018 (Unaudited)
1. Proxy Voting
Fund policies and procedures that the Funds used in determining how to vote proxies relating to the Funds’ securities and a summary of proxies voted by the Funds for the period ended June 30, 2018 are available without a charge, upon request, by contacting Bridgeway Funds at1-800-661-3550 and on the SEC’s website at http://www.sec.gov.
2. Fund Holdings
The complete schedule of the Funds’ holdings for the second and fourth quarters of each fiscal year are contained in the Funds’ Semi-Annual and Annual Shareholder Reports, respectively.
The Bridgeway Funds file complete schedules of the Funds’ holdings with the SEC for the first and third quarters of each fiscal year on FormN-Q within 60 days after the end of the period. Copies of the Funds’ FormN-Q are available without charge, upon request, by contacting Bridgeway Funds at1-800-661-3550 and on the SEC’s website at http://www.sec.gov. You may also review and copy FormN-Q at the SEC’s Public Reference Room in Washington, D.C. For more information about the operation of the Public Reference Room, please call1-800-SEC-0330.
| | |
| DISCLOSURE OF FUND EXPENSES | | |
December 31, 2018 (Unaudited)
As a shareholder of a Fund, you will incur no transaction costs from such Fund, including sales charges (loads) on purchases, on reinvested dividends, or on other distributions. There are no exchange fees. However, as a shareholder of a Fund, you will incur ongoing costs, including management fees and other Fund expenses. The following examples are intended to help you understand your ongoing costs (in dollars) of investing in a Fund and to compare these costs with ongoing costs of investing in other mutual funds. The examples are based on an investment of $1,000 invested on July 1, 2018 and held until December 31, 2018.
Actual Expenses.The first line of the table below provides information about actual account values and actual expenses. You may use the information in this line, together with the amount you invested, to estimate the expenses that you paid over the period. Simply divide your account value by $1,000 (for example, an $8,600 account value divided by $1,000 = 8.6), then multiply the result by the number in the first line under the heading “Expenses Paid During Period” to estimate the expenses you paid on your account during the period.
Hypothetical Example for Comparison Purposes.The second line of the table below provides information about hypothetical account values and hypothetical expenses based on the Fund’s actual expense ratio and an assumed rate of return of 5% per year before expenses, which is not the Fund’s actual return. The hypothetical account values and expenses may not be used to estimate the actual ending account balance or expenses you paid for the period. You may use this information to compare the ongoing costs of investing in a Fund and other mutual funds. To do so, compare this 5% hypothetical example with the 5% hypothetical examples that appear in the shareholder reports of other funds.
The expenses shown in the table are meant to highlight ongoing Fund costs only. Therefore, the second line of the table is useful in comparing ongoing costs only and will not help you determine the relative total costs of owning different funds, because other funds may also have transaction costs, such as sales charges, redemption fees or exchange fees.
| | | | | | | | | | | | | | | | |
| | | Beginning Account
Value at 7/1/18 | | | Ending Account
Value at 12/31/18 | | | Expense
Ratio | | | Expenses Paid
During Period*
7/1/18 - 12/31/18 | |
| | | | |
| Bridgeway Omni Small-Cap Value | | | | | | | | | | | | | | | | |
| | | | |
| Actual Fund Return | | | $1,000.00 | | | | $ 779.60 | | | | 0.60% | | | | $2.69 | |
Hypothetical Fund Return | | | $1,000.00 | | | | $1,022.18 | | | | 0.60% | | | | $3.06 | |
| | | | |
| Bridgeway Omni Tax-Managed Small-Cap Value | | | | | | | | | | | | | | | | |
| | | | |
| Actual Fund Return | | | $1,000.00 | | | | $ 786.50 | | | | 0.60% | | | | $2.70 | |
Hypothetical Fund Return | | | $1,000.00 | | | | $1,022.18 | | | | 0.60% | | | | $3.06 | |
| * | Expenses are equal to the average account value times the Fund’s annualized expense ratio multiplied by the number of days in the most recentsix-month period (184) divided by the number of days in the fiscal year (365). |
| | |
| 44 | | Semi-Annual Report | December 31, 2018 (Unaudited) |
THIS PAGE INTENTIONALLY LEFT BLANK
THIS PAGE INTENTIONALLY LEFT BLANK
| | | | |
| | | | |
| | | | |
| | | | |
| | | | |
| | | | |
| | BRIDGE WAY FUNDS, INC. | | |
| | |
| | BNY Mellon Investment Servicing (US) Inc. | | |
| | P.O. Box 9860 | | |
| | Providence, RI 02940-8060 | | |
| | |
| | CUSTODIAN | | |
| | |
| | The Bank of New York Mellon | | |
| | One Wall Street | | |
| | New York, NY 10286 | | |
| | |
| | DISTRIBUTOR | | |
| | |
| | Foreside Fund Services, LLC | | |
| | Three Canal Plaza, Suite 100 | | |
| | Portland, ME 04101 | | |
| | You can review and copy information about our Funds (including the SAI) at the SEC’s Public Reference Room in Washington, D.C. To find out more about this public service, call the SEC at800-SEC-0330. Reports and other information about the Funds are also available on the SEC’s website at www.sec.gov. You can receive copies of this information, for a fee, by writing the Public Reference Section, Securities and Exchange Commission, Washington, D.C. 20549-1520 or by sending an electronic request to the following email address: publicinfo@sec.gov. | | |
Item 2. Code of Ethics.
Not applicable.
Item 3. Audit Committee Financial Expert.
Not applicable.
Item 4. Principal Accountant Fees and Services.
Not applicable.
Item 5. Audit Committee of Listed Registrants.
Not applicable.
Item 6. Investments.
| (a) | Schedule of Investments in securities of unaffiliated issuers as of the close of the reporting period is included as part of the report to shareholders filed under Item 1 of this form. |
| Item 7. | Disclosure of Proxy Voting Policies and Procedures forClosed-End Management Investment Companies. |
Not applicable.
Item 8. Portfolio Managers ofClosed-End Management Investment Companies.
Not applicable.
| Item 9. | Purchases of Equity Securities byClosed-End Management Investment Company and Affiliated Purchasers. |
Not applicable.
Item 10. Submission of Matters to a Vote of Security Holders.
There have been no material changes to the procedures by which the shareholders may recommend nominees to the Registrant’s Board of Directors, where those changes were implemented after the registrant last provided disclosure in response to the requirements of Item 407(c)(2)(iv) of RegulationS-K (17 CFR 229.407) (as required by Item 22(b)(15) of Schedule 14A (17 CFR240.14a-101)), or this Item.
Item 11. Controls and Procedures.
| | (a) | The registrant’s principal executive officer and principal financial officer, or persons performing similar functions, have concluded that the registrant’s disclosure controls and procedures (as defined in Rule30a-3(c) under the Investment Company Act of 1940, as amended (the “1940 Act”) (17 CFR270.30a-3(c))) are effectively designed, as of a date within 90 days of the filing date of the report that includes the disclosure required by this paragraph, based on their evaluation of these controls and procedures required by Rule30a-3(b) under the 1940 Act (17 CFR270.30a-3(b)) and Rules13a-15(b) or15d-15(b) under the Securities Exchange Act of 1934, as amended (17 CFR240.13a-15(b) or240.15d-15(b)). |
| | (b) | There were no changes in the registrant’s internal control over financial reporting (as defined in Rule30a-3(d) under the Act (17 CFR270.30a-3(d))) that occurred during the registrant’s last fiscal quarter that have materially affected or are reasonably likely to materially affect, the registrant’s internal control over financial reporting. |
| Item 12. Disclosure | of Securities Lending Activities forClosed-End Management Investment Companies. |
Not applicable.
Item 13. Exhibits.
| | (a)(2) | Certifications pursuant to Rule30a-2(a) under the 1940 Act and Section 302 of the Sarbanes-Oxley Act of 2002 are attached hereto. |
| | (b) | Certifications pursuant to Rule30a-2(b) under the 1940 Act and Section 906 of the Sarbanes-Oxley Act of 2002 are attached hereto. |
SIGNATURES
Pursuant to the requirements of the Securities Exchange Act of 1934 and the Investment Company Act of 1940, the registrant has duly caused this report to be signed on its behalf by the undersigned, thereunto duly authorized.
(Registrant) Bridgeway Funds, Inc.
| | |
By (Signature and Title)* | | /s/ Tammira Philippe |
| | Tammira Philippe, President and Principal Executive Officer |
| | (principal executive officer) |
Date 3/8/2019
Pursuant to the requirements of the Securities Exchange Act of 1934 and the Investment Company Act of 1940, this report has been signed below by the following persons on behalf of the registrant and in the capacities and on the dates indicated.
| | |
By (Signature and Title)* | | /s/ Tammira Philippe |
| | Tammira Philippe, President and Principal Executive Officer |
| | (principal executive officer) |
Date 3/8/2019
| | |
By (Signature and Title)* | | /s/ Linda G. Giuffré |
| | Linda G. Giuffré, Treasurer and Principal Financial Officer |
| | (principal financial officer) |
Date 3/8/2019
* Print the name and title of each signing officer under his or her signature.