UNITED STATES
SECURITIES AND EXCHANGE COMMISSION
Washington, D.C. 20549
FORM N-CSR
CERTIFIED SHAREHOLDER REPORT OF REGISTERED MANAGEMENT
INVESTMENT COMPANIES
Investment Company Act file number 811-08200
Bridgeway Funds, Inc.
(Exact name of registrant as specified in charter)
20 Greenway Plaza, Suite 450
Houston, Texas 77046
(Address of principal executive offices) (Zip code)
Tammira Philippe, President
Bridgeway Funds, Inc.
20 Greenway Plaza, Suite 450
Houston, Texas 77046
(Name and address of agent for service)
Registrant’s telephone number, including area code: (713) 661-3500
Date of fiscal year end: June 30
Date of reporting period: December 31, 2017
Form N-CSR is to be used by management investment companies to file reports with the Commission not later than 10 days after the transmission to stockholders of any report that is required to be transmitted to stockholders under Rule 30e-1 under the Investment Company Act of 1940 (17 CFR 270.30e-1). The Commission may use the information provided on Form N-CSR in its regulatory, disclosure review, inspection, and policymaking roles.
A registrant is required to disclose the information specified by Form N-CSR, and the Commission will make this information public. A registrant is not required to respond to the collection of information contained in Form N-CSR unless the Form displays a currently valid Office of Management and Budget (“OMB”) control number. Please direct comments concerning the accuracy of the information collection burden estimate and any suggestions for reducing the burden to Secretary, Securities and Exchange Commission, 450 Fifth Street, NW, Washington, DC 20549-0609. The OMB has reviewed this collection of information under the clearance requirements of 44 U.S.C. § 3507.
Item 1. Reports to Stockholders.
The Report to Shareholders is attached herewith.

A no-load mutual fund family of domestic funds
| | | | |
| | Semi-Annual Report December 31, 2017 (Unaudited) |
| | |
| | AGGRESSIVE INVESTORS 1 | | BRAGX |
| | |
| | ULTRA-SMALL COMPANY | | BRUSX |
| | (Open to Existing Investors — Direct Only) | | |
| | |
| | ULTRA-SMALL COMPANY MARKET | | BRSIX |
| | |
| | SMALL-CAP MOMENTUM | | BRSMX |
| | |
| | SMALL-CAP GROWTH | | BRSGX |
| | |
| | SMALL-CAP VALUE | | BRSVX |
| | |
| | BLUE CHIP 35 INDEX | | BRLIX |
| | |
| | MANAGED VOLATILITY | | BRBPX |
| | www.bridgeway.com | | |
| | |
| TABLE OF CONTENTS | |  |
Bridgeway Funds Standardized Returns as of December 31, 2017* (Unaudited)
| | | | | | | | | | | | | | | | | | | | | | | | | | | | | | | | | | | | | | | | | | | | | | | | | | |
| | | | | | | Annualized | | | | | | |
| Fund | | Quarter | | Six Months | | 1 Year | | 5 Years | | 10 Years | | | | Inception
to Date | | Inception
Date | | Gross
Expense
Ratio2 | | Net
Expense
Ratio2 |
Aggressive Investors 1 | | | | 7.66% | | | | | 13.52% | | | | | 18.44% | | | | | 15.85% | | | | | 3.83% | | | | | | | | | | 13.23% | | | | | 8/5/1994 | | | | | 1.66% | | | | | 1.66% | |
Ultra-Small Company | | | | -0.05% | | | | | 2.71% | | | | | 3.88% | | | | | 9.01% | | | | | 4.93% | | | | | | | | | | 13.62% | | | | | 8/5/1994 | | | | | 1.48% | | | | | 1.48% | |
Ultra-Small Co Market | | | | 2.23% | | | | | 9.01% | | | | | 12.47% | | | | | 14.62% | | | | | 7.59% | | | | | | | | | | 10.91% | | | | | 7/31/1997 | | | | | 0.88%1 | | | | | 0.87%1 | |
Small-Cap Momentum | | | | 3.91% | | | | | 10.53% | | | | | 16.99% | | | | | 12.59% | | | | | NA | | | | | | | | | | 12.43% | | | | | 5/28/2010 | | | | | 3.84%1 | | | | | 0.93%1 | |
Small-Cap Growth | | | | 4.12% | | | | | 11.22% | | | | | 19.62% | | | | | 18.10% | | | | | 6.30% | | | | | | | | | | 7.56% | | | | | 10/31/2003 | | | | | 1.16%1 | | | | | 0.94%1 | |
Small-Cap Value | | | | 2.83% | | | | | 7.84% | | | | | 7.11% | | | | | 11.61% | | | | | 5.49% | | | | | | | | | | 7.93% | | | | | 10/31/2003 | | | | | 0.98%1 | | | | | 0.94%1 | |
Blue Chip 35 Index | | | | 7.30% | | | | | 11.60% | | | | | 18.43% | | | | | 14.99% | | | | | 8.36% | | | | | | | | | | 7.33% | | | | | 7/31/1997 | | | | | 0.25%1 | | | | | 0.15%1 | |
Managed Volatility | | | | 2.72% | | | | | 4.67% | | | | | 8.18% | | | | | 5.14% | | | | | 2.90% | | | | | | | | | | 4.08% | | | | | 6/30/2001 | | | | | 1.12%1 | | | | | 0.94%1 | |
Bridgeway Funds Returns for Calendar Years 2003 through 2017* (Unaudited)
| | | | | | | | | | | | | | | | | | | | | | | | | | | | | | | | | | | | | | | | | | | | | | | | | | | | | | | | | | | | |
| | | 2003 | | | 2004 | | | 2005 | | | 2006 | | | 2007 | | | 2008 | | | 2009 | | | 2010 | | | 2011 | | | 2012 | | | 2013 | | | 2014 | | | 2015 | | | 2016 | | | 2017 | |
Aggressive Investors 1 | | | 53.98% | | | | 12.21% | | | | 14.93% | | | | 7.11% | | | | 25.80% | | | | -56.16% | | | | 23.98% | | | | 17.82% | | | | -10.31% | | | | 21.58% | | | | 42.21% | | | | 14.99% | | | | -9.82% | | | | 19.47% | | | | 18.44% | |
Ultra-Small Company | | | 88.57% | | | | 23.34% | | | | 2.99% | | | | 21.55% | | | | -2.77% | | | | -46.24% | | | | 48.93% | | | | 23.55% | | | | -14.64% | | | | 24.49% | | | | 55.77% | | | | -0.56% | | | | -16.12% | | | | 14.06% | | | | 3.88% | |
Ultra-Small Co Market | | | 79.43% | | | | 20.12% | | | | 4.08% | | | | 11.48% | | | | -5.40% | | | | -39.49% | | | | 25.96% | | | | 24.86% | | | | -7.86% | | | | 19.83% | | | | 50.91% | | | | 4.61% | | | | -8.28% | | | | 21.47% | | | | 12.47% | |
Small-Cap Momentum | | | | | | | | | | | | | | | | | | | | | | | | | | | | | | | | | | | -0.92% | | | | 14.18% | | | | 37.07% | | | | -0.94% | | | | 0.14% | | | | 13.73% | | | | 16.99% | |
Small-Cap Growth | | | | | | | 11.59% | | | | 18.24% | | | | 5.31% | | | | 6.87% | | | | -43.48% | | | | 15.05% | | | | 11.77% | | | | -0.63% | | | | 11.05% | | | | 48.52% | | | | 6.13% | | | | 4.93% | | | | 16.10% | | | | 19.62% | |
Small-Cap Value | | | | | | | 17.33% | | | | 18.92% | | | | 12.77% | | | | 6.93% | | | | -45.57% | | | | 26.98% | | | | 16.56% | | | | 1.05% | | | | 20.99% | | | | 39.72% | | | | 0.79% | | | | -9.43% | | | | 26.79% | | | | 7.11% | |
Blue Chip 35 Index | | | 28.87% | | | | 4.79% | | | | 0.05% | | | | 15.42% | | | | 6.07% | | | | -33.30% | | | | 26.61% | | | | 10.60% | | | | 3.17% | | | | 15.20% | | | | 31.67% | | | | 11.51% | | | | 2.17% | | | | 13.18% | | | | 18.43% | |
Managed Volatility | | | 17.82% | | | | 7.61% | | | | 6.96% | | | | 6.65% | | | | 6.58% | | | | -19.38% | | | | 12.39% | | | | 5.41% | | | | 1.94% | | | | 6.46% | | | | 9.25% | | | | 5.95% | | | | 0.17% | | | | 2.42% | | | | 8.18% | |
Performance figures quoted represent past performance and are no guarantee of future results. Current performance may be lower or higher than the performance data quoted. Investment return and principal value will fluctuate, so that an investor’s shares, when redeemed, may be worth more or less than original cost. To obtain performance current to the most recent month-end, please visit www.bridgeway.com or call 1-800-661-3550. Total return figures include the reinvestment of dividends and capital gains.
| | 1 | Some of the Fund’s fees were waived or expenses reimbursed; otherwise, returns would have been lower. The Adviser has contractually agreed to waive fees and/or reimburse expenses. Any material change to this Fund policy would require a vote by shareholders. |
| | 2 | Expense ratios are as stated in the current prospectus. Please see financial highlights for expense ratios as of December 31, 2017. |
* Numbers highlighted indicate periods when the Fund outperformed its primary benchmark.
This report is submitted for the general information of the shareholders of each Fund. It is not authorized for distribution to prospective investors unless preceded or accompanied by an effective prospectus, which includes information regarding a Fund’s risks, objectives, fees and expenses, experience of its management, and other information. Investors should read the prospectus carefully before investing in a Fund. For questions or other Fund information, call 1-800-661-3550 or visit the Funds’ website at www.bridgeway.com. Funds are available for purchase by residents of the United States, Puerto Rico, U.S. Virgin Islands and Guam only. Foreside Fund Services, LLC, Distributor.
The views expressed here are exclusively those of Fund management. These views, including those relating to the market, sectors, or individual stocks, are not meant as investment advice and should not be considered predictive in nature.
| | | | |
| LETTER FROM THE INVESTMENT MANAGEMENT TEAM | | | | |
December 31, 2017
Dear Fellow Shareholders,
Performance across all segments of the domestic equity markets was positive for the December quarter, capping a year of solid growth for stocks. Large-cap stocks and growth stocks were in favor for the quarter and the calendar year, helping large-cap growth stocks post the best returns during both periods. Market highlights appear on page 2. In this environment, the Bridgeway Funds performed within design expectations, guided by our statistically driven, evidence-based investment approach. Please see the enclosed letters for a detailed explanation of each Fund’s performance during the quarter and calendar year. We hope you find the letters helpful.
In past annual and semi-annual reports, we’ve written articles that explain the factors — such as small size, value and momentum — that are at the heart of Bridgeway’s investment strategies. In this report, we’re examining a term that investors might be noticing more and more these days: “smart beta.” What is smart beta, and what is its relationship to factor-based investing? Bridgeway’s Director of Research, Andrew Berkin, breaks it down in his piece, “‘Smart Beta’ versus Factor Investing: What’s the Difference?” on page 2.
In 2017, Bridgeway was again named among the “Best Places to Work in Money Management.” Learn more about this recognition on page 3.
Finally, 2017 saw Houston and the surrounding area inundated with rain and floodwater from Hurricane Harvey. Partner Donald Chang reflects on lessons learned from his own family’s experience with the storm in, “Transformative Change: Repaying a Friend by Helping Others in the Wake of Hurricane Harvey,” on page 3.
As always, we appreciate your feedback. We take your comments very seriously and regularly discuss them to help us manage our Funds and this company. Please keep your ideas coming — both favorable and critical. They provide us with a vital tool to serve you better.
Sincerely,
Your Investment Management Team
| | | | |
 | |  | |  |
| John Montgomery | | Christine L. Wang | | Michael Whipple |
| | |
 | |  | | |
| Elena Khoziaeva | | Dick Cancelmo | | |
| | | | |
| LETTER FROM THE INVESTMENT MANAGEMENT TEAM (continued) | | | | |
Market Review
Domestic equity markets continued to rise in the fourth quarter, rounding out a year of strong performance for stocks. These gains were fueled by several factors, including steady and sustained economic growth and the passage in December of the long-anticipated tax reform that cut corporate tax rates from 35% to 21%. The S&P 500 returned 6.64% for the quarter, while the Dow Jones Industrial Average returned 10.96%. For the year, the S&P 500 and the DJIA returned 21.83% and 28.11%, respectively.
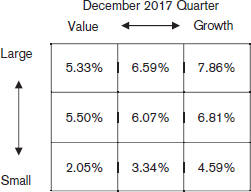
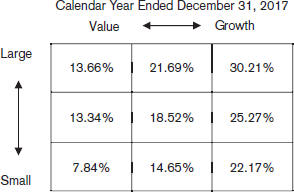
All U.S. equity style categories, as defined by Russell Indices, were up for the quarter, with large-cap and mid-cap stocks outpacing small-cap stocks. Growth stocks also outpaced value stocks in both the fourth quarter and the calendar year. As a result, large-cap growth stocks posted the best quarterly results, returning 7.86%. Small-cap value stocks were the relative laggards, returning 2.05%.
Each sector of the S&P 500 recorded positive performance for the quarter. Consumer Discretionary led the gains, returning 9.87%. The Information Technology and Financials sectors rose 9.01% and 8.63%, respectively. The Utilities sector lagged, gaining just 0.21%.
Below are the stock market style box returns for the quarter and the calendar year.
“Smart Beta” versus Factor Investing: What’s the Difference?
By Andrew Berkin, Director of Research
The term “smart beta” seems to be everywhere these days, with investors increasingly putting money into a host of products marketed under the smart beta umbrella. There are now more than 1,000 so-called smart beta ETFs available, according to Morningstar, up from just a handful of products 15 years ago.
Yet this growth and enthusiasm doesn’t mean that investors are entirely clear on what smart beta really is — and what it might (and might not) do for their portfolios. Some investors also might be wondering how smart beta strategies are different from the factor-based investing strategies that Bridgeway uses.
The answer on one level is simple: The difference between smart beta and factor-based investing is semantics more than anything else. Both approaches target specific investment factors — the characteristics that affect the risk/return profile of a group of stocks or bonds, and that have been shown to provide a return premium over time. Some of the best-known factors include small size, value and momentum.
Bridgeway designs our mutual fund portfolios to target these investment factors, while smart beta providers are offering another way to deliver factor exposure. Companies have created ETFs and other investment products based on indexes that weight securities according to some means other than market capitalization — such as earnings and sales ratios, stock volatility or other performance metrics. These index construction rules give the ETF a tilt toward a specific factor, such as small size.
| | |
| 2 | | Semi-Annual Report | December 31, 2017 (Unaudited) |
| | | | |
| LETTER FROM THE INVESTMENT MANAGEMENT TEAM (continued) | | | | |
But there is another, more important potential difference between factor-based investing and smart beta strategies: Variations in product design and implementation can affect how much exposure smart beta investors really get to the factors they’re seeking — and therefore the potential returns they might expect.
Here are a few considerations that can influence the potential effectiveness of a smart beta or factor-based investment strategy:
| ● | | Untested factors. The rush to fill the smart beta landscape has led to companies creating some products based on exotic or proprietary factors. The risk is that these newer factors aren’t well-tested, and therefore might not deliver their supposed premiums going forward. |
| ● | | Trading costs. If a fund’s sole goal is to replicate an index, it must trade when stocks enter or exit that index. This causes a fund to buy or sell stocks at the exact same time that other index funds are doing so, exposing it to potentially higher trading costs. However, a fund that instead seeks to earn the return of a targeted asset class (or factor), and is willing to live with some temporary deviation from the index’s makeup, can be more patient in its trading strategy and take advantage of opportunities to reduce trading costs. |
| ● | | The choice of index and portfolio construction rules. The choice of a benchmark index and the rules used to construct portfolios — including how closely a fund adheres to its underlying benchmark — are important because returns can be affected by how often an index reconstitutes. Many indexes reconstitute annually. This infrequent reconstitution schedule can create what’s known as “style drift,” as changes in certain stocks’ characteristics push them outside the index’s parameters for a factor such as small size or value. A fund tracking the index that only reconstituted annually would similarly see its exposure to desired factors drift. To avoid this problem, a fund could choose to reconstitute monthly, or quarterly, depending on how it affects turnover and transaction costs. |
We at Bridgeway are advocates of investment strategies that provide exposure to factors, whether they are dubbed “smart beta” or not. But being truly smart about beta and factors requires thoughtful product design and implementation. By selecting investment options that target well-tested factors, adopt cost-conscious trading strategies, and employ sound portfolio construction rules, investors can avoid smart beta products that are more marketing gimmick than substance.
Bridgeway Again Recognized Among “Best Places to Work in Money Management”
We are proud to report that in December 2017, Bridgeway was named one of the Best Places to Work in Money Management by Pensions & Investments, an international publication that covers the money management industry. This is the third time that our unique firm culture has been recognized since Pensions & Investments began ranking U.S. money managers in 2012.
In 2017, Bridgeway ranked fourth among the five winning firms in the category of managers with 20-49 employees. Bridgeway previously ranked first in the same category in Pensions & Investments’ 2015 survey, and third in the same category in the 2014 survey.
We believe this recognition reflects the value of our firm’s servant-leadership model, which empowers our Partners to apply their unique talents to a shared purpose: helping our clients achieve their goals through disciplined, low-cost, evidence-based investment strategies. By embracing this shared purpose, our Partners are driving Bridgeway’s success and making a real difference in the lives of our clients and the communities in which we live and work. We are grateful for their commitment and their contributions.
Transformative Change: Repaying a Friend by Helping Others in the Wake of Hurricane Harvey
By Donald Chang, Investment Management Team
The night of Hurricane Harvey, my wife jarred me awake with the words, “Our house is about to get flooded.” In disbelief, I hurried to the door, opened it, and saw a river at our doorstep. We frantically moved some of our belongings onto tables, and 30 minutes later I found myself wading through water to our neighbor’s house, as I carried our baby, and then our dogs, on my shoulders.
When the water receded, my wife and I returned to our house and just stared at the mess, dumbfounded. Overwhelmed by the daunting clean-up task ahead of us, my wife asked for help on Facebook. The response we got was amazing.
| | | | |
| LETTER FROM THE INVESTMENT MANAGEMENT TEAM (continued) | | | | |
Our friend Nick, whom we hadn’t spoken to in years, rallied a dozen of his friends who labored all day long at our house moving furniture, tearing out drywall and removing carpet and hardwood floors. When the work was finished, I asked Nick how we could repay him. His response was, “Pay it forward.”
Inspired by those words, I decided to go out and help other Harvey victims — tearing out drywall and floors and saving what belongings we could — despite my own family’s obstacles.
After that experience, I found myself thinking about a novel called The Power of One, which tells the story of an English orphan, P.K., in South Africa and his desire to change the world. When P.K. grows up, he is inspired by the mythological “Rainmaker” — a person who brings peace to the tribes of South Africa — to build language schools for South African tribes to bridge cultural divides in his country. The story seeks to prove that one person has the power to make a huge difference with every action he or she takes.
When I first read about P.K., I thought it was overly idealistic, and that few people in real life would be courageous enough to do something like he did. Yet, in the aftermath of Hurricane Harvey, the words “pay it forward” returned to my mind, and I realized that the “power of one” is not necessarily represented by something big like building schools in Africa. Sometimes, the power to effect positive change in the world is the willingness to offer a hand, do what we can, and make a big difference through multiple small actions.
| | |
| 4 | | Semi-Annual Report | December 31, 2017 (Unaudited) |
| | |
| Aggressive Investors 1 Fund | | |
| MANAGER’S COMMENTARY (Unaudited) | | |
| | |
December 31, 2017
Dear Fellow Aggressive Investors 1 Fund Shareholder,
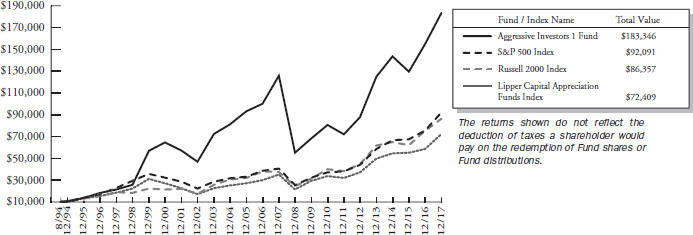
For the quarter ended December 31, 2017, our Fund returned +7.66%, outperforming our primary market benchmark, the S&P 500 Index (+6.64%), our peer benchmark, the Lipper Capital Appreciation Funds Index (+6.43%), and the Russell 2000 Index (+3.34%).
For the six-month semi-annual period ended December 31, 2017, our Fund returned +13.52%, outperforming the S&P 500 Index (+11.42%), the Lipper Capital Appreciation Funds Index (+11.74%), and the Russell 2000 Index (+9.20%).
For the calendar year, our Fund returned +18.44%, underperforming the S&P 500 Index (+21.83%) and the Lipper Capital Appreciation Funds Index (+23.60%), but outperforming the Russell 2000 Index (+14.65%).
The table below presents our December quarter, six-month, one-year, five-year, 10-year, 15-year, and inception-to-date financial results.
Standardized Returns as of December 31, 2017
| | | | | | | | | | | | | | | | | | | | | | | | | | | | |
| | | | | | | | | | | | Annualized | | | | |
| | | Quarter | | | 6 Months | | 1 Year | | 5 Years | | 10 Years | | 15 Years | | Since Inception
(8/5/94) |
| | | | | | | |
Aggressive Investors 1 Fund | | | 7.66 | % | | | 13.52 | % | | | 18.44 | % | | | 15.85 | % | | | 3.83 | % | | | 9.49 | % | | | 13.23 | % |
S&P 500 Index | | | 6.64 | % | | | 11.42 | % | | | 21.83 | % | | | 15.79 | % | | | 8.50 | % | | | 9.92 | % | | | 9.92 | % |
Russell 2000 Index | | | 3.34 | % | | | 9.20 | % | | | 14.65 | % | | | 14.12 | % | | | 8.71 | % | | | 11.17 | % | | | 9.62 | % |
Lipper Capital Appreciation Funds Index | | | 6.43 | % | | | 11.74 | % | | | 23.60 | % | | | 14.22 | % | | | 7.48 | % | | | 9.99 | % | | | 8.75 | % |
Performance figures quoted in the table above represent past performance and are no guarantee of future results. Total return figures in the table above include the reinvestment of dividends and capital gains. The table above does not reflect the deduction of taxes that a shareholder would pay on Fund distributions or on the redemption of Fund shares.
The S&P 500 Index is a broad-based, unmanaged measurement of changes in stock market conditions, based on the average of 500 widely held common stocks with dividends reinvested. The Russell 2000 Index is an unmanaged, market value weighted index that measures performance of the 2,000 companies that are between the 1,000th and 3,000th largest in the market with dividends reinvested. The Lipper Capital Appreciation Funds Index reflects the record of the 30 largest funds in the category of more aggressive domestic growth mutual funds, as reported by Lipper, Inc. It is not possible to invest directly in an index. Periods longer than one year are annualized.
According to data from Lipper, Inc. as of December 31, 2017, Aggressive Investors 1 Fund ranked 154th of 234 capital appreciation funds for the 12 months ended December 31, 2017, 41st of 201 over the last five years, 147th of 160 over the last 10 years, and 3rd of 33 since inception in August 1994. Lipper, Inc. is an independent mutual fund rating service that ranks funds in various fund categories by making comparative calculations using total returns.
| | |
| Aggressive Investors 1 Fund | |
|
| MANAGER’S COMMENTARY (Unaudited) (continued) | |
| | |
Growth of a $10,000 Investment
from Inception August 5, 1994 to December 31, 2017
Detailed Explanation of Quarterly Performance
The Fund’s company financial health and value metrics models outperformed the benchmark during the quarter and boosted relative results. An overweighting in higher-momentum stocks (across all three model categories) also helped relative performance during a quarter in which the momentum factor was in favor. Likewise, a tilt toward higher beta stocks contributed positively to relative results. However, the Fund’s tilt toward smaller stocks significantly detracted from relative performance during the quarter. Increased core exposure (as measured by multiple value metrics) had a small negative impact. Our price momentum models lagged the benchmark and also hurt relative results.
The Fund’s sector allocation effect was positive, with an overweighting in the Consumer Discretionary sector and an underweighting in the Utilities sector — the benchmark’s worst-performing sector during the quarter — boosting relative results. However, the Fund’s stock selection effect was negative, with holdings in the Information Technology and Utilities sectors detracting the most from relative performance. Holdings in the Health Care sector made the largest positive contribution to relative results.
Detailed Explanation of Calendar Year Performance
All three of the Fund’s model categories lagged the benchmark during 2017 and detracted from relative performance. The Fund’s tilt toward smaller stocks significantly dragged on relative results, as smaller stocks underperformed their larger counterparts during the year. Similarly, increased core exposure (as measured by multiple value metrics) hurt results during a year in which growth stocks outperformed value stocks. The Fund’s tilt toward higher beta stocks also slightly hurt relative performance. By contrast, an overweighting in higher momentum stocks improved relative performance.
The Fund’s sector allocation effect was positive, with underweightings in the Energy and Consumer Staples sectors boosting relative performance. However, the Fund’s stock selection effect was negative, with holdings in the Information Technology, Health Care, and Telecommunication Services sectors hurting relative performance.
| | |
| 6 | | Semi-Annual Report | December 31, 2017 (Unaudited) |
| | |
| Aggressive Investors 1 Fund | | |
| MANAGER’S COMMENTARY (Unaudited) (continued) | | |
| | |
Top Ten Holdings as of December 31, 2017
| | | | | | | | |
| Rank | | Description | | Industry | | % of Net
Assets | |
| | VelocityShares Daily | | | | | | |
| 1 | | Inverse VIX Short Term ETN | | Exchange Traded Note | | | 2.4% | |
| 2 | | Lam Research Corp. | | Information Technology | | | 2.2% | |
| 3 | | NVR, Inc. | | Consumer Discretionary | | | 2.2% | |
| 4 | | Applied Materials, Inc. | | Information Technology | | | 2.1% | |
| 5 | | Micron Technology, Inc. | | Information Technology | | | 2.0% | |
| 6 | | ON Semiconductor Corp. | | Information Technology | | | 1.9% | |
| 7 | | Children’s Place, Inc. (The) | | Consumer Discretionary | | | 1.7% | |
| 8 | | Boeing Co. (The) | | Industrials | | | 1.6% | |
| 9 | | Fiat Chrysler Automobiles NV | | Consumer Discretionary | | | 1.6% | |
| 10 | | United Rentals, Inc. | | Industrials | | | 1.5% | |
| | | |
| | Total | | | | | 19.2% | |
Industry Sector Representation as of December 31, 2017
| | | | | | | | | | | | | | | |
| | | % of Net Assets | | % of S&P 500
Index | | Difference |
Consumer Discretionary | | | | 20.4% | | | | | 12.1% | | | | | 8.3% | |
Consumer Staples | | | | 1.5% | | | | | 8.2% | | | | | -6.7% | |
Energy | | | | 3.4% | | | | | 6.1% | | | | | -2.7% | |
Financials | | | | 15.4% | | | | | 14.8% | | | | | 0.6% | |
Health Care | | | | 13.9% | | | | | 13.8% | | | | | 0.1% | |
Industrials | | | | 12.1% | | | | | 10.3% | | | | | 1.8% | |
Information Technology | | | | 20.2% | | | | | 23.8% | | | | | -3.6% | |
Materials | | | | 5.7% | | | | | 3.0% | | | | | 2.7% | |
Real Estate | | | | 2.5% | | | | | 2.9% | | | | | -0.4% | |
Telecommunication Services | | | | 1.9% | | | | | 2.1% | | | | | -0.2% | |
Utilities | | | | 0.4% | | | | | 2.9% | | | | | -2.5% | |
Cash & Other Assets | | | | 2.6% | | | | | 0.0% | | | | | 2.6% | |
| | | |
Total | | | | 100.0% | | | | | 100.0% | | | | | | |
Disclaimer
The views expressed here are exclusively those of Fund management. These views, including those related to market sectors or individual stocks, are not meant as investment advice and should not be considered predictive in nature. Any favorable (or unfavorable) description of a holding applies only as of the quarter end, December 31, 2017, unless otherwise stated. Security positions can and do change thereafter. Discussions of historical performance do not guarantee and may not be indicative of future performance.
Market volatility can significantly affect short-term performance. The Fund is not an appropriate investment for short-term investors. Investments in the small companies within this multi-cap fund generally carry greater risk than is customarily associated with larger companies. This additional risk is attributable to a number of factors, including the relatively limited financial resources that are typically available to small companies and the fact that small companies often have comparatively limited product lines. In addition, the stock of small companies tends to be more volatile than the stock of large companies, particularly in the short term and particularly in the early stages of an economic or market downturn. The Fund’s use of options, futures, and leverage can magnify the risk of loss in an unfavorable market, and the Fund’s use of short-sale positions can, in theory, expose shareholders to unlimited loss. Finally, the Fund exposes shareholders to “focus risk,” which may add to Fund volatility through the possibility that a single company could significantly affect total return. Shareholders of the Fund, therefore, are taking on more risk than they would if they invested in the stock market as a whole.
| | |
| Aggressive Investors 1 Fund | |
|
| MANAGER’S COMMENTARY (Unaudited) (continued) | |
| | |
Conclusion
Thank you for your continued investment in Aggressive Investors 1 Fund. We encourage your feedback; your reactions and concerns are important to us.
Sincerely,
The Investment Management Team
| | |
| 8 | | Semi-Annual Report | December 31, 2017 (Unaudited) |
| | |
| Aggressive Investors 1 Fund | | |
| SCHEDULE OF INVESTMENTS | | |
| Showing percentage of net assets as of December 31, 2017 (Unaudited) | | |
| | | | | | | | |
| Industry Company | | Shares | | Value | | | | |
| | |
COMMON STOCKS - 97.31% | | | | |
| Consumer Discretionary - 20.44% | | | | |
Abercrombie & Fitch Co., Class A | | 89,300 | | $1,556,499 | | | | |
Aptiv PLC | | 33,800 | | 2,867,254 | | | | |
Beazer Homes USA, Inc.* | | 59,700 | | 1,146,837 | | | | |
Best Buy Co., Inc. | | 38,000 | | 2,601,860 | | | | |
Children’s Place, Inc. (The)+ | | 28,000 | | 4,069,800 | | | | |
Dana, Inc. | | 97,000 | | 3,104,970 | | | | |
Delphi Technologies PLC* | | 11,266 | | 591,127 | | | | |
Discovery Communications, Inc., Class A*+ | | 79,600 | | 1,781,448 | | | | |
Fiat Chrysler Automobiles NV+ | | 215,000 | | 3,835,600 | | | | |
Ford Motor Co. | | 200,000 | | 2,498,000 | | | | |
General Motors Co. | | 27,900 | | 1,143,621 | | | | |
Hanesbrands, Inc.+ | | 102,000 | | 2,132,820 | | | | |
KB Home | | 97,000 | | 3,099,150 | | | | |
Lear Corp. | | 16,000 | | 2,826,560 | | | | |
LGI Homes, Inc.* | | 34,000 | | 2,551,020 | | | | |
Netflix, Inc.* | | 16,100 | | 3,090,556 | | | | |
NVR, Inc.* | | 1,500 | | 5,262,330 | | | | |
Winnebago Industries, Inc.+ | | 49,200 | | 2,735,520 | | | | |
Wyndham Worldwide Corp. | | 23,700 | | 2,746,119 | | | | |
| | | | | | | | |
| | | | |
| | | | 49,641,091 | | | | |
| | |
Consumer Staples - 1.48% | | | | |
Central Garden & Pet Co., Class A* | | 66,800 | | 2,519,028 | | | | |
SUPERVALU, Inc.*+ | | 50,400 | | 1,088,640 | | | | |
| | | | | | | | |
| | | | |
| | | | 3,607,668 | | | | |
| | |
Energy - 3.39% | | | | |
Archrock, Inc. | | 99,300 | | 1,042,650 | | | | |
Denbury Resources, Inc.* | | 700,000 | | 1,547,000 | | | | |
EP Energy Corp., Class A*+ | | 350,000 | | 826,000 | | | | |
Newfield Exploration Co.* | | 72,000 | | 2,270,160 | | | | |
Noble Corp. PLC* | | 296,100 | | 1,338,372 | | | | |
Teekay Corp.+ | | 130,000 | | 1,211,600 | | | | |
| | | | | | | | |
| | | | |
| | | | 8,235,782 | | | | |
| | |
Financials - 15.39% | | | | |
Aflac, Inc. | | 29,900 | | 2,624,622 | | | | |
Ally Financial, Inc. | | 73,400 | | 2,140,344 | | | | |
American Financial Group, Inc. | | 24,300 | | 2,637,522 | | | | |
Bank of America Corp. | | 97,000 | | 2,863,440 | | | | |
Cboe Global Markets, Inc. | | 19,600 | | 2,441,964 | | | | |
Morgan Stanley | | 53,100 | | 2,786,157 | | | | |
Progressive Corp. (The) | | 52,000 | | 2,928,640 | | | | |
Prudential Financial, Inc. | | 22,000 | | 2,529,560 | | | | |
Regions Financial Corp. | | 170,000 | | 2,937,600 | | | | |
Royal Bank of Canada+ | | 34,300 | | 2,800,595 | | | | |
SEI Investments Co. | | 37,000 | | 2,658,820 | | | | |
| | | | | | | | | | |
| | Industry Company | | | Shares | | | | Value | |
| |
| | | |
| | Financials (continued) | |
| | Synchrony Financial | | | 80,000 | | | | $3,088,800 | |
| | TD Ameritrade Holding Corp. | | | 48,800 | | | | 2,495,144 | |
| | Toronto-Dominion Bank (The) | | | 42,000 | | | | 2,460,360 | |
| | | | | | | | | | |
| | | |
| | | | | | | | | 37,393,568 | |
| |
| | Health Care - 13.86% | |
| | AbbVie, Inc. | | | 25,000 | | | | 2,417,750 | |
| | Align Technology, Inc.* | | | 9,600 | | | | 2,133,024 | |
| | AmerisourceBergen Corp. | | | 39,900 | | | | 3,663,618 | |
| | Baxter International, Inc. | | | 45,700 | | | | 2,954,048 | |
| | Express Scripts Holding Co.* | | | 40,000 | | | | 2,985,600 | |
| | Gilead Sciences, Inc. | | | 34,000 | | | | 2,435,760 | |
| | Hill-Rom Holdings, Inc. | | | 29,100 | | | | 2,452,839 | |
| | Intuitive Surgical, Inc.* | | | 6,300 | | | | 2,299,122 | |
| | IQVIA Holdings, Inc.* | | | 24,100 | | | | 2,359,390 | |
| | LHC Group, Inc.* | | | 35,400 | | | | 2,168,250 | |
| | Teleflex, Inc. | | | 9,500 | | | | 2,363,790 | |
| | United Therapeutics Corp.* | | | 15,500 | | | | 2,293,225 | |
| | UnitedHealth Group, Inc. | | | 14,200 | | | | 3,130,532 | |
| | | | | | | | | | |
| | | |
| | | | | | | | | 33,656,948 | |
| |
| | Industrials - 12.13% | |
| | AerCap Holdings NV* | | | 26,800 | | | | 1,409,948 | |
| | Alamo Group, Inc. | | | 10,800 | | | | 1,218,996 | |
| | Boeing Co. (The) | | | 13,300 | | | | 3,922,303 | |
| | Briggs & Stratton Corp. | | | 48,000 | | | | 1,217,760 | |
| | Deere & Co. | | | 17,800 | | | | 2,785,878 | |
| | EMCOR Group, Inc. | | | 34,000 | | | | 2,779,500 | |
| | H&E Equipment Services, Inc. | | | 48,500 | | | | 1,971,525 | |
| | Manitowoc Co., Inc. (The)* | | | 59,250 | | | | 2,330,895 | |
| | TriNet Group, Inc.* | | | 31,600 | | | | 1,401,144 | |
| | United Continental Holdings, Inc.* | | | 30,000 | | | | 2,022,000 | |
| | United Rentals, Inc.* | | | 21,500 | | | | 3,696,065 | |
| | WABCO Holdings, Inc.* | | | 15,400 | | | | 2,209,900 | |
| | Xylem, Inc. | | | 36,500 | | | | 2,489,300 | |
| | | | | | | | | | |
| | | |
| | | | | | | | | 29,455,214 | |
| |
| | Information Technology - 20.16% | |
| | Alliance Data Systems Corp. | | | 10,300 | | | | 2,610,844 | |
| | Apple, Inc. | | | 16,000 | | | | 2,707,680 | |
| | Applied Materials, Inc. | | | 99,900 | | | | 5,106,888 | |
| | IPG Photonics Corp.* | | | 8,900 | | | | 1,905,757 | |
| | KEMET Corp.* | | | 51,000 | | | | 768,060 | |
| | Lam Research Corp. | | | 28,600 | | | | 5,264,402 | |
| | Mastercard, Inc., Class A | | | 16,300 | | | | 2,467,168 | |
| | Microchip Technology, Inc. | | | 28,500 | | | | 2,504,580 | |
| | Micron Technology, Inc.* | | | 116,000 | | | | 4,769,920 | |
| | |
| Aggressive Investors 1 Fund | |
|
| SCHEDULE OF INVESTMENTS (continued) | |
| Showing percentage of net assets as of December 31, 2017 (Unaudited) | | |
| | | | | | | | |
| Industry Company | | Shares | | Value | | | | |
| | | | |
Common Stocks (continued) | | | | | | | | |
Information Technology (continued) | | | | |
ON Semiconductor Corp.* | | 220,000 | | $4,606,800 | | | | |
PayPal Holdings, Inc.* | | 32,700 | | 2,407,374 | | | | |
Seagate Technology PLC | | 52,900 | | 2,213,336 | | | | |
Take-Two Interactive Software, Inc.* | | 22,300 | | 2,448,094 | | | | |
Teradyne, Inc. | | 55,000 | | 2,302,850 | | | | |
Western Digital Corp. | | 27,000 | | 2,147,310 | | | | |
Workday, Inc., Class A* | | 23,800 | | 2,421,412 | | | | |
Xerox Corp. | | 79,475 | | 2,316,696 | | | | |
| | | | | | | | |
| | | | 48,969,171 | | | | |
Materials - 5.67% | | | | | | | | |
Constellium NV, Class A* | | 154,700 | | 1,724,905 | | | | |
Crown Holdings, Inc.* | | 37,800 | | 2,126,250 | | | | |
Freeport-McMoRan, Inc.* | | 164,800 | | 3,124,608 | | | | |
Packaging Corp. of America | | 20,900 | | 2,519,495 | | | | |
SunCoke Energy, Inc.* | | 94,000 | | 1,127,060 | | | | |
Teck Resources, Ltd., Class B+ | | 120,000 | | 3,140,400 | | | | |
| | | | | | | | |
| | | | 13,762,718 | | | | |
Real Estate - 2.52% | | | | | | | | |
Ashford Hospitality Trust, Inc. | | 172,600 | | 1,161,598 | | | | |
CBRE Group, Inc., Class A* | | 65,000 | | 2,815,150 | | | | |
Gaming and Leisure Properties, Inc. | | 58,000 | | 2,146,000 | | | | |
| | | | | | | | |
| | | | 6,122,748 | | | | |
Telecommunication Services - 1.92% | | | | |
Cincinnati Bell, Inc.* | | 61,200 | | 1,276,020 | | | | |
T-Mobile US, Inc.* | | 53,200 | | 3,378,732 | | | | |
| | | | | | | | |
| | | | 4,654,752 | | | | |
Utilities - 0.35% | | | | | | | | |
Just Energy Group, Inc.+ | | 200,167 | | 858,716 | | | | |
| | | | | | | | |
TOTAL COMMON STOCKS - 97.31% | | 236,358,376 | | | | |
| | | | | | | | |
(Cost $204,478,566) | | | | | | | | |
| | |
EXCHANGE TRADED NOTE - 2.42% | | | | |
Exchange Traded Note - 2.42% | | | | |
VelocityShares Daily Inverse VIX Short Term ETN*+ | | 43,800 | | 5,888,472 | | | | |
| | | | | | | | |
TOTAL EXCHANGE TRADED NOTE - 2.42% | | | | 5,888,472 | | | | |
| | | | | | | | |
(Cost $3,332,707) | | | | | | | | |
| | | | | | | | | | | | |
| | | Rate^ | | | Shares | | | Value | |
|
MONEY MARKET FUND - 1.05% | |
Fidelity Investments Money Market Government Portfolio Class I | | | 1.14 | % | | | 2,545,425 | | | $ | 2,545,425 | |
| | | | | | | | | | | | |
TOTAL MONEY MARKET FUND - 1.05% | | | | 2,545,425 | |
| | | | | | | | | | | | |
(Cost $2,545,425) | | | | | |
|
| INVESTMENTS PURCHASED WITH CASH PROCEEDS FROM SECURITIES LENDING - 5.16% | |
Fidelity Investments Money Market Government Portfolio Class I** | | | 1.14 | % | | | 12,529,295 | | | | 12,529,295 | |
| | | | | | | | | | | | |
TOTAL INVESTMENTS PURCHASED WITH CASH PROCEEDS FROM SECURITIES LENDING - 5.16% | | | | 12,529,295 | |
| | | | | | | | | | | | |
(Cost $12,529,295) | | | | | |
TOTAL INVESTMENTS - 105.94% | | | $ | 257,321,568 | |
(Cost $222,885,993) | | | | | |
Liabilities in Excess of Other Assets - (5.94%) | | | | (14,421,408 | ) |
| | | | | | | | | | | | |
NET ASSETS - 100.00% | | | $ | 242,900,160 | |
| | | | | | | | | | | | |
| * | Non-income producing security. |
| ** | This security represents the investment of the collateral received in connection with securities out on loan as of December 31, 2017. |
| ^ | Rate disclosed as of December 31, 2017. |
| + | This security or a portion of the security is out on loan as of December 31, 2017. Total loaned securities had a value of $12,038,084 as of December 31, 2017. |
ETN - Exchange Traded Note
PLC - Public Limited Company
| | |
| 10 | | Semi-Annual Report | December 31, 2017 (Unaudited) |
| | |
| Aggressive Investors 1 Fund | | |
| SCHEDULE OF INVESTMENTS (continued) | | |
| Showing percentage of net assets as of December 31, 2017 (Unaudited) | | |
| | | | | | | | | | | | | | | | | | |
| Summary of inputs used to value the Fund’s investments as of 12/31/2017 (See Note 2 in Notes to Financial Statements): | | | |
| | |
| | | Valuation Inputs | | | |
| | | Investment in Securities (Value) | | | |
| | | Level 1
Quoted
Prices | | | Level 2
Significant
Observable
Inputs | | | Level 3
Significant
Unobservable
Inputs | | | Total | | | |
Common Stocks (a) | | $ | 236,358,376 | | | $ | — | | | $ | — | | | $ | 236,358,376 | | | |
Exchange Traded Note | | | 5,888,472 | | | | — | | | | — | | | | 5,888,472 | | | |
Money Market Fund | | | — | | | | 2,545,425 | | | | — | | | | 2,545,425 | | | |
Investments Purchased with Cash Proceeds from Securities Lending | | | — | | | | 12,529,295 | | | | — | | | | 12,529,295 | | | |
| | | | | | | | | | | | | | | | | | |
TOTAL | | $ | 242,246,848 | | | $ | 15,074,720 | | | $ | — | | | $ | 257,321,568 | | | |
| | | | | | | | | | | | | | | | | | |
(a) - Please refer to the Schedule of Investments for the industry classifications of these portfolio holdings. See Notes to Financial Statements. | | | |
| | |
| Ultra-Small Company Fund | |
|
| MANAGER’S COMMENTARY (Unaudited) | |
| | |
December 31, 2017
Dear Fellow Ultra-Small Company Fund Shareholder,
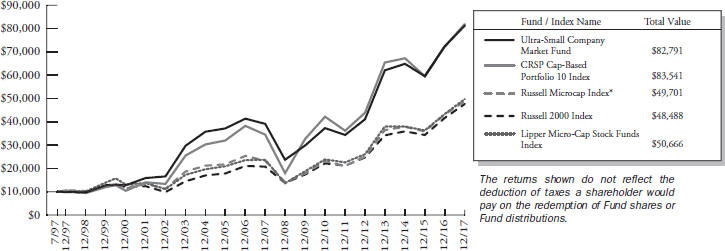
For the quarter ended December 31, 2017, our Fund returned -0.05%, trailing our primary market benchmark, the CRSP Cap-Based Portfolio 10 Index (+2.06%), our peer benchmark, the Lipper Micro-Cap Stock Funds Index (+1.96%), the Russell 2000 Index (+3.34%), and the Russell Microcap Index (+1.80%).
For the six-month semi-annual period ended December 31, 2017, our Fund returned +2.71%, underperforming the CRSP Cap-Based Portfolio 10 Index (+9.20%), the Lipper Micro-Cap Stock Funds Index (+8.60%), the Russell 2000 Index (+9.20%), and the Russell Microcap Index (+8.58%).
For the calendar year, our Fund returned +3.88%, underperforming the CRSP Cap-Based Portfolio 10 Index (+13.46%), as well as the Lipper Micro-Cap Stock Funds Index (+14.87%), the Russell 2000 Index (+14.65%), and the Russell Microcap Index (+13.17%).
The table below presents our December quarter, six-month, one-year, five-year, 10-year, 15-year, and inception-to-date financial results. See the next page for a graph of performance since inception.
Standardized Returns as of December 31, 2017
| | | | | | | | | | | | | | | | | | | | | | | | | | | | |
| | | | | | | | | | | | Annualized | | | | |
| | | Quarter | | | 6 Months | | | 1 Year | | | 5 Years | | | 10 Years | | | 15 Years | | | Since Inception
(8/5/94) | |
| | | | | | | |
Ultra-Small Company Fund | | | -0.05% | | | | 2.71% | | | | 3.88% | | | | 9.01% | | | | 4.93% | | | | 10.68% | | | | 13.62 | % |
CRSP Cap-Based Portfolio 10 Index | | | 2.06% | | | | 9.20% | | | | 13.46% | | | | 13.32% | | | | 9.08% | | | | 12.94% | | | | 12.09 | % |
Russell 2000 Index | | | 3.34% | | | | 9.20% | | | | 14.65% | | | | 14.12% | | | | 8.71% | | | | 11.17% | | | | 9.62 | % |
Russell Microcap Index | | | 1.80% | | | | 8.58% | | | | 13.17% | | | | 14.29% | | | | 7.68% | | | | 10.34% | | | | N/A | |
Lipper Micro-Cap Stock Funds Index | | | 1.96% | | | | 8.60% | | | | 14.87% | | | | 13.82% | | | | 7.72% | | | | 10.61% | | | | N/A | |
Performance figures quoted in the table above represent past performance and are no guarantee of future results. Total return figures in the table above include the reinvestment of dividends and capital gains. The table above does not reflect the deduction of taxes that a shareholder would pay on Fund distributions or on the redemption of Fund shares.
The CRSP Cap-Based Portfolio 10 Index is an unmanaged index of 753 of the smallest publicly traded U.S. stocks (with dividends reinvested), as reported by the Center for Research in Security Prices. The Russell Microcap Index is an unmanaged, market value weighted index that measures performance of 1,000 of the smallest securities in the Russell 2000 Index. The Russell 2000 Index is an unmanaged, market value weighted index that measures performance of the 2,000 companies that are between the 1,000th and 3,000th largest in the market (with dividends reinvested). The Lipper Micro-Cap Stock Funds Index is an index of micro-cap funds compiled by Lipper, Inc. It is not possible to invest directly in an index. Periods longer than one year are annualized.
According to data from Lipper, Inc. as of December 31, 2017, Ultra-Small Company Fund ranked 69th of 70 micro-cap funds for the 12 months ended December 31, 2017, 53rd of 60 over the last five years, 33rd of 40 over the last 10 years, and 1st of 8 since inception in August 1994. Lipper, Inc. is an independent mutual fund rating service that ranks funds in various fund categories by making comparative calculations using total returns.
| | |
| 12 | | Semi-Annual Report | December 31, 2017 (Unaudited) |
| | |
| Ultra-Small Company Fund | | |
| MANAGER’S COMMENTARY (Unaudited) (continued) | | |
| | |
Growth of a $10,000 Investment
from Inception August 5, 1994 to December 31, 2017
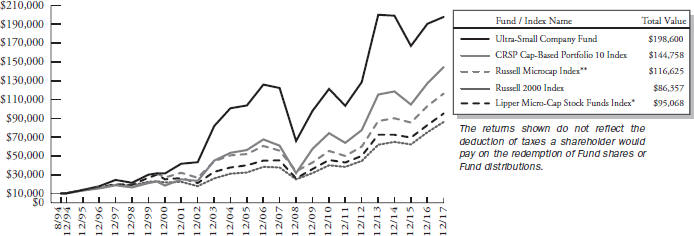
| * | The Lipper Micro-Cap Stock Funds Index began on 12/31/1995, and the line graph for the Index begins at the same value as the Fund on that date. |
| ** | The Russell Microcap Index began on 6/30/2000, and the line graph for the Index begins at the same value as the Fund on that date. |
Detailed Explanation of Quarterly Performance
The Fund’s value metrics and diversifying price momentum models substantially lagged the benchmark and hurt relative performance. An overweighting in high-momentum stocks also detracted from relative results, as these stocks lagged the overall CRSP 10 universe by a large margin. The Fund’s tilt toward deeper-value stocks also had a negative impact on relative performance.
However, the Fund’s diversifying company financial health models outperformed the benchmark and slightly increased relative returns. During the quarter, the Fund held approximately 15% of its assets, on average, in stocks that had appreciated above the CRSP 10 cutoff. These larger holdings overall outperformed the CRSP 10 benchmark and added to relative results.
The Fund’s overall sector allocation effect was slightly positive, with an overweighting in the Telecommunication Services sector contributing the most to relative performance. The Fund’s stock selection effect was negative, with holdings in the Health Care, Materials and Information Technology sectors detracting the most from relative performance. The Fund’s Energy holdings made the largest positive contribution to relative results.
| | |
| Ultra-Small Company Fund | | |
| MANAGER’S COMMENTARY (Unaudited) (continued) | | |
| | |
The table below presents index performance numbers for stocks in the different CRSP deciles during various time periods.
| | | | | | | | | | | | | | | | | | | | | | | | |
| | | | | | | | | | | | Annualized | |
| CRSP Decile1 | | Quarter | | | 6 Months | | | 1 Year | | | 5 Years | | | 10 Years | | | 92 Years | |
1 (ultra-large) | | | 7.02 | %�� | | | 12.29 | % | | | 23.49 | % | | | 15.85 | % | | | 8.33 | % | | | 9.44 | % |
2 | | | 6.38 | % | | | 9.72 | % | | | 18.69 | % | | | 16.38 | % | | | 9.26 | % | | | 10.64 | % |
3 | | | 8.64 | % | | | 13.48 | % | | | 23.26 | % | | | 16.10 | % | | | 9.99 | % | | | 11.15 | % |
4 | | | 5.99 | % | | | 11.22 | % | | | 18.08 | % | | | 14.24 | % | | | 9.82 | % | | | 10.92 | % |
5 | | | 4.96 | % | | | 8.81 | % | | | 15.75 | % | | | 13.28 | % | | | 10.01 | % | | | 11.51 | % |
6 | | | 4.82 | % | | | 13.13 | % | | | 20.05 | % | | | 14.52 | % | | | 9.51 | % | | | 11.47 | % |
7 | | | 3.48 | % | | | 9.06 | % | | | 14.73 | % | | | 15.49 | % | | | 10.69 | % | | | 11.61 | % |
8 | | | 2.10 | % | | | 9.49 | % | | | 12.08 | % | | | 13.25 | % | | | 10.21 | % | | | 11.54 | % |
9 | | | 2.64 | % | | | 8.34 | % | | | 12.76 | % | | | 15.05 | % | | | 10.08 | % | | | 11.58 | % |
10 (ultra-small) | | | 2.06 | % | | | 9.20 | % | | | 13.46 | % | | | 13.32 | % | | | 9.08 | % | | | 13.30 | % |
| 1 | Performance figures are as of the period ended December 31, 2017. The CRSP Cap-Based Portfolio Indexes are unmanaged indexes of publicly traded U.S. stocks with dividends reinvested, grouped by market capitalization, as reported by the Center for Research in Security Prices. Past performance is no guarantee of future results. |
Detailed Explanation of Calendar Year Performance
All three of the Fund’s model categories lagged the benchmark and hurt relative results. The Fund’s overweighting in high-momentum stocks decreased relative performance, as the stocks in the ultra-small universe with the strongest momentum lagged the CRSP 10 index by a large margin. The Fund’s tilt toward deeper-value stocks across multiple value metrics also hurt relative performance. During the year, the Fund held an average of approximately 12% of its assets in stocks that had appreciated above the CRSP 10 cutoff. These larger stocks also underperformed the CRSP 10 index.
The Fund’s sector allocation effect was positive, with an underweighting in the Energy sector contributing the most to relative performance. However, the Fund’s stock selection effect was strongly negative, with holdings in nearly all sectors — particularly in the Financials, Materials and Consumer Discretionary sectors — hurting relative returns.
Top Ten Holdings as of December 31, 2017
| | | | | | | | |
| Rank | | Description | | Industry | | % of Net
Assets |
| 1 | | Sigma Designs, Inc. | | Information Technology | | | 2.2 | % |
| 2 | | Cutera, Inc. | | Health Care | | | 2.2 | % |
| 3 | | Horizon Technology Finance Corp. | | Financials | | | 2.0 | % |
| 4 | | Century Casinos, Inc. | | Consumer Discretionary | | | 2.0 | % |
| 5 | | ION Geophysical Corp. | | Energy | | | 2.0 | % |
| 6 | | inTEST Corp. | | Information Technology | | | 1.9 | % |
| 7 | | Fusion Telecommunications International, Inc. | | Telecommunication Services | | | 1.9 | % |
| 8 | | America’s Car-Mart, Inc. | | Consumer Discretionary | | | 1.9 | % |
| 9 | | Consumer Portfolio Services, Inc. | | Financials | | | 1.9 | % |
| 10 | | Titan Machinery, Inc. | | Industrials | | | 1.9 | % |
| | Total | | | | | 19.9 | % |
| | |
| 14 | | Semi-Annual Report | December 31, 2017 (Unaudited) |
| | |
| Ultra-Small Company Fund | |
|
| MANAGER’S COMMENTARY (Unaudited) (continued) | |
| | |
Industry Sector Representation as of December 31, 2017
| | | | | | | | | | | | |
| | | % of Net Assets | | | % of CRSP 10 Index | | | Difference | |
Consumer Discretionary | | | 15.1% | | | | 15.4% | | | | -0.3% | |
Consumer Staples | | | 0.8% | | | | 2.4% | | | | -1.6% | |
Energy | | | 6.2% | | | | 10.8% | | | | -4.6% | |
Financials | | | 20.2% | | | | 19.3% | | | | 0.9% | |
Health Care | | | 19.2% | | | | 18.5% | | | | 0.7% | |
Industrials | | | 14.2% | | | | 11.7% | | | | 2.5% | |
Information Technology | | | 18.2% | | | | 14.4% | | | | 3.8% | |
Materials | | | 1.9% | | | | 4.1% | | | | -2.2% | |
Real Estate | | | 2.0% | | | | 1.9% | | | | 0.1% | |
Telecommunication Services | | | 3.1% | | | | 0.5% | | | | 2.6% | |
Utilities | | | 0.0% | | | | 1.0% | | | | -1.0% | |
Liabilities in Excess of Other Assets | | | -0.9% | | | | 0.0% | | | | -0.9% | |
Total | | | 100.0% | | | | 100.0% | | | | | |
Disclaimer
The views expressed here are exclusively those of Fund management. These views, including those related to market sectors or individual stocks, are not meant as investment advice and should not be considered predictive in nature. Any favorable (or unfavorable) description of a holding applies only as of the quarter end, December 31, 2017, unless otherwise stated. Security positions can and do change thereafter. Discussions of historical performance do not guarantee and may not be indicative of future performance.
| | |
| Ultra-Small Company Fund | |
|
| MANAGER’S COMMENTARY (Unaudited) (continued) | |
| | |
The Fund is subject to very high, above market risk (volatility) and is not an appropriate investment for short-term investors. Investments in ultra-small companies generally carry greater risk than is customarily associated with larger companies and even “small companies” for various reasons, such as narrower markets (fewer investors), limited financial resources, and greater trading difficulty.
Conclusion
Ultra-Small Company Fund remains closed to new investors. We encourage your feedback; your reactions and concerns are important to us.
Sincerely,
The Investment Management Team
| | |
| 16 | | Semi-Annual Report | December 31, 2017 (Unaudited) |
| | |
| Ultra-Small Company Fund | | |
| SCHEDULE OF INVESTMENTS | | |
| Showing percentage of net assets as of December 31, 2017 (Unaudited) | | |
| | | | | | | | |
| Industry Company | | Shares | | Value | | | | |
| | |
COMMON STOCKS - 100.98% | | | | |
Consumer Discretionary - 15.08% | | | | |
AMCON Distributing Co. | | 2,100 | | $ 188,685 | | | | |
America’s Car-Mart, Inc.* | | 41,700 | | 1,861,905 | | | | |
Beasley Broadcast Group, Inc., Class A+ | | 13,200 | | 176,880 | | | | |
Cambium Learning Group, Inc.* | | 100,100 | | 568,568 | | | | |
Century Casinos, Inc.* | | 215,100 | | 1,963,863 | | | | |
China Automotive Systems, Inc.*+ | | 9,700 | | 46,560 | | | | |
China XD Plastics Co., Ltd.* | | 86,300 | | 396,980 | | | | |
Christopher & Banks Corp.*+ | | 225,100 | | 285,877 | | | | |
Clarus Corp.* | | 69,919 | | 548,864 | | | | |
Educational Development Corp.+ | | 9,200 | | 174,340 | | | | |
Gaming Partners International Corp. | | 13,300 | | 149,492 | | | | |
J Alexander’s Holdings, Inc.* | | 40,500 | | 392,850 | | | | |
Kingold Jewelry, Inc.*+ | | 41,400 | | 83,628 | | | | |
Lakeland Industries, Inc.* | | 116,300 | | 1,692,165 | | | | |
Lee Enterprises, Inc.*+ | | 40,500 | | 95,175 | | | | |
Lincoln Educational Services Corp.* | | 49,564 | | 100,119 | | | | |
Live Ventures, Inc.*+ | | 12,702 | | 202,978 | | | | |
MCBC Holdings, Inc.* | | 71,800 | | 1,595,396 | | | | |
New York & Co., Inc.* | | 136,500 | | 390,390 | | | | |
ONE Group Hospitality, Inc. (The)*+ | | 27,400 | | 65,486 | | | | |
RLJ Entertainment, Inc.*+ | | 72,900 | | 266,814 | | | | |
SORL Auto Parts, Inc.*+ | | 256,600 | | 1,724,352 | | | | |
Superior Uniform Group, Inc. | | 18,457 | | 492,986 | | | | |
Tilly’s, Inc., Class A | | 50,000 | | 738,000 | | | | |
US Auto Parts Network, Inc.* | | 46,000 | | 115,920 | | | | |
VOXX International Corp.* | | 47,423 | | 265,569 | | | | |
| | | | | | | | |
| | | | 14,583,842 | | | | |
| | | | |
Consumer Staples - 0.80% | | | | | | | | |
Mannatech, Inc. | | 13,809 | | 207,135 | | | | |
Natural Alternatives International, Inc.* | | 42,000 | | 433,650 | | | | |
Reliv International, Inc.* | | 26,939 | | 132,540 | | | | |
| | | | | | | | |
| | | | 773,325 | | | | |
| | | | |
Energy - 6.24% | | | | | | | | |
Aspen Aerogels, Inc.* | | 26,600 | | 129,808 | | | | |
Comstock Resources, Inc.*+ | | 19,900 | | 168,354 | | | | |
Contango Oil & Gas Co.* | | 90,900 | | 428,139 | | | | |
Independence Contract Drilling, Inc.*+ | | 278,300 | | 1,107,634 | | | | |
| | | | | | | | |
| Industry Company | | Shares | | | Value | |
|
| |
Energy (continued) | | | | | | | | |
ION Geophysical Corp.* | | | 95,589 | | | $ | 1,887,883 | |
Mitcham Industries, Inc.* | | | 131,600 | | | | 417,172 | |
NACCO Industries, Inc., Class A | | | 46,400 | | | | 1,746,960 | |
W&T Offshore, Inc.* | | | 46,836 | | | | 155,027 | |
| | | | | | | | |
| | | | | | | 6,040,977 | |
Financials - 20.20% | | | | | | | | |
ACNB Corp. | | | 2,700 | | | | 79,785 | |
A-Mark Precious Metals, Inc. | | | 94,100 | | | | 1,384,211 | |
Atlas Financial Holdings, Inc.* | | | 17,900 | | | | 367,845 | |
C&F Financial Corp. | | | 6,852 | | | | 397,416 | |
Capitala Finance Corp.+ | | | 89,100 | | | | 648,648 | |
Central Federal Corp.* | | | 47,800 | | | | 131,450 | |
CM Finance, Inc.+ | | | 195,000 | | | | 1,589,250 | |
Codorus Valley Bancorp, Inc. | | | 27,907 | | | | 768,280 | |
Community West Bancshares | | | 5,000 | | | | 53,500 | |
Consumer Portfolio Services, Inc.* | | | 435,500 | | | | 1,807,325 | |
First United Corp.* | | | 26,800 | | | | 467,660 | |
FS Bancorp, Inc. | | | 6,300 | | | | 343,791 | |
Health Insurance Innovations, Inc., Class A*+ | | | 48,800 | | | | 1,217,560 | |
Horizon Technology Finance Corp. | | | 176,100 | | | | 1,975,842 | |
Impac Mortgage Holdings, Inc.*+ | | | 8,500 | | | | 86,360 | |
KCAP Financial, Inc.+ | | | 510,000 | | | | 1,739,100 | |
Kingstone Cos., Inc. | | | 60,300 | | | | 1,133,640 | |
Landmark Bancorp, Inc. | | | 1,680 | | | | 48,720 | |
MFC Bancorp, Ltd.*+ | | | 5,380 | | | | 41,641 | |
Northeast Bancorp+ | | | 39,100 | | | | 905,165 | |
Provident Bancorp, Inc.* | | | 2,600 | | | | 68,770 | |
Regional Management Corp.* | | | 56,800 | | | | 1,494,408 | |
SB Financial Group, Inc.+ | | | 32,822 | | | | 606,879 | |
Security National Financial Corp., Class A* | | | 78,308 | | | | 415,032 | |
Shore Bancshares, Inc. | | | 98,300 | | | | 1,641,610 | |
ZAIS Group Holdings, Inc.* | | | 32,500 | | | | 126,425 | |
| | | | | | | | |
| | | | | | | 19,540,313 | |
Health Care - 19.23% | | | | | | | | |
American Shared Hospital Services* | | | 79,300 | | | | 205,902 | |
Aratana Therapeutics, Inc.*+ | | | 11,800 | | | | 62,068 | |
Arrowhead Pharmaceuticals, Inc.* | | | 19,200 | | | | 70,656 | |
| | |
| Ultra-Small Company Fund | |
|
| SCHEDULE OF INVESTMENTS (continued) | |
| Showing percentage of net assets as of December 31, 2017 (Unaudited) | | |
| | | | | | | | |
| Industry Company | | Shares | | Value | | | | |
| | |
Common Stocks (continued) | | | | |
Health Care (continued) | | | | |
Bioanalytical Systems, Inc.*+ | | 164,510 | | $406,340 | | | | |
Cerecor, Inc.* | | 258,000 | | 825,600 | | | | |
Champions Oncology, Inc.* | | 6,861 | | 26,621 | | | | |
Chembio Diagnostics, Inc.*+ | | 80,100 | | 656,820 | | | | |
Cogentix Medical, Inc.* | | 25,800 | | 81,270 | | | | |
Cumberland Pharmaceuticals, Inc.* | | 16,400 | | 121,688 | | | | |
Cutera, Inc.* | | 46,200 | | 2,095,170 | | | | |
CynergisTek, Inc.*+ | | 71,000 | | 287,550 | | | | |
Digirad Corp. | | 373,800 | | 962,535 | | | | |
Electromed, Inc.* | | 191,938 | | 1,165,064 | | | | |
Five Star Senior Living, Inc.* | | 45,228 | | 67,842 | | | | |
Harvard Bioscience, Inc.* | | 466,900 | | 1,540,770 | | | | |
HTG Molecular Diagnostics, Inc.*+ | | 52,500 | | 106,575 | | | | |
InfuSystems Holdings, Inc.* | | 273,798 | | 629,735 | | | | |
Invitae Corp.* | | 34,595 | | 314,123 | | | | |
Juniper Pharmaceuticals, Inc.*+ | | 218,300 | | 1,058,755 | | | | |
Kewaunee Scientific Corp. | | 10,200 | | 295,800 | | | | |
Kindred Biosciences, Inc.* | | 13,900 | | 131,355 | | | | |
Leap Therapeutics, Inc.*+ | | 29,800 | | 185,952 | | | | |
Misonix, Inc.*+ | | 28,100 | | 269,760 | | | | |
Neos Therapeutics, Inc.* | | 6,700 | | 68,340 | | | | |
Novelion Therapeutics, Inc.*+ | | 10,000 | | 31,200 | | | | |
Nuvectra Corp.*+ | | 73,400 | | 569,584 | | | | |
Peregrine Pharmaceuticals, Inc.*+ | | 3,045 | | 11,815 | | | | |
Pro-Dex, Inc.*+ | | 76,600 | | 524,710 | | | | |
RTI Surgical, Inc.* | | 399,990 | | 1,639,959 | | | | |
SeaSpine Holdings Corp.* | | 55,500 | | 561,660 | | | | |
Sientra, Inc.*+ | | 124,700 | | 1,753,282 | | | | |
Sorrento Therapeutics, Inc.*+ | | 31,500 | | 119,700 | | | | |
Strata Skin Sciences, Inc.*+ | | 85,000 | | 105,400 | | | | |
SunLink Health Systems, Inc.* | | 4,700 | | 7,473 | | | | |
Synlogic, Inc.*+ | | 2,114 | | 20,506 | | | | |
Veracyte, Inc.* | | 222,600 | | 1,453,578 | | | | |
Vical, Inc.* | | 87,496 | | 160,118 | | | | |
| | | | | | | | |
| | | | 18,595,276 | | | | |
| | |
Industrials - 14.24% | | | | |
Acme United Corp. | | 5,200 | | 121,680 | | | | |
ARC Document Solutions, Inc.* | | 95,300 | | 243,015 | | | | |
Chicago Rivet & Machine Co. | | 1,900 | | 60,420 | | | | |
CompX International, Inc. | | 1,620 | | 21,546 | | | | |
Continental Materials Corp.*+ | | 4,150 | | 78,850 | | | | |
| | | | | | | | |
| Industry Company | | Shares | | Value | | | | |
| | |
Industrials (continued) | | | | |
DMC Global, Inc. | | 57,200 | | $1,432,860 | | | | |
Ecology & Environment, Inc., Class A | | 23,232 | | 243,936 | | | | |
Enphase Energy, Inc.*+ | | 244,200 | | 588,522 | | | | |
Goldfield Corp. (The)* | | 219,100 | | 1,073,590 | | | | |
L.B. Foster Co., Class A* | | 58,600 | | 1,590,990 | | | | |
LSI Industries, Inc. | | 73,300 | | 504,304 | | | | |
Preformed Line Products Co. | | 623 | | 44,264 | | | | |
Radiant Logistics, Inc.* | | 306,600 | | 1,410,360 | | | | |
RCM Technologies, Inc. | | 16,100 | | 101,269 | | | | |
Safe Bulkers, Inc.* | | 475,700 | | 1,536,511 | | | | |
Sterling Construction Co., Inc.* | | 106,270 | | 1,730,076 | | | | |
Titan Machinery, Inc.* | | 84,700 | | 1,793,099 | | | | |
Virco Manufacturing Corp. | | 17,600 | | 88,880 | | | | |
Willdan Group, Inc.* | | 46,200 | | 1,106,028 | | | | |
| | | | | | | | |
| | | | 13,770,200 | | | | |
| | |
Information Technology - 18.18% | | | | |
Amtech Systems, Inc.* | | 106,200 | | 1,069,434 | | | | |
Aviat Networks, Inc.* | | 33,713 | | 511,426 | | | | |
Digital Turbine, Inc.*+ | | 540,500 | | 967,495 | | | | |
Echelon Corp.*+ | | 4,158 | | 23,451 | | | | |
GlobalSCAPE, Inc. | | 98,500 | | 349,675 | | | | |
Identiv, Inc.*+ | | 36,700 | | 122,578 | | | | |
Intermolecular, Inc.* | | 64,200 | | 87,954 | | | | |
inTEST Corp.* | | 217,100 | | 1,877,915 | | | | |
Iteris, Inc.*+ | | 235,502 | | 1,641,449 | | | | |
Luna Innovations, Inc.* | | 182,200 | | 442,746 | | | | |
Marin Software, Inc.*+ | | 51,600 | | 567,600 | | | | |
Napco Security Technologies, Inc.* | | 65,200 | | 570,500 | | | | |
Network-1 Technologies, Inc. | | 312,400 | | 749,760 | | | | |
PC-Tel, Inc. | | 106,800 | | 787,116 | | | | |
PRGX Global, Inc.*+ | | 42,300 | | 300,330 | | | | |
QuinStreet, Inc.* | | 123,300 | | 1,033,254 | | | | |
Rubicon Technology, Inc.*+ | | 25,600 | | 204,800 | | | | |
Sigma Designs, Inc.* | | 301,800 | | 2,097,510 | | | | |
SigmaTron International, Inc.*+ | | 28,700 | | 291,018 | | | | |
Socket Mobile, Inc.* | | 13,900 | | 49,762 | | | | |
StarTek, Inc.* | | 50,900 | | 507,473 | | | | |
TESSCO Technologies, Inc.+ | | 16,200 | | 326,430 | | | | |
TransAct Technologies, Inc. | | 33,300 | | 441,225 | | | | |
Travelzoo*+ | | 29,600 | | 190,920 | | | | |
Trio-Tech International* | | 39,600 | | 277,596 | | | | |
UTStarcom Holdings Corp.*+ | | 12,400 | | 69,812 | | | | |
| | |
| 18 | | Semi-Annual Report | December 31, 2017 (Unaudited) |
| | |
| Ultra-Small Company Fund | |
|
| SCHEDULE OF INVESTMENTS (continued) | |
| Showing percentage of net assets as of December 31, 2017 (Unaudited) | | |
| | | | | | | | |
| Industry Company | | Shares | | Value | | | | |
| | |
Common Stocks (continued) | | | | |
Information Technology (continued) | | | | |
Westell Technologies, Inc., Class A* | | 19,800 | | $74,250 | | | | |
Xplore Technologies Corp.* | | 241,200 | | 682,596 | | | | |
YuMe, Inc. | | 265,900 | | 1,271,002 | | | | |
| | | | | | | | |
| | | | 17,587,077 | | | | |
| | |
Materials - 1.87% | | | | |
China Advanced Construction Materials Group, Inc.* | | 49,200 | | 211,560 | | | | |
China Green Agriculture, Inc.* | | 349,600 | | 433,504 | | | | |
Flexible Solutions International, Inc.* | | 4,507 | | 8,203 | | | | |
Gulf Resources, Inc.* | | 330,400 | | 488,992 | | | | |
Universal Stainless & Alloy Products, Inc.* | | 31,100 | | 666,162 | | | | |
| | | | | | | | |
| | | | 1,808,421 | | | | |
| | |
Real Estate - 2.00% | | | | |
American Realty Investors, Inc.* | | 7,100 | | 88,757 | | | | |
Maui Land & Pineapple Co., Inc.* | | 44,200 | | 764,660 | | | | |
Nam Tai Property, Inc.+ | | 25,000 | | 313,750 | | | | |
Sotherly Hotels, Inc. | | 29,170 | | 188,146 | | | | |
Wheeler Real Estate Investment Trust, Inc.+ | | 57,900 | | 577,842 | | | | |
| | | | | | | | |
| | | | 1,933,155 | | | | |
| | |
Telecommunication Services - 3.14% | | | | |
Alaska Communications Systems Group, Inc.* | | 409,900 | | 1,098,532 | | | | |
Fusion Telecommunications International, Inc.*+ | | 498,817 | | 1,870,564 | | | | |
Hawaiian Telcom Holdco, Inc.* | | 2,100 | | 64,806 | | | | |
| | | | | | | | |
| | | | 3,033,902 | | | | |
| | | | | | | | |
| | | |
TOTAL COMMON STOCKS - 100.98% | | 97,666,488 | | | | |
| | | | | | | | |
| | |
(Cost $88,862,585) | | | | |
| | |
WARRANTS - 0.00% | | | | |
Novelion Therapeutics, Inc. Class Action expire 12/31/21*D | | 34,500 | | — | | | | |
Novelion Therapeutics, Inc. DOJ/SEC expire 12/31/21*D | | 34,500 | | — | | | | |
| | | | | | | | |
| | | |
TOTAL WARRANTS - 0.00% | | — | | | | |
| | | | | | | | |
| | | |
(Cost $ — ) | | | | | | |
| | | | | | |
| | | Rate^ | | Shares | | Value |
| |
MONEY MARKET FUND - 0.00% | | |
Fidelity Investments Money Market Government Portfolio Class I | | 1.14% | | 700 | | $700 |
| | | | | | |
TOTAL MONEY MARKET FUND - 0.00% | | 700 |
| | | | | | |
(Cost $700) | | | | |
| |
| INVESTMENTS PURCHASED WITH CASH PROCEEDS FROM SECURITIES LENDING - 8.28% | | |
Fidelity Investments Money Market Government Portfolio Class I** | | 1.14% | | 8,002,941 | | 8,002,941 |
| | | | | | |
TOTAL INVESTMENTS PURCHASED WITH CASH PROCEEDS FROM SECURITIES LENDING - 8.28% | | 8,002,941 |
| | | | | | |
(Cost $8,002,941) | | |
| | |
TOTAL INVESTMENTS - 109.26% | | | | $105,670,129 |
(Cost $96,866,226) | | | | | | |
Liabilities in Excess of Other Assets - (9.26%) | | (8,955,890) |
| | | | | | |
NET ASSETS - 100.00% | | | | | | $ 96,714,239 |
| | | | | | |
| * | Non-income producing security. |
| ** | This security represents the investment of the collateral received in connection with securities out on loan as of December 31, 2017. |
| ^ | Rate disclosed as of December 31, 2017. |
| D | Security was fair valued under procedures adopted by the Board of Directors (see Note 2). As such, the security is classified as Level 3 in the fair value hierarchy. |
| + | This security or a portion of the security is out on loan as of December 31, 2017. Total loaned securities had a value of $7,551,851 as of December 31, 2017. |
| | |
| Ultra-Small Company Fund | |
|
| SCHEDULE OF INVESTMENTS (continued) | |
| Showing percentage of net assets as of December 31, 2017 (Unaudited) | | |
| | | | | | | | | | | | | | | | | | |
| Summary of inputs used to value the Fund’s investments as of 12/31/2017 (See Note 2 in Notes to Financial Statements): | | | |
| | |
| | | Valuation Inputs | | | |
| | | Investment in Securities (Value) | | | |
| | | Level 1 Quoted Prices | | | Level 2
Significant
Observable
Inputs | | | Level 3
Significant
Unobservable
Inputs | | | Total | | | |
Common Stocks (a) | | $ | 97,666,488 | | | $ | — | | | $ | — | | | $ | 97,666,488 | | | |
Warrants | | | — | | | | — | | | | 0 | | | | 0 | | | |
Money Market Fund | | | — | | | | 700 | | | | — | | | | 700 | | | |
Investments Purchased with Cash Proceeds from Securities Lending | | | — | | | | 8,002,941 | | | | — | | | | 8,002,941 | | | |
| | | | | | | | | | | | | | | | | | |
TOTAL | | $ | 97,666,488 | | | $ | 8,003,641 | | | $ | 0 | | | $ | 105,670,129 | | | |
| | | | | | | | | | | | | | | | | | |
(a) - Please refer to the Schedule of Investments for the industry classifications of these portfolio holdings. See Notes to Financial Statements. | | | |
| | |
| 20 | | Semi-Annual Report | December 31, 2017 (Unaudited) |
| | |
| Ultra-Small Company Market Fund | | |
| MANAGER’S COMMENTARY (Unaudited) | | |
| | |
December 31, 2017
Dear Fellow Ultra-Small Company Market Fund Shareholder,
For the quarter ended December 31, 2017, our Fund returned +2.23%, outperforming our primary market benchmark, the CRSP Cap-Based Portfolio 10 Index (+2.06%), our peer benchmark, the Lipper Micro-Cap Stock Funds Index (+1.96%), and the Russell Microcap Index (+1.80%). Our Fund underperformed the Russell 2000 Index (+3.34%).
For the six-month semi-annual period ended December 31, 2017, our Fund returned +9.01%. It trailed the CRSP Cap-Based Portfolio 10 Index (+9.20%) and the Russell 2000 Index (+9.20%), but outperformed the Lipper Micro-Cap Stock Funds Index (+8.60%) and the Russell Microcap Index (+8.58%).
For the calendar year, our Fund returned +12.47%, underperforming the CRSP Cap-Based Portfolio 10 Index (+13.46%), the Lipper Micro-Cap Stock Funds Index (+14.87%), the Russell 2000 Index (+14.65%), and the Russell Microcap Index (+13.17%).
The table below presents our December quarter, six-month, one-year, five-year, 10-year, 15-year, and inception-to-date financial results. See the next page for a graph of performance since inception.
Standardized Returns as of December 31, 2017
| | | | | | | | | | | | | | | | | | | | | | | | | | | | |
| | | | | | | | | | | | Annualized | | | | |
| | | Quarter | | 6 Months | | 1 Year | | | 5 Years | | 10 Years | | 15 Years | | Since Inception
(7/31/97) |
| | | | | | | |
Ultra-Small Company Market Fund | | | 2.23 | % | | | 9.01 | % | | | 12.47 | % | | | 14.62 | % | | | 7.59 | % | | | 11.20 | % | | | 10.91 | % |
CRSP Cap-Based Portfolio 10 Index | | | 2.06 | % | | | 9.20 | % | | | 13.46 | % | | | 13.32 | % | | | 9.08 | % | | | 12.94 | % | | | 10.96 | % |
Russell 2000 Index | | | 3.34 | % | | | 9.20 | % | | | 14.65 | % | | | 14.12 | % | | | 8.71 | % | | | 11.17 | % | | | 8.04 | % |
Russell Microcap Index | | | 1.80 | % | | | 8.58 | % | | | 13.17 | % | | | 14.29 | % | | | 7.68 | % | | | 10.34 | % | | | N/A | |
Lipper Micro-Cap Stock Funds Index | | | 1.96 | % | | | 8.60 | % | | | 14.87 | % | | | 13.82 | % | | | 7.72 | % | | | 10.61 | % | | | 8.27 | % |
Performance figures quoted in the table above represent past performance and are no guarantee of future results. Total return figures in the table above include the reinvestment of dividends and capital gains. The table above does not reflect the deduction of taxes that a shareholder would pay on Fund distributions or on the redemption of Fund shares.
The CRSP Cap-Based Portfolio 10 Index is an unmanaged index of 753 of the smallest publicly traded U.S. stocks with dividends reinvested, as reported by the Center for Research in Security Prices. The Russell Microcap Index is an unmanaged, market value weighted index that measures performance of 1,000 of the smallest securities in the Russell 2000 Index. The Russell 2000 Index is an unmanaged, market value weighted index that measures performance of the 2,000 companies that are between the 1,000th and 3,000th largest in the market with dividends reinvested. The Lipper Micro-Cap Stock Funds Index is an index of micro-cap funds compiled by Lipper, Inc. It is not possible to invest directly in an index. Periods longer than one year are annualized.
According to data from Lipper, Inc. as of December 31, 2017, Ultra-Small Company Market Fund ranked 31st of 70 micro-cap funds for the 12 months ended December 31, 2017, 20th of 60 over the last five years, 25th of 40 over the last 10 years, and 4th of 17 since inception in July 1997. Lipper, Inc. is an independent mutual fund rating service that ranks funds in various fund categories by making comparative calculations using total returns.
| | |
| Ultra-Small Company Market Fund | |
|
| MANAGER’S COMMENTARY (Unaudited) (continued) | |
| | |
Growth of a $10,000 Investment
from Inception July 31,1997 to December 31, 2017
| * | The Russell Microcap Index began on 6/30/2000, and the line graph for the Index begins at the same value as the Fund on that date. |
Detailed Explanation of Quarterly Performance
The Fund on average held nearly 20% of assets outside of CRSP 10, due to certain stocks appreciating above the CRSP 10 cutoff. These holdings slightly benefited relative performance. The Fund’s sidestepping strategies, which eliminate exposure to stocks with high probability of steep price decline, major financial distress or bankruptcy, also helped relative returns. However, an overweighting in the benchmark’s highest-momentum stocks detracted from relative performance, as high-momentum stocks lagged in the ultra-small universe during the quarter.
The Fund’s stock selection effect was negative, with holdings in the Health Care and Financials sectors detracting the most from relative performance.
The table below presents index performance numbers for stocks in the different CRSP deciles during various time periods.
| | | | | | | | | | | | | | | | | | | | | | | | |
| | | | | | | | | | | Annualized | | |
| CRSP Decile1 | | Quarter | | 6 Months | | 1 Year | | 5 Years | | 10 Years | | 92 Years |
1 (ultra-large) | | | 7.02 | % | | | 12.29 | % | | | 23.49 | % | | | 15.85 | % | | | 8.33 | % | | | 9.44 | % |
2 | | | 6.38 | % | | | 9.72 | % | | | 18.69 | % | | | 16.38 | % | | | 9.26 | % | | | 10.64 | % |
3 | | | 8.64 | % | | | 13.48 | % | | | 23.26 | % | | | 16.10 | % | | | 9.99 | % | | | 11.15 | % |
4 | | | 5.99 | % | | | 11.22 | % | | | 18.08 | % | | | 14.24 | % | | | 9.82 | % | | | 10.92 | % |
5 | | | 4.96 | % | | | 8.81 | % | | | 15.75 | % | | | 13.28 | % | | | 10.01 | % | | | 11.51 | % |
6 | | | 4.82 | % | | | 13.13 | % | | | 20.05 | % | | | 14.52 | % | | | 9.51 | % | | | 11.47 | % |
7 | | | 3.48 | % | | | 9.06 | % | | | 14.73 | % | | | 15.49 | % | | | 10.69 | % | | | 11.61 | % |
8 | | | 2.10 | % | | | 9.49 | % | | | 12.08 | % | | | 13.25 | % | | | 10.21 | % | | | 11.54 | % |
9 | | | 2.64 | % | | | 8.34 | % | | | 12.76 | % | | | 15.05 | % | | | 10.08 | % | | | 11.58 | % |
10 (ultra-small) | | | 2.06 | % | | | 9.20 | % | | | 13.46 | % | | | 13.32 | % | | | 9.08 | % | | | 13.30 | % |
| 1 | Performance figures are as of the period ended December 31, 2017. The CRSP Cap-Based Portfolio Indexes are unmanaged indexes of publicly traded U.S. stocks with dividends reinvested, grouped by market capitalization, as reported by the Center for Research in Security Prices. Past performance is no guarantee of future results. |
| | |
| 22 | | Semi-Annual Report | December 31, 2017 (Unaudited) |
| | |
| Ultra-Small Company Market Fund | |
|
| MANAGER’S COMMENTARY (Unaudited) (continued) | |
| | |
Detailed Explanation of Calendar Year Performance
An overweighting in the highest-momentum stocks hurt relative returns, as the benchmark’s highest-momentum stocks suffered losses during the calendar year. During the calendar year, the Fund held an average of approximately 17% of its assets outside of CRSP 10, due to stocks that had appreciated above the CRSP 10 cutoff. This positioning boosted relative returns, as some of these larger stocks outperformed the CRSP 10 benchmark. The Fund’s sidestepping strategies also helped relative results.
The Fund’s stock selection effect was negative. Holdings in the Materials, Health Care, Real Estate, and Energy sectors detracted most from relative performance.
Top Ten Holdings as of December 31, 2017
| | | | | | | | |
| Rank | | Description | | Industry | | % of Net
Assets |
| 1 | | ION Geophysical Corp. | | Energy | | | 0.7 | % |
| 2 | | Utah Medical Products, Inc. | | Health Care | | | 0.6 | % |
| 3 | | Verso Corp., Class A | | Materials | | | 0.6 | % |
| 4 | | Citi Trends, Inc. | | Consumer Discretionary | | | 0.5 | % |
| 5 | | Boot Barn Holdings, Inc. | | Consumer Discretionary | | | 0.5 | % |
| 6 | | Hurco Cos., Inc. | | Industrials | | | 0.5 | % |
| 7 | | Care.com, Inc. | | Information Technology | | | 0.5 | % |
| 8 | | AXT, Inc. | | Information Technology | | | 0.4 | % |
| 9 | | Tilly’s, Inc., Class A | | Consumer Discretionary | | | 0.4 | % |
| 10 | | Twin Disc, Inc. | | Industrials | | | 0.4 | % |
| | | |
| | Total | | | | | 5.1 | % |
Industry Sector Representation as of December 31, 2017
| | | | | | | | |
| | | % of Net Assets | | % of CRSP 10 Index | | Difference | |
Consumer Discretionary | | 14.3% | | 15.4% | | | -1.1% | |
Consumer Staples | | 1.8% | | 2.4% | | | -0.6% | |
Energy | | 10.2% | | 10.8% | | | -0.6% | |
Financials | | 19.3% | | 19.3% | | | 0.0% | |
Health Care | | 18.8% | | 18.5% | | | 0.3% | |
Industrials | | 12.7% | | 11.7% | | | 1.0% | |
Information Technology | | 15.1% | | 14.4% | | | 0.7% | |
Materials | | 3.9% | | 4.1% | | | -0.2% | |
Real Estate | | 1.1% | | 1.9% | | | -0.8% | |
Telecommunication Services | | 0.8% | | 0.5% | | | 0.3% | |
Utilities | | 1.2% | | 1.0% | | | 0.2% | |
Cash & Other Assets | | 0.8% | | 0.0% | | | 0.8% | |
| | | |
Total | | 100.0% | | 100.0% | | | | |
Disclaimer
The views expressed here are exclusively those of Fund management. These views, including those related to market sectors or individual stocks, are not meant as investment advice and should not be considered predictive in nature. Any favorable (or unfavorable) description of a holding applies only as of the quarter end, December 31, 2017, unless otherwise stated. Security positions can and do change thereafter. Discussions of historical performance do not guarantee and may not be indicative of future performance.
| | |
| Ultra-Small Company Market Fund | |
|
| MANAGER’S COMMENTARY (Unaudited) (continued) | |
| | |
The Fund is subject to very high, above market risk (volatility) and is not an appropriate investment for short-term investors. Investments in ultra-small companies generally carry greater risk than is customarily associated with larger companies and even “small companies” for various reasons, such as narrower markets (fewer investors), limited financial resources and greater trading difficulty.
Conclusion
Thank you for your continued investment in Ultra-Small Company Market Fund. We encourage your feedback; your reactions and concerns are important to us.
Sincerely,
The Investment Management Team
| | |
| 24 | | Semi-Annual Report | December 31, 2017 (Unaudited) |
| | |
| Ultra-Small Company Market Fund | | |
| SCHEDULE OF INVESTMENTS | | |
| Showing percentage of net assets as of December 31, 2017 (Unaudited) | | |
| | | | | | | | |
| Industry Company | | Shares | | Value | | | | |
COMMON STOCKS - 99.05% | | | | | | | | |
Consumer Discretionary - 14.25% | | | | |
A.H. Belo Corp., Class A | | 8,400 | | $ 40,320 | | | | |
AMCON Distributing Co. | | 3,900 | | 350,415 | | | | |
Ark Restaurants Corp. | | 17,900 | | 483,658 | | | | |
Ascent Capital Group, Inc., Class A*+ | | 61,400 | | 705,486 | | | | |
Ballantyne Strong, Inc.* | | 117,020 | | 544,143 | | | | |
Beasley Broadcast Group, Inc., Class A+ | | 28,125 | | 376,875 | | | | |
Big 5 Sporting Goods Corp.+ | | 70,748 | | 537,685 | | | | |
Boot Barn Holdings, Inc.*+ | | 108,000 | | 1,793,880 | | | | |
Bridgepoint Education, Inc.* | | 124,500 | | 1,033,350 | | | | |
Build-A-Bear Workshop, Inc.* | | 29,500 | | 271,400 | | | | |
CafePress, Inc.* | | 42,588 | | 78,362 | | | | |
Cherokee, Inc.* | | 60,000 | | 114,000 | | | | |
China XD Plastics Co., Ltd.* | | 56,000 | | 257,600 | | | | |
Christopher & Banks Corp.* | | 197,800 | | 251,206 | | | | |
Citi Trends, Inc. | | 68,800 | | 1,820,448 | | | | |
Clarus Corp.* | | 69,600 | | 546,360 | | | | |
Collectors Universe, Inc. | | 36,960 | | 1,058,534 | | | | |
Container Store Group, Inc. (The)*+ | | 213,300 | | 1,011,042 | | | | |
CSS Industries, Inc. | | 29,150 | | 811,244 | | | | |
Delta Apparel, Inc.*+ | | 32,988 | | 666,358 | | | | |
Destination Maternity Corp.*+ | | 96,355 | | 286,174 | | | | |
Destination XL Group, Inc.*+ | | 70,822 | | 155,808 | | | | |
DGSE Cos., Inc.* | | 8,045 | | 7,490 | | | | |
Dixie Group, Inc. (The)* | | 100,600 | | 387,310 | | | | |
Dover Downs Gaming & Entertainment, Inc.* | | 50,000 | | 51,000 | | | | |
Dover Motorsports, Inc. | | 123,396 | | 240,622 | | | | |
Drive Shack, Inc. | | 105,000 | | 580,650 | | | | |
Educational Development Corp.+ | | 41,200 | | 780,740 | | | | |
Emerson Radio Corp.* | | 198,100 | | 289,206 | | | | |
Escalade, Inc. | | 39,780 | | 489,294 | | | | |
EVINE Live, Inc.* | | 496,286 | | 694,800 | | | | |
Famous Dave’s of America, Inc.*+ | | 45,200 | | 298,320 | | | | |
Francesca’s Holdings Corp.* | | 50,000 | | 365,500 | | | | |
Fred’s, Inc., Class A+ | | 175,000 | | 708,750 | | | | |
Gaia, Inc.* | | 48,400 | | 600,160 | | | | |
Gaming Partners International Corp. | | 56,300 | | 632,812 | | | | |
Golden Entertainment, Inc.* | | 2,245 | | 73,299 | | | | |
Habit Restaurants, Inc. (The), Class A*+ | | 40,000 | | 382,000 | | | | |
Harte-Hanks, Inc.* | | 233,400 | | 221,427 | | | | |
| | | | |
| Industry Company | | Shares | | Value |
|
Consumer Discretionary (continued) |
Hemisphere Media Group, Inc.* | | 20,000 | | $ 231,000 |
Horizon Global Corp.*+ | | 10,700 | | 150,014 |
J Alexander’s Holdings, Inc.* | | 83,800 | | 812,860 |
JAKKS Pacific, Inc.*+ | | 196,400 | | 461,540 |
Jamba, Inc.*+ | | 51,462 | | 414,784 |
Johnson Outdoors, Inc., Class A | | 3,300 | | 204,897 |
Kirkland’s, Inc.* | | 91,900 | | 1,099,584 |
Kona Grill, Inc.*+ | | 102,500 | | 179,375 |
Lakeland Industries, Inc.*+ | | 51,557 | | 750,154 |
Lee Enterprises, Inc.*+ | | 232,700 | | 546,845 |
Libbey, Inc.+ | | 15,000 | | 112,800 |
Liberty Tax, Inc. | | 70,300 | | 773,300 |
Lifetime Brands, Inc. | | 57,700 | | 952,050 |
Lincoln Educational Services Corp.* | | 103,400 | | 208,868 |
Luby’s, Inc.* | | 164,500 | | 434,280 |
MCBC Holdings, Inc.* | | 30,000 | | 666,600 |
McClatchy Co. (The), Class A*+ | | 20,011 | | 178,698 |
Nathan’s Famous, Inc. | | 7,691 | | 580,670 |
National American University Holdings, Inc. | | 280,000 | | 392,000 |
Nevada Gold & Casinos, Inc.* | | 120,000 | | 320,400 |
New Home Co. Inc., (The)* | | 73,400 | | 919,702 |
New York & Co., Inc.* | | 308,500 | | 882,310 |
Noodles & Co.*+ | | 144,000 | | 756,000 |
P&F Industries, Inc., Class A | | 10,500 | | 89,250 |
Papa Murphy’s Holdings, Inc.*+ | | 88,900 | | 478,282 |
Peak Resorts, Inc. | | 76,000 | | 410,400 |
Perry Ellis International, Inc.* | | 35,000 | | 876,400 |
Red Lion Hotels Corp.* | | 87,000 | | 856,950 |
Rocky Brands, Inc. | | 72,200 | | 1,364,580 |
Saga Communications, Inc., Class A | | 16,866 | | 682,230 |
Salem Media Group, Inc. | | 145,100 | | 652,950 |
Shiloh Industries, Inc.* | | 124,293 | | 1,019,203 |
Skyline Corp.* | | 20,100 | | 258,285 |
SORL Auto Parts, Inc.*+ | | 79,900 | | 536,928 |
Sportsman’s Warehouse Holdings, Inc.*+ | | 164,015 | | 1,084,139 |
Stanley Furniture Co., Inc.* | | 66,383 | | 57,753 |
Stein Mart, Inc.+ | | 60,800 | | 70,528 |
Strattec Security Corp. | | 16,700 | | 727,285 |
Superior Uniform Group, Inc. | | 22,000 | | 587,620 |
Sypris Solutions, Inc.* | | 39,404 | | 53,983 |
| | |
| Ultra-Small Company Market Fund | |
|
| SCHEDULE OF INVESTMENTS (continued) | |
| Showing percentage of net assets as of December 31, 2017 (Unaudited) | | |
| | | | | | | | |
| Industry Company | | Shares | | Value | | | | |
Common Stocks (continued) | | | | |
Consumer Discretionary (continued) | | | | |
Tandy Leather Factory, Inc.*+ | | 82,000 | | $ 631,400 | | | | |
Tilly’s, Inc., Class A | | 102,175 | | 1,508,103 | | | | |
Town Sports International Holdings, Inc.* | | 173,571 | | 963,319 | | | | |
Townsquare Media, Inc., Class A* | | 74,357 | | 571,062 | | | | |
Trans World Entertainment Corp.* | | 198,403 | | 362,085 | | | | |
TravelCenters of America LLC* | | 241,800 | | 991,380 | | | | |
Tuesday Morning Corp.*+ | | 125,000 | | 343,750 | | | | |
Turtle Beach Corp.* | | 267,416 | | 121,139 | | | | |
Unique Fabricating, Inc.+ | | 50,000 | | 371,000 | | | | |
Universal Technical Institute, Inc.* | | 145,000 | | 348,000 | | | | |
UQM Technologies, Inc.* | | 50,000 | | 69,500 | | | | |
US Auto Parts Network, Inc.* | | 164,751 | | 415,173 | | | | |
VOXX International Corp.* | | 134,500 | | 753,200 | | | | |
Xcel Brands, Inc.* | | 44,000 | | 145,200 | | | | |
YogaWorks, Inc.*+ | | 70,000 | | 198,100 | | | | |
ZAGG, Inc.* | | 35,000 | | 645,750 | | | | |
| | | | | | | | |
| | | | 50,271,386 | | | | |
| | | | |
Consumer Staples - 1.85% | | | | | | | | |
Alico, Inc.+ | | 8,700 | | 256,650 | | | | |
Castle Brands, Inc.*+ | | 899,187 | | 1,097,008 | | | | |
CCA Industries, Inc.*+ | | 15,752 | | 49,619 | | | | |
Lifeway Foods, Inc.* | | 90,152 | | 721,216 | | | | |
Limoneira Co. | | 2,596 | | 58,150 | | | | |
Mannatech, Inc. | | 13,600 | | 204,000 | | | | |
Natural Alternatives International, Inc.* | | 34,910 | | 360,446 | | | | |
Natural Grocers by Vitamin Cottage, Inc.*+ | | 136,000 | | 1,214,480 | | | | |
Oil-Dri Corp. of America | | 27,500 | | 1,141,250 | | | | |
Orchids Paper Products Co.+ | | 44,600 | | 570,880 | | | | |
Reed’s, Inc.*+ | | 53,700 | | 83,235 | | | | |
Rocky Mountain Chocolate Factory, Inc.+ | | 30,000 | | 354,000 | | | | |
Seneca Foods Corp., Class A* | | 7,000 | | 215,250 | | | | |
United-Guardian, Inc. | | 10,000 | | 185,000 | | | | |
| | | | | | | | |
| | | | 6,511,184 | | | | |
| | | | |
Energy - 10.14% | | | | | | | | |
Adams Resources & Energy, Inc. | | 24,300 | | 1,057,050 | | | | |
Aemetis, Inc.* | | 185,439 | | 101,991 | | | | |
Amyris, Inc.*+ | | 70,500 | | 264,375 | | | | |
| | | | |
| Industry Company | | Shares | | Value |
|
Energy (continued) |
Approach Resources, Inc.*+ | | 389,900 | | $ 1,154,104 |
Aspen Aerogels, Inc.*+ | | 168,130 | | 820,474 |
Bristow Group, Inc.+ | | 100,000 | | 1,347,000 |
CARBO Ceramics, Inc.*+ | | 50,500 | | 514,090 |
Cloud Peak Energy, Inc.* | | 250,000 | | 1,112,500 |
Comstock Resources, Inc.*+ | | 122,680 | | 1,037,873 |
Contango Oil & Gas Co.* | | 110,000 | | 518,100 |
Dawson Geophysical Co.* | | 128,139 | | 636,851 |
Earthstone Energy, Inc., Class A*+ | | 44,002 | | 467,741 |
Era Group, Inc.* | | 97,350 | | 1,046,512 |
Evolution Petroleum Corp.+ | | 217,123 | | 1,487,293 |
Gastar Exploration, Inc.*+ | | 780,200 | | 819,210 |
Geospace Technologies Corp.* | | 46,663 | | 605,219 |
Goodrich Petroleum Corp.* | | 50,000 | | 545,500 |
Gulf Island Fabrication, Inc. | | 88,000 | | 1,181,400 |
Hornbeck Offshore Services, Inc.* | | 3,900 | | 12,129 |
Independence Contract Drilling, Inc.* | | 273,000 | | 1,086,540 |
ION Geophysical Corp.*+ | | 127,816 | | 2,524,366 |
Jones Energy, Inc., Class A*+ | | 243,958 | | 268,354 |
Key Energy Services, Inc.* | | 89,000 | | 1,049,310 |
Lilis Energy, Inc.* | | 170,000 | | 868,700 |
Lonestar Resources US, Inc., Class A* | | 186,500 | | 740,405 |
Matrix Service Co.* | | 65,000 | | 1,157,000 |
Mexco Energy Corp.* | | 12,000 | | 47,160 |
Mitcham Industries, Inc.* | | 141,900 | | 449,823 |
Natural Gas Services Group, Inc.* | | 47,185 | | 1,236,247 |
New Concept Energy, Inc.*+ | | 8,400 | | 13,094 |
Northern Oil and Gas, Inc.*+ | | 326,000 | | 668,300 |
Overseas Shipholding Group, Inc., Class A* | | 335,000 | | 917,900 |
Panhandle Oil & Gas, Inc., Class A | | 23,594 | | 484,857 |
Parker Drilling Co.* | | 679,630 | | 679,630 |
PetroQuest Energy, Inc.* | | 138,457 | | 261,684 |
PHI, Inc.* | | 104,550 | | 1,209,644 |
Pioneer Energy Services Corp.* | | 395,000 | | 1,204,750 |
Resolute Energy Corp.*+ | | 38,000 | | 1,195,860 |
REX American Resources Corp.* | | 9,249 | | 765,725 |
SEACOR Marine Holdings, Inc.*+ | | 45,440 | | 531,648 |
SilverBow Resources, Inc.* | | 15,000 | | 445,800 |
Smart Sand, Inc.*+ | | 50,000 | | 433,000 |
| | |
| 26 | | Semi-Annual Report | December 31, 2017 (Unaudited) |
| | |
| Ultra-Small Company Market Fund | | |
| SCHEDULE OF INVESTMENTS (continued) | | |
| Showing percentage of net assets as of December 31, 2017 (Unaudited) | | |
| | | | | | | | |
| Industry Company | | Shares | | Value | | | | |
Common Stocks (continued) | | | | | | | | |
Energy (continued) | | | | | | | | |
Uranium Energy Corp.*+ | | 395,000 | | $ 699,150 | | | | |
VAALCO Energy, Inc.* | | 237,100 | | 165,282 | | | | |
W&T Offshore, Inc.* | | 325,000 | | 1,075,750 | | | | |
Westmoreland Coal Co.* | | 100,660 | | 121,799 | | | | |
Willbros Group, Inc.* | | 300,000 | | 426,000 | | | | |
Zion Oil & Gas, Inc.*+ | | 132,285 | | 285,736 | | | | |
| | | | | | | | |
| | | | 35,742,926 | | | | |
| | | | |
Financials - 19.27% | | | | | | | | |
1347 Property Insurance Holdings, Inc.* | | 38,400 | | 280,320 | | | | |
1st Constitution Bancorp+ | | 38,733 | | 714,624 | | | | |
A-Mark Precious Metals, Inc. | | 44,500 | | 654,595 | | | | |
American National Bankshares, Inc. | | 29,746 | | 1,139,272 | | | | |
American River Bankshares | | 56,000 | | 854,000 | | | | |
AmeriServ Financial, Inc. | | 155,671 | | 646,035 | | | | |
Anchor Bancorp, Inc.*+ | | 22,000 | | 545,600 | | | | |
Ashford, Inc.*+ | | 4,000 | | 372,000 | | | | |
Asta Funding, Inc.* | | 68,400 | | 506,160 | | | | |
Atlantic American Corp. | | 56,056 | | 187,788 | | | | |
Atlantic Coast Financial Corp.*+ | | 57,150 | | 538,924 | | | | |
Atlanticus Holdings Corp.* | | 60,812 | | 145,949 | | | | |
Auburn National Bancorporation, Inc.+ | | 2,974 | | 116,997 | | | | |
B. Riley Financial, Inc.+ | | 13,212 | | 239,137 | | | | |
Bank of Commerce Holdings | | 87,441 | | 1,005,572 | | | | |
Bankwell Financial Group, Inc. | | 20,937 | | 718,977 | | | | |
BCB Bancorp, Inc. | | 55,212 | | 800,574 | | | | |
Bryn Mawr Bank Corp. | | 3,200 | | 141,440 | | | | |
C&F Financial Corp. | | 15,400 | | 893,200 | | | | |
Capitala Finance Corp.+ | | 66,280 | | 482,518 | | | | |
Capstar Financial Holdings, Inc.* | | 40,000 | | 830,800 | | | | |
CB Financial Services, Inc. | | 21,700 | | 658,595 | | | | |
Chemung Financial Corp. | | 14,998 | | 721,404 | | | | |
Citizens Community Bancorp, Inc. | | 35,600 | | 480,244 | | | | |
Citizens First Corp.+ | | 2,633 | | 63,192 | | | | |
Citizens Holding Co. | | 20,670 | | 478,510 | | | | |
CM Finance, Inc. | | 78,000 | | 635,700 | | | | |
Codorus Valley Bancorp, Inc. | | 28,061 | | 772,519 | | | | |
Cohen & Co., Inc.+ | | 3,000 | | 24,060 | | | | |
Colony Bankcorp, Inc. | | 22,868 | | 332,729 | | | | |
Community West Bancshares | | 38,357 | | 410,420 | | | | |
Consumer Portfolio Services, Inc.* | | 155,100 | | 643,665 | | | | |
| | | | |
| Industry Company | | Shares | | Value |
| | | | |
Financials (continued) | | | | |
County Bancorp, Inc. | | 24,000 | | $ 714,240 |
Eagle Bancorp Montana, Inc.+ | | 6,289 | | 131,755 |
eHealth, Inc.* | | 30,000 | | 521,100 |
Entegra Financial Corp.* | | 26,800 | | 783,900 |
ESSA Bancorp, Inc. | | 59,000 | | 924,530 |
Evans Bancorp, Inc. | | 18,701 | | 783,572 |
Farmers Capital Bank Corp. | | 27,058 | | 1,041,733 |
Federated National Holding Co. | | 49,012 | | 812,129 |
First Acceptance Corp.* | | 394,700 | | 469,693 |
First Bancorp, Inc. | | 20,800 | | 566,384 |
First Bancshares, Inc. (The) | | 30,094 | | 1,029,215 |
First Bank+ | | 19,345 | | 267,928 |
First Business Financial Services, Inc. | | 42,308 | | 935,853 |
First Financial Northwest, Inc. | | 47,000 | | 728,970 |
First Guaranty Bancshares, Inc. | | 3,411 | | 85,275 |
First Internet Bancorp | | 25,000 | | 953,750 |
First Northwest Bancorp* | | 15,000 | | 244,500 |
First United Corp.* | | 12,192 | | 212,750 |
GAIN Capital Holdings, Inc.+ | | 54,400 | | 544,000 |
Great Elm Capital Group, Inc.* | | 1,666 | | 6,747 |
Guaranty Federal Bancshares, Inc.+ | | 20,856 | | 458,832 |
Hallmark Financial Services, Inc.* | | 80,400 | | 838,572 |
Hawthorn Bancshares, Inc.+ | | 26,000 | | 539,500 |
Health Insurance Innovations, Inc., Class A*+ | | 30,300 | | 755,985 |
HMN Financial, Inc.* | | 30,000 | | 574,500 |
Home Bancorp, Inc. | | 26,500 | | 1,145,330 |
HopFed Bancorp, Inc. | | 32,988 | | 469,089 |
Horizon Technology Finance Corp. | | 24,400 | | 273,768 |
Impac Mortgage Holdings, Inc.*+ | | 23,700 | | 240,792 |
Independence Holding Co.+ | | 37,243 | | 1,022,320 |
Investar Holding Corp. | | 5,000 | | 120,500 |
Investors Title Co. | | 2,028 | | 402,254 |
JMP Group LLC+ | | 96,851 | | 542,366 |
KCAP Financial, Inc.+ | | 156,600 | | 534,006 |
Lake Shore Bancorp, Inc.+ | | 22,150 | | 379,872 |
Landmark Bancorp, Inc. | | 12,773 | | 370,417 |
Malvern Bancorp, Inc.*+ | | 34,800 | | 911,760 |
Marlin Business Services Corp. | | 64,500 | | 1,444,800 |
| | |
| Ultra-Small Company Market Fund | |
|
| SCHEDULE OF INVESTMENTS (continued) | |
| Showing percentage of net assets as of December 31, 2017 (Unaudited) | | |
| | | | | | | | |
| Industry Company | | Shares | | Value | | | | |
Common Stocks (continued) | | | | |
Financials (continued) | | | | |
MBT Financial Corp. | | 119,185 | | $ 1,263,361 | | | | |
Medallion Financial Corp.*+ | | 95,411 | | 339,663 | | | | |
Medley Management, Inc., Class A+ | | 62,400 | | 405,600 | | | | |
Mid Penn Bancorp, Inc.+ | | 14,348 | | 494,289 | | | | |
MidSouth Bancorp, Inc.+ | | 24,700 | | 327,275 | | | | |
Monroe Capital Corp. | | 61,403 | | 844,291 | | | | |
MSB Financial Corp./MD | | 25,000 | | 447,500 | | | | |
MutualFirst Financial, Inc. | | 38,911 | | 1,500,019 | | | | |
Northeast Bancorp | | 35,000 | | 810,250 | | | | |
Northrim BanCorp, Inc. | | 34,750 | | 1,176,288 | | | | |
Norwood Financial Corp.+ | | 12,749 | | 420,717 | | | | |
Oaktree Strategic Income Corp. | | 103 | | 865 | | | | |
Ohio Valley Banc Corp.+ | | 19,500 | | 787,800 | | | | |
Oppenheimer Holdings, Inc., Class A | | 31,250 | | 837,500 | | | | |
Pacific Mercantile Bancorp*+ | | 83,319 | | 729,041 | | | | |
Penns Woods Bancorp, Inc.+ | | 16,400 | | 763,912 | | | | |
Peoples Bancorp of North Carolina, Inc. | | 27,830 | | 854,103 | | | | |
Premier Financial Bancorp, Inc. | | 48,220 | | 968,258 | | | | |
Provident Financial Holdings, Inc. | | 38,617 | | 710,553 | | | | |
Pzena Investment Management, Inc., Class A | | 52,800 | | 563,376 | | | | |
Regional Management Corp.* | | 47,000 | | 1,236,570 | | | | |
Riverview Bancorp, Inc. | | 82,206 | | 712,726 | | | | |
Safeguard Scientifics, Inc.* | | 19,500 | | 218,400 | | | | |
Security National Financial Corp., Class A* | | 53,043 | | 281,128 | | | | |
Select Bancorp, Inc.*+ | | 54,676 | | 690,558 | | | | |
Shore Bancshares, Inc. | | 42,500 | | 709,750 | | | | |
SI Financial Group, Inc. | | 47,676 | | 700,837 | | | | |
Silvercrest Asset Management Group Inc., Class A | | 50,002 | | 802,532 | | | | |
Southern First Bancshares, Inc.* | | 21,215 | | 875,119 | | | | |
Southern Missouri Bancorp, Inc. | | 30,000 | | 1,127,700 | | | | |
Southern National Bancorp of Virginia, Inc. | | 50,194 | | 804,610 | | | | |
Summit State Bank | | 17,200 | | 220,160 | | | | |
Sussex Bancorp+ | | 23,000 | | 618,700 | | | | |
TheStreet, Inc.* | | 272,700 | | 395,415 | | | | |
Timberland Bancorp, Inc. | | 34,222 | | 908,594 | | | | |
| | | | |
| Industry Company | | Shares | | Value |
|
Financials (continued) |
Two River Bancorp+ | | 39,968 | | $ 724,620 |
Union Bankshares, Inc./Morrisville VT+ | | 1,934 | | 102,405 |
United Community Bancorp+ | | 26,200 | | 555,440 |
United Security Bancshares | | 5,400 | | 59,400 |
Unity Bancorp, Inc. | | 46,500 | | 918,375 |
Wayne Savings Bancshares, Inc. | | 19,900 | | 367,155 |
Western New England Bancorp, Inc. | | 78,362 | | 854,146 |
| | | | |
| | | | 67,947,208 |
| | |
Health Care - 18.73% | | | | |
AAC Holdings, Inc.*+ | | 98,000 | | 882,000 |
AcelRx Pharmaceuticals, Inc.*+ | | 241,150 | | 488,329 |
Actinium Pharmaceuticals, Inc.* | | 140,200 | | 93,037 |
Advaxis, Inc.*+ | | 183,400 | | 520,856 |
Adverum Biotechnologies, Inc.*+ | | 183,900 | | 643,650 |
Aeglea BioTherapeutics, Inc.* | | 75,000 | | 405,750 |
Agile Therapeutics, Inc.*+ | | 123,000 | | 330,870 |
Alimera Sciences, Inc.*+ | | 460,000 | | 611,800 |
Almost Family, Inc.* | | 2,400 | | 132,840 |
Alphatec Holdings, Inc.*+ | | 69,800 | | 185,668 |
Alpine Immune Sciences, Inc.* | | 35,000 | | 392,000 |
Altimmune, Inc.+ | | 79,327 | | 157,861 |
Apollo Endosurgery, Inc.*+ | | 79,000 | | 442,400 |
Applied Genetic Technologies Corp.* | | 92,400 | | 332,640 |
Aptevo Therapeutics, Inc.*+ | | 45,802 | | 194,200 |
Aquinox Pharmaceuticals, Inc.*+ | | 50,000 | | 588,000 |
Aratana Therapeutics, Inc.*+ | | 156,983 | | 825,731 |
Ardelyx, Inc.*+ | | 117,500 | | 775,500 |
ArQule, Inc.* | | 289,393 | | 477,498 |
Arrowhead Pharmaceuticals, Inc.* | | 200,000 | | 736,000 |
Asterias Biotherapeutics, Inc.*+ | | 138,363 | | 311,317 |
aTyr Pharma, Inc.*+ | | 102,697 | | 359,440 |
AVEO Pharmaceuticals, Inc.* | | 280,000 | | 781,200 |
Axsome Therapeutics, Inc.*+ | | 50,000 | | 280,000 |
Bellerophon Therapeutics, Inc.* | | 23,000 | | 59,340 |
BioScrip, Inc.* | | 277,000 | | 806,070 |
| | |
| 28 | | Semi-Annual Report | December 31, 2017 (Unaudited) |
| | |
| Ultra-Small Company Market Fund | | |
| SCHEDULE OF INVESTMENTS (continued) | | |
| Showing percentage of net assets as of December 31, 2017 (Unaudited) | | |
| | | | | | | | |
| Industry Company | | Shares | | Value | | | | |
Common Stocks (continued) | | | | |
Health Care (continued) | | | | |
Bovie Medical Corp.*+ | | 124,970 | | $ 324,922 | | | | |
Calithera Biosciences, Inc.*+ | | 47,600 | | 397,460 | | | | |
Cara Therapeutics, Inc.* | | 55,000 | | 673,200 | | | | |
CareDx, Inc.*+ | | 78,598 | | 576,909 | | | | |
Cascadian Therapeutics, Inc.* | | 222,700 | | 823,990 | | | | |
Castlight Health, Inc., Class B*+ | | 45,500 | | 170,625 | | | | |
Cellular Biomedicine Group, Inc.*+ | | 67,800 | | 769,530 | | | | |
ChemoCentryx, Inc.*+ | | 48,496 | | 288,551 | | | | |
Chiasma, Inc.*+ | | 172,389 | | 293,061 | | | | |
Chimerix, Inc.* | | 204,100 | | 944,983 | | | | |
Cidara Therapeutics, Inc.*+ | | 94,000 | | 639,200 | | | | |
Clearside Biomedical, Inc.*+ | | 99,200 | | 694,400 | | | | |
Conatus Pharmaceuticals, Inc.* | | 113,000 | | 522,060 | | | | |
Concert Pharmaceuticals, Inc.* | | 40,000 | | 1,034,800 | | | | |
ConforMIS, Inc.*+ | | 159,200 | | 378,896 | | | | |
Corindus Vascular Robotics, Inc.*+ | | 400,483 | | 404,488 | | | | |
Corium International, Inc.* | | 99,575 | | 956,916 | | | | |
CorMedix, Inc.*+ | | 127,701 | | 64,106 | | | | |
Corvus Pharmaceuticals, Inc.*+ | | 85,000 | | 880,600 | | | | |
Cumberland Pharmaceuticals, Inc.* | | 192,500 | | 1,428,350 | | | | |
Curis, Inc.* | | 377,460 | | 264,222 | | | | |
Dicerna Pharmaceuticals, Inc.*+ | | 141,600 | | 1,278,648 | | | | |
Digirad Corp.+ | | 150,000 | | 386,250 | | | | |
Durect Corp.*+ | | 708,600 | | 653,187 | | | | |
Egalet Corp.*+ | | 49,400 | | 49,400 | | | | |
Eiger BioPharmaceuticals, Inc.*+ | | 50,000 | | 697,500 | | | | |
Electromed, Inc.* | | 70,000 | | 424,900 | | | | |
Eleven Biotherapeutics, Inc.* | | 65,000 | | 52,715 | | | | |
Endocyte, Inc.*+ | | 249,000 | | 1,065,720 | | | | |
Fate Therapeutics, Inc.* | | 180,000 | | 1,099,800 | | | | |
Flex Pharma, Inc.*+ | | 65,189 | | 227,510 | | | | |
Fluidigm Corp.* | | 43,772 | | 257,817 | | | | |
Fulgent Genetics, Inc.*+ | | 78,100 | | 342,078 | | | | |
Gemphire Therapeutics, Inc.*+ | | 46,000 | | 365,700 | | | | |
Genesis Healthcare, Inc.* | | 330,000 | | 251,757 | | | | |
GlycoMimetics, Inc.*+ | | 36,764 | | 617,268 | | | | |
Harvard Bioscience, Inc.* | | 317,017 | | 1,046,156 | | | | |
Histogenics Corp.* | | 100,000 | | 205,000 | | | | |
| | | | |
| Industry Company | | Shares | | Value |
|
Health Care (continued) |
Immune Design Corp.*+ | | 115,000 | | $ 448,500 |
Infinity Pharmaceuticals, Inc.*+ | | 350,000 | | 710,500 |
InfuSystems Holdings, Inc.* | | 124,900 | | 287,270 |
InVivo Therapeutics Holdings Corp.*+ | | 121,350 | | 93,440 |
Invuity, Inc.*+ | | 75,000 | | 465,000 |
IRIDEX Corp.*+ | | 56,900 | | 433,578 |
IsoRay, Inc.* | | 218,700 | | 87,327 |
Juniper Pharmaceuticals, Inc.*+ | | 37,200 | | 180,420 |
Kadmon Holdings, Inc.*+ | | 283,000 | | 1,024,460 |
KalVista Pharmaceuticals, Inc.*+ | | 6,000 | | 58,500 |
Kewaunee Scientific Corp. | | 14,000 | | 406,000 |
Kura Oncology, Inc.* | | 67,200 | | 1,028,160 |
Leap Therapeutics, Inc.*+ | | 6,500 | | 40,560 |
Matinas BioPharma Holdings, Inc.* | | 189,000 | | 219,240 |
MediciNova, Inc.*+ | | 122,710 | | 793,934 |
Melinta Therapeutics, Inc.* | | 30,000 | | 474,000 |
Minerva Neurosciences, Inc.*+ | | 120,700 | | 730,235 |
Misonix, Inc.* | | 25,000 | | 240,000 |
Navidea Biopharmaceuticals, Inc.*+ | | 548,580 | | 196,666 |
Neos Therapeutics, Inc.*+ | | 40,100 | | 409,020 |
NewLink Genetics Corp.*+ | | 100,000 | | 811,000 |
NovaBay Pharmaceuticals, Inc.*+ | | 2,000 | | 7,700 |
Novan, Inc.*+ | | 22,688 | | 95,743 |
Nuvectra Corp.* | | 35,300 | | 273,928 |
Obalon Therapeutics, Inc.* | | 45,000 | | 297,450 |
Ocular Therapeutix, Inc.*+ | | 100,000 | | 445,000 |
Oncobiologics, Inc.* | | 113,000 | | 146,900 |
Oncocyte Corp.*+ | | 130,000 | | 604,500 |
OncoMed Pharmaceuticals, Inc.*+ | | 75,000 | | 307,500 |
Orexigen Therapeutics, Inc.*+ | | 49,100 | | 63,339 |
Organovo Holdings, Inc.*+ | | 150,000 | | 201,000 |
OvaScience, Inc.* | | 350,000 | | 490,000 |
Ovid Therapeutics, Inc.* | | 35,000 | | 345,450 |
Pain Therapeutics, Inc.*+ | | 15,765 | | 63,060 |
Palatin Technologies, Inc.* | | 546,000 | | 468,959 |
Pfenex, Inc.* | | 94,500 | | 251,370 |
Protagonist Therapeutics, Inc.*+ | | 39,000 | | 811,200 |
Protalix BioTherapeutics, Inc.* | | 271,672 | | 179,630 |
| | |
| Ultra-Small Company Market Fund | |
|
| SCHEDULE OF INVESTMENTS (continued) | |
| Showing percentage of net assets as of December 31, 2017 (Unaudited) | | |
| | | | | | | | |
| Industry Company | | Shares | | Value | | | | |
| | |
Common Stocks (continued) | | | | |
Health Care (continued) | | | | |
Proteostasis Therapeutics, Inc.* | | 139,500 | | $ 813,285 | | | | |
pSivida Corp.*+ | | 100,000 | | 108,000 | | | | |
Pulmatrix, Inc.*+ | | 100,000 | | 141,000 | | | | |
Quorum Health Corp.*+ | | 55,000 | | 343,200 | | | | |
RadNet, Inc.* | | 25,000 | | 252,500 | | | | |
Regional Health Properties, Inc.* | | 109,601 | | 18,632 | | | | |
Rexahn Pharmaceuticals, Inc.*+ | | 50,100 | | 101,202 | | | | |
RTI Surgical, Inc.* | | 191,900 | | 786,790 | | | | |
SCYNEXIS, Inc.*+ | | 150,000 | | 348,000 | | | | |
SeaSpine Holdings Corp.*+ | | 78,600 | | 795,432 | | | | |
Selecta Biosciences, Inc.*+ | | 25,000 | | 245,250 | | | | |
Senseonics Holdings, Inc.*+ | | 204,727 | | 544,574 | | | | |
Sientra, Inc.* | | 79,200 | | 1,113,552 | | | | |
Sierra Oncology, Inc.*+ | | 164,300 | | 612,839 | | | | |
Syndax Pharmaceuticals, Inc.* | | 50,500 | | 442,380 | | | | |
Synlogic, Inc.*+ | | 56,428 | | 547,352 | | | | |
T2 Biosystems, Inc.*+ | | 125,000 | | 515,000 | | | | |
Tabula Rasa HealthCare, Inc.* | | 46,800 | | 1,312,740 | | | | |
Tactile Systems Technology, Inc.*+ | | 25,000 | | 724,500 | | | | |
Tetraphase Pharmaceuticals, Inc.*+ | | 75,000 | | 472,500 | | | | |
Tocagen, Inc.*+ | | 100,000 | | 1,025,000 | | | | |
Tracon Pharmaceuticals, Inc.*+ | | 25,000 | | 83,750 | | | | |
Utah Medical Products, Inc. | | 25,400 | | 2,067,560 | | | | |
Veracyte, Inc.* | | 112,400 | | 733,972 | | | | |
Verastem, Inc.*+ | | 153,900 | | 472,473 | | | | |
Vital Therapies, Inc.*+ | | 85,000 | | 505,750 | | | | |
VIVUS, Inc.* | | 392,100 | | 197,069 | | | | |
VolitionRX, Ltd.* | | 80,000 | | 235,200 | | | | |
Voyager Therapeutics, Inc.*+ | | 70,000 | | 1,162,000 | | | | |
vTv Therapeutics, Inc. Class A*+ | | 60,000 | | 360,600 | | | | |
XOMA Corp.*+ | | 14,900 | | 530,440 | | | | |
Zafgen, Inc.*+ | | 85,434 | | 394,705 | | | | |
Zynerba Pharmaceuticals, Inc.*+ | | 40,000 | | 500,800 | | | | |
| | | | | | | | |
| | | | 66,065,258 | | | | |
| | | | |
Industrials - 12.66% | | | | | | | | |
Acacia Research Corp.* | | 81,800 | | 331,290 | | | | |
Acme United Corp. | | 7,735 | | 180,999 | | | | |
AeroCentury Corp.* | | 10,900 | | 166,116 | | | | |
Air Industries Group*+ | | 40,000 | | 67,600 | | | | |
Allied Motion Technologies, Inc. | | 35,650 | | 1,179,658 | | | | |
| | | | |
| Industry Company | | Shares | | Value |
| | | | |
Industrials (continued) | | | | |
Alpha Pro Tech, Ltd.*+ | | 181,200 | | $ 724,800 |
American Superconductor Corp.*+ | | 70,100 | | 254,463 |
AMREP Corp.* | | 30,100 | | 210,700 |
ARC Document Solutions, Inc.* | | 195,000 | | 497,250 |
Arotech Corp.*+ | | 121,367 | | 430,853 |
BG Staffing, Inc.+ | | 37,500 | | 597,750 |
BlueLinx Holdings, Inc.*+ | | 35,600 | | 347,456 |
CAI International, Inc.* | | 30,000 | | 849,600 |
Celadon Group, Inc.+ | | 55,700 | | 356,480 |
Cenveo, Inc.*+ | | 42,662 | | 38,396 |
Chicago Rivet & Machine Co. | | 10,000 | | 318,000 |
Cogint, Inc.*+ | | 73,600 | | 323,840 |
Command Security Corp.*+ | | 44,600 | | 136,922 |
Commercial Vehicle Group, Inc.* | | 91,000 | | 972,790 |
CompX International, Inc. | | 3,200 | | 42,560 |
Covenant Transportation Group, Inc., Class A* | | 15,079 | | 433,220 |
CPI Aerostructures, Inc.* | | 31,300 | | 280,135 |
CRA International, Inc. | | 32,000 | | 1,438,400 |
DMC Global, Inc. | | 59,100 | | 1,480,455 |
Ducommun, Inc.* | | 14,500 | | 412,525 |
Eastern Co. (The) | | 33,600 | | 878,640 |
Ecology & Environment, Inc., Class A | | 7,000 | | 73,500 |
Enphase Energy, Inc.*+ | | 96,000 | | 231,360 |
EnviroStar, Inc.+ | | 35,000 | | 1,400,000 |
Espey Manufacturing & Electronics Corp. | | 10,700 | | 256,393 |
Franklin Covey Co.* | | 33,334 | | 691,680 |
FreightCar America, Inc. | | 20,000 | | 341,600 |
Fuel Tech, Inc.* | | 118,628 | | 132,863 |
Gencor Industries, Inc.* | | 71,450 | | 1,182,498 |
General Finance Corp.*+ | | 136,723 | | 929,716 |
Goldfield Corp. (The)* | | 158,080 | | 774,592 |
Graham Corp.+ | | 35,900 | | 751,387 |
Great Lakes Dredge & Dock Corp.* | | 205,100 | | 1,107,540 |
Hardinge, Inc. | | 53,300 | | 928,486 |
HC2 Holdings, Inc.* | | 104,000 | | 618,800 |
Highpower International, Inc.*+ | | 50,000 | | 185,000 |
Hill International, Inc.* | | 201,551 | | 1,098,453 |
Houston Wire & Cable Co.*+ | | 83,300 | | 599,760 |
Hudson Global, Inc.* | | 125,000 | | 281,250 |
Hurco Cos., Inc. | | 41,334 | | 1,744,295 |
Innovative Solutions & Support, Inc.* | | 172,054 | | 505,839 |
| | |
| 30 | | Semi-Annual Report | December 31, 2017 (Unaudited) |
| | |
| Ultra-Small Company Market Fund | |
|
| SCHEDULE OF INVESTMENTS (continued) | |
| Showing percentage of net assets as of December 31, 2017 (Unaudited) | | |
| | | | | | | | |
| Industry Company | | Shares | | Value | | | | |
| | | | |
Common Stocks (continued) | | | | | | | | |
Industrials (continued) | | | | | | | | |
Intersections, Inc.*+ | | 85,300 | | $ 192,778 | | | | |
Key Technology, Inc.* | | 43,900 | | 809,077 | | | | |
L.B. Foster Co., Class A* | | 44,000 | | 1,194,600 | | | | |
L.S. Starrett Co. (The), Class A | | 50,636 | | 435,470 | | | | |
Lawson Products, Inc.* | | 32,400 | | 801,900 | | | | |
Layne Christensen Co.* | | 81,430 | | 1,021,946 | | | | |
LSI Industries, Inc. | | 120,100 | | 826,288 | | | | |
Mastech Digital, Inc.* | | 6,250 | | 62,875 | | | | |
Miller Industries, Inc. | | 29,800 | | 768,840 | | | | |
Orion Group Holdings, Inc.* | | 108,200 | | 847,206 | | | | |
PAM Transportation Services, Inc.* | | 29,400 | | 1,022,532 | | | | |
Patriot Transportation Holding, Inc.* | | 30,871 | | 543,021 | | | | |
Performant Financial Corp.* | | 305,000 | | 503,250 | | | | |
Perma-Pipe International Holdings, Inc.* | | 71,100 | | 639,900 | | | | |
Radiant Logistics, Inc.* | | 221,300 | | 1,017,980 | | | | |
RCM Technologies, Inc. | | 111,510 | | 701,398 | | | | |
SIFCO Industries, Inc.* | | 16,024 | | 106,564 | | | | |
Sparton Corp.* | | 48,300 | | 1,113,798 | | | | |
Tel-Instrument Electronics Corp.* | | 15,000 | | 39,000 | | | | |
Transcat, Inc.* | | 5,200 | | 74,100 | | | | |
Twin Disc, Inc.*+ | | 56,600 | | 1,503,862 | | | | |
Ultralife Corp.* | | 112,400 | | 736,220 | | | | |
Virco Manufacturing Corp. | | 14,600 | | 73,730 | | | | |
Volt Information Sciences, Inc.* | | 165,900 | | 630,420 | | | | |
Willdan Group, Inc.* | | 45,000 | | 1,077,300 | | | | |
Willis Lease Finance Corp.* | | 39,000 | | 973,830 | | | | |
Xerium Technologies, Inc.* | | 33,550 | | 142,923 | | | | |
| | | | | | | | |
| | | | 44,646,718 | | | | |
| | |
Information Technology - 15.04% | | | | |
Aerohive Networks, Inc.*+ | | 210,000 | | 1,224,300 | | | | |
Agilysys, Inc.* | | 75,000 | | 921,000 | | | | |
ALJ Regional Holdings, Inc.*+ | | 88,000 | | 277,200 | | | | |
Amber Road, Inc.* | | 123,300 | | 905,022 | | | | |
American Software, Inc., Class A | | 15,700 | | 182,591 | | | | |
Amtech Systems, Inc.* | | 57,500 | | 579,025 | | | | |
AstroNova, Inc. | | 32,800 | | 459,200 | | | | |
Aviat Networks, Inc.*+ | | 22,086 | | 335,045 | | | | |
Avid Technology, Inc.*+ | | 150,000 | | 808,500 | | | | |
Aware, Inc.* | | 24,979 | | 112,406 | | | | |
AXT, Inc.* | | 176,006 | | 1,531,252 | | | | |
Black Box Corp. | | 37,345 | | 132,575 | | | | |
Brightcove, Inc.* | | 143,300 | | 1,017,430 | | | | |
| | | | |
| Industry Company | | Shares | | Value |
| | |
| | | | |
|
Information Technology (continued) |
BSQUARE Corp.* | | 79,500 | | $ 369,675 |
Care.com, Inc.* | | 90,000 | | 1,623,600 |
Clearfield, Inc.*+ | | 58,000 | | 710,500 |
Communications Systems, Inc. | | 103,800 | | 377,832 |
Computer Task Group, Inc.* | | 58,800 | | 299,880 |
Concurrent Computer Corp. | | 75,700 | | 436,789 |
CPI Card Group, Inc.+ | | 59,000 | | 216,530 |
CSP, Inc. | | 38,700 | | 614,943 |
CyberOptics Corp.* | | 42,550 | | 638,250 |
DHI Group, Inc.* | | 137,800 | | 261,820 |
Digi International, Inc.* | | 105,000 | | 1,002,750 |
DSP Group, Inc.* | | 83,500 | | 1,043,750 |
Echelon Corp.* | | 30,000 | | 169,200 |
Edgewater Technology, Inc.* | | 91,212 | | 569,163 |
EMCORE Corp.* | | 116,202 | | 749,503 |
Everspin Technologies, Inc.*+ | | 44,000 | | 330,000 |
Frequency Electronics, Inc.* | | 41,000 | | 383,760 |
GlobalSCAPE, Inc. | | 176,600 | | 626,930 |
GSE Systems, Inc.* | | 195,125 | | 634,156 |
GSI Technology, Inc.*+ | | 161,417 | | 1,284,879 |
Harmonic, Inc.* | | 1,300 | | 5,460 |
ID Systems, Inc.* | | 83,000 | | 576,020 |
IEC Electronics Corp.* | | 73,450 | | 302,614 |
Information Services Group, Inc.* | | 183,300 | | 764,361 |
Innodata, Inc.* | | 294,955 | | 401,139 |
Inseego Corp.*+ | | 46,900 | | 75,509 |
Intelligent Systems Corp.*+ | | 35,362 | | 161,251 |
Intermolecular, Inc.* | | 247,600 | | 339,212 |
inTEST Corp.* | | 49,500 | | 428,175 |
Intevac, Inc.* | | 82,933 | | 568,091 |
IntriCon Corp.* | | 21,500 | | 425,700 |
Inuvo, Inc.* | | 140,600 | | 113,886 |
iPass, Inc.* | | 50,000 | | 25,995 |
Issuer Direct Corp.+ | | 25,000 | | 458,750 |
Iteris, Inc.* | | 60,520 | | 421,824 |
Key Tronic Corp.* | | 57,100 | | 389,993 |
KVH Industries, Inc.* | | 84,510 | | 874,678 |
Leaf Group, Ltd.*+ | | 80,000 | | 792,000 |
Limelight Networks, Inc.* | | 50,000 | | 220,500 |
Liquidity Services, Inc.*+ | | 132,000 | | 640,200 |
Marchex, Inc., Class B* | | 122,400 | | 395,352 |
Marin Software, Inc.* | | 23,914 | | 263,054 |
Mattersight Corp.*+ | | 164,896 | | 420,485 |
Maxwell Technologies, Inc.*+ | | 80,000 | | 460,800 |
Napco Security Technologies Inc.* | | 100,176 | | 876,540 |
| | |
| Ultra-Small Company Market Fund | |
|
| SCHEDULE OF INVESTMENTS (continued) | |
| Showing percentage of net assets as of December 31, 2017 (Unaudited) | | |
| | | | | | | | |
| Industry Company | | Shares | | Value | | | | |
| | | | |
Common Stocks (continued) | | | | | | | | |
Information Technology (continued) | | | | |
Network-1 Technologies, Inc. | | 65,000 | | $ 156,000 | | | | |
PAR Technology Corp.* | | 104,750 | | 979,412 | | | | |
PCM, Inc.* | | 22,800 | | 225,720 | | | | |
PC-Tel, Inc. | | 91,100 | | 671,407 | | | | |
Perceptron, Inc.* | | 80,000 | | 780,000 | | | | |
Pixelworks, Inc.*+ | | 113,900 | | 720,987 | | | | |
PRGX Global, Inc.* | | 143,100 | | 1,016,010 | | | | |
QAD, Inc., Class B+ | | 8,250 | | 251,542 | | | | |
Quantum Corp.* | | 147,050 | | 827,892 | | | | |
QuinStreet, Inc.* | | 45,000 | | 377,100 | | | | |
RealNetworks, Inc.* | | 153,800 | | 525,996 | | | | |
Reis, Inc.+ | | 54,800 | | 1,131,620 | | | | |
RELM Wireless Corp.+ | | 168,744 | | 599,041 | | | | |
Richardson Electronics, Ltd. | | 102,011 | | 687,554 | | | | |
Rosetta Stone, Inc.* | | 103,160 | | 1,286,405 | | | | |
Rubicon Project, Inc. (The)* | | 200,000 | | 374,000 | | | | |
Seachange International, Inc.* | | 119,300 | | 468,849 | | | | |
Sigma Designs, Inc.* | | 137,200 | | 953,540 | | | | |
SMTC Corp.* | | 149,000 | | 283,100 | | | | |
StarTek, Inc.* | | 65,000 | | 648,050 | | | | |
Synacor, Inc.* | | 100,000 | | 230,000 | | | | |
Telaria, Inc.*+ | | 341,900 | | 1,377,857 | | | | |
Telenav, Inc.* | | 214,100 | | 1,177,550 | | | | |
TESSCO Technologies, Inc. | | 44,500 | | 896,675 | | | | |
Tintri, Inc.*+ | | 25,000 | | 127,500 | | | | |
TransAct Technologies, Inc. | | 63,688 | | 843,866 | | | | |
Travelzoo* | | 51,000 | | 328,950 | | | | |
Trio-Tech International* | | 6,000 | | 42,060 | | | | |
Vishay Precision Group, Inc.* | | 56,900 | | 1,431,035 | | | | |
Wayside Technology Group, Inc. | | 35,298 | | 589,477 | | | | |
Wireless Telecom Group, Inc.* | | 113,100 | | 274,833 | | | | |
YuMe, Inc. | | 156,226 | | 746,760 | | | | |
Zedge, Inc., Class B* | | 16,855 | | 46,339 | | | | |
Zix Corp.* | | 164,582 | | 720,869 | | | | |
| | | | | | | | |
| | | | 53,029,041 | | | | |
| | | | |
Materials - 3.93% | | | | | | | | |
Advanced Emissions Solutions, Inc.+ | | 77,075 | | 744,544 | | | | |
Ampco-Pittsburgh Corp. | | 69,499 | | 861,788 | | | | |
Codexis, Inc.*+ | | 9,300 | | 77,655 | | | | |
Core Molding Technologies, Inc. | | 45,100 | | 978,670 | | | | |
Flexible Solutions International, Inc.* | | 41,200 | | 74,984 | | | | |
| | | | |
| Industry Company | | Shares | | Value |
| | |
| | | | |
Materials (continued) | | | | |
Friedman Industries, Inc. | | 57,000 | | $323,760 |
Gold Resource Corp. | | 203,100 | | 893,640 |
Gulf Resources, Inc.* | | 285,900 | | 423,132 |
Intrepid Potash, Inc.*+ | | 250,000 | | 1,190,000 |
LSB Industries, Inc.*+ | | 137,500 | | 1,204,500 |
Northern Technologies International Corp.+ | | 13,950 | | 345,960 |
Olympic Steel, Inc. | | 43,200 | | 928,368 |
Orient Paper, Inc.* | | 148,811 | | 191,966 |
Paramount Gold Nevada Corp.* | | 25,000 | | 32,500 |
Pershing Gold Corp.*+ | | 65,000 | | 156,000 |
Ramaco Resources, Inc.*+ | | 122,800 | | 844,864 |
Ryerson Holding Corp.* | | 17,036 | | 177,174 |
Synalloy Corp. | | 77,400 | | 1,037,160 |
Trecora Resources* | | 30,000 | | 405,000 |
Universal Stainless & Alloy Products, Inc.* | | 48,286 | | 1,034,286 |
Verso Corp., Class A* | | 111,000 | | 1,950,270 |
| | | | |
| | | | 13,876,221 |
Real Estate - 1.11% | | | | |
Consolidated-Tomoka Land Co. | | 15,449 | | 981,012 |
Griffin Industrial Realty, Inc. | | 17,905 | | 657,114 |
Maui Land & Pineapple Co., Inc.* | | 30,000 | | 519,000 |
Stratus Properties, Inc.+ | | 37,150 | | 1,103,355 |
Transcontinental Realty Investors, Inc.*+ | | 2,300 | | 72,036 |
Trinity Place Holdings, Inc.* | | 85,100 | | 591,445 |
| | | | |
| | | | 3,923,962 |
Telecommunication Services - 0.83% |
Alaska Communications Systems Group, Inc.* | | 243,000 | | 651,240 |
Hawaiian Telcom Holdco, Inc.* | | 45,642 | | 1,408,512 |
Ooma, Inc.*+ | | 72,500 | | 866,375 |
| | | | |
| | | | 2,926,127 |
Utilities - 1.24% | | | | |
Artesian Resources Corp., Class A | | 19,500 | | 751,920 |
Cadiz, Inc.*+ | | 71,700 | | 1,021,725 |
Genie Energy, Ltd., Class B | | 98,667 | | 430,188 |
Global Water Resources, Inc. | | 42,500 | | 396,950 |
RGC Resources, Inc.+ | | 12,000 | | 324,960 |
| | |
| 32 | | Semi-Annual Report | December 31, 2017 (Unaudited) |
| | |
| Ultra-Small Company Market Fund | | |
| SCHEDULE OF INVESTMENTS (continued) | | |
Showing percentage of net assets as of December 31, 2017 (Unaudited) | | |
| | | | | | | | | | |
| Industry Company | | Shares | | Value | | | | | |
| | | | |
Common Stocks (continued) | | | | | | | | | | |
Utilities (continued) | | | | | | | | | | |
Spark Energy, Inc.,
Class A+ | | 43,000 | | $ | 533,200 | | | | | |
York Water Co., (The)+ | | 26,714 | | | 905,605 | | | | | |
| | | | | | | | | | |
| | | | | 4,364,548 | | | | | |
| | | | | | | | | | |
TOTAL COMMON STOCKS - 99.05% | | | 349,304,579 | | | | | |
| | | | | | | | | | |
(Cost $266,785,334) | | | | | | | | | | |
| | | |
EXCHANGE TRADED FUND -0.23% | | | | | | | | |
iShares Micro-Cap ETF+ | | 8,525 | | | 815,928 | | | | | |
| | | | | | | | | | |
| | | |
TOTAL EXCHANGE TRADED FUND -0.23% | | | 815,928 | | | | | |
| | | | | | | | | | |
(Cost $218,805) | | | | | | | | | | |
| | | | |
WARRANTS - 0.00% | | | | | | | | | | |
BioTime, Inc.,
expire 10/01/18*+ | | 16,058 | | | 1,969 | | | | | |
SAExploration Series A, expire 07/27/21*D | | 848 | | | — | | | | | |
SAExploration Series B, expire 07/27/21*D | | 848 | | | — | | | | | |
| | | | | | | | | | |
TOTAL WARRANTS - 0.00% | | | | | 1,969 | | | | | |
| | | | | | | | | | |
(Cost $15,589) | | | | | | | | | | |
| | | | | | | | | | |
| | | | | | | | | | |
| | | | | | | | | | |
| | | | | | | | | | |
| | | | | | | | | | |
| | | | | | | | | | |
| | | | | | | | | | |
| | | | | | | | | | |
| | | | | | | | | | |
| | | | | | | | | | |
| | | | | | | | | | | | |
| | | Rate^ | | | Shares | | | Value | |
| |
MONEY MARKET FUND - 0.24% | | | | | |
Fidelity Investments Money Market Government Portfolio Class I | | | 1.14 | % | | | 840,076 | | | | $840,076 | |
| | | | | | | | | | | | |
TOTAL MONEY MARKET FUND - 0.24% | | | | 840,076 | |
| | | | | | | | | | | | |
(Cost $840,076) | | | | | | | | | | | | |
| |
| INVESTMENTS PURCHASED WITH CASH PROCEEDS FROM SECURITIES LENDING - 12.53% | | | | | |
Fidelity Investments Money Market Government Portfolio Class I** | | | 1.14 | % | | | 44,206,098 | | | | 44,206,098 | |
| | | | | | | | | | | | |
| |
TOTAL INVESTMENTS PURCHASED WITH CASH PROCEEDS FROM SECURITIES LENDING - 12.53% | | | | 44,206,098 | |
| | | | | | | | | | | | |
(Cost $44,206,098) | | | | | | | | | | | | |
| |
TOTAL INVESTMENTS - 112.05% | | | | $395,168,650 | |
(Cost $312,065,902) | | | | | | | | | | | | |
Liabilities in Excess of Other Assets - (12.05%) | | | | (42,508,736 | ) |
| | | | | | | | | | | | |
| | |
NET ASSETS - 100.00% | | | | | | | | $352,659,914 | |
| | | | | | | | | | | | |
| * | Non-income producing security. |
| ** | This security represents the investment of the collateral received in connection with securities out on loan as of December 31, 2017. |
| ^ | Rate disclosed as of December 31, 2017. |
| D | Security was fair valued under procedures adopted by the Board of Directors (see Note 2). As such, the security is classified as Level 3 in the fair value hierarchy. |
| + | This security or a portion of the security is out on loan as of December 31, 2017. Total loaned securities had a value of $41,747,659 as of December 31, 2017. |
| LLC | - Limited Liability Company |
| | |
| Ultra-Small Company Market Fund | | |
| SCHEDULE OF INVESTMENTS (continued) | | |
| Showing percentage of net assets as of December 31, 2017 (Unaudited) | | |
| | | | | | | | | | | | | | | | |
Summary of inputs used to value the Fund’s investments as of 12/31/2017 (See Note 2 in Notes to Financial Statements): | |
| |
| | | Valuation Inputs | |
| | | Investment in Securities (Value) | |
| | | Level 1 Quoted Prices | | | Level 2
Significant
Observable
Inputs | | | Level 3
Significant
Unobservable
Inputs | | | Total | |
Common Stocks (a) | | $ | 349,304,579 | | | $ | — | | | $ | — | | | $ | 349,304,579 | |
Exchange Traded Fund | | | 815,928 | | | | — | | | | — | | | | 815,928 | |
Warrants | | | 1,969 | | | | — | | | | 0 | | | | 1,969 | |
Money Market Fund | | | — | | | | 840,076 | | | | — | | | | 840,076 | |
Investments Purchased with Cash Proceeds from Securities Lending | | | — | | | | 44,206,098 | | | | — | | | | 44,206,098 | |
| | | | | | | | | | | | | | | | |
TOTAL | | $ | 350,122,476 | | | $ | 45,046,174 | | | $ | 0 | | | $ | 395,168,650 | |
| | | | | | | | | | | | | | | | |
(a) - Please refer to the Schedule of Investments for the industry classifications of these portfolio holdings. | |
Following is a reconciliation of Level 3 investments for which significant unobservable inputs were used to determine fair value:
| | | | | | | | | | |
| | | Investment in Securities (Value) | |
| | | Common Stocks | | | Warrants | | Total | |
Balance as of 06/30/2017 | | $ | 28,062 | | | $0 | | $ | 28,062 | |
Purchases | | | — | | | — | | | — | |
Sales | | | — | | | — | | | — | |
Realized Gain/(Loss) | | | (437,810) | | | — | | | (437,810) | |
Change in Unrealized Appreciation/ (Depreciation) | | | 409,748 | | | — | | | 409,748 | |
Transfers in1 | | | — | | | — | | | — | |
Transfers out | | | — | | | — | | | — | |
| | | | | | | | | | |
Balance as of 12/31/2017 | | $ | — | | | $0 | | $ | — | |
| | | | | | | | | | |
Net Change in Unrealized Appreciation (Depreciation) from Investments Held as of 12/31/2017 | | $ | 409,748 | | | $— | | $ | 409,748 | |
| | | | | | | | | | |
| 1Transfer in represents the value as of the beginning of the reporting period, for any investment security where significant transfers in the pricing level occurred during the period. The purchase value is used in situations where the investment was not held as of the beginning of the period. | |
See Notes to Financial Statements.
| | |
34 | | Semi-Annual Report | December 31, 2017 (Unaudited) |
| | |
| Small-Cap Momentum Fund | |
|
| MANAGER’S COMMENTARY (Unaudited) | |
| | |
December 31, 2017
Dear Fellow Small-Cap Momentum Fund Shareholder,
For the quarter ended December 31, 2017, our Fund returned +3.91%, outperforming our primary market benchmark, the Russell 2000 Index (+3.34%).
For the six-month semi-annual period ended December 31, 2017, the Fund returned +10.53%, outperforming the Russell 2000 Index (+9.20%).
For the calendar year, the Fund returned +16.99%, leading the Russell 2000 Index (+14.65%).
The table below presents our December quarter, six-month, one-year, five-year, and inception-to-date financial results. See the next page for a graph of performance since inception.
Standardized Returns as of December 31, 2017
| | | | | | | | | | | | | | | | | | | | | | | | | |
| | | | | | | | | Annualized |
| | | Quarter | | 6 Months | | 1 Year | | 5 Years | | Since Inception
(5/28/10) |
| | | | | |
Small-Cap Momentum Fund | | | | 3.91% | | | | | 10.53% | | | | | 16.99% | | | | | 12.59% | | | | | 12.43% | |
Russell 2000 Index | | | | 3.34% | | | | | 9.20% | | | | | 14.65% | | | | | 14.12% | | | | | 13.23% | |
Performance figures quoted in the table above represent past performance and are no guarantee of future results. Total return figures in the table above include the reinvestment of dividends and capital gains. The table above does not reflect the deduction of taxes that a shareholder would pay on Fund distributions or on the redemption of Fund shares.
The Russell 2000 Index is an unmanaged, market value weighted index that measures performance of the 2,000 companies that are between the 1,000th and 3,000th largest in the market with dividends reinvested. It is not possible to invest directly in an index. Periods longer than one year are annualized.
According to data from Lipper, Inc. as of December 31, 2017, Small-Cap Momentum Fund ranked 136th of 1,021 small-cap core funds for the 12 months ended December 31, 2017, 484th of 718 over the last five years, and 318th of 604 such funds since inception in May 2010. Lipper, Inc. isan independent mutual fund rating service that ranks funds in various fund categories by making comparative calculations using total returns.
| | |
| Small-Cap Momentum Fund | |
|
| MANAGER’S COMMENTARY (Unaudited) (continued) | |
| | |
Growth of a $10,000 Investment
from Inception May 28, 2010 to December 31, 2017
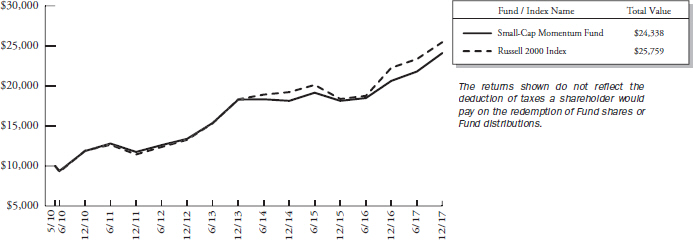
Detailed Explanation of Quarterly Performance
The Fund’s tilt toward higher-momentum stocks added to relative results, as the momentum factor was in favor during the quarter. The Fund’s risk-adjustment feature, which avoids some of the higher-volatility stocks in the momentum factor, also improved relative performance.
Detailed Explanation of Calendar Year Performance
For the calendar year, the Fund’s tilt toward higher-momentum stocks added to relative results. The Fund’s risk-adjustment feature, which avoids some of the higher-volatility stocks in the momentum factor, improved relative performance. A tilt toward shares of higher-quality companies (as measured by lower debt-to-market value ratios) also improved relative results.
Top Ten Holdings as of December 31, 2017
| | | | | | |
| Rank | | Description | | Industry | | % of Net
Assets |
| 1 | | LendingTree, Inc. | | Financials | | 1.0% |
| 2 | | Boyd Gaming Corp. | | Consumer Discretionary | | 0.9% |
| 3 | | Texas Roadhouse, Inc. | | Consumer Discretionary | | 0.9% |
| 4 | | Tech Data Corp. | | Information Technology | | 0.9% |
| 5 | | Kemper Corp. | | Financials | | 0.8% |
| 6 | | Realogy Holdings Corp. | | Real Estate | | 0.8% |
| 7 | | TCF Financial Corp. | | Financials | | 0.8% |
| 8 | | Summit Materials, Inc., Class A | | Materials | | 0.8% |
| 9 | | Stamps.com, Inc. | | Information Technology | | 0.8% |
| 10 | | Performance Food Group Co. | | Consumer Staples | | 0.8% |
| | Total | | | | 8.5% |
| | |
| 36 | | Semi-Annual Report | December 31, 2017 (Unaudited) |
| | |
| Small-Cap Momentum Fund | | |
| MANAGER’S COMMENTARY (Unaudited) (continued) | | |
| | |
Industry Sector Representation as of December 31, 2017
| | | | | | | | | | | | | | | |
| | | % of Net Assets | | % of Russell 2000 Index | | Difference |
Consumer Discretionary | | | | 10.6% | | | | | 12.6% | | | | | -2.0% | |
Consumer Staples | | | | 3.8% | | | | | 2.8% | | | | | 1.0% | |
Energy | | | | 2.0% | | | | | 4.0% | | | | | -2.0% | |
Financials | | | | 16.0% | | | | | 17.8% | | | | | -1.8% | |
Health Care | | | | 14.9% | | | | | 15.3% | | | | | -0.4% | |
Industrials | | | | 12.6% | | | | | 15.4% | | | | | -2.8% | |
Information Technology | | | | 19.6% | | | | | 16.6% | | | | | 3.0% | |
Materials | | | | 5.8% | | | | | 4.5% | | | | | 1.3% | |
Real Estate | | | | 8.4% | | | | | 6.7% | | | | | 1.7% | |
Telecommunication Services | | | | 2.5% | | | | | 0.8% | | | | | 1.7% | |
Utilities | | | | 3.8% | | | | | 3.5% | | | | | 0.3% | |
Cash & Other Assets | | | | 0.0% | | | | | 0.0% | | | | | 0.0% | |
Total | | | | 100.0% | | | | | 100.0% | | | | | | |
Disclaimer
The views expressed here are exclusively those of Fund management. These views, including those related to market sectors or individual stocks, are not meant as investment advice and should not be considered predictive in nature. Any favorable (or unfavorable) description of a holding applies only as of December 31, 2017, unless otherwise stated. Security positions can and do change thereafter. Discussions of historical performance do not guarantee and are not indicative of future performance.
Market volatility can significantly impact short-term performance. The Fund is not an appropriate investment for short-term investors. Investments in small companies generally carry greater risk than is customarily associated with larger companies. This additional risk is attributable to a number of factors, including the relatively limited financial resources that are typically available to small companies and the fact that small companies often have comparatively limited product lines. In addition, the stock of small companies tends to be more volatile than the stock of large companies, particularly in the short term and particularly in the early stages of an economic or market downturn. Shareholders of the Fund, therefore, are taking on more risk than they would if they invested in the stock market as a whole.
Conclusion
Thank you for your continued investment in Small-Cap Momentum Fund. We encourage your feedback; your reactions and concerns are important to us.
Sincerely,
The Investment Management Team
| | |
| Small-Cap Momentum Fund | | |
| SCHEDULE OF INVESTMENTS | | |
| Showing percentage of net assets as of December 31, 2017 (Unaudited) | | |
| | | | | | |
Industry Company | | Shares | | Value | | |
| |
COMMON STOCKS - 99.91% | | |
Consumer Discretionary - 10.57% | | |
Adtalem Global Education, Inc.* | | 835 | | $35,112 | | |
At Home Group, Inc.*+ | | 790 | | 24,008 | | |
Bassett Furniture Industries, Inc. | | 150 | | 5,640 | | |
Beazer Homes USA, Inc.* | | 450 | | 8,645 | | |
Boyd Gaming Corp. | | 1,485 | | 52,049 | | |
Callaway Golf Co. | | 1,300 | | 18,109 | | |
Cambium Learning Group, Inc.* | | 600 | | 3,408 | | |
Chegg, Inc.*+ | | 1,425 | | 23,256 | | |
Crocs, Inc.* | | 1,000 | | 12,640 | | |
Eldorado Resorts, Inc.*+ | | 1,000 | | 33,150 | | |
Fox Factory Holding Corp.* | | 475 | | 18,454 | | |
Gannett Co., Inc.+ | | 1,500 | | 17,385 | | |
Golden Entertainment, Inc.* | | 350 | | 11,428 | | |
Green Brick Partners, Inc.* | | 650 | | 7,345 | | |
Johnson Outdoors, Inc., Class A | | 125 | | 7,761 | | |
La Quinta Holdings, Inc.* | | 1,550 | | 28,613 | | |
LGI Homes, Inc.* | | 300 | | 22,509 | | |
Lindblad Expeditions Holdings, Inc.* | | 600 | | 5,874 | | |
Lithia Motors, Inc., Class A | | 325 | | 36,917 | | |
Modine Manufacturing Co.* | | 700 | | 14,140 | | |
Monarch Casino & Resort, Inc.* | | 225 | | 10,084 | | |
Penn National Gaming, Inc.* | | 1,210 | | 37,909 | | |
PICO Holdings, Inc. | | 300 | | 3,840 | | |
Ruth’s Hospitality Group, Inc. | | 400 | | 8,660 | | |
Strayer Education, Inc. | | 140 | | 12,541 | | |
Superior Uniform Group, Inc. | | 200 | | 5,342 | | |
Texas Roadhouse, Inc. | | 950 | | 50,046 | | |
Town Sports International Holdings, Inc.* | | 350 | | 1,942 | | |
Unifi, Inc.* | | 270 | | 9,685 | | |
Weight Watchers International, Inc.*+ | | 870 | | 38,524 | | |
William Lyon Homes, Class A* | | 400 | | 11,632 | | |
Wingstop, Inc. | | 400 | | 15,592 | | |
Winmark Corp. | | 50 | | 6,470 | | |
ZAGG, Inc.* | | 400 | | 7,380 | | |
| | | | | | |
| | | | 606,090 | | |
| | | |
Consumer Staples - 3.78% | | | | | | |
Alico, Inc. | | 100 | | 2,950 | | |
Calavo Growers, Inc. | | 225 | | 18,990 | | |
Cal-Maine Foods, Inc.*+ | | 600 | | 26,670 | | |
| | | | | | | | |
Industry Company | | | Shares | | | | Value | |
| | |
Consumer Staples (continued) | | | | | | | | |
Central Garden & Pet Co., Class A* | | | 650 | | | $ | 24,512 | |
Coca-Cola Bottling Co. Consolidated | | | 90 | | | | 19,373 | |
Cott Corp. | | | 1,800 | | | | 29,988 | |
Freshpet, Inc.* | | | 450 | | | | 8,528 | |
Nomad Foods, Ltd.* | | | 2,320 | | | | 39,231 | |
Performance Food Group Co.* | | | 1,400 | | | | 46,340 | |
| | | | | | | | |
| | | | | | | 216,582 | |
| | |
Energy - 2.01% | | | | | | | | |
Arch Coal, Inc., Class A | | | 300 | | | | 27,948 | |
Ardmore Shipping Corp.* | | | 450 | | | | 3,600 | |
Delek US Holdings, Inc. | | | 1,100 | | | | 38,434 | |
Kosmos Energy, Ltd.* | | | 5,150 | | | | 35,278 | |
Renewable Energy Group, Inc.*+ | | | 500 | | | | 5,900 | |
Tsakos Energy Navigation, Ltd. | | | 1,050 | | | | 4,106 | |
| | | | | | | | |
| | | | | | | 115,266 | |
| | |
Financials - 16.01% | | | | | | | | |
Atlantic Capital Bancshares, Inc.* | | | 350 | | | | 6,160 | |
BancFirst Corp. | | | 455 | | | | 23,273 | |
Bank of Commerce Holdings | | | 200 | | | | 2,300 | |
Blue Hills Bancorp, Inc. | | | 350 | | | | 7,035 | |
BofI Holding, Inc.*+ | | | 850 | | | | 25,415 | |
Bryn Mawr Bank Corp. | | | 250 | | | | 11,050 | |
Capstar Financial Holdings, Inc.* | | | 150 | | | | 3,116 | |
Carolina Financial Corp. | | | 300 | | | | 11,145 | |
CenterState Bank Corp. | | | 810 | | | | 20,841 | |
Central Valley Community Bancorp | | | 200 | | | | 4,036 | |
Chemung Financial Corp. | | | 50 | | | | 2,405 | |
Citizens & Northern Corp. | | | 150 | | | | 3,600 | |
CNB Financial Corp. | | | 200 | | | | 5,248 | |
CoBiz Financial, Inc. | | | 550 | | | | 10,995 | |
Codorus Valley Bancorp, Inc. | | | 105 | | | | 2,891 | |
Community Bankers Trust Corp.* | | | 250 | | | | 2,038 | |
Community Trust Bancorp, Inc. | | | 250 | | | | 11,775 | |
County Bancorp, Inc. | | | 100 | | | | 2,976 | |
Cowen, Inc.*+ | | | 450 | | | | 6,142 | |
eHealth, Inc.* | | | 250 | | | | 4,342 | |
EMC Insurance Group, Inc. | | | 300 | | | | 8,607 | |
| | |
| 38 | | Semi-Annual Report | December 31, 2017 (Unaudited) |
| | |
| Small-Cap Momentum Fund | | |
| SCHEDULE OF INVESTMENTS (continued) | | |
| Showing percentage of net assets as of December 31, 2017 (Unaudited) | | |
| | | | | | |
Industry Company | | Shares | | Value | | |
| |
Common Stocks (continued) | | |
Financials (continued) | | |
Employers Holdings, Inc. | | 465 | | $20,646 | | |
Enterprise Bancorp, Inc.+ | | 150 | | 5,108 | | |
Equity Bancshares, Inc., Class A* | | 150 | | 5,312 | | |
Farmers Capital Bank Corp. | | 100 | | 3,850 | | |
Farmers National Banc Corp. | | 350 | | 5,162 | | |
Federal Agricultural Mortgage Corp., Class C | | 150 | | 11,736 | | |
First Bancorp, Inc.+ | | 150 | | 4,084 | | |
First Financial Corp. | | 150 | | 6,802 | | |
First Guaranty Bancshares, Inc.+ | | 109 | | 2,725 | | |
First Internet Bancorp | | 120 | | 4,578 | | |
FirstCash, Inc. | | 660 | | 44,517 | | |
FS Bancorp, Inc. | | 50 | | 2,728 | | |
German American Bancorp, Inc. | | 300 | | 10,599 | | |
Great Ajax Corp. | | 250 | | 3,455 | | |
Great Southern Bancorp, Inc. | | 200 | | 10,330 | | |
Green Bancorp, Inc.* | | 505 | | 10,252 | | |
Green Dot Corp., Class A* | | 675 | | 40,676 | | |
Guaranty Bancorp | | 410 | | 11,336 | | |
Heritage Commerce Corp. | | 500 | | 7,660 | | |
Heritage Financial Corp. | | 400 | | 12,320 | | |
Hingham Institution for Savings | | 30 | | 6,210 | | |
Home Bancorp, Inc. | | 100 | | 4,322 | | |
Horizon Bancorp | | 350 | | 9,730 | | |
Houlihan Lokey, Inc. | | 365 | | 16,582 | | |
Independent Bank Corp. MA | | 375 | | 26,194 | | |
Kemper Corp. | | 700 | | 48,230 | | |
Kinsale Capital Group, Inc. | | 265 | | 11,925 | | |
LendingTree, Inc.*+ | | 160 | | 54,472 | | |
MBT Financial Corp. | | 300 | | 3,180 | | |
Moelis & Co., Class A | | 475 | | 23,038 | | |
MutualFirst Financial, Inc. | | 100 | | 3,855 | | |
National Bank Holdings Corp., Class A | | 350 | | 11,350 | | |
National Bankshares, Inc. | | 100 | | 4,545 | | |
National Commerce Corp.* | | 175 | | 7,044 | | |
National Western Life Group, Inc., Class A | | 45 | | 14,896 | | |
Navigators Group, Inc. (The) | | 400 | | 19,480 | | |
Nicolet Bankshares, Inc.* | | 125 | | 6,842 | | |
NMI Holdings, Inc., Class A* | | 750 | | 12,750 | | |
Northeast Bancorp | | 100 | | 2,315 | | |
Northrim BanCorp, Inc. | | 100 | | 3,385 | | |
Oaktree Specialty Lending Corp. | | 1,850 | | 9,046 | | |
OceanFirst Financial Corp. | | 450 | | 11,812 | | |
| | | | | | |
| | | | | | |
| | | | | | |
| | | | | | |
| | | | | | |
| | | | | | |
| | | | | | |
| | | | | | | | |
Industry Company | | | Shares | | | | Value | |
|
Financials (continued) | |
Ohio Valley Banc Corp. | | | 50 | | | $ | 2,020 | |
Old Second Bancorp, Inc. | | | 400 | | | | 5,460 | |
Orchid Island Capital, Inc.+ | | | 600 | | | | 5,568 | |
Pacific Mercantile Bancorp* | | | 300 | | | | 2,625 | |
Peoples Bancorp of North Carolina, Inc. | | | 55 | | | | 1,688 | |
Peoples Financial Services Corp. | | | 100 | | | | 4,658 | |
People’s Utah Bancorp | | | 250 | | | | 7,575 | |
Preferred Bank | | | 180 | | | | 10,580 | |
Premier Financial Bancorp, Inc. | | | 150 | | | | 3,012 | |
Prudential Bancorp, Inc. | | | 100 | | | | 1,760 | |
Pzena Investment Management, Inc., Class A | | | 250 | | | | 2,668 | |
QCR Holdings, Inc. | | | 170 | | | | 7,284 | |
Regional Management Corp.* | | | 150 | | | | 3,946 | |
Reliant Bancorp, Inc. | | | 100 | | | | 2,564 | |
Republic First Bancorp, Inc.*+ | | | 800 | | | | 6,760 | |
Riverview Bancorp, Inc. | | | 300 | | | | 2,601 | |
S&T Bancorp, Inc. | | | 450 | | | | 17,914 | |
Safeguard Scientifics, Inc.* | | | 250 | | | | 2,800 | |
SI Financial Group, Inc. | | | 150 | | | | 2,205 | |
Southern First Bancshares, Inc.*+ | | | 100 | | | | 4,125 | |
Southern Missouri Bancorp, Inc. | | | 100 | | | | 3,759 | |
Summit Financial Group, Inc. | | | 150 | | | | 3,948 | |
TCF Financial Corp. | | | 2,300 | | | | 47,150 | |
Timberland Bancorp, Inc. | | | 100 | | | | 2,655 | |
Triumph Bancorp, Inc.* | | | 300 | | | | 9,450 | |
Union Bankshares, Inc./Morrisville VT+ | | | 50 | | | | 2,648 | |
United Community Financial Corp. | | | 650 | | | | 5,934 | |
United Fire Group, Inc. | | | 350 | | | | 15,953 | |
United Security Bancshares | | | 200 | | | | 2,200 | |
Unity Bancorp, Inc. | | | 150 | | | | 2,962 | |
Veritex Holdings, Inc.* | | | 300 | | | | 8,277 | |
West Bancorporation, Inc.+ | | | 200 | | | | 5,030 | |
| | | | | | | | |
| | | | | | | 918,248 | |
Health Care - 14.95% | |
Adamas Pharmaceuticals, Inc.*+ | | | 300 | | | | 10,167 | |
AngioDynamics, Inc.* | | | 500 | | | | 8,315 | |
Anika Therapeutics, Inc.* | | | 200 | | | | 10,782 | |
Atrion Corp. | | | 25 | | | | 15,765 | |
| | |
| Small-Cap Momentum Fund | |
|
| SCHEDULE OF INVESTMENTS (continued) | |
| Showing percentage of net assets as of December 31, 2017 (Unaudited) | | |
| | | | | | |
Industry Company | | Shares | | Value | | |
| |
Common Stocks (continued) | | |
Health Care (continued) | | |
Audentes Therapeutics, Inc.* | | 400 | | $12,500 | | |
AxoGen, Inc.*+ | | 450 | | 12,735 | | |
Blueprint Medicines Corp.* | | 550 | | 41,476 | | |
ChromaDex Corp.*+ | | 650 | | 3,822 | | |
Civitas Solutions, Inc.* | | 500 | | 8,550 | | |
CONMED Corp. | | 400 | | 20,388 | | |
CorVel Corp.* | | 250 | | 13,225 | | |
CryoLife, Inc.* | | 420 | | 8,043 | | |
CryoPort, Inc.* | | 350 | | 3,006 | | |
Cutera, Inc.* | | 165 | | 7,483 | | |
Dynavax Technologies Corp.*+ | | 850 | | 15,895 | | |
Emergent BioSolutions, Inc.* | | 550 | | 25,558 | | |
Enanta Pharmaceuticals, Inc.* | | 250 | | 14,670 | | |
Ensign Group, Inc. (The) | | 700 | | 15,540 | | |
Enzo Biochem, Inc.* | | 600 | | 4,890 | | |
Globus Medical, Inc., Class A* | | 975 | | 40,072 | | |
Haemonetics Corp.* | | 700 | | 40,656 | | |
Halyard Health, Inc.* | | 650 | | 30,017 | | |
Immunomedics, Inc.* | | 2,150 | | 34,744 | | |
Inogen, Inc.* | | 290 | | 34,533 | | |
Intersect ENT, Inc.* | | 400 | | 12,960 | | |
K2M Group Holdings, Inc.* | | 545 | | 9,810 | | |
LHC Group, Inc.* | | 235 | | 14,394 | | |
Ligand Pharmaceuticals, Inc.*+ | | 300 | | 41,079 | | |
Magellan Health, Inc.* | | 300 | | 28,965 | | |
Marinus Pharmaceuticals, Inc.* | | 500 | | 4,080 | | |
Merit Medical Systems, Inc.* | | 700 | | 30,240 | | |
Myriad Genetics, Inc.* | | 950 | | 32,628 | | |
National Research Corp., Class A | | 120 | | 4,476 | | |
Neogen Corp.* | | 500 | | 41,105 | | |
Novocure, Ltd.*+ | | 1,135 | | 22,927 | | |
OraSure Technologies, Inc.* | | 750 | | 14,145 | | |
Orthofix International N.V.* | | 250 | | 13,675 | | |
Phibro Animal Health Corp., Class A | | 250 | | 8,375 | | |
Providence Service Corp. (The)* | | 200 | | 11,868 | | |
Repligen Corp.* | | 600 | | 21,768 | | |
Revance Therapeutics, Inc.* | | 400 | | 14,300 | | |
Sangamo Biosciences, Inc.*+ | | 1,100 | | 18,040 | | |
Select Medical Holdings Corp.* | | 1,800 | | 31,770 | | |
Simulations Plus, Inc.+ | | 200 | | 3,220 | | |
Supernus Pharmaceuticals, Inc.* | | 700 | | 27,895 | | |
| | | | | | |
| | | | | | |
| | | | | | |
| | | | | | | | |
Industry Company | | | Shares | | | | Value | |
|
Health Care (continued) | |
Utah Medical Products, Inc. | | | 50 | | | $ | 4,070 | |
Vocera Communications, Inc.* | | | 415 | | | | 12,541 | |
| | | | | | | | |
| | | | | | | 857,163 | |
| | |
Industrials - 12.58% | | | | | | | | |
Advanced Disposal | | | | | | | | |
Services, Inc.* | | | 1,200 | | | | 28,728 | |
Aerovironment, Inc.* | | | 300 | | | | 16,848 | |
Alamo Group, Inc. | | | 150 | | | | 16,931 | |
Albany International Corp., Class A | | | 395 | | | | 24,273 | |
Ameresco, Inc., Class A* | | | 350 | | | | 3,010 | |
Argan, Inc. | | | 200 | | | | 9,000 | |
CAI International, Inc.* | | | 250 | | | | 7,080 | |
Casella Waste Systems, Inc., Class A* | | | 550 | | | | 12,661 | |
CBIZ, Inc.* | | | 750 | | | | 11,588 | |
Cogint, Inc.*+ | | | 800 | | | | 3,520 | |
CSW Industrials, Inc.* | | | 200 | | | | 9,190 | |
Daseke, Inc.*+ | | | 600 | | | | 8,574 | |
Douglas Dynamics, Inc. | | | 300 | | | | 11,340 | |
Ennis, Inc. | | | 350 | | | | 7,262 | |
EnPro Industries, Inc. | | | 275 | | | | 25,715 | |
Federal Signal Corp. | | | 800 | | | | 16,072 | |
Forrester Research, Inc. | | | 250 | | | | 11,050 | |
GATX Corp. | | | 525 | | | | 32,634 | |
Gencor Industries, Inc.* | | | 150 | | | | 2,482 | |
GP Strategies Corp.* | | | 200 | | | | 4,640 | |
H&E Equipment Services, Inc. | | | 500 | | | | 20,325 | |
Hardinge, Inc. | | | 200 | | | | 3,484 | |
Herman Miller, Inc. | | | 850 | | | | 34,042 | |
Hurco Cos., Inc. | | | 75 | | | | 3,165 | |
Kadant, Inc. | | | 150 | | | | 15,060 | |
KBR, Inc. | | | 1,825 | | | | 36,190 | |
Kelly Services, Inc., Class A | | | 500 | | | | 13,635 | |
Kimball International, Inc., Class B | | | 500 | | | | 9,335 | |
Korn/Ferry International | | | 800 | | | | 33,104 | |
McGrath RentCorp | | | 350 | | | | 16,443 | |
Multi-Color Corp. | | | 300 | | | | 22,455 | |
NN, Inc. | | | 400 | | | | 11,040 | |
NV5 Global, Inc.* | | | 150 | | | | 8,122 | |
PGT, Inc.* | | | 650 | | | | 10,952 | |
Primoris Services Corp. | | | 700 | | | | 19,033 | |
RBC Bearings, Inc.* | | | 350 | | | | 44,240 | |
RPX Corp. | | | 650 | | | | 8,736 | |
Saia, Inc.* | | | 350 | | | | 24,762 | |
Sterling Construction Co., Inc.* | | | 300 | | | | 4,884 | |
| | |
| 40 | | Semi-Annual Report | December 31, 2017 (Unaudited) |
| | |
| Small-Cap Momentum Fund | | |
| SCHEDULE OF INVESTMENTS (continued) | | |
| Showing percentage of net assets as of December 31, 2017 (Unaudited) | | |
| | | | | | |
Industry Company | | Shares | | Value | | |
| |
Common Stocks (continued) | | |
Industrials (continued) | | | | | | |
Sun Hydraulics Corp. | | 350 | | $22,642 | | |
TPI Composites, Inc.* | | 450 | | 9,207 | | |
TriNet Group, Inc.* | | 950 | | 42,123 | | |
Universal Truckload Services, Inc. | | 350 | | 8,312 | | |
Werner Enterprises, Inc. | | 970 | | 37,490 | | |
| | | | | | |
| | | | 721,379 | | |
| |
Information Technology - 19.61% | | |
ADTRAN, Inc. | | 650 | | 12,578 | | |
Alarm.com Holdings, Inc.* | | 650 | | 24,538 | | |
Amtech Systems, Inc.* | | 200 | | 2,014 | | |
Appfolio, Inc., Class A* | | 220 | | 9,130 | | |
AVX Corp. | | 2,295 | | 39,704 | | |
Badger Meter, Inc. | | 370 | | 17,686 | | |
Belden, Inc. | | 575 | | 44,373 | | |
Blucora, Inc.* | | 610 | | 13,481 | | |
Bottomline Technologies, Inc.* | | 550 | | 19,074 | | |
Callidus Software, Inc.* | | 910 | | 26,072 | | |
CEVA, Inc.* | | 275 | | 12,691 | | |
Cision, Ltd.* | | 1,650 | | 19,586 | | |
CommerceHub, Inc., Class C* | | 600 | | 12,354 | | |
Comtech Telecommunications Corp. | | 300 | | 6,636 | | |
Daktronics, Inc. | | 600 | | 5,478 | | |
Descartes Systems Group, Inc. (The)* | | 1,050 | | 29,820 | | |
Diodes, Inc.* | | 650 | | 18,636 | | |
Electro Scientific Industries, Inc.* | | 450 | | 9,644 | | |
Everbridge, Inc.* | | 400 | | 11,888 | | |
Everi Holdings, Inc.* | | 850 | | 6,409 | | |
ExlService Holdings, Inc.* | | 450 | | 27,158 | | |
Extreme Networks, Inc.* | | 1,550 | | 19,406 | | |
Glu Mobile, Inc.* | | 1,850 | | 6,734 | | |
GTT Communications, Inc.*+ | | 600 | | 28,170 | | |
Hortonworks, Inc.* | | 950 | | 19,104 | | |
Internap Corp.* | | 1,100 | | 17,281 | | |
Iteris, Inc.* | | 400 | | 2,788 | | |
Ituran Location And Control, Ltd. | | 300 | | 10,260 | | |
KEMET Corp.* | | 750 | | 11,295 | | |
Kimball Electronics, Inc.* | | 350 | | 6,388 | | |
Limelight Networks, Inc.* | | 1,400 | | 6,174 | | |
Methode Electronics, Inc. | | 500 | | 20,050 | | |
Novanta, Inc.* | | 475 | | 23,750 | | |
Orbotech, Ltd.* | | 650 | | 32,656 | | |
Power Integrations, Inc. | | 430 | | 31,626 | | |
| | | | | | |
| | | | | | |
| | | | | | |
| | | | | | |
| | | | | | |
| | | | | | |
| | | | | | |
| | | | | | |
| | | | | | |
| | | | | | |
| | | | | | |
| | | | | | |
| | | | | | |
| | | | | | |
| | | | | | |
| | | | | | |
| | | | | | |
| | | | | | | | |
Industry Company | | | Shares | | | | Value | |
|
Information Technology (continued) | |
Progress Software Corp. | | | 650 | | | $ | 27,670 | |
QAD, Inc., Class A | | | 250 | | | | 9,712 | |
Qualys, Inc.* | | | 530 | | | | 31,456 | |
QuinStreet, Inc.* | | | 650 | | | | 5,447 | |
Radware, Ltd.* | | | 600 | | | | 11,640 | |
Rambus, Inc.* | | | 1,450 | | | | 20,619 | |
Ribbon Communications, Inc.* | | | 1,350 | | | | 10,436 | |
RingCentral, Inc., Class A*+ | | | 865 | | | | 41,866 | |
Rogers Corp.* | | | 255 | | | | 41,290 | |
Rudolph Technologies, Inc.* | | | 450 | | | | 10,755 | |
Semtech Corp.* | | | 900 | | | | 30,780 | |
SolarEdge Technologies, Inc.* | | | 600 | | | | 22,530 | |
Stamps.com, Inc.* | | | 250 | | | | 47,000 | |
Systemax, Inc. | | | 510 | | | | 16,968 | |
Tech Data Corp.* | | | 500 | | | | 48,985 | |
Tower Semiconductor, Ltd.*+ | | | 1,250 | | | | 42,600 | |
Travelport Worldwide, Ltd. | | | 1,685 | | | | 22,023 | |
Upland Software, Inc.*+ | | | 300 | | | | 6,498 | |
USA Technologies, Inc.* | | | 750 | | | | 7,312 | |
Varonis Systems, Inc.* | | | 350 | | | | 16,992 | |
Vishay Intertechnology, Inc. | | | 1,810 | | | | 37,558 | |
XO Group, Inc.* | | | 350 | | | | 6,461 | |
| | | | | | | | |
Zix Corp.* | | | 750 | | | | 3,285 | |
| | | | | | | 1,124,515 | |
| | |
Materials - 5.76% | | | | | | | | |
AdvanSix, Inc.* | | | 400 | | | | 16,828 | |
American Vanguard Corp. | | | 400 | | | | 7,860 | |
Core Molding Technologies, Inc. | | | 100 | | | | 2,170 | |
Domtar Corp. | | | 850 | | | | 42,092 | |
Ferroglobe PLC | | | 2,290 | | | | 37,098 | |
FutureFuel Corp. | | | 525 | | | | 7,397 | |
IAMGOLD Corp.* | | | 6,220 | | | | 36,263 | |
Ingevity Corp.* | | | 575 | | | | 40,520 | |
Intrepid Potash, Inc.*+ | | | 1,800 | | | | 8,568 | |
KapStone Paper & Packaging Corp. | | | 1,300 | | | | 29,497 | |
Myers Industries, Inc. | | | 400 | | | | 7,800 | |
Osisko Gold Royalties, Ltd. | | | 2,100 | | | | 24,276 | |
Summit Materials, Inc., Class A* | | | 1,495 | | | | 47,003 | |
Trecora Resources* | | | 300 | | | | 4,050 | |
U.S. Concrete, Inc.*+ | | | 225 | | | | 18,821 | |
| | | | | | | | |
| | | | | | | 330,243 | |
| | |
| Small-Cap Momentum Fund | |
|
| SCHEDULE OF INVESTMENTS (continued) | |
| Showing percentage of net assets as of December 31, 2017 (Unaudited) | | |
| | | | | | | | | | |
Industry Company | | | Shares | | | | Value | | | |
| |
Common Stocks (continued) | | | |
Real Estate - 8.40% | | | |
Ashford Hospitality Trust, Inc. | | | 1,300 | | | $ | 8,749 | | | |
CareTrust REIT, Inc. | | | 1,045 | | | | 17,514 | | | |
DiamondRock Hospitality Co. | | | 2,700 | | | | 30,483 | | | |
EastGroup Properties, Inc. | | | 450 | | | | 39,771 | | | |
FirstService Corp. | | | 450 | | | | 31,464 | | | |
Four Corners Property Trust, Inc. | | | 800 | | | | 20,560 | | | |
Getty Realty Corp. | | | 550 | | | | 14,938 | | | |
Gladstone Land Corp. | | | 150 | | | | 2,014 | | | |
Global Medical REIT, Inc.+ | | | 300 | | | | 2,460 | | | |
HFF, Inc., Class A | | | 550 | | | | 26,752 | | | |
Independence Realty Trust, Inc. | | | 1,150 | | | | 11,604 | | | |
InfraREIT, Inc.* | | | 800 | | | | 14,864 | | | |
Monmouth Real Estate Investment Corp. | | | 1,000 | | | | 17,800 | | | |
Nam Tai Property, Inc. | | | 500 | | | | 6,275 | | | |
National Health Investors, Inc. | | | 550 | | | | 41,459 | | | |
NexPoint Residential Trust, Inc. | | | 300 | | | | 8,382 | | | |
NorthStar Realty Europe Corp. | | | 750 | | | | 10,072 | | | |
Preferred Apartment Communities, Inc., Class A | | | 450 | | | | 9,112 | | | |
RE/MAX Holdings, Inc., Class A | | | 225 | | | | 10,912 | | | |
Realogy Holdings Corp.+ | | | 1,800 | | | | 47,700 | | | |
Rexford Industrial Realty, Inc. | | | 1,050 | | | | 30,618 | | | |
Stratus Properties, Inc. | | | 100 | | | | 2,970 | | | |
Terreno Realty Corp. | | | 715 | | | | 25,068 | | | |
Tier REIT, Inc. | | | 650 | | | | 13,254 | | | |
UMH Properties, Inc. | | | 400 | | | | 5,960 | | | |
Xenia Hotels & Resorts, Inc. | | | 1,450 | | | | 31,306 | | | |
| | | | | | | | | | |
| | | | | | | 482,061 | | | |
| |
Telecommunication Services - 2.48% | | | |
Boingo Wireless, Inc.* | | | 550 | | | | 12,375 | | | |
Cogent Communications Holdings, Inc. | | | 625 | | | | 28,313 | | | |
ORBCOMM, Inc.*+ | | | 1,000 | | | | 10,180 | | | |
Shenandoah Telecommunications Co. | | | 650 | | | | 21,970 | | | |
Telephone & Data Systems, Inc. | | | 1,400 | | | | 38,920 | | | |
| | | | | | | | |
Industry Company | | | Shares | | | | Value | |
|
Telecommunication Services (continued) | |
Vonage Holdings Corp.* | | | 3,025 | | | $ | 30,764 | |
| | | | | | | | |
| | | | | | | 142,522 | |
Utilities - 3.76% | | | | | | | | |
8Point3 Energy Partners LP | | | 400 | | | | 6,084 | |
American States Water Co. | | | 500 | | | | 28,955 | |
Global Water Resources, Inc. | | | 250 | | | | 2,335 | |
Just Energy Group, Inc. | | | 1,950 | | | | 8,366 | |
Kenon Holdings, Ltd./Singapore* | | | 700 | | | | 15,155 | |
Middlesex Water Co. | | | 200 | | | | 7,982 | |
Northwest Natural Gas Co. | | | 400 | | | | 23,860 | |
Otter Tail Corp. | | | 550 | | | | 24,448 | |
PNM Resources, Inc. | | | 1,065 | | | | 43,079 | |
Pure Cycle Corp.* | | | 300 | | | | 2,505 | |
RGC Resources, Inc.+ | | | 100 | | | | 2,708 | |
SJW Group | | | 280 | | | | 17,872 | |
TerraForm Power, Inc., Class A | | | 2,000 | | | | 23,920 | |
Unitil Corp. | | | 180 | | | | 8,212 | |
| | | | | | | | |
| | | | | | | 215,481 | |
| | | | | | | | |
| TOTAL COMMON STOCKS - 99.91% | | | | 5,729,550 | |
| | | | | | | | |
| (Cost $5,349,645) | | | | | |
|
EXCHANGE TRADED FUND - 0.03% | |
iShares Russell 2000 ETF | | | 10 | | | | 1,525 | |
| | | | | | | | |
| TOTAL EXCHANGE TRADED FUND - 0.03% | | | | 1,525 | |
| | | | | | | | |
| (Cost $1,516) | | | | | |
| | | | | | | | | | | | |
| | | Rate^ | | | Shares | | | Value | |
| | | |
MONEY MARKET FUND - 0.23% | | | | | | | | | | | | |
Fidelity Investments Money Market Government Portfolio Class I | | | 1.14 | % | | | 13,447 | | | | 13,447 | |
| | | | | | | | | | | | |
TOTAL MONEY MARKET FUND - 0.23% | | | | 13,447 | |
| | | | | | | | | | | | |
(Cost $13,447) | | | | | | | | | | | | |
| | |
| 42 | | Semi-Annual Report | December 31, 2017 (Unaudited) |
| | |
| Small-Cap Momentum Fund | |
|
| SCHEDULE OF INVESTMENTS (continued) | |
| | |
| | | | | | | | | | | | |
| | | Rate^ | | | Shares | | | Value | |
|
| INVESTMENTS PURCHASED WITH CASH PROCEEDS FROM SECURITIES LENDING - 10.40% | |
Fidelity Investments Money Market Government Portfolio Class I** | | | 1.14% | | | | 596,337 | | | | $596,337 | |
| | | | | | | | | | | | |
TOTAL INVESTMENTS PURCHASED WITH CASH PROCEEDS FROM SECURITIES LENDING -10.40% | | | | 596,337 | |
| | | | | | | | | | | | |
(Cost $ 596,337) | | | | | | | | | | | | |
| |
TOTAL INVESTMENTS - 110.57% | | | | $6,340,859 | |
(Cost $ 5,960,945) | | | | | | | | | | | | |
Liabilities in Excess of Other Assets - (10.57%) | | | | (606,281) | |
| | | | | | | | | | | | |
NET ASSETS - 100.00% | | | | $5,734,578 | |
| | | | | | | | | | | | |
| * | Non-income producing security. |
| ** | This security represents the investment of the collateral received in connection with securities out on loan as of December 31, 2017. |
| ^ | Rate disclosed as of December 31, 2017. |
| + | This security or a portion of the security is out on loan as of December 31, 2017. Total loaned securities had a value of $577,152 as of December 31, 2017. |
PLC - Public Limited Company
Summary of inputs used to value the Fund’s investments as of 12/31/2017 (See Note 2 in Notes to Financial Statements):
| | | | | | | | | | | | | | | | |
| |
| | | Valuation Inputs | |
| | | Investment in Securities (Value) | |
| | | Level 1
Quoted
Prices | | | Level 2
Significant
Observable
Inputs | | | Level 3
Significant
Unobservable
Inputs | | | Total | |
| | | | |
Common Stocks | | $ | 5,729,550 | | | $ | — | | | $ | — | | | $ | 5,729,550 | |
Exchange Traded Fund | | | 1,525 | | | | — | | | | — | | | | 1,525 | |
Money Market Fund | | | — | | | | 13,447 | | | | — | | | | 13,447 | |
Investments Purchased with Cash Proceeds from Securities Lending | | | — | | | | 596,337 | | | | — | | | | 596,337 | |
| | | | | | | | | | | | | | | | |
TOTAL | | $ | 5,731,075 | | | $ | 609,784 | | | $ | — | | | $ | 6,340,859 | |
| | | | | | | | | | | | | | | | |
See Notes to Financial Statements.
| | |
| Small-Cap Growth Fund | | |
| MANAGER’S COMMENTARY (Unaudited) | | |
| | |
December 31, 2017
Dear Fellow Small-Cap Growth Fund Shareholder,
For the quarter ended December 31, 2017, our Fund gained +4.12%, underperforming our primary market benchmark, the Russell 2000 Growth Index (+4.59%), and our peer benchmark, the Lipper Small-Cap Growth Funds Index (+6.17%).
For the six-month semi-annual period ended December 31, 2017, the Fund returned +11.22%, outperforming the Russell 2000 Growth Index (+11.09%), but lagging the Lipper Small-Cap Growth Funds Index (+12.43%).
For the calendar year, the Fund returned +19.62%, trailing both the Russell 2000 Growth Index (+22.17%) and the Lipper Small-Cap Growth Funds Index (+24.77%).
The table below presents our December quarter, six-month, one-year, five-year, 10-year, and inception-to-date financial results. See the next page for a graph of performance since inception.
Standardized Returns as of December 31, 2017
| | | | | | | | | | | | | | | | | | | | | | | | |
| | | | | | | | | | | | Annualized | | | | |
| | | Quarter | | | 6 Months | | | 1 Year | | | 5 Years | | | 10 Years | | | Since Inception
(10/31/03) | |
| | | | | | |
Small-Cap Growth Fund | | | 4.12% | | | | 11.22% | | | | 19.62% | | | | 18.10% | | | | 6.30% | | | | 7.56% | |
Russell 2000 Growth Index | | | 4.59% | | | | 11.09% | | | | 22.17% | | | | 15.21% | | | | 9.19% | | | | 9.48% | |
Lipper Small-Cap Growth Funds Index | | | 6.17% | | | | 12.43% | | | | 24.77% | | | | 13.92% | | | | 7.84% | | | | 8.31% | |
Performance figures quoted in the table above represent past performance and are no guarantee of future results. Total return figures in the table above include the reinvestment of dividends and capital gains. The table above does not reflect the deduction of taxes that a shareholder would pay on Fund distributions or on the redemption of Fund shares.
The Russell 2000 Growth Index is an unmanaged index that consists of stocks in the Russell 2000 Index with higher price-to-book ratios and higher forecasted growth values with dividends reinvested. The Lipper Small-Cap Growth Funds Index is an index of small-company, growth-oriented funds compiled by Lipper, Inc. It is not possible to invest directly in an index. Periods longer than one year are annualized.
According to data from Lipper, Inc. as of December 31, 2017, Small-Cap Growth Fund ranked 382nd of 558 small-cap growth funds for the 12 months ended December 31, 2017, 13th of 457 over the last five years, 302nd of 342 over the last 10 years, and 199th of 228 such funds since inception in October 2003. Lipper, Inc. is an independent mutual fund rating service that ranks funds in various fund categories by making comparative calculations using total returns.
| | |
| 44 | | Semi-Annual Report | December 31, 2017 (Unaudited) |
| | |
| Small-Cap Growth Fund | | |
| MANAGER’S COMMENTARY (Unaudited) (continued) | | |
| | |
Growth of a $10,000 Investment
from Inception October 31, 2003 to December 31, 2017
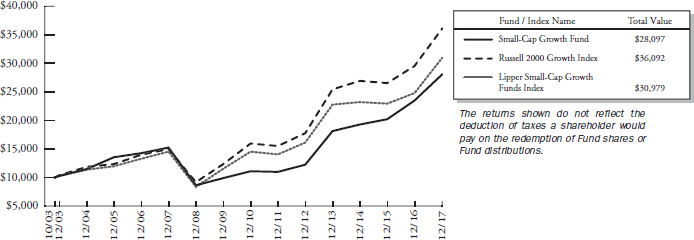
Detailed Explanation of Quarterly Performance
The Fund’s company financial health category of models underperformed the benchmark during the quarter, which weighed on relative returns. The Fund’s tilt toward smaller companies also dragged on relative performance. These losses were partly offset by outperformance of the Fund’s diversifying value metrics and price momentum models.
The Fund’s sector allocation effect was slightly positive, with an overweighting in the Consumer Discretionary sector contributing the most to relative returns. However, the Fund’s stock selection effect was negative, with holdings in the Information Technology and Health Care sectors detracting the most from relative returns. These losses were partly offset by strong performance from holdings in the Consumer Discretionary and Industrials sectors.
Detailed Explanation of Calendar Year Performance
The Fund’s diversifying value metrics models significantly underperformed the benchmark and detracted from relative performance. Increased core exposure (as measured by multiple value metrics) also hurt relative results during a period when value stocks generally underperformed growth stocks. The Fund’s tilt toward smaller companies detracted as well. Our primary company financial health and diversifying price momentum models helped offset some of those negative impacts. The Fund’s tilt toward higher momentum stocks also added to relative results.
The Fund’s sector allocation effect was slightly positive, with underweighting in the Energy, Telecommunication Services, and Consumer Staples sectors adding to relative returns. However, the stock selection effect was negative, with holdings in the Information Technology, Health Care, and Financials sectors detracting the most from relative performance, while holdings in the Consumer Discretionary and Consumer Staples sectors added to relative performance.
| | |
| Small-Cap Growth Fund | |
|
| MANAGER’S COMMENTARY (Unaudited) (continued) | |
| | |
Top Ten Holdings as of December 31, 2017
| | | | | | | | |
| Rank | | Description | | Industry | | % of Net
Assets | |
| 1 | | Builders FirstSource, Inc. | | Industrials | | | 1.6% | |
| 2 | | Versartis, Inc. | | Health Care | | | 1.6% | |
| 3 | | Children’s Place, Inc. (The) | | Consumer Discretionary | | | 1.6% | |
| 4 | | Harsco Corp. | | Industrials | | | 1.6% | |
| 5 | | SPX Corp. | | Industrials | | | 1.6% | |
| 6 | | Extreme Networks, Inc. | | Information Technology | | | 1.5% | |
| 7 | | Financial Engines, Inc. | | Financials | | | 1.5% | |
| 8 | | PCM, Inc. | | Information Technology | | | 1.5% | |
| 9 | | Installed Building Products, Inc. | | Consumer Discretionary | | | 1.5% | |
| 10 | | Walker & Dunlop, Inc. | | Financials | | | 1.5% | |
| | | |
| | Total | | | | | 15.5% | |
Industry Sector Representation as of December 31, 2017
| | | | | | | | | | | | |
| | | % of Net Assets | | | % of Russell 2000
Growth Index | | | Difference | |
Consumer Discretionary | | | 16.7% | | | | 14.0% | | | | 2.7% | |
Consumer Staples | | | 0.7% | | | | 2.8% | | | | -2.1% | |
Energy | | | 0.6% | | | | 1.4% | | | | -0.8% | |
Financials | | | 7.5% | | | | 6.1% | | | | 1.4% | |
Health Care | | | 21.6% | | | | 23.8% | | | | -2.2% | |
Industrials | | | 21.1% | | | | 18.4% | | | | 2.7% | |
Information Technology | | | 23.0% | | | | 23.8% | | | | -0.8% | |
Materials | | | 1.7% | | | | 4.6% | | | | -2.9% | |
Real Estate | | | 4.9% | | | | 3.3% | | | | 1.6% | |
Telecommunication Services | | | 0.0% | | | | 1.0% | | | | -1.0% | |
Utilities | | | 0.7% | | | | 0.8% | | | | -0.1% | |
Cash & Other Assets | | | 1.5% | | | | 0.0% | | | | 1.5% | |
| | | |
Total | | | 100.0% | | | | 100.0% | | | | | |
Disclaimer
The views expressed here are exclusively those of Fund management. These views, including those related to market sectors or individual stocks, are not meant as investment advice and should not be considered predictive in nature. Any favorable (or unfavorable) description of a holding applies only as of the quarter end, December 31, 2017, unless otherwise stated. Security positions can and do change thereafter. Discussions of historical performance do not guarantee and may not be indicative of future performance.
Market volatility can significantly impact short-term performance. The Fund is not an appropriate investment for short-term investors. Investments in small companies generally carry greater risk than is customarily associated with larger companies. This additional risk is attributable to a number of factors, including the relatively limited financial resources that are typically available to small companies and the fact that small companies often have comparatively limited product lines. In addition, the stock of small companies tends to be more volatile than the stock of large companies, particularly in the short term and particularly in the early stages of an economic or market downturn. Shareholders of the Fund, therefore, are taking on more risk than they would if they invested in the stock market as a whole.
| | |
| 46 | | Semi-Annual Report | December 31, 2017 (Unaudited) |
| | |
| Small-Cap Growth Fund | | |
| MANAGER’S COMMENTARY (Unaudited) (continued) | | |
| | |
Conclusion
Thank you for your continued investment in Small-Cap Growth Fund. We encourage your feedback; your reactions and concerns are important to us.
Sincerely,
The Investment Management Team
| | |
| Small-Cap Growth Fund | |
|
| SCHEDULE OF INVESTMENTS | |
| Showing percentage of net assets as of December 31, 2017 (Unaudited) | | |
| | | | | | |
| Industry Company | | Shares | | Value | | |
| |
COMMON STOCKS - 98.35% | | |
| Consumer Discretionary - 16.65% | | |
Big Lots, Inc.+ | | 5,900 | | $ 331,285 | | |
BJ’s Restaurants, Inc. | | 9,000 | | 327,600 | | |
Children’s Place, Inc.
(The)+ | | 5,500 | | 799,425 | | |
Dave & Buster’s Entertainment, Inc.* | | 9,600 | | 529,632 | | |
Groupon, Inc.* | | 139,700 | | 712,470 | | |
Installed Building Products, Inc.* | | 10,100 | | 767,095 | | |
LCI Industries | | 5,300 | | 689,000 | | |
LGI Homes, Inc.* | | 10,100 | | 757,803 | | |
Noodles & Co.*+ | | 128,100 | | 672,525 | | |
Papa John’s International, Inc.+ | | 6,600 | | 370,326 | | |
Pinnacle Entertainment, Inc.* | | 5,900 | | 193,107 | | |
RH*+ | | 7,000 | | 603,470 | | |
Sinclair Broadcast Group, Inc., Class A+ | | 10,900 | | 412,565 | | |
Sturm Ruger & Co., Inc.+ | | 5,600 | | 312,760 | | |
Tailored Brands, Inc. | | 15,600 | | 340,548 | | |
ZAGG, Inc.* | | 31,300 | | 577,485 | | |
| | | | | | |
| | | |
| | | | 8,397,096 | | |
| |
Consumer Staples - 0.69% | | |
Medifast, Inc. | | 5,000 | | 349,050 | | |
| |
Energy - 0.55% | | |
Carrizo Oil & Gas, Inc.*+ | | 6,500 | | 138,320 | | |
Matador Resources Co.* | | 4,500 | | 140,085 | | |
| | | | | | |
| | | |
| | | | 278,405 | | |
| |
Financials - 7.49% | | |
Artisan Partners Asset Management, Inc., Class A | | 3,200 | | 126,400 | | |
Diamond Hill Investment Group, Inc. | | 2,100 | | 433,986 | | |
Enova International, Inc.* | | 48,800 | | 741,760 | | |
Evercore, Inc. Class A | | 6,400 | | 576,000 | | |
Financial Engines, Inc. | | 25,400 | | 769,620 | | |
Meridian Bancorp, Inc. | | 11,900 | | 245,140 | | |
OM Asset Management, PLC | | 7,600 | | 127,300 | | |
Walker & Dunlop, Inc.* | | 16,000 | | 760,000 | | |
| | | | | | |
| | | |
| | | | 3,780,206 | | |
| |
Health Care - 21.63% | | |
Abaxis, Inc. | | 15,300 | | 757,656 | | |
BioTelemetry, Inc.* | | 6,000 | | 179,400 | | |
Cambrex Corp.* | | 14,400 | | 691,200 | | |
Chemed Corp. | | 800 | | 194,416 | | |
Corcept Therapeutics, Inc.*+ | | 36,300 | | 655,578 | | |
| | | | | | |
| | | | | | |
| | | | | | |
| | | | | | |
| | | | | | |
| | | | | | |
| | | | | | |
| | | | | | |
| | | | | | |
| | | | | | |
| | | | | | |
| | | | | | | | |
| Industry Company | | Shares | | | Value | |
|
| |
Health Care (continued) | |
Eagle Pharmaceuticals, Inc.*+ | | | 6,600 | | | $ | 352,572 | |
Emergent BioSolutions, Inc.* | | | 16,000 | | | | 743,520 | |
HealthSouth Corp.* | | | 13,800 | | | | 681,858 | |
LHC Group, Inc.* | | | 12,300 | | | | 753,375 | |
Luminex Corp. | | | 12,100 | | | | 238,370 | |
Masimo Corp.* | | | 7,500 | | | | 636,000 | |
Melinta Therapeutics, Inc.* | | | 38,900 | | | | 614,620 | |
MiMedx Group, Inc.*+ | | | 12,800 | | | | 161,408 | |
PRA Health Sciences, Inc.* | | | 8,200 | | | | 746,774 | |
RadNet, Inc.* | | | 62,800 | | | | 634,280 | |
Supernus Pharmaceuticals, Inc.* | | | 14,800 | | | | 589,780 | |
Triple-S Management Corp., Class B* | | | 29,400 | | | | 730,590 | |
Versartis, Inc.* | | | 363,500 | | | | 799,700 | |
Vocera Communications, Inc.* | | | 24,800 | | | | 749,456 | |
| | | | | | | | |
| | |
| | | | | | | 10,910,553 | |
|
Industrials - 21.04% | |
Allegiant Travel Co.+ | | | 4,800 | | | | 742,800 | |
Avis Budget Group, Inc.* | | | 16,900 | | | | 741,572 | |
Brink’s Co. (The) | | | 9,600 | | | | 755,520 | |
Builders FirstSource, Inc.* | | | 36,900 | | | | 804,051 | |
Commercial Vehicle Group, Inc.* | | | 66,800 | | | | 714,092 | |
Dycom Industries, Inc.* | | | 2,700 | | | | 300,861 | |
GMS, Inc.* | | | 19,800 | | | | 745,272 | |
Harsco Corp.* | | | 42,400 | | | | 790,760 | |
Hawaiian Holdings, Inc. | | | 2,200 | | | | 87,670 | |
HC2 Holdings, Inc.* | | | 24,000 | | | | 142,800 | |
HNI Corp. | | | 12,200 | | | | 470,554 | |
Insperity, Inc. | | | 12,800 | | | | 734,080 | |
Kadant, Inc. | | | 2,400 | | | | 240,960 | |
MasTec, Inc.* | | | 15,200 | | | | 744,040 | |
NN, Inc. | | | 13,200 | | | | 364,320 | |
Radiant Logistics, Inc.* | | | 158,300 | | | | 728,180 | |
SPX Corp.* | | | 24,900 | | | | 781,611 | |
TriNet Group, Inc.* | | | 16,400 | | | | 727,176 | |
| | | | | | | | |
| | |
| | | | | | | 10,616,319 | |
|
Information Technology - 22.95% | |
3D Systems Corp.*+ | | | 76,300 | | | | 659,232 | |
Advanced Energy Industries, Inc.* | | | 4,300 | | | | 290,164 | |
Alarm.com Holdings, Inc.* | | | 8,000 | | | | 302,000 | |
Amkor Technology, Inc.* | | | 58,400 | | | | 586,920 | |
Applied Optoelectronics, Inc.*+ | | | 6,900 | | | | 260,958 | |
Axcelis Technologies, Inc.* | | | 25,400 | | | | 728,980 | |
| | |
| 48 | | Semi-Annual Report | December 31, 2017 (Unaudited) |
| | |
| Small-Cap Growth Fund | | |
| SCHEDULE OF INVESTMENTS (continued) | | |
| Showing percentage of net assets as of December 31, 2017 (Unaudited) | | |
| | | | | | | | | | | | | | |
| Industry Company | | Shares | | | Value | | | | | | |
| | |
Common Stocks (continued) | | | | | | | |
Information Technology (continued) | | | | | | | |
Blucora, Inc.* | | | 16,800 | | | $ | 371,280 | | | | | | | |
Cirrus Logic, Inc.* | | | 9,800 | | | | 508,228 | | | | | | | |
ePlus, Inc.* | | | 9,000 | | | | 676,800 | | | | | | | |
Extreme Networks, Inc.* | | | 61,600 | | | | 771,232 | | | | | | | |
Five9, Inc.* | | | 18,800 | | | | 467,744 | | | | | | | |
KEMET Corp.* | | | 44,500 | | | | 670,170 | | | | | | | |
MAXIMUS, Inc. | | | 10,100 | | | | 722,958 | | | | | | | |
MaxLinear, Inc.* | | | 8,500 | | | | 224,570 | | | | | | | |
Monolithic Power Systems, Inc. | | | 3,000 | | | | 337,080 | | | | | | | |
NIC, Inc. | | | 23,200 | | | | 385,120 | | | | | | | |
Novanta, Inc.* | | | 14,900 | | | | 745,000 | | | | | | | |
PCM, Inc.* | | | 77,600 | | | | 768,240 | | | | | | | |
Plantronics, Inc. | | | 2,400 | | | | 120,912 | | | | | | | |
RealPage, Inc.* | | | 12,800 | | | | 567,040 | | | | | | | |
Rosetta Stone, Inc.* | | | 15,900 | | | | 198,273 | | | | | | | |
Synaptics, Inc.*+ | | | 18,800 | | | | 750,872 | | | | | | | |
TeleTech Holdings, Inc. | | | 11,500 | | | | 462,875 | | | | | | | |
| | | | | | | | | | | | | | |
| | | | |
| | | | | | | 11,576,648 | | | | | | | |
| | |
Materials - 1.72% | | | | | | | |
Koppers Holdings, Inc.* | | | 12,200 | | | | 620,980 | | | | | | | |
Trinseo SA | | | 1,700 | | | | 123,420 | | | | | | | |
Worthington Industries, Inc. | | | 2,800 | | | | 123,368 | | | | | | | |
| | | | | | | | | | | | | | |
| | | | |
| | | | | | | 867,768 | | | | | | | |
| | |
Real Estate - 4.90% | | | | | | | |
Altisource Portfolio Solutions SA*+ | | | 25,000 | | | | 700,000 | | | | | | | |
HFF, Inc., Class A | | | 10,200 | | | | 496,128 | | | | | | | |
National Health Investors, Inc. | | | 6,400 | | | | 482,432 | | | | | | | |
Potlatch Corp. | | | 7,600 | | | | 379,240 | | | | | | | |
Urban Edge Properties | | | 16,199 | | | | 412,912 | | | | | | | |
| | | | | | | | | | | | | | |
| | | | |
| | | | | | | 2,470,712 | | | | | | | |
| | |
Utilities - 0.73% | | | | | | | |
Atlantic Power Corp.* | | | 157,200 | | | | 369,420 | | | | | | | |
| | | | | | | | | | | | | | |
| | | | |
TOTAL COMMON STOCKS - 98.35% | | | | | | | 49,616,177 | | | | | | | |
| | | | | | | | | | | | | | |
(Cost $42,414,565) | | | | | | | | | | | | | | |
| | | | | | | | | | | | | | |
| | | | | | | | | | | | | | |
| | | | | | | | | | | | | | |
| | | | | | | | |
| | | Rate^ | | Shares | | Value | |
|
MONEY MARKET FUND - 1.57% | |
Fidelity Investments Money Market Government Portfolio Class I | | 1.14% | | 791,040 | | | $791,040 | |
| | | | | | | | |
TOTAL MONEY MARKET FUND - 1.57% | | | 791,040 | |
| | | | | | | | |
(Cost $791,040) | | | | | | | | |
|
| INVESTMENTS PURCHASED WITH CASH PROCEEDS FROM SECURITIES LENDING - 11.05% | |
Fidelity Investments Money Market Government Portfolio Class I** | | 1.14% | | 5,573,398 | | | 5,573,398 | |
| | | | | | | | |
TOTAL INVESTMENTS PURCHASED WITH CASH PROCEEDS FROM SECURITIES LENDING - 11.05% | | | 5,573,398 | |
| | | | | | | | |
(Cost $5,573,398) | | | | | | | | |
| |
TOTAL INVESTMENTS - 110.97% | | | $55,980,615 | |
(Cost $48,779,003) | | | | | | | | |
Liabilities in Excess of Other
Assets - (10.97%) | | | (5,535,930) | |
| | | | | | | | |
NET ASSETS - 100.00% | | | $50,444,685 | |
| | | | | | | | |
| * | Non-income producing security. |
| ** | This security represents the investment of the collateral received in connection with securities out on loan as of December 31, 2017. |
| ^ | Rate disclosed as of December 31, 2017. |
| + | This security or a portion of the security is out on loan as of December 31, 2017. Total loaned securities had a value of $5,345,738 as of December 31, 2017. |
Summary of inputs used to value the Fund’s investments as of 12/31/2017 (See Note 2 in Notes to Financial Statements):
| | | | | | | | | | | | | | | | |
| |
| | | Valuation Inputs | |
| |
| | | Investment in Securities (Value) | |
| |
| | | | | | Level 2 | | | Level 3 | | | | |
| | | Level 1 Quoted
Prices | | | Significant
Unobservable
Inputs | | | Significant
Observable
Inputs | | | Total | |
| |
| | | | |
Common Stocks | | $ | 49,616,177 | | | $ | — | | | $ | — | | | $ | 49,616,177 | |
Money Market Fund | | | — | | | | 791,040 | | | | — | | | | 791,040 | |
Investments Purchased with Cash Proceeds from Securities Lending | | | — | | | | 5,573,398 | | | | — | | | | 5,573,398 | |
| | | | | | | | | | | | | | | | |
TOTAL | | $ | 49,616,177 | | | $ | 6,364,438 | | | $ | — | | | $ | 55,980,615 | |
| | | | | | | | | | | | | | | | |
See Notes to Financial Statements.
| | |
| Small-Cap Value Fund | |
|
| MANAGER’S COMMENTARY (Unaudited) | |
| | |
December 31, 2017
Dear Fellow Small-Cap Value Fund Shareholder,
For the quarter ended December 31, 2017, our Fund returned +2.83%, outperforming our primary market benchmark, the Russell 2000 Value Index (+2.05%), but trailing our peer benchmark, the Lipper Small-Cap Value Funds Index (+3.46%).
For the six-month semi-annual period ended December 31, 2017, the Fund returned +7.84%, outperforming the Russell 2000 Value Index (+7.26%), but lagging the Lipper Small-Cap Value Funds Index (+8.83%).
For the calendar year, the Fund returned +7.11%, underperforming both the Russell 2000 Value Index (+7.84%) and the Lipper Small-Cap Value Funds Index (+9.69%).
The table below presents our December quarter, six-month, one-year, five-year, 10-year, and inception-to-date financial results. See the next page for a graph of performance since inception.
Standardized Returns as of December 31, 2017
| | | | | | | | | | | | | | | | | | | | | | | | | | | | | | |
| | | | | | | | | Annualized | | |
| | | Quarter | | 6 Months | | 1 Year | | 5 Years | | 10 Years | | Since Inception (10/31/03) |
| | | | | | |
Small-Cap Value Fund | | | | 2.83 | % | | | | 7.84 | % | | | | 7.11 | % | | | | 11.61 | % | | | | 5.49 | % | | | | 7.93 | % |
Russell 2000 Value Index | | | | 2.05 | % | | | | 7.26 | % | | | | 7.84 | % | | | | 13.01 | % | | | | 8.17 | % | | | | 8.94 | % |
Lipper Small-Cap Value Funds Index | | | | 3.46 | % | | | | 8.83 | % | | | | 9.69 | % | | | | 12.51 | % | | | | 8.34 | % | | | | 9.23 | % |
Performance figures quoted in the table above represent past performance and are no guarantee of future results. Total return figures in the table above include the reinvestment of dividends and capital gains. The table above does not reflect the deduction of taxes that a shareholder would pay on Fund distributions or on the redemption of Fund shares.
The Russell 2000 Value Index is an unmanaged index that consists of stocks in the Russell 2000 Index with lower price-to-book ratios and lower forecasted growth values with dividends reinvested. The Lipper Small-Cap Value Funds Index is an index of small-company, value-oriented funds compiled by Lipper, Inc. It is not possible to invest directly in an index. Periods longer than one year are annualized.
According to data from Lipper, Inc. as of December 31, 2017, Small-Cap Value Fund ranked 176th of 269 small-cap value funds for the 12 months ended December 31, 2017, 138th of 210 over the last five years, 131st of 141 over the last 10 years, and 71st of 86 such funds since inception in October 2003. Lipper, Inc. is an independent mutual fund rating service that ranks funds in various fund categories by making comparative calculations using total returns.
| | |
| 50 | | Semi-Annual Report | December 31, 2017 (Unaudited) |
| | |
| Small-Cap Value Fund | | |
| MANAGER’S COMMENTARY (Unaudited) (continued) | | |
| | |
Growth of a $10,000 Investment
from Inception October 31, 2003 to December 31, 2017
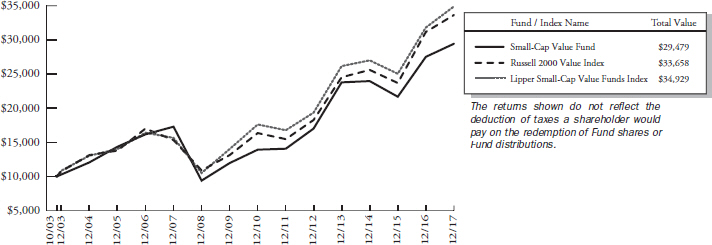
Detailed Explanation of Quarterly Performance
The Fund’s primary value metrics models and diversifying company financial health models outperformed the benchmark and boosted relative returns during the quarter. A tilt toward deeper value stocks across multiple value metrics also added to relative results, as did an overweighting in higher momentum stocks across all three model categories. However, these gains were partly offset by underperformance from the Fund’s diversifying price momentum models.
The Fund’s sector allocation effect was positive, with an overweighting in the Consumer Discretionary sector and an underweighting in the Real Estate sector adding the most to relative returns. An overweighting in the Information Technology sector detracted the most. The Fund’s stock selection effect was strongly positive, with holdings in the Energy and Consumer Discretionary sectors boosting relative returns, even as holdings in the Financials and Real Estate sectors detracted.
Detailed Explanation of Calendar Year Performance
The Fund’s primary value metrics models and diversifying price momentum models underperformed the benchmark and detracted from relative returns for the year. A tilt toward deeper value stocks across multiple metrics also had a negative impact. However, strong performance from the Fund’s diversifying company financial health models boosted relative returns. An overweighting in higher-momentum stocks compared to the benchmark across all model categories also helped relative performance.
The Fund’s sector allocation effect was slightly positive, with an overweighting in the Industrials sector and an underweighting in the Real Estate sector adding the most to relative returns. However, an underweighting in Health Care sector and an overweighting in Telecommunication Services detracted. The Fund’s overall stock selection effect was negative, with holdings in the Consumer Discretionary, Health Care, and Utilities sectors detracting the most from relative performance.
| | |
| Small-Cap Value Fund | |
|
| MANAGER’S COMMENTARY (Unaudited) (continued) | |
| | |
Top Ten Holdings as of December 31, 2017
| | | | | | | | |
| Rank | | Description | | Industry | | % of Net
Assets | |
| 1 | | SkyWest, Inc. | | Industrials | | | 2.7% | |
| 2 | | Dana, Inc. | | Consumer Discretionary | | | 2.6% | |
| 3 | | Selective Insurance Group, Inc. | | Financials | | | 2.5% | |
| 4 | | Sanderson Farms, Inc. | | Consumer Staples | | | 2.1% | |
| 5 | | Sanmina Corp. | | Information Technology | | | 1.9% | |
| 6 | | California Resources Corp. | | Energy | | | 1.8% | |
| 7 | | Walker & Dunlop, Inc. | | Financials | | | 1.8% | |
| 8 | | Greenbrier Companies., Inc. (The) | | Industrials | | | 1.7% | |
| 9 | | ACCO Brands Corp. | | Industrials | | | 1.7% | |
| 10 | | Weight Watchers International, Inc. | | Consumer Discretionary | | | 1.6% | |
| | | |
| | Total | | | | | 20.4% | |
Industry Sector Representation as of December 31, 2017
| | | | | | | | | | | | | | | |
| | | % of Net Assets | | % of Russell 2000
Value Index | | Difference |
Consumer Discretionary | | | | 17.2 | % | | | | 10.9 | % | | | | 6.3% | |
Consumer Staples | | | | 2.7 | % | | | | 2.8 | % | | | | -0.1% | |
Energy | | | | 6.9 | % | | | | 6.8 | % | | | | 0.1% | |
Financials | | | | 24.4 | % | | | | 30.3 | % | | | | -5.9% | |
Health Care | | | | 6.0 | % | | | | 6.2 | % | | | | -0.2% | |
Industrials | | | | 17.2 | % | | | | 12.1 | % | | | | 5.1% | |
Information Technology | | | | 12.0 | % | | | | 9.0 | % | | | | 3.0% | |
Materials | | | | 3.5 | % | | | | 4.5 | % | | | | -1.0% | |
Real Estate | | | | 5.8 | % | | | | 10.3 | % | | | | -4.5% | |
Telecommunication Services | | | | 0.9 | % | | | | 0.5 | % | | | | 0.4% | |
Utilities | | | | 3.1 | % | | | | 6.6 | % | | | | -3.5% | |
Cash & Other Assets | | | | 0.3 | % | | | | 0.0 | % | | | | 0.3% | |
| | | |
Total | | | | 100.0 | % | | | | 100.0 | % | | | | | |
Disclaimer
The views expressed here are exclusively those of Fund management. These views, including those related to market sectors or individual stocks, are not meant as investment advice and should not be considered predictive in nature. Any favorable (or unfavorable) description of a holding applies only as of the quarter end, December 31, 2017, unless otherwise stated. Security positions can and do change thereafter. Discussions of historical performance do not guarantee and may not be indicative of future performance.
Market volatility can significantly impact short-term performance. The Fund is not an appropriate investment for short-term investors. Investments in small companies generally carry greater risk than is customarily associated with larger companies. This additional risk is attributable to a number of factors, including the relatively limited financial resources that are typically available to small companies and the fact that small companies often have comparatively limited product lines. In addition, the stock of small companies tends to be more volatile than the stock of large companies, particularly in the short term and particularly in the early stages of an economic or market downturn. Shareholders of the Fund, therefore, are taking on more risk than they would if they invested in the stock market as a whole.
| | |
| 52 | | Semi-Annual Report | December 31, 2017 (Unaudited) |
| | |
| Small-Cap Value Fund | | |
| MANAGER’S COMMENTARY (Unaudited) (continued) | | |
| | |
Conclusion
Thank you for your continued investment in Small-Cap Value Fund. We encourage your feedback; your reactions and concerns are important to us.
Sincerely,
The Investment Management Team
| | |
| Small-Cap Value Fund | |
|
| SCHEDULE OF INVESTMENTS | |
| Showing percentage of net assets as of December 31, 2017 (Unaudited) | | |
| | | | | | | | |
| Industry Company | | Shares | | Value | | | | |
| | | |
COMMON STOCKS - 99.73% | | | | | | |
Consumer Discretionary - 17.24% | | | | | | |
American Axle & Manufacturing Holdings, Inc.* | | 35,700 | | $ 607,971 | | | | |
Big 5 Sporting Goods Corp.+ | | 39,200 | | 297,920 | | | | |
Caleres, Inc. | | 11,900 | | 398,412 | | | | |
Conn’s, Inc.*+ | | 21,200 | | 753,660 | | | | |
Container Store Group, Inc. (The)* | | 58,300 | | 276,342 | | | | |
Crocs, Inc.* | | 62,900 | | 795,056 | | | | |
Dana, Inc. | | 51,300 | | 1,642,113 | | | | |
Del Taco Restaurants, Inc.* | | 35,400 | | 429,048 | | | | |
Fossil Group, Inc.*+ | | 21,500 | | 167,055 | | | | |
KB Home | | 26,800 | | 856,260 | | | | |
LGI Homes, Inc.*+ | | 12,700 | | 952,881 | | | | |
MDC Holdings, Inc. | | 19,224 | | 612,861 | | | | |
Office Depot, Inc. | | 155,800 | | 551,532 | | | | |
Tailored Brands, Inc.+ | | 35,100 | | 766,233 | | | | |
Tower International, Inc. | | 23,500 | | 717,925 | | | | |
Weight Watchers International, Inc.*+ | | 22,900 | | 1,014,012 | | | | |
| | | | | | | | |
| | | | 10,839,281 | | | | |
| | | | |
Consumer Staples - 2.70% | | | | | | | | |
Sanderson Farms, Inc.+ | | 9,600 | | 1,332,288 | | | | |
SUPERVALU, Inc.*+ | | 16,785 | | 362,556 | | | | |
| | | | | | | | |
| | | | 1,694,844 | | | | |
| | | | |
Energy - 6.95% | | | | | | | | |
Arch Coal, Inc., Class A | | 7,900 | | 735,964 | | | | |
California Resources Corp.*+ | | 57,500 | | 1,117,800 | | | | |
Cloud Peak Energy, Inc.* | | 77,100 | | 343,095 | | | | |
Denbury Resources, Inc.* | | 112,200 | | 247,962 | | | | |
Rowan Cos. PLC, Class A* | | 61,700 | | 966,222 | | | | |
Ship Finance International, Ltd.+ | | 44,900 | | 695,950 | | | | |
W&T Offshore, Inc.* | | 79,700 | | 263,807 | | | | |
| | | | | | | | |
| | | | 4,370,800 | | | | |
Financials - 24.41% | | | | | | | | |
American Equity Investment Life Holding Co. | | 28,600 | | 878,878 | | | | |
Banco Latinoamericano de Comercio Exterior SA, Class E | | 27,700 | | 745,130 | | | | |
Banner Corp. | | 11,700 | | 644,904 | | | | |
Capitol Federal Financial, Inc. | | 45,200 | | 606,132 | | | | |
Employers Holdings, Inc. | | 18,500 | | 821,400 | | | | |
Enstar Group, Ltd.* | | 2,900 | | 582,175 | | | | |
| | | | |
| Industry Company | | Shares | | Value |
| | |
| | | | |
Financials (continued) | | | | |
FBL Financial Group, Inc., Class A | | 5,200 | | $ 362,180 |
First BanCorp Puerto Rico* | | 129,500 | | 660,450 |
Flagstar Bancorp, Inc.* | | 8,500 | | 318,070 |
Heartland Financial USA, Inc. | | 12,400 | | 665,260 |
Investors Bancorp, Inc. | | 63,000 | | 874,440 |
Kearny Financial Corp. | | 55,400 | | 800,530 |
National Western Life Group, Inc., Class A | | 2,600 | | 860,652 |
Nationstar Mortgage Holdings, Inc.*+ | | 46,500 | | 860,250 |
Ocwen Financial Corp.*+ | | 132,000 | | 413,160 |
PHH Corp.* | | 18,000 | | 185,400 |
Safety Insurance Group, Inc. | | 9,800 | | 787,920 |
Selective Insurance Group, Inc. | | 27,500 | | 1,614,250 |
Stifel Financial Corp. | | 7,000 | | 416,920 |
TriState Capital Holdings, Inc.* | | 35,600 | | 818,800 |
Walker & Dunlop, Inc.* | | 23,400 | | 1,111,500 |
Washington Trust Bancorp, Inc. | | 5,900 | | 314,175 |
| | | | |
| | | | 15,342,576 |
| | |
Health Care - 5.97% | | | | |
Community Health Systems, Inc.*+ | | 47,900 | | 204,054 |
Enanta Pharmaceuticals, Inc.* | | 5,900 | | 346,212 |
Kindred Healthcare, Inc. | | 87,800 | | 851,660 |
LHC Group, Inc.* | | 13,200 | | 808,500 |
Magellan Health, Inc.* | | 9,500 | | 917,225 |
Triple-S Management Corp., Class B* | | 25,200 | | 626,220 |
| | | | |
| | | | 3,753,871 |
| | |
Industrials - 17.20% | | | | |
ABM Industries, Inc. | | 18,500 | | 697,820 |
ACCO Brands Corp.* | | 85,600 | | 1,044,320 |
Aircastle, Ltd. | | 27,100 | | 633,869 |
Albany International Corp., Class A | | 11,600 | | 712,820 |
Casella Waste Systems, Inc., Class A* | | 19,500 | | 448,890 |
EMCOR Group, Inc. | | 10,100 | | 825,675 |
Federal Signal Corp. | | 15,700 | | 315,413 |
GATX Corp. | | 13,100 | | 814,296 |
Greenbrier Companies., Inc. (The)+ | | 19,700 | | 1,050,010 |
MasTec, Inc.* | | 11,200 | | 548,240 |
| | |
| 54 | | Semi-Annual Report | December 31, 2017 (Unaudited) |
| | |
| Small-Cap Value Fund | | |
| SCHEDULE OF INVESTMENTS (continued) | | |
| Showing percentage of net assets as of December 31, 2017 (Unaudited) | | |
| | | | | | | | | | | | | | | | |
| Industry Company | | Shares | | | Value | | | | | | | |
Common Stocks (continued) | | | | | | | | | | | | | | | | |
Industrials (continued) | | | | | | | | | | | | | | | | |
Meritor, Inc.* | | | 41,600 | | | $ | 975,936 | | | | | | | | | |
SkyWest, Inc. | | | 31,700 | | | | 1,683,270 | | | | | | | | | |
Spartan Motors, Inc. | | | 9,700 | | | | 152,775 | | | | | | | | | |
Sterling Construction Co., Inc.* | | | 55,737 | | | | 907,399 | | | | | | | | | |
| | | | | | | | | | | | | | | | |
| | | | | | | 10,810,733 | | | | | | | | | |
| | |
Information Technology - 11.97% | | | | | | | | | |
AVX Corp. | | | 41,100 | | | | 711,030 | | | | | | | | | |
Benchmark Electronics, Inc.* | | | 21,500 | | | | 625,650 | | | | | | | | | |
ePlus, Inc.* | | | 10,200 | | | | 767,040 | | | | | | | | | |
Rosetta Stone, Inc.* | | | 28,400 | | | | 354,148 | | | | | | | | | |
Sanmina Corp.* | | | 35,900 | | | | 1,184,700 | | | | | | | | | |
Sykes Enterprises, Inc.* | | | 14,400 | | | | 452,880 | | | | | | | | | |
Systemax, Inc. | | | 22,200 | | | | 738,594 | | | | | | | | | |
Tech Data Corp.* | | | 7,700 | | | | 754,369 | | | | | | | | | |
TTM Technologies, Inc.* | | | 36,100 | | | | 565,687 | | | | | | | | | |
Unisys Corp.*+ | | | 55,800 | | | | 454,770 | | | | | | | | | |
Vishay Intertechnology, Inc. | | | 44,100 | | | | 915,075 | | | | | | | | | |
| | | | | | | | | | | | | | | | |
| | | | | | | 7,523,943 | | | | | | | | | |
| | | | |
Materials - 3.49% | | | | | | | | | | | | | | | | |
Materion Corp. | | | 13,000 | | | | 631,800 | | | | | | | | | |
Ryerson Holding Corp.* | | | 63,900 | | | | 664,560 | | | | | | | | | |
SunCoke Energy, Inc.* | | | 74,700 | | | | 895,653 | | | | | | | | | |
| | | | | | | | | | | | | | | | |
| | | | | | | 2,192,013 | | | | | | | | | |
| | |
Real Estate - 5.82% | | | | | | | | | |
Bluerock Residential Growth | | | | | | | | | | | | | | | | |
REIT, Inc. | | | 12,000 | | | | 121,320 | | | | | | | | | |
CBL & Associates Properties, Inc.+ | | | 87,600 | | | | 495,816 | | | | | | | | | |
Cousins Properties, Inc. | | | 90,600 | | | | 838,050 | | | | | | | | | |
Education Realty Trust, Inc. | | | 17,600 | | | | 614,592 | | | | | | | | | |
Global Net Lease, Inc.+ | | | 29,700 | | | | 611,226 | | | | | | | | | |
Select Income REIT | | | 39,000 | | | | 980,070 | | | | | | | | | |
| | | | | | | | | | | | | | | | |
| | | | | | | 3,661,074 | | | | | | | | | |
| | |
Telecommunication Services - 0.92% | | | | | | | | | |
Intelsat SA*+ | | | 113,400 | | | | 384,426 | | | | | | | | | |
Windstream Holdings, Inc.+ | | | 103,100 | | | | 190,735 | | | | | | | | | |
| | | | | | | | | | | | | | | | |
| | | | | | | 575,161 | | | | | | | | | |
| | | | |
Utilities - 3.06% | | | | | | | | | | | | | | | | |
ALLETE, Inc. | | | 8,500 | | | | 632,060 | | | | | | | | | |
NorthWestern Corp. | | | 11,100 | | | | 662,670 | | | | | | | | | |
ONE Gas, Inc. | | | 8,600 | | | | 630,036 | | | | | | | | | |
| | | | | | | | | | | | | | | | |
| | | | | | | 1,924,766 | | | | | | | | | |
| | | | | | | | | | | | | | | | |
TOTAL COMMON STOCKS - 99.73% | | | | 62,689,062 | | | | | | | | | |
| | | | | | | | | | | | | | | | |
(Cost $53,381,474) | | | | | | | | | | | | | | | | |
| | | | | | | | | | | | |
| | | Rate^ | | | Shares | | | Value | |
MONEY MARKET FUND - 0.66% | | | | | |
Fidelity Investments Money Market Government Portfolio Class I | | | 1.14 | % | | | 413,168 | | | $ | 413,168 | |
| | | | | | | | | | | | |
TOTAL MONEY MARKET FUND - 0.66% | | | | 413,168 | |
| | | | | | | | | | | | |
(Cost $413,168) | | | | | | | | | | | | |
|
| INVESTMENTS PURCHASED WITH CASH PROCEEDS FROM SECURITIES LENDING - 11.62% | |
Fidelity Investments Money Market Government Portfolio Class I** | | | 1.14 | % | | | 7,308,763 | | | | 7,308,763 | |
| | | | | | | | | | | | |
TOTAL INVESTMENTS PURCHASED WITH CASH PROCEEDS FROM SECURITIES LENDING - 11.62% | | | | 7,308,763 | |
| | | | | | | | | | | | |
(Cost $7,308,763) | | | | | | | | | | | | |
| |
TOTAL INVESTMENTS - 112.01% | | | $ | 70,410,993 | |
(Cost $61,103,405) | | | | | | | | | | | | |
Liabilities in Excess of Other Assets - (12.01%) | | | | (7,550,850 | ) |
| | | | | | | | | | | | |
NET ASSETS - 100.00% | | | | | | | | | | $ | 62,860,143 | |
| | | | | | | | | | | | |
| * | Non-income producing security. |
| ** | This security represents the investment of the collateral received in connection with securities out on loan as of December 31, 2017. |
| ^ | Rate disclosed as of December 31, 2017. |
| + | This security or a portion of the security is out on loan as of December 31, 2017. Total loaned securities had a value of $6,974,916 as of December 31, 2017. |
| | |
| Small-Cap Value Fund | |
|
| SCHEDULE OF INVESTMENTS (continued) | |
| Showing percentage of net assets as of December 31, 2017 (Unaudited) | | |
Summary of inputs used to value the Fund’s investments as of 12/31/2017
(See Note 2 in Notes to Financial Statements):
| | | | | | | | | | | | | | | | |
| |
| | | Valuation Inputs | |
| | | Investment in Securities (Value) | |
| | | Level 1 Quoted Prices | | | Level 2
Significant
Observable
Inputs | | | Level 3
Significant
Unobservable
Inputs | | | Total | |
Common Stocks | | $ | 62,689,062 | | | $ | — | | | $ | — | | | $ | 62,689,062 | |
Money Market Fund | | | — | | | | 413,168 | | | | — | | | | 413,168 | |
Investments Purchased with Cash Proceeds from Securities Lending | | | — | | | | 7,308,763 | | | | — | | | | 7,308,763 | |
| | | | | | | | | | | | | | | | |
TOTAL | | $ | 62,689,062 | | | $ | 7,721,931 | | | $ | — | | | $ | 70,410,993 | |
| | | | | | | | | | | | | | | | |
See Notes to Financial Statements
| | |
56 | | Semi-Annual Report | December 31, 2017 (Unaudited) |
| | |
| Blue Chip 35 Index Fund | | |
| MANAGER’S COMMENTARY (Unaudited) | | |
| | |
December 31, 2017
Dear Fellow Blue Chip 35 Index Fund Shareholder,
For the quarter ended December 31, 2017, our Fund returned +7.30%, outperforming our primary market benchmark, the S&P 500 Index (+6.64%), the Russell Top 50 Mega Cap Index (+7.26%), and our peer benchmark, the Lipper Large-Cap Core Funds Index (+6.29%).
For the six-month semi-annual period ended December 31, 2017, the Fund returned +11.60%, outperforming the S&P 500 Index (+11.42%) and the Lipper Large-Cap Core Funds Index (+11.02%), but lagging the Russell Top 50 Mega Cap Index (+12.35%).
For the calendar year, the Fund returned +18.43%, underperforming the S&P 500 Index (+21.83%), the Russell Top 50 Mega Cap Index (+22.81%), and the Lipper Large-Cap Core Funds Index (+20.90%).
The table below presents our December quarter, six-month, one-year, five-year, 10-year, 15-year, and inception-to-date financial results. See the next page for a graph of performance since inception.
Standardized Returns as of December 31, 2017
| | | | | | | | | | | | | | | | | | | | | | | | | | | | |
| | | | | | | | | | | | Annualized | | |
| | | Quarter | | | 6 Months | | 1 Year | | 5 Years | | 10 Years | | 15 Years | | Since Inception
(7/31/97) |
| | | | | | | |
Blue Chip 35 Index Fund | | | 7.30% | | | | 11.60% | | | | 18.43% | | | | 14.99% | | | | 8.36% | | | | 9.10% | | | | 7.33% | |
S&P 500 Index | | | 6.64% | | | | 11.42% | | | | 21.83% | | | | 15.79% | | | | 8.50% | | | | 9.92% | | | | 7.17% | |
Russell Top 50 Mega Cap Index | | | 7.26% | | | | 12.35% | | | | 22.81% | | | | 15.34% | | | | 7.95% | | | | 8.72% | | | | 6.17% | |
Lipper Large-Cap Core Funds Index | | | 6.29% | | | | 11.02% | | | | 20.90% | | | | 14.63% | | | | 7.58% | | | | 8.89% | | | | 6.35% | |
Bridgeway Ultra-Large 35 Index | | | 7.36% | | | | 11.64% | | | | 18.56% | | | | 15.22% | | | | 8.63% | | | | 9.30% | | | | 7.52% | |
Performance figures quoted in the table above represent past performance and are no guarantee of future results. Total return figures in the table above include the reinvestment of dividends and capital gains. The table above does not reflect the deduction of taxes that a shareholder would pay on Fund distributions or on the redemption of Fund shares.
The S&P 500 Index is a broad-based, unmanaged measurement of changes in stock market conditions, based on the average of 500 widely held common stocks with dividends reinvested. The Russell Top 50 Mega Cap Index measures the performance of the largest companies in the Russell 3000 Index. It includes 50 of the largest securities, based on a combination of their market cap and current index membership, and represents approximately 40% of the total market capitalization of the Russell 3000 Index. The Bridgeway Ultra-Large 35 Index is an index composed of very large, “blue chip” U.S. stocks, excluding tobacco; it is compiled by the adviser of the Fund. The Lipper Large-Cap Core Funds Index reflects the aggregate record of domestic large-cap core mutual funds as reported by Lipper, Inc. It is not possible to invest directly in an index. Periods longer than one year are annualized.
According to data from Lipper, Inc. as of December 31, 2017, Blue Chip 35 Index Fund ranked 606th of 800 large-cap core funds for the 12 months ended December 31, 2017, 227th of 640 over the last five years, 100th of 485 over the last 10 years, and 42nd of 145 since inception in July 1997. Lipper, Inc. is an independent mutual fund rating service that ranks funds in various fund categories by making comparative calculations using total returns.
| | |
| Blue Chip 35 Index Fund | |
|
| MANAGER’S COMMENTARY (Unaudited) (continued) | |
| | |
Growth of a $10,000 Investment
from Inception July 31, 1997 to December 31, 2017
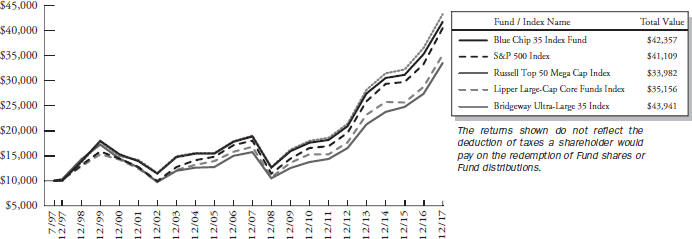
Detailed Explanation of Quarterly Performance
The Fund’s mega-cap design boosted relative results during a quarter in which larger stocks outperformed smaller ones. The Fund’s tilt toward less-risky, lower-beta stocks also slightly benefited relative results.
The Fund’s sector allocation effect was positive, with underweightings in the poor-performing Health Care and Utilities sectors and an overweighting in the Information Technology sector contributing the most to relative returns. The Fund’s stock selection effect was slightly negative overall, with holdings in the Industrials and Health Care sectors detracting the most from relative returns. Those results offset good returns from holdings in the Financials and Information Technology sectors, which made the largest positive contributions to relative performance.
The table below presents index performance numbers for stocks in the different CRSP deciles during various time periods.
| | | | | | | | | | | | | | | | | | | | | | | | |
| | | | | | | | | | | | Annualized | |
| CRSP Decile1 | | Quarter | | | 6 Months | | | 1 Year | | | 5 Years | | | 10 Years | | | 92 Years | |
| 1 (ultra-large) | | | 7.02% | | | | 12.29% | | | | 23.49% | | | | 15.85% | | | | 8.33% | | | | 9.44% | |
| 2 | | | 6.38% | | | | 9.72% | | | | 18.69% | | | | 16.38% | | | | 9.26% | | | | 10.64% | |
| 3 | | | 8.64% | | | | 13.48% | | | | 23.26% | | | | 16.10% | | | | 9.99% | | | | 11.15% | |
| 4 | | | 5.99% | | | | 11.22% | | | | 18.08% | | | | 14.24% | | | | 9.82% | | | | 10.92% | |
| 5 | | | 4.96% | | | | 8.81% | | | | 15.75% | | | | 13.28% | | | | 10.01% | | | | 11.51% | |
| 6 | | | 4.82% | | | | 13.13% | | | | 20.05% | | | | 14.52% | | | | 9.51% | | | | 11.47% | |
| 7 | | | 3.48% | | | | 9.06% | | | | 14.73% | | | | 15.49% | | | | 10.69% | | | | 11.61% | |
| 8 | | | 2.10% | | | | 9.49% | | | | 12.08% | | | | 13.25% | | | | 10.21% | | | | 11.54% | |
| 9 | | | 2.64% | | | | 8.34% | | | | 12.76% | | | | 15.05% | | | | 10.08% | | | | 11.58% | |
| 10 (ultra-small) | | | 2.06% | | | | 9.20% | | | | 13.46% | | | | 13.32% | | | | 9.08% | | | | 13.30% | |
| 1 | Performance figures are as of the period ended December 31, 2017. The CRSP Cap-Based Portfolio Indexes are unmanaged indexes of publicly traded U.S. stocks with dividends reinvested, grouped by market capitalization, as reported by the Center for Research in Security Prices. Past performance is no guarantee of future results. |
| | |
| 58 | | Semi-Annual Report | December 31, 2017 (Unaudited) |
| | |
| Blue Chip 35 Index Fund | | |
| MANAGER’S COMMENTARY (Unaudited) (continued) | | |
| | |
Detailed Explanation of Calendar Year Performance
The Fund’s investments in mega-cap stocks helped relative performance. However, our disciplined rebalancing process to maintain the Fund’s roughly equal weight design detracted from relative performance during a year in which the momentum factor was in favor. Rebalancing requires us to trim holdings of strong-performing, higher-momentum stocks while adding to holdings of weaker performing, lower-momentum stocks. The Fund’s tilt toward less-risky, lower-beta stocks boosted relative performance slightly.
The Fund’s sector allocation effect was essentially flat. However, the Fund’s stock selection effect was strongly negative, with holdings in the Industrials, Information Technology, and Health Care sectors detracting the most from relative results. Holdings in the Financials and Consumer Discretionary sectors made the largest positive contributions to relative performance.
| | |
| Blue Chip 35 Index Fund | | |
| MANAGER’S COMMENTARY (Unaudited) (continued) | | |
| | |
Contribution to Returns for Blue Chip 35 Index Fund stocks for the calendar year December 31, 2017:
| | | | | | |
| Rank | | Company | | Industry | | % Contribution
to Return |
| 1 | | Amazon.com, Inc. | | Consumer Discretionary | | 1.9% |
| 2 | | Apple, Inc. | | Information Technology | | 1.8% |
| 3 | | Visa, Inc., Class A | | Financials | | 1.7% |
| 4 | | Microsoft Corp. | | Information Technology | | 1.6% |
| 5 | | Bank of America Corp. | | Financials | | 1.4% |
| 6 | | McDonald’s Corp. | | Consumer Discretionary | | 1.1% |
| 7 | | Wal-Mart Stores, Inc. | | Consumer Discretionary | | 1.1% |
| 8 | | 3M Co. | | Industrials | | 0.8% |
| 9 | | JPMorgan Chase & Co. | | Financials | | 0.8% |
| 10 | | Intel Corp. | | Information Technology | | 0.8% |
| 11 | | Cisco Systems, Inc. | | Information Technology | | 0.7% |
| 12 | | Oracle Corp. | | Information Technology | | 0.7% |
| 13 | | Alphabet, Inc., Class C | | Information Technology | | 0.7% |
| 14 | | Alphabet, Inc., Class A | | Information Technology | | 0.6% |
| 15 | | Johnson & Johnson | | Health Care | | 0.6% |
| 16 | | Berkshire Hathaway, Inc., Class B | | Financials | | 0.5% |
| 17 | | United Technologies Corp. | | Industrials | | 0.5% |
| 18 | | Comcast Corp., Class A | | Consumer Discretionary | | 0.5% |
| 19 | | PepsiCo, Inc. | | Consumer Staples | | 0.4% |
| 20 | | Pfizer, Inc. | | Health Care | | 0.4% |
| 21 | | Coca-Cola Co. (The) | | Consumer Staples | | 0.4% |
| 22 | | Wells Fargo & Co. | | Financials | | 0.4% |
| 23 | | Procter & Gamble Co. (The) | | Consumer Staples | | 0.3% |
| 24 | | ConocoPhillips | | Energy | | 0.3% |
| 25 | | Chevron Corp. | | Energy | | 0.3% |
| 26 | | United Parcel Service, Inc., Class B | | Industrials | | 0.2% |
| 27 | | Walt Disney Co. (The) | | Consumer Discretionary | | 0.2% |
| 28 | | Gilead Sciences, Inc. | | Health Care | | 0.1% |
| 29 | | Verizon Communications, Inc. | | Telecommunication Services | | 0.1% |
| 30 | | QUALCOMM, Inc. | | Information Technology | | 0.1% |
| 31 | | Merck & Co., Inc. | | Health Care | | 0.0% |
| 32 | | International Business Machines Corp. | | Information Technology | | -0.1% |
| 33 | | Exxon Mobil Corp. | | Energy | | -0.1% |
| 34 | | CVS Health Corp. | | Consumer Staples | | -0.1% |
| 35 | | AT&T, Inc. | | Telecommunication Services | | -0.1% |
| 36 | | Schlumberger, Ltd. | | Energy | | -0.5% |
| 37 | | General Electric Co. | | Industrials | | -1.4% |
| | |
| 60 | | Semi-Annual Report | December 31, 2017 (Unaudited) |
| | |
| Blue Chip 35 Index Fund | | |
| MANAGER’S COMMENTARY (Unaudited) (continued) | | |
| | |
Industry Sector Representation as of December 31, 2017
| | | | | | | | | | | | | | | |
| | | % of Net Assets | | % of S&P 500 Index | | Difference |
Consumer Discretionary | | | | 11.9% | | | | | 12.1% | | | | | -0.2% | |
Consumer Staples | | | | 12.7% | | | | | 8.2% | | | | | 4.5% | |
Energy | | | | 9.8% | | | | | 6.1% | | | | | 3.7% | |
Financials | | | | 12.6% | | | | | 14.8% | | | | | -2.2% | |
Health Care | | | | 9.8% | | | | | 13.8% | | | | | -4.0% | |
Industrials | | | | 9.9% | | | | | 10.3% | | | | | -0.4% | |
Information Technology | | | | 28.3% | | | | | 23.8% | | | | | 4.5% | |
Materials | | | | 0.0% | | | | | 3.0% | | | | | -3.0% | |
Real Estate | | | | 0.0% | | | | | 2.9% | | | | | -2.9% | |
Telecommunication Services | | | | 4.9% | | | | | 2.1% | | | | | 2.8% | |
Utilities | | | | 0.0% | | | | | 2.9% | | | | | -2.9% | |
Cash & Other Assets | | | | 0.1% | | | | | 0.0% | | | | | 0.1% | |
Total | | | | 100.0% | | | | | 100.0% | | | | | | |
Disclaimer
The views expressed here are exclusively those of Fund management. These views, including those concerning market sectors or individual stocks, are not meant as investment advice and should not be considered predictive in nature. Any favorable (or unfavorable) description of a holding applies only as of the quarter end, December 31, 2017, unless otherwise stated. Security positions can and do change thereafter. Discussions of historical performance do not guarantee and are not indicative of future performance.
The Fund is subject to significant market risk (volatility) and is not an appropriate investment for short-term investors.
Conclusion
Thank you for your continued investment in Blue Chip 35 Index Fund. We encourage your feedback; your reactions and concerns are important to us.
Sincerely,
The Investment Management Team
| | |
| Blue Chip 35 Index Fund | |
|
| SCHEDULE OF INVESTMENTS | |
| Showing percentage of net assets as of December 31, 2017 (Unaudited) | | |
| | | | | | | | |
| Industry Company | | Shares | | Value | | | | |
| | |
COMMON STOCKS - 99.89% | | | | |
| Consumer Discretionary - 11.89% | | | | |
Amazon.com, Inc.* | | 19,700 | | $23,038,559 | | | | |
Comcast Corp., Class A | | 350,650 | | 14,043,533 | | | | |
McDonald’s Corp. | | 99,700 | | 17,160,364 | | | | |
Walt Disney Co. (The) | | 131,600 | | 14,148,316 | | | | |
| | | | | | | | |
| | | | 68,390,772 | | | | |
| | |
Consumer Staples - 12.67% | | | | |
Coca-Cola Co. (The) | | 309,814 | | 14,214,266 | | | | |
CVS Health Corp. | | 193,650 | | 14,039,625 | | | | |
PepsiCo, Inc. | | 119,605 | | 14,343,032 | | | | |
Procter & Gamble Co. (The) | | 151,726 | | 13,940,585 | | | | |
Wal-Mart Stores, Inc. | | 165,269 | | 16,320,314 | | | | |
| | | | | | | | |
| | | | 72,857,822 | | | | |
| | |
Energy - 9.82% | | | | |
Chevron Corp. | | 114,295 | | 14,308,591 | | | | |
ConocoPhillips | | 256,350 | | 14,071,052 | | | | |
Exxon Mobil Corp. | | 166,837 | | 13,954,247 | | | | |
Schlumberger, Ltd. | | 209,700 | | 14,131,683 | | | | |
| | | | | | | | |
| | | | 56,465,573 | | | | |
| | |
Financials - 12.64% | | | | |
Bank of America Corp. | | 775,808 | | 22,901,852 | | | | |
Berkshire Hathaway, Inc., | | | | | | | | |
Class B* | | 72,850 | | 14,440,327 | | | | |
JPMorgan Chase & Co. | | 178,695 | | 19,109,643 | | | | |
Wells Fargo & Co. | | 267,259 | | 16,214,604 | | | | |
| | | | | | | | |
| | | | 72,666,426 | | | | |
| | |
Health Care - 9.81% | | | | |
Gilead Sciences, Inc. | | 195,150 | | 13,980,546 | | | | |
Johnson & Johnson | | 102,402 | | 14,307,607 | | | | |
Merck & Co., Inc. | | 249,935 | | 14,063,842 | | | | |
Pfizer, Inc. | | 389,044 | | 14,091,174 | | | | |
| | | | | | | | |
| | | | 56,443,169 | | | | |
| | |
Industrials - 9.90% | | | | |
3M Co. | | 61,500 | | 14,475,255 | | | | |
General Electric Co. | | 814,943 | | 14,220,755 | | | | |
United Parcel Service, Inc., | | | | | | | | |
Class B | | 118,863 | | 14,162,526 | | | | |
United Technologies Corp. | | 110,330 | | 14,074,798 | | | | |
| | | | | | | | |
| | | | 56,933,334 | | | | |
| | |
Information Technology - 28.26% | | | | |
Alphabet, Inc., Class A* | | 10,920 | | 11,503,128 | | | | |
Alphabet, Inc., Class C* | | 11,009 | | 11,519,818 | | | | |
Apple, Inc. | | 134,800 | | 22,812,204 | | | | |
Cisco Systems, Inc. | | 366,558 | | 14,039,171 | | | | |
Intel Corp. | | 306,093 | | 14,129,253 | | | | |
| | | | | | | | |
| Industry Company | | Shares | | Value | | | | |
| | |
| | | | |
Information Technology (continued) | | | | |
International Business | | | | | | | | |
Machines Corp. | | 90,717 | | $13,917,802 | | | | |
Microsoft Corp. | | 272,795 | | 23,334,884 | | | | |
Oracle Corp. | | 297,713 | | 14,075,871 | | | | |
QUALCOMM, Inc. | | 220,100 | | 14,090,802 | | | | |
Visa, Inc., Class A | | 202,900 | | 23,134,658 | | | | |
| | | | | | | | |
| | | | 162,557,591 | | | | |
| | |
Telecommunication Services - 4.90% | | | | |
AT&T, Inc. | | 361,125 | | 14,040,540 | | | | |
Verizon Communications, Inc. | | 267,089 | | 14,137,021 | | | | |
| | | | | | | | |
| | | | 28,177,561 | | | | |
| | | | | | | | |
TOTAL COMMON STOCKS - 99.89% | | | | 574,492,248 | | | | |
| | | | | | | | |
(Cost $291,729,941) | | | | | | | | |
| | | | | | | | | | | | |
| | | Rate^ | | | Shares | | | Value | |
|
MONEY MARKET FUND - 0.09% | |
Fidelity Investments Money Market Government Portfolio Class I | | | 1.14 | % | | | 544,269 | | | | 544,269 | |
| | | | | | | | | | | | |
TOTAL MONEY MARKET FUND - 0.09% | | | | 544,269 | |
| | | | | | | | | | | | |
(Cost $544,269) | | | | | |
TOTAL INVESTMENTS - 99.98% | | | $ | 575,036,517 | |
(Cost $292,274,210) | | | | | |
Other Assets in Excess of Liabilities - 0.02% | | | | 116,623 | |
| | | | | | | | | | | | |
NET ASSETS - 100.00% | | | $ | 575,153,140 | |
| | | | | | | | | | | | |
| * | Non-income producing security. |
| ^ | Rate disclosed as of December 31, 2017. |
Summary of inputs used to value the Fund’s investments as of 12/31/2017 (See Note 2 in Notes to Financial Statements):
| | | | | | | | | | | | | | | | | | | | |
| | | | | | Valuation Inputs | | | | | | | |
| | | | | | Investment in Securities (Value) | | | | |
| | | Level 1 Quoted Prices | | | Level 2
Significant
Observable
Inputs | | | Level 3 Significant
Unobservable
Inputs | | | Total | | | | |
Common Stocks | | $ | 574,492,248 | | | $ | — | | | $ | — | | | $ | 574,492,248 | | | | | |
Money Market Fund | | | — | | | | 544,269 | | | | — | | | | 544,269 | | | | | |
| | | | | | | | | | | | | | | | | | | | |
TOTAL | | $ | 574,492,248 | | | $ | 544,269 | | | $ | — | | | $ | 575,036,517 | | | | | |
| | | | | | | | | | | | | | | | | | | | |
See Notes to Financial Statements.
| | |
| 62 | | Semi-Annual Report | December 31, 2017 (Unaudited) |
| | |
| Managed Volatility Fund | | |
| MANAGER’S COMMENTARY (Unaudited) | | |
| | |
December 31, 2017
Dear Fellow Managed Volatility Fund Shareholder,
For the quarter ended December 31, 2017, our Fund returned +2.72%,underperforming our primary market benchmark, the S&P 500 Index (+6.64%), and our peer benchmark, the Lipper Balanced Funds Index (+3.58%). Performance for the quarter was in line with the Fund’s design, as explained further below.
For the six-month semi-annual period ended December 31, 2017, our Fund returned +4.67%, trailing the S&P 500 Index (+11.42%) and the Lipper Balanced Funds Index (+6.86%).
For the calendar year, our Fund returned +8.18%, trailing the S&P 500 Index (+21.83%) and the Lipper Balanced Funds Index (+14.10%).
The table below presents our December quarter, six-month, one-year, five-year, 10-year, 15-year, and inception-to-date financial results. See the next page for a graph of performance since inception.
Standardized Returns as of December 31, 2017
| | | | | | | | | | | | | | | | | | | | | | | | | | | | |
| | | | | | | | | | | | | | | Annualized | | | | | | | |
| | | Quarter | | | 6 Months | | | 1 Year | | | 5 Years | | | 10 Years | | | 15 Years | | | Since Inception
(6/30/01) | |
| | | | | | | |
Managed Volatility Fund | | | 2.72% | | | | 4.67% | | | | 8.18 | % | | | 5.14 | % | | | 2.90% | | | | 4.91% | | | | 4.08% | |
S&P 500 Index | | | 6.64% | | | | 11.42% | | | | 21.83 | % | | | 15.79 | % | | | 8.50% | | | | 9.92% | | | | 6.97% | |
Lipper Balanced Funds Index | | | 3.58% | | | | 6.86% | | | | 14.10 | % | | | 8.73 | % | | | 5.73% | | | | 7.24% | | | | 5.73% | |
Performance figures quoted in the table above represent past performance and are no guarantee of future results. Total return figures in the table above include the reinvestment of dividends and capital gains. The table above does not reflect the deduction of taxes that a shareholder would pay on Fund distributions or on the redemption of Fund shares.
The S&P 500 Index is a broad-based, unmanaged measurement of changes in stock market conditions, based on the average of 500 widely held common stocks with dividends reinvested. The Lipper Balanced Funds Index is an index of balanced funds compiled by Lipper, Inc. It is not possible to invest directly in an index. Periods longer than one year are annualized.
According to data from Lipper, Inc. as of December 31, 2017, the Managed Volatility Fund ranked 199th of 314 Alternative Long/Short Equity funds for the 12 months ended December 31, 2017, 88rd of 119 over the past five years, 24th of 37 over the last 10 years, and 6th of 12 funds since inception on June 30, 2001. Lipper, Inc. is an independent mutual fund rating service that ranks funds in various fund categories by making comparative calculations using total returns.
| | |
| Managed Volatility Fund | |
|
| MANAGER’S COMMENTARY (Unaudited) (continued) | |
| | |
Growth of a $10,000 Investment
from Inception June 30, 2001 to December 31, 2017
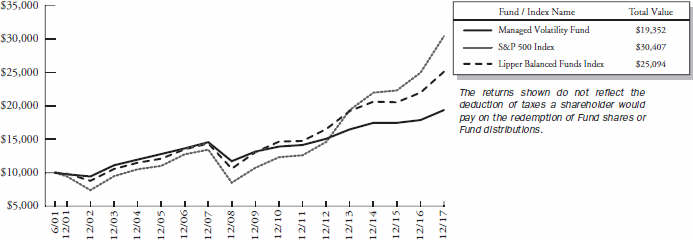
Detailed Explanation of Quarterly Performance
For the quarter, the Managed Volatility Fund met our design objective by capturing 41% of the S&P 500 Index’s return with a standard deviation of 0.12%, which was 65% lower than the S&P 500’s 0.35% standard deviation during the same period.
The portfolio’s equity component made the largest positive impact on performance, contributing +3.60% to the Fund’s return. Performance from the portfolio’s options component was essentially flat during the quarter, contributing +0.04% to the Fund’s return. The portfolio’s fixed-income component detracted slightly from performance, contributing -0.09% to the Fund’s return, while the portfolio’s futures component detracted the most, contributing -0.80% to the Fund’s return. However, this performance was in line with expectations during a quarter characterized by a rising equity market.
Detailed Explanation of Calendar Year Performance
For the year, the Fund’s return fell slightly short of our goal of capturing 40% of the S&P 500 Index’s return. The Fund’s 2.70% standard deviation was roughly 60% lower than the S&P 500 Index’s 6.77% standard deviation during the year.
The portfolio’s futures component detracted the most from performance, contributing -1.81% to the Fund’s return. However, this performance was in line with expectations during a year characterized by a rising equity market. The portfolio’s fixed-income component contributed -0.05% to the Fund’s return. The portfolio’s equities component returned +6.41%, boosting performance, while the portfolio’s options component contributed +0.20% to the Fund’s return.
The Fund continues to perform as designed, particularly over longer time horizons. For 10 years and since inception, the Fund has captured roughly 34% and 59%, respectively, of the S&P 500 Index’s return, with a standard deviation roughly 56% lower than that of the Index’s.
| | |
| 64 | | Semi-Annual Report | December 31, 2017 (Unaudited) |
| | |
| Managed Volatility Fund | | |
| MANAGER’S COMMENTARY (Unaudited) (continued) | | |
| | |
Top Ten Equity Holdings as of December 31, 2017
| | | | | | |
| Rank | | Description | | Industry | | % of Net
Assets |
| 1 | | United Rentals, Inc. | | Industrials | | 1.8% |
| 2 | | United Technologies Corp. | | Industrials | | 1.6% |
| 3 | | Kellogg Co. | | Consumer Staples | | 1.5% |
| 4 | | General Motors Co. | | Consumer Discretionary | | 1.5% |
| 5 | | Amazon.com, Inc. | | Consumer Discretionary | | 1.4% |
| 6 | | Gilead Sciences, Inc. | | Health Care | | 1.2% |
| 7 | | Alliance Data Systems Corp. | | Information Technology | | 1.2% |
| 8 | | Seagate Technology PLC | | Information Technology | | 1.1% |
| 9 | | Goldcorp, Inc. | | Materials | | 1.1% |
| 10 | | Western Digital Corp. | | Information Technology | | 1.0% |
| | Total | | | | 13.4% |
Industry Sector Representation as of December 31, 2017
| | |
| Asset Type | | % of Net
Assets |
Common Stock | | 58.4% |
Consumer Discretionary | | 7.4% |
Consumer Staples | | 5.2% |
Energy | | 2.7% |
Financials | | 7.3% |
Health Care | | 7.1% |
Industrials | | 8.5% |
Information Technology | | 13.9% |
Materials | | 2.4% |
Real Estate | | 1.4% |
Telecommunication Services | | 1.2% |
Utilities | | 1.3% |
U.S. Government Obligations | | 37.0% |
Call Options Written | | -1.3% |
Put Options Written | | -0.5% |
Money Market Fund | | 5.9% |
Liabilities in Excess of Other Assets | | 0.5% |
Total | | 100% |
Disclaimer
The views expressed here are exclusively those of Fund management. These views, including those related to market sectors or individual stocks, are not meant as investment advice and should not be considered predictive in nature. Any favorable (or unfavorable) description of a holding applies only as of the quarter end, December 31, 2017, unless otherwise stated. Security positions can and do change thereafter. Discussions of historical performance do not guarantee and may not be indicative of future performance.
Market volatility can significantly affect short-term performance. The Fund is not an appropriate investment for short-term investors. Investments in the small companies within this multi-cap fund generally carry greater risk than is customarily associated with larger companies. This additional risk is attributable to a number of factors, including the relatively limited financial resources that are typically available to small companies and the fact that small companies often have comparatively limited product lines. In addition, the stock of small companies tends to be more volatile than the stock of large companies, particularly in the short term and particularly in the early stages of an economic or market downturn. The Fund’s use of options,
| | |
| Managed Volatility Fund | |
|
| MANAGER’S COMMENTARY (Unaudited) (continued) | |
| | |
futures, and leverage can magnify the risk of loss in an unfavorable market, and the Fund’s use of short-sale positions can, in theory, expose shareholders to unlimited loss. Shareholders of the Fund, therefore, are taking on more risk than they would if they invested in the stock market as a whole. The Fund uses an option writing strategy in which the Fund may sell covered calls or secured put options. Options are subject to special risks and may not fully protect the Fund against declines in the value of its stocks. In addition, an option writing strategy limits the upside profit potential normally associated with stocks. Finally, the Fund’s fixed-income holdings are subject to three types of risk. Interest rate risk is the chance that bond prices overall will decline as interest rates rise. Credit risk is the chance that a bond issuer will fail to pay interest and principal. Prepayment risk is the chance that a mortgage-backed bond issuer will repay a higher yielding bond, resulting in a lower paying yield.
Conclusion
Thank you for your continued investment in Managed Volatility Fund. We encourage your feedback; your reactions and concerns are important to us.
Sincerely,
The Investment Management Team
| | |
| 66 | | Semi-Annual Report | December 31, 2017 (Unaudited) |
| | |
| Managed Volatility Fund | |
|
| SCHEDULE OF INVESTMENTS | |
| Showing percentage of net assets as of December 31, 2017 (Unaudited) | | |
| | | | | | | | |
| Industry Company | | Shares | | Value | | | | |
COMMON STOCKS - 58.46% | | | | | | |
Consumer Discretionary - 7.41% | | | | |
Adient PLC | | 495 | | $ 38,956 | | | | |
Amazon.com, Inc.* | | 400 | | 467,788 | | | | |
Aptiv PLC | | 500 | | 42,415 | | | | |
AutoZone, Inc.* | | 200 | | 142,274 | | | | |
Carnival Corp. | | 600 | | 39,822 | | | | |
Comcast Corp., Class A# | | 2,500 | | 100,125 | | | | |
Delphi Technologies PLC* | | 166 | | 8,710 | | | | |
Dollar General Corp. | | 500 | | 46,505 | | | | |
Ford Motor Co. | | 2,900 | | 36,221 | | | | |
General Motors Co.# | | 12,000 | | 491,880 | | | | |
Goodyear Tire & Rubber Co. (The) | | 200 | | 6,462 | | | | |
Hasbro, Inc.# | | 700 | | 63,623 | | | | |
McDonald’s Corp. | | 500 | | 86,060 | | | | |
NIKE, Inc., Class B# | | 1,500 | | 93,825 | | | | |
Omnicom Group, Inc.# | | 1,200 | | 87,396 | | | | |
Priceline Group, Inc. (The)* | | 100 | | 173,774 | | | | |
Ross Stores, Inc.# | | 800 | | 64,200 | | | | |
Scripps Networks Interactive, Inc., Class A | | 1,000 | | 85,380 | | | | |
Starbucks Corp.# | | 1,000 | | 57,430 | | | | |
Target Corp.# | | 800 | | 52,200 | | | | |
Time Warner, Inc. | | 933 | | 85,342 | | | | |
Twenty-First Century Fox, Inc., Class A | | 1,200 | | 41,436 | | | | |
Walt Disney Co. (The)# | | 900 | | 96,759 | | | | |
Wynn Resorts, Ltd. | | 200 | | 33,718 | | | | |
Yum China Holdings, Inc. | | 800 | | 32,016 | | | | |
Yum! Brands, Inc.# | | 300 | | 24,483 | | | | |
| | | | | | | | |
| | | | 2,498,800 | | | | |
| | | |
Consumer Staples - 5.24% | | | | | | |
Archer-Daniels-Midland Co.# | | 1,400 | | 56,112 | | | | |
Campbell Soup Co. | | 1,900 | | 91,409 | | | | |
Coca-Cola Co.
(The)# | | 900 | | 41,292 | | | | |
Colgate-Palmolive Co.# | | 700 | | 52,815 | | | | |
Constellation Brands, Inc., Class A | | 500 | | 114,285 | | | | |
Costco Wholesale Corp. | | 300 | | 55,836 | | | | |
CVS Health Corp.# | | 900 | | 65,250 | | | | |
General Mills, Inc.# | | 1,600 | | 94,864 | | | | |
JM Smucker Co. (The) | | 400 | | 49,696 | | | | |
Kellogg Co.# | | 7,500 | | 509,850 | | | | |
Kimberly-Clark Corp.# | | 1,100 | | 132,726 | | | | |
Kroger Co. (The)# | | 1,200 | | 32,940 | | | | |
Mondelez International, Inc. Class A# | | 3,600 | | 154,080 | | | | |
PepsiCo, Inc.# | | 1,300 | | 155,896 | | | | |
Procter & Gamble Co. (The)# | | 1,100 | | 101,068 | | | | |
| | | | |
| Industry Company | | Shares | | Value |
| | | | |
Consumer Staples (continued) |
Wal-Mart Stores, Inc. | | 600 | | $ 59,250 |
| | | | |
| | | | 1,767,369 |
| | |
Energy - 2.75% | | | | |
Anadarko Petroleum Corp. | | 700 | | 37,548 |
Chevron Corp.# | | 1,778 | | 222,588 |
ConocoPhillips# | | 1,287 | | 70,643 |
EOG Resources, Inc. | | 500 | | 53,955 |
Exxon Mobil Corp.# | | 1,900 | | 158,916 |
Halliburton Co.# | | 1,000 | | 48,870 |
Helmerich & Payne, Inc.#+ | | 1,000 | | 64,640 |
Kinder Morgan, Inc.# | | 1,800 | | 32,526 |
Marathon Petroleum Corp.# | | 1,700 | | 112,166 |
Phillips 66 | | 593 | | 59,982 |
Valero Energy Corp.# | | 700 | | 64,337 |
| | | | |
| | | | 926,171 |
| | |
Financials - 7.30% | | | | |
Allstate Corp. (The)# | | 2,100 | | 219,891 |
American Express Co.# | | 900 | | 89,379 |
Aon PLC# | | 800 | | 107,200 |
Bank of America Corp.# | | 2,700 | | 79,704 |
BB&T Corp. | | 800 | | 39,776 |
Berkshire Hathaway, Inc., Class B*# | | 500 | | 99,110 |
BlackRock, Inc. | | 300 | | 154,113 |
Capital One Financial Corp.# | | 700 | | 69,706 |
Charles Schwab Corp. (The)# | | 1,800 | | 92,466 |
Chubb, Ltd. | | 361 | | 52,753 |
Citigroup, Inc.# | | 2,810 | | 209,092 |
Comerica, Inc. | | 300 | | 26,043 |
Goldman Sachs Group, Inc. (The) | | 500 | | 127,380 |
Huntington Bancshares, Inc. | | 3,200 | | 46,592 |
JPMorgan Chase & Co.# | | 1,500 | | 160,410 |
KeyCorp | | 4,800 | | 96,816 |
Marsh & McLennan Cos., Inc. | | 300 | | 24,417 |
Morgan Stanley# | | 2,300 | | 120,681 |
PNC Financial Services Group, Inc. (The) | | 500 | | 72,145 |
Progressive Corp. (The) | | 1,220 | | 68,710 |
S&P Global, Inc. | | 500 | | 84,700 |
State Street Corp.# | | 1,000 | | 97,610 |
U.S. Bancorp | | 1,900 | | 101,802 |
Wells Fargo & Co.# | | 3,671 | | 222,720 |
| | | | |
| | | | 2,463,216 |
| | |
| Managed Volatility Fund | |
|
| SCHEDULE OF INVESTMENTS (continued) | |
| Showing percentage of net assets as of December 31, 2017 (Unaudited) | | |
| | | | | | | | |
| Industry Company | | Shares | | Value | | | | |
| | | |
Common Stocks (continued) | | | | | | |
Health Care - 7.06% | | | | |
Abbott Laboratories# | | 1,300 | | $ 74,191 | | | | |
AbbVie, Inc.# | | 1,400 | | 135,394 | | | | |
Allergan PLC | | 300 | | 49,074 | | | | |
Amgen, Inc. | | 800 | | 139,120 | | | | |
Baxter International, Inc. | | 600 | | 38,784 | | | | |
Becton Dickinson & Co. | | 774 | | 165,650 | | | | |
Biogen, Inc.* | | 400 | | 127,428 | | | | |
Bioverativ, Inc.* | | 300 | | 16,176 | | | | |
Bristol-Myers Squibb Co.# | | 1,479 | | 90,633 | | | | |
Celgene Corp.*# | | 1,100 | | 114,796 | | | | |
Danaher Corp.# | | 1,200 | | 111,384 | | | | |
DaVita, Inc.*# | | 1,100 | | 79,475 | | | | |
Express Scripts Holding Co.*# | | 1,734 | | 129,426 | | | | |
Gilead Sciences, Inc.# | | 5,700 | | 408,348 | | | | |
Johnson & Johnson# | | 800 | | 111,776 | | | | |
Merck & Co., Inc.# | | 2,200 | | 123,794 | | | | |
Pfizer, Inc.# | | 3,600 | | 130,392 | | | | |
Shire PLC, ADR | | 192 | | 29,783 | | | | |
Stryker Corp. | | 660 | | 102,194 | | | | |
Thermo Fisher Scientific, Inc. | | 500 | | 94,940 | | | | |
UnitedHealth Group, Inc. | | 500 | | 110,230 | | | | |
| | | | | | | | |
| | | | 2,382,988 | | | | |
| | | |
Industrials - 8.52% | | | | | | |
3M Co.# | | 800 | | 188,296 | | | | |
AerCap Holdings NV*# | | 1,100 | | 57,871 | | | | |
Deere & Co. | | 400 | | 62,604 | | | | |
Emerson Electric Co.# | | 1,500 | | 104,535 | | | | |
FedEx Corp.# | | 1,000 | | 249,540 | | | | |
General Electric Co.# | | 2,900 | | 50,605 | | | | |
Honeywell International, Inc.# | | 2,000 | | 306,720 | | | | |
Johnson Controls International PLC# | | 754 | | 28,735 | | | | |
Lockheed Martin Corp. | | 270 | | 86,684 | | | | |
Northrop Grumman Corp.# | | 1,000 | | 306,910 | | | | |
NOW, Inc.*+ | | 200 | | 2,206 | | | | |
Raytheon Co. | | 300 | | 56,355 | | | | |
Southwest Airlines Co.# | | 1,400 | | 91,630 | | | | |
Union Pacific Corp. | | 500 | | 67,050 | | | | |
United Rentals, Inc.*# | | 3,600 | | 618,876 | | | | |
United Technologies Corp.# | | 4,140 | | 528,140 | | | | |
Waste Management, Inc.# | | 800 | | 69,040 | | | | |
| | | | | | | | |
| | | | 2,875,797 | | | | |
| | | |
Information Technology - 13.90% | | | | | | |
Adobe Systems, Inc.*# | | 800 | | 140,192 | | | | |
Alliance Data Systems Corp.# | | 1,600 | | 405,568 | | | | |
| | | | |
| Industry Company | | Shares | | Value |
| | | | |
Information Technology (continued) |
Alphabet, Inc., Class A* | | 260 | | $ 273,884 |
Alphabet, Inc., Class C* | | 260 | | 272,064 |
Apple, Inc.# | | 1,900 | | 321,537 |
Applied Materials, Inc.# | | 1,600 | | 81,792 |
Cisco Systems, Inc.# | | 6,000 | | 229,800 |
Citrix Systems, Inc.*# | | 800 | | 70,400 |
Cognizant Technology Solutions Corp., Class A | | 700 | | 49,714 |
Dell Technologies, Inc., Class V* | | 222 | | 18,044 |
DXC Technology Co. | | 171 | | 16,228 |
eBay, Inc.* | | 700 | | 26,418 |
Electronic Arts, Inc.* | | 800 | | 84,048 |
Facebook, Inc., Class A*# | | 1,500 | | 264,690 |
Hewlett Packard Enterprise Co. | | 1,400 | | 20,104 |
HP, Inc. | | 2,000 | | 42,020 |
Intel Corp.# | | 2,400 | | 110,784 |
International Business Machines Corp.# | | 1,300 | | 199,446 |
Intuit, Inc. | | 400 | | 63,112 |
Juniper Networks, Inc.# | | 3,900 | | 111,150 |
LogMeIn, Inc. | | 189 | | 21,641 |
Mastercard, Inc., Class A# | | 800 | | 121,088 |
Micro Focus International PLC, ADR* | | 196 | | 6,584 |
Micron Technology, Inc.*# | | 3,900 | | 160,368 |
Microsoft Corp.# | | 1,200 | | 102,648 |
Oracle Corp.# | | 1,260 | | 59,573 |
PayPal Holdings, Inc.* | | 400 | | 29,448 |
QUALCOMM, Inc.# | | 1,000 | | 64,020 |
salesforce.com, Inc.*# | | 1,900 | | 194,237 |
Seagate Technology PLC# | | 9,000 | | 376,560 |
Texas Instruments, Inc.# | | 970 | | 101,307 |
Visa, Inc., Class A# | | 2,700 | | 307,854 |
Western Digital Corp.# | | 4,310 | | 342,774 |
| | | | |
| | | | 4,689,097 |
| | |
Materials - 2.39% | | | | |
AdvanSix, Inc.* | | 48 | | 2,019 |
DowDuPont, Inc.# | | 900 | | 64,098 |
Goldcorp, Inc.# | | 28,000 | | 357,560 |
International Paper Co.# | | 700 | | 40,558 |
LyondellBasell Industries NV, Class A | | 500 | | 55,160 |
Monsanto Co. | | 600 | | 70,068 |
Praxair, Inc. | | 600 | | 92,808 |
Sherwin-Williams Co. (The) | | 300 | | 123,012 |
| | | | |
| | | | 805,283 |
| | |
| 68 | | Semi-Annual Report | December 31, 2017 (Unaudited) |
| | |
| Managed Volatility Fund | | |
| SCHEDULE OF INVESTMENTS (continued) | | |
| Showing percentage of net assets as of December 31, 2017 (Unaudited) | | |
| | | | | | | | | | |
| Industry Company | | | | Shares | | Value | | | | |
Common Stocks (continued) | | | | | | | | |
Real Estate - 1.39% | | | | | | | | | | |
American Tower Corp. | | 600 | | $ 85,602 | | | | |
Crown Castle International Corp. | | 500 | | 55,505 | | | | |
Public Storage# | | 1,000 | | 209,000 | | | | |
Simon Property Group, Inc.# | | 700 | | 120,218 | | | | |
| | | | | | | | | | |
| | | | | | 470,325 | | | | |
| | | |
Telecommunication Services - 1.24% | | | | | | |
AT&T, Inc.# | | 5,100 | | 198,288 | | | | |
CenturyLink, Inc.# | | 1,200 | | 20,016 | | | | |
T-Mobile US, Inc.*# | | 1,800 | | 114,318 | | | | |
Verizon Communications, Inc.# | | 1,600 | | 84,688 | | | | |
| | | | | | | | | | |
| | | | | | 417,310 | | | | |
| | | |
Utilities - 1.26% | | | | | | |
AES Corp. | | 4,300 | | 46,569 | | | | |
American Electric Power Co., Inc. | | 1,000 | | 73,570 | | | | |
Dominion Energy, Inc.# | | 1,020 | | 82,681 | | | | |
Duke Energy Corp. | | 783 | | 65,858 | | | | |
Exelon Corp.# | | 1,400 | | 55,174 | | | | |
Public Service Enterprise Group, Inc. | | 900 | | 46,350 | | | | |
Sempra Energy | | 500 | | 53,460 | | | | |
| | | | | | | | | | |
| | | | | | 423,662 | | | | |
| | | | | | | | | | |
TOTAL COMMON STOCKS - 58.46% | | | | 19,720,018 | | | | |
| | | | | | | | | | |
(Cost $12,233,874) | | | | | | | | | | |
| | | | | |
| Due Date | | Discount Rate
or Coupon Rate | | Principal
Amount | | Value | | | | |
U.S. GOVERNMENT OBLIGATIONS - 36.97% | | | | |
U.S. Treasury Bills - 36.97% | | | | | | |
01/11/2018 | | 1.088%(a) | | $2,000,000 | | 1,999,411 | | | | |
03/01/2018 | | 1.289%(a) | | 4,000,000 | | 3,991,799 | | | | |
03/15/2018 | | 1.282%(a) | | 1,000,000 | | 997,410 | | | | |
03/22/2018 | | 1.360%(a) | | 2,000,000 | | 1,994,053 | | | | |
03/29/2018 | | 1.450%(a) | | 3,500,000 | | 3,488,556 | | | | |
| | | | | | | | | | |
| | | | | | 12,471,229 | | | | |
| | | | | | | | | | |
TOTAL U.S. GOVERNMENT OBLIGATIONS - 36.97% | | | | 12,471,229 | | | | |
| | | | | | | | | | |
(Cost $12,470,228) | | | | | | | | | | |
| | | | | | |
| | | Rate^ | | Shares | | Value |
MONEY MARKET FUND - 5.92% | | |
Fidelity Investments Money Market Government Portfolio Class I | | 1.14% | | 1,996,236 | | $ 1,996,236 |
| | | | | | |
TOTAL MONEY MARKET FUND — 5.92% | | 1,996,236 |
| | | | | | |
(Cost $1,996,236) | | | | | | |
|
INVESTMENTS PURCHASED WITH CASH PROCEEDS FROM SECURITIES LENDING - 0.14% |
Fidelity Investments Money Market Government Portfolio Class I** | | 1.14% | | 48,675 | | 48,675 |
| | | | | | |
TOTAL INVESTMENTS PURCHASED WITH CASH PROCEEDS FROM SECURITIES LENDING - 0.14% | | 48,675 |
| | |
(Cost $48,675) | | | | | | |
TOTAL INVESTMENTS BEFORE OPTIONS WRITTEN - 101.50% | | $ 34,236,158 |
| | | | | | |
(Cost $26,749,013) | | | | | | |
| |
WRITTEN OPTIONS - (1.82%) | | |
TOTAL WRITTEN OPTIONS - (1.82%) | | $ (614,589) |
| | |
(Premiums Received $(542,143)) | | |
| |
TOTAL INVESTMENTS - 99.68% | | $ 33,621,569 |
(Cost $26,206,870) | | | | | | |
Other Assets in Excess of Liabilities - 0.32% | | 109,095 |
| | | | | | |
NET ASSETS - 100.00% | | | | $ 33,730,664 |
| | | | | | |
| * | Non-income producing security. |
| ** | This security represents the investment of the collateral received in connection with securities out on loan as of December 31, 2017. |
| # | Security subject to call or put option written by the Fund. |
| ^ | Rate disclosed as of December 31, 2017. |
| + | This security or a portion of the security is out on loan as of December 31, 2017. Total loaned securities had a value of $47,454 as of December 31, 2017. |
| (a) | Rate represents the effective yield at purchase. |
PLC - Public Limited Company
ADR - American Depositary Receipt
| | |
| Managed Volatility Fund | |
|
| SCHEDULE OF INVESTMENTS (continued) | |
| Showing percentage of net assets as of December 31, 2017 (Unaudited) | | |
| | | | | | | | | | | | | | | | | | | | | | | | | |
| Description | | Number of Contracts | | Notional Amount | | Exercise
Price | | Expiration
Date | | Value |
EXCHANGE TRADED PUT OPTIONS WRITTEN - (0.52%) | | | | | | | | | | | | | | | | |
| | | | | |
AbbVie, Inc. | | | | 35 | | | | $ | (338,485 | ) | | | $ | 92.50 | | | | | 02/16/18 | | | | $ | (5,670 | ) |
AerCap Holdings NV | | | | 15 | | | | | (78,915 | ) | | | | 50.00 | | | | | 04/20/18 | | | | | (2,025 | ) |
Align Technology, Inc. | | | | 15 | | | | | (333,285 | ) | | | | 230.00 | | | | | 04/20/18 | | | | | (33,000 | ) |
Allstate Corp. (The) | | | | 20 | | | | | (209,420 | ) | | | | 100.00 | | | | | 04/20/18 | | | | | (3,780 | ) |
Apple, Inc. | | | | 20 | | | | | (338,460 | ) | | | | 170.00 | | | | | 02/16/18 | | | | | (12,800 | ) |
Applied Materials, Inc. | | | | 60 | | | | | (306,720 | ) | | | | 50.00 | | | | | 01/19/18 | | | | | (4,980 | ) |
Athene Holding, Ltd. | | | | 57 | | | | | (294,747 | ) | | | | 50.00 | | | | | 02/16/18 | | | | | (8,550 | ) |
Berkshire Hathaway, Inc., Class B | | | | 20 | | | | | (396,440 | ) | | | | 195.00 | | | | | 03/16/18 | | | | | (7,000 | ) |
Coca-Cola Co. (The) | | | | 35 | | | | | (160,580 | ) | | | | 45.00 | | | | | 03/16/18 | | | | | (2,590 | ) |
Fiat Chrysler Automobiles NV | | | | 50 | | | | | (89,200 | ) | | | | 17.00 | | | | | 03/16/18 | | | | | (3,000 | ) |
Honeywell International, Inc. | | | | 10 | | | | | (153,360 | ) | | | | 150.00 | | | | | 03/16/18 | | | | | (2,900 | ) |
Huntsman Corp. | | | | 20 | | | | | (66,580 | ) | | | | 30.00 | | | | | 02/16/18 | | | | | (820 | ) |
Intel Corp. | | | | 80 | | | | | (369,280 | ) | | | | 42.00 | | | | | 03/16/18 | | | | | (4,080 | ) |
IPG Photonics Corp. | | | | 5 | | | | | (107,065 | ) | | | | 200.00 | | | | | 04/20/18 | | | | | (4,450 | ) |
Juniper Networks, Inc. | | | | 65 | | | | | (185,250 | ) | | | | 27.00 | | | | | 01/19/18 | | | | | (780 | ) |
KLA-Tencor Corp. | | | | 35 | | | | | (367,745 | ) | | | | 100.00 | | | | | 03/16/18 | | | | | (13,650 | ) |
Leucadia National Corp. | | | | 20 | | | | | (52,980 | ) | | | | 25.00 | | | | | 03/16/18 | | | | | (1,200 | ) |
Michael Kors Holdings, Ltd. | | | | 61 | | | | | (383,995 | ) | | | | 55.00 | | | | | 02/16/18 | | | | | (5,490 | ) |
Micron Technology, Inc. | | | | 85 | | | | | (349,520 | ) | | | | 40.00 | | | | | 01/19/18 | | | | | (8,755 | ) |
O’Reilly Automotive, Inc. | | | | 16 | | | | | (384,864 | ) | | | | 210.00 | | | | | 02/16/18 | | | | | (3,040 | ) |
Prudential Financial, Inc. | | | | 30 | | | | | (344,940 | ) | | | | 110.00 | | | | | 03/16/18 | | | | | (7,650 | ) |
PulteGroup, Inc. | | | | 100 | | | | | (332,500 | ) | | | | 34.00 | | | | | 04/20/18 | | | | | (21,900 | ) |
Red Hat, Inc. | | | | 7 | | | | | (84,070 | ) | | | | 125.00 | | | | | 03/16/18 | | | | | (4,970 | ) |
Reinsurance Group of America, Inc. | | | | 10 | | | | | (155,930 | ) | | | | 145.00 | | | | | 01/19/18 | | | | | (450 | ) |
TransUnion | | | | 32 | | | | | (175,872 | ) | | | | 55.00 | | | | | 03/16/18 | | | | | (7,200 | ) |
Western Digital Corp. | | | | 10 | | | | | (79,530 | ) | | | | 82.00 | | | | | 01/26/18 | | | | | (4,300 | ) |
| | | | | | | | | | | | | | | | | | | | | | | | | |
Total Exchange Traded Put Options Written (Premiums received $245,936) | | | | | | | | | | | | | | | | | | | | | | | $ | (175,030 | ) |
| | | | | | | | | | | | | | | | | | | | | | | | | |
EXCHANGE TRADED CALL OPTIONS WRITTEN - (1.30%) | | | | | | | | | | | | | | | | |
| | | | | |
3M Co. | | | | 3 | | | | $ | (70,611 | ) | | | $ | 240.00 | | | | | 02/16/18 | | | | $ | (1,170 | ) |
Abbott Laboratories | | | | 4 | | | | | (22,828 | ) | | | | 57.50 | | | | | 01/19/18 | | | | | (240 | ) |
AbbVie, Inc. | | | | 4 | | | | | (38,684 | ) | | | | 97.50 | | | | | 02/16/18 | | | | | (1,100 | ) |
Adobe Systems, Inc. | | | | 3 | | | | | (52,572 | ) | | | | 175.00 | | | | | 01/19/18 | | | | | (1,095 | ) |
AerCap Holdings NV | | | | 11 | | | | | (57,871 | ) | | | | 52.50 | | | | | 01/19/18 | | | | | (1,034 | ) |
Alliance Data Systems Corp. | | | | 16 | | | | | (405,568 | ) | | | | 240.00 | | | | | 03/16/18 | | | | | (36,480 | ) |
Allstate Corp. (The) | | | | 15 | | | | | (157,065 | ) | | | | 105.00 | | | | | 04/20/18 | | | | | (5,400 | ) |
American Express Co. | | | | 3 | | | | | (29,793 | ) | | | | 95.00 | | | | | 01/19/18 | | | | | (1,536 | ) |
Aon PLC | | | | 3 | | | | | (40,200 | ) | | | | 145.00 | | | | | 04/20/18 | | | | | (525 | ) |
Apple, Inc. | | | | 6 | | | | | (101,538 | ) | | | | 180.00 | | | | | 02/16/18 | | | | | (1,224 | ) |
Applied Materials, Inc. | | | | 5 | | | | | (25,560 | ) | | | | 48.00 | | | | | 01/19/18 | | | | | (1,900 | ) |
Archer-Daniels-Midland Co. | | | | 4 | | | | | (16,032 | ) | | | | 44.00 | | | | | 01/19/18 | | | | | (12 | ) |
AT&T, Inc. | | | | 15 | | | | | (58,320 | ) | | | | 39.00 | | | | | 01/19/18 | | | | | (660 | ) |
Bank of America Corp. | | | | 8 | | | | | (23,616 | ) | | | | 27.00 | | | | | 01/19/18 | | | | | (2,120 | ) |
Bristol-Myers Squibb Co. | | | | 6 | | | | | (36,768 | ) | | | | 67.50 | | | | | 03/16/18 | | | | | (498 | ) |
Capital One Financial Corp. | | | | 3 | | | | | (29,874 | ) | | | | 92.50 | | | | | 01/19/18 | | | | | (2,385 | ) |
Celgene Corp. | | | | 4 | | | | | (41,744 | ) | | | | 120.00 | | | | | 03/16/18 | | | | | (396 | ) |
| | |
| 70 | | Semi-Annual Report | December 31, 2017 (Unaudited) |
| | |
| Managed Volatility Fund | | |
| SCHEDULE OF INVESTMENTS (continued) | | |
| Showing percentage of net assets as of December 31, 2017 (Unaudited) | | |
| | | | | | | | | | | | | | | | | | | | | | | | | |
| Description | | Number of
Contracts | | Notional
Amount | | Exercise
Price | | Expiration
Date | | Value |
Exchange Traded Call Options Written (continued) | | | | | | | | | | | | | | | | | | | | | | | | | |
CenturyLink, Inc. | | | | 4 | | | | $ | (6,672 | ) | | | $ | 19.00 | | | | | 01/19/18 | | | | $ | (40 | ) |
Charles Schwab Corp. (The) | | | | 5 | | | | | (25,685 | ) | | | | 42.00 | | | | | 01/19/18 | | | | | (4,850 | ) |
Chevron Corp. | | | | 6 | | | | | (75,114 | ) | | | | 120.00 | | | | | 03/16/18 | | | | | (4,320 | ) |
Cisco Systems, Inc. | | | | 18 | | | | | (68,940 | ) | | | | 37.00 | | | | | 02/16/18 | | | | | (3,222 | ) |
Citigroup, Inc. | | | | 8 | | | | | (59,528 | ) | | | | 75.00 | | | | | 03/16/18 | | | | | (2,048 | ) |
Citrix Systems, Inc. | | | | 3 | | | | | (26,400 | ) | | | | 95.00 | | | | | 03/16/18 | | | | | (495 | ) |
Colgate-Palmolive Co. | | | | 3 | | | | | (22,635 | ) | | | | 72.50 | | | | | 01/19/18 | | | | | (960 | ) |
Comcast Corp., Class A | | | | 8 | | | | | (32,040 | ) | | | | 37.50 | | | | | 01/19/18 | | | | | (2,160 | ) |
ConocoPhillips | | | | 4 | | | | | (21,956 | ) | | | | 50.00 | | | | | 01/19/18 | | | | | (2,096 | ) |
CVS Health Corp. | | | | 3 | | | | | (21,750 | ) | | | | 72.50 | | | | | 02/16/18 | | | | | (765 | ) |
Danaher Corp. | | | | 4 | | | | | (37,128 | ) | | | | 87.50 | | | | | 01/19/18 | | | | | (2,560 | ) |
DaVita, Inc. | | | | 3 | | | | | (21,675 | ) | | | | 62.50 | | | | | 01/19/18 | | | | | (3,240 | ) |
Dominion Energy, Inc. | | | | 3 | | | | | (24,318 | ) | | | | 85.00 | | | | | 04/20/18 | | | | | (240 | ) |
DowDuPont, Inc. | | | | 3 | | | | | (21,366 | ) | | | | 70.00 | | | | | 01/19/18 | | | | | (600 | ) |
Emerson Electric Co. | | | | 5 | | | | | (34,845 | ) | | | | 65.00 | | | | | 01/19/18 | | | | | (2,500 | ) |
Exelon Corp. | | | | 4 | | | | | (15,764 | ) | | | | 40.00 | | | | | 01/19/18 | | | | | (140 | ) |
Express Scripts Holding Co. | | | | 5 | | | | | (37,320 | ) | | | | 62.50 | | | | | 02/16/18 | | | | | (6,500 | ) |
Exxon Mobil Corp. | | | | 6 | | | | | (50,184 | ) | | | | 85.00 | | | | | 01/19/18 | | | | | (234 | ) |
Facebook, Inc., Class A | | | | 5 | | | | | (88,230 | ) | | | | 180.00 | | | | | 02/16/18 | | | | | (2,650 | ) |
FedEx Corp. | | | | 3 | | | | | (74,862 | ) | | | | 230.00 | | | | | 01/19/18 | | | | | (6,045 | ) |
General Electric Co. | | | | 8 | | | | | (13,960 | ) | | | | 21.00 | | | | | 01/19/18 | | | | | (16 | ) |
General Mills, Inc. | | | | 5 | | | | | (29,645 | ) | | | | 52.50 | | | | | 01/19/18 | | | | | (3,535 | ) |
General Motors Co. | | | | 120 | | | | | (491,880 | ) | | | | 44.00 | | | | | 02/16/18 | | | | | (5,760 | ) |
Gilead Sciences, Inc. | | | | 50 | | | | | (358,200 | ) | | | | 72.50 | | | | | 02/16/18 | | | | | (12,000 | ) |
Goldcorp, Inc. | | | | 280 | | | | | (357,560 | ) | | | | 12.00 | | | | | 02/16/18 | | | | | (26,880 | ) |
Halliburton Co. | | | | 3 | | | | | (14,661 | ) | | | | 42.50 | | | | | 02/16/18 | | | | | (2,034 | ) |
Hasbro, Inc. | | | | 3 | | | | | (27,267 | ) | | | | 95.00 | | | | | 01/19/18 | | | | | (171 | ) |
Helmerich & Payne, Inc. | | | | 3 | | | | | (19,392 | ) | | | | 60.00 | | | | | 01/19/18 | | | | | (1,551 | ) |
Honeywell International, Inc. | | | | 12 | | | | | (184,032 | ) | | | | 155.00 | | | | | 03/16/18 | | | | | (4,500 | ) |
Honeywell International, Inc. | | | | 3 | | | | | (46,008 | ) | | | | 145.00 | | | | | 01/19/18 | | | | | (2,820 | ) |
Intel Corp. | | | | 7 | | | | | (32,312 | ) | | | | 48.00 | | | | | 02/16/18 | | | | | (609 | ) |
International Business Machines Corp. | | | | 4 | | | | | (61,368 | ) | | | | 165.00 | | | | | 01/19/18 | | | | | (148 | ) |
International Paper Co. | | | | 3 | | | | | (17,382 | ) | | | | 60.00 | | | | | 01/19/18 | | | | | (63 | ) |
Johnson & Johnson | | | | 3 | | | | | (41,916 | ) | | | | 145.00 | | | | | 03/16/18 | | | | | (405 | ) |
Johnson Controls International PLC | | | | 3 | | | | | (11,433 | ) | | | | 37.00 | | | | | 04/20/18 | | | | | (795 | ) |
JPMorgan Chase & Co. | | | | 5 | | | | | (53,470 | ) | | | | 100.00 | | | | | 03/16/18 | | | | | (4,250 | ) |
Juniper Networks, Inc. | | | | 12 | | | | | (34,200 | ) | | | | 27.00 | | | | | 01/19/18 | | | | | (2,148 | ) |
Kellogg Co. | | | | 75 | | | | | (509,850 | ) | | | | 67.50 | | | | | 02/16/18 | | | | | (19,125 | ) |
Kimberly-Clark Corp. | | | | 4 | | | | | (48,264 | ) | | | | 115.00 | | | | | 01/19/18 | | | | | (2,560 | ) |
Kinder Morgan, Inc./DE | | | | 5 | | | | | (9,035 | ) | | | | 20.00 | | | | | 01/19/18 | | | | | (25 | ) |
Kroger Co. (The) | | | | 4 | | | | | (10,980 | ) | | | | 28.00 | | | | | 02/16/18 | | | | | (332 | ) |
Marathon Petroleum Corp. | | | | 5 | | | | | (32,990 | ) | | | | 57.50 | | | | | 01/19/18 | | | | | (4,450 | ) |
Mastercard, Inc., Class A | | | | 3 | | | | | (45,408 | ) | | | | 150.00 | | | | | 01/19/18 | | | | | (957 | ) |
Merck & Co., Inc. | | | | 7 | | | | | (39,389 | ) | | | | 67.50 | | | | | 01/19/18 | | | | | (7 | ) |
Micron Technology, Inc. | | | | 12 | | | | | (49,344 | ) | | | | 48.00 | | | | | 02/16/18 | | | | | (696 | ) |
Microsoft Corp. | | | | 4 | | | | | (34,216 | ) | | | | 85.00 | | | | | 02/16/18 | | | | | (1,188 | ) |
Mondelez International, Inc. Class A | | | | 10 | | | | | (42,800 | ) | | | | 44.00 | | | | | 03/16/18 | | | | | (910 | ) |
Morgan Stanley | | | | 7 | | | | | (36,729 | ) | | | | 49.00 | | | | | 01/19/18 | | | | | (2,723 | ) |
NIKE, Inc., Class B | | | | 5 | | | | | (31,275 | ) | | | | 55.00 | | | | | 01/19/18 | | | | | (3,985 | ) |
| | |
| Managed Volatility Fund | |
|
| SCHEDULE OF INVESTMENTS (continued) | |
| Showing percentage of net assets as of December 31, 2017 (Unaudited) | | |
| | | | | | | | | | | | | | | | | | | | | | | | | |
| Description | | Number of
Contracts | | Notional
Amount | | Exercise
Price | | Expiration
Date | | Value |
Exchange Traded Call Options Written (continued) | | | | | | | | | | | | | | | | | | | | | | | | | |
Northrop Grumman Corp. | | | | 3 | | | | $ | (92,073 | ) | | | $ | 290.00 | | | | | 01/19/18 | | | | $ | (5,730 | ) |
Omnicom Group, Inc. | | | | 3 | | | | | (21,849 | ) | | | | 72.50 | | | | | 01/19/18 | | | | | (540 | ) |
Oracle Corp. | | | | 4 | | | | | (18,912 | ) | | | | 50.00 | | | | | 01/19/18 | | | | | (16 | ) |
PepsiCo, Inc. | | | | 4 | | | | | (47,968 | ) | | | | 120.00 | | | | | 03/16/18 | | | | | (1,412 | ) |
Pfizer, Inc. | | | | 11 | | | | | (39,842 | ) | | | | 36.00 | | | | | 03/16/18 | | | | | (1,155 | ) |
Procter & Gamble Co. (The) | | | | 4 | | | | | (36,752 | ) | | | | 92.50 | | | | | 03/16/18 | | | | | (704 | ) |
Public Storage | | | | 4 | | | | | (83,600 | ) | | | | 220.00 | | | | | 03/16/18 | | | | | (1,232 | ) |
QUALCOMM, Inc. | | | | 2 | | | | | (12,804 | ) | | | | 70.00 | | | | | 02/16/18 | | | | | (112 | ) |
Ross Stores, Inc. | | | | 3 | | | | | (24,075 | ) | | | | 75.00 | | | | | 02/16/18 | | | | | (2,067 | ) |
salesforce.com, Inc. | | | | 6 | | | | | (61,338 | ) | | | | 100.00 | | | | | 01/19/18 | | | | | (1,890 | ) |
Seagate Technology PLC | | | | 90 | | | | | (376,560 | ) | | | | 42.00 | | | | | 03/16/18 | | | | | (25,020 | ) |
Simon Property Group, Inc. | | | | 3 | | | | | (51,522 | ) | | | | 170.00 | | | | | 01/19/18 | | | | | (1,245 | ) |
Southwest Airlines Co. | | | | 4 | | | | | (26,180 | ) | | | | 55.00 | | | | | 01/19/18 | | | | | (4,316 | ) |
Starbucks Corp. | | | | 3 | | | | | (17,229 | ) | | | | 57.50 | | | | | 02/16/18 | | | | | (474 | ) |
State Street Corp. | | | | 3 | | | | | (29,283 | ) | | | | 95.00 | | | | | 02/16/18 | | | | | (1,425 | ) |
Target Corp. | | | | 3 | | | | | (19,575 | ) | | | | 67.50 | | | | | 03/16/18 | | | | | (690 | ) |
Texas Instruments, Inc. | | | | 3 | | | | | (31,332 | ) | | | | 100.00 | | | | | 01/19/18 | | | | | (1,500 | ) |
T-Mobile US, Inc. | | | | 18 | | | | | (114,318 | ) | | | | 62.50 | | | | | 02/16/18 | | | | | (5,328 | ) |
United Rentals, Inc. | | | | 36 | | | | | (618,876 | ) | | | | 145.00 | | | | | 03/16/18 | | | | | (110,160 | ) |
United Technologies Corp. | | | | 30 | | | | | (382,710 | ) | | | | 120.00 | | | | | 02/16/18 | | | | | (26,760 | ) |
Valero Energy Corp. | | | | 3 | | | | | (27,573 | ) | | | | 92.50 | | | | | 03/16/18 | | | | | (1,035 | ) |
Verizon Communications, Inc. | | | | 5 | | | | | (26,465 | ) | | | | 50.00 | | | | | 01/19/18 | | | | | (1,590 | ) |
Visa, Inc., Class A | | | | 8 | | | | | (91,216 | ) | | | | 115.00 | | | | | 03/16/18 | | | | | (2,960 | ) |
Walt Disney Co. (The) | | | | 3 | | | | | (32,253 | ) | | | | 110.00 | | | | | 03/16/18 | | | | | (918 | ) |
Waste Management, Inc. | | | | 3 | | | | | (25,890 | ) | | | | 82.50 | | | | | 01/19/18 | | | | | (1,230 | ) |
Wells Fargo & Co. | | | | 11 | | | | | (66,737 | ) | | | | 57.50 | | | | | 01/19/18 | | | | | (4,037 | ) |
Western Digital Corp. | | | | 33 | | | | | (262,449 | ) | | | | 82.50 | | | | | 04/20/18 | | | | | (14,685 | ) |
Yum! Brands, Inc. | | | | 3 | | | | | (24,483 | ) | | | | 40.00 | | | | | 01/19/18 | | | | | (13,245 | ) |
| | | | | | | | | | | | | | | | | | | | | | | | | |
Total Exchange Traded Call Options Written (Premiums received $296,207) | | | | | | | | | | | | | | | | | | | | | | | $ | (439,559 | ) |
| | | | | | | | | | | | | | | | | | | | | | | | | |
| | |
| 72 | | Semi-Annual Report | December 31, 2017 (Unaudited) |
| | |
| Managed Volatility Fund | | |
| SCHEDULE OF INVESTMENTS (continued) | | |
Summary of inputs used to value the Fund’s investments as of
12/31/2017 (See Note 2 in Notes to Financial Statements):
| | | | | | | | | | | | | | | | | | | | |
| | | |
| | | | | Assets Table | | |
| | | | | Valuation Inputs | | |
| | | | | Investment in Securities (Value) | | |
| | | Level 1
Quoted
Prices | | Level 2
Significant
Observable
Inputs | | Level 3
Significant
Unobservable
Inputs | | Total |
| | | | |
Common | | | | | | | | | | | | | | | | | | | | |
Stocks | | | $ | 19,720,018 | | | | $ | — | | | | $ | — | | | | $ | 19,720,018 | |
U.S. | | | | | | | | | | | | | | | | | | | | |
Government | | | | | | | | | | | | | | | | | | | | |
Obligations | | | | — | | | | | 12,471,229 | | | | | — | | | | | 12,471,229 | |
Money Market | | | | | | | | | | | | | | | | | | | | |
Fund | | | | — | | | | | 1,996,236 | | | | | — | | | | | 1,996,236 | |
Investments | | | | | | | | | | | | | | | | | | | | |
Purchased | | | | | | | | | | | | | | | | | | | | |
with Cash | | | | | | | | | | | | | | | | | | | | |
Proceeds | | | | | | | | | | | | | | | | | | | | |
from | | | | | | | | | | | | | | | | | | | | |
Securities | | | | | | | | | | | | | | | | | | | | |
Lending | | | | — | | | | | 48,675 | | | | | — | | | | | 48,675 | |
| | | | | | | | | | | | | | | | | | | | |
TOTAL | | | $ | 19,720,018 | | | | $ | 14,516,140 | | | | $ | — | | | | $ | 34,236,158 | |
| | | | | | | | | | | | | | | | | | | | |
| | | |
| | | | | Liabilities Table | | |
| | | | | Valuation Inputs | | |
| | | | | Investment in Securities (Value) | | |
| | | Level 1
Quoted
Prices | | Level 2
Significant
Observable
Inputs | | Level 3
Significant
Unobservable
Inputs | | Total |
| | | | |
Options Written | | | $ | (317,162 | ) | | | $ | (297,427 | ) | | | $ | — | | | | $ | (614,589 | ) |
| | | | | | | | | | | | | | | | | | | | |
TOTAL | | | $ | (317,162 | ) | | | $ | (297,427 | ) | | | $ | — | | | | $ | (614,589 | ) |
| | | | | | | | | | | | | | | | | | | | |
See Notes to Financial Statements.
| | |
| STATEMENTS OF ASSETS AND LIABILITIES | | |
December 31, 2017 (Unaudited)
| | | | | | | | | | | | |
| ASSETS | | Aggressive
Investors 1 | | | Ultra-Small
Company | | | Ultra-Small
Company Market | |
Investments at value | | | $257,321,568 | | | | $105,670,129 | | | | $395,168,650 | |
Receivables: | | | | | | | | | | | | |
Portfolio securities sold | | | - | | | | 99,851 | | | | 1,457,507 | |
Fund shares sold | | | 117,440 | | | | - | | | | 790,363 | |
Dividends and interest | | | 199,848 | | | | 199,864 | | | | 352,641 | |
Receivable from investment adviser | | | - | | | | - | | | | - | |
Deposits with brokers | | | - | | | | - | | | | - | |
Prepaid expenses | | | 24,762 | | | | 10,954 | | | | 44,050 | |
Total assets | | | 257,663,618 | | | | 105,980,798 | | | | 397,813,211 | |
| | | |
LIABILITIES | | | | | | | | | | | | |
Payables: | | | | | | | | | | | | |
Portfolio securities purchased | | | 1,901,611 | | | | - | | | | 435,400 | |
Fund shares redeemed | | | 34,395 | | | | 28,371 | | | | 203,253 | |
Loan payable | | | - | | | | 1,112,000 | | | | - | |
Payable upon return of securities loaned | | | 12,529,295 | | | | 8,002,941 | | | | 44,206,098 | |
Accrued Liabilities: | | | | | | | | | | | | |
Investment adviser fees | | | 184,352 | | | | 74,178 | | | | 148,854 | |
Administration fees | | | 5,481 | | | | 2,225 | | | | 8,133 | |
Directors’ fees | | | 167 | | | | 180 | | | | 861 | |
Other | | | 108,157 | | | | 46,664 | | | | 150,698 | |
Put options written at value | | | - | | | | - | | | | - | |
Call options written at value | | | - | | | | - | | | | - | |
Total liabilities | | | 14,763,458 | | | | 9,266,559 | | | | 45,153,297 | |
NET ASSETS | | | $242,900,160 | | | | $96,714,239 | | | | $352,659,914 | |
| | | |
NET ASSETS REPRESENT | | | | | | | | | | | | |
Paid-in capital | | | $225,379,725 | | | | $85,632,345 | | | | $258,108,662 | |
Undistributed net investment income (loss) | | | (63,185 | ) | | | 174,206 | | | | 1,303,266 | |
Accumulated net realized gain (loss) on investments | | | (16,851,955 | ) | | | 2,103,785 | | | | 10,145,238 | |
Net unrealized appreciation on investments | | | 34,435,575 | | | | 8,803,903 | | | | 83,102,748 | |
NET ASSETS | | | $242,900,160 | | | | $96,714,239 | | | | $352,659,914 | |
Shares of common stock outstanding of $.001 par value* | | | 3,224,148 | | | | 3,197,568 | | | | 24,729,044 | |
Net asset value, offering price and redemption price per share | | | $ 75.34 | | | | $30.25 | | | | $14.26(a | ) |
Total investments at cost | | | $222,885,993 | | | | $96,866,226 | | | | $312,065,902 | |
Premiums received on put options written | | | $ - | | | | $ - | | | | $ - | |
Premiums received on call options written | | | $ - | | | | $ - | | | | $ - | |
| * | See Note 1 - Organization in the Notes to Financial Statements for shares authorized for each Fund. |
| (a) | Redemption of shares held less than six months may be charged a 2% redemption fee. See Note 8. |
See Notes to Financial Statements.
| | |
| 74 | | Semi-Annual Report | December 31, 2017 (Unaudited) |
| | |
| | | |
| | | |
| | | | | | | | | | | | | | | | | | |
| Small-Cap
Momentum |
| |
| Small-Cap
Growth |
| |
| Small-Cap
Value |
| |
| Blue Chip 35
Index |
| |
| Managed
Volatility |
|
| | |
| $ | 6,340,859 | | | $ | 55,980,615 | | | $ | 70,410,993 | | | $ | 575,036,517 | | | $ | 34,236,158 | |
| | | | | | | | | | | | | | | | | | |
| | - | | | | - | | | | 308,667 | | | | 10,558,953 | | | | 111,465 | |
| | - | | | | 35,652 | | | | 175 | | | | 515,859 | | | | - | |
| | 5,202 | | | | 48,402 | | | | 36,372 | | | | 574,918 | | | | 21,948 | |
| | 5,420 | | | | - | | | | - | | | | 3,719 | | | | - | |
| | - | | | | - | | | | - | | | | - | | | | 81,626 | |
| | 9,341 | | | | 14,023 | | | | 13,414 | | | | 21,148 | | | | 11,730 | |
| | |
| | 6,360,822 | | | | 56,078,692 | | | | 70,769,621 | | | | 586,711,114 | | | | 34,462,927 | |
| | |
| | | | |
| | | | | | | | | | | | | | | | | | |
| | | | | | | | | | | | | | | | | | |
| | - | | | | - | | | | 475,916 | | | | 11,108,618 | | | | - | |
| | 2,000 | | | | 550 | | | | 48,367 | | | | 293,892 | | | | 14,277 | |
| | - | | | | - | | | | - | | | | - | | | | - | |
| | 596,337 | | | | 5,573,398 | | | | 7,308,763 | | | | - | | | | 48,675 | |
| | | | |
| | - | | | | 24,814 | | | | 30,795 | | | | - | | | | 11,526 | |
| | 131 | | | | 1,144 | | | | 1,456 | | | | 13,215 | | | | 786 | |
| | - | | | | - | | | | 114 | | | | 627 | | | | 362 | |
| | 27,776 | | | | 34,101 | | | | 44,067 | | | | 141,622 | | | | 42,048 | |
| | - | | | | - | | | | - | | | | - | | | | 175,030 | |
| | - | | | | - | | | | - | | | | - | | | | 439,559 | |
| | |
| | 626,244 | | | | 5,634,007 | | | | 7,909,478 | | | | 11,557,974 | | | | 732,263 | |
| | |
| $ | 5,734,578 | | | $ | 50,444,685 | | | $ | 62,860,143 | | | $ | 575,153,140 | | | $ | 33,730,664 | |
| | |
| | | | | | | | | | | | | | | | | | |
| $ | 4,895,685 | | | $ | 46,261,162 | | | $ | 70,631,649 | | | $ | 279,581,507 | | | $ | 27,060,396 | |
| | 780 | | | | 72,162 | | | | 186,392 | | | | (78,424 | ) | | | 93,979 | |
| | 458,199 | | | | (3,090,251 | ) | | | (17,265,486 | ) | | | 12,887,750 | | | | (838,410 | ) |
| | 379,914 | | | | 7,201,612 | | | | 9,307,588 | | | | 282,762,307 | | | | 7,414,699 | |
| | |
| $ | 5,734,578 | | | $ | 50,444,685 | | | $ | 62,860,143 | | | $ | 575,153,140 | | | $ | 33,730,664 | |
| | |
| | | | |
| | 441,485 | | | | 1,823,691 | | | | 2,369,037 | | | | 39,464,071 | | | | 2,191,031 | |
| | |
| | | | |
| $ | 12.99(a | ) | | $ | 27.66 | | | $ | 26.53 | | | $ | 14.57 | | | $ | 15.39 | |
| | |
| $ | 5,960,945 | | | $ | 48,779,003 | | | $ | 61,103,405 | | | $ | 292,274,210 | | | $ | 26,749,013 | |
| $ | - | | | $ | - | | | $ | - | | | $ | - | | | $ | 245,936 | |
| $ | - | | | $ | - | | | $ | - | | | $ | - | | | $ | 296,207 | |
STATEMENTS OF OPERATIONS
Six Months Ended December 31, 2017 (Unaudited)
| | | | | | | | | | | | |
| | | Aggressive
Investors 1 | | | Ultra-Small
Company | | | Ultra-Small
Company Market | |
| |
INVESTMENT INCOME | | | | | | | | | | | | |
Dividends | | | $ 1,471,233 | | | | $ 636,684 | | | | $ 1,345,926 | |
Less: foreign taxes withheld | | | (25,498 | ) | | | - | | | | - | |
Interest | | | - | | | | - | | | | - | |
Securities lending | | | 86,464 | | | | 286,297 | | | | 1,291,203 | |
| |
Total Investment Income | | | 1,532,199 | | | | 922,981 | | | | 2,637,129 | |
| |
| | | |
EXPENSES | | | | | | | | | | | | |
Investment advisory fees - Base fees | | | 1,050,795 | | | | 446,463 | | | | 889,228 | |
Investment advisory fees - Performance adjustment | | | 119,816 | | | | - | | | | - | |
Administration fees. | | | 32,057 | | | | 13,637 | | | | 48,847 | |
Accounting fees | | | 39,397 | | | | 33,301 | | | | 59,770 | |
Transfer agent fees | | | 64,727 | | | | 31,791 | | | | 57,933 | |
Audit fees | | | 10,976 | | | | 7,365 | | | | 14,462 | |
Legal fees | | | 16,434 | | | | 7,248 | | | | 25,276 | |
Custody fees | | | 3,736 | | | | 5,670 | | | | 10,957 | |
Blue sky fees | | | 12,517 | | | | 5,750 | | | | 16,112 | |
Directors’ and officers’ fees | | | 13,127 | | | | 5,804 | | | | 19,919 | |
Shareholder servicing fees | | | 67,384 | | | | 14,401 | | | | 153,599 | |
Reports to shareholders | | | 16,535 | | | | 6,232 | | | | 24,188 | |
Miscellaneous expenses | | | 19,056 | | | | 11,293 | | | | 28,780 | |
| |
Total Expenses | | | 1,466,557 | | | | 588,955 | | | | 1,349,071 | |
| |
Less investment advisory fees waived | | | - | | | | - | | | | (15,229 | ) |
Less expenses reimbursed by investment adviser | | | - | | | | - | | | | - | |
| |
Net Expenses | | | 1,466,557 | | | | 588,955 | | | | 1,333,842 | |
| |
NET INVESTMENT INCOME | | | 65,642 | | | | 334,026 | | | | 1,303,287 | |
| |
| | | |
NET REALIZED AND UNREALIZED GAIN (LOSS) ON INVESTMENTS | | | | | | | | | | | | |
Realized Gain (Loss) on: | | | | | | | | | | | | |
Investments | | | (757,637 | ) | | | 2,241,794 | | | | 26,564,112 | |
Written options | | | - | | | | - | | | | - | |
Futures contracts | | | - | | | | - | | | | - | |
| |
Net Realized Gain (Loss) | | | (757,637 | ) | | | 2,241,794 | | | | 26,564,112 | |
| |
Change in Unrealized Appreciation (Depreciation) on: | | | | | | | | | | | | |
Investments | | | 30,248,970 | | | | 23,238 | | | | 2,425,097 | |
Written options | | | - | | | | - | | | | - | |
| |
Net Change in Unrealized Appreciation (Depreciation) | | | 30,248,970 | | | | 23,238 | | | | 2,425,097 | |
| |
Net Realized and Unrealized Gain on Investments | | | 29,491,333 | | | | 2,265,032 | | | | 28,989,209 | |
| |
INCREASE IN NET ASSETS RESULTING FROM OPERATIONS | | | $29,556,975 | | | | $2,599,058 | | | | $30,292,496 | |
| |
See Notes to Financial Statements.
| | |
| 76 | | Semi-Annual Report | December 31, 2017 (Unaudited) |
| | |
| | | |
| | | |
| | | | | | | | | | | | | | | | | | |
Small-Cap
Momentum | | | Small-Cap
Growth | | | Small-Cap
Value | | | Blue Chip 35
Index | | | Managed
Volatility | |
| | |
| | | | |
| $ | 30,445 | | | $ | 134,633 | | | $ | 451,969 | | | | $6,849,506 | | | | $211,380 | |
| | (157 | ) | | | - | | | | - | | | | - | | | | (598) | |
| | - | | | | - | | | | - | | | | - | | | | 63,446 | |
| | 4,121 | | | | 162,881 | | | | 28,398 | | | | - | | | | 241 | |
| | |
| | 34,409 | | | | 297,514 | | | | 480,367 | | | | 6,849,506 | | | | 274,469 | |
| | |
| | | | |
| | 15,394 | | | | 143,892 | | | | 187,631 | | | | 229,879 | | | | 104,031 | |
| | - | | | | 9,125 | | | | (14,668 | ) | | | - | | | | - | |
| | 769 | | | | 6,583 | | | | 8,591 | | | | 78,951 | | | | 4,773 | |
| | 31,525 | | | | 26,957 | | | | 28,032 | | | | 61,348 | | | | 31,150 | |
| | 13,878 | | | | 29,523 | | | | 33,316 | | | | 29,864 | | | | 21,319 | |
| | 4,688 | | | | 5,862 | | | | 6,287 | | | | 20,379 | | | | 8,067 | |
| | 383 | | | | 3,367 | | | | 4,459 | | | | 40,971 | | | | 2,637 | |
| | 6,705 | | | | 2,421 | | | | 1,913 | | | | 4,829 | | | | 3,848 | |
| | 9,830 | | | | 11,312 | | | | 12,044 | | | | 27,698 | | | | 12,248 | |
| | 308 | | | | 2,728 | | | | 3,562 | | | | 32,012 | | | | 1,950 | |
| | 1,992 | | | | 13,098 | | | | 18,316 | | | | 39,825 | | | | 11,983 | |
| | 1,212 | | | | 4,062 | | | | 5,811 | | | | 68,820 | | | | 4,749 | |
| | 2,267 | | | | 4,300 | | | | 6,238 | | | | 48,419 | | | | 8,176 | |
| | |
| | 88,951 | | | | 263,230 | | | | 301,532 | | | | 682,995 | | | | 214,931 | |
| | |
| | (15,394 | ) | | | (37,881 | ) | | | (7,563 | ) | | | (229,879 | ) | | | (48,388) | |
| | (48,366 | ) | | | - | | | | - | | | | (22,093 | ) | | | - | |
| | |
| | 25,191 | | | | 225,349 | | | | 293,969 | | | | 431,023 | | | | 166,543 | |
| | |
| | 9,218 | | | | 72,165 | | | | 186,398 | | | | 6,418,483 | | | | 107,926 | |
| | |
| | | | |
| | 623,081 | | | | 3,526,460 | | | | 2,745,729 | | | | 19,937,032 | | | | 1,085,895 | |
| | - | | | | - | | | | - | | | | - | | | | 346,908 | |
| | - | | | | - | | | | - | | | | - | | | | (752,066) | |
| | |
| | 623,081 | | | | 3,526,460 | | | | 2,745,729 | | | | 19,937,032 | | | | 680,737 | |
| | |
| | | | |
| | (80,883 | ) | | | 1,463,273 | | | | 1,762,333 | | | | 36,689,899 | | | | 887,736 | |
| | - | | | | - | | | | - | | | | - | | | | (127,426) | |
| | |
| | (80,883 | ) | | | 1,463,273 | | | | 1,762,333 | | | | 36,689,899 | | | | 760,310 | |
| | |
| | 542,198 | | | | 4,989,733 | | | | 4,508,062 | | | | 56,626,931 | | | | 1,441,047 | |
| | |
| | | | |
| $ | 551,416 | | | $ | 5,061,898 | | | $ | 4,694,460 | | | | $63,045,414 | | | | $1,548,973 | |
| | |
STATEMENTS OF CHANGES IN NET ASSETS
| | | | | | | | | | | | | | | | |
| | | Aggressive Investors 1 | | | Ultra-Small Company | |
| | | Six Months Ended
December 31, 2017 | | | Year Ended
June 30, 2017 | | | Six Months Ended
December 31, 2017 | | | Year Ended
June 30, 2017 | |
| | | (Unaudited) | | | | | | (Unaudited) | | | | |
| | | | |
OPERATIONS | | | | | | | | | | | | | | | | |
Net investment income (loss) | | $ | 65,642 | | | $ | (512,747 | ) | | $ | 334,026 | | | $ | 1,168,356 | |
Net realized gain (loss) on investments | | | (757,637 | ) | | | 52,731,300 | | | | 2,241,794 | | | | 9,710,185 | |
Net change in unrealized appreciation (depreciation) on investments | | | 30,248,970 | | | | (9,290,204 | ) | | | 23,238 | | | | 5,136,677 | |
| |
Net increase in net assets resulting from operations | | | 29,556,975 | | | | 42,928,349 | | | | 2,599,058 | | | | 16,015,218 | |
| |
| | | | |
DISTRIBUTIONS: | | | | | | | | | | | | | | | | |
From net investment income | | | - | | | | (1,255,319 | ) | | | (1,299,998 | ) | | | (1,212,208 | ) |
From net realized gains | | | - | | | | - | | | | (614,549 | ) | | | - | |
| |
Net decrease in net assets from distributions | | | - | | | | (1,255,319 | ) | | | (1,914,547 | ) | | | (1,212,208 | ) |
| |
| | | | |
SHARE TRANSACTIONS: | | | | | | | | | | | | | | | | |
Proceeds from sale of shares | | | 2,716,734 | | | | 8,479,231 | | | | 420,849 | | | | 1,300,515 | |
Reinvestment of distributions | | | - | | | | 1,210,679 | | | | 1,769,198 | | | | 1,132,706 | |
Cost of shares redeemed | | | (13,446,872 | ) | | | (34,518,694 | ) | | | (7,144,172 | ) | | | (17,703,091 | ) |
Redemption fees | | | - | | | | - | | | | - | | | | - | |
| |
Net increase (decrease) in net assets resulting from share transactions | | | (10,730,138 | ) | | | (24,828,784 | ) | | | (4,954,125 | ) | | | (15,269,870 | ) |
| |
Net increase (decrease) in net assets | | | 18,826,837 | | | | 16,844,246 | | | | (4,269,614 | ) | | | (466,860 | ) |
| | | | |
NET ASSETS: | | | | | | | | | | | | | | | | |
Beginning of period | | | 224,073,323 | | | | 207,229,077 | | | | 100,983,853 | | | | 101,450,713 | |
| |
End of period** | | $ | 242,900,160 | | | $ | 224,073,323 | | | $ | 96,714,239 | | | $ | 100,983,853 | |
| |
| | | | |
SHARES ISSUED & REDEEMED | | | | | | | | | | | | | | | | |
Issued | | | 38,997 | | | | 133,731 | | | | 13,976 | | | | 45,001 | |
Distributions reinvested | | | - | | | | 18,811 | | | | 59,509 | | | | 38,177 | |
Redeemed | | | (191,150 | ) | | | (561,401 | ) | | | (237,704 | ) | | | (624,860 | ) |
| |
Net increase (decrease) | | | (152,153 | ) | | | (408,859 | ) | | | (164,219 | ) | | | (541,682 | ) |
Outstanding at beginning of period | | | 3,376,301 | | | | 3,785,160 | | | | 3,361,787 | | | | 3,903,469 | |
| |
Outstanding at end of period | | | 3,224,148 | | | | 3,376,301 | | | | 3,197,568 | | | | 3,361,787 | |
| |
| | | | |
** Including undistributed net investment income (loss) of: | | $ | (63,185 | ) | | $ | (128,827 | ) | | $ | 174,206 | | | $ | 1,140,178 | |
See Notes to Financial Statements.
| | |
| 78 | | Semi-Annual Report | December 31, 2017 (Unaudited) |
| | |
| | | |
| | | |
| | | | | | | | | | | | | | | | | | | | | | | | | | |
Ultra-Small Company Market | | | | | | Small-Cap Momentum | |
Six Months Ended
December 31, 2017 | | | | | | Year Ended
June 30, 2017 | | | | | | Six Months Ended
December 31, 2017 | | | | | | Year Ended
June 30, 2017 | |
| (Unaudited) | | | | | | | | | | | | (Unaudited) | | | | | | | |
| | | | | | |
| | $ 1,303,287 | | | | | | | | $ 4,216,600 | | | | | | | | $ 9,218 | | | | | | | | $ 29,117 | |
| | 26,564,112 | | | | | | | | 37,591,817 | | | | | | | | 623,081 | | | | | | | | 535,990 | |
| | | | | | |
| | 2,425,097 | | | | | | | | 40,759,414 | | | | | | | | (80,883 | ) | | | | | | | 203,270 | |
| | 30,292,496 | | | | | | | | 82,567,831 | | | | | | | | 551,416 | | | | | | | | 768,377 | |
| | | | | | |
| | (449,186 | ) | | | | | | | (3,465,525 | ) | | | | | | | (16,157 | ) | | | | | | | (48,202 | ) |
| | (43,056,482 | ) | | | | | | | (24,304,051 | ) | | | | | | | (535,304 | ) | | | | | | | (147,252 | ) |
| | (43,505,668 | ) | | | | | | | (27,769,576 | ) | | | | | | | (551,461 | ) | | | | | | | (195,454 | ) |
| | | | | | |
| | 12,955,650 | | | | | | | | 33,169,406 | | | | | | | | 486,521 | | | | | | | | 272,512 | |
| | 41,869,482 | | | | | | | | 26,765,299 | | | | | | | | 549,829 | | | | | | | | 194,812 | |
| | (41,150,799 | ) | | | | | | | (94,110,373 | ) | | | | | | | (380,336 | ) | | | | | | | (137,445 | ) |
| | 8,840 | | | | | | | | 31,936 | | | | | | | | - | | | | | | | | 218 | |
| | | | | | |
| | 13,683,173 | | | | | | | | (34,143,732 | ) | | | | | | | 656,014 | | | | | | | | 330,097 | |
| | 470,001 | | | | | | | | 20,654,523 | | | | | | | | 655,969 | | | | | | | | 903,020 | |
| | | | | | |
| | 352,189,913 | | | | | | | | 331,535,390 | | | | | | | | 5,078,609 | | | | | | | | 4,175,589 | |
| | $352,659,914 | | | | | | | | $352,189,913 | | | | | | | | $5,734,578 | | | | | | | | $5,078,609 | |
| | | | | | |
| | 867,448 | | | | | | | | 2,305,325 | | | | | | | | 36,072 | | | | | | | | 23,323 | |
| | 3,025,252 | | | | | | | | 1,858,701 | | | | | | | | 43,158 | | | | | | | | 15,787 | |
| | (2,748,213 | ) | | | | | | | (6,546,492 | ) | | | | | | | (27,419 | ) | | | | | | | (12,284 | ) |
| | 1,144,487 | | | | | | | | (2,382,466 | ) | | | | | | | 51,811 | | | | | | | | 26,826 | |
| | 23,584,557 | | | | | | | | 25,967,023 | | | | | | | | 389,674 | | | | | | | | 362,848 | |
| | 24,729,044 | | | | | | | | 23,584,557 | | | | | | | | 441,485 | | | | | | | | 389,674 | |
| | | | | | |
| | $ 1,303,266 | | | | | | | | $ 449,165 | | | | | | | | $ 780 | | | | | | | | $ 7,719 | |
STATEMENTS OF CHANGES IN NET ASSETS (continued)
| | | | | | | | | | | | | | | | | | | | |
| | | Small-Cap Growth | | | Small-Cap Value | | | | |
| | | Six Months Ended
December 31, 2017 | | | Year Ended
June 30, 2017 | | | Six Months Ended
December 31, 2017 | | | Year Ended
June 30, 2017 | | | | |
| | | (Unaudited) | | | | | | (Unaudited) | | | | | | | |
| | | | | |
OPERATIONS | | | | | | | | | | | | | | | | | | | | |
Net investment income | | | $ 72,165 | | | | $ 98,933 | | | | $ 186,398 | | | | $ 589,999 | | | | | |
Net realized gain on investments | | | 3,526,460 | | | | 6,078,273 | | | | 2,745,729 | | | | 3,054,674 | | | | | |
Net change in unrealized appreciation (depreciation) on investments | | | 1,463,273 | | | | 2,032,306 | | | | 1,762,333 | | | | 7,518,282 | | | | | |
| |
Net increase in net assets resulting from operations | | | 5,061,898 | | | | 8,209,512 | | | | 4,694,460 | | | | 11,162,955 | | | | | |
| |
| | | | | |
DISTRIBUTIONS: | | | | | | | | | | | | | | | | | | | | |
From net investment income | | | (98,928 | ) | | | (128,436 | ) | | | (547,905 | ) | | | (644,905 | ) | | | | |
From net realized gains | | | - | | | | - | | | | - | | | | - | | | | | |
| |
Net decrease in net assets from distributions | | | (98,928 | ) | | | (128,436 | ) | | | (547,905 | ) | | | (644,905 | ) | | | | |
| |
| | | | | |
SHARE TRANSACTIONS: | | | | | | | | | | | | | | | | | | | | |
Proceeds from sale of shares | | | 2,614,646 | | | | 10,067,573 | | | | 921,682 | | | | 3,643,910 | | | | | |
Reinvestment of distributions. | | | 95,874 | | | | 124,435 | | | | 525,341 | | | | 621,803 | | | | | |
Cost of shares redeemed | | | (3,772,324 | ) | | | (8,123,208 | ) | | | (4,714,141 | ) | | | (11,543,562 | ) | | | | |
| |
Net increase (decrease) in net assets resulting from share transactions | | | (1,061,804 | ) | | | 2,068,800 | | | | (3,267,118 | ) | | | (7,277,849 | ) | | | | |
| |
Net increase (decrease) in net assets | | | 3,901,166 | | | | 10,149,876 | | | | 879,437 | | | | 3,240,201 | | | | | |
| | | | | |
NET ASSETS: | | | | | | | | | | | | | | | | | | | | |
Beginning of period | | | 46,543,519 | | | | 36,393,643 | | | | 61,980,706 | | | | 58,740,505 | | | | | |
| |
End of period* | | | $50,444,685 | | | | $46,543,519 | | | | $62,860,143 | | | | $61,980,706 | | | | | |
| |
| | | | | |
SHARES ISSUED & REDEEMED | | | | | | | | | | | | | | | | | | | | |
Issued. | | | 98,110 | | | | 435,958 | | | | 35,640 | | | | 150,968 | | | | | |
Distributions reinvested | | | 3,546 | | | | 5,311 | | | | 20,268 | | | | 24,714 | | | | | |
Redeemed | | | (145,553 | ) | | | (364,034 | ) | | | (184,113 | ) | | | (492,525 | ) | | | | |
| |
Net increase (decrease) | | | (43,897 | ) | | | 77,235 | | | | (128,205 | ) | | | (316,843 | ) | | | | |
Outstanding at beginning of period | | | 1,867,588 | | | | 1,790,353 | | | | 2,497,242 | | | | 2,814,085 | | | | | |
| |
Outstanding at end of period | | | 1,823,691 | | | | 1,867,588 | | | | 2,369,037 | | | | 2,497,242 | | | | | |
| |
| | | | | |
* Including undistributed net investment income of: | | | $ 72,162 | | | | $ 98,925 | | | | $ 186,392 | | | | $ 547,899 | | | | | |
See Notes to Financial Statements.
| | |
| 80 | | Semi-Annual Report | December 31, 2017 (Unaudited) |
| | |
| | | |
| | | |
| | | | | | | | | | | | | | | | | | | | | | | | | | |
| Blue Chip 35 Index | | | | | | Managed Volatility | |
Six Months Ended
December 31, 2017 | | | | | | Year Ended
June 30, 2017 | | | | | | Six Months Ended
December 31, 2017 | | | | | | Year Ended
June 30,
2017 | |
| (Unaudited) | | | | | | | | | | | | (Unaudited) | | | | | | | |
| | | | | | |
| | $ 6,418,483 | | | | | | | | $ 12,971,148 | | | | | | | | $ 107,926 | | | | | | | | $ 204,871 | |
| | 19,937,032 | | | | | | | | 17,816,996 | | | | | | | | 680,737 | | | | | | | | 2,076,155 | |
| | 36,689,899 | | | | | | | | 44,258,705 | | | | | | | | 760,310 | | | | | | | | (180,364 | ) |
| | 63,045,414 | | | | | | | | 75,046,849 | | | | | | | | 1,548,973 | | | | | | | | 2,100,662 | |
| | | | | | |
| | (11,665,696 | ) | | | | | | | (13,425,245 | ) | | | | | | | (194,557 | ) | | | | | | | (195,475 | ) |
| | (15,737,305 | ) | | | | | | | - | | | | | | | | - | | | | | | | | - | |
| | (27,403,001 | ) | | | | | | | (13,425,245 | ) | | | | | | | (194,557 | ) | | | | | | | (195,475 | ) |
| | | | | | |
| | 41,520,861 | | | | | | | | 141,781,165 | | | | | | | | 1,302,084 | | | | | | | | 5,629,461 | |
| | 25,719,282 | | | | | | | | 12,574,239 | | | | | | | | 181,357 | | | | | | | | 183,367 | |
| | (78,631,261 | ) | | | | | | | (236,718,752 | ) | | | | | | | (5,630,473 | ) | | | | | | | (28,780,897 | ) |
| | (11,391,118 | ) | | | | | | | (82,363,348 | ) | | | | | | | (4,147,032 | ) | | | | | | | (22,968,069 | ) |
| | 24,251,295 | | | | | | | | (20,741,744 | ) | | | | | | | (2,792,616 | ) | | | | | | | (21,062,882 | ) |
| | | | | | |
| | 550,901,845 | | | | | | | | 571,643,589 | | | | | | | | 36,523,280 | | | | | | | | 57,586,162 | |
| | $575,153,140 | | | | | | | | $ 550,901,845 | | | | | | | | $33,730,664 | | | | | | | | $36,523,280 | |
| | | | | | |
| | 2,896,093 | | | | | | | | 10,843,864 | | | | | | | | 85,602 | | | | | | | | 390,649 | |
| | 1,779,881 | | | | | | | | 962,069 | | | | | | | | 11,807 | | | | | | | | 12,814 | |
| | (5,398,510 | ) | | | | | | | (18,162,153 | ) | | | | | | | (375,734 | ) | | | | | | | (1,988,231 | ) |
| | (722,536 | ) | | | | | | | (6,356,220 | ) | | | | | | | (278,325 | ) | | | | | | | (1,584,768 | ) |
| | 40,186,607 | | | | | | | | 46,542,827 | | | | | | | | 2,469,356 | | | | | | | | 4,054,124 | |
| | 39,464,071 | | | | | | | | 40,186,607 | | | | | | | | 2,191,031 | | | | | | | | 2,469,356 | |
| | $ (78,424 | ) | | | | | | | $ 5,168,789 | | | | | | | | $ 93,979 | | | | | | | | $ 180,610 | |
FINANCIAL HIGHLIGHTS
(for a share outstanding throughout each period indicated)
AGGRESSIVE INVESTORS 1
| | | | | | | | | | | | | | | | | | | | | | | | |
| | | For the
Period Ended
12/31/17
(Unaudited) | | | Year Ended June 30 | |
| | | | 2017 | | | 2016 | | | 2015 | | | 2014 | | | 2013 | |
| | | | | | |
Net Asset Value, Beginning of Period | | | $66.37 | | | | $54.75 | | | | $59.15 | | | | $56.69 | | | | $43.21 | | | | $33.13 | |
| | | | | | |
| | | | | | | | | | | | | | | | | | | | | | | | |
| | | | | | |
Income from Investment Operations: | | | | | | | | | | | | | | | | | | | | | | | | |
Net Investment Income (Loss)(a) | | | 0.02 | | | | (0.14) | | | | 0.31 | | | | 0.02 | | | | 0.11 | | | | 0.65 | |
Net Realized and Unrealized Gain (Loss) | | | 8.95 | | | | 12.12 | | | | (4.69) | | | | 2.56 | | | | 13.73 | | | | 9.84 | |
| | | | | | |
| | | | | | | | | | | | | | | | | | | | | | | | |
| | | | | | |
Total from Investment Operations | | | 8.97 | | | | 11.98 | | | | (4.38) | | | | 2.58 | | | | 13.84 | | | | 10.49 | |
| | | | | | |
| | | | | | | | | | | | | | | | | | | | | | | | |
| | | | | | |
Less Distributions to Shareholders from: | | | | | | | | | | | | | | | | | | | | | | | | |
Net Investment Income | | | - | | | | (0.36) | | | | (0.02) | | | | (0.12) | | | | (0.36) | | | | (0.41) | |
| | | | | | |
| | | | | | | | | | | | | | | | | | | | | | | | |
| | | | | | |
Total Distributions | | | - | | | | (0.36) | | | | (0.02) | | | | (0.12) | | | | (0.36) | | | | (0.41) | |
| | | | | | |
| | | | | | | | | | | | | | | | | | | | | | | | |
| | | | | | |
Net Asset Value, End of Period | | | $75.34 | | | | $66.37(b) | | | | $54.75 | | | | $59.15 | | | | $56.69 | | | | $43.21 | |
| | | | | | | | | | | | | | | | | | | | | | | | |
| | | | | | |
Total Return | | | 13.52%(c) | | | | 21.90%(b) | | | | (7.40%) | | | | 4.57% | | | | 32.14% | | | | 31.92% | |
| | | | | | |
Ratios and Supplemental Data: | | | | | | | | | | | | | | | | | | | | | | | | |
Net Assets, End of Period (in 000’s) | | | $242,900 | | | | $224,073 | | | | $207,229 | | | | $248,046 | | | | $259,402 | | | | $221,337 | |
Expenses Before Waivers and Reimbursements | | | 1.26%(d) | | | | 1.66% | | | | 0.63%(e) | | | | 1.32% | | | | 1.01% | | | | 0.74%(e) | |
Expenses After Waivers and Reimbursements . | | | 1.26%(d) | | | | 1.66% | | | | 0.63% | | | | 1.32% | | | | 1.01% | | | | 0.74% | |
Net Investment Income (Loss) After Waivers and Reimbursements | | | 0.06%(d) | | | | (0.23%) | | | | 0.58% | | | | 0.04% | | | | 0.22% | | | | 1.69% | |
Portfolio Turnover Rate | | | 55%(c) | | | | 153% | | | | 124% | | | | 107% | | | | 125% | | | | 149% | |
| (a) | Per share amounts calculated based on the average daily shares outstanding during the period. |
| (b) | Includes adjustments in accordance with accounting principles generally accepted in the United States and, consequently, the net asset value for financial reporting purposes and the returns based upon those net asset values may differ from the net asset values and returns for shareholder transactions. |
| (d) | Annualized for periods less than one year. |
| (e) | For the years ended June 30, 2013 and June 30, 2016 the expense ratio was significantly lower than in other years, due to a negative performance adjustment to the investment advisory fee. Please refer to Note 3 of the Notes to Financial Statements for further information. The rate shown may not be indicative of the rate going forward. |
See Notes to Financial Statements.
| | |
| 82 | | Semi-Annual Report | December 31, 2017 (Unaudited) |
FINANCIAL HIGHLIGHTS
(for a share outstanding throughout each period indicated)
ULTRA-SMALL COMPANY
| | | | | | | | | | | | | | | | | | | | | | | | |
| | | For the
Period Ended
12/31/17
(Unaudited) | | | Year Ended June 30 | |
| | | | 2017 | | | 2016 | | | 2015 | | | 2014 | | | 2013 | |
| | | | | | |
Net Asset Value, Beginning of Period | | | $30.04 | | | | $25.99 | | | | $30.37 | | | | $41.83 | | | | $39.36 | | | | $27.57 | |
| | | | | | |
| | | | | | | | | | | | | | | | | | | | | | | | |
| | | | | | |
Income from Investment Operations: | | | | | | | | | | | | | | | | | | | | | | | | |
Net Investment Income(a) | | | 0.10 | | | | 0.32 | | | | 0.28 | | | | 0.24 | | | | 0.41 | | | | 0.43 | |
Net Realized and Unrealized Gain (Loss) | | | 0.71 | | | | 4.06 | | | | (4.39) | | | | (3.53) | | | | 8.33 | | | | 11.38 | |
| | | | | | |
| | | | | | | | | | | | | | | | | | | | | | | | |
| | | | | | |
Total from Investment Operations | | | 0.81 | | | | 4.38 | | | | (4.11) | | | | (3.29) | | | | 8.74 | | | | 11.81 | |
| | | | | | |
| | | | | | | | | | | | | | | | | | | | | | | | |
| | | | | | |
Less Distributions to Shareholders from: | | | | | | | | | | | | | | | | | | | | | | | | |
Net Investment Income | | | (0.41) | | | | (0.33) | | | | (0.27) | | | | (0.30) | | | | (0.76) | | | | (0.02) | |
Net Realized Gain | | | (0.19) | | | | - | | | | - | | | | (7.87) | | | | (5.51) | | | | - | |
| | | | | | |
| | | | | | | | | | | | | | | | | | | | | | | | |
| | | | | | |
Total Distributions | | | (0.60) | | | | (0.33) | | | | (0.27) | | | | (8.17) | | | | (6.27) | | | | (0.02) | |
| | | | | | |
| | | | | | | | | | | | | | | | | | | | | | | | |
| | | | | | |
Net Asset Value, End of Period | | | $30.25 | | | | $30.04 | | | | $25.99 | | | | $30.37 | | | | $41.83 | | | | $39.36 | |
| | | | | | | | | | | | | | | | | | | | | | | | |
| | | | | | |
Total Return | | | 2.71%(b) | | | | 16.88% | | | | (13.53)% | | | | (7.60)% | | | | 23.72% | | | | 42.85% | |
| | | | | | |
Ratios and Supplemental Data: | | | | | | | | | | | | | | | | | | | | | | | | |
Net Assets, End of Period (in 000’s) | | | $96,714 | | | | $100,984 | | | | $101,451 | | | | $127,717 | | | | $152,331 | | | | $132,064 | |
Expenses Before Waivers and Reimbursements | | | 1.19%(c) | | | | 1.18% | | | | 1.17% | | | | 1.11% | | | | 1.10% | | | | 1.17% | |
Expenses After Waivers and Reimbursements . | | | 1.19%(c) | | | | 1.18% | | | | 1.17% | | | | 1.11% | | | | 1.10% | | | | 1.17% | |
Net Investment Income After Waivers and Reimbursements | | | 0.67%(c) | | | | 1.14% | | | | 1.05% | | | | 0.68% | | | | 0.98% | | | | 1.33% | |
Portfolio Turnover Rate | | | 43%(b) | | | | 113% | | | | 101% | | | | 90% | | | | 99% | | | | 89% | |
| (a) | Per share amounts calculated based on the average daily shares outstanding during the period. |
| (c) | Annualized for periods less than one year. |
See Notes to Financial Statements.
FINANCIAL HIGHLIGHTS
(for a share outstanding throughout each period indicated)
ULTRA-SMALL COMPANY MARKET
| | | | | | | | | | | | | | | | | | | | | | | | |
| | | For the
Period Ended
12/31/17
(Unaudited) | | | Year Ended June 30 | |
| | | | 2017 | | | 2016 | | | 2015 | | | 2014 | | | 2013 | |
| | | | | | |
Net Asset Value, Beginning of Period | | | $14.93 | | | | $12.77 | | | | $16.18 | | | | $17.46 | | | | $15.44 | | | | $14.67 | |
| | | | | | |
| | | | | | | | | | | | | | | | | | | | | | | | |
| | | | | | |
Income from Investment Operations: | | | | | | | | | | | | | | | | | | | | | | | | |
Net Investment Income(a) | | | 0.06 | | | | 0.17 | | | | 0.12 | | | | 0.12 | | | | 0.12 | | | | 0.22 | |
Net Realized and Unrealized Gain (Loss) | | | 1.23 | | | | 3.18 | | | | (1.87) | | | | 0.38 | | | | 3.66 | | | | 3.49 | |
| | | | | | |
| | | | | | | | | | | | | | | | | | | | | | | | |
| | | | | | |
Total from Investment Operations | | | 1.29 | | | | 3.35 | | | | (1.75) | | | | 0.50 | | | | 3.78 | | | | 3.71 | |
| | | | | | |
| | | | | | | | | | | | | | | | | | | | | | | | |
| | | | | | |
Less Distributions to Shareholders from: | | | | | | | | | | | | | | | | | | | | | | | | |
Net Investment Income | | | (0.02) | | | | (0.15) | | | | (0.13) | | | | (0.14) | | | | (0.18) | | | | (0.40) | |
Net Realized Gain | | | (1.94) | | | | (1.04) | | | | (1.53) | | | | (1.64) | | | | (1.59) | | | | (2.54) | |
| | | | | | |
| | | | | | | | | | | | | | | | | | | | | | | | |
| | | | | | |
Total Distributions | | | (1.96) | | | | (1.19) | | | | (1.66) | | | | (1.78) | | | | (1.77) | | | | (2.94) | |
| | | | | | |
| | | | | | | | | | | | | | | | | | | | | | | | |
| | | | | | |
Paid in Capital from Redemption Fees(a) | | | 0.00(b) | | | | 0.00(b) | | | | 0.00(b) | | | | 0.00(b) | | | | 0.01 | | | | 0.00(b) | |
| | | | | | |
| | | | | | | | | | | | | | | | | | | | | | | | |
| | | | | | |
Net Asset Value, End of Period | | | $14.26 | | | | $14.93 | | | | $12.77 | | | | $16.18 | | | | $17.46 | | | | $15.44 | |
| | | | | | | | | | | | | | | | | | | | | | | | |
| | | | | | |
Total Return | | | 9.01%(c)(d) | | | | 26.61%(d) | | | | (10.83%)(d) | | | | 3.72% | | | | 25.48% | | | | 29.95%(d) | |
| | | | | | |
Ratios and Supplemental Data: | | | | | | | | | | | | | | | | | | | | | | | | |
Net Assets, End of Period (in 000’s) | | | $352,660 | | | | $352,190 | | | | $331,535 | | | | $402,853 | | | | $424,096 | | | | $341,647 | |
Expenses Before Waivers and Reimbursements | | | 0.76%(e) | | | | 0.76% | | | | 0.75% | | | | 0.73% | | | | 0.72% | | | | 0.79% | |
Expenses After Waivers and Reimbursements . | | | 0.75%(e) | | | | 0.75% | | | | 0.75% | | | | 0.73% | | | | 0.72% | | | | 0.75% | |
Net Investment Income After Waivers and Reimbursements | | | 0.73%(e) | | | | 1.21% | | | | 0.91% | | | | 0.74% | | | | 0.73% | | | | 1.52% | |
Portfolio Turnover Rate | | | 17%(c) | | | | 31% | | | | 41% | | | | 32% | | | | 29% | | | | 41% | |
| (a) | Per share amounts calculated based on the average daily shares outstanding during the period. |
| (b) | Amount represents less than $0.005. |
| (d) | Total return would have been lower had various fees not been waived during the period. |
| (e) | Annualized for periods less than one year. |
See Notes to Financial Statements.
| | |
| 84 | | Semi-Annual Report | December 31, 2017 (Unaudited) |
FINANCIAL HIGHLIGHTS
(for a share outstanding throughout each period indicated)
SMALL-CAP MOMENTUM
| | | | | | | | | | | | | | | | | | | | | | | | |
| | | For the
Period Ended
12/31/17
(Unaudited) | | | Year Ended June 30 | |
| | | | 2017 | | | 2016 | | | 2015 | | | 2014 | | | 2013 | |
| | | | | | |
Net Asset Value, Beginning of Period | | | $13.03 | | | | $11.51 | | | | $12.29 | | | | $13.00 | | | | $12.19 | | | | $11.25 | |
| | | | | | |
| | | | | | | | | | | | | | | | | | | | | | | | |
| | | | | | |
Income from Investment Operations: | | | | | | | | | | | | | | | | | | | | | | | | |
Net Investment Income(a) | | | 0.02 | | | | 0.08 | | | | 0.07 | | | | 0.09 | | | | 0.01 | | | | 0.10 | |
Net Realized and Unrealized Gain (Loss) | | | 1.32 | | | | 1.97 | | | | (0.50) | | | | 0.37 | | | | 2.29 | | | | 2.20 | |
| | | | | | |
| | | | | | | | | | | | | | | | | | | | | | | | |
| | | | | | |
Total from Investment Operations | | | 1.34 | | | | 2.05 | | | | (0.43) | | | | 0.46 | | | | 2.30 | | | | 2.30 | |
| | | | | | |
| | | | | | | | | | | | | | | | | | | | | | | | |
| | | | | | |
Less Distributions to Shareholders from: | | | | | | | | | | | | | | | | | | | | | | | | |
Net Investment Income | | | (0.04) | | | | (0.13) | | | | (0.03) | | | | (0.07) | | | | (0.02) | | | | (0.19) | |
Net Realized Gain | | | (1.34) | | | | (0.40) | | | | (0.32) | | | | (1.10) | | | | (1.47) | | | | (1.17) | |
| | | | | | |
| | | | | | | | | | | | | | | | | | | | | | | | |
| | | | | | |
Total Distributions | | | (1.38) | | | | (0.53) | | | | (0.35) | | | | (1.17) | | | | (1.49) | | | | (1.36) | |
| | | | | | |
| | | | | | | | | | | | | | | | | | | | | | | | |
| | | | | | |
Paid in Capital from Redemption Fees(a) | | | - | | | | 0.00(b) | | | | 0.00(b) | | | | 0.00(b) | | | | 0.00(b) | | | | 0.00(b) | |
| | | | | | |
| | | | | | | | | | | | | | | | | | | | | | | | |
| | | | | | |
Net Asset Value, End of Period | | | $12.99 | | | | $13.03 | | | | $11.51 | | | | $12.29 | | | | $13.00 | | | | $12.19 | |
| | | | | | | | | | | | | | | | | | | | | | | | |
| | | | | | |
Total Return(c) | | | 10.53%(d) | | | | 18.08% | | | | (3.48%) | | | | 4.54% | | | | 19.46% | | | | 22.31% | |
| | | | | | |
Ratios and Supplemental Data: | | | | | | | | | | | | | | | | | | | | | | | | |
Net Assets, End of Period (in 000’s) | | | $5,735 | | | | $5,079 | | | | $4,176 | | | | $5,123 | | | | $5,894 | | | | $4,437 | |
Expenses Before Waivers and Reimbursements | | | 3.18%(e) | | | | 3.81% | | | | 3.95% | | | | 3.36% | | | | 3.08% | | | | 5.42% | |
Expenses After Waivers and Reimbursements . | | | 0.90%(e) | | | | 0.90% | | | | 0.90% | | | | 0.90% | | | | 0.90% | | | | 0.90% | |
Net Investment Income After Waivers and Reimbursements | | | 0.33%(e) | | | | 0.62% | | | | 0.62% | | | | 0.77% | | | | 0.07% | | | | 0.89% | |
Portfolio Turnover Rate | | | 114%(d) | | | | 208% | | | | 184% | | | | 198% | | | | 242% | | | | 264% | |
| (a) | Per share amounts calculated based on the average daily shares outstanding during the period. |
| (b) | Amount represents less than $0.005. |
| (c) | Total return would have been lower had various fees not been waived during the period. |
| (e) | Annualized for periods less than one year. |
See Notes to Financial Statements.
FINANCIAL HIGHLIGHTS
(for a share outstanding throughout each period indicated)
SMALL-CAP GROWTH
| | | | | | | | | | | | | | | | | | | | | | | | |
| | | For the
Period Ended
12/31/17
(Unaudited) | | | Year Ended June 30 | |
| | | | 2017 | | | 2016 | | | 2015 | | | 2014 | | | 2013 | |
| | | | | | |
Net Asset Value, Beginning of Period | | | $24.92 | | | | $20.33 | | | | $21.17 | | | | $18.68 | | | | $15.11 | | | | $11.63 | |
| | | | | | |
| | | | | | | | | | | | | | | | | | | | | | | | |
| | | | | | |
Income from Investment Operations: | | | | | | | | | | | | | | | | | | | | | | | | |
Net Investment Income (Loss)(a) | | | 0.04 | | | | 0.06 | | | | 0.07 | | | | (0.01) | | | | 0.01 | | | | 0.08 | |
Net Realized and Unrealized Gain (Loss) | | | 2.75 | | | | 4.60 | | | | (0.91) | | | | 2.51 | | | | 3.63 | | | | 3.40 | |
| | | | | | |
| | | | | | | | | | | | | | | | | | | | | | | | |
| | | | | | |
Total from Investment Operations | | | 2.79 | | | | 4.66 | | | | (0.84) | | | | 2.50 | | | | 3.64 | | | | 3.48 | |
| | | | | | |
| | | | | | | | | | | | | | | | | | | | | | | | |
| | | | | | |
Less Distributions to Shareholders from: | | | | | | | | | | | | | | | | | | | | | | | | |
Net Investment Income | | | (0.05) | | | | (0.07) | | | | - | | | | (0.01) | | | | (0.07) | | | | - | |
| | | | | | |
| | | | | | | | | | | | | | | | | | | | | | | | |
Total Distributions | | | (0.05) | | | | (0.07) | | | | - | | | | (0.01) | | | | (0.07) | | | | - | |
| | | | | | |
| | | | | | | | | | | | | | | | | | | | | | | | |
Net Asset Value, End of Period | | | $27.66 | | | | $24.92 | | | | $20.33 | | | | $21.17 | | | | $18.68 | | | | $15.11 | |
| | | | | | | | | | | | | | | | | | | | | | | | |
| | | | | | |
Total Return(b) | | | 11.22%(c) | | | | 22.97% | | | | (3.97%) | | | | 13.41% | | | | 24.11% | | | | 29.92% | |
| | | | | | |
Ratios and Supplemental Data: | | | | | | | | | | | | | | | | | | | | | | | | |
Net Assets, End of Period (in 000’s) | | | $50,445 | | | | $46,544 | | | | $36,394 | | | | $36,801 | | | | $33,419 | | | | $30,605 | |
Expenses Before Waivers and Reimbursements | | | 1.10%(d) | | | | 1.16% | | | | 1.20% | | | | 1.08% | | | | 1.07% | | | | 1.13% | |
Expenses After Waivers and Reimbursements . | | | 0.94%(d) | | | | 0.94% | | | | 0.94% | | | | 0.94% | | | | 0.94% | | | | 0.94% | |
Net Investment Income (Loss) After Waivers and Reimbursements | | | 0.30%(d) | | | | 0.24% | | | | 0.36% | | | | (0.07%) | | | | 0.06% | | | | 0.60% | |
Portfolio Turnover Rate | | | 59%(c) | | | | 136% | | | | 137% | | | | 123% | | | | 121% | | | | 78% | |
| (a) | Per share amounts calculated based on the average daily shares outstanding during the period. |
| (b) | Total return would have been lower had various fees not been waived during the period. |
| (d) | Annualized for periods less than one year. |
See Notes to Financial Statements.
| | |
| 86 | | Semi-Annual Report | December 31, 2017 (Unaudited) |
FINANCIAL HIGHLIGHTS
(for a share outstanding throughout each period indicated)
SMALL-CAP VALUE
| | | | | | | | | | | | | | | | | | | | | | | | |
| | | For the
Period Ended
12/31/17
(Unaudited) | | | Year Ended June 30 | |
| | | | 2017 | | | 2016 | | | 2015 | | | 2014 | | | 2013 | |
| | | | | | |
Net Asset Value, Beginning of Period | | | $24.82 | | | | $20.87 | | | | $22.40 | | | | $23.06 | | | | $19.21 | | | | $14.82 | |
| | | | | | |
| | | | | | | | | | | | | | | | | | | | | | | | |
| | | | | | |
Income from Investment Operations: | | | | | | | | | | | | | | | | | | | | | | | | |
Net Investment Income(a) | | | 0.08 | | | | 0.22 | | | | 0.29 | | | | 0.29 | | | | 0.15 | | | | 0.29 | |
Net Realized and Unrealized Gain (Loss) | | | 1.86 | | | | 3.97 | | | | (1.43) | | | | (0.78) | | | | 3.80 | | | | 4.46 | |
| | | | | | |
| | | | | | | | | | | | | | | | | | | | | | | | |
| | | | | | |
Total from Investment Operations | | | 1.94 | | | | 4.19 | | | | (1.14) | | | | (0.49) | | | | 3.95 | | | | 4.75 | |
| | | | | | |
| | | | | | | | | | | | | | | | | | | | | | | | |
| | | | | | |
Less Distributions to Shareholders from: | | | | | | | | | | | | | | | | | | | | | | | | |
Net Investment Income | | | (0.23) | | | | (0.24) | | | | (0.39) | | | | (0.17) | | | | (0.10) | | | | (0.36) | |
| | | | | | |
| | | | | | | | | | | | | | | | | | | | | | | | |
Total Distributions | | | (0.23) | | | | (0.24) | | | | (0.39) | | | | (0.17) | | | | (0.10) | | | | (0.36) | |
| | | | | | |
| | | | | | | | | | | | | | | | | | | | | | | | |
Net Asset Value, End of Period | | | $26.53 | | | | $24.82 | | | | $20.87 | | | | $22.40 | | | | $23.06 | | | | $19.21 | |
| | | | | | | | | | | | | | | | | | | | | | | | |
| | | | | | |
Total Return | | | 7.84%(b)(c) | | | | 20.08%(c) | | | | (5.02%)(c) | | | | (2.10%)(c) | | | | 20.63%(c) | | | | 32.49% | |
| | | | | | |
Ratios and Supplemental Data: | | | | | | | | | | | | | | | | | | | | | | | | |
Net Assets, End of Period (in 000’s) | | | $62,860 | | | | $61,981 | | | | $58,741 | | | | $73,241 | | | | $85,782 | | | | $79,248 | |
Expenses Before Waivers and Reimbursements | | | 0.96%(d) | | | | 0.98% | | | | 1.03% | | | | 0.98% | | | | 0.97% | | | | 0.91% | |
Expenses After Waivers and Reimbursements . | | | 0.94%(d) | | | | 0.94% | | | | 0.94% | | | | 0.94% | | | | 0.94% | | | | 0.91% | |
Net Investment Income After Waivers and Reimbursements | | | 0.60%(d) | | | | 0.95% | | | | 1.41% | | | | 1.30% | | | | 0.71% | | | | 1.71% | |
Portfolio Turnover Rate | | | 30%(b) | | | | 77% | | | | 62% | | | | 74% | | | | 83% | | | | 64% | |
| (a) | Per share amounts calculated based on the average daily shares outstanding during the period. |
| (c) | Total return would have been lower had various fees not been waived during the period. |
| (d) | Annualized for periods less than one year. |
See Notes to Financial Statements.
FINANCIAL HIGHLIGHTS
(for a share outstanding throughout each period indicated)
BLUE CHIP 35 INDEX
| | | | | | | | | | | | | | | | | | | | | | | | |
| | | For the
Period Ended
12/31/17
(Unaudited) | | | Year Ended June 30 | |
| | | | 2017 | | | 2016 | | | 2015 | | | 2014 | | | 2013 | |
| | | | | | |
Net Asset Value, Beginning of Period | | | $13.71 | | | | $12.28 | | | | $11.81 | | | | $11.39 | | | | $9.59 | | | | $8.16 | |
| | | | | | |
| | | | | | | | | | | | | | | | | | | | | | | | |
| | | | | | |
Income from Investment Operations: | | | | | | | | | | | | | | | | | | | | | | | | |
Net Investment Income(a) | | | 0.16 | | | | 0.30 | | | | 0.28 | | | | 0.26 | | | | 0.23 | | | | 0.21 | |
Net Realized and Unrealized Gain | | | 1.43 | | | | 1.44 | | | | 0.49 | | | | 0.39 | | | | 1.77 | | | | 1.46 | |
| | | | | | |
| | | | | | | | | | | | | | | | | | | | | | | | |
| | | | | | |
Total from Investment Operations | | | 1.59 | | | | 1.74 | | | | 0.77 | | | | 0.65 | | | | 2.00 | | | | 1.67 | |
| | | | | | |
| | | | | | | | | | | | | | | | | | | | | | | | |
| | | | | | |
Less Distributions to Shareholders from: | | | | | | | | | | | | | | | | | | | | | | | | |
Net Investment Income | | | (0.31) | | | | (0.31) | | | | (0.30) | | | | (0.23) | | | | (0.20) | | | | (0.24) | |
Net Realized Gain | | | (0.42) | | | | - | | | | - | | | | - | | | | - | | | | - | |
| | | | | | |
| | | | | | | | | | | | | | | | | | | | | | | | |
| | | | | | |
Total Distributions | | | (0.73) | | | | (0.31) | | | | (0.30) | | | | (0.23) | | | | (0.20) | | | | (0.24) | |
| | | | | | |
| | | | | | | | | | | | | | | | | | | | | | | | |
Net Asset Value, End of Period | | | $14.57 | | | | $13.71 | | | | $12.28 | | | | $11.81 | | | | $11.39 | | | | $9.59 | |
| | | | | | | | | | | | | | | | | | | | | | | | |
| | | | | | |
Total Return(b) | | | 11.60%(c) | | | | 14.33% | | | | 6.60% | | | | 5.77% | | | | 21.11% | | | | 20.89% | |
| | | | | | |
Ratios and Supplemental Data: | | | | | | | | | | | | | | | | | | | | | | | | |
Net Assets, End of Period (in 000’s) | | | $575,153 | | | | $550,902 | | | | $571,644 | | | | $600,823 | | | | $556,985 | | | | $463,146 | |
Expenses Before Waivers and Reimbursements | | | 0.24%(d) | | | | 0.25% | | | | 0.25% | | | | 0.23% | | | | 0.25% | | | | 0.27% | |
Expenses After Waivers and Reimbursements | | | 0.15%(d) | | | | 0.15% | | | | 0.15% | | | | 0.15% | | | | 0.15% | | | | 0.15% | |
Net Investment Income After Waivers and Reimbursements | | | 2.23%(d) | | | | 2.30% | | | | 2.42% | | | | 2.19% | | | | 2.20% | | | | 2.36% | |
Portfolio Turnover Rate | | | 7%(c) | | | | 17% | | | | 23% | | | | 19% | | | | 28% | | | | 28% | |
| (a) | Per share amounts calculated based on the average daily shares outstanding during the period. |
| (b) | Total return would have been lower had various fees not been waived during the period. |
| (d) | Annualized for periods less than one year. |
See Notes to Financial Statements.
| | |
| 88 | | Semi-Annual Report | December 31, 2017 (Unaudited) |
FINANCIAL HIGHLIGHTS
(for a share outstanding throughout each period indicated)
MANAGED VOLATILITY
| | | | | | | | | | | | | | | | | | | | | | | | |
| | | For the
Period Ended
12/31/17
(Unaudited) | | | Year Ended June 30 | |
| | | | 2017 | | | 2016 | | | 2015 | | | 2014 | | | 2013 | |
| | | | | | |
Net Asset Value, Beginning of Period | | | $14.79 | | | | $14.20 | | | | $14.05 | | | | $13.94 | | | | $12.75 | | | | $11.94 | |
| | | | | | |
| | | | | | | | | | | | | | | | | | | | | | | | |
| | | | | | |
Income from Investment Operations: | | | | | | | | | | | | | | | | | | | | | | | | |
Net Investment Income(a) | | | 0.05 | | | | 0.06 | | | | 0.04 | | | | 0.00(b) | | | | 0.02 | | | | 0.05 | |
Net Realized and Unrealized Gain | | | 0.64 | | | | 0.59 | | | | 0.11 | | | | 0.13 | | | | 1.20 | | | | 0.81 | |
| | | | | | |
| | | | | | | | | | | | | | | | | | | | | | | | |
| | | | | | |
Total from Investment Operations | | | 0.69 | | | | 0.65 | | | | 0.15 | | | | 0.13 | | | | 1.22 | | | | 0.86 | |
| | | | | | |
| | | | | | | | | | | | | | | | | | | | | | | | |
| | | | | | |
Less Distributions to Shareholders from: | | | | | | | | | | | | | | | | | | | | | | | | |
Net Investment Income | | | (0.09) | | | | (0.06) | | | | 0.00(b) | | | | (0.02) | | | | (0.03) | | | | (0.05) | |
| | | | | | |
| | | | | | | | | | | | | | | | | | | | | | | | |
| | | | | | |
Total Distributions | | | (0.09) | | | | (0.06) | | | | 0.00(b) | | | | (0.02) | | | | (0.03) | | | | (0.05) | |
| | | | | | |
| | | | | | | | | | | | | | | | | | | | | | | | |
Net Asset Value, End of Period | | | $15.39 | | | | $14.79 | | | | $14.20 | | | | $14.05 | | | | $13.94 | | | | $12.75 | |
| | | | | | | | | | | | | | | | | | | | | | | | |
| | | | | | |
Total Return(c) | | | 4.67%(d) | | | | 4.59% | | | | 1.10% | | | | 0.92% | | | | 9.61% | | | | 7.23% | |
| | | | | | |
Ratios and Supplemental Data: | | | | | | | | | | | | | | | | | | | | | | | | |
Net Assets, End of Period (in 000’s) | | | $33,731 | | | | $36,523 | | | | $57,586 | | | | $59,008 | | | | $46,908 | | | | $26,703 | |
Expenses Before Waivers and Reimbursements | | | 1.24%(e) | | | | 1.12% | | | | 1.06% | | | | 1.04% | | | | 1.14% | | | | 1.35% | |
Expenses After Waivers and Reimbursements . | | | 0.96%(e) | | | | 0.95% | | | | 0.94% | | | | 0.94% | | | | 0.94% | | | | 0.94% | |
Net Investment Income After Waivers and Reimbursements | | | 0.62%(e) | | | | 0.42% | | | | 0.31% | | | | 0.03% | | | | 0.17% | | | | 0.37% | |
Portfolio Turnover Rate | | | 15%(d) | | | | 50% | | | | 54% | | | | 38% | | | | 39% | | | | 45% | |
| (a) | Per share amounts calculated based on the average daily shares outstanding during the period. |
| (b) | Amount represents less than $0.005. |
| (c) | Total return would have been lower had various fees not been waived during the period. |
| (e) | Annualized for periods less than one year. |
See Notes to Financial Statements.
| | |
| NOTES TO FINANCIAL STATEMENTS | | |
December 31, 2017 (Unaudited)
1. Organization:
Bridgeway Funds, Inc. (“Bridgeway” or the “Company”) was organized as a Maryland corporation on October 19, 1993, and is registered under the Investment Company Act of 1940, as amended (the “1940 Act”), as an open-end management investment company.
Bridgeway is organized as a series fund, with 10 investment funds as of December 31, 2017. The Aggressive Investors
1, Ultra-Small Company, Ultra-Small Company Market, Small-Cap Momentum, Small-Cap Growth, Small-Cap Value, Blue Chip 35 Index and Managed Volatility Funds are presented in this report (each is referred to as a “Fund” and collectively, the “Funds”). The Omni Small-Cap Value and Omni Tax-Managed Small-Cap Value Funds are included in a separate report.
Bridgeway is authorized to issue 1,915,000,000 shares of common stock at $0.001 per share. As of December 31, 2017, 100,000,000 shares have been classified into the Aggressive Investors 1 Fund. 130,000,000 shares have been classified into the Blue Chip 35 Index Fund. 15,000,000 shares have been classified into the Ultra-Small Company Fund. 100,000,000 shares each have been classified into the Ultra-Small Company Market, Omni Small-Cap Value, Omni Tax-Managed Small-Cap Value, Small-Cap Momentum, Small-Cap Growth, and Small-Cap Value Funds. 50,000,000 shares have been classified into the Managed Volatility Fund.
The Ultra-Small Company Fund is open to existing investors (direct only).
All of the Funds are no-load, diversified funds.
The Aggressive Investors 1 Fund seeks to exceed the stock market total return (primarily through capital appreciation) at a level of total risk roughly equal to that of the stock market over longer periods of time (three year intervals or more).
The Ultra-Small Company, Ultra-Small Company Market, Small-Cap Momentum, Small-Cap Growth, and Small-Cap Value Funds seek to provide a long-term total return on capital, primarily through capital appreciation.
The Blue Chip 35 Index Fund seeks to provide long-term total return on capital, primarily through capital appreciation, but also some income.
The Managed Volatility Fund seeks to provide a high current return with short-term risk less than or equal to 40% of the stock market.
Bridgeway Capital Management, Inc. (the “Adviser”) is the investment adviser for all of the Funds.
2. Significant Accounting Policies:
The following summary of significant accounting policies, followed in the preparation of the financial statements of the Funds, are in conformity with accounting principles generally accepted in the United States of America (“GAAP”). Each Fund is considered an investment company under GAAP and follows the accounting and reporting guidance applicable to investment companies.
Securities, Options, Futures and Other Investments Valuation Other than options, securities for which market quotations are readily available are valued at the last sale price on the national exchange on which such securities are primarily traded. In the case of securities reported on the National Association of Securities Dealers Automated Quotation (“NASDAQ”) system, the securities are valued based on the NASDAQ Official Closing Price (“NOCP”). In the absence of recorded sales on their primary exchange, or NOCP, in the case of NASDAQ traded securities, the security will be valued as follows: bid prices for long positions and ask prices for short positions.
Fixed income securities are valued on the basis of current market quotations provided by a pricing service. Options are valued at the close if there is trading volume and, if there is no trading volume, the options are valued at the bid on long positions and the ask on the short positions.
| | |
| 90 | | Semi-Annual Report | December 31, 2017 (Unaudited) |
| | |
| NOTES TO FINANCIAL STATEMENTS (continued) | | |
December 31, 2017 (Unaudited)
Investments in open-end registered investment companies and closed-end registered investment companies that do not trade on an exchange are valued at the end of day net asset value (“NAV”) per share.
Investments in closed-end registered investment companies that trade on an exchange are valued at the last sales price as of the close of the customary trading session on the exchange where the security is principally traded.
When market quotations are not readily available or when events occur that make established valuation methods unreliable, securities of the Funds may be valued at fair value as determined in good faith by or under the direction of the Board of Directors. The valuation assigned to a fair valued security for purposes of calculating the Funds’ NAVs may differ from the security’s most recent closing market price and from the prices used by other mutual funds to calculate their NAVs.
The inputs and valuation techniques used to determine the value of a Fund’s investments are summarized into three levels as described in the hierarchy below:
| ● | | Level 1 — quoted prices in active markets for identical assets |
Investments whose values are based on quoted market prices in active markets, and whose values are therefore classified as Level 1 prices, include active listed equity securities. The Funds do not adjust the quoted price for such investments, even in situations where the Funds hold a large position and a sale could reasonably impact the quoted price.
| ● | | Level 2 — other significant observable inputs (including quoted prices for similar securities, interest rates, prepayment speeds, credit risk, etc.) |
Investments that trade in markets that are not considered to be active, but whose values are based on quoted market prices, dealer quotations or valuations provided by alternative pricing sources supported by observable inputs, are classified as Level 2 prices. These generally include certain U.S. Government and sovereign obligations, most government agency securities, investment-grade corporate bonds and less liquid listed equity securities. As investments whose values are classified as Level 2 prices include positions that are not traded in active markets and/or are subject to transfer restrictions, valuations may be adjusted to reflect illiquidity and/or non-transferability, which are generally based on available market information.
The Fidelity Investments Money Market Government Portfolio - Class I, which is held by each Fund, invests primarily in securities that are valued at amortized cost. Therefore, this investment is classified as a Level 2 investment.
| ● | | Level 3 — significant unobservable inputs (including the Fund’s own assumptions in determining the fair value of investments) |
Investments whose values are classified as Level 3 prices have significant unobservable inputs, as they may trade infrequently or not at all. When observable prices are not available for these securities, the Funds use one or more valuation techniques for which sufficient and reliable data is available. The inputs used by the Funds in estimating the value of Level 3 prices may include the original transaction price, quoted prices for similar securities or assets in active markets, completed or pending third-party transactions in the underlying investment or comparable issuers, and changes in financial ratios or cash flows. Level 3 prices may also be adjusted to reflect illiquidity and/or non-transferability, with the amount of such discount estimated by the Funds in the absence of market information. Assumptions used by the Funds due to the lack of observable inputs may significantly impact the resulting value and therefore the results of the Funds’ operations.
The inputs or methodology used for valuing investments are not necessarily an indication of the risk associated with investing in those investments. A summary of the inputs used to value the Funds’ investments as of December 31, 2017 is included with each Fund’s Schedule of Investments.
The Funds’ policy is to recognize transfers into, and transfers out of, each level of hierarchy as of the beginning of the reporting period. For the period ended December 31, 2017, there were no transfers between Level 1 and Level 2 in any of the Funds. Details regarding material transfers into, and material transfers out of, Level 3, if any, can be found at the end of each Schedule of Investments for Funds that held Level 3 securities.
| | |
| NOTES TO FINANCIAL STATEMENTS (continued) | | |
December 31, 2017 (Unaudited)
Securities Lending Upon lending its securities to third parties, each participating Fund receives compensation in the form of fees. The loans are secured by collateral at least equal to the fair value of the securities loaned plus accrued interest. Each Fund has the right under the lending agreement to recover the securities from the borrower on demand. Additionally, a Fund does not have the right to sell or re-pledge collateral received in the form of securities unless the borrower goes into default. The risks to a Fund of securities lending are that the borrower may not provide additional collateral when required or return the securities when due, resulting in a loss. Under the terms of the Securities Lending Agreement, the Funds are indemnified for such losses by the securities lending agent.
While securities are on loan, the Fund continues to receive dividends on the securities loaned and recognizes any gain or loss in the fair value of the securities loaned.
Securities lending transactions are entered into by a Fund under a Securities Lending Agreement which provides the right, in the event of default (including bankruptcy or insolvency) for the non-defaulting party to liquidate the collateral or to offset the market value of the collateral received against the market value of the securities loaned. The value of the collateral is typically greater than that of the market value of the securities loaned, leaving the lender with a net amount payable to the defaulting party. However, bankruptcy or insolvency laws of a particular jurisdiction may impose restrictions on or prohibitions against such a right of offset in the event of a counterparty’s bankruptcy or insolvency.
The market value of securities on loan, all of which are classified as common stocks in the Funds’ Schedules of Investments, and the value of the related collateral are shown in the Statements of Assets and Liabilities as a component of Investments at value. During the period ended December 31, 2017 the Blue Chip 35 Index Fund did not have any securities lending transactions.
The following table is a summary of the Funds’ securities loaned and related collateral, which are subject to a netting agreement as of December 31, 2017:
| | | | | | | | | | | | | | | | | | | | | | |
| | | | | | | | | | | | Gross Amount Not
Offset in the Statement
of Assets and Liabilities | | | | |
| Fund | | Gross
Amounts of
Recognized
Assets1 | | | Gross Amounts
Offset in the
Statement of
Assets and
Liabilities | | | Net Amounts of
Assets Presented
in the Statement
of Assets and
Liabilities | | | Financial
Instruments | | Cash
Collateral
Received2 | | | Net
Amount | |
| |
| | | | | | |
Aggressive Investors 1 | | | | | | | | | | | | | | | | | | | | | | |
Securities lending | | | $12,038,084 | | | | - | | | | $12,038,084 | | | - | | | $12,038,084 | | | | - | |
| | | | | | |
Ultra-Small Company | | | | | | | | | | | | | | | | | | | | | | |
Securities lending | | | $ 7,551,851 | | | | - | | | | $ 7,551,851 | | | - | | | $ 7,551,851 | | | | - | |
| | | | | | |
Ultra-Small Company Market | | | | | | | | | | | | | | | | | | | | | | |
Securities lending | | | $41,747,659 | | | | - | | | | $41,747,659 | | | - | | | $41,747,659 | | | | - | |
| | | | | | |
Small-Cap Momentum | | | | | | | | | | | | | | | | | | | | | | |
Securities lending | | | $ 577,152 | | | | - | | | | $ 577,152 | | | - | | | $ 577,152 | | | | - | |
| | | | | | |
Small-Cap Growth | | | | | | | | | | | | | | | | | | | | | | |
Securities lending | | | $ 5,345,738 | | | | - | | | | $ 5,345,738 | | | - | | | $ 5,345,738 | | | | - | |
| | | | | | |
Small-Cap Value | | | | | | | | | | | | | | | | | | | | | | |
Securities lending | | | $ 6,974,916 | | | | - | | | | $ 6,974,916 | | | - | | | $ 6,974,916 | | | | - | |
| | | | | | |
Managed Volatility | | | | | | | | | | | | | | | | | | | | | | |
Securities lending | | | $ 47,454 | | | | - | | | | $ 47,454 | | | - | | | $ 47,454 | | | | - | |
| 1 | Securities loaned with a value of $2,562 in Small-Cap Momentum have been sold and are pending settlement on January 2, 2018. |
| 2 | Collateral with a value of $12,529,295, $8,002,941, $44,206,098, $596,337, $5,573,398, $7,308,763, and $48,675 has been received in connection with securities lending of Aggressive Investors 1, Ultra-Small Company, Ultra-Small Company Market, Small-Cap Momentum, Small-Cap Growth, Small-Cap Value, and Managed Volatility Funds, respectively. Excess of collateral received from an individual counterparty is not shown here for financial reporting purposes. |
| | |
| 92 | | Semi-Annual Report | December 31, 2017 (Unaudited) |
| | |
| NOTES TO FINANCIAL STATEMENTS (continued) | | |
December 31, 2017 (Unaudited)
It is each Fund’s policy to obtain additional collateral from, or return excess collateral to, the borrower by the end of the next business day following the valuation date of the securities loaned. Therefore, the value of the collateral held may be temporarily less than that required under the lending contract. As of December 31, 2017 the collateral consisted of an institutional government money market fund.
Use of Estimates in Financial Statements In preparing financial statements in conformity with GAAP, management makes estimates and assumptions that affect the reported amounts of assets and liabilities on the date of the financial statements and the disclosure of contingent assets and liabilities on the date of the financial statements, as well as the reported amounts of revenue and expenses during the reporting period. Actual results could differ from those estimates.
Concentrations of Credit Risk The Funds maintain cash and securities in its custody account maintained by a high-credit, quality financial institution. Cash balances may, at times, exceed the FDIC insurance limit. Cash balances are generally invested in a short-term investment vehicle which minimizes the risk of cash balances exceeding the FDIC insurance limit.
Risks and Uncertainties The Funds provide for various investment options, including stocks, bonds and call and put options. Such investments are exposed to various risks, such as interest rate, market and credit risks. Due to the risks involved, it is at least reasonably possible that changes in risks in the near term would materially affect shareholders’ account values and the amounts reported in the financial statements.
Security Transactions, Investment Income and Expenses Security transactions are accounted for as of the trade date, the date the order to buy or sell is executed. Realized gains and losses are computed on the identified cost basis. Dividend income is recorded on the ex-dividend date, and interest income is recorded on the accrual basis from settlement date. Particularly related to the Managed Volatility Fund, discounts and premiums are accreted/amortized on the effective interest method.
Fund expenses that are not series-specific are allocated to each series based upon its relative proportion of net assets to the Funds’ total net assets or other appropriate basis.
Distributions to Shareholders The Funds pay dividends from net investment income and distribute realized capital gains annually, usually in December.
Derivatives
The Funds’ use of derivatives for the period ended December 31, 2017 was limited to futures contracts, purchased options, and written options. The following is a summary of how these derivatives are treated in the financial statements and their impact on the Funds, categorized by primary underlying risk.
| | | | | | | | | | | | | | |
Primary Underlying Risk/Fund | | Derivative
Assets | | | | | | Derivative
Liabilities | | | Location on Statement of Assets and Liabilities |
|
Equity Risk | | | | | | | | | | | | | | |
Managed Volatility: | | | | | | | | | | | | | | |
Written Call Options | | | - | | | | | | | | $439,559 | | | Call options written at value |
Written Put Options | | | - | | | | | | | | 175,030 | | | Put options written at value |
| | | | | | | | | | |
| | | |
Primary Underlying Risk/Fund | | Amount of
Realized Gain
(Loss) on Derivatives | | | Amount of
Unrealized Gain
(Loss) on Derivatives | | | Location of Gain (Loss) in the Statement of Operations |
| | | |
Equity Risk | | | | | | | | | | |
Managed Volatility: | | | | | | | | | | |
Written Options | | | $346,908 | | | | | | | Realized Gain (Loss) on Written Options |
| | | | | | | | | | Change in Unrealized Depreciation |
| | | | | | | $(127,426) | | | (Depreciation) on Written Options |
Futures Contracts | | | $(752,066) | | | | $ - | | | Realized Gain (Loss) on Futures Contracts |
| | |
| NOTES TO FINANCIAL STATEMENTS (continued) | | |
December 31, 2017 (Unaudited)
The derivative instruments outstanding as of December 31, 2017, as disclosed in the Notes to the Financial Statements, and the amounts of realized and changes in unrealized gains and losses on derivative instruments during the period, as disclosed in the Statements of Operations, serve as indicators of the volume of derivatives activity for the Funds.
Futures Contracts The Funds may purchase or sell financial futures contracts to hedge cash positions, manage market risk, and to dampen volatility in line with investment objectives. A futures contract is an agreement between two parties to buy or sell a financial instrument at a set price on a future date. Upon entering into such a contract, a Fund is required to pledge to the broker an amount of cash or U.S. Government securities equal to the minimum “initial margin” requirements of the exchange on which the futures contract is traded. The contract amount reflects the extent of a Fund’s exposure in these financial instruments. A Fund’s participation in the futures markets involves certain risks, including imperfect correlation between movements in the price of futures contracts and movements in the price of the securities hedged or used for cover. Pursuant to a contract, such Fund agrees to receive from, or pay to, the broker an amount of cash equal to the fluctuation in value of the contract. Such receipts or payments are known as “variation margin” and are recorded by a Fund as unrealized appreciation or depreciation. When a contract is closed, a Fund records a realized gain or loss equal to the difference between the value of the contract at the time it was opened and the value at the time it was closed. With futures, there is minimal counterparty risk to the Funds, since futures are exchange traded and the exchange’s clearinghouse, as counterparty to all exchange traded futures, guarantees the futures against default. As of December 31, 2017, the Funds had no open futures contracts.
Options The Aggressive Investors 1 Fund may buy and sell calls and puts to increase or decrease the Fund’s exposure to stock market risk or for purposes of diversification of risk. The Managed Volatility Fund may buy and sell calls and puts to reduce the Fund’s volatility and provide some cash flow. An option is a contract conveying a right to buy or sell a financial instrument at a specified price during a stipulated period. The premium paid by a Fund for the purchase of a call or a put option is included in such Fund’s Schedule of Investments as an investment and subsequently marked-to-market to reflect the current market value of the option. When a Fund writes a call or a put option, an amount equal to the premium received by such Fund is included in its Statement of Assets and Liabilities as a liability and is subsequently marked-to-market to reflect the current market value of the option written. If an option that a Fund has written either expires on its stipulated expiration date, or if such Fund enters into a closing purchase transaction, that Fund realizes a gain (or a loss if the cost of a closing purchase transaction exceeds the premium received when the option was written) without regard to any unrealized gain or loss on the underlying security, and the liability related to such options is extinguished. If a call option that a Fund has written is assigned, such Fund realizes a gain or loss from the sale of the underlying security, and the proceeds from such sale are increased by the premium originally received. If a put option that a Fund has written is assigned, the amount of the premium originally received reduces the cost of the security that such Fund purchased upon exercise of the option. Buying calls increases a Fund’s exposure to the underlying security to the extent of any premium paid. Buying puts on a stock market index tends to limit a Fund’s exposure to a stock market decline. All options purchased by the Funds were listed on exchanges and considered liquid positions with readily available market quotes.
Covered Call Options and Secured Puts The Aggressive Investors 1 and Managed Volatility Funds may write call options on a covered basis; that is, a Fund will own the underlying security, or a Fund may write secured puts. The principal reason for writing covered calls and secured puts on a security is to attempt to realize income through the receipt of premiums. The option writer has, in return for the premium, given up the opportunity for profit from a substantial price increase in the underlying security so long as the obligation as a writer continues, but has retained the risk of loss should the price of the security decline. All options were listed on exchanges and considered liquid positions with readily available market quotes.
The Aggressive Investors 1 Fund had no transactions in written options during the period ended December 31, 2017.
Indemnification Under the Company’s organizational documents, the Funds’ officers, directors, employees and agents are indemnified against certain liabilities that may arise out of the performance of their duties to the Funds. Additionally, in the normal course of business, the Funds enter into contracts that contain a variety of indemnification clauses. The Funds’ maximum exposure under these arrangements is unknown, as this would involve future claims that may be made against the Funds that have not yet occurred. However, the Funds have not had prior claims or losses pursuant to these contracts.
| | |
| 94 | | Semi-Annual Report | December 31, 2017 (Unaudited) |
| | |
| NOTES TO FINANCIAL STATEMENTS (continued) | | |
December 31, 2017 (Unaudited)
3. Advisory Fees, Other Related Party Transactions and Contingencies:
The Funds have entered into management agreements with the Adviser. As compensation for the advisory services rendered, facilities furnished, and expenses borne by the Adviser, the Funds pay the Adviser a fee pursuant to each Fund’s management agreement, as described below.
Aggressive Investors 1: A total advisory fee is paid by the Fund to the Adviser that is comprised of a Base Fee and a Performance Adjustment. The Base Fee equals the Base Fee Rate times the average daily net assets of the Fund. The Base Fee Rate is based on the following annual rates: 0.90% of the first $250 million of the Fund’s average daily net assets, 0.875% of the next $250 million, 0.85% of the next $500 million and 0.80% of any excess over $1 billion.
The Performance Adjustment equals 4.67% times the difference in cumulative total return between the Fund and the Standard and Poor’s 500 Composite Stock Price Index with dividends reinvested (hereinafter “Index”) over a rolling five-year performance period. The Performance Adjustment Rate varies from a minimum of -0.70% to a maximum of +0.70%. However, the Performance Adjustment Rate is zero if the difference between the cumulative Fund performance and the Index performance is less than or equal to 2%.
Ultra-Small Company: The Fund pays advisory fees based on the following annual rates: 0.90% of the first $250 million of the Fund’s average daily net assets, 0.875% of the next $250 million and 0.85% of any excess over $500 million. The management fees are computed daily and are payable monthly. However, during any period when the Fund’s net assets range from $27,500,000 to $55,000,000, the advisory fee will be determined as if the Fund had $55,000,000 under management. This is limited to a maximum annualized expense ratio of 1.49% of average net assets.
Ultra-Small Company Market: The Fund’s advisory fee is a flat 0.50% of the value of the Fund’s average daily net assets, computed daily and payable monthly.
Small-Cap Momentum: The Fund’s advisory fee is a flat 0.55% of the value of the Fund’s average daily net assets, computed daily and payable monthly.
Small-Cap Growth and Small-Cap Value: A total advisory fee is paid by each Fund to the Adviser that is comprised of a Base Fee and a Performance Adjustment. The Base Fee equals the Base Fee Rate times the average daily net assets of the Fund. The Base Fee Rate is based on the annual rate of 0.60% of the value of each Fund’s average daily net assets.
The Performance Adjustment equals 0.33% times the difference in cumulative total return between the Fund and the Russell 2000 Growth Index for Small-Cap Growth Fund and the Russell 2000 Value Index for Small-Cap Value Fund, with dividends reinvested (hereinafter “Index”) over a rolling five-year performance period. The Performance Adjustment Rate varies from a minimum of -0.05% to a maximum of +0.05%. However, the Performance Adjustment Rate is zero if the difference between the cumulative Fund’s performance and the Index performance is less than or equal to 2%.
Blue Chip 35 Index: The Fund’s advisory fee is a flat 0.08% of the value of the Fund’s average daily net assets, computed daily and payable monthly.
Managed Volatility: The Fund’s advisory fee is a flat 0.60% of the value of the Fund’s average daily net assets, computed daily and payable monthly.
Expense limitations: The Adviser has agreed to reimburse the Funds for operating expenses and management fees above the expense limitations shown in the table below, which are shown as a ratio of net expenses to average net assets, for each Fund, for the year ended December 31, 2017. Any material change to the expense limitation would require a vote by shareholders of the applicable Fund.
| | |
| NOTES TO FINANCIAL STATEMENTS (continued) | | |
December 31, 2017 (Unaudited)
| | | | | | |
| Bridgeway Fund | | Expense
Limitation | | Total Waivers and
Reimbursements
for Period Ending
12/31/17 | |
| | | | | | |
Aggressive Investors 1 | | 1.75% | | | $ - | |
Ultra-Small Company | | 1.85% | | | - | |
Ultra-Small Company Market | | 0.75% | | | 15,229 | |
Small-Cap Momentum* | | 0.90% | | | 63,760 | |
Small-Cap Growth | | 0.94% | | | 37,881 | |
Small-Cap Value | | 0.94% | | | 7,563 | |
Blue Chip 35 Index | | 0.15% | | | 251,972 | |
Managed Volatility | | 0.94% | | | 48,388 | |
| | | | | | |
*The Fund is authorized to reimburse the Adviser for management fees previously waived and/or for expenses previously reimbursed by the Adviser, provided, however, that any reimbursements must be paid at a date not more than three years after the Adviser waived the fees or reimbursed the expenses and the reimbursements do not cause the Fund to exceed the expense limitation in effect at the time of the waiver or the current expense limitation, if different. The Fund has recoupable expenses of $63,258, $131,006, $136,535 and $63,760 which expire no later than June 30, 2018, June 30, 2019, June 30, 2020, and December 31, 2020, respectively.
Other Related Party Transactions: The Funds will engage in inter-portfolio trades when it is to the benefit of both parties. The Board of Directors reviews and approves these trades quarterly. Inter-portfolio purchases and sales during the period ended December 31, 2017 were as follows:
| | | | | | | | | | |
| Bridgeway Fund | | Inter-Portfolio
Purchases | | Inter-Portfolio
Sales |
| | | | | | | | | | |
Aggressive Investors 1 | | | | $ 334,000 | | | | | $2,516,605 | |
Ultra-Small Company | | | | 226,524 | | | | | 3,228,251 | |
Ultra-Small Company Market | | | | 5,183,310 | | | | | 4,997,903 | |
Small-Cap Momentum | | | | 7,624 | | | | | 12,432 | |
Small-Cap Growth | | | | 250,884 | | | | | 242,518 | |
Small-Cap Value | | | | 572,164 | | | | | 2,715,469 | |
The Adviser entered into an Administrative Services Agreement with Bridgeway, pursuant to which the Adviser provides various administrative services to the Funds including, but not limited to: (i) supervising and managing various aspects of the Funds’ business and affairs; (ii) selecting, overseeing and/or coordinating activities with other service providers to the Funds; (iii) providing reports to the Board of Directors as requested from time to time; (iv) assisting and/or reviewing amendments and updates to the Funds’ registration statement and other filings with the Securities and Exchange Commission (“SEC”); (v) providing certain shareholder services; (vi) providing administrative support in connection with meetings of the Board of Directors; and (vii) providing certain record-keeping services. Effective July 1, 2017, for its services to all of the Bridgeway Funds, the Adviser is paid an aggregate annual fee of $775,000, payable in equal monthly installments. For the allocation of this expense to each of the Funds, please see the Statement of Operations.
Board of Directors Compensation Independent Directors are paid an annual retainer of $15,000, with an additional retainer of $5,000 paid to the Independent Chairman of the Board and an additional retainer of $1,000 paid to the Nominating and Corporate Governance Committee Chair. The retainer is paid in quarterly installments. Effective November 9, 2017, Independent Directors are paid $9,000 per meeting for meeting fees. Prior to November 9, 2017, Independent Directors were paid $8,500 per meeting. Such compensation is the total compensation from all Bridgeway Funds and is allocated among the Bridgeway Funds.
| | |
| 96 | | Semi-Annual Report | December 31, 2017 (Unaudited) |
| | |
| NOTES TO FINANCIAL STATEMENTS (continued) | | |
December 31, 2017 (Unaudited)
Each Independent Director receives this compensation in the form of shares of the Bridgeway Funds, credited to his or her account. Such Directors are reimbursed for any expenses incurred in attending meetings and conferences, as well as expenses for subscriptions or printed materials. The amount of directors’ fees attributable to each Fund is disclosed in the Statements of Operations.
One director of Bridgeway, John Montgomery, is an owner and director of the Adviser. Under the 1940 Act definitions, he is considered to be an “affiliated person” of the Adviser and an “interested person” of the Adviser and of Bridgeway. Compensation for Mr. Montgomery is borne by the Adviser rather than the Funds.
4. Distribution Agreement:
Foreside Fund Services, LLC acts as distributor of the Funds’ shares, pursuant to a Distribution Agreement dated May 31, 2017. The Adviser pays all costs and expenses associated with distribution of the Funds’ shares, pursuant to a protective plan adopted by shareholders pursuant to Rule 12b-1.
5. Purchases and Sales of Investment Securities:
Purchases and sales of investments, other than short-term securities, for each Fund for the period ended December 31, 2017 were as follows:
| | | | | | | | | | | | |
| | | Purchases | | | Sales | | | |
| Bridgeway Fund | | U.S. Government | | Other | | | U.S. Government | | Other | |
| | | | | | | | | | | | |
Aggressive Investors 1 | | $ - | | | $126,731,165 | | | $ - | | | $132,380,035 | |
Ultra-Small Company | | | | | 42,705,730 | | | - | | | 48,267,261 | |
Ultra-Small Company Market | | - | | | 59,071,937 | | | - | | | 88,025,156 | |
Small-Cap Momentum | | - | | | 6,498,784 | | | - | | | 6,393,116 | |
Small-Cap Growth | | - | | | 28,307,947 | | | - | | | 30,170,583 | |
Small-Cap Value | | - | | | 18,458,272 | | | - | | | 21,435,547 | |
Blue Chip 35 Index | | - | | | 40,171,621 | | | - | | | 72,988,508 | |
Managed Volatility | | �� - | | | 3,262,697 | | | - | | | 7,423,438 | |
6. Federal Income Taxes
It is the Funds’ policy to continue to comply with the provisions of the Internal Revenue Code of 1986, as amended (“Internal Revenue Code”), applicable to regulated investment companies, and to distribute income to the extent necessary so that the Funds are not subject to federal income tax. Therefore, no federal income tax provision is required.
Unrealized Appreciation and Depreciation on Investments (Tax Basis) The amount of net unrealized appreciation/ depreciation and the cost of investment securities for tax purposes, including short-term securities as of December 31, 2017, were as follows:
| | | | | | | | | | |
| | | Aggressive Investors 1 | | | Ultra-Small
Company | | Ultra-Small
Company Market | |
Gross appreciation (excess of value over tax cost) | | | $ 38,846,607 | | | $16,116,410 | | | $108,072,106 | |
Gross depreciation (excess of tax cost over value) | | | (4,411,032) | | | (7,518,144) | | | (25,029,334) | |
Net unrealized appreciation | | | $ 34,435,575 | | | $ 8,598,266 | | | $83,042,772 | |
Cost of investments for income tax purposes | | | $ 222,885,993 | | | $97,071,863 | | | $312,125,878 | |
| | | |
| | | Small-Cap Momentum | | | Small-Cap Growth | | Small-Cap Value | |
Gross appreciation (excess of value over tax cost) | | | $ 502,648 | | | $ 9,117,901 | | | $12,627,348 | |
Gross depreciation (excess of tax cost over value) | | | (122,841) | | | (2,010,034) | | | (3,319,760) | |
Net unrealized appreciation | | | $ 379,807 | | | $ 7,107,867 | | | $ 9,307,588 | |
Cost of investments for income tax purposes | | | $ 5,961,052 | | | $ 48,872,748 | | | $61,103,405 | |
| | |
| NOTES TO FINANCIAL STATEMENTS (continued) | | |
December 31, 2017 (Unaudited)
| | | | | | | | | | | | |
| | | |
| | | Blue Chip 35 Index | | | | | | Managed Volatility | |
Gross appreciation (excess of value over tax cost) | | $ | 280,365,455 | | | | | | | $ | 7,939,920 | |
Gross depreciation (excess of tax cost over value) | | | (805,565 | ) | | | | | | | (529,484 | ) |
Net unrealized appreciation | | $ | 279,559,890 | | | | | | | $ | 7,410,436 | |
| | | |
Cost of investments for income tax purposes | | $ | 295,476,627 | | | | | | | $ | 26,211,133 | |
The differences between book and tax net unrealized appreciation (depreciation) are primarily due to wash sale and straddle loss deferrals and basis adjustments on investments in business development companies, partnerships and passive foreign investment companies (PFICs).
Classifications of Distributions Net investment income (loss) and net realized gain (loss) may differ for financial statement and tax purposes. The character of distributions made during the year from net investment income or net realized gains may differ from its ultimate characterization for federal income tax purposes.
The tax character of the distributions paid by the Funds during the last two fiscal years ended June 30, 2017 and June 30, 2016 respectively, are as follows:
| | | | | | | | | | | | | | | | |
| | | Aggressive Investors 1 | | | Ultra-Small Company | |
| | | Year Ended
June 30, 2017 | | | Year Ended
June 30, 2016 | | | Year Ended June 30, 2017 | | | Year Ended June 30, 2016 | |
| | | | |
Distributions paid from: | | | | | | | | | | | | | | | | |
Ordinary Income | | | $1,255,319 | | | | $99,024 | | | | $1,212,208 | | | | $1,116,218 | |
Long-Term Capital Gain | | | - | | | | - | | | | - | | | | - | |
Total | | | $1,255,319 | | | | $99,024 | | | | $1,212,208 | | | | $1,116,218 | |
| | |
| | | Ultra-Small Company Market | | | Small-Cap Momentum | |
| | | Year Ended June 30, 2017 | | | Year Ended June 30, 2016 | | | Year Ended
June 30, 2017 | | | Year Ended
June 30, 2016 | |
| | | | |
Distributions paid from: | | | | | | | | | | | | | | | | |
Ordinary Income | | | $ 3,465,525 | | | | $ 3,152,924 | | | | $147,281 | | | | $ 9,442 | |
Long-Term Capital Gain | | | 24,304,051 | | | | 37,504,226 | | | | 48,173 | | | | 115,288 | |
Total | | | $27,769,576 | | | | $40,657,150 | | | | $195,454 | | | | $124,730 | |
| | |
| | | Small-Cap Growth | | | Small-Cap Value | |
| | | Year Ended
June 30, 2017 | | | Year Ended
June 30, 2016 | | | Year Ended
June 30, 2017 | | | Year Ended
June 30, 2016 | |
| | | | |
Distributions paid from: | | | | | | | | | | | | | | | | |
Ordinary Income | | | $ 128,436 | | | | $ - | | | | $644,905 | | | | $1,200,493 | |
Total | | | $ 128,436 | | | | $ - | | | | $644,905 | | | | $1,200,493 | |
| | |
| | | Blue Chip 35 Index | | | Managed Volatility | |
| | | Year Ended
June 30, 2017 | | | Year Ended
June 30, 2016 | | | Year Ended
June 30, 2017 | | | Year Ended
June 30, 2016 | |
| | | | |
Distributions paid from: | | | | | | | | | | | | | | | | |
Ordinary Income | | | $13,425,245 | | | | $14,480,684 | | | | $195,475 | | | | $ 15,844 | |
Total | | | $13,425,245 | | | | $14,480,684 | | | | $195,475 | | | | $ 15,844 | |
| | |
| 98 | | Semi-Annual Report | December 31, 2017 (Unaudited) |
| | |
| NOTES TO FINANCIAL STATEMENTS (continued) | | |
December 31, 2017 (Unaudited)
As of June 30, 2017, the Funds had available for tax purposes expiring capital loss carryovers as follows:
| | | | |
| | | Aggressive Investors 1 | | Small-Cap Growth |
Expiring 6/30/2018 | | $16,094,318 | | $6,535,338 |
| | |
| | | Small-Cap Value | | Managed Volatility |
Expiring 6/30/2018 | | $20,011,215 | | $1,499,825 |
For Aggressive Investors 1, capital losses related to prior year reorganizations are subject to limitations under Internal Revenue Code Sections 381-384. Aggressive Investors 1, has capital losses of $16,094,318 subject to limitation.
Under the Regulated Investment Company Modernization Act of 2010, capital losses incurred by these Funds after June 30, 2011 will not be subject to expiration and will retain their character as either short-term or long-term capital losses. In addition, such losses must be utilized prior to the losses incurred in the years preceding enactment.
There are no capital loss carryovers for Ultra-Small Company Fund, Ultra-Small Company Market Fund, Small-Cap Momentum Fund, and Blue Chip 35 Index Fund as of June 30, 2017.
Capital loss carryovers utilized during the period ended June 30, 2017 were as follows:
| | | | |
| Bridgeway Fund | | Capital Loss
Carryover Utilized | |
| | | | |
Aggressive Investors 1 | | | $46,629,631 | |
Ultra-Small Company | | | 9,063,579 | |
Small-Cap Momentum | | | 10,440 | |
Small-Cap Growth | | | 4,279,188 | |
Small-Cap Value | | | 3,054,674 | |
Blue Chip 35 Index | | | 2,100,878 | |
Managed Volatility | | | 1,270,304 | |
During the period ended June 30, 2017, $33,557,457 of the capital loss carryforwards for Aggressive Investor 1 expired.
Components of Accumulated Earnings (Deficit) As of June 30, 2017, the components of accumulated earnings (deficit) on a tax basis were:
| | | | | | | | | | | | |
| | | Aggressive Investors 1 | | | Ultra-Small Company | | | Ultra-Small Company Market | |
| |
Accumulated Net Investment Income | | | $ - | | | | $ 1,299,976 | | | | $ 449,162 | |
Accumulated Net Realized Gain (Loss) on Investments* | | | (16,223,145) | | | | 566,419 | | | | 26,615,393 | |
Net Unrealized Appreciation of Investments | | | 4,186,605 | | | | 8,530,988 | | | | 80,699,869 | |
| |
Total | | | $(12,036,540) | | | | $10,397,383 | | | | $107,764,424 | |
| |
| | | |
| | | Small-Cap Momentum | | | Small-Cap Growth | | | Small-Cap Value | |
Accumulated Net Investment Income | | | $ 218,377 | | | | $ 98,925 | | | | $ 547,899 | |
Accumulated Net Realized Gain (Loss) on Investments* | | | 159,764 | | | | (6,535,338) | | | | (20,011,215) | |
Net Unrealized Appreciation of Investments | | | 460,797 | | | | 5,656,966 | | | | 7,545,255 | |
| |
Total | | | $ 838,938 | | | | $ (779,447) | | | | $(11,918,061) | |
| |
| | | | | | | | | | | | |
| | | Blue Chip 35 Index | | | | | | Managed Volatility | |
| |
Accumulated Net Investment Income | | | $ 5,169,144 | | | | | | | | $ 180,610 | |
Accumulated Net Realized Gain (Loss) on Investments* | | | 12,133,158 | | | | | | | | (1,499,825) | |
Net Unrealized Appreciation of Investments | | | 242,626,918 | | | | | | | | 6,635,067 | |
| |
Total | | | $259,929,220 | | | | | | | | $ 5,315,852 | |
| |
| | |
| NOTES TO FINANCIAL STATEMENTS (continued) | | |
December 31, 2017 (Unaudited)
| * | Includes qualified late-year losses that the Funds have elected to defer to the beginning of their next fiscal year ending June 30, 2018. The Aggressive Investors I Fund has elected to defer qualified short-term late-year losses of ($128,827). The Ultra-Small Company, Ultra-Small Company Market, Small-Cap Momentum, Small-Cap Growth, Small-Cap Value, Blue Chip 35 Index and Managed Volatility Funds have no deferred qualified late-year losses. |
For the fiscal year June 30, 2017, the Funds recorded the following reclassifications to the accounts listed below:
| | | | | | | | | | | | |
| | | Increase (Decrease) | |
| |
| | | Aggressive Investors 1 | | | Ultra-Small Company | | | Ultra-Small Company Market | |
| |
Paid-in-Capital | | | $(33,941,405) | | | | $ 140,052 | | | | $ 3,173,738 | |
Undistributed Net Investment Income | | | 383,949 | | | | 28,119 | | | | (301,913) | |
Accumulated Net Realized Gain (Loss) on Investments | | | 33,557,456 | | | | (168,171) | | | | (2,871,825) | |
| |
| | | |
| | | Small-Cap Momentum | | | Small-Cap Growth | | | Small-Cap Value | |
| |
Paid-in-Capital | | | $ 5,148 | | | | $ - | | | | $ - | |
Undistributed Net Investment Income | | | 2,727 | | | | - | | | | - | |
Accumulated Net Realized Gain (Loss) on Investments | | | (7,875) | | | | - | | | | - | |
| |
| | | |
| | | Blue Chip 35 Index | | | Managed Volatility | | | | |
Paid-in-Capital | | | $ 1,375,373 | | | | $ - | | | | | |
Undistributed Net Investment Income | | | (1,037,692) | | | | - | | | | | |
Accumulated Net Realized Gain (Loss) on Investments | | | (337,681) | | | | - | | | | | |
| | | | | |
The difference between book and tax components of net assets and the resulting reclassifications were primarily a result of the differing book/tax treatment of the deduction of equalization debits for tax purposes, redesignation of dividends paid and investments in real estate investment trusts, business development companies, partnerships and passive foreign investment companies (PFICs).
Accounting for Uncertainty in Income Taxes sets forth a minimum threshold for financial statement recognition of the benefit of a tax position taken or expected to be taken in a tax return. Management has analyzed each Fund’s tax positions and has concluded that no provision for income tax is required in each Fund’s financial statements. The Funds are not aware of any tax position for which it is reasonably possible that the total amounts of unrecognized tax benefits will significantly change in the next twelve months. Each Fund’s federal tax returns for the prior three fiscal years remain subject to examination by the Internal Revenue Service.
7. Line of Credit
Bridgeway established a line of credit agreement (“Facility”) with The Bank of New York Mellon, effective November 5, 2010. The Facility is for temporary or emergency purposes, such as to provide liquidity for shareholder redemptions, and is cancellable by either party. Unless cancelled earlier, the Facility shall be held available until September 13, 2018. Advances under the Facility are limited to $15,000,000 in total for all Funds, and advances to each Fund shall not exceed certain limits set forth in the credit agreement, including, but not limited to, the maximum amount a Fund is permitted to borrow under the 1940 Act.
The Funds incur a commitment fee of 0.085% per annum on the unused portion of the Facility and interest expense to the extent of amounts borrowed under the Facility. Interest is based on the “Overnight Rate” plus 1.25%. The Overnight Rate means the higher of (a) the Federal Funds rate, (b) the Overnight Eurodollar Rate, or (c) the One-Month Eurodollar Rate. The commitment fees are payable quarterly in arrears and are allocated to all participating Funds. Interest expense is charged directly to a Fund based upon actual amounts borrowed by such Fund.
| | |
| 100 | | Semi-Annual Report | December 31, 2017 (Unaudited) |
| | |
| NOTES TO FINANCIAL STATEMENTS (continued) | | |
December 31, 2017 (Unaudited)
For the period ended December 31, 2017, borrowings by the Funds under this line of credit were as follows:
| | | | | | | | | | | | | | | | | | | | | | | | | |
| Bridgeway Fund | | Weighted
Average
Interest Rate | | Weighted
Average
Loan Balance | | Number of
Days
Outstanding | | Interest
Expense
Incurred1 | | Maximum Amount Borrowed During the Period |
| | | | | | | | | | | | | | | | | | | | | | | | | |
Aggressive Investors 1 | | | | 2.53 | % | | | | $ 791,938 | | | | | 16 | | | | | $ 878 | | | | | $ 1,682,000 | |
Ultra-Small Company | | | | 2.61 | % | | | | 820,846 | | | | | 65 | | | | | 3,813 | | | | | 1,370,000 | |
Ultra-Small Company Market | | | | 2.61 | % | | | | 924,875 | | | | | 56 | | | | | 3,701 | | | | | 4,527,000 | |
Small-Cap Growth | | | | 2.48 | % | | | | 320,000 | | | | | 7 | | | | | 152 | | | | | 342,000 | |
Small-Cap Value | | | | 2.57 | % | | | | 312,235 | | | | | 17 | | | | | 374 | | | | | 1,304,000 | |
Blue Chip 35 Index | | | | 2.61 | % | | | | 1,482,962 | | | | | 53 | | | | | 5,627 | | | | | 12,930,000 | |
Managed Volatility | | | | 2.48 | % | | | | 383,000 | | | | | 5 | | | | | 130 | | | | | 701,000 | |
Small Cap Momentum | | | | 2.49 | % | | | | 273,000 | | | | | 1 | | | | | 19 | | | | | 273,000 | |
1Interest expense is included on the Statements of Operations in Miscellaneous expenses. | |
On December 31, 2017, Ultra-Small Company Fund had loans outstanding in the amount of $1,112,000, exclusive of interest payable on the loans.
8. Redemption Fees
In Ultra-Small Company Market and Small-Cap Momentum Funds, a 2% redemption fee may be charged on shares held less than six months. The fee is charged for the benefit of the remaining shareholders and will be paid to the appropriate Fund to help offset transaction costs. The fee is accounted for as an addition to paid-in capital.
9. Subsequent Events
Management has evaluated the impact of all subsequent events on the Funds and has determined that there were no subsequent events requiring recognition or disclosure in the financial statements except for the following:
On February 8, 2018, the Board of Directors of Bridgeway Funds, Inc. approved a proposal to liquidate and dissolve the Small-Cap Momentum Fund. The Small-Cap Momentum Fund will be liquidated pursuant to a Board-approved Plan of Liquidation and Dissolution on or about May 14, 2018.
| | |
| OTHER INFORMATION | | |
December 31, 2017 (unaudited)
1. Proxy Voting
Fund policies and procedures used in determining how to vote proxies relating to the Funds’ securities and a summary of proxies voted by the Funds for the period ended June 30, 2017 are available without a charge, upon request, by contacting Bridgeway Funds at 1-800-661-3550 and on the SEC’s website at http://www.sec.gov.
2. Fund Holdings
The complete schedules of the Funds’ holdings for the second and fourth quarters of each fiscal year are contained in the Funds’ Semi-Annual and Annual Shareholder Reports, respectively.
The Bridgeway Funds file complete schedules of the Funds’ holdings with the SEC for the first and third quarters of each fiscal year on Form N-Q within 60 days after the end of the period. Copies of the Funds’ Form N-Q are available without charge, upon request, by contacting Bridgeway Funds at 1-800-661-3550 and on the SEC’s website at http://www.sec.gov. You may also review and copy Form N-Q at the SEC’s Public Reference Room in Washington, D.C. For more information about the operation of the Public Reference Room, please call 1-800-SEC-0330.
| | |
| 102 | | Semi-Annual Report | December 31, 2017 (Unaudited) |
| | |
| DISCLOSURE OF FUND EXPENSES | | |
December 31, 2017 (Unaudited)
As a shareholder of a Fund, you will incur no transaction costs from such Fund, including sales charges (loads) on purchases, on reinvested dividends or on other distributions. There are no exchange fees. Shareholders are subject to redemption fees on the Ultra-Small Company Market and Small-Cap Momentum Funds under certain circumstances. However, as a shareholder of a Fund, you will incur ongoing costs, including management fees and other Fund expenses. The following examples are intended to help you understand your ongoing costs (in dollars) of investing in a Fund and to compare these costs with ongoing costs of investing in other mutual funds. The examples are based on an investment of $1,000 invested on July 1, 2017 and held until December 31, 2017.
Actual Expenses. The first line of the table below provides information about actual account values and actual expenses. You may use the information in this line, together with the amount you invested, to estimate the expenses that you paid over the period. Simply divide your account value by $1,000 (for example, an $8,600 account value divided by $1,000 = 8.6), then multiply the result by the number in the first line under the heading “Expenses Paid During Period” to estimate the expenses you paid on your account during the period.
Hypothetical Example for Comparison Purposes. The second line of the table below provides information about hypothetical account values and hypothetical expenses based on the Fund’s actual expense ratio and an assumed rate of return of 5% per year before expenses, which is not the Fund’s actual return. The hypothetical account values and expenses may not be used to estimate the actual ending account balance or expenses you paid for the period. You may use this information to compare the ongoing costs of investing in a Fund and other mutual funds. To do so, compare this 5% hypothetical example with the 5% hypothetical examples that appear in the shareholder reports of other funds.
The expenses shown in the table are meant to highlight ongoing Fund costs only. Therefore, the second line of the table is useful in comparing ongoing costs only and will not help you determine the relative total costs of owning different funds, because other funds may also have transaction costs, such as sales charges, redemption fees or exchange fees.
| | | | | | | | | | | | | | | | | | | | |
| | | Beginning Account
Value at 7/1/17 | | Ending Account
Value at 12/31/17 | | Expense
Ratio | | Expenses Paid
During Period*
7/1/17 - 12/31/17 |
| | | | |
Bridgeway Aggressive Investors 1 Fund | | | | | | | | | | | | | | | | | | | | |
Actual Fund Return | | | | $1,000.00 | | | | | $1,135.20 | | | | | 1.26% | | | | | $6.78 | |
Hypothetical Fund Return | | | | $1,000.00 | | | | | $1,018.85 | | | | | 1.26% | | | | | $6.41 | |
| | | | |
Bridgeway Ultra-Small Company Fund | | | | | | | | | | | | | | | | | | | | |
Actual Fund Return | | | | $1,000.00 | | | | | $1,027.10 | | | | | 1.19% | | | | | $6.08 | |
Hypothetical Fund Return | | | | $1,000.00 | | | | | $1,019.21 | | | | | 1.19% | | | | | $6.06 | |
| | | | |
Bridgeway Ultra-Small Company Market Fund | | | | | | | | | | | | | | | | | | | | |
Actual Fund Return | | | | $1,000.00 | | | | | $1,090.10 | | | | | 0.75% | | | | | $3.95 | |
Hypothetical Fund Return | | | | $1,000.00 | | | | | $1,021.42 | | | | | 0.75% | | | | | $3.82 | |
| | | | |
Bridgeway Small-Cap Momentum Fund | | | | | | | | | | | | | | | | | | | | |
Actual Fund Return | | | | $1,000.00 | | | | | $1,105.30 | | | | | 0.90% | | | | | $4.78 | |
Hypothetical Fund Return | | | | $1,000.00 | | | | | $1,020.67 | | | | | 0.90% | | | | | $4.58 | |
| | | | |
Bridgeway Small-Cap Growth Fund | | | | | | | | | | | | | | | | | | | | |
Actual Fund Return | | | | $1,000.00 | | | | | $1,112.20 | | | | | 0.94% | | | | | $5.00 | |
Hypothetical Fund Return | | | | $1,000.00 | | | | | $1,020.47 | | | | | 0.94% | | | | | $4.79 | |
| | | | |
Bridgeway Small-Cap Value Fund | | | | | | | | | | | | | | | | | | | | |
Actual Fund Return | | | | $1,000.00 | | | | | $1,078.40 | | | | | 0.94% | | | | | $4.92 | |
Hypothetical Fund Return | | | | $1,000.00 | | | | | $1,020.47 | | | | | 0.94% | | | | | $4.79 | |
| | |
| DISCLOSURE OF FUND EXPENSES (continued) | | |
December 31, 2017 (Unaudited)
| | | | | | | | | | | | | | | | | | | | |
| | | Beginning Account
Value at 7/1/17 | | Ending Account
Value at 12/31/17 | | Expense
Ratio | | Expenses Paid During Period*
7/1/17-12/31/17 |
| | | | |
Bridgeway Blue Chip 35 Index Fund | | | | | | | | | | | | | | | | | | | | |
Actual Fund Return | | | | $1,000.00 | | | | | $1,116.00 | | | | | 0.15% | | | | | $0.80 | |
Hypothetical Fund Return | | | | $1,000.00 | | | | | $1,024.45 | | | | | 0.15% | | | | | $0.77 | |
| | | | |
Bridgeway Managed Volatility | | | | | | | | | | | | | | | | | | | | |
Actual Fund Return | | | | $1,000.00 | | | | | $1,046.70 | | | | | 0.94% | | | | | $4.85 | |
Hypothetical Fund Return | | | | $1,000.00 | | | | | $1,020.47 | | | | | 0.94% | | | | | $4.79 | |
| * | Expenses are equal to the average account value times the Fund’s annualized expense ratio multiplied by the number of days in the most recent six- month period (184) divided by the number of days in the fiscal year (365). |
| | |
| 104 | | Semi-Annual Report | December 31, 2017 (Unaudited) |
THIS PAGE INTENTIONALLY LEFT BLANK
THIS PAGE INTENTIONALLY LEFT BLANK
| | | | | | |
| | | | | | |
| | | | | | |
| | BRIDGEWAY FUNDS, INC. BNY Mellon Investment Servicing (US) Inc. P.O. Box 9860 Providence, RI 02940-8060 CUSTODIAN The Bank of New York Mellon One Wall Street New York, NY 10286 DISTRIBUTOR Foreside Fund Services, LLC Three Canal Plaza, Suite 100 Portland, ME 04101 | | | | |
| | | |
| | | | | | |
| | You can review and copy information about our Funds (including the SAIs) at the SEC’s Public Reference Room in Washington, D.C. To find out more about this public service, call the SEC at 800-SEC-0330. Reports and other information about the Funds are also available on the SEC’s website at www.sec.gov. You can receive copies of this information, for a fee, by writing the Public Reference Section, Securities and Exchange Commission, Washington, D.C. 20549-1520 or by sending an electronic request to the following email address: publicinfo@sec.gov. | | |
| | | | | | |

A no-load mutual fund family of domestic funds
| | | | |
| | Semi-Annual Report | | |
| | December 31, 2017 (Unaudited) | | |
| | OMNI SMALL-CAP VALUE | | BOSVX |
| | OMNI TAX-MANAGED SMALL-CAP VALUE | | BOTSX |
| | www.bridgeway.com | | |
| | |
TABLE OF CONTENTS | |  |
Bridgeway Funds Standardized Returns as of December 31, 2017 (Unaudited)
| | | | | | | | | | | | | | | | | | | | | | | | | | | | | | | | | | | | | | | | |
| | | | | | | | | Annualized | | | | | | |
| Fund | | Quarter | | Six Months | | 1 Year | | 5 Years | | Inception
to Date | | Inception
Date | | Gross
Expense
Ratio2 | | Net
Expense
Ratio2 |
| | | | | | | | | | | | | | | | | | | | | | | | | |
Omni Small-Cap Value | | 3.42% | | 9.86% | | 6.01% | | 14.19% | | 14.63% | | 8/31/2011 | | 0.71%1 | | 0.60%1 |
Omni Tax-Managed Small-Cap Value | | 3.00% | | 9.16% | | 5.52% | | 14.05% | | 11.39% | | 12/31/2010 | | 0.71%1 | | 0.60%1 |
| | 1 | Some of the Fund’s fees were waived or expenses reimbursed; otherwise, returns would have been lower. The Adviser has contractually agreed to waive fees and/or reimburse expenses. Any material change to this Fund policy would require a vote by shareholders. |
| | 2 | Expense ratios are as stated in the current prospectus. Please see financial highlights for expense ratios as of December 31, 2017. |
Performance figures quoted represent past performance and are no guarantee of future results. Current performance may be lower or higher than the performance data quoted. Investment return and principal value will fluctuate, so that an investor’s shares, when redeemed, may be worth more or less than original cost. To obtain performance current to the most recent month-end, please visit our website at www.bridgeway.com or call 1-800-661-3550. Total return figures include the reinvestment of dividends and capital gains.
This report is submitted for the general information of the shareholders of each Fund. It is not authorized for distribution to prospective investors unless preceded or accompanied by an effective prospectus, which includes information regarding a Fund’s risks, objectives, fees and expenses, experience of its management, and other information. Investors should read the prospectus carefully before investing in a Fund. For questions or other Fund information, call 1-800-661-3550 or visit the Funds’ website at www.bridgeway.com. Funds are available for purchase by residents of the United States, Puerto Rico, U.S. Virgin Islands and Guam only. Foreside Fund Services, LLC, Distributor.
The views expressed here are exclusively those of Fund management. These views, including those relating to the market, sectors or individual stocks, are not meant as investment advice and should not be considered predictive in nature.
| | |
LETTER FROM THE INVESTMENT MANAGEMENT TEAM | | |
December 31, 2017
Dear Fellow Shareholders,
At Bridgeway, we have a shared passion for applying logic, data and evidence to develop investment solutions. Our Omni Small-Cap Value and Omni Tax-Managed Small-Cap Value Funds are constructed based on fundamental academic research that relies on market efficiency to better capture risk premiums. We manage these Funds to provide broad diversification within the small-cap value universe and to keep transaction fees and expenses low. Bridgeway offers the Omni Small-Cap Value and Omni Tax-Managed Small-Cap Value Funds through a select group of advisers. We are committed to advisers and their clients who take a long-term perspective and whose investment goals fit our expertise: delivering investment solutions that are statistically driven and grounded in academic theory.
Thank you for your investment in Bridgeway’s Omni Small-Cap Value and Omni Tax-Managed Small-Cap Value Funds.
Sincerely,
Your Investment Management Team
| | | | |
 | |  | | 
|
| John Montgomery | | Christine L. Wang | | Michael Whipple |
 | | | | |
Elena Khoziaeva | | | | |
| | |
LETTER FROM THE INVESTMENT MANAGEMENT TEAM (continued) | | |
Market Review
Performance across domestic equity markets was up for the December 2017 quarter. Broad market returns for the quarter were up 6.34% as represented by the Russell 3000 Index.
For the calendar year ended December 31, 2017, broad market stocks advanced 21.13%, as represented by the Russell 3000 Index. Growth stocks outperformed value stocks across the market cap spectrum. Large-cap growth stocks, as represented by the Russell 1000 Growth Index, led the way (+30.21%), followed by broad market growth stocks, as represented by the Russell 3000 Growth Index (+29.59%).
The following table presents returns for broad market, small-cap, mid-cap, and large-cap stocks, as represented by various style-based Russell Indexes. Size (market capitalization) and style (value/growth) are among the key factors that drive differences in returns among U.S. stocks.
Russell Style-Based Indexes Ranked by Performance for the Quarter and Calendar Year Ended December 31, 2017
| | | | |
| | Quarter | | Calendar Year |
| Best | | 7.86% | | 30.21% |
| Performing | | Russell 1000 Growth Index | | Russell 1000 Growth Index |
| | 7.61% | | 29.59% |
| | Russell 3000 Growth Index | | Russell 3000 Growth Index |
| | 6.81% | | 25.27% |
| | Russell Midcap Growth Index | | Russell Midcap Growth Index |
| | 5.50% | | 22.17% |
| | Russell Midcap Value Index | | Russell 2000 Growth Index |
| | 5.33% | | 13.66% |
| | Russell 1000 Value Index | | Russell 1000 Value Index |
| | 5.08% | | 13.34% |
| | Russell 3000 Value Index | | Russell Midcap Value Index |
| | 4.59% | | 13.19% |
| | Russell 2000 Growth Index | | Russell 3000 Value Index |
| Worst | | 2.05% | | 7.84% |
| Performing | | Russell 2000 Value Index | | Russell 2000 Value Index |
The Bridgeway Omni Funds in this annual report are asset class exposure strategies that seek broad diversification and risk premium exposure. These Funds were designed to capture the size and style benefits within a specific asset class.
| | |
| 2 | | Semi-Annual Report | December 31, 2017 (Unaudited) |
| | |
Omni Small-Cap Value Fund MANAGER’S COMMENTARY (Unaudited) | | |
December 31, 2017
Dear Fellow Omni Small-Cap Value Fund Shareholder,
For the quarter ended December 31, 2017, our Fund returned +3.42%, outperforming our primary market benchmark, the Russell 2000 Value Index (+2.05%).
For the six-month semi-annual period ended December 31, 2017, our Fund returned +9.86%, outpacing the Russell 2000 Value Index (+7.26%).
For the calendar year, our Fund returned +6.01%, underperforming the Russell 2000 Value Index (+7.84%).
The table below presents our December quarter, six-month, one-year, five-year, and inception-to-date financial results. See the next page for a graph of performance since inception.
Standardized Returns as of December 31, 2017
| | | | | | | | | | | | | | | | | | | | |
| | | | | | | | | | | | Annualized | |
| | | Quarter | | | 6 Months | | | 1 Year | | | 5 Years | | | Since Inception
(8/31/11) | |
| | | | | |
Omni Small-Cap Value Fund | | | 3.42% | | | | 9.86% | | | | 6.01% | | | | 14.19% | | | | 14.63% | |
Russell 2000 Value Index | | | 2.05% | | | | 7.26% | | | | 7.84% | | | | 13.01% | | | | 13.64% | |
Performance figures quoted in the table above and the graph on the next page represent past performance and are no guarantee of future results. Total return figures in the table above include the reinvestment of dividends and capital gains. The table above and the graph on the next page do not reflect the deduction of taxes that a shareholder would pay on Fund distributions or on the redemption of Fund shares.
The Russell 2000 Value Index is an unmanaged index that consists of stocks in the Russell 2000 Index with lower price-to-book ratios and lower forecasted growth values with dividends reinvested. It is not possible to invest directly in an index. Periods longer than one year are annualized.
According to data from Lipper, Inc. as of December 31, 2017, Omni Small-Cap Value Fund ranked 202nd of 269 small-cap value funds for the 12 months ended December 31, 2017, 42nd of 210 over the past five years and 39th of 197 such funds since inception in August 2011. Lipper, Inc. is an independent mutual fund rating service that ranks funds in various fund categories by making comparative calculations using total returns.
| | |
Omni Small-Cap Value Fund MANAGER’S COMMENTARY (Unaudited) (continued) | | |
Growth of a $10,000 Investment
from Inception August 31, 2011 to December 31, 2017
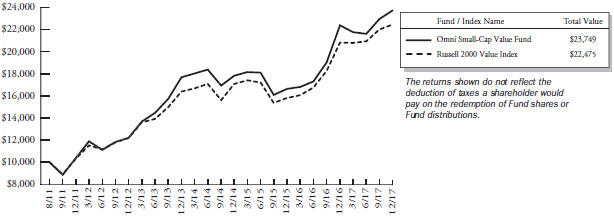
Detailed Explanation of Quarterly Performance
The Omni Small-Cap Value Fund is designed to capture the returns of the small-cap value asset class through broad diversification of small company and value stocks. This approach is sometimes referred to as “passive, asset class investing.” As of December 31, 2017, we held 671 such stocks in a market-cap weighted style. We make no attempt to track any particular index in either performance or statistics.
The Fund’s tilt toward deeper value stocks across multiple value metrics improved relative performance. An overweighting in higher momentum stocks also added modestly to relative results, as the momentum factor was in favor during the quarter. However, the Fund’s tilt toward smaller stocks in the small-cap value universe detracted from relative performance due to smaller stocks underperforming their larger counterparts.
By design, the Fund does not hold Real Estate Investment Trusts (REITs) and Utilities stocks. Our lack of exposure to both REITs and Utilities stocks boosted relative performance.
Detailed Explanation of Calendar Year Performance
The Fund’s tilt toward smaller stocks in the small-cap value universe detracted from relative performance, as smaller stocks underperformed their larger counterparts during the year. The Fund’s tilt toward deeper value stocks across multiple value metrics also hurt the Fund’s relative performance. However, an overweighting in higher momentum stocks compared to the benchmark improved relative performance because the momentum factor was in favor during the year.
By design, the Fund does not hold Utilities stocks. That positioning hurt relative results, as the Utilities sector performed relatively well during the year. An overweight position in the Energy sector dragged on relative results amid volatility in commodity prices. The Fund by design does not hold Real Estate Investment Trusts (REITs), and that positioning helped relative results.
| | |
| 4 | | Semi-Annual Report | December 31, 2017 (Unaudited) |
| | |
Omni Small-Cap Value Fund MANAGER’S COMMENTARY (Unaudited) (continued) | | |
Top Ten Holdings as of December 31, 2017
| | | | | | | | | |
| Rank | | Description | | Industry | | % of Net
Assets |
| 1 | | TTM Technologies, Inc. | | Information Technology | | 1.0% |
| 2 | | Rush Enterprises, Inc., Class A | | Industrials | | 1.0% |
| 3 | | SkyWest, Inc. | | Industrials | | 0.9% |
| 4 | | Kraton Corp. | | Materials | | 0.9% |
| 5 | | Cooper-Standard Holdings, Inc. | | Consumer Discretionary | | 0.8% |
| 6 | | KB Home | | Consumer Discretionary | | 0.7% |
| 7 | | ManTech International Corp., Class A | | Information Technology | | 0.7% |
| 8 | | Marten Transport, Ltd. | | Industrials | | 0.6% |
| 9 | | Delek US Holdings, Inc. | | Energy | | 0.6% |
| 10 | | RH | | Consumer Discretionary | | 0.6% |
| | Total | | | | 7.8% |
Industry Sector Representation as of December 31, 2017
| | | | | | | | | | | | | | | |
| | | % of Net Assets | | % of Russell 2000
Value Index | | Difference |
| Consumer Discretionary | | | | 21.6% | | | | | 10.9% | | | | | 10.7% | |
| Consumer Staples | | | | 2.4% | | | | | 2.8% | | | | | -0.4% | |
| Energy | | | | 9.8% | | | | | 6.8% | | | | | 3.0% | |
| Financials | | | | 29.3% | | | | | 30.4% | | | | | -1.1% | |
| Health Care | | | | 2.2% | | | | | 6.2% | | | | | -4.0% | |
| Industrials | | | | 19.0% | | | | | 12.1% | | | | | 6.9% | |
| Information Technology | | | | 8.0% | | | | | 8.9% | | | | | -0.9% | |
| Materials | | | | 6.2% | | | | | 4.5% | | | | | 1.7% | |
| Real Estate | | | | 0.1% | | | | | 10.3% | | | | | -10.2% | |
| Telecommunication Services | | | | 1.3% | | | | | 0.5% | | | | | 0.8% | |
| Utilities | | | | 0.0% | | | | | 6.6% | | | | | -6.6% | |
| Cash & Other Assets | | | | 0.1% | | | | | 0.0% | | | | | 0.1% | |
Total | | | | 100.0% | | | | | 100.0% | | | | | | |
Disclaimer
The views expressed here are exclusively those of Fund management. These views, including those related to market sectors or individual stocks, are not meant as investment advice and should not be considered predictive in nature. Any favorable (or unfavorable) description of a holding applies only as of the quarter end, December 31, 2017, unless otherwise stated. Security positions can and do change thereafter. Discussions of historical performance do not guarantee and may not be indicative of future performance.
Market volatility can significantly impact short-term performance. The Fund is not an appropriate investment for short-term investors. Investments in small companies generally carry greater risk than is customarily associated with larger companies. This additional risk is attributable to a number of factors, including the relatively limited financial resources that are typically available to small companies and the fact that small companies often have comparatively limited product lines. In addition, the stock of small companies tends to be more volatile than the stock of large companies, particularly in the short term and particularly in the early stages of an economic or market downturn. Shareholders of the Fund, therefore, are taking on more risk than they would if they invested in the stock market as a whole.
| | |
Omni Small-Cap Value Fund MANAGER’S COMMENTARY (Unaudited) (continued) | | |
Conclusion
Thank you for your continued investment in Omni Small-Cap Value Fund. We encourage your feedback; your reactions and concerns are important to us.
Sincerely,
The Investment Management Team
| | |
| 6 | | Semi-Annual Report | December 31, 2017 (Unaudited) |
| | |
Omni Small-Cap Value Fund SCHEDULE OF INVESTMENTS | | |
Showing percentage of net assets as of December 31, 2017 (Unaudited)
| | | | | | | | | | | | | | | | |
| Industry | | Company | | Shares | | | Value | | | | | | |
| | |
COMMON STOCKS - 99.75% | | | | | | | | |
Consumer Discretionary - 21.55% | | | | | | | | |
| | 1-800-Flowers.com, Inc., Class A* | | | 60,000 | | | $ 642,000 | | | | | | | | |
| | A.H. Belo Corp., Class A | | | 37,983 | | | 182,318 | | | | | | | | |
| | Abercrombie & Fitch Co., Class A | | | 111,000 | | | 1,934,730 | | | | | | | | |
| | Adtalem Global Education, Inc.* | | | 22,900 | | | 962,945 | | | | | | | | |
| | AMCON Distributing Co. | | | 1,350 | | | 121,298 | | | | | | | | |
| | American Axle & Manufacturing Holdings, Inc.* | | | 105,000 | | | 1,788,150 | | | | | | | | |
| | American Public Education, Inc.* | | | 32,800 | | | 821,640 | | | | | | | | |
| | Appliance Recycling Centers of America, Inc.* | | | 2,900 | | | 3,103 | | | | | | | | |
| | Ark Restaurants Corp. | | | 12,600 | | | 340,452 | | | | | | | | |
| | Ascent Capital Group, Inc., Class A* | | | 17,000 | | | 195,330 | | | | | | | | |
| | AV Homes, Inc.*+ | | | 52,300 | | | 870,795 | | | | | | | | |
| | Barnes & Noble Education, Inc.* | | | 81,824 | | | 674,230 | | | | | | | | |
| | Barnes & Noble, Inc. | | | 82,000 | | | 549,400 | | | | | | | | |
| | Bassett Furniture Industries, Inc. | | | 80,500 | | | 3,026,800 | | | | | | | | |
| | BBX Capital Corp. | | | 351,039 | | | 2,797,781 | | | | | | | | |
| | Beasley Broadcast Group, Inc., Class A+ | | | 13,500 | | | 180,900 | | | | | | | | |
| | Beazer Homes USA, Inc.* | | | 95,000 | | | 1,824,950 | | | | | | | | |
| | Big 5 Sporting Goods Corp.+ | | | 117,600 | | | 893,760 | | | | | | | | |
| | Biglari Holdings, Inc.* | | | 1,600 | | | 663,040 | | | | | | | | |
| | BJ’s Restaurants, Inc. | | | 59,000 | | | 2,147,600 | | | | | | | | |
| | Bojangles’, Inc.* | | | 70,000 | | | 826,000 | | | | | | | | |
| | Boot Barn Holdings, Inc.* | | | 54,000 | | | 896,940 | | | | | | | | |
| | Build-A-Bear Workshop, Inc.* | | | 26,000 | | | 239,200 | | | | | | | | |
| | Caleres, Inc. | | | 98,500 | | | 3,297,780 | | | | | | | | |
| | Canterbury Park Holding Corp. | | | 3,900 | | | 64,155 | | | | | | | | |
| | Carrols Restaurant Group, Inc.*+ | | | 41,900 | | | 509,085 | | | | | | | | |
| | Century Casinos, Inc.* | | | 124,600 | | | 1,137,598 | | | | | | | | |
| | Century Communities, Inc.*+ | | | 4,202 | | | 130,682 | | | | | | | | |
| | Chico’s FAS, Inc. | | | 121,000 | | | 1,067,220 | | | | | | | | |
| | China Automotive Systems, Inc.* | | | 20,400 | | | 97,920 | | | | | | | | |
| | China XD Plastics Co., Ltd.* | | | 163,000 | | | 749,800 | | | | | | | | |
| | Christopher & Banks Corp.* | | | 27,700 | | | 35,179 | | | | | | | | |
| | Citi Trends, Inc. | | | 78,840 | | | 2,086,106 | | | | | | | | |
| | Clarus Corp.* | | | 23,300 | | | 182,905 | | | | | | | | |
| | Conn’s, Inc.*+ | | | 78,000 | | | 2,772,900 | | | | | | | | |
| | | | | | | | |
| Industry | | Company | | Shares | | | Value |
| | | |
| | | | | | | | |
Consumer Discretionary (continued) |
| | Container Store Group, Inc. (The)*+ | | | 112,000 | | | $ 530,880 |
| | Cooper Tire & Rubber Co. | | | 29,550 | | | 1,044,592 |
| | Cooper-Standard Holding, Inc.* | | | 51,000 | | | 6,247,500 |
| | Crown Crafts, Inc. | | | 13,050 | | | 84,172 |
| | CSS Industries, Inc. | | | 53,100 | | | 1,477,773 |
| | Del Frisco’s Restaurant Group, Inc.* | | | 49,700 | | | 757,925 |
| | Del Taco Restaurants, Inc.* | | | 102,300 | | | 1,239,876 |
| | Delta Apparel, Inc.*+ | | | 25,500 | | | 515,100 |
| | Destination Maternity Corp.*+ | | | 9,800 | | | 29,106 |
| | Dillard’s, Inc., Class A+ | | | 50,000 | | | 3,002,500 |
| | Dixie Group, Inc. (The)* | | | 50,000 | | | 192,500 |
| | DSW, Inc., Class A | | | 125,000 | | | 2,676,250 |
| | E.W. Scripps Co., (The) Class A* | | | 220,000 | | | 3,438,600 |
| | El Pollo Loco Holdings, Inc.* | | | 90,500 | | | 895,950 |
| | Eldorado Resorts, Inc.*+ | | | 15,000 | | | 497,250 |
| | Emmis Communications Corp., Class A* | | | 1,000 | | | 3,540 |
| | Entercom Communications Corp., Class A | | | 220,225 | | | 2,378,430 |
| | Eros International PLC*+ | | | 121,100 | | | 1,168,615 |
| | EVINE Live, Inc.* | | | 162,700 | | | 227,780 |
| | Fiesta Restaurant Group, Inc.*+ | | | 45,800 | | | 870,200 |
| | Finish Line, Inc. (The), Class A | | | 23,600 | | | 342,908 |
| | Flanigan’s Enterprises, Inc. | | | 2,500 | | | 57,000 |
| | Flexsteel Industries, Inc. | | | 17,000 | | | 795,260 |
| | Fogo De Chao, Inc.*+ | | | 65,700 | | | 762,120 |
| | FTD Cos., Inc.* | | | 17,420 | | | 125,250 |
| | Full House Resorts, Inc.* | | | 71,000 | | | 277,610 |
| | Gaming Partners International Corp. | | | 1,000 | | | 11,240 |
| | Gannett Co., Inc. | | | 203,200 | | | 2,355,088 |
| | Golden Entertainment, Inc.* | | | 40,000 | | | 1,306,000 |
| | Good Times Restaurants, Inc.* | | | 3,000 | | | 7,950 |
| | Gray Television, Inc.* | | | 256,200 | | | 4,291,350 |
| | Group 1 Automotive, Inc. | | | 59,000 | | | 4,187,230 |
| | Guess?, Inc.+ | | | 124,100 | | | 2,094,808 |
| | Hamilton Beach Brands Holding Co., Class A | | | 26,090 | | | 670,252 |
| | Haverty Furniture Cos., Inc. | | | 98,400 | | | 2,228,760 |
| | Hooker Furniture Corp. | | | 15,000 | | | 636,750 |
| | Houghton Mifflin Harcourt Co.* | | | 225,000 | | | 2,092,500 |
| | Iconix Brand Group, Inc.*+ | | | 22,000 | | | 28,380 |
| | |
Omni Small-Cap Value Fund SCHEDULE OF INVESTMENTS (continued) | | |
Showing percentage of net assets as of December 31, 2017 (Unaudited)
| | | | | | | | | | | | | | | | |
| Industry | | Company | | Shares | | | Value | | | | | | |
| | |
Common Stocks (continued) | | | | | | | | |
Consumer Discretionary (continued) | | | | | | | | |
| | International Speedway Corp., Class A | | | 118,456 | | | $4,720,472 | | | | | | | | |
| | J Alexander’s Holdings, Inc.* | | | 37,450 | | | 363,265 | | | | | | | | |
| | Johnson Outdoors, Inc., Class A | | | 32,779 | | | 2,035,248 | | | | | | | | |
| | K12, Inc.* | | | 121,217 | | | 1,927,350 | | | | | | | | |
| | KB Home | | | 175,900 | | | 5,620,005 | | | | | | | | |
| | Lakeland Industries, Inc.* | | | 18,600 | | | 270,630 | | | | | | | | |
| | La-Z-Boy, Inc. | | | 29,500 | | | 920,400 | | | | | | | | |
| | Liberty Tax, Inc.+ | | | 20,000 | | | 220,000 | | | | | | | | |
| | Lifetime Brands, Inc. | | | 60,900 | | | 1,004,850 | | | | | | | | |
| | Lincoln Educational Services Corp.* | | | 91,900 | | | 185,638 | | | | | | | | |
| | Live Ventures, Inc.*+ | | | 3,200 | | | 51,136 | | | | | | | | |
| | Luby’s, Inc.* | | | 156,900 | | | 414,216 | | | | | | | | |
| | M/I Homes, Inc.* | | | 48,000 | | | 1,651,200 | | | | | | | | |
| | Marcus Corp. (The) | | | 130,150 | | | 3,559,602 | | | | | | | | |
| | McClatchy Co. (The), Class A*+ | | | 15,432 | | | 137,808 | | | | | | | | |
| | MDC Holdings, Inc. | | | 131,760 | | | 4,200,509 | | | | | | | | |
| | Modine Manufacturing Co.* | | | 142,900 | | | 2,886,580 | | | | | | | | |
| | Movado Group, Inc. | | | 45,000 | | | 1,449,000 | | | | | | | | |
| | Nevada Gold & Casinos, Inc.*+ | | | 38,300 | | | 102,261 | | | | | | | | |
| | New Home Co. Inc., (The)* | | | 45,300 | | | 567,609 | | | | | | | | |
| | New Media Investment Group, Inc. | | | 93,300 | | | 1,565,574 | | | | | | | | |
| | New York & Co., Inc.*+ | | | 126,700 | | | 362,362 | | | | | | | | |
| | Office Depot, Inc. | | | 500,000 | | | 1,770,000 | | | | | | | | |
| | P&F Industries, Inc., Class A | | | 696 | | | 5,916 | | | | | | | | |
| | Papa Murphy’s Holdings, Inc.*+ | | | 55,000 | | | 295,900 | | | | | | | | |
| | Party City Holdco, Inc.*+ | | | 205,700 | | | 2,869,515 | | | | | | | | |
| | Peak Resorts, Inc.+ | | | 114,000 | | | 615,600 | | | | | | | | |
| | Perry Ellis International, Inc.* | | | 138,100 | | | 3,458,024 | | | | | | | | |
| | PICO Holdings, Inc. | | | 62,500 | | | 800,000 | | | | | | | | |
| | Pier 1 Imports, Inc. | | | 261,200 | | | 1,081,368 | | | | | | | | |
| | Reading International, Inc., Class A* | | | 17,848 | | | 298,062 | | | | | | | | |
| | Red Lion Hotels Corp.* | | | 34,405 | | | 338,889 | | | | | | | | |
| | Red Robin Gourmet Burgers, Inc.* | | | 38,500 | | | 2,171,400 | | | | | | | | |
| | Regis Corp.* | | | 153,150 | | | 2,352,384 | | | | | | | | |
| | Rent-A-Center, Inc.+ | | | 67,500 | | | 749,250 | | | | | | | | |
| | RH*+ | | | 55,200 | | | 4,758,792 | | | | | | | | |
| | Rocky Brands, Inc. | | | 24,300 | | | 459,270 | | | | | | | | |
| | Saga Communications, Inc., Class A | | | 8,761 | | | 354,382 | | | | | | | | |
| | Salem Media Group, Inc. | | | 24,800 | | | 111,600 | | | | | | | | |
| | Scholastic Corp. | | | 72,800 | | | 2,920,008 | | | | | | | | |
| | Shiloh Industries, Inc.* | | | 61,500 | | | 504,300 | | | | | | | | |
| | | | | | | | |
| Industry | | Company | | Shares | | | Value |
| | | | | | | | |
Consumer Discretionary (continued) |
| | Shoe Carnival, Inc. | | | 63,600 | | | $ 1,701,300 |
| | Sonic Automotive, Inc., Class A | | | 119,100 | | | 2,197,395 |
| | SORL Auto Parts, Inc.*+ | | | 129,900 | | | 872,928 |
| | SPAR Group, Inc.* | | | 1,500 | | | 1,845 |
| | Speedway Motorsports, Inc. | | | 120,800 | | | 2,279,496 |
| | Stoneridge, Inc.* | | | 50,000 | | | 1,143,000 |
| | Strattec Security Corp.+ | | | 8,400 | | | 365,820 |
| | Superior Industries International, Inc. | | | 115,400 | | | 1,713,690 |
| | Tandy Leather Factory, Inc.*+ | | | 8,000 | | | 61,600 |
| | Tilly’s, Inc., Class A | | | 125,300 | | | 1,849,428 |
| | Time, Inc. | | | 174,350 | | | 3,216,758 |
| | Tower International, Inc. | | | 47,000 | | | 1,435,850 |
| | Townsquare Media, Inc., Class A*+ | | | 185,556 | | | 1,425,070 |
| | TravelCenters of America LLC* | | | 161,900 | | | 663,790 |
| | Unifi, Inc.* | | | 11,900 | | | 426,853 |
| | Urban One, Inc.* | | | 800 | | | 1,400 |
| | US Auto Parts Network, Inc.* | | | 98,900 | | | 249,228 |
| | Vera Bradley, Inc.* | | | 20,000 | | | 243,600 |
| | VOXX International Corp.* | | | 73,000 | | | 408,800 |
| | Weyco Group, Inc. | | | 18,700 | | | 555,764 |
| | William Lyon Homes,
Class A* | | | 80,500 | | | 2,340,940 |
| | ZAGG, Inc.* | | | 133,200 | | | 2,457,540 |
| | Zumiez, Inc.* | | | 69,000 | | | 1,436,925 |
| | | | | | | | |
| | | | | | | | 171,443,082 |
|
Consumer Staples - 2.39% |
| | Alico, Inc. | | | 6,800 | | | 200,600 |
| | Andersons, Inc. (The) | | | 88,100 | | | 2,744,315 |
| | Central Garden & Pet Co., Class A* | | | 59,603 | | | 2,247,629 |
| | Chefs’ Warehouse, Inc.
(The)* | | | 50,000 | | | 1,025,000 |
| | Dean Foods Co. | | | 135,000 | | | 1,560,600 |
| | Hostess Brands, Inc.* | | | 121,000 | | | 1,792,010 |
| | Ingles Markets, Inc., Class A | | | 59,800 | | | 2,069,080 |
| | Landec Corp.* | | | 16,000 | | | 201,600 |
| | Mannatech, Inc. | | | 8,400 | | | 126,000 |
| | Natural Alternatives | | | | | | |
| | International, Inc.* | | | 18,100 | | | 186,882 |
| | Natural Health Trends Corp. | | | 3,000 | | | 45,570 |
| | S&W Seed Co.*+ | | | 7,000 | | | 27,300 |
| | Seneca Foods Corp.,
Class A* | | | 40,100 | | | 1,233,075 |
| | SpartanNash Co. | | | 145,946 | | | 3,893,839 |
| | |
| 8 | | Semi-Annual Report | December 31, 2017 (Unaudited) |
| | |
Omni Small-Cap Value Fund SCHEDULE OF INVESTMENTS (continued) | | |
Showing percentage of net assets as of December 31, 2017 (Unaudited)
| | | | | | | | | | | | | | | | |
| Industry | | Company | | Shares | | | Value | | | | | | |
| | |
Common Stocks (continued) | | | | | | | | |
Consumer Staples (continued) | | | | | | | | |
| | Village Super Market, Inc., Class A | | | 1,709 | | | $ 39,187 | | | | | | | | |
| | Weis Markets, Inc. | | | 38,525 | | | 1,594,550 | | | | | | | | |
| | | | | | | | | | | | | | | | |
| | | | | | | | 18,987,237 | | | | | | | | |
| | |
Energy - 9.75% | | | | | | | | |
| | Adams Resources & Energy, Inc.+ | | | 23,100 | | | 1,004,850 | | | | | | | | |
| | Approach Resources, Inc.*+ | | | 180,726 | | | 534,949 | | | | | | | | |
| | Archrock, Inc. | | | 160,000 | | | 1,680,000 | | | | | | | | |
| | Ardmore Shipping Corp.*+ | | | 99,700 | | | 797,600 | | | | | | | | |
| | Bill Barrett Corp.* | | | 140,900 | | | 722,817 | | | | | | | | |
| | Bristow Group, Inc.+ | | | 65,500 | | | 882,285 | | | | | | | | |
| | Callon Petroleum Co.* | | | 140,000 | | | 1,701,000 | | | | | | | | |
| | Clean Energy Fuels Corp.* | | | 115,000 | | | 233,450 | | | | | | | | |
| | Cloud Peak Energy, Inc.* | | | 316,100 | | | 1,406,645 | | | | | | | | |
| | CVR Energy, Inc.+ | | | 105,000 | | | 3,910,200 | | | | | | | | |
| | Dawson Geophysical Co.*+ | | | 45,000 | | | 223,650 | | | | | | | | |
| | Delek US Holdings, Inc. | | | 141,080 | | | 4,929,335 | | | | | | | | |
| | Denbury Resources, Inc.* | | | 277,500 | | | 613,275 | | | | | | | | |
| | DHT Holdings, Inc. | | | 253,422 | | | 909,785 | | | | | | | | |
| | Dorian LPG, Ltd.*+ | | | 193,869 | | | 1,593,603 | | | | | | | | |
| | ENGlobal Corp.* | | | 60,422 | | | 53,171 | | | | | | | | |
| | Ensco PLC, Class A+ | | | 368,000 | | | 2,174,880 | | | | | | | | |
| | EP Energy Corp.,
Class A*+ | | | 300,000 | | | 708,000 | | | | | | | | |
| | Era Group, Inc.*+ | | | 45,800 | | | 492,350 | | | | | | | | |
| | Exterran Corp.* | | | 92,000 | | | 2,892,480 | | | | | | | | |
| | Forum Energy Technologies, Inc.* | | | 148,310 | | | 2,306,220 | | | | | | | | |
| | Frontline, Ltd.+ | | | 180,000 | | | 826,200 | | | | | | | | |
| | GasLog Ltd.+ | | | 209,300 | | | 4,656,925 | | | | | | | | |
| | Gener8 Maritime, Inc.*+ | | | 172,500 | | | 1,141,950 | | | | | | | | |
| | Gran Tierra Energy, Inc.* | | | 147,100 | | | 397,170 | | | | | | | | |
| | Green Plains, Inc.+ | | | 90,200 | | | 1,519,870 | | | | | | | | |
| | Gulf Island Fabrication, Inc. | | | 30,403 | | | 408,160 | | | | | | | | |
| | Hallador Energy Co. | | | 70,000 | | | 426,300 | | | | | | | | |
| | Helix Energy Solutions Group, Inc.* | | | 40,000 | | | 301,600 | | | | | | | | |
| | Independence Contract Drilling, Inc.*+ | | | 83,319 | | | 331,610 | | | | | | | | |
| | International Seaways, Inc.* | | | 438 | | | 8,085 | | | | | | | | |
| | Matador Resources Co.* | | | 95,000 | | | 2,957,350 | | | | | | | | |
| | McDermott International, Inc.* | | | 538,400 | | | 3,542,672 | | | | | | | | |
| | Mitcham Industries, Inc.* | | | 28,700 | | | 90,979 | | | | | | | | |
| | NACCO Industries, Inc., Class A | | | 13,045 | | | 491,144 | | | | | | | | |
| | Natural Gas Services Group, Inc.* | | | 68,800 | | | 1,802,560 | | | | | | | | |
| | Navios Maritime Acquisition Corp. | | | 423,400 | | | 469,974 | | | | | | | | |
| | Newpark Resources, Inc.* | | | 101,500 | | | 872,900 | | | | | | | | |
| | | | | | | | |
| Industry | | Company | | Shares | | | Value |
| | | |
| | | | | | | | |
Energy (continued) |
| | Oasis Petroleum, Inc.* | | | 237,000 | | | $ 1,993,170 |
| | Oil States International, Inc.* | | | 18,000 | | | 509,400 |
| | Overseas Shipholding Group, Inc., Class A* | | | 60,016 | | | 164,444 |
| | Pacific Ethanol, Inc.* | | | 86,900 | | | 395,395 |
| | Par Pacific Holdings, Inc.* | | | 119,900 | | | 2,311,672 |
| | Parker Drilling Co.* | | | 440,500 | | | 440,500 |
| | Penn Virginia Corp.* | | | 20,000 | | | 782,200 |
| | Pioneer Energy Services Corp.* | | | 108,100 | | | 329,705 |
| | Renewable Energy Group, Inc.*+ | | | 163,885 | | | 1,933,843 |
| | REX American Resources Corp.* | | | 33,920 | | | 2,808,237 |
| | Ring Energy, Inc.* | | | 50,000 | | | 695,000 |
| | Rowan Cos. PLC, Class A* | | | 100,000 | | | 1,566,000 |
| | Scorpio Tankers, Inc. | | | 250,000 | | | 762,500 |
| | SEACOR Holdings, Inc.* | | | 45,900 | | | 2,121,498 |
| | SEACOR Marine Holdings, Inc.* | | | 20,008 | | | 234,094 |
| | Ship Finance International, Ltd. | | | 204,000 | | | 3,162,000 |
| | SilverBow Resources, Inc.* | | | 3,100 | | | 92,132 |
| | SM Energy Co. | | | 12,000 | | | 264,960 |
| | SRC Energy, Inc.* | | | 110,000 | | | 938,300 |
| | Stone Energy Corp.* | | | 20,000 | | | 643,200 |
| | Teekay Corp.+ | | | 165,000 | | | 1,537,800 |
| | TransAtlantic Petroleum, Ltd.* | | | 15,000 | | | 20,850 |
| | Unit Corp.* | | | 175,725 | | | 3,865,950 |
| | | | | | | | |
| | | | | | | | 77,588,844 |
|
Financials - 29.26% |
| | 1347 Property Insurance Holdings, Inc.*+ | | | 24,300 | | | 177,390 |
| | 1st Constitution Bancorp+ | | | 3,000 | | | 55,350 |
| | 1st Source Corp. | | | 59,347 | | | 2,934,709 |
| | Access National Corp.+ | | | 31,191 | | | 868,357 |
| | ACNB Corp.+ | | | 1,000 | | | 29,550 |
| | Ambac Financial Group, Inc.* | | | 49,000 | | | 783,020 |
| | American Equity Investment Life Holding Co. | | | 850 | | | 26,121 |
| | American National Bankshares, Inc. | | | 21,800 | | | 834,940 |
| | American River Bankshares | | | 21,300 | | | 324,825 |
| | AmeriServ Financial, Inc. | | | 78,000 | | | 323,700 |
| | Argo Group International Holdings Ltd. | | | 39,160 | | | 2,414,214 |
| | Arlington Asset Investment Corp., Class A+ | | | 45,300 | | | 533,634 |
| | Asta Funding, Inc.*+ | | | 20,000 | | | 148,000 |
| | |
Omni Small-Cap Value Fund SCHEDULE OF INVESTMENTS (continued) | | |
Showing percentage of net assets as of December 31, 2017 (Unaudited)
| | | | | | | | | | | | | | | | | | |
| Industry | | Company | | Shares | | | Value | | | | | | | | |
| | | |
Common Stocks (continued) | | | | | | | | | | |
Financials (continued) | | | | | | | | | | |
| | Atlantic Capital Bancshares, Inc.* | | | 52,300 | | | $ 920,480 | | | | | | | | | | |
| | Atlantic Coast Financial Corp.* | | | 36,000 | | | 339,480 | | | | | | | | | | |
| | Atlas Financial Holdings, Inc.* | | | 5,000 | | | 102,750 | | | | | | | | | | |
| | B. Riley Financial, Inc. | | | 10,402 | | | 188,276 | | | | | | | | | | |
| | Baldwin & Lyons, Inc., Class B | | | 75,300 | | | 1,803,435 | | | | | | | | | | |
| | Banc of California, Inc.+ | | | 105,000 | | | 2,168,250 | | | | | | | | | | |
| | Banco Latinoamericano de Comercio Exterior SA, Class E | | | 70,000 | | | 1,883,000 | | | | | | | | | | |
| | Bank of Commerce Holdings+ | | | 83,450 | | | 959,675 | | | | | | | | | | |
| | Bankwell Financial Group, Inc. | | | 300 | | | 10,302 | | | | | | | | | | |
| | Bar Harbor Bankshares+ | | | 18,366 | | | 496,066 | | | | | | | | | | |
| | Bay Bancorp, Inc.* | | | 25,000 | | | 307,500 | | | | | | | | | | |
| | BCB Bancorp, Inc. | | | 10,400 | | | 150,800 | | | | | | | | | | |
| | Bear State Financial, Inc.+ | | | 5,000 | | | 51,150 | | | | | | | | | | |
| | Berkshire Hills Bancorp, Inc. | | | 108,065 | | | 3,955,179 | | | | | | | | | | |
| | Blue Capital Reinsurance Holdings, Ltd.+ | | | 12,173 | | | 146,685 | | | | | | | | | | |
| | BofI Holding, Inc.*+ | | | 70,000 | | | 2,093,000 | | | | | | | | | | |
| | BSB Bancorp, Inc.* | | | 400 | | | 11,700 | | | | | | | | | | |
| | C&F Financial Corp.+ | | | 2,200 | | | 127,600 | | | | | | | | | | |
| | California First National Bancorp | | | 33,500 | | | 505,180 | | | | | | | | | | |
| | Camden National Corp. | | | 30,100 | | | 1,268,113 | | | | | | | | | | |
| | Cannae Holdings, Inc.* | | | 126,700 | | | 2,157,701 | | | | | | | | | | |
| | Capital City Bank Group, Inc. | | | 83,150 | | | 1,907,461 | | | | | | | | | | |
| | Capstar Financial Holdings, Inc.* | | | 2,000 | | | 41,540 | | | | | | | | | | |
| | Carolina Financial Corp. | | | 12,660 | | | 470,319 | | | | | | | | | | |
| | CB Financial Services, Inc. | | | 14,000 | | | 424,900 | | | | | | | | | | |
| | Central Pacific Financial Corp. | | | 17,500 | | | 522,025 | | | | | | | | | | |
| | Central Valley Community Bancorp | | | 50,000 | | | 1,009,000 | | | | | | | | | | |
| | Century Bancorp, Inc., Class A+ | | | 15,200 | | | 1,189,400 | | | | | | | | | | |
| | Charter Financial Corp. | | | 17,500 | | | 306,950 | | | | | | | | | | |
| | Chemung Financial Corp. | | | 13,500 | | | 649,350 | | | | | | | | | | |
| | Citizens Community Bancorp, Inc. | | | 15,000 | | | 202,350 | | | | | | | | | | |
| | Citizens, Inc.*+ | | | 106,040 | | | 779,394 | | | | | | | | | | |
| | Civista Bancshares, Inc.+ | | | 21,500 | | | 473,000 | | | | | | | | | | |
| | CNB Financial Corp. | | | 83,800 | | | 2,198,912 | | | | | | | | | | |
| | Coastway Bancorp, Inc.*+ | | | 1,513 | | | 32,227 | | | | | | | | | | |
| | Codorus Valley Bancorp, Inc.+ | | | 7,767 | | | 213,826 | | | | | | | | | | |
| | | | | | | | |
| Industry | | Company | | Shares | | | Value |
| | | |
| | | | | | | | |
Financials (continued) |
| | Community Bankers Trust Corp.* | | | 40,800 | | | $ 332,520 |
| | Community Financial Corp. (The)+ | | | 12,500 | | | 478,750 |
| | Community Trust Bancorp, Inc. | | | 17,500 | | | 824,250 |
| | ConnectOne Bancorp, Inc. | | | 43,000 | | | 1,107,250 |
| | Consumer Portfolio Services, Inc.* | | | 217,000 | | | 900,550 |
| | County Bancorp, Inc.+ | | | 15,237 | | | 453,453 |
| | Cowen, Inc.*+ | | | 31,000 | | | 423,150 |
| | Crawford & Co., Class A | | | 47,600 | | | 404,600 |
| | Crawford & Co., Class B | | | 16,400 | | | 157,768 |
| | Customers Bancorp, Inc.* | | | 36,500 | | | 948,635 |
| | DNB Financial Corp. | | | 465 | | | 15,670 |
| | Donegal Group, Inc., Class A | | | 64,000 | | | 1,107,200 |
| | Eagle Bancorp Montana, Inc. | | | 3,000 | | | 62,850 |
| | eHealth, Inc.* | | | 15,000 | | | 260,550 |
| | EMC Insurance Group, Inc. | | | 46,550 | | | 1,335,520 |
| | Employers Holdings, Inc. | | | 93,900 | | | 4,169,160 |
| | Encore Capital Group, Inc.*+ | | | 66,000 | | | 2,778,600 |
| | Enova International, Inc.* | | | 132,307 | | | 2,011,066 |
| | Entegra Financial Corp.*+ | | | 15,000 | | | 438,750 |
| | Enterprise Bancorp, Inc.+ | | | 38,775 | | | 1,320,289 |
| | ESSA Bancorp, Inc.+ | | | 33,100 | | | 518,677 |
| | Evans Bancorp, Inc.+ | | | 4,000 | | | 167,600 |
| | EZCORP, Inc., Class A* | | | 127,169 | | | 1,551,462 |
| | Farmers Capital Bank Corp. | | | 34,400 | | | 1,324,400 |
| | Farmers National Banc Corp. | | | 150 | | | 2,212 |
| | FBL Financial Group, Inc., Class A+ | | | 50,806 | | | 3,538,638 |
| | Federal Agricultural Mortgage Corp., Class C | | | 24,000 | | | 1,877,760 |
| | Federated National Holding Co.+ | | | 41,888 | | | 694,084 |
| | Fidelity Southern Corp. | | | 76,123 | | | 1,659,481 |
| | Financial Institutions, Inc. | | | 39,300 | | | 1,222,230 |
| | First BanCorp Puerto Rico* | | | 476,500 | | | 2,430,150 |
| | First BanCorp Southern
Pines NC | | | 114,988 | | | 4,060,226 |
| | First Bancorp, Inc. | | | 5,500 | | | 149,765 |
| | First Bancshares, Inc. (The) | | | 14,900 | | | 509,580 |
| | First Business Financial Services, Inc.+ | | | 16,000 | | | 353,920 |
| | First Commonwealth Financial Corp. | | | 143,300 | | | 2,052,056 |
| | First Community Bancshares, Inc. | | | 44,000 | | | 1,264,120 |
| | |
| 10 | | Semi-Annual Report | December 31, 2017 (Unaudited) |
| | |
Omni Small-Cap Value Fund SCHEDULE OF INVESTMENTS (continued) | | |
Showing percentage of net assets as of December 31, 2017 (Unaudited)
| | | | | | | | | | | | | | | | |
| Industry | | Company | | Shares | | | Value | | | | | | |
| | |
Common Stocks (continued) | | | | | | | | |
Financials (continued) | | | | | | | | |
| | First Community Corp. | | | 600 | | | $ 13,560 | | | | | | | | |
| | First Connecticut Bancorp, Inc.+ | | | 2,100 | | | 54,915 | | | | | | | | |
| | First Financial Corp. | | | 37,000 | | | 1,677,950 | | | | | | | | |
| | First Financial Northwest, Inc. | | | 35,182 | | | 545,673 | | | | | | | | |
| | First Guaranty Bancshares, Inc.+ | | | 5,499 | | | 137,475 | | | | | | | | |
| | First Internet Bancorp+ | | | 14,500 | | | 553,175 | | | | | | | | |
| | First Interstate BancSystem, Inc., Class A | | | 2,633 | | | 105,452 | | | | | | | | |
| | First Mid-Illinois Bancshares, Inc. | | | 2,500 | | | 96,350 | | | | | | | | |
| | First Midwest Bancorp, Inc. | | | 78,700 | | | 1,889,587 | | | | | | | | |
| | First of Long Island Corp. (The) | | | 18,000 | | | 513,000 | | | | | | | | |
| | First United Corp.* | | | 8,526 | | | 148,779 | | | | | | | | |
| | First US Bancshares, Inc. | | | 4,368 | | | 55,910 | | | | | | | | |
| | Flushing Financial Corp. | | | 44,297 | | | 1,218,168 | | | | | | | | |
| | Franklin Financial Network, Inc.* | | | 3,000 | | | 102,300 | | | | | | | | |
| | FS Bancorp, Inc. | | | 1,450 | | | 79,126 | | | | | | | | |
| | GAIN Capital Holdings, Inc. | | | 139,805 | | | 1,398,050 | | | | | | | | |
| | GAMCO Investors, Inc., Class A | | | 10,000 | | | 296,500 | | | | | | | | |
| | Great Southern Bancorp, Inc. | | | 26,900 | | | 1,389,385 | | | | | | | | |
| | Green Bancorp, Inc.* | | | 52,000 | | | 1,055,600 | | | | | | | | |
| | Greenhill & Co., Inc.+ | | | 60,000 | | | 1,170,000 | | | | | | | | |
| | Greenlight Capital Re, Ltd., Class A* | | | 45,000 | | | 904,500 | | | | | | | | |
| | Hallmark Financial Services, Inc.*+ | | | 57,800 | | | 602,854 | | | | | | | | |
| | Hawthorn Bancshares, Inc. | | | 15,700 | | | 325,775 | | | | | | | | |
| | HCI Group, Inc.+ | | | 40,400 | | | 1,207,960 | | | | | | | | |
| | Heartland Financial USA, Inc. | | | 64,600 | | | 3,465,790 | | | | | | | | |
| | Heritage Financial Corp. | | | 69,860 | | | 2,151,688 | | | | | | | | |
| | Heritage Insurance Holdings, Inc.+ | | | 60,000 | | | 1,081,200 | | | | | | | | |
| | Hingham Institution for Savings | | | 30 | | | 6,210 | | | | | | | | |
| | HMN Financial, Inc.* | | | 23,800 | | | 455,770 | | | | | | | | |
| | Home Bancorp, Inc. | | | 31,994 | | | 1,382,781 | | | | | | | | |
| | HomeStreet, Inc.*+ | | | 57,000 | | | 1,650,150 | | | | | | | | |
| | HomeTrust Bancshares, Inc.* | | | 2,961 | | | 76,246 | | | | | | | | |
| | HopFed Bancorp, Inc. | | | 18,100 | | | 257,382 | | | | | | | | |
| | Horace Mann Educators Corp. | | | 104,600 | | | 4,612,860 | | | | | | | | |
| | Horizon Bancorp | | | 4,725 | | | 131,355 | | | | | | | | |
| | Impac Mortgage Holdings, Inc.*+ | | | 20,300 | | | 206,248 | | | | | | | | |
| | | | | | | | |
| Industry | | Company | | Shares | | | Value |
| | | |
| | | | | | | | |
Financials (continued) |
| | Independence Holding Co. | | | 15,050 | | | $ 413,122 |
| | Independent Bank Group, Inc. | | | 16,900 | | | 1,142,440 |
| | Infinity Property & Casualty Corp. | | | 22,400 | | | 2,374,400 |
| | International Bancshares Corp. | | | 65,687 | | | 2,607,774 |
| | INTL.FCStone, Inc.* | | | 28,500 | | | 1,212,105 |
| | Investar Holding Corp. | | | 22,000 | | | 530,200 |
| | Investment Technology Group, Inc. | | | 88,242 | | | 1,698,658 |
| | Investors Title Co. | | | 1,000 | | | 198,350 |
| | James River Group Holdings, Ltd. | | | 70,600 | | | 2,824,706 |
| | JMP Group LLC+ | | | 300 | | | 1,680 |
| | Kansas City Life Insurance Co.+ | | | 7,000 | | | 316,750 |
| | Kingstone Cos., Inc.+ | | | 12,100 | | | 227,480 |
| | Lakeland Bancorp, Inc. | | | 95,250 | | | 1,833,562 |
| | Landmark Bancorp, Inc. | | | 1,157 | | | 33,553 |
| | Mackinac Financial Corp.+ | | | 15,800 | | | 252,800 |
| | Maiden Holdings, Ltd. | | | 162,600 | | | 1,073,160 |
| | MainSource Financial Group, Inc. | | | 67,610 | | | 2,454,919 |
| | Marlin Business Services Corp.+ | | | 17,080 | | | 382,592 |
| | Mercantile Bank Corp. | | | 2,200 | | | 77,814 |
| | Meta Financial Group, Inc. | | | 16,477 | | | 1,526,594 |
| | Mid Penn Bancorp, Inc.+ | | | 12,300 | | | 423,735 |
| | Midland States Bancorp, Inc. | | | 57,658 | | | 1,872,732 |
| | MidSouth Bancorp, Inc.+ | | | 21,512 | | | 285,034 |
| | MidWestOne Financial Group, Inc. | | | 24,860 | | | 833,556 |
| | MMA Capital Management, LLC* | | | 500 | | | 12,150 |
| | MutualFirst Financial, Inc. | | | 18,900 | | | 728,595 |
| | National Bankshares, Inc.+ | | | 2,500 | | | 113,625 |
| | National Commerce Corp.* | | | 5,400 | | | 217,350 |
| | National Security Group, Inc. (The)+ | | | 200 | | | 3,290 |
| | National Western Life Group, Inc., Class A+ | | | 8,614 | | | 2,851,406 |
| | Nationstar Mortgage Holdings, Inc.* | | | 170,000 | | | 3,145,000 |
| | Navigators Group, Inc. (The) | | | 74,700 | | | 3,637,890 |
| | Nelnet, Inc., Class A | | | 37,800 | | | 2,070,684 |
| | Nicholas Financial, Inc.* | | | 43,400 | | | 381,920 |
| | Nicolet Bankshares, Inc.* | | | 1,355 | | | 74,173 |
| | NMI Holdings, Inc., Class A* | | | 250,000 | | | 4,250,000 |
| | Northeast Bancorp | | | 12,500 | | | 289,375 |
| | Northrim BanCorp, Inc. | | | 30,445 | | | 1,030,563 |
| | |
Omni Small-Cap Value Fund SCHEDULE OF INVESTMENTS (continued) | | |
Showing percentage of net assets as of December 31, 2017 (Unaudited)
| | | | | | | | | | | | | | | | |
| Industry | | Company | | Shares | | | Value | | | | | | |
| | |
Common Stocks (continued) | | | | | | | | |
Financials (continued) | | | | | | | | |
| | Northwest Bancshares, Inc. | | | 120,000 | | | $2,007,600 | | | | | | | | |
| | Ocwen Financial Corp.* | | | 270,000 | | | 845,100 | | | | | | | | |
| | OFG Bancorp | | | 112,200 | | | 1,054,680 | | | | | | | | |
| | Old Line Bancshares, Inc.+ | | | 50 | | | 1,472 | | | | | | | | |
| | Old Second Bancorp, Inc. | | | 79,750 | | | 1,088,588 | | | | | | | | |
| | On Deck Capital, Inc.* | | | 38,200 | | | 219,268 | | | | | | | | |
| | Oppenheimer Holdings, Inc., Class A+ | | | 31,093 | | | 833,292 | | | | | | | | |
| | Opus Bank* | | | 16,500 | | | 450,450 | | | | | | | | |
| | Orrstown Financial Services, Inc. | | | 35,500 | | | 896,375 | | | | | | | | |
| | Pacific Premier Bancorp, Inc.* | | | 13,524 | | | 540,960 | | | | | | | | |
| | Parke Bancorp, Inc. | | | 21,463 | | | 441,065 | | | | | | | | |
| | Pathfinder Bancorp, Inc.+ | | | 3,000 | | | 45,720 | | | | | | | | |
| | Peapack Gladstone Financial Corp. | | | 16,894 | | | 591,628 | | | | | | | | |
| | Penns Woods Bancorp, Inc.+ | | | 1,000 | | | 46,580 | | | | | | | | |
| | Peoples Bancorp of North Carolina, Inc. | | | 5,280 | | | 162,043 | | | | | | | | |
| | Peoples Bancorp, Inc. | | | 43,400 | | | 1,415,708 | | | | | | | | |
| | Peoples Financial Services Corp. | | | 900 | | | 41,922 | | | | | | | | |
| | PHH Corp.* | | | 113,350 | | | 1,167,505 | | | | | | | | |
| | Piper Jaffray Cos. | | | 35,500 | | | 3,061,875 | | | | | | | | |
| | Premier Financial Bancorp, Inc. | | | 27,720 | | | 556,618 | | | | | | | | |
| | Provident Financial Holdings, Inc. | | | 51,000 | | | 938,400 | | | | | | | | |
| | QCR Holdings, Inc. | | | 2,000 | | | 85,700 | | | | | | | | |
| | Regional Management Corp.* | | | 43,100 | | | 1,133,961 | | | | | | | | |
| | Reliant Bancorp, Inc. | | | 2,500 | | | 64,100 | | | | | | | | |
| | Renasant Corp. | | | 97,046 | | | 3,968,211 | | | | | | | | |
| | Republic Bancorp, Inc., Class A | | | 38,642 | | | 1,469,169 | | | | | | | | |
| | Riverview Bancorp, Inc. | | | 87,000 | | | 754,290 | | | | | | | | |
| | S&T Bancorp, Inc. | | | 40,045 | | | 1,594,191 | | | | | | | | |
| | Safety Insurance Group, Inc. | | | 32,000 | | | 2,572,800 | | | | | | | | |
| | Salisbury Bancorp, Inc. | | | 1,183 | | | 53,117 | | | | | | | | |
| | Sandy Spring Bancorp, Inc. | | | 7,400 | | | 288,748 | | | | | | | | |
| | SB Financial Group, Inc.+ | | | 30,400 | | | 562,096 | | | | | | | | |
| | Security National Financial Corp.,
Class A* | | | 86,301 | | | 457,395 | | | | | | | | |
| | Selective Insurance Group, Inc. | | | 65,950 | | | 3,871,265 | | | | | | | | |
| | Shore Bancshares, Inc.+ | | | 67,012 | | | 1,119,100 | | | | | | | | |
| | SI Financial Group, Inc. | | | 55,700 | | | 818,790 | | | | | | | | |
| | Sierra Bancorp | | | 77,800 | | | 2,066,368 | | | | | | | | |
| | | | | | | | |
| Industry | | Company | | Shares | | | Value |
| | | |
| | | | | | | | |
Financials (continued) |
| | South State Corp. | | | 34,834 | | | $ 3,035,783 |
| | Southern National Bancorp of Virginia, Inc. | | | 461 | | | 7,390 |
| | State Auto Financial Corp. | | | 80,550 | | | 2,345,616 |
| | Stewart Information Services Corp. | | | 87,150 | | | 3,686,445 |
| | Summit Financial Group, Inc.+ | | | 22,015 | | | 579,435 |
| | Sussex Bancorp+ | | | 15,000 | | | 403,500 |
| | Territorial Bancorp, Inc. | | | 21,200 | | | 654,444 |
| | Third Point Reinsurance Ltd.* | | | 40,000 | | | 586,000 |
| | Timberland Bancorp, Inc. | | | 39,000 | | | 1,035,450 |
| | Tiptree, Inc. | | | 28,600 | | | 170,170 |
| | TowneBank | | | 1,642 | | | 50,492 |
| | TriCo Bancshares | | | 600 | | | 22,716 |
| | TriState Capital Holdings, Inc.* | | | 46,900 | | | 1,078,700 |
| | Triumph Bancorp, Inc.* | | | 10,700 | | | 337,050 |
| | Two River Bancorp | | | 29,505 | | | 534,926 |
| | Union Bankshares Corp. | | | 60,966 | | | 2,205,140 |
| | United Community Financial Corp. | | | 324 | | | 2,958 |
| | United Fire Group, Inc. | | | 78,800 | | | 3,591,704 |
| | United Insurance Holdings Corp. | | | 84,700 | | | 1,461,075 |
| | Universal Insurance Holdings, Inc. | | | 86,316 | | | 2,360,743 |
| | Univest Corp. of Pennsylvania | | | 72,764 | | | 2,041,030 |
| | Veritex Holdings, Inc.* | | | 30,400 | | | 838,736 |
| | Waddell & Reed Financial, Inc., Class A+ | | | 70,000 | | | 1,563,800 |
| | Walker & Dunlop, Inc.* | | | 70,475 | | | 3,347,562 |
| | Waterstone Financial, Inc. | | | 8,000 | | | 136,400 |
| | WesBanco, Inc. | | | 70,273 | | | 2,856,597 |
| | Westbury Bancorp, Inc.*+ | | | 3,750 | | | 86,250 |
| | Western New England Bancorp, Inc. | | | 60,312 | | | 657,401 |
| | World Acceptance Corp.*+ | | | 19,200 | | | 1,549,824 |
| | Xenith Bankshares, Inc.* | | | 41,175 | | | 1,392,950 |
| | | | | | | | |
| | | | | | | | 232,757,626 |
|
Health Care - 2.20% |
| | Almost Family, Inc.* | | | 600 | | | 33,210 |
| | AMAG Pharmaceuticals, Inc.* | | | 29,900 | | | 396,175 |
| | AngioDynamics, Inc.* | | | 70,300 | | | 1,169,089 |
| | Bioanalytical Systems, Inc.* | | | 10,000 | | | 24,700 |
| | |
| 12 | | Semi-Annual Report | December 31, 2017 (Unaudited) |
| | |
Omni Small-Cap Value Fund SCHEDULE OF INVESTMENTS (continued) | | |
Showing percentage of net assets as of December 31, 2017 (Unaudited)
| | | | | | | | | | | | | | | | |
| Industry | | Company | | Shares | | | Value | | | | | | |
| | |
Common Stocks (continued) | | | | | | | | |
Health Care (continued) | | | | | | | | |
| | Community Health Systems, Inc.*+ | | | 303,500 | | | $ 1,292,910 | | | | | | | | |
| | Concert Pharmaceuticals, Inc.* | | | 65,700 | | | 1,699,659 | | | | | | | | |
| | Cumberland Pharmaceuticals, Inc.* | | | 23,000 | | | 170,660 | | | | | | | | |
| | Digirad Corp. | | | 36,447 | | | 93,851 | | | | | | | | |
| | FONAR Corp.*+ | | | 30,400 | | | 740,240 | | | | | | | | |
| | InfuSystems Holdings, Inc.* | | | 21,100 | | | 48,530 | | | | | | | | |
| | Juniper Pharmaceuticals, Inc.* | | | 32,000 | | | 155,200 | | | | | | | | |
| | Kewaunee Scientific Corp. | | | 3,000 | | | 87,000 | | | | | | | | |
| | Kindred Healthcare, Inc. | | | 98,350 | | | 953,995 | | | | | | | | |
| | Lannett Co., Inc.*+ | | | 60,000 | | | 1,392,000 | | | | | | | | |
| | LHC Group, Inc.* | | | 1,000 | | | 61,250 | | | | | | | | |
| | National HealthCare Corp. | | | 19,700 | | | 1,200,518 | | | | | | | | |
| | Nobilis Health Corp.*+ | | | 15,000 | | | 20,250 | | | | | | | | |
| | PDL BioPharma, Inc.* | | | 456,000 | | | 1,249,440 | | | | | | | | |
| | Quorum Health Corp.* | | | 25,000 | | | 156,000 | | | | | | | | |
| | Select Medical Holdings Corp.* | | | 200,000 | | | 3,530,000 | | | | | | | | |
| | Triple-S Management Corp., Class B* | | | 122,300 | | | 3,039,155 | | | | | | | | |
| | | | | | | | | | | | | | | | |
| | | | | | | | 17,513,832 | | | | | | | | |
| | |
Industrials - 18.97% | | | | | | | | |
| | AAR Corp. | | | 7,000 | | | 275,030 | | | | | | | | |
| | Acacia Research Corp.* | | | 35,000 | | | 141,750 | | | | | | | | |
| | ACCO Brands Corp.* | | | 364,300 | | | 4,444,460 | | | | | | | | |
| | Aegion Corp.* | | | 99,341 | | | 2,526,242 | | | | | | | | |
| | AeroCentury Corp.* | | | 4,300 | | | 65,532 | | | | | | | | |
| | Air T, Inc.*+ | | | 2,800 | | | 69,020 | | | | | | | | |
| | Air Transport Services Group, Inc.* | | | 116,924 | | | 2,705,621 | | | | | | | | |
| | Aircastle, Ltd. | | | 97,100 | | | 2,271,169 | | | | | | | | |
| | Alpha Pro Tech, Ltd.*+ | | | 20,743 | | | 82,972 | | | | | | | | |
| | American Railcar Industries, Inc.+ | | | 36,900 | | | 1,536,516 | | | | | | | | |
| | AMREP Corp.* | | | 25,500 | | | 178,500 | | | | | | | | |
| | ARC Document Solutions, Inc.* | | | 118,000 | | | 300,900 | | | | | | | | |
| | ArcBest Corp. | | | 94,500 | | | 3,378,375 | | | | | | | | |
| | Argan, Inc. | | | 17,500 | | | 787,500 | | | | | | | | |
| | Armstrong Flooring, Inc.* | | | 65,000 | | | 1,099,800 | | | | | | | | |
| | Arotech Corp.*+ | | | 94,300 | | | 334,765 | | | | | | | | |
| | Atlas Air Worldwide Holdings, Inc.* | | | 57,700 | | | 3,384,105 | | | | | | | | |
| | Briggs & Stratton Corp. | | | 114,300 | | | 2,899,791 | | | | | | | | |
| | Broadwind Energy, Inc.* | | | 24,375 | | | 66,300 | | | | | | | | |
| | Caesarstone, Ltd.*+ | | | 70,000 | | | 1,540,000 | | | | | | | | |
| | CAI International, Inc.* | | | 52,600 | | | 1,489,632 | | | | | | | | |
| | | | | | | | |
| Industry | | Company | | Shares | | | Value |
| | | |
| | | | | | | | |
Industrials (continued) |
| | CBIZ, Inc.* | | | 192,600 | | | $2,975,670 |
| | Cemtrex, Inc.+ | | | 21,000 | | | 53,970 |
| | Chart Industries, Inc.* | | | 67,575 | | | 3,166,564 |
| | Chicago Rivet & Machine Co.+ | | | 1,000 | | | 31,800 |
| | Civeo Corp.*+ | | | 531,500 | | | 1,450,995 |
| | Columbus McKinnon Corp. | | | 40,400 | | | 1,615,192 |
| | Commercial Vehicle Group, Inc.* | | | 67,300 | | | 719,437 |
| | Costamare, Inc. | | | 160,000 | | | 923,200 |
| | Covenant Transportation Group, Inc., Class A* | | | 93,900 | | | 2,697,747 |
| | CRA International, Inc. | | | 53,500 | | | 2,404,825 |
| | DLH Holdings Corp.* | | | 57,500 | | | 354,200 |
| | DMC Global, Inc.+ | | | 20,000 | | | 501,000 |
| | Ducommun, Inc.* | | | 43,300 | | | 1,231,885 |
| | Eastern Co. (The) | | | 18,401 | | | 481,186 |
| | Ecology & Environment, Inc., Class A+ | | | 3,500 | | | 36,750 |
| | Encore Wire Corp. | | | 16,500 | | | 802,725 |
| | Engility Holdings, Inc.* | | | 56,700 | | | 1,608,579 |
| | Ennis, Inc. | | | 136,892 | | | 2,840,509 |
| | FreightCar America, Inc. | | | 22,381 | | | 382,267 |
| | FTI Consulting, Inc.* | | | 56,700 | | | 2,435,832 |
| | General Finance Corp.* | | | 115,764 | | | 787,195 |
| | Gibraltar Industries, Inc.* | | | 28,350 | | | 935,550 |
| | Goldfield Corp. (The)* | | | 121,000 | | | 592,900 |
| | Great Lakes Dredge & Dock Corp.* | | | 212,550 | | | 1,147,770 |
| | Greenbrier Companies., Inc. (The)+ | | | 87,800 | | | 4,679,740 |
| | Griffon Corp. | | | 112,800 | | | 2,295,480 |
| | Hardinge, Inc.+ | | | 86,400 | | | 1,505,088 |
| | HC2 Holdings, Inc.*+ | | | 81,100 | | | 482,545 |
| | Heidrick & Struggles International, Inc. | | | 56,250 | | | 1,380,938 |
| | Heritage-Crystal Clean, Inc.*+ | | | 39,854 | | | 866,824 |
| | Hertz Global Holdings, Inc.* | | | 88,000 | | | 1,944,800 |
| | Highpower International, Inc.* | | | 60,923 | | | 225,415 |
| | Houston Wire & Cable Co.* | | | 46,100 | | | 331,920 |
| | Hurco Cos., Inc. | | | 17,857 | | | 753,565 |
| | Huron Consulting Group, Inc.* | | | 32,800 | | | 1,326,760 |
| | ICF International, Inc.* | | | 36,229 | | | 1,902,022 |
| | IES Holdings, Inc.*+ | | | 2,717 | | | 46,868 |
| | Kelly Services, Inc., Class A | | | 57,500 | | | 1,568,025 |
| | Key Technology, Inc.* | | | 2,500 | | | 46,075 |
| | Kratos Defense & Security Solutions, Inc.*+ | | | 25,000 | | | 264,750 |
| | |
Omni Small-Cap Value Fund SCHEDULE OF INVESTMENTS (continued) | | |
Showing percentage of net assets as of December 31, 2017 (Unaudited)
| | | | | | | | | | | | | | | | |
| Industry | | Company | | Shares | | | Value | | | | | | |
| | |
Common Stocks (continued) | | | | | | | | |
Industrials (continued) | | | | | | | | |
| | L.B. Foster Co., Class A* | | | 38,400 | | | $1,042,560 | | | | | | | | |
| | L.S. Starrett Co. (The), Class A | | | 5,000 | | | 43,000 | | | | | | | | |
| | Marten Transport, Ltd. | | | 254,970 | | | 5,175,891 | | | | | | | | |
| | McGrath RentCorp | | | 83,300 | | | 3,913,434 | | | | | | | | |
| | Miller Industries, Inc. | | | 7,300 | | | 188,340 | | | | | | | | |
| | Navigant Consulting, Inc.* | | | 239,600 | | | 4,650,636 | | | | | | | | |
| | Navios Maritime Holdings, Inc.* | | | 386,786 | | | 464,143 | | | | | | | | |
| | Nexeo Solutions, Inc.* | | | 155,000 | | | 1,410,500 | | | | | | | | |
| | NN, Inc. | | | 45,500 | | | 1,255,800 | | | | | | | | |
| | Northwest Pipe Co.* | | | 21,800 | | | 417,252 | | | | | | | | |
| | Orion Group Holdings, Inc.* | | | 123,386 | | | 966,112 | | | | | | | | |
| | PAM Transportation Services, Inc.* | | | 16,905 | | | 587,956 | | | | | | | | |
| | Park-Ohio Holdings Corp. | | | 15,000 | | | 689,250 | | | | | | | | |
| | Patriot Transportation Holding, Inc.* | | | 7,500 | | | 131,925 | | | | | | | | |
| | Performant Financial Corp.* | | | 97,367 | | | 160,656 | | | | | | | | |
| | Powell Industries, Inc. | | | 25,000 | | | 716,250 | | | | | | | | |
| | Preformed Line Products Co. | | | 1,135 | | | 80,642 | | | | | | | | |
| | Quad/Graphics, Inc. | | | 75,300 | | | 1,701,780 | | | | | | | | |
| | Quanex Building Products Corp. | | | 35,000 | | | 819,000 | | | | | | | | |
| | Radiant Logistics, Inc.* | | | 69,000 | | | 317,400 | | | | | | | | |
| | RCM Technologies, Inc.+ | | | 55,200 | | | 347,208 | | | | | | | | |
| | RPX Corp. | | | 212,600 | | | 2,857,344 | | | | | | | | |
| | Rush Enterprises, Inc., Class A* | | | 154,600 | | | 7,855,226 | | | | | | | | |
| | Rush Enterprises, Inc., Class B* | | | 46,500 | | | 2,241,765 | | | | | | | | |
| | Safe Bulkers, Inc.* | | | 44,550 | | | 143,896 | | | | | | | | |
| | Sino-Global Shipping America, Ltd.*+ | | | 21,635 | | | 55,386 | | | | | | | | |
| | SkyWest, Inc. | | | 133,791 | | | 7,104,302 | | | | | | | | |
| | Spartan Motors, Inc. | | | 22,000 | | | 346,500 | | | | | | | | |
| | SPX FLOW, Inc.* | | | 20,000 | | | 951,000 | | | | | | | | |
| | Steelcase, Inc., Class A | | | 245,000 | | | 3,724,000 | | | | | | | | |
| | Sterling Construction Co., Inc.* | | | 96,400 | | | 1,569,392 | | | | | | | | |
| | Textainer Group Holdings Ltd.*+ | | | 139,500 | | | 2,999,250 | | | | | | | | |
| | Titan Machinery, Inc.* | | | 83,900 | | | 1,776,163 | | | | | | | | |
| | Triumph Group, Inc. | | | 83,000 | | | 2,257,600 | | | | | | | | |
| | TrueBlue, Inc.* | | | 74,750 | | | 2,055,625 | | | | | | | | |
| | Tutor Perini Corp.* | | | 107,300 | | | 2,720,055 | | | | | | | | |
| | Ultralife Corp.* | | | 63,050 | | | 412,978 | | | | | | | | |
| | USA Truck, Inc.* | | | 9,636 | | | 174,701 | | | | | | | | |
| | Vectrus, Inc.* | | | 5,000 | | | 154,250 | | | | | | | | |
| | Veritiv Corp.* | | | 45,200 | | | 1,306,280 | | | | | | | | |
| | | | | | | | |
| Industry | | Company | | Shares | | | Value |
| | | |
| | | | | | | | |
Industrials (continued) |
| | Viad Corp. | | | 17,400 | | | $ 963,960 |
| | VSE Corp. | | | 23,600 | | | 1,142,948 |
| | Wabash National Corp.+ | | | 110,100 | | | 2,389,170 |
| | Westport Fuel Systems, Inc.* | | | 302 | | | 1,136 |
| | Willis Lease Finance Corp.* | | | 48,400 | | | 1,208,548 |
| | | | | | | | |
| | | | | | | | 150,867,753 |
|
Information Technology - 8.03% |
| | Alpha & Omega Semiconductor, Ltd.* | | | 214,244 | | | 3,505,032 |
| | Amkor Technology, Inc.* | | | 202,291 | | | 2,033,025 |
| | AutoWeb, Inc.* | | | 500 | | | 4,505 |
| | Aviat Networks, Inc.* | | | 15,200 | | | 230,584 |
| | AXT, Inc.* | | | 70,700 | | | 615,090 |
| | Bel Fuse, Inc., Class B | | | 18,500 | | | 465,738 |
| | Benchmark Electronics, Inc.* | | | 134,000 | | | 3,899,400 |
| | Black Box Corp. | | | 40,000 | | | 142,000 |
| | Blucora, Inc.* | | | 89,297 | | | 1,973,464 |
| | Communications Systems, Inc. | | | 12,500 | | | 45,500 |
| | Computer Task Group, Inc.* | | | 73,862 | | | 376,696 |
| | Comtech Telecommunications Corp. | | | 64,215 | | | 1,420,436 |
| | Concurrent Computer Corp. | | | 53,600 | | | 309,272 |
| | CSP, Inc.+ | | | 5,150 | | | 81,834 |
| | DASAN Zhone Solutions, Inc.* | | | 7,620 | | | 70,561 |
| | Digi International, Inc.* | | | 45,325 | | | 432,854 |
| | Diodes, Inc.* | | | 123,899 | | | 3,552,184 |
| | Electro Scientific Industries, Inc.* | | | 15,000 | | | 321,450 |
| | Finjan Holdings, Inc.* | | | 50,000 | | | 108,000 |
| | FORM Holdings Corp.* | | | 30,000 | | | 41,100 |
| | GSE Systems, Inc.* | | | 22,500 | | | 73,125 |
| | IEC Electronics Corp.*+ | | | 19,000 | | | 78,280 |
| | Insight Enterprises, Inc.* | | | 23,600 | | | 903,644 |
| | inTEST Corp.* | | | 55,000 | | | 475,750 |
| | IXYS Corp.* | | | 57,500 | | | 1,377,125 |
| | KEMET Corp.* | | | 59,250 | | | 892,305 |
| | Key Tronic Corp.* | | | 52,500 | | | 358,575 |
| | Kimball Electronics, Inc.* | | | 69,400 | | | 1,266,550 |
| | Knowles Corp.* | | | 198,200 | | | 2,905,612 |
| | Kulicke & Soffa Industries, Inc.* | | | 123,632 | | | 3,008,585 |
| | Liquidity Services, Inc.* | | | 43,550 | | | 211,218 |
| | ManTech International Corp., Class A | | | 108,800 | | | 5,460,672 |
| | Mind CTI Ltd. | | | 200 | | | 554 |
| | |
| 14 | | Semi-Annual Report | December 31, 2017 (Unaudited) |
| | |
Omni Small-Cap Value Fund SCHEDULE OF INVESTMENTS (continued) | | |
Showing percentage of net assets as of December 31, 2017 (Unaudited)
| | | | | | | | | | | | | | | | |
| Industry | | Company | | Shares | | | Value | | | | | | |
| | |
Common Stocks (continued) | | | | | | | | |
Information Technology (continued) | | | | | | | | |
| | Net 1 UEPS Technologies, Inc.* | | | 252,900 | | | $ 3,006,981 | | | | | | | | |
| | NetSol Technologies, Inc.* | | | 26,000 | | | 123,500 | | | | | | | | |
| | Network-1 Technologies, Inc.+ | | | 60,000 | | | 144,000 | | | | | | | | |
| | Nortech Systems, Inc.* | | | 1,500 | | | 5,790 | | | | | | | | |
| | PCM, Inc.* | | | 26,769 | | | 265,013 | | | | | | | | |
| | PC-Tel, Inc. | | | 56,700 | | | 417,879 | | | | | | | | |
| | Photronics, Inc.* | | | 205,050 | | | 1,748,051 | | | | | | | | |
| | PRGX Global, Inc.* | | | 40,739 | | | 289,247 | | | | | | | | |
| | RELM Wireless Corp. | | | 40,000 | | | 142,000 | | | | | | | | |
| | Sanmina Corp.* | | | 32,600 | | | 1,075,800 | | | | | | | | |
| | ScanSource, Inc.* | | | 48,600 | | | 1,739,880 | | | | | | | | |
| | SigmaTron International, Inc.* | | | 6,500 | | | 65,910 | | | | | | | | |
| | SMTC Corp.* | | | 7,500 | | | 14,250 | | | | | | | | |
| | Sohu.com, Inc.* | | | 10,000 | | | 433,500 | | | | | | | | |
| | SunPower Corp.*+ | | | 185,000 | | | 1,559,550 | | | | | | | | |
| | Sykes Enterprises, Inc.* | | | 90,134 | | | 2,834,714 | | | | | | | | |
| | Synacor, Inc.* | | | 64,000 | | | 147,200 | | | | | | | | |
| | Systemax, Inc. | | | 8,500 | | | 282,795 | | | | | | | | |
| | TESSCO Technologies, Inc. | | | 15,250 | | | 307,288 | | | | | | | | |
| | Trio-Tech International* | | | 3,000 | | | 21,030 | | | | | | | | |
| | TSR, Inc. | | | 1,000 | | | 5,350 | | | | | | | | |
| | TTM Technologies, Inc.* | | | 520,153 | | | 8,150,798 | | | | | | | | |
| | Vishay Precision Group, Inc.* | | | 158,248 | | | 3,979,937 | | | | | | | | |
| | Wayside Technology Group, Inc. | | | 7,900 | | | 131,930 | | | | | | | | |
| | Westell Technologies, Inc., Class A* | | | 6,200 | | | 23,250 | | | | | | | | |
| | YuMe, Inc. | | | 65,700 | | | 314,046 | | | | | | | | |
| | | | | | | | | | | | | | | | |
| | | | | | | | 63,870,409 | | | | | | | | |
| | |
Materials - 6.16% | | | | | | | | |
| | AgroFresh Solutions, Inc.*+ | | | 83,500 | | | 617,900 | | | | | | | | |
| | American Vanguard Corp. | | | 20,000 | | | 393,000 | | | | | | | | |
| | Boise Cascade Co. | | | 78,500 | | | 3,132,150 | | | | | | | | |
| | Carpenter Technology Corp. | | | 51,600 | | | 2,631,084 | | | | | | | | |
| | China Green Agriculture, Inc.* | | | 169,800 | | | 210,552 | | | | | | | | |
| | Clearwater Paper Corp.* | | | 30,500 | | | 1,384,700 | | | | | | | | |
| | Core Molding Technologies, Inc.+ | | | 17,000 | | | 368,900 | | | | | | | | |
| | Flexible Solutions International, Inc.* | | | 5,000 | | | 9,100 | | | | | | | | |
| | Friedman Industries, Inc.+ | | | 5,000 | | | 28,400 | | | | | | | | |
| | FutureFuel Corp. | | | 102,800 | | | 1,448,452 | | | | | | | | |
| | Gulf Resources, Inc.* | | | 178,200 | | | 263,736 | | | | | | | | |
| | Haynes International, Inc.+ | | | 25,200 | | | 807,660 | | | | | | | | |
| | Hecla Mining Co. | | | 557,000 | | | 2,211,290 | | | | | | | | |
| | | | | | | | |
| Industry | | Company | | Shares | | | Value |
| | | |
| | | | | | | | |
Materials (continued) |
| | Kaiser Aluminum Corp. | | | 22,630 | | | $ 2,418,016 |
| | KMG Chemicals, Inc. | | | 9,900 | | | 654,192 |
| | Kraton Corp.* | | | 142,150 | | | 6,847,366 |
| | Materion Corp. | | | 48,600 | | | 2,361,960 |
| | Mercer International, Inc. | | | 276,250 | | | 3,950,375 |
| | Olympic Steel, Inc. | | | 20,000 | | | 429,800 |
| | PH Glatfelter Co. | | | 95,500 | | | 2,047,520 |
| | Rayonier Advanced Materials, Inc. | | | 81,700 | | | 1,670,765 |
| | Resolute Forest Products, Inc.* | | | 143,500 | | | 1,585,675 |
| | Schnitzer Steel Industries, Inc., Class A | | | 79,700 | | | 2,669,950 |
| | Stepan Co. | | | 57,000 | | | 4,501,290 |
| | SunCoke Energy, Inc.* | | | 234,700 | | | 2,814,053 |
| | Synalloy Corp. | | | 14,000 | | | 187,600 |
| | TimkenSteel Corp.* | | | 55,000 | | | 835,450 |
| | Trecora Resources* | | | 21,002 | | | 283,527 |
| | Tredegar Corp. | | | 76,700 | | | 1,472,640 |
| | Universal Stainless & Alloy Products, Inc.*+ | | | 16,250 | | | 348,075 |
| | Verso Corp., Class A* | | | 25,000 | | | 439,250 |
| | | | | | | | |
| | | | | | | | 49,024,428 |
|
Real Estate - 0.14% |
| | Consolidated-Tomoka Land Co. | | | 5,900 | | | 374,650 |
| | Forestar Group, Inc.*+ | | | 8,776 | | | 193,072 |
| | RE/MAX Holdings, Inc., Class A | | | 6,168 | | | 299,148 |
| | St. Joe Co. (The)* | | | 15,000 | | | 270,750 |
| | | | | | | | |
| | | | | | | | 1,137,620 |
|
Telecommunication Services - 1.30% |
| | Alaska Communications Systems Group, Inc.* | | | 347,100 | | | 930,228 |
| | ATN International, Inc. | | | 28,500 | | | 1,574,910 |
| | Hawaiian Telcom Holdco, Inc.* | | | 44,500 | | | 1,373,270 |
| | Iridium Communications, Inc.*+ | | | 391,325 | | | 4,617,635 |
| | Spok Holdings, Inc. | | | 118,864 | | | 1,860,222 |
| | | | | | | | |
| | | |
| | | | | | | | 10,356,265 |
| | | | | | | | |
| |
TOTAL COMMON STOCKS - 99.75% | | | 793,547,096 |
| | | | | | | | |
(Cost $585,176,798) | | | |
| | |
Omni Small-Cap Value Fund SCHEDULE OF INVESTMENTS (continued) | | |
Showing percentage of net assets as of December 31, 2017 (Unaudited)
| | | | | | | | | | | | | | | | |
| Industry | | Company | | Shares | | | Value | | | | | | |
| | |
RIGHTS - 0.01% | | | | | | | | |
| | NewStar Financial, Inc.,
expiring 12/26/19*D | | | 120,000 | | | $64,800 | | | | | | | | |
| | | | | | | | | | | | | | | | |
| | | | |
TOTAL RIGHTS - 0.01% | | | | | | 64,800 | | | | | | | | |
| | | | | | | | | | | | | | | | |
(Cost $ 120,000) | | | | | | | | | | | | | | |
| | |
WARRANTS - 0.00% | | | | | | | | |
| | Eagle Bulk Shipping, Inc.,
expiring 10/15/21* | | | 3,317 | | | 299 | | | | | | | | |
| | | | | | | | | | | | | | | | |
| | | | |
TOTAL WARRANTS - 0.00% | | | | | | 299 | | | | | | | | |
| | | | | | | | | | | | | | | | |
(Cost $ 105,563) | | | | | | | | | | | | | | |
| | | | | | | | | | | | | | |
| | | | | | | | | | | | | | |
| | | | | | | | | | | | | | |
| | | | | | | | | | | | | | |
| | | | | | | | | | | | | | |
| | | | | | | | | | | | | | |
| | | | | | | | | | | | | | |
| | | | | | | | | | | | | | |
| | | | | | | | | | | | | | |
| | | | | | | | | | | | | | |
| | | | | | | | | | | | | | |
| | | | | | | | | | | | | | |
| | | | | | | | | | | | | | |
| | | | | | | | | | | | | | |
| | | | | | | | | | | | | | |
| | | | | | | | | | | | | | |
| | | | | | | | | | | | | | |
| | | | | | | | | | | | | | |
| | | | | | | | | | | | | | |
| | | | | | | | | | | | | | |
| | | | | | | | | | | | | | |
| | | | | | | | | | | | | | |
| | | | | | | | | | | | | | |
| | | | | | | | | | | | | | |
| | | | | | | | | | |
| | | Rate^ | | | Shares | | Value | |
|
| MONEY MARKET FUND - 0.50% | |
Fidelity Investments Money Market Government Portfolio Class I | | | 1.14 | % | | 3,959,017 | | | $3,959,017 | |
| | | | | | | | | | |
| |
| TOTAL MONEY MARKET FUND - 0.50% | | | 3,959,017 | |
| | | | | | | | | | |
| (Cost $3,959,017) | | | | |
|
INVESTMENTS PURCHASED WITH
CASH PROCEEDS FROM SECURITIES
LENDING - 6.06% | |
Fidelity Investments Money Market Government Portfolio Class I** | | | 1.14 | % | | 48,224,394 | | | 48,224,394 | |
| | | | | | | | | | |
| |
TOTAL INVESTMENTS PURCHASED WITH CASH PROCEEDS FROM SECURITIES LENDING - 6.06% | | | 48,224,394 | |
| | | | | | | | | | |
| (Cost $48,224,394) | | | | |
| |
| TOTAL INVESTMENTS - 106.32% | | | $845,795,606 | |
| (Cost $637,585,772) | | | | |
| Liabilities in Excess of Other Assets - (6.32%) | | | (50,257,550 | ) |
| | | | | | | | | | |
| |
| NET ASSETS - 100.00% | | | $795,538,056 | |
| | | | | | | | | | |
| * | Non-income producing security. |
| ** | This security represents the investment of the collateral received in connection with securities out on loan as of December 31, 2017. |
| ^ | Rate disclosed as of December 31, 2017. |
| D | Security was fair valued under procedures adopted by the Board of Directors (see Note 2). As such, the security is classified as Level 3 in the fair value hierarchy. |
| + | This security or a portion of the security is out on loan as of December 31, 2017. Total loaned securities had a value of $46,313,493 as of December 31, 2017. |
LLC - Limited Liability Company
PLC - Public Limited Company
| | |
| 16 | | Semi-Annual Report | December 31, 2017 (Unaudited) |
| | |
Omni Small-Cap Value Fund SCHEDULE OF INVESTMENTS (continued) | | |
Showing percentage of net assets as of December 31, 2017 (Unaudited)
| | | | | | | | | | | | | | | | | | | | |
| Summary of inputs used to value the Fund’s investments as of 12/31/2017 (See Note 2 in Notes to Financial Statements): | | | | | |
| | | | | | | | | | | | | | | | | | | | |
Valuation Inputs | | | | | |
Investment in Securities (Value) | | | | | |
| | | Level 1 Quoted Prices | | | Level 2 Significant Observable Inputs | | | Level 3 Significant Unobservable Inputs | | | Total | | | | | |
| | | | | |
Common Stocks (a) | | $ | 793,547,096 | | | $ | — | | | $ | — | | | $ | 793,547,096 | | | | | |
Rights | | | — | | | | — | | | | 64,800 | | | | 64,800 | | | | | |
Warrants | | | 299 | | | | — | | | | — | | | | 299 | | | | | |
Money Market Fund | | | — | | | | 3,959,017 | | | | — | | | | 3,959,017 | | | | | |
Investments Purchased with Cash Proceeds from Securities Lending | | | — | | | | 48,224,394 | | | | — | | | | 48,224,394 | | | | | |
| | | | | | | | | | | | | | | | | | | | |
TOTAL | | $ | 793,547,395 | | | $ | 52,183,411 | | | $ | 64,800 | | | $ | 845,795,606 | | | | | |
| | | | | | | | | | | | | | | | | | | | |
| | | | | | | | | | | | | | | | | | | | |
| | | | | | | | | | | | | | | | | | | | | |
(a) - please refer to the Schedule of Investments for the industry classifications of these portfolio holdings. | | | | | |
| | | | | |
| | | | | |
| | | | | |
| | | | | |
| | | | | |
| | | | | |
| | | | | |
| | | | | |
| | | | | |
| | | | | |
| | | | | |
| | | | | |
| | | | | |
| | | | | |
| | | | | |
| | | | | |
| | | | | |
| | | | | |
| | | | | |
| | | | | |
| | | | | |
| | | | | |
| | | | | |
| | | | | |
| | | | | |
| | | | | |
| | | | | |
| | | | |
| Following is a reconciliation of Level 3 investments for which significant unobservable inputs were used to determine fair value: |
| | | | |
Investment in Securities (Value) |
| | | Rights | | Total |
|
| | |
Balance as of 06/30/2017 | | $ — | | $ — |
Purchases | | 120,000 | | 120,000 |
Sales | | — | | — |
Realized gain/(loss) | | — | | — |
Change in unrealized appreciation/(depreciation) | | (55,200) | | (55,200) |
Transfers in1 | | — | | — |
Transfers out | | — | | — |
| | | | |
| | |
Balance as of 12/31/17 | | $ 64,800 | | $ 64,800 |
| | | | |
| | |
Net change in unrealized appreciation (depreciation) from investments held as of 12/31/2017 | | $ (55,200) | | $ (55,200) |
| | | | |
1Transfer in represents the value as of the beginning of the reporting period, for any investment security where significant transfers in the pricing level occurred during the period. The purchase value is used in situations where the investment was not held as of the beginning of the period.
See Notes to Financial Statements.
| | |
Omni Tax-Managed Small-Cap Value Fund MANAGER’S COMMENTARY (Unaudited) | | |
December 31, 2017
Dear Fellow Omni Tax-Managed Small-Cap Value Fund Shareholder,
For the quarter ended December 31, 2017, our Fund returned +3.00%, outperforming our primary market benchmark, the Russell 2000 Value Index (+2.05%).
For the six-month semi-annual period ended December 31, 2017, our Fund returned +9.16%, outperforming the Russell 2000 Value Index (+7.26%).
For the calendar year, our Fund returned +5.52%, underperforming the Russell 2000 Value Index (+7.84%).
The table below presents our December quarter, six-month, one-year, five-year, and inception-to-date financial results. See the next page for a graph of performance since inception.
Standardized Returns as of December 31, 2017
| | | | | | | | | | | | | | | | | | | | | | | | | |
| | | | | | | | | Annualized |
| | | Quarter | | 6 Months | | 1 Year | | 5 Years | | Since Inception
(12/31/10) |
| | | | | |
Omni Tax-Managed Small-Cap Value Fund | | | | 3.00% | | | | | 9.16% | | | | | 5.52% | | | | | 14.05% | | | | | 11.39% | |
Russell 2000 Value Index | | | | 2.05% | | | | | 7.26% | | | | | 7.84% | | | | | 13.01% | | | | | 10.84% | |
Performance figures quoted in the table above and the graph on the next page represent past performance and are no guarantee of future results. Total return figures in the table above include the reinvestment of dividends and capital gains. The table above and the graph on the next page do not reflect the deduction of taxes that a shareholder would pay on Fund distributions or on the redemption of Fund shares.
The Russell 2000 Value Index is an unmanaged index that consists of stocks in the Russell 2000 Index with lower price-to-book ratios and lower forecasted growth values with dividends reinvested. It is not possible to invest directly in an index. Periods longer than one year are annualized.
According to data from Lipper, Inc. as of December 31, 2017, Omni Tax-Managed Small-Cap Value Fund ranked 212th of 269 small-cap value funds for the 12 months ended December 31, 2017, 49th of 210 over the past five years and 39th of 181 such funds since inception in December 2010. Lipper, Inc. is an independent mutual fund rating service that ranks funds in various fund categories by making comparative calculations using total returns.
| | |
| 18 | | Semi-Annual Report | December 31, 2017 (Unaudited) |
| | |
Omni Tax-Managed Small-Cap Value Fund MANAGER’S COMMENTARY (Unaudited) (continued) | | |
Growth of a $10,000 Investment
from Inception December 31, 2010 to December 31, 2017
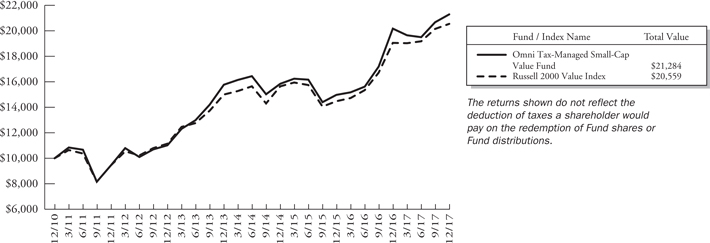
Detailed Explanation of Quarterly Performance
The Omni Tax-Managed Small-Cap Value Fund is designed to capture the returns of the small-cap value asset class through broad diversification of small company and value stocks. We also seek to minimize the distribution of capital gains within the constraints of the investment objective. This approach is sometimes referred to as “passive, asset class investing.” As of December 31, 2017, we held 665 such stocks in a market-cap weighted style. We make no attempt to track any particular index in either performance or statistics.
The Fund’s tilt toward deeper value stocks across multiple value metrics improved relative performance during the quarter. An overweighting in higher momentum stocks compared to the benchmark also added modestly to results. However, the Fund’s tilt toward smaller stocks in the small-cap value universe hurt relative performance.
By design, the Fund does not hold Real Estate Investment Trusts (REITs) and Utilities stocks. Our lack of exposure to both REITs and Utilities stocks boosted relative performance.
Detailed Explanation of Calendar Year Performance
The Fund’s tilt toward smaller stocks in the small-cap value universe hurt relative results during the year. Likewise, the impact of the Fund’s tilt toward deeper value stocks across multiple value metrics was negative. However, an overweighting in higher momentum stocks compared to the benchmark improved relative results.
By design, the Fund does not hold Real Estate Investment Trusts (REITs) and Utilities stocks. Our lack of exposure to REITs boosted relative performance. However, the lack of exposure to Utilities stocks dragged on relative results. An overweighting in the Energy sector hurt relative results amid volatility in commodity prices.
| | |
Omni Tax-Managed Small-Cap Value Fund MANAGER’S COMMENTARY (Unaudited) (continued) | | |
Top Ten Holdings as of December 31, 2017
| | | | | | | | | |
| Rank | | Description | | Industry | | % of Net
Assets |
| 1 | | Kraton Corp. | | Materials | | 1.2% |
| 2 | | Cooper-Standard Holding, Inc. | | Consumer Discretionary | | 1.0% |
| 3 | | SkyWest, Inc. | | Industrials | | 0.9% |
| 4 | | Delek US Holdings, Inc. | | Energy | | 0.8% |
| 5 | | McDermott International, Inc. | | Energy | | 0.8% |
| 6 | | Iridium Communications, Inc. | | Telecommunication Services | | 0.6% |
| 7 | | Greenbrier Companies., Inc. | | Industrials | | 0.6% |
| 8 | | McGrath RentCorp | | Industrials | | 0.6% |
| 9 | | KB Home | | Consumer Discretionary | | 0.6% |
| 10 | | Briggs & Stratton Corp. | | Industrials | | 0.6% |
| | Total | | | | 7.7% |
Industry Sector Representation as of December 31, 2017
| | | | | | | | | | | | | | | |
| | | % of Net Assets | | % of Russell 2000
Value Index | | Difference |
| Consumer Discretionary | | | | 22.3% | | | | | 10.9% | | | | | 11.4% | |
| Consumer Staples | | | | 2.0% | | | | | 2.8% | | | | | -0.8% | |
| Energy | | | | 9.8% | | | | | 6.8% | | | | | 3.0% | |
| Financials | | | | 28.9% | | | | | 30.4% | | | | | -1.5% | |
| Health Care | | | | 2.2% | | | | | 6.2% | | | | | -4.0% | |
| Industrials | | | | 18.5% | | | | | 12.1% | | | | | 6.4% | |
| Information Technology | | | | 7.7% | | | | | 8.9% | | | | | -1.2% | |
| Materials | | | | 6.8% | | | | | 4.5% | | | | | 2.3% | |
| Real Estate | | | | 0.2% | | | | | 10.3% | | | | | -10.1% | |
| Telecommunication Services | | | | 1.3% | | | | | 0.5% | | | | | 0.8% | |
| Utilities | | | | 0.0% | | | | | 6.6% | | | | | -6.6% | |
| Cash & Other Assets | | | | 0.3% | | | | | 0.0% | | | | | 0.3% | |
Total | | | | 100.0% | | | | | 100.0% | | | | | | |
Disclaimer
The views expressed here are exclusively those of Fund management. These views, including those related to market sectors or individual stocks, are not meant as investment advice and should not be considered predictive in nature. Any favorable (or unfavorable) description of a holding applies only as of the quarter end, December 31, 2017, unless otherwise stated. Security positions can and do change thereafter. Discussions of historical performance do not guarantee and may not be indicative of future performance.
Market volatility can significantly impact short-term performance. The Fund is not an appropriate investment for short-term investors. Investments in small companies generally carry greater risk than is customarily associated with larger companies. This additional risk is attributable to a number of factors, including the relatively limited financial resources that are typically available to small companies and the fact that small companies often have comparatively limited product lines. In addition, the stock of small companies tends to be more volatile than the stock of large companies, particularly in the short term and particularly in the early stages of an economic or market downturn. Shareholders of the Fund, therefore, are taking on more risk than they would if they invested in the stock market as a whole.
| | |
| 20 | | Semi-Annual Report | December 31, 2017 (Unaudited) |
| | |
Omni Tax-Managed Small-Cap Value Fund MANAGER’S COMMENTARY (Unaudited) (continued) | | |
Conclusion
Thank you for your continued investment in Omni Tax-Managed Small-Cap Value Fund. We encourage your feedback; your reactions and concerns are important to us.
Sincerely,
The Investment Management Team
| | |
Omni Tax-Managed Small-Cap Value Fund SCHEDULE OF INVESTMENTS | | |
Showing percentage of net assets as of December 31, 2017 (Unaudited)
| | | | | | | | | | | | | | |
| Industry | | Company | | Shares | | | Value | | | | |
| |
COMMON STOCKS - 99.61% | | | | | |
Consumer Discretionary - 22.25% | | | | | |
| | 1-800-Flowers.com, Inc., Class A* | | | 60,000 | | | $ | 642,000 | | | | | |
| | Abercrombie & Fitch Co., Class A | | | 123,500 | | | | 2,152,605 | | | | | |
| | Adtalem Global Education, Inc.* | | | 39,000 | | | | 1,639,950 | | | | | |
| | AMCON Distributing Co. | | | 1,350 | | | | 121,298 | | | | | |
| | American Axle &
Manufacturing Holdings, Inc.* | | | 105,450 | | | | 1,795,814 | | | | | |
| | American Public Education, Inc.* | | | 27,700 | | | | 693,885 | | | | | |
| | America’s Car-Mart, Inc.* | | | 10,000 | | | | 446,500 | | | | | |
| | Appliance Recycling Centers of America, Inc.* | | | 2,000 | | | | 2,140 | | | | | |
| | Ark Restaurants Corp. | | | 8,500 | | | | 229,670 | | | | | |
| | Ascent Capital Group, Inc., Class A* | | | 25,400 | | | | 291,846 | | | | | |
| | AV Homes, Inc.* | | | 39,300 | | | | 654,345 | | | | | |
| | Barnes & Noble Education, Inc.* | | | 82,060 | | | | 676,174 | | | | | |
| | Barnes & Noble, Inc. | | | 80,000 | | | | 536,000 | | | | | |
| | Bassett Furniture Industries, Inc. | | | 52,959 | | | | 1,991,258 | | | | | |
| | BBX Capital Corp. | | | 311,200 | | | | 2,480,264 | | | | | |
| | Beasley Broadcast Group, Inc., Class A | | | 20,900 | | | | 280,060 | | | | | |
| | Beazer Homes USA, Inc.* | | | 80,000 | | | | 1,536,800 | | | | | |
| | Big 5 Sporting Goods Corp.+ | | | 103,600 | | | | 787,360 | | | | | |
| | Biglari Holdings, Inc.* | | | 1,400 | | | | 580,160 | | | | | |
| | BJ’s Restaurants, Inc. | | | 53,500 | | | | 1,947,400 | | | | | |
| | Bojangles’, Inc.*+ | | | 59,600 | | | | 703,280 | | | | | |
| | Boot Barn Holdings, Inc.* | | | 150,000 | | | | 2,491,500 | | | | | |
| | Build-A-Bear Workshop, Inc.* | | | 25,000 | | | | 230,000 | | | | | |
| | Caleres, Inc. | | | 90,000 | | | | 3,013,200 | | | | | |
| | Canterbury Park Holding Corp. | | | 511 | | | | 8,406 | | | | | |
| | Carrols Restaurant Group, Inc.*+ | | | 80,000 | | | | 972,000 | | | | | |
| | Century Casinos, Inc.* | | | 114,200 | | | | 1,042,646 | | | | | |
| | Chico’s FAS, Inc. | | | 115,000 | | | | 1,014,300 | | | | | |
| | China Automotive Systems, Inc.* | | | 36,300 | | | | 174,240 | | | | | |
| | China XD Plastics Co., Ltd.* | | | 48,400 | | | | 222,640 | | | | | |
| | Christopher & Banks Corp.* | | | 43,200 | | | | 54,864 | | | | | |
| | Citi Trends, Inc. | | | 76,150 | | | | 2,014,929 | | | | | |
| | Clarus Corp.* | | | 10,000 | | | | 78,500 | | | | | |
| | Conn’s, Inc.*+ | | | 71,500 | | | | 2,541,825 | | | | | |
| | Container Store Group, Inc. (The)* | | | 92,000 | | | | 436,080 | | | | | |
| | Cooper Tire & Rubber Co. | | | 26,550 | | | | 938,543 | | | | | |
| | | | | | | | | | |
| Industry | | Company | | Shares | | | Value | |
| | | |
| | | | | | | | | | |
Consumer Discretionary (continued) | |
| | Cooper-Standard Holding, Inc.* | | | 55,510 | | | $ | 6,799,975 | |
| | Crown Crafts, Inc. | | | 13,050 | | | | 84,172 | |
| | CSS Industries, Inc. | | | 68,558 | | | | 1,907,969 | |
| | Del Frisco’s Restaurant Group, Inc.* | | | 44,768 | | | | 682,712 | |
| | Del Taco Restaurants, Inc.* | | | 92,600 | | | | 1,122,312 | |
| | Delta Apparel, Inc.* | | | 23,700 | | | | 478,740 | |
| | Dillard’s, Inc., Class A+ | | | 43,500 | | | | 2,612,175 | |
| | Dixie Group, Inc. (The)* | | | 27,600 | | | | 106,260 | |
| | DSW, Inc., Class A | | | 113,000 | | | | 2,419,330 | |
| | E.W. Scripps Co., (The) Class A* | | | 173,500 | | | | 2,711,805 | |
| | El Pollo Loco Holdings, Inc.* | | | 89,300 | | | | 884,070 | |
| | Eldorado Resorts, Inc.*+ | | | 15,000 | | | | 497,250 | |
| | Emmis Communications Corp., Class A* | | | 1,500 | | | | 5,310 | |
| | Entercom Communications Corp., Class A | | | 122,405 | | | | 1,321,974 | |
| | Eros International PLC*+ | | | 111,750 | | | | 1,078,388 | |
| | Escalade, Inc. | | | 4,000 | | | | 49,200 | |
| | EVINE Live, Inc.* | | | 147,300 | | | | 206,220 | |
| | Fiesta Restaurant Group, Inc.*+ | | | 32,853 | | | | 624,207 | |
| | Flanigan’s Enterprises, Inc.+ | | | 2,500 | | | | 57,000 | |
| | Flexsteel Industries, Inc. | | | 7,300 | | | | 341,494 | |
| | Fogo De Chao, Inc.*+ | | | 62,000 | | | | 719,200 | |
| | FTD Cos., Inc.* | | | 17,160 | | | | 123,380 | |
| | Full House Resorts, Inc.* | | | 70,000 | | | | 273,700 | |
| | Gaming Partners International Corp. | | | 1,000 | | | | 11,240 | |
| | Gannett Co., Inc. | | | 181,900 | | | | 2,108,221 | |
| | Golden Entertainment, Inc.* | | | 42,000 | | | | 1,371,300 | |
| | Good Times Restaurants, Inc.* | | | 4,300 | | | | 11,395 | |
| | Gray Television, Inc.* | | | 212,100 | | | | 3,552,675 | |
| | Group 1 Automotive, Inc. | | | 58,000 | | | | 4,116,260 | |
| | Guess?, Inc.+ | | | 112,000 | | | | 1,890,560 | |
| | Hamilton Beach Brands Holding Co., Class A | | | 32,900 | | | | 845,201 | |
| | Haverty Furniture Cos., Inc. | | | 69,659 | | | | 1,577,776 | |
| | Hooker Furniture Corp. | | | 15,000 | | | | 636,750 | |
| | Houghton Mifflin Harcourt Co.* | | | 190,000 | | | | 1,767,000 | |
| | Iconix Brand Group, Inc.*+ | | | 23,000 | | | | 29,670 | |
| | International Speedway Corp., Class A | | | 105,760 | | | | 4,214,536 | |
| | J Alexander’s Holdings, Inc.* | | | 34,250 | | | | 332,225 | |
| | JAKKS Pacific, Inc.* | | | 4,100 | | | | 9,635 | |
| | Johnson Outdoors, Inc., Class A | | | 63,850 | | | | 3,964,446 | |
| | K12, Inc.* | | | 107,850 | | | | 1,714,815 | |
| | |
| 22 | | Semi-Annual Report | December 31, 2017 (Unaudited) |
| | |
Omni Tax-Managed Small-Cap Value Fund SCHEDULE OF INVESTMENTS (continued) | | |
Showing percentage of net assets as of December 31, 2017 (Unaudited)
| | | | | | | | | | | | | | |
| Industry | | Company | | Shares | | | Value | | | | |
| |
| Common Stocks (continued) | | | | |
| Consumer Discretionary (continued) | | | | |
| | KB Home | | | 134,700 | | | $ | 4,303,665 | | | | | |
| | Kirkland’s, Inc.* | | | 19,900 | | | | 238,104 | | | | | |
| | Lakeland Industries, Inc.* | | | 15,000 | | | | 218,250 | | | | | |
| | La-Z-Boy, Inc. | | | 51,000 | | | | 1,591,200 | | | | | |
| | Liberty Tax, Inc. | | | 19,500 | | | | 214,500 | | | | | |
| | Lifetime Brands, Inc. | | | 51,499 | | | | 849,734 | | | | | |
| | Lincoln Educational Services Corp.* | | | 134,605 | | | | 271,902 | | | | | |
| | Live Ventures, Inc.* | | | 3,200 | | | | 51,136 | | | | | |
| | Luby’s, Inc.* | | | 130,800 | | | | 345,312 | | | | | |
| | M/I Homes, Inc.* | | | 31,700 | | | | 1,090,480 | | | | | |
| | Marcus Corp. (The) | | | 136,454 | | | | 3,732,017 | | | | | |
| | McClatchy Co. (The), Class A*+ | | | 15,432 | | | | 137,808 | | | | | |
| | MDC Holdings, Inc. | | | 117,504 | | | | 3,746,028 | | | | | |
| | Modine Manufacturing Co.* | | | 28,900 | | | | 583,780 | | | | | |
| | Movado Group, Inc. | | | 61,600 | | | | 1,983,520 | | | | | |
| | Nevada Gold & Casinos, Inc.* | | | 36,100 | | | | 96,387 | | | | | |
| | New Home Co. Inc.,
(The)* | | | 33,100 | | | | 414,743 | | | | | |
| | New Media Investment Group, Inc. | | | 102,400 | | | | 1,718,272 | | | | | |
| | New York & Co., Inc.* | | | 125,700 | | | | 359,502 | | | | | |
| | Office Depot, Inc. | | | 445,000 | | | | 1,575,300 | | | | | |
| | P&F Industries, Inc., Class A | | | 492 | | | | 4,182 | | | | | |
| | Papa Murphy’s Holdings, Inc.*+ | | | 45,000 | | | | 242,100 | | | | | |
| | Party City Holdco, Inc.*+ | | | 175,800 | | | | 2,452,410 | | | | | |
| | Peak Resorts, Inc. | | | 103,600 | | | | 559,440 | | | | | |
| | Perry Ellis International, Inc.* | | | 135,184 | | | | 3,385,007 | | | | | |
| | PICO Holdings, Inc. | | | 37,500 | | | | 480,000 | | | | | |
| | Pier 1 Imports, Inc. | | | 238,300 | | | | 986,562 | | | | | |
| | Reading International, Inc., Class A* | | | 55,500 | | | | 926,850 | | | | | |
| | Red Lion Hotels Corp.* | | | 80,695 | | | | 794,846 | | | | | |
| | Red Robin Gourmet Burgers, Inc.* | | | 31,000 | | | | 1,748,400 | | | | | |
| | Regis Corp.* | | | 148,350 | | | | 2,278,656 | | | | | |
| | Rent-A-Center, Inc.+ | | | 84,000 | | | | 932,400 | | | | | |
| | RH*+ | | | 49,300 | | | | 4,250,153 | | | | | |
| | Rocky Brands, Inc. | | | 16,050 | | | | 303,345 | | | | | |
| | Saga Communications, Inc., Class A | | | 4,250 | | | | 171,912 | | | | | |
| | Salem Media Group, Inc. | | | 139,852 | | | | 629,334 | | | | | |
| | Scholastic Corp. | | | 75,950 | | | | 3,046,354 | | | | | |
| | Shiloh Industries, Inc.* | | | 41,400 | | | | 339,480 | | | | | |
| | Shoe Carnival, Inc. | | | 57,500 | | | | 1,538,125 | | | | | |
| | Sonic Automotive, Inc., Class A | | | 113,500 | | | | 2,094,075 | | | | | |
| | SORL Auto Parts, Inc.*+ | | | 74,129 | | | | 498,147 | | | | | |
| | SPAR Group, Inc.* | | | 1,500 | | | | 1,845 | | | | | |
| | Speedway Motorsports, Inc. | | | 118,963 | | | | 2,244,832 | | | | | |
| | | | | | | | | | |
| Industry | | Company | | Shares | | | Value | |
| | | |
| | | | | | | | | | |
Consumer Discretionary (continued) | |
| | Stoneridge, Inc.* | | | 47,000 | | | $ | 1,074,420 | |
| | Strattec Security Corp. | | | 3,600 | | | | 156,780 | |
| | Summer Infant, Inc.* | | | 5,000 | | | | 7,500 | |
| | Superior Industries International, Inc. | | | 43,800 | | | | 650,430 | |
| | Tilly’s, Inc., Class A | | | 114,300 | | | | 1,687,068 | |
| | Time, Inc. | | | 160,350 | | | | 2,958,458 | |
| | Tower International, Inc. | | | 46,000 | | | | 1,405,300 | |
| | Townsquare Media, Inc., Class A* | | | 160,044 | | | | 1,229,138 | |
| | TravelCenters of America LLC*+ | | | 129,850 | | | | 532,385 | |
| | Unifi, Inc.* | | | 10,800 | | | | 387,396 | |
| | US Auto Parts Network, Inc.* | | | 100,000 | | | | 252,000 | |
| | VOXX International Corp.* | | | 83,064 | | | | 465,158 | |
| | Weyco Group, Inc. | | | 16,400 | | | | 487,408 | |
| | William Lyon Homes, Class A* | | | 59,497 | | | | 1,730,173 | |
| | ZAGG, Inc.* | | | 131,500 | | | | 2,426,175 | |
| | Zumiez, Inc.* | | | 50,900 | | | | 1,059,992 | |
| | | | | | | | | | |
| | | | | | | | | 158,622,906 | |
|
Consumer Staples - 2.00% | |
| | Alico, Inc. | | | 12,600 | | | | 371,700 | |
| | Andersons, Inc. (The) | | | 94,700 | | | | 2,949,905 | |
| | Central Garden & Pet Co., Class A* | | | 6,200 | | | | 233,802 | |
| | Chefs’ Warehouse, Inc. (The)* | | | 25,000 | | | | 512,500 | |
| | Dean Foods Co. | | | 110,000 | | | | 1,271,600 | |
| | Hostess Brands, Inc.* | | | 105,000 | | | | 1,555,050 | |
| | Ingles Markets, Inc., Class A | | | 50,950 | | | | 1,762,870 | |
| | Landec Corp.* | | | 9,900 | | | | 124,740 | |
| | Mannatech, Inc. | | | 25,700 | | | | 385,500 | |
| | Natural Alternatives International, Inc.* | | | 16,800 | | | | 173,460 | |
| | Natural Health Trends Corp. | | | 3,000 | | | | 45,570 | |
| | Seneca Foods Corp., Class A* | | | 23,150 | | | | 711,862 | |
| | SpartanNash Co. | | | 78,682 | | | | 2,099,236 | |
| | Village Super Market, Inc., Class A | | | 24,500 | | | | 561,785 | |
| | Weis Markets, Inc. | | | 35,700 | | | | 1,477,623 | |
| | | | | | | | | | |
| | | | | | | | | 14,237,203 | |
|
Energy - 9.78% | |
| | Adams Resources & Energy, Inc. | | | 9,600 | | | | 417,600 | |
| | Approach Resources, Inc.*+ | | | 132,174 | | | | 391,235 | |
| | Archrock, Inc. | | | 123,000 | | | | 1,291,500 | |
| | Ardmore Shipping Corp.* | | | 123,988 | | | | 991,904 | |
| | |
Omni Tax-Managed Small-Cap Value Fund SCHEDULE OF INVESTMENTS (continued) | | |
Showing percentage of net assets as of December 31, 2017 (Unaudited)
| | | | | | | | | | | | | | |
| Industry | | Company | | Shares | | | Value | | | | |
| |
| Common Stocks (continued) | | | | |
| Energy (continued) | | | | |
| | Bill Barrett Corp.* | | | 90,000 | | | $ | 461,700 | | | | | |
| | Bristow Group, Inc.+ | | | 20,000 | | | | 269,400 | | | | | |
| | Callon Petroleum Co.*+ | | | 56,300 | | | | 684,045 | | | | | |
| | Clean Energy Fuels Corp.* | | | 100,000 | | | | 203,000 | | | | | |
| | Cloud Peak Energy, Inc.* | | | 123,700 | | | | 550,465 | | | | | |
| | CVR Energy, Inc.+ | | | 105,000 | | | | 3,910,200 | | | | | |
| | Dawson Geophysical Co.* | | | 45,000 | | | | 223,650 | | | | | |
| | Delek US Holdings, Inc. | | | 173,502 | | | | 6,062,160 | | | | | |
| | Denbury Resources, Inc.* | | | 263,000 | | | | 581,230 | | | | | |
| | DHT Holdings, Inc. | | | 291,800 | | | | 1,047,562 | | | | | |
| | Dorian LPG, Ltd.*+ | | | 140,160 | | | | 1,152,115 | | | | | |
| | ENGlobal Corp.* | | | 55,878 | | | | 49,173 | | | | | |
| | Ensco PLC, Class A+ | | | 192,000 | | | | 1,134,720 | | | | | |
| | EP Energy Corp., Class A*+ | | | 195,000 | | | | 460,200 | | | | | |
| | Era Group, Inc.* | | | 32,800 | | | | 352,600 | | | | | |
| | Exterran Corp.* | | | 75,200 | | | | 2,364,288 | | | | | |
| | Forum Energy Technologies, Inc.* | | | 50,000 | | | | 777,500 | | | | | |
| | Frontline, Ltd.+ | | | 175,000 | | | | 803,250 | | | | | |
| | GasLog Ltd. | | | 148,137 | | | | 3,296,048 | | | | | |
| | Gener8 Maritime, Inc.*+ | | | 135,300 | | | | 895,686 | | | | | |
| | Gran Tierra Energy, Inc.* | | | 527,700 | | | | 1,424,790 | | | | | |
| | Green Plains, Inc.+ | | | 54,150 | | | | 912,428 | | | | | |
| | Gulf Island Fabrication, Inc. | | | 28,200 | | | | 378,585 | | | | | |
| | Hallador Energy Co. | | | 71,600 | | | | 436,044 | | | | | |
| | Helix Energy Solutions Group, Inc.* | | | 75,500 | | | | 569,270 | | | | | |
| | Independence Contract Drilling, Inc.* | | | 115,281 | | | | 458,818 | | | | | |
| | International Seaways, Inc.* | | | 399 | | | | 7,366 | | | | | |
| | Matador Resources Co.* | | | 59,500 | | | | 1,852,235 | | | | | |
| | McDermott International, Inc.* | | | 857,000 | | | | 5,639,060 | | | | | |
| | Mitcham Industries, Inc.* | | | 27,400 | | | | 86,858 | | | | | |
| | NACCO Industries, Inc., Class A | | | 16,450 | | | | 619,342 | | | | | |
| | Natural Gas Services Group, Inc.* | | | 75,888 | | | | 1,988,266 | | | | | |
| | Navios Maritime Acquisition Corp. | | | 377,600 | | | | 419,136 | | | | | |
| | Newpark Resources, Inc.* | | | 51,000 | | | | 438,600 | | | | | |
| | Oasis Petroleum, Inc.* | | | 213,000 | | | | 1,791,330 | | | | | |
| | Oil States International, Inc.* | | | 18,000 | | | | 509,400 | | | | | |
| | Overseas Shipholding Group, Inc., Class A* | | | 42,500 | | | | 116,450 | | | | | |
| | Pacific Ethanol, Inc.* | | | 77,500 | | | | 352,625 | | | | | |
| | Par Pacific Holdings, Inc.* | | | 110,300 | | | | 2,126,584 | | | | | |
| | Parker Drilling Co.* | | | 89,550 | | | | 89,550 | | | | | |
| | Penn Virginia Corp.* | | | 17,500 | | | | 684,425 | | | | | |
| | Pioneer Energy Services Corp.* | | | 100,000 | | | | 305,000 | | | | | |
| | | | | | | | | | |
| Industry | | Company | | Shares | | | Value | |
| | | |
| | | | | | | | | | |
Energy (continued) | |
| | Renewable Energy Group, Inc.*+ | | | 348,319 | | | $ | 4,110,164 | |
| | REX American Resources Corp.* | | | 25,250 | | | | 2,090,448 | |
| | Ring Energy, Inc.* | | | 28,300 | | | | 393,370 | |
| | Rowan Cos. PLC, Class A* | | | 125,500 | | | | 1,965,330 | |
| | Scorpio Tankers, Inc. | | | 392,100 | | | | 1,195,905 | |
| | SEACOR Holdings, Inc.* | | | 40,200 | | | | 1,858,044 | |
| | SEACOR Marine Holdings, Inc.* | | | 11,063 | | | | 129,437 | |
| | Ship Finance International, Ltd.+ | | | 180,500 | | | | 2,797,750 | |
| | SilverBow Resources, Inc.* | | | 5,000 | | | | 148,600 | |
| | SM Energy Co. | | | 22,000 | | | | 485,760 | |
| | SRC Energy, Inc.* | | | 100,000 | | | | 853,000 | |
| | Stone Energy Corp.*+ | | | 20,000 | | | | 643,200 | |
| | Teekay Corp.+ | | | 190,000 | | | | 1,770,800 | |
| | TransAtlantic Petroleum, Ltd.* | | | 20,000 | | | | 27,800 | |
| | Unit Corp.* | | | 74,025 | | | | 1,628,550 | |
| | | | | | | | | | |
| | | | | | | | | 69,675,551 | |
|
Financials - 28.90% | |
| | 1347 Property Insurance Holdings, Inc.* | | | 17,500 | | | | 127,750 | |
| | 1st Constitution Bancorp | | | 5,250 | | | | 96,862 | |
| | 1st Source Corp. | | | 57,750 | | | | 2,855,738 | |
| | Access National Corp. | | | 30,506 | | | | 849,287 | |
| | ACNB Corp. | | | 600 | | | | 17,730 | |
| | Ambac Financial Group, Inc.* | | | 46,500 | | | | 743,070 | |
| | American Equity Investment Life Holding Co. | | | 30,250 | | | | 929,583 | |
| | American National Bankshares, Inc. | | | 13,060 | | | | 500,198 | |
| | American River Bankshares | | | 20,744 | | | | 316,346 | |
| | AmeriServ Financial, Inc. | | | 66,000 | | | | 273,900 | |
| | Argo Group International Holdings Ltd. | | | 34,865 | | | | 2,149,427 | |
| | Arlington Asset Investment Corp., Class A+ | | | 33,700 | | | | 396,986 | |
| | Asta Funding, Inc.* | | | 18,500 | | | | 136,900 | |
| | Atlantic Capital Bancshares, Inc.* | | | 47,200 | | | | 830,720 | |
| | Atlantic Coast Financial Corp.* | | | 31,000 | | | | 292,330 | |
| | Atlas Financial Holdings, Inc.* | | | 700 | | | | 14,385 | |
| | B. Riley Financial, Inc.+ | | | 10,520 | | | | 190,412 | |
| | Baldwin & Lyons, Inc., Class B | | | 43,700 | | | | 1,046,615 | |
| | |
| 24 | | Semi-Annual Report | December 31, 2017 (Unaudited) |
| | |
Omni Tax-Managed Small-Cap Value Fund SCHEDULE OF INVESTMENTS (continued) | | |
Showing percentage of net assets as of December 31, 2017 (Unaudited)
| | | | | | | | | | |
| Industry | | Company | | Shares | | | Value | |
| | |
Common Stocks (continued) | | | | | | | | |
Financials (continued) | | | | | | | | |
| | Banc of California, Inc.+ | | | 58,000 | | | $ | 1,197,700 | |
| | Banco Latinoamericano de Comercio Exterior SA, Class E | | | 60,500 | | | | 1,627,450 | |
| | Bank of Commerce Holdings | | | 75,550 | | | | 868,825 | |
| | Bar Harbor Bankshares | | | 17,241 | | | | 465,679 | |
| | Bay Bancorp, Inc.* | | | 25,000 | | | | 307,500 | |
| | BCB Bancorp, Inc. | | | 11,300 | | | | 163,850 | |
| | Bear State Financial, Inc. | | | 5,000 | | | | 51,150 | |
| | Berkshire Hills Bancorp, Inc. | | | 111,570 | | | | 4,083,462 | |
| | Blue Capital Reinsurance Holdings, Ltd. | | | 16,127 | | | | 194,330 | |
| | BofI Holding, Inc.*+ | | | 65,000 | | | | 1,943,500 | |
| | C&F Financial Corp. | | | 3,400 | | | | 197,200 | |
| | California First National Bancorp | | | 31,500 | | | | 475,020 | |
| | Camden National Corp. | | | 33,779 | | | | 1,423,109 | |
| | Cannae Holdings, Inc.* | | | 118,400 | | | | 2,016,352 | |
| | Capital City Bank Group, Inc. | | | 81,250 | | | | 1,863,875 | |
| | Capstar Financial Holdings, Inc.* | | | 1,900 | | | | 39,463 | |
| | Carolina Financial Corp. | | | 10,938 | | | | 406,347 | |
| | CB Financial Services, Inc. | | | 13,500 | | | | 409,725 | |
| | Central Pacific Financial Corp. | | | 17,400 | | | | 519,042 | |
| | Central Valley Community Bancorp | | | 51,000 | | | | 1,029,180 | |
| | Century Bancorp, Inc., Class A | | | 14,300 | | | | 1,118,975 | |
| | Charter Financial Corp. | | | 12,500 | | | | 219,250 | |
| | Chemung Financial Corp. | | | 12,293 | | | | 591,293 | |
| | Citizens Community Bancorp, Inc. | | | 17,500 | | | | 236,075 | |
| | Citizens, Inc.*+ | | | 17,200 | | | | 126,420 | |
| | Civista Bancshares, Inc. | | | 19,921 | | | | 438,262 | |
| | CNB Financial Corp. | | | 70,800 | | | | 1,857,792 | |
| | Codorus Valley Bancorp, Inc. | | | 7,766 | | | | 213,798 | |
| | Columbia Banking System, Inc. | | | 5,200 | | | | 225,888 | |
| | Community Bankers Trust Corp.* | | | 48,000 | | | | 391,200 | |
| | Community Financial Corp. (The)+ | | | 3,840 | | | | 147,072 | |
| | Community Trust Bancorp, Inc. | | | 32,500 | | | | 1,530,750 | |
| | ConnectOne Bancorp, Inc. | | | 58,000 | | | | 1,493,500 | |
| | Consumer Portfolio Services, Inc.* | | | 71,650 | | | | 297,348 | |
| | County Bancorp, Inc. | | | 8,700 | | | | 258,912 | |
| | | | | | | | | | |
| Industry | | Company | | Shares | | | Value | |
| | | |
| | | | | | | | | | |
Financials (continued) | | | | | | | | |
| | Cowen, Inc.*+ | | | 65,800 | | | $ | 898,170 | |
| | Crawford & Co., Class A+ | | | 44,000 | | | | 374,000 | |
| | Crawford & Co., Class B | | | 40,000 | | | | 384,800 | |
| | Customers Bancorp, Inc.* | | | 34,500 | | | | 896,655 | |
| | Donegal Group, Inc., Class A | | | 74,100 | | | | 1,281,930 | |
| | Eagle Bancorp Montana, Inc. | | | 1,500 | | | | 31,425 | |
| | eHealth, Inc.* | | | 15,000 | | | | 260,550 | |
| | EMC Insurance Group, Inc. | | | 39,025 | | | | 1,119,627 | |
| | Employers Holdings, Inc. | | | 90,900 | | | | 4,035,960 | |
| | Encore Capital Group, Inc.*+ | | | 59,100 | | | | 2,488,110 | |
| | Enova International, Inc.* | | | 92,400 | | | | 1,404,480 | |
| | Entegra Financial Corp.* | | | 13,600 | | | | 397,800 | |
| | Enterprise Bancorp, Inc. | | | 53,175 | | | | 1,810,609 | |
| | ESSA Bancorp, Inc. | | | 35,000 | | | | 548,450 | |
| | Evans Bancorp, Inc. | | | 9,000 | | | | 377,100 | |
| | EZCORP, Inc., Class A* | | | 121,100 | | | | 1,477,420 | |
| | Farmers Capital Bank Corp. | | | 30,400 | | | | 1,170,400 | |
| | Farmers National Banc Corp. | | | 150 | | | | 2,212 | |
| | FBL Financial Group, Inc., Class A | | | 45,666 | | | | 3,180,637 | |
| | Federal Agricultural Mortgage Corp., Class C | | | 18,200 | | | | 1,423,968 | |
| | Federated National Holding Co. | | | 52,000 | | | | 861,640 | |
| | Fidelity Southern Corp. | | | 61,400 | | | | 1,338,520 | |
| | Financial Institutions, Inc. | | | 40,300 | | | | 1,253,330 | |
| | First BanCorp Puerto Rico* | | | 469,100 | | | | 2,392,410 | |
| | First BanCorp Southern Pines NC | | | 102,856 | | | | 3,631,845 | |
| | First Bancorp, Inc. | | | 19,550 | | | | 532,346 | |
| | First Business Financial Services, Inc. | | | 14,100 | | | | 311,892 | |
| | First Commonwealth Financial Corp. | | | 106,900 | | | | 1,530,808 | |
| | First Community Bancshares, Inc. | | | 61,300 | | | | 1,761,149 | |
| | First Financial Corp. | | | 38,830 | | | | 1,760,940 | |
| | First Financial Northwest, Inc. | | | 26,400 | | | | 409,464 | |
| | First Guaranty Bancshares, Inc.+ | | | 5,499 | | | | 137,475 | |
| | First Internet Bancorp | | | 13,800 | | | | 526,470 | |
| | First Mid-Illinois Bancshares, Inc. | | | 2,000 | | | | 77,080 | |
| | First United Corp.* | | | 5,875 | | | | 102,519 | |
| | First US Bancshares, Inc. | | | 5,000 | | | | 64,000 | |
| | Flushing Financial Corp. | | | 43,300 | | | | 1,190,750 | |
| | |
Omni Tax-Managed Small-Cap Value Fund SCHEDULE OF INVESTMENTS (continued) | | |
Showing percentage of net assets as of December 31, 2017 (Unaudited)
| | | | | | | | | | |
| Industry | | Company | | Shares | | | Value | |
| | |
Common Stocks (continued) | | | | | | | | |
Financials (continued) | | | | | | | | |
| | Franklin Financial Network, Inc.* | | | 3,000 | | | $ | 102,300 | |
| | FS Bancorp, Inc. | | | 3,450 | | | | 188,266 | |
| | GAIN Capital Holdings, Inc. | | | 146,000 | | | | 1,460,000 | |
| | German American Bancorp, Inc. | | | 750 | | | | 26,498 | |
| | Great Southern Bancorp, Inc. | | | 39,850 | | | | 2,058,252 | |
| | Green Bancorp, Inc.* | | | 100,000 | | | | 2,030,000 | |
| | Greenhill & Co., Inc.+ | | | 55,000 | | | | 1,072,500 | |
| | Greenlight Capital Re, Ltd., Class A* | | | 27,000 | | | | 542,700 | |
| | Hallmark Financial Services, Inc.* | | | 50,158 | | | | 523,148 | |
| | Hawthorn Bancshares, Inc. | | | 12,000 | | | | 249,000 | |
| | HCI Group, Inc. | | | 25,000 | | | | 747,500 | |
| | Heartland Financial USA, Inc. | | | 61,950 | | | | 3,323,618 | |
| | Heritage Financial Corp. | | | 60,102 | | | | 1,851,142 | |
| | Heritage Insurance Holdings, Inc.+ | | | 20,000 | | | | 360,400 | |
| | Home Bancorp, Inc. | | | 15,597 | | | | 674,102 | |
| | HomeStreet, Inc.* | | | 54,000 | | | | 1,563,300 | |
| | HomeTrust Bancshares, Inc.* | | | 50,000 | | | | 1,287,500 | |
| | HopFed Bancorp, Inc. | | | 23,500 | | | | 334,170 | |
| | Horace Mann Educators Corp. | | | 94,950 | | | | 4,187,295 | |
| | Horizon Bancorp | | | 35,695 | | | | 992,321 | |
| | Impac Mortgage Holdings, Inc.* | | | 20,300 | | | | 206,248 | |
| | Independence Holding Co. | | | 14,950 | | | | 410,378 | |
| | Infinity Property & Casualty Corp. | | | 22,700 | | | | 2,406,200 | |
| | International Bancshares Corp. | | | 64,600 | | | | 2,564,620 | |
| | INTL.FCStone, Inc.* | | | 11,900 | | | | 506,107 | |
| | Investar Holding Corp. | | | 19,524 | | | | 470,528 | |
| | Investment Technology Group, Inc. | | | 76,000 | | | | 1,463,000 | |
| | Investors Title Co. | | | 1,000 | | | | 198,350 | |
| | James River Group Holdings, Ltd. | | | 65,600 | | | | 2,624,656 | |
| | Kansas City Life Insurance Co. | | | 24,900 | | | | 1,126,725 | |
| | Kingstone Cos., Inc. | | | 11,200 | | | | 210,560 | |
| | Lakeland Bancorp, Inc. | | | 100,040 | | | | 1,925,770 | |
| | Landmark Bancorp, Inc. | | | 2,315 | | | | 67,135 | |
| | LCNB Corp.+ | | | 1,500 | | | | 30,675 | |
| | Mackinac Financial Corp.+ | | | 13,400 | | | | 214,400 | |
| | Maiden Holdings, Ltd. | | | 64,450 | | | | 425,370 | |
| | MainSource Financial Group, Inc. | | | 41,765 | | | | 1,516,487 | |
| | | | | | | | | | |
| Industry | | Company | | Shares | | | Value | |
| | | |
| | | | | | | | | | |
Financials (continued) | | | | | | | | |
| | Marlin Business Services Corp. | | | 28,875 | | | $ | 646,800 | |
| | Mercantile Bank Corp. | | | 2,000 | | | | 70,740 | |
| | Meta Financial Group, Inc. | | | 20,078 | | | | 1,860,227 | |
| | Mid Penn Bancorp, Inc. | | | 11,200 | | | | 385,840 | |
| | Midland States Bancorp, Inc. | | | 55,417 | | | | 1,799,944 | |
| | MidSouth Bancorp, Inc. | | | 41,000 | | | | 543,250 | |
| | MidWestOne Financial Group, Inc. | | | 23,300 | | | | 781,249 | |
| | MMA Capital Management, LLC* | | | 500 | | | | 12,150 | |
| | MutualFirst Financial, Inc. | | | 700 | | | | 26,985 | |
| | National Bankshares, Inc.+ | | | 1,000 | | | | 45,450 | |
| | National Commerce Corp.* | | | 10,000 | | | | 402,500 | |
| | National Security Group, Inc. (The)+ | | | 200 | | | | 3,290 | |
| | National Western Life Group, Inc., Class A | | | 8,450 | | | | 2,797,119 | |
| | Nationstar Mortgage Holdings, Inc.* | | | 126,500 | | | | 2,340,250 | |
| | Navigators Group, Inc. (The) | | | 75,300 | | | | 3,667,110 | |
| | Nelnet, Inc., Class A | | | 36,900 | | | | 2,021,382 | |
| | Nicholas Financial, Inc.*+ | | | 18,400 | | | | 161,920 | |
| | NMI Holdings, Inc.,
Class A* | | | 185,000 | | | | 3,145,000 | |
| | Northeast Bancorp | | | 8,400 | | | | 194,460 | |
| | Northrim BanCorp, Inc. | | | 24,073 | | | | 814,871 | |
| | Northwest Bancshares, Inc. | | | 122,000 | | | | 2,041,060 | |
| | Norwood Financial Corp. | | | 1,500 | | | | 49,500 | |
| | Ocwen Financial Corp.*+ | | | 325,000 | | | | 1,017,250 | |
| | OFG Bancorp | | | 75,000 | | | | 705,000 | |
| | Old Line Bancshares, Inc. | | | 8,050 | | | | 236,992 | |
| | Old Second Bancorp, Inc. | | | 68,712 | | | | 937,919 | |
| | On Deck Capital, Inc.* | | | 95,400 | | | | 547,596 | |
| | Oppenheimer Holdings, Inc., Class A | | | 4,419 | | | | 118,429 | |
| | Opus Bank* | | | 15,000 | | | | 409,500 | |
| | Orrstown Financial Services, Inc. | | | 28,000 | | | | 707,000 | |
| | Oxbridge Re Holdings, Ltd. | | | 1,500 | | | | 3,225 | |
| | Parke Bancorp, Inc.+ | | | 15,752 | | | | 323,704 | |
| | Peapack Gladstone Financial Corp. | | | 19,968 | | | | 699,279 | |
| | Penns Woods Bancorp, Inc. | | | 1,000 | | | | 46,580 | |
| | Peoples Bancorp of North Carolina, Inc. | | | 5,280 | | | | 162,043 | |
| | Peoples Bancorp, Inc. | | | 39,550 | | | | 1,290,121 | |
| | Peoples Financial Services Corp.+ | | | 2,600 | | | | 121,108 | |
| | PHH Corp.* | | | 65,000 | | | | 669,500 | |
| | Piper Jaffray Cos. | | | 28,700 | | | | 2,475,375 | |
| | |
| 26 | | Semi-Annual Report | December 31, 2017 (Unaudited) |
| | |
Omni Tax-Managed Small-Cap Value Fund SCHEDULE OF INVESTMENTS (continued) | | |
Showing percentage of net assets as of December 31, 2017 (Unaudited)
| | | | | | | | | | |
| Industry | | Company | | Shares | | | Value | |
| | |
Common Stocks (continued) | | | | | | | | |
Financials (continued) | | | | | | | | |
| | Premier Financial Bancorp, Inc. | | | 28,672 | | | $ | 575,734 | |
| | Provident Financial Holdings, Inc. | | | 53,710 | | | | 988,264 | |
| | Prudential Bancorp, Inc.+ | | | 957 | | | | 16,843 | |
| | QCR Holdings, Inc. | | | 19,700 | | | | 844,145 | |
| | Regional Management Corp.* | | | 52,100 | | | | 1,370,751 | |
| | Reliant Bancorp, Inc. | | | 1,000 | | | | 25,640 | |
| | Renasant Corp. | | | 70,004 | | | | 2,862,464 | |
| | Republic Bancorp, Inc., Class A | | | 25,700 | | | | 977,114 | |
| | Riverview Bancorp, Inc. | | | 72,478 | | | | 628,384 | |
| | Safety Insurance Group, Inc. | | | 31,800 | | | | 2,556,720 | |
| | Salisbury Bancorp, Inc. | | | 1,183 | | | | 53,117 | |
| | Sandy Spring Bancorp, Inc. | | | 14,300 | | | | 557,986 | |
| | SB Financial Group, Inc. | | | 30,952 | | | | 572,302 | |
| | Security National Financial Corp., Class A* | | | 14,355 | | | | 76,082 | |
| | Selective Insurance Group, Inc. | | | 42,100 | | | | 2,471,270 | |
| | Shore Bancshares, Inc. | | | 60,400 | | | | 1,008,680 | |
| | SI Financial Group, Inc. | | | 35,500 | | | | 521,850 | |
| | Sierra Bancorp | | | 59,400 | | | | 1,577,664 | |
| | Southern National Bancorp of Virginia, Inc. | | | 22,539 | | | | 361,300 | |
| | State Auto Financial Corp. | | | 81,836 | | | | 2,383,064 | |
| | Stewart Information Services Corp. | | | 68,350 | | | | 2,891,205 | |
| | Summit Financial Group, Inc. | | | 20,600 | | | | 542,192 | |
| | Summit State Bank | | | 6,250 | | | | 80,000 | |
| | Sussex Bancorp+ | | | 15,000 | | | | 403,500 | |
| | Territorial Bancorp, Inc. | | | 21,900 | | | | 676,053 | |
| | Third Point Reinsurance Ltd.* | | | 42,300 | | | | 619,695 | |
| | Timberland Bancorp, Inc. | | | 32,000 | | | | 849,600 | |
| | Tiptree, Inc. | | | 56,200 | | | | 334,390 | |
| | TowneBank | | | 743 | | | | 22,847 | |
| | TriCo Bancshares | | | 200 | | | | 7,572 | |
| | TriState Capital Holdings, Inc.* | | | 36,760 | | | | 845,480 | |
| | Triumph Bancorp, Inc.* | | | 11,600 | | | | 365,400 | |
| | Two River Bancorp | | | 36,015 | | | | 652,952 | |
| | Union Bankshares Corp. | | | 84,148 | | | | 3,043,633 | |
| | United Community Financial Corp. | | | 163 | | | | 1,488 | |
| | United Fire Group, Inc. | | | 60,900 | | | | 2,775,822 | |
| | United Insurance Holdings Corp.+ | | | 78,400 | | | | 1,352,400 | |
| | Universal Insurance Holdings, Inc. | | | 81,795 | | | | 2,237,093 | |
| | | | | | | | | | |
| Industry | | Company | | Shares | | | Value | |
| | | |
| | | | | | | | | | |
Financials (continued) | | | | | | | | |
| | Univest Corp. of Pennsylvania | | | 36,915 | | | $ | 1,035,466 | |
| | Waddell & Reed Financial, Inc., Class A+ | | | 63,000 | | | | 1,407,420 | |
| | Walker & Dunlop, Inc.* | | | 58,175 | | | | 2,763,312 | |
| | Waterstone Financial, Inc. | | | 25,400 | | | | 433,070 | |
| | WesBanco, Inc. | | | 66,385 | | | | 2,698,550 | |
| | Westbury Bancorp, Inc.* | | | 3,750 | | | | 86,250 | |
| | Western New England Bancorp, Inc. | | | 30,312 | | | | 330,401 | |
| | World Acceptance Corp.*+ | | | 20,000 | | | | 1,614,400 | |
| | WSFS Financial Corp. | | | 15,600 | | | | 746,460 | |
| | Xenith Bankshares, Inc.*+ | | | 26,522 | | | | 897,239 | |
| | | | | | | | | | |
| | | | | | | | | 206,010,677 | |
Health Care - 2.21% | |
| | AMAG Pharmaceuticals, Inc.* | | | 17,000 | | | | 225,250 | |
| | AngioDynamics, Inc.* | | | 67,300 | | | | 1,119,199 | |
| | Bioanalytical Systems, Inc.* | | | 4,000 | | | | 9,880 | |
| | Community Health Systems, Inc.*+ | | | 275,000 | | | | 1,171,500 | |
| | Concert Pharmaceuticals, Inc.* | | | 59,300 | | | | 1,534,091 | |
| | Cumberland Pharmaceuticals, Inc.* | | | 20,300 | | | | 150,626 | |
| | Digirad Corp. | | | 36,447 | | | | 93,851 | |
| | Electromed, Inc.* | | | 10,000 | | | | 60,700 | |
| | FONAR Corp.* | | | 23,400 | | | | 569,790 | |
| | InfuSystems Holdings, Inc.* | | | 70,178 | | | | 161,409 | |
| | Juniper Pharmaceuticals, Inc.* | | | 50,000 | | | | 242,500 | |
| | Kewaunee Scientific Corp. | | | 2,500 | | | | 72,500 | |
| | Kindred Healthcare, Inc. | | | 71,700 | | | | 695,490 | |
| | Lannett Co., Inc.*+ | | | 60,000 | | | | 1,392,000 | |
| | LHC Group, Inc.* | | | 500 | | | | 30,625 | |
| | National HealthCare Corp. | | | 18,982 | | | | 1,156,763 | |
| | PDL BioPharma, Inc.* | | | 395,000 | | | | 1,082,300 | |
| | Quorum Health Corp.* | | | 26,700 | | | | 166,608 | |
| | Select Medical Holdings Corp.* | | | 185,000 | | | | 3,265,250 | |
| | Triple-S Management Corp., Class B* | | | 102,100 | | | | 2,537,185 | |
| | | | | | | | | | |
| | | | | | | | | 15,737,517 | |
Industrials - 18.54% | |
| | AAR Corp. | | | 6,660 | | | | 261,671 | |
| | Acacia Research Corp.* | | | 35,000 | | | | 141,750 | |
| | ACCO Brands Corp.* | | | 339,800 | | | | 4,145,560 | |
| | Aegion Corp.* | | | 120,300 | | | | 3,059,229 | |
| | AeroCentury Corp.* | | | 4,300 | | | | 65,532 | |
| | |
Omni Tax-Managed Small-Cap Value Fund SCHEDULE OF INVESTMENTS (continued) | | |
Showing percentage of net assets as of December 31, 2017 (Unaudited)
| | | | | | | | | | |
| Industry | | Company | | Shares | | | Value | |
| | |
Common Stocks (continued) | | | | | | | | |
Industrials (continued) | | | | | | | | |
| | Air T, Inc.* | | | 6,700 | | | $ | 165,155 | |
| | Air Transport Services Group, Inc.* | | | 149,226 | | | | 3,453,090 | |
| | Aircastle, Ltd. | | | 137,400 | | | | 3,213,786 | |
| | Alpha Pro Tech, Ltd.* | | | 30,500 | | | | 122,000 | |
| | American Railcar Industries, Inc.+ | | | 20,000 | | | | 832,800 | |
| | AMREP Corp.* | | | 21,000 | | | | 147,000 | |
| | ARC Document Solutions, Inc.* | | | 106,300 | | | | 271,065 | |
| | ArcBest Corp. | | | 55,400 | | | | 1,980,550 | |
| | Argan, Inc. | | | 4,000 | | | | 180,000 | |
| | Armstrong Flooring, Inc.* | | | 45,000 | | | | 761,400 | |
| | Arotech Corp.*+ | | | 35,596 | | | | 126,366 | |
| | Atlas Air Worldwide Holdings, Inc.* | | | 54,900 | | | | 3,219,885 | |
| | Briggs & Stratton Corp. | | | 169,450 | | | | 4,298,947 | |
| | Broadwind Energy, Inc.* | | | 12,192 | | | | 33,162 | |
| | Caesarstone, Ltd.*+ | | | 60,000 | | | | 1,320,000 | |
| | CAI International, Inc.* | | | 48,600 | | | | 1,376,352 | |
| | CBIZ, Inc.* | | | 170,033 | | | | 2,627,010 | |
| | CECO Environmental Corp. | | | 33,022 | | | | 169,403 | |
| | Cemtrex, Inc. | | | 19,000 | | | | 48,830 | |
| | Chart Industries, Inc.* | | | 63,175 | | | | 2,960,381 | |
| | Chicago Rivet & Machine Co. | | | 1,000 | | | | 31,800 | |
| | Civeo Corp.*+ | | | 443,200 | | | | 1,209,936 | |
| | Columbus McKinnon Corp. | | | 33,800 | | | | 1,351,324 | |
| | Commercial Vehicle Group, Inc.* | | | 60,000 | | | | 641,400 | |
| | Costamare, Inc. | | | 100,000 | | | | 577,000 | |
| | Covenant Transportation Group, Inc., Class A* | | | 80,650 | | | | 2,317,074 | |
| | CRA International, Inc. | | | 51,000 | | | | 2,292,450 | |
| | DLH Holdings Corp.* | | | 52,500 | | | | 323,400 | |
| | DMC Global, Inc. | | | 20,000 | | | | 501,000 | |
| | Ducommun, Inc.* | | | 39,750 | | | | 1,130,888 | |
| | Eastern Co. (The) | | | 20,104 | | | | 525,720 | |
| | Ecology & Environment, Inc., Class A | | | 2,811 | | | | 29,516 | |
| | Encore Wire Corp. | | | 6,500 | | | | 316,225 | |
| | Engility Holdings, Inc.* | | | 9,500 | | | | 269,515 | |
| | Ennis, Inc. | | | 149,265 | | | | 3,097,249 | |
| | FreightCar America, Inc. | | | 29,700 | | | | 507,276 | |
| | FTI Consulting, Inc.* | | | 56,500 | | | | 2,427,240 | |
| | General Finance Corp.* | | | 50,000 | | | | 340,000 | |
| | Gibraltar Industries, Inc.* | | | 6,706 | | | | 221,298 | |
| | Goldfield Corp. (The)* | | | 114,000 | | | | 558,600 | |
| | Great Lakes Dredge & Dock Corp.* | | | 189,800 | | | | 1,024,920 | |
| | Greenbrier Companies., Inc. (The)+ | | | 83,400 | | | | 4,445,220 | |
| | | | | | | | | | |
| Industry | | Company | | Shares | | | Value | |
| | |
| | | | | | | | |
Industrials (continued) | | | | | | | | |
| | Griffon Corp.+ | | | 112,150 | | | $ | 2,282,252 | |
| | Hardinge, Inc. | | | 82,600 | | | | 1,438,892 | |
| | Hawaiian Holdings, Inc. | | | 12,000 | | | | 478,200 | |
| | HC2 Holdings, Inc.* | | | 83,900 | | | | 499,205 | |
| | Heidrick & Struggles International, Inc. | | | 54,190 | | | | 1,330,364 | |
| | Heritage-Crystal Clean, Inc.* | | | 14,246 | | | | 309,850 | |
| | Hertz Global Holdings, Inc.*+ | | | 78,800 | | | | 1,741,480 | |
| | Highpower International, Inc.*+ | | | 55,922 | | | | 206,911 | |
| | Houston Wire & Cable Co.* | | | 22,100 | | | | 159,120 | |
| | Hurco Cos., Inc. | | | 17,615 | | | | 743,353 | |
| | Huron Consulting Group, Inc.* | | | 10,300 | | | | 416,635 | |
| | Hyster-Yale Materials Handling, Inc. | | | 2,700 | | | | 229,932 | |
| | ICF International, Inc.* | | | 35,000 | | | | 1,837,500 | |
| | IES Holdings, Inc.*+ | | | 3,600 | | | | 62,100 | |
| | Innovative Solutions & Support, Inc.* | | | 1,300 | | | | 3,822 | |
| | Kelly Services, Inc., Class A | | | 68,400 | | | | 1,865,268 | |
| | Key Technology, Inc.* | | | 2,500 | | | | 46,075 | |
| | Kratos Defense & Security Solutions, Inc.*+ | | | 10,000 | | | | 105,900 | |
| | L.B. Foster Co., Class A* | | | 39,400 | | | | 1,069,710 | |
| | L.S. Starrett Co. (The), Class A | | | 9,400 | | | | 80,840 | |
| | Marten Transport, Ltd. | | | 100,776 | | | | 2,045,753 | |
| | McGrath RentCorp | | | 93,000 | | | | 4,369,140 | |
| | Miller Industries, Inc. | | | 22,700 | | | | 585,660 | |
| | Navigant Consulting, Inc.* | | | 215,900 | | | | 4,190,619 | |
| | Navios Maritime Holdings, Inc.* | | | 310,914 | | | | 373,097 | |
| | Nexeo Solutions, Inc.* | | | 116,100 | | | | 1,056,510 | |
| | NN, Inc. | | | 47,500 | | | | 1,311,000 | |
| | Northwest Pipe Co.* | | | 20,100 | | | | 384,714 | |
| | Orion Group Holdings, Inc.* | | | 79,678 | | | | 623,879 | |
| | PAM Transportation Services, Inc.* | | | 10,000 | | | | 347,800 | |
| | Park-Ohio Holdings Corp. | | | 10,000 | | | | 459,500 | |
| | Patriot Transportation Holding, Inc.* | | | 7,500 | | | | 131,925 | |
| | Performant Financial Corp.* | | | 93,833 | | | | 154,824 | |
| | Powell Industries, Inc. | | | 25,000 | | | | 716,250 | |
| | Preformed Line Products Co. | | | 2,200 | | | | 156,310 | |
| | Quad/Graphics, Inc. | | | 52,500 | | | | 1,186,500 | |
| | Quanex Building Products Corp. | | | 35,000 | | | | 819,000 | |
| | Radiant Logistics, Inc.* | | | 53,200 | | | | 244,720 | |
| | RCM Technologies, Inc. | | | 14,000 | | | | 88,060 | |
| | |
| 28 | | Semi-Annual Report | December 31, 2017 (Unaudited) |
| | |
Omni Tax-Managed Small-Cap Value Fund SCHEDULE OF INVESTMENTS (continued) | | |
Showing percentage of net assets as of December 31, 2017 (Unaudited)
| | | | | | | | | | |
| Industry | | Company | | Shares | | | Value | |
| | |
Common Stocks (continued) | | | | | | | | |
Industrials (continued) | |
| | RPX Corp. | | | 120,096 | | | $ | 1,614,090 | |
| | Rush Enterprises, Inc., Class A* | | | 48,600 | | | | 2,469,366 | |
| | Rush Enterprises, Inc., Class B* | | | 41,700 | | | | 2,010,357 | |
| | Safe Bulkers, Inc.* | | | 151,450 | | | | 489,184 | |
| | Sino-Global Shipping America, Ltd.*+ | | | 22,300 | | | | 57,088 | |
| | SkyWest, Inc. | | | 120,200 | | | | 6,382,620 | |
| | Spartan Motors, Inc. | | | 88,600 | | | | 1,395,450 | |
| | SPX FLOW, Inc.* | | | 20,000 | | | | 951,000 | |
| | Steelcase, Inc., Class A | | | 223,000 | | | | 3,389,600 | |
| | Sterling Construction Co., Inc.* | | | 35,000 | | | | 569,800 | |
| | Textainer Group Holdings Ltd.*+ | | | 121,300 | | | | 2,607,950 | |
| | Titan International, Inc. | | | 96,700 | | | | 1,245,496 | |
| | Titan Machinery, Inc.* | | | 75,500 | | | | 1,598,335 | |
| | Triumph Group, Inc. | | | 55,000 | | | | 1,496,000 | |
| | TrueBlue, Inc.* | | | 77,550 | | | | 2,132,625 | |
| | Tutor Perini Corp.* | | | 96,200 | | | | 2,438,670 | |
| | Ultralife Corp.* | | | 57,350 | | | | 375,642 | |
| | USA Truck, Inc.* | | | 9,635 | | | | 174,683 | |
| | Vectrus, Inc.* | | | 5,000 | | | | 154,250 | |
| | Veritiv Corp.* | | | 31,133 | | | | 899,744 | |
| | Viad Corp. | | | 27,894 | | | | 1,545,328 | |
| | Virco Manufacturing Corp. | | | 200 | | | | 1,010 | |
| | VSE Corp. | | | 31,660 | | | | 1,533,294 | |
| | Wabash National Corp. | | | 96,000 | | | | 2,083,200 | |
| | Westport Fuel Systems, Inc.*+ | | | 995 | | | | 3,741 | |
| | Willis Lease Finance Corp.* | | | 50,950 | | | | 1,272,222 | |
| | | | | | | | | | |
| | | | | | | | | 132,163,390 | |
| |
Information Technology - 7.68% | |
| | Alpha & Omega Semiconductor, Ltd.* | | | 161,905 | | | | 2,648,766 | |
| | Amkor Technology, Inc.* | | | 255,200 | | | | 2,564,760 | |
| | AutoWeb, Inc.* | | | 600 | | | | 5,406 | |
| | Aviat Networks, Inc.* | | | 13,800 | | | | 209,346 | |
| | AXT, Inc.* | | | 25,000 | | | | 217,500 | |
| | Bel Fuse, Inc., Class B | | | 63,600 | | | | 1,601,130 | |
| | Benchmark Electronics, Inc.* | | | 121,800 | | | | 3,544,380 | |
| | Black Box Corp. | | | 23,775 | | | | 84,401 | |
| | Blucora, Inc.* | | | 82,400 | | | | 1,821,040 | |
| | ClearOne, Inc.+ | | | 5,000 | | | | 44,750 | |
| | Communications Systems, Inc. | | | 5,800 | | | | 21,112 | |
| | Computer Task Group, Inc.* | | | 84,900 | | | | 432,990 | |
| | Comtech Telecommuni-cations Corp. | | | 61,785 | | | | 1,366,684 | |
| | | | | | | | | | |
| Industry | | Company | | Shares | | | Value | |
| | | |
| | | | | | | | | | |
Information Technology (continued) | |
| | Concurrent Computer Corp. | | | 3,400 | | | $ | 19,618 | |
| | CSP, Inc. | | | 5,150 | | | | 81,834 | |
| | CVD Equipment Corp.*+ | | | 1,500 | | | | 17,430 | |
| | DASAN Zhone Solutions, Inc.* | | | 6,800 | | | | 62,968 | |
| | Digi International, Inc.* | | | 58,325 | | | | 557,004 | |
| | Diodes, Inc.* | | | 112,600 | | | | 3,228,242 | |
| | Edgewater Technology, Inc.* | | | 9,810 | | | | 61,214 | |
| | Electro Scientific Industries, Inc.* | | | 15,000 | | | | 321,450 | |
| | Finjan Holdings, Inc.*+ | | | 20,700 | | | | 44,712 | |
| | FORM Holdings Corp.* | | | 30,000 | | | | 41,100 | |
| | GSE Systems, Inc.* | | | 22,500 | | | | 73,125 | |
| | IEC Electronics Corp.* | | | 17,700 | | | | 72,924 | |
| | Insight Enterprises, Inc.* | | | 43,383 | | | | 1,661,135 | |
| | inTEST Corp.* | | | 54,500 | | | | 471,425 | |
| | IXYS Corp.* | | | 39,000 | | | | 934,050 | |
| | KEMET Corp.* | | | 126,750 | | | | 1,908,855 | |
| | Key Tronic Corp.* | | | 18,600 | | | | 127,038 | |
| | Kimball Electronics, Inc.* | | | 64,600 | | | | 1,178,950 | |
| | Knowles Corp.* | | | 156,800 | | | | 2,298,688 | |
| | Kulicke & Soffa Industries, Inc.* | | | 100,300 | | | | 2,440,800 | |
| | KVH Industries, Inc.* | | | 18,200 | | | | 188,370 | |
| | Liquidity Services, Inc.* | | | 37,350 | | | | 181,148 | |
| | ManTech International Corp., Class A | | | 78,882 | | | | 3,959,088 | |
| | Meet Group Inc. (The)* | | | 26,831 | | | | 75,663 | |
| | Mind CTI Ltd. | | | 500 | | | | 1,385 | |
| | Net 1 UEPS Technologies, Inc.* | | | 171,100 | | | | 2,034,379 | |
| | NetSol Technologies, Inc.*+ | | | 11,680 | | | | 55,480 | |
| | Network-1 Technologies, Inc. | | | 50,000 | | | | 120,000 | |
| | Nortech Systems, Inc.* | | | 1,500 | | | | 5,790 | |
| | PCM, Inc.* | | | 82,175 | | | | 813,532 | |
| | PC-Tel, Inc. | | | 56,000 | | | | 412,720 | |
| | Photronics, Inc.* | | | 171,470 | | | | 1,461,782 | |
| | Plexus Corp.* | | | 500 | | | | 30,360 | |
| | PRGX Global, Inc.* | | | 16,377 | | | | 116,277 | |
| | RELM Wireless Corp. | | | 35,000 | | | | 124,250 | |
| | RF Industries, Ltd.+ | | | 35,000 | | | | 94,500 | |
| | Sanmina Corp.* | | | 48,800 | | | | 1,610,400 | |
| | ScanSource, Inc.* | | | 63,200 | | | | 2,262,560 | |
| | SigmaTron International, Inc.* | | | 4,000 | | | | 40,560 | |
| | SMTC Corp.* | | | 13,500 | | | | 25,650 | |
| | Sohu.com, Inc.* | | | 17,500 | | | | 758,625 | |
| | SunPower Corp.*+ | | | 160,000 | | | | 1,348,800 | |
| | Sykes Enterprises, Inc.* | | | 79,250 | | | | 2,492,412 | |
| | Synacor, Inc.* | | | 15,000 | | | | 34,500 | |
| | |
Omni Tax-Managed Small-Cap Value Fund SCHEDULE OF INVESTMENTS (continued) | | |
Showing percentage of net assets as of December 31, 2017 (Unaudited)
| | | | | | | | | | |
| Industry | | Company | | Shares | | | Value | |
| |
Common Stocks (continued) | |
Information Technology (continued) | |
| | Systemax, Inc. | | | 21,000 | | | $ | 698,670 | |
| | TESSCO Technologies, Inc. | | | 15,250 | | | | 307,288 | |
| | Trio-Tech International* | | | 13,000 | | | | 91,130 | |
| | TSR, Inc. | | | 1,385 | | | | 7,410 | |
| | TTM Technologies, Inc.* | | | 219,402 | | | | 3,438,029 | |
| | Ultra Clean Holdings, Inc.* | | | 32,000 | | | | 738,880 | |
| | Vishay Precision Group, Inc.* | | | 31,667 | | | | 796,425 | |
| | Wayside Technology Group, Inc. | | | 7,200 | | | | 120,240 | |
| | YuMe, Inc. | | | 25,000 | | | | 119,500 | |
| | | | | | | | | | |
| | | | | | | | | 54,730,630 | |
| |
Materials - 6.76% | |
| | AgroFresh Solutions, Inc.* | | | 51,700 | | | | 382,580 | |
| | American Vanguard Corp. | | | 34,200 | | | | 672,030 | |
| | Boise Cascade Co. | | | 65,000 | | | | 2,593,500 | |
| | Carpenter Technology Corp. | | | 50,400 | | | | 2,569,896 | |
| | China Green Agriculture, Inc.* | | | 43,500 | | | | 53,940 | |
| | Clearwater Paper Corp.* | | | 16,182 | | | | 734,663 | |
| | Core Molding Technologies, Inc. | | | 11,900 | | | | 258,230 | |
| | Flexible Solutions International, Inc.* | | | 5,000 | | | | 9,100 | |
| | Friedman Industries, Inc. | | | 5,000 | | | | 28,400 | |
| | FutureFuel Corp. | | | 54,500 | | | | 767,905 | |
| | Gulf Resources, Inc.* | | | 78,150 | | | | 115,662 | |
| | Haynes International, Inc. | | | 22,200 | | | | 711,510 | |
| | Hecla Mining Co. | | | 749,000 | | | | 2,973,530 | |
| | Kaiser Aluminum Corp. | | | 23,350 | | | | 2,494,948 | |
| | Kraton Corp.* | | | 169,500 | | | | 8,164,815 | |
| | Materion Corp. | | | 71,700 | | | | 3,484,620 | |
| | Mercer International, Inc. | | | 109,950 | | | | 1,572,285 | |
| | Olympic Steel, Inc. | | | 22,300 | | | | 479,227 | |
| | PH Glatfelter Co. | | | 113,900 | | | | 2,442,016 | |
| | Rayonier Advanced Materials, Inc.+ | | | 74,500 | | | | 1,523,525 | |
| | Resolute Forest Products, Inc.* | | | 157,500 | | | | 1,740,375 | |
| | Schnitzer Steel Industries, Inc., Class A | | | 77,600 | | | | 2,599,600 | |
| | Stepan Co. | | | 50,400 | | | | 3,980,088 | |
| | SunCoke Energy, Inc.* | | | 216,200 | | | | 2,592,238 | |
| | Synalloy Corp. | | | 5,000 | | | | 67,000 | |
| | TimkenSteel Corp.* | | | 33,800 | | | | 513,422 | |
| | Trecora Resources* | | | 23,200 | | | | 313,200 | |
| | | | | | | | | | |
| Industry | | Company | | Shares | | | Value | |
| | | |
| | | | | | | | | | |
Materials (continued) | |
| | Tredegar Corp. | | | 53,900 | | | $ | 1,034,880 | |
| | Tronox, Ltd., Class A | | | 124,000 | | | | 2,543,240 | |
| | Universal Stainless & Alloy Products, Inc.* | | | 16,250 | | | | 348,075 | |
| | Verso Corp., Class A* | | | 25,000 | | | | 439,250 | |
| | | | | | | | | | |
| | | | | | | | | 48,203,750 | |
|
Real Estate - 0.22% | |
| | Consolidated-Tomoka Land Co. | | | 8,000 | | | | 508,000 | |
| | Forestar Group, Inc.*+ | | | 11,025 | | | | 242,550 | |
| | RE/MAX Holdings, Inc., Class A | | | 16,900 | | | | 819,650 | |
| | | | | | | | | | |
| | | | | | | | | 1,570,200 | |
|
Telecommunication Services - 1.27% | |
| | Alaska Communications Systems Group, Inc.* | | | 344,187 | | | | 922,421 | |
| | ATN International, Inc. | | | 22,000 | | | | 1,215,720 | |
| | Hawaiian Telcom Holdco, Inc.* | | | 17,600 | | | | 543,136 | |
| | Iridium Communications, Inc.*+ | | | 392,125 | | | | 4,627,075 | |
| | Spok Holdings, Inc. | | | 111,100 | | | | 1,738,715 | |
| | | | | | | | | | |
| | | | | | | | | 9,047,067 | |
| | | | | | | | | | |
TOTAL COMMON STOCKS - 99.61% | | | | 709,998,891 | |
| | | | | | | | | | |
(Cost $519,836,291) | | | | | | | | |
|
RIGHTS - 0.01% | |
| | NewStar Financial, Inc., expiring 12/26/19*D | | | 105,100 | | | | 56,754 | |
| | | | | | | | | | |
TOTAL RIGHTS - 0.01% | | | | 56,754 | |
| | | | | | | | | | |
(Cost $105,100) | | | | | | | | |
|
WARRANTS - 0.00% | |
| | Eagle Bulk Shipping, Inc., expiring 10/15/21* | | | 8,501 | | | | 765 | |
| | | | | | | | | | |
TOTAL WARRANTS - 0.00% | | | | 765 | |
| | | | | | | | | | |
(Cost $ 70,770) | | | | | | | | |
| | |
| 30 | | Semi-Annual Report | December 31, 2017 (Unaudited) |
| | |
Omni Tax-Managed Small-Cap Value Fund SCHEDULE OF INVESTMENTS (continued) | | |
Showing percentage of net assets as of December 31, 2017 (Unaudited)
| | | | | | | | | | | | | | | | |
| | | Rate^ | | | Shares | | | Value | | | | |
MONEY MARKET FUND - 1.20% | | | | | |
Fidelity Investments Money Market Government Portfolio
Class I | | | 1.14 | % | | | 8,588,116 | | | $ | 8,588,116 | | | | | |
| | | | | | | | | | | | | | | | |
TOTAL MONEY MARKET
FUND - 1.20% | | | | 8,588,116 | | | | | |
| | | | | | | | | | | | | | | | |
(Cost $8,588,116) | | | | | | | | | | | | | | | | |
| |
INVESTMENTS PURCHASED WITH CASH PROCEEDS FROM SECURITIES
LENDING - 7.11% | | | | | |
Fidelity Investments Money Market Government Portfolio Class I** | | | 1.14 | % | | | 50,678,658 | | | | 50,678,658 | | | | | |
| | | | | | | | | | | | | | | | |
TOTAL INVESTMENTS PURCHASED WITH CASH PROCEEDS FROM SECURITIES LENDING - 7.11% | | | | 50,678,658 | | | | | |
| | | | | | | | | | | | | | | | |
(Cost $50,678,658) | | | | | | | | | | | | | | | | |
| | |
TOTAL INVESTMENTS - 107.93% | | | $ | 769,323,184 | | | | | |
(Cost $579,278,935) | | | | | | | | | | | | | | | | |
Liabilities in Excess of Other
Assets - (7.93%) | | | | (56,553,436 | ) | | | | |
| | | | | | | | | | | | | | | | |
NET ASSETS - 100.00% | | | $ | 712,769,748 | | | | | |
| | | | | | | | | | | | | | | | |
| * | Non-income producing security. |
| ** | This security represents the investment of the collateral received in connection with securities out on loan as of December 31, 2017. |
| ^ | Rate disclosed as of December 31, 2017. |
| D | Security was fair valued under procedures adopted by the Board of Directors (see Note 2). As such, the security is classified as Level 3 in the fair value hierarchy. |
| + | This security or a portion of the security is out on loan as of December 31, 2017. Total loaned securities had a value of $48,652,736 as of December 31, 2017. |
LLC - Limited Liability Company
PLC - Public Limited Company
| | | | | | | | | | | | | | | | |
| | | | | | | | | | | | | | | | | |
Summary of inputs used to value the Fund’s investments as of 12/31/2017 (See Note 2 in Notes to Financial Statements): | |
| | | Valuation Inputs | |
| |
| | | Investment in Securities (Value) | |
| |
| |
| Level 1
Quoted
Prices |
| |
| Level 2
Significant
Observable
Inputs |
| |
| Level 3
Significant
Unobservable
Inputs |
| �� | | Total | |
| |
| | | | |
Common Stocks (a) | | $ | 709,998,891 | | | $ | — | | | $ | — | | | $ | 709,998,891 | |
Rights | | | — | | | | — | | | | 56,754 | | | | 56,754 | |
Warrants | | | 765 | | | | — | | | | — | | | | 765 | |
Money Market Fund | | | — | | | | 8,588,116 | | | | — | | | | 8,588,116 | |
Investments Purchased with Cash Proceeds from Securities Lending | | | — | | | | 50,678,658 | | | | — | | | | 50,678,658 | |
| | | | | | | | | | | | | | | | |
TOTAL | | $ | 709,999,656 | | | $ | 59,266,774 | | | $ | 56,754 | | | $ | 769,323,184 | |
| | | | | | | | | | | | | | | | |
| (a) | - please refer to the Schedule of Investments for the industry classifications of these portfolio holdings |
Following is a reconciliation of Level 3 investments for which significant unobservable inputs were used to determine fair value:
| | | | | | | | |
| | | Investment in Securities (Value) | |
| |
| | | Rights | | | | Total | |
| |
Balance as of 06/30/2017 | | $ | — | | | $ | — | |
Purchases | | | 105,100 | | | | 105,100 | |
Change in unrealized appreciation/ (depreciation) | | | (48,346 | ) | | | (48,346 | ) |
| | | | | | | | |
Balance as of 12/31/2017 | | $ | 56,754 | | | $ | 56,754 | |
| | | | | | | | |
Net change in unrealized appreciation (depreciation) from investments held as of 12/31/2017 | | $ | (48,346 | ) | | $ | (48,346 | ) |
| | | | | | | | |
| 1 | Transfers in represent the value as of the beginning of the reporting period, for any investment security where significant transfers in the pricing level occurred during the period. The purchase value is used in situations where the investment was not held as of the beginning of the period. |
See Notes to Financial Statements.
| | |
STATEMENTS OF ASSETS AND LIABILITIES | | |
December 31, 2017 (Unaudited)
| | | | | | | | | | | | | | | | | | | | |
| ASSETS | | Omni Small-Cap Value | | | | | Omni Tax-Managed
Small-Cap Value | | | |
| | | | | | |
Investments at value | | | $845,795,606 | | | | | | | | | | $769,323,184 | | | | | | | |
| | | | | | |
Receivables: | | | | | | | | | | | | | | | | | | | | |
| | | | | | |
Portfolio securities sold | | | 1,278,587 | | | | | | | | | | - | | | | | | | |
| | | | | | |
Fund shares sold | | | 3,007,842 | | | | | | | | | | 1,020,968 | | | | | | | |
| | | | | | |
Dividends and interest | | | 523,119 | | | | | | | | | | 416,504 | | | | | | | |
| | | | | | |
Prepaid expenses | | | 48,270 | | | | | | | | | | 25,583 | | | | | | | |
| | | | | | |
Total assets | | | 850,653,424 | | | | | | | | | | 770,786,239 | | | | | | | |
| | | | | | |
LIABILITIES | | | | | | | | | | | | | | | | | | | | |
| | | | | | |
Payables: | | | | | | | | | | | | | | | | | | | | |
| | | | | | |
Portfolio securities purchased | | | 5,049,000 | | | | | | | | | | 6,647,039 | | | | | | | |
| | | | | | |
Fund shares redeemed | | | 1,341,480 | | | | | | | | | | 233,736 | | | | | | | |
| | | | | | |
Payable upon return of securities loaned | | | 48,224,394 | | | | | | | | | | 50,678,658 | | | | | | | |
| | | | | | |
Accrued Liabilities: | | | | | | | | | | | | | | | | | | | | |
| | | | | | |
Investment advisory fees | | | 275,367 | | | | | | | | | | 244,890 | | | | | | | |
| | | | | | |
Administration fees | | | 18,717 | | | | | | | | | | 16,479 | | | | | | | |
| | | | | | |
Other | | | 206,410 | | | | | | | | | | 195,689 | | | | | | | |
| | | | | | |
Total liabilities | | | 55,115,368 | | | | | | | | | | 58,016,491 | | | | | | | |
| | | | | | |
NET ASSETS | | | $795,538,056 | | | | | | | | | | $712,769,748 | | | | | | | |
| | | | | | |
NET ASSETS REPRESENT | | | | | | | | | | | | | | | | | | | | |
| | | | | | |
Paid-in capital | | | $569,207,009 | | | | | | | | | | $501,284,516 | | | | | | | |
| | | | | | |
Undistributed net investment income | | | 50,109 | | | | | | | | | | 12,699 | | | | | | | |
| | | | | | |
Undistributed net realized gain on investments | | | 18,071,104 | | | | | | | | | | 21,428,284 | | | | | | | |
| | | | | | |
Net unrealized appreciation on investments | | | 208,209,834 | | | | | | | | | | 190,044,249 | | | | | | | |
| | | | | | |
NET ASSETS | | | $795,538,056 | | | | | | | | | | $712,769,748 | | | | | | | |
| | | | | | |
Shares of common stock outstanding of $.001 par value* | | | 42,626,631 | | | | | | | | | | 39,818,589 | | | | | | | |
| | | | | | |
Net asset value, offering price and redemption price per share | | | $ 18.66 | | | | | | | | | | $ 17.90 | | | | | | | |
| | | | | | |
Total investments at cost | | | $637,585,772 | | | | | | | | | | $579,278,935 | | | | | | | |
* See Note 1 - Organization in the Notes to Financial Statements for shares authorized for each Fund.
See Notes to Financial Statements.
| | |
| 32 | | Semi-Annual Report | December 31, 2017 (Unaudited) |
| | |
STATEMENTS OF OPERATIONS | | |
Six Months Ended December 31, 2017 (Unaudited)
| | | | | | | | | | | | | | | | | | | | |
| | | Omni
Small-Cap Value | | | | Omni Tax-Managed
Small-Cap Value | | |
| | | | |
INVESTMENT INCOME | | | | | | | | | | | | | | | | | | | | |
| | | | |
Dividends | | | | $ 5,188,729 | | | | | | | | | | $ 4,559,036 | | | | | | |
| | | | |
Less: foreign taxes withheld | | | | (1,190 | ) | | | | | | | | | (1,056 | ) | | | | | |
| | | | |
Securities lending | | | | 809,179 | | | | | | | | | | 625,574 | | | | | | |
| | | | |
Total Investment Income | | | | 5,996,718 | | | | | | | | | | 5,183,554 | | | | | | |
| | | | |
EXPENSES | | | | | | | | | | | | | | | | | | | | |
| | | | |
Investment advisory fees | | | | 1,896,151 | | | | | | | | | | 1,710,326 | | | | | | |
| | | | |
Administration fees | | | | 104,041 | | | | | | | | | | 93,857 | | | | | | |
| | | | |
Accounting fees | | | | 89,154 | | | | | | | | | | 83,846 | | | | | | |
| | | | |
Transfer agent fees | | | | 8,869 | | | | | | | | | | 8,695 | | | | | | |
| | | | |
Professional fees | | | | 76,492 | | | | | | | | | | 69,639 | | | | | | |
| | | | |
Custody fees | | | | 11,719 | | | | | | | | | | 11,083 | | | | | | |
| | | | |
Blue sky fees | | | | 27,753 | | | | | | | | | | 33,595 | | | | | | |
| | | | |
Directors’ and officers’ fees | | | | 41,509 | | | | | | | | | | 37,571 | | | | | | |
| | | | |
Shareholder servicing fees | | | | 314,914 | | | | | | | | | | 289,812 | | | | | | |
| | | | |
Reports to shareholders | | | | 18,520 | | | | | | | | | | 14,491 | | | | | | |
| | | | |
Miscellaneous expenses | | | | 54,940 | | | | | | | | | | 51,071 | | | | | | |
| | | | |
Total Expenses | | | | 2,644,062 | | | | | | | | | | 2,403,986 | | | | | | |
| | | | |
Less investment advisory fees waived | | | | (368,681 | ) | | | | | | | | | (351,595 | ) | | | | | |
| | | | |
Net Expenses | | | | 2,275,381 | | | | | | | | | | 2,052,391 | | | | | | |
| | | | |
NET INVESTMENT INCOME | | | | 3,721,337 | | | | | | | | | | 3,131,163 | | | | | | |
| | | | |
NET REALIZED AND UNREALIZED GAIN ON INVESTMENTS | | | | | | | | | | | | | | | | | | | | |
| | | | |
Realized Gain on: | | | | | | | | | | | | | | | | | | | | |
| | | | |
Investments | | | | 33,724,824 | | | | | | | | | | 32,139,459 | | | | | | |
| | | | |
Change in Unrealized Appreciation on: | | | | | | | | | | | | | | | | | | | | |
| | | | |
Investments | | | | 34,721,971 | | | | | | | | | | 24,413,011 | | | | | | |
| | | | |
Net Realized and Unrealized Gain on Investments | | | | 68,446,795 | | | | | | | | | | 56,552,470 | | | | | | |
| | | | |
NET INCREASE IN NET ASSETS RESULTING FROM OPERATIONS | | | | $72,168,132 | | | | | | | | | | $59,683,633 | | | | | | |
See Notes to Financial Statements.
| | |
STATEMENTS OF CHANGES IN NET ASSETS | | |
| | | | | | | | | | | | | | | | | | | | |
| | | Omni Small-Cap Value | | Omni Tax-Managed Small-Cap Value |
| | | | |
| | | Six Months Ended
December 31, 2017
(Unaudited) | | Year Ended
June 30, 2017 | | Six Months Ended
December 31, 2017 (Unaudited) | | Year Ended
June 30, 2017 |
| | | | |
OPERATIONS | | | | | | | | | | | | | | | | | | | | |
| | | | |
Net investment income | | | | $ 3,721,337 | | | | | $ 6,528,404 | | | | | $ 3,131,163 | | | | | $ 6,198,317 | |
| | | | |
Net realized gain on investments | | | | 33,724,824 | | | | | 39,014,429 | | | | | 32,139,459 | | | | | 30,306,951 | |
| | | | |
Net change in unrealized appreciation (depreciation) on investments | | | | 34,721,971 | | | | | 93,770,758 | | | | | 24,413,011 | | | | | 89,592,888 | |
| | | | |
Net increase in net assets resulting from operations | | | | 72,168,132 | | | | | 139,313,591 | | | | | 59,683,633 | | | | | 126,098,156 | |
| | | | |
DISTRIBUTIONS: | | | | | | | | | | | | | | | | | | | | |
| | | | |
From net investment income | | | | (6,405,244 | ) | | | | (6,191,149 | ) | | | | (8,820,586 | ) | | | | (4,983,381 | ) |
| | | | |
From net realized gains | | | | (44,141,688 | ) | | | | - | | | | | (31,691,559 | ) | | | | - | |
| | | | |
Net decrease in net assets resulting from distributions | | | | (50,546,932 | ) | | | | (6,191,149 | ) | | | | (40,512,145 | ) | | | | (4,983,381 | ) |
| | | | |
SHARE TRANSACTIONS: | | | | | | | | | | | | | | | | | | | | |
| | | | |
Proceeds from sale of shares | | | | 84,014,313 | | | | | 137,957,334 | | | | | 76,103,472 | | | | | 115,240,335 | |
| | | | |
Reinvestment of distributions | | | | 50,537,299 | | | | | 6,188,289 | | | | | 40,413,658 | | | | | 4,967,931 | |
| | | | |
Cost of shares redeemed | | | | (70,991,692 | ) | | | | (125,196,672 | ) | | | | (66,134,219 | ) | | | | (104,102,649 | ) |
| | | | |
Net increase in net assets resulting from share transactions | | | | 63,559,920 | | | | | 18,948,951 | | | | | 50,382,911 | | | | | 16,105,617 | |
| | | | |
Net increase in net assets | | | | 85,181,120 | | | | | 152,071,393 | | | | | 69,554,399 | | | | | 137,220,392 | |
| | | | |
NET ASSETS: | | | | | | | | | | | | | | | | | | | | |
| | | | |
Beginning of period | | | | 710,356,936 | | | | | 558,285,543 | | | | | 643,215,349 | | | | | 505,994,957 | |
| | | | |
End of period* | | | | $795,538,056 | | | | | $710,356,936 | | | | | $712,769,748 | | | | | $643,215,349 | |
| | | | |
SHARES ISSUED & REDEEMED | | | | | | | | | | | | | | | | | | | | |
| | | | |
Issued | | | | 4,536,644 | | | | | 7,807,866 | | | | | 4,279,108 | | | | | 6,888,395 | |
| | | | |
Distributions reinvested | | | | 2,766,136 | | | | | 328,117 | | | | | 2,304,085 | | | | | 275,079 | |
| | | | |
Redeemed | | | | (3,825,327 | ) | | | | (7,074,972 | ) | | | | (3,756,700 | ) | | | | (6,209,008 | ) |
| | | | |
Net increase in shares | | | | 3,477,453 | | | | | 1,061,011 | | | | | 2,826,493 | | | | | 954,466 | |
| | | | |
Outstanding at beginning of period | | | | 39,149,178 | | | | | 38,088,167 | | | | | 36,992,096 | | | | | 36,037,630 | |
| | | | |
Outstanding at end of period | | | | 42,626,631 | | | | | 39,149,178 | | | | | 39,818,589 | | | | | 36,992,096 | |
| | | | |
* Including undistributed net investment income of: | | | | $ 50,109 | | | | | $ 2,734,016 | | | | | $ 12,699 | | | | | $ 5,702,122 | |
See Notes to Financial Statements.
| | |
| 34 | | Semi-Annual Report | December 31, 2017 (Unaudited) |
(for a share outstanding throughout each period indicated)
| | | | | | | | | | | | | | | | | | | | | | | | |
| OMNI SMALL-CAP VALUE | | | | | | | | | | | | | | | | | | | | | | | | |
| | | For the
Period Ended
12/31/17
(Unaudited) | | | Year Ended June 30 | |
| | | | 2017 | | | 2016 | | | 2015 | | | 2014 | | | 2013 | |
| | | | | | | | | | | | | | | | | | | | | | | | |
Net Asset Value, Beginning of Period | | | $18.14 | | | | $14.66 | | | | $15.49 | | | | $16.63 | | | | $14.11 | | | | $11.11 | |
| | | | | | | | | | | | | | | | | | | | | | | | |
| | | | | |
Income from Investment Operations: | | | | | | | | | | | | | | | | | | | | | |
| | | | | | |
Net Investment Income(a) | | | 0.09 | | | | 0.17 | | | | 0.17 | | | | 0.14 | | | | 0.11 | | | | 0.17 | |
Net Realized and Unrealized Gain (Loss) | | | 1.68 | | | | 3.48 | | | | (0.86) | | | | (0.46) | | | | 3.58 | | | | 3.12 | |
| | | | | | | | | | | | | | | | | | | | | | | | |
| | | | | | |
Total from Investment Operations | | | 1.77 | | | | 3.65 | | | | (0.69) | | | | (0.32) | | | | 3.69 | | | | 3.29 | |
| | | | | | | | | | | | | | | | | | | | | | | | |
| | | | | |
Less Distributions to Shareholders from: | | | | | | | | | | | | | | | | | | | | | |
| | | | | | |
Net Investment Income | | | (0.16) | | | | (0.17) | | | | (0.14) | | | | (0.09) | | | | (0.08) | | | | (0.16) | |
Net Realized Gain | | | (1.09) | | | | - | | | | - | | | | (0.73) | | | | (1.09) | | | | (0.13) | |
| | | | | | | | | | | | | | | | | | | | | | | | |
| | | | | | |
Total Distributions | | | (1.25) | | | | (0.17) | | | | (0.14) | | | | (0.82) | | | | (1.17) | | | | (0.29) | |
| | | | | | | | | | | | | | | | | | | | | | | | |
| | | | | | |
Net Asset Value, End of Period | | | $18.66 | | | | $18.14 | | | | $14.66 | | | | $15.49 | | | | $16.63 | | | | $14.11 | |
| | | | | | | | | | | | | | | | | | | | | | | | |
| | | | | | |
Total Return(b) | | | 9.86%(c) | | | | 24.83% | | | | (4.42%) | | | | (1.48%) | | | | 26.89% | | | | 30.08% | |
| | | | | |
Ratios and Supplemental Data: | | | | | | | | | | | | | | | | | | | | | |
| | | | | | |
Net Assets, End of Period (in 000’s) | | | $795,538 | | | | $710,357 | | | | $558,286 | | | | $459,367 | | | | $407,192 | | | | $260,909 | |
| | | | | | |
Expenses Before Waivers and Reimbursements | | | 0.70%(d) | | | | 0.71% | | | | 0.71% | | | | 0.71% | | | | 0.71% | | | | 0.78% | |
| | | | | | |
Expenses After Waivers and Reimbursements | | | 0.60%(d) | | | | 0.60% | | | | 0.60% | | | | 0.60% | | | | 0.60% | | | | 0.60% | |
| | | | | | |
Net Investment Income After Waivers and Reimbursements | | | 0.98%(d) | | | | 1.00% | | | | 1.17% | | | | 0.88% | | | | 0.70% | | | | 1.36% | |
| | | | | | |
Portfolio Turnover Rate | | | 15%(c) | | | | 23% | | | | 24% | | | | 25% | | | | 31% | | | | 34% | |
| (a) | Per share amounts calculated based on the average daily shares outstanding during the period. |
| (b) | Total return would have been lower had various fees not been waived during the period. |
| (d) | Annualized for periods less than one year. |
See Notes to Financial Statements.
(for a share outstanding throughout each period indicated)
| | | | | | | | | | | | | | | | | | | | | | | | |
| OMNI TAX-MANAGED SMALL-CAP VALUE | | | | | | | | | | | | | | | | | | | | | | | | |
| | | For the
Period Ended
12/31/17 (Unaudited) | | | Year Ended June 30 | |
| | | | 2017 | | | 2016 | | | 2015 | | | 2014 | | | 2013 | |
| | | | | | | | | | | | | | | | | | | | | | | | |
Net Asset Value, Beginning of Period | | | $17.39 | | | | $14.04 | | | | $14.65 | | | | $15.54 | | | | $12.75 | | | | $10.05 | |
| | | | | | | | | | | | | | | | | | | | | | | | |
| | | | | |
Income from Investment Operations: | | | | | | | | | | | | | | | | | | | | | |
| | | | | | |
Net Investment Income(a) | | | 0.08 | | | | 0.17 | | | | 0.16 | | | | 0.12 | | | | 0.09 | | | | 0.15 | |
Net Realized and Unrealized Gain (Loss) | | | 1.49 | | | | 3.32 | | | | (0.66) | | | | (0.42) | | | | 3.26 | | | | 2.68 | |
| | | | | | | | | | | | | | | | | | | | | | | | |
| | | | | | |
Total from Investment Operations | | | 1.57 | | | | 3.49 | | | | (0.50) | | | | (0.30) | | | | 3.35 | | | | 2.83 | |
| | | | | | | | | | | | | | | | | | | | | | | | |
| | | | | |
Less Distributions to Shareholders from: | | | | | | | | | | | | | | | | | | | | | |
| | | | | | |
Net Investment Income | | | (0.23) | | | | (0.14) | | | | (0.11) | | | | (0.03) | | | | (0.08) | | | | (0.13) | |
Net Realized Gain | | | (0.83) | | | | - | | | | - | | | | (0.56) | | | | (0.48) | | | | - | |
| | | | | | | | | | | | | | | | | | | | | | | | |
| | | | | | |
Total Distributions | | | (1.06) | | | | (0.14) | | | | (0.11) | | | | (0.59) | | | | (0.56) | | | | (0.13) | |
| | | | | | | | | | | | | | | | | | | | | | | | |
| | | | | | |
Net Asset Value, End of Period | | | $17.90 | | | | $17.39 | | | | $14.04 | | | | $14.65 | | | | $15.54 | | | | $12.75 | |
| | | | | | | | | | | | | | | | | | | | | | | | |
| | | | | | |
Total Return(b) | | | 9.16%(c) | | | | 24.83% | | | | (3.42%) | | | | (1.62%) | | | | 26.71% | | | | 28.43% | |
| | | | | |
Ratios and Supplemental Data: | | | | | | | | | | | | | | | | | | | | | |
| | | | | | |
Net Assets, End of Period (in 000’s) | | | $712,770 | | | | $643,215 | | | | $505,995 | | | | $461,101 | | | | $425,330 | | | | $262,088 | |
| | | | | | |
Expenses Before Waivers and Reimbursements | | | 0.70%(d) | | | | 0.71% | | | | 0.72% | | | | 0.71% | | | | 0.71% | | | | 0.77% | |
| | | | | | |
Expenses After Waivers and Reimbursements | | | 0.60%(d) | | | | 0.60% | | | | 0.60% | | | | 0.60% | | | | 0.60% | | | | 0.60% | |
| | | | | | |
Net Investment Income After Waivers and Reimbursements | | | 0.92%(d) | | | | 1.04% | | | | 1.20% | | | | 0.84% | | | | 0.65% | | | | 1.34% | |
| | | | | | |
Portfolio Turnover Rate | | | 19%(c) | | | | 23% | | | | 29% | | | | 30% | | | | 25% | | | | 34% | |
| (a) | Per share amounts calculated based on the average daily shares outstanding during the period. |
| (b) | Total return would have been lower had various fees not been waived during the period. |
| (d) | Annualized for periods less than one year. |
See Notes to Financial Statements.
| | |
| 36 | | Semi-Annual Report | December 31, 2017 (Unaudited) |
| | |
NOTES TO FINANCIAL STATEMENTS | | |
December 31, 2017 (Unaudited)
1. Organization:
Bridgeway Funds, Inc. (“Bridgeway” or the “Company”) was organized as a Maryland corporation on October 19, 1993, and is registered under the Investment Company Act of 1940, as amended (the “1940 Act”), as an open-end management investment company.
Bridgeway is organized as a series fund, with 10 investment funds as of December 31, 2017 (each is referred to as a “Bridgeway Fund” and collectively, the “Bridgeway Funds”). The Aggressive Investors 1, Ultra-Small Company, Ultra-Small Company Market, Small-Cap Momentum, Small-Cap Growth, Small-Cap Value, Blue Chip 35 Index and Managed Volatility Funds are presented in a separate report. The Omni Small-Cap Value Fund and the Omni Tax-Managed Small-Cap Value Fund (each a “Fund” and together, the “Funds”) are presented in this report.
Bridgeway is authorized to issue 1,915,000,000 shares of common stock at $0.001 per share. As of December 31, 2017, 100,000,000 shares have been classified into the Aggressive Investors 1 Fund. 130,000,000 shares have been classified into the Blue Chip 35 Index Fund. 15,000,000 shares have been classified into the Ultra-Small Company Fund. 100,000,000 shares each have been classified into the Ultra-Small Company Market, Omni Small-Cap Value, Omni Tax-Managed Small-Cap Value, Small-Cap Momentum, Small-Cap Growth and Small-Cap Value Funds. 50,000,000 shares have been classified into the Managed Volatility Fund.
All of the Bridgeway Funds are no-load, diversified funds.
The Funds seek to provide long-term total return on capital, primarily through capital appreciation.
Bridgeway Capital Management, Inc. (the “Adviser”) is the investment adviser for all of the Bridgeway Funds.
2. Significant Accounting Policies:
The following summary of significant accounting policies, followed in the preparation of the financial statements of the Funds, are in conformity with accounting principles generally accepted in the United States of America (“GAAP”). Each Fund is considered an investment company under GAAP and follows the accounting and reporting guidance applicable to investment companies.
Securities and Other Investments Valuation Securities for which market quotations are readily available are valued at the last sale price on the national exchange on which such securities are primarily traded. In the case of securities reported on the National Association of Securities Dealers Automated Quotation (“NASDAQ”) system, the securities are valued based on the NASDAQ Official Closing Price (“NOCP”). In the absence of recorded sales on their home exchange, or NOCP, in the case of NASDAQ traded securities, the security will be valued as follows: bid prices for long positions and ask prices for short positions.
Investments in open-end registered investment companies and closed-end registered investment companies that do not trade on an exchange are valued at the end of day net asset value (“NAV”) per share.
Investments in closed-end registered investment companies that trade on an exchange are valued at the last sales price as of the close of the customary trading session on the exchange where the security is principally traded.
When market quotations are not readily available or when events occur that make established valuation methods unreliable, securities of the Funds may be valued at fair value as determined in good faith by or under the direction of the Board of Directors. The valuation assigned to a fair valued security for purposes of calculating the Funds’ NAV may differ from the security’s most recent closing market price and from the prices used by other mutual funds to calculate their NAVs.
| | |
NOTES TO FINANCIAL STATEMENTS (continued) | | |
December 31, 2017 (Unaudited)
The inputs and valuation techniques used to determine the value of a Fund’s investments are summarized into three levels as described in the hierarchy below:
| ● | | Level 1 — quoted prices in active markets for identical assets |
Investments whose values are based on quoted market prices in active markets, and whose values are therefore classified as Level 1 prices, include active listed equity securities. The Funds do not adjust the quoted price for such investments, even in situations where the Funds hold a large position and a sale could reasonably impact the quoted price.
| ● | | Level 2 — other significant observable inputs (including quoted prices for similar securities, interest rates, prepayment speeds, credit risk, etc.) |
Investments that trade in markets that are not considered to be active, but whose values are based on quoted market prices, dealer quotations or valuations provided by alternative pricing sources supported by observable inputs, are classified as Level 2 prices. These generally include certain U.S. Government and sovereign obligations, most government agency securities, investment-grade corporate bonds and less liquid listed equity securities. As investments whose values are classified as Level 2 prices include positions that are not traded in active markets and/or are subject to transfer restrictions, valuations may be adjusted to reflect illiquidity and/or non-transferability, which are generally based on available market information.
The Fidelity Investments Money Market Government Portfolio — Class I, which is held by the Funds, invests primarily in securities that are valued at amortized cost. Therefore, this investment is classified as a Level 2 investment.
| ● | | Level 3 — significant unobservable inputs (including the Funds’ own assumptions in determining the fair value of investments) |
Investments whose values are classified as Level 3 prices have significant unobservable inputs, as they may trade infrequently or not at all. When observable prices are not available for these securities, the Funds use one or more valuation techniques for which sufficient and reliable data is available. The inputs used by the Funds in estimating the value of Level 3 prices may include the original transaction price, quoted prices for similar securities or assets in active markets, completed or pending third-party transactions in the underlying investment or comparable issuers, and changes in financial ratios or cash flows. Level 3 prices may also be adjusted to reflect illiquidity and/or non-transferability, with the amount of such discount estimated by the Funds in the absence of market information. Assumptions used by the Funds due to the lack of observable inputs may significantly impact the resulting value and therefore the results of the Funds’ operations.
The inputs or methodology used for valuing investments are not necessarily an indication of the risk associated with investing in those investments. A summary of the inputs used to value the Funds’ investments as of December 31, 2017 is included with each Fund’s Schedule of Investments.
The Funds’ policy is to recognize transfers into, and transfers out of, each level of hierarchy as of the beginning of the reporting period. For the period ended December 31, 2017, there were no transfers from Level 1 to Level 2 or from Level 2 to Level 1 in any of the Funds. Details regarding material transfers into, and material transfers out of, Level 3, if any, can be found at the end of each Schedule of Investments for Funds that held Level 3 securities.
Securities Lending Upon lending its securities to third parties, each Fund receives compensation in the form of fees. The loans are secured by collateral at least equal to the fair value of the securities loaned plus accrued interest. Each Fund has the right under the lending agreement to recover the securities from the borrower on demand. Additionally, a Fund does not have the right to sell or repledge collateral received in the form of securities unless the borrower goes into default. The risks to a Fund of securities lending are that the borrower may not provide additional collateral when required or return the securities when due, resulting in a loss. Under the terms of the Securities Lending Agreement, the Funds are indemnified for such losses by the securities lending agent.
While securities are on loan, the Fund continues to receive dividends on the securities loaned and recognizes any gain or loss in the fair value of the securities loaned.
| | |
| 38 | | Semi-Annual Report | December 31, 2017 (Unaudited) |
| | |
NOTES TO FINANCIAL STATEMENTS (continued) | | |
December 31, 2017 (Unaudited)
Securities lending transactions are entered into by a Fund under a Securities Lending Agreement which provides the right, in the event of default (including bankruptcy or insolvency) for the non-defaulting party to liquidate the collateral or to offset the market value of the collateral received against the market value of the securities loaned. The value of the collateral is typically greater than that of the market value of the securities loaned, leaving the lender with a net amount payable to the defaulting party. However, bankruptcy or insolvency laws of a particular jurisdiction may impose restrictions on or prohibitions against such a right of offset in the event of a counterparty’s bankruptcy or insolvency.
The market value of securities on loan, all of which are classified as common stocks in the Funds’ Schedules of Investments, and the value of the related collateral are shown in the Statements of Assets and Liabilities as a component of Investments at value.
The following table is a summary of the Funds’ securities loaned and related collateral, which are subject to a netting agreement as of December 31, 2017:
| | | | | | | | | | | | | | | | | | | | | | | | |
| | | | | | | | | | | | Gross Amount Not
Offset in the Statement
of Assets and Liabilities | | | | |
| Fund | | Gross
Amounts of
Recognized
Assets | | | Gross Amounts
Offset in the
Statement of
Assets and
Liabilities | | | Net Amounts of
Assets Presented
in the Statement
of Assets and
Liabilities | | | Financial
Instruments | | | Cash
Collateral
Received1 | | | Net
Amount | |
| | | | | | |
| Omni Small-Cap Value | | | | | | | | | | | | | | | | | | | | | | | | |
Securities lending | | | $46,313,493 | | | | - | | | | $46,313,493 | | | | - | | | | $46,313,493 | | | | - | |
| | | | | | |
Omni Tax-Managed Small-Cap Value | | | | | | | | | | | | | | | | | | | | | | | | |
Securities lending | | | $48,652,736 | | | | - | | | | $48,652,736 | | | | - | | | | $48,652,736 | | | | - | |
| 1 | Collateral with a value of $48,224,394 and $50,678,658 has been received in connection with securities lending of Omni Small-Cap Value Fund and Omni Tax-Managed Small-Cap Value Fund, respectively. Excess of collateral received from an individual counterparty is not shown here for financial reporting purposes. |
It is each Fund’s policy to obtain additional collateral from or return excess collateral to the borrower by the end of the next business day following the valuation date of the securities loaned. Therefore, the value of the collateral held may be temporarily less than that required under the lending contract. As of December 31, 2017, the collateral consisted of an institutional government money market fund.
Use of Estimates in Financial Statements In preparing financial statements in conformity with GAAP, management makes estimates and assumptions that affect the reported amounts of assets and liabilities on the date of the financial statements and the disclosure of contingent assets and liabilities on the date of the financial statements, as well as the reported amounts of revenue and expenses during the reporting period. Actual results could differ from those estimates.
Risks and Uncertainties The Funds provide for various investment options, including stocks. Such investments are exposed to various risks, such as interest rate, market and credit risks. Due to the risks involved, it is at least reasonably possible that changes in risks in the near term would materially affect shareholders’ account values and the amounts reported in the financial statements.
Security Transactions, Investment Income and Expenses Security transactions are accounted for as of the trade date, the date the order to buy or sell is executed. Realized gains and losses are computed on the identified cost basis. Dividend income is recorded on the ex-dividend date, and interest income is recorded on the accrual basis from settlement date.
Bridgeway Funds’ expenses that are not series-specific are allocated to each series based upon its relative proportion of net assets to the Bridgeway Funds’ total net assets or other appropriate basis.
| | |
| NOTES TO FINANCIAL STATEMENTS (continued) | | |
December 31, 2017 (Unaudited)
Distributions to Shareholders The Funds pay dividends from net investment income and distribute realized capital gains annually, usually in December.
Indemnification Under the Company’s organizational documents, the Funds’ officers, directors, employees and agents are indemnified against certain liabilities that may arise out of the performance of their duties to the Funds. Additionally, in the normal course of business, the Funds enter into contracts that contain a variety of indemnification clauses. The Funds’ maximum exposure under these arrangements is unknown, as this would involve future claims that may be made against the Funds that have not yet occurred. However, the Funds have not had prior claims or losses pursuant to these contracts.
3. Advisory Fees, Other Related Party Transactions and Contingencies:
The Funds have entered into a management agreement with the Adviser. As compensation for the advisory services rendered, facilities furnished, and expenses borne by the Adviser, the Funds pay the Adviser a fee of 0.50% of the value of each Fund’s average daily net assets, computed daily and payable monthly.
Expense limitations: The Adviser has agreed to reimburse the Funds for operating expenses and advisory fees above the expense limitations shown in the table below, which are shown as a ratio of net expenses to average net assets, for each Fund, for the period ended December 31, 2017. Any material change to the expense limitation would require a vote by shareholders of the applicable Fund.
| | | | | | | | |
| Bridgeway Fund | | Expense
Limitation | | | Total Waivers
for Period Ending
12/31/17 | |
| | | | | | | | | |
| Omni Small-Cap Value* | | | 0.60% | | | | $368,681 | |
| Omni Tax-Managed Small-Cap Value* | | | 0.60% | | | | 351,595 | |
| | | | | | | | | |
*The Funds are authorized to reimburse the Adviser for management fees previously waived and/or for expenses previously reimbursed by the Adviser, provided, however, that any reimbursements must be paid at a date not more than three years after the Adviser waived the fees or reimbursed the expenses and that the reimbursements do not cause the Funds to exceed the expense limitation in effect at the time of the waiver or the current expense limitation, if different. The Omni Small-Cap Value Fund has recoupable expenses of $271,353, $561,512, $716,803, and $368,681 which expire no later than June 30, 2018, June 30, 2019, June 30, 2020, and December 31, 2020 respectively. The Omni Tax-Managed Small-Cap Value Fund has recoupable expenses of $254,089, $547,245, $674,880, and $351,595 which expire no later than June 30, 2018, June 30, 2019, June 30, 2020, and December 31, 2020 respectively.
Other Related Party Transactions: The Bridgeway Funds will engage in inter-portfolio trades with other Bridgeway Funds when it is to the benefit of both parties. The Board of Directors reviews and approves these trades quarterly. Inter-portfolio purchases and sales for the Funds during the period ended December 31, 2017 were as follows:
| | | | | | |
| Bridgeway Fund | | Inter-Portfolio
Purchases | | | Inter-Portfolio
Sales |
| | | | | | |
| Omni Small-Cap Value | | | $11,657,947 | | | $4,658,980 |
| Omni Tax-Managed Small-Cap Value | | | 8,835,000 | | | 8,695,295 |
The Adviser entered into an Administrative Services Agreement with Bridgeway Funds, pursuant to which the Adviser provides various administrative services to the Funds including, but not limited to: (i) supervising and managing various aspects of the Funds’ business and affairs; (ii) selecting, overseeing and/or coordinating activities with other service providers to the Funds; (iii) providing reports to the Board of Directors as requested from time to time; (iv) assisting and/or reviewing amendments and updates to the Funds’ registration statement and other filings with the Securities and Exchange Commission (“SEC”); (v) providing certain shareholder services; (vi) providing administrative support in connection with meetings of the Board of Directors; and (vii) providing certain record-keeping services. Effective July 1, 2017, for its services to all of the Bridgeway Funds, the Adviser is paid an aggregate annual fee of $775,000, payable in equal monthly installments. During the
| | |
| 40 | | Semi-Annual Report | December 31, 2017 (Unaudited) |
| | |
NOTES TO FINANCIAL STATEMENTS (continued) | | |
December 31, 2017 (Unaudited)
period ended December 31, 2017, the allocation of this expense to the Omni Small-Cap Value and Omni Tax-Managed Small-Cap Value Funds was $104,041 and $93,857, respectively.
Board of Directors Compensation Independent Directors are paid an annual retainer of $15,000, with an additional retainer of $5,000 paid to the Independent Chairman of the Board and an additional retainer of $1,000 paid to the Nominating and Corporate Governance Committee Chair. The retainer is paid in quarterly installments. Effective November 9, 2017, Independent Directors are paid $9,000 per meeting for meeting fees. Prior to November 9, 2017, Independent Directors were paid $8,500 per meeting. Such compensation is the total compensation from all Bridgeway Funds and is allocated among the Bridgeway Funds.
Each Independent Director receives this compensation in the form of shares of the Bridgeway Funds, credited to his or her account. Such Directors are reimbursed for any expenses incurred in attending meetings and conferences, as well as expenses for subscriptions or printed materials. The amount of Directors’ fees attributable to each Fund is disclosed in the Statement of Operations.
One director of Bridgeway, John Montgomery, is an owner and director of the Adviser. Under the 1940 Act definitions, he is considered to be an “affiliated person” of the Adviser and an “interested person” of the Adviser and of Bridgeway. Compensation for Mr. Montgomery is borne by the Adviser rather than the Bridgeway Funds.
4. Distribution Agreement:
Foreside Fund Services, LLC acts as distributor of the Funds’ shares pursuant to a Distribution Agreement dated May 31, 2017. The Adviser pays all costs and expenses associated with distribution of the Funds’ shares, pursuant to a protective plan adopted by shareholders pursuant to Rule 12b-1.
5. Purchases and Sales of Investment Securities:
Purchases and sales of investments, other than short-term securities, for each Fund for the period ended December 31, 2017 were as follows:
| | | | | | | | | | | | | | | | | | | | |
| | | Purchases | | Sales |
| | | U.S. Government | | Other | | U.S. Government | | Other |
| | | | | | | | | | | | | | | | | | | | |
| Omni Small-Cap Value | | | | $ - | | | | $ | 135,697,445 | | | | $ | - | | | | $ | 115,981,120 | |
| Omni Tax-Managed Small-Cap Value | | | | - | | | | | 141,175,700 | | | | | - | | | | | 127,024,909 | |
6. Federal Income Taxes
It is the Funds’ policy to continue to comply with the provisions of the Internal Revenue Code of 1986, as amended (“Internal Revenue Code”), applicable to regulated investment companies, and to distribute income to the extent necessary so that such Fund is not subject to federal income tax. Therefore, no federal income tax provision is required.
Unrealized Appreciation and Depreciation on Investments (Tax Basis) The amount of net unrealized appreciation/ depreciation and the cost of investment securities for tax purposes, including short-term securities at December 31, 2017, were as follows:
| | | | | | | | | | |
| | | Omni Small-Cap Value | | Omni Tax-Managed Small-Cap Value |
| Gross appreciation (excess of value over tax cost) | | | $ | 227,151,403 | | | | $ | 204,405,413 | |
| Gross depreciation (excess of tax cost over value) | | | | (18,941,586 | ) | | | | (14,371,120 | ) |
| Net unrealized appreciation | | | $ | 208,209,817 | | | | $ | 190,034,293 | |
| Cost of investments for income tax purposes | | | $ | 637,585,789 | | | | $ | 579,288,891 | |
The differences between book and tax net unrealized appreciation (depreciation) are due to wash sale loss deferrals and basis adjustments on passive foreign investment companies (PFICs) and partnerships.
| | |
| NOTES TO FINANCIAL STATEMENTS (continued) | | |
December 31, 2017 (Unaudited)
Classifications of Distributions Net investment income (loss) and net realized gain (loss) may differ for financial statement and tax purposes. The character of distributions made during the year from net investment income or net realized gains may differ from its ultimate characterization for federal income tax purposes.
The tax character of the distributions paid by the Funds during the fiscal years ended June 30, 2017 and 2016, is as follows:
| | | | | | | | | | | | | | | | |
| | | Omni
Small-Cap Value | | | Omni Tax-Managed
Small-Cap Value | |
| | | Year
Ended
June 30, 2017 | | | Year
Ended
June 30, 2016 | | | Year
Ended
June 30, 2017 | | | Year
Ended
June 30, 2016 | |
Distributions paid from: | | | | | | | | | | | | | | | | |
Ordinary Income | | | $6,191,149 | | | | $4,704,613 | | | | $4,983,381 | | | | $3,274,284 | |
Total | | | $6,191,149 | | | | $4,704,613 | | | | $4,983,381 | | | | $3,274,284 | |
Components of Accumulated Earnings As of June 30, 2017, the components of accumulated earnings on a tax basis were:
| | | | | | | | | | |
| | | Omni
Small-Cap Value | | Omni Tax-Managed
Small-Cap Value |
| Undistributed Net Investment Income | | $ 2,734,016 | | | $ | 5,702,122 | |
| Undistributed Net Realized Gain on Investments | | 28,516,636 | | | | 20,989,187 | |
| Net Unrealized Appreciation of Investments | | 173,459,195 | | | | 165,622,435 | |
| Total | | $204,709,847 | | | $ | 192,313,744 | |
For the fiscal year June 30, 2017, the Funds recorded the following reclassifications to the accounts listed below:
| | | | | | | | |
| | | Increase (Decrease) | |
| | | Omni
Small-Cap Value | | | Omni Tax-Managed
Small-Cap Value | |
Paid-in Capital | | | $1,844,385 | | | | $1,240,344 | |
Undistributed Net Investment Income | | | (521,813 | ) | | | (495,865 | ) |
Undistributed Net Realized Gain on Investments | | | (1,322,572 | ) | | | (744,479 | ) |
The difference between book and tax components of net assets and the resulting reclassifications were primarily a result of the differing book/tax treatment of the deduction of equalization debits for tax purposes and investments in passive foreign investment companies (PFICs), partnerships and business development companies.
Accounting for Uncertainty in Income Taxes sets forth a minimum threshold for financial statement recognition of the benefit of a tax position taken or expected to be taken in a tax return. Management has analyzed each Fund’s tax positions and has concluded that no provision for income tax is required in any Fund’s financial statements. The Funds are not aware of any tax position for which it is reasonably possible that the total amounts of unrecognized tax benefits will significantly change in the next twelve months. Each Fund’s federal tax returns for the prior three fiscal years remain subject to examination by the Internal Revenue Service.
7. Line of Credit
Bridgeway established a line of credit agreement (“Facility”) with The Bank of New York Mellon, effective November 5, 2010. The Facility is for temporary or emergency purposes, such as to provide liquidity for shareholder redemptions, and is cancellable by either party. Unless cancelled earlier, the Facility shall be held available until September 13, 2018. Advances under the Facility are limited to $15,000,000 in total for all Bridgeway Funds, and advances to each Bridgeway Fund shall not exceed certain limits set forth in the credit agreement, including, but not limited to, the maximum amount a Bridgeway Fund is permitted to borrow under the 1940 Act.
| | |
| 42 | | Semi-Annual Report | December 31, 2017 (Unaudited) |
| | |
NOTES TO FINANCIAL STATEMENTS (continued) | | |
December 31, 2017 (unaudited)
The Bridgeway Funds incur a commitment fee of 0.085% per annum on the unused portion of the Facility and interest expense to the extent of amounts borrowed under the Facility. Interest is based on the “Overnight Rate” plus 1.25%. The Overnight Rate means the higher of (a) the Federal Funds rate, (b) the Overnight Eurodollar Rate, or (c) the One-month Euro-dollar Rate. The commitment fees are payable quarterly in arrears and are allocated to all participating Bridgeway Funds. Interest expense is charged directly to each Bridgeway Fund, based upon actual amounts borrowed by such Bridgeway Fund.
For the period ended December 31, 2017, borrowings by the Funds under this line of credit were as follows:
| | | | | | | | | | | | | | | | | | | | |
| Bridgeway Fund | | Weighted
Average
Interest Rate | | | Weighted
Average
Loan Balance | | | Number of
Days
Outstanding | | | Interest
Expense
Incurred1 | | | Maximum Amount
Borrowed During
the Period | |
| | | | | | | | | | | | | | | | | | | | |
| Omni Small-Cap Value | | | 2.55% | | | | $ 943,000 | | | | 23 | | | | $1,517 | | | | $2,917,000 | |
Omni Tax-Managed Small-Cap Value | | | 2.59% | | | | 1,622,233 | | | | 30 | | | | 3,448 | | | | 3,119,000 | |
| 1 Interest expense is included on the Statements of Operations in Miscellaneous expenses. | |
8. Subsequent Events
Management has evaluated the impact of all subsequent events on the Funds and has determined that there were no subsequent events requiring recognition or disclosure in the financial statements.
| | |
| OTHER INFORMATION | | |
December 31, 2017 (unaudited)
1. Proxy Voting
Fund policies and procedures used in determining how to vote proxies relating to the Funds’ securities and a summary of proxies voted by the Funds for the period ended June 30, 2017 are available without a charge, upon request, by contacting Bridgeway Funds at 1-800-661-3550 and on the SEC’s website at http://www.sec.gov.
2. Fund Holdings
The complete schedule of the Funds’ holdings for the second and fourth quarters of each fiscal year are contained in the Funds’ Semi-Annual and Annual Shareholder Reports, respectively.
The Bridgeway Funds file complete schedules of the Funds’ holdings with the SEC for the first and third quarters of each fiscal year on Form N-Q within 60 days after the end of the period. Copies of the Funds’ Form N-Q are available without charge, upon request, by contacting Bridgeway Funds at 1-800-661-3550 and on the SEC’s website at http://www.sec.gov. You may also review and copy Form N-Q at the SEC’s Public Reference Room in Washington, D.C. For more information about the operation of the Public Reference Room, please call 1-800-SEC-0330.
| | |
| 44 | | Semi-Annual Report | December 31, 2017 (Unaudited) |
| | |
| DISCLOSURE OF FUND EXPENSES | | |
December 31, 2017 (unaudited)
As a shareholder of a Fund, you will incur no transaction costs from such Fund, including sales charges (loads) on purchases, on reinvested dividends, or on other distributions. There are no exchange fees. However, as a shareholder of a Fund, you will incur ongoing costs, including management fees and other Fund expenses. The following examples are intended to help you understand your ongoing costs (in dollars) of investing in a Fund and to compare these costs with ongoing costs of investing in other mutual funds. The examples are based on an investment of $1,000 invested on July 1, 2017 and held until December 31, 2017.
Actual Expenses. The first line of the table below provides information about actual account values and actual expenses. You may use the information in this line, together with the amount you invested, to estimate the expenses that you paid over the period. Simply divide your account value by $1,000 (for example, an $8,600 account value divided by $1,000 = 8.6), then multiply the result by the number in the first line under the heading “Expenses Paid During Period” to estimate the expenses you paid on your account during the period.
Hypothetical Example for Comparison Purposes. The second line of the table below provides information about hypothetical account values and hypothetical expenses based on the Fund’s actual expense ratio and an assumed rate of return of 5% per year before expenses, which is not the Fund’s actual return. The hypothetical account values and expenses may not be used to estimate the actual ending account balance or expenses you paid for the period. You may use this information to compare the ongoing costs of investing in a Fund and other mutual funds. To do so, compare this 5%hypothetical example with the 5% hypothetical examples that appear in the shareholder reports of other funds.
The expenses shown in the table are meant to highlight ongoing Fund costs only. Therefore, the second line of the table is useful in comparing ongoing costs only and will not help you determine the relative total costs of owning different funds, because other funds may also have transaction costs, such as sales charges, redemption fees or exchange fees.
| | | | | | | | | | | | | | | | | | | | |
| | | Beginning Account
Value at 7/1/17 | | Ending Account
Value at 12/31/17 | | Expense
Ratio | | Expenses Paid During Period* 7/1/17 - 12/31/17 |
| | | | |
| Bridgeway Omni Small-Cap Value | | | | | | | | | | | | | | | | | | | | |
| Actual Fund Return | | | | $1,000.00 | | | | | $1,098.60 | | | | | 0.60% | | | | | $3.17 | |
Hypothetical Fund Return | | | | $1,000.00 | | | | | $1,022.18 | | | | | 0.60% | | | | | $3.06 | |
| | | | |
| Bridgeway Omni Tax-Managed Small-Cap Value | | | | | | | | | | | | | | | | | | | | |
| Actual Fund Return | | | | $1,000.00 | | | | | $1,091.60 | | | | | 0.60% | | | | | $3.16 | |
Hypothetical Fund Return | | | | $1,000.00 | | | | | $1,022.18 | | | | | 0.60% | | | | | $3.06 | |
| * | Expenses are equal to the average account value times the Fund’s annualized expense ratio multiplied by the number of days in the most recent six-month period (184) divided by the number of days in the fiscal year (365). |
THIS PAGE INTENTIONALLY LEFT BLANK
| | | | |
| | | | |
| | | | |
| | | | |
| | | | |
| | | | |
| | BRIDGEWAY FUNDS, INC. | | |
| | |
| | BNY Mellon Investment Servicing (US) Inc. | | |
| | P.O. Box 9860 | | |
| | Providence, RI 02940-8060 | | |
| | |
| | CUSTODIAN | | |
| | |
| | The Bank of New York Mellon | | |
| | One Wall Street | | |
| | New York, NY 10286 | | |
| | |
| | DISTRIBUTOR | | |
| | |
| | Foreside Fund Services, LLC | | |
| | Three Canal Plaza, Suite 100 | | |
| | Portland, ME 04101 | | |
| | You can review and copy information about our Funds (including the SAI) at the SEC’s Public Reference Room in Washington, D.C. To find out more about this public service, call the SEC at 800-SEC-0330. Reports and other information about the Funds are also available on the SEC’s website at www.sec.gov. You can receive copies of this information, for a fee, by writing the Public Reference Section, Securities and Exchange Commission, Washington, D.C. 20549-1520 or by sending an electronic request to the following email address: publicinfo@sec.gov. | | |
Item 2. Code of Ethics.
Not applicable.
Item 3. Audit Committee Financial Expert.
Not applicable.
Item 4. Principal Accountant Fees and Services.
Not applicable.
Item 5. Audit Committee of Listed Registrants.
Not applicable.
Item 6. Investments.
| (a) | Schedule of Investments in securities of unaffiliated issuers as of the close of the reporting period is included as part of the report to shareholders filed under Item 1 of this form. |
| Item 7. | Disclosure of Proxy Voting Policies and Procedures for Closed-End Management Investment Companies. |
Not applicable.
Item 8. Portfolio Managers of Closed-End Management Investment Companies.
Not applicable.
| Item 9. | Purchases of Equity Securities by Closed-End Management Investment Company and Affiliated Purchasers. |
Not applicable.
Item 10. Submission of Matters to a Vote of Security Holders.
There have been no material changes to the procedures by which the shareholders may recommend nominees to the Registrant’s Board of Directors, where those changes were implemented after the registrant last provided disclosure in response to the requirements of Item 407(c)(2)(iv) of Regulation S-K (17 CFR 229.407) (as required by Item 22(b)(15) of Schedule 14A (17 CFR 240.14a-101)), or this Item.
Item 11. Controls and Procedures.
| | (a) | The registrant’s principal executive officer and principal financial officer, or persons performing similar functions, have concluded that the registrant’s disclosure controls and procedures (as defined in Rule 30a-3(c) under the Investment Company Act of 1940, as amended (the “1940 Act”) (17 CFR 270.30a-3(c))) are effectively designed, as of a date within 90 days of the filing date of the report that includes the disclosure required by this paragraph, based on their evaluation of these controls and procedures required by Rule 30a-3(b) under the 1940 Act (17 CFR 270.30a-3(b)) and Rules 13a-15(b) or 15d-15(b) under the Securities Exchange Act of 1934, as amended (17 CFR 240.13a-15(b) or 240.15d-15(b)). |
| | (b) | There were no changes in the registrant’s internal control over financial reporting (as defined in Rule 30a-3(d) under the Act (17 CFR 270.30a-3(d))) that occurred during the registrant’s last fiscal quarter that have materially affected or are reasonably likely to materially affect, the registrant’s internal control over financial reporting. |
| Item 12. | Disclosure of Securities Lending Activities for Closed-End Management Investment Companies. |
Not applicable.
Item 13. Exhibits.
| | (a)(2) | Certifications pursuant to Rule 30a-2(a) under the 1940 Act and Section 302 of the Sarbanes-Oxley Act of 2002 are attached hereto. |
| | (b) | Certifications pursuant to Rule 30a-2(b) under the 1940 Act and Section 906 of the Sarbanes-Oxley Act of 2002 are attached hereto. |
SIGNATURES
Pursuant to the requirements of the Securities Exchange Act of 1934 and the Investment Company Act of 1940, the registrant has duly caused this report to be signed on its behalf by the undersigned, thereunto duly authorized.
| | |
(Registrant) Bridgeway Funds, Inc. |
|
By (Signature and Title)* /s/ Tammira Philippe |
Tammira Philippe, President and Principal Executive Officer |
(principal executive officer) |
|
Date 3/8/2018 |
Pursuant to the requirements of the Securities Exchange Act of 1934 and the Investment Company Act of 1940, this report has been signed below by the following persons on behalf of the registrant and in the capacities and on the dates indicated.
| | |
By (Signature and Title)* /s/ Tammira Philippe |
Tammira Philippe, President and Principal Executive Officer |
(principal executive officer) |
|
Date 3/8/2018 |
|
By (Signature and Title)* /s/ Linda G. Giuffré |
Linda G. Giuffré, Treasurer and Principal Financial Officer |
(principal financial officer) |
|
Date 3/8/2018 |
| * | Print the name and title of each signing officer under his or her signature. |